
| 2023-12-31 | 2023-09-30 | 2023-06-30 | 2023-03-31 | 2022-12-31 | 2022-09-30 | 2022-06-30 | 2022-03-31 | 2021-12-31 | 2021-09-30 | 2021-06-30 | 2021-03-31 | 2020-12-31 | 2020-09-30 | 2020-06-30 | 2020-03-31 | 2019-12-31 | 2019-09-30 | 2019-06-30 | 2019-03-31 | 2018-12-31 | 2018-09-30 | 2018-06-30 | 2018-03-31 | 2017-12-31 | 2017-09-30 | 2017-06-30 | 2017-03-31 | 2016-12-31 | 2016-09-30 | 2016-06-30 | 2016-03-31 | 2015-12-31 | 2015-09-30 | ||
|---|---|---|---|---|---|---|---|---|---|---|---|---|---|---|---|---|---|---|---|---|---|---|---|---|---|---|---|---|---|---|---|---|---|---|---|
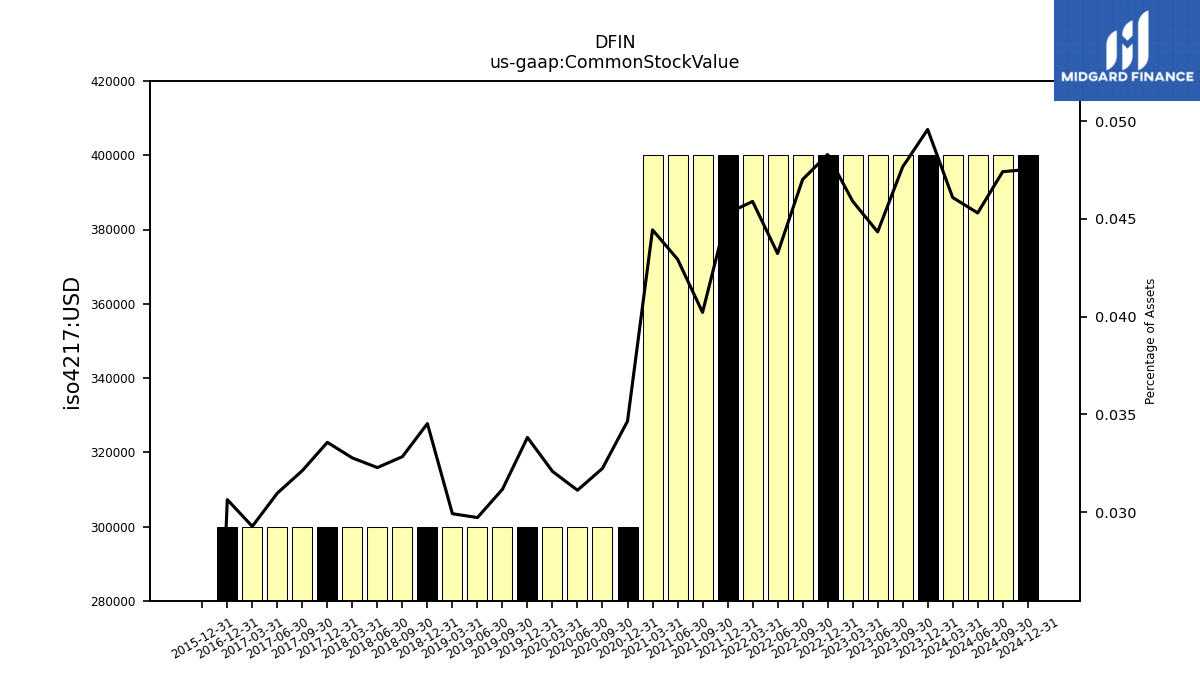
| Common Stock Value | 0.40 | 0.40 | 0.40 | 0.40 | 0.40 | 0.40 | 0.40 | 0.40 | 0.40 | 0.40 | 0.40 | 0.40 | 0.30 | 0.30 | 0.30 | 0.30 | 0.30 | 0.30 | 0.30 | 0.30 | 0.30 | 0.30 | 0.30 | 0.30 | 0.30 | 0.30 | 0.30 | 0.30 | 0.30 | NA | NA | NA | 0.00 | NA | |
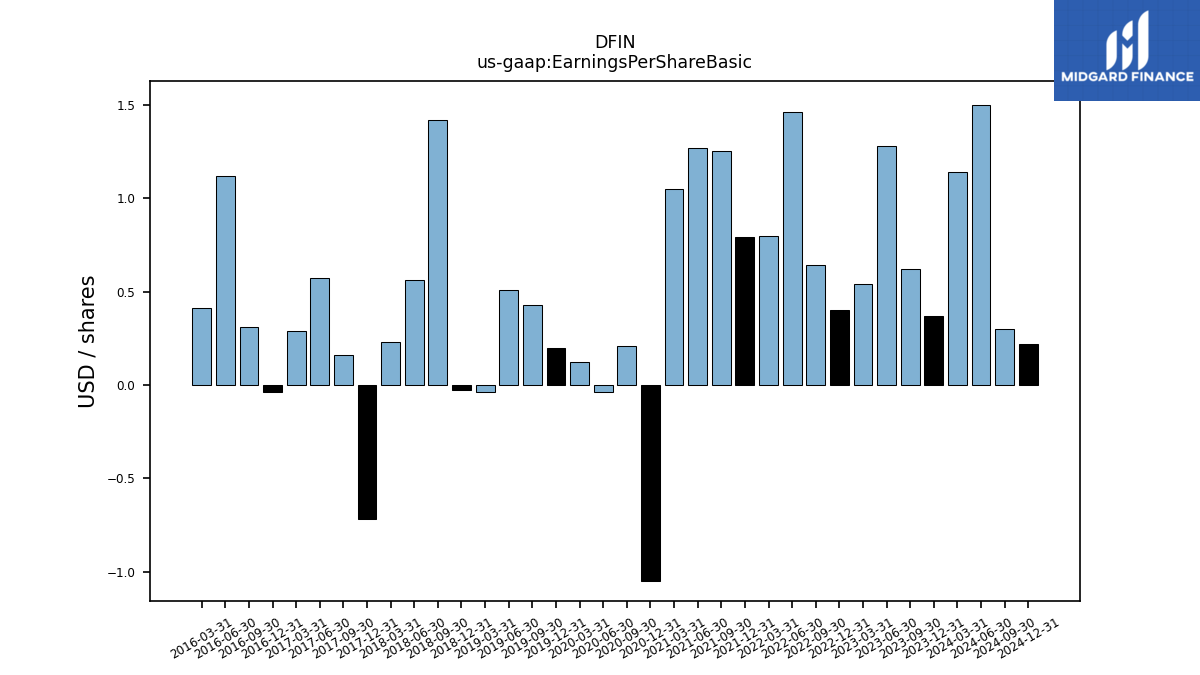
| Earnings Per Share Basic | 0.37 | 0.62 | 1.28 | 0.54 | 0.40 | 0.64 | 1.46 | 0.80 | 0.79 | 1.25 | 1.27 | 1.05 | -1.05 | 0.21 | -0.04 | 0.12 | 0.20 | 0.43 | 0.51 | -0.04 | -0.03 | 1.42 | 0.56 | 0.23 | -0.72 | 0.16 | 0.57 | 0.29 | -0.04 | 0.31 | 1.12 | 0.41 | NA | NA | |
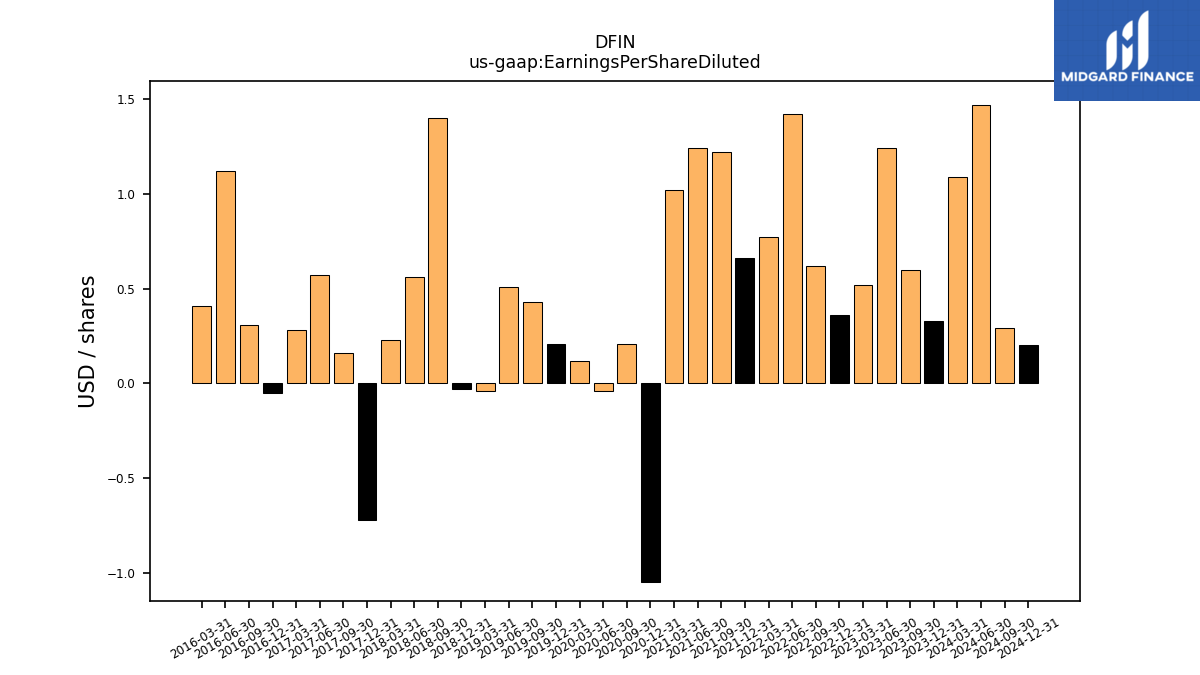
| Earnings Per Share Diluted | 0.33 | 0.60 | 1.24 | 0.52 | 0.36 | 0.62 | 1.42 | 0.77 | 0.66 | 1.22 | 1.24 | 1.02 | -1.05 | 0.21 | -0.04 | 0.12 | 0.21 | 0.43 | 0.51 | -0.04 | -0.03 | 1.40 | 0.56 | 0.23 | -0.72 | 0.16 | 0.57 | 0.28 | -0.05 | 0.31 | 1.12 | 0.41 | NA | NA |
| 2023-12-31 | 2023-09-30 | 2023-06-30 | 2023-03-31 | 2022-12-31 | 2022-09-30 | 2022-06-30 | 2022-03-31 | 2021-12-31 | 2021-09-30 | 2021-06-30 | 2021-03-31 | 2020-12-31 | 2020-09-30 | 2020-06-30 | 2020-03-31 | 2019-12-31 | 2019-09-30 | 2019-06-30 | 2019-03-31 | 2018-12-31 | 2018-09-30 | 2018-06-30 | 2018-03-31 | 2017-12-31 | 2017-09-30 | 2017-06-30 | 2017-03-31 | 2016-12-31 | 2016-09-30 | 2016-06-30 | 2016-03-31 | 2015-12-31 | 2015-09-30 | ||
|---|---|---|---|---|---|---|---|---|---|---|---|---|---|---|---|---|---|---|---|---|---|---|---|---|---|---|---|---|---|---|---|---|---|---|---|
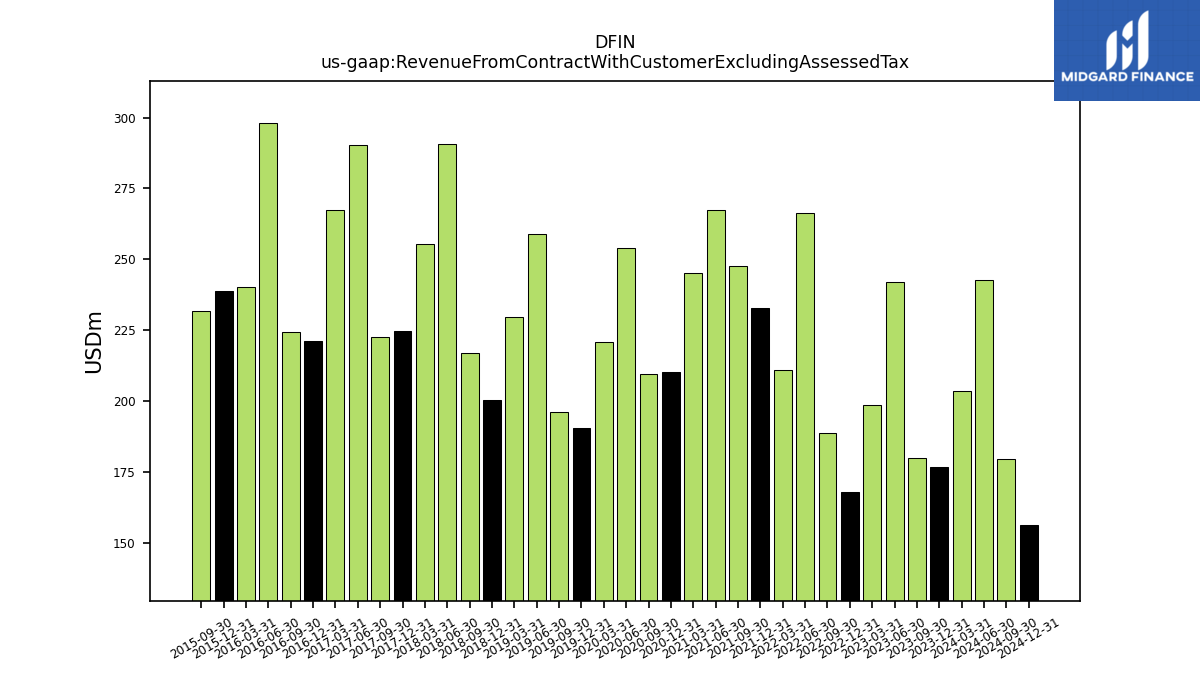
| Revenue From Contract With Customer Excluding Assessed Tax | 176.50 | 180.00 | 242.10 | 198.60 | 167.70 | 188.70 | 266.20 | 211.00 | 232.80 | 247.70 | 267.50 | 245.30 | 210.30 | 209.50 | 254.00 | 220.70 | 190.30 | 195.90 | 258.90 | 229.60 | 200.30 | 216.90 | 290.60 | 255.20 | 224.80 | 222.60 | 290.20 | 267.30 | 221.00 | 224.40 | 298.00 | 240.10 | 238.60 | 231.60 | |
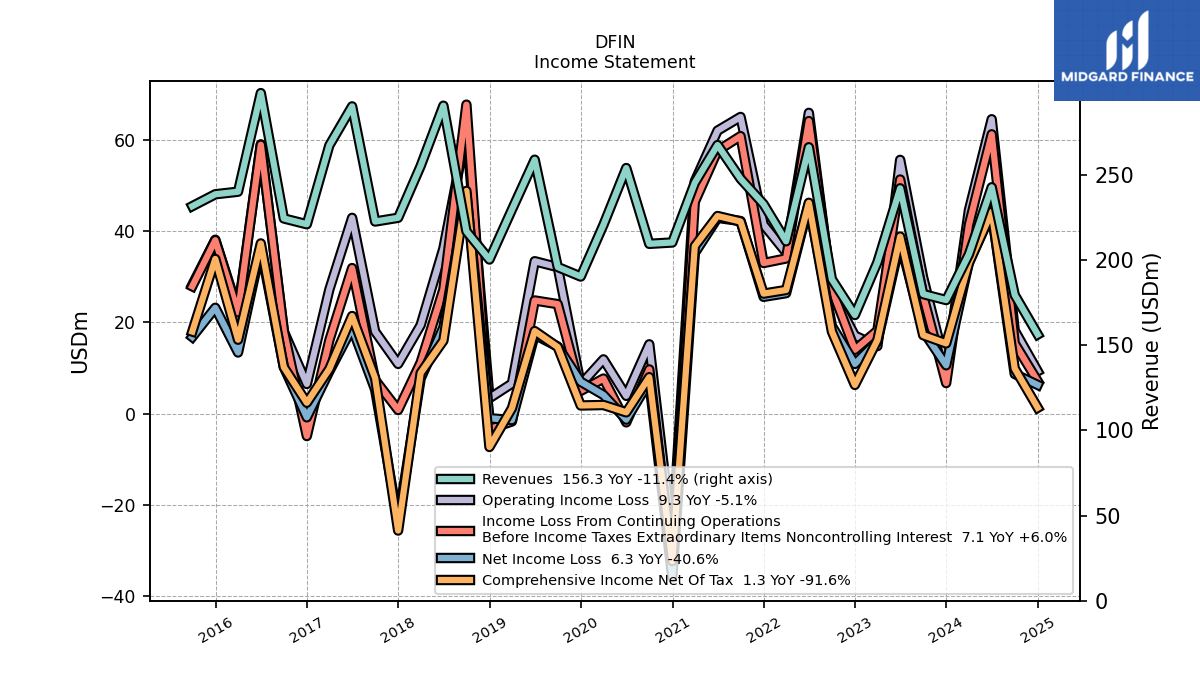
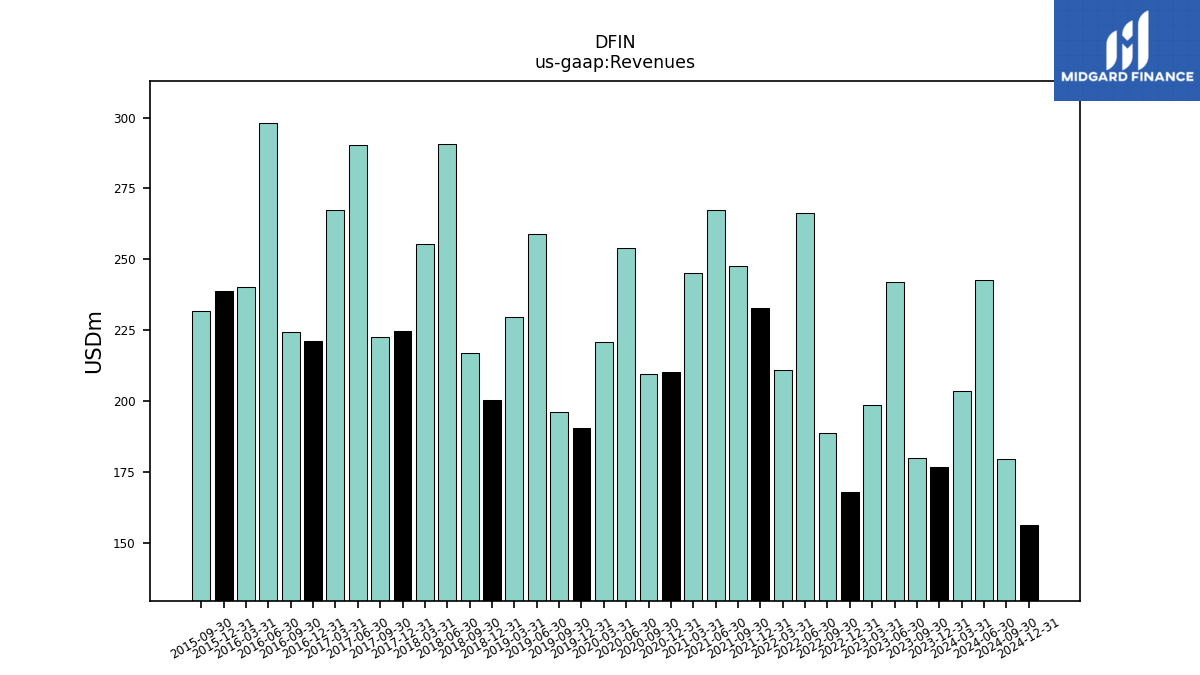
| Revenues | 176.50 | 180.00 | 242.10 | 198.60 | 167.70 | 188.70 | 266.20 | 211.00 | 232.80 | 247.70 | 267.50 | 245.30 | 210.30 | 209.50 | 254.00 | 220.70 | 190.30 | 195.90 | 258.90 | 229.60 | 200.30 | 216.90 | 290.60 | 255.20 | 224.80 | 222.60 | 290.20 | 267.30 | 221.00 | 224.40 | 298.00 | 240.10 | 238.60 | 231.60 | |
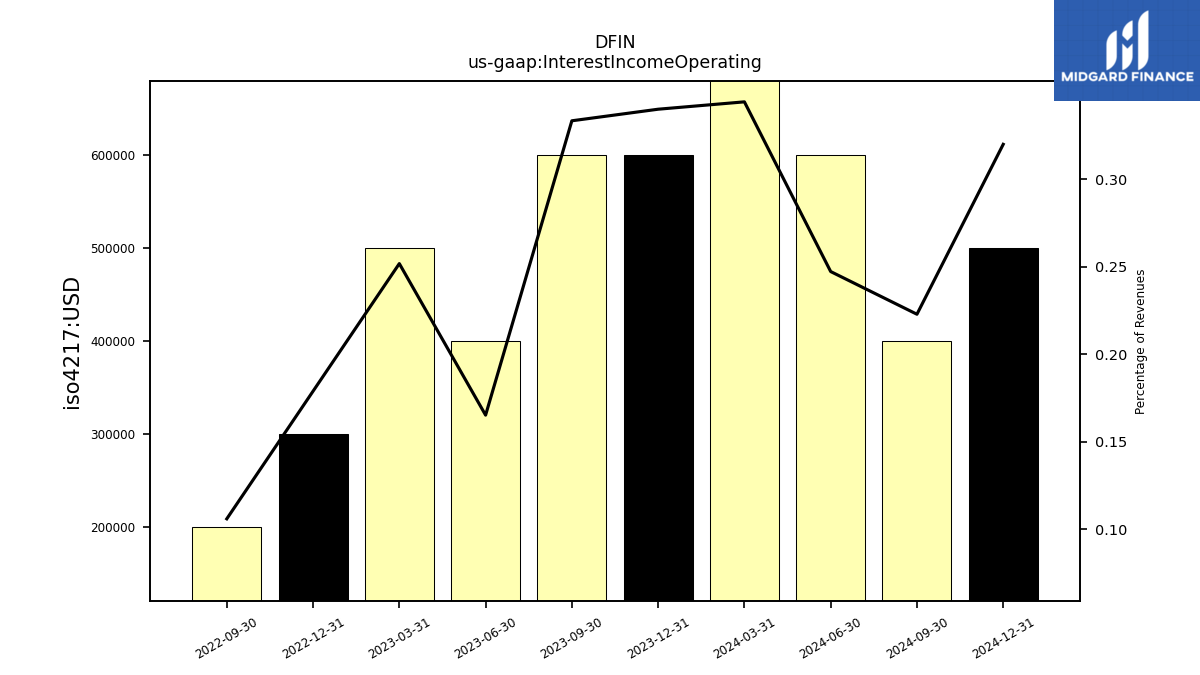
| Interest Income Operating | 0.60 | 0.60 | NA | NA | 0.30 | 0.20 | NA | NA | NA | NA | NA | NA | NA | NA | NA | NA | NA | NA | NA | NA | NA | NA | NA | NA | NA | NA | NA | NA | NA | NA | NA | NA | NA | NA | |
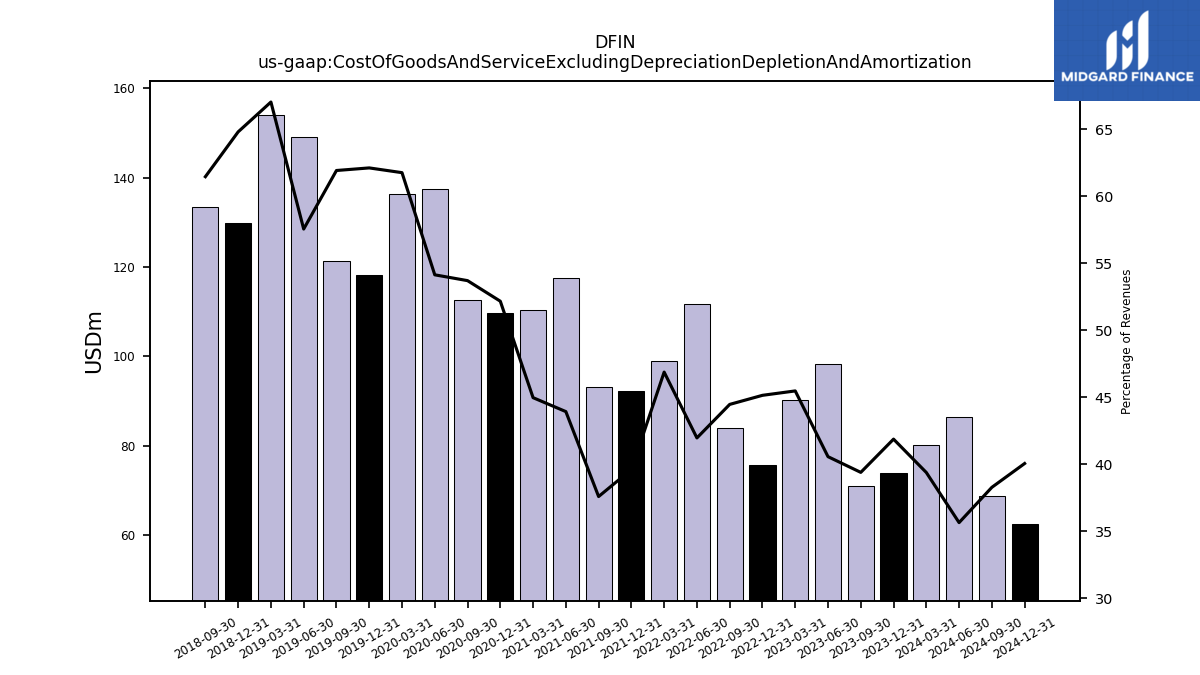
| Cost Of Goods And Service Excluding Depreciation Depletion And Amortization | 73.90 | 70.90 | 98.20 | 90.30 | 75.70 | 83.90 | 111.70 | 98.90 | 92.20 | 93.10 | 117.50 | 110.30 | 109.70 | 112.50 | 137.50 | 136.30 | 118.20 | 121.30 | 149.00 | 153.90 | 129.80 | 133.30 | NA | NA | NA | NA | NA | NA | NA | NA | NA | NA | NA | NA | |
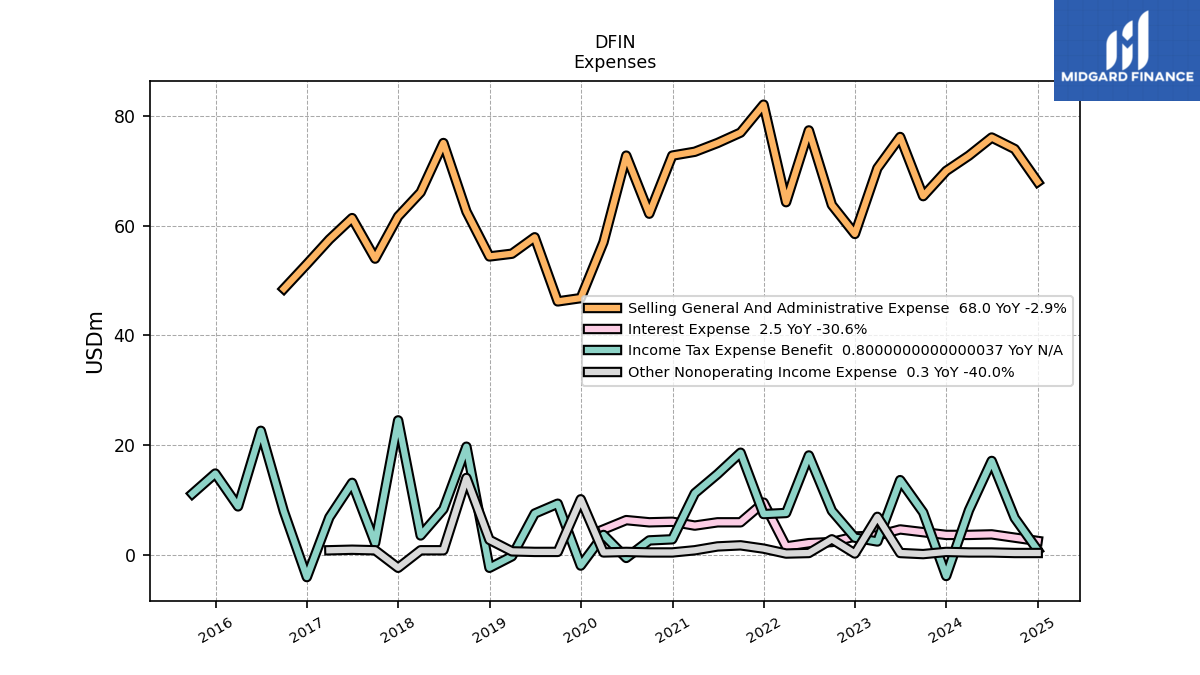
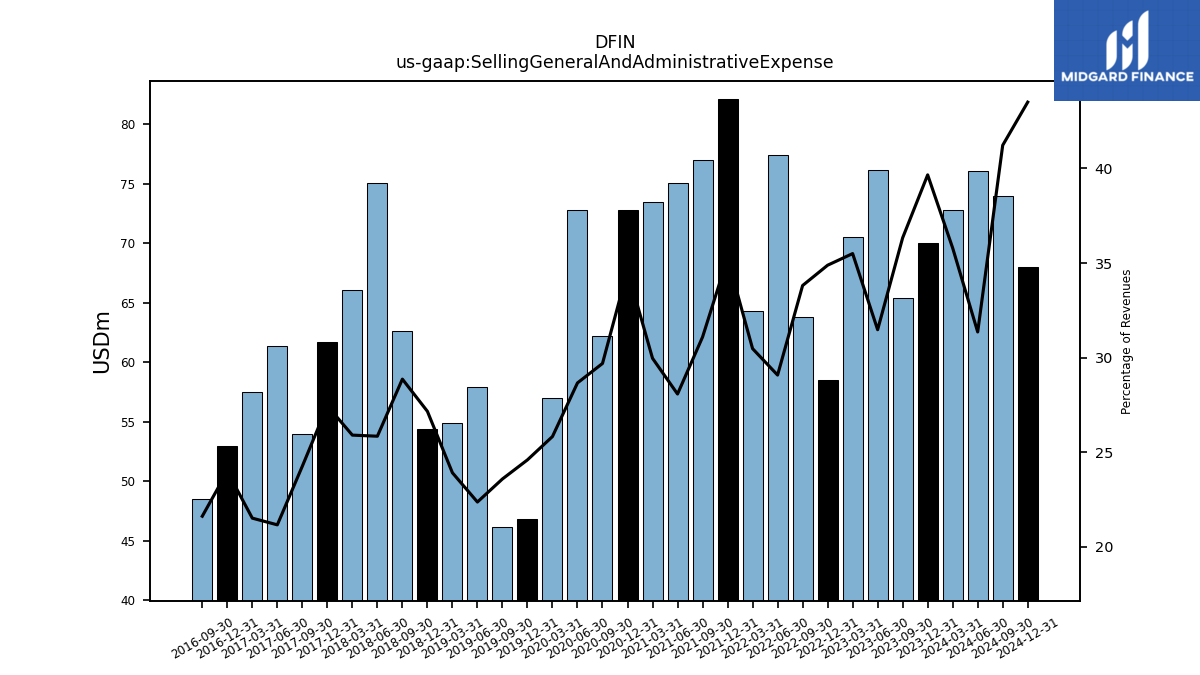
| Selling General And Administrative Expense | 70.00 | 65.40 | 76.20 | 70.50 | 58.50 | 63.80 | 77.40 | 64.30 | 82.10 | 77.00 | 75.10 | 73.50 | 72.80 | 62.20 | 72.80 | 57.00 | 46.80 | 46.20 | 57.90 | 54.90 | 54.40 | 62.60 | 75.10 | 66.10 | 61.70 | 54.00 | 61.40 | 57.50 | 53.00 | 48.50 | NA | NA | NA | NA | |
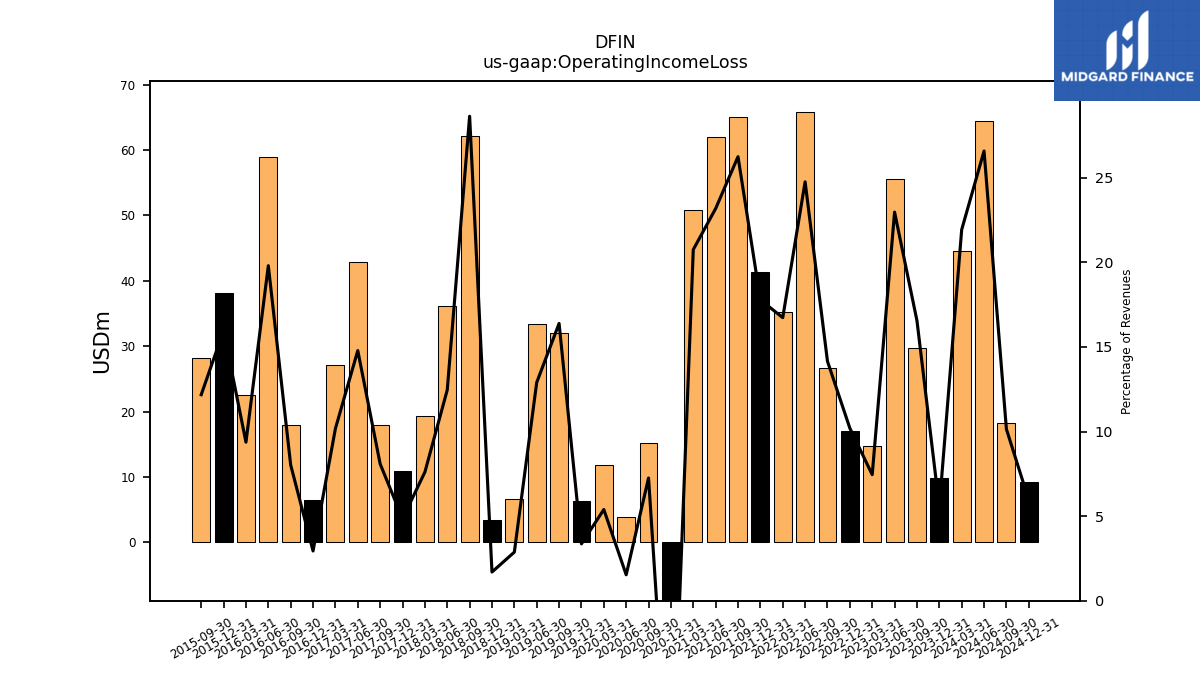
| Operating Income Loss | 9.80 | 29.80 | 55.60 | 14.80 | 17.10 | 26.70 | 65.90 | 35.30 | 41.40 | 65.00 | 62.00 | 50.90 | -27.40 | 15.20 | 3.90 | 11.90 | 6.40 | 32.10 | 33.40 | 6.60 | 3.40 | 62.10 | 36.20 | 19.40 | 10.90 | 18.00 | 42.90 | 27.20 | 6.50 | 18.00 | 59.00 | 22.50 | 38.10 | 28.20 | |
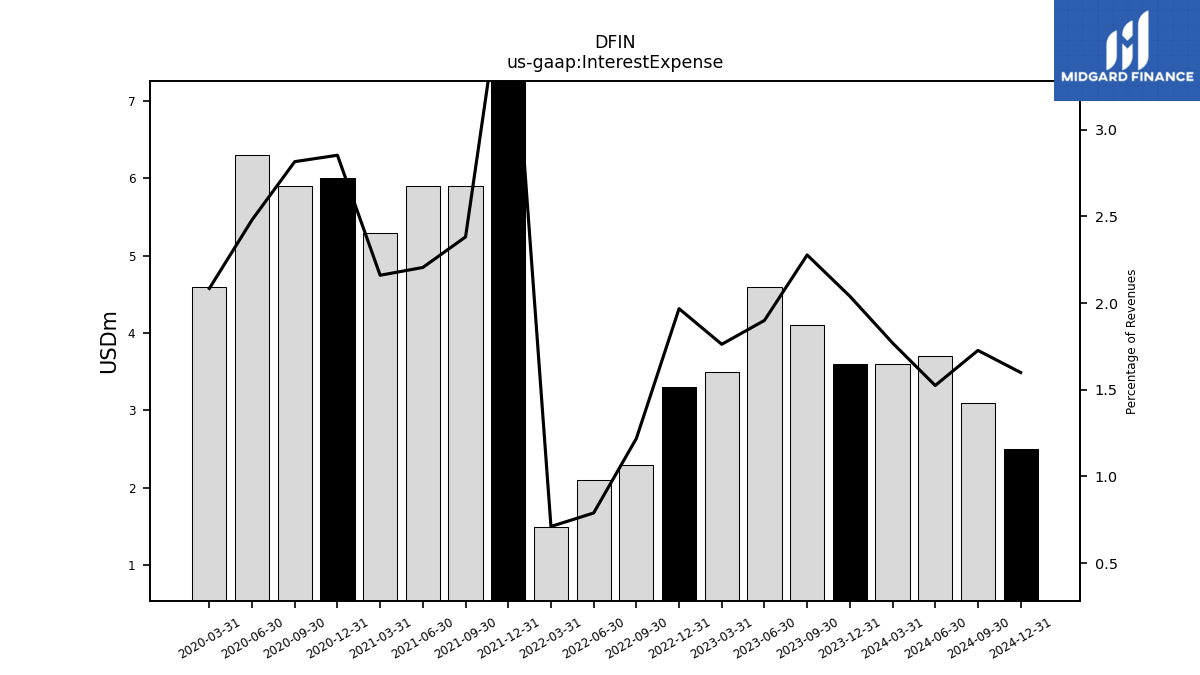
| Interest Expense | 3.60 | 4.10 | 4.60 | 3.50 | 3.30 | 2.30 | 2.10 | 1.50 | 9.50 | 5.90 | 5.90 | 5.30 | 6.00 | 5.90 | 6.30 | 4.60 | NA | NA | NA | NA | NA | NA | NA | NA | NA | NA | NA | NA | NA | NA | NA | NA | NA | NA | |
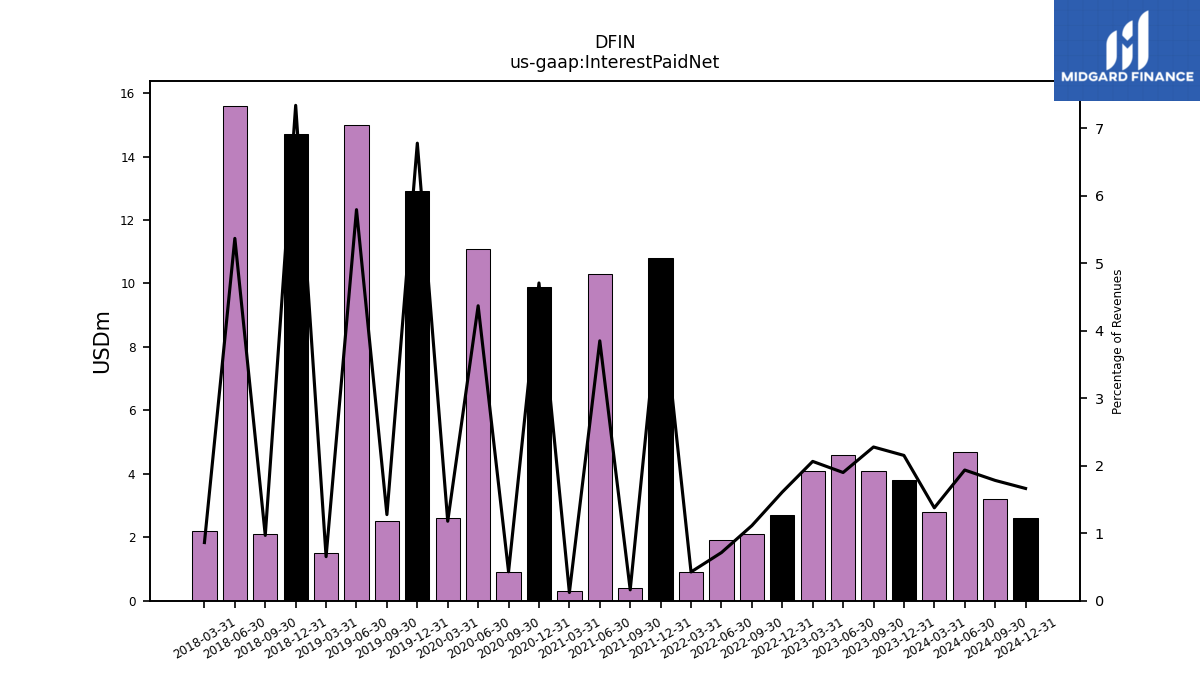
| Interest Paid Net | 3.80 | 4.10 | 4.60 | 4.10 | 2.70 | 2.10 | 1.90 | 0.90 | 10.80 | 0.40 | 10.30 | 0.30 | 9.90 | 0.90 | 11.10 | 2.60 | 12.90 | 2.50 | 15.00 | 1.50 | 14.70 | 2.10 | 15.60 | 2.20 | NA | NA | NA | NA | NA | NA | NA | NA | NA | NA | |
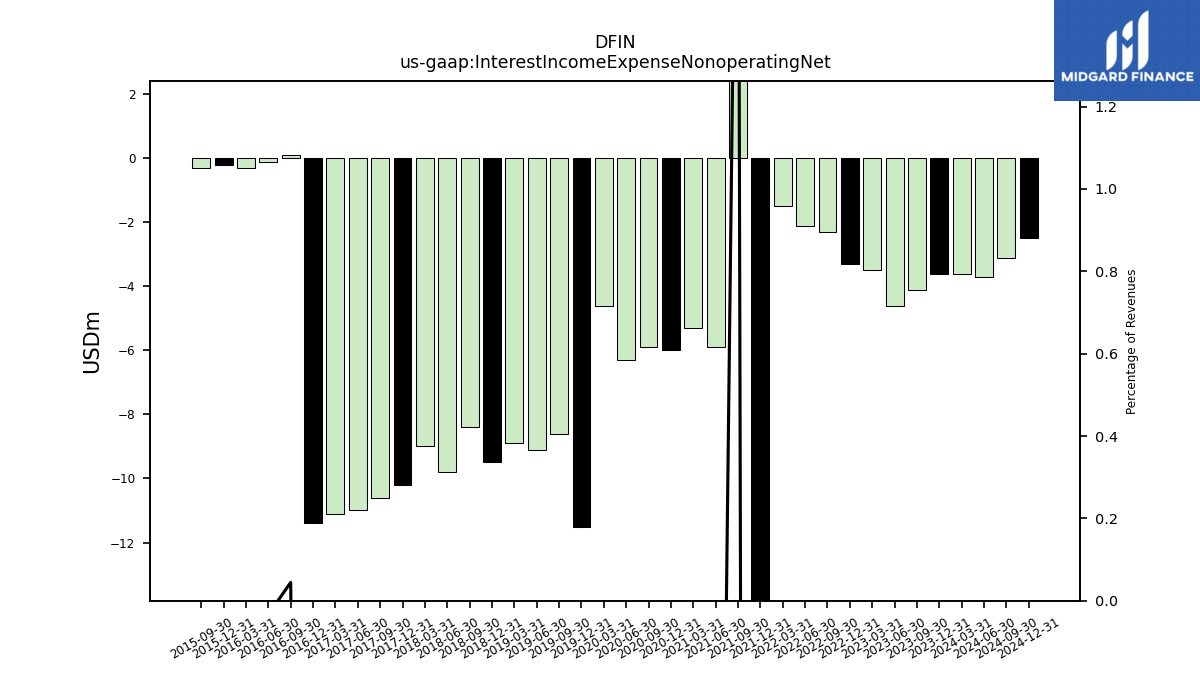
| Interest Income Expense Nonoperating Net | -3.60 | -4.10 | -4.60 | -3.50 | -3.30 | -2.30 | -2.10 | -1.50 | -43.70 | 5.90 | -5.90 | -5.30 | -6.00 | -5.90 | -6.30 | -4.60 | -11.50 | -8.60 | -9.10 | -8.90 | -9.50 | -8.40 | -9.80 | -9.00 | -10.20 | -10.60 | -11.00 | -11.10 | -11.40 | 0.10 | -0.10 | -0.30 | -0.20 | -0.30 | |
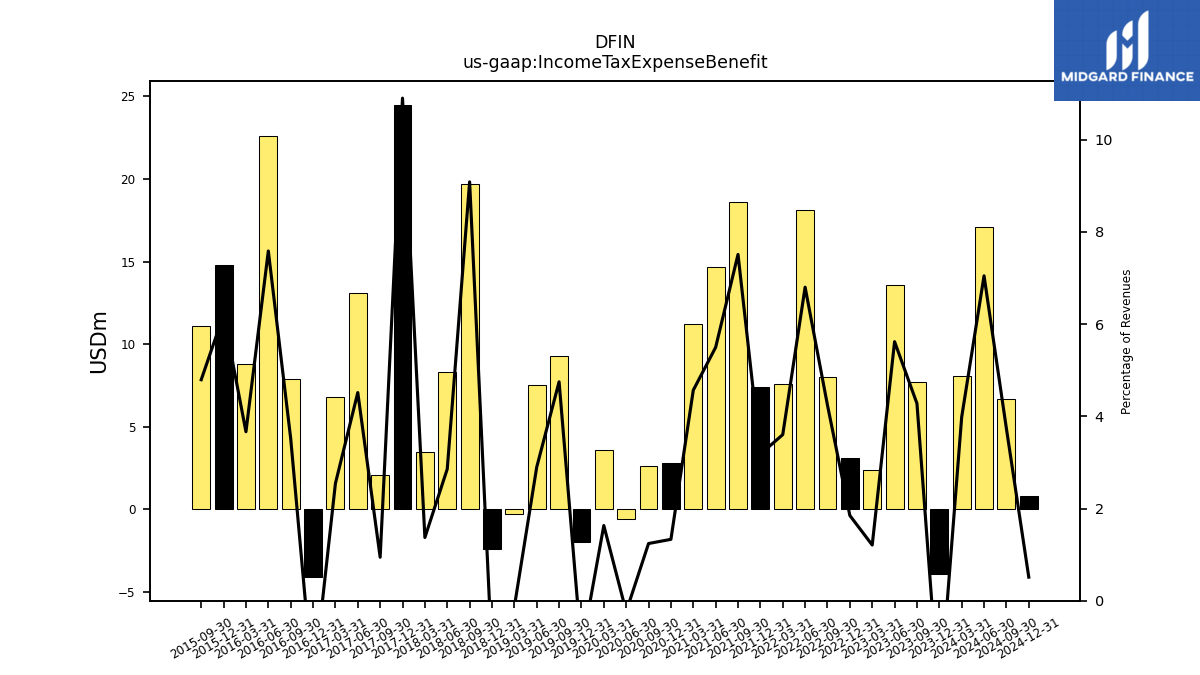
| Income Tax Expense Benefit | -3.90 | 7.70 | 13.60 | 2.40 | 3.10 | 8.00 | 18.10 | 7.60 | 7.40 | 18.60 | 14.70 | 11.20 | 2.80 | 2.60 | -0.60 | 3.60 | -2.00 | 9.30 | 7.50 | -0.30 | -2.40 | 19.70 | 8.30 | 3.50 | 24.50 | 2.10 | 13.10 | 6.80 | -4.10 | 7.90 | 22.60 | 8.80 | 14.80 | 11.10 | |
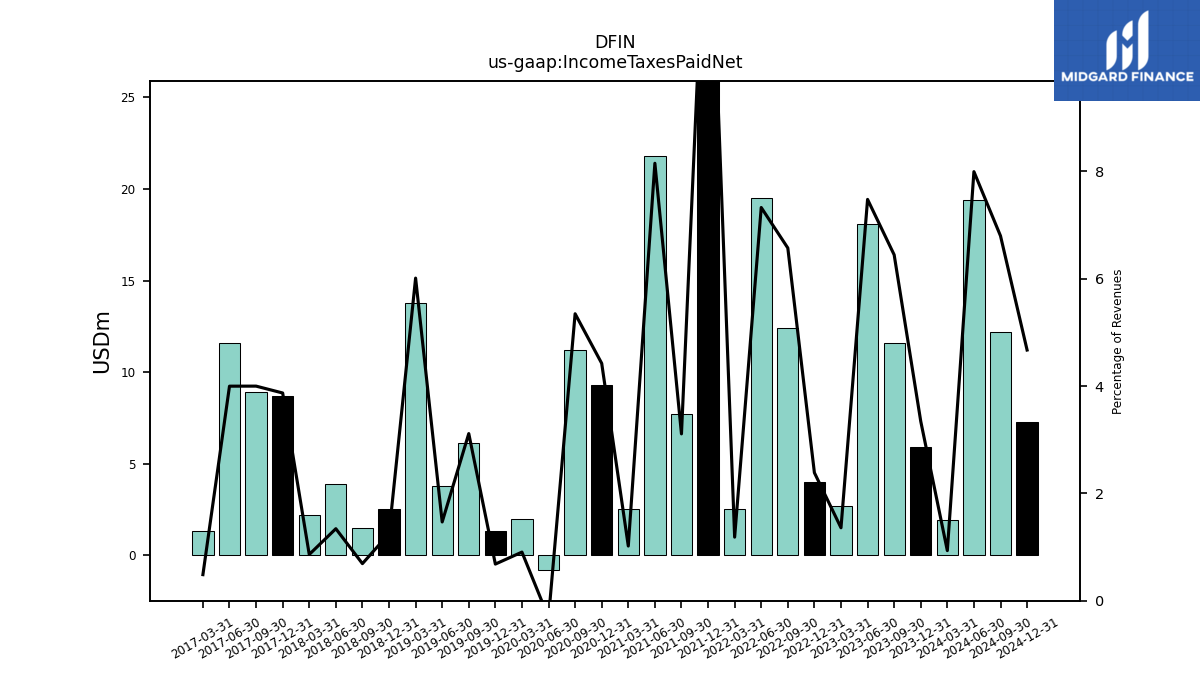
| Income Taxes Paid Net | 5.90 | 11.60 | 18.10 | 2.70 | 4.00 | 12.40 | 19.50 | 2.50 | 33.00 | 7.70 | 21.80 | 2.50 | 9.30 | 11.20 | -0.80 | 2.00 | 1.30 | 6.10 | 3.80 | 13.80 | 2.50 | 1.50 | 3.90 | 2.20 | 8.70 | 8.90 | 11.60 | 1.30 | NA | NA | NA | NA | NA | NA | |
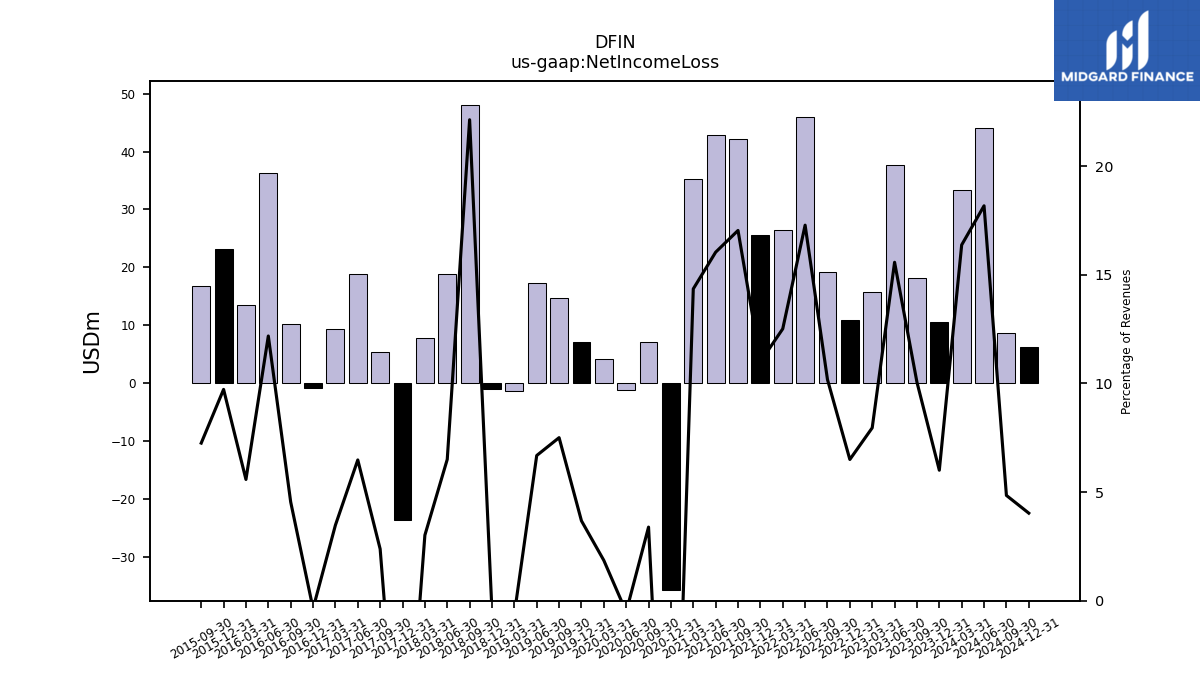
| Net Income Loss | 10.60 | 18.10 | 37.70 | 15.80 | 10.90 | 19.20 | 46.00 | 26.40 | 25.60 | 42.20 | 42.90 | 35.20 | -35.80 | 7.10 | -1.30 | 4.10 | 7.00 | 14.70 | 17.30 | -1.40 | -1.00 | 48.00 | 18.90 | 7.70 | -23.70 | 5.30 | 18.80 | 9.30 | -0.80 | 10.20 | 36.30 | 13.40 | 23.20 | 16.80 | |
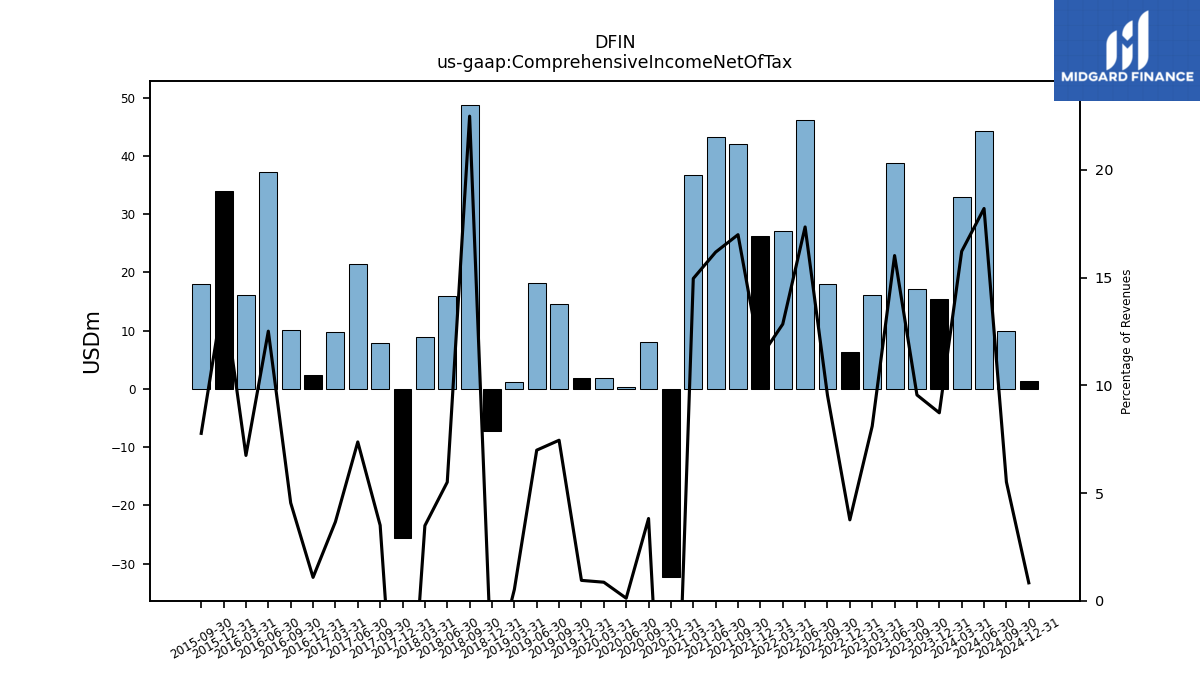
| Comprehensive Income Net Of Tax | 15.40 | 17.20 | 38.80 | 16.10 | 6.30 | 18.00 | 46.20 | 27.10 | 26.30 | 42.10 | 43.30 | 36.70 | -32.30 | 8.00 | 0.30 | 1.90 | 1.80 | 14.60 | 18.10 | 1.20 | -7.30 | 48.80 | 16.00 | 8.90 | -25.60 | 7.80 | 21.40 | 9.80 | 2.40 | 10.20 | 37.30 | 16.20 | 33.90 | 18.00 |
| 2023-12-31 | 2023-09-30 | 2023-06-30 | 2023-03-31 | 2022-12-31 | 2022-09-30 | 2022-06-30 | 2022-03-31 | 2021-12-31 | 2021-09-30 | 2021-06-30 | 2021-03-31 | 2020-12-31 | 2020-09-30 | 2020-06-30 | 2020-03-31 | 2019-12-31 | 2019-09-30 | 2019-06-30 | 2019-03-31 | 2018-12-31 | 2018-09-30 | 2018-06-30 | 2018-03-31 | 2017-12-31 | 2017-09-30 | 2017-06-30 | 2017-03-31 | 2016-12-31 | 2016-09-30 | 2016-06-30 | 2016-03-31 | 2015-12-31 | 2015-09-30 | ||
|---|---|---|---|---|---|---|---|---|---|---|---|---|---|---|---|---|---|---|---|---|---|---|---|---|---|---|---|---|---|---|---|---|---|---|---|
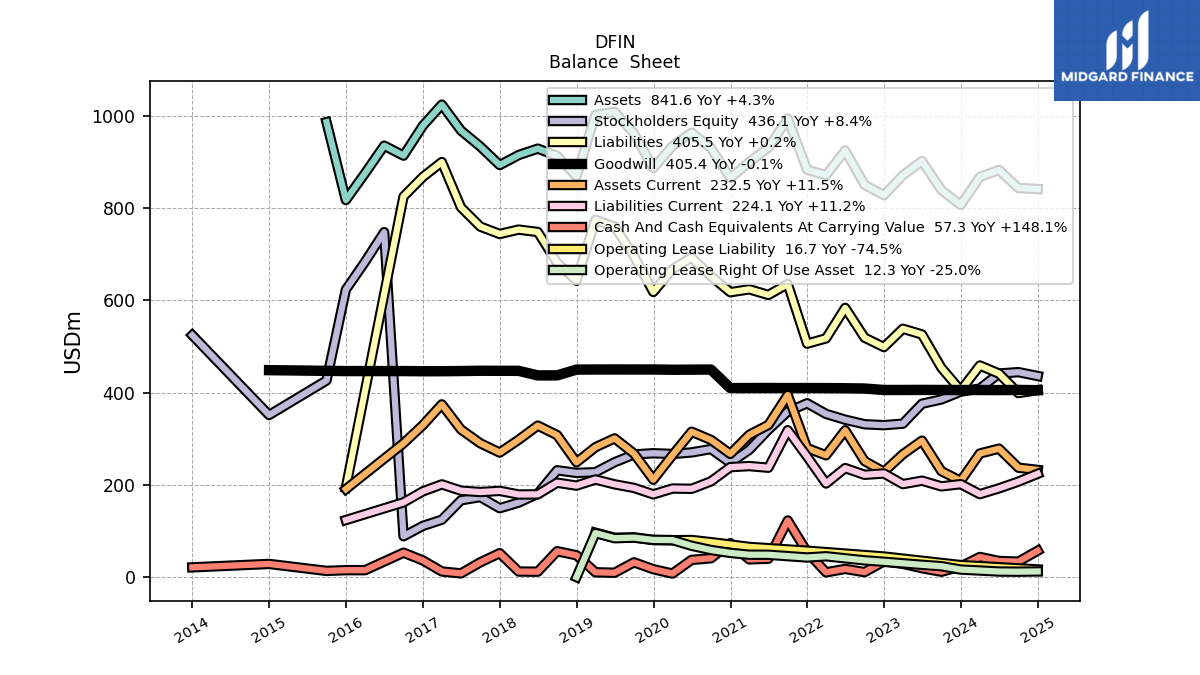
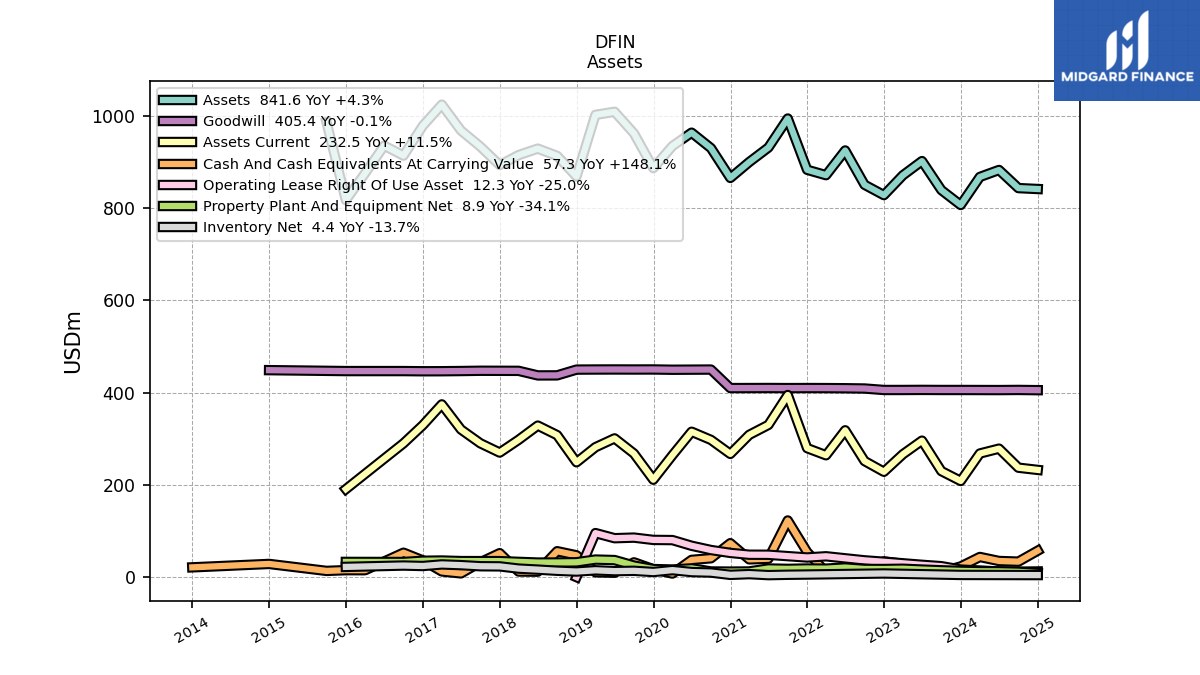
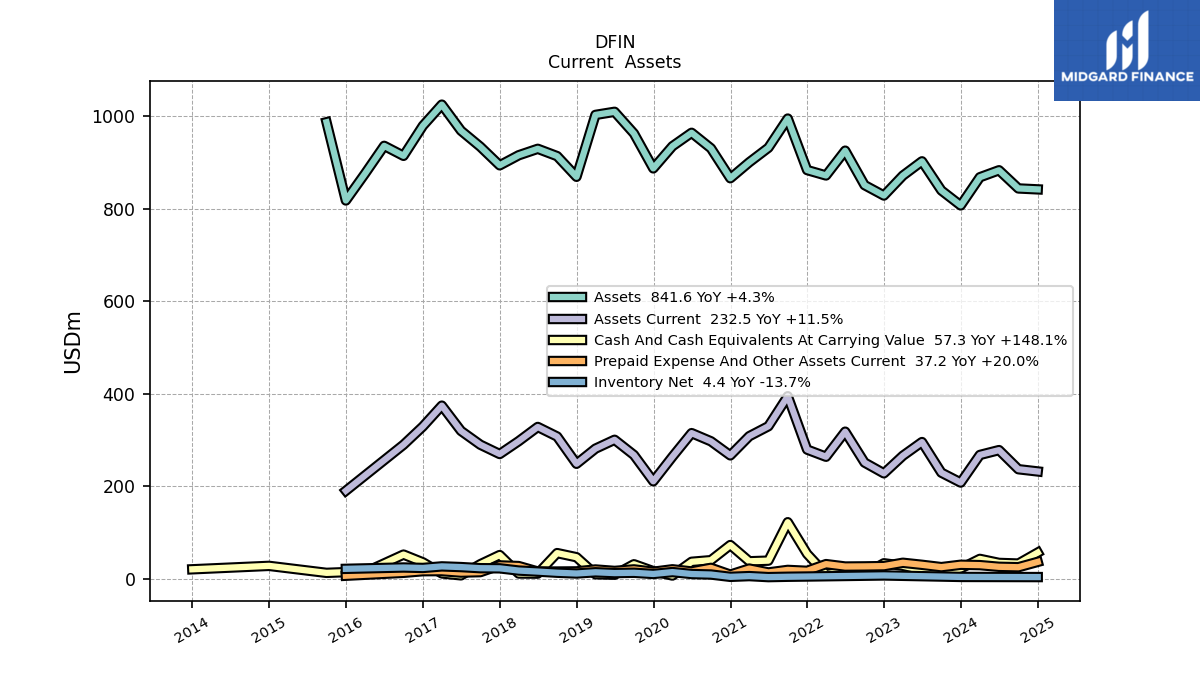
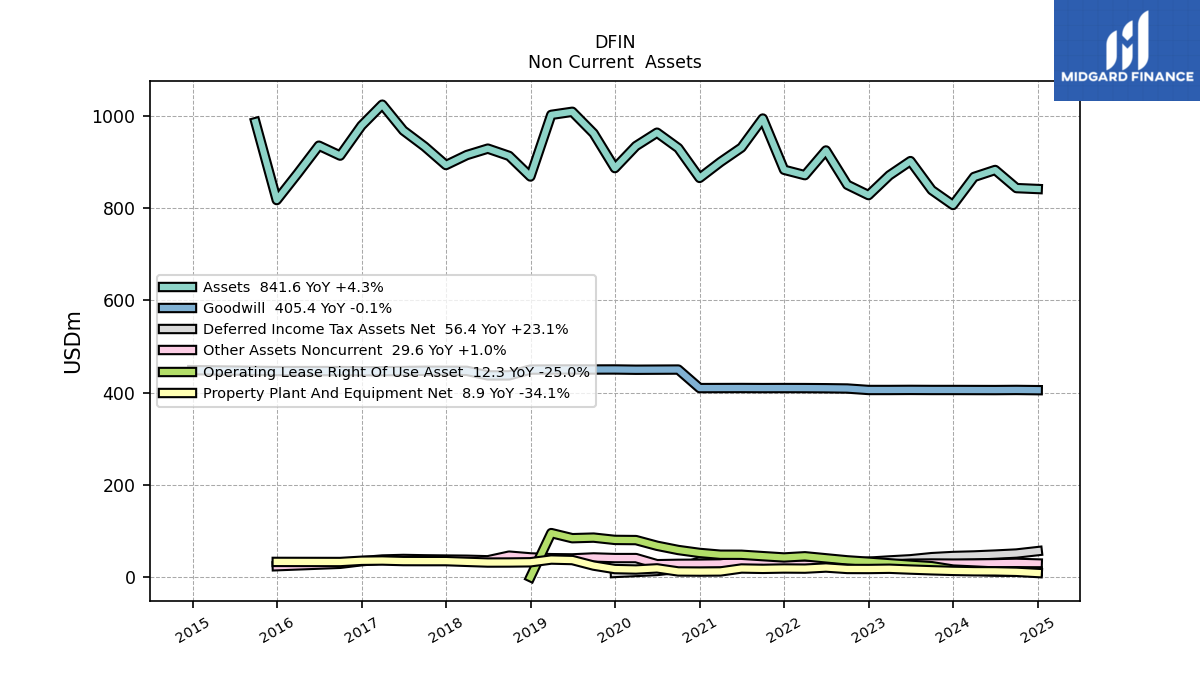
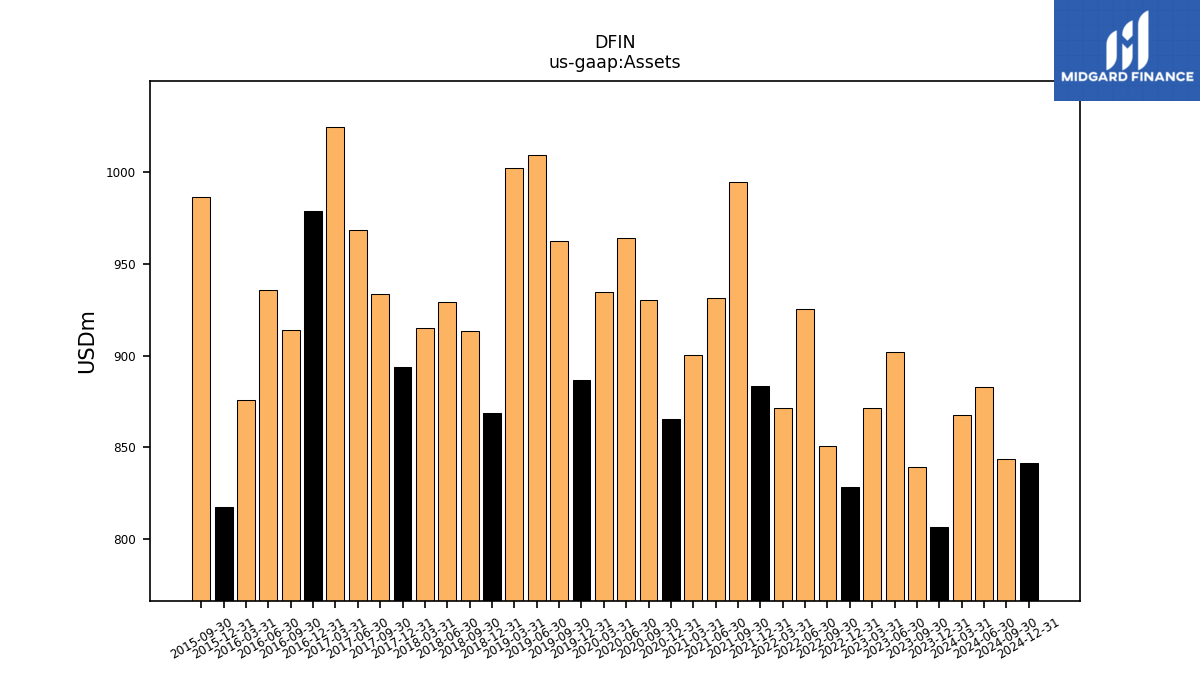
| Assets | 806.90 | 839.30 | 902.20 | 871.30 | 828.30 | 850.80 | 925.20 | 871.60 | 883.30 | 994.50 | 931.50 | 900.10 | 865.60 | 930.30 | 963.80 | 934.80 | 886.90 | 962.30 | 1009.10 | 1002.40 | 868.70 | 913.40 | 929.20 | 915.20 | 893.50 | 933.70 | 968.40 | 1024.60 | 978.90 | 914.00 | 935.60 | 875.60 | 817.60 | 986.60 | |
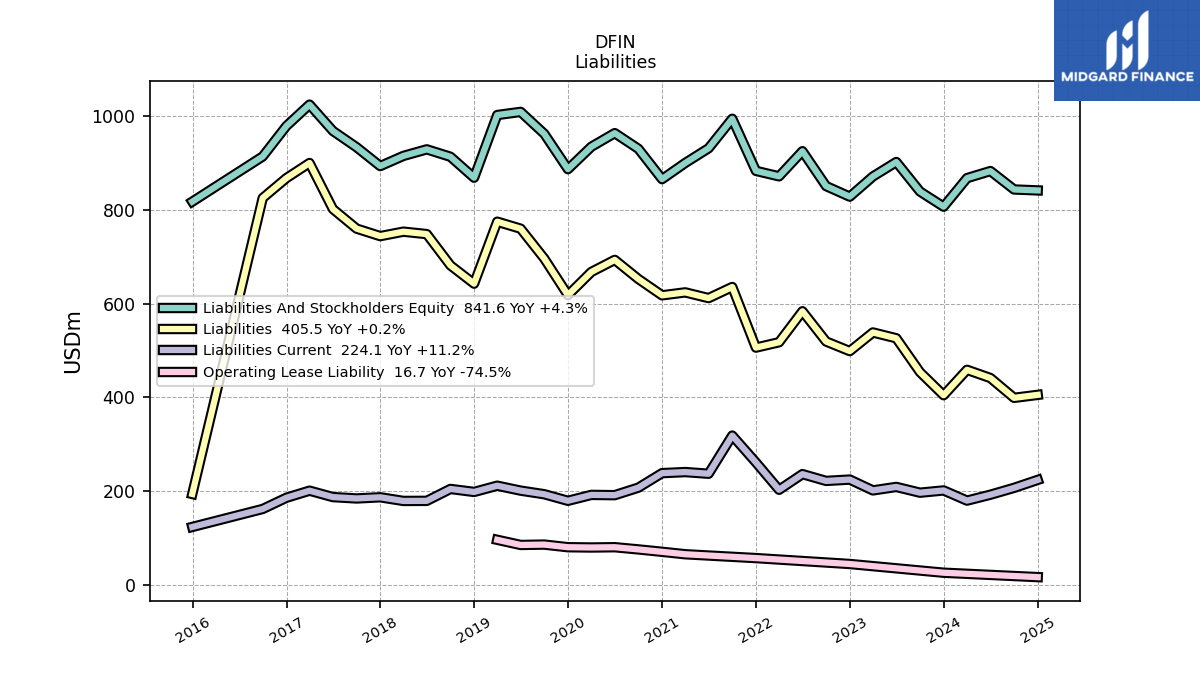
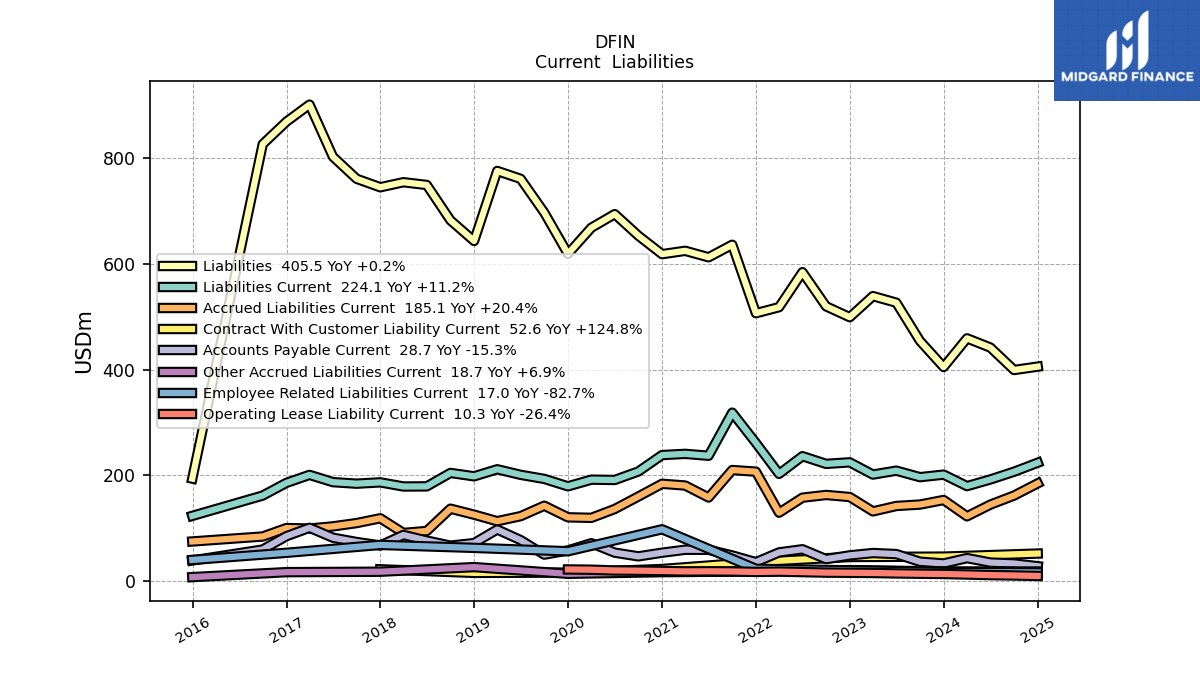
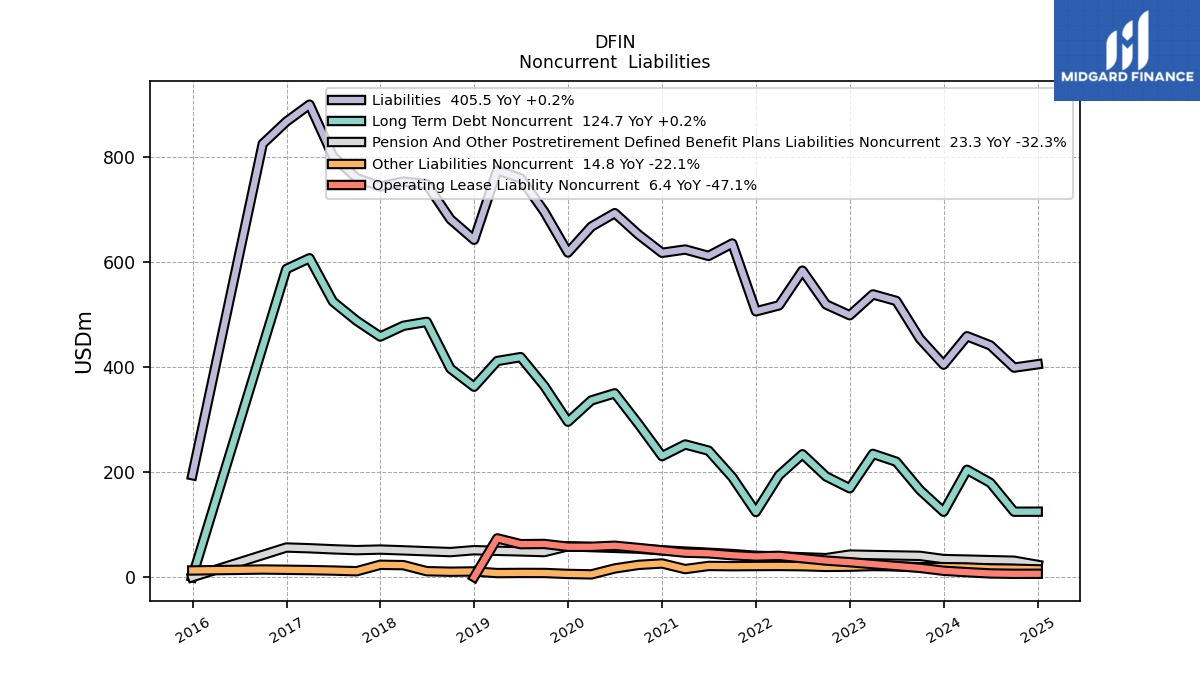
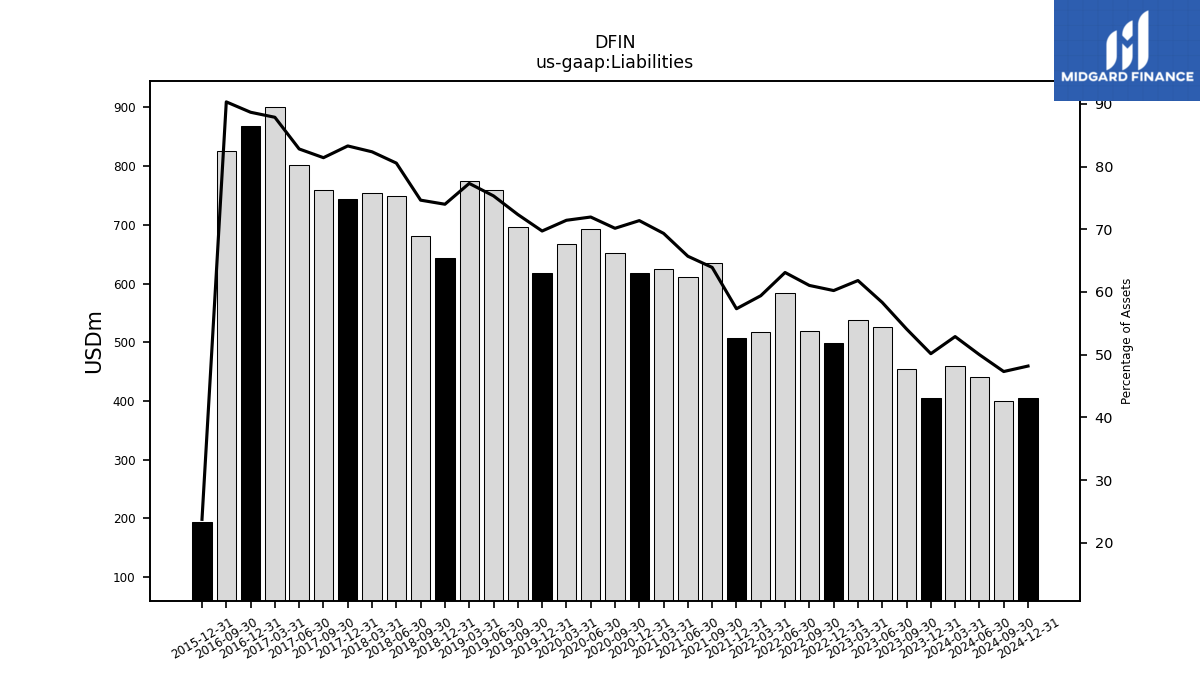
| Liabilities | 404.70 | 454.00 | 526.20 | 538.60 | 498.80 | 519.30 | 583.80 | 517.70 | 506.30 | 635.60 | 611.90 | 624.10 | 617.80 | 652.60 | 693.40 | 667.70 | 618.30 | 696.20 | 760.00 | 774.90 | 642.70 | 681.70 | 748.40 | 753.60 | 744.10 | 760.10 | 801.80 | 900.10 | 867.80 | 825.40 | NA | NA | 194.10 | NA | |
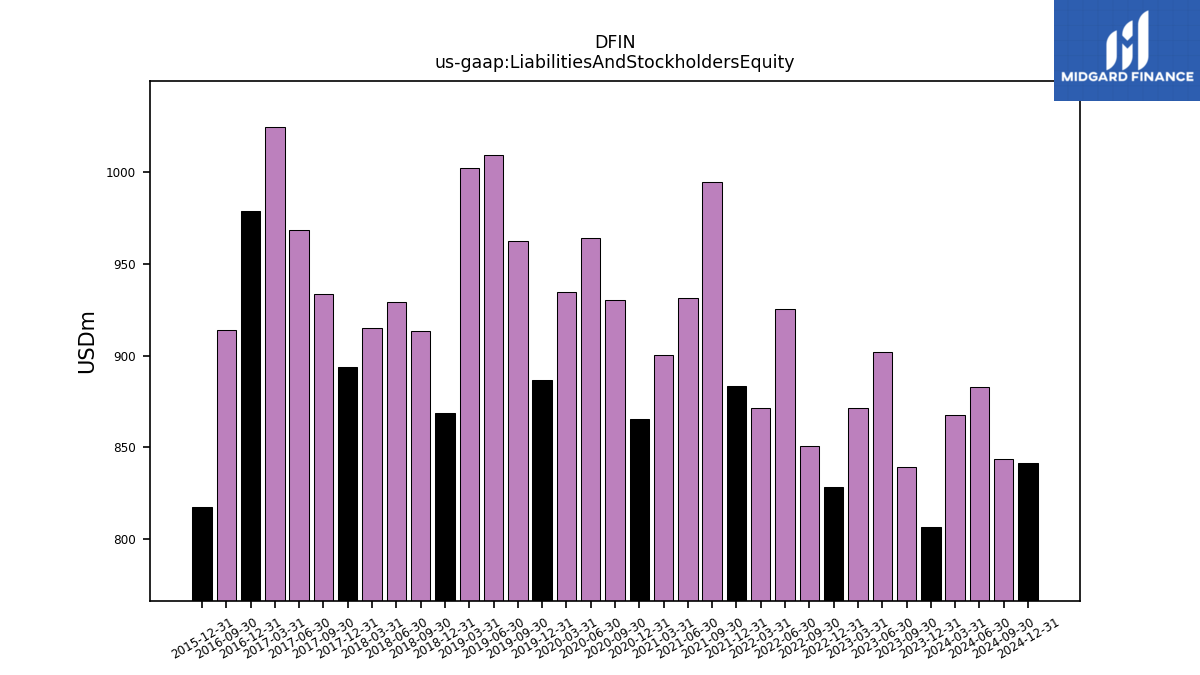
| Liabilities And Stockholders Equity | 806.90 | 839.30 | 902.20 | 871.30 | 828.30 | 850.80 | 925.20 | 871.60 | 883.30 | 994.50 | 931.50 | 900.10 | 865.60 | 930.30 | 963.80 | 934.80 | 886.90 | 962.30 | 1009.10 | 1002.40 | 868.70 | 913.40 | 929.20 | 915.20 | 893.50 | 933.70 | 968.40 | 1024.60 | 978.90 | 914.00 | NA | NA | 817.60 | NA | |
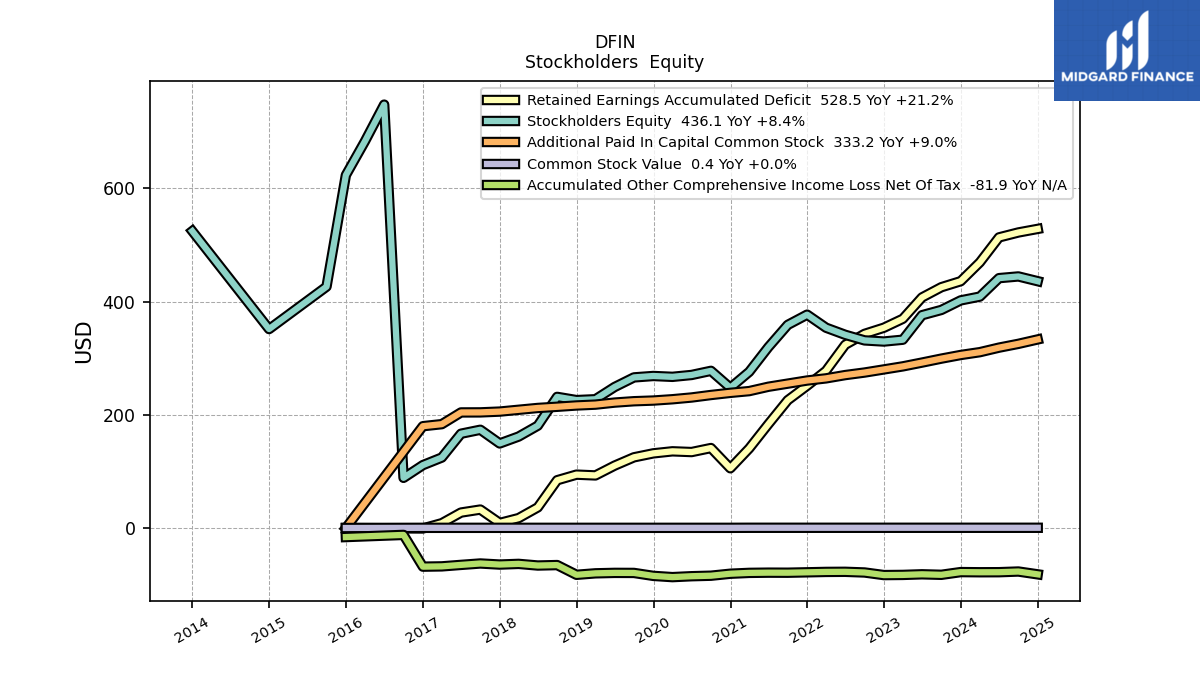
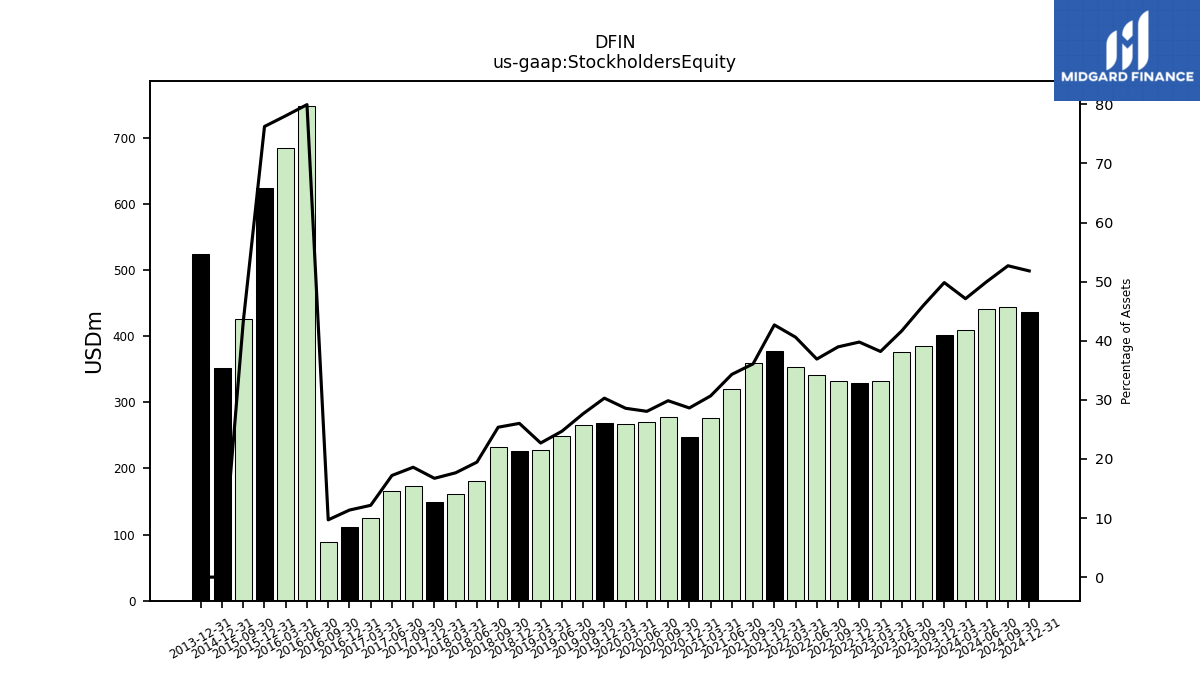
| Stockholders Equity | 402.20 | 385.30 | 376.00 | 332.70 | 329.50 | 331.50 | 341.40 | 353.90 | 377.00 | 358.90 | 319.60 | 276.00 | 247.80 | 277.70 | 270.40 | 267.10 | 268.60 | 266.10 | 249.10 | 227.50 | 226.00 | 231.70 | 180.80 | 161.60 | 149.40 | 173.60 | 166.60 | 124.50 | 111.10 | 88.60 | 748.10 | 683.60 | 623.50 | 426.40 |
| 2023-12-31 | 2023-09-30 | 2023-06-30 | 2023-03-31 | 2022-12-31 | 2022-09-30 | 2022-06-30 | 2022-03-31 | 2021-12-31 | 2021-09-30 | 2021-06-30 | 2021-03-31 | 2020-12-31 | 2020-09-30 | 2020-06-30 | 2020-03-31 | 2019-12-31 | 2019-09-30 | 2019-06-30 | 2019-03-31 | 2018-12-31 | 2018-09-30 | 2018-06-30 | 2018-03-31 | 2017-12-31 | 2017-09-30 | 2017-06-30 | 2017-03-31 | 2016-12-31 | 2016-09-30 | 2016-06-30 | 2016-03-31 | 2015-12-31 | 2015-09-30 | ||
|---|---|---|---|---|---|---|---|---|---|---|---|---|---|---|---|---|---|---|---|---|---|---|---|---|---|---|---|---|---|---|---|---|---|---|---|
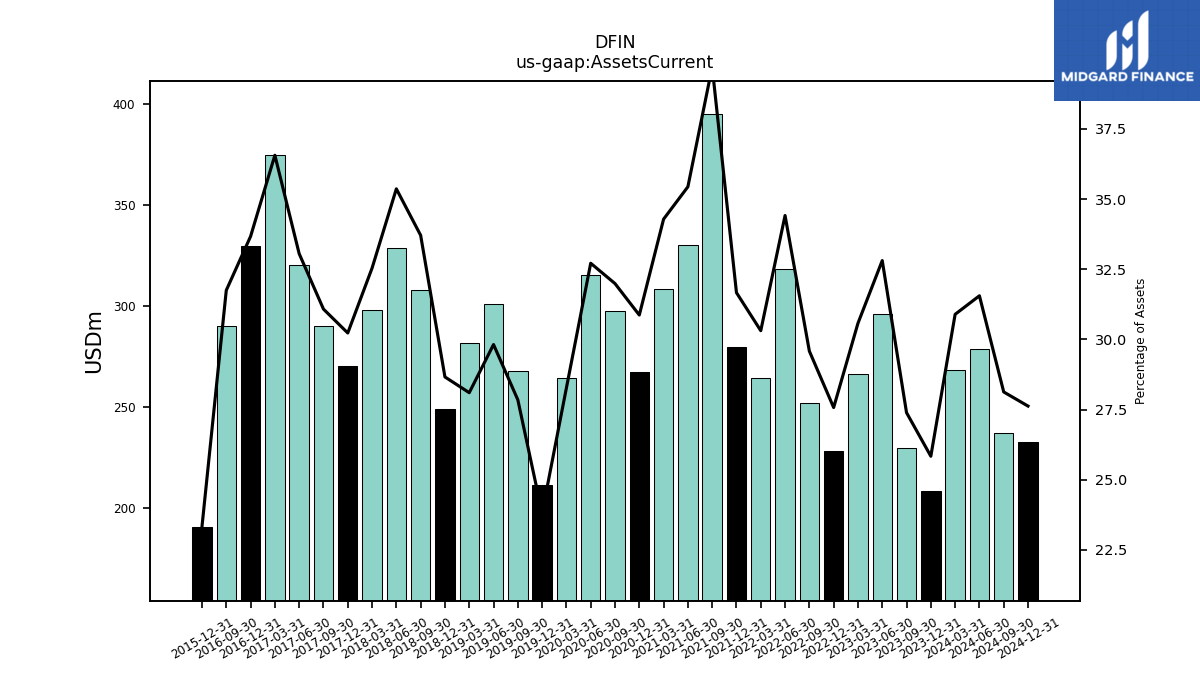
| Assets Current | 208.50 | 229.90 | 296.00 | 266.40 | 228.40 | 251.70 | 318.40 | 264.20 | 279.70 | 394.90 | 330.10 | 308.60 | 267.20 | 297.60 | 315.30 | 264.30 | 211.20 | 268.00 | 300.90 | 281.70 | 249.00 | 307.90 | 328.60 | 297.80 | 270.10 | 290.20 | 320.10 | 374.60 | 329.60 | 290.20 | NA | NA | 190.80 | NA | |
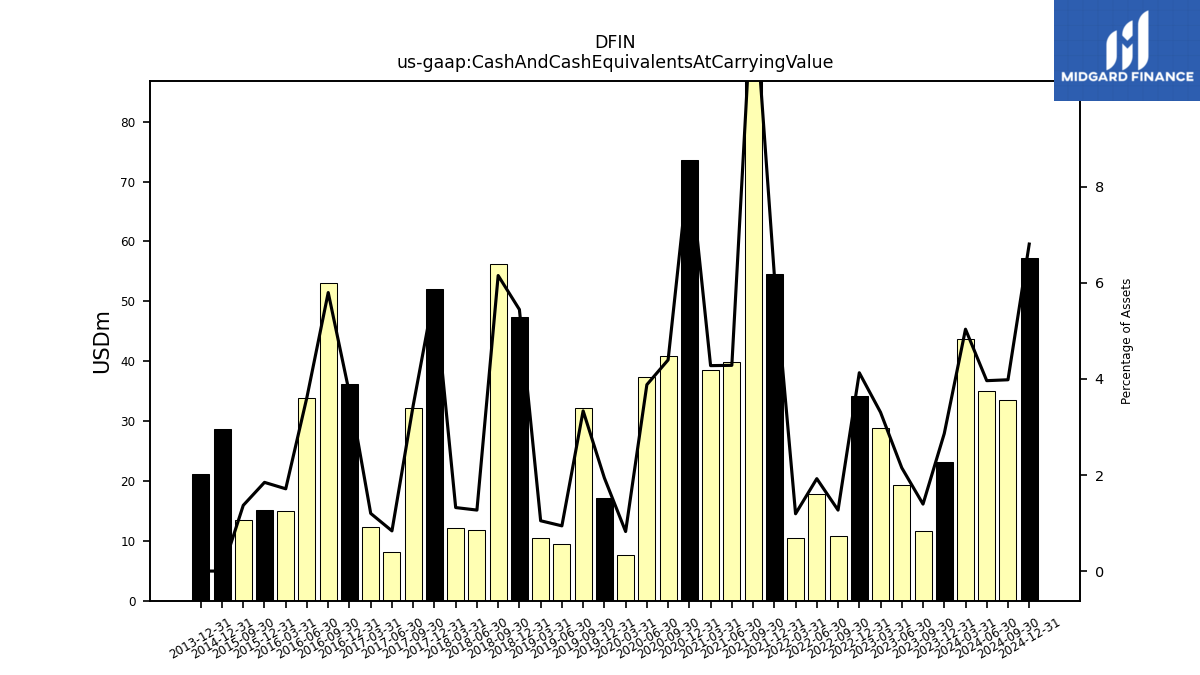
| Cash And Cash Equivalents At Carrying Value | 23.10 | 11.70 | 19.40 | 28.80 | 34.20 | 10.80 | 17.80 | 10.40 | 54.50 | 122.90 | 39.90 | 38.50 | 73.60 | 40.90 | 37.40 | 7.70 | 17.20 | 32.10 | 9.50 | 10.50 | 47.30 | 56.20 | 11.80 | 12.10 | 52.00 | 32.20 | 8.10 | 12.30 | 36.20 | 53.00 | 33.90 | 15.00 | 15.10 | 13.50 | |
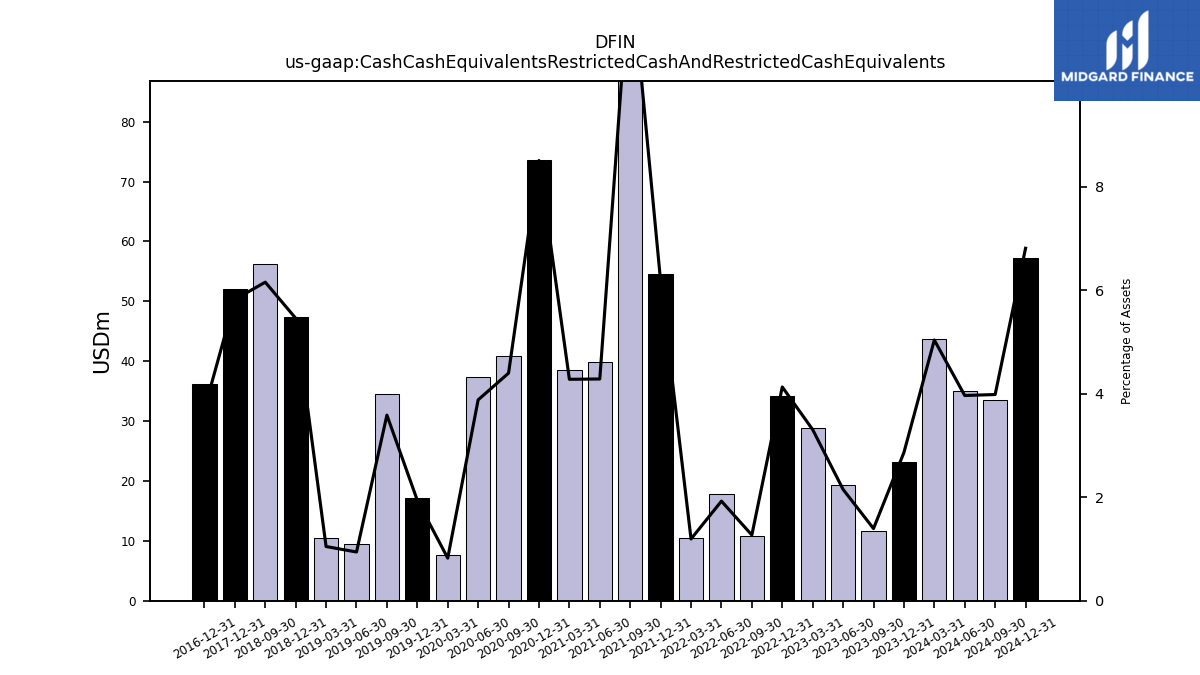
| Cash Cash Equivalents Restricted Cash And Restricted Cash Equivalents | 23.10 | 11.70 | 19.40 | 28.80 | 34.20 | 10.80 | 17.80 | 10.40 | 54.50 | 122.90 | 39.90 | 38.50 | 73.60 | 40.90 | 37.40 | 7.70 | 17.20 | 34.50 | 9.50 | 10.50 | 47.40 | 56.20 | NA | NA | 52.00 | NA | NA | NA | 36.20 | NA | NA | NA | NA | NA | |
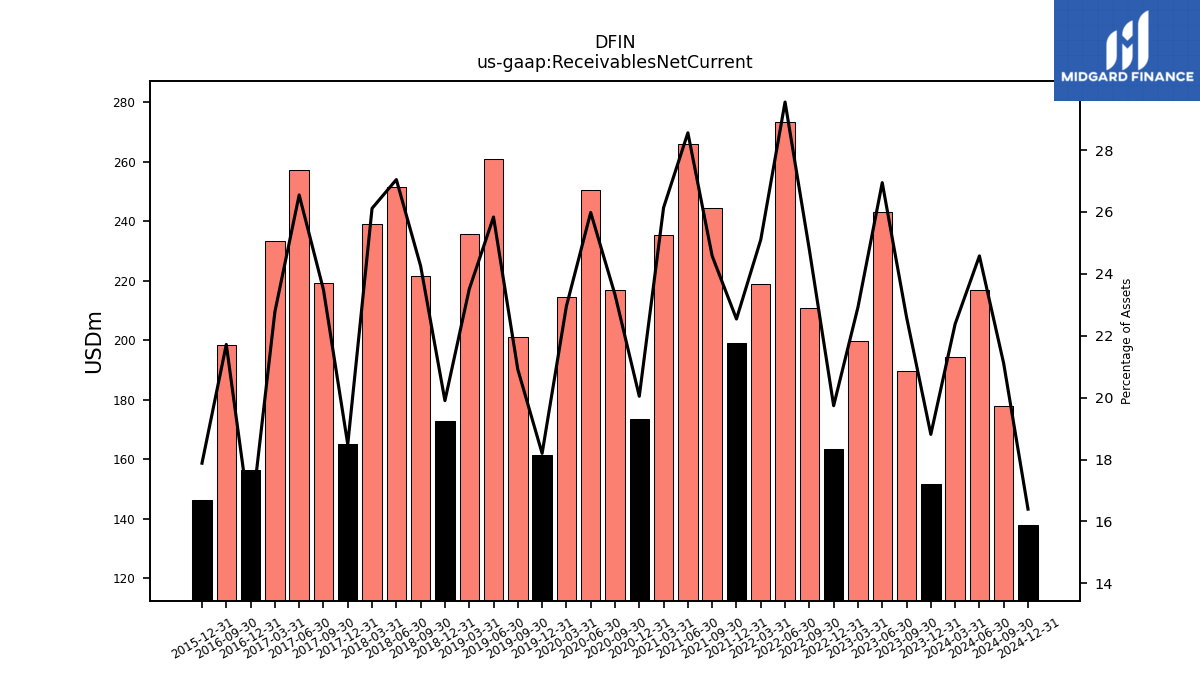
| Receivables Net Current | 151.80 | 189.70 | 243.10 | 199.70 | 163.50 | 210.80 | 273.40 | 218.80 | 199.10 | 244.40 | 266.00 | 235.30 | 173.50 | 217.00 | 250.40 | 214.60 | 161.40 | 201.20 | 260.70 | 235.60 | 172.90 | 221.50 | 251.30 | 239.00 | 165.20 | 219.30 | 257.10 | 233.30 | 156.20 | 198.50 | NA | NA | 146.20 | NA | |
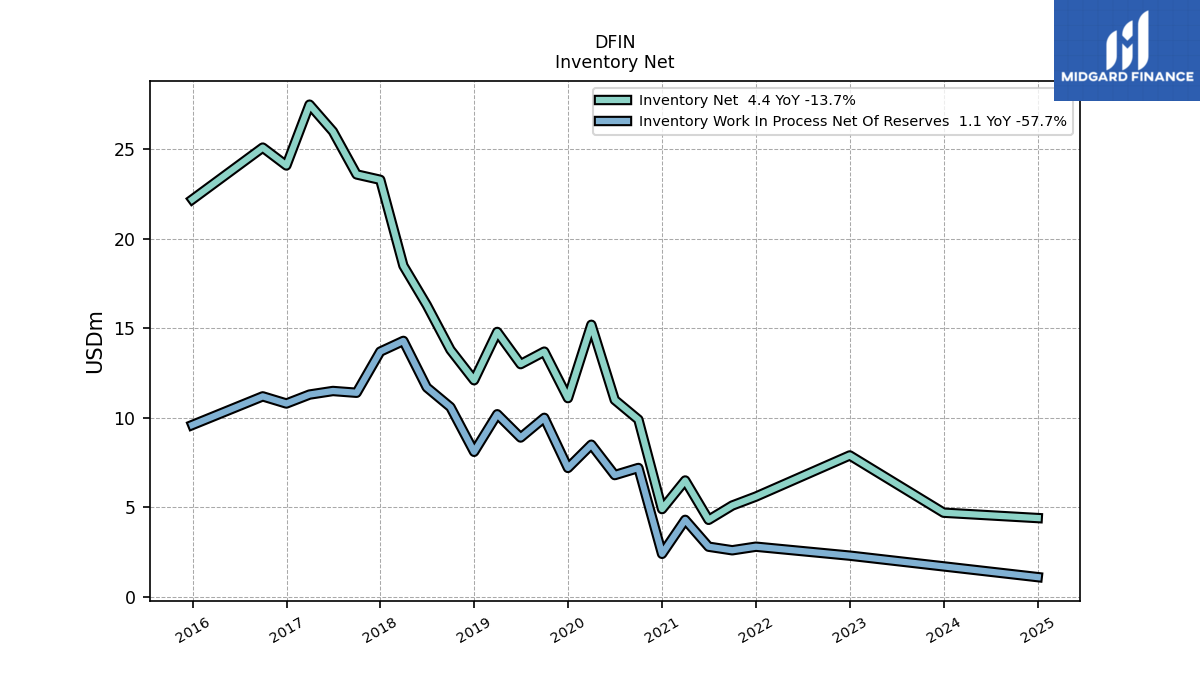
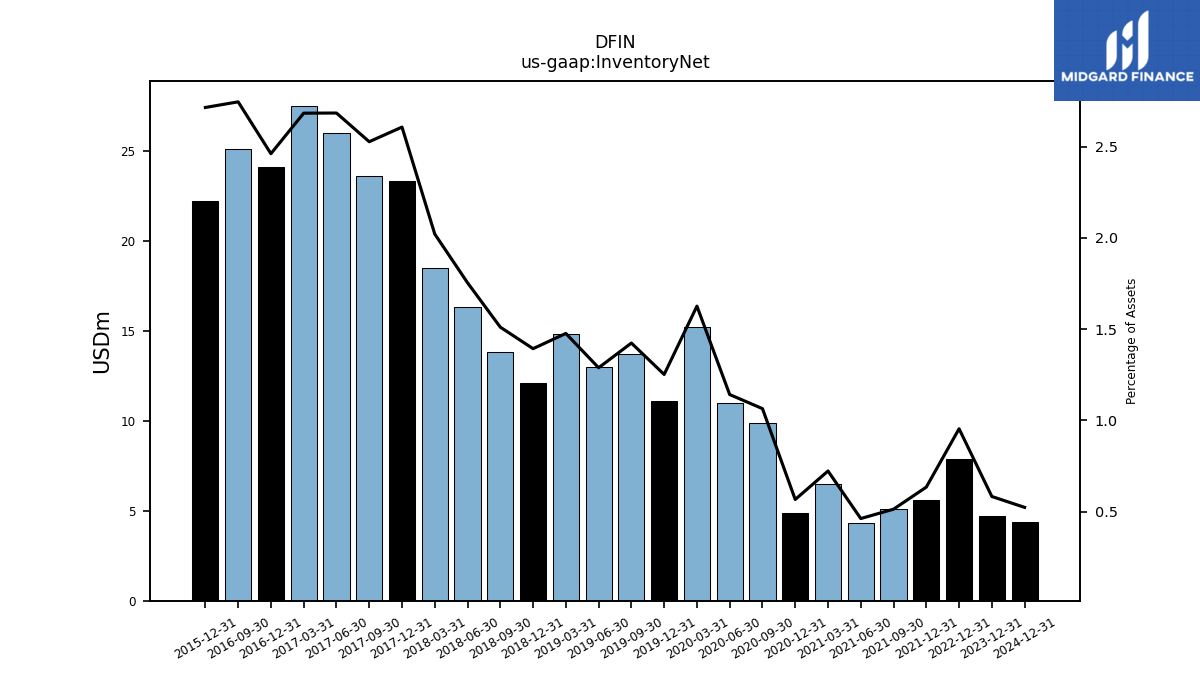
| Inventory Net | 4.70 | NA | NA | NA | 7.90 | NA | NA | NA | 5.60 | 5.10 | 4.30 | 6.50 | 4.90 | 9.90 | 11.00 | 15.20 | 11.10 | 13.70 | 13.00 | 14.80 | 12.10 | 13.80 | 16.30 | 18.50 | 23.30 | 23.60 | 26.00 | 27.50 | 24.10 | 25.10 | NA | NA | 22.20 | NA | |
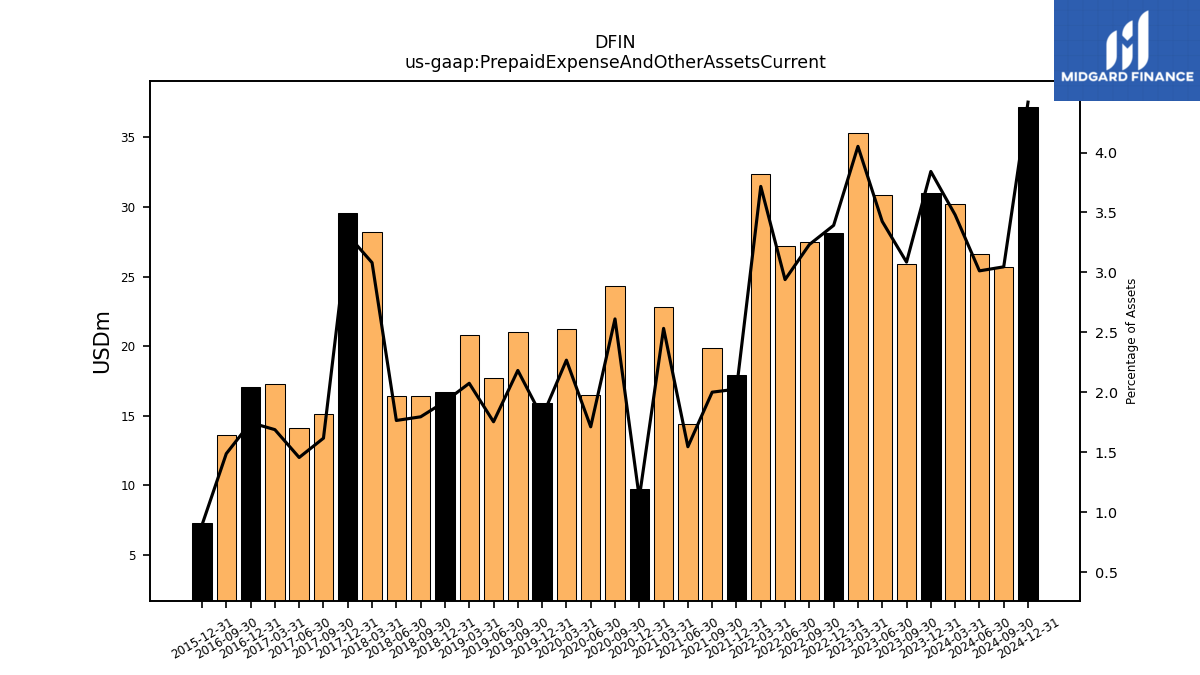
| Prepaid Expense And Other Assets Current | 31.00 | 25.90 | 30.90 | 35.30 | 28.10 | 27.50 | 27.20 | 32.40 | 17.90 | 19.90 | 14.40 | 22.80 | 9.70 | 24.30 | 16.50 | 21.20 | 15.90 | 21.00 | 17.70 | 20.80 | 16.70 | 16.40 | 16.40 | 28.20 | 29.60 | 15.10 | 14.10 | 17.30 | 17.10 | 13.60 | NA | NA | 7.30 | NA |
| 2023-12-31 | 2023-09-30 | 2023-06-30 | 2023-03-31 | 2022-12-31 | 2022-09-30 | 2022-06-30 | 2022-03-31 | 2021-12-31 | 2021-09-30 | 2021-06-30 | 2021-03-31 | 2020-12-31 | 2020-09-30 | 2020-06-30 | 2020-03-31 | 2019-12-31 | 2019-09-30 | 2019-06-30 | 2019-03-31 | 2018-12-31 | 2018-09-30 | 2018-06-30 | 2018-03-31 | 2017-12-31 | 2017-09-30 | 2017-06-30 | 2017-03-31 | 2016-12-31 | 2016-09-30 | 2016-06-30 | 2016-03-31 | 2015-12-31 | 2015-09-30 | ||
|---|---|---|---|---|---|---|---|---|---|---|---|---|---|---|---|---|---|---|---|---|---|---|---|---|---|---|---|---|---|---|---|---|---|---|---|
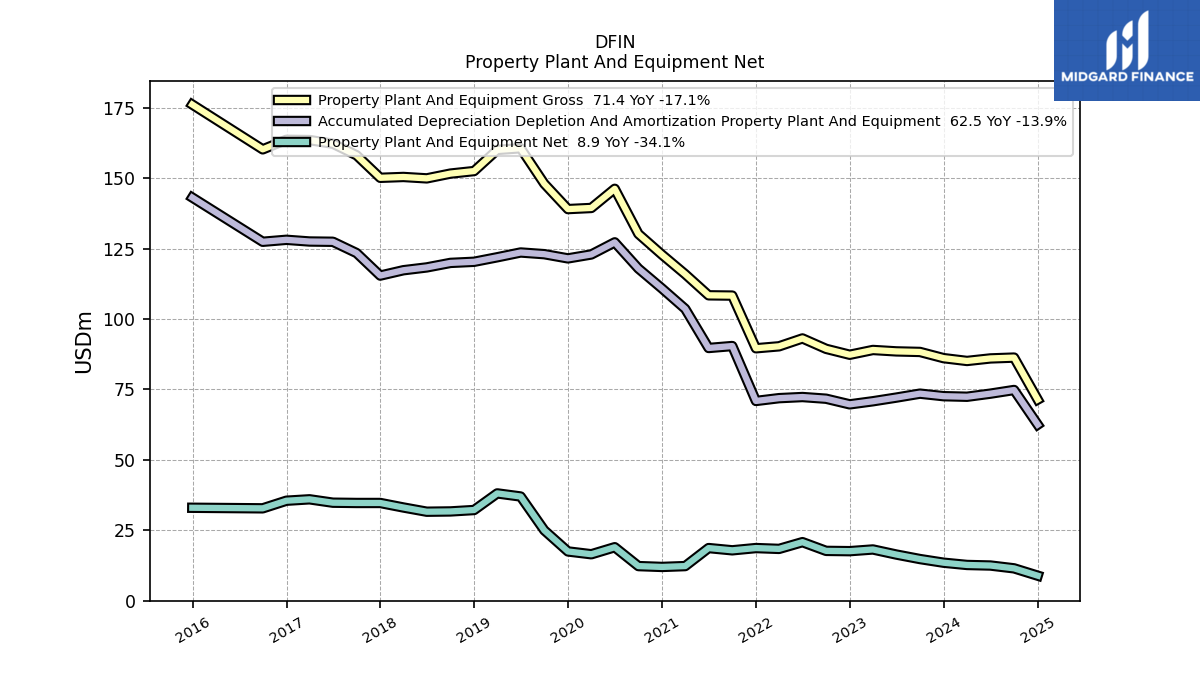
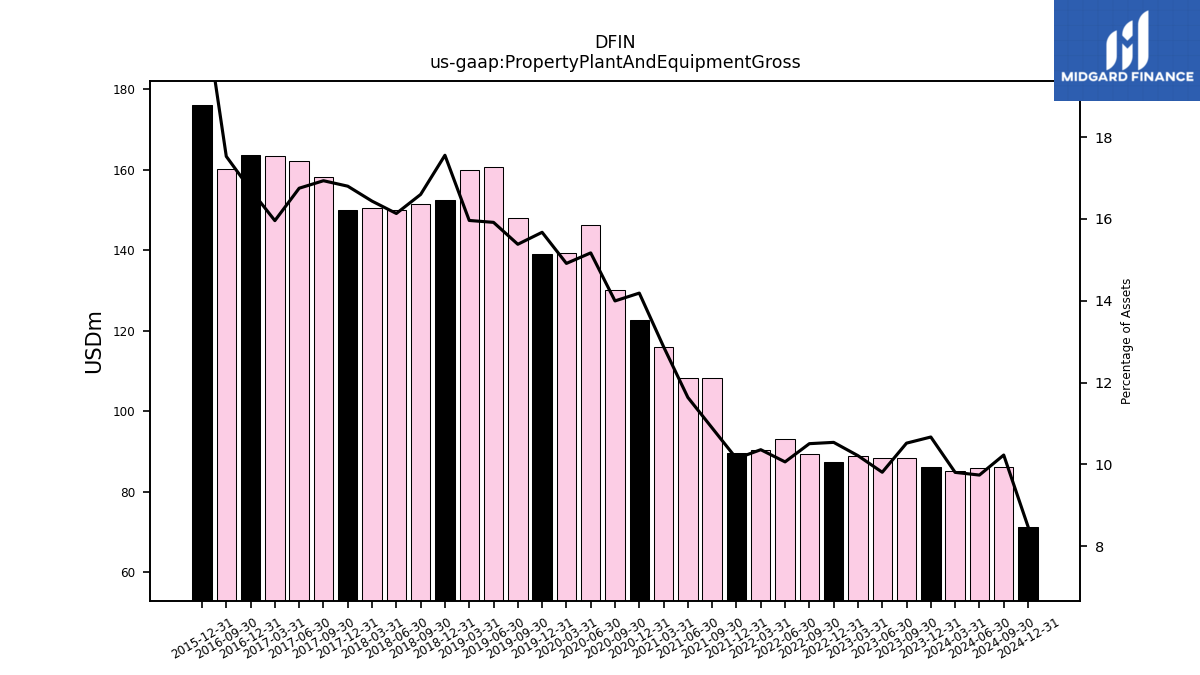
| Property Plant And Equipment Gross | 86.10 | 88.30 | 88.50 | 89.00 | 87.30 | 89.40 | 93.10 | 90.30 | 89.60 | 108.30 | 108.40 | 115.90 | 122.80 | 130.20 | 146.20 | 139.40 | 139.00 | 148.00 | 160.60 | 160.00 | 152.50 | 151.60 | 149.90 | 150.40 | 150.10 | 158.10 | 162.20 | 163.50 | 163.60 | 160.20 | NA | NA | 176.10 | NA | |
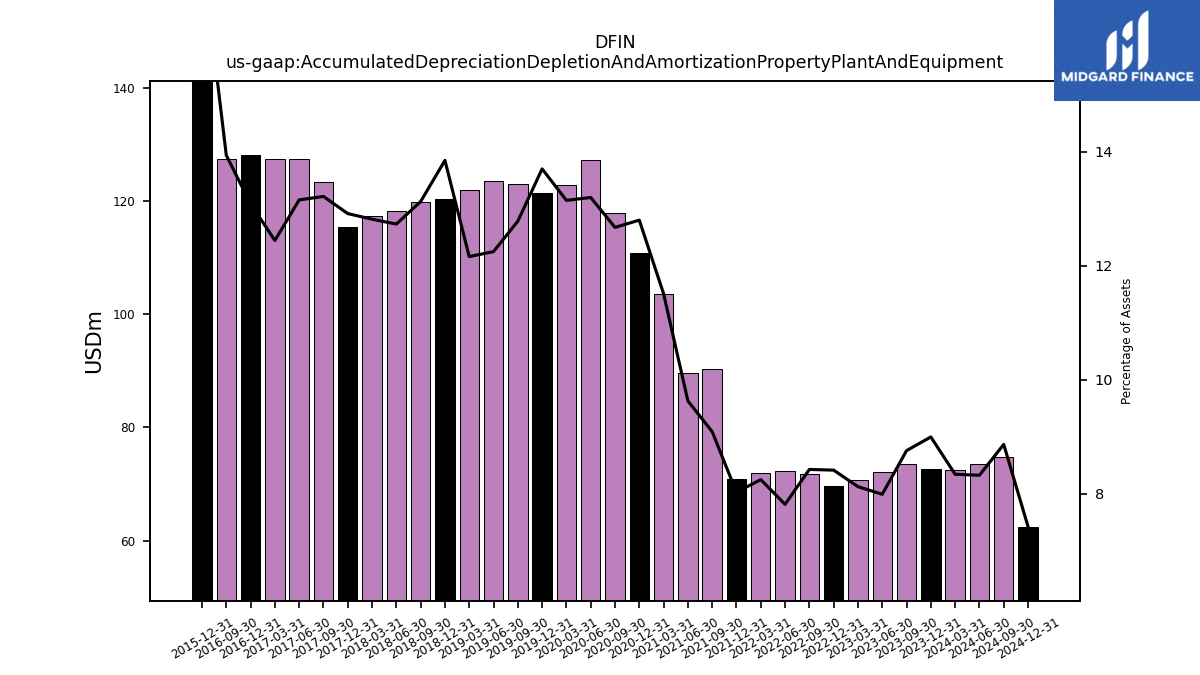
| Accumulated Depreciation Depletion And Amortization Property Plant And Equipment | 72.60 | 73.50 | 72.10 | 70.80 | 69.70 | 71.70 | 72.30 | 71.90 | 70.90 | 90.40 | 89.70 | 103.60 | 110.80 | 117.90 | 127.20 | 122.90 | 121.50 | 123.00 | 123.60 | 121.90 | 120.30 | 119.90 | 118.30 | 117.30 | 115.40 | 123.40 | 127.40 | 127.50 | 128.10 | 127.40 | NA | NA | 143.10 | NA | |
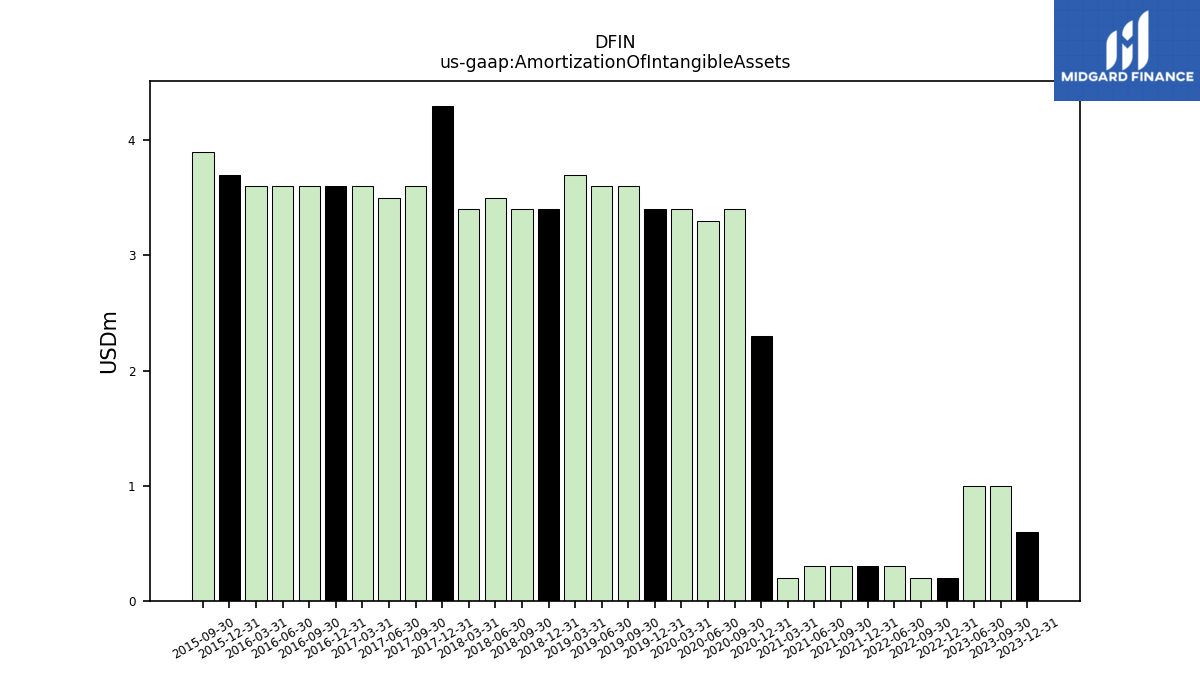
| Amortization Of Intangible Assets | 0.60 | 1.00 | 1.00 | NA | 0.20 | 0.20 | 0.30 | NA | 0.30 | 0.30 | 0.30 | 0.20 | 2.30 | 3.40 | 3.30 | 3.40 | 3.40 | 3.60 | 3.60 | 3.70 | 3.40 | 3.40 | 3.50 | 3.40 | 4.30 | 3.60 | 3.50 | 3.60 | 3.60 | 3.60 | 3.60 | 3.60 | 3.70 | 3.90 | |
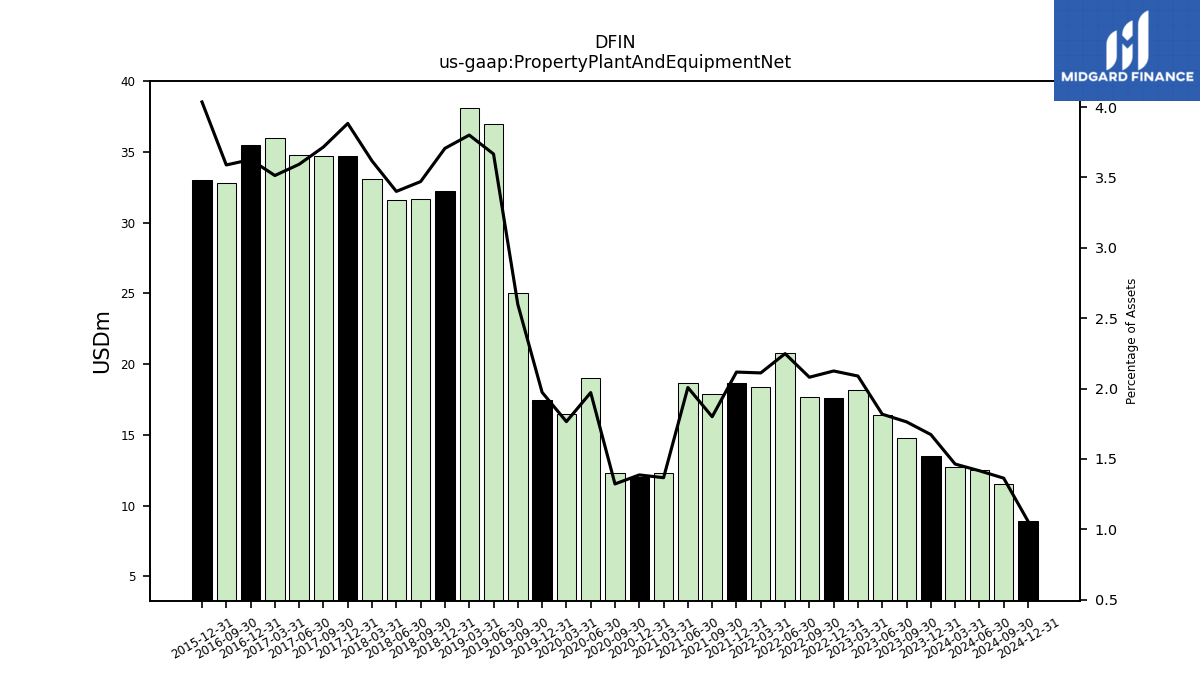
| Property Plant And Equipment Net | 13.50 | 14.80 | 16.40 | 18.20 | 17.60 | 17.70 | 20.80 | 18.40 | 18.70 | 17.90 | 18.70 | 12.30 | 12.00 | 12.30 | 19.00 | 16.50 | 17.50 | 25.00 | 37.00 | 38.10 | 32.20 | 31.70 | 31.60 | 33.10 | 34.70 | 34.70 | 34.80 | 36.00 | 35.50 | 32.80 | NA | NA | 33.00 | NA | |
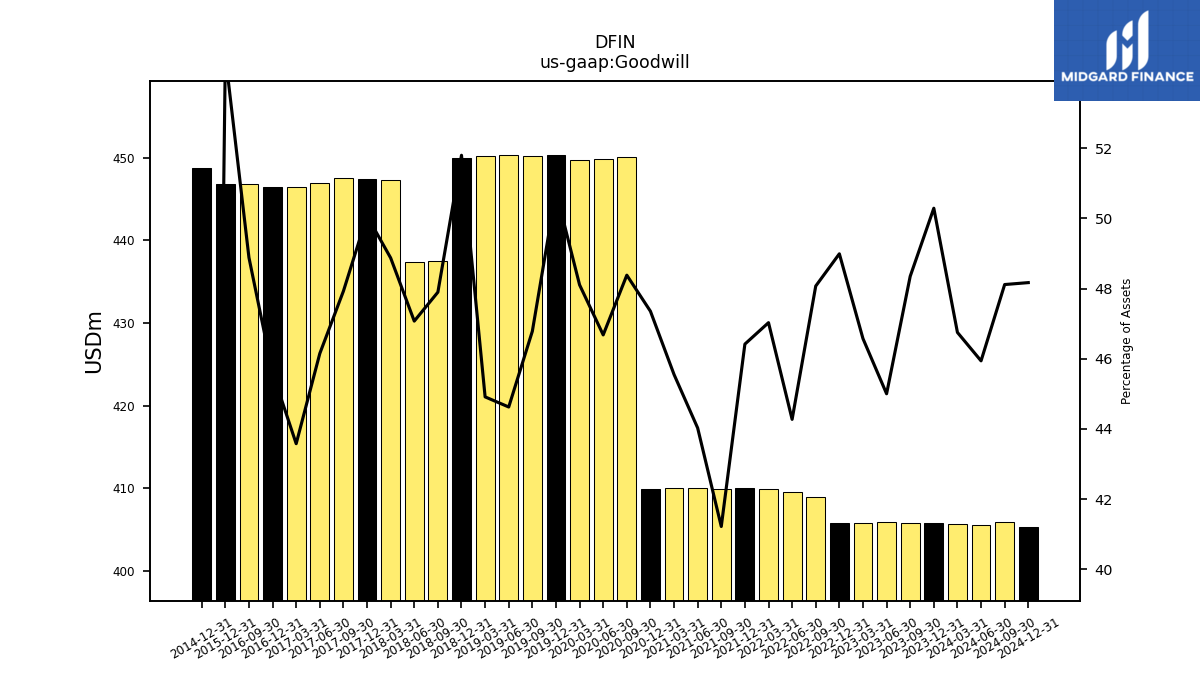
| Goodwill | 405.80 | 405.80 | 406.00 | 405.80 | 405.80 | 409.00 | 409.60 | 409.90 | 410.00 | 409.90 | 410.10 | 410.00 | 409.90 | 450.10 | 449.90 | 449.70 | 450.30 | 450.20 | 450.30 | 450.20 | 450.00 | 437.50 | 437.40 | 447.30 | 447.40 | 447.50 | 446.90 | 446.50 | 446.40 | 446.80 | NA | NA | 446.80 | NA | |
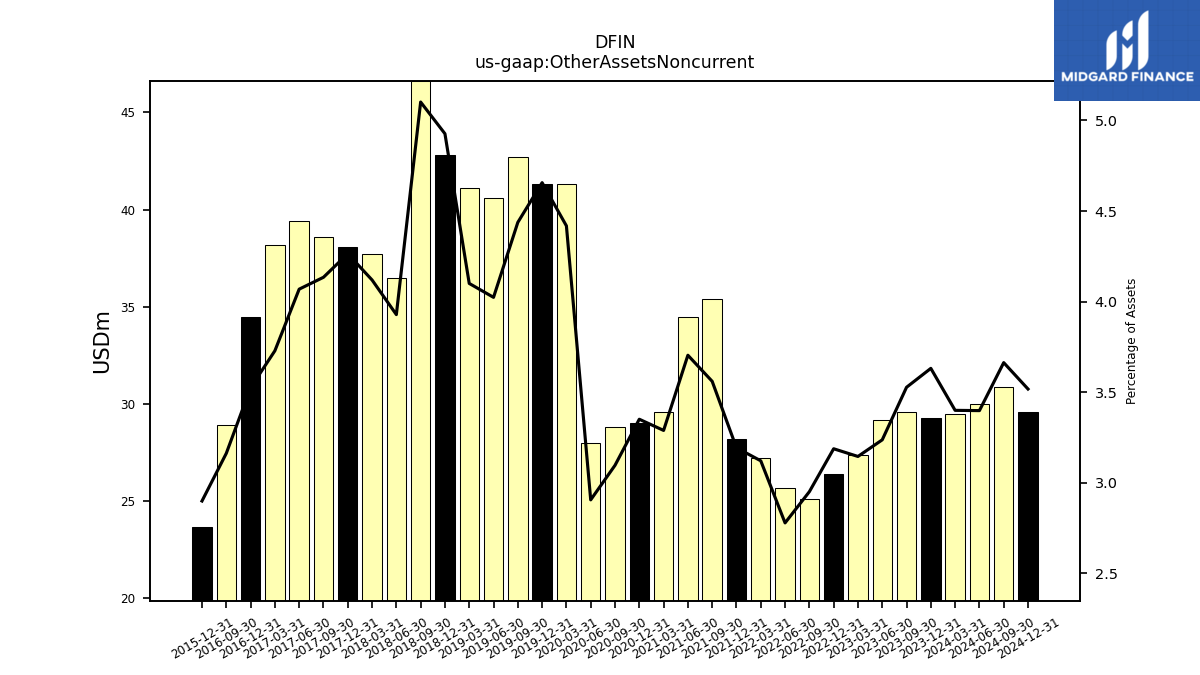
| Other Assets Noncurrent | 29.30 | 29.60 | 29.20 | 27.40 | 26.40 | 25.10 | 25.70 | 27.20 | 28.20 | 35.40 | 34.50 | 29.60 | 29.00 | 28.80 | 28.00 | 41.30 | 41.30 | 42.70 | 40.60 | 41.10 | 42.80 | 46.60 | 36.50 | 37.70 | 38.10 | 38.60 | 39.40 | 38.20 | 34.50 | 28.90 | NA | NA | 23.70 | NA |
| 2023-12-31 | 2023-09-30 | 2023-06-30 | 2023-03-31 | 2022-12-31 | 2022-09-30 | 2022-06-30 | 2022-03-31 | 2021-12-31 | 2021-09-30 | 2021-06-30 | 2021-03-31 | 2020-12-31 | 2020-09-30 | 2020-06-30 | 2020-03-31 | 2019-12-31 | 2019-09-30 | 2019-06-30 | 2019-03-31 | 2018-12-31 | 2018-09-30 | 2018-06-30 | 2018-03-31 | 2017-12-31 | 2017-09-30 | 2017-06-30 | 2017-03-31 | 2016-12-31 | 2016-09-30 | 2016-06-30 | 2016-03-31 | 2015-12-31 | 2015-09-30 | ||
|---|---|---|---|---|---|---|---|---|---|---|---|---|---|---|---|---|---|---|---|---|---|---|---|---|---|---|---|---|---|---|---|---|---|---|---|
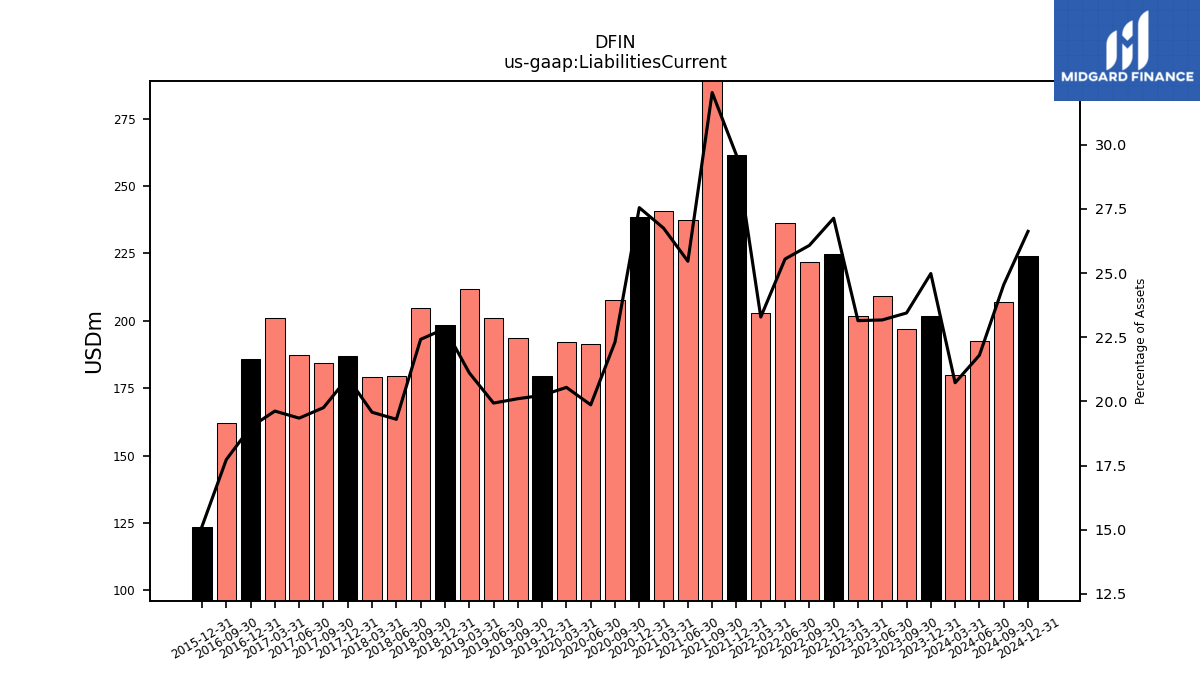
| Liabilities Current | 201.60 | 196.80 | 209.10 | 201.70 | 224.80 | 221.90 | 236.40 | 203.00 | 261.40 | 318.60 | 237.20 | 240.80 | 238.50 | 207.60 | 191.50 | 192.10 | 179.50 | 193.50 | 201.20 | 211.70 | 198.40 | 204.80 | 179.40 | 179.20 | 187.00 | 184.50 | 187.40 | 201.10 | 186.00 | 162.10 | NA | NA | 123.70 | NA | |
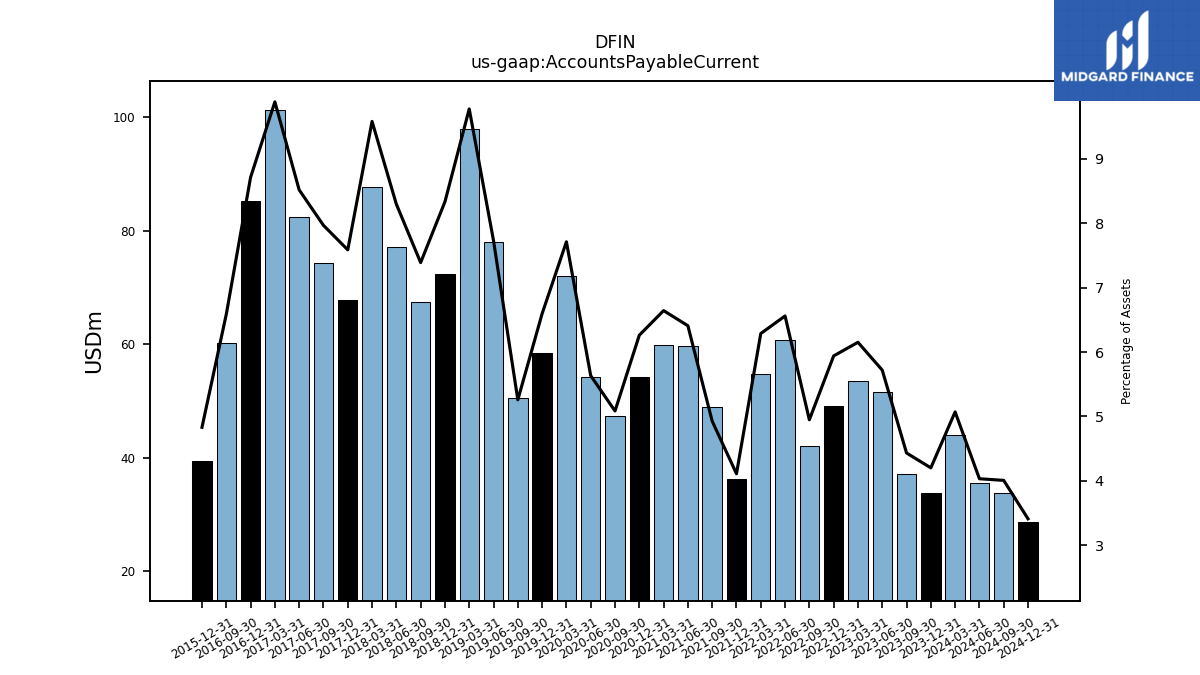
| Accounts Payable Current | 33.90 | 37.20 | 51.60 | 53.60 | 49.20 | 42.10 | 60.70 | 54.80 | 36.30 | 49.00 | 59.70 | 59.80 | 54.20 | 47.30 | 54.30 | 72.10 | 58.50 | 50.60 | 78.00 | 98.00 | 72.40 | 67.50 | 77.10 | 87.70 | 67.80 | 74.40 | 82.50 | 101.30 | 85.30 | 60.20 | NA | NA | 39.50 | NA | |
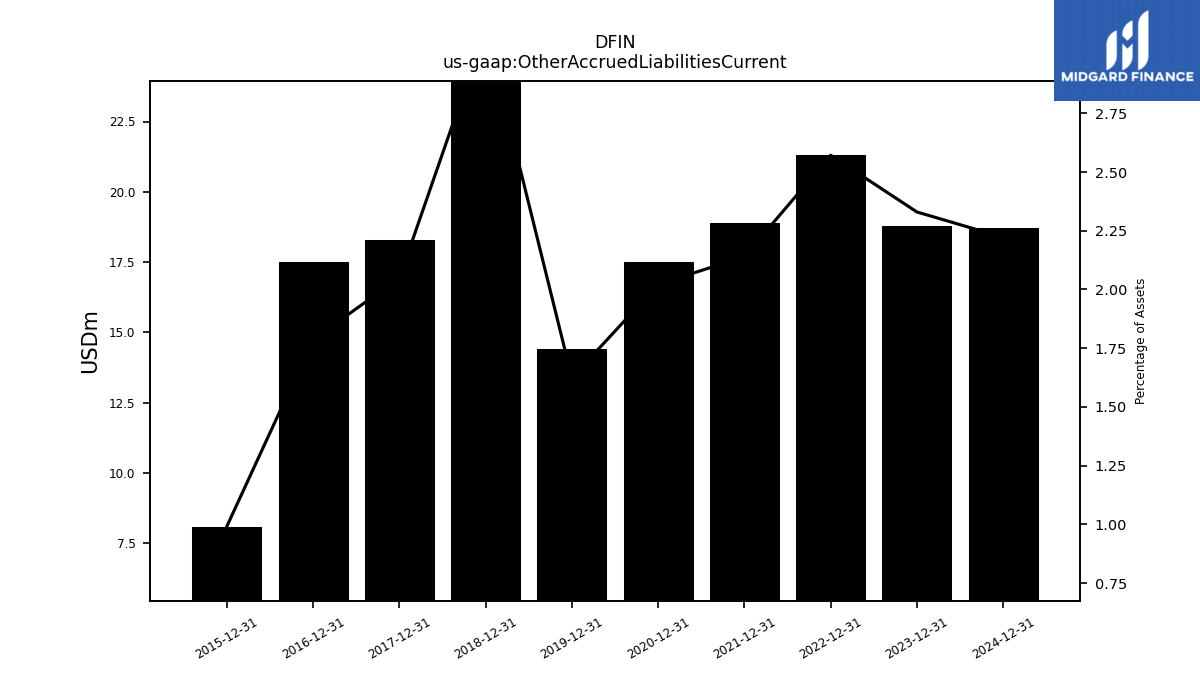
| Other Accrued Liabilities Current | 18.80 | NA | NA | NA | 21.30 | NA | NA | NA | 18.90 | NA | NA | NA | 17.50 | NA | NA | NA | 14.40 | NA | NA | NA | 27.00 | NA | NA | NA | 18.30 | NA | NA | NA | 17.50 | NA | NA | NA | 8.10 | NA | |
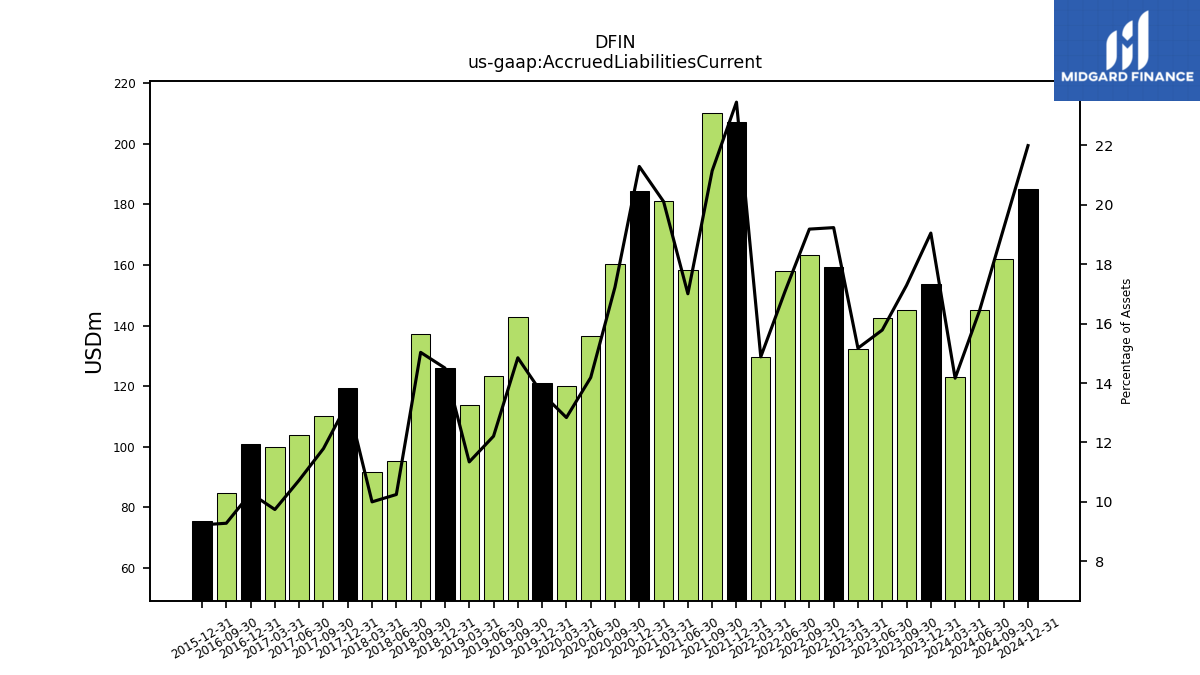
| Accrued Liabilities Current | 153.70 | 145.10 | 142.40 | 132.20 | 159.30 | 163.20 | 158.10 | 129.70 | 207.20 | 210.30 | 158.40 | 181.00 | 184.30 | 160.30 | 136.70 | 120.00 | 121.00 | 142.90 | 123.20 | 113.70 | 126.00 | 137.30 | 95.20 | 91.50 | 119.20 | 110.10 | 103.90 | 99.80 | 100.70 | 84.80 | NA | NA | 75.40 | NA | |
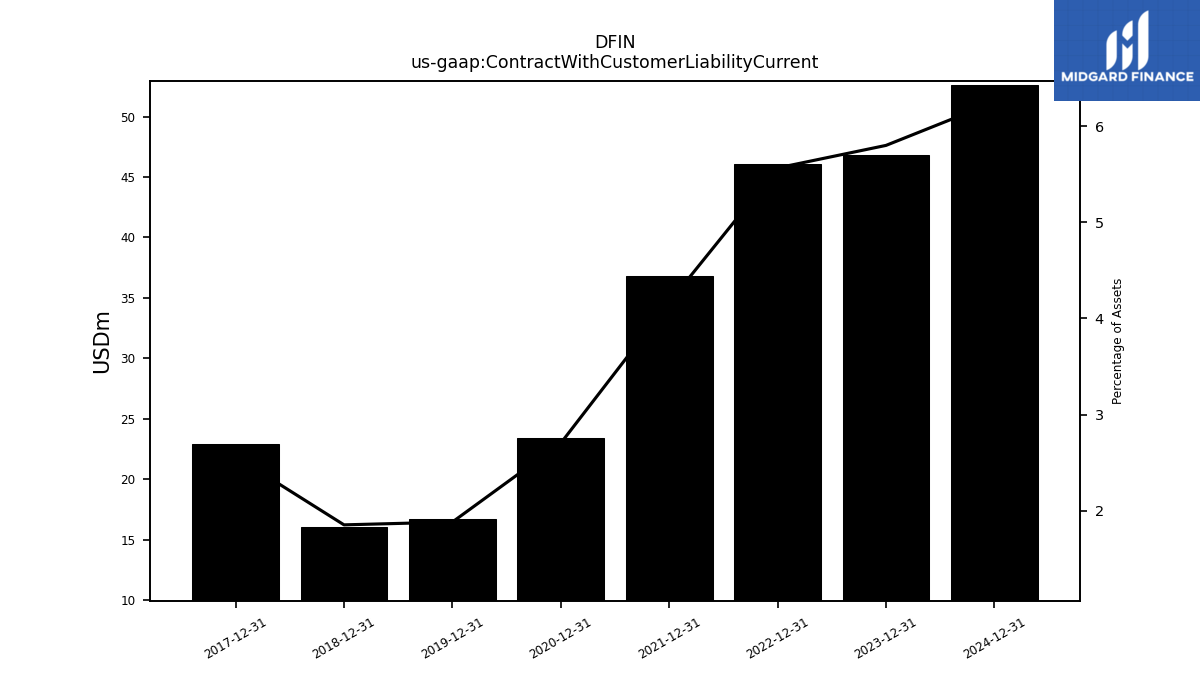
| Contract With Customer Liability Current | 46.80 | NA | NA | NA | 46.10 | NA | NA | NA | 36.80 | NA | NA | NA | 23.40 | NA | NA | NA | 16.70 | NA | NA | NA | 16.10 | NA | NA | NA | 22.90 | NA | NA | NA | NA | NA | NA | NA | NA | NA |
| 2023-12-31 | 2023-09-30 | 2023-06-30 | 2023-03-31 | 2022-12-31 | 2022-09-30 | 2022-06-30 | 2022-03-31 | 2021-12-31 | 2021-09-30 | 2021-06-30 | 2021-03-31 | 2020-12-31 | 2020-09-30 | 2020-06-30 | 2020-03-31 | 2019-12-31 | 2019-09-30 | 2019-06-30 | 2019-03-31 | 2018-12-31 | 2018-09-30 | 2018-06-30 | 2018-03-31 | 2017-12-31 | 2017-09-30 | 2017-06-30 | 2017-03-31 | 2016-12-31 | 2016-09-30 | 2016-06-30 | 2016-03-31 | 2015-12-31 | 2015-09-30 | ||
|---|---|---|---|---|---|---|---|---|---|---|---|---|---|---|---|---|---|---|---|---|---|---|---|---|---|---|---|---|---|---|---|---|---|---|---|
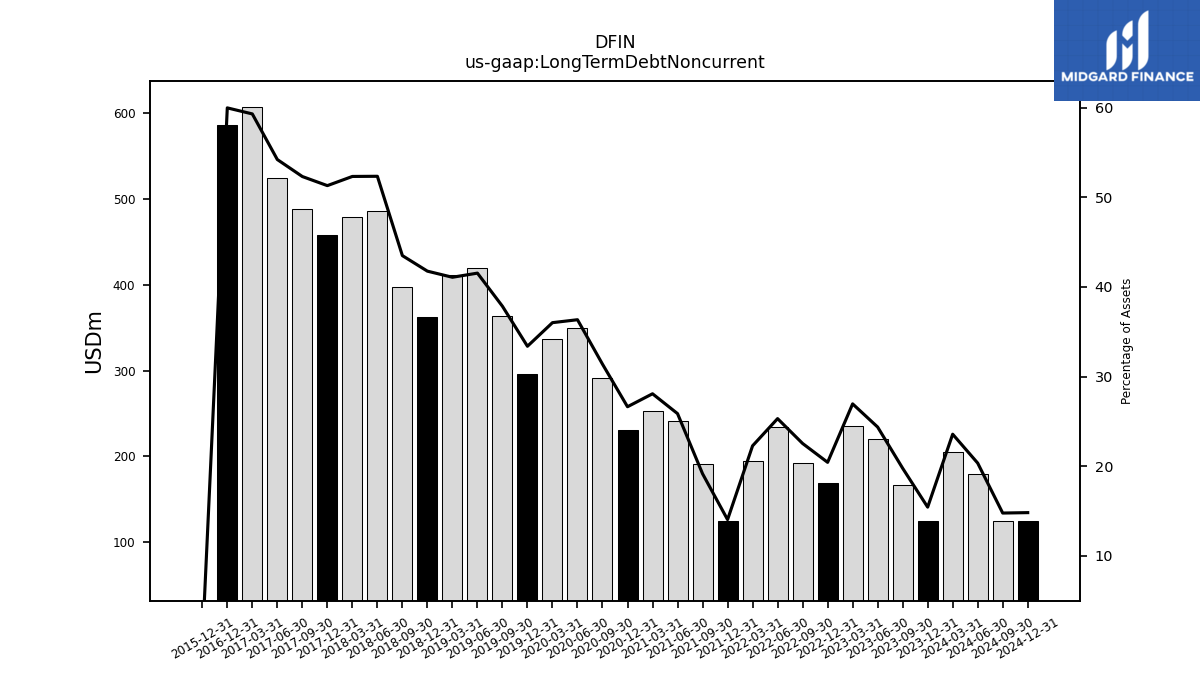
| Long Term Debt Noncurrent | 124.50 | 165.90 | 219.80 | 234.80 | 169.20 | 191.70 | 234.10 | 194.10 | 124.00 | 190.50 | 240.90 | 252.70 | 230.50 | 291.90 | 350.20 | 336.60 | 296.00 | 364.10 | 419.10 | 411.70 | 362.70 | 397.20 | 486.30 | 478.80 | 458.30 | 488.40 | 524.90 | 607.50 | 587.00 | NA | NA | NA | 0.00 | NA | |
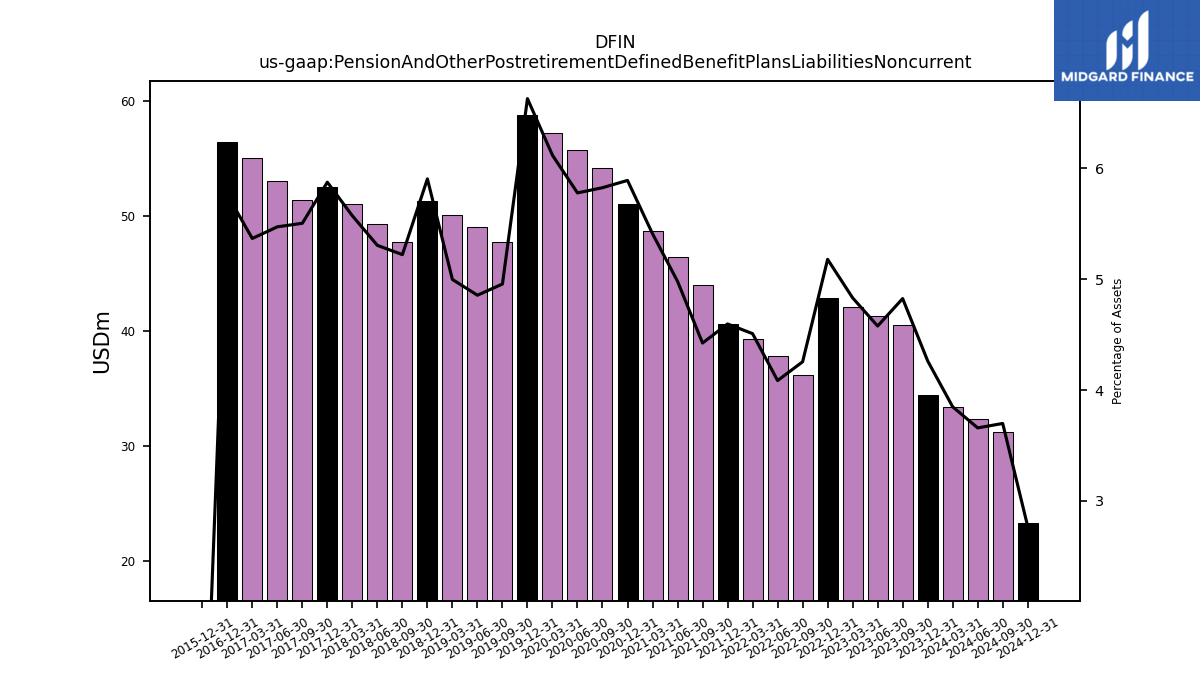
| Pension And Other Postretirement Defined Benefit Plans Liabilities Noncurrent | 34.40 | 40.50 | 41.30 | 42.10 | 42.90 | 36.20 | 37.80 | 39.30 | 40.60 | 44.00 | 46.40 | 48.70 | 51.00 | 54.20 | 55.70 | 57.20 | 58.80 | 47.70 | 49.00 | 50.10 | 51.30 | 47.70 | 49.30 | 51.00 | 52.50 | 51.40 | 53.00 | 55.00 | 56.40 | NA | NA | NA | 0.00 | NA | |
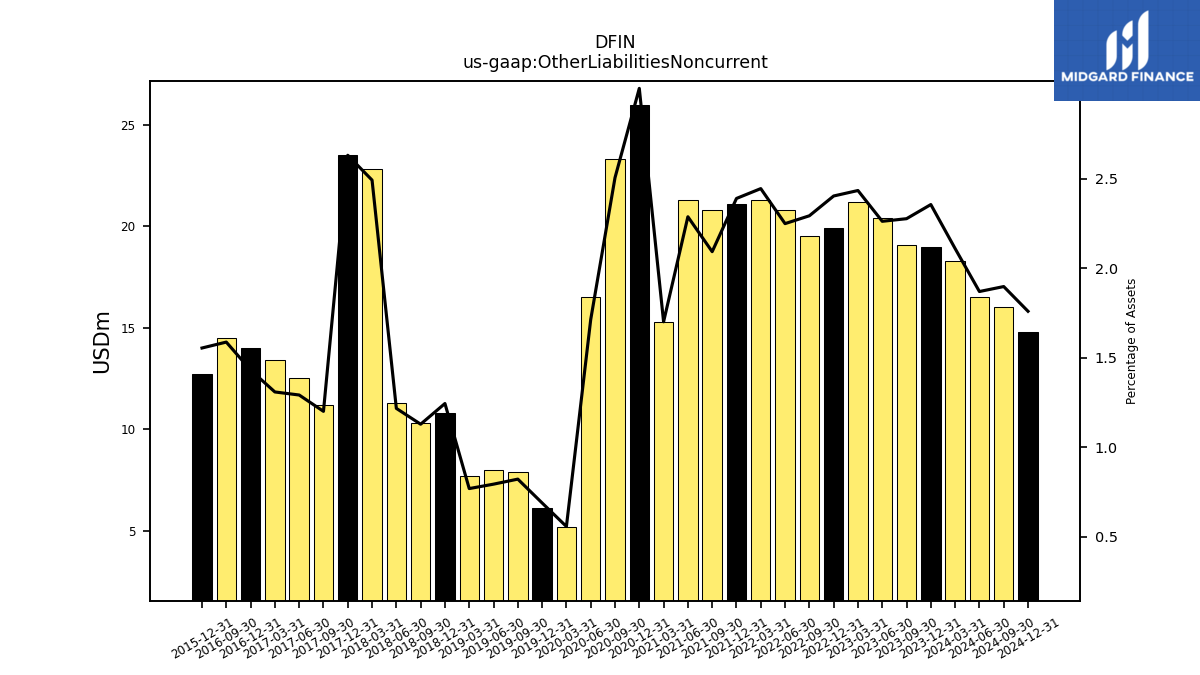
| Other Liabilities Noncurrent | 19.00 | 19.10 | 20.40 | 21.20 | 19.90 | 19.50 | 20.80 | 21.30 | 21.10 | 20.80 | 21.30 | 15.30 | 26.00 | 23.30 | 16.50 | 5.20 | 6.10 | 7.90 | 8.00 | 7.70 | 10.80 | 10.30 | 11.30 | 22.80 | 23.50 | 11.20 | 12.50 | 13.40 | 14.00 | 14.50 | NA | NA | 12.70 | NA | |
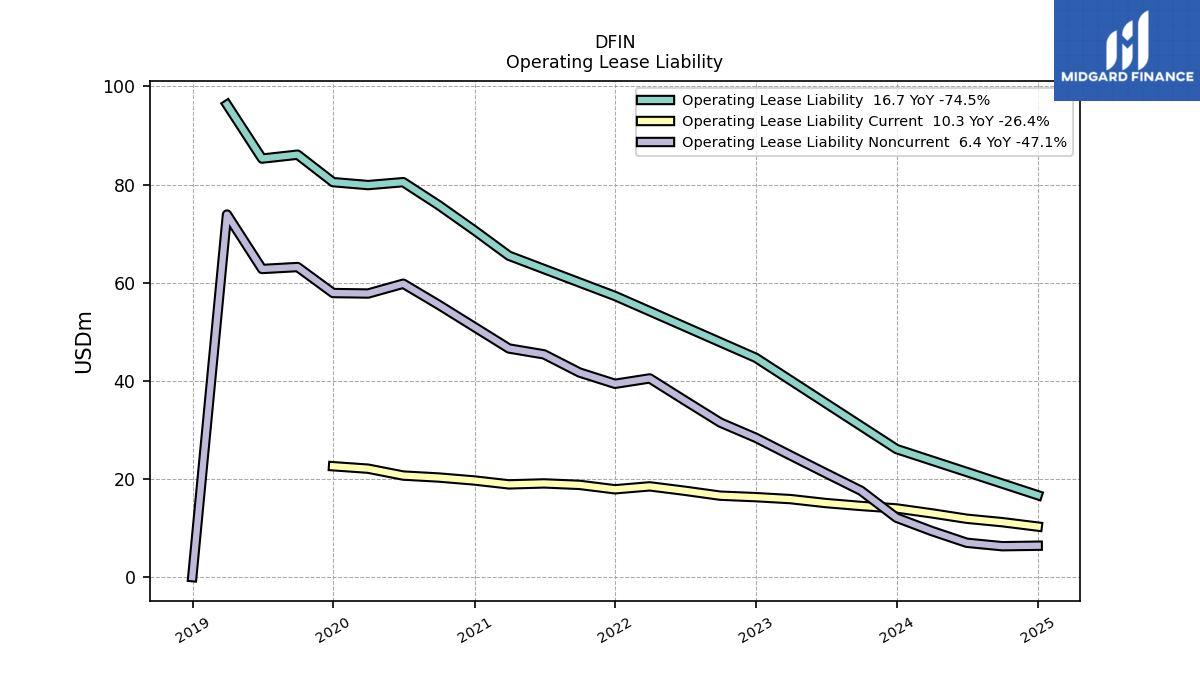
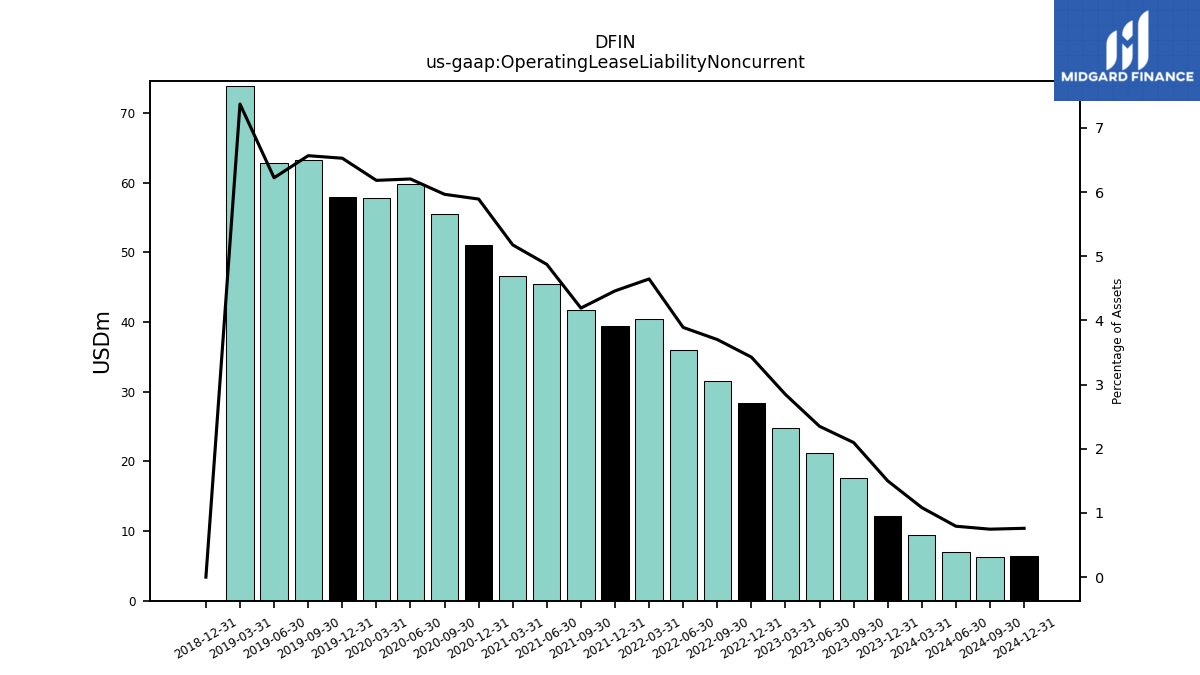
| Operating Lease Liability Noncurrent | 12.10 | 17.60 | 21.20 | 24.80 | 28.40 | 31.50 | 36.00 | 40.50 | 39.40 | 41.70 | 45.40 | 46.60 | 51.00 | 55.50 | 59.80 | 57.80 | 57.90 | 63.20 | 62.80 | 73.90 | 0.00 | NA | NA | NA | NA | NA | NA | NA | NA | NA | NA | NA | NA | NA |
| 2023-12-31 | 2023-09-30 | 2023-06-30 | 2023-03-31 | 2022-12-31 | 2022-09-30 | 2022-06-30 | 2022-03-31 | 2021-12-31 | 2021-09-30 | 2021-06-30 | 2021-03-31 | 2020-12-31 | 2020-09-30 | 2020-06-30 | 2020-03-31 | 2019-12-31 | 2019-09-30 | 2019-06-30 | 2019-03-31 | 2018-12-31 | 2018-09-30 | 2018-06-30 | 2018-03-31 | 2017-12-31 | 2017-09-30 | 2017-06-30 | 2017-03-31 | 2016-12-31 | 2016-09-30 | 2016-06-30 | 2016-03-31 | 2015-12-31 | 2015-09-30 | ||
|---|---|---|---|---|---|---|---|---|---|---|---|---|---|---|---|---|---|---|---|---|---|---|---|---|---|---|---|---|---|---|---|---|---|---|---|
| Stockholders Equity | 402.20 | 385.30 | 376.00 | 332.70 | 329.50 | 331.50 | 341.40 | 353.90 | 377.00 | 358.90 | 319.60 | 276.00 | 247.80 | 277.70 | 270.40 | 267.10 | 268.60 | 266.10 | 249.10 | 227.50 | 226.00 | 231.70 | 180.80 | 161.60 | 149.40 | 173.60 | 166.60 | 124.50 | 111.10 | 88.60 | 748.10 | 683.60 | 623.50 | 426.40 | |
| Common Stock Value | 0.40 | 0.40 | 0.40 | 0.40 | 0.40 | 0.40 | 0.40 | 0.40 | 0.40 | 0.40 | 0.40 | 0.40 | 0.30 | 0.30 | 0.30 | 0.30 | 0.30 | 0.30 | 0.30 | 0.30 | 0.30 | 0.30 | 0.30 | 0.30 | 0.30 | 0.30 | 0.30 | 0.30 | 0.30 | NA | NA | NA | 0.00 | NA | |
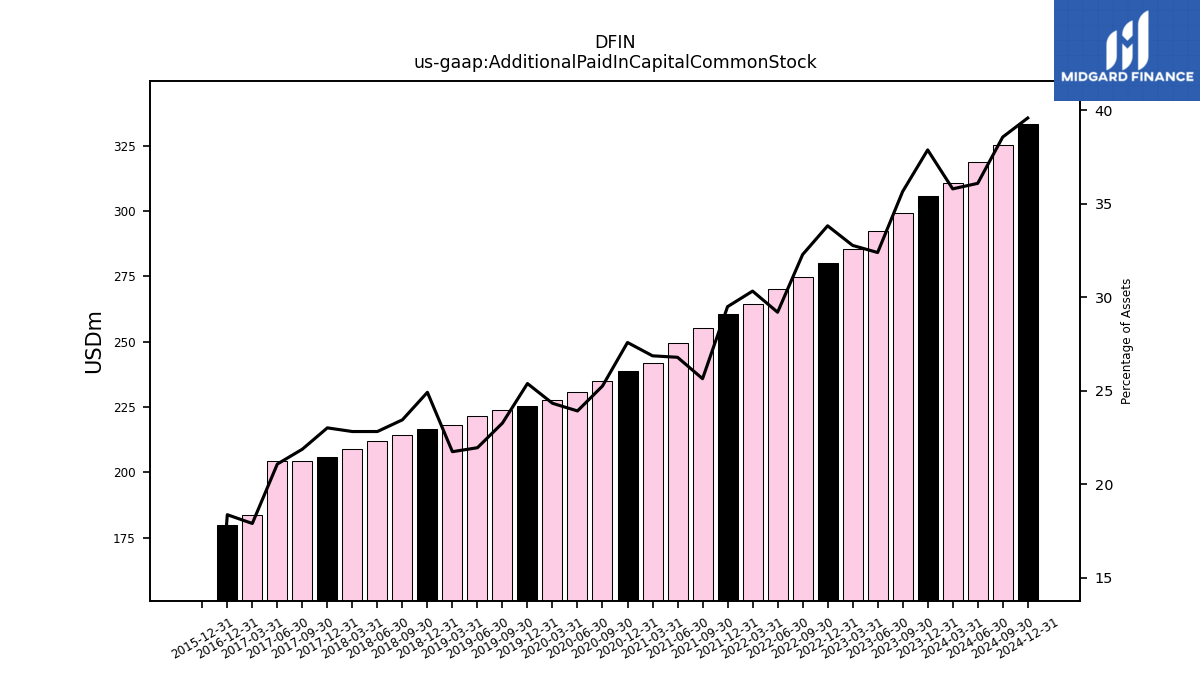
| Additional Paid In Capital Common Stock | 305.70 | 299.30 | 292.30 | 285.60 | 280.20 | 274.70 | 270.20 | 264.40 | 260.60 | 255.10 | 249.60 | 241.90 | 238.80 | 235.00 | 230.60 | 227.50 | 225.20 | 224.00 | 221.60 | 218.00 | 216.50 | 214.20 | 212.10 | 208.90 | 205.70 | 204.30 | 204.20 | 183.50 | 179.90 | NA | NA | NA | 0.00 | NA | |
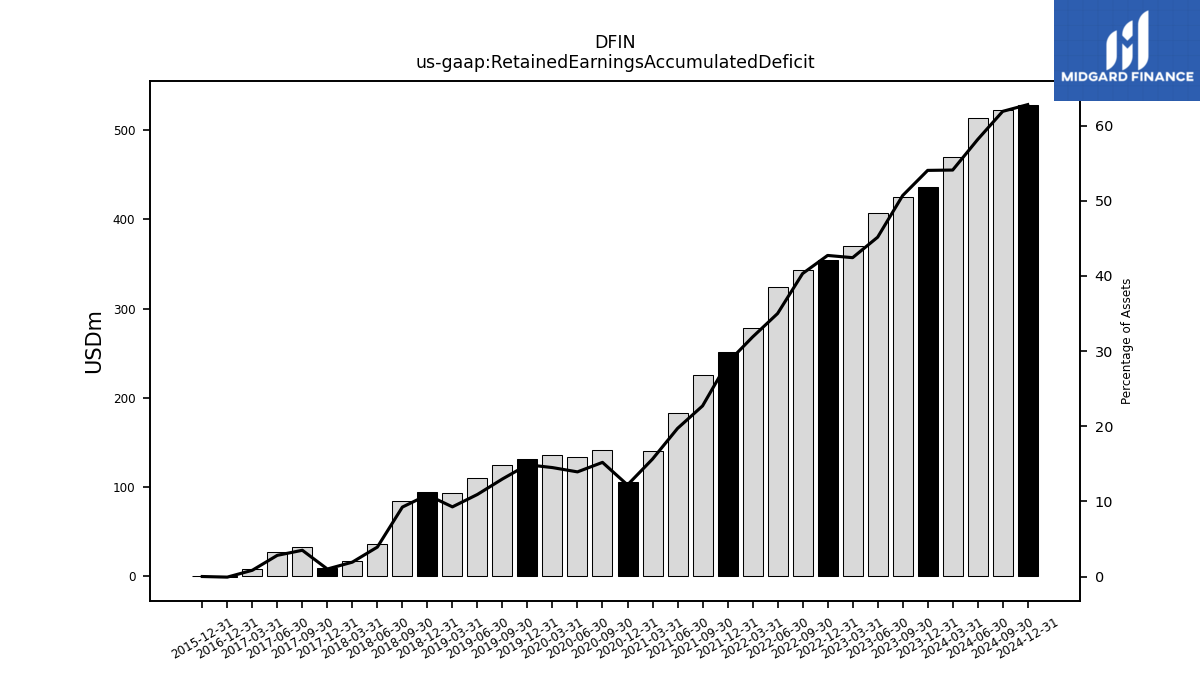
| Retained Earnings Accumulated Deficit | 436.10 | 425.50 | 407.40 | 369.70 | 353.90 | 343.00 | 323.80 | 277.80 | 251.40 | 225.80 | 183.60 | 140.70 | 105.50 | 141.30 | 134.20 | 135.50 | 131.90 | 124.90 | 110.20 | 92.90 | 94.30 | 84.40 | 36.40 | 17.50 | 8.90 | 32.60 | 27.30 | 8.50 | -0.80 | NA | NA | NA | 0.00 | NA | |
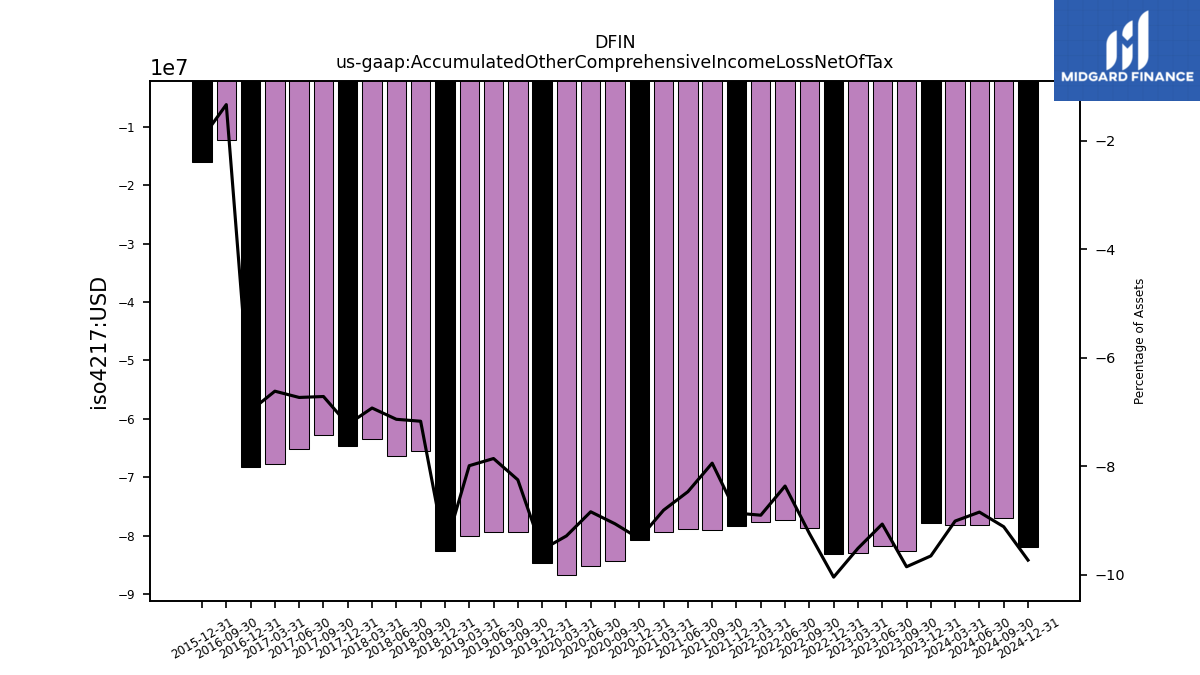
| Accumulated Other Comprehensive Income Loss Net Of Tax | -77.90 | -82.70 | -81.80 | -82.90 | -83.20 | -78.60 | -77.40 | -77.60 | -78.30 | -79.00 | -78.90 | -79.30 | -80.80 | -84.30 | -85.20 | -86.80 | -84.60 | -79.40 | -79.30 | -80.10 | -82.70 | -65.50 | -66.30 | -63.40 | -64.60 | -62.70 | -65.20 | -67.80 | -68.30 | -12.20 | NA | NA | -16.00 | NA | |
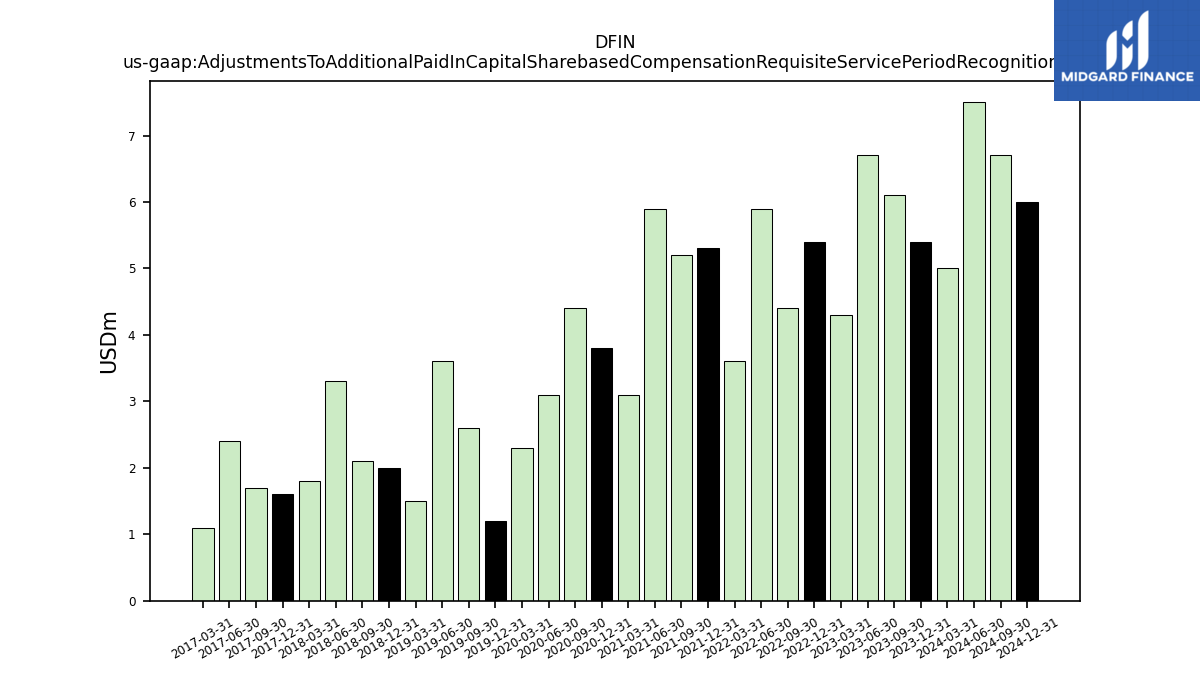
| Adjustments To Additional Paid In Capital Sharebased Compensation Requisite Service Period Recognition Value | 5.40 | 6.10 | 6.70 | 4.30 | 5.40 | 4.40 | 5.90 | 3.60 | 5.30 | 5.20 | 5.90 | 3.10 | 3.80 | 4.40 | 3.10 | 2.30 | 1.20 | 2.60 | 3.60 | 1.50 | 2.00 | 2.10 | 3.30 | 1.80 | 1.60 | 1.70 | 2.40 | 1.10 | NA | NA | NA | NA | NA | NA |
| 2023-12-31 | 2023-09-30 | 2023-06-30 | 2023-03-31 | 2022-12-31 | 2022-09-30 | 2022-06-30 | 2022-03-31 | 2021-12-31 | 2021-09-30 | 2021-06-30 | 2021-03-31 | 2020-12-31 | 2020-09-30 | 2020-06-30 | 2020-03-31 | 2019-12-31 | 2019-09-30 | 2019-06-30 | 2019-03-31 | 2018-12-31 | 2018-09-30 | 2018-06-30 | 2018-03-31 | 2017-12-31 | 2017-09-30 | 2017-06-30 | 2017-03-31 | 2016-12-31 | 2016-09-30 | 2016-06-30 | 2016-03-31 | 2015-12-31 | 2015-09-30 | ||
|---|---|---|---|---|---|---|---|---|---|---|---|---|---|---|---|---|---|---|---|---|---|---|---|---|---|---|---|---|---|---|---|---|---|---|---|
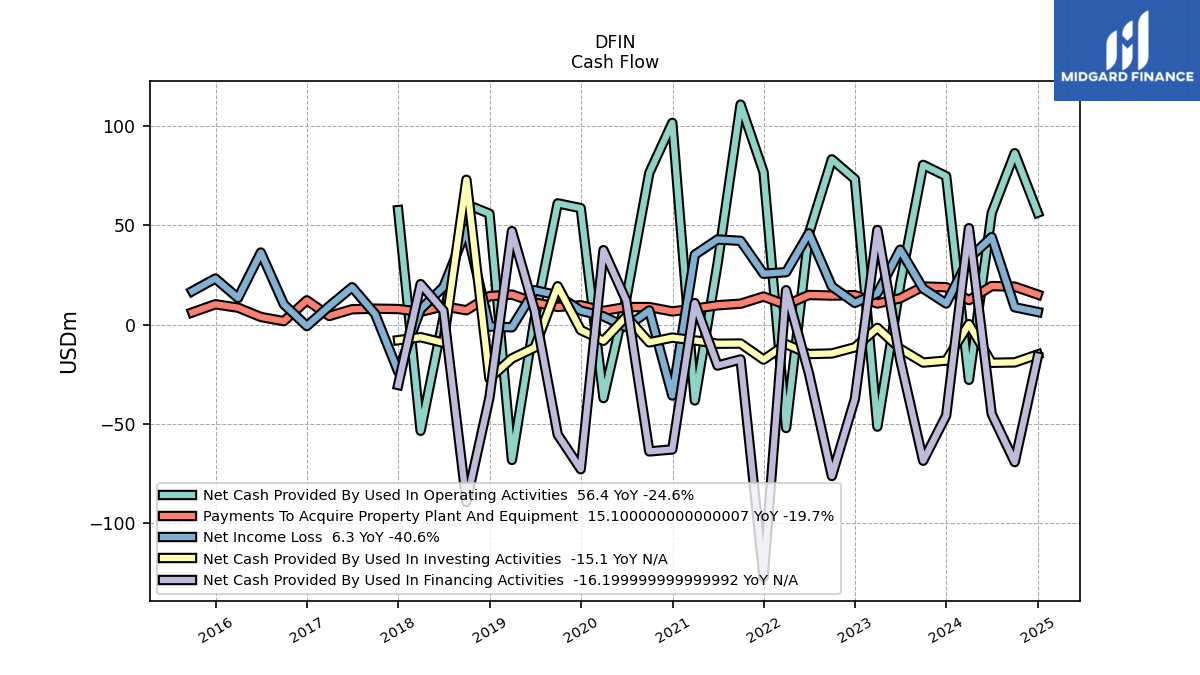
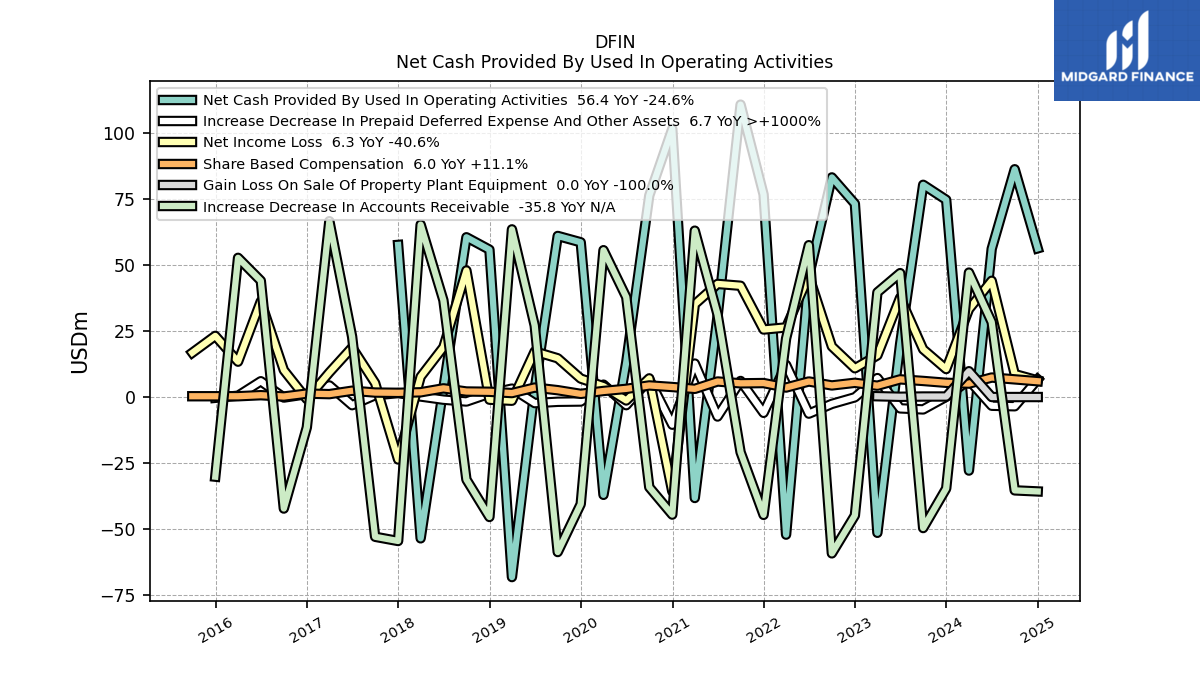
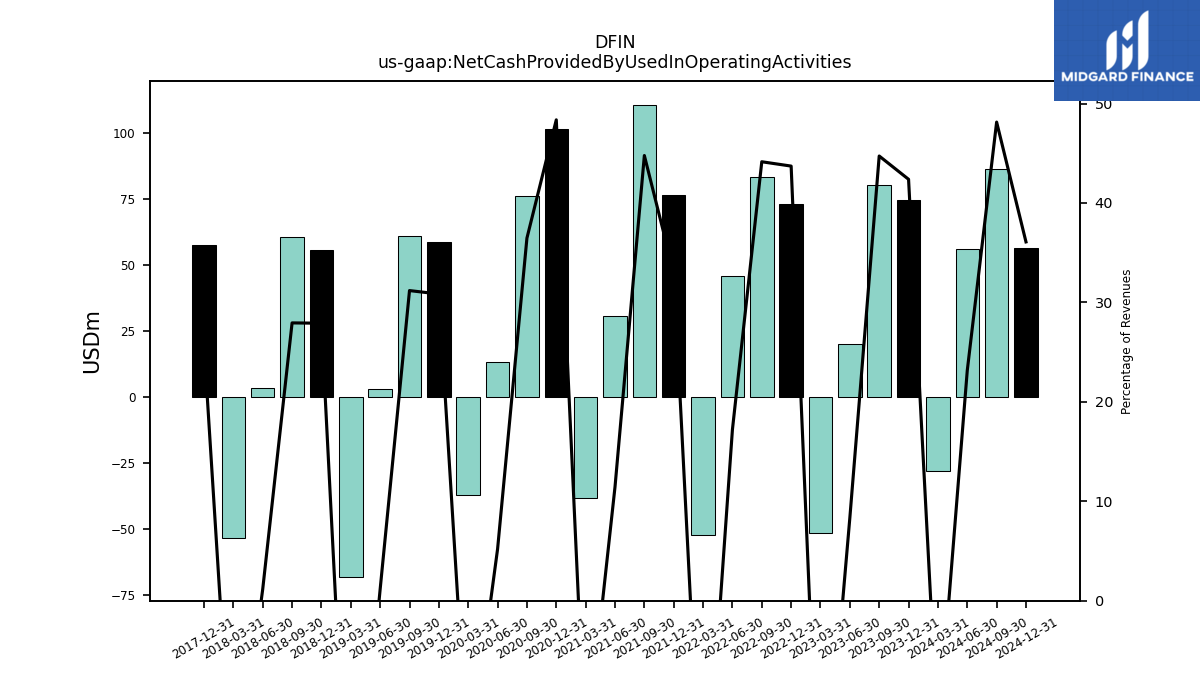
| Net Cash Provided By Used In Operating Activities | 74.80 | 80.50 | 20.20 | -51.50 | 73.30 | 83.30 | 45.80 | -52.20 | 76.80 | 110.90 | 30.60 | -38.30 | 101.70 | 76.40 | 13.20 | -37.10 | 58.70 | 61.10 | 3.00 | -68.30 | 55.90 | 60.60 | 3.40 | -53.60 | 57.70 | NA | NA | NA | NA | NA | NA | NA | NA | NA | |
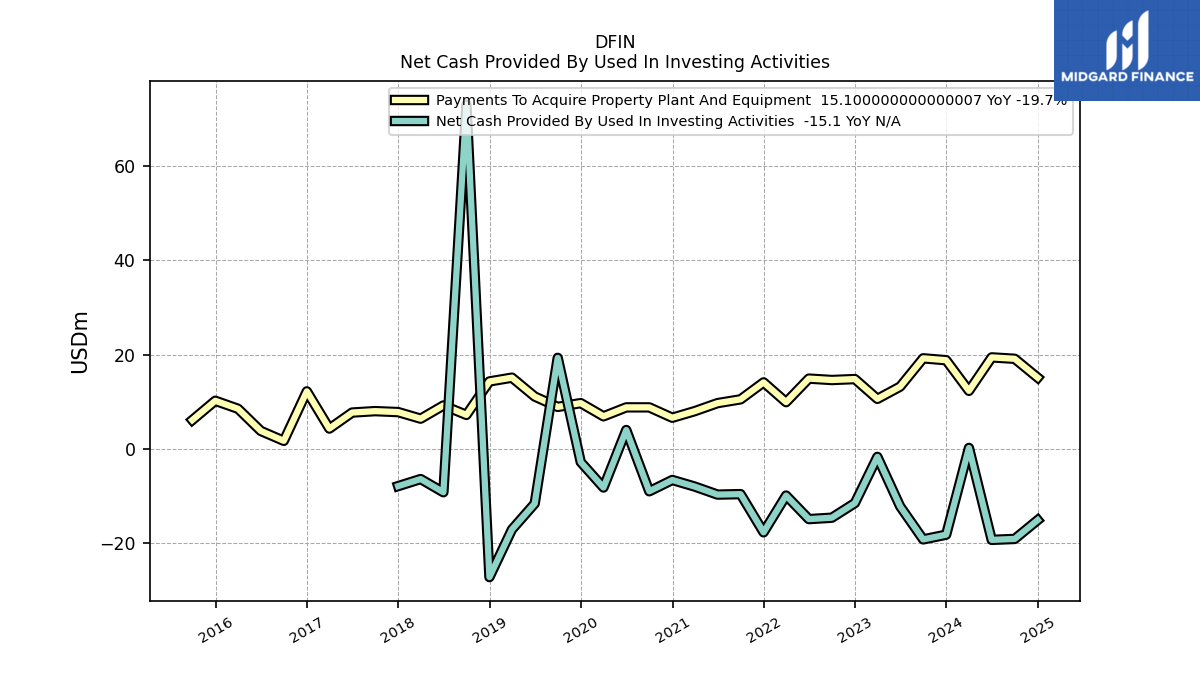
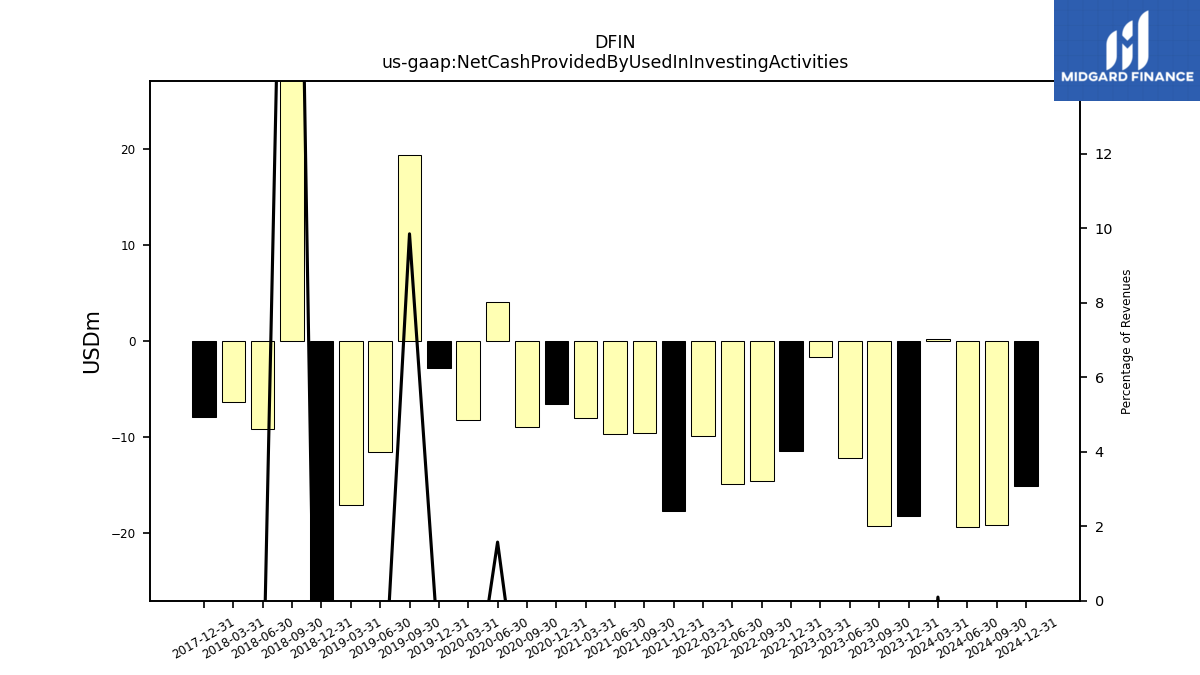
| Net Cash Provided By Used In Investing Activities | -18.20 | -19.20 | -12.20 | -1.70 | -11.50 | -14.60 | -14.90 | -9.90 | -17.70 | -9.60 | -9.70 | -8.00 | -6.60 | -9.00 | 4.00 | -8.20 | -2.80 | 19.30 | -11.60 | -17.10 | -27.20 | 73.00 | -9.20 | -6.40 | -7.90 | NA | NA | NA | NA | NA | NA | NA | NA | NA | |
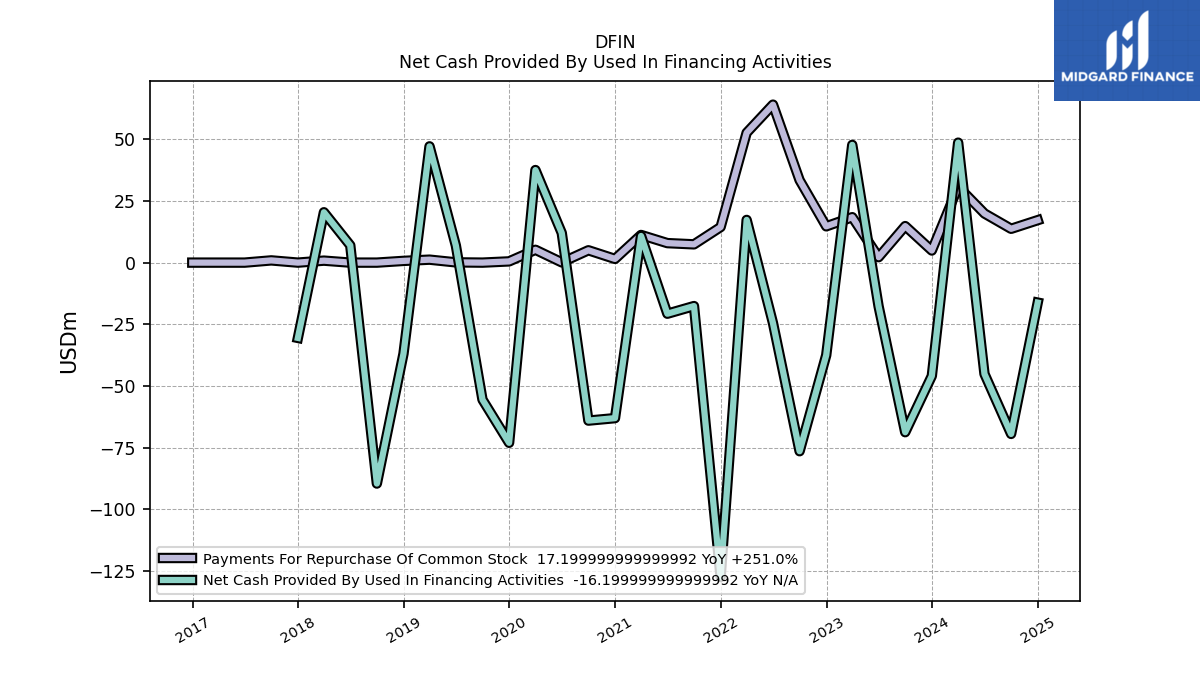
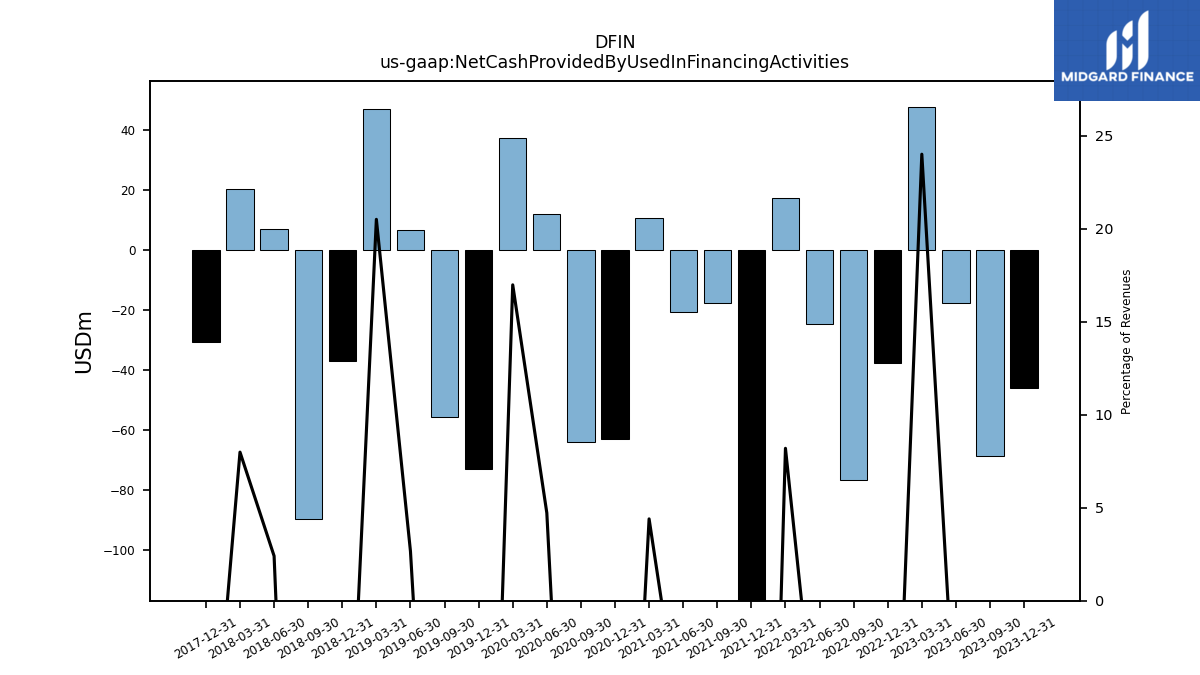
| Net Cash Provided By Used In Financing Activities | -45.90 | -68.70 | -17.70 | 47.70 | -37.50 | -76.40 | -24.50 | 17.30 | -127.40 | -17.60 | -20.70 | 10.80 | -63.00 | -64.00 | 12.00 | 37.50 | -73.00 | -55.50 | 6.90 | 47.10 | -36.90 | -89.50 | 7.00 | 20.40 | -30.50 | NA | NA | NA | NA | NA | NA | NA | NA | NA |
| 2023-12-31 | 2023-09-30 | 2023-06-30 | 2023-03-31 | 2022-12-31 | 2022-09-30 | 2022-06-30 | 2022-03-31 | 2021-12-31 | 2021-09-30 | 2021-06-30 | 2021-03-31 | 2020-12-31 | 2020-09-30 | 2020-06-30 | 2020-03-31 | 2019-12-31 | 2019-09-30 | 2019-06-30 | 2019-03-31 | 2018-12-31 | 2018-09-30 | 2018-06-30 | 2018-03-31 | 2017-12-31 | 2017-09-30 | 2017-06-30 | 2017-03-31 | 2016-12-31 | 2016-09-30 | 2016-06-30 | 2016-03-31 | 2015-12-31 | 2015-09-30 | ||
|---|---|---|---|---|---|---|---|---|---|---|---|---|---|---|---|---|---|---|---|---|---|---|---|---|---|---|---|---|---|---|---|---|---|---|---|
| Net Cash Provided By Used In Operating Activities | 74.80 | 80.50 | 20.20 | -51.50 | 73.30 | 83.30 | 45.80 | -52.20 | 76.80 | 110.90 | 30.60 | -38.30 | 101.70 | 76.40 | 13.20 | -37.10 | 58.70 | 61.10 | 3.00 | -68.30 | 55.90 | 60.60 | 3.40 | -53.60 | 57.70 | NA | NA | NA | NA | NA | NA | NA | NA | NA | |
| Net Income Loss | 10.60 | 18.10 | 37.70 | 15.80 | 10.90 | 19.20 | 46.00 | 26.40 | 25.60 | 42.20 | 42.90 | 35.20 | -35.80 | 7.10 | -1.30 | 4.10 | 7.00 | 14.70 | 17.30 | -1.40 | -1.00 | 48.00 | 18.90 | 7.70 | -23.70 | 5.30 | 18.80 | 9.30 | -0.80 | 10.20 | 36.30 | 13.40 | 23.20 | 16.80 | |
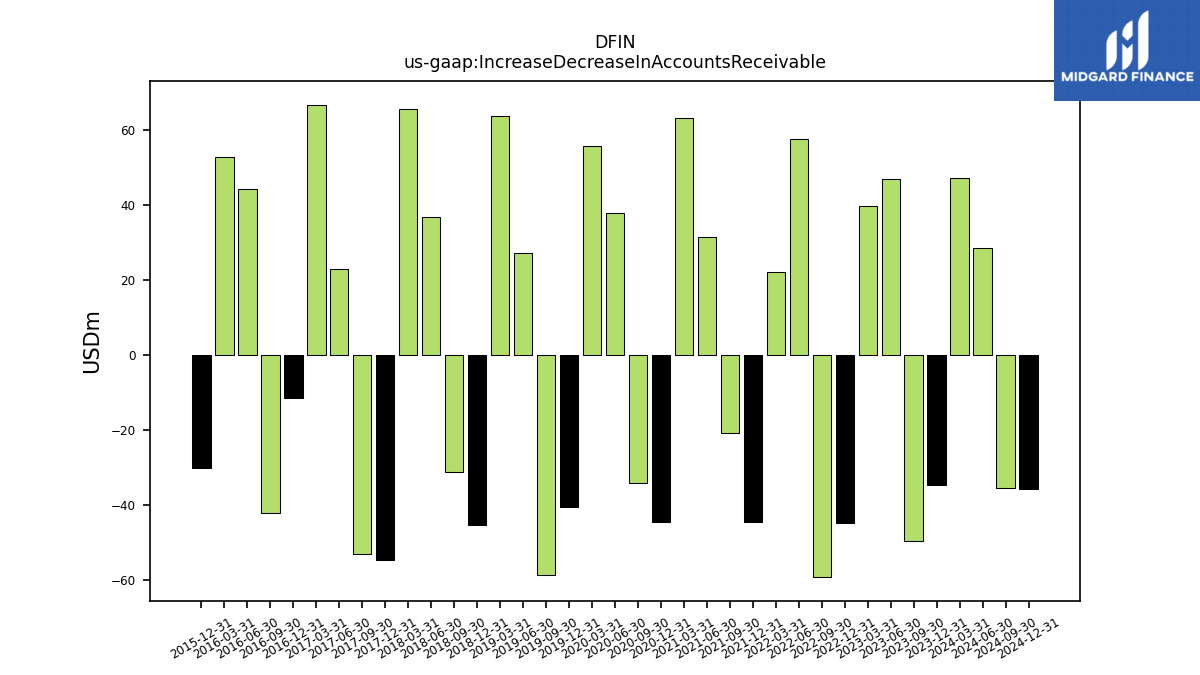
| Increase Decrease In Accounts Receivable | -34.70 | -49.70 | 47.00 | 39.70 | -44.90 | -59.30 | 57.60 | 22.20 | -44.70 | -20.90 | 31.30 | 63.10 | -44.60 | -34.20 | 37.90 | 55.70 | -40.60 | -58.80 | 27.10 | 63.60 | -45.50 | -31.30 | 36.70 | 65.40 | -54.60 | -53.00 | 22.90 | 66.70 | -11.50 | -42.30 | 44.10 | 52.80 | -30.20 | NA | |
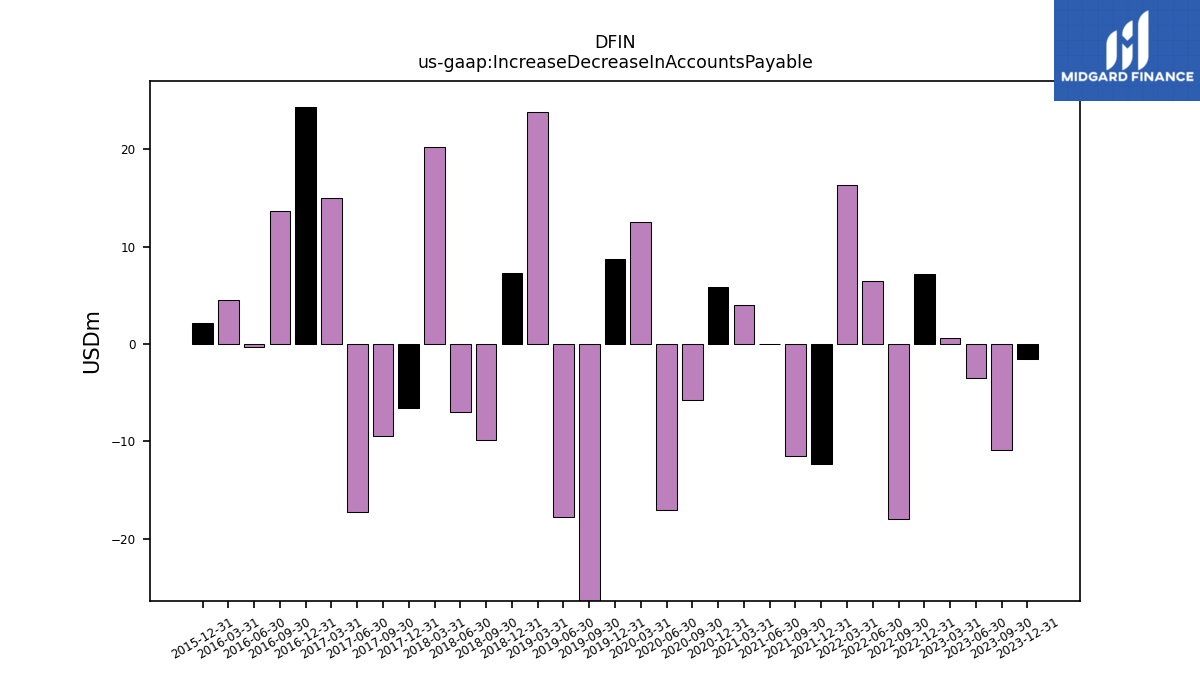
| Increase Decrease In Accounts Payable | -1.50 | -10.90 | -3.50 | 0.60 | 7.20 | -18.00 | 6.50 | 16.40 | -12.30 | -11.50 | 0.00 | 4.00 | 5.90 | -5.70 | -17.10 | 12.50 | 8.70 | -28.40 | -17.80 | 23.90 | 7.30 | -9.90 | -7.00 | 20.30 | -6.60 | -9.40 | -17.30 | 15.00 | 24.40 | 13.70 | -0.30 | 4.50 | 2.20 | NA | |
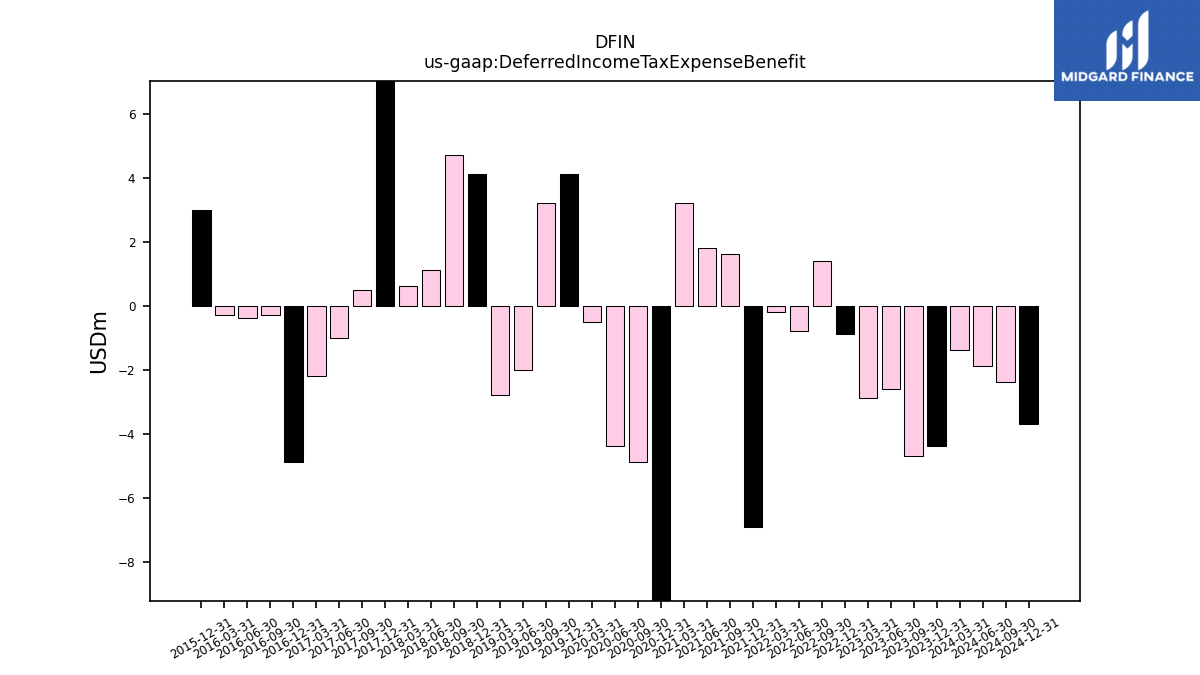
| Deferred Income Tax Expense Benefit | -4.40 | -4.70 | -2.60 | -2.90 | -0.90 | 1.40 | -0.80 | -0.20 | -6.90 | 1.60 | 1.80 | 3.20 | -16.60 | -4.90 | -4.40 | -0.50 | 4.10 | 3.20 | -2.00 | -2.80 | 4.10 | 4.70 | 1.10 | 0.60 | 15.10 | 0.50 | -1.00 | -2.20 | -4.90 | -0.30 | -0.40 | -0.30 | 3.00 | NA | |
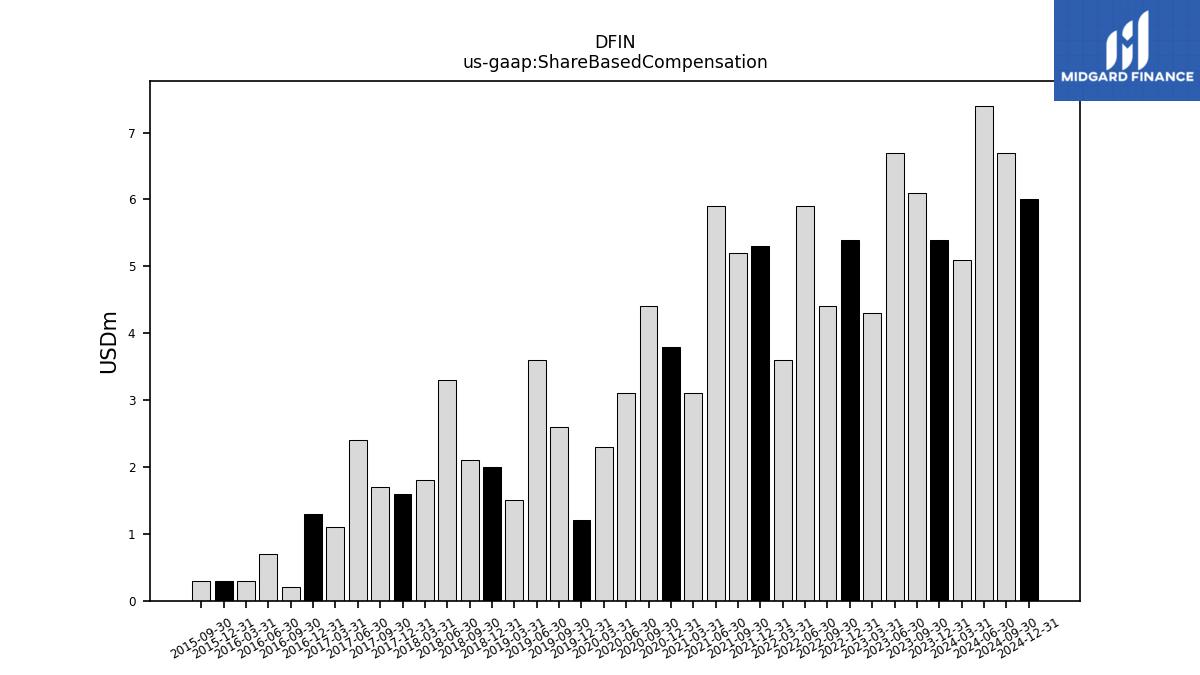
| Share Based Compensation | 5.40 | 6.10 | 6.70 | 4.30 | 5.40 | 4.40 | 5.90 | 3.60 | 5.30 | 5.20 | 5.90 | 3.10 | 3.80 | 4.40 | 3.10 | 2.30 | 1.20 | 2.60 | 3.60 | 1.50 | 2.00 | 2.10 | 3.30 | 1.80 | 1.60 | 1.70 | 2.40 | 1.10 | 1.30 | 0.20 | 0.70 | 0.30 | 0.30 | 0.30 |
| 2023-12-31 | 2023-09-30 | 2023-06-30 | 2023-03-31 | 2022-12-31 | 2022-09-30 | 2022-06-30 | 2022-03-31 | 2021-12-31 | 2021-09-30 | 2021-06-30 | 2021-03-31 | 2020-12-31 | 2020-09-30 | 2020-06-30 | 2020-03-31 | 2019-12-31 | 2019-09-30 | 2019-06-30 | 2019-03-31 | 2018-12-31 | 2018-09-30 | 2018-06-30 | 2018-03-31 | 2017-12-31 | 2017-09-30 | 2017-06-30 | 2017-03-31 | 2016-12-31 | 2016-09-30 | 2016-06-30 | 2016-03-31 | 2015-12-31 | 2015-09-30 | ||
|---|---|---|---|---|---|---|---|---|---|---|---|---|---|---|---|---|---|---|---|---|---|---|---|---|---|---|---|---|---|---|---|---|---|---|---|
| Net Cash Provided By Used In Investing Activities | -18.20 | -19.20 | -12.20 | -1.70 | -11.50 | -14.60 | -14.90 | -9.90 | -17.70 | -9.60 | -9.70 | -8.00 | -6.60 | -9.00 | 4.00 | -8.20 | -2.80 | 19.30 | -11.60 | -17.10 | -27.20 | 73.00 | -9.20 | -6.40 | -7.90 | NA | NA | NA | NA | NA | NA | NA | NA | NA | |
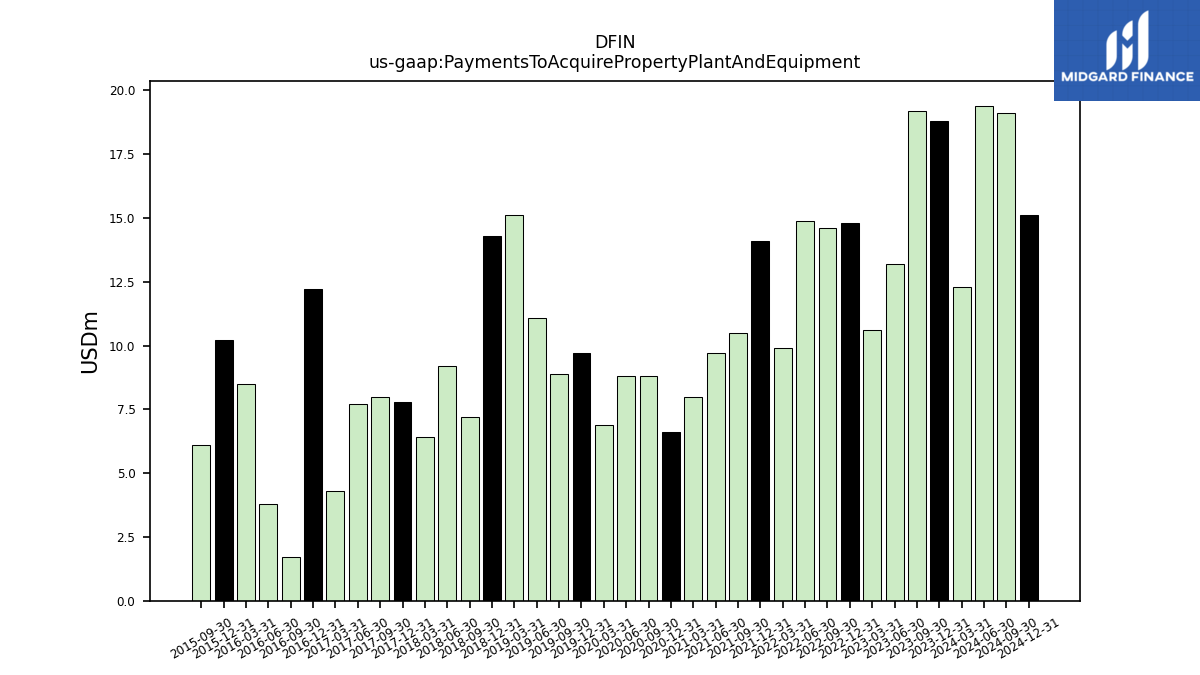
| Payments To Acquire Property Plant And Equipment | 18.80 | 19.20 | 13.20 | 10.60 | 14.80 | 14.60 | 14.90 | 9.90 | 14.10 | 10.50 | 9.70 | 8.00 | 6.60 | 8.80 | 8.80 | 6.90 | 9.70 | 8.90 | 11.10 | 15.10 | 14.30 | 7.20 | 9.20 | 6.40 | 7.80 | 8.00 | 7.70 | 4.30 | 12.20 | 1.70 | 3.80 | 8.50 | 10.20 | 6.10 |
| 2023-12-31 | 2023-09-30 | 2023-06-30 | 2023-03-31 | 2022-12-31 | 2022-09-30 | 2022-06-30 | 2022-03-31 | 2021-12-31 | 2021-09-30 | 2021-06-30 | 2021-03-31 | 2020-12-31 | 2020-09-30 | 2020-06-30 | 2020-03-31 | 2019-12-31 | 2019-09-30 | 2019-06-30 | 2019-03-31 | 2018-12-31 | 2018-09-30 | 2018-06-30 | 2018-03-31 | 2017-12-31 | 2017-09-30 | 2017-06-30 | 2017-03-31 | 2016-12-31 | 2016-09-30 | 2016-06-30 | 2016-03-31 | 2015-12-31 | 2015-09-30 | ||
|---|---|---|---|---|---|---|---|---|---|---|---|---|---|---|---|---|---|---|---|---|---|---|---|---|---|---|---|---|---|---|---|---|---|---|---|
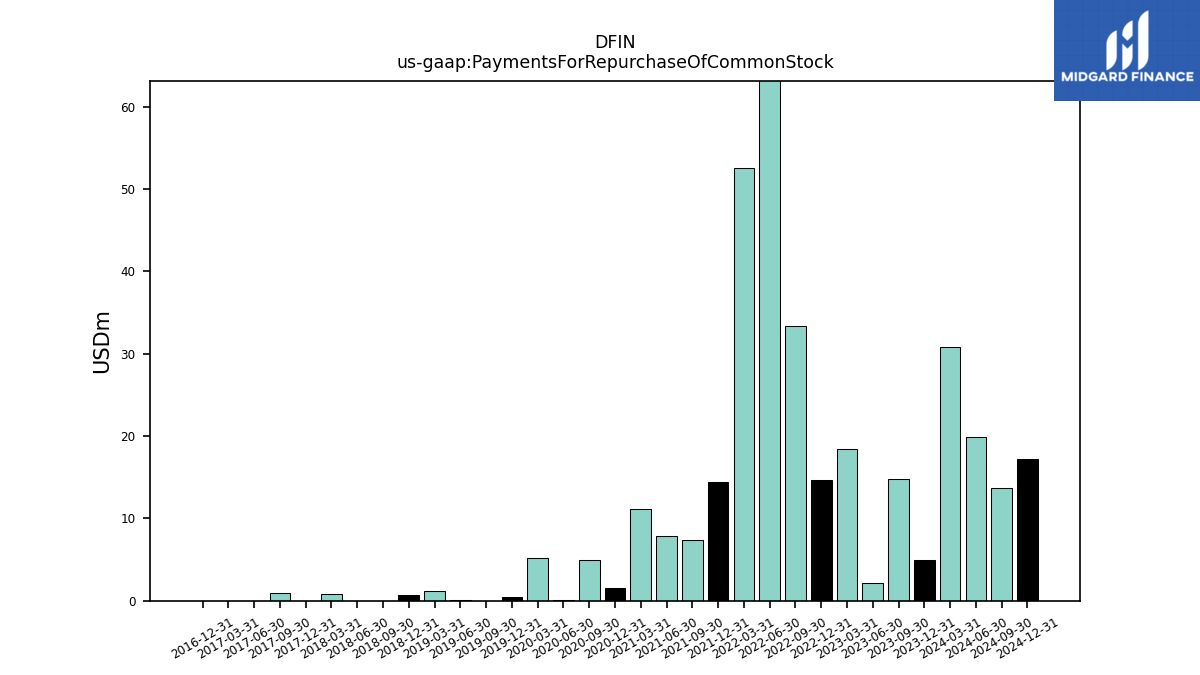
| Net Cash Provided By Used In Financing Activities | -45.90 | -68.70 | -17.70 | 47.70 | -37.50 | -76.40 | -24.50 | 17.30 | -127.40 | -17.60 | -20.70 | 10.80 | -63.00 | -64.00 | 12.00 | 37.50 | -73.00 | -55.50 | 6.90 | 47.10 | -36.90 | -89.50 | 7.00 | 20.40 | -30.50 | NA | NA | NA | NA | NA | NA | NA | NA | NA | |
| Payments For Repurchase Of Common Stock | 4.90 | 14.80 | 2.20 | 18.40 | 14.70 | 33.40 | 64.00 | 52.60 | 14.40 | 7.40 | 7.90 | 11.20 | 1.50 | 5.00 | 0.10 | 5.20 | 0.50 | 0.00 | 0.10 | 1.20 | 0.70 | 0.00 | 0.00 | 0.80 | 0.00 | 0.90 | 0.00 | 0.00 | 0.00 | NA | NA | NA | NA | NA |
| 2023-12-31 | 2023-09-30 | 2023-06-30 | 2023-03-31 | 2022-12-31 | 2022-09-30 | 2022-06-30 | 2022-03-31 | 2021-12-31 | 2021-09-30 | 2021-06-30 | 2021-03-31 | 2020-12-31 | 2020-09-30 | 2020-06-30 | 2020-03-31 | 2019-12-31 | 2019-09-30 | 2019-06-30 | 2019-03-31 | 2018-12-31 | 2018-09-30 | 2018-06-30 | 2018-03-31 | 2017-12-31 | 2017-09-30 | 2017-06-30 | 2017-03-31 | 2016-12-31 | 2016-09-30 | 2016-06-30 | 2016-03-31 | 2015-12-31 | 2015-09-30 | ||
|---|---|---|---|---|---|---|---|---|---|---|---|---|---|---|---|---|---|---|---|---|---|---|---|---|---|---|---|---|---|---|---|---|---|---|---|
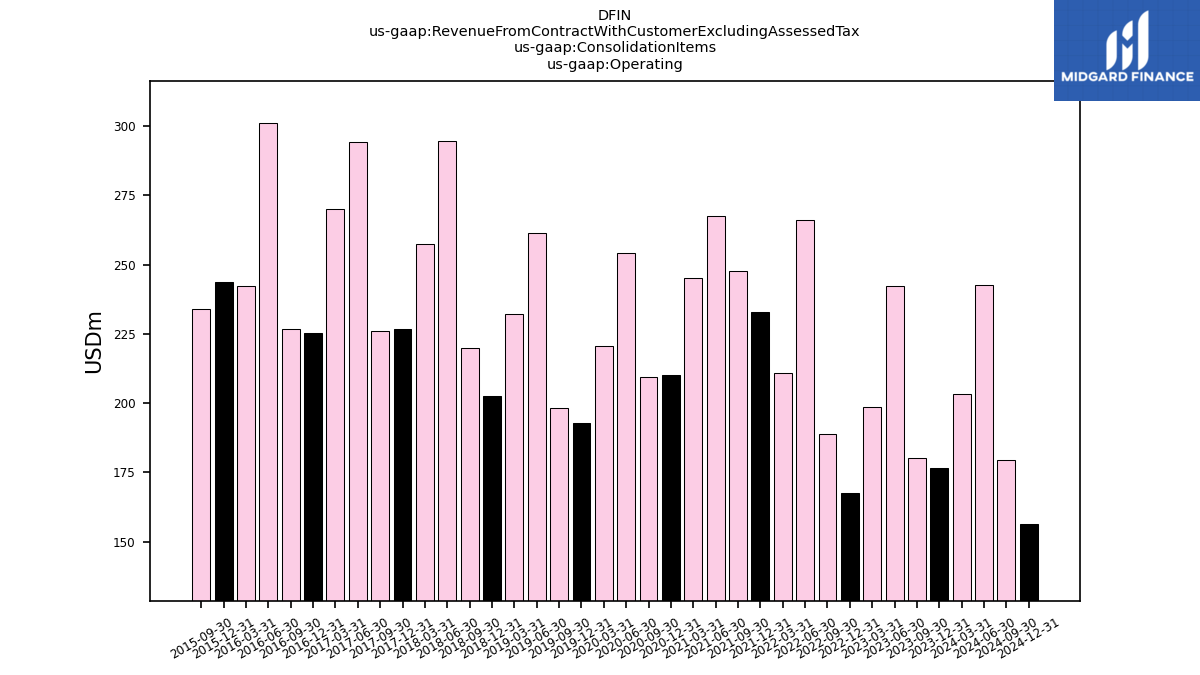
| Revenues | 176.50 | 180.00 | 242.10 | 198.60 | 167.70 | 188.70 | 266.20 | 211.00 | 232.80 | 247.70 | 267.50 | 245.30 | 210.30 | 209.50 | 254.00 | 220.70 | 190.30 | 195.90 | 258.90 | 229.60 | 200.30 | 216.90 | 290.60 | 255.20 | 224.80 | 222.60 | 290.20 | 267.30 | 221.00 | 224.40 | 298.00 | 240.10 | 238.60 | 231.60 | |
| Revenue From Contract With Customer Excluding Assessed Tax | 176.50 | 180.00 | 242.10 | 198.60 | 167.70 | 188.70 | 266.20 | 211.00 | 232.80 | 247.70 | 267.50 | 245.30 | 210.30 | 209.50 | 254.00 | 220.70 | 190.30 | 195.90 | 258.90 | 229.60 | 200.30 | 216.90 | 290.60 | 255.20 | 224.80 | 222.60 | 290.20 | 267.30 | 221.00 | 224.40 | 298.00 | 240.10 | 238.60 | 231.60 | |
| Operating | 176.50 | 180.00 | 242.10 | 198.60 | 167.70 | 188.70 | 266.20 | 211.00 | 232.80 | 247.70 | 267.50 | 245.30 | 210.30 | 209.50 | 254.00 | 220.70 | 192.90 | 198.20 | 261.40 | 232.20 | 202.40 | 219.80 | 294.70 | 257.30 | 226.80 | 226.00 | 294.40 | 270.20 | 225.20 | 226.80 | 301.20 | 242.30 | 243.80 | 233.90 | |
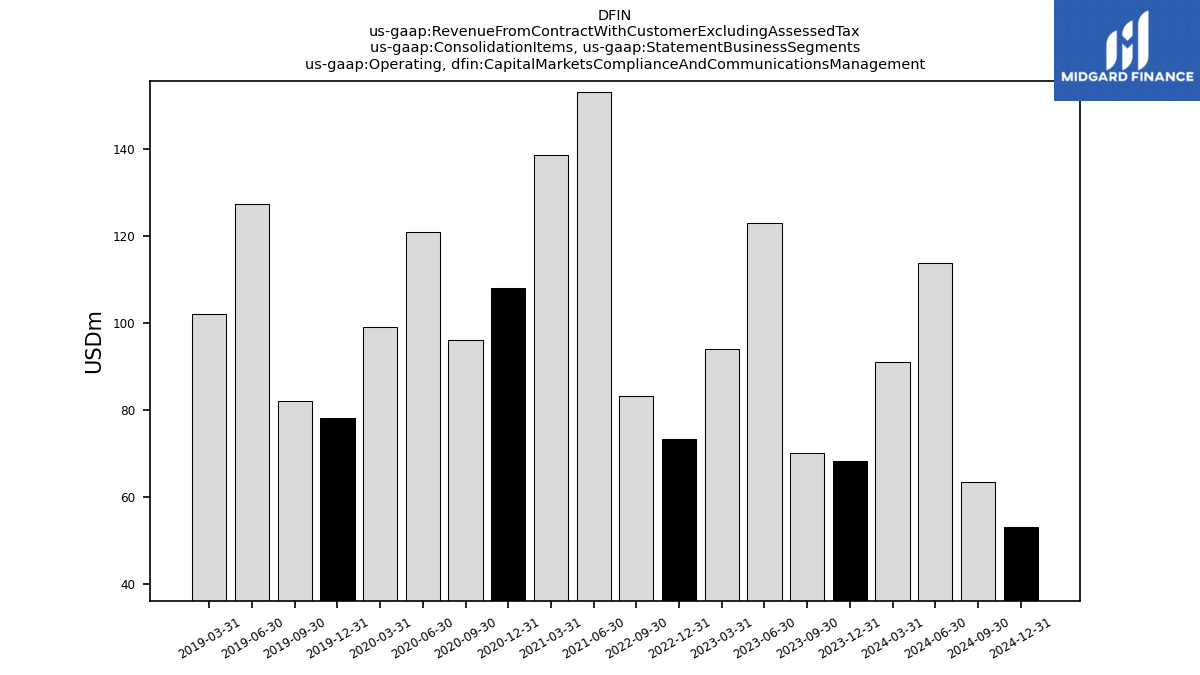
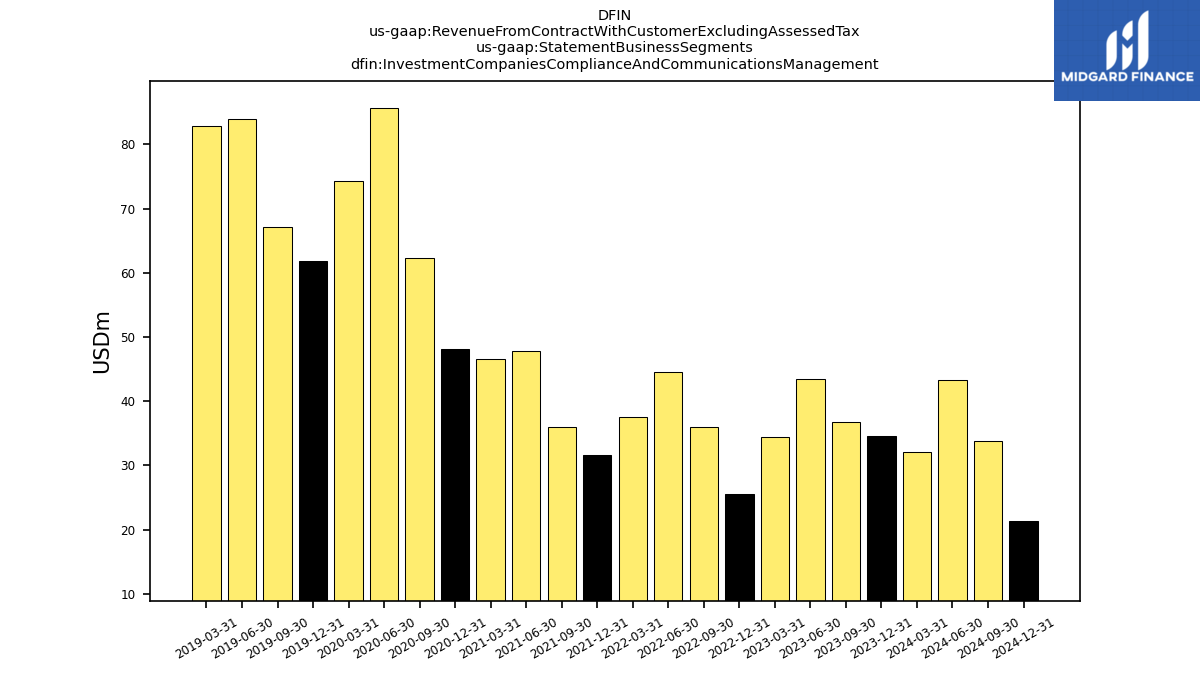
| Operating, Capital Markets Compliance And Communications Management | 68.30 | 70.10 | NA | NA | 73.40 | 83.30 | NA | NA | NA | NA | 153.10 | 138.50 | 108.00 | 96.10 | 120.80 | 99.10 | 78.30 | 82.20 | 127.20 | 102.00 | NA | NA | NA | NA | NA | NA | NA | NA | NA | NA | NA | NA | NA | NA | |
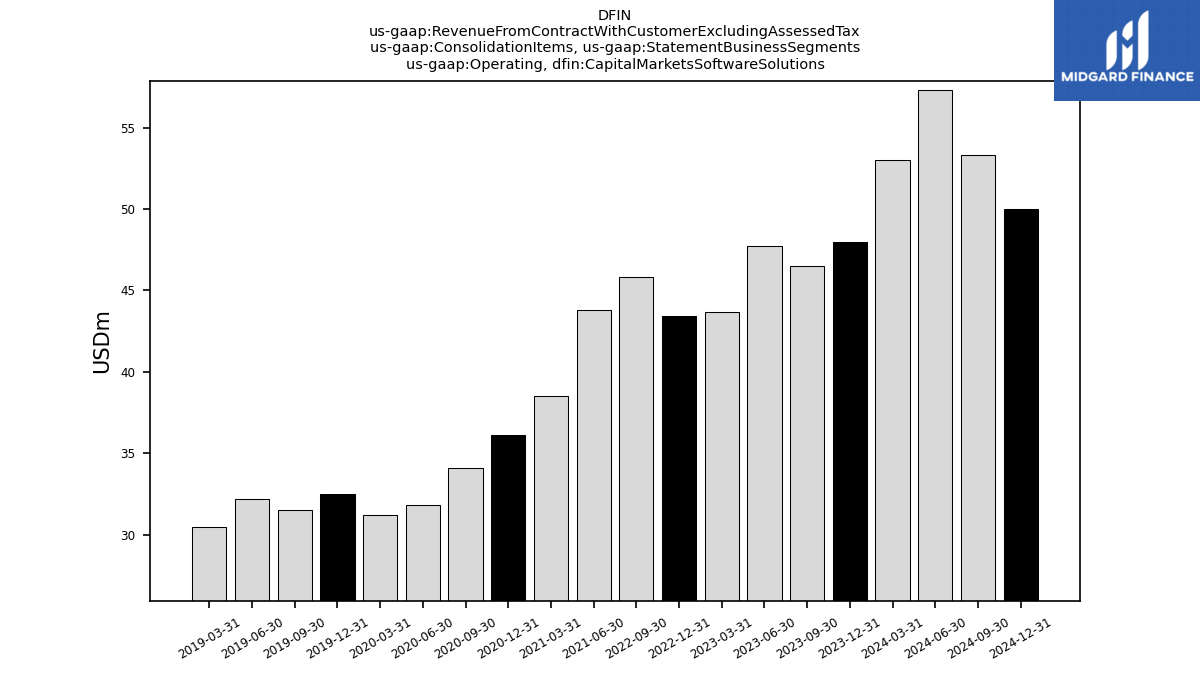
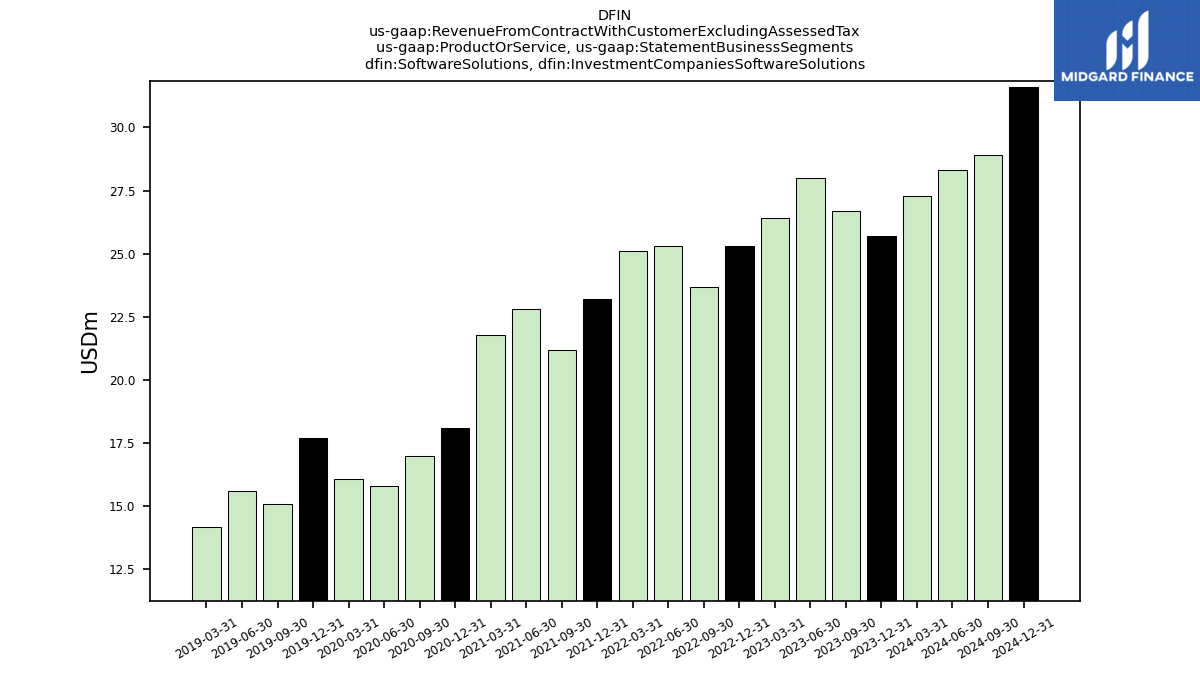
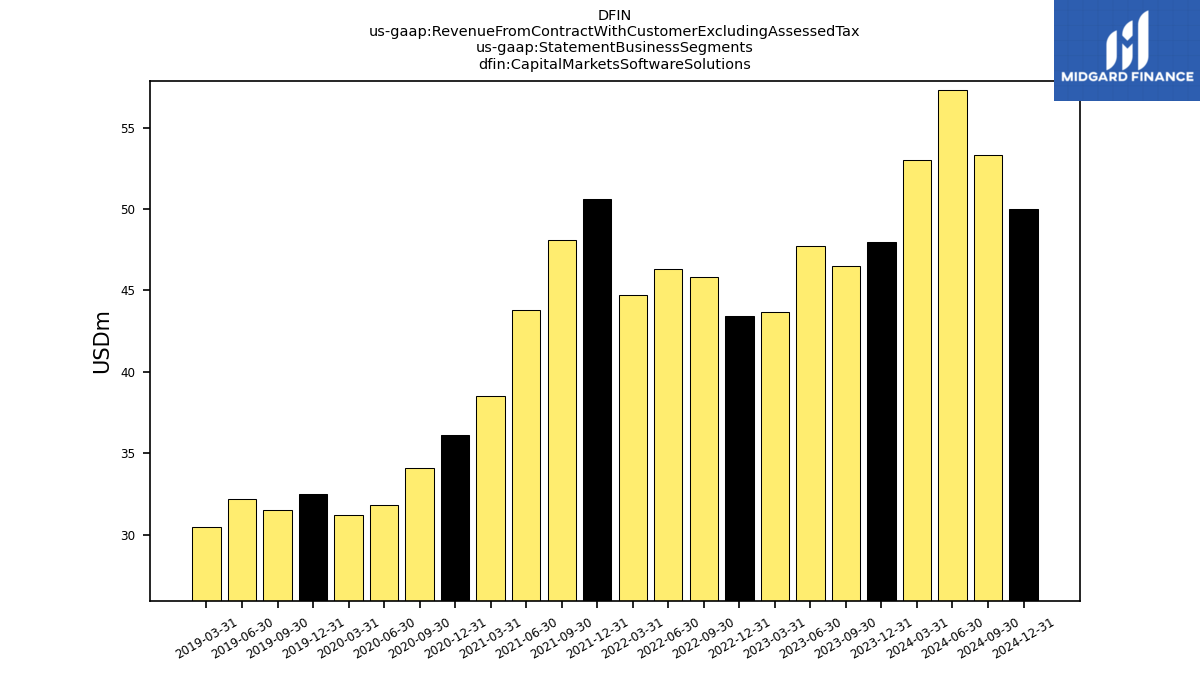
| Operating, Capital Markets Software Solutions | 48.00 | 46.50 | NA | NA | 43.40 | 45.80 | NA | NA | NA | NA | 43.80 | 38.50 | 36.10 | 34.10 | 31.80 | 31.20 | 32.50 | 31.50 | 32.20 | 30.50 | NA | NA | NA | NA | NA | NA | NA | NA | NA | NA | NA | NA | NA | NA | |
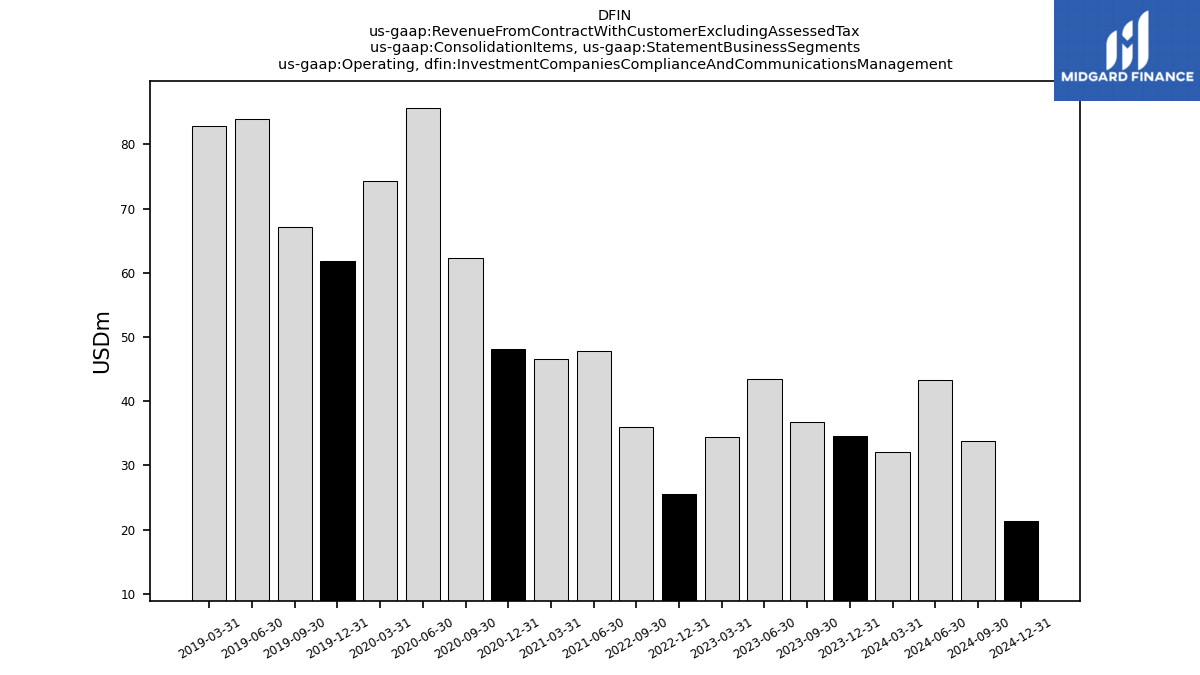
| Operating, Investment Companies Compliance And Communications Management | 34.50 | 36.70 | NA | NA | 25.60 | 35.90 | NA | NA | NA | NA | 47.80 | 46.50 | 48.10 | 62.30 | 85.60 | 74.30 | 61.80 | 67.10 | 83.90 | 82.90 | NA | NA | NA | NA | NA | NA | NA | NA | NA | NA | NA | NA | NA | NA | |
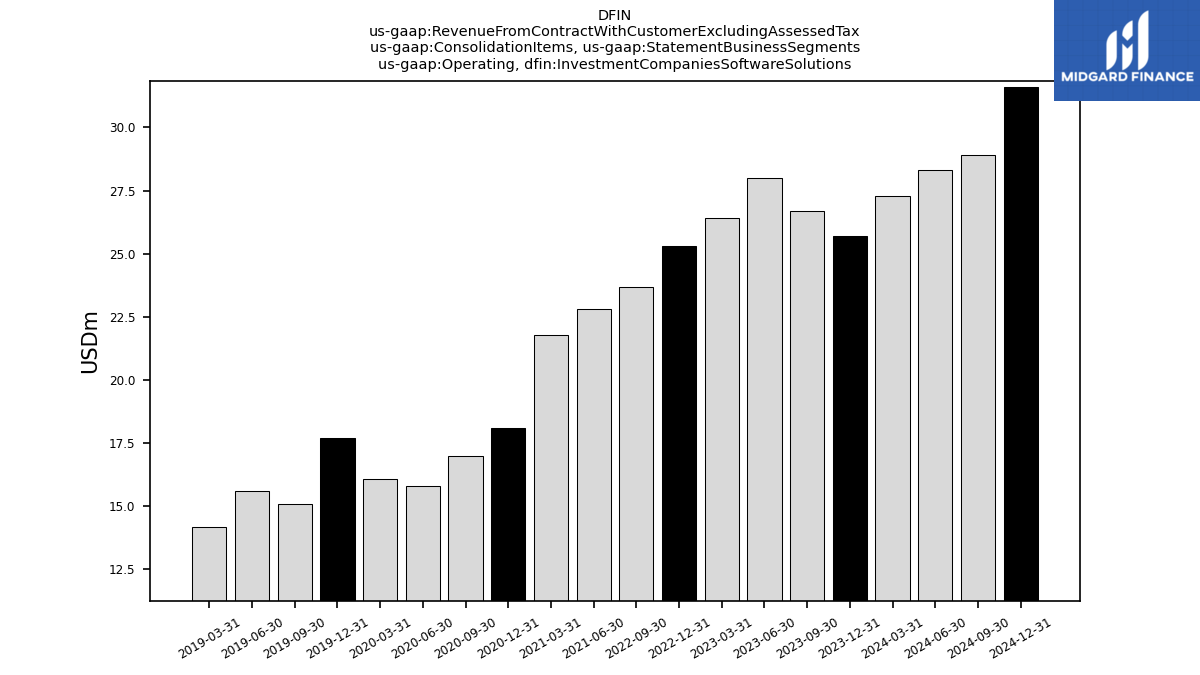
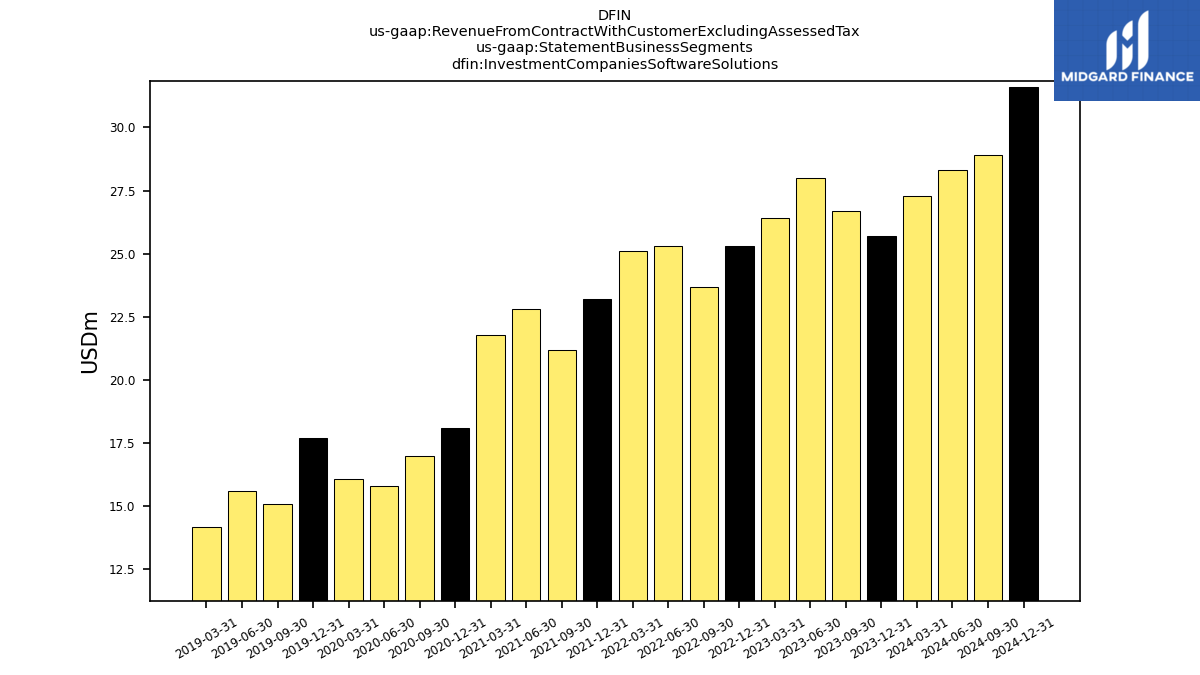
| Operating, Investment Companies Software Solutions | 25.70 | 26.70 | NA | NA | 25.30 | 23.70 | NA | NA | NA | NA | 22.80 | 21.80 | 18.10 | 17.00 | 15.80 | 16.10 | 17.70 | 15.10 | 15.60 | 14.20 | NA | NA | NA | NA | NA | NA | NA | NA | NA | NA | NA | NA | NA | NA | |
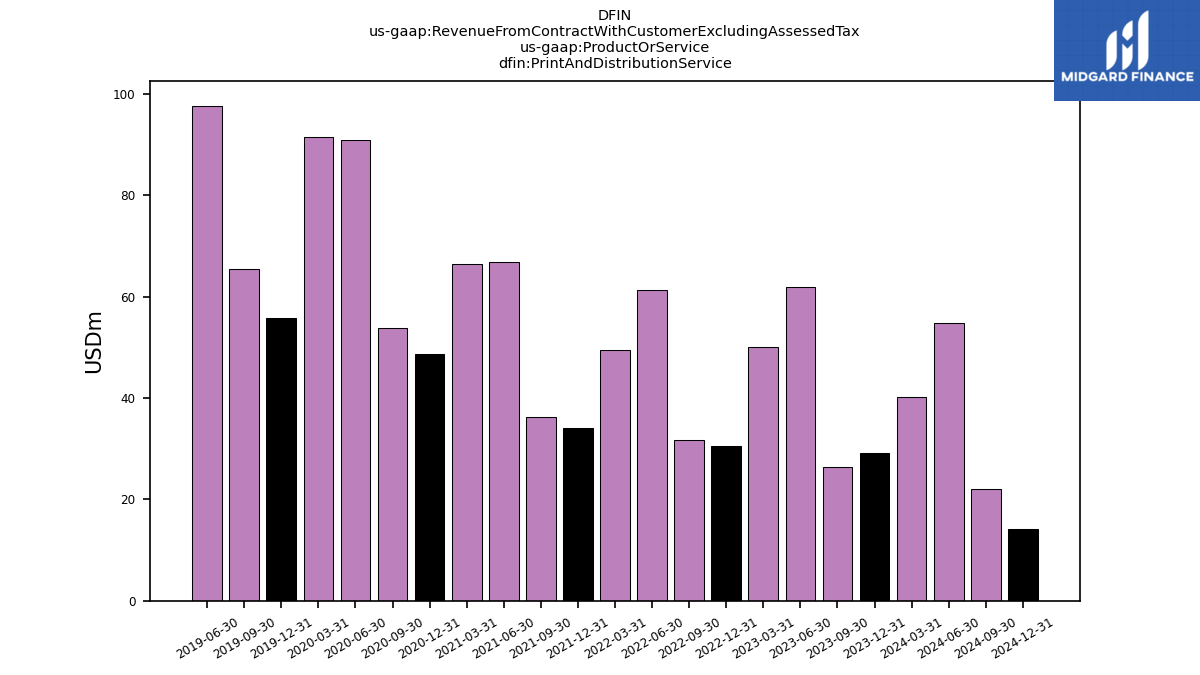
| Print And Distribution Service | 29.20 | 26.40 | 61.90 | 50.10 | 30.50 | 31.80 | 61.30 | 49.50 | 34.10 | 36.30 | 66.90 | 66.50 | 48.70 | 53.90 | 91.00 | 91.50 | 55.90 | 65.40 | 97.70 | NA | NA | NA | NA | NA | NA | NA | NA | NA | NA | NA | NA | NA | NA | NA | |
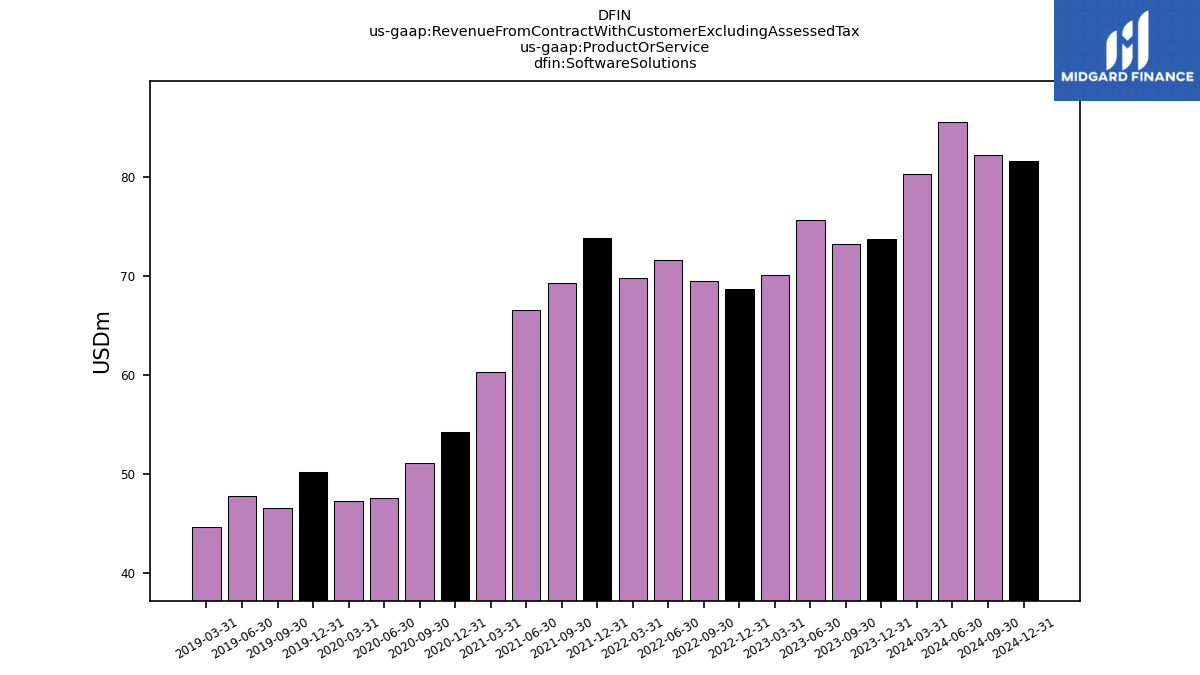
| Software Solutions | 73.70 | 73.20 | 75.70 | 70.10 | 68.70 | 69.50 | 71.60 | 69.80 | 73.80 | 69.30 | 66.60 | 60.30 | 54.20 | 51.10 | 47.60 | 47.30 | 50.20 | 46.60 | 47.80 | 44.70 | NA | NA | NA | NA | NA | NA | NA | NA | NA | NA | NA | NA | NA | NA | |
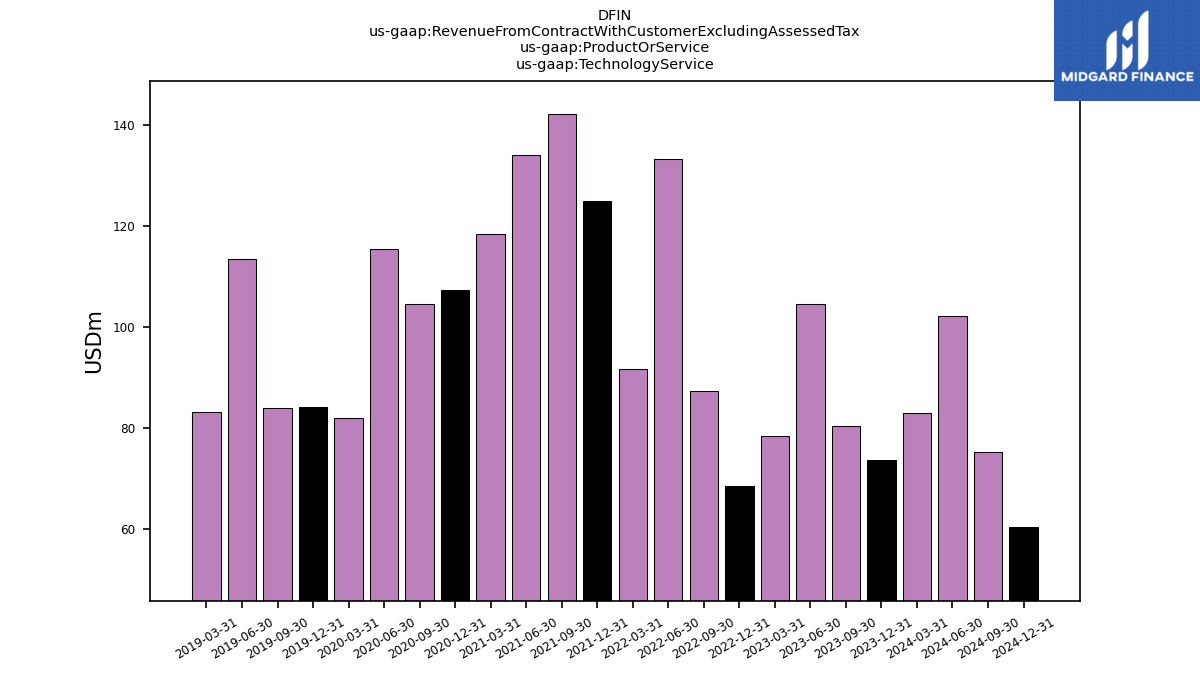
| Technology Service | 73.60 | 80.40 | 104.50 | 78.40 | 68.50 | 87.40 | 133.30 | 91.70 | 124.90 | 142.10 | 134.00 | 118.50 | 107.40 | 104.50 | 115.40 | 81.90 | 84.20 | 83.90 | 113.40 | 83.20 | NA | NA | NA | NA | NA | NA | NA | NA | NA | NA | NA | NA | NA | NA | |
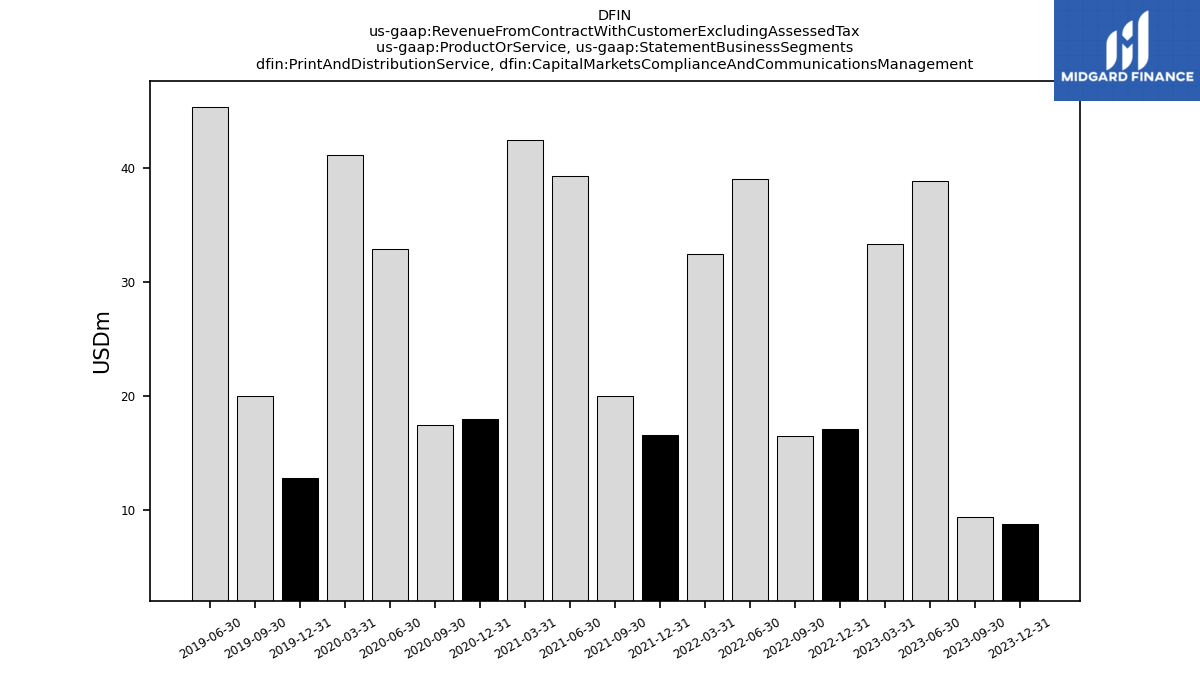
| Print And Distribution Service, Capital Markets Compliance And Communications Management | 8.80 | 9.40 | 38.90 | 33.40 | 17.10 | 16.50 | 39.10 | 32.50 | 16.60 | 20.00 | 39.30 | 42.50 | 18.00 | 17.50 | 32.90 | 41.20 | 12.80 | 20.00 | 45.40 | NA | NA | NA | NA | NA | NA | NA | NA | NA | NA | NA | NA | NA | NA | NA | |
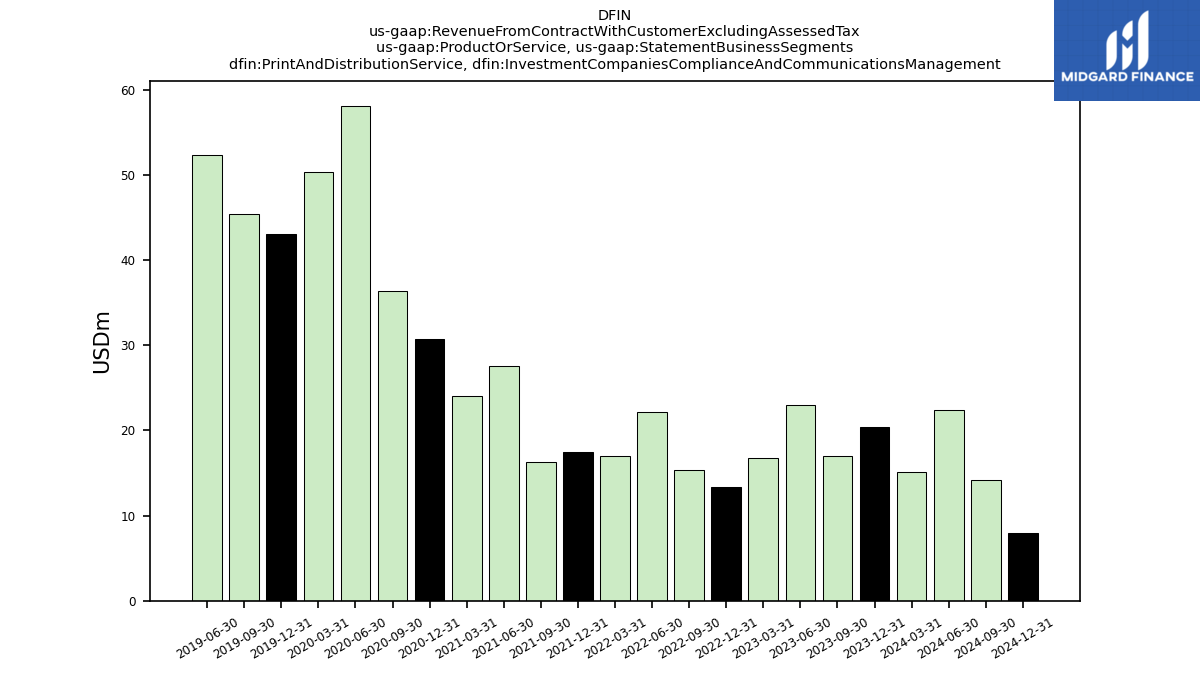
| Print And Distribution Service, Investment Companies Compliance And Communications Management | 20.40 | 17.00 | 23.00 | 16.70 | 13.40 | 15.30 | 22.20 | 17.00 | 17.50 | 16.30 | 27.60 | 24.00 | 30.70 | 36.40 | 58.10 | 50.30 | 43.10 | 45.40 | 52.30 | NA | NA | NA | NA | NA | NA | NA | NA | NA | NA | NA | NA | NA | NA | NA | |
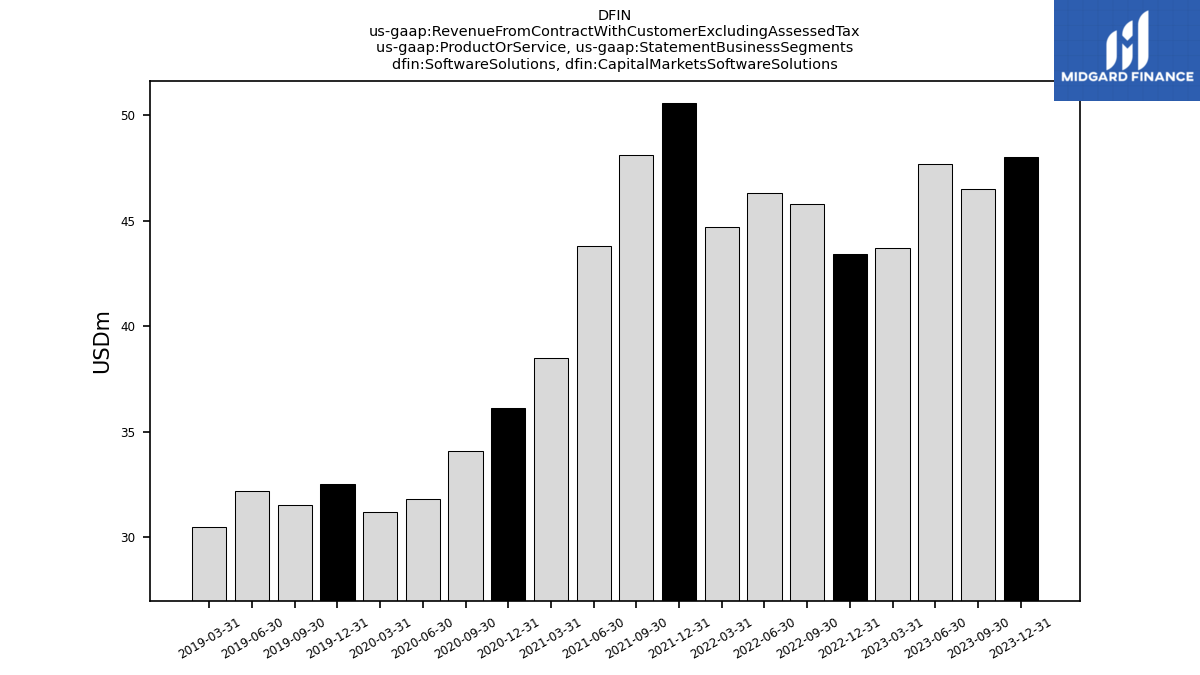
| Software Solutions, Capital Markets Software Solutions | 48.00 | 46.50 | 47.70 | 43.70 | 43.40 | 45.80 | 46.30 | 44.70 | 50.60 | 48.10 | 43.80 | 38.50 | 36.10 | 34.10 | 31.80 | 31.20 | 32.50 | 31.50 | 32.20 | 30.50 | NA | NA | NA | NA | NA | NA | NA | NA | NA | NA | NA | NA | NA | NA | |
| Software Solutions, Investment Companies Software Solutions | 25.70 | 26.70 | 28.00 | 26.40 | 25.30 | 23.70 | 25.30 | 25.10 | 23.20 | 21.20 | 22.80 | 21.80 | 18.10 | 17.00 | 15.80 | 16.10 | 17.70 | 15.10 | 15.60 | 14.20 | NA | NA | NA | NA | NA | NA | NA | NA | NA | NA | NA | NA | NA | NA | |
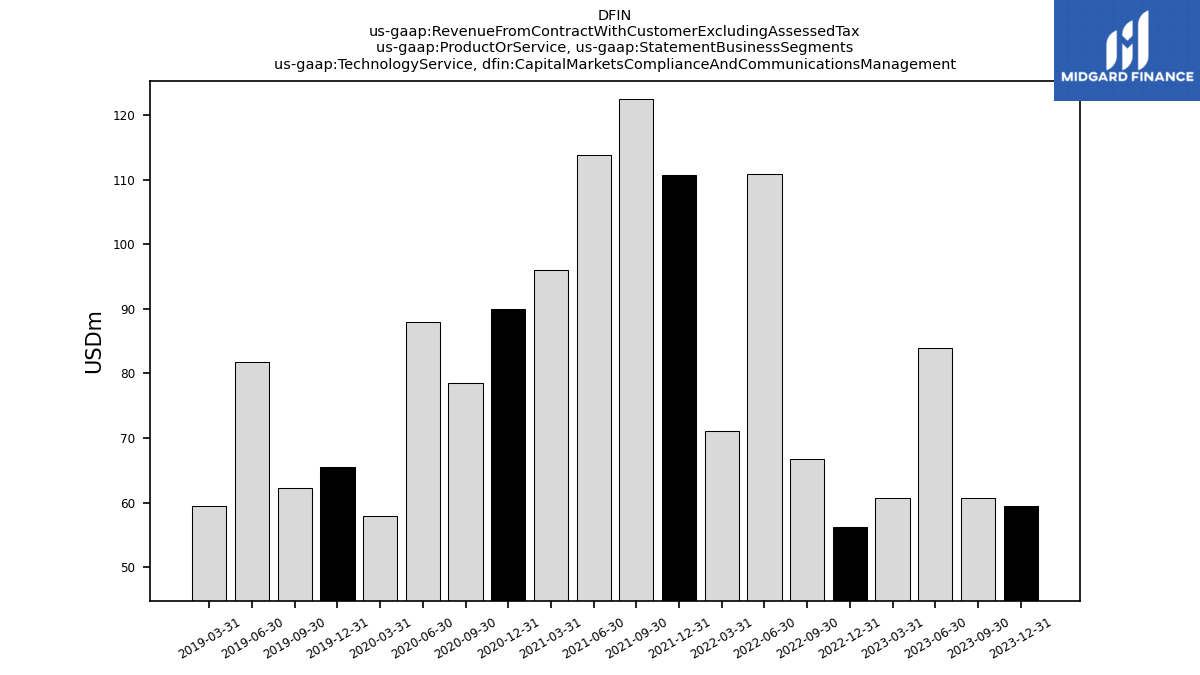
| Technology Service, Capital Markets Compliance And Communications Management | 59.50 | 60.70 | 84.00 | 60.70 | 56.30 | 66.80 | 110.90 | 71.10 | 110.80 | 122.50 | 113.80 | 96.00 | 90.00 | 78.60 | 87.90 | 57.90 | 65.50 | 62.20 | 81.80 | 59.50 | NA | NA | NA | NA | NA | NA | NA | NA | NA | NA | NA | NA | NA | NA | |
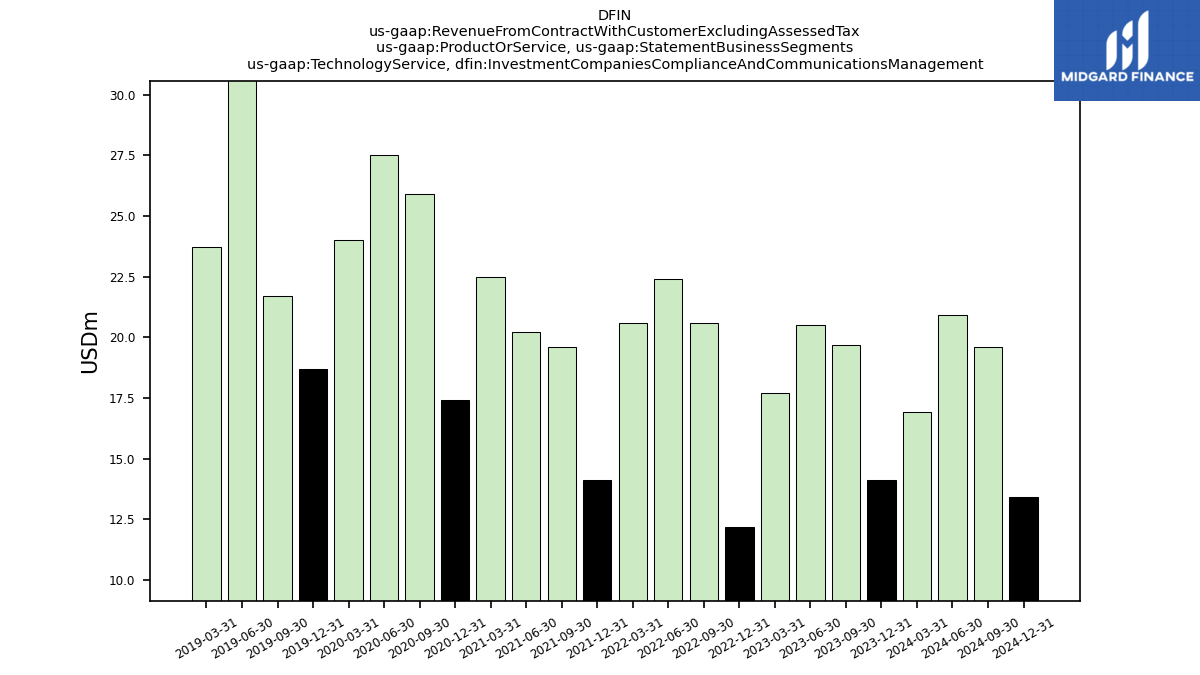
| Technology Service, Investment Companies Compliance And Communications Management | 14.10 | 19.70 | 20.50 | 17.70 | 12.20 | 20.60 | 22.40 | 20.60 | 14.10 | 19.60 | 20.20 | 22.50 | 17.40 | 25.90 | 27.50 | 24.00 | 18.70 | 21.70 | 31.60 | 23.70 | NA | NA | NA | NA | NA | NA | NA | NA | NA | NA | NA | NA | NA | NA | |
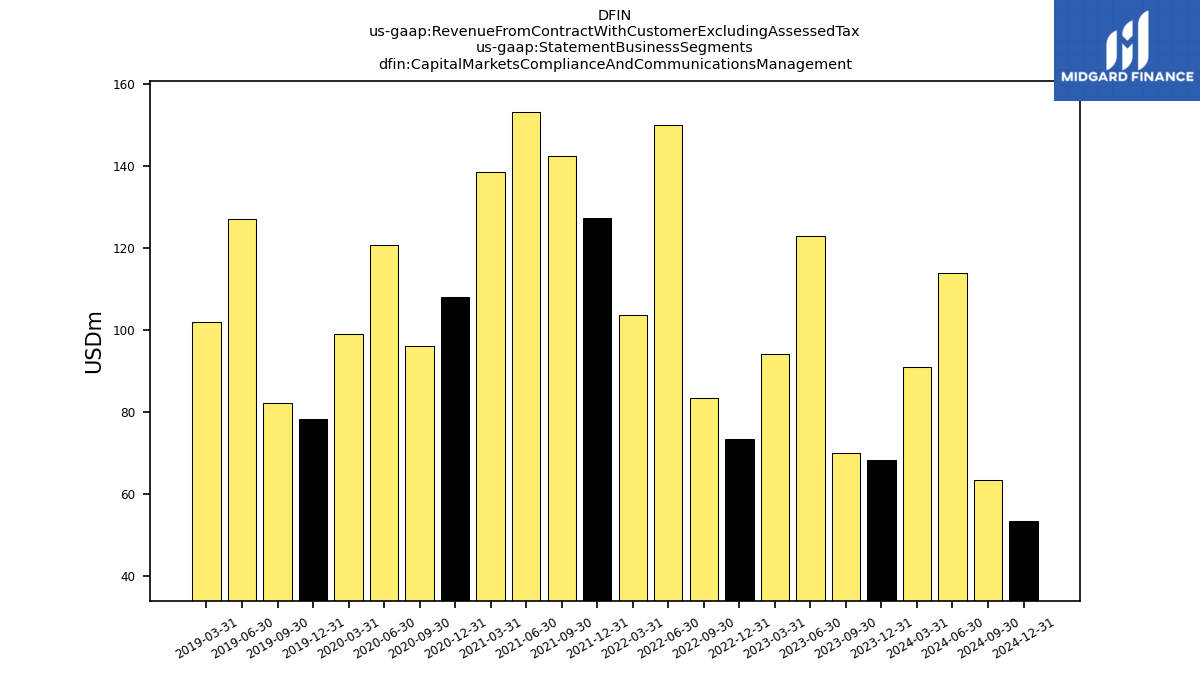
| Capital Markets Compliance And Communications Management | 68.30 | 70.10 | 122.90 | 94.10 | 73.40 | 83.30 | 150.00 | 103.60 | 127.40 | 142.50 | 153.10 | 138.50 | 108.00 | 96.10 | 120.80 | 99.10 | 78.30 | 82.20 | 127.20 | 102.00 | NA | NA | NA | NA | NA | NA | NA | NA | NA | NA | NA | NA | NA | NA | |
| Capital Markets Software Solutions | 48.00 | 46.50 | 47.70 | 43.70 | 43.40 | 45.80 | 46.30 | 44.70 | 50.60 | 48.10 | 43.80 | 38.50 | 36.10 | 34.10 | 31.80 | 31.20 | 32.50 | 31.50 | 32.20 | 30.50 | NA | NA | NA | NA | NA | NA | NA | NA | NA | NA | NA | NA | NA | NA | |
| Investment Companies Compliance And Communications Management | 34.50 | 36.70 | 43.50 | 34.40 | 25.60 | 35.90 | 44.60 | 37.60 | 31.60 | 35.90 | 47.80 | 46.50 | 48.10 | 62.30 | 85.60 | 74.30 | 61.80 | 67.10 | 83.90 | 82.90 | NA | NA | NA | NA | NA | NA | NA | NA | NA | NA | NA | NA | NA | NA | |
| Investment Companies Software Solutions | 25.70 | 26.70 | 28.00 | 26.40 | 25.30 | 23.70 | 25.30 | 25.10 | 23.20 | 21.20 | 22.80 | 21.80 | 18.10 | 17.00 | 15.80 | 16.10 | 17.70 | 15.10 | 15.60 | 14.20 | NA | NA | NA | NA | NA | NA | NA | NA | NA | NA | NA | NA | NA | NA | |
| Interest Income Operating | 0.60 | 0.60 | NA | NA | 0.30 | 0.20 | NA | NA | NA | NA | NA | NA | NA | NA | NA | NA | NA | NA | NA | NA | NA | NA | NA | NA | NA | NA | NA | NA | NA | NA | NA | NA | NA | NA |