

| 2024-02-03 | 2023-10-28 | 2023-07-29 | 2023-04-29 | 2023-01-28 | 2022-10-29 | 2022-07-30 | 2022-04-30 | 2022-01-29 | 2021-10-30 | 2021-07-31 | 2021-05-01 | 2021-01-30 | 2020-10-31 | 2020-08-01 | 2020-05-02 | 2020-02-01 | 2019-11-02 | 2019-08-03 | 2019-05-04 | 2019-02-02 | 2018-11-03 | 2018-08-04 | 2018-05-05 | 2018-02-03 | 2017-10-28 | 2017-07-29 | 2017-04-29 | 2017-01-28 | 2016-10-29 | 2016-07-30 | 2016-04-30 | 2016-01-30 | 2015-10-31 | 2015-08-01 | 2015-05-02 | 2015-01-31 | 2014-11-01 | 2014-08-02 | 2014-05-03 | 2014-02-01 | 2013-11-02 | 2013-08-03 | 2013-05-04 | 2013-02-02 | 2012-10-27 | 2012-07-28 | 2012-04-28 | 2012-01-28 | 2011-10-29 | 2011-07-30 | 2011-04-30 | 2011-01-29 | 2010-01-30 | ||
|---|---|---|---|---|---|---|---|---|---|---|---|---|---|---|---|---|---|---|---|---|---|---|---|---|---|---|---|---|---|---|---|---|---|---|---|---|---|---|---|---|---|---|---|---|---|---|---|---|---|---|---|---|---|---|---|
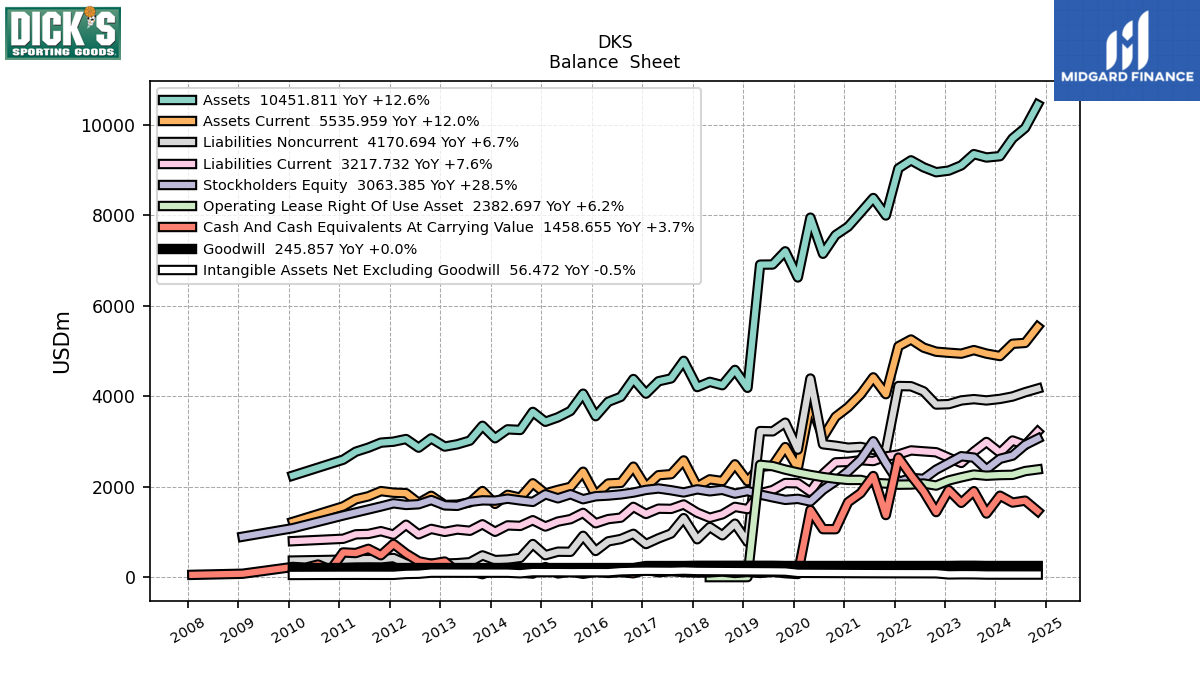
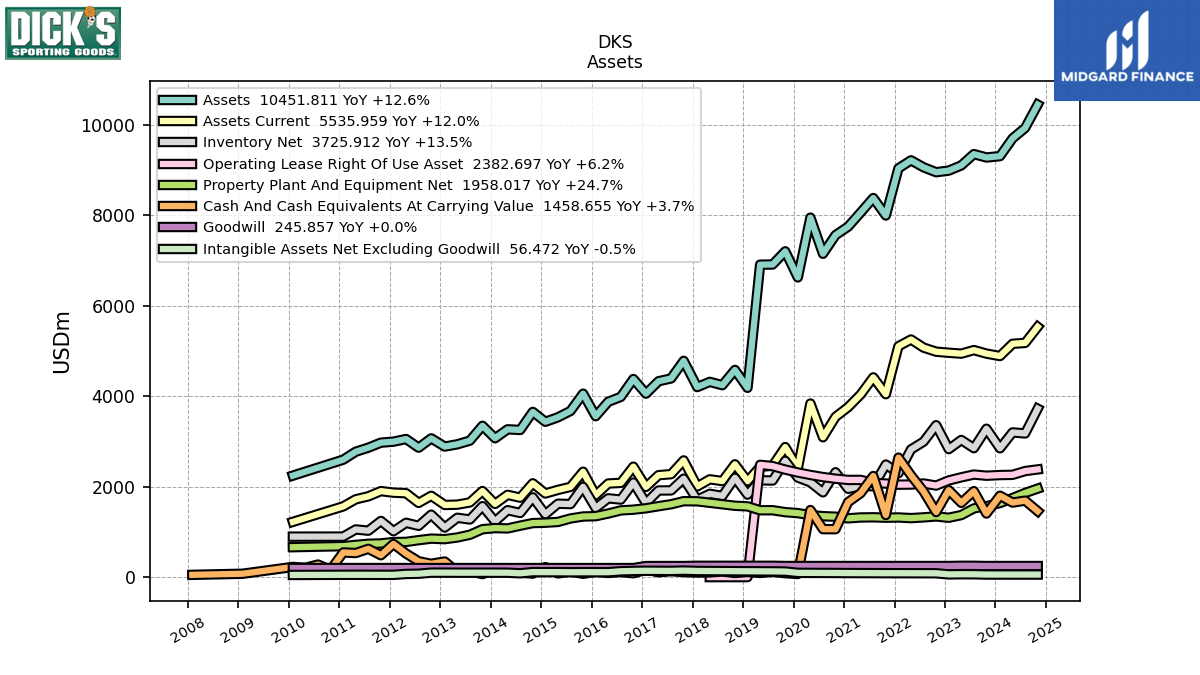
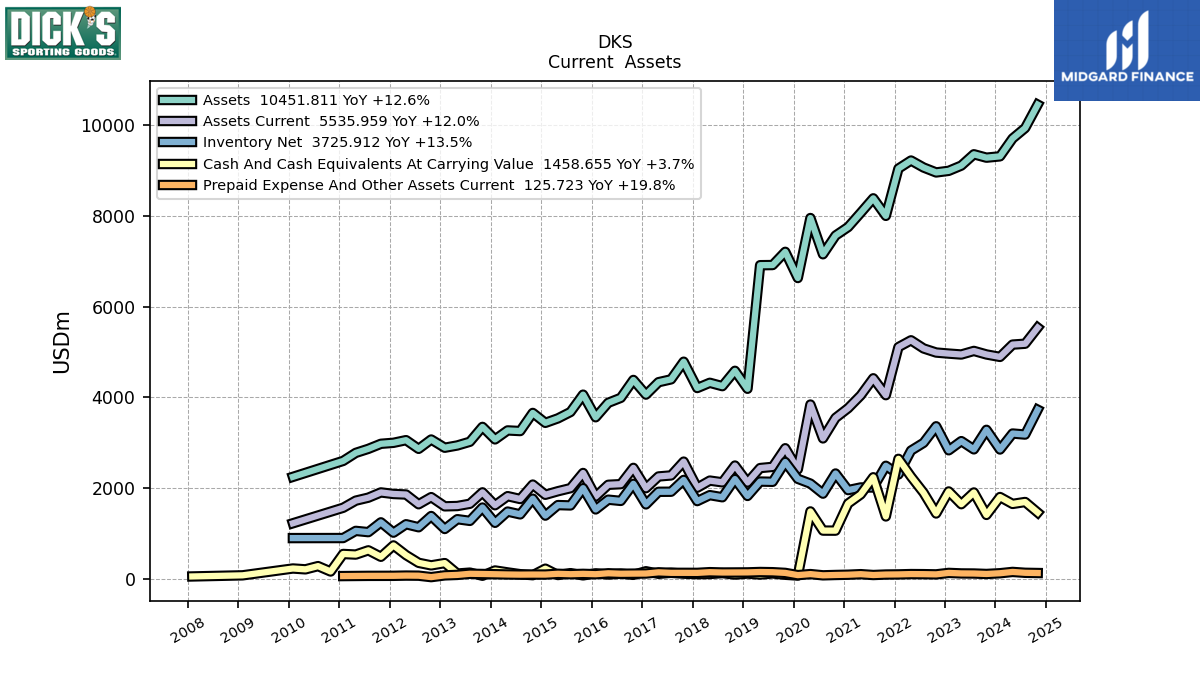
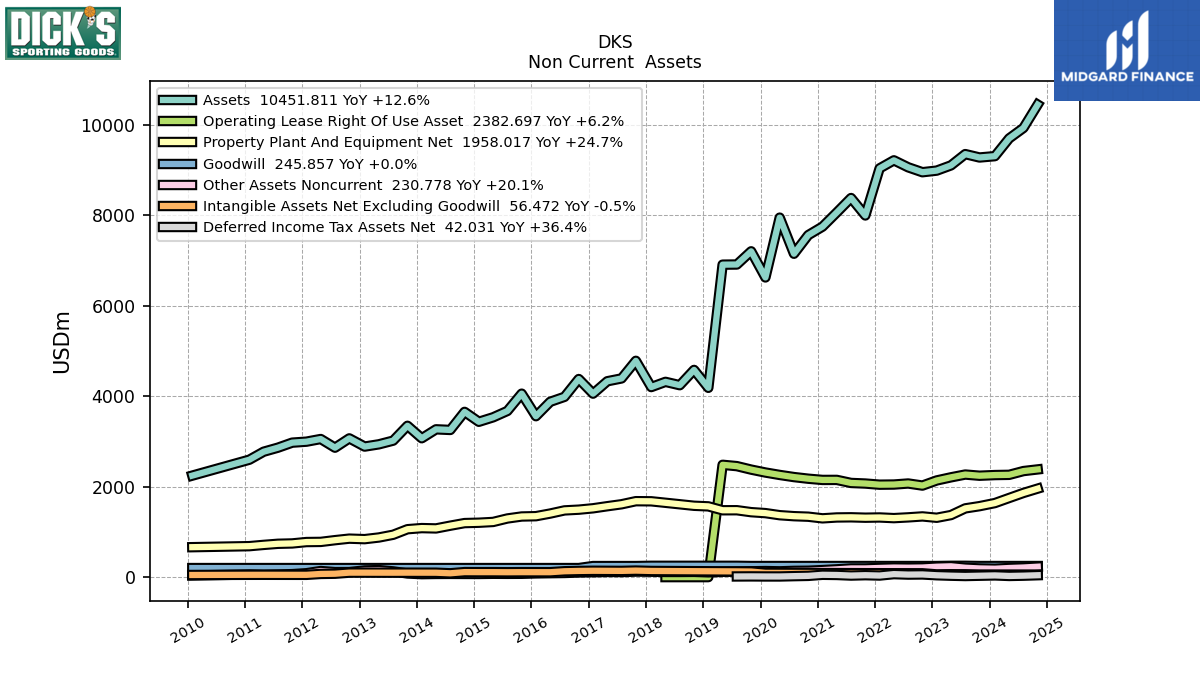
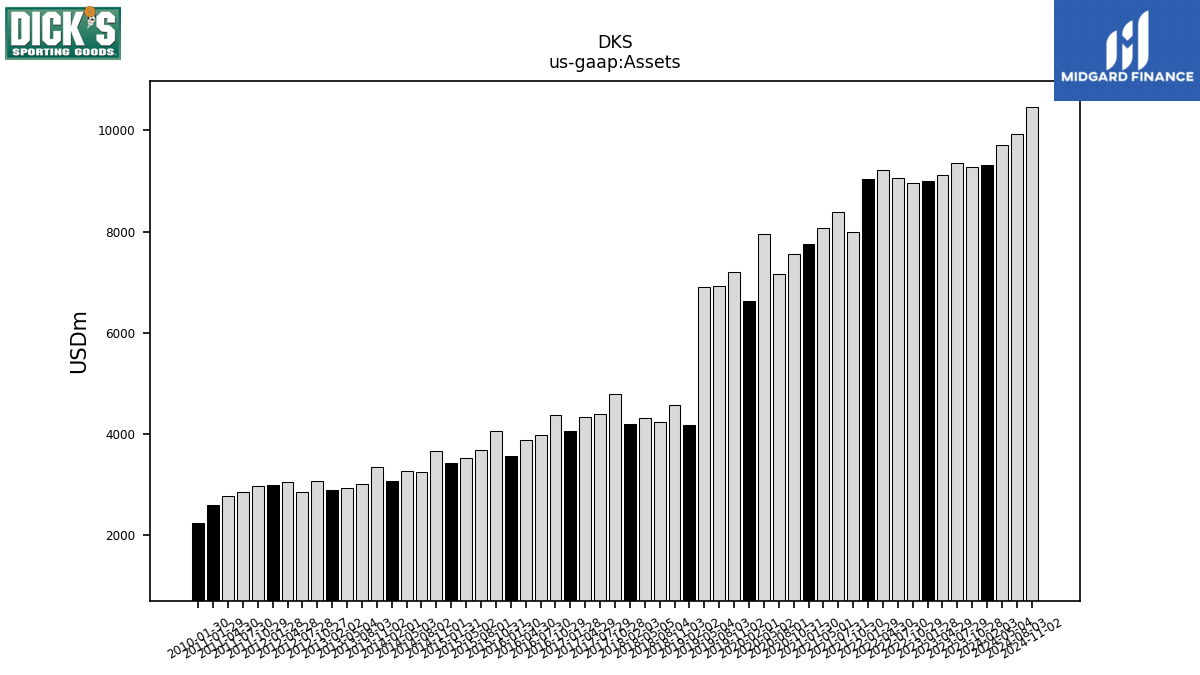
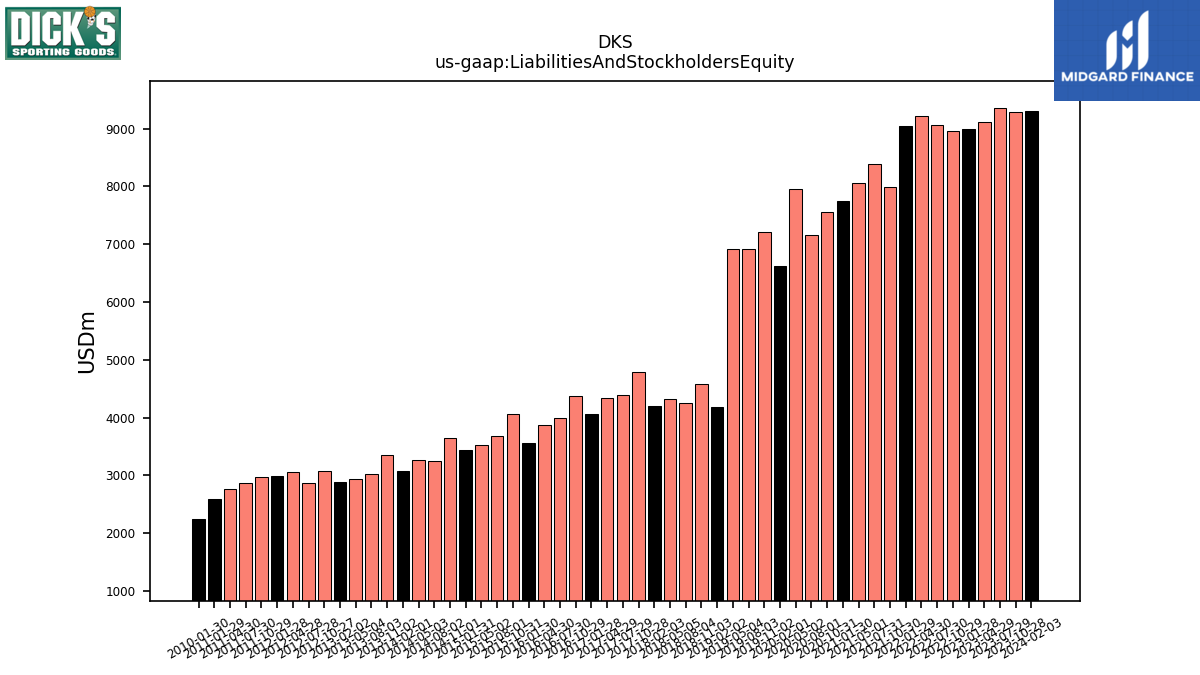
| Assets | 9311.75 | 9282.33 | 9357.36 | 9107.81 | 8992.20 | 8956.60 | 9065.27 | 9219.80 | 9041.68 | 7999.28 | 8386.16 | 8066.58 | 7752.86 | 7565.49 | 7152.57 | 7952.55 | 6628.56 | 7207.00 | 6915.22 | 6911.99 | 4187.15 | 4583.76 | 4245.16 | 4319.41 | 4203.94 | 4784.91 | 4395.31 | 4332.72 | 4058.30 | 4382.21 | 3987.67 | 3878.37 | 3559.34 | 4058.43 | 3675.86 | 3535.03 | 3436.20 | 3655.53 | 3255.48 | 3269.44 | 3071.49 | 3347.89 | 3019.47 | 2937.88 | 2887.81 | 3069.58 | 2862.94 | 3055.15 | 2996.45 | 2974.63 | 2863.38 | 2774.21 | 2597.54 | 2245.33 | |
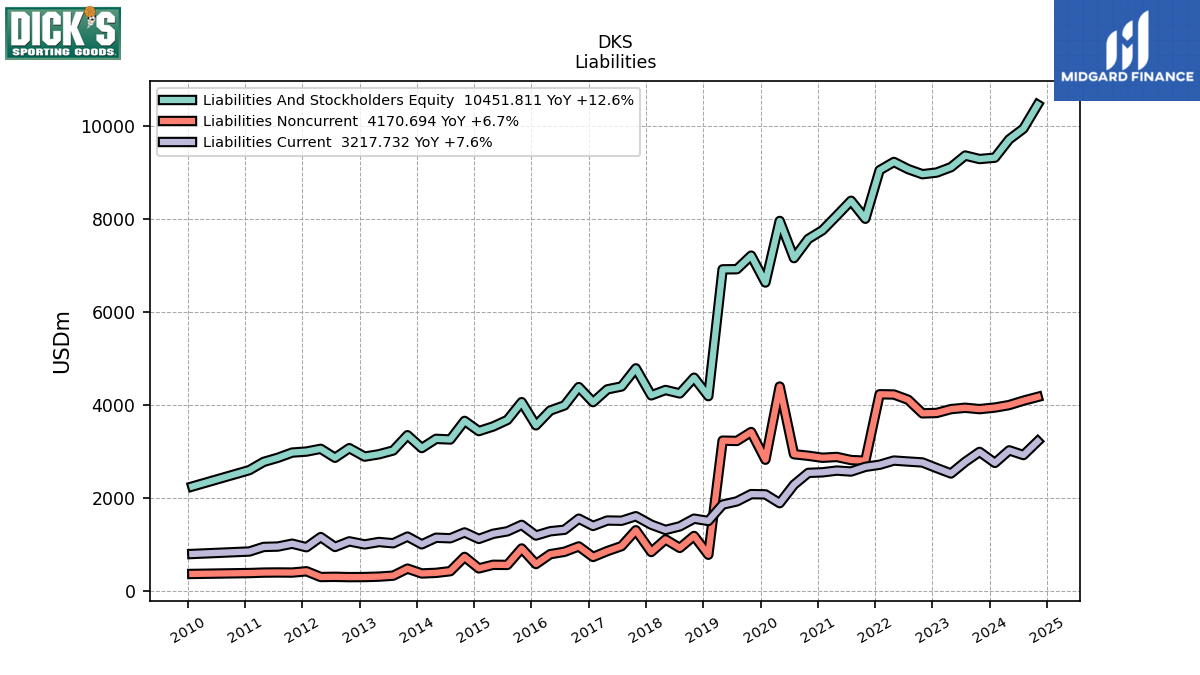
| Liabilities And Stockholders Equity | 9311.75 | 9282.33 | 9357.36 | 9107.81 | 8992.20 | 8956.60 | 9065.27 | 9219.80 | 9041.68 | 7999.28 | 8386.16 | 8066.58 | 7752.86 | 7565.49 | 7152.57 | 7952.55 | 6628.56 | 7207.00 | 6915.22 | 6911.99 | 4187.15 | 4583.76 | 4245.16 | 4319.41 | 4203.94 | 4784.91 | 4395.31 | 4332.72 | 4058.30 | 4382.21 | 3987.67 | 3878.37 | 3559.34 | 4058.43 | 3675.86 | 3535.03 | 3436.20 | 3655.53 | 3255.48 | 3269.44 | 3071.49 | 3347.89 | 3019.47 | 2937.88 | 2887.81 | 3069.58 | 2862.94 | 3055.15 | 2996.45 | 2974.63 | 2863.38 | 2774.21 | 2597.54 | 2245.33 | |
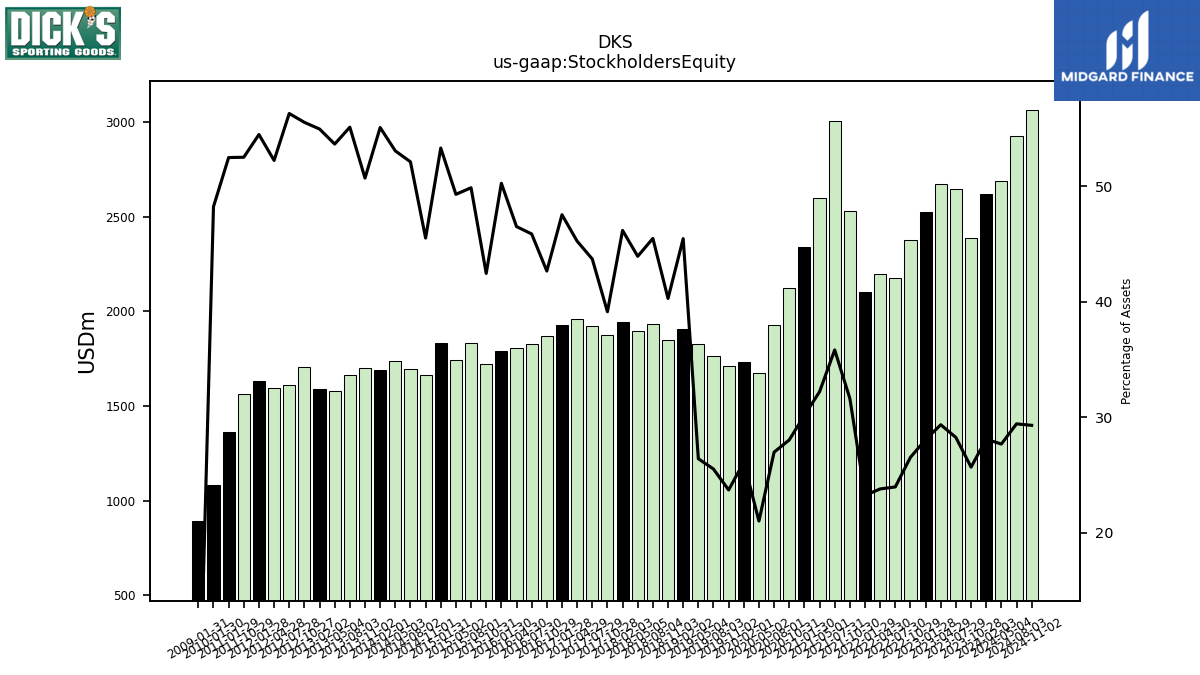
| Stockholders Equity | 2617.28 | 2384.70 | 2644.36 | 2674.17 | 2524.62 | 2377.17 | 2173.51 | 2194.61 | 2101.59 | 2530.82 | 3005.38 | 2598.72 | 2339.53 | 2121.64 | 1930.30 | 1672.03 | 1731.60 | 1708.90 | 1765.09 | 1826.04 | 1904.16 | 1847.04 | 1931.23 | 1898.21 | 1941.50 | 1872.99 | 1921.26 | 1960.82 | 1929.49 | 1869.87 | 1829.60 | 1804.13 | 1789.19 | 1723.31 | 1833.50 | 1743.12 | 1832.22 | 1664.15 | 1696.88 | 1735.21 | 1692.18 | 1698.02 | 1664.45 | 1576.54 | 1587.32 | 1704.93 | 1612.06 | 1596.17 | 1632.74 | 1562.35 | NA | NA | 1363.58 | 1083.23 |
| 2024-02-03 | 2023-10-28 | 2023-07-29 | 2023-04-29 | 2023-01-28 | 2022-10-29 | 2022-07-30 | 2022-04-30 | 2022-01-29 | 2021-10-30 | 2021-07-31 | 2021-05-01 | 2021-01-30 | 2020-10-31 | 2020-08-01 | 2020-05-02 | 2020-02-01 | 2019-11-02 | 2019-08-03 | 2019-05-04 | 2019-02-02 | 2018-11-03 | 2018-08-04 | 2018-05-05 | 2018-02-03 | 2017-10-28 | 2017-07-29 | 2017-04-29 | 2017-01-28 | 2016-10-29 | 2016-07-30 | 2016-04-30 | 2016-01-30 | 2015-10-31 | 2015-08-01 | 2015-05-02 | 2015-01-31 | 2014-11-01 | 2014-08-02 | 2014-05-03 | 2014-02-01 | 2013-11-02 | 2013-08-03 | 2013-05-04 | 2013-02-02 | 2012-10-27 | 2012-07-28 | 2012-04-28 | 2012-01-28 | 2011-10-29 | 2011-07-30 | 2011-04-30 | 2011-01-29 | 2010-01-30 | ||
|---|---|---|---|---|---|---|---|---|---|---|---|---|---|---|---|---|---|---|---|---|---|---|---|---|---|---|---|---|---|---|---|---|---|---|---|---|---|---|---|---|---|---|---|---|---|---|---|---|---|---|---|---|---|---|---|
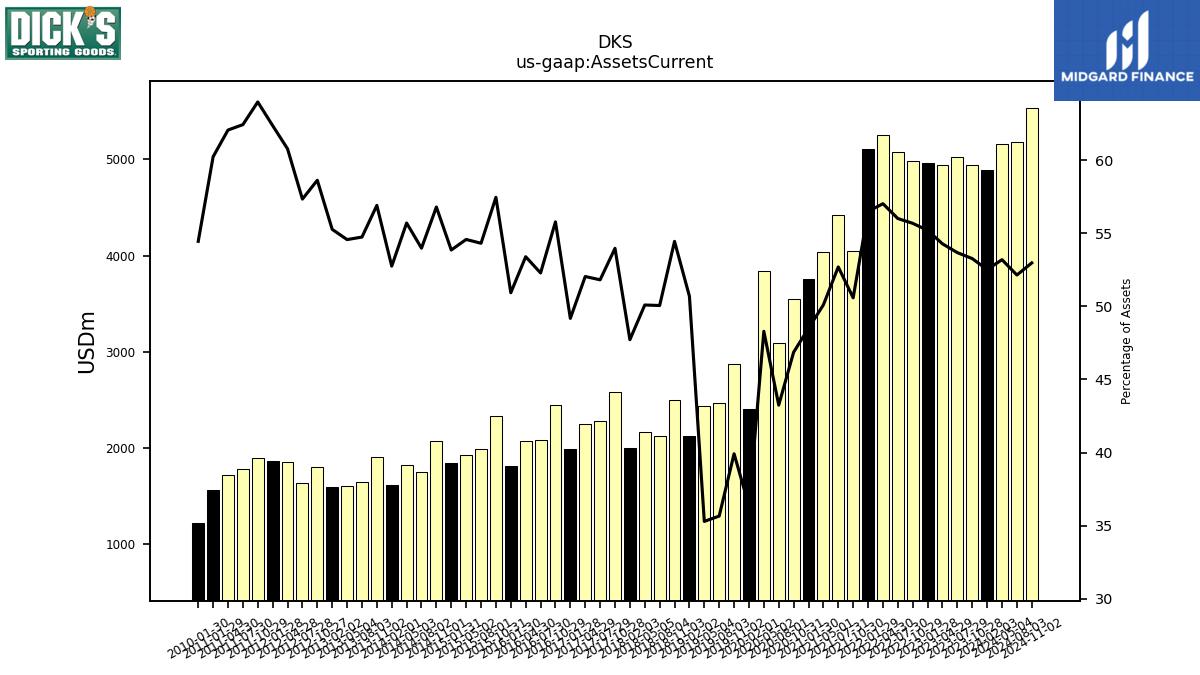
| Assets Current | 4890.05 | 4944.00 | 5022.04 | 4942.99 | 4963.19 | 4986.46 | 5076.67 | 5256.66 | 5106.66 | 4046.16 | 4418.94 | 4041.32 | 3759.65 | 3545.30 | 3093.25 | 3840.40 | 2410.02 | 2876.91 | 2466.02 | 2439.70 | 2122.40 | 2495.33 | 2124.94 | 2163.57 | 2006.09 | 2582.08 | 2277.28 | 2254.62 | 1995.68 | 2444.11 | 2084.77 | 2070.68 | 1812.69 | 2331.57 | 1996.36 | 1929.11 | 1850.38 | 2075.86 | 1757.16 | 1820.90 | 1620.07 | 1904.92 | 1652.67 | 1602.92 | 1595.89 | 1799.29 | 1641.31 | 1856.50 | 1868.39 | 1902.84 | 1787.33 | 1721.39 | 1564.33 | 1222.36 | |
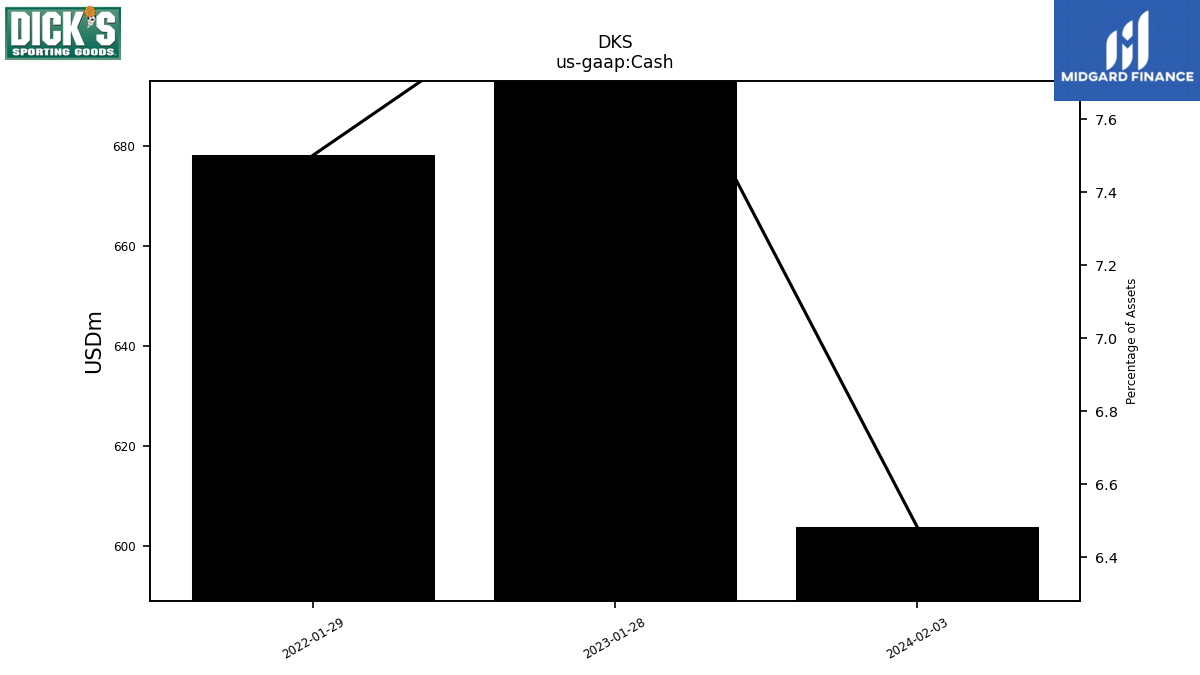
| Cash | 603.82 | NA | NA | NA | 725.60 | NA | NA | NA | 678.24 | NA | NA | NA | NA | NA | NA | NA | NA | NA | NA | NA | NA | NA | NA | NA | NA | NA | NA | NA | NA | NA | NA | NA | NA | NA | NA | NA | NA | NA | NA | NA | NA | NA | NA | NA | NA | NA | NA | NA | NA | NA | NA | NA | NA | NA | |
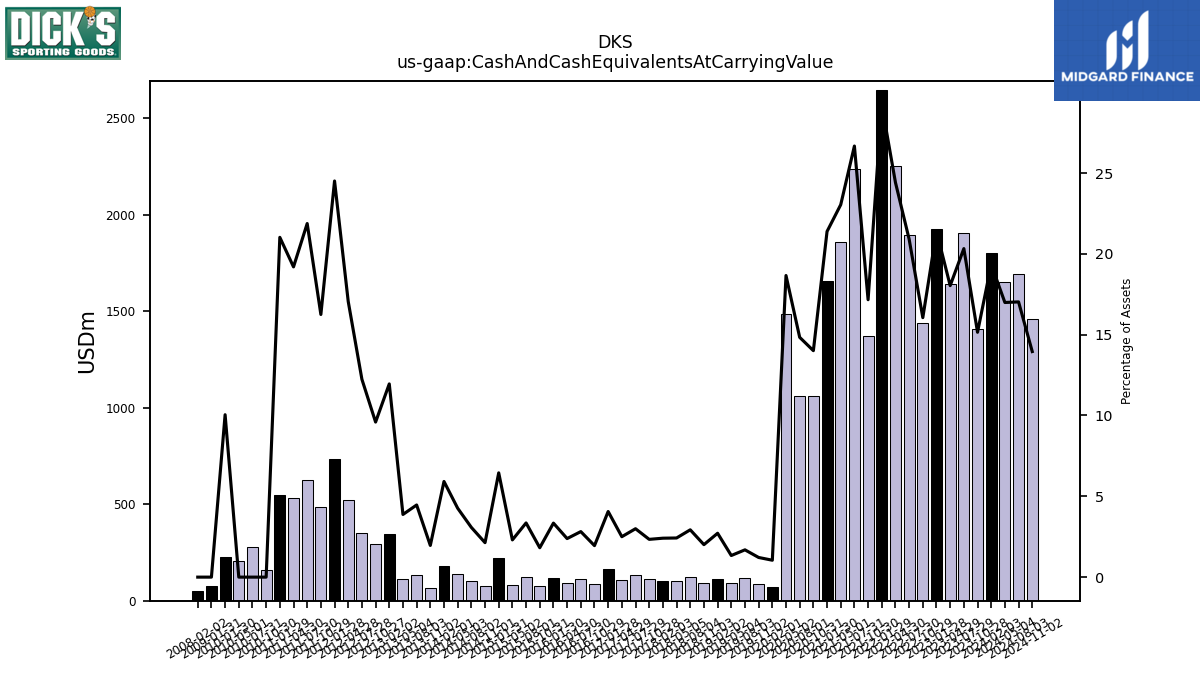
| Cash And Cash Equivalents At Carrying Value | 1801.22 | 1406.21 | 1901.90 | 1642.68 | 1924.39 | 1438.00 | 1895.52 | 2251.34 | 2643.20 | 1372.89 | 2236.73 | 1858.74 | 1658.07 | 1059.99 | 1061.14 | 1484.00 | 69.33 | 87.62 | 116.73 | 92.42 | 113.65 | 92.10 | 124.27 | 104.60 | 101.25 | 111.81 | 131.62 | 108.40 | 164.78 | 85.41 | 112.33 | 92.49 | 118.94 | 73.80 | 123.22 | 81.41 | 221.68 | 77.93 | 100.13 | 139.37 | 181.73 | 65.65 | 134.76 | 113.89 | 345.21 | 294.49 | 350.40 | 520.97 | 734.40 | 483.37 | 626.41 | 532.52 | 546.05 | 225.61 | |
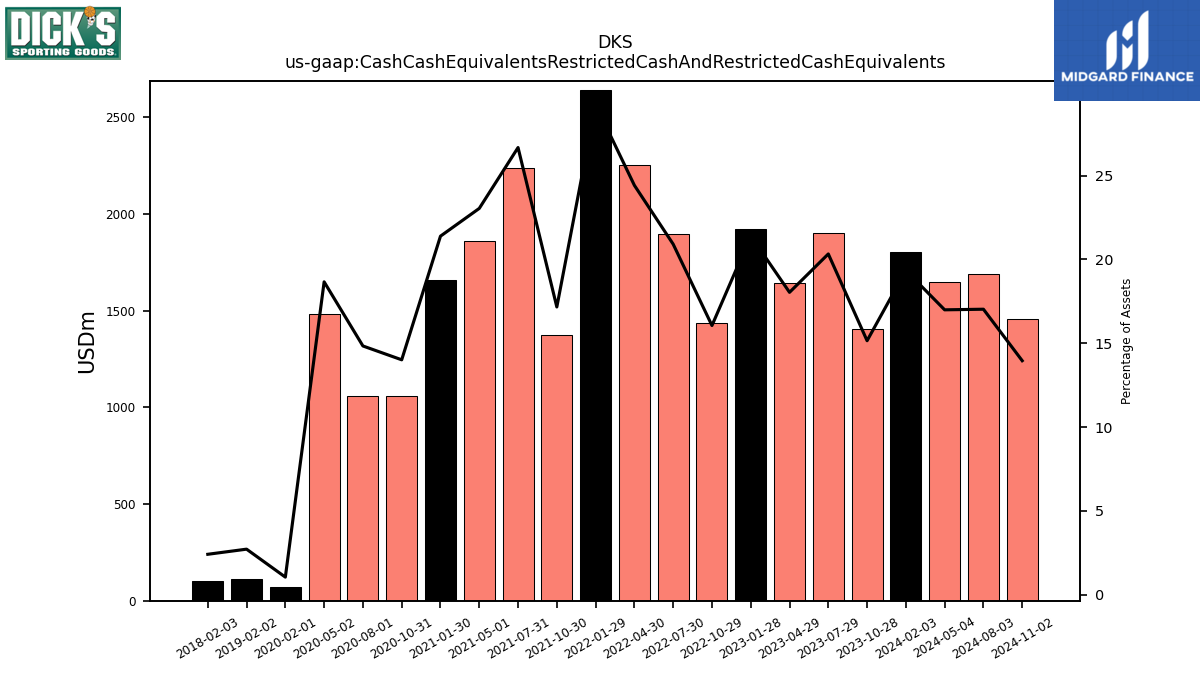
| Cash Cash Equivalents Restricted Cash And Restricted Cash Equivalents | 1801.22 | 1406.21 | 1901.90 | 1642.68 | 1924.39 | 1438.00 | 1895.52 | 2251.34 | 2643.20 | 1372.89 | 2236.73 | 1858.74 | 1658.07 | 1059.99 | 1061.14 | 1484.00 | 69.33 | NA | NA | NA | 113.65 | NA | NA | NA | 101.25 | NA | NA | NA | NA | NA | NA | NA | NA | NA | NA | NA | NA | NA | NA | NA | NA | NA | NA | NA | NA | NA | NA | NA | NA | NA | NA | NA | NA | NA | |
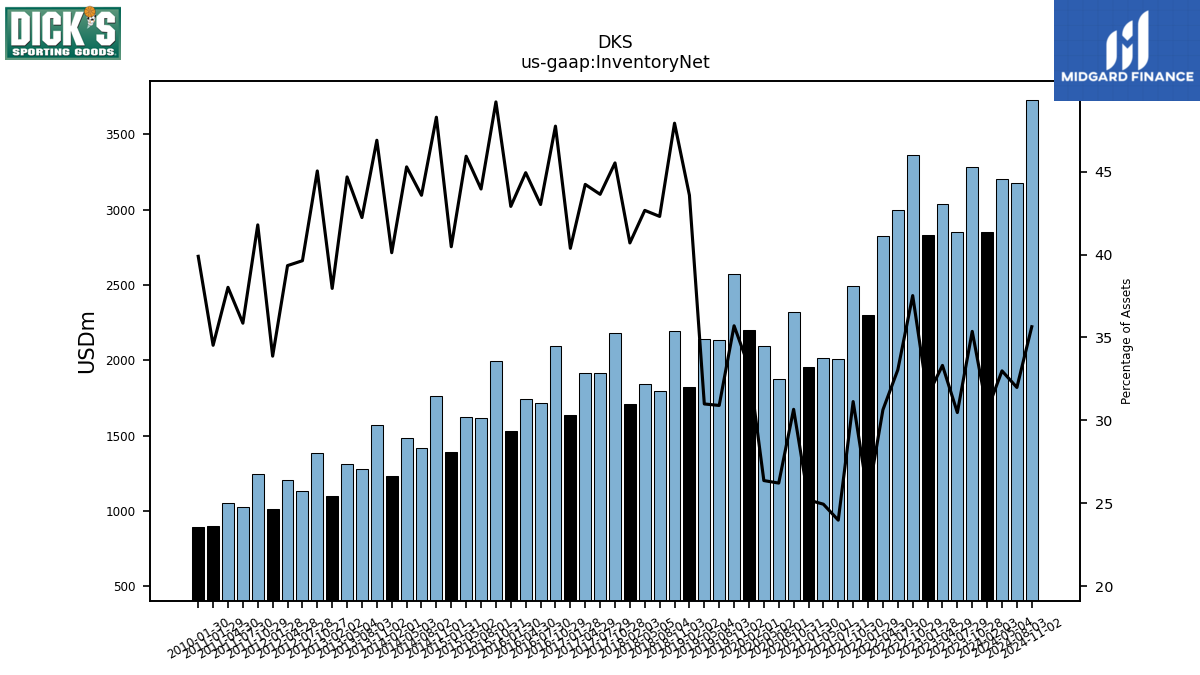
| Inventory Net | 2848.80 | 3282.91 | 2851.37 | 3034.20 | 2830.92 | 3361.06 | 2995.96 | 2824.83 | 2297.61 | 2490.44 | 2011.02 | 2012.05 | 1953.57 | 2319.99 | 1875.15 | 2096.96 | 2202.28 | 2573.25 | 2136.80 | 2142.02 | 1824.70 | 2196.78 | 1795.79 | 1842.90 | 1711.10 | 2178.49 | 1917.91 | 1916.51 | 1638.63 | 2092.40 | 1715.53 | 1742.95 | 1527.19 | 1997.11 | 1615.72 | 1623.75 | 1390.77 | 1765.12 | 1418.66 | 1480.72 | 1232.07 | 1570.03 | 1275.21 | 1312.74 | 1096.19 | 1382.68 | 1134.59 | 1201.75 | 1015.00 | 1243.15 | 1026.86 | 1054.87 | 896.89 | 895.78 | |
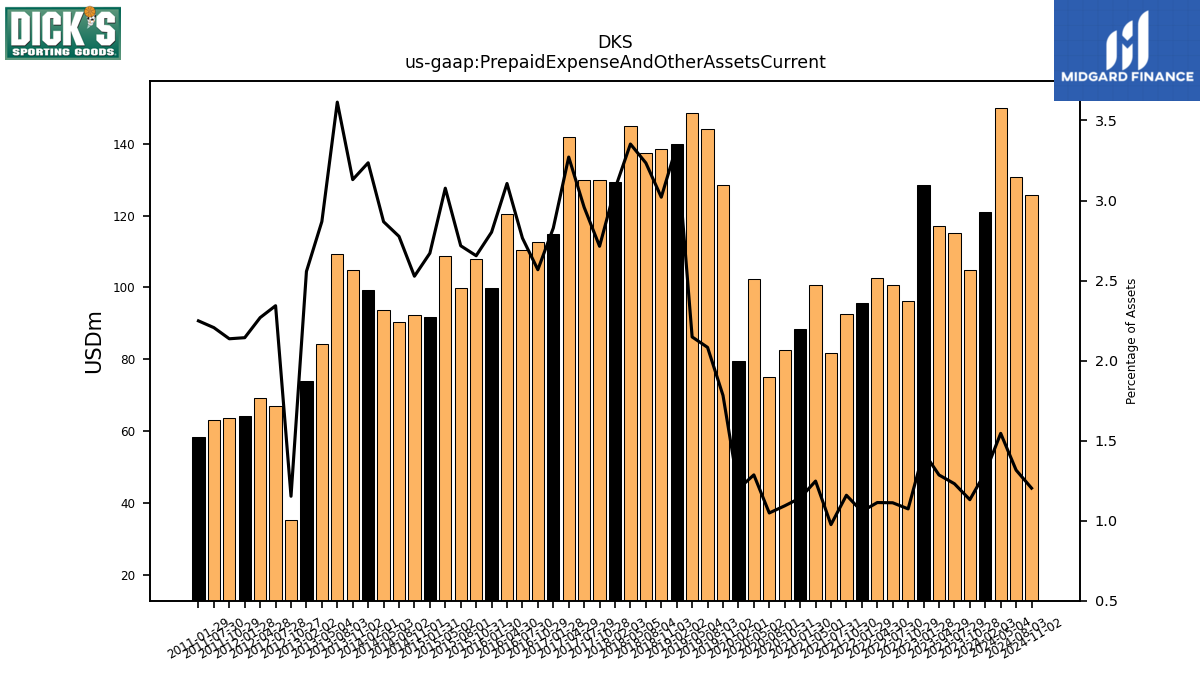
| Prepaid Expense And Other Assets Current | 121.05 | 104.96 | 115.14 | 117.07 | 128.41 | 96.14 | 100.76 | 102.60 | 95.60 | 92.67 | 81.76 | 100.59 | 88.47 | 82.65 | 74.95 | 102.25 | 79.47 | 128.46 | 144.00 | 148.44 | 139.94 | 138.47 | 137.32 | 144.83 | 129.19 | 129.88 | 130.00 | 141.74 | 114.76 | 112.52 | 110.27 | 120.48 | 99.74 | 107.75 | 99.88 | 108.77 | 91.77 | 92.38 | 90.37 | 93.75 | 99.39 | 104.81 | 109.15 | 84.28 | 73.84 | 35.37 | 67.07 | 69.30 | 64.21 | 63.54 | 63.16 | NA | 58.39 | NA |
| 2024-02-03 | 2023-10-28 | 2023-07-29 | 2023-04-29 | 2023-01-28 | 2022-10-29 | 2022-07-30 | 2022-04-30 | 2022-01-29 | 2021-10-30 | 2021-07-31 | 2021-05-01 | 2021-01-30 | 2020-10-31 | 2020-08-01 | 2020-05-02 | 2020-02-01 | 2019-11-02 | 2019-08-03 | 2019-05-04 | 2019-02-02 | 2018-11-03 | 2018-08-04 | 2018-05-05 | 2018-02-03 | 2017-10-28 | 2017-07-29 | 2017-04-29 | 2017-01-28 | 2016-10-29 | 2016-07-30 | 2016-04-30 | 2016-01-30 | 2015-10-31 | 2015-08-01 | 2015-05-02 | 2015-01-31 | 2014-11-01 | 2014-08-02 | 2014-05-03 | 2014-02-01 | 2013-11-02 | 2013-08-03 | 2013-05-04 | 2013-02-02 | 2012-10-27 | 2012-07-28 | 2012-04-28 | 2012-01-28 | 2011-10-29 | 2011-07-30 | 2011-04-30 | 2011-01-29 | 2010-01-30 | ||
|---|---|---|---|---|---|---|---|---|---|---|---|---|---|---|---|---|---|---|---|---|---|---|---|---|---|---|---|---|---|---|---|---|---|---|---|---|---|---|---|---|---|---|---|---|---|---|---|---|---|---|---|---|---|---|---|
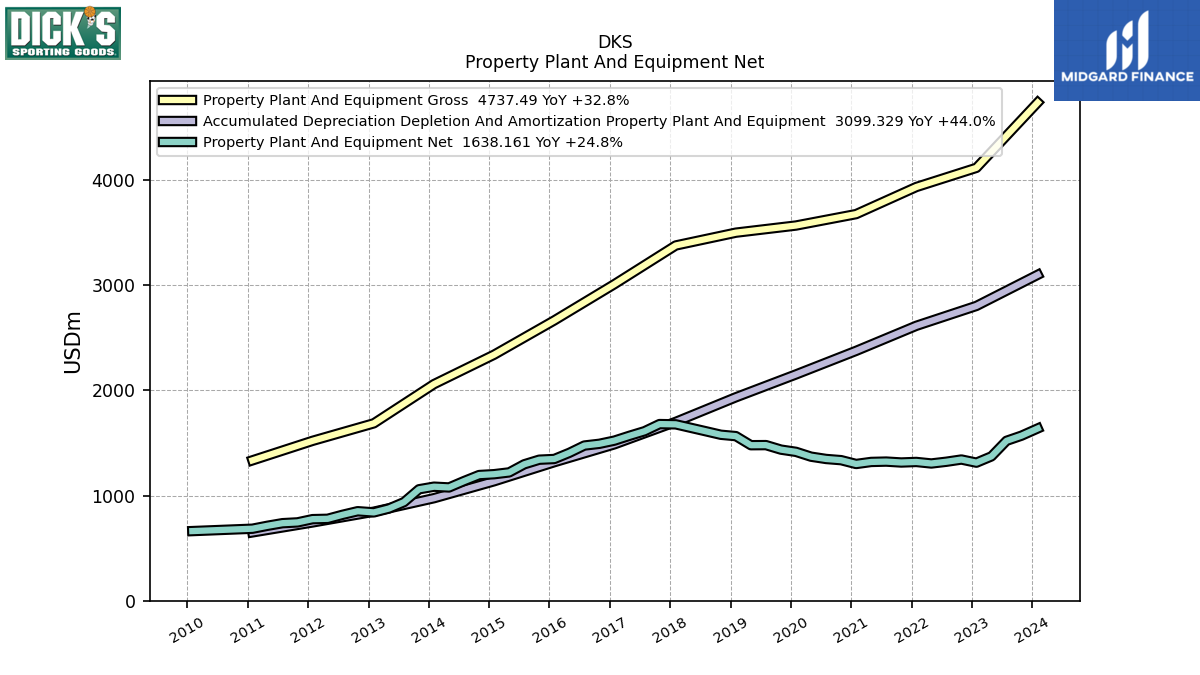
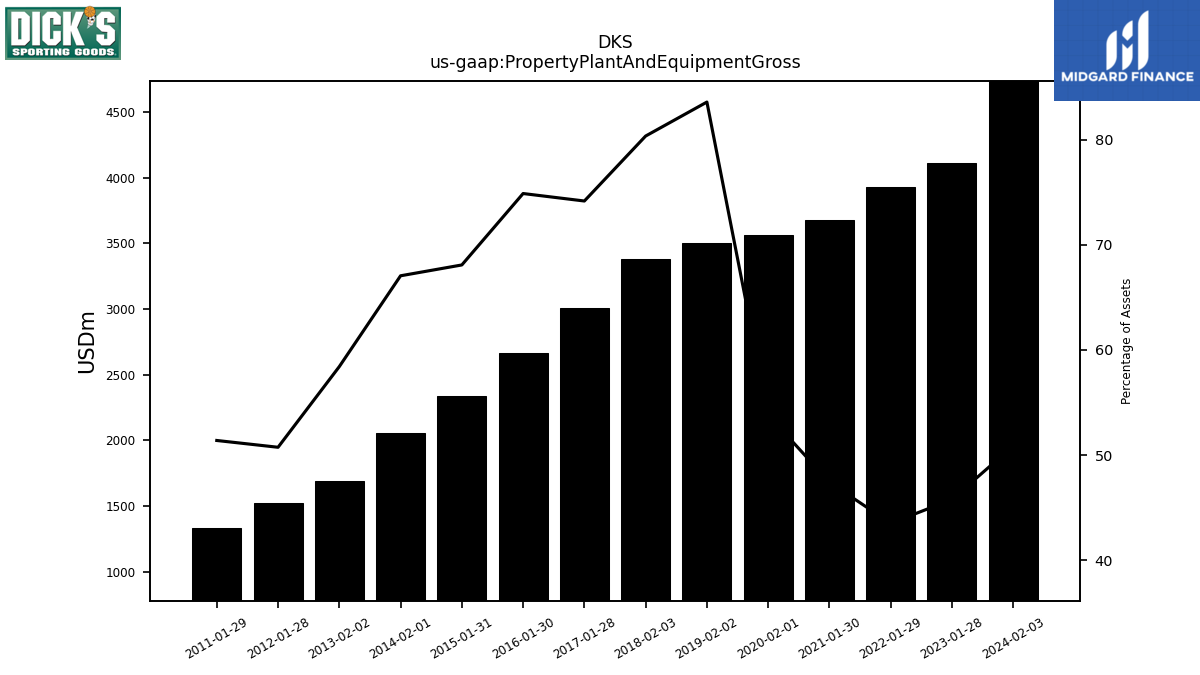
| Property Plant And Equipment Gross | 4737.49 | NA | NA | NA | 4116.19 | NA | NA | NA | 3933.84 | NA | NA | NA | 3676.35 | NA | NA | NA | 3567.65 | NA | NA | NA | 3499.82 | NA | NA | NA | 3377.95 | NA | NA | NA | 3010.08 | NA | NA | NA | 2665.31 | NA | NA | NA | 2339.61 | NA | NA | NA | 2059.62 | NA | NA | NA | 1687.01 | NA | NA | NA | 1520.42 | NA | NA | NA | 1334.80 | NA | |
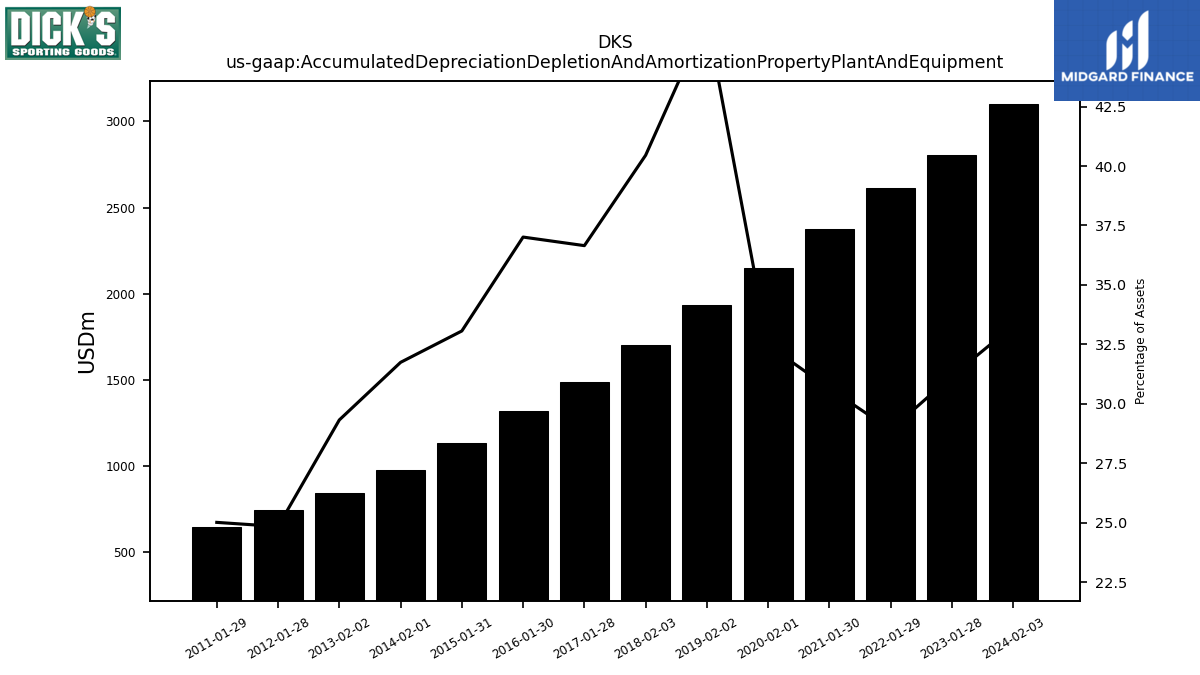
| Accumulated Depreciation Depletion And Amortization Property Plant And Equipment | 3099.33 | NA | NA | NA | 2803.20 | NA | NA | NA | 2614.16 | NA | NA | NA | 2376.09 | NA | NA | NA | 2151.93 | NA | NA | NA | 1934.55 | NA | NA | NA | 1700.61 | NA | NA | NA | 1487.50 | NA | NA | NA | 1317.43 | NA | NA | NA | 1136.22 | NA | NA | NA | 975.10 | NA | NA | NA | 846.87 | NA | NA | NA | 744.53 | NA | NA | NA | 649.91 | NA | |
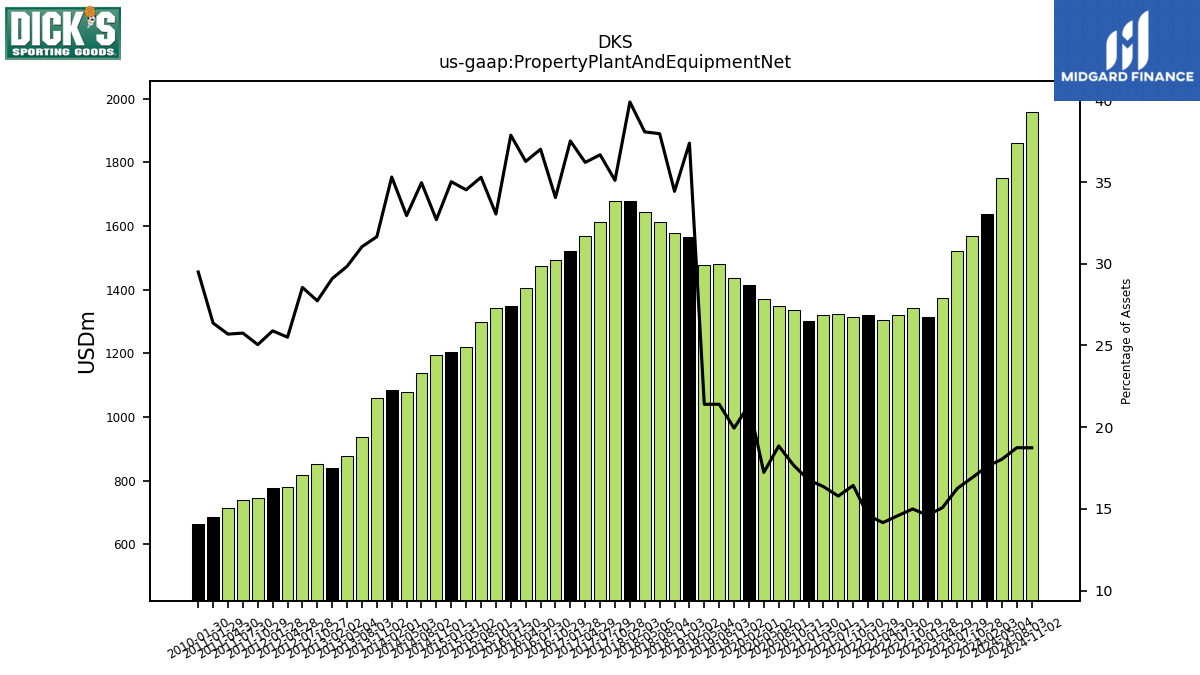
| Property Plant And Equipment Net | 1638.16 | 1569.70 | 1520.68 | 1372.78 | 1312.99 | 1342.79 | 1321.74 | 1305.14 | 1319.68 | 1314.57 | 1323.17 | 1319.77 | 1300.27 | 1336.68 | 1348.06 | 1369.87 | 1415.73 | 1436.97 | 1479.86 | 1478.91 | 1565.27 | 1578.31 | 1611.53 | 1644.39 | 1677.34 | 1679.87 | 1611.83 | 1568.52 | 1522.57 | 1492.27 | 1475.80 | 1406.47 | 1347.88 | 1341.17 | 1297.30 | 1220.47 | 1203.38 | 1195.27 | 1138.18 | 1077.25 | 1084.53 | 1059.87 | 937.31 | 876.73 | 840.13 | 851.30 | 817.43 | 779.19 | 775.90 | 745.13 | 737.48 | 712.81 | 684.89 | 662.30 | |
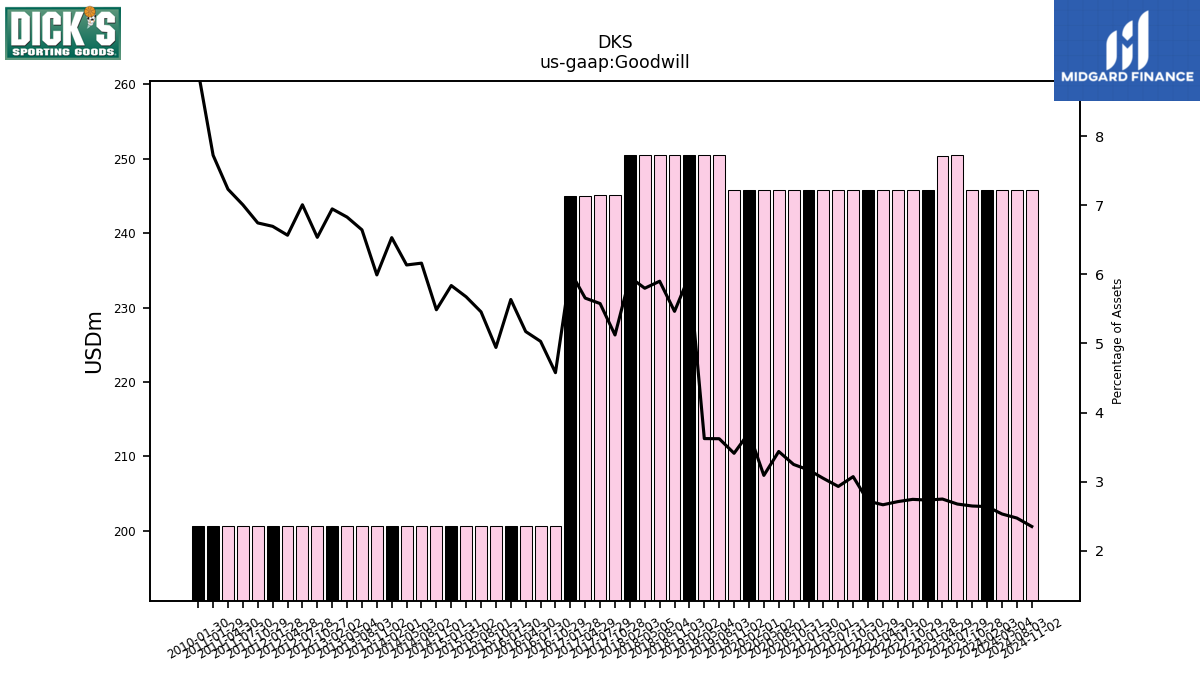
| Goodwill | 245.86 | 245.86 | 250.50 | 250.40 | 245.86 | 245.86 | 245.86 | 245.86 | 245.86 | 245.86 | 245.86 | 245.86 | 245.86 | 245.86 | 245.86 | 245.86 | 245.86 | 245.86 | 250.48 | 250.48 | 250.48 | 250.48 | 250.48 | 250.48 | 250.48 | 245.13 | 245.13 | 245.06 | 245.06 | 200.59 | 200.59 | 200.59 | 200.59 | 200.59 | 200.59 | 200.59 | 200.59 | 200.59 | 200.59 | 200.59 | 200.59 | 200.59 | 200.59 | 200.59 | 200.59 | 200.59 | 200.59 | 200.59 | 200.59 | 200.59 | 200.59 | 200.59 | 200.59 | 200.59 | |
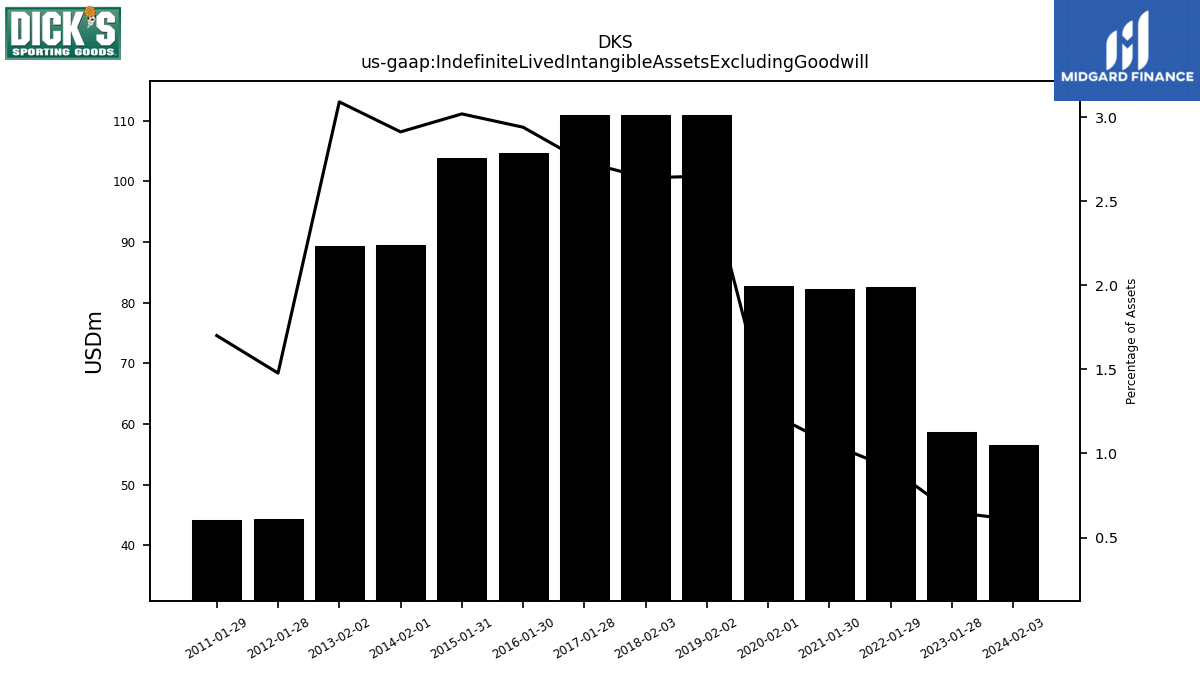
| Indefinite Lived Intangible Assets Excluding Goodwill | 56.47 | NA | NA | NA | 58.60 | NA | NA | NA | 82.60 | NA | NA | NA | 82.20 | NA | NA | NA | 82.70 | NA | NA | NA | 111.00 | NA | NA | NA | 111.00 | NA | NA | NA | 111.00 | NA | NA | NA | 104.70 | NA | NA | NA | 103.80 | NA | NA | NA | 89.50 | NA | NA | NA | 89.30 | NA | NA | NA | 44.30 | NA | NA | NA | 44.20 | NA | |
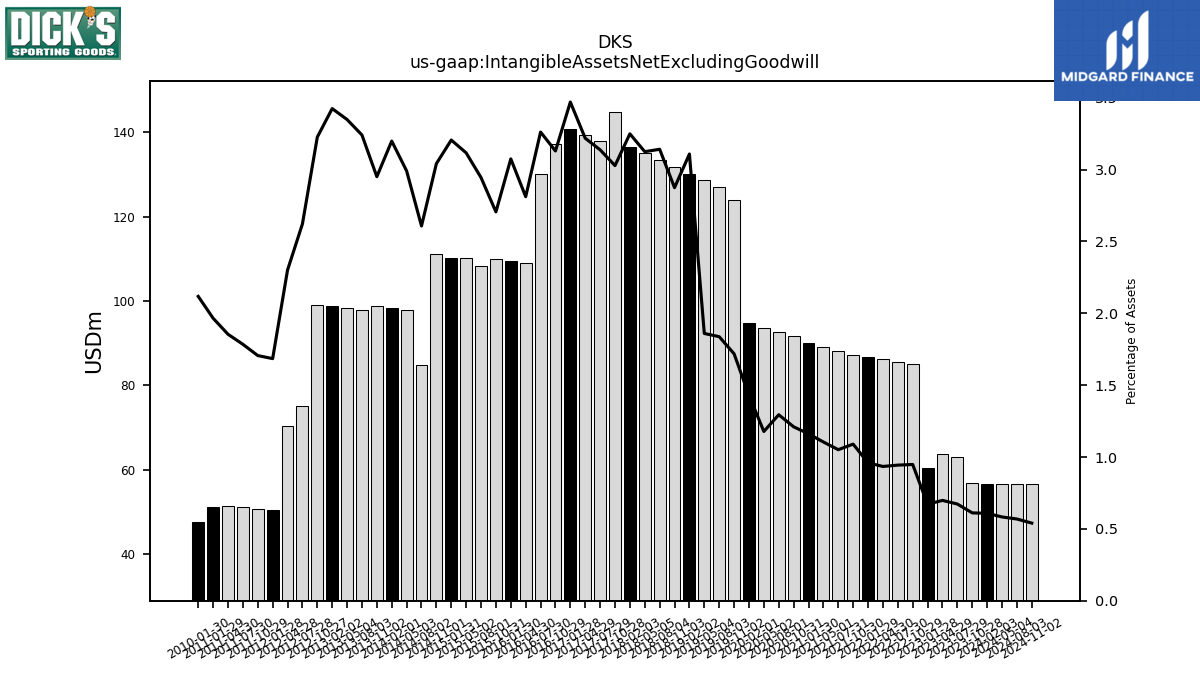
| Intangible Assets Net Excluding Goodwill | 56.66 | 56.75 | 62.99 | 63.60 | 60.36 | 84.95 | 85.55 | 86.16 | 86.77 | 87.19 | 88.16 | 89.12 | 90.05 | 91.58 | 92.58 | 93.68 | 94.77 | 123.86 | 127.08 | 128.56 | 130.17 | 131.76 | 133.37 | 134.98 | 136.59 | 144.90 | 137.92 | 139.45 | 140.84 | 137.16 | 130.06 | 109.05 | 109.44 | 109.83 | 108.24 | 110.18 | 110.16 | 111.19 | 84.90 | 97.80 | 98.25 | 98.79 | 97.86 | 98.38 | 98.90 | 99.03 | 75.06 | 70.30 | 50.49 | 50.76 | 51.10 | 51.45 | 51.07 | 47.56 | |
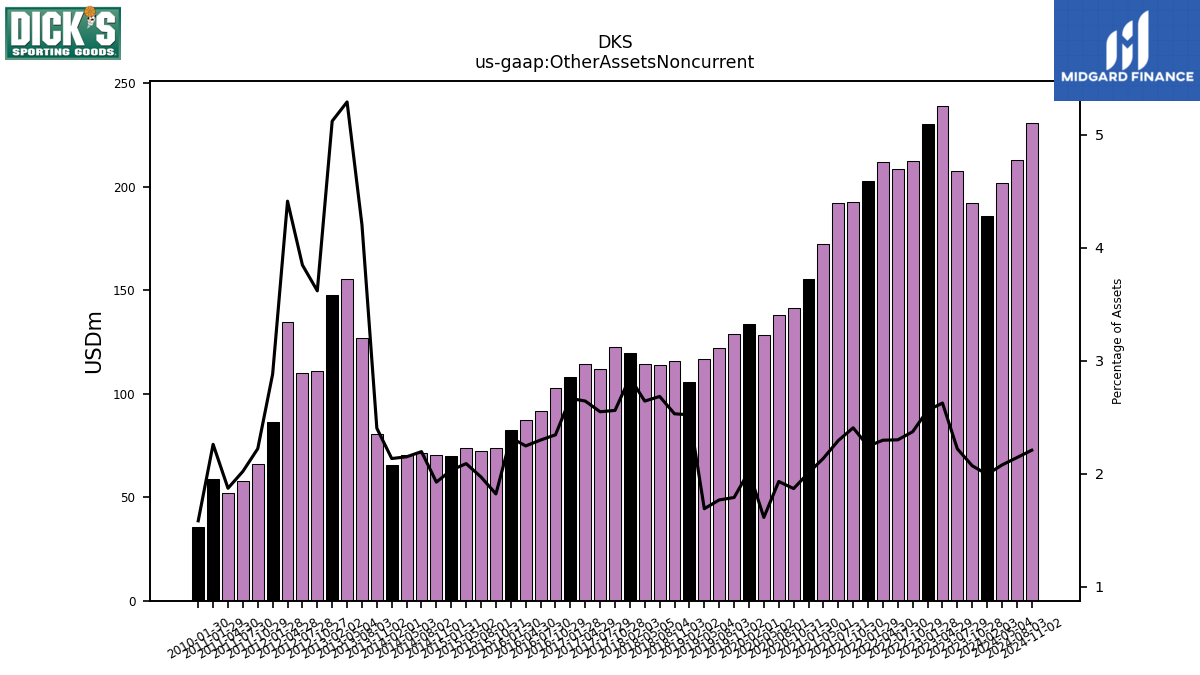
| Other Assets Noncurrent | 185.69 | 192.17 | 207.77 | 239.14 | 230.25 | 212.46 | 208.50 | 211.75 | 202.87 | 192.50 | 192.36 | 172.35 | 155.65 | 141.35 | 138.12 | 128.29 | 133.93 | 128.97 | 122.26 | 116.82 | 105.59 | 115.99 | 113.94 | 114.16 | 119.81 | 122.52 | 112.02 | 114.53 | 108.22 | 102.73 | 91.64 | 87.11 | 82.56 | 73.91 | 72.45 | 73.86 | 69.81 | 70.39 | 71.48 | 70.29 | 65.56 | 80.43 | 126.92 | 155.45 | 147.90 | 111.09 | 110.15 | 134.82 | 86.38 | 66.09 | 57.86 | 51.91 | 58.71 | 35.55 |
| 2024-02-03 | 2023-10-28 | 2023-07-29 | 2023-04-29 | 2023-01-28 | 2022-10-29 | 2022-07-30 | 2022-04-30 | 2022-01-29 | 2021-10-30 | 2021-07-31 | 2021-05-01 | 2021-01-30 | 2020-10-31 | 2020-08-01 | 2020-05-02 | 2020-02-01 | 2019-11-02 | 2019-08-03 | 2019-05-04 | 2019-02-02 | 2018-11-03 | 2018-08-04 | 2018-05-05 | 2018-02-03 | 2017-10-28 | 2017-07-29 | 2017-04-29 | 2017-01-28 | 2016-10-29 | 2016-07-30 | 2016-04-30 | 2016-01-30 | 2015-10-31 | 2015-08-01 | 2015-05-02 | 2015-01-31 | 2014-11-01 | 2014-08-02 | 2014-05-03 | 2014-02-01 | 2013-11-02 | 2013-08-03 | 2013-05-04 | 2013-02-02 | 2012-10-27 | 2012-07-28 | 2012-04-28 | 2012-01-28 | 2011-10-29 | 2011-07-30 | 2011-04-30 | 2011-01-29 | 2010-01-30 | ||
|---|---|---|---|---|---|---|---|---|---|---|---|---|---|---|---|---|---|---|---|---|---|---|---|---|---|---|---|---|---|---|---|---|---|---|---|---|---|---|---|---|---|---|---|---|---|---|---|---|---|---|---|---|---|---|---|
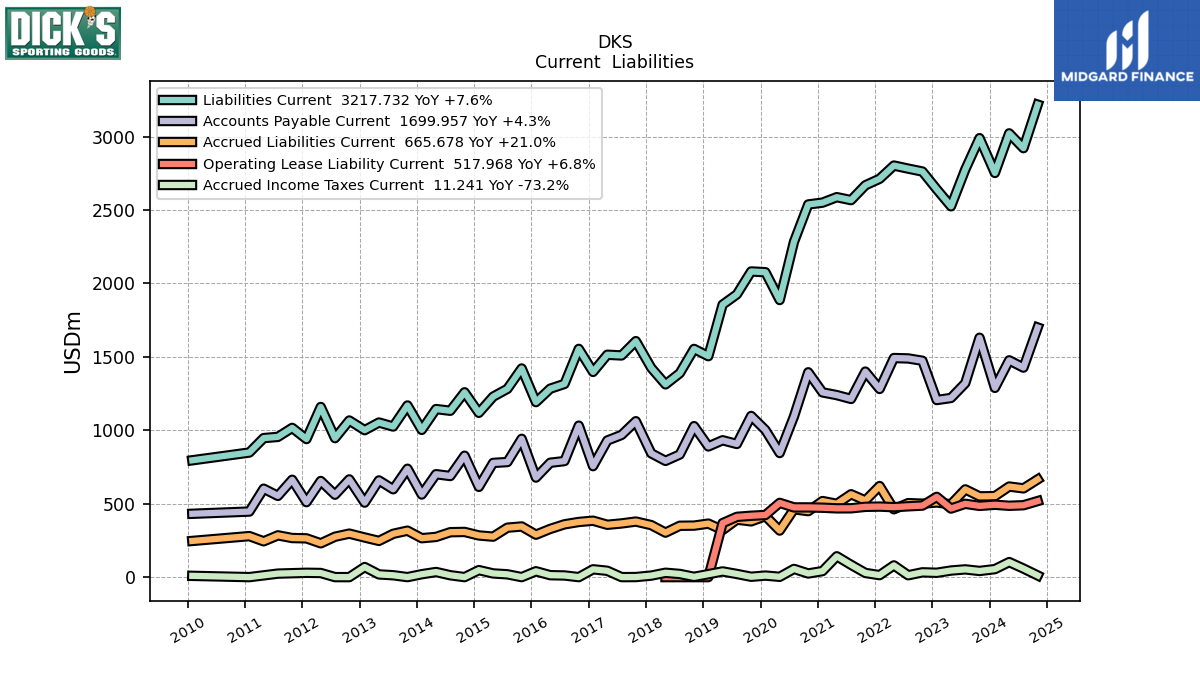
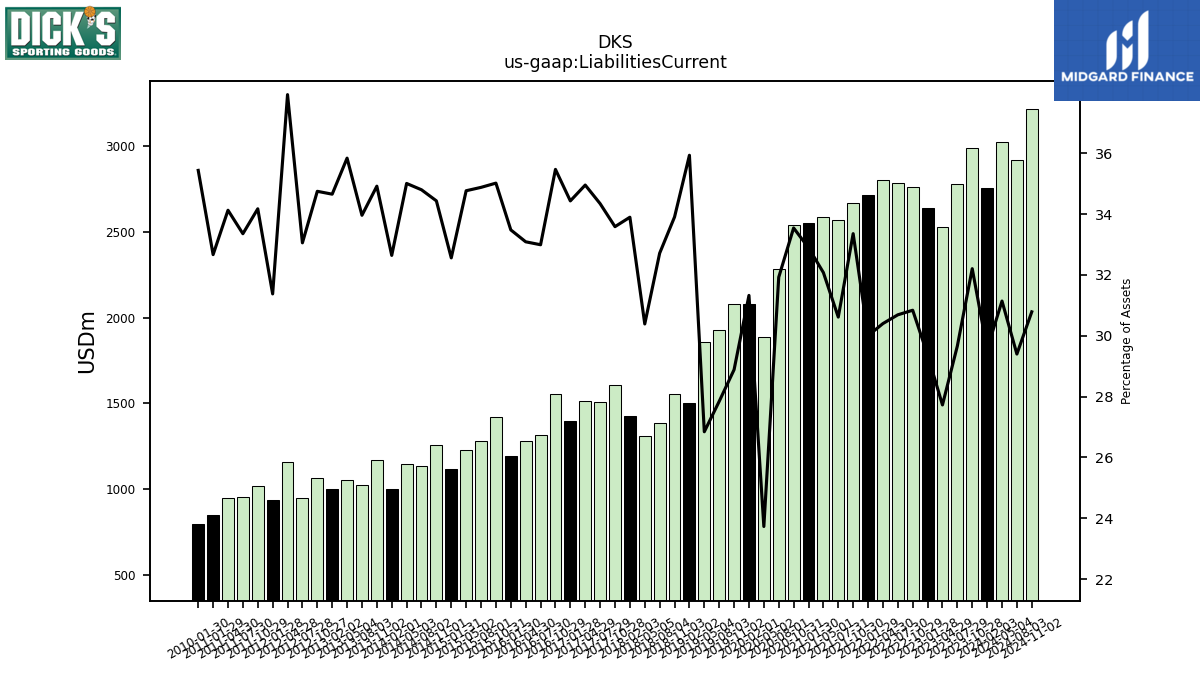
| Liabilities Current | 2752.39 | 2989.39 | 2775.68 | 2525.16 | 2641.45 | 2762.13 | 2781.95 | 2802.84 | 2712.68 | 2668.30 | 2567.30 | 2587.51 | 2550.20 | 2537.77 | 2283.38 | 1886.98 | 2076.47 | 2081.64 | 1925.39 | 1855.39 | 1504.64 | 1554.08 | 1388.73 | 1312.56 | 1425.01 | 1607.11 | 1509.50 | 1514.48 | 1397.41 | 1554.34 | 1315.61 | 1283.31 | 1191.67 | 1421.19 | 1282.09 | 1229.05 | 1118.83 | 1258.78 | 1132.88 | 1144.55 | 1002.59 | 1169.00 | 1025.45 | 1052.92 | 1000.77 | 1066.66 | 946.34 | 1158.76 | 940.15 | 1016.53 | 955.07 | 946.75 | 848.54 | 795.67 | |
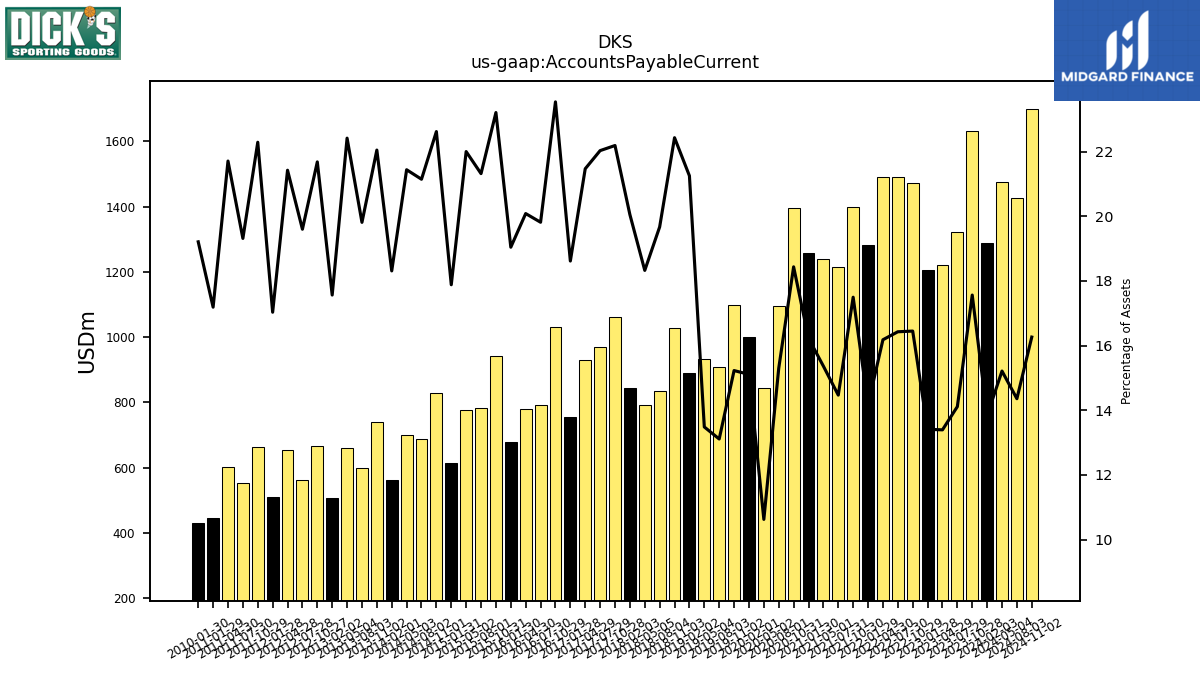
| Accounts Payable Current | 1288.73 | 1630.40 | 1320.66 | 1220.00 | 1206.07 | 1473.42 | 1489.32 | 1491.93 | 1281.32 | 1399.72 | 1213.45 | 1239.50 | 1258.09 | 1394.90 | 1094.26 | 844.99 | 1001.59 | 1097.56 | 906.72 | 932.05 | 889.91 | 1028.23 | 835.10 | 791.65 | 843.08 | 1061.78 | 968.40 | 930.29 | 755.54 | 1031.59 | 790.22 | 778.98 | 677.86 | 941.97 | 783.72 | 777.80 | 614.51 | 826.95 | 688.44 | 701.00 | 562.44 | 738.20 | 598.26 | 658.63 | 507.25 | 665.61 | 561.16 | 654.60 | 510.40 | 663.09 | 553.11 | 602.28 | 446.51 | 431.37 | |
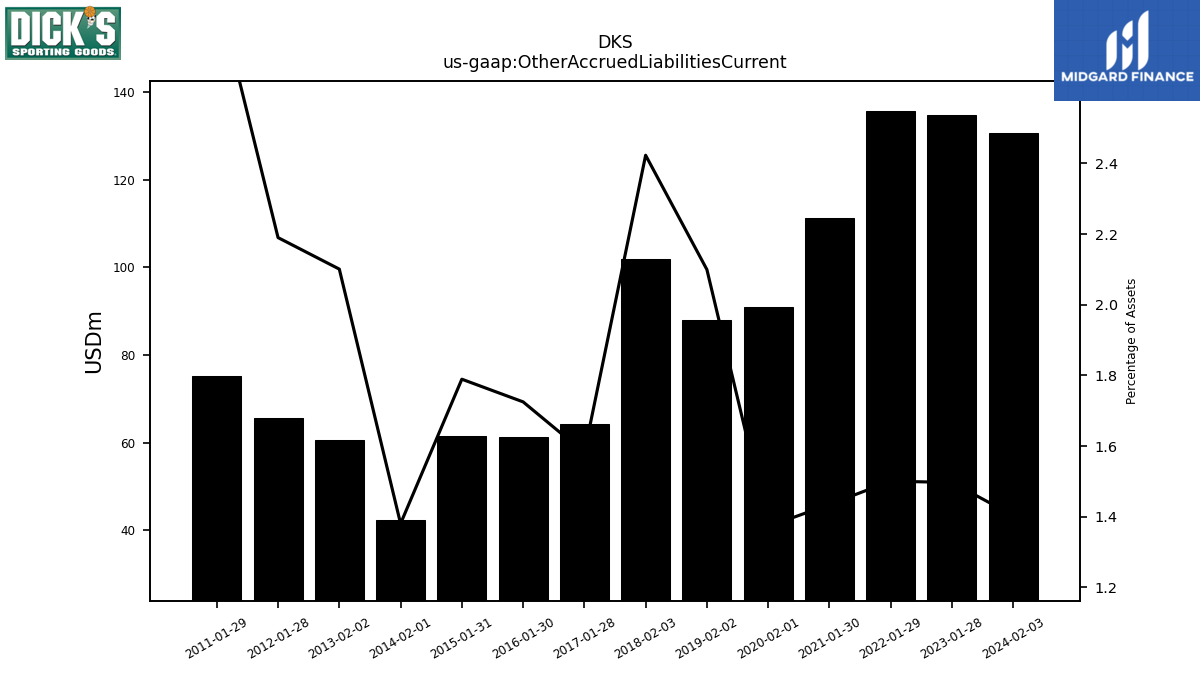
| Other Accrued Liabilities Current | 130.70 | NA | NA | NA | 134.62 | NA | NA | NA | 135.70 | NA | NA | NA | 111.25 | NA | NA | NA | 90.98 | NA | NA | NA | 87.91 | NA | NA | NA | 101.86 | NA | NA | NA | 64.18 | NA | NA | NA | 61.40 | NA | NA | NA | 61.48 | NA | NA | NA | 42.41 | NA | NA | NA | 60.66 | NA | NA | NA | 65.62 | NA | NA | NA | 75.15 | NA | |
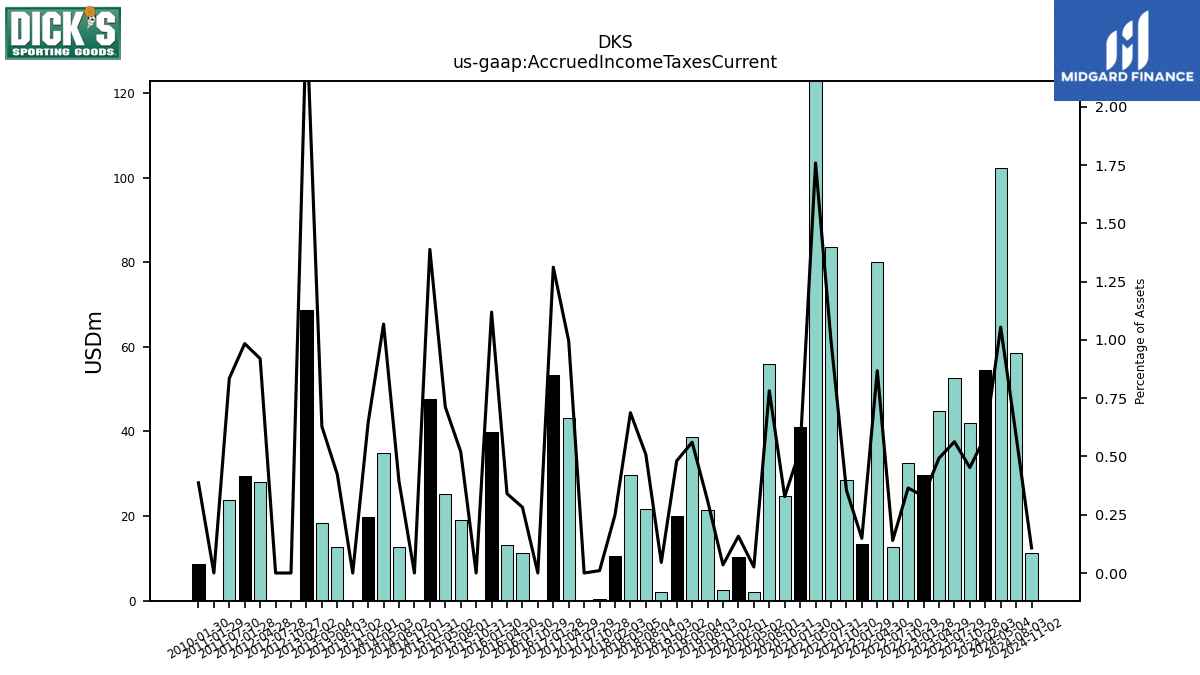
| Accrued Income Taxes Current | 54.51 | 42.01 | 52.70 | 44.87 | 29.62 | 32.66 | 12.67 | 80.02 | 13.46 | 28.43 | 83.64 | 141.87 | 41.00 | 24.80 | 55.90 | 2.06 | 10.46 | 2.52 | 21.49 | 38.77 | 20.14 | 2.08 | 21.57 | 29.70 | 10.48 | 0.49 | 0.00 | 43.12 | 53.23 | 0.00 | 11.25 | 13.20 | 39.84 | 0.00 | 19.13 | 25.18 | 47.70 | 0.00 | 12.78 | 34.91 | 19.82 | 0.00 | 12.78 | 18.47 | 68.75 | 0.00 | 0.00 | 28.09 | 29.48 | NA | 23.91 | NA | 0.00 | 8.69 | |
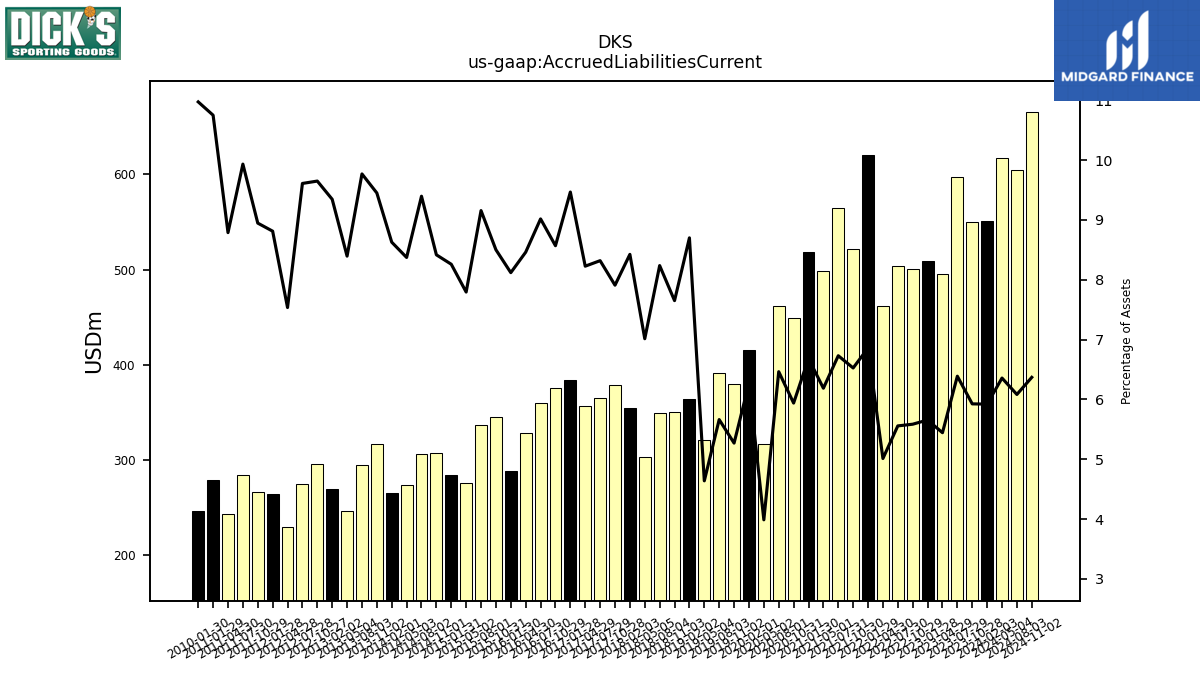
| Accrued Liabilities Current | 551.37 | 550.01 | 597.74 | 495.74 | 508.57 | 500.25 | 503.76 | 462.08 | 620.14 | 522.01 | 564.40 | 499.07 | 518.13 | 449.30 | 462.28 | 317.03 | 415.50 | 379.77 | 391.56 | 320.60 | 364.34 | 350.74 | 349.70 | 302.99 | 354.18 | 378.48 | 365.68 | 356.48 | 384.21 | 375.55 | 359.61 | 328.18 | 289.00 | 345.05 | 336.60 | 275.56 | 283.83 | 307.71 | 305.94 | 273.76 | 265.04 | 316.42 | 295.01 | 246.65 | 269.90 | 296.23 | 275.16 | 230.23 | 264.07 | 266.16 | 284.46 | 243.81 | 279.28 | 246.41 | |
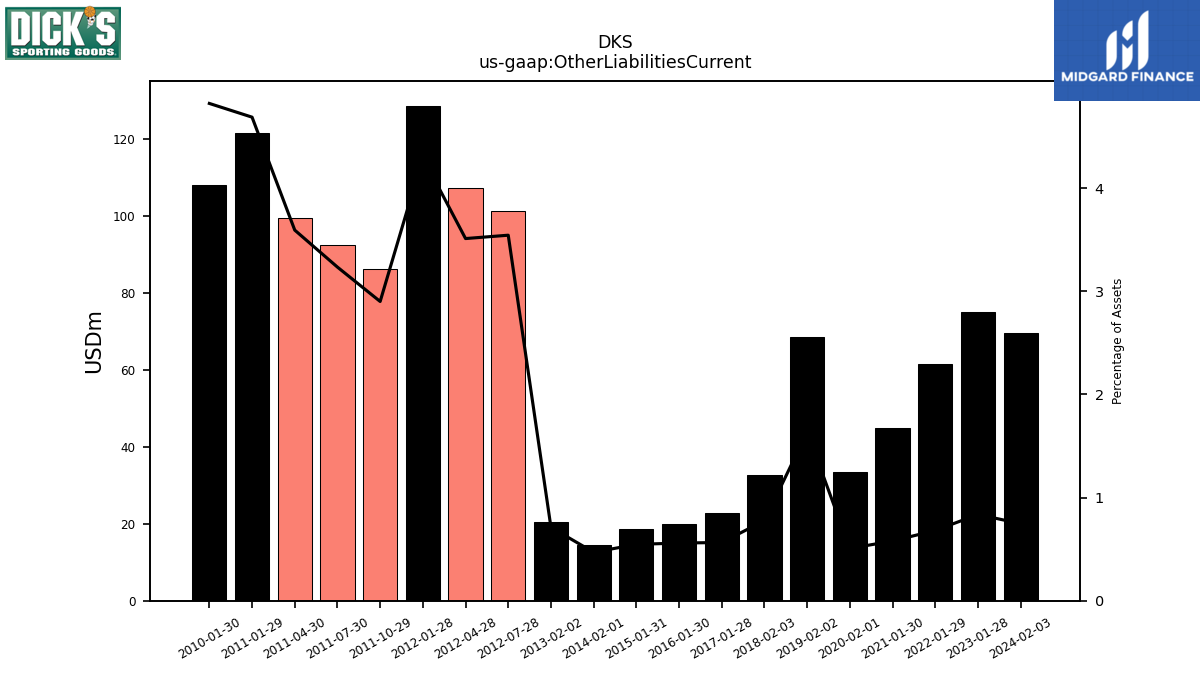
| Other Liabilities Current | 69.58 | NA | NA | NA | 75.18 | NA | NA | NA | 61.60 | NA | NA | NA | 44.92 | NA | NA | NA | 33.59 | NA | NA | NA | 68.53 | NA | NA | NA | 32.62 | NA | NA | NA | 22.93 | NA | NA | NA | 19.90 | NA | NA | NA | 18.78 | NA | NA | NA | 14.43 | NA | NA | NA | 20.55 | NA | 101.44 | 107.25 | 128.76 | 86.29 | 92.59 | 99.66 | 121.75 | 108.23 |
| 2024-02-03 | 2023-10-28 | 2023-07-29 | 2023-04-29 | 2023-01-28 | 2022-10-29 | 2022-07-30 | 2022-04-30 | 2022-01-29 | 2021-10-30 | 2021-07-31 | 2021-05-01 | 2021-01-30 | 2020-10-31 | 2020-08-01 | 2020-05-02 | 2020-02-01 | 2019-11-02 | 2019-08-03 | 2019-05-04 | 2019-02-02 | 2018-11-03 | 2018-08-04 | 2018-05-05 | 2018-02-03 | 2017-10-28 | 2017-07-29 | 2017-04-29 | 2017-01-28 | 2016-10-29 | 2016-07-30 | 2016-04-30 | 2016-01-30 | 2015-10-31 | 2015-08-01 | 2015-05-02 | 2015-01-31 | 2014-11-01 | 2014-08-02 | 2014-05-03 | 2014-02-01 | 2013-11-02 | 2013-08-03 | 2013-05-04 | 2013-02-02 | 2012-10-27 | 2012-07-28 | 2012-04-28 | 2012-01-28 | 2011-10-29 | 2011-07-30 | 2011-04-30 | 2011-01-29 | 2010-01-30 | ||
|---|---|---|---|---|---|---|---|---|---|---|---|---|---|---|---|---|---|---|---|---|---|---|---|---|---|---|---|---|---|---|---|---|---|---|---|---|---|---|---|---|---|---|---|---|---|---|---|---|---|---|---|---|---|---|---|
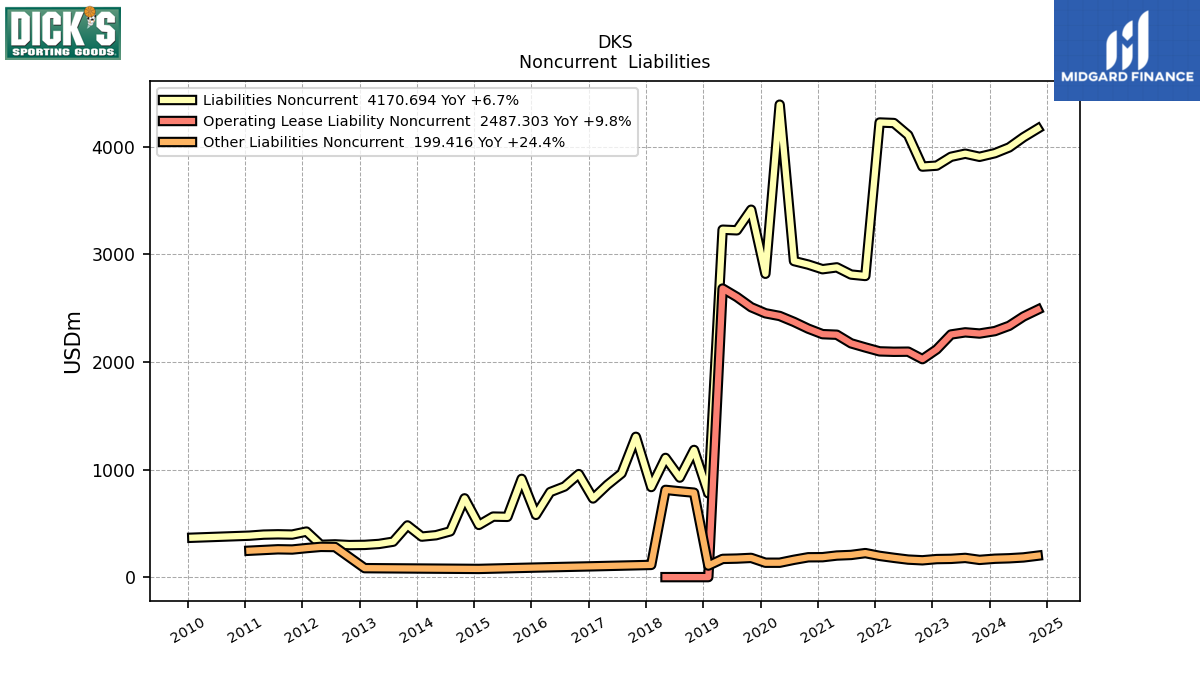
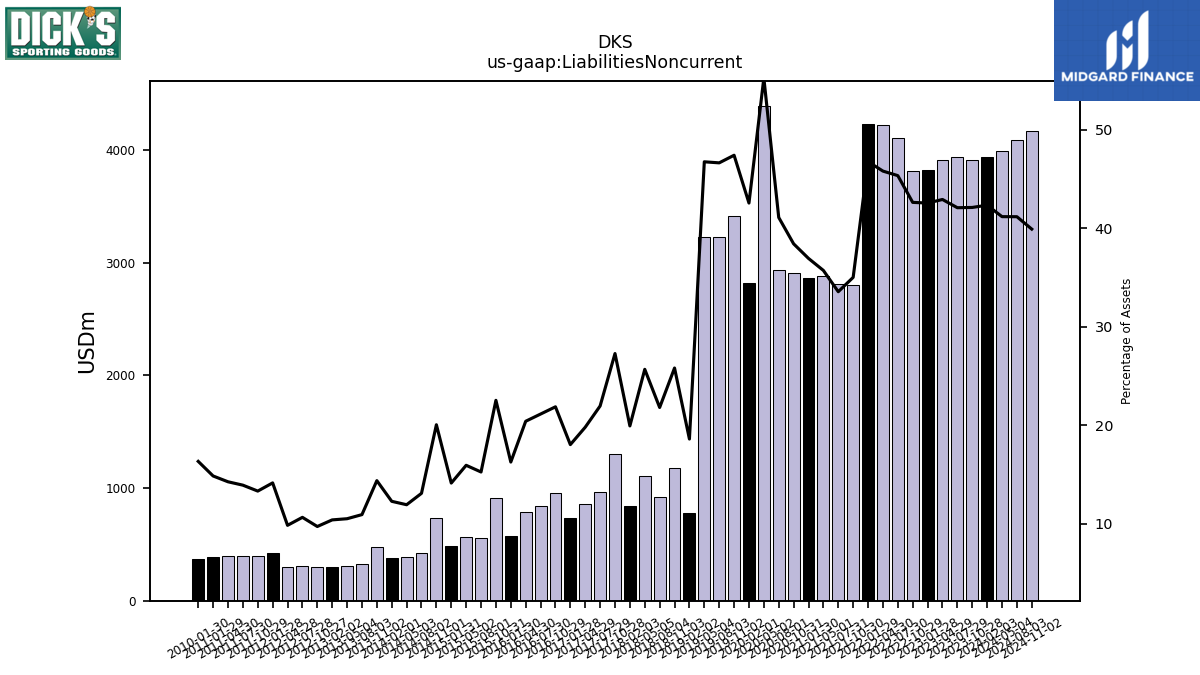
| Liabilities Noncurrent | 3942.08 | 3908.23 | 3937.32 | 3908.49 | 3826.13 | 3817.30 | 4109.81 | 4222.35 | 4227.41 | 2800.16 | 2813.49 | 2880.34 | 2863.13 | 2906.08 | 2938.90 | 4393.55 | 2820.49 | 3416.45 | 3224.74 | 3230.57 | 778.35 | 1182.63 | 925.20 | 1108.65 | 837.42 | 1304.82 | 964.55 | 857.42 | 731.39 | 958.00 | 842.46 | 790.92 | 578.47 | 913.93 | 560.27 | 562.86 | 485.14 | 732.60 | 425.73 | 389.68 | 376.72 | 480.87 | 329.56 | 308.41 | 299.71 | 297.99 | 304.54 | 300.22 | 423.56 | 395.75 | 398.16 | 395.29 | 385.41 | 366.43 | |
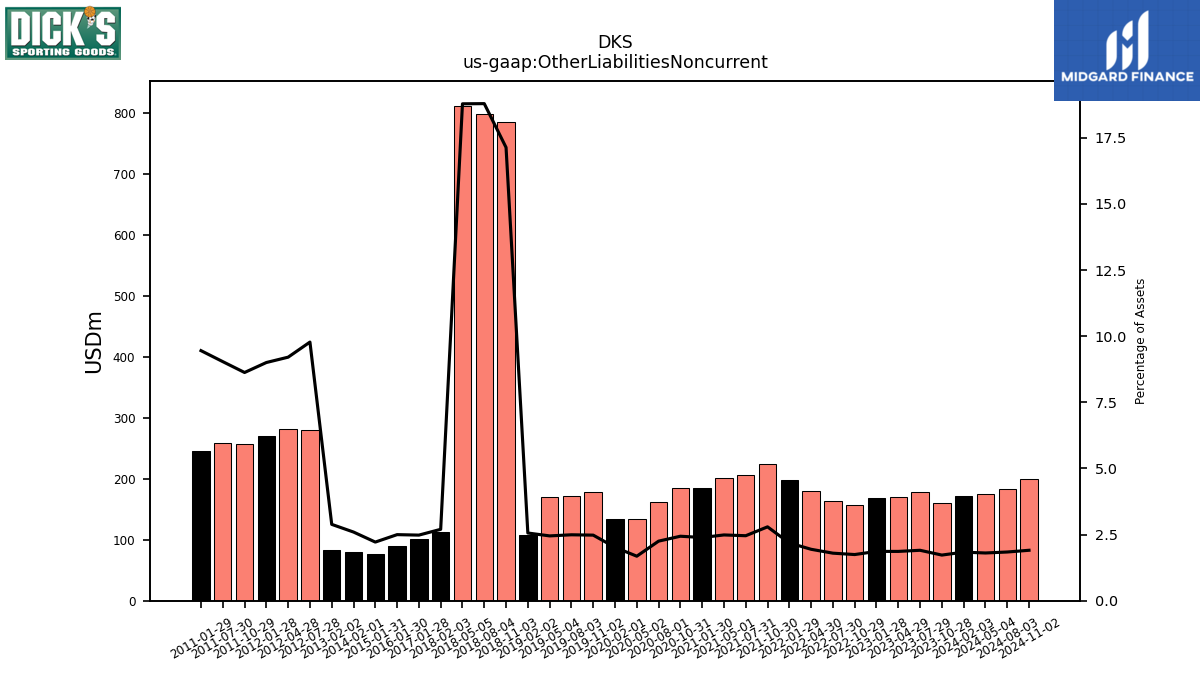
| Other Liabilities Noncurrent | 171.10 | 160.26 | 178.49 | 169.85 | 167.75 | 156.41 | 163.04 | 179.35 | 197.53 | 223.46 | 206.13 | 200.66 | 185.33 | 184.50 | 161.15 | 133.93 | 133.85 | 178.76 | 172.41 | 169.44 | 107.22 | 785.38 | 797.70 | 811.36 | 113.50 | NA | NA | NA | 100.70 | NA | NA | NA | 88.95 | NA | NA | NA | 76.21 | NA | NA | NA | 79.77 | NA | NA | NA | 83.38 | NA | 279.93 | 281.29 | 269.83 | 256.64 | 258.80 | NA | 245.57 | NA | |
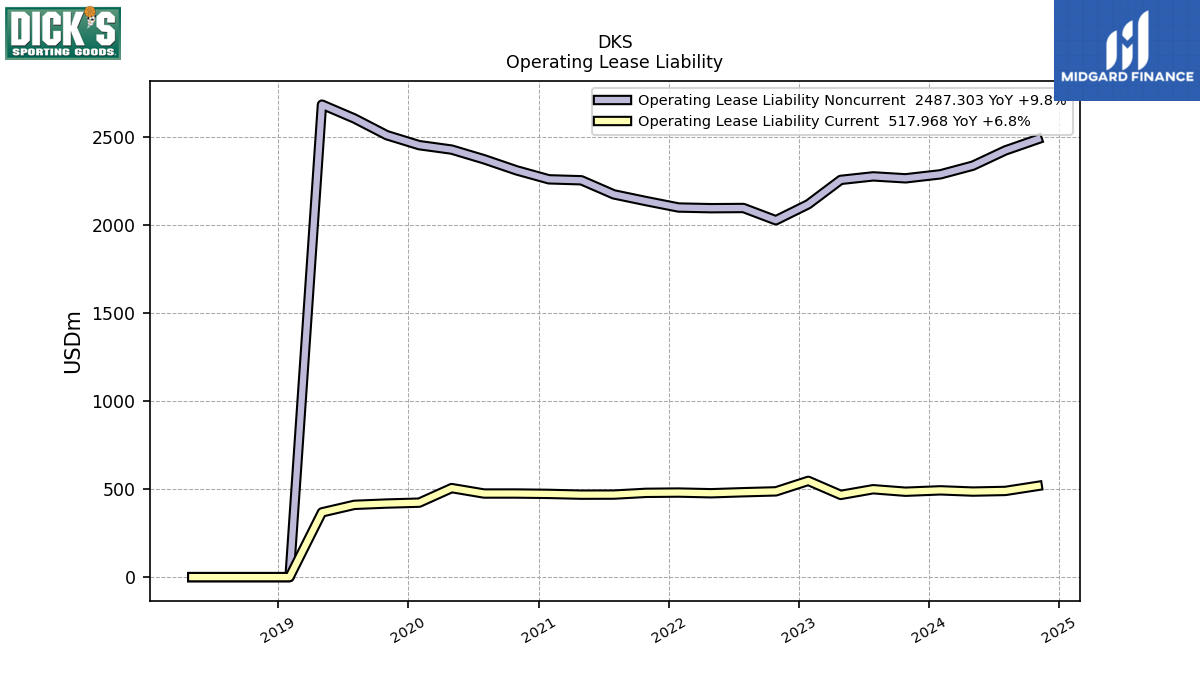
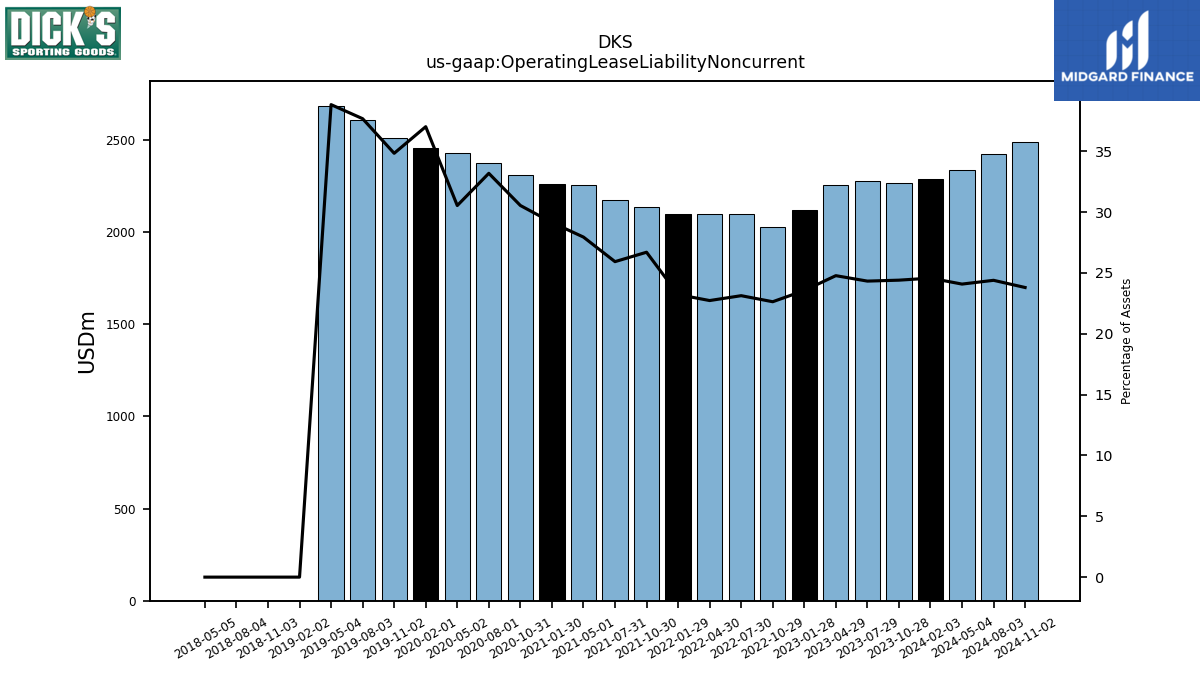
| Operating Lease Liability Noncurrent | 2287.71 | 2264.94 | 2276.04 | 2256.07 | 2117.77 | 2026.77 | 2096.41 | 2095.31 | 2099.15 | 2135.51 | 2173.90 | 2253.88 | 2259.31 | 2310.32 | 2373.17 | 2428.13 | 2453.35 | 2509.87 | 2604.90 | 2683.56 | 0.00 | 0.00 | 0.00 | 0.00 | NA | NA | NA | NA | NA | NA | NA | NA | NA | NA | NA | NA | NA | NA | NA | NA | NA | NA | NA | NA | NA | NA | NA | NA | NA | NA | NA | NA | NA | NA |
| 2024-02-03 | 2023-10-28 | 2023-07-29 | 2023-04-29 | 2023-01-28 | 2022-10-29 | 2022-07-30 | 2022-04-30 | 2022-01-29 | 2021-10-30 | 2021-07-31 | 2021-05-01 | 2021-01-30 | 2020-10-31 | 2020-08-01 | 2020-05-02 | 2020-02-01 | 2019-11-02 | 2019-08-03 | 2019-05-04 | 2019-02-02 | 2018-11-03 | 2018-08-04 | 2018-05-05 | 2018-02-03 | 2017-10-28 | 2017-07-29 | 2017-04-29 | 2017-01-28 | 2016-10-29 | 2016-07-30 | 2016-04-30 | 2016-01-30 | 2015-10-31 | 2015-08-01 | 2015-05-02 | 2015-01-31 | 2014-11-01 | 2014-08-02 | 2014-05-03 | 2014-02-01 | 2013-11-02 | 2013-08-03 | 2013-05-04 | 2013-02-02 | 2012-10-27 | 2012-07-28 | 2012-04-28 | 2012-01-28 | 2011-10-29 | 2011-07-30 | 2011-04-30 | 2011-01-29 | 2010-01-30 | ||
|---|---|---|---|---|---|---|---|---|---|---|---|---|---|---|---|---|---|---|---|---|---|---|---|---|---|---|---|---|---|---|---|---|---|---|---|---|---|---|---|---|---|---|---|---|---|---|---|---|---|---|---|---|---|---|---|
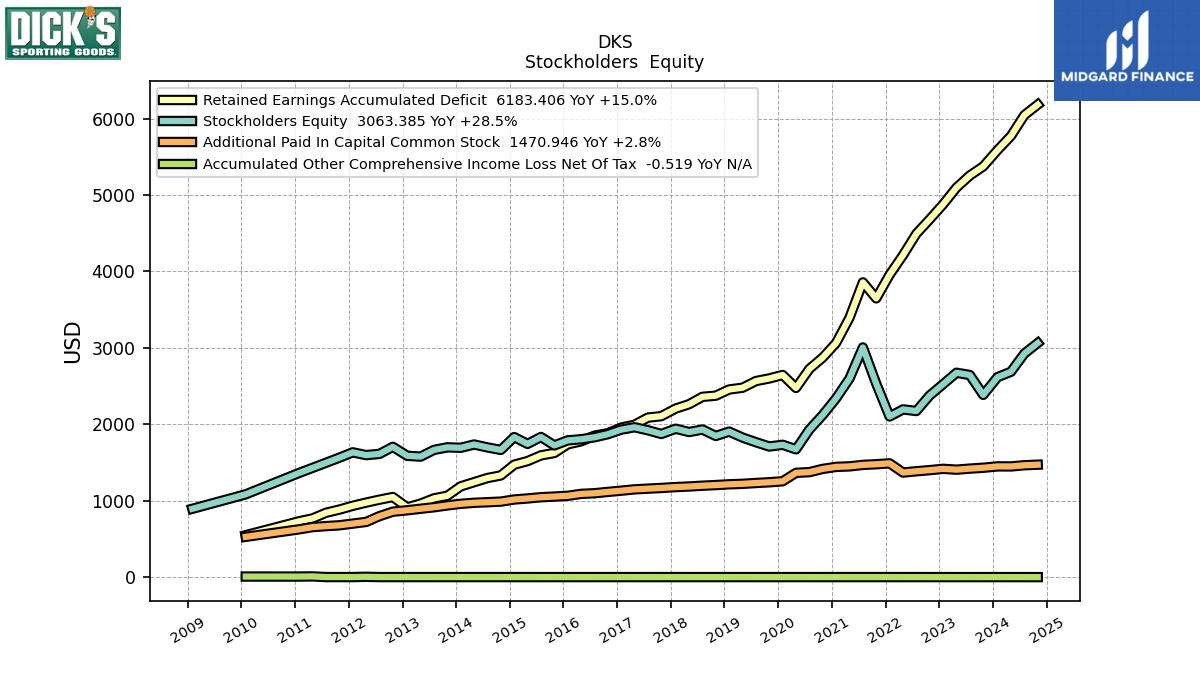
| Stockholders Equity | 2617.28 | 2384.70 | 2644.36 | 2674.17 | 2524.62 | 2377.17 | 2173.51 | 2194.61 | 2101.59 | 2530.82 | 3005.38 | 2598.72 | 2339.53 | 2121.64 | 1930.30 | 1672.03 | 1731.60 | 1708.90 | 1765.09 | 1826.04 | 1904.16 | 1847.04 | 1931.23 | 1898.21 | 1941.50 | 1872.99 | 1921.26 | 1960.82 | 1929.49 | 1869.87 | 1829.60 | 1804.13 | 1789.19 | 1723.31 | 1833.50 | 1743.12 | 1832.22 | 1664.15 | 1696.88 | 1735.21 | 1692.18 | 1698.02 | 1664.45 | 1576.54 | 1587.32 | 1704.93 | 1612.06 | 1596.17 | 1632.74 | 1562.35 | NA | NA | 1363.58 | 1083.23 | |
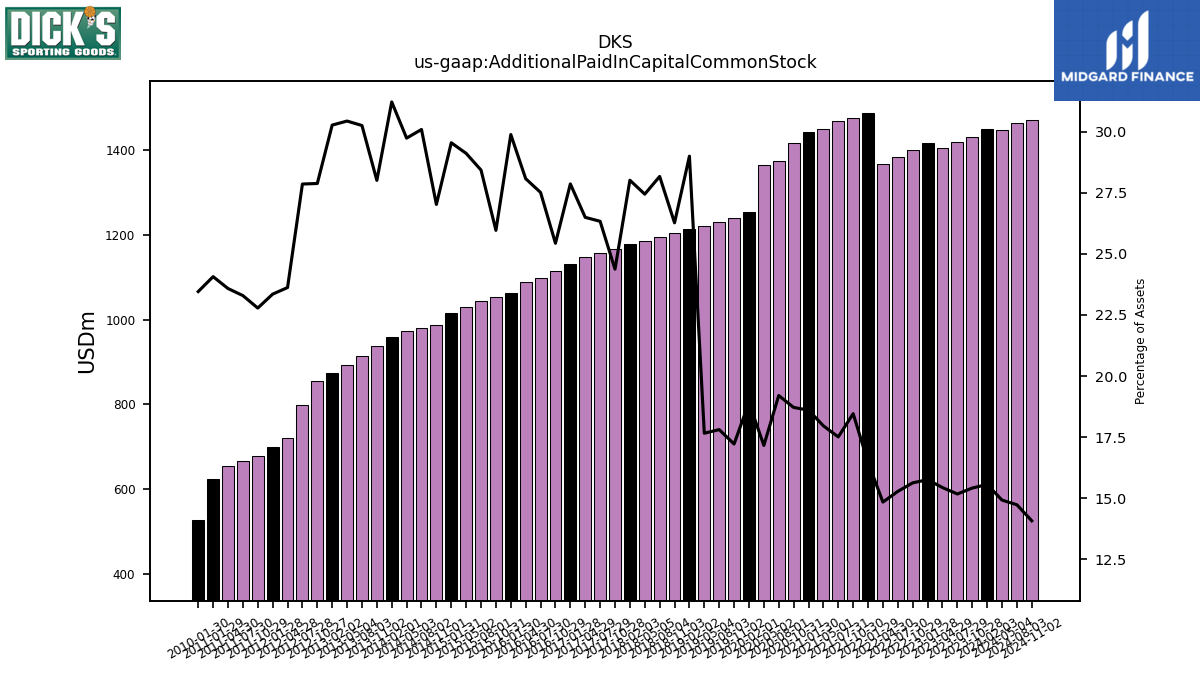
| Additional Paid In Capital Common Stock | 1448.86 | 1430.80 | 1419.63 | 1405.77 | 1416.85 | 1399.69 | 1384.95 | 1368.21 | 1488.83 | 1476.70 | 1468.22 | 1448.89 | 1442.30 | 1415.91 | 1373.43 | 1364.57 | 1253.87 | 1240.86 | 1231.33 | 1220.54 | 1214.29 | 1204.29 | 1195.88 | 1185.52 | 1177.78 | 1166.37 | 1157.48 | 1148.02 | 1130.83 | 1114.62 | 1097.20 | 1088.98 | 1063.70 | 1053.75 | 1045.08 | 1029.21 | 1015.40 | 987.89 | 979.70 | 972.34 | 958.94 | 937.74 | 913.58 | 894.24 | 874.24 | 855.88 | 797.62 | 721.70 | 699.77 | 677.72 | 666.98 | 654.23 | 625.18 | 526.72 | |
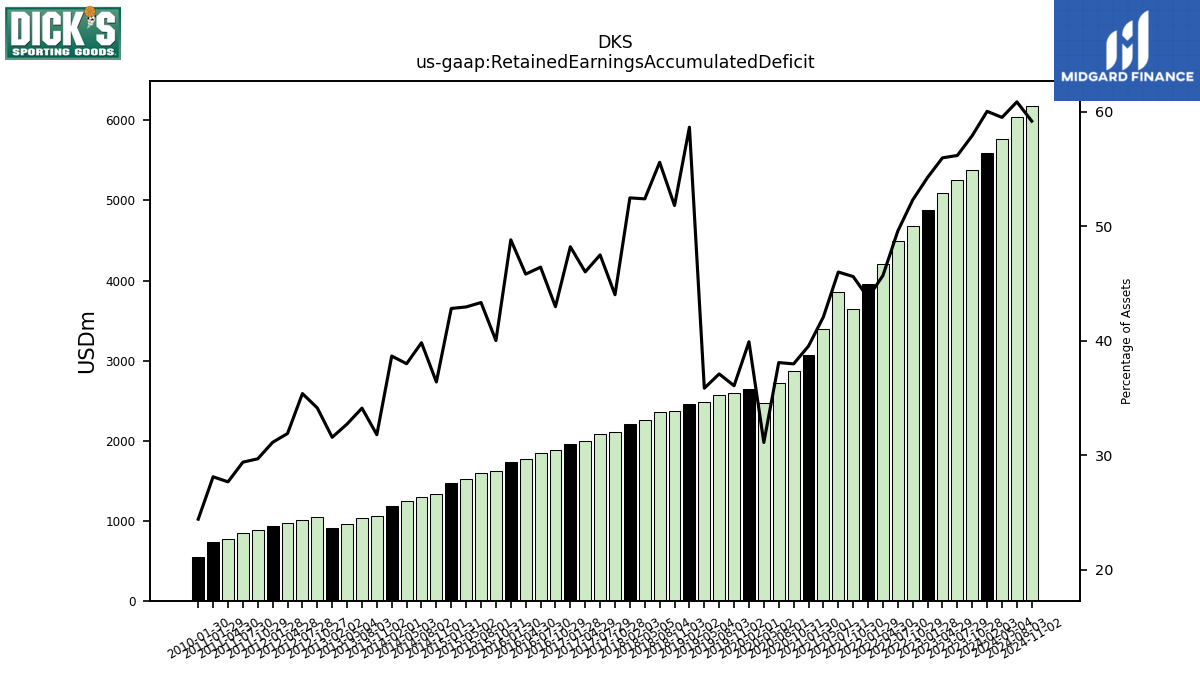
| Retained Earnings Accumulated Deficit | 5588.91 | 5374.57 | 5255.79 | 5096.79 | 4878.40 | 4682.66 | 4493.52 | 4212.45 | 3956.60 | 3647.62 | 3857.26 | 3394.07 | 3064.70 | 2873.26 | 2724.42 | 2475.07 | 2645.28 | 2599.49 | 2565.70 | 2478.13 | 2455.19 | 2374.34 | 2359.02 | 2262.55 | 2205.65 | 2106.09 | 2087.32 | 1993.43 | 1956.07 | 1882.93 | 1851.06 | 1776.78 | 1737.21 | 1623.96 | 1592.80 | 1518.24 | 1471.18 | 1330.54 | 1296.43 | 1242.14 | 1187.51 | 1064.51 | 1030.11 | 961.52 | 911.70 | 1047.67 | 1013.09 | 974.59 | 932.87 | 883.30 | 841.81 | 767.97 | 730.47 | 548.39 | |
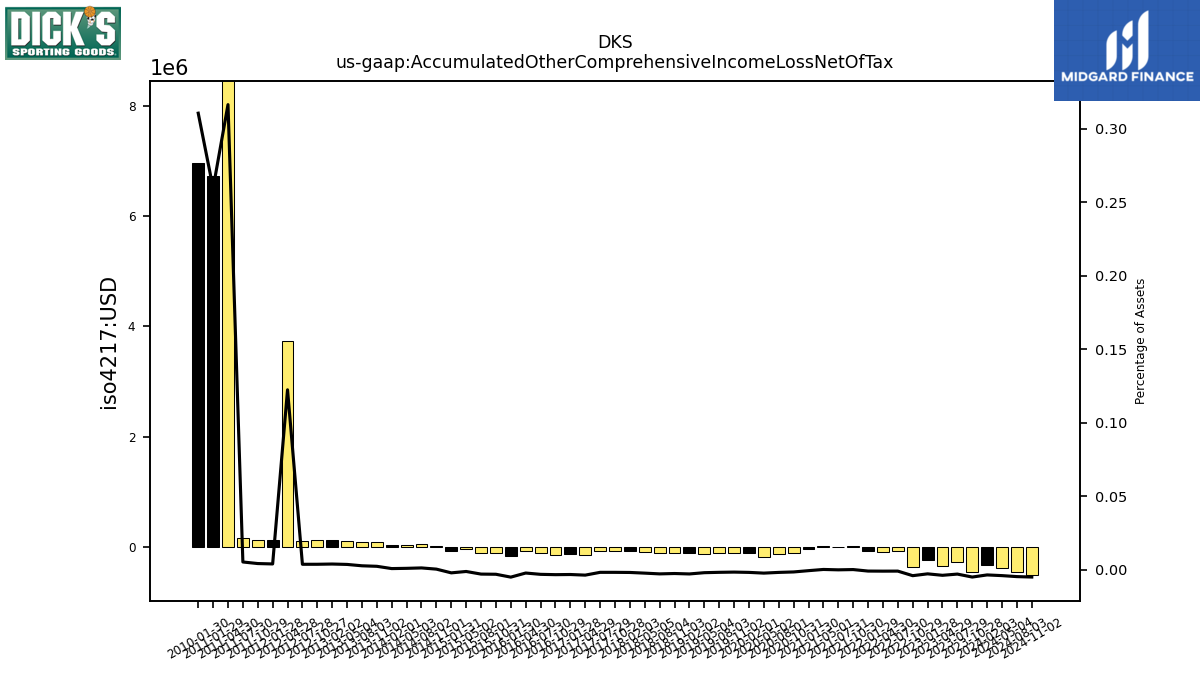
| Accumulated Other Comprehensive Income Loss Net Of Tax | -0.33 | -0.46 | -0.28 | -0.34 | -0.25 | -0.36 | -0.09 | -0.09 | -0.08 | 0.01 | -0.01 | 0.01 | -0.05 | -0.11 | -0.13 | -0.18 | -0.12 | -0.12 | -0.12 | -0.14 | -0.12 | -0.12 | -0.12 | -0.10 | -0.08 | -0.09 | -0.08 | -0.16 | -0.13 | -0.15 | -0.12 | -0.09 | -0.18 | -0.12 | -0.11 | -0.04 | -0.07 | 0.01 | 0.04 | 0.03 | 0.02 | 0.08 | 0.08 | 0.11 | 0.11 | 0.11 | 0.11 | 3.74 | 0.12 | 0.12 | 0.15 | 8.78 | 6.74 | 6.97 |