
| 2023-07-31 | 2023-04-30 | 2023-01-31 | 2022-10-31 | 2022-07-31 | 2022-04-30 | 2022-01-31 | 2021-10-31 | 2021-07-31 | 2021-04-30 | 2021-01-31 | 2020-10-31 | 2020-07-31 | 2020-04-30 | 2020-01-31 | 2019-10-31 | 2019-07-31 | 2019-04-30 | 2019-01-31 | 2018-10-31 | 2018-07-31 | 2018-04-30 | 2018-01-31 | 2017-10-31 | 2017-07-31 | 2017-04-30 | ||
|---|---|---|---|---|---|---|---|---|---|---|---|---|---|---|---|---|---|---|---|---|---|---|---|---|---|---|---|
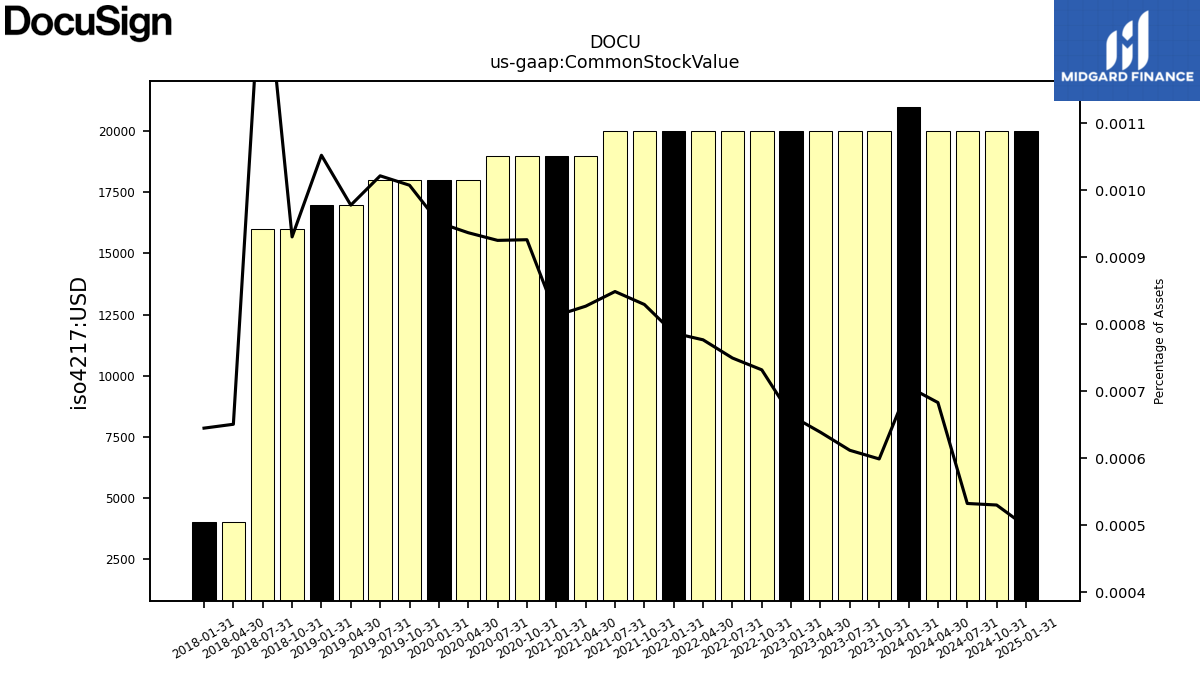
| Common Stock Value | 0.02 | 0.02 | 0.02 | 0.02 | 0.02 | 0.02 | 0.02 | 0.02 | 0.02 | 0.02 | 0.02 | 0.02 | 0.02 | 0.02 | 0.02 | 0.02 | 0.02 | 0.02 | 0.02 | 0.02 | 0.02 | 0.00 | 0.00 | NA | NA | NA | |
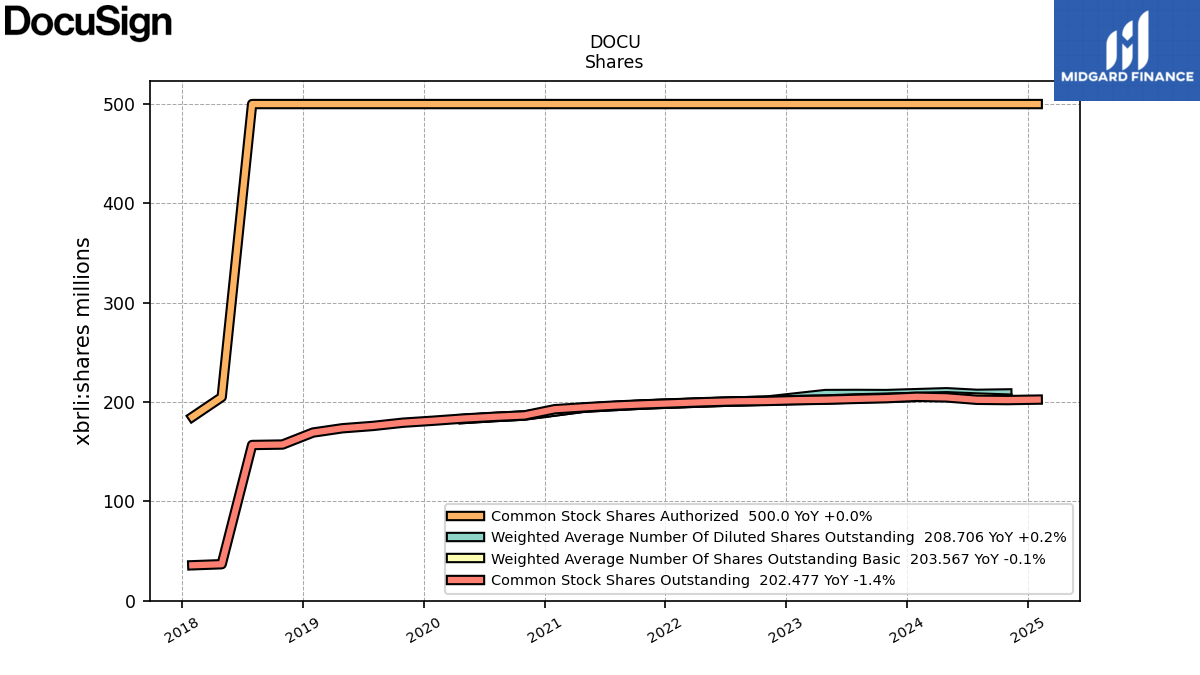
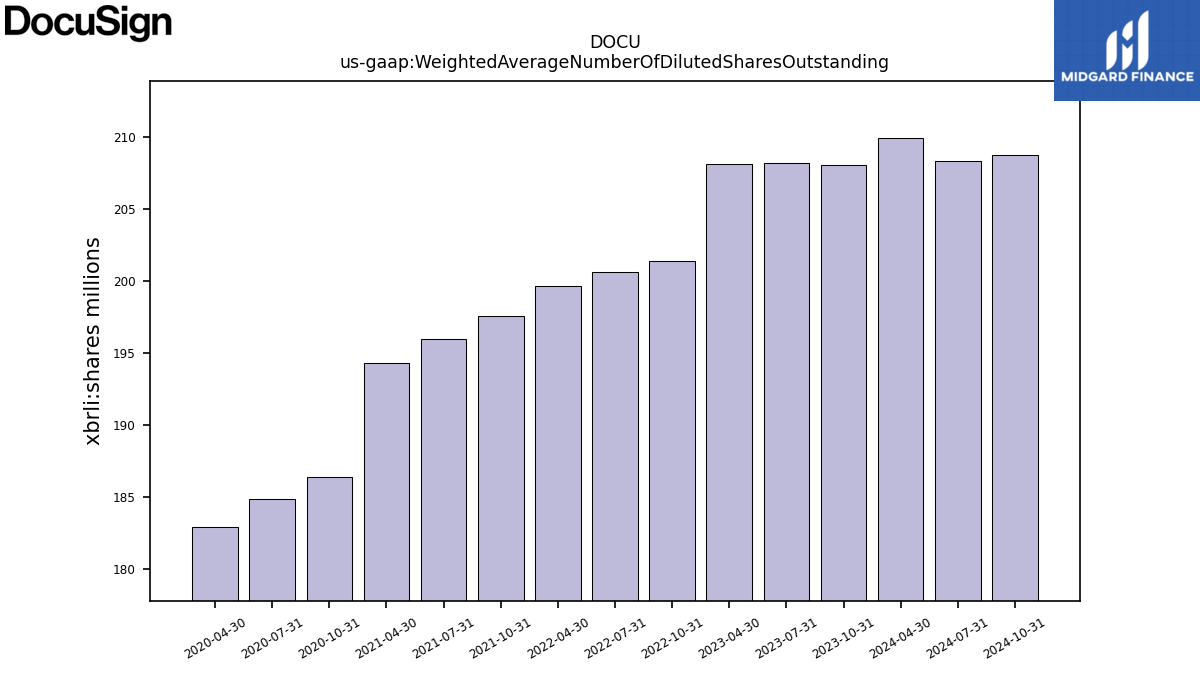
| Weighted Average Number Of Diluted Shares Outstanding | 208.19 | 208.07 | NA | 201.39 | 200.62 | 199.67 | NA | 197.60 | 196.00 | 194.34 | NA | 186.42 | 184.86 | 182.98 | NA | NA | NA | NA | NA | NA | NA | NA | NA | NA | NA | NA | |
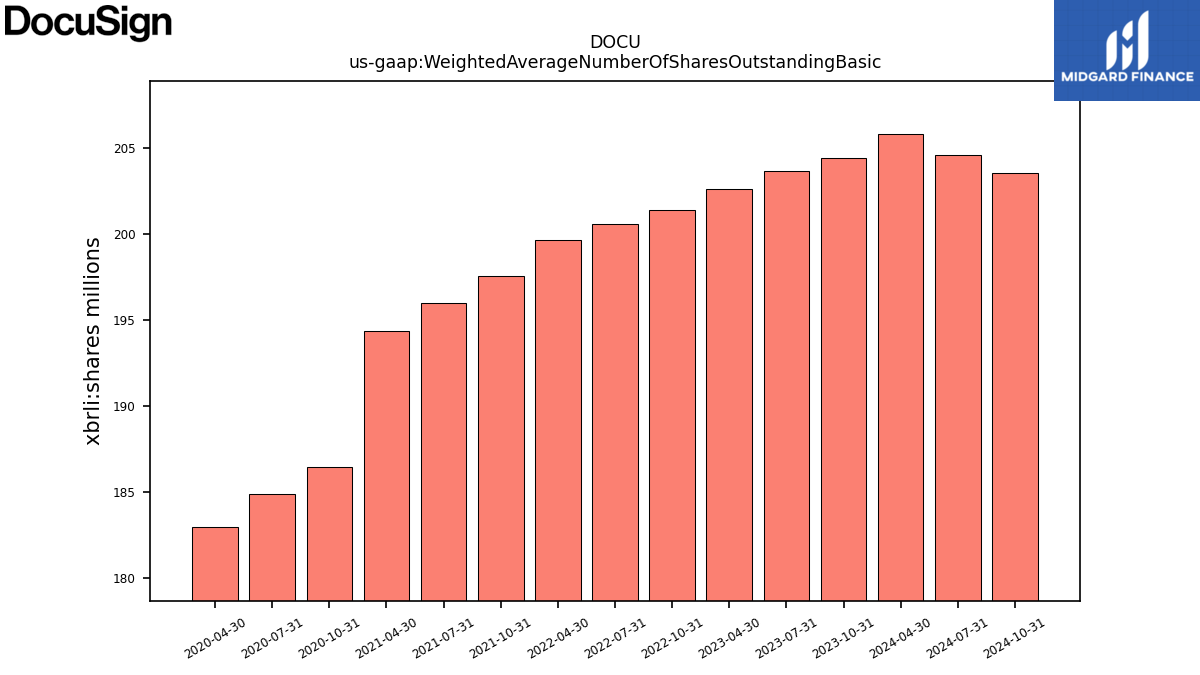
| Weighted Average Number Of Shares Outstanding Basic | 203.70 | 202.63 | NA | 201.39 | 200.62 | 199.67 | NA | 197.60 | 196.00 | 194.34 | NA | 186.42 | 184.86 | 182.98 | NA | NA | NA | NA | NA | NA | NA | NA | NA | NA | NA | NA | |
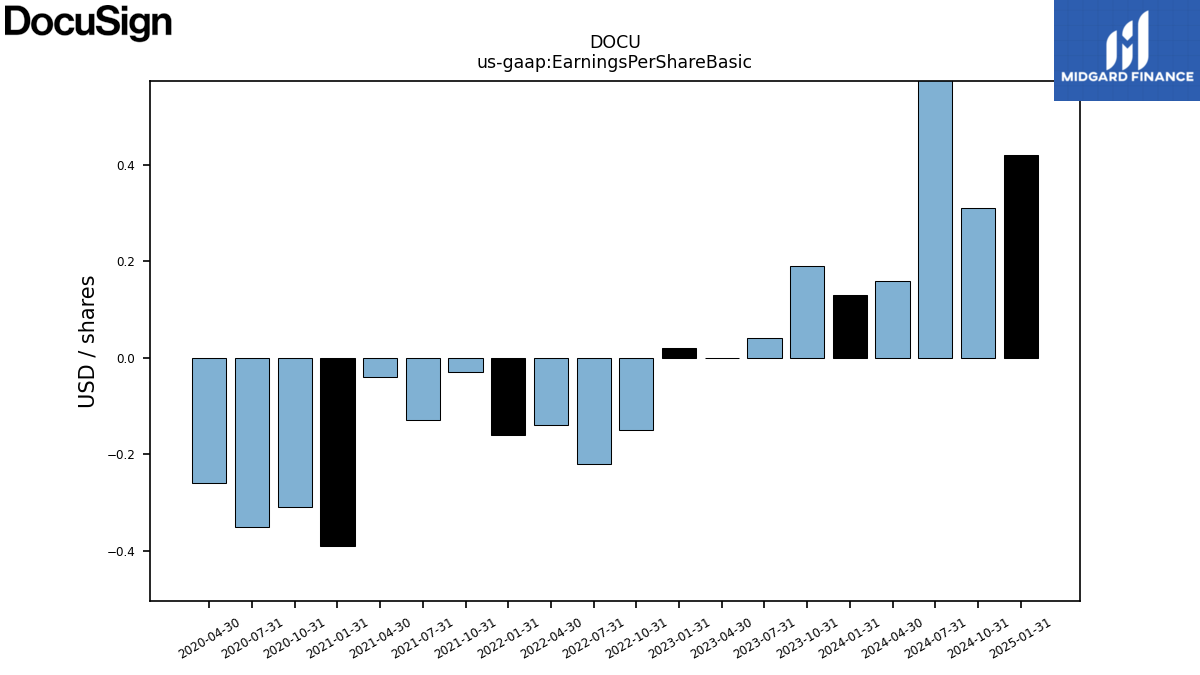
| Earnings Per Share Basic | 0.04 | 0.00 | 0.02 | -0.15 | -0.22 | -0.14 | -0.16 | -0.03 | -0.13 | -0.04 | -0.39 | -0.31 | -0.35 | -0.26 | NA | NA | NA | NA | NA | NA | NA | NA | NA | NA | NA | NA | |
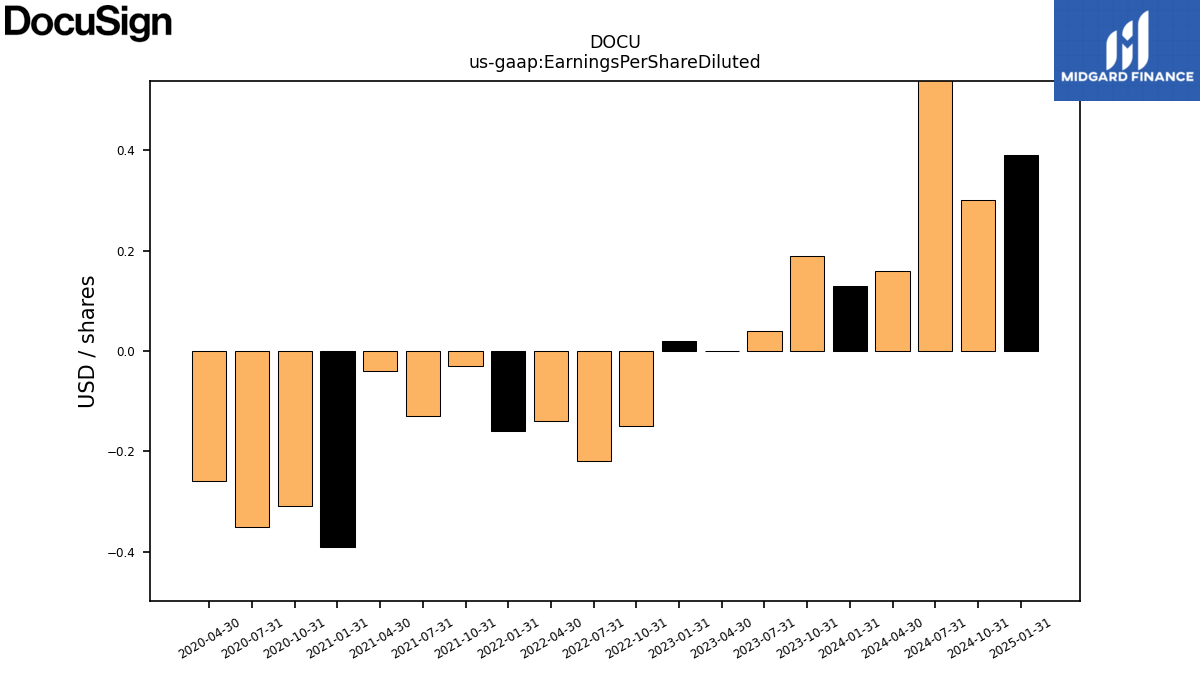
| Earnings Per Share Diluted | 0.04 | 0.00 | 0.02 | -0.15 | -0.22 | -0.14 | -0.16 | -0.03 | -0.13 | -0.04 | -0.39 | -0.31 | -0.35 | -0.26 | NA | NA | NA | NA | NA | NA | NA | NA | NA | NA | NA | NA |
| 2023-07-31 | 2023-04-30 | 2023-01-31 | 2022-10-31 | 2022-07-31 | 2022-04-30 | 2022-01-31 | 2021-10-31 | 2021-07-31 | 2021-04-30 | 2021-01-31 | 2020-10-31 | 2020-07-31 | 2020-04-30 | 2020-01-31 | 2019-10-31 | 2019-07-31 | 2019-04-30 | 2019-01-31 | 2018-10-31 | 2018-07-31 | 2018-04-30 | 2018-01-31 | 2017-10-31 | 2017-07-31 | 2017-04-30 | ||
|---|---|---|---|---|---|---|---|---|---|---|---|---|---|---|---|---|---|---|---|---|---|---|---|---|---|---|---|
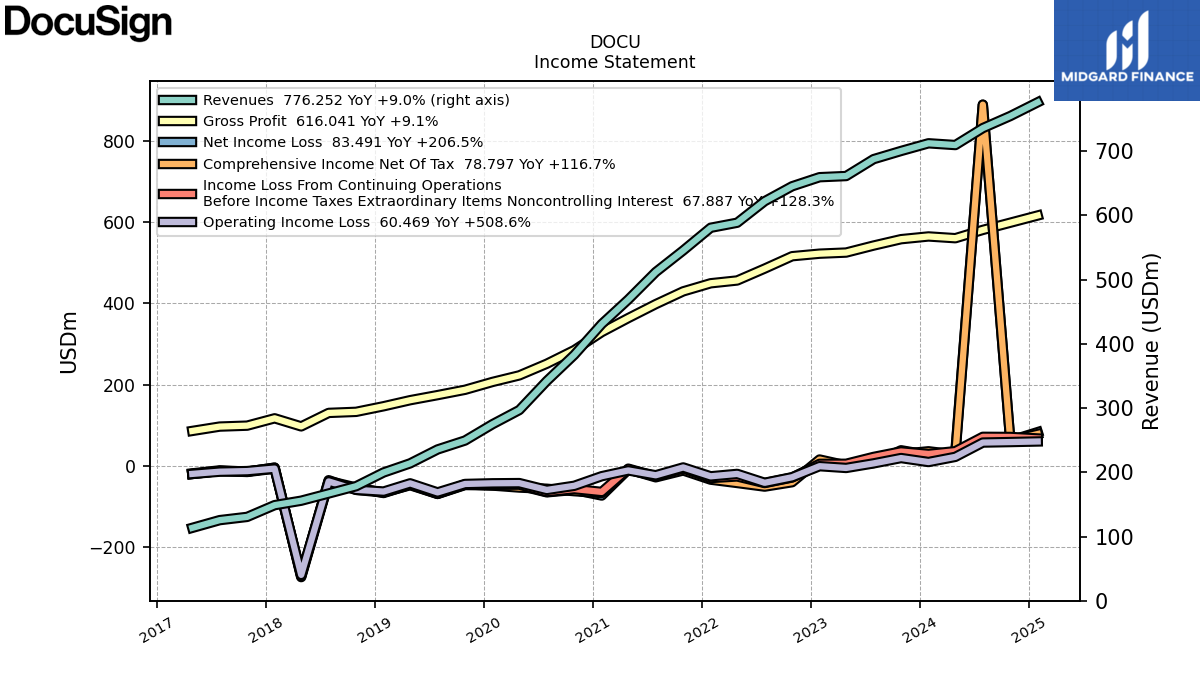
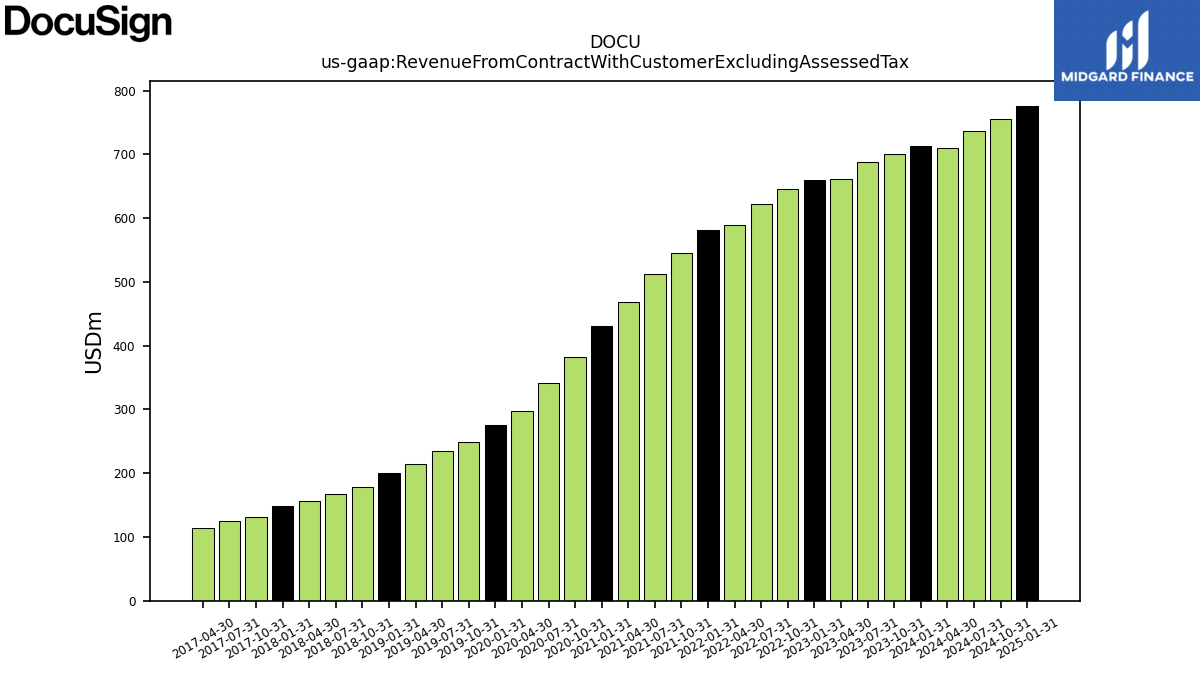
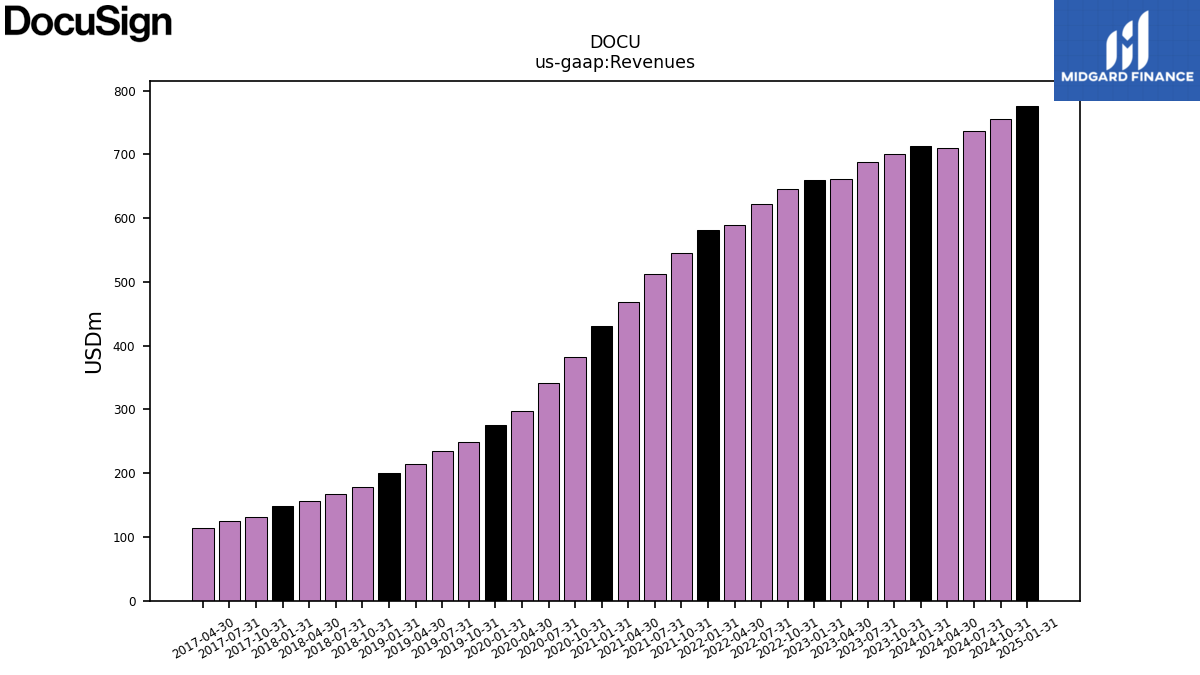
| Revenue From Contract With Customer Excluding Assessed Tax | 687.69 | 661.39 | 659.58 | 645.46 | 622.18 | 588.69 | 580.83 | 545.46 | 511.84 | 469.08 | 430.90 | 382.92 | 342.21 | 297.02 | 274.89 | 249.50 | 235.61 | 213.96 | 199.73 | 178.38 | 167.04 | 155.81 | 148.87 | 130.59 | 125.54 | 113.50 | |
| Revenues | 687.69 | 661.39 | 659.58 | 645.46 | 622.18 | 588.69 | 580.83 | 545.46 | 511.84 | 469.08 | 430.90 | 382.92 | 342.21 | 297.02 | 274.89 | 249.50 | 235.61 | 213.96 | 199.73 | 178.38 | 167.04 | 155.81 | 148.87 | 130.59 | 125.54 | 113.50 | |
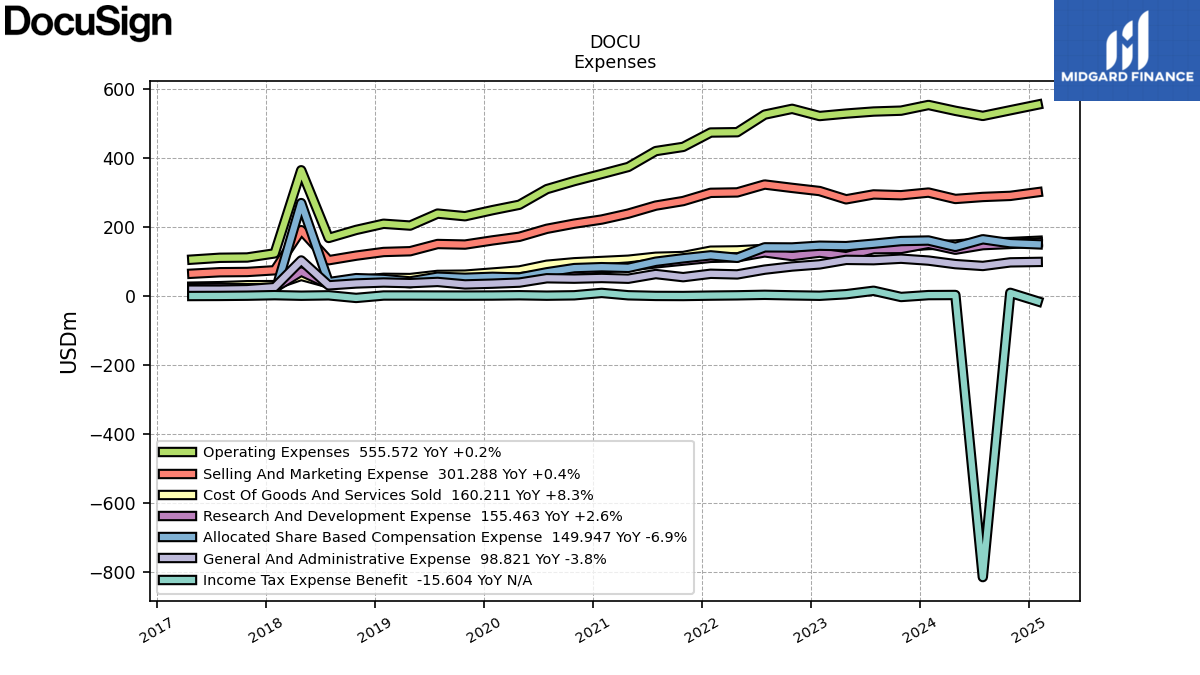
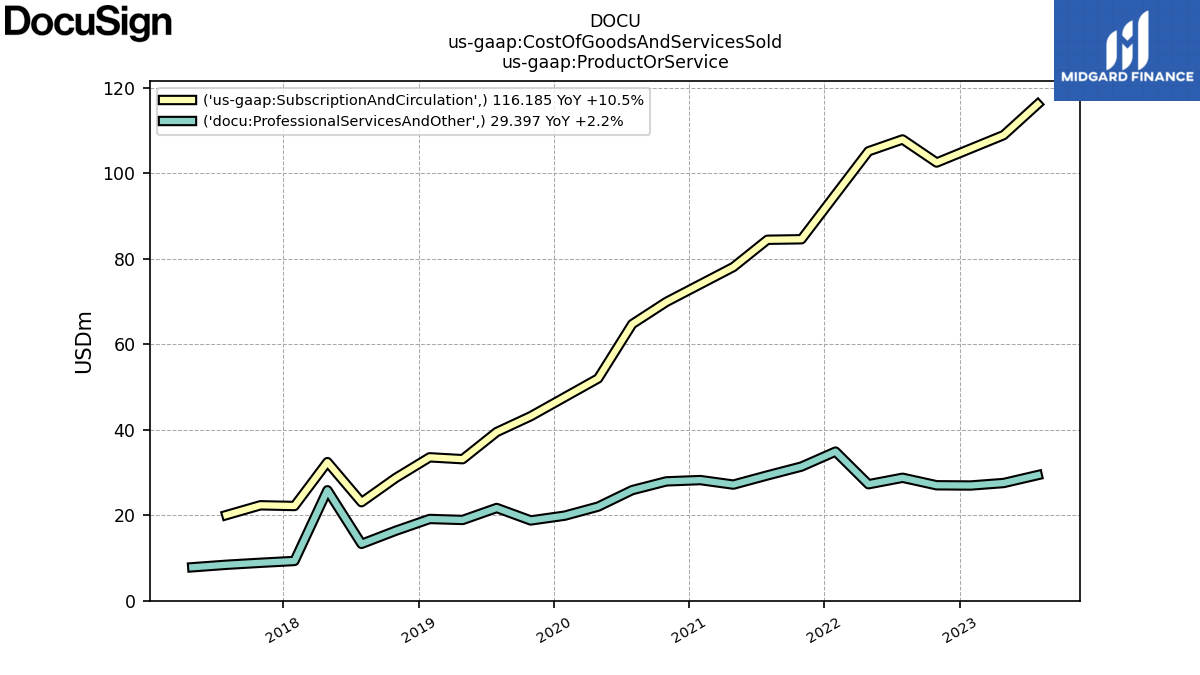
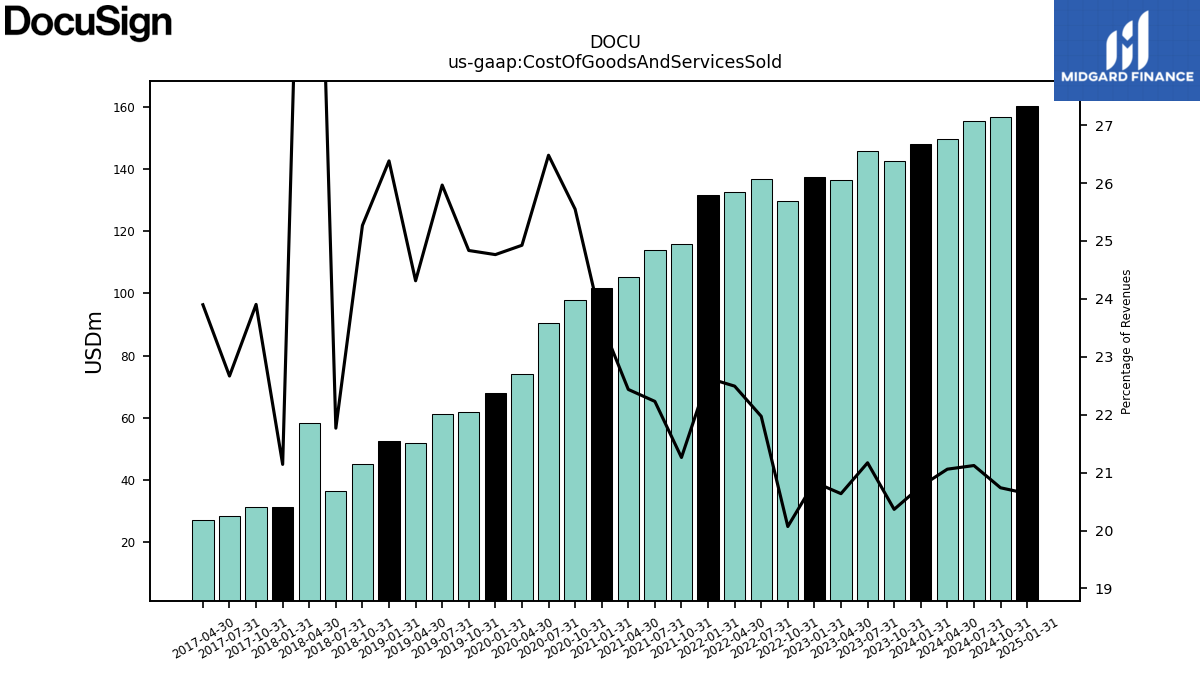
| Cost Of Goods And Services Sold | 145.58 | 136.49 | 137.43 | 129.54 | 136.70 | 132.42 | 131.45 | 115.97 | 113.78 | 105.24 | 101.58 | 97.83 | 90.61 | 74.03 | 68.08 | 61.96 | 61.18 | 52.02 | 52.69 | 45.07 | 36.36 | 58.29 | 31.48 | 31.22 | 28.46 | 27.12 | |
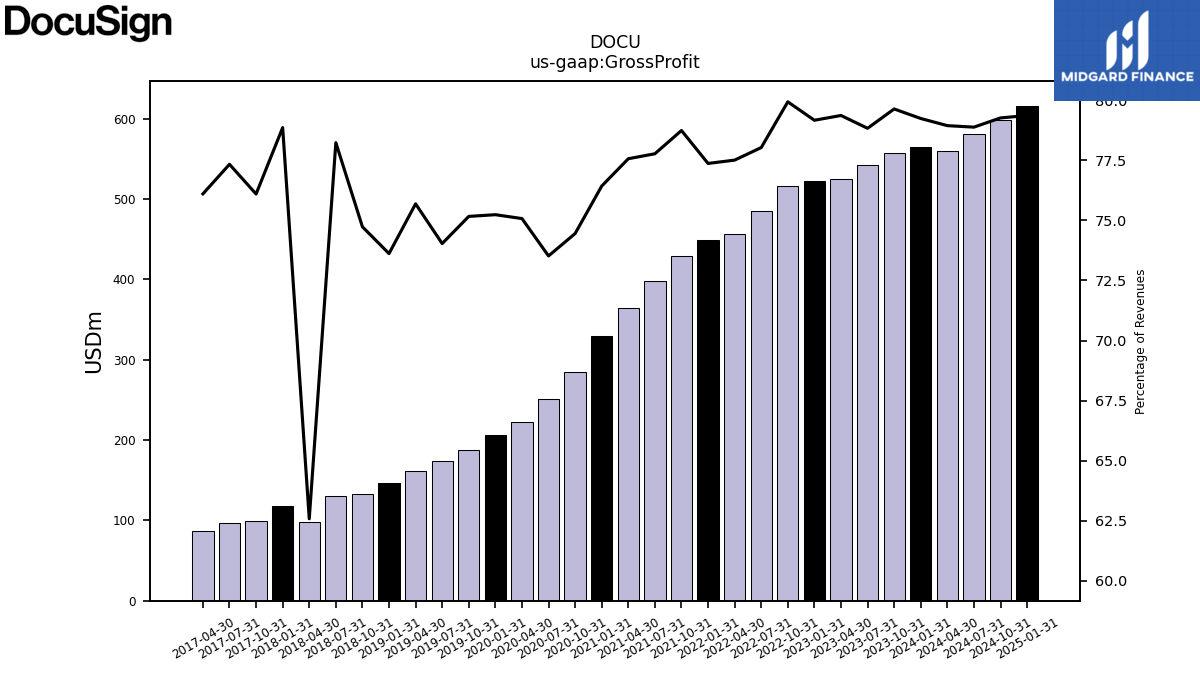
| Gross Profit | 542.11 | 524.90 | 522.15 | 515.92 | 485.48 | 456.28 | 449.37 | 429.49 | 398.06 | 363.84 | 329.32 | 285.09 | 251.59 | 222.99 | 206.82 | 187.54 | 174.44 | 161.94 | 147.04 | 133.31 | 130.68 | 97.51 | 117.40 | 99.37 | 97.08 | 86.37 | |
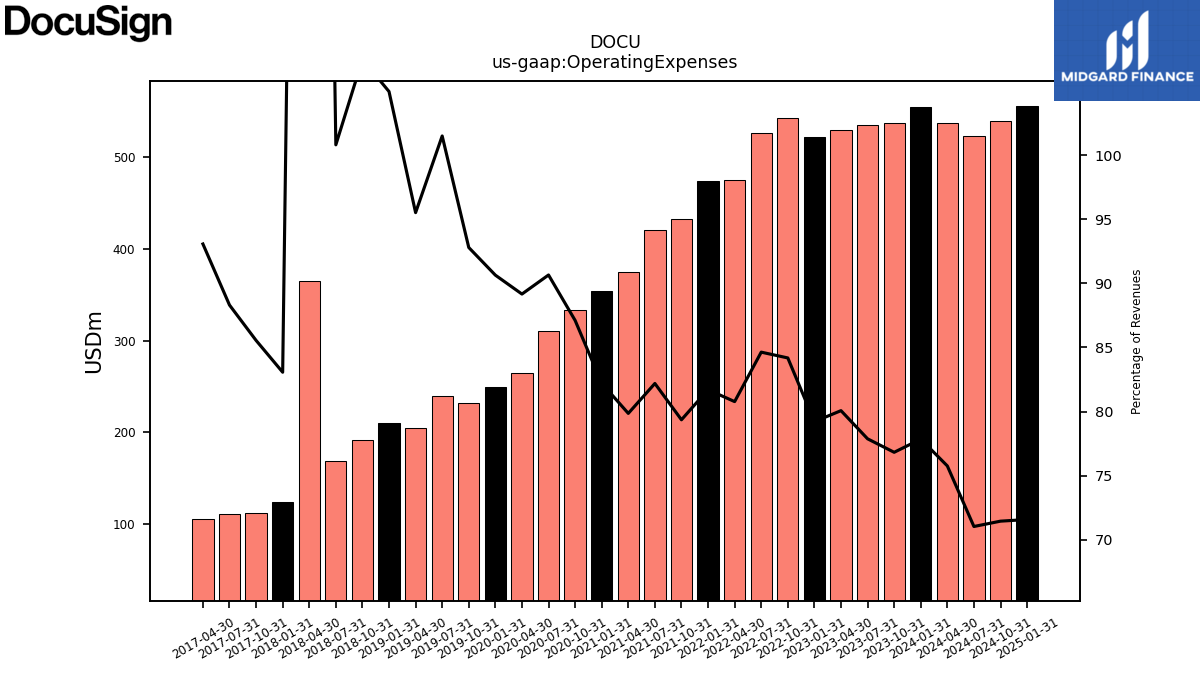
| Operating Expenses | 535.49 | 529.55 | 522.43 | 543.35 | 526.57 | 475.50 | 474.55 | 432.85 | 420.68 | 374.57 | 354.21 | 333.56 | 310.23 | 264.84 | 249.17 | 231.53 | 239.16 | 204.38 | 209.67 | 191.73 | 168.40 | 365.07 | 123.66 | 111.72 | 110.87 | 105.64 | |
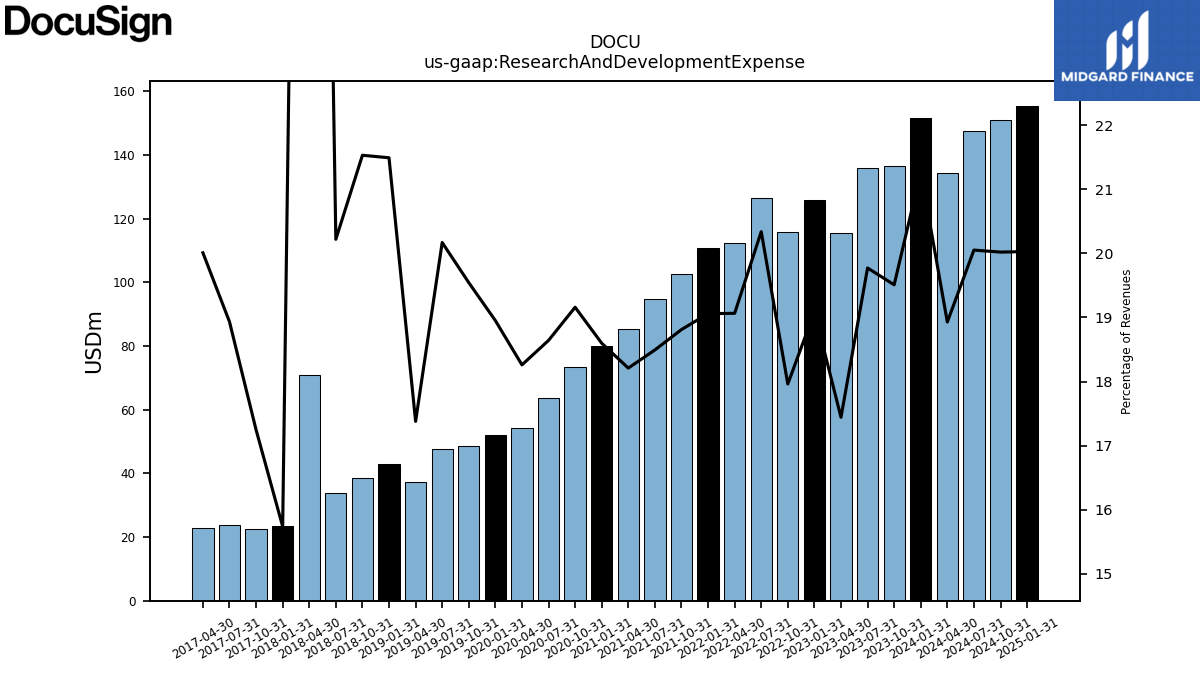
| Research And Development Expense | 135.96 | 115.36 | 125.89 | 115.93 | 126.53 | 112.23 | 110.69 | 102.60 | 94.65 | 85.42 | 80.14 | 73.36 | 63.79 | 54.23 | 52.09 | 48.76 | 47.52 | 37.18 | 42.92 | 38.40 | 33.77 | 70.87 | 23.43 | 22.52 | 23.77 | 22.71 | |
| General And Administrative Expense | 103.88 | 104.81 | 91.64 | 85.55 | 76.46 | 62.58 | 64.44 | 54.62 | 63.65 | 50.04 | 52.18 | 50.26 | 51.45 | 38.81 | 35.75 | 33.55 | 40.76 | 37.26 | 39.05 | 36.27 | 30.85 | 103.12 | 25.60 | 19.53 | 18.16 | 18.24 | |
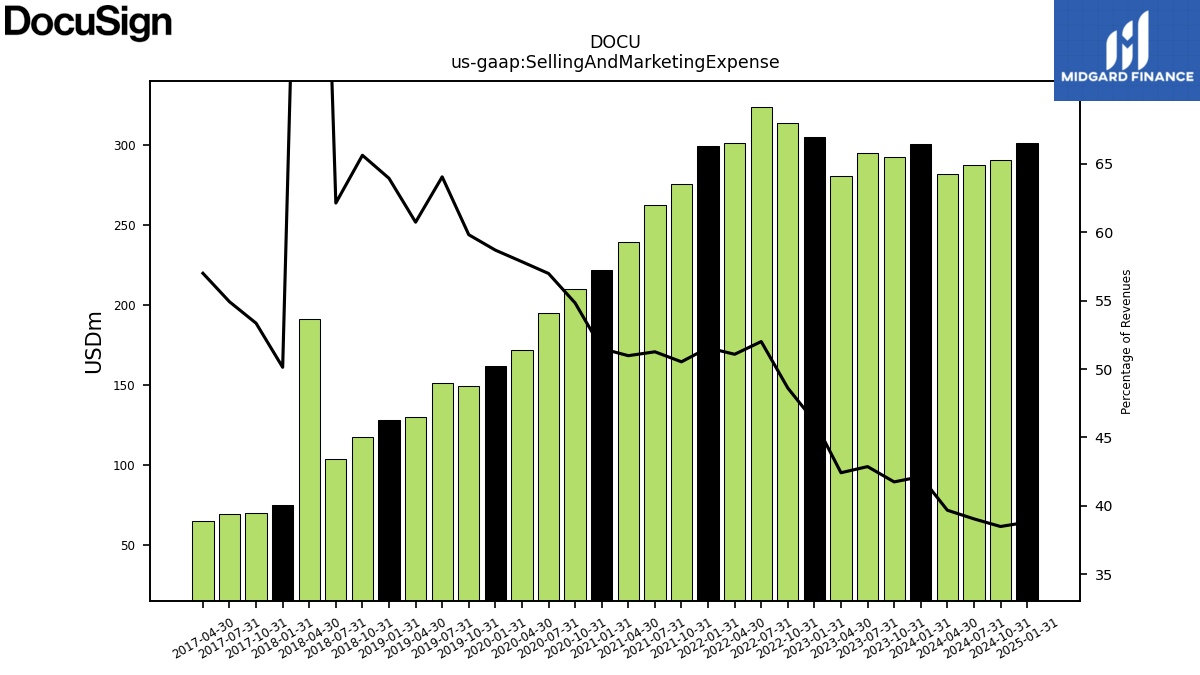
| Selling And Marketing Expense | 294.84 | 280.61 | 304.65 | 313.78 | 323.58 | 300.70 | 299.42 | 275.62 | 262.37 | 239.12 | 221.90 | 209.94 | 194.99 | 171.79 | 161.33 | 149.23 | 150.89 | 129.94 | 127.69 | 117.05 | 103.78 | 191.09 | 74.63 | 69.67 | 68.94 | 64.69 | |
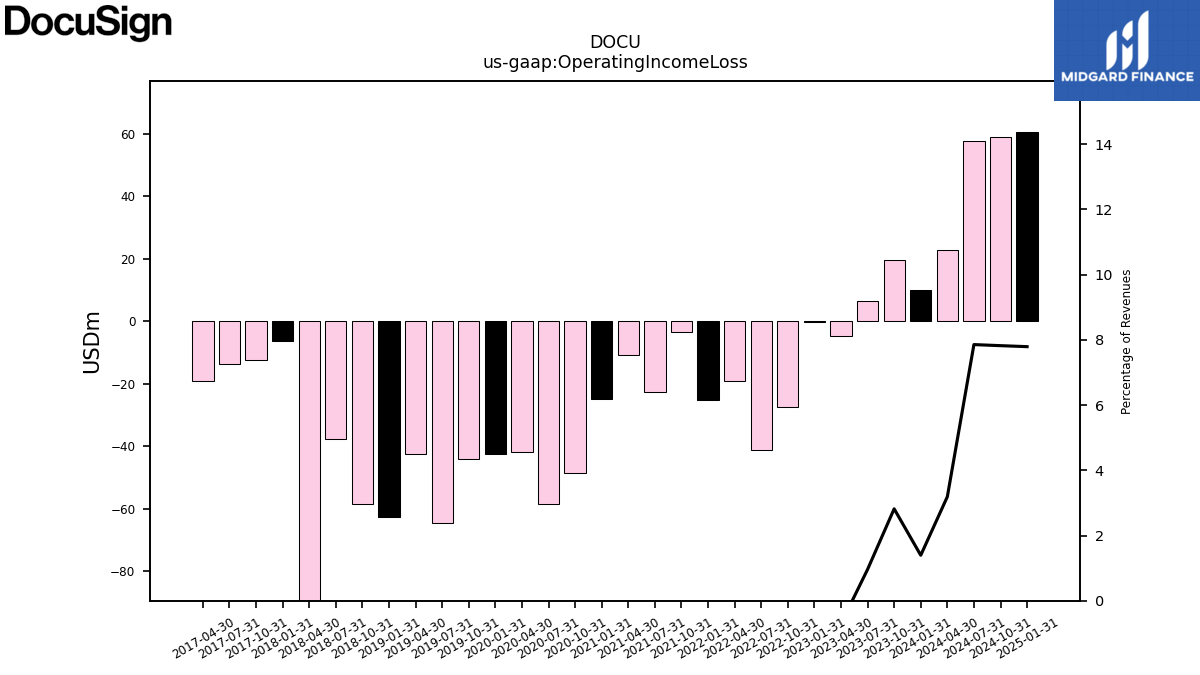
| Operating Income Loss | 6.61 | -4.65 | -0.28 | -27.43 | -41.09 | -19.23 | -25.18 | -3.36 | -22.61 | -10.74 | -24.90 | -48.47 | -58.63 | -41.85 | -42.35 | -44.00 | -64.72 | -42.44 | -62.63 | -58.42 | -37.72 | -267.56 | -6.26 | -12.34 | -13.78 | -19.26 | |
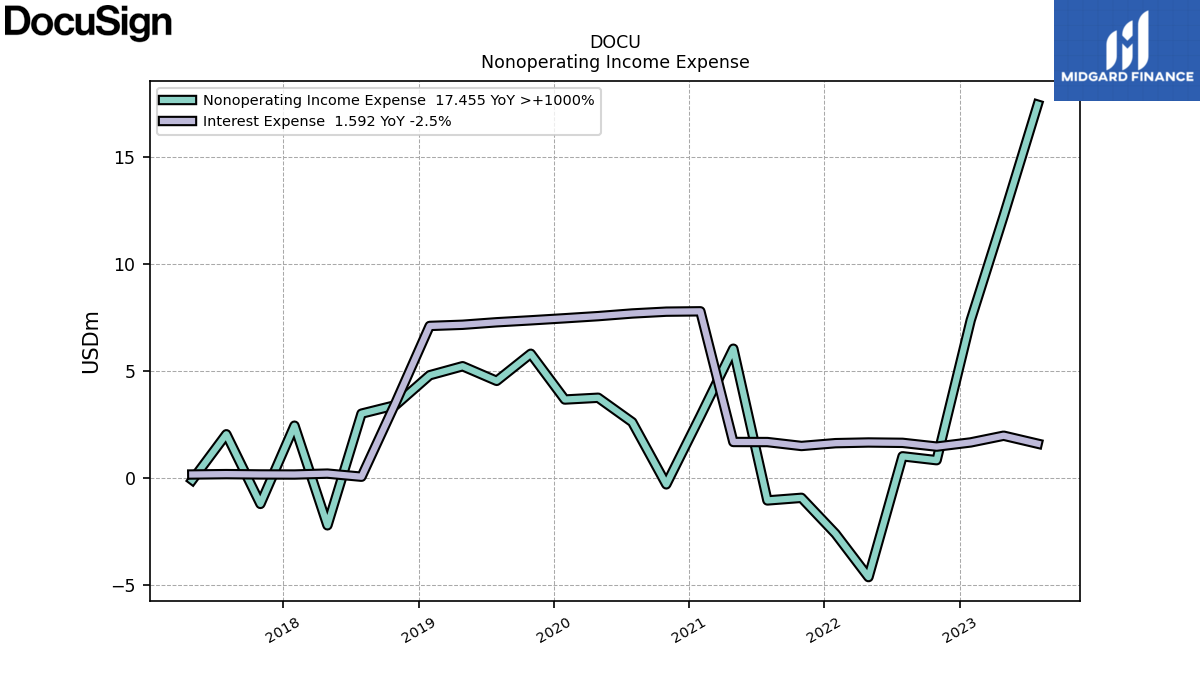
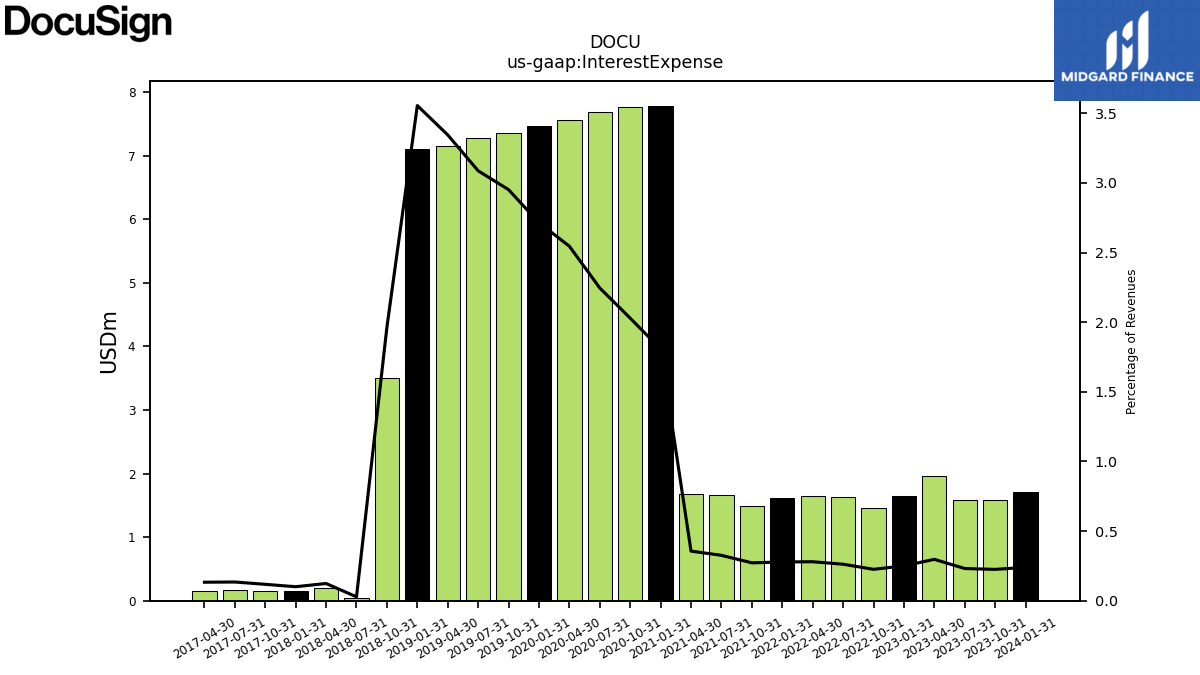
| Interest Expense | 1.59 | 1.97 | 1.65 | 1.46 | 1.63 | 1.65 | 1.62 | 1.49 | 1.67 | 1.67 | 7.79 | 7.77 | 7.68 | 7.56 | 7.46 | 7.36 | 7.27 | 7.16 | 7.10 | 3.50 | 0.05 | 0.19 | 0.15 | 0.15 | 0.17 | 0.15 | |
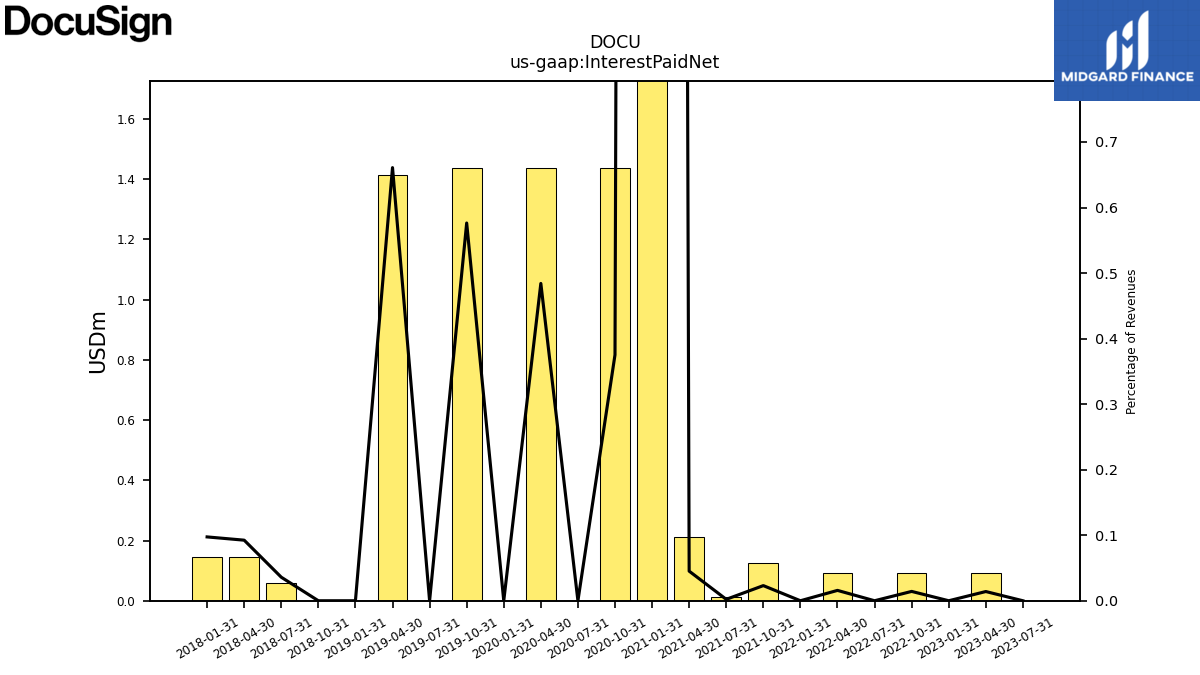
| Interest Paid Net | 0.00 | 0.09 | 0.00 | 0.09 | 0.00 | 0.09 | 0.00 | 0.13 | 0.01 | 0.21 | 75.17 | 1.44 | 0.00 | 1.44 | 0.00 | 1.44 | 0.00 | 1.41 | 0.00 | 0.00 | 0.06 | 0.14 | 0.14 | NA | NA | NA | |
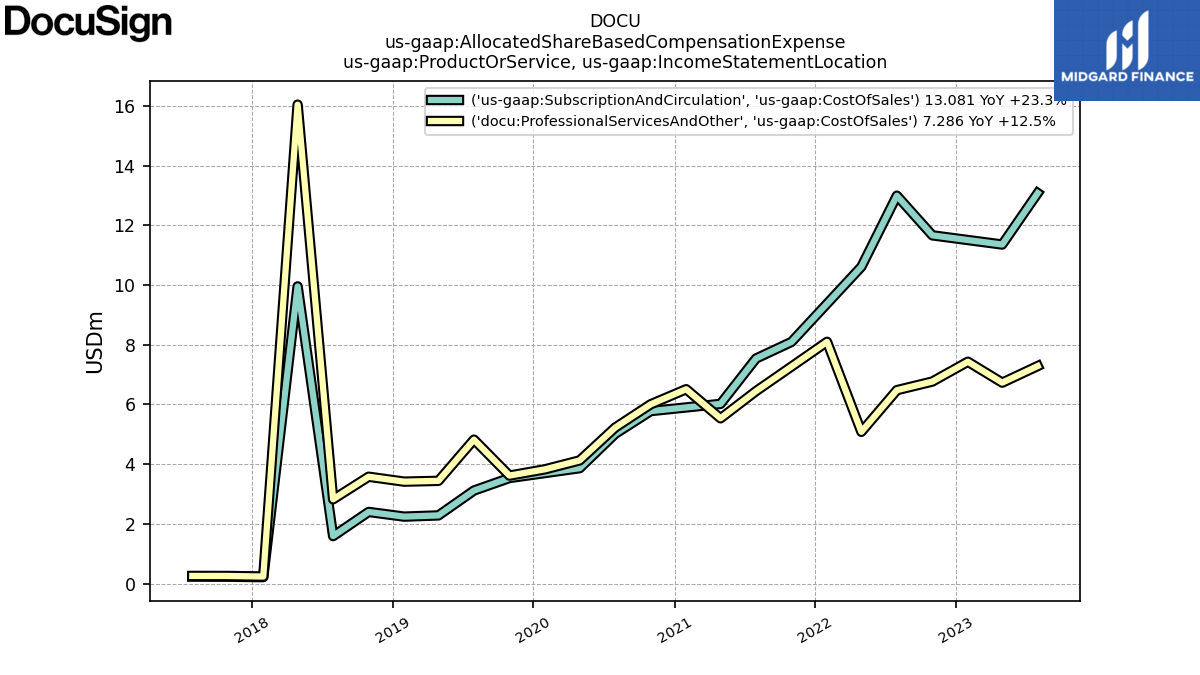
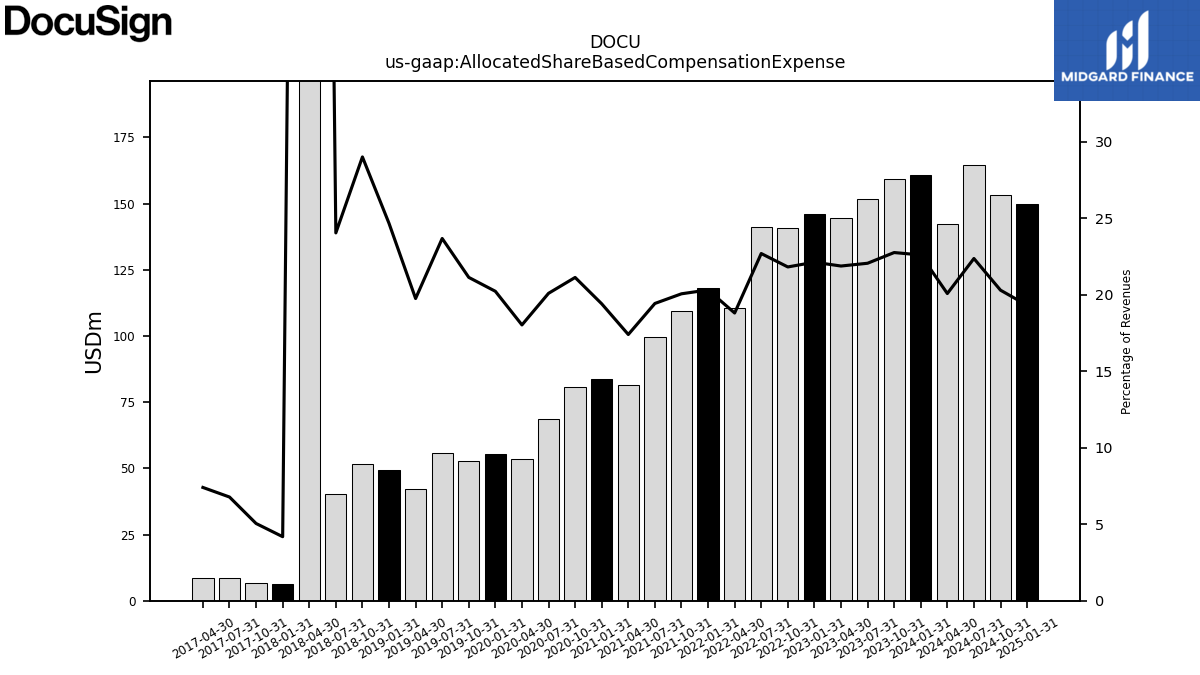
| Allocated Share Based Compensation Expense | 151.71 | 144.71 | 145.96 | 140.84 | 141.21 | 110.72 | 118.01 | 109.44 | 99.46 | 81.64 | 83.64 | 80.92 | 68.77 | 53.55 | 55.60 | 52.74 | 55.79 | 42.27 | 49.27 | 51.75 | 40.16 | 269.79 | 6.23 | 6.59 | 8.51 | 8.41 | |
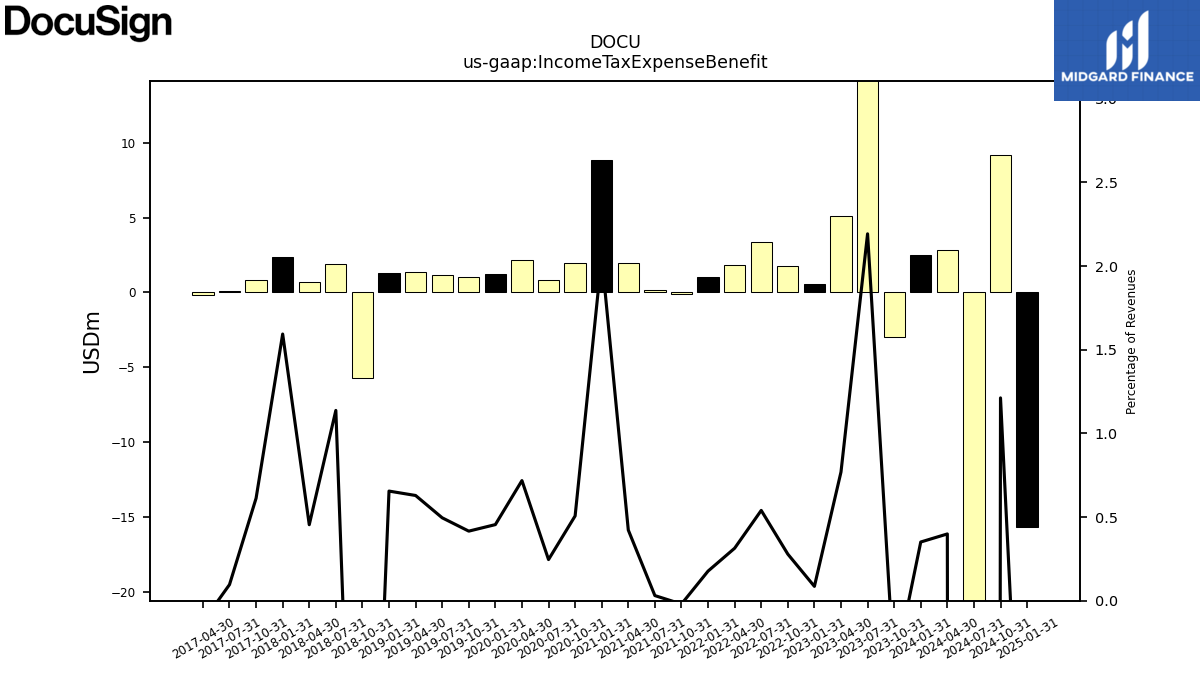
| Income Tax Expense Benefit | 15.08 | 5.09 | 0.57 | 1.80 | 3.36 | 1.85 | 1.03 | -0.11 | 0.16 | 1.98 | 8.86 | 1.94 | 0.84 | 2.13 | 1.25 | 1.04 | 1.17 | 1.35 | 1.31 | -5.70 | 1.90 | 0.71 | 2.37 | 0.80 | 0.12 | -0.14 | |
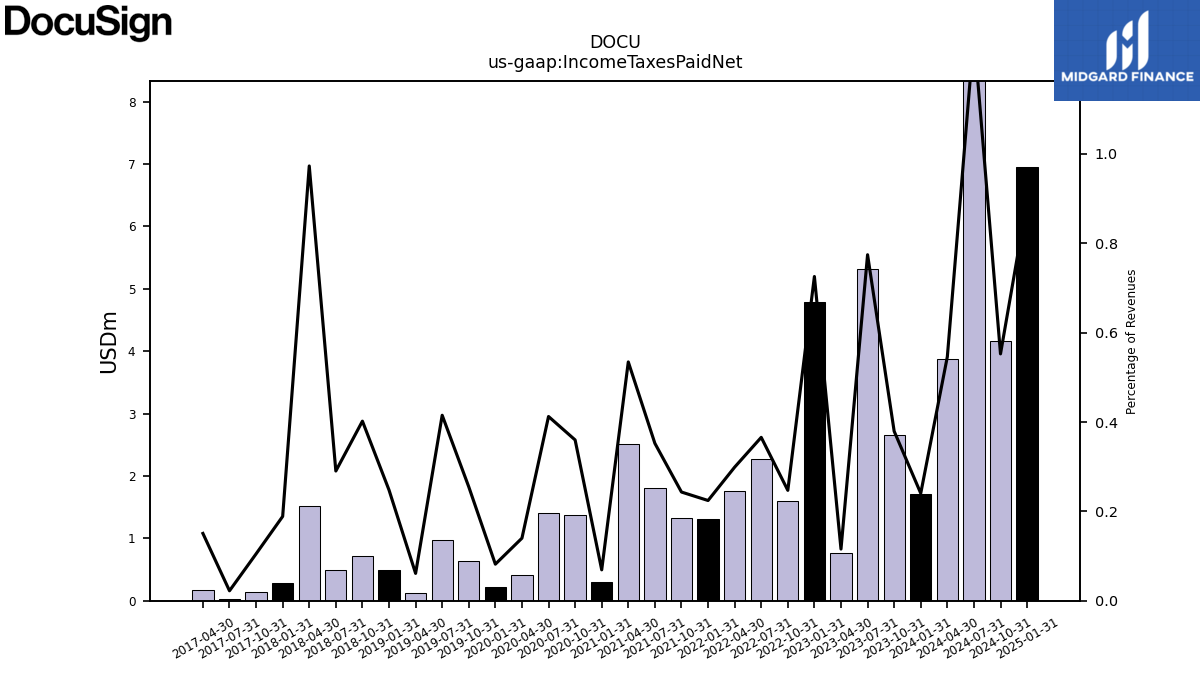
| Income Taxes Paid Net | 5.33 | 0.77 | 4.79 | 1.59 | 2.27 | 1.76 | 1.30 | 1.33 | 1.80 | 2.51 | 0.30 | 1.38 | 1.41 | 0.42 | 0.23 | 0.64 | 0.98 | 0.13 | 0.49 | 0.72 | 0.48 | 1.52 | 0.28 | 0.14 | 0.03 | 0.17 | |
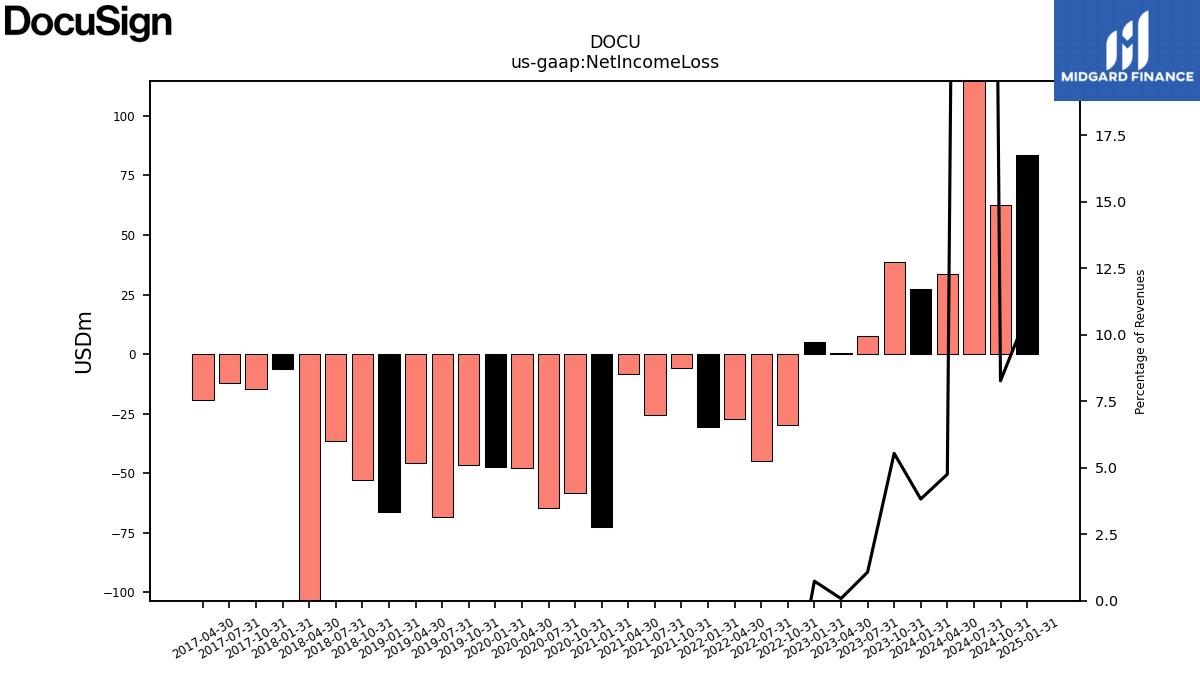
| Net Income Loss | 7.39 | 0.54 | 4.86 | -29.87 | -45.08 | -27.37 | -30.45 | -5.68 | -25.50 | -8.35 | -72.41 | -58.49 | -64.56 | -47.80 | -47.41 | -46.60 | -68.63 | -45.72 | -66.24 | -52.81 | -36.71 | -270.69 | -6.35 | -14.51 | -12.04 | -19.38 | |
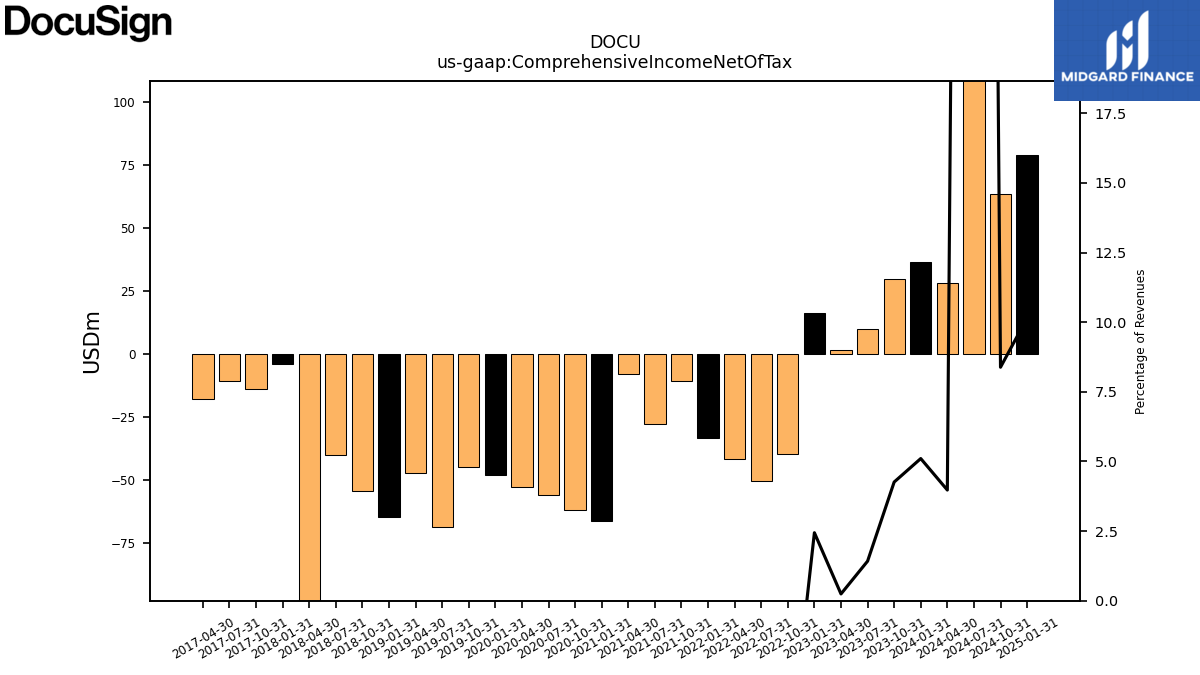
| Comprehensive Income Net Of Tax | 9.78 | 1.62 | 16.11 | -39.66 | -50.48 | -41.61 | -33.37 | -10.81 | -27.61 | -7.96 | -66.31 | -61.73 | -55.76 | -52.83 | -47.89 | -44.84 | -68.32 | -47.02 | -64.72 | -54.30 | -39.80 | -273.01 | -3.90 | -13.64 | -10.60 | -17.99 | |
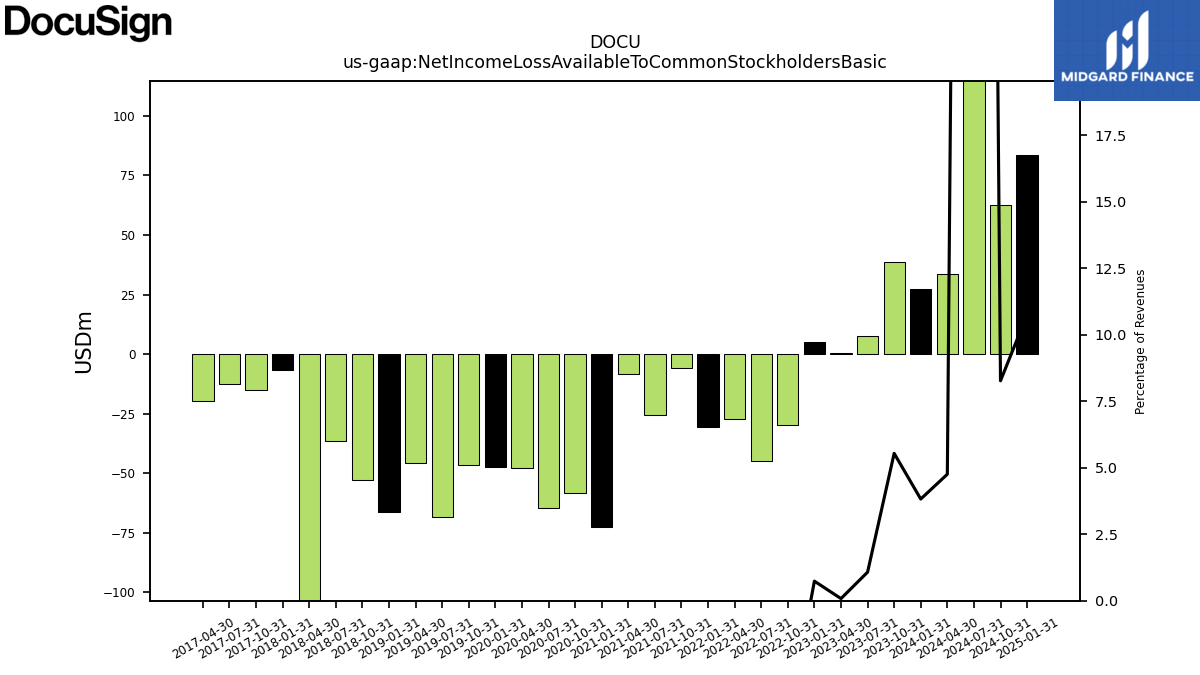
| Net Income Loss Available To Common Stockholders Basic | 7.39 | 0.54 | 4.86 | -29.87 | -45.08 | -27.37 | -30.45 | -5.68 | -25.50 | -8.35 | -72.41 | -58.49 | -64.56 | -47.80 | -47.41 | -46.60 | -68.63 | -45.72 | -66.24 | -52.81 | -36.71 | -271.04 | -6.72 | -14.88 | -12.40 | -19.74 | |
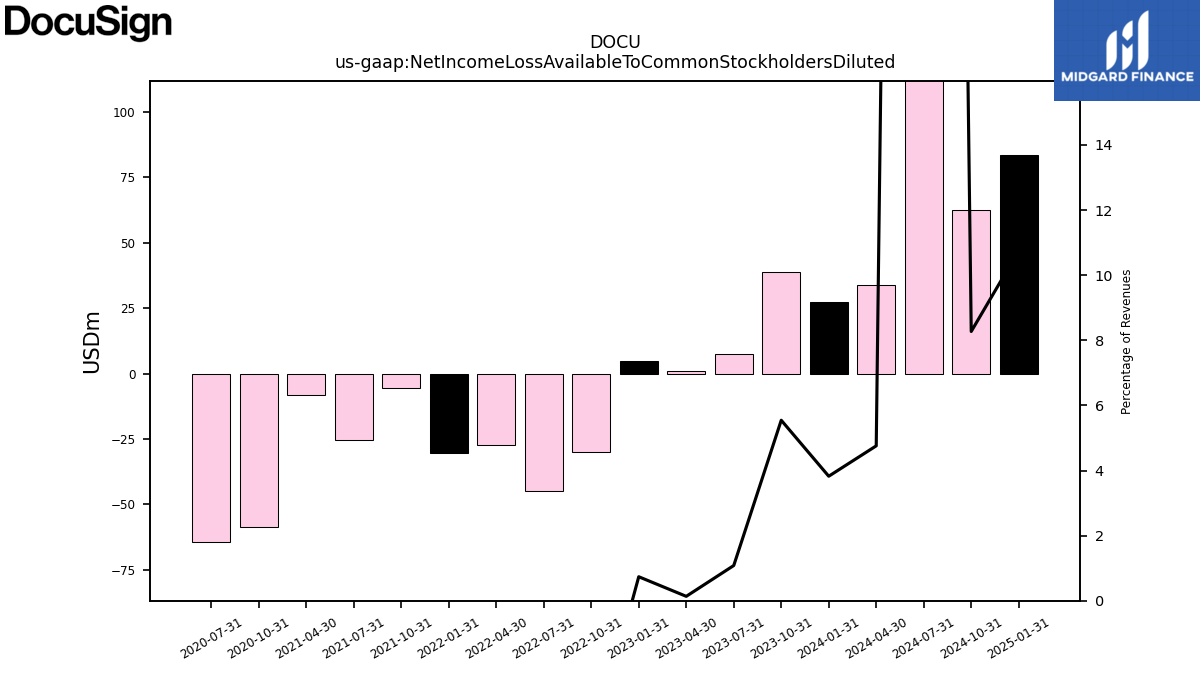
| Net Income Loss Available To Common Stockholders Diluted | 7.44 | 0.90 | NA | -29.87 | -45.08 | -27.37 | NA | -5.68 | -25.50 | -8.35 | NA | -58.49 | -64.56 | NA | NA | NA | NA | NA | NA | NA | NA | NA | NA | NA | NA | NA |
| 2023-07-31 | 2023-04-30 | 2023-01-31 | 2022-10-31 | 2022-07-31 | 2022-04-30 | 2022-01-31 | 2021-10-31 | 2021-07-31 | 2021-04-30 | 2021-01-31 | 2020-10-31 | 2020-07-31 | 2020-04-30 | 2020-01-31 | 2019-10-31 | 2019-07-31 | 2019-04-30 | 2019-01-31 | 2018-10-31 | 2018-07-31 | 2018-04-30 | 2018-01-31 | 2017-10-31 | 2017-07-31 | 2017-04-30 | ||
|---|---|---|---|---|---|---|---|---|---|---|---|---|---|---|---|---|---|---|---|---|---|---|---|---|---|---|---|
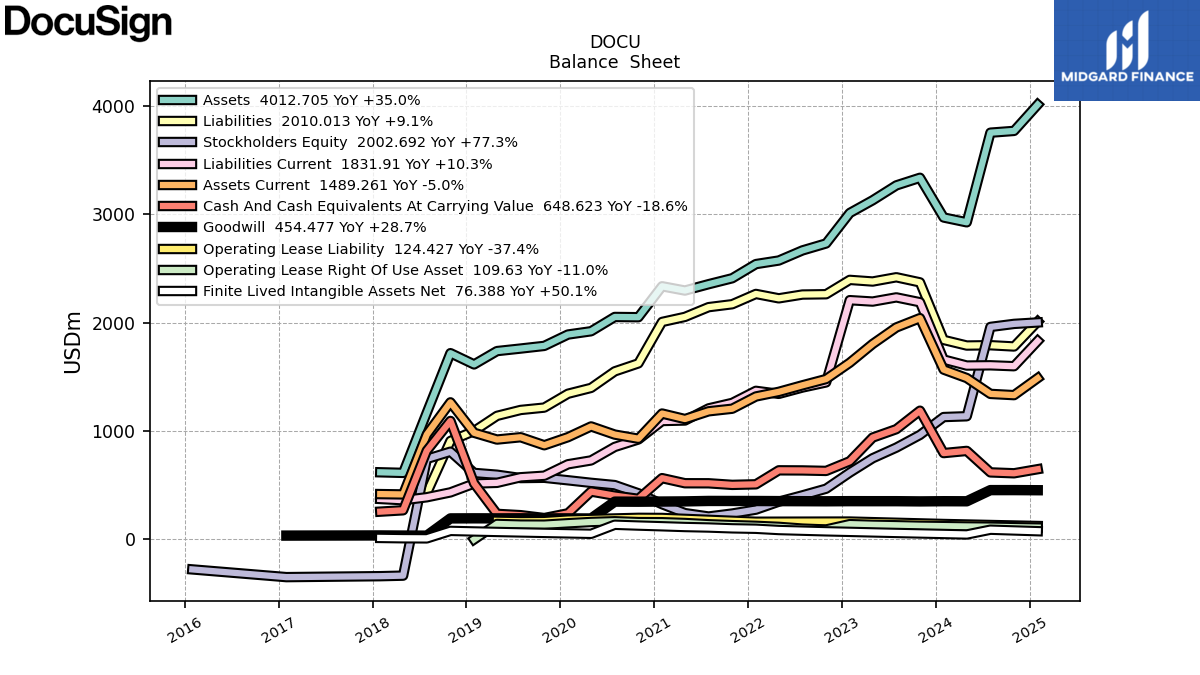
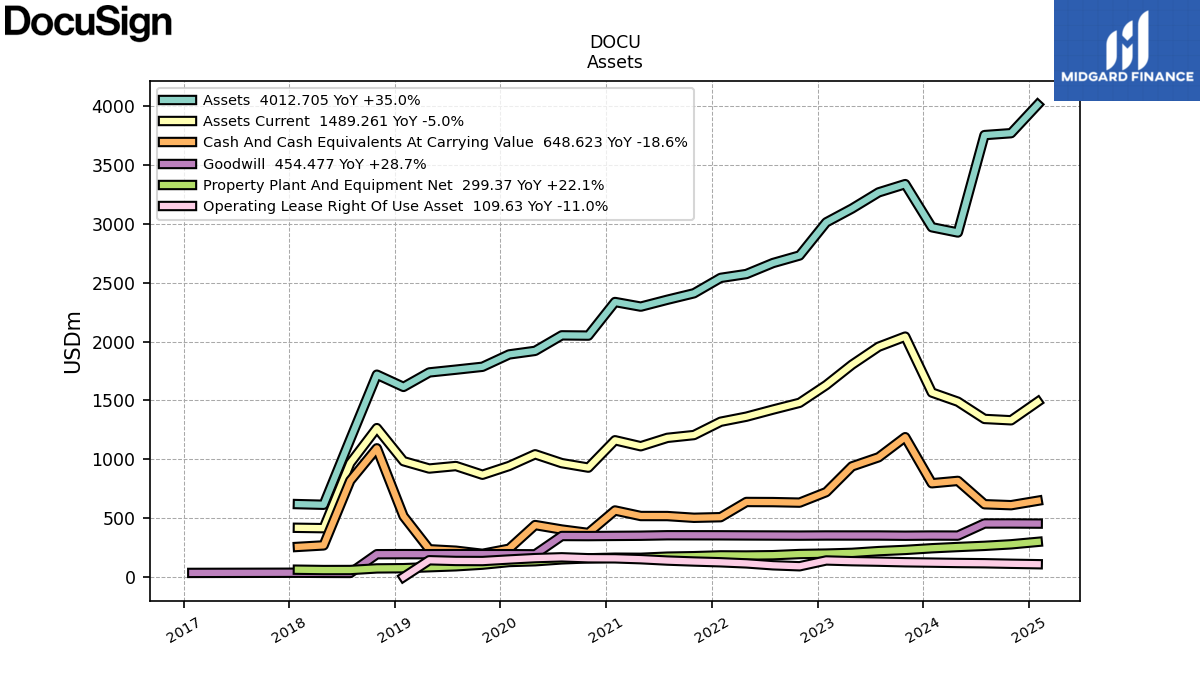
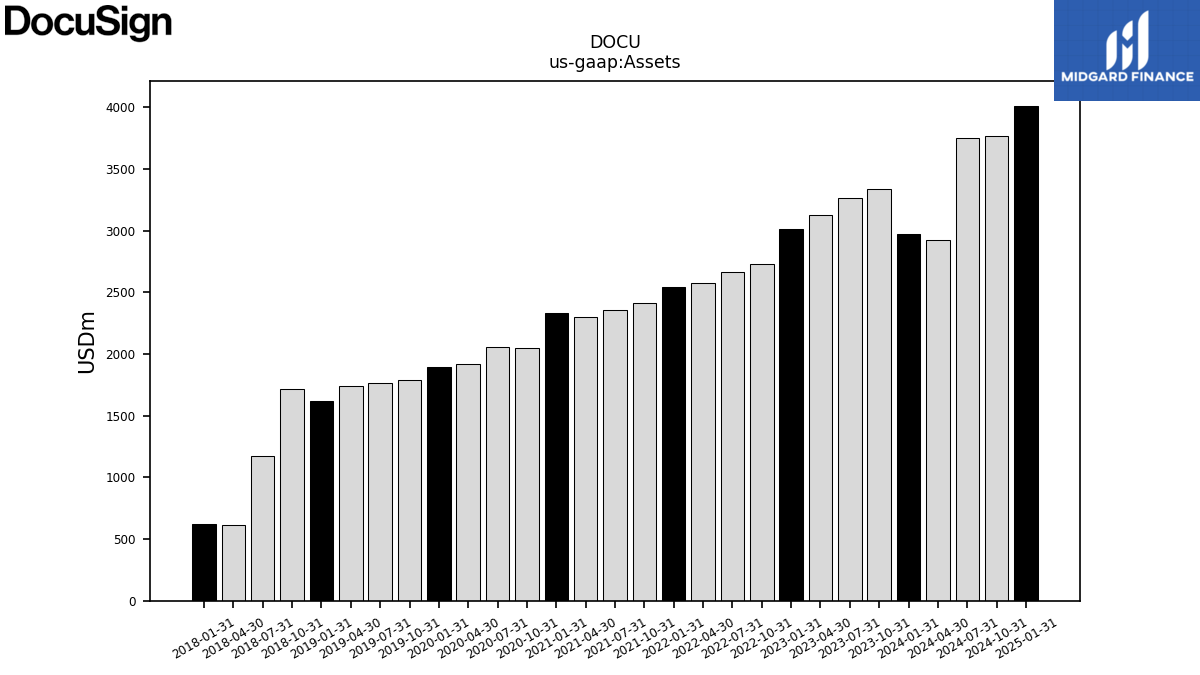
| Assets | 3267.41 | 3129.90 | 3012.72 | 2731.58 | 2667.35 | 2574.13 | 2541.26 | 2410.50 | 2355.69 | 2297.12 | 2336.51 | 2051.12 | 2053.31 | 1921.49 | 1891.14 | 1786.37 | 1761.84 | 1738.40 | 1615.42 | 1719.44 | 1169.70 | 614.47 | 619.97 | NA | NA | NA | |
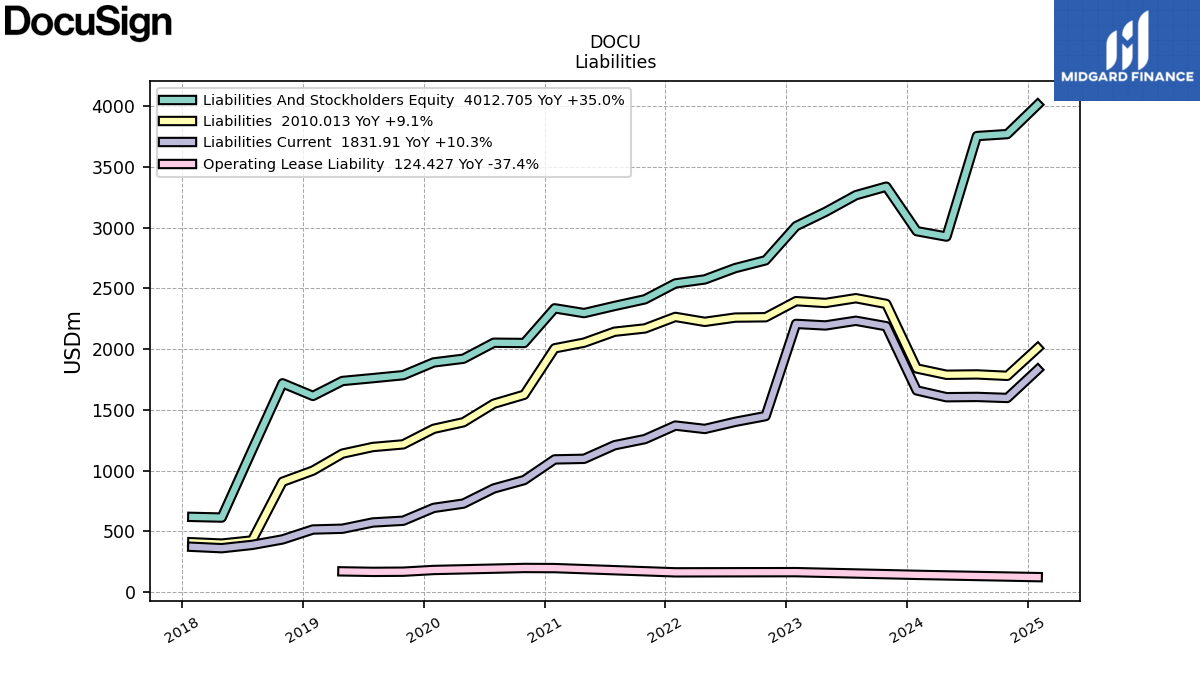
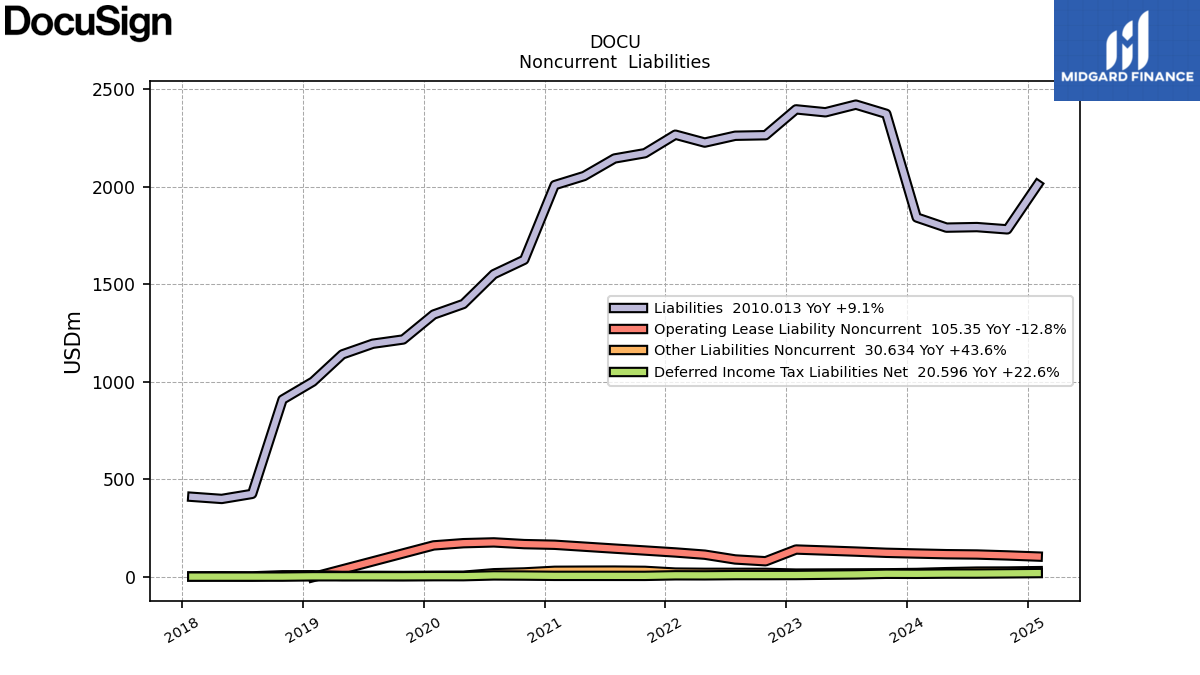
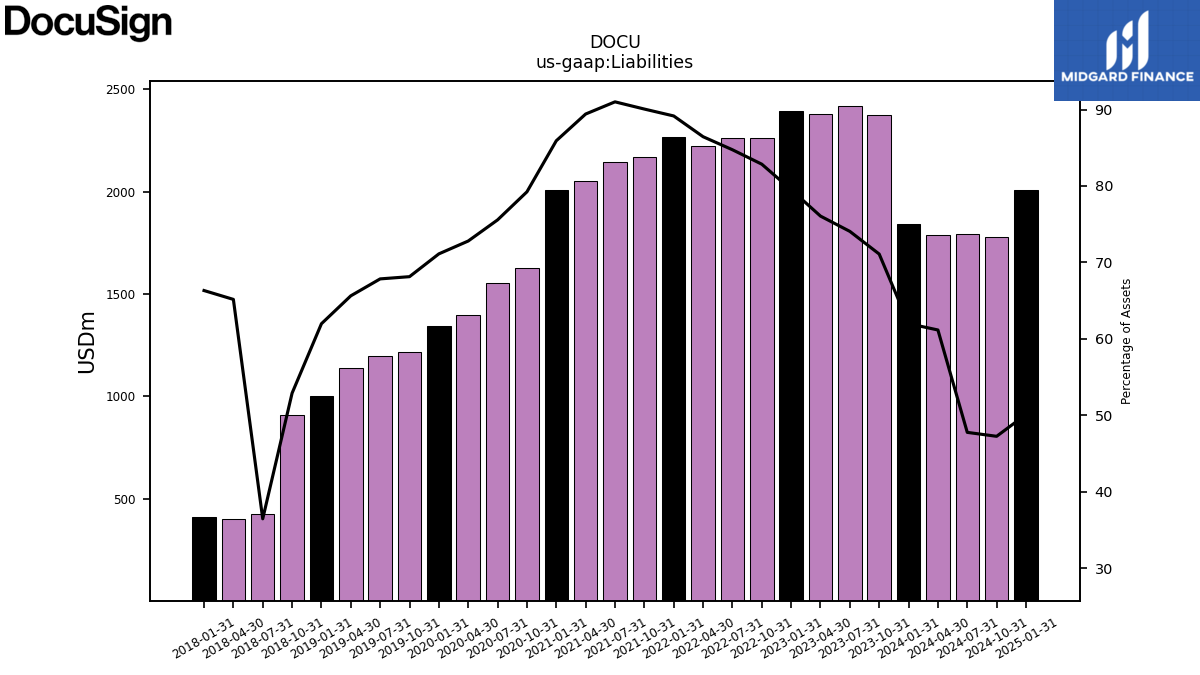
| Liabilities | 2419.65 | 2380.41 | 2395.43 | 2263.08 | 2260.22 | 2225.18 | 2265.76 | 2170.93 | 2143.81 | 2053.88 | 2007.38 | 1625.09 | 1551.42 | 1398.70 | 1344.81 | 1217.00 | 1195.16 | 1140.72 | 1001.05 | 909.27 | 426.23 | 400.35 | 411.12 | NA | NA | NA | |
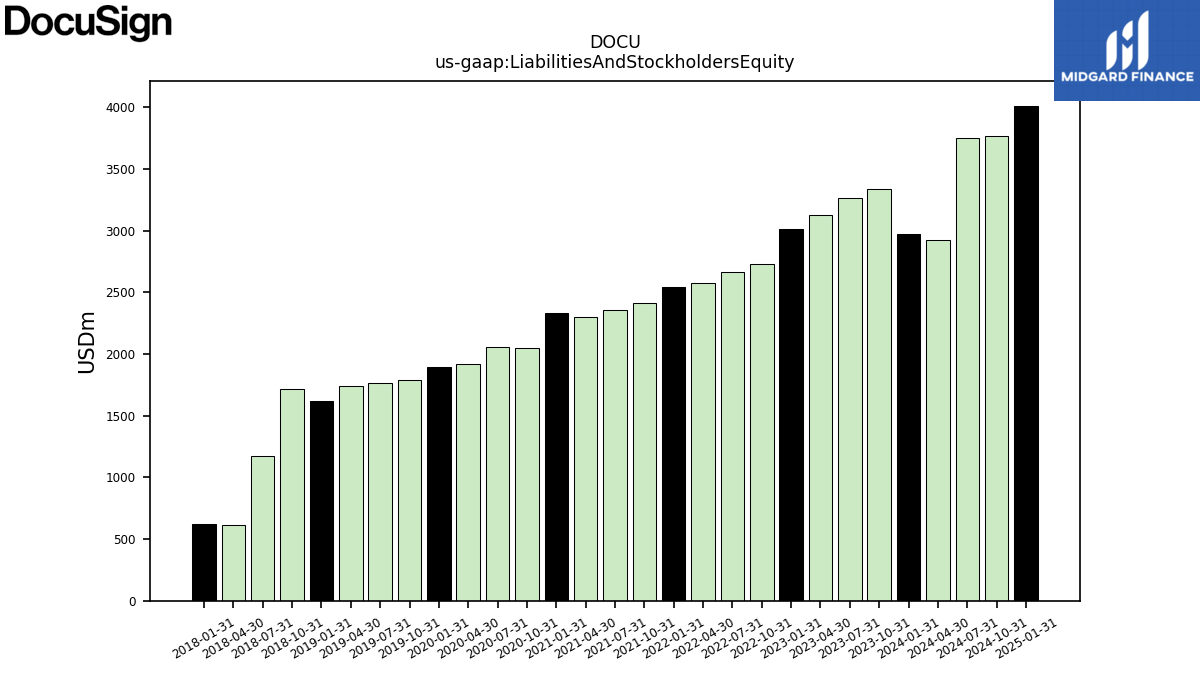
| Liabilities And Stockholders Equity | 3267.41 | 3129.90 | 3012.72 | 2731.58 | 2667.35 | 2574.13 | 2541.26 | 2410.50 | 2355.69 | 2297.12 | 2336.51 | 2051.12 | 2053.31 | 1921.49 | 1891.14 | 1786.37 | 1761.84 | 1738.40 | 1615.42 | 1719.44 | 1169.70 | 614.47 | 619.97 | NA | NA | NA | |
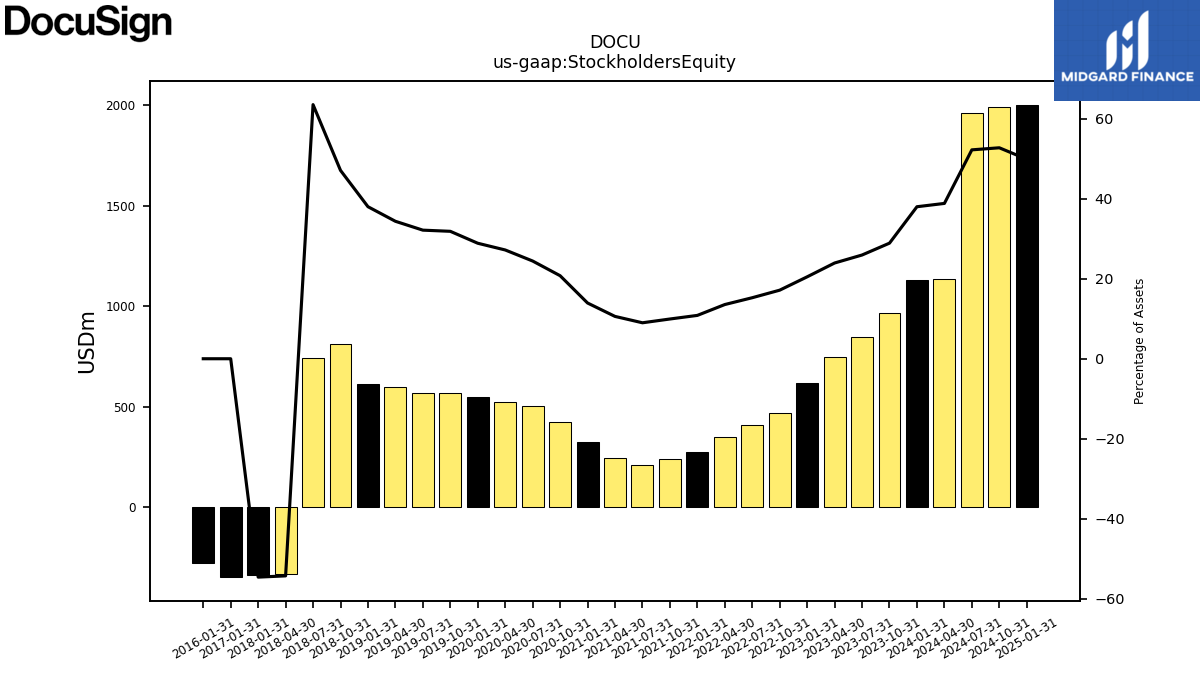
| Stockholders Equity | 847.76 | 749.49 | 617.29 | 468.51 | 407.13 | 348.95 | 275.50 | 239.57 | 211.88 | 243.24 | 325.74 | 426.03 | 501.89 | 522.79 | 546.33 | 569.36 | 566.68 | 597.68 | 614.36 | 810.17 | 743.47 | -333.73 | -338.65 | NA | NA | NA |
| 2023-07-31 | 2023-04-30 | 2023-01-31 | 2022-10-31 | 2022-07-31 | 2022-04-30 | 2022-01-31 | 2021-10-31 | 2021-07-31 | 2021-04-30 | 2021-01-31 | 2020-10-31 | 2020-07-31 | 2020-04-30 | 2020-01-31 | 2019-10-31 | 2019-07-31 | 2019-04-30 | 2019-01-31 | 2018-10-31 | 2018-07-31 | 2018-04-30 | 2018-01-31 | 2017-10-31 | 2017-07-31 | 2017-04-30 | ||
|---|---|---|---|---|---|---|---|---|---|---|---|---|---|---|---|---|---|---|---|---|---|---|---|---|---|---|---|
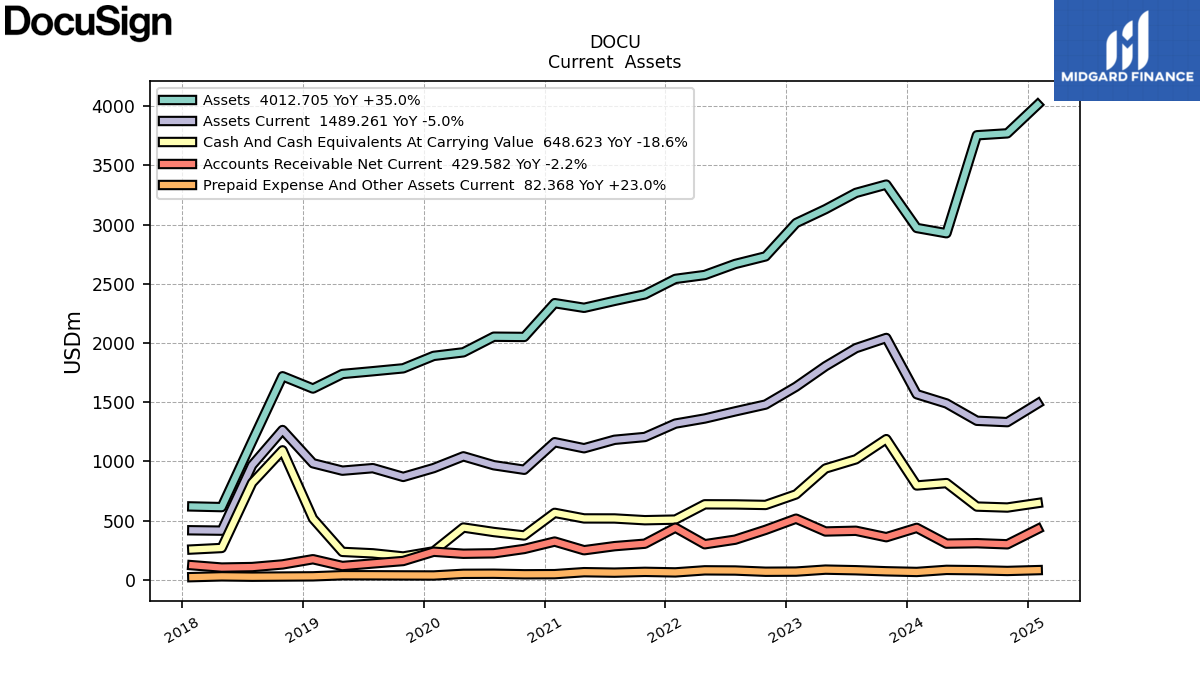
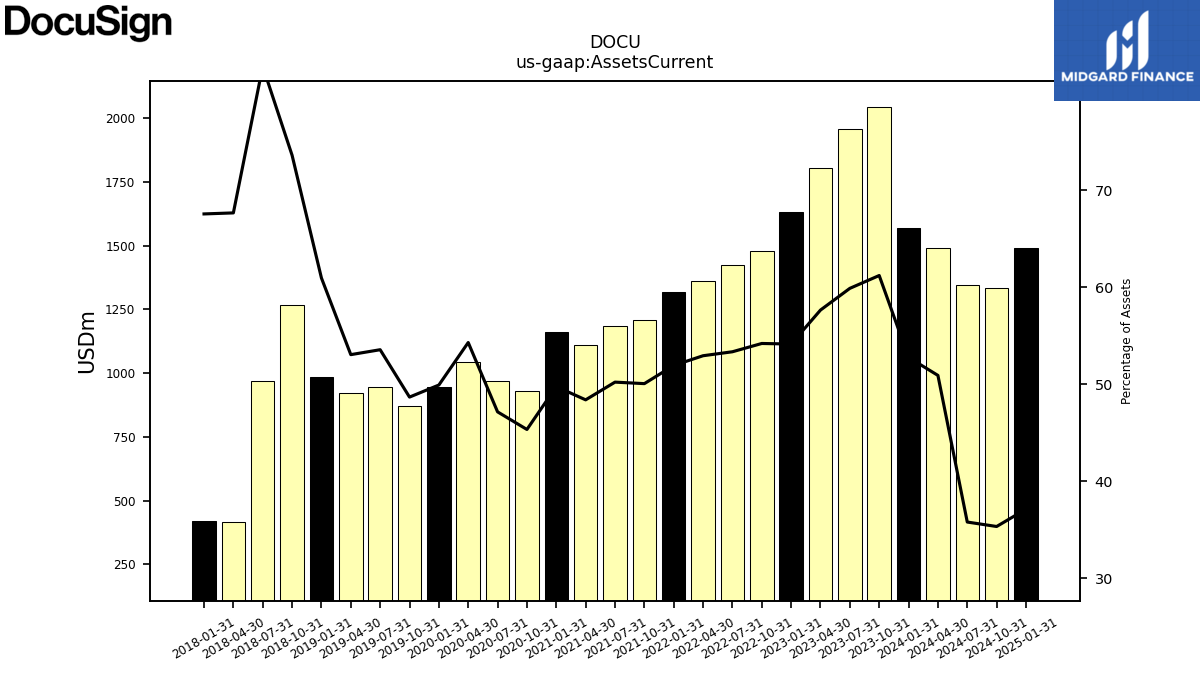
| Assets Current | 1956.47 | 1804.06 | 1631.00 | 1480.38 | 1422.78 | 1362.52 | 1319.60 | 1206.59 | 1182.79 | 1111.44 | 1162.35 | 929.76 | 968.02 | 1043.24 | 943.89 | 869.39 | 943.49 | 922.13 | 984.52 | 1265.51 | 968.06 | 415.73 | 418.80 | NA | NA | NA | |
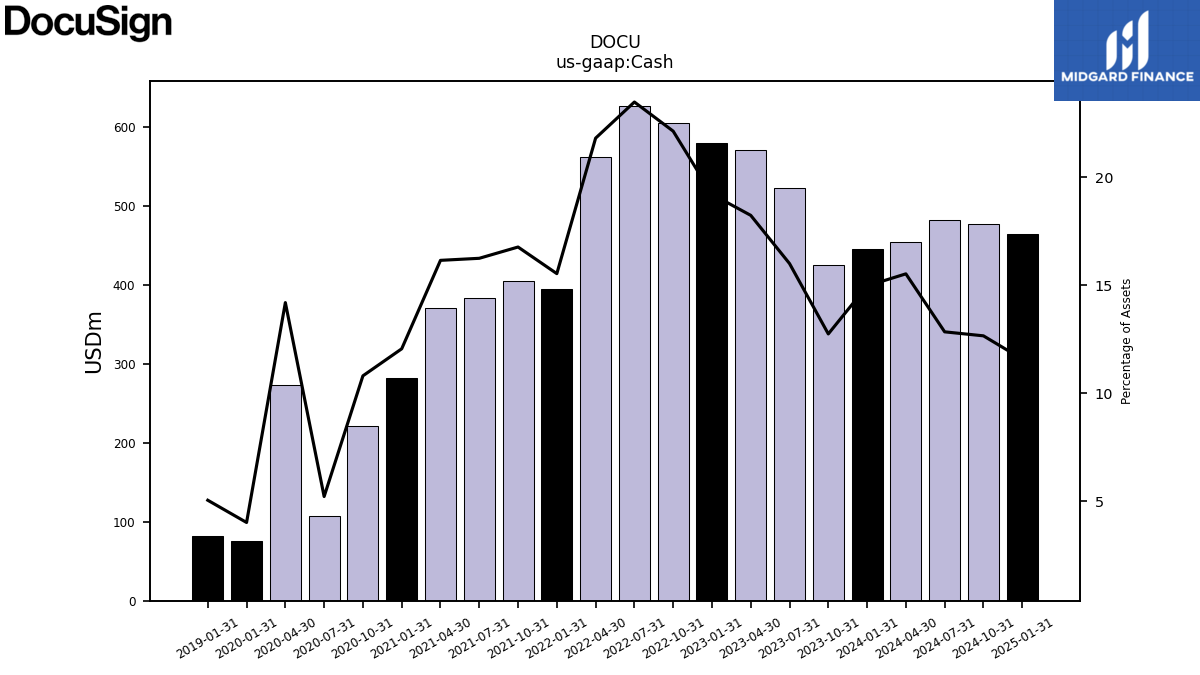
| Cash | 523.00 | 570.90 | 578.90 | 604.80 | 626.60 | 561.60 | 394.90 | 404.30 | 382.80 | 371.10 | 281.70 | 221.60 | 107.00 | 272.80 | 75.80 | NA | NA | NA | 81.40 | NA | NA | NA | NA | NA | NA | NA | |
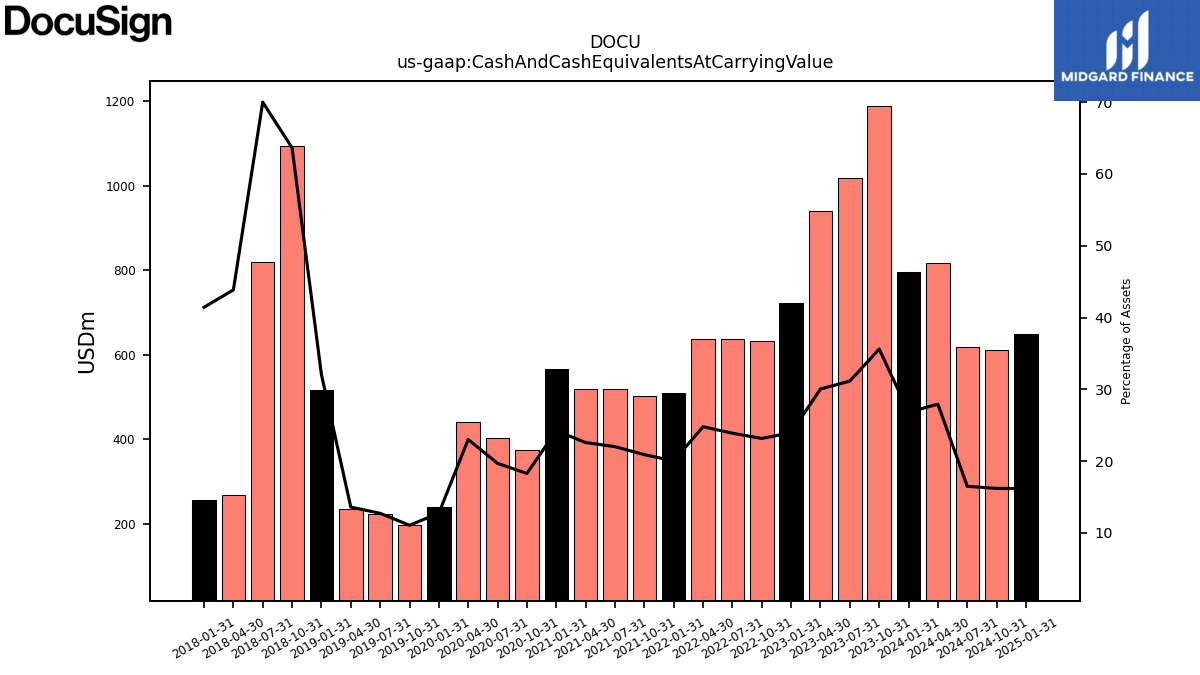
| Cash And Cash Equivalents At Carrying Value | 1017.78 | 940.49 | 721.89 | 632.62 | 637.19 | 638.19 | 509.06 | 503.88 | 518.58 | 518.97 | 566.05 | 374.98 | 404.26 | 442.24 | 241.20 | 197.70 | 224.29 | 236.48 | 517.81 | 1094.13 | 818.79 | 269.43 | 256.87 | NA | NA | NA | |
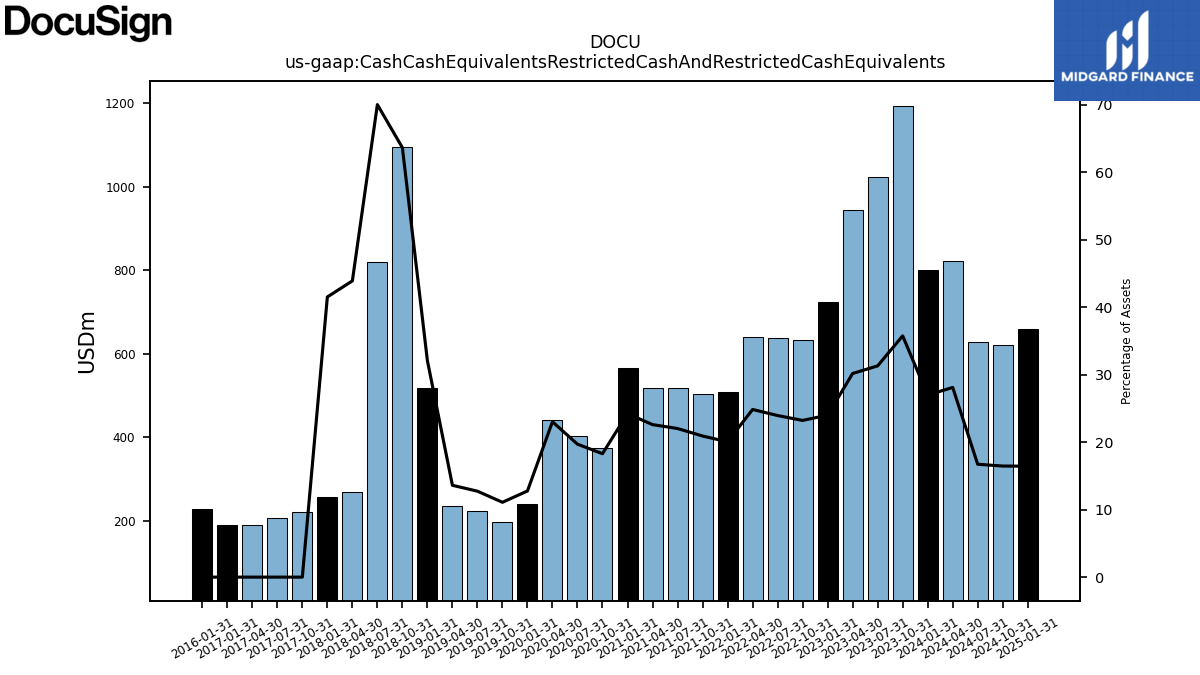
| Cash Cash Equivalents Restricted Cash And Restricted Cash Equivalents | 1022.98 | 944.75 | 723.20 | 634.39 | 638.85 | 639.62 | 509.68 | 504.16 | 518.86 | 519.25 | 566.34 | 375.26 | 404.54 | 442.52 | 241.48 | 198.11 | 224.42 | 236.64 | 518.18 | 1094.50 | 819.16 | 269.80 | 257.44 | 222.17 | 207.68 | 190.09 | |
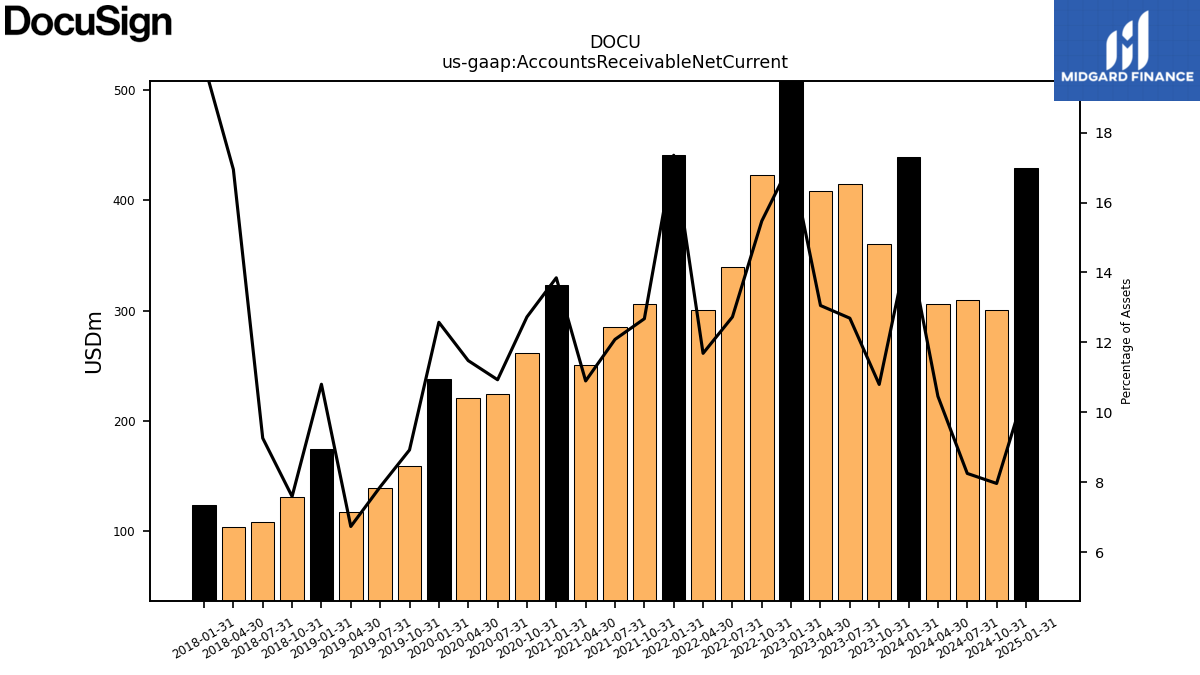
| Accounts Receivable Net Current | 414.74 | 408.63 | 516.91 | 422.61 | 339.53 | 300.87 | 440.95 | 305.60 | 284.73 | 250.37 | 323.57 | 261.08 | 224.50 | 220.60 | 237.84 | 159.46 | 138.65 | 117.13 | 174.55 | 130.61 | 108.36 | 104.13 | 123.75 | NA | NA | NA | |
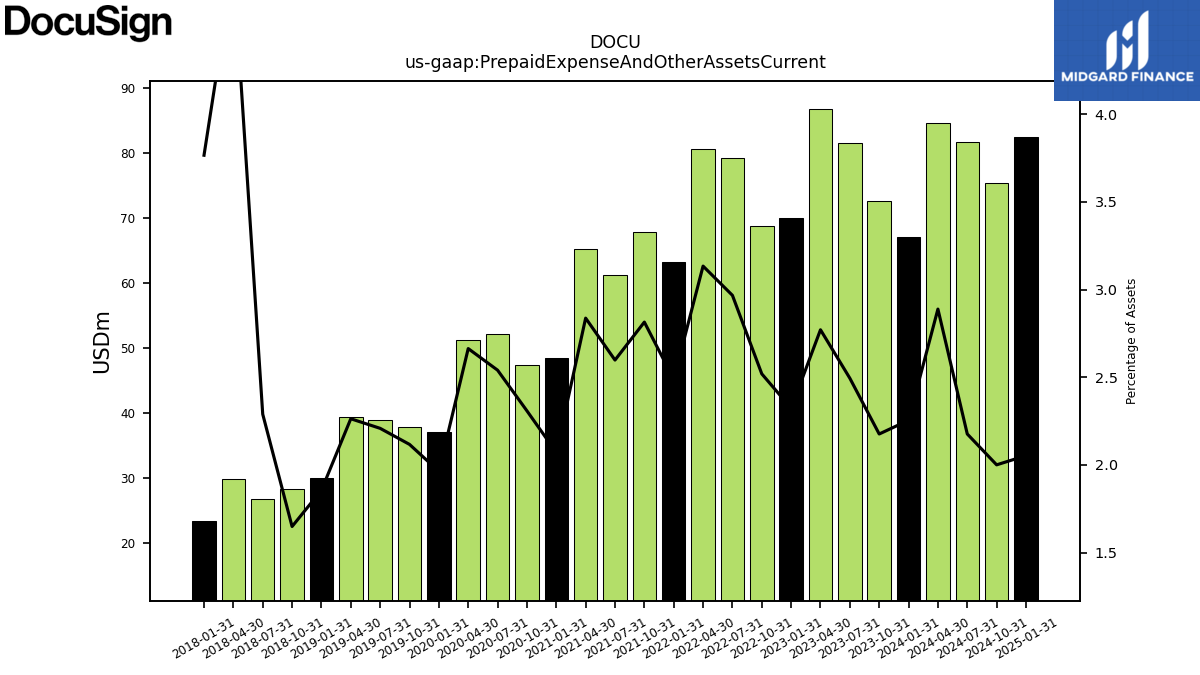
| Prepaid Expense And Other Assets Current | 81.49 | 86.72 | 69.99 | 68.81 | 79.14 | 80.67 | 63.24 | 67.84 | 61.20 | 65.17 | 48.39 | 47.34 | 52.16 | 51.18 | 37.12 | 37.81 | 38.91 | 39.34 | 29.98 | 28.34 | 26.78 | 29.78 | 23.35 | NA | NA | NA | |
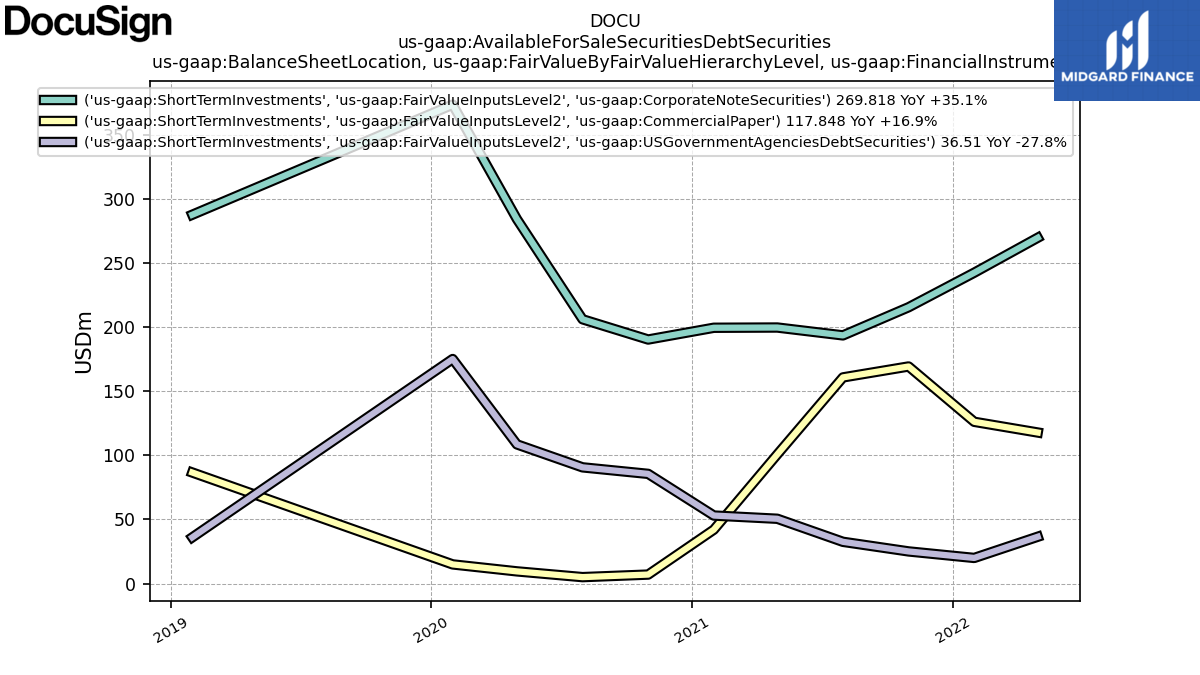
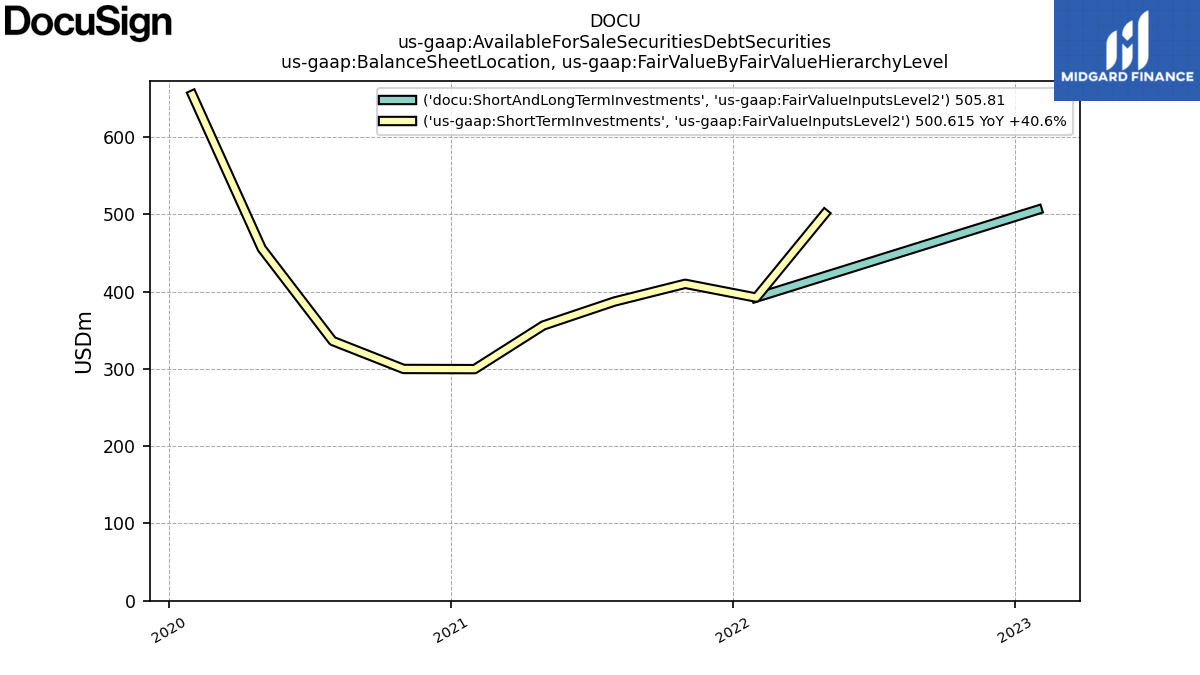
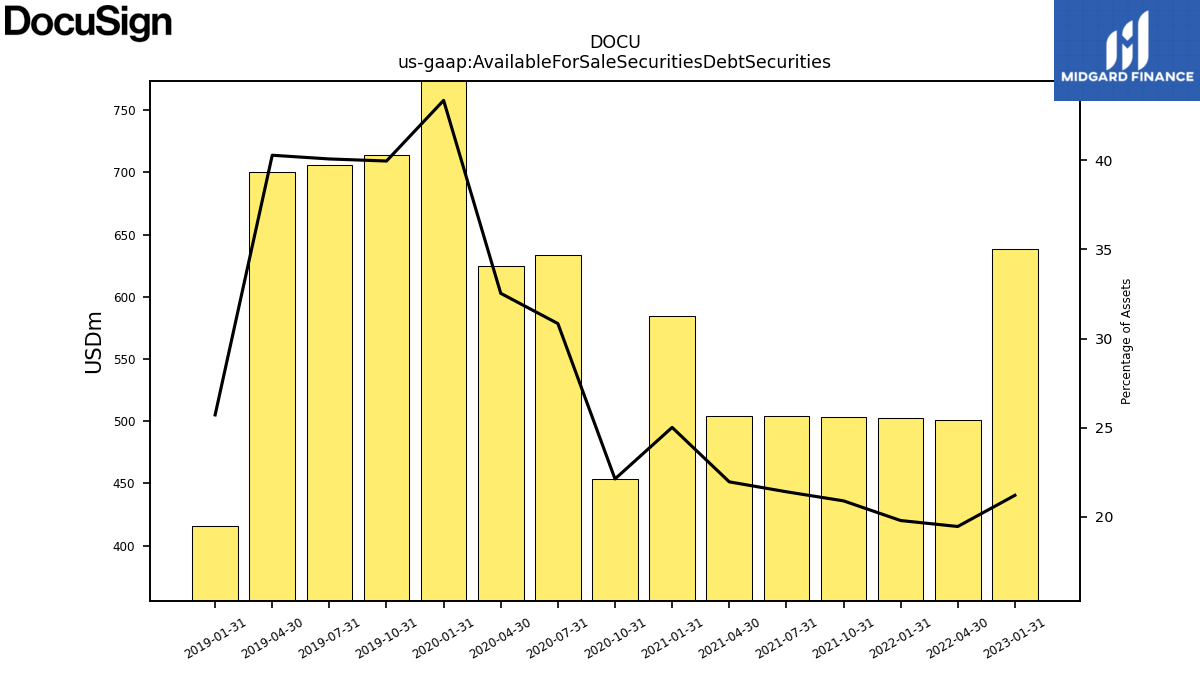
| Available For Sale Securities Debt Securities | NA | NA | 638.82 | NA | NA | 500.79 | 502.92 | 503.65 | 504.19 | 504.46 | 584.48 | 453.78 | 633.28 | 625.23 | 820.09 | 713.86 | 706.11 | 700.33 | 415.42 | NA | NA | NA | NA | NA | NA | NA |
| 2023-07-31 | 2023-04-30 | 2023-01-31 | 2022-10-31 | 2022-07-31 | 2022-04-30 | 2022-01-31 | 2021-10-31 | 2021-07-31 | 2021-04-30 | 2021-01-31 | 2020-10-31 | 2020-07-31 | 2020-04-30 | 2020-01-31 | 2019-10-31 | 2019-07-31 | 2019-04-30 | 2019-01-31 | 2018-10-31 | 2018-07-31 | 2018-04-30 | 2018-01-31 | 2017-10-31 | 2017-07-31 | 2017-04-30 | ||
|---|---|---|---|---|---|---|---|---|---|---|---|---|---|---|---|---|---|---|---|---|---|---|---|---|---|---|---|
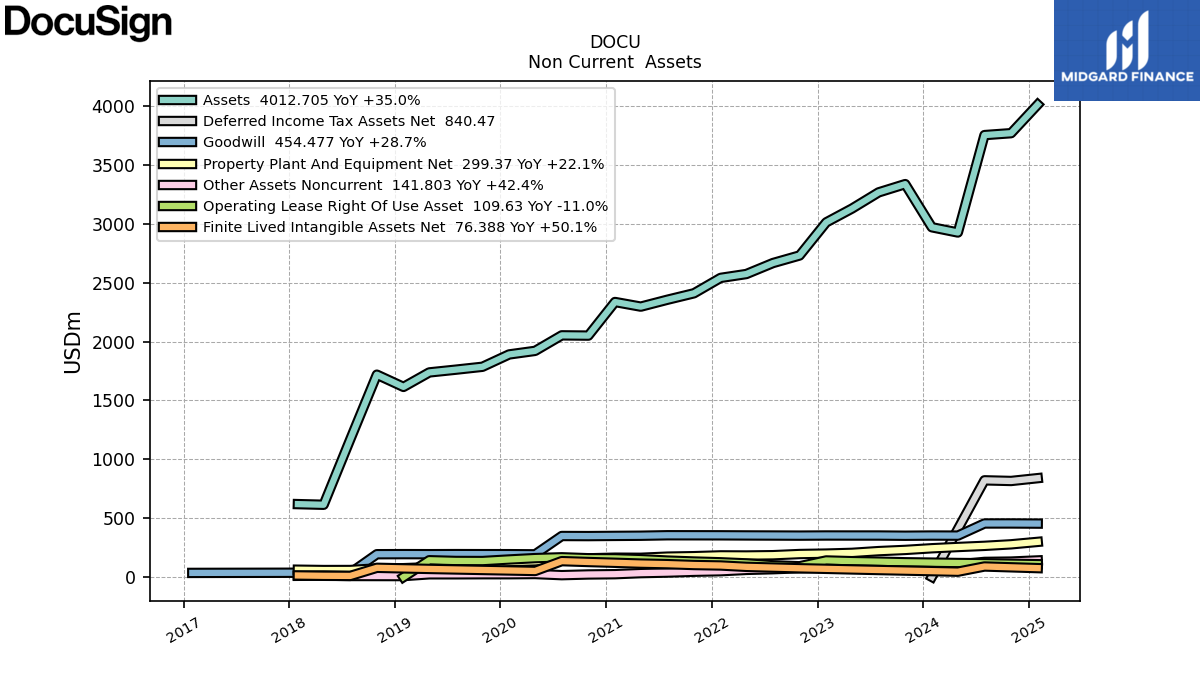
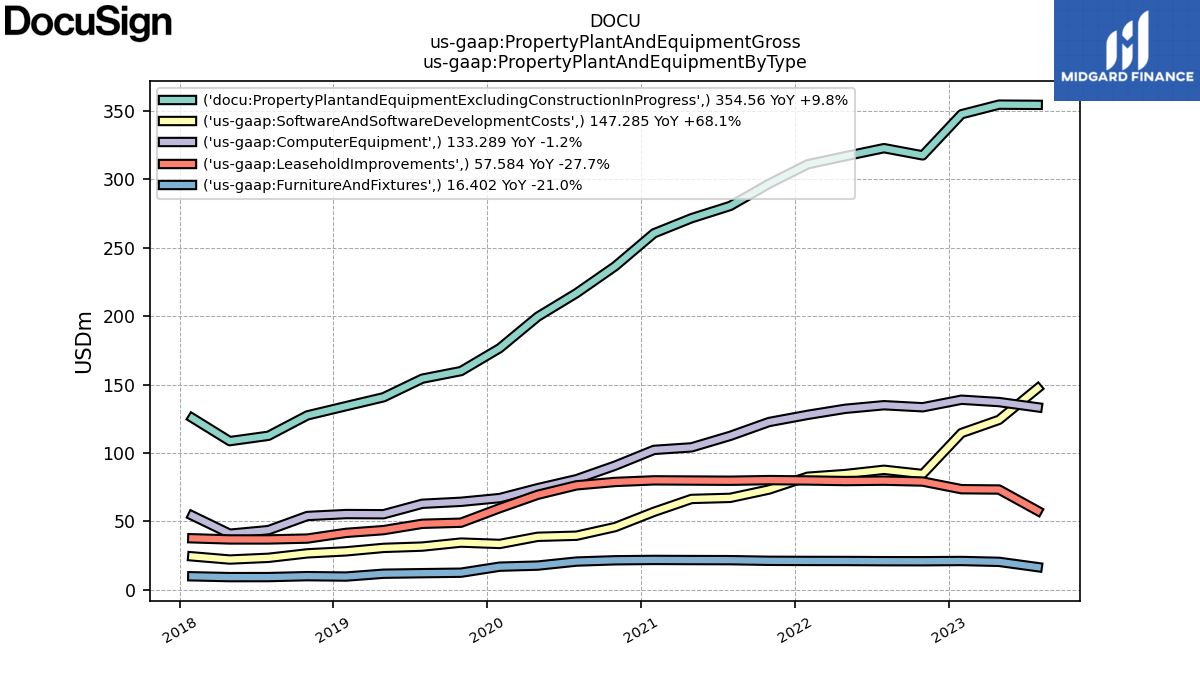
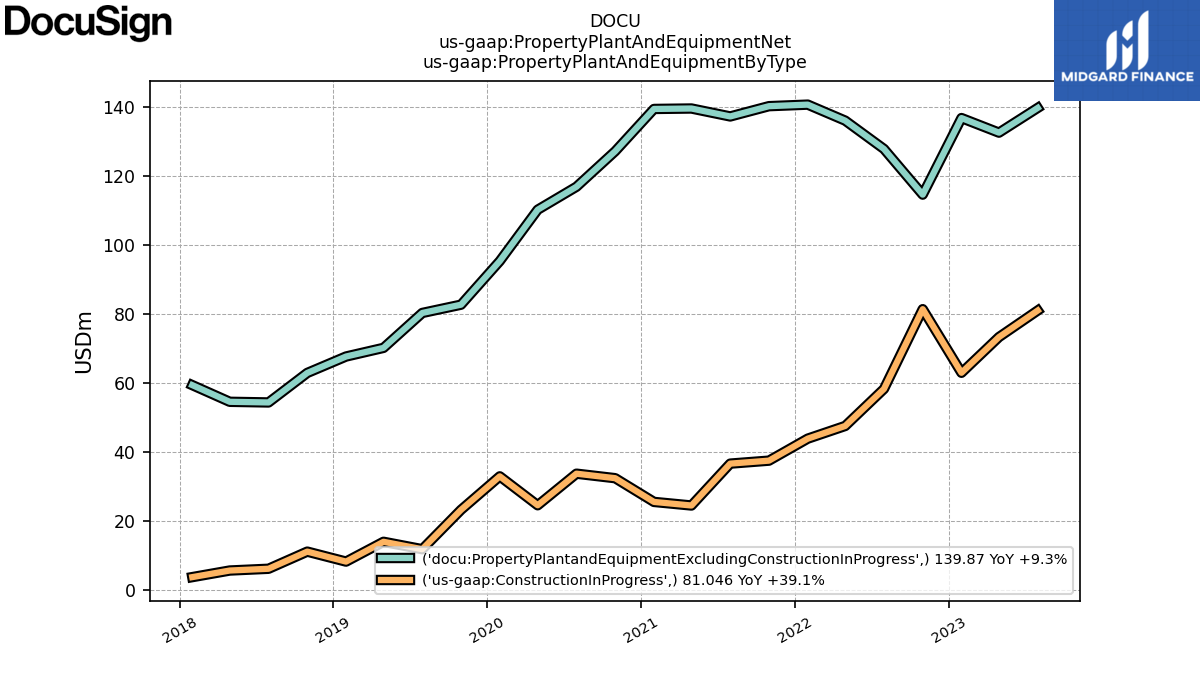
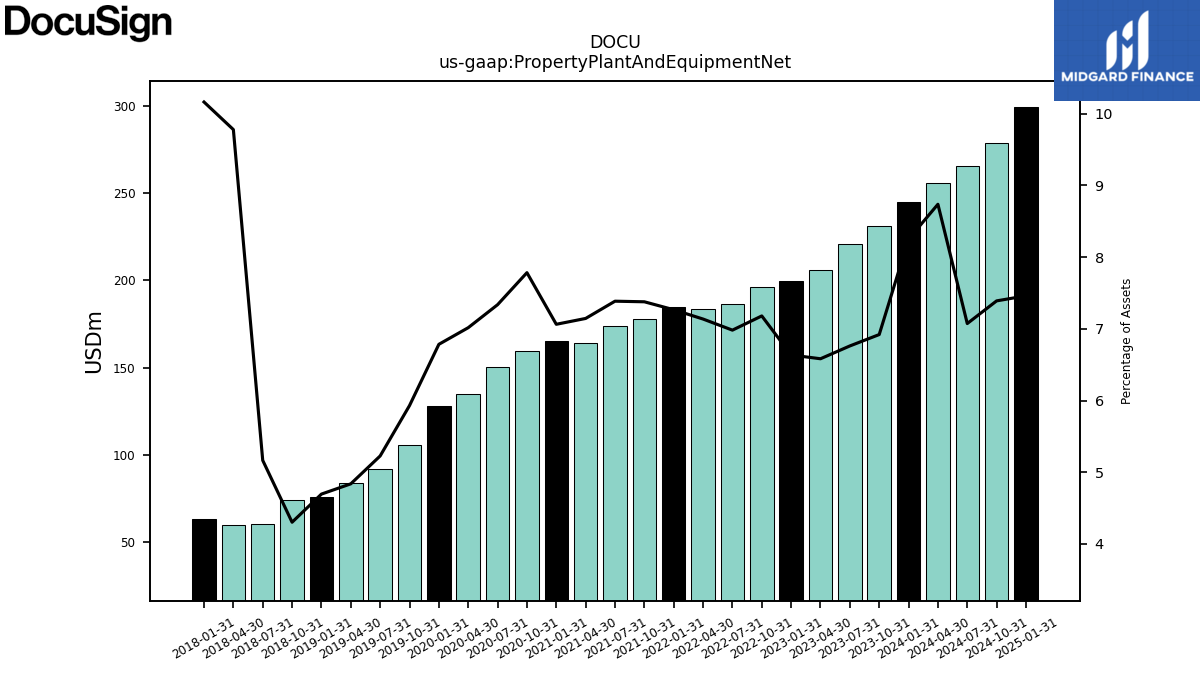
| Property Plant And Equipment Net | 220.92 | 206.03 | 199.89 | 196.13 | 186.23 | 183.70 | 184.66 | 177.83 | 173.98 | 164.13 | 165.04 | 159.65 | 150.65 | 134.81 | 128.29 | 105.92 | 92.08 | 84.09 | 75.83 | 73.97 | 60.41 | 60.09 | 63.02 | NA | NA | NA | |
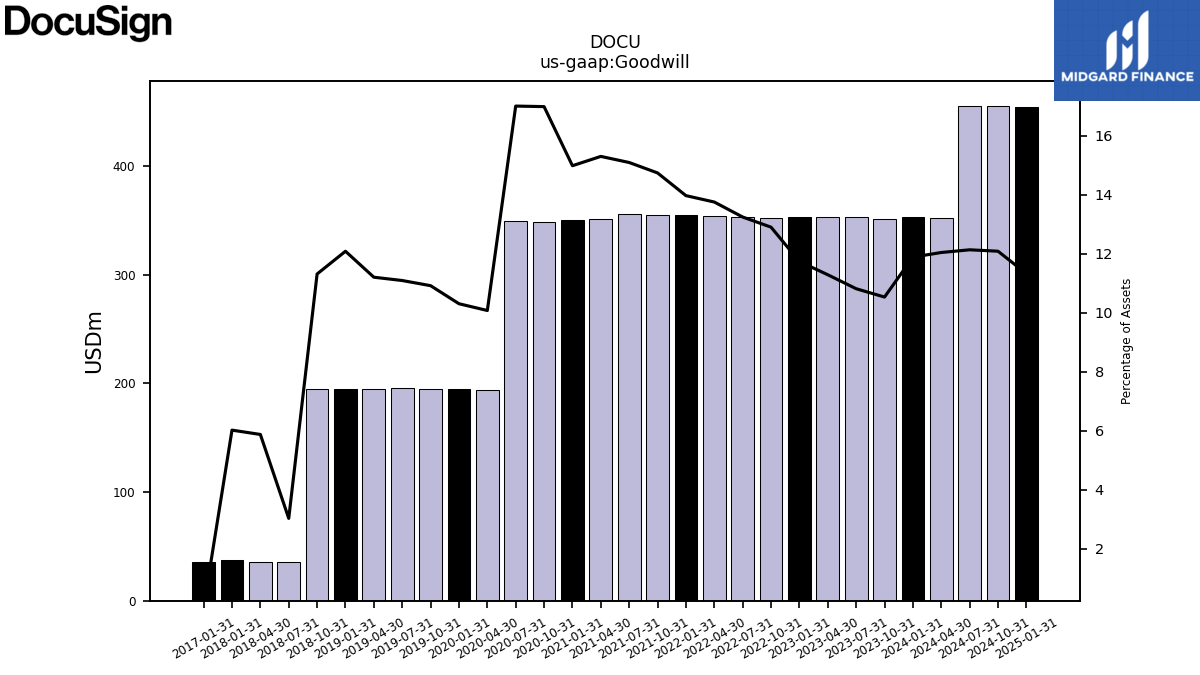
| Goodwill | 353.35 | 353.31 | 353.62 | 352.42 | 353.33 | 354.06 | 355.06 | 355.35 | 355.60 | 351.51 | 350.15 | 348.50 | 349.25 | 193.59 | 194.88 | 195.02 | 195.43 | 194.78 | 195.22 | 194.53 | 35.37 | 36.07 | 37.31 | NA | NA | NA | |
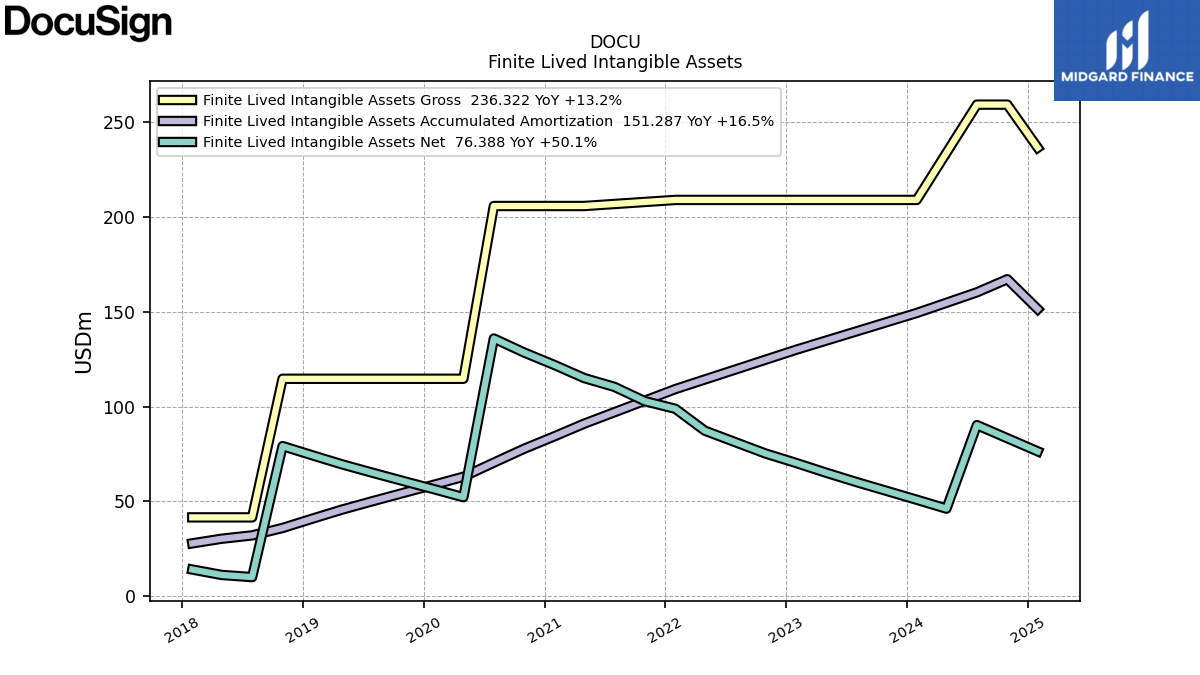
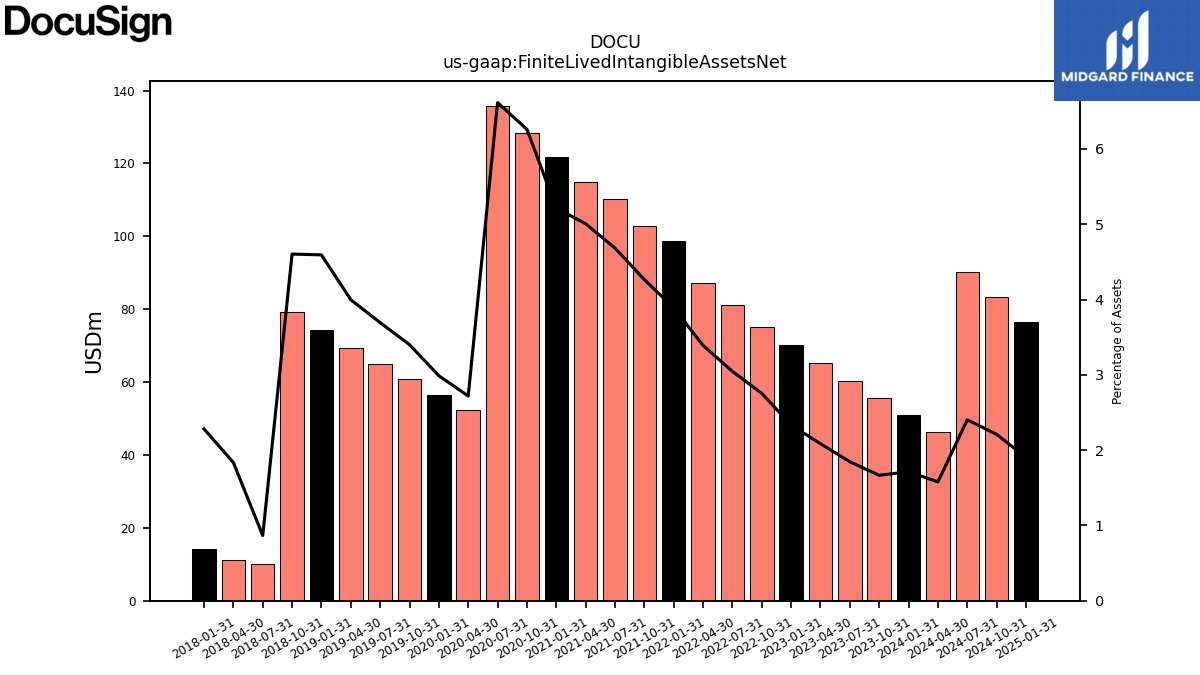
| Finite Lived Intangible Assets Net | 60.30 | 65.25 | 70.28 | 75.23 | 81.25 | 87.28 | 98.82 | 102.80 | 110.33 | 115.01 | 121.83 | 128.41 | 135.82 | 52.24 | 56.50 | 60.76 | 65.07 | 69.49 | 74.20 | 79.16 | 10.14 | 11.28 | 14.15 | NA | NA | NA | |
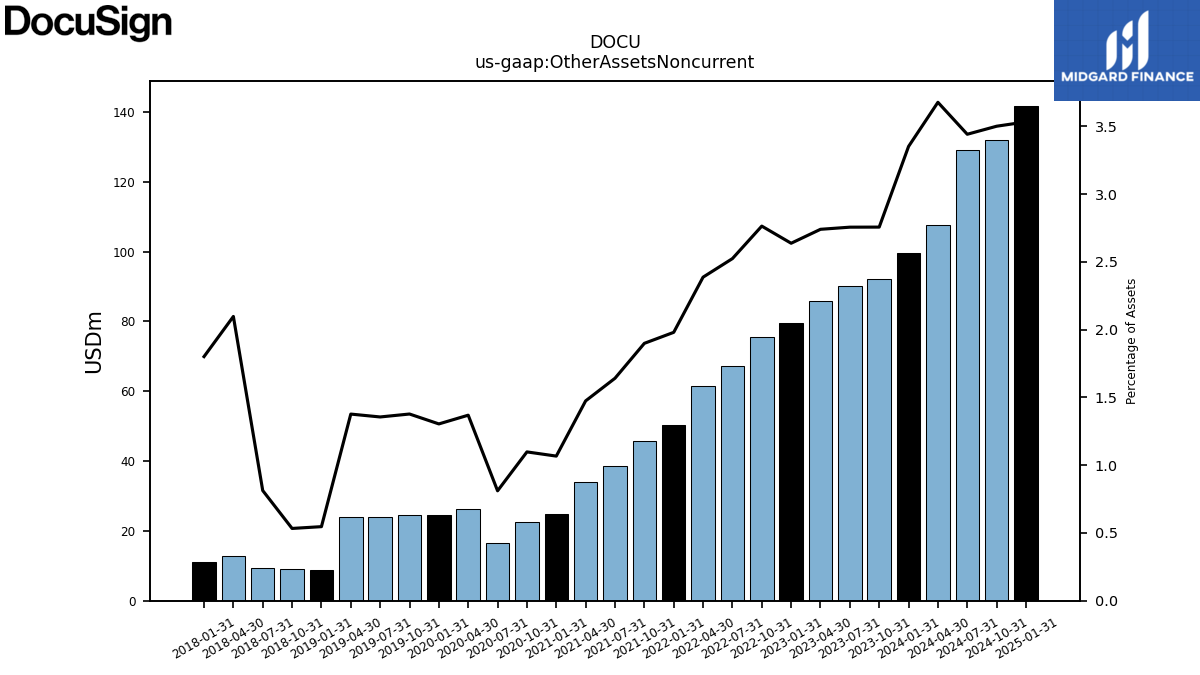
| Other Assets Noncurrent | 90.08 | 85.80 | 79.48 | 75.52 | 67.35 | 61.47 | 50.34 | 45.79 | 38.68 | 33.88 | 24.94 | 22.53 | 16.66 | 26.31 | 24.68 | 24.62 | 23.90 | 23.95 | 8.83 | 9.18 | 9.51 | 12.89 | 11.17 | NA | NA | NA | |
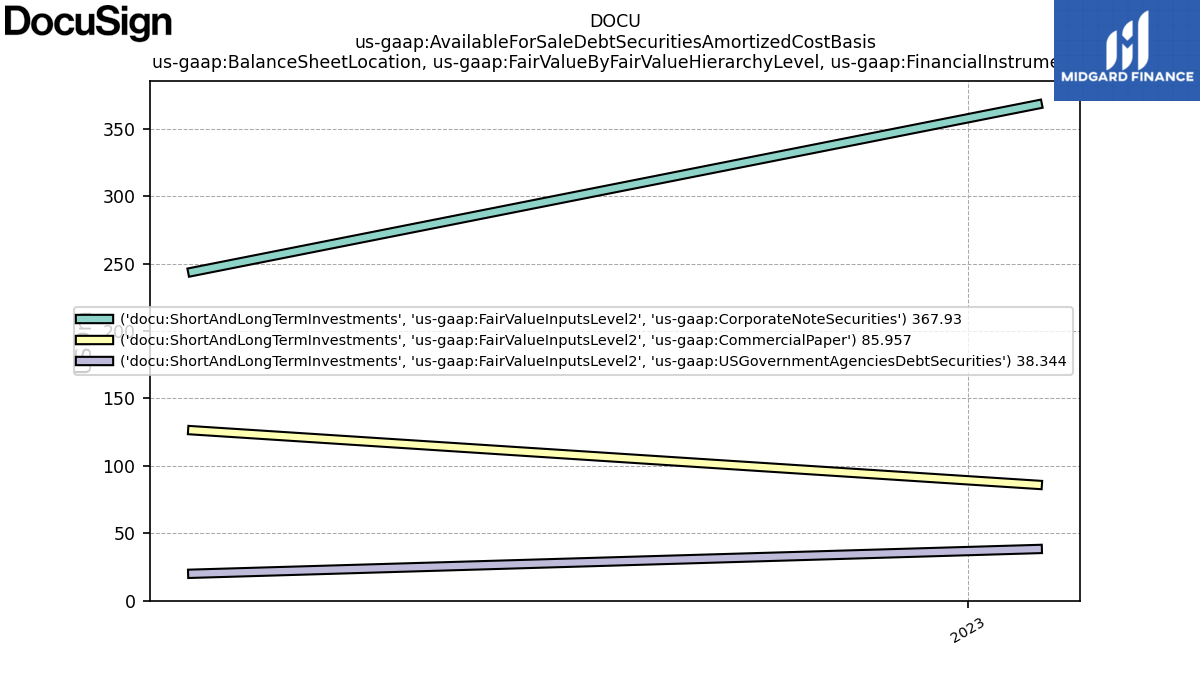
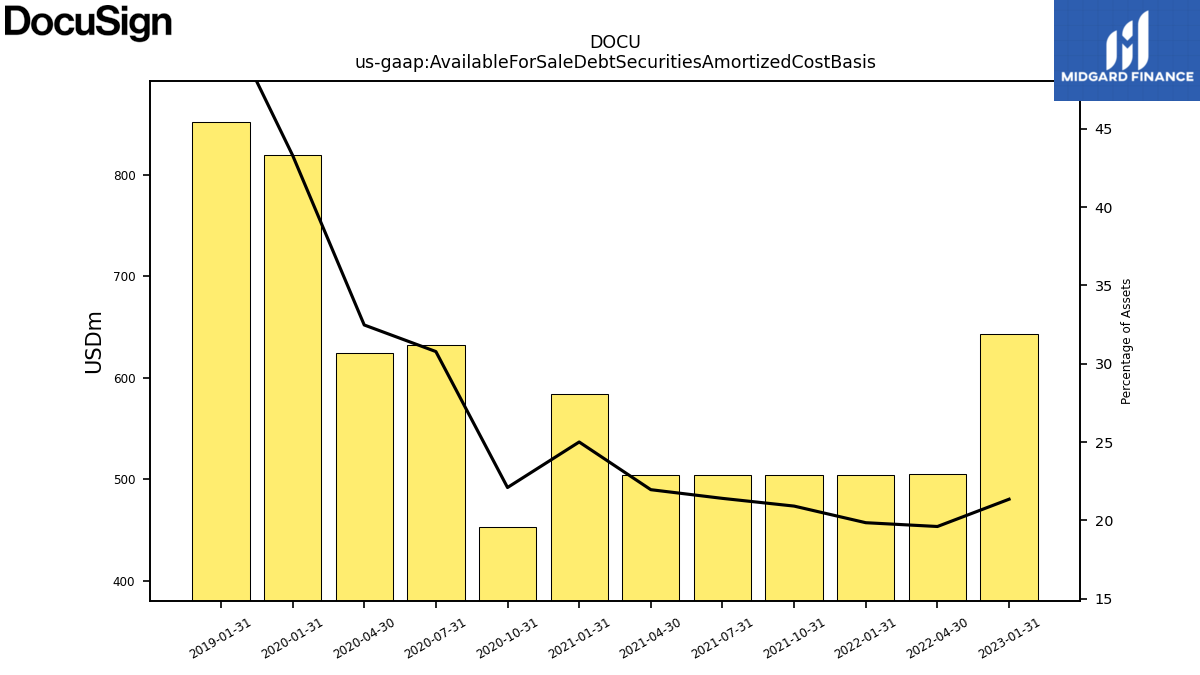
| Available For Sale Debt Securities Amortized Cost Basis | NA | NA | 643.22 | NA | NA | 504.75 | 504.46 | 504.07 | 504.20 | 504.41 | 584.19 | 453.24 | 631.91 | 623.94 | 818.97 | NA | NA | NA | 851.53 | NA | NA | NA | NA | NA | NA | NA |
| 2023-07-31 | 2023-04-30 | 2023-01-31 | 2022-10-31 | 2022-07-31 | 2022-04-30 | 2022-01-31 | 2021-10-31 | 2021-07-31 | 2021-04-30 | 2021-01-31 | 2020-10-31 | 2020-07-31 | 2020-04-30 | 2020-01-31 | 2019-10-31 | 2019-07-31 | 2019-04-30 | 2019-01-31 | 2018-10-31 | 2018-07-31 | 2018-04-30 | 2018-01-31 | 2017-10-31 | 2017-07-31 | 2017-04-30 | ||
|---|---|---|---|---|---|---|---|---|---|---|---|---|---|---|---|---|---|---|---|---|---|---|---|---|---|---|---|
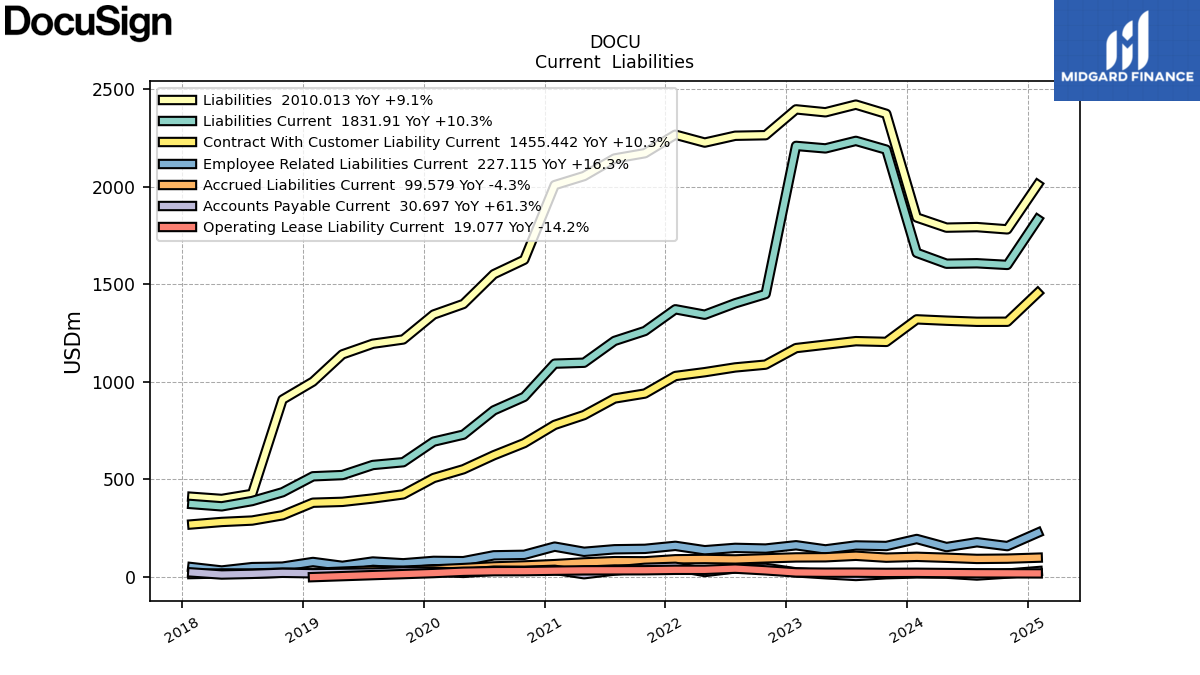
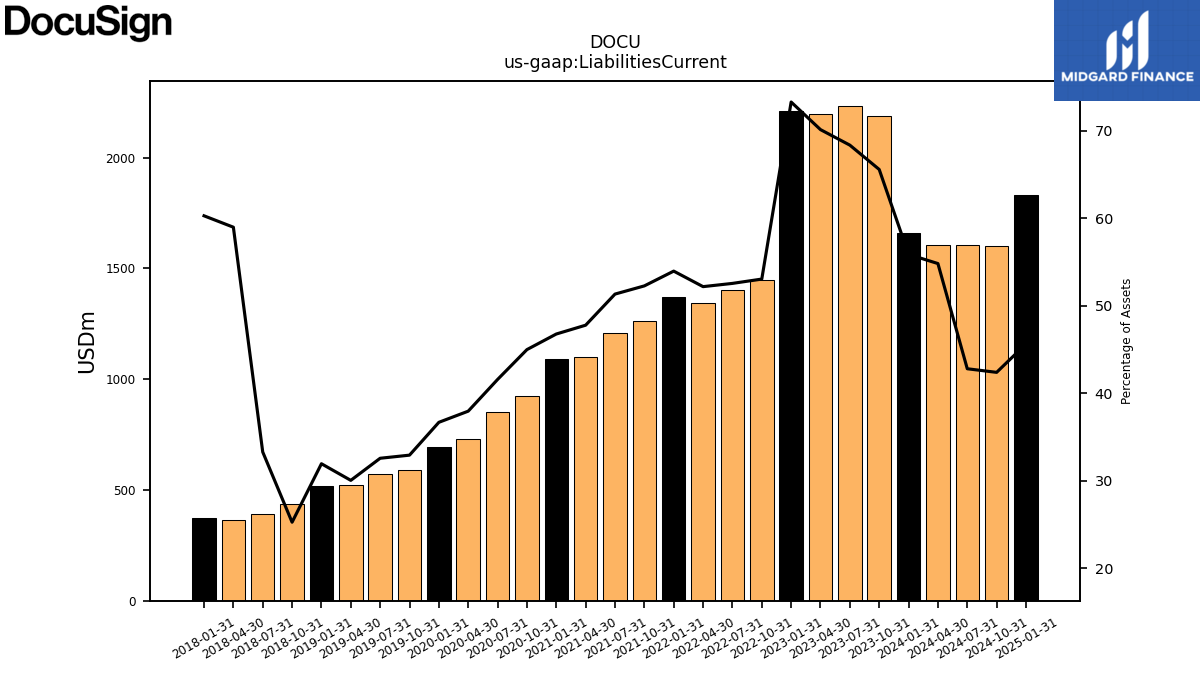
| Liabilities Current | 2233.96 | 2195.46 | 2208.32 | 1449.53 | 1402.24 | 1343.72 | 1371.64 | 1260.37 | 1209.63 | 1097.91 | 1093.17 | 923.10 | 854.04 | 729.59 | 693.97 | 588.49 | 574.15 | 522.61 | 516.31 | 434.64 | 389.59 | 362.50 | 373.82 | NA | NA | NA | |
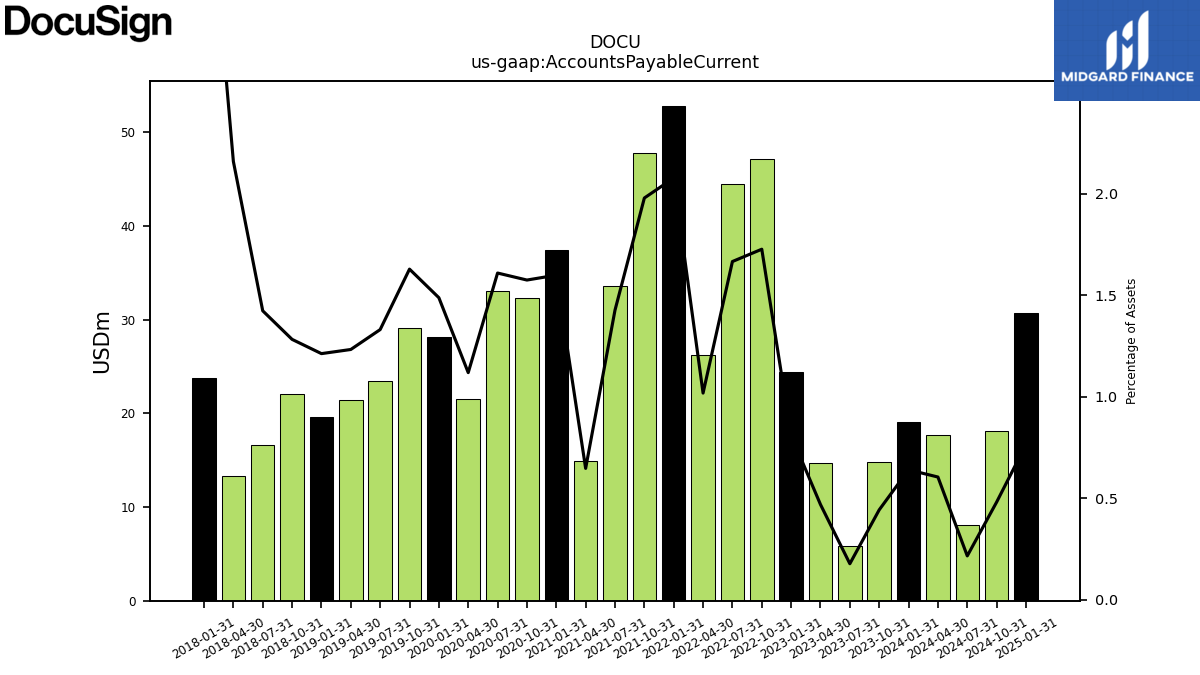
| Accounts Payable Current | 5.80 | 14.69 | 24.39 | 47.18 | 44.45 | 26.21 | 52.80 | 47.71 | 33.61 | 14.87 | 37.37 | 32.31 | 33.05 | 21.50 | 28.14 | 29.10 | 23.45 | 21.44 | 19.59 | 22.06 | 16.65 | 13.27 | 23.71 | NA | NA | NA | |
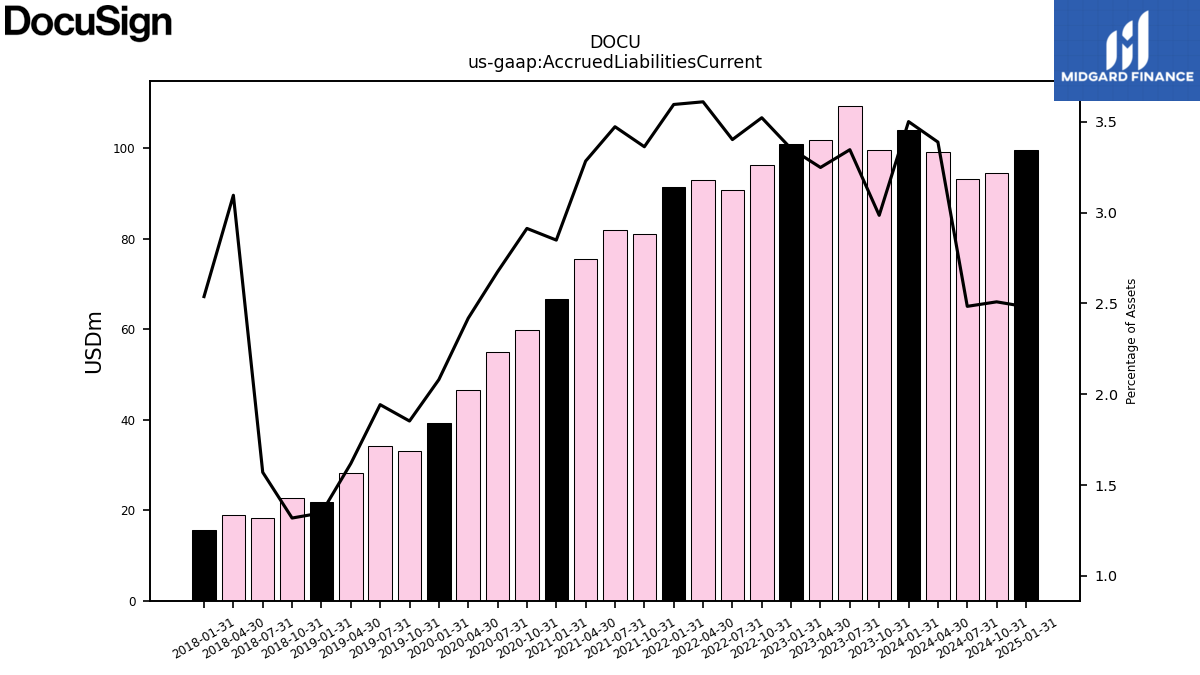
| Accrued Liabilities Current | 109.35 | 101.69 | 100.99 | 96.23 | 90.76 | 92.94 | 91.38 | 81.06 | 81.82 | 75.44 | 66.57 | 59.75 | 54.92 | 46.48 | 39.35 | 33.09 | 34.23 | 28.13 | 21.75 | 22.67 | 18.37 | 19.02 | 15.73 | NA | NA | NA | |
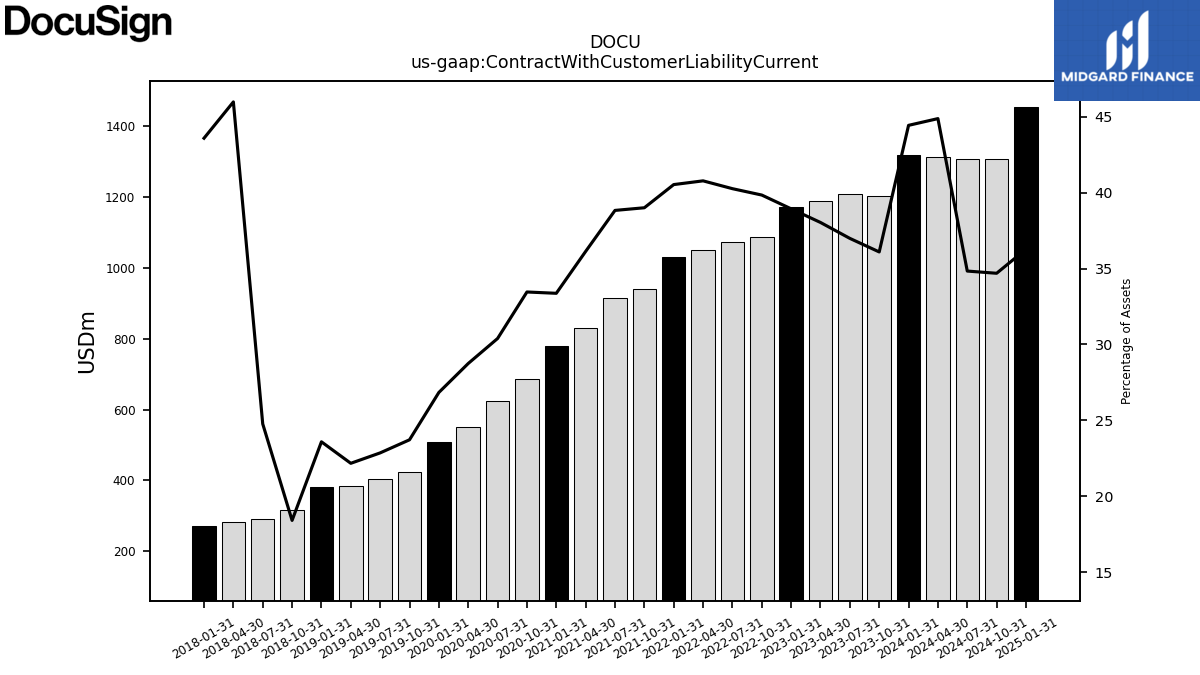
| Contract With Customer Liability Current | 1208.41 | 1190.36 | 1172.87 | 1088.20 | 1073.80 | 1049.53 | 1029.89 | 940.11 | 914.62 | 829.84 | 779.64 | 686.18 | 624.03 | 552.35 | 507.56 | 423.74 | 402.73 | 385.46 | 381.06 | 316.62 | 289.72 | 282.47 | 270.19 | NA | NA | NA |
| 2023-07-31 | 2023-04-30 | 2023-01-31 | 2022-10-31 | 2022-07-31 | 2022-04-30 | 2022-01-31 | 2021-10-31 | 2021-07-31 | 2021-04-30 | 2021-01-31 | 2020-10-31 | 2020-07-31 | 2020-04-30 | 2020-01-31 | 2019-10-31 | 2019-07-31 | 2019-04-30 | 2019-01-31 | 2018-10-31 | 2018-07-31 | 2018-04-30 | 2018-01-31 | 2017-10-31 | 2017-07-31 | 2017-04-30 | ||
|---|---|---|---|---|---|---|---|---|---|---|---|---|---|---|---|---|---|---|---|---|---|---|---|---|---|---|---|
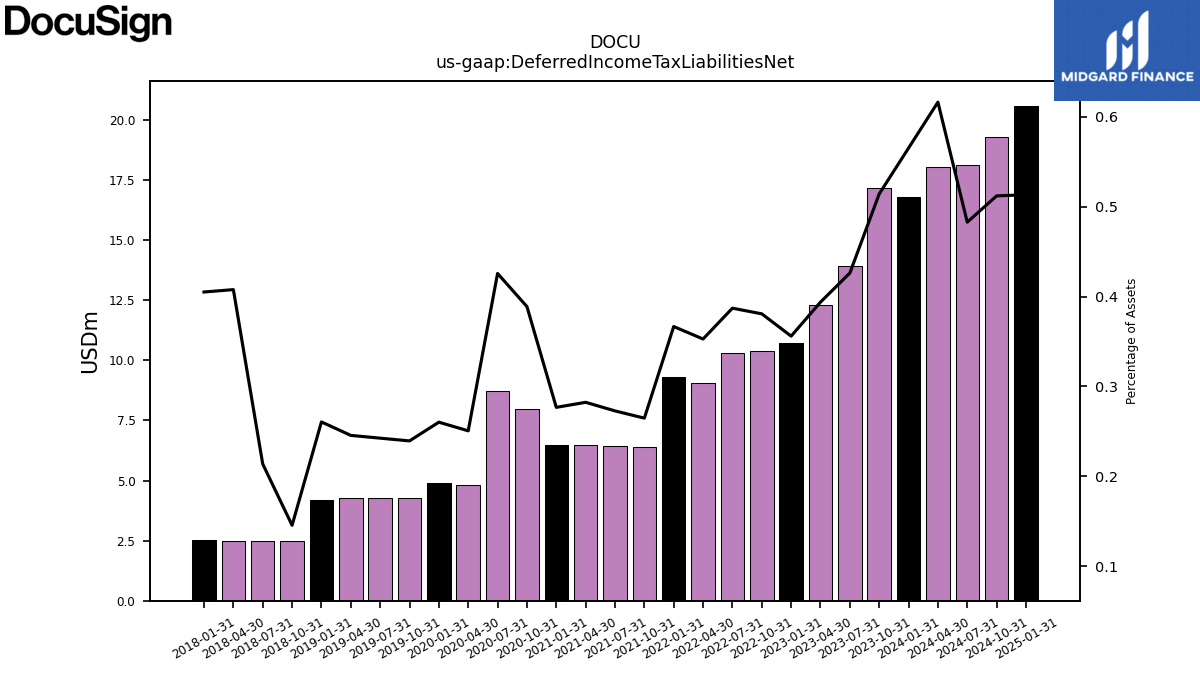
| Deferred Income Tax Liabilities Net | 13.92 | 12.32 | 10.72 | 10.40 | 10.32 | 9.08 | 9.32 | 6.38 | 6.42 | 6.48 | 6.46 | 7.97 | 8.74 | 4.81 | 4.92 | 4.28 | 4.27 | 4.27 | 4.21 | 2.50 | 2.50 | 2.50 | 2.51 | NA | NA | NA | |
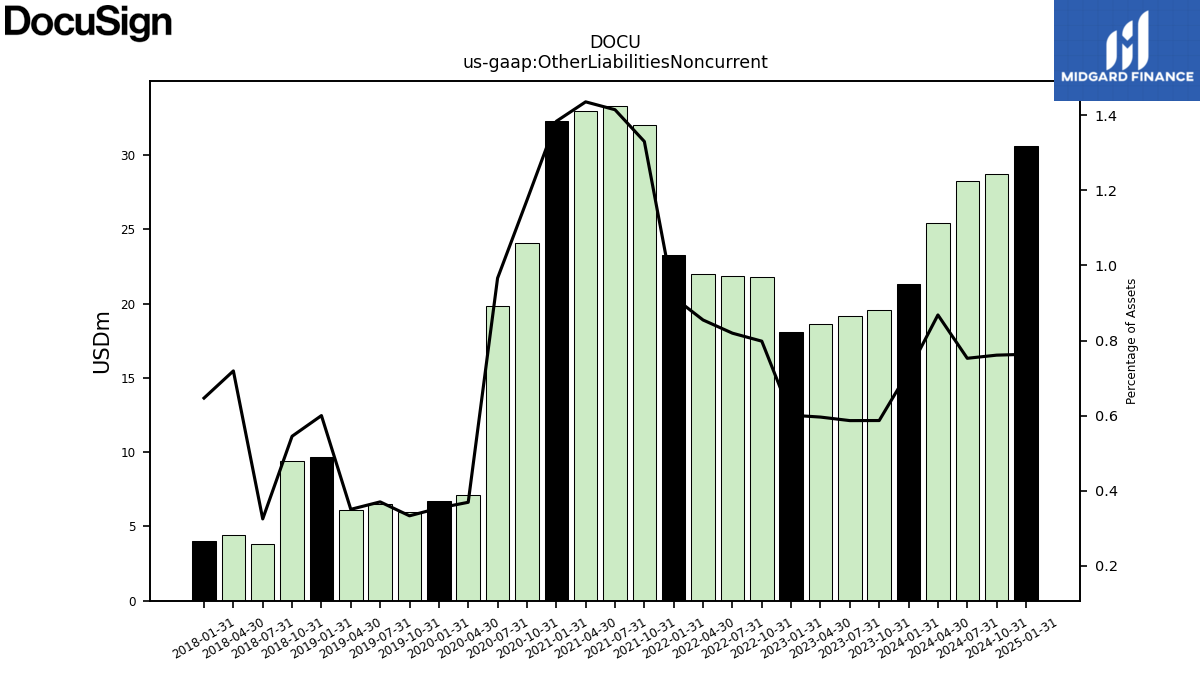
| Other Liabilities Noncurrent | 19.17 | 18.66 | 18.11 | 21.81 | 21.86 | 22.00 | 23.25 | 32.06 | 33.32 | 32.97 | 32.33 | 24.07 | 19.84 | 7.10 | 6.70 | 5.96 | 6.53 | 6.09 | 9.70 | 9.37 | 3.80 | 4.42 | 4.01 | NA | NA | NA | |
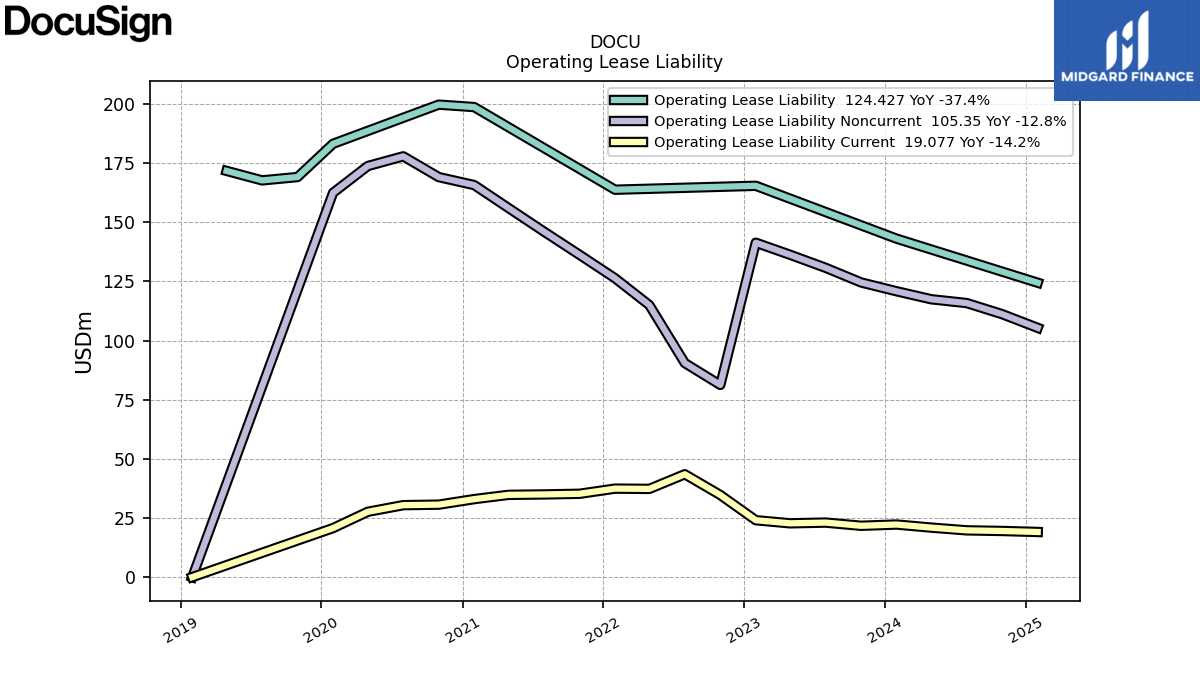
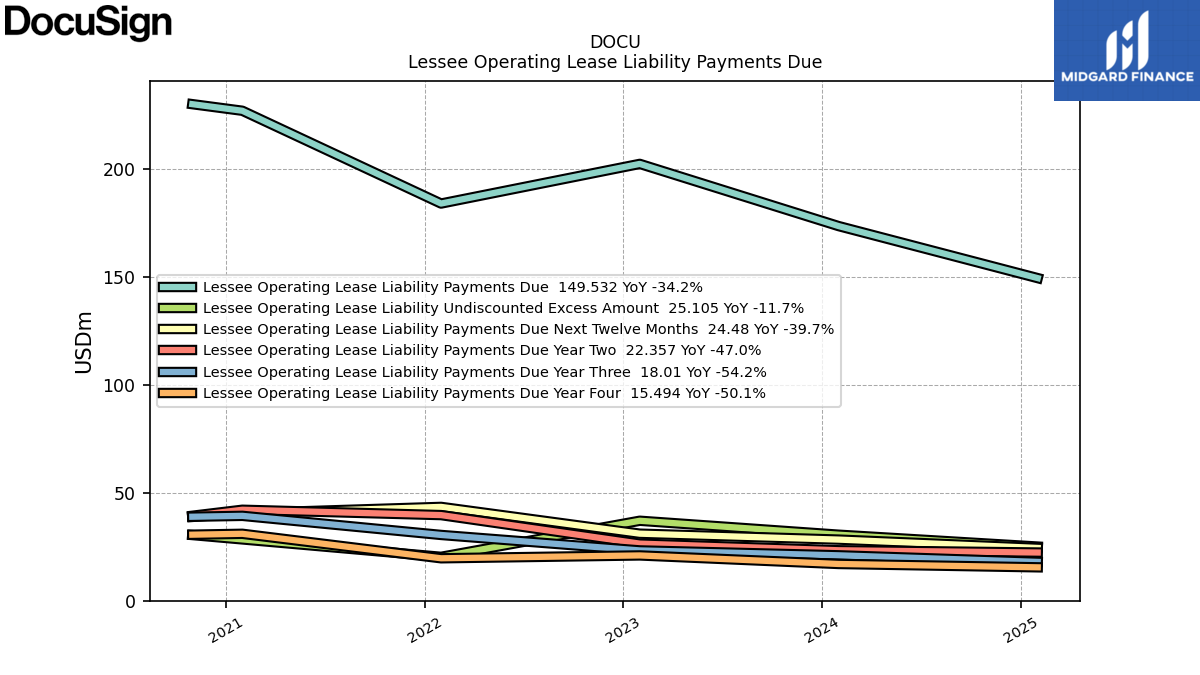
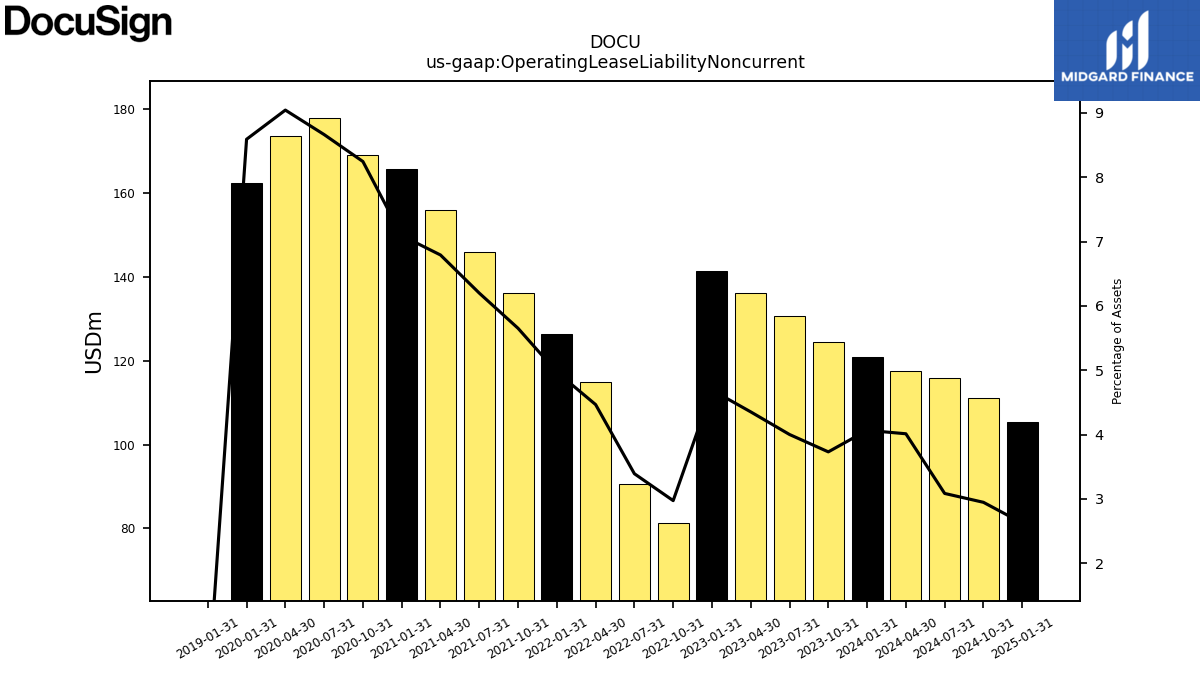
| Operating Lease Liability Noncurrent | 130.75 | 136.24 | 141.35 | 81.24 | 90.48 | 114.98 | 126.34 | 136.24 | 146.03 | 156.00 | 165.70 | 169.08 | 177.86 | 173.75 | 162.43 | NA | NA | NA | 0.00 | NA | NA | NA | NA | NA | NA | NA |
| 2023-07-31 | 2023-04-30 | 2023-01-31 | 2022-10-31 | 2022-07-31 | 2022-04-30 | 2022-01-31 | 2021-10-31 | 2021-07-31 | 2021-04-30 | 2021-01-31 | 2020-10-31 | 2020-07-31 | 2020-04-30 | 2020-01-31 | 2019-10-31 | 2019-07-31 | 2019-04-30 | 2019-01-31 | 2018-10-31 | 2018-07-31 | 2018-04-30 | 2018-01-31 | 2017-10-31 | 2017-07-31 | 2017-04-30 | ||
|---|---|---|---|---|---|---|---|---|---|---|---|---|---|---|---|---|---|---|---|---|---|---|---|---|---|---|---|
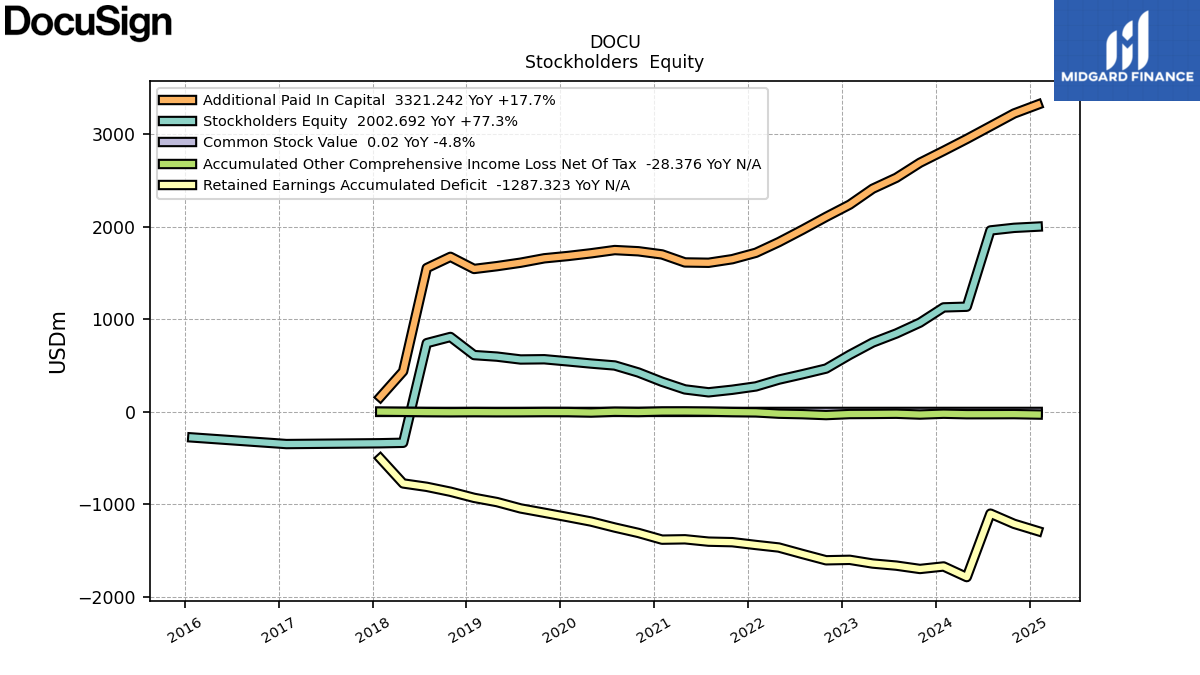
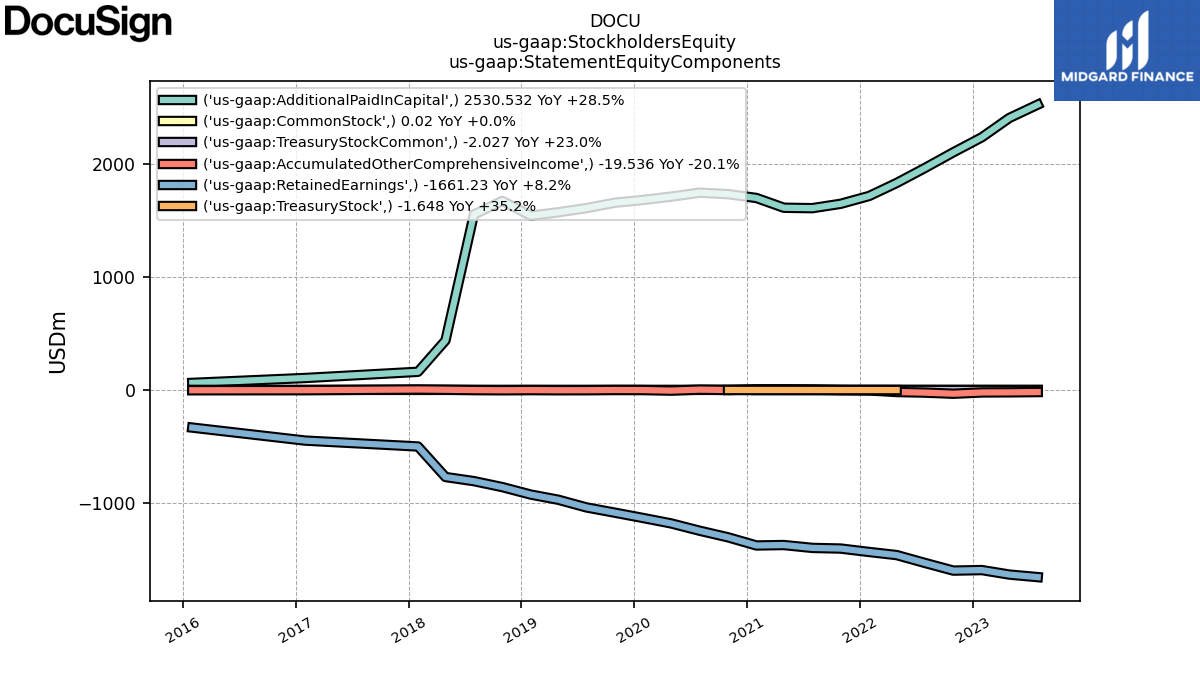
| Stockholders Equity | 847.76 | 749.49 | 617.29 | 468.51 | 407.13 | 348.95 | 275.50 | 239.57 | 211.88 | 243.24 | 325.74 | 426.03 | 501.89 | 522.79 | 546.33 | 569.36 | 566.68 | 597.68 | 614.36 | 810.17 | 743.47 | -333.73 | -338.65 | NA | NA | NA | |
| Common Stock Value | 0.02 | 0.02 | 0.02 | 0.02 | 0.02 | 0.02 | 0.02 | 0.02 | 0.02 | 0.02 | 0.02 | 0.02 | 0.02 | 0.02 | 0.02 | 0.02 | 0.02 | 0.02 | 0.02 | 0.02 | 0.02 | 0.00 | 0.00 | NA | NA | NA | |
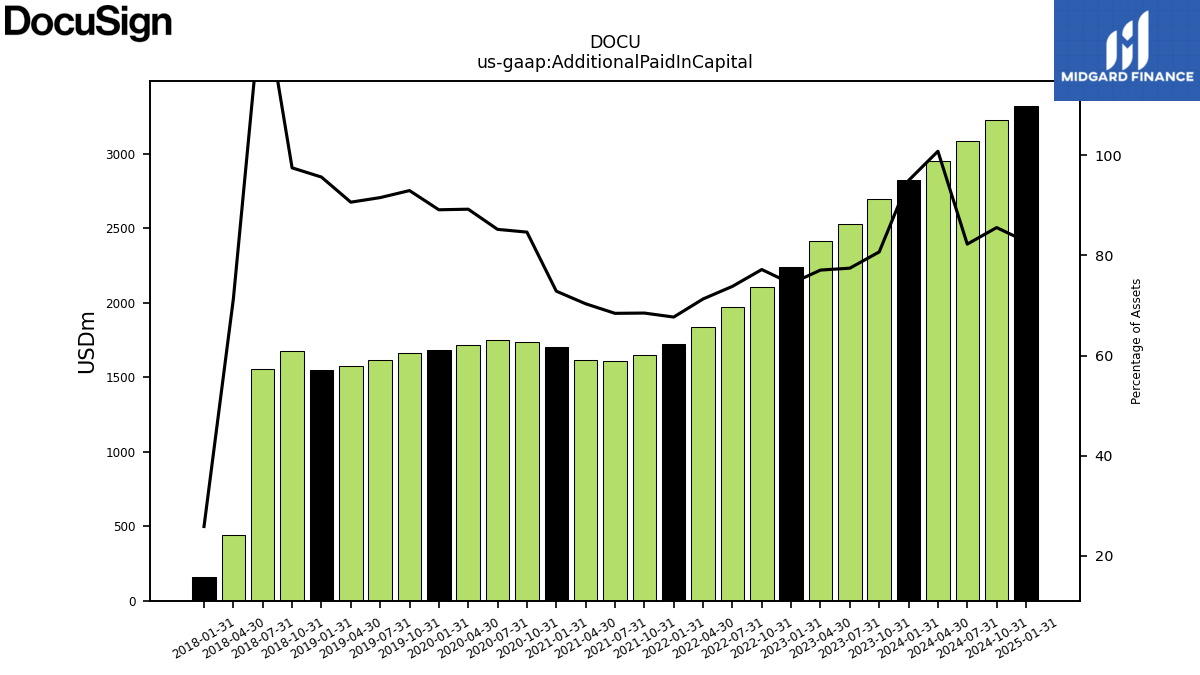
| Additional Paid In Capital | 2530.53 | 2412.03 | 2240.73 | 2108.06 | 1968.85 | 1835.19 | 1720.01 | 1650.71 | 1611.90 | 1615.65 | 1702.25 | 1736.24 | 1749.32 | 1714.46 | 1685.17 | 1660.31 | 1612.79 | 1575.47 | 1545.09 | 1676.18 | 1555.18 | 438.20 | 160.26 | NA | NA | NA | |
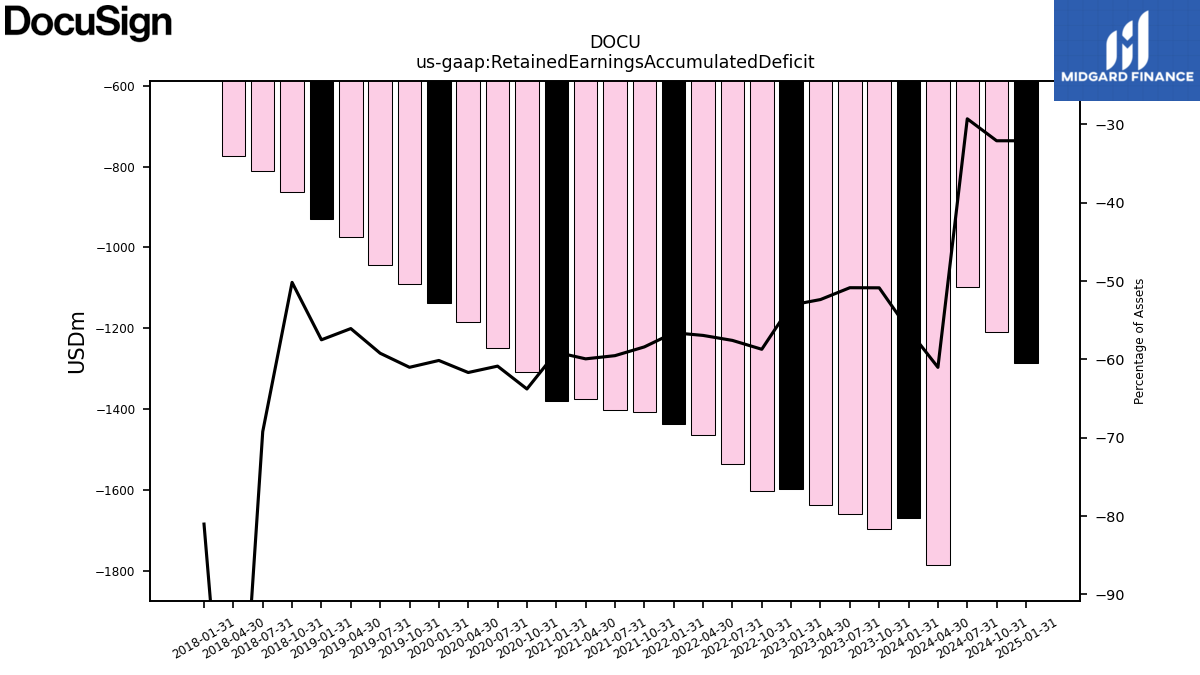
| Retained Earnings Accumulated Deficit | -1661.23 | -1638.62 | -1598.68 | -1603.55 | -1535.65 | -1465.56 | -1438.19 | -1407.74 | -1402.07 | -1376.57 | -1380.45 | -1308.04 | -1249.55 | -1184.99 | -1137.18 | -1089.78 | -1043.18 | -974.55 | -928.78 | -862.53 | -809.72 | -773.01 | -502.32 | NA | NA | NA | |
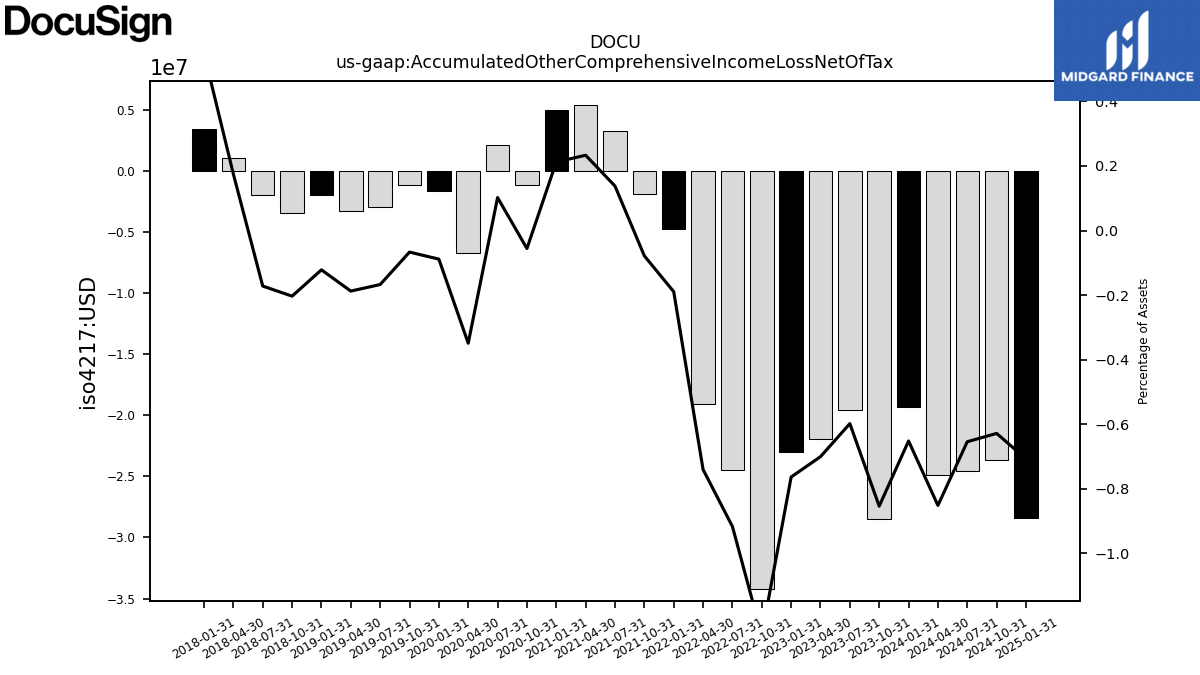
| Accumulated Other Comprehensive Income Loss Net Of Tax | -19.54 | -21.92 | -23.00 | -34.24 | -24.45 | -19.05 | -4.81 | -1.89 | 3.25 | 5.36 | 4.96 | -1.14 | 2.10 | -6.70 | -1.67 | -1.19 | -2.94 | -3.26 | -1.97 | -3.49 | -2.01 | 1.07 | 3.40 | NA | NA | NA | |
| Treasury Stock Value | NA | NA | NA | NA | NA | 1.65 | 1.53 | 1.53 | 1.22 | 1.22 | 1.05 | 1.05 | NA | NA | NA | NA | NA | NA | NA | NA | NA | NA | NA | NA | NA | NA |
| 2023-07-31 | 2023-04-30 | 2023-01-31 | 2022-10-31 | 2022-07-31 | 2022-04-30 | 2022-01-31 | 2021-10-31 | 2021-07-31 | 2021-04-30 | 2021-01-31 | 2020-10-31 | 2020-07-31 | 2020-04-30 | 2020-01-31 | 2019-10-31 | 2019-07-31 | 2019-04-30 | 2019-01-31 | 2018-10-31 | 2018-07-31 | 2018-04-30 | 2018-01-31 | 2017-10-31 | 2017-07-31 | 2017-04-30 | ||
|---|---|---|---|---|---|---|---|---|---|---|---|---|---|---|---|---|---|---|---|---|---|---|---|---|---|---|---|
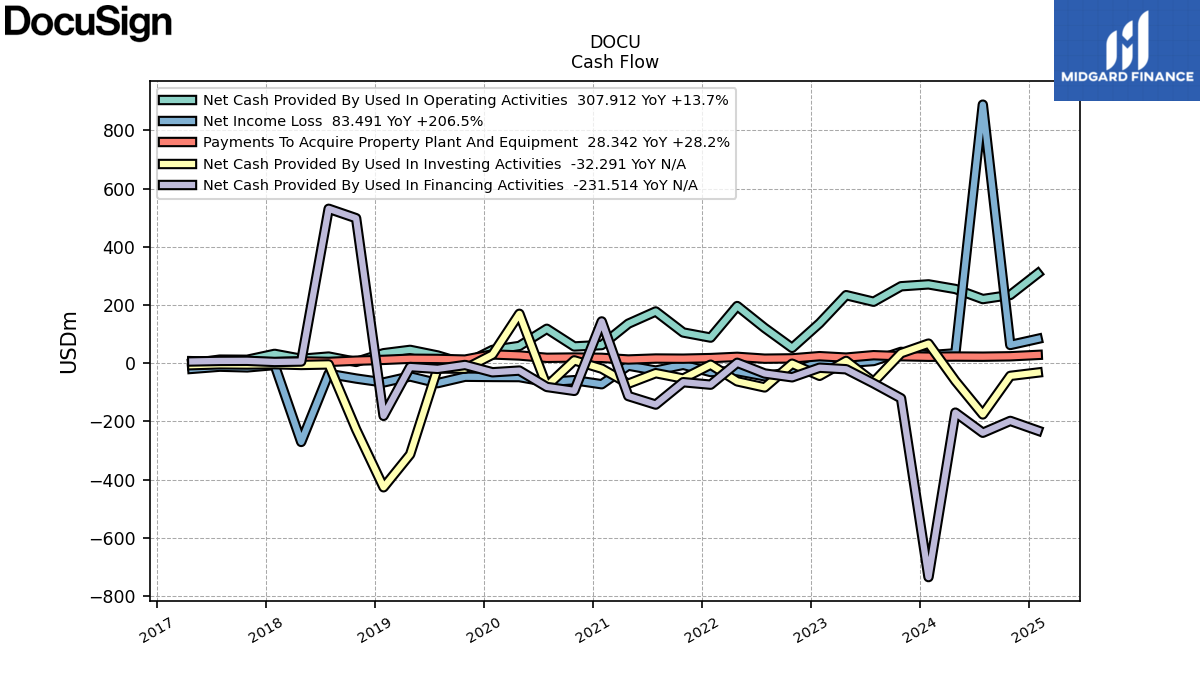
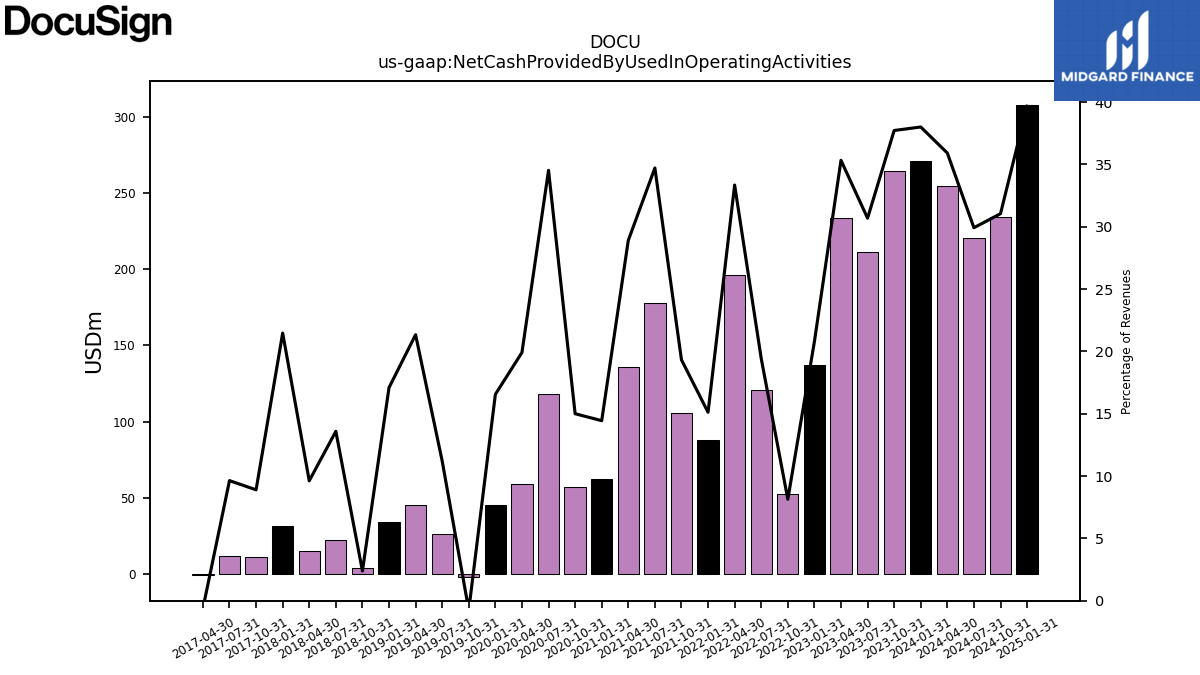
| Net Cash Provided By Used In Operating Activities | 211.02 | 233.63 | 137.06 | 52.54 | 120.88 | 196.29 | 87.79 | 105.41 | 177.67 | 135.60 | 62.23 | 57.44 | 118.13 | 59.14 | 45.51 | -1.87 | 26.41 | 45.66 | 34.14 | 4.26 | 22.70 | 14.99 | 31.96 | 11.62 | 12.10 | -0.70 | |
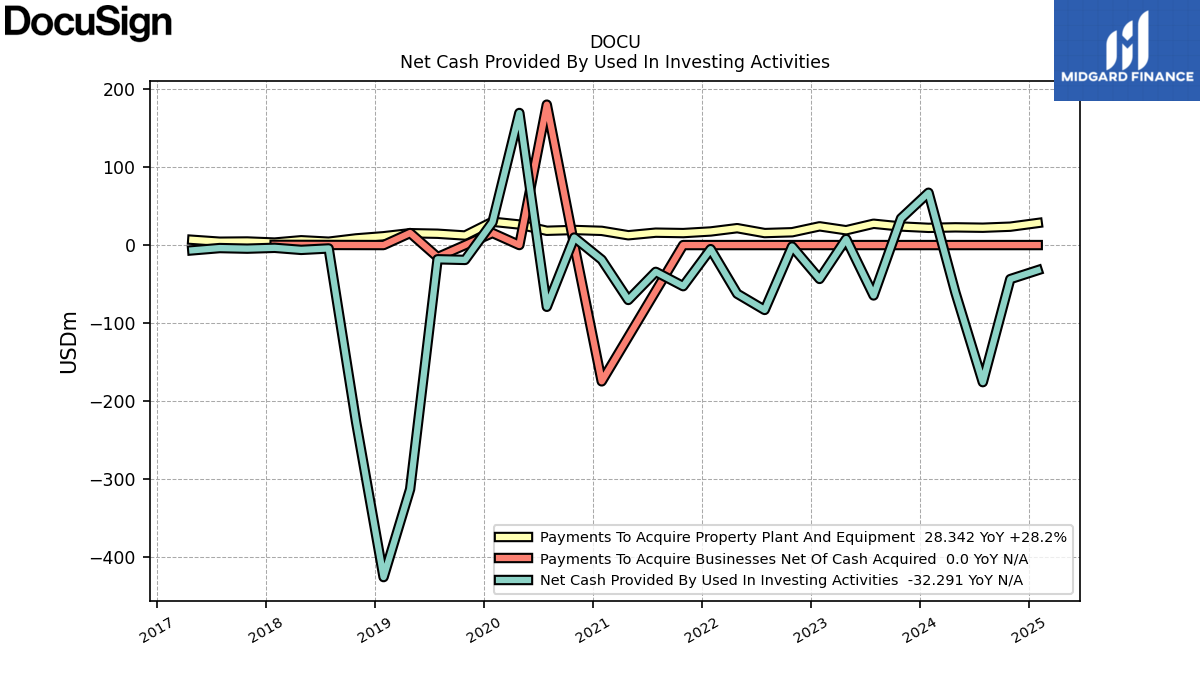
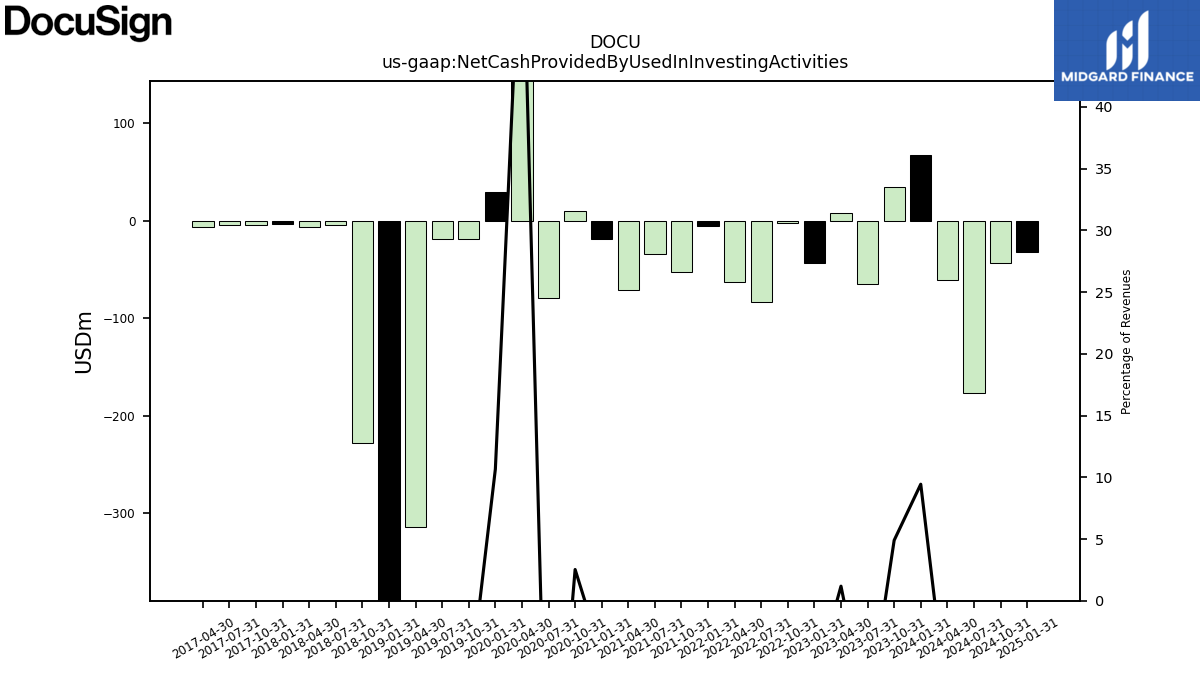
| Net Cash Provided By Used In Investing Activities | -64.72 | 7.81 | -43.50 | -1.84 | -83.34 | -62.51 | -5.22 | -52.81 | -34.37 | -70.51 | -18.84 | 9.69 | -79.30 | 169.67 | 29.31 | -19.07 | -18.24 | -313.49 | -426.45 | -227.35 | -4.34 | -6.18 | -3.54 | -4.60 | -3.85 | -6.77 | |
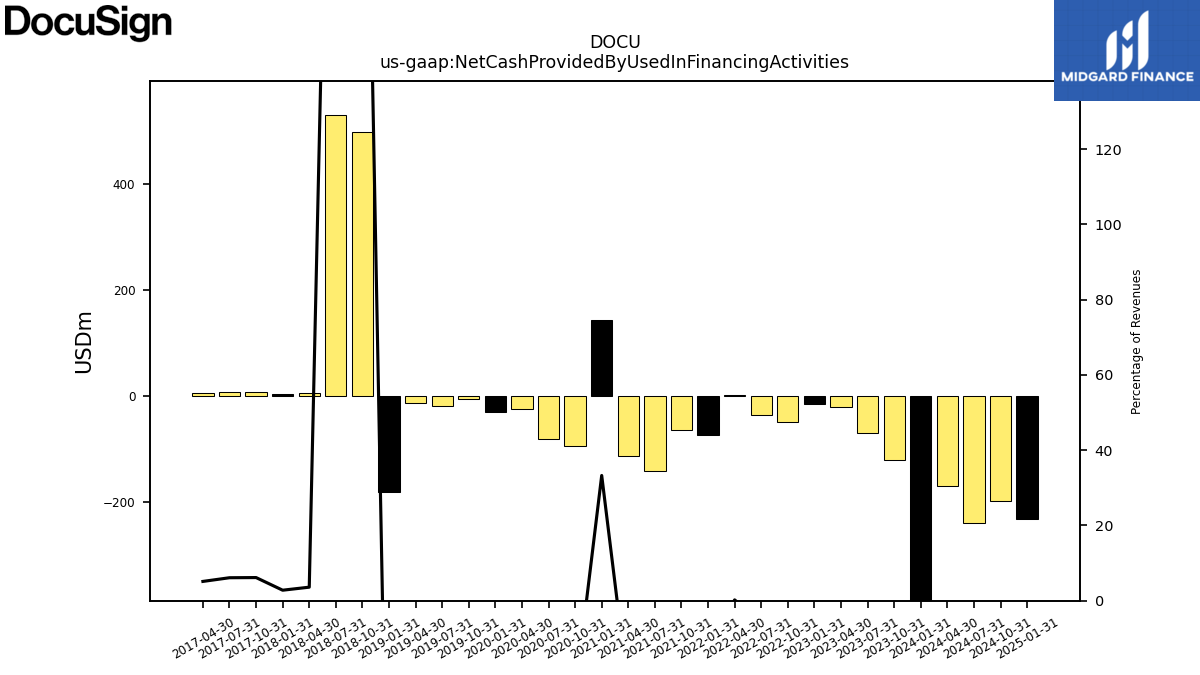
| Net Cash Provided By Used In Financing Activities | -69.35 | -20.90 | -15.61 | -48.54 | -35.45 | 1.35 | -73.93 | -65.39 | -142.35 | -112.95 | 143.46 | -95.20 | -81.73 | -25.50 | -31.30 | -6.19 | -19.65 | -13.32 | -181.06 | 498.07 | 530.48 | 5.62 | 4.17 | 8.05 | 7.68 | 5.83 |
| 2023-07-31 | 2023-04-30 | 2023-01-31 | 2022-10-31 | 2022-07-31 | 2022-04-30 | 2022-01-31 | 2021-10-31 | 2021-07-31 | 2021-04-30 | 2021-01-31 | 2020-10-31 | 2020-07-31 | 2020-04-30 | 2020-01-31 | 2019-10-31 | 2019-07-31 | 2019-04-30 | 2019-01-31 | 2018-10-31 | 2018-07-31 | 2018-04-30 | 2018-01-31 | 2017-10-31 | 2017-07-31 | 2017-04-30 | ||
|---|---|---|---|---|---|---|---|---|---|---|---|---|---|---|---|---|---|---|---|---|---|---|---|---|---|---|---|
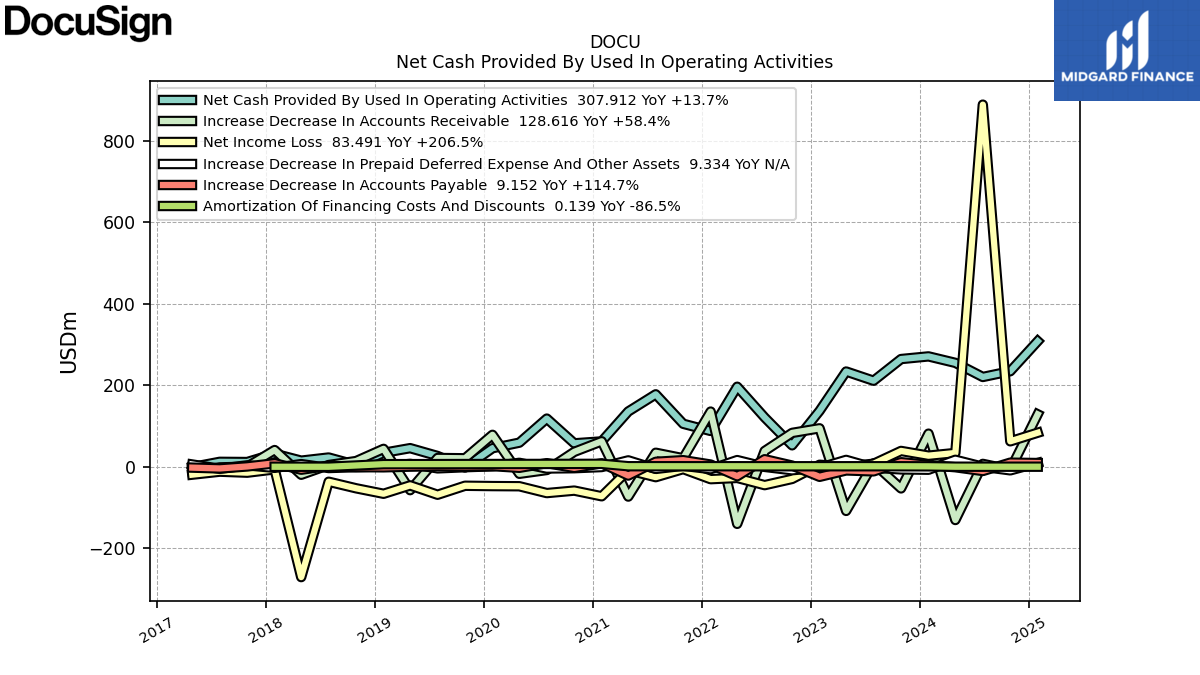
| Net Cash Provided By Used In Operating Activities | 211.02 | 233.63 | 137.06 | 52.54 | 120.88 | 196.29 | 87.79 | 105.41 | 177.67 | 135.60 | 62.23 | 57.44 | 118.13 | 59.14 | 45.51 | -1.87 | 26.41 | 45.66 | 34.14 | 4.26 | 22.70 | 14.99 | 31.96 | 11.62 | 12.10 | -0.70 | |
| Net Income Loss | 7.39 | 0.54 | 4.86 | -29.87 | -45.08 | -27.37 | -30.45 | -5.68 | -25.50 | -8.35 | -72.41 | -58.49 | -64.56 | -47.80 | -47.41 | -46.60 | -68.63 | -45.72 | -66.24 | -52.81 | -36.71 | -270.69 | -6.35 | -14.51 | -12.04 | -19.38 | |
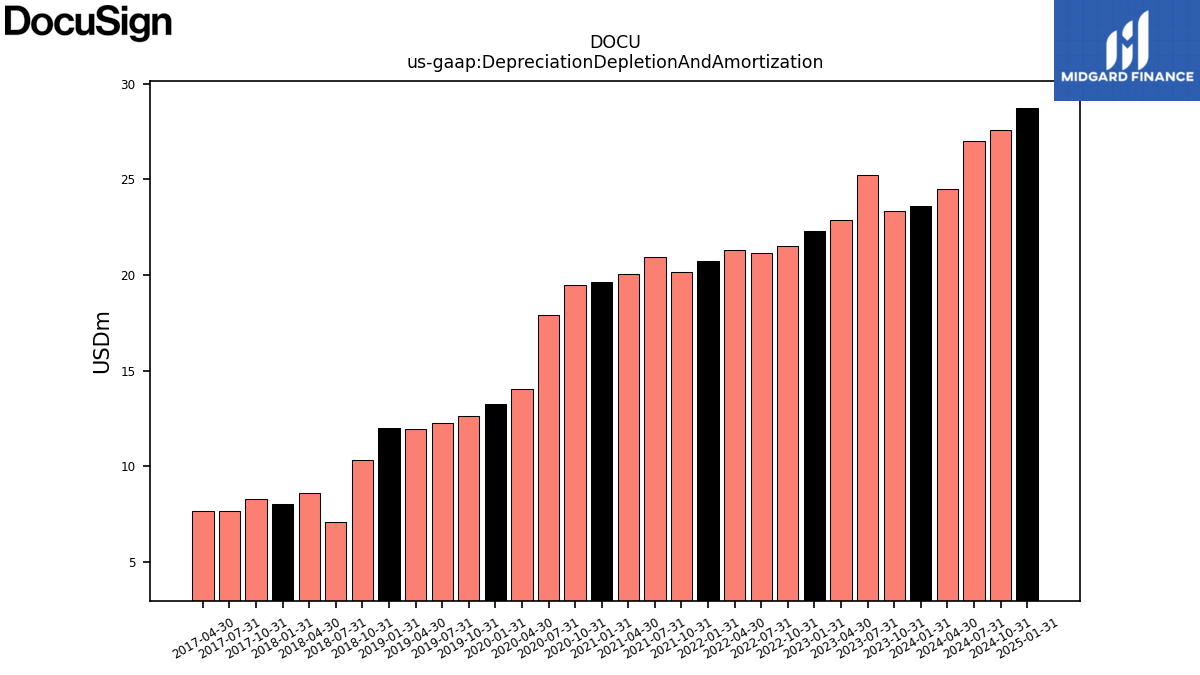
| Depreciation Depletion And Amortization | 25.24 | 22.87 | 22.28 | 21.53 | 21.14 | 21.30 | 20.75 | 20.17 | 20.96 | 20.04 | 19.64 | 19.48 | 17.94 | 14.04 | 13.27 | 12.65 | 12.29 | 11.97 | 12.00 | 10.34 | 7.08 | 8.60 | 8.05 | 8.32 | 7.70 | 7.69 | |
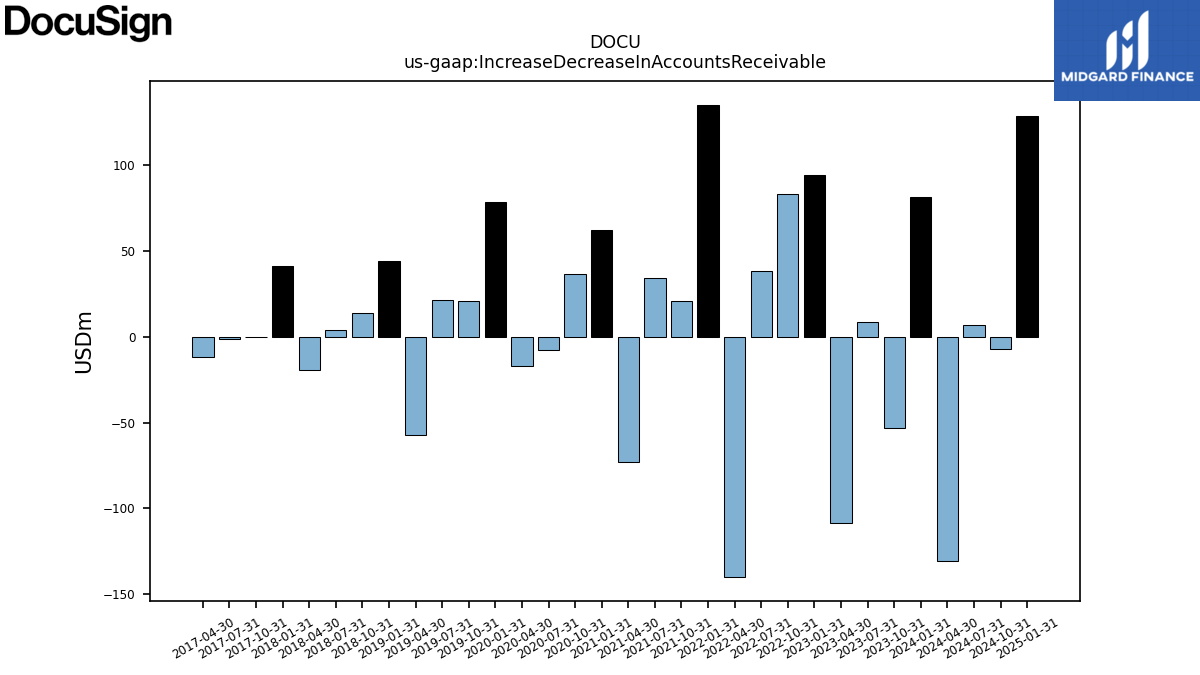
| Increase Decrease In Accounts Receivable | 8.48 | -108.28 | 94.30 | 83.08 | 38.66 | -140.08 | 135.35 | 20.87 | 34.37 | -73.20 | 62.48 | 36.58 | -7.92 | -17.24 | 78.38 | 20.81 | 21.52 | -57.41 | 43.94 | 14.02 | 4.24 | -19.62 | 41.04 | 0.15 | -1.53 | -11.58 | |
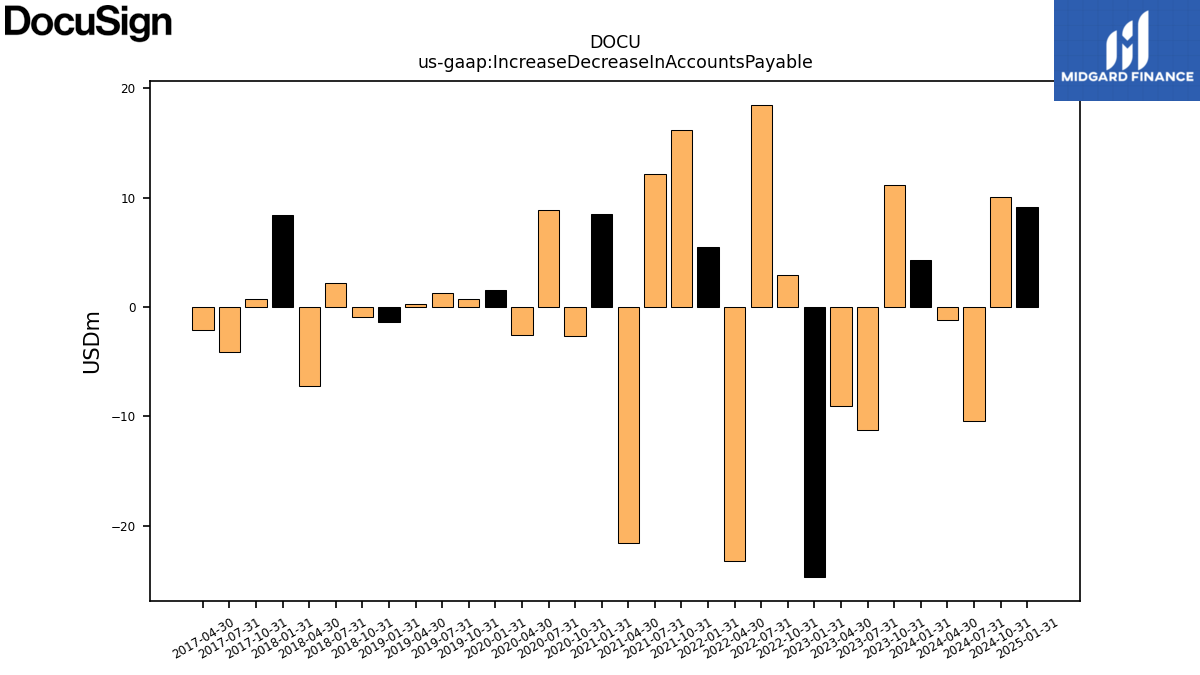
| Increase Decrease In Accounts Payable | -11.27 | -9.02 | -24.70 | 2.95 | 18.51 | -23.20 | 5.45 | 16.15 | 12.15 | -21.59 | 8.47 | -2.62 | 8.83 | -2.55 | 1.54 | 0.72 | 1.31 | 0.28 | -1.39 | -0.96 | 2.18 | -7.22 | 8.41 | 0.73 | -4.15 | -2.12 | |
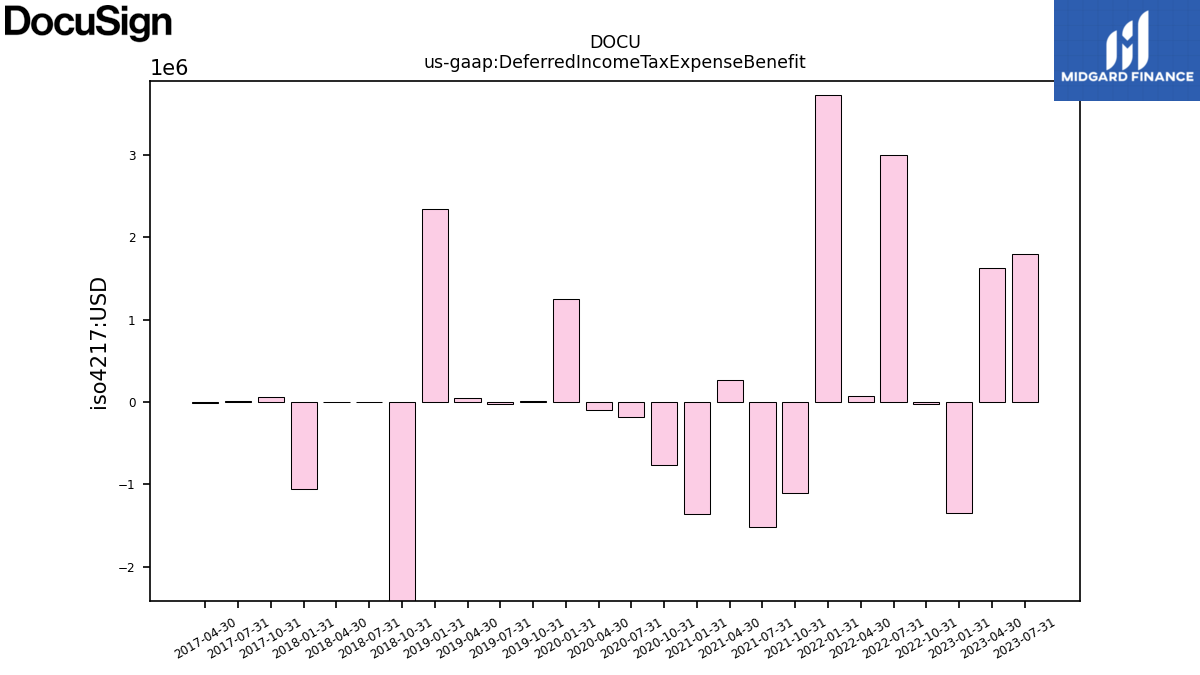
| Deferred Income Tax Expense Benefit | 1.80 | 1.62 | -1.35 | -0.02 | 3.00 | 0.07 | 3.73 | -1.11 | -1.51 | 0.26 | -1.36 | -0.77 | -0.18 | -0.10 | 1.25 | 0.01 | -0.02 | 0.05 | 2.35 | -7.33 | -0.01 | -0.01 | -1.05 | 0.06 | 0.01 | -0.01 |
| 2023-07-31 | 2023-04-30 | 2023-01-31 | 2022-10-31 | 2022-07-31 | 2022-04-30 | 2022-01-31 | 2021-10-31 | 2021-07-31 | 2021-04-30 | 2021-01-31 | 2020-10-31 | 2020-07-31 | 2020-04-30 | 2020-01-31 | 2019-10-31 | 2019-07-31 | 2019-04-30 | 2019-01-31 | 2018-10-31 | 2018-07-31 | 2018-04-30 | 2018-01-31 | 2017-10-31 | 2017-07-31 | 2017-04-30 | ||
|---|---|---|---|---|---|---|---|---|---|---|---|---|---|---|---|---|---|---|---|---|---|---|---|---|---|---|---|
| Net Cash Provided By Used In Investing Activities | -64.72 | 7.81 | -43.50 | -1.84 | -83.34 | -62.51 | -5.22 | -52.81 | -34.37 | -70.51 | -18.84 | 9.69 | -79.30 | 169.67 | 29.31 | -19.07 | -18.24 | -313.49 | -426.45 | -227.35 | -4.34 | -6.18 | -3.54 | -4.60 | -3.85 | -6.77 | |
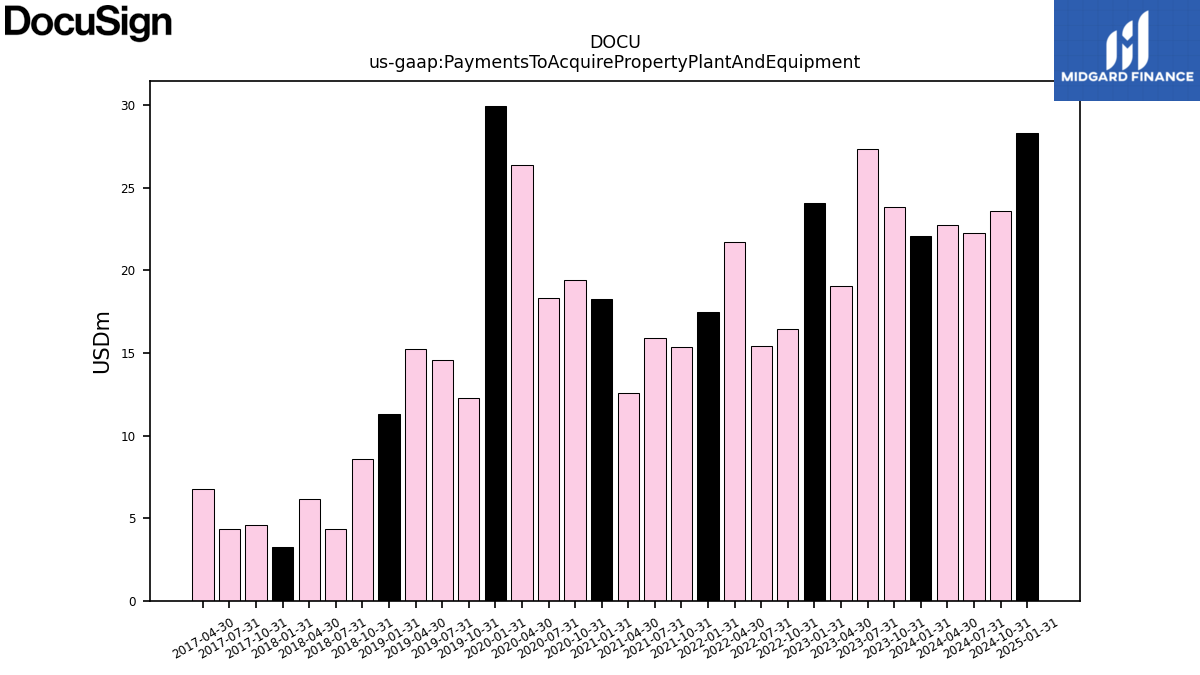
| Payments To Acquire Property Plant And Equipment | 27.38 | 19.06 | 24.06 | 16.48 | 15.40 | 21.71 | 17.47 | 15.39 | 15.94 | 12.60 | 18.25 | 19.39 | 18.36 | 26.39 | 29.98 | 12.28 | 14.55 | 15.24 | 11.32 | 8.58 | 4.34 | 6.18 | 3.24 | 4.60 | 4.32 | 6.77 |
| 2023-07-31 | 2023-04-30 | 2023-01-31 | 2022-10-31 | 2022-07-31 | 2022-04-30 | 2022-01-31 | 2021-10-31 | 2021-07-31 | 2021-04-30 | 2021-01-31 | 2020-10-31 | 2020-07-31 | 2020-04-30 | 2020-01-31 | 2019-10-31 | 2019-07-31 | 2019-04-30 | 2019-01-31 | 2018-10-31 | 2018-07-31 | 2018-04-30 | 2018-01-31 | 2017-10-31 | 2017-07-31 | 2017-04-30 | ||
|---|---|---|---|---|---|---|---|---|---|---|---|---|---|---|---|---|---|---|---|---|---|---|---|---|---|---|---|
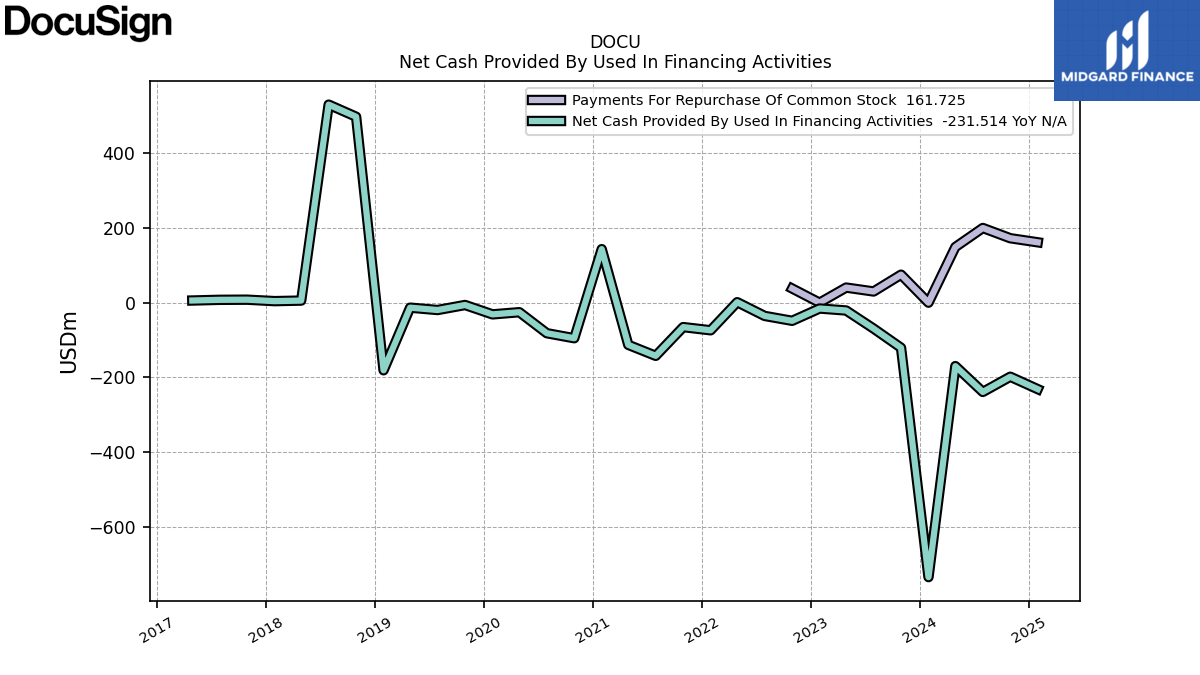
| Net Cash Provided By Used In Financing Activities | -69.35 | -20.90 | -15.61 | -48.54 | -35.45 | 1.35 | -73.93 | -65.39 | -142.35 | -112.95 | 143.46 | -95.20 | -81.73 | -25.50 | -31.30 | -6.19 | -19.65 | -13.32 | -181.06 | 498.07 | 530.48 | 5.62 | 4.17 | 8.05 | 7.68 | 5.83 | |
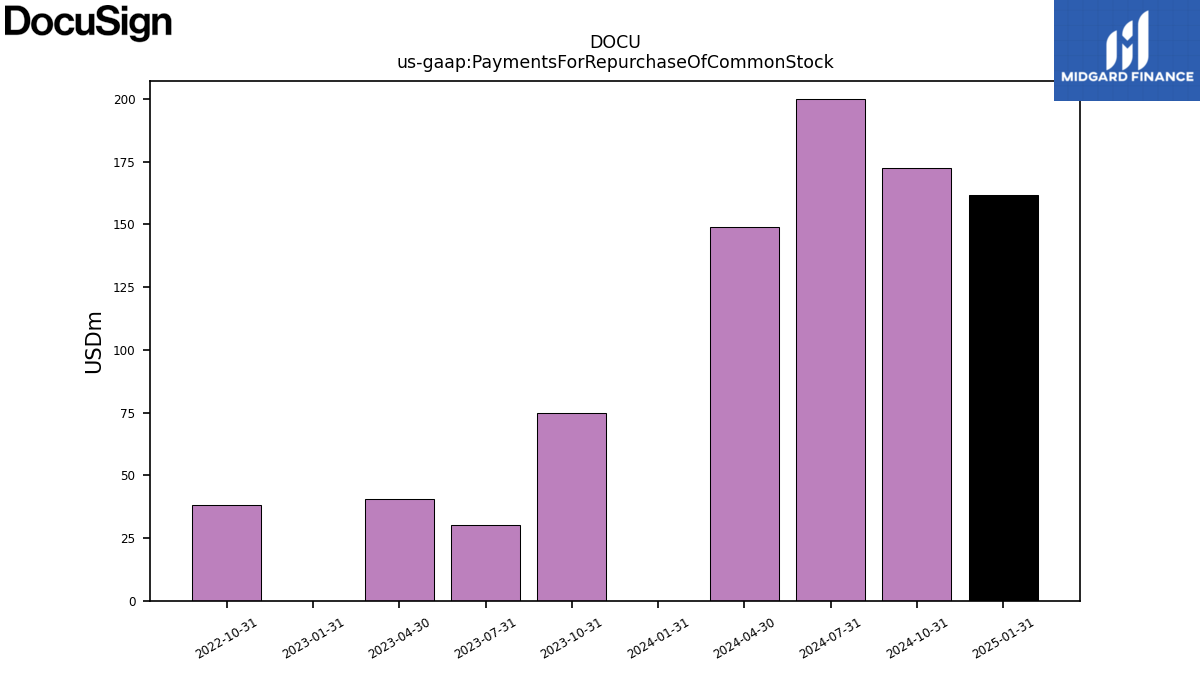
| Payments For Repurchase Of Common Stock | 30.01 | 40.47 | 0.00 | 38.03 | NA | NA | NA | NA | NA | NA | NA | NA | NA | NA | NA | NA | NA | NA | NA | NA | NA | NA | NA | NA | NA | NA |
| 2023-07-31 | 2023-04-30 | 2023-01-31 | 2022-10-31 | 2022-07-31 | 2022-04-30 | 2022-01-31 | 2021-10-31 | 2021-07-31 | 2021-04-30 | 2021-01-31 | 2020-10-31 | 2020-07-31 | 2020-04-30 | 2020-01-31 | 2019-10-31 | 2019-07-31 | 2019-04-30 | 2019-01-31 | 2018-10-31 | 2018-07-31 | 2018-04-30 | 2018-01-31 | 2017-10-31 | 2017-07-31 | 2017-04-30 | ||
|---|---|---|---|---|---|---|---|---|---|---|---|---|---|---|---|---|---|---|---|---|---|---|---|---|---|---|---|
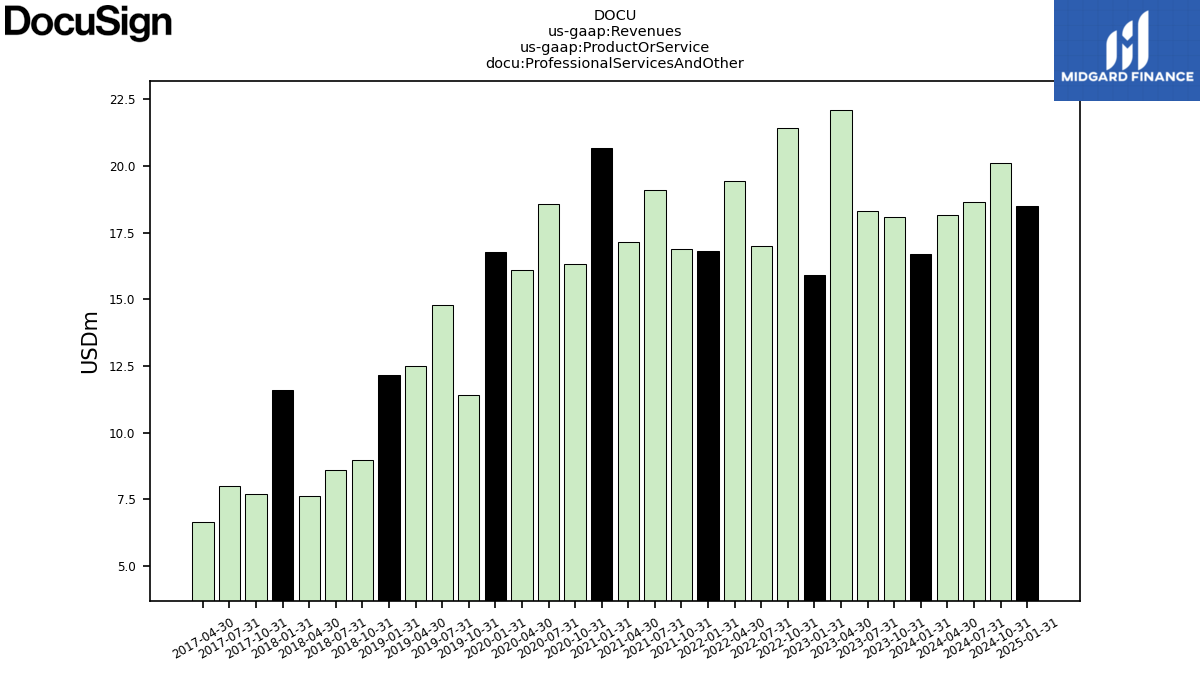
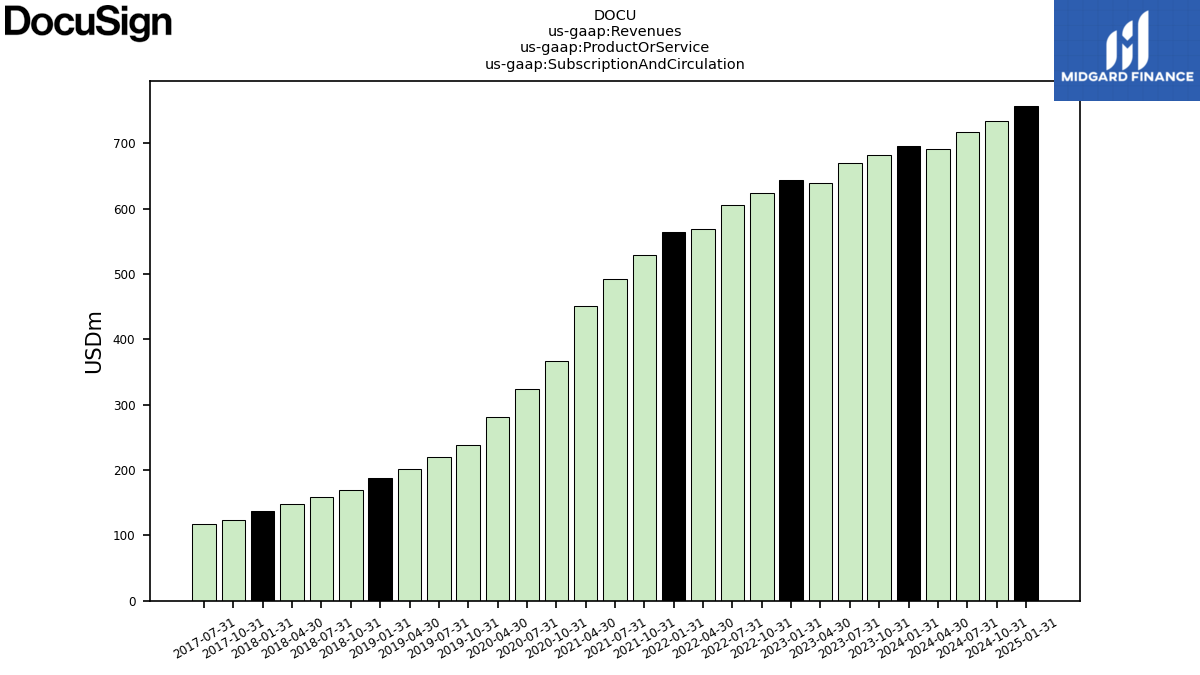
| Revenues | 687.69 | 661.39 | 659.58 | 645.46 | 622.18 | 588.69 | 580.83 | 545.46 | 511.84 | 469.08 | 430.90 | 382.92 | 342.21 | 297.02 | 274.89 | 249.50 | 235.61 | 213.96 | 199.73 | 178.38 | 167.04 | 155.81 | 148.87 | 130.59 | 125.54 | 113.50 | |
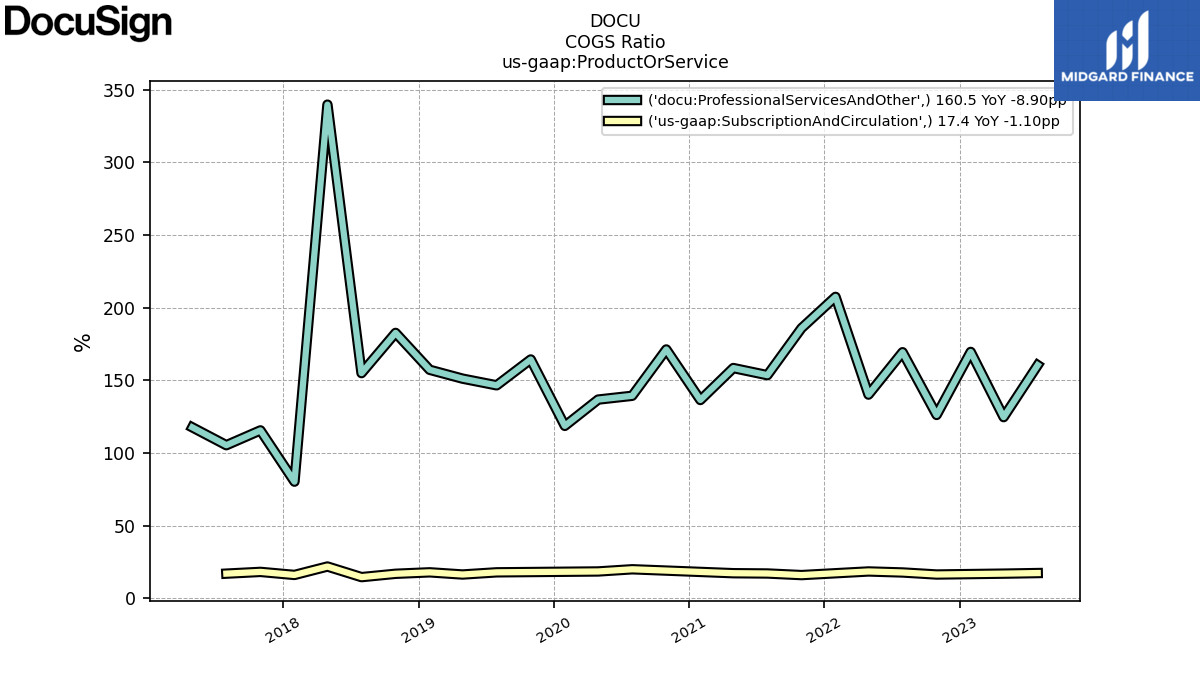
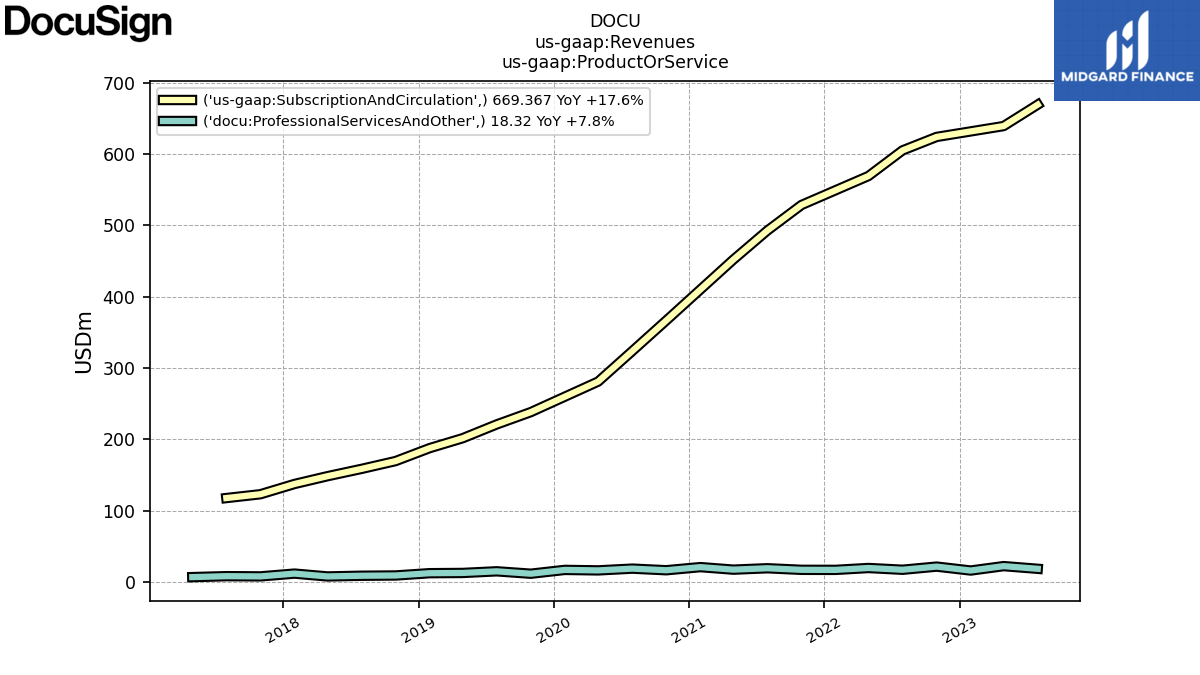
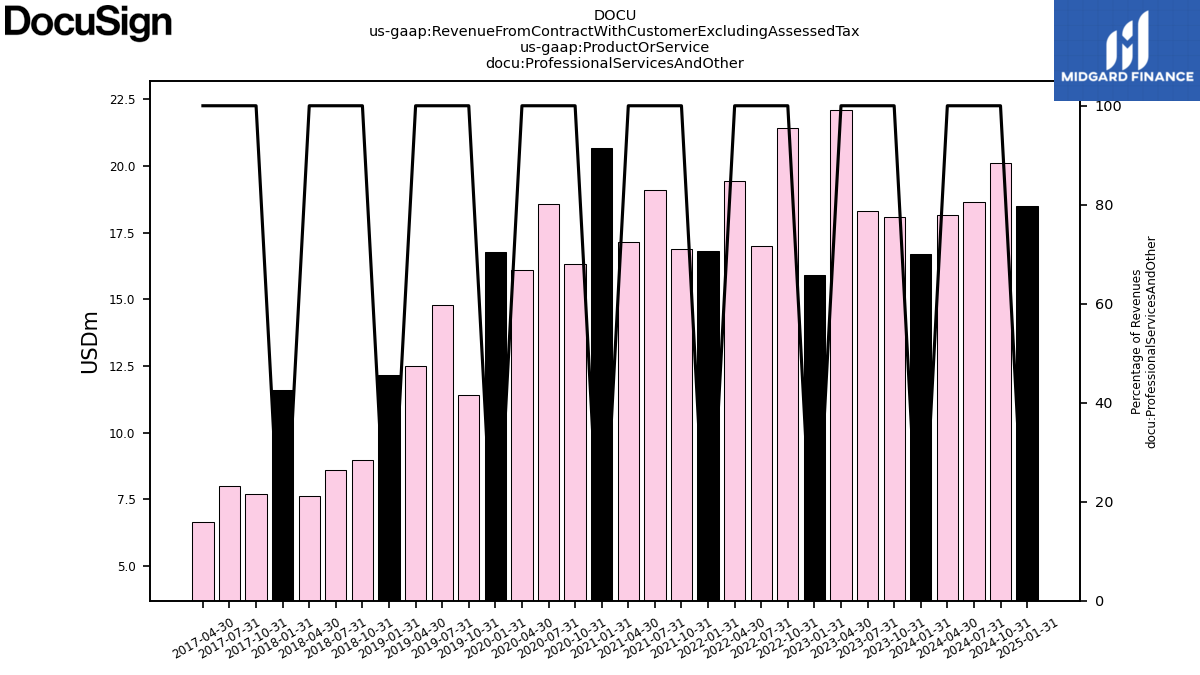
| Professional Services And Other | 18.32 | 22.08 | 15.90 | 21.41 | 16.99 | 19.44 | 16.82 | 16.89 | 19.09 | 17.14 | 20.68 | 16.31 | 18.57 | 16.09 | 16.77 | 11.43 | 14.80 | 12.50 | 12.16 | 8.96 | 8.58 | 7.61 | 11.60 | 7.68 | 7.99 | 6.65 | |
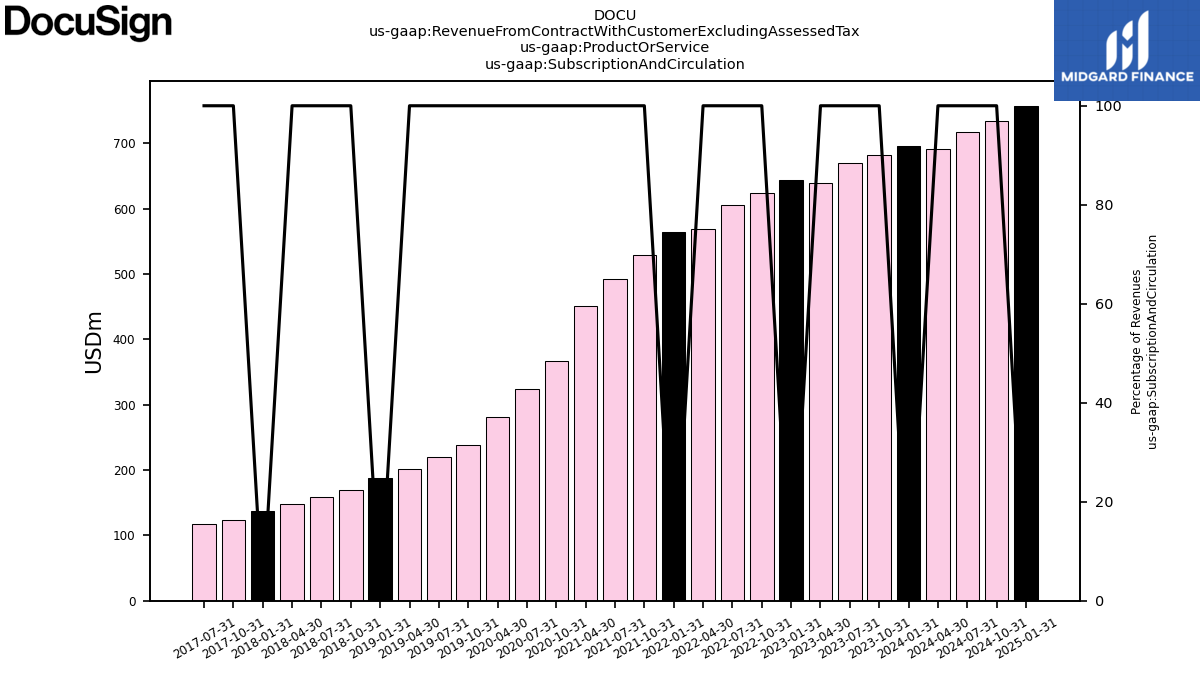
| Subscription And Circulation | 669.37 | 639.31 | NA | 624.05 | 605.19 | 569.25 | NA | 528.57 | 492.76 | 451.94 | NA | 366.62 | 323.64 | 280.92 | NA | 238.07 | 220.81 | 201.46 | 187.57 | 169.43 | 158.46 | 148.20 | 137.28 | 122.91 | 117.55 | NA | |
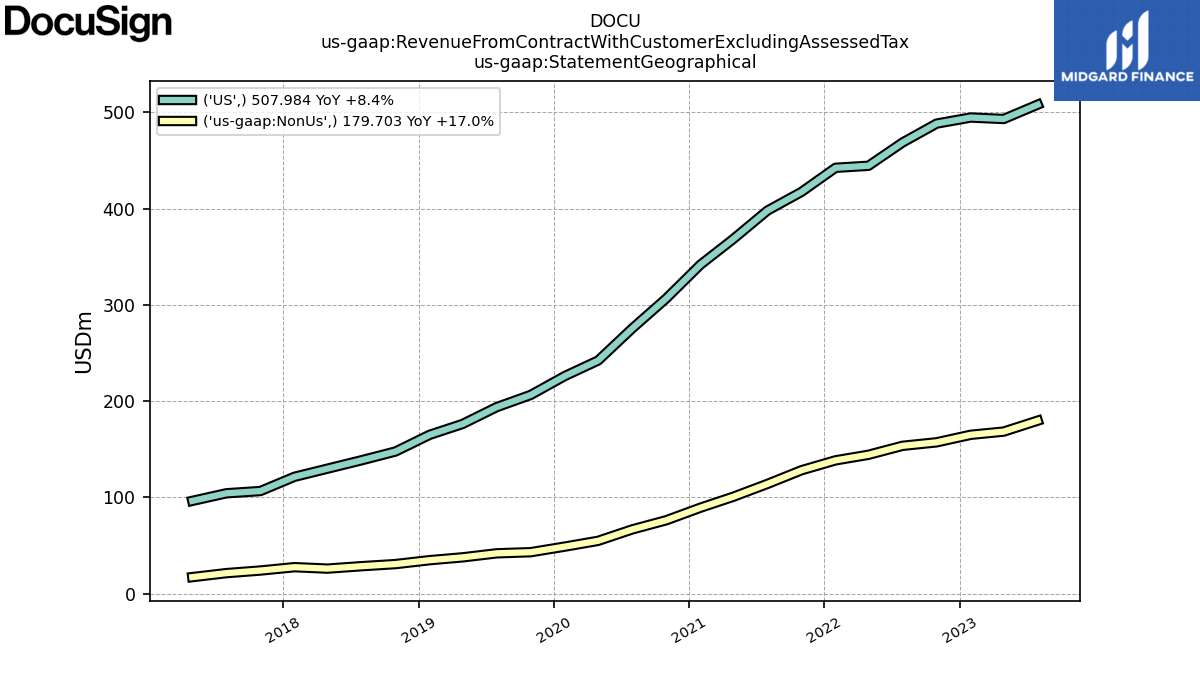
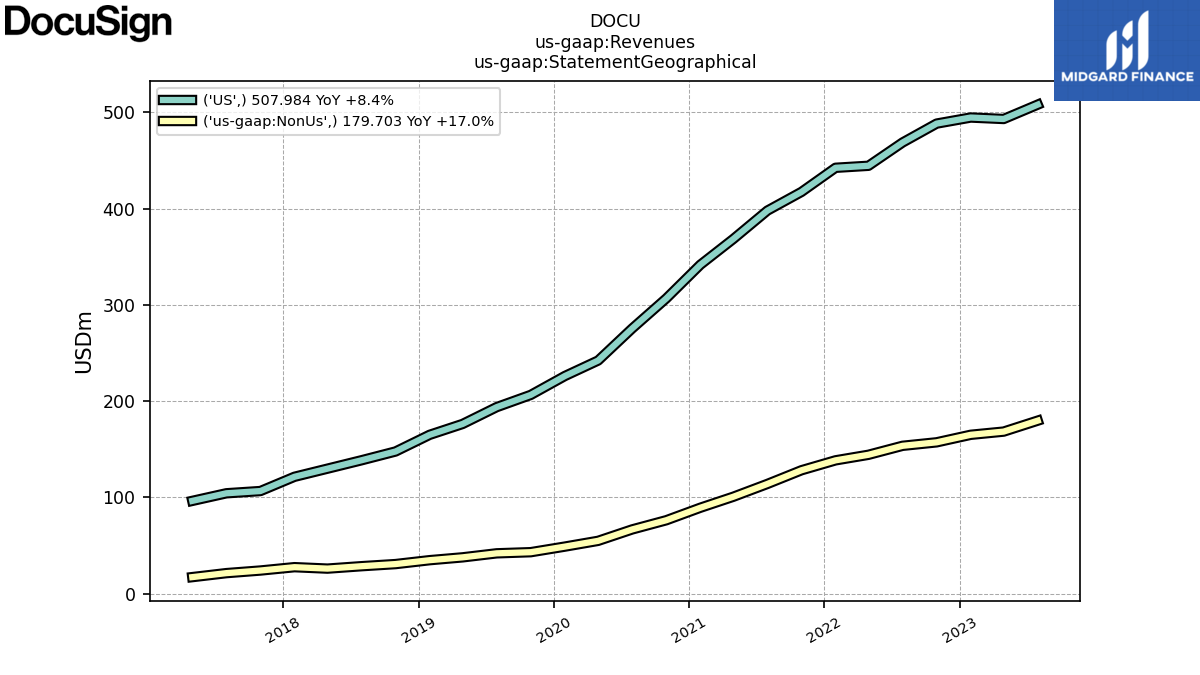
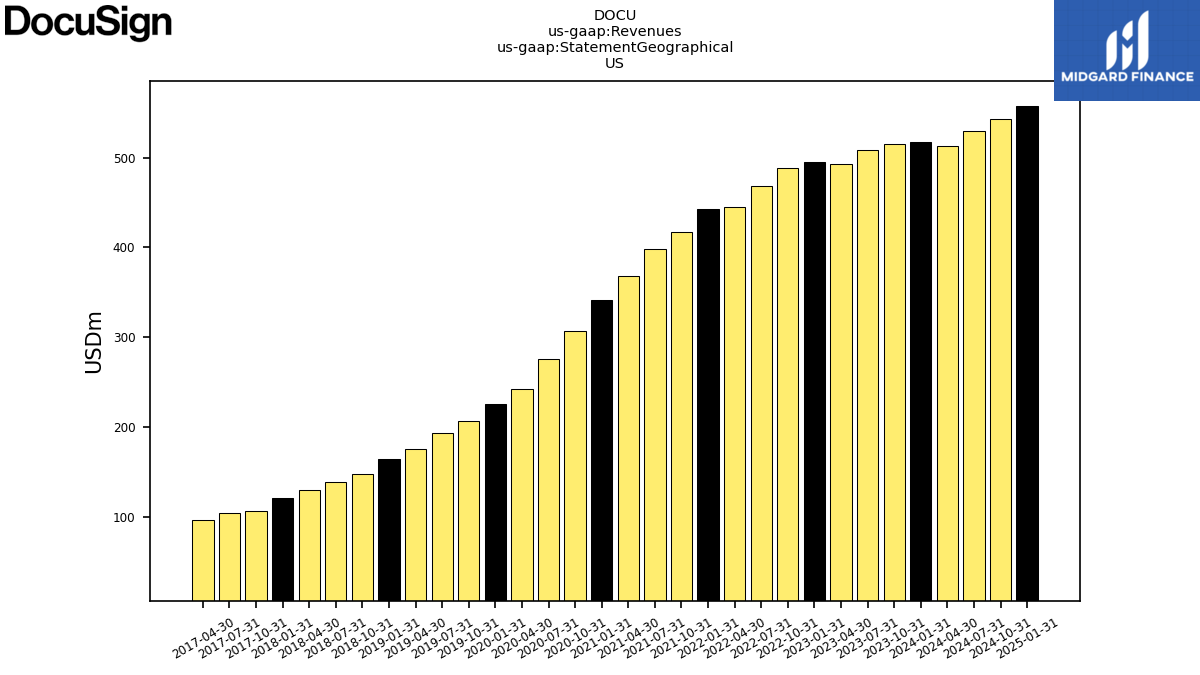
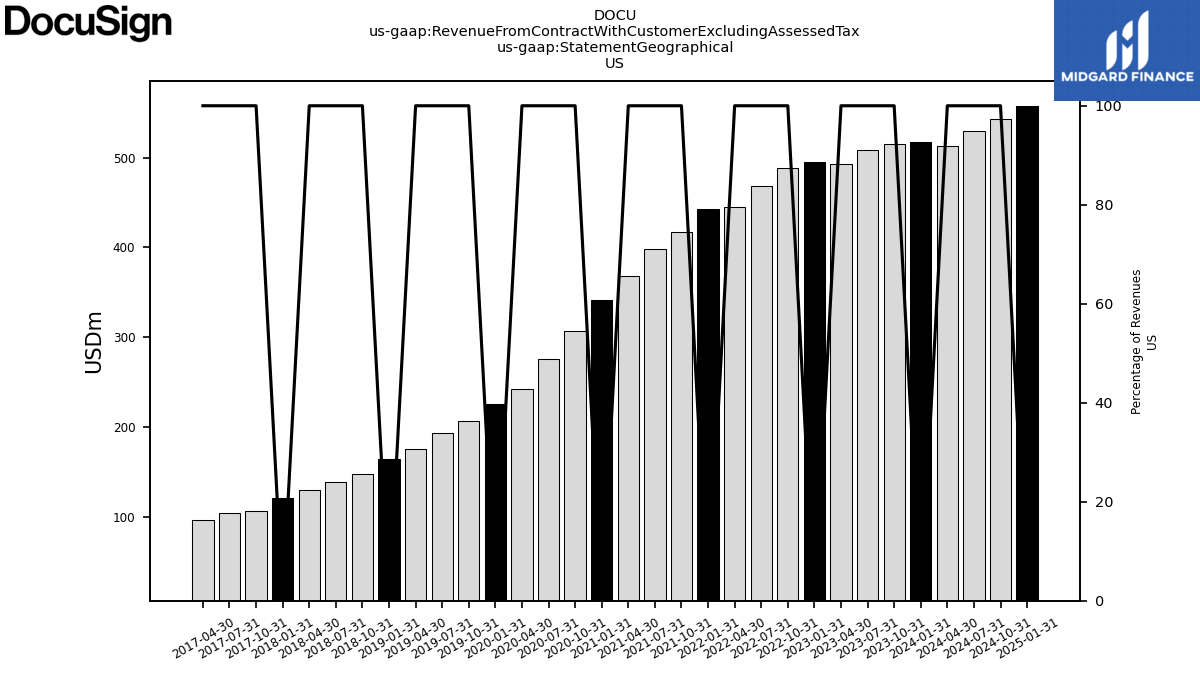
| US | 507.98 | 493.06 | 494.58 | 488.28 | 468.62 | 444.45 | 442.37 | 417.30 | 397.88 | 368.42 | 341.66 | 306.68 | 275.49 | 242.17 | 226.04 | 206.44 | 193.74 | 176.27 | 164.98 | 147.68 | 138.54 | 129.81 | 121.39 | 106.58 | 104.24 | 96.34 | |
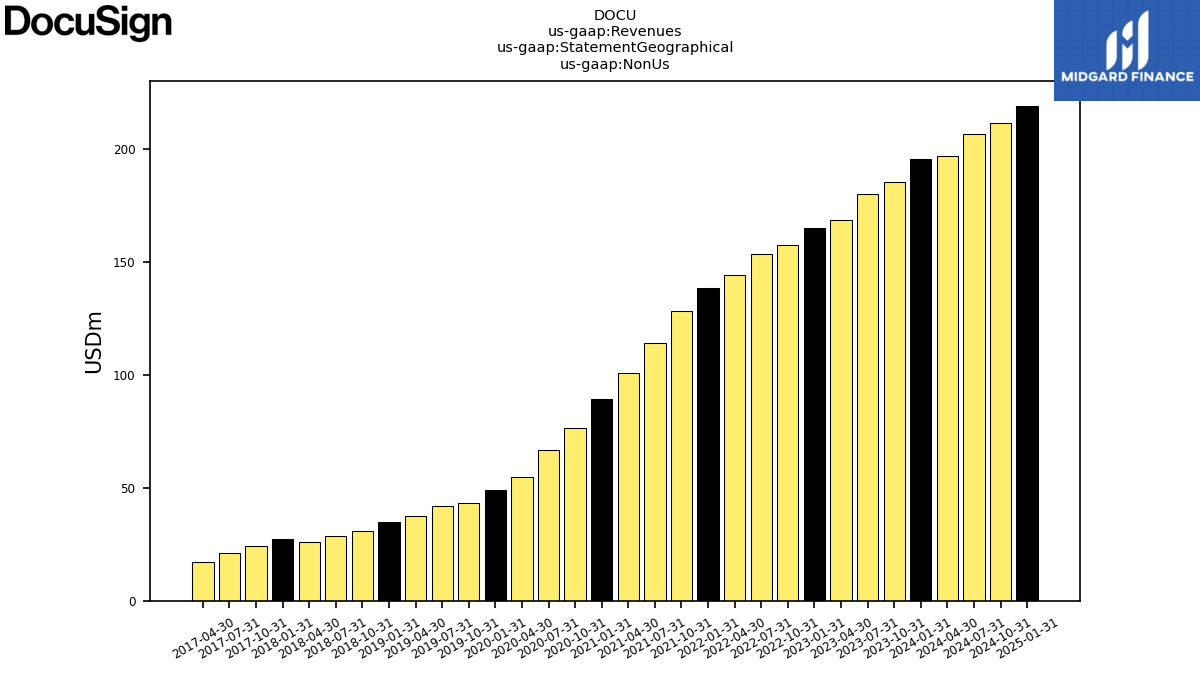
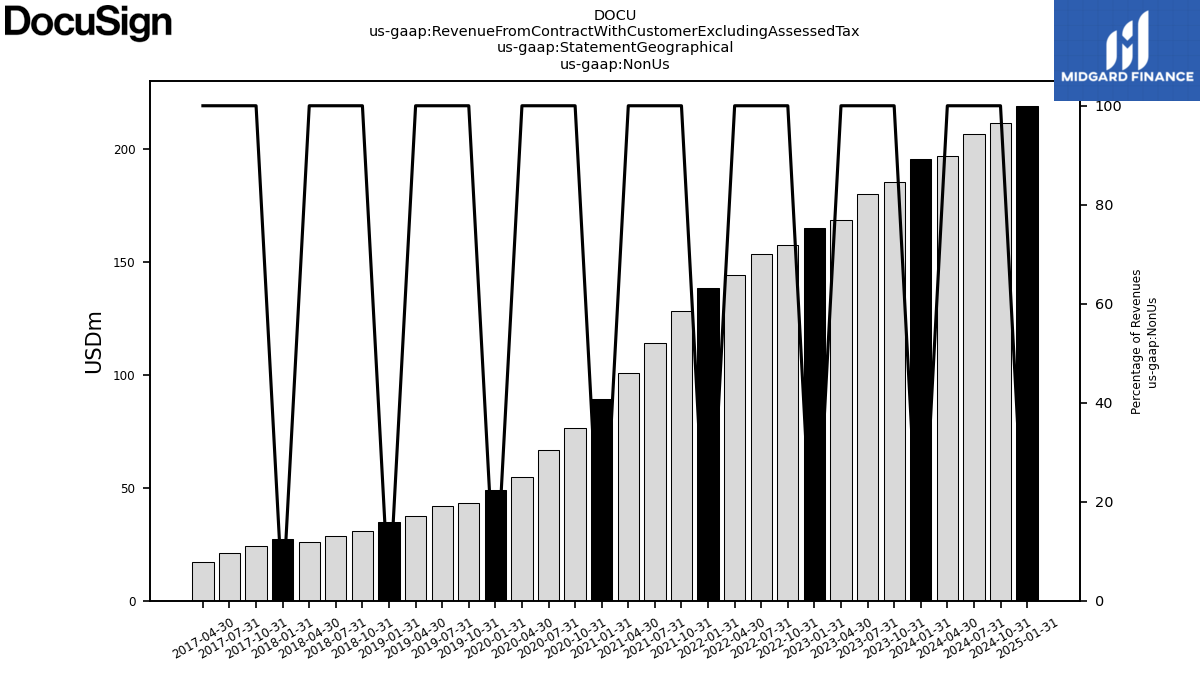
| Non Us | 179.70 | 168.33 | 165.00 | 157.18 | 153.56 | 144.24 | 138.46 | 128.17 | 113.96 | 100.66 | 89.24 | 76.24 | 66.72 | 54.85 | 48.86 | 43.06 | 41.88 | 37.70 | 34.76 | 30.71 | 28.50 | 25.99 | 27.49 | 24.01 | 21.30 | 17.15 | |
| Revenue From Contract With Customer Excluding Assessed Tax | 687.69 | 661.39 | 659.58 | 645.46 | 622.18 | 588.69 | 580.83 | 545.46 | 511.84 | 469.08 | 430.90 | 382.92 | 342.21 | 297.02 | 274.89 | 249.50 | 235.61 | 213.96 | 199.73 | 178.38 | 167.04 | 155.81 | 148.87 | 130.59 | 125.54 | 113.50 | |
| Professional Services And Other | 18.32 | 22.08 | 15.90 | 21.41 | 16.99 | 19.44 | 16.82 | 16.89 | 19.09 | 17.14 | 20.68 | 16.31 | 18.57 | 16.09 | 16.77 | 11.43 | 14.80 | 12.50 | 12.16 | 8.96 | 8.58 | 7.61 | 11.60 | 7.68 | 7.99 | 6.65 | |
| Subscription And Circulation | 669.37 | 639.31 | NA | 624.05 | 605.19 | 569.25 | NA | 528.57 | 492.76 | 451.94 | NA | 366.62 | 323.64 | 280.92 | NA | 238.07 | 220.81 | 201.46 | 187.57 | 169.43 | 158.46 | 148.20 | 137.28 | 122.91 | 117.55 | NA | |
| US | 507.98 | 493.06 | 494.58 | 488.28 | 468.62 | 444.45 | 442.37 | 417.30 | 397.88 | 368.42 | 341.66 | 306.68 | 275.49 | 242.17 | 226.04 | 206.44 | 193.74 | 176.27 | 164.98 | 147.68 | 138.54 | 129.81 | 121.39 | 106.58 | 104.24 | 96.34 | |
| Non Us | 179.70 | 168.33 | 165.00 | 157.18 | 153.56 | 144.24 | 138.46 | 128.17 | 113.96 | 100.66 | 89.24 | 76.24 | 66.72 | 54.85 | 48.86 | 43.06 | 41.88 | 37.70 | 34.76 | 30.71 | 28.50 | 25.99 | 27.49 | 24.01 | 21.30 | 17.15 |


