
| 2023-10-01 | 2023-07-02 | 2023-04-02 | 2023-01-01 | 2022-10-02 | 2022-07-03 | 2022-04-03 | 2022-01-02 | 2021-10-03 | 2021-07-04 | 2021-04-04 | 2021-01-03 | 2020-09-27 | 2020-06-28 | 2020-03-29 | 2019-12-29 | 2019-09-29 | 2019-06-30 | 2019-03-31 | 2018-12-30 | 2018-09-30 | 2018-07-01 | 2018-04-01 | 2017-12-31 | 2017-10-01 | 2017-07-02 | 2017-04-02 | 2017-01-01 | 2016-10-02 | 2016-07-03 | 2016-04-03 | 2016-01-03 | 2015-09-27 | 2015-06-28 | 2015-03-29 | 2014-12-28 | 2014-09-28 | 2014-06-29 | 2014-03-30 | 2013-12-29 | 2013-09-29 | 2013-06-30 | 2013-03-31 | 2012-12-30 | 2012-09-30 | 2012-07-01 | 2012-04-01 | ||
|---|---|---|---|---|---|---|---|---|---|---|---|---|---|---|---|---|---|---|---|---|---|---|---|---|---|---|---|---|---|---|---|---|---|---|---|---|---|---|---|---|---|---|---|---|---|---|---|---|
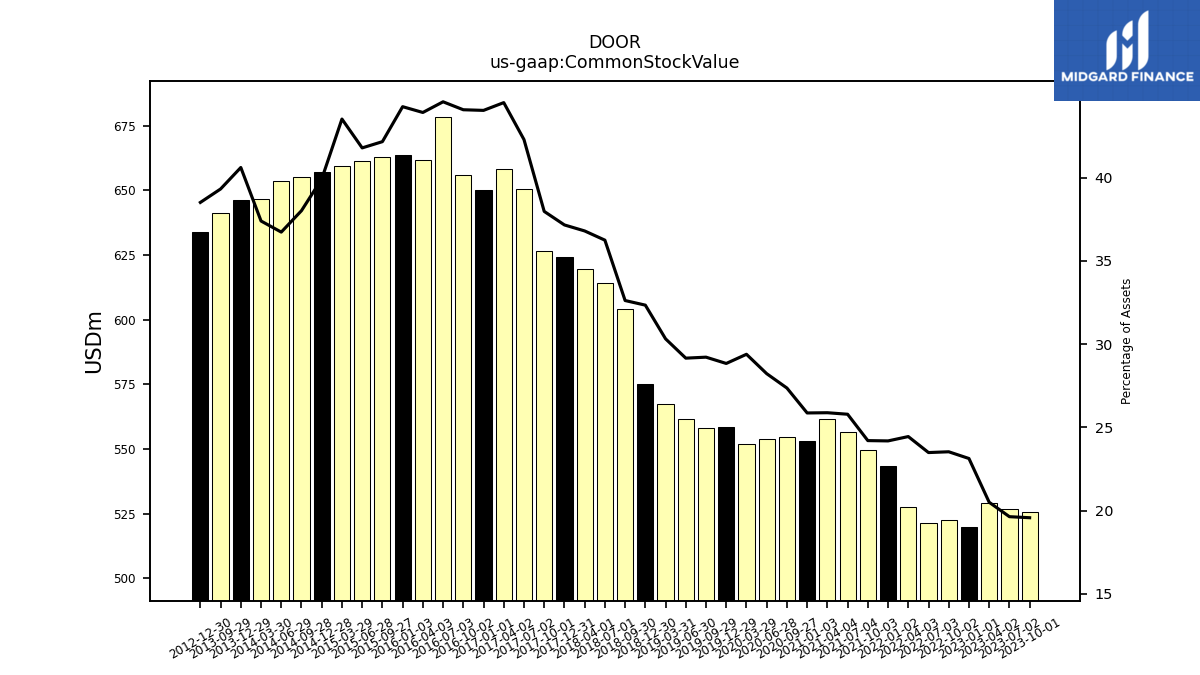
| Common Stock Value | 525.71 | 526.82 | 529.16 | 520.00 | 522.58 | 521.24 | 527.39 | 543.40 | 549.47 | 556.40 | 561.78 | 552.97 | 554.67 | 553.77 | 551.98 | 558.51 | 558.03 | 561.54 | 567.49 | 575.21 | 603.97 | 614.37 | 619.55 | 624.40 | 626.68 | 650.41 | 658.16 | 650.01 | 656.05 | 678.41 | 661.60 | 663.60 | 662.77 | 661.36 | 659.30 | 657.29 | 655.15 | 653.65 | 646.87 | 646.20 | 641.31 | NA | NA | 633.91 | NA | NA | NA | |
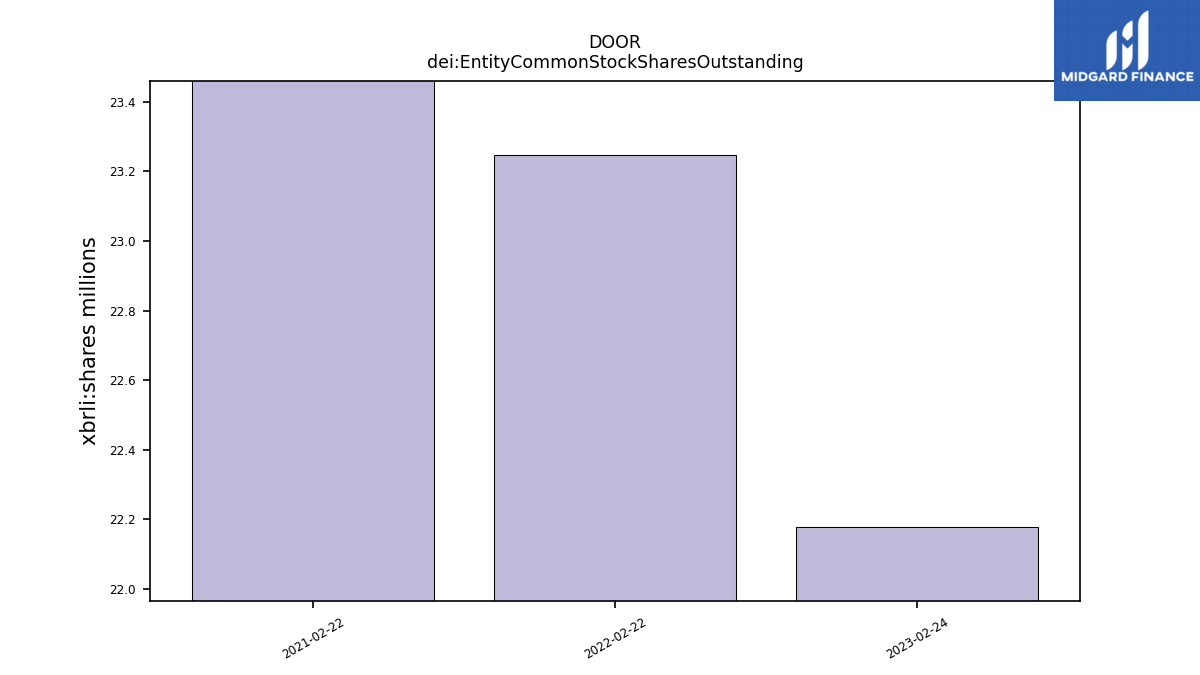
| dei: Entity Common Stock Shares Outstanding | NA | NA | NA | NA | NA | NA | NA | NA | NA | NA | NA | NA | NA | NA | NA | NA | NA | NA | NA | NA | NA | NA | NA | NA | NA | NA | NA | NA | NA | NA | NA | NA | NA | NA | NA | NA | NA | NA | NA | NA | NA | NA | NA | NA | NA | NA | NA | |
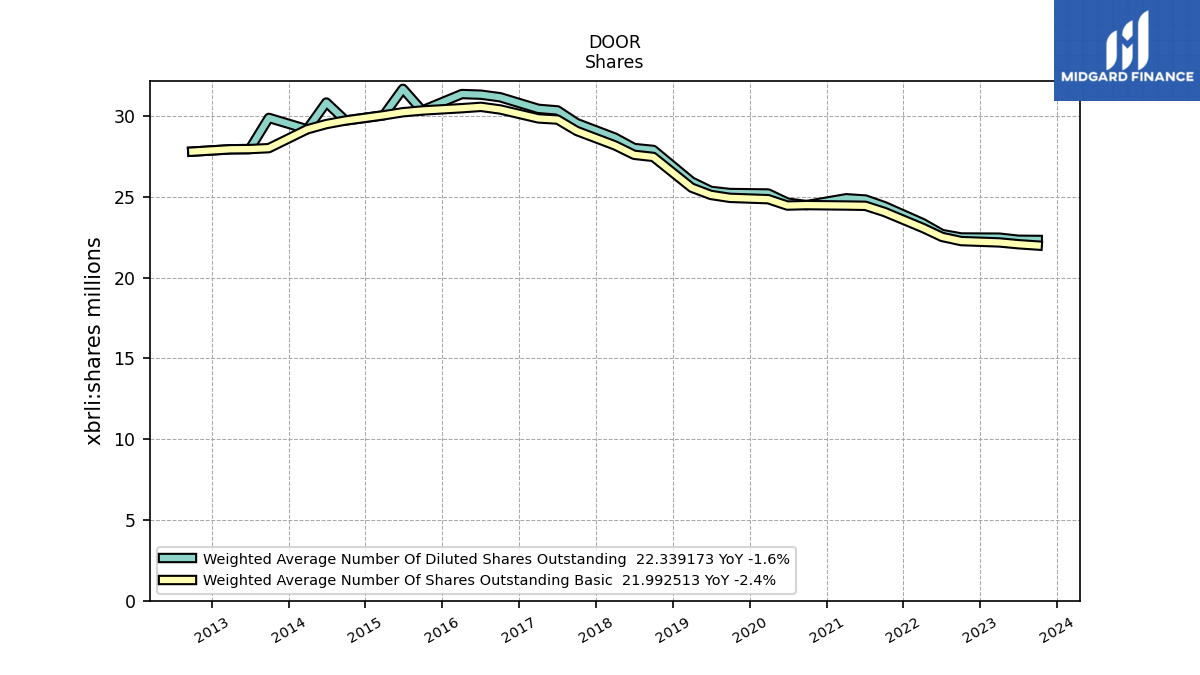
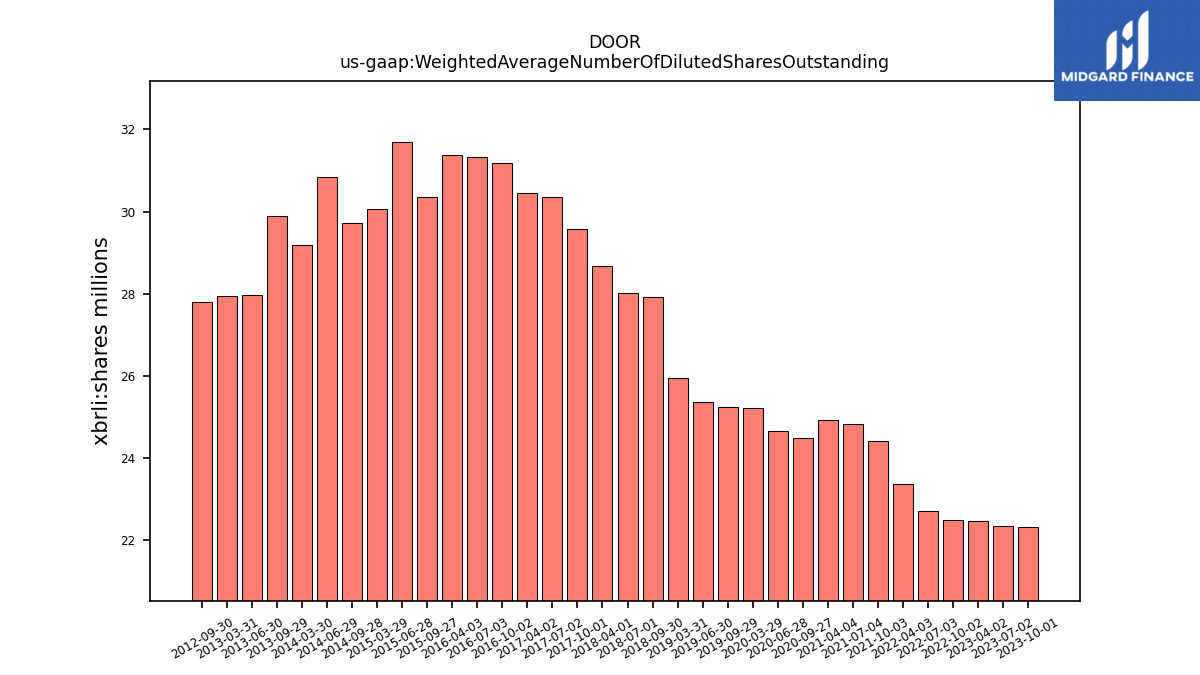
| Weighted Average Number Of Diluted Shares Outstanding | 22.34 | 22.35 | 22.48 | NA | 22.49 | 22.70 | 23.38 | NA | 24.43 | 24.84 | 24.92 | NA | 24.50 | 24.65 | 25.21 | NA | 25.24 | 25.38 | 25.95 | NA | 27.91 | 28.03 | 28.67 | NA | 29.57 | 30.36 | 30.45 | NA | 31.17 | 31.33 | 31.37 | NA | 30.35 | 31.69 | 30.06 | NA | 29.73 | 30.85 | 29.19 | NA | 29.90 | 27.96 | 27.95 | NA | 27.81 | NA | NA | |
| Weighted Average Number Of Shares Outstanding Basic | 21.99 | 22.07 | 22.18 | NA | 22.27 | 22.53 | 23.08 | NA | 24.07 | 24.45 | 24.47 | NA | 24.50 | 24.47 | 24.86 | NA | 24.94 | 25.13 | 25.57 | NA | 27.48 | 27.61 | 28.19 | NA | 29.09 | 29.79 | 29.86 | NA | 30.42 | 30.58 | 30.49 | NA | 30.35 | 30.24 | 30.06 | NA | 29.73 | 29.51 | 29.19 | NA | 28.02 | 27.96 | 27.95 | NA | 27.81 | NA | NA | |
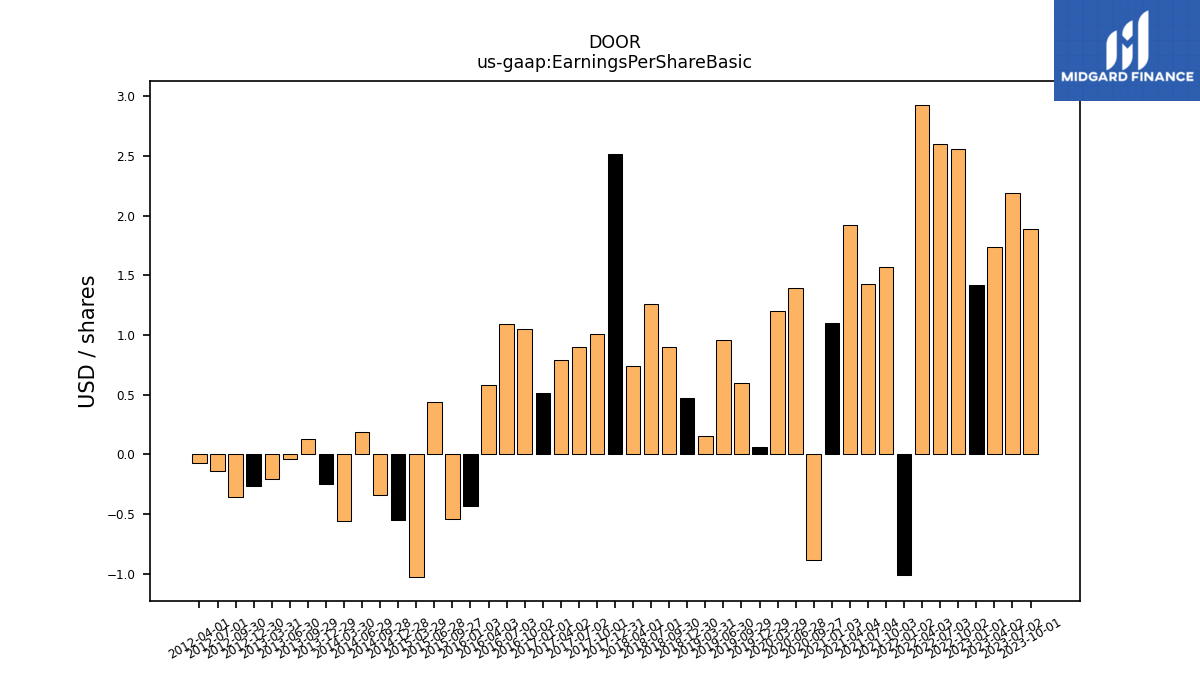
| Earnings Per Share Basic | 1.89 | 2.19 | 1.74 | 1.42 | 2.56 | 2.60 | 2.93 | -1.01 | 1.57 | 1.43 | 1.92 | 1.10 | -0.89 | 1.39 | 1.20 | 0.06 | 0.60 | 0.96 | 0.15 | 0.47 | 0.90 | 1.26 | 0.74 | 2.52 | 1.01 | 0.90 | 0.79 | 0.51 | 1.05 | 1.09 | 0.58 | -0.43 | -0.54 | 0.44 | -1.03 | -0.55 | -0.34 | 0.19 | -0.56 | -0.25 | 0.13 | -0.04 | -0.21 | -0.27 | -0.36 | -0.14 | -0.07 | |
| Earnings Per Share Diluted | 1.86 | 2.16 | 1.71 | 1.40 | 2.54 | 2.58 | 2.89 | -0.99 | 1.54 | 1.41 | 1.89 | 1.08 | -0.89 | 1.38 | 1.19 | 0.06 | 0.59 | 0.96 | 0.15 | 0.46 | 0.89 | 1.24 | 0.73 | 2.48 | 1.00 | 0.89 | 0.77 | 0.50 | 1.03 | 1.06 | 0.57 | -0.43 | -0.54 | 0.42 | -1.03 | -0.55 | -0.34 | 0.18 | -0.56 | -0.25 | 0.12 | -0.04 | -0.21 | -0.27 | -0.36 | -0.14 | -0.07 |
| 2023-10-01 | 2023-07-02 | 2023-04-02 | 2023-01-01 | 2022-10-02 | 2022-07-03 | 2022-04-03 | 2022-01-02 | 2021-10-03 | 2021-07-04 | 2021-04-04 | 2021-01-03 | 2020-09-27 | 2020-06-28 | 2020-03-29 | 2019-12-29 | 2019-09-29 | 2019-06-30 | 2019-03-31 | 2018-12-30 | 2018-09-30 | 2018-07-01 | 2018-04-01 | 2017-12-31 | 2017-10-01 | 2017-07-02 | 2017-04-02 | 2017-01-01 | 2016-10-02 | 2016-07-03 | 2016-04-03 | 2016-01-03 | 2015-09-27 | 2015-06-28 | 2015-03-29 | 2014-12-28 | 2014-09-28 | 2014-06-29 | 2014-03-30 | 2013-12-29 | 2013-09-29 | 2013-06-30 | 2013-03-31 | 2012-12-30 | 2012-09-30 | 2012-07-01 | 2012-04-01 | ||
|---|---|---|---|---|---|---|---|---|---|---|---|---|---|---|---|---|---|---|---|---|---|---|---|---|---|---|---|---|---|---|---|---|---|---|---|---|---|---|---|---|---|---|---|---|---|---|---|---|
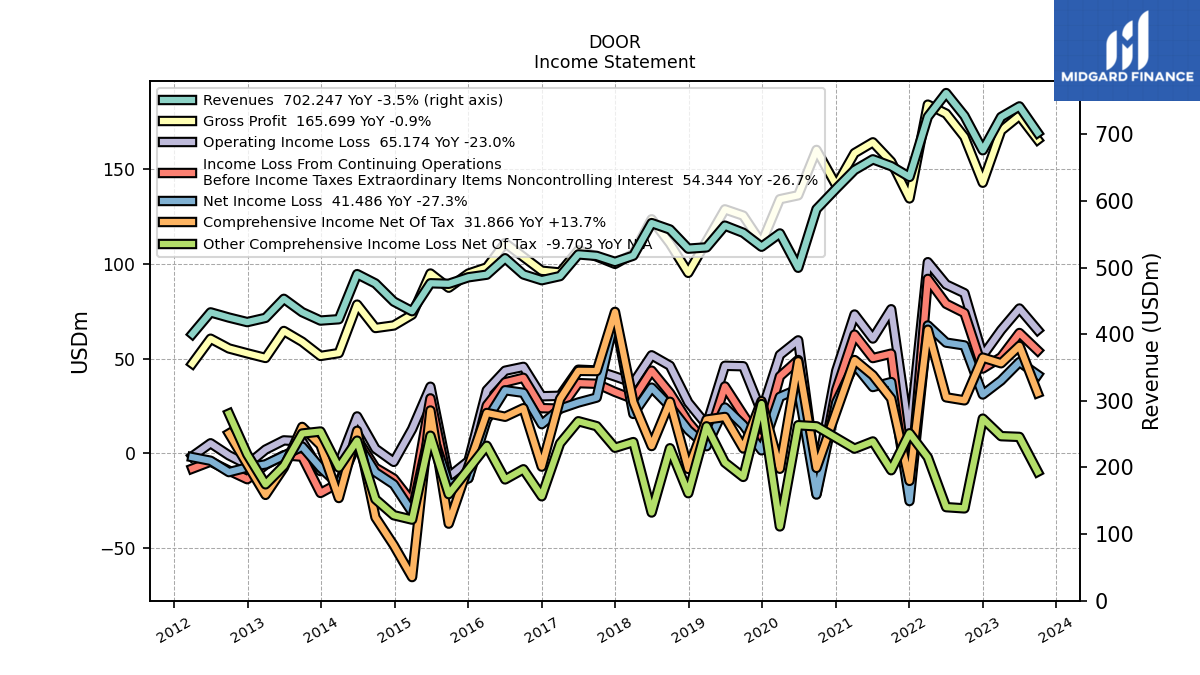
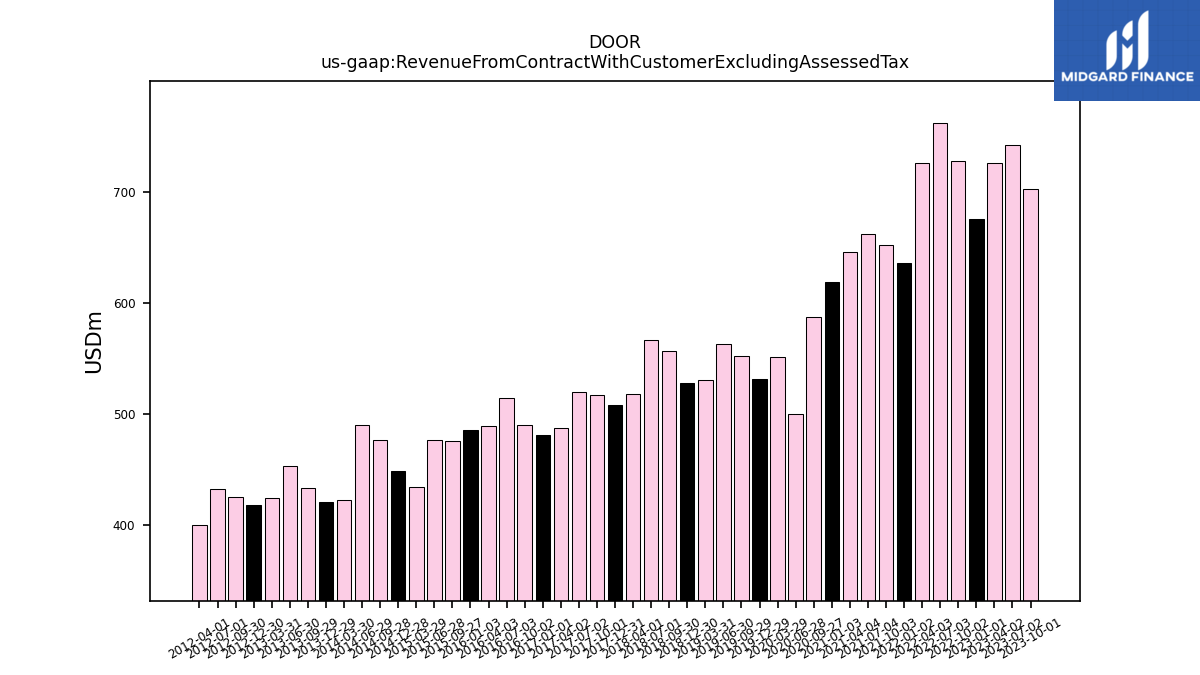
| Revenue From Contract With Customer Excluding Assessed Tax | 702.25 | 741.88 | 725.98 | 675.97 | 727.63 | 761.87 | 726.22 | 635.97 | 652.21 | 662.41 | 646.34 | 618.54 | 587.65 | 499.66 | 551.23 | 531.24 | 552.19 | 562.94 | 530.31 | 528.35 | 557.15 | 566.73 | 517.88 | 508.50 | 517.50 | 519.74 | 487.18 | 481.03 | 489.65 | 513.99 | 489.31 | 485.42 | 475.65 | 476.43 | 434.46 | 448.94 | 476.12 | 490.18 | 422.46 | 420.48 | 433.05 | 453.09 | 424.52 | 418.16 | 424.96 | 432.77 | 400.12 | |
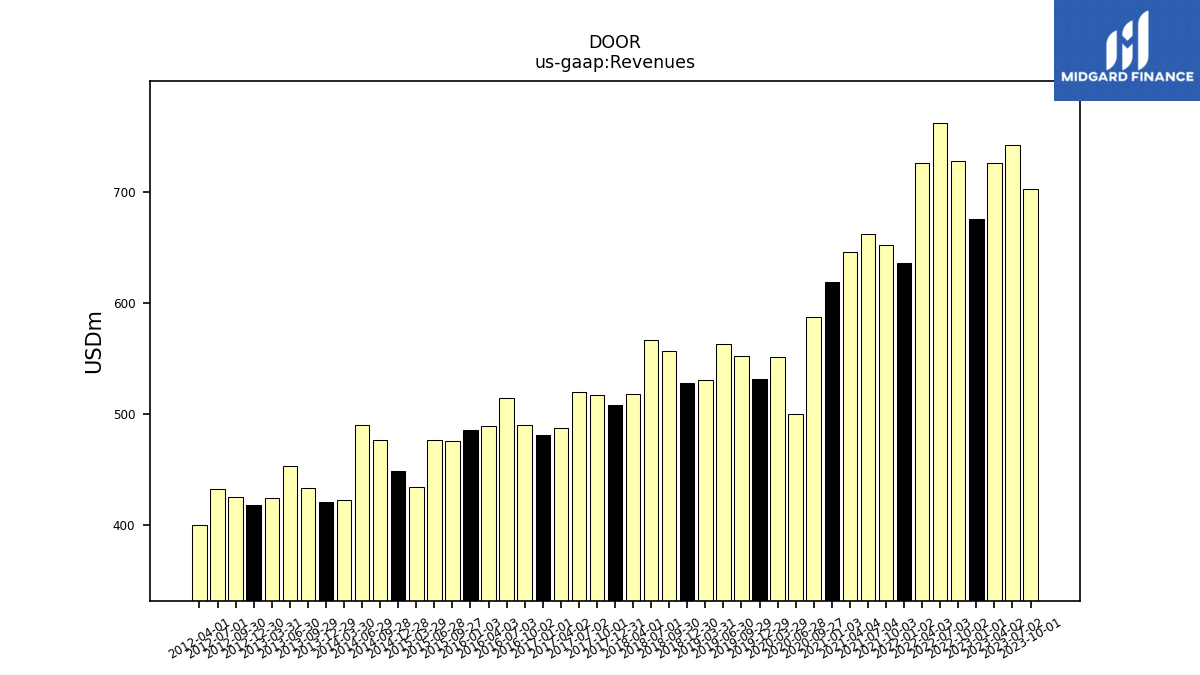
| Revenues | 702.25 | 741.88 | 725.98 | 675.97 | 727.63 | 761.87 | 726.22 | 635.97 | 652.21 | 662.41 | 646.34 | 618.54 | 587.65 | 499.66 | 551.23 | 531.24 | 552.19 | 562.94 | 530.31 | 528.35 | 557.15 | 566.73 | 517.88 | 508.50 | 517.50 | 519.74 | 487.18 | 481.03 | 489.65 | 513.99 | 489.31 | 485.42 | 475.65 | 476.43 | 434.46 | 448.94 | 476.12 | 490.18 | 422.46 | 420.48 | 433.05 | 453.09 | 424.52 | 418.16 | 424.96 | 432.77 | 400.12 | |
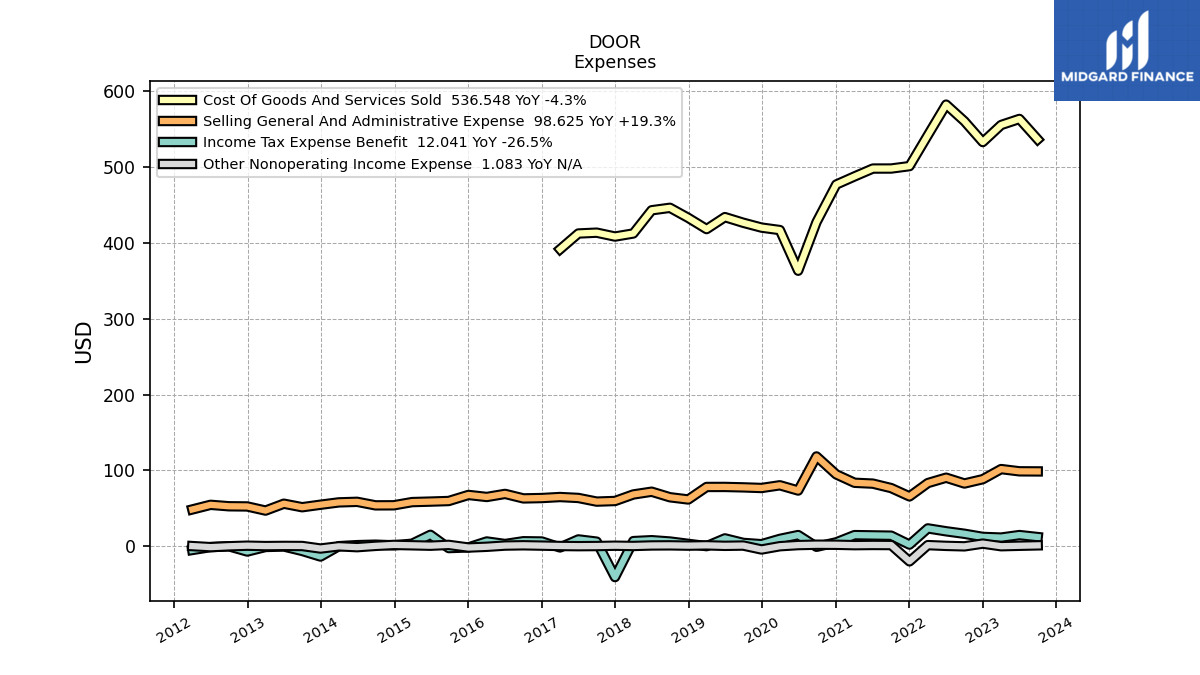
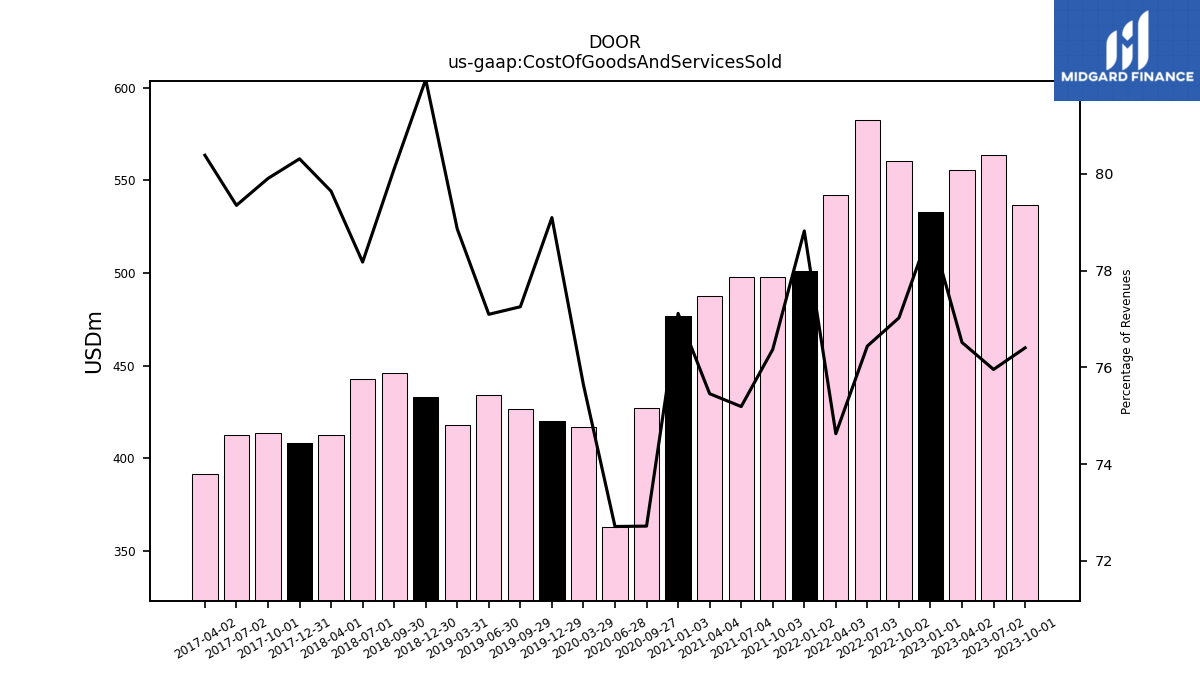
| Cost Of Goods And Services Sold | 536.55 | 563.52 | 555.49 | 532.99 | 560.44 | 582.39 | 541.97 | 501.27 | 498.10 | 498.07 | 487.70 | 476.99 | 427.33 | 363.30 | 416.95 | 420.19 | 426.59 | 434.01 | 418.21 | 432.99 | 446.31 | 443.05 | 412.45 | 408.39 | 413.52 | 412.42 | 391.62 | NA | NA | NA | NA | NA | NA | NA | NA | NA | NA | NA | NA | NA | NA | NA | NA | NA | NA | NA | NA | |
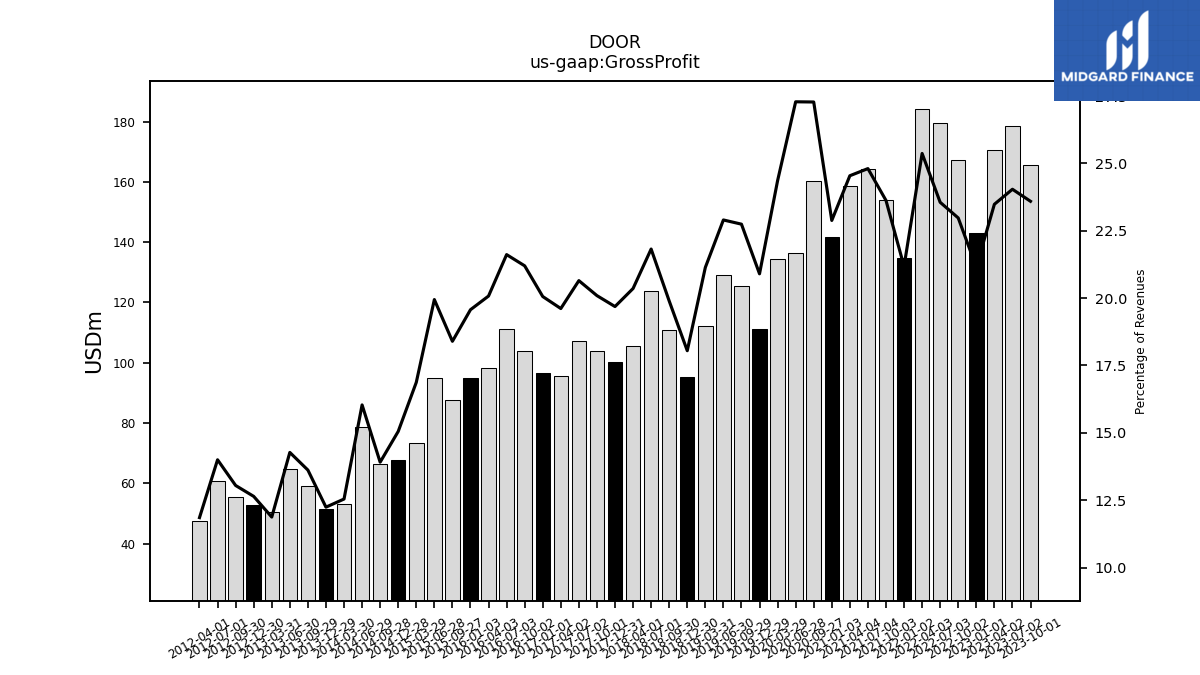
| Gross Profit | 165.70 | 178.37 | 170.49 | 142.98 | 167.18 | 179.49 | 184.25 | 134.69 | 154.10 | 164.34 | 158.64 | 141.55 | 160.32 | 136.35 | 134.28 | 111.05 | 125.60 | 128.93 | 112.10 | 95.36 | 110.84 | 123.67 | 105.43 | 100.11 | 103.99 | 107.33 | 95.56 | 96.49 | 103.80 | 111.10 | 98.25 | 95.00 | 87.51 | 95.03 | 73.31 | 67.58 | 66.23 | 78.61 | 52.99 | 51.47 | 58.97 | 64.67 | 50.40 | 52.86 | 55.44 | 60.59 | 47.42 | |
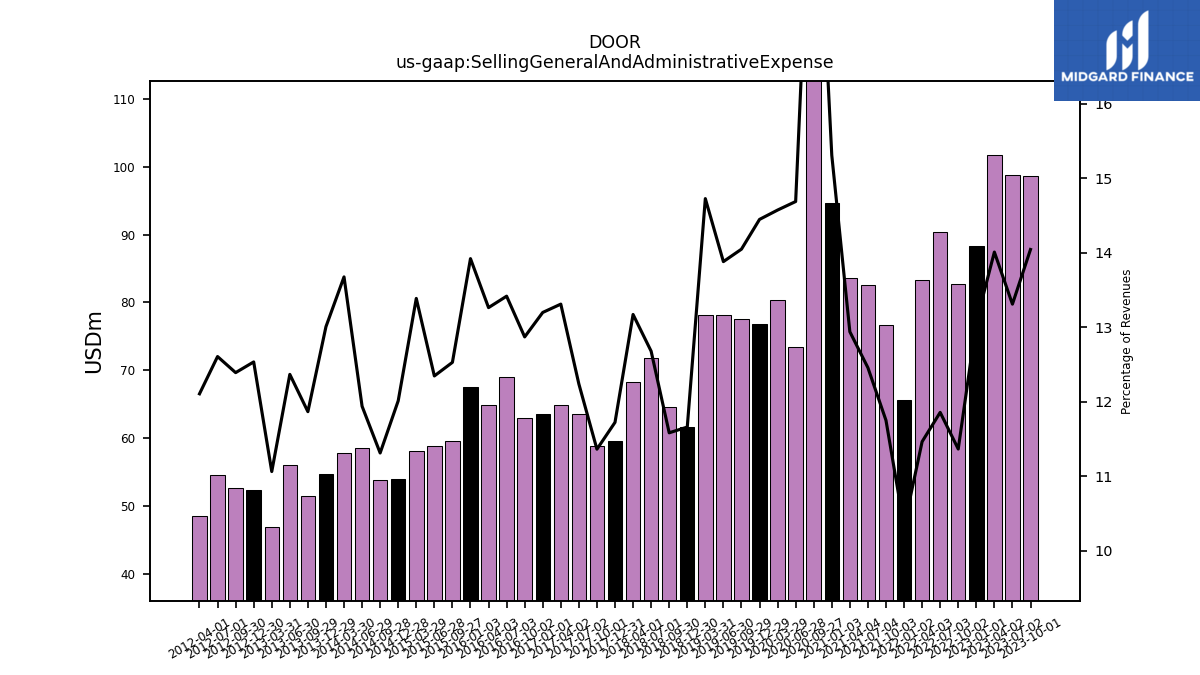
| Selling General And Administrative Expense | 98.62 | 98.75 | 101.70 | 88.35 | 82.69 | 90.33 | 83.25 | 65.66 | 76.63 | 82.51 | 83.63 | 94.69 | 118.35 | 73.39 | 80.33 | 76.75 | 77.57 | 78.14 | 78.10 | 61.60 | 64.53 | 71.85 | 68.21 | 59.61 | 58.80 | 63.60 | 64.84 | 63.49 | 63.02 | 68.96 | 64.90 | 67.58 | 59.59 | 58.82 | 58.16 | 53.93 | 53.85 | 58.52 | 57.77 | 54.69 | 51.39 | 56.03 | 46.96 | 52.41 | 52.65 | 54.56 | 48.44 | |
| Operating Income Loss | 65.17 | 76.56 | 65.11 | 51.65 | 84.64 | 89.22 | 101.02 | 9.09 | 76.16 | 60.67 | 73.36 | 43.60 | -11.44 | 59.73 | 52.01 | 21.96 | 46.04 | 46.28 | 15.03 | 26.89 | 46.31 | 51.82 | 37.22 | 40.64 | 43.80 | 44.21 | 30.42 | 30.18 | 45.71 | 43.68 | 33.33 | -4.04 | -12.38 | 35.23 | 12.79 | -4.50 | 2.46 | 19.53 | -5.51 | -9.39 | 6.32 | 6.88 | 2.00 | -5.93 | -1.04 | 5.35 | -1.56 | |
| Interest Income Expense Net | -11.91 | -13.49 | -14.25 | -10.23 | -10.27 | -10.59 | -10.24 | -10.91 | -11.35 | -11.92 | -11.95 | -11.90 | -11.80 | -11.82 | -11.28 | -12.10 | -11.91 | -11.36 | -11.13 | -11.03 | -10.15 | -9.07 | -8.76 | -8.80 | -7.21 | -7.11 | -7.02 | -7.03 | -6.99 | -6.93 | -7.23 | -7.17 | -7.18 | -6.79 | -11.75 | -10.49 | -10.45 | -10.59 | -9.99 | -8.44 | -8.33 | -8.21 | -8.25 | -8.38 | -7.97 | -8.45 | -6.65 | |
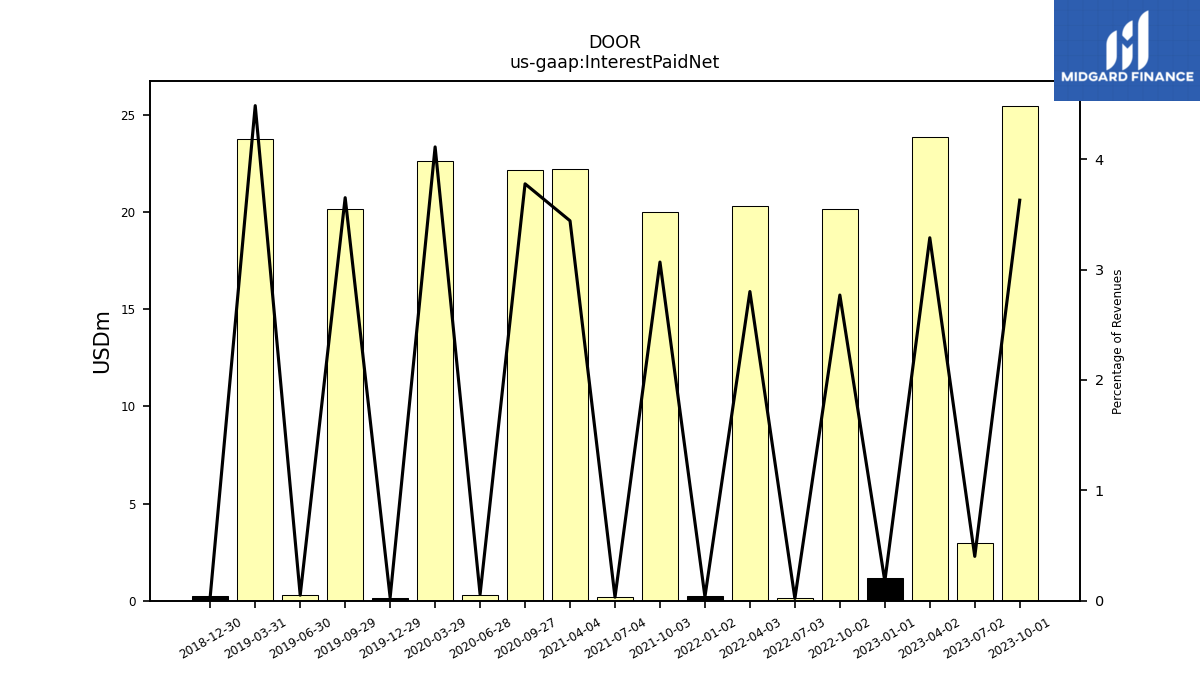
| Interest Paid Net | 25.48 | 2.98 | 23.87 | 1.20 | 20.15 | 0.16 | 20.34 | 0.23 | 20.01 | 0.21 | 22.25 | NA | 22.20 | 0.29 | 22.66 | 0.16 | 20.16 | 0.28 | 23.79 | 0.22 | NA | NA | NA | NA | NA | NA | NA | NA | NA | NA | NA | NA | NA | NA | NA | NA | NA | NA | NA | NA | NA | NA | NA | NA | NA | NA | NA | |
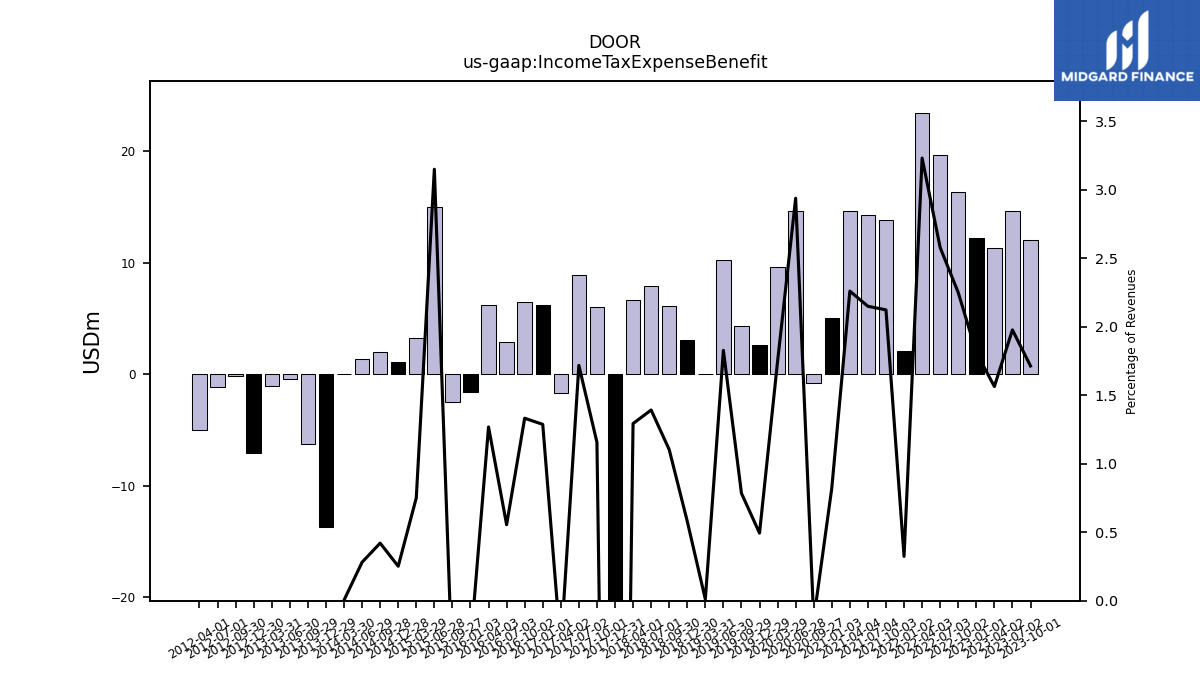
| Income Tax Expense Benefit | 12.04 | 14.67 | 11.36 | 12.25 | 16.38 | 19.65 | 23.48 | 2.06 | 13.85 | 14.25 | 14.61 | 5.09 | -0.80 | 14.69 | 9.64 | 2.62 | 4.33 | 10.29 | 0.06 | 3.07 | 6.15 | 7.89 | 6.70 | -40.80 | 5.99 | 8.93 | -1.68 | 6.20 | 6.53 | 2.85 | 6.21 | -1.59 | -2.51 | 15.01 | 3.26 | 1.13 | 2.00 | 1.38 | 0.02 | -13.66 | -6.27 | -0.41 | -1.04 | -7.03 | -0.14 | -1.18 | -5.02 | |
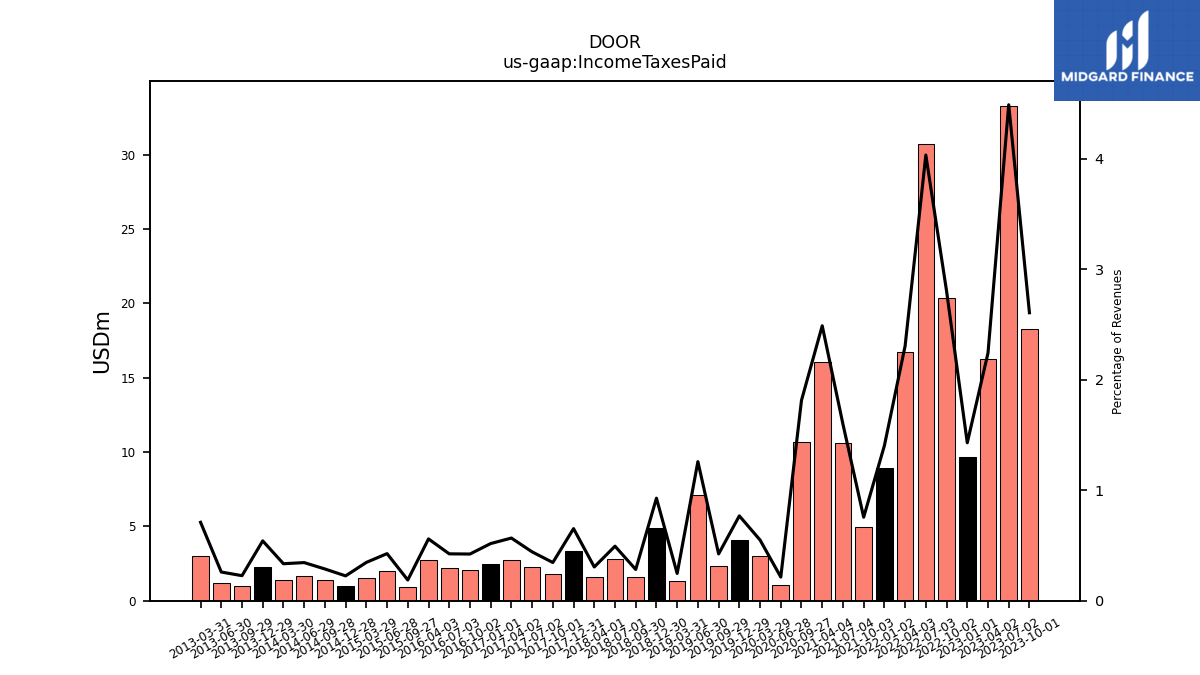
| Income Taxes Paid | 18.30 | 33.28 | 16.27 | 9.66 | 20.39 | 30.72 | 16.73 | 8.92 | 4.93 | 10.58 | 16.08 | NA | 10.65 | 1.07 | 3.03 | 4.08 | 2.34 | 7.08 | 1.31 | 4.90 | 1.58 | 2.80 | 1.58 | 3.32 | 1.79 | 2.30 | 2.76 | 2.49 | 2.07 | 2.18 | 2.74 | NA | 0.89 | 2.03 | 1.51 | 1.01 | 1.37 | 1.69 | 1.42 | 2.28 | 0.98 | 1.18 | 3.01 | NA | NA | NA | NA | |
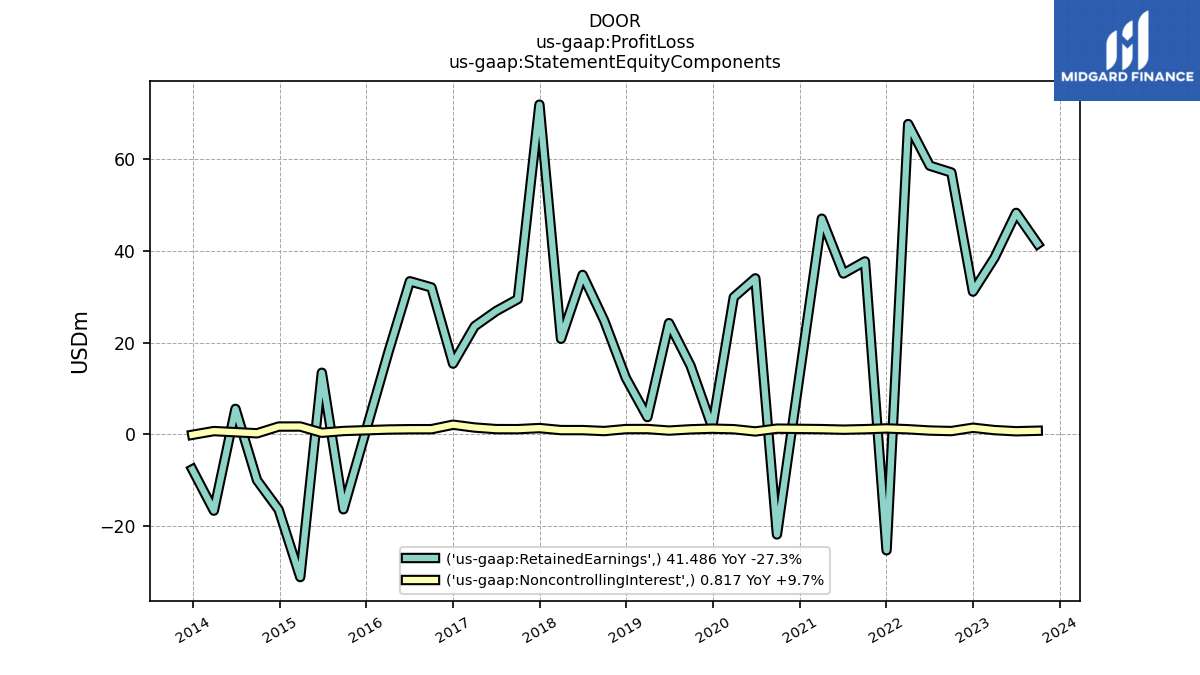
| Profit Loss | 42.30 | 48.95 | 39.44 | 32.57 | 57.78 | 59.37 | 68.72 | -23.90 | 38.85 | 36.10 | 48.15 | 28.48 | -20.49 | 34.66 | 31.04 | 2.87 | 16.09 | 25.09 | 4.98 | 13.52 | 25.54 | 35.69 | 21.78 | 73.21 | 30.64 | 28.05 | 25.08 | 17.56 | 33.17 | 34.51 | 18.91 | -11.63 | -15.52 | 13.82 | -29.32 | -14.64 | -9.71 | 6.08 | -15.85 | -7.66 | 4.45 | -0.61 | -5.14 | -6.66 | -9.00 | -3.20 | -1.46 | |
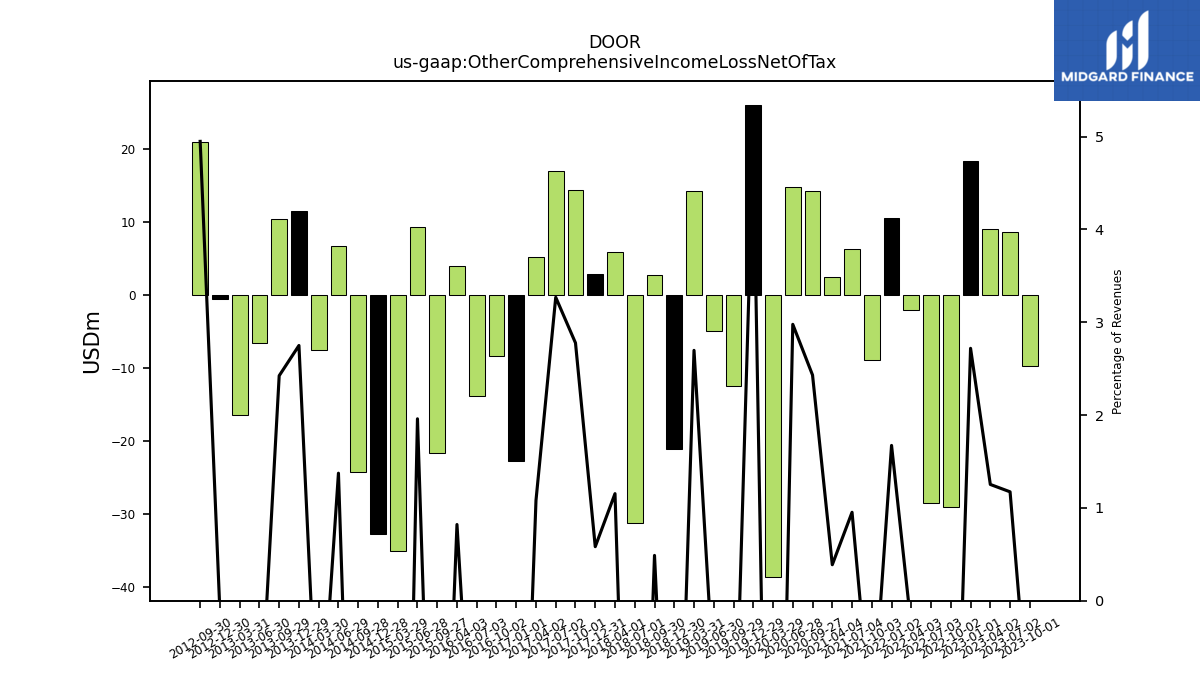
| Other Comprehensive Income Loss Net Of Tax | -9.70 | 8.70 | 9.10 | 18.38 | -29.06 | -28.41 | -2.09 | 10.64 | -8.91 | 6.31 | 2.51 | NA | 14.29 | 14.88 | -38.60 | 26.10 | -12.44 | -4.87 | 14.30 | -21.05 | 2.72 | -31.25 | 5.97 | 2.96 | 14.37 | 16.99 | 5.26 | -22.67 | -8.39 | -13.77 | 4.02 | NA | -21.54 | 9.34 | -35.01 | -32.68 | -24.21 | 6.74 | -7.49 | 11.56 | 10.50 | -6.56 | -16.37 | -0.52 | 21.03 | NA | NA | |
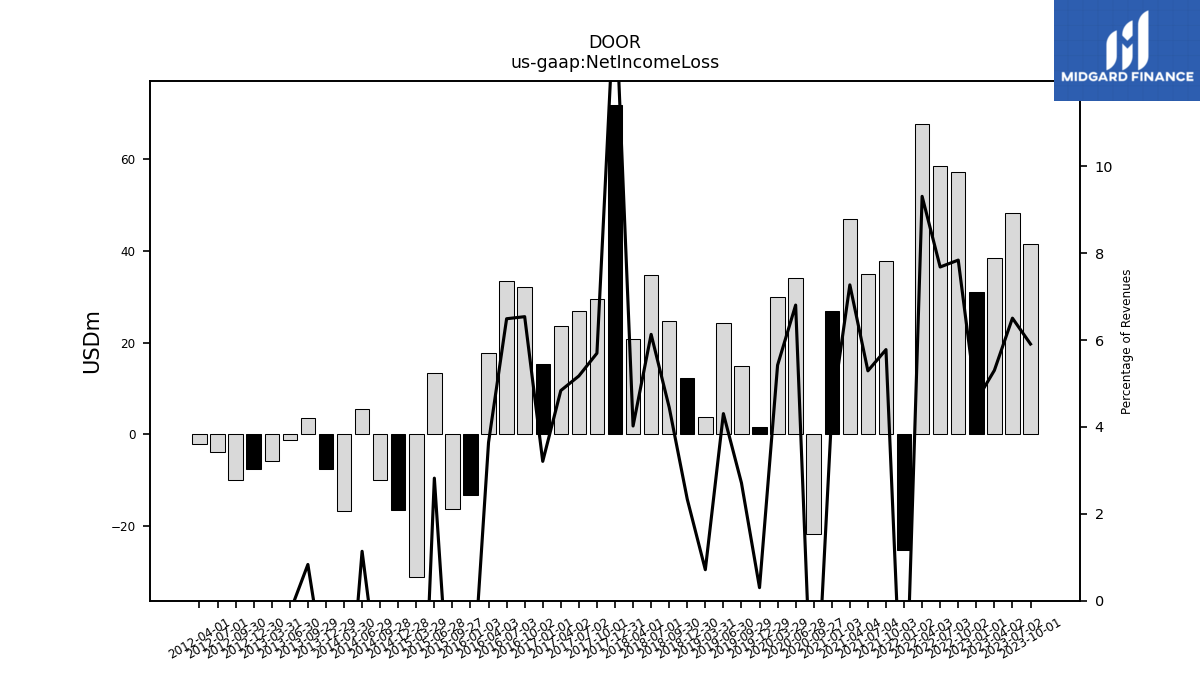
| Net Income Loss | 41.49 | 48.24 | 38.49 | 31.10 | 57.04 | 58.52 | 67.58 | -25.22 | 37.69 | 35.05 | 46.98 | 26.92 | -21.77 | 34.00 | 29.89 | 1.60 | 14.97 | 24.24 | 3.79 | 12.35 | 24.80 | 34.74 | 20.83 | 71.81 | 29.48 | 26.88 | 23.57 | 15.43 | 32.01 | 33.35 | 17.83 | -13.22 | -16.28 | 13.44 | -31.05 | -16.37 | -9.97 | 5.58 | -16.59 | -7.59 | 3.62 | -1.21 | -5.83 | -7.45 | -9.92 | -3.89 | -1.99 | |
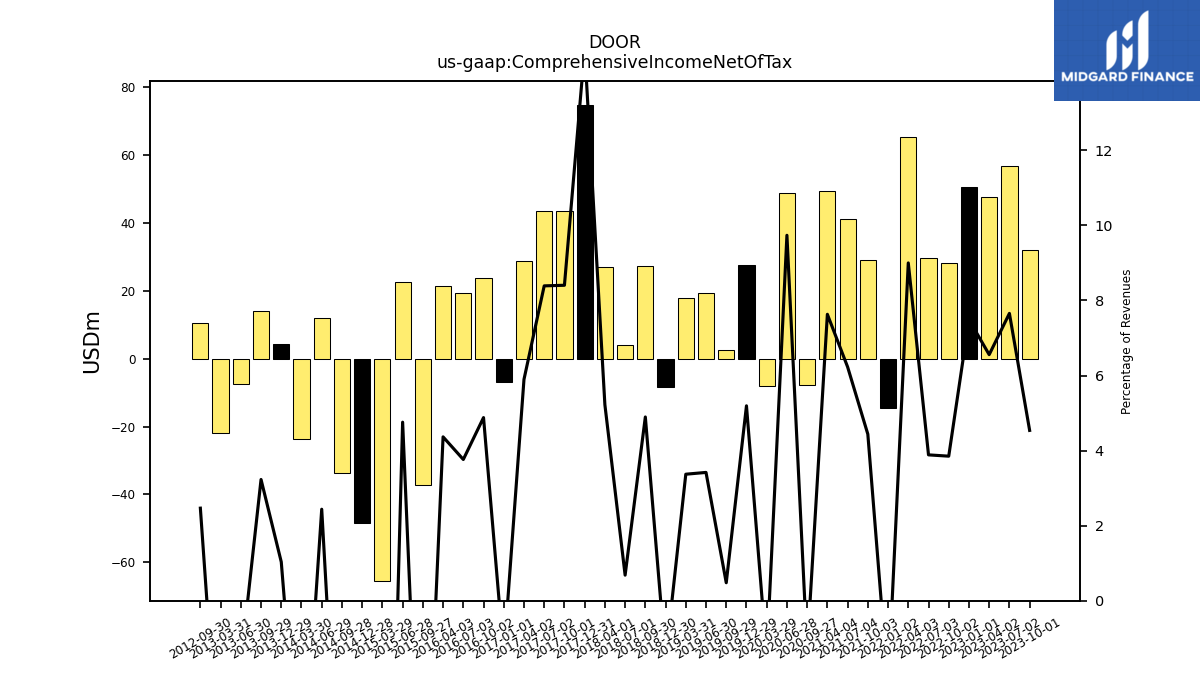
| Comprehensive Income Net Of Tax | 31.87 | 56.78 | 47.59 | 50.61 | 28.02 | 29.61 | 65.35 | -14.54 | 28.94 | 41.26 | 49.32 | NA | -7.69 | 48.64 | -8.14 | 27.59 | 2.65 | 19.24 | 17.88 | -8.24 | 27.27 | 3.86 | 27.04 | 74.76 | 43.49 | 43.59 | 28.73 | -7.01 | 23.89 | 19.34 | 21.36 | NA | -37.13 | 22.66 | -65.37 | -48.55 | -33.80 | 11.95 | -23.60 | 4.35 | 13.99 | -7.51 | -21.94 | NA | 10.48 | NA | NA |
| 2023-10-01 | 2023-07-02 | 2023-04-02 | 2023-01-01 | 2022-10-02 | 2022-07-03 | 2022-04-03 | 2022-01-02 | 2021-10-03 | 2021-07-04 | 2021-04-04 | 2021-01-03 | 2020-09-27 | 2020-06-28 | 2020-03-29 | 2019-12-29 | 2019-09-29 | 2019-06-30 | 2019-03-31 | 2018-12-30 | 2018-09-30 | 2018-07-01 | 2018-04-01 | 2017-12-31 | 2017-10-01 | 2017-07-02 | 2017-04-02 | 2017-01-01 | 2016-10-02 | 2016-07-03 | 2016-04-03 | 2016-01-03 | 2015-09-27 | 2015-06-28 | 2015-03-29 | 2014-12-28 | 2014-09-28 | 2014-06-29 | 2014-03-30 | 2013-12-29 | 2013-09-29 | 2013-06-30 | 2013-03-31 | 2012-12-30 | 2012-09-30 | 2012-07-01 | 2012-04-01 | ||
|---|---|---|---|---|---|---|---|---|---|---|---|---|---|---|---|---|---|---|---|---|---|---|---|---|---|---|---|---|---|---|---|---|---|---|---|---|---|---|---|---|---|---|---|---|---|---|---|---|
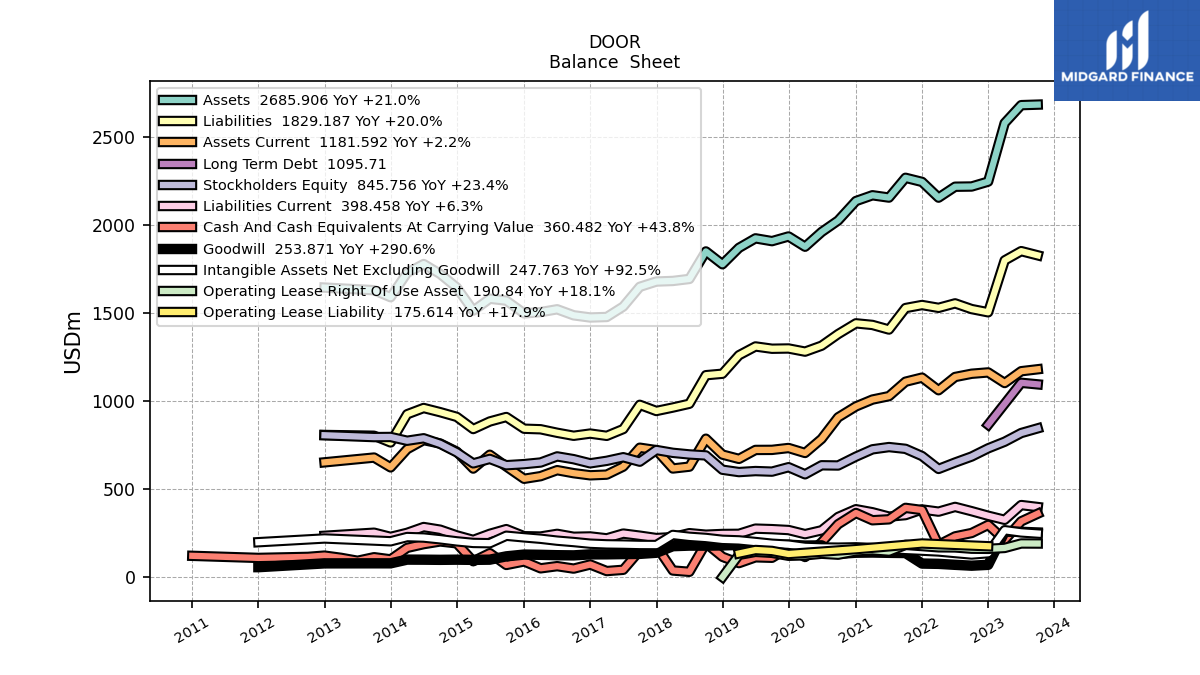
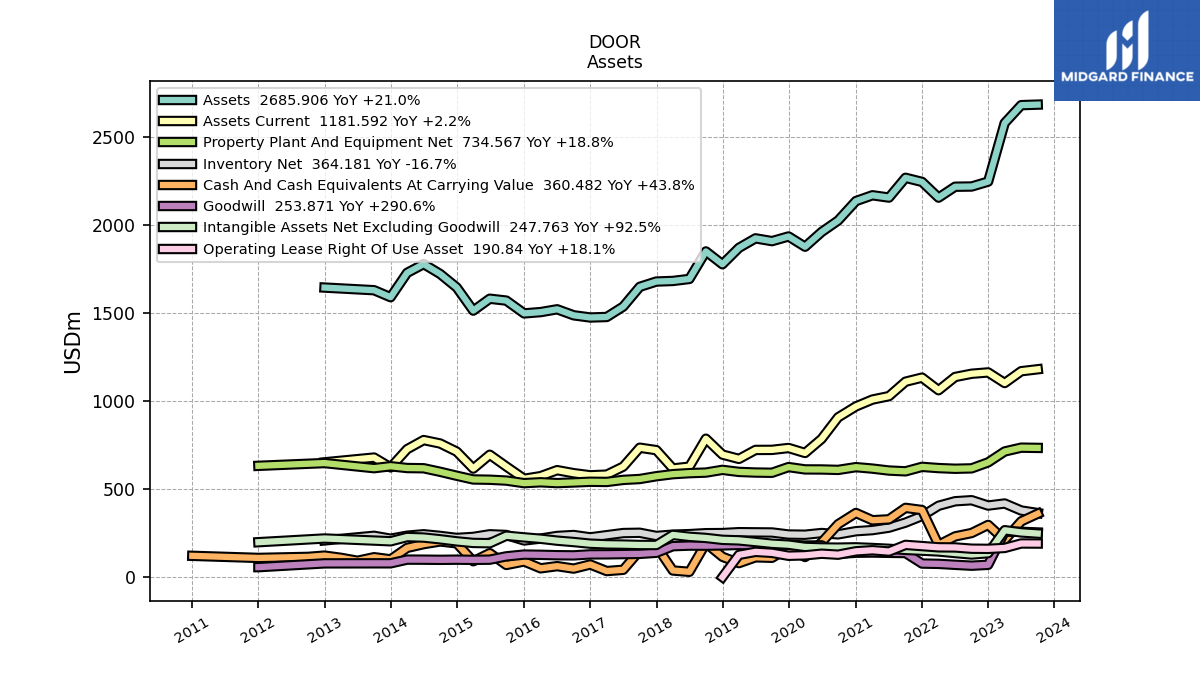
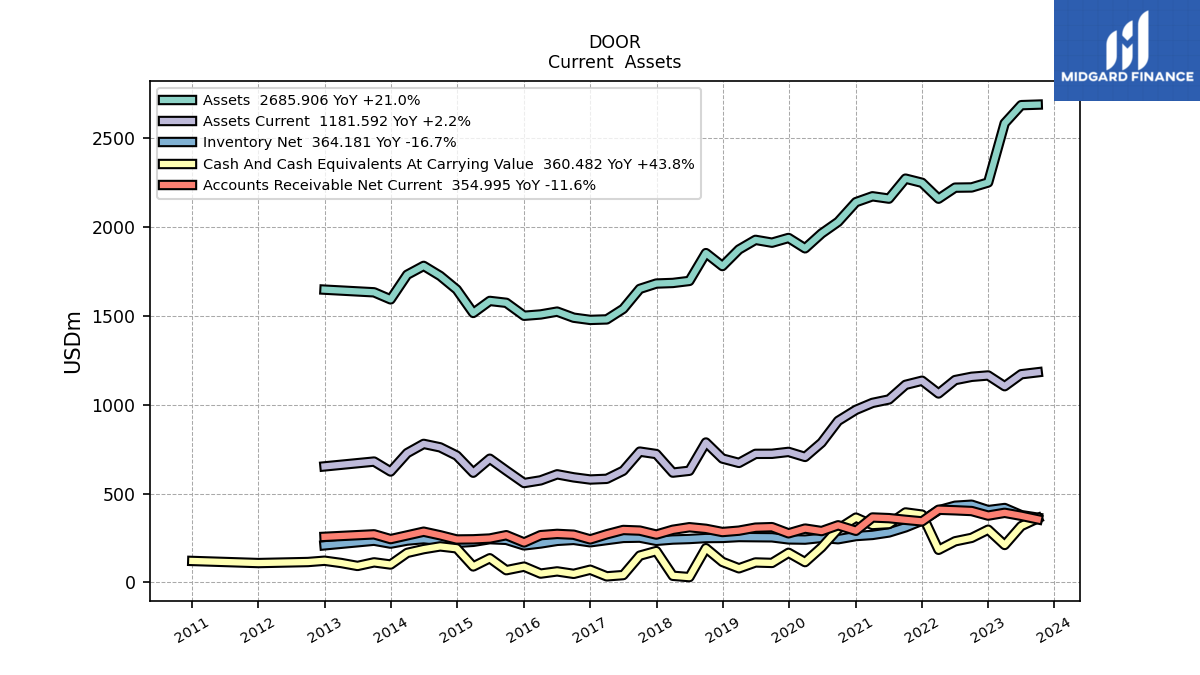
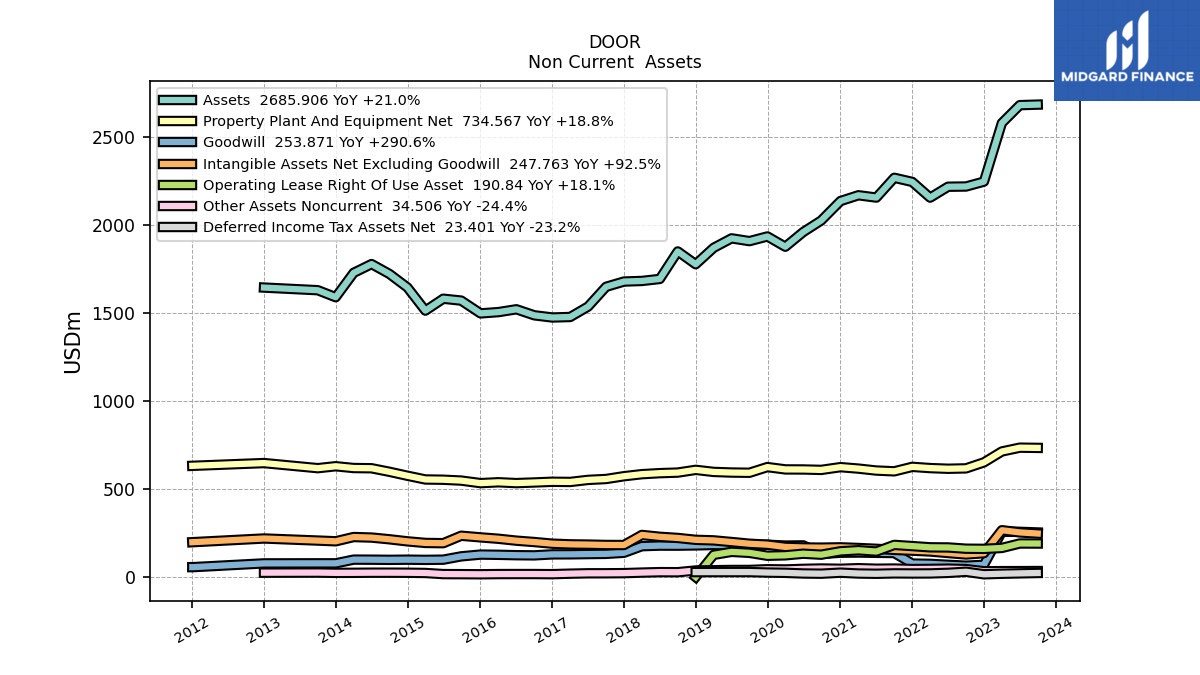
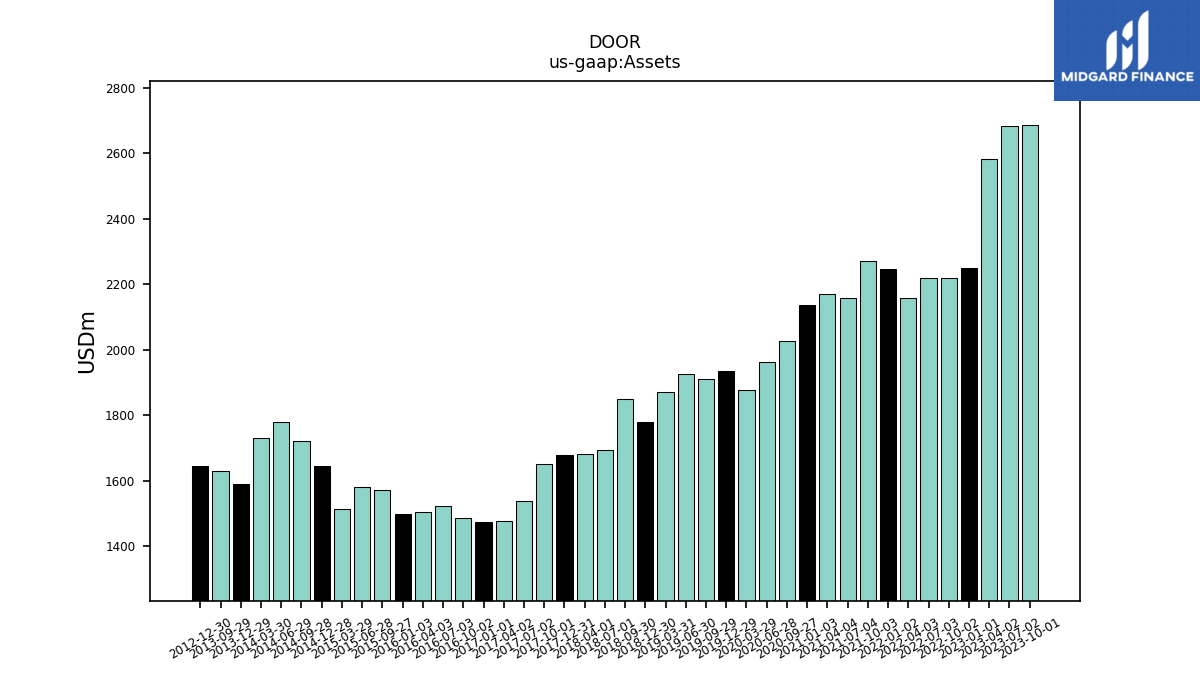
| Assets | 2685.91 | 2682.95 | 2581.06 | 2248.18 | 2220.44 | 2219.24 | 2157.13 | 2246.62 | 2270.00 | 2157.45 | 2170.65 | 2137.76 | 2027.08 | 1961.83 | 1878.05 | 1936.58 | 1909.88 | 1925.80 | 1871.72 | 1778.46 | 1851.49 | 1694.95 | 1683.56 | 1680.26 | 1650.27 | 1538.02 | 1478.70 | 1475.86 | 1488.30 | 1522.52 | 1506.48 | 1499.15 | 1571.90 | 1582.63 | 1514.87 | 1646.55 | 1723.21 | 1779.59 | 1729.71 | 1591.14 | 1630.93 | NA | NA | 1645.95 | NA | NA | NA | |
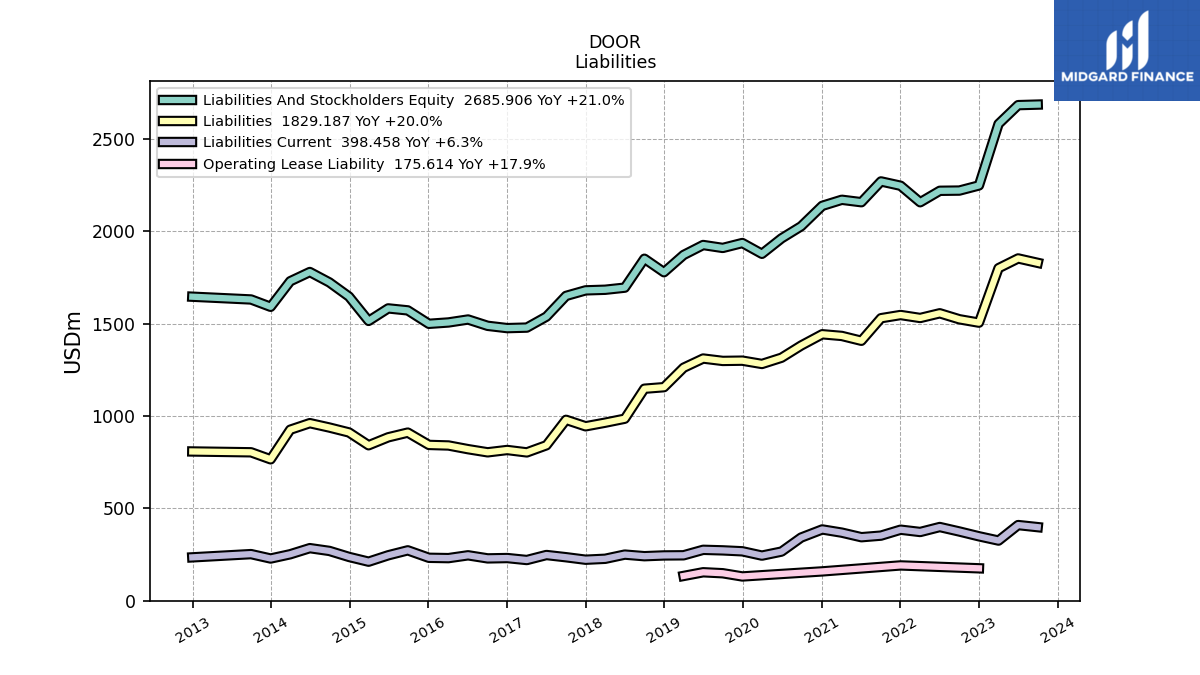
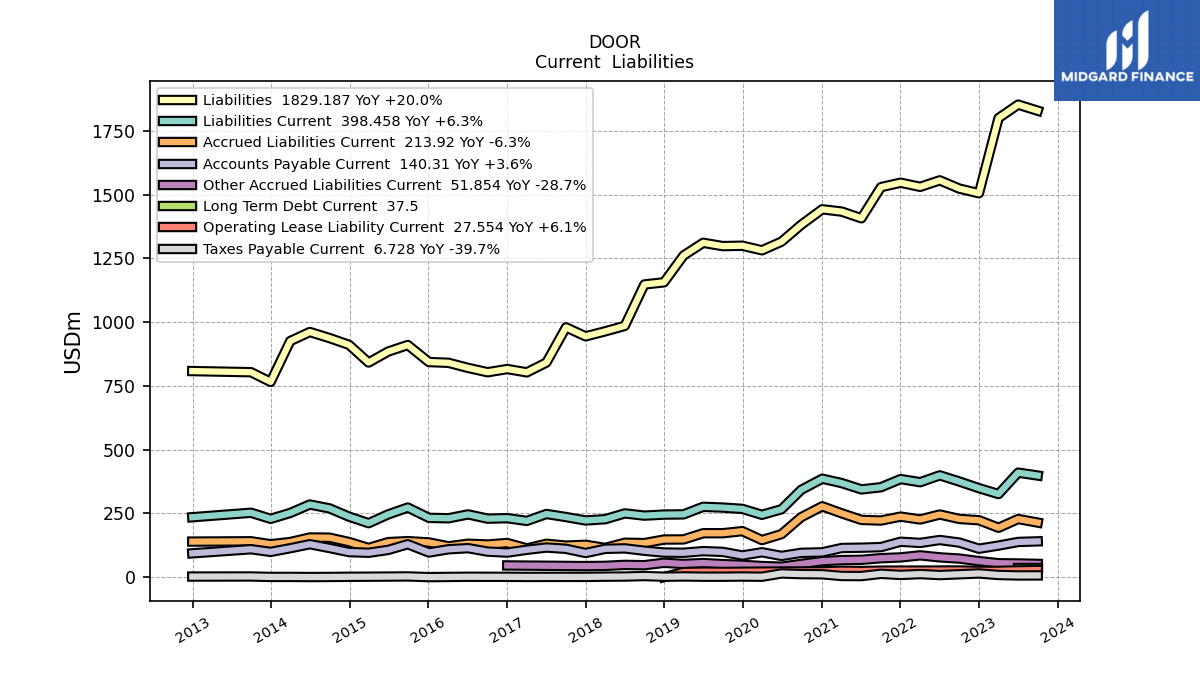
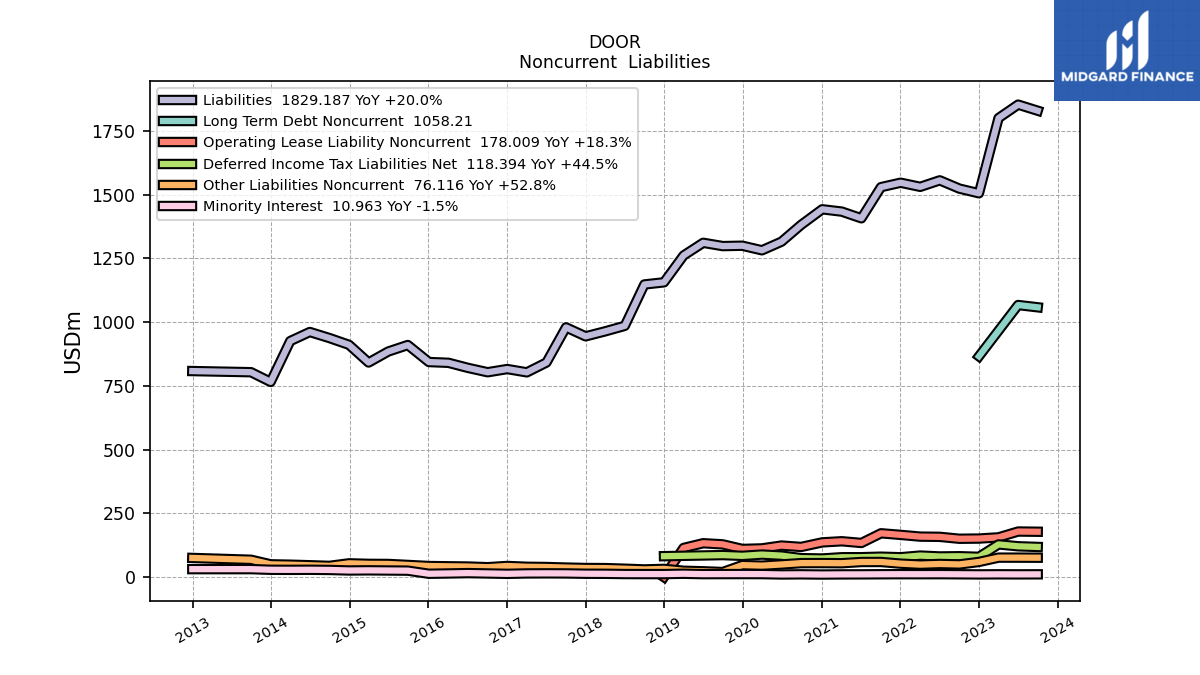
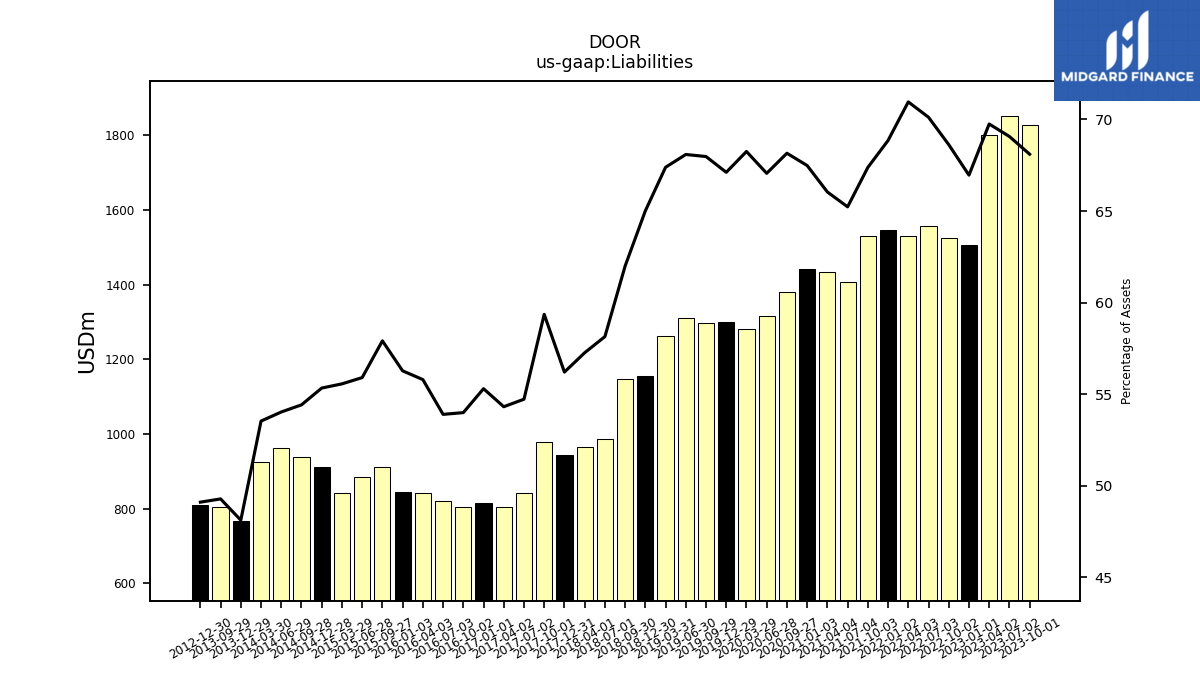
| Liabilities | 1829.19 | 1853.12 | 1800.33 | 1505.40 | 1523.80 | 1556.17 | 1530.68 | 1546.84 | 1529.52 | 1407.28 | 1433.50 | 1442.64 | 1381.57 | 1315.59 | 1281.79 | 1299.72 | 1298.26 | 1311.23 | 1261.35 | 1156.16 | 1147.81 | 985.43 | 963.99 | 944.36 | 979.50 | 841.63 | 803.10 | 816.09 | 803.52 | 820.54 | 840.52 | 843.58 | 910.28 | 884.73 | 841.65 | 911.05 | 937.66 | 961.39 | 925.87 | 765.58 | 803.66 | NA | NA | 808.13 | NA | NA | NA | |
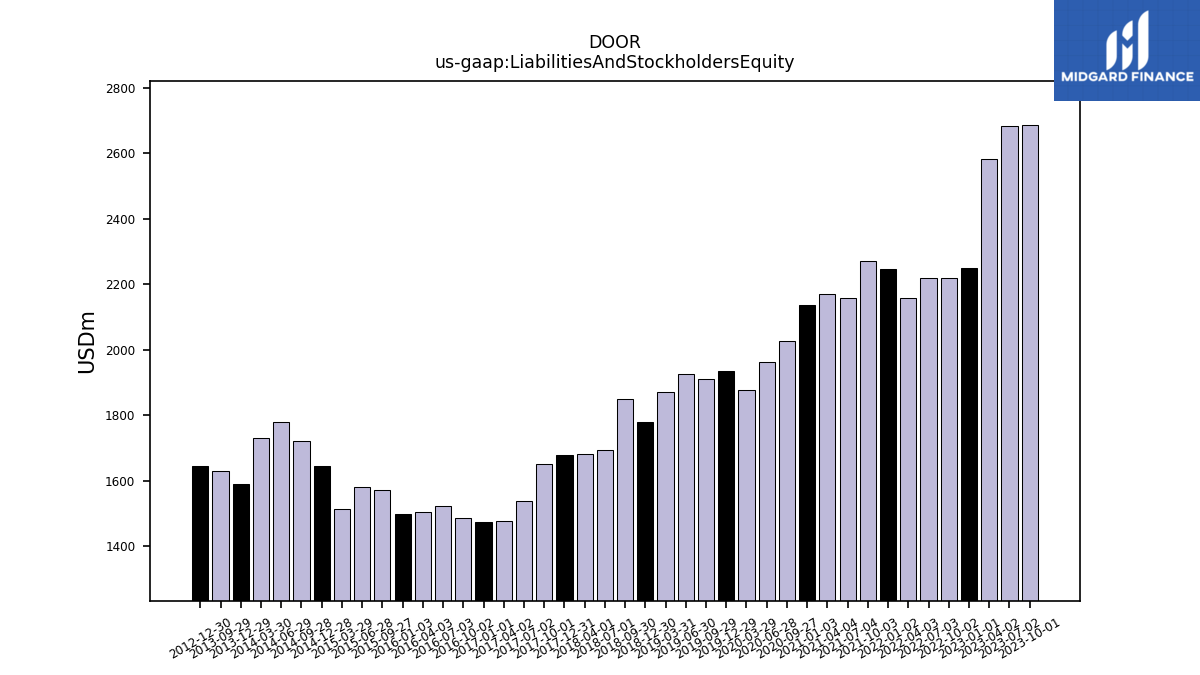
| Liabilities And Stockholders Equity | 2685.91 | 2682.95 | 2581.06 | 2248.18 | 2220.44 | 2219.24 | 2157.13 | 2246.62 | 2270.00 | 2157.45 | 2170.65 | 2137.76 | 2027.08 | 1961.83 | 1878.05 | 1936.58 | 1909.88 | 1925.80 | 1871.72 | 1778.46 | 1851.49 | 1694.95 | 1683.56 | 1680.26 | 1650.27 | 1538.02 | 1478.70 | 1475.86 | 1488.30 | 1522.52 | 1506.48 | 1499.15 | 1571.90 | 1582.63 | 1514.87 | 1646.55 | 1723.21 | 1779.59 | 1729.71 | 1591.14 | 1630.93 | NA | NA | 1645.95 | NA | NA | NA | |
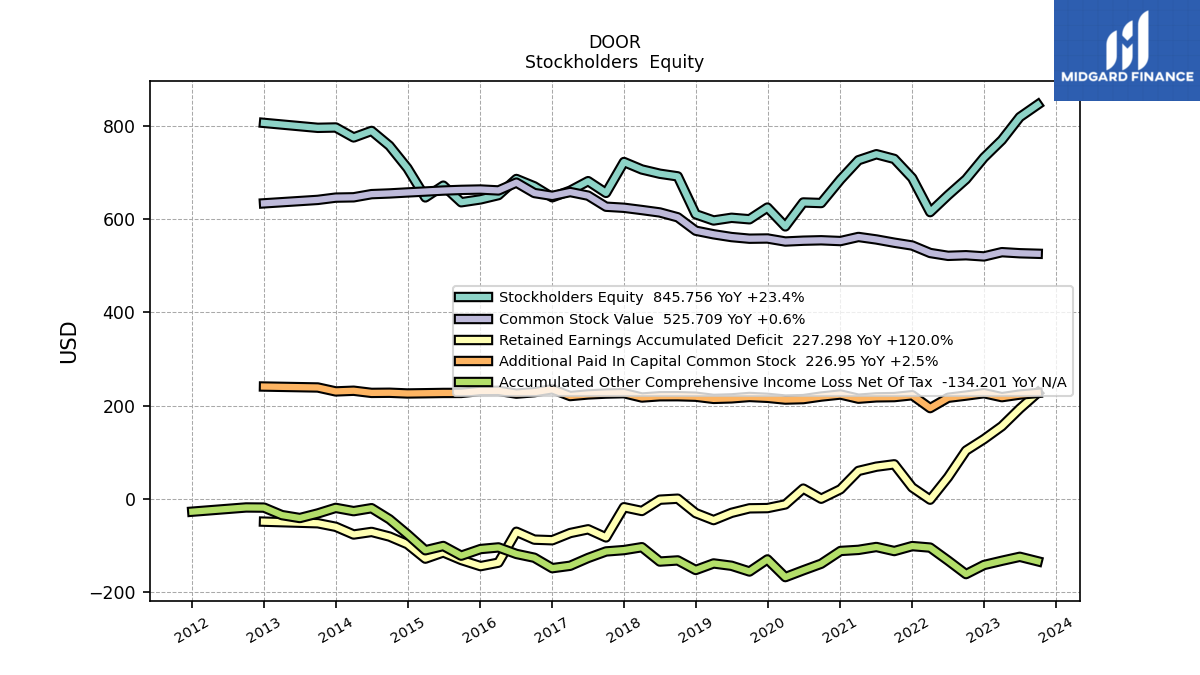
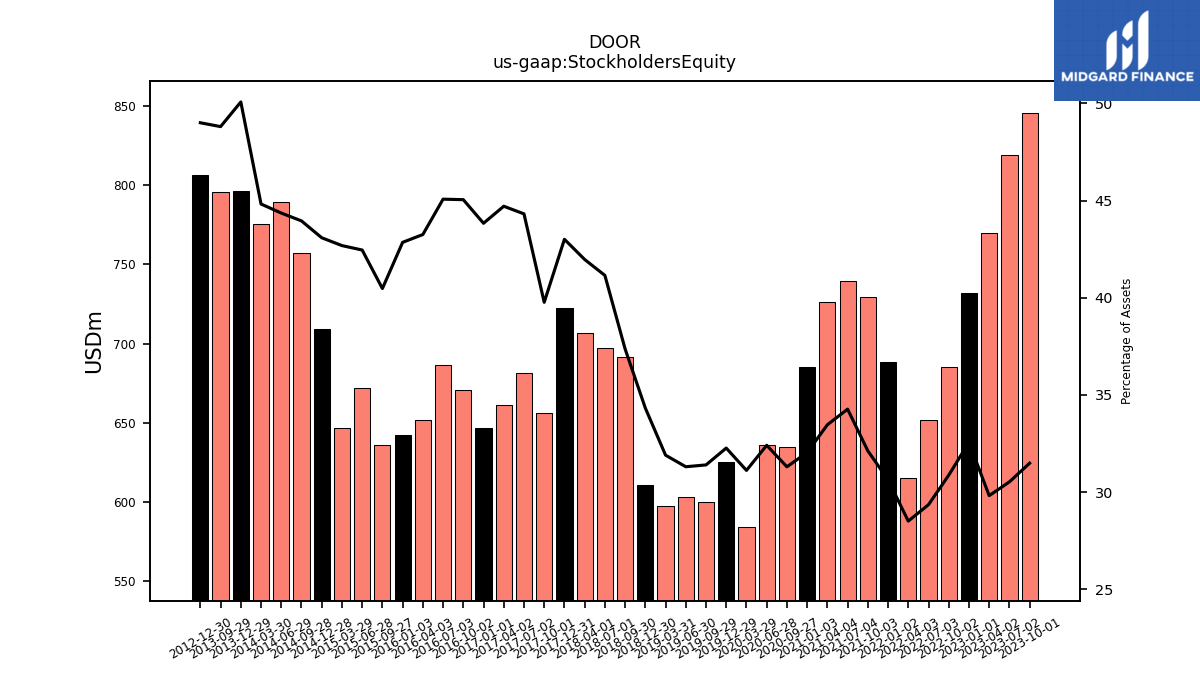
| Stockholders Equity | 845.76 | 819.04 | 769.67 | 732.12 | 685.50 | 651.45 | 615.01 | 688.24 | 729.24 | 739.33 | 726.45 | 684.96 | 634.54 | 635.83 | 584.41 | 624.88 | 599.70 | 602.90 | 597.10 | 610.44 | 691.80 | 697.47 | 706.56 | 722.63 | 656.24 | 681.58 | 661.09 | 646.88 | 670.41 | 686.22 | 651.59 | 642.39 | 636.21 | 671.90 | 646.60 | 709.43 | 757.40 | 789.36 | 775.29 | 796.72 | 795.96 | NA | NA | 806.54 | NA | NA | NA |
| 2023-10-01 | 2023-07-02 | 2023-04-02 | 2023-01-01 | 2022-10-02 | 2022-07-03 | 2022-04-03 | 2022-01-02 | 2021-10-03 | 2021-07-04 | 2021-04-04 | 2021-01-03 | 2020-09-27 | 2020-06-28 | 2020-03-29 | 2019-12-29 | 2019-09-29 | 2019-06-30 | 2019-03-31 | 2018-12-30 | 2018-09-30 | 2018-07-01 | 2018-04-01 | 2017-12-31 | 2017-10-01 | 2017-07-02 | 2017-04-02 | 2017-01-01 | 2016-10-02 | 2016-07-03 | 2016-04-03 | 2016-01-03 | 2015-09-27 | 2015-06-28 | 2015-03-29 | 2014-12-28 | 2014-09-28 | 2014-06-29 | 2014-03-30 | 2013-12-29 | 2013-09-29 | 2013-06-30 | 2013-03-31 | 2012-12-30 | 2012-09-30 | 2012-07-01 | 2012-04-01 | ||
|---|---|---|---|---|---|---|---|---|---|---|---|---|---|---|---|---|---|---|---|---|---|---|---|---|---|---|---|---|---|---|---|---|---|---|---|---|---|---|---|---|---|---|---|---|---|---|---|---|
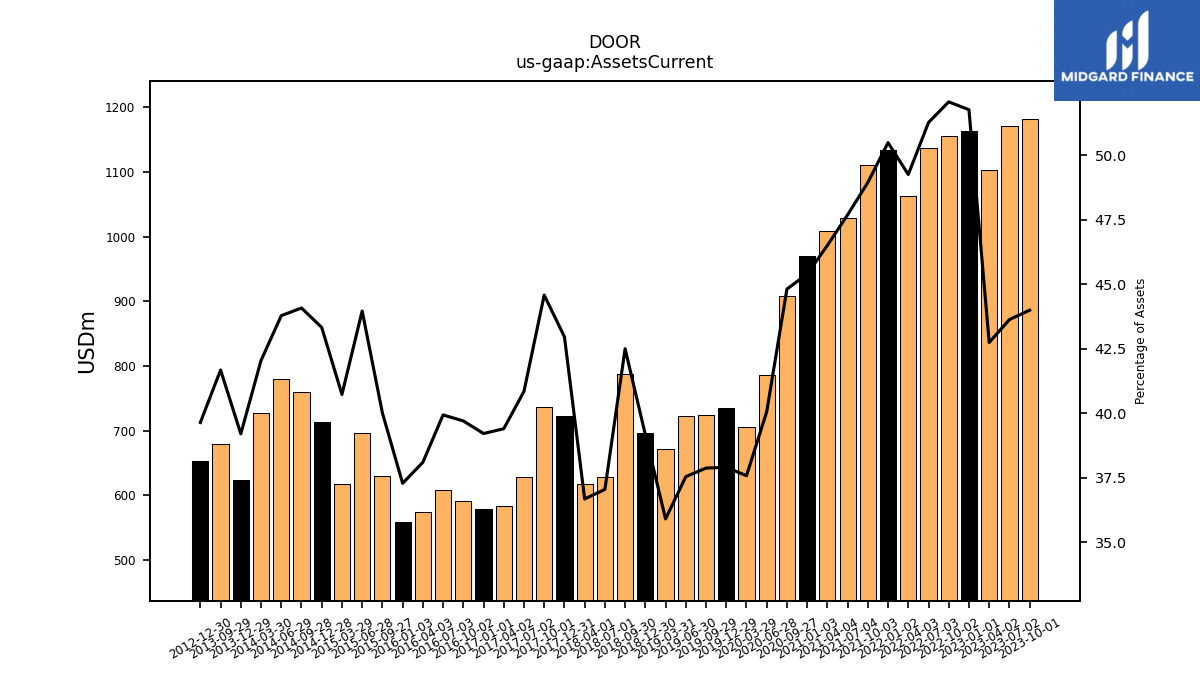
| Assets Current | 1181.59 | 1170.49 | 1103.16 | 1163.64 | 1156.04 | 1137.68 | 1062.36 | 1134.13 | 1110.90 | 1028.77 | 1009.38 | 970.37 | 908.34 | 785.80 | 705.73 | 734.05 | 723.34 | 722.97 | 672.04 | 696.59 | 786.86 | 627.96 | 617.48 | 721.87 | 735.63 | 628.21 | 582.60 | 578.74 | 590.87 | 608.00 | 573.94 | 558.95 | 628.91 | 695.71 | 616.98 | 713.34 | 759.54 | 779.09 | 727.26 | 623.74 | 679.68 | NA | NA | 652.47 | NA | NA | NA | |
| Cash And Cash Equivalents At Carrying Value | 360.48 | 317.16 | 210.72 | 296.92 | 250.71 | 231.54 | 183.53 | 381.39 | 393.73 | 328.60 | 323.20 | 364.67 | 300.80 | 197.51 | 114.38 | 166.96 | 109.95 | 112.64 | 79.64 | 115.66 | 192.84 | 30.15 | 37.65 | 176.67 | 151.03 | 41.65 | 34.47 | 71.71 | 48.42 | 62.37 | 49.98 | 89.19 | 69.05 | 136.31 | 90.10 | 192.04 | 202.75 | 187.53 | 166.26 | 100.87 | 113.17 | 92.94 | 109.65 | 122.31 | 115.05 | NA | NA | |
| Cash Cash Equivalents Restricted Cash And Restricted Cash Equivalents | 372.41 | 328.74 | 222.31 | 308.92 | 262.70 | 242.64 | 194.62 | 391.50 | 403.98 | 339.16 | 333.76 | 375.23 | 311.36 | 208.15 | 125.02 | 177.61 | 120.60 | 123.29 | 90.63 | 126.14 | 203.33 | 40.64 | 48.87 | 188.56 | 162.93 | 53.54 | 46.68 | 83.91 | NA | NA | NA | 101.83 | NA | NA | NA | NA | NA | NA | NA | NA | NA | NA | NA | NA | NA | NA | NA | |
| Accounts Receivable Net Current | 355.00 | 374.79 | 391.56 | 375.92 | 401.66 | 405.76 | 408.92 | 343.41 | 352.17 | 361.66 | 365.40 | 290.51 | 321.50 | 289.03 | 303.11 | 276.21 | 311.07 | 308.24 | 291.30 | 283.58 | 301.60 | 310.63 | 296.31 | 269.24 | 291.62 | 295.18 | 270.85 | 242.20 | 268.53 | 273.14 | 266.01 | 224.98 | 265.84 | 247.15 | 242.67 | 241.72 | 265.23 | 285.55 | 264.63 | 243.82 | 270.64 | NA | NA | 256.67 | NA | NA | NA | |
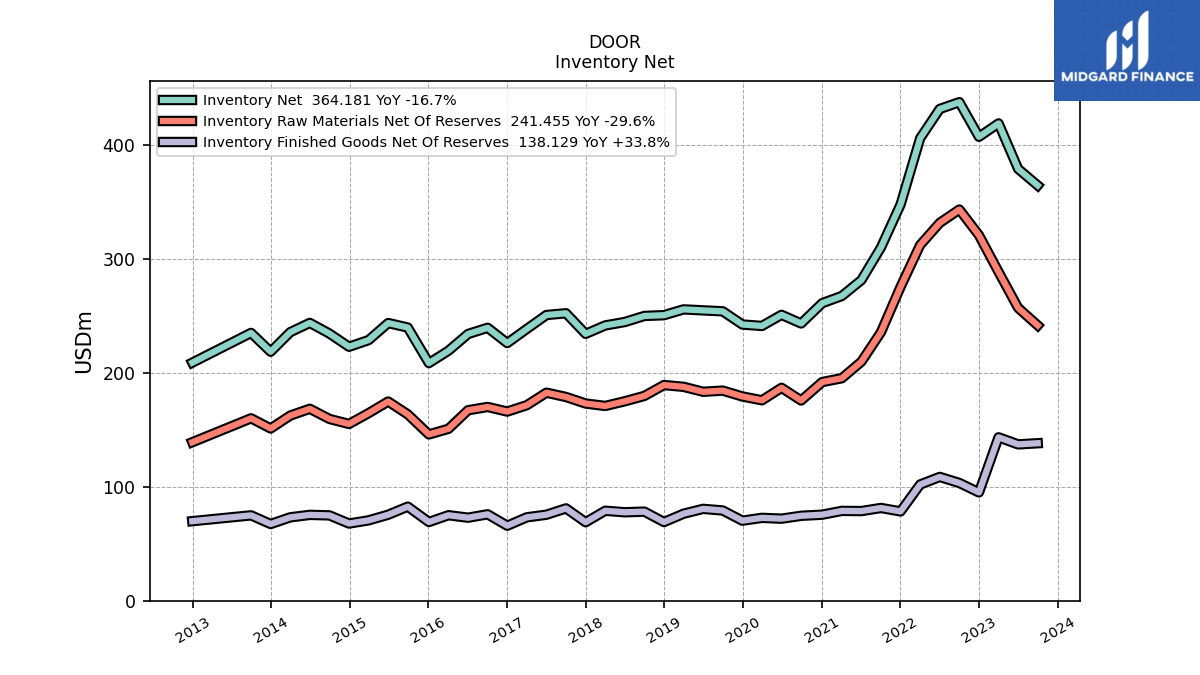
| Inventory Net | 364.18 | 378.70 | 418.58 | 406.83 | 437.20 | 431.27 | 405.62 | 347.48 | 309.83 | 281.18 | 267.23 | 260.96 | 243.15 | 250.72 | 240.97 | 242.23 | 253.81 | 254.62 | 255.50 | 250.41 | 249.74 | 244.42 | 241.41 | 234.04 | 252.10 | 250.56 | 238.38 | 225.94 | 239.36 | 233.94 | 219.25 | 208.39 | 239.58 | 243.51 | 228.56 | 222.73 | 234.30 | 243.65 | 235.52 | 218.35 | 234.88 | NA | NA | 208.78 | NA | NA | NA |
| 2023-10-01 | 2023-07-02 | 2023-04-02 | 2023-01-01 | 2022-10-02 | 2022-07-03 | 2022-04-03 | 2022-01-02 | 2021-10-03 | 2021-07-04 | 2021-04-04 | 2021-01-03 | 2020-09-27 | 2020-06-28 | 2020-03-29 | 2019-12-29 | 2019-09-29 | 2019-06-30 | 2019-03-31 | 2018-12-30 | 2018-09-30 | 2018-07-01 | 2018-04-01 | 2017-12-31 | 2017-10-01 | 2017-07-02 | 2017-04-02 | 2017-01-01 | 2016-10-02 | 2016-07-03 | 2016-04-03 | 2016-01-03 | 2015-09-27 | 2015-06-28 | 2015-03-29 | 2014-12-28 | 2014-09-28 | 2014-06-29 | 2014-03-30 | 2013-12-29 | 2013-09-29 | 2013-06-30 | 2013-03-31 | 2012-12-30 | 2012-09-30 | 2012-07-01 | 2012-04-01 | ||
|---|---|---|---|---|---|---|---|---|---|---|---|---|---|---|---|---|---|---|---|---|---|---|---|---|---|---|---|---|---|---|---|---|---|---|---|---|---|---|---|---|---|---|---|---|---|---|---|---|
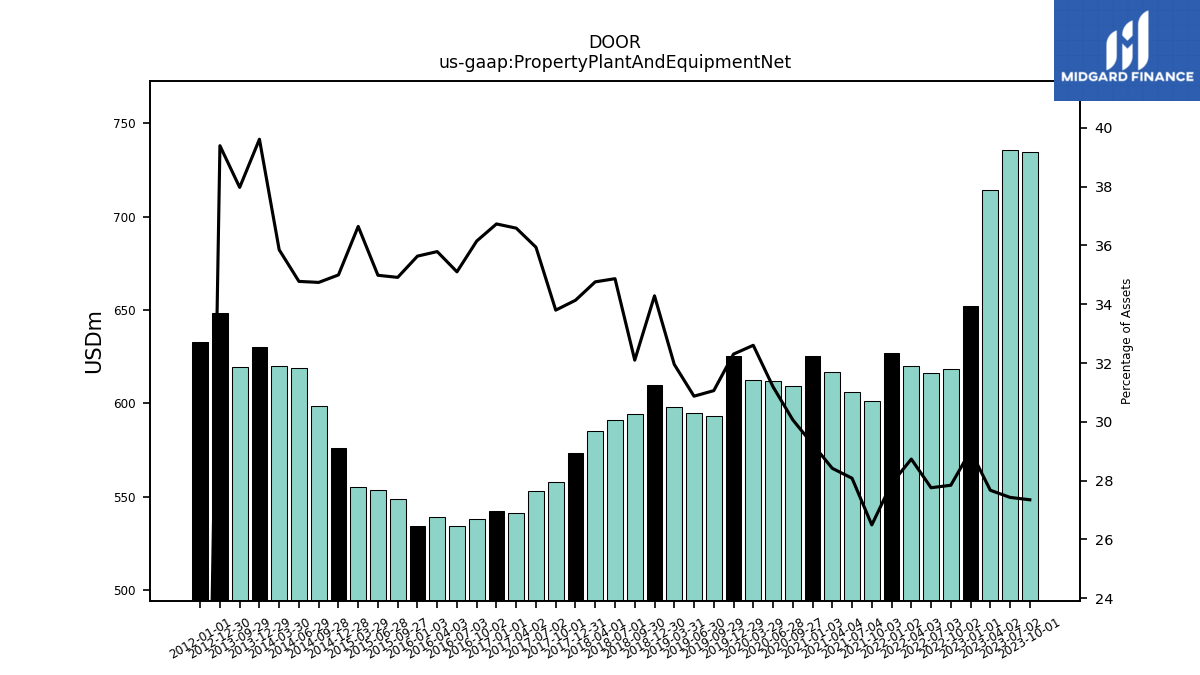
| Property Plant And Equipment Net | 734.57 | 735.93 | 714.26 | 652.33 | 618.24 | 616.01 | 619.80 | 626.80 | 601.41 | 605.85 | 616.87 | 625.13 | 609.49 | 611.94 | 612.30 | 625.59 | 593.23 | 594.54 | 598.06 | 609.75 | 594.28 | 591.00 | 585.23 | 573.56 | 557.77 | 552.73 | 541.02 | 542.09 | 538.01 | 534.44 | 539.17 | 534.23 | 548.80 | 553.66 | 555.13 | 576.23 | 598.68 | 618.87 | 620.13 | 630.28 | 619.32 | NA | NA | 648.36 | NA | NA | NA | |
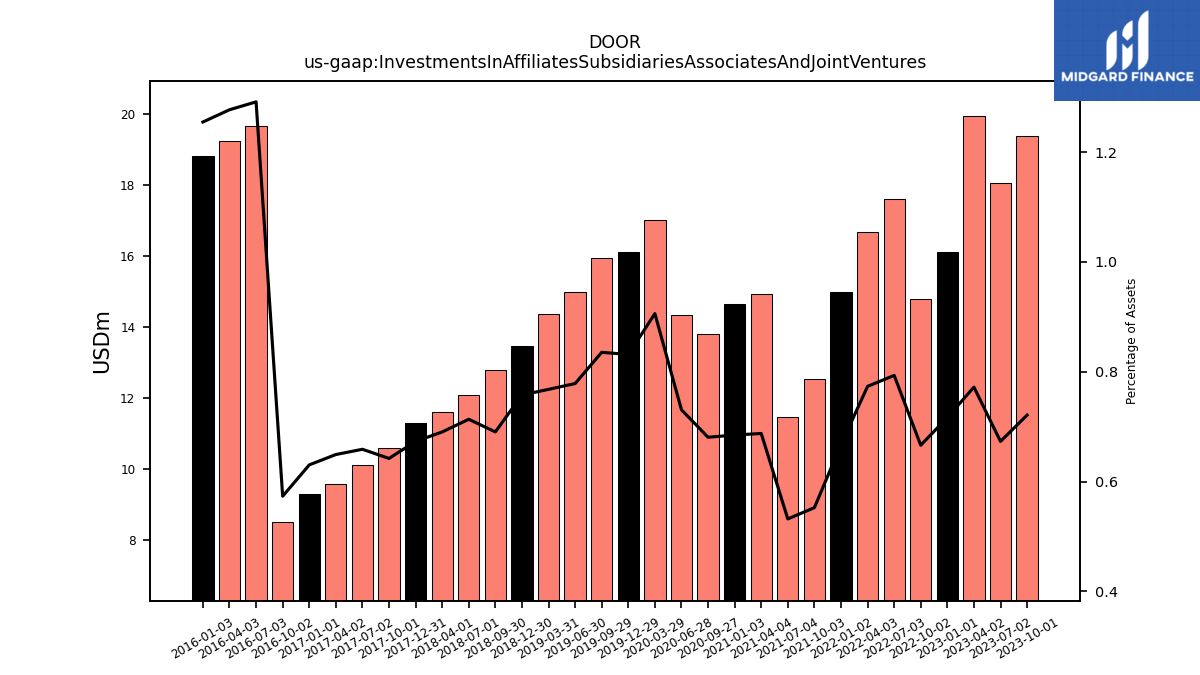
| Investments In Affiliates Subsidiaries Associates And Joint Ventures | 19.37 | 18.06 | 19.92 | 16.11 | 14.79 | 17.60 | 16.68 | 14.99 | 12.54 | 11.47 | 14.92 | 14.64 | 13.80 | 14.33 | 17.01 | 16.10 | 15.95 | 14.99 | 14.37 | 13.47 | 12.78 | 12.09 | 11.62 | 11.31 | 10.60 | 10.13 | 9.60 | 9.30 | 8.53 | 19.66 | 19.24 | 18.81 | NA | NA | NA | NA | NA | NA | NA | NA | NA | NA | NA | NA | NA | NA | NA | |
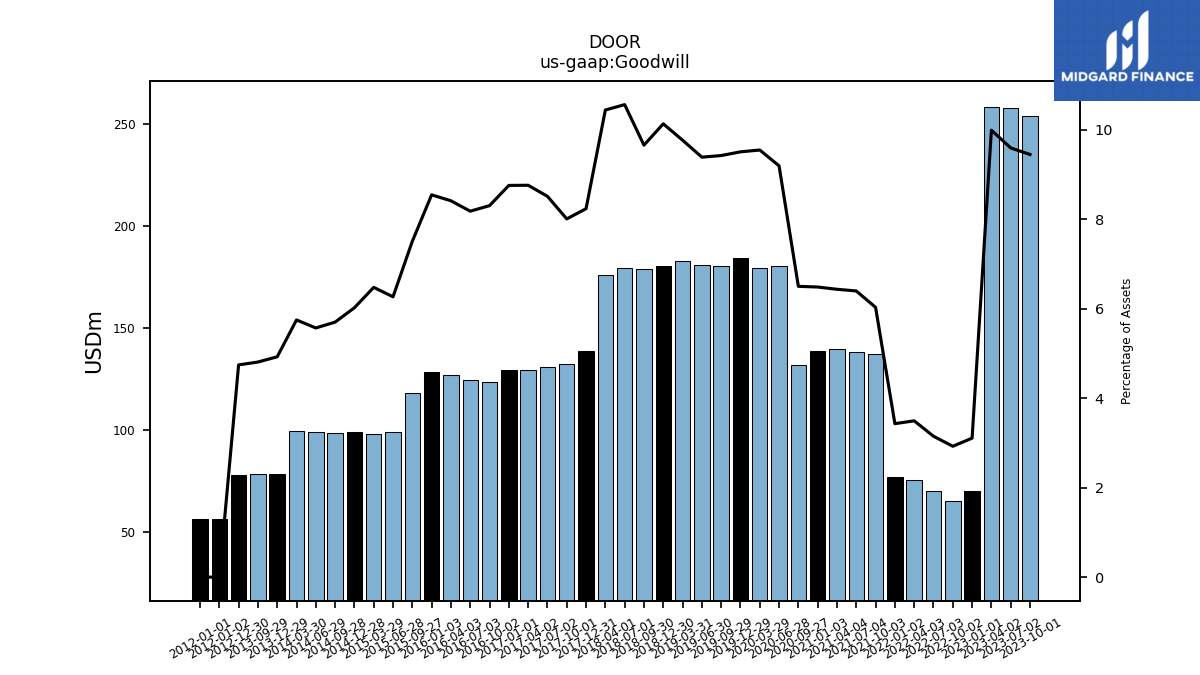
| Goodwill | 253.87 | 257.53 | 257.98 | 69.87 | 64.99 | 69.92 | 75.40 | 77.10 | 136.96 | 138.07 | 139.73 | 138.69 | 131.83 | 180.44 | 179.39 | 184.19 | 180.07 | 180.87 | 182.90 | 180.30 | 178.86 | 179.10 | 175.87 | 138.45 | 132.21 | 130.98 | 129.59 | 129.29 | 123.65 | 124.60 | 126.79 | 128.17 | 118.06 | 99.22 | 98.17 | 99.20 | 98.28 | 99.16 | 99.48 | 78.40 | 78.45 | NA | NA | 78.12 | NA | NA | NA | |
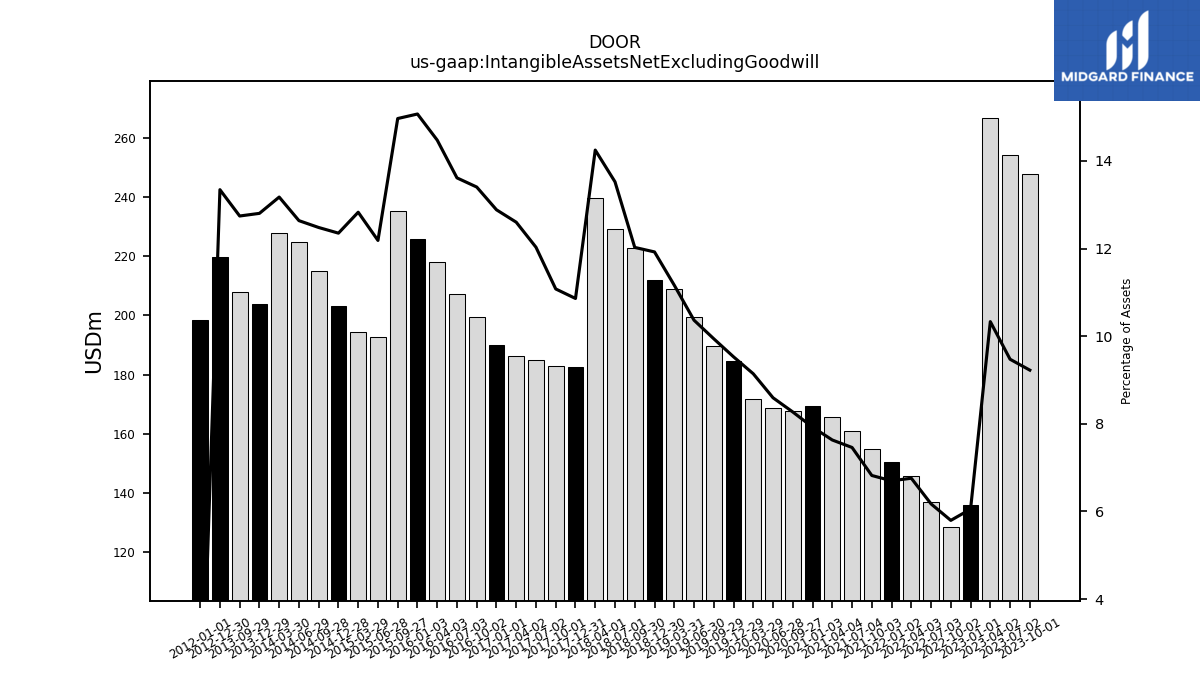
| Intangible Assets Net Excluding Goodwill | 247.76 | 254.16 | 266.66 | 136.06 | 128.68 | 136.96 | 145.76 | 150.49 | 154.82 | 160.93 | 165.62 | 169.39 | 167.63 | 168.59 | 171.68 | 184.53 | 189.85 | 199.60 | 208.95 | 212.04 | 222.66 | 229.21 | 239.86 | 182.48 | 182.81 | 185.01 | 186.33 | 190.15 | 199.49 | 207.26 | 218.06 | 225.93 | 235.27 | 192.85 | 194.34 | 203.37 | 215.06 | 224.88 | 227.88 | 203.71 | 207.82 | NA | NA | 219.62 | NA | NA | NA | |
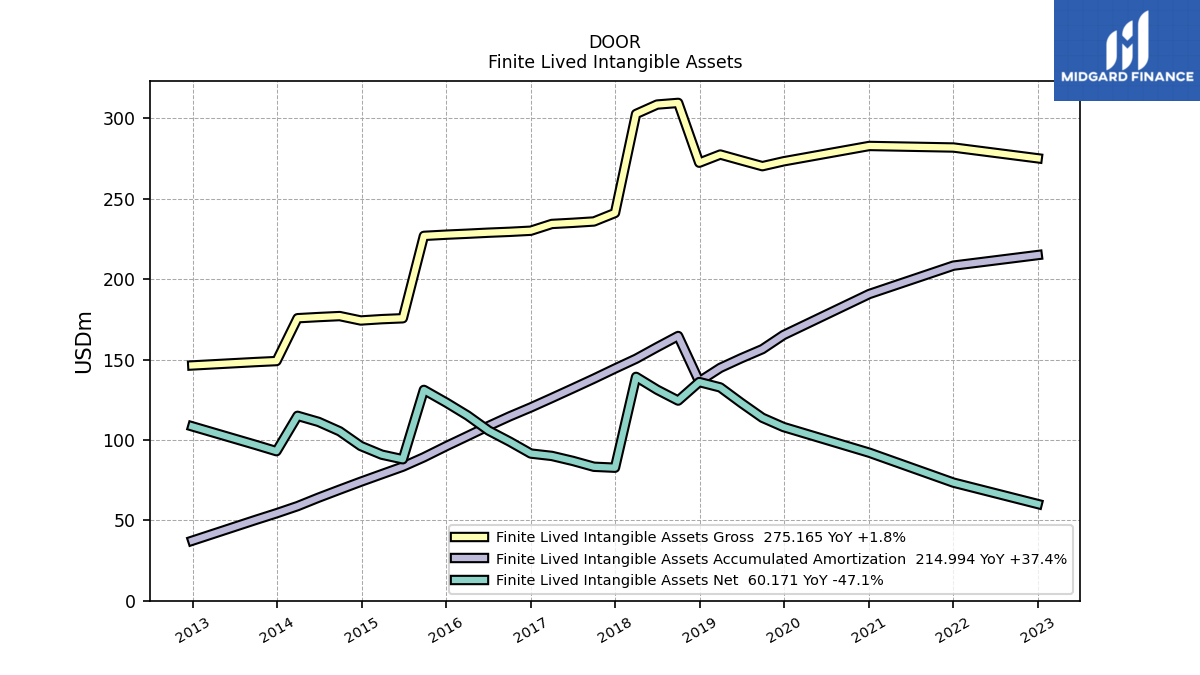
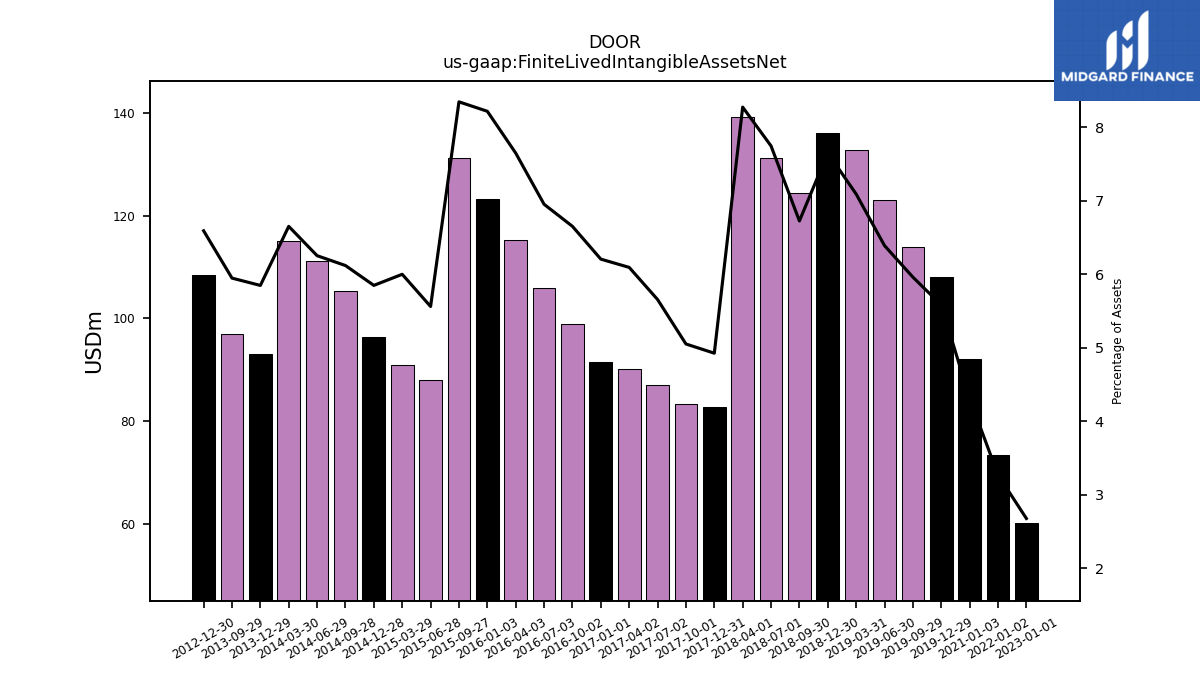
| Finite Lived Intangible Assets Net | NA | NA | NA | 60.17 | NA | NA | NA | 73.45 | NA | NA | NA | 92.07 | NA | NA | NA | 108.05 | 113.80 | 123.00 | 132.67 | 136.01 | 124.47 | 131.23 | 139.24 | 82.74 | 83.33 | 86.96 | 90.07 | 91.55 | 98.96 | 105.81 | 115.18 | 123.14 | 131.13 | 87.98 | 90.85 | 96.26 | 105.39 | 111.22 | 115.01 | 93.01 | 96.96 | NA | NA | 108.45 | NA | NA | NA | |
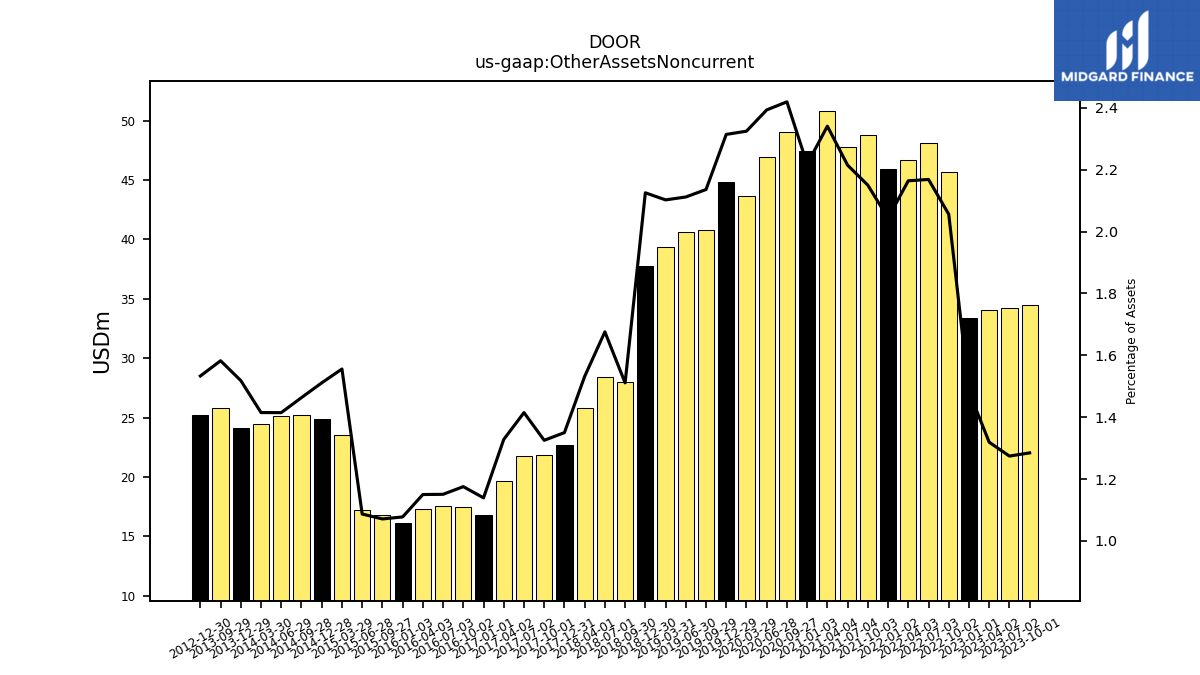
| Other Assets Noncurrent | 34.51 | 34.19 | 34.05 | 33.35 | 45.65 | 48.12 | 46.68 | 45.90 | 48.80 | 47.77 | 50.80 | 47.41 | 49.03 | 46.95 | 43.65 | 44.81 | 40.79 | 40.66 | 39.35 | 37.79 | 27.97 | 28.40 | 25.79 | 22.69 | 21.87 | 21.76 | 19.64 | 16.82 | 17.50 | 17.52 | 17.33 | 16.16 | 16.84 | 17.20 | 23.57 | 24.88 | 25.22 | 25.18 | 24.48 | 24.16 | 25.81 | NA | NA | 25.23 | NA | NA | NA |
| 2023-10-01 | 2023-07-02 | 2023-04-02 | 2023-01-01 | 2022-10-02 | 2022-07-03 | 2022-04-03 | 2022-01-02 | 2021-10-03 | 2021-07-04 | 2021-04-04 | 2021-01-03 | 2020-09-27 | 2020-06-28 | 2020-03-29 | 2019-12-29 | 2019-09-29 | 2019-06-30 | 2019-03-31 | 2018-12-30 | 2018-09-30 | 2018-07-01 | 2018-04-01 | 2017-12-31 | 2017-10-01 | 2017-07-02 | 2017-04-02 | 2017-01-01 | 2016-10-02 | 2016-07-03 | 2016-04-03 | 2016-01-03 | 2015-09-27 | 2015-06-28 | 2015-03-29 | 2014-12-28 | 2014-09-28 | 2014-06-29 | 2014-03-30 | 2013-12-29 | 2013-09-29 | 2013-06-30 | 2013-03-31 | 2012-12-30 | 2012-09-30 | 2012-07-01 | 2012-04-01 | ||
|---|---|---|---|---|---|---|---|---|---|---|---|---|---|---|---|---|---|---|---|---|---|---|---|---|---|---|---|---|---|---|---|---|---|---|---|---|---|---|---|---|---|---|---|---|---|---|---|---|
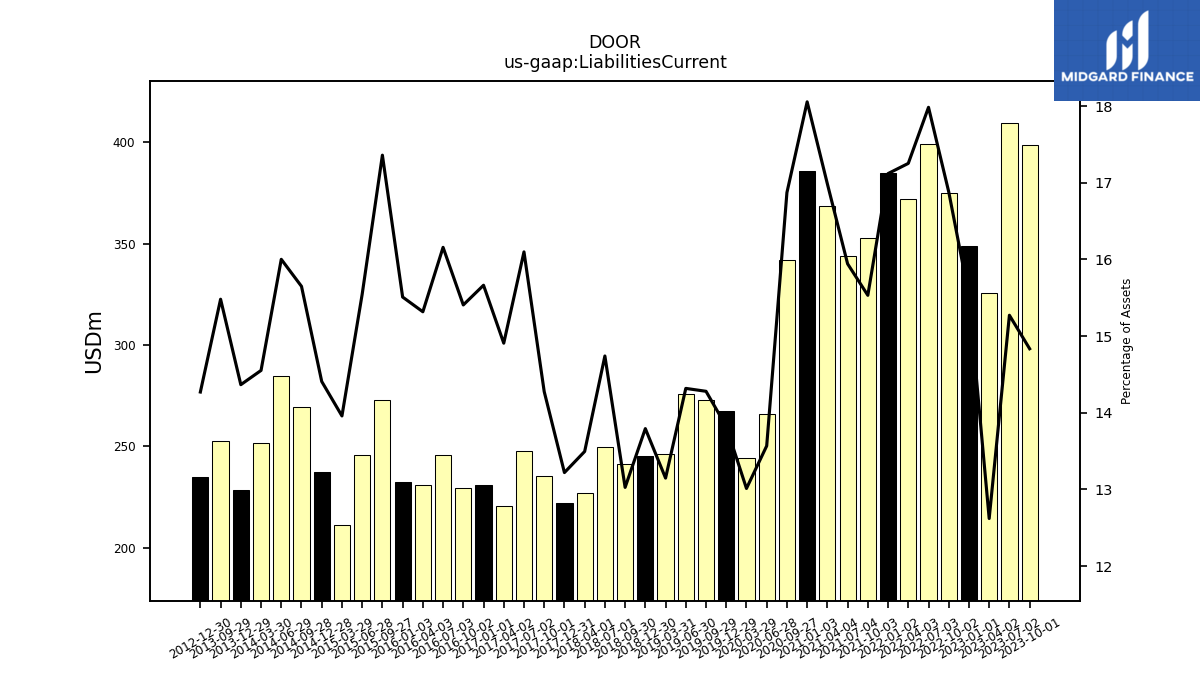
| Liabilities Current | 398.46 | 409.75 | 325.74 | 348.93 | 374.87 | 399.14 | 372.18 | 384.64 | 352.59 | 343.98 | 368.71 | 386.01 | 342.03 | 266.18 | 244.38 | 267.67 | 272.73 | 275.74 | 246.09 | 245.31 | 241.18 | 249.85 | 227.20 | 222.12 | 235.60 | 247.61 | 220.45 | 231.18 | 229.30 | 246.01 | 230.76 | 232.52 | 272.90 | 246.04 | 211.46 | 237.24 | 269.67 | 284.77 | 251.72 | 228.59 | 252.49 | NA | NA | 234.89 | NA | NA | NA | |
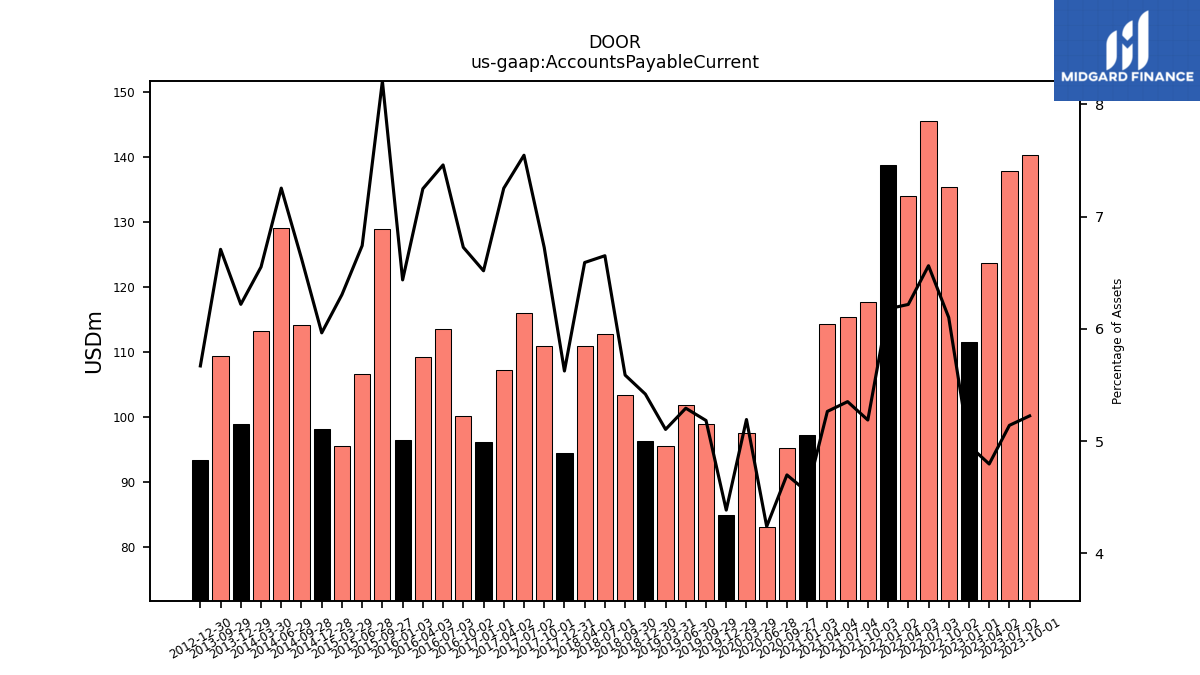
| Accounts Payable Current | 140.31 | 137.90 | 123.77 | 111.53 | 135.46 | 145.63 | 134.11 | 138.79 | 117.75 | 115.44 | 114.26 | 97.21 | 95.23 | 83.15 | 97.50 | 84.91 | 98.98 | 101.92 | 95.52 | 96.36 | 103.45 | 112.73 | 110.96 | 94.50 | 110.99 | 116.06 | 107.24 | 96.18 | 100.10 | 113.58 | 109.19 | 96.48 | 129.00 | 106.69 | 95.50 | 98.20 | 114.19 | 129.08 | 113.31 | 98.94 | 109.40 | NA | NA | 93.31 | NA | NA | NA | |
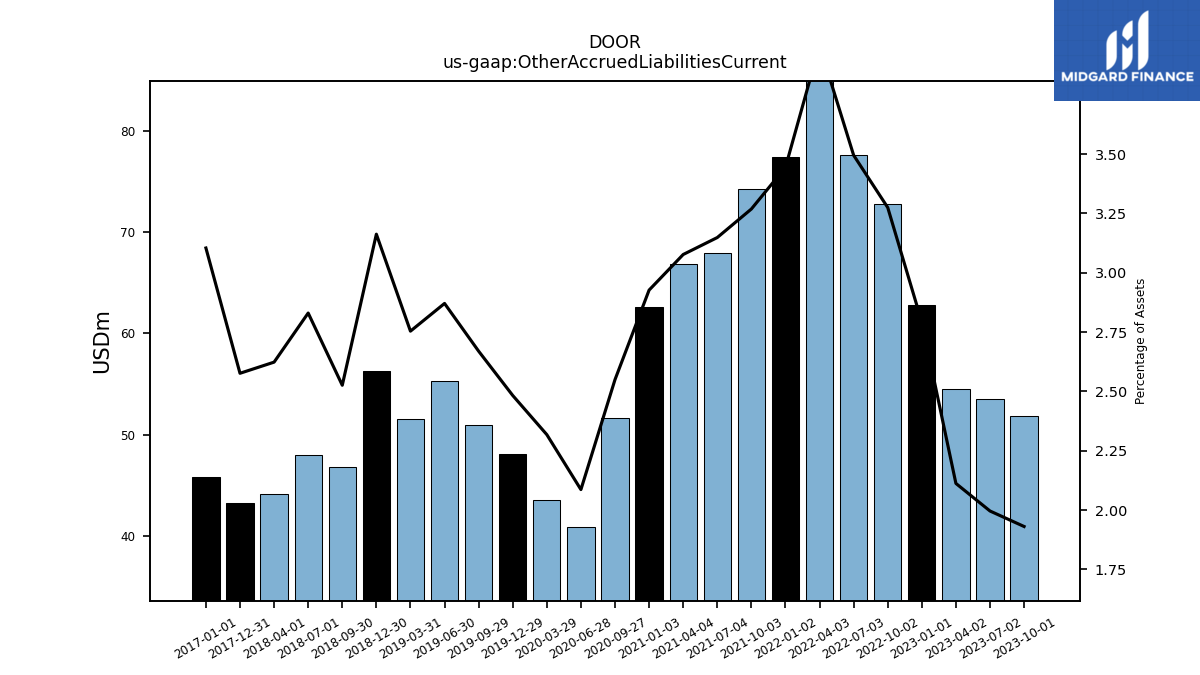
| Other Accrued Liabilities Current | 51.85 | 53.55 | 54.51 | 62.77 | 72.71 | 77.56 | 85.38 | 77.38 | 74.19 | 67.92 | 66.78 | 62.57 | 51.68 | 40.93 | 43.53 | 48.08 | 50.98 | 55.28 | 51.54 | 56.24 | 46.77 | 47.97 | 44.16 | 43.29 | NA | NA | NA | 45.81 | NA | NA | NA | NA | NA | NA | NA | NA | NA | NA | NA | NA | NA | NA | NA | NA | NA | NA | NA | |
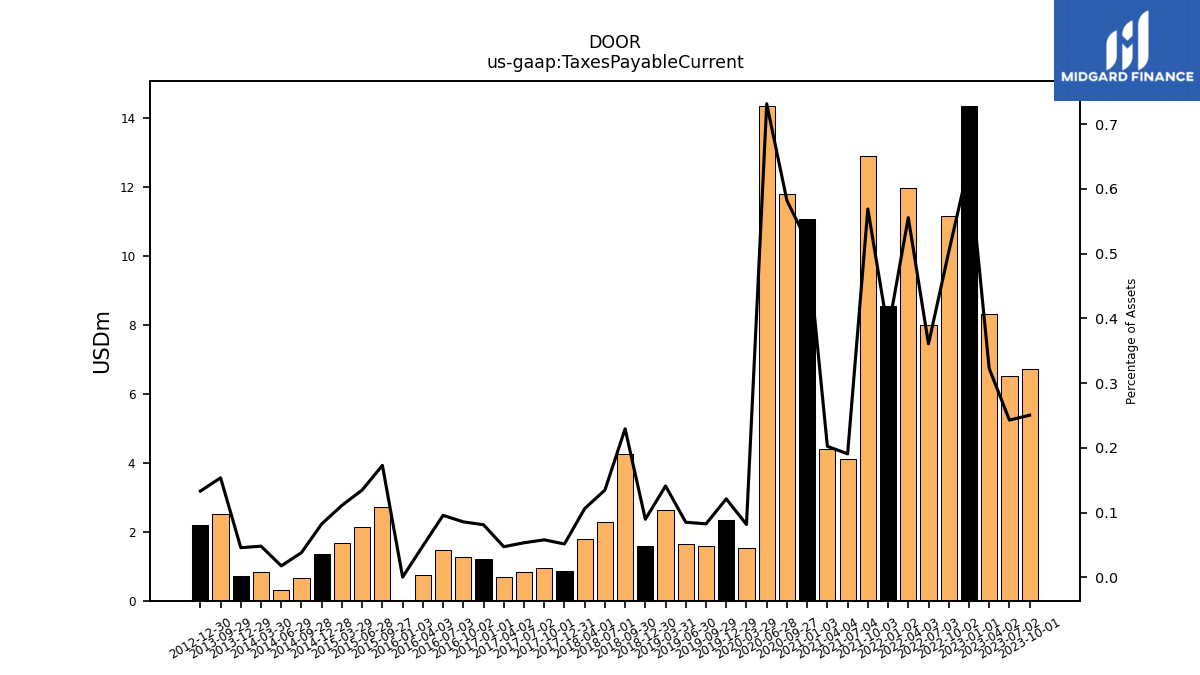
| Taxes Payable Current | 6.73 | 6.52 | 8.33 | 14.36 | 11.16 | 8.00 | 11.98 | 8.55 | 12.91 | 4.12 | 4.39 | 11.09 | 11.79 | 14.35 | 1.54 | 2.35 | 1.58 | 1.64 | 2.64 | 1.60 | 4.25 | 2.29 | 1.79 | 0.87 | 0.96 | 0.82 | 0.70 | 1.20 | 1.28 | 1.46 | 0.73 | 0.01 | 2.72 | 2.14 | 1.69 | 1.36 | 0.66 | 0.32 | 0.84 | 0.73 | 2.51 | NA | NA | 2.19 | NA | NA | NA | |
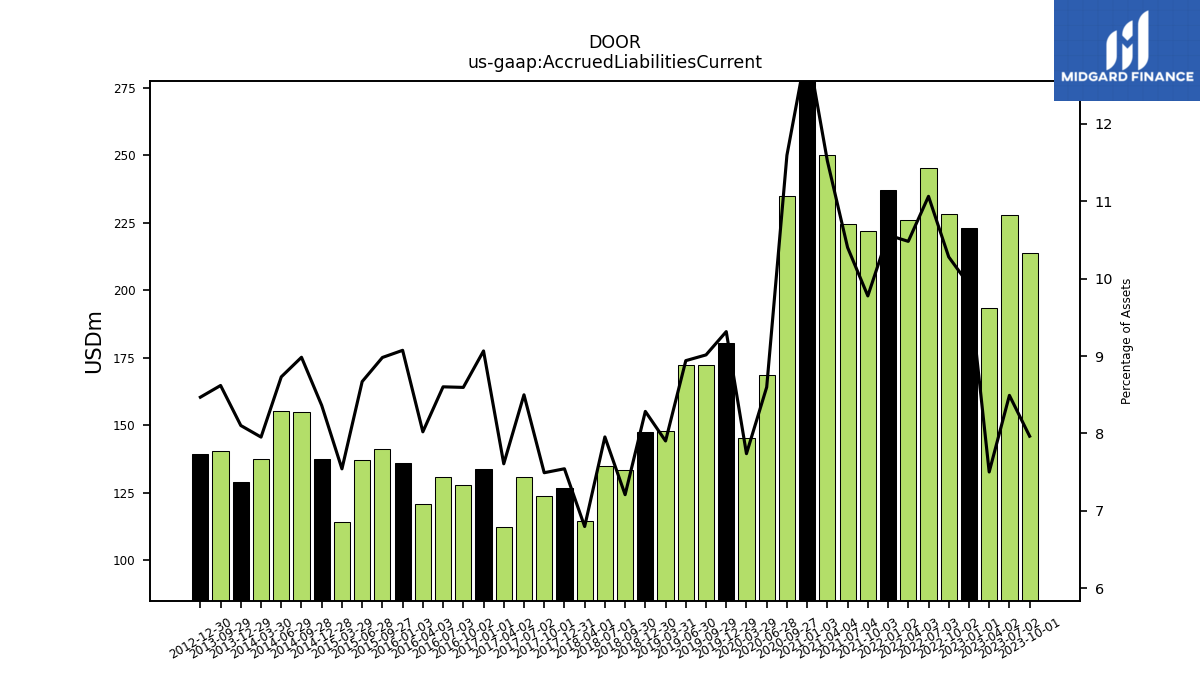
| Accrued Liabilities Current | 213.92 | 227.83 | 193.64 | 223.05 | 228.26 | 245.50 | 226.09 | 237.30 | 221.93 | 224.41 | 250.06 | 277.72 | 235.01 | 168.68 | 145.34 | 180.41 | 172.17 | 172.18 | 147.92 | 147.34 | 133.48 | 134.84 | 114.45 | 126.76 | 123.65 | 130.72 | 112.50 | 133.80 | 127.92 | 130.97 | 120.84 | 136.03 | 141.18 | 137.22 | 114.27 | 137.68 | 154.82 | 155.37 | 137.56 | 128.92 | 140.58 | NA | NA | 139.38 | NA | NA | NA |
| 2023-10-01 | 2023-07-02 | 2023-04-02 | 2023-01-01 | 2022-10-02 | 2022-07-03 | 2022-04-03 | 2022-01-02 | 2021-10-03 | 2021-07-04 | 2021-04-04 | 2021-01-03 | 2020-09-27 | 2020-06-28 | 2020-03-29 | 2019-12-29 | 2019-09-29 | 2019-06-30 | 2019-03-31 | 2018-12-30 | 2018-09-30 | 2018-07-01 | 2018-04-01 | 2017-12-31 | 2017-10-01 | 2017-07-02 | 2017-04-02 | 2017-01-01 | 2016-10-02 | 2016-07-03 | 2016-04-03 | 2016-01-03 | 2015-09-27 | 2015-06-28 | 2015-03-29 | 2014-12-28 | 2014-09-28 | 2014-06-29 | 2014-03-30 | 2013-12-29 | 2013-09-29 | 2013-06-30 | 2013-03-31 | 2012-12-30 | 2012-09-30 | 2012-07-01 | 2012-04-01 | ||
|---|---|---|---|---|---|---|---|---|---|---|---|---|---|---|---|---|---|---|---|---|---|---|---|---|---|---|---|---|---|---|---|---|---|---|---|---|---|---|---|---|---|---|---|---|---|---|---|---|
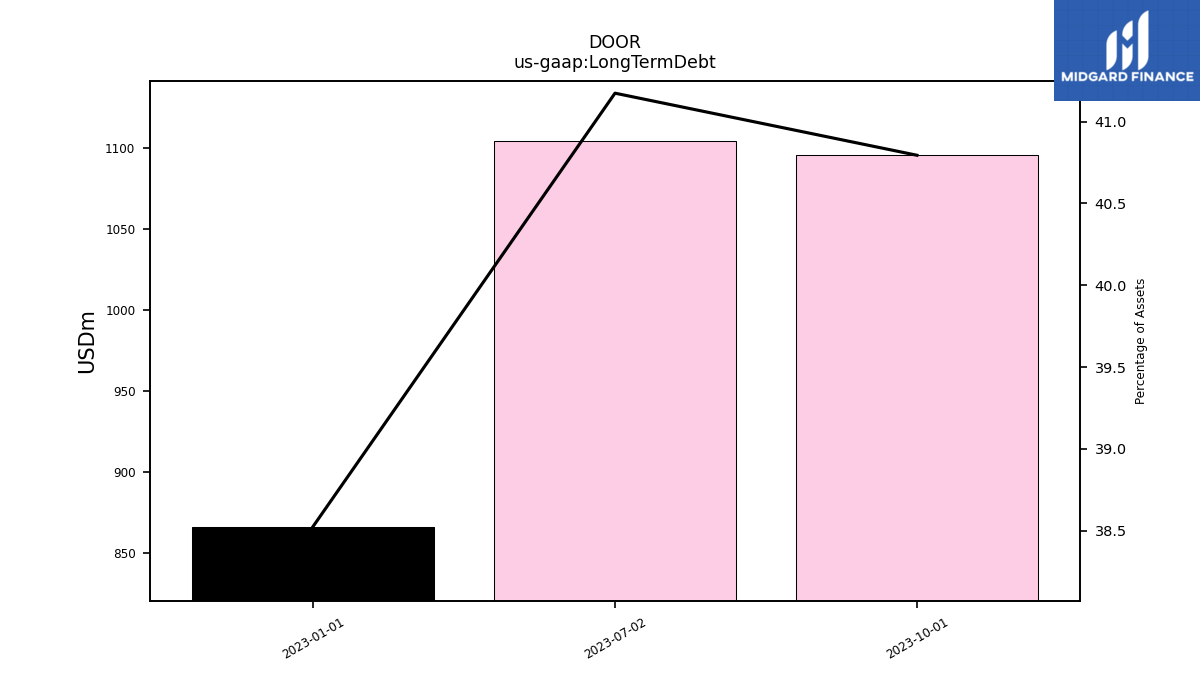
| Long Term Debt | 1095.71 | 1104.68 | NA | 866.12 | NA | NA | NA | NA | NA | NA | NA | NA | NA | NA | NA | NA | NA | NA | NA | NA | NA | NA | NA | NA | NA | NA | NA | NA | NA | NA | NA | NA | NA | NA | NA | NA | NA | NA | NA | NA | NA | NA | NA | NA | NA | NA | NA | |
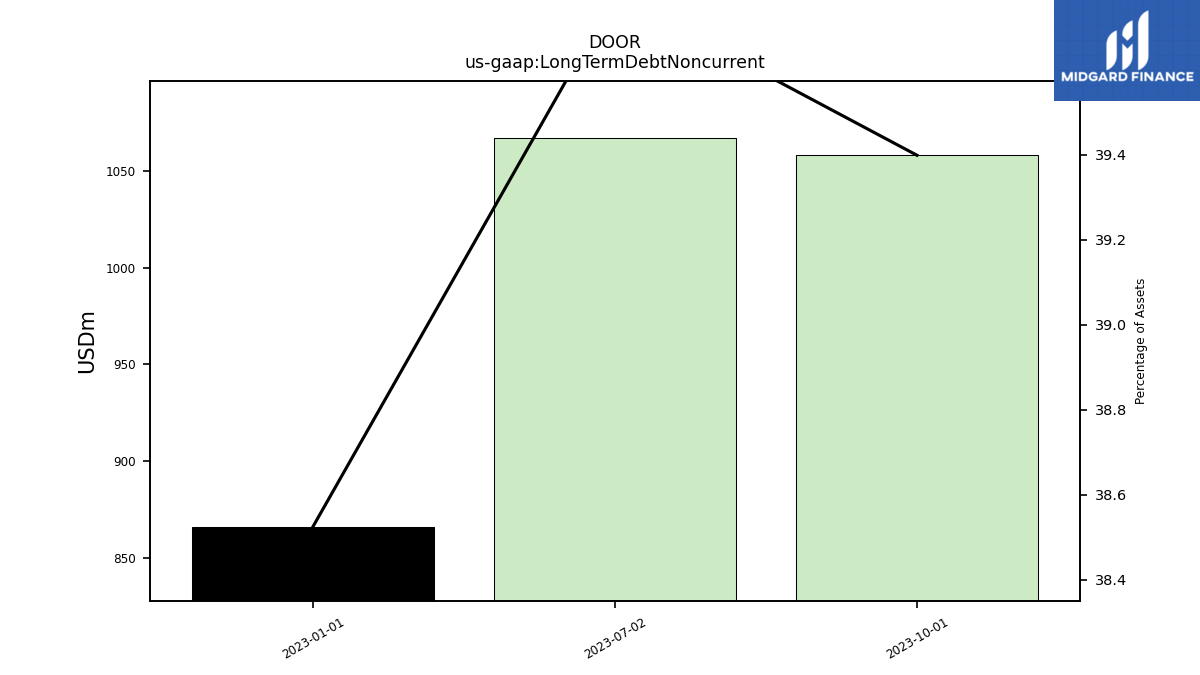
| Long Term Debt Noncurrent | 1058.21 | 1067.18 | NA | 866.12 | NA | NA | NA | NA | NA | NA | NA | NA | NA | NA | NA | NA | NA | NA | NA | NA | NA | NA | NA | NA | NA | NA | NA | NA | NA | NA | NA | NA | NA | NA | NA | NA | NA | NA | NA | NA | NA | NA | NA | NA | NA | NA | NA | |
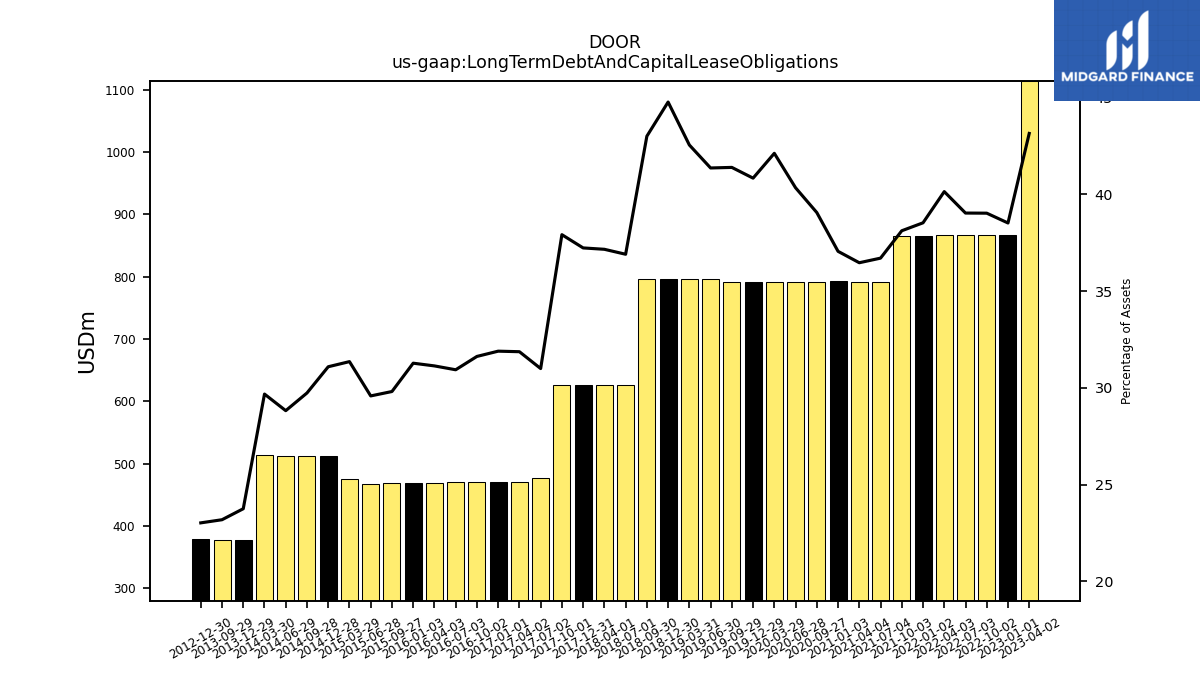
| Long Term Debt And Capital Lease Obligations | NA | NA | 1113.88 | 866.12 | 866.70 | 866.36 | 866.04 | 865.72 | 865.40 | 791.95 | 791.63 | 792.24 | 791.88 | 791.54 | 791.19 | 790.98 | 790.69 | 796.71 | 796.59 | 796.40 | 796.39 | 625.58 | 625.69 | 625.66 | 625.80 | 476.74 | 471.24 | 470.75 | 470.67 | 470.98 | 469.03 | 468.86 | 468.58 | 468.17 | 475.00 | 511.92 | 512.39 | 512.87 | 513.34 | 377.86 | 378.04 | NA | NA | 378.85 | NA | NA | NA | |
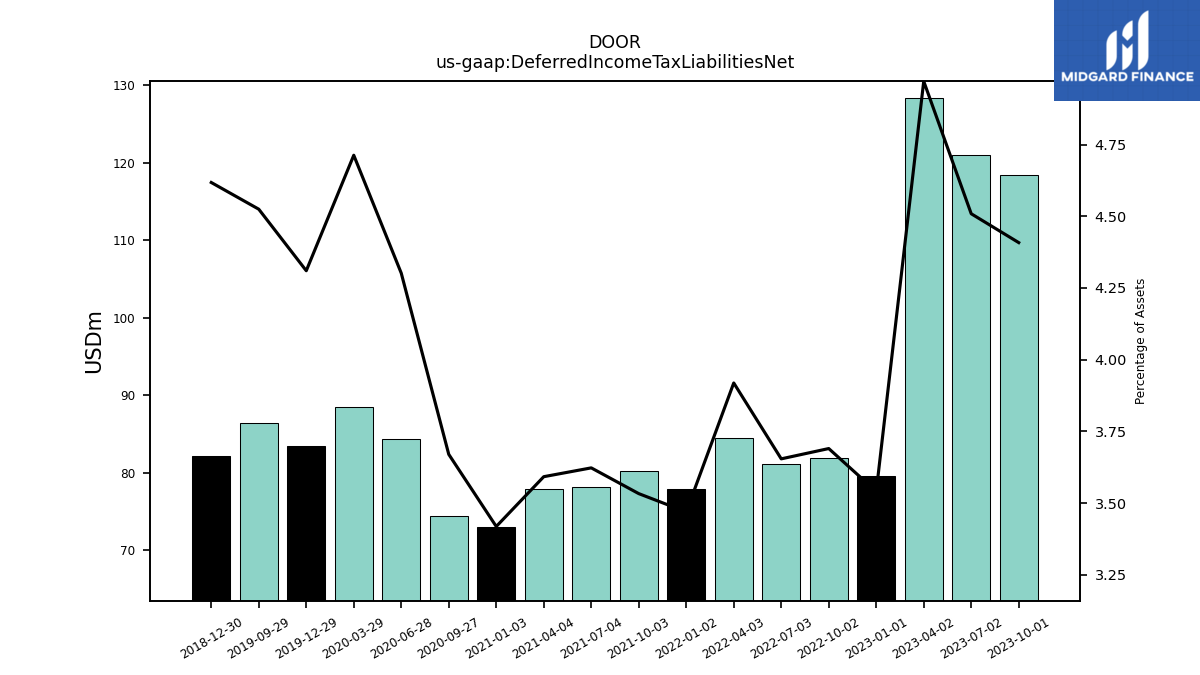
| Deferred Income Tax Liabilities Net | 118.39 | 120.96 | 128.29 | 79.59 | 81.93 | 81.09 | 84.53 | 77.94 | 80.19 | 78.16 | 77.97 | 73.07 | 74.39 | 84.39 | 88.50 | 83.47 | 86.41 | NA | NA | 82.12 | NA | NA | NA | NA | NA | NA | NA | NA | NA | NA | NA | NA | NA | NA | NA | NA | NA | NA | NA | NA | NA | NA | NA | NA | NA | NA | NA | |
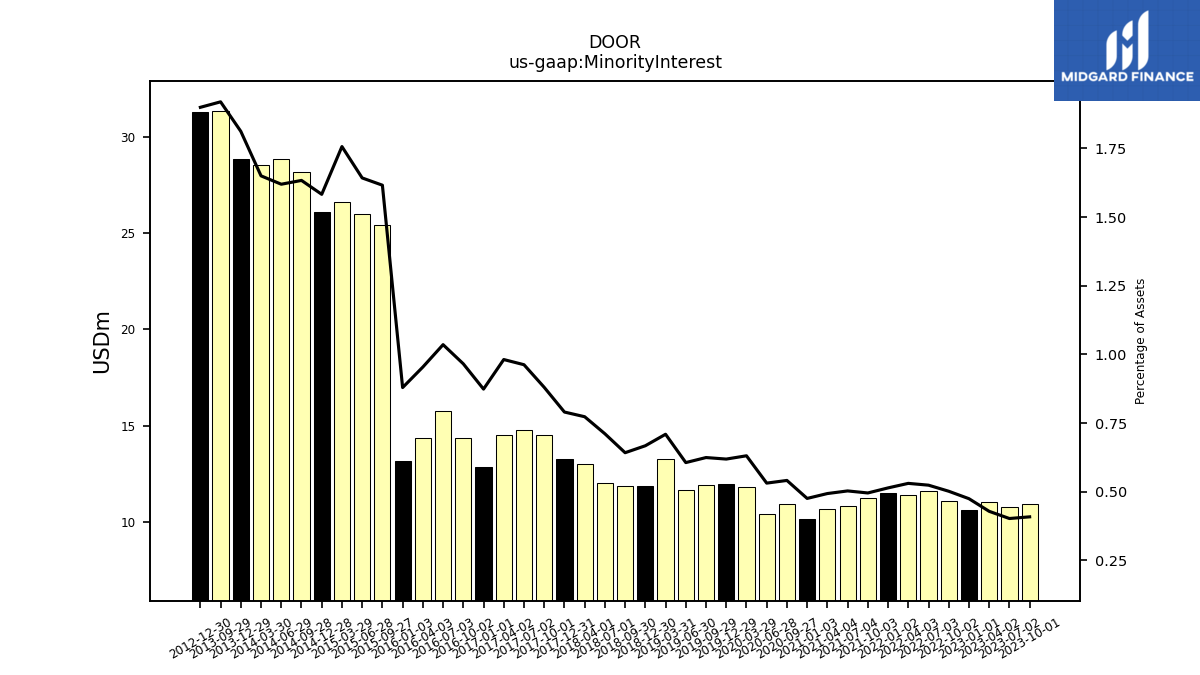
| Minority Interest | 10.96 | 10.79 | 11.05 | 10.66 | 11.13 | 11.62 | 11.44 | 11.54 | 11.24 | 10.84 | 10.70 | 10.16 | 10.96 | 10.42 | 11.84 | 11.98 | 11.92 | 11.67 | 13.27 | 11.87 | 11.88 | 12.05 | 13.01 | 13.27 | 14.52 | 14.80 | 14.51 | 12.89 | 14.37 | 15.76 | 14.37 | 13.18 | 25.41 | 26.00 | 26.62 | 26.07 | 28.15 | 28.83 | 28.55 | 28.84 | 31.31 | NA | NA | 31.27 | NA | NA | NA | |
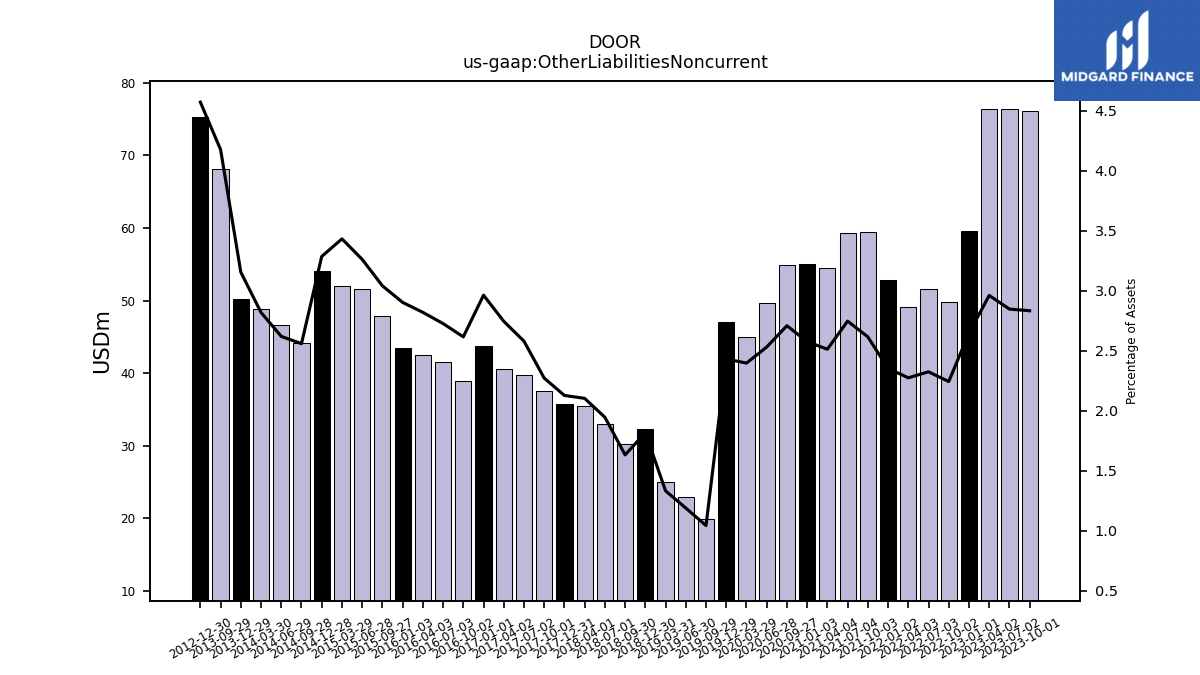
| Other Liabilities Noncurrent | 76.12 | 76.41 | 76.43 | 59.52 | 49.83 | 51.59 | 49.07 | 52.87 | 59.39 | 59.27 | 54.55 | 55.08 | 54.92 | 49.66 | 45.03 | 47.11 | 19.93 | 22.91 | 24.94 | 32.33 | 30.23 | 32.99 | 35.41 | 35.75 | 37.50 | 39.68 | 40.60 | 43.74 | 38.94 | 41.52 | 42.49 | 43.53 | 47.81 | 51.63 | 52.01 | 54.11 | 44.11 | 46.63 | 48.77 | 50.21 | 68.12 | NA | NA | 75.26 | NA | NA | NA | |
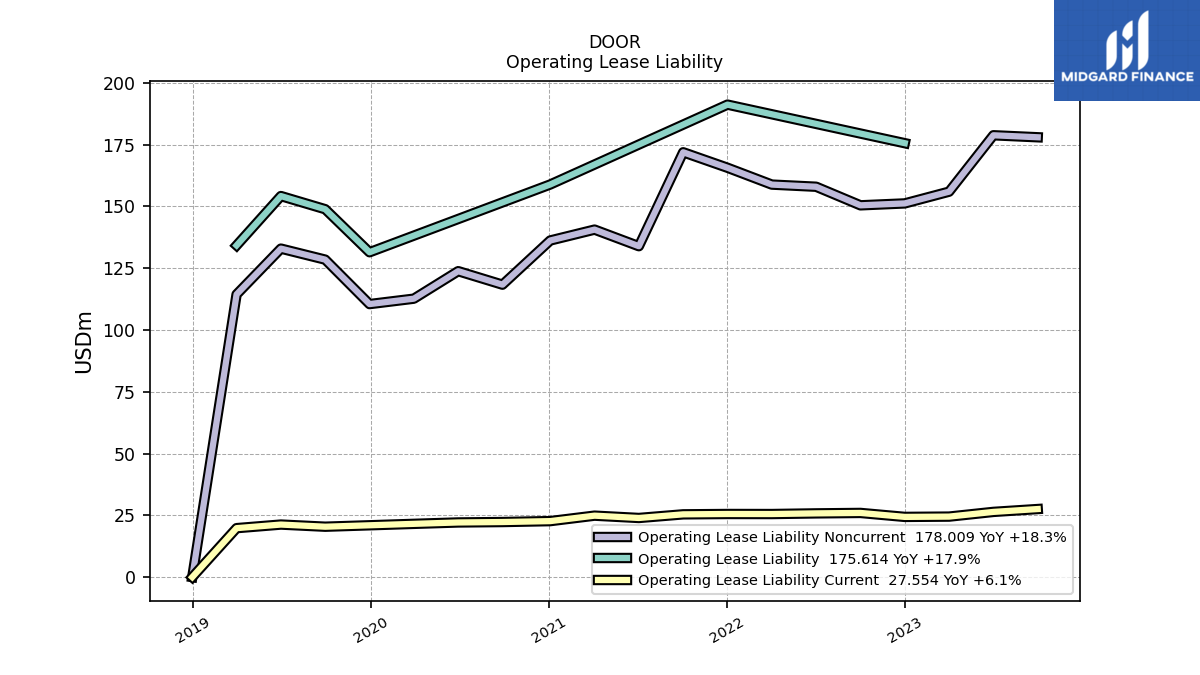
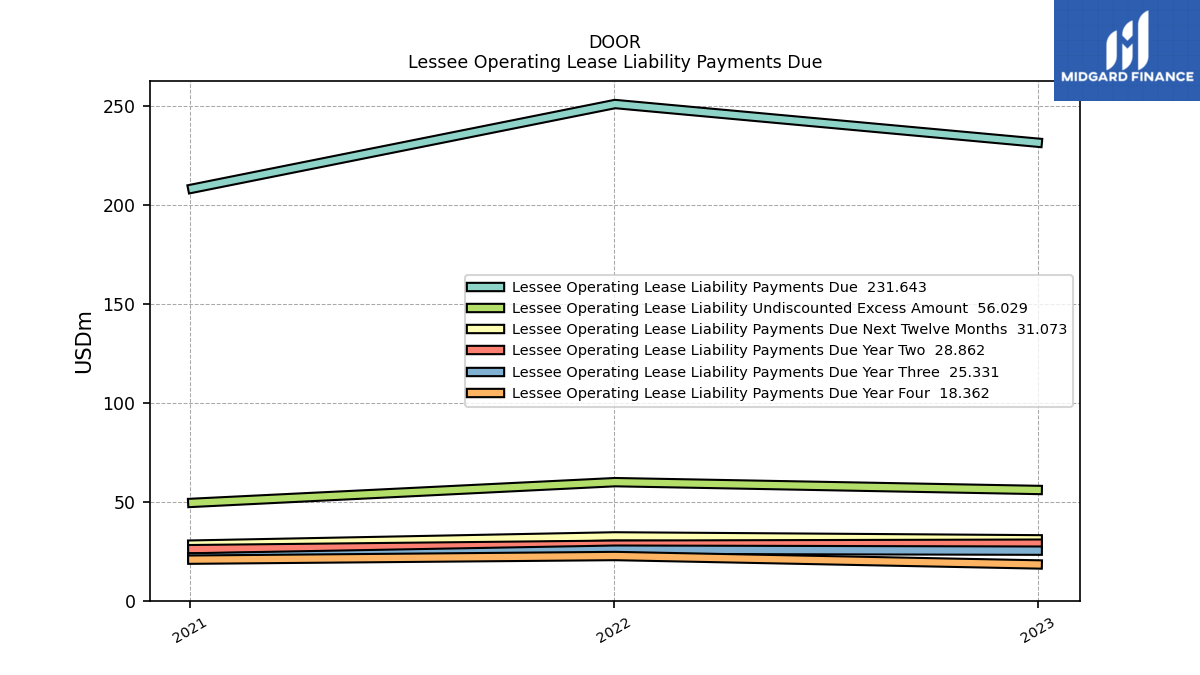
| Operating Lease Liability Noncurrent | 178.01 | 178.82 | 155.99 | 151.24 | 150.47 | 157.99 | 158.86 | 165.67 | 171.94 | 133.92 | 140.64 | 136.24 | 118.35 | 123.83 | 112.69 | 110.50 | 128.49 | 132.95 | 114.43 | 0.00 | NA | NA | NA | NA | NA | NA | NA | NA | NA | NA | NA | NA | NA | NA | NA | NA | NA | NA | NA | NA | NA | NA | NA | NA | NA | NA | NA |
| 2023-10-01 | 2023-07-02 | 2023-04-02 | 2023-01-01 | 2022-10-02 | 2022-07-03 | 2022-04-03 | 2022-01-02 | 2021-10-03 | 2021-07-04 | 2021-04-04 | 2021-01-03 | 2020-09-27 | 2020-06-28 | 2020-03-29 | 2019-12-29 | 2019-09-29 | 2019-06-30 | 2019-03-31 | 2018-12-30 | 2018-09-30 | 2018-07-01 | 2018-04-01 | 2017-12-31 | 2017-10-01 | 2017-07-02 | 2017-04-02 | 2017-01-01 | 2016-10-02 | 2016-07-03 | 2016-04-03 | 2016-01-03 | 2015-09-27 | 2015-06-28 | 2015-03-29 | 2014-12-28 | 2014-09-28 | 2014-06-29 | 2014-03-30 | 2013-12-29 | 2013-09-29 | 2013-06-30 | 2013-03-31 | 2012-12-30 | 2012-09-30 | 2012-07-01 | 2012-04-01 | ||
|---|---|---|---|---|---|---|---|---|---|---|---|---|---|---|---|---|---|---|---|---|---|---|---|---|---|---|---|---|---|---|---|---|---|---|---|---|---|---|---|---|---|---|---|---|---|---|---|---|
| Stockholders Equity | 845.76 | 819.04 | 769.67 | 732.12 | 685.50 | 651.45 | 615.01 | 688.24 | 729.24 | 739.33 | 726.45 | 684.96 | 634.54 | 635.83 | 584.41 | 624.88 | 599.70 | 602.90 | 597.10 | 610.44 | 691.80 | 697.47 | 706.56 | 722.63 | 656.24 | 681.58 | 661.09 | 646.88 | 670.41 | 686.22 | 651.59 | 642.39 | 636.21 | 671.90 | 646.60 | 709.43 | 757.40 | 789.36 | 775.29 | 796.72 | 795.96 | NA | NA | 806.54 | NA | NA | NA | |
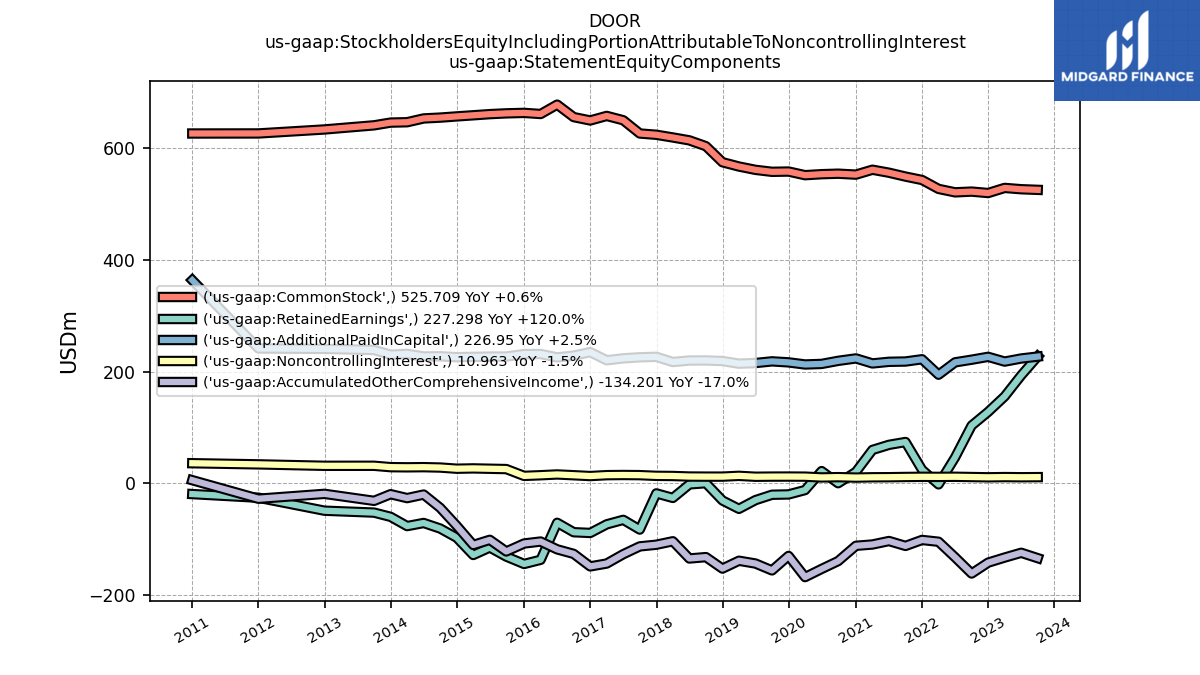
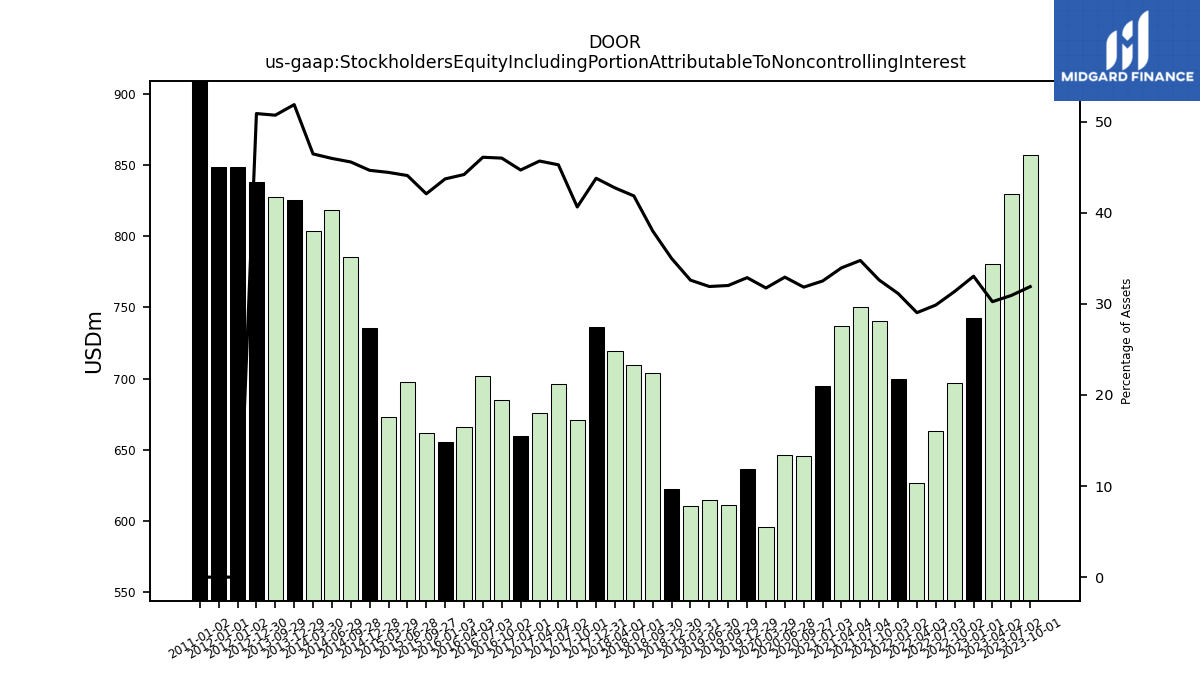
| Stockholders Equity Including Portion Attributable To Noncontrolling Interest | 856.72 | 829.83 | 780.72 | 742.78 | 696.64 | 663.07 | 626.45 | 699.78 | 740.48 | 750.17 | 737.15 | 695.12 | 645.50 | 646.25 | 596.26 | 636.86 | 611.62 | 614.57 | 610.37 | 622.30 | 703.69 | 709.51 | 719.57 | 735.90 | 670.76 | 696.38 | 675.60 | 659.78 | 684.78 | 701.98 | 665.96 | 655.57 | 661.62 | 697.90 | 673.22 | 735.50 | 785.55 | 818.19 | 803.84 | 825.56 | 827.27 | NA | NA | 837.82 | NA | NA | NA | |
| Common Stock Value | 525.71 | 526.82 | 529.16 | 520.00 | 522.58 | 521.24 | 527.39 | 543.40 | 549.47 | 556.40 | 561.78 | 552.97 | 554.67 | 553.77 | 551.98 | 558.51 | 558.03 | 561.54 | 567.49 | 575.21 | 603.97 | 614.37 | 619.55 | 624.40 | 626.68 | 650.41 | 658.16 | 650.01 | 656.05 | 678.41 | 661.60 | 663.60 | 662.77 | 661.36 | 659.30 | 657.29 | 655.15 | 653.65 | 646.87 | 646.20 | 641.31 | NA | NA | 633.91 | NA | NA | NA | |
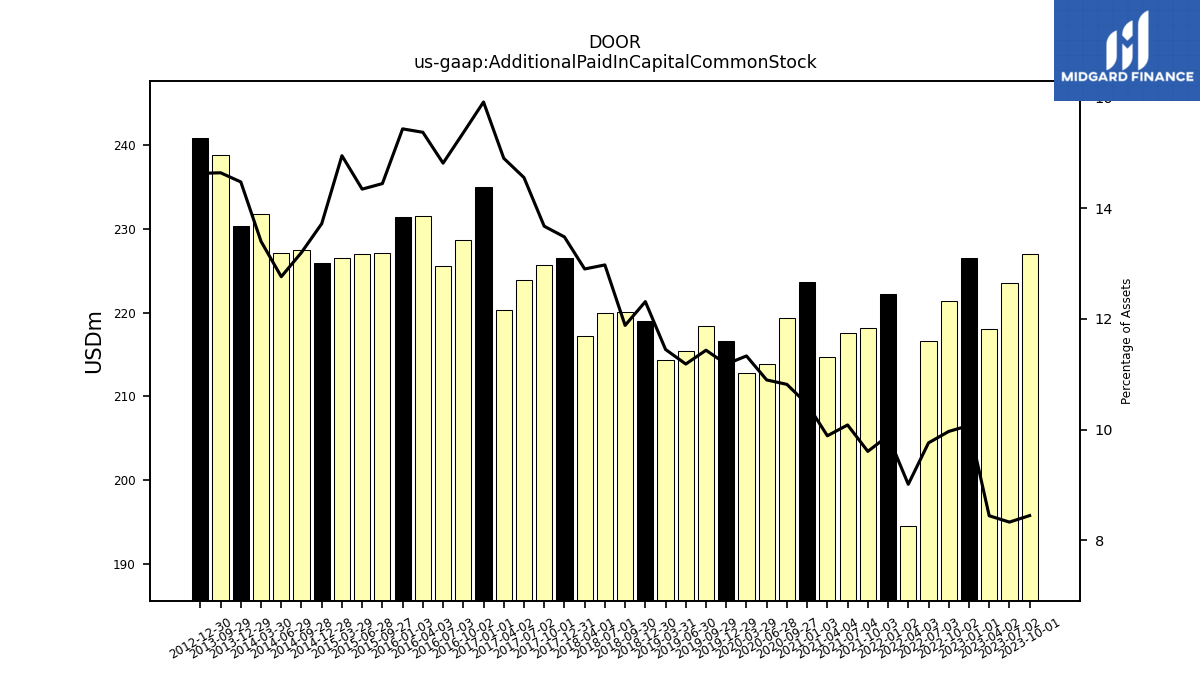
| Additional Paid In Capital Common Stock | 226.95 | 223.54 | 218.01 | 226.51 | 221.36 | 216.65 | 194.46 | 222.18 | 218.13 | 217.60 | 214.69 | 223.67 | 219.31 | 213.81 | 212.83 | 216.58 | 218.41 | 215.42 | 214.29 | 218.99 | 220.03 | 219.93 | 217.23 | 226.53 | 225.67 | 223.83 | 220.36 | 234.93 | 228.64 | 225.54 | 231.56 | 231.36 | 227.06 | 227.02 | 226.45 | 225.92 | 227.48 | 227.14 | 231.80 | 230.31 | 238.77 | NA | NA | 240.78 | NA | NA | NA | |
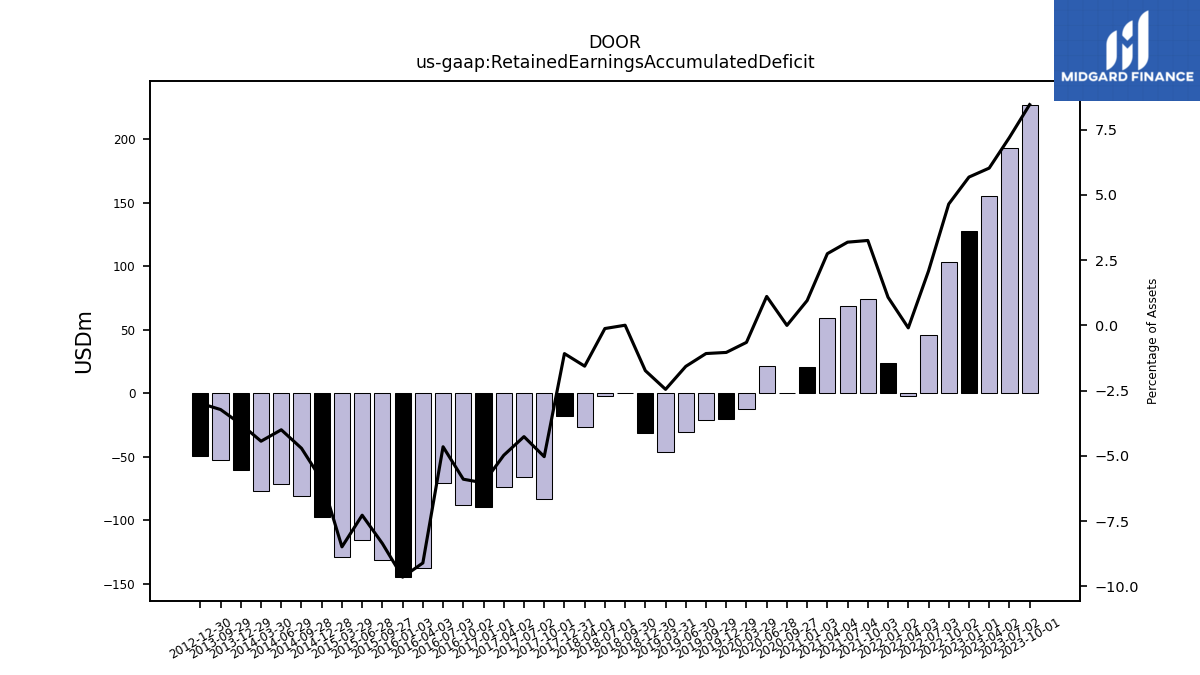
| Retained Earnings Accumulated Deficit | 227.30 | 193.26 | 155.62 | 127.83 | 103.31 | 46.27 | -2.02 | 24.24 | 73.91 | 68.84 | 59.71 | 20.39 | 0.03 | 21.79 | -12.20 | -20.05 | -20.58 | -30.23 | -45.85 | -30.84 | 0.14 | -2.02 | -26.29 | -18.15 | -83.01 | -65.55 | -73.59 | -89.06 | -87.72 | -70.82 | -137.16 | -144.63 | -131.41 | -115.13 | -128.57 | -97.52 | -81.15 | -71.18 | -76.76 | -60.18 | -52.59 | NA | NA | -49.17 | NA | NA | NA | |
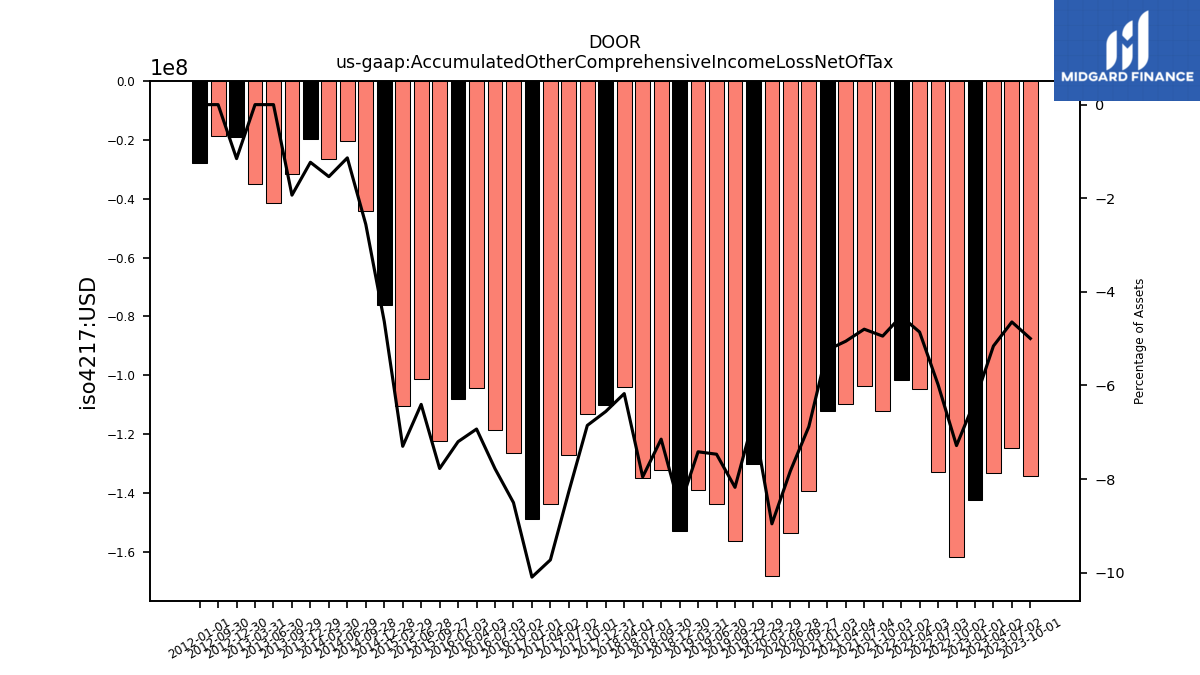
| Accumulated Other Comprehensive Income Loss Net Of Tax | -134.20 | -124.58 | -133.12 | -142.22 | -161.74 | -132.72 | -104.81 | -101.58 | -112.26 | -103.51 | -109.73 | -112.06 | -139.47 | -153.55 | -168.19 | -130.17 | -156.15 | -143.83 | -138.83 | -152.92 | -132.33 | -134.81 | -103.94 | -110.15 | -113.10 | -127.11 | -143.82 | -148.99 | -126.55 | -118.43 | -104.42 | -107.95 | -122.20 | -101.36 | -110.58 | -76.26 | -44.08 | -20.24 | -26.61 | -19.60 | -31.54 | -41.40 | -35.10 | -18.98 | -18.71 | NA | NA | |
| Minority Interest | 10.96 | 10.79 | 11.05 | 10.66 | 11.13 | 11.62 | 11.44 | 11.54 | 11.24 | 10.84 | 10.70 | 10.16 | 10.96 | 10.42 | 11.84 | 11.98 | 11.92 | 11.67 | 13.27 | 11.87 | 11.88 | 12.05 | 13.01 | 13.27 | 14.52 | 14.80 | 14.51 | 12.89 | 14.37 | 15.76 | 14.37 | 13.18 | 25.41 | 26.00 | 26.62 | 26.07 | 28.15 | 28.83 | 28.55 | 28.84 | 31.31 | NA | NA | 31.27 | NA | NA | NA |
| 2023-10-01 | 2023-07-02 | 2023-04-02 | 2023-01-01 | 2022-10-02 | 2022-07-03 | 2022-04-03 | 2022-01-02 | 2021-10-03 | 2021-07-04 | 2021-04-04 | 2021-01-03 | 2020-09-27 | 2020-06-28 | 2020-03-29 | 2019-12-29 | 2019-09-29 | 2019-06-30 | 2019-03-31 | 2018-12-30 | 2018-09-30 | 2018-07-01 | 2018-04-01 | 2017-12-31 | 2017-10-01 | 2017-07-02 | 2017-04-02 | 2017-01-01 | 2016-10-02 | 2016-07-03 | 2016-04-03 | 2016-01-03 | 2015-09-27 | 2015-06-28 | 2015-03-29 | 2014-12-28 | 2014-09-28 | 2014-06-29 | 2014-03-30 | 2013-12-29 | 2013-09-29 | 2013-06-30 | 2013-03-31 | 2012-12-30 | 2012-09-30 | 2012-07-01 | 2012-04-01 | ||
|---|---|---|---|---|---|---|---|---|---|---|---|---|---|---|---|---|---|---|---|---|---|---|---|---|---|---|---|---|---|---|---|---|---|---|---|---|---|---|---|---|---|---|---|---|---|---|---|---|
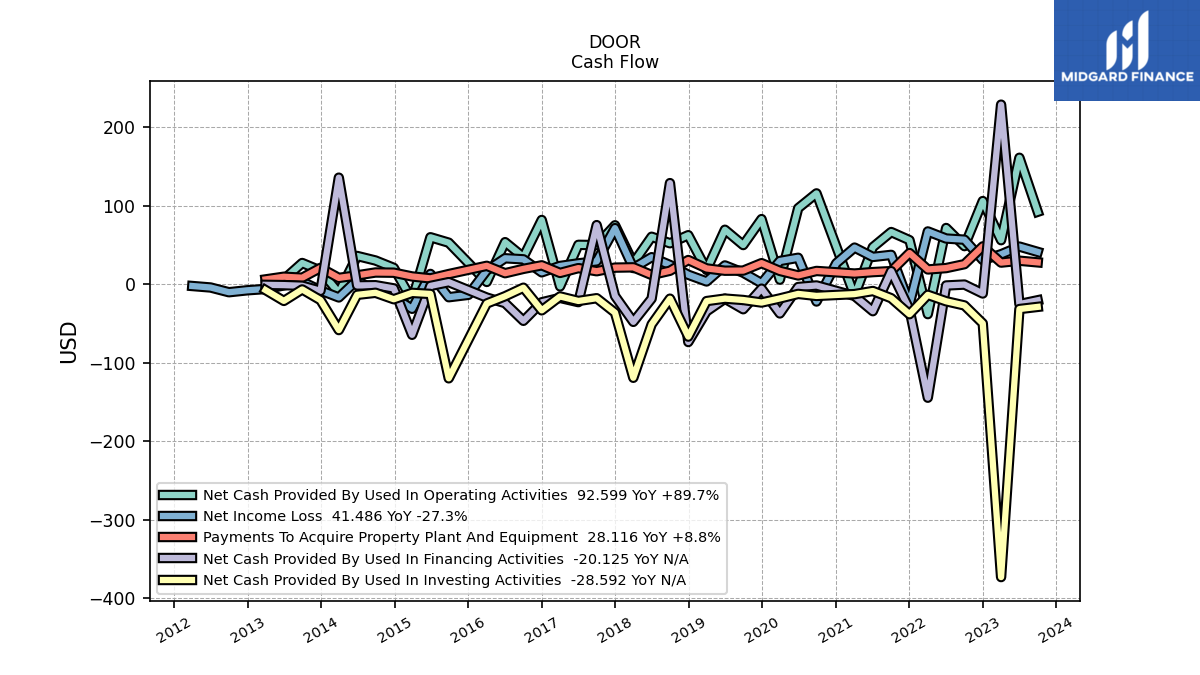
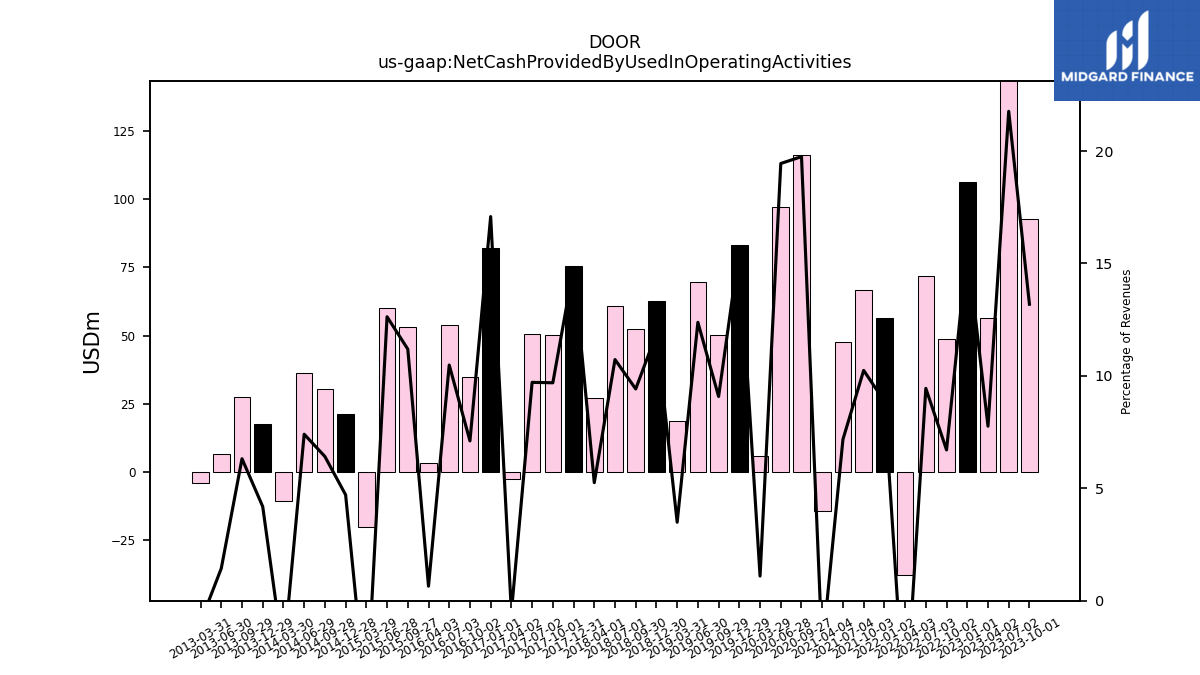
| Net Cash Provided By Used In Operating Activities | 92.60 | 161.47 | 56.35 | 106.28 | 48.80 | 71.96 | -37.85 | 56.44 | 66.81 | 47.53 | -14.32 | NA | 116.06 | 97.15 | 6.05 | 83.29 | 50.16 | 69.70 | 18.51 | 62.78 | 52.47 | 60.78 | 27.19 | 75.38 | 50.16 | 50.48 | -2.53 | 82.18 | 34.81 | 53.88 | 3.17 | NA | 53.23 | 60.16 | -19.97 | 21.15 | 30.54 | 36.30 | -10.60 | 17.61 | 27.35 | 6.52 | -4.03 | NA | NA | NA | NA | |
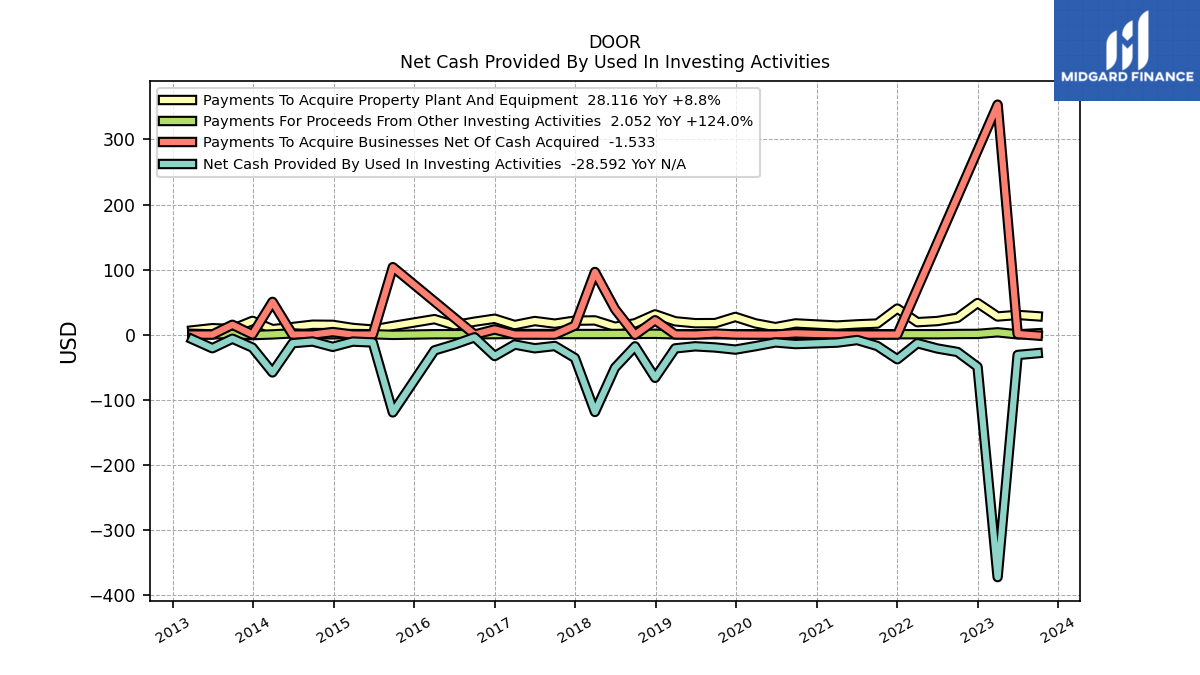
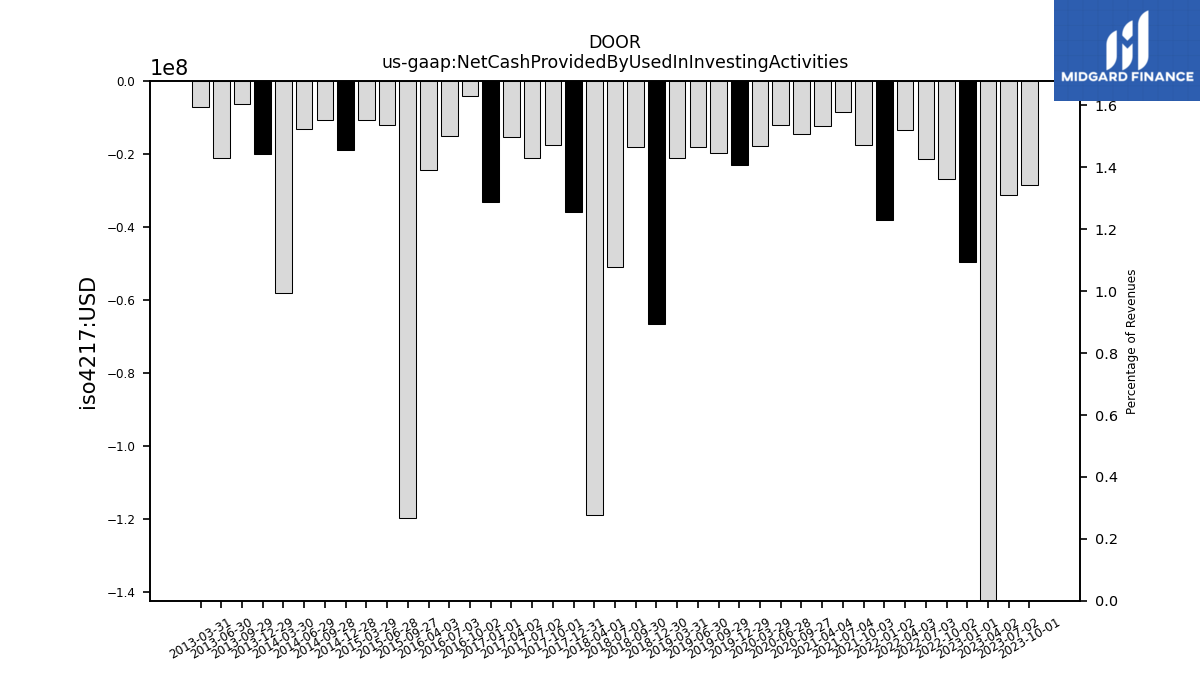
| Net Cash Provided By Used In Investing Activities | -28.59 | -31.34 | -372.95 | -49.63 | -26.75 | -21.42 | -13.29 | -37.95 | -17.52 | -8.36 | -12.31 | NA | -14.62 | -12.05 | -17.82 | -23.07 | -19.82 | -18.04 | -21.20 | -66.48 | -18.10 | -50.92 | -118.97 | -35.96 | -17.52 | -21.05 | -15.29 | -33.02 | -4.15 | -15.01 | -24.28 | NA | -119.67 | -12.10 | -10.74 | -18.86 | -10.62 | -13.25 | -58.18 | -19.99 | -6.34 | -21.00 | -7.14 | NA | NA | NA | NA | |
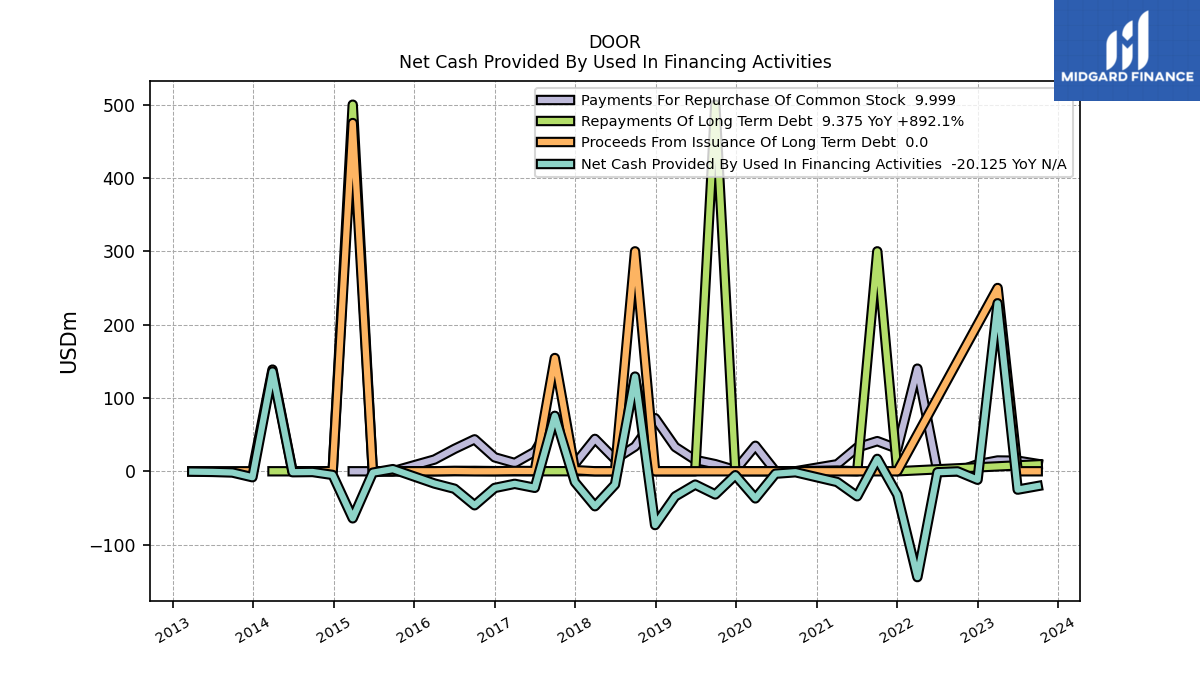
| Net Cash Provided By Used In Financing Activities | -20.12 | -25.03 | 229.14 | -11.57 | -0.16 | -1.32 | -144.35 | -31.94 | 16.93 | -34.09 | -14.62 | NA | -1.29 | -3.29 | -36.96 | -5.35 | -31.59 | -18.17 | -34.29 | -73.40 | 129.16 | -18.12 | -47.69 | -14.71 | 75.63 | -22.56 | -17.14 | -22.74 | -46.37 | -23.82 | -16.72 | NA | 2.93 | -1.88 | -64.19 | -5.00 | -0.98 | -1.26 | 136.09 | -8.12 | -1.69 | -0.84 | -0.49 | NA | NA | NA | NA |
| 2023-10-01 | 2023-07-02 | 2023-04-02 | 2023-01-01 | 2022-10-02 | 2022-07-03 | 2022-04-03 | 2022-01-02 | 2021-10-03 | 2021-07-04 | 2021-04-04 | 2021-01-03 | 2020-09-27 | 2020-06-28 | 2020-03-29 | 2019-12-29 | 2019-09-29 | 2019-06-30 | 2019-03-31 | 2018-12-30 | 2018-09-30 | 2018-07-01 | 2018-04-01 | 2017-12-31 | 2017-10-01 | 2017-07-02 | 2017-04-02 | 2017-01-01 | 2016-10-02 | 2016-07-03 | 2016-04-03 | 2016-01-03 | 2015-09-27 | 2015-06-28 | 2015-03-29 | 2014-12-28 | 2014-09-28 | 2014-06-29 | 2014-03-30 | 2013-12-29 | 2013-09-29 | 2013-06-30 | 2013-03-31 | 2012-12-30 | 2012-09-30 | 2012-07-01 | 2012-04-01 | ||
|---|---|---|---|---|---|---|---|---|---|---|---|---|---|---|---|---|---|---|---|---|---|---|---|---|---|---|---|---|---|---|---|---|---|---|---|---|---|---|---|---|---|---|---|---|---|---|---|---|
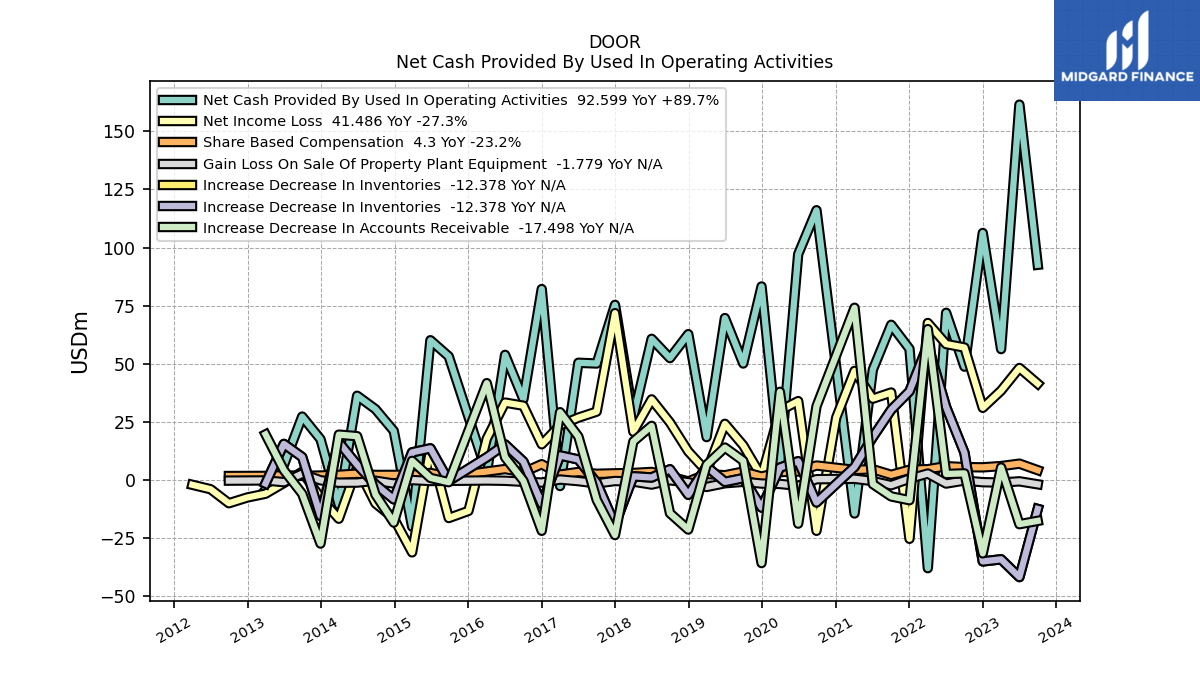
| Net Cash Provided By Used In Operating Activities | 92.60 | 161.47 | 56.35 | 106.28 | 48.80 | 71.96 | -37.85 | 56.44 | 66.81 | 47.53 | -14.32 | NA | 116.06 | 97.15 | 6.05 | 83.29 | 50.16 | 69.70 | 18.51 | 62.78 | 52.47 | 60.78 | 27.19 | 75.38 | 50.16 | 50.48 | -2.53 | 82.18 | 34.81 | 53.88 | 3.17 | NA | 53.23 | 60.16 | -19.97 | 21.15 | 30.54 | 36.30 | -10.60 | 17.61 | 27.35 | 6.52 | -4.03 | NA | NA | NA | NA | |
| Net Income Loss | 41.49 | 48.24 | 38.49 | 31.10 | 57.04 | 58.52 | 67.58 | -25.22 | 37.69 | 35.05 | 46.98 | 26.92 | -21.77 | 34.00 | 29.89 | 1.60 | 14.97 | 24.24 | 3.79 | 12.35 | 24.80 | 34.74 | 20.83 | 71.81 | 29.48 | 26.88 | 23.57 | 15.43 | 32.01 | 33.35 | 17.83 | -13.22 | -16.28 | 13.44 | -31.05 | -16.37 | -9.97 | 5.58 | -16.59 | -7.59 | 3.62 | -1.21 | -5.83 | -7.45 | -9.92 | -3.89 | -1.99 | |
| Profit Loss | 42.30 | 48.95 | 39.44 | 32.57 | 57.78 | 59.37 | 68.72 | -23.90 | 38.85 | 36.10 | 48.15 | 28.48 | -20.49 | 34.66 | 31.04 | 2.87 | 16.09 | 25.09 | 4.98 | 13.52 | 25.54 | 35.69 | 21.78 | 73.21 | 30.64 | 28.05 | 25.08 | 17.56 | 33.17 | 34.51 | 18.91 | -11.63 | -15.52 | 13.82 | -29.32 | -14.64 | -9.71 | 6.08 | -15.85 | -7.66 | 4.45 | -0.61 | -5.14 | -6.66 | -9.00 | -3.20 | -1.46 | |
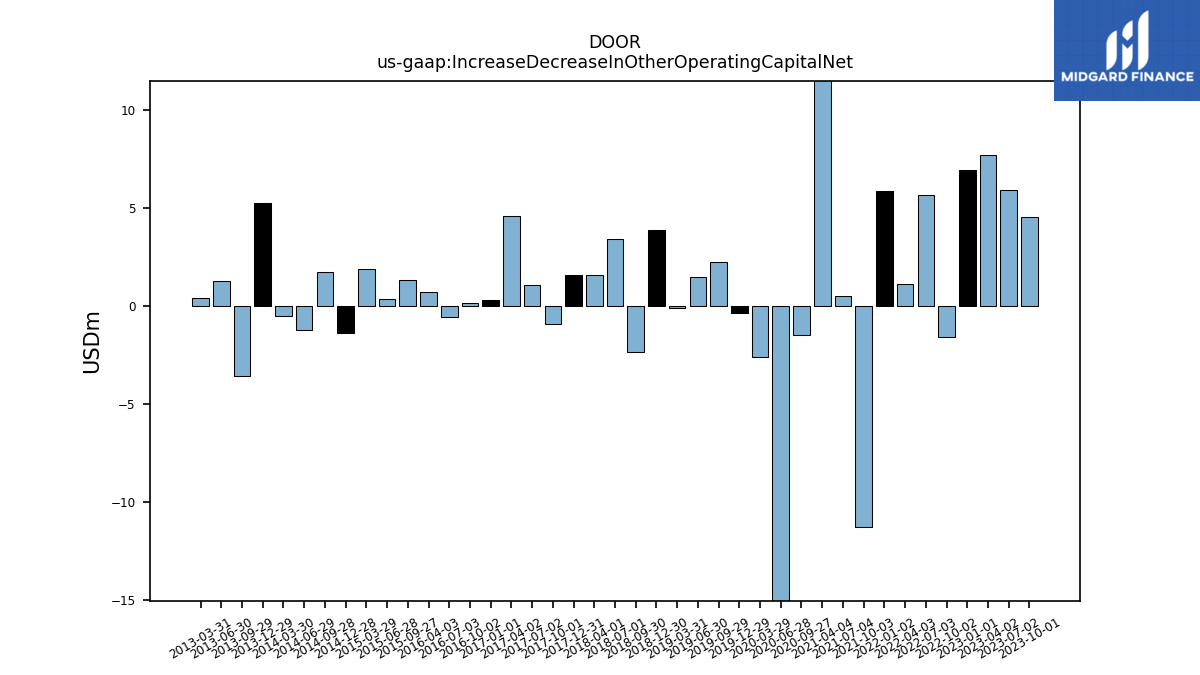
| Increase Decrease In Other Operating Capital Net | 4.52 | 5.93 | 7.68 | 6.92 | -1.61 | 5.64 | 1.10 | 5.84 | -11.25 | 0.50 | 13.36 | NA | -1.47 | -15.69 | -2.60 | -0.34 | 2.22 | 1.49 | -0.08 | 3.85 | -2.33 | 3.39 | 1.58 | 1.58 | -0.90 | 1.08 | 4.58 | 0.31 | 0.13 | -0.55 | 0.69 | NA | 1.32 | 0.35 | 1.87 | -1.40 | 1.73 | -1.25 | -0.50 | 5.25 | -3.56 | 1.26 | 0.41 | NA | NA | NA | NA | |
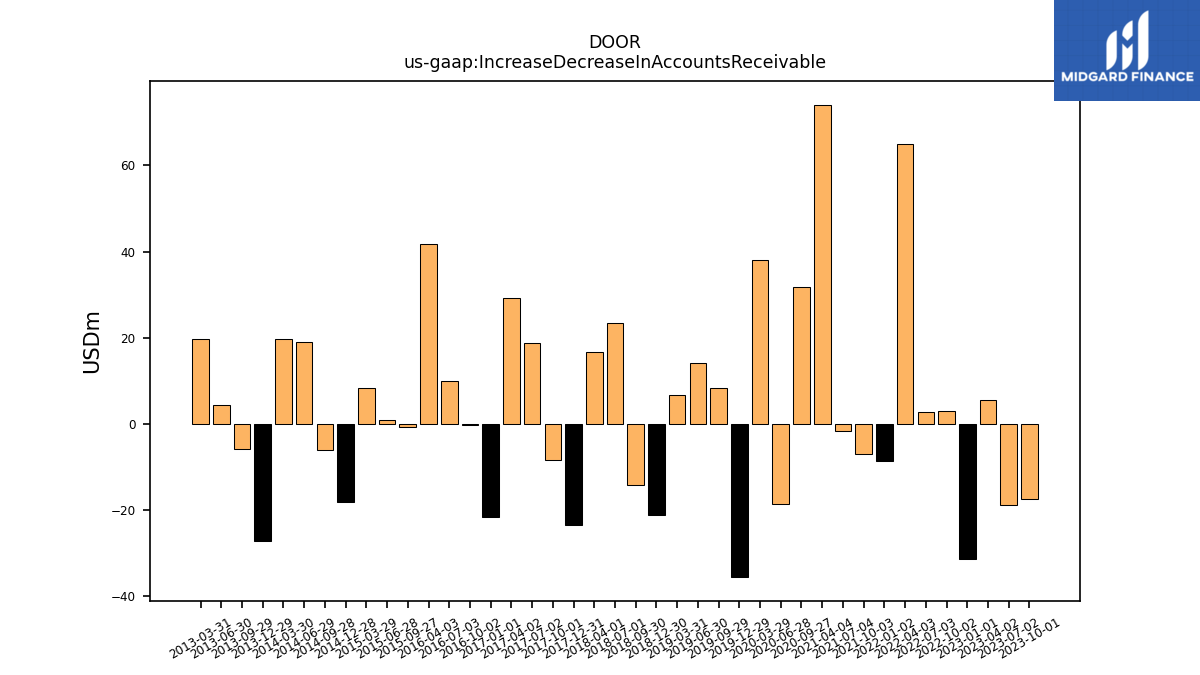
| Increase Decrease In Accounts Receivable | -17.50 | -18.93 | 5.46 | -31.47 | 2.92 | 2.66 | 64.95 | -8.62 | -6.99 | -1.70 | 74.13 | NA | 31.77 | -18.69 | 37.99 | -35.64 | 8.31 | 14.02 | 6.59 | -21.24 | -14.20 | 23.35 | 16.63 | -23.61 | -8.46 | 18.76 | 29.23 | -21.77 | -0.26 | 9.82 | 41.72 | NA | -0.87 | 0.96 | 8.31 | -18.24 | -6.21 | 18.91 | 19.58 | -27.26 | -5.88 | 4.30 | 19.67 | NA | NA | NA | NA | |
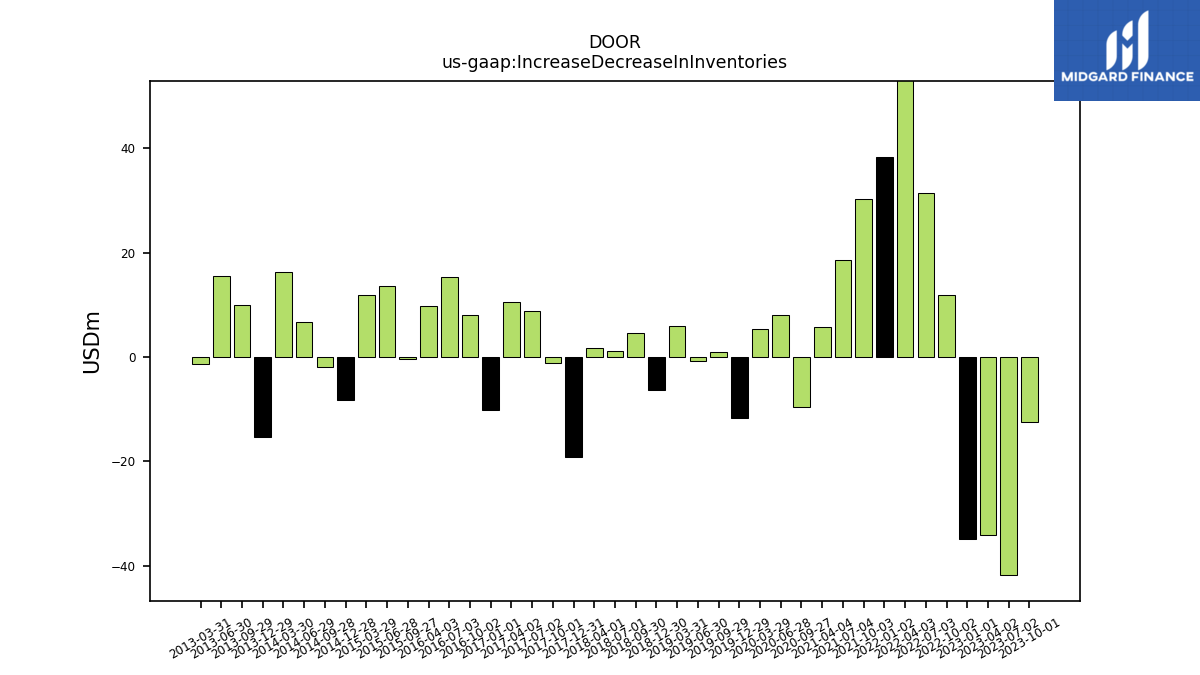
| Increase Decrease In Inventories | -12.38 | -41.69 | -34.02 | -34.93 | 11.80 | 31.40 | 58.11 | 38.22 | 30.24 | 18.50 | 5.68 | NA | -9.57 | 8.13 | 5.39 | -11.77 | 0.87 | -0.74 | 5.90 | -6.29 | 4.68 | 1.16 | 1.64 | -19.09 | -1.10 | 8.88 | 10.61 | -10.20 | 8.00 | 15.38 | 9.84 | NA | -0.34 | 13.68 | 11.96 | -8.23 | -1.83 | 6.62 | 16.30 | -15.36 | 9.93 | 15.58 | -1.43 | NA | NA | NA | NA | |
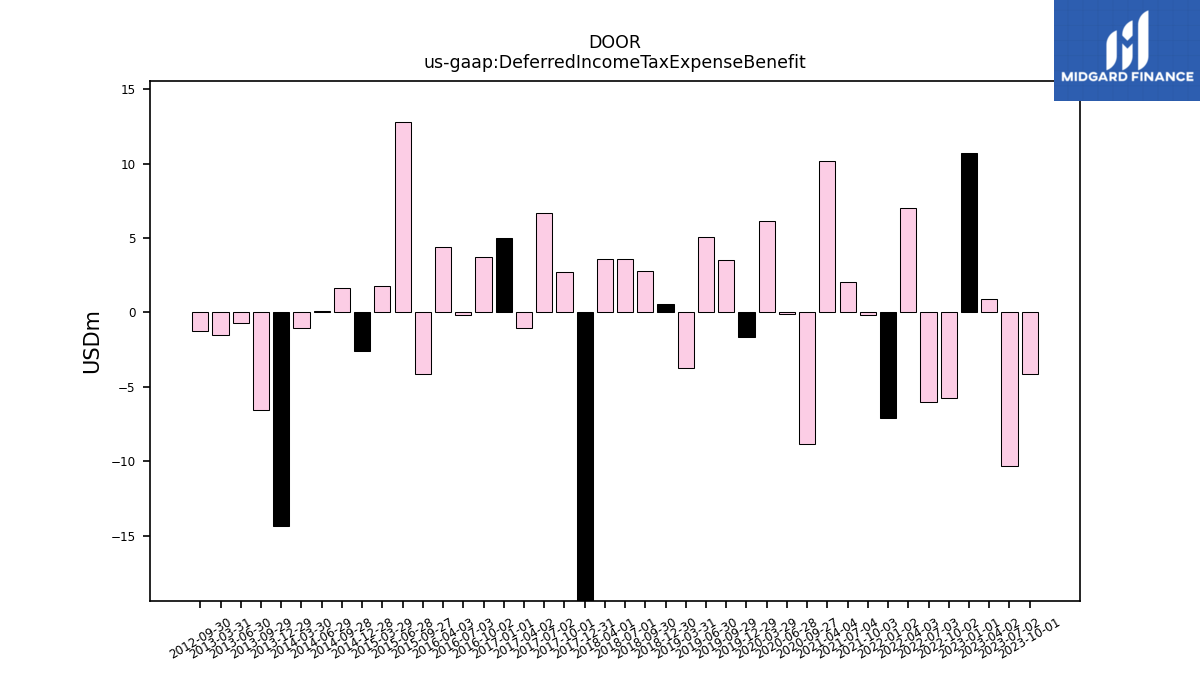
| Deferred Income Tax Expense Benefit | -4.16 | -10.34 | 0.89 | 10.70 | -5.72 | -5.99 | 7.03 | -7.11 | -0.17 | 2.02 | 10.14 | NA | -8.85 | -0.12 | 6.16 | -1.62 | 3.55 | 5.08 | -3.71 | 0.58 | 2.75 | 3.62 | 3.62 | -42.59 | 2.71 | 6.70 | -1.05 | 4.99 | 3.75 | -0.20 | 4.37 | NA | -4.14 | 12.78 | 1.76 | -2.61 | 1.62 | 0.07 | -1.05 | -14.35 | -6.58 | -0.71 | -1.54 | NA | -1.23 | NA | NA | |
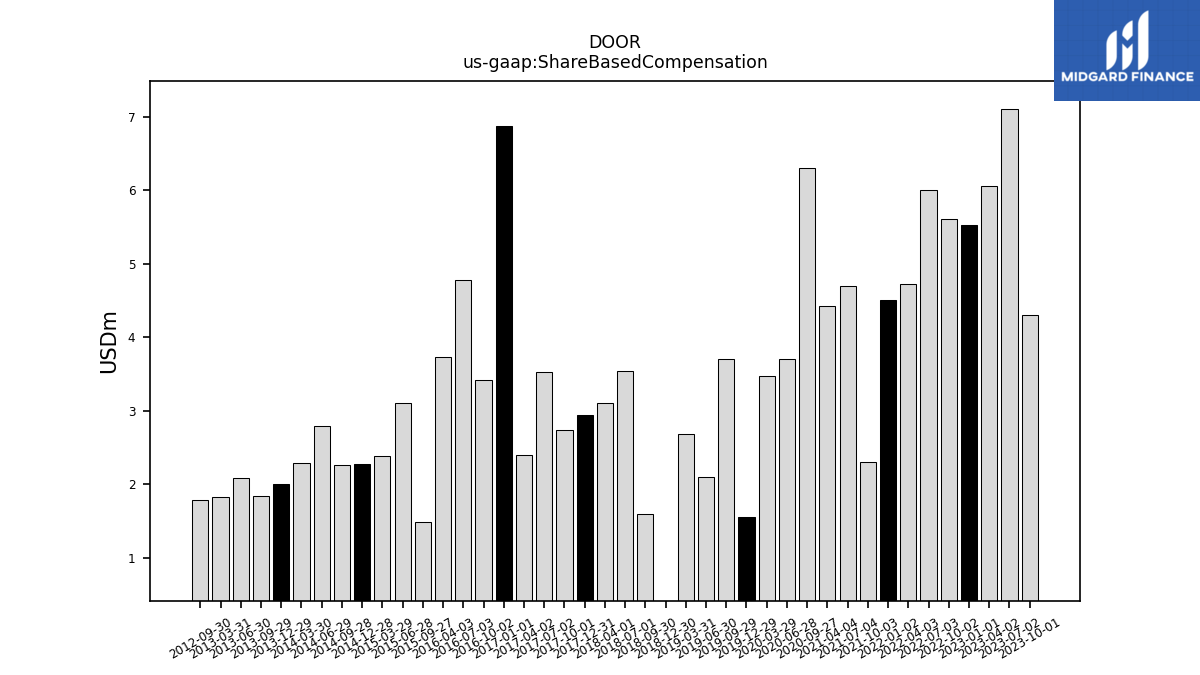
| Share Based Compensation | 4.30 | 7.10 | 6.05 | 5.52 | 5.60 | 6.00 | 4.72 | 4.50 | 2.30 | 4.70 | 4.42 | NA | 6.30 | 3.70 | 3.47 | 1.55 | 3.70 | 2.10 | 2.68 | -0.56 | 1.60 | 3.54 | 3.10 | 2.94 | 2.74 | 3.53 | 2.40 | 6.87 | 3.41 | 4.78 | 3.73 | NA | 1.49 | 3.11 | 2.38 | 2.27 | 2.25 | 2.80 | 2.28 | 2.00 | 1.84 | 2.08 | 1.83 | NA | 1.79 | NA | NA |
| 2023-10-01 | 2023-07-02 | 2023-04-02 | 2023-01-01 | 2022-10-02 | 2022-07-03 | 2022-04-03 | 2022-01-02 | 2021-10-03 | 2021-07-04 | 2021-04-04 | 2021-01-03 | 2020-09-27 | 2020-06-28 | 2020-03-29 | 2019-12-29 | 2019-09-29 | 2019-06-30 | 2019-03-31 | 2018-12-30 | 2018-09-30 | 2018-07-01 | 2018-04-01 | 2017-12-31 | 2017-10-01 | 2017-07-02 | 2017-04-02 | 2017-01-01 | 2016-10-02 | 2016-07-03 | 2016-04-03 | 2016-01-03 | 2015-09-27 | 2015-06-28 | 2015-03-29 | 2014-12-28 | 2014-09-28 | 2014-06-29 | 2014-03-30 | 2013-12-29 | 2013-09-29 | 2013-06-30 | 2013-03-31 | 2012-12-30 | 2012-09-30 | 2012-07-01 | 2012-04-01 | ||
|---|---|---|---|---|---|---|---|---|---|---|---|---|---|---|---|---|---|---|---|---|---|---|---|---|---|---|---|---|---|---|---|---|---|---|---|---|---|---|---|---|---|---|---|---|---|---|---|---|
| Net Cash Provided By Used In Investing Activities | -28.59 | -31.34 | -372.95 | -49.63 | -26.75 | -21.42 | -13.29 | -37.95 | -17.52 | -8.36 | -12.31 | NA | -14.62 | -12.05 | -17.82 | -23.07 | -19.82 | -18.04 | -21.20 | -66.48 | -18.10 | -50.92 | -118.97 | -35.96 | -17.52 | -21.05 | -15.29 | -33.02 | -4.15 | -15.01 | -24.28 | NA | -119.67 | -12.10 | -10.74 | -18.86 | -10.62 | -13.25 | -58.18 | -19.99 | -6.34 | -21.00 | -7.14 | NA | NA | NA | NA | |
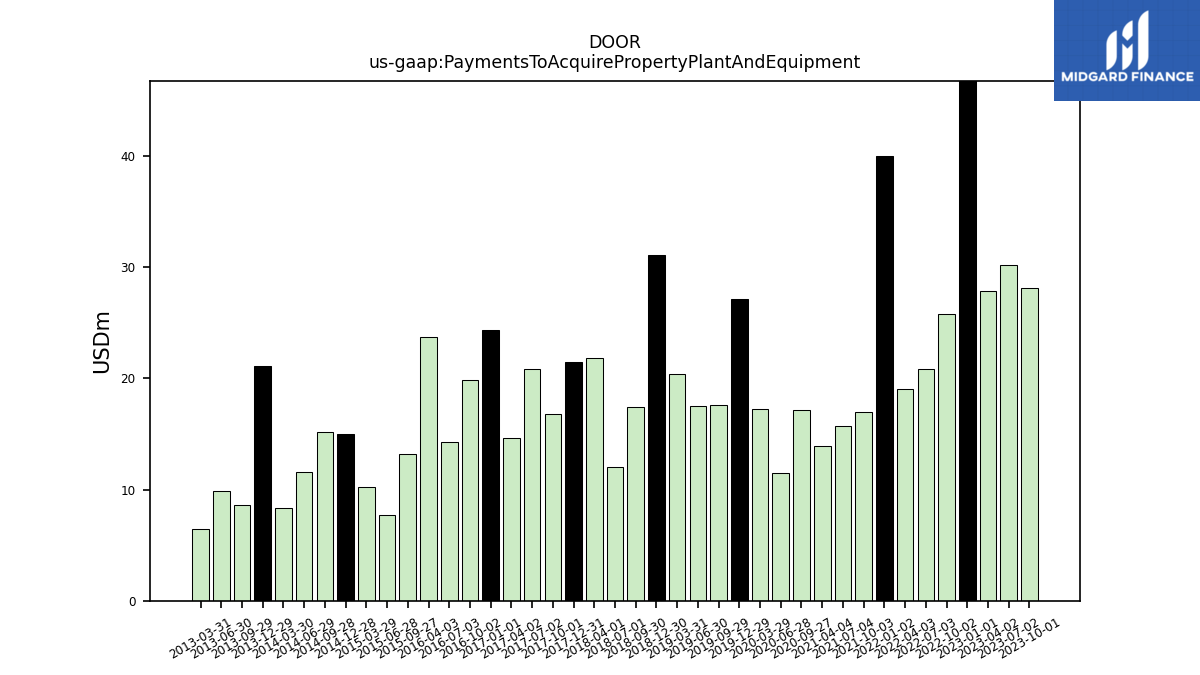
| Payments To Acquire Property Plant And Equipment | 28.12 | 30.23 | 27.83 | 48.52 | 25.84 | 20.86 | 19.09 | 40.04 | 16.97 | 15.73 | 13.93 | NA | 17.19 | 11.47 | 17.25 | 27.15 | 17.65 | 17.50 | 20.42 | 31.12 | 17.42 | 12.03 | 21.80 | 21.44 | 16.84 | 20.83 | 14.67 | 24.37 | 19.84 | 14.32 | 23.76 | NA | 13.23 | 7.73 | 10.19 | 14.97 | 15.21 | 11.61 | 8.35 | 21.12 | 8.57 | 9.84 | 6.44 | NA | NA | NA | NA |
| 2023-10-01 | 2023-07-02 | 2023-04-02 | 2023-01-01 | 2022-10-02 | 2022-07-03 | 2022-04-03 | 2022-01-02 | 2021-10-03 | 2021-07-04 | 2021-04-04 | 2021-01-03 | 2020-09-27 | 2020-06-28 | 2020-03-29 | 2019-12-29 | 2019-09-29 | 2019-06-30 | 2019-03-31 | 2018-12-30 | 2018-09-30 | 2018-07-01 | 2018-04-01 | 2017-12-31 | 2017-10-01 | 2017-07-02 | 2017-04-02 | 2017-01-01 | 2016-10-02 | 2016-07-03 | 2016-04-03 | 2016-01-03 | 2015-09-27 | 2015-06-28 | 2015-03-29 | 2014-12-28 | 2014-09-28 | 2014-06-29 | 2014-03-30 | 2013-12-29 | 2013-09-29 | 2013-06-30 | 2013-03-31 | 2012-12-30 | 2012-09-30 | 2012-07-01 | 2012-04-01 | ||
|---|---|---|---|---|---|---|---|---|---|---|---|---|---|---|---|---|---|---|---|---|---|---|---|---|---|---|---|---|---|---|---|---|---|---|---|---|---|---|---|---|---|---|---|---|---|---|---|---|
| Net Cash Provided By Used In Financing Activities | -20.12 | -25.03 | 229.14 | -11.57 | -0.16 | -1.32 | -144.35 | -31.94 | 16.93 | -34.09 | -14.62 | NA | -1.29 | -3.29 | -36.96 | -5.35 | -31.59 | -18.17 | -34.29 | -73.40 | 129.16 | -18.12 | -47.69 | -14.71 | 75.63 | -22.56 | -17.14 | -22.74 | -46.37 | -23.82 | -16.72 | NA | 2.93 | -1.88 | -64.19 | -5.00 | -0.98 | -1.26 | 136.09 | -8.12 | -1.69 | -0.84 | -0.49 | NA | NA | NA | NA | |
| Payments For Repurchase Of Common Stock | 10.00 | 14.42 | 14.72 | 9.49 | 0.00 | 0.00 | 140.00 | 30.79 | 41.11 | 32.42 | 9.60 | NA | 0.00 | 0.00 | 34.77 | 1.56 | 9.70 | 15.49 | 33.19 | 72.41 | 33.84 | 16.48 | 44.19 | 10.02 | 71.98 | 26.63 | 11.25 | 19.02 | 43.58 | 30.57 | 16.03 | NA | 0.00 | 0.00 | 0.00 | NA | NA | NA | NA | NA | NA | NA | NA | NA | NA | NA | NA |
| 2023-10-01 | 2023-07-02 | 2023-04-02 | 2023-01-01 | 2022-10-02 | 2022-07-03 | 2022-04-03 | 2022-01-02 | 2021-10-03 | 2021-07-04 | 2021-04-04 | 2021-01-03 | 2020-09-27 | 2020-06-28 | 2020-03-29 | 2019-12-29 | 2019-09-29 | 2019-06-30 | 2019-03-31 | 2018-12-30 | 2018-09-30 | 2018-07-01 | 2018-04-01 | 2017-12-31 | 2017-10-01 | 2017-07-02 | 2017-04-02 | 2017-01-01 | 2016-10-02 | 2016-07-03 | 2016-04-03 | 2016-01-03 | 2015-09-27 | 2015-06-28 | 2015-03-29 | 2014-12-28 | 2014-09-28 | 2014-06-29 | 2014-03-30 | 2013-12-29 | 2013-09-29 | 2013-06-30 | 2013-03-31 | 2012-12-30 | 2012-09-30 | 2012-07-01 | 2012-04-01 | ||
|---|---|---|---|---|---|---|---|---|---|---|---|---|---|---|---|---|---|---|---|---|---|---|---|---|---|---|---|---|---|---|---|---|---|---|---|---|---|---|---|---|---|---|---|---|---|---|---|---|
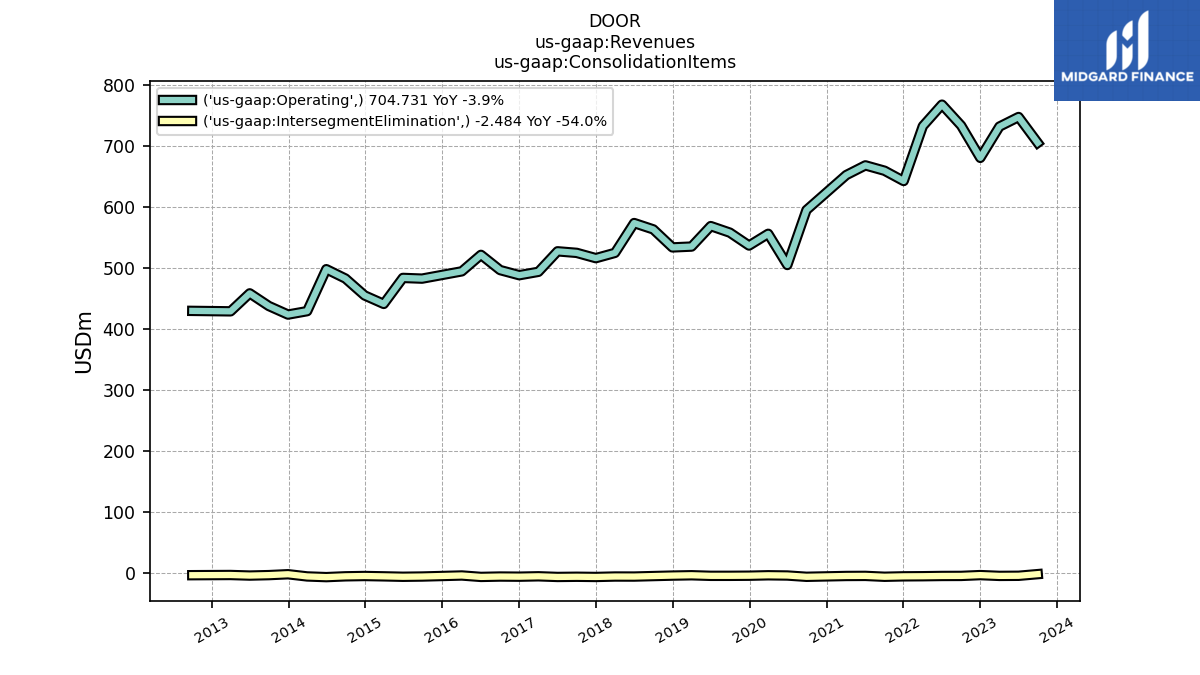
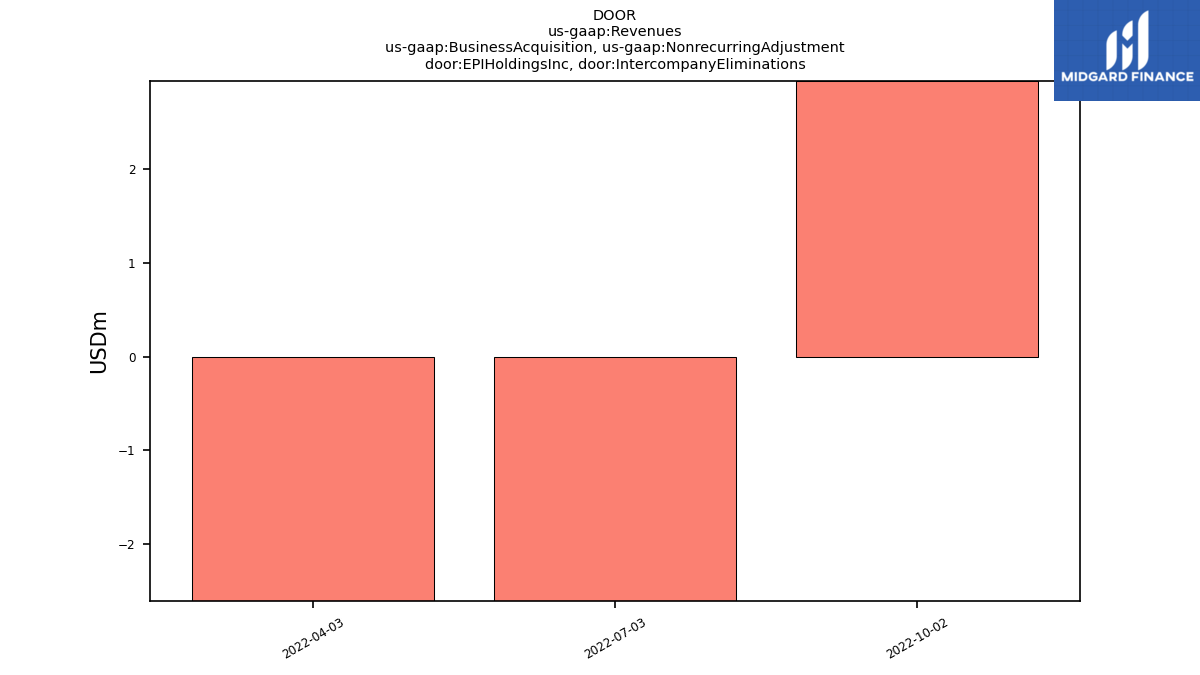
| Revenues | 702.25 | 741.88 | 725.98 | 675.97 | 727.63 | 761.87 | 726.22 | 635.97 | 652.21 | 662.41 | 646.34 | 618.54 | 587.65 | 499.66 | 551.23 | 531.24 | 552.19 | 562.94 | 530.31 | 528.35 | 557.15 | 566.73 | 517.88 | 508.50 | 517.50 | 519.74 | 487.18 | 481.03 | 489.65 | 513.99 | 489.31 | 485.42 | 475.65 | 476.43 | 434.46 | 448.94 | 476.12 | 490.18 | 422.46 | 420.48 | 433.05 | 453.09 | 424.52 | 418.16 | 424.96 | 432.77 | 400.12 | |
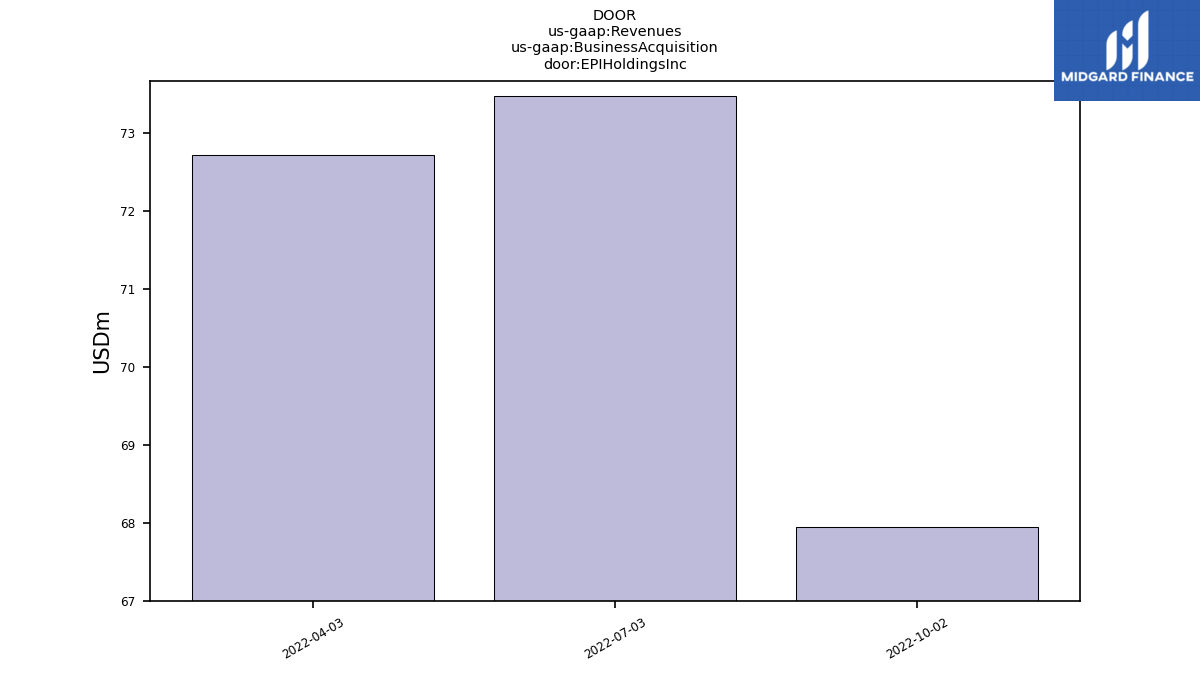
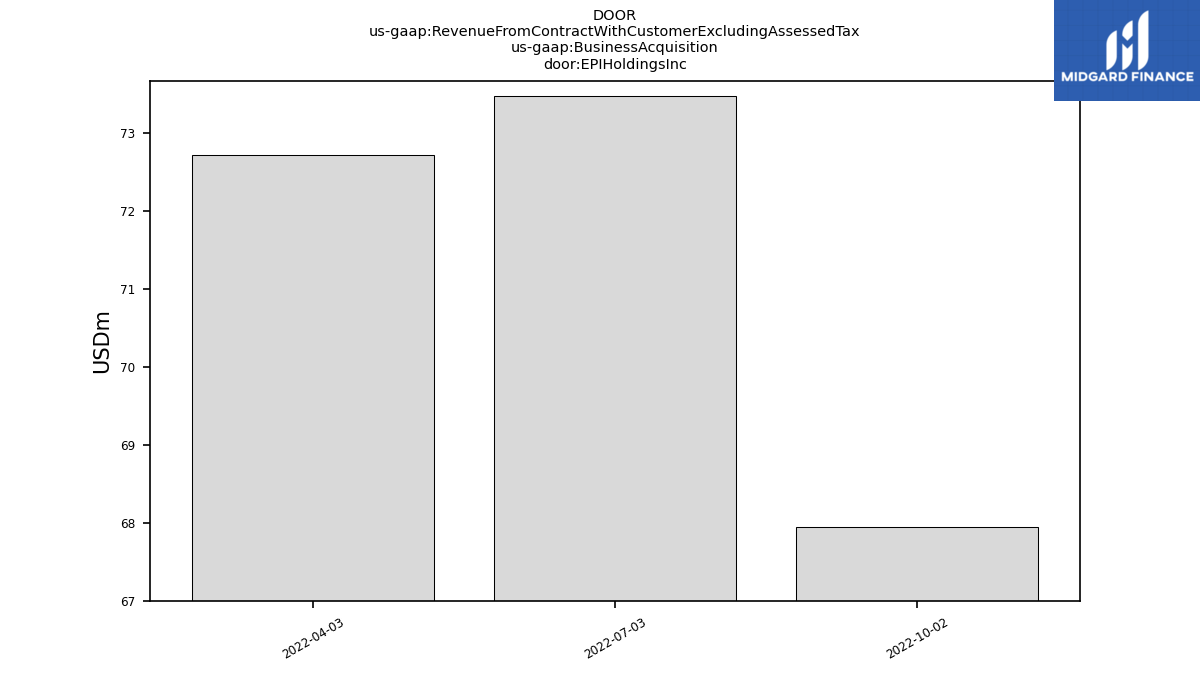
| E P I Holdings Inc | NA | NA | NA | NA | 67.95 | 73.48 | 72.72 | NA | NA | NA | NA | NA | NA | NA | NA | NA | NA | NA | NA | NA | NA | NA | NA | NA | NA | NA | NA | NA | NA | NA | NA | NA | NA | NA | NA | NA | NA | NA | NA | NA | NA | NA | NA | NA | NA | NA | NA | |
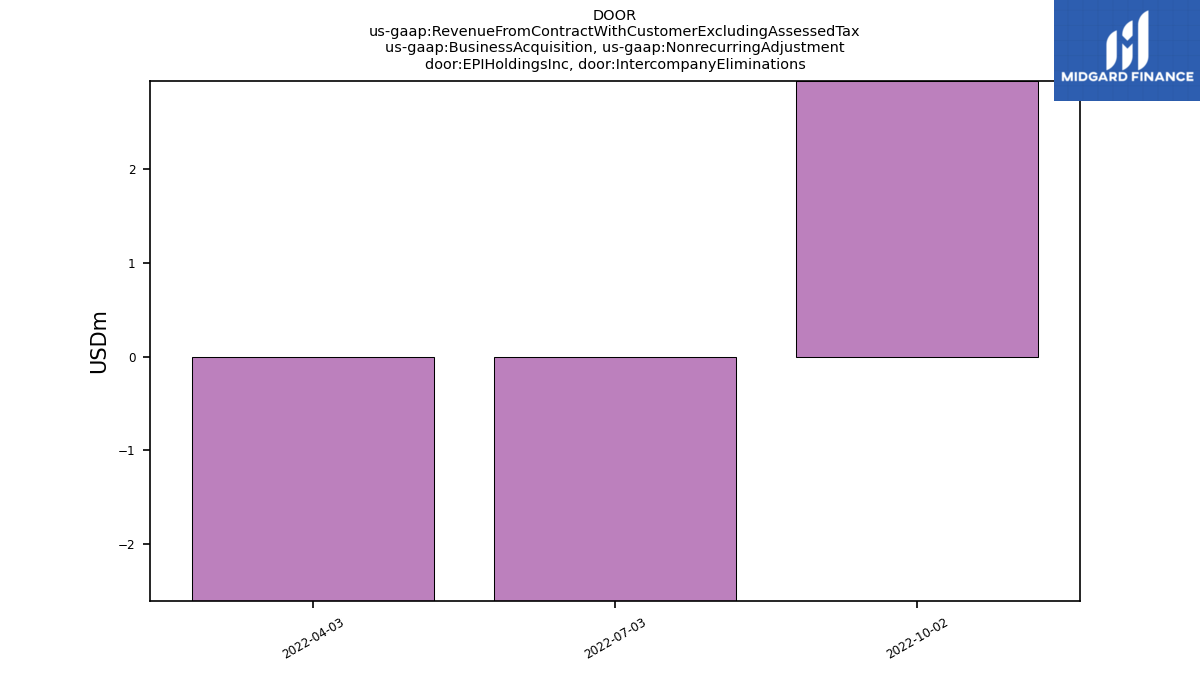
| E P I Holdings Inc, Intercompany Eliminations | NA | NA | NA | NA | 2.94 | -3.22 | -2.60 | NA | NA | NA | NA | NA | NA | NA | NA | NA | NA | NA | NA | NA | NA | NA | NA | NA | NA | NA | NA | NA | NA | NA | NA | NA | NA | NA | NA | NA | NA | NA | NA | NA | NA | NA | NA | NA | NA | NA | NA | |
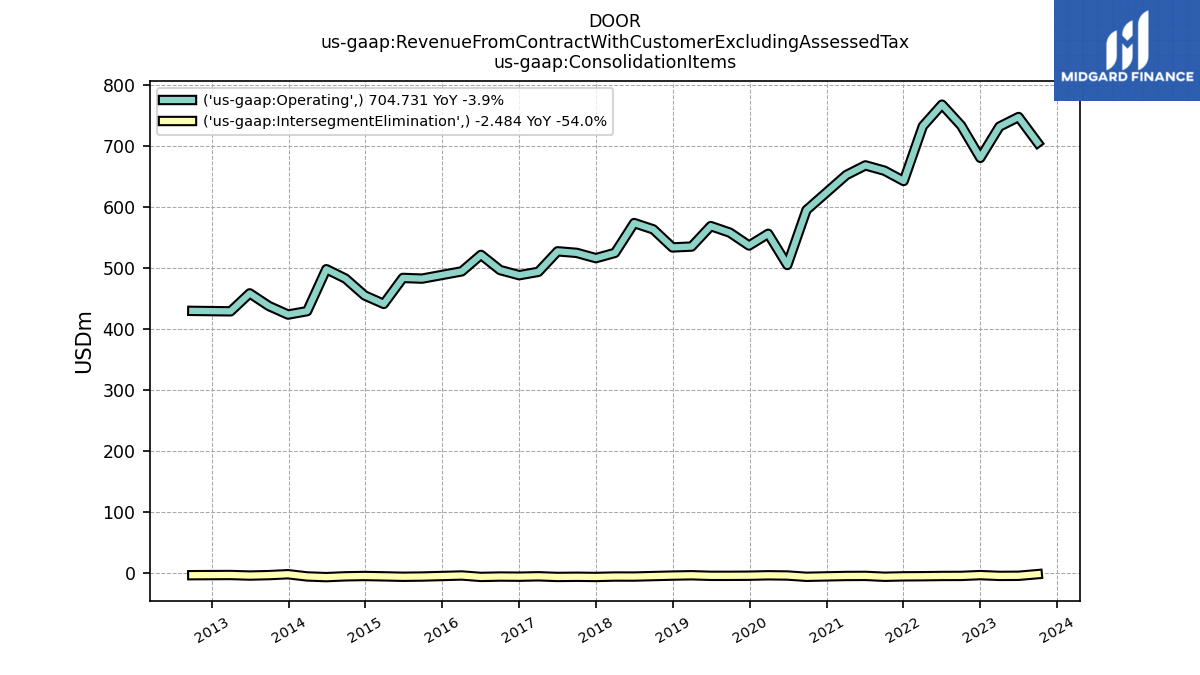
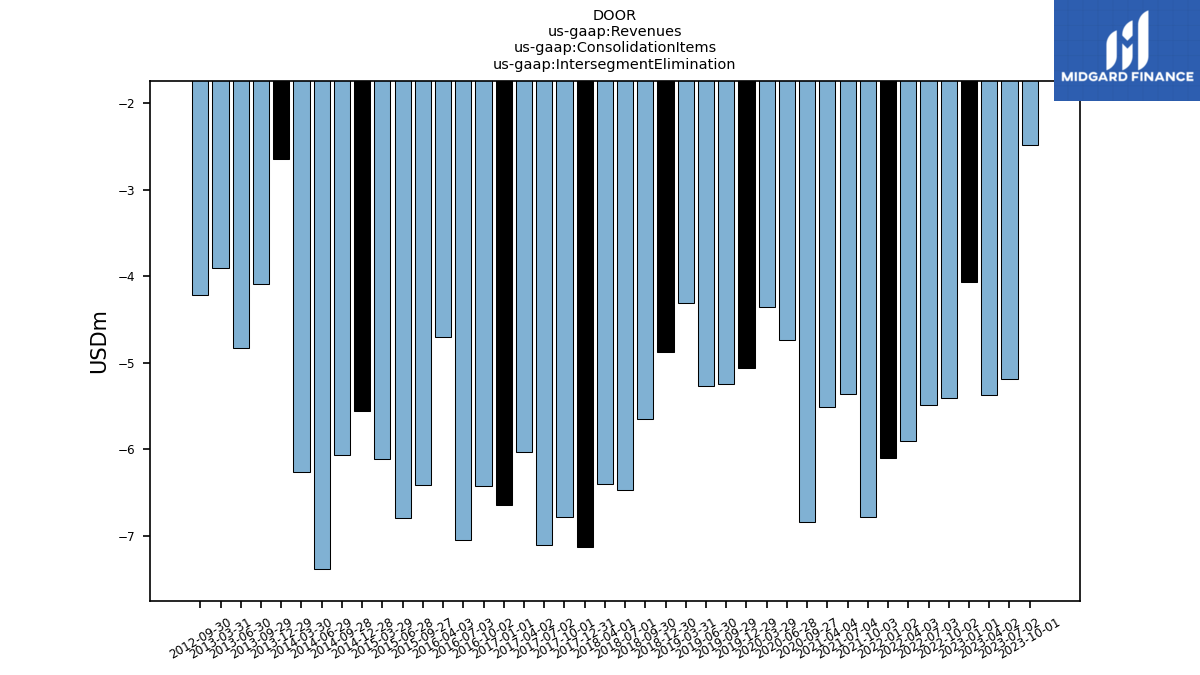
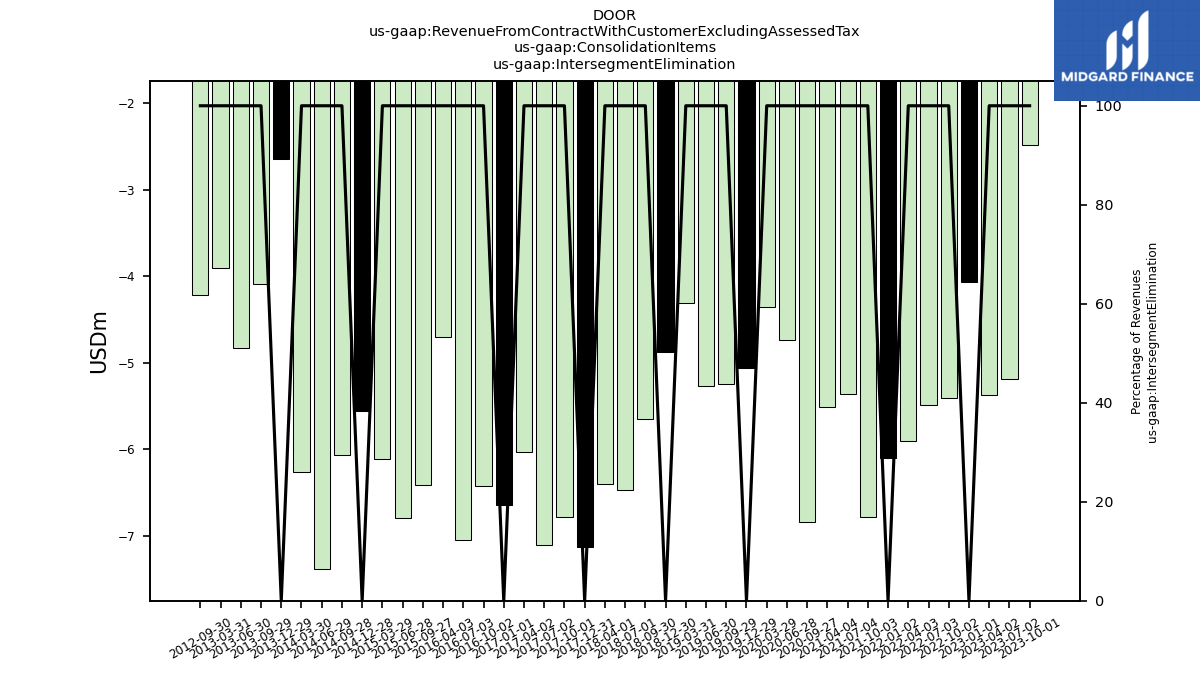
| Intersegment Elimination | -2.48 | -5.19 | -5.37 | -4.06 | -5.40 | -5.50 | -5.91 | -6.11 | -6.78 | -5.36 | -5.51 | NA | -6.85 | -4.74 | -4.36 | -5.06 | -5.25 | -5.27 | -4.31 | -4.87 | -5.66 | -6.47 | -6.40 | -7.13 | -6.78 | -7.10 | -6.04 | -6.65 | -6.43 | -7.05 | -4.70 | NA | -6.41 | -6.79 | -6.12 | -5.55 | -6.07 | -7.38 | -6.26 | -2.64 | -4.09 | -4.83 | -3.90 | NA | -4.22 | NA | NA | |
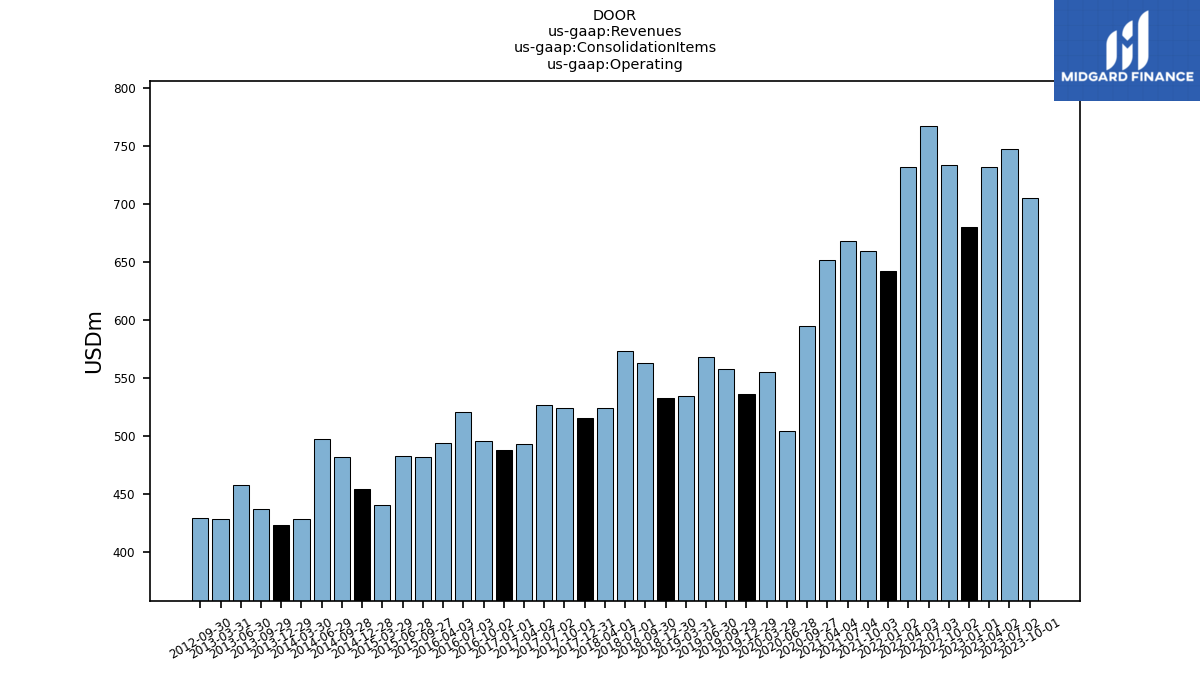
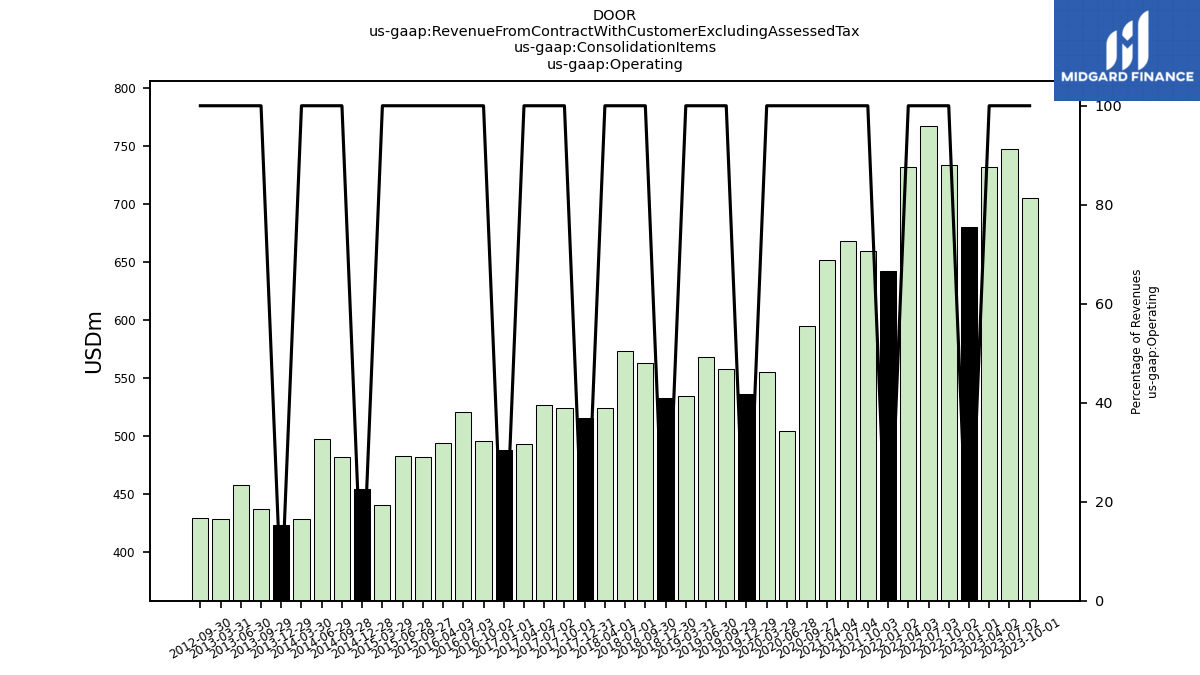
| Operating | 704.73 | 747.07 | 731.36 | 680.03 | 733.03 | 767.37 | 732.12 | 642.07 | 658.99 | 667.77 | 651.85 | NA | 594.50 | 504.40 | 555.58 | 536.30 | 557.44 | 568.21 | 534.62 | 533.22 | 562.80 | 573.19 | 524.28 | 515.63 | 524.28 | 526.85 | 493.22 | 487.68 | 496.07 | 521.03 | 494.00 | NA | 482.06 | 483.22 | 440.58 | 454.49 | 482.19 | 497.56 | 428.72 | 423.11 | 437.14 | 457.92 | 428.42 | NA | 429.18 | NA | NA | |
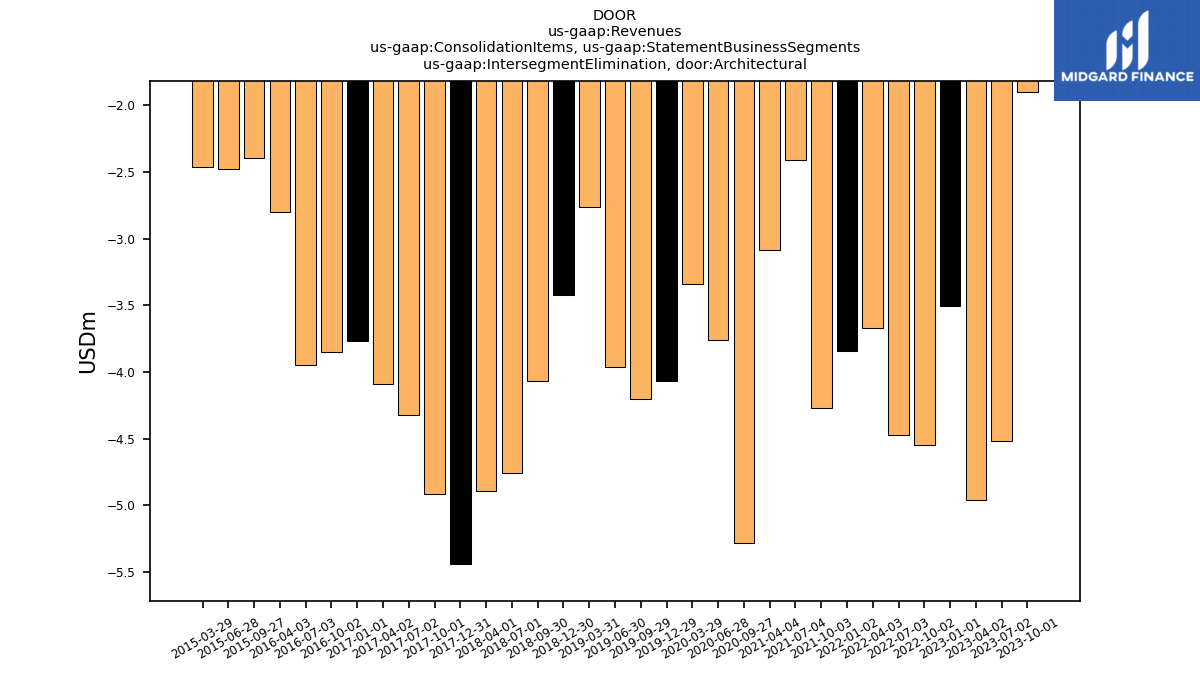
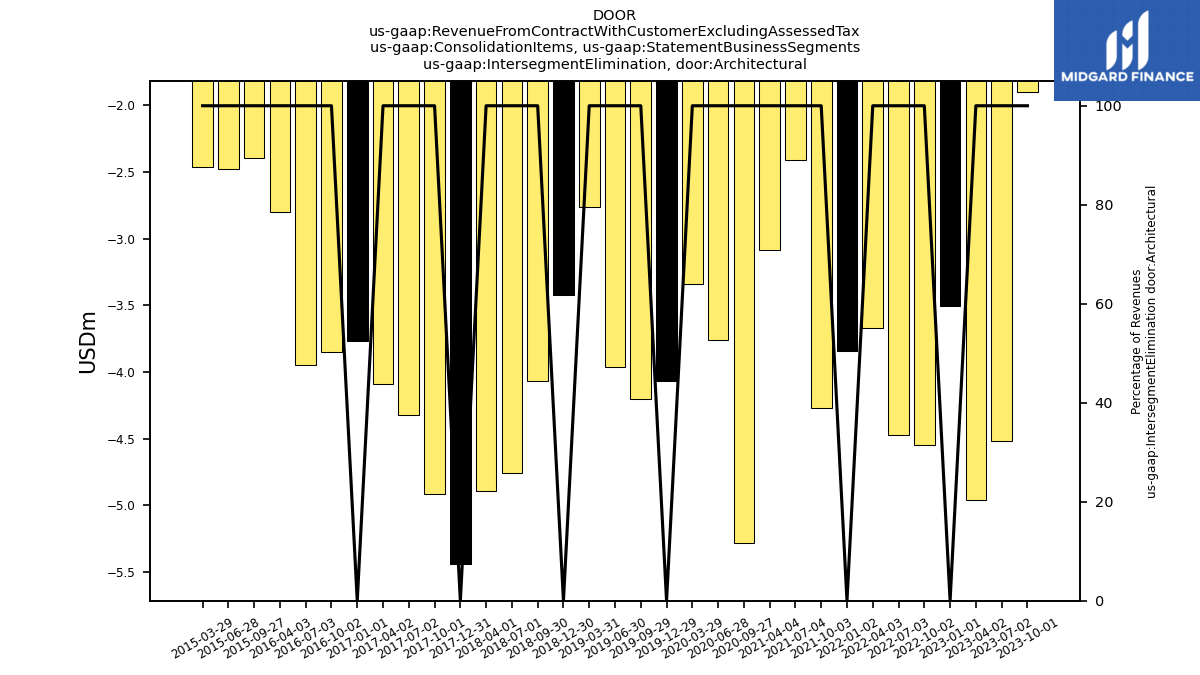
| Intersegment Elimination, Architectural | -1.90 | -4.51 | -4.96 | -3.51 | -4.54 | -4.47 | -3.67 | -3.84 | -4.27 | -2.41 | -3.08 | NA | -5.28 | -3.76 | -3.34 | -4.07 | -4.21 | -3.96 | -2.76 | -3.42 | -4.07 | -4.75 | -4.89 | -5.44 | -4.92 | -4.32 | -4.09 | -3.76 | -3.85 | -3.95 | -2.80 | NA | -2.40 | -2.48 | -2.47 | NA | NA | NA | NA | NA | NA | NA | NA | NA | NA | NA | NA | |
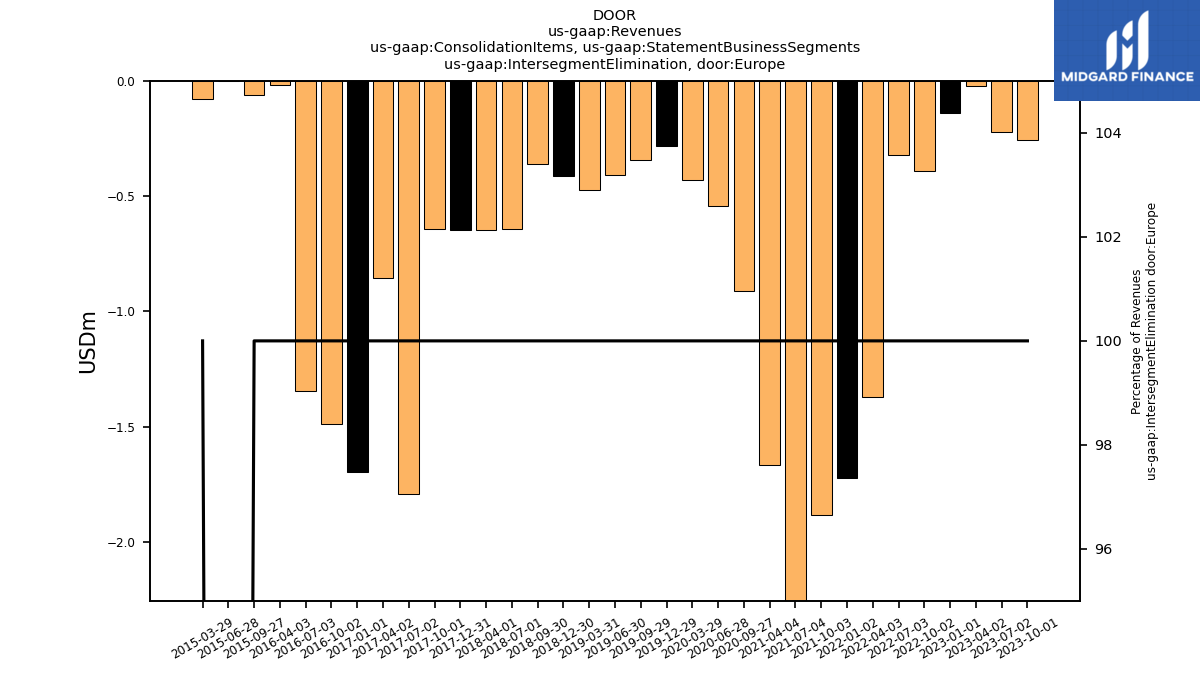
| Intersegment Elimination, Europe | -0.25 | -0.22 | -0.02 | -0.14 | -0.39 | -0.32 | -1.37 | -1.72 | -1.88 | -2.37 | -1.67 | NA | -0.91 | -0.54 | -0.43 | -0.28 | -0.34 | -0.41 | -0.47 | -0.41 | -0.36 | -0.64 | -0.65 | -0.65 | -0.64 | -1.79 | -0.86 | -1.70 | -1.49 | -1.34 | -0.02 | NA | -0.06 | 0.00 | -0.08 | NA | NA | NA | NA | NA | NA | NA | NA | NA | NA | NA | NA | |
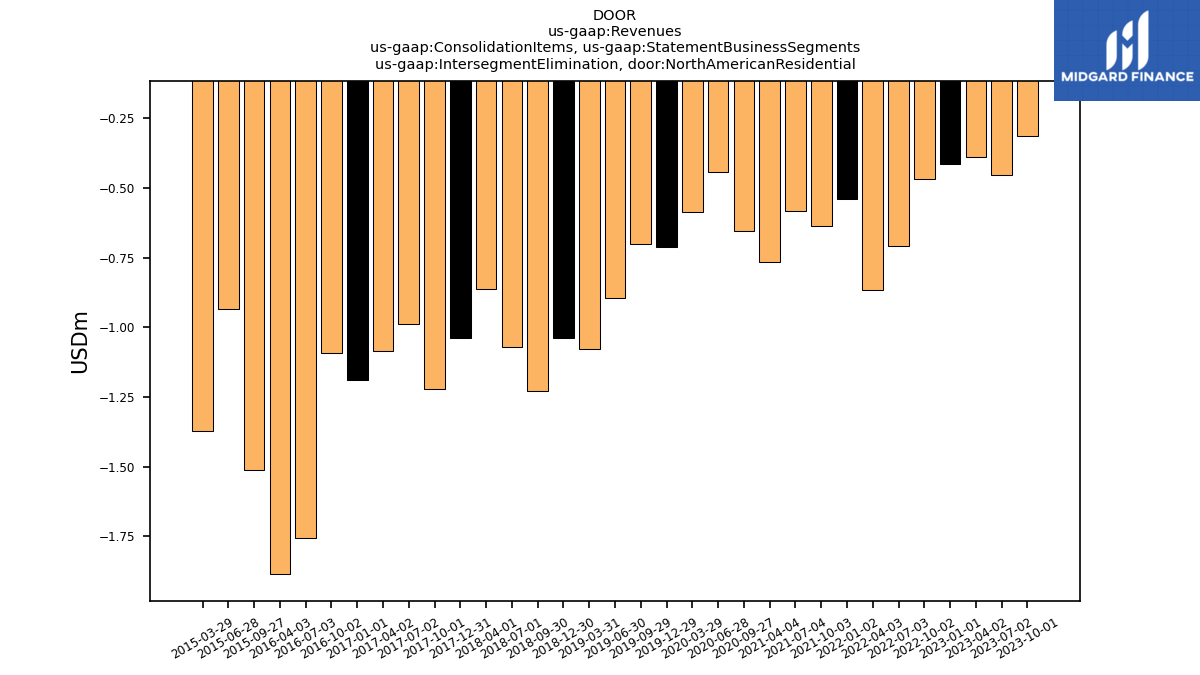
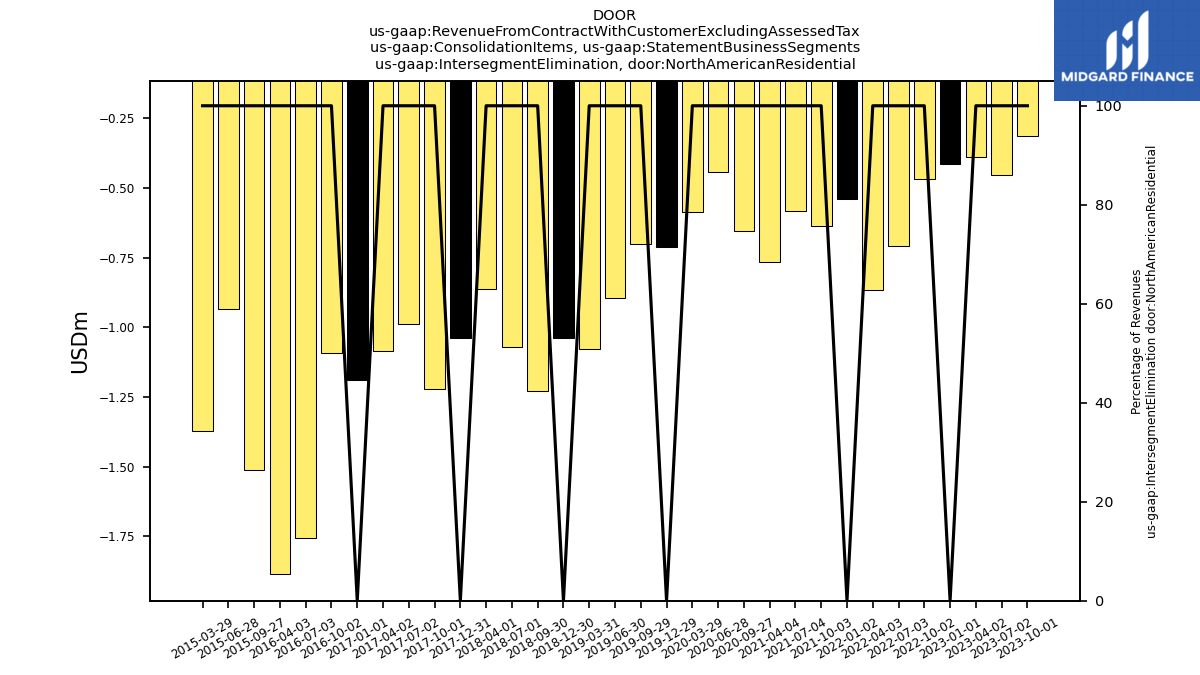
| Intersegment Elimination, North American Residential | -0.32 | -0.45 | -0.39 | -0.42 | -0.47 | -0.71 | -0.86 | -0.54 | -0.64 | -0.58 | -0.77 | NA | -0.65 | -0.44 | -0.59 | -0.71 | -0.70 | -0.90 | -1.08 | -1.04 | -1.23 | -1.07 | -0.86 | -1.04 | -1.22 | -0.99 | -1.09 | -1.19 | -1.09 | -1.76 | -1.89 | NA | -1.51 | -0.93 | -1.37 | NA | NA | NA | NA | NA | NA | NA | NA | NA | NA | NA | NA | |
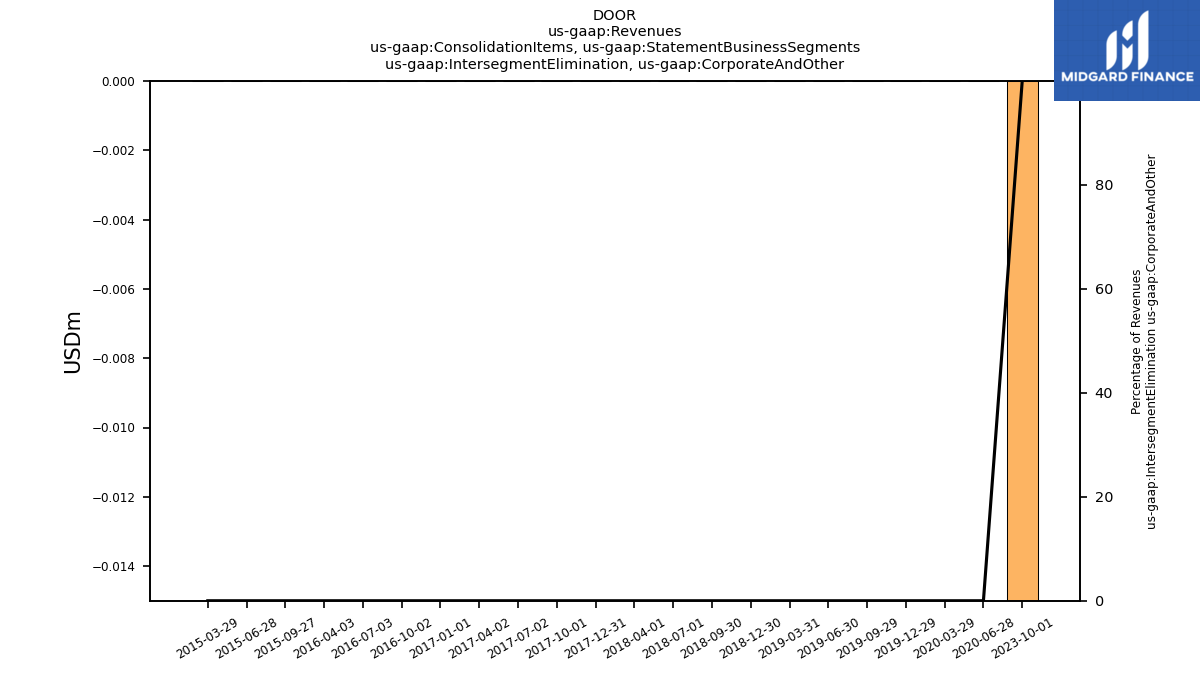
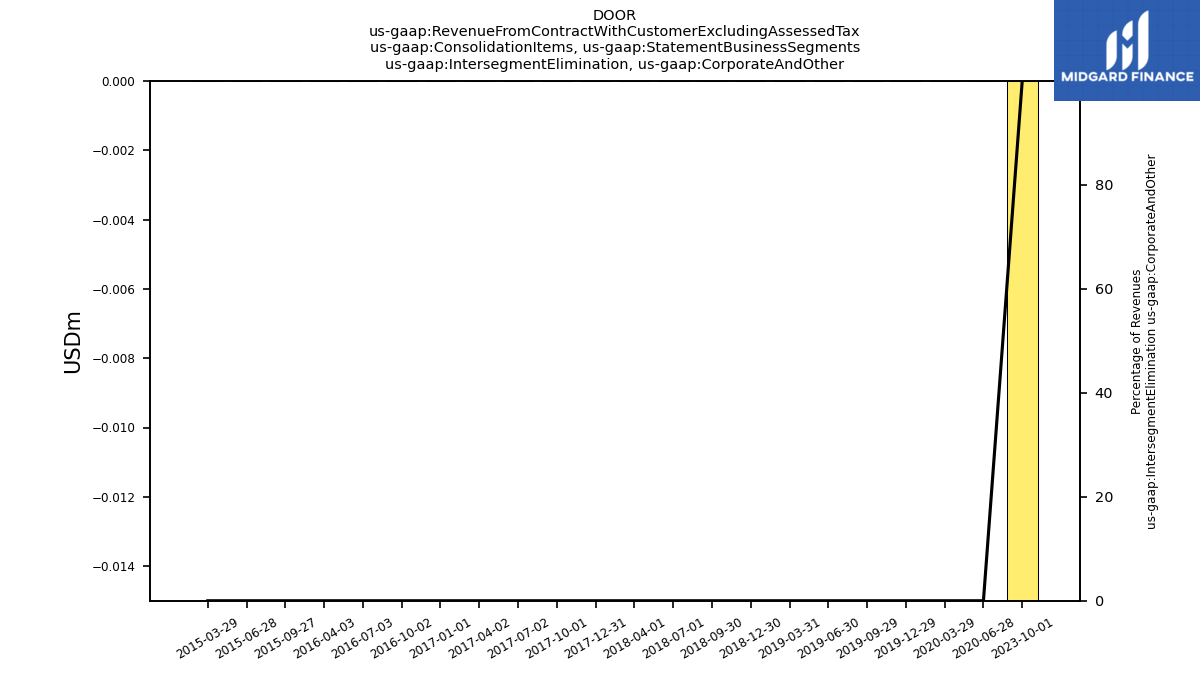
| Intersegment Elimination, Corporate And Other | -0.01 | NA | NA | NA | NA | NA | NA | NA | NA | NA | NA | NA | NA | 0.00 | 0.00 | 0.00 | 0.00 | 0.00 | 0.00 | 0.00 | 0.00 | 0.00 | 0.00 | 0.00 | 0.00 | 0.00 | 0.00 | 0.00 | 0.00 | 0.00 | 0.00 | NA | 0.00 | 0.00 | 0.00 | NA | NA | NA | NA | NA | NA | NA | NA | NA | NA | NA | NA | |
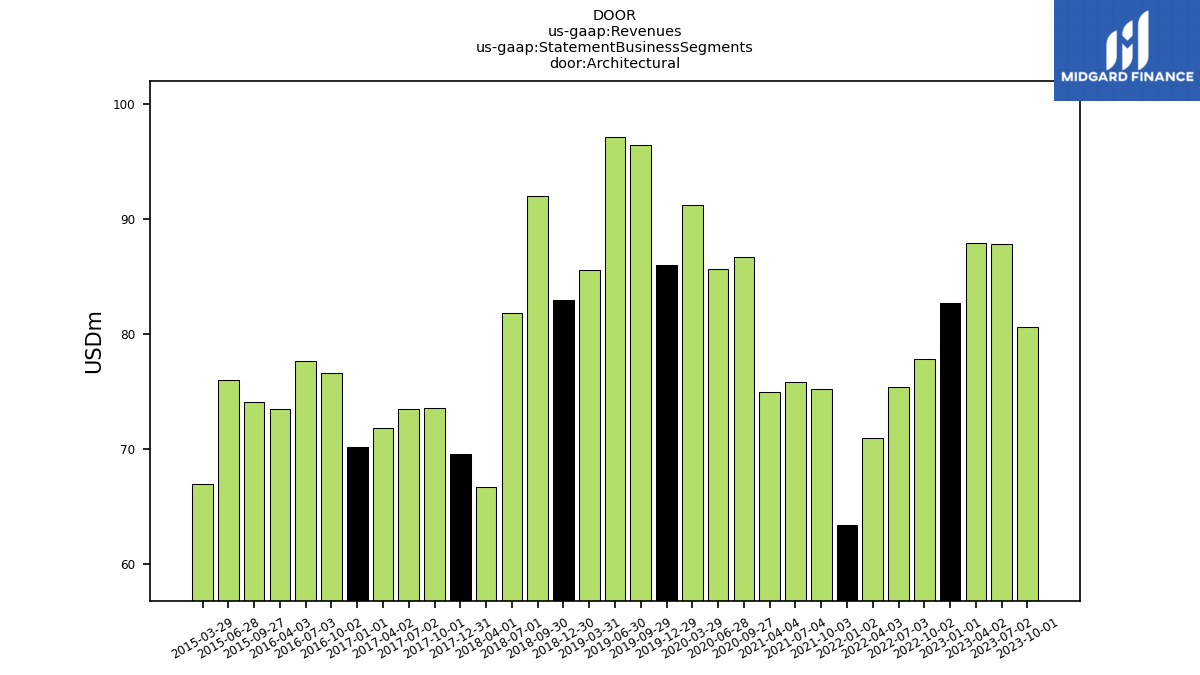
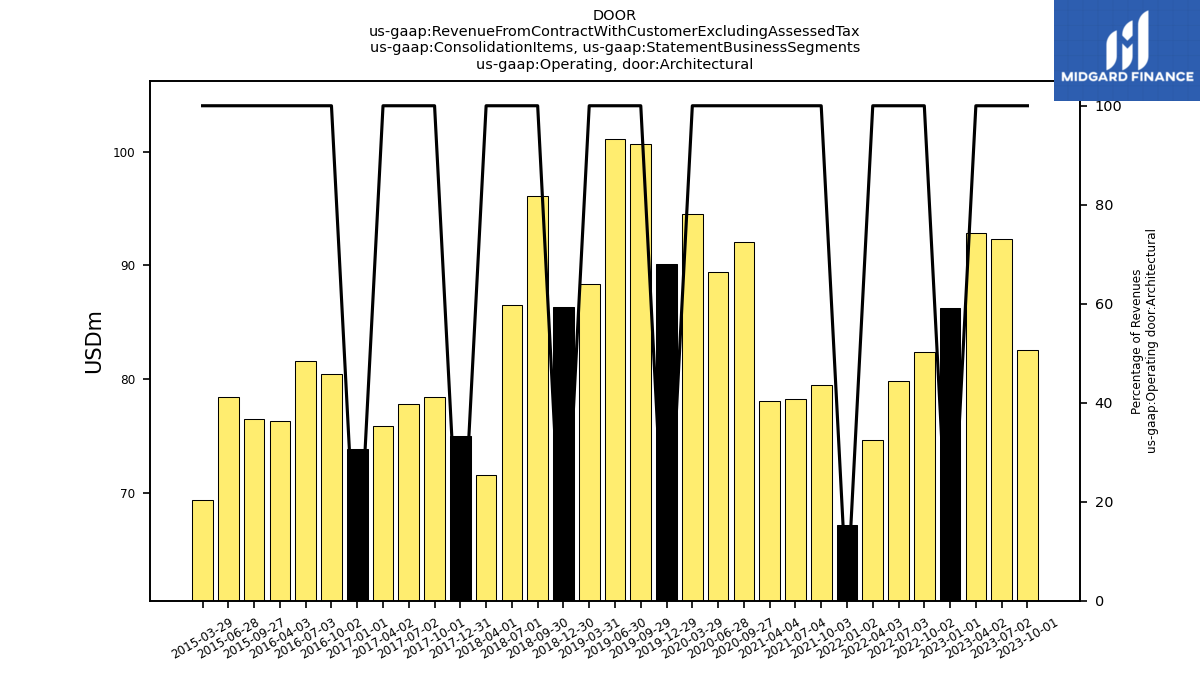
| Operating, Architectural | 82.56 | 92.33 | 92.86 | 86.23 | 82.39 | 79.89 | 74.66 | 67.24 | 79.53 | 78.23 | 78.07 | NA | 92.02 | 89.40 | 94.56 | 90.09 | 100.71 | 101.15 | 88.35 | 86.38 | 96.12 | 86.55 | 71.56 | 75.01 | 78.47 | 77.84 | 75.92 | 73.92 | 80.42 | 81.59 | 76.31 | NA | 76.51 | 78.49 | 69.39 | NA | NA | NA | NA | NA | NA | NA | NA | NA | NA | NA | NA | |
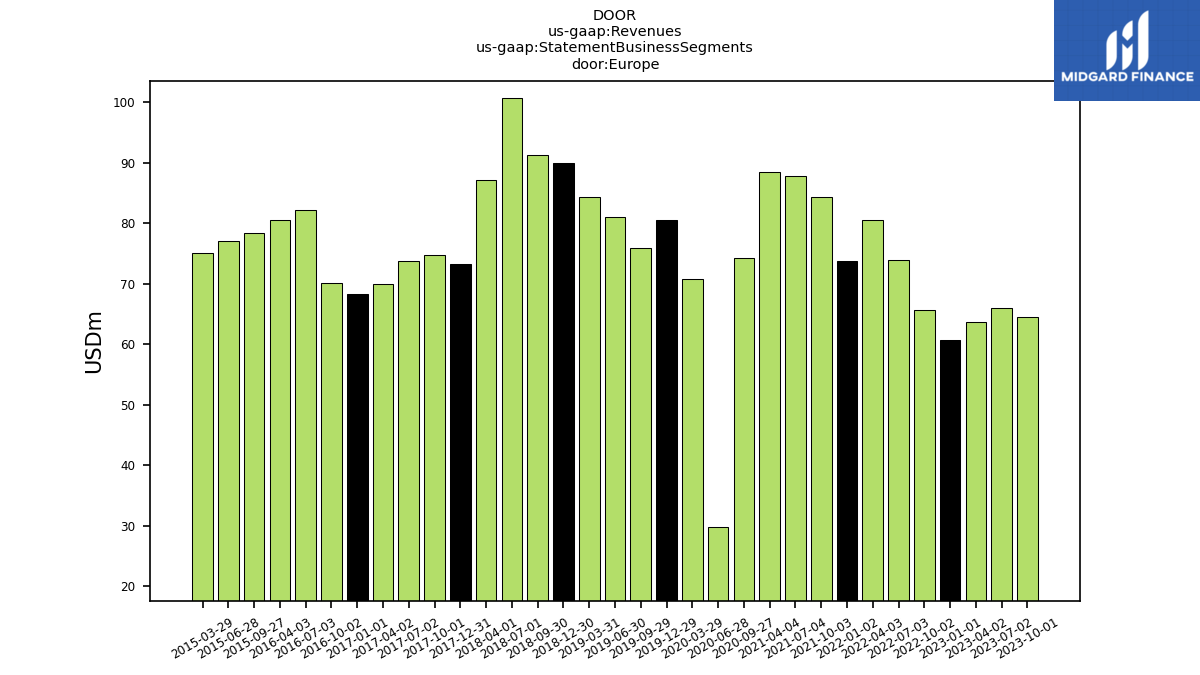
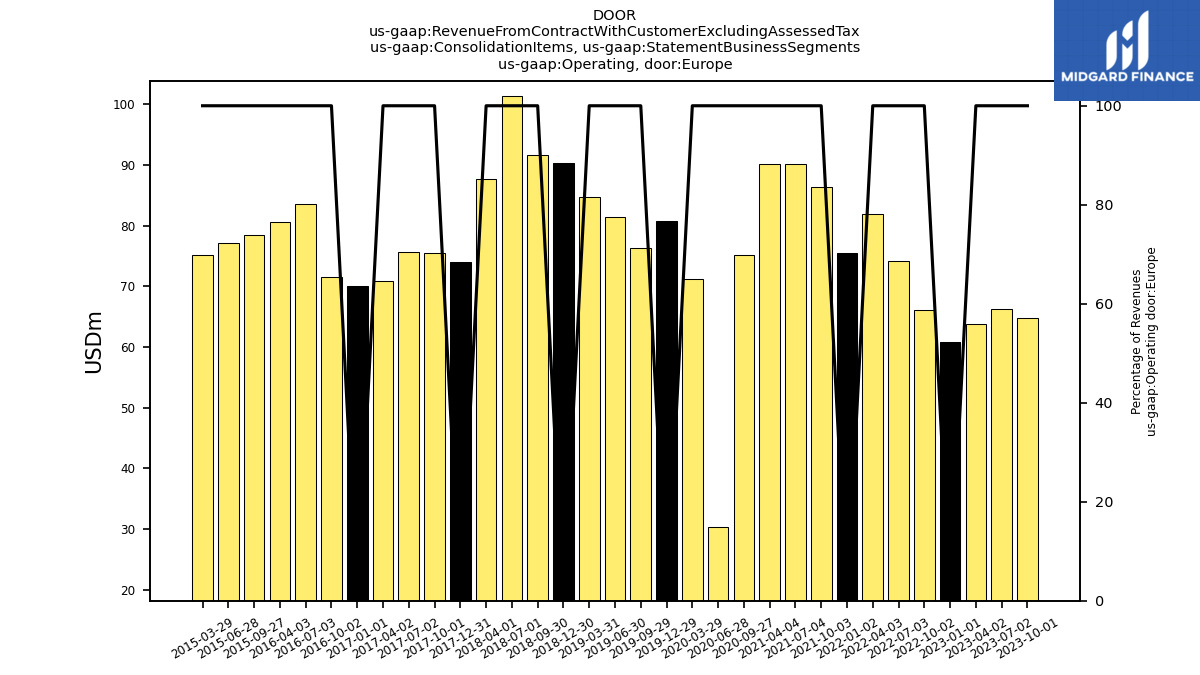
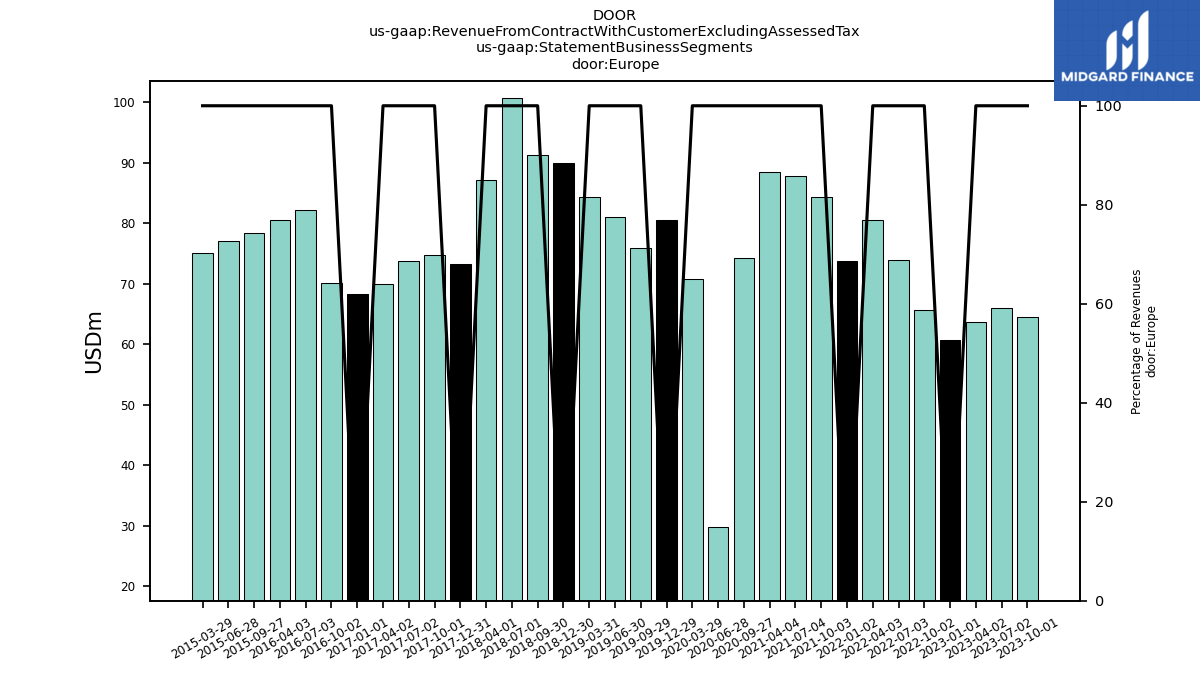
| Operating, Europe | 64.81 | 66.23 | 63.72 | 60.87 | 66.11 | 74.17 | 81.84 | 75.51 | 86.28 | 90.18 | 90.21 | NA | 75.19 | 30.43 | 71.16 | 80.73 | 76.31 | 81.36 | 84.74 | 90.34 | 91.59 | 101.39 | 87.75 | 73.95 | 75.46 | 75.63 | 70.83 | 70.02 | 71.53 | 83.56 | 80.61 | NA | 78.46 | 77.07 | 75.10 | NA | NA | NA | NA | NA | NA | NA | NA | NA | NA | NA | NA | |
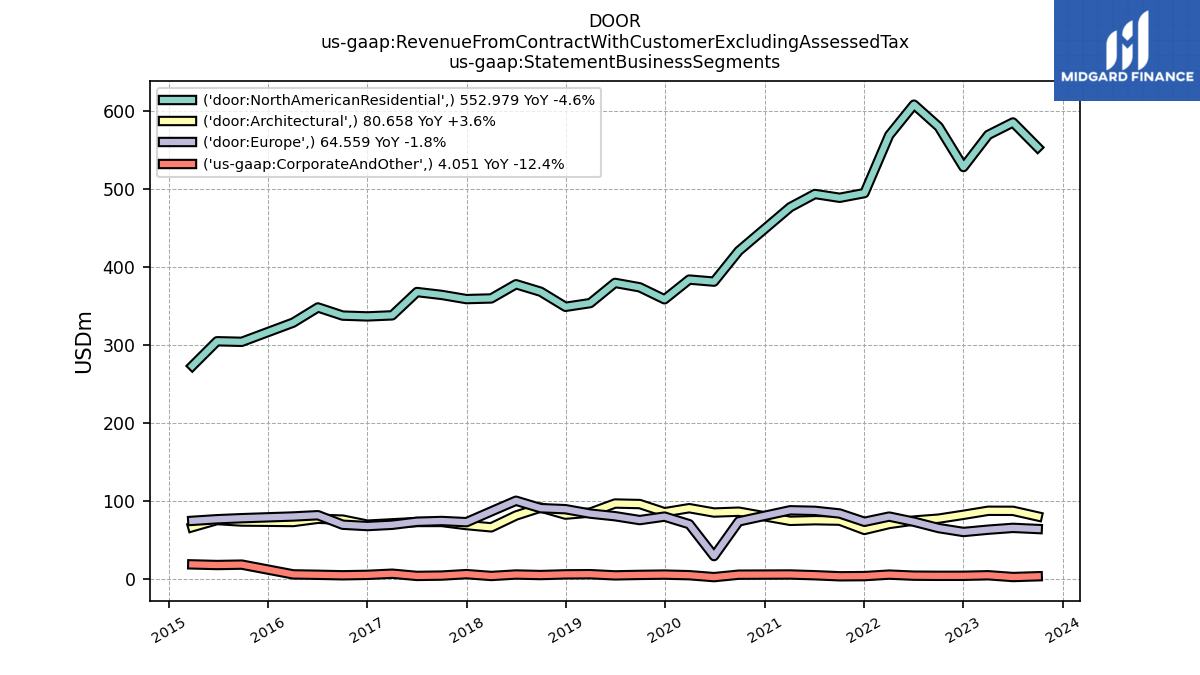
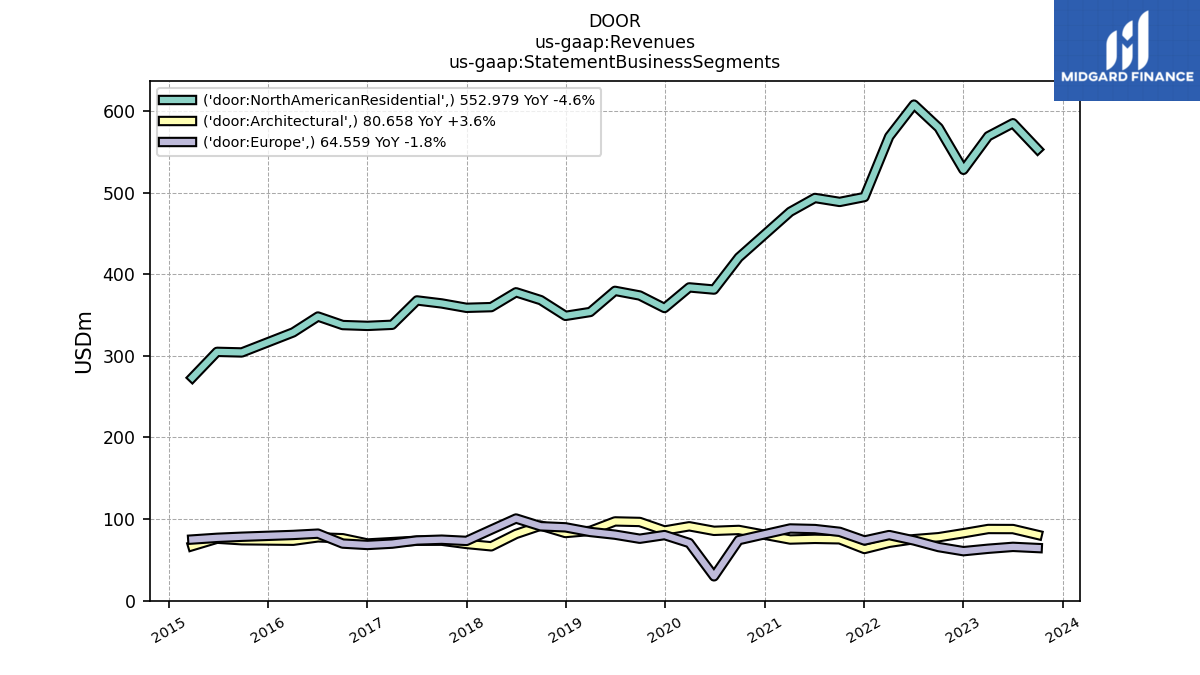
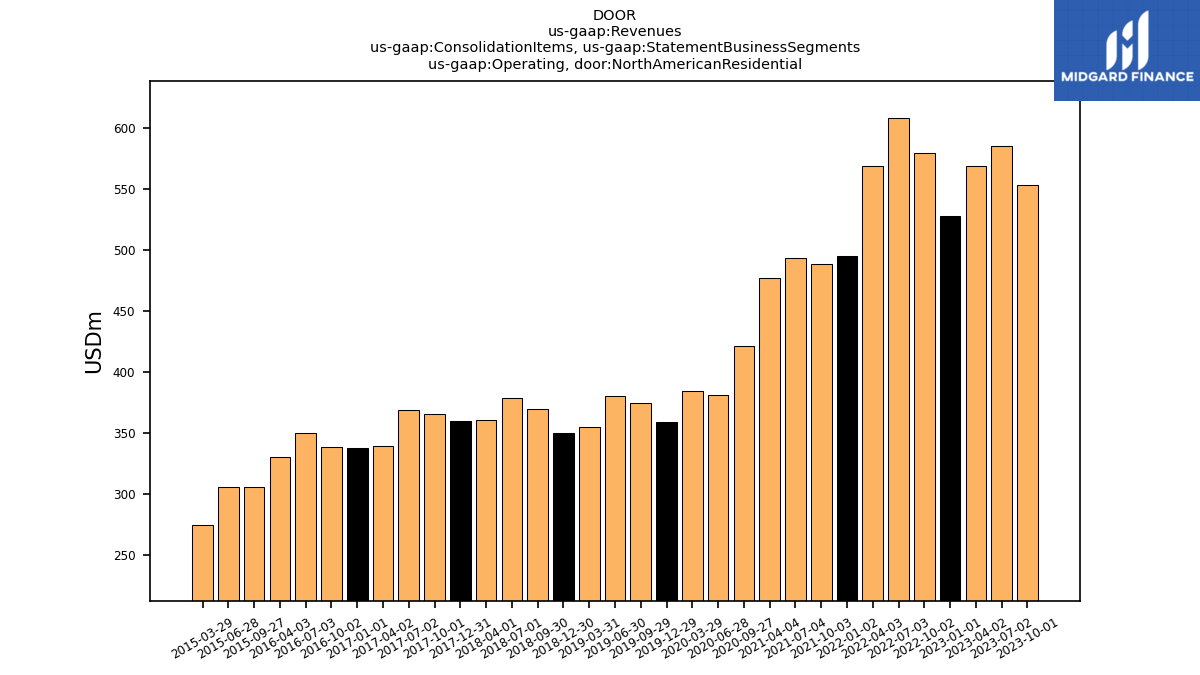
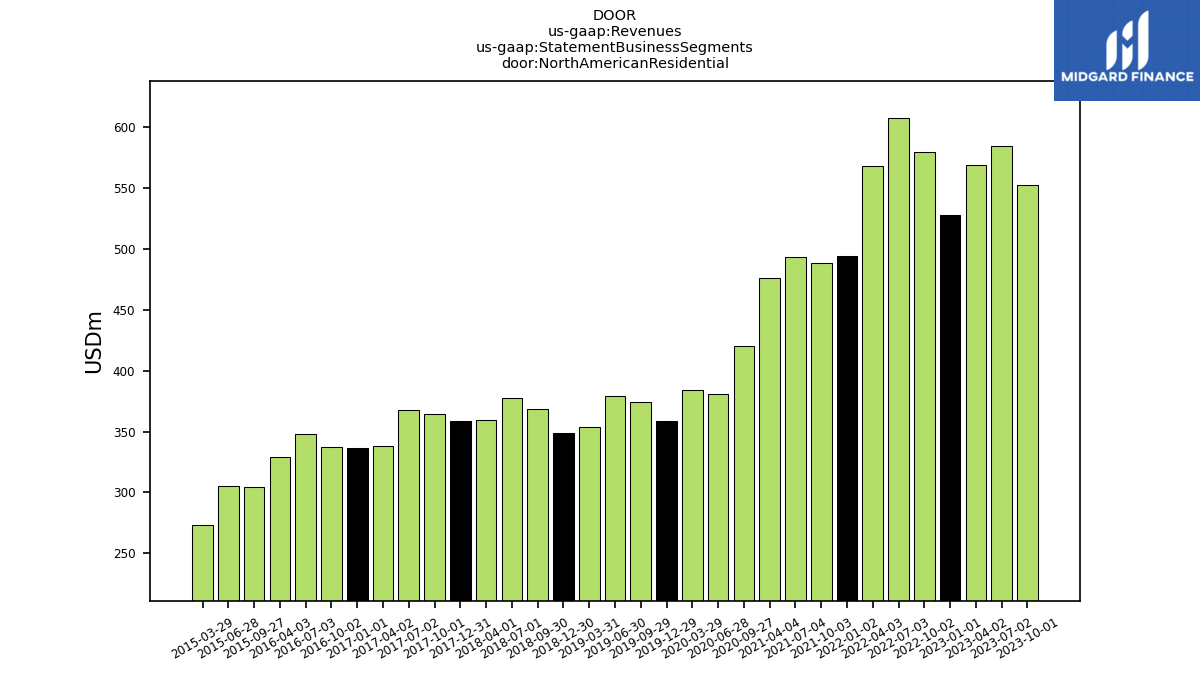
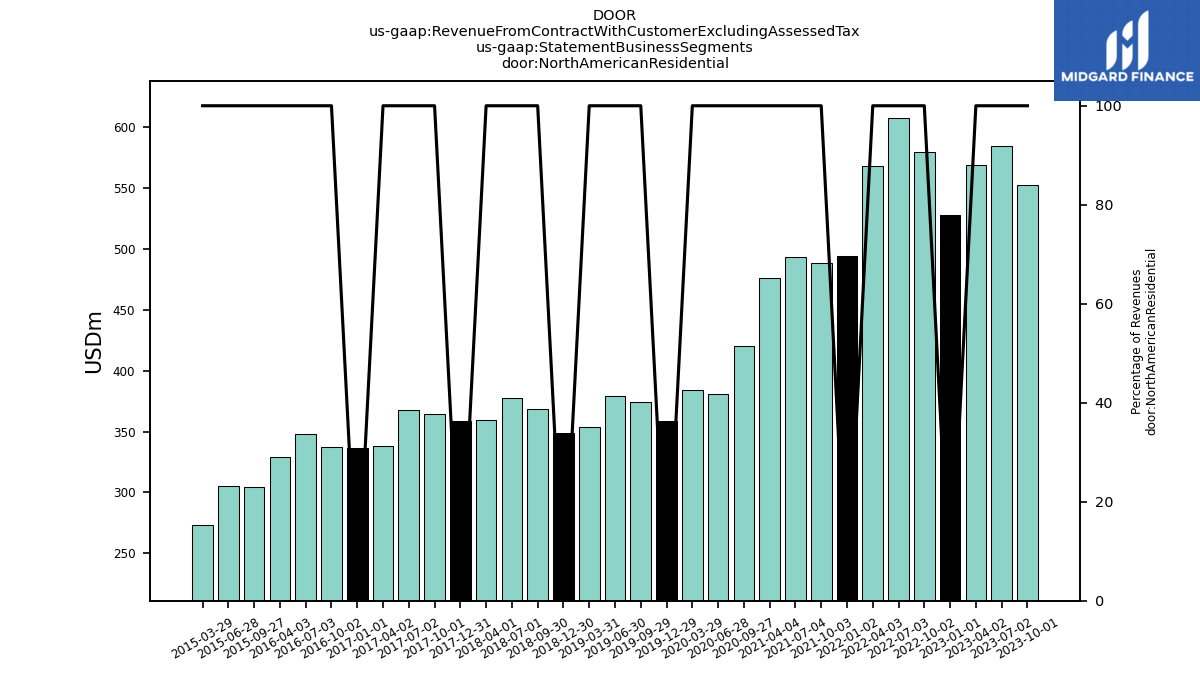
| Operating, North American Residential | 553.29 | 585.42 | 569.43 | 528.28 | 579.91 | 608.48 | 569.43 | 495.07 | 489.16 | 493.97 | 477.23 | NA | 421.19 | 381.61 | 384.44 | 359.27 | 374.61 | 380.50 | 354.80 | 349.99 | 369.49 | 378.94 | 360.54 | 359.86 | 365.41 | 368.87 | 339.13 | 337.88 | 338.81 | 349.93 | 330.62 | NA | 305.67 | 305.83 | 274.64 | NA | NA | NA | NA | NA | NA | NA | NA | NA | NA | NA | NA | |
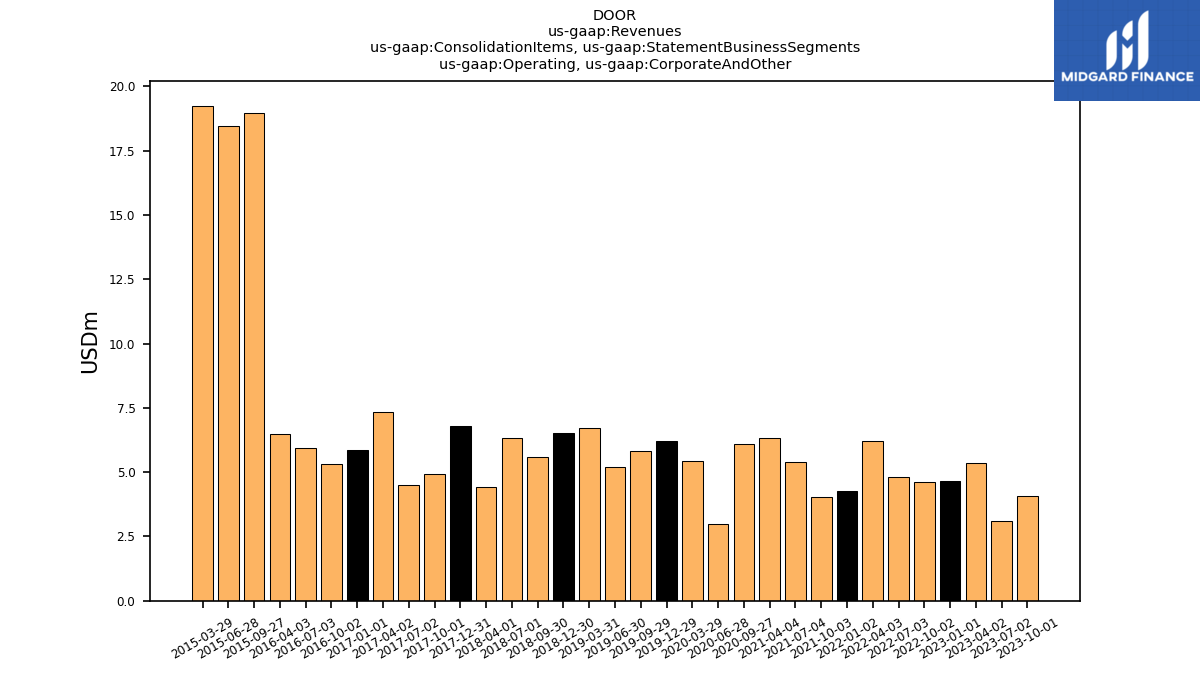
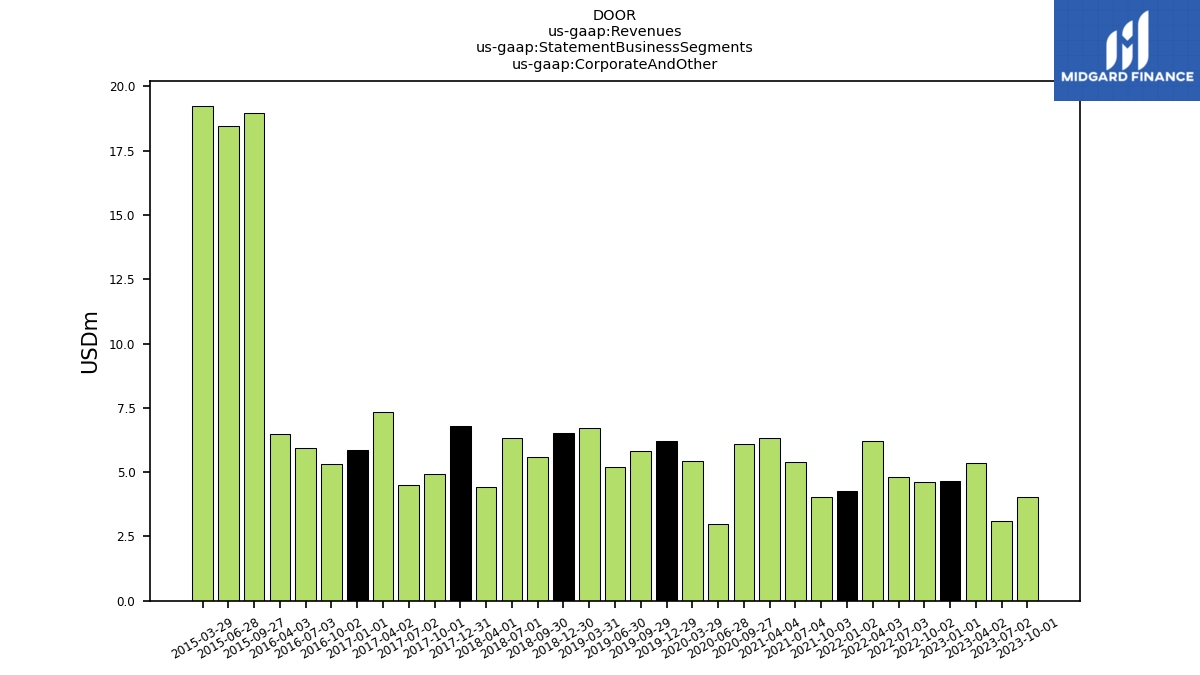
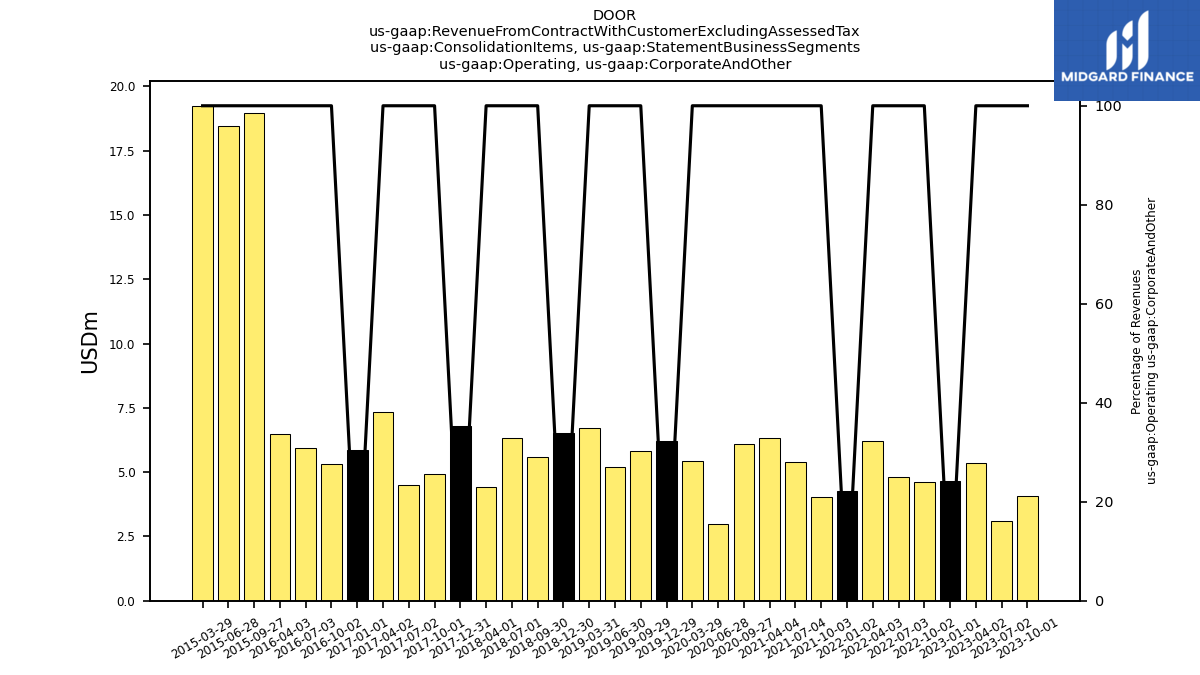
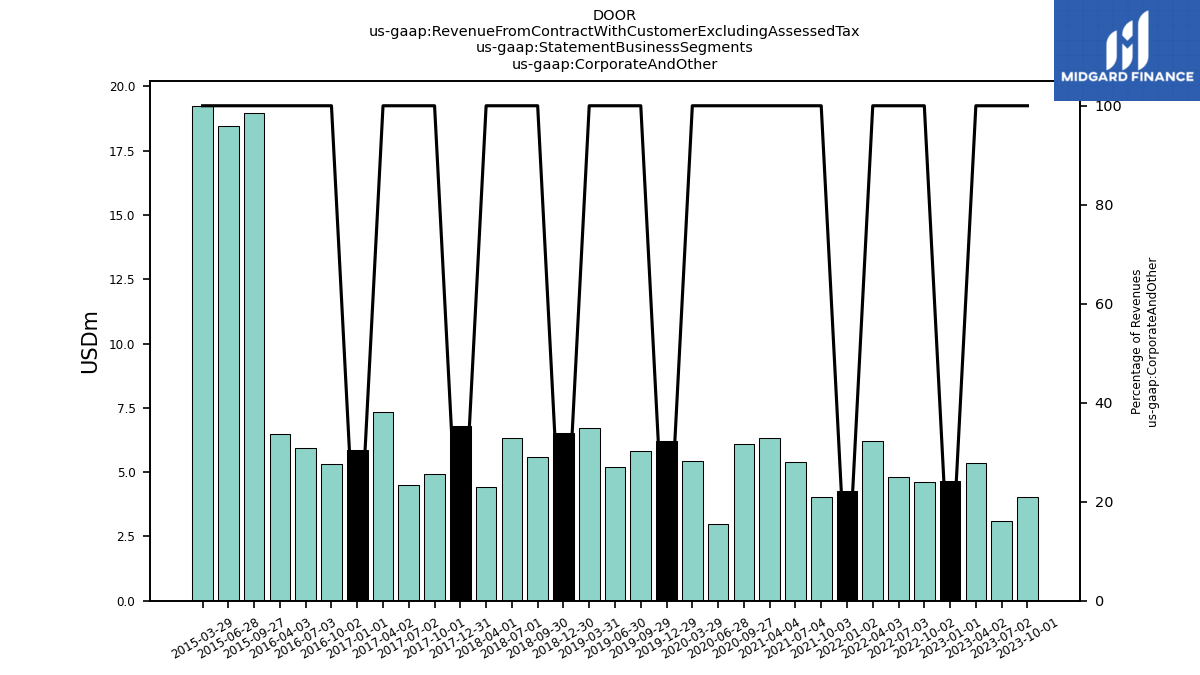
| Operating, Corporate And Other | 4.07 | 3.09 | 5.35 | 4.65 | 4.62 | 4.82 | 6.20 | 4.25 | 4.03 | 5.39 | 6.34 | NA | 6.10 | 2.97 | 5.43 | 6.20 | 5.81 | 5.20 | 6.73 | 6.52 | 5.61 | 6.32 | 4.42 | 6.80 | 4.95 | 4.51 | 7.34 | 5.87 | 5.32 | 5.95 | 6.47 | NA | 18.98 | 18.45 | 19.25 | NA | NA | NA | NA | NA | NA | NA | NA | NA | NA | NA | NA | |
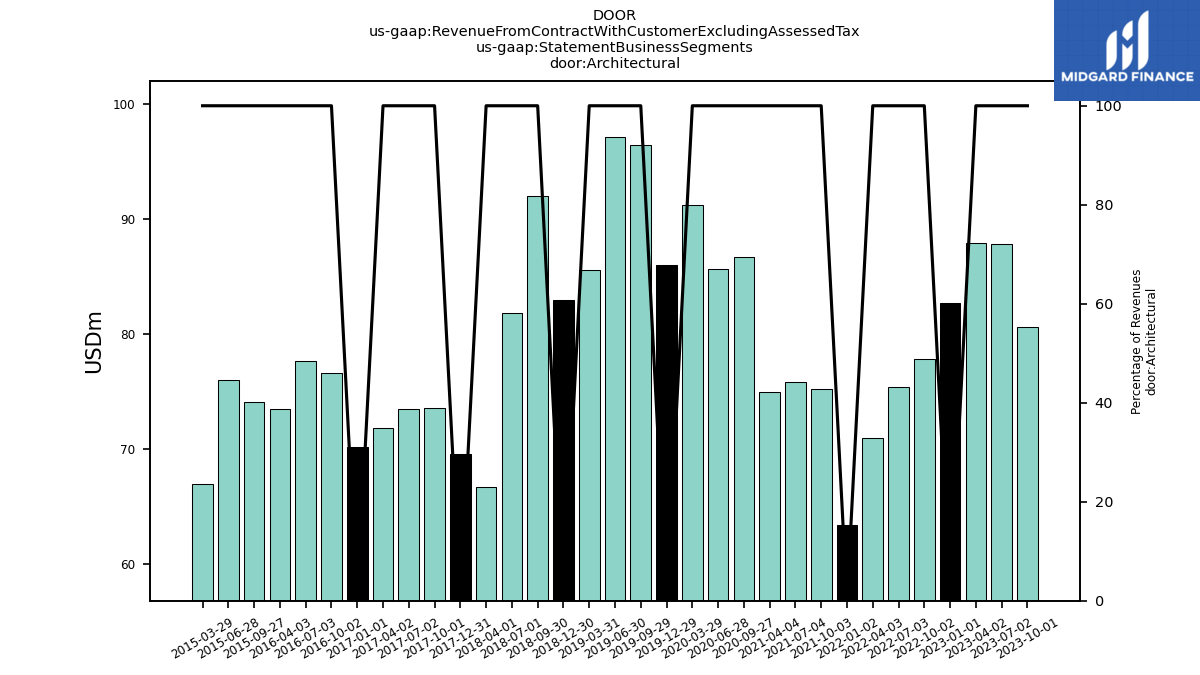
| Architectural | 80.66 | 87.82 | 87.90 | 82.73 | 77.84 | 75.42 | 70.99 | 63.40 | 75.26 | 75.82 | 74.99 | NA | 86.74 | 85.64 | 91.22 | 86.03 | 96.50 | 97.18 | 85.59 | 82.95 | 92.05 | 81.80 | 66.67 | 69.57 | 73.55 | 73.51 | 71.83 | 70.15 | 76.58 | 77.65 | 73.51 | NA | 74.11 | 76.01 | 66.92 | NA | NA | NA | NA | NA | NA | NA | NA | NA | NA | NA | NA | |
| Europe | 64.56 | 66.01 | 63.69 | 60.73 | 65.72 | 73.85 | 80.47 | 73.78 | 84.40 | 87.81 | 88.54 | NA | 74.28 | 29.89 | 70.73 | 80.45 | 75.97 | 80.95 | 84.27 | 89.93 | 91.23 | 100.75 | 87.10 | 73.30 | 74.82 | 73.83 | 69.97 | 68.32 | 70.04 | 82.22 | 80.59 | NA | 78.40 | 77.07 | 75.03 | NA | NA | NA | NA | NA | NA | NA | NA | NA | NA | NA | NA | |
| North American Residential | 552.98 | 584.97 | 569.04 | 527.86 | 579.44 | 607.78 | 568.56 | 494.52 | 488.52 | 493.39 | 476.46 | NA | 420.53 | 381.17 | 383.86 | 358.56 | 373.91 | 379.61 | 353.73 | 348.95 | 368.26 | 377.87 | 359.68 | 358.82 | 364.18 | 367.88 | 338.04 | 336.69 | 337.71 | 348.17 | 328.73 | NA | 304.16 | 304.89 | 273.27 | NA | NA | NA | NA | NA | NA | NA | NA | NA | NA | NA | NA | |
| Corporate And Other | 4.05 | 3.09 | 5.35 | 4.65 | 4.62 | 4.82 | 6.20 | 4.25 | 4.03 | 5.39 | 6.34 | NA | 6.10 | 2.97 | 5.43 | 6.20 | 5.81 | 5.20 | 6.73 | 6.52 | 5.61 | 6.32 | 4.42 | 6.80 | 4.95 | 4.51 | 7.34 | 5.87 | 5.32 | 5.95 | 6.47 | NA | 18.98 | 18.45 | 19.25 | NA | NA | NA | NA | NA | NA | NA | NA | NA | NA | NA | NA | |
| Revenue From Contract With Customer Excluding Assessed Tax | 702.25 | 741.88 | 725.98 | 675.97 | 727.63 | 761.87 | 726.22 | 635.97 | 652.21 | 662.41 | 646.34 | 618.54 | 587.65 | 499.66 | 551.23 | 531.24 | 552.19 | 562.94 | 530.31 | 528.35 | 557.15 | 566.73 | 517.88 | 508.50 | 517.50 | 519.74 | 487.18 | 481.03 | 489.65 | 513.99 | 489.31 | 485.42 | 475.65 | 476.43 | 434.46 | 448.94 | 476.12 | 490.18 | 422.46 | 420.48 | 433.05 | 453.09 | 424.52 | 418.16 | 424.96 | 432.77 | 400.12 | |
| E P I Holdings Inc | NA | NA | NA | NA | 67.95 | 73.48 | 72.72 | NA | NA | NA | NA | NA | NA | NA | NA | NA | NA | NA | NA | NA | NA | NA | NA | NA | NA | NA | NA | NA | NA | NA | NA | NA | NA | NA | NA | NA | NA | NA | NA | NA | NA | NA | NA | NA | NA | NA | NA | |
| E P I Holdings Inc, Intercompany Eliminations | NA | NA | NA | NA | 2.94 | -3.22 | -2.60 | NA | NA | NA | NA | NA | NA | NA | NA | NA | NA | NA | NA | NA | NA | NA | NA | NA | NA | NA | NA | NA | NA | NA | NA | NA | NA | NA | NA | NA | NA | NA | NA | NA | NA | NA | NA | NA | NA | NA | NA | |
| Intersegment Elimination | -2.48 | -5.19 | -5.37 | -4.06 | -5.40 | -5.50 | -5.91 | -6.11 | -6.78 | -5.36 | -5.51 | NA | -6.85 | -4.74 | -4.36 | -5.06 | -5.25 | -5.27 | -4.31 | -4.87 | -5.66 | -6.47 | -6.40 | -7.13 | -6.78 | -7.10 | -6.04 | -6.65 | -6.43 | -7.05 | -4.70 | NA | -6.41 | -6.79 | -6.12 | -5.55 | -6.07 | -7.38 | -6.26 | -2.64 | -4.09 | -4.83 | -3.90 | NA | -4.22 | NA | NA | |
| Operating | 704.73 | 747.07 | 731.36 | 680.03 | 733.03 | 767.37 | 732.12 | 642.07 | 658.99 | 667.77 | 651.85 | NA | 594.50 | 504.40 | 555.58 | 536.30 | 557.44 | 568.21 | 534.62 | 533.22 | 562.80 | 573.19 | 524.28 | 515.63 | 524.28 | 526.85 | 493.22 | 487.68 | 496.07 | 521.03 | 494.00 | NA | 482.06 | 483.22 | 440.58 | 454.49 | 482.19 | 497.56 | 428.72 | 423.11 | 437.14 | 457.92 | 428.42 | NA | 429.18 | NA | NA | |
| Intersegment Elimination, Architectural | -1.90 | -4.51 | -4.96 | -3.51 | -4.54 | -4.47 | -3.67 | -3.84 | -4.27 | -2.41 | -3.08 | NA | -5.28 | -3.76 | -3.34 | -4.07 | -4.21 | -3.96 | -2.76 | -3.42 | -4.07 | -4.75 | -4.89 | -5.44 | -4.92 | -4.32 | -4.09 | -3.76 | -3.85 | -3.95 | -2.80 | NA | -2.40 | -2.48 | -2.47 | NA | NA | NA | NA | NA | NA | NA | NA | NA | NA | NA | NA | |
| Intersegment Elimination, Europe | -0.25 | -0.22 | -0.02 | -0.14 | -0.39 | -0.32 | -1.37 | -1.72 | -1.88 | -2.37 | -1.67 | NA | -0.91 | -0.54 | -0.43 | -0.28 | -0.34 | -0.41 | -0.47 | -0.41 | -0.36 | -0.64 | -0.65 | -0.65 | -0.64 | -1.79 | -0.86 | -1.70 | -1.49 | -1.34 | -0.02 | NA | -0.06 | 0.00 | -0.08 | NA | NA | NA | NA | NA | NA | NA | NA | NA | NA | NA | NA | |
| Intersegment Elimination, North American Residential | -0.32 | -0.45 | -0.39 | -0.42 | -0.47 | -0.71 | -0.86 | -0.54 | -0.64 | -0.58 | -0.77 | NA | -0.65 | -0.44 | -0.59 | -0.71 | -0.70 | -0.90 | -1.08 | -1.04 | -1.23 | -1.07 | -0.86 | -1.04 | -1.22 | -0.99 | -1.09 | -1.19 | -1.09 | -1.76 | -1.89 | NA | -1.51 | -0.93 | -1.37 | NA | NA | NA | NA | NA | NA | NA | NA | NA | NA | NA | NA | |
| Intersegment Elimination, Corporate And Other | -0.01 | NA | NA | NA | NA | NA | NA | NA | NA | NA | NA | NA | NA | 0.00 | 0.00 | 0.00 | 0.00 | 0.00 | 0.00 | 0.00 | 0.00 | 0.00 | 0.00 | 0.00 | 0.00 | 0.00 | 0.00 | 0.00 | 0.00 | 0.00 | 0.00 | NA | 0.00 | 0.00 | 0.00 | NA | NA | NA | NA | NA | NA | NA | NA | NA | NA | NA | NA | |
| Operating, Architectural | 82.56 | 92.33 | 92.86 | 86.23 | 82.39 | 79.89 | 74.66 | 67.24 | 79.53 | 78.23 | 78.07 | NA | 92.02 | 89.40 | 94.56 | 90.09 | 100.71 | 101.15 | 88.35 | 86.38 | 96.12 | 86.55 | 71.56 | 75.01 | 78.47 | 77.84 | 75.92 | 73.92 | 80.42 | 81.59 | 76.31 | NA | 76.51 | 78.49 | 69.39 | NA | NA | NA | NA | NA | NA | NA | NA | NA | NA | NA | NA | |
| Operating, Europe | 64.81 | 66.23 | 63.72 | 60.87 | 66.11 | 74.17 | 81.84 | 75.51 | 86.28 | 90.18 | 90.21 | NA | 75.19 | 30.43 | 71.16 | 80.73 | 76.31 | 81.36 | 84.74 | 90.34 | 91.59 | 101.39 | 87.75 | 73.95 | 75.46 | 75.63 | 70.83 | 70.02 | 71.53 | 83.56 | 80.61 | NA | 78.46 | 77.07 | 75.10 | NA | NA | NA | NA | NA | NA | NA | NA | NA | NA | NA | NA | |
| Operating, North American Residential | 553.29 | 585.42 | 569.43 | 528.28 | 579.91 | 608.48 | 569.43 | 495.07 | 489.16 | 493.97 | 477.23 | NA | 421.19 | 381.61 | 384.44 | 359.27 | 374.61 | 380.50 | 354.80 | 349.99 | 369.49 | 378.94 | 360.54 | 359.86 | 365.41 | 368.87 | 339.13 | 337.88 | 338.81 | 349.93 | 330.62 | NA | 305.67 | 305.83 | 274.64 | NA | NA | NA | NA | NA | NA | NA | NA | NA | NA | NA | NA | |
| Operating, Corporate And Other | 4.07 | 3.09 | 5.35 | 4.65 | 4.62 | 4.82 | 6.20 | 4.25 | 4.03 | 5.39 | 6.34 | NA | 6.10 | 2.97 | 5.43 | 6.20 | 5.81 | 5.20 | 6.73 | 6.52 | 5.61 | 6.32 | 4.42 | 6.80 | 4.95 | 4.51 | 7.34 | 5.87 | 5.32 | 5.95 | 6.47 | NA | 18.98 | 18.45 | 19.25 | NA | NA | NA | NA | NA | NA | NA | NA | NA | NA | NA | NA | |
| Architectural | 80.66 | 87.82 | 87.90 | 82.73 | 77.84 | 75.42 | 70.99 | 63.40 | 75.26 | 75.82 | 74.99 | NA | 86.74 | 85.64 | 91.22 | 86.03 | 96.50 | 97.18 | 85.59 | 82.95 | 92.05 | 81.80 | 66.67 | 69.57 | 73.55 | 73.51 | 71.83 | 70.15 | 76.58 | 77.65 | 73.51 | NA | 74.11 | 76.01 | 66.92 | NA | NA | NA | NA | NA | NA | NA | NA | NA | NA | NA | NA | |
| Europe | 64.56 | 66.01 | 63.69 | 60.73 | 65.72 | 73.85 | 80.47 | 73.78 | 84.40 | 87.81 | 88.54 | NA | 74.28 | 29.89 | 70.73 | 80.45 | 75.97 | 80.95 | 84.27 | 89.93 | 91.23 | 100.75 | 87.10 | 73.30 | 74.82 | 73.83 | 69.97 | 68.32 | 70.04 | 82.22 | 80.59 | NA | 78.40 | 77.07 | 75.03 | NA | NA | NA | NA | NA | NA | NA | NA | NA | NA | NA | NA | |
| North American Residential | 552.98 | 584.97 | 569.04 | 527.86 | 579.44 | 607.78 | 568.56 | 494.52 | 488.52 | 493.39 | 476.46 | NA | 420.53 | 381.17 | 383.86 | 358.56 | 373.91 | 379.61 | 353.73 | 348.95 | 368.26 | 377.87 | 359.68 | 358.82 | 364.18 | 367.88 | 338.04 | 336.69 | 337.71 | 348.17 | 328.73 | NA | 304.16 | 304.89 | 273.27 | NA | NA | NA | NA | NA | NA | NA | NA | NA | NA | NA | NA | |
| Corporate And Other | 4.05 | 3.09 | 5.35 | 4.65 | 4.62 | 4.82 | 6.20 | 4.25 | 4.03 | 5.39 | 6.34 | NA | 6.10 | 2.97 | 5.43 | 6.20 | 5.81 | 5.20 | 6.73 | 6.52 | 5.61 | 6.32 | 4.42 | 6.80 | 4.95 | 4.51 | 7.34 | 5.87 | 5.32 | 5.95 | 6.47 | NA | 18.98 | 18.45 | 19.25 | NA | NA | NA | NA | NA | NA | NA | NA | NA | NA | NA | NA |


