
| 2023-12-31 | 2023-09-30 | 2023-07-01 | 2023-04-01 | 2022-12-31 | 2022-09-24 | 2022-06-25 | 2022-03-26 | 2021-12-25 | 2021-09-25 | 2021-06-26 | 2021-03-27 | 2020-12-26 | 2020-09-26 | 2020-06-27 | 2020-03-28 | 2019-12-28 | 2019-09-28 | 2019-06-29 | 2019-03-30 | 2018-12-29 | 2018-09-29 | 2018-06-30 | 2018-03-31 | 2017-12-30 | 2017-09-30 | 2017-07-01 | 2017-04-01 | 2016-12-31 | 2016-09-24 | 2016-06-25 | 2016-03-26 | 2015-12-26 | 2015-09-26 | 2015-06-27 | 2015-03-28 | 2014-12-27 | 2014-09-27 | 2014-06-28 | 2014-03-29 | 2013-12-28 | 2013-09-28 | 2013-06-29 | 2013-03-30 | 2012-12-29 | 2012-09-29 | 2012-06-30 | 2012-03-31 | 2011-12-31 | 2011-09-24 | 2011-06-25 | 2011-03-26 | 2010-12-25 | 2010-09-25 | 2010-06-26 | ||
|---|---|---|---|---|---|---|---|---|---|---|---|---|---|---|---|---|---|---|---|---|---|---|---|---|---|---|---|---|---|---|---|---|---|---|---|---|---|---|---|---|---|---|---|---|---|---|---|---|---|---|---|---|---|---|---|---|
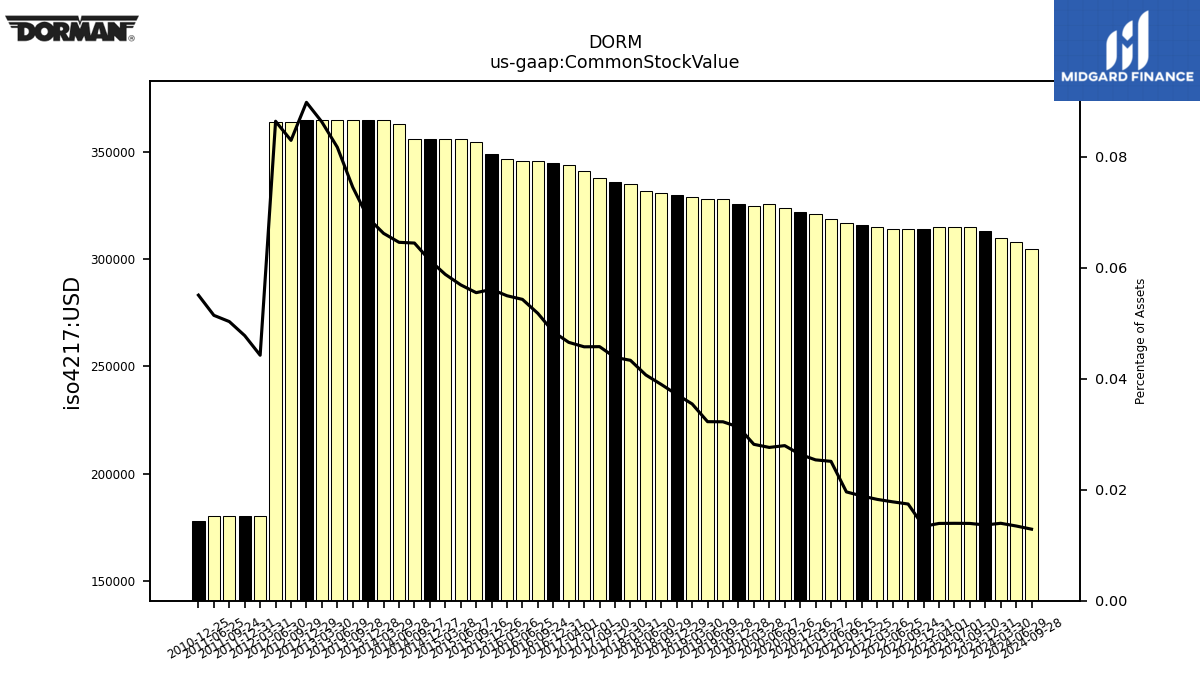
| Common Stock Value | 0.31 | 0.32 | 0.32 | 0.32 | 0.31 | 0.31 | 0.31 | 0.32 | 0.32 | 0.32 | 0.32 | 0.32 | 0.32 | 0.32 | 0.33 | 0.33 | 0.33 | 0.33 | 0.33 | 0.33 | 0.33 | 0.33 | 0.33 | 0.34 | 0.34 | 0.34 | 0.34 | 0.34 | 0.34 | 0.35 | 0.35 | 0.35 | 0.35 | 0.35 | 0.36 | 0.36 | 0.36 | 0.36 | 0.36 | 0.36 | 0.36 | 0.36 | 0.36 | 0.36 | 0.36 | 0.36 | 0.36 | 0.18 | 0.18 | 0.18 | 0.18 | NA | 0.18 | NA | NA | |
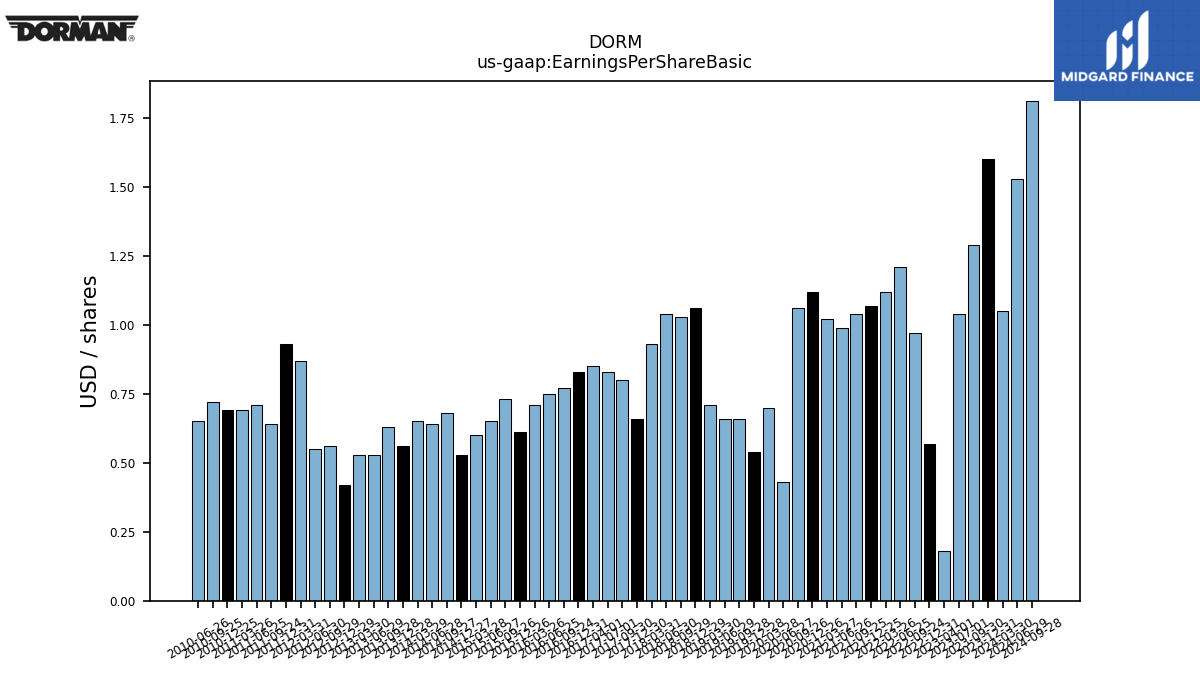
| Earnings Per Share Basic | 1.60 | 1.29 | 1.04 | 0.18 | 0.57 | 0.97 | 1.21 | 1.12 | 1.07 | 1.04 | 0.99 | 1.02 | 1.12 | 1.06 | 0.43 | 0.70 | 0.54 | 0.66 | 0.66 | 0.71 | 1.06 | 1.03 | 1.04 | 0.93 | 0.66 | 0.80 | 0.83 | 0.85 | 0.83 | 0.77 | 0.75 | 0.71 | 0.61 | 0.73 | 0.65 | 0.60 | 0.53 | 0.68 | 0.64 | 0.65 | 0.56 | 0.63 | 0.53 | 0.53 | 0.42 | 0.56 | 0.55 | 0.87 | 0.93 | 0.64 | 0.71 | 0.69 | 0.69 | 0.72 | 0.65 | |
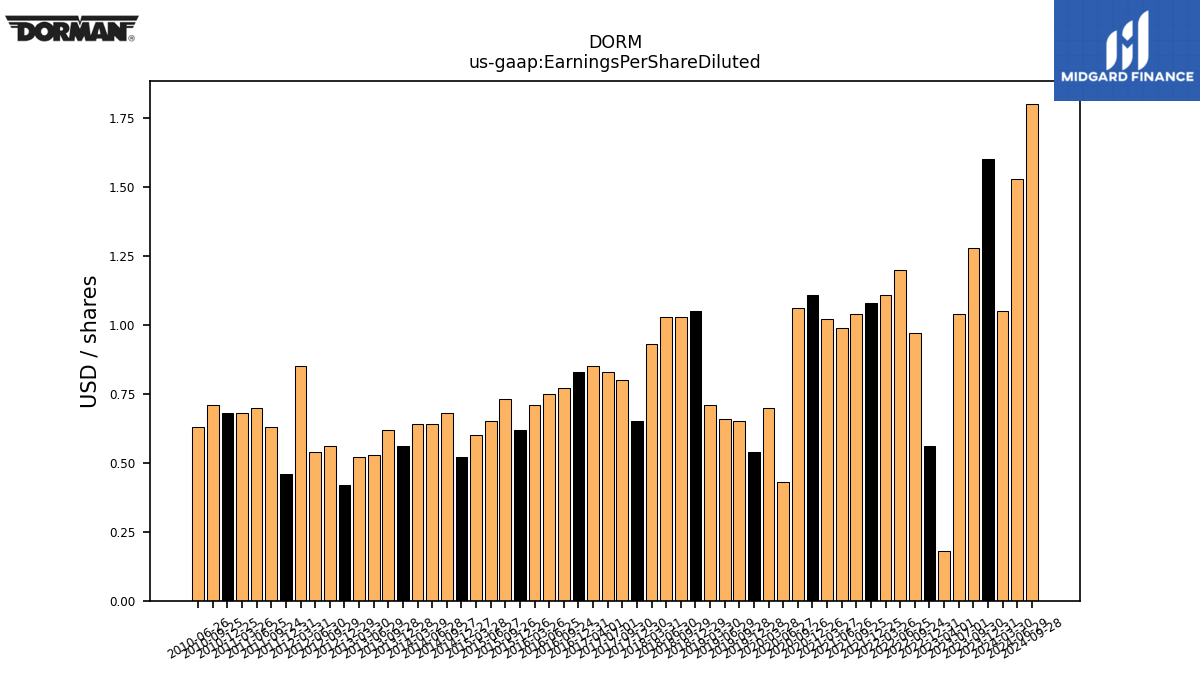
| Earnings Per Share Diluted | 1.60 | 1.28 | 1.04 | 0.18 | 0.56 | 0.97 | 1.20 | 1.11 | 1.08 | 1.04 | 0.99 | 1.02 | 1.11 | 1.06 | 0.43 | 0.70 | 0.54 | 0.65 | 0.66 | 0.71 | 1.05 | 1.03 | 1.03 | 0.93 | 0.65 | 0.80 | 0.83 | 0.85 | 0.83 | 0.77 | 0.75 | 0.71 | 0.62 | 0.73 | 0.65 | 0.60 | 0.52 | 0.68 | 0.64 | 0.64 | 0.56 | 0.62 | 0.53 | 0.52 | 0.42 | 0.56 | 0.54 | 0.85 | 0.46 | 0.63 | 0.70 | 0.68 | 0.68 | 0.71 | 0.63 |
| 2023-12-31 | 2023-09-30 | 2023-07-01 | 2023-04-01 | 2022-12-31 | 2022-09-24 | 2022-06-25 | 2022-03-26 | 2021-12-25 | 2021-09-25 | 2021-06-26 | 2021-03-27 | 2020-12-26 | 2020-09-26 | 2020-06-27 | 2020-03-28 | 2019-12-28 | 2019-09-28 | 2019-06-29 | 2019-03-30 | 2018-12-29 | 2018-09-29 | 2018-06-30 | 2018-03-31 | 2017-12-30 | 2017-09-30 | 2017-07-01 | 2017-04-01 | 2016-12-31 | 2016-09-24 | 2016-06-25 | 2016-03-26 | 2015-12-26 | 2015-09-26 | 2015-06-27 | 2015-03-28 | 2014-12-27 | 2014-09-27 | 2014-06-28 | 2014-03-29 | 2013-12-28 | 2013-09-28 | 2013-06-29 | 2013-03-30 | 2012-12-29 | 2012-09-29 | 2012-06-30 | 2012-03-31 | 2011-12-31 | 2011-09-24 | 2011-06-25 | 2011-03-26 | 2010-12-25 | 2010-09-25 | 2010-06-26 | ||
|---|---|---|---|---|---|---|---|---|---|---|---|---|---|---|---|---|---|---|---|---|---|---|---|---|---|---|---|---|---|---|---|---|---|---|---|---|---|---|---|---|---|---|---|---|---|---|---|---|---|---|---|---|---|---|---|---|
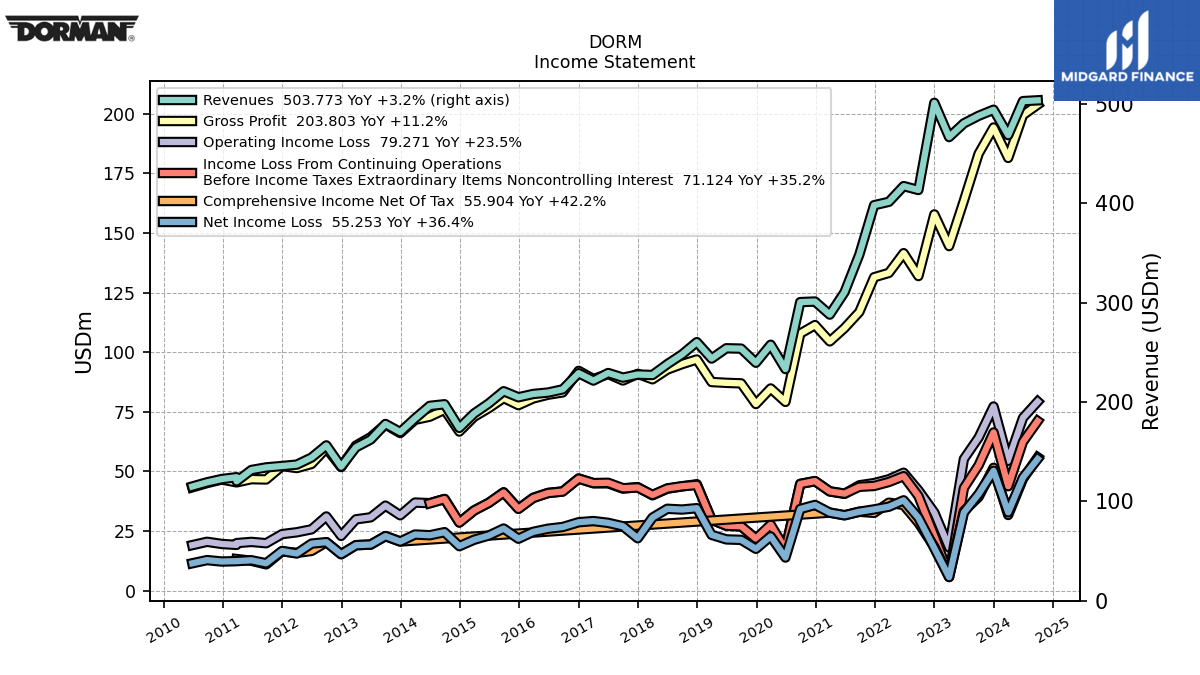
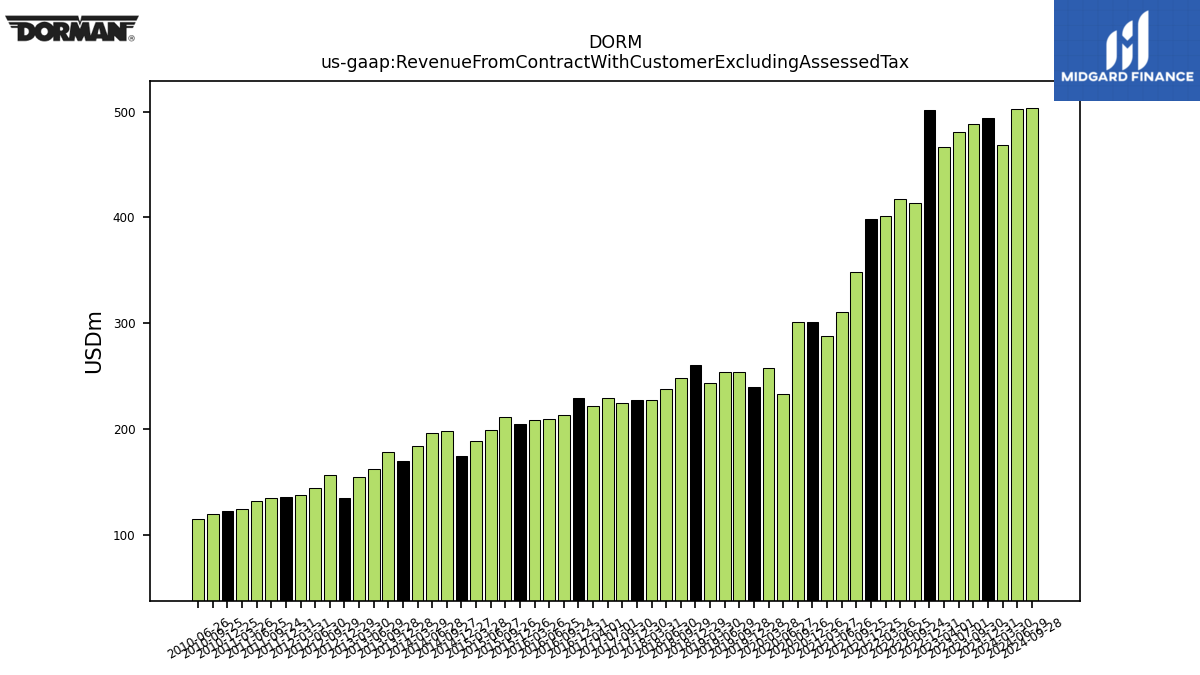
| Revenue From Contract With Customer Excluding Assessed Tax | 494.30 | 488.19 | 480.57 | 466.74 | 501.28 | 413.47 | 417.42 | 401.58 | 398.18 | 348.43 | 310.63 | 288.01 | 301.22 | 300.62 | 233.18 | 257.73 | 239.57 | 253.80 | 254.18 | 243.79 | 260.34 | 247.95 | 238.15 | 227.26 | 227.72 | 224.62 | 229.26 | 221.62 | 229.10 | 212.79 | 209.57 | 208.15 | 204.83 | 210.93 | 198.72 | 188.47 | 173.98 | 197.80 | 196.19 | 183.51 | 169.81 | 177.95 | 162.26 | 154.44 | 135.01 | 156.41 | 144.17 | 137.04 | 135.64 | 134.24 | 131.62 | 124.37 | 122.52 | 119.21 | 115.01 | |
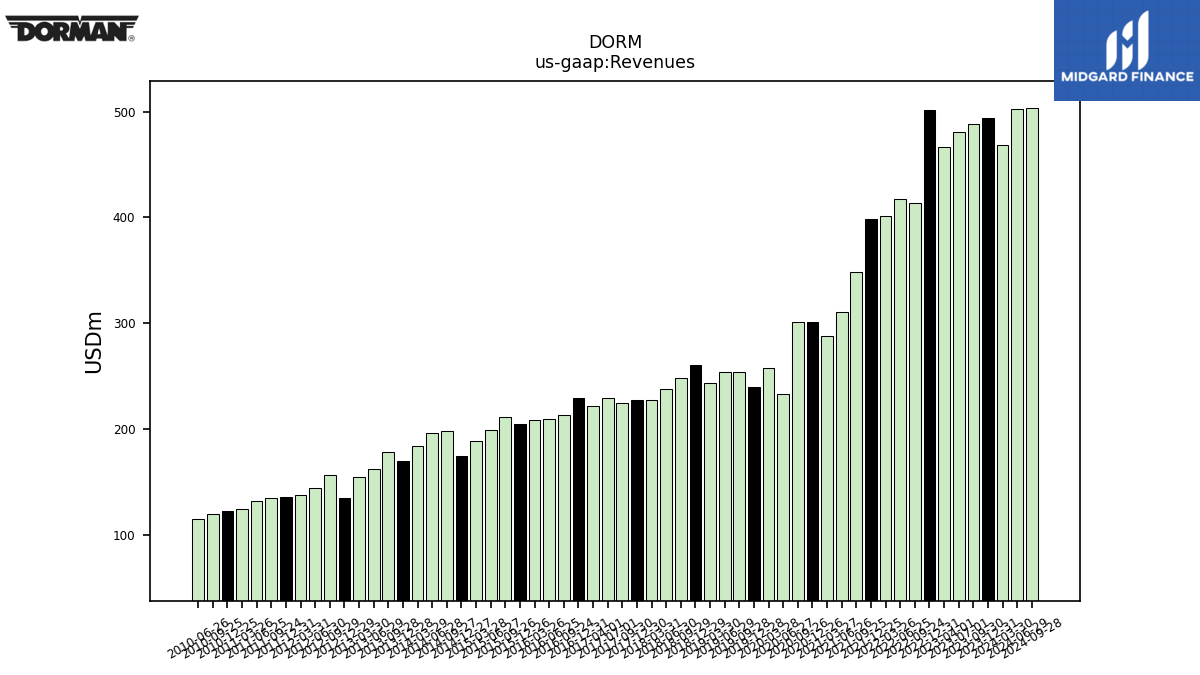
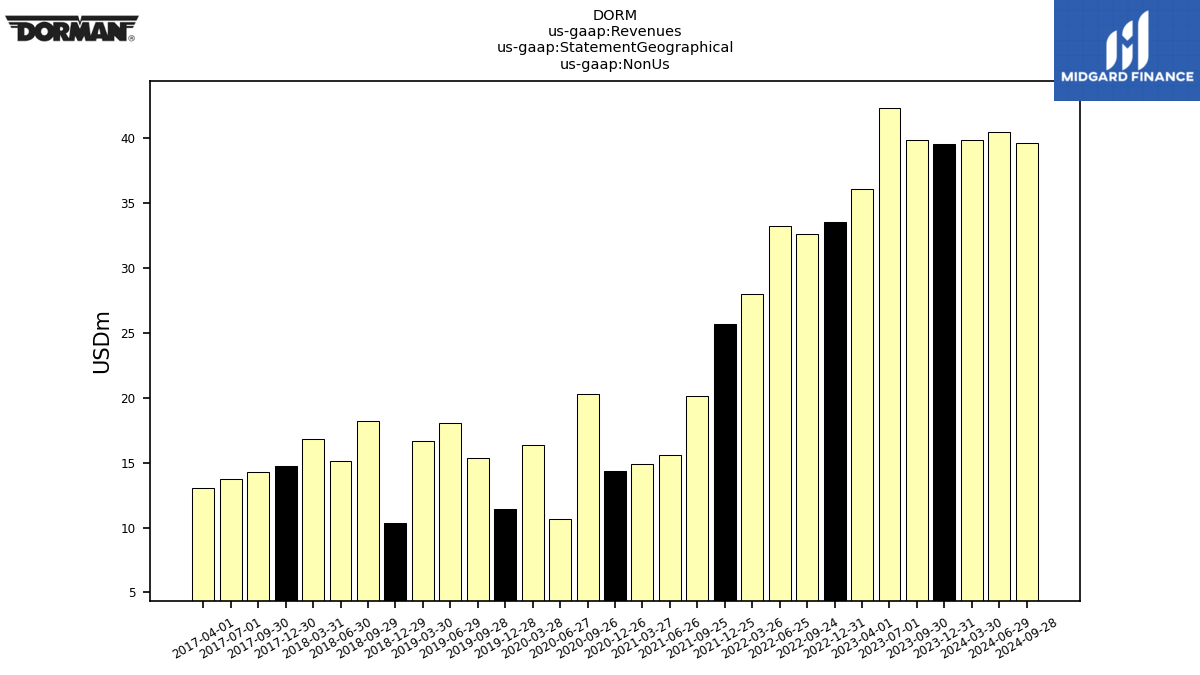
| Revenues | 494.30 | 488.19 | 480.57 | 466.74 | 501.28 | 413.47 | 417.42 | 401.58 | 398.18 | 348.43 | 310.63 | 288.01 | 301.22 | 300.62 | 233.18 | 257.73 | 239.57 | 253.80 | 254.18 | 243.79 | 260.34 | 247.95 | 238.15 | 227.26 | 227.72 | 224.62 | 229.26 | 221.62 | 229.10 | 212.79 | 209.57 | 208.15 | 204.83 | 210.93 | 198.72 | 188.47 | 173.98 | 197.80 | 196.19 | 183.51 | 169.81 | 177.95 | 162.26 | 154.44 | 135.01 | 156.41 | 144.17 | 137.04 | 135.64 | 134.24 | 131.62 | 124.37 | 122.52 | 119.21 | 115.01 | |
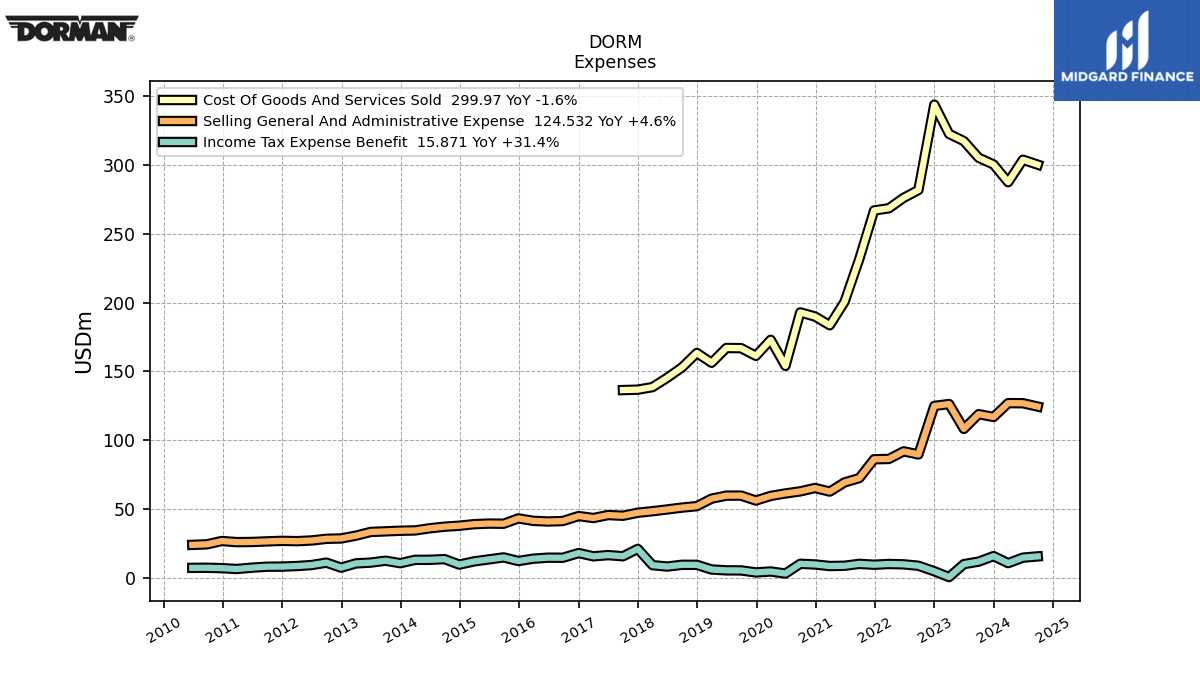
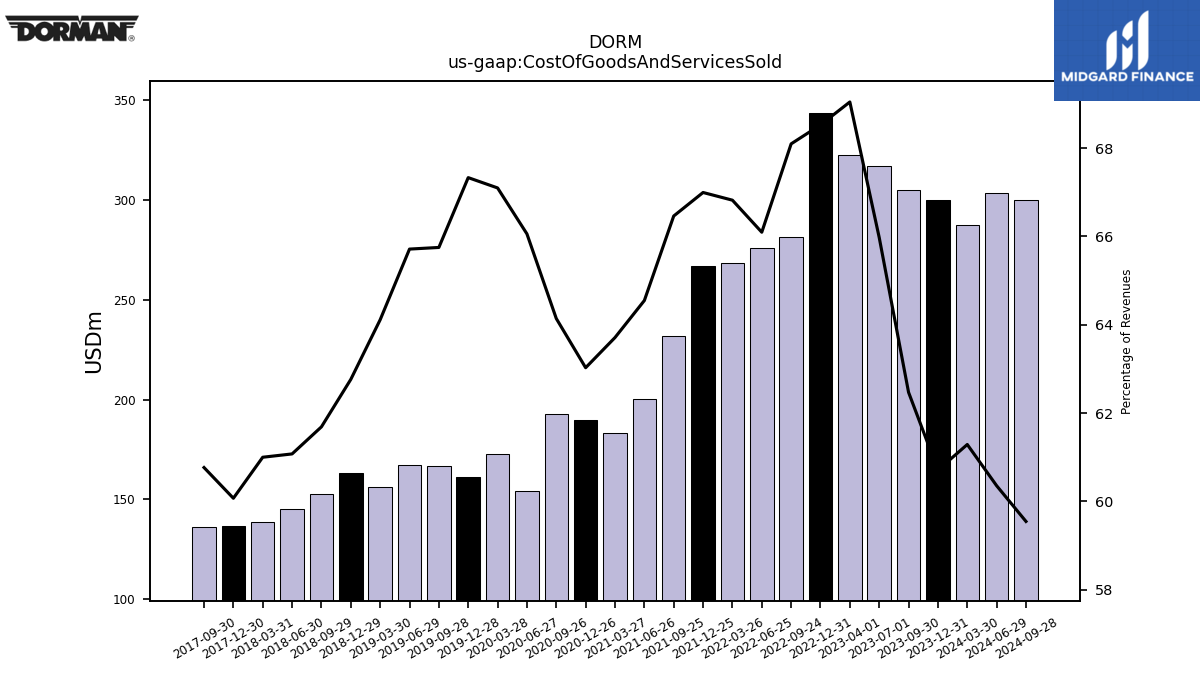
| Cost Of Goods And Services Sold | 300.07 | 304.97 | 317.06 | 322.26 | 343.51 | 281.56 | 275.89 | 268.34 | 266.76 | 231.57 | 200.51 | 183.49 | 189.85 | 192.82 | 154.03 | 172.93 | 161.31 | 166.87 | 167.03 | 156.30 | 163.40 | 152.96 | 145.45 | 138.63 | 136.79 | 136.49 | NA | NA | NA | NA | NA | NA | NA | NA | NA | NA | NA | NA | NA | NA | NA | NA | NA | NA | NA | NA | NA | NA | NA | NA | NA | NA | NA | NA | NA | |
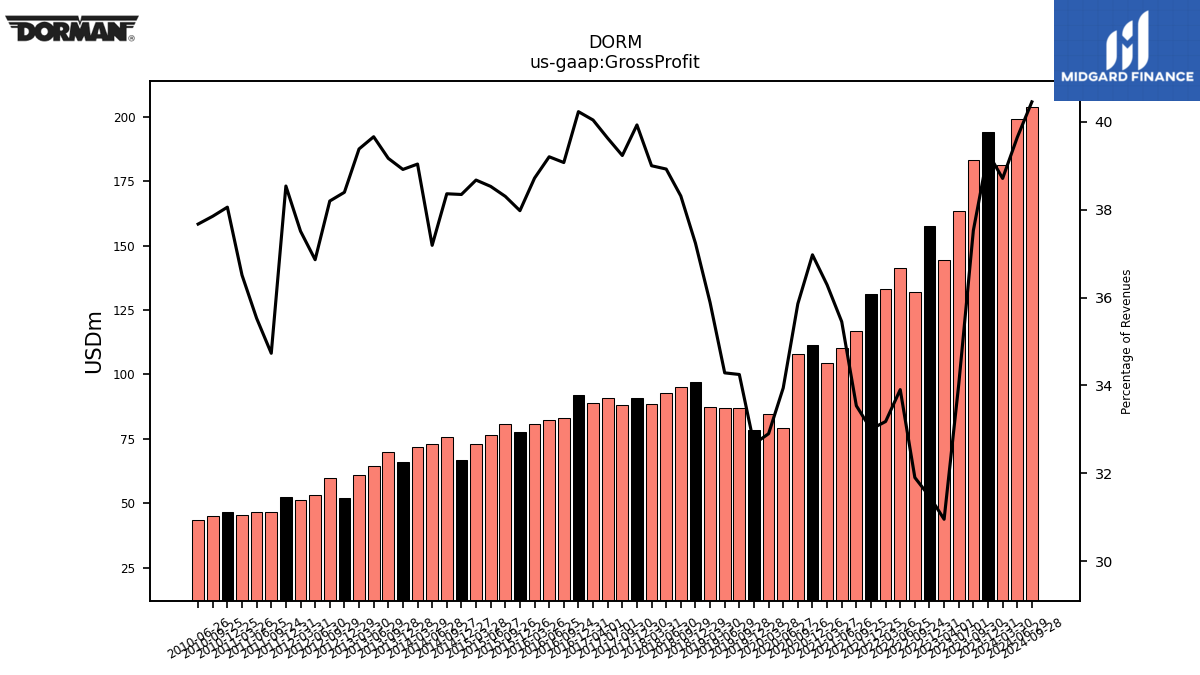
| Gross Profit | 194.22 | 183.22 | 163.51 | 144.48 | 157.77 | 131.91 | 141.53 | 133.24 | 131.42 | 116.85 | 110.12 | 104.52 | 111.37 | 107.80 | 79.15 | 84.80 | 78.26 | 86.92 | 87.15 | 87.49 | 96.95 | 95.00 | 92.70 | 88.64 | 90.93 | 88.13 | 90.85 | 88.74 | 92.17 | 83.14 | 82.16 | 80.59 | 77.79 | 80.79 | 76.57 | 72.89 | 66.72 | 75.88 | 72.96 | 71.64 | 66.08 | 69.70 | 64.36 | 60.82 | 51.84 | 59.75 | 53.15 | 51.41 | 52.28 | 46.63 | 46.76 | 45.41 | 46.63 | 45.12 | 43.33 | |
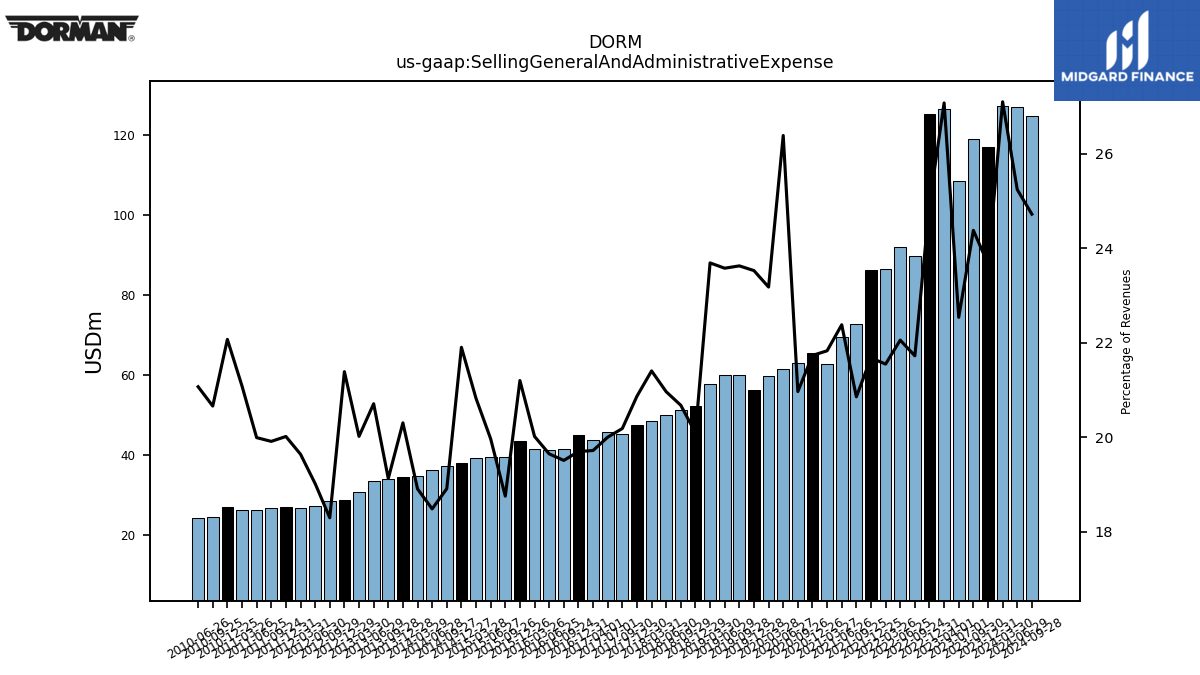
| Selling General And Administrative Expense | 116.98 | 119.01 | 108.31 | 126.36 | 125.00 | 89.81 | 92.06 | 86.53 | 86.32 | 72.66 | 69.52 | 62.87 | 65.45 | 63.03 | 61.52 | 59.73 | 56.36 | 59.96 | 59.92 | 57.75 | 52.31 | 51.26 | 49.92 | 48.64 | 47.52 | 45.34 | 45.85 | 43.70 | 45.12 | 41.51 | 41.17 | 41.66 | 43.42 | 39.55 | 39.67 | 39.24 | 38.11 | 37.41 | 36.26 | 34.70 | 34.48 | 34.03 | 33.60 | 30.92 | 28.88 | 28.61 | 27.42 | 26.91 | 27.15 | 26.73 | 26.31 | 26.22 | 27.04 | 24.63 | 24.23 | |
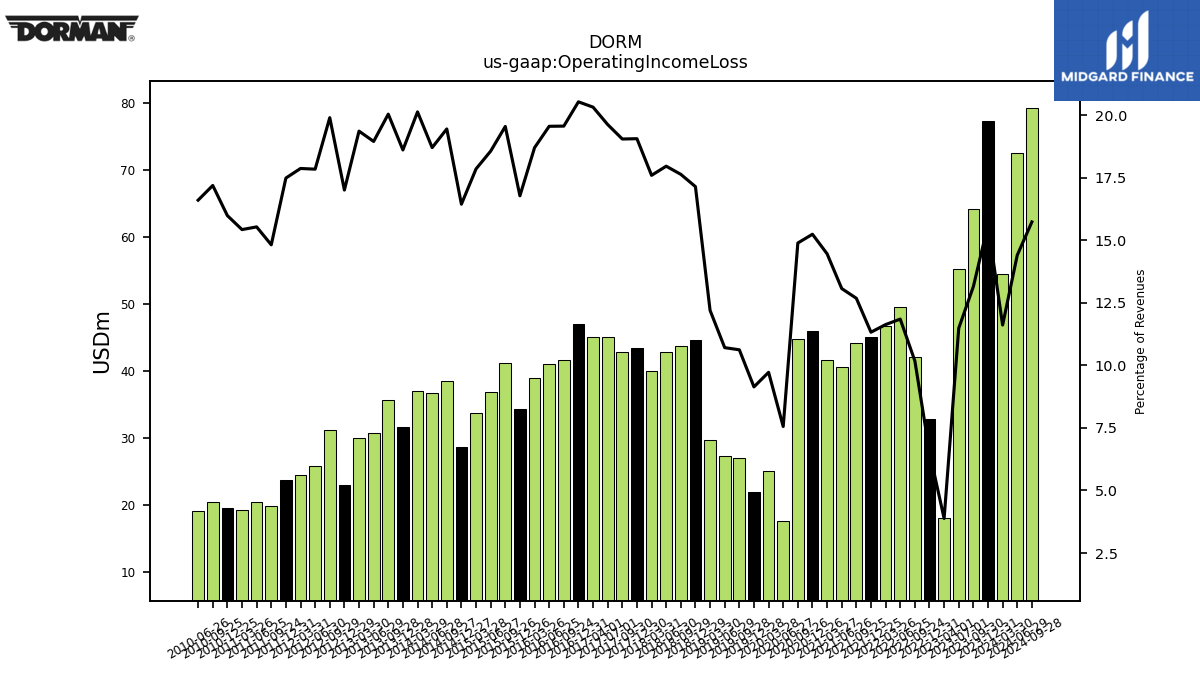
| Operating Income Loss | 77.24 | 64.21 | 55.20 | 18.11 | 32.77 | 42.10 | 49.47 | 46.71 | 45.10 | 44.19 | 40.61 | 41.65 | 45.91 | 44.77 | 17.62 | 25.06 | 21.90 | 26.96 | 27.22 | 29.74 | 44.64 | 43.73 | 42.78 | 39.99 | 43.41 | 42.79 | 45.00 | 45.04 | 47.05 | 41.63 | 40.99 | 38.93 | 34.37 | 41.24 | 36.90 | 33.65 | 28.61 | 38.48 | 36.70 | 36.95 | 31.61 | 35.67 | 30.75 | 29.91 | 22.97 | 31.13 | 25.73 | 24.49 | 23.72 | 19.90 | 20.45 | 19.19 | 19.59 | 20.50 | 19.10 | |
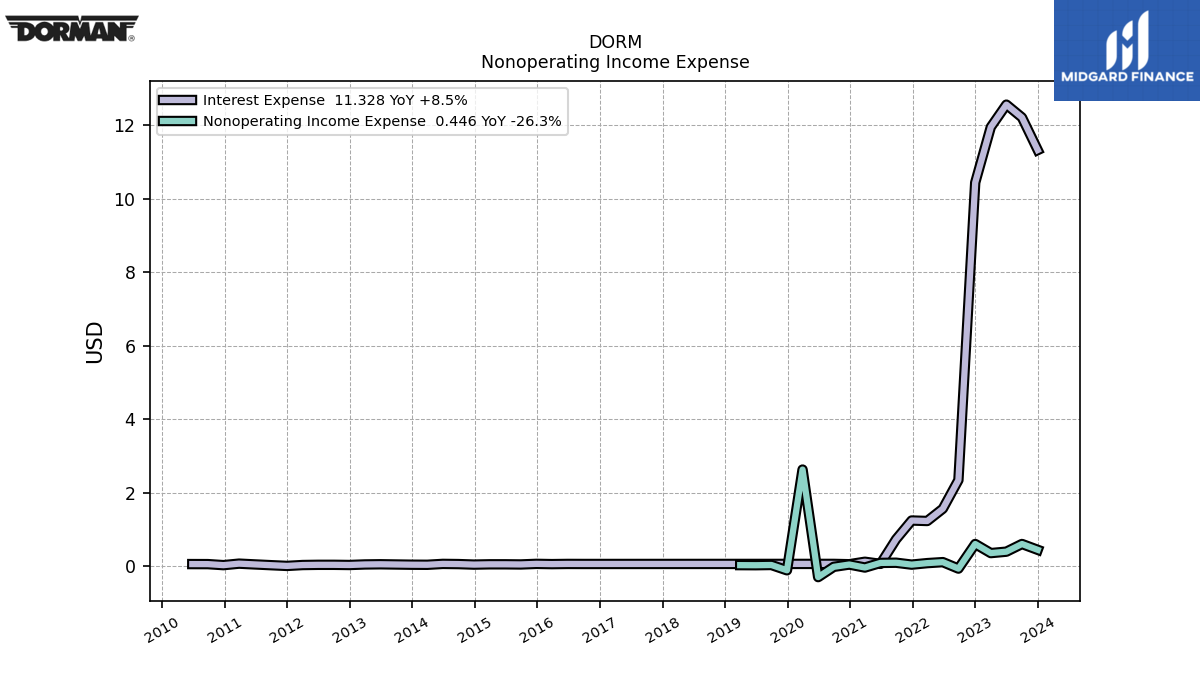
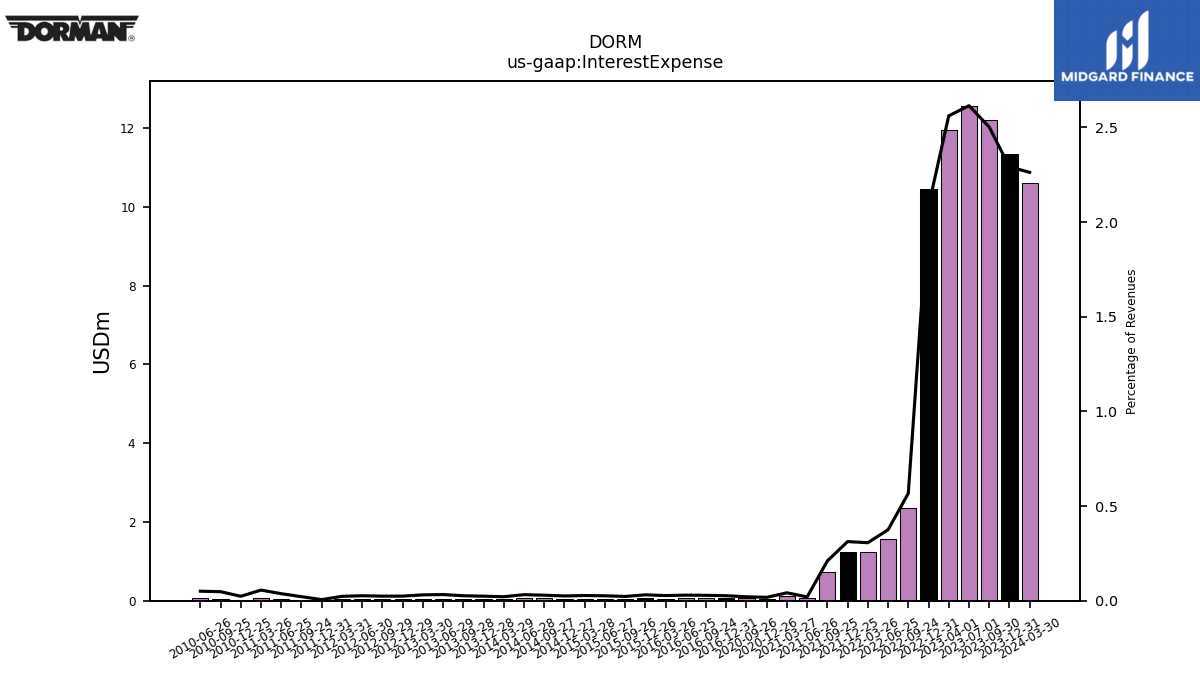
| Interest Expense | 11.33 | 12.21 | 12.56 | 11.95 | 10.44 | 2.34 | 1.56 | 1.23 | 1.24 | 0.73 | 0.06 | 0.12 | 0.05 | 0.06 | NA | NA | NA | NA | NA | NA | NA | NA | NA | NA | NA | NA | NA | NA | 0.06 | 0.06 | 0.06 | 0.06 | 0.06 | 0.05 | 0.05 | 0.05 | 0.04 | 0.06 | 0.06 | 0.04 | 0.04 | 0.05 | 0.05 | 0.05 | 0.03 | 0.04 | 0.04 | 0.03 | 0.01 | 0.03 | 0.05 | 0.07 | 0.03 | 0.06 | 0.06 | |
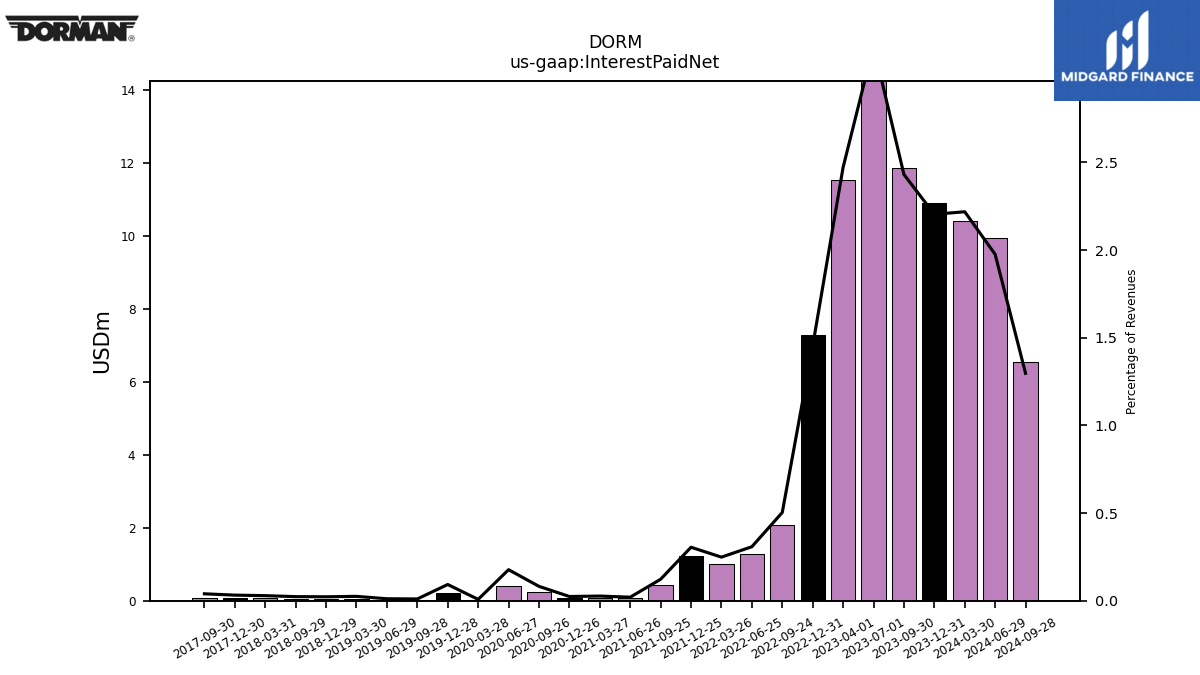
| Interest Paid Net | 10.89 | 11.87 | 15.21 | 11.53 | 7.28 | 2.08 | 1.29 | 1.00 | 1.22 | 0.43 | 0.06 | 0.08 | 0.07 | 0.25 | 0.41 | 0.02 | 0.22 | 0.03 | 0.03 | 0.06 | 0.06 | 0.06 | NA | 0.07 | 0.07 | 0.09 | NA | NA | NA | NA | NA | NA | NA | NA | NA | NA | NA | NA | NA | NA | NA | NA | NA | NA | NA | NA | NA | NA | NA | NA | NA | NA | NA | NA | NA | |
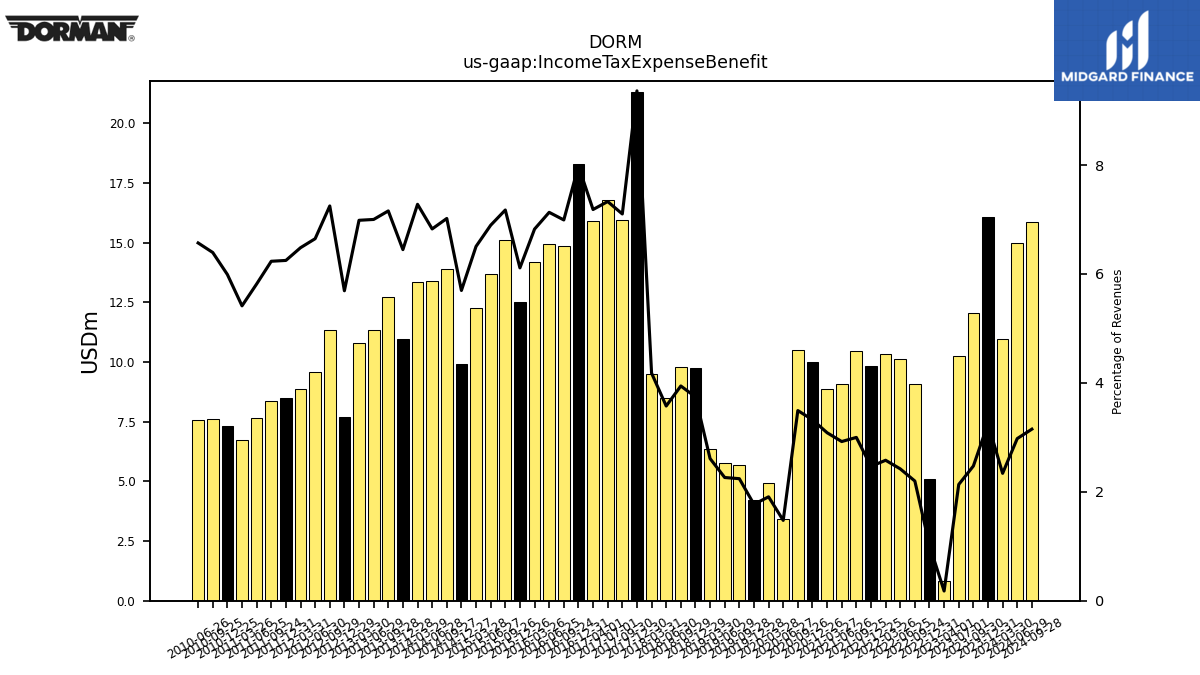
| Income Tax Expense Benefit | 16.07 | 12.08 | 10.26 | 0.83 | 5.10 | 9.09 | 10.11 | 10.36 | 9.82 | 10.45 | 9.08 | 8.88 | 10.01 | 10.50 | 3.44 | 4.92 | 4.24 | 5.69 | 5.75 | 6.36 | 9.74 | 9.78 | 8.51 | 9.50 | 21.32 | 15.95 | 16.80 | 15.92 | 18.29 | 14.88 | 14.95 | 14.20 | 12.52 | 15.13 | 13.70 | 12.26 | 9.91 | 13.88 | 13.39 | 13.36 | 10.95 | 12.74 | 11.36 | 10.79 | 7.68 | 11.34 | 9.58 | 8.88 | 8.47 | 8.37 | 7.65 | 6.73 | 7.34 | 7.62 | 7.55 | |
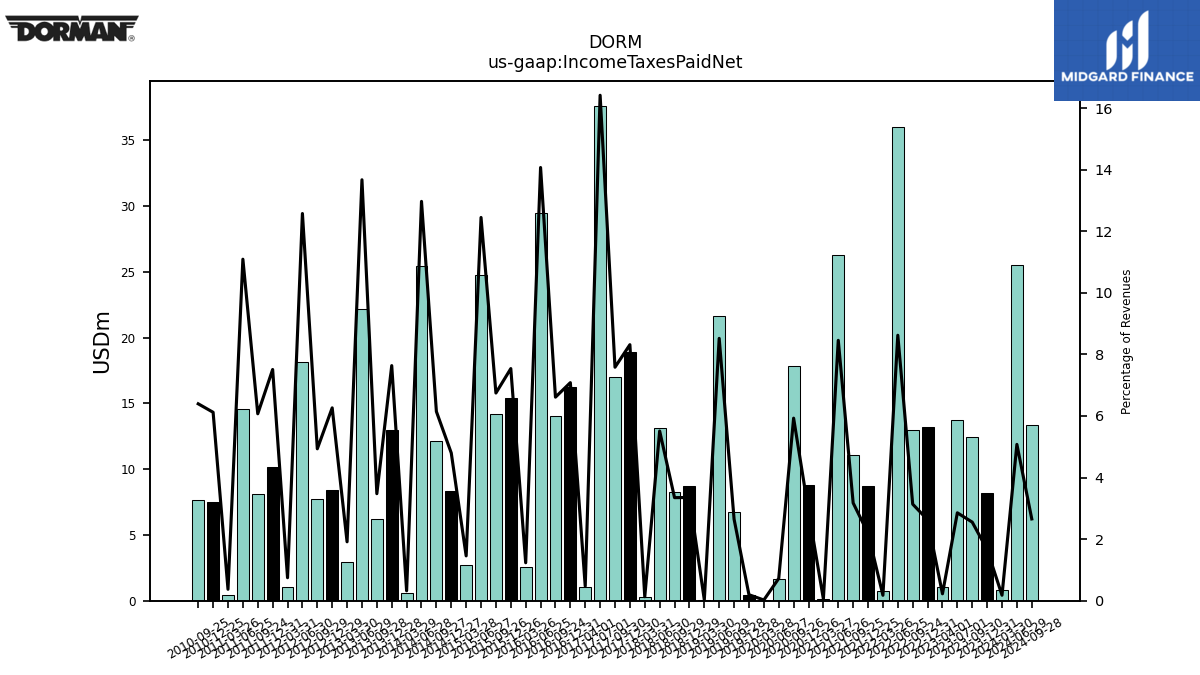
| Income Taxes Paid Net | 8.22 | 12.46 | 13.72 | 1.05 | 13.19 | 12.97 | 35.99 | 0.71 | 8.72 | 11.06 | 26.27 | 0.17 | 8.77 | 17.82 | 1.69 | 0.06 | 0.47 | 6.72 | 21.66 | 0.07 | 8.73 | 8.30 | 13.12 | 0.29 | 18.93 | 17.03 | 37.63 | 1.05 | 16.23 | 14.07 | 29.48 | 2.57 | 15.44 | 14.23 | 24.73 | 2.75 | 8.35 | 12.16 | 25.44 | 0.59 | 12.97 | 6.19 | 22.18 | 2.96 | 8.46 | 7.72 | 18.13 | 1.02 | 10.19 | 8.15 | 14.60 | 0.46 | 7.50 | 7.62 | NA | |
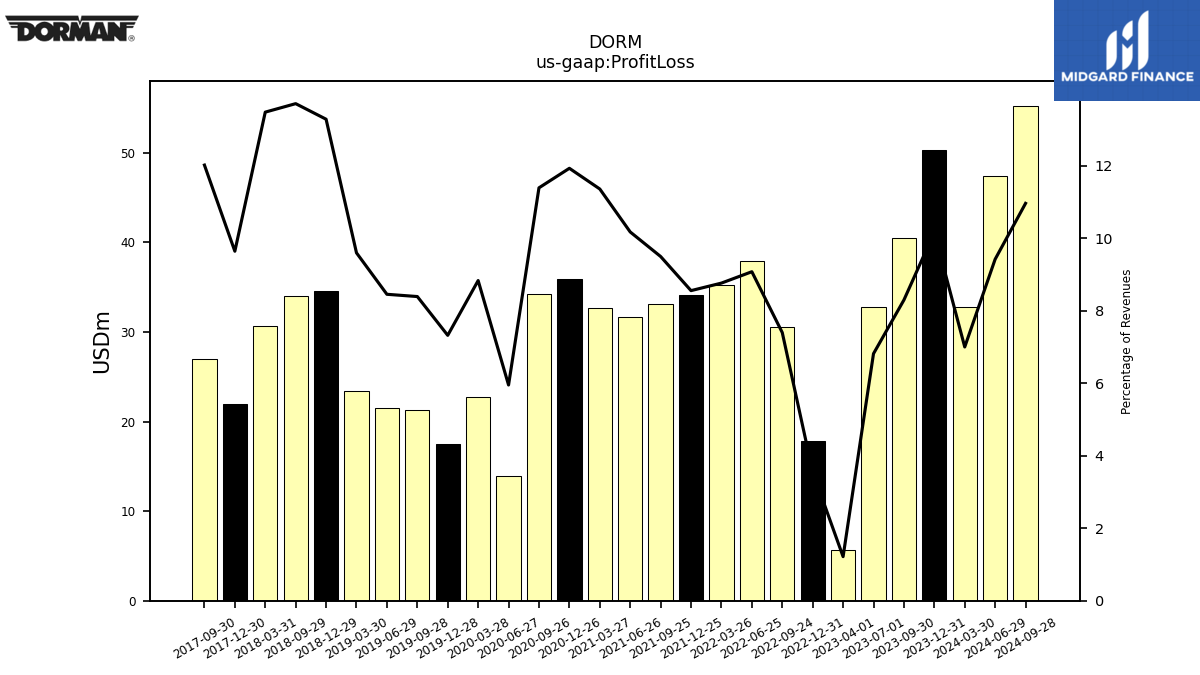
| Profit Loss | 50.28 | 40.52 | 32.77 | 5.68 | 17.84 | 30.60 | 37.91 | 35.21 | 34.08 | 33.10 | 31.62 | 32.73 | 35.95 | 34.26 | 13.88 | 22.77 | 17.55 | 21.31 | 21.50 | 23.41 | 34.60 | 34.02 | NA | 30.65 | 21.97 | 27.01 | NA | NA | NA | NA | NA | NA | NA | NA | NA | NA | NA | NA | NA | NA | NA | NA | NA | NA | NA | NA | NA | NA | NA | NA | NA | NA | NA | NA | NA | |
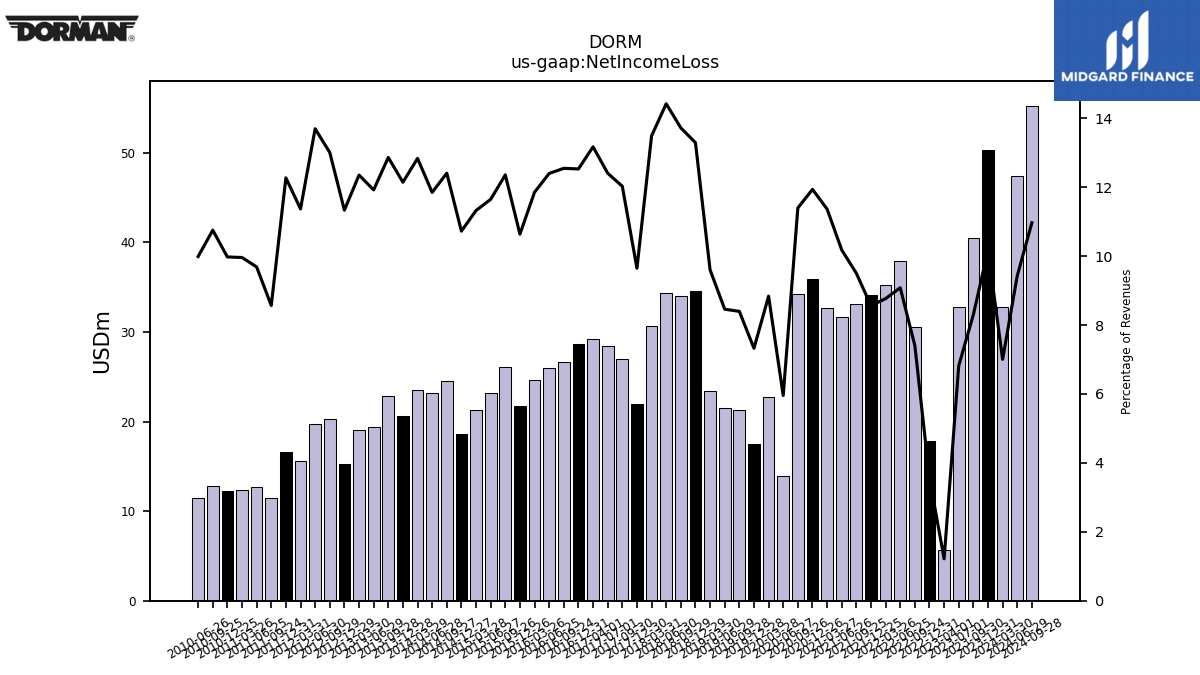
| Net Income Loss | 50.28 | 40.52 | 32.77 | 5.68 | 17.84 | 30.60 | 37.91 | 35.21 | 34.08 | 33.10 | 31.62 | 32.73 | 35.95 | 34.26 | 13.88 | 22.77 | 17.55 | 21.31 | 21.50 | 23.41 | 34.60 | 34.02 | 34.34 | 30.65 | 21.97 | 27.01 | 28.44 | 29.19 | 28.70 | 26.70 | 25.98 | 24.67 | 21.79 | 26.06 | 23.14 | 21.34 | 18.66 | 24.54 | 23.24 | 23.55 | 20.62 | 22.89 | 19.34 | 19.07 | 15.30 | 20.34 | 19.74 | 15.58 | 16.64 | 11.50 | 12.75 | 12.39 | 12.22 | 12.82 | 11.48 | |
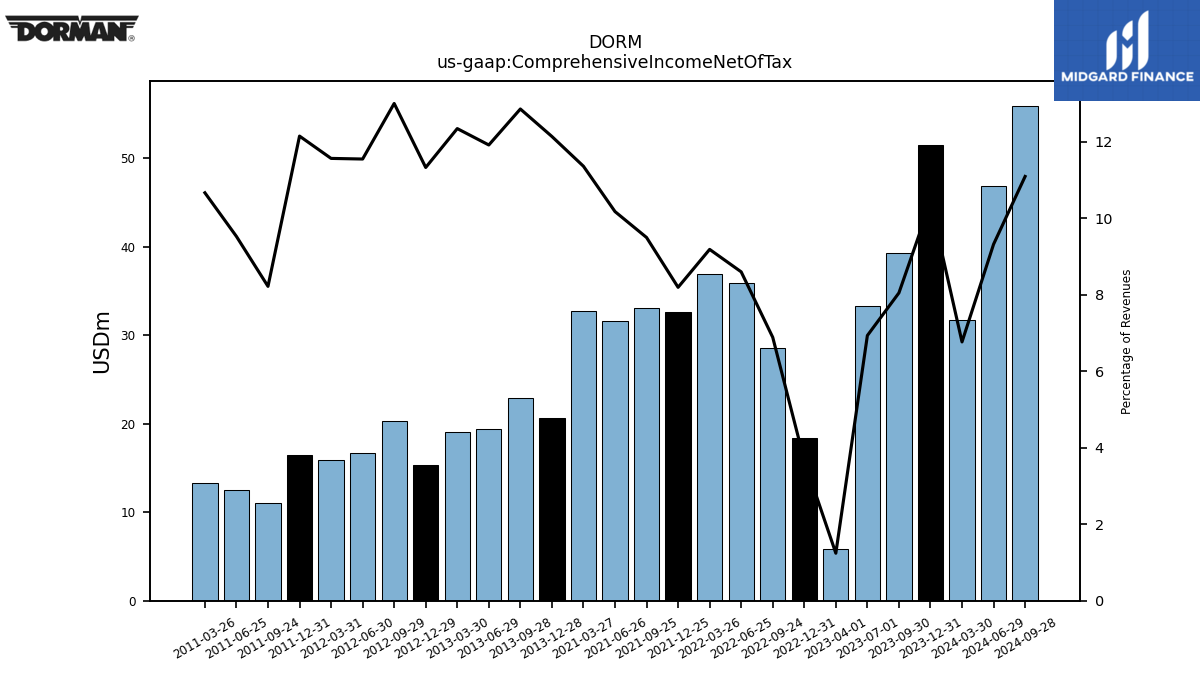
| Comprehensive Income Net Of Tax | 51.53 | 39.31 | 33.34 | 5.80 | 18.39 | 28.49 | 35.91 | 36.90 | 32.64 | 33.10 | 31.62 | 32.73 | NA | NA | NA | NA | NA | NA | NA | NA | NA | NA | NA | NA | NA | NA | NA | NA | NA | NA | NA | NA | NA | NA | NA | NA | NA | NA | NA | NA | 20.62 | 22.89 | 19.34 | 19.07 | 15.30 | 20.34 | 16.66 | 15.85 | 16.48 | 11.04 | 12.54 | 13.27 | NA | NA | NA |
| 2023-12-31 | 2023-09-30 | 2023-07-01 | 2023-04-01 | 2022-12-31 | 2022-09-24 | 2022-06-25 | 2022-03-26 | 2021-12-25 | 2021-09-25 | 2021-06-26 | 2021-03-27 | 2020-12-26 | 2020-09-26 | 2020-06-27 | 2020-03-28 | 2019-12-28 | 2019-09-28 | 2019-06-29 | 2019-03-30 | 2018-12-29 | 2018-09-29 | 2018-06-30 | 2018-03-31 | 2017-12-30 | 2017-09-30 | 2017-07-01 | 2017-04-01 | 2016-12-31 | 2016-09-24 | 2016-06-25 | 2016-03-26 | 2015-12-26 | 2015-09-26 | 2015-06-27 | 2015-03-28 | 2014-12-27 | 2014-09-27 | 2014-06-28 | 2014-03-29 | 2013-12-28 | 2013-09-28 | 2013-06-29 | 2013-03-30 | 2012-12-29 | 2012-09-29 | 2012-06-30 | 2012-03-31 | 2011-12-31 | 2011-09-24 | 2011-06-25 | 2011-03-26 | 2010-12-25 | 2010-09-25 | 2010-06-26 | ||
|---|---|---|---|---|---|---|---|---|---|---|---|---|---|---|---|---|---|---|---|---|---|---|---|---|---|---|---|---|---|---|---|---|---|---|---|---|---|---|---|---|---|---|---|---|---|---|---|---|---|---|---|---|---|---|---|---|
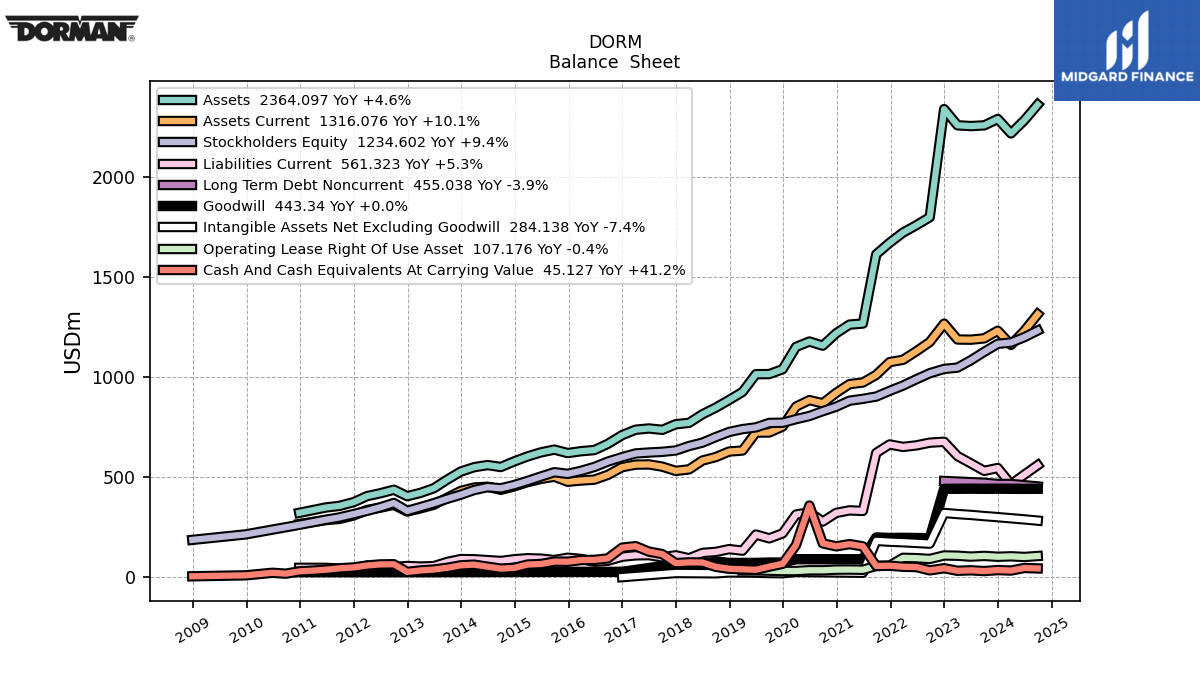
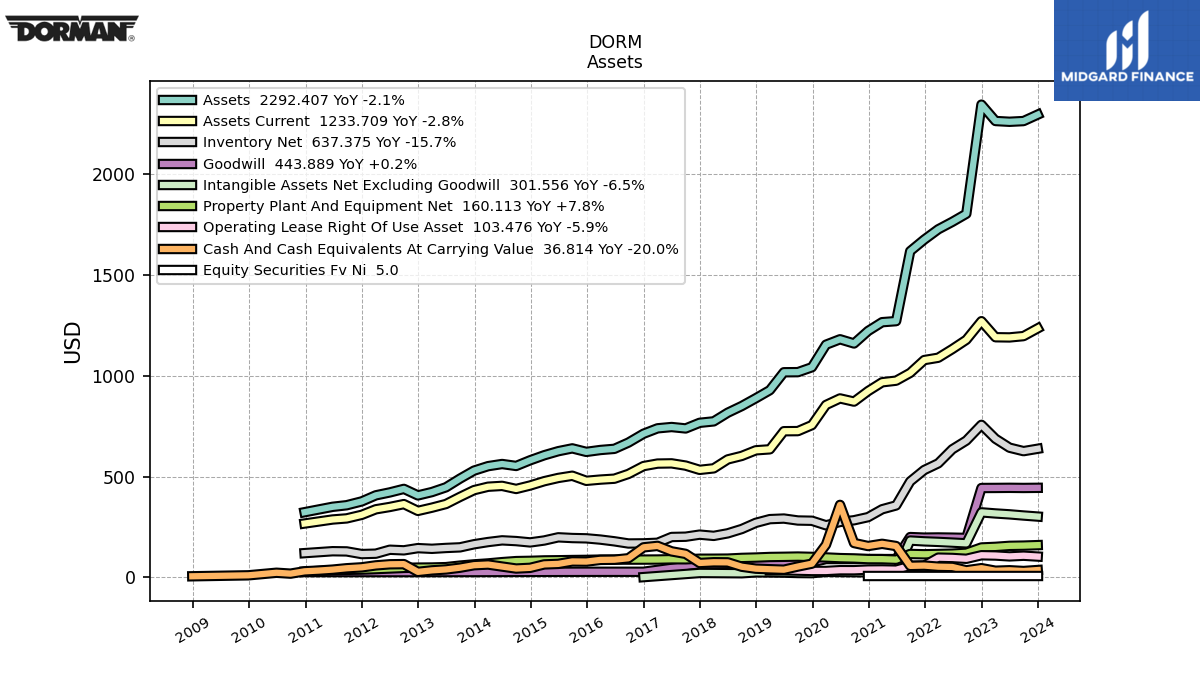
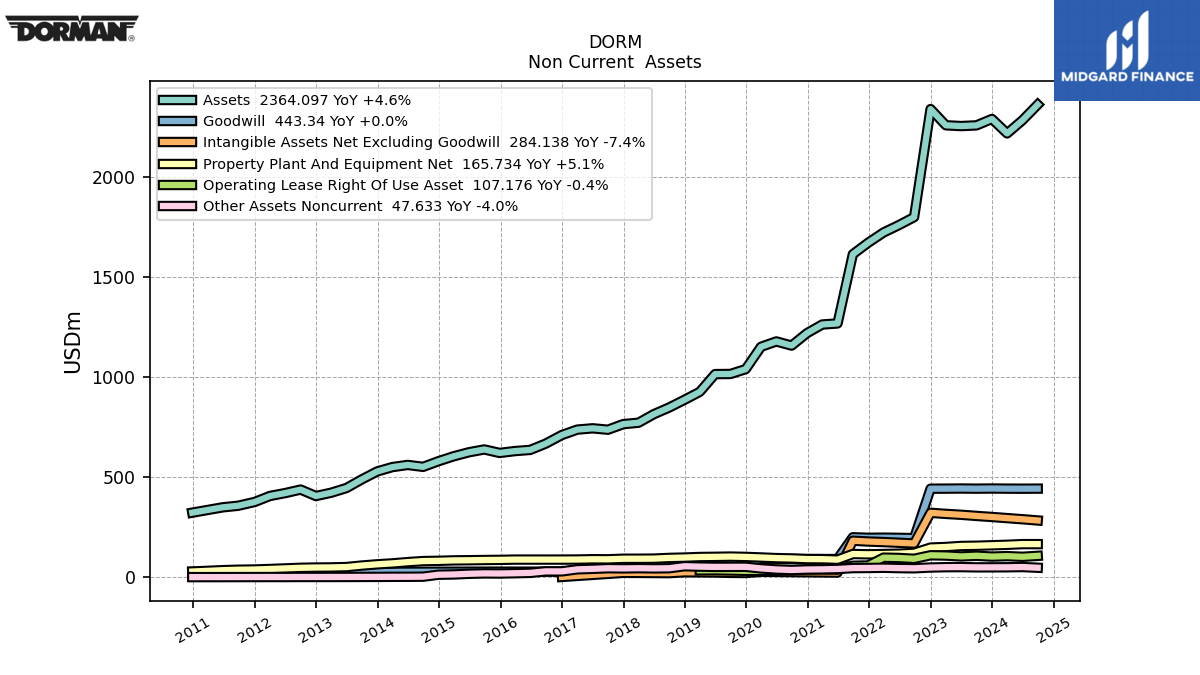
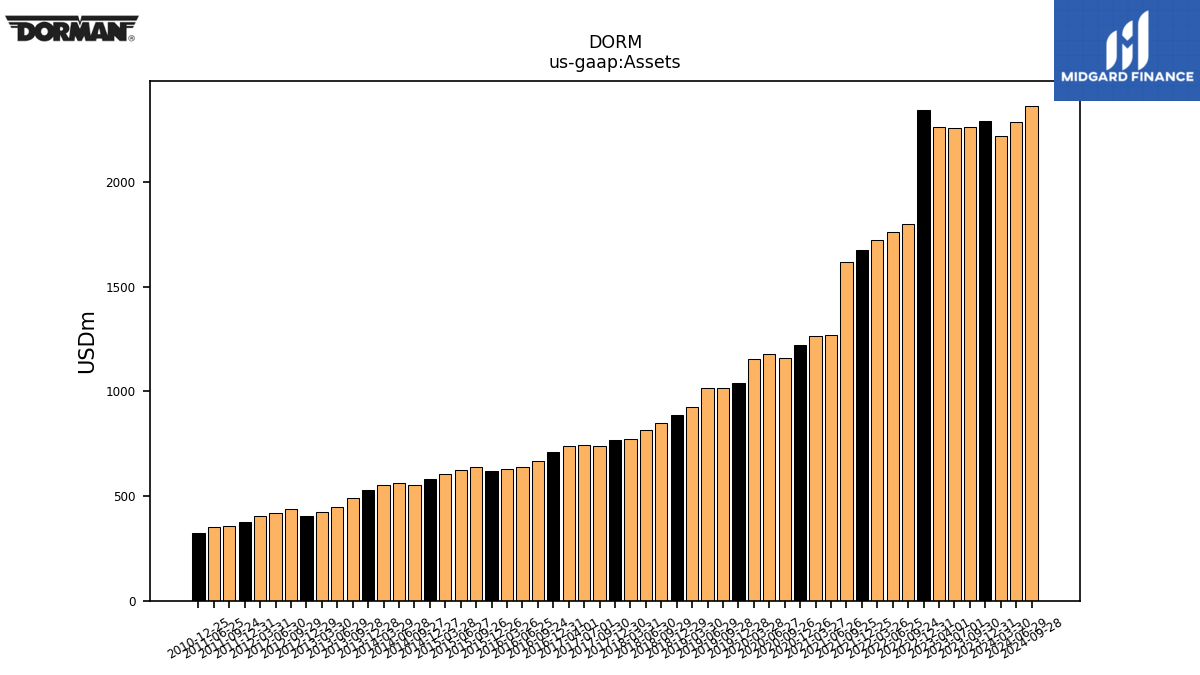
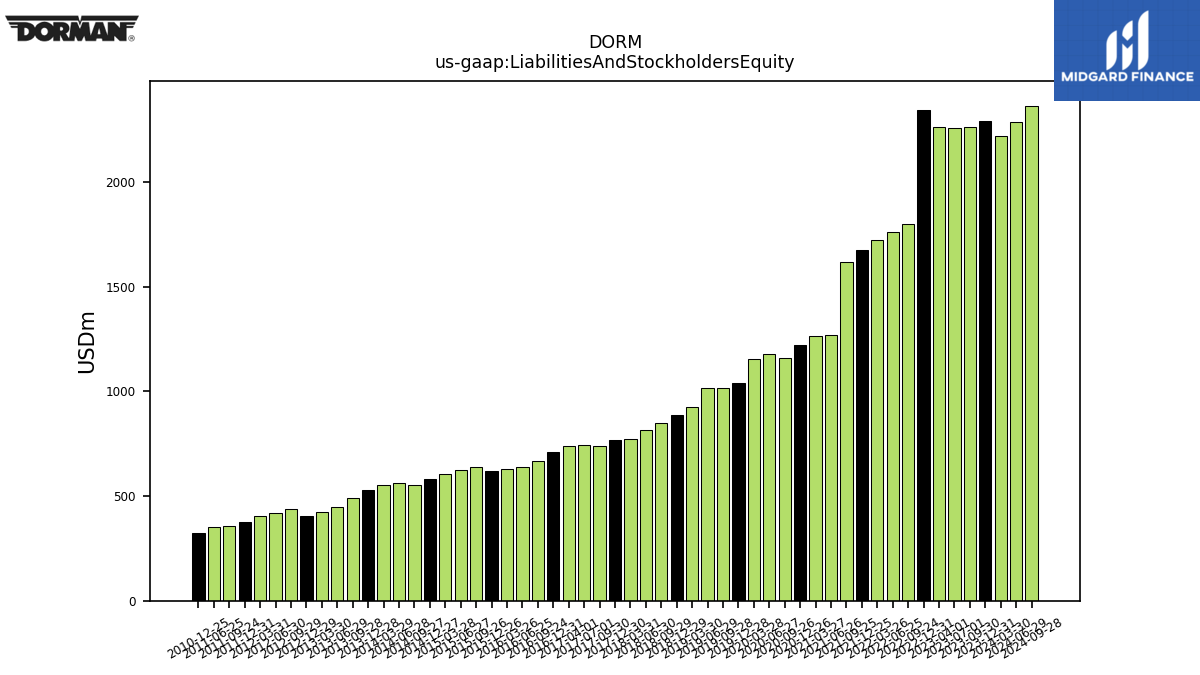
| Assets | 2292.41 | 2260.35 | 2256.84 | 2260.66 | 2341.79 | 1801.21 | 1761.17 | 1724.30 | 1673.12 | 1615.85 | 1269.48 | 1264.27 | 1220.66 | 1158.83 | 1179.65 | 1152.78 | 1041.07 | 1016.82 | 1016.26 | 927.48 | 887.56 | 849.06 | 815.85 | 773.05 | 765.92 | 738.02 | 745.03 | 738.60 | 711.79 | 668.00 | 636.97 | 631.21 | 621.87 | 639.30 | 625.29 | 605.19 | 580.37 | 552.19 | 561.89 | 551.22 | 529.17 | 489.59 | 446.50 | 422.95 | 406.31 | 438.67 | 421.18 | 406.74 | 376.69 | 357.73 | 349.91 | NA | 323.16 | NA | NA | |
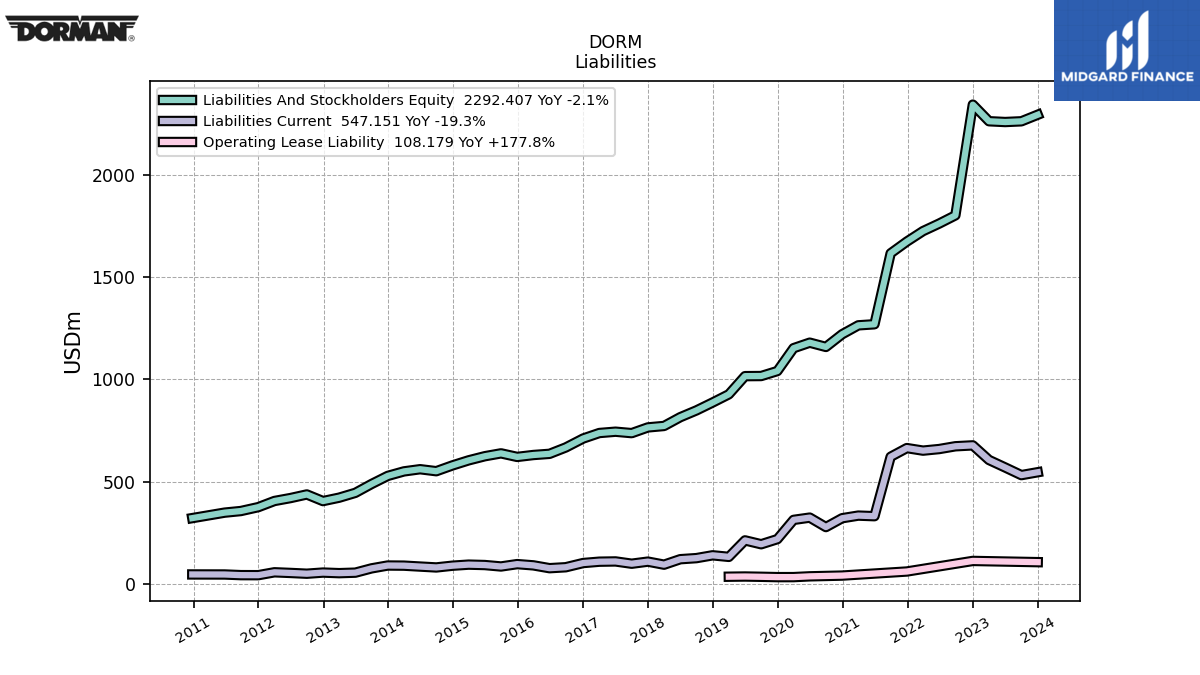
| Liabilities And Stockholders Equity | 2292.41 | 2260.35 | 2256.84 | 2260.66 | 2341.79 | 1801.21 | 1761.17 | 1724.30 | 1673.12 | 1615.85 | 1269.48 | 1264.27 | 1220.66 | 1158.83 | 1179.65 | 1152.78 | 1041.07 | 1016.82 | 1016.26 | 927.48 | 887.56 | 849.06 | 815.85 | 773.05 | 765.92 | 738.02 | 745.03 | 738.60 | 711.79 | 668.00 | 636.97 | 631.21 | 621.87 | 639.30 | 625.29 | 605.19 | 580.37 | 552.19 | 561.89 | 551.22 | 529.17 | 489.59 | 446.50 | 422.95 | 406.31 | 438.67 | 421.18 | 406.74 | 376.69 | 357.73 | 349.91 | NA | 323.16 | NA | NA | |
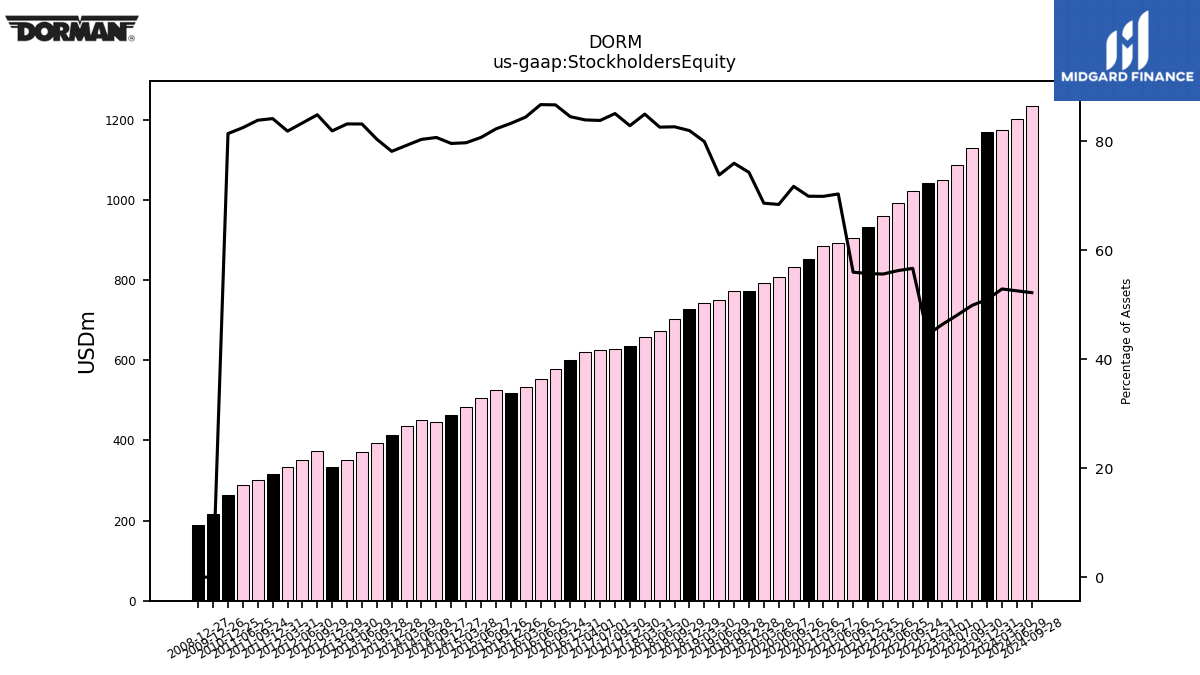
| Stockholders Equity | 1168.20 | 1128.09 | 1086.07 | 1049.14 | 1042.63 | 1021.04 | 990.96 | 959.40 | 932.74 | 904.52 | 892.99 | 883.81 | 853.56 | 831.37 | 807.13 | 791.38 | 773.58 | 772.59 | 750.33 | 741.71 | 727.62 | 701.95 | 674.02 | 657.14 | 634.81 | 628.10 | 624.64 | 619.98 | 601.64 | 579.16 | 552.55 | 533.15 | 518.04 | 526.07 | 504.77 | 482.63 | 462.06 | 445.69 | 451.57 | 436.97 | 413.64 | 393.57 | 371.45 | 351.90 | 332.87 | 372.35 | 351.17 | 333.05 | 317.10 | 300.06 | 288.74 | NA | 263.15 | NA | NA |
| 2023-12-31 | 2023-09-30 | 2023-07-01 | 2023-04-01 | 2022-12-31 | 2022-09-24 | 2022-06-25 | 2022-03-26 | 2021-12-25 | 2021-09-25 | 2021-06-26 | 2021-03-27 | 2020-12-26 | 2020-09-26 | 2020-06-27 | 2020-03-28 | 2019-12-28 | 2019-09-28 | 2019-06-29 | 2019-03-30 | 2018-12-29 | 2018-09-29 | 2018-06-30 | 2018-03-31 | 2017-12-30 | 2017-09-30 | 2017-07-01 | 2017-04-01 | 2016-12-31 | 2016-09-24 | 2016-06-25 | 2016-03-26 | 2015-12-26 | 2015-09-26 | 2015-06-27 | 2015-03-28 | 2014-12-27 | 2014-09-27 | 2014-06-28 | 2014-03-29 | 2013-12-28 | 2013-09-28 | 2013-06-29 | 2013-03-30 | 2012-12-29 | 2012-09-29 | 2012-06-30 | 2012-03-31 | 2011-12-31 | 2011-09-24 | 2011-06-25 | 2011-03-26 | 2010-12-25 | 2010-09-25 | 2010-06-26 | ||
|---|---|---|---|---|---|---|---|---|---|---|---|---|---|---|---|---|---|---|---|---|---|---|---|---|---|---|---|---|---|---|---|---|---|---|---|---|---|---|---|---|---|---|---|---|---|---|---|---|---|---|---|---|---|---|---|---|
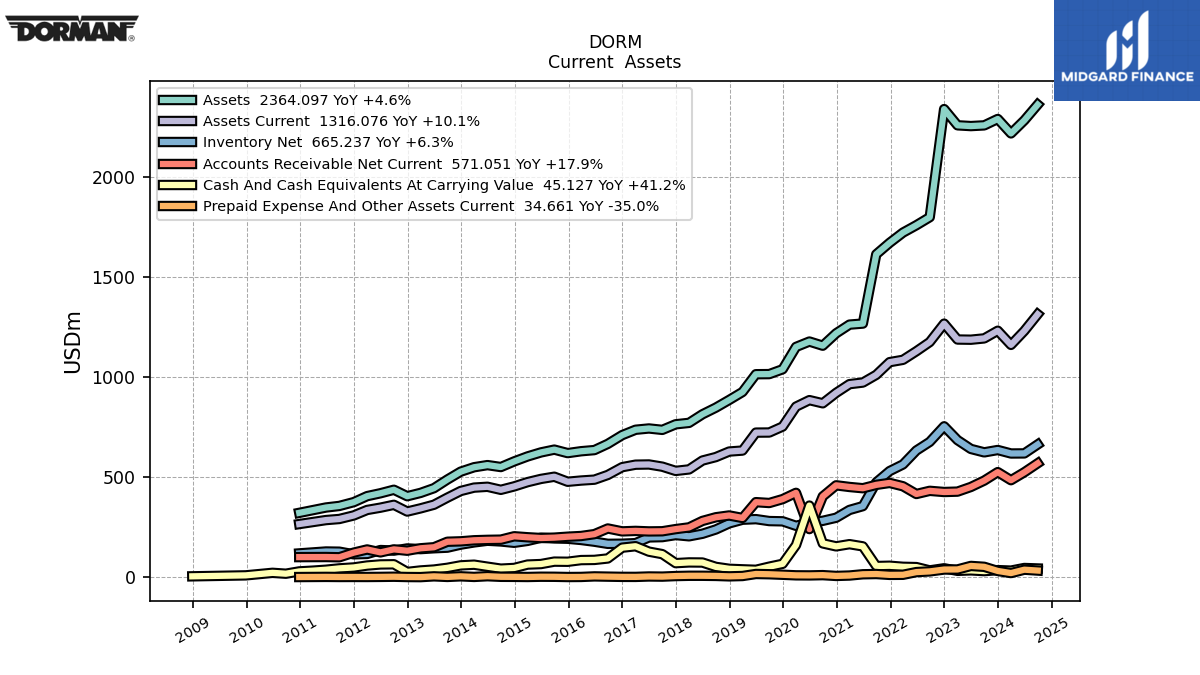
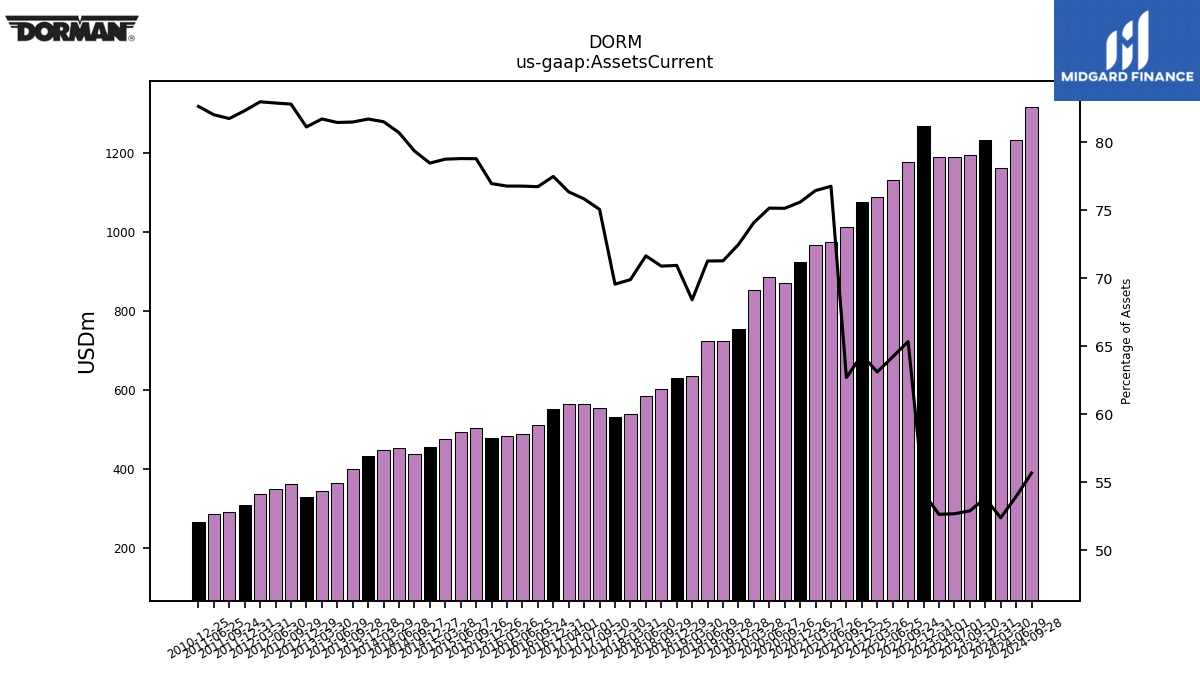
| Assets Current | 1233.71 | 1195.36 | 1188.78 | 1189.74 | 1269.12 | 1177.02 | 1131.06 | 1088.20 | 1076.58 | 1013.13 | 974.61 | 966.64 | 922.93 | 870.88 | 886.70 | 854.26 | 754.59 | 724.85 | 724.32 | 634.57 | 629.73 | 601.96 | 584.60 | 540.37 | 532.85 | 554.04 | 565.05 | 564.00 | 551.61 | 512.65 | 489.10 | 484.69 | 478.63 | 503.79 | 492.80 | 476.69 | 455.46 | 438.26 | 453.54 | 449.37 | 432.44 | 399.03 | 363.75 | 345.66 | 329.68 | 363.31 | 349.15 | 337.55 | 310.15 | 292.48 | 287.05 | NA | 267.10 | NA | NA | |
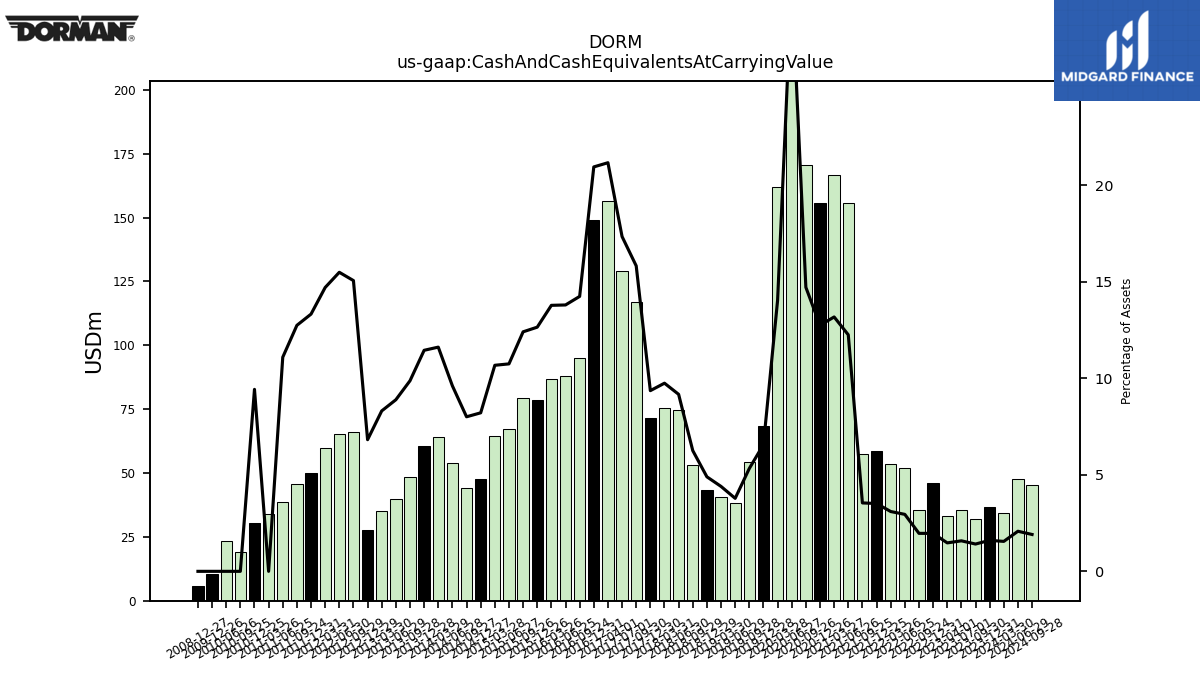
| Cash And Cash Equivalents At Carrying Value | 36.81 | 31.95 | 35.67 | 33.31 | 46.03 | 35.44 | 51.97 | 53.43 | 58.78 | 57.26 | 155.54 | 166.60 | 155.58 | 170.50 | 359.56 | 161.78 | 68.35 | 54.17 | 38.42 | 40.79 | 43.46 | 53.11 | 74.81 | 75.34 | 71.69 | 116.79 | 129.21 | 156.34 | 149.12 | 95.14 | 87.90 | 86.98 | 78.66 | 79.32 | 67.20 | 64.60 | 47.66 | 44.21 | 53.98 | 64.02 | 60.59 | 48.34 | 39.69 | 35.15 | 27.71 | 66.07 | 65.25 | 59.81 | 50.20 | 45.59 | 38.81 | 34.14 | 30.46 | 18.89 | 23.31 | |
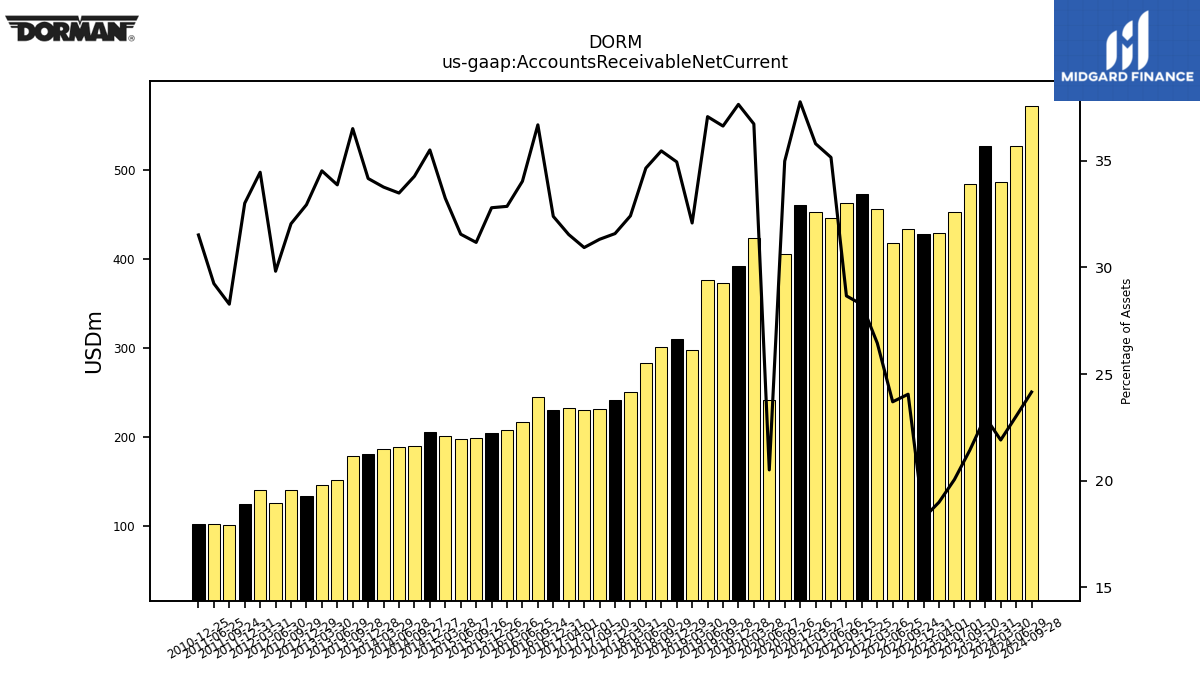
| Accounts Receivable Net Current | 526.87 | 484.45 | 452.60 | 429.31 | 427.38 | 433.23 | 417.35 | 456.07 | 472.76 | 463.11 | 446.24 | 452.52 | 460.88 | 405.31 | 241.90 | 423.30 | 391.81 | 372.36 | 376.64 | 297.51 | 310.11 | 301.05 | 282.68 | 250.56 | 241.88 | 231.09 | 230.41 | 232.92 | 230.53 | 245.01 | 216.78 | 207.40 | 203.92 | 199.26 | 197.29 | 201.14 | 206.03 | 189.22 | 188.13 | 186.09 | 180.78 | 178.70 | 151.21 | 146.01 | 133.81 | 140.56 | 125.58 | 140.14 | 124.32 | 101.14 | 102.31 | NA | 101.85 | NA | NA | |
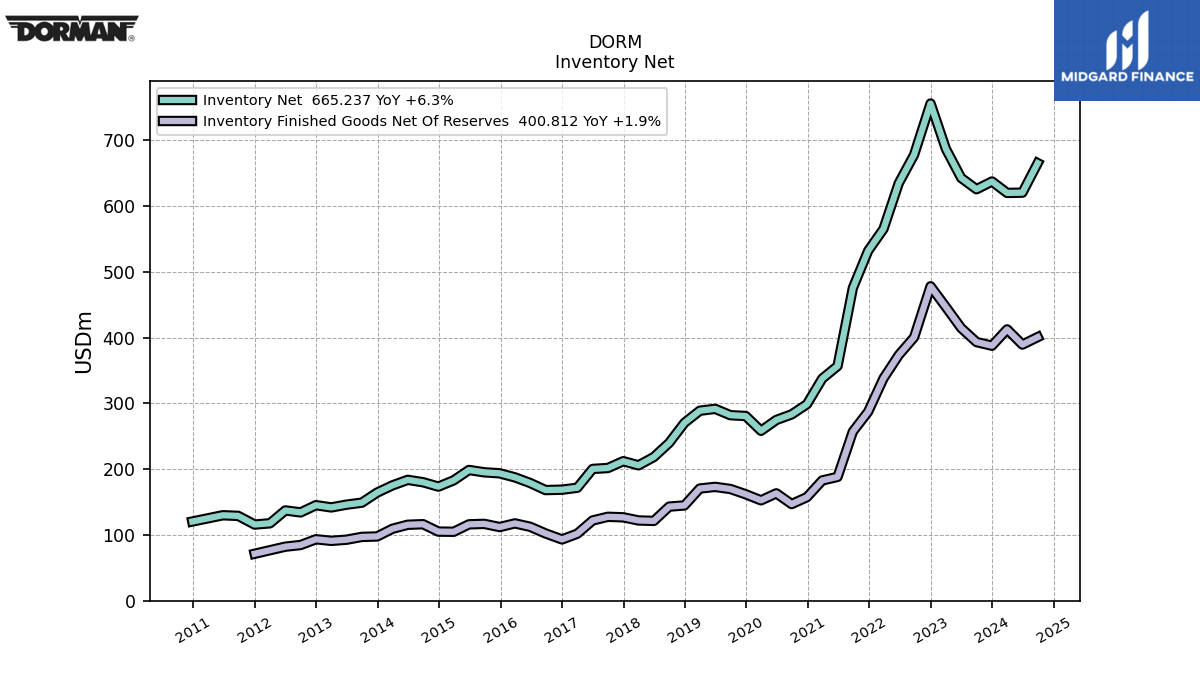
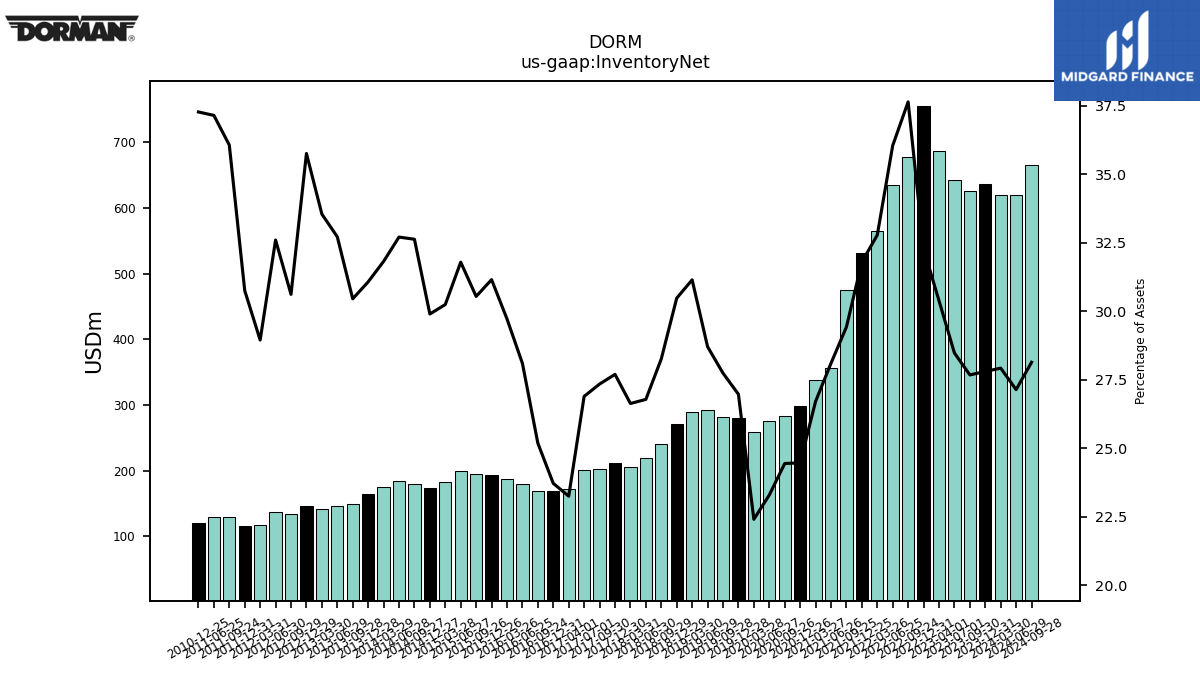
| Inventory Net | 637.38 | 625.59 | 642.72 | 686.95 | 755.90 | 677.90 | 634.77 | 565.20 | 531.99 | 475.46 | 356.76 | 337.70 | 298.72 | 283.29 | 274.82 | 258.37 | 280.81 | 282.09 | 291.74 | 288.86 | 270.50 | 239.96 | 218.52 | 205.91 | 212.15 | 201.81 | 200.38 | 171.76 | 168.85 | 168.25 | 178.97 | 187.59 | 193.72 | 195.25 | 198.78 | 183.04 | 173.52 | 180.16 | 183.76 | 175.38 | 164.42 | 149.10 | 146.07 | 141.87 | 145.27 | 134.30 | 137.29 | 117.75 | 115.84 | 129.00 | 129.96 | NA | 120.43 | NA | NA | |
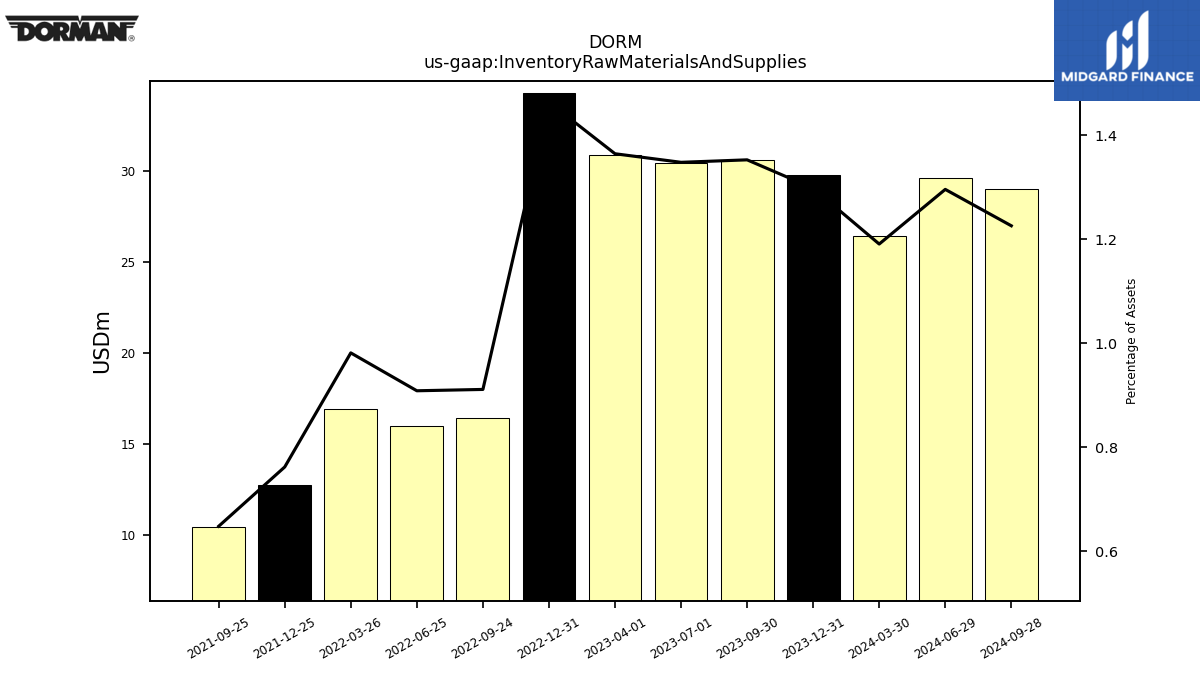
| Inventory Raw Materials And Supplies | 29.75 | 30.57 | 30.41 | 30.84 | 34.27 | 16.41 | 16.00 | 16.92 | 12.75 | 10.47 | NA | NA | NA | NA | NA | NA | NA | NA | NA | NA | NA | NA | NA | NA | NA | NA | NA | NA | NA | NA | NA | NA | NA | NA | NA | NA | NA | NA | NA | NA | NA | NA | NA | NA | NA | NA | NA | NA | NA | NA | NA | NA | NA | NA | NA | |
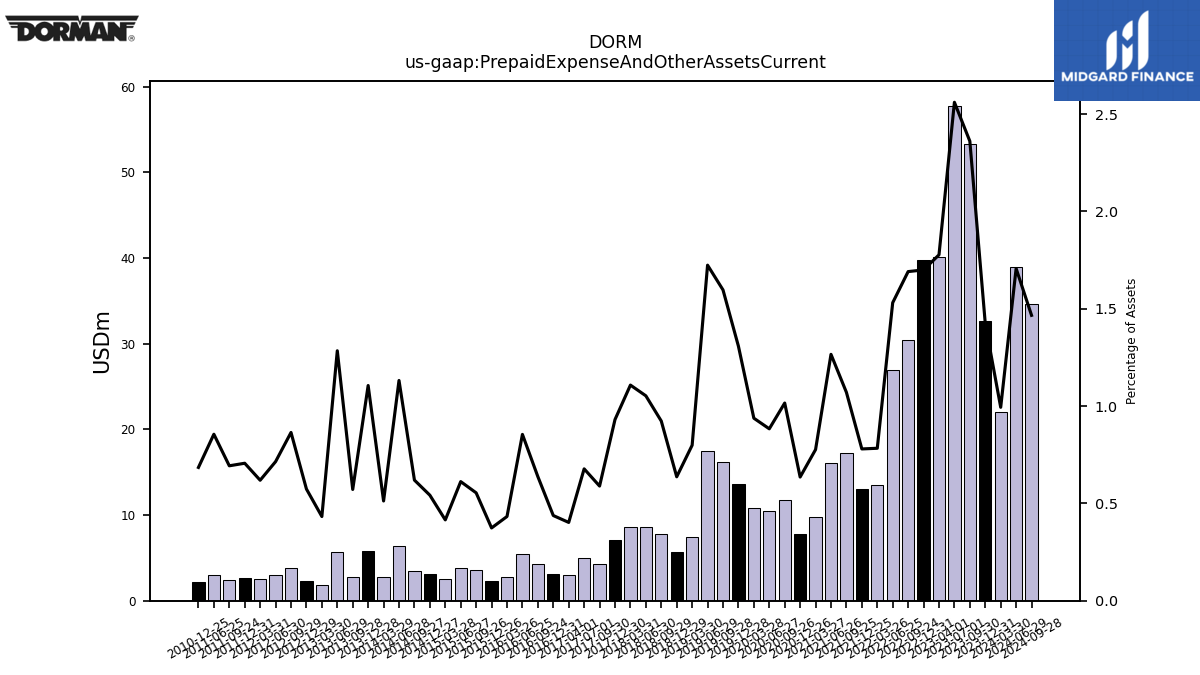
| Prepaid Expense And Other Assets Current | 32.65 | 53.36 | 57.79 | 40.17 | 39.80 | 30.46 | 26.96 | 13.51 | 13.05 | 17.30 | 16.07 | 9.82 | 7.76 | 11.77 | 10.42 | 10.81 | 13.61 | 16.24 | 17.52 | 7.41 | 5.65 | 7.84 | 8.59 | 8.56 | 7.13 | 4.35 | 5.05 | 2.97 | 3.12 | 4.26 | 5.44 | 2.73 | 2.33 | 3.54 | 3.83 | 2.51 | 3.15 | 3.42 | 6.36 | 2.83 | 5.85 | 2.80 | 5.73 | 1.83 | 2.33 | 3.79 | 3.01 | 2.52 | 2.66 | 2.48 | 2.99 | NA | 2.21 | NA | NA |
| 2023-12-31 | 2023-09-30 | 2023-07-01 | 2023-04-01 | 2022-12-31 | 2022-09-24 | 2022-06-25 | 2022-03-26 | 2021-12-25 | 2021-09-25 | 2021-06-26 | 2021-03-27 | 2020-12-26 | 2020-09-26 | 2020-06-27 | 2020-03-28 | 2019-12-28 | 2019-09-28 | 2019-06-29 | 2019-03-30 | 2018-12-29 | 2018-09-29 | 2018-06-30 | 2018-03-31 | 2017-12-30 | 2017-09-30 | 2017-07-01 | 2017-04-01 | 2016-12-31 | 2016-09-24 | 2016-06-25 | 2016-03-26 | 2015-12-26 | 2015-09-26 | 2015-06-27 | 2015-03-28 | 2014-12-27 | 2014-09-27 | 2014-06-28 | 2014-03-29 | 2013-12-28 | 2013-09-28 | 2013-06-29 | 2013-03-30 | 2012-12-29 | 2012-09-29 | 2012-06-30 | 2012-03-31 | 2011-12-31 | 2011-09-24 | 2011-06-25 | 2011-03-26 | 2010-12-25 | 2010-09-25 | 2010-06-26 | ||
|---|---|---|---|---|---|---|---|---|---|---|---|---|---|---|---|---|---|---|---|---|---|---|---|---|---|---|---|---|---|---|---|---|---|---|---|---|---|---|---|---|---|---|---|---|---|---|---|---|---|---|---|---|---|---|---|---|
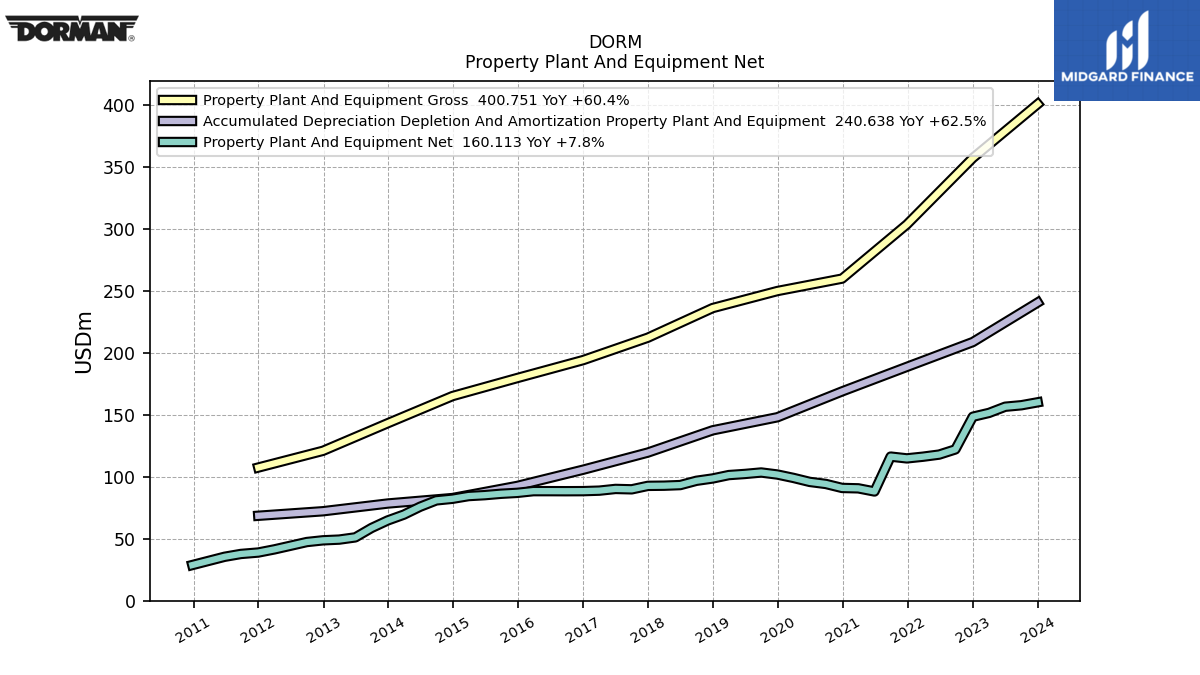
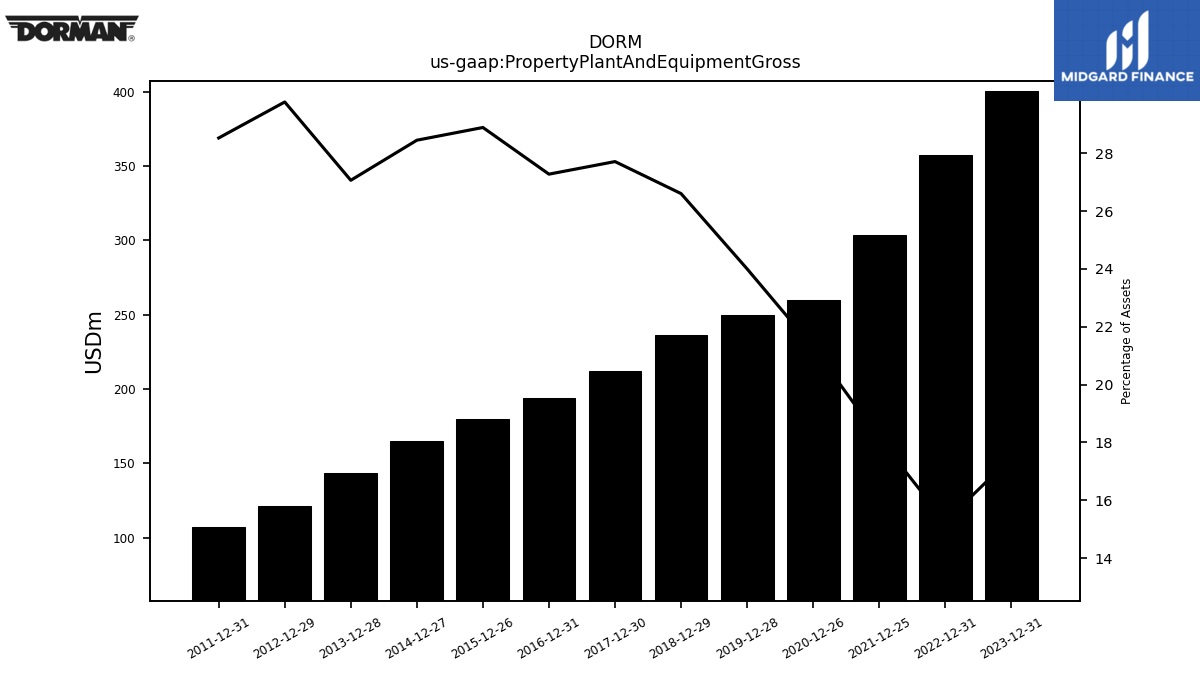
| Property Plant And Equipment Gross | 400.75 | NA | NA | NA | 357.20 | NA | NA | NA | 303.56 | NA | NA | NA | 259.92 | NA | NA | NA | 249.88 | NA | NA | NA | 236.15 | NA | NA | NA | 212.26 | NA | NA | NA | 194.16 | NA | NA | NA | 179.67 | NA | NA | NA | 165.12 | NA | NA | NA | 143.23 | NA | NA | NA | 120.97 | NA | NA | NA | 107.47 | NA | NA | NA | NA | NA | NA | |
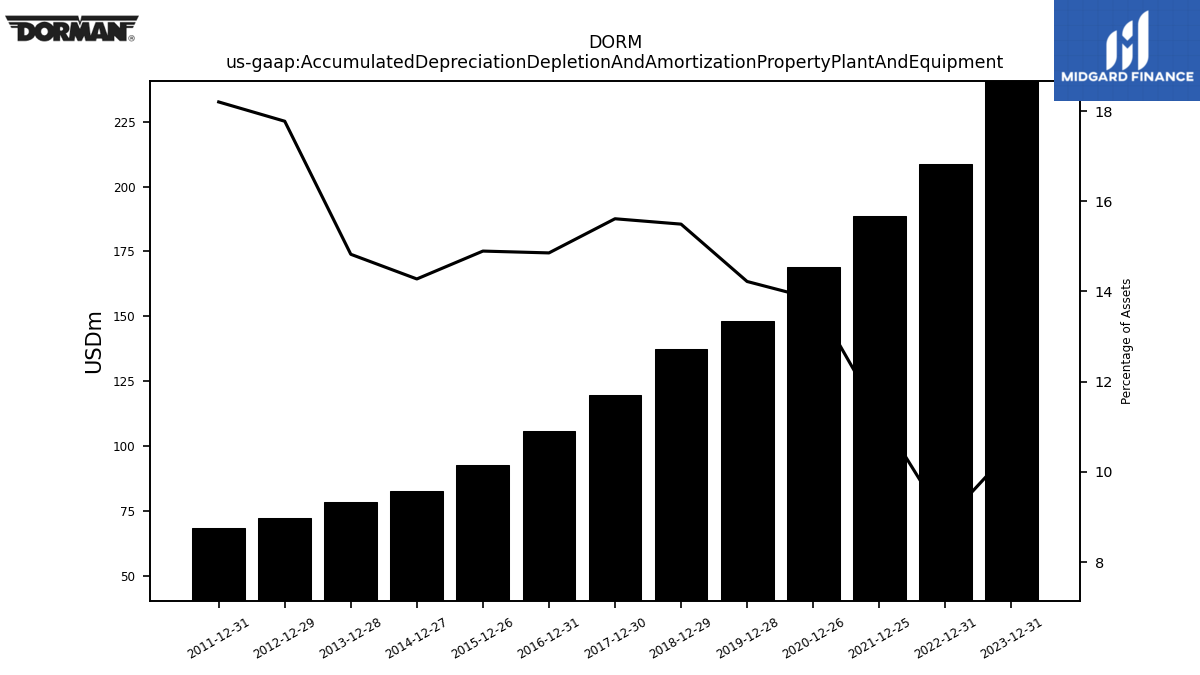
| Accumulated Depreciation Depletion And Amortization Property Plant And Equipment | 240.64 | NA | NA | NA | 208.73 | NA | NA | NA | 188.70 | NA | NA | NA | 168.91 | NA | NA | NA | 148.04 | NA | NA | NA | 137.50 | NA | NA | NA | 119.57 | NA | NA | NA | 105.73 | NA | NA | NA | 92.62 | NA | NA | NA | 82.86 | NA | NA | NA | 78.44 | NA | NA | NA | 72.22 | NA | NA | NA | 68.56 | NA | NA | NA | NA | NA | NA | |
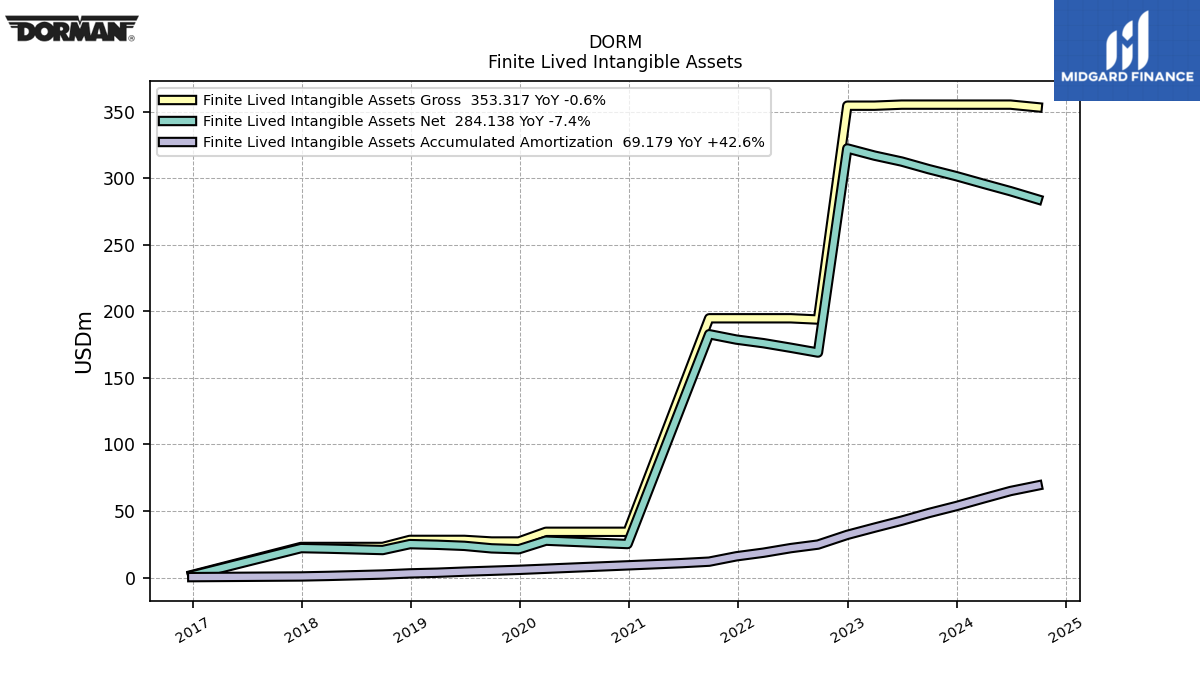
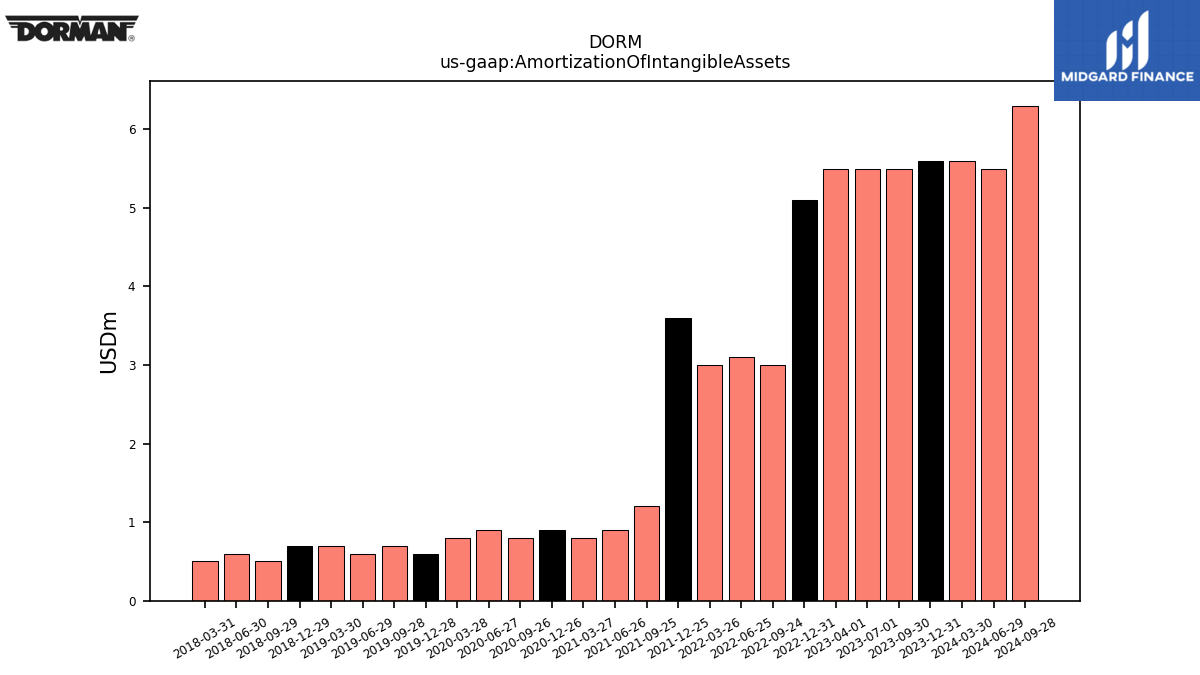
| Amortization Of Intangible Assets | 5.60 | 5.50 | 5.50 | 5.50 | 5.10 | 3.00 | 3.10 | 3.00 | 3.60 | 1.20 | 0.90 | 0.80 | 0.90 | 0.80 | 0.90 | 0.80 | 0.60 | 0.70 | 0.60 | 0.70 | 0.70 | 0.50 | 0.60 | 0.50 | NA | NA | NA | NA | NA | NA | NA | NA | NA | NA | NA | NA | NA | NA | NA | NA | NA | NA | NA | NA | NA | NA | NA | NA | NA | NA | NA | NA | NA | NA | NA | |
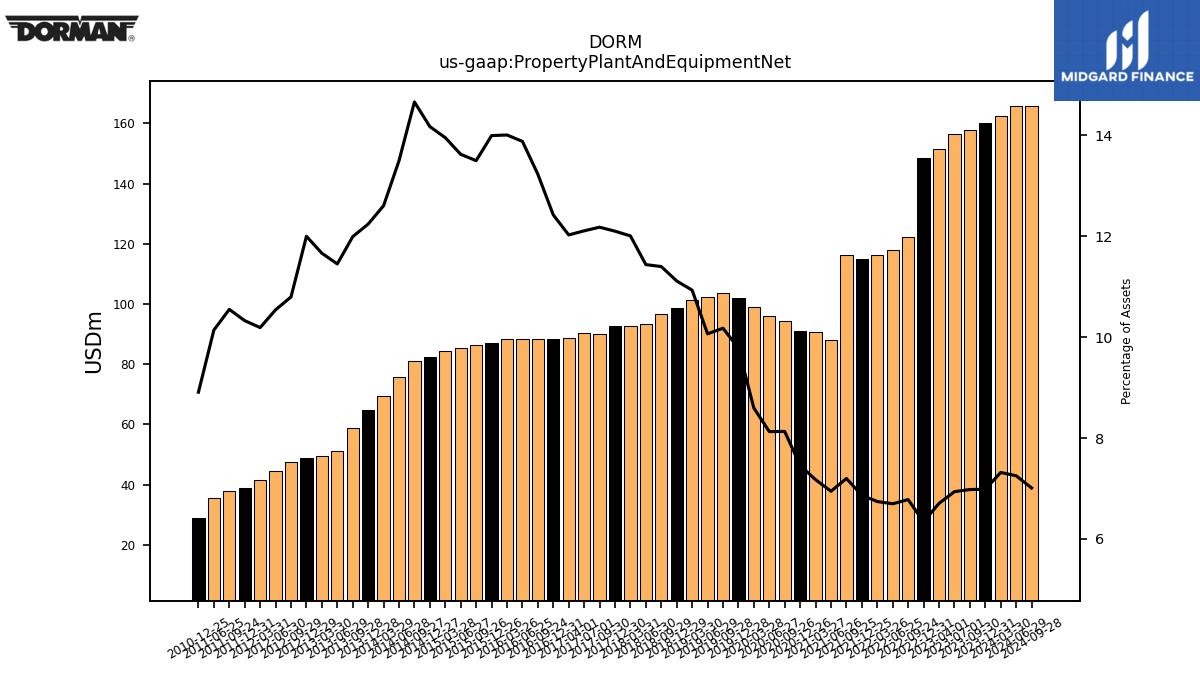
| Property Plant And Equipment Net | 160.11 | 157.74 | 156.54 | 151.54 | 148.48 | 122.11 | 117.93 | 116.22 | 114.86 | 116.31 | 88.16 | 90.70 | 91.01 | 94.22 | 95.89 | 99.08 | 101.84 | 103.48 | 102.30 | 101.39 | 98.65 | 96.79 | 93.33 | 92.83 | 92.69 | 89.90 | 90.22 | 88.84 | 88.44 | 88.38 | 88.43 | 88.43 | 87.05 | 86.31 | 85.20 | 84.46 | 82.27 | 80.97 | 75.85 | 69.49 | 64.79 | 58.72 | 51.14 | 49.34 | 48.76 | 47.37 | 44.40 | 41.45 | 38.90 | 37.74 | 35.48 | NA | 28.79 | NA | NA | |
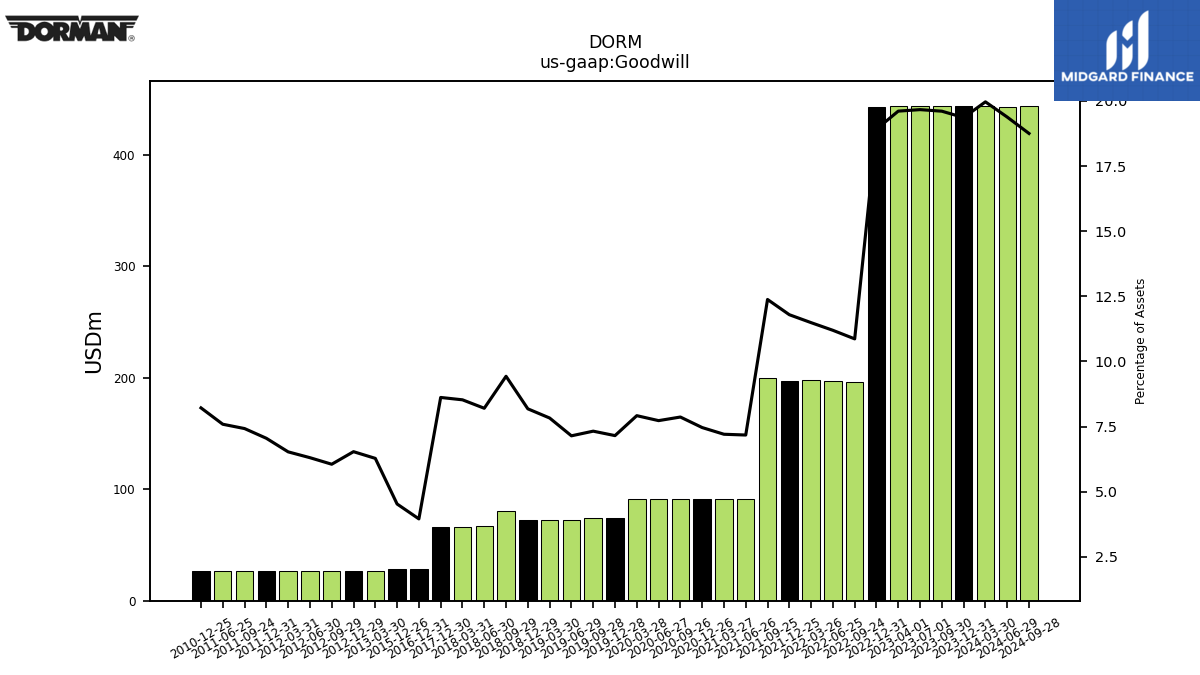
| Goodwill | 443.89 | 443.22 | 443.89 | 443.34 | 443.04 | 195.72 | 197.16 | 198.11 | 197.33 | 200.03 | 91.08 | 91.08 | 91.08 | 91.15 | 91.16 | 91.28 | 74.46 | 74.46 | 72.60 | 72.60 | 72.61 | 80.06 | 66.92 | 65.91 | 66.00 | NA | NA | NA | 28.15 | NA | NA | NA | 28.15 | NA | NA | NA | NA | NA | NA | NA | NA | NA | NA | 26.55 | 26.55 | 26.55 | 26.55 | 26.55 | 26.55 | 26.55 | 26.55 | NA | 26.55 | NA | NA | |
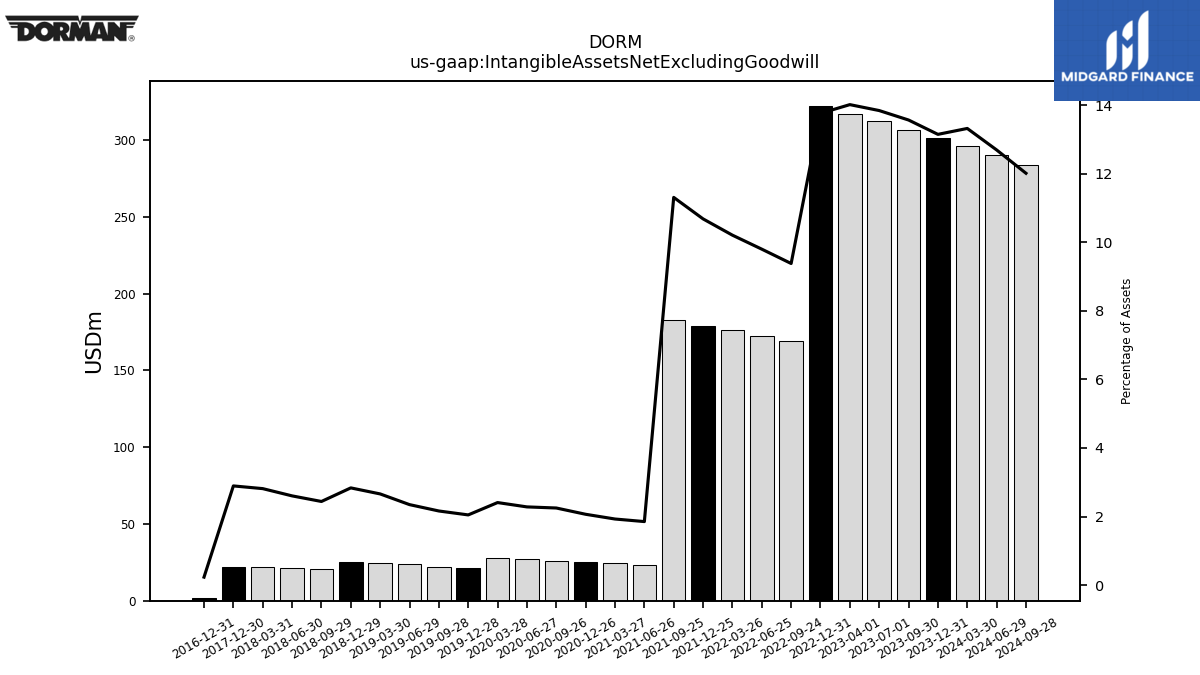
| Intangible Assets Net Excluding Goodwill | 301.56 | 306.80 | 312.55 | 317.00 | 322.41 | 169.05 | 172.66 | 176.09 | 178.81 | 182.83 | 23.51 | 24.36 | 25.21 | 26.05 | 26.90 | 27.75 | 21.30 | 21.97 | 23.85 | 24.66 | 25.16 | 20.71 | 21.23 | 21.75 | 22.16 | NA | NA | NA | 1.64 | NA | NA | NA | NA | NA | NA | NA | NA | NA | NA | NA | NA | NA | NA | NA | NA | NA | NA | NA | NA | NA | NA | NA | NA | NA | NA | |
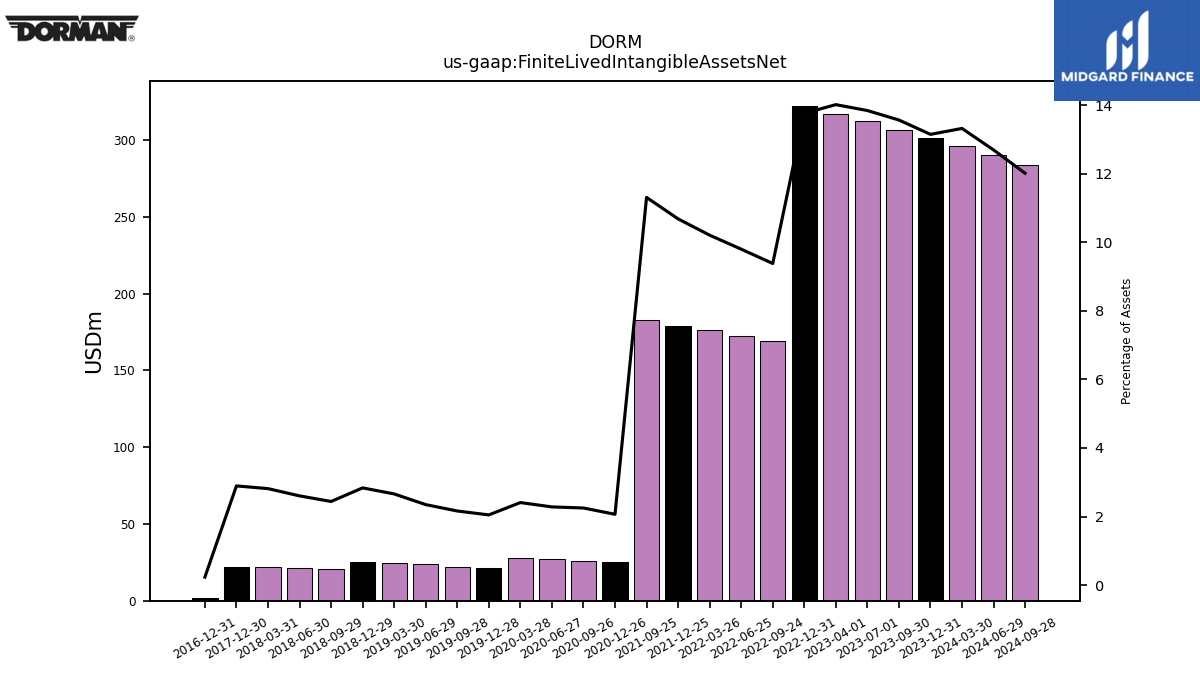
| Finite Lived Intangible Assets Net | 301.56 | 306.80 | 312.55 | 317.00 | 322.41 | 169.05 | 172.66 | 176.09 | 178.81 | 182.83 | NA | NA | 25.21 | 26.05 | 26.90 | 27.75 | 21.30 | 21.97 | 23.85 | 24.66 | 25.16 | 20.71 | 21.23 | 21.75 | 22.16 | NA | NA | NA | 1.64 | NA | NA | NA | NA | NA | NA | NA | NA | NA | NA | NA | NA | NA | NA | NA | NA | NA | NA | NA | NA | NA | NA | NA | NA | NA | NA | |
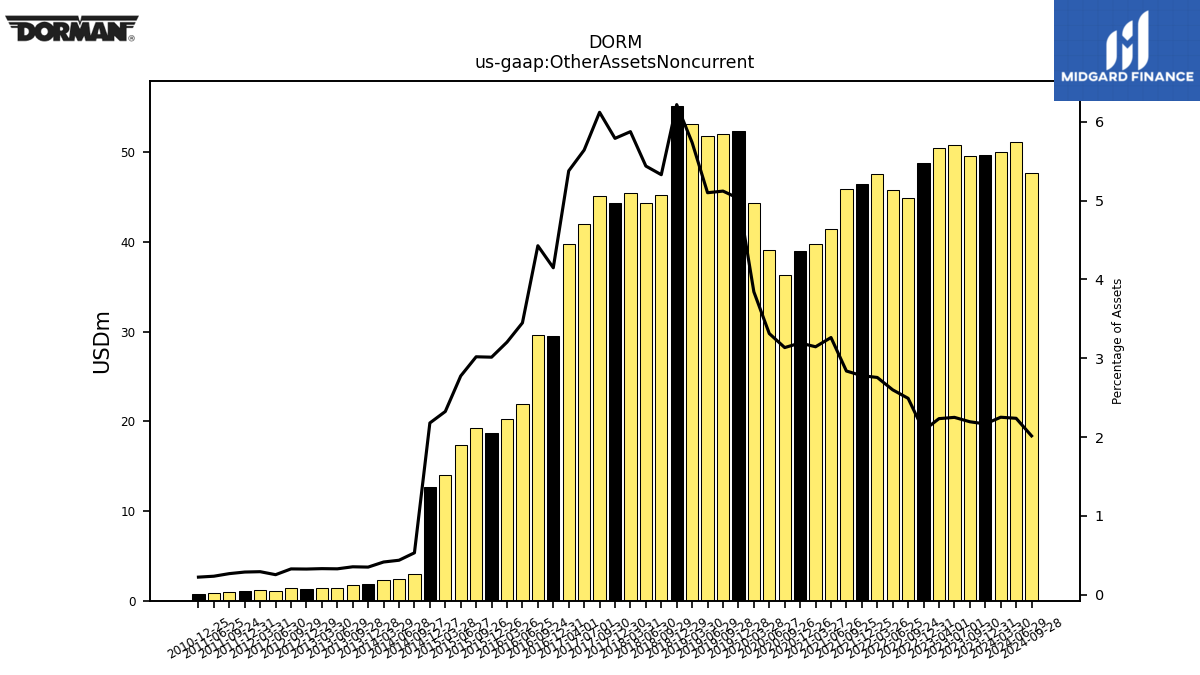
| Other Assets Noncurrent | 49.66 | 49.59 | 50.78 | 50.50 | 48.77 | 44.87 | 45.77 | 47.52 | 46.50 | 45.85 | 41.42 | 39.77 | 38.98 | 36.33 | 39.09 | 44.30 | 52.35 | 52.07 | 51.83 | 53.20 | 55.18 | 45.24 | 44.37 | 45.41 | 44.34 | 45.17 | 42.03 | 39.72 | 29.52 | 29.57 | 21.97 | 20.23 | 18.74 | 19.30 | 17.35 | 14.07 | 12.64 | 2.94 | 2.46 | 2.29 | 1.85 | 1.73 | 1.47 | 1.40 | 1.32 | 1.44 | 1.07 | 1.19 | 1.08 | 0.96 | 0.82 | NA | 0.72 | NA | NA |
| 2023-12-31 | 2023-09-30 | 2023-07-01 | 2023-04-01 | 2022-12-31 | 2022-09-24 | 2022-06-25 | 2022-03-26 | 2021-12-25 | 2021-09-25 | 2021-06-26 | 2021-03-27 | 2020-12-26 | 2020-09-26 | 2020-06-27 | 2020-03-28 | 2019-12-28 | 2019-09-28 | 2019-06-29 | 2019-03-30 | 2018-12-29 | 2018-09-29 | 2018-06-30 | 2018-03-31 | 2017-12-30 | 2017-09-30 | 2017-07-01 | 2017-04-01 | 2016-12-31 | 2016-09-24 | 2016-06-25 | 2016-03-26 | 2015-12-26 | 2015-09-26 | 2015-06-27 | 2015-03-28 | 2014-12-27 | 2014-09-27 | 2014-06-28 | 2014-03-29 | 2013-12-28 | 2013-09-28 | 2013-06-29 | 2013-03-30 | 2012-12-29 | 2012-09-29 | 2012-06-30 | 2012-03-31 | 2011-12-31 | 2011-09-24 | 2011-06-25 | 2011-03-26 | 2010-12-25 | 2010-09-25 | 2010-06-26 | ||
|---|---|---|---|---|---|---|---|---|---|---|---|---|---|---|---|---|---|---|---|---|---|---|---|---|---|---|---|---|---|---|---|---|---|---|---|---|---|---|---|---|---|---|---|---|---|---|---|---|---|---|---|---|---|---|---|---|
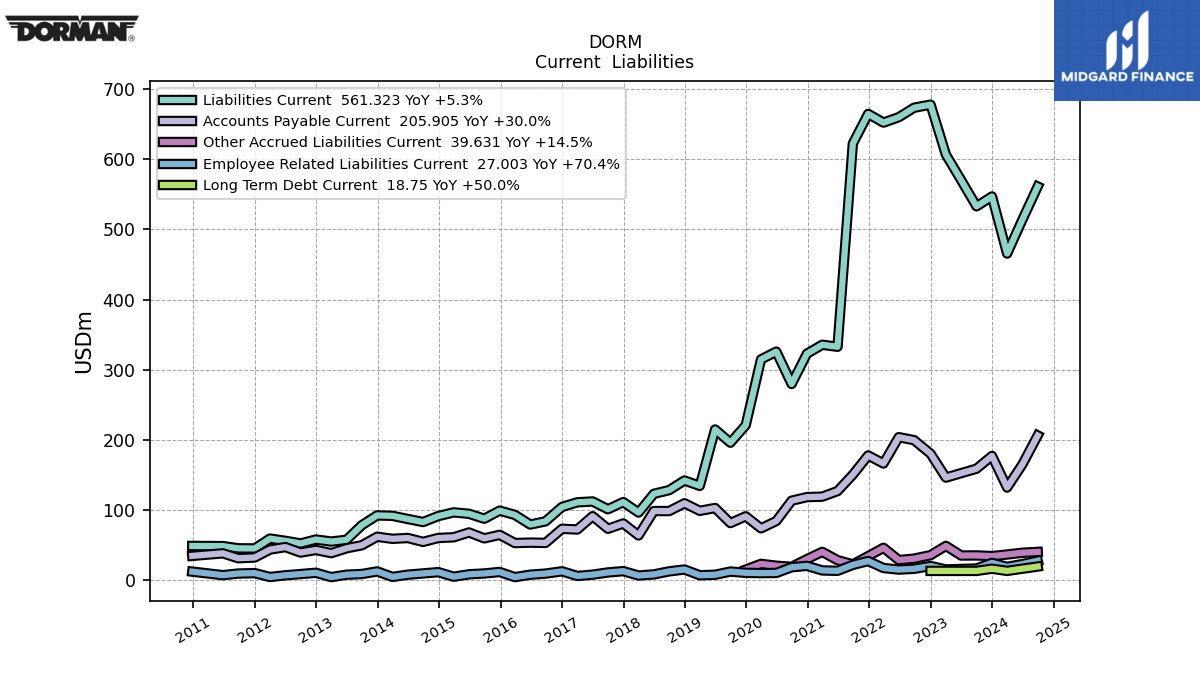
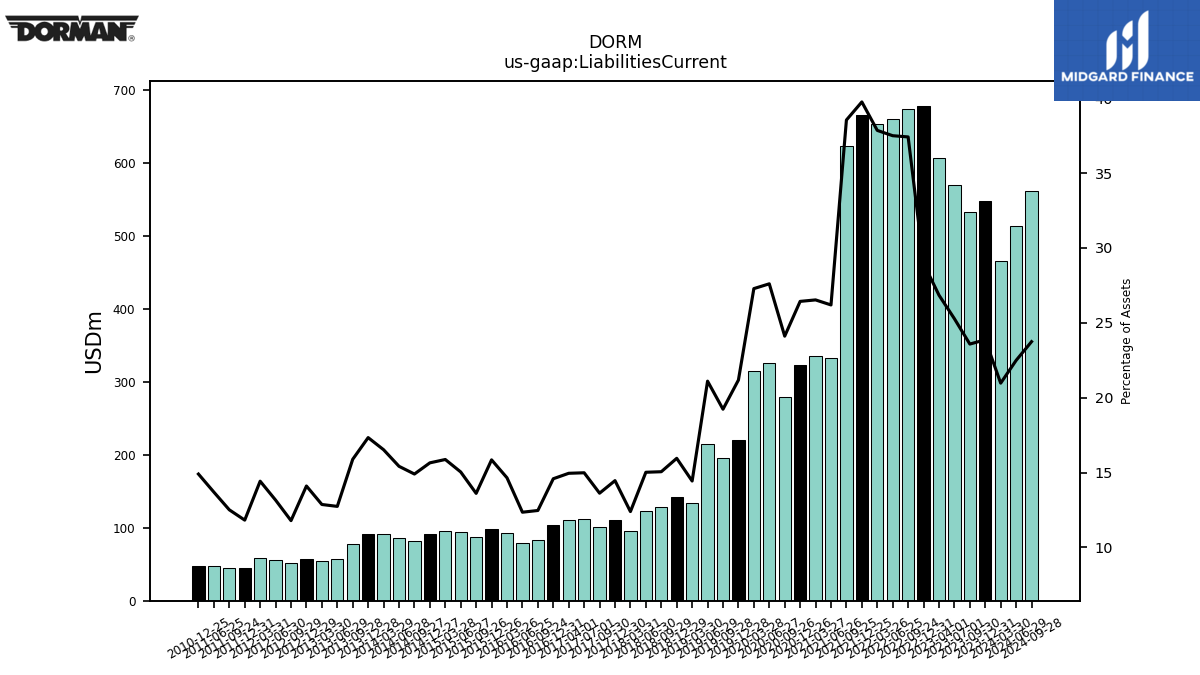
| Liabilities Current | 547.15 | 533.05 | 570.37 | 606.92 | 678.29 | 673.88 | 660.34 | 652.62 | 665.05 | 622.76 | 332.53 | 335.42 | 322.64 | 279.40 | 325.64 | 314.54 | 220.50 | 195.55 | 214.48 | 133.92 | 141.59 | 127.86 | 122.56 | 95.83 | 110.78 | 100.56 | 111.67 | 110.45 | 103.85 | 83.31 | 78.70 | 92.49 | 98.57 | 87.03 | 94.05 | 96.07 | 90.83 | 82.30 | 86.64 | 91.10 | 91.74 | 77.79 | 56.90 | 54.44 | 57.31 | 51.73 | 55.45 | 58.68 | 44.55 | 44.77 | 47.93 | NA | 48.16 | NA | NA | |
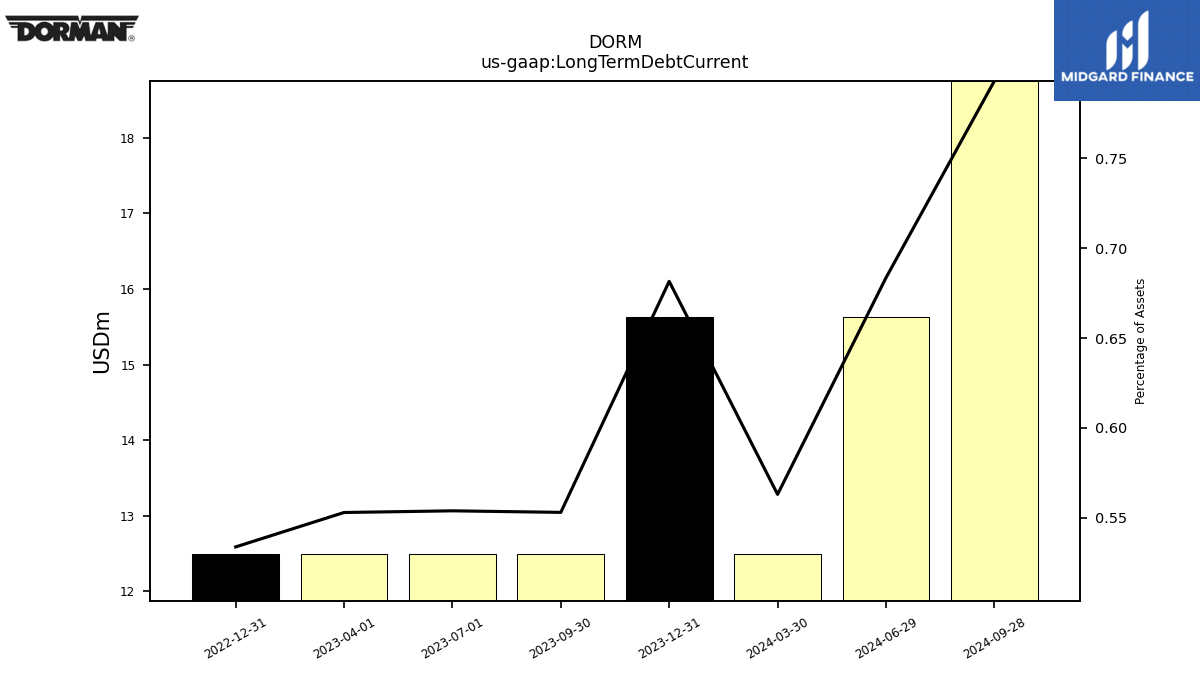
| Long Term Debt Current | 15.62 | 12.50 | 12.50 | 12.50 | 12.50 | NA | NA | NA | NA | NA | NA | NA | NA | NA | NA | NA | NA | NA | NA | NA | NA | NA | NA | NA | NA | NA | NA | NA | NA | NA | NA | NA | NA | NA | NA | NA | NA | NA | NA | NA | NA | NA | NA | NA | NA | NA | NA | NA | NA | NA | NA | NA | NA | NA | NA | |
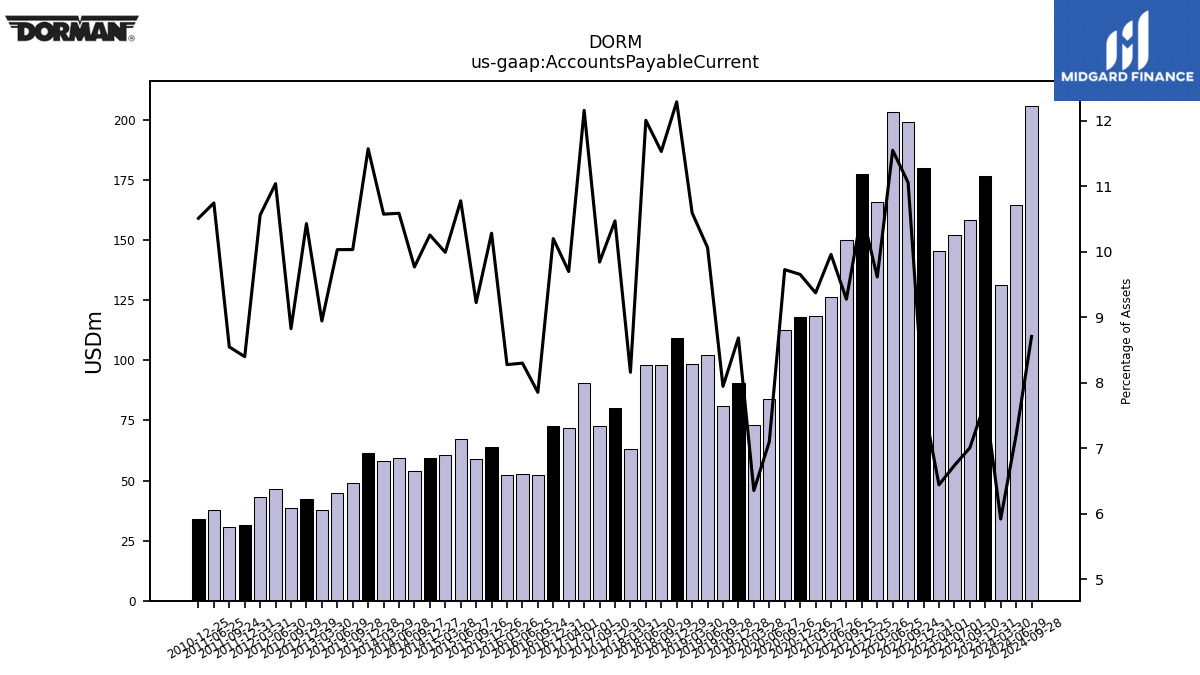
| Accounts Payable Current | 176.66 | 158.42 | 152.12 | 145.69 | 179.82 | 199.18 | 203.46 | 165.84 | 177.39 | 149.93 | 126.46 | 118.53 | 117.88 | 112.76 | 83.75 | 73.28 | 90.44 | 80.81 | 102.31 | 98.28 | 109.10 | 97.94 | 97.98 | 63.10 | 80.22 | 72.66 | 90.61 | 71.65 | 72.63 | 52.48 | 52.88 | 52.26 | 63.97 | 58.98 | 67.41 | 60.48 | 59.54 | 53.95 | 59.51 | 58.30 | 61.26 | 49.14 | 44.81 | 37.84 | 42.39 | 38.73 | 46.51 | 42.97 | 31.65 | 30.59 | 37.61 | NA | 33.98 | NA | NA | |
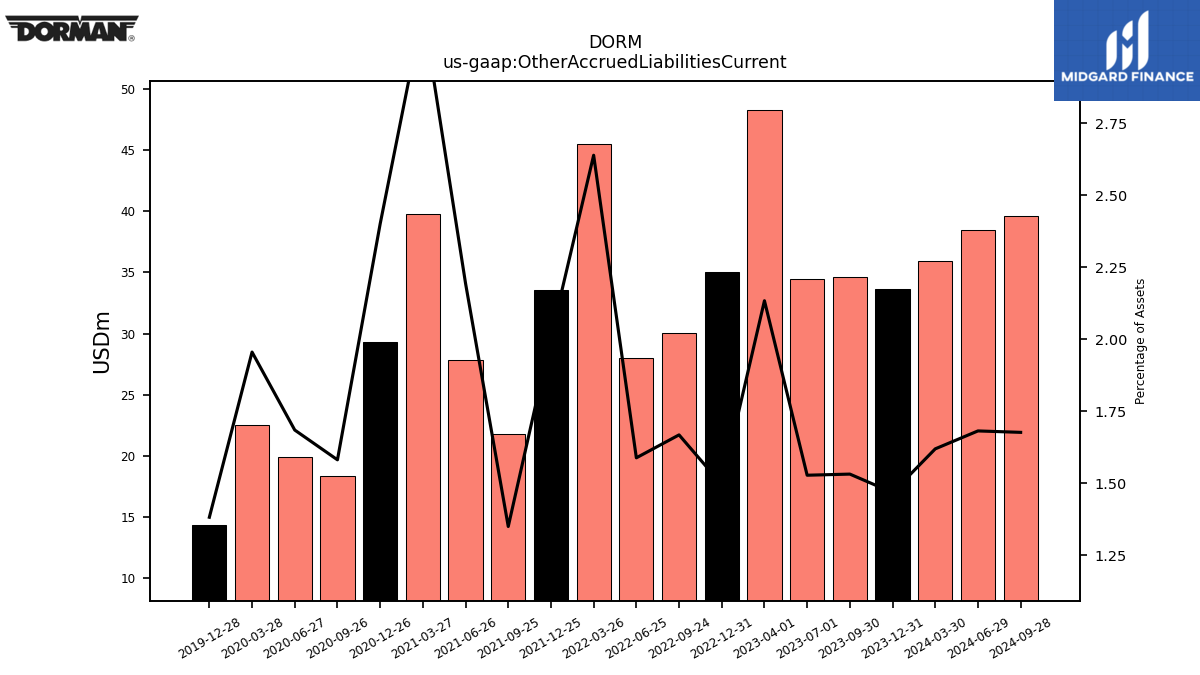
| Other Accrued Liabilities Current | 33.64 | 34.61 | 34.47 | 48.24 | 35.01 | 30.04 | 27.96 | 45.51 | 33.58 | 21.80 | 27.85 | 39.75 | 29.30 | 18.32 | 19.87 | 22.54 | 14.38 | NA | NA | NA | NA | NA | NA | NA | NA | NA | NA | NA | NA | NA | NA | NA | NA | NA | NA | NA | NA | NA | NA | NA | NA | NA | NA | NA | NA | NA | NA | NA | NA | NA | NA | NA | NA | NA | NA |
| 2023-12-31 | 2023-09-30 | 2023-07-01 | 2023-04-01 | 2022-12-31 | 2022-09-24 | 2022-06-25 | 2022-03-26 | 2021-12-25 | 2021-09-25 | 2021-06-26 | 2021-03-27 | 2020-12-26 | 2020-09-26 | 2020-06-27 | 2020-03-28 | 2019-12-28 | 2019-09-28 | 2019-06-29 | 2019-03-30 | 2018-12-29 | 2018-09-29 | 2018-06-30 | 2018-03-31 | 2017-12-30 | 2017-09-30 | 2017-07-01 | 2017-04-01 | 2016-12-31 | 2016-09-24 | 2016-06-25 | 2016-03-26 | 2015-12-26 | 2015-09-26 | 2015-06-27 | 2015-03-28 | 2014-12-27 | 2014-09-27 | 2014-06-28 | 2014-03-29 | 2013-12-28 | 2013-09-28 | 2013-06-29 | 2013-03-30 | 2012-12-29 | 2012-09-29 | 2012-06-30 | 2012-03-31 | 2011-12-31 | 2011-09-24 | 2011-06-25 | 2011-03-26 | 2010-12-25 | 2010-09-25 | 2010-06-26 | ||
|---|---|---|---|---|---|---|---|---|---|---|---|---|---|---|---|---|---|---|---|---|---|---|---|---|---|---|---|---|---|---|---|---|---|---|---|---|---|---|---|---|---|---|---|---|---|---|---|---|---|---|---|---|---|---|---|---|
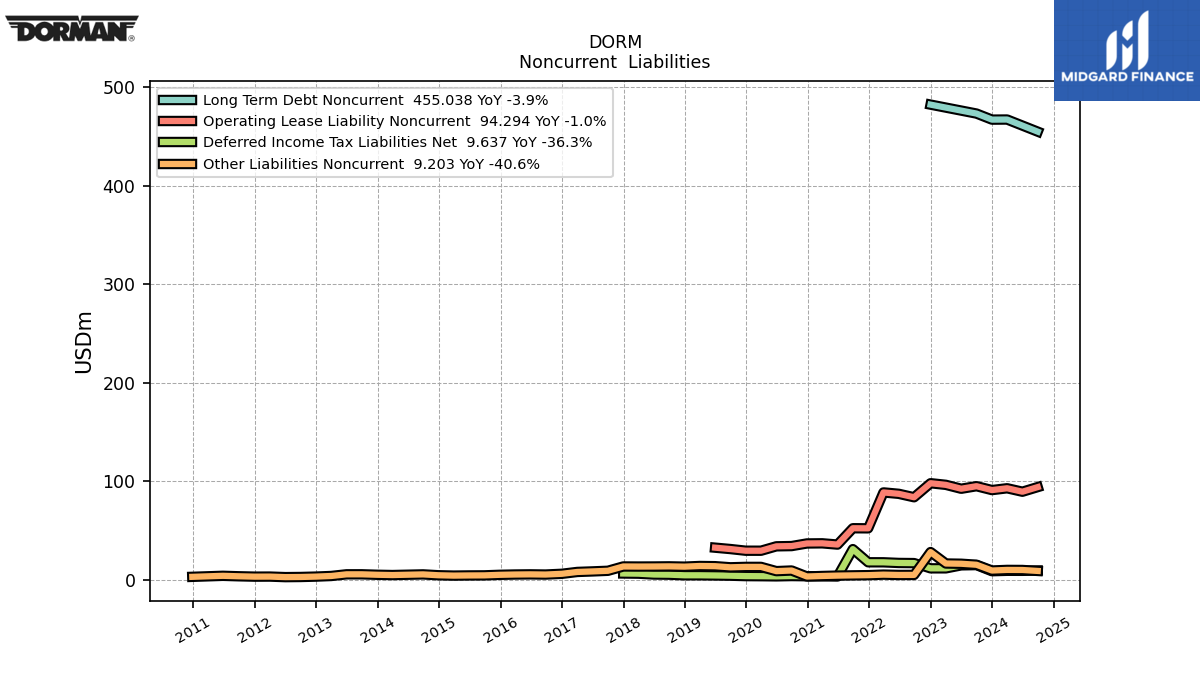
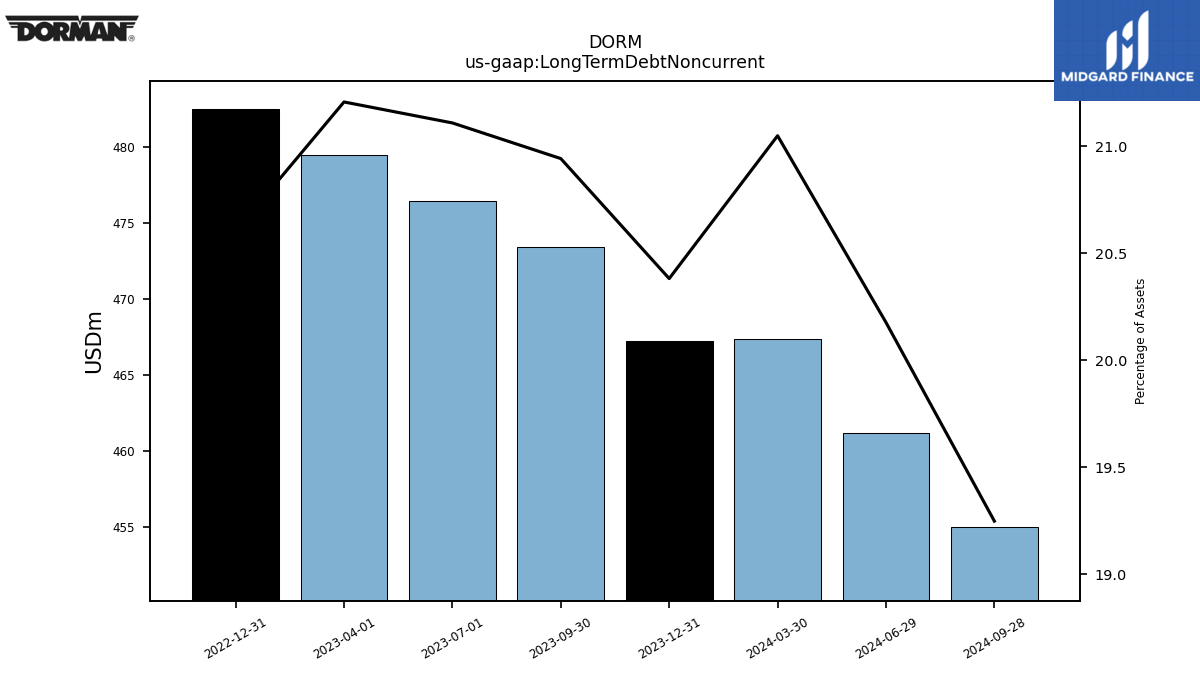
| Long Term Debt Noncurrent | 467.24 | 473.39 | 476.41 | 479.44 | 482.46 | NA | NA | NA | NA | NA | NA | NA | NA | NA | NA | NA | NA | NA | NA | NA | NA | NA | NA | NA | NA | NA | NA | NA | NA | NA | NA | NA | NA | NA | NA | NA | NA | NA | NA | NA | NA | NA | NA | NA | NA | NA | NA | NA | NA | NA | NA | NA | NA | NA | NA | |
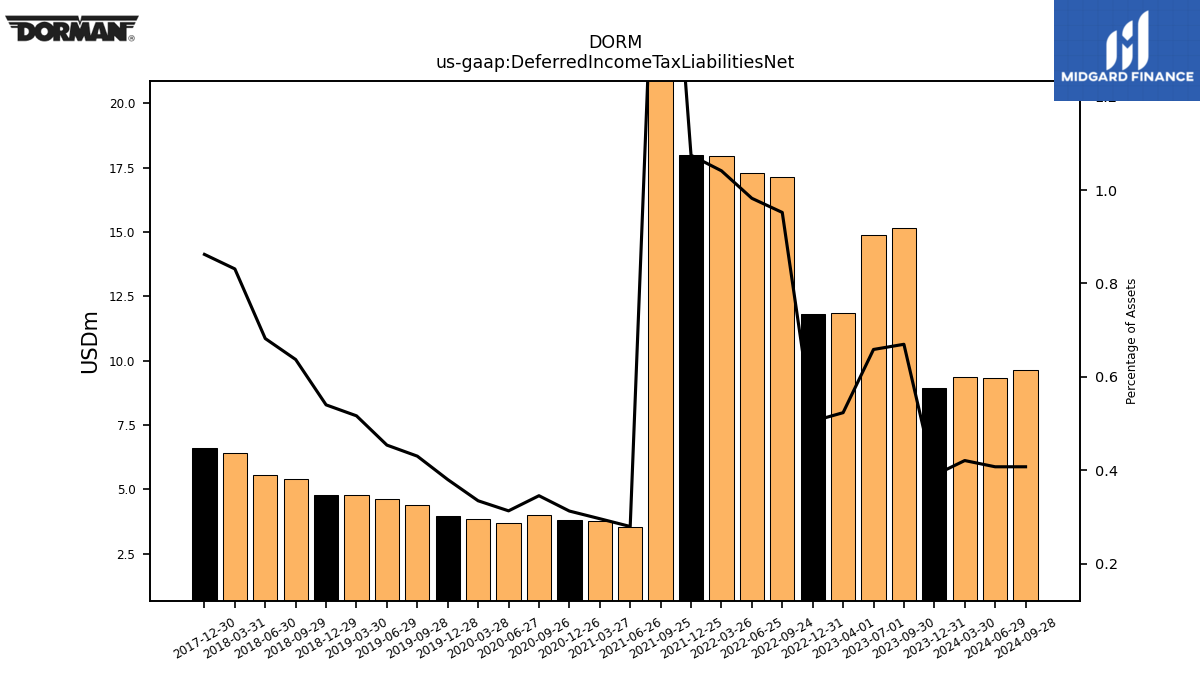
| Deferred Income Tax Liabilities Net | 8.93 | 15.14 | 14.87 | 11.83 | 11.83 | 17.15 | 17.30 | 17.95 | 17.98 | 31.33 | 3.55 | 3.75 | 3.82 | 4.01 | 3.70 | 3.86 | 3.96 | 4.38 | 4.61 | 4.79 | 4.79 | 5.41 | 5.57 | 6.42 | 6.60 | NA | NA | NA | NA | NA | NA | NA | NA | NA | NA | NA | NA | NA | NA | NA | NA | NA | NA | NA | NA | NA | NA | NA | NA | NA | NA | NA | NA | NA | NA | |
| Other Liabilities Noncurrent | 9.63 | 15.48 | 16.50 | 16.75 | 28.35 | 5.16 | 5.12 | 5.45 | 4.92 | 4.71 | 4.46 | 4.07 | 3.56 | 9.63 | 9.01 | 13.30 | 13.30 | 12.88 | 14.02 | 14.21 | 13.55 | 13.84 | 13.71 | 13.65 | 13.73 | 9.36 | 8.72 | 8.17 | 6.30 | 5.54 | 5.72 | 5.57 | 5.26 | 4.71 | 4.63 | 4.46 | 4.82 | 5.69 | 5.36 | 5.02 | 5.31 | 5.78 | 5.76 | 4.07 | 3.45 | 3.06 | 2.92 | 3.46 | 3.41 | 3.79 | 4.25 | NA | 3.21 | NA | NA | |
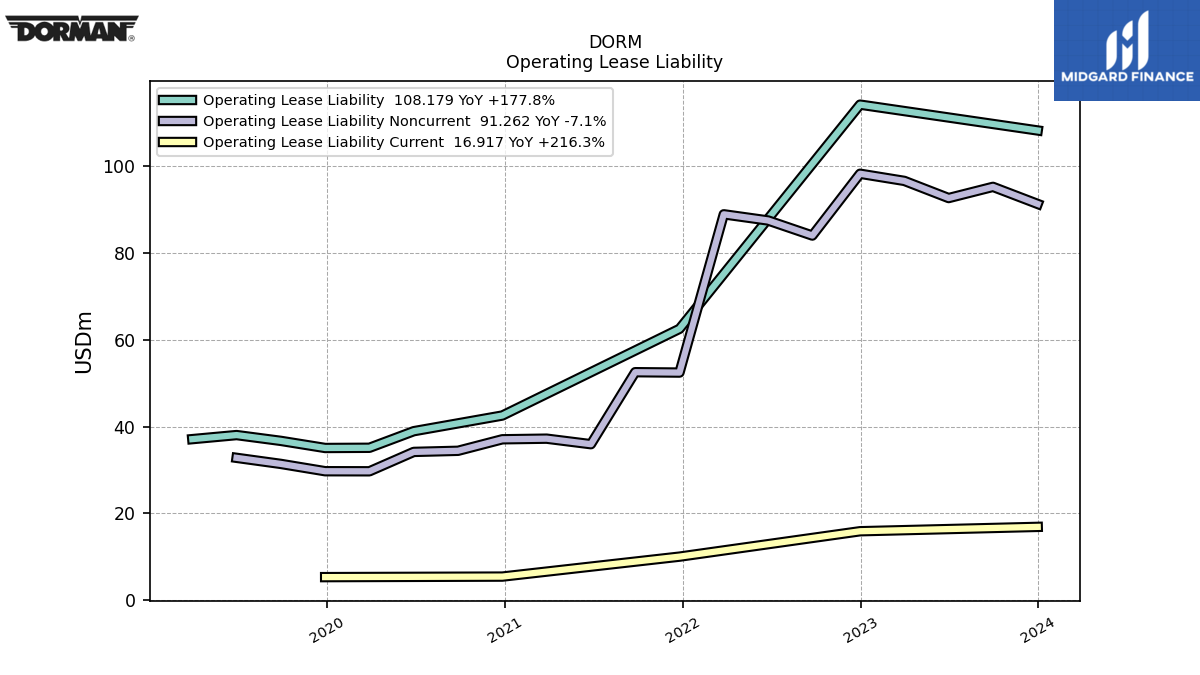
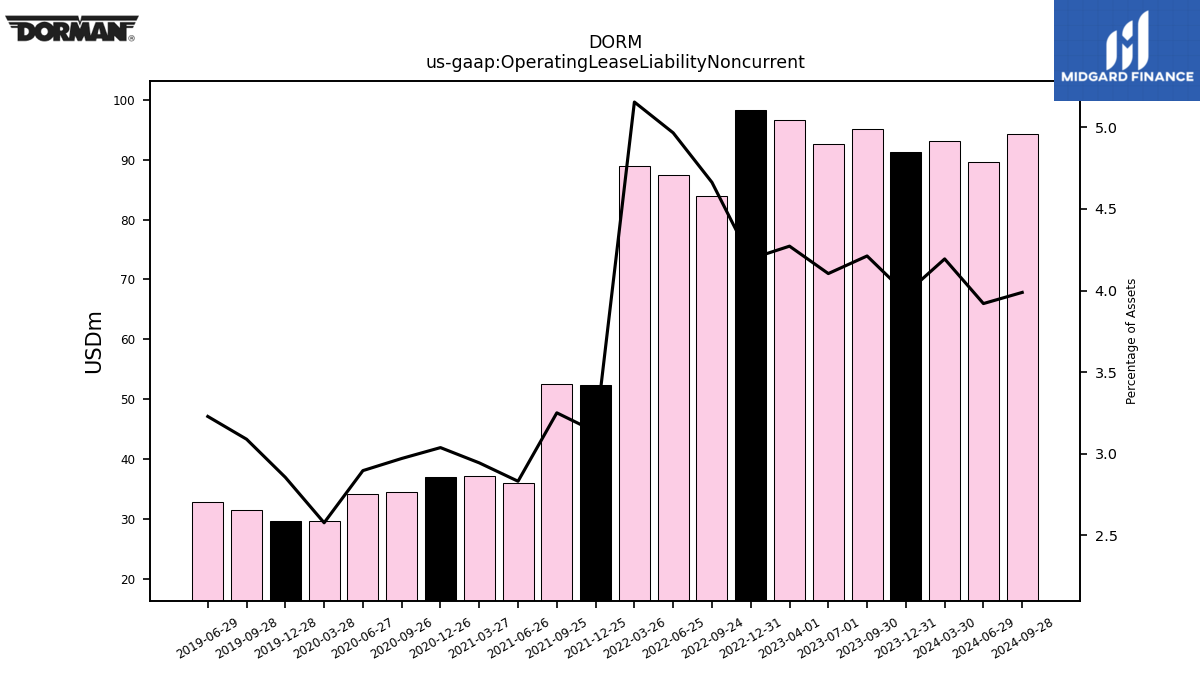
| Operating Lease Liability Noncurrent | 91.26 | 95.20 | 92.62 | 96.57 | 98.22 | 83.98 | 87.46 | 88.88 | 52.44 | 52.53 | 35.95 | 37.23 | 37.08 | 34.43 | 34.17 | 29.71 | 29.73 | 31.41 | 32.81 | NA | NA | NA | NA | NA | NA | NA | NA | NA | NA | NA | NA | NA | NA | NA | NA | NA | NA | NA | NA | NA | NA | NA | NA | NA | NA | NA | NA | NA | NA | NA | NA | NA | NA | NA | NA |
| 2023-12-31 | 2023-09-30 | 2023-07-01 | 2023-04-01 | 2022-12-31 | 2022-09-24 | 2022-06-25 | 2022-03-26 | 2021-12-25 | 2021-09-25 | 2021-06-26 | 2021-03-27 | 2020-12-26 | 2020-09-26 | 2020-06-27 | 2020-03-28 | 2019-12-28 | 2019-09-28 | 2019-06-29 | 2019-03-30 | 2018-12-29 | 2018-09-29 | 2018-06-30 | 2018-03-31 | 2017-12-30 | 2017-09-30 | 2017-07-01 | 2017-04-01 | 2016-12-31 | 2016-09-24 | 2016-06-25 | 2016-03-26 | 2015-12-26 | 2015-09-26 | 2015-06-27 | 2015-03-28 | 2014-12-27 | 2014-09-27 | 2014-06-28 | 2014-03-29 | 2013-12-28 | 2013-09-28 | 2013-06-29 | 2013-03-30 | 2012-12-29 | 2012-09-29 | 2012-06-30 | 2012-03-31 | 2011-12-31 | 2011-09-24 | 2011-06-25 | 2011-03-26 | 2010-12-25 | 2010-09-25 | 2010-06-26 | ||
|---|---|---|---|---|---|---|---|---|---|---|---|---|---|---|---|---|---|---|---|---|---|---|---|---|---|---|---|---|---|---|---|---|---|---|---|---|---|---|---|---|---|---|---|---|---|---|---|---|---|---|---|---|---|---|---|---|
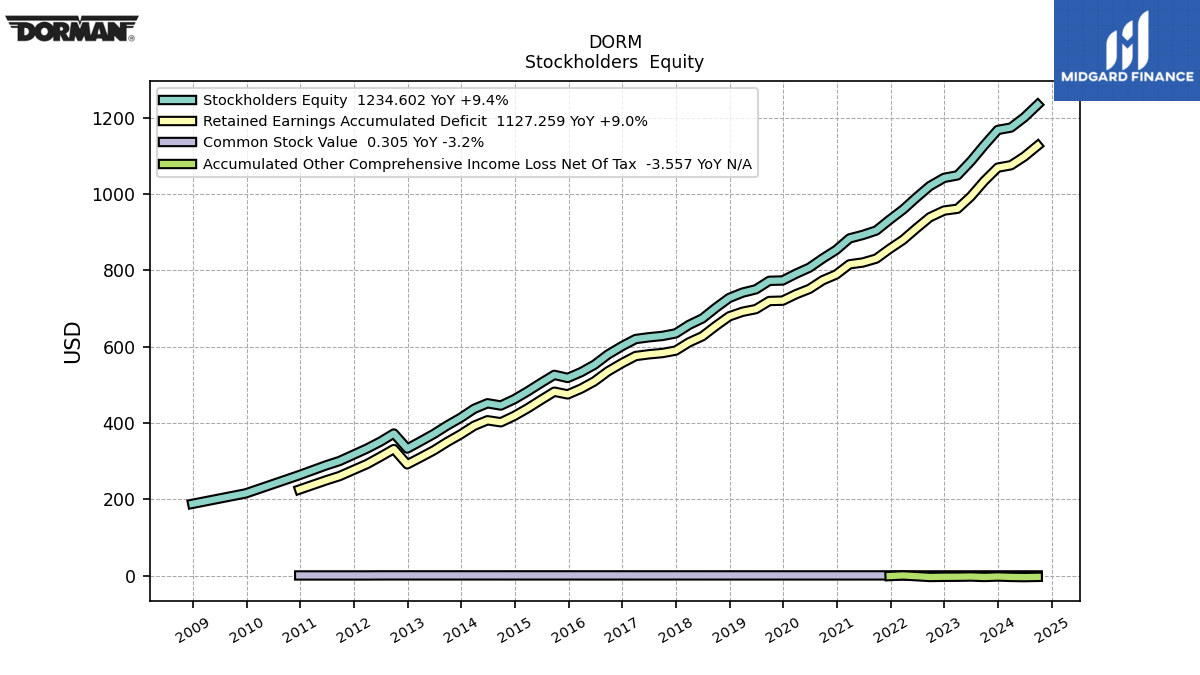
| Stockholders Equity | 1168.20 | 1128.09 | 1086.07 | 1049.14 | 1042.63 | 1021.04 | 990.96 | 959.40 | 932.74 | 904.52 | 892.99 | 883.81 | 853.56 | 831.37 | 807.13 | 791.38 | 773.58 | 772.59 | 750.33 | 741.71 | 727.62 | 701.95 | 674.02 | 657.14 | 634.81 | 628.10 | 624.64 | 619.98 | 601.64 | 579.16 | 552.55 | 533.15 | 518.04 | 526.07 | 504.77 | 482.63 | 462.06 | 445.69 | 451.57 | 436.97 | 413.64 | 393.57 | 371.45 | 351.90 | 332.87 | 372.35 | 351.17 | 333.05 | 317.10 | 300.06 | 288.74 | NA | 263.15 | NA | NA | |
| Common Stock Value | 0.31 | 0.32 | 0.32 | 0.32 | 0.31 | 0.31 | 0.31 | 0.32 | 0.32 | 0.32 | 0.32 | 0.32 | 0.32 | 0.32 | 0.33 | 0.33 | 0.33 | 0.33 | 0.33 | 0.33 | 0.33 | 0.33 | 0.33 | 0.34 | 0.34 | 0.34 | 0.34 | 0.34 | 0.34 | 0.35 | 0.35 | 0.35 | 0.35 | 0.35 | 0.36 | 0.36 | 0.36 | 0.36 | 0.36 | 0.36 | 0.36 | 0.36 | 0.36 | 0.36 | 0.36 | 0.36 | 0.36 | 0.18 | 0.18 | 0.18 | 0.18 | NA | 0.18 | NA | NA | |
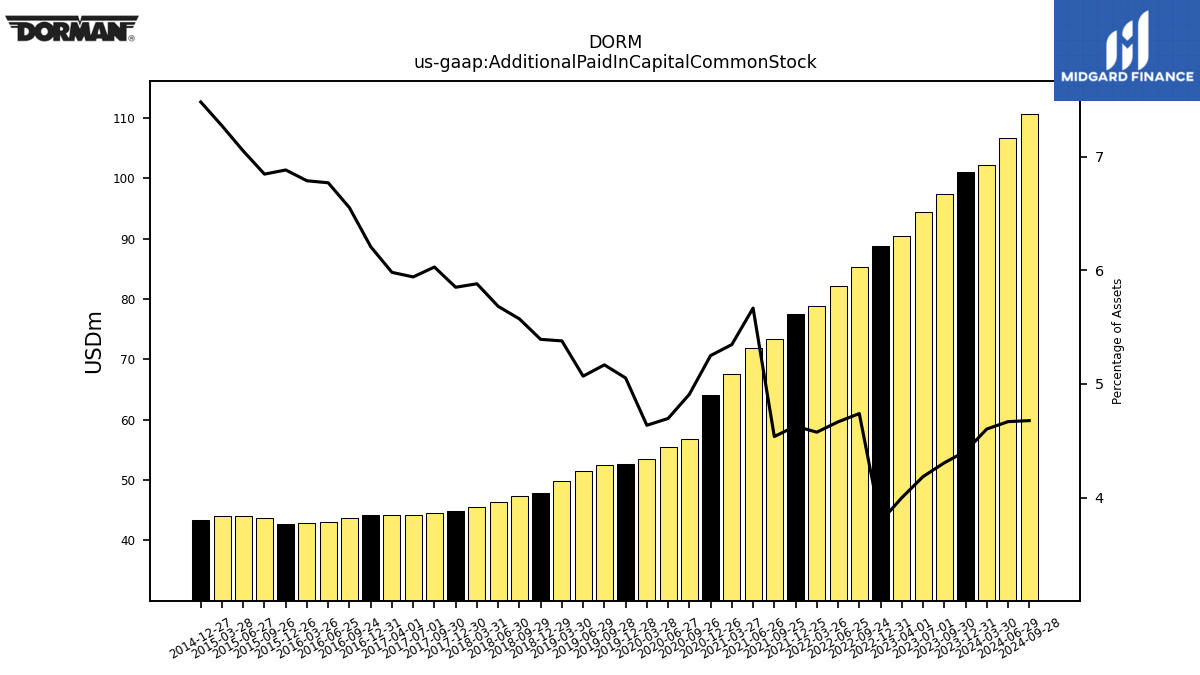
| Additional Paid In Capital Common Stock | 101.05 | 97.34 | 94.45 | 90.42 | 88.75 | 85.37 | 82.19 | 78.91 | 77.45 | 73.33 | 71.95 | 67.60 | 64.08 | 56.89 | 55.41 | 53.45 | 52.60 | 52.55 | 51.51 | 49.89 | 47.86 | 47.31 | 46.37 | 45.47 | 44.81 | 44.49 | 44.27 | 44.18 | 44.19 | 43.76 | 43.12 | 42.84 | 42.80 | 43.77 | 44.08 | 44.00 | 43.41 | NA | NA | NA | NA | NA | NA | NA | NA | NA | NA | NA | NA | NA | NA | NA | NA | NA | NA | |
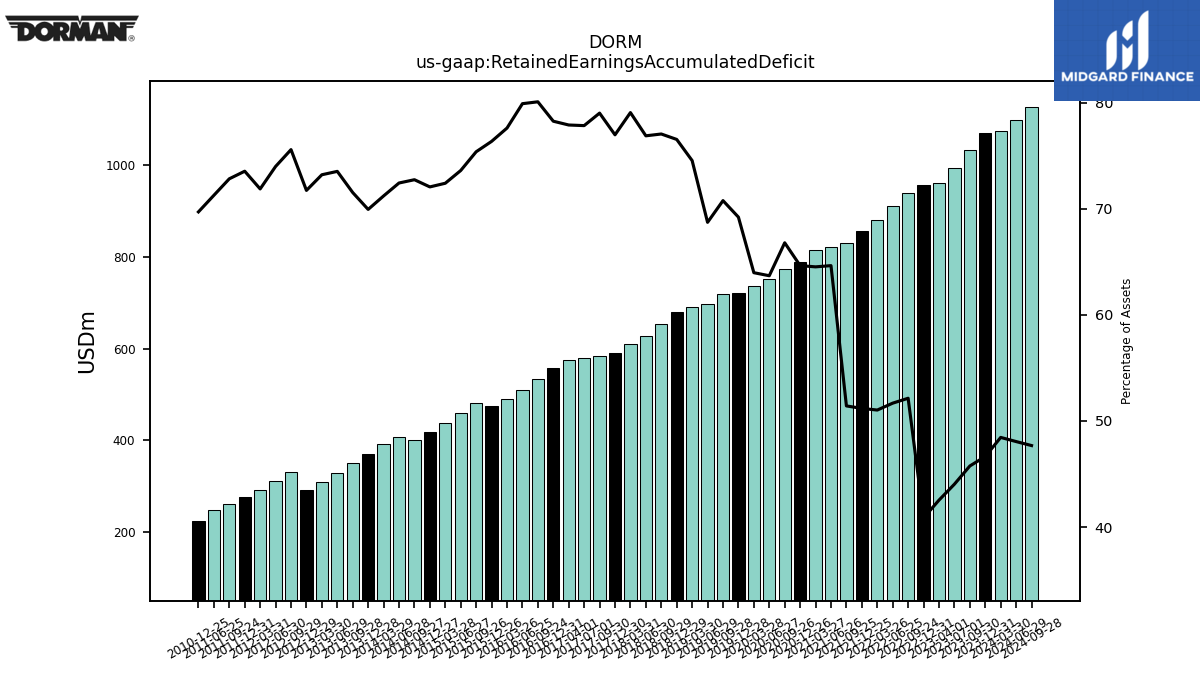
| Retained Earnings Accumulated Deficit | 1069.43 | 1034.27 | 993.92 | 961.60 | 956.87 | 939.21 | 910.19 | 879.92 | 856.41 | 830.88 | 820.72 | 815.89 | 789.15 | 774.15 | 751.40 | 737.60 | 720.65 | 719.71 | 698.49 | 691.49 | 679.43 | 654.31 | 627.32 | 611.34 | 589.66 | 583.27 | 580.03 | 575.45 | 557.11 | 535.06 | 509.08 | 489.96 | 474.89 | 481.95 | 460.34 | 438.27 | 418.29 | 401.72 | 407.04 | 392.58 | 370.16 | 350.27 | 328.35 | 309.68 | 291.50 | 331.59 | 311.67 | 292.38 | 277.07 | 260.56 | 249.42 | NA | 225.30 | NA | NA | |
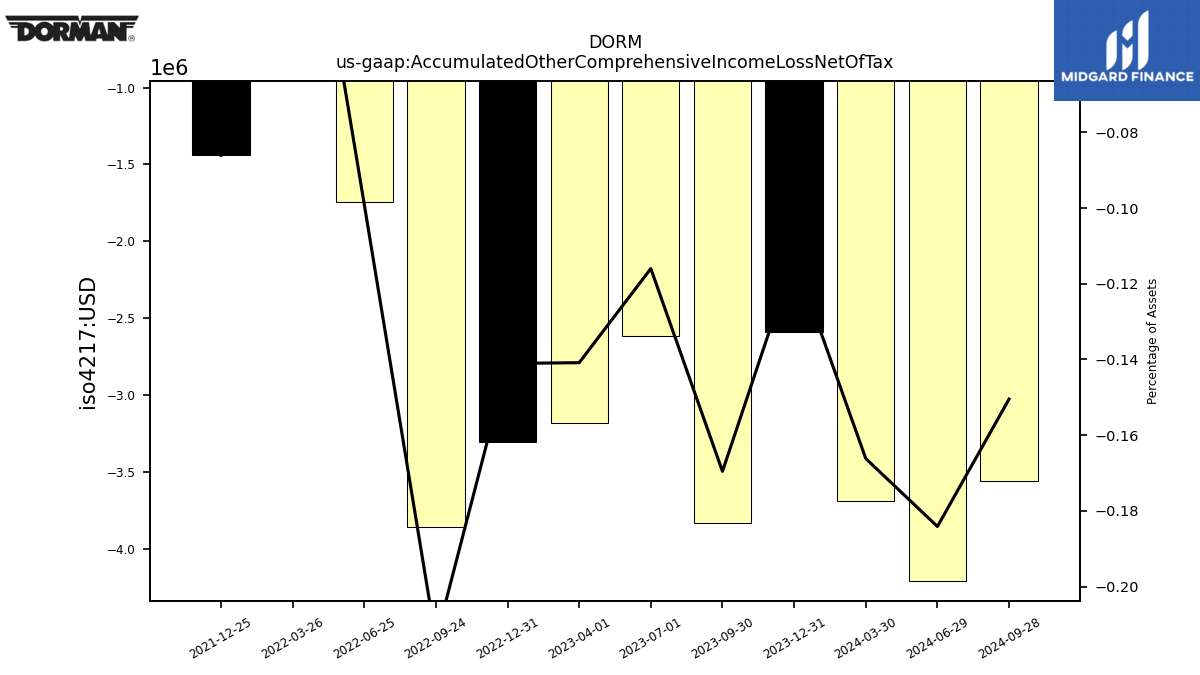
| Accumulated Other Comprehensive Income Loss Net Of Tax | -2.59 | -3.83 | -2.62 | -3.18 | -3.30 | -3.85 | -1.74 | 0.26 | -1.44 | NA | NA | NA | NA | NA | NA | NA | NA | NA | NA | NA | NA | NA | NA | NA | NA | NA | NA | NA | NA | NA | NA | NA | NA | NA | NA | NA | NA | NA | NA | NA | NA | NA | NA | NA | NA | NA | NA | NA | NA | NA | NA | NA | NA | NA | NA | |
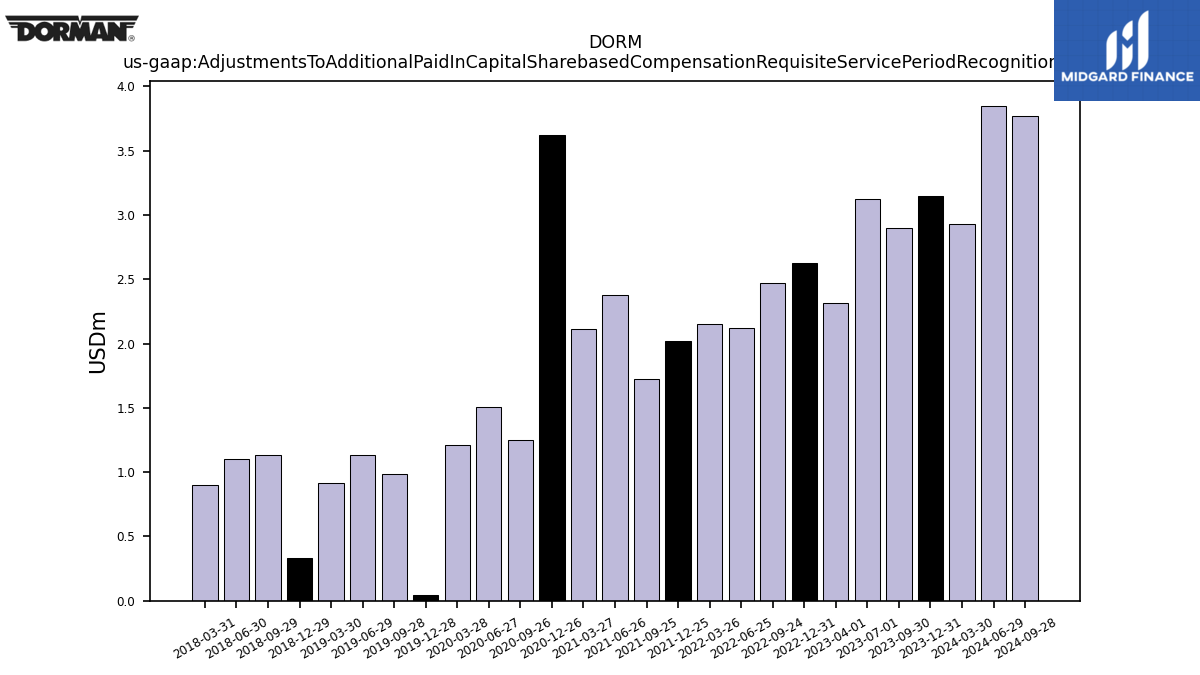
| Adjustments To Additional Paid In Capital Sharebased Compensation Requisite Service Period Recognition Value | 3.15 | 2.90 | 3.12 | 2.31 | 2.63 | 2.47 | 2.12 | 2.15 | 2.02 | 1.72 | 2.38 | 2.11 | 3.62 | 1.25 | 1.50 | 1.21 | 0.04 | 0.99 | 1.13 | 0.92 | 0.33 | 1.13 | 1.10 | 0.90 | NA | NA | NA | NA | NA | NA | NA | NA | NA | NA | NA | NA | NA | NA | NA | NA | NA | NA | NA | NA | NA | NA | NA | NA | NA | NA | NA | NA | NA | NA | NA |
| 2023-12-31 | 2023-09-30 | 2023-07-01 | 2023-04-01 | 2022-12-31 | 2022-09-24 | 2022-06-25 | 2022-03-26 | 2021-12-25 | 2021-09-25 | 2021-06-26 | 2021-03-27 | 2020-12-26 | 2020-09-26 | 2020-06-27 | 2020-03-28 | 2019-12-28 | 2019-09-28 | 2019-06-29 | 2019-03-30 | 2018-12-29 | 2018-09-29 | 2018-06-30 | 2018-03-31 | 2017-12-30 | 2017-09-30 | 2017-07-01 | 2017-04-01 | 2016-12-31 | 2016-09-24 | 2016-06-25 | 2016-03-26 | 2015-12-26 | 2015-09-26 | 2015-06-27 | 2015-03-28 | 2014-12-27 | 2014-09-27 | 2014-06-28 | 2014-03-29 | 2013-12-28 | 2013-09-28 | 2013-06-29 | 2013-03-30 | 2012-12-29 | 2012-09-29 | 2012-06-30 | 2012-03-31 | 2011-12-31 | 2011-09-24 | 2011-06-25 | 2011-03-26 | 2010-12-25 | 2010-09-25 | 2010-06-26 | ||
|---|---|---|---|---|---|---|---|---|---|---|---|---|---|---|---|---|---|---|---|---|---|---|---|---|---|---|---|---|---|---|---|---|---|---|---|---|---|---|---|---|---|---|---|---|---|---|---|---|---|---|---|---|---|---|---|---|
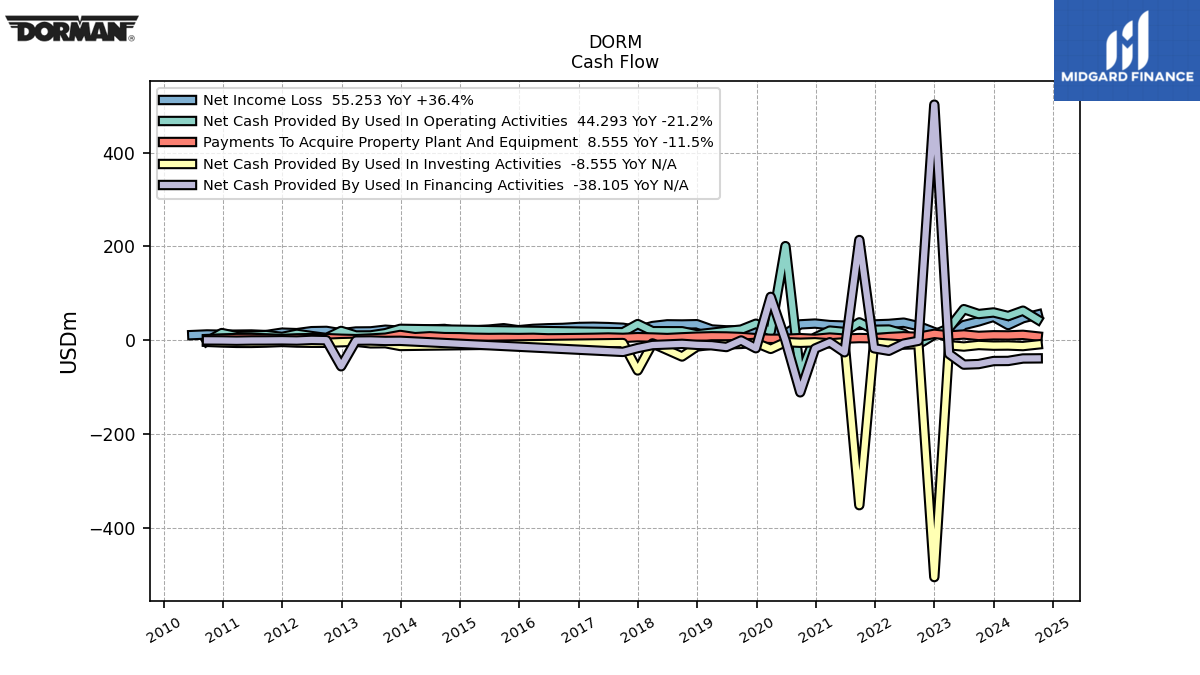
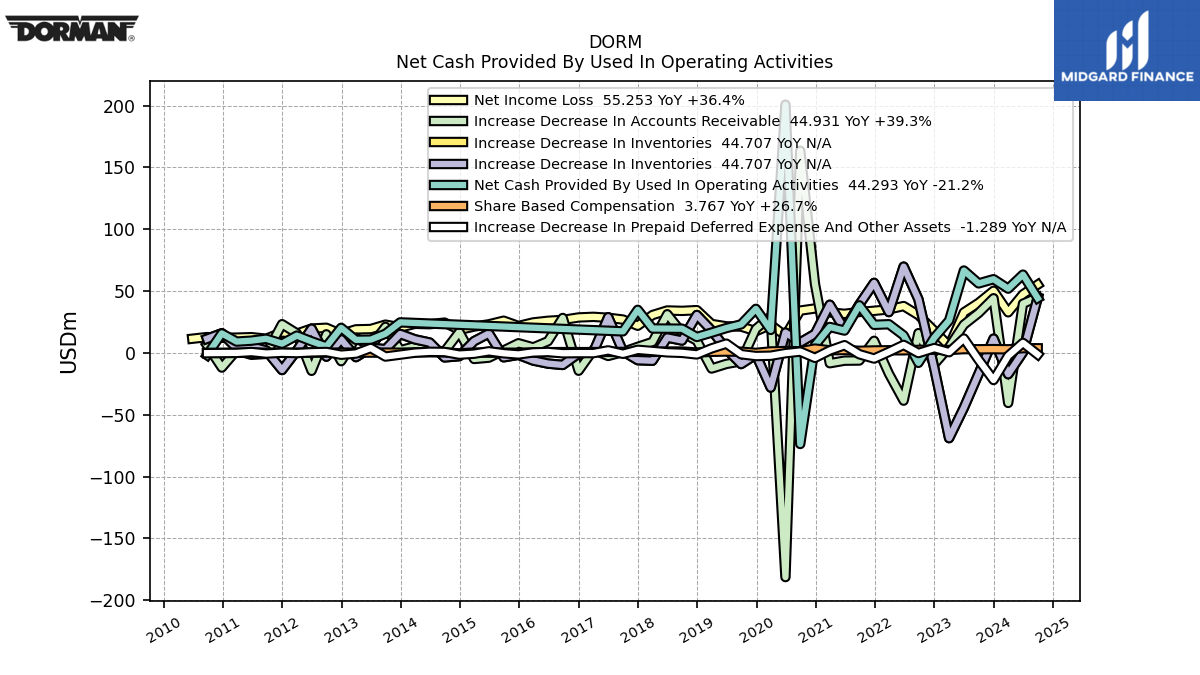
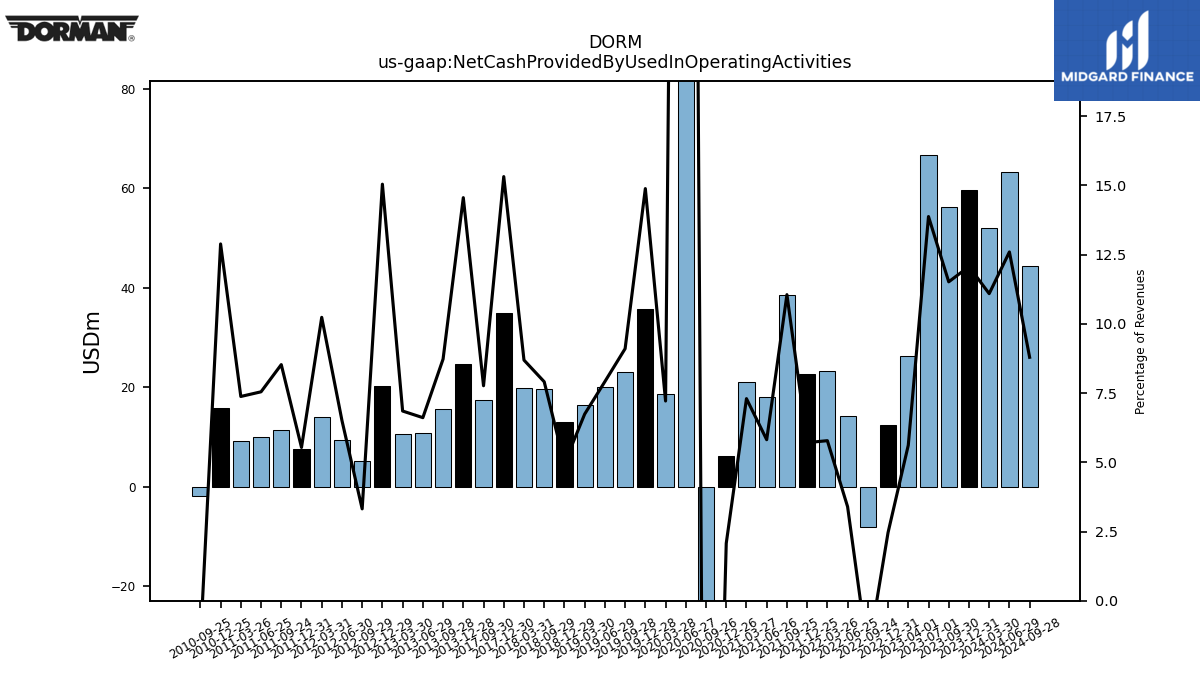
| Net Cash Provided By Used In Operating Activities | 59.65 | 56.22 | 66.68 | 26.21 | 12.34 | -8.04 | 14.17 | 23.21 | 22.74 | 38.51 | 18.07 | 21.02 | 6.25 | -73.68 | 200.81 | 18.59 | 35.66 | 23.10 | 20.12 | 16.43 | 12.90 | 19.61 | NA | 19.75 | 34.88 | 17.44 | NA | NA | NA | NA | NA | NA | NA | NA | NA | NA | NA | NA | NA | NA | 24.72 | 15.53 | 10.73 | 10.58 | 20.31 | 5.19 | 9.39 | 14.03 | 7.51 | 11.45 | 9.93 | 9.18 | 15.79 | -1.82 | NA | |
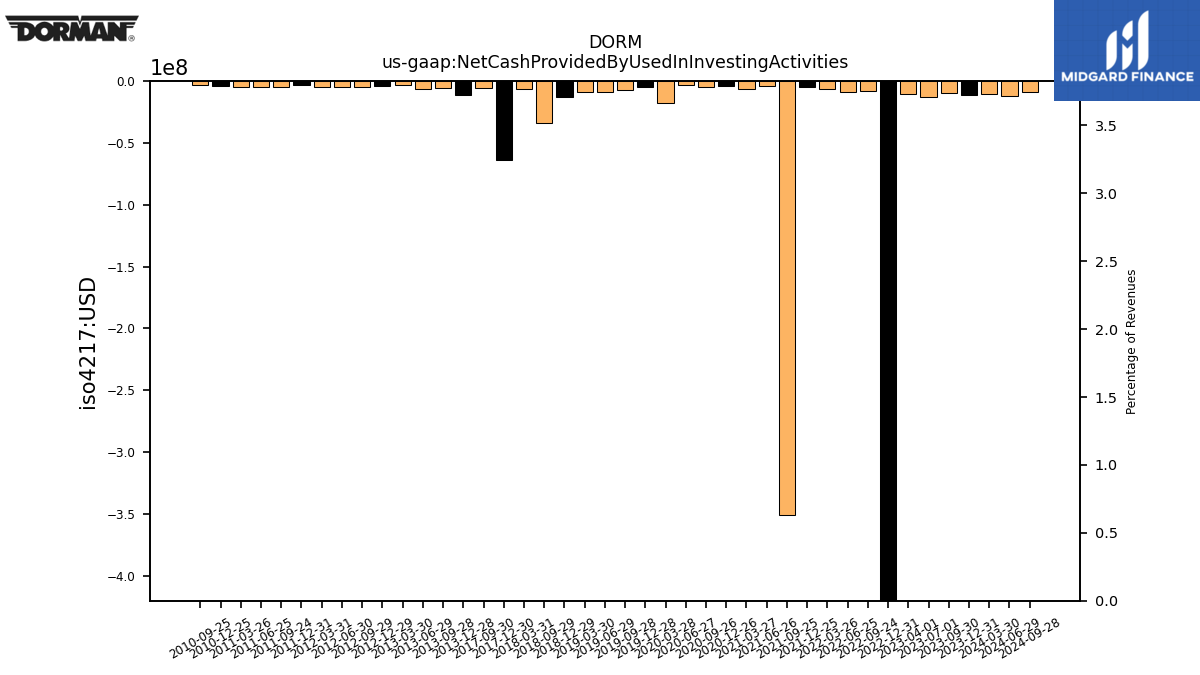
| Net Cash Provided By Used In Investing Activities | -11.03 | -9.67 | -12.93 | -10.27 | -503.65 | -7.68 | -8.85 | -6.65 | -4.57 | -350.60 | -3.95 | -6.21 | -3.89 | -4.92 | -3.48 | -17.97 | -4.90 | -7.32 | -8.50 | -8.84 | -13.01 | -34.16 | NA | -6.28 | -63.87 | -5.50 | NA | NA | NA | NA | NA | NA | NA | NA | NA | NA | NA | NA | NA | NA | -11.72 | -5.86 | -6.14 | -2.85 | -3.64 | -4.98 | -4.96 | -4.50 | -3.19 | -4.52 | -5.24 | -5.15 | -4.27 | -3.02 | NA | |
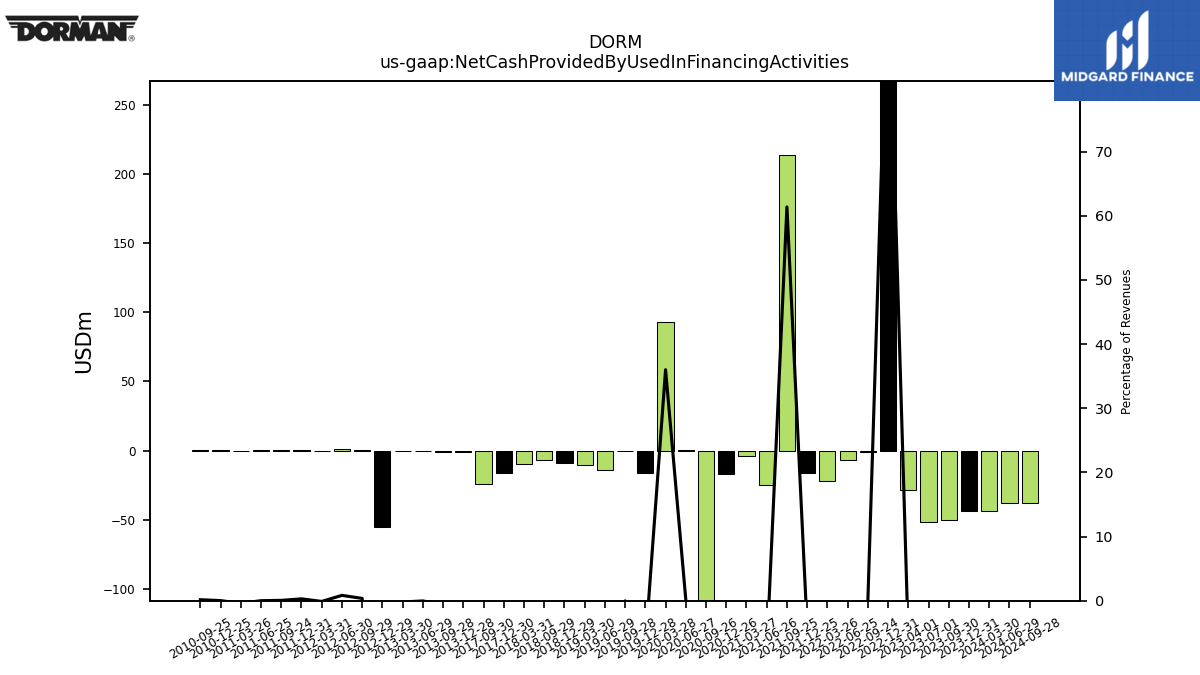
| Net Cash Provided By Used In Financing Activities | -43.80 | -50.21 | -51.43 | -28.66 | 501.91 | -0.72 | -6.72 | -21.96 | -16.62 | 213.83 | -25.18 | -3.79 | -17.28 | -110.46 | 0.45 | 92.80 | -16.57 | -0.04 | -13.99 | -10.26 | -9.31 | -7.20 | NA | -9.77 | -16.14 | -24.35 | NA | NA | NA | NA | NA | NA | NA | NA | NA | NA | NA | NA | NA | NA | -0.74 | -1.02 | -0.05 | -0.29 | -55.03 | 0.57 | 1.21 | -0.14 | 0.40 | 0.08 | 0.01 | -0.50 | 0.03 | 0.19 | NA |
| 2023-12-31 | 2023-09-30 | 2023-07-01 | 2023-04-01 | 2022-12-31 | 2022-09-24 | 2022-06-25 | 2022-03-26 | 2021-12-25 | 2021-09-25 | 2021-06-26 | 2021-03-27 | 2020-12-26 | 2020-09-26 | 2020-06-27 | 2020-03-28 | 2019-12-28 | 2019-09-28 | 2019-06-29 | 2019-03-30 | 2018-12-29 | 2018-09-29 | 2018-06-30 | 2018-03-31 | 2017-12-30 | 2017-09-30 | 2017-07-01 | 2017-04-01 | 2016-12-31 | 2016-09-24 | 2016-06-25 | 2016-03-26 | 2015-12-26 | 2015-09-26 | 2015-06-27 | 2015-03-28 | 2014-12-27 | 2014-09-27 | 2014-06-28 | 2014-03-29 | 2013-12-28 | 2013-09-28 | 2013-06-29 | 2013-03-30 | 2012-12-29 | 2012-09-29 | 2012-06-30 | 2012-03-31 | 2011-12-31 | 2011-09-24 | 2011-06-25 | 2011-03-26 | 2010-12-25 | 2010-09-25 | 2010-06-26 | ||
|---|---|---|---|---|---|---|---|---|---|---|---|---|---|---|---|---|---|---|---|---|---|---|---|---|---|---|---|---|---|---|---|---|---|---|---|---|---|---|---|---|---|---|---|---|---|---|---|---|---|---|---|---|---|---|---|---|
| Net Cash Provided By Used In Operating Activities | 59.65 | 56.22 | 66.68 | 26.21 | 12.34 | -8.04 | 14.17 | 23.21 | 22.74 | 38.51 | 18.07 | 21.02 | 6.25 | -73.68 | 200.81 | 18.59 | 35.66 | 23.10 | 20.12 | 16.43 | 12.90 | 19.61 | NA | 19.75 | 34.88 | 17.44 | NA | NA | NA | NA | NA | NA | NA | NA | NA | NA | NA | NA | NA | NA | 24.72 | 15.53 | 10.73 | 10.58 | 20.31 | 5.19 | 9.39 | 14.03 | 7.51 | 11.45 | 9.93 | 9.18 | 15.79 | -1.82 | NA | |
| Net Income Loss | 50.28 | 40.52 | 32.77 | 5.68 | 17.84 | 30.60 | 37.91 | 35.21 | 34.08 | 33.10 | 31.62 | 32.73 | 35.95 | 34.26 | 13.88 | 22.77 | 17.55 | 21.31 | 21.50 | 23.41 | 34.60 | 34.02 | 34.34 | 30.65 | 21.97 | 27.01 | 28.44 | 29.19 | 28.70 | 26.70 | 25.98 | 24.67 | 21.79 | 26.06 | 23.14 | 21.34 | 18.66 | 24.54 | 23.24 | 23.55 | 20.62 | 22.89 | 19.34 | 19.07 | 15.30 | 20.34 | 19.74 | 15.58 | 16.64 | 11.50 | 12.75 | 12.39 | 12.22 | 12.82 | 11.48 | |
| Profit Loss | 50.28 | 40.52 | 32.77 | 5.68 | 17.84 | 30.60 | 37.91 | 35.21 | 34.08 | 33.10 | 31.62 | 32.73 | 35.95 | 34.26 | 13.88 | 22.77 | 17.55 | 21.31 | 21.50 | 23.41 | 34.60 | 34.02 | NA | 30.65 | 21.97 | 27.01 | NA | NA | NA | NA | NA | NA | NA | NA | NA | NA | NA | NA | NA | NA | NA | NA | NA | NA | NA | NA | NA | NA | NA | NA | NA | NA | NA | NA | NA | |
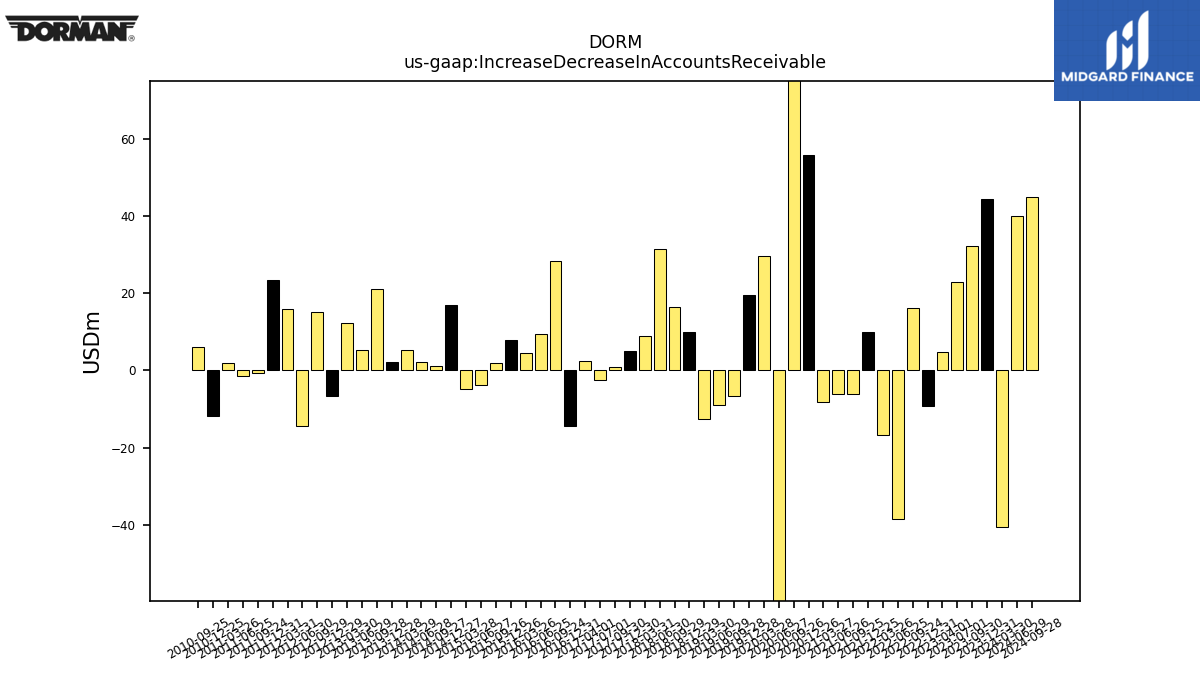
| Increase Decrease In Accounts Receivable | 44.23 | 32.26 | 22.85 | 4.67 | -9.15 | 16.02 | -38.61 | -16.73 | 9.83 | -6.14 | -6.27 | -8.34 | 55.68 | 163.50 | -181.31 | 29.49 | 19.47 | -6.78 | -8.89 | -12.61 | 9.92 | 16.30 | 31.30 | 8.88 | 4.92 | 0.76 | -2.44 | 2.47 | -14.40 | 28.30 | 9.46 | 4.47 | 7.84 | 2.02 | -3.83 | -4.88 | 16.90 | 1.18 | 2.10 | 5.38 | 2.17 | 21.12 | 5.21 | 12.29 | -6.68 | 15.06 | -14.49 | 15.85 | 23.27 | -0.77 | -1.53 | 2.00 | -11.86 | 6.15 | NA | |
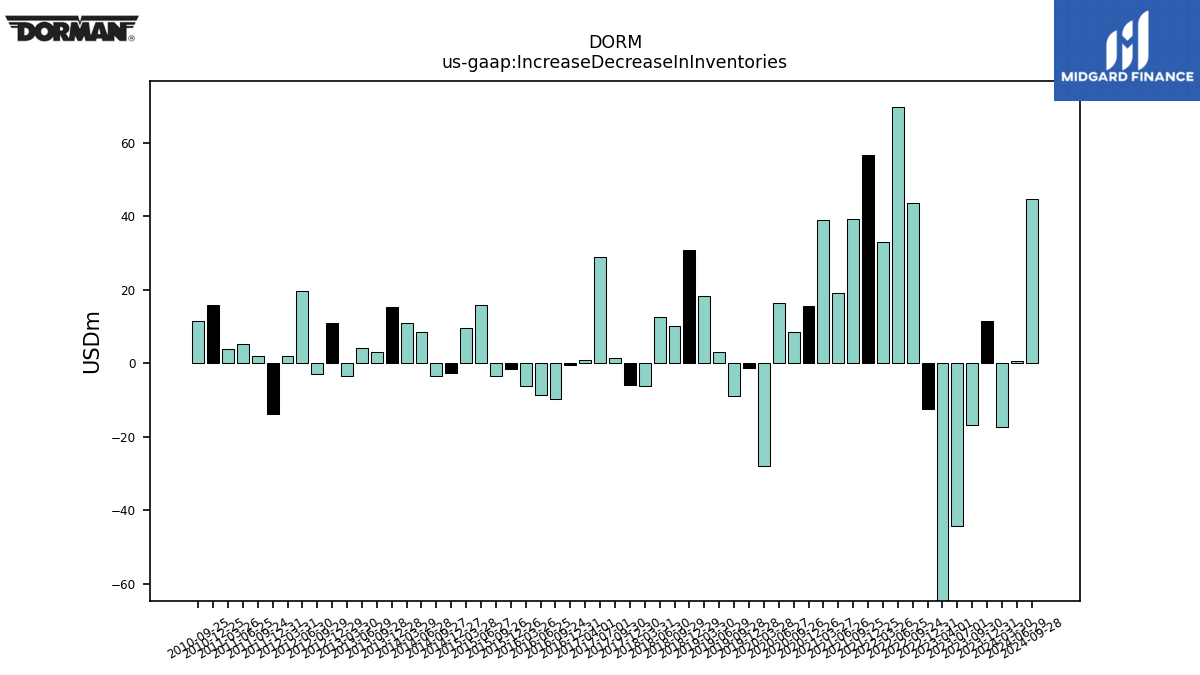
| Increase Decrease In Inventories | 11.55 | -16.82 | -44.40 | -68.94 | -12.49 | 43.45 | 69.79 | 33.03 | 56.67 | 39.12 | 19.06 | 38.98 | 15.43 | 8.47 | 16.45 | -28.02 | -1.27 | -9.00 | 3.05 | 18.18 | 30.69 | 10.02 | 12.43 | -6.31 | -5.84 | 1.30 | 28.87 | 0.82 | -0.39 | -9.73 | -8.61 | -6.14 | -1.52 | -3.53 | 15.74 | 9.52 | -2.60 | -3.61 | 8.38 | 10.96 | 15.32 | 3.02 | 4.10 | -3.40 | 10.97 | -3.00 | 19.57 | 1.86 | -13.83 | 2.01 | 5.16 | 3.87 | 15.88 | 11.46 | NA | |
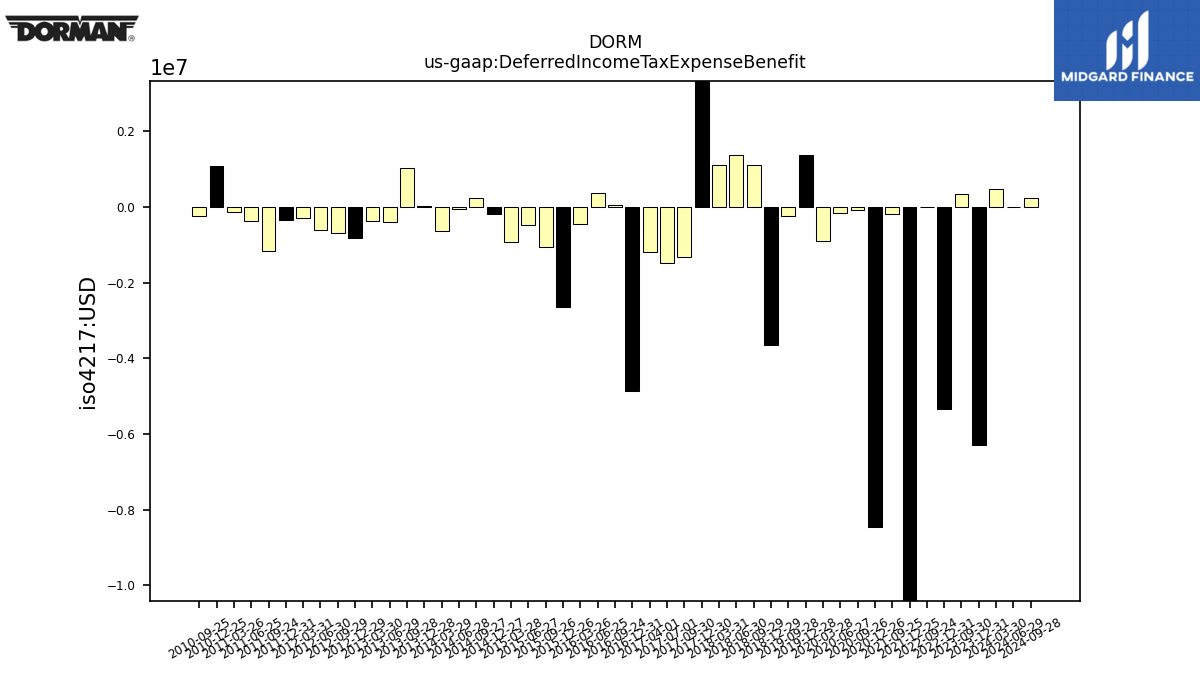
| Deferred Income Tax Expense Benefit | -6.28 | 0.34 | NA | NA | -5.33 | 0.01 | NA | NA | -11.56 | -0.20 | NA | NA | -8.45 | -0.08 | -0.16 | -0.91 | 1.36 | -0.24 | NA | NA | -3.64 | 1.11 | 1.36 | 1.11 | 8.67 | -1.33 | -1.48 | -1.19 | -4.86 | 0.06 | 0.36 | -0.44 | -2.64 | -1.05 | -0.49 | -0.93 | -0.20 | 0.24 | -0.05 | -0.63 | 0.03 | 1.02 | -0.41 | -0.38 | -0.82 | -0.68 | -0.60 | -0.28 | -0.35 | -1.17 | -0.36 | -0.12 | 1.09 | -0.24 | NA | |
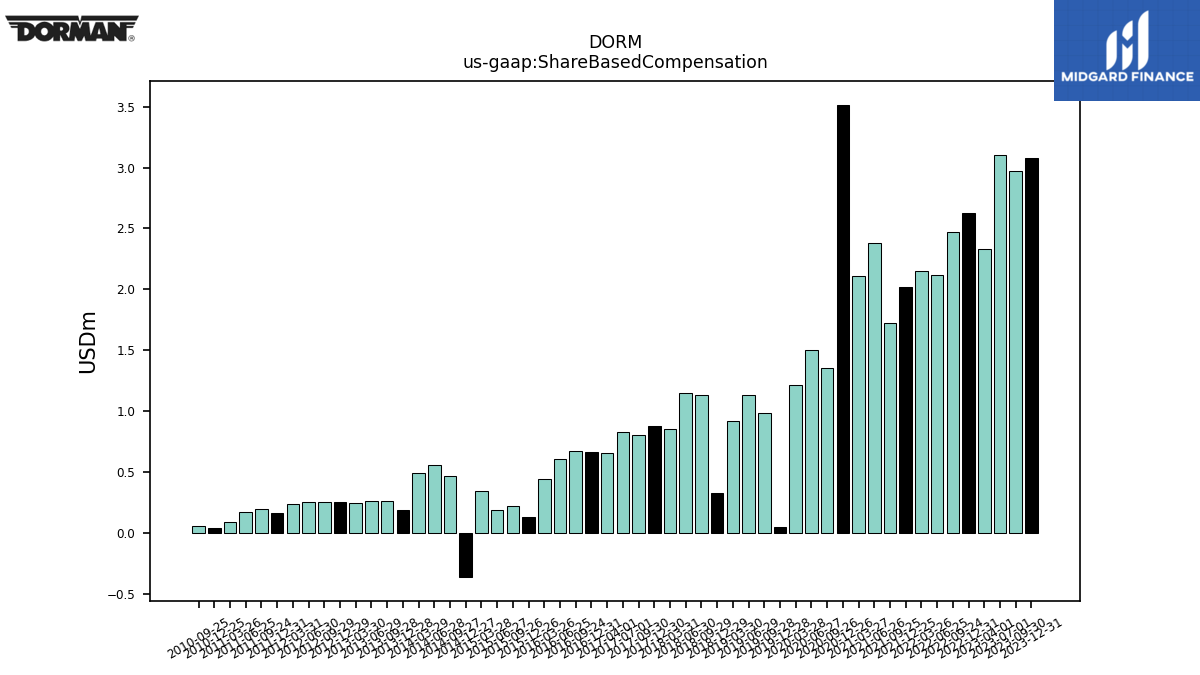
| Share Based Compensation | 3.08 | 2.97 | 3.10 | 2.33 | 2.63 | 2.47 | 2.12 | 2.15 | 2.02 | 1.72 | 2.38 | 2.11 | 3.52 | 1.35 | 1.50 | 1.21 | 0.04 | 0.99 | 1.13 | 0.92 | 0.33 | 1.13 | 1.15 | 0.85 | 0.88 | 0.80 | 0.82 | 0.65 | 0.66 | 0.67 | 0.61 | 0.44 | 0.13 | 0.22 | 0.19 | 0.34 | -0.36 | 0.47 | 0.55 | 0.49 | 0.19 | 0.26 | 0.26 | 0.25 | 0.26 | 0.26 | 0.26 | 0.24 | 0.17 | 0.20 | 0.17 | 0.09 | 0.04 | 0.06 | NA |
| 2023-12-31 | 2023-09-30 | 2023-07-01 | 2023-04-01 | 2022-12-31 | 2022-09-24 | 2022-06-25 | 2022-03-26 | 2021-12-25 | 2021-09-25 | 2021-06-26 | 2021-03-27 | 2020-12-26 | 2020-09-26 | 2020-06-27 | 2020-03-28 | 2019-12-28 | 2019-09-28 | 2019-06-29 | 2019-03-30 | 2018-12-29 | 2018-09-29 | 2018-06-30 | 2018-03-31 | 2017-12-30 | 2017-09-30 | 2017-07-01 | 2017-04-01 | 2016-12-31 | 2016-09-24 | 2016-06-25 | 2016-03-26 | 2015-12-26 | 2015-09-26 | 2015-06-27 | 2015-03-28 | 2014-12-27 | 2014-09-27 | 2014-06-28 | 2014-03-29 | 2013-12-28 | 2013-09-28 | 2013-06-29 | 2013-03-30 | 2012-12-29 | 2012-09-29 | 2012-06-30 | 2012-03-31 | 2011-12-31 | 2011-09-24 | 2011-06-25 | 2011-03-26 | 2010-12-25 | 2010-09-25 | 2010-06-26 | ||
|---|---|---|---|---|---|---|---|---|---|---|---|---|---|---|---|---|---|---|---|---|---|---|---|---|---|---|---|---|---|---|---|---|---|---|---|---|---|---|---|---|---|---|---|---|---|---|---|---|---|---|---|---|---|---|---|---|
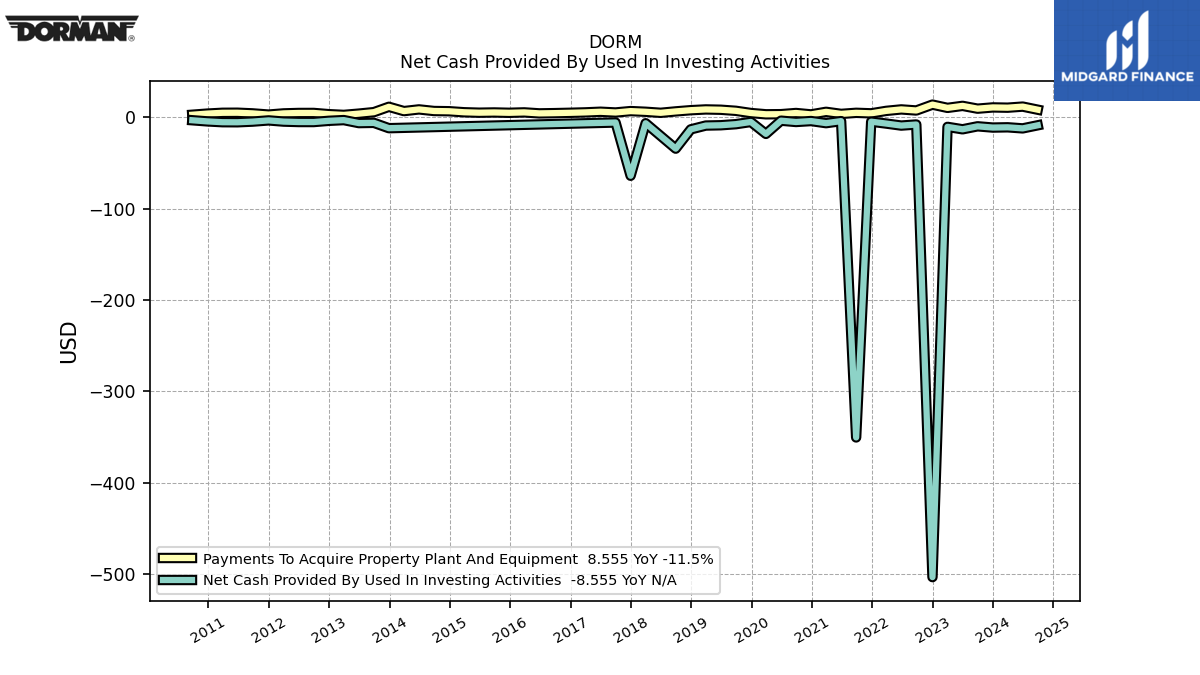
| Net Cash Provided By Used In Investing Activities | -11.03 | -9.67 | -12.93 | -10.27 | -503.65 | -7.68 | -8.85 | -6.65 | -4.57 | -350.60 | -3.95 | -6.21 | -3.89 | -4.92 | -3.48 | -17.97 | -4.90 | -7.32 | -8.50 | -8.84 | -13.01 | -34.16 | NA | -6.28 | -63.87 | -5.50 | NA | NA | NA | NA | NA | NA | NA | NA | NA | NA | NA | NA | NA | NA | -11.72 | -5.86 | -6.14 | -2.85 | -3.64 | -4.98 | -4.96 | -4.50 | -3.19 | -4.52 | -5.24 | -5.15 | -4.27 | -3.02 | NA | |
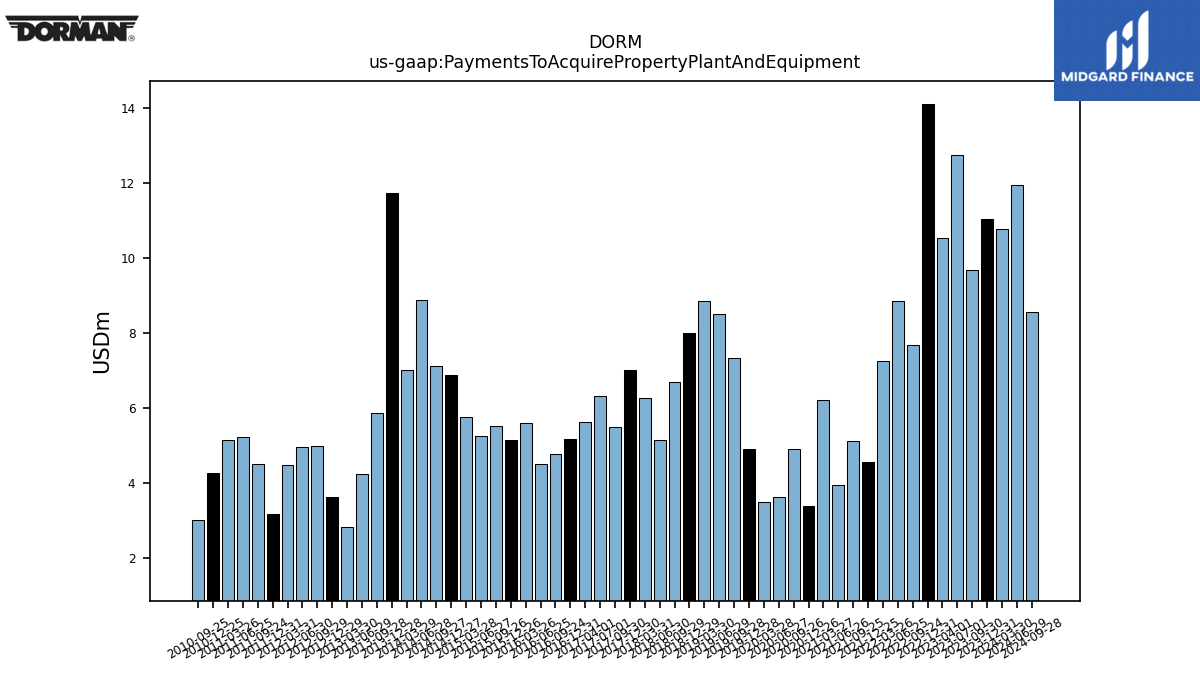
| Payments To Acquire Property Plant And Equipment | 11.03 | 9.67 | 12.73 | 10.54 | 14.10 | 7.68 | 8.85 | 7.25 | 4.57 | 5.12 | 3.95 | 6.21 | 3.39 | 4.92 | 3.64 | 3.50 | 4.90 | 7.32 | 8.50 | 8.84 | 8.01 | 6.68 | 5.14 | 6.28 | 7.01 | 5.50 | 6.31 | 5.62 | 5.17 | 4.77 | 4.52 | 5.60 | 5.15 | 5.52 | 5.27 | 5.75 | 6.87 | 7.11 | 8.87 | 7.01 | 11.72 | 5.86 | 4.24 | 2.85 | 3.64 | 4.98 | 4.96 | 4.50 | 3.19 | 4.52 | 5.24 | 5.15 | 4.27 | 3.02 | NA |
| 2023-12-31 | 2023-09-30 | 2023-07-01 | 2023-04-01 | 2022-12-31 | 2022-09-24 | 2022-06-25 | 2022-03-26 | 2021-12-25 | 2021-09-25 | 2021-06-26 | 2021-03-27 | 2020-12-26 | 2020-09-26 | 2020-06-27 | 2020-03-28 | 2019-12-28 | 2019-09-28 | 2019-06-29 | 2019-03-30 | 2018-12-29 | 2018-09-29 | 2018-06-30 | 2018-03-31 | 2017-12-30 | 2017-09-30 | 2017-07-01 | 2017-04-01 | 2016-12-31 | 2016-09-24 | 2016-06-25 | 2016-03-26 | 2015-12-26 | 2015-09-26 | 2015-06-27 | 2015-03-28 | 2014-12-27 | 2014-09-27 | 2014-06-28 | 2014-03-29 | 2013-12-28 | 2013-09-28 | 2013-06-29 | 2013-03-30 | 2012-12-29 | 2012-09-29 | 2012-06-30 | 2012-03-31 | 2011-12-31 | 2011-09-24 | 2011-06-25 | 2011-03-26 | 2010-12-25 | 2010-09-25 | 2010-06-26 | ||
|---|---|---|---|---|---|---|---|---|---|---|---|---|---|---|---|---|---|---|---|---|---|---|---|---|---|---|---|---|---|---|---|---|---|---|---|---|---|---|---|---|---|---|---|---|---|---|---|---|---|---|---|---|---|---|---|---|
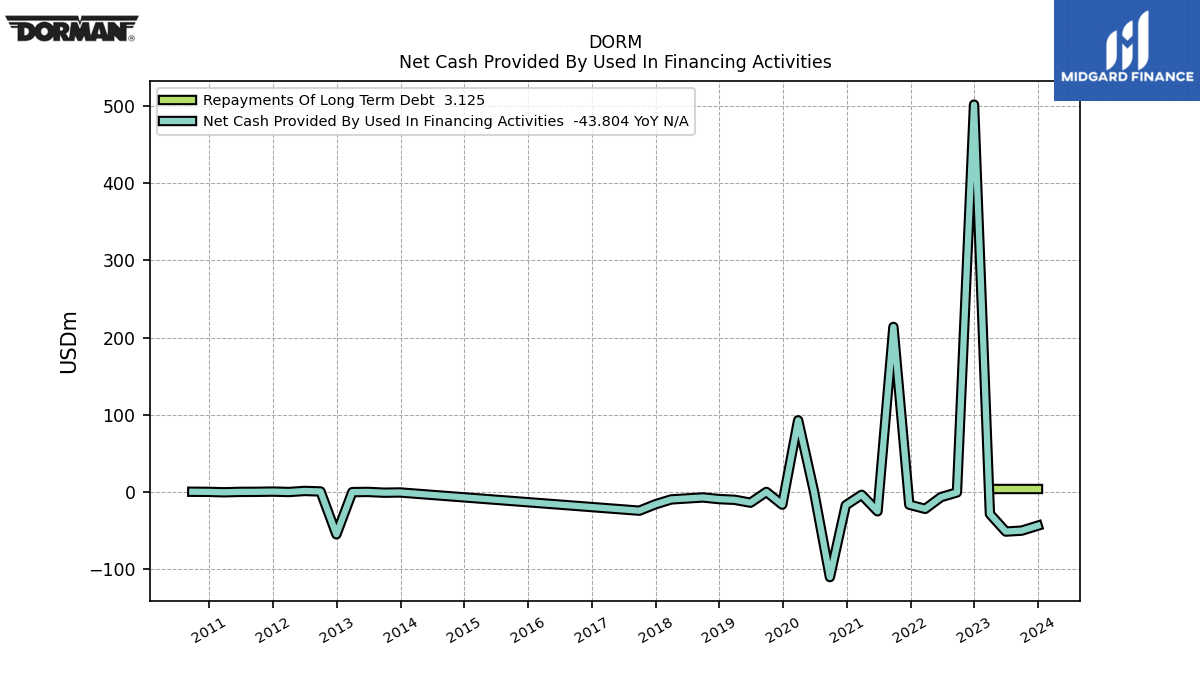
| Net Cash Provided By Used In Financing Activities | -43.80 | -50.21 | -51.43 | -28.66 | 501.91 | -0.72 | -6.72 | -21.96 | -16.62 | 213.83 | -25.18 | -3.79 | -17.28 | -110.46 | 0.45 | 92.80 | -16.57 | -0.04 | -13.99 | -10.26 | -9.31 | -7.20 | NA | -9.77 | -16.14 | -24.35 | NA | NA | NA | NA | NA | NA | NA | NA | NA | NA | NA | NA | NA | NA | -0.74 | -1.02 | -0.05 | -0.29 | -55.03 | 0.57 | 1.21 | -0.14 | 0.40 | 0.08 | 0.01 | -0.50 | 0.03 | 0.19 | NA |
| 2023-12-31 | 2023-09-30 | 2023-07-01 | 2023-04-01 | 2022-12-31 | 2022-09-24 | 2022-06-25 | 2022-03-26 | 2021-12-25 | 2021-09-25 | 2021-06-26 | 2021-03-27 | 2020-12-26 | 2020-09-26 | 2020-06-27 | 2020-03-28 | 2019-12-28 | 2019-09-28 | 2019-06-29 | 2019-03-30 | 2018-12-29 | 2018-09-29 | 2018-06-30 | 2018-03-31 | 2017-12-30 | 2017-09-30 | 2017-07-01 | 2017-04-01 | 2016-12-31 | 2016-09-24 | 2016-06-25 | 2016-03-26 | 2015-12-26 | 2015-09-26 | 2015-06-27 | 2015-03-28 | 2014-12-27 | 2014-09-27 | 2014-06-28 | 2014-03-29 | 2013-12-28 | 2013-09-28 | 2013-06-29 | 2013-03-30 | 2012-12-29 | 2012-09-29 | 2012-06-30 | 2012-03-31 | 2011-12-31 | 2011-09-24 | 2011-06-25 | 2011-03-26 | 2010-12-25 | 2010-09-25 | 2010-06-26 | ||
|---|---|---|---|---|---|---|---|---|---|---|---|---|---|---|---|---|---|---|---|---|---|---|---|---|---|---|---|---|---|---|---|---|---|---|---|---|---|---|---|---|---|---|---|---|---|---|---|---|---|---|---|---|---|---|---|---|
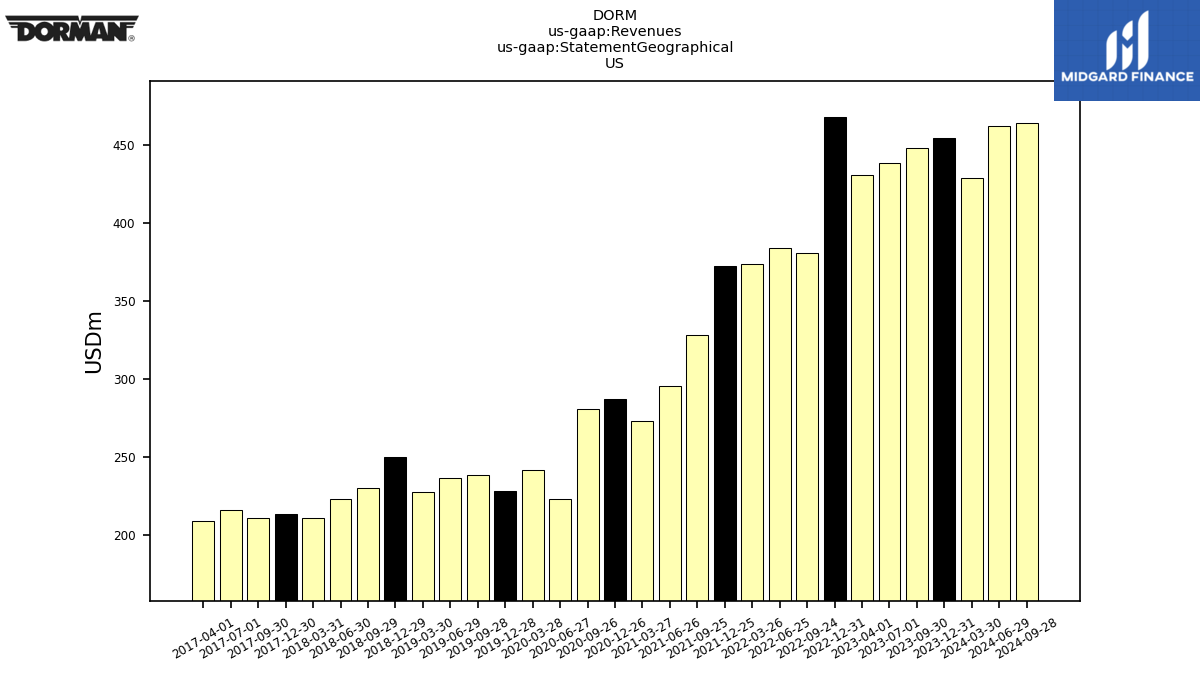
| Revenues | 494.30 | 488.19 | 480.57 | 466.74 | 501.28 | 413.47 | 417.42 | 401.58 | 398.18 | 348.43 | 310.63 | 288.01 | 301.22 | 300.62 | 233.18 | 257.73 | 239.57 | 253.80 | 254.18 | 243.79 | 260.34 | 247.95 | 238.15 | 227.26 | 227.72 | 224.62 | 229.26 | 221.62 | 229.10 | 212.79 | 209.57 | 208.15 | 204.83 | 210.93 | 198.72 | 188.47 | 173.98 | 197.80 | 196.19 | 183.51 | 169.81 | 177.95 | 162.26 | 154.44 | 135.01 | 156.41 | 144.17 | 137.04 | 135.64 | 134.24 | 131.62 | 124.37 | 122.52 | 119.21 | 115.01 | |
| US | 454.74 | 448.36 | 438.30 | 430.69 | 467.79 | 380.84 | 384.22 | 373.62 | 372.50 | 328.31 | 295.08 | 273.15 | 286.90 | 280.33 | 222.56 | 241.39 | 228.13 | 238.47 | 236.16 | 227.15 | 249.97 | 229.76 | 223.03 | 210.43 | 212.97 | 210.35 | 215.49 | 208.58 | NA | NA | NA | NA | NA | NA | NA | NA | NA | NA | NA | NA | NA | NA | NA | NA | NA | NA | NA | NA | NA | NA | NA | NA | NA | NA | NA | |
| Non Us | 39.56 | 39.83 | 42.27 | 36.05 | 33.49 | 32.63 | 33.20 | 27.96 | 25.67 | 20.11 | 15.55 | 14.86 | 14.32 | 20.29 | 10.62 | 16.34 | 11.44 | 15.33 | 18.01 | 16.64 | 10.37 | 18.19 | 15.12 | 16.84 | 14.75 | 14.27 | 13.77 | 13.04 | NA | NA | NA | NA | NA | NA | NA | NA | NA | NA | NA | NA | NA | NA | NA | NA | NA | NA | NA | NA | NA | NA | NA | NA | NA | NA | NA | |
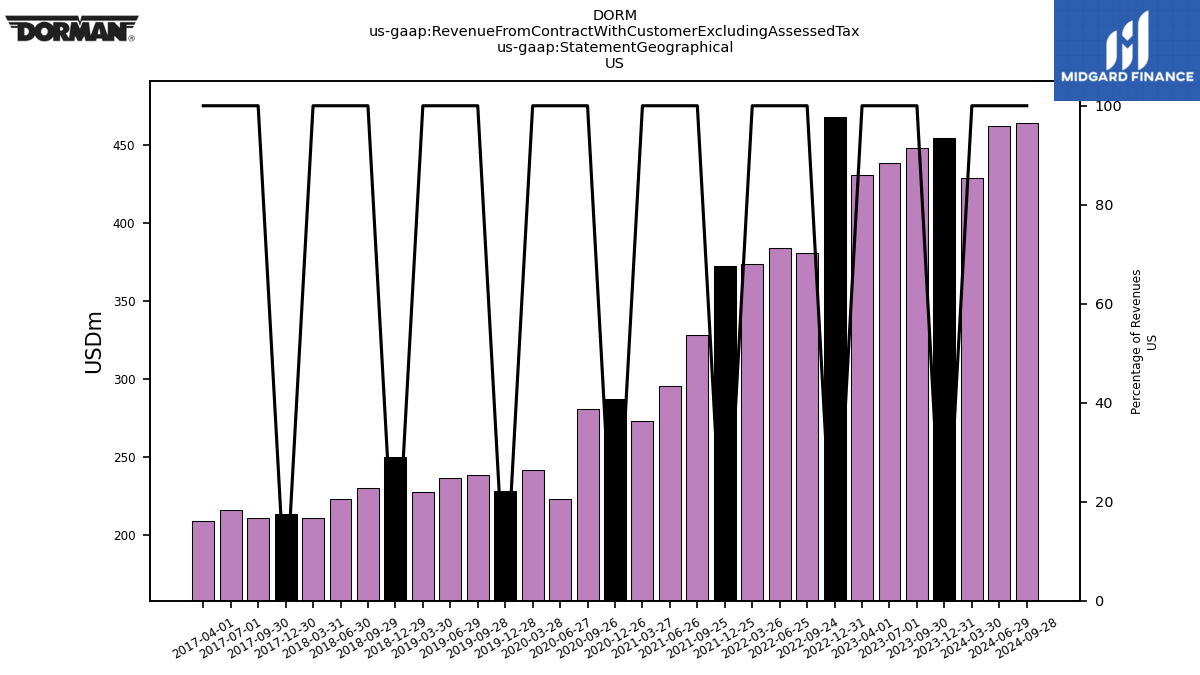
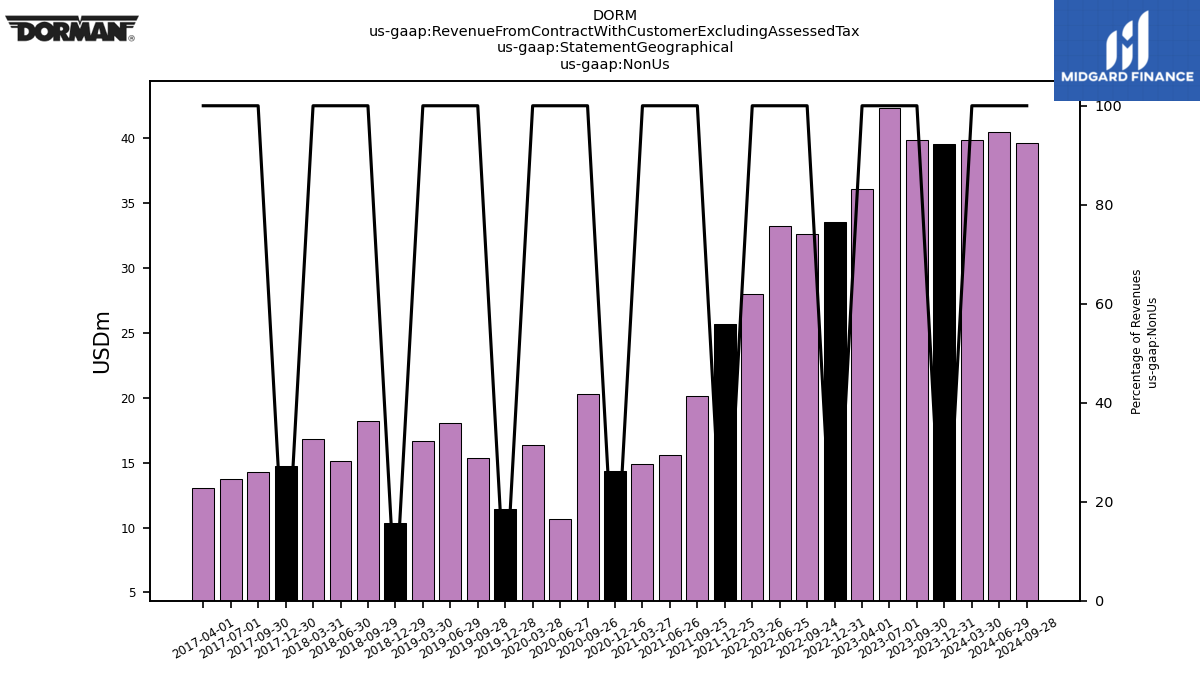
| Revenue From Contract With Customer Excluding Assessed Tax | 494.30 | 488.19 | 480.57 | 466.74 | 501.28 | 413.47 | 417.42 | 401.58 | 398.18 | 348.43 | 310.63 | 288.01 | 301.22 | 300.62 | 233.18 | 257.73 | 239.57 | 253.80 | 254.18 | 243.79 | 260.34 | 247.95 | 238.15 | 227.26 | 227.72 | 224.62 | 229.26 | 221.62 | 229.10 | 212.79 | 209.57 | 208.15 | 204.83 | 210.93 | 198.72 | 188.47 | 173.98 | 197.80 | 196.19 | 183.51 | 169.81 | 177.95 | 162.26 | 154.44 | 135.01 | 156.41 | 144.17 | 137.04 | 135.64 | 134.24 | 131.62 | 124.37 | 122.52 | 119.21 | 115.01 | |
| US | 454.74 | 448.36 | 438.30 | 430.69 | 467.79 | 380.84 | 384.22 | 373.62 | 372.50 | 328.31 | 295.08 | 273.15 | 286.90 | 280.33 | 222.56 | 241.39 | 228.13 | 238.47 | 236.16 | 227.15 | 249.97 | 229.76 | 223.03 | 210.43 | 212.97 | 210.35 | 215.49 | 208.58 | NA | NA | NA | NA | NA | NA | NA | NA | NA | NA | NA | NA | NA | NA | NA | NA | NA | NA | NA | NA | NA | NA | NA | NA | NA | NA | NA | |
| Non Us | 39.56 | 39.83 | 42.27 | 36.05 | 33.49 | 32.63 | 33.20 | 27.96 | 25.67 | 20.11 | 15.55 | 14.86 | 14.32 | 20.29 | 10.62 | 16.34 | 11.44 | 15.33 | 18.01 | 16.64 | 10.37 | 18.19 | 15.12 | 16.84 | 14.75 | 14.27 | 13.77 | 13.04 | NA | NA | NA | NA | NA | NA | NA | NA | NA | NA | NA | NA | NA | NA | NA | NA | NA | NA | NA | NA | NA | NA | NA | NA | NA | NA | NA |
