
| 2023-09-30 | 2023-06-30 | 2023-03-31 | 2022-12-31 | 2022-09-30 | 2022-06-30 | 2022-03-31 | 2021-12-31 | 2021-09-30 | 2021-06-30 | 2021-03-31 | 2020-12-31 | ||
|---|---|---|---|---|---|---|---|---|---|---|---|---|---|
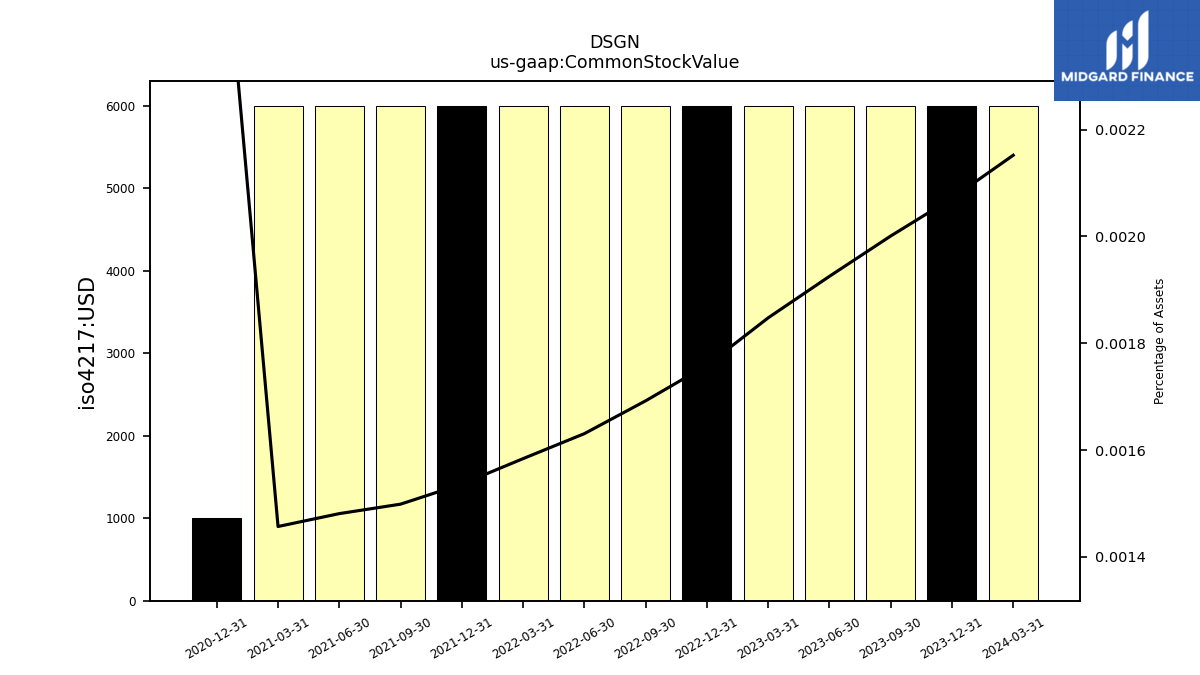
| Common Stock Value | 0.01 | 0.01 | 0.01 | 0.01 | 0.01 | 0.01 | 0.01 | 0.01 | 0.01 | 0.01 | 0.01 | 0.00 | |
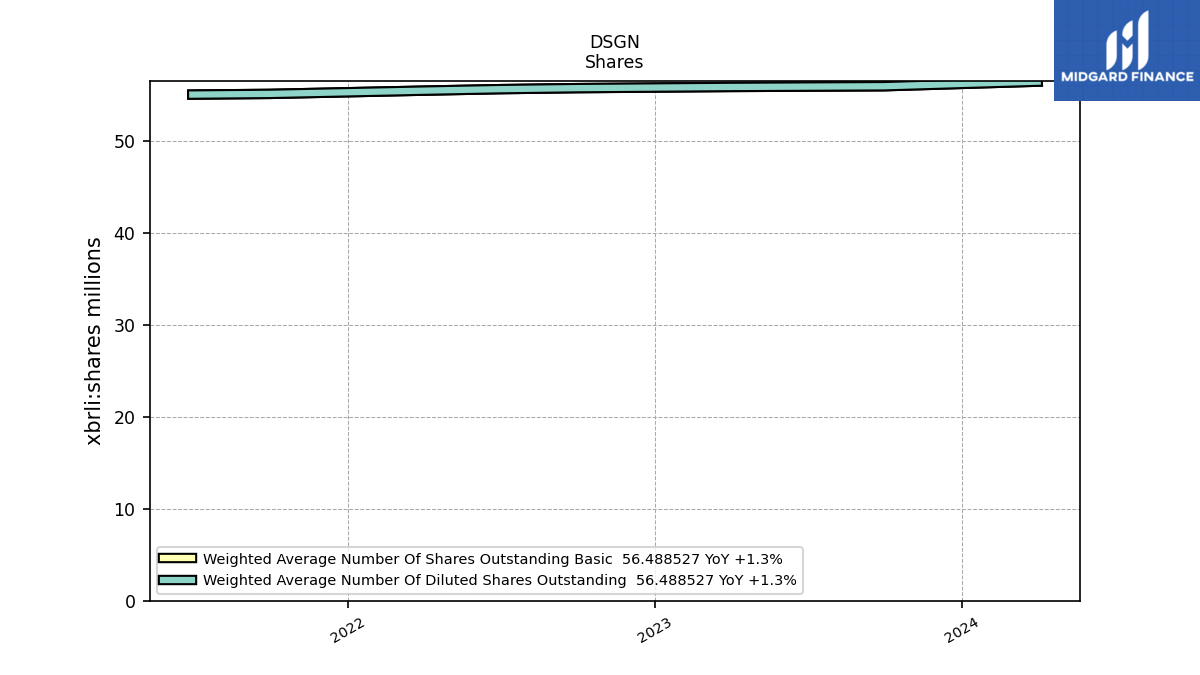
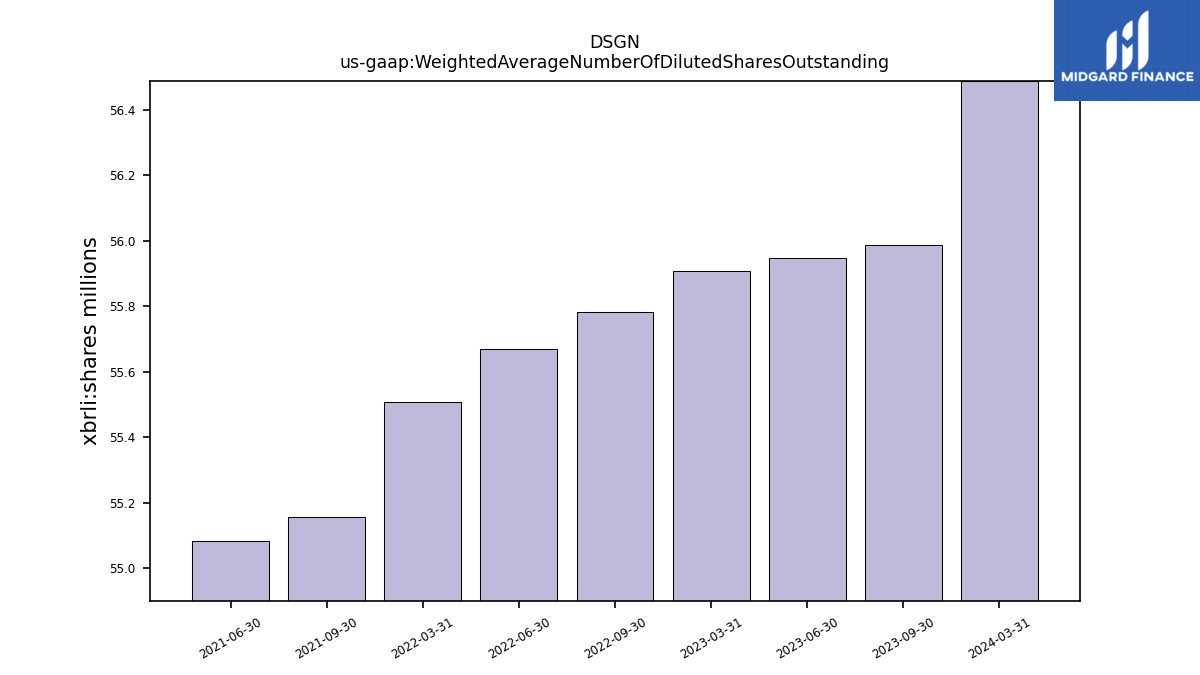
| Weighted Average Number Of Diluted Shares Outstanding | 55.99 | 55.95 | 55.91 | NA | 55.78 | 55.67 | 55.51 | NA | 55.16 | 55.08 | NA | NA | |
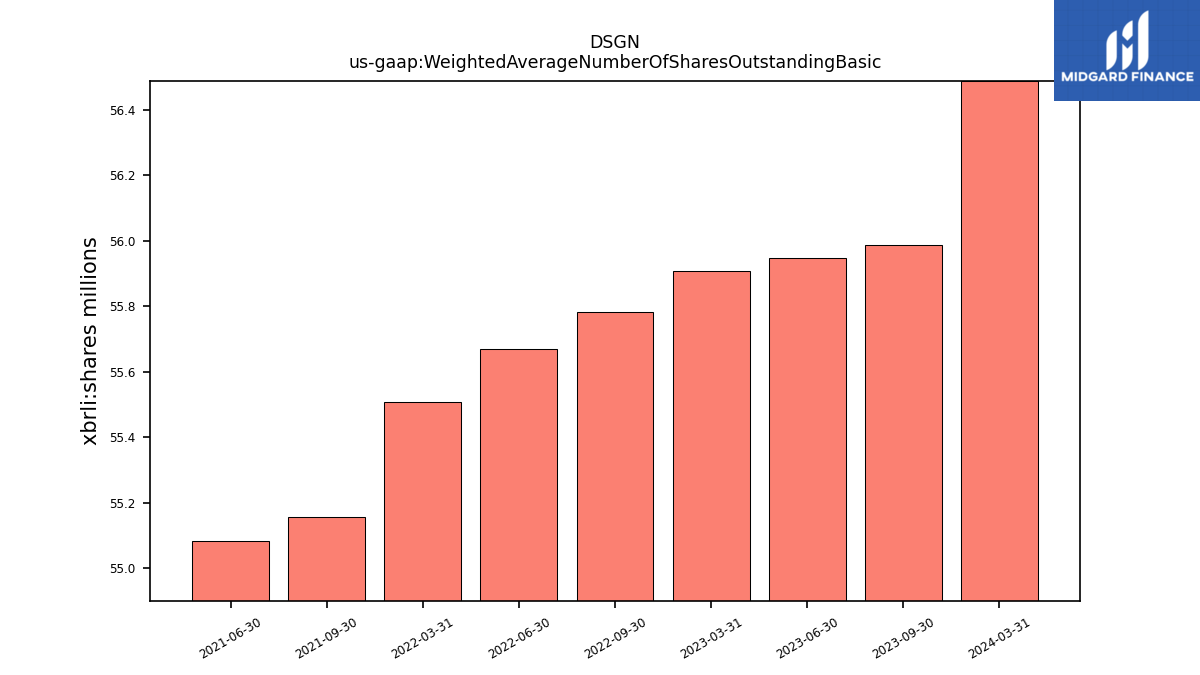
| Weighted Average Number Of Shares Outstanding Basic | 55.99 | 55.95 | 55.91 | NA | 55.78 | 55.67 | 55.51 | NA | 55.16 | 55.08 | NA | NA | |
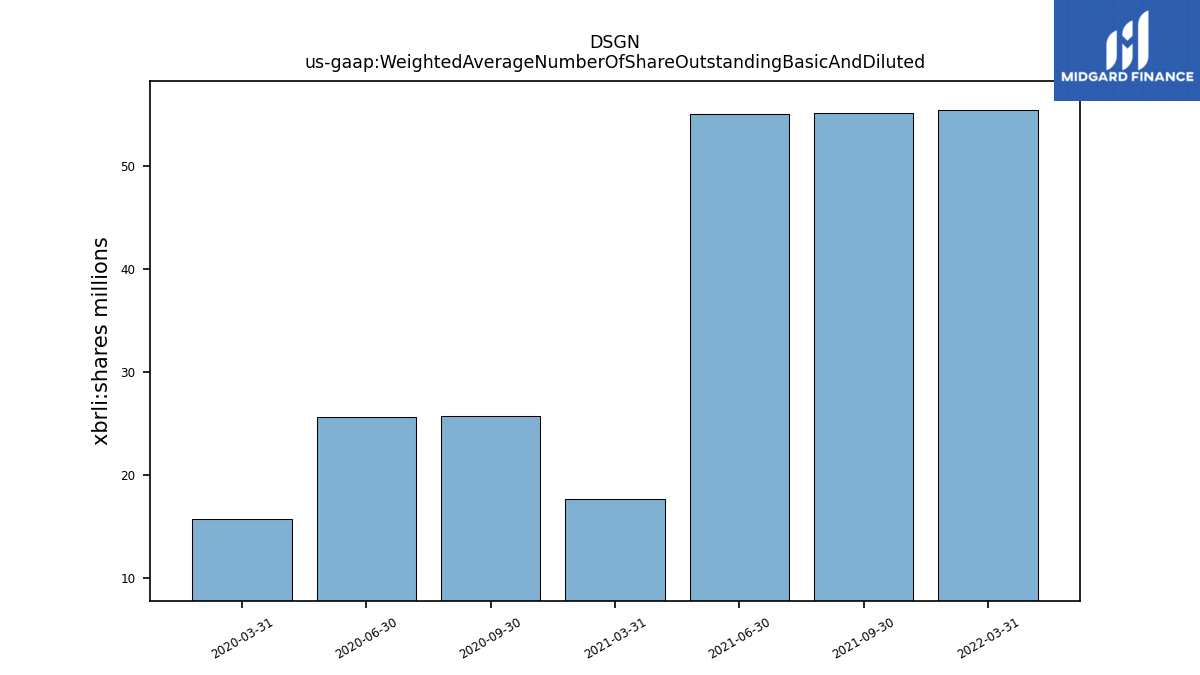
| Weighted Average Number Of Share Outstanding Basic And Diluted | NA | NA | NA | NA | NA | NA | 55.51 | NA | 55.16 | 55.08 | 17.63 | NA | |
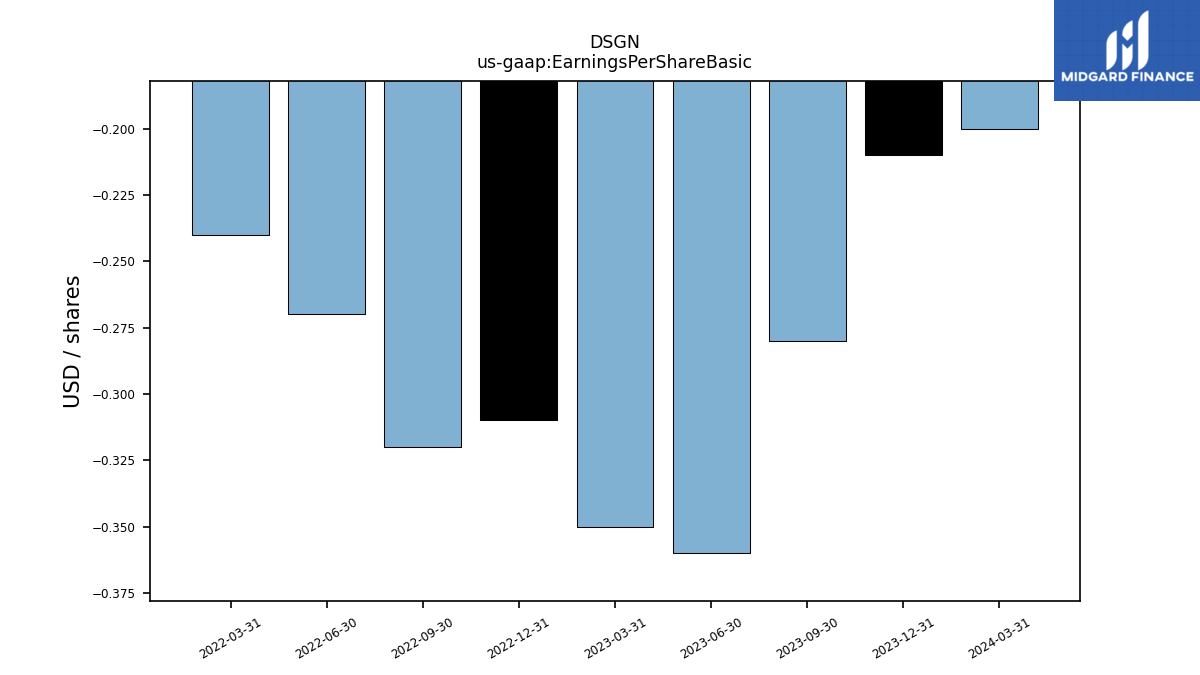
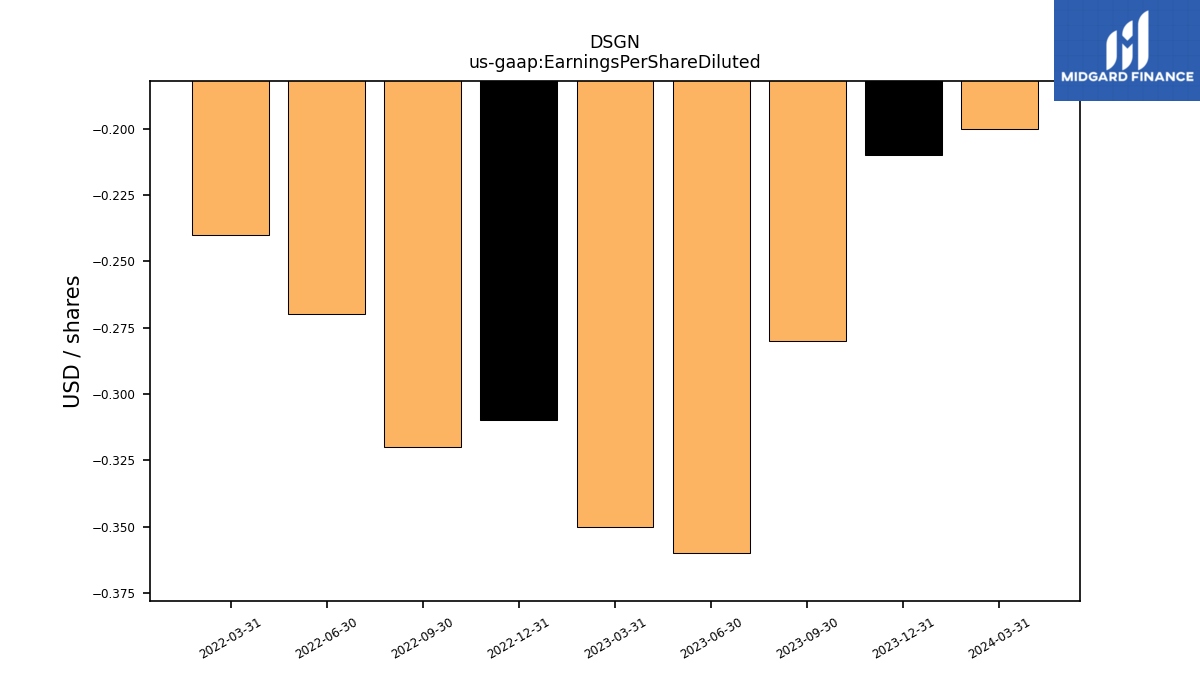
| Earnings Per Share Basic | -0.28 | -0.36 | -0.35 | -0.31 | -0.32 | -0.27 | -0.24 | NA | NA | NA | NA | NA | |
| Earnings Per Share Diluted | -0.28 | -0.36 | -0.35 | -0.31 | -0.32 | -0.27 | -0.24 | NA | NA | NA | NA | NA |
| 2023-09-30 | 2023-06-30 | 2023-03-31 | 2022-12-31 | 2022-09-30 | 2022-06-30 | 2022-03-31 | 2021-12-31 | 2021-09-30 | 2021-06-30 | 2021-03-31 | 2020-12-31 | ||
|---|---|---|---|---|---|---|---|---|---|---|---|---|---|
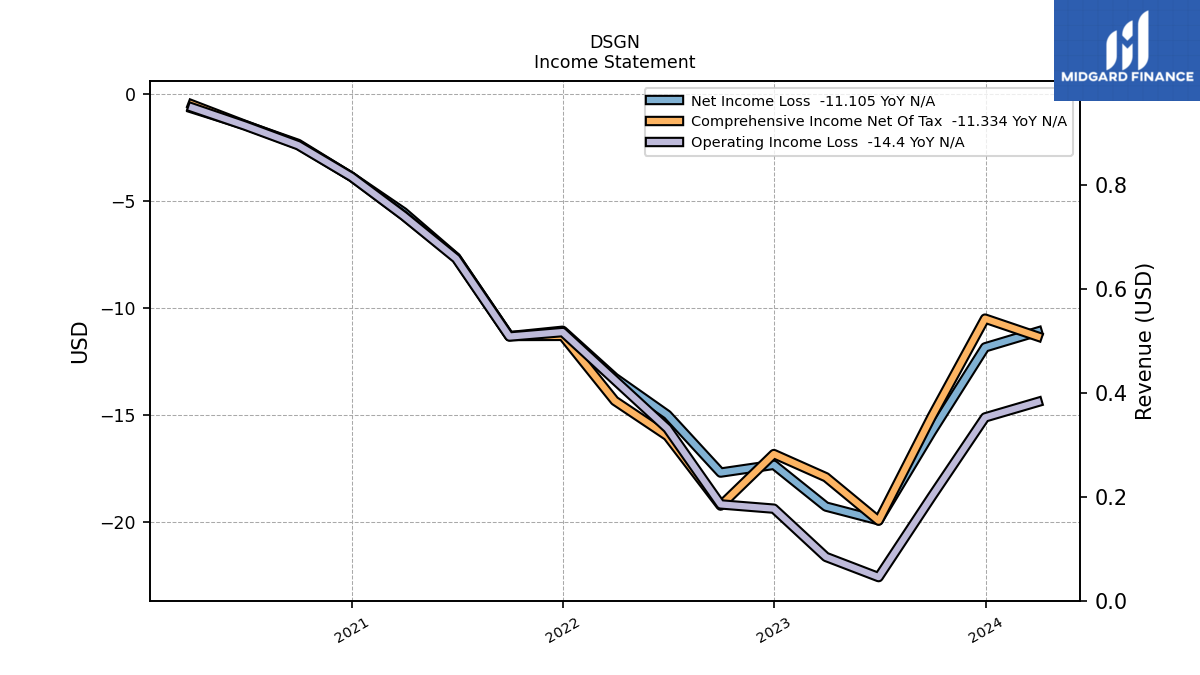
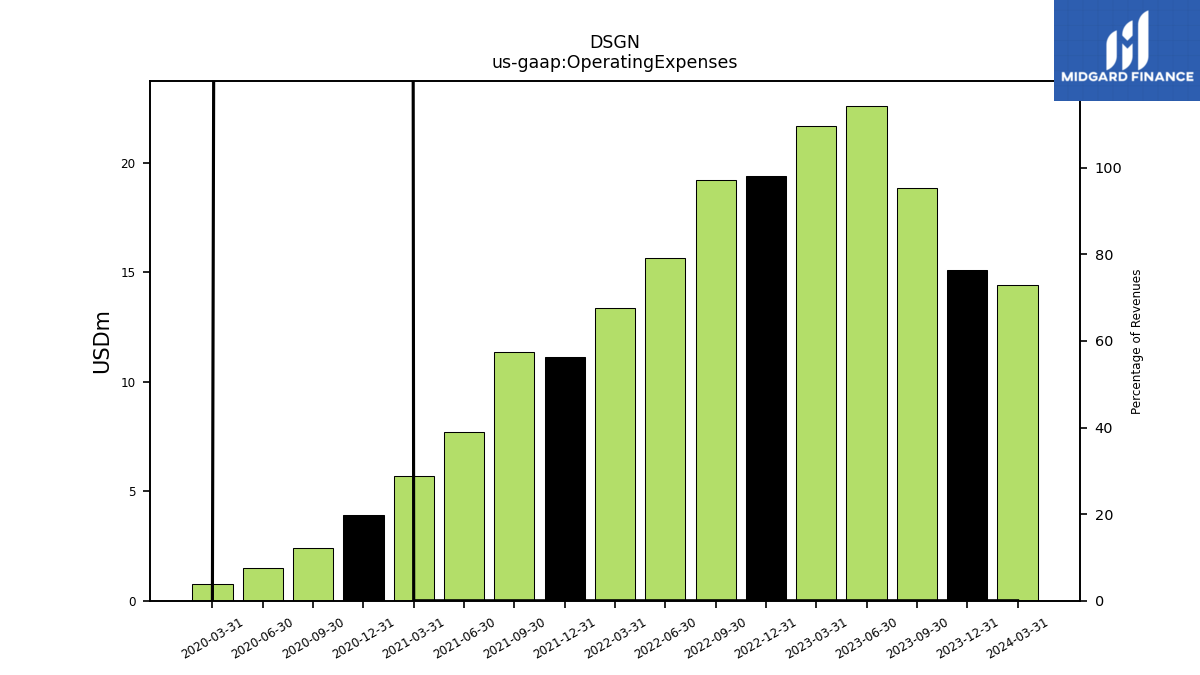
| Operating Expenses | 18.82 | 22.60 | 21.65 | 19.39 | 19.19 | 15.64 | 13.37 | 11.13 | 11.34 | 7.69 | 5.68 | 3.89 | |
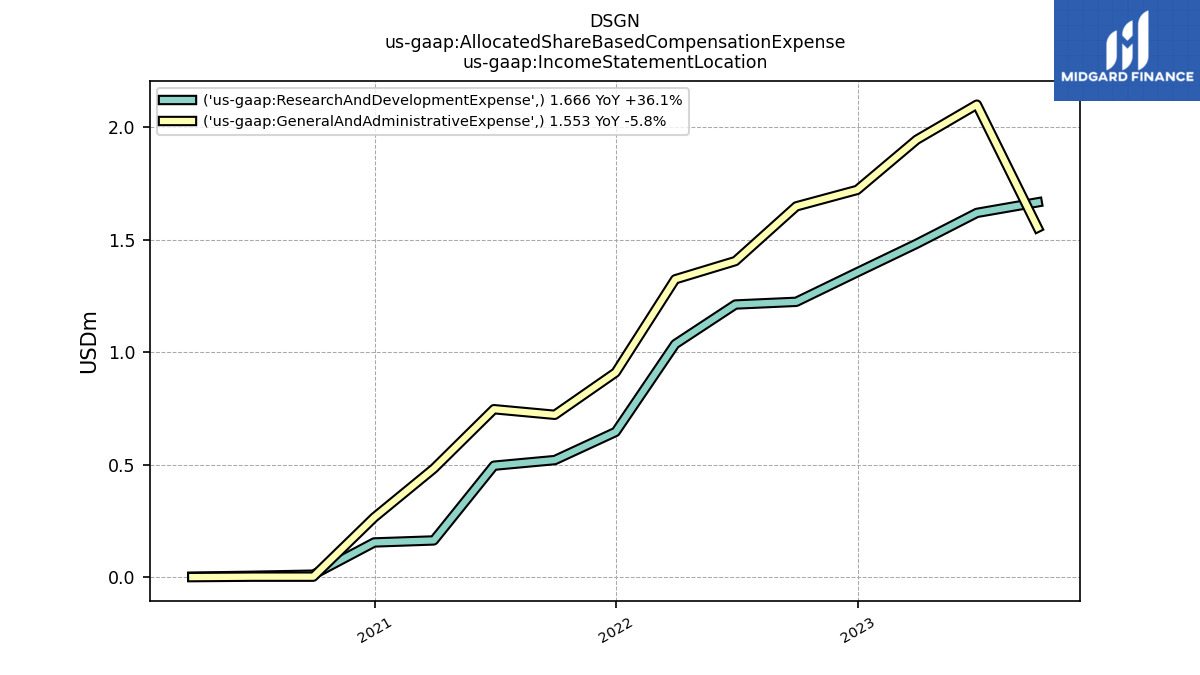
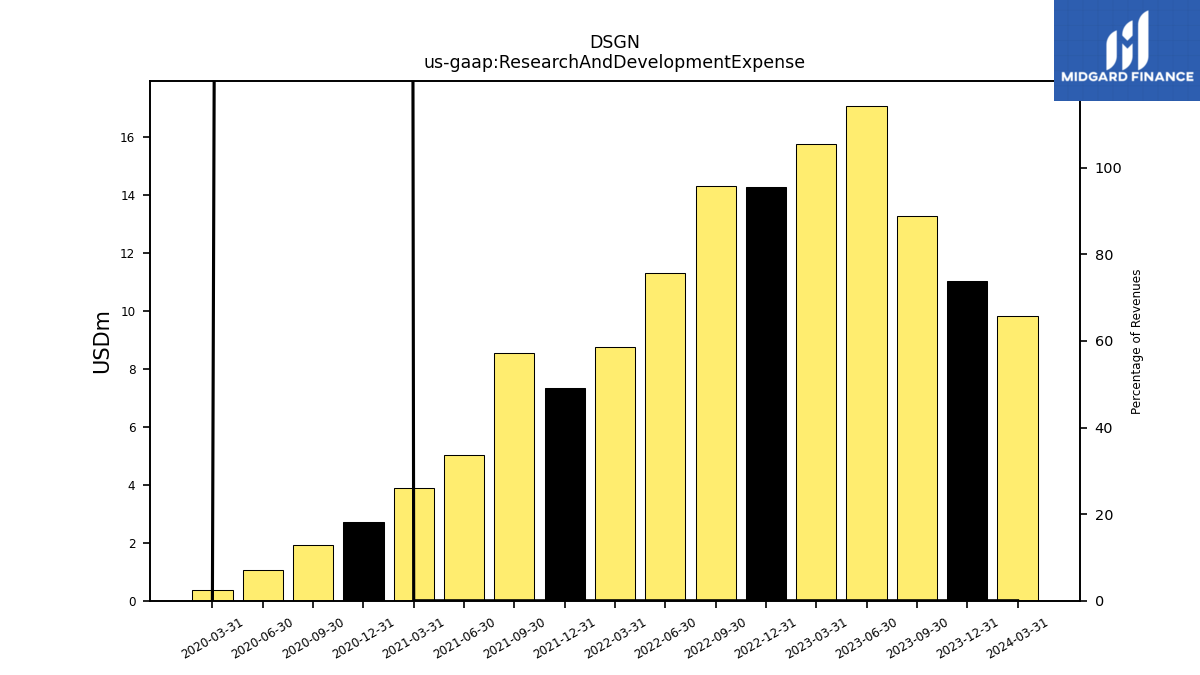
| Research And Development Expense | 13.26 | 17.06 | 15.73 | 14.26 | 14.30 | 11.29 | 8.76 | 7.34 | 8.54 | 5.03 | 3.88 | 2.71 | |
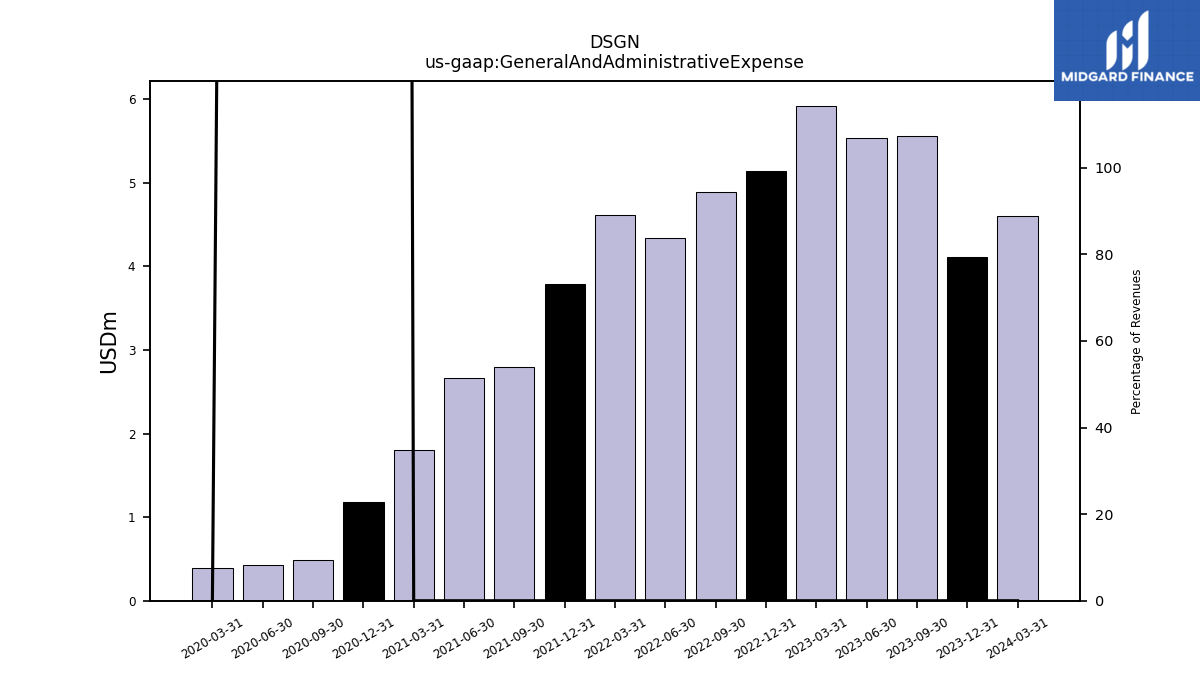
| General And Administrative Expense | 5.57 | 5.53 | 5.92 | 5.14 | 4.89 | 4.34 | 4.61 | 3.79 | 2.80 | 2.66 | 1.80 | 1.19 | |
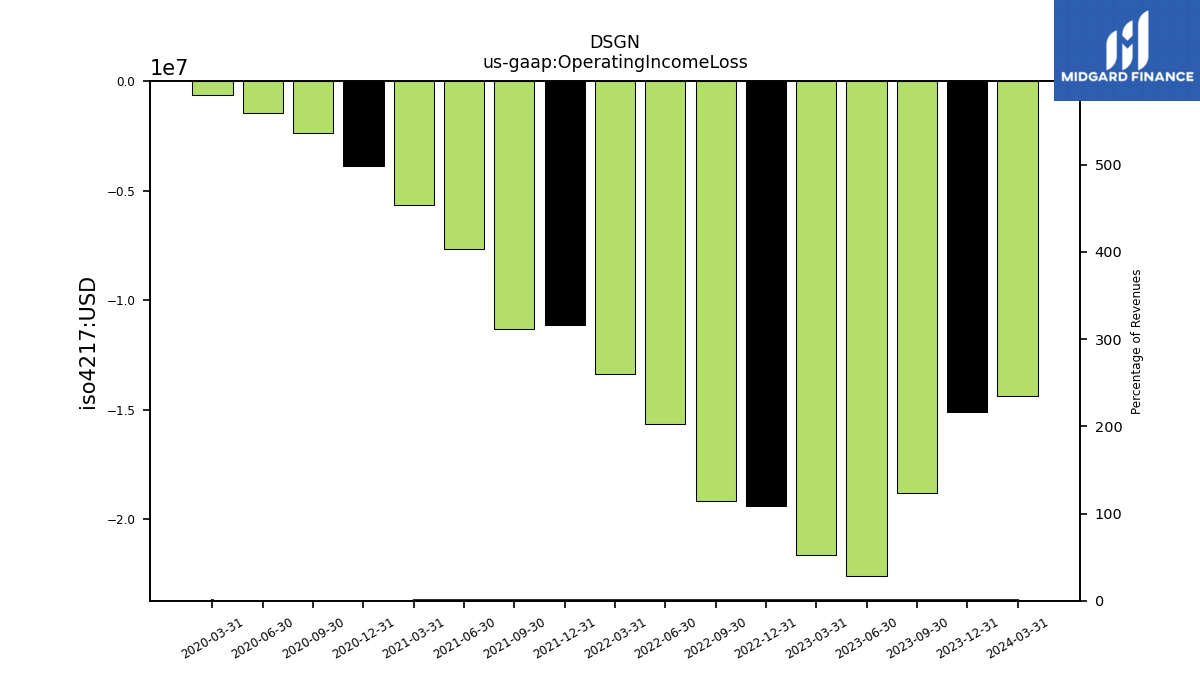
| Operating Income Loss | -18.82 | -22.60 | -21.65 | -19.39 | -19.19 | -15.64 | -13.37 | -11.13 | -11.34 | -7.69 | -5.68 | -3.86 | |
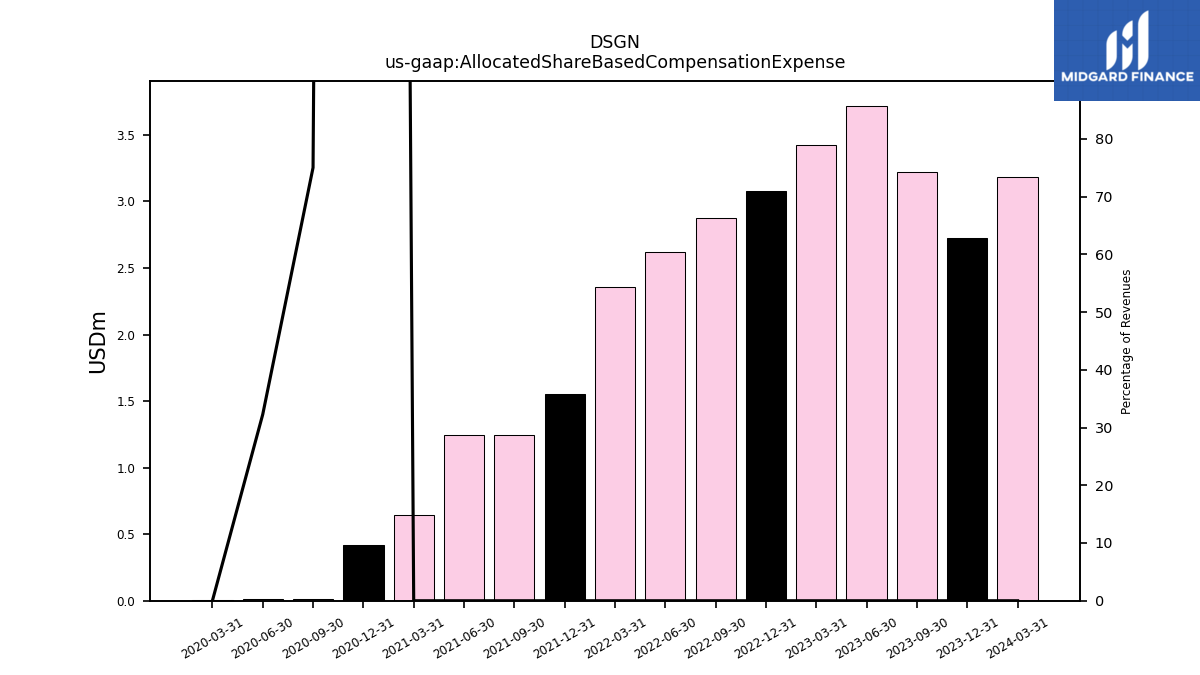
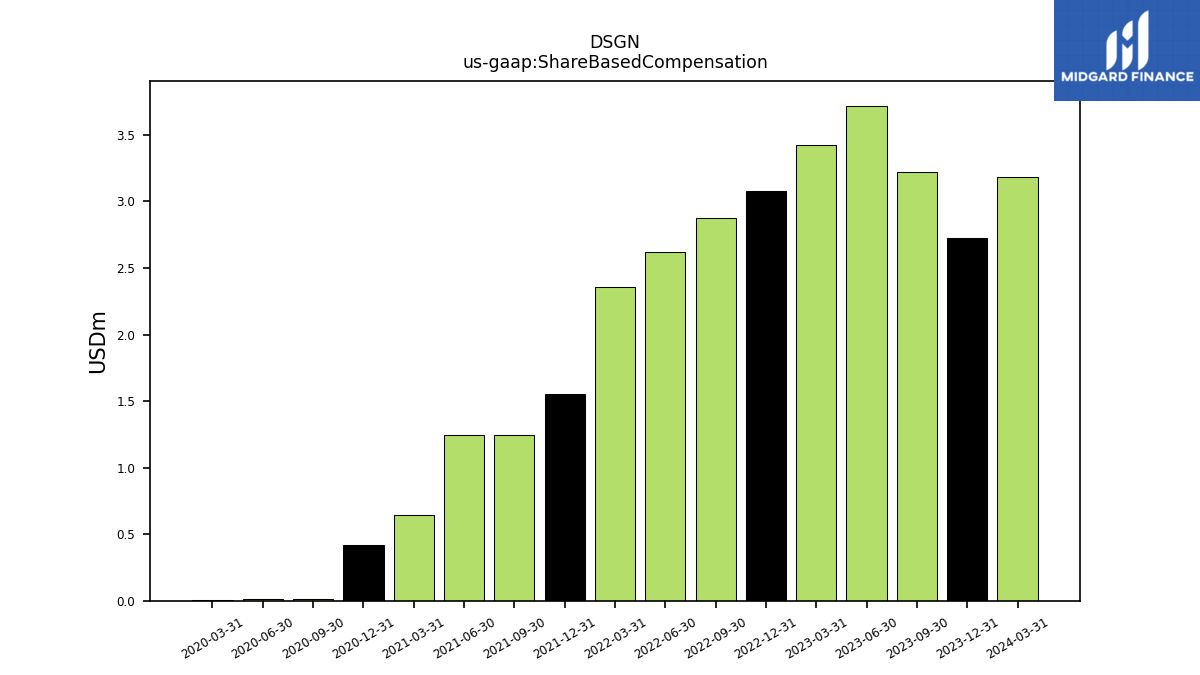
| Allocated Share Based Compensation Expense | 3.22 | 3.72 | 3.43 | 3.08 | 2.87 | 2.62 | 2.36 | 1.56 | 1.24 | 1.24 | 0.65 | 0.42 | |
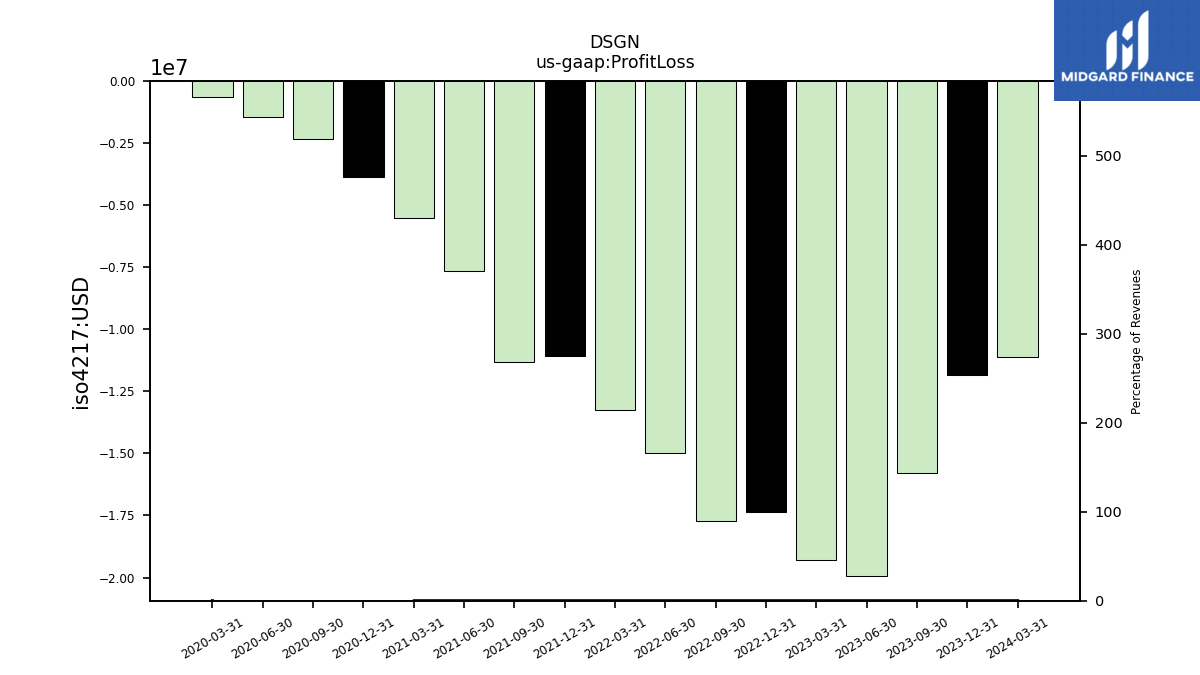
| Profit Loss | -15.79 | -19.94 | -19.29 | -17.34 | -17.70 | -15.00 | -13.27 | -11.06 | -11.32 | -7.64 | -5.51 | -3.85 | |
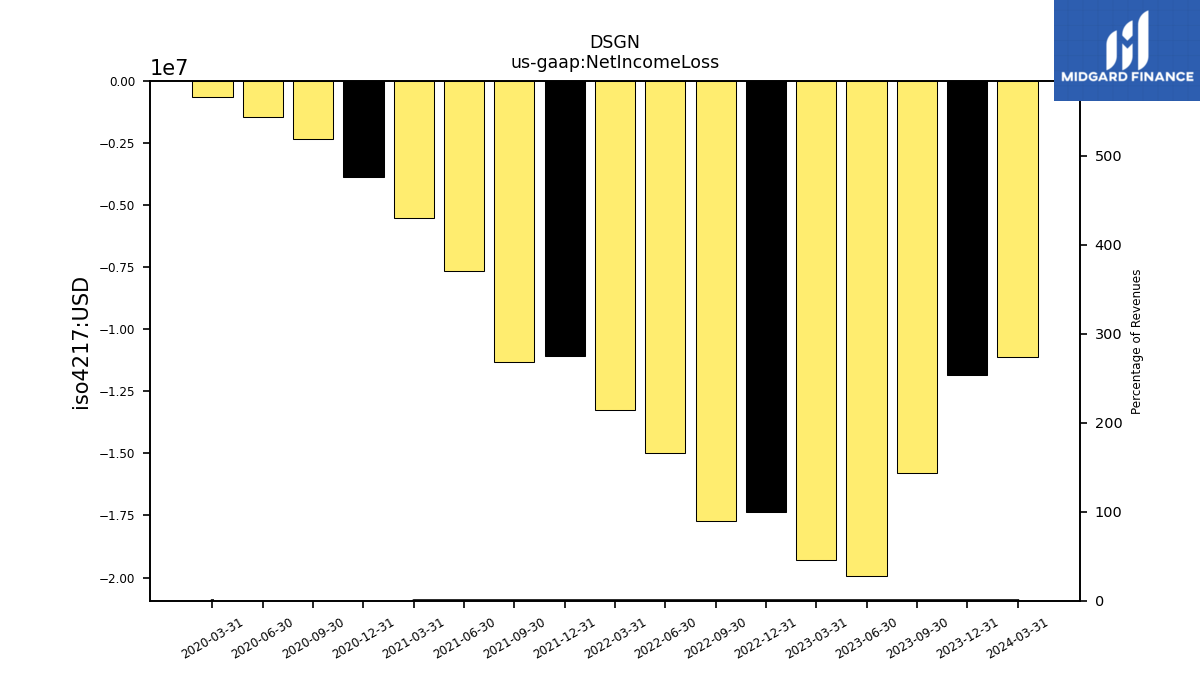
| Net Income Loss | -15.79 | -19.94 | -19.29 | -17.34 | -17.70 | -15.00 | -13.27 | -11.06 | -11.32 | -7.64 | -5.51 | -3.85 | |
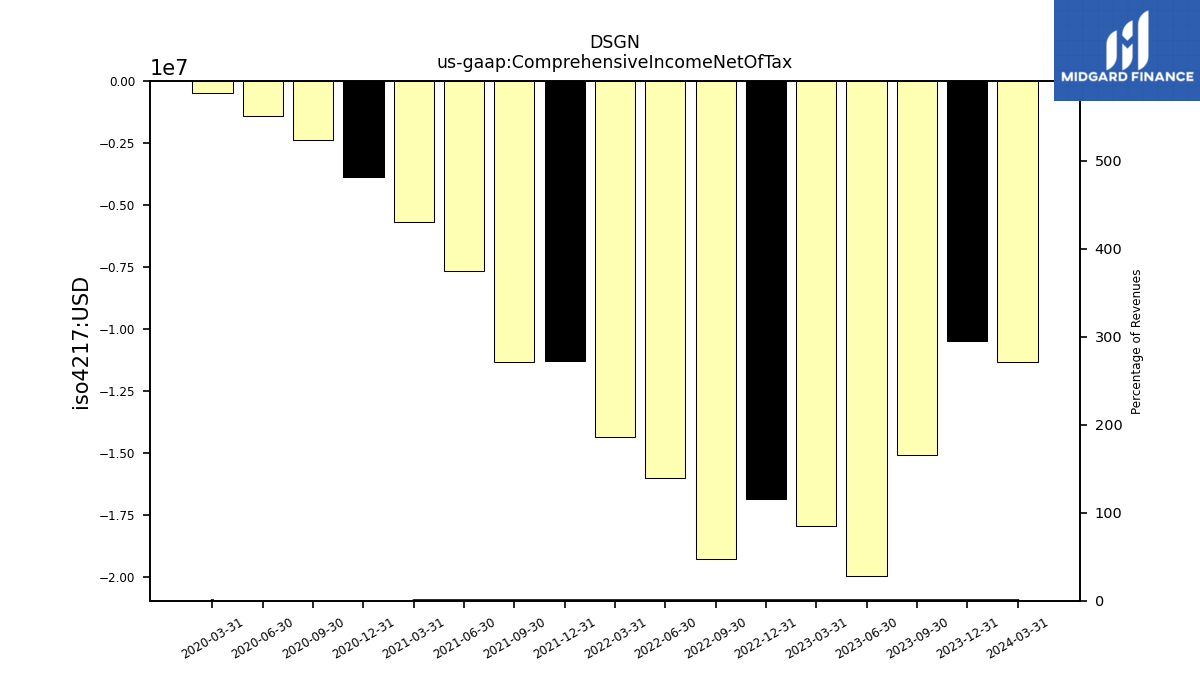
| Comprehensive Income Net Of Tax | -15.07 | -19.95 | -17.92 | -16.84 | -19.25 | -15.99 | -14.34 | -11.30 | -11.31 | -7.65 | -5.67 | -3.85 |
| 2023-09-30 | 2023-06-30 | 2023-03-31 | 2022-12-31 | 2022-09-30 | 2022-06-30 | 2022-03-31 | 2021-12-31 | 2021-09-30 | 2021-06-30 | 2021-03-31 | 2020-12-31 | ||
|---|---|---|---|---|---|---|---|---|---|---|---|---|---|
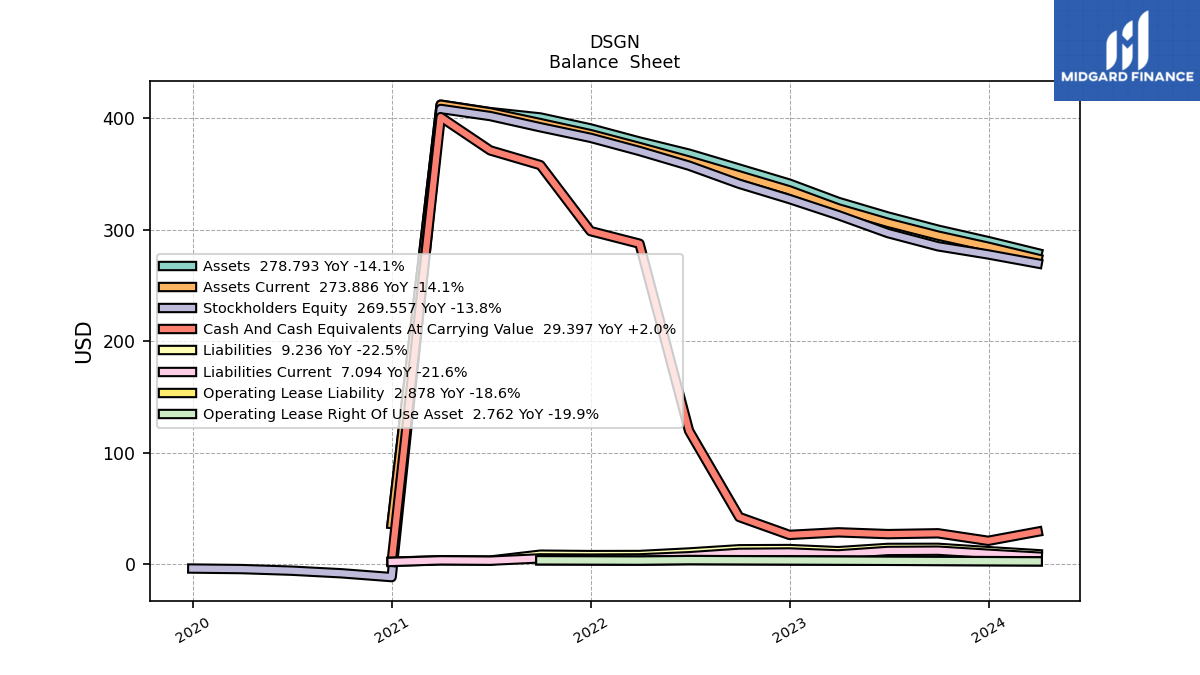
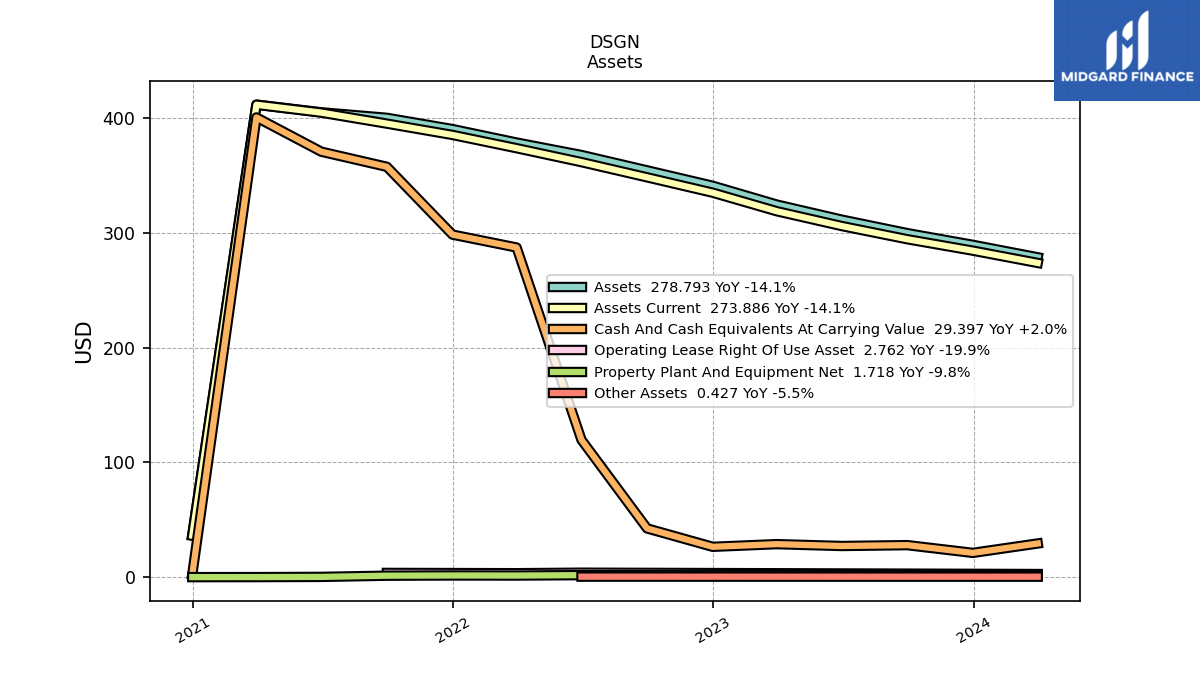
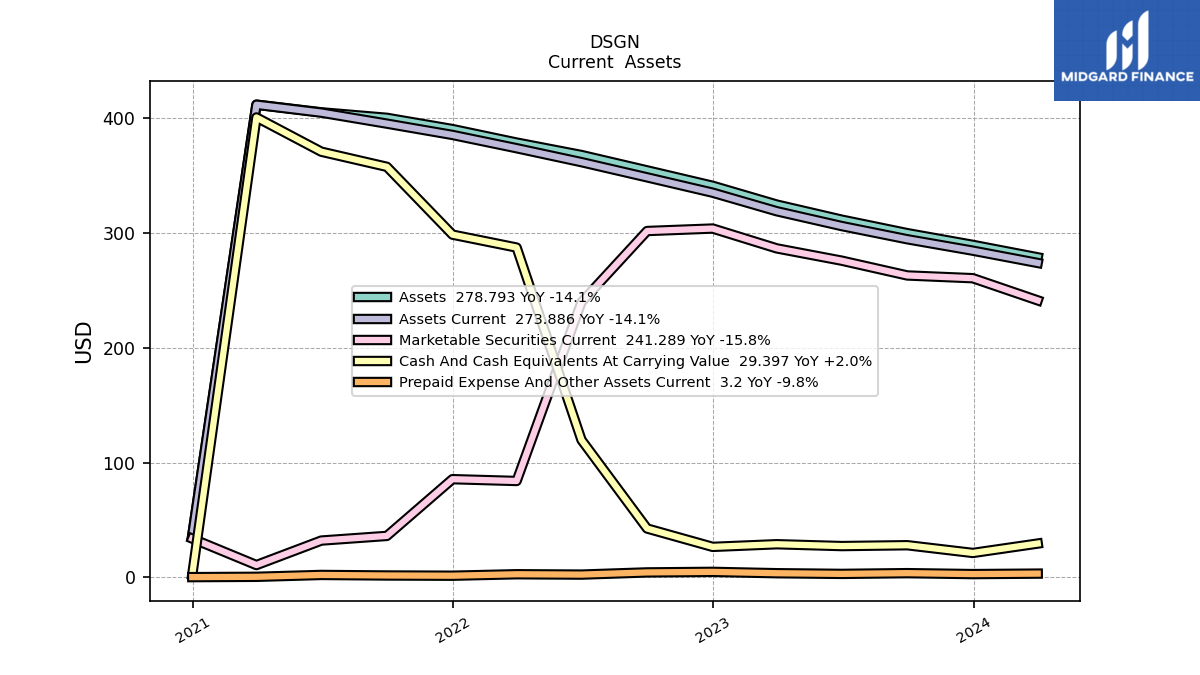
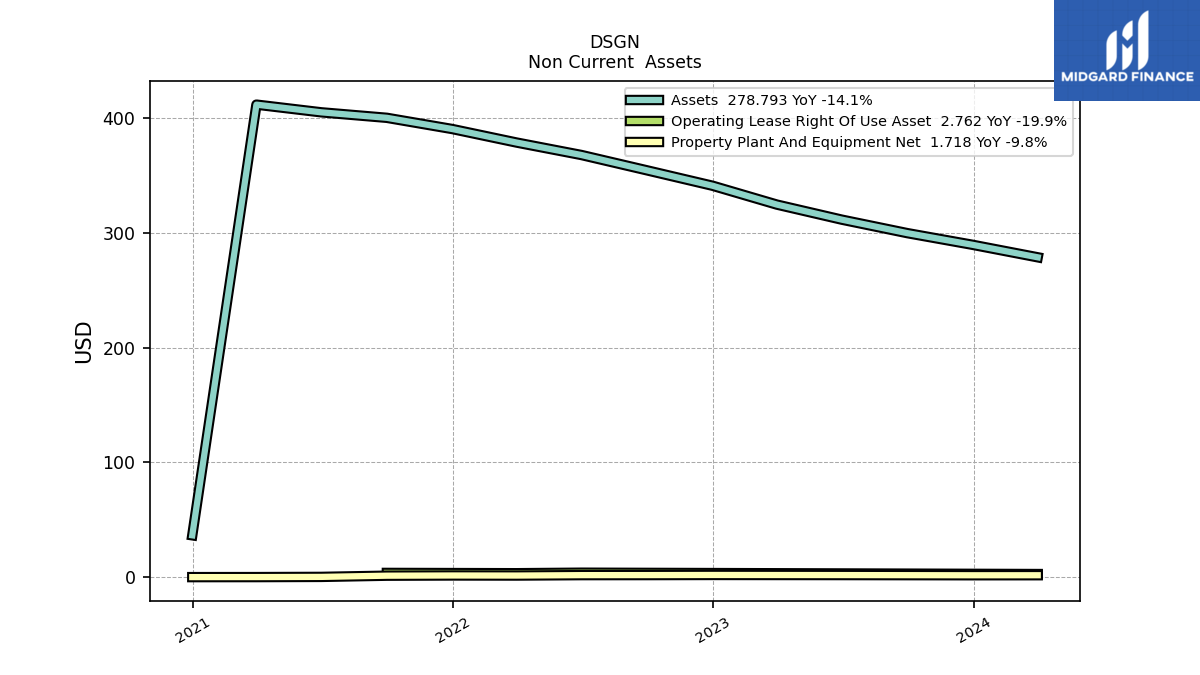
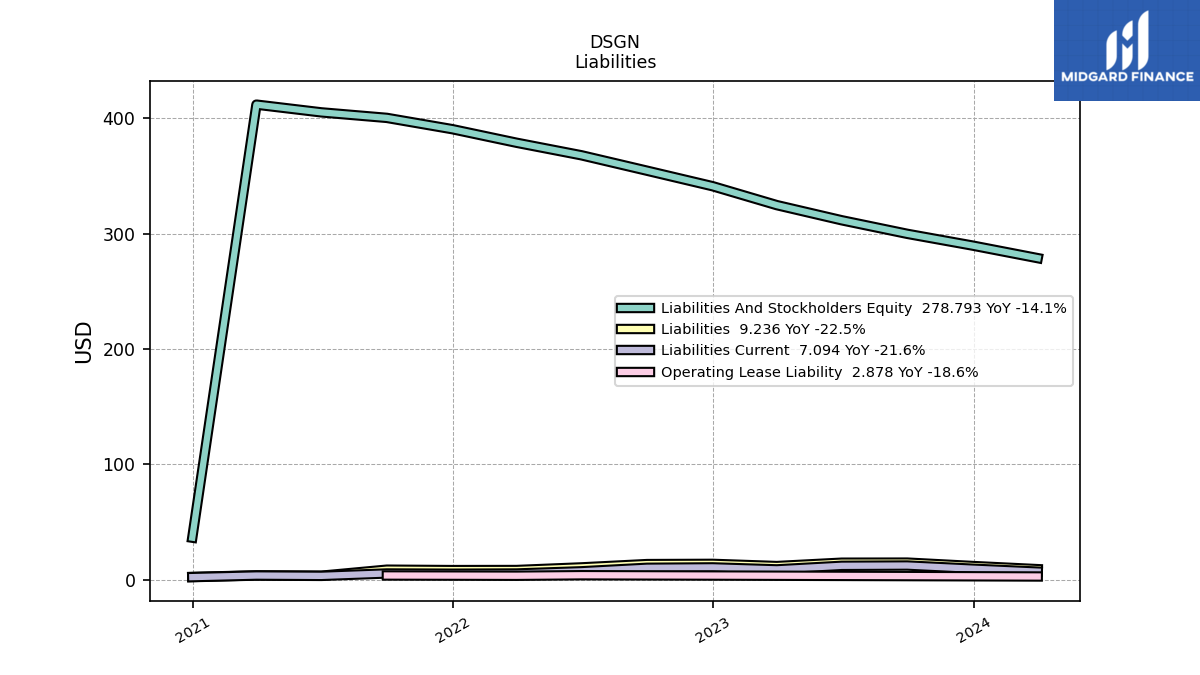
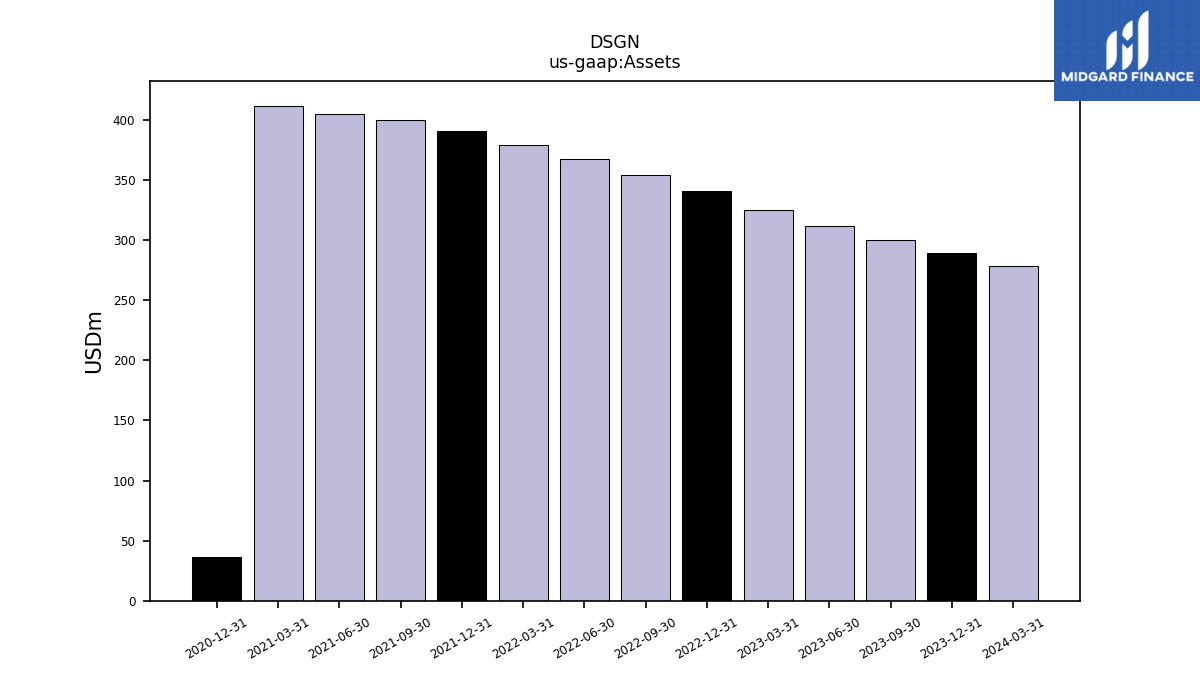
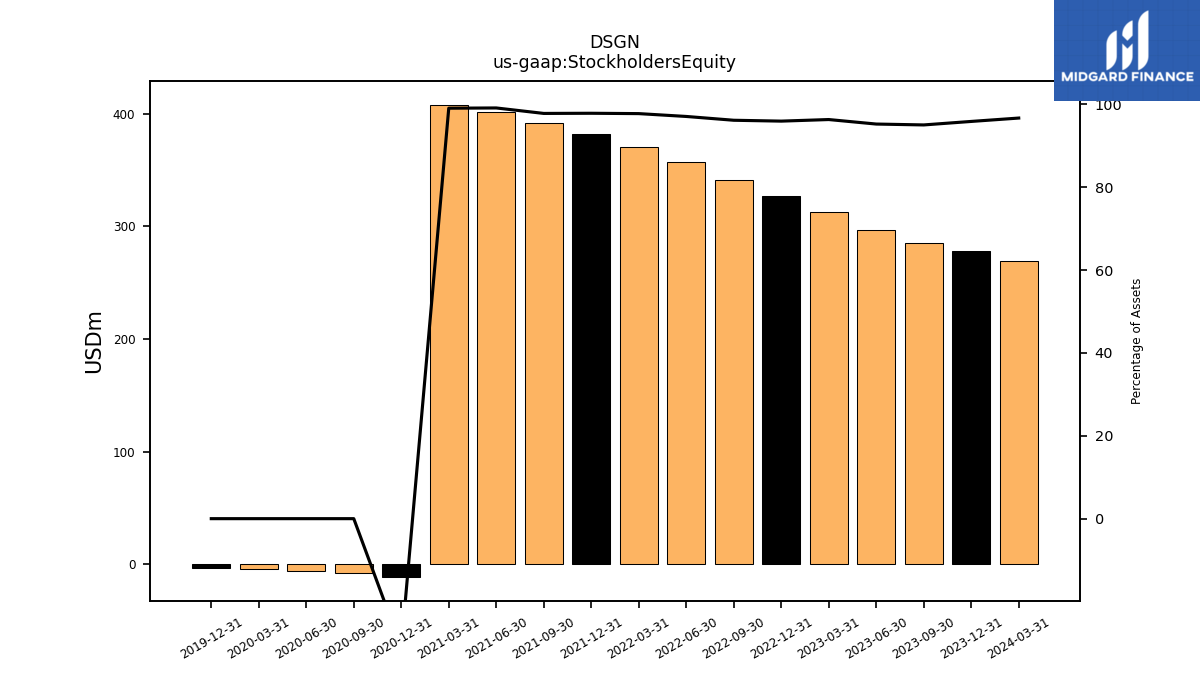
| Assets | 299.87 | 311.63 | 324.74 | 341.14 | 354.57 | 367.93 | 378.80 | 390.56 | 400.35 | 405.15 | 411.85 | 36.52 | |
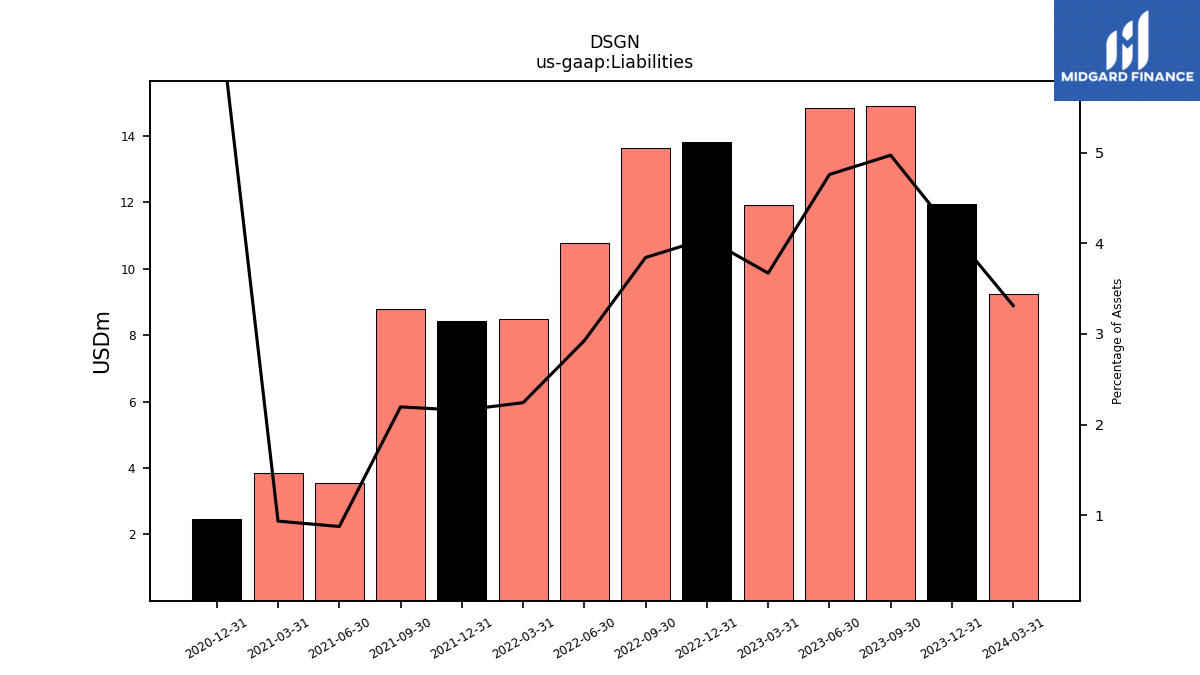
| Liabilities | 14.91 | 14.84 | 11.93 | 13.83 | 13.63 | 10.77 | 8.49 | 8.43 | 8.79 | 3.54 | 3.85 | 2.48 | |
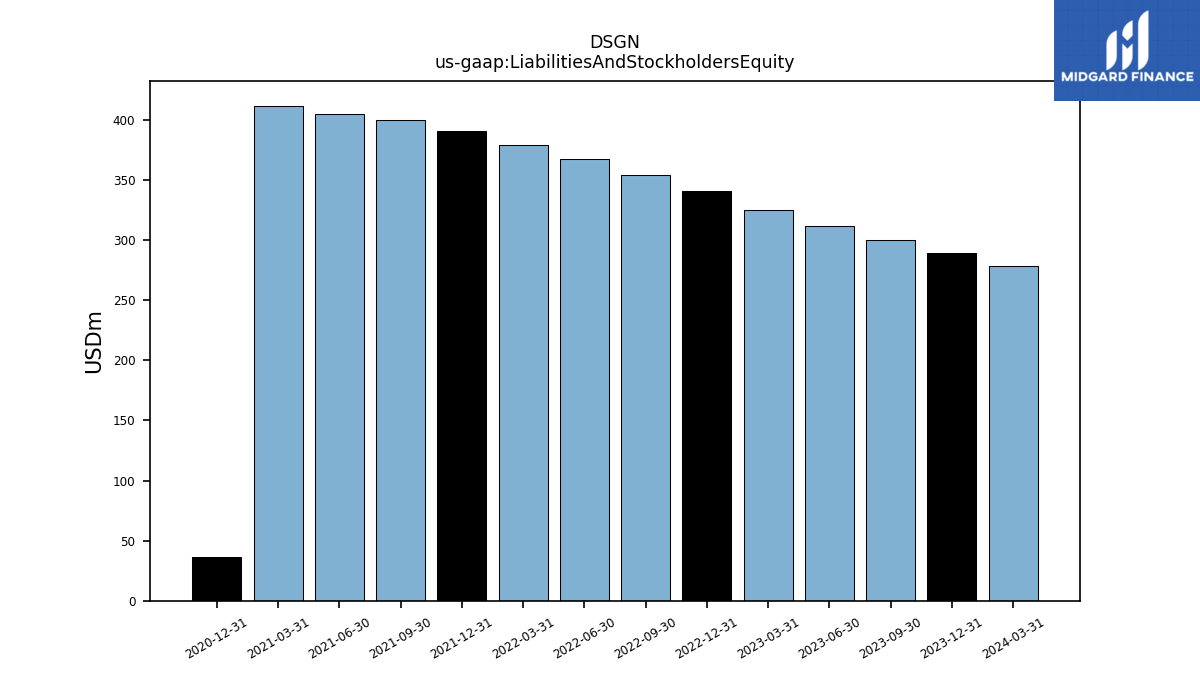
| Liabilities And Stockholders Equity | 299.87 | 311.63 | 324.74 | 341.14 | 354.57 | 367.93 | 378.80 | 390.56 | 400.35 | 405.15 | 411.85 | 36.52 | |
| Stockholders Equity | 284.96 | 296.80 | 312.82 | 327.31 | 340.94 | 357.16 | 370.31 | 382.13 | 391.56 | 401.60 | 408.01 | -11.31 |
| 2023-09-30 | 2023-06-30 | 2023-03-31 | 2022-12-31 | 2022-09-30 | 2022-06-30 | 2022-03-31 | 2021-12-31 | 2021-09-30 | 2021-06-30 | 2021-03-31 | 2020-12-31 | ||
|---|---|---|---|---|---|---|---|---|---|---|---|---|---|
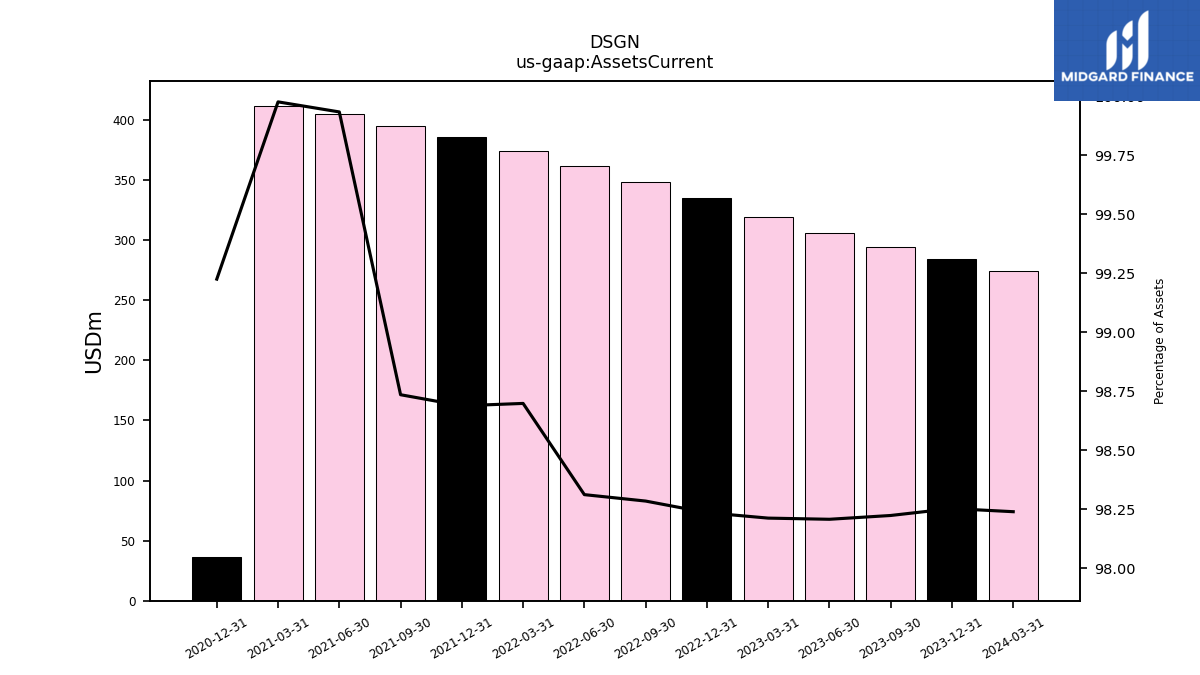
| Assets Current | 294.54 | 306.05 | 318.94 | 335.12 | 348.49 | 361.72 | 373.87 | 385.44 | 395.29 | 404.88 | 411.75 | 36.23 | |
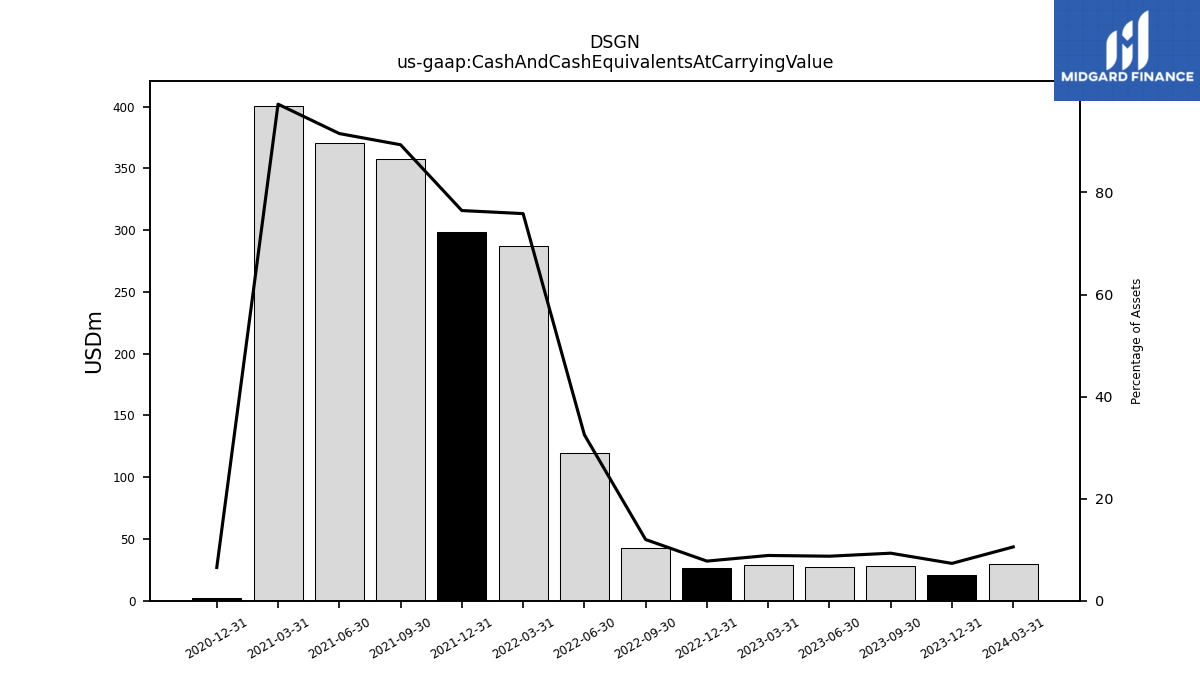
| Cash And Cash Equivalents At Carrying Value | 27.94 | 27.20 | 28.81 | 26.50 | 42.52 | 119.65 | 287.31 | 298.57 | 357.66 | 370.84 | 400.69 | 2.38 | |
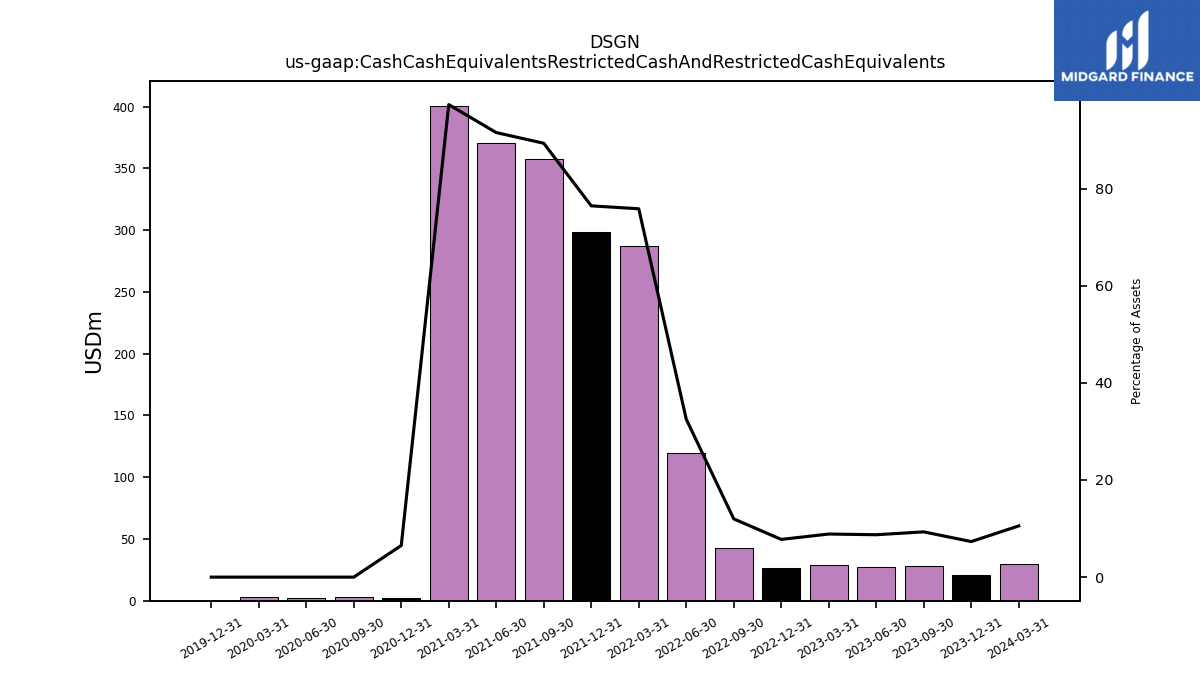
| Cash Cash Equivalents Restricted Cash And Restricted Cash Equivalents | 27.94 | 27.20 | 28.81 | 26.50 | 42.52 | 119.65 | 287.31 | 298.57 | 357.66 | 370.84 | 400.69 | 2.38 | |
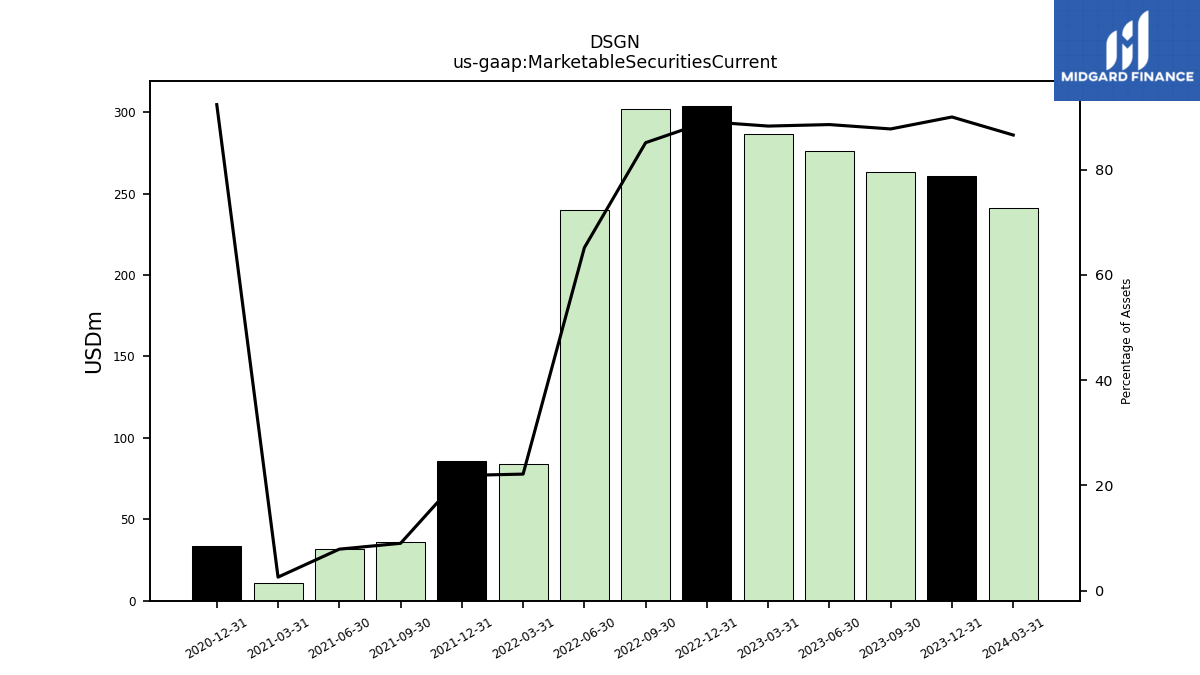
| Marketable Securities Current | 263.00 | 275.89 | 286.58 | 303.89 | 301.72 | 239.72 | 83.91 | 85.50 | 36.06 | 32.00 | 10.65 | 33.71 | |
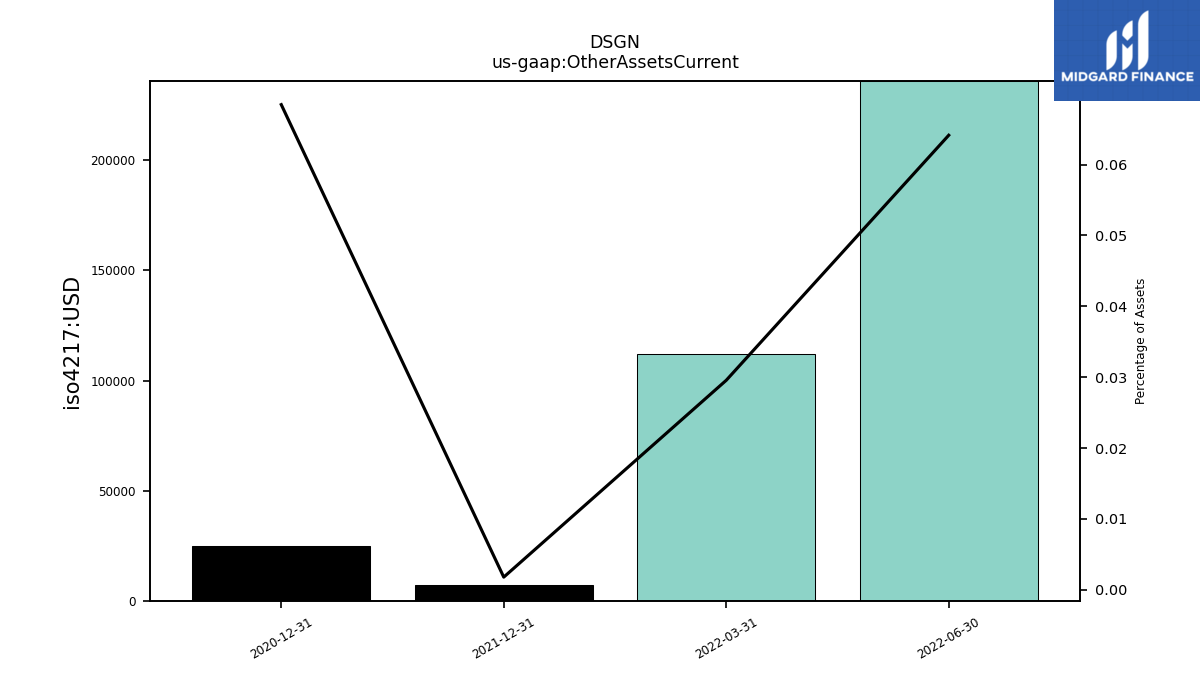
| Other Assets Current | NA | NA | NA | NA | NA | 0.24 | 0.11 | 0.01 | NA | NA | NA | 0.03 | |
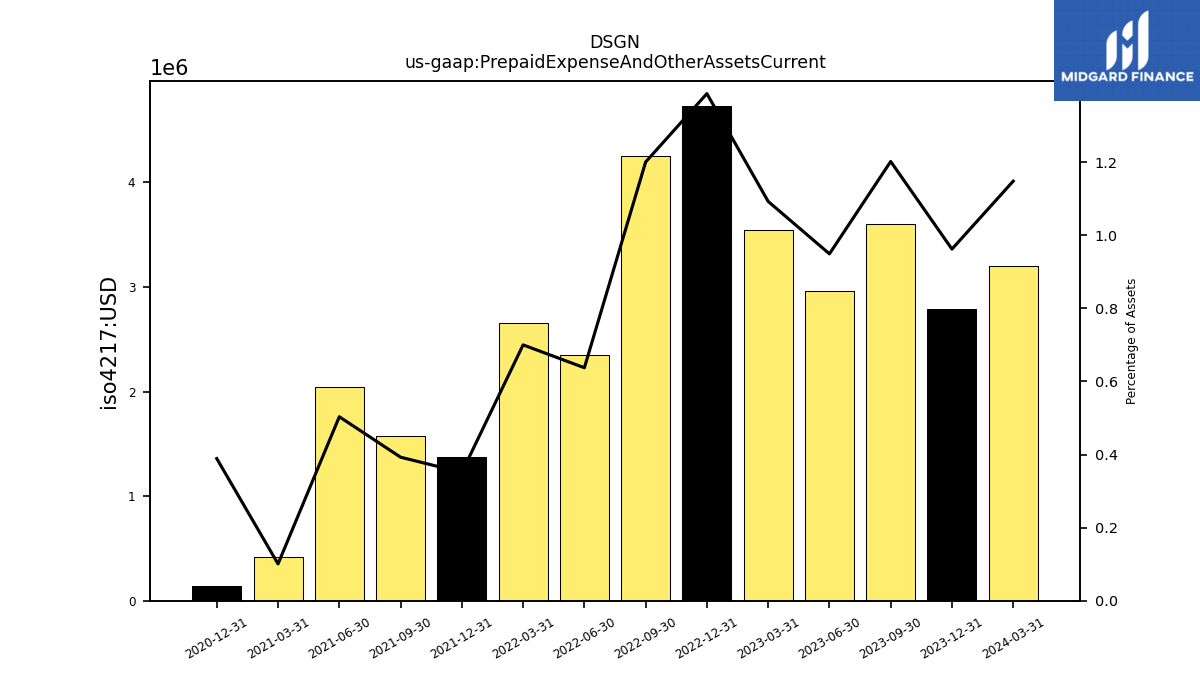
| Prepaid Expense And Other Assets Current | 3.60 | 2.96 | 3.55 | 4.73 | 4.25 | 2.35 | 2.65 | 1.37 | 1.57 | 2.04 | 0.41 | 0.14 |
| 2023-09-30 | 2023-06-30 | 2023-03-31 | 2022-12-31 | 2022-09-30 | 2022-06-30 | 2022-03-31 | 2021-12-31 | 2021-09-30 | 2021-06-30 | 2021-03-31 | 2020-12-31 | ||
|---|---|---|---|---|---|---|---|---|---|---|---|---|---|
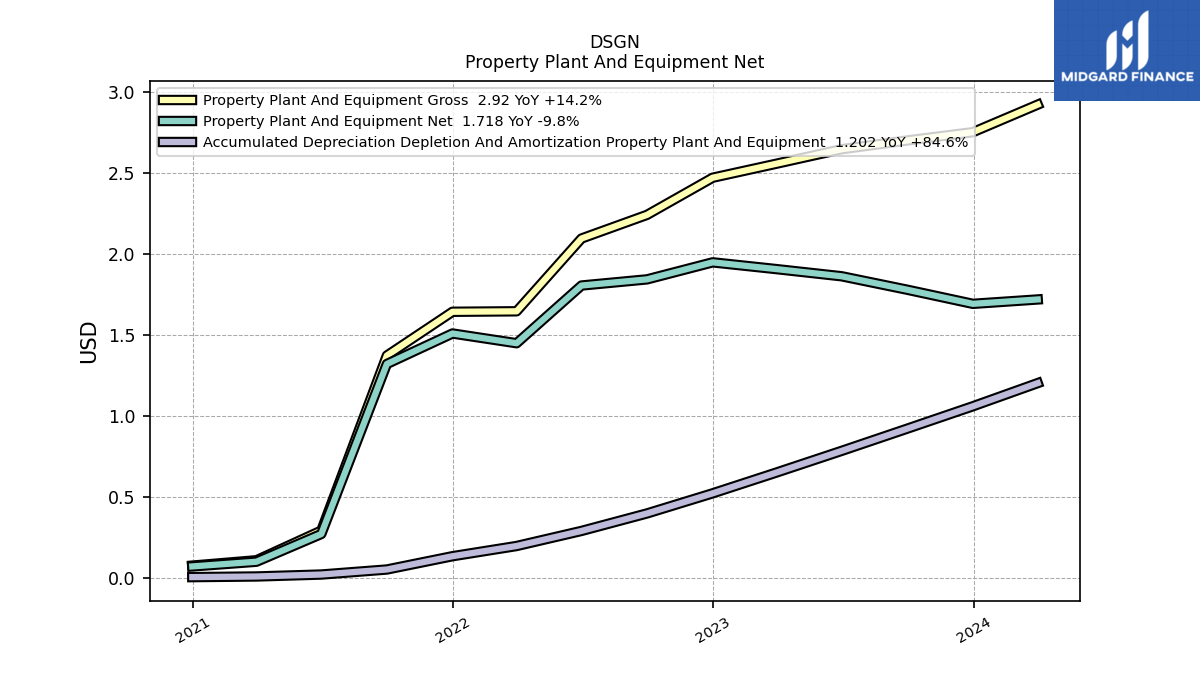
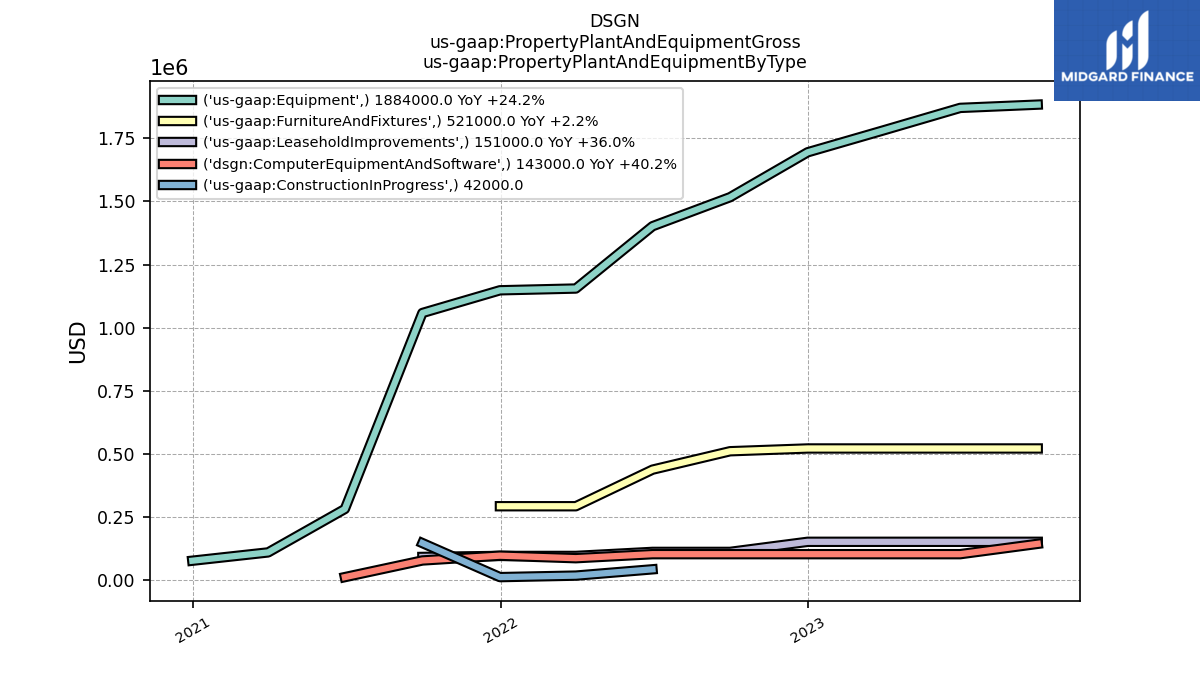
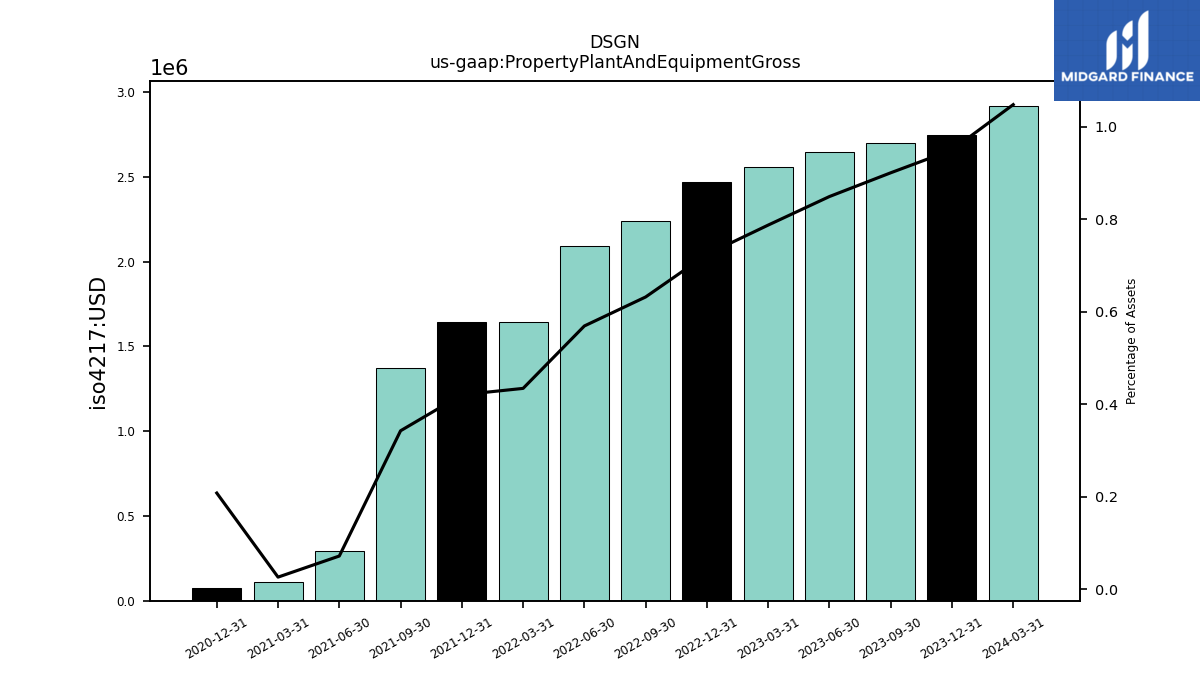
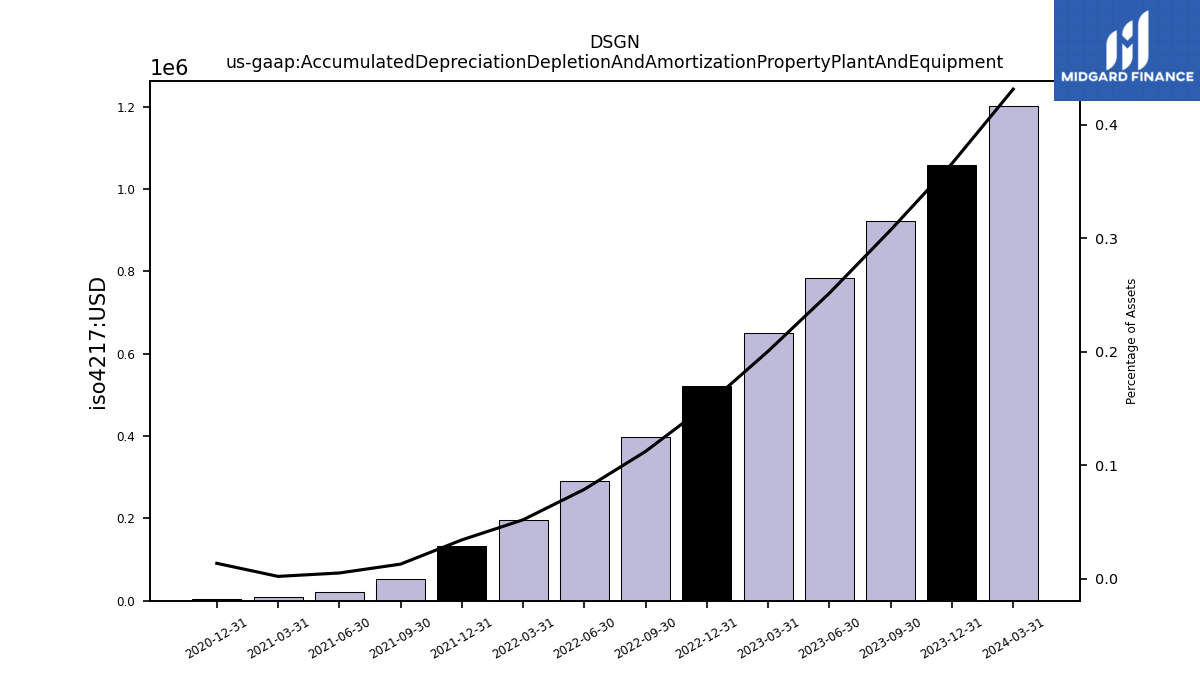
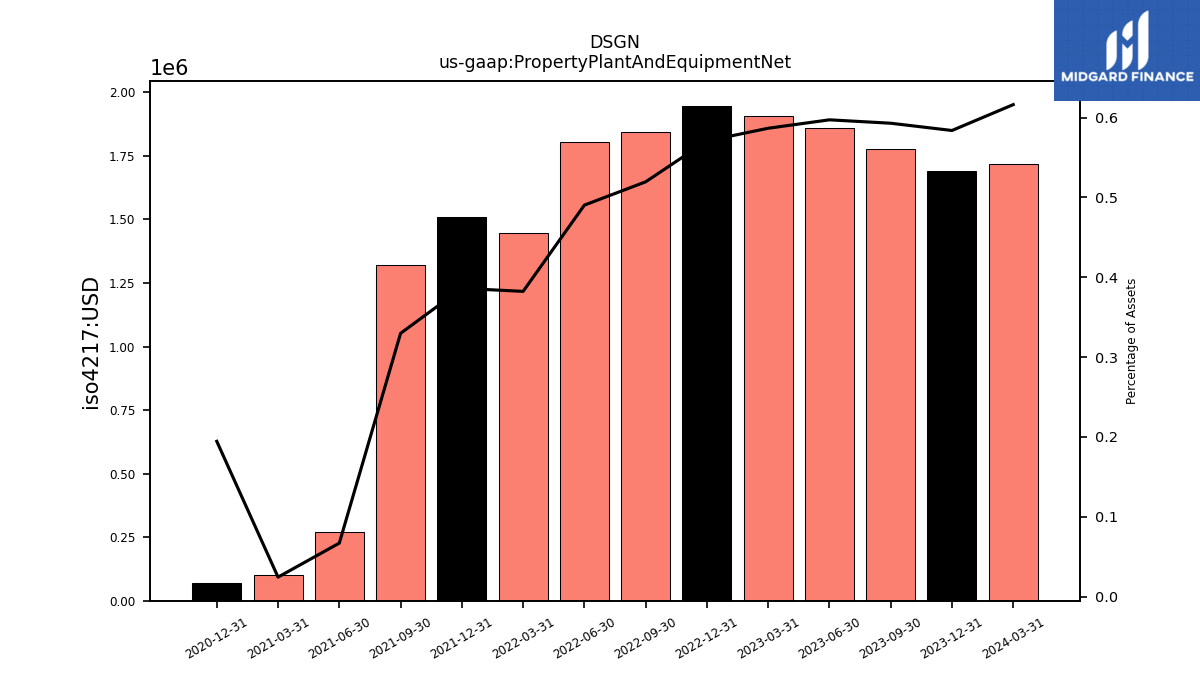
| Property Plant And Equipment Gross | 2.70 | 2.65 | 2.56 | 2.47 | 2.24 | 2.09 | 1.65 | 1.64 | 1.37 | 0.29 | 0.11 | 0.08 | |
| Accumulated Depreciation Depletion And Amortization Property Plant And Equipment | 0.92 | 0.78 | 0.65 | 0.52 | 0.40 | 0.29 | 0.20 | 0.13 | 0.05 | 0.02 | 0.01 | 0.01 | |
| Property Plant And Equipment Net | 1.78 | 1.86 | 1.91 | 1.95 | 1.84 | 1.80 | 1.45 | 1.51 | 1.32 | 0.27 | 0.10 | 0.07 | |
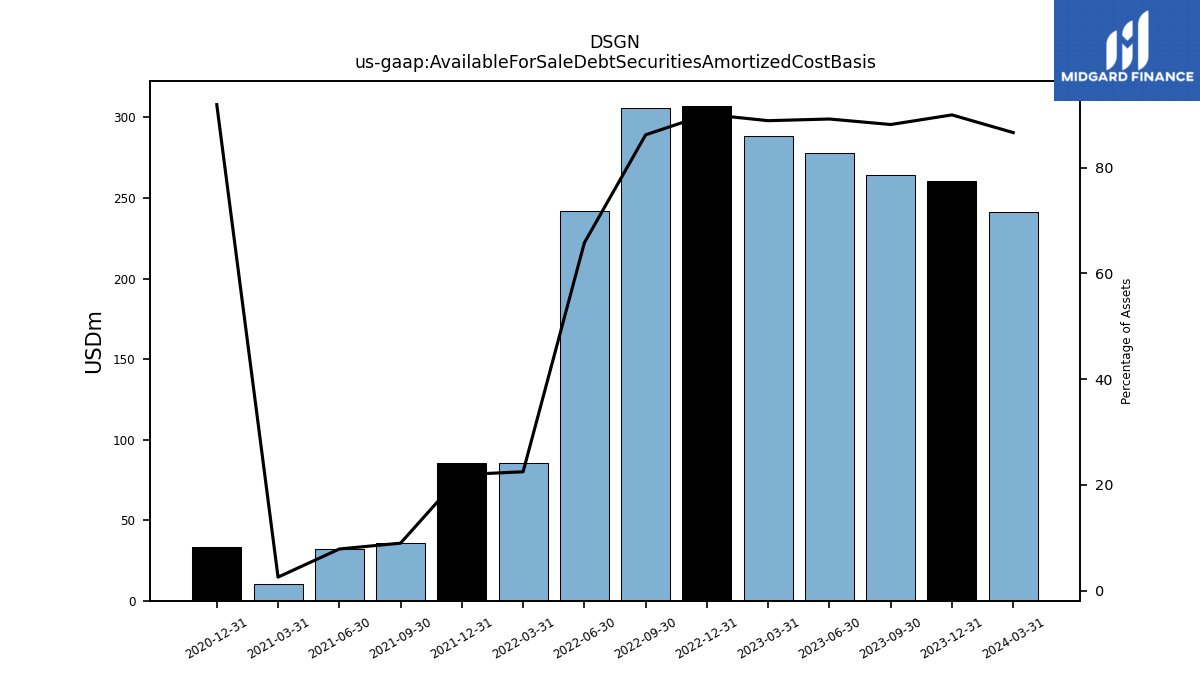
| Available For Sale Debt Securities Amortized Cost Basis | 264.28 | 277.89 | 288.56 | 307.24 | 305.58 | 242.04 | 85.23 | 85.74 | 36.06 | 32.01 | 10.64 | 33.56 |
| 2023-09-30 | 2023-06-30 | 2023-03-31 | 2022-12-31 | 2022-09-30 | 2022-06-30 | 2022-03-31 | 2021-12-31 | 2021-09-30 | 2021-06-30 | 2021-03-31 | 2020-12-31 | ||
|---|---|---|---|---|---|---|---|---|---|---|---|---|---|
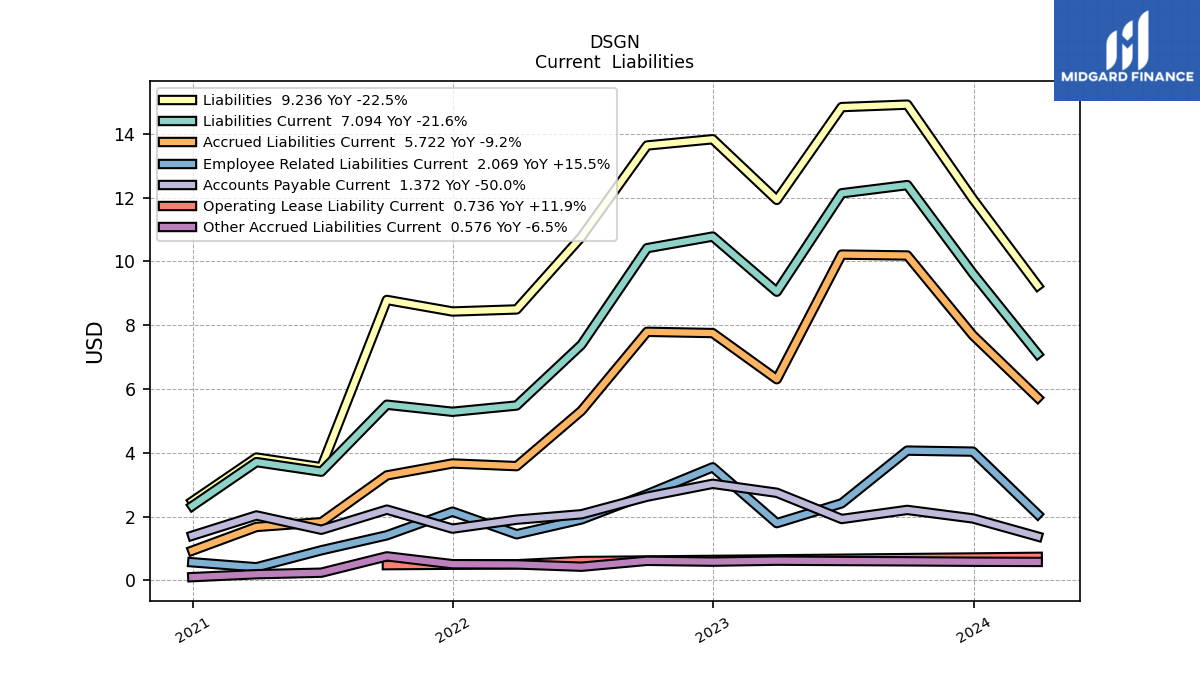
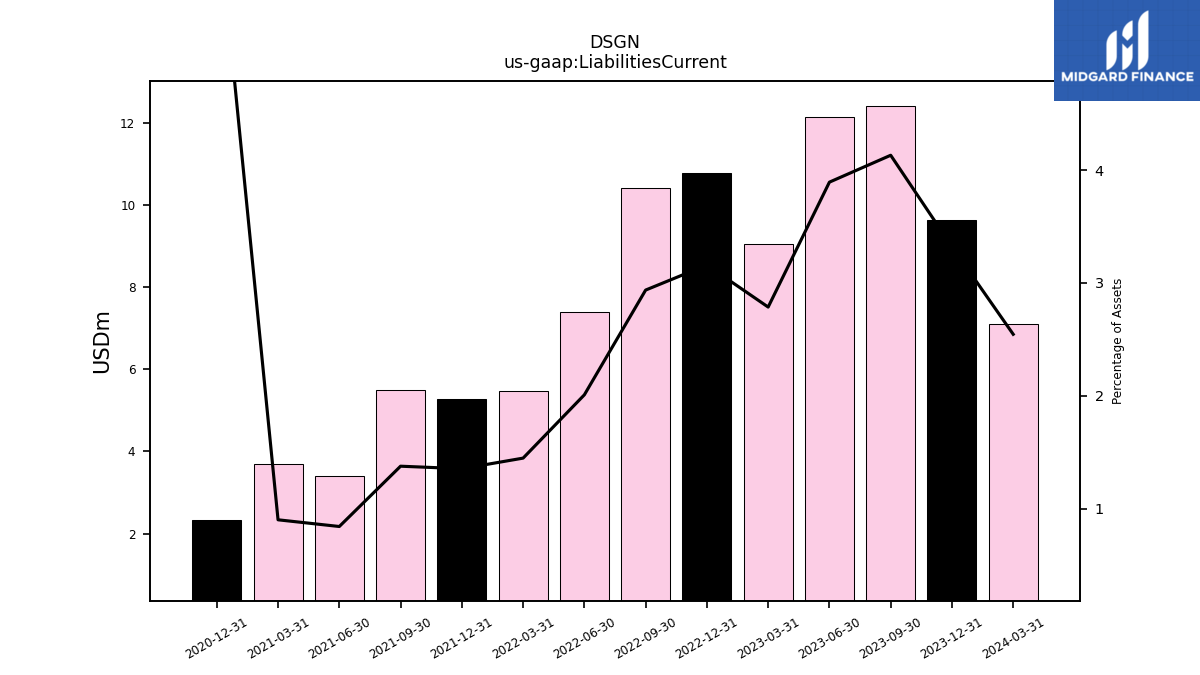
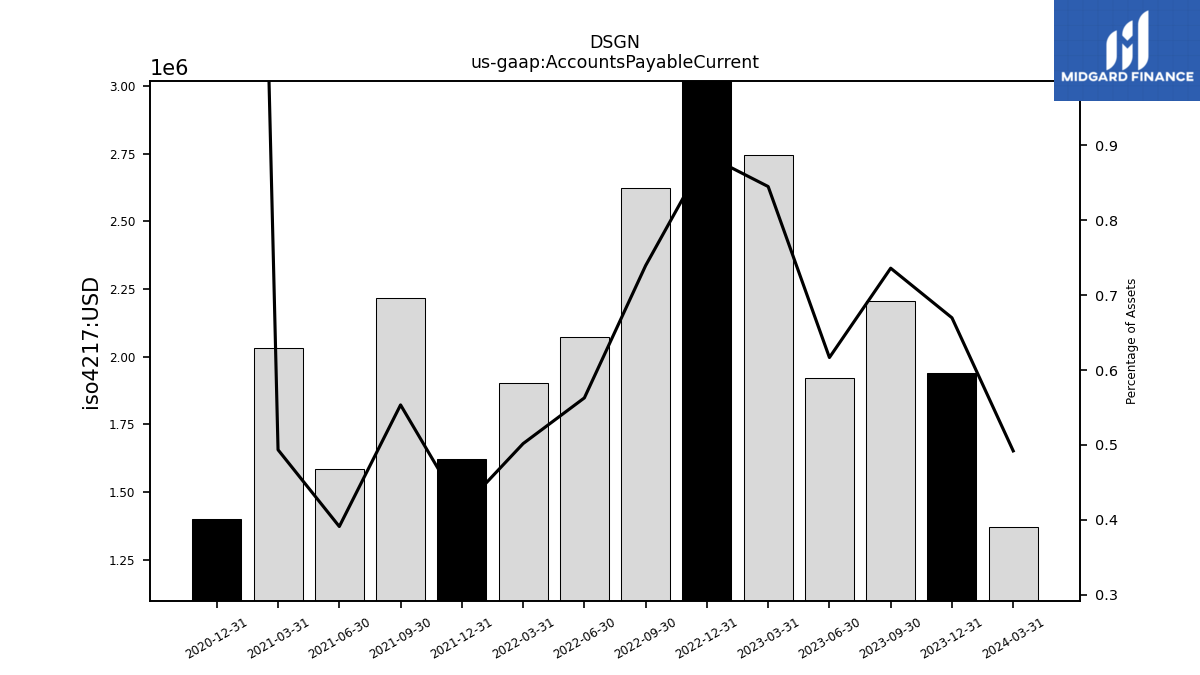
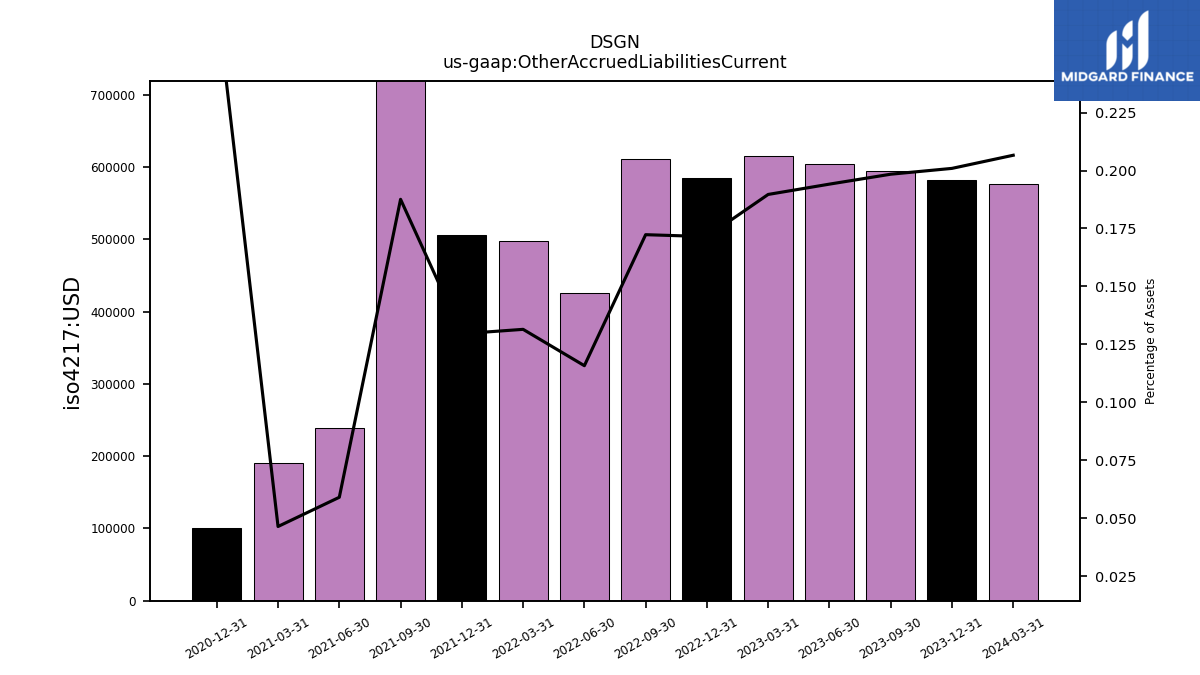
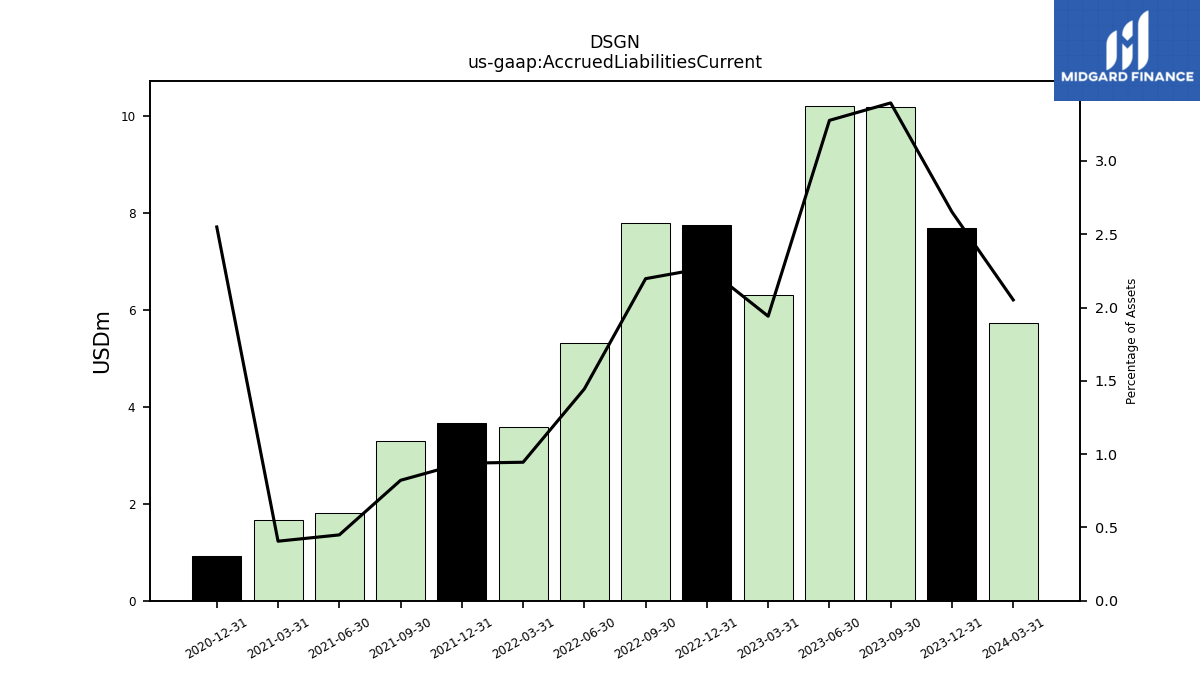
| Liabilities Current | 12.39 | 12.13 | 9.05 | 10.78 | 10.41 | 7.39 | 5.48 | 5.28 | 5.50 | 3.40 | 3.71 | 2.33 | |
| Accounts Payable Current | 2.21 | 1.92 | 2.74 | 3.02 | 2.62 | 2.07 | 1.90 | 1.62 | 2.22 | 1.58 | 2.03 | 1.40 | |
| Other Accrued Liabilities Current | 0.59 | 0.60 | 0.62 | 0.58 | 0.61 | 0.43 | 0.50 | 0.51 | 0.75 | 0.24 | 0.19 | 0.10 | |
| Accrued Liabilities Current | 10.18 | 10.21 | 6.30 | 7.75 | 7.79 | 5.32 | 3.58 | 3.66 | 3.29 | 1.82 | 1.67 | 0.93 |
| 2023-09-30 | 2023-06-30 | 2023-03-31 | 2022-12-31 | 2022-09-30 | 2022-06-30 | 2022-03-31 | 2021-12-31 | 2021-09-30 | 2021-06-30 | 2021-03-31 | 2020-12-31 | ||
|---|---|---|---|---|---|---|---|---|---|---|---|---|---|
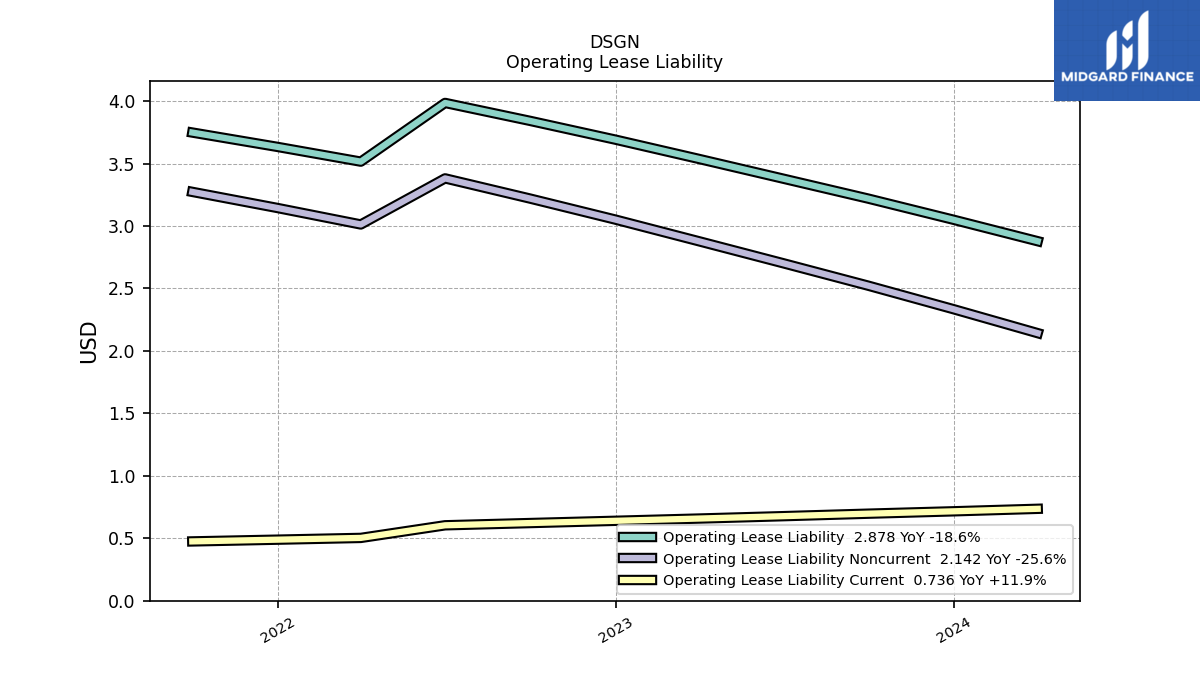
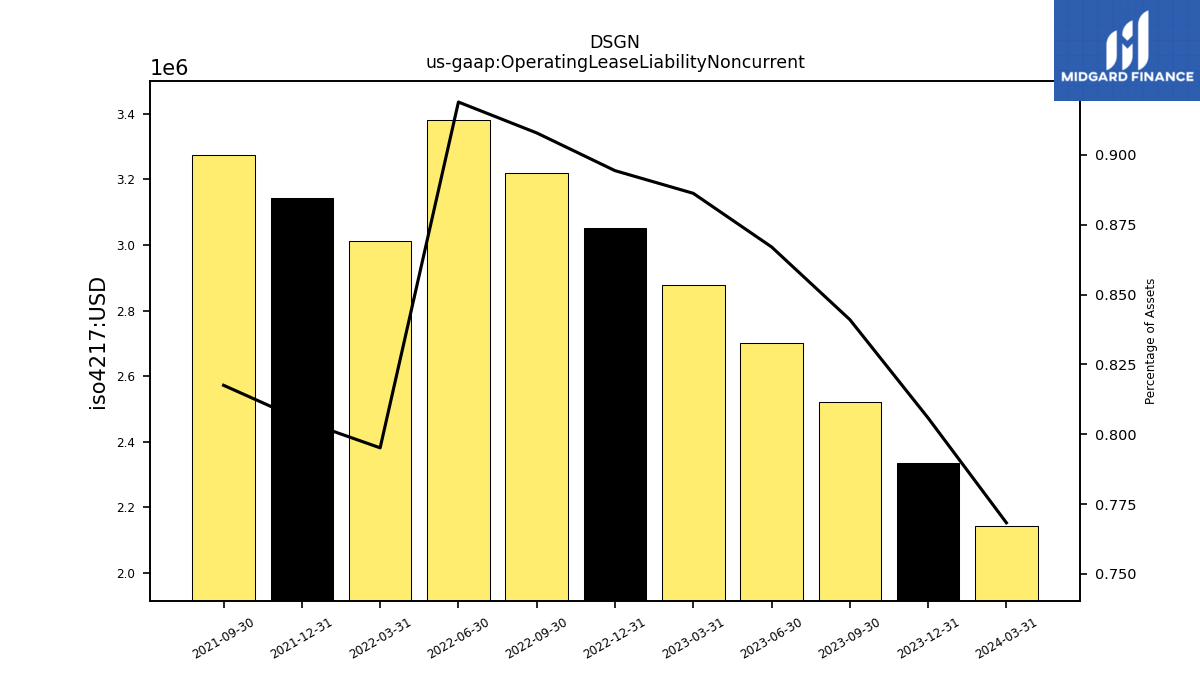
| Operating Lease Liability Noncurrent | 2.52 | 2.70 | 2.88 | 3.05 | 3.22 | 3.38 | 3.01 | 3.14 | 3.27 | NA | NA | NA |
| 2023-09-30 | 2023-06-30 | 2023-03-31 | 2022-12-31 | 2022-09-30 | 2022-06-30 | 2022-03-31 | 2021-12-31 | 2021-09-30 | 2021-06-30 | 2021-03-31 | 2020-12-31 | ||
|---|---|---|---|---|---|---|---|---|---|---|---|---|---|
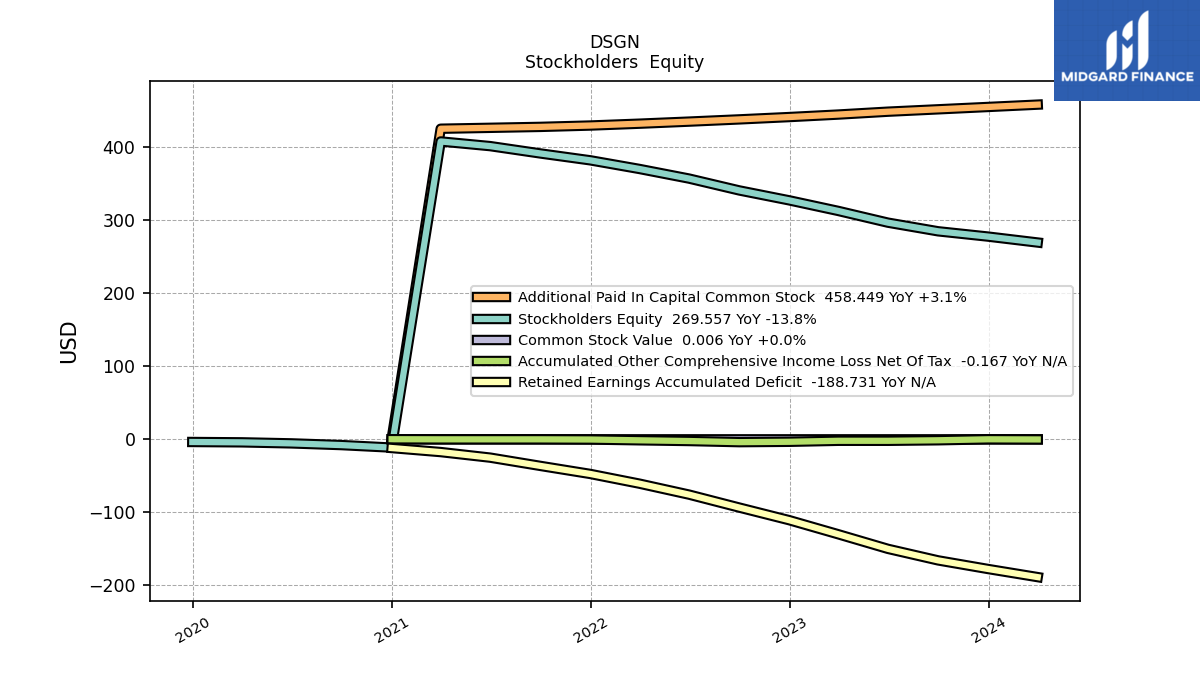
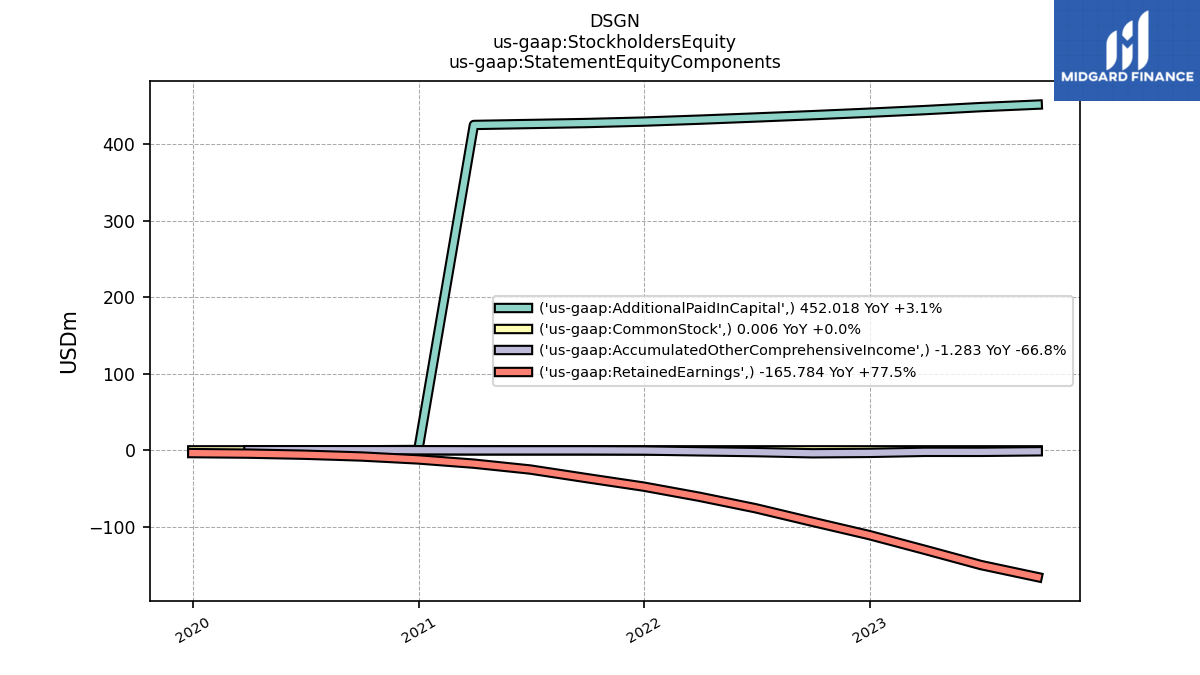
| Stockholders Equity | 284.96 | 296.80 | 312.82 | 327.31 | 340.94 | 357.16 | 370.31 | 382.13 | 391.56 | 401.60 | 408.01 | -11.31 | |
| Common Stock Value | 0.01 | 0.01 | 0.01 | 0.01 | 0.01 | 0.01 | 0.01 | 0.01 | 0.01 | 0.01 | 0.01 | 0.00 | |
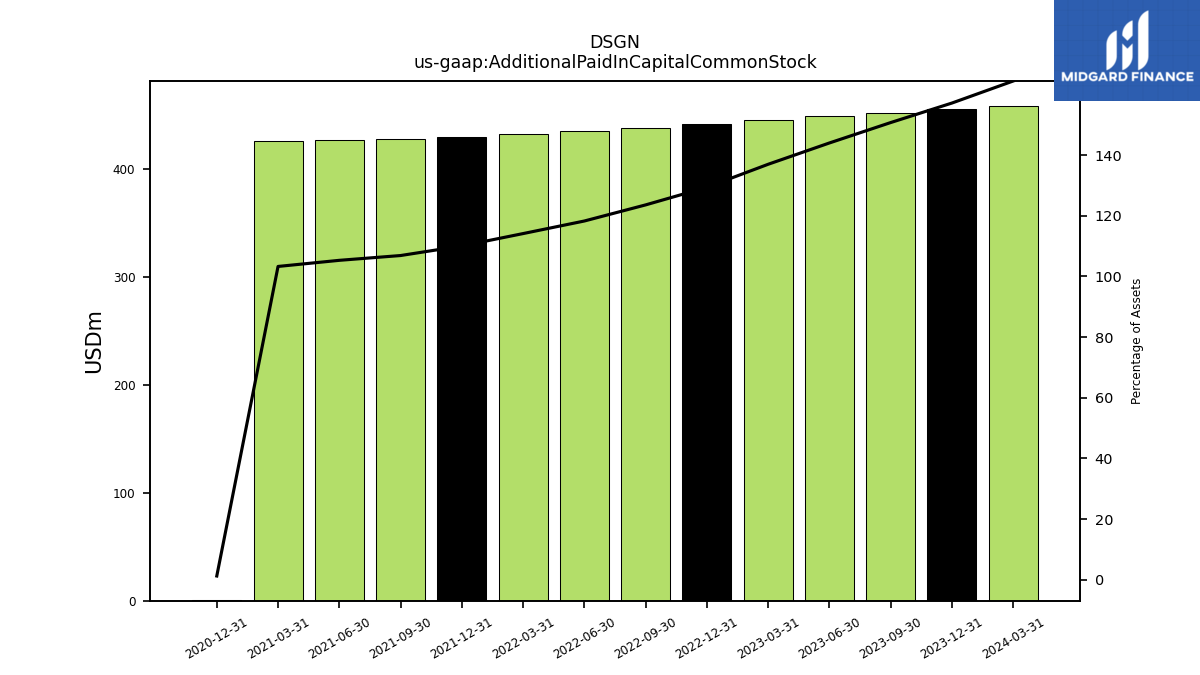
| Additional Paid In Capital Common Stock | 452.02 | 448.78 | 444.85 | 441.42 | 438.22 | 435.19 | 432.35 | 429.82 | 427.95 | 426.68 | 425.44 | 0.45 | |
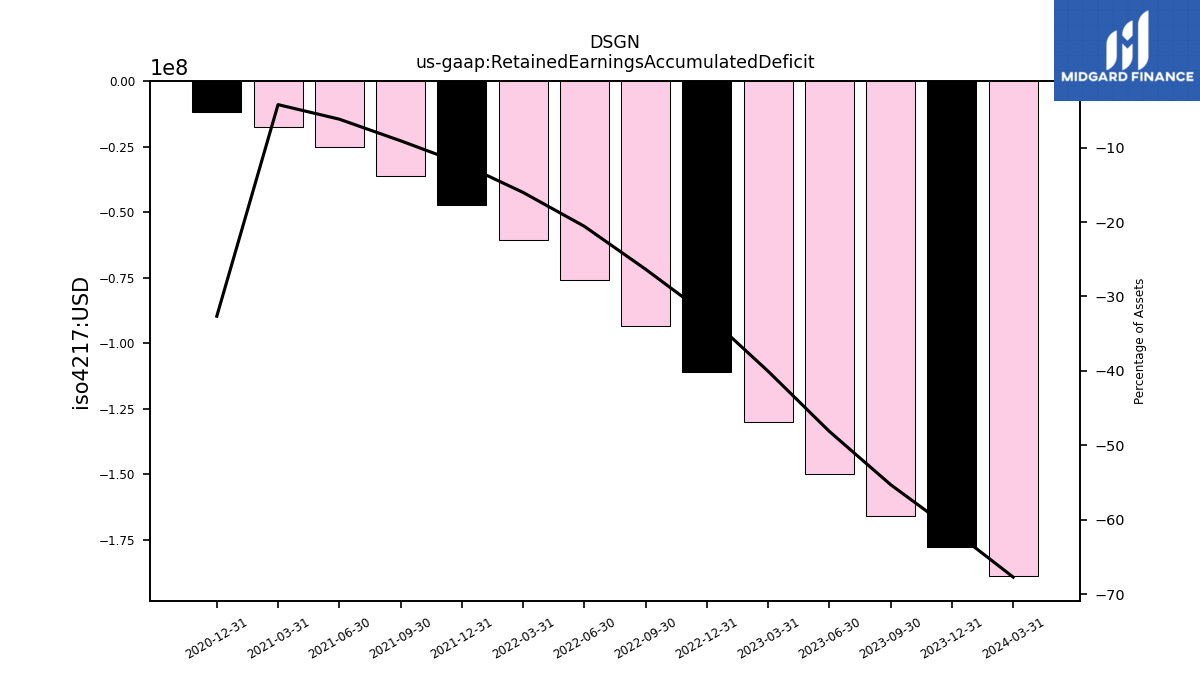
| Retained Earnings Accumulated Deficit | -165.78 | -150.00 | -130.06 | -110.76 | -93.42 | -75.72 | -60.72 | -47.46 | -36.39 | -25.07 | -17.44 | -11.92 | |
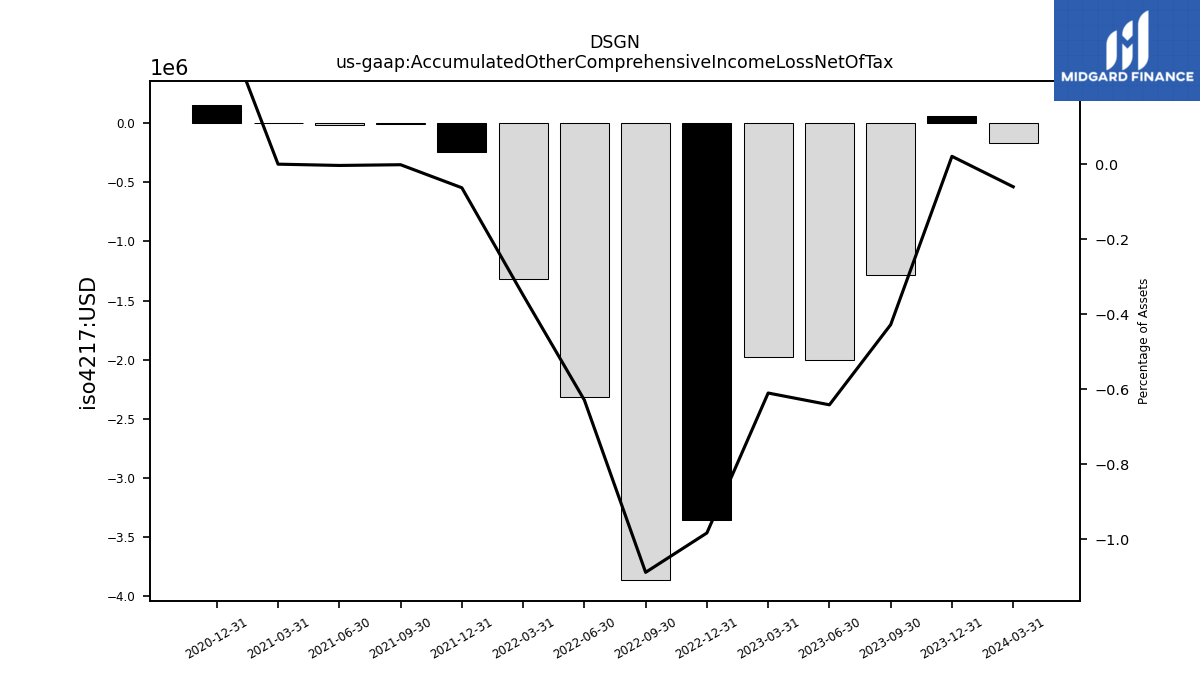
| Accumulated Other Comprehensive Income Loss Net Of Tax | -1.28 | -2.00 | -1.98 | -3.36 | -3.86 | -2.31 | -1.32 | -0.24 | -0.00 | -0.01 | 0.00 | 0.16 | |
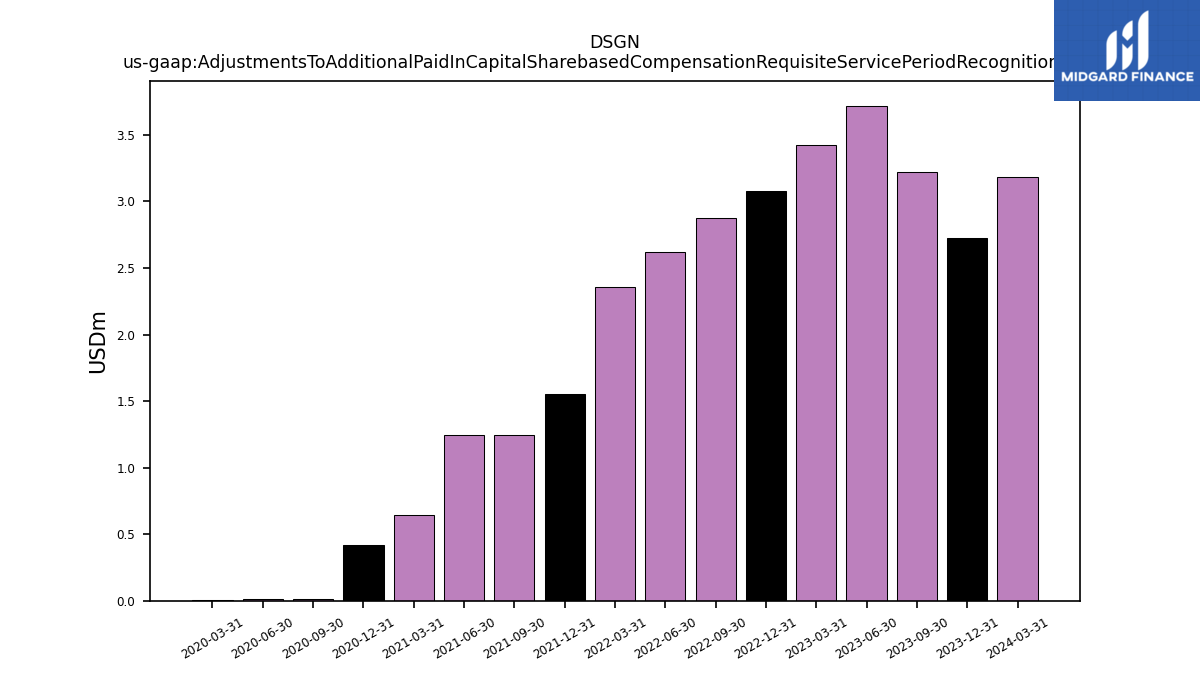
| Adjustments To Additional Paid In Capital Sharebased Compensation Requisite Service Period Recognition Value | 3.22 | 3.72 | 3.43 | 3.08 | 2.87 | 2.62 | 2.36 | 1.56 | 1.24 | 1.24 | 0.65 | 0.42 |
| 2023-09-30 | 2023-06-30 | 2023-03-31 | 2022-12-31 | 2022-09-30 | 2022-06-30 | 2022-03-31 | 2021-12-31 | 2021-09-30 | 2021-06-30 | 2021-03-31 | 2020-12-31 | ||
|---|---|---|---|---|---|---|---|---|---|---|---|---|---|
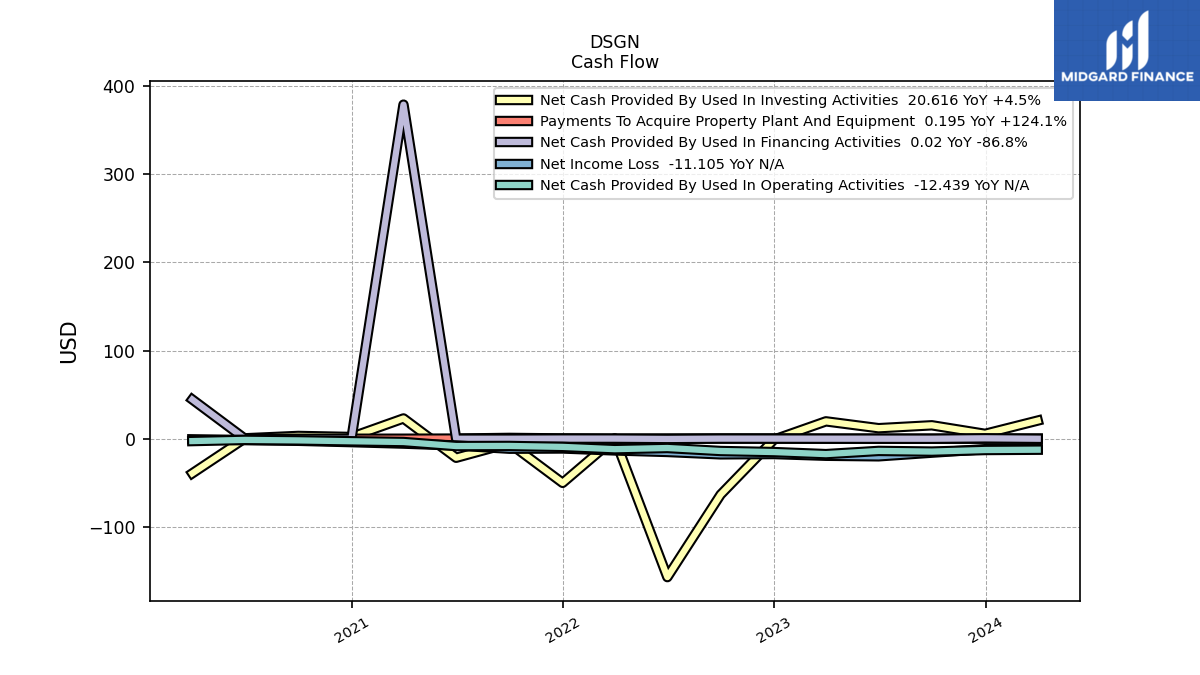
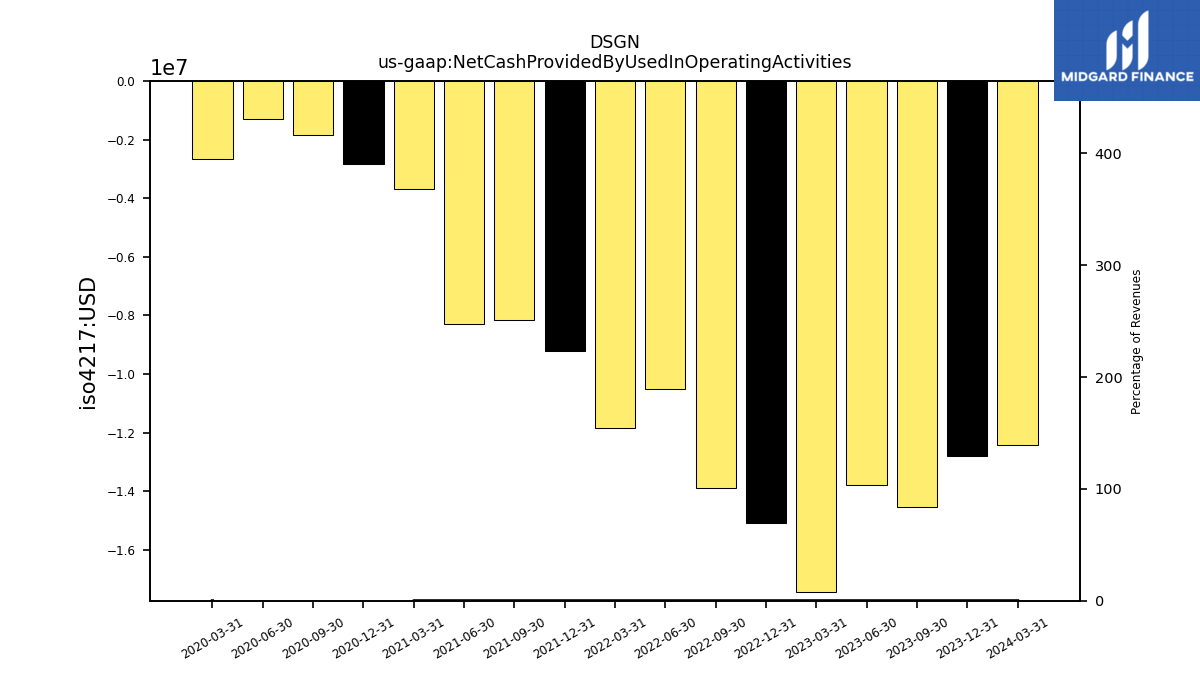
| Net Cash Provided By Used In Operating Activities | -14.53 | -13.80 | -17.42 | -15.09 | -13.90 | -10.50 | -11.83 | -9.23 | -8.16 | -8.29 | -3.70 | -2.84 | |
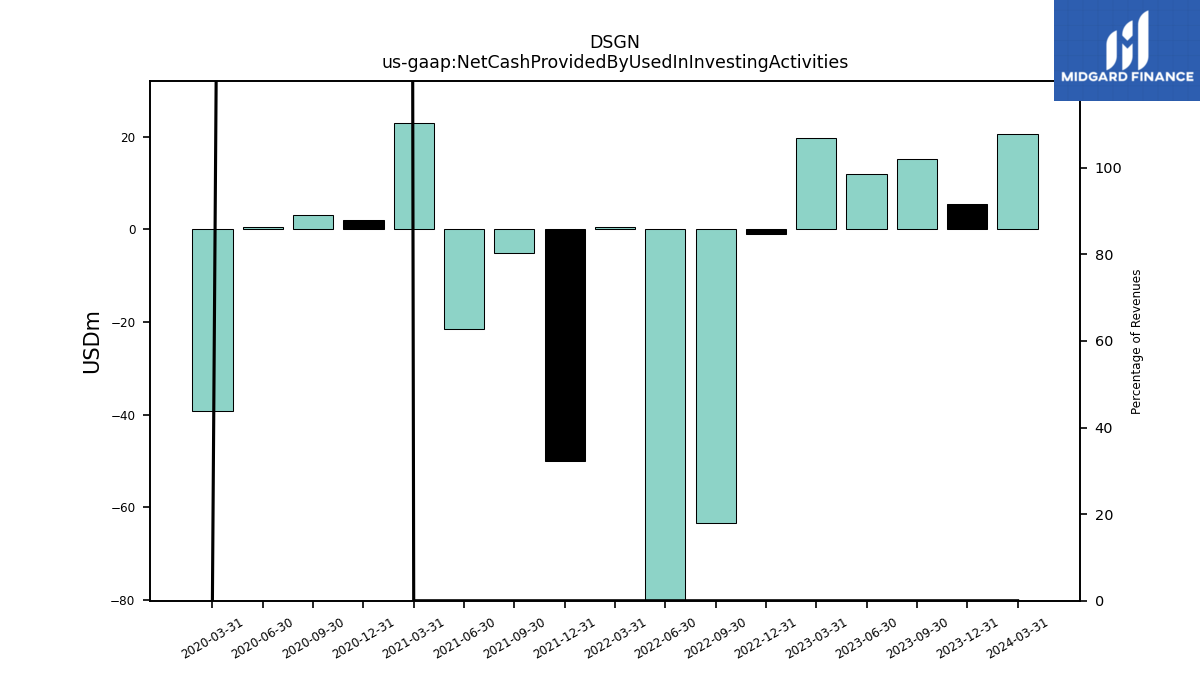
| Net Cash Provided By Used In Investing Activities | 15.27 | 11.98 | 19.73 | -1.06 | -63.39 | -156.96 | 0.41 | -50.06 | -5.04 | -21.57 | 23.03 | 2.00 | |
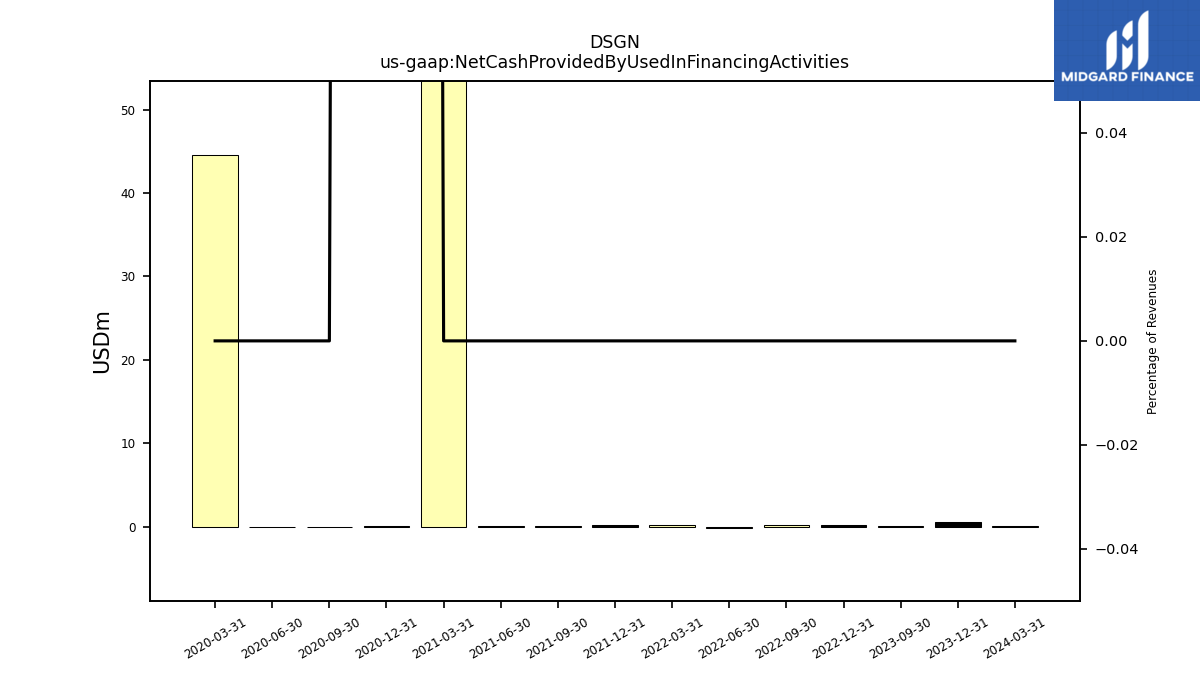
| Net Cash Provided By Used In Financing Activities | 0.01 | NA | NA | 0.13 | 0.15 | -0.20 | 0.16 | 0.19 | 0.03 | 0.01 | 378.98 | 0.00 |
| 2023-09-30 | 2023-06-30 | 2023-03-31 | 2022-12-31 | 2022-09-30 | 2022-06-30 | 2022-03-31 | 2021-12-31 | 2021-09-30 | 2021-06-30 | 2021-03-31 | 2020-12-31 | ||
|---|---|---|---|---|---|---|---|---|---|---|---|---|---|
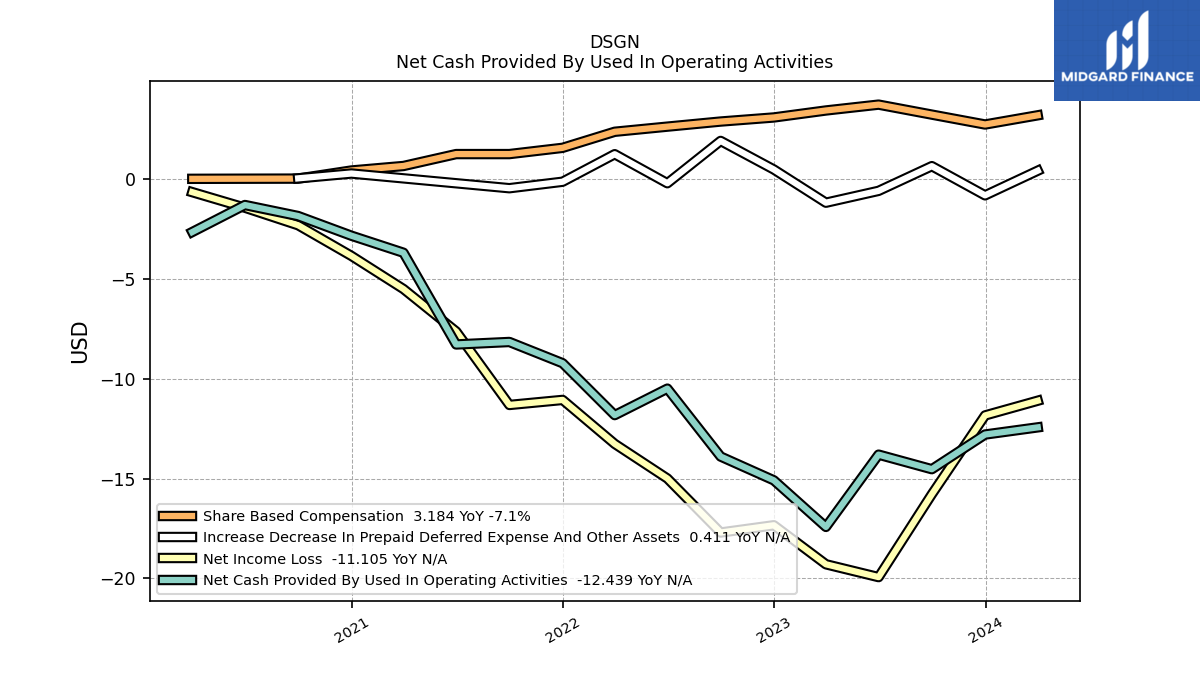
| Net Cash Provided By Used In Operating Activities | -14.53 | -13.80 | -17.42 | -15.09 | -13.90 | -10.50 | -11.83 | -9.23 | -8.16 | -8.29 | -3.70 | -2.84 | |
| Net Income Loss | -15.79 | -19.94 | -19.29 | -17.34 | -17.70 | -15.00 | -13.27 | -11.06 | -11.32 | -7.64 | -5.51 | -3.85 | |
| Profit Loss | -15.79 | -19.94 | -19.29 | -17.34 | -17.70 | -15.00 | -13.27 | -11.06 | -11.32 | -7.64 | -5.51 | -3.85 | |
| Share Based Compensation | 3.22 | 3.72 | 3.43 | 3.08 | 2.87 | 2.62 | 2.36 | 1.56 | 1.24 | 1.24 | 0.65 | 0.42 |
| 2023-09-30 | 2023-06-30 | 2023-03-31 | 2022-12-31 | 2022-09-30 | 2022-06-30 | 2022-03-31 | 2021-12-31 | 2021-09-30 | 2021-06-30 | 2021-03-31 | 2020-12-31 | ||
|---|---|---|---|---|---|---|---|---|---|---|---|---|---|
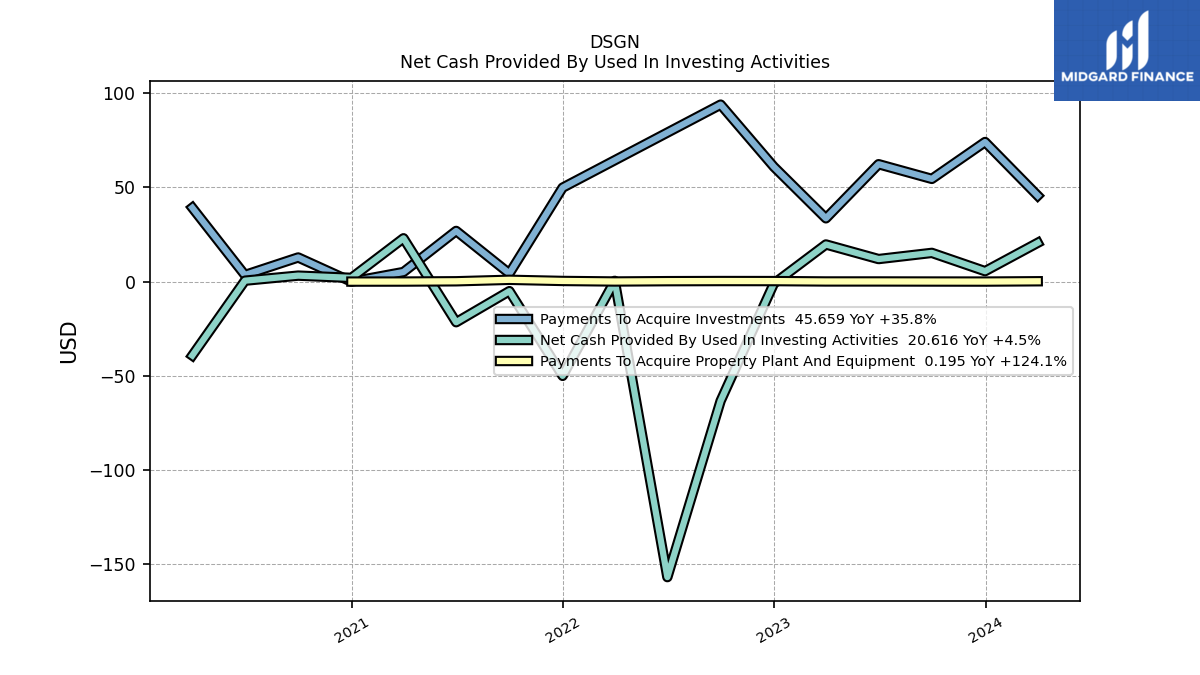
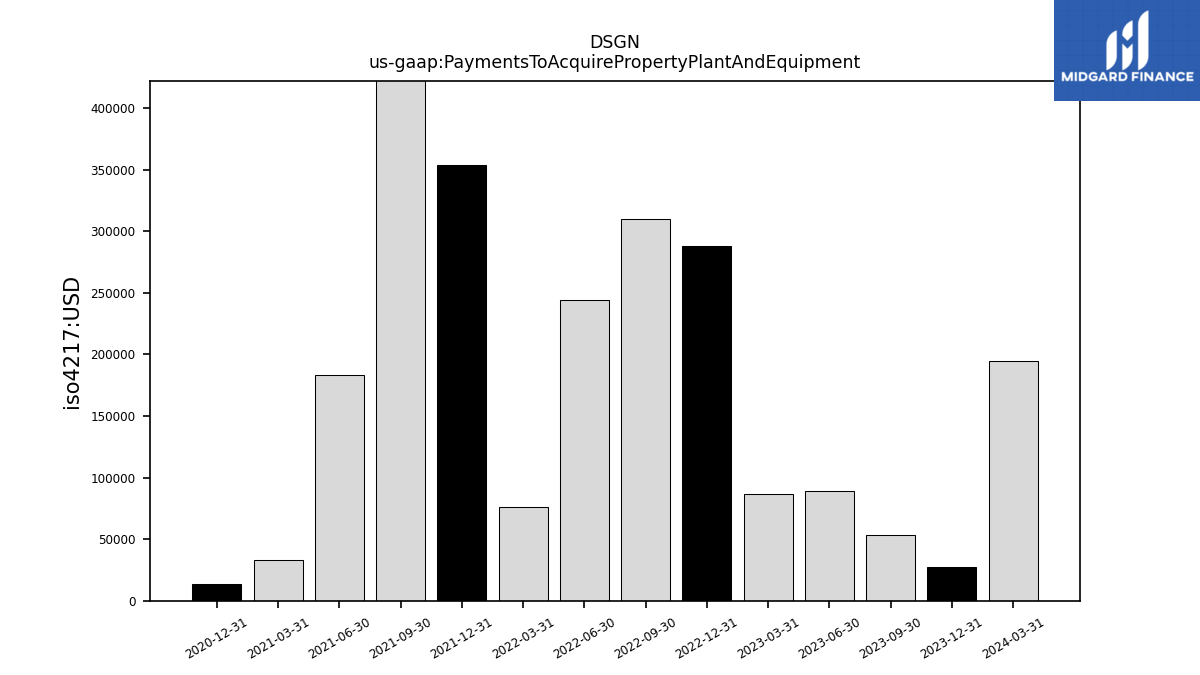
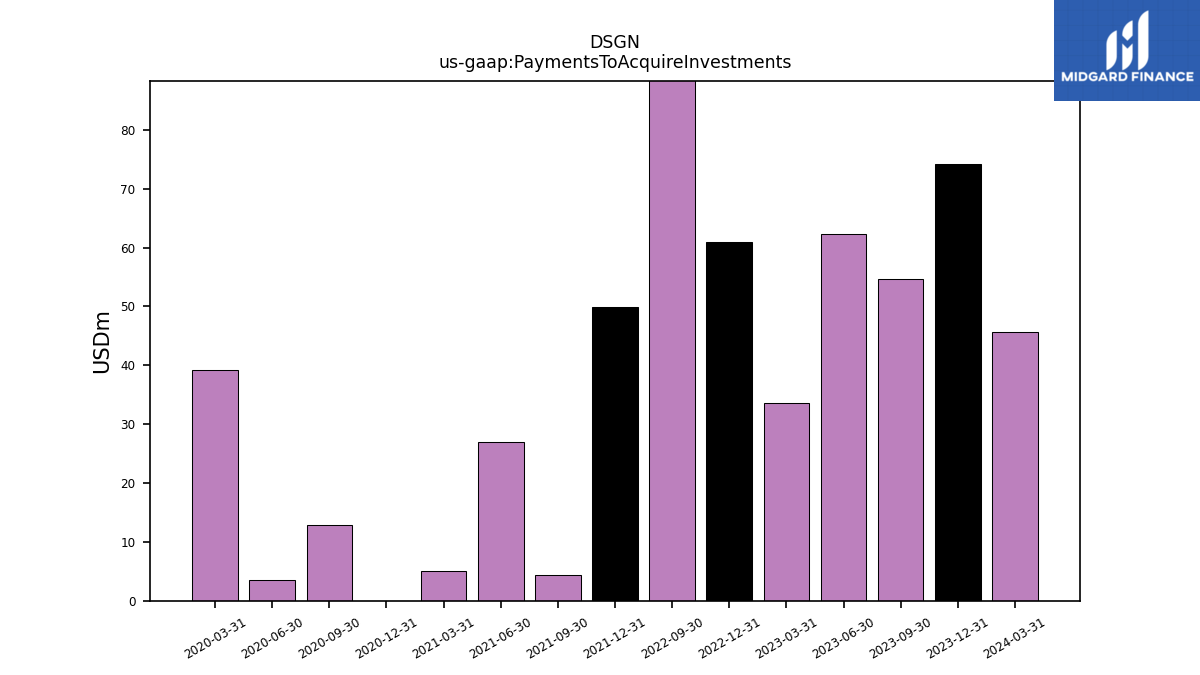
| Net Cash Provided By Used In Investing Activities | 15.27 | 11.98 | 19.73 | -1.06 | -63.39 | -156.96 | 0.41 | -50.06 | -5.04 | -21.57 | 23.03 | 2.00 | |
| Payments To Acquire Property Plant And Equipment | 0.05 | 0.09 | 0.09 | 0.29 | 0.31 | 0.24 | 0.08 | 0.35 | 0.97 | 0.18 | 0.03 | 0.01 | |
| Payments To Acquire Investments | 54.57 | 62.37 | 33.62 | 61.01 | 94.01 | NA | NA | 49.91 | 4.32 | 26.93 | 5.11 | 0.00 |
| 2023-09-30 | 2023-06-30 | 2023-03-31 | 2022-12-31 | 2022-09-30 | 2022-06-30 | 2022-03-31 | 2021-12-31 | 2021-09-30 | 2021-06-30 | 2021-03-31 | 2020-12-31 | ||
|---|---|---|---|---|---|---|---|---|---|---|---|---|---|
| Net Cash Provided By Used In Financing Activities | 0.01 | NA | NA | 0.13 | 0.15 | -0.20 | 0.16 | 0.19 | 0.03 | 0.01 | 378.98 | 0.00 |