
| 2023-12-31 | 2023-09-30 | 2023-06-30 | 2023-03-31 | 2022-12-31 | 2022-09-30 | 2022-06-30 | 2022-03-31 | 2021-12-31 | 2021-09-30 | 2021-06-30 | 2021-03-31 | 2020-12-31 | 2020-09-30 | 2020-06-30 | 2020-03-31 | 2019-12-31 | 2019-09-30 | 2019-06-30 | 2019-03-31 | 2018-12-31 | 2018-09-30 | 2018-06-30 | 2018-03-31 | 2017-12-31 | 2017-09-30 | 2017-06-30 | 2017-03-31 | 2016-12-31 | 2016-09-30 | 2016-06-30 | 2016-03-31 | 2015-12-31 | 2015-09-30 | 2015-06-30 | 2015-03-31 | 2014-12-31 | 2014-09-30 | 2014-06-30 | 2014-03-31 | 2013-12-31 | 2013-09-30 | 2013-06-30 | 2013-03-31 | 2012-12-31 | 2012-09-30 | 2012-06-30 | 2012-03-31 | 2011-12-31 | 2011-09-30 | 2011-06-30 | 2011-03-31 | 2010-12-31 | 2009-12-31 | ||
|---|---|---|---|---|---|---|---|---|---|---|---|---|---|---|---|---|---|---|---|---|---|---|---|---|---|---|---|---|---|---|---|---|---|---|---|---|---|---|---|---|---|---|---|---|---|---|---|---|---|---|---|---|---|---|---|
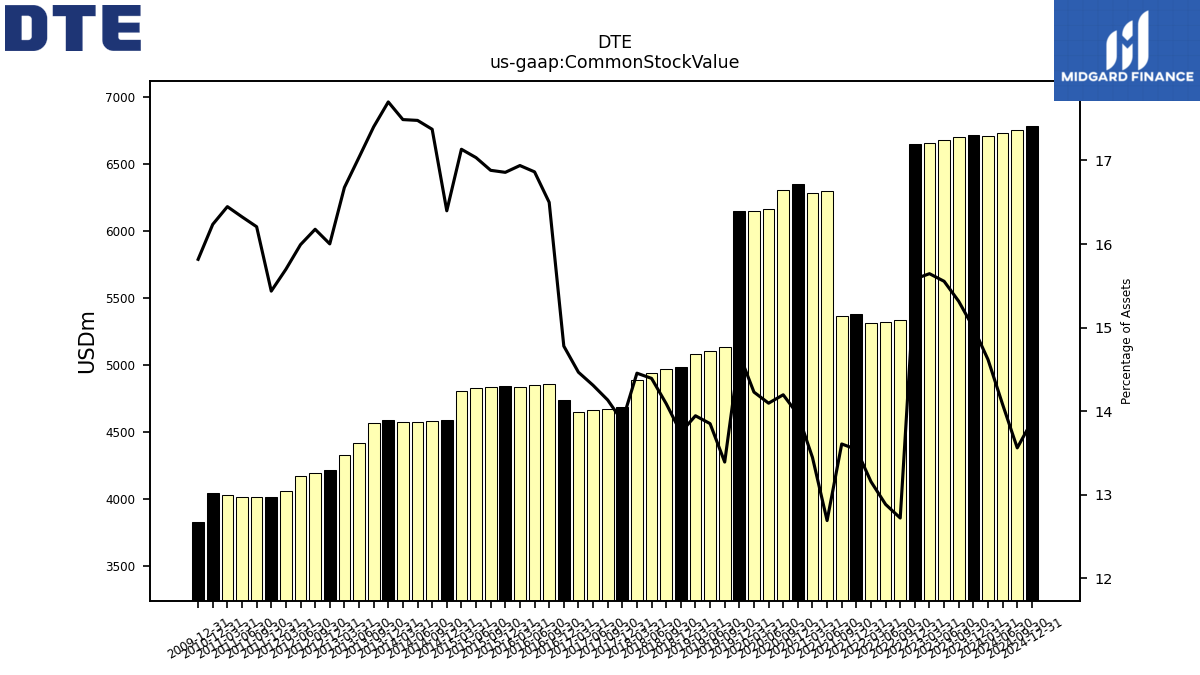
| Common Stock Value | 6713.00 | 6697.00 | 6676.00 | 6652.00 | 6651.00 | 5337.00 | 5323.00 | 5310.00 | 5379.00 | 5366.00 | 5361.00 | 5344.00 | 5406.00 | 5369.00 | 5247.00 | 5235.00 | 5233.00 | 4370.00 | 4344.00 | 4324.00 | 4245.00 | 4232.00 | 4205.00 | 4163.00 | 3989.00 | 3978.00 | 3968.00 | 3958.00 | 4030.00 | 4137.00 | 4129.00 | 4118.00 | 4123.00 | 4117.00 | 4110.00 | 4093.00 | 3904.00 | 3900.00 | 3896.00 | 3894.00 | 3907.00 | 3885.00 | 3762.00 | 3683.00 | 3587.00 | 3567.00 | 3549.00 | 3453.00 | 3417.00 | 3418.00 | 3415.00 | 3428.00 | 3440.00 | 3257.00 | |
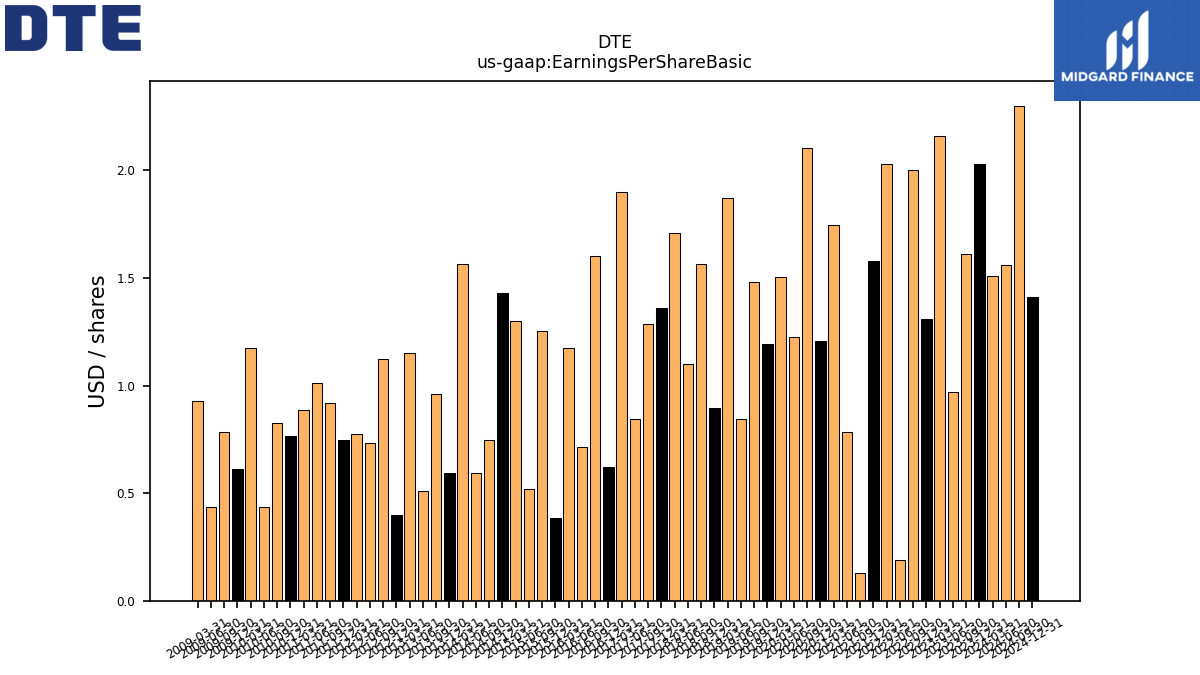
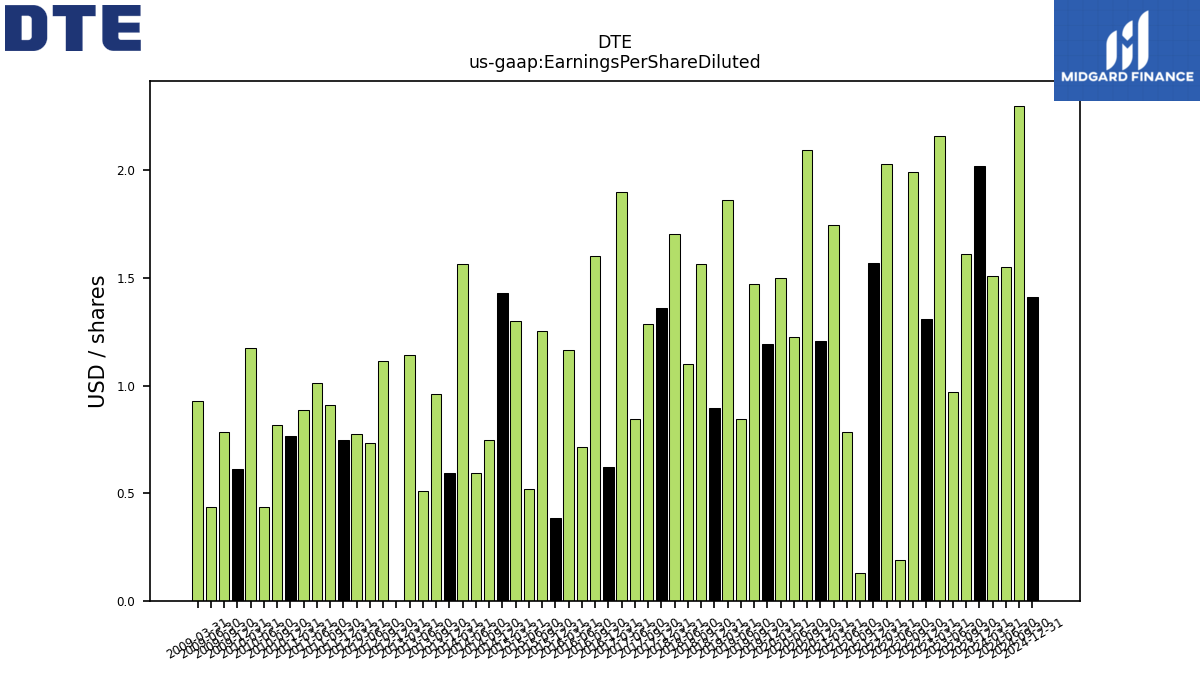
| Earnings Per Share Basic | 2.03 | 1.61 | 0.97 | 2.16 | 1.31 | 2.00 | 0.19 | 2.03 | 1.58 | 0.13 | 0.92 | 2.05 | 1.42 | 2.47 | 1.44 | 1.77 | 1.40 | 1.74 | 0.99 | 2.20 | 1.05 | 1.84 | 1.29 | 2.01 | 1.60 | 1.51 | 0.99 | 2.23 | 0.73 | 1.88 | 0.84 | 1.38 | 0.45 | 1.47 | 0.61 | 1.53 | 1.68 | 0.88 | 0.70 | 1.84 | 0.70 | 1.13 | 0.60 | 1.35 | 0.47 | 1.32 | 0.86 | 0.91 | 0.88 | 1.08 | 1.19 | 1.04 | 0.90 | 0.72 | |
| Earnings Per Share Diluted | 2.02 | 1.61 | 0.97 | 2.16 | 1.31 | 1.99 | 0.19 | 2.03 | 1.57 | 0.13 | 0.92 | 2.05 | 1.42 | 2.46 | 1.44 | 1.76 | 1.40 | 1.73 | 0.99 | 2.19 | 1.05 | 1.84 | 1.29 | 2.00 | 1.60 | 1.51 | 0.99 | 2.23 | 0.73 | 1.88 | 0.84 | 1.37 | 0.45 | 1.47 | 0.61 | 1.53 | 1.68 | 0.88 | 0.70 | 1.84 | 0.70 | 1.13 | 0.60 | 1.34 | 0.00 | 1.31 | 0.86 | 0.91 | 0.88 | 1.07 | 1.19 | 1.04 | 0.90 | 0.72 |
| 2023-12-31 | 2023-09-30 | 2023-06-30 | 2023-03-31 | 2022-12-31 | 2022-09-30 | 2022-06-30 | 2022-03-31 | 2021-12-31 | 2021-09-30 | 2021-06-30 | 2021-03-31 | 2020-12-31 | 2020-09-30 | 2020-06-30 | 2020-03-31 | 2019-12-31 | 2019-09-30 | 2019-06-30 | 2019-03-31 | 2018-12-31 | 2018-09-30 | 2018-06-30 | 2018-03-31 | 2017-12-31 | 2017-09-30 | 2017-06-30 | 2017-03-31 | 2016-12-31 | 2016-09-30 | 2016-06-30 | 2016-03-31 | 2015-12-31 | 2015-09-30 | 2015-06-30 | 2015-03-31 | 2014-12-31 | 2014-09-30 | 2014-06-30 | 2014-03-31 | 2013-12-31 | 2013-09-30 | 2013-06-30 | 2013-03-31 | 2012-12-31 | 2012-09-30 | 2012-06-30 | 2012-03-31 | 2011-12-31 | 2011-09-30 | 2011-06-30 | 2011-03-31 | 2010-12-31 | 2009-12-31 | ||
|---|---|---|---|---|---|---|---|---|---|---|---|---|---|---|---|---|---|---|---|---|---|---|---|---|---|---|---|---|---|---|---|---|---|---|---|---|---|---|---|---|---|---|---|---|---|---|---|---|---|---|---|---|---|---|---|
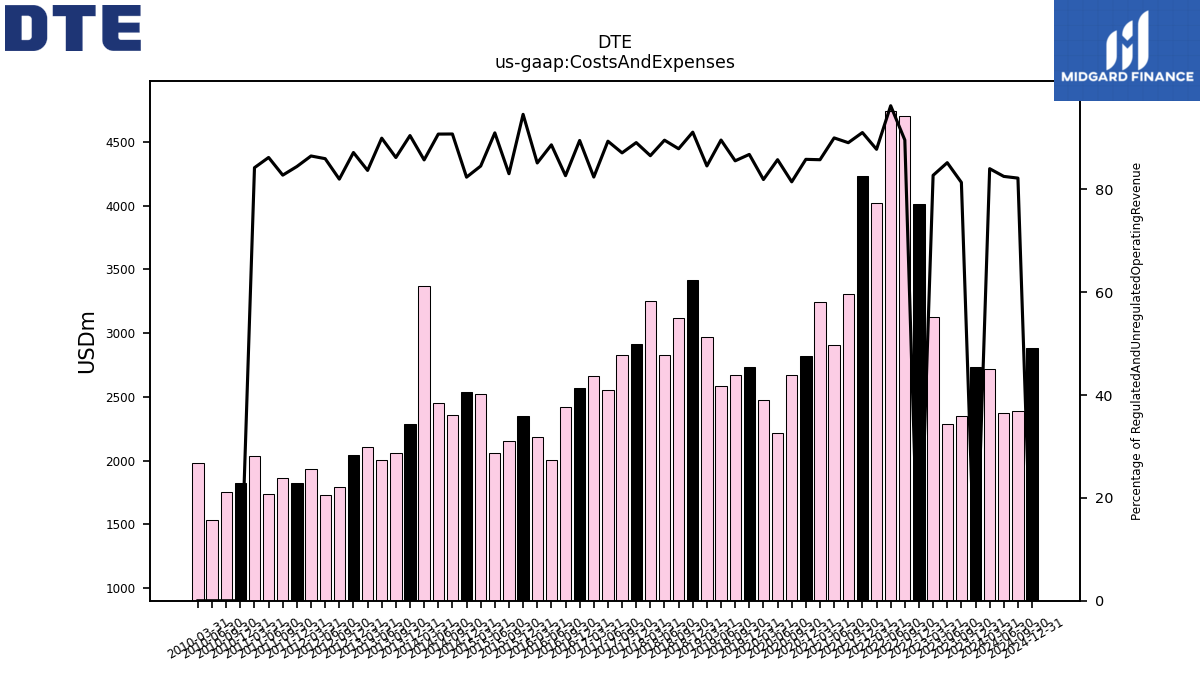
| Costs And Expenses | 2738.00 | 2350.00 | 2287.00 | 3127.00 | 4014.00 | 4706.00 | 4741.00 | 4019.00 | 4232.00 | 3310.00 | 2907.00 | 3241.00 | 2823.00 | 2676.00 | 2216.00 | 2476.00 | 2733.00 | 2669.00 | 2588.00 | 2972.00 | 3418.00 | 3121.00 | 2830.00 | 3249.00 | 2915.00 | 2827.00 | 2552.00 | 2667.00 | 2573.00 | 2421.00 | 2006.00 | 2185.00 | 2353.00 | 2158.00 | 2064.00 | 2523.00 | 2536.00 | 2356.00 | 2449.00 | 3370.00 | 2292.00 | 2058.00 | 2002.00 | 2106.00 | 2048.00 | 1796.00 | 1731.00 | 1937.00 | 1827.00 | 1866.00 | 1740.00 | 2041.00 | 1823.00 | NA | |
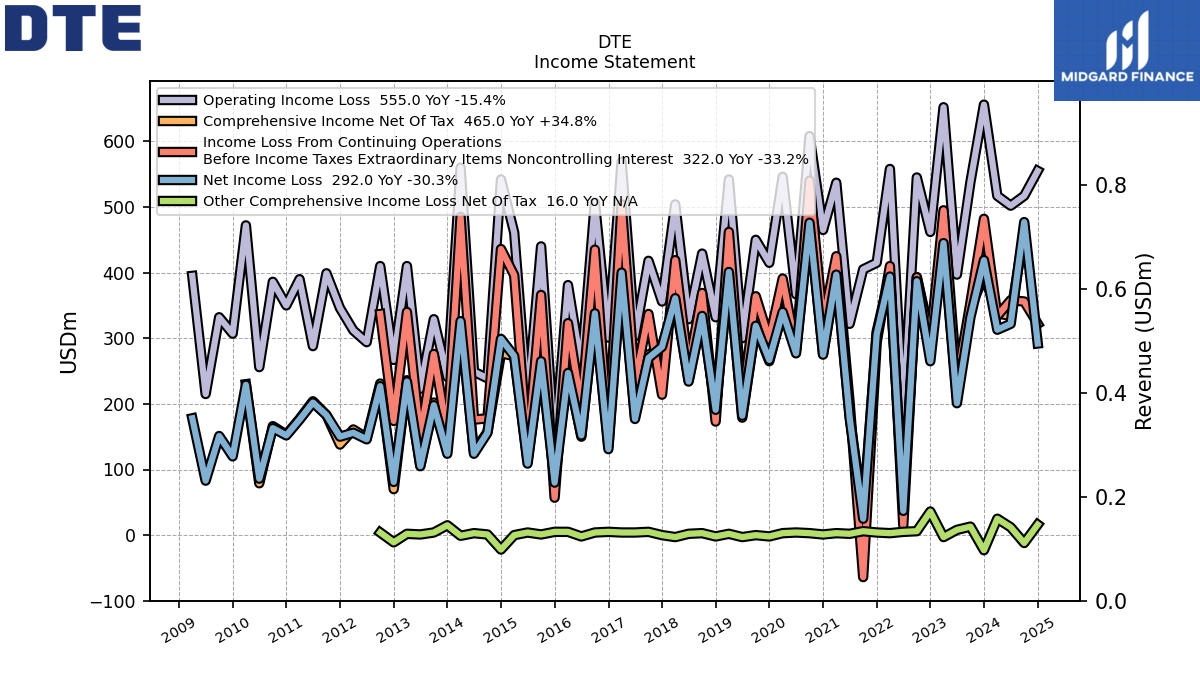
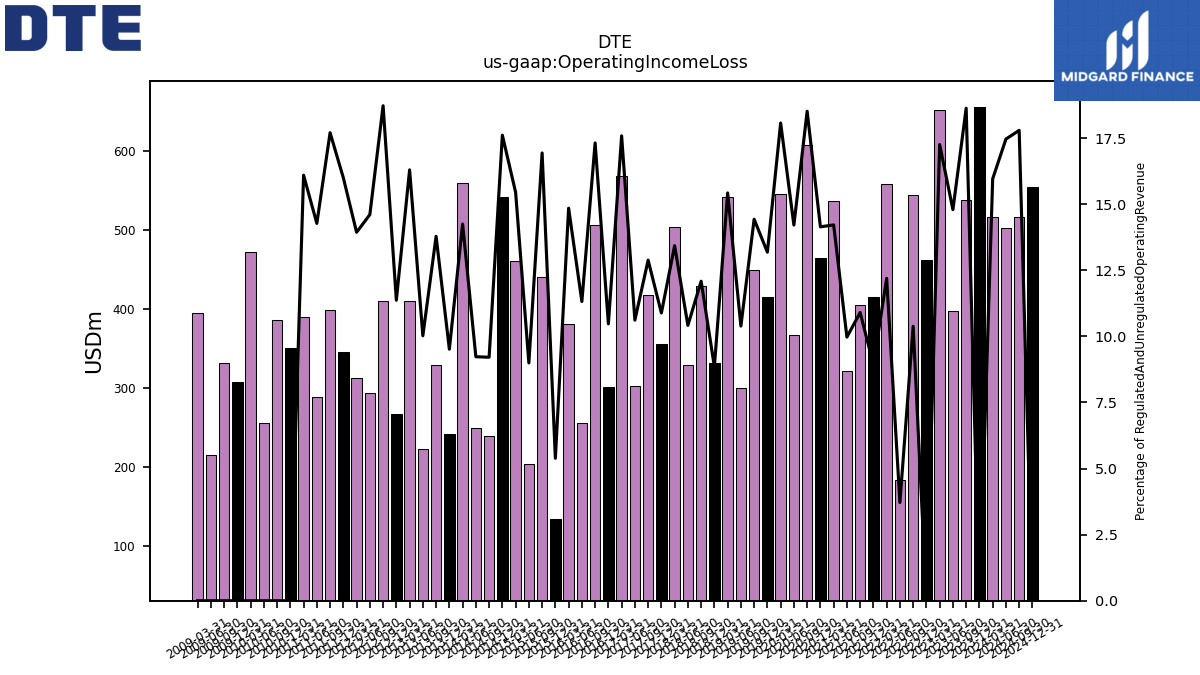
| Operating Income Loss | 656.00 | 538.00 | 397.00 | 652.00 | 462.00 | 545.00 | 183.00 | 558.00 | 415.00 | 405.00 | 322.00 | 537.00 | 465.00 | 608.00 | 367.00 | 546.00 | 415.00 | 450.00 | 300.00 | 542.00 | 332.00 | 429.00 | 329.00 | 504.00 | 356.00 | 418.00 | 303.00 | 569.00 | 301.00 | 507.00 | 256.00 | 381.00 | 134.00 | 440.00 | 204.00 | 461.00 | 542.00 | 239.00 | 249.00 | 560.00 | 241.00 | 329.00 | 223.00 | 410.00 | 267.00 | 410.00 | 294.00 | 312.00 | 346.00 | 399.00 | 288.00 | 390.00 | 350.00 | 307.00 | |
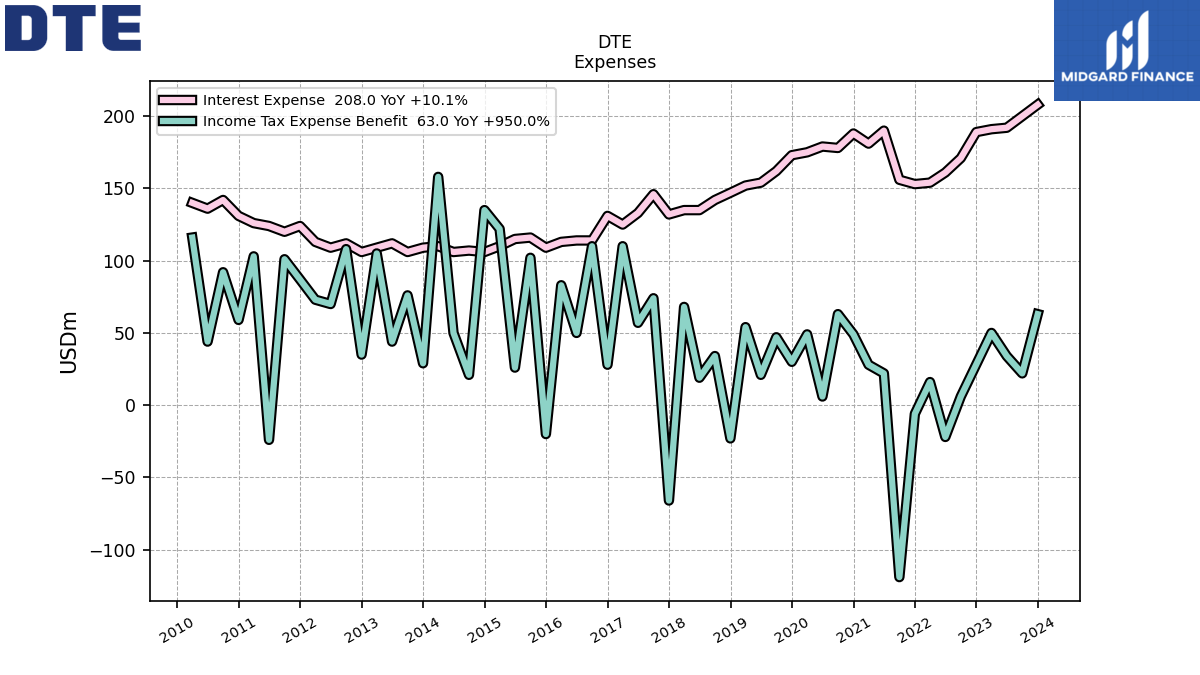
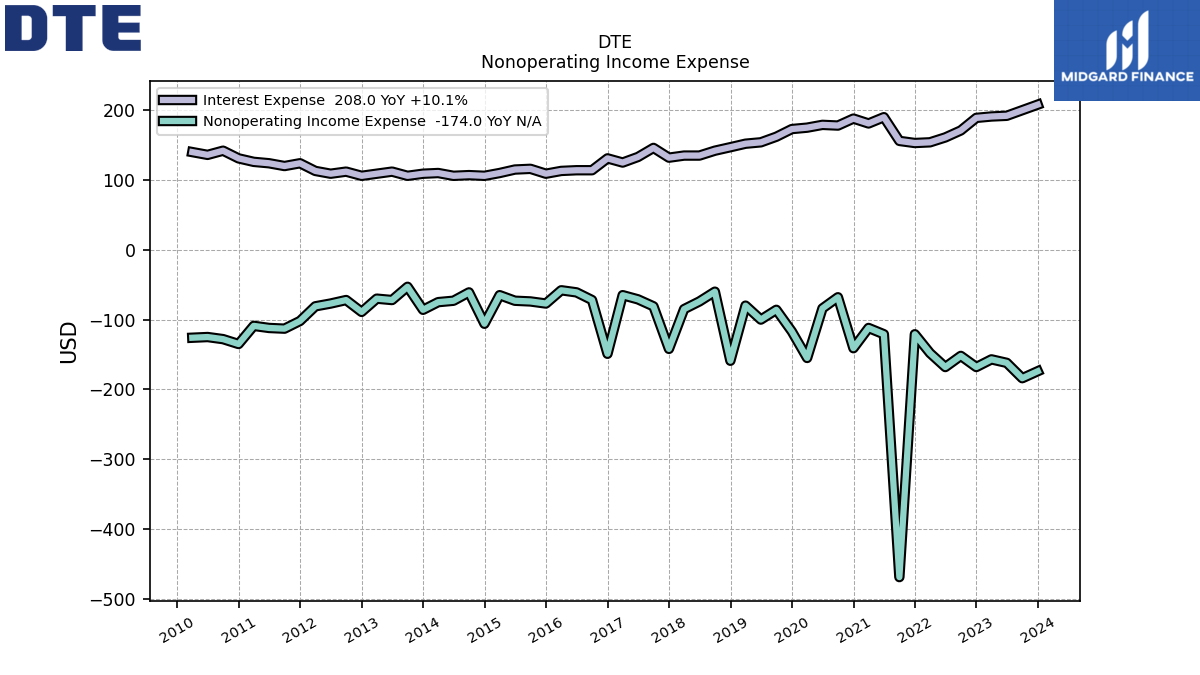
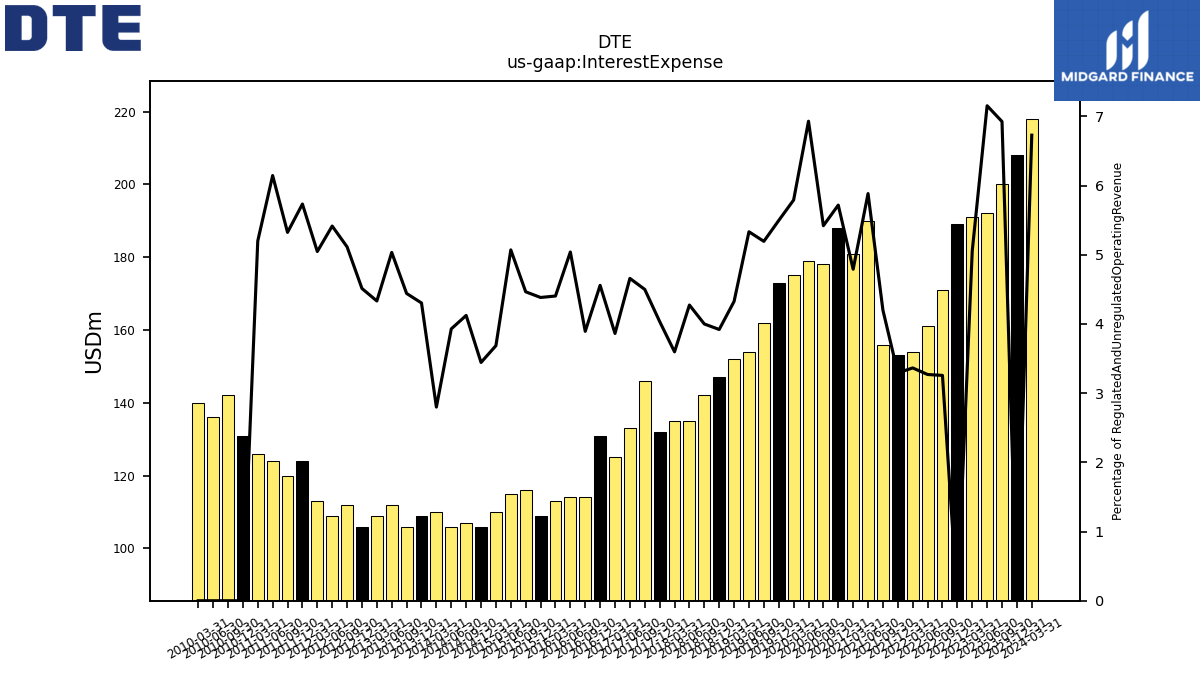
| Interest Expense | 208.00 | 200.00 | 192.00 | 191.00 | 189.00 | 171.00 | 161.00 | 154.00 | 153.00 | 156.00 | 190.00 | 181.00 | 188.00 | 178.00 | 179.00 | 175.00 | 173.00 | 162.00 | 154.00 | 152.00 | 147.00 | 142.00 | 135.00 | 135.00 | 132.00 | 146.00 | 133.00 | 125.00 | 131.00 | 114.00 | 114.00 | 113.00 | 109.00 | 116.00 | 115.00 | 110.00 | 106.00 | 107.00 | 106.00 | 110.00 | 109.00 | 106.00 | 112.00 | 109.00 | 106.00 | 112.00 | 109.00 | 113.00 | 124.00 | 120.00 | 124.00 | 126.00 | 131.00 | NA | |
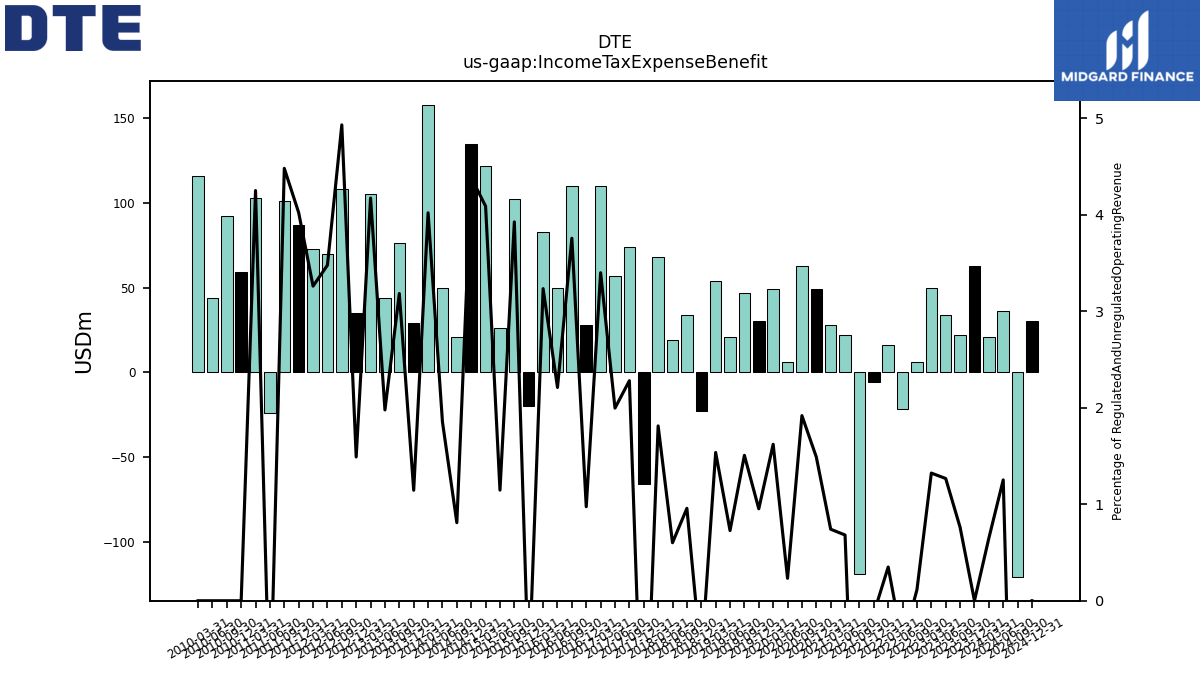
| Income Tax Expense Benefit | 63.00 | 22.00 | 34.00 | 50.00 | NA | 6.00 | -22.00 | 16.00 | -6.00 | -119.00 | 22.00 | 28.00 | 49.00 | 63.00 | 6.00 | 49.00 | 30.00 | 47.00 | 21.00 | 54.00 | -23.00 | 34.00 | 19.00 | 68.00 | -66.00 | 74.00 | 57.00 | 110.00 | 28.00 | 110.00 | 50.00 | 83.00 | -20.00 | 102.00 | 26.00 | 122.00 | 135.00 | 21.00 | 50.00 | 158.00 | 29.00 | 76.00 | 44.00 | 105.00 | 35.00 | 108.00 | 70.00 | 73.00 | 87.00 | 101.00 | -24.00 | 103.00 | 59.00 | NA | |
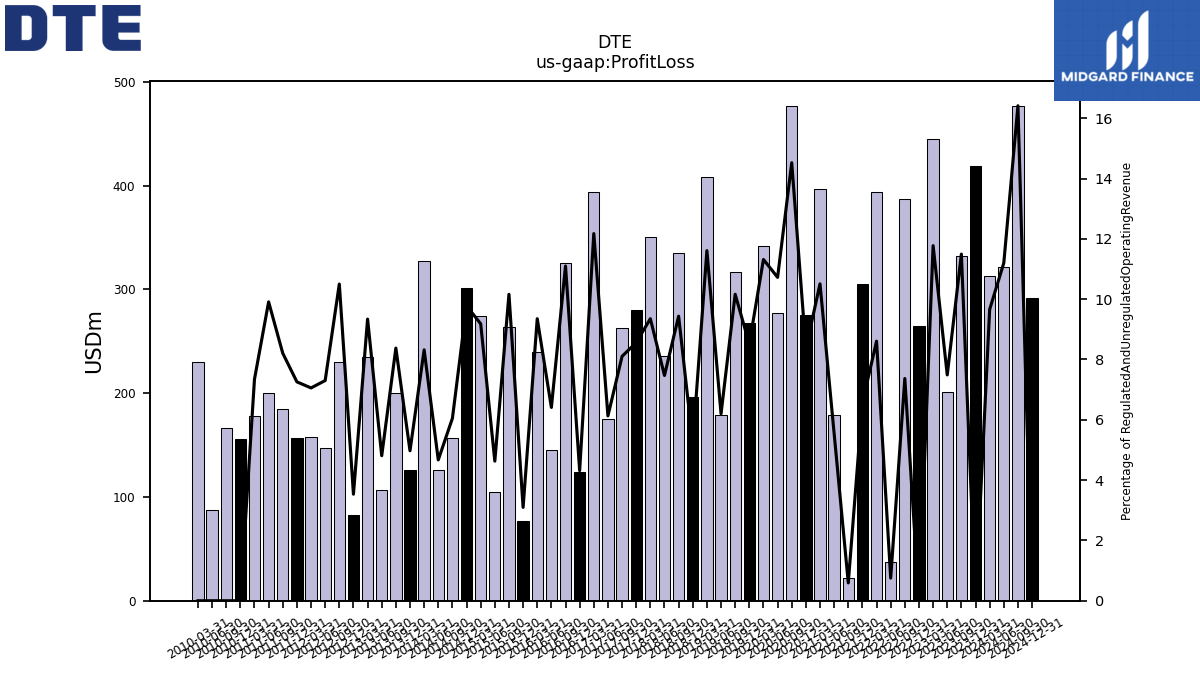
| Profit Loss | 419.00 | 332.00 | 201.00 | 445.00 | 265.00 | 387.00 | 37.00 | 394.00 | 305.00 | 22.00 | 179.00 | 397.00 | 275.00 | 477.00 | 277.00 | 342.00 | 268.00 | 317.00 | 179.00 | 408.00 | 196.00 | 335.00 | 236.00 | 351.00 | 280.00 | 263.00 | 175.00 | 394.00 | 124.00 | 325.00 | 145.00 | 240.00 | 77.00 | 264.00 | 105.00 | 274.00 | 301.00 | 157.00 | 126.00 | 327.00 | 126.00 | 200.00 | 107.00 | 235.00 | 83.00 | 230.00 | 147.00 | 158.00 | 157.00 | 185.00 | 200.00 | 178.00 | 156.00 | NA | |
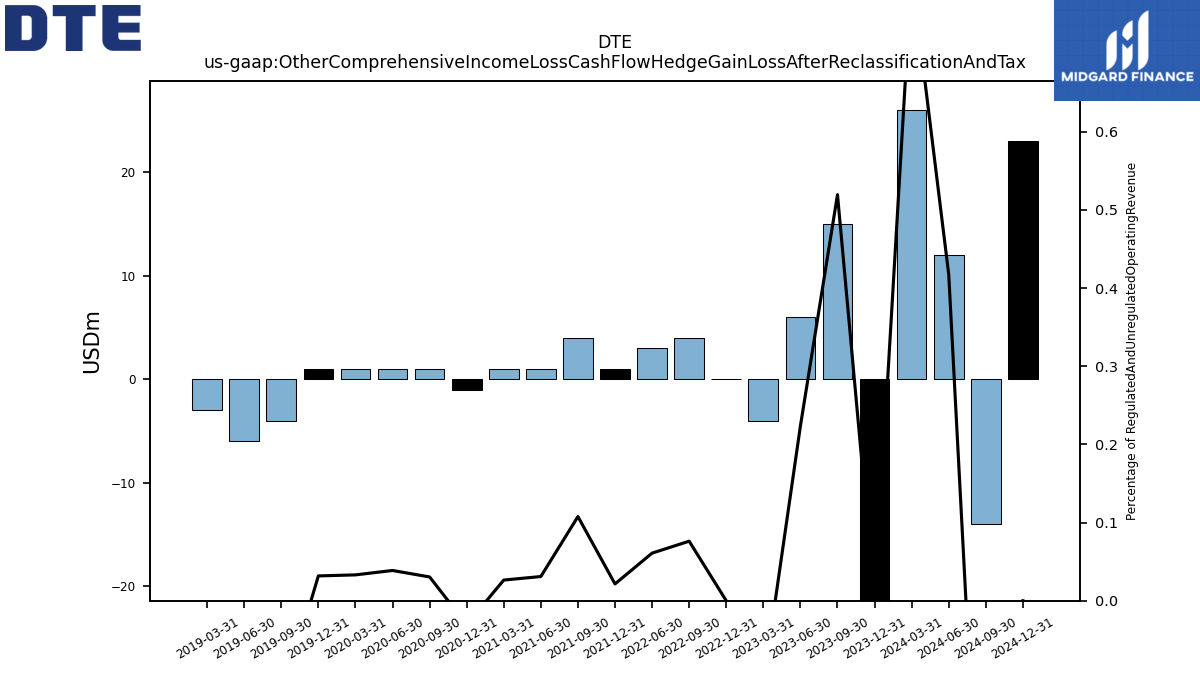
| Other Comprehensive Income Loss Cash Flow Hedge Gain Loss After Reclassification And Tax | -30.00 | 15.00 | 6.00 | -4.00 | 0.00 | 4.00 | 3.00 | NA | 1.00 | 4.00 | 1.00 | 1.00 | -1.00 | 1.00 | 1.00 | 1.00 | 1.00 | -4.00 | -6.00 | -3.00 | NA | NA | NA | NA | NA | NA | NA | NA | NA | NA | NA | NA | NA | NA | NA | NA | NA | NA | NA | NA | NA | NA | NA | NA | NA | NA | NA | NA | NA | NA | NA | NA | NA | NA | |
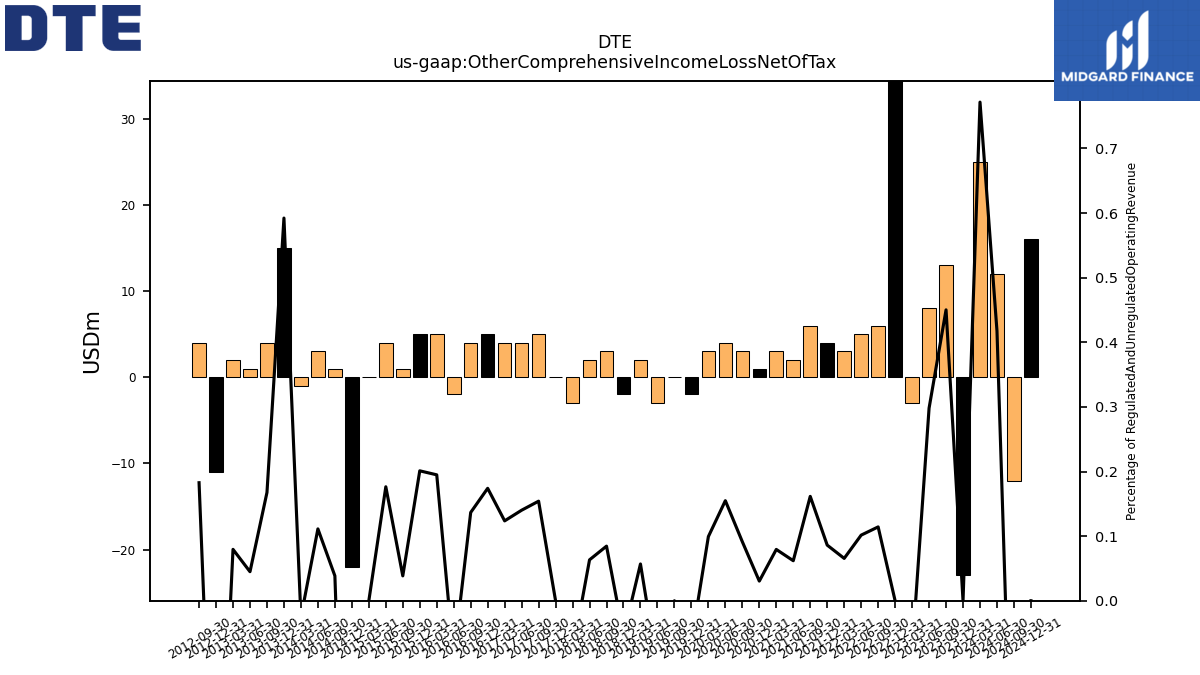
| Other Comprehensive Income Loss Net Of Tax | -23.00 | 13.00 | 8.00 | -3.00 | 36.00 | 6.00 | 5.00 | 3.00 | 4.00 | 6.00 | 2.00 | 3.00 | 1.00 | 3.00 | 4.00 | 3.00 | -2.00 | 0.00 | -3.00 | 2.00 | -2.00 | 3.00 | 2.00 | -3.00 | 0.00 | 5.00 | 4.00 | 4.00 | 5.00 | 4.00 | -2.00 | 5.00 | 5.00 | 1.00 | 4.00 | 0.00 | -22.00 | 1.00 | 3.00 | -1.00 | 15.00 | 4.00 | 1.00 | 2.00 | -11.00 | 4.00 | NA | NA | NA | NA | NA | NA | NA | NA | |
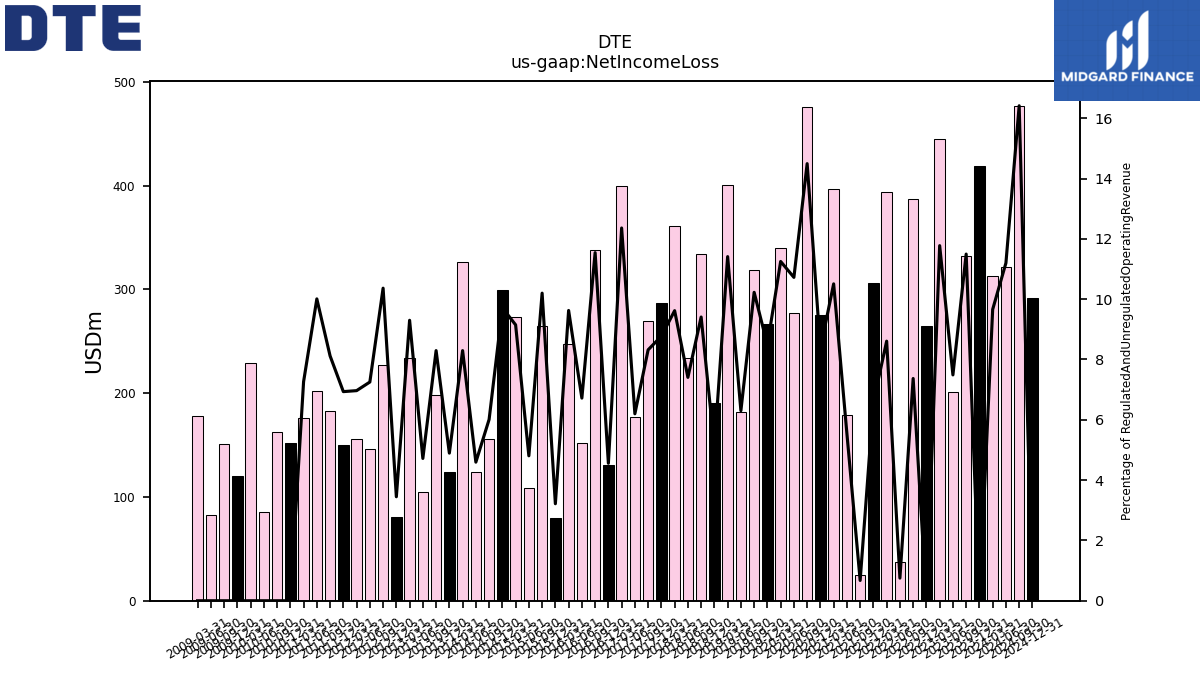
| Net Income Loss | 419.00 | 332.00 | 201.00 | 445.00 | 265.00 | 387.00 | 37.00 | 394.00 | 306.00 | 25.00 | 179.00 | 397.00 | 275.00 | 476.00 | 277.00 | 340.00 | 267.00 | 319.00 | 182.00 | 401.00 | 191.00 | 334.00 | 234.00 | 361.00 | 287.00 | 270.00 | 177.00 | 400.00 | 131.00 | 338.00 | 152.00 | 247.00 | 80.00 | 265.00 | 109.00 | 273.00 | 299.00 | 156.00 | 124.00 | 326.00 | 124.00 | 198.00 | 105.00 | 234.00 | 81.00 | 227.00 | 146.00 | 156.00 | 150.00 | 183.00 | 202.00 | 176.00 | 152.00 | 120.00 | |
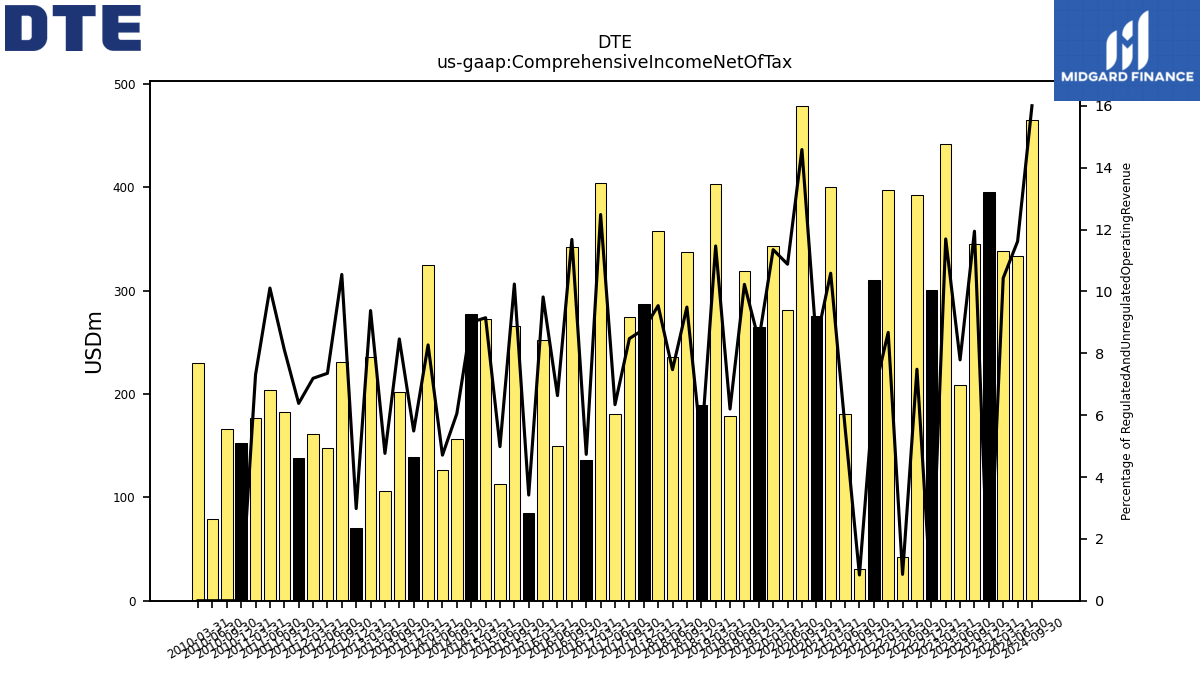
| Comprehensive Income Net Of Tax | 396.00 | 345.00 | 209.00 | 442.00 | 301.00 | 393.00 | 42.00 | 397.00 | 310.00 | 31.00 | 181.00 | 400.00 | 276.00 | 479.00 | 281.00 | 343.00 | 265.00 | 319.00 | 179.00 | 403.00 | 189.00 | 337.00 | 236.00 | 358.00 | 287.00 | 275.00 | 181.00 | 404.00 | 136.00 | 342.00 | 150.00 | 252.00 | 85.00 | 266.00 | 113.00 | 273.00 | 277.00 | 157.00 | 127.00 | 325.00 | 139.00 | 202.00 | 106.00 | 236.00 | 70.00 | 231.00 | 148.00 | 161.00 | 138.00 | 183.00 | 204.00 | 177.00 | 153.00 | NA | |
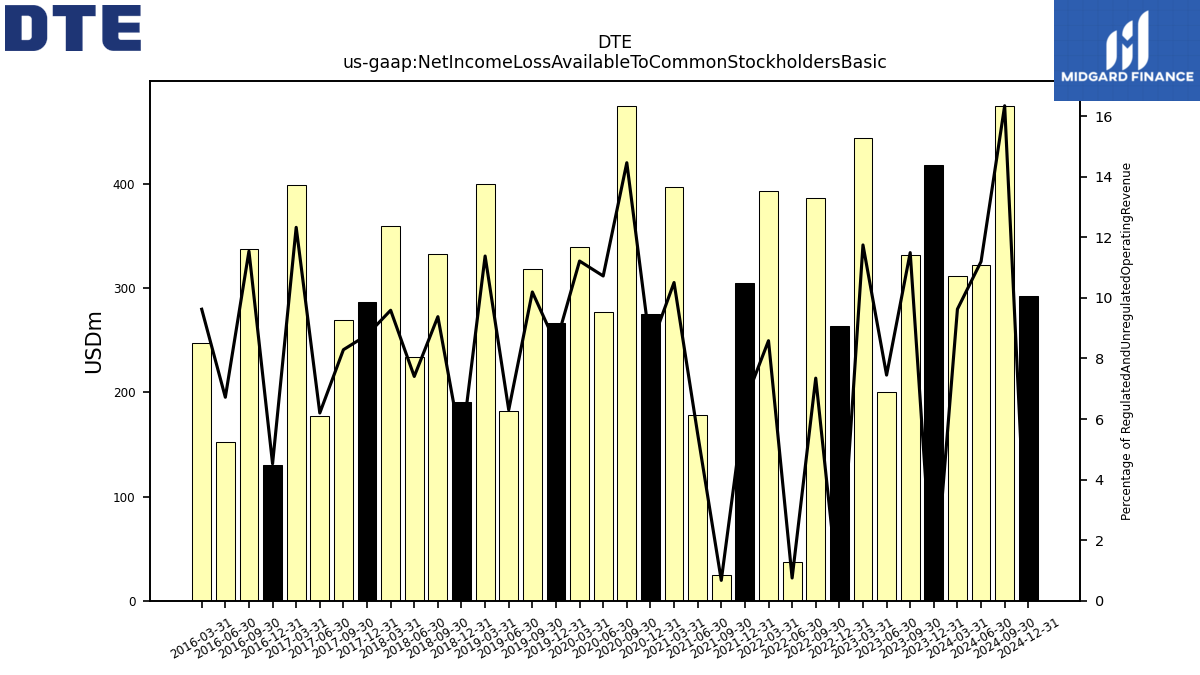
| Net Income Loss Available To Common Stockholders Basic | 418.00 | 332.00 | 200.00 | 444.00 | 264.00 | 386.00 | 37.00 | 393.00 | 305.00 | 25.00 | 178.00 | 397.00 | 275.00 | 475.00 | 277.00 | 339.00 | 267.00 | 318.00 | 182.00 | 400.00 | 191.00 | 333.00 | 234.00 | 360.00 | 287.00 | 269.00 | 177.00 | 399.00 | 130.00 | 338.00 | 152.00 | 247.00 | NA | NA | NA | NA | NA | NA | NA | NA | NA | NA | NA | NA | NA | NA | NA | NA | NA | NA | NA | NA | NA | NA | |
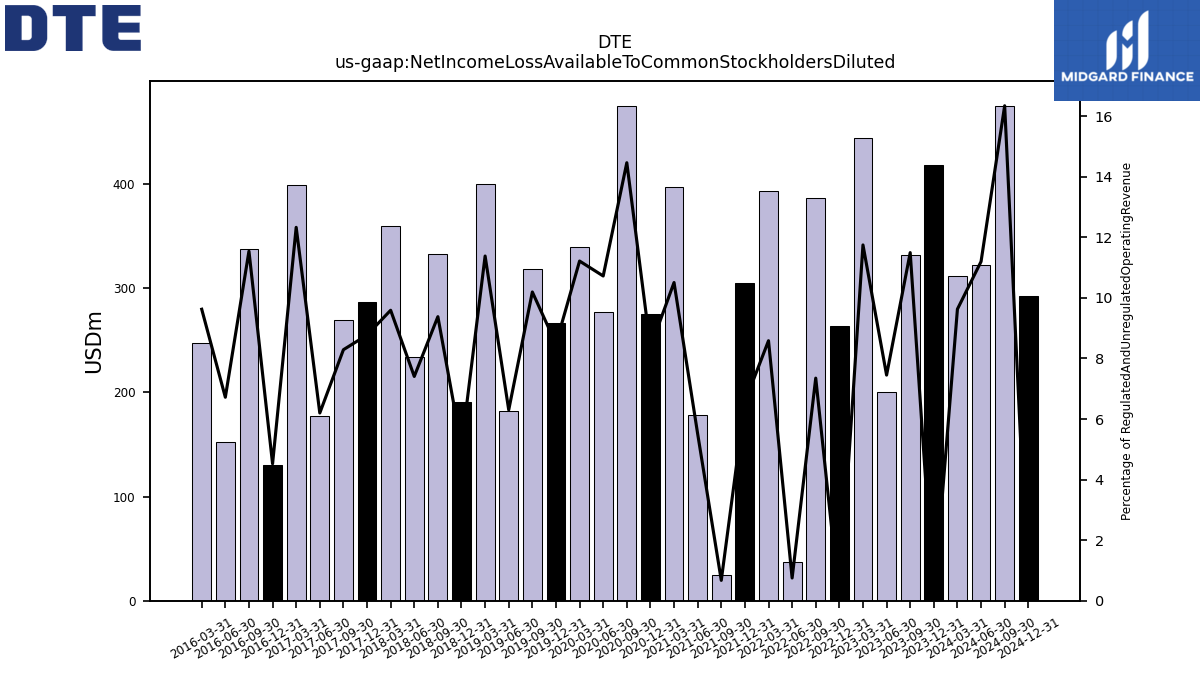
| Net Income Loss Available To Common Stockholders Diluted | 418.00 | 332.00 | 200.00 | 444.00 | 264.00 | 386.00 | 37.00 | 393.00 | 305.00 | 25.00 | 178.00 | 397.00 | 275.00 | 475.00 | 277.00 | 339.00 | 267.00 | 318.00 | 182.00 | 400.00 | 191.00 | 333.00 | 234.00 | 360.00 | 287.00 | 269.00 | 177.00 | 399.00 | 130.00 | 338.00 | 152.00 | 247.00 | NA | NA | NA | NA | NA | NA | NA | NA | NA | NA | NA | NA | NA | NA | NA | NA | NA | NA | NA | NA | NA | NA |
| 2023-12-31 | 2023-09-30 | 2023-06-30 | 2023-03-31 | 2022-12-31 | 2022-09-30 | 2022-06-30 | 2022-03-31 | 2021-12-31 | 2021-09-30 | 2021-06-30 | 2021-03-31 | 2020-12-31 | 2020-09-30 | 2020-06-30 | 2020-03-31 | 2019-12-31 | 2019-09-30 | 2019-06-30 | 2019-03-31 | 2018-12-31 | 2018-09-30 | 2018-06-30 | 2018-03-31 | 2017-12-31 | 2017-09-30 | 2017-06-30 | 2017-03-31 | 2016-12-31 | 2016-09-30 | 2016-06-30 | 2016-03-31 | 2015-12-31 | 2015-09-30 | 2015-06-30 | 2015-03-31 | 2014-12-31 | 2014-09-30 | 2014-06-30 | 2014-03-31 | 2013-12-31 | 2013-09-30 | 2013-06-30 | 2013-03-31 | 2012-12-31 | 2012-09-30 | 2012-06-30 | 2012-03-31 | 2011-12-31 | 2011-09-30 | 2011-06-30 | 2011-03-31 | 2010-12-31 | 2009-12-31 | ||
|---|---|---|---|---|---|---|---|---|---|---|---|---|---|---|---|---|---|---|---|---|---|---|---|---|---|---|---|---|---|---|---|---|---|---|---|---|---|---|---|---|---|---|---|---|---|---|---|---|---|---|---|---|---|---|---|
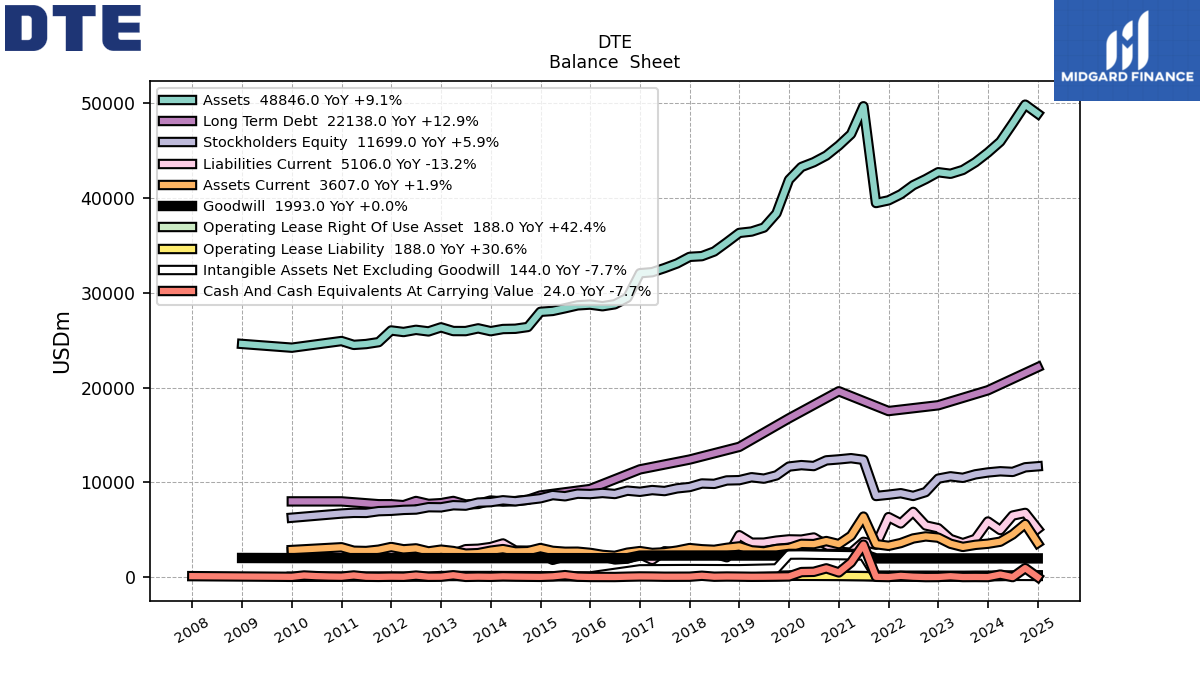
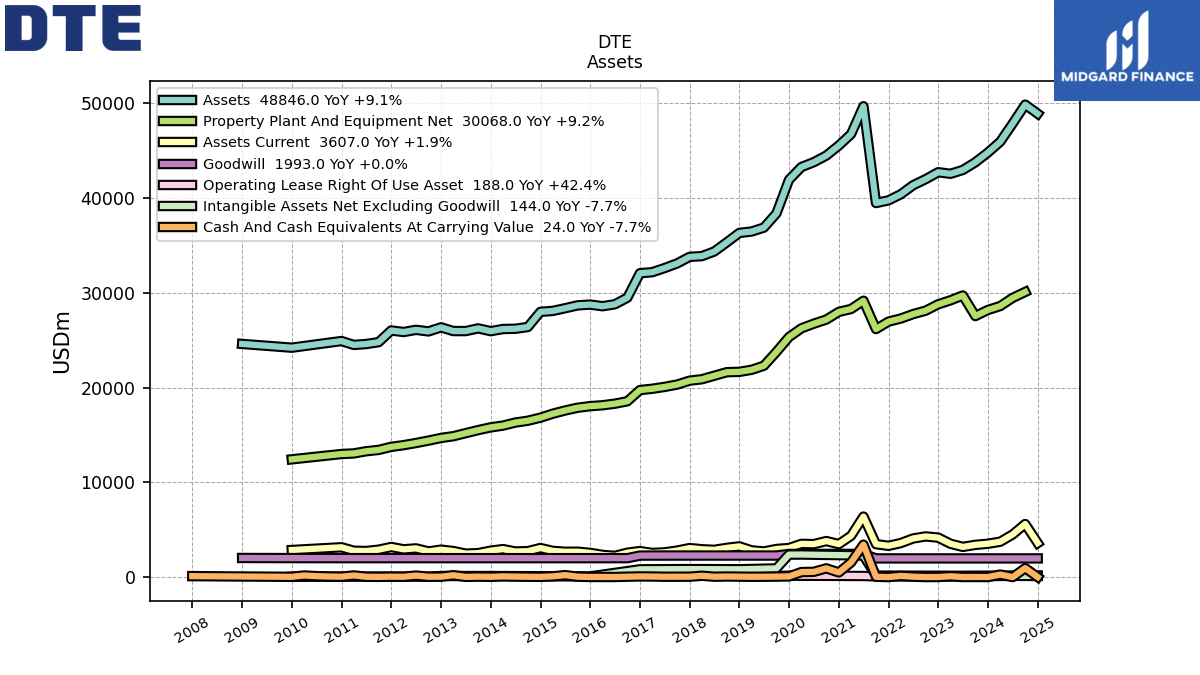
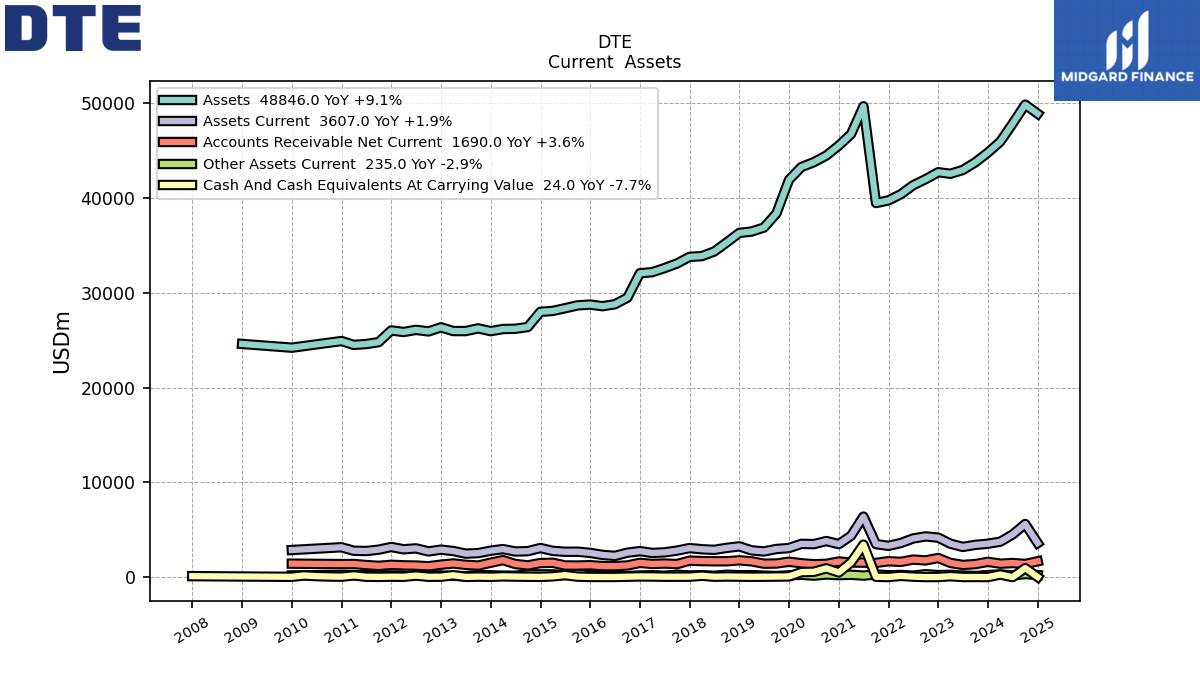
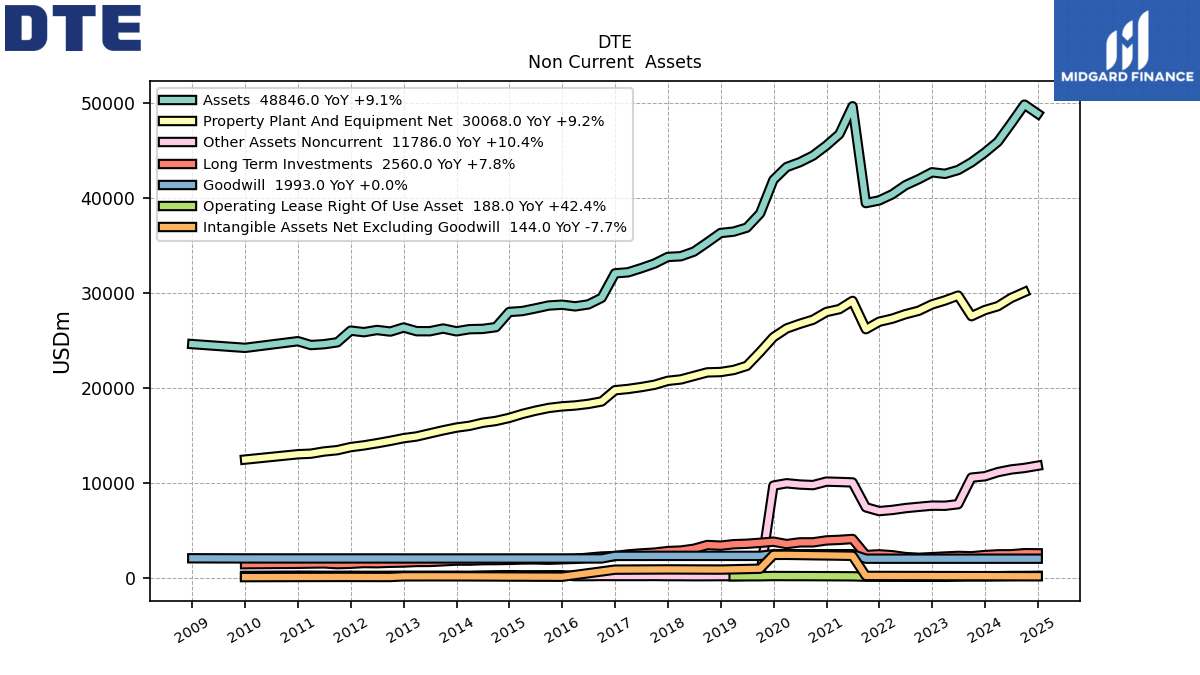
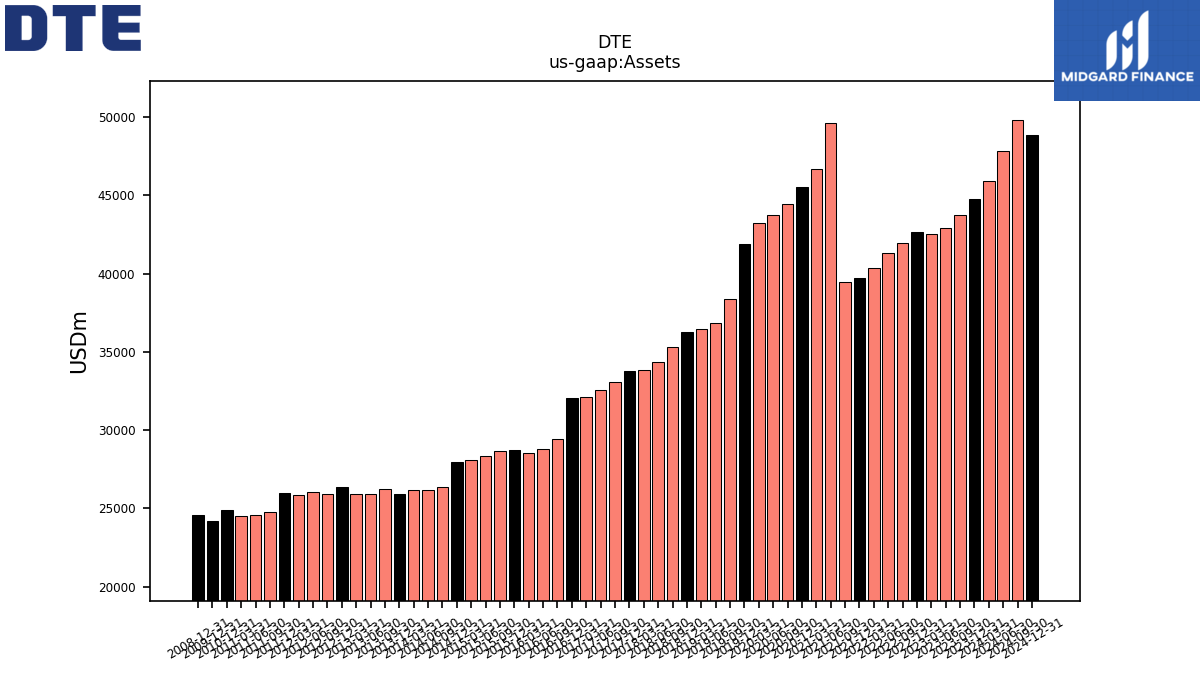
| Assets | 44755.00 | 43730.00 | 42921.00 | 42518.00 | 42683.00 | 41954.00 | 41314.00 | 40360.00 | 39719.00 | 39435.00 | 49636.00 | 46699.00 | 45496.00 | 44439.00 | 43739.00 | 43232.00 | 41882.00 | 38345.00 | 36851.00 | 36434.00 | 36288.00 | 35292.00 | 34330.00 | 33841.00 | 33767.00 | 33071.00 | 32582.00 | 32149.00 | 32041.00 | 29462.00 | 28769.00 | 28564.00 | 28737.00 | 28654.00 | 28350.00 | 28068.00 | 27974.00 | 26376.00 | 26189.00 | 26161.00 | 25935.00 | 26231.00 | 25944.00 | 25949.00 | 26339.00 | 25909.00 | 26075.00 | 25846.00 | 26009.00 | 24780.00 | 24579.00 | 24489.00 | 24896.00 | 24195.00 | |
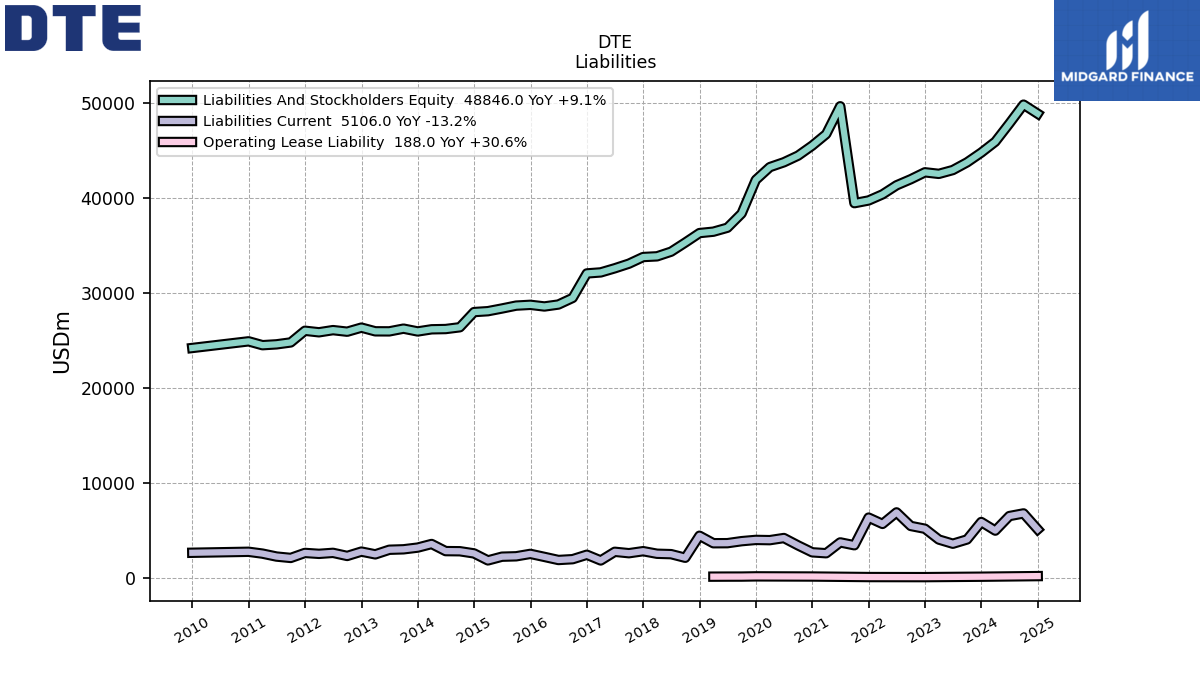
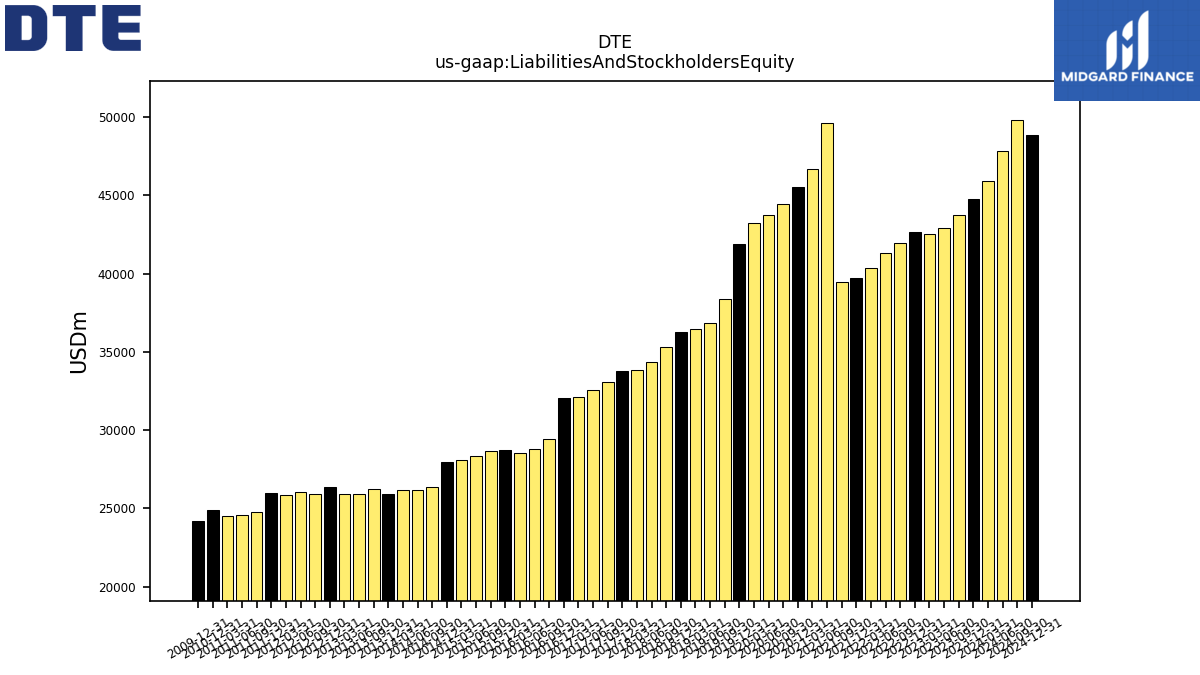
| Liabilities And Stockholders Equity | 44755.00 | 43730.00 | 42921.00 | 42518.00 | 42683.00 | 41954.00 | 41314.00 | 40360.00 | 39719.00 | 39435.00 | 49636.00 | 46699.00 | 45496.00 | 44439.00 | 43739.00 | 43232.00 | 41882.00 | 38345.00 | 36851.00 | 36434.00 | 36288.00 | 35292.00 | 34330.00 | 33841.00 | 33767.00 | 33071.00 | 32582.00 | 32149.00 | 32041.00 | 29462.00 | 28769.00 | 28564.00 | 28737.00 | 28654.00 | 28350.00 | 28068.00 | 27974.00 | 26376.00 | 26189.00 | 26161.00 | 25935.00 | 26231.00 | 25944.00 | 25949.00 | 26339.00 | 25909.00 | 26075.00 | 25846.00 | 26009.00 | 24780.00 | 24579.00 | 24489.00 | 24896.00 | 24195.00 | |
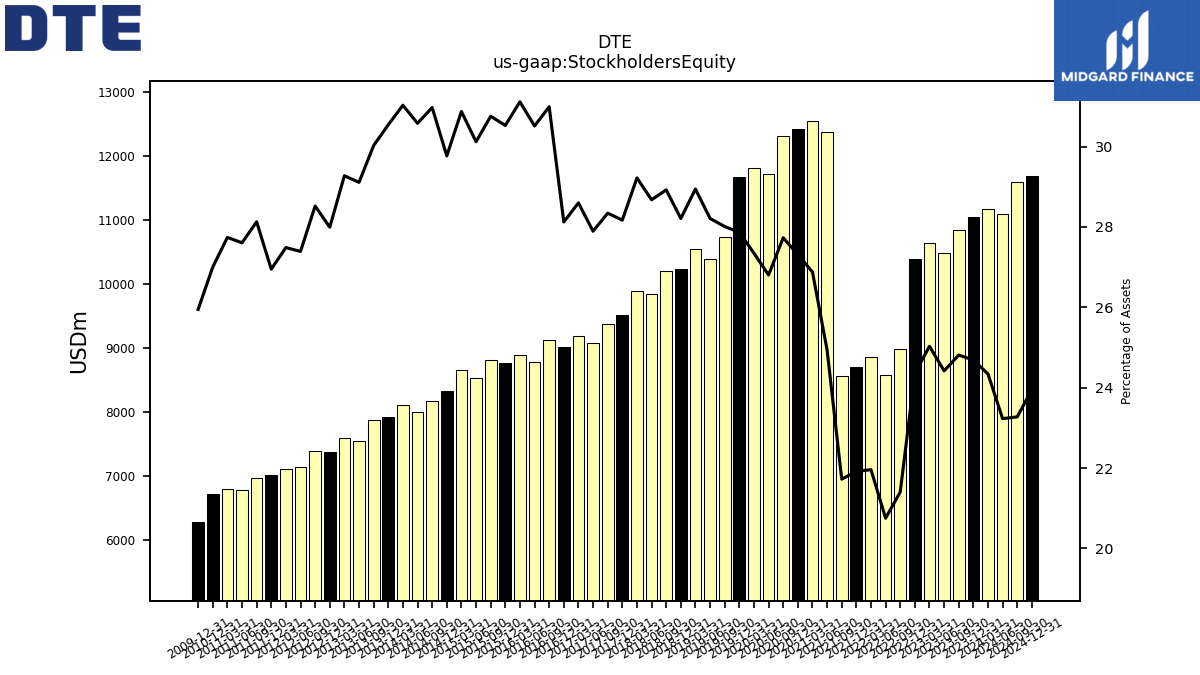
| Stockholders Equity | 11050.00 | 10850.00 | 10481.00 | 10642.00 | 10397.00 | 8980.00 | 8574.00 | 8863.00 | 8705.00 | 8567.00 | 12378.00 | 12552.00 | 12425.00 | 12323.00 | 11724.00 | 11822.00 | 11672.00 | 10740.00 | 10396.00 | 10545.00 | 10237.00 | 10207.00 | 9844.00 | 9888.00 | 9512.00 | 9373.00 | 9088.00 | 9194.00 | 9011.00 | 9130.00 | 8778.00 | 8887.00 | 8772.00 | 8812.00 | 8539.00 | 8665.00 | 8327.00 | 8169.00 | 8008.00 | 8117.00 | 7921.00 | 7876.00 | 7552.00 | 7596.00 | 7373.00 | 7389.00 | 7142.00 | 7104.00 | 7009.00 | 6970.00 | 6785.00 | 6793.00 | 6722.00 | 6278.00 |
| 2023-12-31 | 2023-09-30 | 2023-06-30 | 2023-03-31 | 2022-12-31 | 2022-09-30 | 2022-06-30 | 2022-03-31 | 2021-12-31 | 2021-09-30 | 2021-06-30 | 2021-03-31 | 2020-12-31 | 2020-09-30 | 2020-06-30 | 2020-03-31 | 2019-12-31 | 2019-09-30 | 2019-06-30 | 2019-03-31 | 2018-12-31 | 2018-09-30 | 2018-06-30 | 2018-03-31 | 2017-12-31 | 2017-09-30 | 2017-06-30 | 2017-03-31 | 2016-12-31 | 2016-09-30 | 2016-06-30 | 2016-03-31 | 2015-12-31 | 2015-09-30 | 2015-06-30 | 2015-03-31 | 2014-12-31 | 2014-09-30 | 2014-06-30 | 2014-03-31 | 2013-12-31 | 2013-09-30 | 2013-06-30 | 2013-03-31 | 2012-12-31 | 2012-09-30 | 2012-06-30 | 2012-03-31 | 2011-12-31 | 2011-09-30 | 2011-06-30 | 2011-03-31 | 2010-12-31 | 2009-12-31 | ||
|---|---|---|---|---|---|---|---|---|---|---|---|---|---|---|---|---|---|---|---|---|---|---|---|---|---|---|---|---|---|---|---|---|---|---|---|---|---|---|---|---|---|---|---|---|---|---|---|---|---|---|---|---|---|---|---|
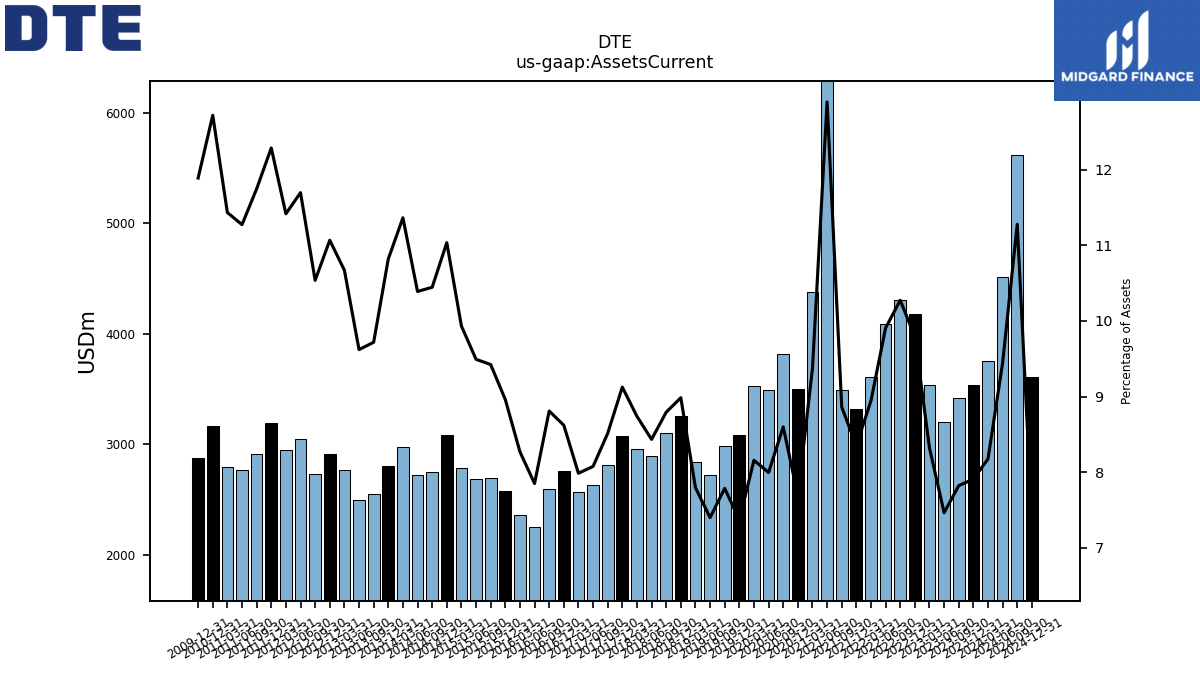
| Assets Current | 3539.00 | 3420.00 | 3203.00 | 3537.00 | 4180.00 | 4310.00 | 4093.00 | 3610.00 | 3317.00 | 3494.00 | 6402.00 | 4376.00 | 3498.00 | 3821.00 | 3497.00 | 3526.00 | 3086.00 | 2985.00 | 2726.00 | 2840.00 | 3260.00 | 3103.00 | 2895.00 | 2957.00 | 3081.00 | 2815.00 | 2631.00 | 2567.00 | 2762.00 | 2595.00 | 2258.00 | 2362.00 | 2575.00 | 2700.00 | 2691.00 | 2788.00 | 3087.00 | 2755.00 | 2721.00 | 2973.00 | 2806.00 | 2549.00 | 2496.00 | 2769.00 | 2915.00 | 2730.00 | 3050.00 | 2951.00 | 3196.00 | 2911.00 | 2771.00 | 2800.00 | 3167.00 | 2877.00 | |
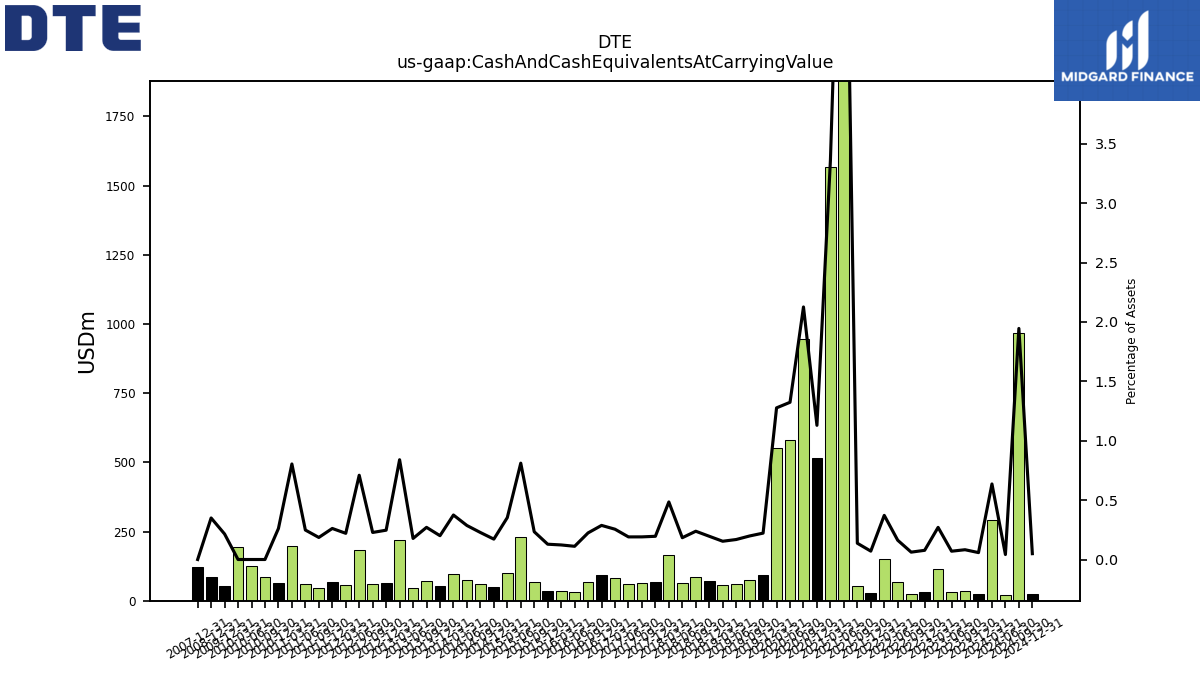
| Cash And Cash Equivalents At Carrying Value | 26.00 | 36.00 | 30.00 | 115.00 | 33.00 | 26.00 | 67.00 | 150.00 | 28.00 | 54.00 | 3448.00 | 1568.00 | 514.00 | 945.00 | 579.00 | 552.00 | 93.00 | 76.00 | 62.00 | 56.00 | 71.00 | 84.00 | 63.00 | 164.00 | 66.00 | 63.00 | 62.00 | 82.00 | 92.00 | 66.00 | 32.00 | 35.00 | 37.00 | 67.00 | 230.00 | 99.00 | 48.00 | 60.00 | 75.00 | 98.00 | 52.00 | 71.00 | 46.00 | 218.00 | 65.00 | 59.00 | 185.00 | 57.00 | 68.00 | 46.00 | 61.00 | 197.00 | 65.00 | 52.00 | |
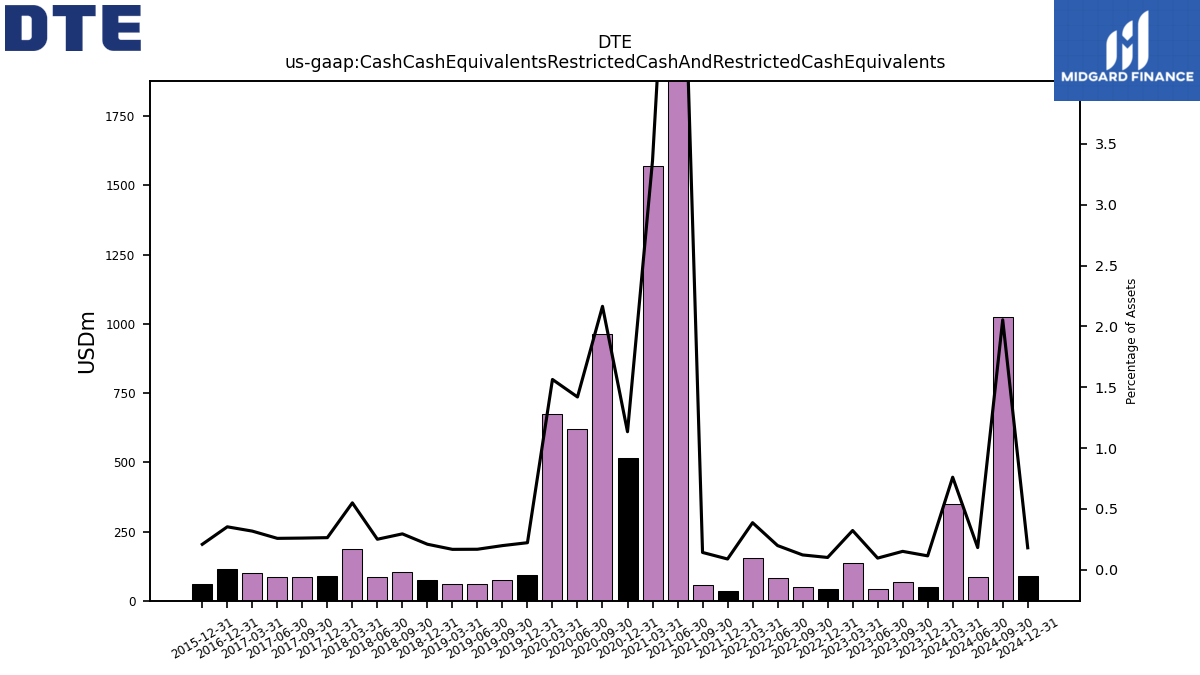
| Cash Cash Equivalents Restricted Cash And Restricted Cash Equivalents | 51.00 | 66.00 | 41.00 | 137.00 | 43.00 | 51.00 | 82.00 | 156.00 | 35.00 | 56.00 | 3450.00 | 1570.00 | 516.00 | 962.00 | 621.00 | 676.00 | 93.00 | 76.00 | 62.00 | 61.00 | 76.00 | 104.00 | 86.00 | 186.00 | 89.00 | 86.00 | 84.00 | 102.00 | 113.00 | NA | NA | NA | 60.00 | NA | NA | NA | NA | NA | NA | NA | NA | NA | NA | NA | NA | NA | NA | NA | NA | NA | NA | NA | NA | NA | |
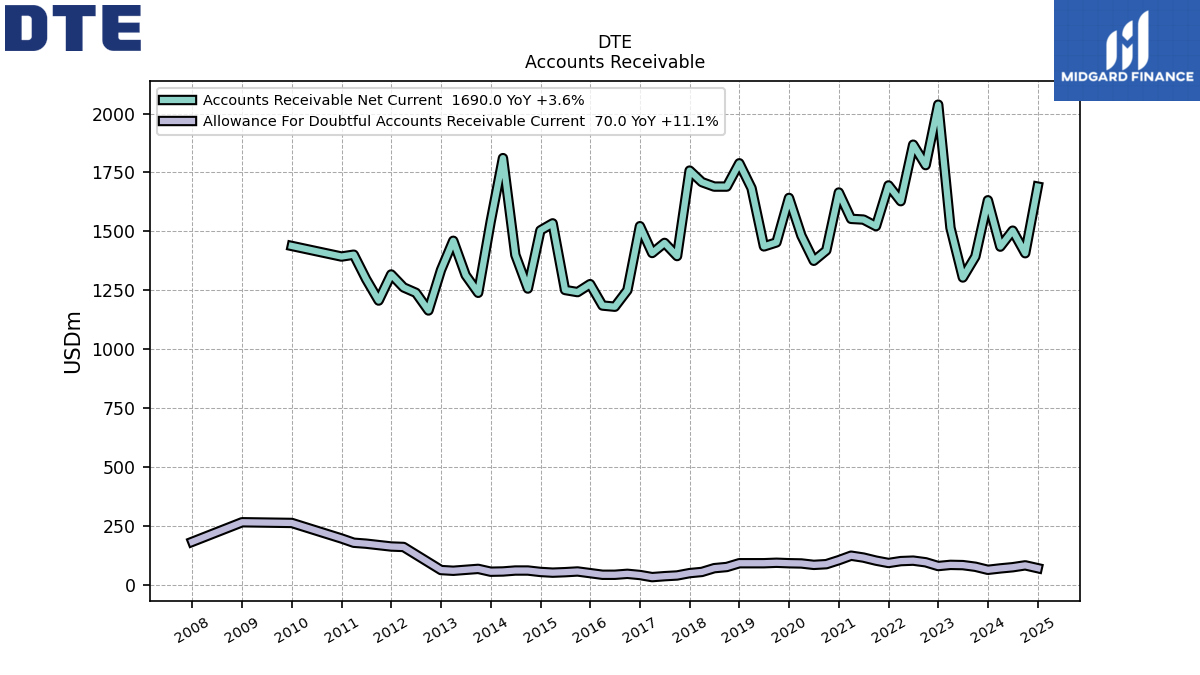
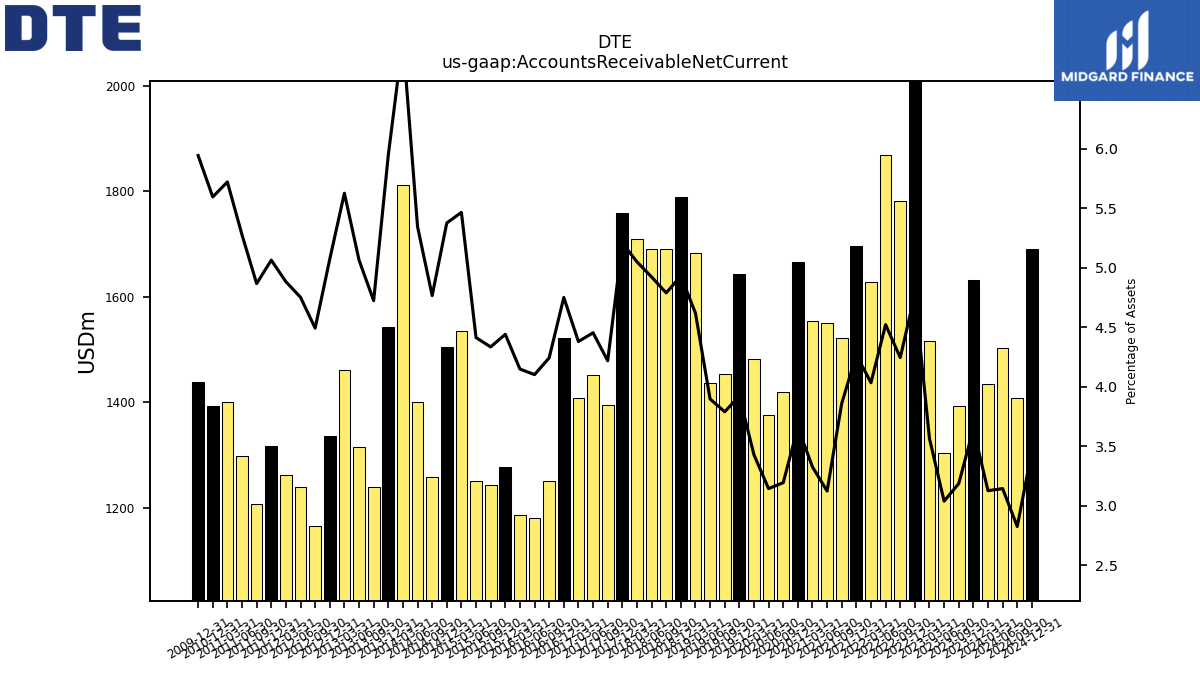
| Accounts Receivable Net Current | 1632.00 | 1393.00 | 1304.00 | 1515.00 | 2038.00 | 1781.00 | 1868.00 | 1628.00 | 1695.00 | 1522.00 | 1550.00 | 1553.00 | 1665.00 | 1419.00 | 1375.00 | 1482.00 | 1642.00 | 1453.00 | 1436.00 | 1683.00 | 1789.00 | 1690.00 | 1690.00 | 1709.00 | 1758.00 | 1395.00 | 1451.00 | 1408.00 | 1522.00 | 1250.00 | 1180.00 | 1185.00 | 1276.00 | 1242.00 | 1251.00 | 1534.00 | 1504.00 | 1257.00 | 1400.00 | 1811.00 | 1542.00 | 1239.00 | 1314.00 | 1460.00 | 1336.00 | 1164.00 | 1239.00 | 1262.00 | 1317.00 | 1206.00 | 1297.00 | 1401.00 | 1393.00 | 1438.00 | |
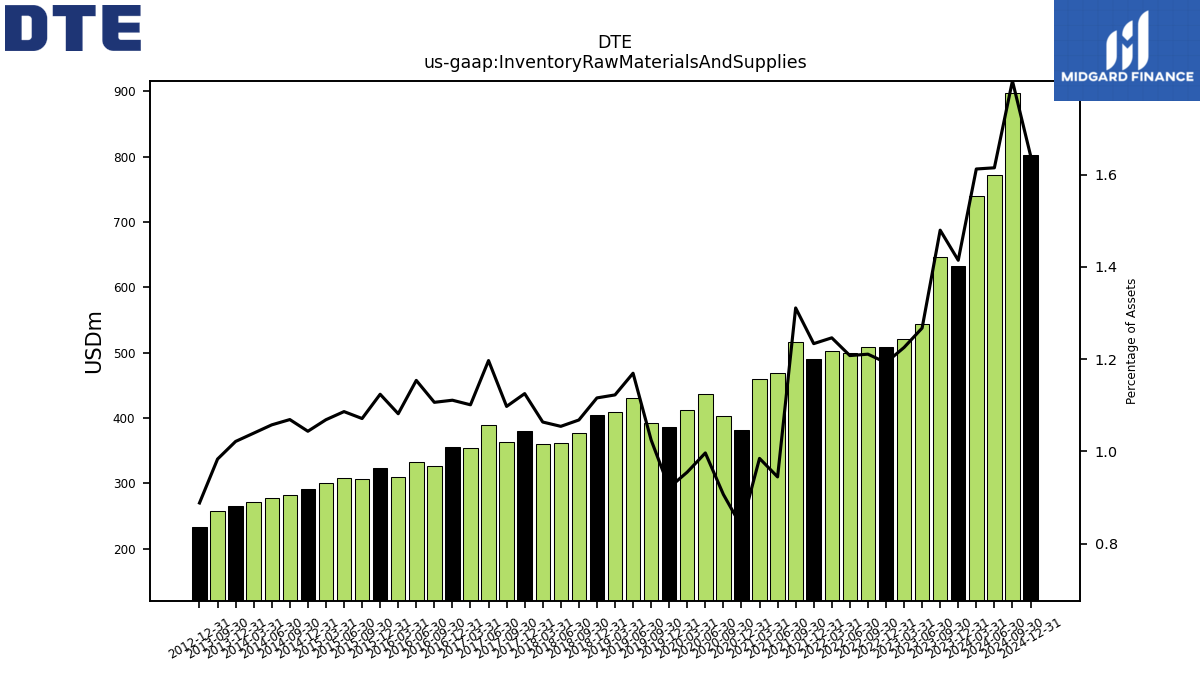
| Inventory Raw Materials And Supplies | 633.00 | 647.00 | 544.00 | 521.00 | 509.00 | 508.00 | 499.00 | 503.00 | 490.00 | 517.00 | 469.00 | 460.00 | 381.00 | 403.00 | 436.00 | 413.00 | 386.00 | 393.00 | 431.00 | 409.00 | 405.00 | 377.00 | 362.00 | 360.00 | 380.00 | 363.00 | 390.00 | 354.00 | 356.00 | 326.00 | 332.00 | 309.00 | 323.00 | 307.00 | 308.00 | 300.00 | 292.00 | 282.00 | 277.00 | 272.00 | 265.00 | 258.00 | NA | NA | 234.00 | NA | NA | NA | NA | NA | NA | NA | NA | NA | |
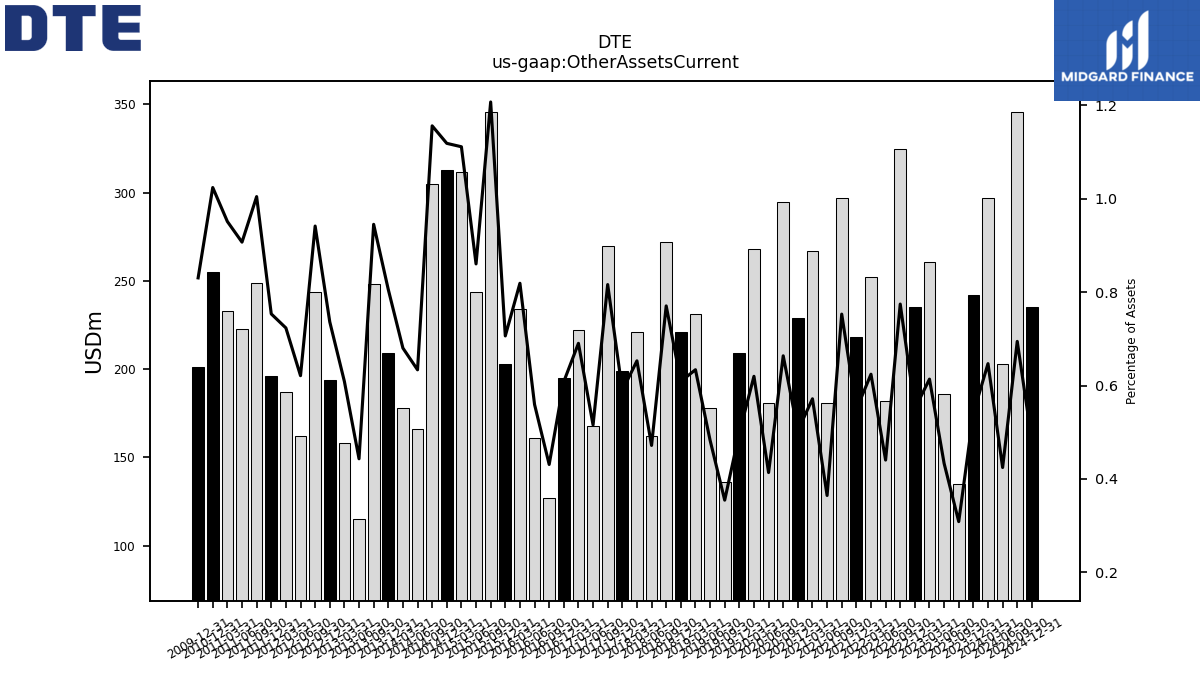
| Other Assets Current | 242.00 | 135.00 | 186.00 | 261.00 | 235.00 | 325.00 | 182.00 | 252.00 | 218.00 | 297.00 | 181.00 | 267.00 | 229.00 | 295.00 | 181.00 | 268.00 | 209.00 | 136.00 | 178.00 | 231.00 | 221.00 | 272.00 | 162.00 | 221.00 | 199.00 | 270.00 | 168.00 | 222.00 | 195.00 | 127.00 | 161.00 | 234.00 | 203.00 | 346.00 | 244.00 | 312.00 | 313.00 | 305.00 | 166.00 | 178.00 | 209.00 | 248.00 | 115.00 | 158.00 | 194.00 | 244.00 | 162.00 | 187.00 | 196.00 | 249.00 | 223.00 | 233.00 | 255.00 | 201.00 |
| 2023-12-31 | 2023-09-30 | 2023-06-30 | 2023-03-31 | 2022-12-31 | 2022-09-30 | 2022-06-30 | 2022-03-31 | 2021-12-31 | 2021-09-30 | 2021-06-30 | 2021-03-31 | 2020-12-31 | 2020-09-30 | 2020-06-30 | 2020-03-31 | 2019-12-31 | 2019-09-30 | 2019-06-30 | 2019-03-31 | 2018-12-31 | 2018-09-30 | 2018-06-30 | 2018-03-31 | 2017-12-31 | 2017-09-30 | 2017-06-30 | 2017-03-31 | 2016-12-31 | 2016-09-30 | 2016-06-30 | 2016-03-31 | 2015-12-31 | 2015-09-30 | 2015-06-30 | 2015-03-31 | 2014-12-31 | 2014-09-30 | 2014-06-30 | 2014-03-31 | 2013-12-31 | 2013-09-30 | 2013-06-30 | 2013-03-31 | 2012-12-31 | 2012-09-30 | 2012-06-30 | 2012-03-31 | 2011-12-31 | 2011-09-30 | 2011-06-30 | 2011-03-31 | 2010-12-31 | 2009-12-31 | ||
|---|---|---|---|---|---|---|---|---|---|---|---|---|---|---|---|---|---|---|---|---|---|---|---|---|---|---|---|---|---|---|---|---|---|---|---|---|---|---|---|---|---|---|---|---|---|---|---|---|---|---|---|---|---|---|---|
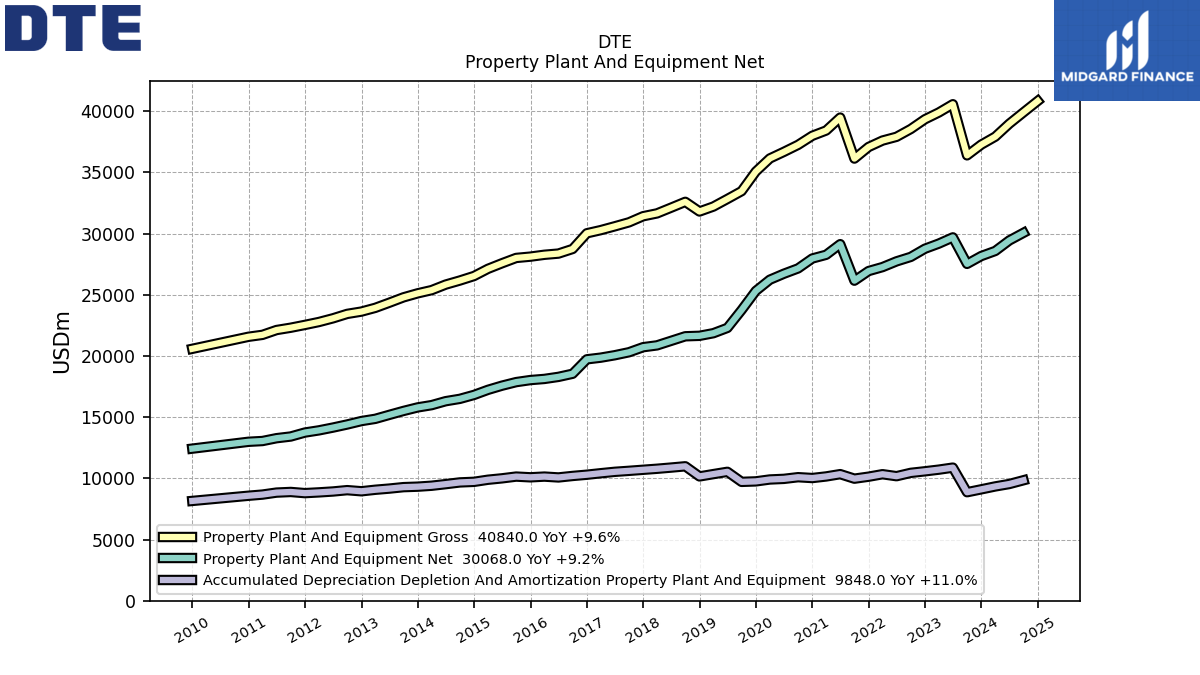
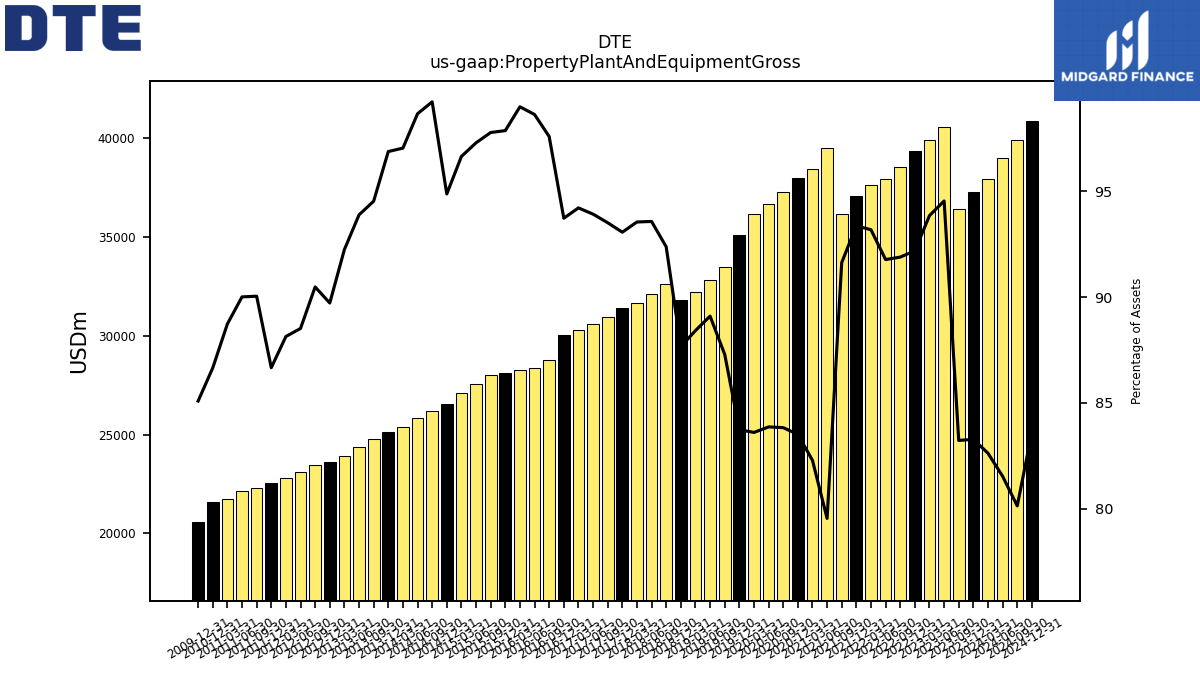
| Property Plant And Equipment Gross | 37274.00 | 36397.00 | 40576.00 | 39901.00 | 39346.00 | 38550.00 | 37914.00 | 37606.00 | 37083.00 | 36134.00 | 39486.00 | 38430.00 | 37997.00 | 37256.00 | 36684.00 | 36146.00 | 35072.00 | 33473.00 | 32834.00 | 32214.00 | 31810.00 | 32600.00 | 32122.00 | 31656.00 | 31424.00 | 30924.00 | 30599.00 | 30287.00 | 30029.00 | 28748.00 | 28371.00 | 28273.00 | 28121.00 | 28014.00 | 27579.00 | 27124.00 | 26538.00 | 26169.00 | 25836.00 | 25384.00 | 25123.00 | 24795.00 | 24356.00 | 23936.00 | 23631.00 | 23442.00 | 23081.00 | 22780.00 | 22541.00 | 22312.00 | 22123.00 | 21729.00 | 21574.00 | 20588.00 | |
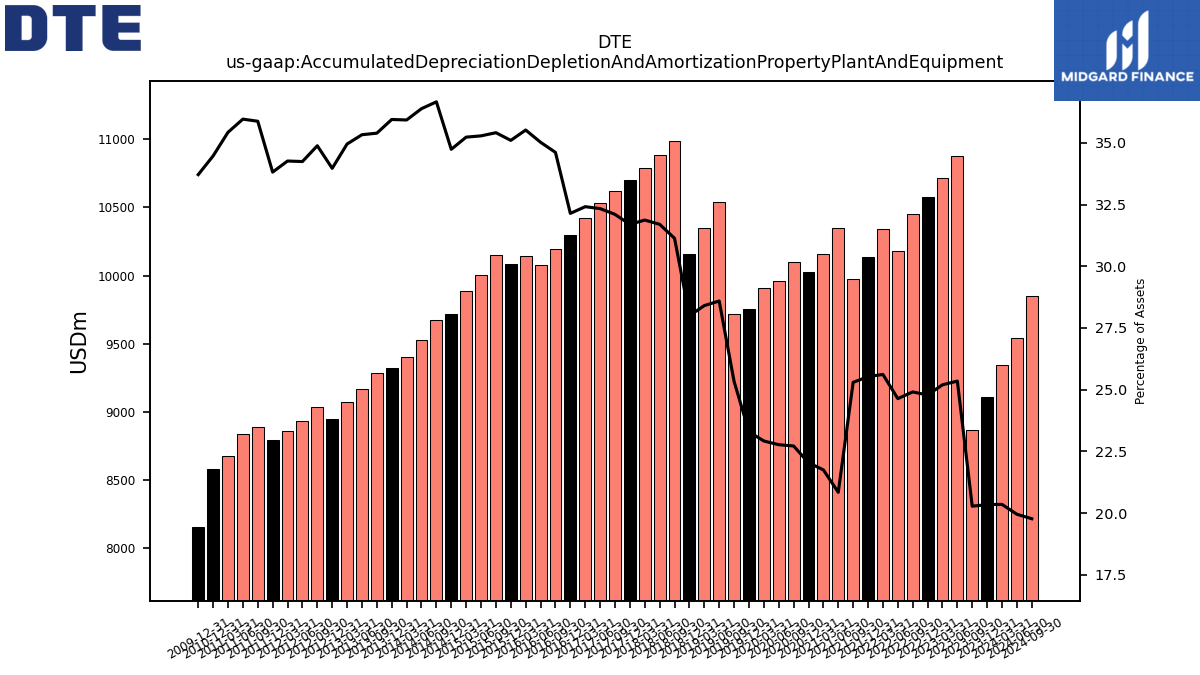
| Accumulated Depreciation Depletion And Amortization Property Plant And Equipment | 9105.00 | 8869.00 | 10880.00 | 10714.00 | 10579.00 | 10451.00 | 10179.00 | 10340.00 | 10139.00 | 9977.00 | 10346.00 | 10158.00 | 10028.00 | 10097.00 | 9960.00 | 9910.00 | 9755.00 | 9715.00 | 10537.00 | 10350.00 | 10160.00 | 10988.00 | 10883.00 | 10786.00 | 10703.00 | 10617.00 | 10536.00 | 10421.00 | 10299.00 | 10198.00 | 10076.00 | 10146.00 | 10087.00 | 10147.00 | 10003.00 | 9889.00 | 9718.00 | 9670.00 | 9529.00 | 9399.00 | 9323.00 | 9284.00 | 9166.00 | 9070.00 | 8947.00 | 9038.00 | 8929.00 | 8856.00 | 8795.00 | 8890.00 | 8839.00 | 8676.00 | 8582.00 | 8157.00 | |
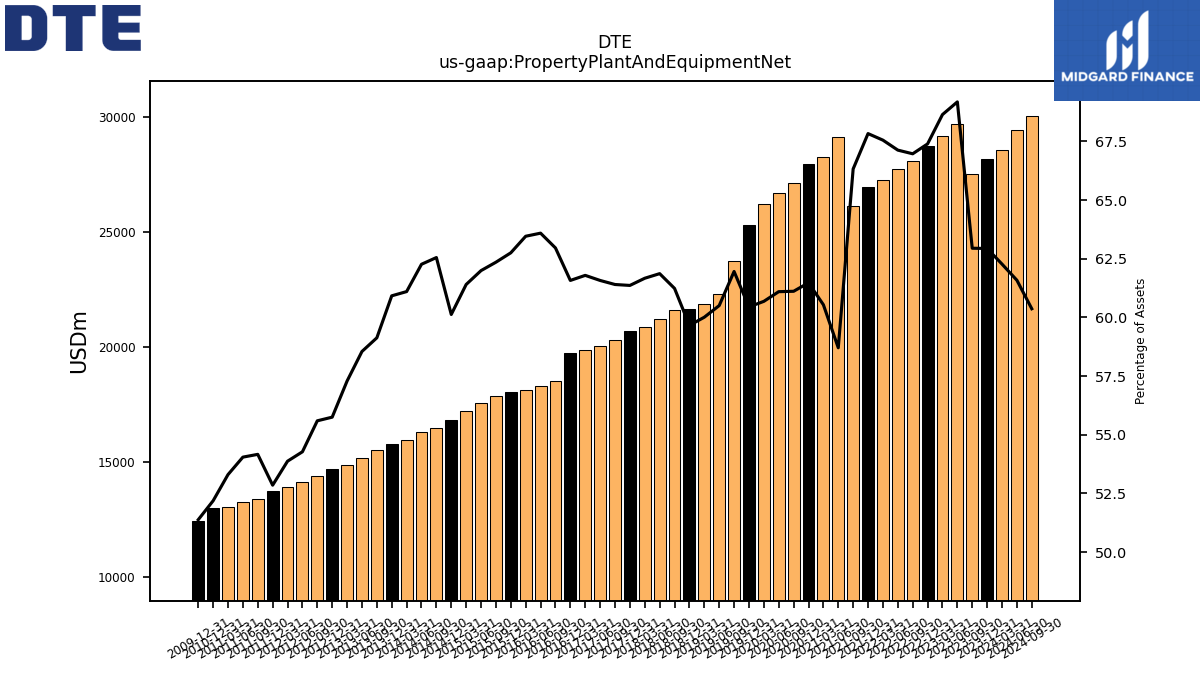
| Property Plant And Equipment Net | 28169.00 | 27528.00 | 29696.00 | 29187.00 | 28767.00 | 28099.00 | 27735.00 | 27266.00 | 26944.00 | 26157.00 | 29140.00 | 28272.00 | 27969.00 | 27159.00 | 26724.00 | 26236.00 | 25317.00 | 23758.00 | 22297.00 | 21864.00 | 21650.00 | 21612.00 | 21239.00 | 20870.00 | 20721.00 | 20307.00 | 20063.00 | 19866.00 | 19730.00 | 18550.00 | 18295.00 | 18127.00 | 18034.00 | 17867.00 | 17576.00 | 17235.00 | 16820.00 | 16499.00 | 16307.00 | 15985.00 | 15800.00 | 15511.00 | 15190.00 | 14866.00 | 14684.00 | 14404.00 | 14152.00 | 13924.00 | 13746.00 | 13422.00 | 13284.00 | 13053.00 | 12992.00 | 12431.00 | |
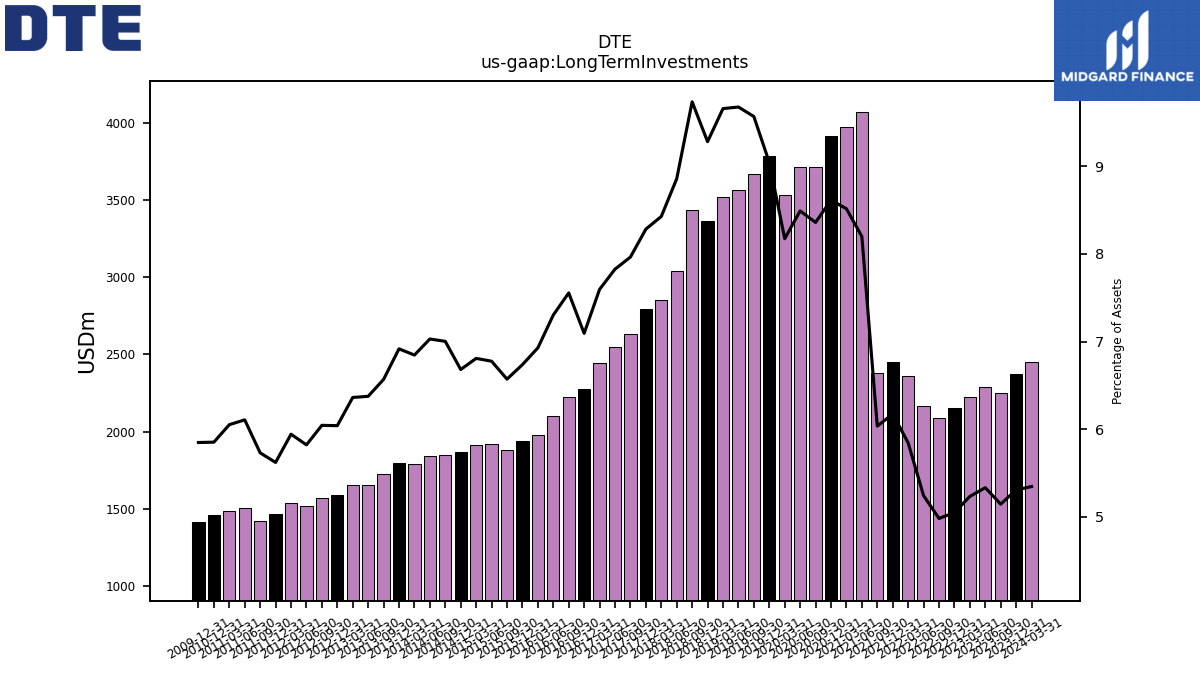
| Long Term Investments | 2375.00 | 2250.00 | 2289.00 | 2225.00 | 2155.00 | 2090.00 | 2166.00 | 2359.00 | 2452.00 | 2380.00 | 4070.00 | 3977.00 | 3919.00 | 3715.00 | 3714.00 | 3534.00 | 3788.00 | 3669.00 | 3566.00 | 3519.00 | 3368.00 | 3436.00 | 3041.00 | 2852.00 | 2797.00 | 2634.00 | 2550.00 | 2442.00 | 2273.00 | 2226.00 | 2101.00 | 1979.00 | 1936.00 | 1883.00 | 1921.00 | 1911.00 | 1869.00 | 1847.00 | 1841.00 | 1791.00 | 1794.00 | 1723.00 | 1654.00 | 1651.00 | 1591.00 | 1566.00 | 1518.00 | 1536.00 | 1462.00 | 1420.00 | 1501.00 | 1482.00 | 1457.00 | 1415.00 | |
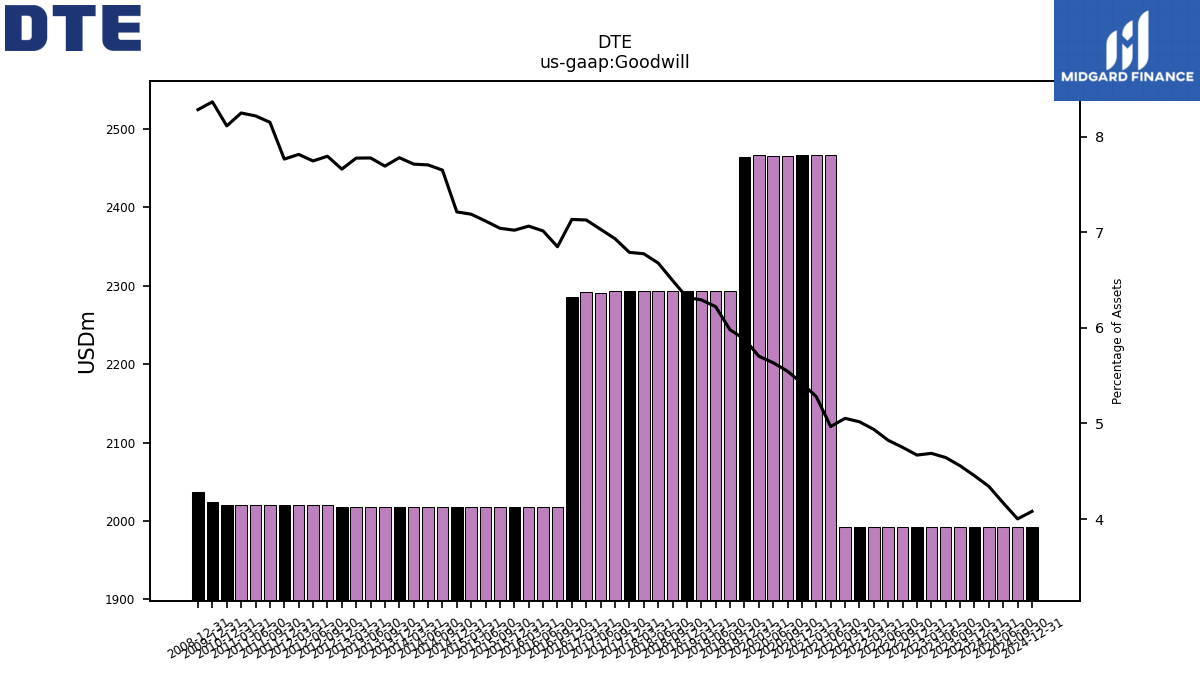
| Goodwill | 1993.00 | 1993.00 | 1993.00 | 1993.00 | 1993.00 | 1993.00 | 1993.00 | 1993.00 | 1993.00 | 1993.00 | 2466.00 | 2466.00 | 2466.00 | 2465.00 | 2465.00 | 2466.00 | 2464.00 | 2293.00 | 2293.00 | 2293.00 | 2293.00 | 2293.00 | 2293.00 | 2293.00 | 2293.00 | 2293.00 | 2291.00 | 2292.00 | 2286.00 | 2018.00 | 2018.00 | 2018.00 | 2018.00 | 2018.00 | 2018.00 | 2018.00 | 2018.00 | 2018.00 | 2018.00 | 2018.00 | 2018.00 | 2018.00 | 2018.00 | 2018.00 | 2018.00 | 2020.00 | 2020.00 | 2020.00 | 2020.00 | 2020.00 | 2020.00 | 2020.00 | 2020.00 | 2024.00 | |
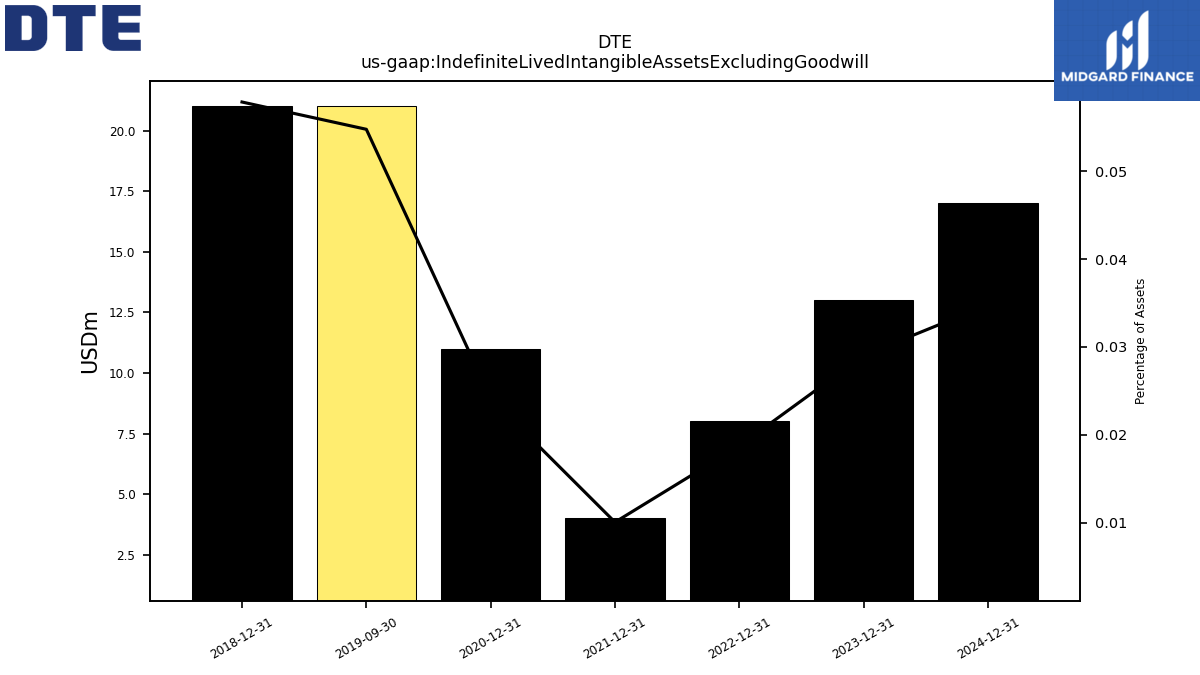
| Indefinite Lived Intangible Assets Excluding Goodwill | 13.00 | NA | NA | NA | 8.00 | NA | NA | NA | 4.00 | NA | NA | NA | 11.00 | NA | NA | NA | NA | 21.00 | NA | NA | 21.00 | NA | NA | NA | NA | NA | NA | NA | NA | NA | NA | NA | NA | NA | NA | NA | NA | NA | NA | NA | NA | NA | NA | NA | NA | NA | NA | NA | NA | NA | NA | NA | NA | NA | |
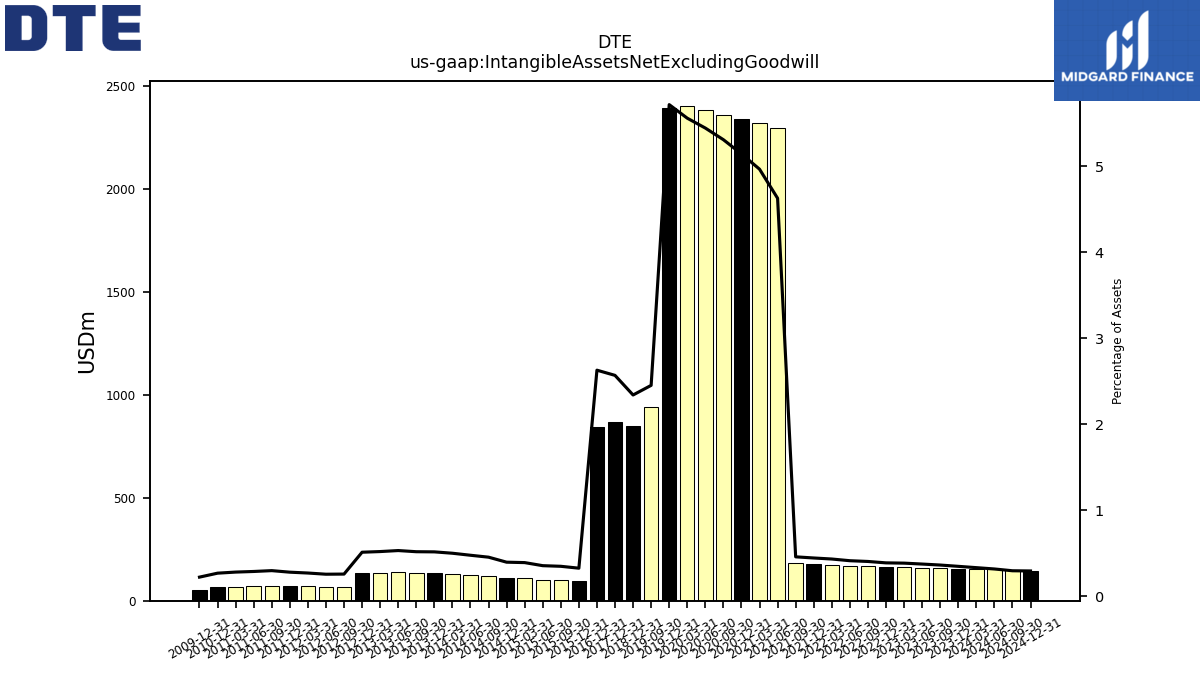
| Intangible Assets Net Excluding Goodwill | 156.00 | 159.00 | 161.00 | 164.00 | 166.00 | 170.00 | 171.00 | 175.00 | 177.00 | 181.00 | 2296.00 | 2318.00 | 2339.00 | 2358.00 | 2380.00 | 2402.00 | 2393.00 | 940.00 | NA | NA | 849.00 | NA | NA | NA | 867.00 | NA | NA | NA | 842.00 | NA | NA | NA | 94.00 | 100.00 | 101.00 | 110.00 | 111.00 | 120.00 | 125.00 | 131.00 | 134.00 | 136.00 | 138.00 | 135.00 | 135.00 | 67.00 | 67.00 | 70.00 | 73.00 | 74.00 | 71.00 | 69.00 | 67.00 | 54.00 | |
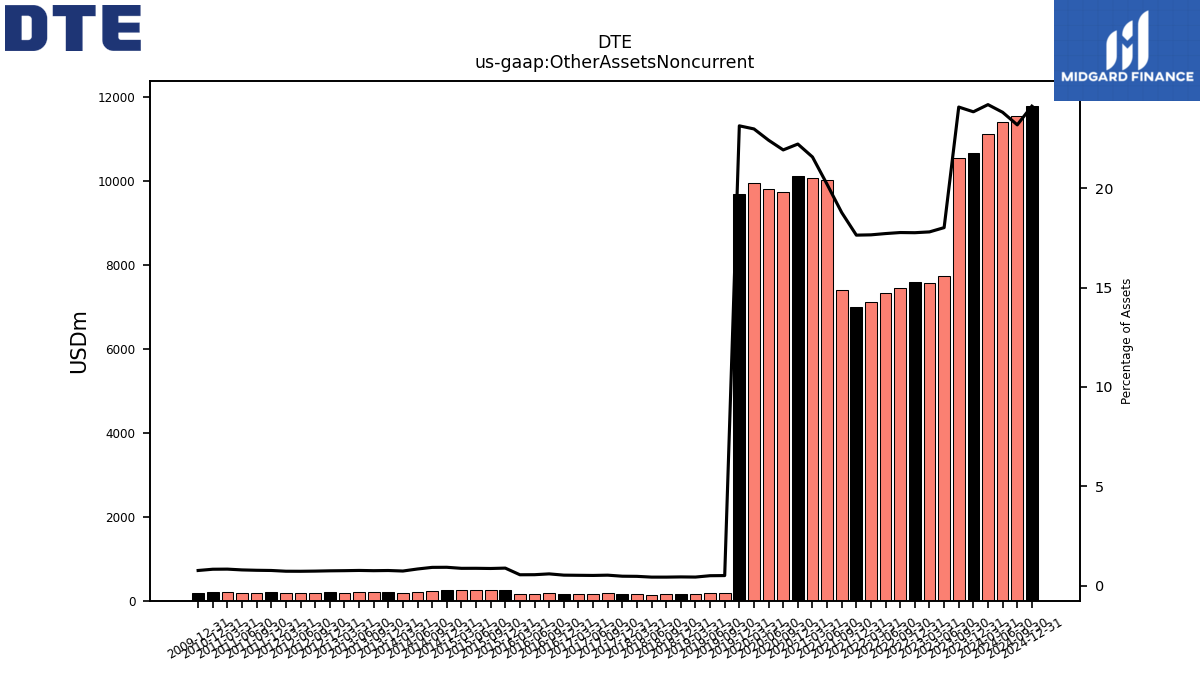
| Other Assets Noncurrent | 10672.00 | 10532.00 | 7733.00 | 7569.00 | 7581.00 | 7455.00 | 7320.00 | 7125.00 | 7006.00 | 7404.00 | 10024.00 | 10074.00 | 10110.00 | 9744.00 | 9804.00 | 9936.00 | 9691.00 | 195.00 | 185.00 | 158.00 | 160.00 | 152.00 | 148.00 | 159.00 | 161.00 | 175.00 | 168.00 | 168.00 | 170.00 | 175.00 | 159.00 | 157.00 | 254.00 | 248.00 | 248.00 | 245.00 | 259.00 | 243.00 | 220.00 | 193.00 | 198.00 | 198.00 | 199.00 | 196.00 | 197.00 | 190.00 | 189.00 | 188.00 | 199.00 | 192.00 | 195.00 | 204.00 | 206.00 | 185.00 |
| 2023-12-31 | 2023-09-30 | 2023-06-30 | 2023-03-31 | 2022-12-31 | 2022-09-30 | 2022-06-30 | 2022-03-31 | 2021-12-31 | 2021-09-30 | 2021-06-30 | 2021-03-31 | 2020-12-31 | 2020-09-30 | 2020-06-30 | 2020-03-31 | 2019-12-31 | 2019-09-30 | 2019-06-30 | 2019-03-31 | 2018-12-31 | 2018-09-30 | 2018-06-30 | 2018-03-31 | 2017-12-31 | 2017-09-30 | 2017-06-30 | 2017-03-31 | 2016-12-31 | 2016-09-30 | 2016-06-30 | 2016-03-31 | 2015-12-31 | 2015-09-30 | 2015-06-30 | 2015-03-31 | 2014-12-31 | 2014-09-30 | 2014-06-30 | 2014-03-31 | 2013-12-31 | 2013-09-30 | 2013-06-30 | 2013-03-31 | 2012-12-31 | 2012-09-30 | 2012-06-30 | 2012-03-31 | 2011-12-31 | 2011-09-30 | 2011-06-30 | 2011-03-31 | 2010-12-31 | 2009-12-31 | ||
|---|---|---|---|---|---|---|---|---|---|---|---|---|---|---|---|---|---|---|---|---|---|---|---|---|---|---|---|---|---|---|---|---|---|---|---|---|---|---|---|---|---|---|---|---|---|---|---|---|---|---|---|---|---|---|---|
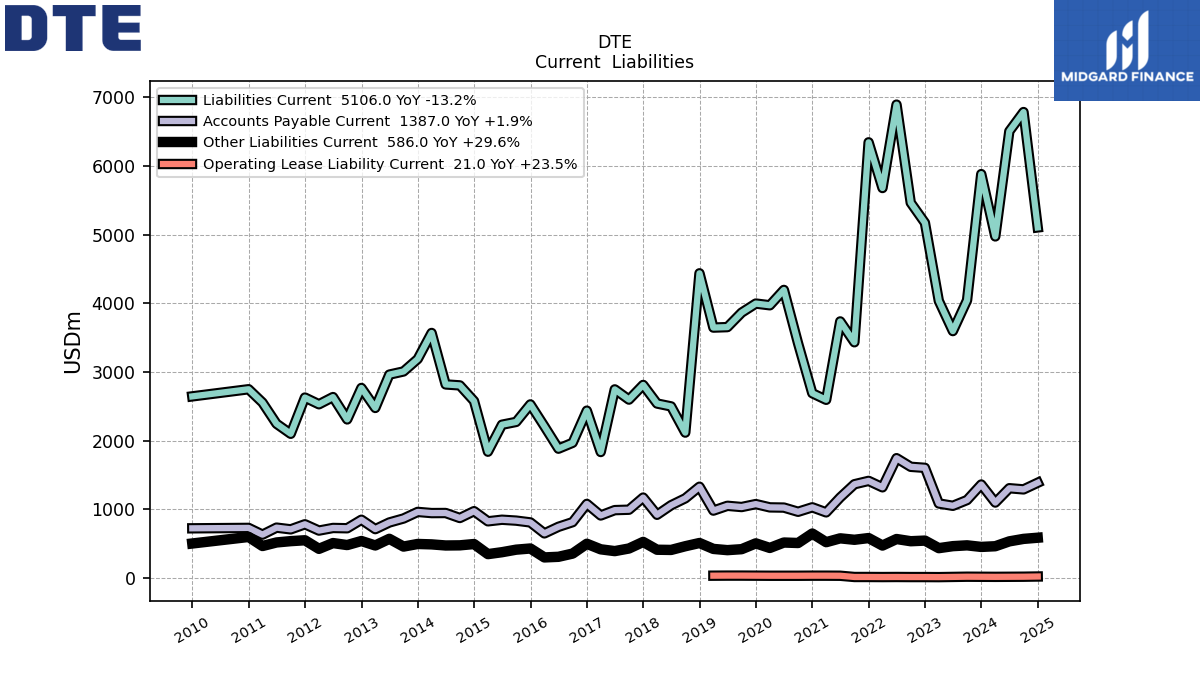
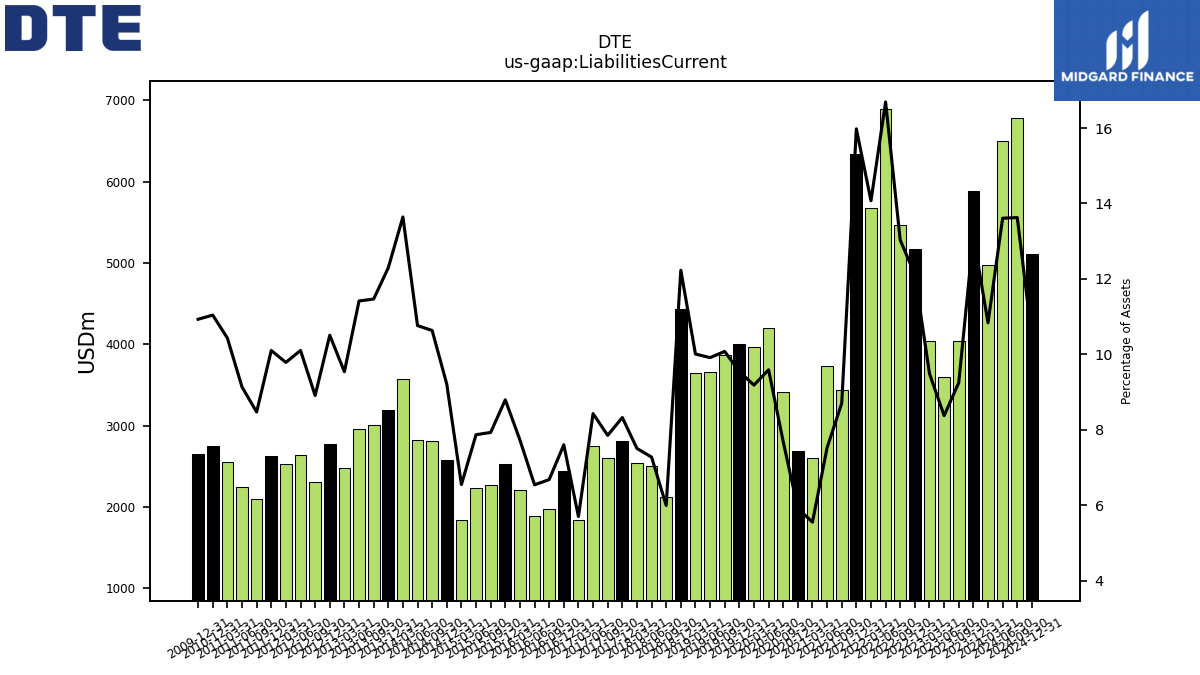
| Liabilities Current | 5883.00 | 4045.00 | 3596.00 | 4036.00 | 5173.00 | 5466.00 | 6895.00 | 5680.00 | 6346.00 | 3433.00 | 3737.00 | 2595.00 | 2691.00 | 3417.00 | 4196.00 | 3972.00 | 3997.00 | 3865.00 | 3654.00 | 3647.00 | 4438.00 | 2117.00 | 2499.00 | 2541.00 | 2812.00 | 2598.00 | 2747.00 | 1834.00 | 2437.00 | 1969.00 | 1883.00 | 2209.00 | 2528.00 | 2273.00 | 2232.00 | 1839.00 | 2577.00 | 2805.00 | 2819.00 | 3569.00 | 3189.00 | 3008.00 | 2962.00 | 2476.00 | 2768.00 | 2309.00 | 2635.00 | 2530.00 | 2628.00 | 2100.00 | 2246.00 | 2555.00 | 2749.00 | 2645.00 | |
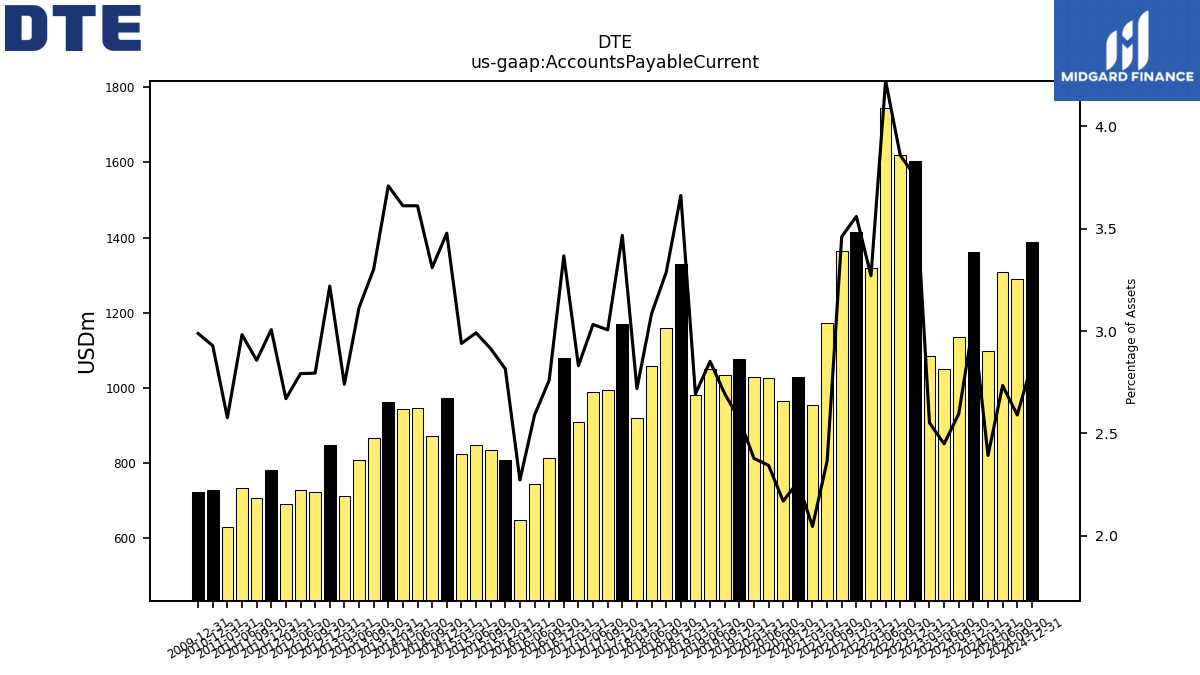
| Accounts Payable Current | 1361.00 | 1135.00 | 1051.00 | 1085.00 | 1604.00 | 1619.00 | 1745.00 | 1320.00 | 1414.00 | 1365.00 | 1173.00 | 955.00 | 1029.00 | 964.00 | 1025.00 | 1028.00 | 1076.00 | 1033.00 | 1051.00 | 981.00 | 1329.00 | 1160.00 | 1059.00 | 920.00 | 1171.00 | 994.00 | 988.00 | 910.00 | 1079.00 | 813.00 | 745.00 | 649.00 | 809.00 | 835.00 | 848.00 | 825.00 | 973.00 | 873.00 | 946.00 | 945.00 | 962.00 | 866.00 | 808.00 | 711.00 | 848.00 | 724.00 | 728.00 | 690.00 | 782.00 | 708.00 | 733.00 | 631.00 | 729.00 | 723.00 | |
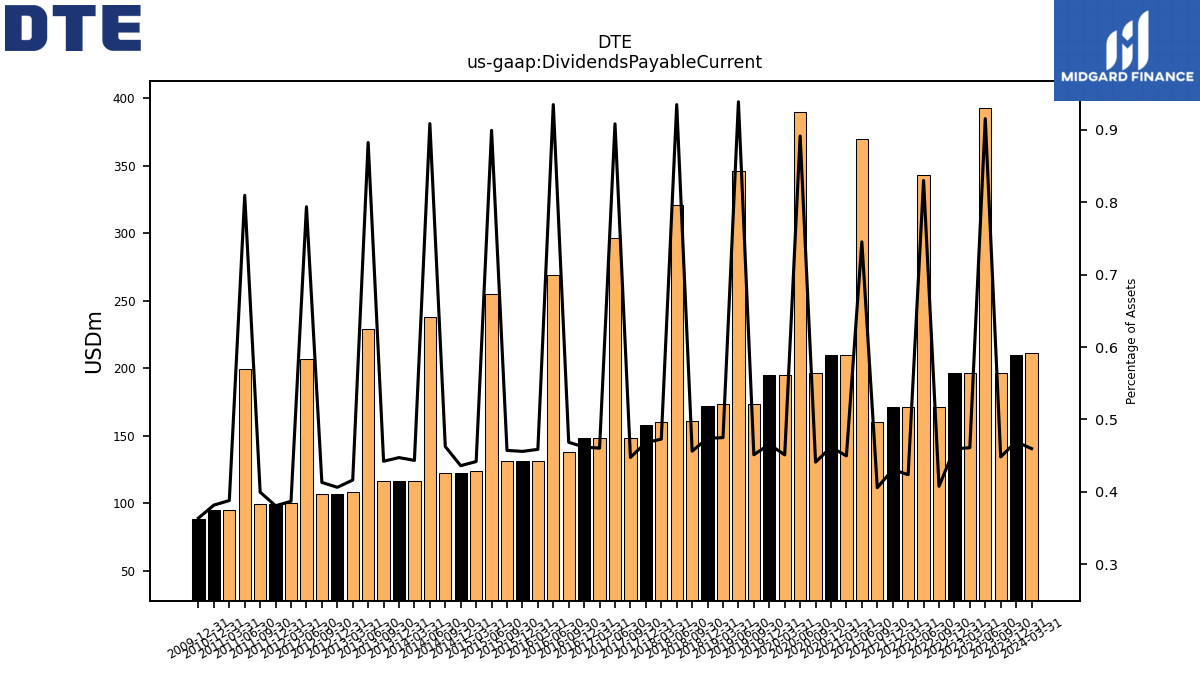
| Dividends Payable Current | 210.00 | 196.00 | 393.00 | 196.00 | 196.00 | 171.00 | 343.00 | 171.00 | 171.00 | 160.00 | 370.00 | 210.00 | 210.00 | 196.00 | 390.00 | 195.00 | 195.00 | 173.00 | 346.00 | 173.00 | 172.00 | 161.00 | 321.00 | 160.00 | 158.00 | 148.00 | 296.00 | 148.00 | 148.00 | 138.00 | 269.00 | 131.00 | 131.00 | 131.00 | 255.00 | 124.00 | 122.00 | 122.00 | 238.00 | 116.00 | 116.00 | 116.00 | 229.00 | 108.00 | 107.00 | 107.00 | 207.00 | 100.00 | 99.00 | 99.00 | 199.00 | 95.00 | 95.00 | 88.00 | |
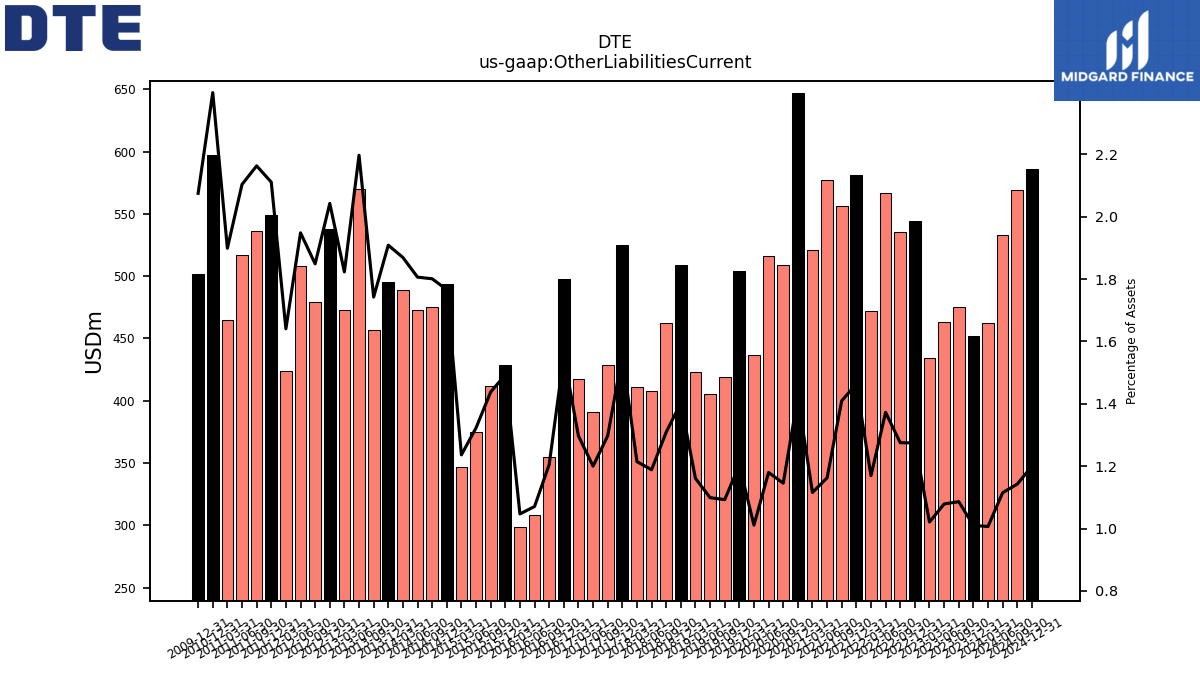
| Other Liabilities Current | 452.00 | 475.00 | 463.00 | 434.00 | 544.00 | 535.00 | 567.00 | 472.00 | 581.00 | 556.00 | 577.00 | 521.00 | 647.00 | 509.00 | 516.00 | 437.00 | 504.00 | 419.00 | 405.00 | 423.00 | 509.00 | 462.00 | 408.00 | 411.00 | 525.00 | 429.00 | 391.00 | 417.00 | 498.00 | 355.00 | 308.00 | 299.00 | 429.00 | 412.00 | 375.00 | 347.00 | 494.00 | 475.00 | 473.00 | 489.00 | 495.00 | 457.00 | 570.00 | 473.00 | 538.00 | 479.00 | 508.00 | 424.00 | 549.00 | 536.00 | 517.00 | 465.00 | 597.00 | 502.00 |
| 2023-12-31 | 2023-09-30 | 2023-06-30 | 2023-03-31 | 2022-12-31 | 2022-09-30 | 2022-06-30 | 2022-03-31 | 2021-12-31 | 2021-09-30 | 2021-06-30 | 2021-03-31 | 2020-12-31 | 2020-09-30 | 2020-06-30 | 2020-03-31 | 2019-12-31 | 2019-09-30 | 2019-06-30 | 2019-03-31 | 2018-12-31 | 2018-09-30 | 2018-06-30 | 2018-03-31 | 2017-12-31 | 2017-09-30 | 2017-06-30 | 2017-03-31 | 2016-12-31 | 2016-09-30 | 2016-06-30 | 2016-03-31 | 2015-12-31 | 2015-09-30 | 2015-06-30 | 2015-03-31 | 2014-12-31 | 2014-09-30 | 2014-06-30 | 2014-03-31 | 2013-12-31 | 2013-09-30 | 2013-06-30 | 2013-03-31 | 2012-12-31 | 2012-09-30 | 2012-06-30 | 2012-03-31 | 2011-12-31 | 2011-09-30 | 2011-06-30 | 2011-03-31 | 2010-12-31 | 2009-12-31 | ||
|---|---|---|---|---|---|---|---|---|---|---|---|---|---|---|---|---|---|---|---|---|---|---|---|---|---|---|---|---|---|---|---|---|---|---|---|---|---|---|---|---|---|---|---|---|---|---|---|---|---|---|---|---|---|---|---|
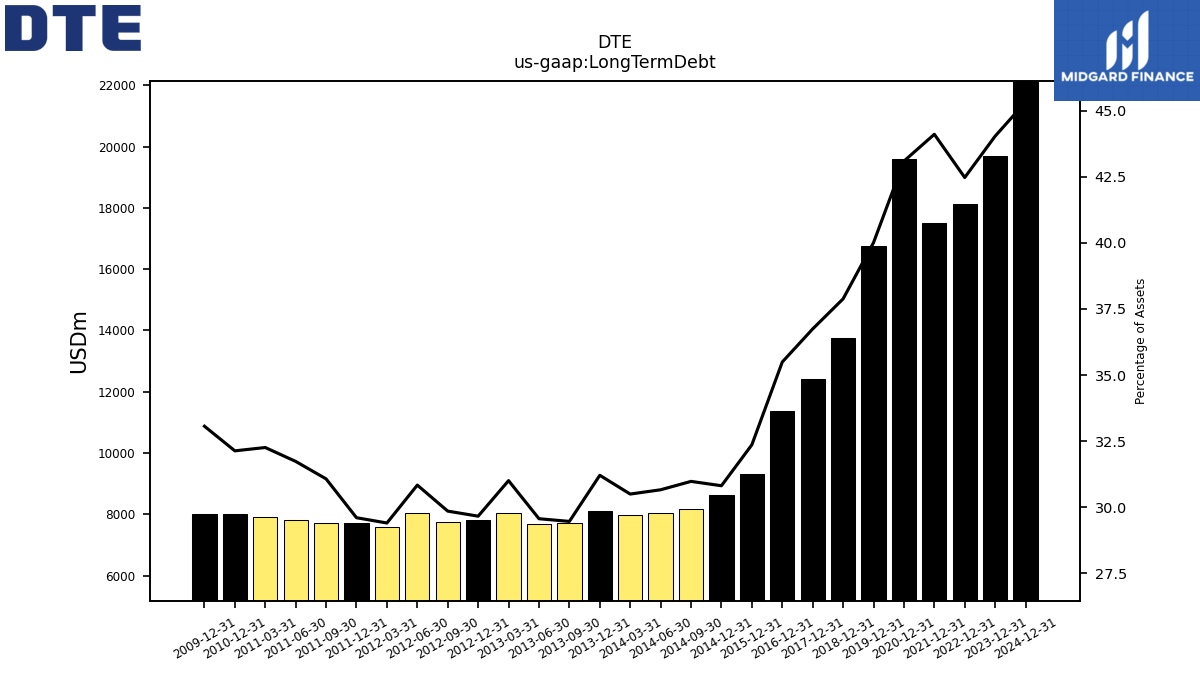
| Long Term Debt | 19707.00 | NA | NA | NA | 18127.00 | NA | NA | NA | 17517.00 | NA | NA | NA | 19603.00 | NA | NA | NA | 16755.00 | NA | NA | NA | 13746.00 | NA | NA | NA | 12407.00 | NA | NA | NA | 11372.00 | NA | NA | NA | 9300.00 | NA | NA | NA | 8620.00 | 8171.00 | 8030.00 | 7979.00 | 8094.00 | 7729.00 | 7671.00 | 8046.00 | 7813.00 | 7735.00 | 8041.00 | 7600.00 | 7700.00 | 7700.00 | 7800.00 | 7900.00 | 8000.00 | 8000.00 | |
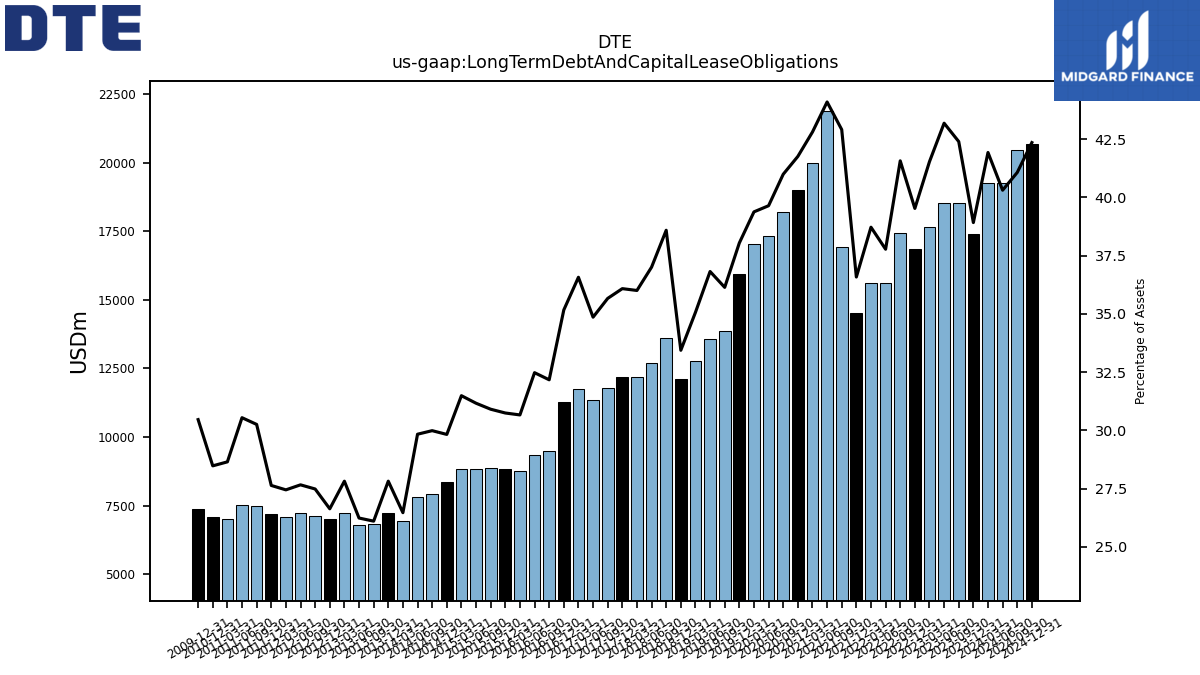
| Long Term Debt And Capital Lease Obligations | 17420.00 | 18542.00 | 18538.00 | 17662.00 | 16873.00 | 17442.00 | 15608.00 | 15629.00 | 14531.00 | 16924.00 | 21891.00 | 19993.00 | 19001.00 | 18219.00 | 17341.00 | 17026.00 | 15935.00 | 13858.00 | 13569.00 | 12776.00 | 12134.00 | 13620.00 | 12705.00 | 12185.00 | 12185.00 | 11795.00 | 11358.00 | 11758.00 | 11269.00 | 9478.00 | 9343.00 | 8758.00 | 8835.00 | 8856.00 | 8835.00 | 8838.00 | 8343.00 | 7909.00 | 7813.00 | 6923.00 | 7214.00 | 6846.00 | 6806.00 | 7218.00 | 7014.00 | 7120.00 | 7212.00 | 7093.00 | 7187.00 | 7497.00 | 7507.00 | 7015.00 | 7089.00 | 7370.00 | |
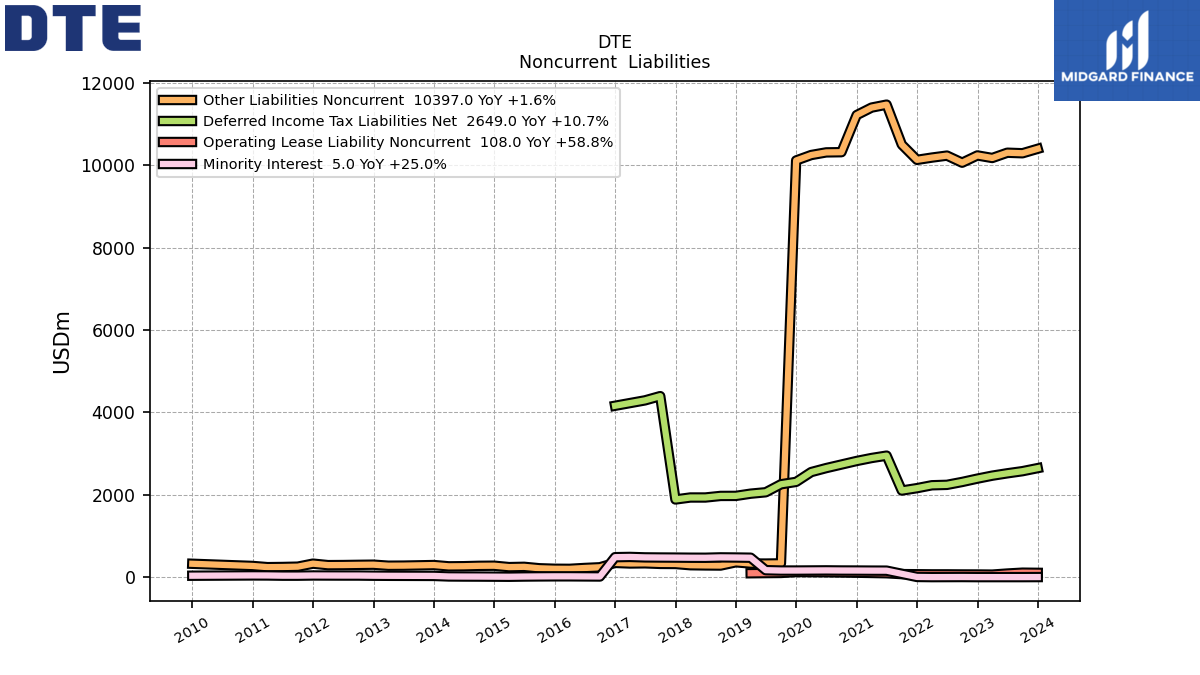
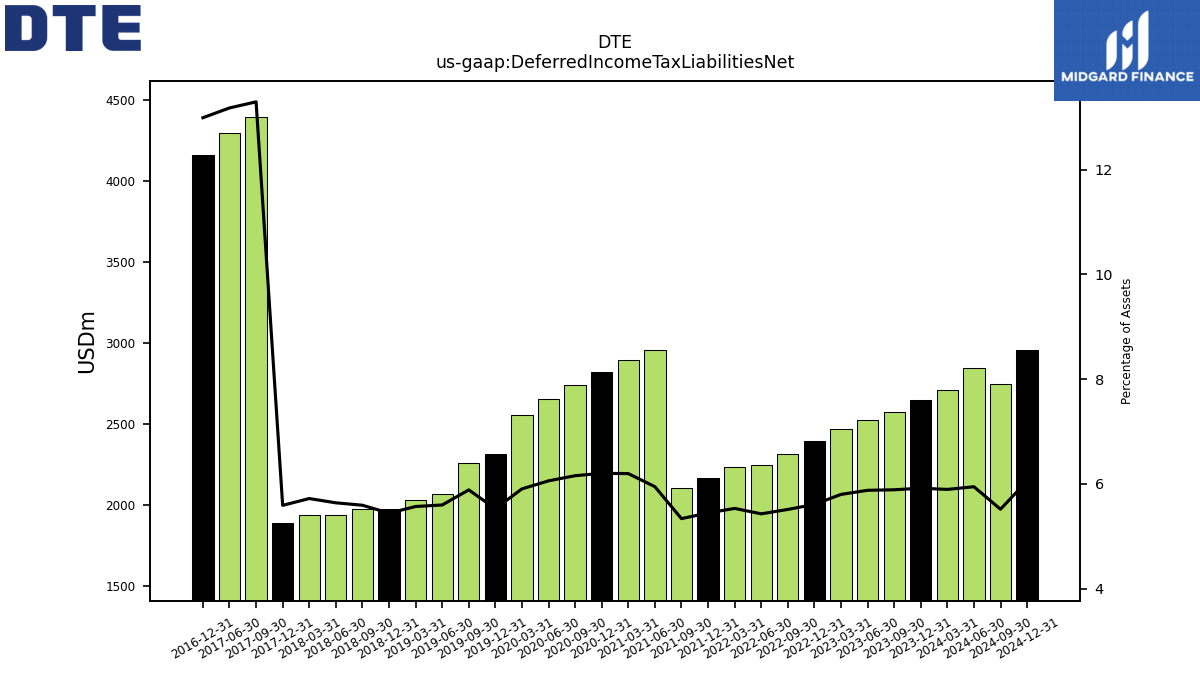
| Deferred Income Tax Liabilities Net | 2649.00 | 2575.00 | 2523.00 | 2466.00 | 2394.00 | 2313.00 | 2243.00 | 2233.00 | 2163.00 | 2105.00 | 2952.00 | 2894.00 | 2822.00 | 2736.00 | 2650.00 | 2553.00 | 2315.00 | 2257.00 | 2063.00 | 2029.00 | 1975.00 | 1974.00 | 1936.00 | 1936.00 | 1888.00 | 4396.00 | 4293.00 | NA | 4162.00 | NA | NA | NA | NA | NA | NA | NA | NA | NA | NA | NA | NA | NA | NA | NA | NA | NA | NA | NA | NA | NA | NA | NA | NA | NA | |
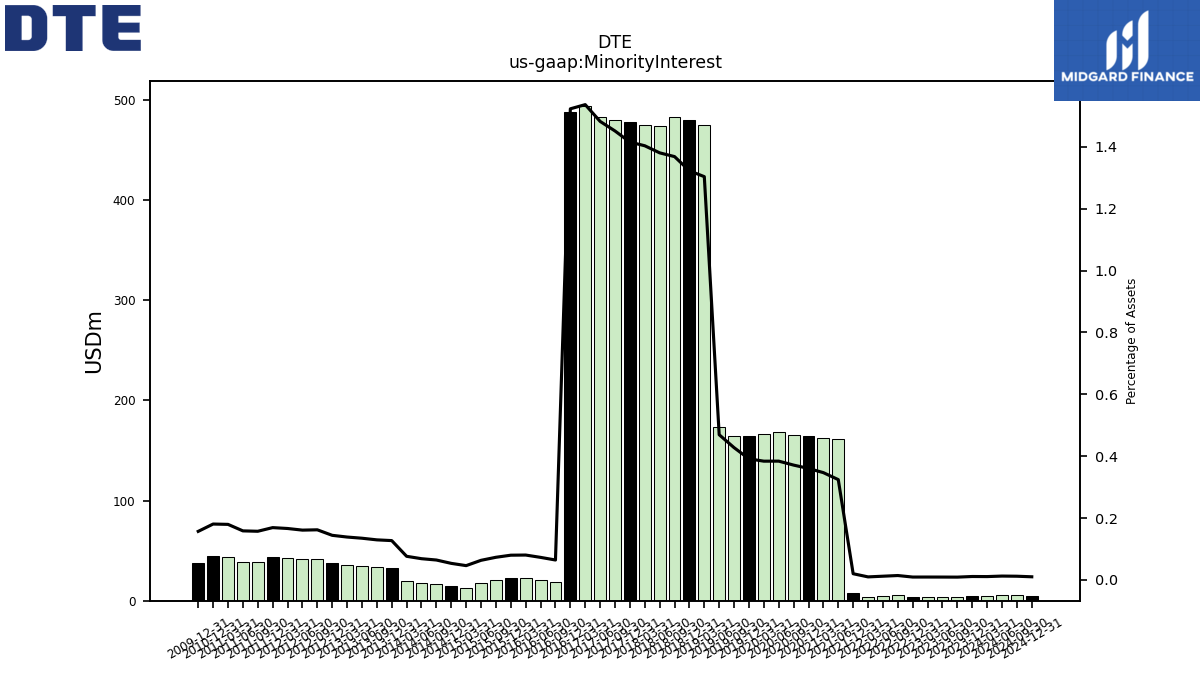
| Minority Interest | 5.00 | 4.00 | 4.00 | 4.00 | 4.00 | 6.00 | 5.00 | 4.00 | 8.00 | NA | 161.00 | 162.00 | 164.00 | 165.00 | 168.00 | 166.00 | 164.00 | 164.00 | 173.00 | 475.00 | 480.00 | 483.00 | 474.00 | 475.00 | 478.00 | 480.00 | 483.00 | 494.00 | 488.00 | 19.00 | 21.00 | 23.00 | 23.00 | 21.00 | 18.00 | 13.00 | 15.00 | 17.00 | 18.00 | 20.00 | 33.00 | 34.00 | 35.00 | 36.00 | 38.00 | 42.00 | 42.00 | 43.00 | 44.00 | 39.00 | 39.00 | 44.00 | 45.00 | 38.00 | |
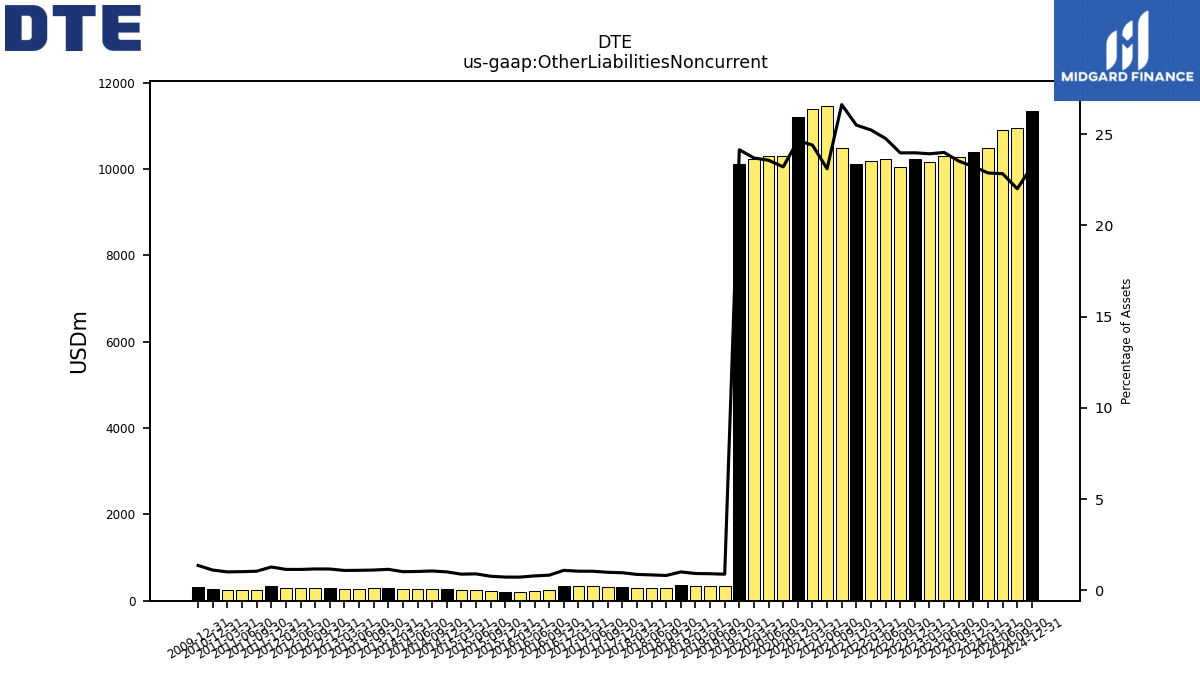
| Other Liabilities Noncurrent | 10397.00 | 10289.00 | 10302.00 | 10174.00 | 10236.00 | 10060.00 | 10232.00 | 10184.00 | 10129.00 | 10499.00 | 11469.00 | 11397.00 | 11215.00 | 10315.00 | 10310.00 | 10246.00 | 10114.00 | 337.00 | 333.00 | 334.00 | 364.00 | 285.00 | 288.00 | 293.00 | 323.00 | 325.00 | 339.00 | 335.00 | 349.00 | 243.00 | 226.00 | 205.00 | 207.00 | 219.00 | 254.00 | 247.00 | 281.00 | 278.00 | 269.00 | 266.00 | 297.00 | 290.00 | 283.00 | 281.00 | 306.00 | 302.00 | 297.00 | 295.00 | 331.00 | 258.00 | 250.00 | 246.00 | 275.00 | 328.00 | |
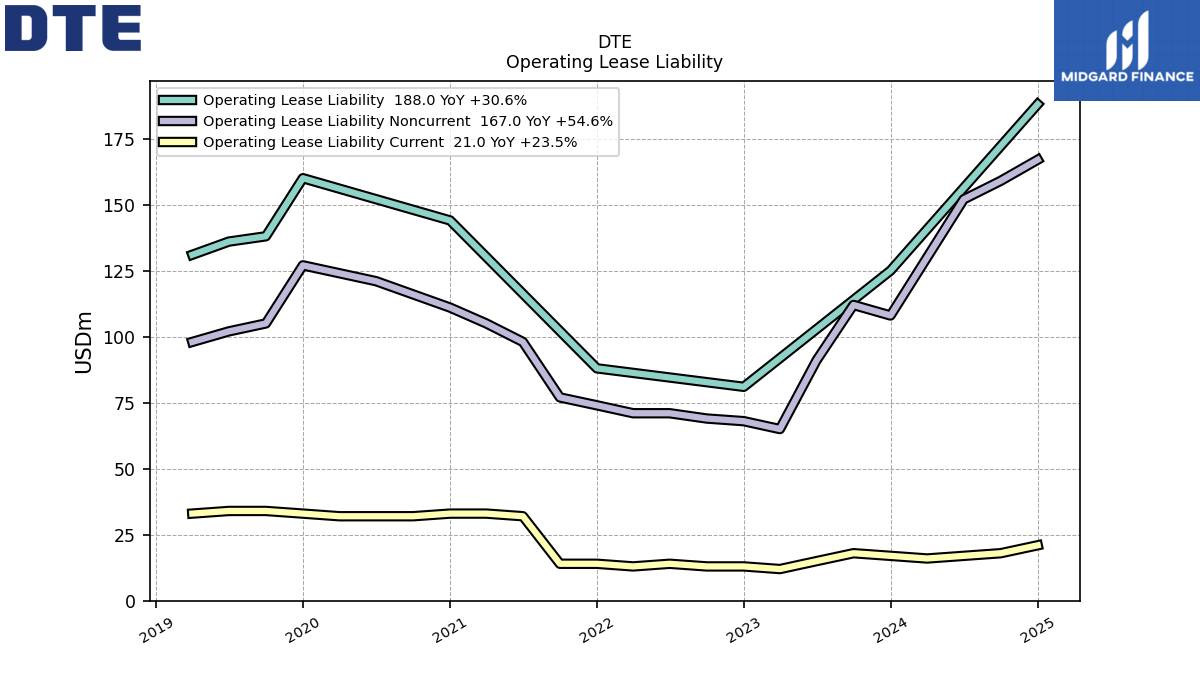
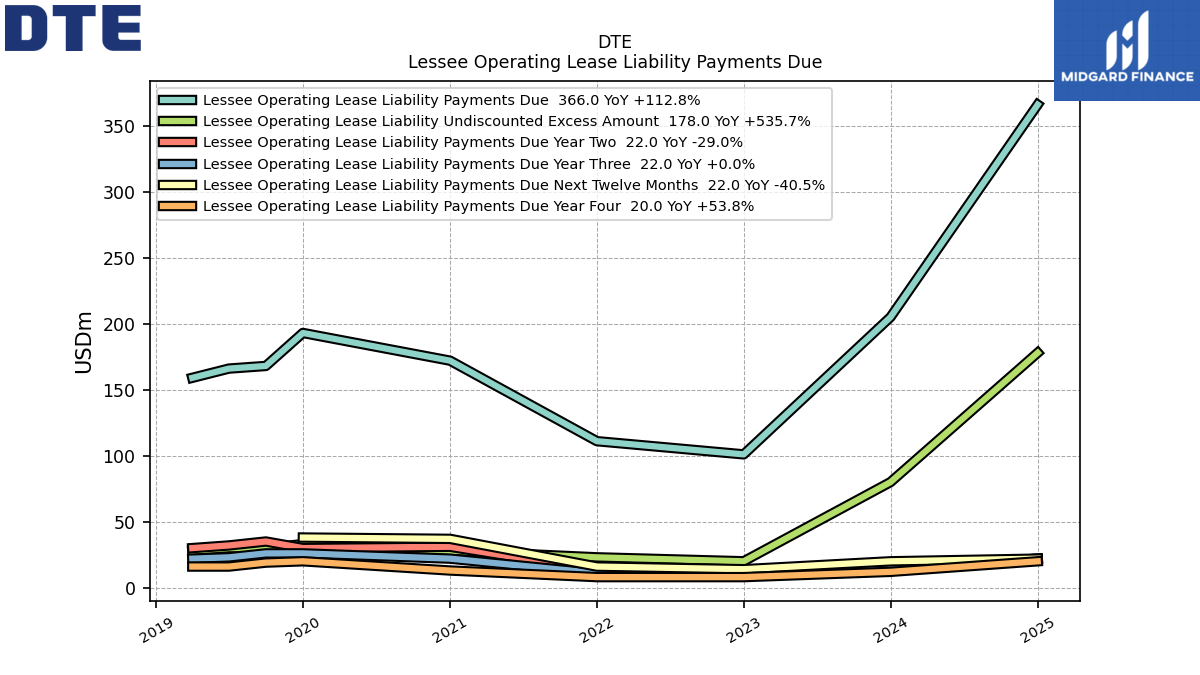
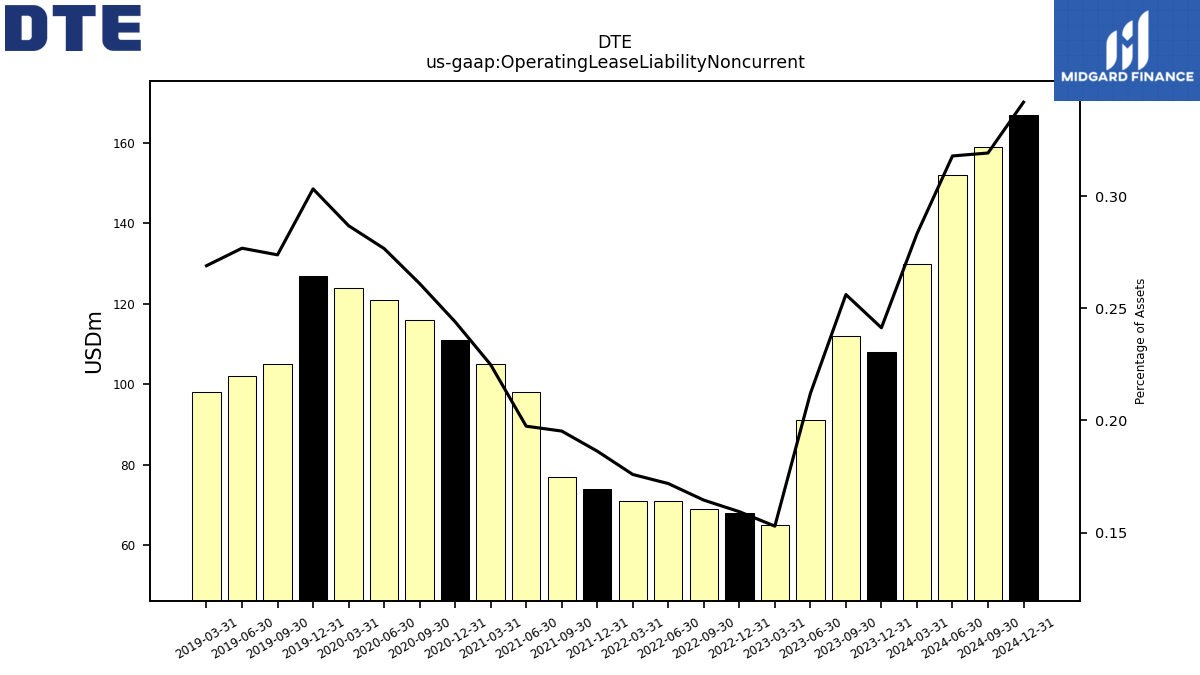
| Operating Lease Liability Noncurrent | 108.00 | 112.00 | 91.00 | 65.00 | 68.00 | 69.00 | 71.00 | 71.00 | 74.00 | 77.00 | 98.00 | 105.00 | 111.00 | 116.00 | 121.00 | 124.00 | 127.00 | 105.00 | 102.00 | 98.00 | NA | NA | NA | NA | NA | NA | NA | NA | NA | NA | NA | NA | NA | NA | NA | NA | NA | NA | NA | NA | NA | NA | NA | NA | NA | NA | NA | NA | NA | NA | NA | NA | NA | NA |
| 2023-12-31 | 2023-09-30 | 2023-06-30 | 2023-03-31 | 2022-12-31 | 2022-09-30 | 2022-06-30 | 2022-03-31 | 2021-12-31 | 2021-09-30 | 2021-06-30 | 2021-03-31 | 2020-12-31 | 2020-09-30 | 2020-06-30 | 2020-03-31 | 2019-12-31 | 2019-09-30 | 2019-06-30 | 2019-03-31 | 2018-12-31 | 2018-09-30 | 2018-06-30 | 2018-03-31 | 2017-12-31 | 2017-09-30 | 2017-06-30 | 2017-03-31 | 2016-12-31 | 2016-09-30 | 2016-06-30 | 2016-03-31 | 2015-12-31 | 2015-09-30 | 2015-06-30 | 2015-03-31 | 2014-12-31 | 2014-09-30 | 2014-06-30 | 2014-03-31 | 2013-12-31 | 2013-09-30 | 2013-06-30 | 2013-03-31 | 2012-12-31 | 2012-09-30 | 2012-06-30 | 2012-03-31 | 2011-12-31 | 2011-09-30 | 2011-06-30 | 2011-03-31 | 2010-12-31 | 2009-12-31 | ||
|---|---|---|---|---|---|---|---|---|---|---|---|---|---|---|---|---|---|---|---|---|---|---|---|---|---|---|---|---|---|---|---|---|---|---|---|---|---|---|---|---|---|---|---|---|---|---|---|---|---|---|---|---|---|---|---|
| Stockholders Equity | 11050.00 | 10850.00 | 10481.00 | 10642.00 | 10397.00 | 8980.00 | 8574.00 | 8863.00 | 8705.00 | 8567.00 | 12378.00 | 12552.00 | 12425.00 | 12323.00 | 11724.00 | 11822.00 | 11672.00 | 10740.00 | 10396.00 | 10545.00 | 10237.00 | 10207.00 | 9844.00 | 9888.00 | 9512.00 | 9373.00 | 9088.00 | 9194.00 | 9011.00 | 9130.00 | 8778.00 | 8887.00 | 8772.00 | 8812.00 | 8539.00 | 8665.00 | 8327.00 | 8169.00 | 8008.00 | 8117.00 | 7921.00 | 7876.00 | 7552.00 | 7596.00 | 7373.00 | 7389.00 | 7142.00 | 7104.00 | 7009.00 | 6970.00 | 6785.00 | 6793.00 | 6722.00 | 6278.00 | |
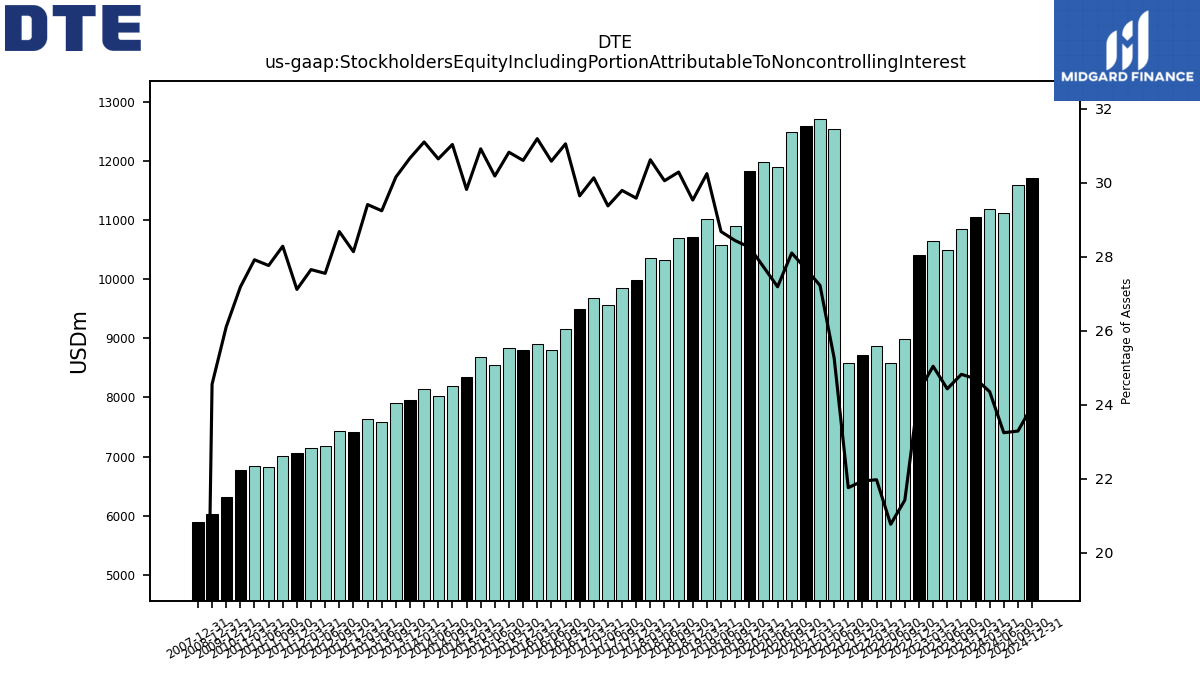
| Stockholders Equity Including Portion Attributable To Noncontrolling Interest | 11055.00 | 10854.00 | 10485.00 | 10646.00 | 10401.00 | 8986.00 | 8579.00 | 8867.00 | 8713.00 | 8579.00 | 12539.00 | 12714.00 | 12589.00 | 12488.00 | 11892.00 | 11988.00 | 11836.00 | 10904.00 | 10569.00 | 11020.00 | 10717.00 | 10690.00 | 10318.00 | 10363.00 | 9990.00 | 9853.00 | 9571.00 | 9688.00 | 9499.00 | 9149.00 | 8799.00 | 8910.00 | 8795.00 | 8833.00 | 8557.00 | 8678.00 | 8342.00 | 8186.00 | 8026.00 | 8137.00 | 7954.00 | 7910.00 | 7587.00 | 7632.00 | 7411.00 | 7431.00 | 7184.00 | 7147.00 | 7053.00 | 7009.00 | 6824.00 | 6837.00 | 6767.00 | 6316.00 | |
| Common Stock Value | 6713.00 | 6697.00 | 6676.00 | 6652.00 | 6651.00 | 5337.00 | 5323.00 | 5310.00 | 5379.00 | 5366.00 | 5361.00 | 5344.00 | 5406.00 | 5369.00 | 5247.00 | 5235.00 | 5233.00 | 4370.00 | 4344.00 | 4324.00 | 4245.00 | 4232.00 | 4205.00 | 4163.00 | 3989.00 | 3978.00 | 3968.00 | 3958.00 | 4030.00 | 4137.00 | 4129.00 | 4118.00 | 4123.00 | 4117.00 | 4110.00 | 4093.00 | 3904.00 | 3900.00 | 3896.00 | 3894.00 | 3907.00 | 3885.00 | 3762.00 | 3683.00 | 3587.00 | 3567.00 | 3549.00 | 3453.00 | 3417.00 | 3418.00 | 3415.00 | 3428.00 | 3440.00 | 3257.00 | |
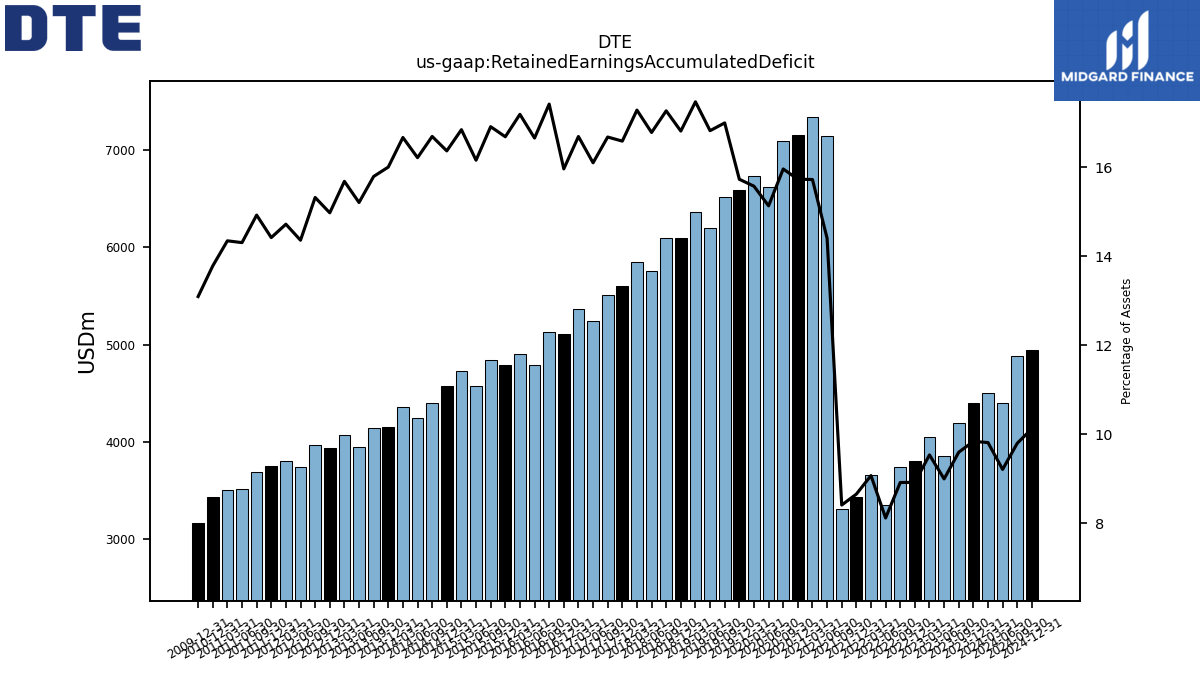
| Retained Earnings Accumulated Deficit | 4404.00 | 4197.00 | 3862.00 | 4055.00 | 3808.00 | 3741.00 | 3355.00 | 3662.00 | 3438.00 | 3317.00 | 7149.00 | 7342.00 | 7156.00 | 7092.00 | 6618.00 | 6732.00 | 6587.00 | 6516.00 | 6198.00 | 6364.00 | 6100.00 | 6093.00 | 5760.00 | 5848.00 | 5600.00 | 5515.00 | 5245.00 | 5365.00 | 5114.00 | 5131.00 | 4791.00 | 4909.00 | 4794.00 | 4845.00 | 4580.00 | 4727.00 | 4578.00 | 4402.00 | 4246.00 | 4360.00 | 4150.00 | 4142.00 | 3945.00 | 4069.00 | 3944.00 | 3969.00 | 3744.00 | 3804.00 | 3750.00 | 3698.00 | 3516.00 | 3513.00 | 3431.00 | 3168.00 | |
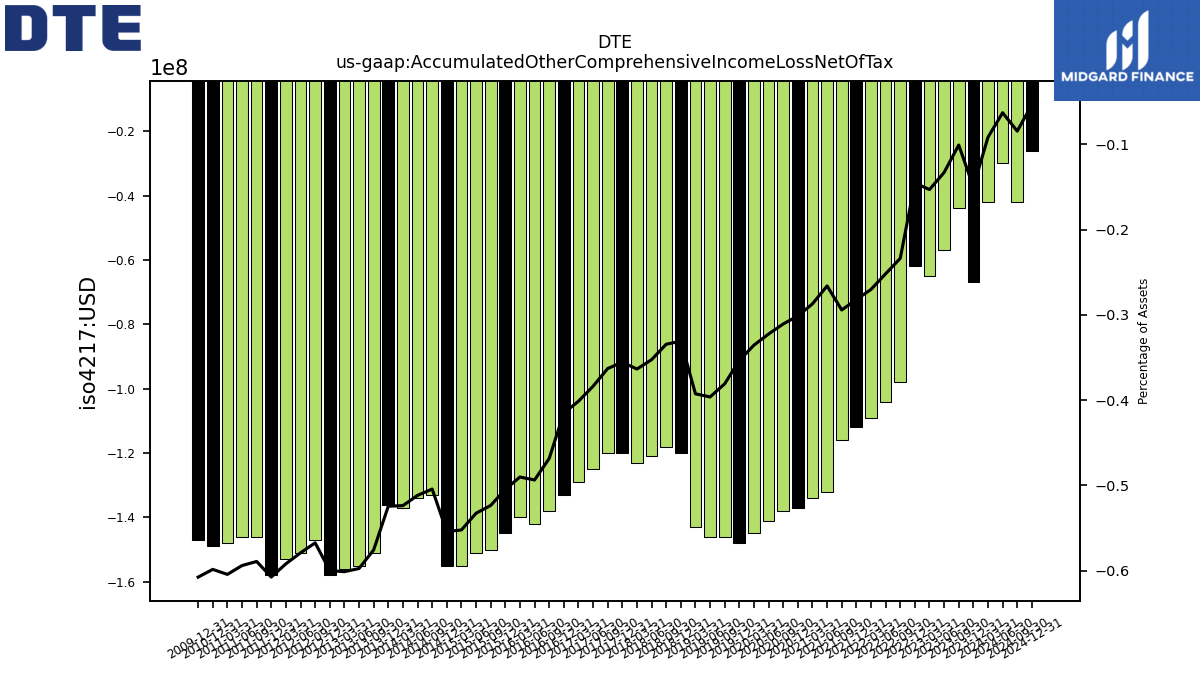
| Accumulated Other Comprehensive Income Loss Net Of Tax | -67.00 | -44.00 | -57.00 | -65.00 | -62.00 | -98.00 | -104.00 | -109.00 | -112.00 | -116.00 | -132.00 | -134.00 | -137.00 | -138.00 | -141.00 | -145.00 | -148.00 | -146.00 | -146.00 | -143.00 | -120.00 | -118.00 | -121.00 | -123.00 | -120.00 | -120.00 | -125.00 | -129.00 | -133.00 | -138.00 | -142.00 | -140.00 | -145.00 | -150.00 | -151.00 | -155.00 | -155.00 | -133.00 | -134.00 | -137.00 | -136.00 | -151.00 | -155.00 | -156.00 | -158.00 | -147.00 | -151.00 | -153.00 | -158.00 | -146.00 | -146.00 | -148.00 | -149.00 | -147.00 | |
| Minority Interest | 5.00 | 4.00 | 4.00 | 4.00 | 4.00 | 6.00 | 5.00 | 4.00 | 8.00 | NA | 161.00 | 162.00 | 164.00 | 165.00 | 168.00 | 166.00 | 164.00 | 164.00 | 173.00 | 475.00 | 480.00 | 483.00 | 474.00 | 475.00 | 478.00 | 480.00 | 483.00 | 494.00 | 488.00 | 19.00 | 21.00 | 23.00 | 23.00 | 21.00 | 18.00 | 13.00 | 15.00 | 17.00 | 18.00 | 20.00 | 33.00 | 34.00 | 35.00 | 36.00 | 38.00 | 42.00 | 42.00 | 43.00 | 44.00 | 39.00 | 39.00 | 44.00 | 45.00 | 38.00 |
| 2023-12-31 | 2023-09-30 | 2023-06-30 | 2023-03-31 | 2022-12-31 | 2022-09-30 | 2022-06-30 | 2022-03-31 | 2021-12-31 | 2021-09-30 | 2021-06-30 | 2021-03-31 | 2020-12-31 | 2020-09-30 | 2020-06-30 | 2020-03-31 | 2019-12-31 | 2019-09-30 | 2019-06-30 | 2019-03-31 | 2018-12-31 | 2018-09-30 | 2018-06-30 | 2018-03-31 | 2017-12-31 | 2017-09-30 | 2017-06-30 | 2017-03-31 | 2016-12-31 | 2016-09-30 | 2016-06-30 | 2016-03-31 | 2015-12-31 | 2015-09-30 | 2015-06-30 | 2015-03-31 | 2014-12-31 | 2014-09-30 | 2014-06-30 | 2014-03-31 | 2013-12-31 | 2013-09-30 | 2013-06-30 | 2013-03-31 | 2012-12-31 | 2012-09-30 | 2012-06-30 | 2012-03-31 | 2011-12-31 | 2011-09-30 | 2011-06-30 | 2011-03-31 | 2010-12-31 | 2009-12-31 | ||
|---|---|---|---|---|---|---|---|---|---|---|---|---|---|---|---|---|---|---|---|---|---|---|---|---|---|---|---|---|---|---|---|---|---|---|---|---|---|---|---|---|---|---|---|---|---|---|---|---|---|---|---|---|---|---|---|
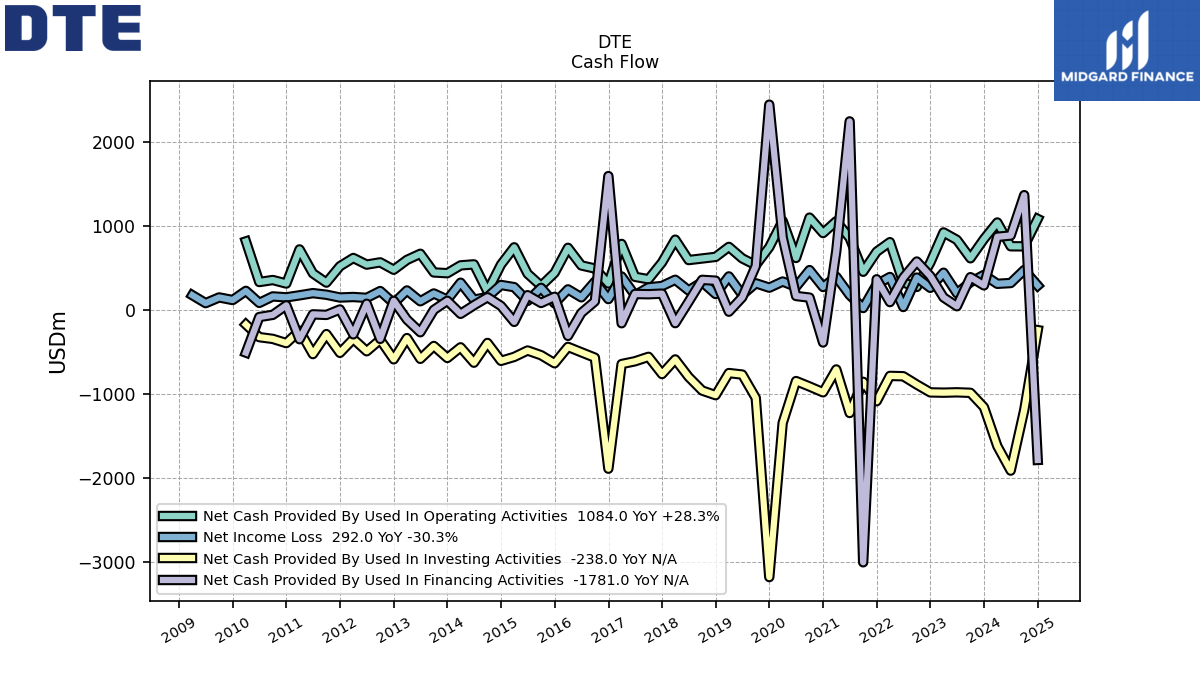
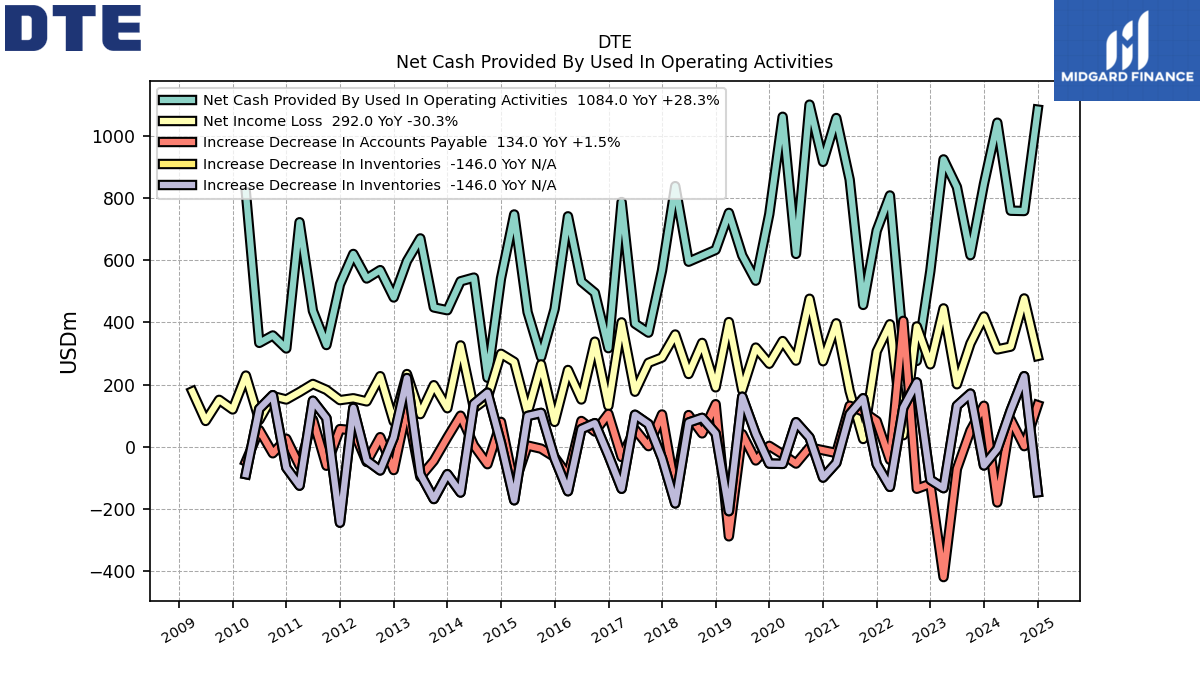
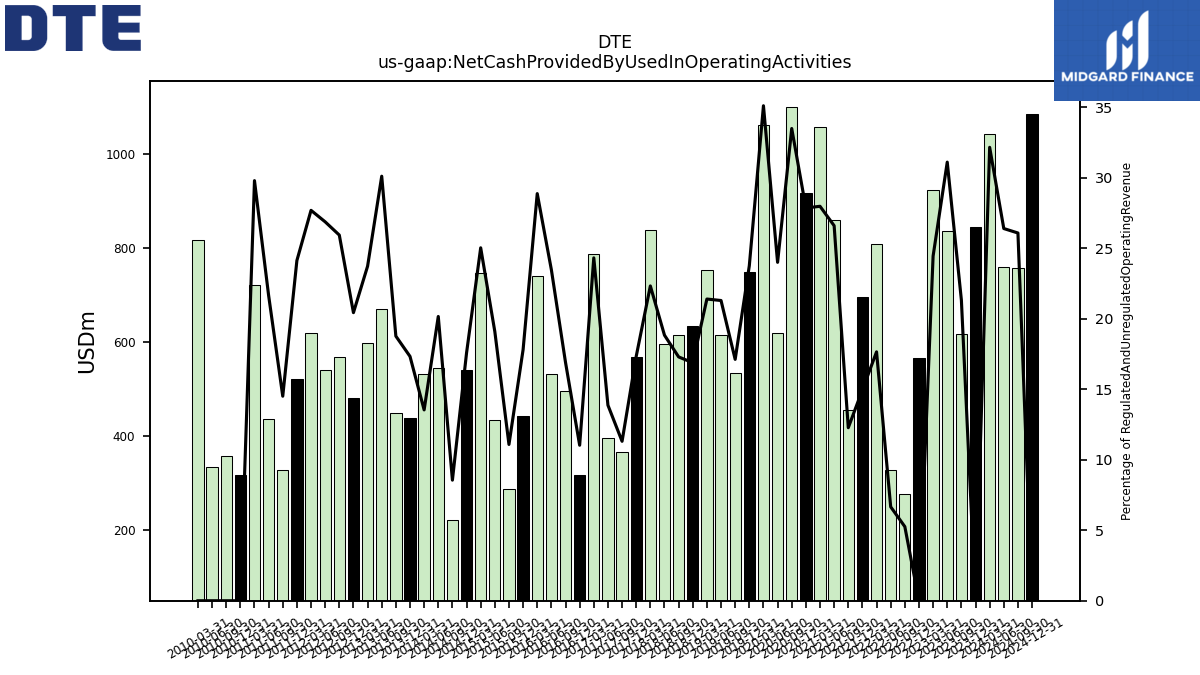
| Net Cash Provided By Used In Operating Activities | 845.00 | 616.00 | 835.00 | 924.00 | 565.00 | 276.00 | 328.00 | 808.00 | 695.00 | 456.00 | 859.00 | 1057.00 | 916.00 | 1100.00 | 620.00 | 1061.00 | 748.00 | 534.00 | 615.00 | 752.00 | 633.00 | 614.00 | 595.00 | 838.00 | 567.00 | 367.00 | 396.00 | 787.00 | 317.00 | 495.00 | 531.00 | 741.00 | 443.00 | 288.00 | 433.00 | 747.00 | 541.00 | 222.00 | 544.00 | 532.00 | 439.00 | 448.00 | 670.00 | 597.00 | 480.00 | 568.00 | 541.00 | 620.00 | 522.00 | 327.00 | 437.00 | 722.00 | 316.00 | NA | |
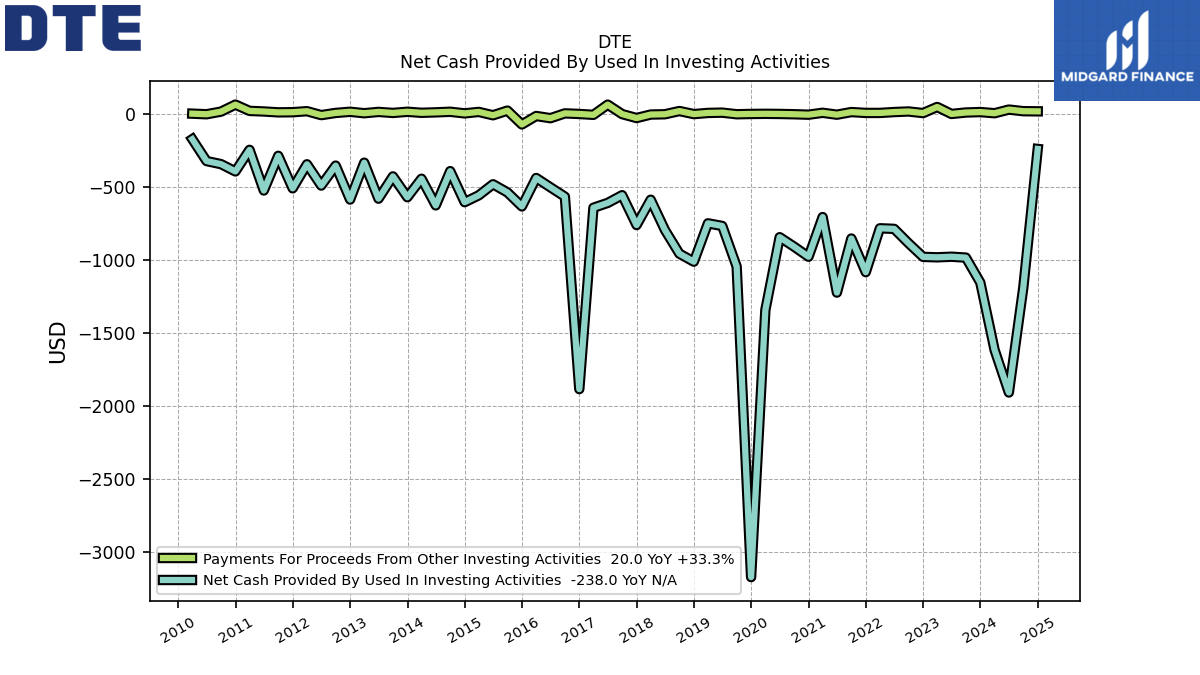
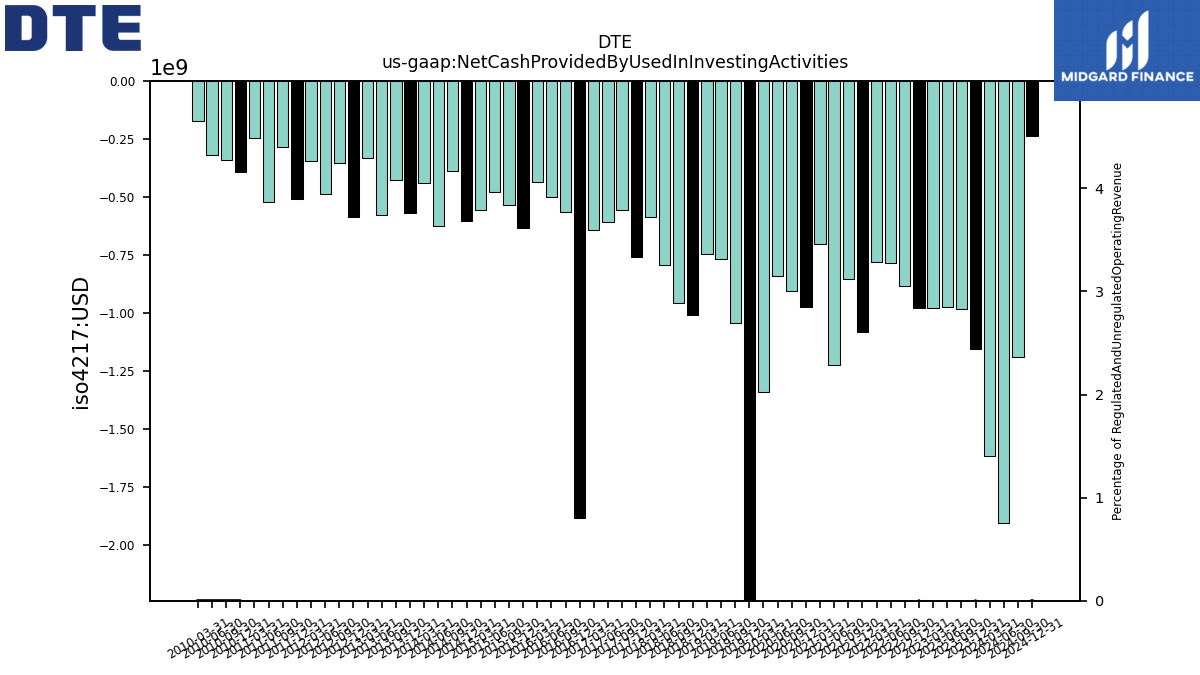
| Net Cash Provided By Used In Investing Activities | -1154.00 | -983.00 | -977.00 | -981.00 | -978.00 | -885.00 | -786.00 | -782.00 | -1083.00 | -852.00 | -1223.00 | -705.00 | -977.00 | -908.00 | -843.00 | -1342.00 | -3174.00 | -1044.00 | -766.00 | -748.00 | -1011.00 | -956.00 | -794.00 | -586.00 | -760.00 | -555.00 | -608.00 | -641.00 | -1885.00 | -565.00 | -501.00 | -437.00 | -632.00 | -536.00 | -480.00 | -556.00 | -603.00 | -390.00 | -625.00 | -442.00 | -569.00 | -426.00 | -579.00 | -332.00 | -585.00 | -352.00 | -489.00 | -343.00 | -508.00 | -285.00 | -523.00 | -244.00 | -392.00 | NA | |
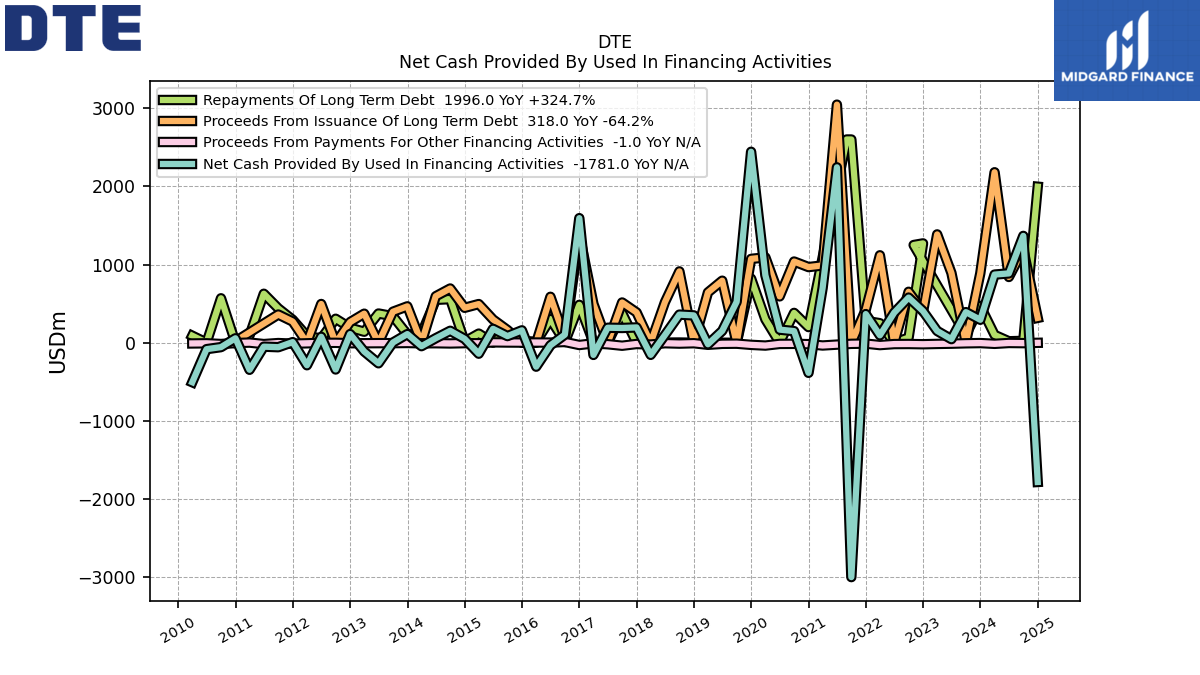
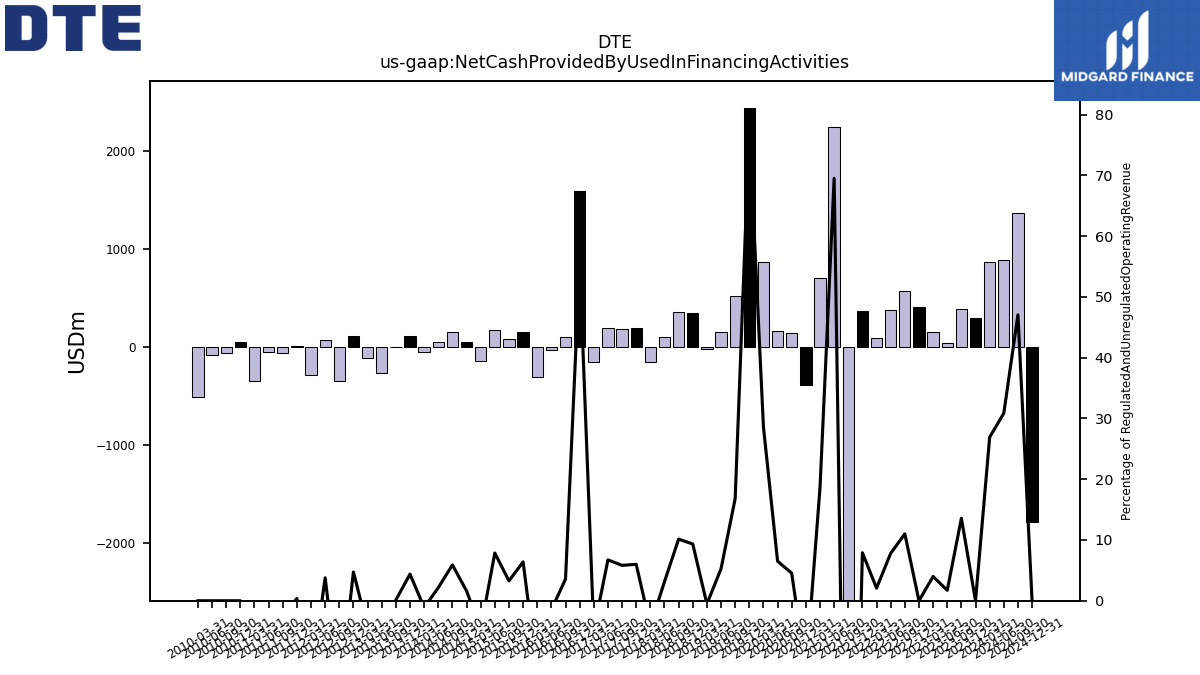
| Net Cash Provided By Used In Financing Activities | 294.00 | 392.00 | 46.00 | 151.00 | 405.00 | 578.00 | 384.00 | 95.00 | 367.00 | -2998.00 | 2244.00 | 702.00 | -385.00 | 149.00 | 168.00 | 864.00 | 2443.00 | 524.00 | 152.00 | -19.00 | 350.00 | 360.00 | 99.00 | -155.00 | 196.00 | 189.00 | 192.00 | -156.00 | 1594.00 | 104.00 | -33.00 | -306.00 | 159.00 | 85.00 | 178.00 | -140.00 | 50.00 | 153.00 | 58.00 | -44.00 | 111.00 | 3.00 | -263.00 | -112.00 | 111.00 | -342.00 | 76.00 | -288.00 | 8.00 | -57.00 | -50.00 | -346.00 | 57.00 | NA |
| 2023-12-31 | 2023-09-30 | 2023-06-30 | 2023-03-31 | 2022-12-31 | 2022-09-30 | 2022-06-30 | 2022-03-31 | 2021-12-31 | 2021-09-30 | 2021-06-30 | 2021-03-31 | 2020-12-31 | 2020-09-30 | 2020-06-30 | 2020-03-31 | 2019-12-31 | 2019-09-30 | 2019-06-30 | 2019-03-31 | 2018-12-31 | 2018-09-30 | 2018-06-30 | 2018-03-31 | 2017-12-31 | 2017-09-30 | 2017-06-30 | 2017-03-31 | 2016-12-31 | 2016-09-30 | 2016-06-30 | 2016-03-31 | 2015-12-31 | 2015-09-30 | 2015-06-30 | 2015-03-31 | 2014-12-31 | 2014-09-30 | 2014-06-30 | 2014-03-31 | 2013-12-31 | 2013-09-30 | 2013-06-30 | 2013-03-31 | 2012-12-31 | 2012-09-30 | 2012-06-30 | 2012-03-31 | 2011-12-31 | 2011-09-30 | 2011-06-30 | 2011-03-31 | 2010-12-31 | 2009-12-31 | ||
|---|---|---|---|---|---|---|---|---|---|---|---|---|---|---|---|---|---|---|---|---|---|---|---|---|---|---|---|---|---|---|---|---|---|---|---|---|---|---|---|---|---|---|---|---|---|---|---|---|---|---|---|---|---|---|---|
| Net Cash Provided By Used In Operating Activities | 845.00 | 616.00 | 835.00 | 924.00 | 565.00 | 276.00 | 328.00 | 808.00 | 695.00 | 456.00 | 859.00 | 1057.00 | 916.00 | 1100.00 | 620.00 | 1061.00 | 748.00 | 534.00 | 615.00 | 752.00 | 633.00 | 614.00 | 595.00 | 838.00 | 567.00 | 367.00 | 396.00 | 787.00 | 317.00 | 495.00 | 531.00 | 741.00 | 443.00 | 288.00 | 433.00 | 747.00 | 541.00 | 222.00 | 544.00 | 532.00 | 439.00 | 448.00 | 670.00 | 597.00 | 480.00 | 568.00 | 541.00 | 620.00 | 522.00 | 327.00 | 437.00 | 722.00 | 316.00 | NA | |
| Net Income Loss | 419.00 | 332.00 | 201.00 | 445.00 | 265.00 | 387.00 | 37.00 | 394.00 | 306.00 | 25.00 | 179.00 | 397.00 | 275.00 | 476.00 | 277.00 | 340.00 | 267.00 | 319.00 | 182.00 | 401.00 | 191.00 | 334.00 | 234.00 | 361.00 | 287.00 | 270.00 | 177.00 | 400.00 | 131.00 | 338.00 | 152.00 | 247.00 | 80.00 | 265.00 | 109.00 | 273.00 | 299.00 | 156.00 | 124.00 | 326.00 | 124.00 | 198.00 | 105.00 | 234.00 | 81.00 | 227.00 | 146.00 | 156.00 | 150.00 | 183.00 | 202.00 | 176.00 | 152.00 | 120.00 | |
| Profit Loss | 419.00 | 332.00 | 201.00 | 445.00 | 265.00 | 387.00 | 37.00 | 394.00 | 305.00 | 22.00 | 179.00 | 397.00 | 275.00 | 477.00 | 277.00 | 342.00 | 268.00 | 317.00 | 179.00 | 408.00 | 196.00 | 335.00 | 236.00 | 351.00 | 280.00 | 263.00 | 175.00 | 394.00 | 124.00 | 325.00 | 145.00 | 240.00 | 77.00 | 264.00 | 105.00 | 274.00 | 301.00 | 157.00 | 126.00 | 327.00 | 126.00 | 200.00 | 107.00 | 235.00 | 83.00 | 230.00 | 147.00 | 158.00 | 157.00 | 185.00 | 200.00 | 178.00 | 156.00 | NA | |
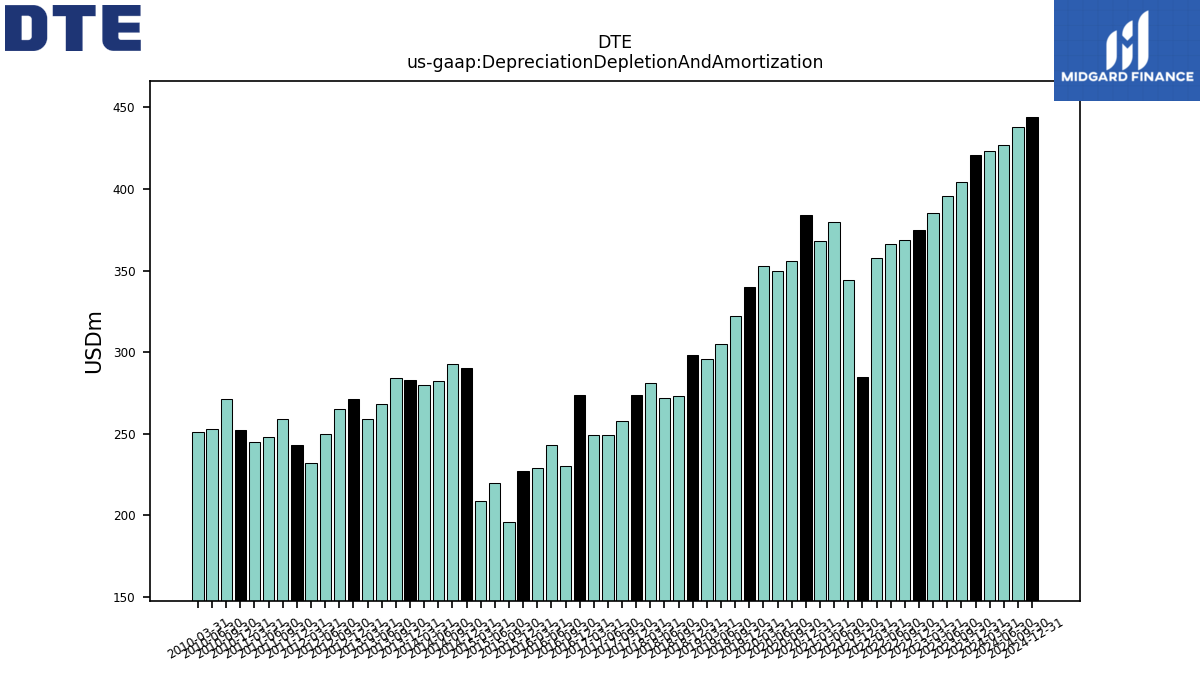
| Depreciation Depletion And Amortization | 421.00 | 404.00 | 396.00 | 385.00 | 375.00 | 369.00 | 366.00 | 358.00 | 285.00 | 344.00 | 380.00 | 368.00 | 384.00 | 356.00 | 350.00 | 353.00 | 340.00 | 322.00 | 305.00 | 296.00 | 298.00 | 273.00 | 272.00 | 281.00 | 274.00 | 258.00 | 249.00 | 249.00 | 274.00 | 230.00 | 243.00 | 229.00 | 227.00 | 196.00 | 220.00 | 209.00 | 290.00 | 293.00 | 282.00 | 280.00 | 283.00 | 284.00 | 268.00 | 259.00 | 271.00 | 265.00 | 250.00 | 232.00 | 243.00 | 259.00 | 248.00 | 245.00 | 252.00 | NA | |
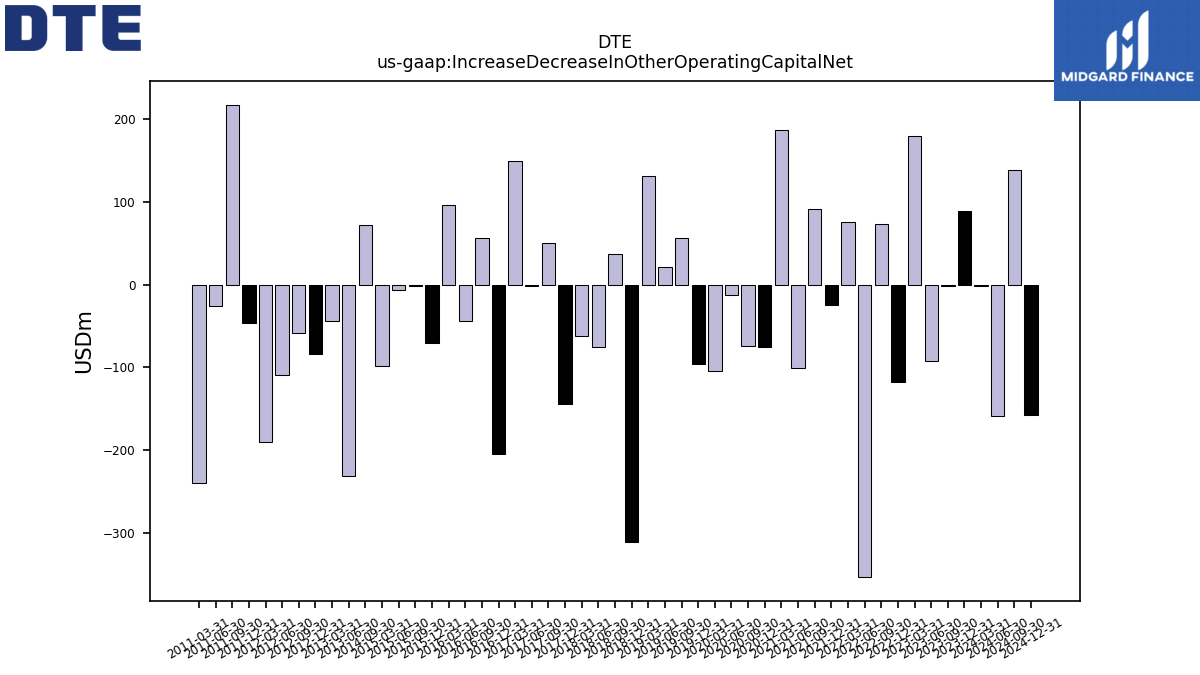
| Increase Decrease In Other Operating Capital Net | 89.00 | -1.00 | -92.00 | 180.00 | -118.00 | 73.00 | -354.00 | 76.00 | -25.00 | 92.00 | -101.00 | 187.00 | -75.00 | -74.00 | -13.00 | -104.00 | -96.00 | 57.00 | 21.00 | 131.00 | -312.00 | 37.00 | -76.00 | -62.00 | -144.00 | 50.00 | -2.00 | 150.00 | -205.00 | 57.00 | -44.00 | 97.00 | -71.00 | -1.00 | -6.00 | -99.00 | NA | 72.00 | NA | NA | NA | NA | -231.00 | -44.00 | -84.00 | -58.00 | -109.00 | -191.00 | -46.00 | 218.00 | -26.00 | -240.00 | NA | NA | |
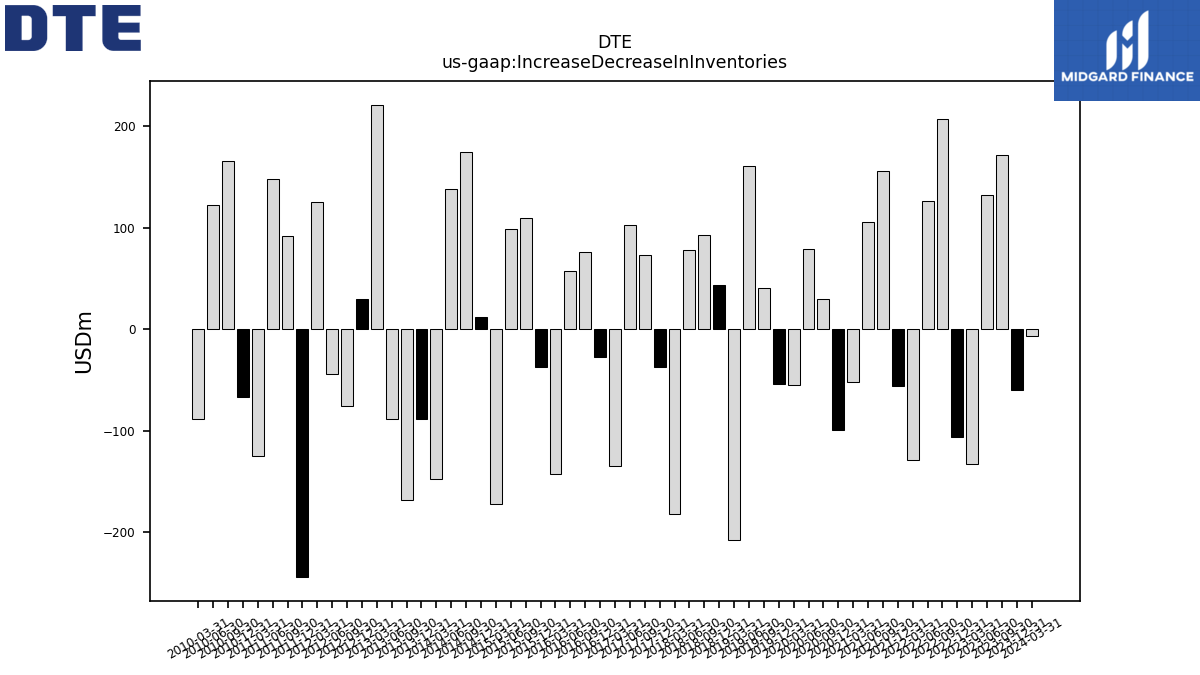
| Increase Decrease In Inventories | -60.00 | 171.00 | 132.00 | -133.00 | -106.00 | 207.00 | 126.00 | -129.00 | -56.00 | 156.00 | 105.00 | -52.00 | -99.00 | 30.00 | 79.00 | -55.00 | -54.00 | 41.00 | 161.00 | -207.00 | 43.00 | 93.00 | 78.00 | -182.00 | -37.00 | 73.00 | 103.00 | -135.00 | -27.00 | 76.00 | 57.00 | -143.00 | -37.00 | 109.00 | 99.00 | -172.00 | 12.00 | 174.00 | 138.00 | -147.00 | -88.00 | -168.00 | -88.00 | 221.00 | 30.00 | -76.00 | -44.00 | 125.00 | -244.00 | 92.00 | 148.00 | -125.00 | -67.00 | NA | |
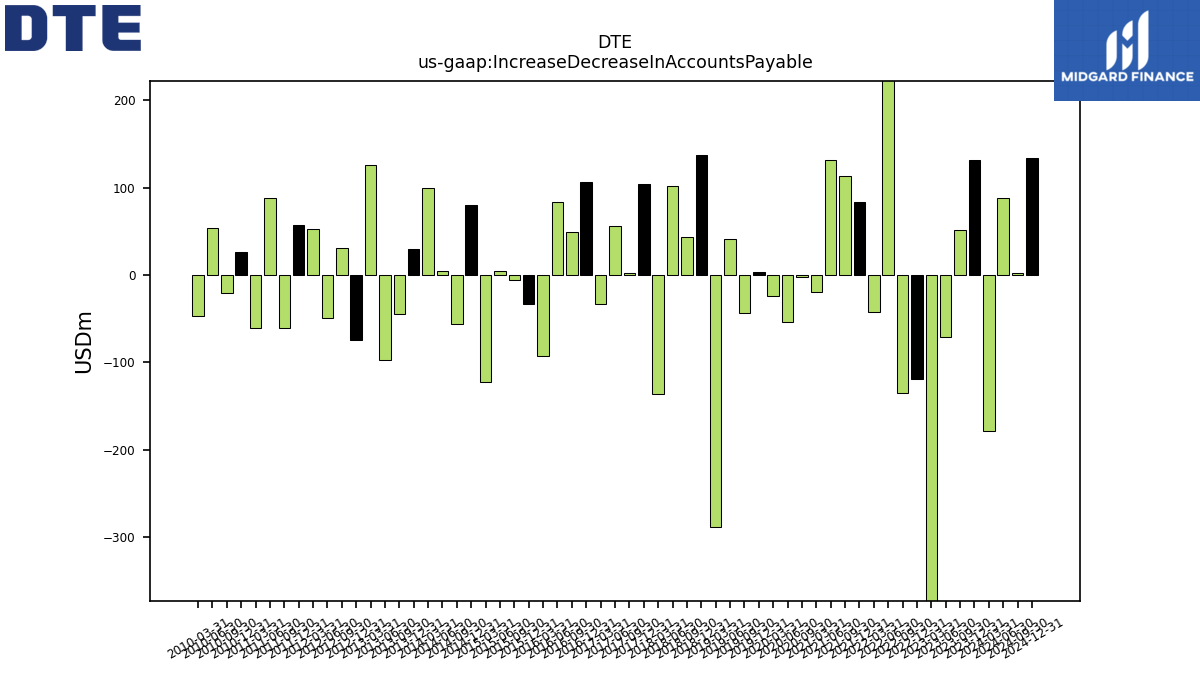
| Increase Decrease In Accounts Payable | 132.00 | 52.00 | -71.00 | -419.00 | -119.00 | -135.00 | 405.00 | -42.00 | 83.00 | 113.00 | 132.00 | -20.00 | NA | -2.00 | -54.00 | -24.00 | 3.00 | -44.00 | 41.00 | -288.00 | 137.00 | 43.00 | 102.00 | -136.00 | 104.00 | 2.00 | 56.00 | -33.00 | 106.00 | 49.00 | 83.00 | -93.00 | -33.00 | -6.00 | 4.00 | -123.00 | 80.00 | -56.00 | 4.00 | 100.00 | 30.00 | -45.00 | -97.00 | 126.00 | -75.00 | 31.00 | -49.00 | 53.00 | 57.00 | -61.00 | 88.00 | -61.00 | 26.00 | NA |
| 2023-12-31 | 2023-09-30 | 2023-06-30 | 2023-03-31 | 2022-12-31 | 2022-09-30 | 2022-06-30 | 2022-03-31 | 2021-12-31 | 2021-09-30 | 2021-06-30 | 2021-03-31 | 2020-12-31 | 2020-09-30 | 2020-06-30 | 2020-03-31 | 2019-12-31 | 2019-09-30 | 2019-06-30 | 2019-03-31 | 2018-12-31 | 2018-09-30 | 2018-06-30 | 2018-03-31 | 2017-12-31 | 2017-09-30 | 2017-06-30 | 2017-03-31 | 2016-12-31 | 2016-09-30 | 2016-06-30 | 2016-03-31 | 2015-12-31 | 2015-09-30 | 2015-06-30 | 2015-03-31 | 2014-12-31 | 2014-09-30 | 2014-06-30 | 2014-03-31 | 2013-12-31 | 2013-09-30 | 2013-06-30 | 2013-03-31 | 2012-12-31 | 2012-09-30 | 2012-06-30 | 2012-03-31 | 2011-12-31 | 2011-09-30 | 2011-06-30 | 2011-03-31 | 2010-12-31 | 2009-12-31 | ||
|---|---|---|---|---|---|---|---|---|---|---|---|---|---|---|---|---|---|---|---|---|---|---|---|---|---|---|---|---|---|---|---|---|---|---|---|---|---|---|---|---|---|---|---|---|---|---|---|---|---|---|---|---|---|---|---|
| Net Cash Provided By Used In Investing Activities | -1154.00 | -983.00 | -977.00 | -981.00 | -978.00 | -885.00 | -786.00 | -782.00 | -1083.00 | -852.00 | -1223.00 | -705.00 | -977.00 | -908.00 | -843.00 | -1342.00 | -3174.00 | -1044.00 | -766.00 | -748.00 | -1011.00 | -956.00 | -794.00 | -586.00 | -760.00 | -555.00 | -608.00 | -641.00 | -1885.00 | -565.00 | -501.00 | -437.00 | -632.00 | -536.00 | -480.00 | -556.00 | -603.00 | -390.00 | -625.00 | -442.00 | -569.00 | -426.00 | -579.00 | -332.00 | -585.00 | -352.00 | -489.00 | -343.00 | -508.00 | -285.00 | -523.00 | -244.00 | -392.00 | NA |
| 2023-12-31 | 2023-09-30 | 2023-06-30 | 2023-03-31 | 2022-12-31 | 2022-09-30 | 2022-06-30 | 2022-03-31 | 2021-12-31 | 2021-09-30 | 2021-06-30 | 2021-03-31 | 2020-12-31 | 2020-09-30 | 2020-06-30 | 2020-03-31 | 2019-12-31 | 2019-09-30 | 2019-06-30 | 2019-03-31 | 2018-12-31 | 2018-09-30 | 2018-06-30 | 2018-03-31 | 2017-12-31 | 2017-09-30 | 2017-06-30 | 2017-03-31 | 2016-12-31 | 2016-09-30 | 2016-06-30 | 2016-03-31 | 2015-12-31 | 2015-09-30 | 2015-06-30 | 2015-03-31 | 2014-12-31 | 2014-09-30 | 2014-06-30 | 2014-03-31 | 2013-12-31 | 2013-09-30 | 2013-06-30 | 2013-03-31 | 2012-12-31 | 2012-09-30 | 2012-06-30 | 2012-03-31 | 2011-12-31 | 2011-09-30 | 2011-06-30 | 2011-03-31 | 2010-12-31 | 2009-12-31 | ||
|---|---|---|---|---|---|---|---|---|---|---|---|---|---|---|---|---|---|---|---|---|---|---|---|---|---|---|---|---|---|---|---|---|---|---|---|---|---|---|---|---|---|---|---|---|---|---|---|---|---|---|---|---|---|---|---|
| Net Cash Provided By Used In Financing Activities | 294.00 | 392.00 | 46.00 | 151.00 | 405.00 | 578.00 | 384.00 | 95.00 | 367.00 | -2998.00 | 2244.00 | 702.00 | -385.00 | 149.00 | 168.00 | 864.00 | 2443.00 | 524.00 | 152.00 | -19.00 | 350.00 | 360.00 | 99.00 | -155.00 | 196.00 | 189.00 | 192.00 | -156.00 | 1594.00 | 104.00 | -33.00 | -306.00 | 159.00 | 85.00 | 178.00 | -140.00 | 50.00 | 153.00 | 58.00 | -44.00 | 111.00 | 3.00 | -263.00 | -112.00 | 111.00 | -342.00 | 76.00 | -288.00 | 8.00 | -57.00 | -50.00 | -346.00 | 57.00 | NA | |
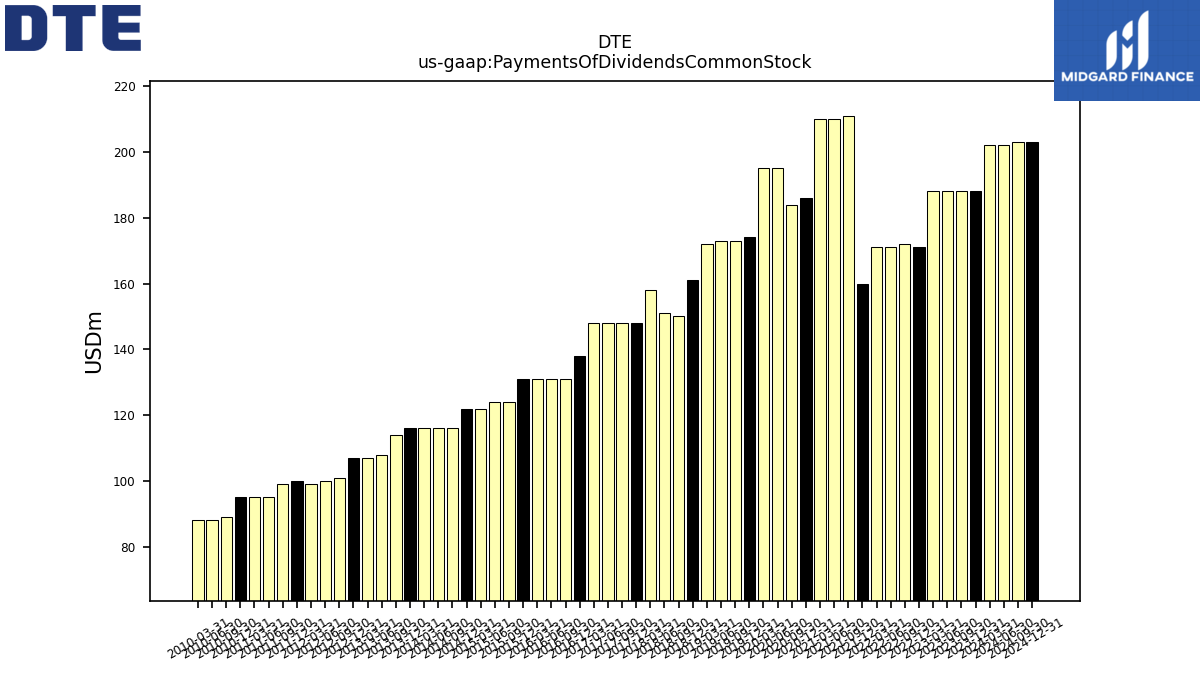
| Payments Of Dividends Common Stock | 188.00 | 188.00 | 188.00 | 188.00 | 171.00 | 172.00 | 171.00 | 171.00 | 160.00 | 211.00 | 210.00 | 210.00 | 186.00 | 184.00 | 195.00 | 195.00 | 174.00 | 173.00 | 173.00 | 172.00 | 161.00 | 150.00 | 151.00 | 158.00 | 148.00 | 148.00 | 148.00 | 148.00 | 138.00 | 131.00 | 131.00 | 131.00 | 131.00 | 124.00 | 124.00 | 122.00 | 122.00 | 116.00 | 116.00 | 116.00 | 116.00 | 114.00 | 108.00 | 107.00 | 107.00 | 101.00 | 100.00 | 99.00 | 100.00 | 99.00 | 95.00 | 95.00 | 95.00 | NA |
