
| 2023-12-31 | 2023-09-30 | 2023-06-30 | 2023-03-31 | 2022-12-31 | 2022-09-30 | 2022-06-30 | 2022-03-31 | 2021-12-31 | 2021-09-30 | 2021-06-30 | 2021-03-31 | 2020-12-31 | 2020-09-30 | 2020-06-30 | ||
|---|---|---|---|---|---|---|---|---|---|---|---|---|---|---|---|---|
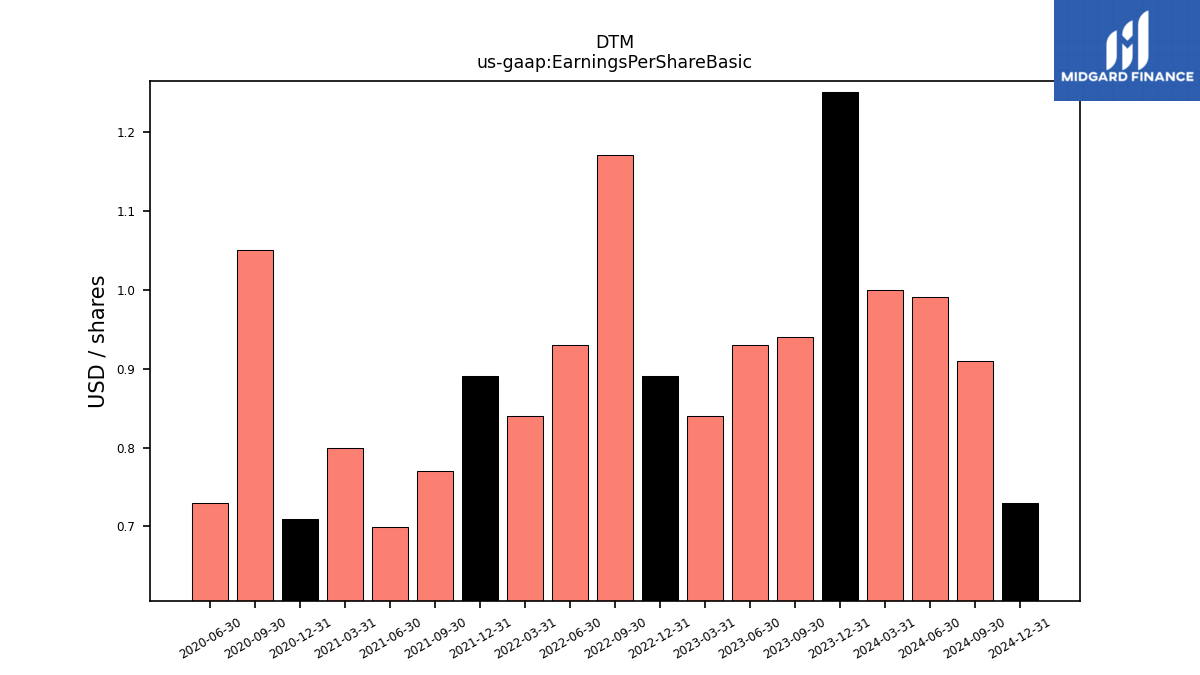
| Earnings Per Share Basic | 1.25 | 0.94 | 0.93 | 0.84 | 0.89 | 1.17 | 0.93 | 0.84 | 0.89 | 0.77 | 0.70 | 0.80 | 0.71 | 1.05 | 0.73 | |
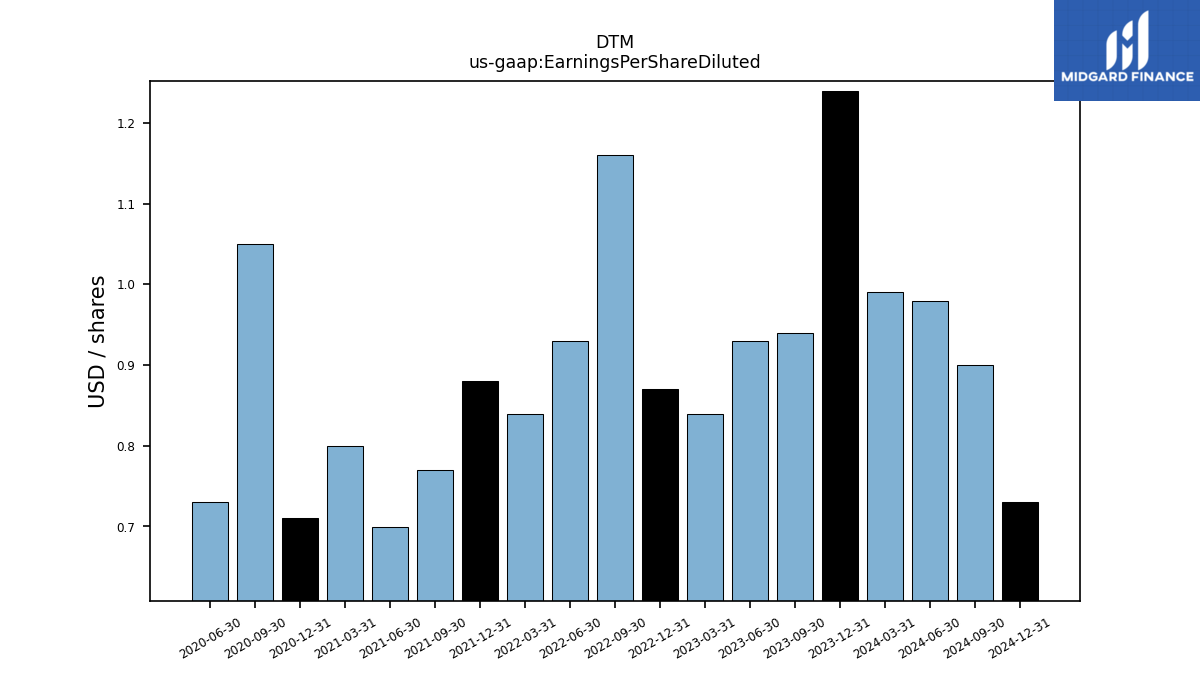
| Earnings Per Share Diluted | 1.24 | 0.94 | 0.93 | 0.84 | 0.87 | 1.16 | 0.93 | 0.84 | 0.88 | 0.77 | 0.70 | 0.80 | 0.71 | 1.05 | 0.73 |
| 2023-12-31 | 2023-09-30 | 2023-06-30 | 2023-03-31 | 2022-12-31 | 2022-09-30 | 2022-06-30 | 2022-03-31 | 2021-12-31 | 2021-09-30 | 2021-06-30 | 2021-03-31 | 2020-12-31 | 2020-09-30 | 2020-06-30 | ||
|---|---|---|---|---|---|---|---|---|---|---|---|---|---|---|---|---|
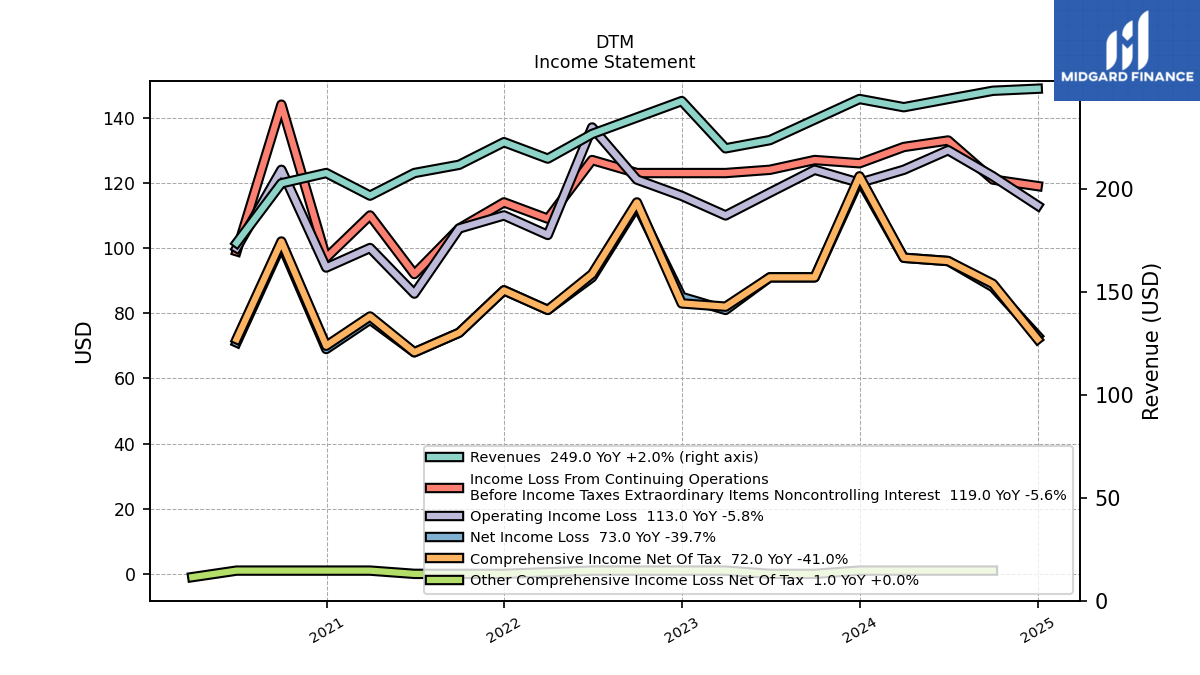
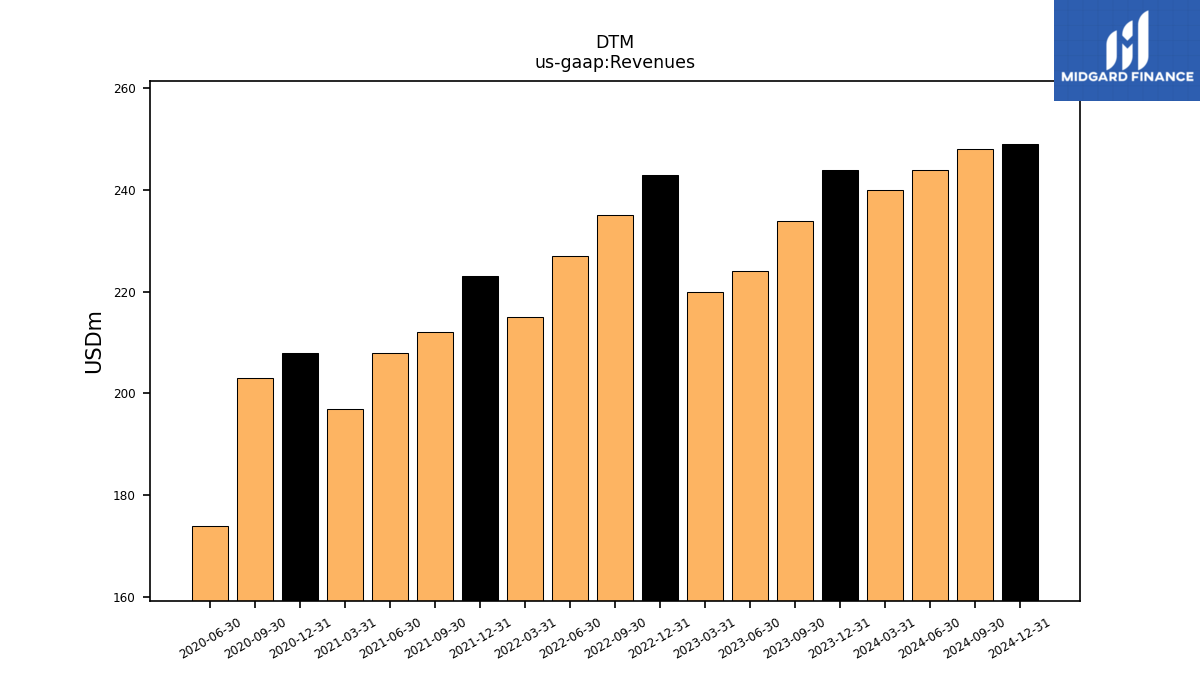
| Revenues | 244.00 | 234.00 | 224.00 | 220.00 | 243.00 | 235.00 | 227.00 | 215.00 | 223.00 | 212.00 | 208.00 | 197.00 | 208.00 | 203.00 | 174.00 | |
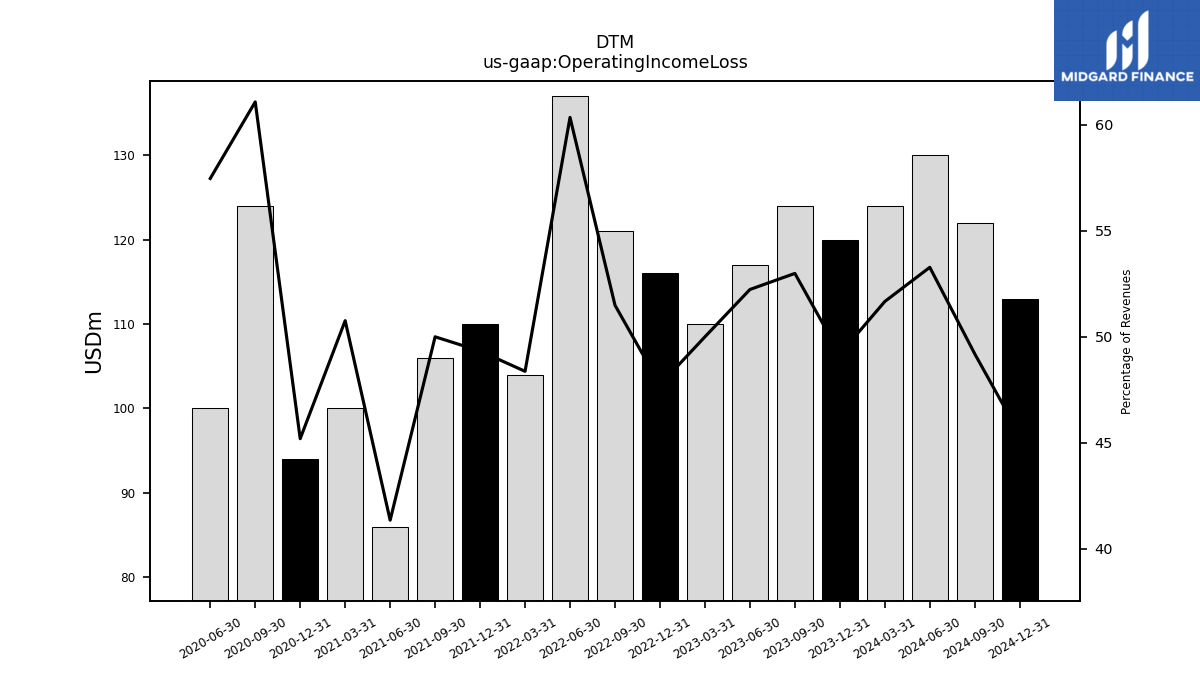
| Operating Income Loss | 120.00 | 124.00 | 117.00 | 110.00 | 116.00 | 121.00 | 137.00 | 104.00 | 110.00 | 106.00 | 86.00 | 100.00 | 94.00 | 124.00 | 100.00 | |
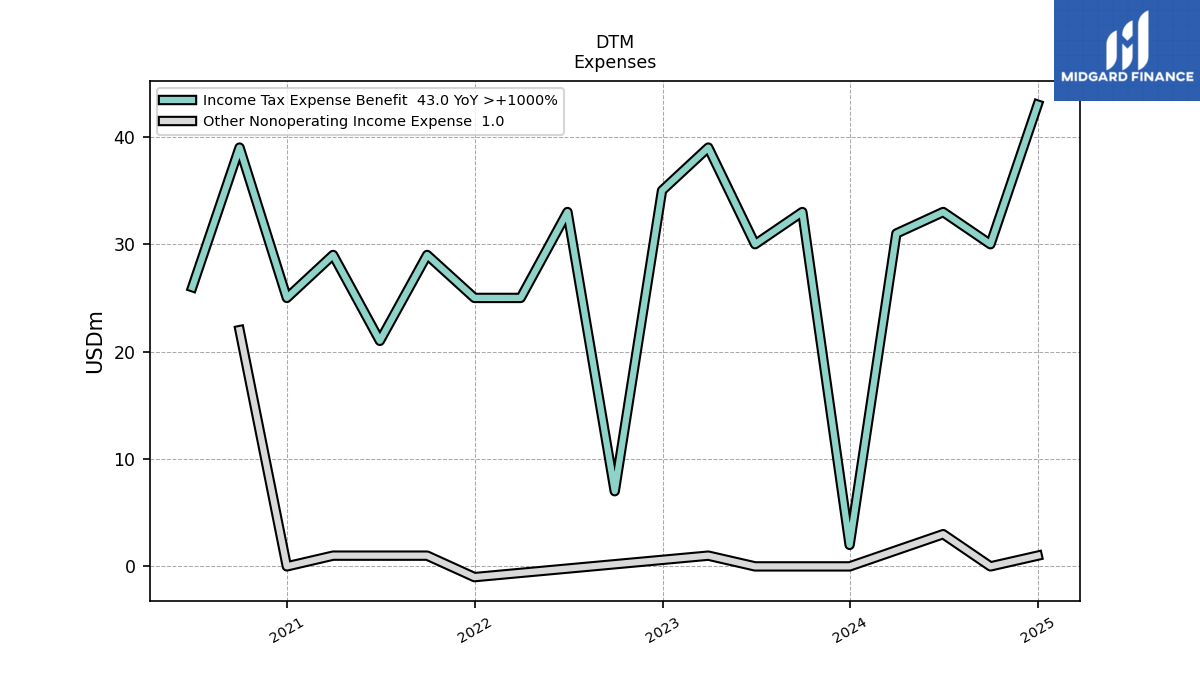
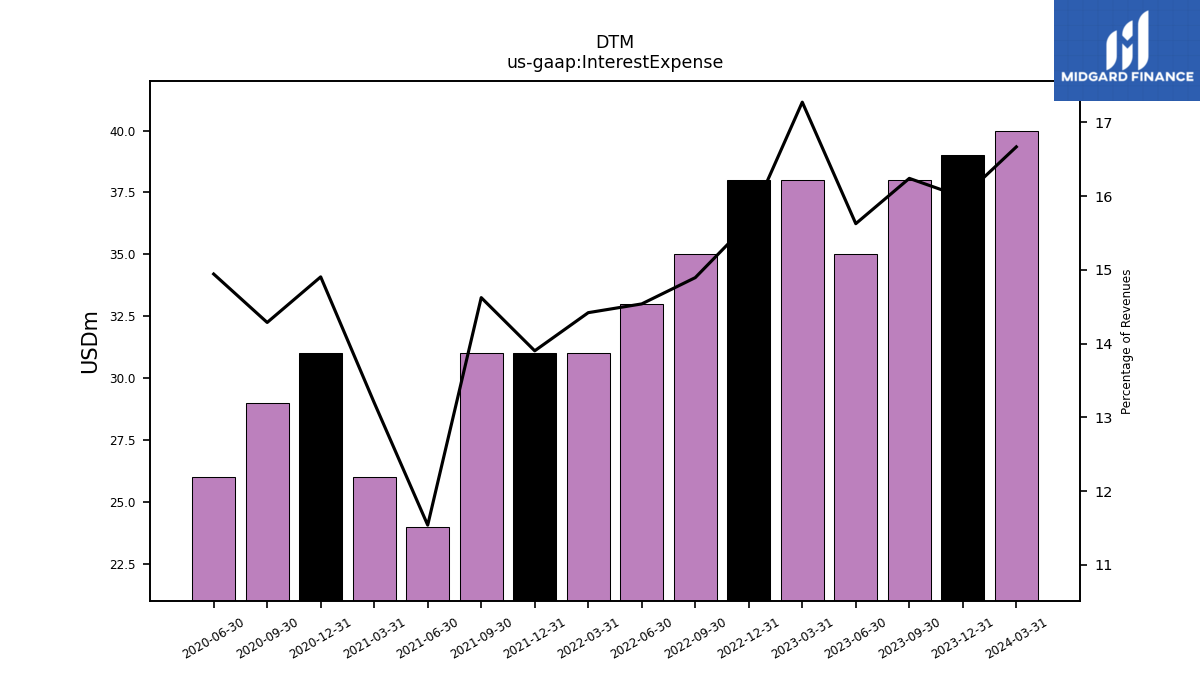
| Interest Expense | 39.00 | 38.00 | 35.00 | 38.00 | 38.00 | 35.00 | 33.00 | 31.00 | 31.00 | 31.00 | 24.00 | 26.00 | 31.00 | 29.00 | 26.00 | |
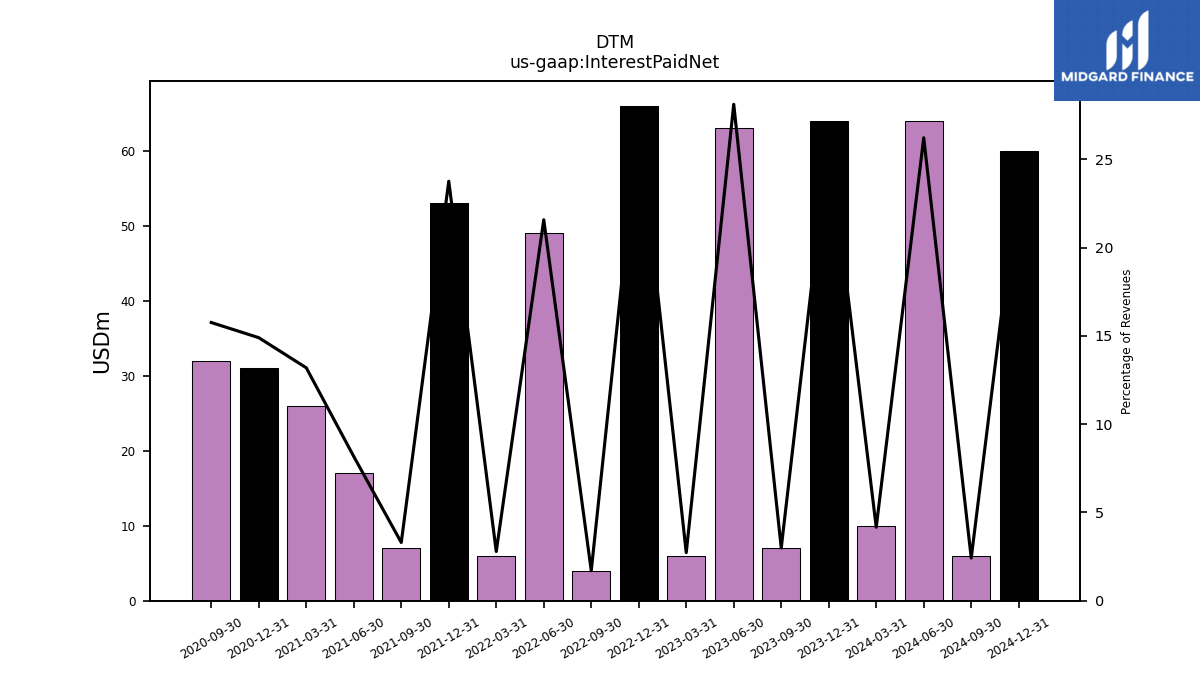
| Interest Paid Net | 64.00 | 7.00 | 63.00 | 6.00 | 66.00 | 4.00 | 49.00 | 6.00 | 53.00 | 7.00 | 17.00 | 26.00 | 31.00 | 32.00 | NA | |
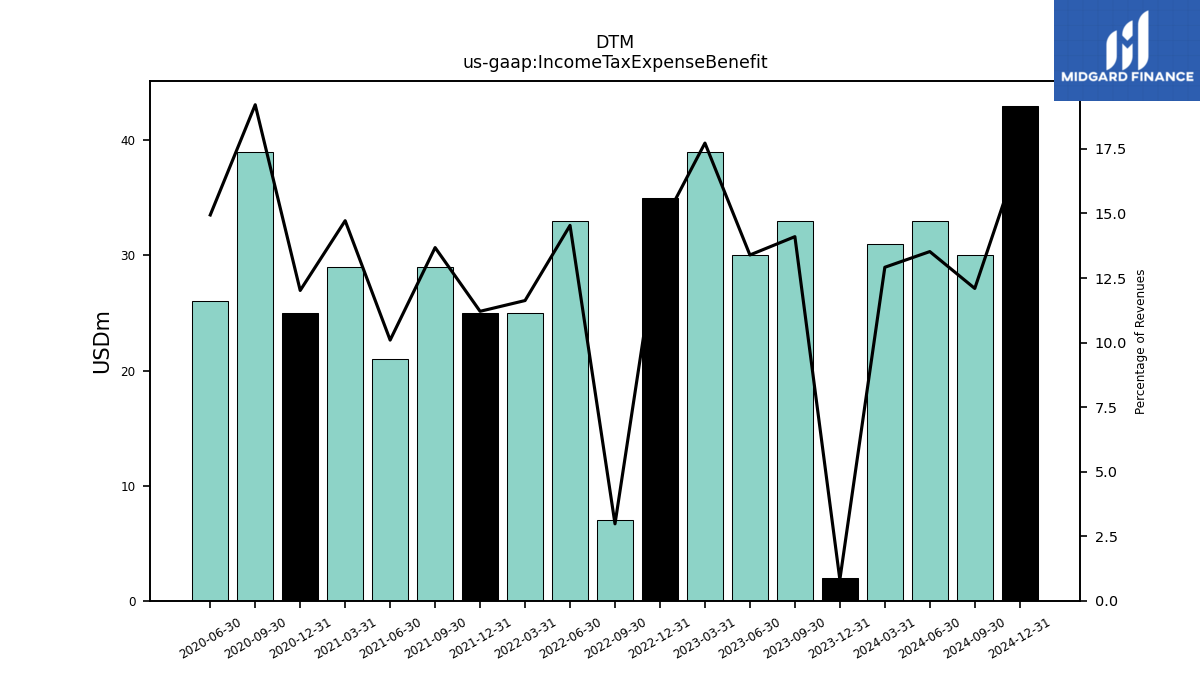
| Income Tax Expense Benefit | 2.00 | 33.00 | 30.00 | 39.00 | 35.00 | 7.00 | 33.00 | 25.00 | 25.00 | 29.00 | 21.00 | 29.00 | 25.00 | 39.00 | 26.00 | |
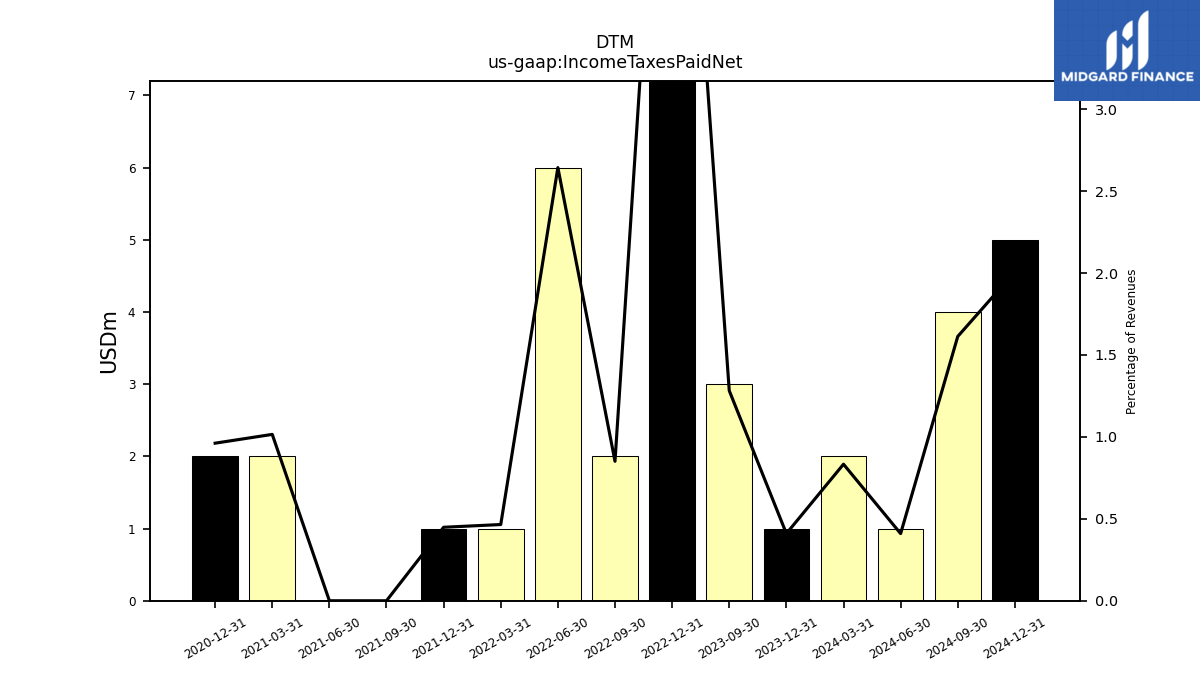
| Income Taxes Paid Net | 1.00 | 3.00 | NA | NA | 15.00 | 2.00 | 6.00 | 1.00 | 1.00 | 0.00 | 0.00 | 2.00 | 2.00 | NA | NA | |
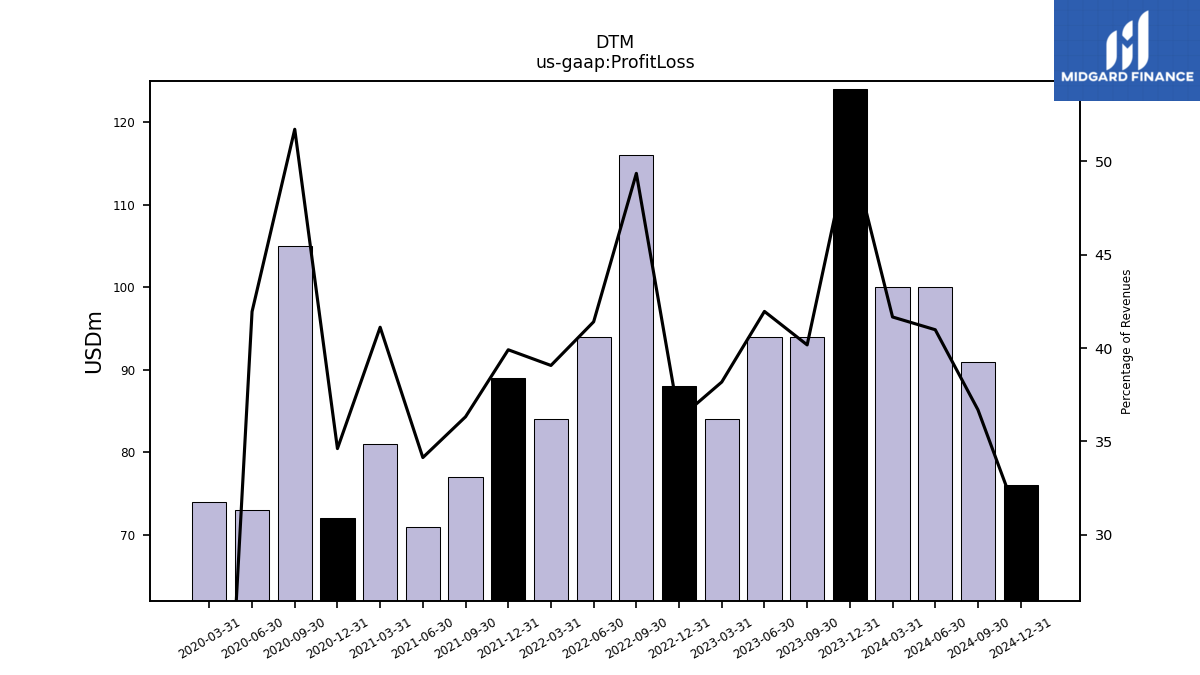
| Profit Loss | 124.00 | 94.00 | 94.00 | 84.00 | 88.00 | 116.00 | 94.00 | 84.00 | 89.00 | 77.00 | 71.00 | 81.00 | 72.00 | 105.00 | 73.00 | |
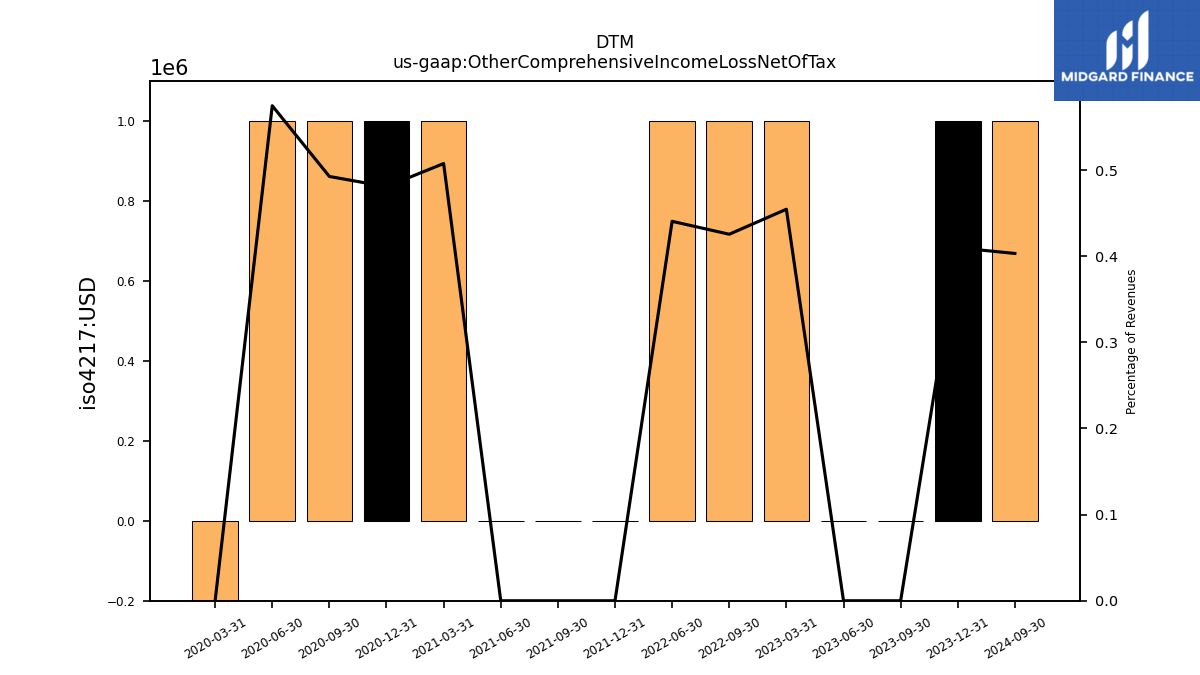
| Other Comprehensive Income Loss Net Of Tax | 1.00 | 0.00 | 0.00 | 1.00 | NA | 1.00 | 1.00 | NA | 0.00 | 0.00 | 0.00 | 1.00 | 1.00 | 1.00 | 1.00 | |
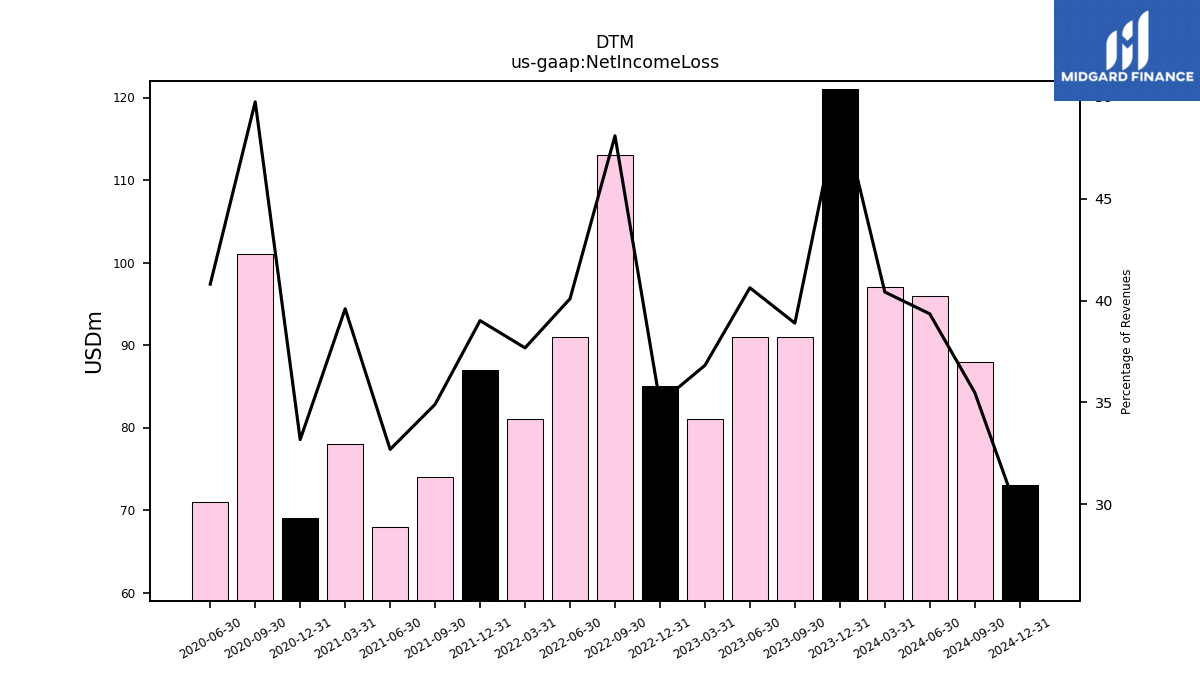
| Net Income Loss | 121.00 | 91.00 | 91.00 | 81.00 | 85.00 | 113.00 | 91.00 | 81.00 | 87.00 | 74.00 | 68.00 | 78.00 | 69.00 | 101.00 | 71.00 | |
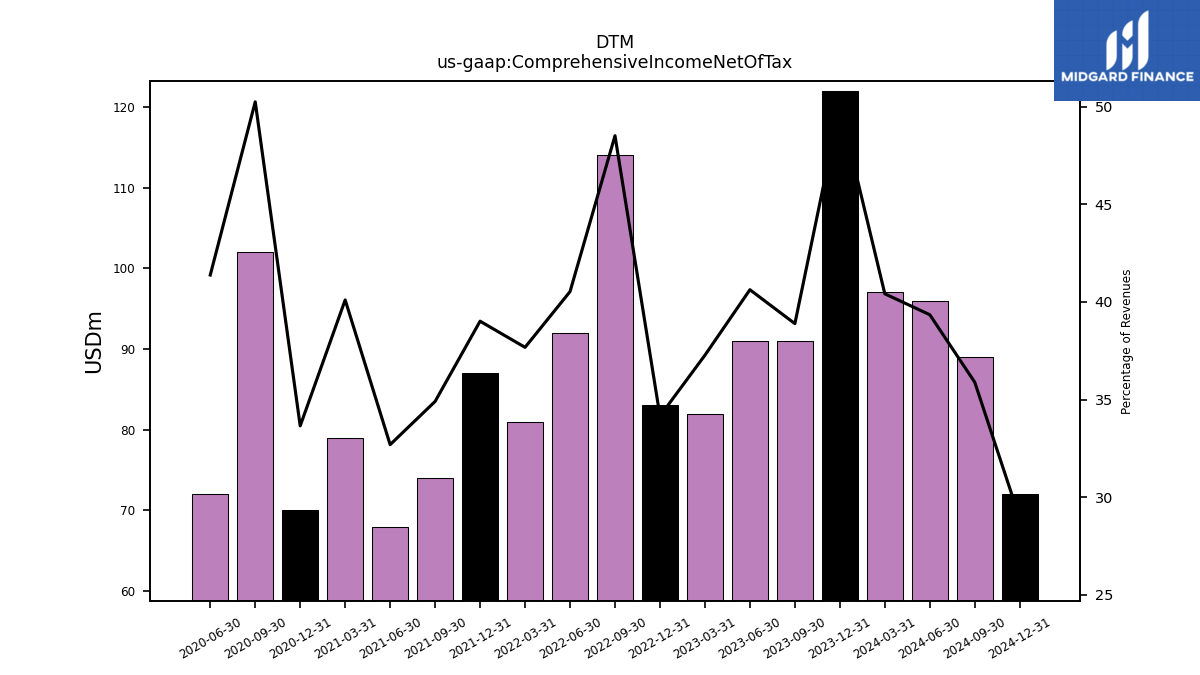
| Comprehensive Income Net Of Tax | 122.00 | 91.00 | 91.00 | 82.00 | 83.00 | 114.00 | 92.00 | 81.00 | 87.00 | 74.00 | 68.00 | 79.00 | 70.00 | 102.00 | 72.00 |
| 2023-12-31 | 2023-09-30 | 2023-06-30 | 2023-03-31 | 2022-12-31 | 2022-09-30 | 2022-06-30 | 2022-03-31 | 2021-12-31 | 2021-09-30 | 2021-06-30 | 2021-03-31 | 2020-12-31 | 2020-09-30 | 2020-06-30 | ||
|---|---|---|---|---|---|---|---|---|---|---|---|---|---|---|---|---|
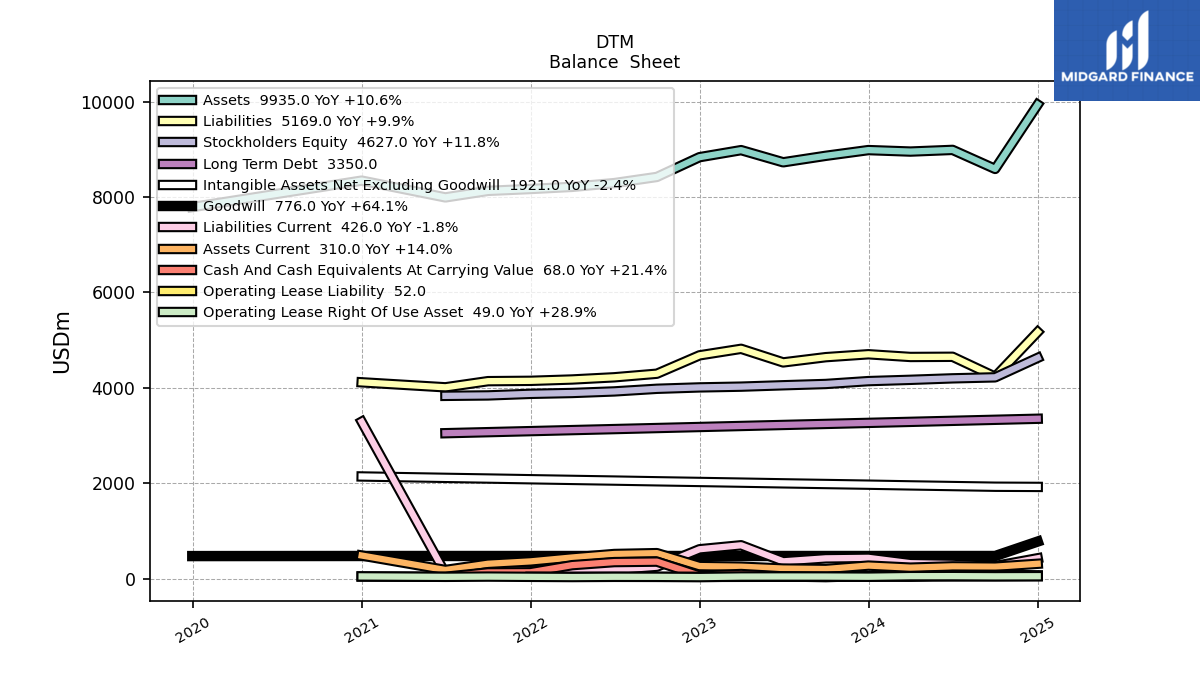
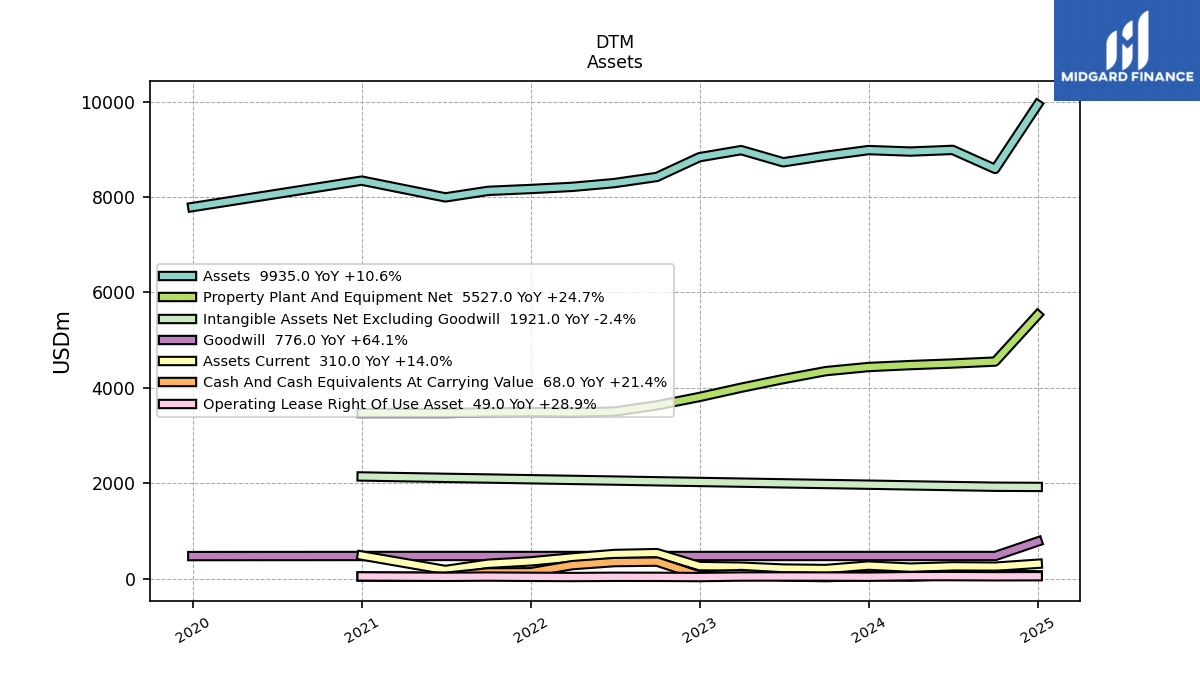
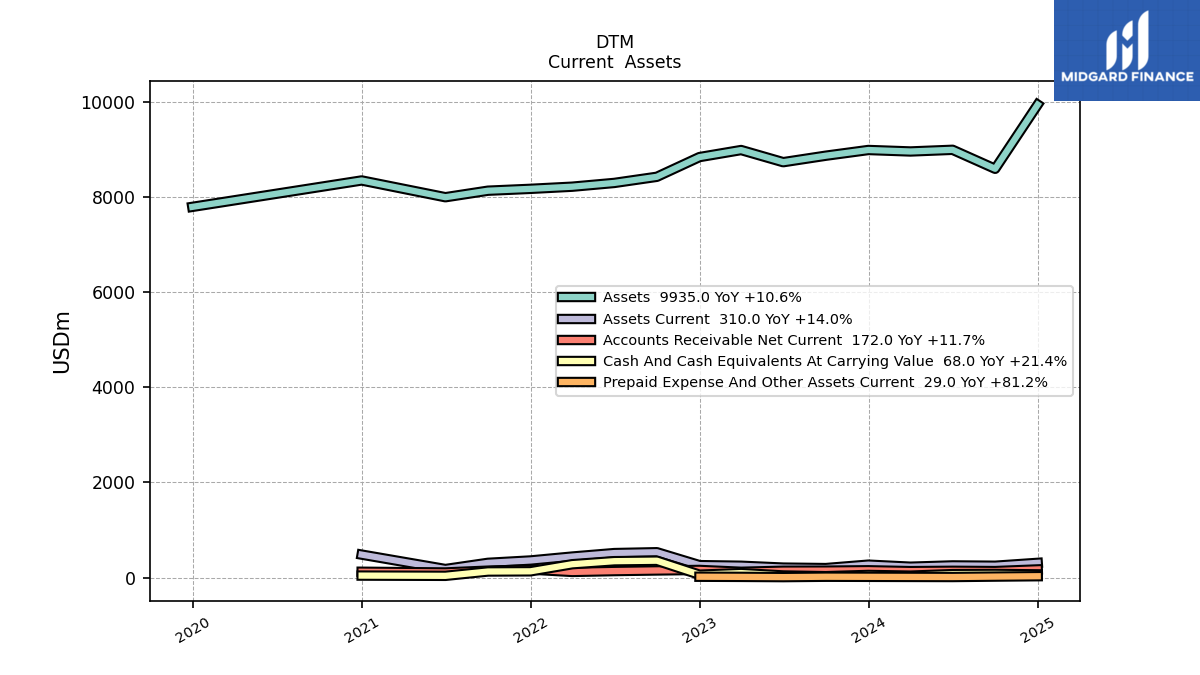
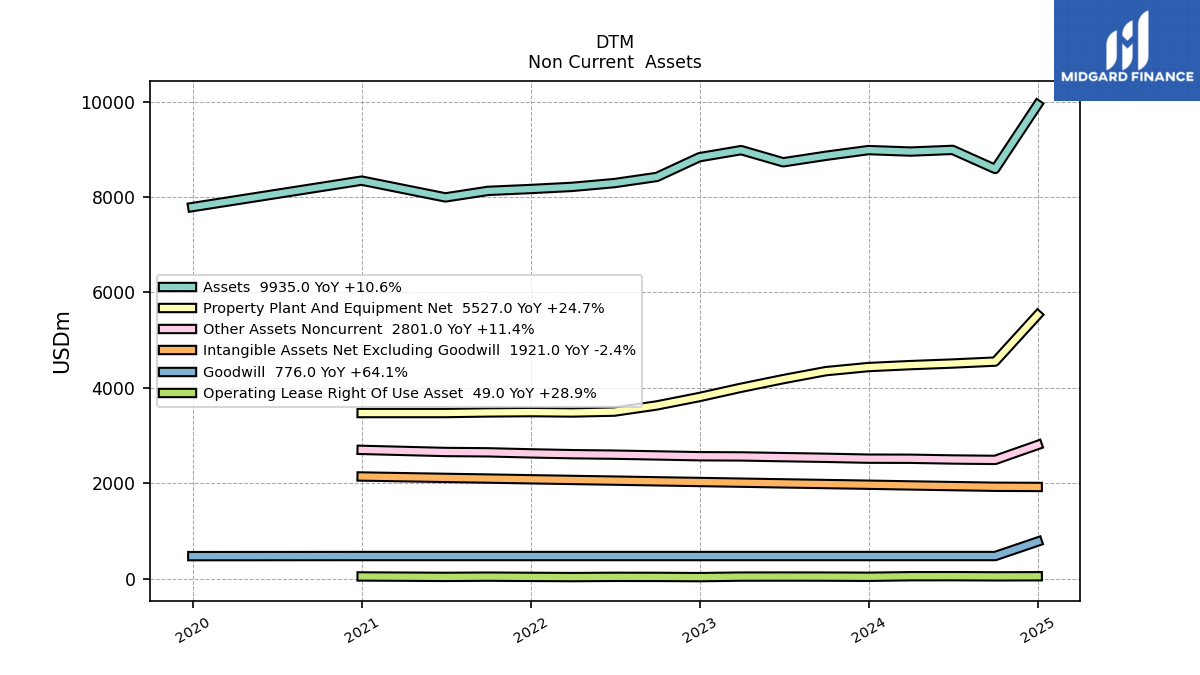
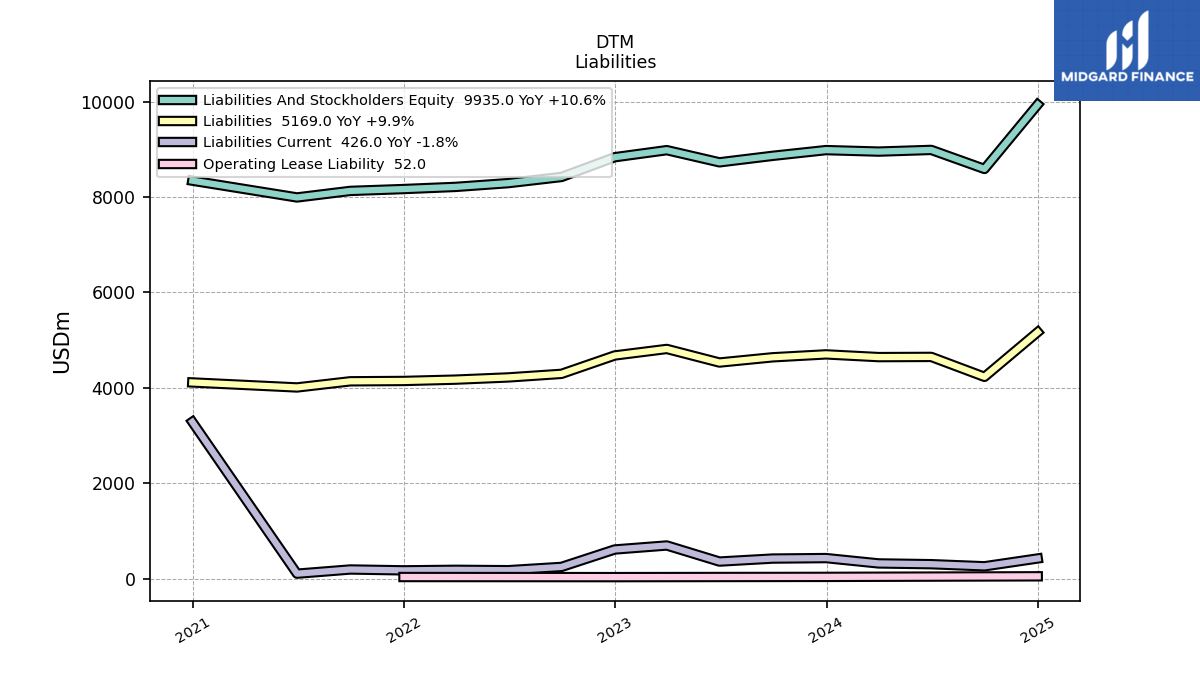
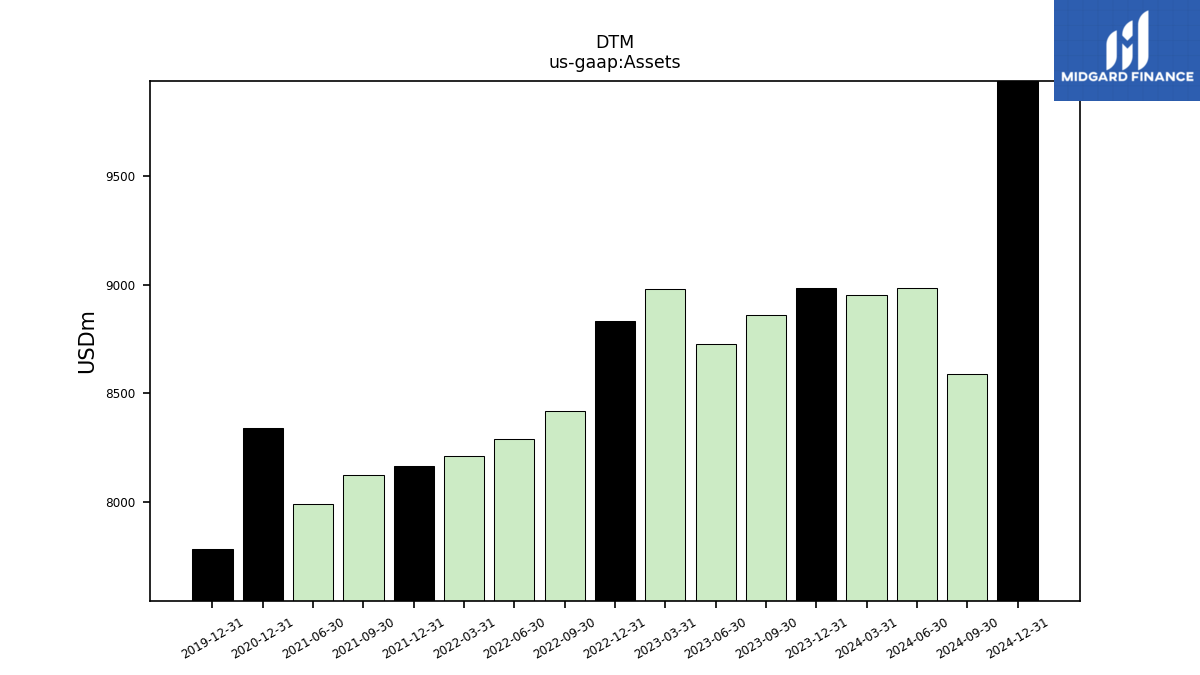
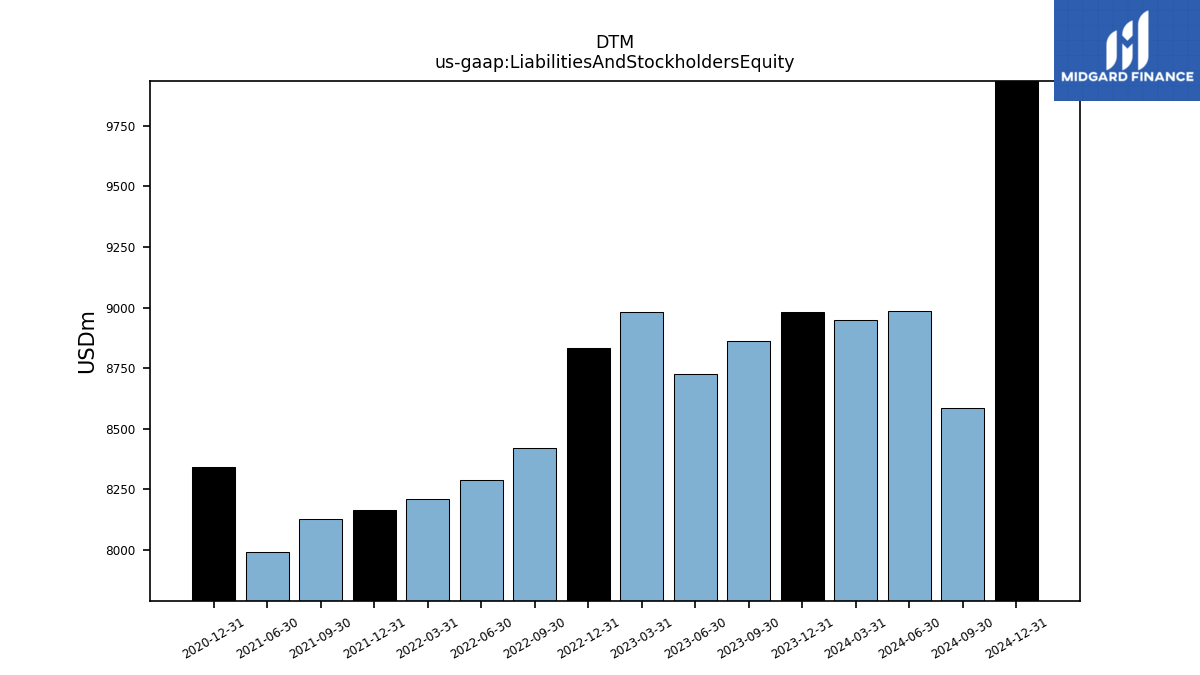
| Assets | 8982.00 | 8862.00 | 8726.00 | 8981.00 | 8833.00 | 8419.00 | 8290.00 | 8211.00 | 8166.00 | 8127.00 | 7990.00 | NA | 8342.00 | NA | NA | |
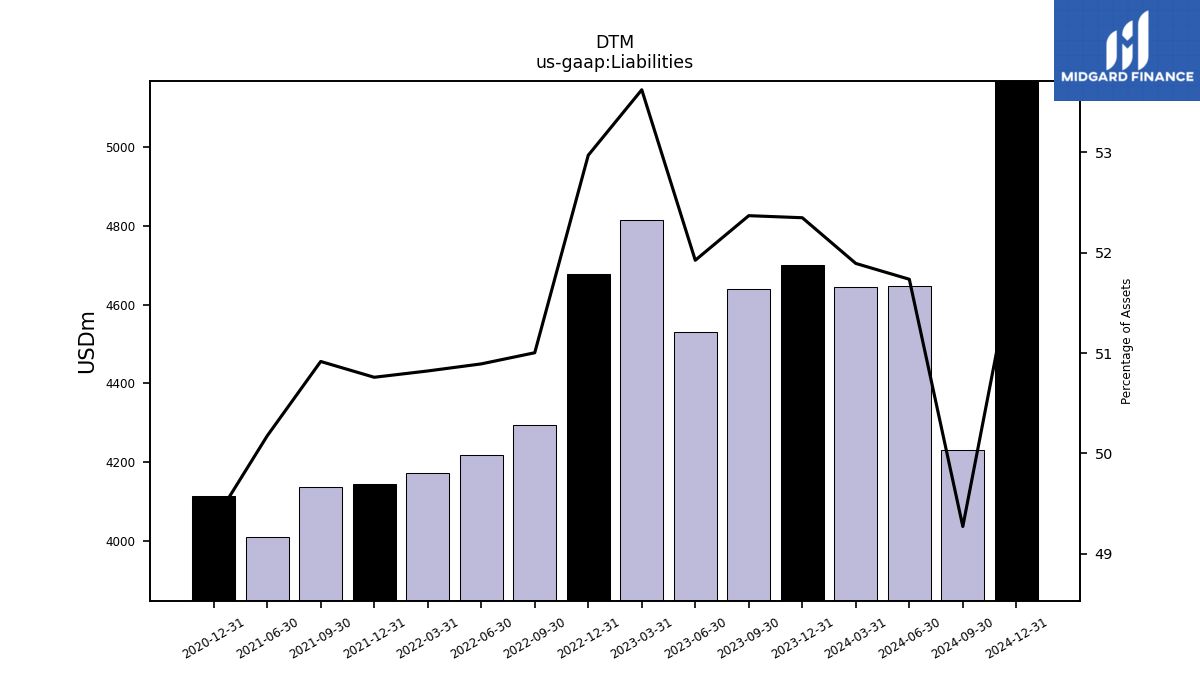
| Liabilities | 4702.00 | 4641.00 | 4531.00 | 4816.00 | 4679.00 | 4294.00 | 4219.00 | 4173.00 | 4145.00 | 4138.00 | 4009.00 | NA | 4114.00 | NA | NA | |
| Liabilities And Stockholders Equity | 8982.00 | 8862.00 | 8726.00 | 8981.00 | 8833.00 | 8419.00 | 8290.00 | 8211.00 | 8166.00 | 8127.00 | 7990.00 | NA | 8342.00 | NA | NA | |
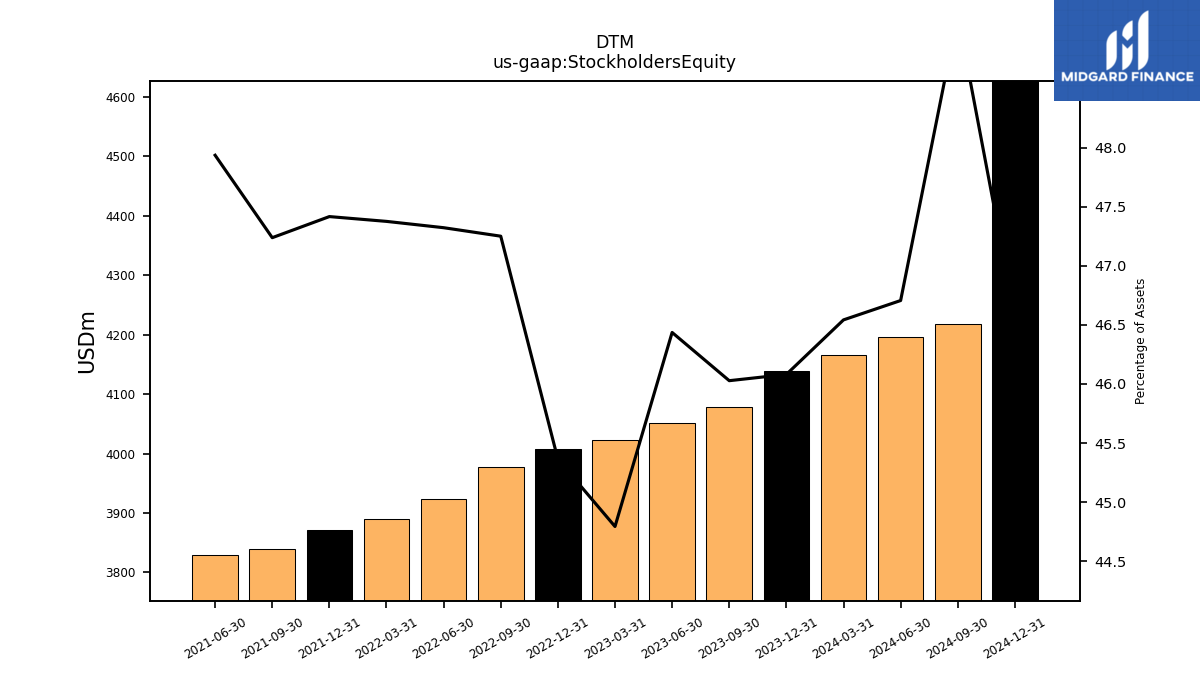
| Stockholders Equity | 4139.00 | 4079.00 | 4052.00 | 4023.00 | 4007.00 | 3978.00 | 3923.00 | 3890.00 | 3872.00 | 3839.00 | 3830.00 | NA | NA | NA | NA |
| 2023-12-31 | 2023-09-30 | 2023-06-30 | 2023-03-31 | 2022-12-31 | 2022-09-30 | 2022-06-30 | 2022-03-31 | 2021-12-31 | 2021-09-30 | 2021-06-30 | 2021-03-31 | 2020-12-31 | 2020-09-30 | 2020-06-30 | ||
|---|---|---|---|---|---|---|---|---|---|---|---|---|---|---|---|---|
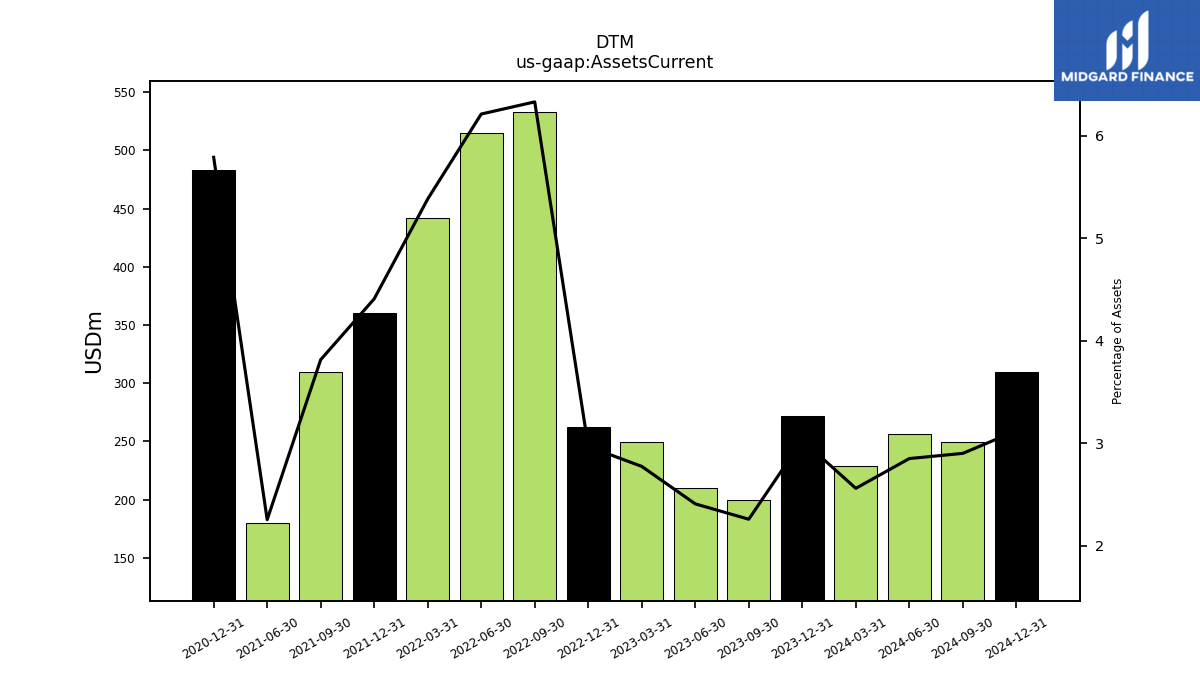
| Assets Current | 272.00 | 200.00 | 210.00 | 249.00 | 262.00 | 533.00 | 515.00 | 442.00 | 360.00 | 310.00 | 180.00 | NA | 483.00 | NA | NA | |
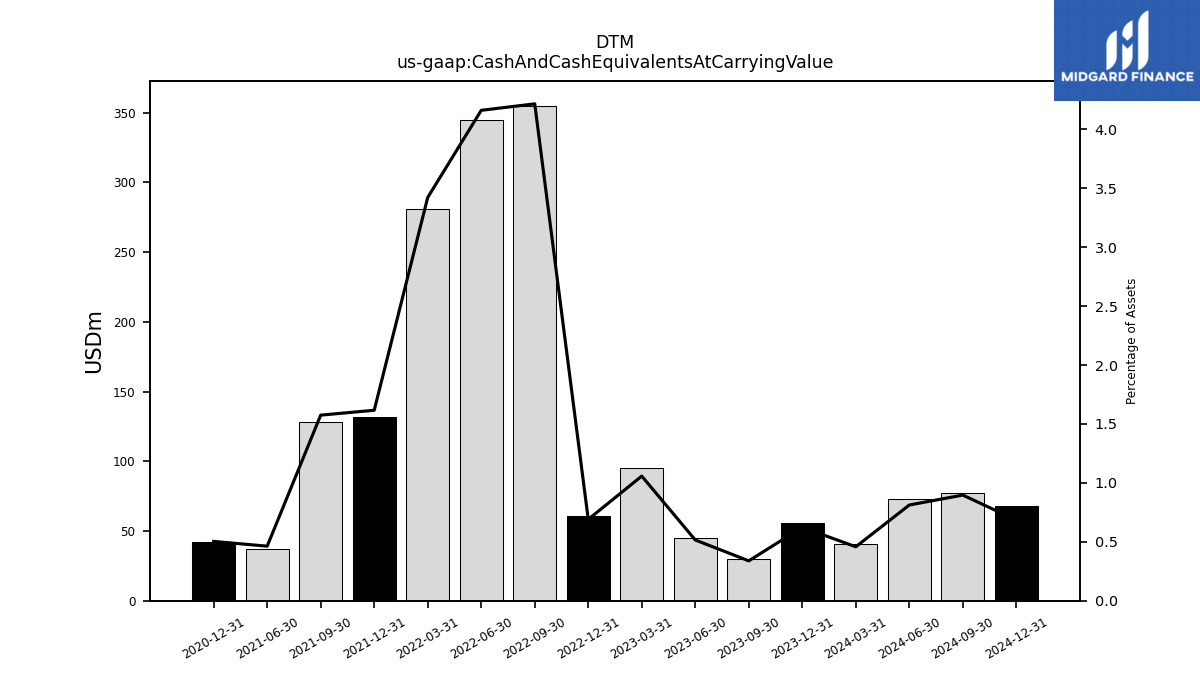
| Cash And Cash Equivalents At Carrying Value | 56.00 | 30.00 | 45.00 | 95.00 | 61.00 | 355.00 | 345.00 | 281.00 | 132.00 | 128.00 | 37.00 | NA | 42.00 | NA | NA | |
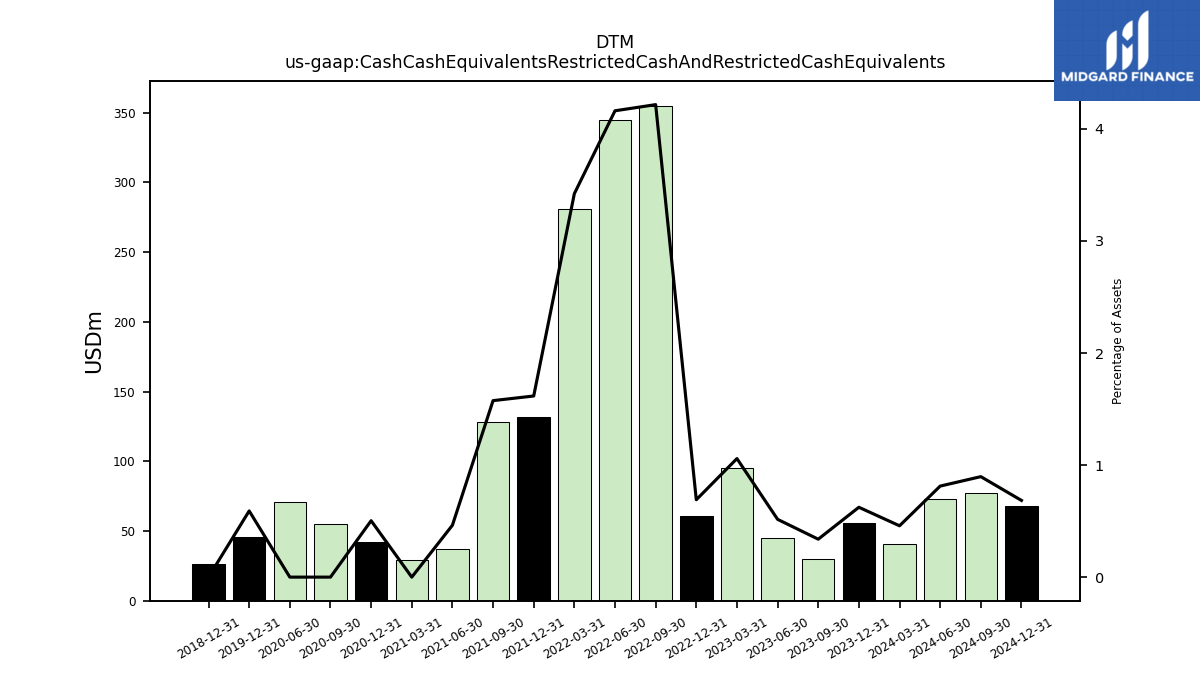
| Cash Cash Equivalents Restricted Cash And Restricted Cash Equivalents | 56.00 | 30.00 | 45.00 | 95.00 | 61.00 | 355.00 | 345.00 | 281.00 | 132.00 | 128.00 | 37.00 | 29.00 | 42.00 | 55.00 | 71.00 | |
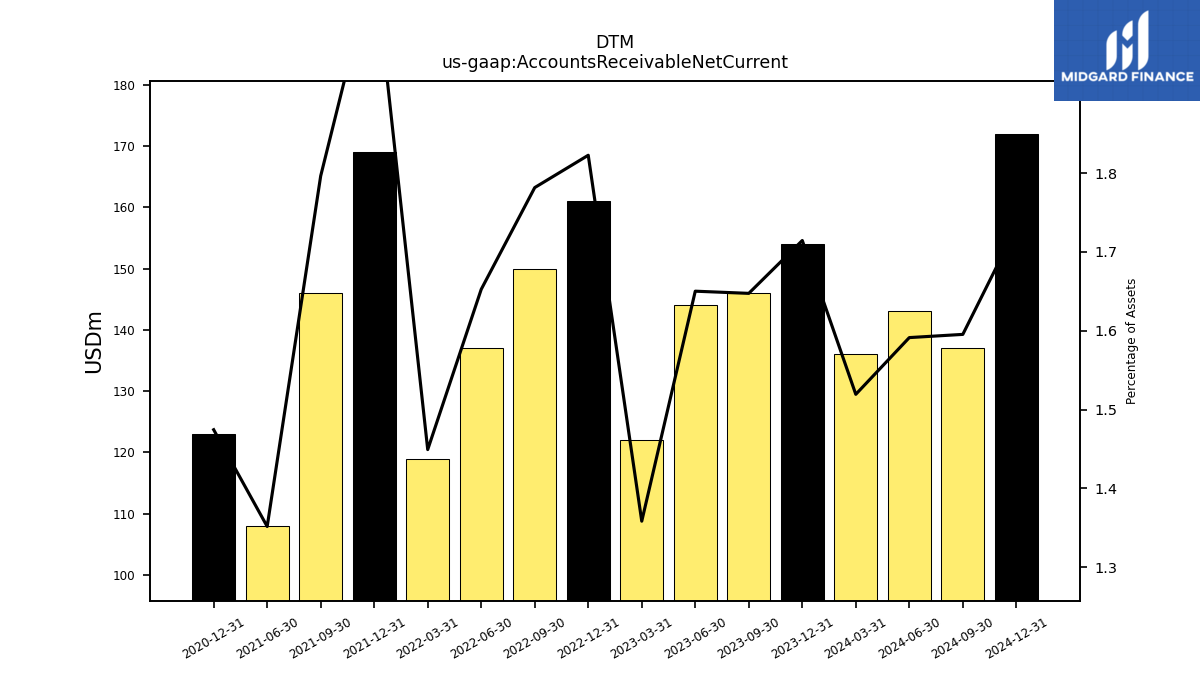
| Accounts Receivable Net Current | 154.00 | 146.00 | 144.00 | 122.00 | 161.00 | 150.00 | 137.00 | 119.00 | 169.00 | 146.00 | 108.00 | NA | 123.00 | NA | NA | |
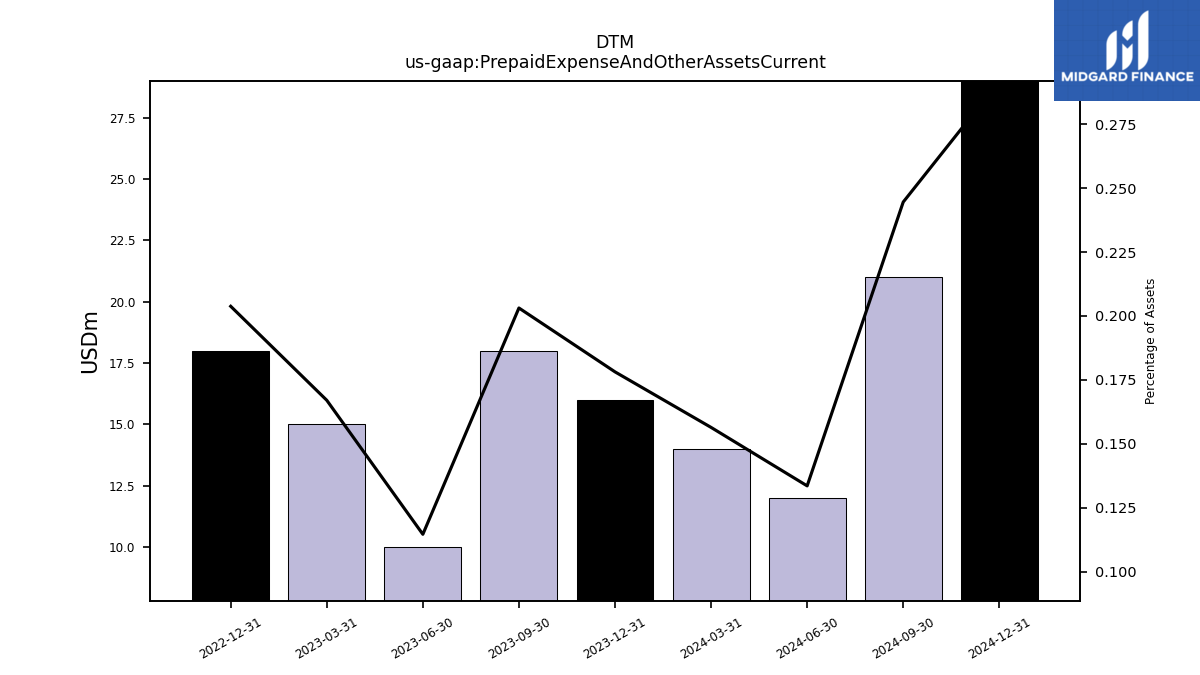
| Prepaid Expense And Other Assets Current | 16.00 | 18.00 | 10.00 | 15.00 | 18.00 | NA | NA | NA | NA | NA | NA | NA | NA | NA | NA |
| 2023-12-31 | 2023-09-30 | 2023-06-30 | 2023-03-31 | 2022-12-31 | 2022-09-30 | 2022-06-30 | 2022-03-31 | 2021-12-31 | 2021-09-30 | 2021-06-30 | 2021-03-31 | 2020-12-31 | 2020-09-30 | 2020-06-30 | ||
|---|---|---|---|---|---|---|---|---|---|---|---|---|---|---|---|---|
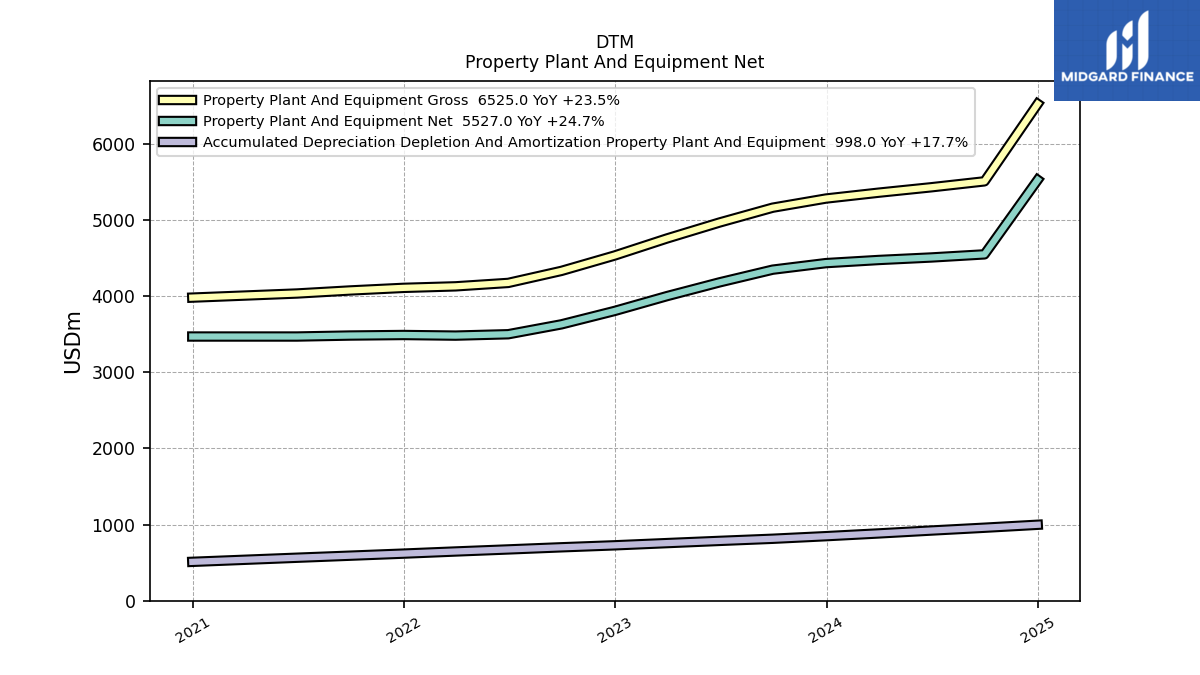
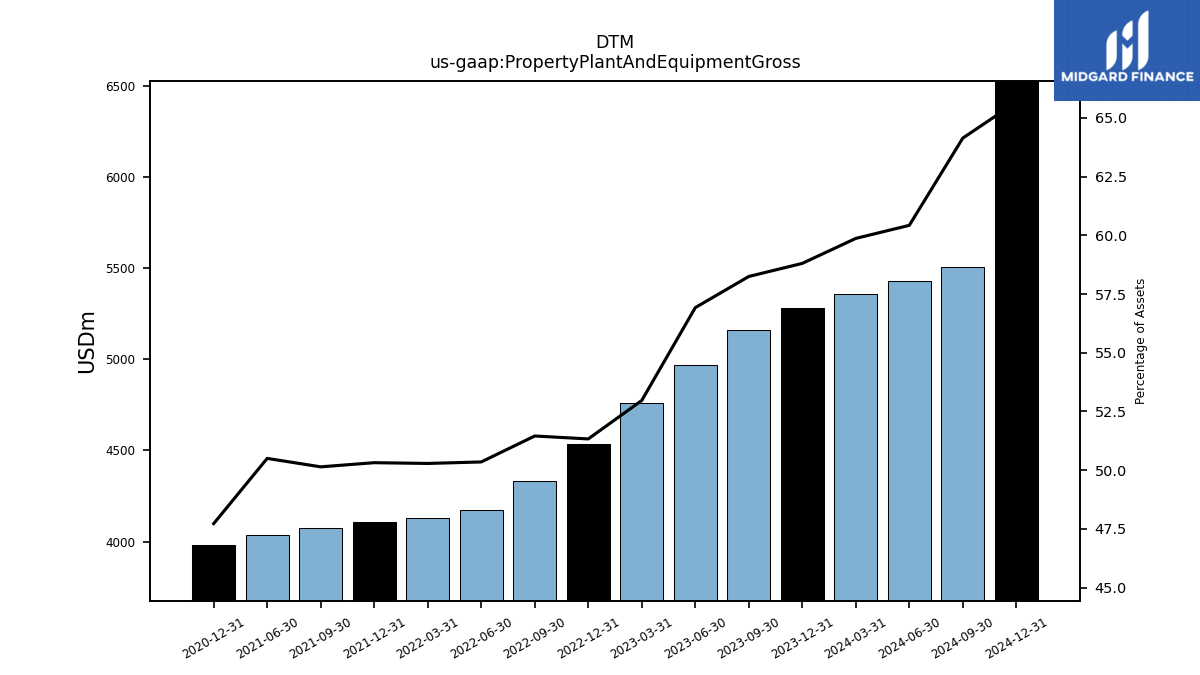
| Property Plant And Equipment Gross | 5282.00 | 5162.00 | 4967.00 | 4757.00 | 4534.00 | 4332.00 | 4174.00 | 4129.00 | 4109.00 | 4075.00 | 4035.00 | NA | 3981.00 | NA | NA | |
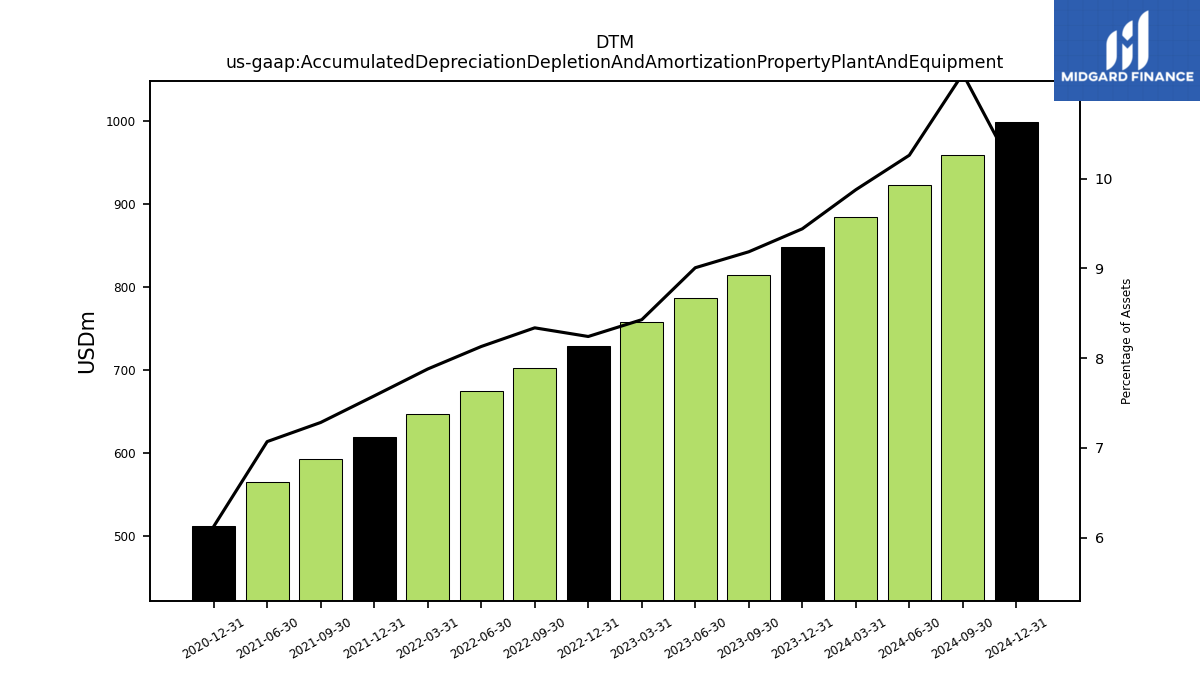
| Accumulated Depreciation Depletion And Amortization Property Plant And Equipment | 848.00 | 814.00 | 786.00 | 757.00 | 728.00 | 702.00 | 674.00 | 647.00 | 619.00 | 592.00 | 565.00 | NA | 511.00 | NA | NA | |
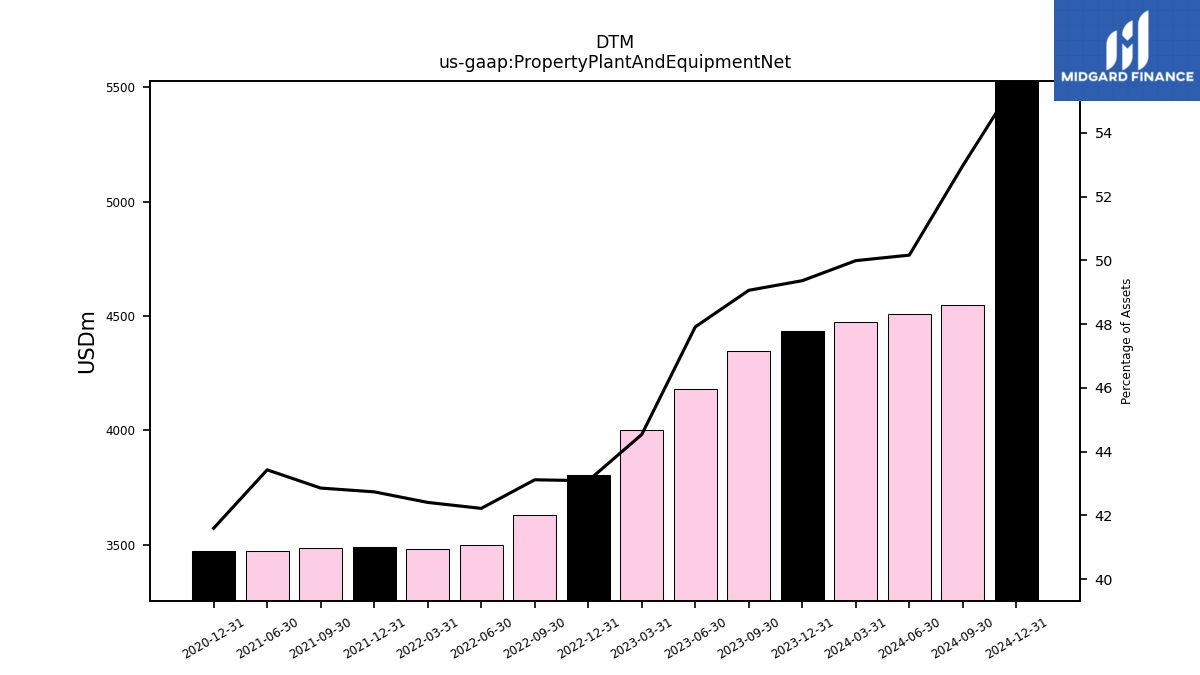
| Property Plant And Equipment Net | 4434.00 | 4348.00 | 4181.00 | 4000.00 | 3806.00 | 3630.00 | 3500.00 | 3482.00 | 3490.00 | 3483.00 | 3470.00 | NA | 3470.00 | NA | NA | |
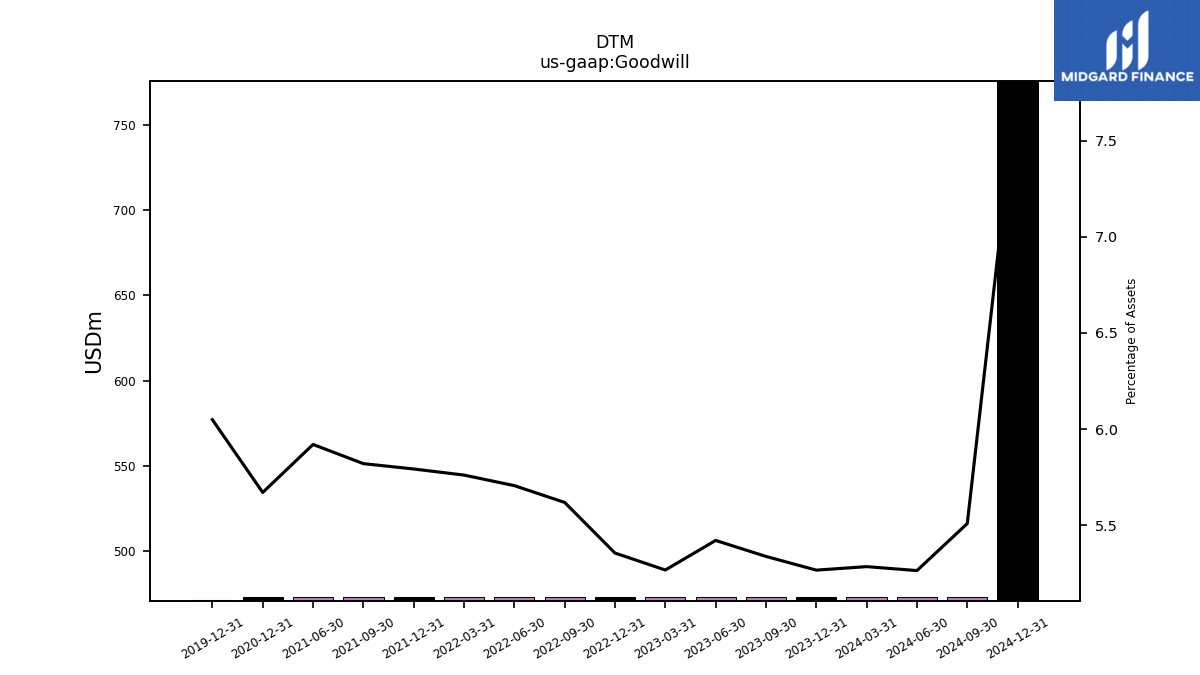
| Goodwill | 473.00 | 473.00 | 473.00 | 473.00 | 473.00 | 473.00 | 473.00 | 473.00 | 473.00 | 473.00 | 473.00 | NA | 473.00 | NA | NA | |
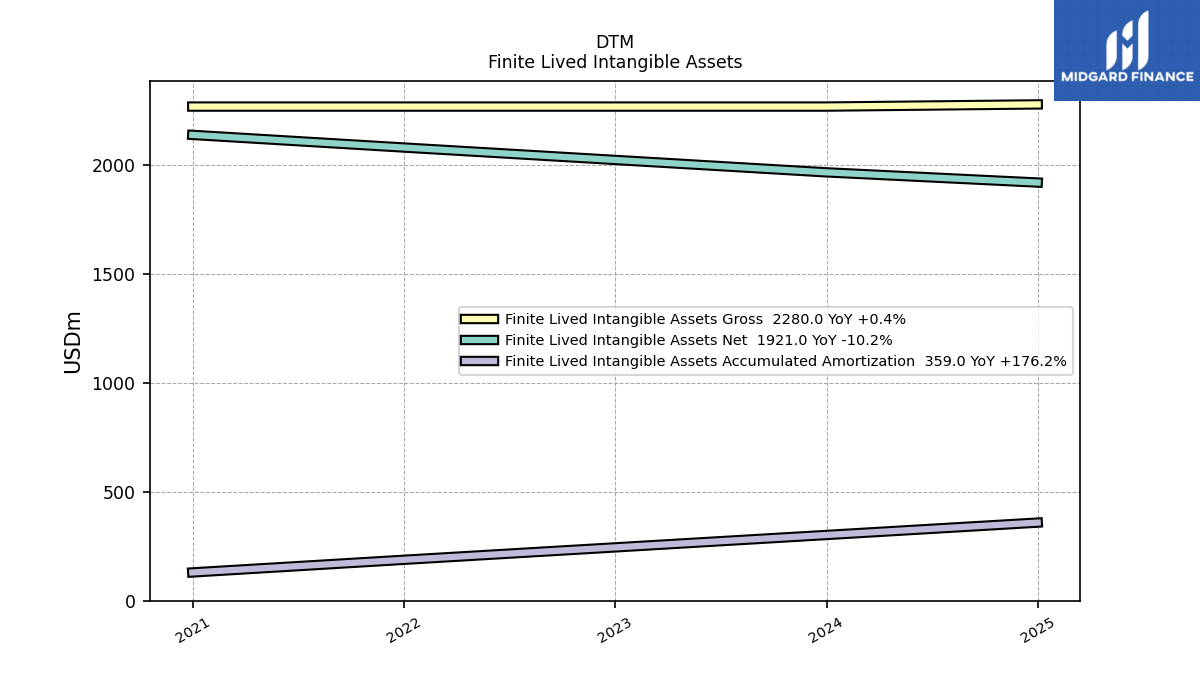
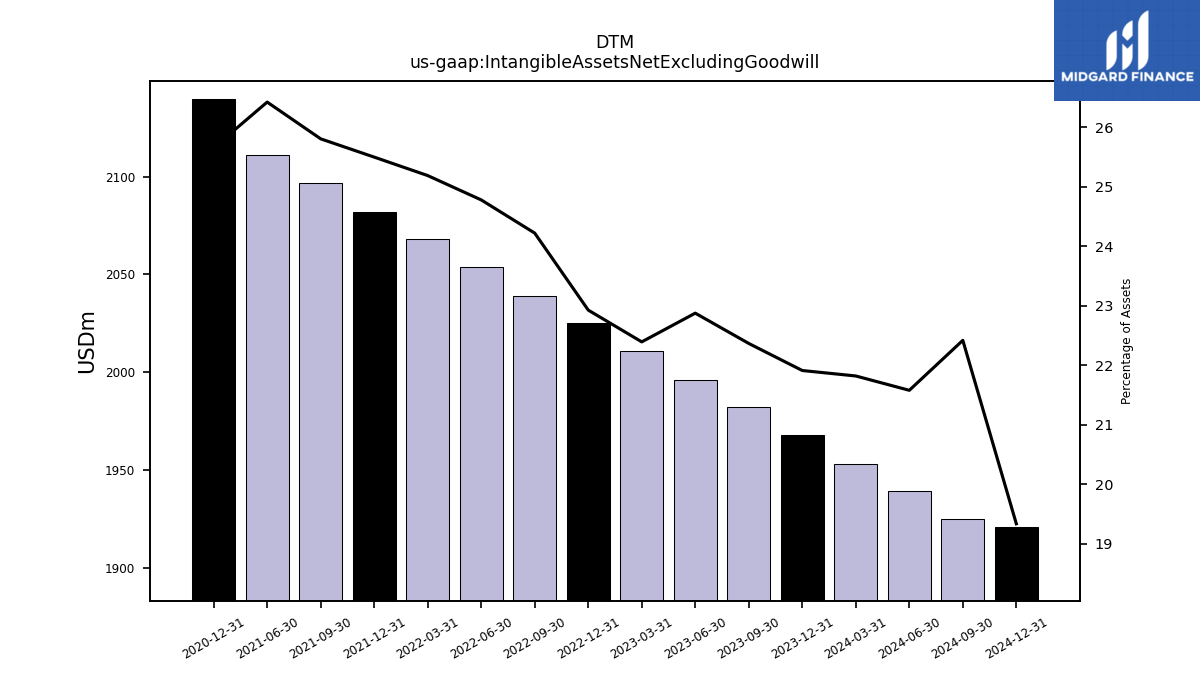
| Intangible Assets Net Excluding Goodwill | 1968.00 | 1982.00 | 1996.00 | 2011.00 | 2025.00 | 2039.00 | 2054.00 | 2068.00 | 2082.00 | 2097.00 | 2111.00 | NA | 2140.00 | NA | NA | |
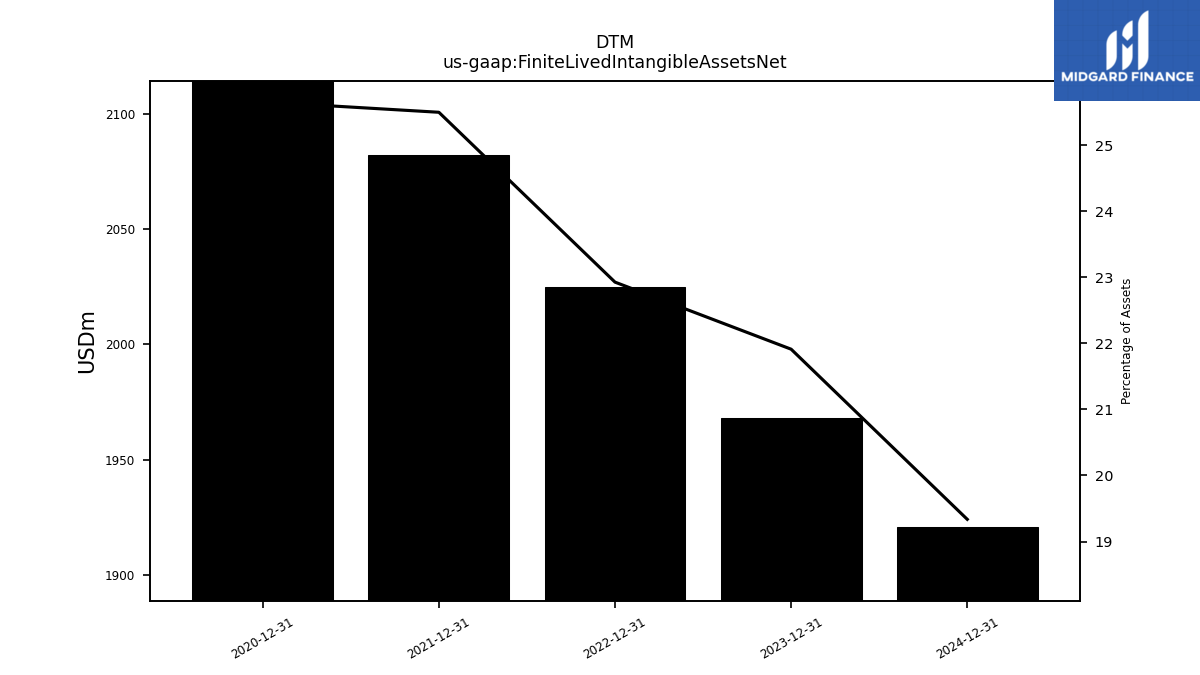
| Finite Lived Intangible Assets Net | 1968.00 | NA | NA | NA | 2025.00 | NA | NA | NA | 2082.00 | NA | NA | NA | 2140.00 | NA | NA | |
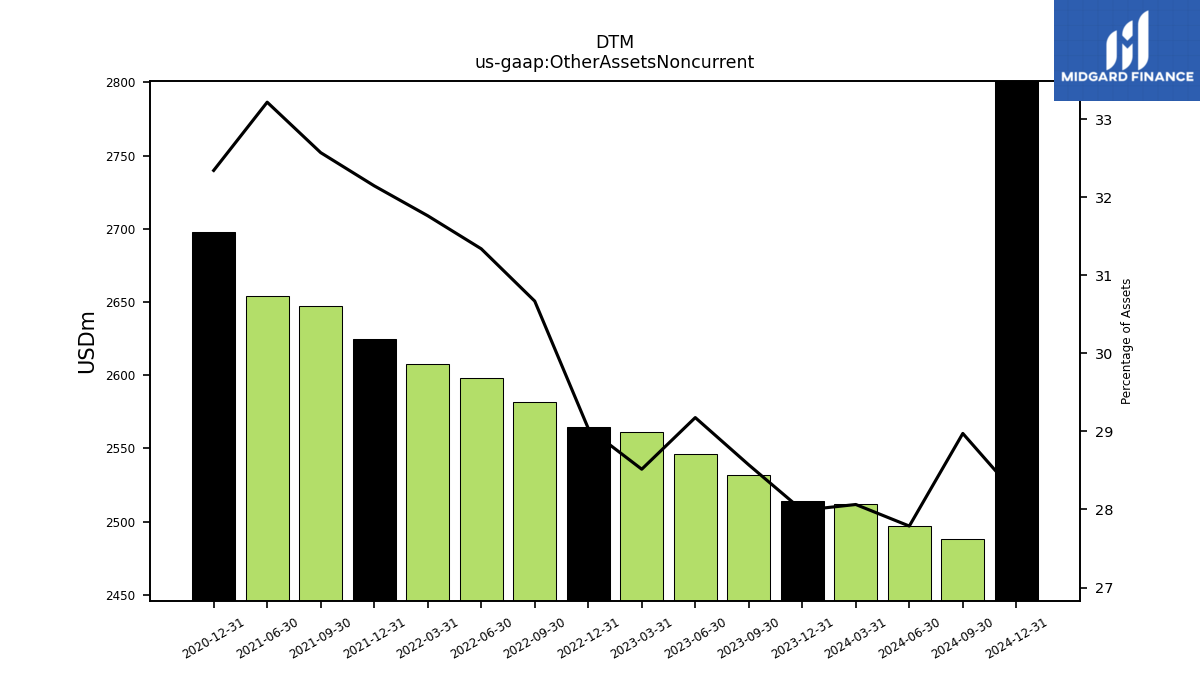
| Other Assets Noncurrent | 2514.00 | 2532.00 | 2546.00 | 2561.00 | 2565.00 | 2582.00 | 2598.00 | 2608.00 | 2625.00 | 2647.00 | 2654.00 | NA | 2698.00 | NA | NA |
| 2023-12-31 | 2023-09-30 | 2023-06-30 | 2023-03-31 | 2022-12-31 | 2022-09-30 | 2022-06-30 | 2022-03-31 | 2021-12-31 | 2021-09-30 | 2021-06-30 | 2021-03-31 | 2020-12-31 | 2020-09-30 | 2020-06-30 | ||
|---|---|---|---|---|---|---|---|---|---|---|---|---|---|---|---|---|
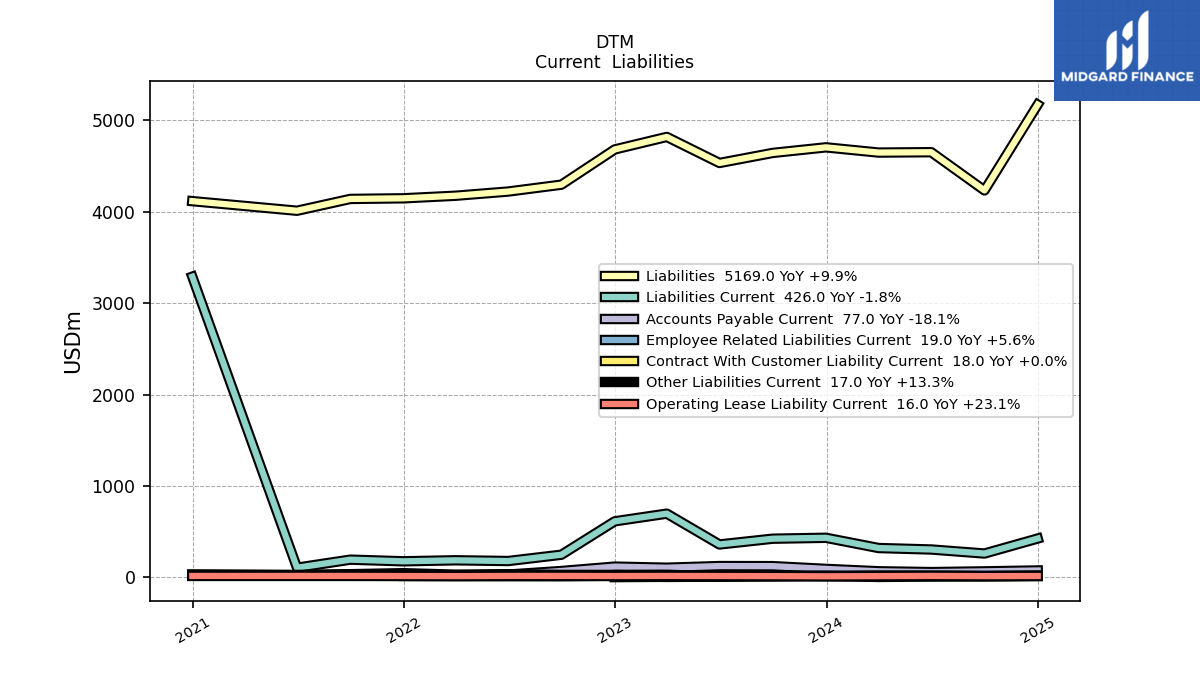
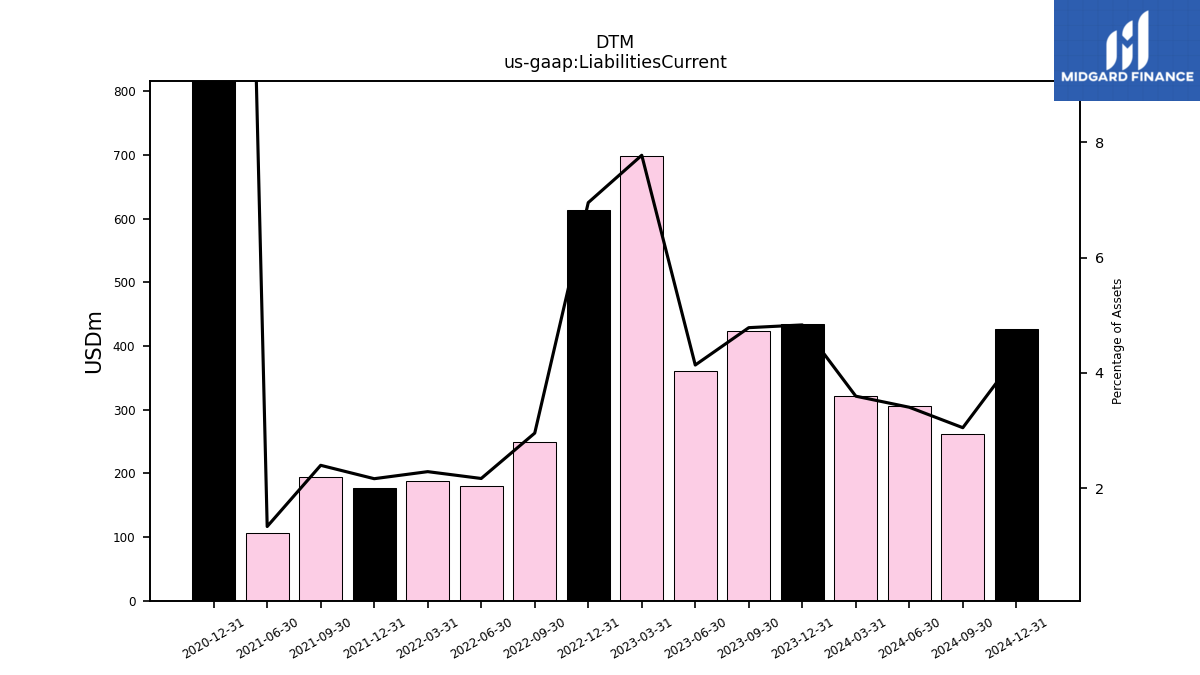
| Liabilities Current | 434.00 | 424.00 | 361.00 | 698.00 | 614.00 | 249.00 | 180.00 | 188.00 | 177.00 | 195.00 | 107.00 | NA | 3288.00 | NA | NA | |
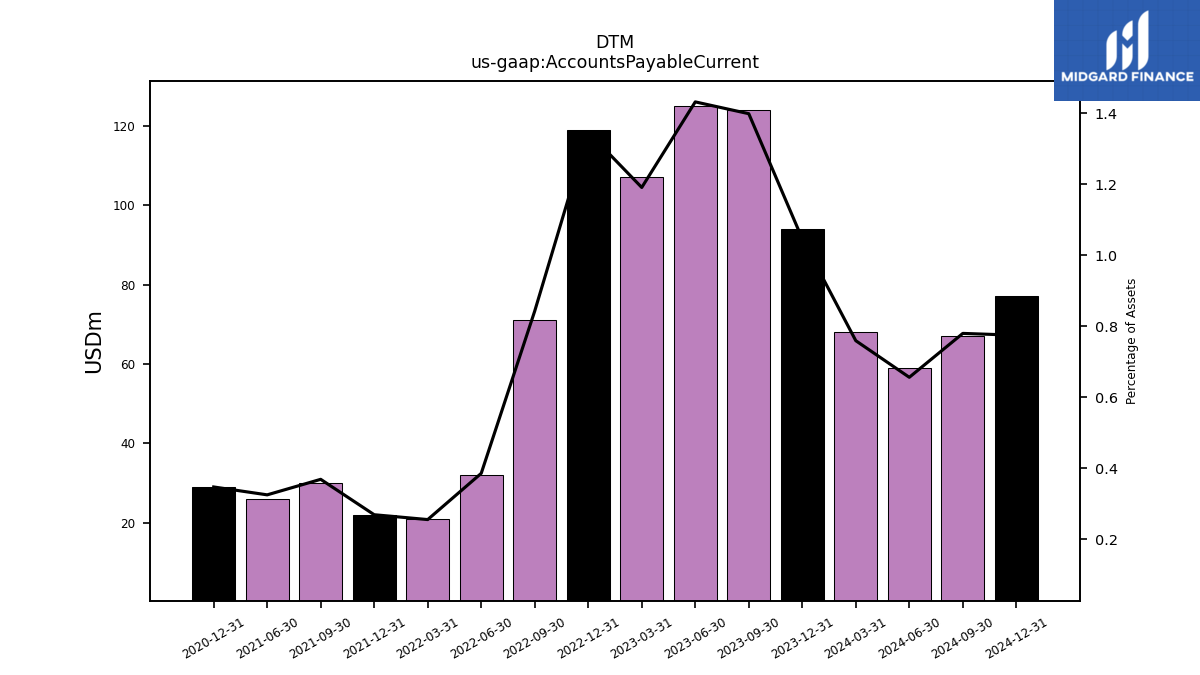
| Accounts Payable Current | 94.00 | 124.00 | 125.00 | 107.00 | 119.00 | 71.00 | 32.00 | 21.00 | 22.00 | 30.00 | 26.00 | NA | 29.00 | NA | NA | |
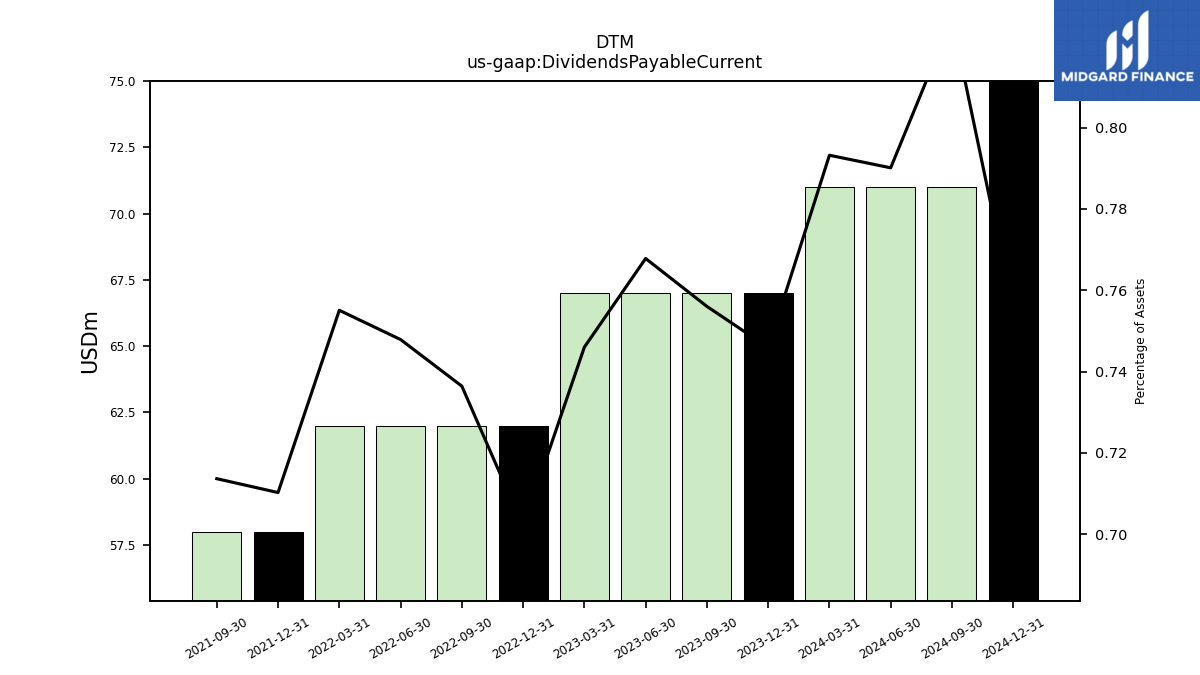
| Dividends Payable Current | 67.00 | 67.00 | 67.00 | 67.00 | 62.00 | 62.00 | 62.00 | 62.00 | 58.00 | 58.00 | NA | NA | NA | NA | NA | |
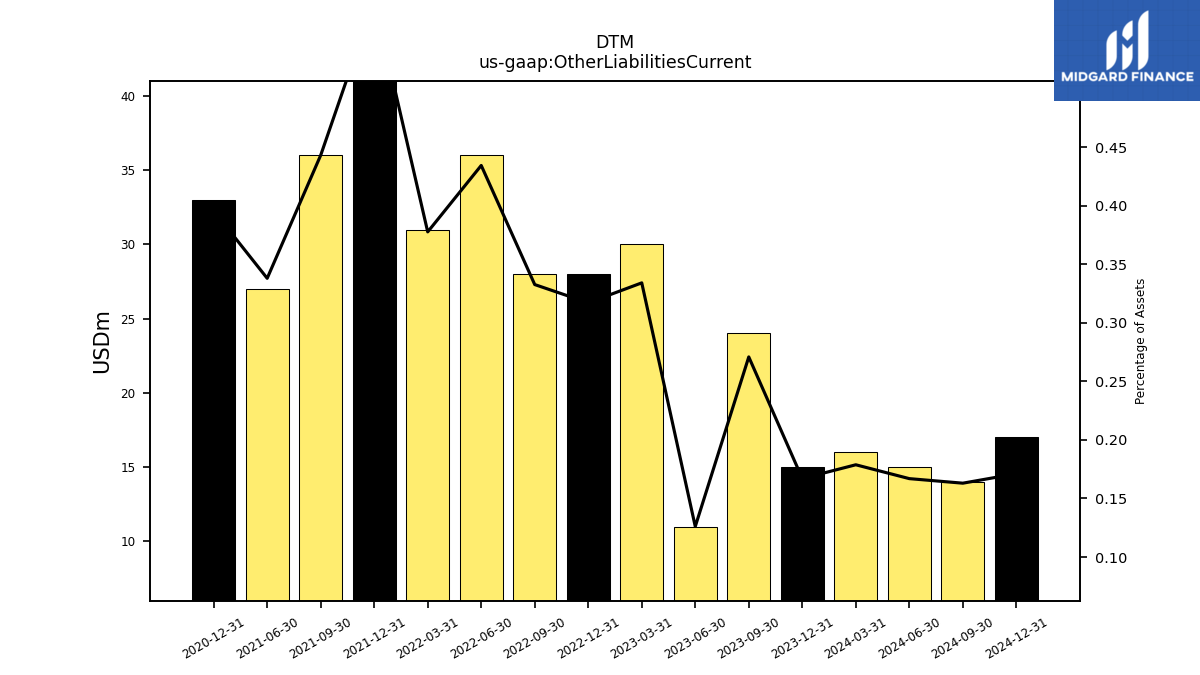
| Other Liabilities Current | 15.00 | 24.00 | 11.00 | 30.00 | 28.00 | 28.00 | 36.00 | 31.00 | 47.00 | 36.00 | 27.00 | NA | 33.00 | NA | NA | |
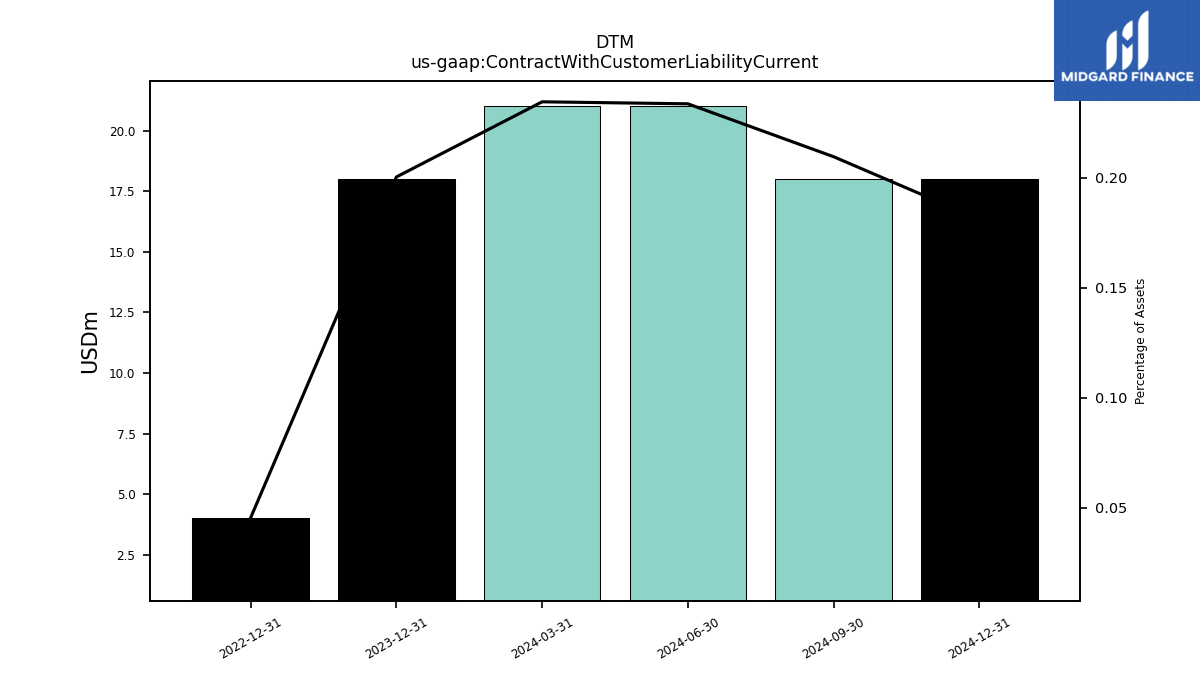
| Contract With Customer Liability Current | 18.00 | NA | NA | NA | 4.00 | NA | NA | NA | NA | NA | NA | NA | NA | NA | NA |
| 2023-12-31 | 2023-09-30 | 2023-06-30 | 2023-03-31 | 2022-12-31 | 2022-09-30 | 2022-06-30 | 2022-03-31 | 2021-12-31 | 2021-09-30 | 2021-06-30 | 2021-03-31 | 2020-12-31 | 2020-09-30 | 2020-06-30 | ||
|---|---|---|---|---|---|---|---|---|---|---|---|---|---|---|---|---|
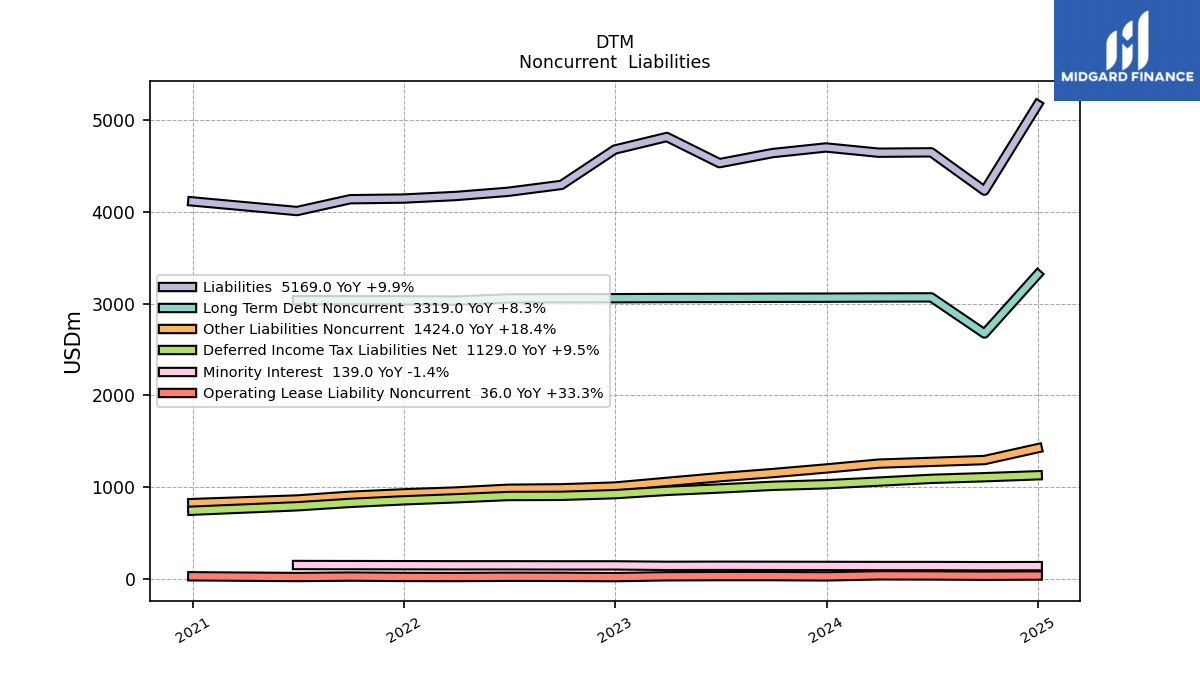
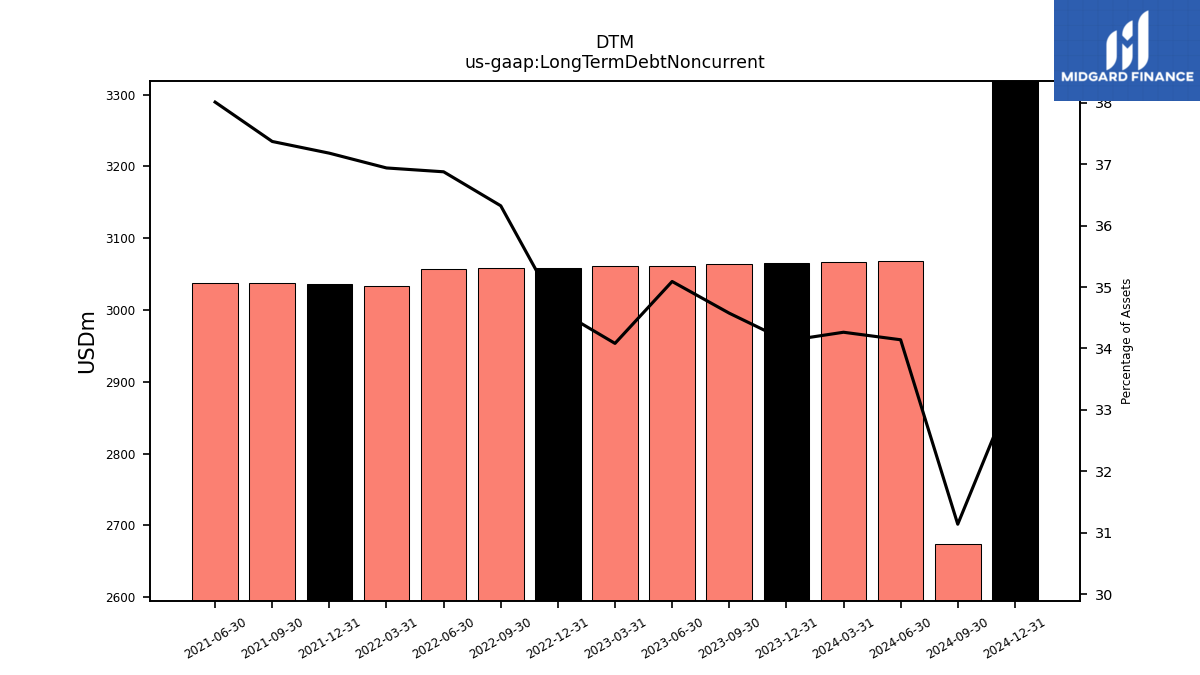
| Long Term Debt Noncurrent | 3065.00 | 3064.00 | 3062.00 | 3061.00 | 3059.00 | 3058.00 | 3057.00 | 3033.00 | 3036.00 | 3037.00 | 3037.00 | NA | NA | NA | NA | |
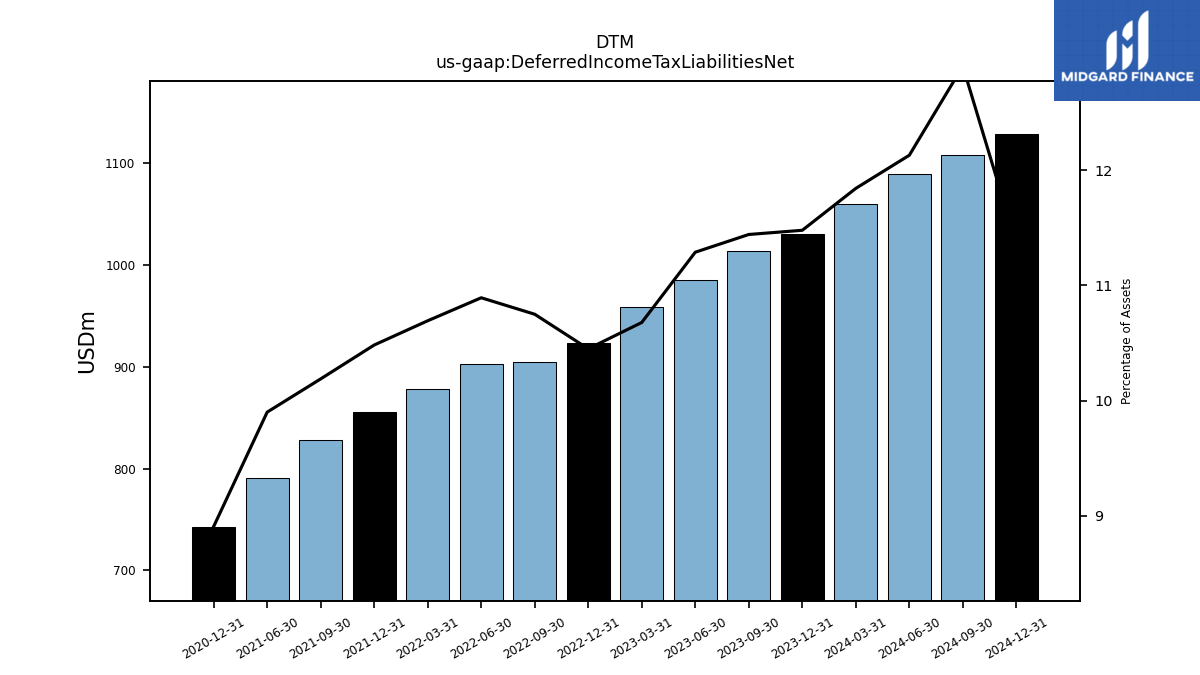
| Deferred Income Tax Liabilities Net | 1031.00 | 1014.00 | 985.00 | 959.00 | 923.00 | 905.00 | 903.00 | 878.00 | 856.00 | 828.00 | 791.00 | NA | 743.00 | NA | NA | |
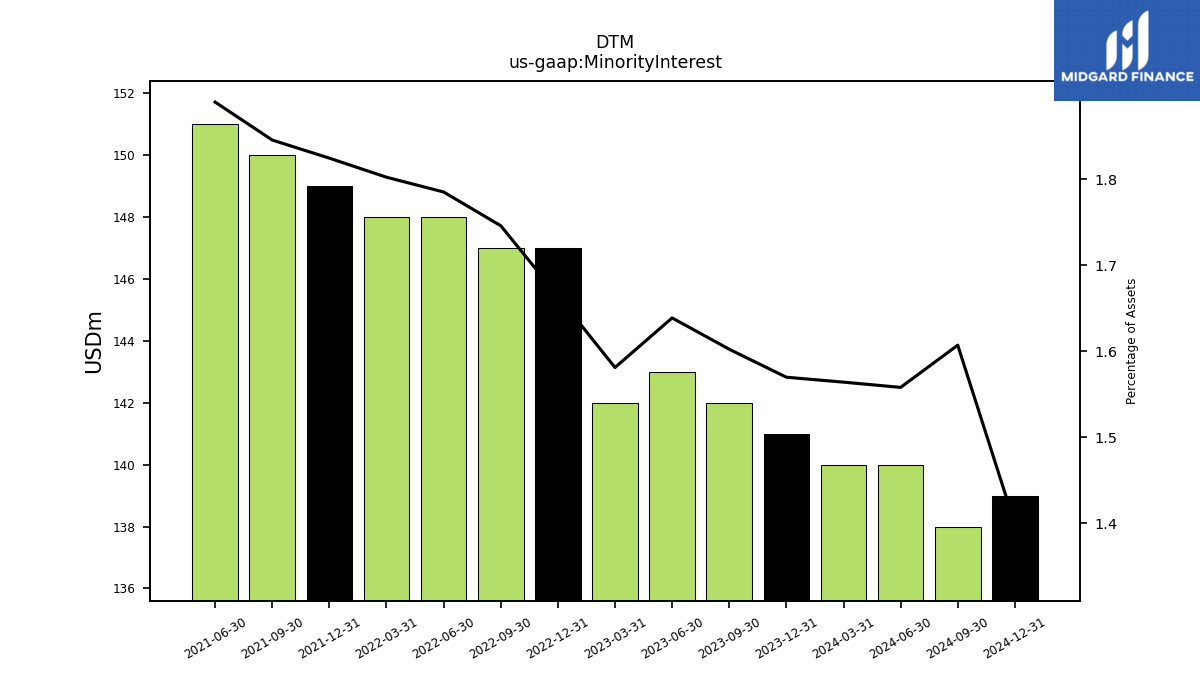
| Minority Interest | 141.00 | 142.00 | 143.00 | 142.00 | 147.00 | 147.00 | 148.00 | 148.00 | 149.00 | 150.00 | 151.00 | NA | NA | NA | NA | |
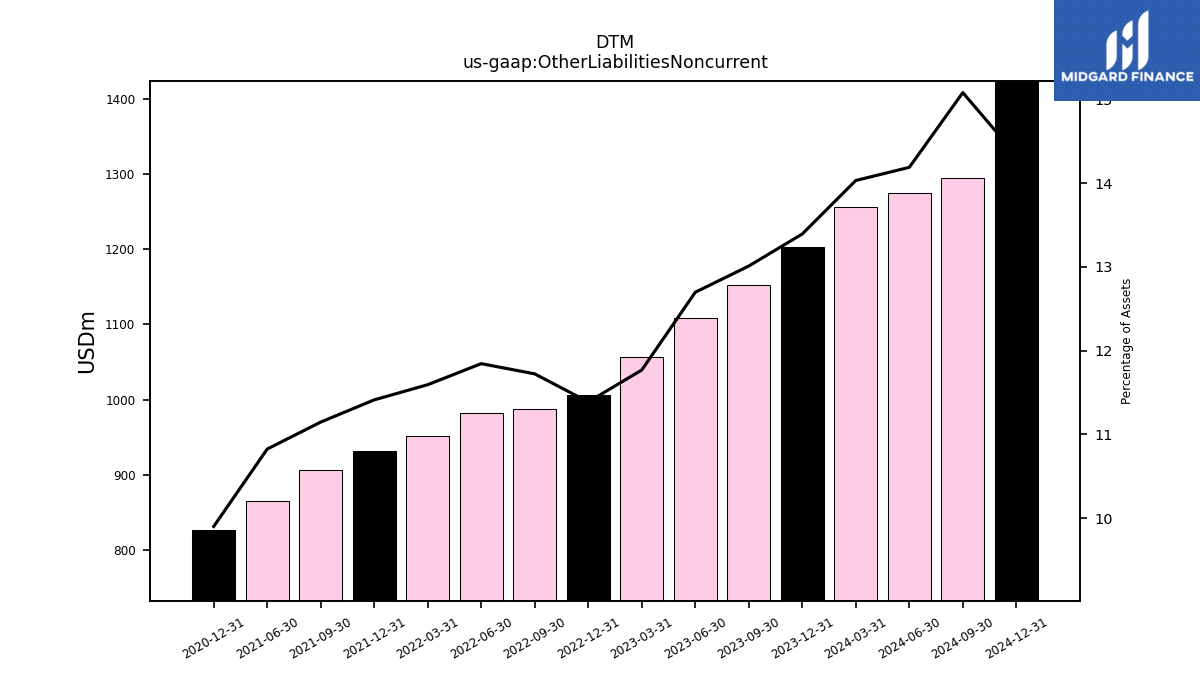
| Other Liabilities Noncurrent | 1203.00 | 1153.00 | 1108.00 | 1057.00 | 1006.00 | 987.00 | 982.00 | 952.00 | 932.00 | 906.00 | 865.00 | NA | 826.00 | NA | NA | |
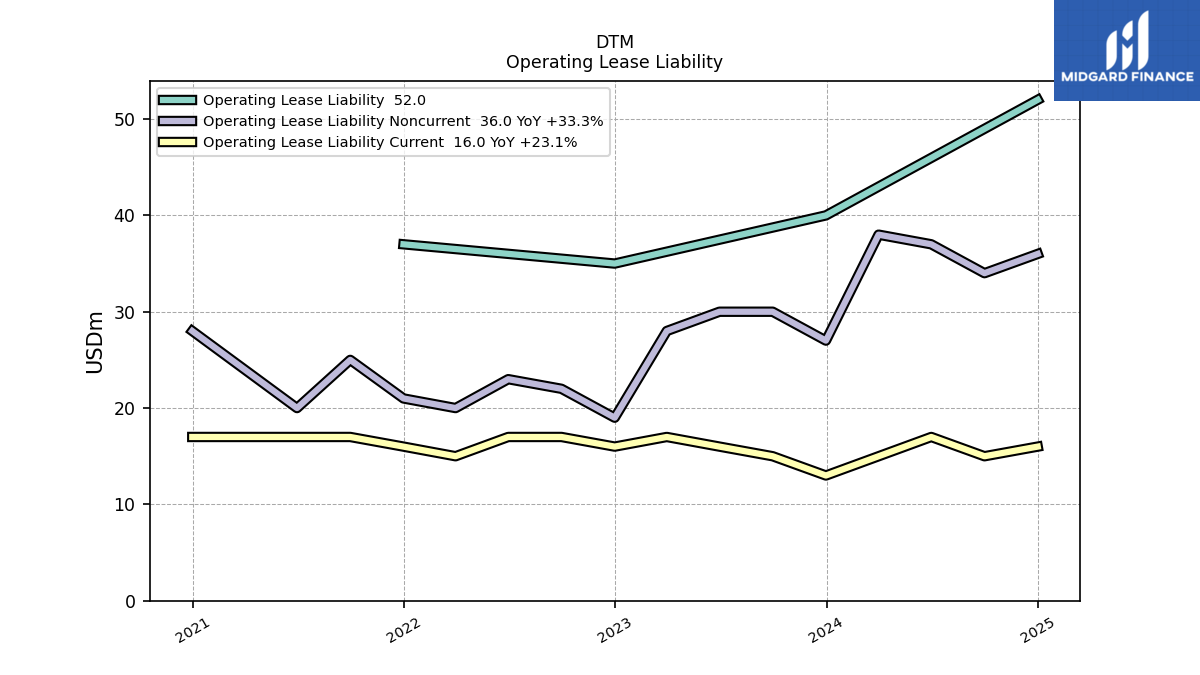
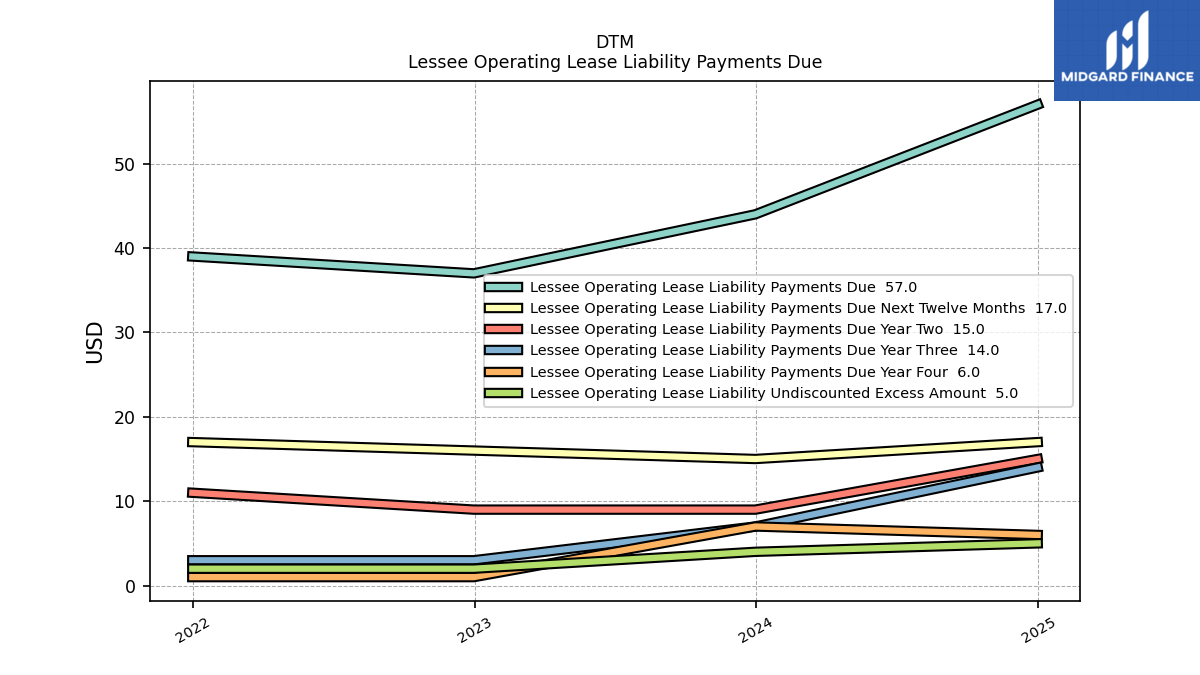
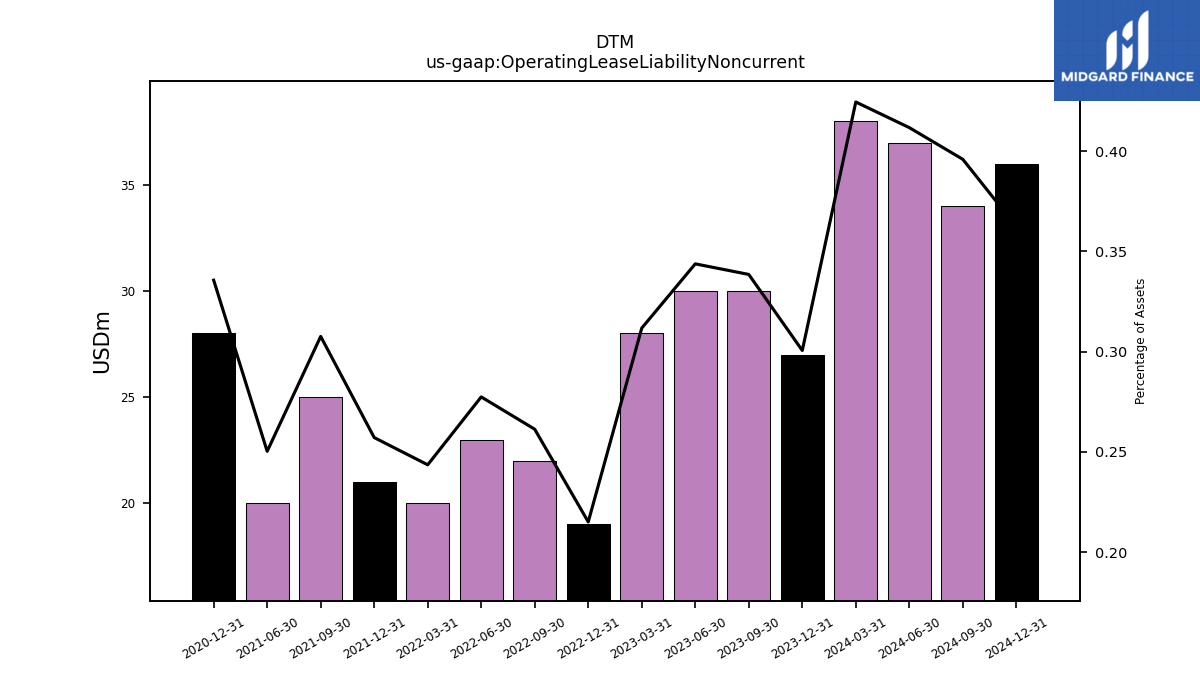
| Operating Lease Liability Noncurrent | 27.00 | 30.00 | 30.00 | 28.00 | 19.00 | 22.00 | 23.00 | 20.00 | 21.00 | 25.00 | 20.00 | NA | 28.00 | NA | NA |
| 2023-12-31 | 2023-09-30 | 2023-06-30 | 2023-03-31 | 2022-12-31 | 2022-09-30 | 2022-06-30 | 2022-03-31 | 2021-12-31 | 2021-09-30 | 2021-06-30 | 2021-03-31 | 2020-12-31 | 2020-09-30 | 2020-06-30 | ||
|---|---|---|---|---|---|---|---|---|---|---|---|---|---|---|---|---|
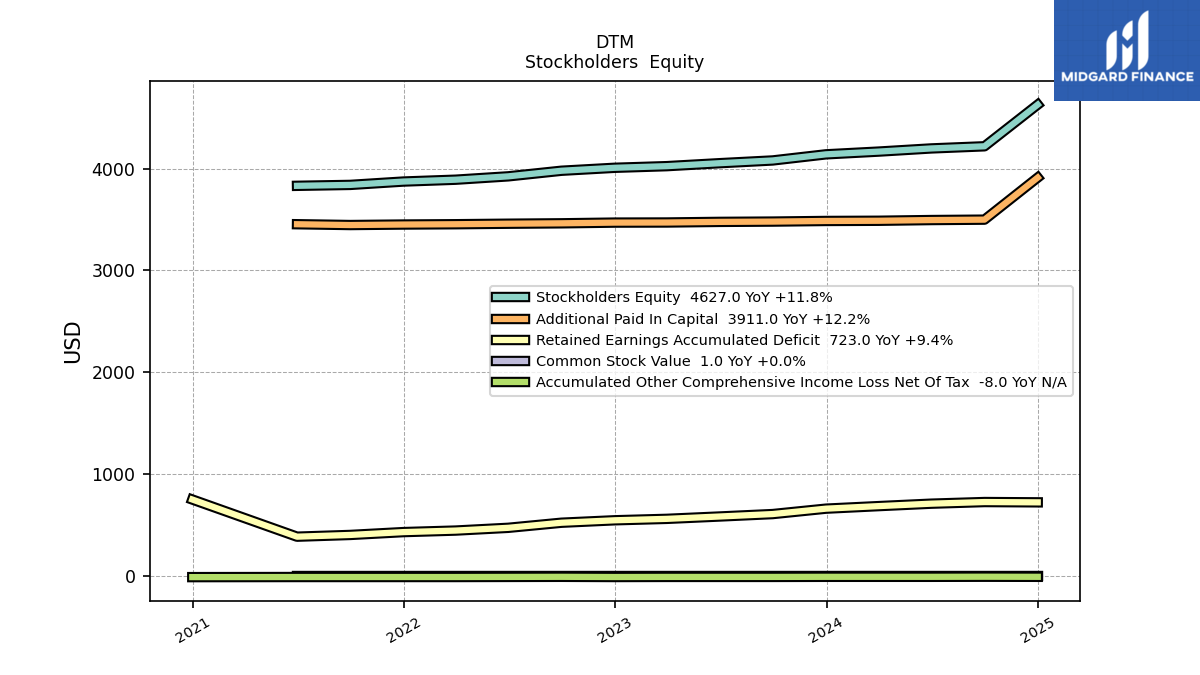
| Stockholders Equity | 4139.00 | 4079.00 | 4052.00 | 4023.00 | 4007.00 | 3978.00 | 3923.00 | 3890.00 | 3872.00 | 3839.00 | 3830.00 | NA | NA | NA | NA | |
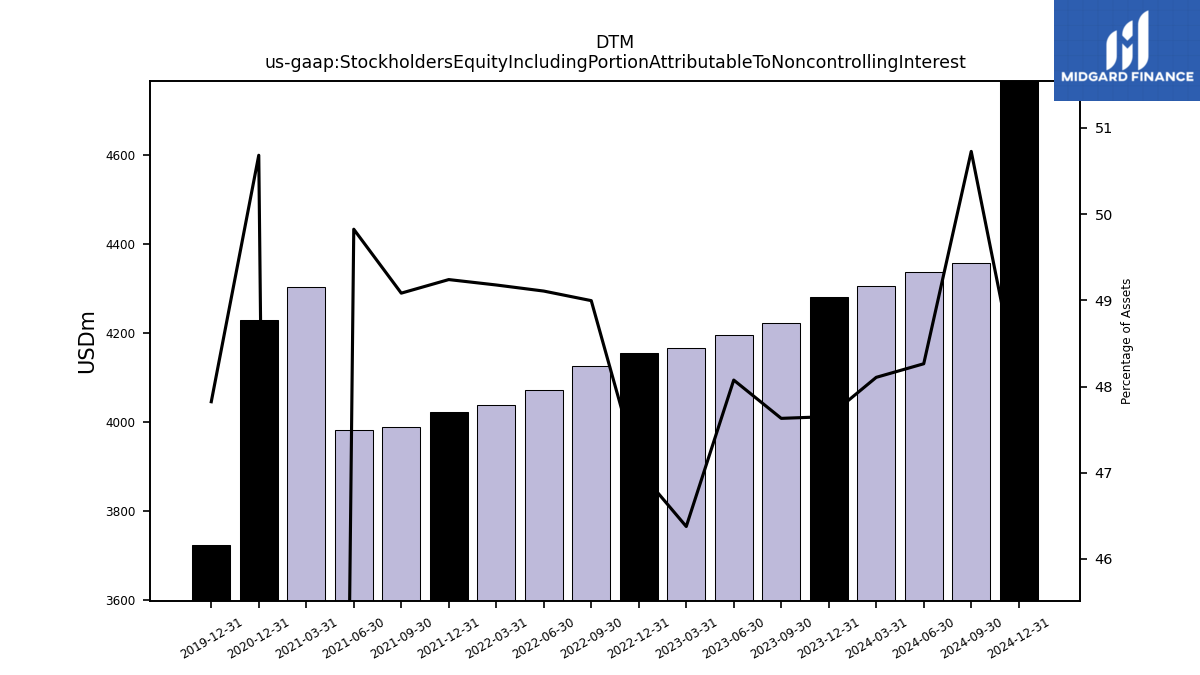
| Stockholders Equity Including Portion Attributable To Noncontrolling Interest | 4280.00 | 4221.00 | 4195.00 | 4165.00 | 4154.00 | 4125.00 | 4071.00 | 4038.00 | 4021.00 | 3989.00 | 3981.00 | 4304.00 | 4228.00 | NA | NA | |
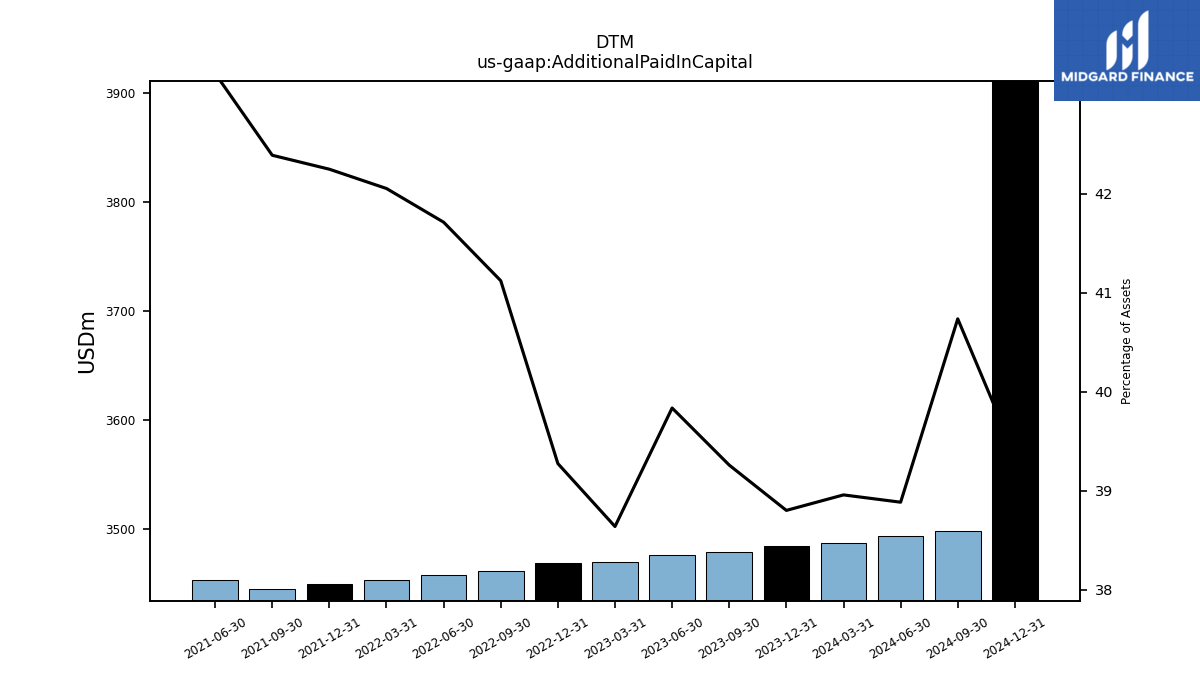
| Additional Paid In Capital | 3485.00 | 3479.00 | 3476.00 | 3470.00 | 3469.00 | 3462.00 | 3458.00 | 3453.00 | 3450.00 | 3445.00 | 3453.00 | NA | NA | NA | NA | |
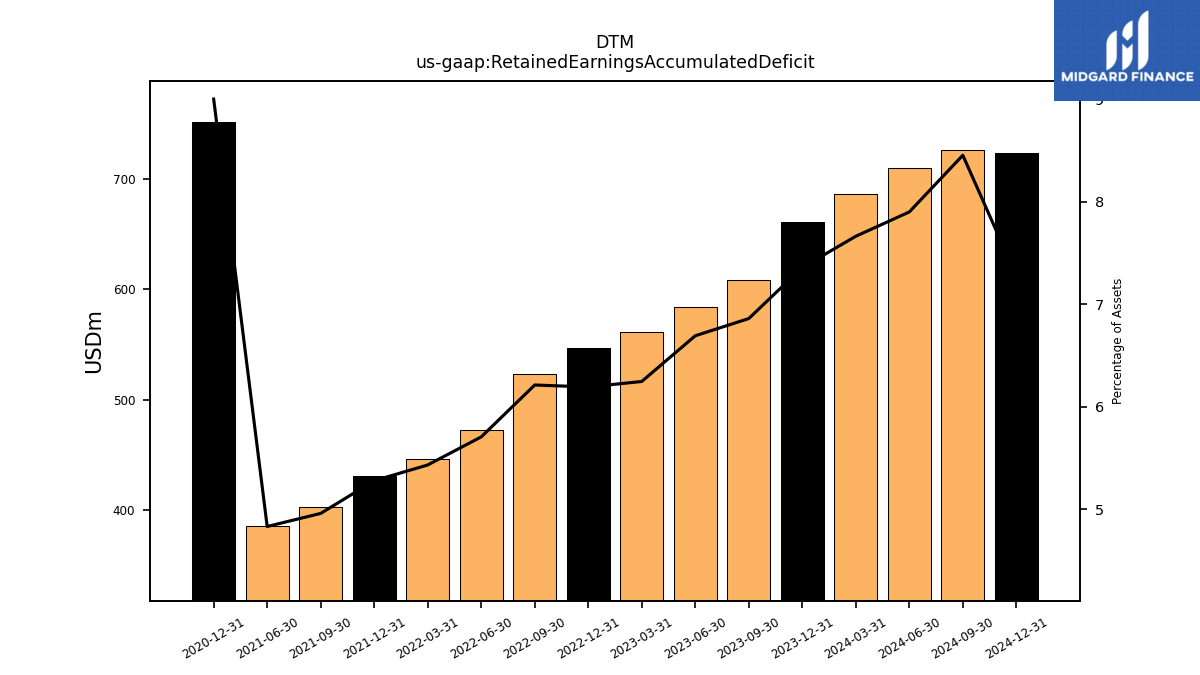
| Retained Earnings Accumulated Deficit | 661.00 | 608.00 | 584.00 | 561.00 | 547.00 | 523.00 | 473.00 | 446.00 | 431.00 | 403.00 | 386.00 | NA | 751.00 | NA | NA | |
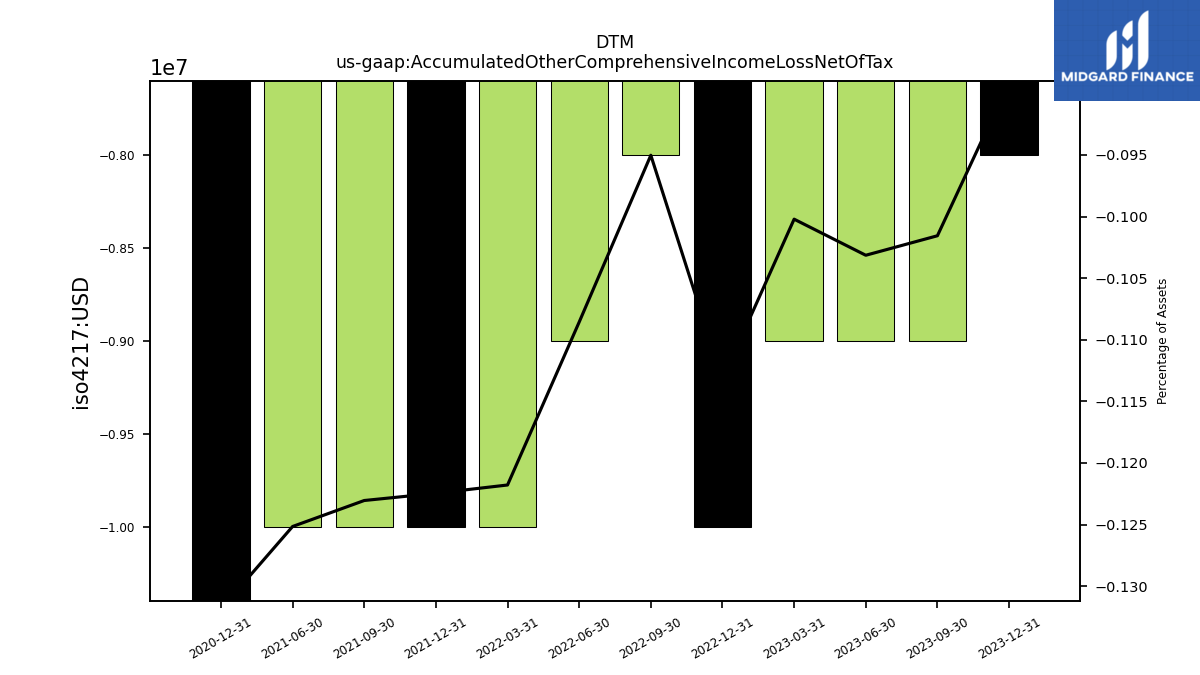
| Accumulated Other Comprehensive Income Loss Net Of Tax | -8.00 | -9.00 | -9.00 | -9.00 | -10.00 | -8.00 | -9.00 | -10.00 | -10.00 | -10.00 | -10.00 | NA | -11.00 | NA | NA | |
| Minority Interest | 141.00 | 142.00 | 143.00 | 142.00 | 147.00 | 147.00 | 148.00 | 148.00 | 149.00 | 150.00 | 151.00 | NA | NA | NA | NA |
| 2023-12-31 | 2023-09-30 | 2023-06-30 | 2023-03-31 | 2022-12-31 | 2022-09-30 | 2022-06-30 | 2022-03-31 | 2021-12-31 | 2021-09-30 | 2021-06-30 | 2021-03-31 | 2020-12-31 | 2020-09-30 | 2020-06-30 | ||
|---|---|---|---|---|---|---|---|---|---|---|---|---|---|---|---|---|
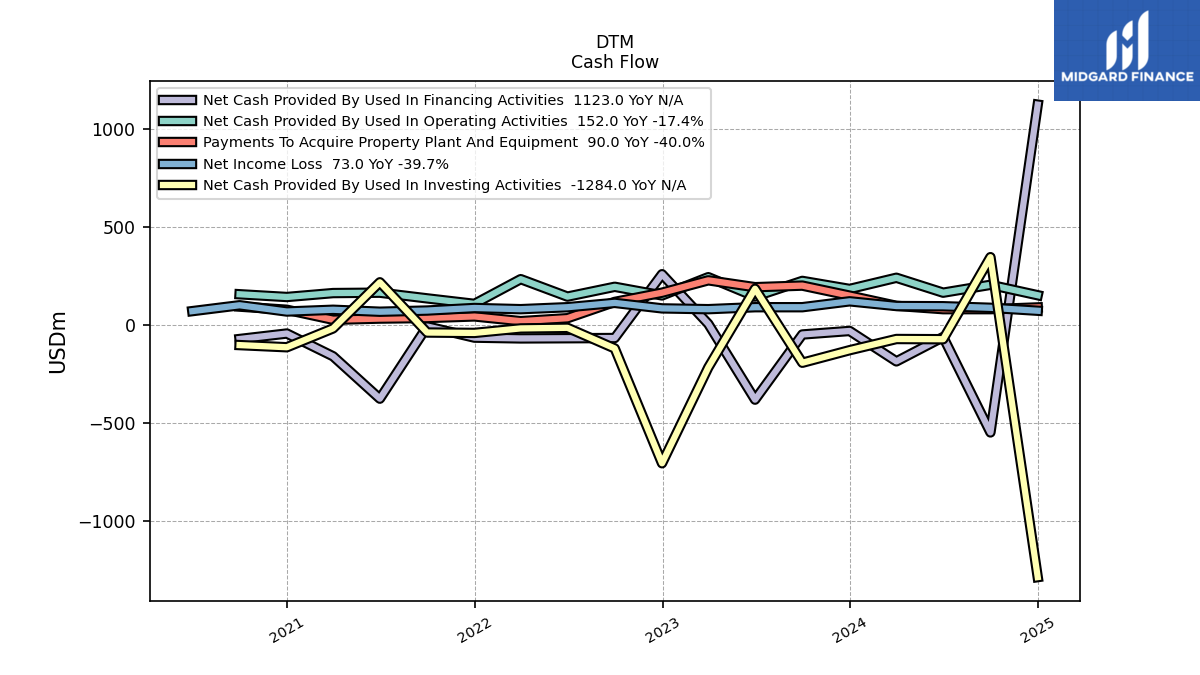
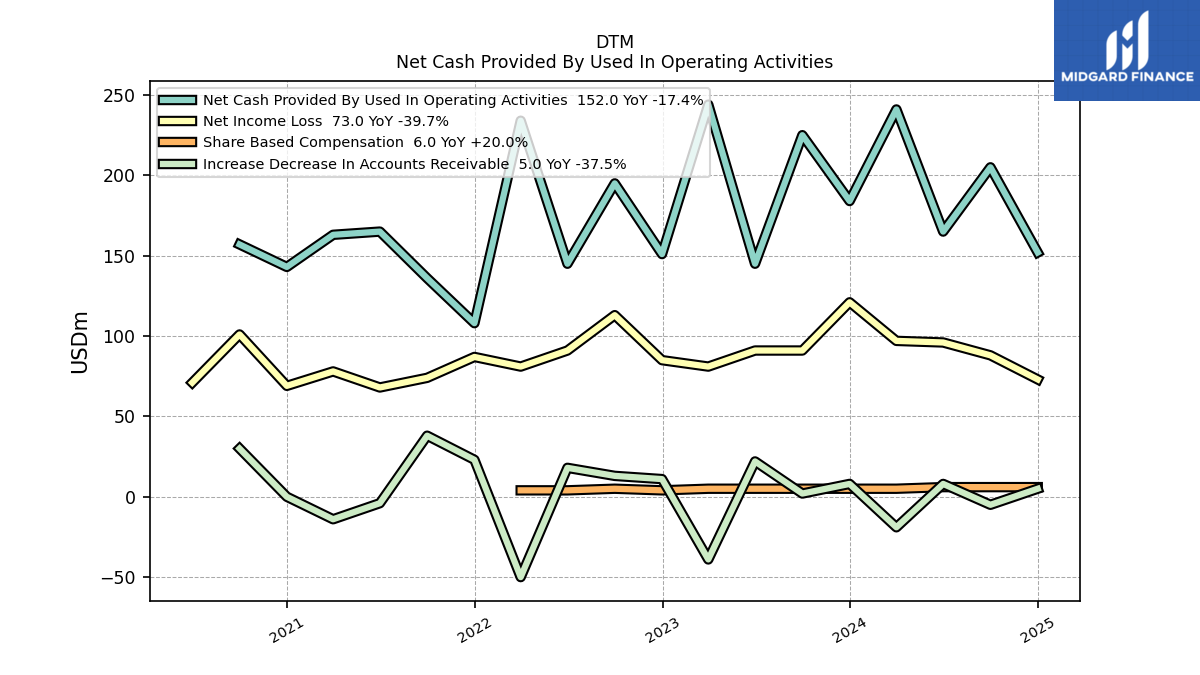
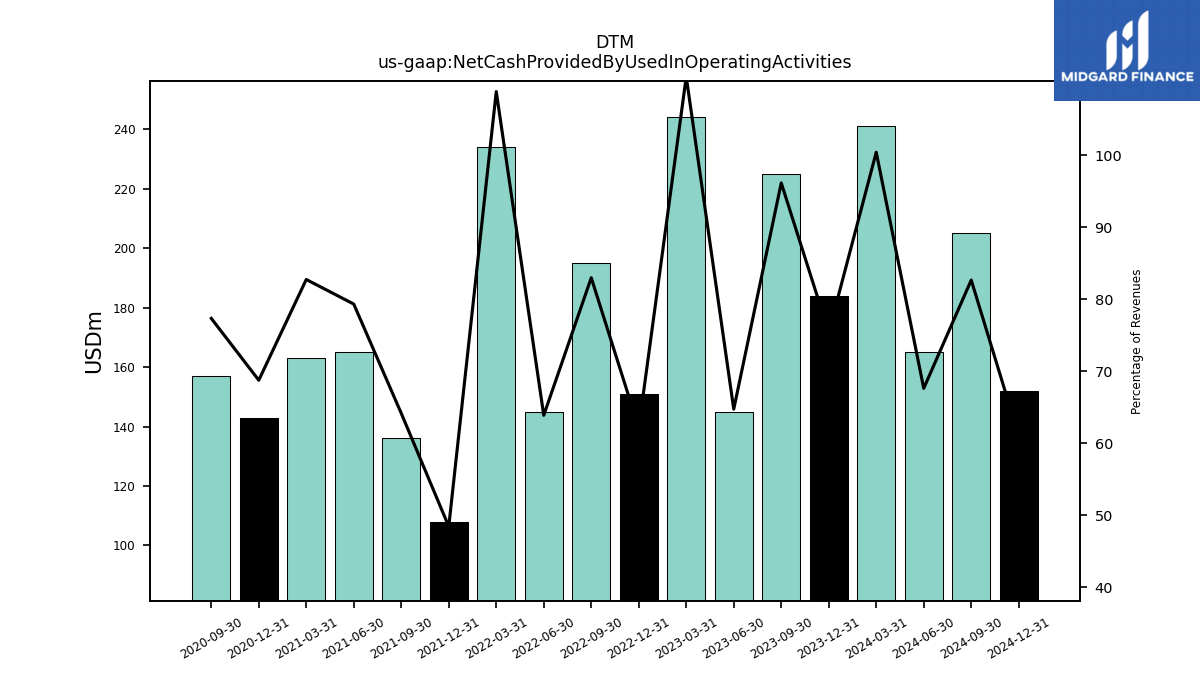
| Net Cash Provided By Used In Operating Activities | 184.00 | 225.00 | 145.00 | 244.00 | 151.00 | 195.00 | 145.00 | 234.00 | 108.00 | 136.00 | 165.00 | 163.00 | 143.00 | 157.00 | NA | |
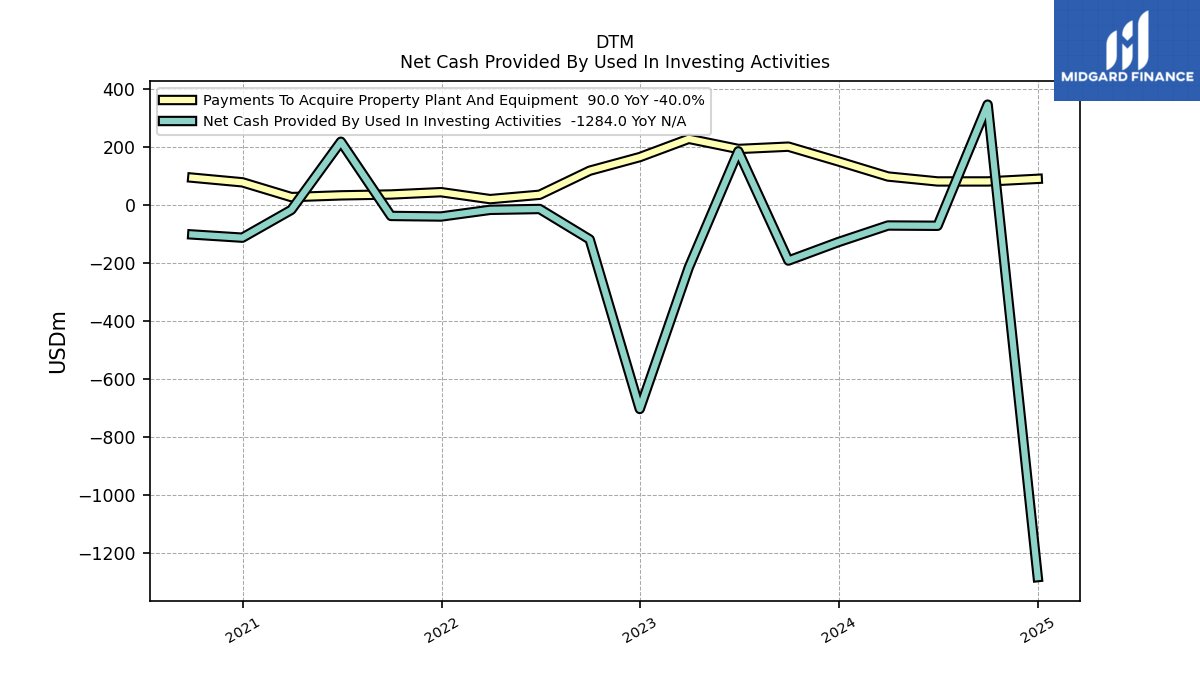
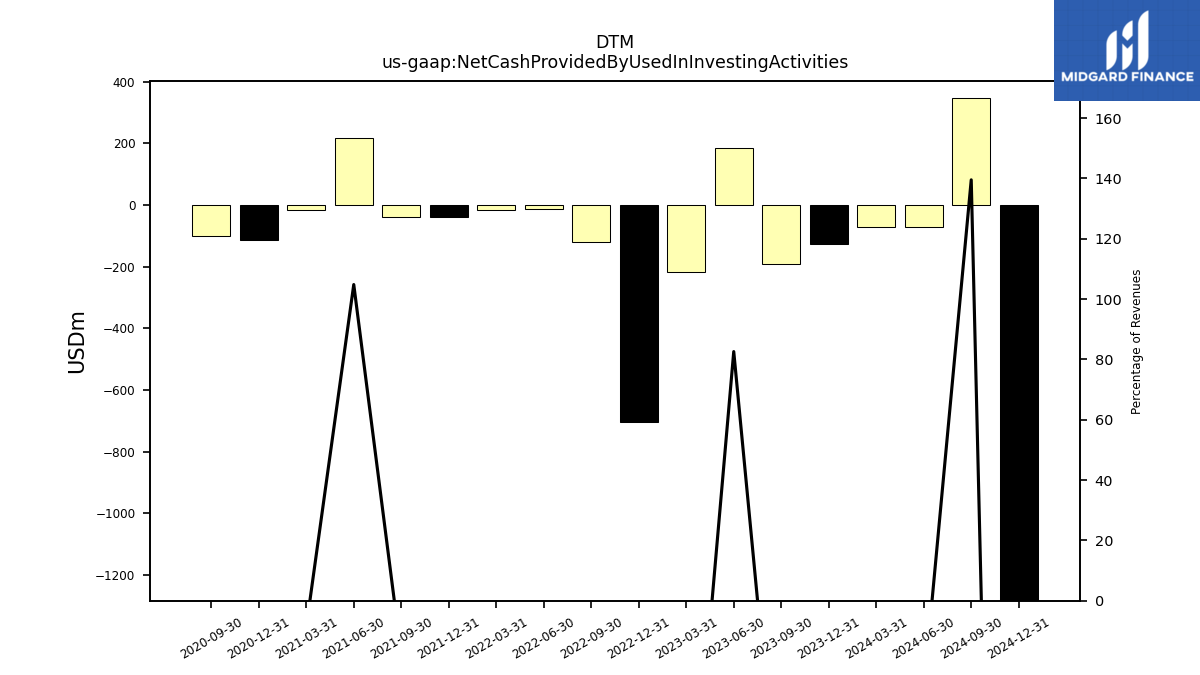
| Net Cash Provided By Used In Investing Activities | -128.00 | -192.00 | 185.00 | -216.00 | -704.00 | -119.00 | -14.00 | -17.00 | -40.00 | -38.00 | 218.00 | -17.00 | -113.00 | -102.00 | NA | |
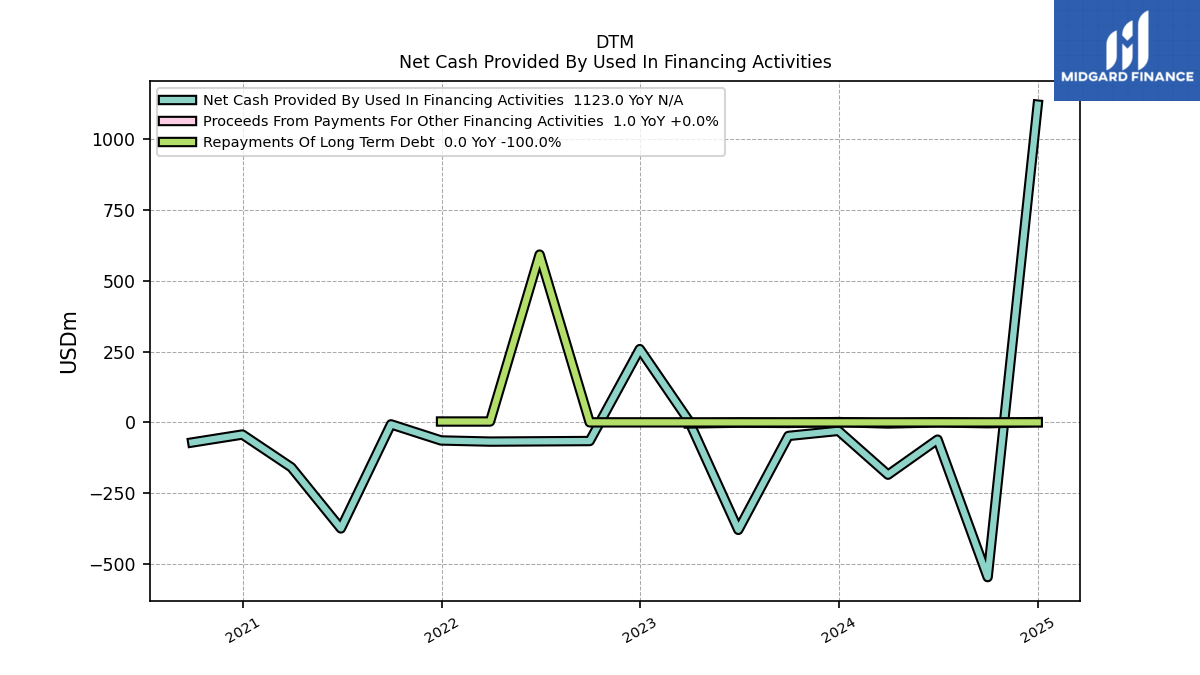
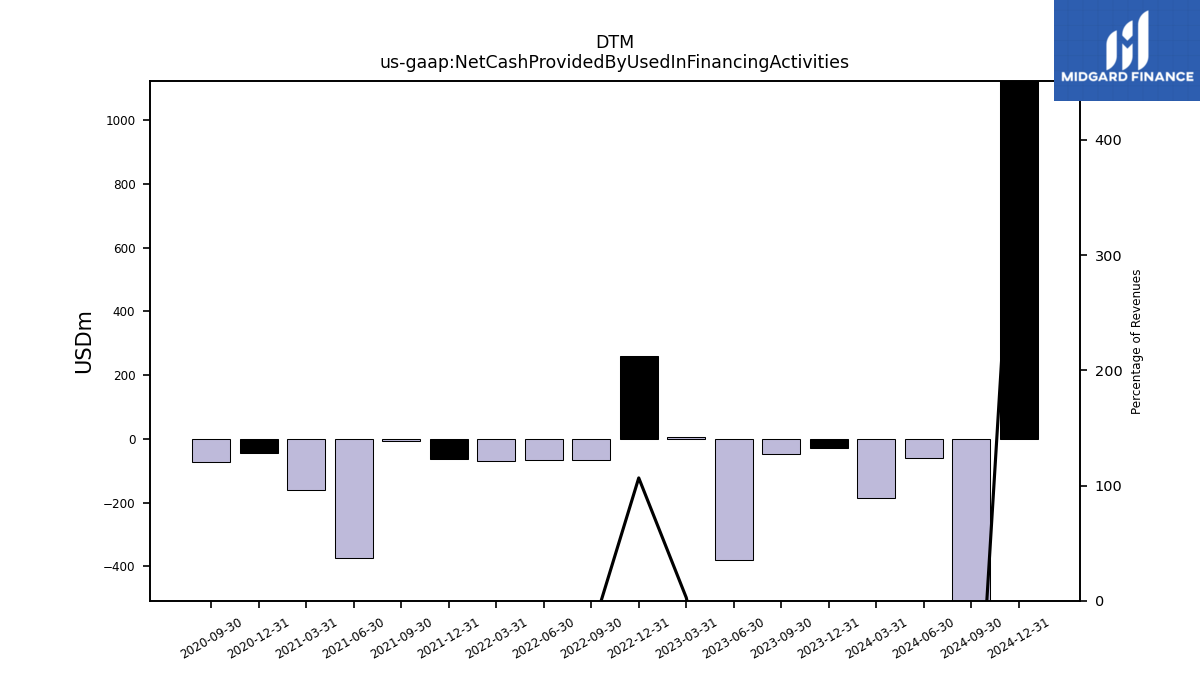
| Net Cash Provided By Used In Financing Activities | -30.00 | -48.00 | -380.00 | 6.00 | 259.00 | -66.00 | -67.00 | -68.00 | -64.00 | -7.00 | -375.00 | -159.00 | -43.00 | -71.00 | NA |
| 2023-12-31 | 2023-09-30 | 2023-06-30 | 2023-03-31 | 2022-12-31 | 2022-09-30 | 2022-06-30 | 2022-03-31 | 2021-12-31 | 2021-09-30 | 2021-06-30 | 2021-03-31 | 2020-12-31 | 2020-09-30 | 2020-06-30 | ||
|---|---|---|---|---|---|---|---|---|---|---|---|---|---|---|---|---|
| Net Cash Provided By Used In Operating Activities | 184.00 | 225.00 | 145.00 | 244.00 | 151.00 | 195.00 | 145.00 | 234.00 | 108.00 | 136.00 | 165.00 | 163.00 | 143.00 | 157.00 | NA | |
| Net Income Loss | 121.00 | 91.00 | 91.00 | 81.00 | 85.00 | 113.00 | 91.00 | 81.00 | 87.00 | 74.00 | 68.00 | 78.00 | 69.00 | 101.00 | 71.00 | |
| Profit Loss | 124.00 | 94.00 | 94.00 | 84.00 | 88.00 | 116.00 | 94.00 | 84.00 | 89.00 | 77.00 | 71.00 | 81.00 | 72.00 | 105.00 | 73.00 | |
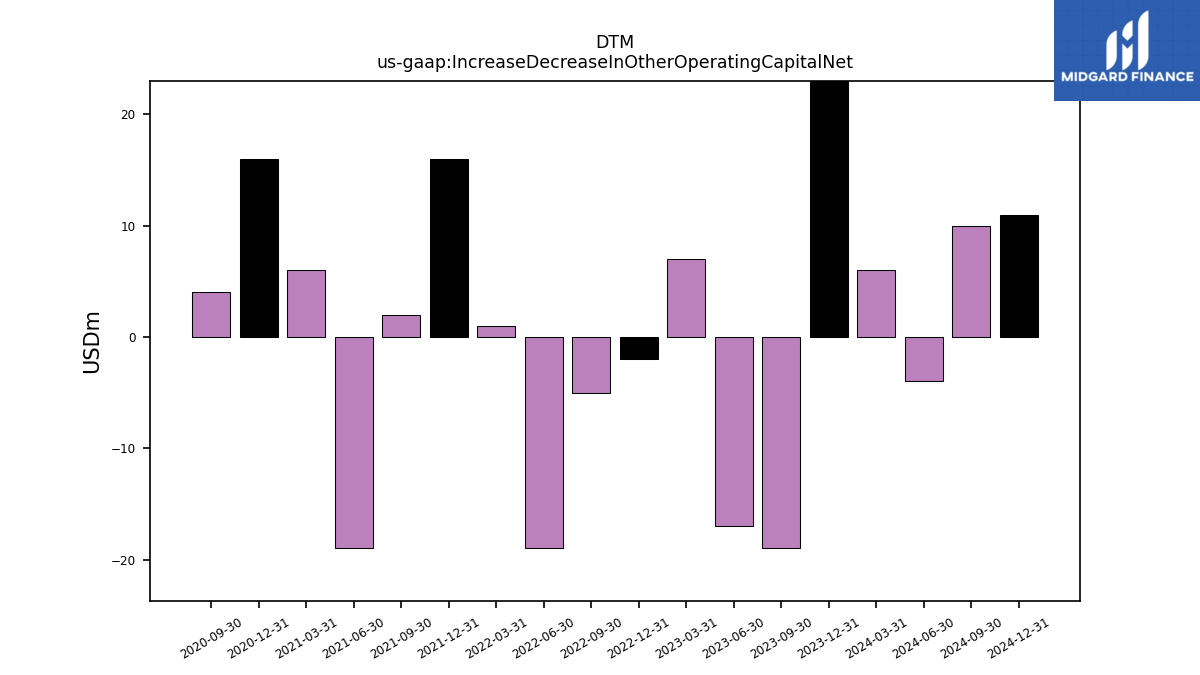
| Increase Decrease In Other Operating Capital Net | 75.00 | -19.00 | -17.00 | 7.00 | -2.00 | -5.00 | -19.00 | 1.00 | 16.00 | 2.00 | -19.00 | 6.00 | 16.00 | 4.00 | NA | |
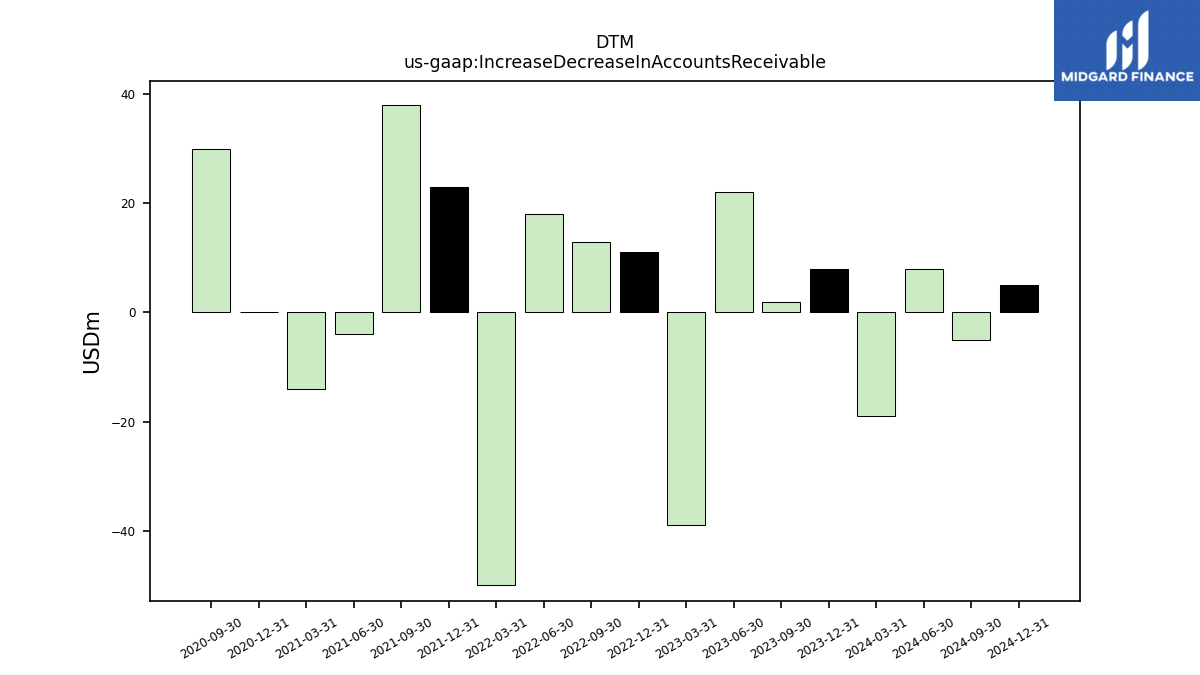
| Increase Decrease In Accounts Receivable | 8.00 | 2.00 | 22.00 | -39.00 | 11.00 | 13.00 | 18.00 | -50.00 | 23.00 | 38.00 | -4.00 | -14.00 | 0.00 | 30.00 | NA | |
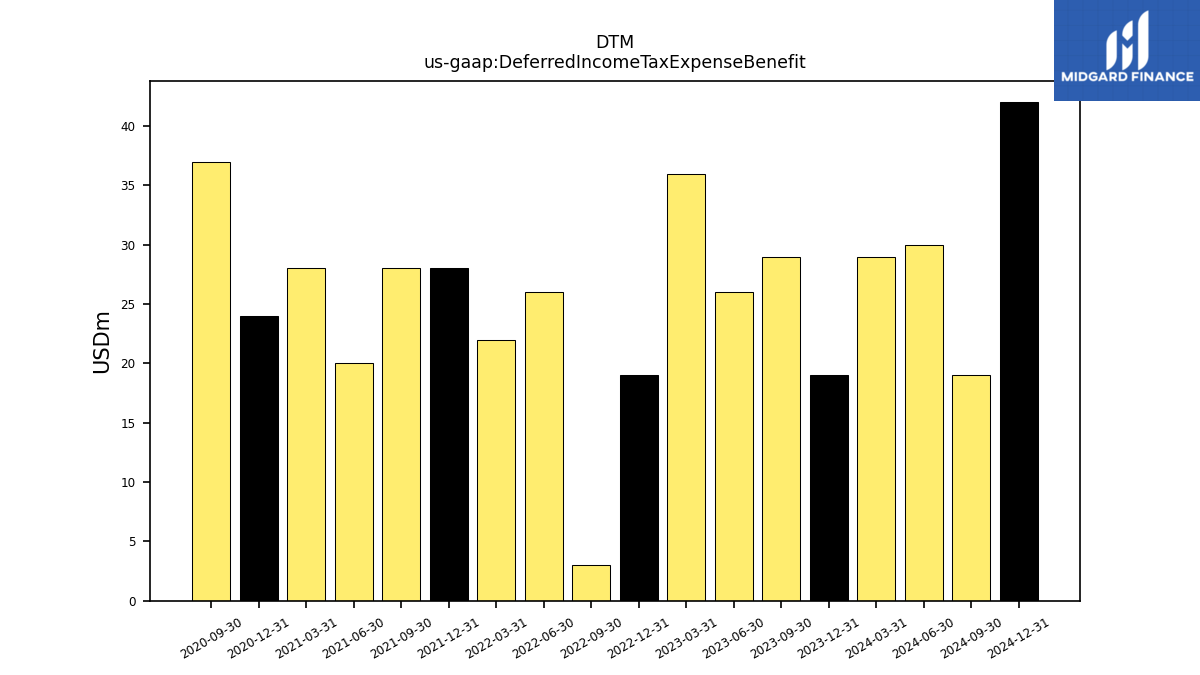
| Deferred Income Tax Expense Benefit | 19.00 | 29.00 | 26.00 | 36.00 | 19.00 | 3.00 | 26.00 | 22.00 | 28.00 | 28.00 | 20.00 | 28.00 | 24.00 | 37.00 | NA | |
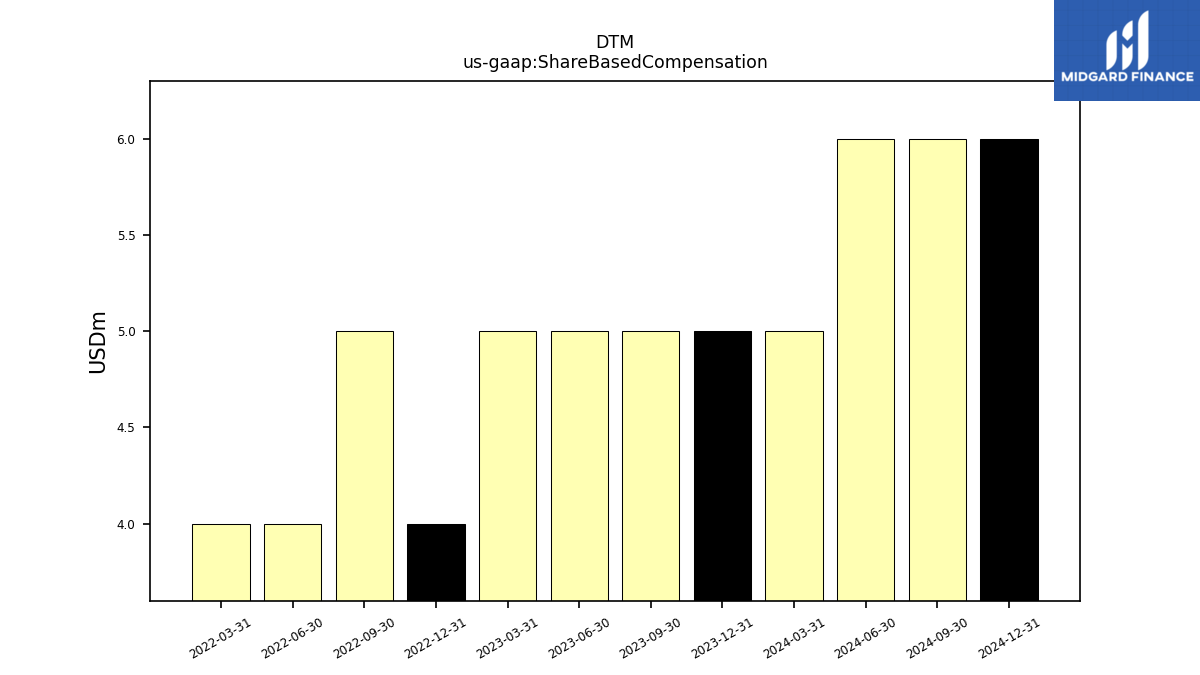
| Share Based Compensation | 5.00 | 5.00 | 5.00 | 5.00 | 4.00 | 5.00 | 4.00 | 4.00 | NA | NA | NA | NA | NA | NA | NA |
| 2023-12-31 | 2023-09-30 | 2023-06-30 | 2023-03-31 | 2022-12-31 | 2022-09-30 | 2022-06-30 | 2022-03-31 | 2021-12-31 | 2021-09-30 | 2021-06-30 | 2021-03-31 | 2020-12-31 | 2020-09-30 | 2020-06-30 | ||
|---|---|---|---|---|---|---|---|---|---|---|---|---|---|---|---|---|
| Net Cash Provided By Used In Investing Activities | -128.00 | -192.00 | 185.00 | -216.00 | -704.00 | -119.00 | -14.00 | -17.00 | -40.00 | -38.00 | 218.00 | -17.00 | -113.00 | -102.00 | NA | |
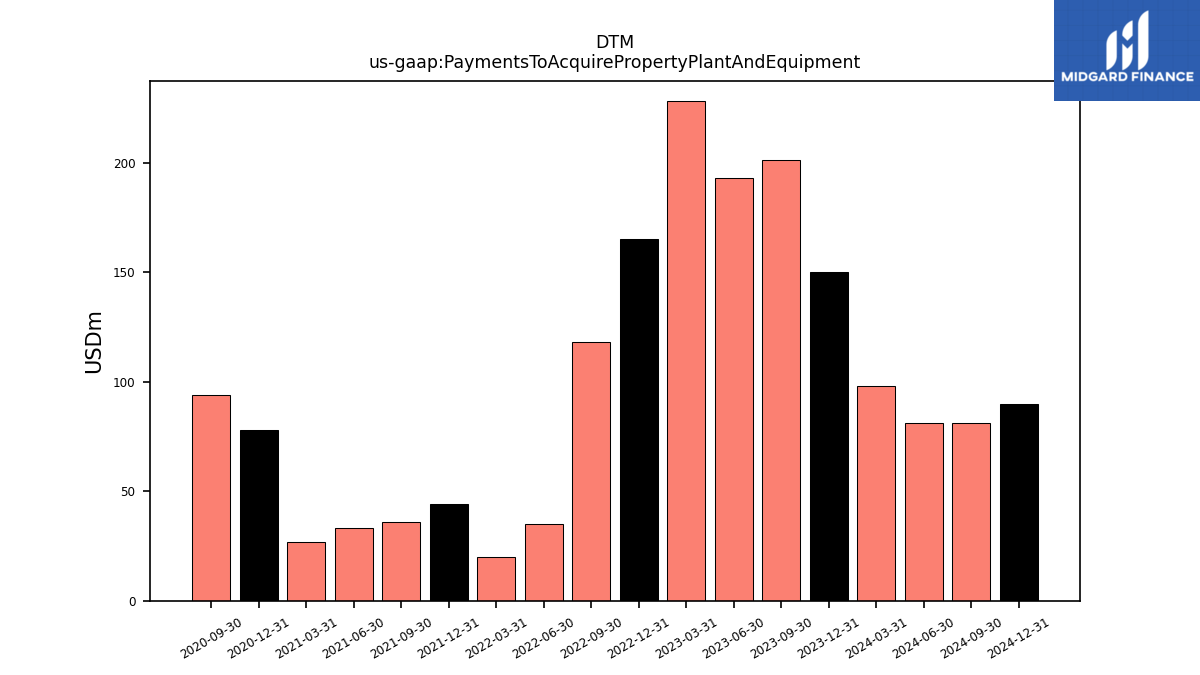
| Payments To Acquire Property Plant And Equipment | 150.00 | 201.00 | 193.00 | 228.00 | 165.00 | 118.00 | 35.00 | 20.00 | 44.00 | 36.00 | 33.00 | 27.00 | 78.00 | 94.00 | NA |
| 2023-12-31 | 2023-09-30 | 2023-06-30 | 2023-03-31 | 2022-12-31 | 2022-09-30 | 2022-06-30 | 2022-03-31 | 2021-12-31 | 2021-09-30 | 2021-06-30 | 2021-03-31 | 2020-12-31 | 2020-09-30 | 2020-06-30 | ||
|---|---|---|---|---|---|---|---|---|---|---|---|---|---|---|---|---|
| Net Cash Provided By Used In Financing Activities | -30.00 | -48.00 | -380.00 | 6.00 | 259.00 | -66.00 | -67.00 | -68.00 | -64.00 | -7.00 | -375.00 | -159.00 | -43.00 | -71.00 | NA | |
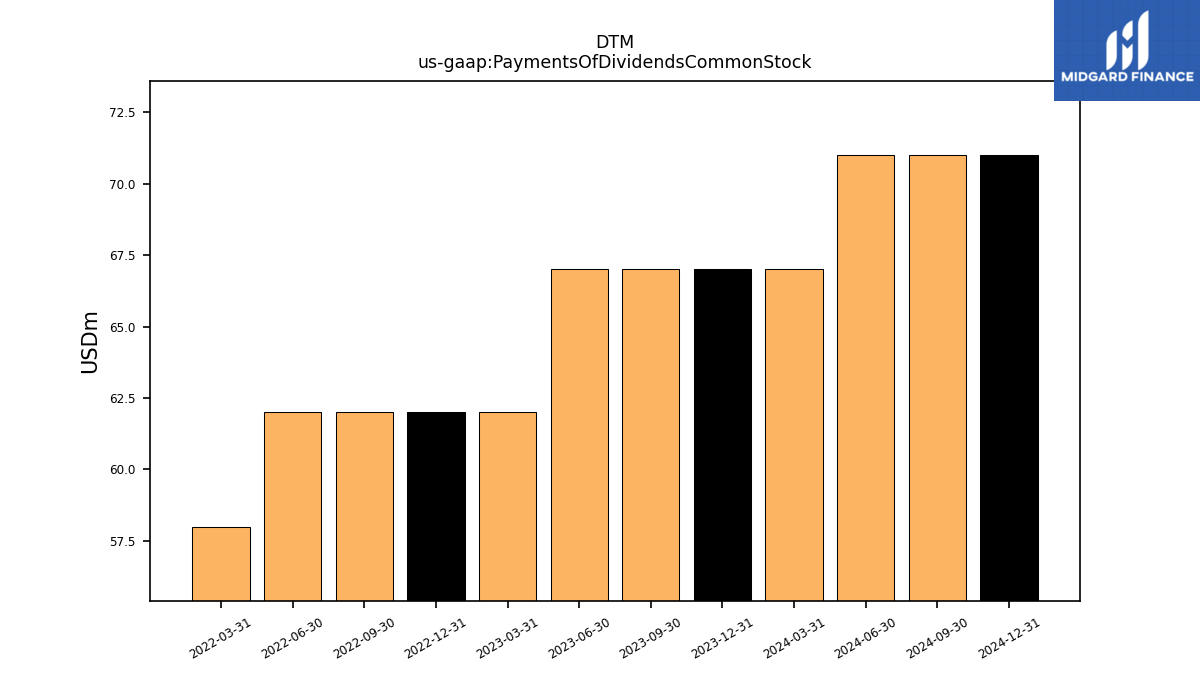
| Payments Of Dividends Common Stock | 67.00 | 67.00 | 67.00 | 62.00 | 62.00 | 62.00 | 62.00 | 58.00 | NA | NA | NA | NA | NA | NA | NA |
| 2023-12-31 | 2023-09-30 | 2023-06-30 | 2023-03-31 | 2022-12-31 | 2022-09-30 | 2022-06-30 | 2022-03-31 | 2021-12-31 | 2021-09-30 | 2021-06-30 | 2021-03-31 | 2020-12-31 | 2020-09-30 | 2020-06-30 | ||
|---|---|---|---|---|---|---|---|---|---|---|---|---|---|---|---|---|
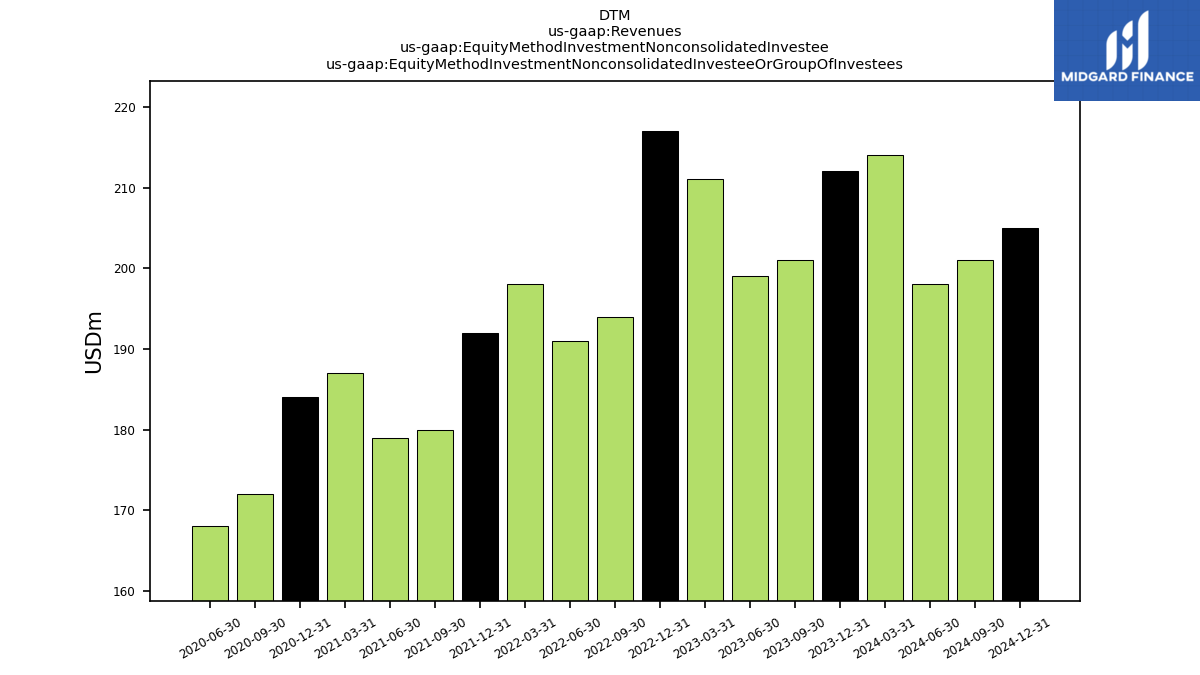
| Revenues | 244.00 | 234.00 | 224.00 | 220.00 | 243.00 | 235.00 | 227.00 | 215.00 | 223.00 | 212.00 | 208.00 | 197.00 | 208.00 | 203.00 | 174.00 | |
| Equity Method Investment Nonconsolidated Investee Or Group Of Investees | 212.00 | 201.00 | 199.00 | 211.00 | 217.00 | 194.00 | 191.00 | 198.00 | 192.00 | 180.00 | 179.00 | 187.00 | 184.00 | 172.00 | 168.00 |