
| 2023-12-31 | 2023-09-30 | 2023-06-30 | 2023-03-31 | 2022-12-31 | 2022-09-30 | 2022-06-30 | 2022-03-31 | 2021-12-31 | 2021-09-30 | 2021-06-30 | 2021-03-31 | 2020-12-31 | 2020-09-30 | 2020-06-30 | 2020-03-31 | 2019-12-31 | 2019-09-30 | 2019-06-30 | 2019-03-31 | 2018-12-31 | 2018-09-30 | 2018-06-30 | 2018-03-31 | 2017-12-31 | 2017-09-30 | 2017-06-30 | 2017-03-31 | 2016-12-31 | 2016-09-30 | 2016-06-30 | 2016-03-31 | 2015-12-31 | 2015-09-30 | 2015-06-30 | 2015-03-31 | 2014-12-31 | 2014-09-30 | 2014-06-30 | 2014-03-31 | 2013-12-31 | 2013-09-30 | 2013-06-30 | 2013-03-31 | 2012-12-31 | 2012-09-30 | 2012-06-30 | 2012-03-31 | 2011-12-31 | 2011-09-30 | 2011-06-30 | 2011-03-31 | 2010-12-31 | 2010-09-30 | 2010-06-30 | 2010-03-31 | ||
|---|---|---|---|---|---|---|---|---|---|---|---|---|---|---|---|---|---|---|---|---|---|---|---|---|---|---|---|---|---|---|---|---|---|---|---|---|---|---|---|---|---|---|---|---|---|---|---|---|---|---|---|---|---|---|---|---|---|
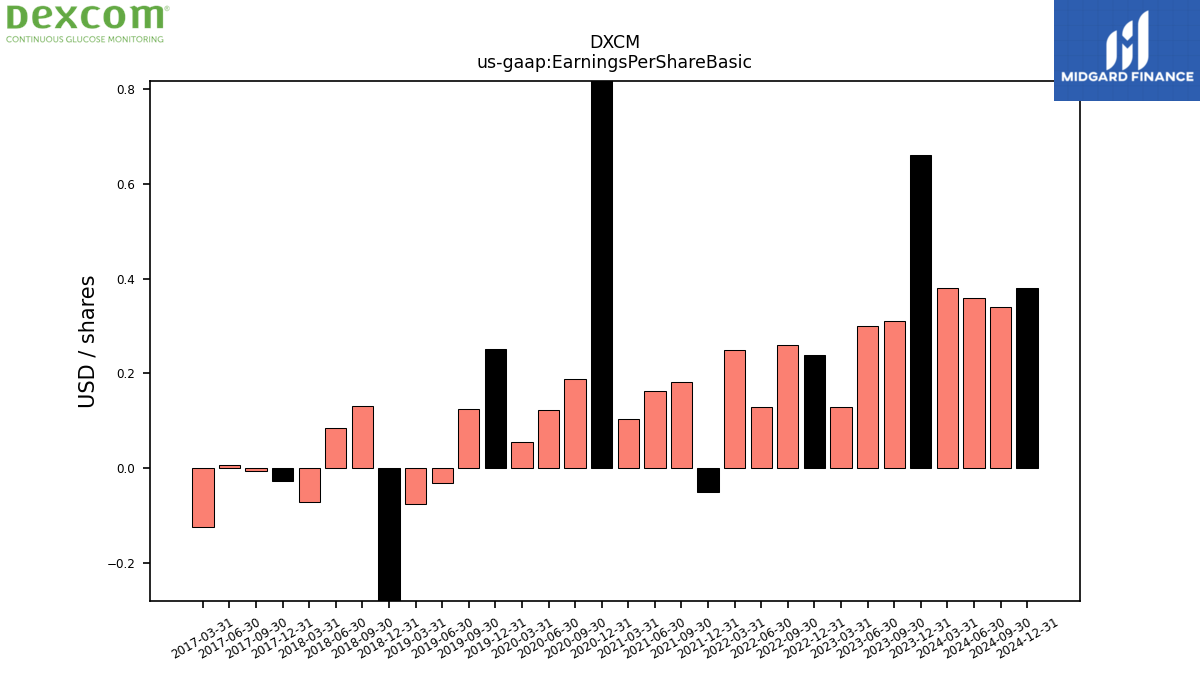
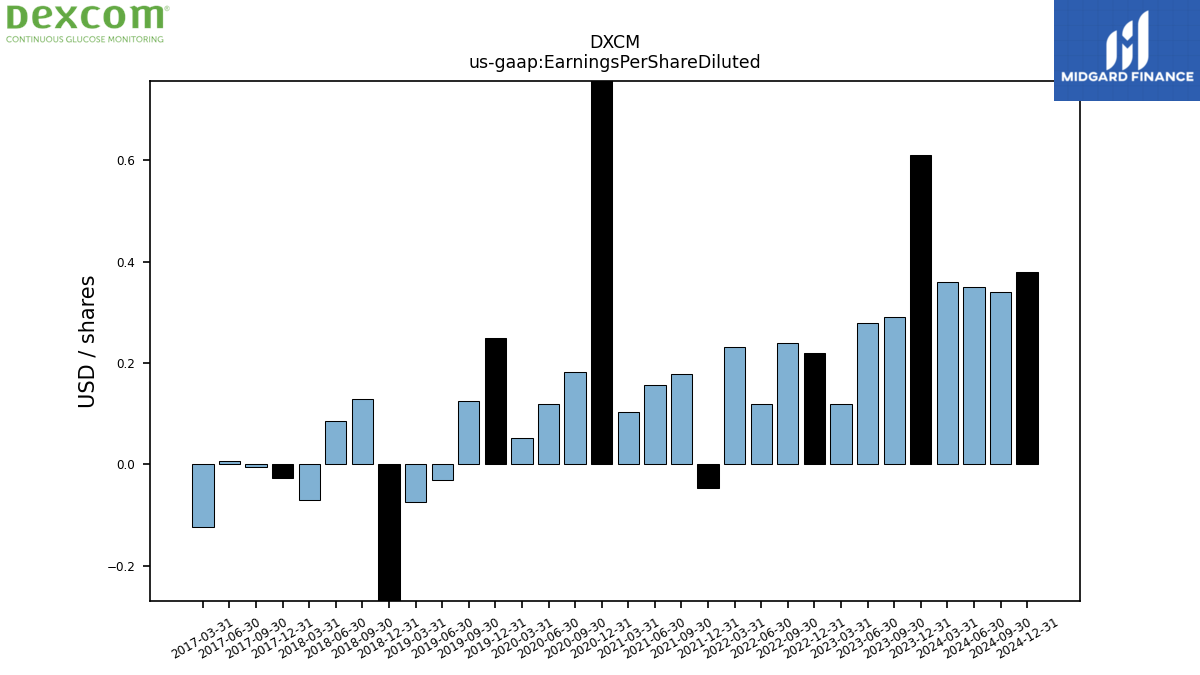
| Earnings Per Share Basic | 0.66 | 0.31 | 0.30 | 0.13 | 0.24 | 0.26 | 0.13 | 1.00 | -0.20 | 0.73 | 0.65 | 0.42 | 3.75 | 0.75 | 0.49 | 0.22 | 1.01 | 0.50 | -0.12 | -0.30 | -2.03 | 0.53 | 0.34 | -0.28 | -0.11 | -0.02 | 0.03 | -0.49 | NA | NA | NA | NA | NA | NA | NA | NA | NA | NA | NA | NA | NA | NA | NA | NA | NA | NA | NA | NA | NA | NA | NA | NA | NA | NA | NA | NA | |
| Earnings Per Share Diluted | 0.61 | 0.29 | 0.28 | 0.12 | 0.22 | 0.24 | 0.12 | 0.93 | -0.19 | 0.71 | 0.63 | 0.41 | 3.63 | 0.73 | 0.48 | 0.21 | 1.00 | 0.50 | -0.12 | -0.30 | -2.03 | 0.52 | 0.34 | -0.28 | -0.11 | -0.02 | 0.03 | -0.49 | NA | NA | NA | NA | NA | NA | NA | NA | NA | NA | NA | NA | NA | NA | NA | NA | NA | NA | NA | NA | NA | NA | NA | NA | NA | NA | NA | NA |
| 2023-12-31 | 2023-09-30 | 2023-06-30 | 2023-03-31 | 2022-12-31 | 2022-09-30 | 2022-06-30 | 2022-03-31 | 2021-12-31 | 2021-09-30 | 2021-06-30 | 2021-03-31 | 2020-12-31 | 2020-09-30 | 2020-06-30 | 2020-03-31 | 2019-12-31 | 2019-09-30 | 2019-06-30 | 2019-03-31 | 2018-12-31 | 2018-09-30 | 2018-06-30 | 2018-03-31 | 2017-12-31 | 2017-09-30 | 2017-06-30 | 2017-03-31 | 2016-12-31 | 2016-09-30 | 2016-06-30 | 2016-03-31 | 2015-12-31 | 2015-09-30 | 2015-06-30 | 2015-03-31 | 2014-12-31 | 2014-09-30 | 2014-06-30 | 2014-03-31 | 2013-12-31 | 2013-09-30 | 2013-06-30 | 2013-03-31 | 2012-12-31 | 2012-09-30 | 2012-06-30 | 2012-03-31 | 2011-12-31 | 2011-09-30 | 2011-06-30 | 2011-03-31 | 2010-12-31 | 2010-09-30 | 2010-06-30 | 2010-03-31 | ||
|---|---|---|---|---|---|---|---|---|---|---|---|---|---|---|---|---|---|---|---|---|---|---|---|---|---|---|---|---|---|---|---|---|---|---|---|---|---|---|---|---|---|---|---|---|---|---|---|---|---|---|---|---|---|---|---|---|---|
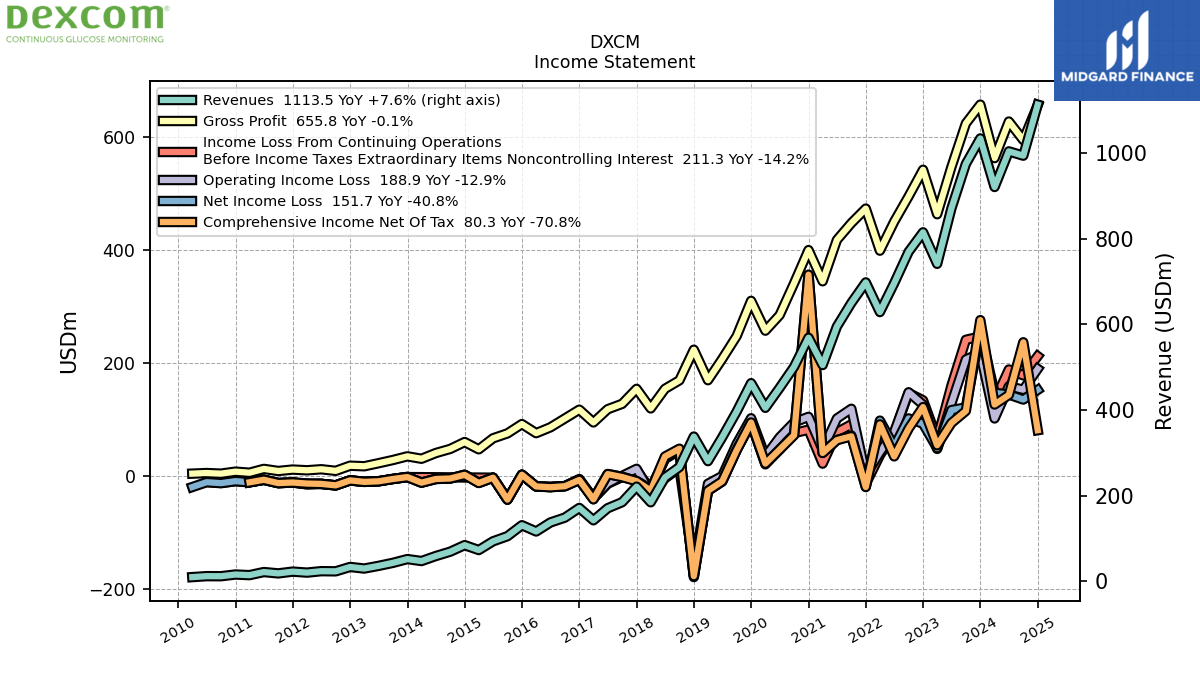
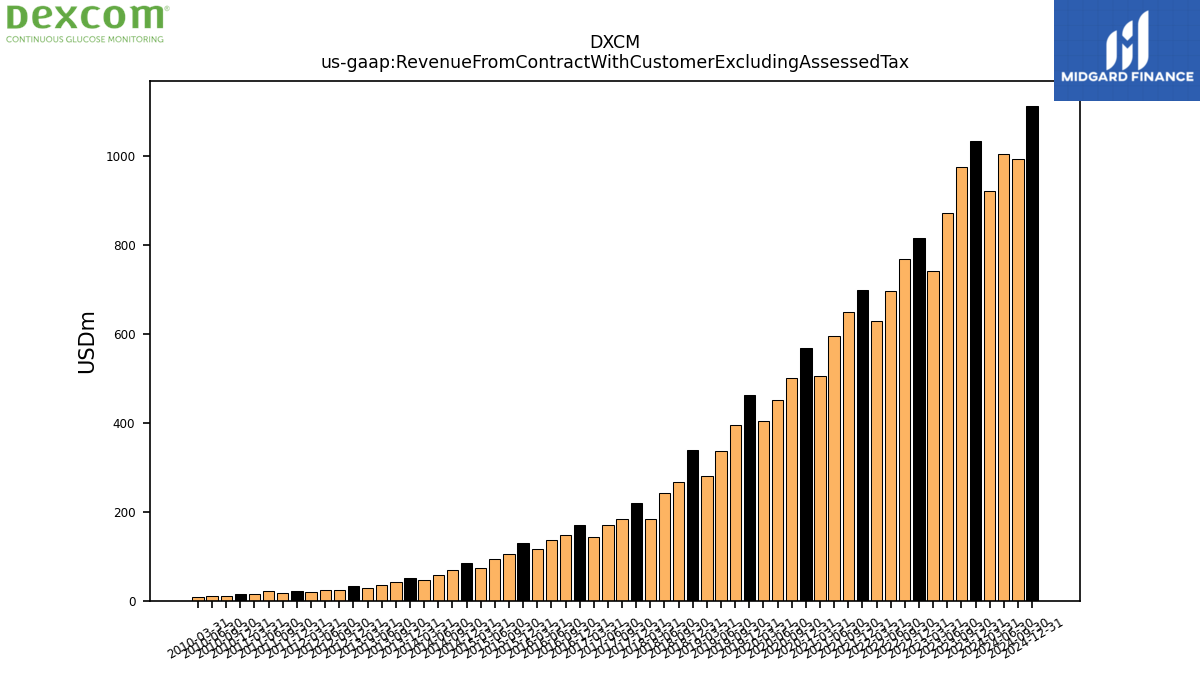
| Revenue From Contract With Customer Excluding Assessed Tax | 1034.50 | 975.00 | 871.30 | 741.50 | 815.20 | 769.60 | 696.20 | 628.80 | 698.20 | 650.20 | 595.10 | 505.00 | 568.90 | 500.90 | 451.80 | 405.10 | 462.80 | 396.30 | 336.40 | 280.50 | 338.00 | 266.70 | 242.50 | 184.40 | 221.00 | 184.60 | 170.60 | 142.30 | 171.20 | 148.60 | 137.30 | 116.20 | 130.80 | 105.20 | 93.20 | 72.80 | 84.30 | 69.00 | 58.80 | 47.10 | 51.70 | 42.90 | 35.80 | 29.60 | 33.30 | 23.09 | 23.45 | 20.09 | 22.42 | 18.25 | 21.42 | 14.17 | 15.64 | 11.66 | 11.79 | 9.54 | |
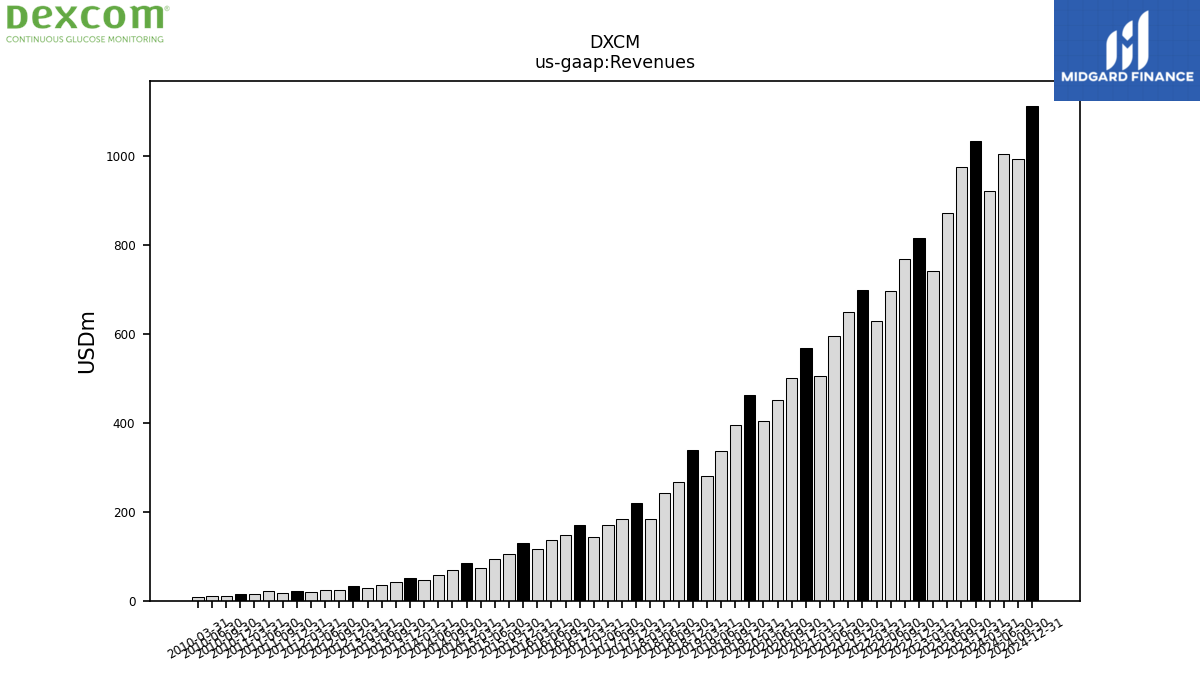
| Revenues | 1034.50 | 975.00 | 871.30 | 741.50 | 815.20 | 769.60 | 696.20 | 628.80 | 698.20 | 650.20 | 595.10 | 505.00 | 568.90 | 500.90 | 451.80 | 405.10 | 462.80 | 396.30 | 336.40 | 280.50 | 338.00 | 266.70 | 242.50 | 184.40 | 221.00 | 184.60 | 170.60 | 142.30 | 171.20 | 148.60 | 137.30 | 116.20 | 130.80 | 105.20 | 93.20 | 72.80 | 84.30 | 69.00 | 58.80 | 47.10 | 51.70 | 42.90 | 35.80 | 29.60 | 33.30 | 23.09 | 23.45 | 20.09 | 22.42 | 18.25 | 21.42 | 14.17 | 15.64 | 11.66 | 11.79 | 9.54 | |
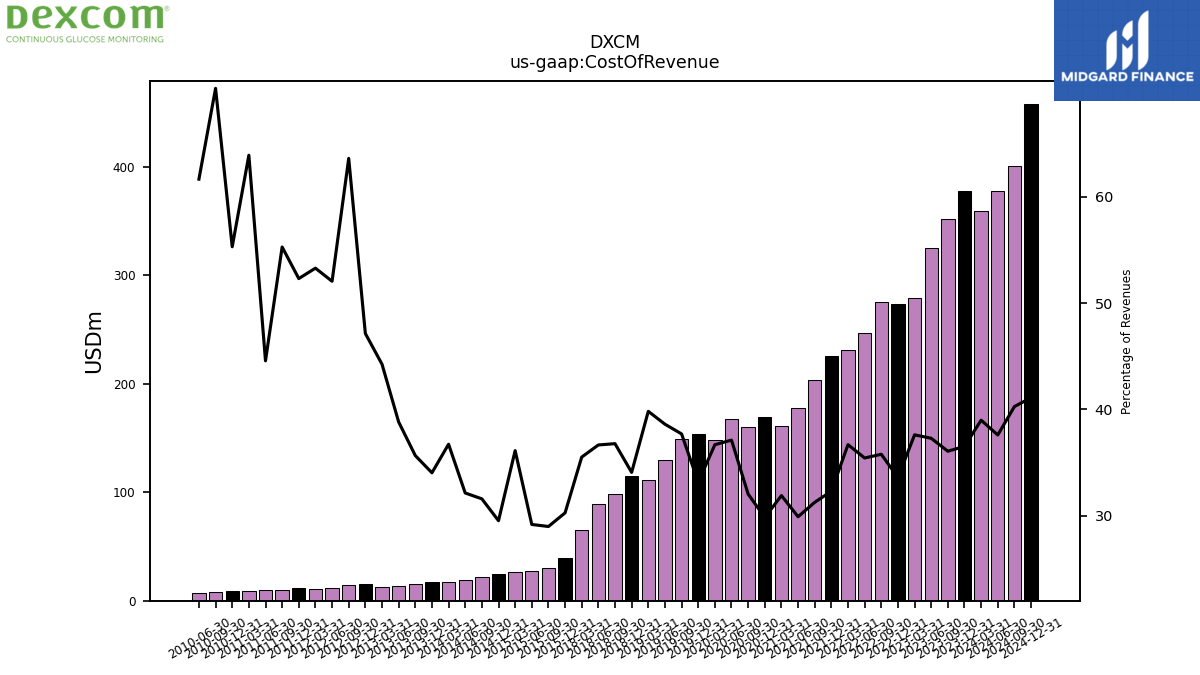
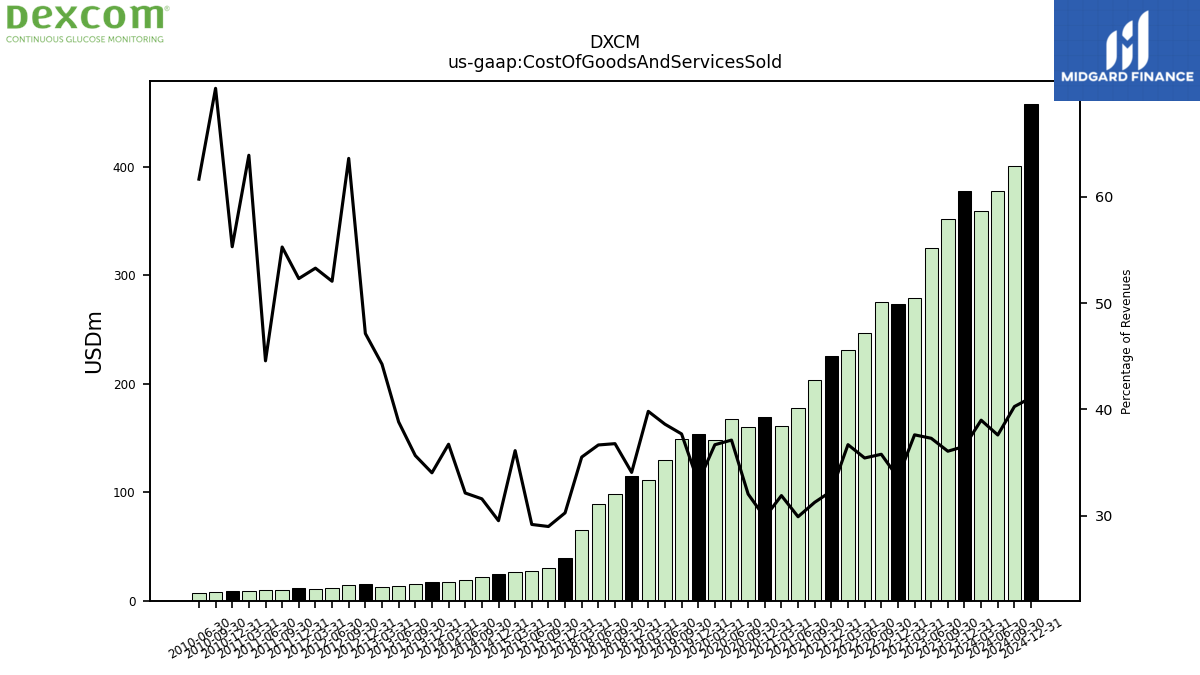
| Cost Of Revenue | 377.90 | 351.70 | 324.90 | 278.90 | 273.90 | 275.40 | 246.70 | 230.70 | 225.60 | 203.30 | 178.00 | 161.10 | 169.80 | 160.50 | 167.70 | 148.60 | 153.50 | 149.40 | 129.90 | 111.70 | 115.20 | 98.10 | 88.90 | 65.50 | NA | NA | NA | NA | NA | NA | NA | NA | 39.60 | 30.50 | 27.20 | 26.30 | 24.90 | 21.80 | 18.90 | 17.30 | 17.60 | 15.30 | 13.90 | 13.10 | 15.70 | 14.69 | 12.21 | 10.71 | 11.73 | 10.09 | 9.55 | 9.06 | 8.65 | 8.19 | 7.27 | NA | |
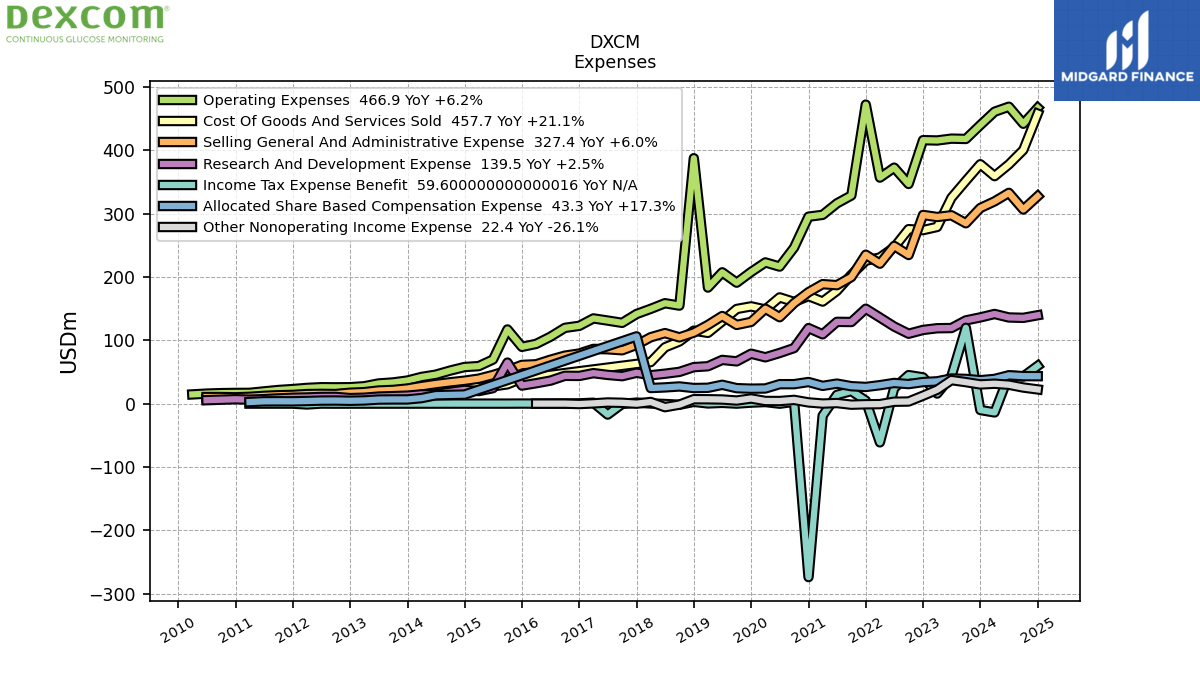
| Cost Of Goods And Services Sold | 377.90 | 351.70 | 324.90 | 278.90 | 273.90 | 275.40 | 246.70 | 230.70 | 225.60 | 203.30 | 178.00 | 161.10 | 169.80 | 160.50 | 167.70 | 148.60 | 153.50 | 149.40 | 129.90 | 111.70 | 115.20 | 98.10 | 88.90 | 65.50 | NA | NA | NA | NA | NA | NA | NA | NA | 39.60 | 30.50 | 27.20 | 26.30 | 24.90 | 21.80 | 18.90 | 17.30 | 17.60 | 15.30 | 13.90 | 13.10 | 15.70 | 14.69 | 12.21 | 10.71 | 11.73 | 10.09 | 9.55 | 9.06 | 8.65 | 8.19 | 7.27 | NA | |
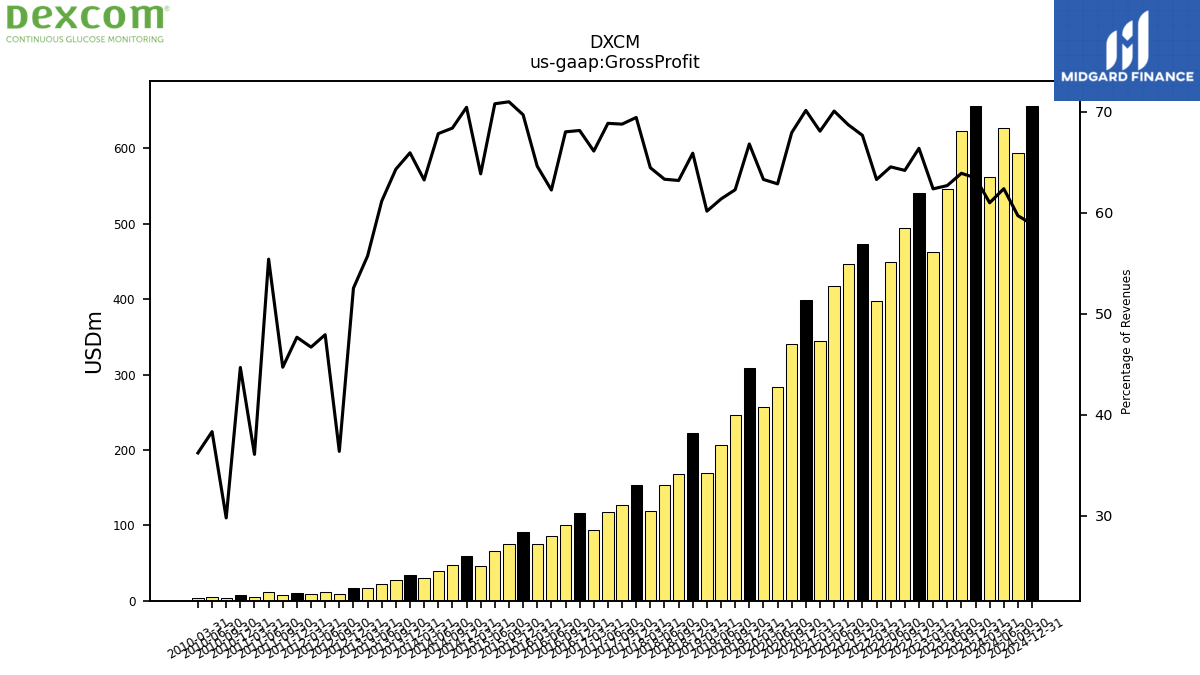
| Gross Profit | 656.60 | 623.30 | 546.40 | 462.60 | 541.30 | 494.20 | 449.50 | 398.10 | 472.60 | 446.90 | 417.10 | 343.90 | 399.10 | 340.40 | 284.10 | 256.50 | 309.30 | 246.90 | 206.50 | 168.80 | 222.80 | 168.60 | 153.60 | 118.90 | 153.50 | 127.00 | 117.50 | 94.10 | 116.70 | 101.10 | 85.50 | 75.10 | 91.20 | 74.70 | 66.00 | 46.50 | 59.40 | 47.20 | 39.90 | 29.80 | 34.10 | 27.60 | 21.90 | 16.50 | 17.50 | 8.40 | 11.24 | 9.39 | 10.69 | 8.16 | 11.87 | 5.12 | 6.99 | 3.48 | 4.52 | 3.46 | |
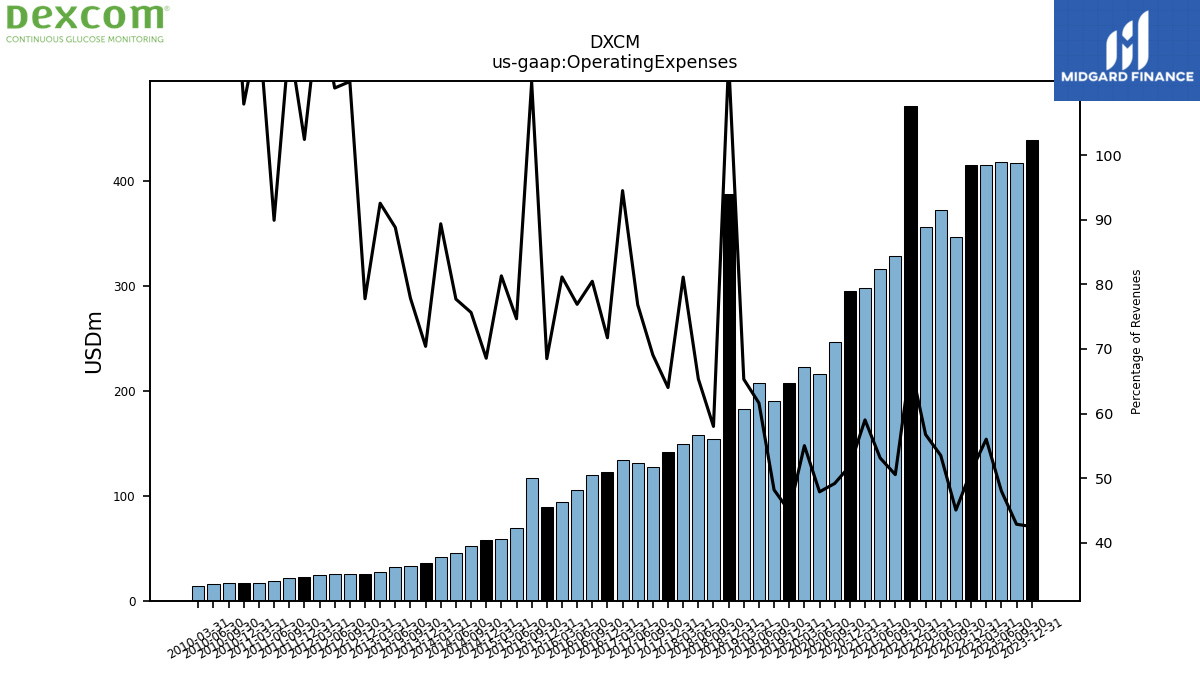
| Operating Expenses | 439.70 | 417.80 | 418.30 | 415.40 | 415.90 | 346.70 | 372.50 | 356.80 | 472.00 | 328.60 | 316.10 | 298.00 | 295.10 | 246.30 | 216.30 | 222.90 | 207.80 | 190.90 | 207.30 | 183.20 | 387.40 | 154.70 | 158.50 | 149.60 | 141.50 | 127.50 | 131.10 | 134.50 | 122.80 | 119.60 | 105.60 | 94.30 | 89.60 | 117.10 | 69.60 | 59.20 | 57.80 | 52.20 | 45.70 | 42.10 | 36.40 | 33.40 | 31.80 | 27.40 | 25.90 | 25.72 | 25.89 | 24.78 | 22.97 | 21.47 | 19.26 | 16.99 | 16.88 | 16.54 | 15.79 | 14.53 | |
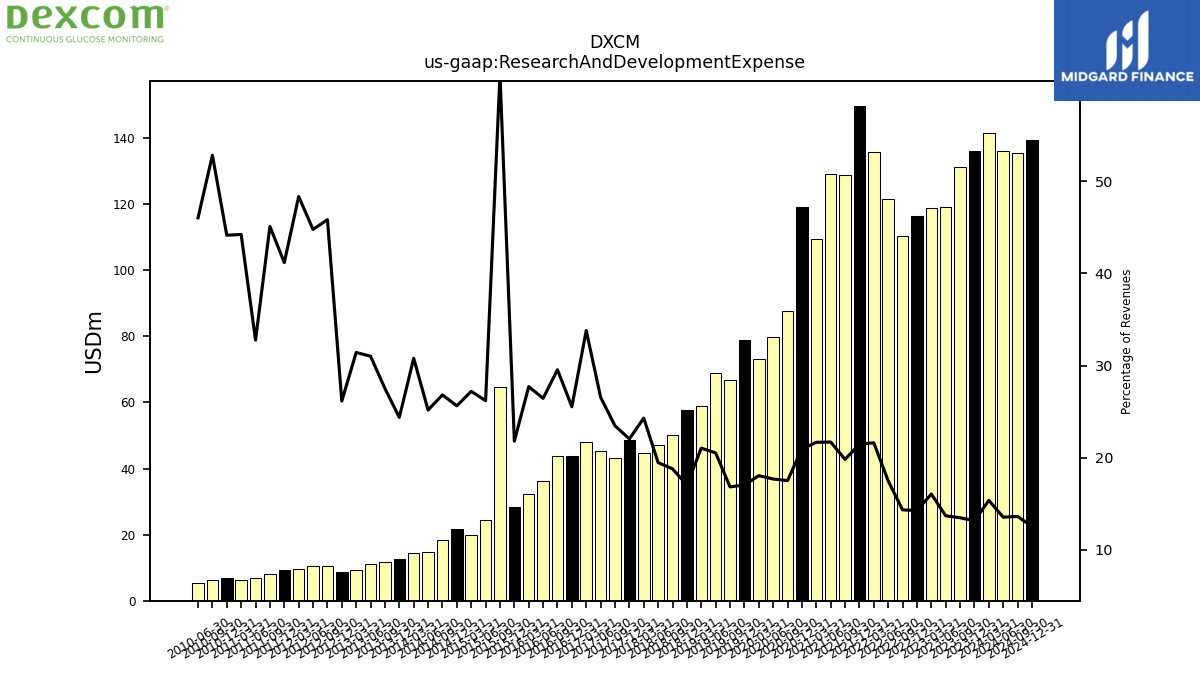
| Research And Development Expense | 136.10 | 131.40 | 119.30 | 119.00 | 116.30 | 110.30 | 121.70 | 135.90 | 149.80 | 128.80 | 129.10 | 109.40 | 119.20 | 87.70 | 79.90 | 73.10 | 78.80 | 66.70 | 69.00 | 59.00 | 57.60 | 50.10 | 47.20 | 44.80 | 48.70 | 43.30 | 45.30 | 48.10 | 43.70 | 43.90 | 36.30 | 32.20 | 28.50 | 64.80 | 24.40 | 19.80 | 21.60 | 18.50 | 14.80 | 14.50 | 12.60 | 11.80 | 11.10 | 9.30 | 8.71 | 10.58 | 10.50 | 9.71 | 9.23 | 8.23 | 7.02 | 6.27 | 6.90 | 6.16 | 5.42 | NA | |
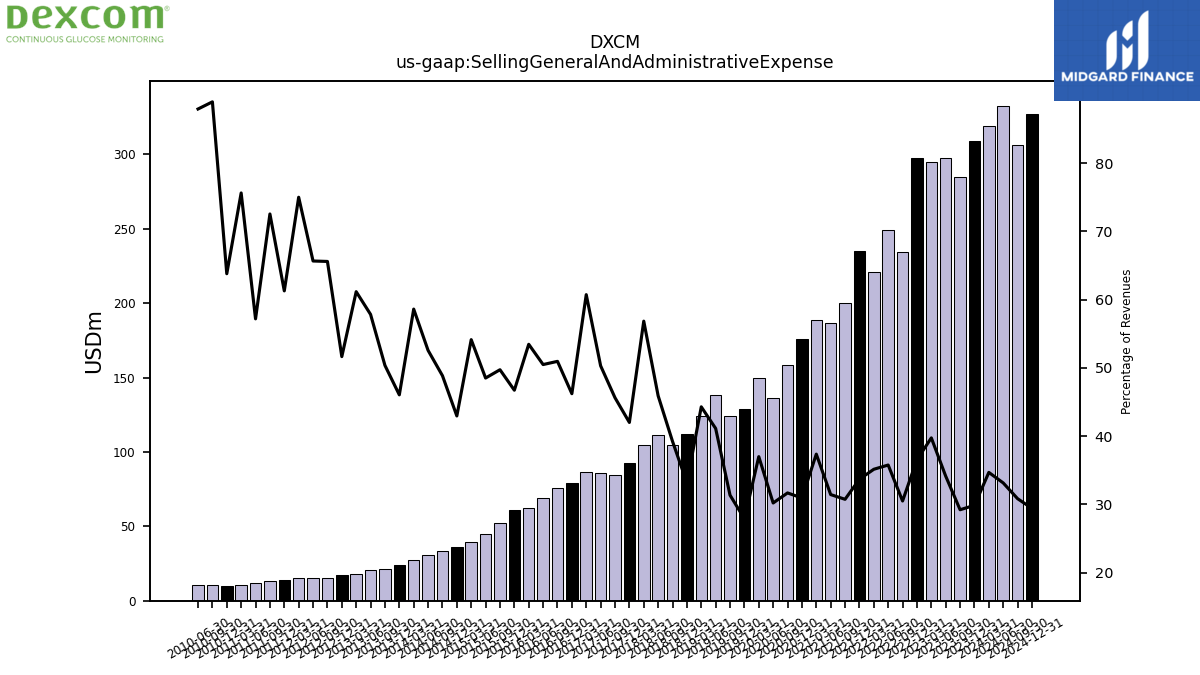
| Selling General And Administrative Expense | 308.80 | 284.70 | 297.30 | 294.60 | 297.80 | 234.60 | 248.90 | 220.90 | 235.10 | 199.80 | 187.00 | 188.60 | 175.90 | 158.60 | 136.40 | 149.80 | 129.00 | 124.20 | 138.30 | 124.20 | 112.10 | 104.60 | 111.30 | 104.80 | 92.80 | 84.20 | 85.80 | 86.40 | 79.10 | 75.70 | 69.30 | 62.10 | 61.10 | 52.30 | 45.20 | 39.40 | 36.20 | 33.70 | 30.90 | 27.60 | 23.80 | 21.60 | 20.70 | 18.10 | 17.20 | 15.14 | 15.39 | 15.07 | 13.74 | 13.24 | 12.24 | 10.72 | 9.97 | 10.38 | 10.36 | NA | |
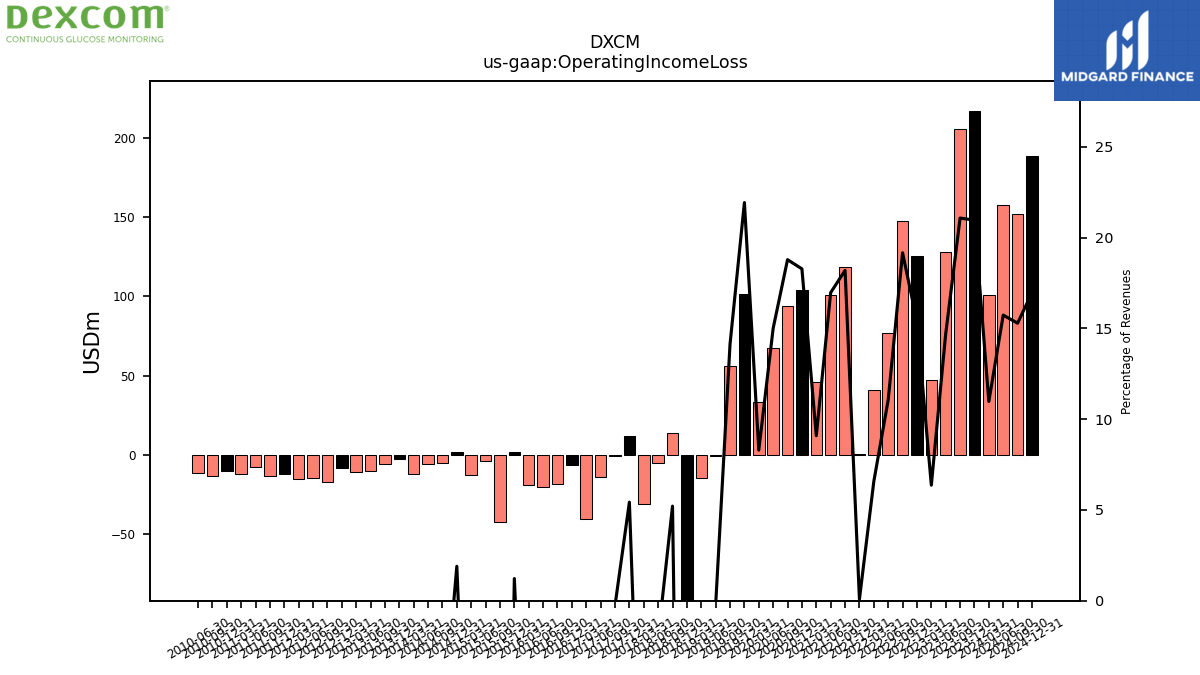
| Operating Income Loss | 216.90 | 205.50 | 128.10 | 47.20 | 125.40 | 147.50 | 77.00 | 41.30 | 0.60 | 118.30 | 101.00 | 45.90 | 104.00 | 94.10 | 67.80 | 33.60 | 101.50 | 56.00 | -0.80 | -14.40 | -164.60 | 13.90 | -4.90 | -30.70 | 12.00 | -0.50 | -13.60 | -40.40 | -6.10 | -18.50 | -20.10 | -19.20 | 1.60 | -42.40 | -3.60 | -12.70 | 1.60 | -5.00 | -5.80 | -12.30 | -2.30 | -5.80 | -9.90 | -10.90 | -8.33 | -17.32 | -14.65 | -15.40 | -12.28 | -13.31 | -7.39 | -11.87 | -9.89 | -13.06 | -11.27 | NA | |
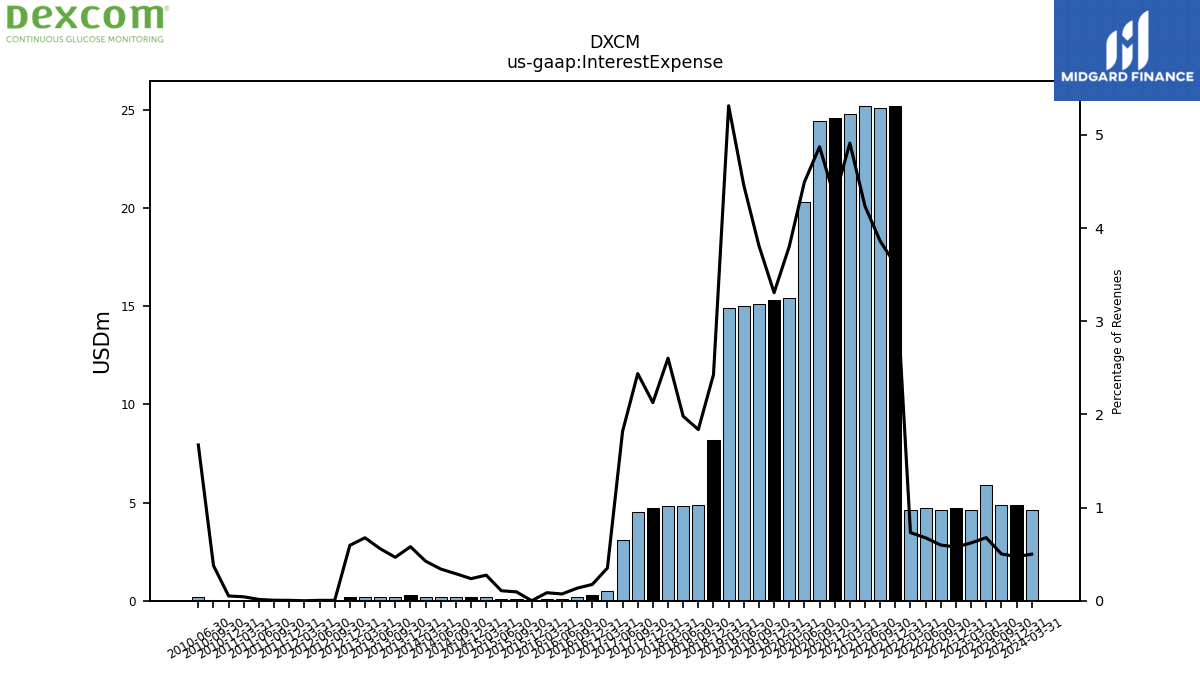
| Interest Expense | 4.90 | 4.90 | 5.90 | 4.60 | 4.70 | 4.60 | 4.70 | 4.60 | 25.20 | 25.10 | 25.20 | 24.80 | 24.60 | 24.40 | 20.30 | 15.40 | 15.30 | 15.10 | 15.00 | 14.90 | 8.20 | 4.90 | 4.80 | 4.80 | 4.70 | 4.50 | 3.10 | 0.50 | 0.30 | 0.20 | 0.10 | 0.10 | 0.00 | 0.10 | 0.10 | 0.20 | 0.20 | 0.20 | 0.20 | 0.20 | 0.30 | 0.20 | 0.20 | 0.20 | 0.20 | 0.00 | 0.00 | 0.00 | 0.00 | 0.00 | 0.00 | 0.01 | 0.01 | 0.04 | 0.20 | NA | |
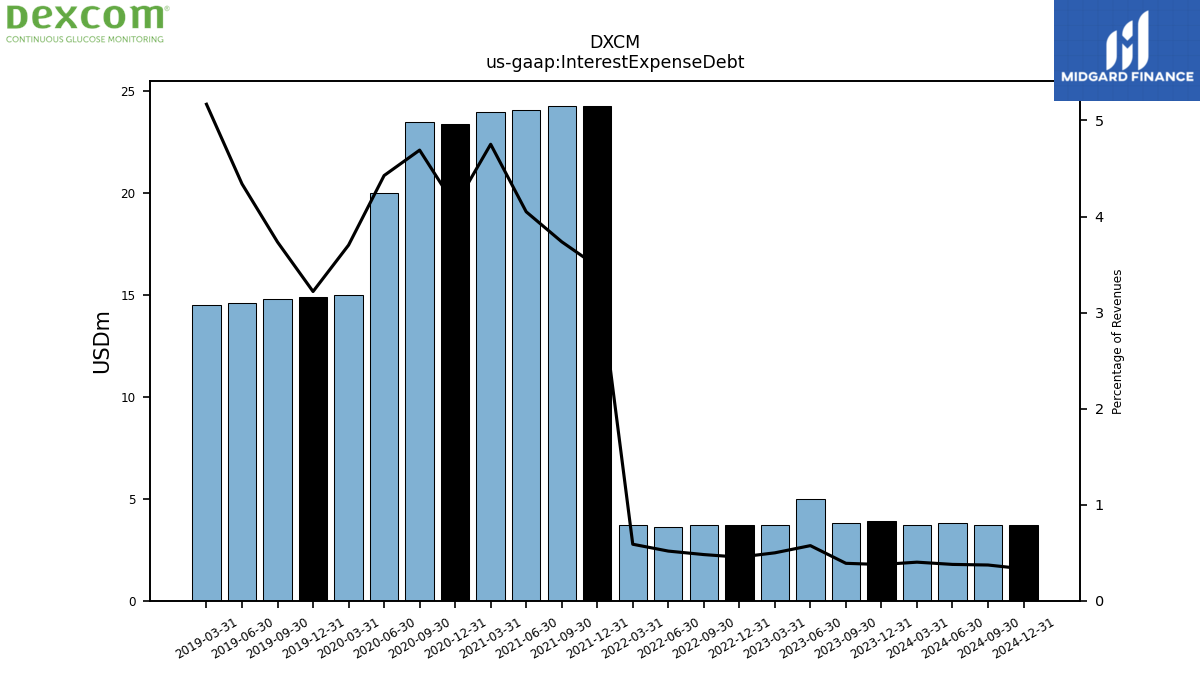
| Interest Expense Debt | 3.90 | 3.80 | 5.00 | 3.70 | 3.70 | 3.70 | 3.60 | 3.70 | 24.30 | 24.30 | 24.10 | 24.00 | 23.40 | 23.50 | 20.00 | 15.00 | 14.90 | 14.80 | 14.60 | 14.50 | NA | NA | NA | NA | NA | NA | NA | NA | NA | NA | NA | NA | NA | NA | NA | NA | NA | NA | NA | NA | NA | NA | NA | NA | NA | NA | NA | NA | NA | NA | NA | NA | NA | NA | NA | NA | |
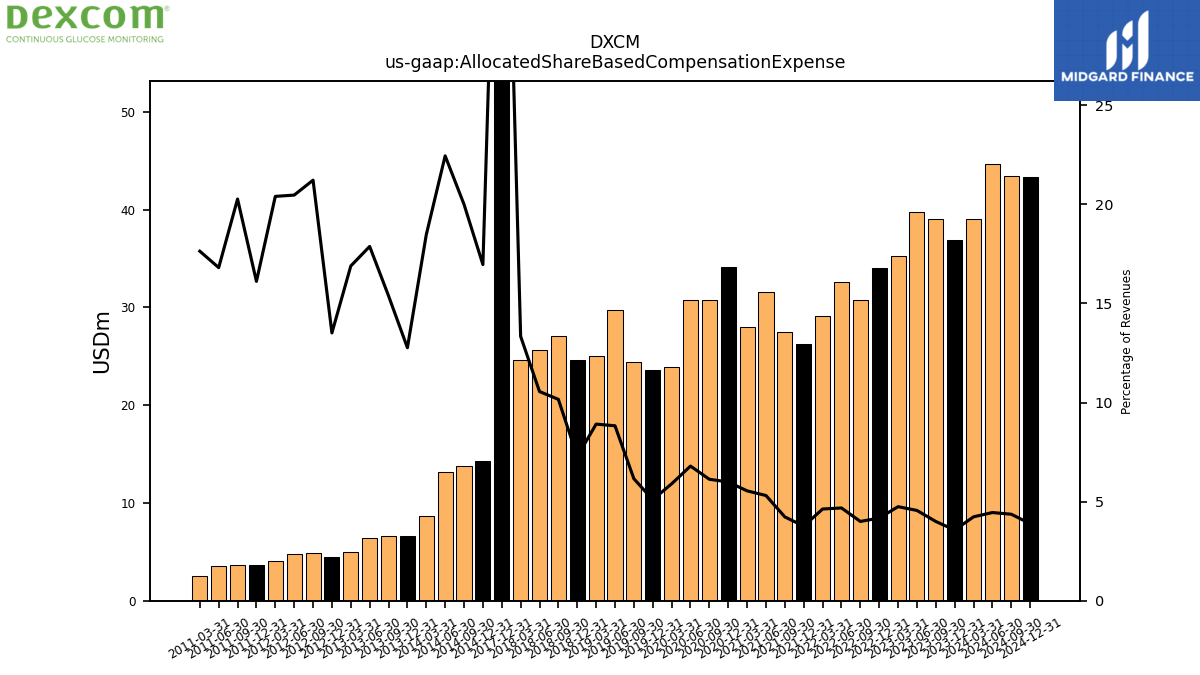
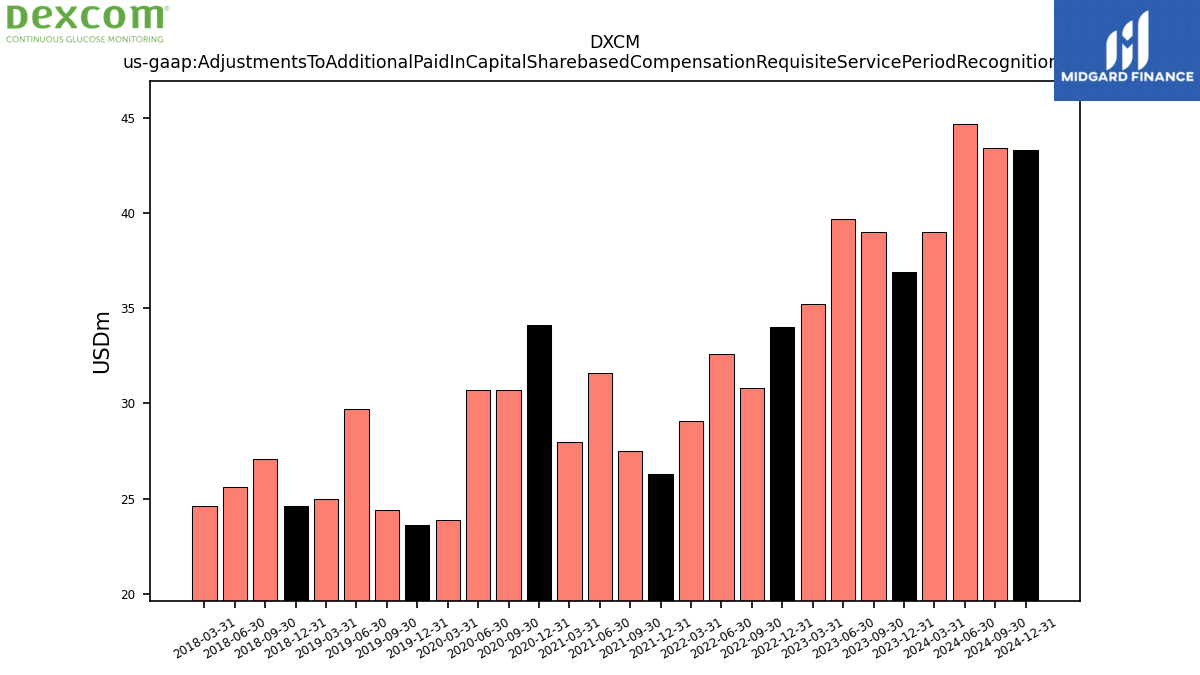
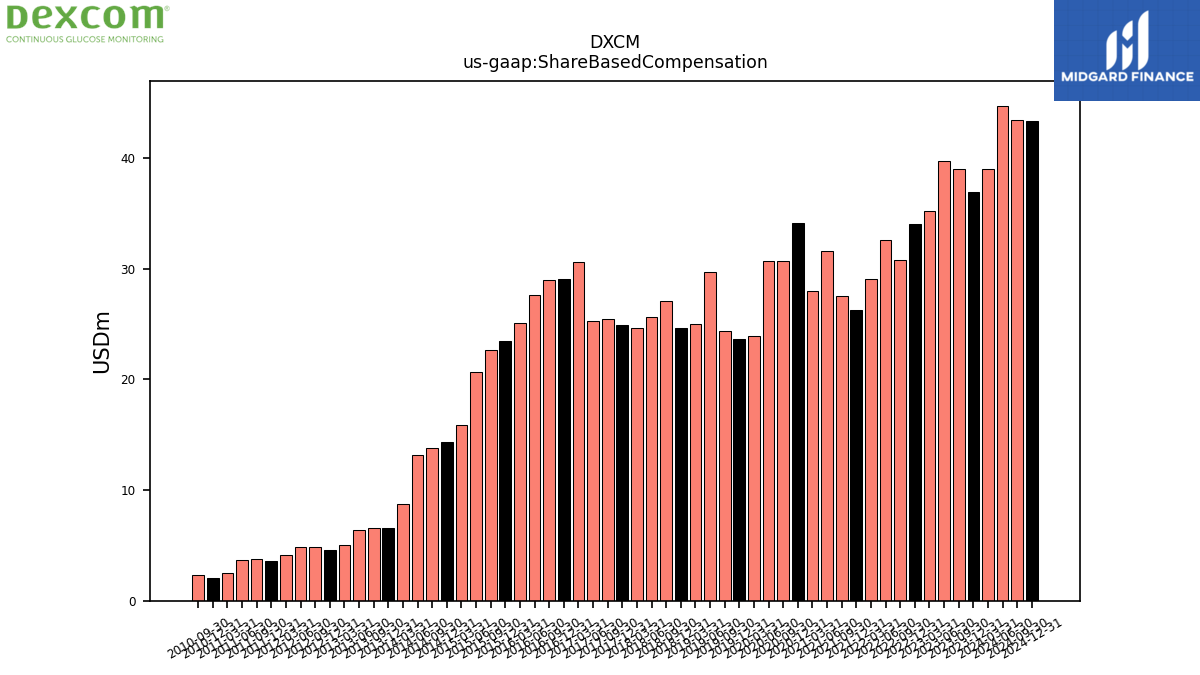
| Allocated Share Based Compensation Expense | 36.90 | 39.00 | 39.70 | 35.20 | 34.00 | 30.80 | 32.60 | 29.10 | 26.30 | 27.50 | 31.60 | 28.00 | 34.10 | 30.70 | 30.70 | 23.90 | 23.60 | 24.40 | 29.70 | 25.00 | 24.60 | 27.10 | 25.60 | 24.60 | 106.20 | NA | NA | NA | NA | NA | NA | NA | NA | NA | NA | NA | 14.30 | 13.80 | 13.20 | 8.70 | 6.60 | 6.60 | 6.40 | 5.00 | 4.50 | 4.90 | 4.80 | 4.10 | 3.61 | 3.70 | 3.60 | 2.50 | NA | NA | NA | NA | |
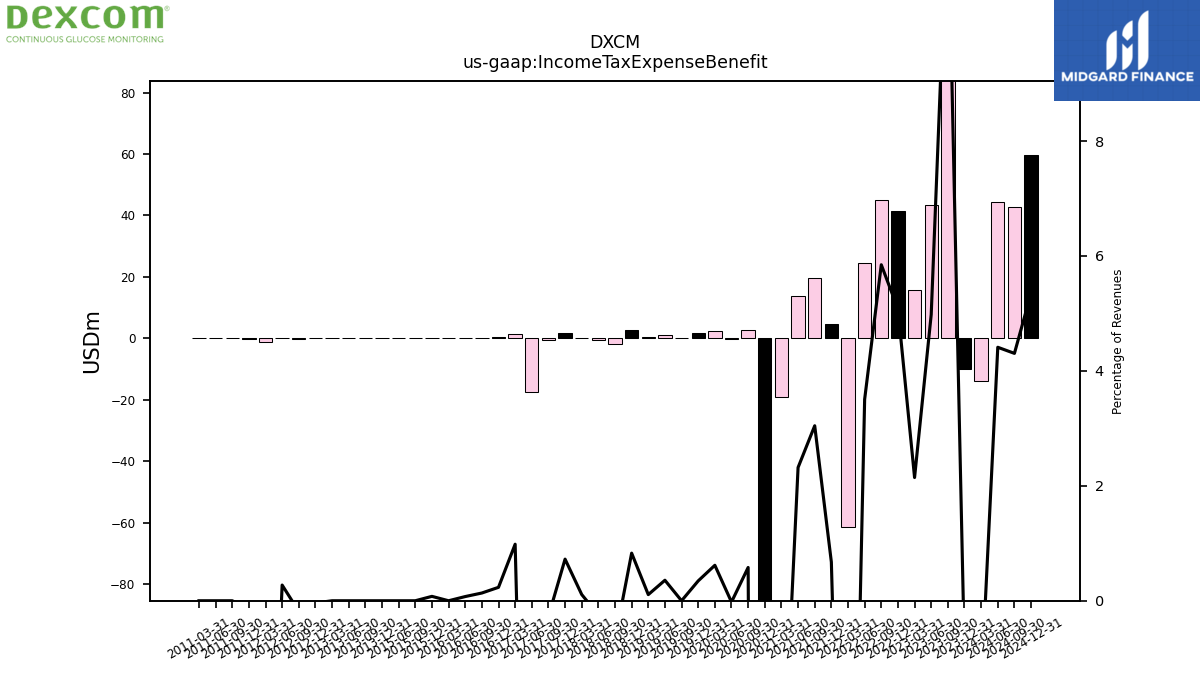
| Income Tax Expense Benefit | -10.10 | 119.70 | 43.40 | 15.90 | 41.40 | 45.00 | 24.40 | -61.20 | 4.70 | 19.80 | 13.80 | -19.10 | -273.90 | 2.90 | -0.10 | 2.50 | 1.60 | 0.00 | 1.20 | 0.30 | 2.80 | -1.80 | -0.60 | 0.20 | 1.60 | -0.50 | -17.30 | 1.40 | 0.40 | 0.20 | 0.10 | 0.00 | 0.10 | 0.00 | 0.00 | NA | NA | NA | NA | NA | 0.00 | 0.00 | 0.00 | 0.00 | -0.01 | -0.04 | 0.06 | -1.31 | -0.03 | 0.00 | 0.00 | 0.00 | NA | NA | NA | NA | |
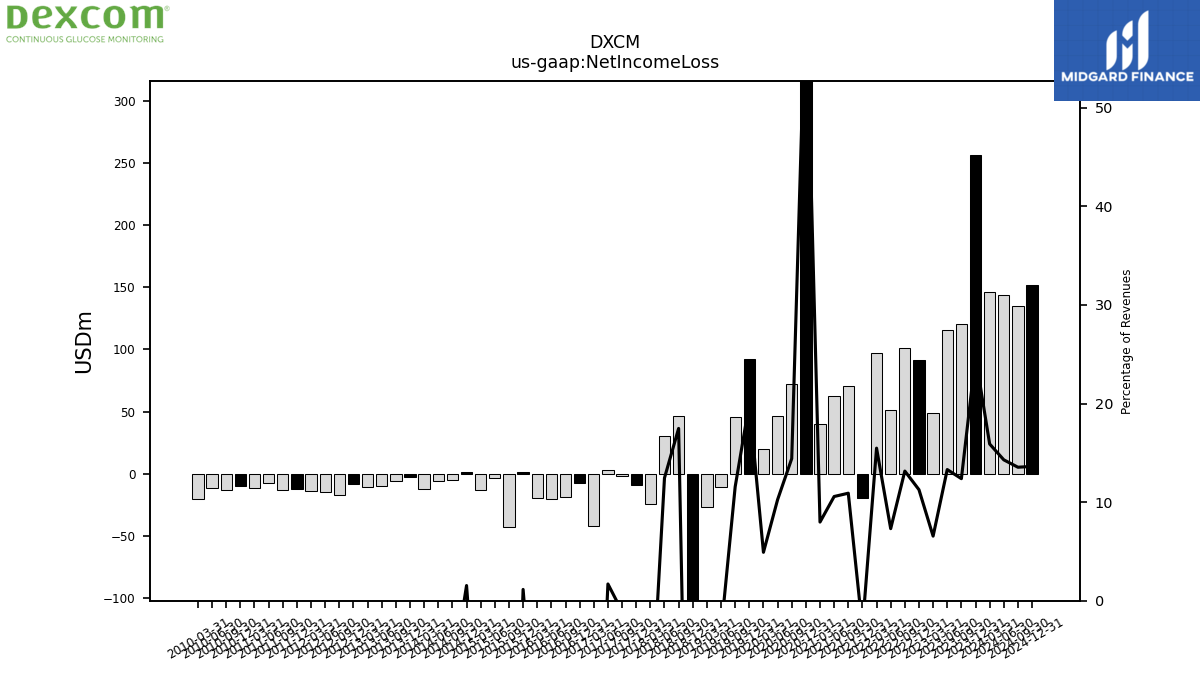
| Net Income Loss | 256.30 | 120.70 | 115.90 | 48.60 | 91.80 | 101.20 | 50.90 | 97.30 | -19.40 | 70.90 | 62.90 | 40.30 | 355.20 | 72.20 | 46.30 | 19.90 | 92.70 | 45.80 | -10.50 | -26.90 | -179.70 | 46.60 | 30.20 | -24.20 | -9.40 | -2.00 | 2.90 | -41.70 | -7.40 | -18.80 | -20.20 | -19.20 | 1.50 | -42.50 | -3.70 | -12.90 | 1.30 | -5.20 | -6.00 | -12.50 | -2.60 | -6.00 | -10.10 | -11.10 | -8.50 | -17.26 | -14.69 | -14.06 | -12.25 | -13.28 | -7.37 | -11.85 | -9.81 | -13.40 | -11.69 | -20.27 | |
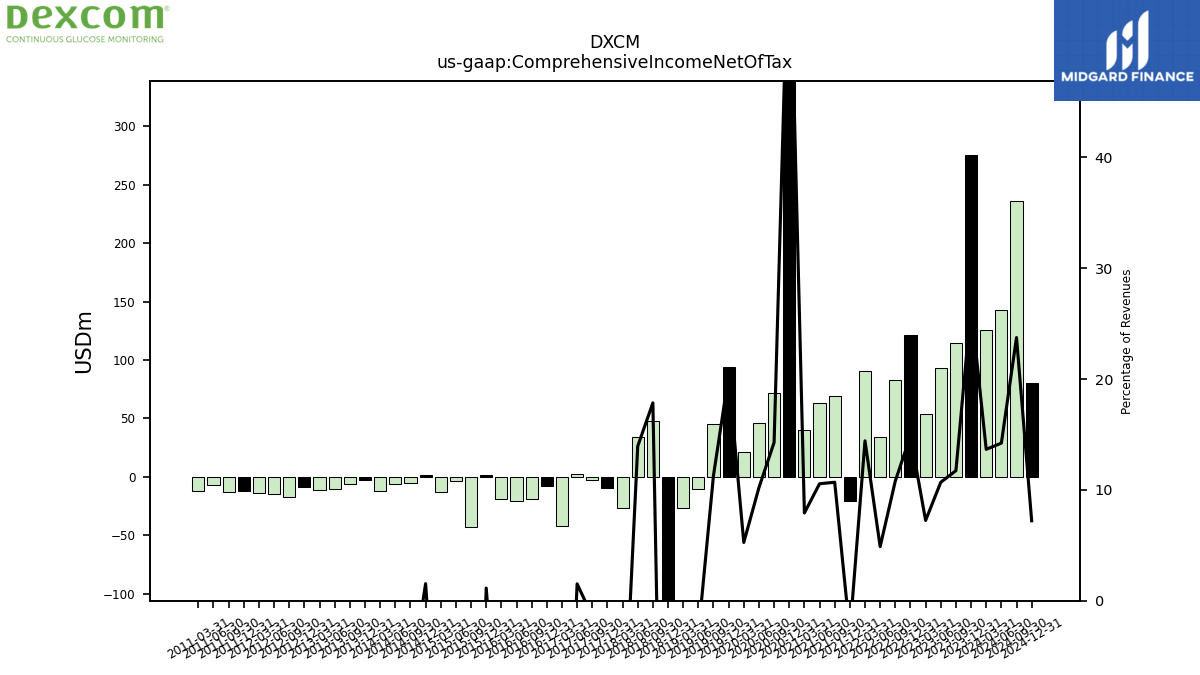
| Comprehensive Income Net Of Tax | 275.20 | 114.40 | 93.10 | 53.70 | 121.30 | 83.10 | 34.00 | 90.70 | -20.30 | 69.50 | 62.80 | 40.00 | 355.60 | 71.50 | 46.10 | 21.30 | 94.00 | 44.80 | -10.10 | -26.80 | -177.90 | 47.60 | 33.80 | -26.50 | -9.80 | -2.60 | 2.60 | -42.00 | -7.70 | -18.80 | -20.60 | -19.20 | 1.50 | -42.50 | -3.70 | -13.10 | 1.30 | -5.10 | -6.00 | -12.50 | -2.60 | -6.00 | -10.10 | -11.10 | -8.47 | -17.27 | -14.68 | -14.09 | -12.24 | -13.27 | -7.38 | -11.87 | NA | NA | NA | NA |
| 2023-12-31 | 2023-09-30 | 2023-06-30 | 2023-03-31 | 2022-12-31 | 2022-09-30 | 2022-06-30 | 2022-03-31 | 2021-12-31 | 2021-09-30 | 2021-06-30 | 2021-03-31 | 2020-12-31 | 2020-09-30 | 2020-06-30 | 2020-03-31 | 2019-12-31 | 2019-09-30 | 2019-06-30 | 2019-03-31 | 2018-12-31 | 2018-09-30 | 2018-06-30 | 2018-03-31 | 2017-12-31 | 2017-09-30 | 2017-06-30 | 2017-03-31 | 2016-12-31 | 2016-09-30 | 2016-06-30 | 2016-03-31 | 2015-12-31 | 2015-09-30 | 2015-06-30 | 2015-03-31 | 2014-12-31 | 2014-09-30 | 2014-06-30 | 2014-03-31 | 2013-12-31 | 2013-09-30 | 2013-06-30 | 2013-03-31 | 2012-12-31 | 2012-09-30 | 2012-06-30 | 2012-03-31 | 2011-12-31 | 2011-09-30 | 2011-06-30 | 2011-03-31 | 2010-12-31 | 2010-09-30 | 2010-06-30 | 2010-03-31 | ||
|---|---|---|---|---|---|---|---|---|---|---|---|---|---|---|---|---|---|---|---|---|---|---|---|---|---|---|---|---|---|---|---|---|---|---|---|---|---|---|---|---|---|---|---|---|---|---|---|---|---|---|---|---|---|---|---|---|---|
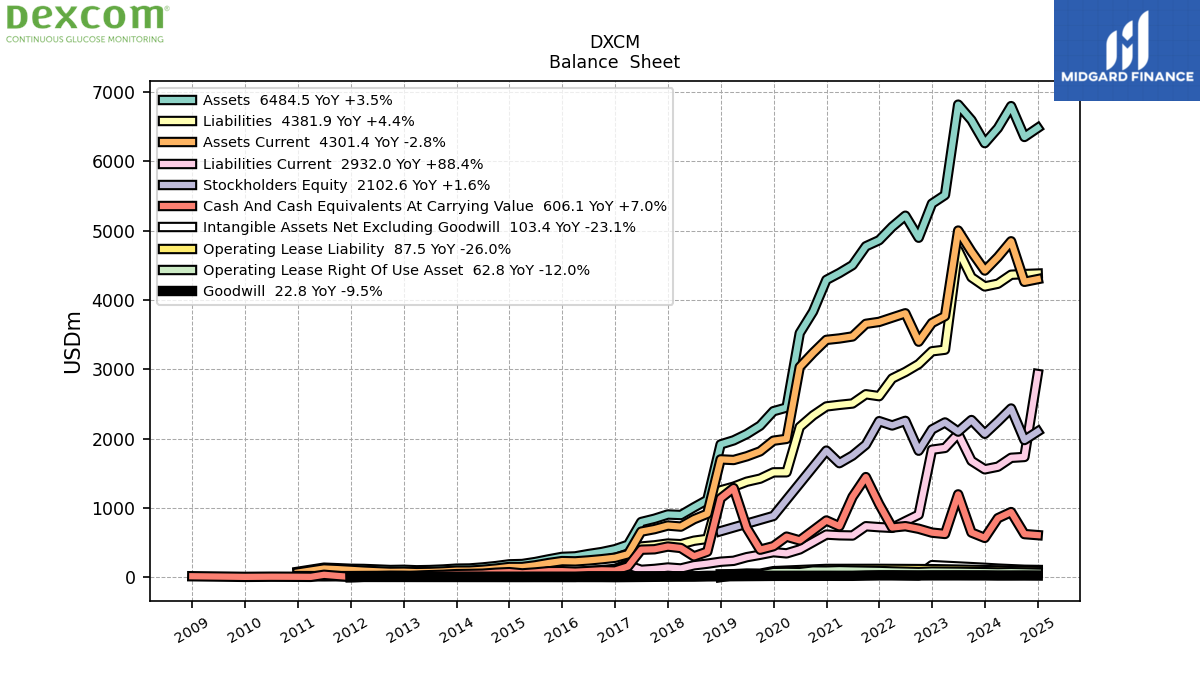
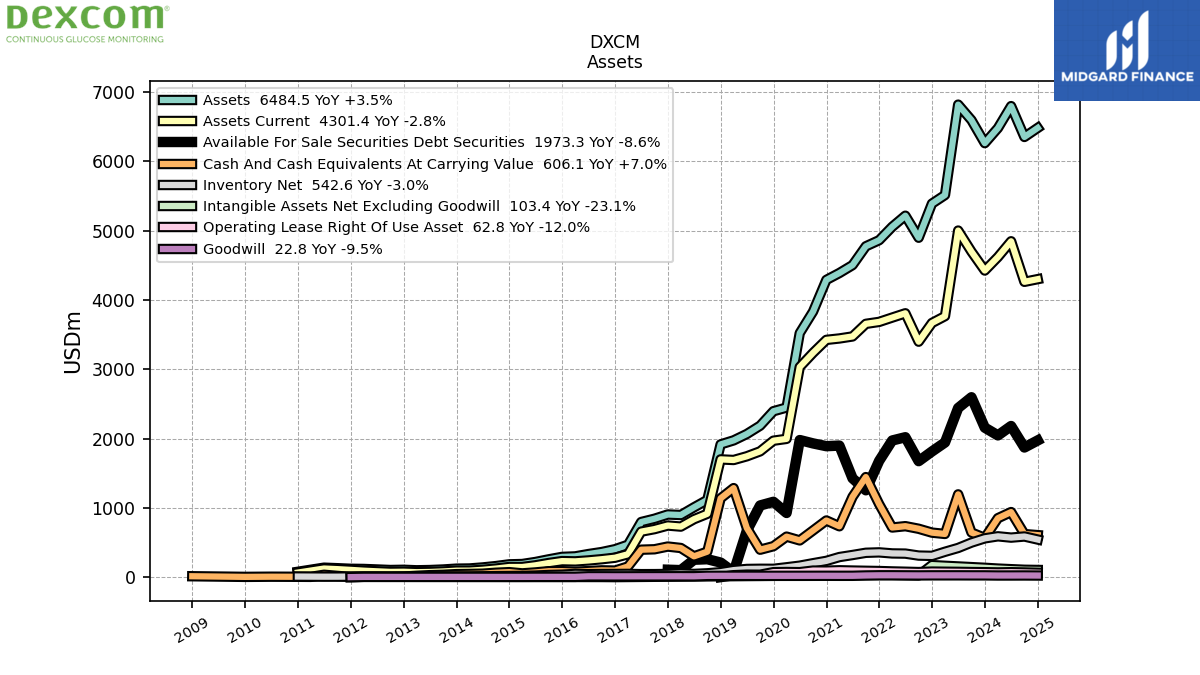
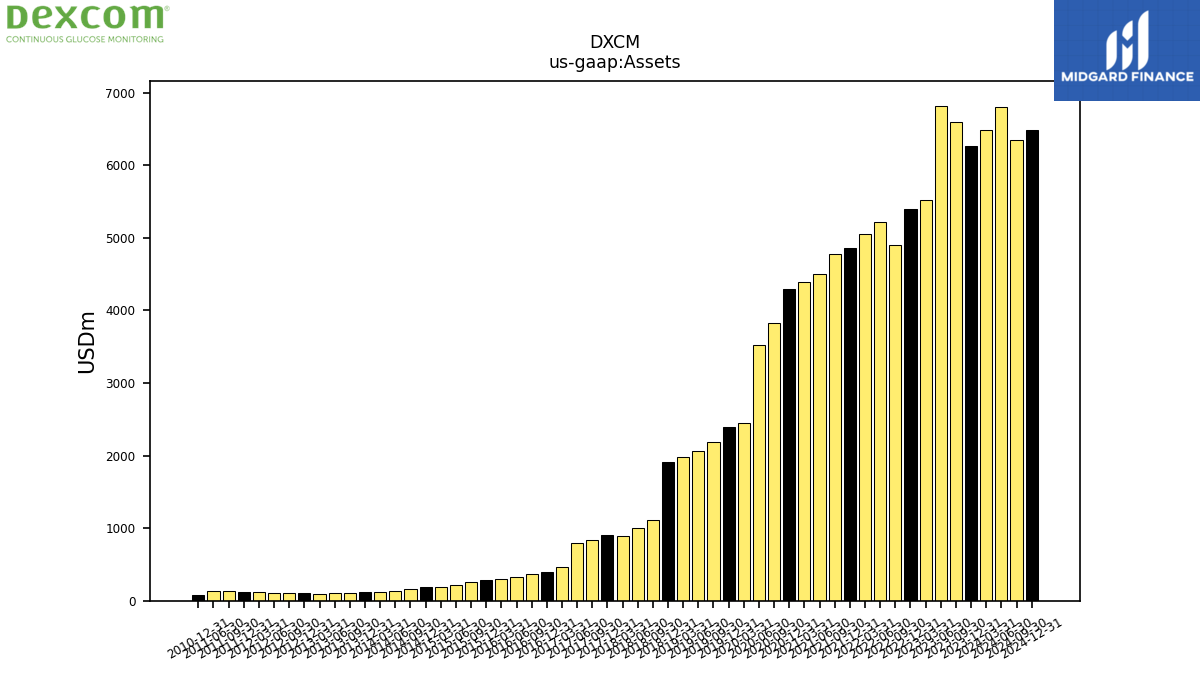
| Assets | 6264.50 | 6596.20 | 6820.70 | 5515.90 | 5391.70 | 4899.20 | 5217.40 | 5057.00 | 4863.60 | 4775.90 | 4503.80 | 4389.80 | 4290.50 | 3833.20 | 3521.80 | 2447.90 | 2395.00 | 2185.70 | 2065.90 | 1974.00 | 1916.00 | 1114.30 | 1007.50 | 896.80 | 904.10 | 842.90 | 795.60 | 467.20 | 402.80 | 361.90 | 332.80 | 299.40 | 292.00 | 256.70 | 218.40 | 189.30 | 184.60 | 159.40 | 139.70 | 124.90 | 122.50 | 110.10 | 102.30 | 98.80 | 106.00 | 102.80 | 110.52 | 117.96 | 120.47 | 128.79 | 136.37 | NA | 77.16 | NA | NA | NA | |
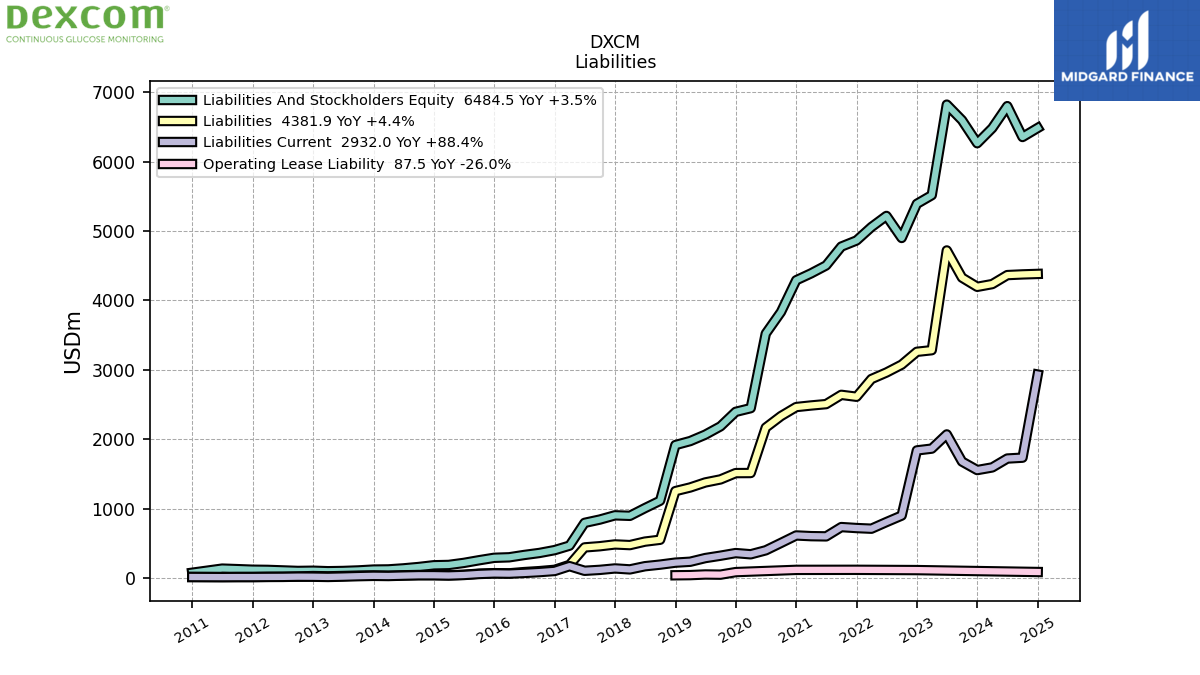
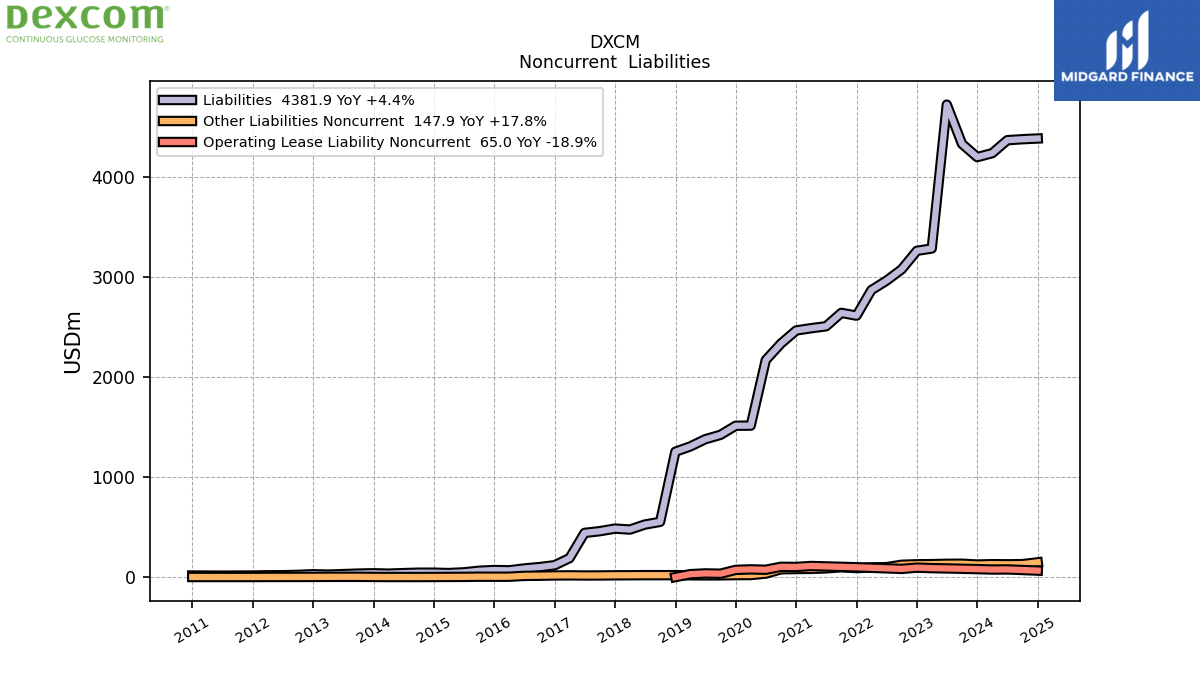
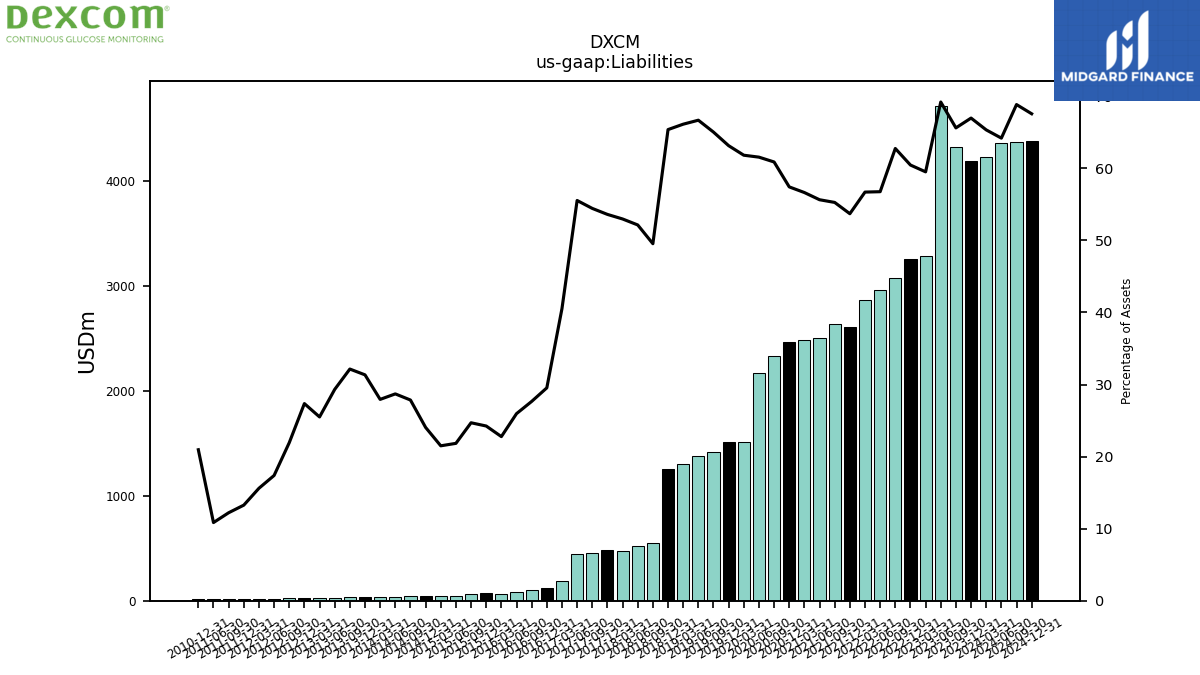
| Liabilities | 4195.90 | 4328.30 | 4720.30 | 3282.90 | 3259.90 | 3074.70 | 2961.50 | 2867.70 | 2612.10 | 2639.80 | 2506.20 | 2486.60 | 2464.00 | 2333.90 | 2167.90 | 1513.40 | 1512.40 | 1421.40 | 1377.60 | 1305.40 | 1252.70 | 552.10 | 525.40 | 475.10 | 484.70 | 458.90 | 441.90 | 189.40 | 119.00 | 100.10 | 86.40 | 68.20 | 70.80 | 63.40 | 47.70 | 40.70 | 44.40 | 44.40 | 40.10 | 34.90 | 38.40 | 35.40 | 30.00 | 25.20 | 29.00 | 22.54 | 19.21 | 18.41 | 15.98 | 15.73 | 14.79 | NA | 16.17 | NA | NA | NA | |
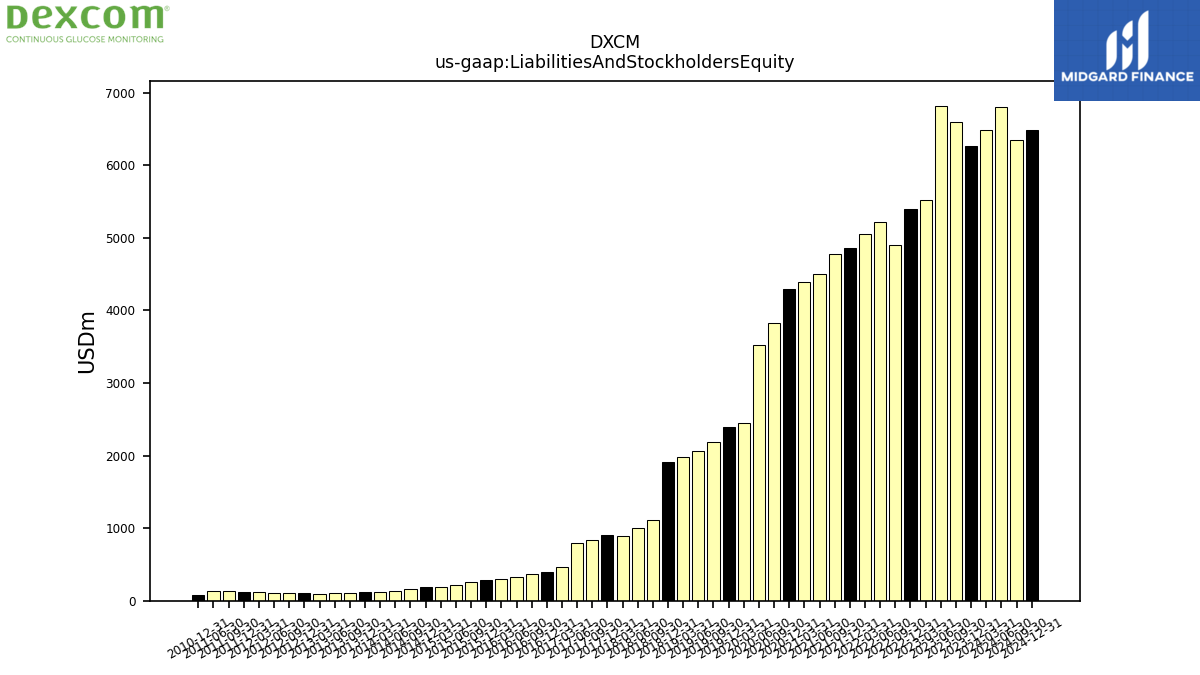
| Liabilities And Stockholders Equity | 6264.50 | 6596.20 | 6820.70 | 5515.90 | 5391.70 | 4899.20 | 5217.40 | 5057.00 | 4863.60 | 4775.90 | 4503.80 | 4389.80 | 4290.50 | 3833.20 | 3521.80 | 2447.90 | 2395.00 | 2185.70 | 2065.90 | 1974.00 | 1916.00 | 1114.30 | 1007.50 | 896.80 | 904.10 | 842.90 | 795.60 | 467.20 | 402.80 | 361.90 | 332.80 | 299.40 | 292.00 | 256.70 | 218.40 | 189.30 | 184.60 | 159.40 | 139.70 | 124.90 | 122.50 | 110.10 | 102.30 | 98.80 | 106.00 | 102.80 | 110.52 | 117.96 | 120.47 | 128.79 | 136.37 | NA | 77.16 | NA | NA | NA | |
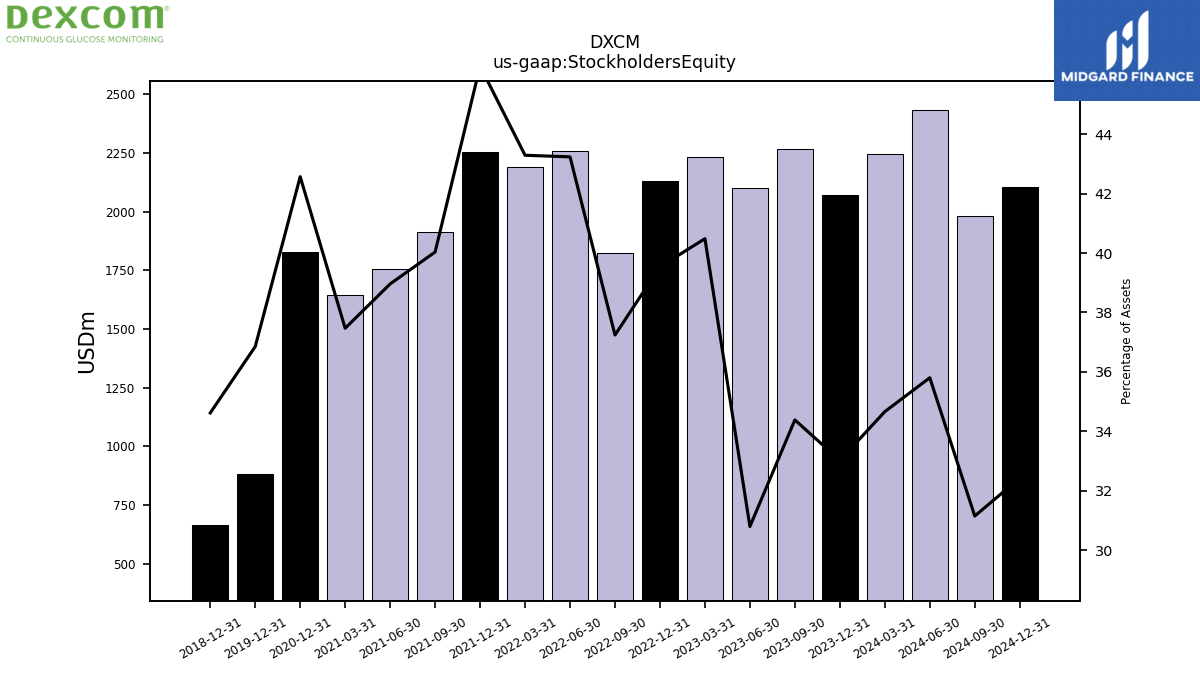
| Stockholders Equity | 2068.60 | 2267.90 | 2100.40 | 2233.00 | 2131.80 | 1824.50 | 2255.90 | 2189.30 | 2251.50 | 1912.00 | 1754.70 | 1644.80 | 1826.50 | NA | NA | NA | 882.60 | NA | NA | NA | 663.30 | NA | NA | NA | NA | NA | NA | NA | NA | NA | NA | NA | NA | NA | NA | NA | NA | NA | NA | NA | NA | NA | NA | NA | NA | NA | NA | NA | NA | NA | NA | NA | NA | NA | NA | NA |
| 2023-12-31 | 2023-09-30 | 2023-06-30 | 2023-03-31 | 2022-12-31 | 2022-09-30 | 2022-06-30 | 2022-03-31 | 2021-12-31 | 2021-09-30 | 2021-06-30 | 2021-03-31 | 2020-12-31 | 2020-09-30 | 2020-06-30 | 2020-03-31 | 2019-12-31 | 2019-09-30 | 2019-06-30 | 2019-03-31 | 2018-12-31 | 2018-09-30 | 2018-06-30 | 2018-03-31 | 2017-12-31 | 2017-09-30 | 2017-06-30 | 2017-03-31 | 2016-12-31 | 2016-09-30 | 2016-06-30 | 2016-03-31 | 2015-12-31 | 2015-09-30 | 2015-06-30 | 2015-03-31 | 2014-12-31 | 2014-09-30 | 2014-06-30 | 2014-03-31 | 2013-12-31 | 2013-09-30 | 2013-06-30 | 2013-03-31 | 2012-12-31 | 2012-09-30 | 2012-06-30 | 2012-03-31 | 2011-12-31 | 2011-09-30 | 2011-06-30 | 2011-03-31 | 2010-12-31 | 2010-09-30 | 2010-06-30 | 2010-03-31 | ||
|---|---|---|---|---|---|---|---|---|---|---|---|---|---|---|---|---|---|---|---|---|---|---|---|---|---|---|---|---|---|---|---|---|---|---|---|---|---|---|---|---|---|---|---|---|---|---|---|---|---|---|---|---|---|---|---|---|---|
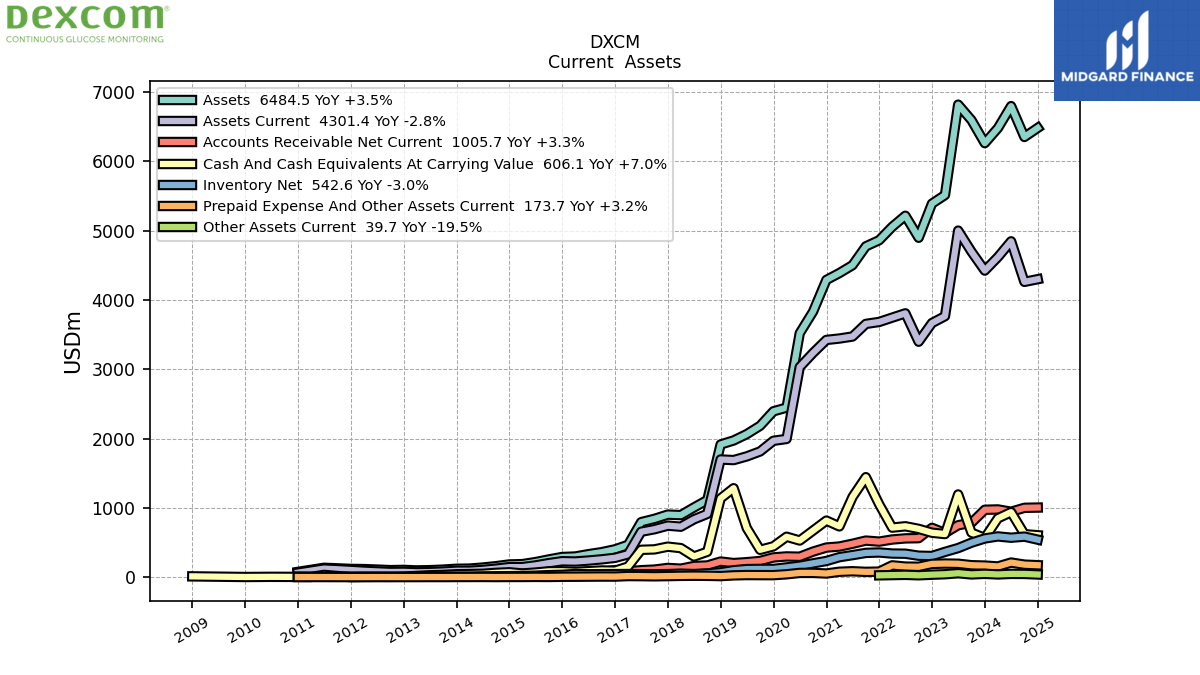
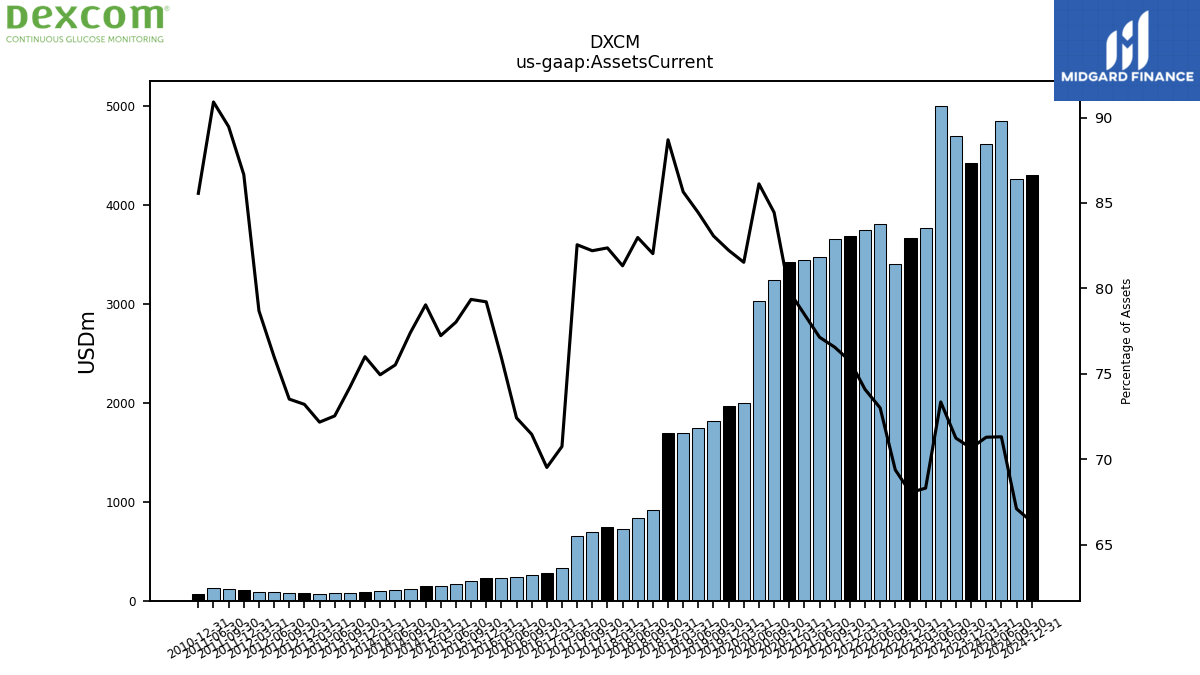
| Assets Current | 4425.90 | 4698.40 | 5002.90 | 3767.40 | 3668.80 | 3398.50 | 3808.70 | 3746.60 | 3684.40 | 3656.20 | 3474.20 | 3445.10 | 3424.80 | 3237.10 | 3033.00 | 1995.70 | 1969.40 | 1815.70 | 1744.20 | 1690.80 | 1699.50 | 914.10 | 836.00 | 729.30 | 744.70 | 692.90 | 656.80 | 330.50 | 280.00 | 258.60 | 241.00 | 227.40 | 231.30 | 203.70 | 170.40 | 146.20 | 145.90 | 123.40 | 105.50 | 93.60 | 93.10 | 81.70 | 74.20 | 71.30 | 77.60 | 75.57 | 83.99 | 92.82 | 104.41 | 115.23 | 123.98 | NA | 66.03 | NA | NA | NA | |
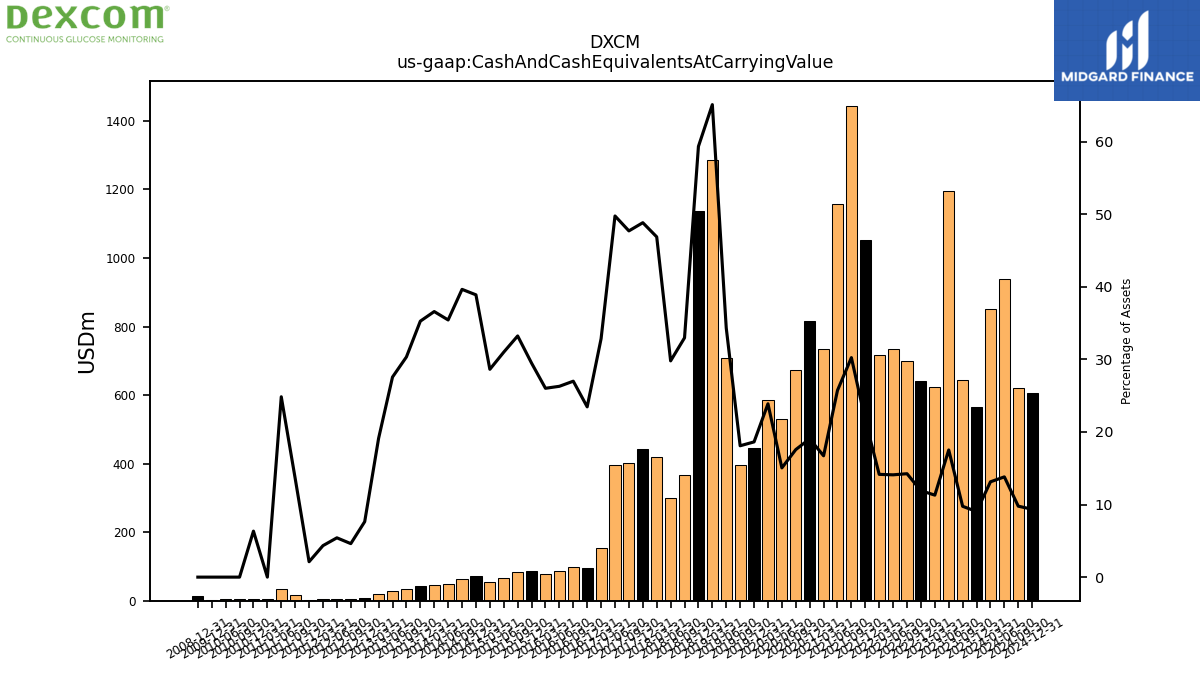
| Cash And Cash Equivalents At Carrying Value | 566.30 | 643.70 | 1194.90 | 623.20 | 642.30 | 698.10 | 735.40 | 716.00 | 1052.60 | 1444.30 | 1158.80 | 733.80 | 817.60 | 673.50 | 530.00 | 584.60 | 446.20 | 395.60 | 709.20 | 1285.10 | 1137.00 | 367.40 | 300.20 | 420.40 | 441.50 | 402.10 | 395.90 | 153.50 | 94.50 | 97.70 | 87.50 | 77.90 | 86.10 | 85.30 | 67.70 | 54.20 | 71.80 | 63.20 | 49.50 | 45.70 | 43.20 | 33.40 | 28.20 | 18.90 | 8.10 | 4.74 | 5.99 | 5.12 | 2.55 | 17.52 | 33.89 | 3.81 | 4.89 | 5.53 | 6.09 | NA | |
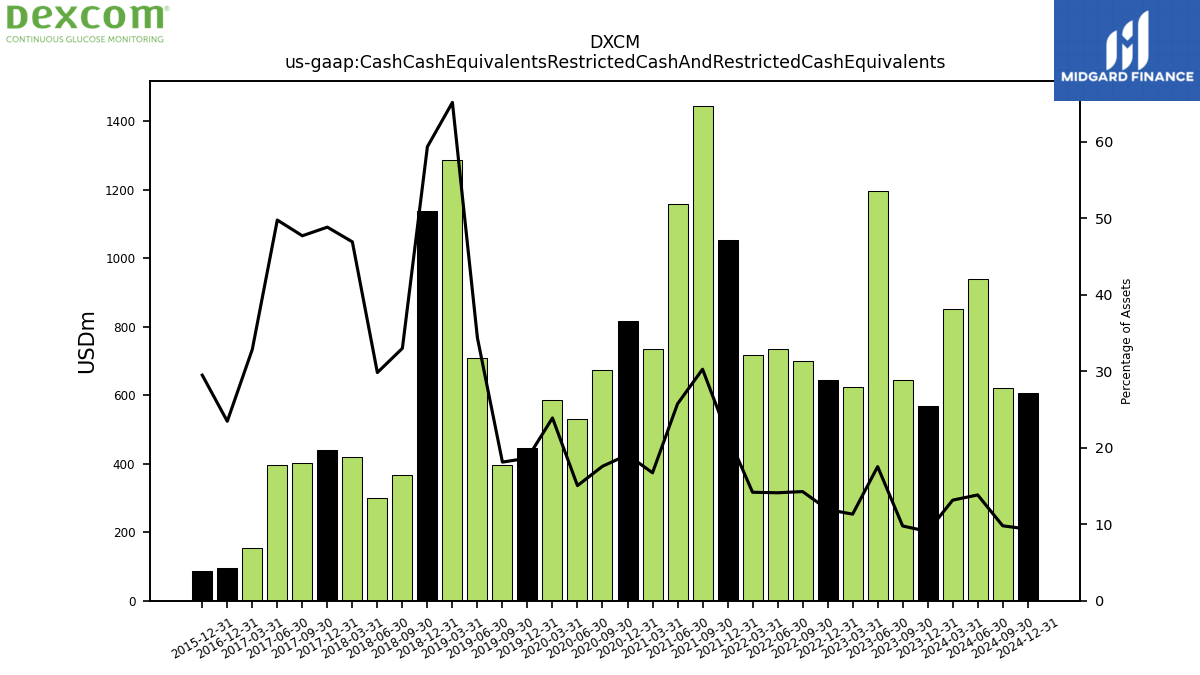
| Cash Cash Equivalents Restricted Cash And Restricted Cash Equivalents | 567.50 | 644.80 | 1196.00 | 624.30 | 643.30 | 699.10 | 736.40 | 717.10 | 1053.60 | 1445.20 | 1159.10 | 734.20 | 818.20 | 673.80 | 530.00 | 584.90 | 446.40 | 396.10 | 709.80 | 1285.70 | 1137.10 | 367.70 | 300.50 | 420.70 | 441.50 | 402.10 | 395.90 | 153.50 | 94.50 | NA | NA | NA | 86.10 | NA | NA | NA | NA | NA | NA | NA | NA | NA | NA | NA | NA | NA | NA | NA | NA | NA | NA | NA | NA | NA | NA | NA | |
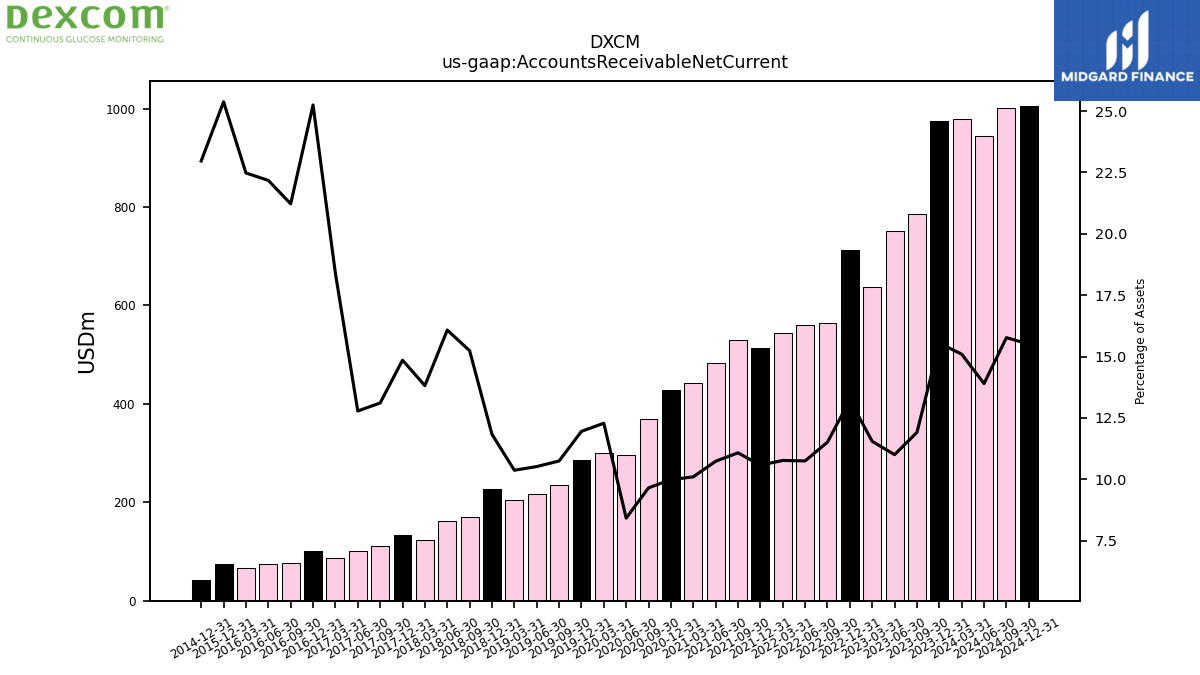
| Accounts Receivable Net Current | 973.90 | 785.70 | 750.60 | 636.80 | 713.30 | 564.10 | 560.80 | 544.50 | 514.30 | 529.10 | 483.50 | 443.40 | 428.50 | 370.00 | 296.50 | 300.70 | 286.30 | 234.90 | 217.30 | 204.70 | 226.70 | 169.80 | 162.00 | 123.90 | 134.30 | 110.50 | 101.70 | 85.90 | 101.70 | 76.80 | 73.80 | 67.30 | 74.10 | NA | NA | NA | 42.40 | NA | NA | NA | NA | NA | NA | NA | NA | NA | NA | NA | NA | NA | NA | NA | NA | NA | NA | NA | |
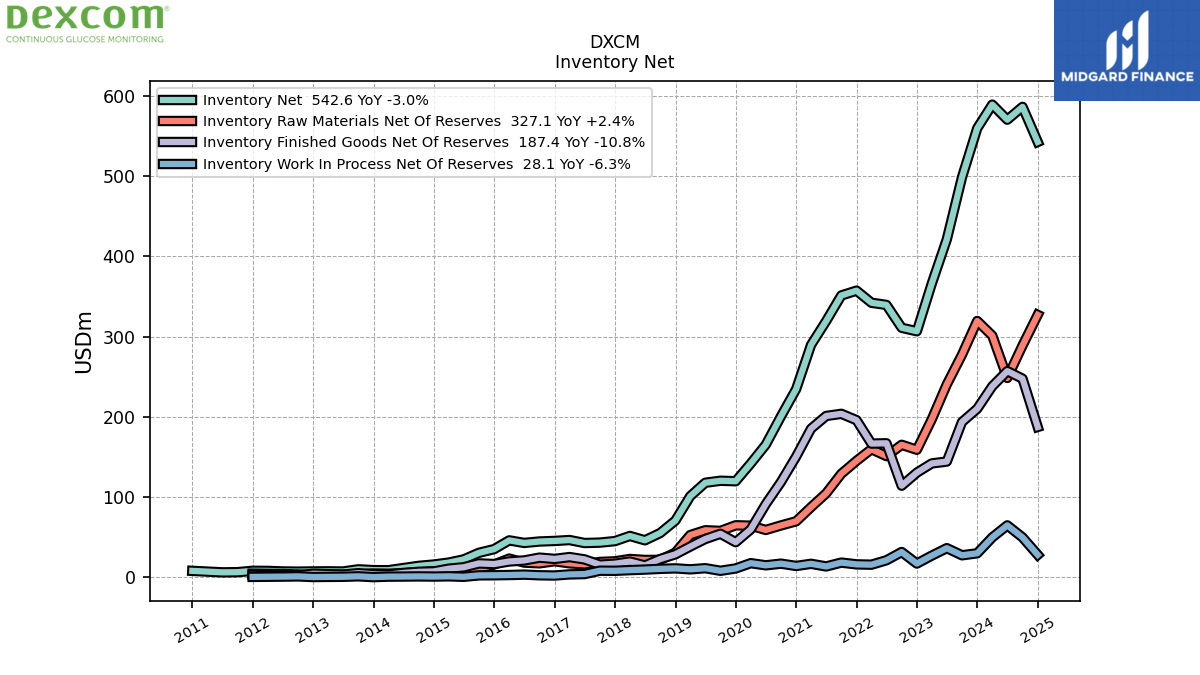
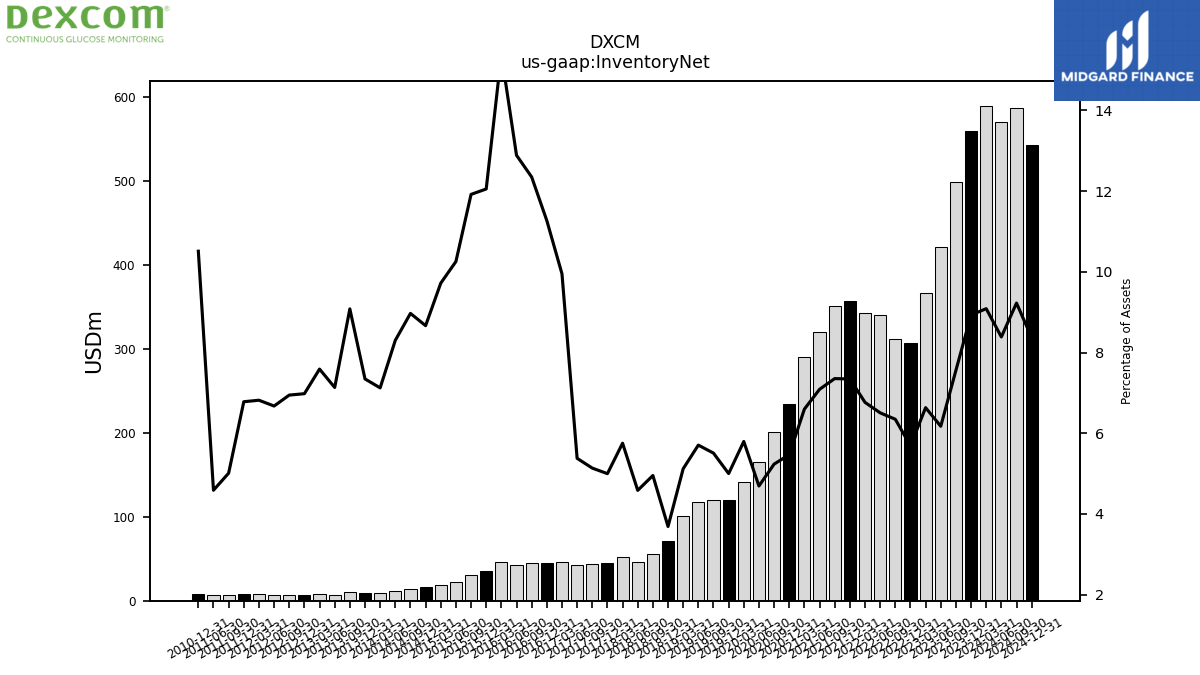
| Inventory Net | 559.60 | 498.60 | 421.10 | 366.00 | 306.70 | 311.00 | 339.50 | 342.20 | 357.30 | 351.30 | 319.30 | 289.70 | 234.70 | 200.70 | 165.30 | 141.90 | 119.80 | 120.40 | 117.90 | 101.10 | 70.70 | 55.20 | 46.20 | 51.60 | 45.20 | 43.30 | 42.80 | 46.50 | 45.40 | 44.70 | 42.90 | 46.10 | 35.20 | 30.60 | 22.40 | 18.40 | 16.00 | 14.30 | 11.60 | 8.90 | 9.00 | 10.00 | 7.30 | 7.50 | 7.40 | 7.14 | 7.38 | 8.04 | 8.17 | 6.46 | 6.26 | NA | 8.11 | NA | NA | NA | |
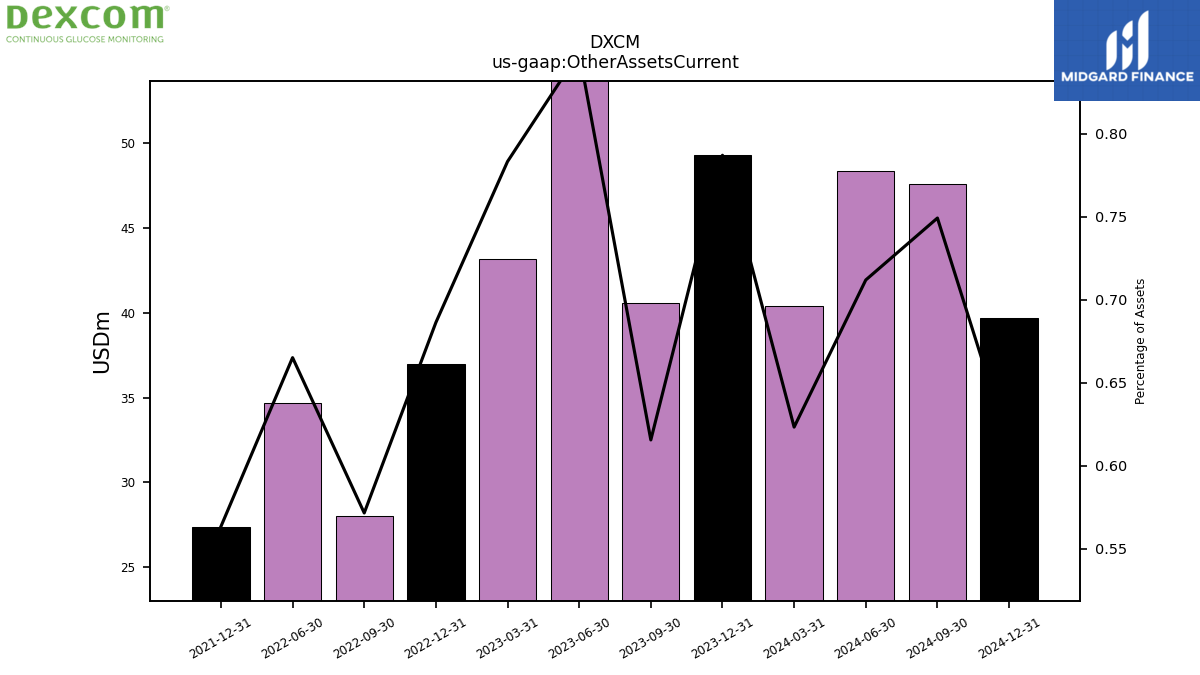
| Other Assets Current | 49.30 | 40.60 | 57.90 | 43.20 | 37.00 | 28.00 | 34.70 | NA | 27.40 | NA | NA | NA | NA | NA | NA | NA | NA | NA | NA | NA | NA | NA | NA | NA | NA | NA | NA | NA | NA | NA | NA | NA | NA | NA | NA | NA | NA | NA | NA | NA | NA | NA | NA | NA | NA | NA | NA | NA | NA | NA | NA | NA | NA | NA | NA | NA | |
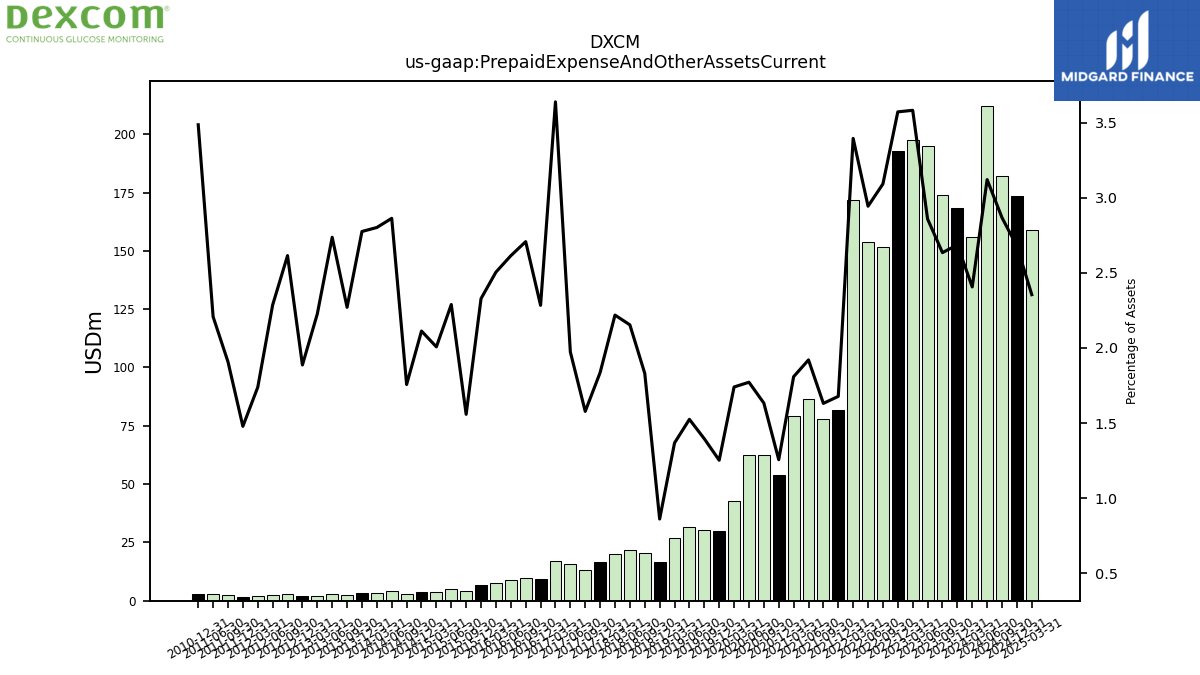
| Prepaid Expense And Other Assets Current | 168.30 | 173.80 | 195.00 | 197.60 | 192.60 | 151.50 | 153.60 | 171.70 | 81.60 | 77.90 | 86.50 | 79.40 | 53.90 | 62.60 | 62.40 | 42.60 | 30.00 | 30.50 | 31.50 | 27.00 | 16.50 | 20.40 | 21.70 | 19.90 | 16.60 | 13.30 | 15.70 | 17.00 | 9.20 | 9.80 | 8.70 | 7.50 | 6.80 | 4.00 | 5.00 | 3.80 | 3.90 | 2.80 | 4.00 | 3.50 | 3.40 | 2.50 | 2.80 | 2.20 | 2.00 | 2.69 | 2.53 | 2.05 | 1.78 | 2.46 | 3.01 | NA | 2.69 | NA | NA | NA | |
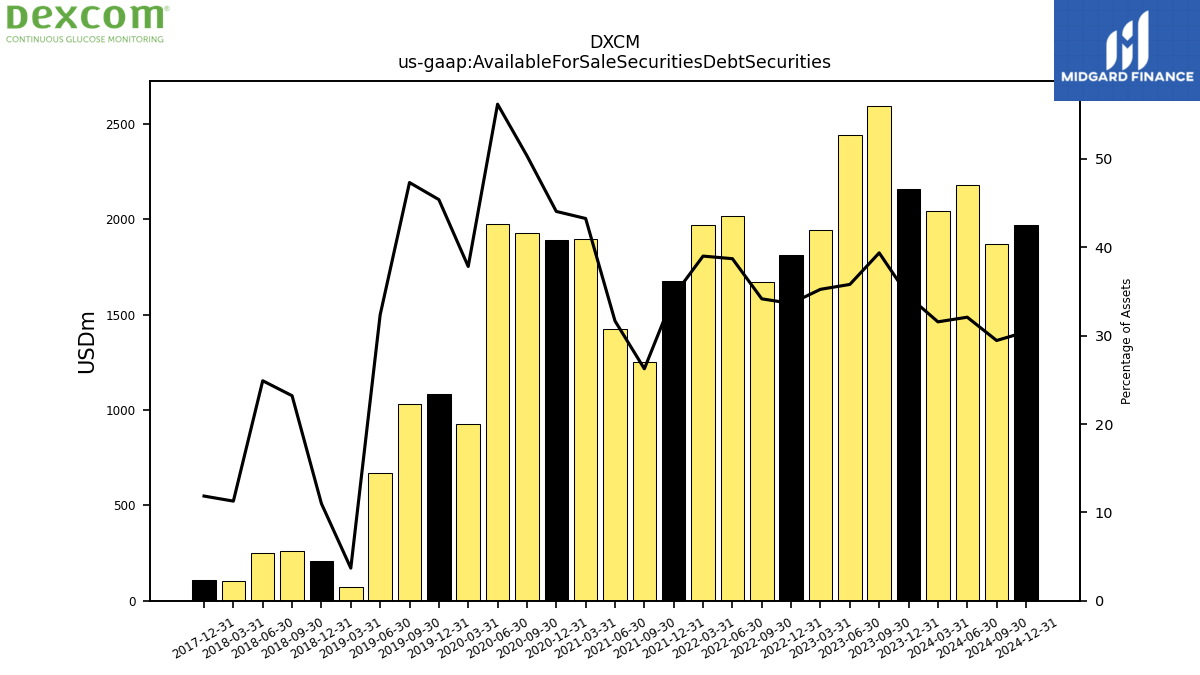
| Available For Sale Securities Debt Securities | 2157.80 | 2596.60 | 2441.30 | 1943.80 | 1813.90 | 1673.80 | 2019.40 | 1972.20 | 1678.60 | 1253.60 | 1426.10 | 1898.80 | 1890.10 | 1930.30 | 1978.80 | 925.90 | 1087.10 | 1034.30 | 668.30 | 72.90 | 210.60 | 258.50 | 250.80 | 101.10 | 107.10 | NA | NA | NA | NA | NA | NA | NA | NA | NA | NA | NA | NA | NA | NA | NA | NA | NA | NA | NA | NA | NA | NA | NA | NA | NA | NA | NA | NA | NA | NA | NA |
| 2023-12-31 | 2023-09-30 | 2023-06-30 | 2023-03-31 | 2022-12-31 | 2022-09-30 | 2022-06-30 | 2022-03-31 | 2021-12-31 | 2021-09-30 | 2021-06-30 | 2021-03-31 | 2020-12-31 | 2020-09-30 | 2020-06-30 | 2020-03-31 | 2019-12-31 | 2019-09-30 | 2019-06-30 | 2019-03-31 | 2018-12-31 | 2018-09-30 | 2018-06-30 | 2018-03-31 | 2017-12-31 | 2017-09-30 | 2017-06-30 | 2017-03-31 | 2016-12-31 | 2016-09-30 | 2016-06-30 | 2016-03-31 | 2015-12-31 | 2015-09-30 | 2015-06-30 | 2015-03-31 | 2014-12-31 | 2014-09-30 | 2014-06-30 | 2014-03-31 | 2013-12-31 | 2013-09-30 | 2013-06-30 | 2013-03-31 | 2012-12-31 | 2012-09-30 | 2012-06-30 | 2012-03-31 | 2011-12-31 | 2011-09-30 | 2011-06-30 | 2011-03-31 | 2010-12-31 | 2010-09-30 | 2010-06-30 | 2010-03-31 | ||
|---|---|---|---|---|---|---|---|---|---|---|---|---|---|---|---|---|---|---|---|---|---|---|---|---|---|---|---|---|---|---|---|---|---|---|---|---|---|---|---|---|---|---|---|---|---|---|---|---|---|---|---|---|---|---|---|---|---|
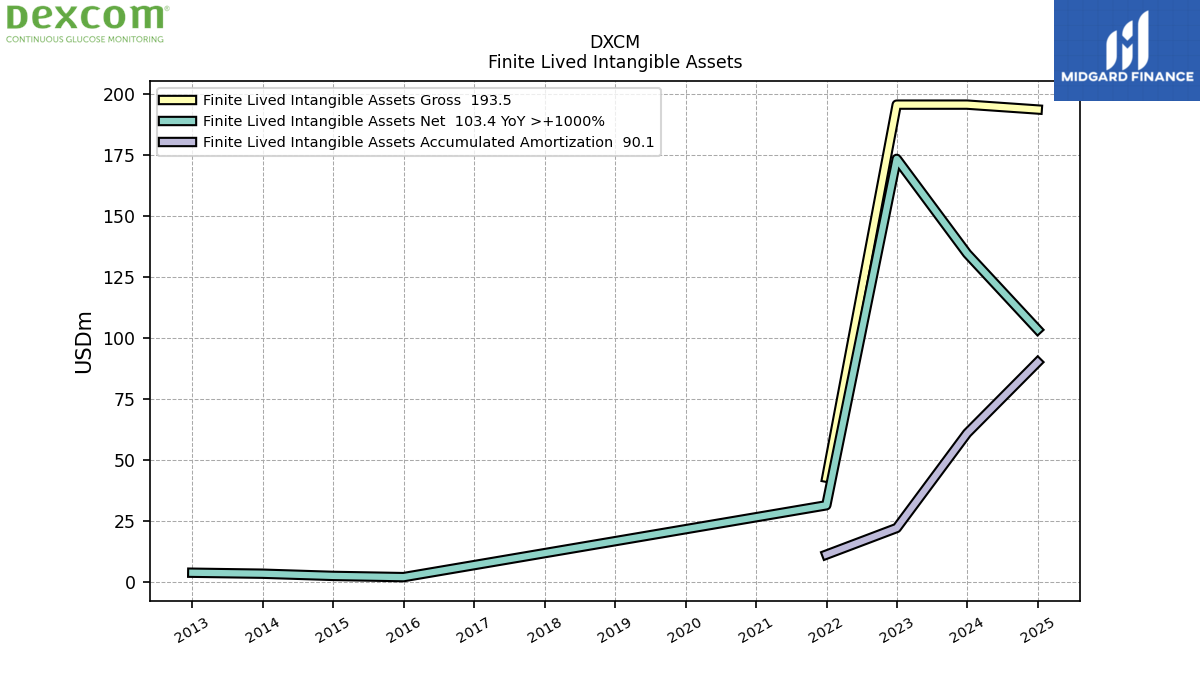
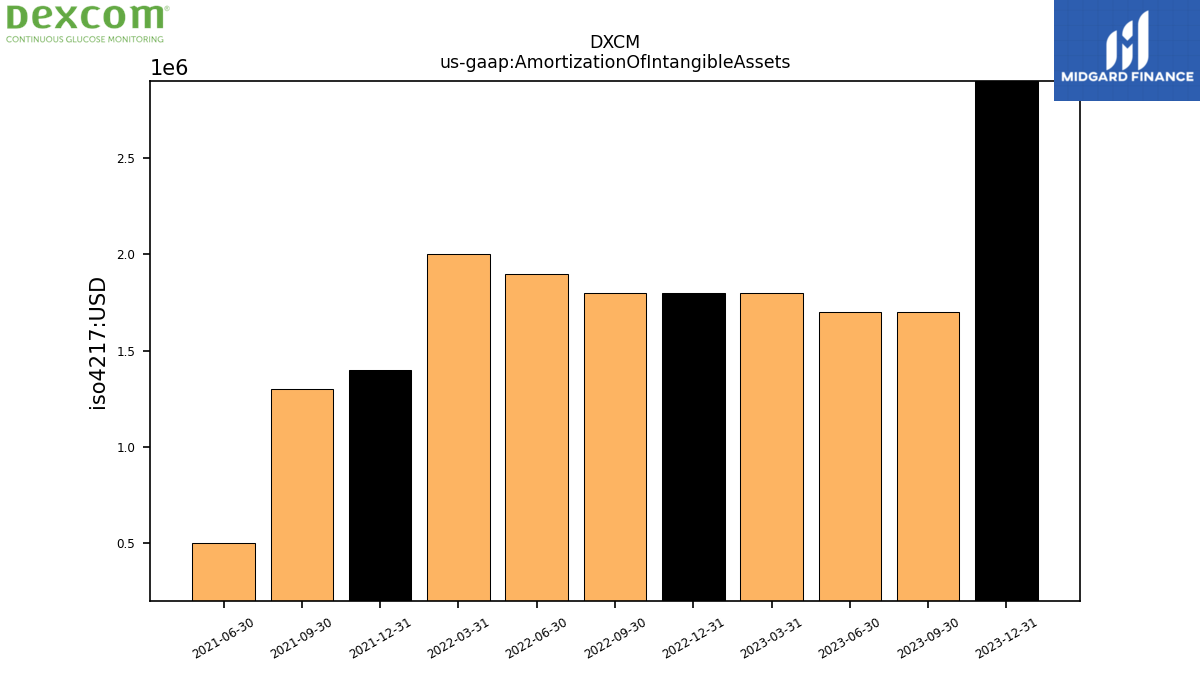
| Amortization Of Intangible Assets | 2.90 | 1.70 | 1.70 | 1.80 | 1.80 | 1.80 | 1.90 | 2.00 | 1.40 | 1.30 | 0.50 | NA | NA | NA | NA | NA | NA | NA | NA | NA | NA | NA | NA | NA | NA | NA | NA | NA | NA | NA | NA | NA | NA | NA | NA | NA | NA | NA | NA | NA | NA | NA | NA | NA | NA | NA | NA | NA | NA | NA | NA | NA | NA | NA | NA | NA | |
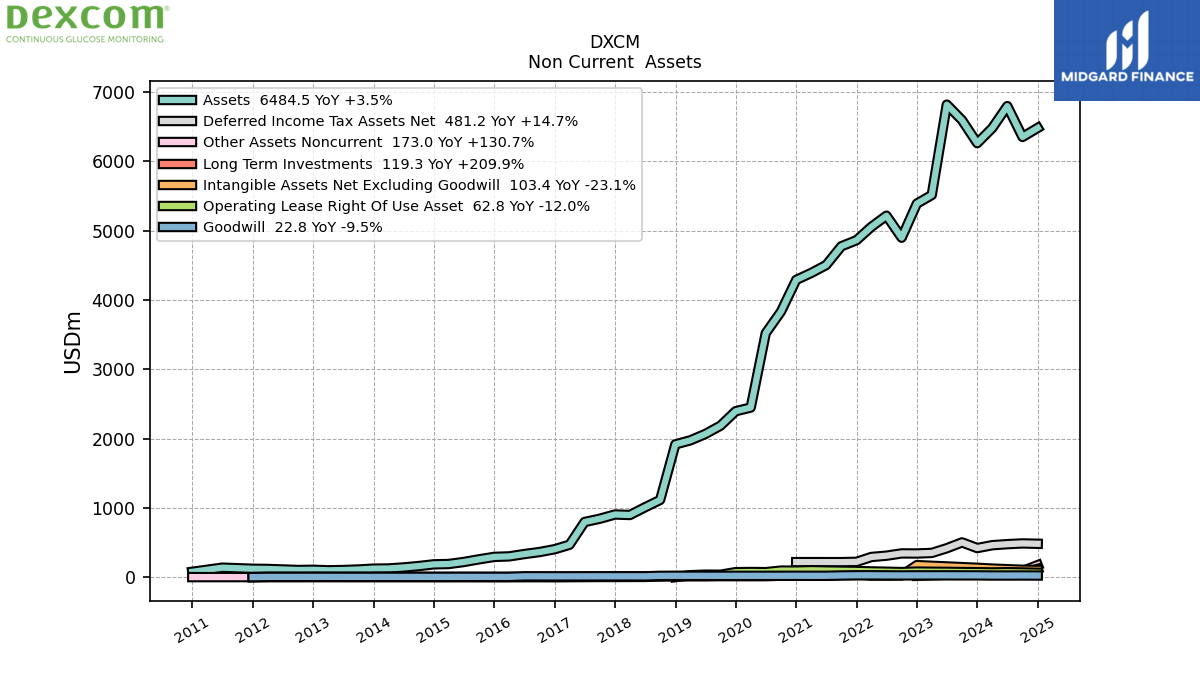
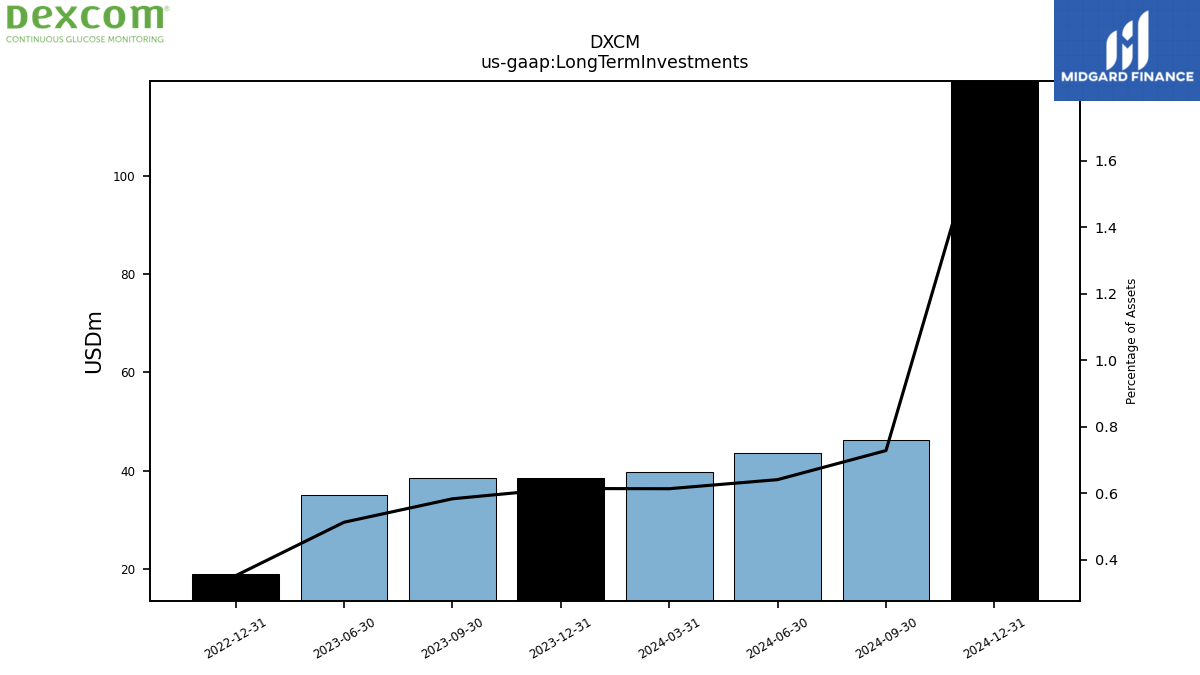
| Long Term Investments | 38.50 | 38.50 | 35.00 | NA | 19.00 | NA | NA | NA | NA | NA | NA | NA | NA | NA | NA | NA | NA | NA | NA | NA | NA | NA | NA | NA | NA | NA | NA | NA | NA | NA | NA | NA | NA | NA | NA | NA | NA | NA | NA | NA | NA | NA | NA | NA | NA | NA | NA | NA | NA | NA | NA | NA | NA | NA | NA | NA | |
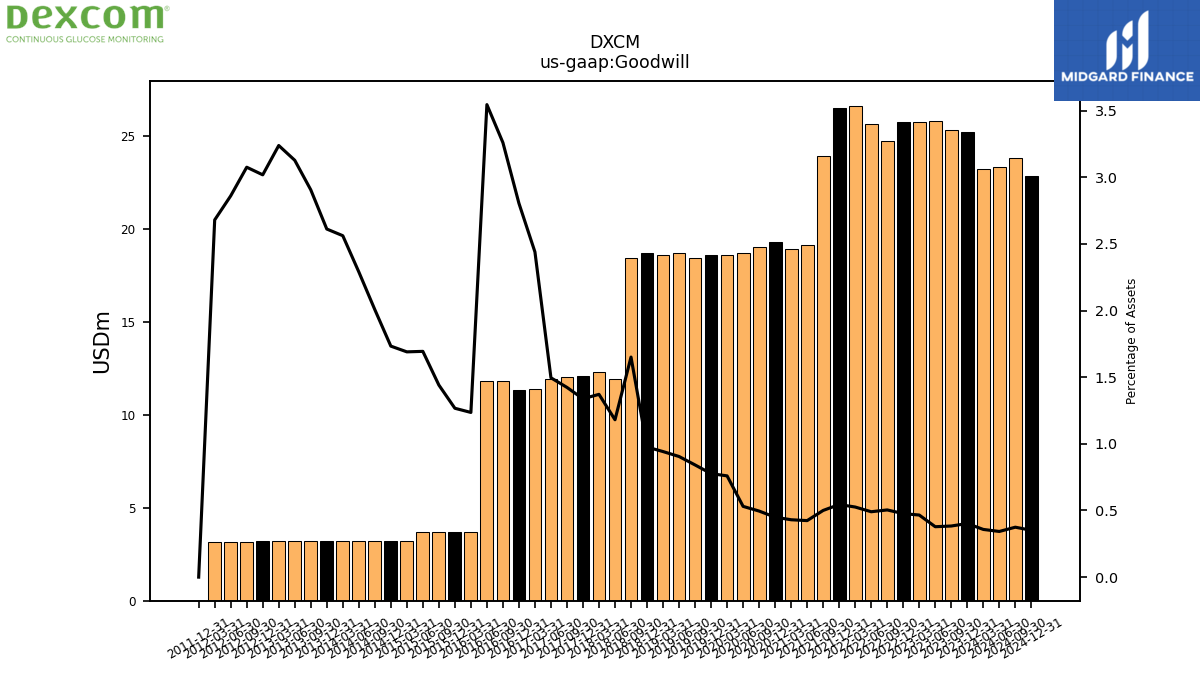
| Goodwill | 25.20 | 25.30 | 25.80 | 25.70 | 25.70 | 24.70 | 25.60 | 26.60 | 26.50 | 23.90 | 19.10 | 18.90 | 19.30 | 19.00 | 18.70 | 18.60 | 18.60 | 18.40 | 18.70 | 18.60 | 18.70 | 18.40 | 11.90 | 12.30 | 12.10 | 12.00 | 11.90 | 11.40 | 11.30 | 11.80 | 11.80 | 3.70 | 3.70 | 3.70 | 3.70 | 3.20 | 3.20 | 3.20 | 3.20 | 3.20 | 3.20 | 3.20 | 3.20 | 3.20 | 3.20 | 3.16 | 3.16 | 3.16 | 0.00 | NA | NA | NA | NA | NA | NA | NA | |
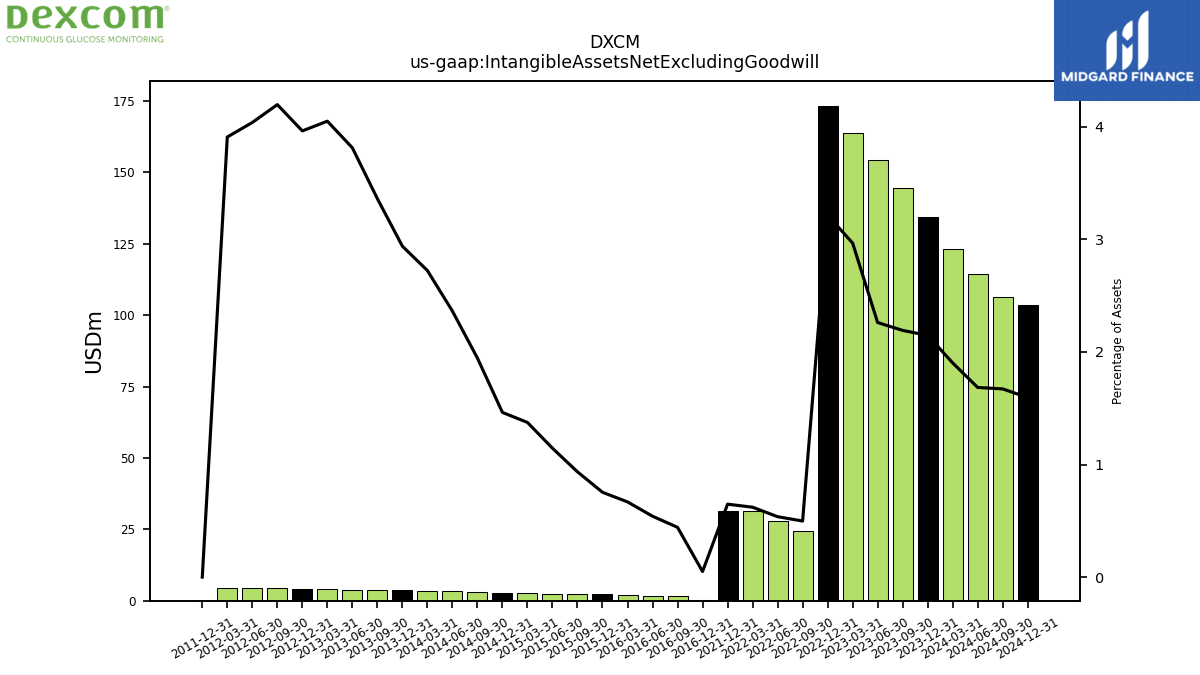
| Intangible Assets Net Excluding Goodwill | 134.50 | 144.50 | 154.20 | 163.60 | 173.30 | 24.40 | 28.00 | 31.40 | 31.50 | NA | NA | NA | NA | NA | NA | NA | NA | NA | NA | NA | NA | NA | NA | NA | NA | NA | NA | NA | 0.20 | 1.60 | 1.80 | 2.00 | 2.20 | 2.40 | 2.50 | 2.60 | 2.70 | 3.10 | 3.30 | 3.40 | 3.60 | 3.70 | 3.90 | 4.00 | 4.20 | 4.31 | 4.46 | 4.61 | 0.00 | NA | NA | NA | NA | NA | NA | NA | |
| Finite Lived Intangible Assets Net | 134.50 | NA | NA | NA | 173.30 | NA | NA | NA | 31.50 | NA | NA | NA | NA | NA | NA | NA | NA | NA | NA | NA | NA | NA | NA | NA | NA | NA | NA | NA | NA | NA | NA | NA | 2.10 | NA | NA | NA | 2.60 | NA | NA | NA | 3.50 | NA | NA | NA | 3.90 | NA | NA | NA | NA | NA | NA | NA | NA | NA | NA | NA | |
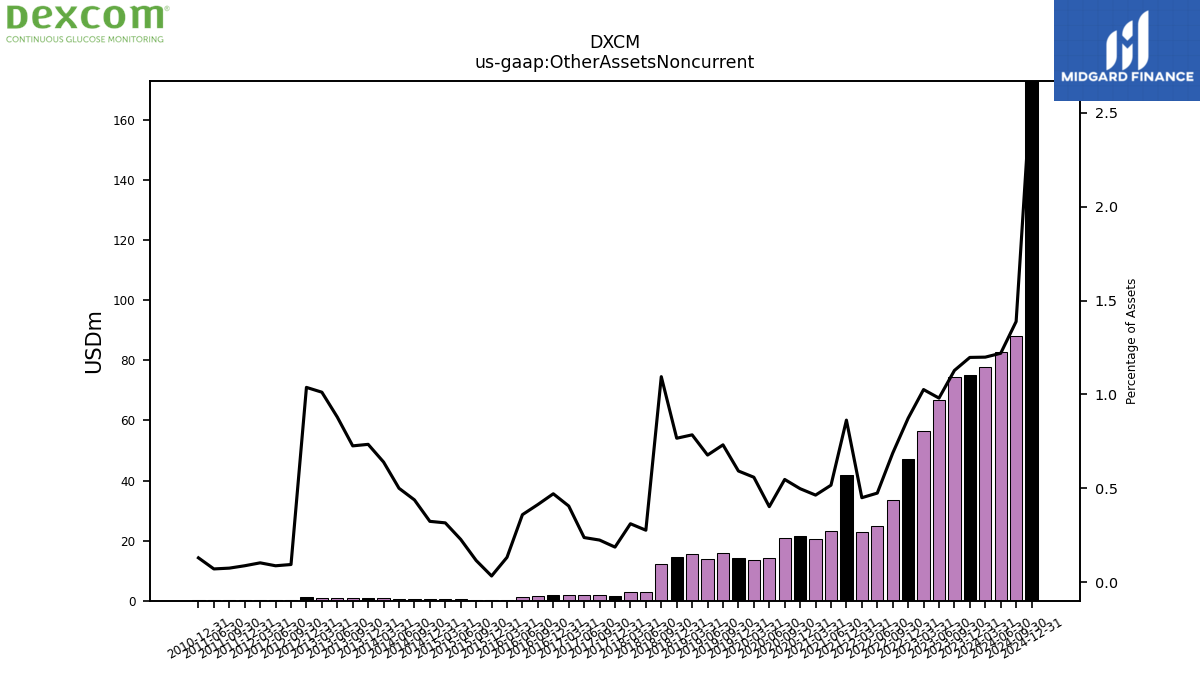
| Other Assets Noncurrent | 75.00 | 74.40 | 66.90 | 56.60 | 47.10 | 33.70 | 24.80 | 22.80 | 42.00 | NA | 23.30 | 20.40 | 21.40 | 21.00 | 14.20 | 13.70 | 14.20 | 16.00 | 14.00 | 15.50 | 14.70 | 12.20 | 2.80 | 2.80 | 1.70 | 1.90 | 1.90 | 1.90 | 1.90 | 1.50 | 1.20 | 0.40 | 0.10 | 0.30 | 0.50 | 0.60 | 0.60 | 0.70 | 0.70 | 0.80 | 0.90 | 0.80 | 0.90 | 1.00 | 1.10 | 0.10 | 0.10 | 0.12 | 0.11 | 0.10 | 0.10 | NA | 0.10 | NA | NA | NA | |
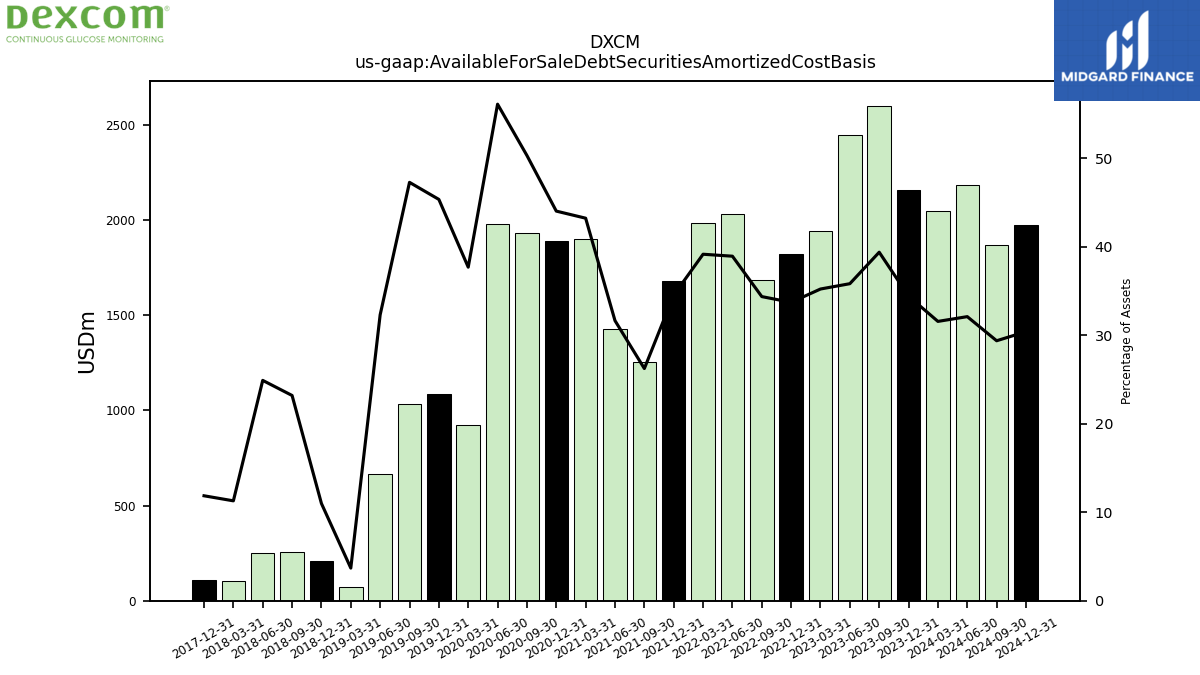
| Available For Sale Debt Securities Amortized Cost Basis | 2157.40 | 2599.20 | 2444.90 | 1944.00 | 1819.00 | 1684.70 | 2032.40 | 1981.10 | 1680.60 | 1253.80 | 1426.20 | 1898.60 | 1890.00 | 1929.60 | 1977.10 | 923.20 | 1086.70 | 1033.90 | 667.80 | 72.90 | 210.70 | 258.60 | 251.00 | 101.30 | 107.30 | NA | NA | NA | NA | NA | NA | NA | NA | NA | NA | NA | NA | NA | NA | NA | NA | NA | NA | NA | NA | NA | NA | NA | NA | NA | NA | NA | NA | NA | NA | NA |
| 2023-12-31 | 2023-09-30 | 2023-06-30 | 2023-03-31 | 2022-12-31 | 2022-09-30 | 2022-06-30 | 2022-03-31 | 2021-12-31 | 2021-09-30 | 2021-06-30 | 2021-03-31 | 2020-12-31 | 2020-09-30 | 2020-06-30 | 2020-03-31 | 2019-12-31 | 2019-09-30 | 2019-06-30 | 2019-03-31 | 2018-12-31 | 2018-09-30 | 2018-06-30 | 2018-03-31 | 2017-12-31 | 2017-09-30 | 2017-06-30 | 2017-03-31 | 2016-12-31 | 2016-09-30 | 2016-06-30 | 2016-03-31 | 2015-12-31 | 2015-09-30 | 2015-06-30 | 2015-03-31 | 2014-12-31 | 2014-09-30 | 2014-06-30 | 2014-03-31 | 2013-12-31 | 2013-09-30 | 2013-06-30 | 2013-03-31 | 2012-12-31 | 2012-09-30 | 2012-06-30 | 2012-03-31 | 2011-12-31 | 2011-09-30 | 2011-06-30 | 2011-03-31 | 2010-12-31 | 2010-09-30 | 2010-06-30 | 2010-03-31 | ||
|---|---|---|---|---|---|---|---|---|---|---|---|---|---|---|---|---|---|---|---|---|---|---|---|---|---|---|---|---|---|---|---|---|---|---|---|---|---|---|---|---|---|---|---|---|---|---|---|---|---|---|---|---|---|---|---|---|---|
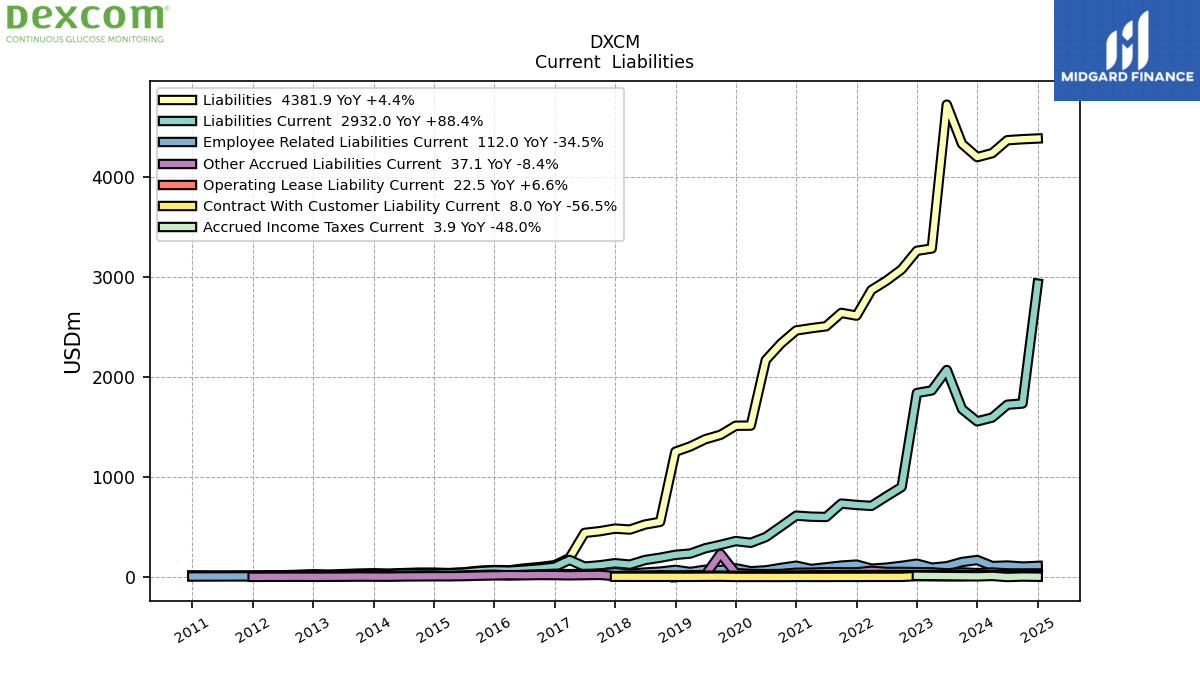
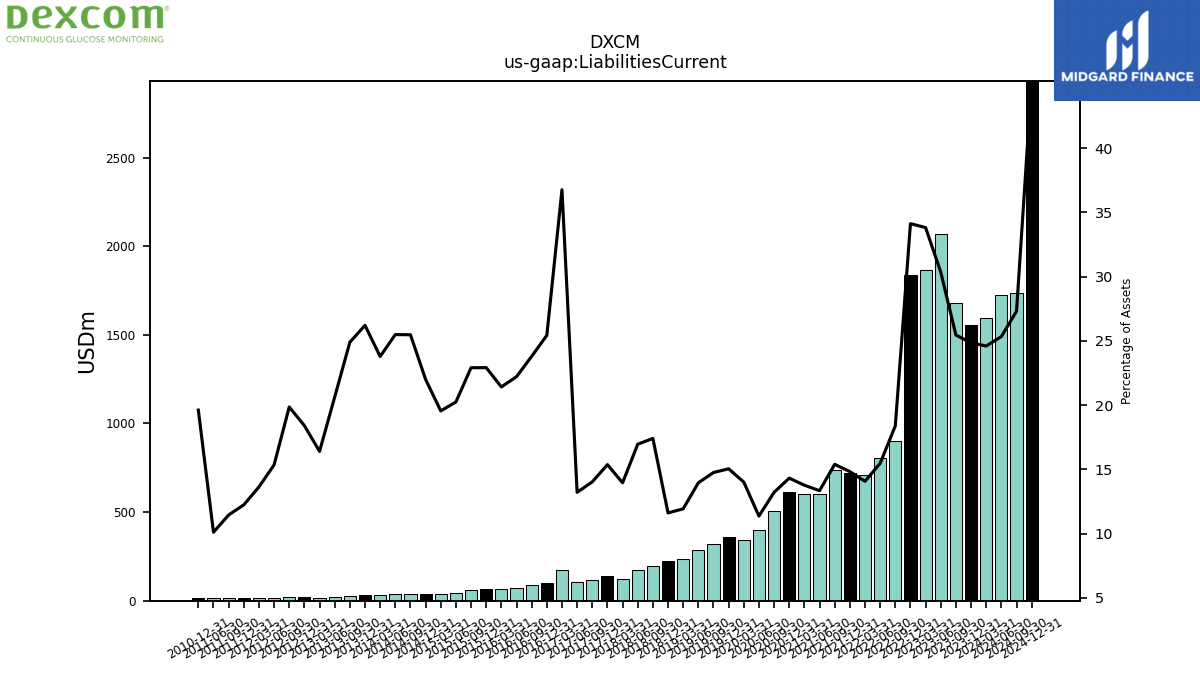
| Liabilities Current | 1556.00 | 1678.60 | 2069.70 | 1865.00 | 1839.30 | 900.50 | 807.00 | 711.40 | 720.80 | 734.90 | 600.70 | 604.10 | 614.10 | 506.40 | 400.10 | 342.80 | 360.20 | 322.40 | 288.20 | 235.40 | 222.40 | 193.90 | 170.80 | 125.10 | 138.90 | 118.20 | 105.10 | 171.70 | 102.40 | 86.10 | 73.90 | 64.10 | 66.90 | 58.80 | 44.20 | 37.00 | 40.60 | 40.60 | 35.60 | 29.70 | 32.10 | 27.40 | 21.10 | 16.20 | 19.50 | 20.40 | 16.96 | 16.08 | 14.74 | 14.74 | 13.78 | NA | 15.13 | NA | NA | NA | |
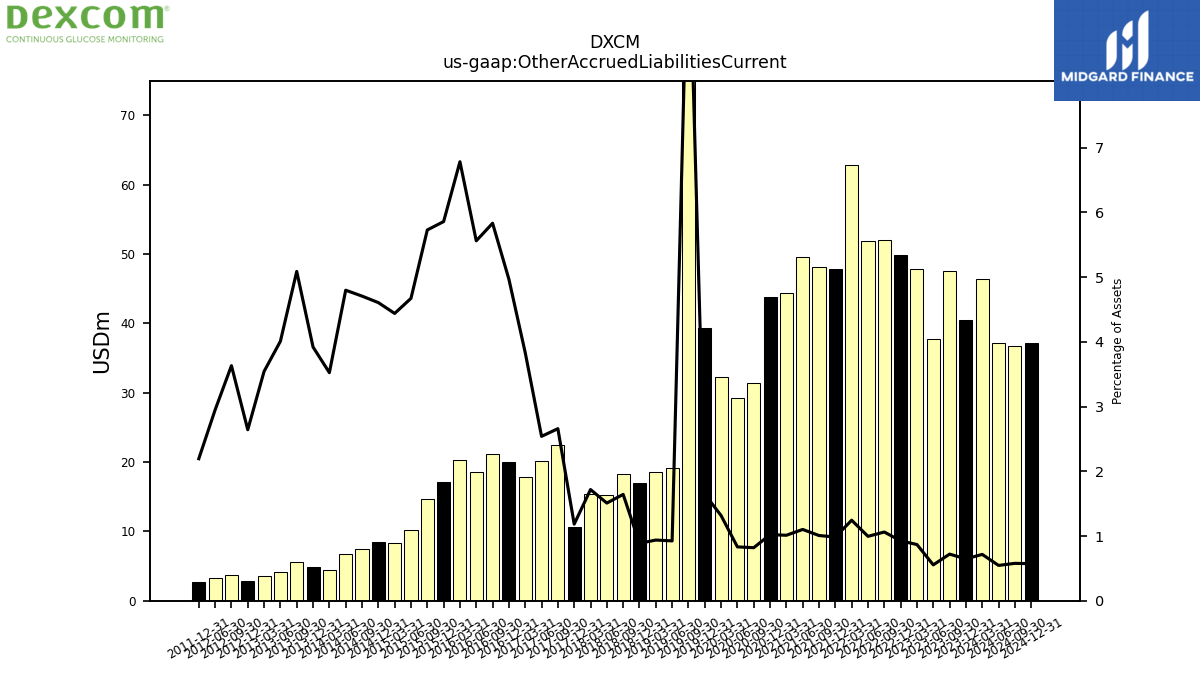
| Other Accrued Liabilities Current | 40.50 | 47.50 | 37.80 | 47.90 | 49.90 | 52.00 | 51.90 | 62.90 | 47.90 | 48.10 | 49.60 | 44.40 | 43.80 | 31.40 | 29.30 | 32.20 | 39.40 | 232.40 | 19.10 | 18.50 | 17.00 | 18.30 | 15.20 | 15.40 | 10.70 | 22.40 | 20.20 | 17.90 | 20.00 | 21.10 | 18.50 | 20.30 | 17.10 | 14.70 | 10.20 | 8.40 | 8.50 | 7.50 | 6.70 | 4.40 | 4.80 | 5.60 | 4.10 | 3.50 | 2.80 | 3.73 | 3.26 | NA | 2.64 | NA | NA | NA | NA | NA | NA | NA | |
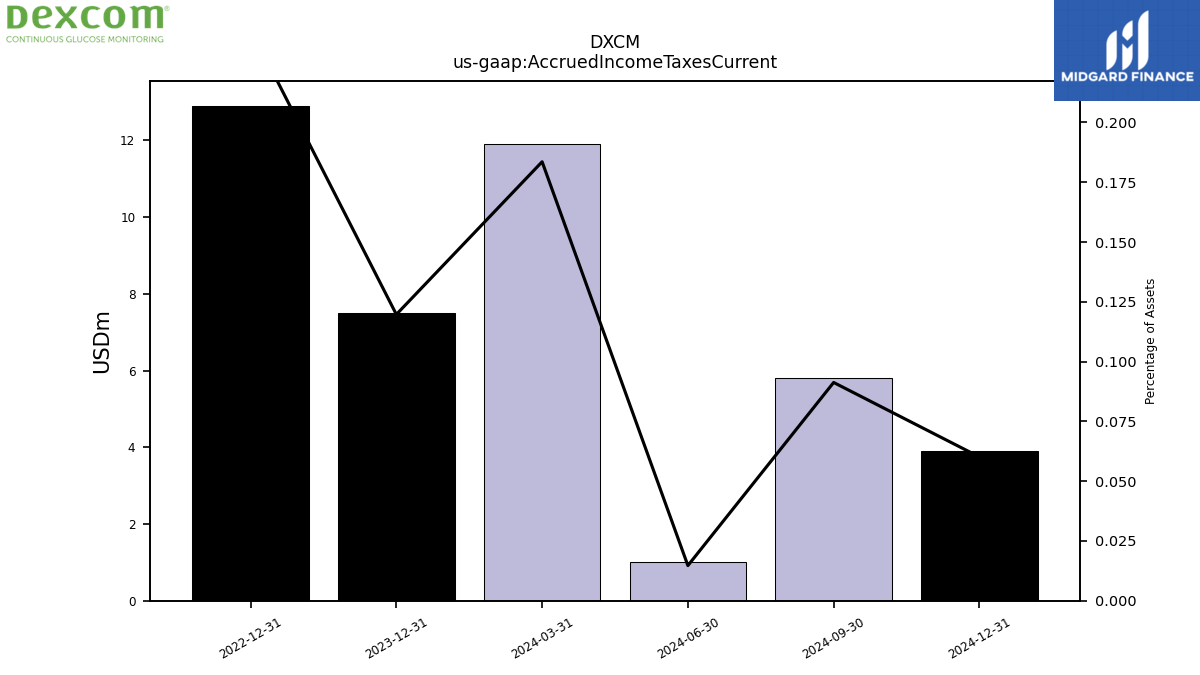
| Accrued Income Taxes Current | 7.50 | NA | NA | NA | 12.90 | NA | NA | NA | NA | NA | NA | NA | NA | NA | NA | NA | NA | NA | NA | NA | NA | NA | NA | NA | NA | NA | NA | NA | NA | NA | NA | NA | NA | NA | NA | NA | NA | NA | NA | NA | NA | NA | NA | NA | NA | NA | NA | NA | NA | NA | NA | NA | NA | NA | NA | NA | |
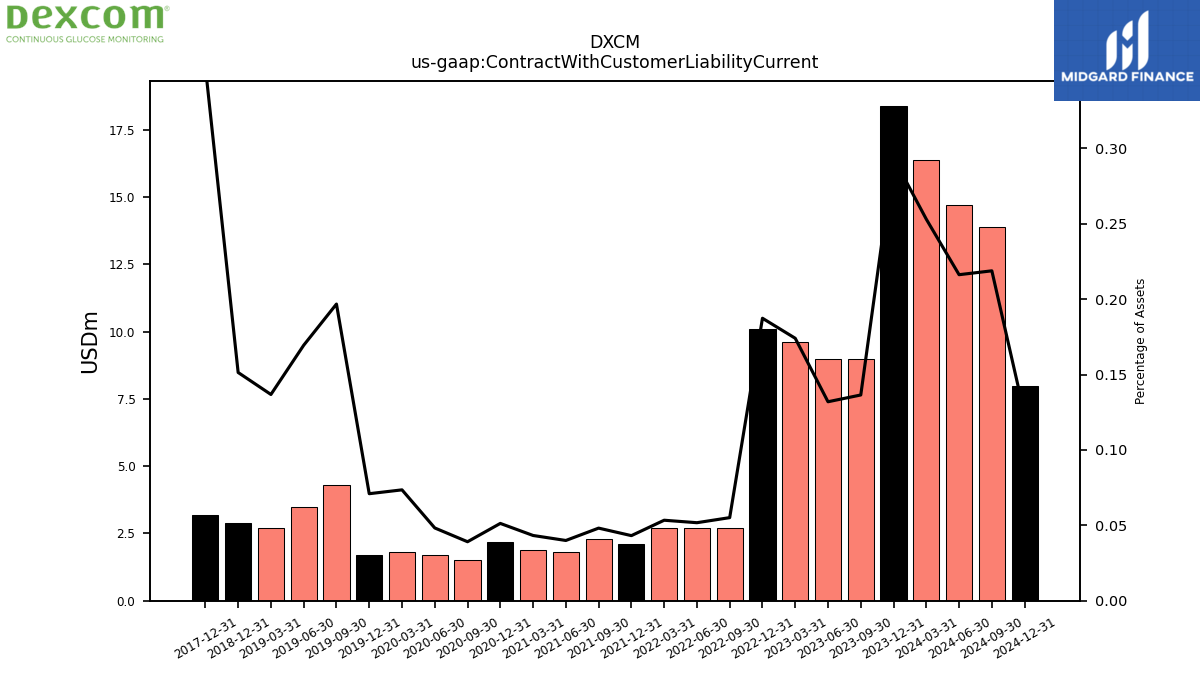
| Contract With Customer Liability Current | 18.40 | 9.00 | 9.00 | 9.60 | 10.10 | 2.70 | 2.70 | 2.70 | 2.10 | 2.30 | 1.80 | 1.90 | 2.20 | 1.50 | 1.70 | 1.80 | 1.70 | 4.30 | 3.50 | 2.70 | 2.90 | NA | NA | NA | 3.20 | NA | NA | NA | NA | NA | NA | NA | NA | NA | NA | NA | NA | NA | NA | NA | NA | NA | NA | NA | NA | NA | NA | NA | NA | NA | NA | NA | NA | NA | NA | NA |
| 2023-12-31 | 2023-09-30 | 2023-06-30 | 2023-03-31 | 2022-12-31 | 2022-09-30 | 2022-06-30 | 2022-03-31 | 2021-12-31 | 2021-09-30 | 2021-06-30 | 2021-03-31 | 2020-12-31 | 2020-09-30 | 2020-06-30 | 2020-03-31 | 2019-12-31 | 2019-09-30 | 2019-06-30 | 2019-03-31 | 2018-12-31 | 2018-09-30 | 2018-06-30 | 2018-03-31 | 2017-12-31 | 2017-09-30 | 2017-06-30 | 2017-03-31 | 2016-12-31 | 2016-09-30 | 2016-06-30 | 2016-03-31 | 2015-12-31 | 2015-09-30 | 2015-06-30 | 2015-03-31 | 2014-12-31 | 2014-09-30 | 2014-06-30 | 2014-03-31 | 2013-12-31 | 2013-09-30 | 2013-06-30 | 2013-03-31 | 2012-12-31 | 2012-09-30 | 2012-06-30 | 2012-03-31 | 2011-12-31 | 2011-09-30 | 2011-06-30 | 2011-03-31 | 2010-12-31 | 2010-09-30 | 2010-06-30 | 2010-03-31 | ||
|---|---|---|---|---|---|---|---|---|---|---|---|---|---|---|---|---|---|---|---|---|---|---|---|---|---|---|---|---|---|---|---|---|---|---|---|---|---|---|---|---|---|---|---|---|---|---|---|---|---|---|---|---|---|---|---|---|---|
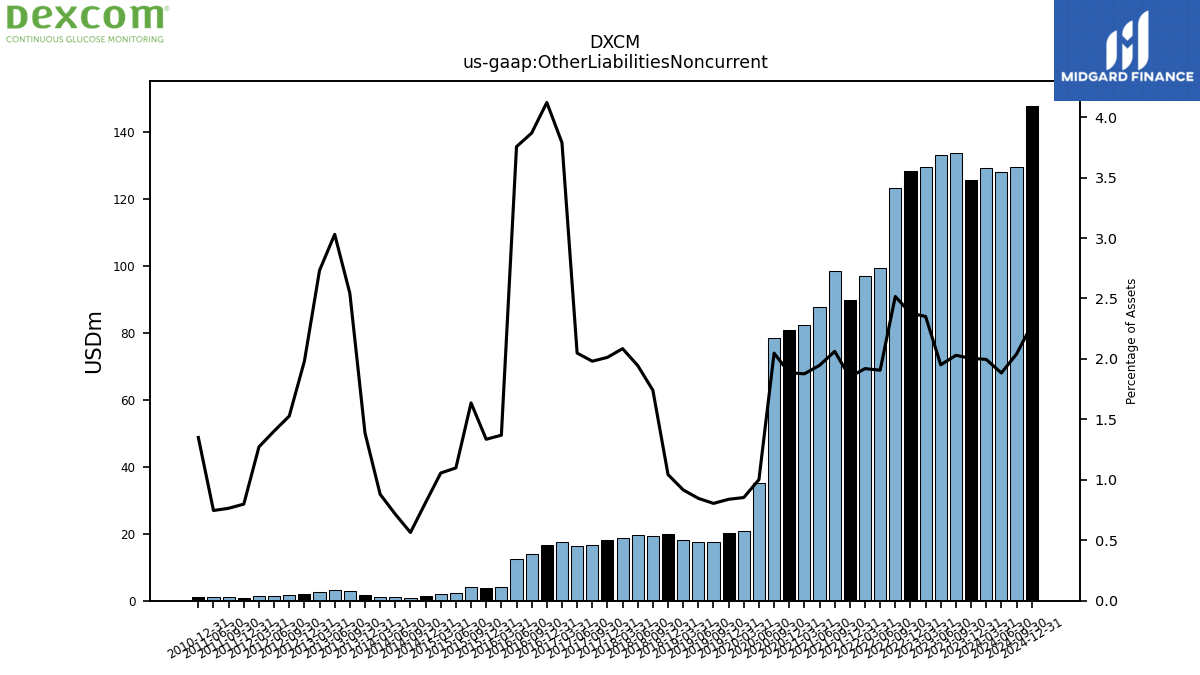
| Other Liabilities Noncurrent | 125.60 | 133.90 | 133.10 | 129.70 | 128.30 | 123.30 | 99.50 | 97.10 | 90.00 | 98.50 | 87.70 | 82.40 | 80.90 | 78.50 | 35.30 | 20.90 | 20.10 | 17.60 | 17.50 | 18.10 | 20.00 | 19.40 | 19.60 | 18.70 | 18.20 | 16.70 | 16.30 | 17.70 | 16.60 | 14.00 | 12.50 | 4.10 | 3.90 | 4.20 | 2.40 | 2.00 | 1.50 | 0.90 | 1.00 | 1.10 | 1.70 | 2.80 | 3.10 | 2.70 | 2.10 | 1.57 | 1.55 | 1.50 | 0.96 | 0.98 | 1.02 | NA | 1.04 | NA | NA | NA | |
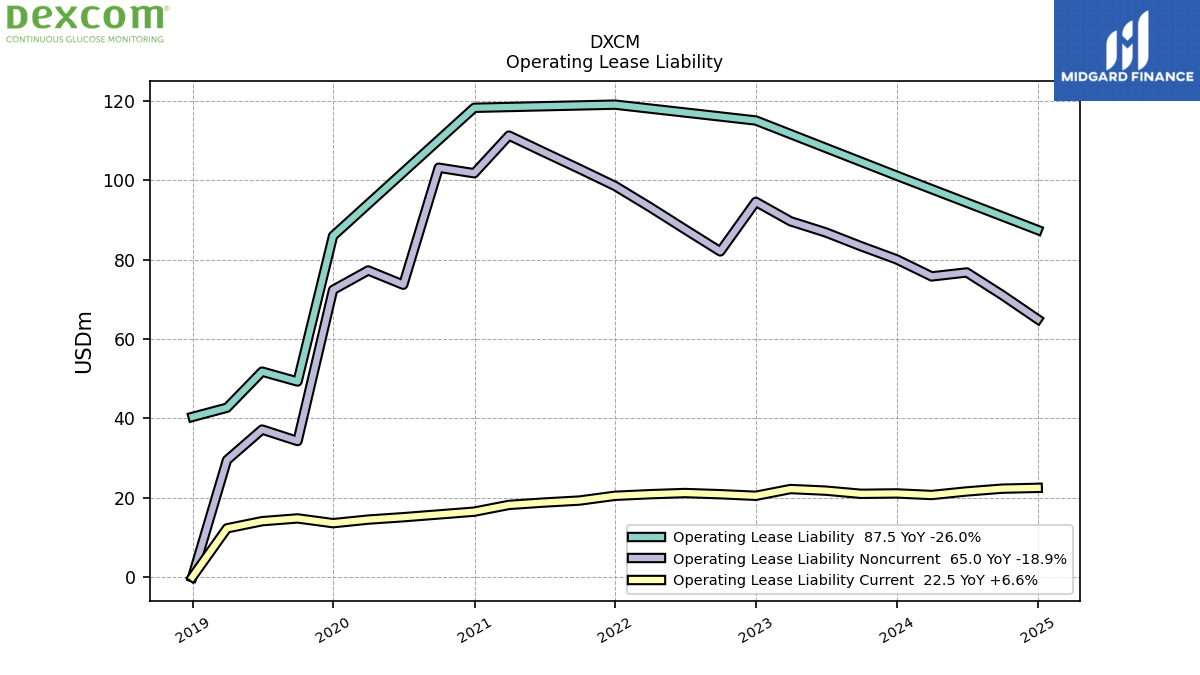
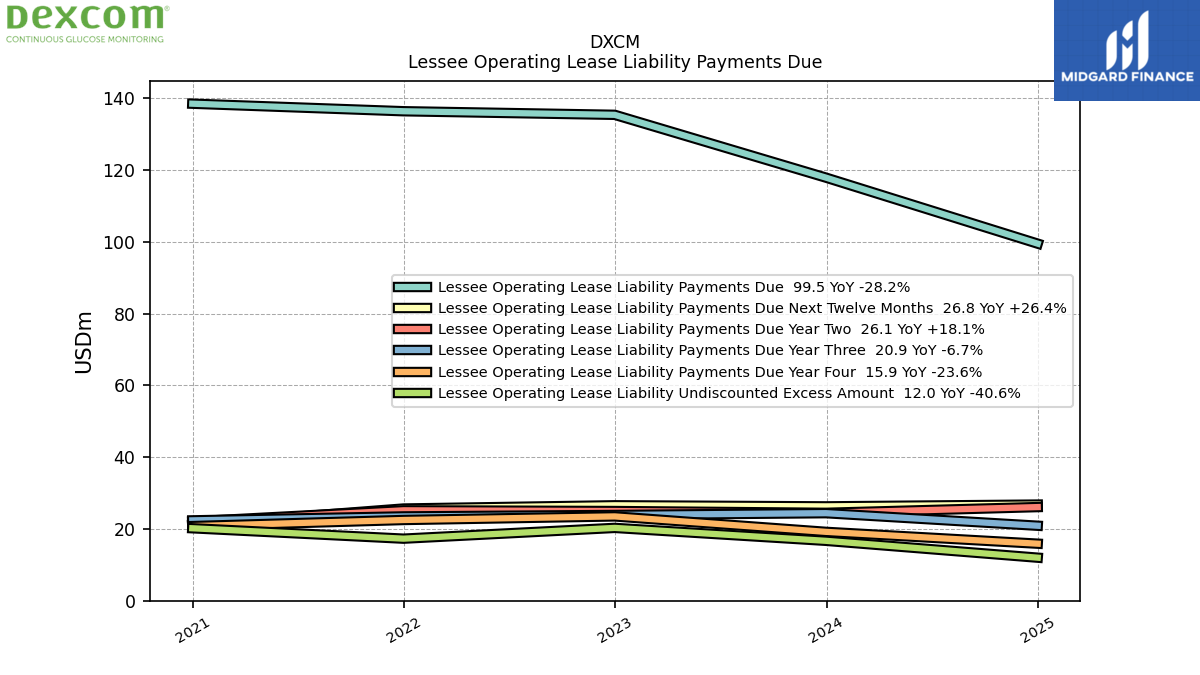
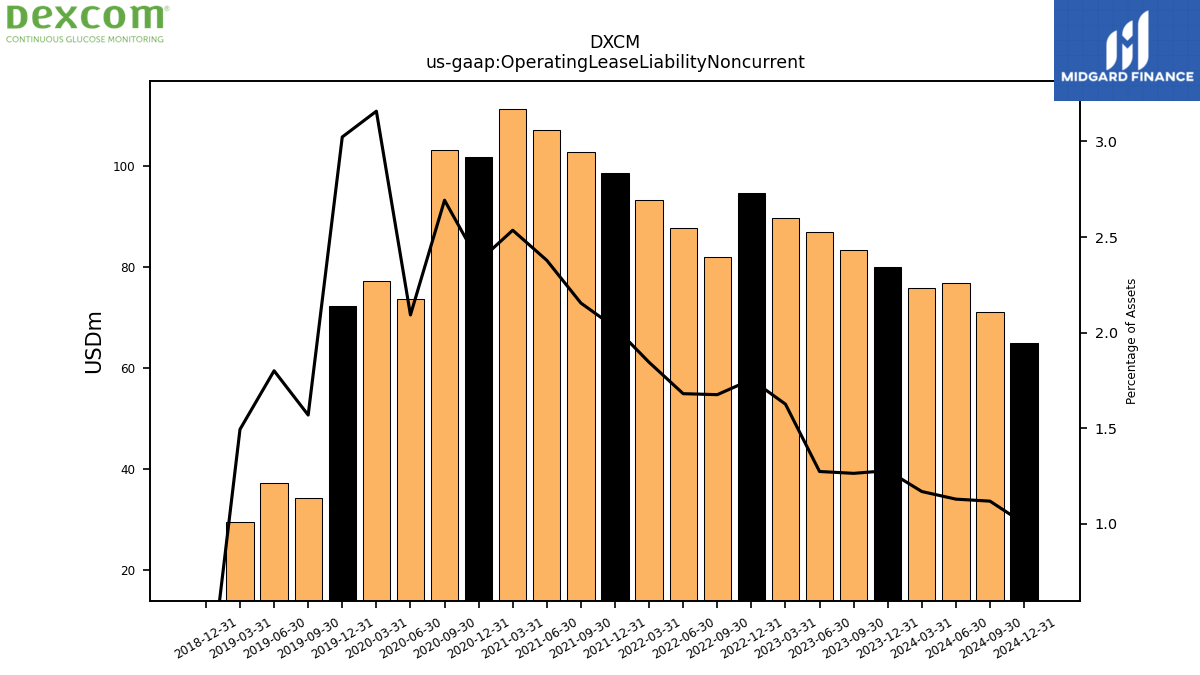
| Operating Lease Liability Noncurrent | 80.10 | 83.40 | 86.90 | 89.70 | 94.60 | 82.10 | 87.70 | 93.30 | 98.60 | 102.90 | 107.10 | 111.30 | 101.80 | 103.20 | 73.70 | 77.30 | 72.40 | 34.30 | 37.20 | 29.50 | 0.00 | NA | NA | NA | NA | NA | NA | NA | NA | NA | NA | NA | NA | NA | NA | NA | NA | NA | NA | NA | NA | NA | NA | NA | NA | NA | NA | NA | NA | NA | NA | NA | NA | NA | NA | NA |
| 2023-12-31 | 2023-09-30 | 2023-06-30 | 2023-03-31 | 2022-12-31 | 2022-09-30 | 2022-06-30 | 2022-03-31 | 2021-12-31 | 2021-09-30 | 2021-06-30 | 2021-03-31 | 2020-12-31 | 2020-09-30 | 2020-06-30 | 2020-03-31 | 2019-12-31 | 2019-09-30 | 2019-06-30 | 2019-03-31 | 2018-12-31 | 2018-09-30 | 2018-06-30 | 2018-03-31 | 2017-12-31 | 2017-09-30 | 2017-06-30 | 2017-03-31 | 2016-12-31 | 2016-09-30 | 2016-06-30 | 2016-03-31 | 2015-12-31 | 2015-09-30 | 2015-06-30 | 2015-03-31 | 2014-12-31 | 2014-09-30 | 2014-06-30 | 2014-03-31 | 2013-12-31 | 2013-09-30 | 2013-06-30 | 2013-03-31 | 2012-12-31 | 2012-09-30 | 2012-06-30 | 2012-03-31 | 2011-12-31 | 2011-09-30 | 2011-06-30 | 2011-03-31 | 2010-12-31 | 2010-09-30 | 2010-06-30 | 2010-03-31 | ||
|---|---|---|---|---|---|---|---|---|---|---|---|---|---|---|---|---|---|---|---|---|---|---|---|---|---|---|---|---|---|---|---|---|---|---|---|---|---|---|---|---|---|---|---|---|---|---|---|---|---|---|---|---|---|---|---|---|---|
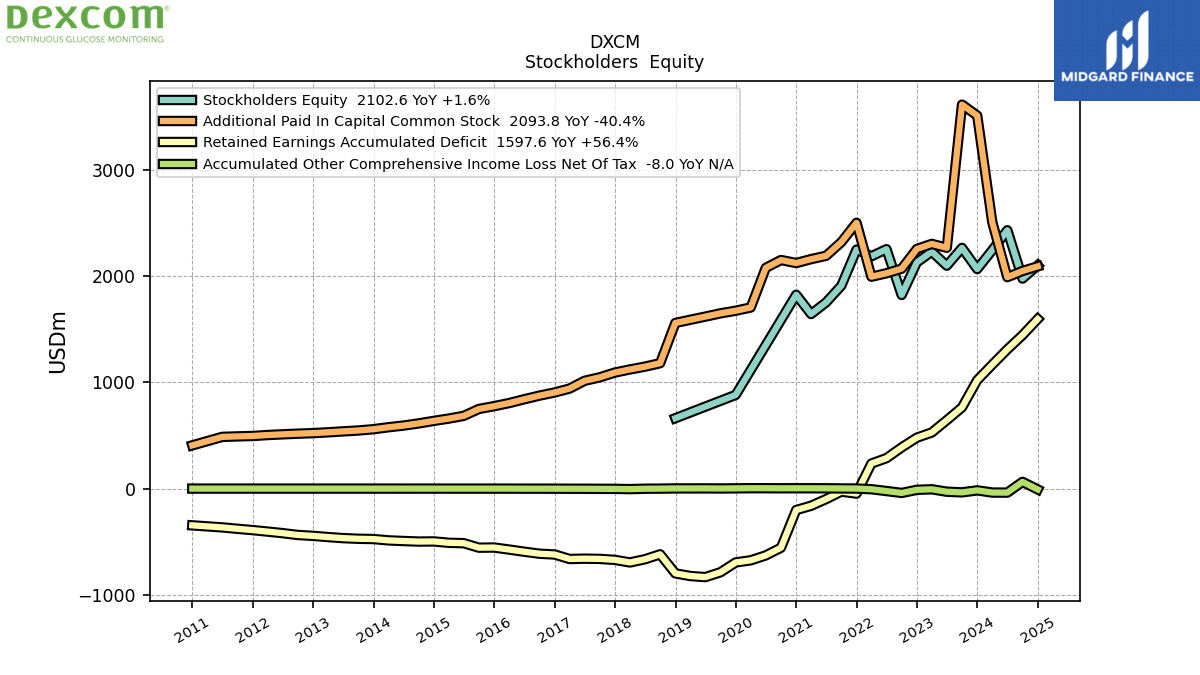
| Stockholders Equity | 2068.60 | 2267.90 | 2100.40 | 2233.00 | 2131.80 | 1824.50 | 2255.90 | 2189.30 | 2251.50 | 1912.00 | 1754.70 | 1644.80 | 1826.50 | NA | NA | NA | 882.60 | NA | NA | NA | 663.30 | NA | NA | NA | NA | NA | NA | NA | NA | NA | NA | NA | NA | NA | NA | NA | NA | NA | NA | NA | NA | NA | NA | NA | NA | NA | NA | NA | NA | NA | NA | NA | NA | NA | NA | NA | |
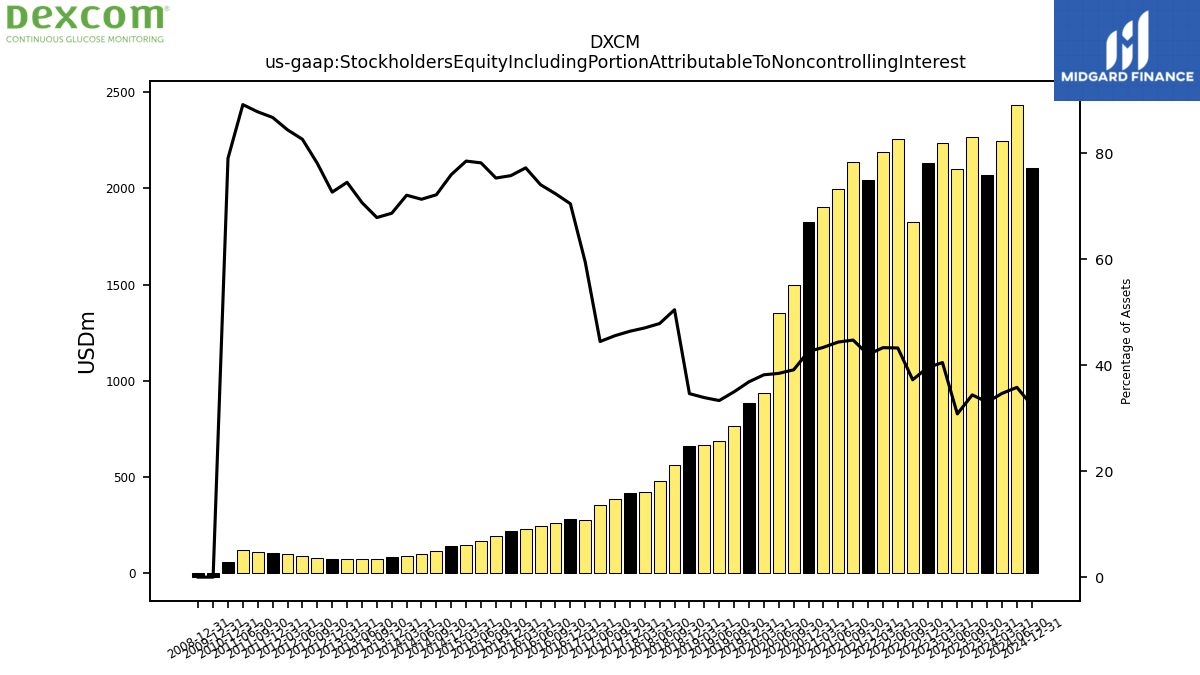
| Stockholders Equity Including Portion Attributable To Noncontrolling Interest | 2068.60 | 2267.90 | 2100.40 | 2233.00 | 2131.80 | 1824.50 | 2255.90 | 2189.30 | 2042.10 | 2136.10 | 1997.60 | 1903.20 | 1826.50 | 1499.30 | 1353.90 | 934.50 | 882.60 | 764.30 | 688.30 | 668.60 | 663.30 | 562.20 | 482.10 | 421.70 | 419.40 | 384.00 | 353.70 | 277.80 | 283.80 | 261.80 | 246.40 | 231.20 | 221.20 | 193.30 | 170.70 | 148.60 | 140.20 | 115.00 | 99.60 | 90.00 | 84.10 | 74.70 | 72.30 | 73.60 | 77.00 | 80.25 | 91.31 | 99.55 | 104.49 | 113.06 | 121.58 | NA | 60.99 | NA | NA | NA | |
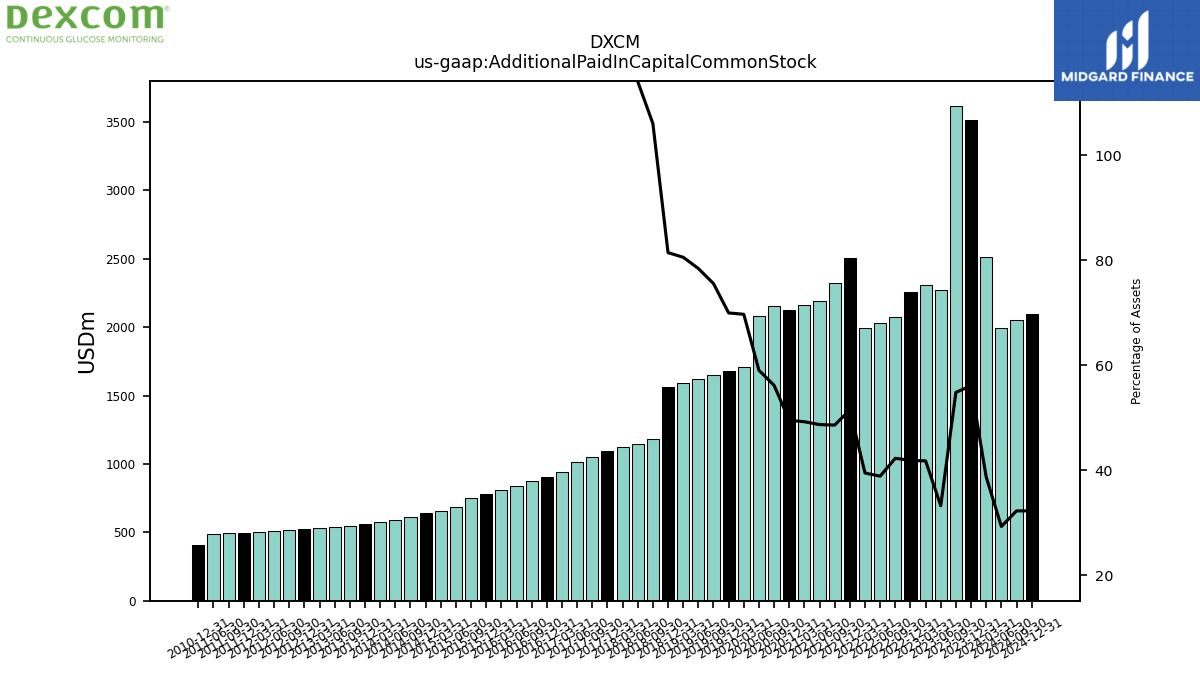
| Additional Paid In Capital Common Stock | 3514.60 | 3618.00 | 2269.00 | 2305.60 | 2258.10 | 2072.10 | 2028.90 | 1996.60 | 2504.50 | 2322.10 | 2193.60 | 2162.00 | 2125.30 | 2153.70 | 2079.80 | 1706.50 | 1675.90 | 1651.60 | 1620.40 | 1590.60 | 1560.60 | 1181.60 | 1149.10 | 1122.50 | 1093.70 | 1048.50 | 1015.60 | 942.30 | 905.70 | 876.00 | 841.80 | 806.00 | 776.80 | 750.40 | 685.30 | 659.50 | 638.00 | 614.10 | 593.60 | 577.90 | 559.50 | 547.50 | 539.10 | 530.30 | 522.60 | 517.42 | 511.21 | 504.77 | 495.63 | 491.96 | 487.20 | NA | 407.38 | NA | NA | NA | |
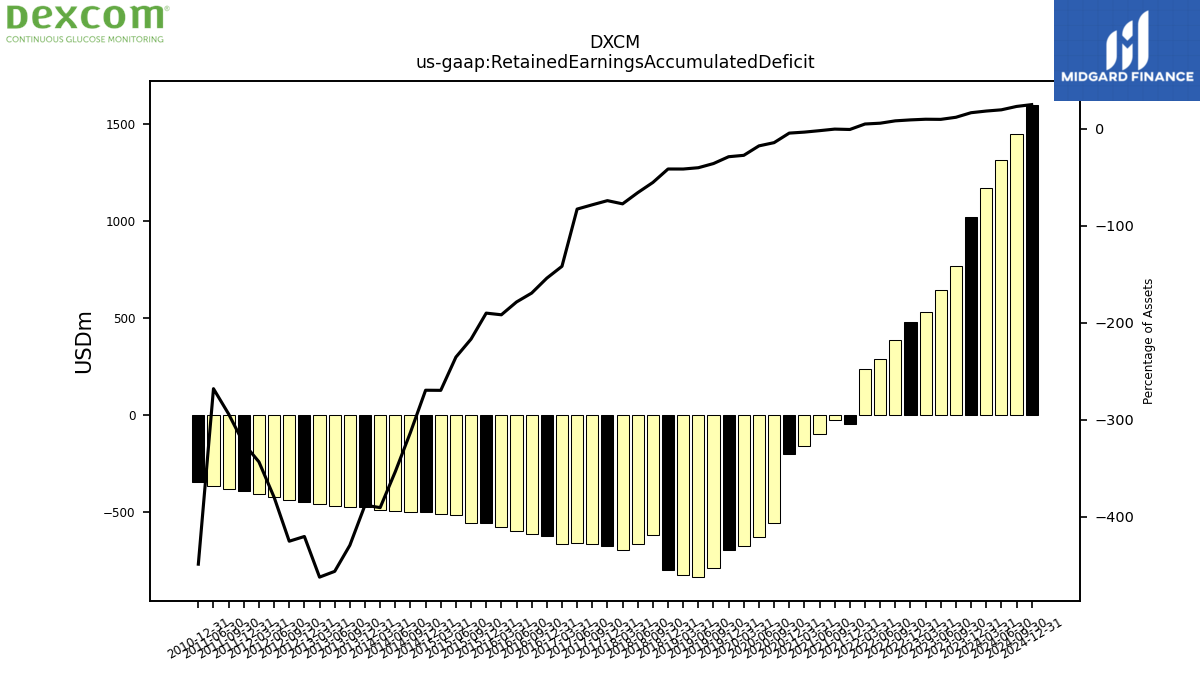
| Retained Earnings Accumulated Deficit | 1021.40 | 765.10 | 644.40 | 528.50 | 479.90 | 388.10 | 286.90 | 236.00 | -47.40 | -28.00 | -98.90 | -161.80 | -202.10 | -557.30 | -629.50 | -675.80 | -695.70 | -788.40 | -834.20 | -823.70 | -798.90 | -619.20 | -665.80 | -696.00 | -671.80 | -662.40 | -660.40 | -663.30 | -621.00 | -613.60 | -594.80 | -574.60 | -555.40 | -556.90 | -514.40 | -510.70 | -497.80 | -499.10 | -493.90 | -487.90 | -475.40 | -472.80 | -466.80 | -456.70 | -445.60 | -437.14 | -419.88 | -405.19 | -391.12 | -378.87 | -365.60 | NA | -346.38 | NA | NA | NA | |
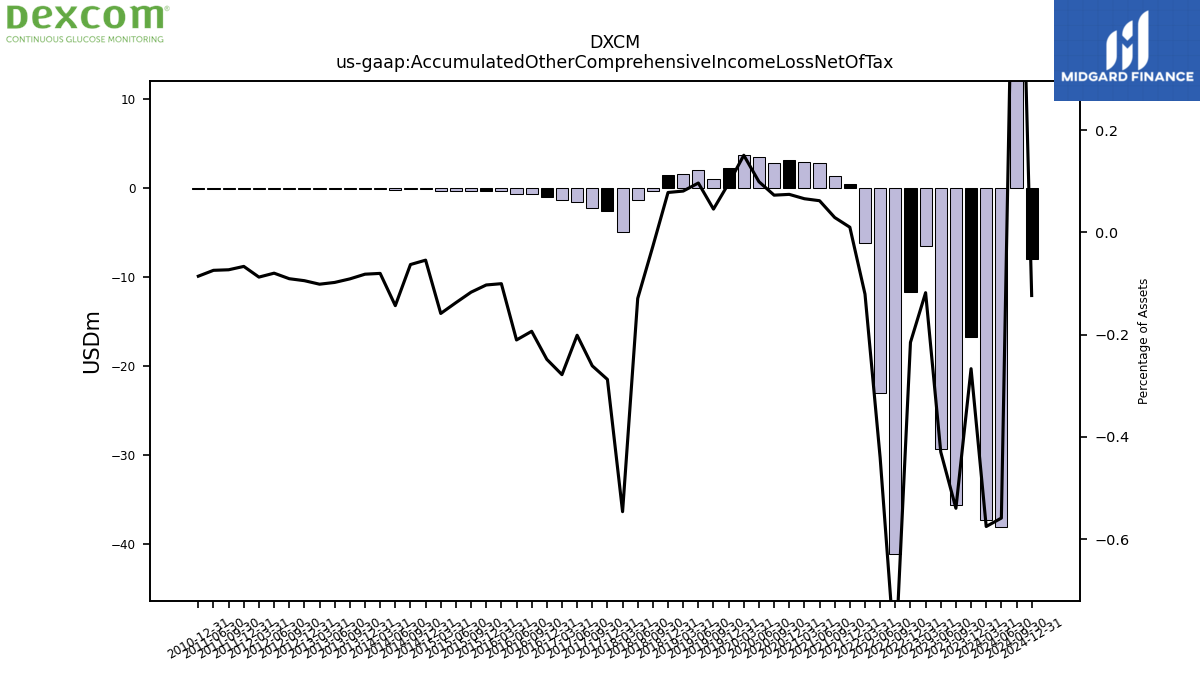
| Accumulated Other Comprehensive Income Loss Net Of Tax | -16.70 | -35.60 | -29.30 | -6.50 | -11.60 | -41.10 | -23.00 | -6.10 | 0.50 | 1.40 | 2.80 | 2.90 | 3.20 | 2.80 | 3.50 | 3.70 | 2.30 | 1.00 | 2.00 | 1.60 | 1.50 | -0.30 | -1.30 | -4.90 | -2.60 | -2.20 | -1.60 | -1.30 | -1.00 | -0.70 | -0.70 | -0.30 | -0.30 | -0.30 | -0.30 | -0.30 | -0.10 | -0.10 | -0.20 | -0.10 | -0.10 | -0.10 | -0.10 | -0.10 | -0.10 | -0.09 | -0.09 | -0.10 | -0.08 | -0.09 | -0.10 | NA | -0.07 | NA | NA | NA | |
| Adjustments To Additional Paid In Capital Sharebased Compensation Requisite Service Period Recognition Value | 36.90 | 39.00 | 39.70 | 35.20 | 34.00 | 30.80 | 32.60 | 29.10 | 26.30 | 27.50 | 31.60 | 28.00 | 34.10 | 30.70 | 30.70 | 23.90 | 23.60 | 24.40 | 29.70 | 25.00 | 24.60 | 27.10 | 25.60 | 24.60 | NA | NA | NA | NA | NA | NA | NA | NA | NA | NA | NA | NA | NA | NA | NA | NA | NA | NA | NA | NA | NA | NA | NA | NA | NA | NA | NA | NA | NA | NA | NA | NA |
| 2023-12-31 | 2023-09-30 | 2023-06-30 | 2023-03-31 | 2022-12-31 | 2022-09-30 | 2022-06-30 | 2022-03-31 | 2021-12-31 | 2021-09-30 | 2021-06-30 | 2021-03-31 | 2020-12-31 | 2020-09-30 | 2020-06-30 | 2020-03-31 | 2019-12-31 | 2019-09-30 | 2019-06-30 | 2019-03-31 | 2018-12-31 | 2018-09-30 | 2018-06-30 | 2018-03-31 | 2017-12-31 | 2017-09-30 | 2017-06-30 | 2017-03-31 | 2016-12-31 | 2016-09-30 | 2016-06-30 | 2016-03-31 | 2015-12-31 | 2015-09-30 | 2015-06-30 | 2015-03-31 | 2014-12-31 | 2014-09-30 | 2014-06-30 | 2014-03-31 | 2013-12-31 | 2013-09-30 | 2013-06-30 | 2013-03-31 | 2012-12-31 | 2012-09-30 | 2012-06-30 | 2012-03-31 | 2011-12-31 | 2011-09-30 | 2011-06-30 | 2011-03-31 | 2010-12-31 | 2010-09-30 | 2010-06-30 | 2010-03-31 | ||
|---|---|---|---|---|---|---|---|---|---|---|---|---|---|---|---|---|---|---|---|---|---|---|---|---|---|---|---|---|---|---|---|---|---|---|---|---|---|---|---|---|---|---|---|---|---|---|---|---|---|---|---|---|---|---|---|---|---|
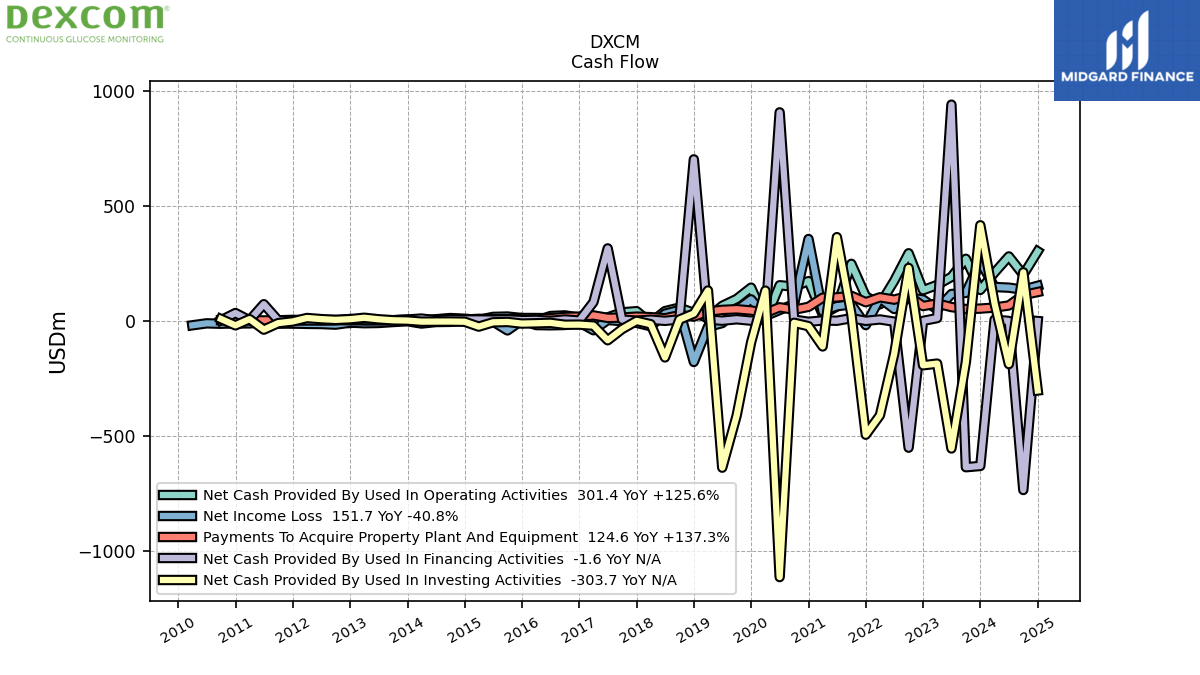
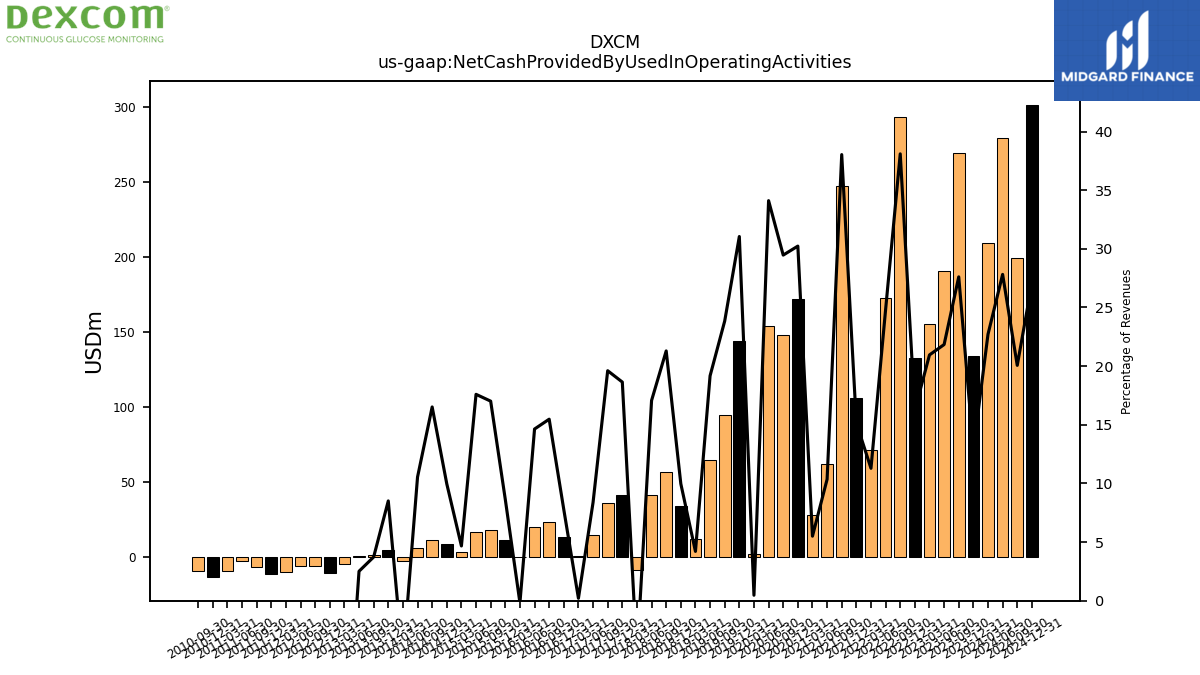
| Net Cash Provided By Used In Operating Activities | 133.60 | 269.20 | 190.30 | 155.40 | 132.50 | 293.20 | 172.80 | 71.00 | 105.80 | 247.30 | 61.60 | 27.80 | 172.00 | 147.60 | 154.10 | 1.90 | 143.70 | 94.50 | 64.50 | 11.80 | 33.70 | 56.80 | 41.40 | -8.70 | 41.20 | 36.20 | 14.30 | 0.30 | 13.30 | 23.00 | 20.10 | -0.20 | 11.30 | 17.90 | 16.40 | 3.40 | 8.40 | 11.40 | 6.20 | -2.40 | 4.40 | 1.60 | 0.90 | -4.50 | -10.56 | -6.05 | -6.33 | -10.16 | -11.57 | -6.74 | -2.53 | -9.29 | -13.46 | -9.47 | NA | NA | |
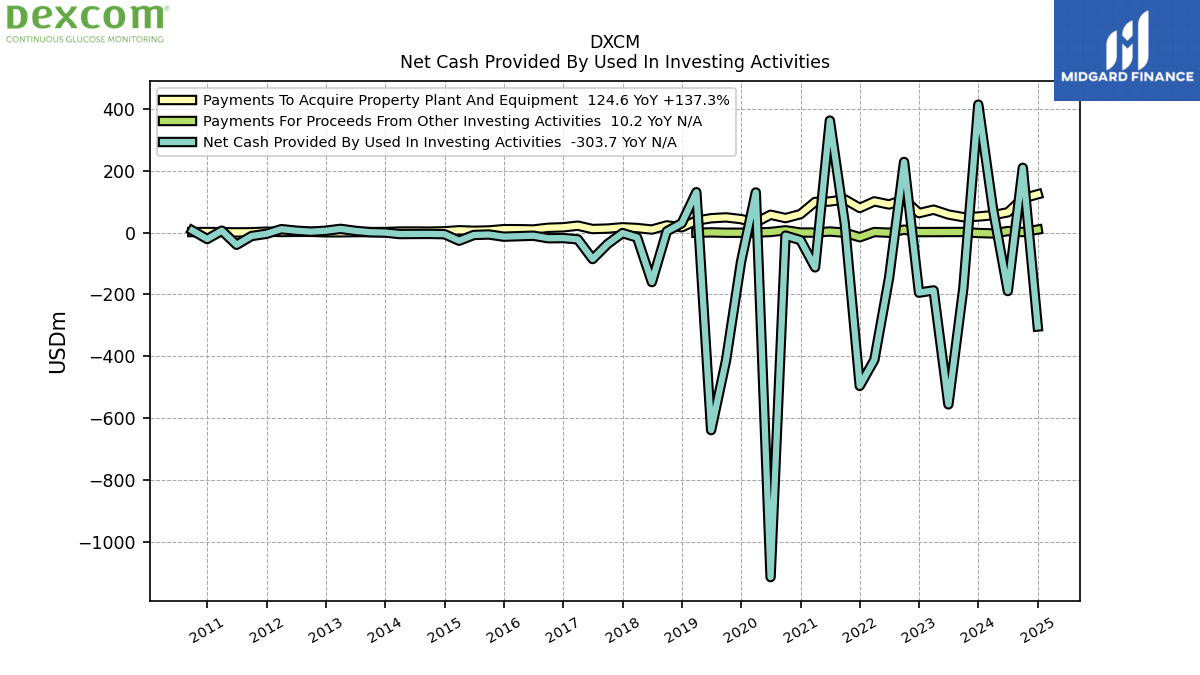
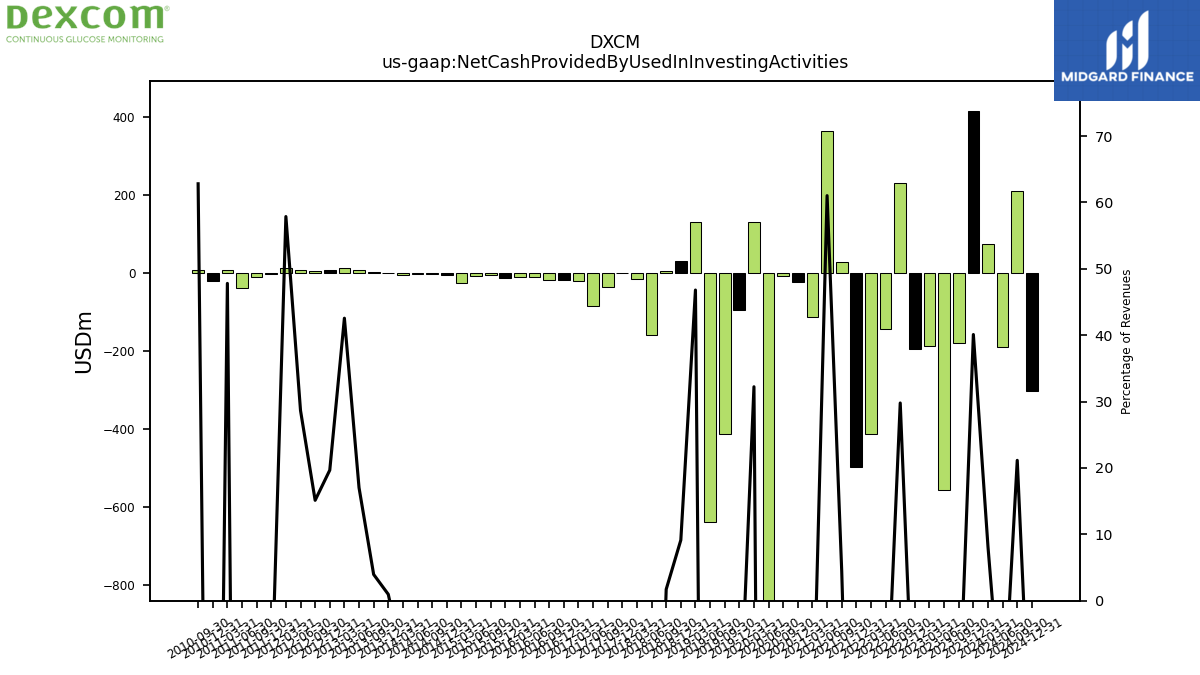
| Net Cash Provided By Used In Investing Activities | 414.90 | -179.50 | -555.90 | -186.70 | -194.10 | 229.30 | -144.90 | -411.80 | -496.10 | 29.00 | 363.20 | -112.20 | -24.00 | -9.30 | -1115.30 | 130.60 | -94.30 | -412.80 | -639.40 | 131.30 | 30.90 | 4.60 | -159.90 | -15.40 | -1.10 | -36.60 | -85.30 | -21.40 | -17.30 | -17.80 | -9.60 | -11.20 | -12.70 | -5.70 | -7.20 | -25.90 | -4.70 | -3.80 | -4.00 | -4.30 | 0.50 | 1.70 | 6.10 | 12.60 | 6.55 | 3.49 | 6.72 | 11.63 | -3.45 | -10.60 | -39.10 | 6.78 | -20.43 | 7.33 | NA | NA | |
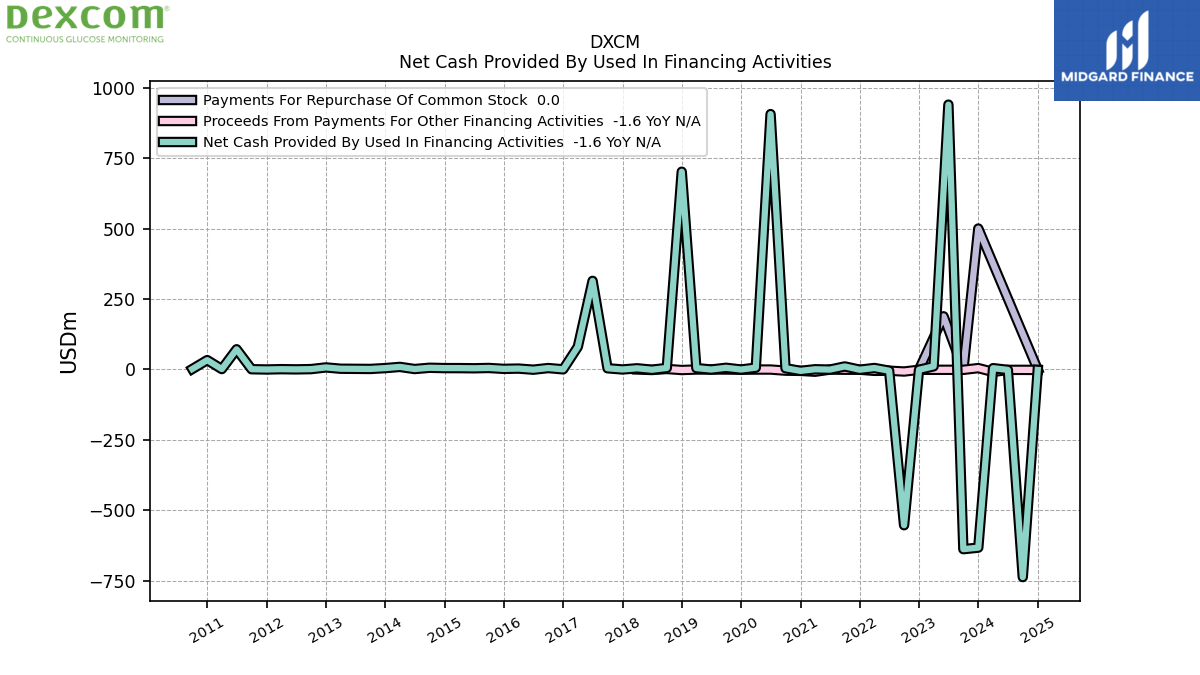
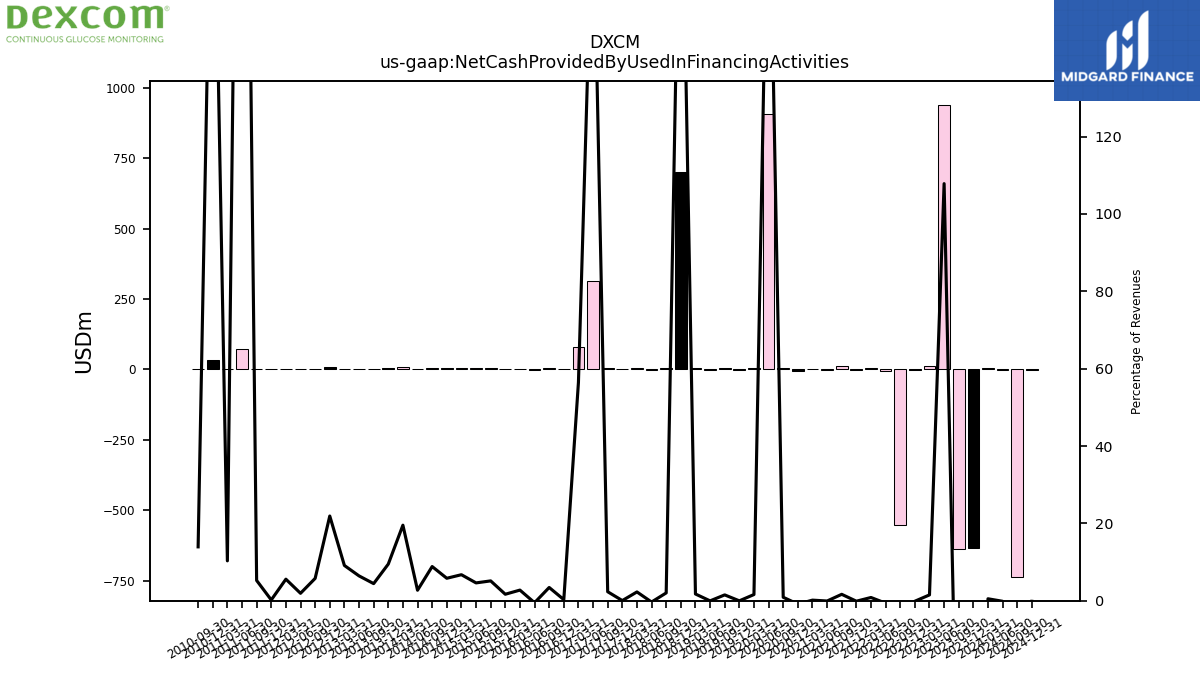
| Net Cash Provided By Used In Financing Activities | -631.90 | -637.40 | 939.50 | 11.20 | -1.00 | -552.50 | -4.30 | 5.30 | -0.80 | 10.80 | -0.40 | 0.80 | -4.90 | 4.50 | 906.00 | 6.50 | -0.10 | 6.00 | -0.10 | 4.90 | 701.60 | 5.40 | -0.80 | 4.20 | 0.10 | 4.30 | 314.40 | 80.30 | 0.50 | 5.10 | -0.70 | 3.20 | 2.20 | 5.40 | 4.30 | 4.90 | 4.90 | 6.10 | 1.60 | 9.20 | 4.90 | 1.90 | 2.30 | 2.70 | 7.29 | 1.33 | 0.45 | 1.12 | 0.05 | 0.96 | 71.72 | 1.46 | 33.26 | 1.62 | NA | NA |
| 2023-12-31 | 2023-09-30 | 2023-06-30 | 2023-03-31 | 2022-12-31 | 2022-09-30 | 2022-06-30 | 2022-03-31 | 2021-12-31 | 2021-09-30 | 2021-06-30 | 2021-03-31 | 2020-12-31 | 2020-09-30 | 2020-06-30 | 2020-03-31 | 2019-12-31 | 2019-09-30 | 2019-06-30 | 2019-03-31 | 2018-12-31 | 2018-09-30 | 2018-06-30 | 2018-03-31 | 2017-12-31 | 2017-09-30 | 2017-06-30 | 2017-03-31 | 2016-12-31 | 2016-09-30 | 2016-06-30 | 2016-03-31 | 2015-12-31 | 2015-09-30 | 2015-06-30 | 2015-03-31 | 2014-12-31 | 2014-09-30 | 2014-06-30 | 2014-03-31 | 2013-12-31 | 2013-09-30 | 2013-06-30 | 2013-03-31 | 2012-12-31 | 2012-09-30 | 2012-06-30 | 2012-03-31 | 2011-12-31 | 2011-09-30 | 2011-06-30 | 2011-03-31 | 2010-12-31 | 2010-09-30 | 2010-06-30 | 2010-03-31 | ||
|---|---|---|---|---|---|---|---|---|---|---|---|---|---|---|---|---|---|---|---|---|---|---|---|---|---|---|---|---|---|---|---|---|---|---|---|---|---|---|---|---|---|---|---|---|---|---|---|---|---|---|---|---|---|---|---|---|---|
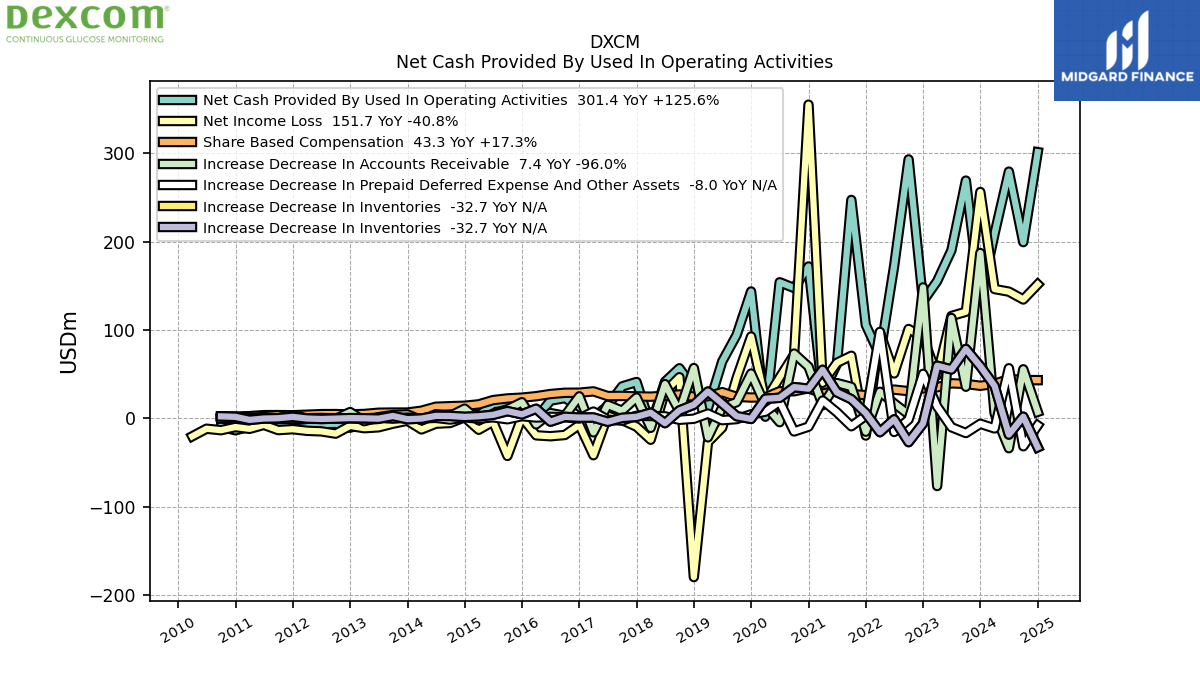
| Net Cash Provided By Used In Operating Activities | 133.60 | 269.20 | 190.30 | 155.40 | 132.50 | 293.20 | 172.80 | 71.00 | 105.80 | 247.30 | 61.60 | 27.80 | 172.00 | 147.60 | 154.10 | 1.90 | 143.70 | 94.50 | 64.50 | 11.80 | 33.70 | 56.80 | 41.40 | -8.70 | 41.20 | 36.20 | 14.30 | 0.30 | 13.30 | 23.00 | 20.10 | -0.20 | 11.30 | 17.90 | 16.40 | 3.40 | 8.40 | 11.40 | 6.20 | -2.40 | 4.40 | 1.60 | 0.90 | -4.50 | -10.56 | -6.05 | -6.33 | -10.16 | -11.57 | -6.74 | -2.53 | -9.29 | -13.46 | -9.47 | NA | NA | |
| Net Income Loss | 256.30 | 120.70 | 115.90 | 48.60 | 91.80 | 101.20 | 50.90 | 97.30 | -19.40 | 70.90 | 62.90 | 40.30 | 355.20 | 72.20 | 46.30 | 19.90 | 92.70 | 45.80 | -10.50 | -26.90 | -179.70 | 46.60 | 30.20 | -24.20 | -9.40 | -2.00 | 2.90 | -41.70 | -7.40 | -18.80 | -20.20 | -19.20 | 1.50 | -42.50 | -3.70 | -12.90 | 1.30 | -5.20 | -6.00 | -12.50 | -2.60 | -6.00 | -10.10 | -11.10 | -8.50 | -17.26 | -14.69 | -14.06 | -12.25 | -13.28 | -7.37 | -11.85 | -9.81 | -13.40 | -11.69 | -20.27 | |
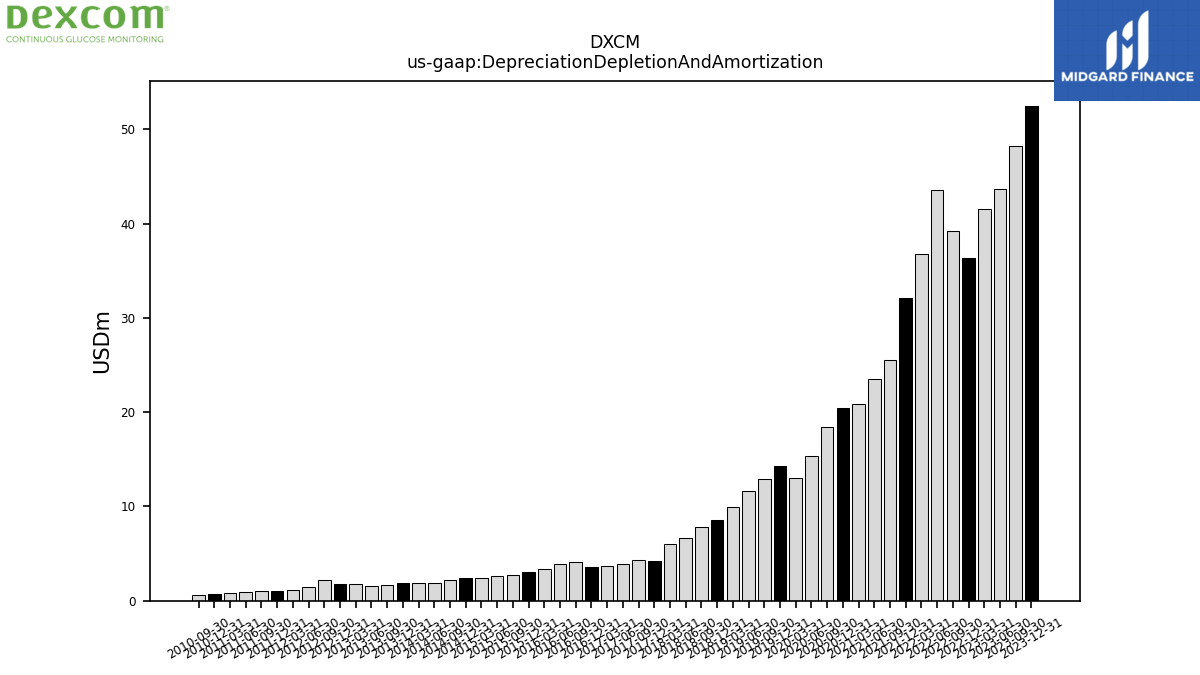
| Depreciation Depletion And Amortization | 52.50 | 48.20 | 43.70 | 41.60 | 36.30 | 39.20 | 43.60 | 36.80 | 32.10 | 25.50 | 23.50 | 20.90 | 20.40 | 18.40 | 15.30 | 13.00 | 14.30 | 12.90 | 11.60 | 9.90 | 8.60 | 7.80 | 6.70 | 6.00 | 4.20 | 4.30 | 3.90 | 3.70 | 3.60 | 4.10 | 3.90 | 3.40 | 3.10 | 2.70 | 2.60 | 2.40 | 2.40 | 2.20 | 1.90 | 1.90 | 1.90 | 1.70 | 1.60 | 1.80 | 1.75 | 2.20 | 1.47 | 1.18 | 1.06 | 1.00 | 0.89 | 0.81 | 0.72 | 0.63 | NA | NA | |
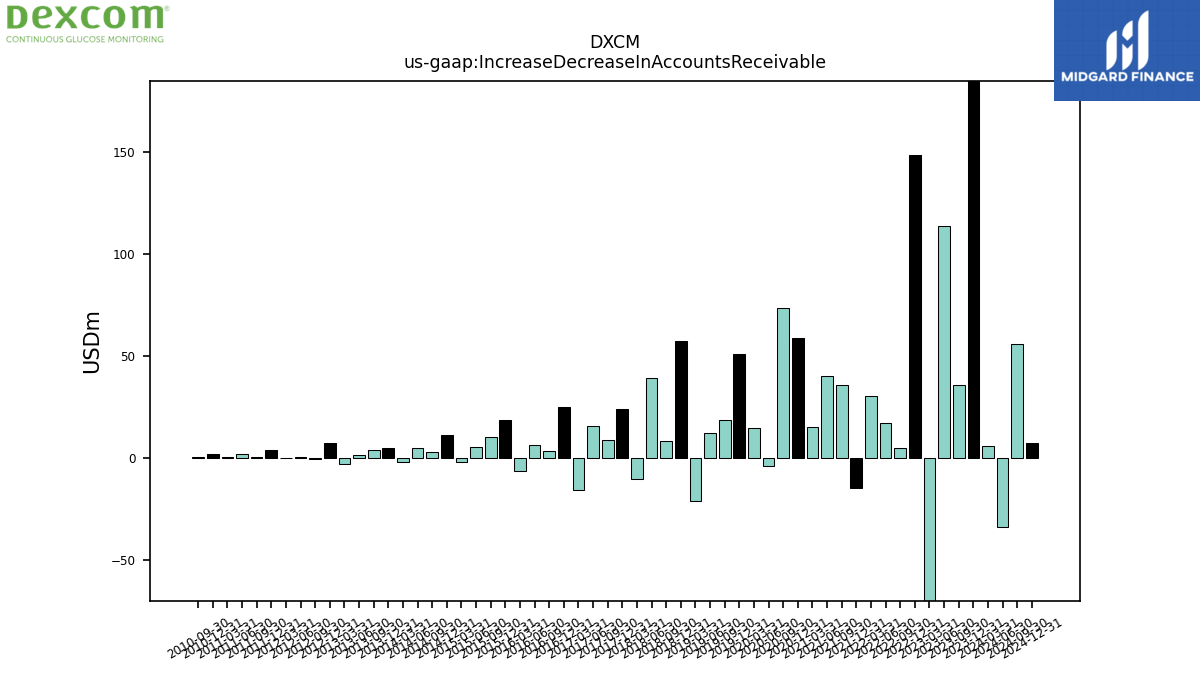
| Increase Decrease In Accounts Receivable | 187.20 | 35.80 | 113.70 | -76.60 | 148.30 | 4.50 | 17.00 | 30.10 | -15.10 | 35.70 | 40.00 | 14.90 | 58.50 | 73.40 | -4.30 | 14.70 | 50.80 | 18.40 | 12.30 | -21.50 | 57.00 | 8.10 | 38.80 | -10.70 | 23.60 | 8.70 | 15.30 | -15.80 | 25.00 | 3.00 | 6.00 | -6.80 | 18.30 | 10.30 | 5.30 | -2.20 | 11.00 | 2.80 | 4.70 | -2.20 | 4.50 | 3.80 | 1.40 | -3.20 | 7.19 | -0.54 | 0.36 | -0.00 | 3.54 | 0.31 | 1.54 | 0.49 | 1.57 | 0.44 | NA | NA | |
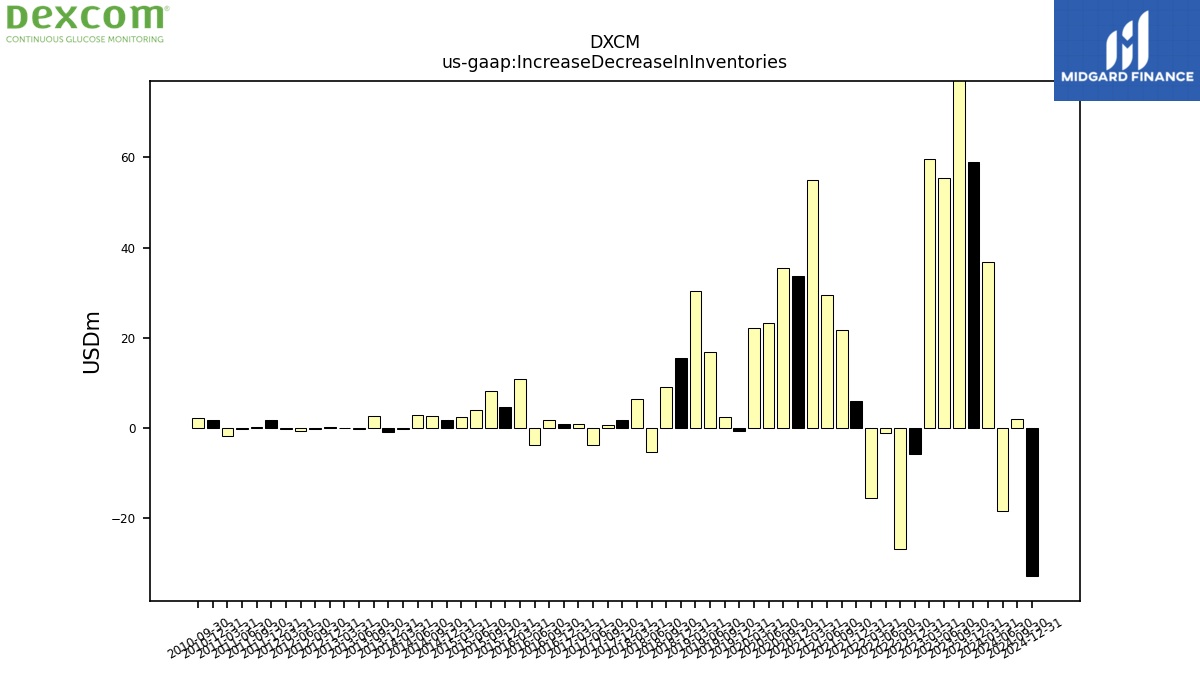
| Increase Decrease In Inventories | 59.00 | 78.60 | 55.40 | 59.60 | -5.70 | -26.90 | -1.10 | -15.60 | 6.00 | 21.70 | 29.50 | 55.00 | 33.60 | 35.40 | 23.30 | 22.20 | -0.60 | 2.50 | 16.80 | 30.40 | 15.50 | 9.00 | -5.40 | 6.40 | 1.80 | 0.60 | -3.80 | 1.00 | 0.90 | 1.70 | -3.70 | 10.90 | 4.60 | 8.20 | 4.00 | 2.40 | 1.70 | 2.70 | 2.80 | -0.20 | -0.90 | 2.70 | -0.30 | 0.10 | 0.33 | -0.24 | -0.67 | -0.13 | 1.72 | 0.20 | -0.17 | -1.69 | 1.76 | 2.27 | NA | NA | |
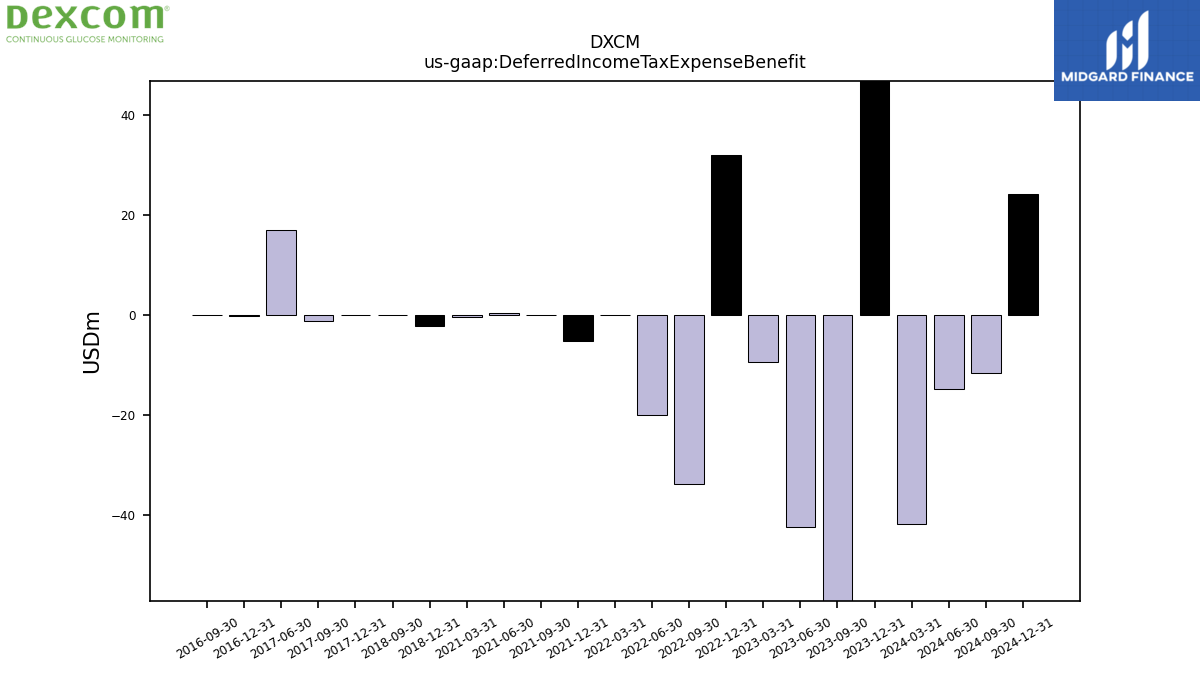
| Deferred Income Tax Expense Benefit | 81.50 | -85.00 | -42.20 | -9.30 | 32.00 | -33.80 | -19.90 | 0.10 | -5.10 | 0.10 | 0.40 | -0.30 | NA | NA | NA | NA | NA | NA | NA | NA | -2.20 | 0.00 | NA | NA | 0.00 | -1.10 | 17.10 | NA | -0.20 | 0.00 | NA | NA | NA | NA | NA | NA | NA | NA | NA | NA | NA | NA | NA | NA | NA | NA | NA | NA | NA | NA | NA | NA | NA | NA | NA | NA | |
| Share Based Compensation | 36.90 | 39.00 | 39.70 | 35.20 | 34.00 | 30.80 | 32.60 | 29.10 | 26.30 | 27.50 | 31.60 | 28.00 | 34.10 | 30.70 | 30.70 | 23.90 | 23.60 | 24.40 | 29.70 | 25.00 | 24.60 | 27.10 | 25.60 | 24.60 | 24.90 | 25.40 | 25.30 | 30.60 | 29.10 | 29.00 | 27.60 | 25.10 | 23.50 | 22.60 | 20.70 | 15.90 | 14.30 | 13.80 | 13.20 | 8.70 | 6.60 | 6.60 | 6.40 | 5.00 | 4.54 | 4.88 | 4.83 | 4.15 | 3.58 | 3.73 | 3.66 | 2.55 | 2.08 | 2.32 | NA | NA | |
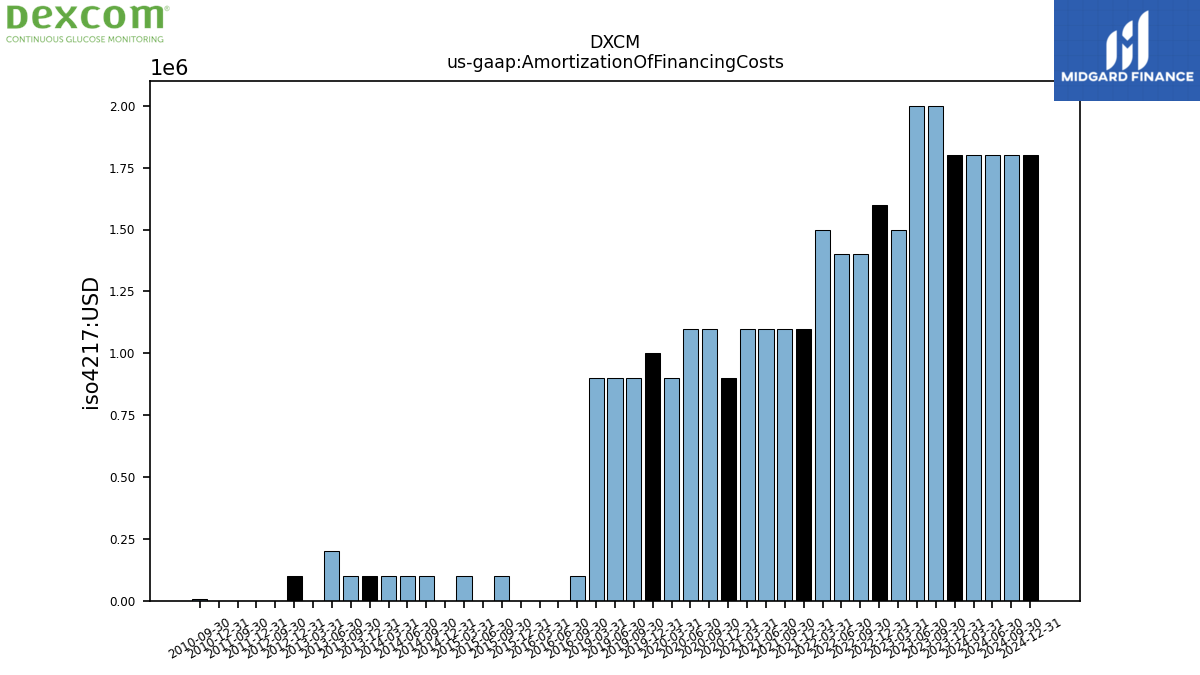
| Amortization Of Financing Costs | 1.80 | 2.00 | 2.00 | 1.50 | 1.60 | 1.40 | 1.40 | 1.50 | 1.10 | 1.10 | 1.10 | 1.10 | 0.90 | 1.10 | 1.10 | 0.90 | 1.00 | 0.90 | 0.90 | 0.90 | NA | NA | NA | NA | NA | NA | NA | NA | NA | 0.10 | 0.00 | 0.00 | 0.00 | 0.10 | 0.00 | 0.10 | 0.00 | 0.10 | 0.10 | 0.10 | 0.10 | 0.10 | 0.20 | 0.00 | 0.10 | 0.00 | NA | NA | 0.00 | 0.00 | NA | NA | 0.00 | 0.01 | NA | NA |
| 2023-12-31 | 2023-09-30 | 2023-06-30 | 2023-03-31 | 2022-12-31 | 2022-09-30 | 2022-06-30 | 2022-03-31 | 2021-12-31 | 2021-09-30 | 2021-06-30 | 2021-03-31 | 2020-12-31 | 2020-09-30 | 2020-06-30 | 2020-03-31 | 2019-12-31 | 2019-09-30 | 2019-06-30 | 2019-03-31 | 2018-12-31 | 2018-09-30 | 2018-06-30 | 2018-03-31 | 2017-12-31 | 2017-09-30 | 2017-06-30 | 2017-03-31 | 2016-12-31 | 2016-09-30 | 2016-06-30 | 2016-03-31 | 2015-12-31 | 2015-09-30 | 2015-06-30 | 2015-03-31 | 2014-12-31 | 2014-09-30 | 2014-06-30 | 2014-03-31 | 2013-12-31 | 2013-09-30 | 2013-06-30 | 2013-03-31 | 2012-12-31 | 2012-09-30 | 2012-06-30 | 2012-03-31 | 2011-12-31 | 2011-09-30 | 2011-06-30 | 2011-03-31 | 2010-12-31 | 2010-09-30 | 2010-06-30 | 2010-03-31 | ||
|---|---|---|---|---|---|---|---|---|---|---|---|---|---|---|---|---|---|---|---|---|---|---|---|---|---|---|---|---|---|---|---|---|---|---|---|---|---|---|---|---|---|---|---|---|---|---|---|---|---|---|---|---|---|---|---|---|---|
| Net Cash Provided By Used In Investing Activities | 414.90 | -179.50 | -555.90 | -186.70 | -194.10 | 229.30 | -144.90 | -411.80 | -496.10 | 29.00 | 363.20 | -112.20 | -24.00 | -9.30 | -1115.30 | 130.60 | -94.30 | -412.80 | -639.40 | 131.30 | 30.90 | 4.60 | -159.90 | -15.40 | -1.10 | -36.60 | -85.30 | -21.40 | -17.30 | -17.80 | -9.60 | -11.20 | -12.70 | -5.70 | -7.20 | -25.90 | -4.70 | -3.80 | -4.00 | -4.30 | 0.50 | 1.70 | 6.10 | 12.60 | 6.55 | 3.49 | 6.72 | 11.63 | -3.45 | -10.60 | -39.10 | 6.78 | -20.43 | 7.33 | NA | NA | |
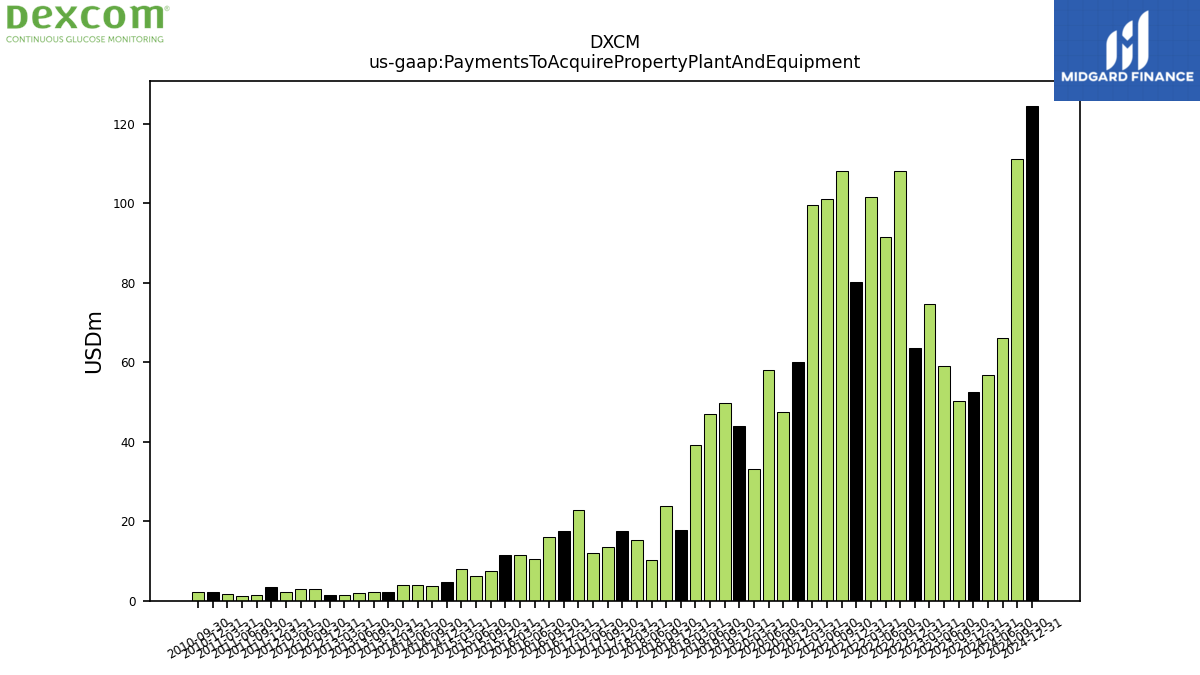
| Payments To Acquire Property Plant And Equipment | 52.50 | 50.40 | 59.00 | 74.70 | 63.50 | 108.20 | 91.50 | 101.60 | 80.20 | 108.10 | 101.20 | 99.70 | 60.20 | 47.40 | 58.20 | 33.20 | 44.10 | 49.70 | 46.90 | 39.30 | 17.70 | 23.80 | 10.30 | 15.30 | 17.60 | 13.50 | 12.00 | 22.90 | 17.60 | 16.10 | 10.50 | 11.50 | 11.60 | 7.40 | 6.30 | 8.00 | 4.60 | 3.70 | 4.00 | 3.90 | 2.30 | 2.20 | 2.00 | 1.40 | 1.40 | 2.89 | 2.88 | 2.32 | 3.55 | 1.51 | 1.16 | 1.79 | 2.33 | 2.09 | NA | NA |
| 2023-12-31 | 2023-09-30 | 2023-06-30 | 2023-03-31 | 2022-12-31 | 2022-09-30 | 2022-06-30 | 2022-03-31 | 2021-12-31 | 2021-09-30 | 2021-06-30 | 2021-03-31 | 2020-12-31 | 2020-09-30 | 2020-06-30 | 2020-03-31 | 2019-12-31 | 2019-09-30 | 2019-06-30 | 2019-03-31 | 2018-12-31 | 2018-09-30 | 2018-06-30 | 2018-03-31 | 2017-12-31 | 2017-09-30 | 2017-06-30 | 2017-03-31 | 2016-12-31 | 2016-09-30 | 2016-06-30 | 2016-03-31 | 2015-12-31 | 2015-09-30 | 2015-06-30 | 2015-03-31 | 2014-12-31 | 2014-09-30 | 2014-06-30 | 2014-03-31 | 2013-12-31 | 2013-09-30 | 2013-06-30 | 2013-03-31 | 2012-12-31 | 2012-09-30 | 2012-06-30 | 2012-03-31 | 2011-12-31 | 2011-09-30 | 2011-06-30 | 2011-03-31 | 2010-12-31 | 2010-09-30 | 2010-06-30 | 2010-03-31 | ||
|---|---|---|---|---|---|---|---|---|---|---|---|---|---|---|---|---|---|---|---|---|---|---|---|---|---|---|---|---|---|---|---|---|---|---|---|---|---|---|---|---|---|---|---|---|---|---|---|---|---|---|---|---|---|---|---|---|---|
| Net Cash Provided By Used In Financing Activities | -631.90 | -637.40 | 939.50 | 11.20 | -1.00 | -552.50 | -4.30 | 5.30 | -0.80 | 10.80 | -0.40 | 0.80 | -4.90 | 4.50 | 906.00 | 6.50 | -0.10 | 6.00 | -0.10 | 4.90 | 701.60 | 5.40 | -0.80 | 4.20 | 0.10 | 4.30 | 314.40 | 80.30 | 0.50 | 5.10 | -0.70 | 3.20 | 2.20 | 5.40 | 4.30 | 4.90 | 4.90 | 6.10 | 1.60 | 9.20 | 4.90 | 1.90 | 2.30 | 2.70 | 7.29 | 1.33 | 0.45 | 1.12 | 0.05 | 0.96 | 71.72 | 1.46 | 33.26 | 1.62 | NA | NA | |
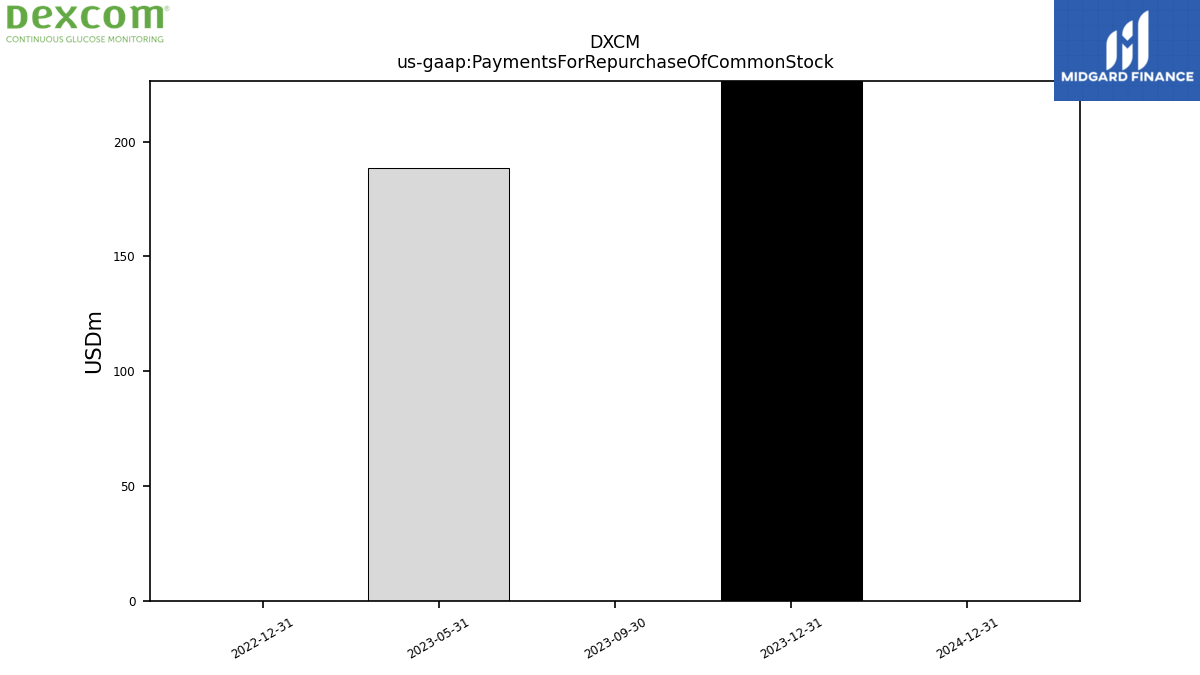
| Payments For Repurchase Of Common Stock | 500.00 | 0.00 | NA | NA | 0.00 | NA | NA | NA | NA | NA | NA | NA | NA | NA | NA | NA | NA | NA | NA | NA | NA | NA | NA | NA | NA | NA | NA | NA | NA | NA | NA | NA | NA | NA | NA | NA | NA | NA | NA | NA | NA | NA | NA | NA | NA | NA | NA | NA | NA | NA | NA | NA | NA | NA | NA | NA |
| 2023-12-31 | 2023-09-30 | 2023-06-30 | 2023-03-31 | 2022-12-31 | 2022-09-30 | 2022-06-30 | 2022-03-31 | 2021-12-31 | 2021-09-30 | 2021-06-30 | 2021-03-31 | 2020-12-31 | 2020-09-30 | 2020-06-30 | 2020-03-31 | 2019-12-31 | 2019-09-30 | 2019-06-30 | 2019-03-31 | 2018-12-31 | 2018-09-30 | 2018-06-30 | 2018-03-31 | 2017-12-31 | 2017-09-30 | 2017-06-30 | 2017-03-31 | 2016-12-31 | 2016-09-30 | 2016-06-30 | 2016-03-31 | 2015-12-31 | 2015-09-30 | 2015-06-30 | 2015-03-31 | 2014-12-31 | 2014-09-30 | 2014-06-30 | 2014-03-31 | 2013-12-31 | 2013-09-30 | 2013-06-30 | 2013-03-31 | 2012-12-31 | 2012-09-30 | 2012-06-30 | 2012-03-31 | 2011-12-31 | 2011-09-30 | 2011-06-30 | 2011-03-31 | 2010-12-31 | 2010-09-30 | 2010-06-30 | 2010-03-31 | ||
|---|---|---|---|---|---|---|---|---|---|---|---|---|---|---|---|---|---|---|---|---|---|---|---|---|---|---|---|---|---|---|---|---|---|---|---|---|---|---|---|---|---|---|---|---|---|---|---|---|---|---|---|---|---|---|---|---|---|
| Revenues | 1034.50 | 975.00 | 871.30 | 741.50 | 815.20 | 769.60 | 696.20 | 628.80 | 698.20 | 650.20 | 595.10 | 505.00 | 568.90 | 500.90 | 451.80 | 405.10 | 462.80 | 396.30 | 336.40 | 280.50 | 338.00 | 266.70 | 242.50 | 184.40 | 221.00 | 184.60 | 170.60 | 142.30 | 171.20 | 148.60 | 137.30 | 116.20 | 130.80 | 105.20 | 93.20 | 72.80 | 84.30 | 69.00 | 58.80 | 47.10 | 51.70 | 42.90 | 35.80 | 29.60 | 33.30 | 23.09 | 23.45 | 20.09 | 22.42 | 18.25 | 21.42 | 14.17 | 15.64 | 11.66 | 11.79 | 9.54 | |
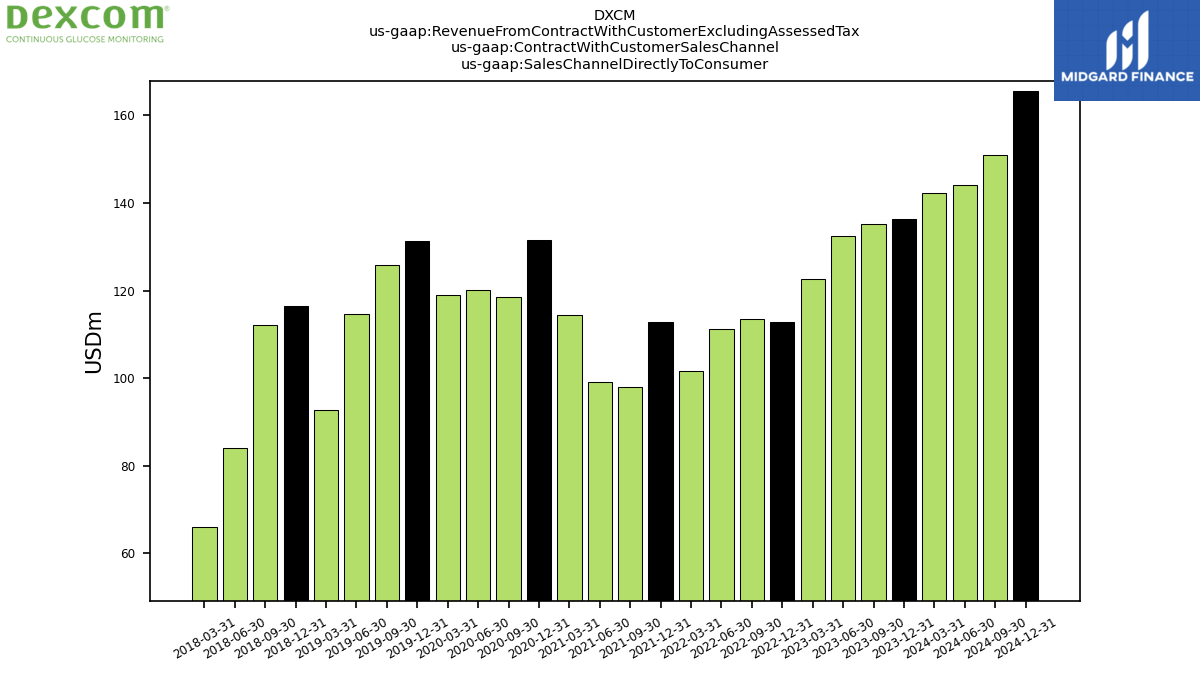
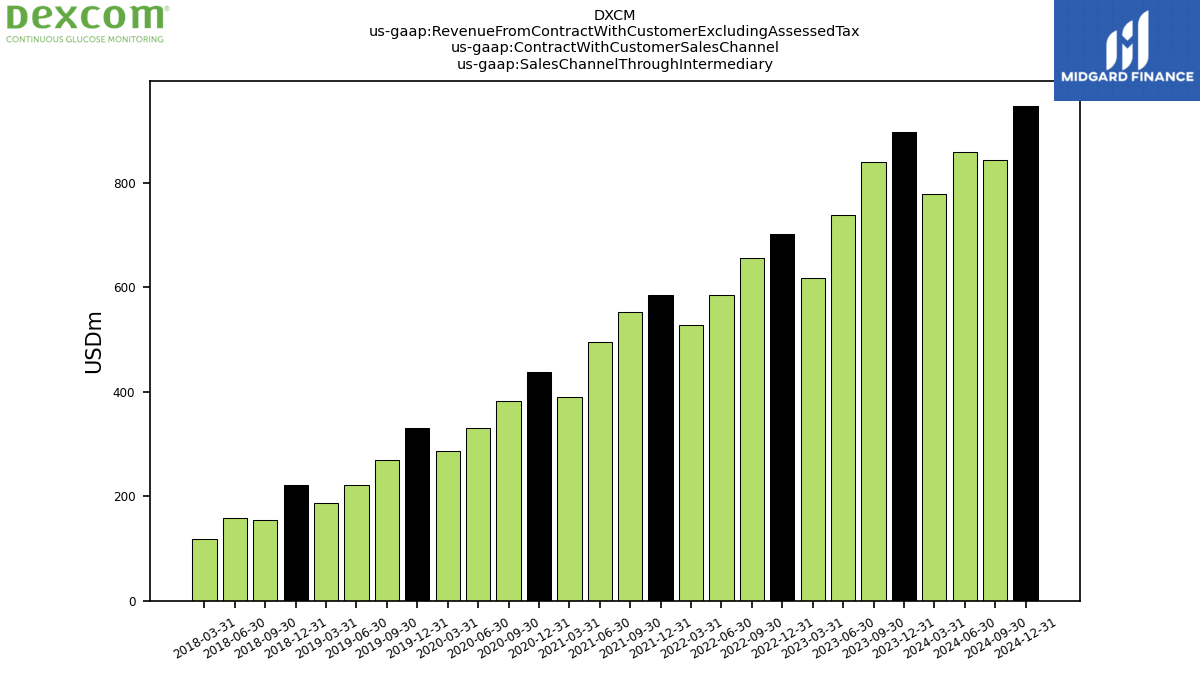
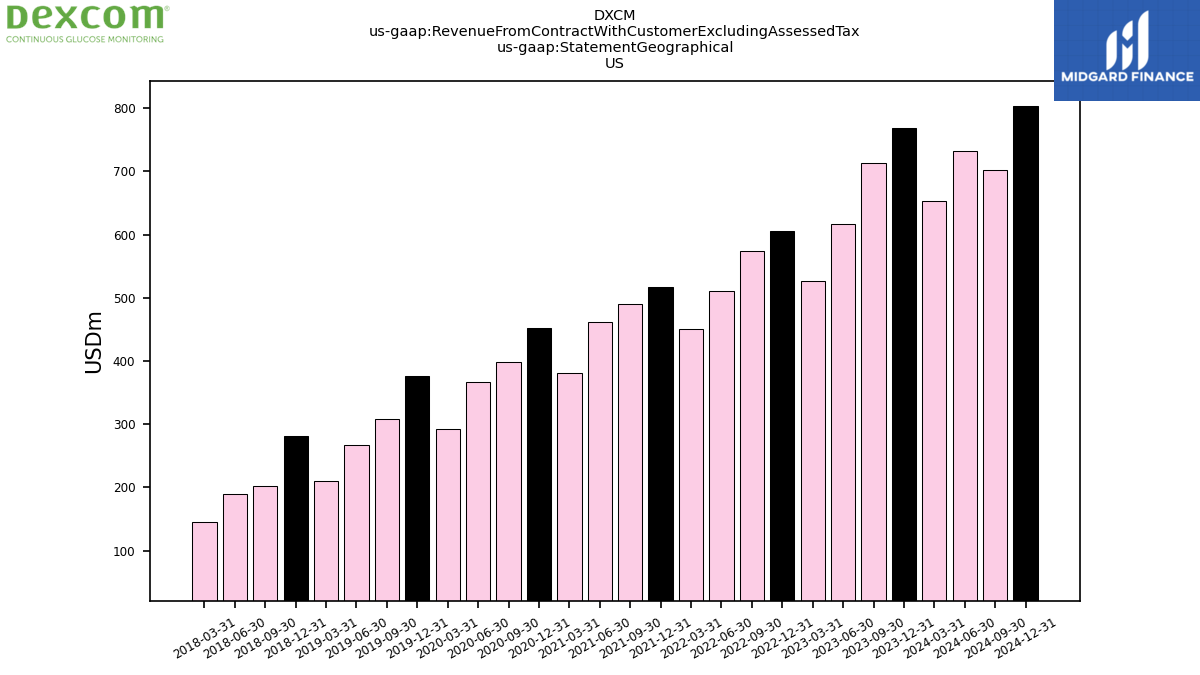
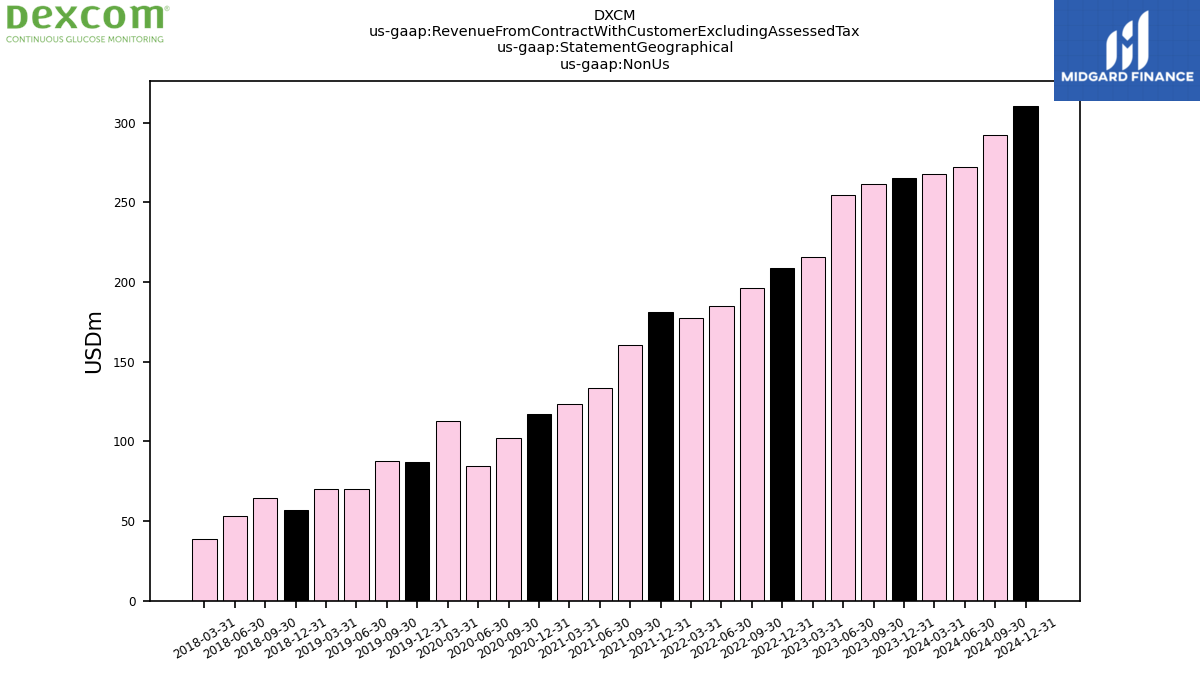
| Revenue From Contract With Customer Excluding Assessed Tax | 1034.50 | 975.00 | 871.30 | 741.50 | 815.20 | 769.60 | 696.20 | 628.80 | 698.20 | 650.20 | 595.10 | 505.00 | 568.90 | 500.90 | 451.80 | 405.10 | 462.80 | 396.30 | 336.40 | 280.50 | 338.00 | 266.70 | 242.50 | 184.40 | 221.00 | 184.60 | 170.60 | 142.30 | 171.20 | 148.60 | 137.30 | 116.20 | 130.80 | 105.20 | 93.20 | 72.80 | 84.30 | 69.00 | 58.80 | 47.10 | 51.70 | 42.90 | 35.80 | 29.60 | 33.30 | 23.09 | 23.45 | 20.09 | 22.42 | 18.25 | 21.42 | 14.17 | 15.64 | 11.66 | 11.79 | 9.54 | |
| Sales Channel Directly To Consumer | 136.30 | 135.30 | 132.50 | 122.60 | 112.80 | 113.40 | 111.10 | 101.70 | 112.80 | 97.90 | 99.20 | 114.30 | 131.50 | 118.50 | 120.10 | 119.00 | 131.20 | 125.90 | 114.60 | 92.70 | 116.40 | 112.10 | 84.10 | 66.10 | NA | NA | NA | NA | NA | NA | NA | NA | NA | NA | NA | NA | NA | NA | NA | NA | NA | NA | NA | NA | NA | NA | NA | NA | NA | NA | NA | NA | NA | NA | NA | NA | |
| Sales Channel Through Intermediary | 898.20 | 839.70 | 738.80 | 618.90 | 702.40 | 656.20 | 585.10 | 527.10 | 585.40 | 552.30 | 495.90 | 390.70 | 437.40 | 382.40 | 331.70 | 286.10 | 331.60 | 270.40 | 221.80 | 187.80 | 221.60 | 154.60 | 158.40 | 118.30 | NA | NA | NA | NA | NA | NA | NA | NA | NA | NA | NA | NA | NA | NA | NA | NA | NA | NA | NA | NA | NA | NA | NA | NA | NA | NA | NA | NA | NA | NA | NA | NA | |
| US | 769.10 | 713.60 | 616.60 | 526.00 | 606.40 | 573.40 | 511.00 | 451.20 | 517.10 | 489.60 | 461.50 | 381.20 | 451.50 | 398.60 | 367.10 | 292.30 | 375.90 | 308.80 | 266.30 | 210.50 | 281.00 | 202.40 | 189.60 | 145.40 | NA | NA | NA | NA | NA | NA | NA | NA | NA | NA | NA | NA | NA | NA | NA | NA | NA | NA | NA | NA | NA | NA | NA | NA | NA | NA | NA | NA | NA | NA | NA | NA | |
| Non Us | 265.40 | 261.40 | 254.70 | 215.50 | 208.80 | 196.20 | 185.20 | 177.60 | 181.10 | 160.60 | 133.60 | 123.80 | 117.40 | 102.30 | 84.70 | 112.80 | 86.90 | 87.50 | 70.10 | 70.00 | 57.00 | 64.30 | 52.90 | 39.00 | NA | NA | NA | NA | NA | NA | NA | NA | NA | NA | NA | NA | NA | NA | NA | NA | NA | NA | NA | NA | NA | NA | NA | NA | NA | NA | NA | NA | NA | NA | NA | NA |