
| 2023-12-31 | 2023-09-30 | 2023-06-30 | 2023-03-31 | 2022-12-31 | 2022-09-30 | 2022-06-30 | 2022-03-31 | 2021-12-31 | 2021-09-30 | 2021-06-30 | 2021-03-31 | 2020-12-31 | 2020-09-30 | 2020-06-30 | 2020-03-31 | 2019-12-31 | 2019-09-30 | 2019-06-30 | 2019-03-31 | 2018-12-31 | 2018-09-30 | 2018-06-30 | 2018-03-31 | 2017-12-31 | 2017-09-30 | 2017-06-30 | 2017-03-31 | 2016-12-31 | 2016-09-30 | 2016-06-30 | 2016-03-31 | 2015-12-31 | 2015-09-30 | 2015-06-30 | 2015-03-31 | 2014-12-31 | 2014-09-30 | 2014-06-30 | 2014-03-31 | 2013-12-31 | 2013-09-30 | 2013-06-30 | 2013-03-31 | 2012-12-31 | 2012-09-30 | 2012-06-30 | 2012-03-31 | 2011-12-31 | 2011-09-30 | 2011-06-30 | 2011-03-31 | 2010-12-31 | 2010-09-30 | 2010-06-30 | ||
|---|---|---|---|---|---|---|---|---|---|---|---|---|---|---|---|---|---|---|---|---|---|---|---|---|---|---|---|---|---|---|---|---|---|---|---|---|---|---|---|---|---|---|---|---|---|---|---|---|---|---|---|---|---|---|---|---|
| Common Stock Value | 0.23 | 0.23 | 0.23 | 0.23 | 0.23 | 0.23 | 0.24 | 0.24 | 0.24 | 0.30 | 0.30 | 0.31 | 0.31 | 0.31 | 0.31 | 0.31 | 0.31 | 0.31 | 0.31 | 0.31 | 0.31 | 0.31 | 0.26 | 0.26 | 0.26 | 0.26 | 0.26 | 0.26 | 0.26 | 0.26 | 0.26 | 0.26 | 0.25 | 0.25 | 0.25 | 0.26 | 0.26 | 0.26 | 0.26 | 0.26 | 0.26 | 0.25 | 0.25 | 0.23 | 0.23 | 0.25 | 0.25 | 0.25 | 0.24 | 0.24 | 0.24 | NA | 0.24 | NA | NA | |
| Earnings Per Share Basic | -11.44 | 0.82 | 1.11 | 0.79 | -2.94 | 1.31 | 2.48 | 7.11 | 2.74 | 2.76 | 3.12 | 3.01 | 1.18 | 1.74 | 4.15 | -0.33 | 1.38 | 1.24 | 1.17 | 1.58 | 1.51 | 0.69 | 1.01 | 0.84 | 0.49 | 1.08 | 0.78 | 0.85 | 0.88 | -0.06 | 1.15 | 1.01 | -0.04 | -0.43 | 1.07 | 1.13 | 1.03 | 1.17 | 0.91 | 0.90 | 0.90 | 0.86 | 0.46 | 0.83 | 0.82 | 0.85 | 0.67 | 0.46 | 0.69 | 0.62 | 0.60 | 0.56 | 0.58 | 0.51 | 0.49 | |
| Earnings Per Share Diluted | -11.34 | 0.79 | 1.08 | 0.75 | -2.60 | 1.22 | 2.29 | 6.40 | 2.55 | 2.66 | 3.07 | 2.97 | 1.17 | 1.72 | 4.13 | -0.33 | 1.36 | 1.23 | 1.17 | 1.57 | 1.50 | 0.69 | 1.00 | 0.83 | 0.48 | 1.05 | 0.77 | 0.85 | 0.88 | -0.06 | 1.14 | 0.99 | -0.04 | -0.43 | 1.03 | 1.08 | 0.98 | 1.11 | 0.86 | 0.82 | 0.82 | 0.81 | 0.44 | 0.80 | 0.79 | 0.82 | 0.64 | 0.44 | 0.67 | 0.60 | 0.58 | 0.54 | 0.56 | 0.49 | 0.47 |
| 2023-12-31 | 2023-09-30 | 2023-06-30 | 2023-03-31 | 2022-12-31 | 2022-09-30 | 2022-06-30 | 2022-03-31 | 2021-12-31 | 2021-09-30 | 2021-06-30 | 2021-03-31 | 2020-12-31 | 2020-09-30 | 2020-06-30 | 2020-03-31 | 2019-12-31 | 2019-09-30 | 2019-06-30 | 2019-03-31 | 2018-12-31 | 2018-09-30 | 2018-06-30 | 2018-03-31 | 2017-12-31 | 2017-09-30 | 2017-06-30 | 2017-03-31 | 2016-12-31 | 2016-09-30 | 2016-06-30 | 2016-03-31 | 2015-12-31 | 2015-09-30 | 2015-06-30 | 2015-03-31 | 2014-12-31 | 2014-09-30 | 2014-06-30 | 2014-03-31 | 2013-12-31 | 2013-09-30 | 2013-06-30 | 2013-03-31 | 2012-12-31 | 2012-09-30 | 2012-06-30 | 2012-03-31 | 2011-12-31 | 2011-09-30 | 2011-06-30 | 2011-03-31 | 2010-12-31 | 2010-09-30 | 2010-06-30 | ||
|---|---|---|---|---|---|---|---|---|---|---|---|---|---|---|---|---|---|---|---|---|---|---|---|---|---|---|---|---|---|---|---|---|---|---|---|---|---|---|---|---|---|---|---|---|---|---|---|---|---|---|---|---|---|---|---|---|
| Revenue From Contract With Customer Excluding Assessed Tax | 19.65 | 19.89 | 21.01 | 22.59 | 23.00 | 21.99 | 23.79 | 26.15 | 26.88 | 29.32 | 32.06 | 32.52 | 32.70 | 29.79 | 23.95 | 28.68 | 347.79 | 31.20 | 32.32 | 34.55 | 348.72 | 37.39 | 39.45 | 35.97 | 317.48 | 23.11 | 18.68 | 19.97 | 271.38 | 179.41 | 289.44 | 289.02 | 297.76 | 287.80 | 290.36 | 285.66 | 276.57 | 273.28 | 269.19 | 253.74 | 237.10 | 235.56 | 156.12 | 144.28 | 143.61 | 144.79 | 141.06 | 130.22 | 116.45 | 120.56 | 115.83 | 110.30 | 99.77 | 97.97 | 96.23 | |
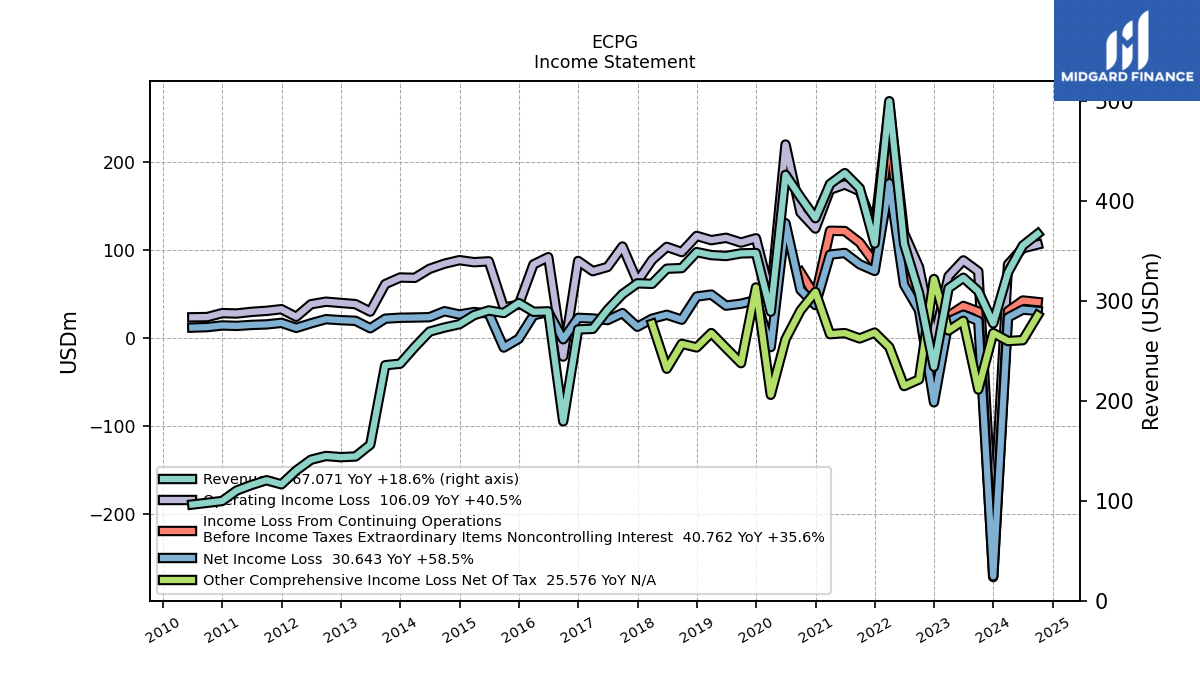
| Revenues | 277.39 | 309.62 | 323.04 | 312.63 | 234.00 | 307.75 | 356.92 | 499.68 | 357.30 | 412.62 | 427.74 | 416.84 | 382.61 | 403.68 | 426.03 | 289.08 | 347.79 | 347.42 | 344.81 | 345.71 | 348.72 | 332.75 | 332.12 | 316.98 | 317.48 | 306.70 | 290.92 | 271.94 | 271.38 | 179.41 | 289.44 | 289.02 | 297.76 | 287.80 | 290.36 | 285.66 | 276.57 | 273.28 | 269.19 | 253.74 | 237.10 | 235.56 | 156.12 | 144.28 | 143.61 | 144.79 | 141.06 | 130.22 | 116.45 | 120.56 | 115.83 | 110.30 | 99.77 | 97.97 | 96.23 | |
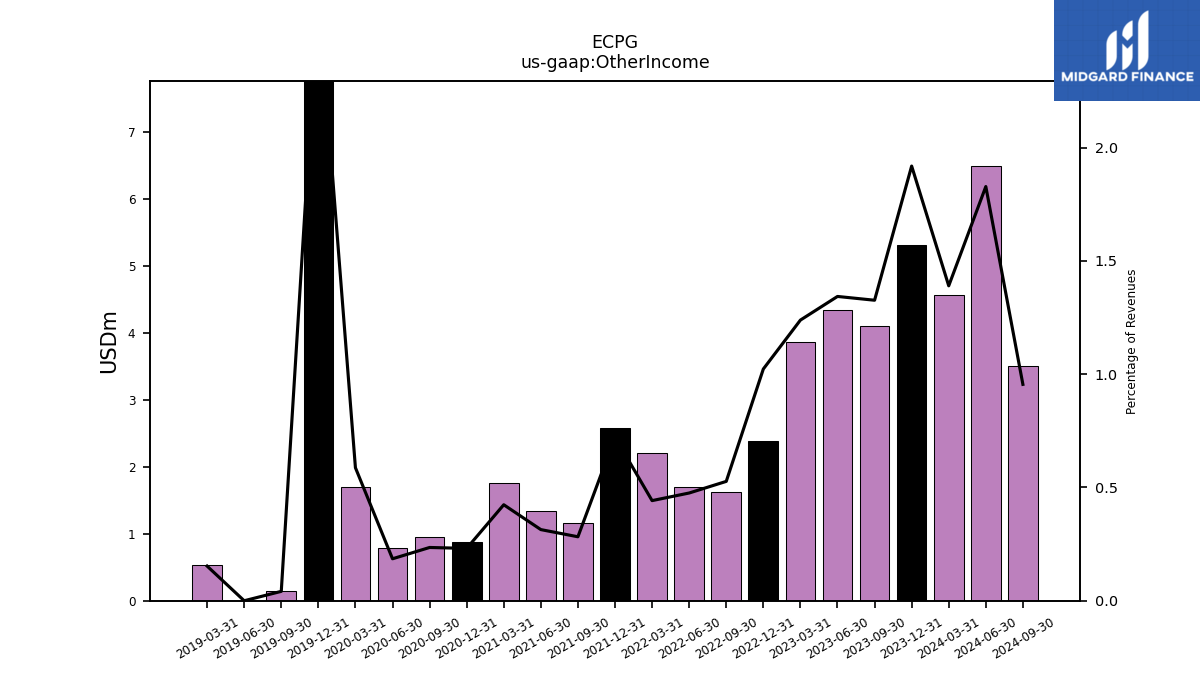
| Other Income | 5.32 | 4.11 | 4.34 | 3.87 | 2.39 | 1.62 | 1.70 | 2.21 | 2.58 | 1.17 | 1.34 | 1.77 | 0.88 | 0.95 | 0.79 | 1.70 | 9.30 | 0.14 | 0.00 | 0.53 | NA | NA | NA | NA | NA | NA | NA | NA | NA | NA | NA | NA | NA | NA | NA | NA | NA | NA | NA | NA | NA | NA | NA | NA | NA | NA | NA | NA | NA | NA | NA | NA | NA | NA | NA | |
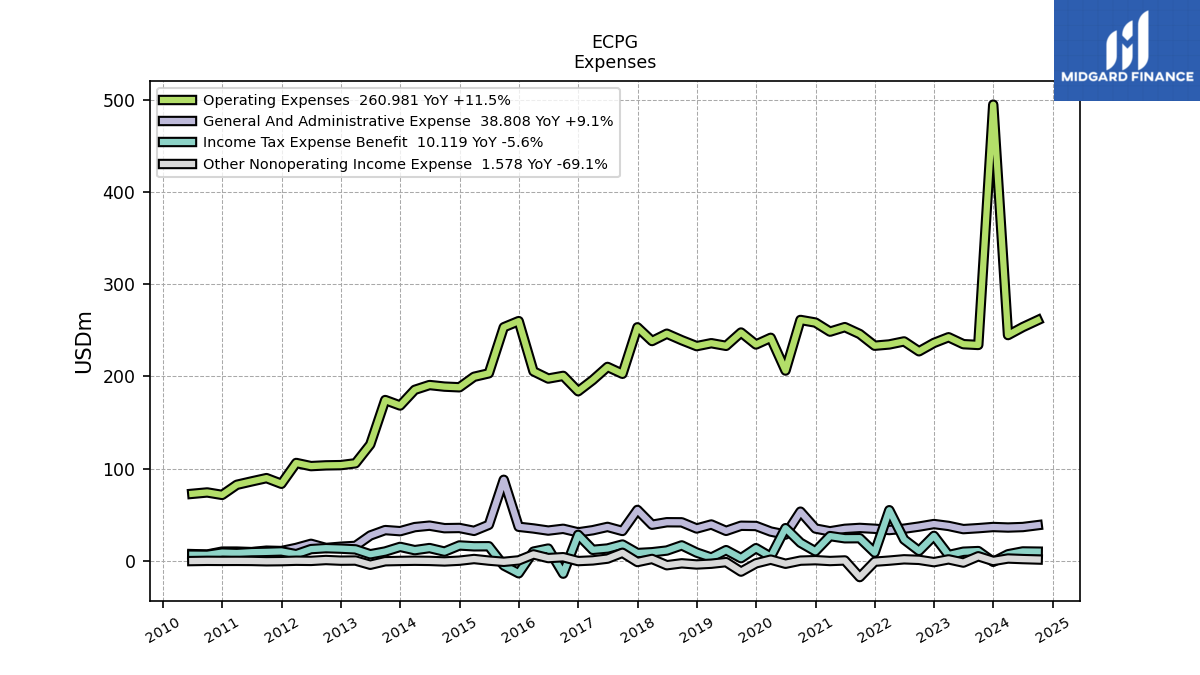
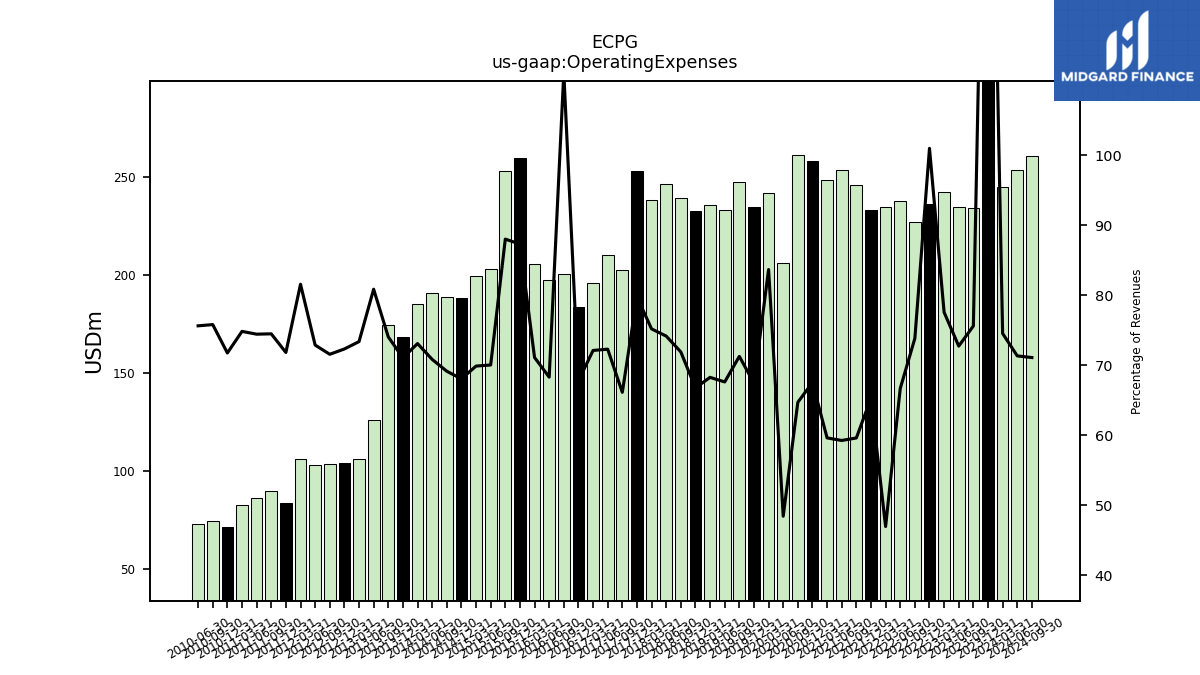
| Operating Expenses | 494.58 | 234.10 | 234.97 | 242.49 | 236.30 | 227.24 | 237.97 | 234.67 | 233.28 | 245.98 | 253.45 | 248.52 | 258.40 | 261.22 | 206.34 | 241.88 | 234.58 | 247.59 | 233.14 | 236.02 | 232.83 | 239.25 | 246.31 | 238.34 | 253.25 | 202.83 | 210.32 | 196.10 | 183.94 | 200.60 | 197.69 | 205.51 | 259.98 | 253.31 | 203.35 | 199.63 | 188.22 | 188.96 | 190.69 | 185.47 | 168.47 | 174.43 | 126.24 | 105.87 | 103.87 | 103.62 | 102.81 | 106.22 | 83.64 | 89.80 | 86.22 | 82.55 | 71.59 | 74.27 | 72.78 | |
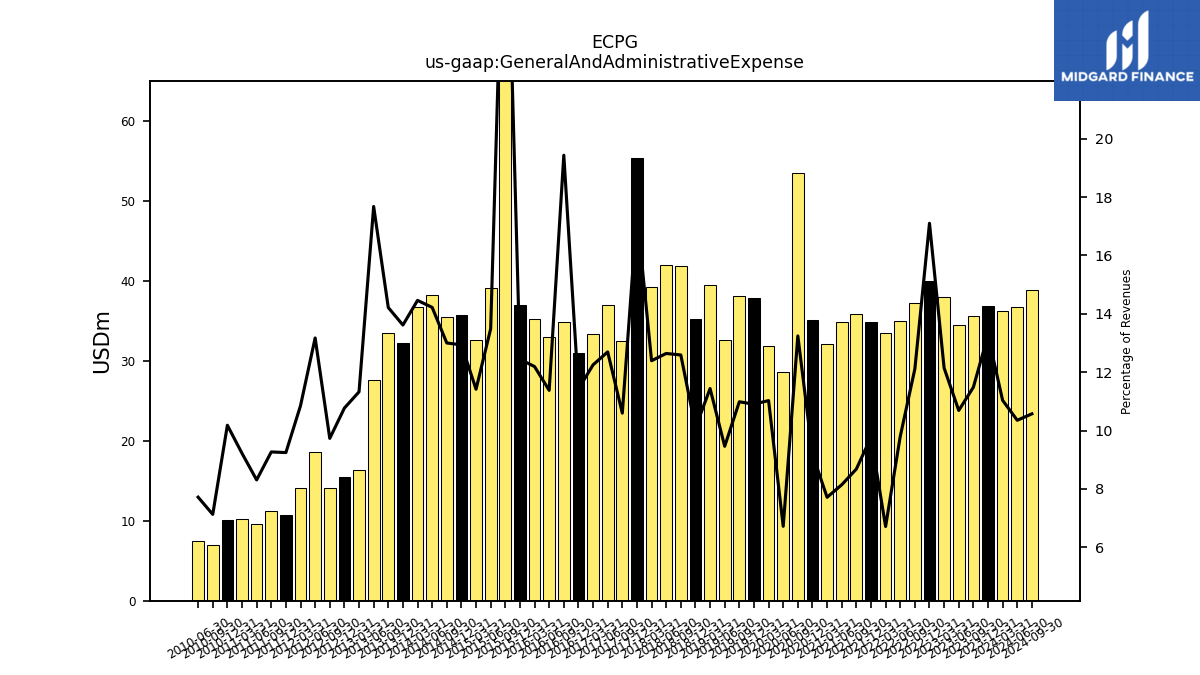
| General And Administrative Expense | 36.81 | 35.56 | 34.53 | 37.97 | 40.02 | 37.27 | 34.97 | 33.53 | 34.91 | 35.82 | 34.82 | 32.15 | 35.16 | 53.46 | 28.62 | 31.88 | 37.92 | 38.17 | 32.62 | 39.55 | 35.19 | 41.89 | 41.99 | 39.28 | 55.33 | 32.50 | 36.93 | 33.32 | 31.00 | 34.87 | 32.93 | 35.24 | 37.05 | 88.00 | 39.17 | 32.61 | 35.78 | 35.53 | 38.28 | 36.69 | 32.28 | 33.49 | 27.60 | 16.34 | 15.47 | 14.09 | 18.58 | 14.13 | 10.77 | 11.17 | 9.62 | 10.17 | 10.16 | 6.98 | 7.42 | |
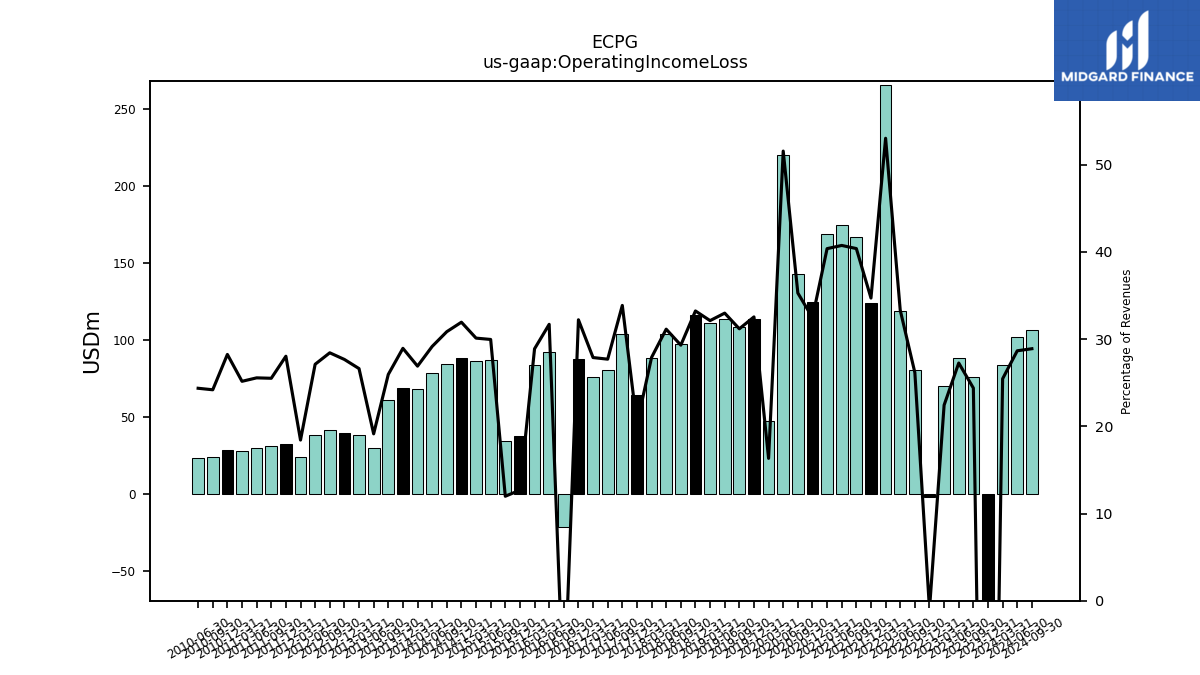
| Operating Income Loss | -217.19 | 75.52 | 88.07 | 70.14 | -2.31 | 80.52 | 118.95 | 265.01 | 124.02 | 166.65 | 174.29 | 168.31 | 124.21 | 142.46 | 219.69 | 47.20 | 113.21 | 108.34 | 113.73 | 111.06 | 115.89 | 97.53 | 103.43 | 88.45 | 64.23 | 103.87 | 80.59 | 75.84 | 87.44 | -21.18 | 91.75 | 83.50 | 37.77 | 34.49 | 87.00 | 86.04 | 88.35 | 84.32 | 78.51 | 68.27 | 68.63 | 61.13 | 29.88 | 38.41 | 39.74 | 41.17 | 38.25 | 24.00 | 32.65 | 30.76 | 29.61 | 27.76 | 28.18 | 23.70 | 23.45 | |
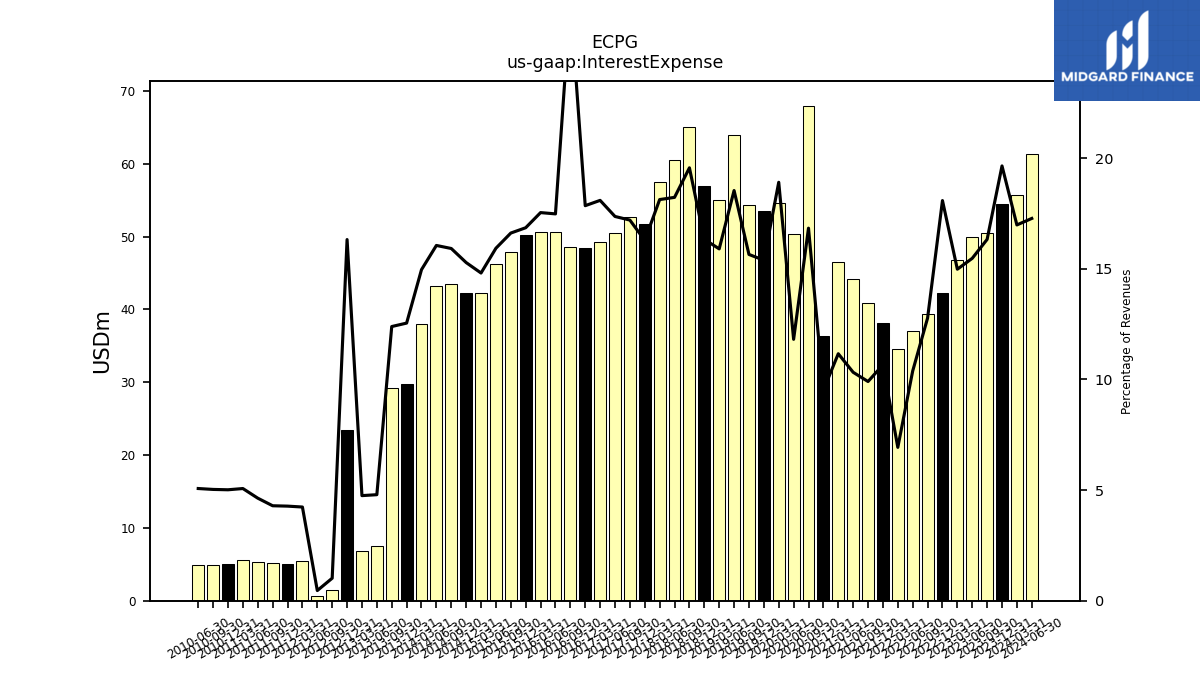
| Interest Expense | 54.50 | 50.56 | 49.98 | 46.84 | 42.31 | 39.31 | 37.05 | 34.63 | 38.09 | 40.87 | 44.16 | 46.53 | 36.41 | 67.96 | 50.33 | 54.66 | 53.52 | 54.37 | 63.91 | 54.97 | 56.96 | 65.09 | 60.54 | 57.46 | 51.69 | 52.76 | 50.52 | 49.20 | 48.45 | 48.63 | 50.60 | 50.69 | 50.19 | 47.82 | 46.25 | 42.30 | 42.26 | 43.50 | 43.22 | 37.96 | 29.75 | 29.19 | 7.48 | 6.85 | 23.44 | 1.48 | 0.65 | 5.51 | 4.98 | 5.17 | 5.37 | 5.59 | 5.00 | 4.93 | 4.88 | |
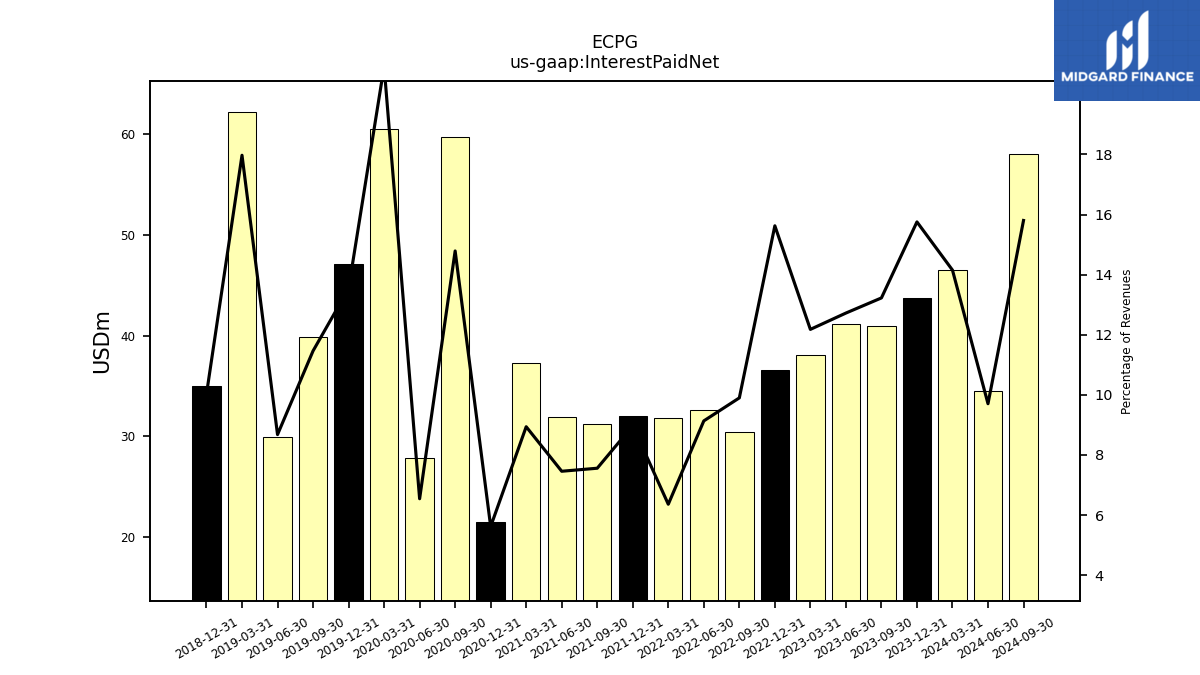
| Interest Paid Net | 43.70 | 40.95 | 41.09 | 38.07 | 36.56 | 30.46 | 32.59 | 31.77 | 32.06 | 31.18 | 31.89 | 37.26 | 21.49 | 59.70 | 27.87 | 60.49 | 47.08 | 39.82 | 29.92 | 62.13 | 34.95 | NA | NA | NA | NA | NA | NA | NA | NA | NA | NA | NA | NA | NA | NA | NA | NA | NA | NA | NA | NA | NA | NA | NA | NA | NA | NA | NA | NA | NA | NA | NA | NA | NA | NA | |
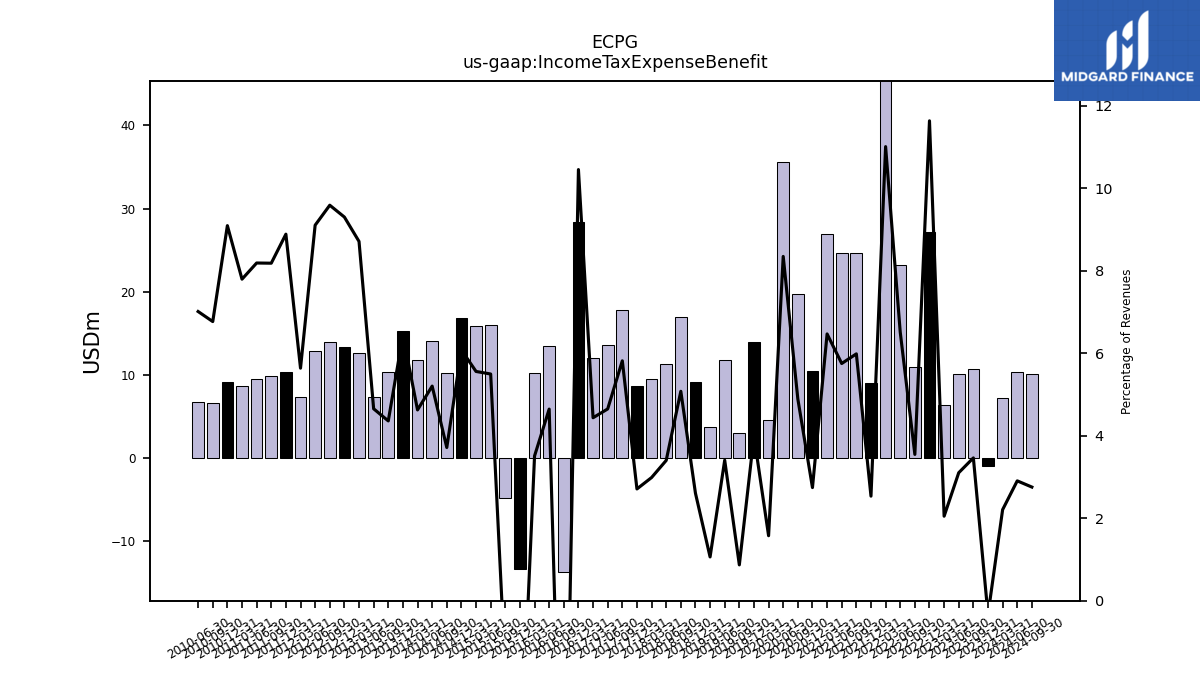
| Income Tax Expense Benefit | -0.93 | 10.72 | 10.03 | 6.41 | 27.23 | 10.92 | 23.25 | 55.02 | 9.06 | 24.70 | 24.61 | 26.97 | 10.50 | 19.75 | 35.57 | 4.56 | 13.89 | 3.02 | 11.75 | 3.67 | 9.10 | 16.90 | 11.30 | 9.47 | 8.61 | 17.84 | 13.53 | 12.07 | 28.37 | -13.77 | 13.45 | 10.15 | -13.36 | -4.89 | 15.96 | 15.88 | 16.82 | 10.15 | 14.01 | 11.74 | 15.28 | 10.27 | 7.27 | 12.57 | 13.36 | 13.89 | 12.85 | 7.34 | 10.35 | 9.87 | 9.49 | 8.60 | 9.07 | 6.63 | 6.75 | |
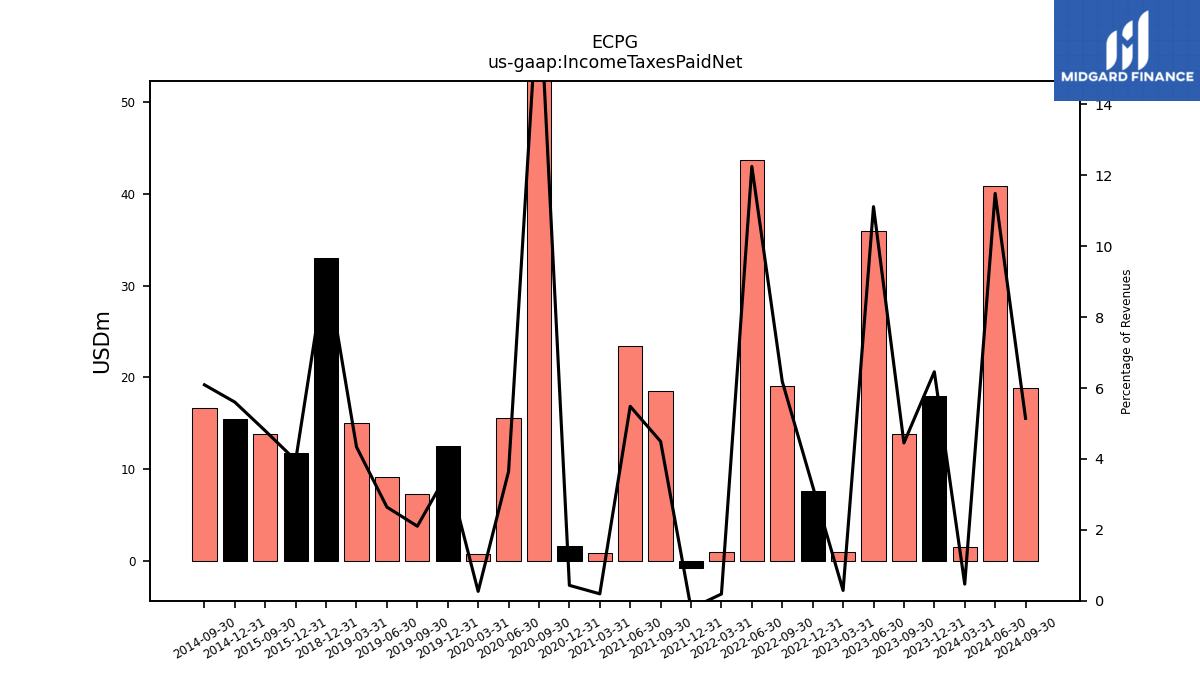
| Income Taxes Paid Net | 17.92 | 13.78 | 35.91 | 0.91 | 7.57 | 19.04 | 43.72 | 0.95 | -0.78 | 18.54 | 23.46 | 0.81 | 1.66 | 70.86 | 15.53 | 0.77 | 12.55 | 7.31 | 9.11 | 15.00 | 32.97 | NA | NA | NA | NA | NA | NA | NA | NA | NA | NA | NA | 11.79 | 13.80 | NA | NA | 15.50 | 16.65 | NA | NA | NA | NA | NA | NA | NA | NA | NA | NA | NA | NA | NA | NA | NA | NA | NA | |
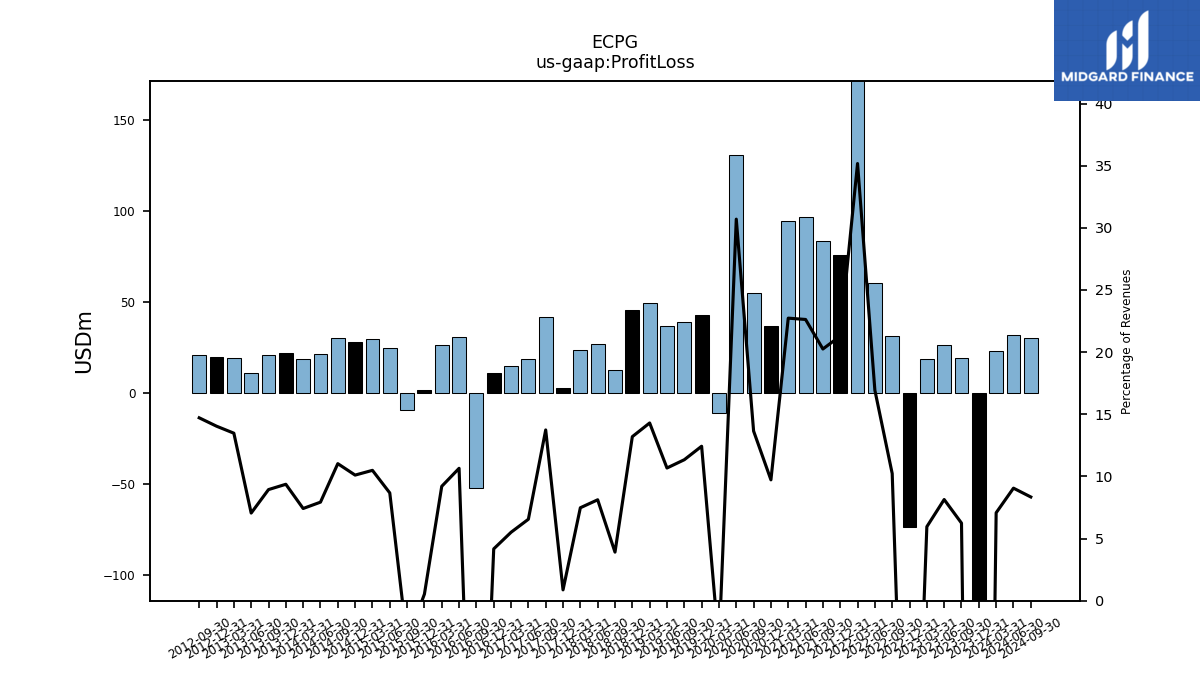
| Profit Loss | -270.76 | 19.34 | 26.30 | 18.63 | -73.12 | 31.49 | 60.44 | 175.75 | 76.08 | 83.57 | 96.79 | 94.77 | 37.21 | 55.11 | 130.78 | -10.58 | 43.23 | 39.41 | 36.82 | 49.44 | 46.03 | 13.02 | 26.97 | 23.71 | 2.78 | 42.14 | 19.08 | 14.98 | 11.32 | -51.95 | 30.83 | 26.61 | 1.60 | -9.36 | 25.18 | 29.97 | 27.96 | 30.14 | 21.35 | 18.83 | 22.22 | 21.06 | 11.01 | 19.45 | 20.17 | 21.31 | NA | NA | NA | NA | NA | NA | NA | NA | NA | |
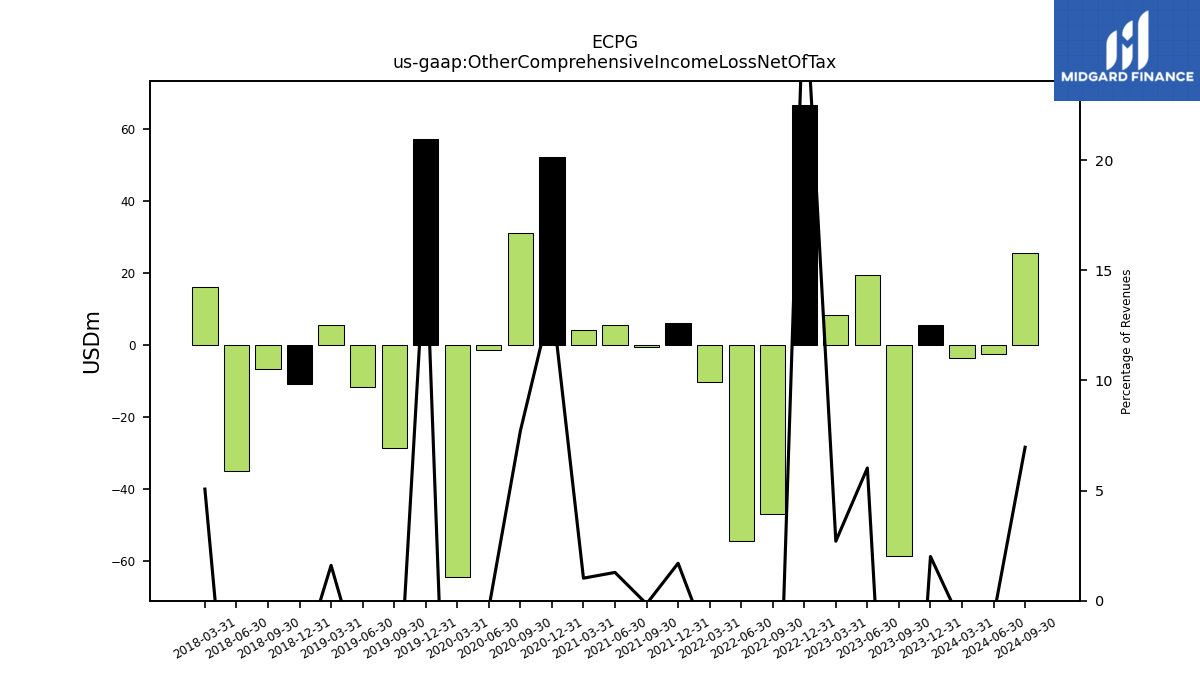
| Other Comprehensive Income Loss Net Of Tax | 5.57 | -58.59 | 19.47 | 8.45 | 66.91 | -47.14 | -54.67 | -10.36 | 6.08 | -0.59 | 5.50 | 4.27 | 52.28 | 31.11 | -1.47 | -64.59 | 57.40 | -28.68 | -11.56 | 5.55 | -10.77 | -6.68 | -34.99 | 16.06 | NA | NA | NA | NA | NA | NA | NA | NA | NA | NA | NA | NA | NA | NA | NA | NA | NA | NA | NA | NA | NA | NA | NA | NA | NA | NA | NA | NA | NA | NA | NA | |
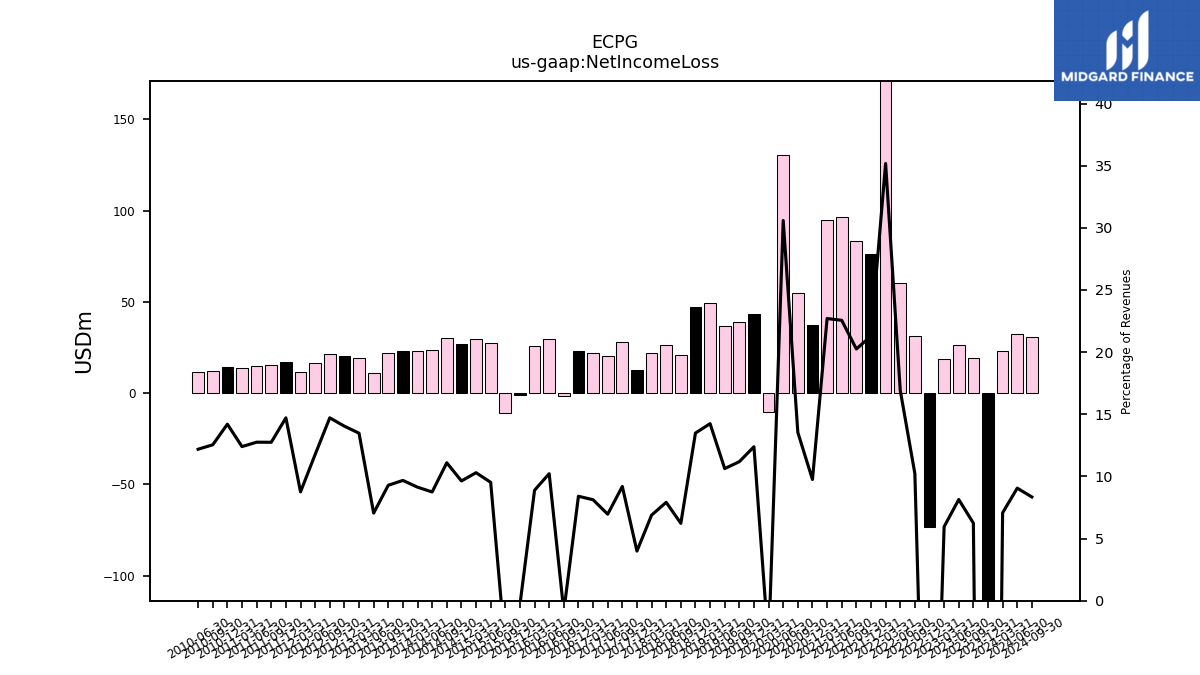
| Net Income Loss | -270.76 | 19.34 | 26.30 | 18.63 | -73.12 | 31.49 | 60.44 | 175.75 | 76.08 | 83.57 | 96.50 | 94.63 | 37.32 | 54.65 | 130.33 | -10.45 | 43.09 | 38.87 | 36.66 | 49.25 | 47.04 | 20.73 | 26.30 | 21.83 | 12.68 | 28.19 | 20.25 | 22.10 | 22.81 | -1.52 | 29.59 | 25.69 | -0.99 | -10.96 | 27.66 | 29.43 | 26.65 | 30.34 | 23.56 | 23.18 | 22.95 | 21.89 | 11.01 | 19.45 | 20.17 | 21.31 | 16.60 | 11.41 | 17.13 | 15.37 | 14.78 | 13.68 | 14.17 | 12.29 | 11.73 | |
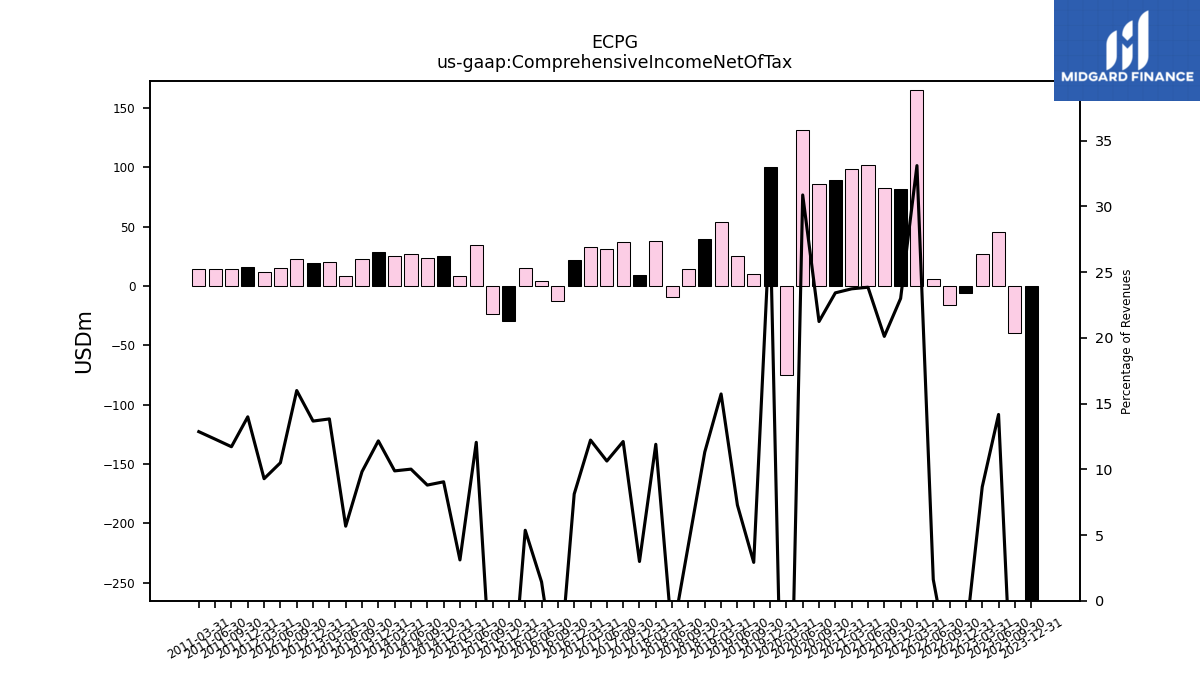
| Comprehensive Income Net Of Tax | -265.19 | -39.25 | 45.77 | 27.07 | -6.21 | -15.65 | 5.77 | 165.39 | 82.16 | 82.98 | 102.00 | 98.90 | 89.61 | 85.74 | 131.50 | -75.04 | 100.48 | 10.14 | 25.10 | 54.38 | 39.44 | 14.23 | -9.14 | 37.72 | 9.48 | 37.15 | 30.92 | 33.24 | 22.03 | -12.19 | 4.15 | 15.49 | -29.34 | -23.13 | 34.99 | 8.87 | 25.02 | 24.04 | 26.95 | 25.07 | 28.83 | 23.13 | 8.86 | 19.95 | 19.63 | 23.15 | 14.81 | 12.09 | 16.29 | 14.12 | 14.24 | 14.19 | NA | NA | NA |
| 2023-12-31 | 2023-09-30 | 2023-06-30 | 2023-03-31 | 2022-12-31 | 2022-09-30 | 2022-06-30 | 2022-03-31 | 2021-12-31 | 2021-09-30 | 2021-06-30 | 2021-03-31 | 2020-12-31 | 2020-09-30 | 2020-06-30 | 2020-03-31 | 2019-12-31 | 2019-09-30 | 2019-06-30 | 2019-03-31 | 2018-12-31 | 2018-09-30 | 2018-06-30 | 2018-03-31 | 2017-12-31 | 2017-09-30 | 2017-06-30 | 2017-03-31 | 2016-12-31 | 2016-09-30 | 2016-06-30 | 2016-03-31 | 2015-12-31 | 2015-09-30 | 2015-06-30 | 2015-03-31 | 2014-12-31 | 2014-09-30 | 2014-06-30 | 2014-03-31 | 2013-12-31 | 2013-09-30 | 2013-06-30 | 2013-03-31 | 2012-12-31 | 2012-09-30 | 2012-06-30 | 2012-03-31 | 2011-12-31 | 2011-09-30 | 2011-06-30 | 2011-03-31 | 2010-12-31 | 2010-09-30 | 2010-06-30 | ||
|---|---|---|---|---|---|---|---|---|---|---|---|---|---|---|---|---|---|---|---|---|---|---|---|---|---|---|---|---|---|---|---|---|---|---|---|---|---|---|---|---|---|---|---|---|---|---|---|---|---|---|---|---|---|---|---|---|
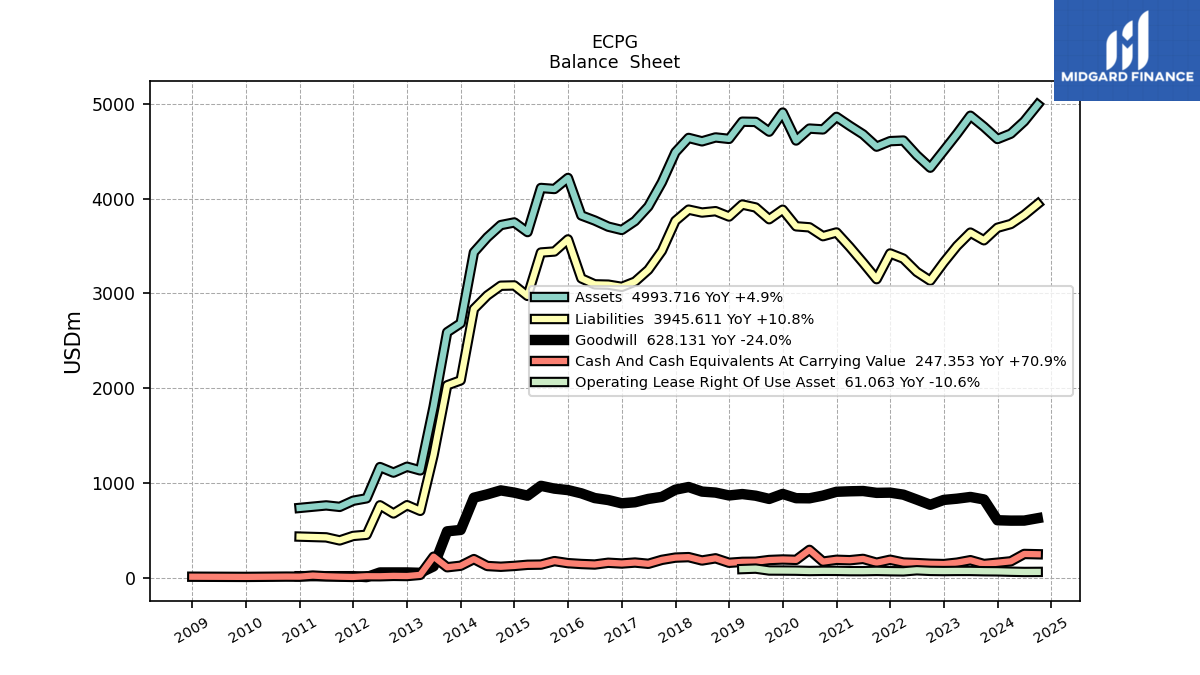
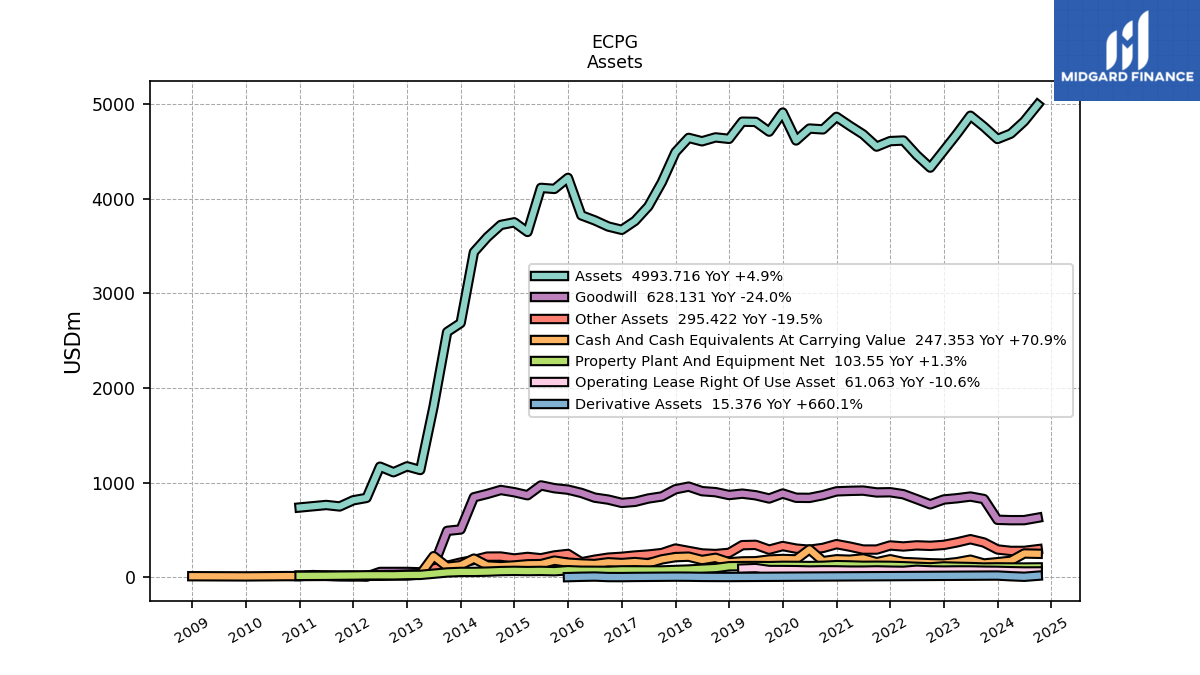
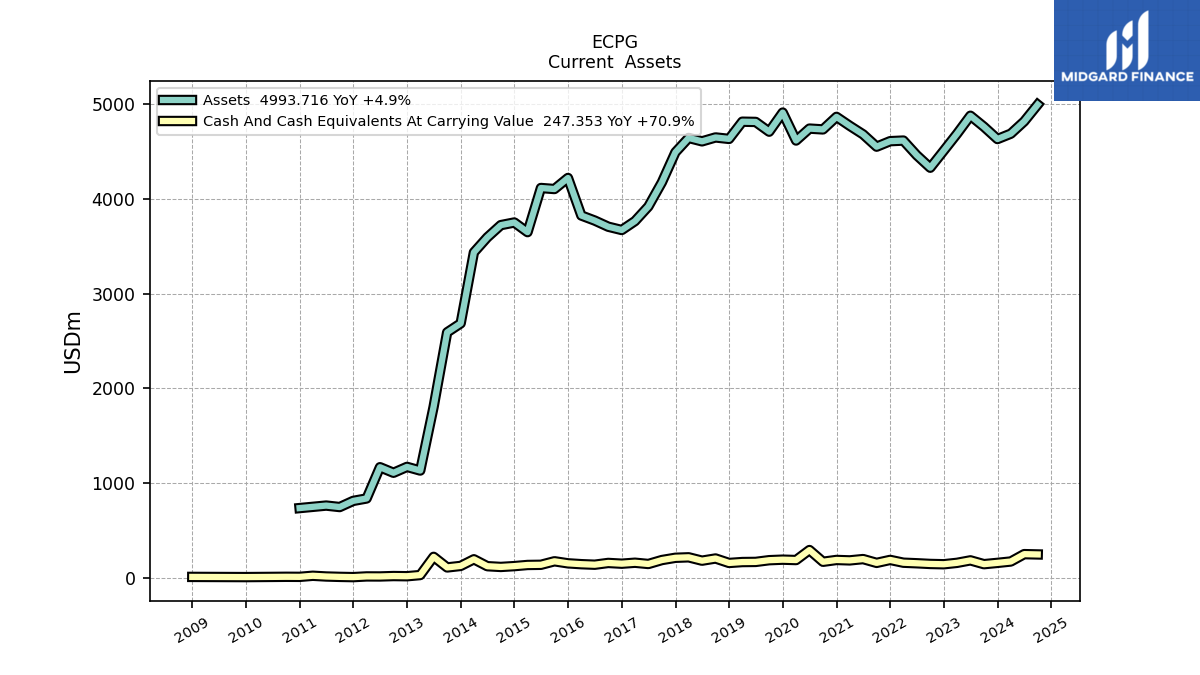
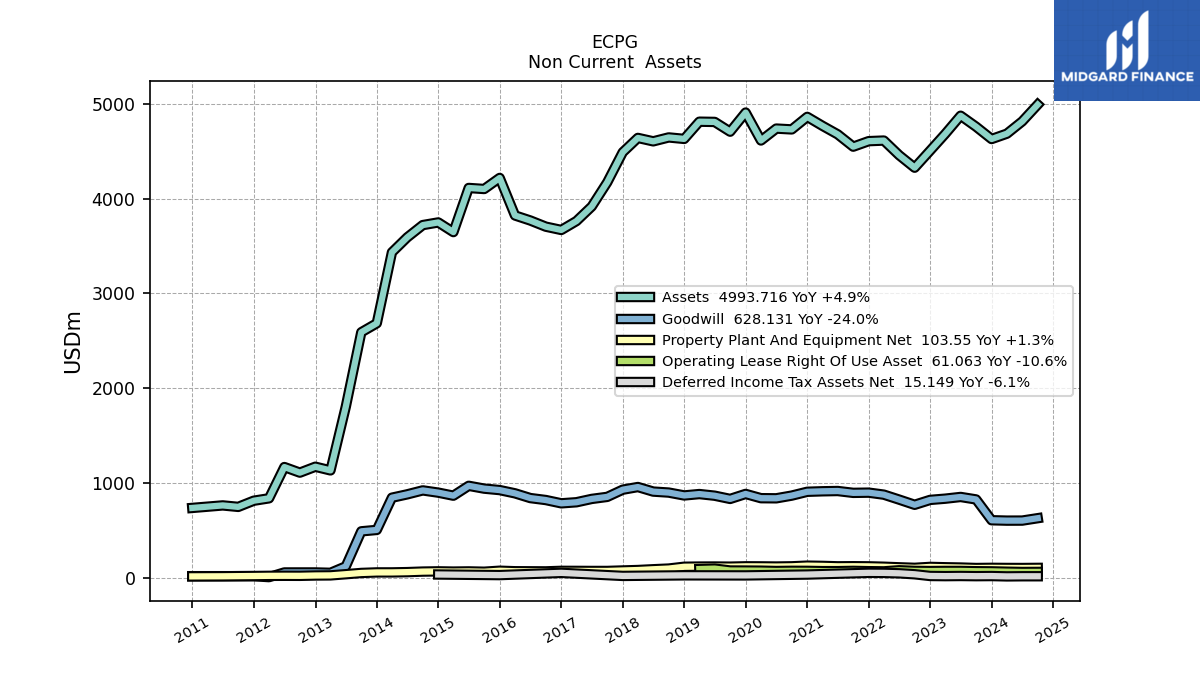
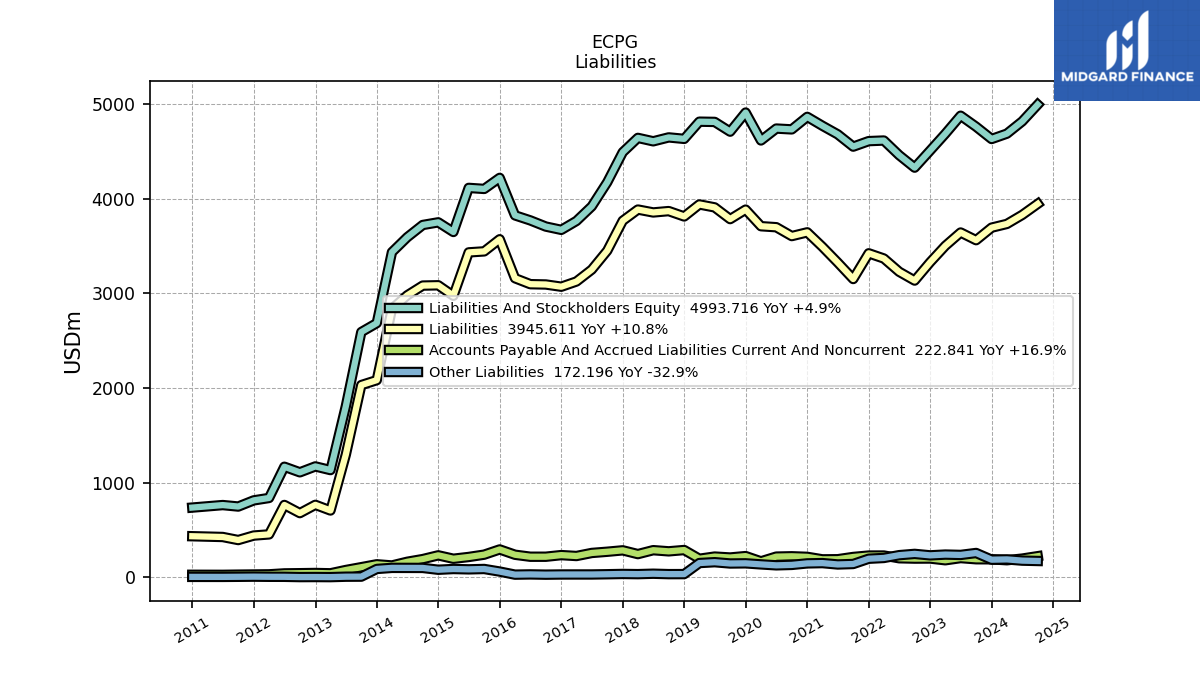
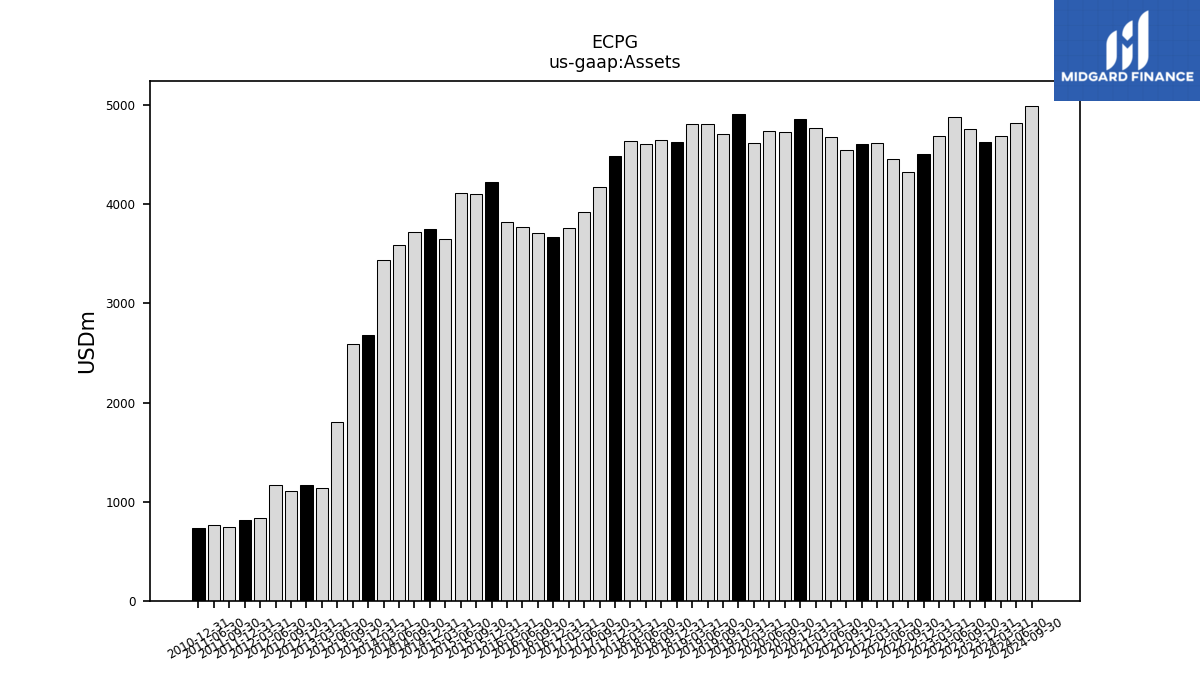
| Assets | 4630.49 | 4760.29 | 4876.57 | 4685.97 | 4508.36 | 4327.86 | 4459.48 | 4614.38 | 4608.12 | 4549.97 | 4679.75 | 4770.17 | 4864.52 | 4732.05 | 4740.85 | 4614.95 | 4909.95 | 4708.06 | 4811.02 | 4813.61 | 4631.88 | 4647.40 | 4606.21 | 4642.26 | 4490.71 | 4173.79 | 3918.80 | 3764.66 | 3670.50 | 3705.48 | 3770.45 | 3823.62 | 4219.85 | 4103.01 | 4113.98 | 3648.19 | 3750.14 | 3722.09 | 3592.80 | 3434.70 | 2685.27 | 2591.00 | 1805.45 | 1132.48 | 1171.34 | 1109.09 | 1167.94 | 837.97 | 812.48 | 747.44 | 762.98 | NA | 736.47 | NA | NA | |
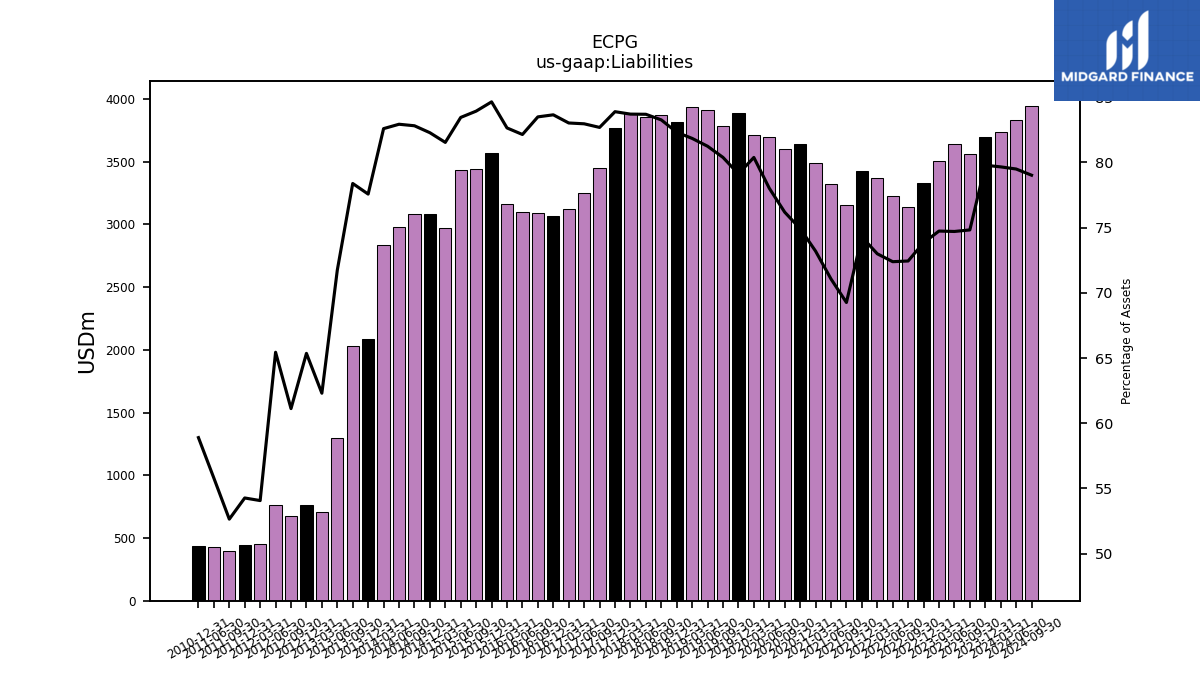
| Liabilities | 3693.95 | 3561.51 | 3642.74 | 3501.81 | 3328.73 | 3134.94 | 3227.88 | 3368.01 | 3422.86 | 3151.15 | 3325.40 | 3491.39 | 3644.45 | 3604.80 | 3698.47 | 3709.14 | 3884.54 | 3784.06 | 3908.07 | 3939.05 | 3812.19 | 3868.96 | 3854.53 | 3885.24 | 3766.80 | 3450.63 | 3250.69 | 3125.19 | 3069.98 | 3093.40 | 3096.73 | 3159.61 | 3571.36 | 3443.33 | 3432.68 | 2974.23 | 3085.20 | 3081.92 | 2979.03 | 2836.41 | 2082.80 | 2030.73 | 1295.08 | 705.55 | 765.52 | 677.90 | 764.30 | 453.12 | 440.95 | 393.52 | 425.71 | NA | 433.77 | NA | NA | |
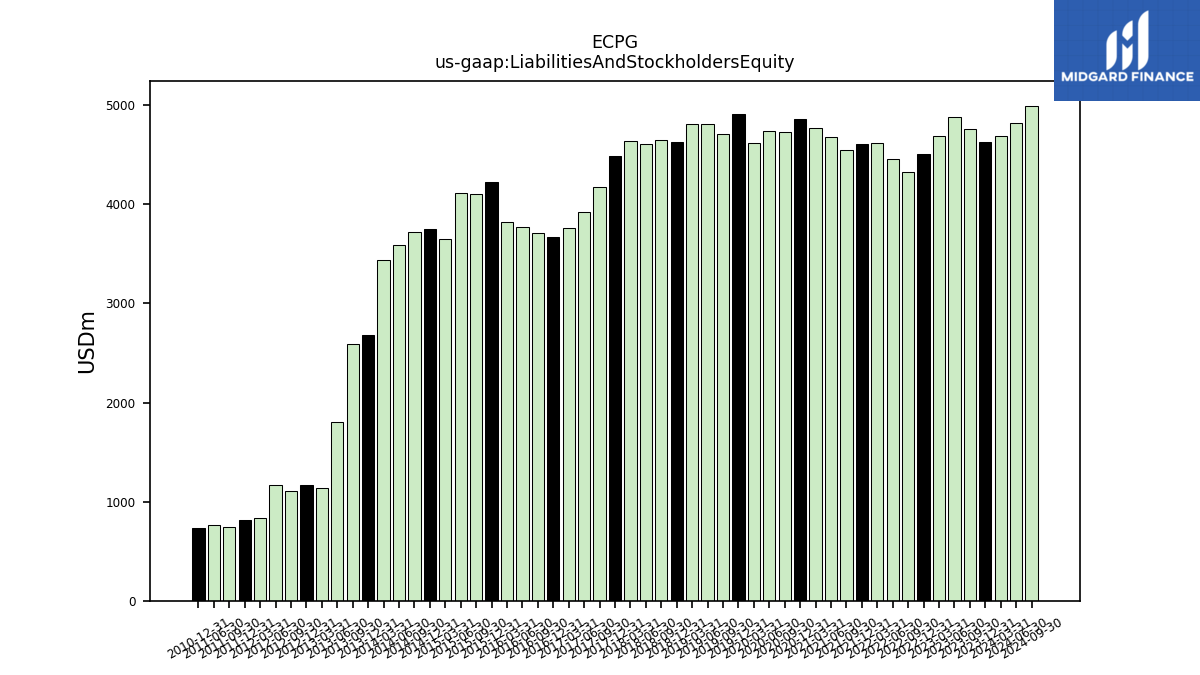
| Liabilities And Stockholders Equity | 4630.49 | 4760.29 | 4876.57 | 4685.97 | 4508.36 | 4327.86 | 4459.48 | 4614.38 | 4608.12 | 4549.97 | 4679.75 | 4770.17 | 4864.52 | 4732.05 | 4740.85 | 4614.95 | 4909.95 | 4708.06 | 4811.02 | 4813.61 | 4631.88 | 4647.40 | 4606.21 | 4642.26 | 4490.71 | 4173.79 | 3918.80 | 3764.66 | 3670.50 | 3705.48 | 3770.45 | 3823.62 | 4219.85 | 4103.01 | 4113.98 | 3648.19 | 3750.14 | 3722.09 | 3592.80 | 3434.70 | 2685.27 | 2591.00 | 1805.45 | 1132.48 | 1171.34 | 1109.09 | 1167.94 | 837.97 | 812.48 | 747.44 | 762.98 | NA | 736.47 | NA | NA |
| 2023-12-31 | 2023-09-30 | 2023-06-30 | 2023-03-31 | 2022-12-31 | 2022-09-30 | 2022-06-30 | 2022-03-31 | 2021-12-31 | 2021-09-30 | 2021-06-30 | 2021-03-31 | 2020-12-31 | 2020-09-30 | 2020-06-30 | 2020-03-31 | 2019-12-31 | 2019-09-30 | 2019-06-30 | 2019-03-31 | 2018-12-31 | 2018-09-30 | 2018-06-30 | 2018-03-31 | 2017-12-31 | 2017-09-30 | 2017-06-30 | 2017-03-31 | 2016-12-31 | 2016-09-30 | 2016-06-30 | 2016-03-31 | 2015-12-31 | 2015-09-30 | 2015-06-30 | 2015-03-31 | 2014-12-31 | 2014-09-30 | 2014-06-30 | 2014-03-31 | 2013-12-31 | 2013-09-30 | 2013-06-30 | 2013-03-31 | 2012-12-31 | 2012-09-30 | 2012-06-30 | 2012-03-31 | 2011-12-31 | 2011-09-30 | 2011-06-30 | 2011-03-31 | 2010-12-31 | 2010-09-30 | 2010-06-30 | ||
|---|---|---|---|---|---|---|---|---|---|---|---|---|---|---|---|---|---|---|---|---|---|---|---|---|---|---|---|---|---|---|---|---|---|---|---|---|---|---|---|---|---|---|---|---|---|---|---|---|---|---|---|---|---|---|---|---|
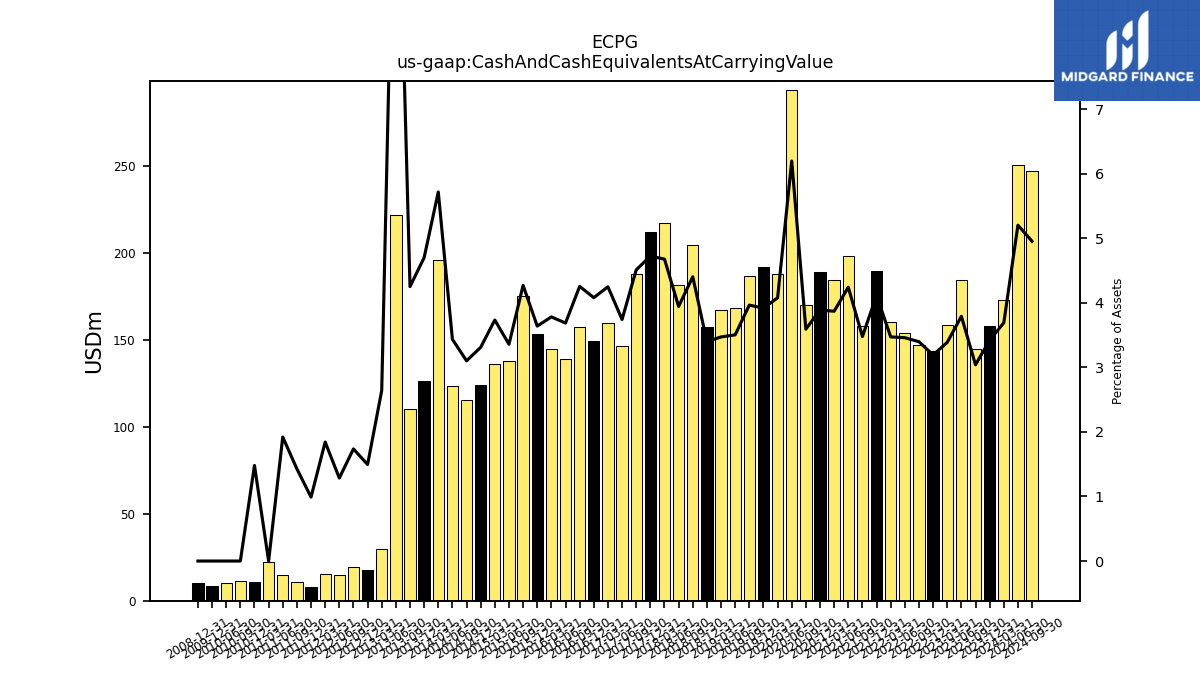
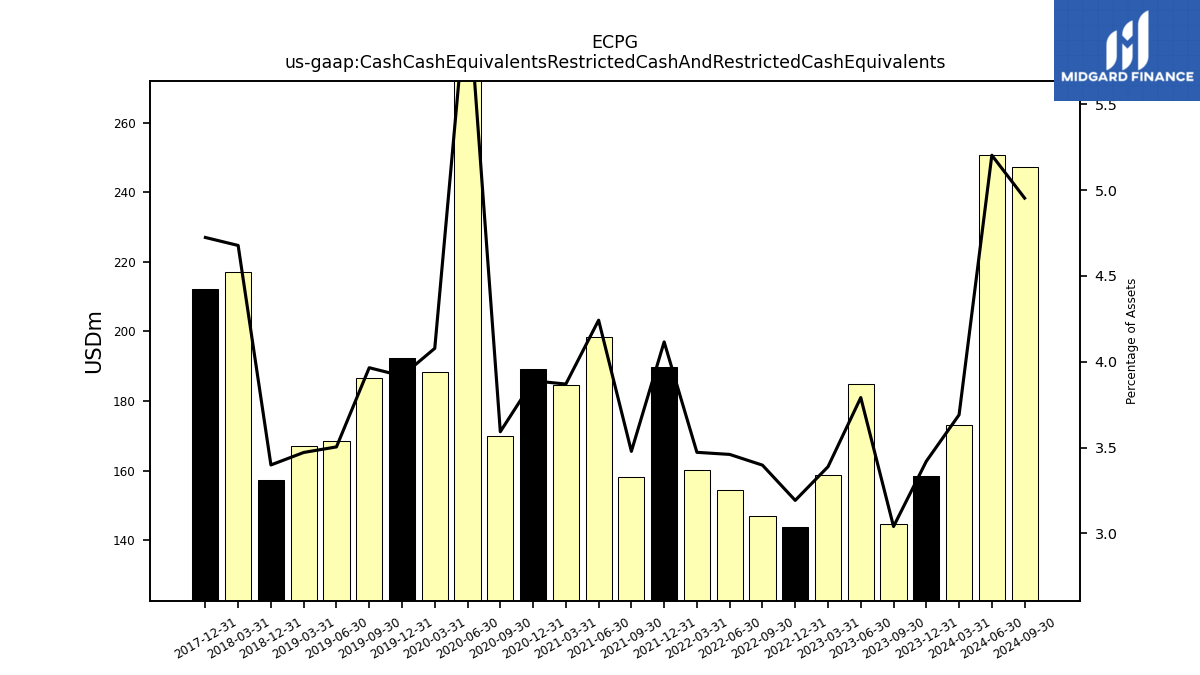
| Cash And Cash Equivalents At Carrying Value | 158.36 | 144.71 | 184.87 | 158.77 | 143.91 | 147.03 | 154.29 | 160.22 | 189.65 | 158.24 | 198.52 | 184.60 | 189.18 | 169.98 | 293.80 | 188.20 | 192.34 | 186.68 | 168.56 | 167.10 | 157.42 | 204.65 | 181.66 | 217.14 | 212.14 | 188.25 | 146.65 | 159.93 | 149.76 | 157.67 | 139.01 | 144.61 | 153.59 | 175.22 | 138.16 | 136.21 | 124.16 | 115.44 | 123.41 | 196.39 | 126.21 | 110.16 | 222.17 | 29.90 | 17.51 | 19.26 | 15.01 | 15.45 | 8.05 | 10.67 | 14.66 | 22.38 | 10.90 | 11.53 | 10.40 | |
| Cash Cash Equivalents Restricted Cash And Restricted Cash Equivalents | 158.36 | 144.71 | 184.87 | 158.77 | 143.91 | 147.03 | 154.29 | 160.22 | 189.65 | 158.24 | 198.52 | 184.60 | 189.18 | 169.98 | 293.80 | 188.20 | 192.34 | 186.68 | 168.56 | 167.10 | 157.42 | NA | NA | 217.14 | 212.14 | NA | NA | NA | NA | NA | NA | NA | NA | NA | NA | NA | NA | NA | NA | NA | NA | NA | NA | NA | NA | NA | NA | NA | NA | NA | NA | NA | NA | NA | NA |
| 2023-12-31 | 2023-09-30 | 2023-06-30 | 2023-03-31 | 2022-12-31 | 2022-09-30 | 2022-06-30 | 2022-03-31 | 2021-12-31 | 2021-09-30 | 2021-06-30 | 2021-03-31 | 2020-12-31 | 2020-09-30 | 2020-06-30 | 2020-03-31 | 2019-12-31 | 2019-09-30 | 2019-06-30 | 2019-03-31 | 2018-12-31 | 2018-09-30 | 2018-06-30 | 2018-03-31 | 2017-12-31 | 2017-09-30 | 2017-06-30 | 2017-03-31 | 2016-12-31 | 2016-09-30 | 2016-06-30 | 2016-03-31 | 2015-12-31 | 2015-09-30 | 2015-06-30 | 2015-03-31 | 2014-12-31 | 2014-09-30 | 2014-06-30 | 2014-03-31 | 2013-12-31 | 2013-09-30 | 2013-06-30 | 2013-03-31 | 2012-12-31 | 2012-09-30 | 2012-06-30 | 2012-03-31 | 2011-12-31 | 2011-09-30 | 2011-06-30 | 2011-03-31 | 2010-12-31 | 2010-09-30 | 2010-06-30 | ||
|---|---|---|---|---|---|---|---|---|---|---|---|---|---|---|---|---|---|---|---|---|---|---|---|---|---|---|---|---|---|---|---|---|---|---|---|---|---|---|---|---|---|---|---|---|---|---|---|---|---|---|---|---|---|---|---|---|
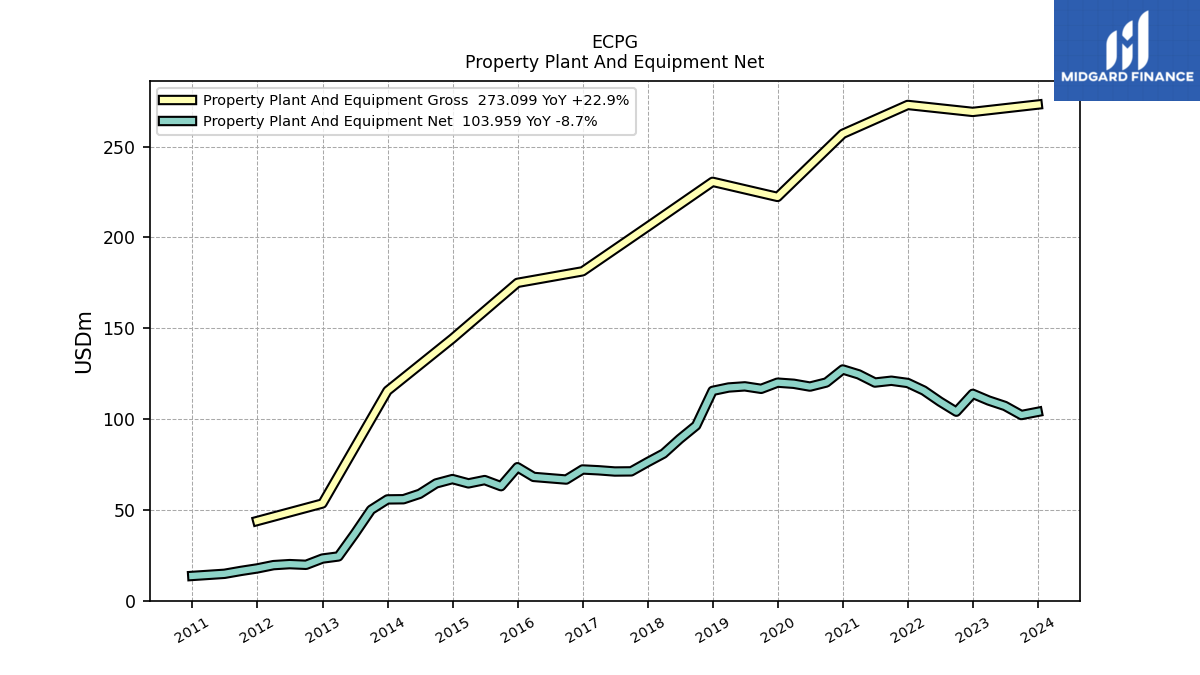
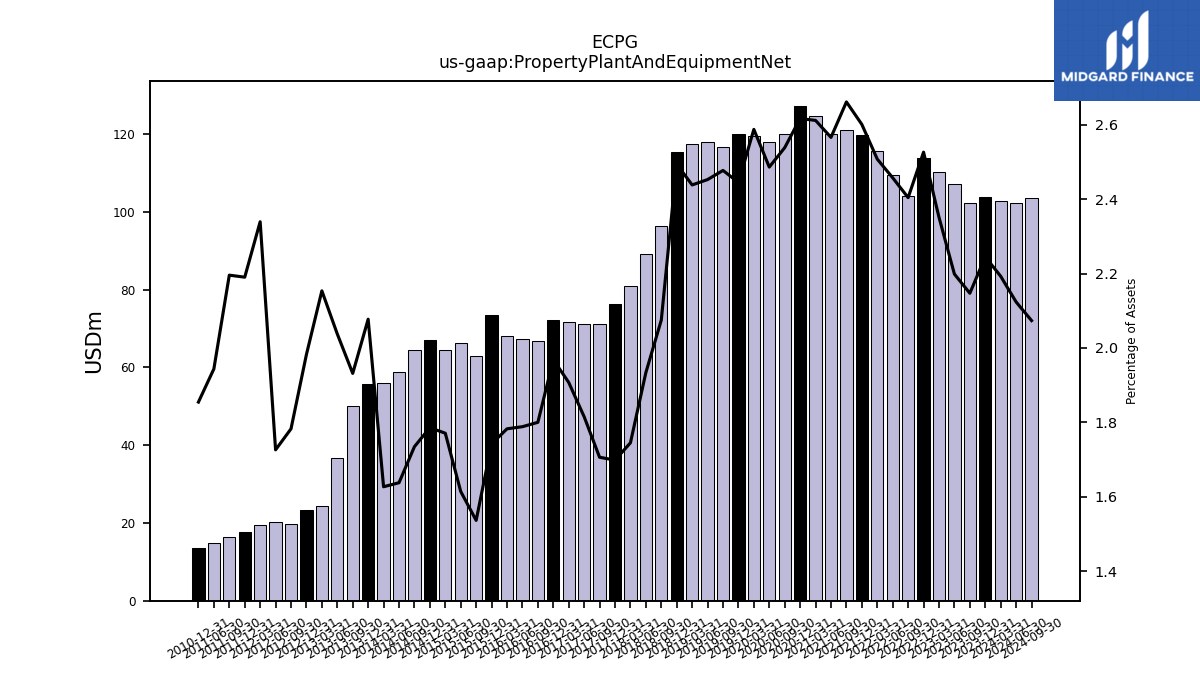
| Property Plant And Equipment Gross | 273.10 | NA | NA | NA | 269.05 | NA | NA | NA | 272.90 | NA | NA | NA | 257.00 | NA | NA | NA | 222.26 | NA | NA | NA | 230.58 | NA | NA | NA | 205.85 | NA | NA | NA | 181.32 | NA | NA | NA | 174.96 | NA | NA | NA | 144.29 | NA | NA | NA | 115.54 | NA | NA | NA | 53.52 | NA | NA | NA | 43.90 | NA | NA | NA | NA | NA | NA | |
| Property Plant And Equipment Net | 103.96 | 102.21 | 107.22 | 110.18 | 113.90 | 104.05 | 109.59 | 115.72 | 119.86 | 121.10 | 120.09 | 124.59 | 127.30 | 120.12 | 117.87 | 119.42 | 120.05 | 116.63 | 118.00 | 117.37 | 115.52 | 96.43 | 89.07 | 81.01 | 76.28 | 71.21 | 71.14 | 71.81 | 72.26 | 66.70 | 67.43 | 68.16 | 73.50 | 63.04 | 66.41 | 64.60 | 66.97 | 64.56 | 58.84 | 55.88 | 55.78 | 50.05 | 36.79 | 24.39 | 23.22 | 19.77 | 20.16 | 19.60 | 17.80 | 16.41 | 14.83 | NA | 13.66 | NA | NA | |
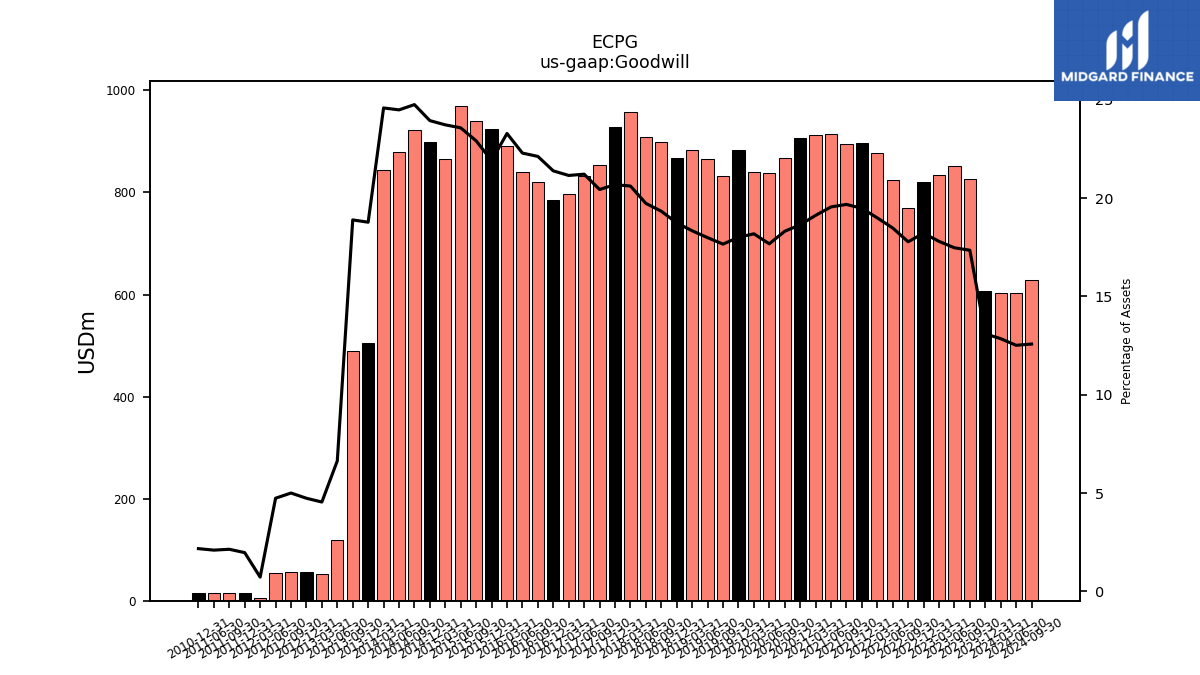
| Goodwill | 606.48 | 826.01 | 852.20 | 834.17 | 821.21 | 769.55 | 824.21 | 876.54 | 897.79 | 895.51 | 915.07 | 912.17 | 906.96 | 866.66 | 838.02 | 839.30 | 884.18 | 831.55 | 865.53 | 882.88 | 868.13 | 898.59 | 909.06 | 957.12 | 928.99 | 853.16 | 831.56 | 796.41 | 785.03 | 819.78 | 840.54 | 890.50 | 924.85 | 940.18 | 969.93 | 865.70 | 897.93 | 921.52 | 879.91 | 844.57 | 504.21 | 489.52 | 119.79 | 51.44 | 55.45 | 55.45 | 55.32 | 6.05 | 15.98 | 15.98 | 15.98 | NA | 15.98 | NA | NA | |
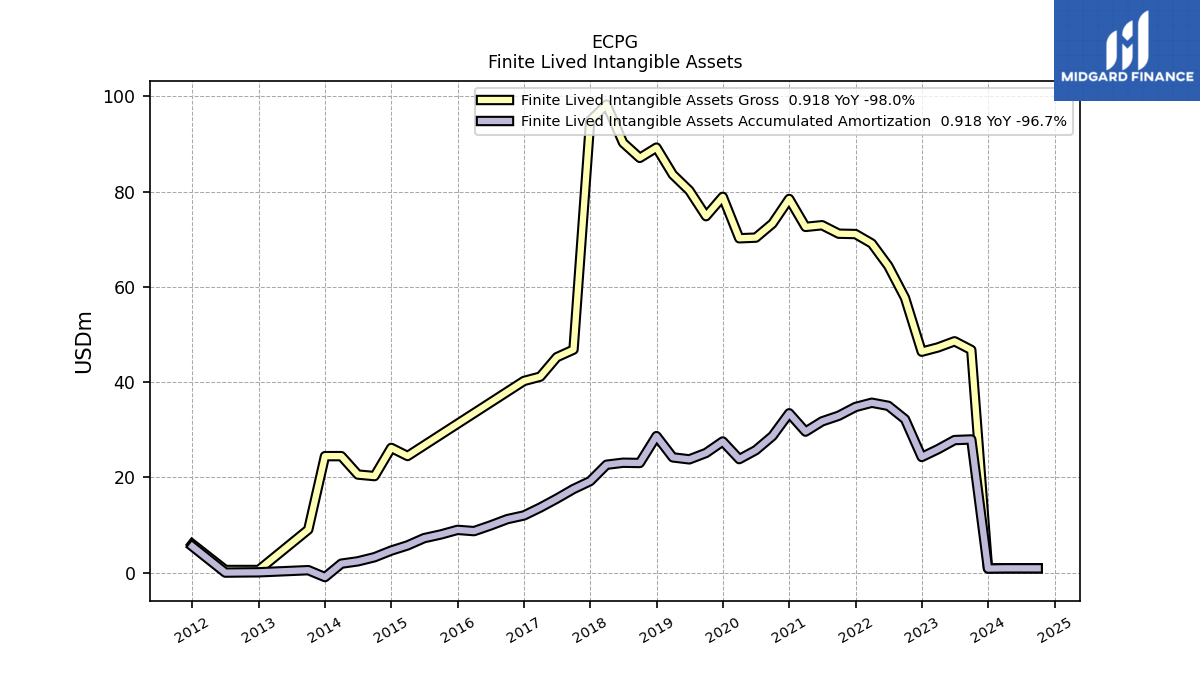
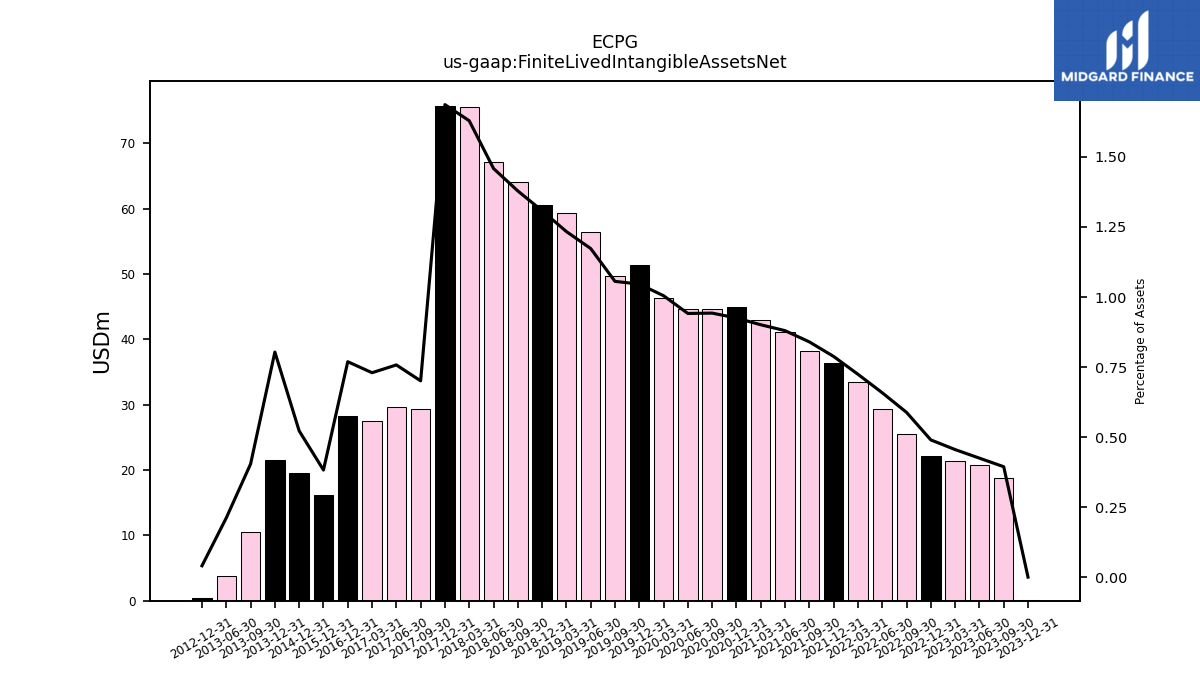
| Finite Lived Intangible Assets Net | 0.05 | 18.80 | 20.75 | 21.37 | 22.11 | 25.48 | 29.37 | 33.44 | 36.32 | 38.22 | 41.19 | 42.99 | 45.01 | 44.62 | 44.64 | 46.37 | 51.37 | 49.72 | 56.44 | 59.38 | 60.58 | 64.07 | 67.19 | 75.62 | 75.74 | 29.27 | 29.70 | 27.49 | 28.24 | NA | NA | NA | 16.17 | NA | NA | NA | 19.60 | NA | NA | NA | 21.59 | 10.48 | 3.83 | NA | 0.49 | NA | NA | NA | NA | NA | NA | NA | NA | NA | NA | |
| Intangible Assets Net Including Goodwill | 0.05 | 18.80 | 20.75 | 21.37 | 22.11 | 25.48 | 29.37 | 33.44 | 36.32 | NA | NA | NA | 45.01 | NA | NA | NA | NA | NA | NA | NA | NA | NA | NA | NA | NA | NA | NA | NA | NA | NA | NA | NA | NA | NA | NA | NA | NA | NA | NA | NA | NA | NA | NA | NA | 0.49 | 0.52 | 0.55 | NA | 0.46 | NA | NA | NA | NA | NA | NA |
| 2023-12-31 | 2023-09-30 | 2023-06-30 | 2023-03-31 | 2022-12-31 | 2022-09-30 | 2022-06-30 | 2022-03-31 | 2021-12-31 | 2021-09-30 | 2021-06-30 | 2021-03-31 | 2020-12-31 | 2020-09-30 | 2020-06-30 | 2020-03-31 | 2019-12-31 | 2019-09-30 | 2019-06-30 | 2019-03-31 | 2018-12-31 | 2018-09-30 | 2018-06-30 | 2018-03-31 | 2017-12-31 | 2017-09-30 | 2017-06-30 | 2017-03-31 | 2016-12-31 | 2016-09-30 | 2016-06-30 | 2016-03-31 | 2015-12-31 | 2015-09-30 | 2015-06-30 | 2015-03-31 | 2014-12-31 | 2014-09-30 | 2014-06-30 | 2014-03-31 | 2013-12-31 | 2013-09-30 | 2013-06-30 | 2013-03-31 | 2012-12-31 | 2012-09-30 | 2012-06-30 | 2012-03-31 | 2011-12-31 | 2011-09-30 | 2011-06-30 | 2011-03-31 | 2010-12-31 | 2010-09-30 | 2010-06-30 | ||
|---|---|---|---|---|---|---|---|---|---|---|---|---|---|---|---|---|---|---|---|---|---|---|---|---|---|---|---|---|---|---|---|---|---|---|---|---|---|---|---|---|---|---|---|---|---|---|---|---|---|---|---|---|---|---|---|---|
| Debt And Capital Lease Obligations | 3318.03 | 3114.18 | 3203.43 | 3081.79 | 2898.82 | 2690.22 | 2793.01 | 2934.03 | 2997.33 | 2796.22 | 2999.30 | 3151.93 | 3281.63 | 3252.10 | 3353.73 | 3404.43 | 3513.20 | 3429.34 | 3529.72 | 3592.91 | 3490.63 | 3561.47 | 3530.41 | 3607.10 | 3446.88 | 3148.50 | 2963.93 | 2870.61 | 2805.98 | 2848.44 | 2849.07 | 2893.43 | 3216.57 | 3116.44 | 3134.19 | 2690.88 | 2773.55 | 2790.75 | 2715.87 | 2612.13 | 1850.43 | 1806.68 | 1107.66 | 646.01 | 706.04 | 615.13 | 702.32 | 398.25 | 388.95 | 344.20 | 378.17 | NA | 385.26 | NA | NA | |
| Long Term Debt And Capital Lease Obligations | 3358.55 | NA | NA | NA | 2941.22 | NA | NA | NA | 3055.68 | NA | NA | NA | 3373.49 | NA | NA | NA | NA | NA | NA | NA | NA | NA | NA | NA | NA | NA | NA | NA | NA | NA | NA | NA | NA | NA | NA | NA | NA | NA | NA | NA | NA | NA | NA | NA | NA | NA | NA | NA | NA | NA | NA | NA | NA | NA | NA |
| 2023-12-31 | 2023-09-30 | 2023-06-30 | 2023-03-31 | 2022-12-31 | 2022-09-30 | 2022-06-30 | 2022-03-31 | 2021-12-31 | 2021-09-30 | 2021-06-30 | 2021-03-31 | 2020-12-31 | 2020-09-30 | 2020-06-30 | 2020-03-31 | 2019-12-31 | 2019-09-30 | 2019-06-30 | 2019-03-31 | 2018-12-31 | 2018-09-30 | 2018-06-30 | 2018-03-31 | 2017-12-31 | 2017-09-30 | 2017-06-30 | 2017-03-31 | 2016-12-31 | 2016-09-30 | 2016-06-30 | 2016-03-31 | 2015-12-31 | 2015-09-30 | 2015-06-30 | 2015-03-31 | 2014-12-31 | 2014-09-30 | 2014-06-30 | 2014-03-31 | 2013-12-31 | 2013-09-30 | 2013-06-30 | 2013-03-31 | 2012-12-31 | 2012-09-30 | 2012-06-30 | 2012-03-31 | 2011-12-31 | 2011-09-30 | 2011-06-30 | 2011-03-31 | 2010-12-31 | 2010-09-30 | 2010-06-30 | ||
|---|---|---|---|---|---|---|---|---|---|---|---|---|---|---|---|---|---|---|---|---|---|---|---|---|---|---|---|---|---|---|---|---|---|---|---|---|---|---|---|---|---|---|---|---|---|---|---|---|---|---|---|---|---|---|---|---|
| Stockholders Equity Including Portion Attributable To Noncontrolling Interest | 936.54 | 1198.78 | 1233.84 | 1184.16 | 1179.63 | 1192.93 | 1231.60 | 1246.38 | 1185.26 | 1398.82 | 1354.35 | 1278.78 | 1220.08 | 1127.26 | 1042.39 | 905.81 | 1025.41 | 924.00 | 902.96 | 874.56 | 819.69 | 777.21 | 615.49 | 601.77 | 571.93 | 562.41 | 541.70 | 591.82 | 551.76 | 574.53 | 628.39 | 618.70 | 603.74 | 625.87 | 645.74 | 637.17 | 626.98 | 600.10 | 571.55 | 560.68 | 575.91 | 548.04 | NA | NA | 405.82 | NA | NA | NA | 371.54 | NA | NA | NA | NA | NA | NA | |
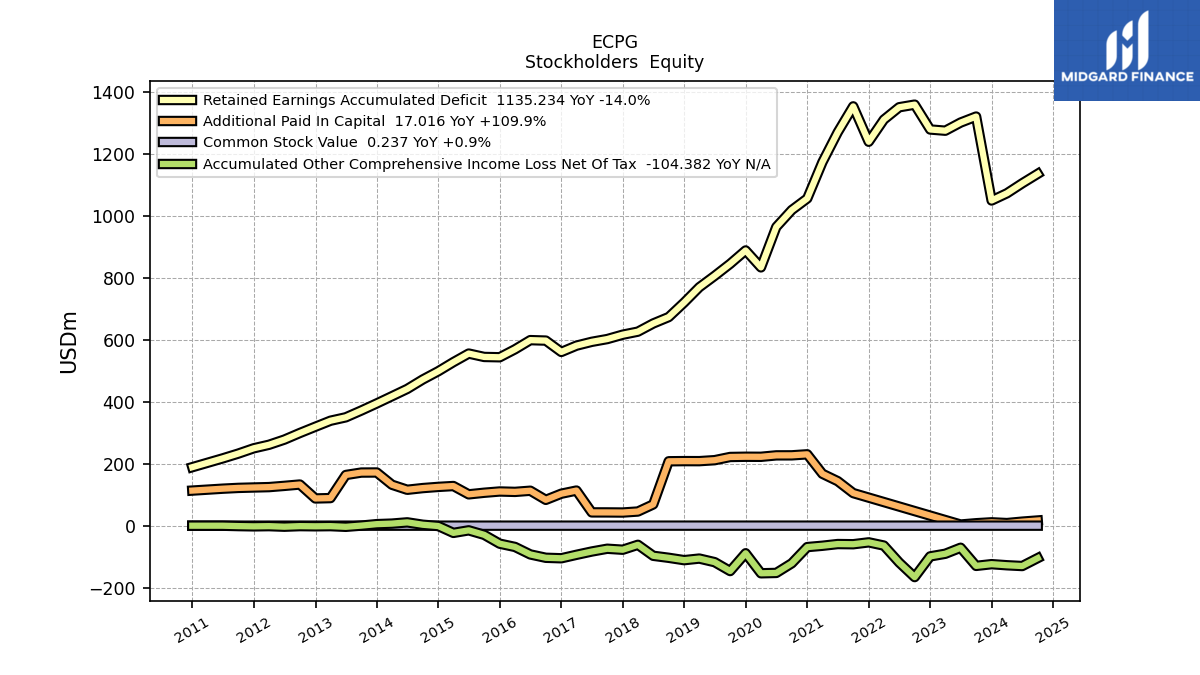
| Common Stock Value | 0.23 | 0.23 | 0.23 | 0.23 | 0.23 | 0.23 | 0.24 | 0.24 | 0.24 | 0.30 | 0.30 | 0.31 | 0.31 | 0.31 | 0.31 | 0.31 | 0.31 | 0.31 | 0.31 | 0.31 | 0.31 | 0.31 | 0.26 | 0.26 | 0.26 | 0.26 | 0.26 | 0.26 | 0.26 | 0.26 | 0.26 | 0.26 | 0.25 | 0.25 | 0.25 | 0.26 | 0.26 | 0.26 | 0.26 | 0.26 | 0.26 | 0.25 | 0.25 | 0.23 | 0.23 | 0.25 | 0.25 | 0.25 | 0.24 | 0.24 | 0.24 | NA | 0.24 | NA | NA | |
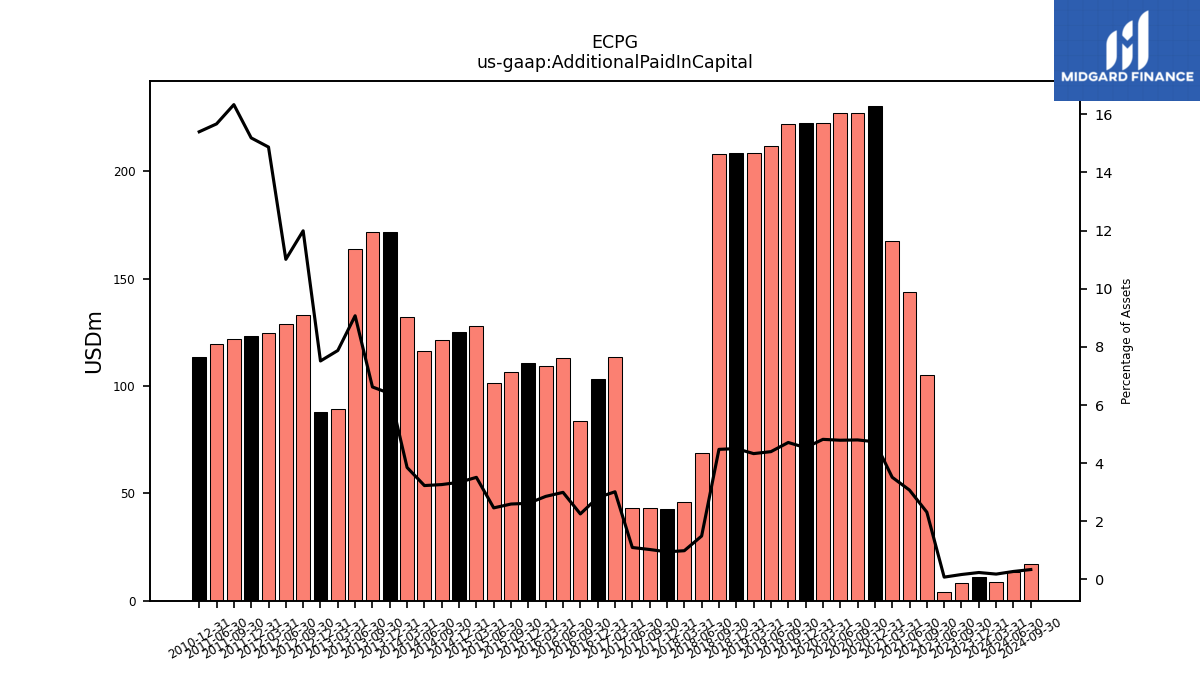
| Additional Paid In Capital | 11.05 | 8.11 | 3.91 | NA | NA | NA | NA | NA | NA | 105.33 | 143.83 | 167.66 | 230.44 | 227.11 | 227.03 | 222.40 | 222.59 | 221.81 | 211.51 | 208.37 | 208.50 | 207.99 | 68.82 | 45.91 | 42.65 | 43.01 | 43.08 | 113.53 | 103.39 | 83.52 | 112.96 | 109.23 | 110.53 | 106.45 | 101.29 | 128.13 | 125.31 | 121.49 | 116.04 | 132.29 | 171.82 | 171.55 | 163.75 | 89.19 | 88.03 | 133.00 | 128.62 | 124.64 | 123.41 | 122.08 | 119.56 | NA | 113.41 | NA | NA | |
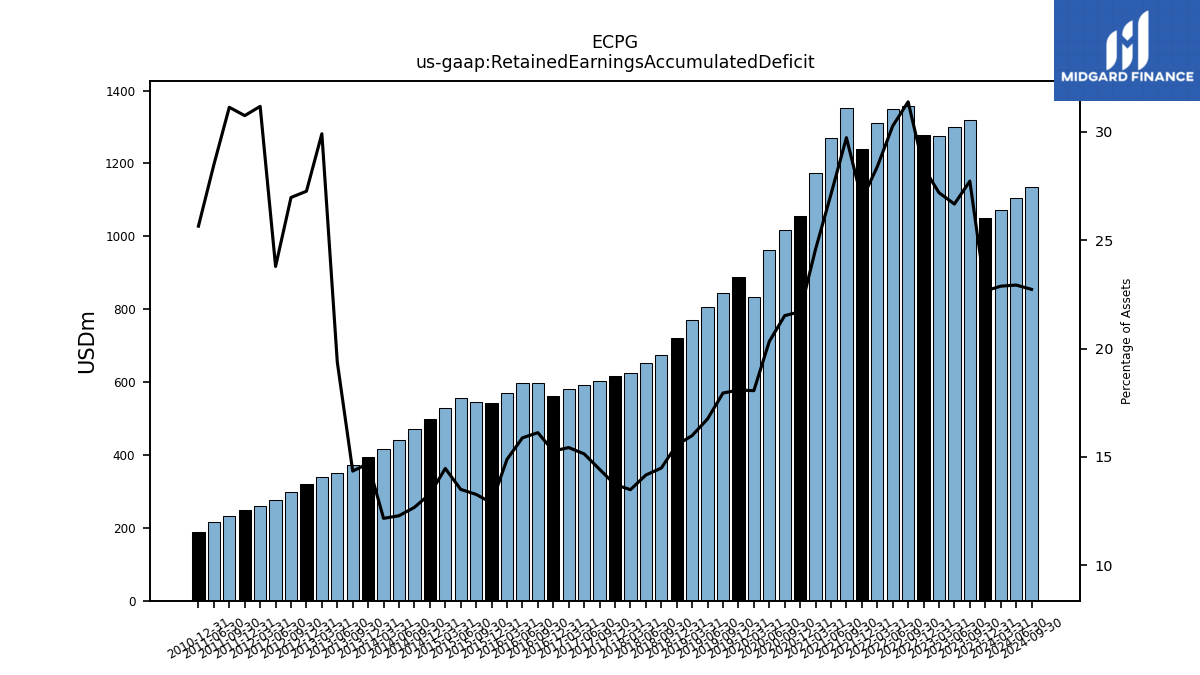
| Retained Earnings Accumulated Deficit | 1049.17 | 1319.93 | 1300.59 | 1274.29 | 1278.21 | 1358.41 | 1349.94 | 1310.04 | 1238.56 | 1352.83 | 1269.26 | 1172.76 | 1055.67 | 1018.35 | 963.70 | 833.37 | 888.06 | 844.97 | 806.10 | 769.44 | 720.19 | 673.15 | 652.43 | 626.13 | 616.31 | 602.20 | 593.29 | 580.96 | 560.57 | 597.25 | 598.77 | 569.18 | 543.49 | 544.48 | 555.44 | 527.78 | 498.35 | 471.70 | 441.37 | 417.81 | 394.63 | 371.68 | 349.79 | 338.78 | 319.33 | 299.16 | 277.85 | 261.26 | 249.85 | 232.72 | 217.35 | NA | 188.89 | NA | NA | |
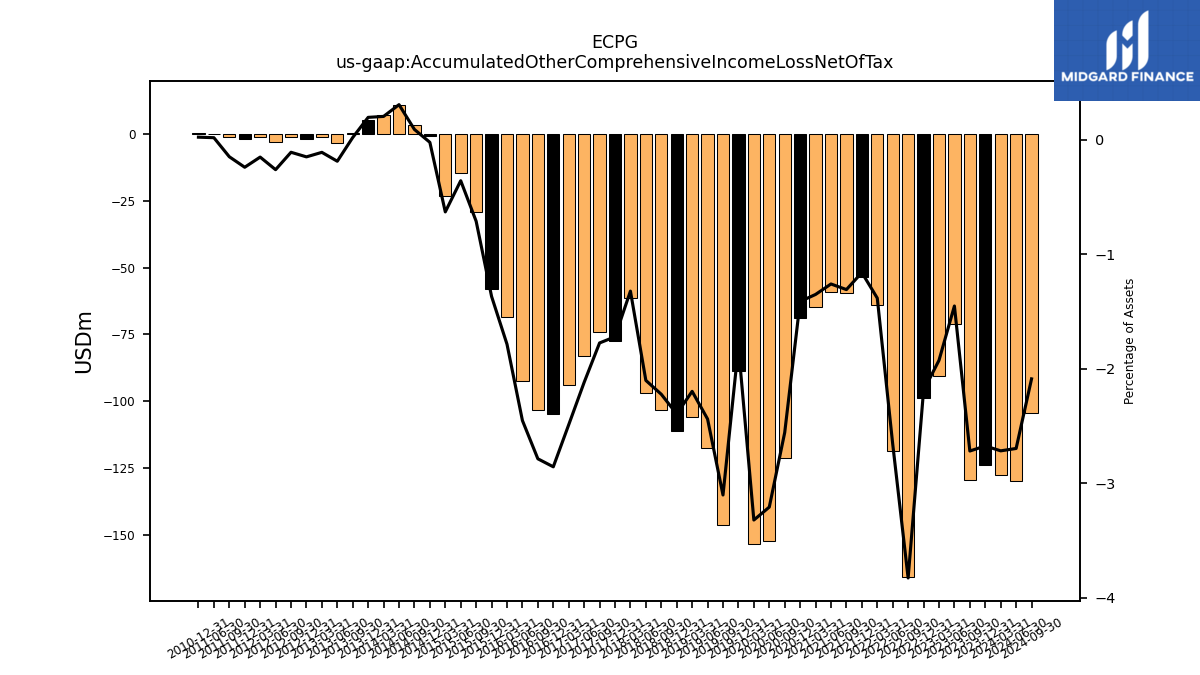
| Accumulated Other Comprehensive Income Loss Net Of Tax | -123.92 | -129.49 | -70.90 | -90.37 | -98.82 | -165.72 | -118.58 | -63.91 | -53.55 | -59.63 | -59.04 | -64.54 | -68.81 | -121.10 | -152.19 | -153.35 | -88.77 | -146.16 | -117.43 | -105.86 | -110.99 | -103.39 | -96.90 | -61.46 | -77.36 | -74.15 | -83.11 | -93.77 | -104.91 | -103.32 | -92.54 | -68.36 | -57.82 | -29.28 | -14.80 | -23.06 | -0.92 | 3.27 | 10.94 | 6.93 | 5.20 | 0.46 | -3.42 | -1.27 | -1.77 | -1.24 | -3.08 | -1.29 | -1.97 | -1.12 | 0.12 | NA | 0.15 | NA | NA | |
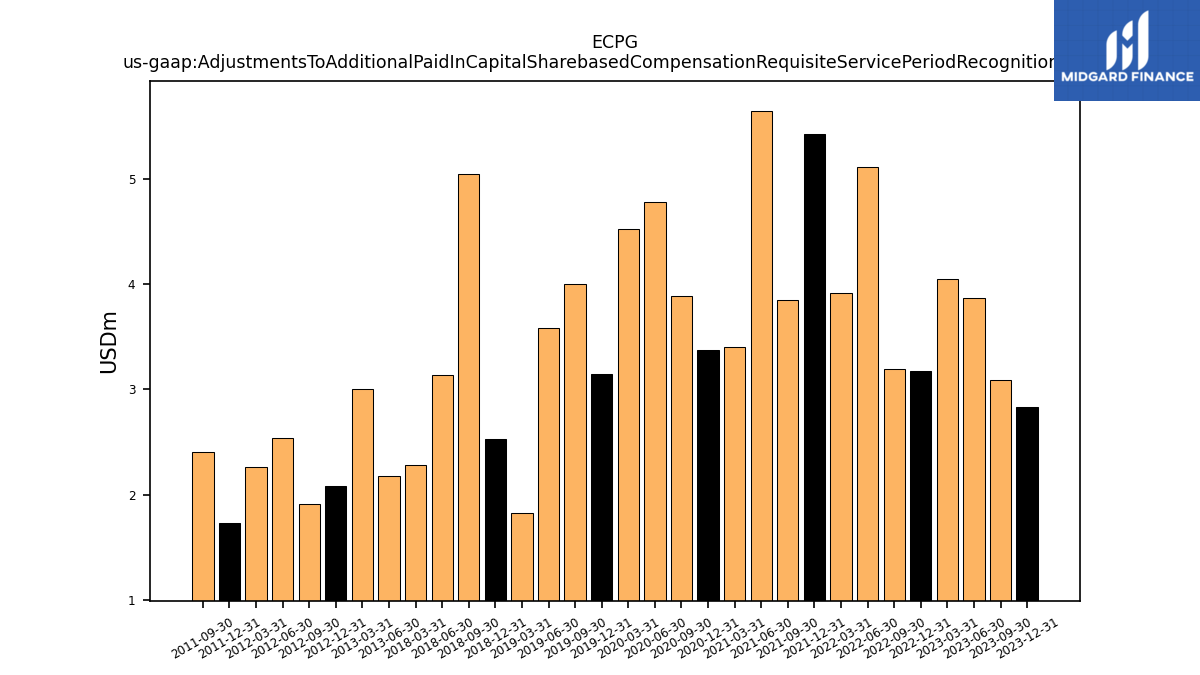
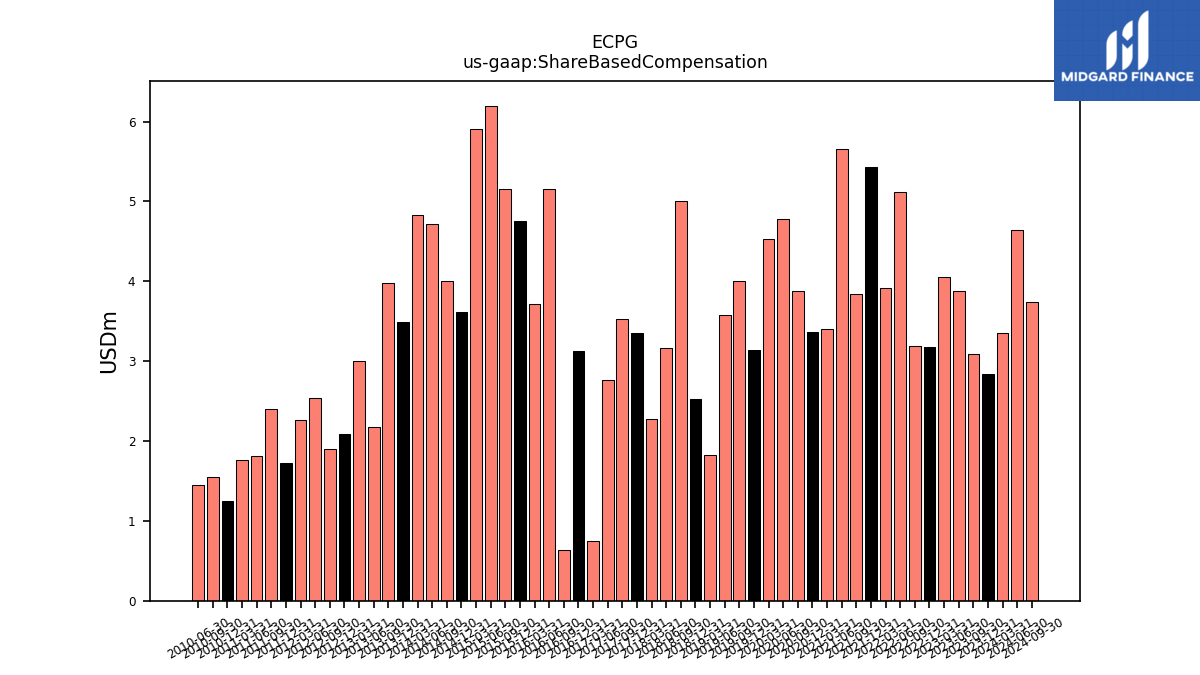
| Adjustments To Additional Paid In Capital Sharebased Compensation Requisite Service Period Recognition Value | 2.84 | 3.09 | 3.87 | 4.05 | 3.17 | 3.19 | 5.12 | 3.92 | 5.43 | 3.85 | 5.65 | 3.40 | 3.37 | 3.88 | 4.78 | 4.53 | 3.15 | 4.00 | 3.58 | 1.83 | 2.53 | 5.04 | 3.14 | 2.28 | NA | NA | NA | NA | NA | NA | NA | NA | NA | NA | NA | NA | NA | NA | NA | NA | NA | NA | 2.18 | 3.00 | 2.08 | 1.91 | 2.54 | 2.27 | 1.73 | 2.40 | NA | NA | NA | NA | NA |
| 2023-12-31 | 2023-09-30 | 2023-06-30 | 2023-03-31 | 2022-12-31 | 2022-09-30 | 2022-06-30 | 2022-03-31 | 2021-12-31 | 2021-09-30 | 2021-06-30 | 2021-03-31 | 2020-12-31 | 2020-09-30 | 2020-06-30 | 2020-03-31 | 2019-12-31 | 2019-09-30 | 2019-06-30 | 2019-03-31 | 2018-12-31 | 2018-09-30 | 2018-06-30 | 2018-03-31 | 2017-12-31 | 2017-09-30 | 2017-06-30 | 2017-03-31 | 2016-12-31 | 2016-09-30 | 2016-06-30 | 2016-03-31 | 2015-12-31 | 2015-09-30 | 2015-06-30 | 2015-03-31 | 2014-12-31 | 2014-09-30 | 2014-06-30 | 2014-03-31 | 2013-12-31 | 2013-09-30 | 2013-06-30 | 2013-03-31 | 2012-12-31 | 2012-09-30 | 2012-06-30 | 2012-03-31 | 2011-12-31 | 2011-09-30 | 2011-06-30 | 2011-03-31 | 2010-12-31 | 2010-09-30 | 2010-06-30 | ||
|---|---|---|---|---|---|---|---|---|---|---|---|---|---|---|---|---|---|---|---|---|---|---|---|---|---|---|---|---|---|---|---|---|---|---|---|---|---|---|---|---|---|---|---|---|---|---|---|---|---|---|---|---|---|---|---|---|
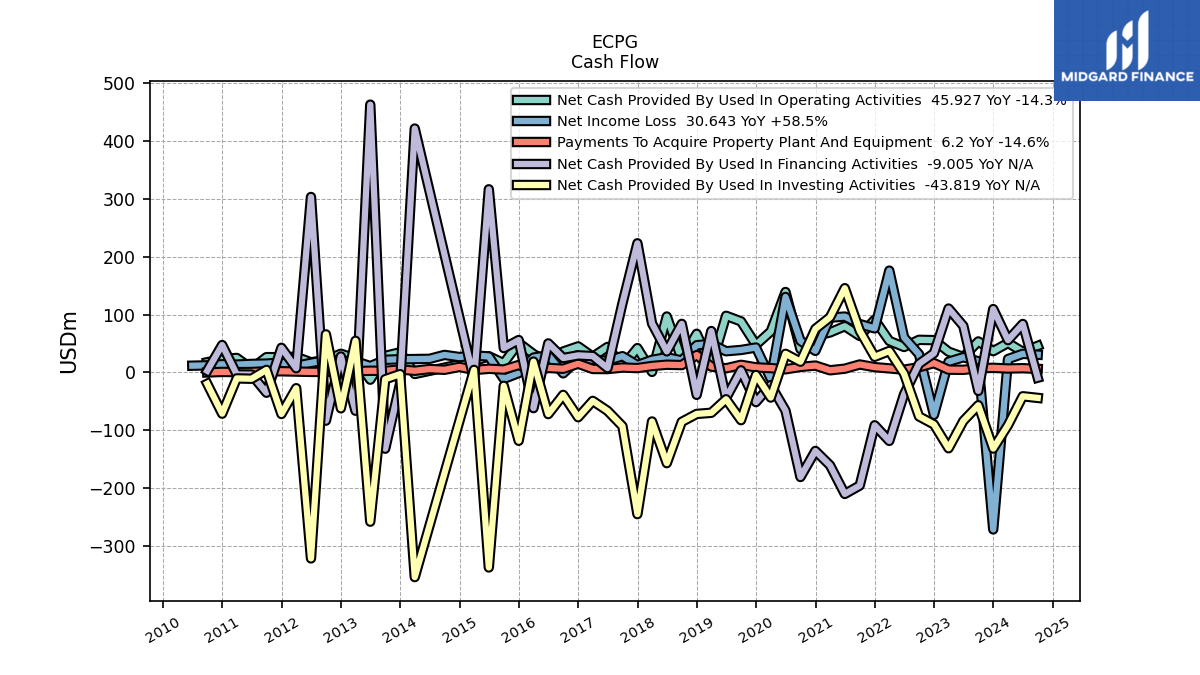
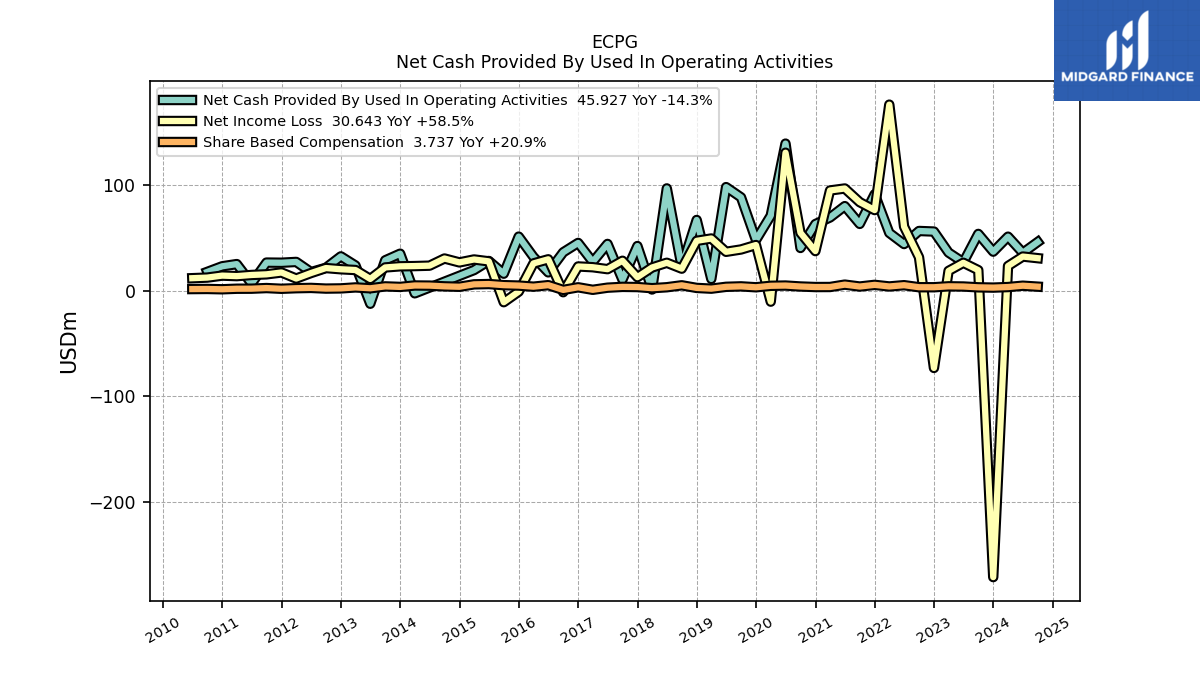
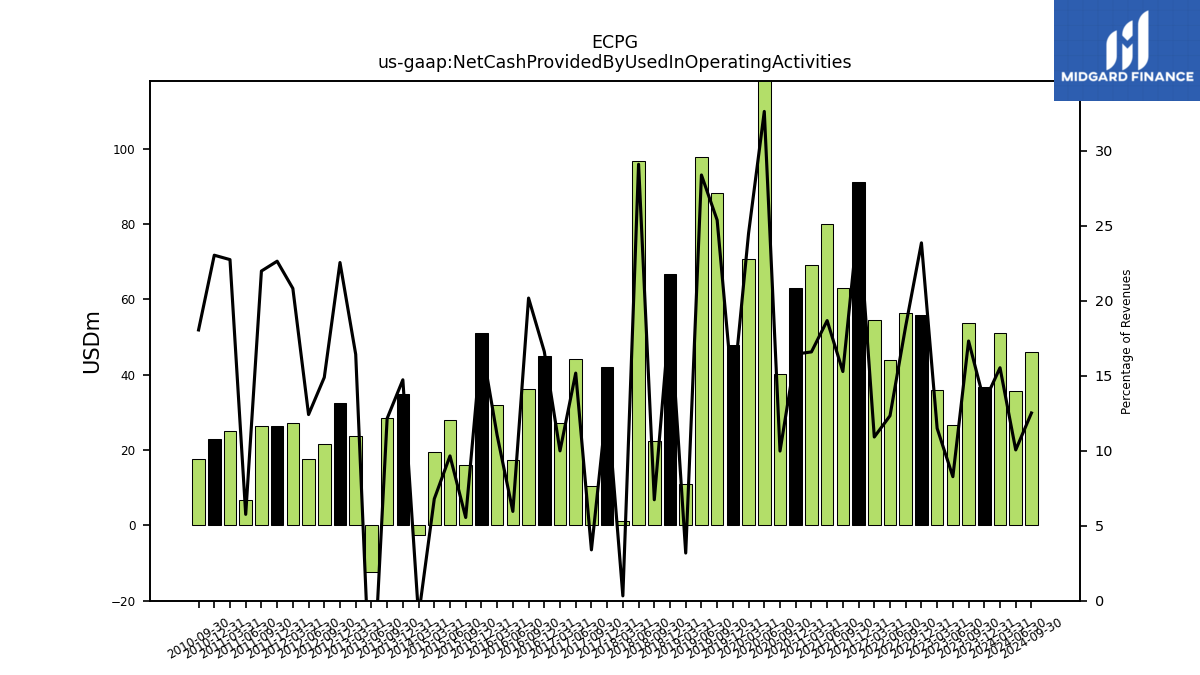
| Net Cash Provided By Used In Operating Activities | 36.78 | 53.59 | 26.71 | 35.91 | 55.80 | 56.35 | 44.00 | 54.53 | 91.06 | 63.02 | 79.85 | 69.12 | 62.88 | 40.27 | 138.91 | 70.81 | 47.79 | 88.13 | 97.83 | 10.99 | 66.77 | 22.39 | 96.60 | 1.03 | 42.13 | 10.40 | 44.13 | 27.16 | 45.06 | 36.19 | 17.23 | 31.85 | 51.04 | 15.97 | 28.02 | 19.39 | NA | NA | NA | -2.59 | 34.91 | 28.61 | -12.44 | 23.69 | 32.37 | 21.55 | 17.50 | 27.10 | 26.35 | 26.49 | 6.67 | 25.07 | 22.97 | 17.68 | NA | |
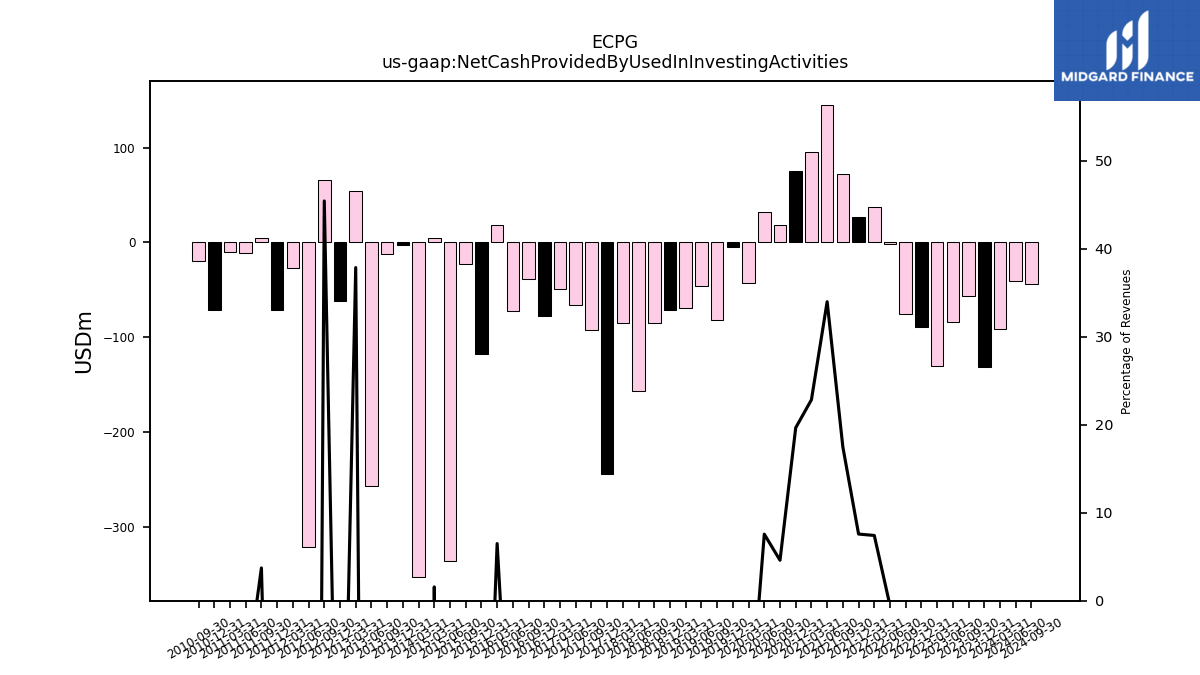
| Net Cash Provided By Used In Investing Activities | -131.22 | -56.48 | -83.53 | -130.72 | -89.56 | -75.78 | -1.98 | 37.09 | 27.09 | 72.11 | 145.43 | 95.27 | 75.25 | 18.59 | 32.24 | -43.26 | -4.38 | -82.27 | -46.17 | -69.51 | -71.44 | -85.18 | -156.40 | -84.49 | -244.35 | -92.70 | -66.08 | -48.99 | -77.18 | -38.63 | -71.78 | 18.80 | -117.80 | -23.02 | -336.37 | 4.49 | NA | NA | NA | -352.99 | -2.85 | -11.67 | -257.37 | 54.65 | -61.77 | 65.81 | -320.75 | -27.05 | -71.59 | 4.50 | -10.80 | -10.19 | -71.03 | -19.47 | NA | |
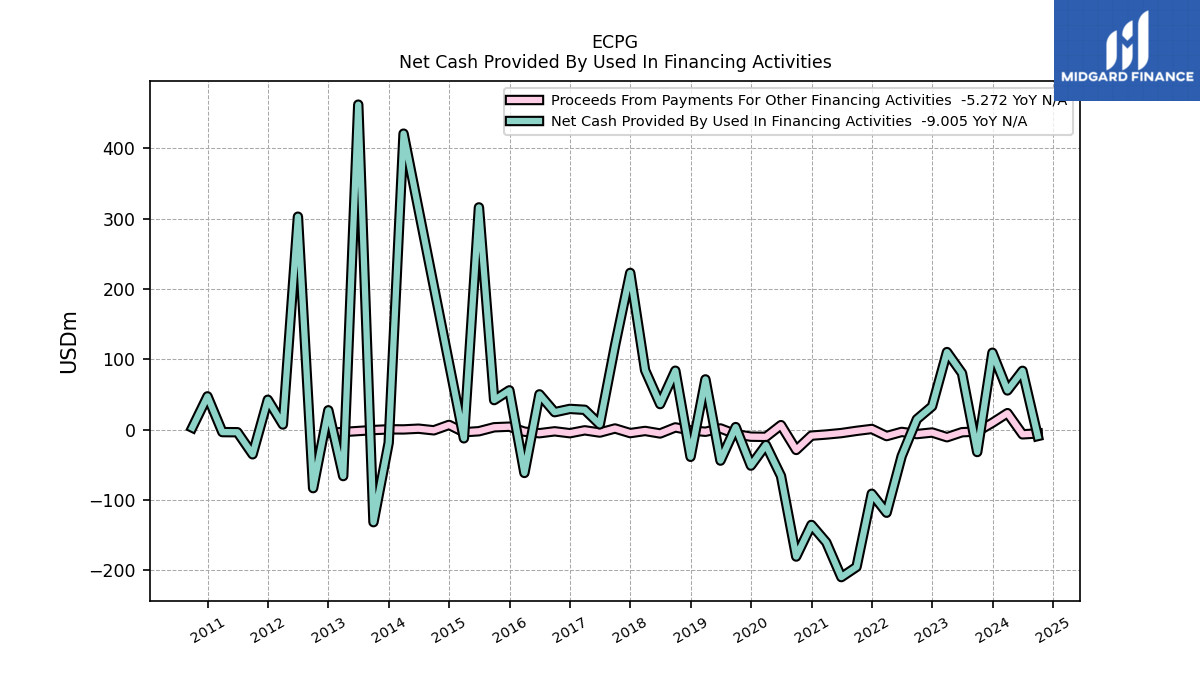
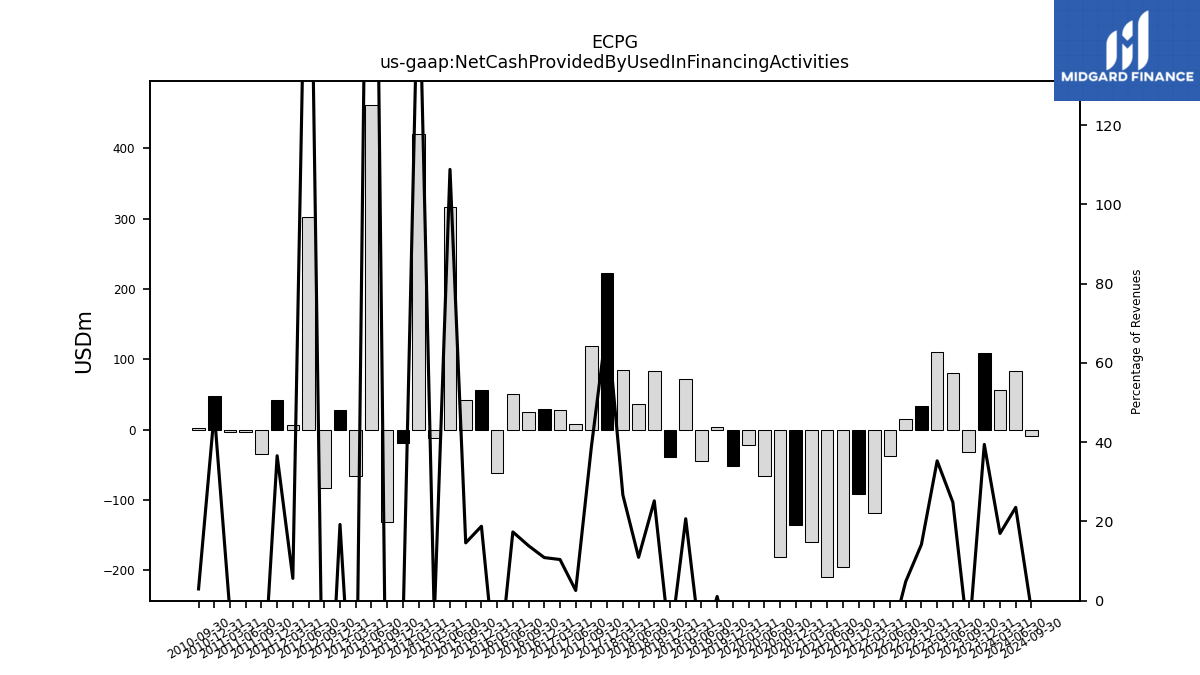
| Net Cash Provided By Used In Financing Activities | 109.43 | -31.75 | 80.25 | 110.37 | 33.25 | 14.91 | -37.58 | -118.02 | -91.02 | -195.03 | -209.54 | -160.11 | -135.31 | -180.32 | -65.81 | -21.76 | -51.08 | 3.73 | -43.97 | 71.55 | -38.55 | 83.89 | 36.40 | 84.64 | 222.91 | 119.46 | 7.56 | 28.29 | 29.57 | 24.91 | 50.27 | -61.49 | 55.99 | 42.06 | 316.07 | -12.27 | NA | NA | NA | 420.85 | -18.68 | -131.47 | 462.08 | -65.95 | 27.65 | -83.10 | 302.82 | 7.35 | 42.62 | -34.98 | -3.58 | -3.41 | 47.43 | 2.92 | NA |
| 2023-12-31 | 2023-09-30 | 2023-06-30 | 2023-03-31 | 2022-12-31 | 2022-09-30 | 2022-06-30 | 2022-03-31 | 2021-12-31 | 2021-09-30 | 2021-06-30 | 2021-03-31 | 2020-12-31 | 2020-09-30 | 2020-06-30 | 2020-03-31 | 2019-12-31 | 2019-09-30 | 2019-06-30 | 2019-03-31 | 2018-12-31 | 2018-09-30 | 2018-06-30 | 2018-03-31 | 2017-12-31 | 2017-09-30 | 2017-06-30 | 2017-03-31 | 2016-12-31 | 2016-09-30 | 2016-06-30 | 2016-03-31 | 2015-12-31 | 2015-09-30 | 2015-06-30 | 2015-03-31 | 2014-12-31 | 2014-09-30 | 2014-06-30 | 2014-03-31 | 2013-12-31 | 2013-09-30 | 2013-06-30 | 2013-03-31 | 2012-12-31 | 2012-09-30 | 2012-06-30 | 2012-03-31 | 2011-12-31 | 2011-09-30 | 2011-06-30 | 2011-03-31 | 2010-12-31 | 2010-09-30 | 2010-06-30 | ||
|---|---|---|---|---|---|---|---|---|---|---|---|---|---|---|---|---|---|---|---|---|---|---|---|---|---|---|---|---|---|---|---|---|---|---|---|---|---|---|---|---|---|---|---|---|---|---|---|---|---|---|---|---|---|---|---|---|
| Net Cash Provided By Used In Operating Activities | 36.78 | 53.59 | 26.71 | 35.91 | 55.80 | 56.35 | 44.00 | 54.53 | 91.06 | 63.02 | 79.85 | 69.12 | 62.88 | 40.27 | 138.91 | 70.81 | 47.79 | 88.13 | 97.83 | 10.99 | 66.77 | 22.39 | 96.60 | 1.03 | 42.13 | 10.40 | 44.13 | 27.16 | 45.06 | 36.19 | 17.23 | 31.85 | 51.04 | 15.97 | 28.02 | 19.39 | NA | NA | NA | -2.59 | 34.91 | 28.61 | -12.44 | 23.69 | 32.37 | 21.55 | 17.50 | 27.10 | 26.35 | 26.49 | 6.67 | 25.07 | 22.97 | 17.68 | NA | |
| Net Income Loss | -270.76 | 19.34 | 26.30 | 18.63 | -73.12 | 31.49 | 60.44 | 175.75 | 76.08 | 83.57 | 96.50 | 94.63 | 37.32 | 54.65 | 130.33 | -10.45 | 43.09 | 38.87 | 36.66 | 49.25 | 47.04 | 20.73 | 26.30 | 21.83 | 12.68 | 28.19 | 20.25 | 22.10 | 22.81 | -1.52 | 29.59 | 25.69 | -0.99 | -10.96 | 27.66 | 29.43 | 26.65 | 30.34 | 23.56 | 23.18 | 22.95 | 21.89 | 11.01 | 19.45 | 20.17 | 21.31 | 16.60 | 11.41 | 17.13 | 15.37 | 14.78 | 13.68 | 14.17 | 12.29 | 11.73 | |
| Profit Loss | -270.76 | 19.34 | 26.30 | 18.63 | -73.12 | 31.49 | 60.44 | 175.75 | 76.08 | 83.57 | 96.79 | 94.77 | 37.21 | 55.11 | 130.78 | -10.58 | 43.23 | 39.41 | 36.82 | 49.44 | 46.03 | 13.02 | 26.97 | 23.71 | 2.78 | 42.14 | 19.08 | 14.98 | 11.32 | -51.95 | 30.83 | 26.61 | 1.60 | -9.36 | 25.18 | 29.97 | 27.96 | 30.14 | 21.35 | 18.83 | 22.22 | 21.06 | 11.01 | 19.45 | 20.17 | 21.31 | NA | NA | NA | NA | NA | NA | NA | NA | NA | |
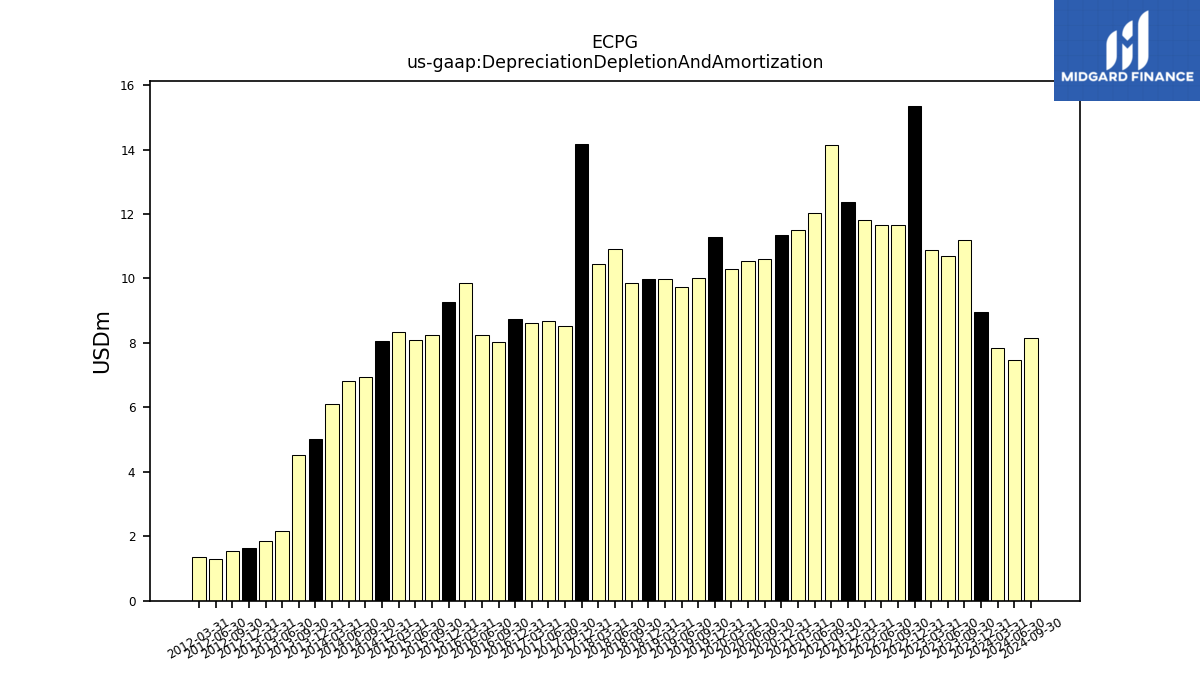
| Depreciation Depletion And Amortization | 8.97 | 11.20 | 10.70 | 10.87 | 15.36 | 11.66 | 11.65 | 11.83 | 12.38 | 14.14 | 12.05 | 11.51 | 11.34 | 10.61 | 10.54 | 10.29 | 11.29 | 10.00 | 9.74 | 9.99 | 10.00 | 9.87 | 10.92 | 10.44 | 14.16 | 8.52 | 8.67 | 8.62 | 8.74 | 8.03 | 8.23 | 9.86 | 9.28 | 8.23 | 8.08 | 8.35 | 8.07 | 6.93 | 6.83 | 6.12 | 5.02 | 4.52 | 2.16 | 1.85 | 1.65 | 1.53 | 1.30 | 1.36 | NA | NA | NA | NA | NA | NA | NA | |
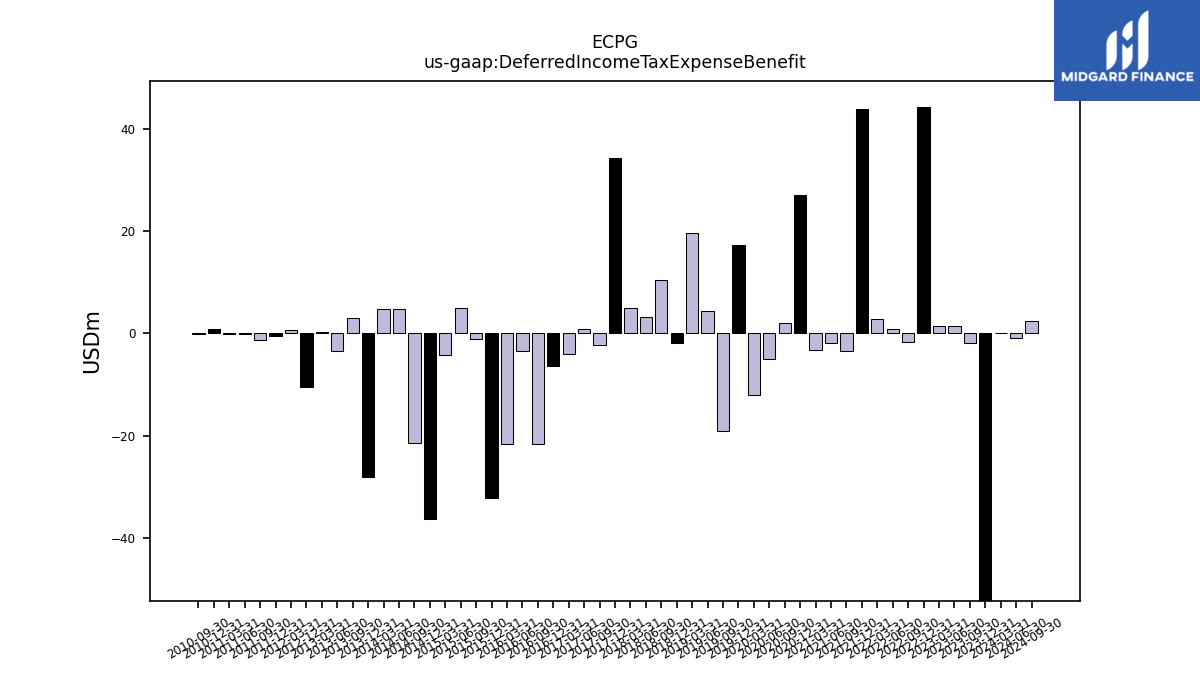
| Deferred Income Tax Expense Benefit | -56.87 | -1.83 | 1.42 | 1.37 | 44.28 | -1.57 | 0.89 | 2.81 | 43.88 | -3.41 | -1.79 | -3.30 | 26.97 | 2.03 | -5.07 | -12.03 | 17.33 | -18.96 | 4.29 | 19.68 | -1.92 | 10.48 | 3.19 | 5.07 | 34.37 | -2.23 | 0.88 | -4.04 | -6.38 | -21.52 | -3.41 | -21.59 | -32.11 | -1.02 | 5.04 | -4.28 | -36.22 | -21.48 | 4.85 | 4.77 | -27.97 | 3.08 | -3.50 | 0.21 | -10.40 | NA | NA | 0.62 | -0.45 | -1.31 | -0.10 | -0.06 | 0.85 | -0.19 | NA | |
| Share Based Compensation | 2.84 | 3.09 | 3.87 | 4.05 | 3.17 | 3.19 | 5.12 | 3.92 | 5.43 | 3.85 | 5.65 | 3.40 | 3.37 | 3.88 | 4.78 | 4.53 | 3.15 | 4.00 | 3.58 | 1.83 | 2.53 | 5.01 | 3.17 | 2.28 | 3.36 | 3.53 | 2.76 | 0.75 | 3.12 | 0.63 | 5.15 | 3.72 | 4.75 | 5.16 | 6.20 | 5.91 | 3.62 | 4.01 | 4.71 | 4.84 | 3.49 | 3.98 | 2.18 | 3.00 | 2.08 | 1.90 | 2.54 | 2.27 | 1.73 | 2.40 | 1.81 | 1.76 | 1.25 | 1.55 | 1.45 |
| 2023-12-31 | 2023-09-30 | 2023-06-30 | 2023-03-31 | 2022-12-31 | 2022-09-30 | 2022-06-30 | 2022-03-31 | 2021-12-31 | 2021-09-30 | 2021-06-30 | 2021-03-31 | 2020-12-31 | 2020-09-30 | 2020-06-30 | 2020-03-31 | 2019-12-31 | 2019-09-30 | 2019-06-30 | 2019-03-31 | 2018-12-31 | 2018-09-30 | 2018-06-30 | 2018-03-31 | 2017-12-31 | 2017-09-30 | 2017-06-30 | 2017-03-31 | 2016-12-31 | 2016-09-30 | 2016-06-30 | 2016-03-31 | 2015-12-31 | 2015-09-30 | 2015-06-30 | 2015-03-31 | 2014-12-31 | 2014-09-30 | 2014-06-30 | 2014-03-31 | 2013-12-31 | 2013-09-30 | 2013-06-30 | 2013-03-31 | 2012-12-31 | 2012-09-30 | 2012-06-30 | 2012-03-31 | 2011-12-31 | 2011-09-30 | 2011-06-30 | 2011-03-31 | 2010-12-31 | 2010-09-30 | 2010-06-30 | ||
|---|---|---|---|---|---|---|---|---|---|---|---|---|---|---|---|---|---|---|---|---|---|---|---|---|---|---|---|---|---|---|---|---|---|---|---|---|---|---|---|---|---|---|---|---|---|---|---|---|---|---|---|---|---|---|---|---|
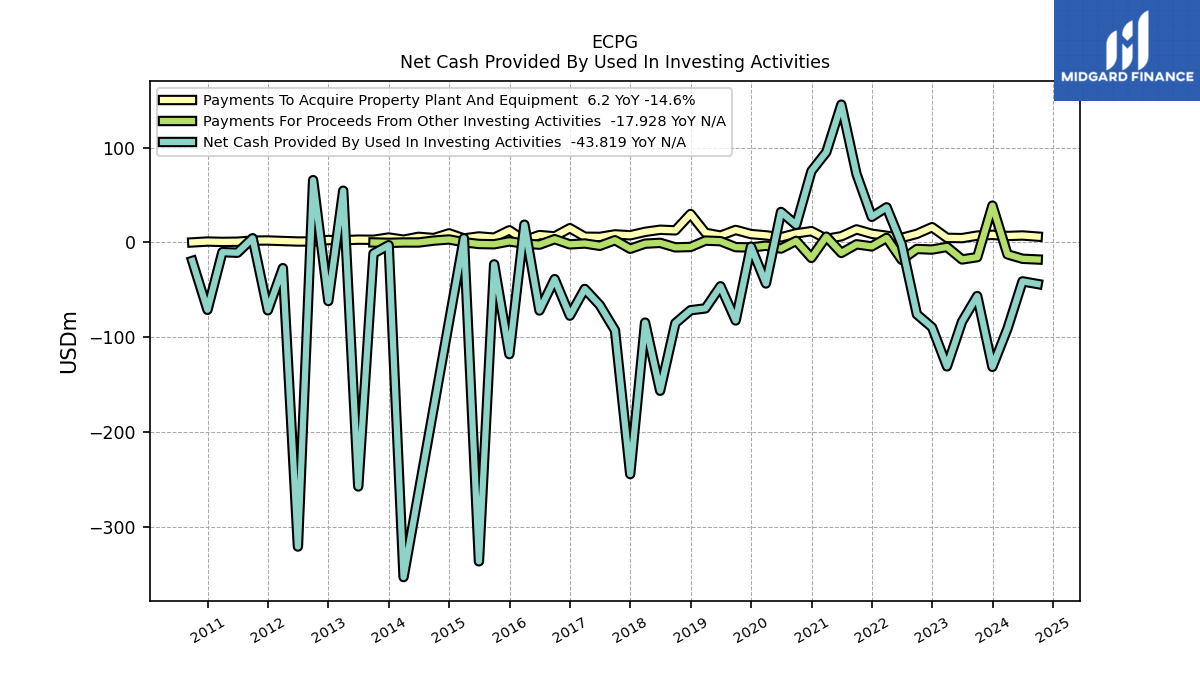
| Net Cash Provided By Used In Investing Activities | -131.22 | -56.48 | -83.53 | -130.72 | -89.56 | -75.78 | -1.98 | 37.09 | 27.09 | 72.11 | 145.43 | 95.27 | 75.25 | 18.59 | 32.24 | -43.26 | -4.38 | -82.27 | -46.17 | -69.51 | -71.44 | -85.18 | -156.40 | -84.49 | -244.35 | -92.70 | -66.08 | -48.99 | -77.18 | -38.63 | -71.78 | 18.80 | -117.80 | -23.02 | -336.37 | 4.49 | NA | NA | NA | -352.99 | -2.85 | -11.67 | -257.37 | 54.65 | -61.77 | 65.81 | -320.75 | -27.05 | -71.59 | 4.50 | -10.80 | -10.19 | -71.03 | -19.47 | NA | |
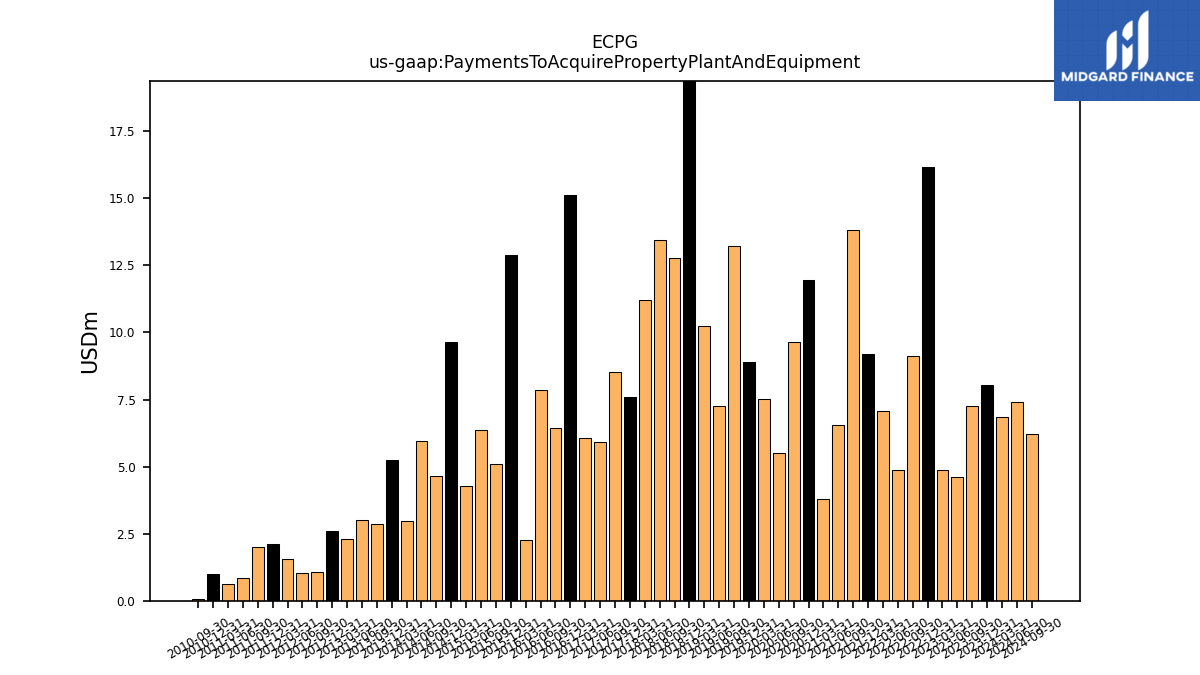
| Payments To Acquire Property Plant And Equipment | 8.04 | 7.26 | 4.62 | 4.88 | 16.16 | 9.13 | 4.86 | 7.08 | 9.21 | 13.81 | 6.56 | 3.79 | 11.94 | 9.63 | 5.49 | 7.54 | 8.89 | 13.23 | 7.25 | 10.23 | 30.04 | 12.78 | 13.44 | 11.22 | 7.61 | 8.53 | 5.90 | 6.08 | 15.12 | 6.45 | 7.84 | 2.25 | 12.89 | 5.11 | 6.37 | 4.27 | 9.64 | 4.66 | 5.96 | 2.98 | 5.25 | 2.84 | 3.02 | 2.31 | 2.60 | 1.07 | 1.04 | 1.55 | 2.11 | 2.00 | 0.83 | 0.63 | 1.00 | 0.08 | NA |
| 2023-12-31 | 2023-09-30 | 2023-06-30 | 2023-03-31 | 2022-12-31 | 2022-09-30 | 2022-06-30 | 2022-03-31 | 2021-12-31 | 2021-09-30 | 2021-06-30 | 2021-03-31 | 2020-12-31 | 2020-09-30 | 2020-06-30 | 2020-03-31 | 2019-12-31 | 2019-09-30 | 2019-06-30 | 2019-03-31 | 2018-12-31 | 2018-09-30 | 2018-06-30 | 2018-03-31 | 2017-12-31 | 2017-09-30 | 2017-06-30 | 2017-03-31 | 2016-12-31 | 2016-09-30 | 2016-06-30 | 2016-03-31 | 2015-12-31 | 2015-09-30 | 2015-06-30 | 2015-03-31 | 2014-12-31 | 2014-09-30 | 2014-06-30 | 2014-03-31 | 2013-12-31 | 2013-09-30 | 2013-06-30 | 2013-03-31 | 2012-12-31 | 2012-09-30 | 2012-06-30 | 2012-03-31 | 2011-12-31 | 2011-09-30 | 2011-06-30 | 2011-03-31 | 2010-12-31 | 2010-09-30 | 2010-06-30 | ||
|---|---|---|---|---|---|---|---|---|---|---|---|---|---|---|---|---|---|---|---|---|---|---|---|---|---|---|---|---|---|---|---|---|---|---|---|---|---|---|---|---|---|---|---|---|---|---|---|---|---|---|---|---|---|---|---|---|
| Net Cash Provided By Used In Financing Activities | 109.43 | -31.75 | 80.25 | 110.37 | 33.25 | 14.91 | -37.58 | -118.02 | -91.02 | -195.03 | -209.54 | -160.11 | -135.31 | -180.32 | -65.81 | -21.76 | -51.08 | 3.73 | -43.97 | 71.55 | -38.55 | 83.89 | 36.40 | 84.64 | 222.91 | 119.46 | 7.56 | 28.29 | 29.57 | 24.91 | 50.27 | -61.49 | 55.99 | 42.06 | 316.07 | -12.27 | NA | NA | NA | 420.85 | -18.68 | -131.47 | 462.08 | -65.95 | 27.65 | -83.10 | 302.82 | 7.35 | 42.62 | -34.98 | -3.58 | -3.41 | 47.43 | 2.92 | NA |
| 2023-12-31 | 2023-09-30 | 2023-06-30 | 2023-03-31 | 2022-12-31 | 2022-09-30 | 2022-06-30 | 2022-03-31 | 2021-12-31 | 2021-09-30 | 2021-06-30 | 2021-03-31 | 2020-12-31 | 2020-09-30 | 2020-06-30 | 2020-03-31 | 2019-12-31 | 2019-09-30 | 2019-06-30 | 2019-03-31 | 2018-12-31 | 2018-09-30 | 2018-06-30 | 2018-03-31 | 2017-12-31 | 2017-09-30 | 2017-06-30 | 2017-03-31 | 2016-12-31 | 2016-09-30 | 2016-06-30 | 2016-03-31 | 2015-12-31 | 2015-09-30 | 2015-06-30 | 2015-03-31 | 2014-12-31 | 2014-09-30 | 2014-06-30 | 2014-03-31 | 2013-12-31 | 2013-09-30 | 2013-06-30 | 2013-03-31 | 2012-12-31 | 2012-09-30 | 2012-06-30 | 2012-03-31 | 2011-12-31 | 2011-09-30 | 2011-06-30 | 2011-03-31 | 2010-12-31 | 2010-09-30 | 2010-06-30 | ||
|---|---|---|---|---|---|---|---|---|---|---|---|---|---|---|---|---|---|---|---|---|---|---|---|---|---|---|---|---|---|---|---|---|---|---|---|---|---|---|---|---|---|---|---|---|---|---|---|---|---|---|---|---|---|---|---|---|
| Revenues | 277.39 | 309.62 | 323.04 | 312.63 | 234.00 | 307.75 | 356.92 | 499.68 | 357.30 | 412.62 | 427.74 | 416.84 | 382.61 | 403.68 | 426.03 | 289.08 | 347.79 | 347.42 | 344.81 | 345.71 | 348.72 | 332.75 | 332.12 | 316.98 | 317.48 | 306.70 | 290.92 | 271.94 | 271.38 | 179.41 | 289.44 | 289.02 | 297.76 | 287.80 | 290.36 | 285.66 | 276.57 | 273.28 | 269.19 | 253.74 | 237.10 | 235.56 | 156.12 | 144.28 | 143.61 | 144.79 | 141.06 | 130.22 | 116.45 | 120.56 | 115.83 | 110.30 | 99.77 | 97.97 | 96.23 | |
| Revenue From Contract With Customer Excluding Assessed Tax | 19.65 | 19.89 | 21.01 | 22.59 | 23.00 | 21.99 | 23.79 | 26.15 | 26.88 | 29.32 | 32.06 | 32.52 | 32.70 | 29.79 | 23.95 | 28.68 | 347.79 | 31.20 | 32.32 | 34.55 | 348.72 | 37.39 | 39.45 | 35.97 | 317.48 | 23.11 | 18.68 | 19.97 | 271.38 | 179.41 | 289.44 | 289.02 | 297.76 | 287.80 | 290.36 | 285.66 | 276.57 | 273.28 | 269.19 | 253.74 | 237.10 | 235.56 | 156.12 | 144.28 | 143.61 | 144.79 | 141.06 | 130.22 | 116.45 | 120.56 | 115.83 | 110.30 | 99.77 | 97.97 | 96.23 |