
| 2023-12-31 | 2023-09-30 | 2023-06-30 | 2023-03-31 | 2022-12-31 | 2022-09-30 | 2022-06-30 | 2022-03-31 | 2021-12-31 | 2021-09-30 | 2021-06-30 | 2021-03-31 | 2020-12-31 | 2020-09-30 | 2020-06-30 | 2020-03-31 | 2019-12-31 | 2019-09-30 | 2019-06-30 | 2019-03-31 | 2018-12-31 | 2018-09-30 | 2018-06-30 | 2018-03-31 | 2017-12-31 | 2017-09-30 | 2017-06-30 | 2017-03-31 | 2016-12-31 | 2016-09-30 | 2016-06-30 | 2016-03-31 | 2015-12-31 | 2015-09-30 | 2015-06-30 | 2015-03-31 | 2014-12-31 | 2014-09-30 | 2014-06-30 | 2014-03-31 | 2013-12-31 | 2013-09-30 | 2013-06-30 | 2013-03-31 | 2012-12-31 | 2012-09-30 | 2012-06-30 | 2012-03-31 | 2011-12-31 | 2011-09-30 | 2011-06-30 | 2010-12-31 | ||
|---|---|---|---|---|---|---|---|---|---|---|---|---|---|---|---|---|---|---|---|---|---|---|---|---|---|---|---|---|---|---|---|---|---|---|---|---|---|---|---|---|---|---|---|---|---|---|---|---|---|---|---|---|---|
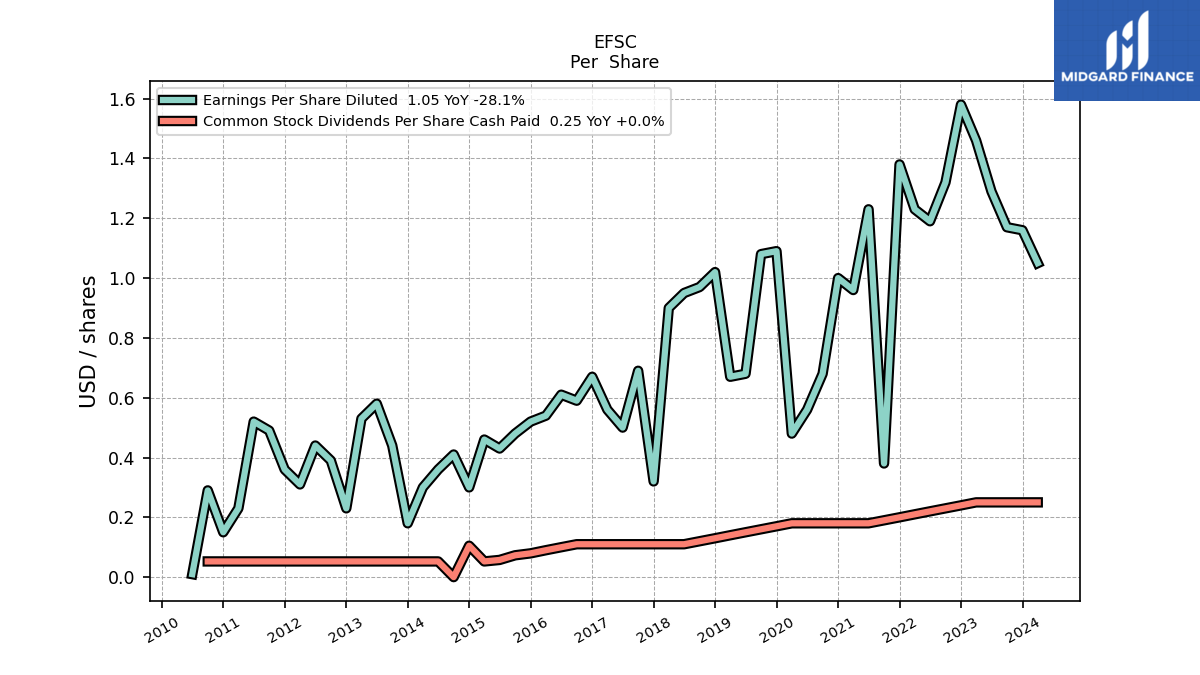
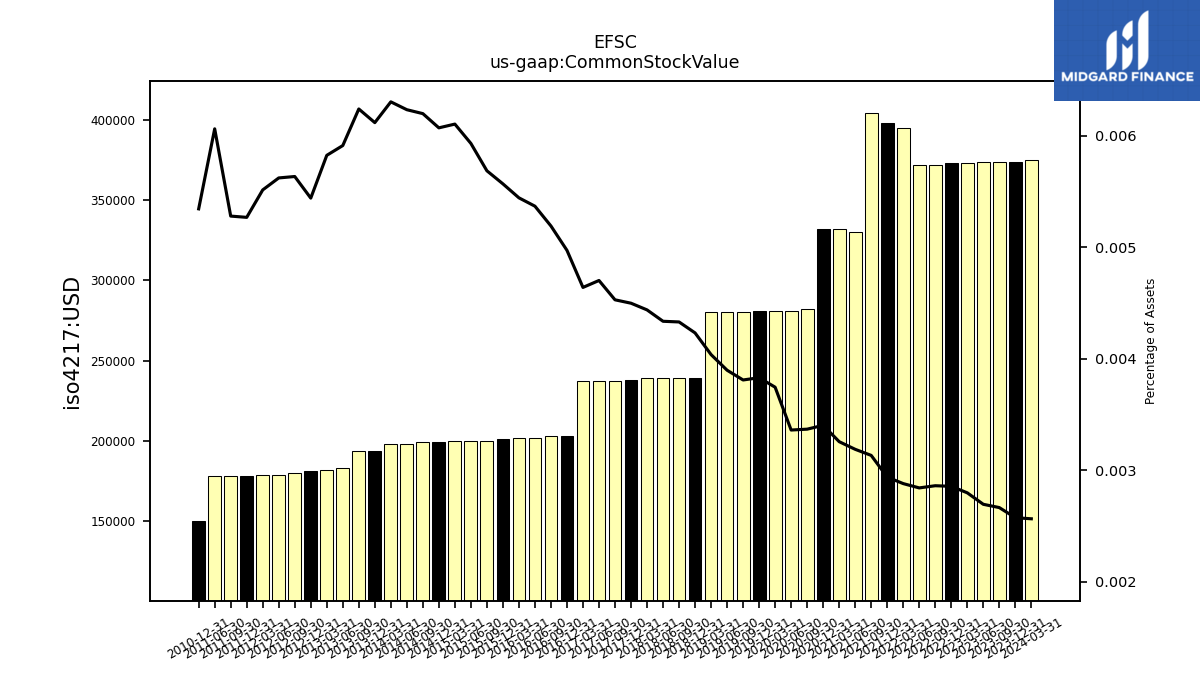
| Common Stock Value | 0.37 | 0.37 | 0.37 | 0.37 | 0.37 | 0.37 | 0.37 | 0.40 | 0.40 | 0.40 | 0.33 | 0.33 | 0.33 | 0.28 | 0.28 | 0.28 | 0.28 | 0.28 | 0.28 | 0.28 | 0.24 | 0.24 | 0.24 | 0.24 | 0.24 | 0.24 | 0.24 | 0.24 | 0.20 | 0.20 | 0.20 | 0.20 | 0.20 | 0.20 | 0.20 | 0.20 | 0.20 | 0.20 | 0.20 | 0.20 | 0.19 | 0.19 | 0.18 | 0.18 | 0.18 | 0.18 | 0.18 | 0.18 | 0.18 | 0.18 | 0.18 | 0.15 | |
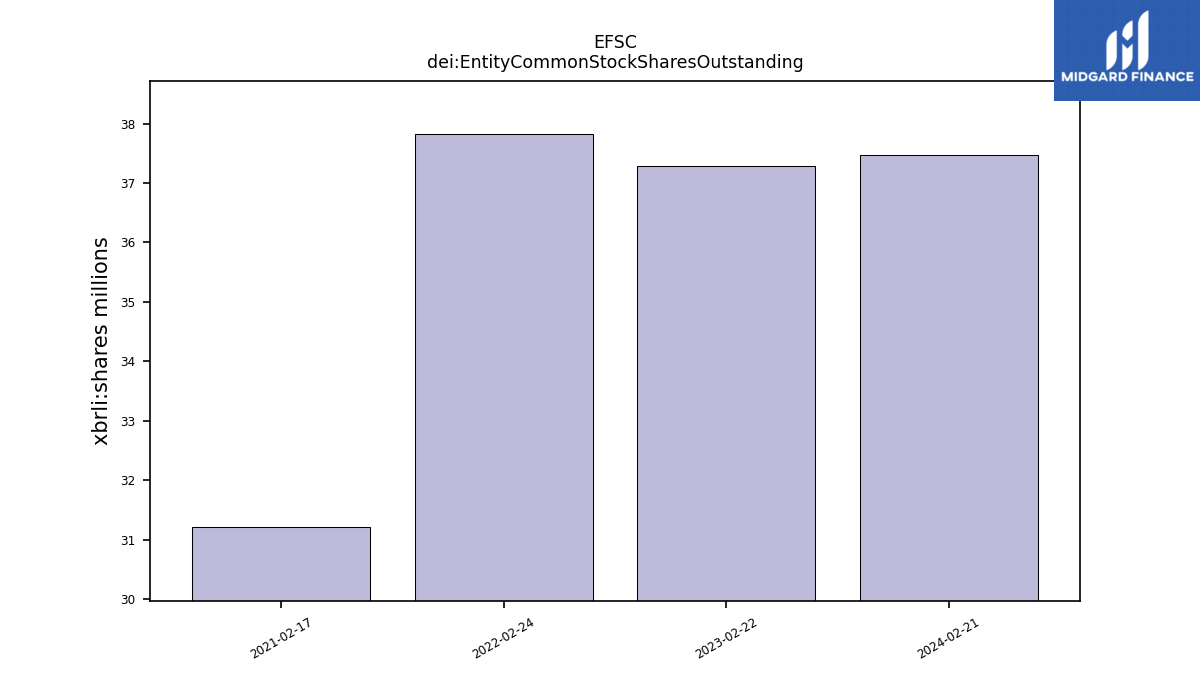
| dei: Entity Common Stock Shares Outstanding | NA | NA | NA | NA | NA | NA | NA | NA | NA | NA | NA | NA | NA | NA | NA | NA | NA | NA | NA | NA | NA | NA | NA | NA | NA | NA | NA | NA | NA | NA | NA | NA | NA | NA | NA | NA | NA | NA | NA | NA | NA | NA | NA | NA | NA | NA | NA | NA | NA | NA | NA | NA | |
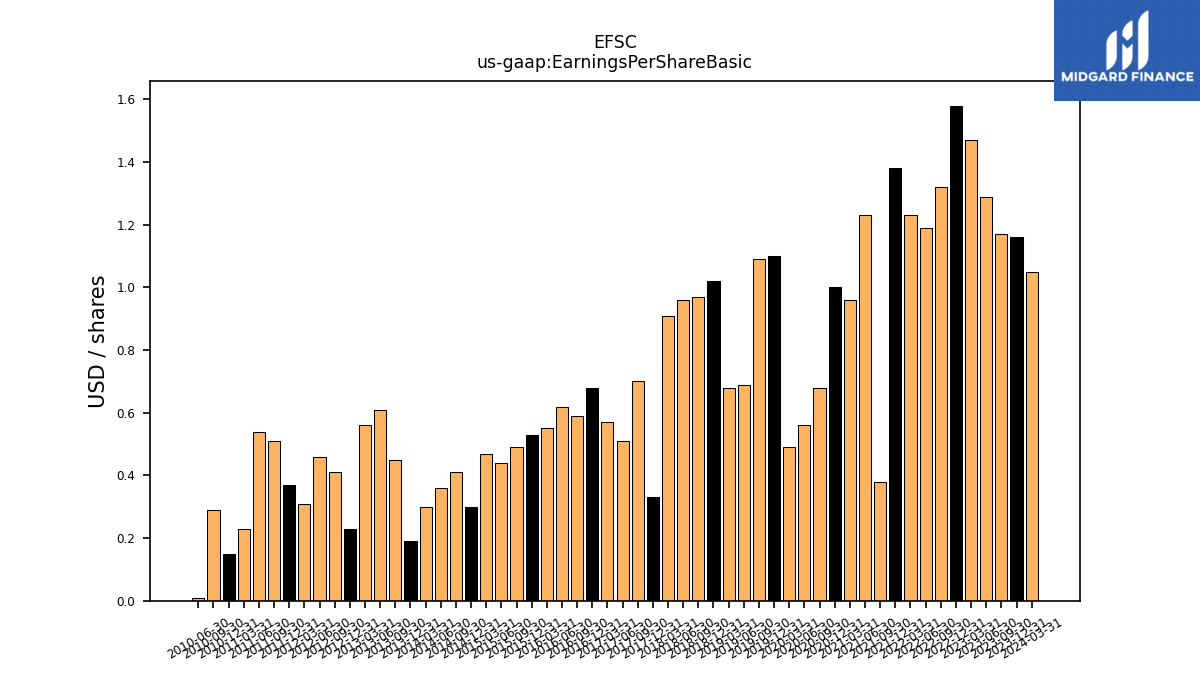
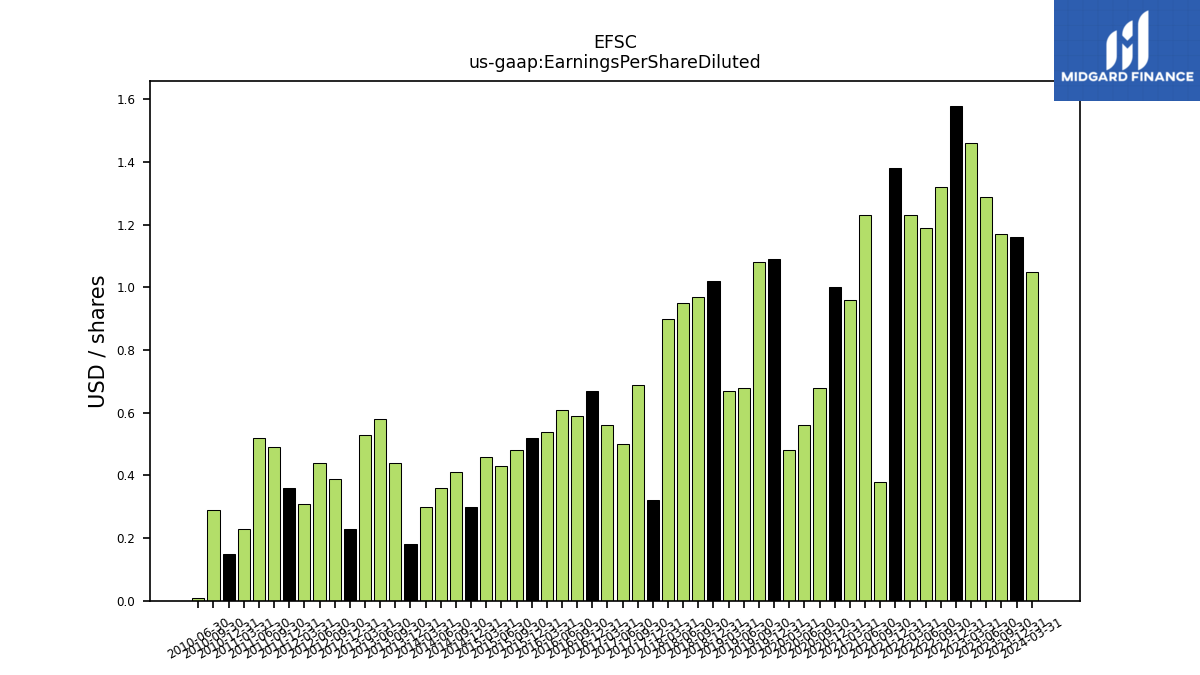
| Earnings Per Share Basic | 1.16 | 1.17 | 1.29 | 1.47 | 1.58 | 1.32 | 1.19 | 1.23 | 1.38 | 0.38 | 1.23 | 0.96 | 1.00 | 0.68 | 0.56 | 0.49 | 1.10 | 1.09 | 0.69 | 0.68 | 1.02 | 0.97 | 0.96 | 0.91 | 0.33 | 0.70 | 0.51 | 0.57 | 0.68 | 0.59 | 0.62 | 0.55 | 0.53 | 0.49 | 0.44 | 0.47 | 0.30 | 0.41 | 0.36 | 0.30 | 0.19 | 0.45 | 0.61 | 0.56 | 0.23 | 0.41 | 0.46 | 0.31 | 0.37 | 0.51 | 0.54 | 0.15 | |
| Earnings Per Share Diluted | 1.16 | 1.17 | 1.29 | 1.46 | 1.58 | 1.32 | 1.19 | 1.23 | 1.38 | 0.38 | 1.23 | 0.96 | 1.00 | 0.68 | 0.56 | 0.48 | 1.09 | 1.08 | 0.68 | 0.67 | 1.02 | 0.97 | 0.95 | 0.90 | 0.32 | 0.69 | 0.50 | 0.56 | 0.67 | 0.59 | 0.61 | 0.54 | 0.52 | 0.48 | 0.43 | 0.46 | 0.30 | 0.41 | 0.36 | 0.30 | 0.18 | 0.44 | 0.58 | 0.53 | 0.23 | 0.39 | 0.44 | 0.31 | 0.36 | 0.49 | 0.52 | 0.15 |
| 2023-12-31 | 2023-09-30 | 2023-06-30 | 2023-03-31 | 2022-12-31 | 2022-09-30 | 2022-06-30 | 2022-03-31 | 2021-12-31 | 2021-09-30 | 2021-06-30 | 2021-03-31 | 2020-12-31 | 2020-09-30 | 2020-06-30 | 2020-03-31 | 2019-12-31 | 2019-09-30 | 2019-06-30 | 2019-03-31 | 2018-12-31 | 2018-09-30 | 2018-06-30 | 2018-03-31 | 2017-12-31 | 2017-09-30 | 2017-06-30 | 2017-03-31 | 2016-12-31 | 2016-09-30 | 2016-06-30 | 2016-03-31 | 2015-12-31 | 2015-09-30 | 2015-06-30 | 2015-03-31 | 2014-12-31 | 2014-09-30 | 2014-06-30 | 2014-03-31 | 2013-12-31 | 2013-09-30 | 2013-06-30 | 2013-03-31 | 2012-12-31 | 2012-09-30 | 2012-06-30 | 2012-03-31 | 2011-12-31 | 2011-09-30 | 2011-06-30 | 2010-12-31 | ||
|---|---|---|---|---|---|---|---|---|---|---|---|---|---|---|---|---|---|---|---|---|---|---|---|---|---|---|---|---|---|---|---|---|---|---|---|---|---|---|---|---|---|---|---|---|---|---|---|---|---|---|---|---|---|
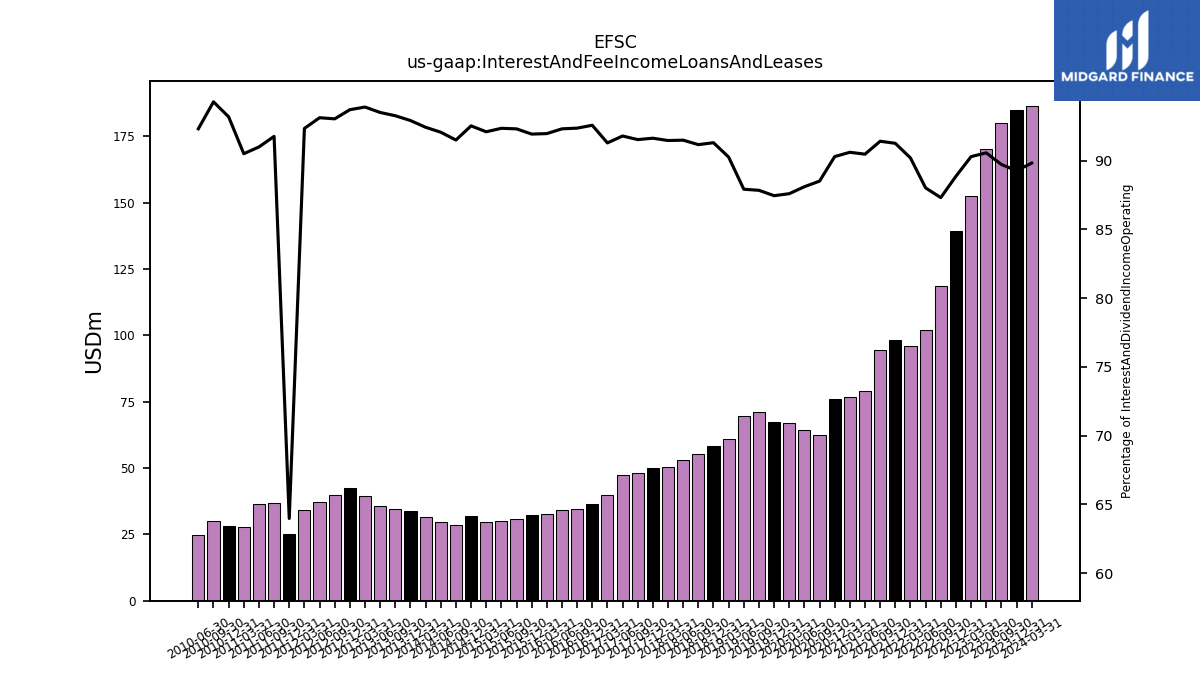
| Interest And Fee Income Loans And Leases | 184.85 | 180.24 | 170.16 | 152.61 | 139.27 | 118.47 | 102.15 | 96.12 | 98.22 | 94.35 | 79.06 | 76.97 | 75.94 | 62.65 | 64.48 | 67.17 | 67.54 | 71.21 | 69.63 | 61.02 | 58.43 | 55.38 | 52.95 | 50.45 | 50.20 | 48.02 | 47.31 | 39.93 | 36.51 | 34.44 | 34.18 | 32.61 | 32.26 | 30.63 | 29.88 | 29.61 | 31.81 | 28.39 | 29.74 | 31.44 | 33.85 | 34.40 | 35.59 | 39.35 | 42.49 | 39.89 | 37.27 | 34.36 | 25.24 | 36.75 | 36.42 | 28.30 | |
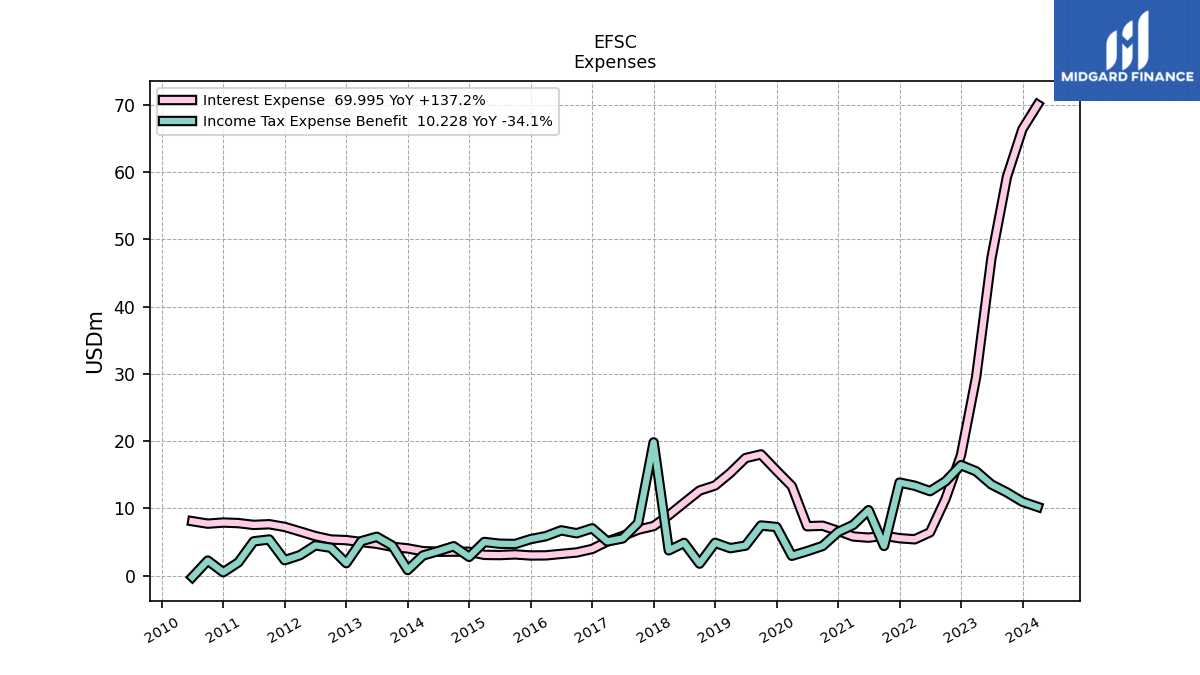
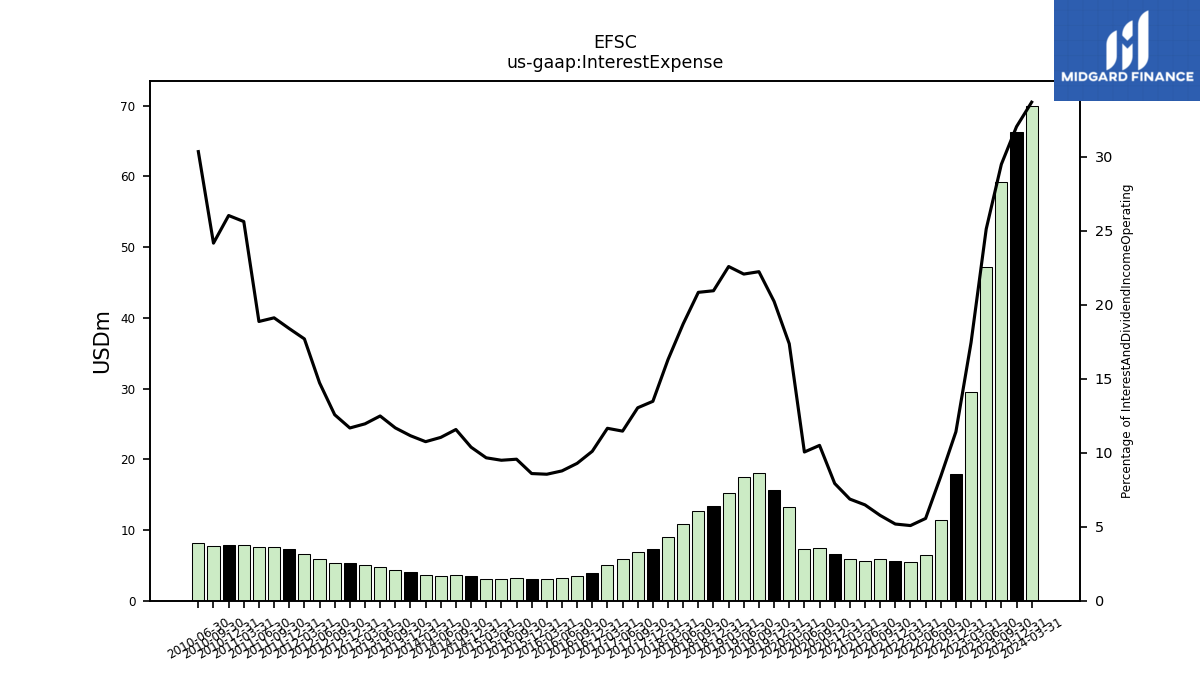
| Interest Expense | 66.35 | 59.27 | 47.20 | 29.50 | 17.90 | 11.40 | 6.46 | 5.42 | 5.58 | 5.96 | 5.66 | 5.84 | 6.67 | 7.43 | 7.36 | 13.32 | 15.62 | 18.03 | 17.49 | 15.27 | 13.41 | 12.66 | 10.83 | 8.99 | 7.38 | 6.84 | 5.91 | 5.10 | 3.98 | 3.46 | 3.25 | 3.03 | 3.02 | 3.17 | 3.07 | 3.11 | 3.57 | 3.59 | 3.57 | 3.66 | 4.06 | 4.31 | 4.75 | 5.01 | 5.29 | 5.39 | 5.90 | 6.59 | 7.26 | 7.66 | 7.55 | 7.91 | |
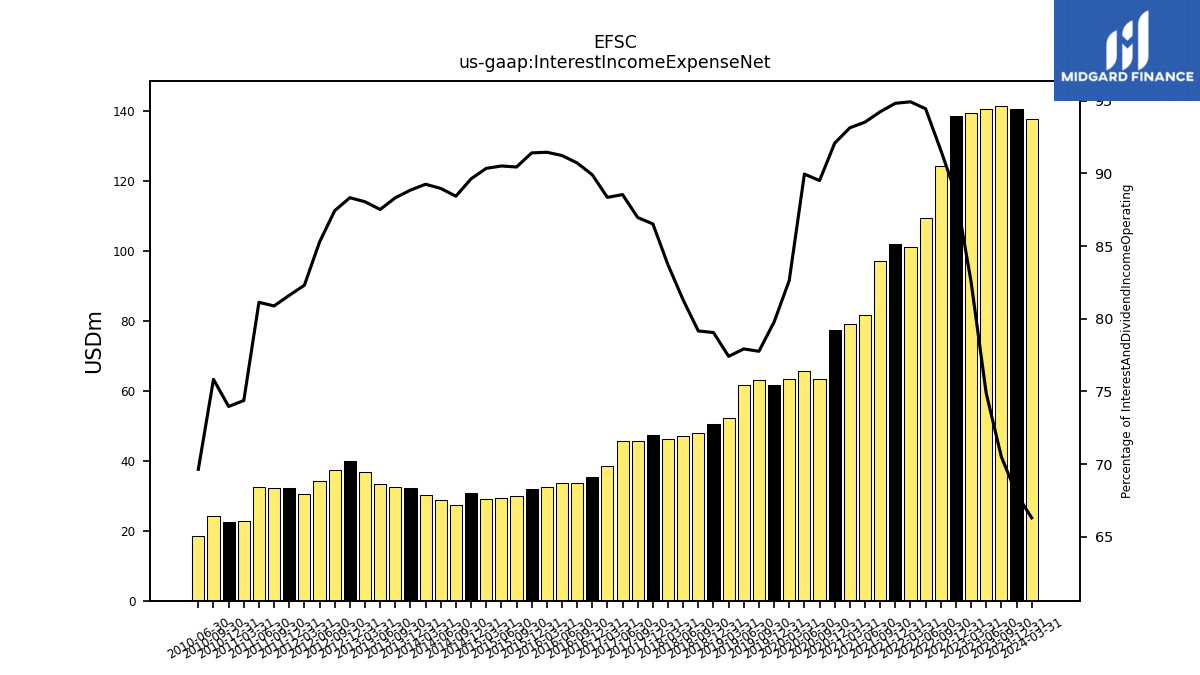
| Interest Income Expense Net | 140.73 | 141.64 | 140.69 | 139.53 | 138.84 | 124.29 | 109.61 | 101.17 | 102.06 | 97.27 | 81.74 | 79.12 | 77.45 | 63.35 | 65.83 | 63.37 | 61.61 | 63.05 | 61.72 | 52.34 | 50.59 | 48.09 | 47.05 | 46.17 | 47.40 | 45.62 | 45.63 | 38.64 | 35.45 | 33.83 | 33.78 | 32.43 | 32.08 | 30.01 | 29.28 | 29.05 | 30.82 | 27.44 | 28.74 | 30.37 | 32.37 | 32.57 | 33.31 | 36.90 | 40.05 | 37.48 | 34.13 | 30.63 | 32.20 | 32.39 | 32.47 | 22.47 | |
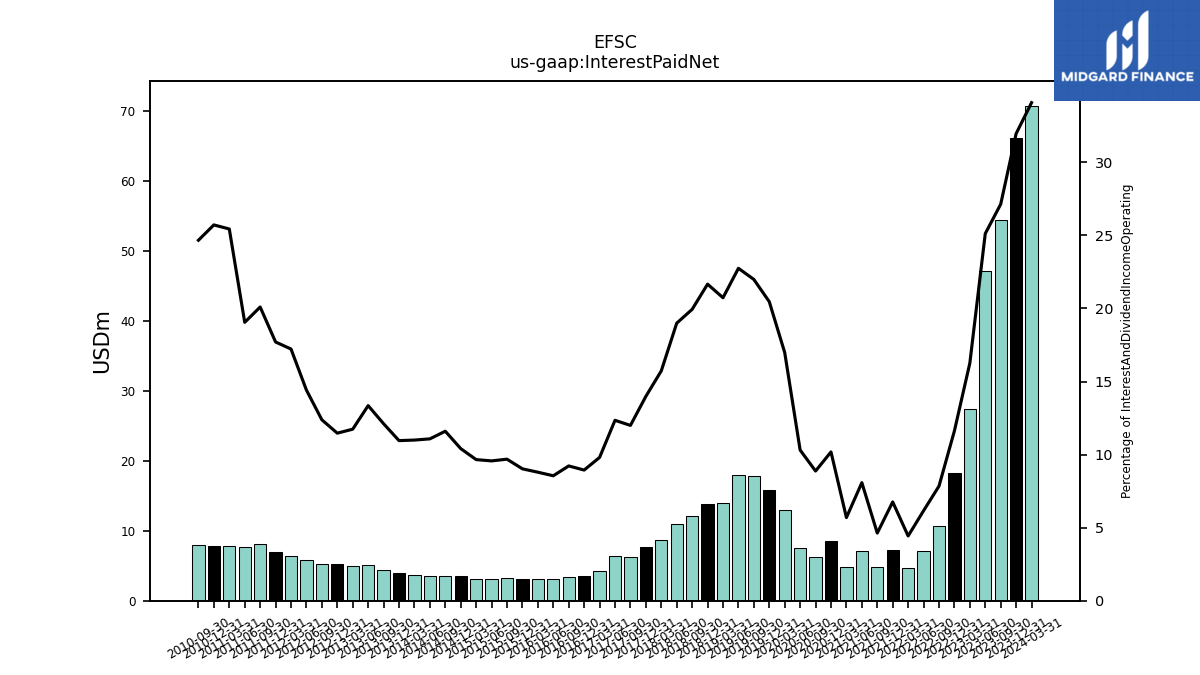
| Interest Paid Net | 66.19 | 54.51 | 47.20 | 27.49 | 18.22 | 10.64 | 7.15 | 4.72 | 7.28 | 4.78 | 7.06 | 4.84 | 8.56 | 6.28 | 7.55 | 13.03 | 15.80 | 17.83 | 18.02 | 14.02 | 13.87 | 12.12 | 10.99 | 8.68 | 7.66 | 6.29 | 6.36 | 4.29 | 3.53 | 3.44 | 3.17 | 3.12 | 3.17 | 3.21 | 3.10 | 3.10 | 3.58 | 3.60 | 3.58 | 3.74 | 3.99 | 4.47 | 5.08 | 4.92 | 5.20 | 5.31 | 5.77 | 6.41 | 6.99 | 8.05 | 7.62 | 7.81 | |
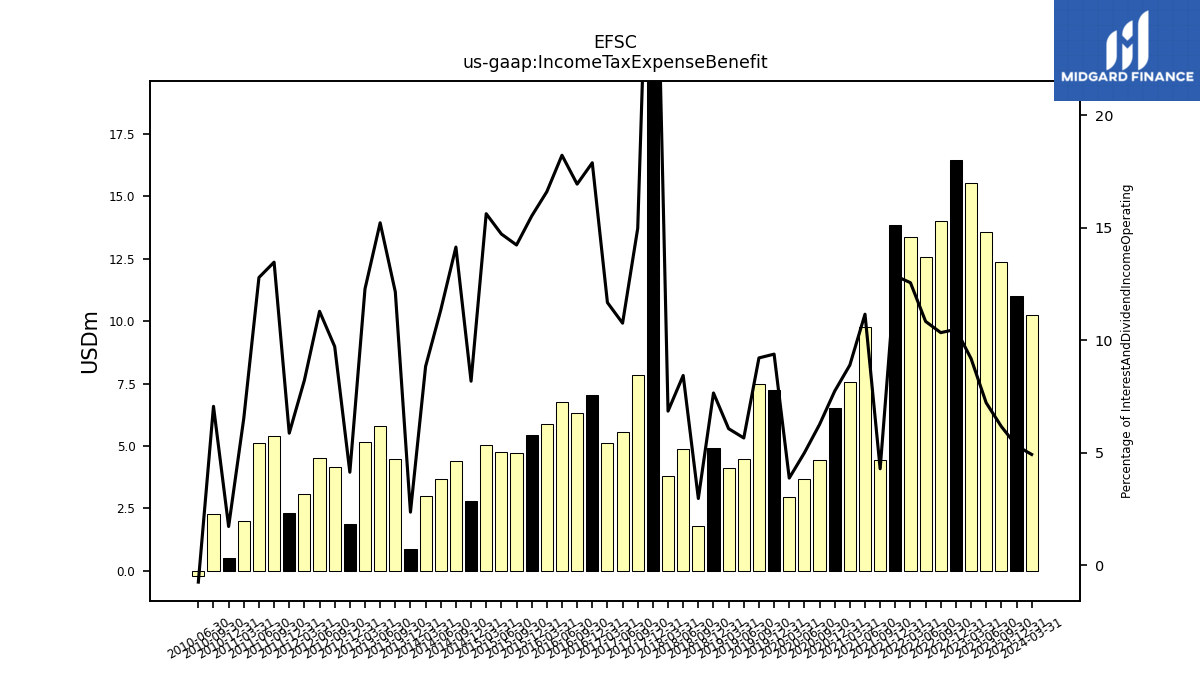
| Income Tax Expense Benefit | 11.00 | 12.38 | 13.56 | 15.52 | 16.43 | 14.03 | 12.58 | 13.38 | 13.85 | 4.43 | 9.75 | 7.56 | 6.51 | 4.43 | 3.66 | 2.97 | 7.25 | 7.47 | 4.48 | 4.10 | 4.90 | 1.80 | 4.88 | 3.78 | 19.82 | 7.86 | 5.54 | 5.11 | 7.05 | 6.32 | 6.75 | 5.89 | 5.45 | 4.72 | 4.76 | 5.02 | 2.81 | 4.39 | 3.66 | 3.01 | 0.86 | 4.48 | 5.79 | 5.15 | 1.87 | 4.17 | 4.52 | 3.06 | 2.32 | 5.39 | 5.12 | 0.52 | |
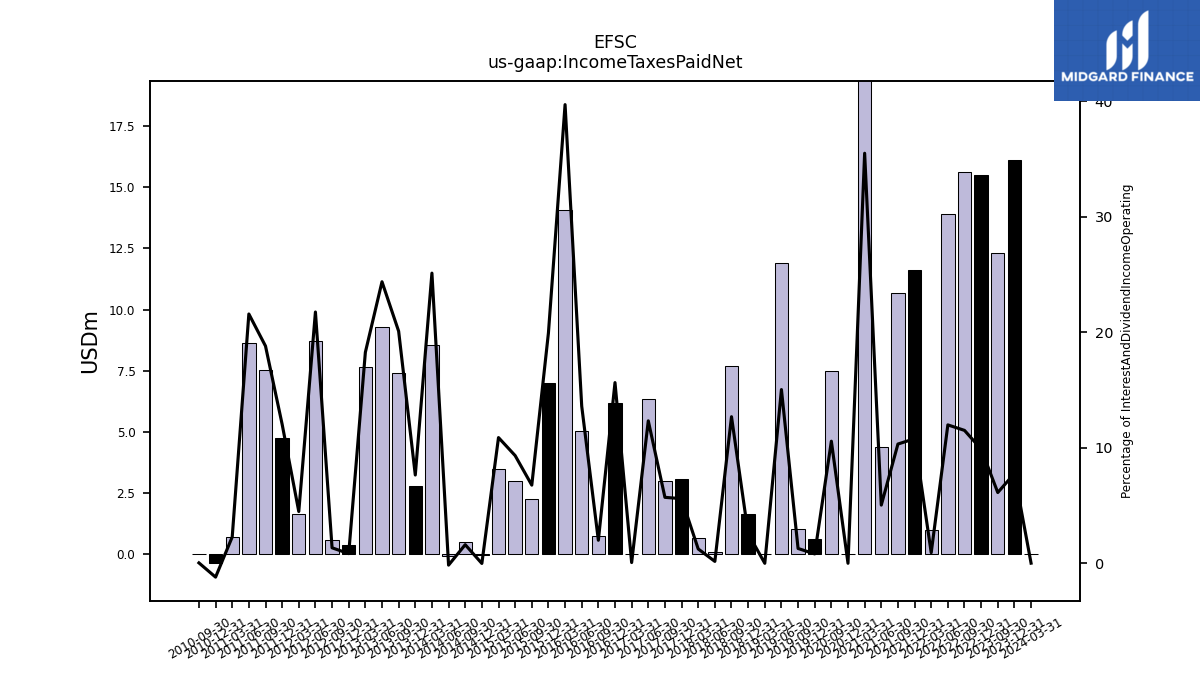
| Income Taxes Paid Net | 16.10 | 12.31 | NA | NA | 15.50 | 15.62 | 13.91 | 0.98 | 11.62 | 10.66 | 4.40 | 30.17 | 0.00 | 7.48 | NA | NA | 0.63 | 1.04 | 11.91 | 0.00 | 1.64 | 7.71 | 0.10 | 0.69 | 3.07 | 3.00 | 6.36 | 0.03 | 6.17 | 0.74 | 5.04 | 14.08 | 7.00 | 2.25 | 3.02 | 3.50 | -0.01 | 0.50 | -0.05 | 8.55 | 2.79 | 7.41 | 9.28 | 7.66 | 0.38 | 0.57 | 8.71 | 1.67 | 4.75 | 7.53 | 8.64 | -0.36 | |
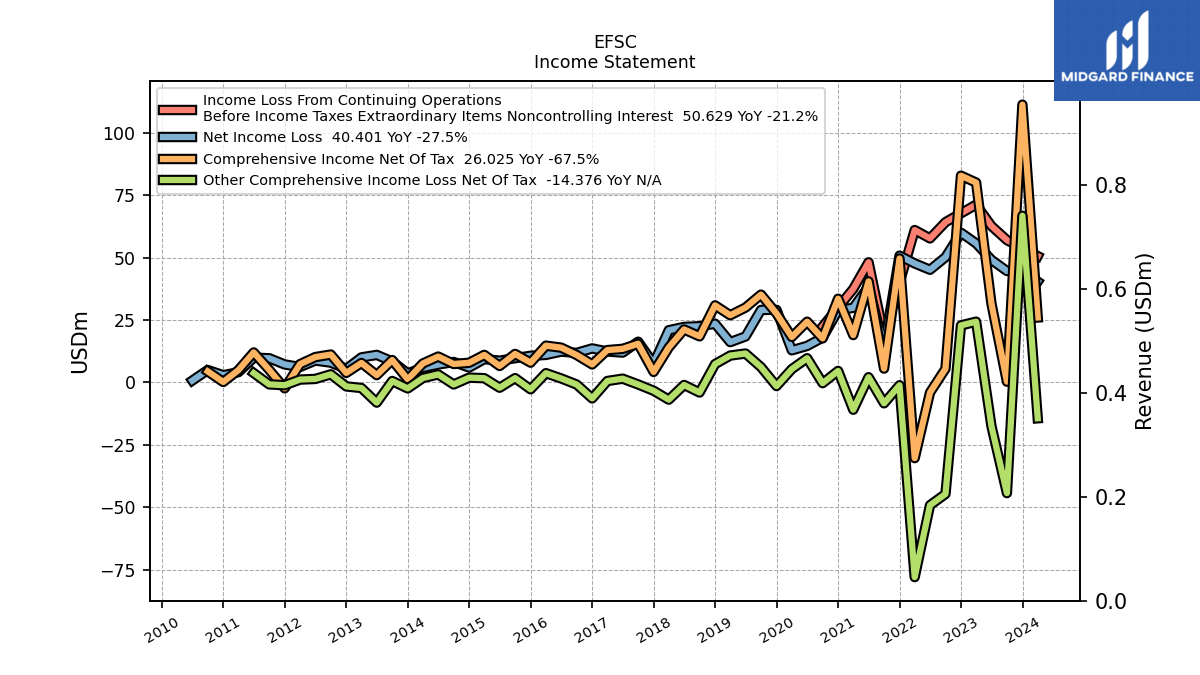
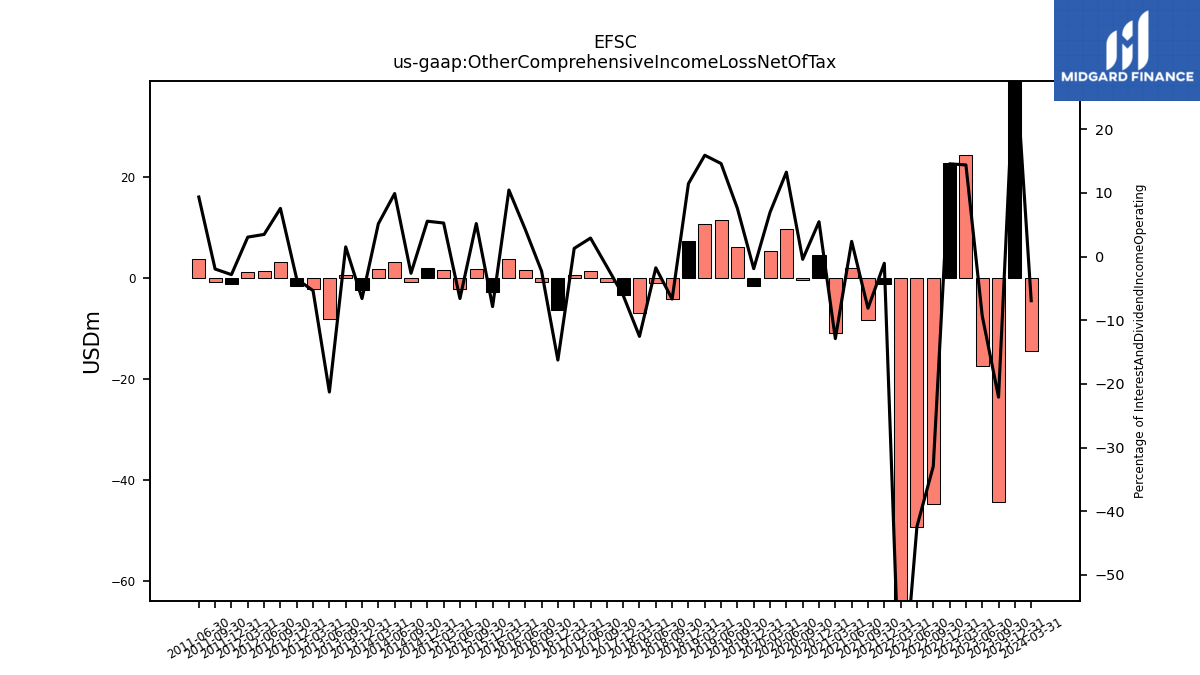
| Other Comprehensive Income Loss Net Of Tax | 66.81 | -44.36 | -17.49 | 24.36 | 22.86 | -44.71 | -49.22 | -78.04 | -1.12 | -8.37 | 2.10 | -10.94 | 4.61 | -0.30 | 9.71 | 5.35 | -1.46 | 6.14 | 11.58 | 10.77 | 7.34 | -4.05 | -1.02 | -6.91 | -3.33 | -0.82 | 1.50 | 0.57 | -6.41 | -0.85 | 1.59 | 3.71 | -2.75 | 1.72 | -2.13 | 1.70 | 1.91 | -0.81 | 3.20 | 1.76 | -2.40 | 0.57 | -8.10 | -2.24 | -1.60 | 3.25 | 1.40 | 1.14 | -1.12 | -0.78 | 3.75 | NA | |
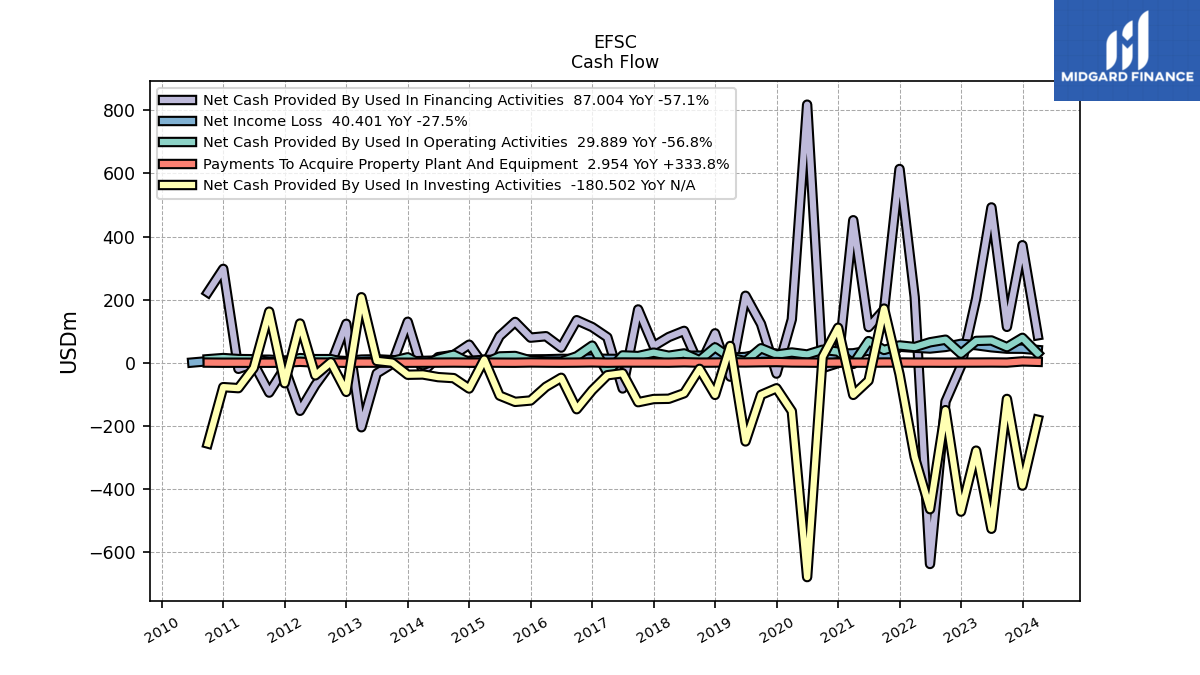
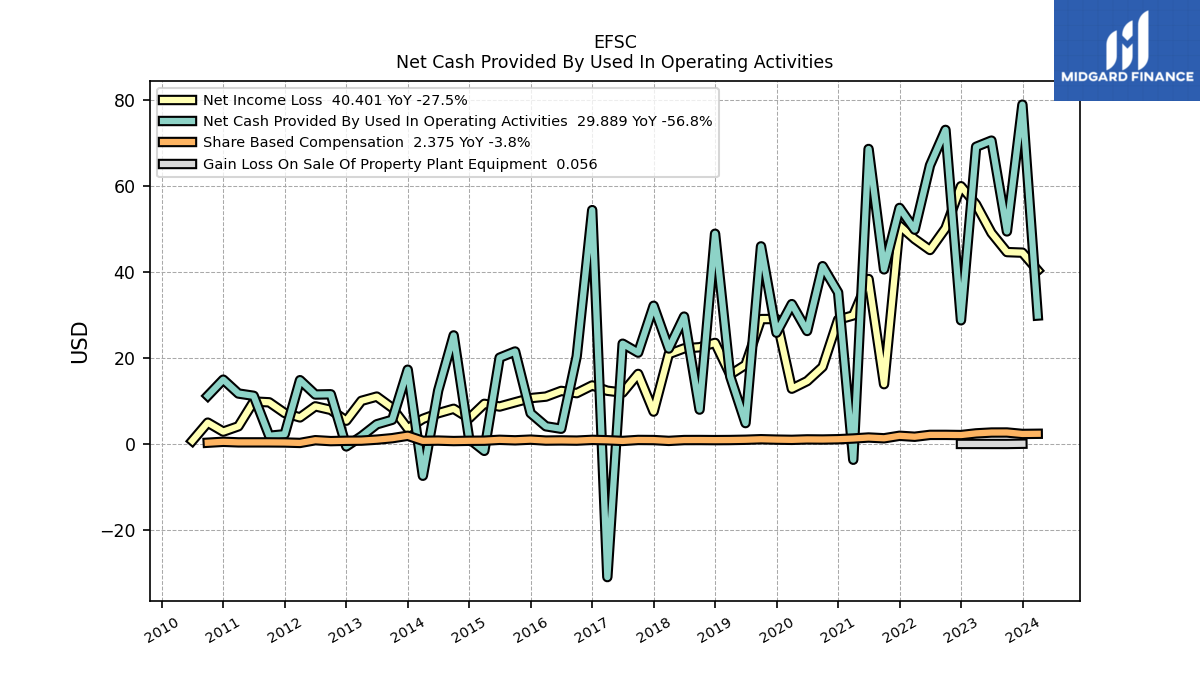
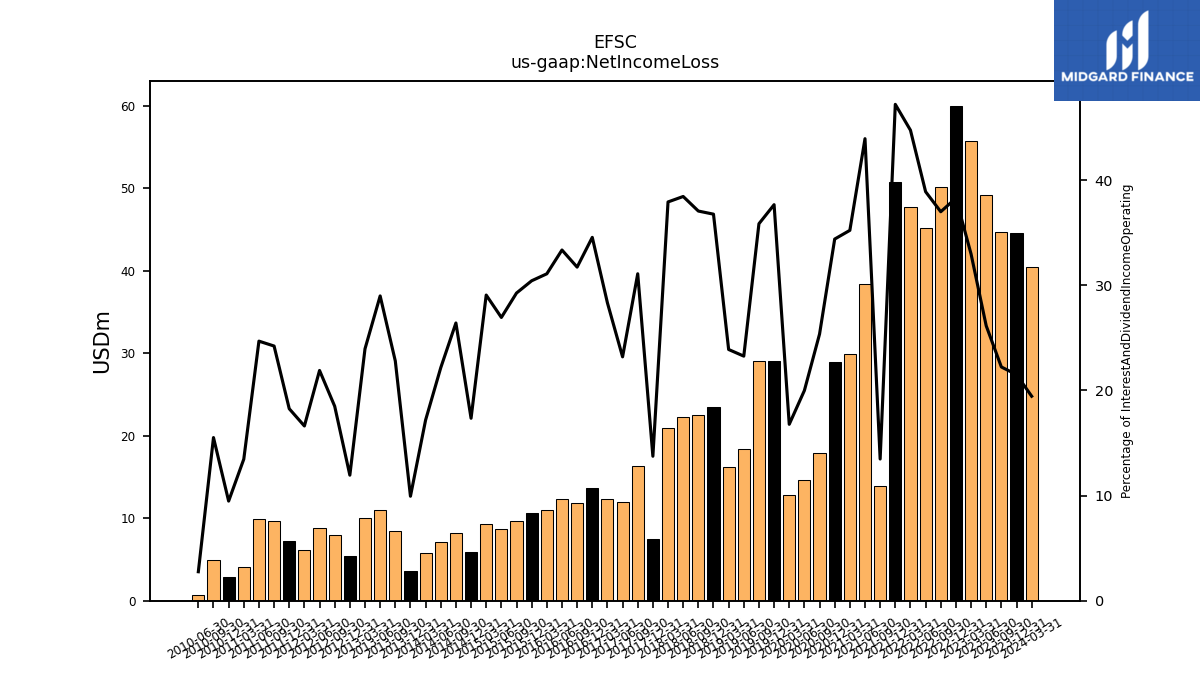
| Net Income Loss | 44.53 | 44.66 | 49.13 | 55.74 | 60.00 | 50.20 | 45.15 | 47.69 | 50.81 | 13.91 | 38.41 | 29.93 | 28.93 | 17.95 | 14.63 | 12.87 | 29.09 | 29.07 | 18.42 | 16.16 | 23.53 | 22.52 | 22.25 | 20.92 | 7.53 | 16.32 | 11.96 | 12.39 | 13.63 | 11.83 | 12.35 | 11.03 | 10.68 | 9.71 | 8.72 | 9.35 | 5.97 | 8.20 | 7.16 | 5.85 | 3.62 | 8.41 | 11.03 | 10.04 | 5.42 | 7.93 | 8.77 | 6.18 | 7.21 | 9.70 | 9.88 | 2.88 | |
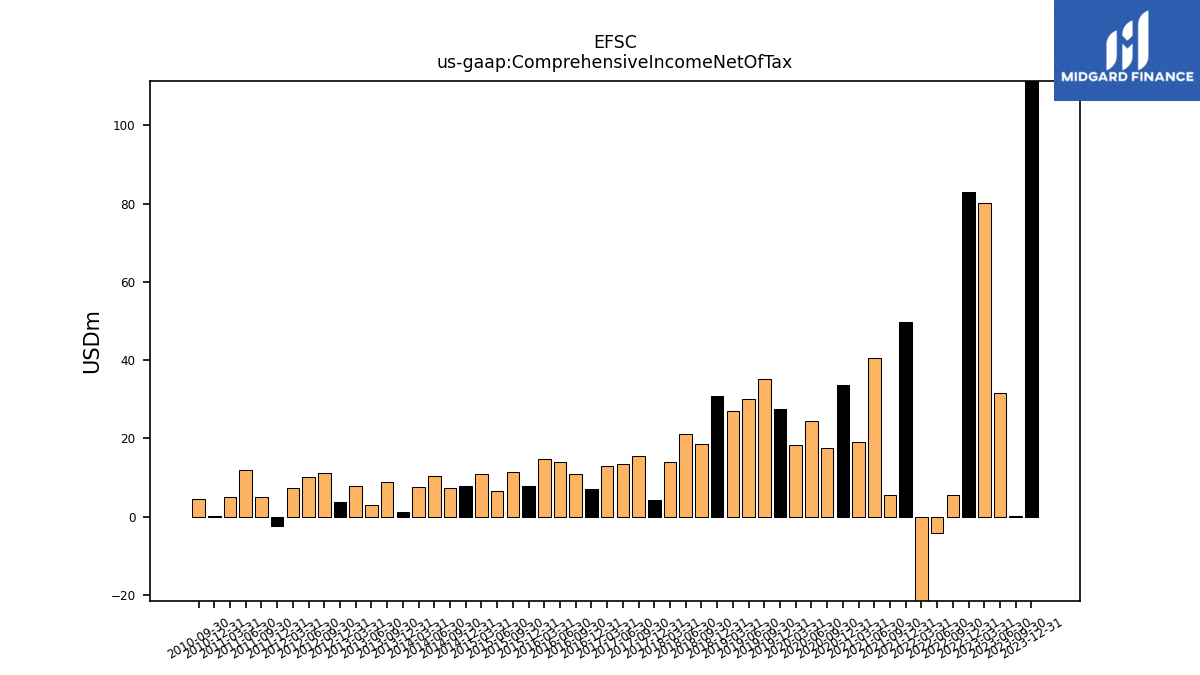
| Comprehensive Income Net Of Tax | 111.34 | 0.30 | 31.64 | 80.09 | 82.86 | 5.49 | -4.07 | -30.34 | 49.69 | 5.54 | 40.50 | 18.98 | 33.54 | 17.65 | 24.35 | 18.22 | 27.63 | 35.21 | 30.01 | 26.93 | 30.87 | 18.47 | 21.23 | 14.01 | 4.20 | 15.50 | 13.46 | 12.96 | 7.22 | 10.98 | 13.94 | 14.74 | 7.92 | 11.43 | 6.59 | 11.04 | 7.88 | 7.39 | 10.36 | 7.61 | 1.22 | 8.98 | 2.94 | 7.80 | 3.82 | 11.18 | 10.16 | 7.33 | -2.35 | 5.05 | 12.02 | 0.17 | |
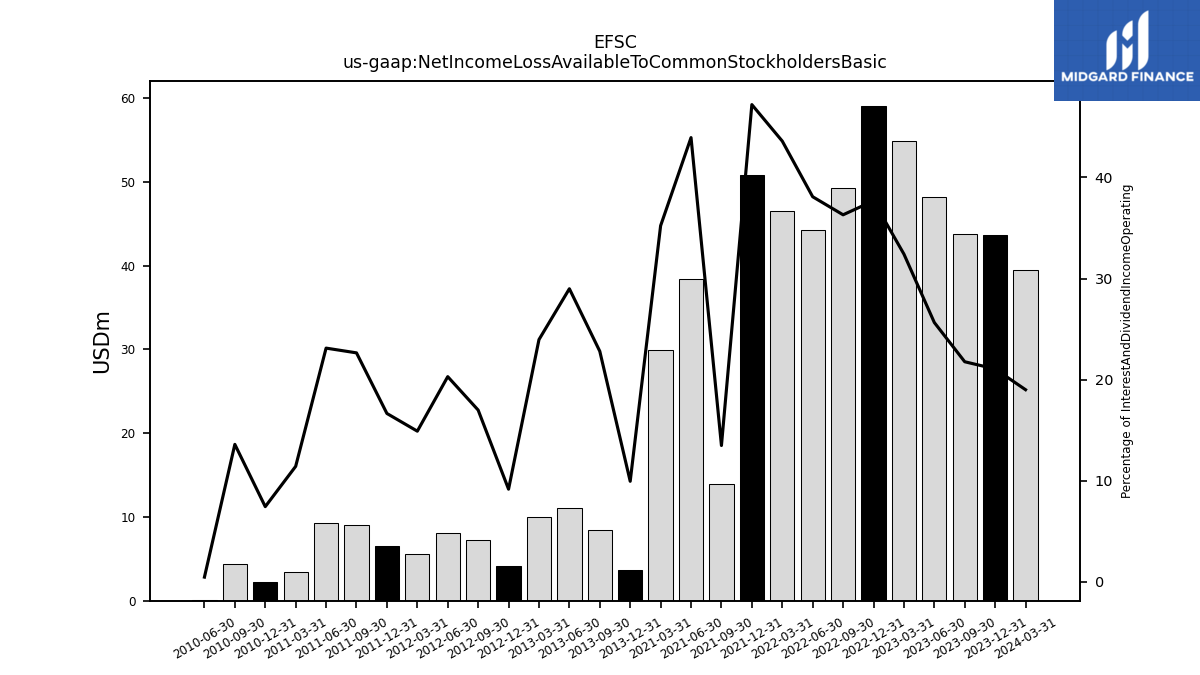
| Net Income Loss Available To Common Stockholders Basic | 43.59 | 43.73 | 48.19 | 54.80 | 59.06 | 49.26 | 44.21 | 46.46 | 50.81 | 13.91 | 38.41 | 29.93 | NA | NA | NA | NA | NA | NA | NA | NA | NA | NA | NA | NA | NA | NA | NA | NA | NA | NA | NA | NA | NA | NA | NA | NA | NA | NA | NA | NA | 3.62 | 8.41 | 11.03 | 10.04 | 4.15 | 7.28 | 8.12 | 5.54 | 6.57 | 9.07 | 9.25 | 2.26 | |
| Interest Income Expense After Provision For Loan Loss | 122.68 | 133.61 | 134.35 | 135.35 | 136.71 | 123.61 | 108.95 | 105.23 | 105.72 | 77.61 | 84.41 | 79.08 | 67.98 | 49.27 | 46.24 | 41.10 | 60.27 | 61.21 | 59.99 | 50.87 | 48.47 | 45.83 | 46.66 | 44.30 | 44.50 | 43.20 | 42.22 | 37.26 | 34.83 | 31.99 | 33.40 | 31.67 | 32.45 | 29.63 | 27.13 | 30.73 | 28.72 | 29.25 | 27.86 | 26.04 | 27.73 | 30.41 | 39.88 | 32.79 | 33.48 | 25.55 | 33.85 | 26.63 | 32.35 | 26.84 | 27.90 | 19.14 | |
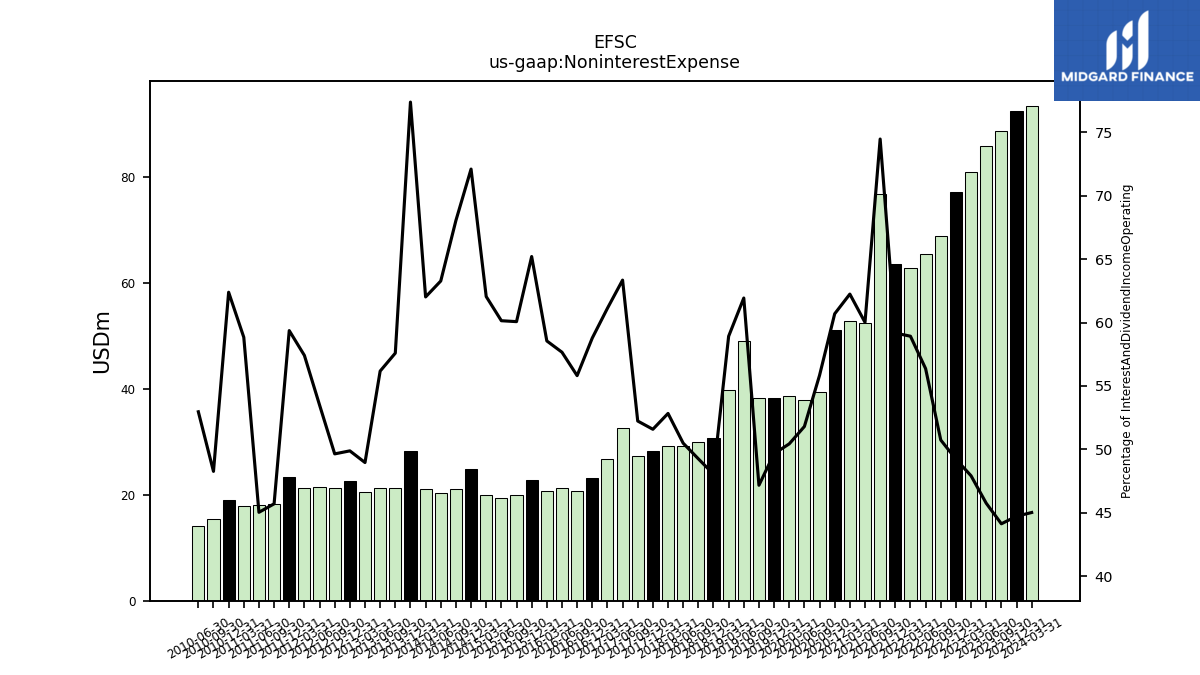
| Noninterest Expense | 92.60 | 88.64 | 85.96 | 80.98 | 77.15 | 68.84 | 65.42 | 62.80 | 63.69 | 76.89 | 52.46 | 52.88 | 51.05 | 39.52 | 37.91 | 38.67 | 38.35 | 38.24 | 49.05 | 39.84 | 30.75 | 29.92 | 29.22 | 29.14 | 28.26 | 27.40 | 32.65 | 26.74 | 23.18 | 20.81 | 21.35 | 20.76 | 22.89 | 19.93 | 19.46 | 19.95 | 24.80 | 21.12 | 20.45 | 21.10 | 28.20 | 21.24 | 21.38 | 20.52 | 22.62 | 21.28 | 21.41 | 21.36 | 23.43 | 18.30 | 18.02 | 18.95 | |
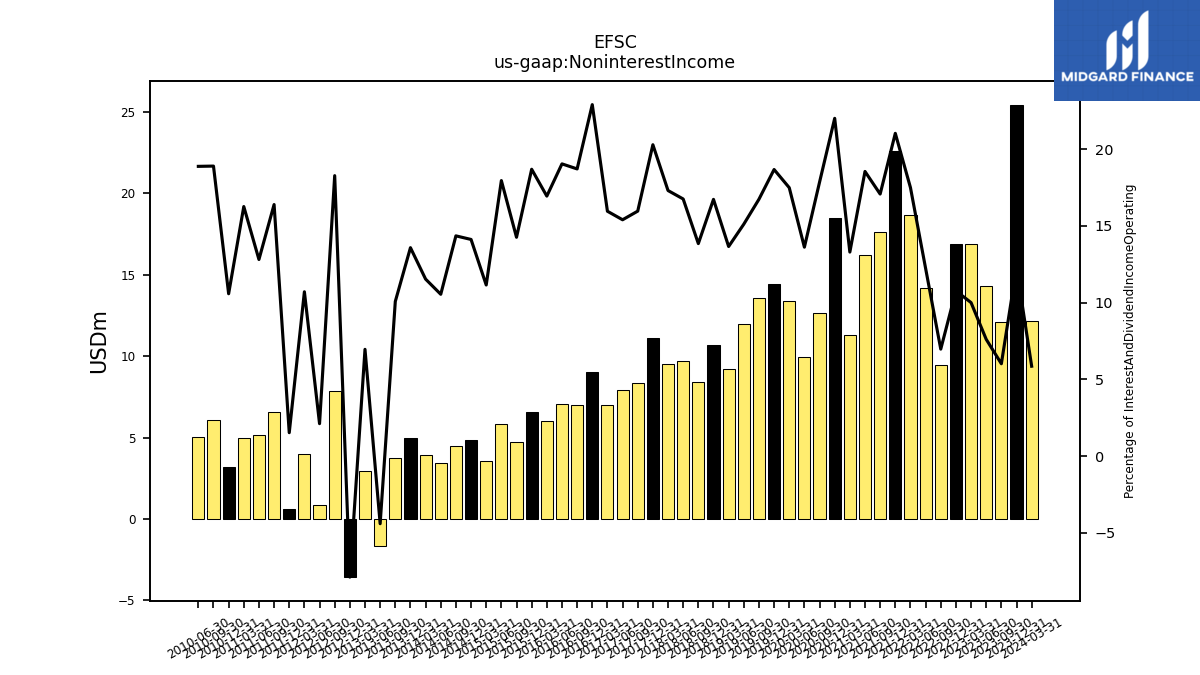
| Noninterest Income | 25.45 | 12.09 | 14.29 | 16.90 | 16.87 | 9.45 | 14.19 | 18.64 | 22.63 | 17.62 | 16.20 | 11.29 | 18.51 | 12.63 | 9.96 | 13.41 | 14.42 | 13.56 | 11.96 | 9.23 | 10.70 | 8.41 | 9.69 | 9.54 | 11.11 | 8.37 | 7.93 | 6.98 | 9.03 | 6.98 | 7.05 | 6.00 | 6.56 | 4.73 | 5.81 | 3.58 | 4.85 | 4.45 | 3.40 | 3.92 | 4.95 | 3.72 | -1.68 | 2.91 | -3.58 | 7.83 | 0.84 | 3.98 | 0.60 | 6.56 | 5.13 | 3.21 |
| 2023-12-31 | 2023-09-30 | 2023-06-30 | 2023-03-31 | 2022-12-31 | 2022-09-30 | 2022-06-30 | 2022-03-31 | 2021-12-31 | 2021-09-30 | 2021-06-30 | 2021-03-31 | 2020-12-31 | 2020-09-30 | 2020-06-30 | 2020-03-31 | 2019-12-31 | 2019-09-30 | 2019-06-30 | 2019-03-31 | 2018-12-31 | 2018-09-30 | 2018-06-30 | 2018-03-31 | 2017-12-31 | 2017-09-30 | 2017-06-30 | 2017-03-31 | 2016-12-31 | 2016-09-30 | 2016-06-30 | 2016-03-31 | 2015-12-31 | 2015-09-30 | 2015-06-30 | 2015-03-31 | 2014-12-31 | 2014-09-30 | 2014-06-30 | 2014-03-31 | 2013-12-31 | 2013-09-30 | 2013-06-30 | 2013-03-31 | 2012-12-31 | 2012-09-30 | 2012-06-30 | 2012-03-31 | 2011-12-31 | 2011-09-30 | 2011-06-30 | 2010-12-31 | ||
|---|---|---|---|---|---|---|---|---|---|---|---|---|---|---|---|---|---|---|---|---|---|---|---|---|---|---|---|---|---|---|---|---|---|---|---|---|---|---|---|---|---|---|---|---|---|---|---|---|---|---|---|---|---|
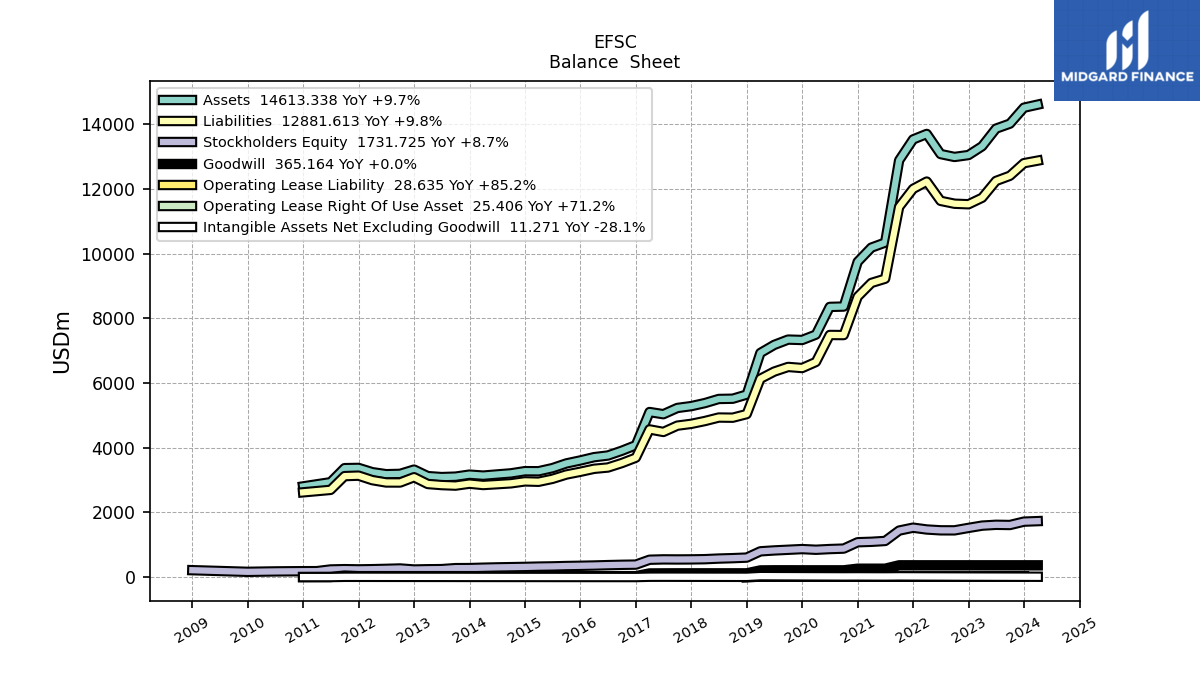
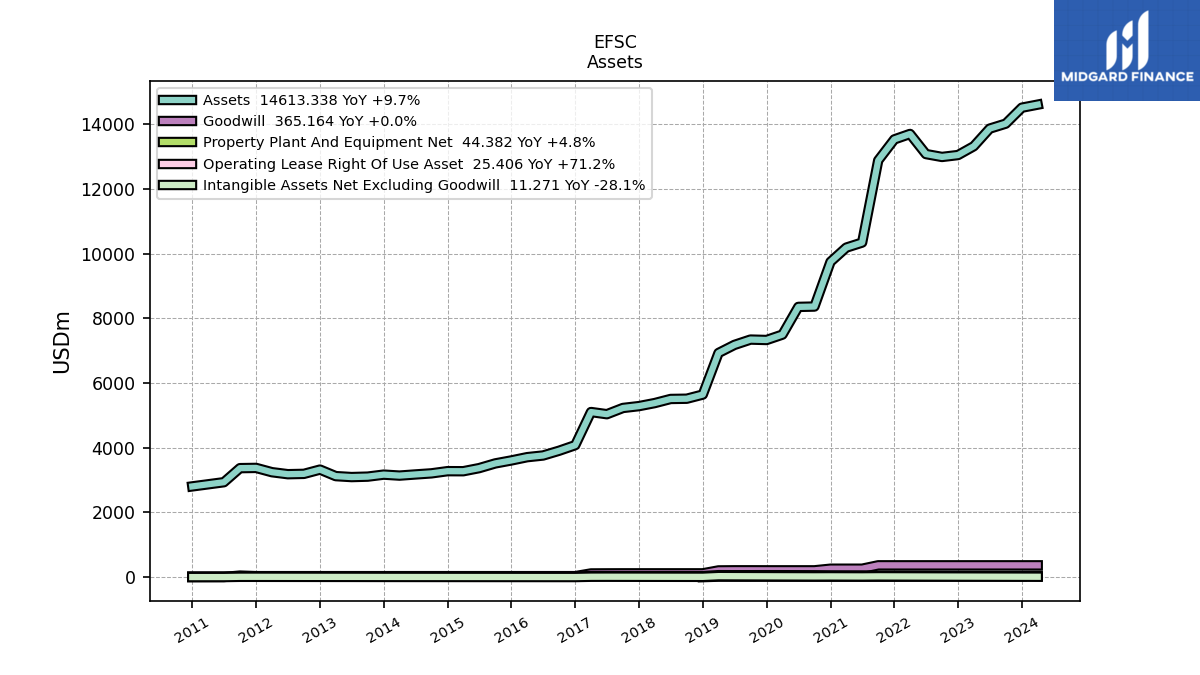
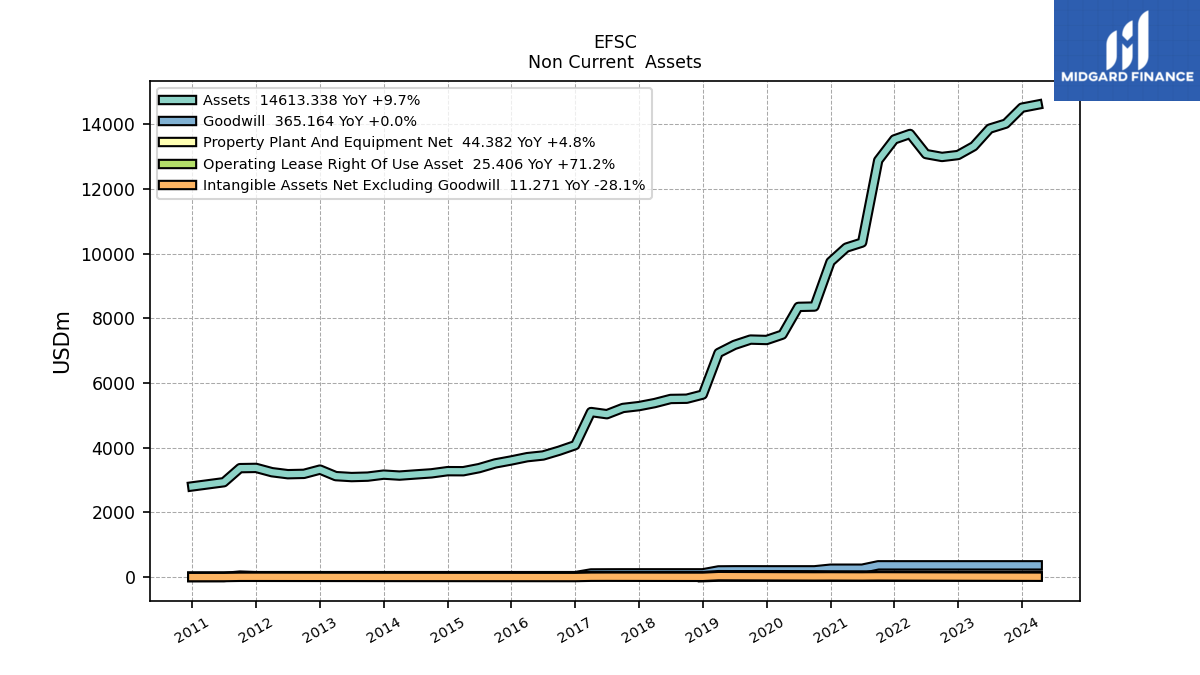
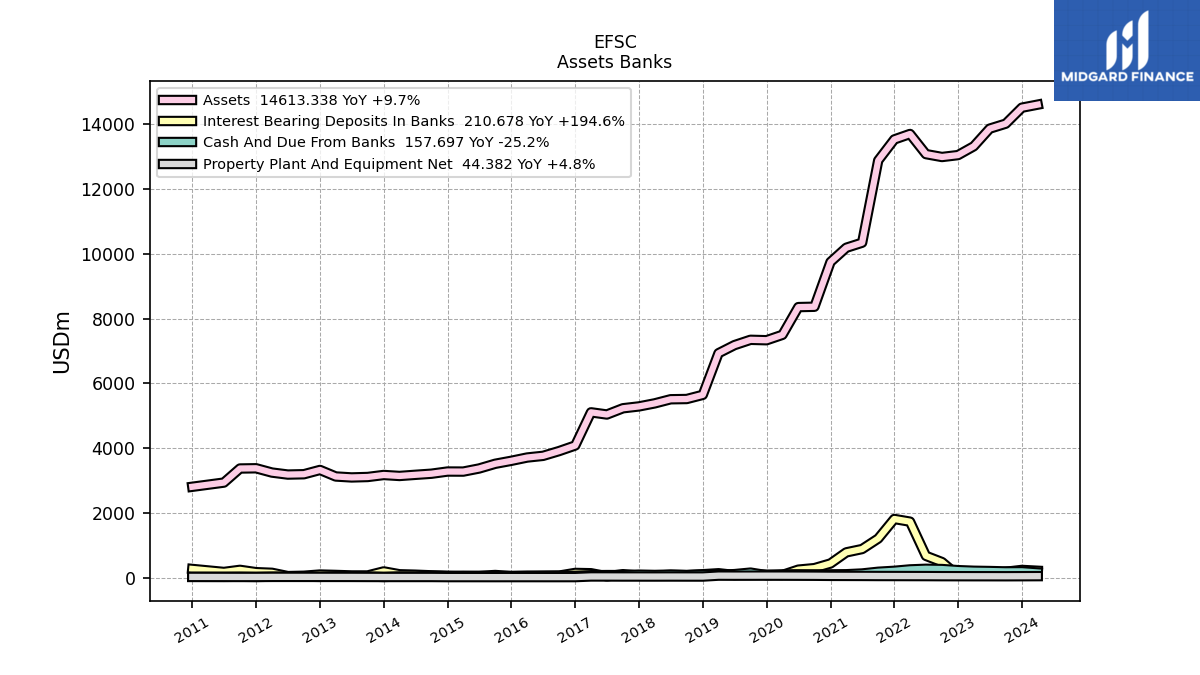
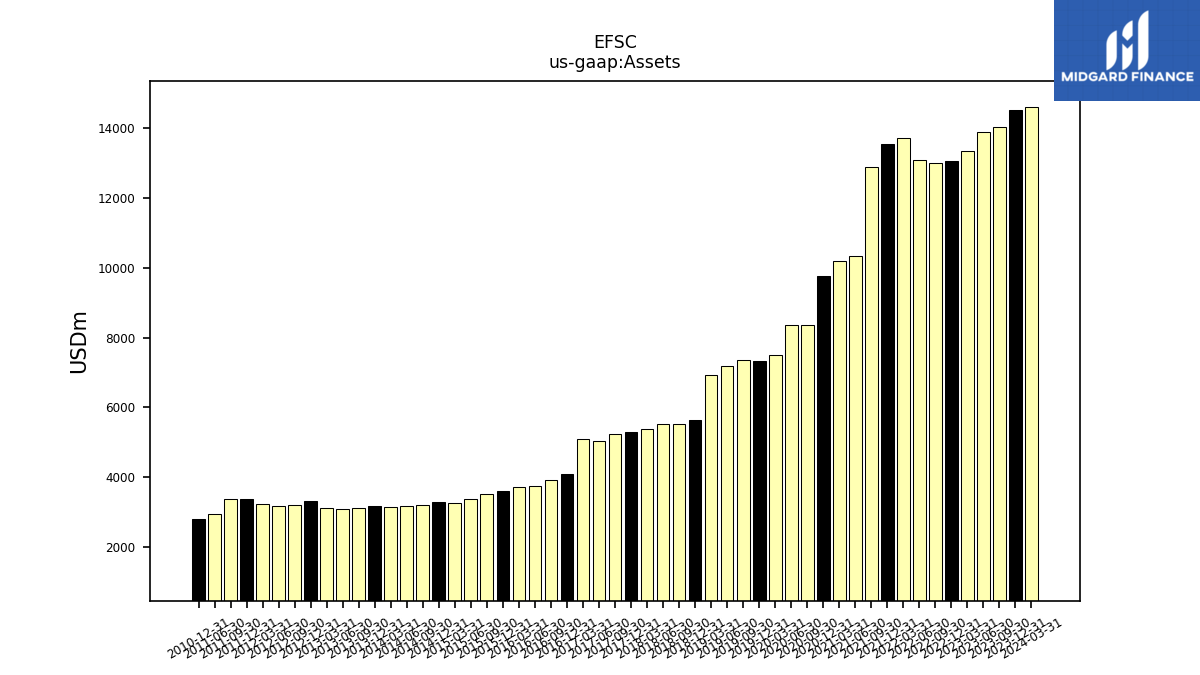
| Assets | 14518.59 | 14025.04 | 13871.15 | 13325.98 | 13054.17 | 12994.79 | 13084.51 | 13706.77 | 13537.36 | 12888.02 | 10346.99 | 10190.70 | 9751.57 | 8367.98 | 8357.50 | 7500.64 | 7333.79 | 7346.79 | 7181.85 | 6932.76 | 5645.66 | 5517.54 | 5509.92 | 5383.10 | 5289.23 | 5231.49 | 5038.70 | 5106.23 | 4081.33 | 3909.64 | 3761.66 | 3709.91 | 3608.48 | 3516.54 | 3371.08 | 3275.30 | 3277.00 | 3209.59 | 3175.44 | 3139.95 | 3170.20 | 3108.06 | 3094.42 | 3123.93 | 3325.79 | 3193.69 | 3183.13 | 3245.15 | 3377.78 | 3370.47 | 2935.43 | 2805.84 | |
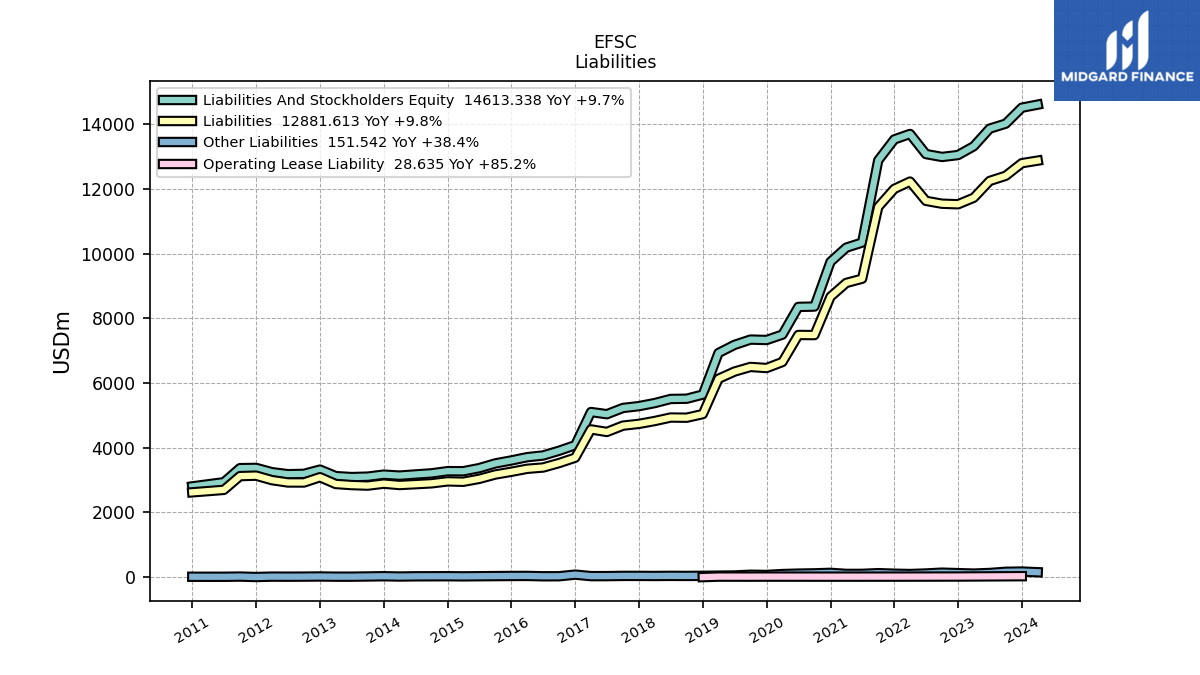
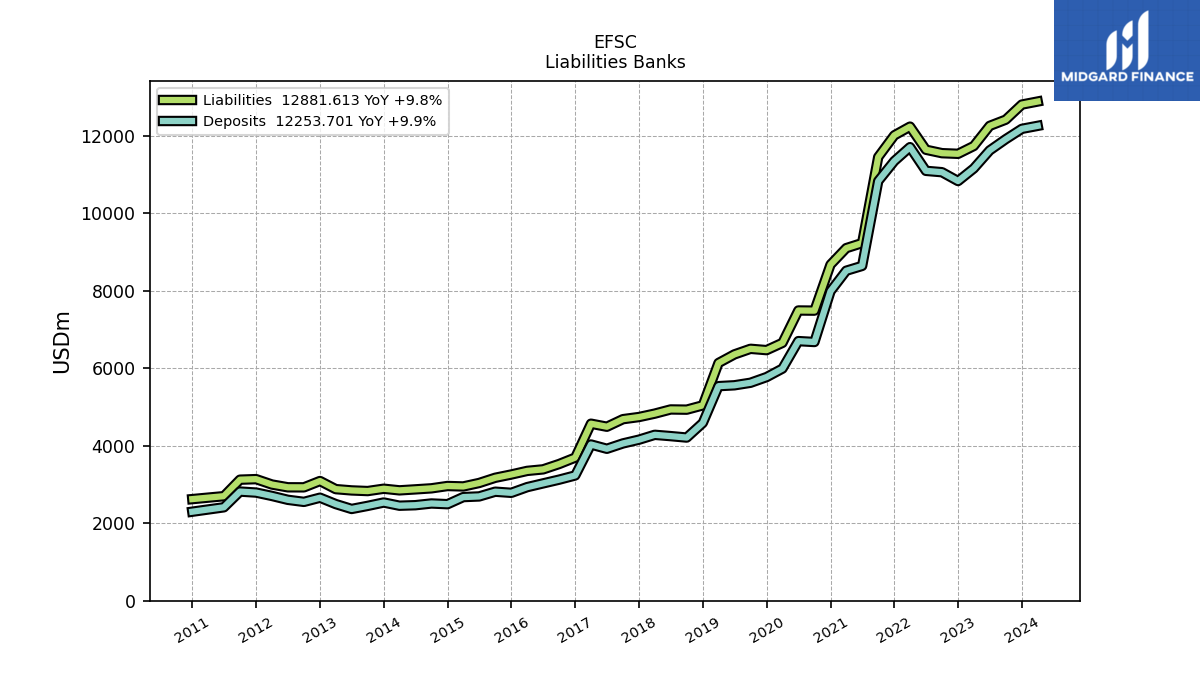
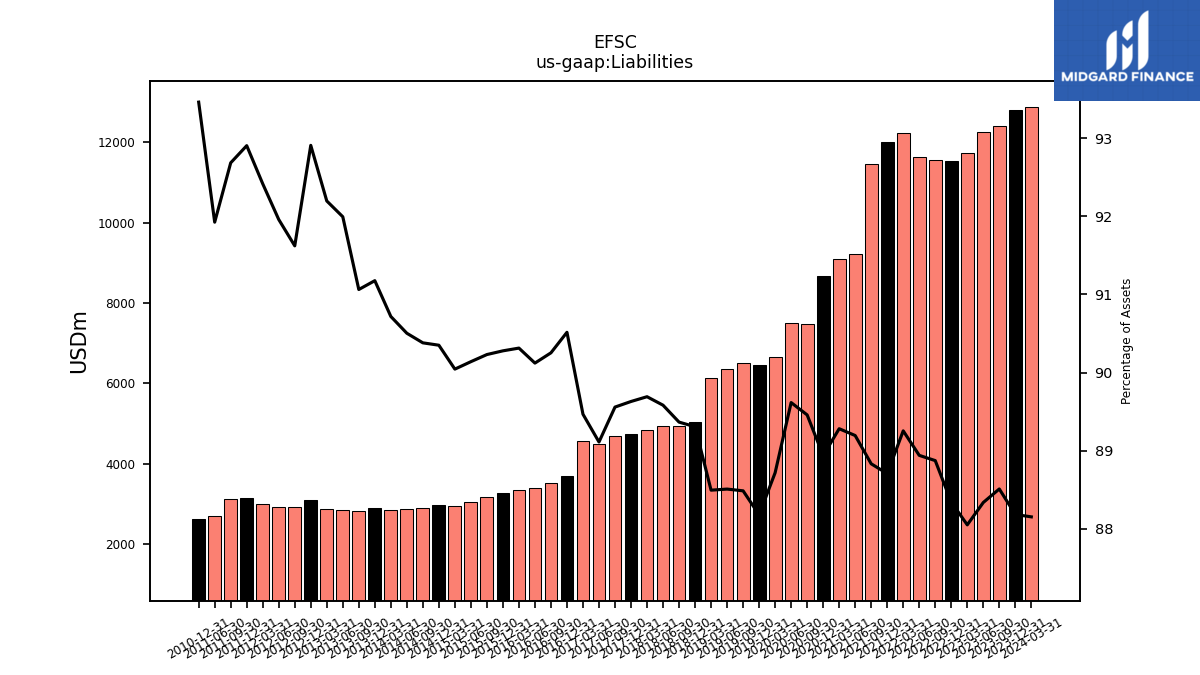
| Liabilities | 12802.52 | 12413.16 | 12252.92 | 11733.16 | 11531.91 | 11548.57 | 11637.09 | 12233.59 | 12008.24 | 11448.38 | 9228.69 | 9098.20 | 8672.60 | 7485.71 | 7489.54 | 6654.21 | 6466.61 | 6500.70 | 6356.35 | 6134.92 | 5041.86 | 4930.70 | 4935.84 | 4828.09 | 4740.65 | 4685.15 | 4489.94 | 4568.31 | 3694.23 | 3528.55 | 3390.04 | 3350.52 | 3257.65 | 3172.98 | 3038.65 | 2949.19 | 2960.76 | 2900.84 | 2873.88 | 2848.50 | 2890.49 | 2830.32 | 2846.74 | 2880.22 | 3090.04 | 2926.18 | 2927.25 | 2999.14 | 3138.21 | 3124.00 | 2698.45 | 2622.49 | |
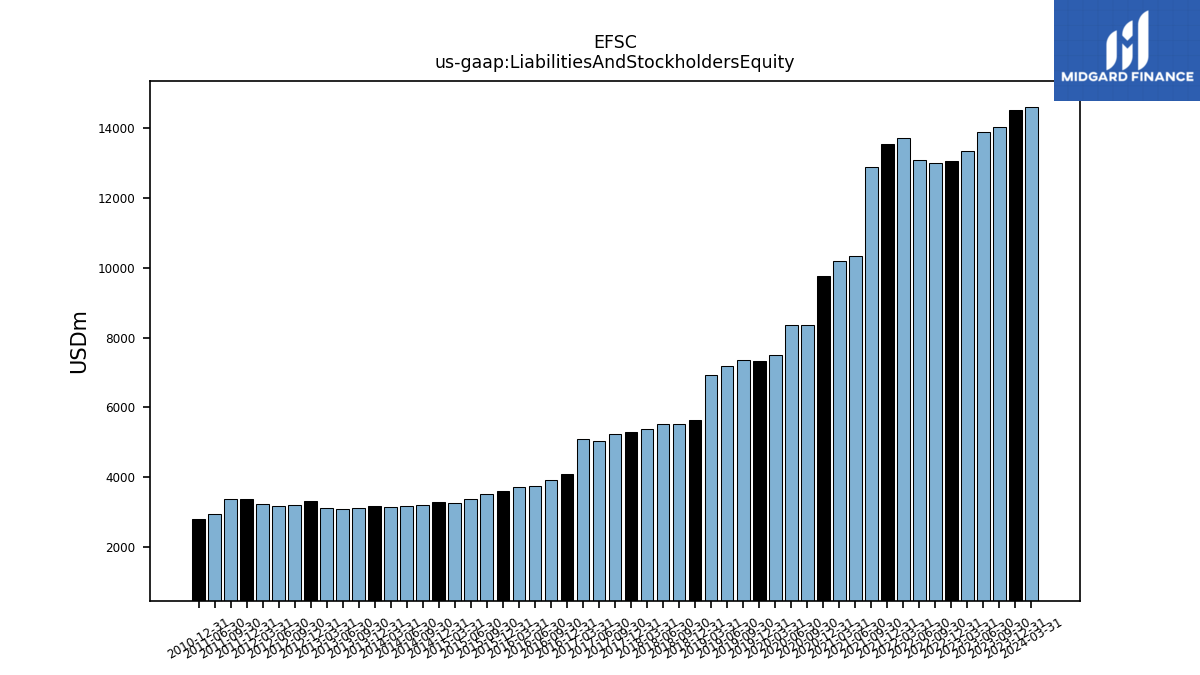
| Liabilities And Stockholders Equity | 14518.59 | 14025.04 | 13871.15 | 13325.98 | 13054.17 | 12994.79 | 13084.51 | 13706.77 | 13537.36 | 12888.02 | 10346.99 | 10190.70 | 9751.57 | 8367.98 | 8357.50 | 7500.64 | 7333.79 | 7346.79 | 7181.85 | 6932.76 | 5645.66 | 5517.54 | 5509.92 | 5383.10 | 5289.23 | 5231.49 | 5038.70 | 5106.23 | 4081.33 | 3909.64 | 3761.66 | 3709.91 | 3608.48 | 3516.54 | 3371.08 | 3275.30 | 3277.00 | 3209.59 | 3175.44 | 3139.95 | 3170.20 | 3108.06 | 3094.42 | 3123.93 | 3325.79 | 3193.69 | 3183.13 | 3245.15 | 3377.78 | 3370.47 | 2935.43 | 2805.84 | |
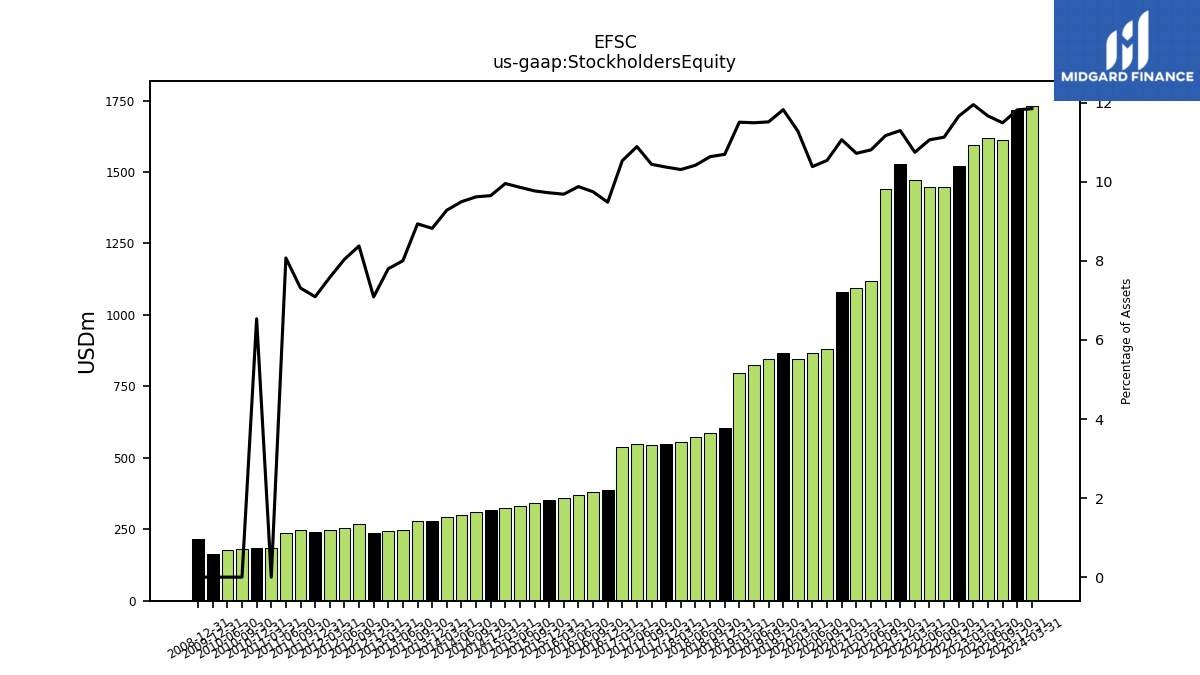
| Stockholders Equity | 1716.07 | 1611.88 | 1618.23 | 1592.82 | 1522.26 | 1446.22 | 1447.41 | 1473.18 | 1529.12 | 1439.63 | 1118.30 | 1092.50 | 1078.97 | 882.27 | 867.96 | 846.44 | 867.18 | 846.10 | 825.50 | 797.84 | 603.80 | 586.84 | 574.08 | 555.01 | 548.57 | 546.34 | 548.75 | 537.92 | 387.10 | 381.10 | 371.63 | 359.38 | 350.83 | 343.56 | 332.43 | 326.11 | 316.24 | 308.75 | 301.56 | 291.45 | 279.70 | 277.74 | 247.68 | 243.70 | 235.75 | 267.52 | 255.89 | 246.02 | 239.56 | 246.46 | 236.98 | 183.35 |
| 2023-12-31 | 2023-09-30 | 2023-06-30 | 2023-03-31 | 2022-12-31 | 2022-09-30 | 2022-06-30 | 2022-03-31 | 2021-12-31 | 2021-09-30 | 2021-06-30 | 2021-03-31 | 2020-12-31 | 2020-09-30 | 2020-06-30 | 2020-03-31 | 2019-12-31 | 2019-09-30 | 2019-06-30 | 2019-03-31 | 2018-12-31 | 2018-09-30 | 2018-06-30 | 2018-03-31 | 2017-12-31 | 2017-09-30 | 2017-06-30 | 2017-03-31 | 2016-12-31 | 2016-09-30 | 2016-06-30 | 2016-03-31 | 2015-12-31 | 2015-09-30 | 2015-06-30 | 2015-03-31 | 2014-12-31 | 2014-09-30 | 2014-06-30 | 2014-03-31 | 2013-12-31 | 2013-09-30 | 2013-06-30 | 2013-03-31 | 2012-12-31 | 2012-09-30 | 2012-06-30 | 2012-03-31 | 2011-12-31 | 2011-09-30 | 2011-06-30 | 2010-12-31 | ||
|---|---|---|---|---|---|---|---|---|---|---|---|---|---|---|---|---|---|---|---|---|---|---|---|---|---|---|---|---|---|---|---|---|---|---|---|---|---|---|---|---|---|---|---|---|---|---|---|---|---|---|---|---|---|
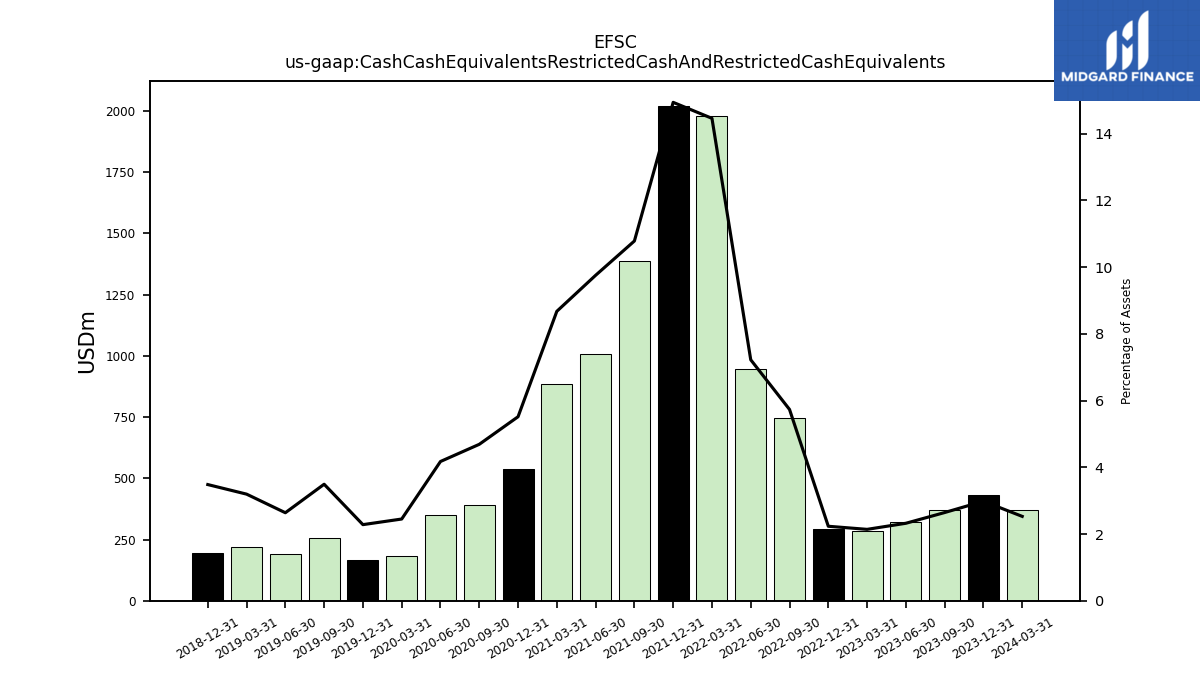
| Cash Cash Equivalents Restricted Cash And Restricted Cash Equivalents | 433.03 | 370.70 | 322.02 | 285.08 | 291.36 | 744.88 | 944.80 | 1981.32 | 2021.69 | 1389.29 | 1008.99 | 883.82 | 537.70 | 392.21 | 348.73 | 183.68 | 167.26 | 256.50 | 189.40 | 221.48 | 196.55 | NA | NA | NA | NA | NA | NA | NA | NA | NA | NA | NA | NA | NA | NA | NA | NA | NA | NA | NA | NA | NA | NA | NA | NA | NA | NA | NA | NA | NA | NA | NA | |
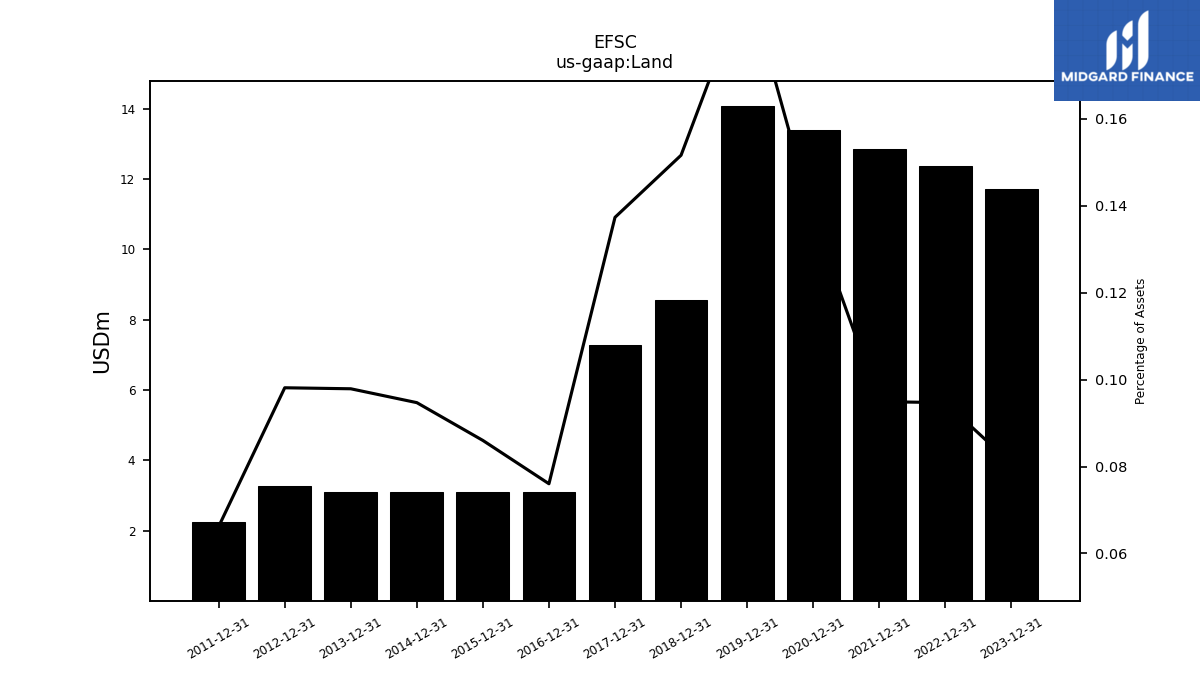
| Land | 11.72 | NA | NA | NA | 12.36 | NA | NA | NA | 12.85 | NA | NA | NA | 13.39 | NA | NA | NA | 14.08 | NA | NA | NA | 8.56 | NA | NA | NA | 7.26 | NA | NA | NA | 3.10 | NA | NA | NA | 3.10 | NA | NA | NA | 3.10 | NA | NA | NA | 3.10 | NA | NA | NA | 3.26 | NA | NA | NA | 2.24 | NA | NA | NA |
| 2023-12-31 | 2023-09-30 | 2023-06-30 | 2023-03-31 | 2022-12-31 | 2022-09-30 | 2022-06-30 | 2022-03-31 | 2021-12-31 | 2021-09-30 | 2021-06-30 | 2021-03-31 | 2020-12-31 | 2020-09-30 | 2020-06-30 | 2020-03-31 | 2019-12-31 | 2019-09-30 | 2019-06-30 | 2019-03-31 | 2018-12-31 | 2018-09-30 | 2018-06-30 | 2018-03-31 | 2017-12-31 | 2017-09-30 | 2017-06-30 | 2017-03-31 | 2016-12-31 | 2016-09-30 | 2016-06-30 | 2016-03-31 | 2015-12-31 | 2015-09-30 | 2015-06-30 | 2015-03-31 | 2014-12-31 | 2014-09-30 | 2014-06-30 | 2014-03-31 | 2013-12-31 | 2013-09-30 | 2013-06-30 | 2013-03-31 | 2012-12-31 | 2012-09-30 | 2012-06-30 | 2012-03-31 | 2011-12-31 | 2011-09-30 | 2011-06-30 | 2010-12-31 | ||
|---|---|---|---|---|---|---|---|---|---|---|---|---|---|---|---|---|---|---|---|---|---|---|---|---|---|---|---|---|---|---|---|---|---|---|---|---|---|---|---|---|---|---|---|---|---|---|---|---|---|---|---|---|---|
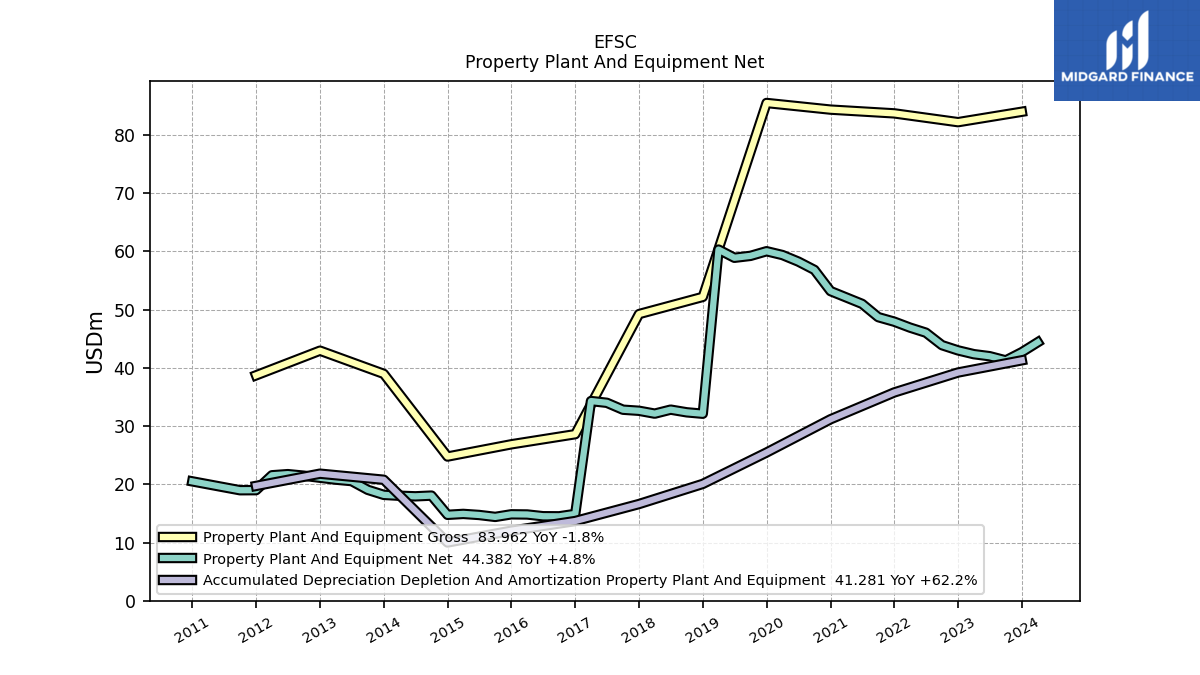
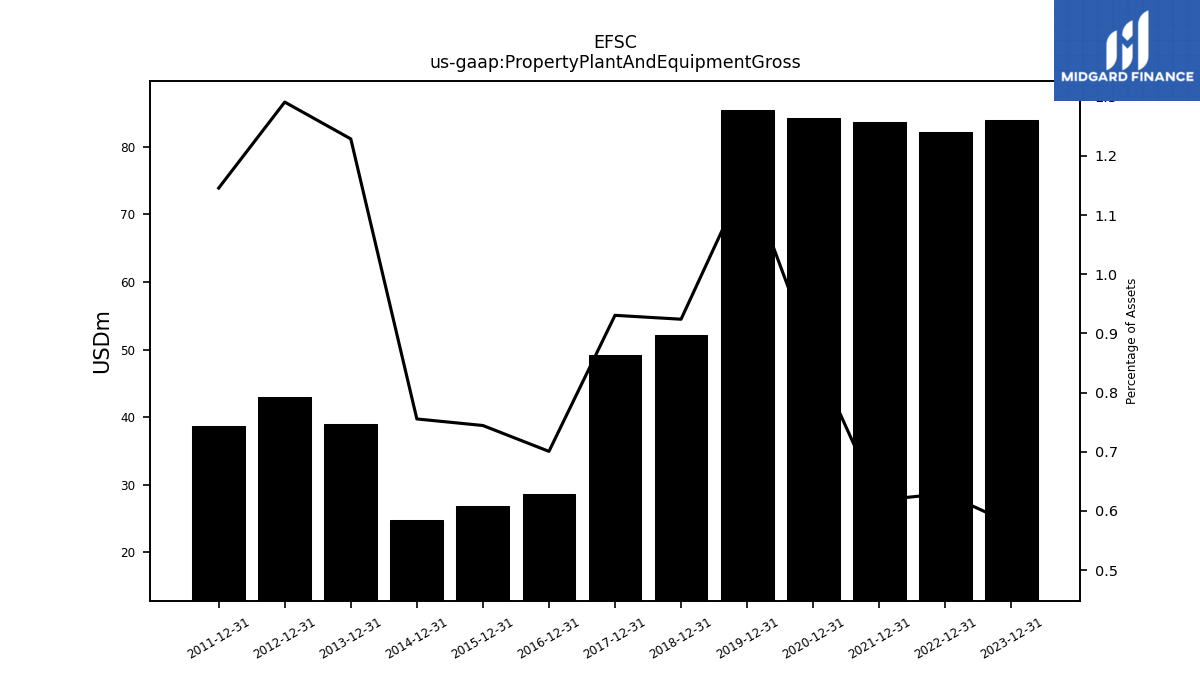
| Property Plant And Equipment Gross | 83.96 | NA | NA | NA | 82.17 | NA | NA | NA | 83.68 | NA | NA | NA | 84.33 | NA | NA | NA | 85.47 | NA | NA | NA | 52.17 | NA | NA | NA | 49.22 | NA | NA | NA | 28.60 | NA | NA | NA | 26.86 | NA | NA | NA | 24.76 | NA | NA | NA | 38.96 | NA | NA | NA | 42.94 | NA | NA | NA | 38.70 | NA | NA | NA | |
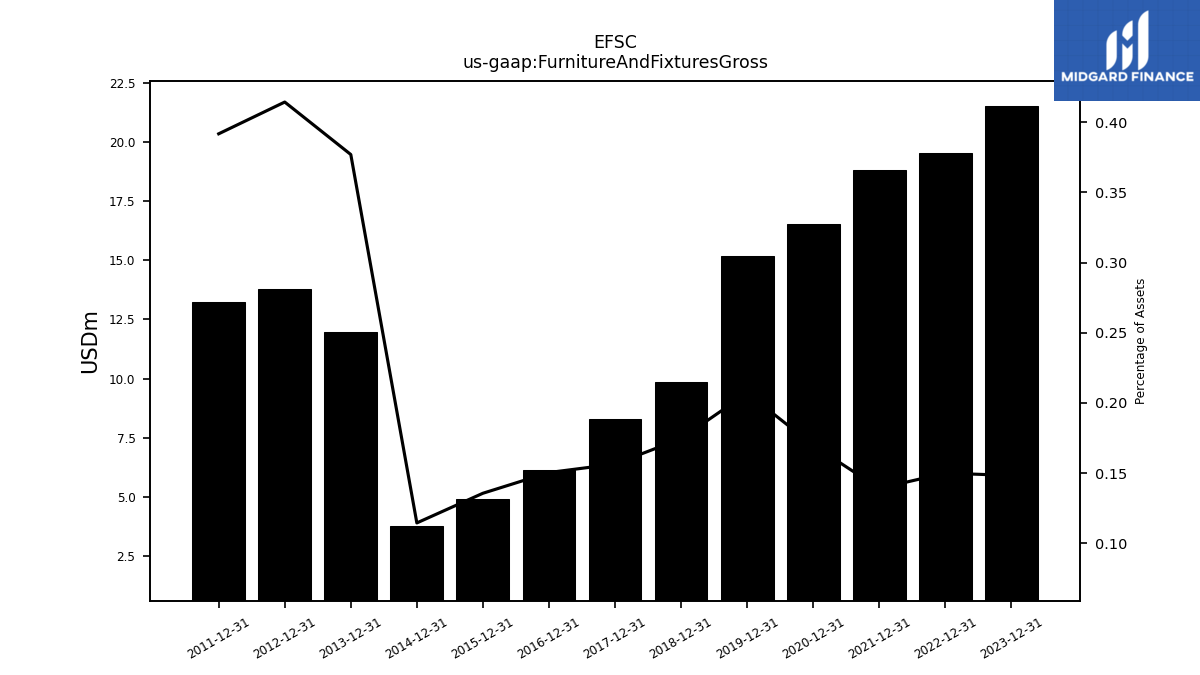
| Furniture And Fixtures Gross | 21.53 | NA | NA | NA | 19.57 | NA | NA | NA | 18.82 | NA | NA | NA | 16.56 | NA | NA | NA | 15.18 | NA | NA | NA | 9.85 | NA | NA | NA | 8.27 | NA | NA | NA | 6.14 | NA | NA | NA | 4.89 | NA | NA | NA | 3.75 | NA | NA | NA | 11.95 | NA | NA | NA | 13.78 | NA | NA | NA | 13.23 | NA | NA | NA | |
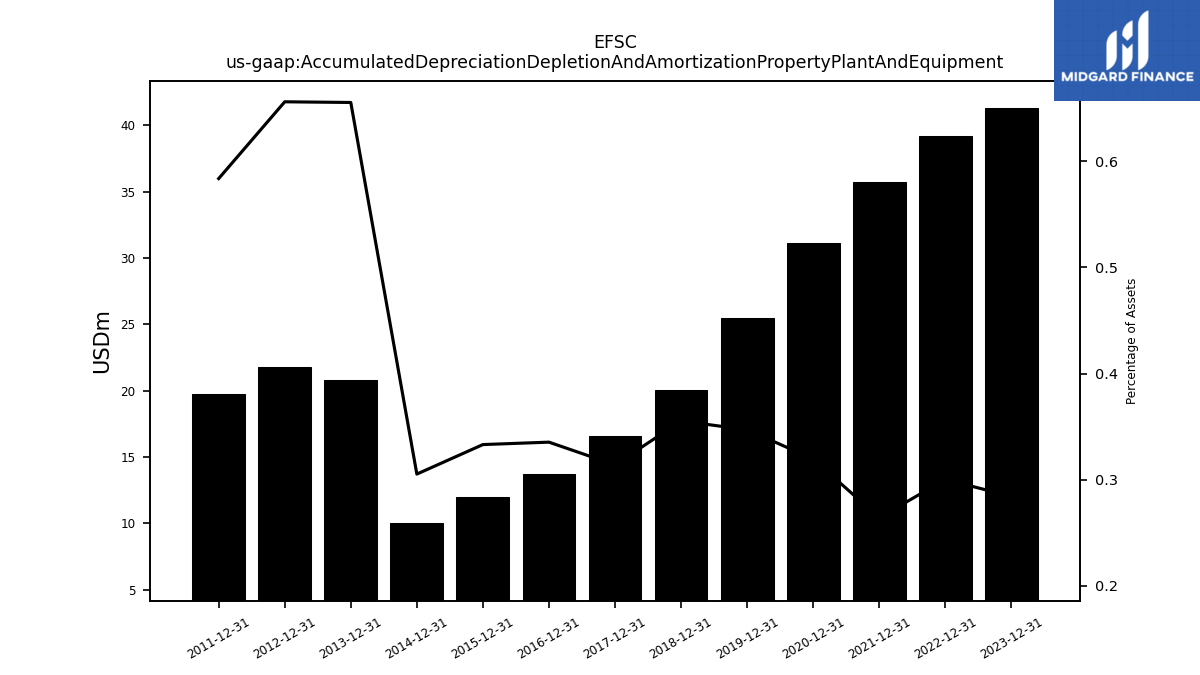
| Accumulated Depreciation Depletion And Amortization Property Plant And Equipment | 41.28 | NA | NA | NA | 39.19 | NA | NA | NA | 35.77 | NA | NA | NA | 31.16 | NA | NA | NA | 25.45 | NA | NA | NA | 20.06 | NA | NA | NA | 16.61 | NA | NA | NA | 13.69 | NA | NA | NA | 12.02 | NA | NA | NA | 10.01 | NA | NA | NA | 20.78 | NA | NA | NA | 21.82 | NA | NA | NA | 19.72 | NA | NA | NA | |
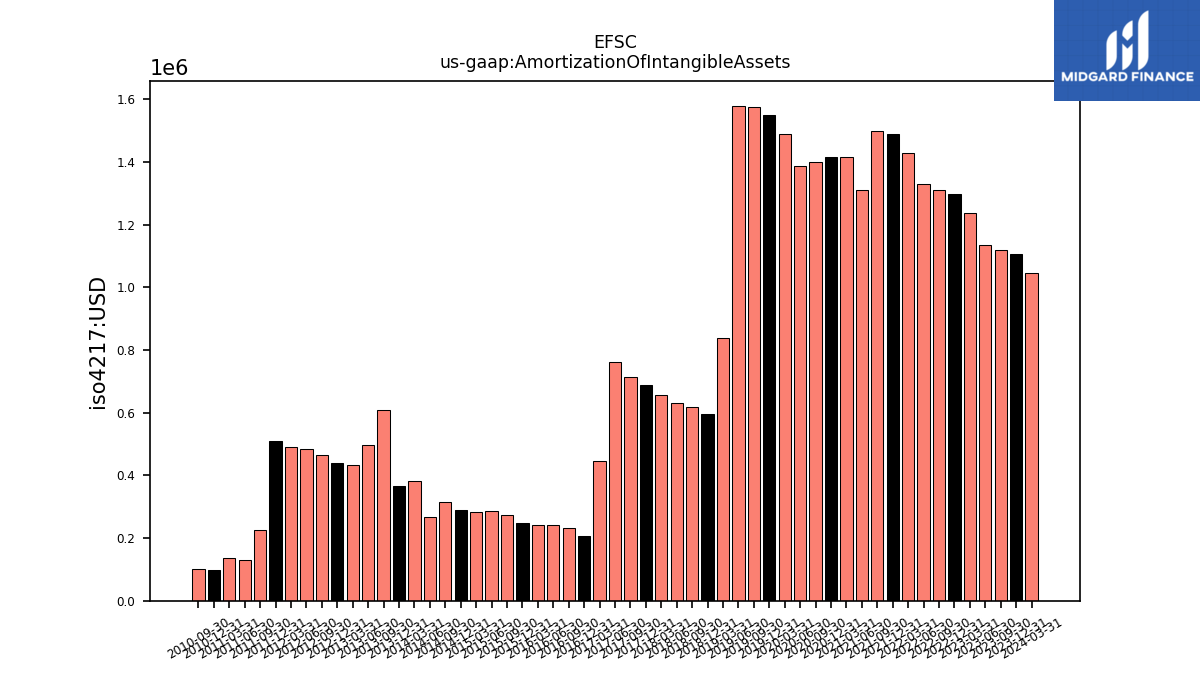
| Amortization Of Intangible Assets | 1.11 | 1.12 | 1.14 | 1.24 | 1.30 | 1.31 | 1.33 | 1.43 | 1.49 | 1.50 | 1.31 | 1.42 | 1.42 | 1.40 | 1.39 | 1.49 | 1.55 | 1.57 | 1.58 | 0.84 | 0.59 | 0.62 | 0.63 | 0.66 | 0.69 | 0.71 | 0.76 | 0.45 | 0.21 | 0.23 | 0.24 | 0.24 | 0.25 | 0.27 | 0.28 | 0.28 | 0.29 | 0.31 | 0.27 | 0.38 | 0.36 | 0.61 | 0.50 | 0.43 | 0.44 | 0.47 | 0.48 | 0.49 | 0.51 | 0.23 | 0.13 | 0.10 | |
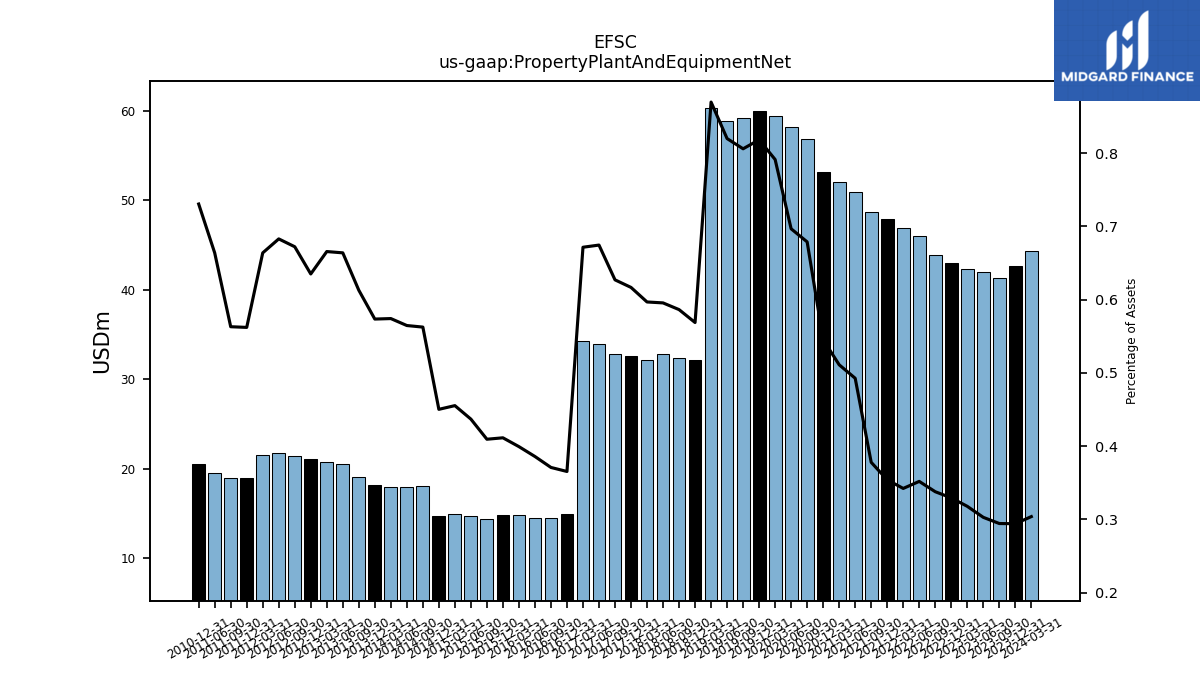
| Property Plant And Equipment Net | 42.68 | 41.27 | 41.99 | 42.34 | 42.98 | 43.88 | 46.03 | 46.90 | 47.91 | 48.70 | 50.97 | 52.08 | 53.17 | 56.81 | 58.23 | 59.36 | 60.01 | 59.22 | 58.89 | 60.30 | 32.11 | 32.35 | 32.81 | 32.13 | 32.62 | 32.80 | 33.99 | 34.29 | 14.91 | 14.50 | 14.51 | 14.81 | 14.84 | 14.39 | 14.73 | 14.91 | 14.75 | 18.05 | 17.93 | 18.03 | 18.18 | 19.05 | 20.54 | 20.80 | 21.12 | 21.47 | 21.74 | 21.54 | 18.99 | 18.98 | 19.49 | 20.50 | |
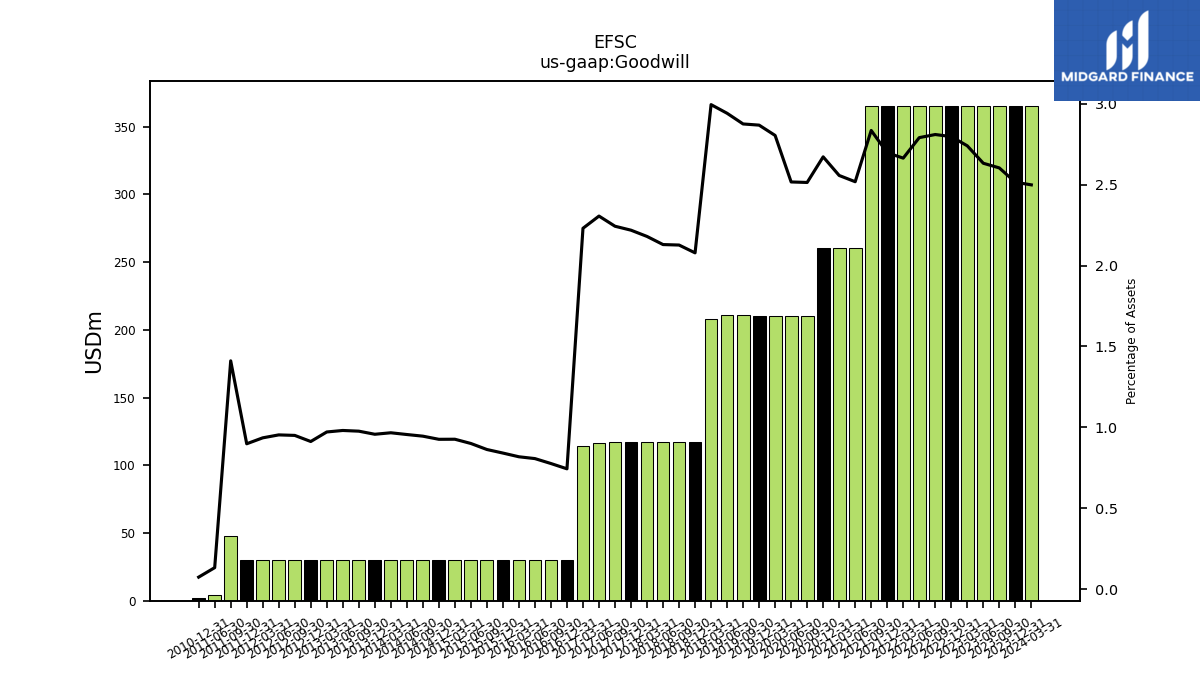
| Goodwill | 365.16 | 365.16 | 365.16 | 365.16 | 365.16 | 365.16 | 365.16 | 365.16 | 365.16 | 365.42 | 260.57 | 260.57 | 260.57 | 210.34 | 210.34 | 210.34 | 210.34 | 211.25 | 211.25 | 207.63 | 117.34 | 117.34 | 117.34 | 117.34 | 117.34 | 117.34 | 116.19 | 113.89 | 30.33 | 30.33 | 30.33 | 30.33 | 30.33 | 30.33 | 30.33 | 30.33 | 30.33 | 30.33 | 30.33 | 30.33 | 30.33 | 30.33 | 30.33 | 30.33 | 30.33 | 30.33 | 30.33 | 30.33 | 30.33 | 47.55 | 3.88 | 2.06 | |
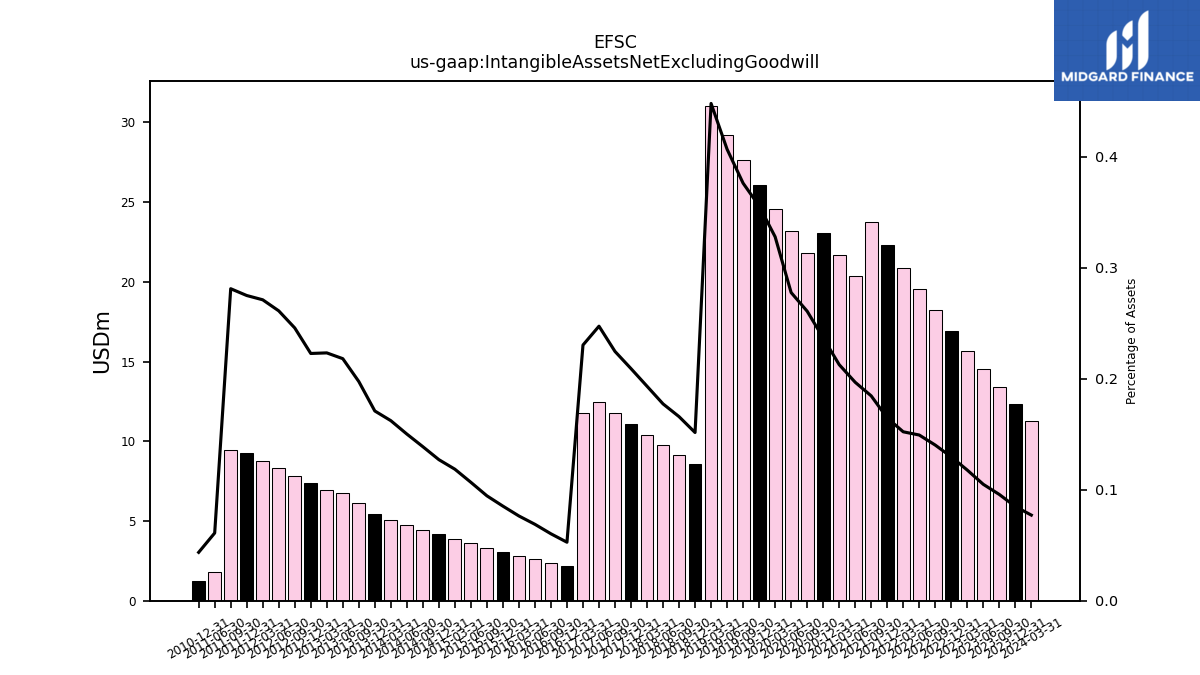
| Intangible Assets Net Excluding Goodwill | 12.32 | 13.43 | 14.54 | 15.68 | 16.92 | 18.22 | 19.53 | 20.86 | 22.29 | 23.78 | 20.36 | 21.67 | 23.08 | 21.82 | 23.20 | 24.59 | 26.08 | 27.63 | 29.20 | 31.05 | 8.55 | 9.15 | 9.77 | 10.40 | 11.06 | 11.74 | 12.46 | 11.76 | 2.15 | 2.36 | 2.59 | 2.83 | 3.08 | 3.32 | 3.60 | 3.88 | 4.16 | 4.45 | 4.77 | 5.09 | 5.42 | 6.14 | 6.75 | 6.97 | 7.41 | 7.85 | 8.31 | 8.79 | 9.29 | 9.47 | 1.79 | 1.22 | |
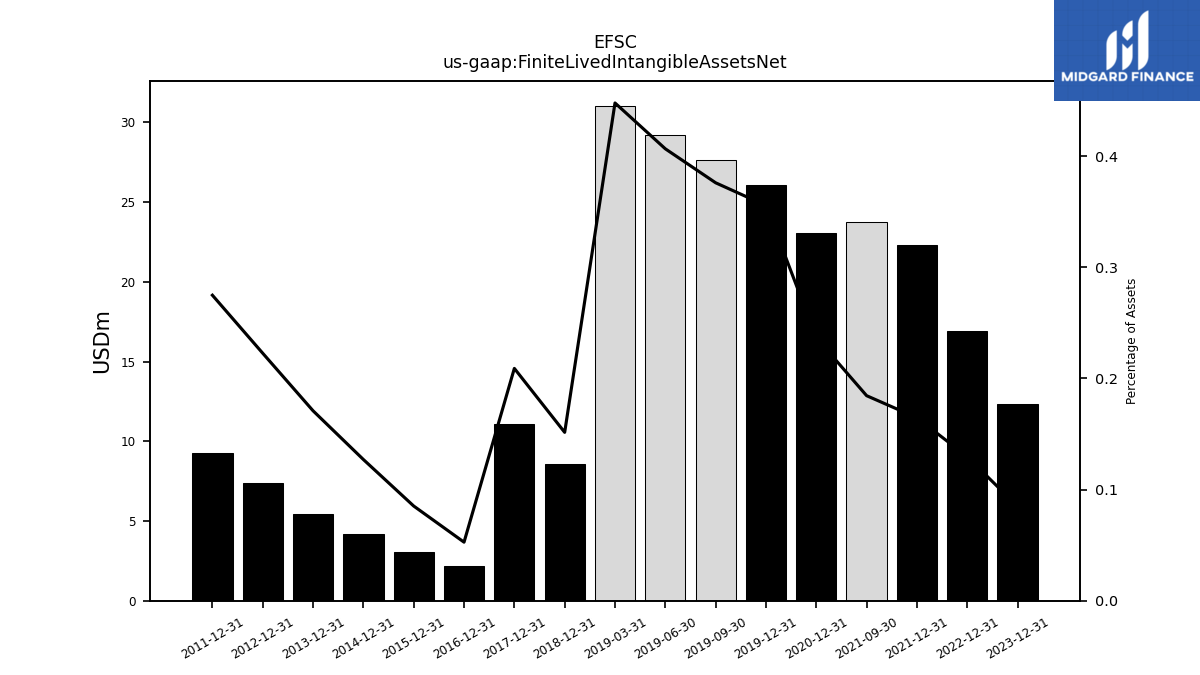
| Finite Lived Intangible Assets Net | 12.32 | NA | NA | NA | 16.92 | NA | NA | NA | 22.29 | 23.78 | NA | NA | 23.08 | NA | NA | NA | 26.08 | 27.63 | 29.20 | 31.05 | 8.55 | NA | NA | NA | 11.06 | NA | NA | NA | 2.15 | NA | NA | NA | 3.08 | NA | NA | NA | 4.16 | NA | NA | NA | 5.42 | NA | NA | NA | 7.41 | NA | NA | NA | 9.29 | NA | NA | NA | |
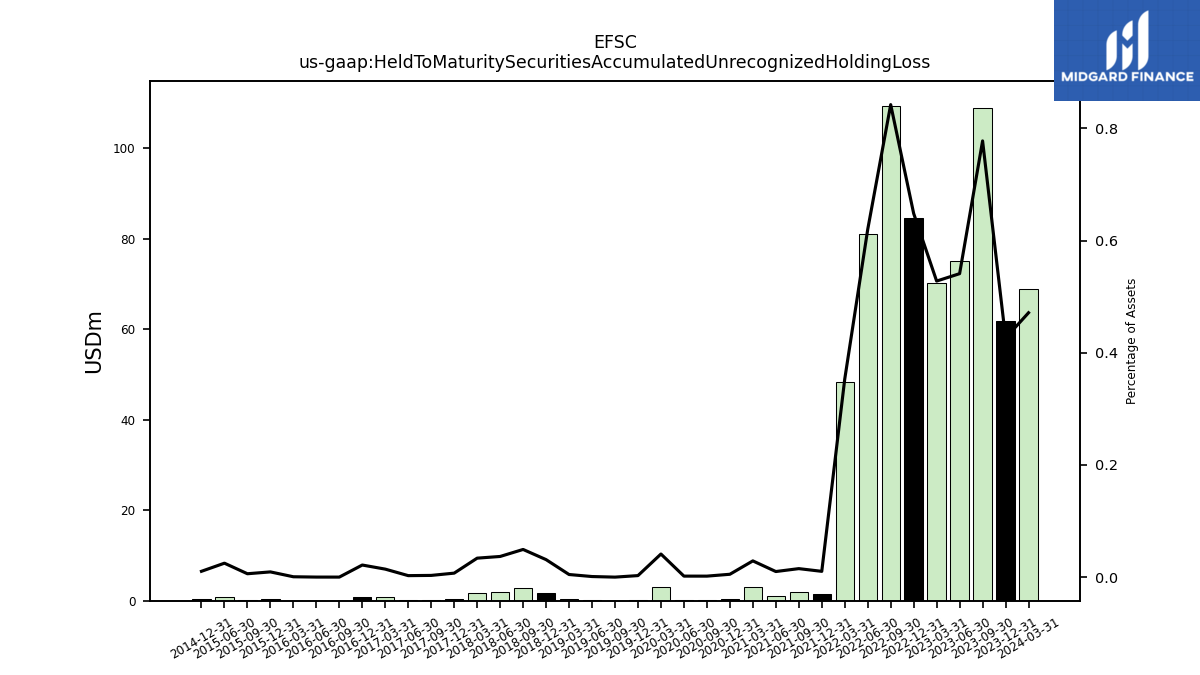
| Held To Maturity Securities Accumulated Unrecognized Holding Loss | 61.87 | 109.05 | 75.03 | 70.32 | 84.62 | 109.44 | 81.09 | 48.39 | 1.40 | 1.95 | 1.03 | 2.95 | 0.50 | 0.15 | 0.15 | 3.09 | 0.20 | 0.00 | 0.07 | 0.32 | 1.76 | 2.72 | 2.03 | 1.82 | 0.38 | 0.16 | 0.13 | 0.73 | 0.88 | 0.00 | 0.00 | 0.02 | 0.34 | 0.21 | 0.84 | NA | 0.34 | NA | NA | NA | NA | NA | NA | NA | NA | NA | NA | NA | NA | NA | NA | NA | |
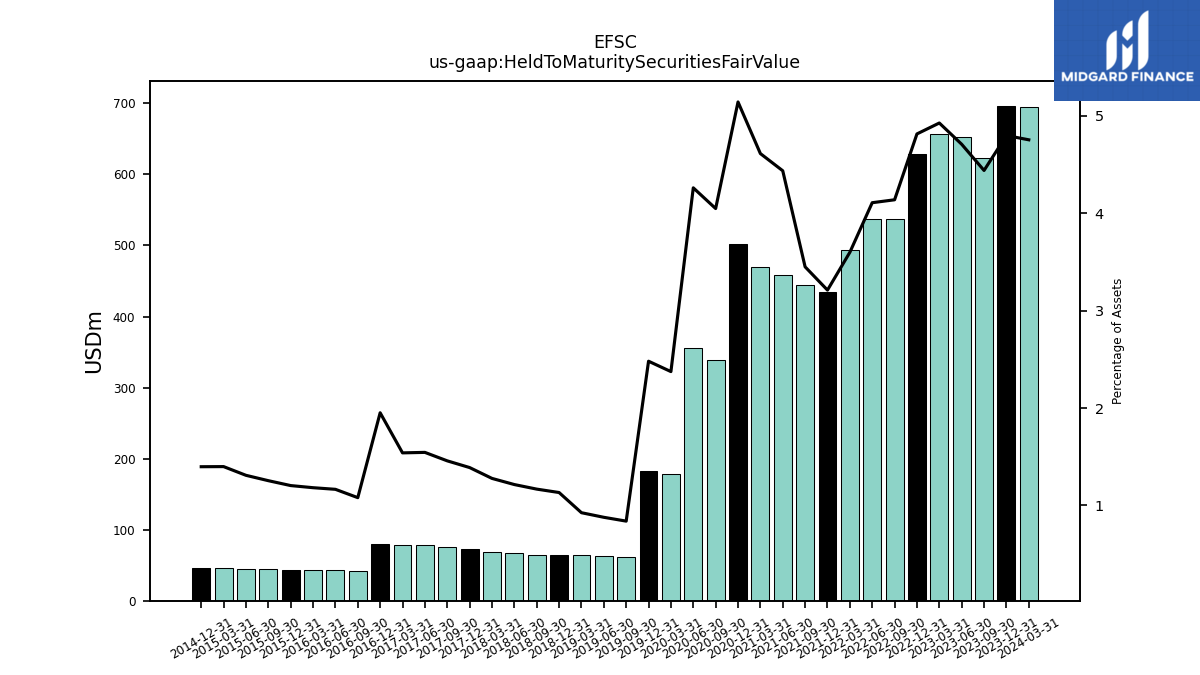
| Held To Maturity Securities Fair Value | 696.65 | 622.66 | 653.14 | 656.55 | 628.52 | 537.79 | 537.58 | 493.34 | 434.67 | 444.62 | 459.02 | 470.10 | 501.52 | 338.77 | 356.14 | 178.08 | 181.94 | 61.62 | 63.06 | 64.15 | 63.93 | 64.42 | 66.91 | 68.77 | 73.46 | 76.26 | 77.83 | 78.62 | 79.64 | 42.22 | 43.84 | 43.85 | 43.44 | 44.10 | 44.13 | 45.81 | 45.80 | NA | NA | NA | NA | NA | NA | NA | NA | NA | NA | NA | NA | NA | NA | NA | |
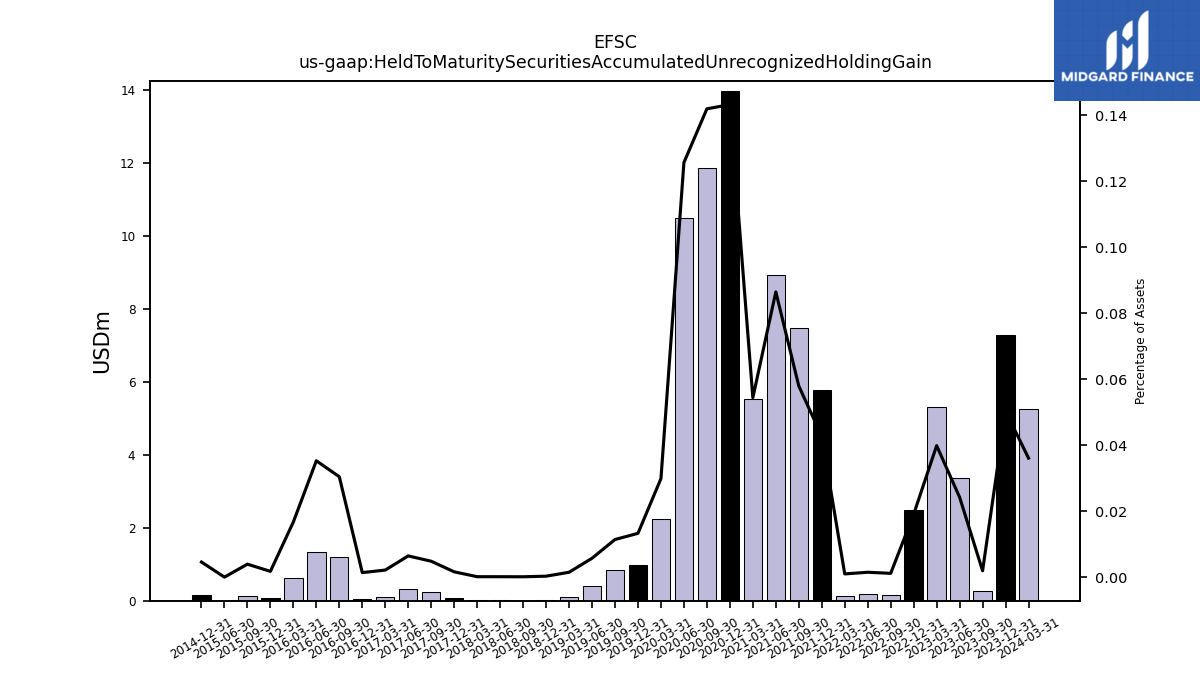
| Held To Maturity Securities Accumulated Unrecognized Holding Gain | 7.29 | 0.27 | 3.36 | 5.31 | 2.48 | 0.15 | 0.19 | 0.13 | 5.77 | 7.46 | 8.94 | 5.54 | 13.96 | 11.87 | 10.50 | 2.24 | 0.97 | 0.84 | 0.41 | 0.10 | 0.02 | 0.01 | 0.01 | 0.01 | 0.09 | 0.25 | 0.32 | 0.11 | 0.06 | 1.19 | 1.33 | 0.62 | 0.06 | 0.14 | 0.00 | NA | 0.15 | NA | NA | NA | NA | NA | NA | NA | NA | NA | NA | NA | NA | NA | NA | NA | |
| Held To Maturity Securities Accumulated Unrecognized Holding Loss | 61.87 | 109.05 | 75.03 | 70.32 | 84.62 | 109.44 | 81.09 | 48.39 | 1.40 | 1.95 | 1.03 | 2.95 | 0.50 | 0.15 | 0.15 | 3.09 | 0.20 | 0.00 | 0.07 | 0.32 | 1.76 | 2.72 | 2.03 | 1.82 | 0.38 | 0.16 | 0.13 | 0.73 | 0.88 | 0.00 | 0.00 | 0.02 | 0.34 | 0.21 | 0.84 | NA | 0.34 | NA | NA | NA | NA | NA | NA | NA | NA | NA | NA | NA | NA | NA | NA | NA | |
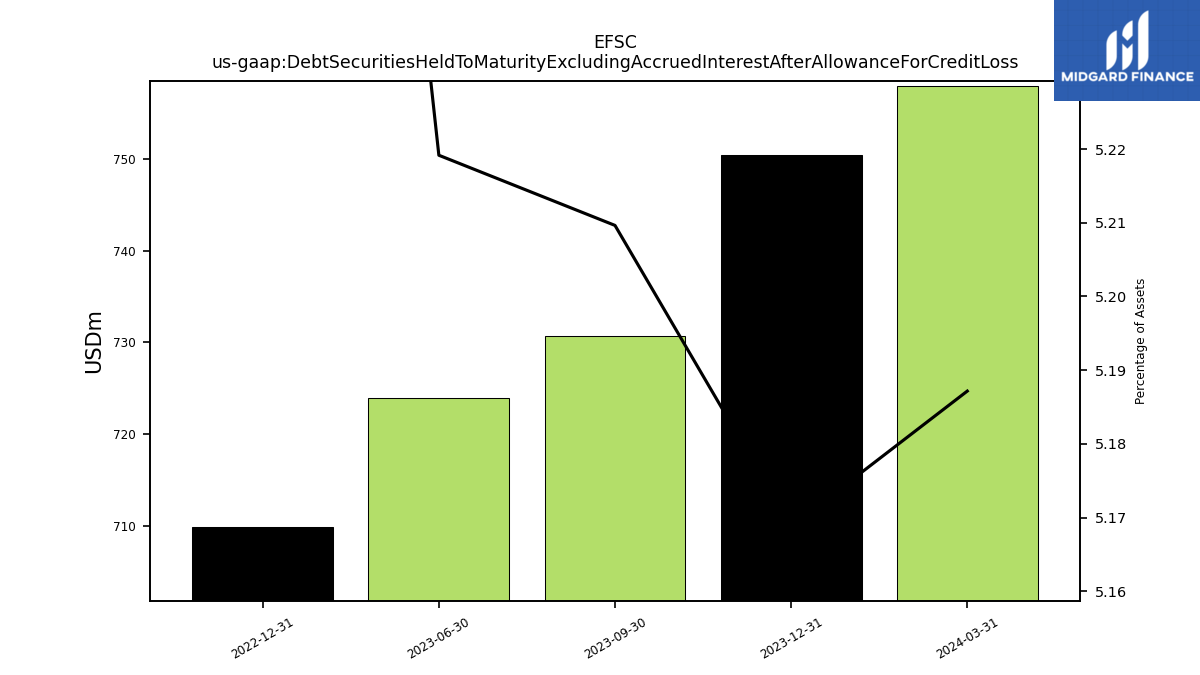
| Debt Securities Held To Maturity Excluding Accrued Interest After Allowance For Credit Loss | 750.43 | 730.65 | 723.96 | NA | 709.91 | NA | NA | NA | NA | NA | NA | NA | NA | NA | NA | NA | NA | NA | NA | NA | NA | NA | NA | NA | NA | NA | NA | NA | NA | NA | NA | NA | NA | NA | NA | NA | NA | NA | NA | NA | NA | NA | NA | NA | NA | NA | NA | NA | NA | NA | NA | NA | |
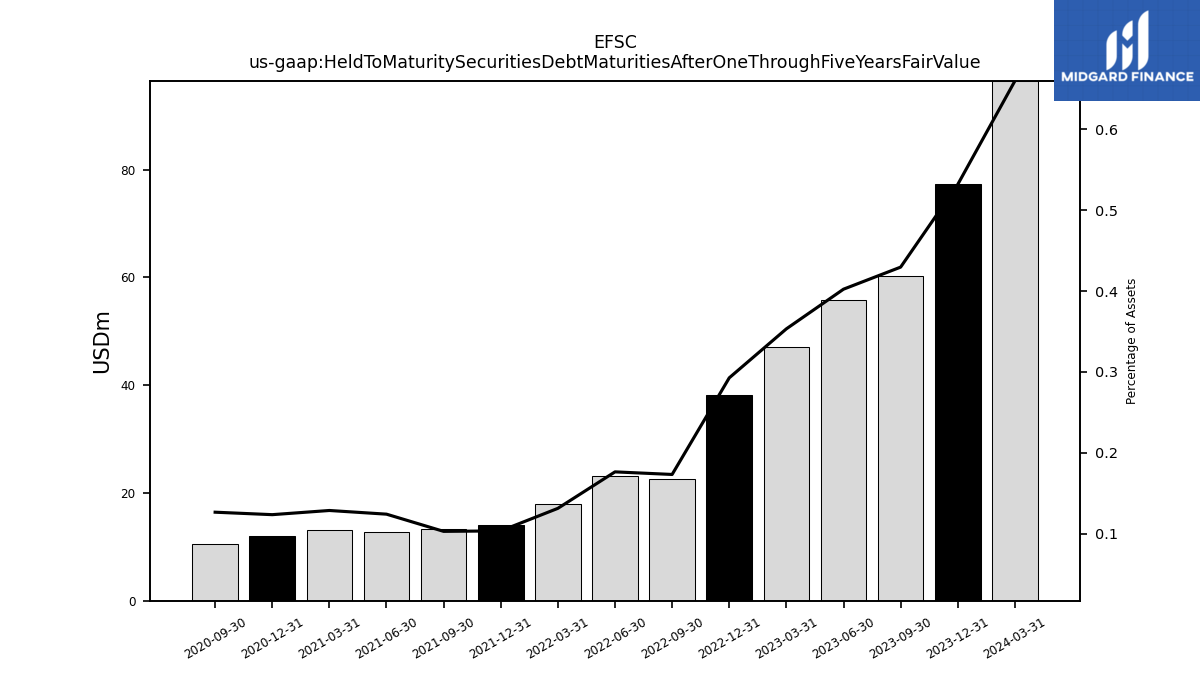
| Held To Maturity Securities Debt Maturities After One Through Five Years Fair Value | 77.23 | 60.26 | 55.81 | 47.08 | 38.21 | 22.51 | 23.08 | 17.99 | 14.00 | 13.25 | 12.84 | 13.11 | 12.04 | 10.59 | NA | NA | NA | NA | NA | NA | NA | NA | NA | NA | NA | NA | NA | NA | NA | NA | NA | NA | NA | NA | NA | NA | NA | NA | NA | NA | NA | NA | NA | NA | NA | NA | NA | NA | NA | NA | NA | NA | |
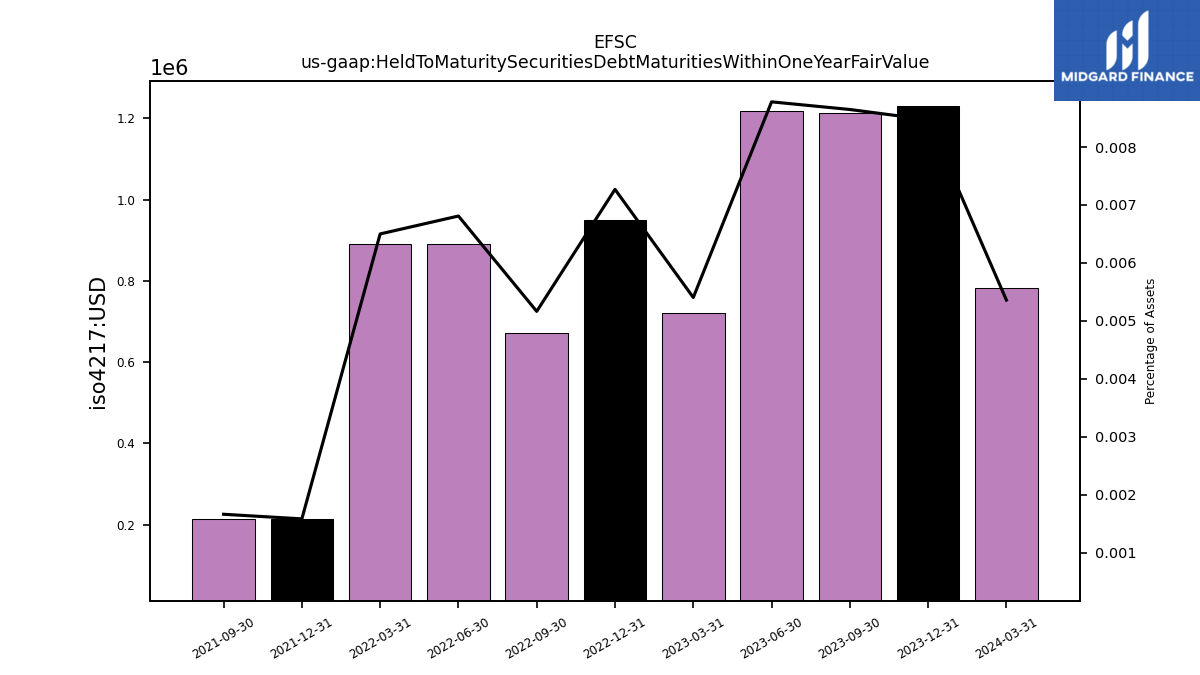
| Held To Maturity Securities Debt Maturities Within One Year Fair Value | 1.23 | 1.21 | 1.22 | 0.72 | 0.95 | 0.67 | 0.89 | 0.89 | 0.21 | 0.21 | NA | NA | NA | NA | NA | NA | NA | NA | NA | NA | NA | NA | NA | NA | NA | NA | NA | NA | NA | NA | NA | NA | NA | NA | NA | NA | NA | NA | NA | NA | NA | NA | NA | NA | NA | NA | NA | NA | NA | NA | NA | NA | |
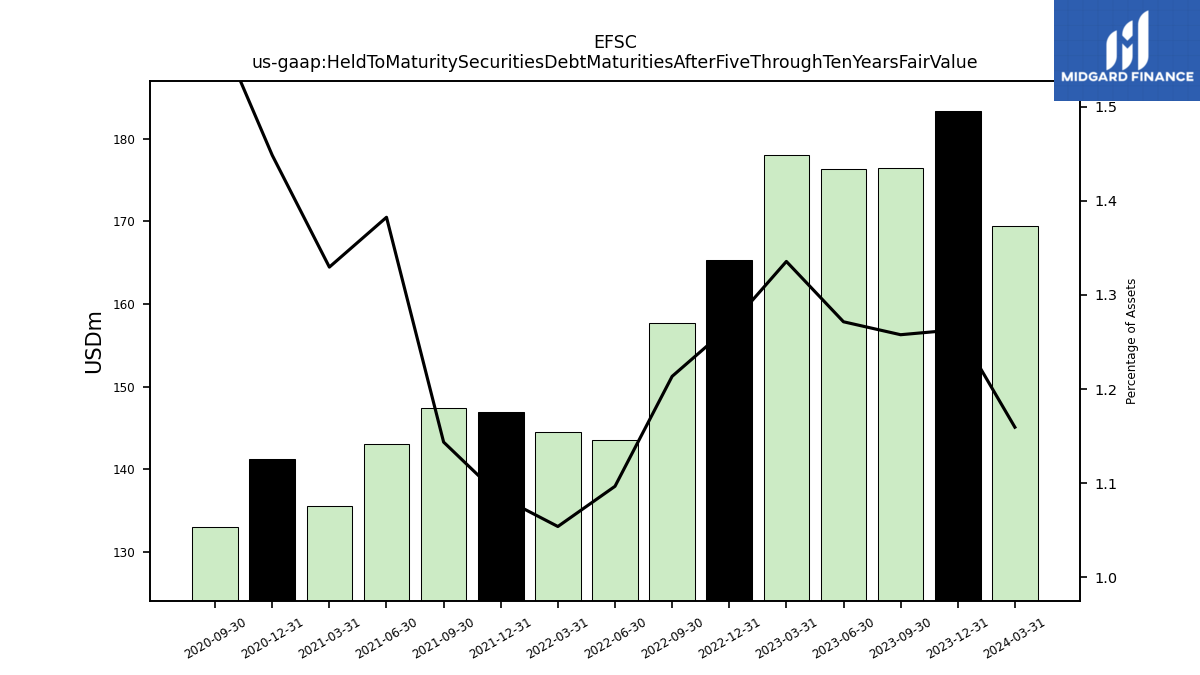
| Held To Maturity Securities Debt Maturities After Five Through Ten Years Fair Value | 183.40 | 176.40 | 176.37 | 177.99 | 165.30 | 157.69 | 143.49 | 144.46 | 146.93 | 147.39 | 143.06 | 135.50 | 141.25 | 133.06 | NA | NA | NA | NA | NA | NA | NA | NA | NA | NA | NA | NA | NA | NA | NA | NA | NA | NA | NA | NA | NA | NA | NA | NA | NA | NA | NA | NA | NA | NA | NA | NA | NA | NA | NA | NA | NA | NA | |
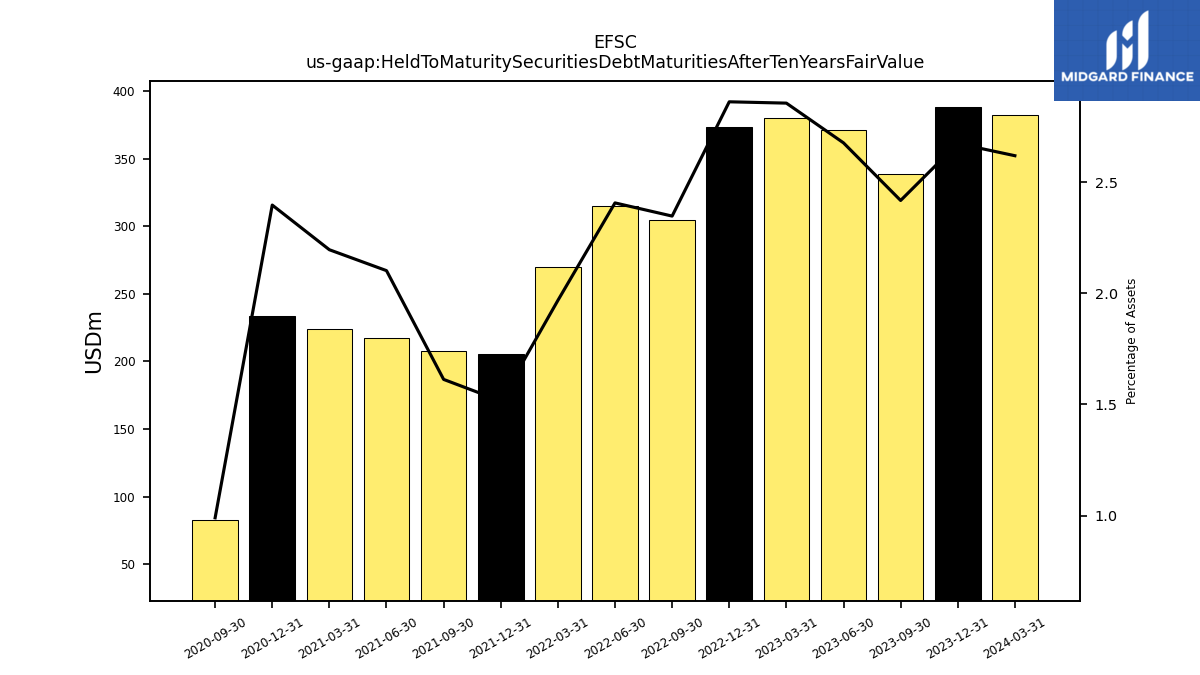
| Held To Maturity Securities Debt Maturities After Ten Years Fair Value | 388.12 | 339.01 | 371.21 | 380.44 | 373.45 | 304.98 | 314.83 | 269.69 | 205.15 | 207.81 | 217.45 | 223.74 | 233.69 | 82.85 | NA | NA | NA | NA | NA | NA | NA | NA | NA | NA | NA | NA | NA | NA | NA | NA | NA | NA | NA | NA | NA | NA | NA | NA | NA | NA | NA | NA | NA | NA | NA | NA | NA | NA | NA | NA | NA | NA |
| 2023-12-31 | 2023-09-30 | 2023-06-30 | 2023-03-31 | 2022-12-31 | 2022-09-30 | 2022-06-30 | 2022-03-31 | 2021-12-31 | 2021-09-30 | 2021-06-30 | 2021-03-31 | 2020-12-31 | 2020-09-30 | 2020-06-30 | 2020-03-31 | 2019-12-31 | 2019-09-30 | 2019-06-30 | 2019-03-31 | 2018-12-31 | 2018-09-30 | 2018-06-30 | 2018-03-31 | 2017-12-31 | 2017-09-30 | 2017-06-30 | 2017-03-31 | 2016-12-31 | 2016-09-30 | 2016-06-30 | 2016-03-31 | 2015-12-31 | 2015-09-30 | 2015-06-30 | 2015-03-31 | 2014-12-31 | 2014-09-30 | 2014-06-30 | 2014-03-31 | 2013-12-31 | 2013-09-30 | 2013-06-30 | 2013-03-31 | 2012-12-31 | 2012-09-30 | 2012-06-30 | 2012-03-31 | 2011-12-31 | 2011-09-30 | 2011-06-30 | 2010-12-31 | ||
|---|---|---|---|---|---|---|---|---|---|---|---|---|---|---|---|---|---|---|---|---|---|---|---|---|---|---|---|---|---|---|---|---|---|---|---|---|---|---|---|---|---|---|---|---|---|---|---|---|---|---|---|---|---|
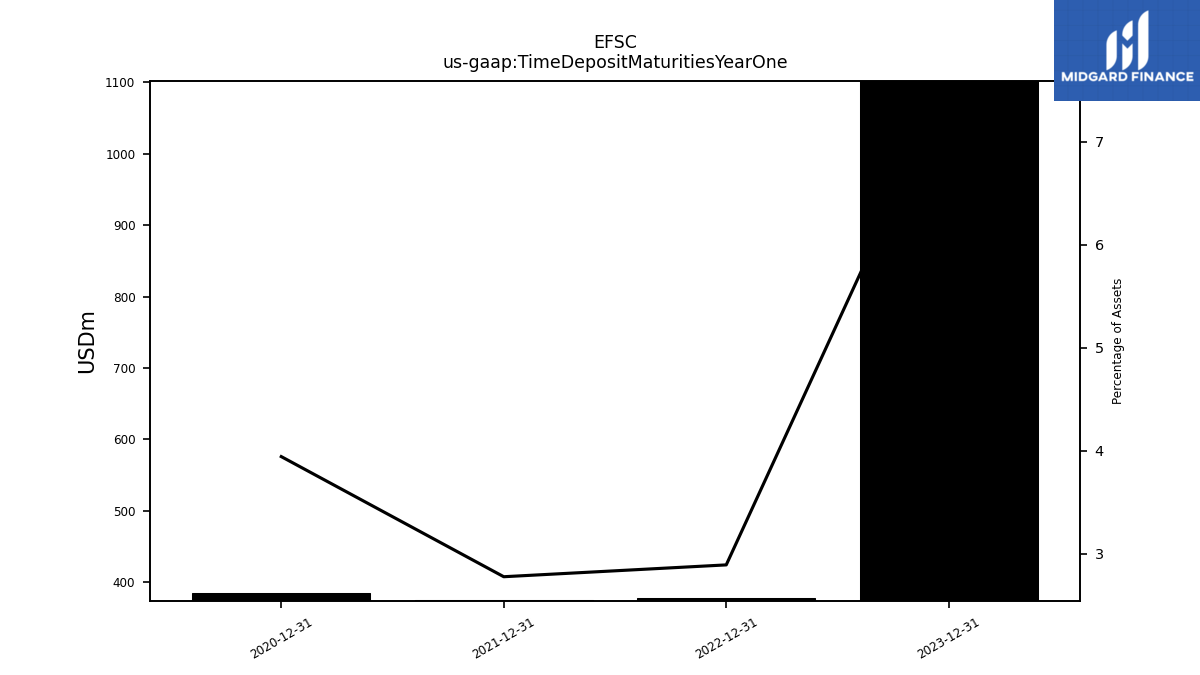
| Time Deposit Maturities Year One | 1101.82 | NA | NA | NA | 377.54 | NA | NA | NA | 375.96 | NA | NA | NA | 384.53 | NA | NA | NA | NA | NA | NA | NA | NA | NA | NA | NA | NA | NA | NA | NA | NA | NA | NA | NA | NA | NA | NA | NA | NA | NA | NA | NA | NA | NA | NA | NA | NA | NA | NA | NA | NA | NA | NA | NA | |
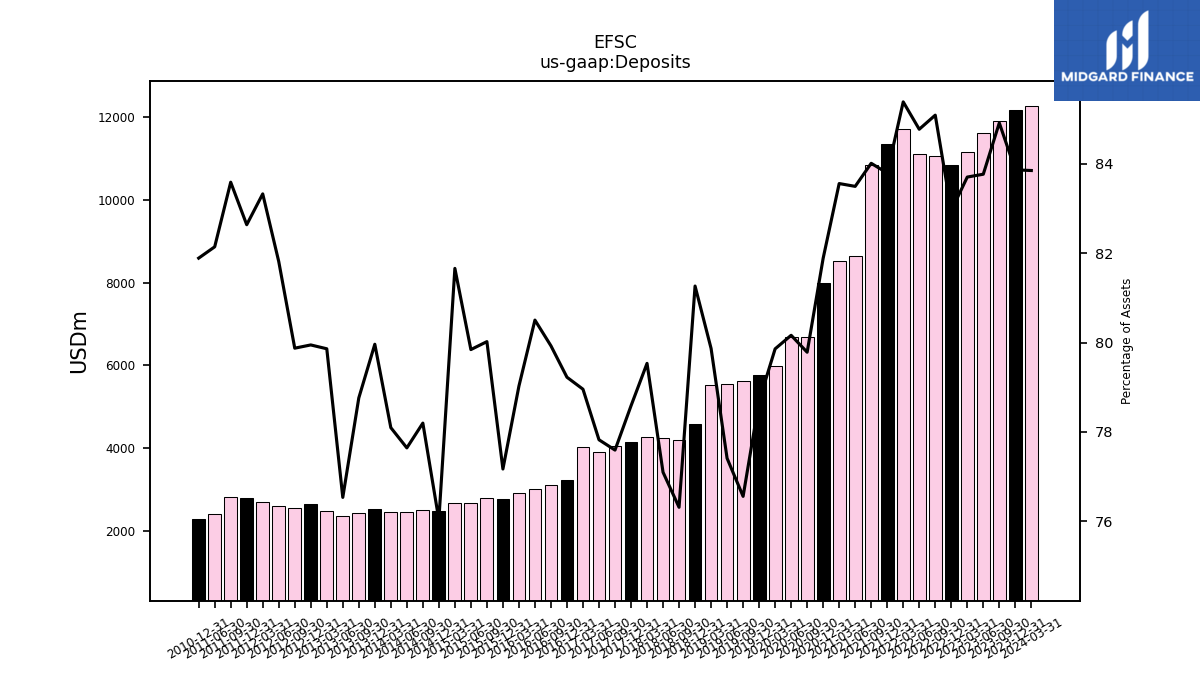
| Deposits | 12176.37 | 11909.91 | 11619.86 | 11154.64 | 10829.15 | 11057.59 | 11092.62 | 11704.14 | 11343.80 | 10827.77 | 8639.50 | 8515.44 | 7985.39 | 6676.23 | 6699.58 | 5989.91 | 5771.02 | 5624.38 | 5559.34 | 5537.11 | 4587.98 | 4210.48 | 4247.91 | 4281.38 | 4156.41 | 4059.21 | 3921.25 | 4031.62 | 3233.36 | 3124.82 | 3028.24 | 2931.75 | 2784.59 | 2813.96 | 2691.56 | 2674.63 | 2491.51 | 2509.76 | 2465.45 | 2452.12 | 2534.95 | 2447.92 | 2368.23 | 2494.79 | 2658.85 | 2550.93 | 2604.27 | 2704.16 | 2791.35 | 2817.41 | 2411.28 | 2297.72 |
| 2023-12-31 | 2023-09-30 | 2023-06-30 | 2023-03-31 | 2022-12-31 | 2022-09-30 | 2022-06-30 | 2022-03-31 | 2021-12-31 | 2021-09-30 | 2021-06-30 | 2021-03-31 | 2020-12-31 | 2020-09-30 | 2020-06-30 | 2020-03-31 | 2019-12-31 | 2019-09-30 | 2019-06-30 | 2019-03-31 | 2018-12-31 | 2018-09-30 | 2018-06-30 | 2018-03-31 | 2017-12-31 | 2017-09-30 | 2017-06-30 | 2017-03-31 | 2016-12-31 | 2016-09-30 | 2016-06-30 | 2016-03-31 | 2015-12-31 | 2015-09-30 | 2015-06-30 | 2015-03-31 | 2014-12-31 | 2014-09-30 | 2014-06-30 | 2014-03-31 | 2013-12-31 | 2013-09-30 | 2013-06-30 | 2013-03-31 | 2012-12-31 | 2012-09-30 | 2012-06-30 | 2012-03-31 | 2011-12-31 | 2011-09-30 | 2011-06-30 | 2010-12-31 | ||
|---|---|---|---|---|---|---|---|---|---|---|---|---|---|---|---|---|---|---|---|---|---|---|---|---|---|---|---|---|---|---|---|---|---|---|---|---|---|---|---|---|---|---|---|---|---|---|---|---|---|---|---|---|---|
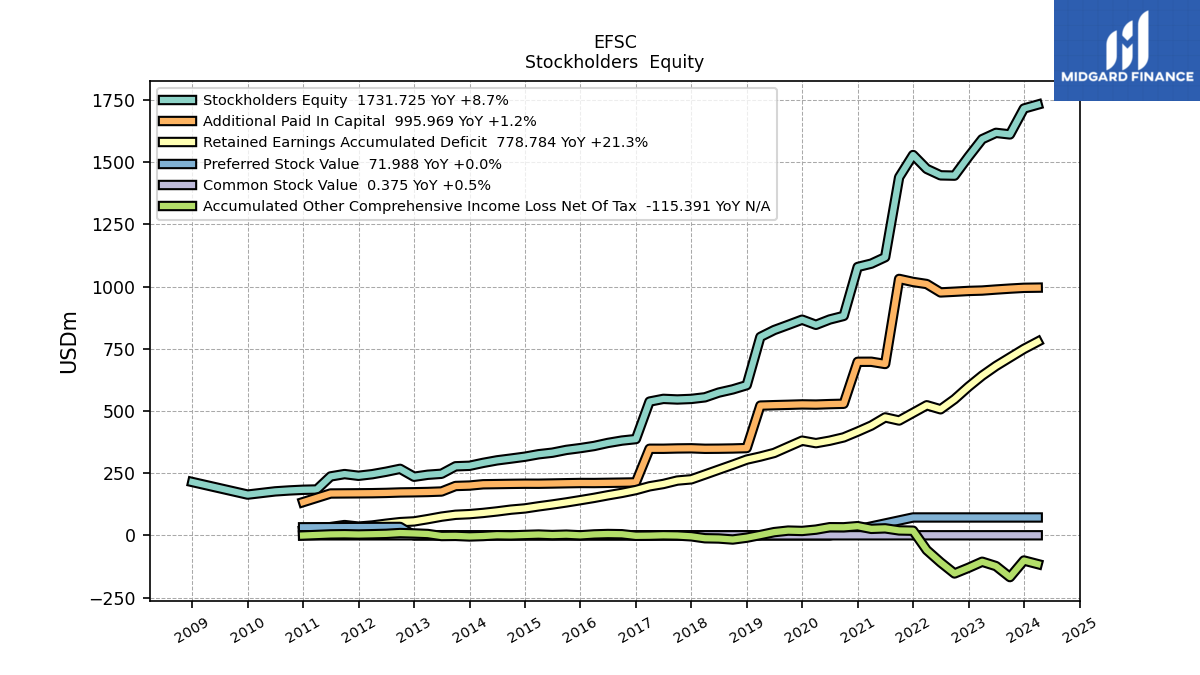
| Stockholders Equity | 1716.07 | 1611.88 | 1618.23 | 1592.82 | 1522.26 | 1446.22 | 1447.41 | 1473.18 | 1529.12 | 1439.63 | 1118.30 | 1092.50 | 1078.97 | 882.27 | 867.96 | 846.44 | 867.18 | 846.10 | 825.50 | 797.84 | 603.80 | 586.84 | 574.08 | 555.01 | 548.57 | 546.34 | 548.75 | 537.92 | 387.10 | 381.10 | 371.63 | 359.38 | 350.83 | 343.56 | 332.43 | 326.11 | 316.24 | 308.75 | 301.56 | 291.45 | 279.70 | 277.74 | 247.68 | 243.70 | 235.75 | 267.52 | 255.89 | 246.02 | 239.56 | 246.46 | 236.98 | 183.35 | |
| Common Stock Value | 0.37 | 0.37 | 0.37 | 0.37 | 0.37 | 0.37 | 0.37 | 0.40 | 0.40 | 0.40 | 0.33 | 0.33 | 0.33 | 0.28 | 0.28 | 0.28 | 0.28 | 0.28 | 0.28 | 0.28 | 0.24 | 0.24 | 0.24 | 0.24 | 0.24 | 0.24 | 0.24 | 0.24 | 0.20 | 0.20 | 0.20 | 0.20 | 0.20 | 0.20 | 0.20 | 0.20 | 0.20 | 0.20 | 0.20 | 0.20 | 0.19 | 0.19 | 0.18 | 0.18 | 0.18 | 0.18 | 0.18 | 0.18 | 0.18 | 0.18 | 0.18 | 0.15 | |
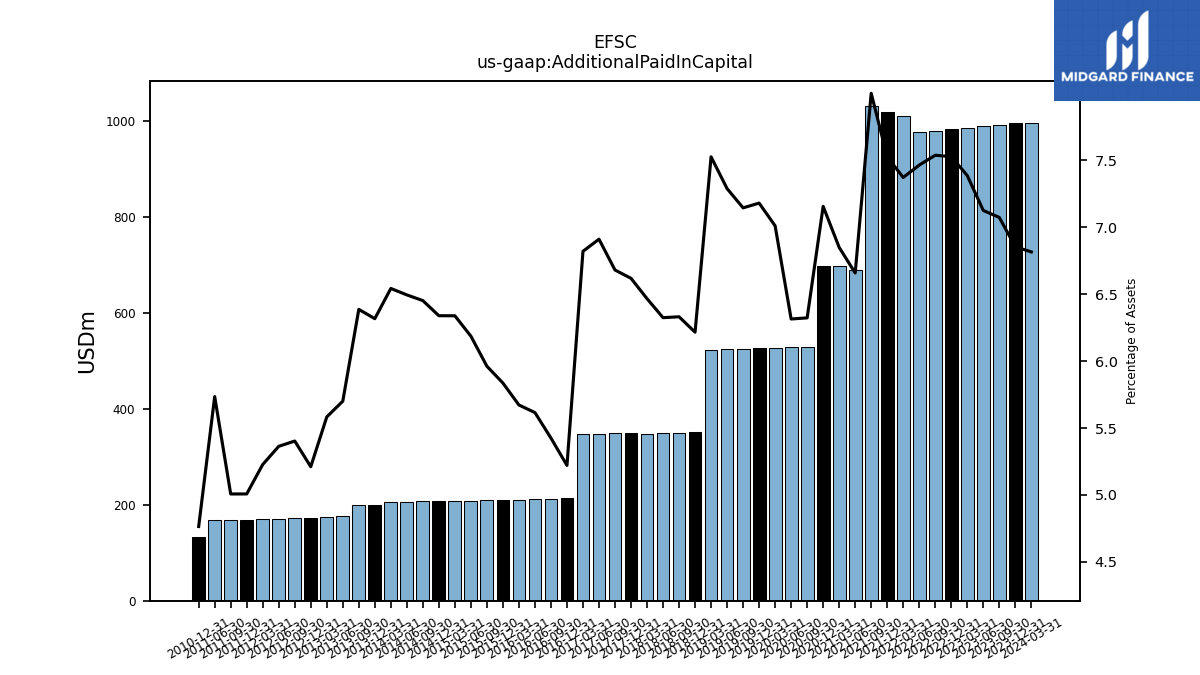
| Additional Paid In Capital | 995.21 | 992.04 | 988.36 | 984.28 | 982.66 | 979.54 | 976.68 | 1010.45 | 1018.80 | 1031.15 | 688.95 | 698.00 | 697.84 | 529.11 | 527.73 | 525.84 | 526.60 | 524.92 | 523.45 | 521.76 | 350.94 | 349.32 | 348.47 | 348.09 | 350.06 | 349.49 | 348.22 | 348.26 | 213.08 | 212.09 | 211.23 | 210.42 | 210.59 | 209.64 | 208.54 | 207.60 | 207.73 | 207.08 | 206.23 | 205.44 | 200.26 | 198.49 | 176.40 | 174.40 | 173.30 | 172.54 | 170.72 | 169.63 | 169.14 | 168.76 | 168.34 | 133.67 | |
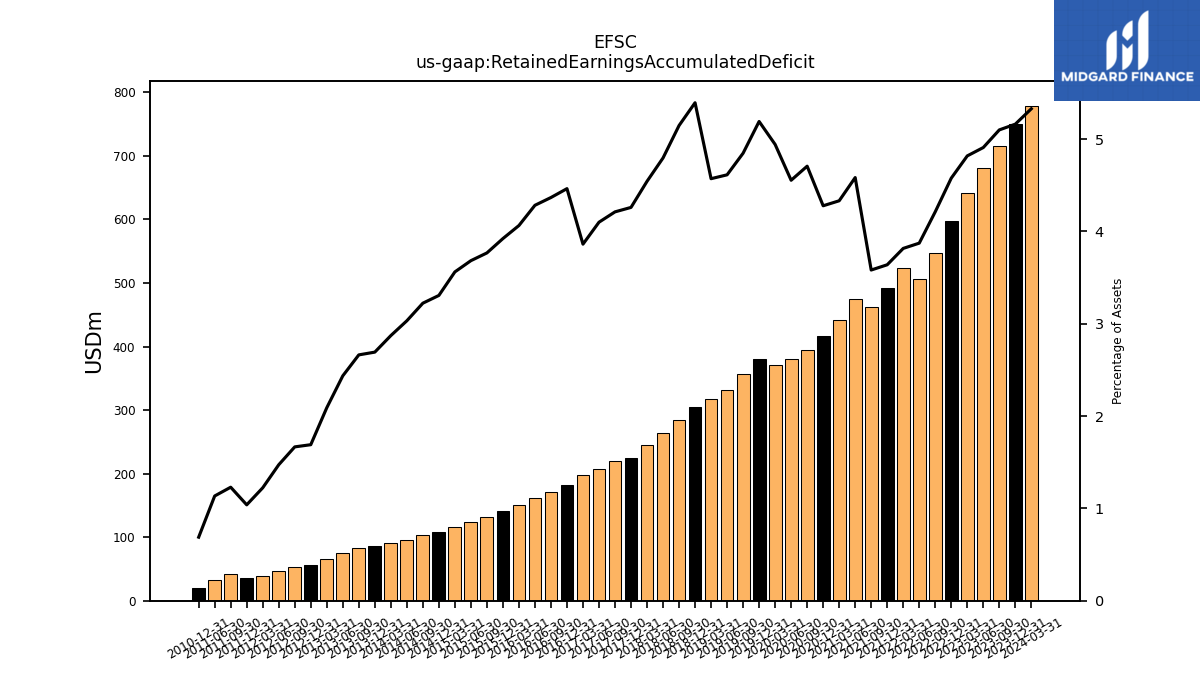
| Retained Earnings Accumulated Deficit | 749.51 | 715.30 | 680.98 | 642.15 | 597.57 | 547.51 | 506.85 | 523.14 | 492.68 | 461.71 | 474.28 | 441.51 | 417.21 | 393.90 | 380.67 | 370.75 | 380.74 | 356.16 | 331.35 | 316.96 | 304.57 | 284.02 | 264.28 | 244.57 | 225.36 | 220.37 | 206.60 | 197.23 | 182.19 | 170.77 | 161.14 | 150.79 | 141.56 | 132.49 | 124.18 | 116.67 | 108.37 | 103.45 | 96.30 | 90.18 | 85.38 | 82.78 | 75.39 | 65.31 | 56.22 | 53.23 | 46.89 | 39.71 | 35.10 | 41.45 | 33.31 | 19.32 | |
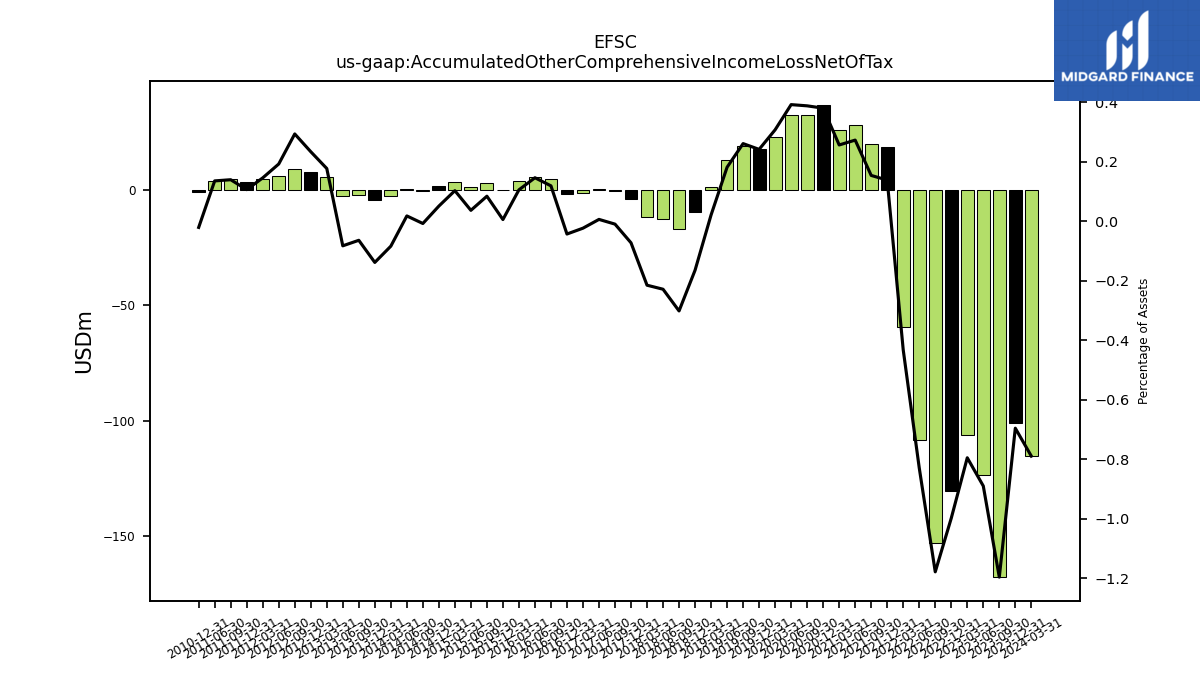
| Accumulated Other Comprehensive Income Loss Net Of Tax | -101.02 | -167.83 | -123.47 | -105.97 | -130.33 | -153.19 | -108.48 | -59.26 | 18.78 | 19.90 | 28.27 | 26.18 | 37.12 | 32.51 | 32.81 | 23.10 | 17.75 | 19.21 | 13.07 | 1.49 | -9.28 | -16.63 | -12.58 | -11.56 | -3.82 | -0.49 | 0.33 | -1.17 | -1.74 | 4.67 | 5.52 | 3.93 | 0.22 | 2.97 | 1.25 | 3.38 | 1.68 | -0.23 | 0.58 | -2.62 | -4.38 | -1.98 | -2.55 | 5.55 | 7.79 | 9.39 | 6.14 | 4.74 | 3.60 | 4.72 | 3.99 | -0.57 |
| 2023-12-31 | 2023-09-30 | 2023-06-30 | 2023-03-31 | 2022-12-31 | 2022-09-30 | 2022-06-30 | 2022-03-31 | 2021-12-31 | 2021-09-30 | 2021-06-30 | 2021-03-31 | 2020-12-31 | 2020-09-30 | 2020-06-30 | 2020-03-31 | 2019-12-31 | 2019-09-30 | 2019-06-30 | 2019-03-31 | 2018-12-31 | 2018-09-30 | 2018-06-30 | 2018-03-31 | 2017-12-31 | 2017-09-30 | 2017-06-30 | 2017-03-31 | 2016-12-31 | 2016-09-30 | 2016-06-30 | 2016-03-31 | 2015-12-31 | 2015-09-30 | 2015-06-30 | 2015-03-31 | 2014-12-31 | 2014-09-30 | 2014-06-30 | 2014-03-31 | 2013-12-31 | 2013-09-30 | 2013-06-30 | 2013-03-31 | 2012-12-31 | 2012-09-30 | 2012-06-30 | 2012-03-31 | 2011-12-31 | 2011-09-30 | 2011-06-30 | 2010-12-31 | ||
|---|---|---|---|---|---|---|---|---|---|---|---|---|---|---|---|---|---|---|---|---|---|---|---|---|---|---|---|---|---|---|---|---|---|---|---|---|---|---|---|---|---|---|---|---|---|---|---|---|---|---|---|---|---|
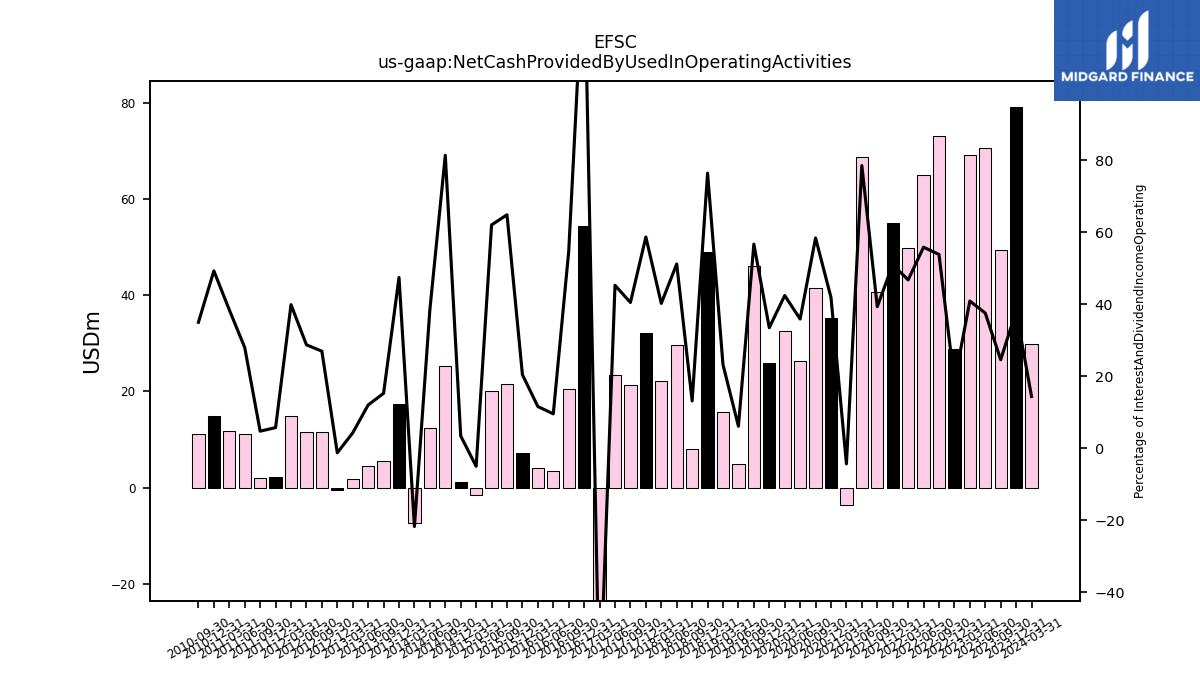
| Net Cash Provided By Used In Operating Activities | 78.99 | 49.47 | 70.61 | 69.18 | 28.78 | 73.11 | 64.87 | 49.88 | 54.95 | 40.63 | 68.67 | -3.67 | 35.27 | 41.39 | 26.30 | 32.56 | 25.89 | 46.00 | 4.86 | 15.71 | 48.94 | 8.00 | 29.65 | 22.21 | 32.17 | 21.26 | 23.34 | -30.99 | 54.44 | 20.42 | 3.54 | 4.12 | 7.18 | 21.54 | 20.08 | -1.61 | 1.18 | 25.28 | 12.44 | -7.40 | 17.30 | 5.63 | 4.58 | 1.79 | -0.56 | 11.57 | 11.51 | 14.86 | 2.27 | 1.90 | 11.21 | 14.98 | |
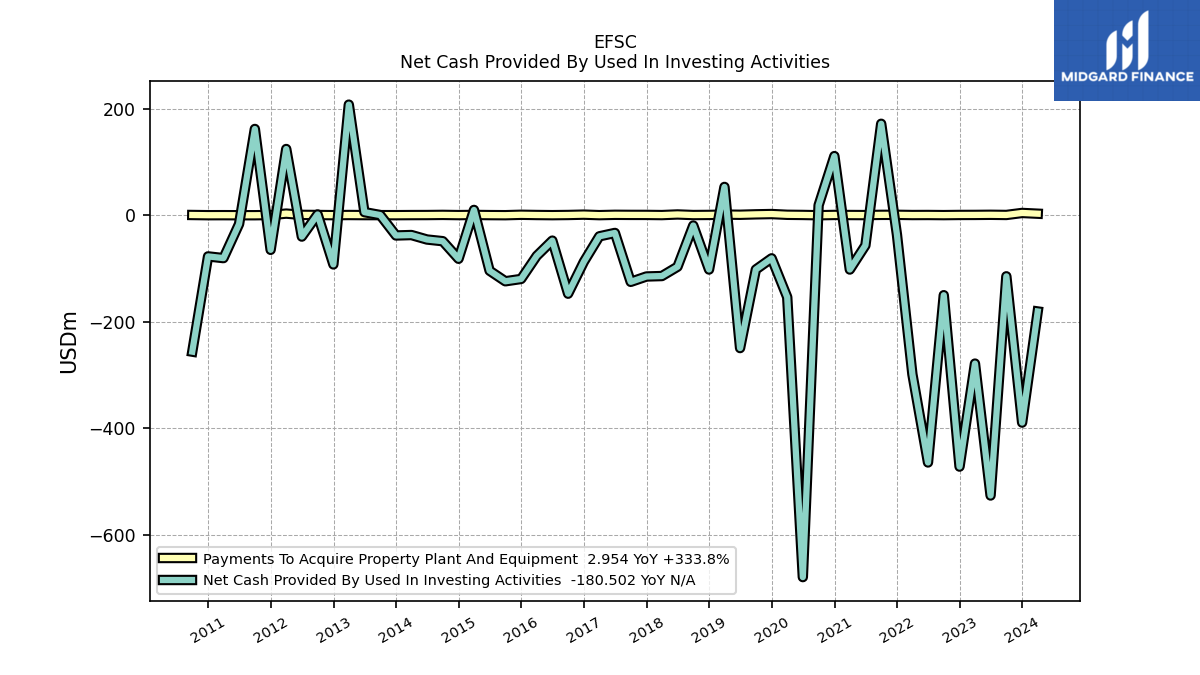
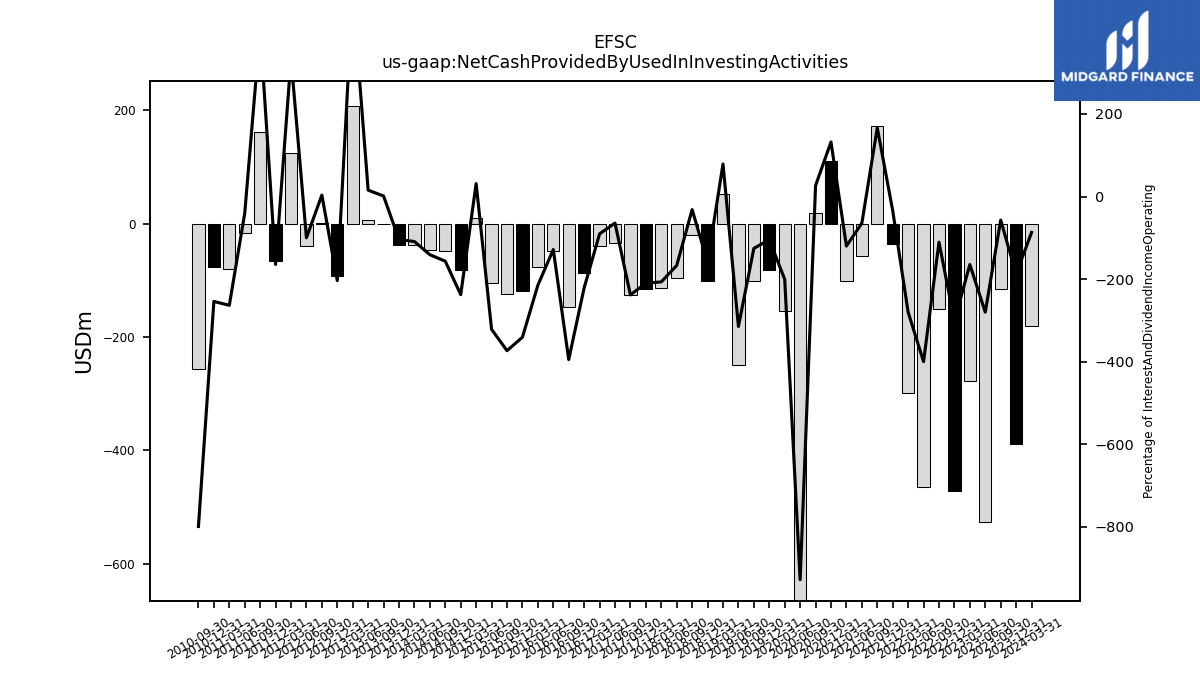
| Net Cash Provided By Used In Investing Activities | -389.08 | -114.49 | -525.91 | -278.30 | -471.66 | -149.93 | -463.90 | -298.29 | -36.55 | 171.74 | -56.47 | -101.84 | 111.10 | 18.76 | -679.03 | -153.65 | -80.76 | -101.75 | -249.24 | 53.23 | -101.81 | -19.19 | -96.58 | -114.03 | -114.86 | -124.95 | -33.13 | -39.51 | -87.19 | -147.17 | -47.52 | -76.18 | -119.51 | -123.83 | -104.00 | 10.09 | -81.66 | -48.61 | -45.48 | -37.08 | -37.91 | 0.43 | 5.90 | 207.66 | -92.25 | 1.56 | -39.99 | 124.40 | -64.87 | 162.02 | -16.36 | -77.15 | |
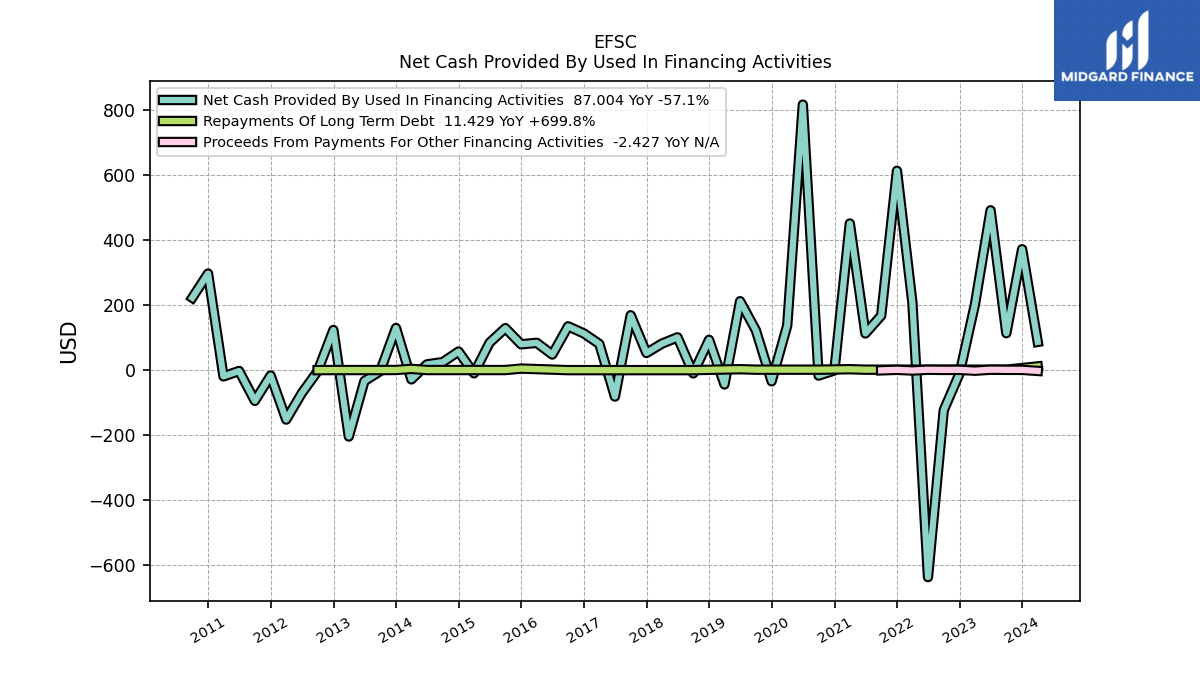
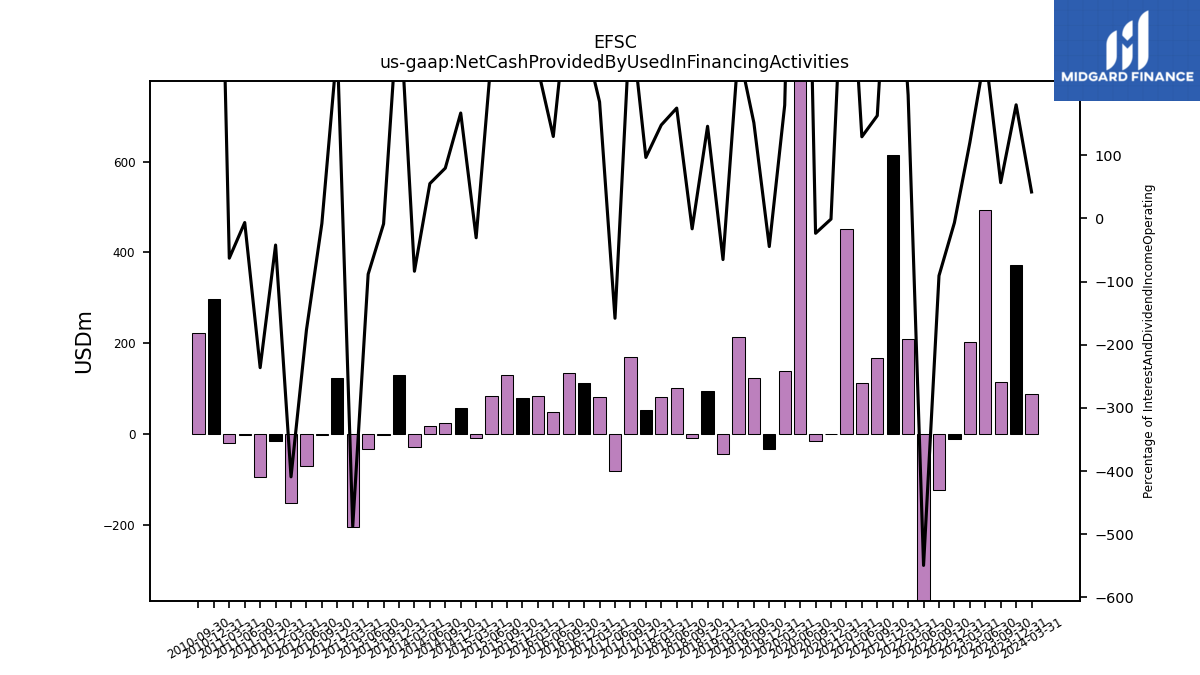
| Net Cash Provided By Used In Financing Activities | 372.43 | 113.70 | 492.24 | 202.85 | -10.64 | -123.10 | -637.48 | 208.04 | 614.00 | 167.92 | 112.98 | 451.63 | -0.88 | -16.66 | 817.78 | 137.52 | -34.37 | 122.85 | 212.31 | -44.02 | 93.36 | -10.00 | 101.08 | 81.59 | 52.90 | 169.03 | -81.45 | 80.69 | 113.05 | 134.95 | 48.04 | 84.14 | 79.60 | 129.39 | 84.38 | -9.84 | 57.37 | 24.72 | 17.82 | -28.45 | 129.94 | -3.16 | -33.60 | -204.37 | 123.50 | -3.43 | -70.71 | -152.22 | -16.63 | -94.60 | -2.61 | 297.53 |
| 2023-12-31 | 2023-09-30 | 2023-06-30 | 2023-03-31 | 2022-12-31 | 2022-09-30 | 2022-06-30 | 2022-03-31 | 2021-12-31 | 2021-09-30 | 2021-06-30 | 2021-03-31 | 2020-12-31 | 2020-09-30 | 2020-06-30 | 2020-03-31 | 2019-12-31 | 2019-09-30 | 2019-06-30 | 2019-03-31 | 2018-12-31 | 2018-09-30 | 2018-06-30 | 2018-03-31 | 2017-12-31 | 2017-09-30 | 2017-06-30 | 2017-03-31 | 2016-12-31 | 2016-09-30 | 2016-06-30 | 2016-03-31 | 2015-12-31 | 2015-09-30 | 2015-06-30 | 2015-03-31 | 2014-12-31 | 2014-09-30 | 2014-06-30 | 2014-03-31 | 2013-12-31 | 2013-09-30 | 2013-06-30 | 2013-03-31 | 2012-12-31 | 2012-09-30 | 2012-06-30 | 2012-03-31 | 2011-12-31 | 2011-09-30 | 2011-06-30 | 2010-12-31 | ||
|---|---|---|---|---|---|---|---|---|---|---|---|---|---|---|---|---|---|---|---|---|---|---|---|---|---|---|---|---|---|---|---|---|---|---|---|---|---|---|---|---|---|---|---|---|---|---|---|---|---|---|---|---|---|
| Net Cash Provided By Used In Operating Activities | 78.99 | 49.47 | 70.61 | 69.18 | 28.78 | 73.11 | 64.87 | 49.88 | 54.95 | 40.63 | 68.67 | -3.67 | 35.27 | 41.39 | 26.30 | 32.56 | 25.89 | 46.00 | 4.86 | 15.71 | 48.94 | 8.00 | 29.65 | 22.21 | 32.17 | 21.26 | 23.34 | -30.99 | 54.44 | 20.42 | 3.54 | 4.12 | 7.18 | 21.54 | 20.08 | -1.61 | 1.18 | 25.28 | 12.44 | -7.40 | 17.30 | 5.63 | 4.58 | 1.79 | -0.56 | 11.57 | 11.51 | 14.86 | 2.27 | 1.90 | 11.21 | 14.98 | |
| Net Income Loss | 44.53 | 44.66 | 49.13 | 55.74 | 60.00 | 50.20 | 45.15 | 47.69 | 50.81 | 13.91 | 38.41 | 29.93 | 28.93 | 17.95 | 14.63 | 12.87 | 29.09 | 29.07 | 18.42 | 16.16 | 23.53 | 22.52 | 22.25 | 20.92 | 7.53 | 16.32 | 11.96 | 12.39 | 13.63 | 11.83 | 12.35 | 11.03 | 10.68 | 9.71 | 8.72 | 9.35 | 5.97 | 8.20 | 7.16 | 5.85 | 3.62 | 8.41 | 11.03 | 10.04 | 5.42 | 7.93 | 8.77 | 6.18 | 7.21 | 9.70 | 9.88 | 2.88 | |
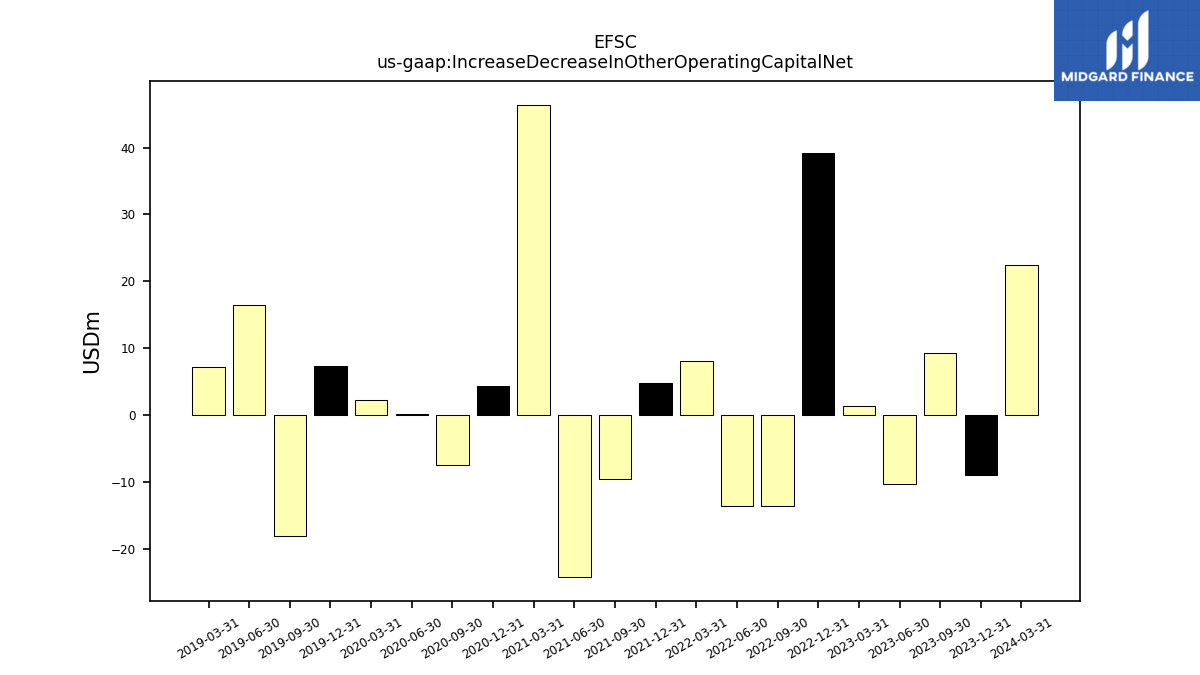
| Increase Decrease In Other Operating Capital Net | -8.98 | 9.26 | -10.30 | 1.32 | 39.20 | -13.68 | -13.61 | 8.08 | 4.72 | -9.62 | -24.26 | 46.42 | 4.33 | -7.52 | 0.10 | 2.18 | 7.31 | -18.04 | 16.52 | 7.18 | NA | NA | NA | NA | NA | NA | NA | NA | NA | NA | NA | NA | NA | NA | NA | NA | NA | NA | NA | NA | NA | NA | NA | NA | NA | NA | NA | NA | NA | NA | NA | NA | |
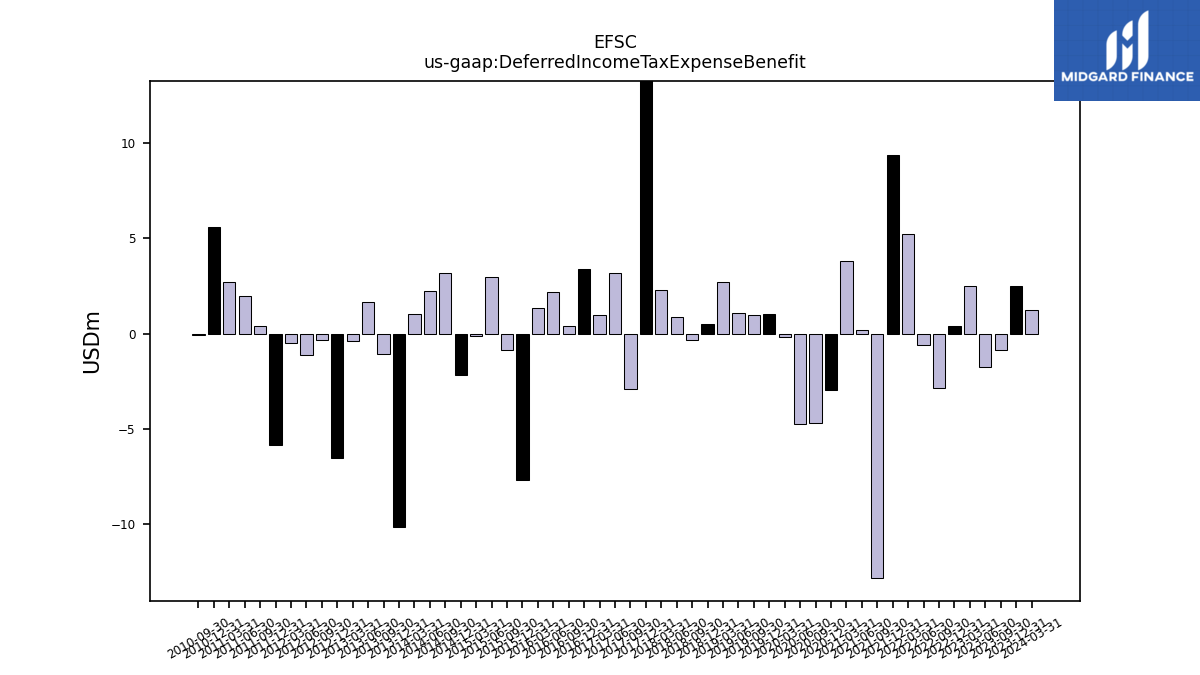
| Deferred Income Tax Expense Benefit | 2.48 | -0.88 | -1.74 | 2.52 | 0.40 | -2.85 | -0.60 | 5.25 | 9.36 | -12.84 | 0.19 | 3.83 | -2.97 | -4.67 | -4.75 | -0.18 | 1.02 | 0.96 | 1.09 | 2.73 | 0.48 | -0.33 | 0.87 | 2.29 | 19.87 | -2.93 | 3.20 | 0.96 | 3.38 | 0.37 | 2.17 | 1.34 | -7.70 | -0.87 | 2.96 | -0.15 | -2.18 | 3.20 | 2.23 | 1.03 | -10.12 | -1.09 | 1.67 | -0.41 | -6.55 | -0.36 | -1.14 | -0.49 | -5.82 | 0.41 | 1.95 | 5.58 | |
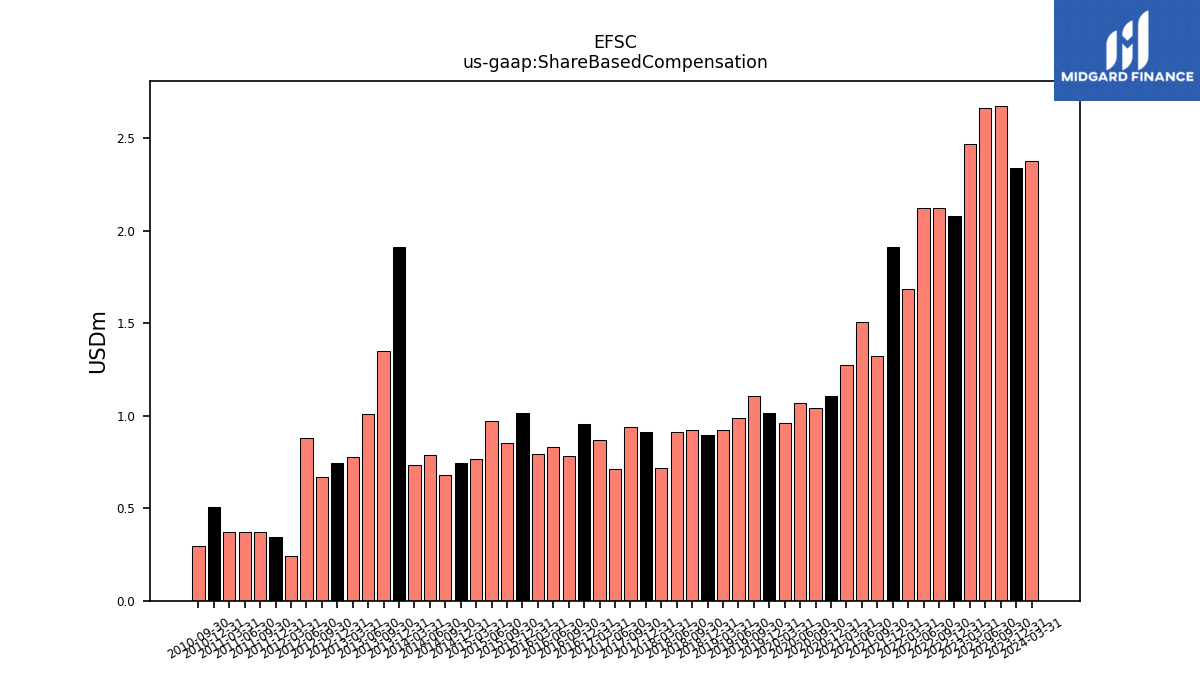
| Share Based Compensation | 2.34 | 2.67 | 2.67 | 2.47 | 2.08 | 2.12 | 2.12 | 1.69 | 1.91 | 1.32 | 1.51 | 1.27 | 1.11 | 1.04 | 1.07 | 0.96 | 1.02 | 1.11 | 0.99 | 0.92 | 0.90 | 0.92 | 0.91 | 0.72 | 0.91 | 0.94 | 0.71 | 0.87 | 0.96 | 0.78 | 0.83 | 0.79 | 1.01 | 0.85 | 0.97 | 0.77 | 0.74 | 0.68 | 0.79 | 0.73 | 1.91 | 1.35 | 1.01 | 0.78 | 0.75 | 0.67 | 0.88 | 0.24 | 0.35 | 0.37 | 0.37 | 0.51 |
| 2023-12-31 | 2023-09-30 | 2023-06-30 | 2023-03-31 | 2022-12-31 | 2022-09-30 | 2022-06-30 | 2022-03-31 | 2021-12-31 | 2021-09-30 | 2021-06-30 | 2021-03-31 | 2020-12-31 | 2020-09-30 | 2020-06-30 | 2020-03-31 | 2019-12-31 | 2019-09-30 | 2019-06-30 | 2019-03-31 | 2018-12-31 | 2018-09-30 | 2018-06-30 | 2018-03-31 | 2017-12-31 | 2017-09-30 | 2017-06-30 | 2017-03-31 | 2016-12-31 | 2016-09-30 | 2016-06-30 | 2016-03-31 | 2015-12-31 | 2015-09-30 | 2015-06-30 | 2015-03-31 | 2014-12-31 | 2014-09-30 | 2014-06-30 | 2014-03-31 | 2013-12-31 | 2013-09-30 | 2013-06-30 | 2013-03-31 | 2012-12-31 | 2012-09-30 | 2012-06-30 | 2012-03-31 | 2011-12-31 | 2011-09-30 | 2011-06-30 | 2010-12-31 | ||
|---|---|---|---|---|---|---|---|---|---|---|---|---|---|---|---|---|---|---|---|---|---|---|---|---|---|---|---|---|---|---|---|---|---|---|---|---|---|---|---|---|---|---|---|---|---|---|---|---|---|---|---|---|---|
| Net Cash Provided By Used In Investing Activities | -389.08 | -114.49 | -525.91 | -278.30 | -471.66 | -149.93 | -463.90 | -298.29 | -36.55 | 171.74 | -56.47 | -101.84 | 111.10 | 18.76 | -679.03 | -153.65 | -80.76 | -101.75 | -249.24 | 53.23 | -101.81 | -19.19 | -96.58 | -114.03 | -114.86 | -124.95 | -33.13 | -39.51 | -87.19 | -147.17 | -47.52 | -76.18 | -119.51 | -123.83 | -104.00 | 10.09 | -81.66 | -48.61 | -45.48 | -37.08 | -37.91 | 0.43 | 5.90 | 207.66 | -92.25 | 1.56 | -39.99 | 124.40 | -64.87 | 162.02 | -16.36 | -77.15 | |
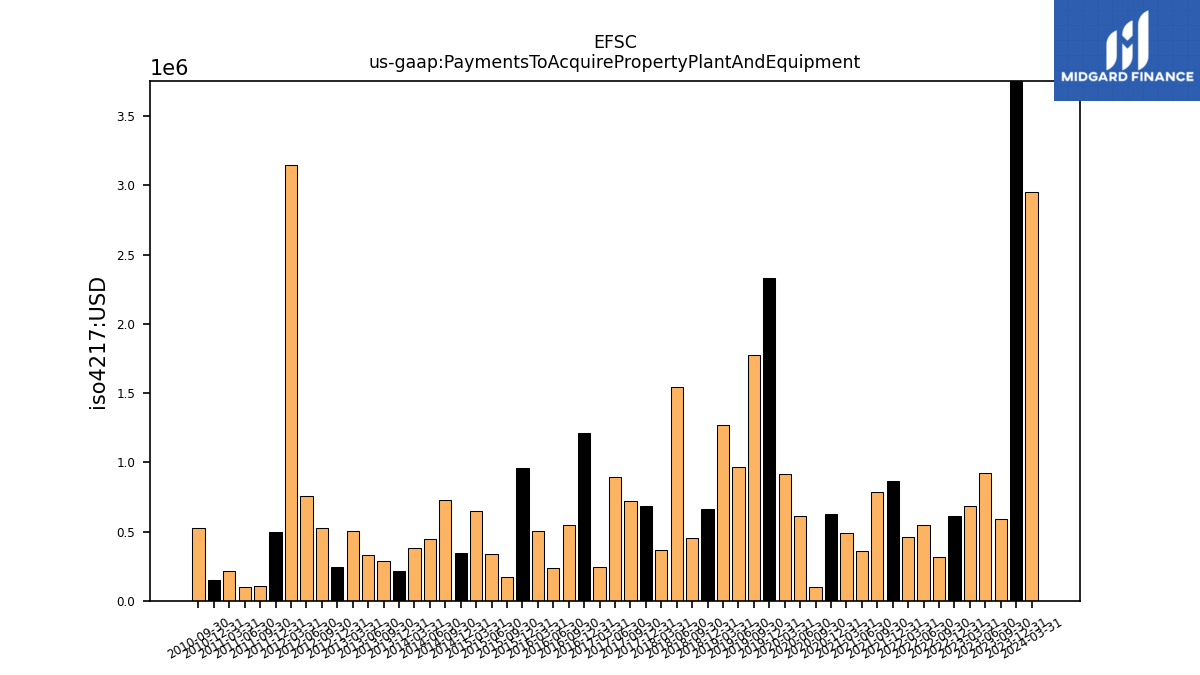
| Payments To Acquire Property Plant And Equipment | 4.36 | 0.59 | 0.92 | 0.68 | 0.61 | 0.32 | 0.55 | 0.46 | 0.86 | 0.79 | 0.36 | 0.49 | 0.63 | 0.10 | 0.61 | 0.92 | 2.33 | 1.77 | 0.97 | 1.27 | 0.67 | 0.45 | 1.54 | 0.37 | 0.68 | 0.72 | 0.89 | 0.25 | 1.21 | 0.54 | 0.23 | 0.51 | 0.96 | 0.17 | 0.34 | 0.65 | 0.34 | 0.73 | 0.45 | 0.38 | 0.22 | 0.29 | 0.33 | 0.50 | 0.24 | 0.53 | 0.76 | 3.15 | 0.49 | 0.11 | 0.10 | 0.15 |
| 2023-12-31 | 2023-09-30 | 2023-06-30 | 2023-03-31 | 2022-12-31 | 2022-09-30 | 2022-06-30 | 2022-03-31 | 2021-12-31 | 2021-09-30 | 2021-06-30 | 2021-03-31 | 2020-12-31 | 2020-09-30 | 2020-06-30 | 2020-03-31 | 2019-12-31 | 2019-09-30 | 2019-06-30 | 2019-03-31 | 2018-12-31 | 2018-09-30 | 2018-06-30 | 2018-03-31 | 2017-12-31 | 2017-09-30 | 2017-06-30 | 2017-03-31 | 2016-12-31 | 2016-09-30 | 2016-06-30 | 2016-03-31 | 2015-12-31 | 2015-09-30 | 2015-06-30 | 2015-03-31 | 2014-12-31 | 2014-09-30 | 2014-06-30 | 2014-03-31 | 2013-12-31 | 2013-09-30 | 2013-06-30 | 2013-03-31 | 2012-12-31 | 2012-09-30 | 2012-06-30 | 2012-03-31 | 2011-12-31 | 2011-09-30 | 2011-06-30 | 2010-12-31 | ||
|---|---|---|---|---|---|---|---|---|---|---|---|---|---|---|---|---|---|---|---|---|---|---|---|---|---|---|---|---|---|---|---|---|---|---|---|---|---|---|---|---|---|---|---|---|---|---|---|---|---|---|---|---|---|
| Net Cash Provided By Used In Financing Activities | 372.43 | 113.70 | 492.24 | 202.85 | -10.64 | -123.10 | -637.48 | 208.04 | 614.00 | 167.92 | 112.98 | 451.63 | -0.88 | -16.66 | 817.78 | 137.52 | -34.37 | 122.85 | 212.31 | -44.02 | 93.36 | -10.00 | 101.08 | 81.59 | 52.90 | 169.03 | -81.45 | 80.69 | 113.05 | 134.95 | 48.04 | 84.14 | 79.60 | 129.39 | 84.38 | -9.84 | 57.37 | 24.72 | 17.82 | -28.45 | 129.94 | -3.16 | -33.60 | -204.37 | 123.50 | -3.43 | -70.71 | -152.22 | -16.63 | -94.60 | -2.61 | 297.53 | |
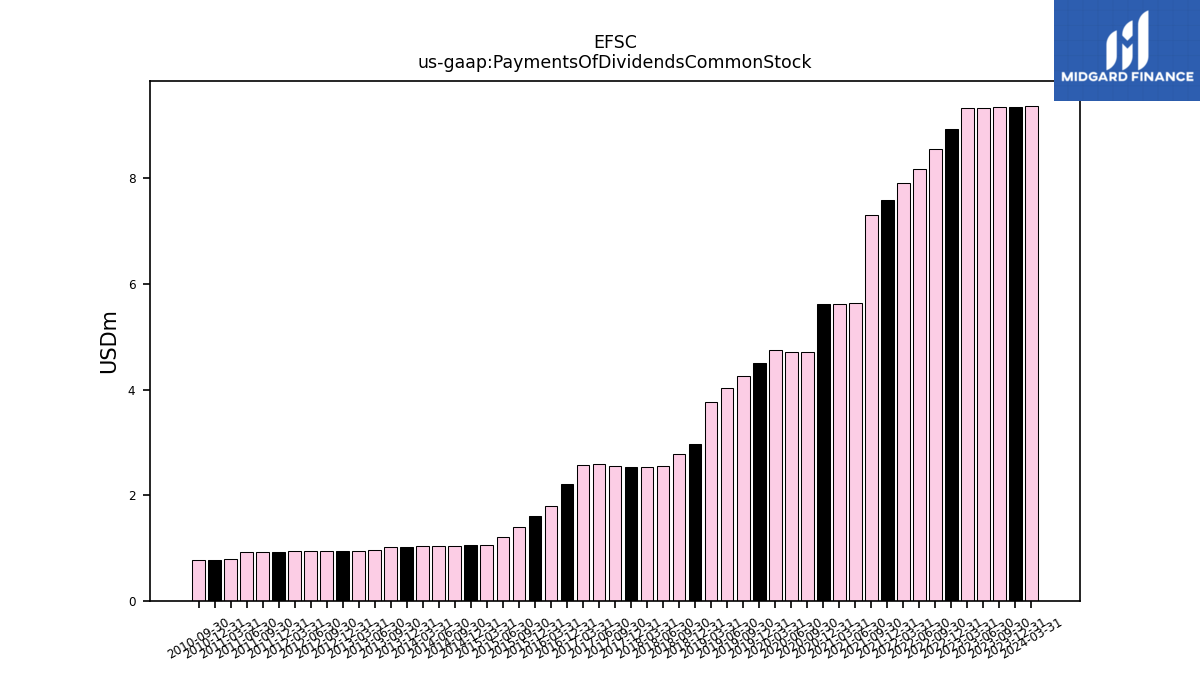
| Payments Of Dividends Common Stock | 9.35 | 9.35 | 9.34 | 9.33 | 8.94 | 8.56 | 8.19 | 7.92 | 7.59 | 7.30 | 5.63 | 5.63 | 5.62 | 4.72 | 4.71 | 4.74 | 4.51 | 4.26 | 4.04 | 3.76 | 2.98 | 2.78 | 2.54 | 2.54 | 2.54 | 2.55 | 2.58 | 2.58 | 2.21 | NA | NA | 1.80 | 1.60 | 1.40 | 1.20 | 1.05 | 1.05 | 1.04 | 1.04 | 1.04 | 1.02 | 1.02 | 0.96 | 0.95 | 0.94 | 0.94 | 0.94 | 0.93 | 0.93 | 0.93 | 0.93 | 0.78 |