
| 2023-12-31 | 2023-09-30 | 2023-06-30 | 2023-03-31 | 2022-12-31 | 2022-09-30 | 2022-06-30 | 2022-03-31 | 2021-12-31 | 2021-09-30 | 2021-06-30 | 2021-03-31 | 2020-12-31 | 2020-09-30 | 2020-06-30 | 2020-03-31 | 2019-12-31 | 2019-09-30 | 2019-06-30 | 2019-03-31 | 2018-12-31 | 2018-09-30 | 2018-06-30 | 2018-03-31 | 2017-12-31 | 2017-09-30 | 2017-06-30 | 2017-03-31 | 2016-12-31 | 2016-09-30 | 2016-06-30 | 2016-03-31 | 2015-12-31 | 2015-09-30 | 2015-06-30 | 2015-03-31 | 2014-12-31 | 2014-09-30 | 2014-06-30 | 2014-03-31 | 2013-12-31 | 2013-09-30 | 2013-06-30 | 2013-03-31 | 2012-12-31 | 2012-09-30 | 2012-06-30 | 2012-03-31 | 2011-12-31 | 2011-09-30 | 2011-06-30 | 2011-03-31 | 2010-12-31 | 2010-09-30 | 2010-06-30 | 2010-03-31 | ||
|---|---|---|---|---|---|---|---|---|---|---|---|---|---|---|---|---|---|---|---|---|---|---|---|---|---|---|---|---|---|---|---|---|---|---|---|---|---|---|---|---|---|---|---|---|---|---|---|---|---|---|---|---|---|---|---|---|---|
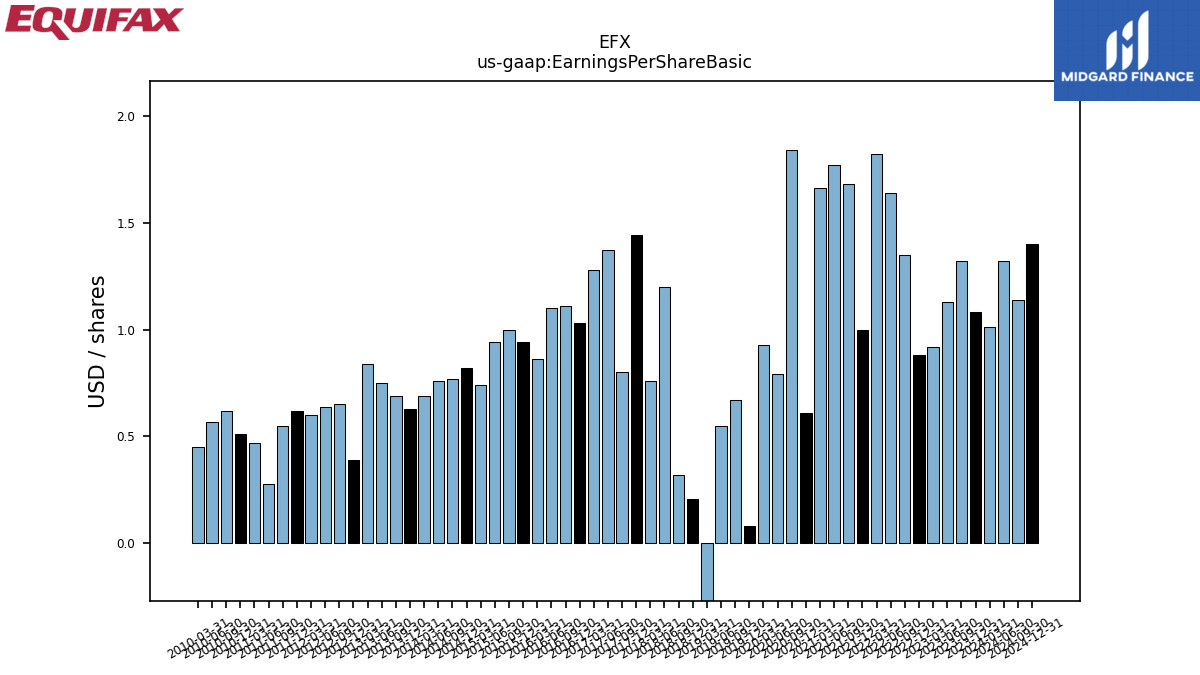
| Earnings Per Share Basic | 1.08 | 1.32 | 1.13 | 0.92 | 0.88 | 1.35 | 1.64 | 1.82 | 1.00 | 1.68 | 1.77 | 1.66 | 0.61 | 1.84 | 0.79 | 0.93 | 0.08 | 0.67 | 0.55 | -4.60 | 0.21 | 0.32 | 1.20 | 0.76 | 1.44 | 0.80 | 1.37 | 1.28 | 1.03 | 1.11 | 1.10 | 0.86 | 0.94 | 1.00 | 0.94 | 0.74 | 0.82 | 0.77 | 0.76 | 0.69 | 0.63 | 0.69 | 0.75 | 0.84 | 0.39 | 0.65 | 0.64 | 0.60 | 0.62 | 0.55 | 0.28 | 0.47 | 0.51 | 0.62 | 0.57 | 0.45 | |
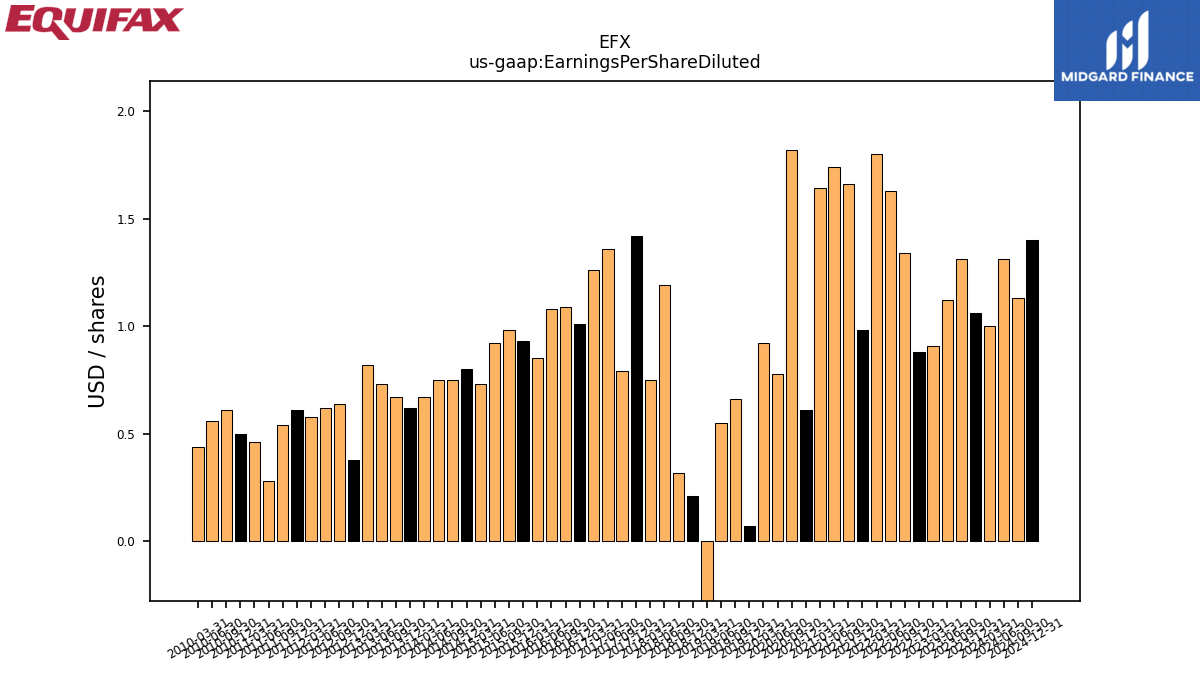
| Earnings Per Share Diluted | 1.06 | 1.31 | 1.12 | 0.91 | 0.88 | 1.34 | 1.63 | 1.80 | 0.98 | 1.66 | 1.74 | 1.64 | 0.61 | 1.82 | 0.78 | 0.92 | 0.07 | 0.66 | 0.55 | -4.57 | 0.21 | 0.32 | 1.19 | 0.75 | 1.42 | 0.79 | 1.36 | 1.26 | 1.01 | 1.09 | 1.08 | 0.85 | 0.93 | 0.98 | 0.92 | 0.73 | 0.80 | 0.75 | 0.75 | 0.67 | 0.62 | 0.67 | 0.73 | 0.82 | 0.38 | 0.64 | 0.62 | 0.58 | 0.61 | 0.54 | 0.28 | 0.46 | 0.50 | 0.61 | 0.56 | 0.44 |
| 2023-12-31 | 2023-09-30 | 2023-06-30 | 2023-03-31 | 2022-12-31 | 2022-09-30 | 2022-06-30 | 2022-03-31 | 2021-12-31 | 2021-09-30 | 2021-06-30 | 2021-03-31 | 2020-12-31 | 2020-09-30 | 2020-06-30 | 2020-03-31 | 2019-12-31 | 2019-09-30 | 2019-06-30 | 2019-03-31 | 2018-12-31 | 2018-09-30 | 2018-06-30 | 2018-03-31 | 2017-12-31 | 2017-09-30 | 2017-06-30 | 2017-03-31 | 2016-12-31 | 2016-09-30 | 2016-06-30 | 2016-03-31 | 2015-12-31 | 2015-09-30 | 2015-06-30 | 2015-03-31 | 2014-12-31 | 2014-09-30 | 2014-06-30 | 2014-03-31 | 2013-12-31 | 2013-09-30 | 2013-06-30 | 2013-03-31 | 2012-12-31 | 2012-09-30 | 2012-06-30 | 2012-03-31 | 2011-12-31 | 2011-09-30 | 2011-06-30 | 2011-03-31 | 2010-12-31 | 2010-09-30 | 2010-06-30 | 2010-03-31 | ||
|---|---|---|---|---|---|---|---|---|---|---|---|---|---|---|---|---|---|---|---|---|---|---|---|---|---|---|---|---|---|---|---|---|---|---|---|---|---|---|---|---|---|---|---|---|---|---|---|---|---|---|---|---|---|---|---|---|---|
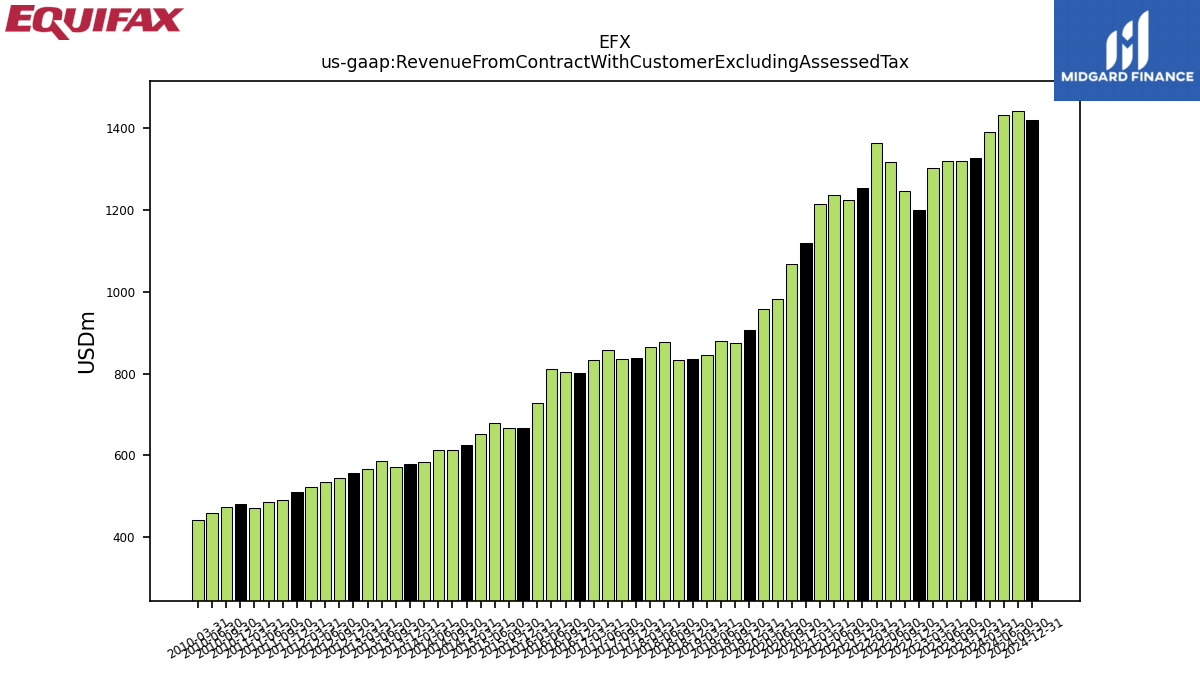
| Revenue From Contract With Customer Excluding Assessed Tax | 1326.50 | 1319.10 | 1317.60 | 1302.00 | 1197.90 | 1244.30 | 1316.70 | 1363.20 | 1253.20 | 1222.90 | 1234.80 | 1213.00 | 1118.50 | 1068.30 | 982.80 | 957.90 | 905.80 | 875.70 | 880.00 | 846.10 | 835.30 | 834.20 | 876.90 | 865.70 | 838.50 | 834.80 | 856.70 | 832.20 | 801.10 | 804.10 | 811.30 | 728.30 | 666.30 | 667.40 | 678.10 | 651.80 | 624.60 | 613.40 | 613.90 | 584.50 | 578.50 | 572.00 | 586.90 | 566.50 | 558.10 | 543.90 | 535.80 | 522.70 | 509.70 | 490.40 | 487.10 | 472.60 | 482.00 | 473.80 | 460.70 | 443.00 | |
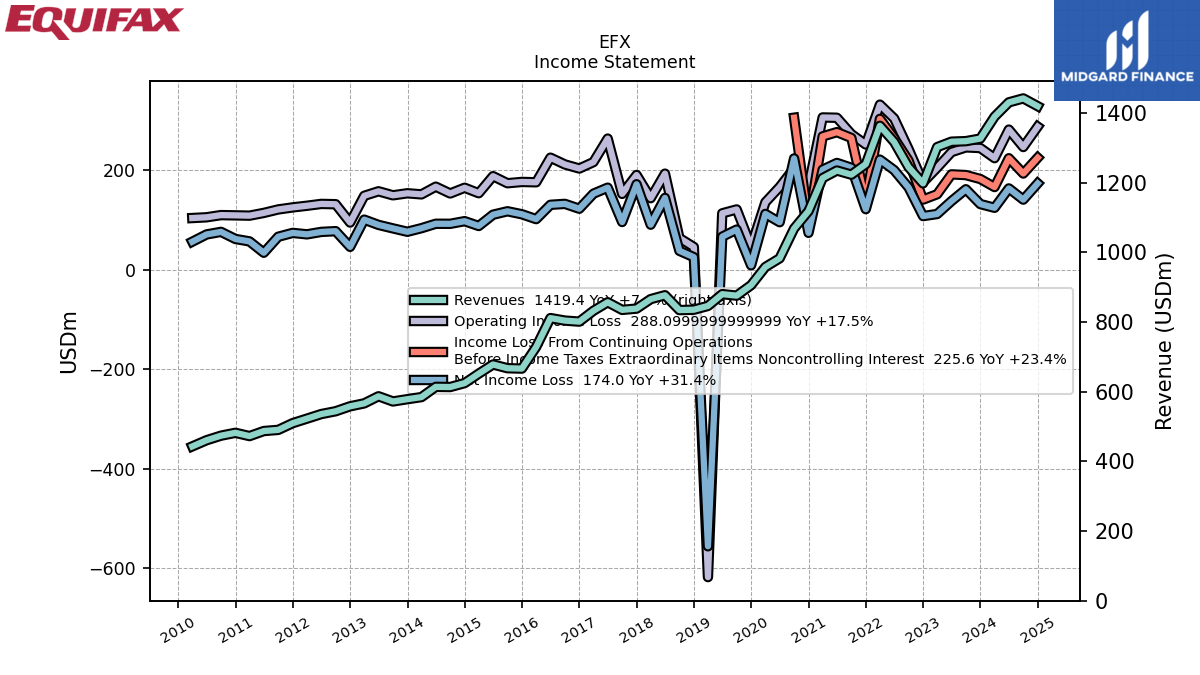
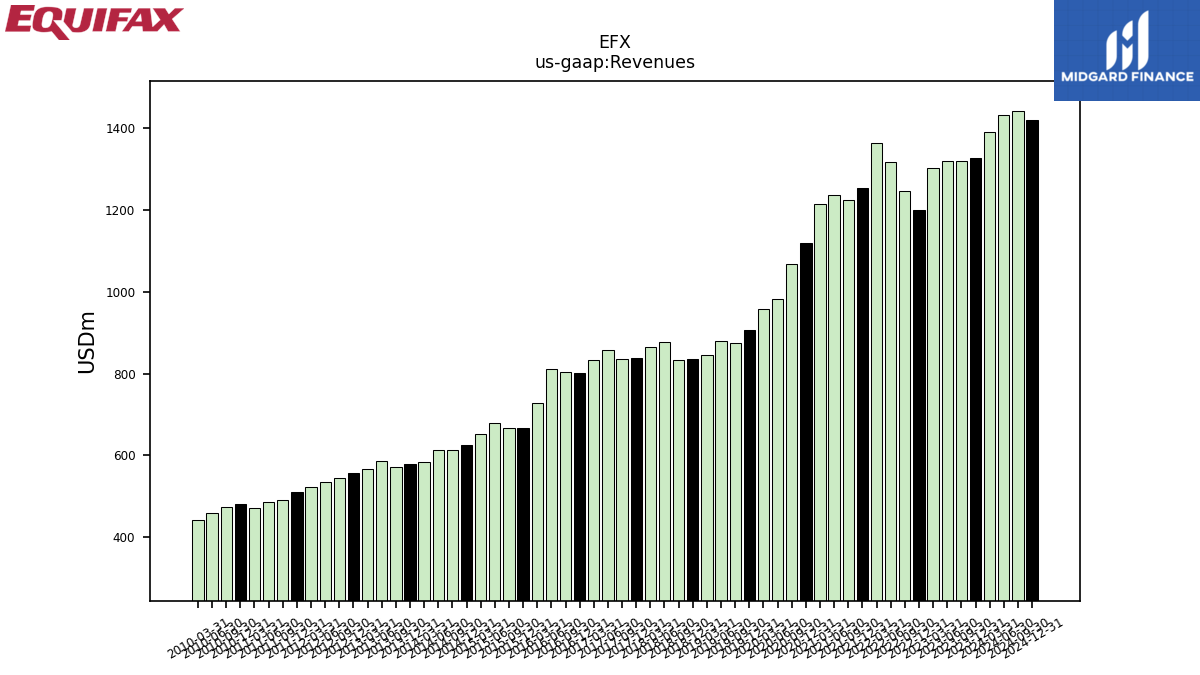
| Revenues | 1326.50 | 1319.10 | 1317.60 | 1302.00 | 1197.90 | 1244.30 | 1316.70 | 1363.20 | 1253.20 | 1222.90 | 1234.80 | 1213.00 | 1118.50 | 1068.30 | 982.80 | 957.90 | 905.80 | 875.70 | 880.00 | 846.10 | 835.30 | 834.20 | 876.90 | 865.70 | 838.50 | 834.80 | 856.70 | 832.20 | 801.10 | 804.10 | 811.30 | 728.30 | 666.30 | 667.40 | 678.10 | 651.80 | 624.60 | 613.40 | 613.90 | 584.50 | 578.50 | 572.00 | 586.90 | 566.50 | 558.10 | 543.90 | 535.80 | 522.70 | 509.70 | 490.40 | 487.10 | 472.60 | 482.00 | 473.80 | 460.70 | 443.00 | |
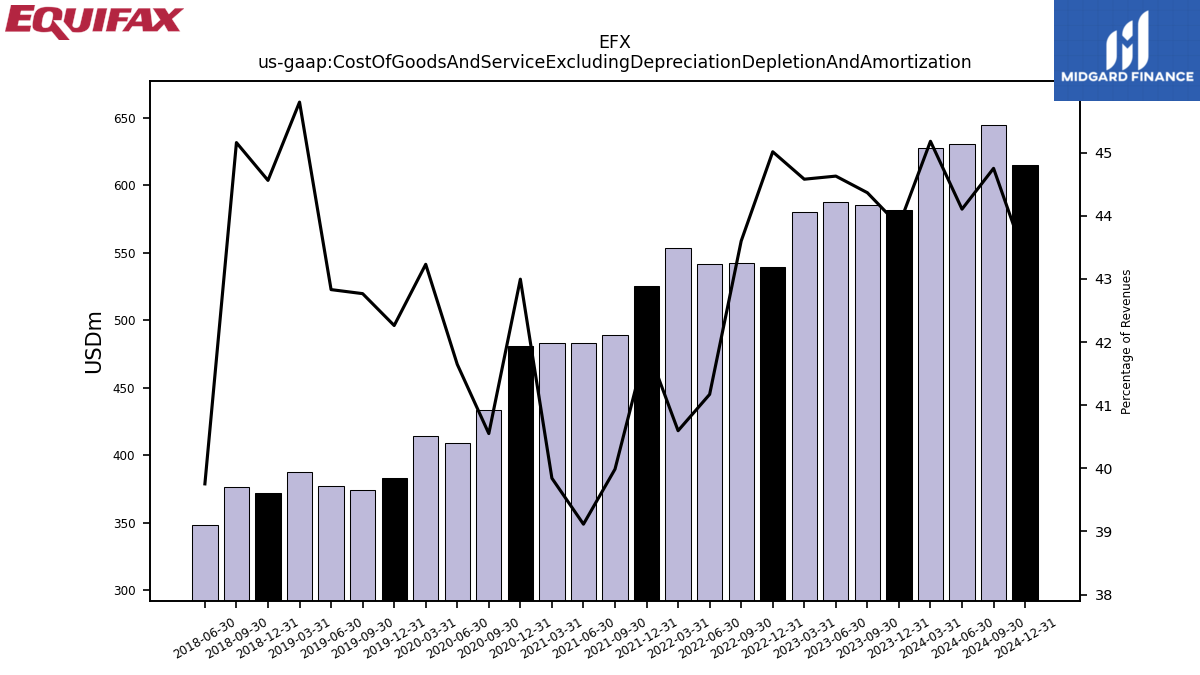
| Cost Of Goods And Service Excluding Depreciation Depletion And Amortization | 581.60 | 585.20 | 588.00 | 580.40 | 539.20 | 542.50 | 542.10 | 553.40 | 525.60 | 489.00 | 483.00 | 483.30 | 480.90 | 433.20 | 409.30 | 414.10 | 382.80 | 374.50 | 376.90 | 387.50 | 372.20 | 376.70 | 348.60 | NA | NA | NA | NA | NA | NA | NA | NA | NA | NA | NA | NA | NA | NA | NA | NA | NA | NA | NA | NA | NA | NA | NA | NA | NA | NA | NA | NA | NA | NA | NA | NA | NA | |
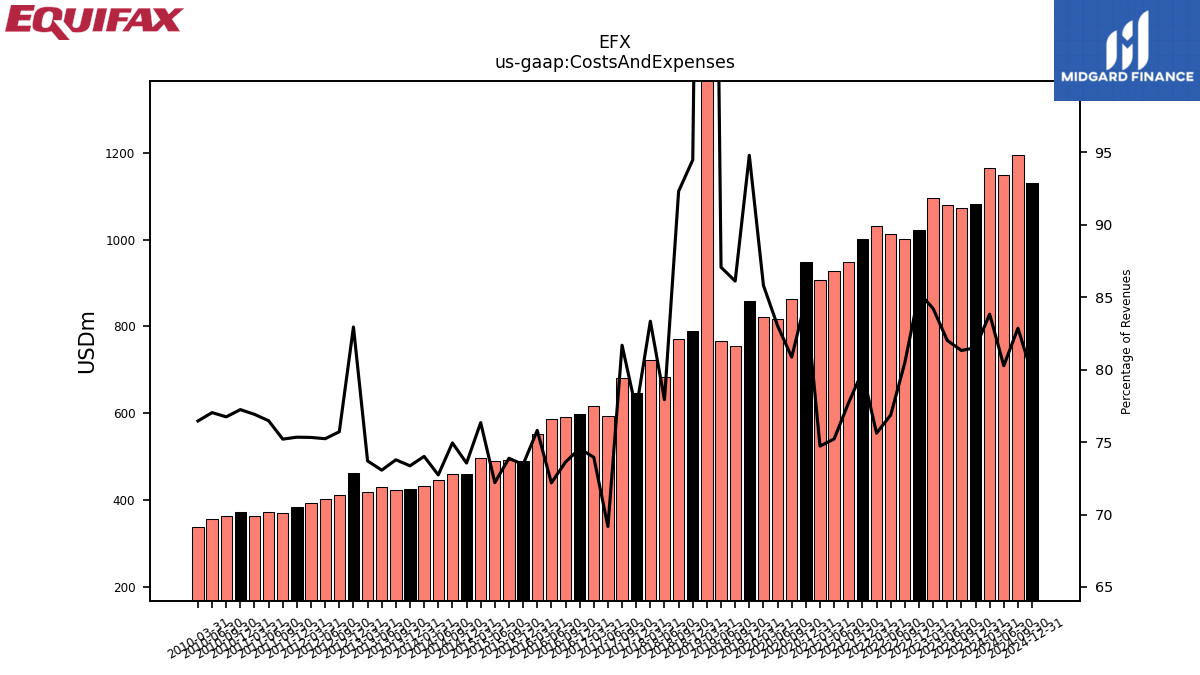
| Costs And Expenses | 1081.40 | 1072.70 | 1080.70 | 1096.60 | 1021.90 | 1001.40 | 1012.10 | 1030.80 | 1001.00 | 949.70 | 928.80 | 906.40 | 949.00 | 863.90 | 816.00 | 822.00 | 858.70 | 754.10 | 766.20 | 1464.00 | 789.20 | 770.10 | 683.30 | 721.50 | 647.60 | 681.90 | 592.60 | 615.40 | 597.20 | 592.00 | 585.60 | 552.10 | 489.40 | 493.10 | 489.60 | 497.60 | 459.40 | 459.70 | 446.50 | 432.60 | 424.40 | 422.00 | 428.80 | 417.50 | 462.90 | 411.80 | 403.10 | 393.70 | 384.00 | 368.80 | 372.50 | 363.50 | 372.30 | 363.60 | 354.90 | 338.70 | |
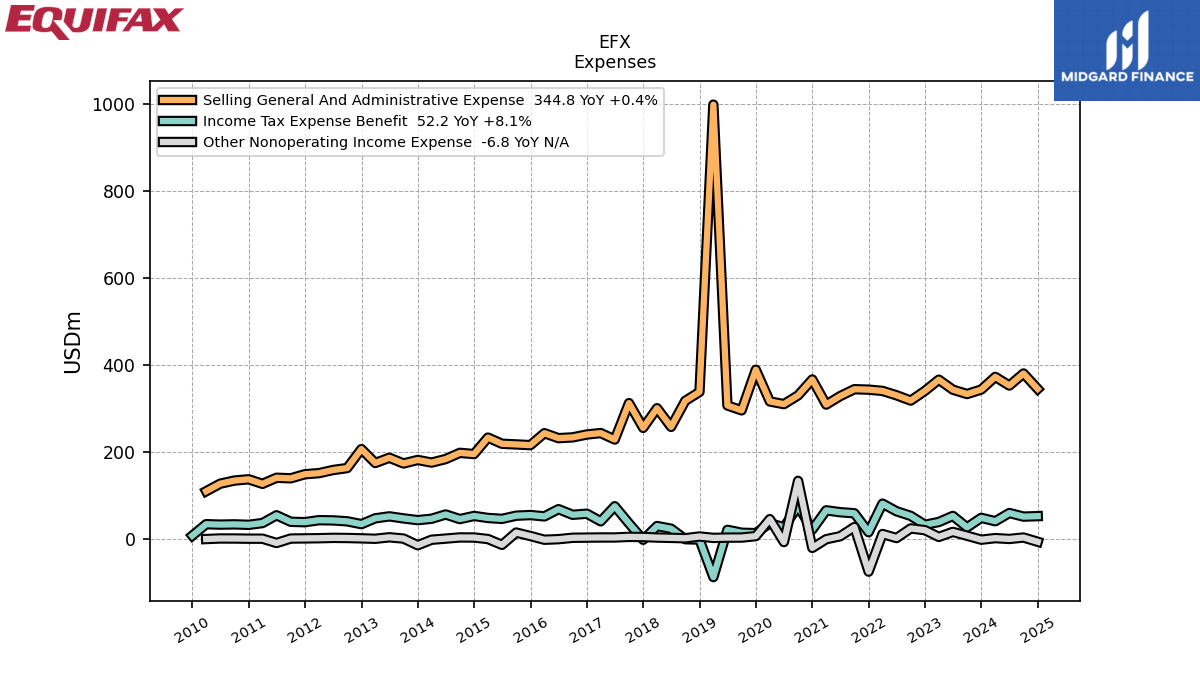
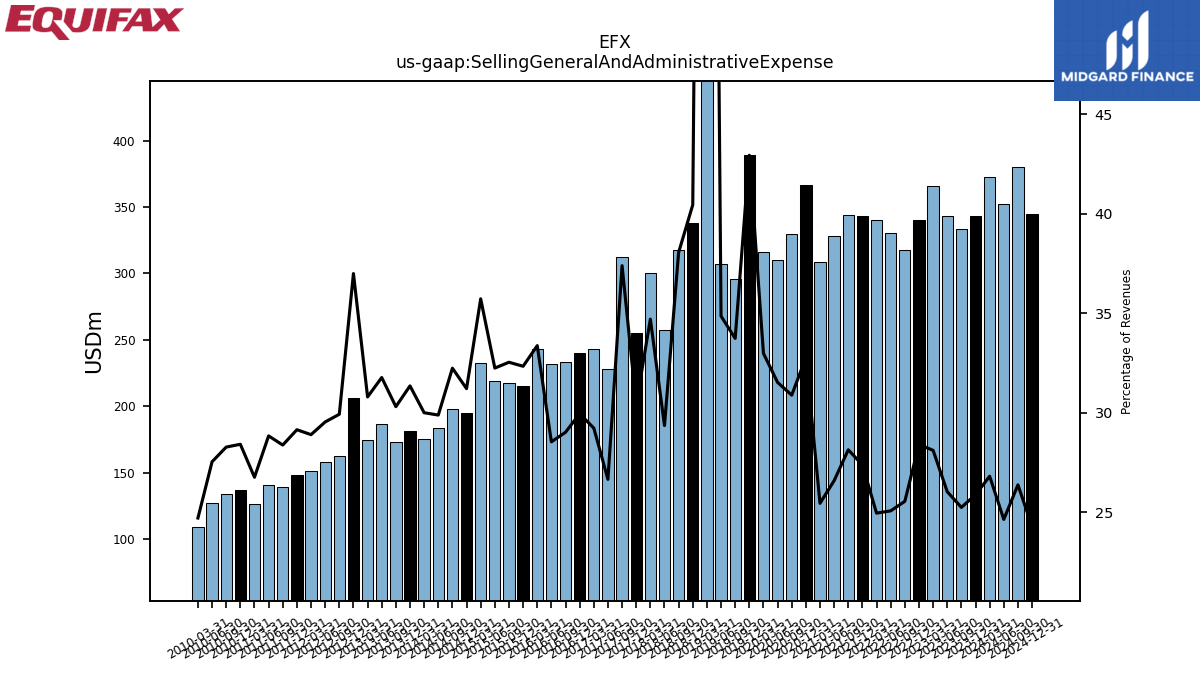
| Selling General And Administrative Expense | 343.40 | 333.10 | 343.10 | 366.10 | 340.40 | 318.00 | 330.20 | 340.30 | 343.20 | 344.20 | 328.40 | 308.80 | 366.60 | 330.00 | 309.90 | 316.00 | 389.00 | 295.50 | 306.80 | 998.90 | 337.90 | 317.50 | 257.50 | 300.50 | 255.20 | 312.20 | 228.40 | 243.30 | 240.00 | 233.40 | 231.60 | 243.10 | 215.50 | 217.20 | 218.70 | 232.90 | 195.00 | 197.80 | 183.50 | 175.40 | 181.40 | 173.40 | 186.50 | 174.50 | 206.50 | 162.80 | 158.30 | 151.10 | 148.60 | 139.20 | 140.50 | 126.50 | 137.00 | 134.00 | 126.90 | 109.50 | |
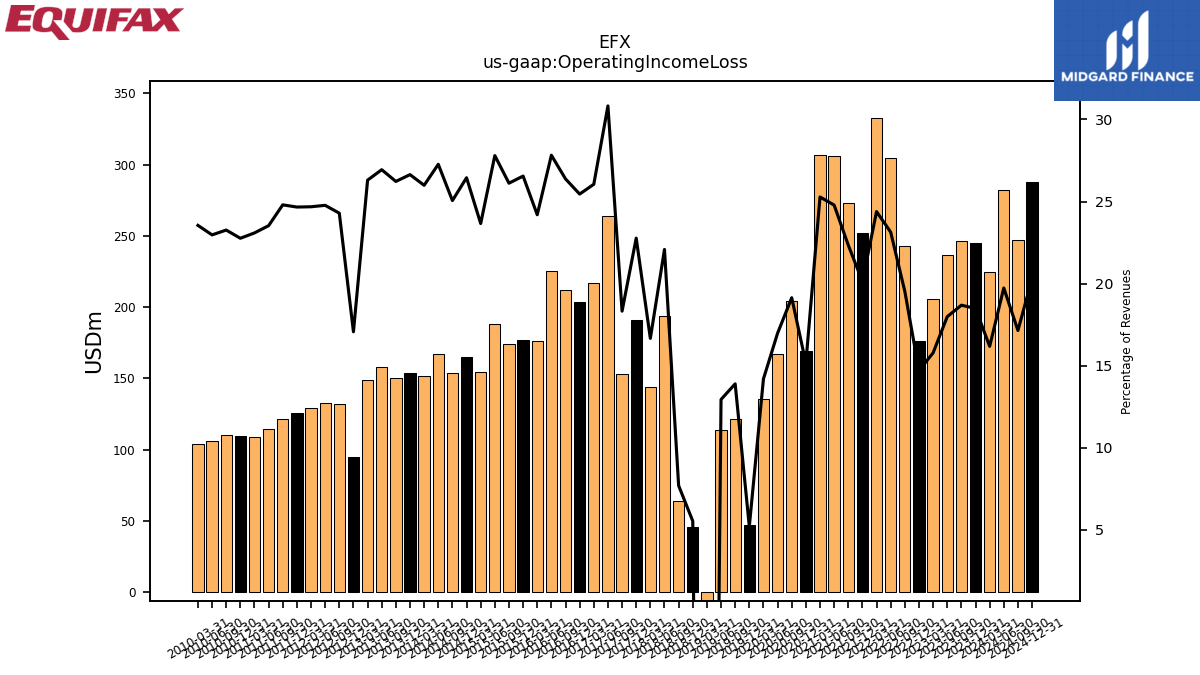
| Operating Income Loss | 245.10 | 246.40 | 236.90 | 205.40 | 176.00 | 242.90 | 304.60 | 332.40 | 252.20 | 273.20 | 306.00 | 306.60 | 169.50 | 204.40 | 166.80 | 135.90 | 47.00 | 121.60 | 113.80 | -617.90 | 46.10 | 64.10 | 193.60 | 144.20 | 190.90 | 152.90 | 264.10 | 216.80 | 203.90 | 212.10 | 225.70 | 176.20 | 176.90 | 174.30 | 188.50 | 154.20 | 165.20 | 153.70 | 167.40 | 151.90 | 154.10 | 150.00 | 158.10 | 149.00 | 95.20 | 132.10 | 132.70 | 129.00 | 125.70 | 121.60 | 114.60 | 109.10 | 109.70 | 110.20 | 105.80 | 104.30 | |
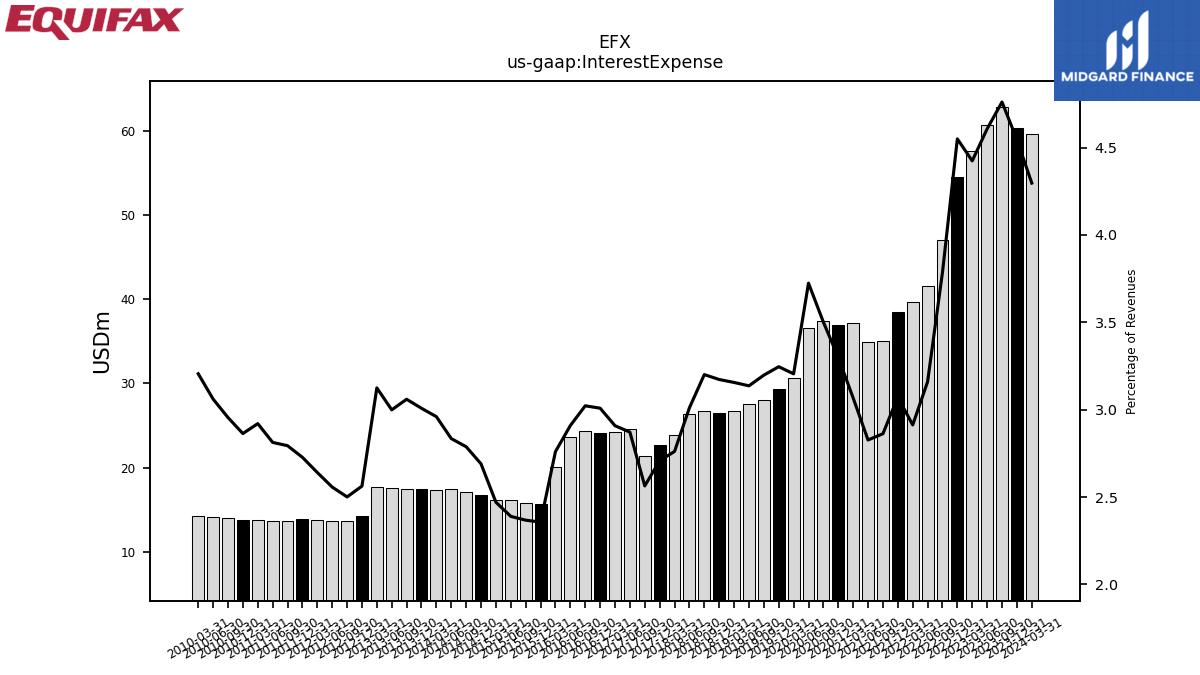
| Interest Expense | 60.30 | 62.80 | 60.70 | 57.60 | 54.50 | 47.10 | 41.60 | 39.70 | 38.50 | 35.00 | 34.90 | 37.20 | 36.90 | 37.40 | 36.60 | 30.70 | 29.40 | 28.00 | 27.60 | 26.70 | 26.50 | 26.70 | 26.40 | 23.90 | 22.70 | 21.40 | 24.60 | 24.20 | 24.10 | 24.30 | 23.60 | 20.10 | 15.70 | 15.80 | 16.20 | 16.10 | 16.80 | 17.10 | 17.40 | 17.30 | 17.40 | 17.50 | 17.60 | 17.70 | 14.30 | 13.60 | 13.70 | 13.80 | 13.90 | 13.70 | 13.70 | 13.80 | 13.80 | 14.00 | 14.10 | 14.20 | |
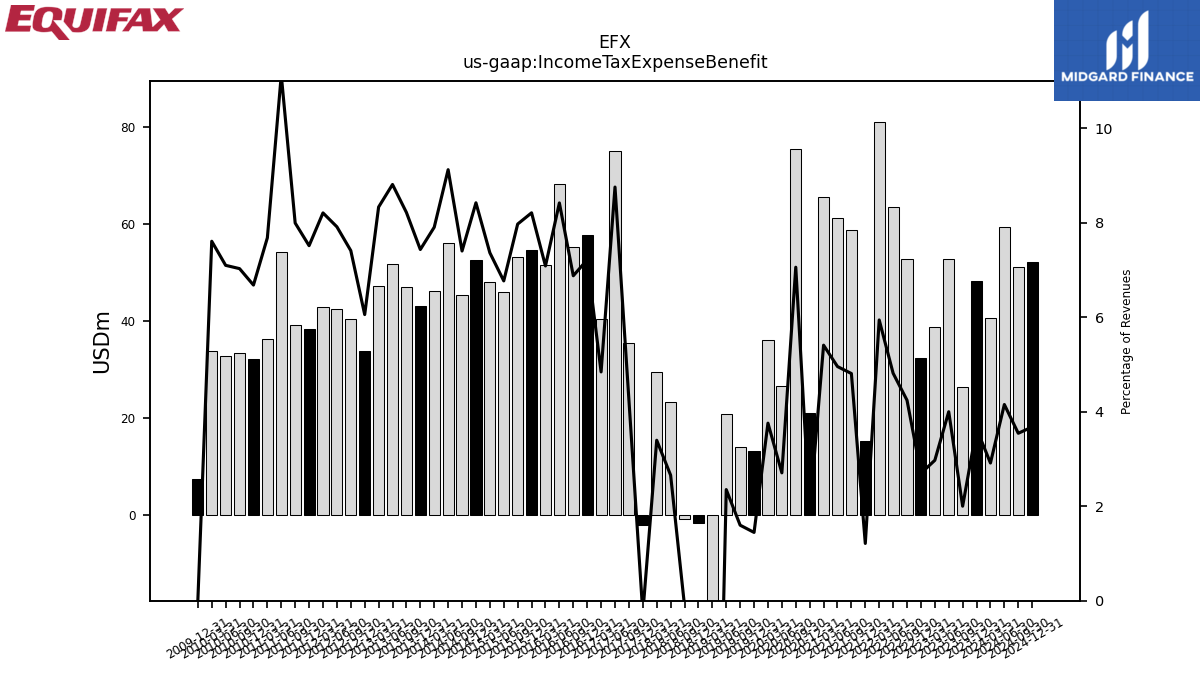
| Income Tax Expense Benefit | 48.30 | 26.40 | 52.70 | 38.70 | 32.30 | 52.80 | 63.40 | 81.00 | 15.20 | 58.80 | 61.20 | 65.60 | 21.00 | 75.40 | 26.60 | 36.00 | 13.10 | 14.00 | 20.70 | -88.10 | -1.70 | -0.90 | 23.30 | 29.40 | -2.20 | 35.50 | 75.00 | 40.30 | 57.80 | 55.30 | 68.30 | 51.60 | 54.70 | 53.20 | 45.90 | 48.00 | 52.60 | 45.40 | 56.00 | 46.20 | 43.00 | 47.00 | 51.70 | 47.20 | 33.80 | 40.30 | 42.40 | 42.90 | 38.30 | 39.20 | 54.20 | 36.30 | 32.20 | 33.30 | 32.70 | 33.70 | |
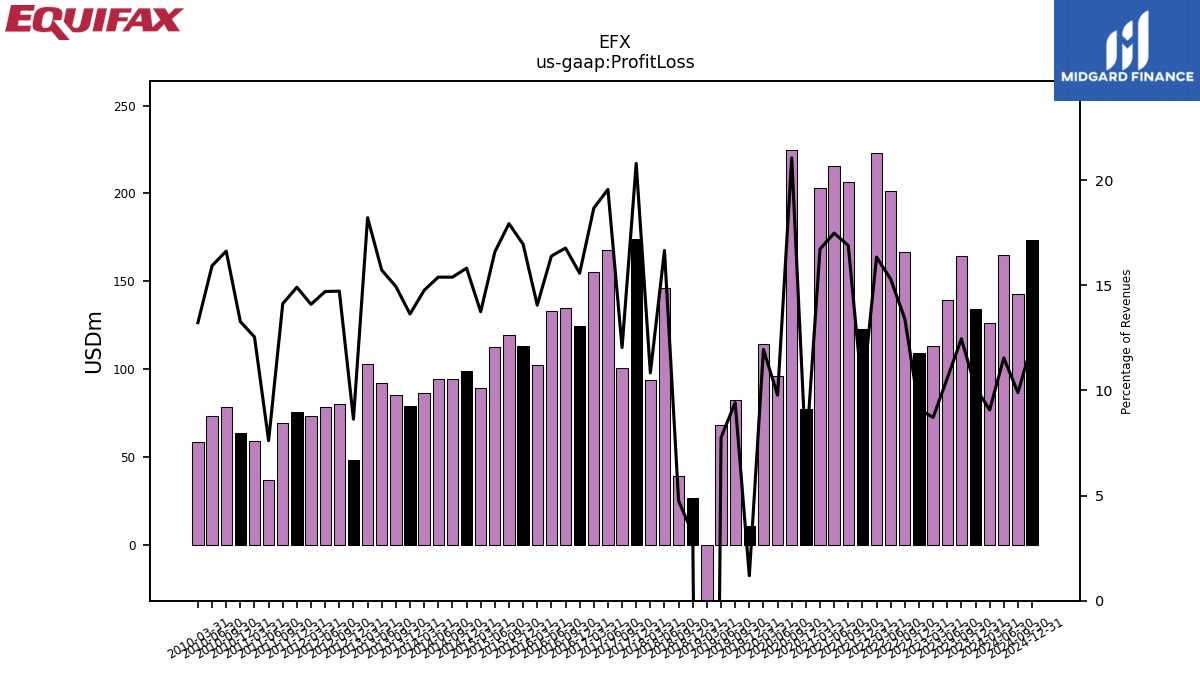
| Profit Loss | 134.50 | 164.30 | 139.40 | 113.50 | 109.10 | 166.90 | 201.40 | 222.80 | 123.00 | 206.60 | 215.90 | 202.90 | 77.70 | 225.00 | 96.10 | 114.50 | 10.80 | 82.50 | 68.30 | -554.40 | 26.70 | 39.60 | 146.10 | 93.80 | 174.40 | 100.50 | 167.60 | 155.40 | 124.80 | 134.90 | 133.00 | 102.40 | 113.00 | 119.70 | 112.50 | 89.60 | 98.80 | 94.40 | 94.50 | 86.30 | 78.90 | 85.50 | 92.30 | 103.20 | 48.20 | 80.10 | 78.80 | 73.70 | 76.00 | 69.30 | 37.10 | 59.30 | 64.00 | 78.80 | 73.40 | 58.60 | |
| Other Comprehensive Income Loss Net Of Tax | 134.70 | -120.60 | 15.00 | 12.90 | 122.50 | -182.30 | -196.60 | 77.40 | -39.60 | -100.10 | 4.10 | 11.10 | 182.60 | 53.40 | 237.70 | -289.50 | 86.90 | -78.90 | -55.10 | 41.20 | -52.10 | -40.10 | -142.00 | 46.90 | -50.30 | 94.90 | 9.70 | 115.90 | -167.30 | 84.50 | -64.80 | 100.50 | -10.20 | -31.00 | 20.70 | -36.00 | -102.30 | -35.80 | 17.00 | -4.50 | 57.50 | 8.80 | -12.70 | -7.10 | -221.70 | 98.10 | NA | NA | -236.10 | 43.50 | NA | NA | NA | NA | NA | NA | |
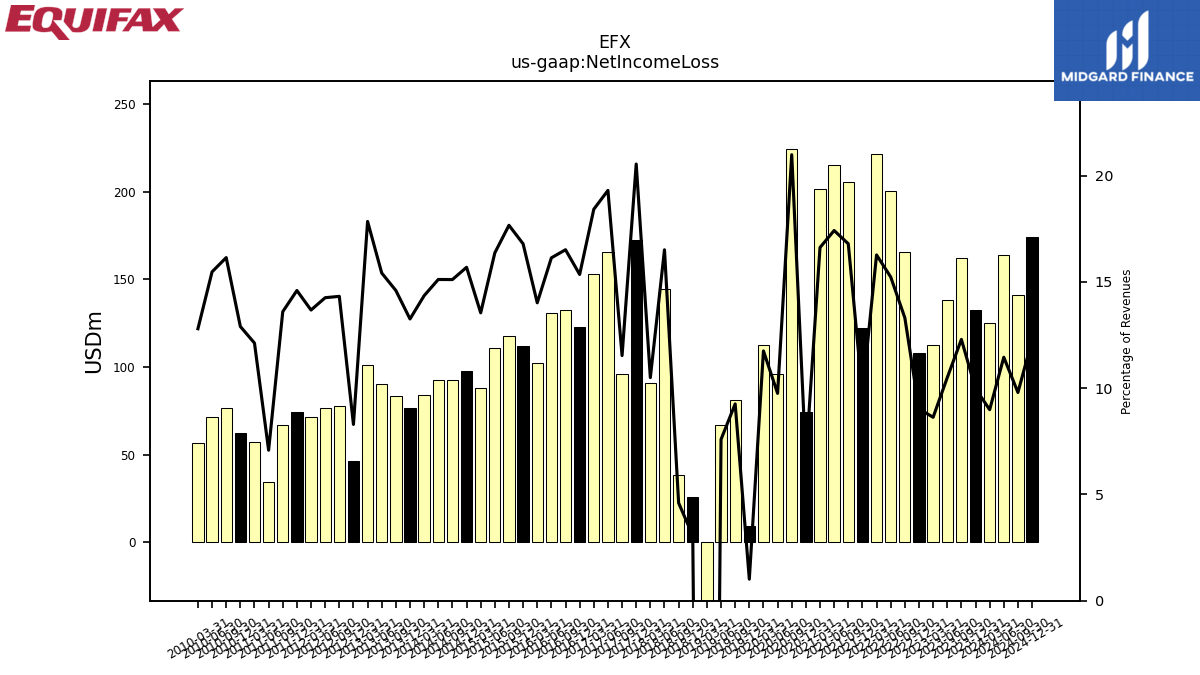
| Net Income Loss | 132.40 | 162.20 | 138.30 | 112.40 | 108.20 | 165.70 | 200.60 | 221.80 | 122.10 | 205.40 | 215.10 | 201.60 | 74.50 | 224.20 | 95.90 | 112.60 | 9.20 | 81.10 | 66.80 | -555.90 | 25.60 | 38.40 | 144.80 | 90.90 | 172.30 | 96.30 | 165.40 | 153.30 | 123.00 | 132.80 | 130.90 | 102.10 | 111.90 | 117.90 | 111.00 | 88.30 | 98.00 | 92.70 | 92.80 | 83.90 | 76.70 | 83.50 | 90.50 | 101.10 | 46.30 | 77.90 | 76.40 | 71.50 | 74.40 | 66.70 | 34.50 | 57.30 | 62.20 | 76.50 | 71.30 | 56.70 |
| 2023-12-31 | 2023-09-30 | 2023-06-30 | 2023-03-31 | 2022-12-31 | 2022-09-30 | 2022-06-30 | 2022-03-31 | 2021-12-31 | 2021-09-30 | 2021-06-30 | 2021-03-31 | 2020-12-31 | 2020-09-30 | 2020-06-30 | 2020-03-31 | 2019-12-31 | 2019-09-30 | 2019-06-30 | 2019-03-31 | 2018-12-31 | 2018-09-30 | 2018-06-30 | 2018-03-31 | 2017-12-31 | 2017-09-30 | 2017-06-30 | 2017-03-31 | 2016-12-31 | 2016-09-30 | 2016-06-30 | 2016-03-31 | 2015-12-31 | 2015-09-30 | 2015-06-30 | 2015-03-31 | 2014-12-31 | 2014-09-30 | 2014-06-30 | 2014-03-31 | 2013-12-31 | 2013-09-30 | 2013-06-30 | 2013-03-31 | 2012-12-31 | 2012-09-30 | 2012-06-30 | 2012-03-31 | 2011-12-31 | 2011-09-30 | 2011-06-30 | 2011-03-31 | 2010-12-31 | 2010-09-30 | 2010-06-30 | 2010-03-31 | ||
|---|---|---|---|---|---|---|---|---|---|---|---|---|---|---|---|---|---|---|---|---|---|---|---|---|---|---|---|---|---|---|---|---|---|---|---|---|---|---|---|---|---|---|---|---|---|---|---|---|---|---|---|---|---|---|---|---|---|
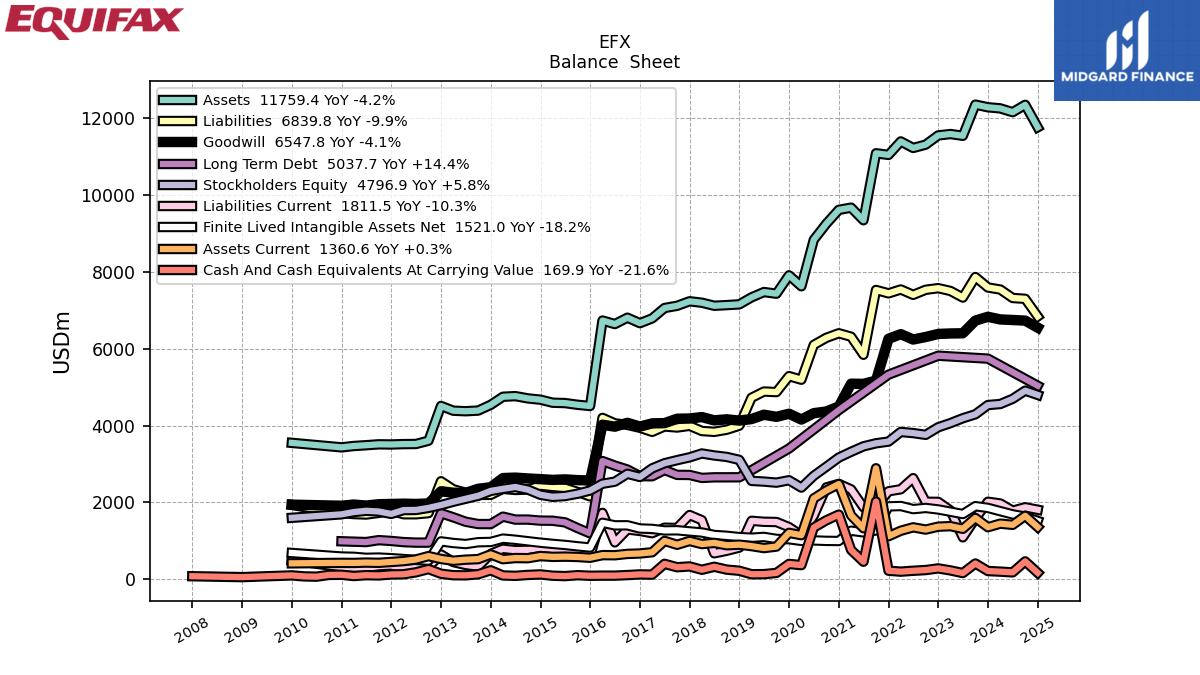
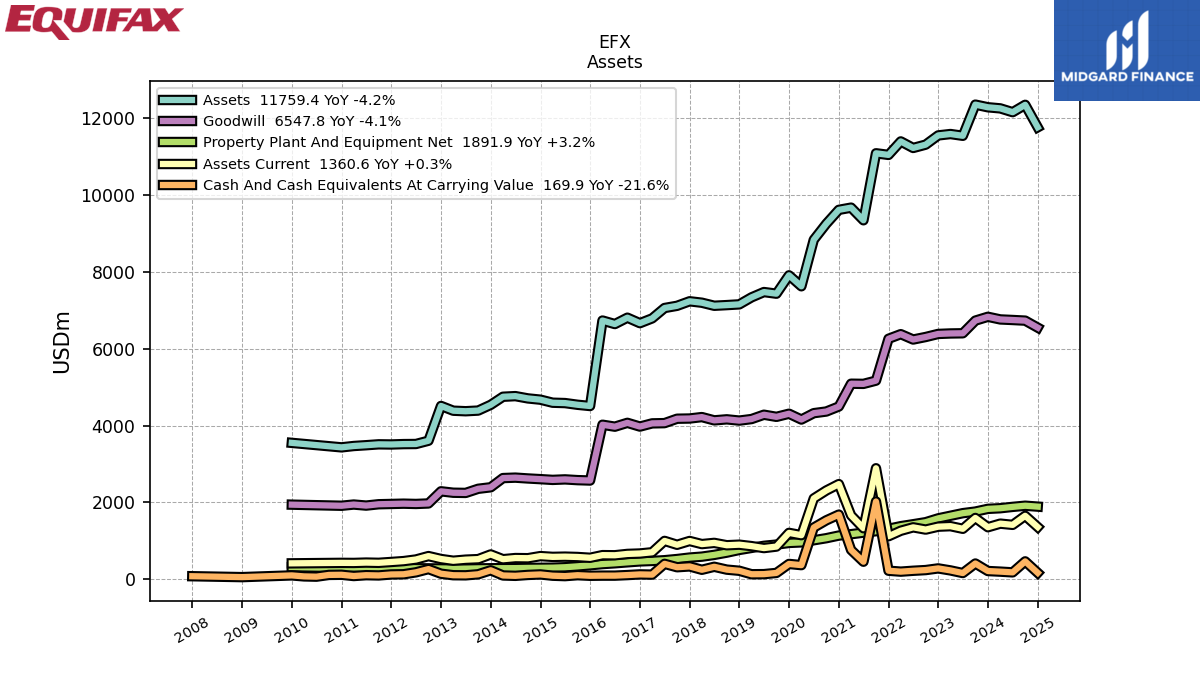
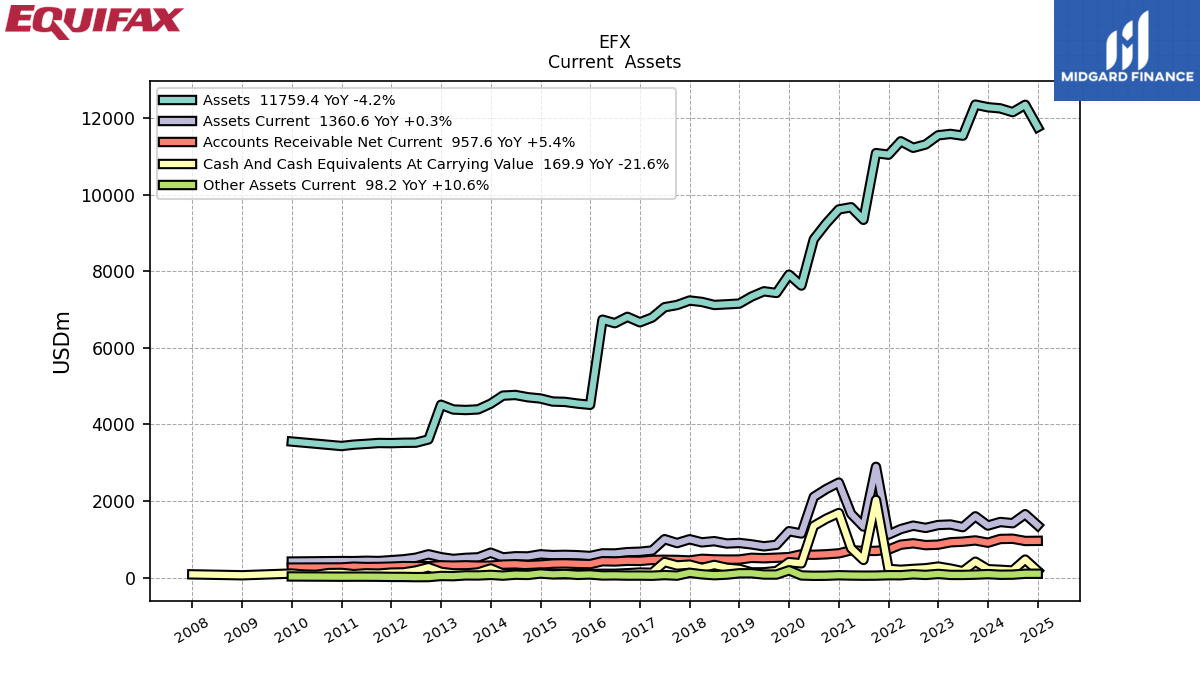
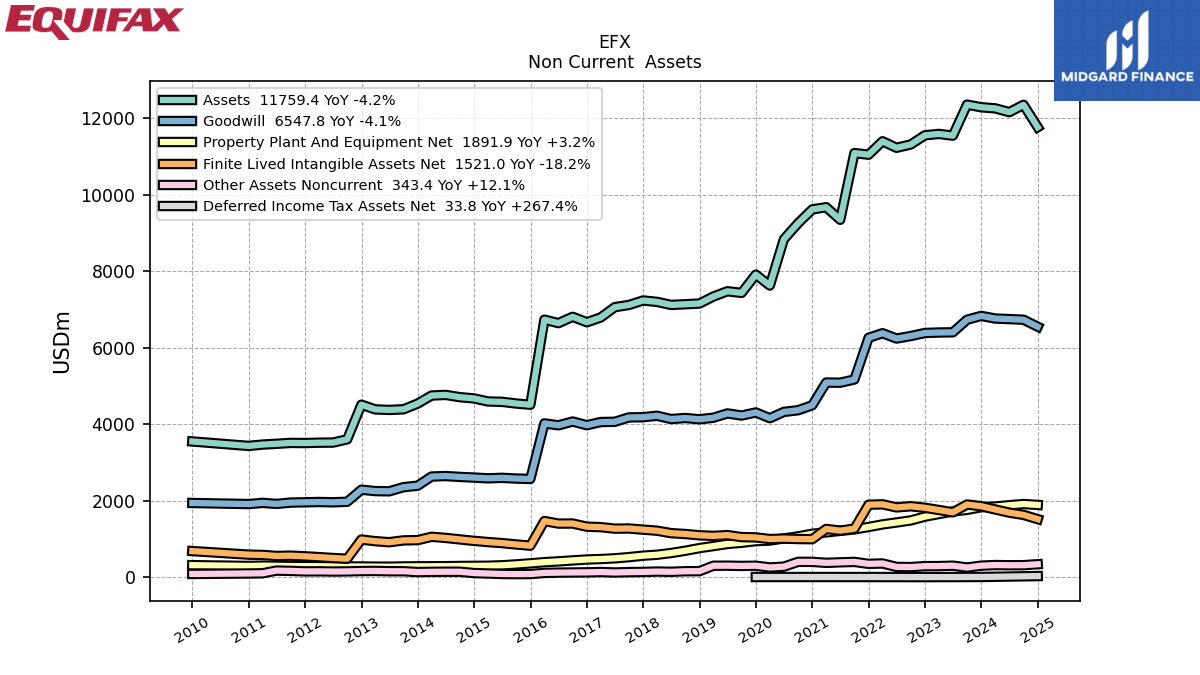
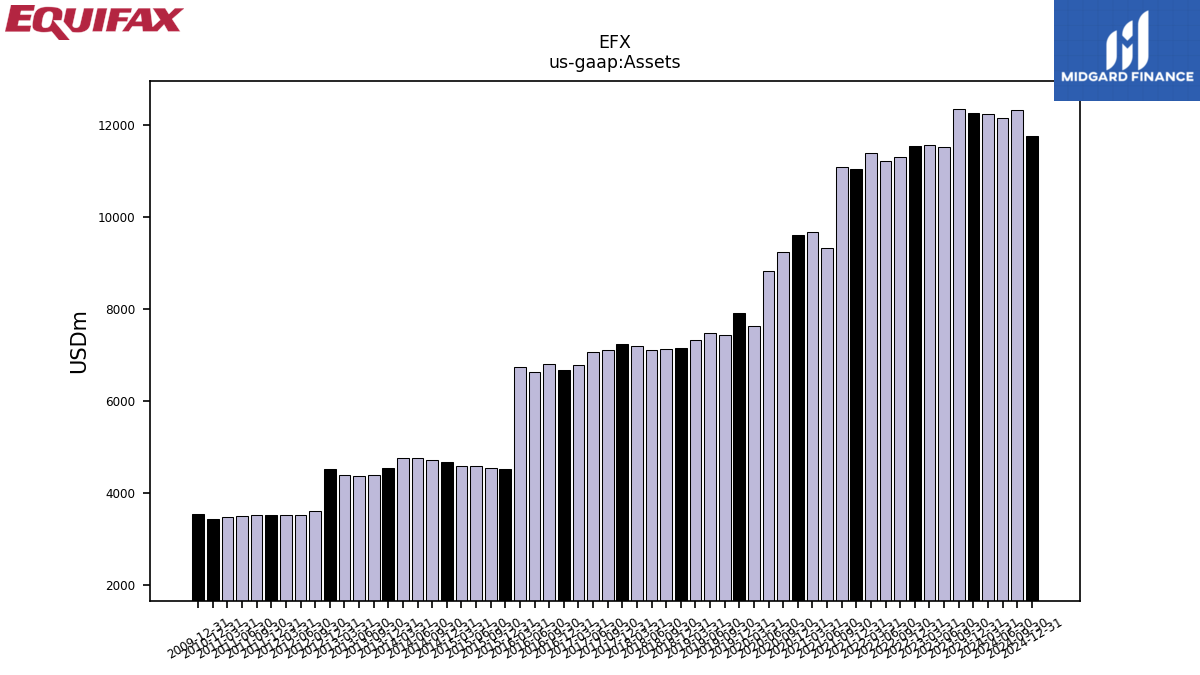
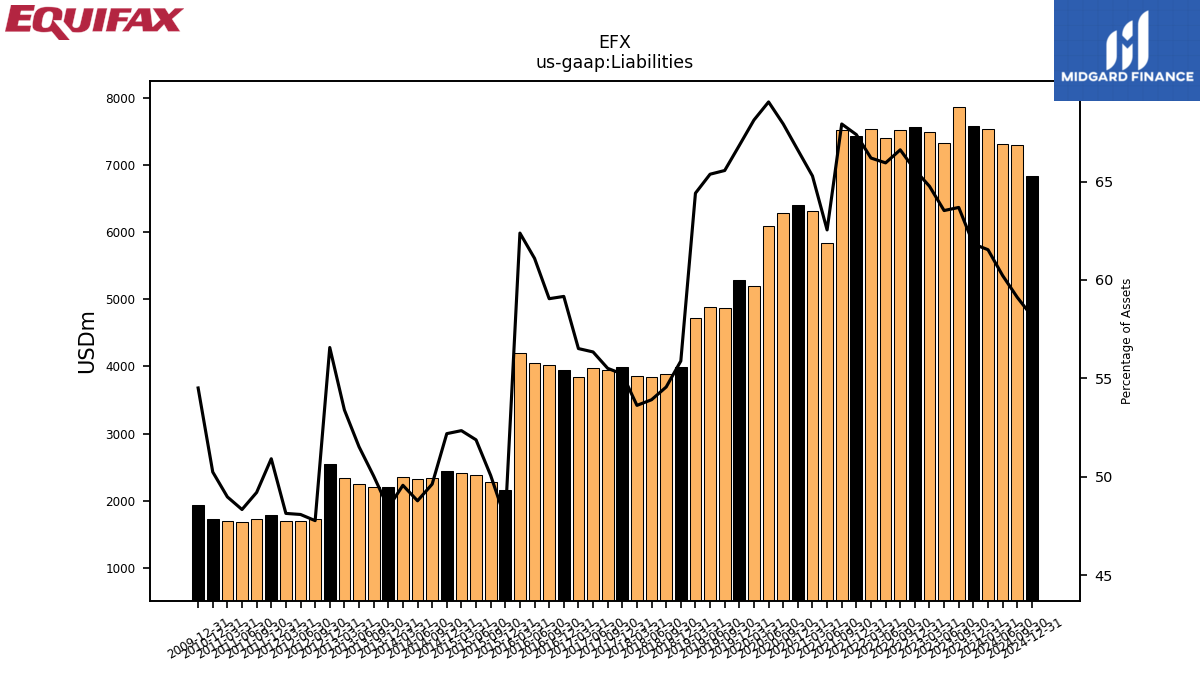
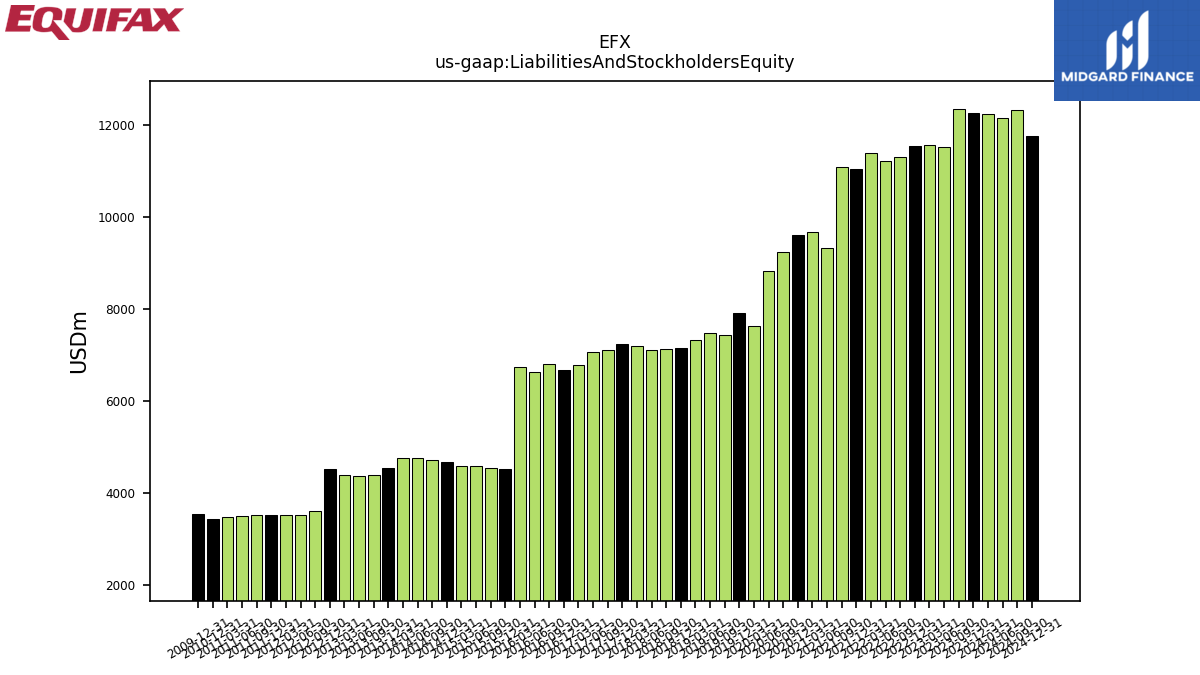
| Assets | 12280.00 | 12348.90 | 11537.90 | 11583.90 | 11547.90 | 11308.00 | 11221.20 | 11391.70 | 11040.90 | 11083.30 | 9340.30 | 9669.40 | 9611.80 | 9249.80 | 8832.80 | 7622.80 | 7909.00 | 7430.70 | 7473.50 | 7335.70 | 7153.20 | 7134.00 | 7116.90 | 7196.10 | 7233.40 | 7115.70 | 7058.30 | 6789.00 | 6664.00 | 6806.60 | 6640.80 | 6732.90 | 4509.00 | 4541.40 | 4585.50 | 4595.00 | 4674.20 | 4707.10 | 4766.30 | 4750.10 | 4539.90 | 4390.40 | 4373.60 | 4387.20 | 4511.10 | 3605.90 | 3521.10 | 3518.40 | 3508.60 | 3512.50 | 3489.30 | 3468.80 | 3433.60 | NA | NA | NA | |
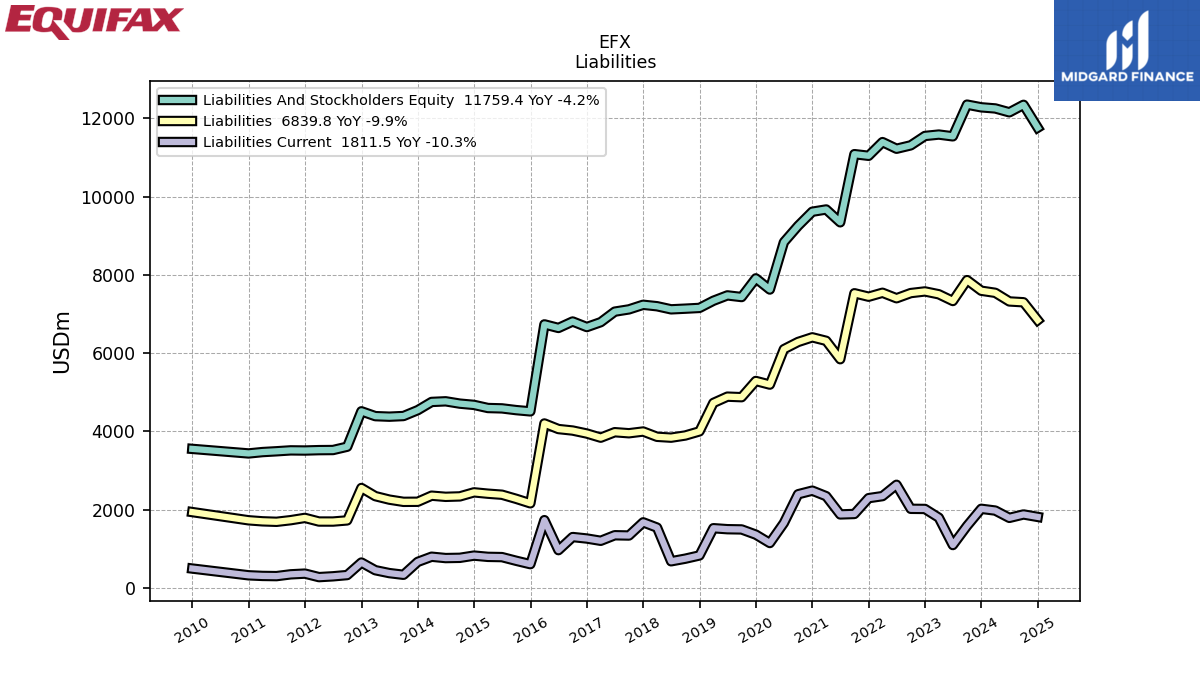
| Liabilities | 7592.50 | 7864.30 | 7329.60 | 7501.70 | 7574.60 | 7532.40 | 7400.20 | 7540.60 | 7439.70 | 7528.20 | 5841.70 | 6312.40 | 6401.50 | 6283.00 | 6098.50 | 5193.00 | 5286.10 | 4871.60 | 4885.60 | 4724.80 | 3997.50 | 3892.50 | 3837.20 | 3859.20 | 3994.40 | 3950.00 | 3976.90 | 3836.80 | 3942.70 | 4019.20 | 4057.40 | 4200.10 | 2158.60 | 2273.90 | 2378.90 | 2405.30 | 2439.60 | 2336.10 | 2325.10 | 2354.60 | 2198.90 | 2197.00 | 2253.60 | 2342.70 | 2551.90 | 1722.70 | 1693.20 | 1693.80 | 1786.50 | 1728.40 | 1686.70 | 1699.00 | 1725.20 | NA | NA | NA | |
| Liabilities And Stockholders Equity | 12280.00 | 12348.90 | 11537.90 | 11583.90 | 11547.90 | 11308.00 | 11221.20 | 11391.70 | 11040.90 | 11083.30 | 9340.30 | 9669.40 | 9611.80 | 9249.80 | 8832.80 | 7622.80 | 7909.00 | 7430.70 | 7473.50 | 7335.70 | 7153.20 | 7134.00 | 7116.90 | 7196.10 | 7233.40 | 7115.70 | 7058.30 | 6789.00 | 6664.00 | 6806.60 | 6640.80 | 6732.90 | 4509.00 | 4541.40 | 4585.50 | 4595.00 | 4674.20 | 4707.10 | 4766.30 | 4750.10 | 4539.90 | 4390.40 | 4373.60 | 4387.20 | 4511.10 | 3605.90 | 3521.10 | 3518.40 | 3508.60 | 3512.50 | 3489.30 | 3468.80 | 3433.60 | NA | NA | NA | |
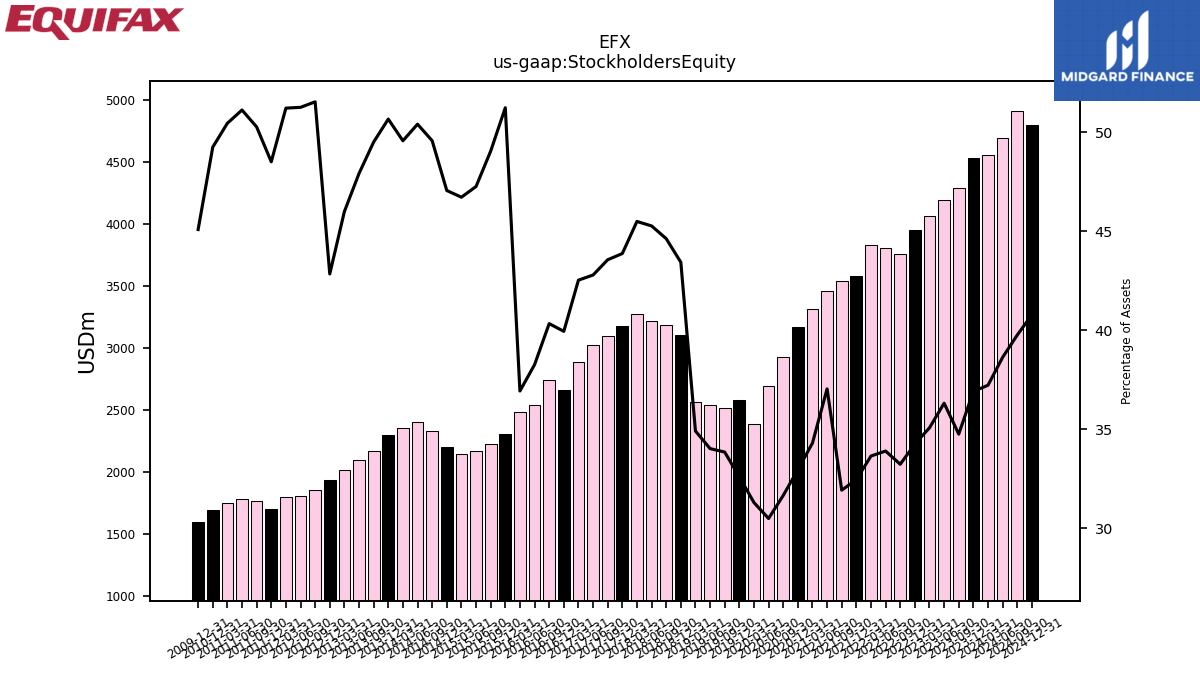
| Stockholders Equity | 4534.10 | 4293.30 | 4191.20 | 4064.00 | 3956.50 | 3759.00 | 3805.00 | 3834.10 | 3584.40 | 3539.20 | 3460.50 | 3318.00 | 3168.40 | 2929.00 | 2694.10 | 2386.50 | 2578.60 | 2515.80 | 2543.40 | 2561.70 | 3107.80 | 3184.50 | 3222.60 | 3274.70 | 3174.40 | 3100.40 | 3021.00 | 2888.10 | 2662.70 | 2746.10 | 2541.50 | 2487.30 | 2310.90 | 2227.90 | 2167.60 | 2147.30 | 2200.10 | 2334.00 | 2403.20 | 2355.20 | 2300.70 | 2174.00 | 2096.30 | 2018.50 | 1933.20 | 1858.80 | 1805.30 | 1802.50 | 1702.40 | 1766.10 | 1784.30 | 1750.60 | 1691.40 | NA | NA | NA |
| 2023-12-31 | 2023-09-30 | 2023-06-30 | 2023-03-31 | 2022-12-31 | 2022-09-30 | 2022-06-30 | 2022-03-31 | 2021-12-31 | 2021-09-30 | 2021-06-30 | 2021-03-31 | 2020-12-31 | 2020-09-30 | 2020-06-30 | 2020-03-31 | 2019-12-31 | 2019-09-30 | 2019-06-30 | 2019-03-31 | 2018-12-31 | 2018-09-30 | 2018-06-30 | 2018-03-31 | 2017-12-31 | 2017-09-30 | 2017-06-30 | 2017-03-31 | 2016-12-31 | 2016-09-30 | 2016-06-30 | 2016-03-31 | 2015-12-31 | 2015-09-30 | 2015-06-30 | 2015-03-31 | 2014-12-31 | 2014-09-30 | 2014-06-30 | 2014-03-31 | 2013-12-31 | 2013-09-30 | 2013-06-30 | 2013-03-31 | 2012-12-31 | 2012-09-30 | 2012-06-30 | 2012-03-31 | 2011-12-31 | 2011-09-30 | 2011-06-30 | 2011-03-31 | 2010-12-31 | 2010-09-30 | 2010-06-30 | 2010-03-31 | ||
|---|---|---|---|---|---|---|---|---|---|---|---|---|---|---|---|---|---|---|---|---|---|---|---|---|---|---|---|---|---|---|---|---|---|---|---|---|---|---|---|---|---|---|---|---|---|---|---|---|---|---|---|---|---|---|---|---|---|
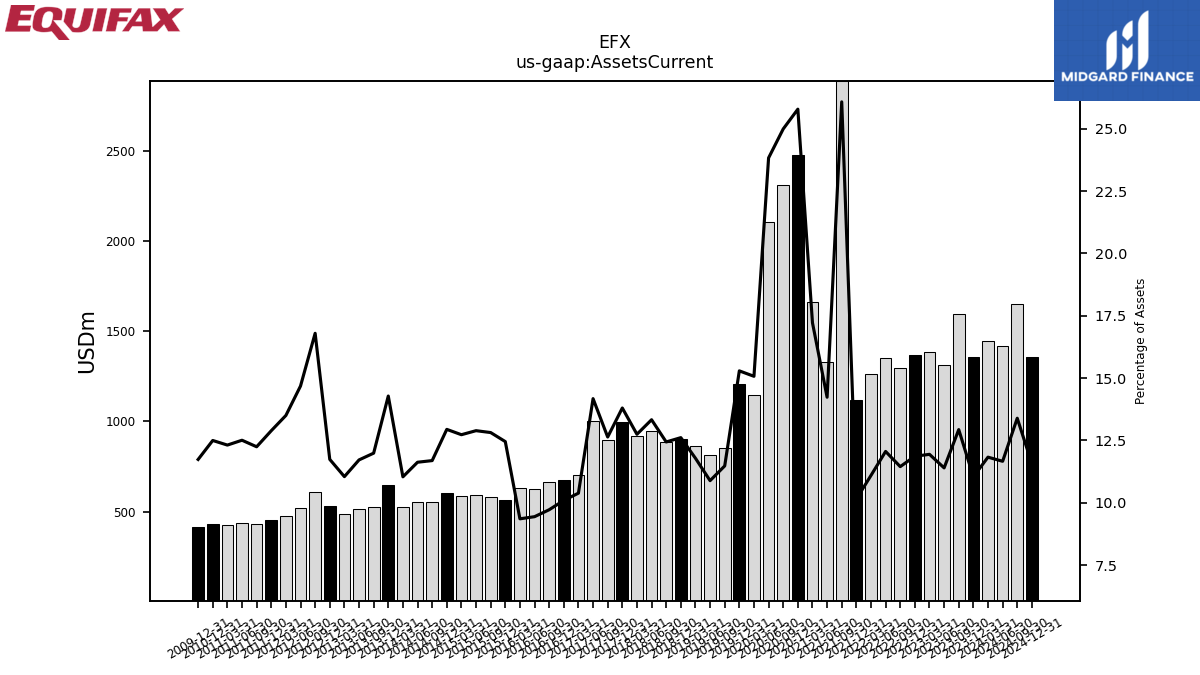
| Assets Current | 1356.30 | 1597.40 | 1315.40 | 1383.60 | 1370.50 | 1294.90 | 1353.30 | 1264.20 | 1120.90 | 2890.30 | 1329.50 | 1665.00 | 2478.30 | 2311.60 | 2104.90 | 1149.00 | 1209.40 | 853.00 | 813.80 | 864.70 | 902.30 | 887.50 | 948.80 | 917.40 | 998.40 | 899.30 | 1000.70 | 705.20 | 672.90 | 661.80 | 627.20 | 630.10 | 561.60 | 582.10 | 591.20 | 585.00 | 605.10 | 550.40 | 554.20 | 524.50 | 648.40 | 526.50 | 512.60 | 484.80 | 529.70 | 605.70 | 517.00 | 475.10 | 452.30 | 430.20 | 436.50 | 427.20 | 429.20 | NA | NA | NA | |
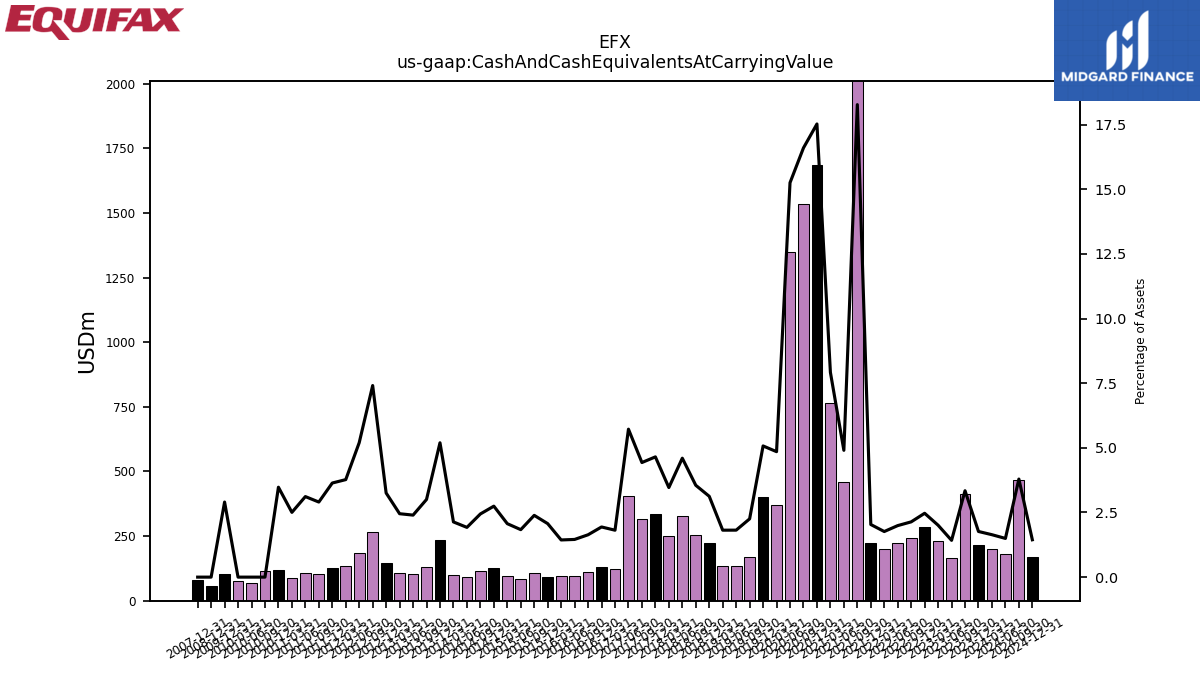
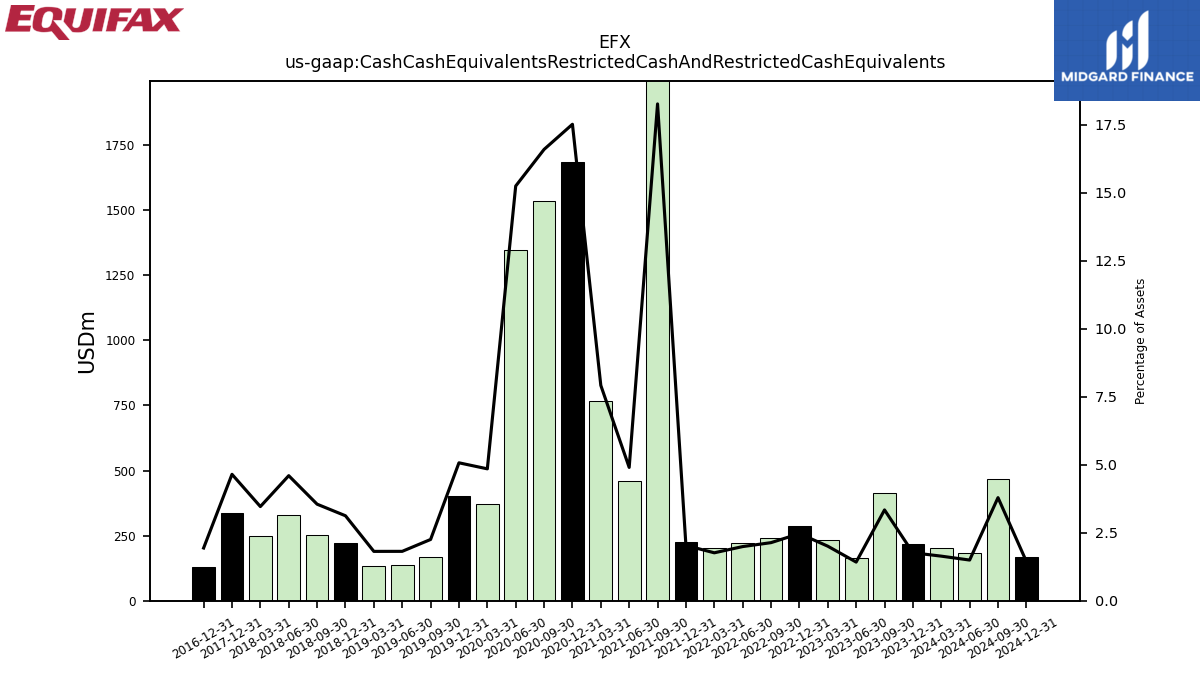
| Cash And Cash Equivalents At Carrying Value | 216.80 | 412.60 | 164.10 | 232.50 | 285.20 | 241.70 | 223.60 | 200.90 | 224.70 | 2025.50 | 458.10 | 765.90 | 1684.60 | 1535.60 | 1347.40 | 369.90 | 401.30 | 167.50 | 135.80 | 133.20 | 223.60 | 253.40 | 327.40 | 249.30 | 336.40 | 315.40 | 403.90 | 123.20 | 129.30 | 111.50 | 96.80 | 96.80 | 93.30 | 108.50 | 84.20 | 95.00 | 128.30 | 115.00 | 91.70 | 101.40 | 235.90 | 131.90 | 104.90 | 107.60 | 146.80 | 267.20 | 183.10 | 132.70 | 127.70 | 102.00 | 108.70 | 86.90 | 119.40 | 115.60 | 70.10 | 77.10 | |
| Cash Cash Equivalents Restricted Cash And Restricted Cash Equivalents | 216.80 | 412.60 | 164.10 | 232.50 | 285.20 | 241.70 | 223.60 | 200.90 | 224.70 | 2025.50 | 458.10 | 765.90 | 1684.60 | 1535.60 | 1347.40 | 369.90 | 401.30 | 167.50 | 135.80 | 133.20 | 223.60 | 253.40 | 327.40 | 249.30 | 336.40 | NA | NA | NA | 129.30 | NA | NA | NA | NA | NA | NA | NA | NA | NA | NA | NA | NA | NA | NA | NA | NA | NA | NA | NA | NA | NA | NA | NA | NA | NA | NA | NA | |
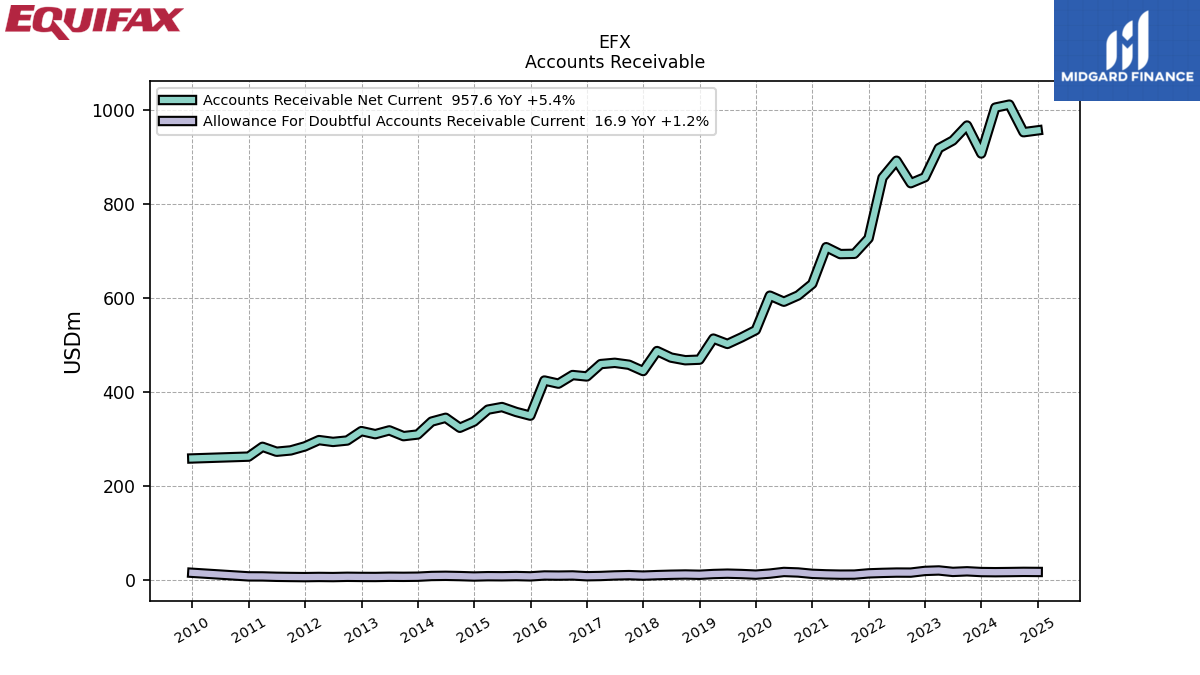
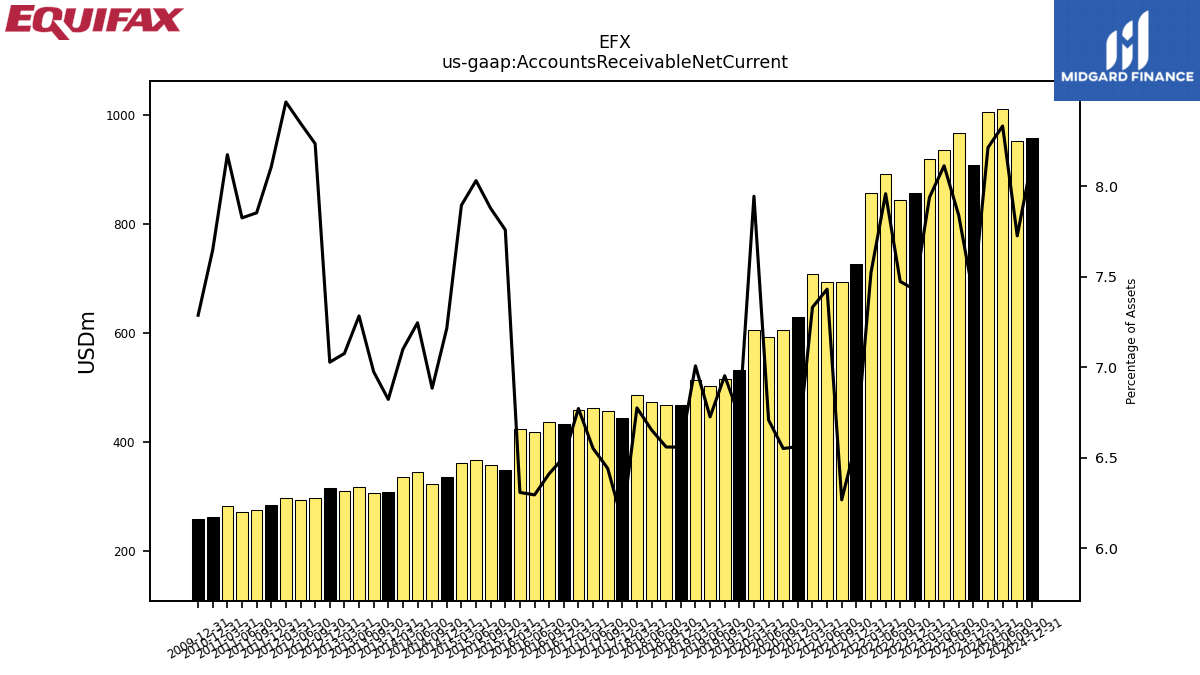
| Accounts Receivable Net Current | 908.20 | 967.90 | 935.90 | 919.50 | 857.70 | 845.00 | 892.90 | 856.80 | 727.60 | 694.60 | 694.00 | 708.80 | 630.60 | 605.90 | 592.50 | 605.50 | 532.10 | 516.60 | 502.60 | 514.00 | 469.10 | 467.90 | 473.50 | 487.50 | 444.80 | 458.30 | 462.40 | 459.70 | 433.30 | 436.40 | 418.00 | 424.70 | 349.80 | 357.70 | 368.20 | 362.70 | 337.20 | 324.00 | 345.30 | 337.20 | 309.70 | 306.20 | 318.50 | 310.40 | 317.00 | 296.90 | 293.90 | 297.80 | 284.40 | 275.80 | 273.00 | 283.50 | 262.60 | NA | NA | NA | |
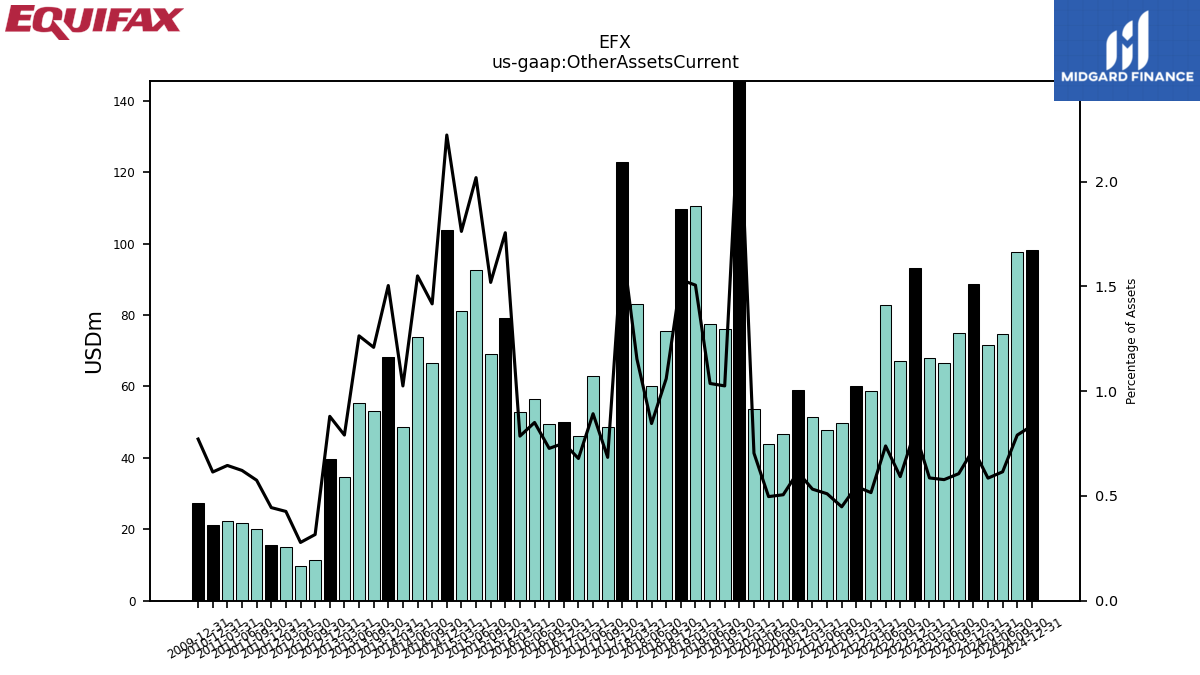
| Other Assets Current | 88.80 | 74.90 | 66.70 | 67.90 | 93.30 | 67.00 | 82.90 | 58.80 | 60.20 | 49.70 | 47.70 | 51.50 | 59.00 | 46.80 | 43.90 | 53.70 | 187.90 | 76.20 | 77.50 | 110.50 | 109.60 | 75.60 | 60.20 | 83.00 | 122.90 | 48.70 | 63.00 | 46.10 | 50.10 | 49.50 | 56.50 | 52.90 | 79.20 | 69.00 | 92.60 | 81.00 | 103.90 | 66.70 | 73.90 | 48.70 | 68.30 | 53.10 | 55.30 | 34.70 | 39.70 | 11.40 | 9.80 | 15.00 | 15.60 | 20.20 | 21.70 | 22.40 | 21.10 | NA | NA | NA | |
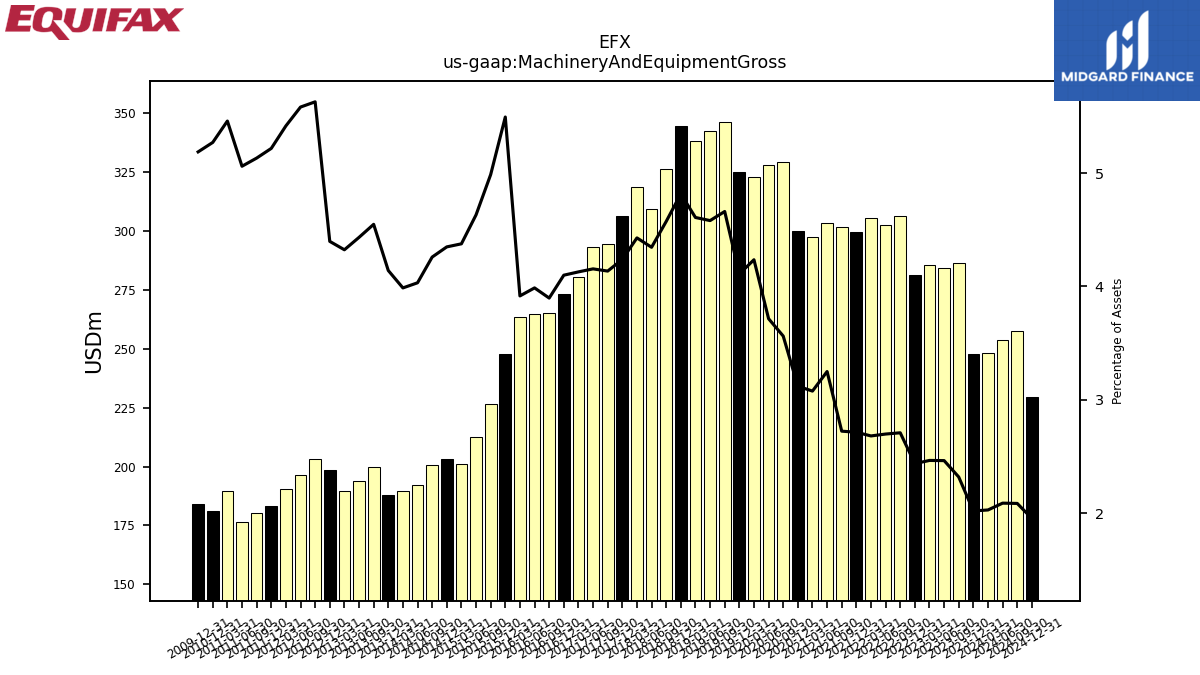
| Machinery And Equipment Gross | 247.90 | 286.30 | 284.20 | 285.50 | 281.40 | 306.30 | 302.70 | 305.40 | 299.60 | 301.80 | 303.50 | 297.50 | 299.90 | 329.50 | 328.20 | 322.90 | 325.10 | 346.40 | 342.40 | 338.10 | 344.60 | 326.30 | 309.30 | 318.70 | 306.60 | 294.30 | 293.30 | 280.30 | 273.20 | 265.30 | 264.80 | 263.70 | 247.80 | 226.50 | 212.40 | 201.10 | 203.30 | 200.50 | 192.20 | 189.40 | 188.00 | 199.70 | 193.90 | 189.70 | 198.40 | 203.00 | 196.60 | 190.60 | 183.10 | 180.30 | 176.60 | 189.40 | 181.00 | NA | NA | NA |
| 2023-12-31 | 2023-09-30 | 2023-06-30 | 2023-03-31 | 2022-12-31 | 2022-09-30 | 2022-06-30 | 2022-03-31 | 2021-12-31 | 2021-09-30 | 2021-06-30 | 2021-03-31 | 2020-12-31 | 2020-09-30 | 2020-06-30 | 2020-03-31 | 2019-12-31 | 2019-09-30 | 2019-06-30 | 2019-03-31 | 2018-12-31 | 2018-09-30 | 2018-06-30 | 2018-03-31 | 2017-12-31 | 2017-09-30 | 2017-06-30 | 2017-03-31 | 2016-12-31 | 2016-09-30 | 2016-06-30 | 2016-03-31 | 2015-12-31 | 2015-09-30 | 2015-06-30 | 2015-03-31 | 2014-12-31 | 2014-09-30 | 2014-06-30 | 2014-03-31 | 2013-12-31 | 2013-09-30 | 2013-06-30 | 2013-03-31 | 2012-12-31 | 2012-09-30 | 2012-06-30 | 2012-03-31 | 2011-12-31 | 2011-09-30 | 2011-06-30 | 2011-03-31 | 2010-12-31 | 2010-09-30 | 2010-06-30 | 2010-03-31 | ||
|---|---|---|---|---|---|---|---|---|---|---|---|---|---|---|---|---|---|---|---|---|---|---|---|---|---|---|---|---|---|---|---|---|---|---|---|---|---|---|---|---|---|---|---|---|---|---|---|---|---|---|---|---|---|---|---|---|---|
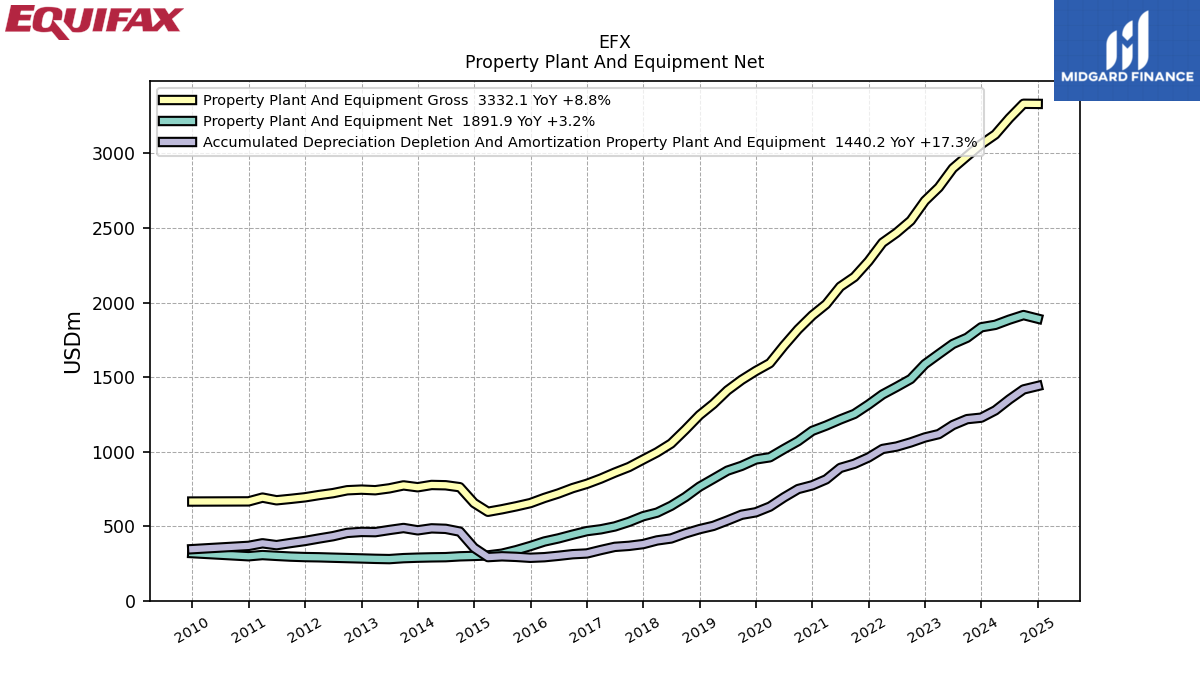
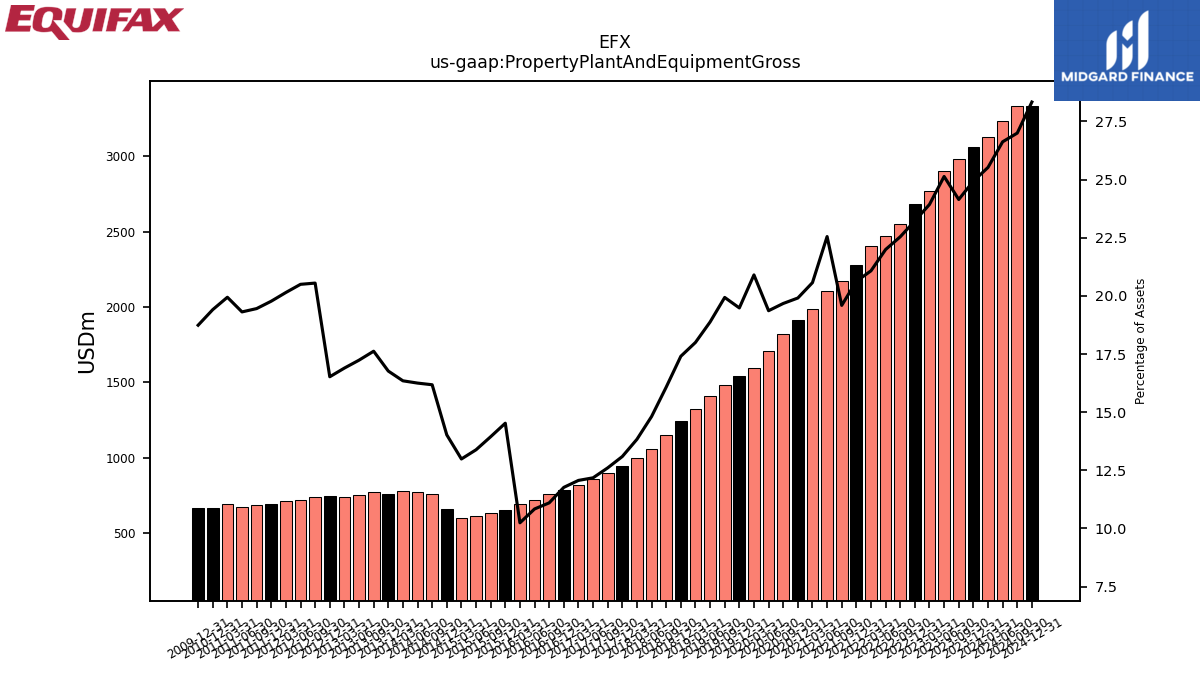
| Property Plant And Equipment Gross | 3061.80 | 2981.60 | 2900.00 | 2772.20 | 2682.10 | 2548.90 | 2467.90 | 2401.10 | 2277.20 | 2171.40 | 2106.30 | 1988.90 | 1913.50 | 1819.70 | 1710.20 | 1593.20 | 1540.80 | 1481.10 | 1410.70 | 1320.20 | 1244.80 | 1146.80 | 1054.10 | 995.40 | 947.00 | 896.80 | 859.40 | 819.00 | 784.00 | 755.40 | 719.60 | 689.50 | 654.90 | 633.20 | 613.60 | 596.70 | 655.40 | 761.50 | 774.50 | 776.50 | 761.20 | 773.60 | 753.80 | 741.20 | 745.30 | 741.00 | 721.70 | 708.80 | 693.70 | 683.30 | 673.80 | 691.70 | 666.40 | NA | NA | NA | |
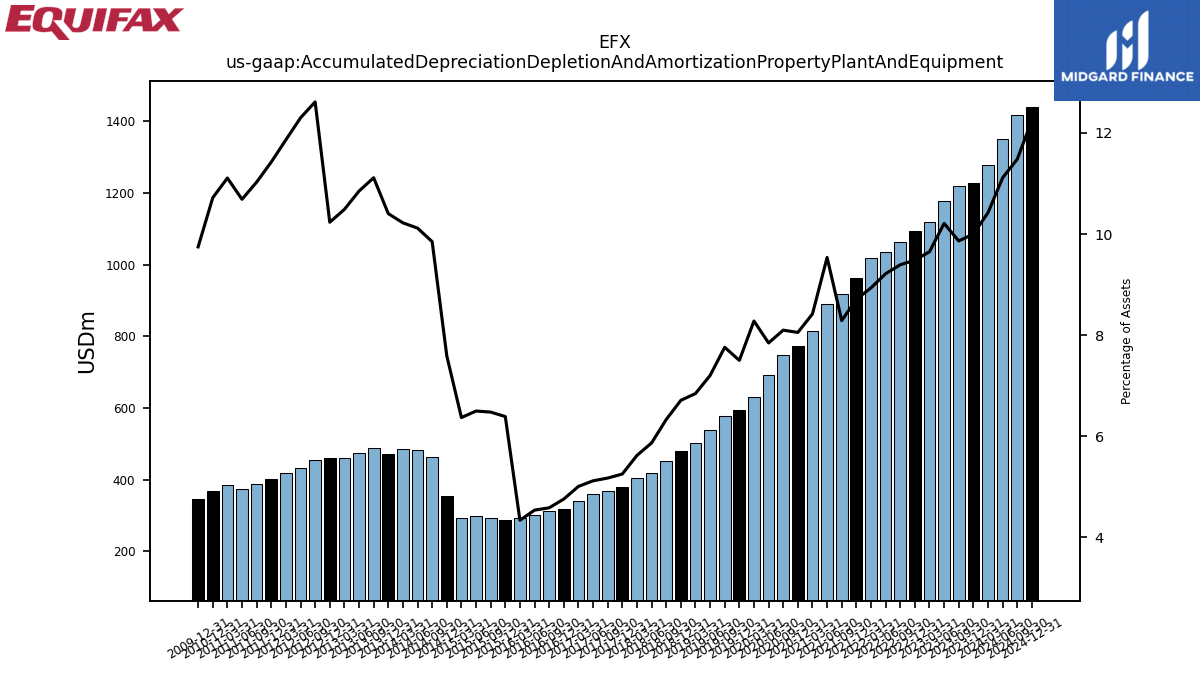
| Accumulated Depreciation Depletion And Amortization Property Plant And Equipment | 1227.80 | 1218.00 | 1178.00 | 1117.70 | 1095.10 | 1061.90 | 1034.00 | 1017.80 | 961.30 | 918.50 | 890.70 | 814.10 | 774.10 | 749.10 | 693.00 | 631.10 | 593.20 | 576.60 | 538.20 | 502.10 | 480.00 | 451.60 | 417.60 | 404.50 | 380.00 | 368.10 | 361.30 | 340.00 | 317.10 | 312.10 | 301.40 | 292.10 | 288.10 | 294.20 | 298.00 | 292.70 | 354.80 | 463.60 | 482.20 | 485.50 | 472.30 | 487.90 | 474.50 | 460.10 | 461.60 | 454.80 | 433.00 | 417.40 | 400.80 | 387.30 | 372.90 | 385.30 | 368.00 | NA | NA | NA | |
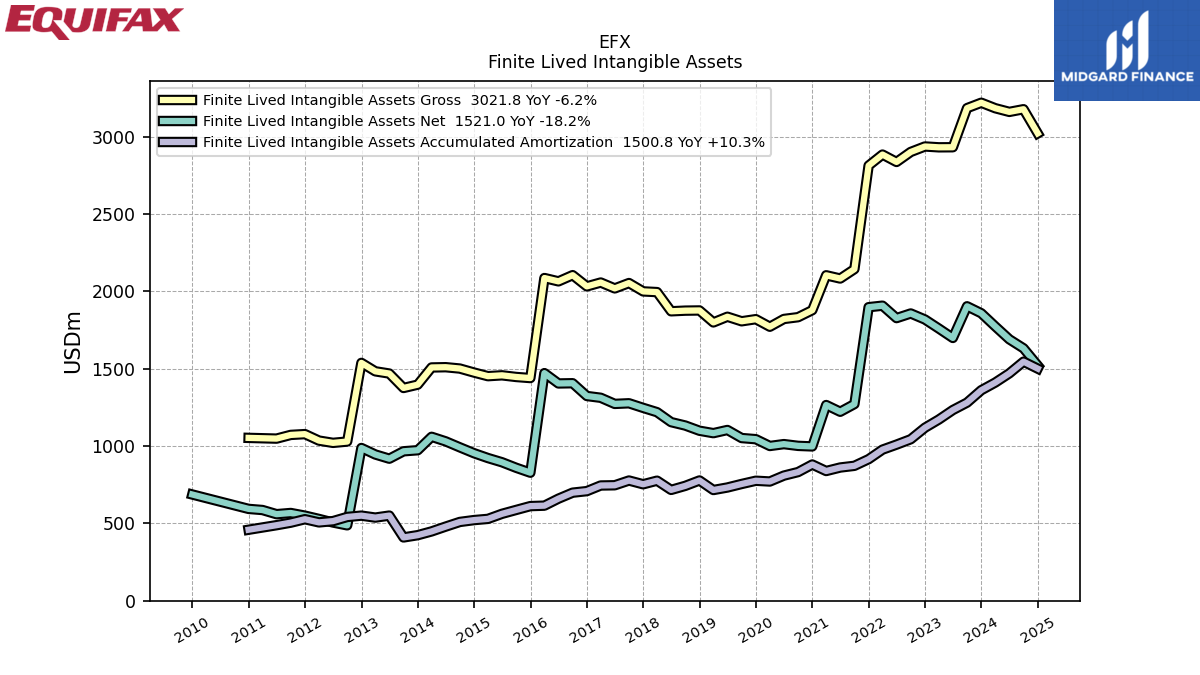
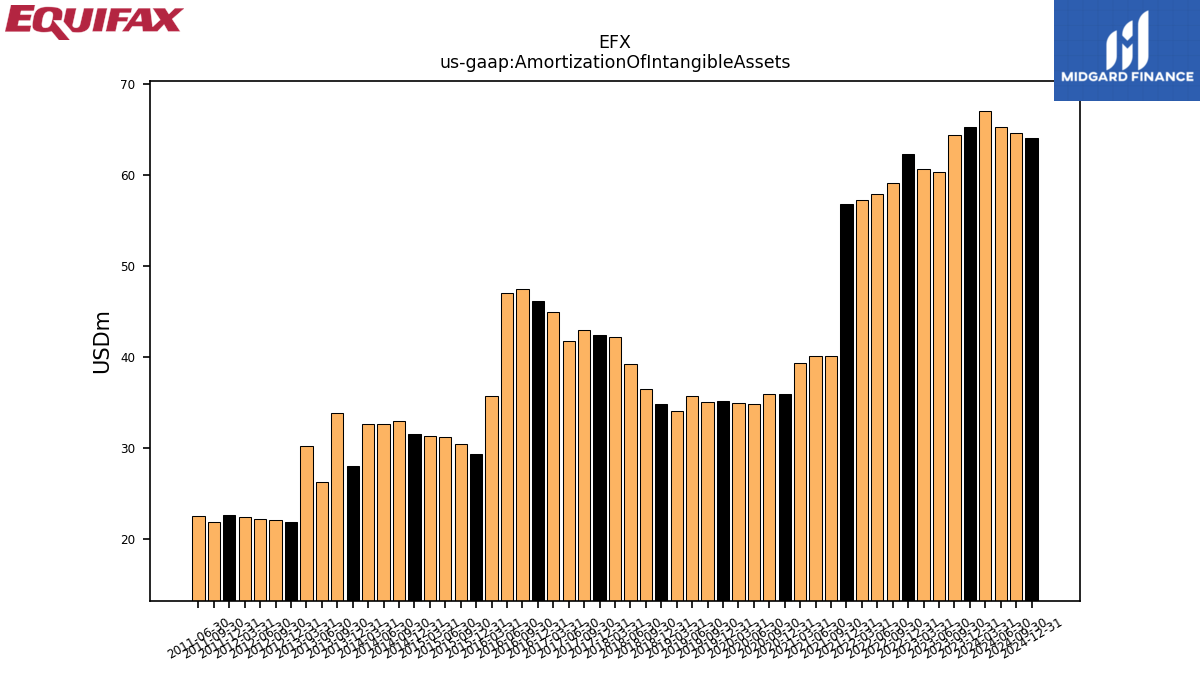
| Amortization Of Intangible Assets | 65.30 | 64.40 | 60.30 | 60.70 | 62.30 | 59.10 | 57.90 | 57.30 | 56.80 | 40.10 | 40.10 | 39.40 | 36.00 | 36.00 | 34.80 | 35.00 | 35.20 | 35.10 | 35.70 | 34.10 | 34.90 | 36.50 | 39.20 | 42.20 | 42.40 | 43.00 | 41.80 | 45.00 | 46.20 | 47.50 | 47.10 | 35.70 | 29.30 | 30.50 | 31.20 | 31.30 | 31.60 | 33.00 | 32.60 | 32.70 | 28.00 | 33.90 | 26.30 | 30.20 | 21.90 | 22.10 | 22.20 | 22.40 | 22.60 | 21.90 | 22.50 | NA | NA | NA | NA | NA | |
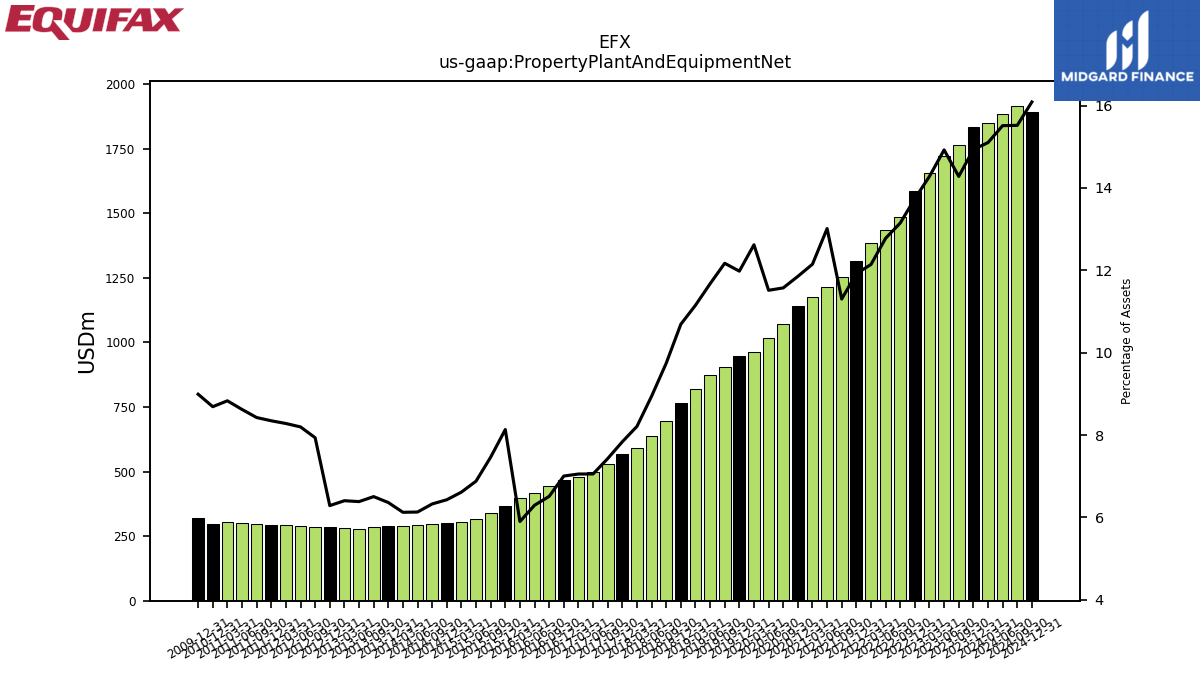
| Property Plant And Equipment Net | 1834.00 | 1763.60 | 1722.00 | 1654.50 | 1587.00 | 1487.00 | 1433.90 | 1383.30 | 1315.90 | 1252.90 | 1215.60 | 1174.80 | 1139.40 | 1070.60 | 1017.20 | 962.10 | 947.60 | 904.50 | 872.50 | 818.10 | 764.80 | 695.20 | 636.50 | 590.90 | 567.00 | 528.70 | 498.10 | 479.00 | 466.90 | 443.30 | 418.20 | 397.40 | 366.80 | 339.00 | 315.60 | 304.00 | 300.60 | 297.90 | 292.30 | 291.00 | 288.90 | 285.70 | 279.30 | 281.10 | 283.70 | 286.20 | 288.70 | 291.40 | 292.90 | 296.00 | 300.90 | 306.40 | 298.40 | NA | NA | NA | |
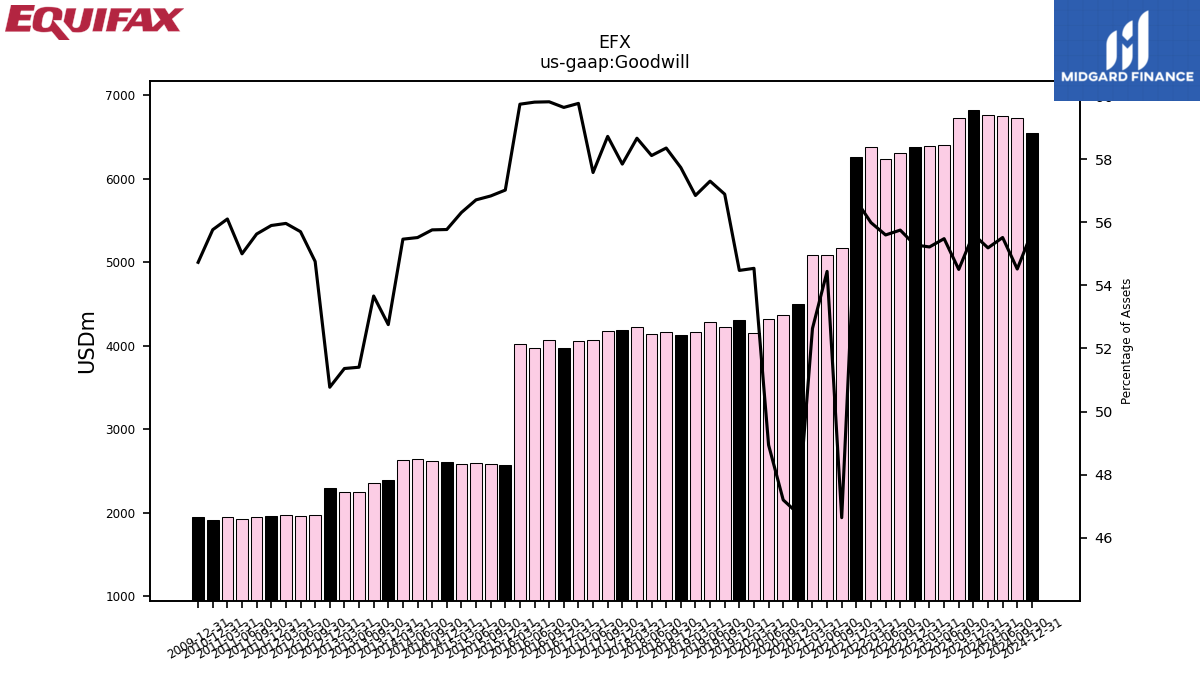
| Goodwill | 6829.90 | 6730.80 | 6401.20 | 6396.30 | 6383.90 | 6304.30 | 6238.70 | 6378.10 | 6258.10 | 5169.20 | 5085.10 | 5089.30 | 4495.80 | 4366.00 | 4322.90 | 4157.40 | 4308.30 | 4227.30 | 4282.50 | 4170.20 | 4129.70 | 4162.80 | 4135.90 | 4221.40 | 4184.00 | 4178.40 | 4063.90 | 4057.50 | 3974.30 | 4071.50 | 3971.60 | 4022.30 | 2571.00 | 2581.00 | 2600.40 | 2587.40 | 2606.80 | 2624.60 | 2646.00 | 2634.60 | 2395.10 | 2356.00 | 2248.30 | 2253.50 | 2290.40 | 1974.50 | 1961.30 | 1969.00 | 1961.20 | 1953.90 | 1919.10 | 1946.10 | 1914.70 | NA | NA | NA | |
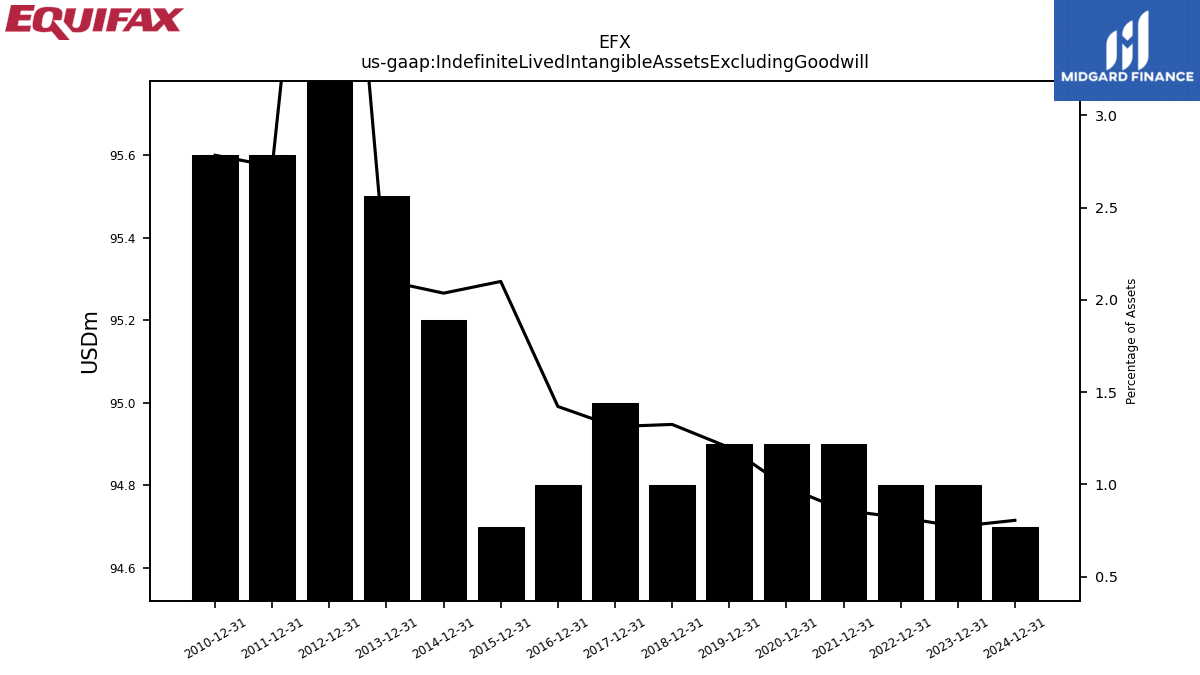
| Indefinite Lived Intangible Assets Excluding Goodwill | 94.80 | NA | NA | NA | 94.80 | NA | NA | NA | 94.90 | NA | NA | NA | 94.90 | NA | NA | NA | 94.90 | NA | NA | NA | 94.80 | NA | NA | NA | 95.00 | NA | NA | NA | 94.80 | NA | NA | NA | 94.70 | NA | NA | NA | 95.20 | NA | NA | NA | 95.50 | NA | NA | NA | 254.50 | NA | NA | NA | 95.60 | NA | NA | NA | 95.60 | NA | NA | NA | |
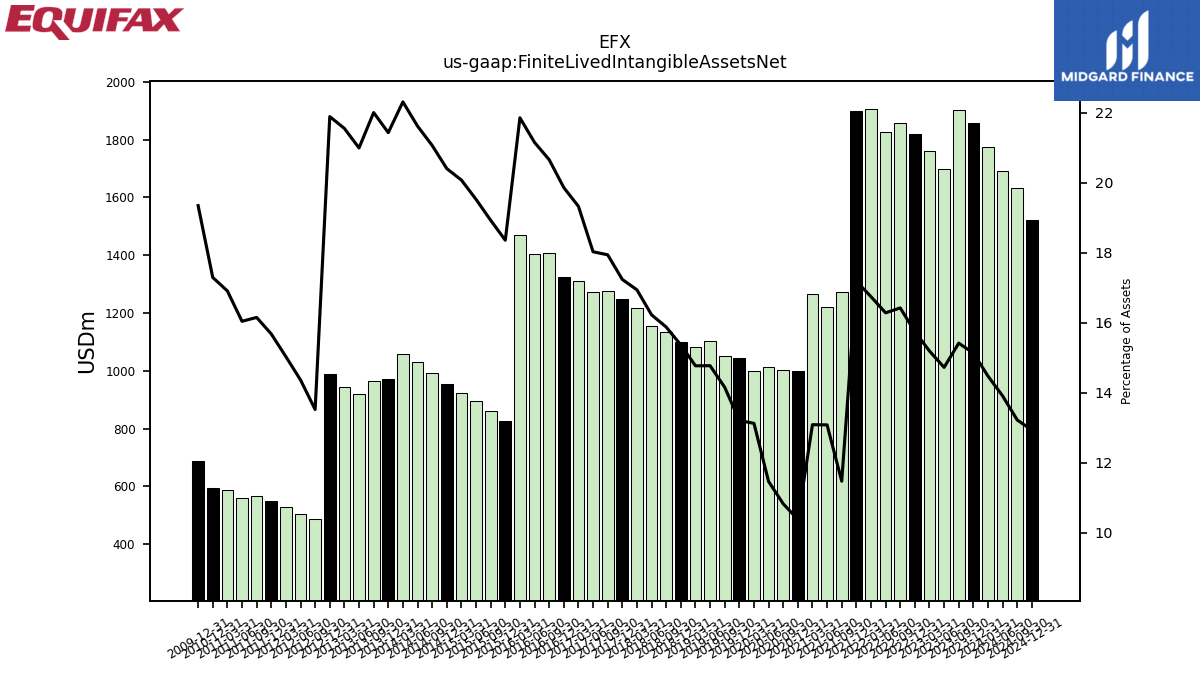
| Finite Lived Intangible Assets Net | 1858.80 | 1903.90 | 1699.10 | 1759.90 | 1818.50 | 1857.40 | 1827.40 | 1907.80 | 1898.00 | 1271.60 | 1221.90 | 1265.50 | 997.80 | 1001.40 | 1012.70 | 1000.60 | 1044.60 | 1052.00 | 1104.10 | 1083.60 | 1099.20 | 1132.80 | 1154.90 | 1219.20 | 1247.00 | 1276.80 | 1272.70 | 1312.30 | 1323.80 | 1406.40 | 1404.90 | 1471.80 | 827.90 | 859.70 | 895.50 | 922.70 | 953.90 | 991.80 | 1030.60 | 1060.00 | 973.20 | 966.30 | 918.40 | 945.70 | 987.70 | 487.60 | 505.90 | 528.90 | 550.20 | 567.40 | 559.80 | 586.60 | 593.90 | NA | NA | NA | |
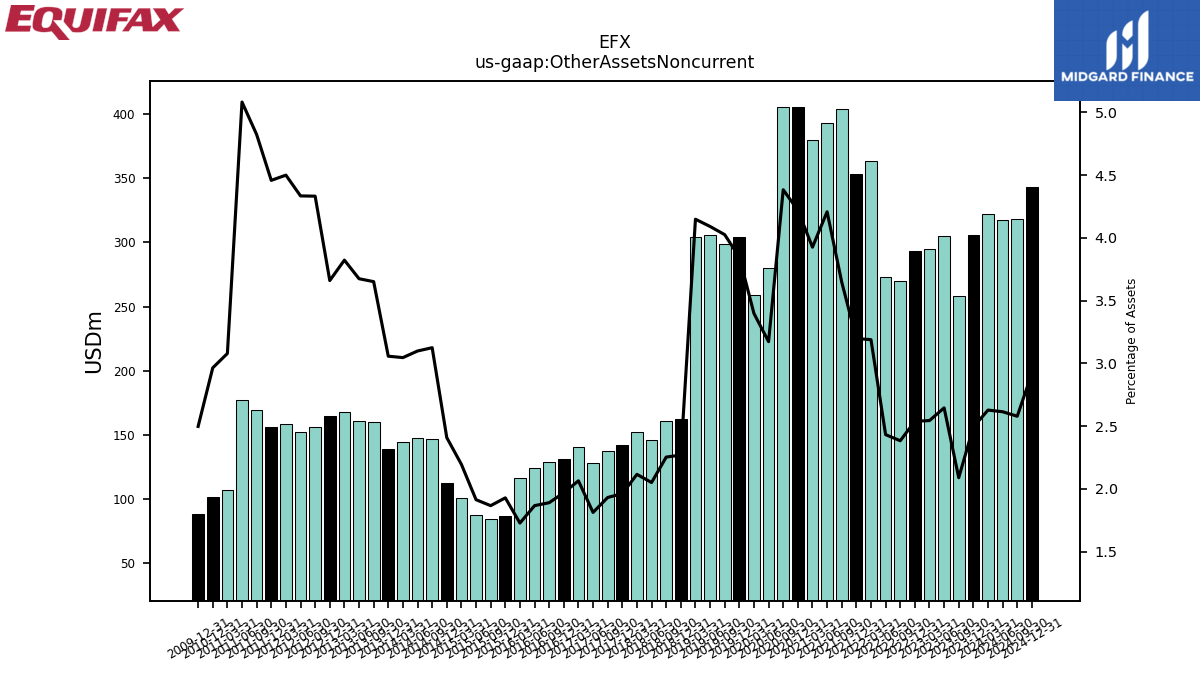
| Other Assets Noncurrent | 306.20 | 258.10 | 305.30 | 294.80 | 293.20 | 269.60 | 273.00 | 363.30 | 353.10 | 404.30 | 393.00 | 379.60 | 405.60 | 405.40 | 280.30 | 259.00 | 304.20 | 299.10 | 305.70 | 304.30 | 162.40 | 160.80 | 146.00 | 152.30 | 142.00 | 137.50 | 128.00 | 140.20 | 131.30 | 128.70 | 124.00 | 116.40 | 87.00 | 84.80 | 87.80 | 100.90 | 112.60 | 147.10 | 147.70 | 144.70 | 138.80 | 160.30 | 160.70 | 167.70 | 165.10 | 156.20 | 152.60 | 158.30 | 156.40 | 169.40 | 177.30 | 106.80 | 101.80 | NA | NA | NA |
| 2023-12-31 | 2023-09-30 | 2023-06-30 | 2023-03-31 | 2022-12-31 | 2022-09-30 | 2022-06-30 | 2022-03-31 | 2021-12-31 | 2021-09-30 | 2021-06-30 | 2021-03-31 | 2020-12-31 | 2020-09-30 | 2020-06-30 | 2020-03-31 | 2019-12-31 | 2019-09-30 | 2019-06-30 | 2019-03-31 | 2018-12-31 | 2018-09-30 | 2018-06-30 | 2018-03-31 | 2017-12-31 | 2017-09-30 | 2017-06-30 | 2017-03-31 | 2016-12-31 | 2016-09-30 | 2016-06-30 | 2016-03-31 | 2015-12-31 | 2015-09-30 | 2015-06-30 | 2015-03-31 | 2014-12-31 | 2014-09-30 | 2014-06-30 | 2014-03-31 | 2013-12-31 | 2013-09-30 | 2013-06-30 | 2013-03-31 | 2012-12-31 | 2012-09-30 | 2012-06-30 | 2012-03-31 | 2011-12-31 | 2011-09-30 | 2011-06-30 | 2011-03-31 | 2010-12-31 | 2010-09-30 | 2010-06-30 | 2010-03-31 | ||
|---|---|---|---|---|---|---|---|---|---|---|---|---|---|---|---|---|---|---|---|---|---|---|---|---|---|---|---|---|---|---|---|---|---|---|---|---|---|---|---|---|---|---|---|---|---|---|---|---|---|---|---|---|---|---|---|---|---|
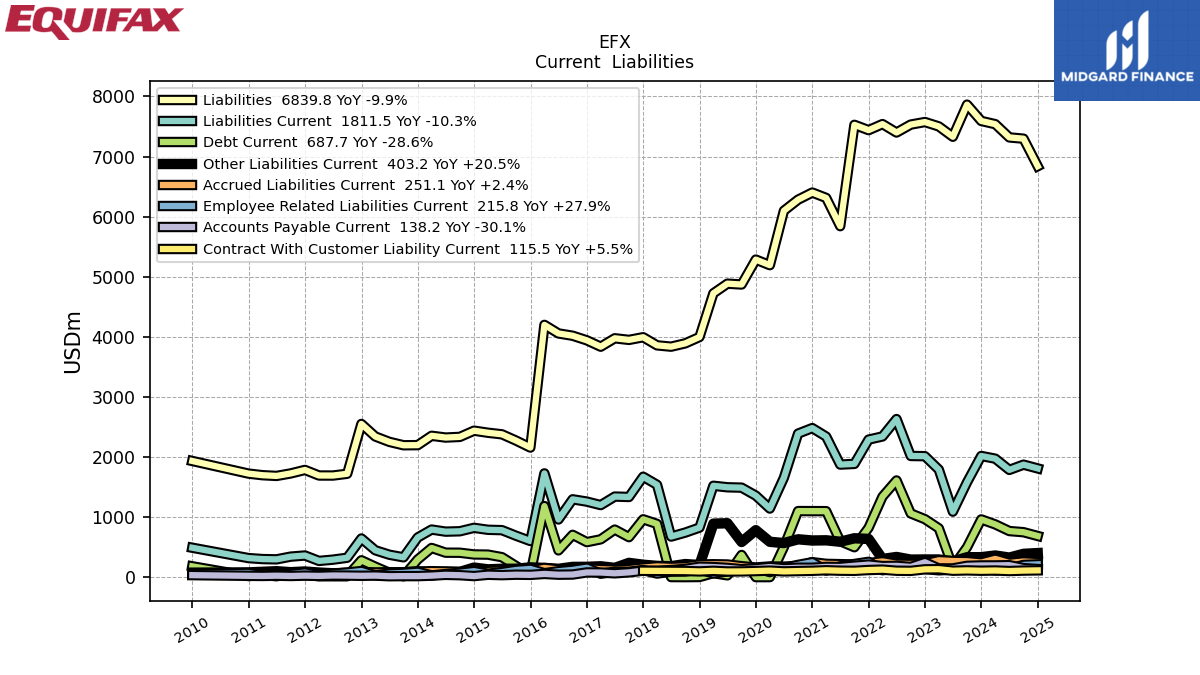
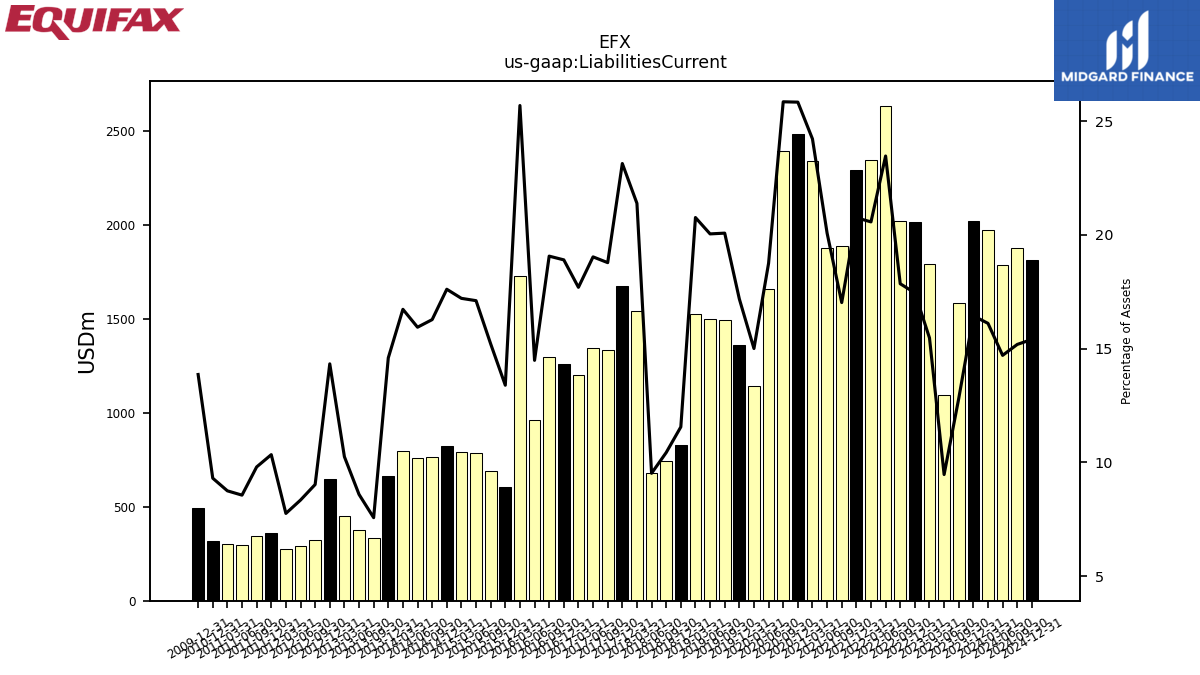
| Liabilities Current | 2019.00 | 1581.80 | 1092.20 | 1792.10 | 2015.20 | 2018.70 | 2633.20 | 2343.40 | 2291.30 | 1886.90 | 1875.20 | 2341.70 | 2483.10 | 2391.00 | 1656.40 | 1143.80 | 1359.10 | 1491.80 | 1497.90 | 1523.00 | 826.80 | 744.20 | 677.60 | 1538.90 | 1673.50 | 1336.30 | 1343.40 | 1201.30 | 1259.60 | 1297.70 | 961.90 | 1729.40 | 603.80 | 690.70 | 784.50 | 790.80 | 823.10 | 766.10 | 759.80 | 794.60 | 662.50 | 332.40 | 375.80 | 449.70 | 646.50 | 325.50 | 293.80 | 272.90 | 362.80 | 344.20 | 298.70 | 303.50 | 319.50 | NA | NA | NA | |
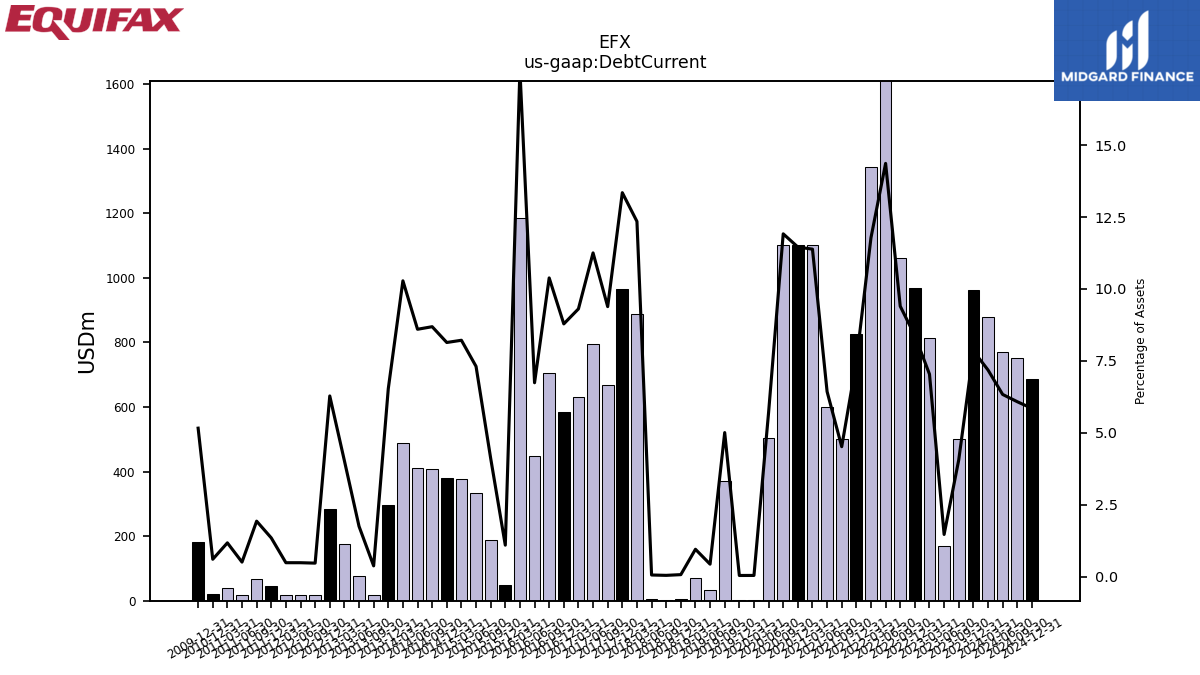
| Debt Current | 963.40 | 501.00 | 169.10 | 815.10 | 967.20 | 1062.90 | 1611.70 | 1342.10 | 824.80 | 500.60 | 600.70 | 1100.60 | 1101.10 | 1102.10 | 503.70 | 3.10 | 3.10 | 372.00 | 32.30 | 69.70 | 4.90 | 3.10 | 4.00 | 888.50 | 965.30 | 667.80 | 794.20 | 631.80 | 585.40 | 706.70 | 447.50 | 1185.40 | 49.30 | 186.80 | 335.10 | 377.50 | 380.40 | 408.90 | 409.80 | 488.40 | 296.50 | 16.40 | 76.50 | 176.70 | 283.30 | 16.90 | 17.00 | 17.00 | 47.20 | 67.70 | 17.60 | 40.70 | 20.70 | NA | NA | NA | |
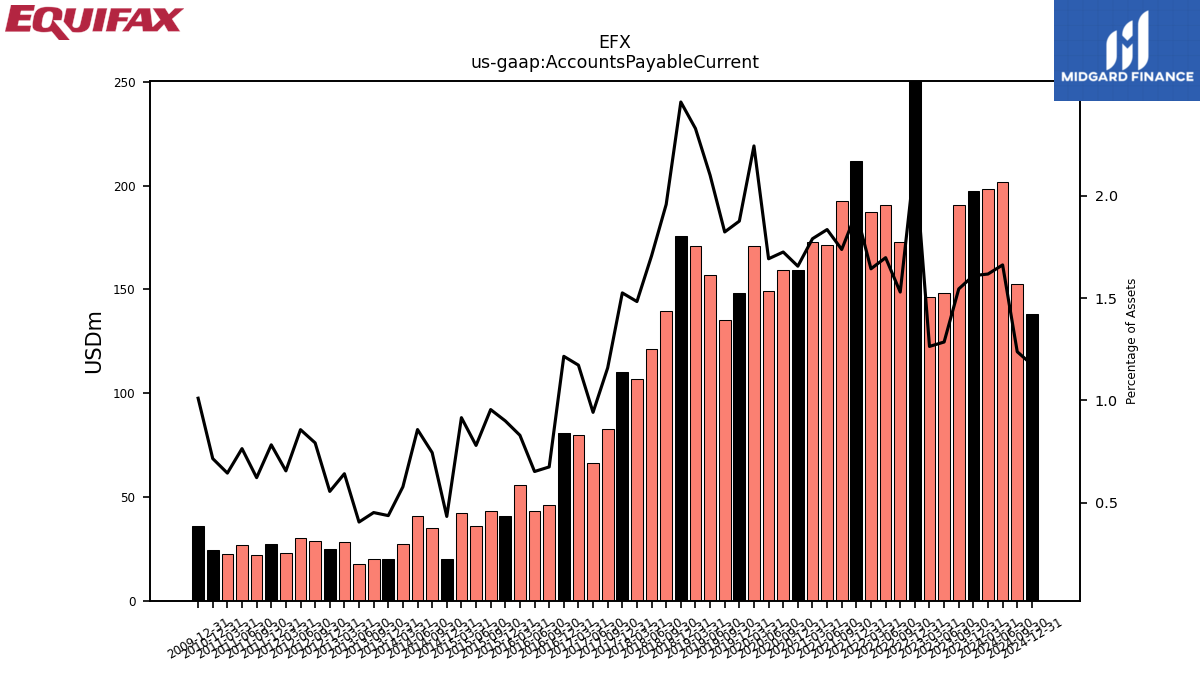
| Accounts Payable Current | 197.60 | 190.70 | 148.30 | 146.40 | 250.80 | 172.90 | 190.40 | 187.10 | 211.60 | 192.50 | 171.30 | 173.00 | 159.10 | 159.50 | 149.40 | 170.90 | 148.30 | 135.40 | 156.90 | 170.70 | 175.70 | 139.60 | 121.40 | 106.70 | 110.30 | 82.50 | 66.50 | 79.60 | 81.00 | 46.00 | 43.40 | 55.90 | 40.60 | 43.40 | 35.80 | 42.10 | 20.30 | 35.10 | 40.90 | 27.50 | 19.90 | 19.90 | 17.80 | 28.20 | 25.10 | 28.60 | 30.20 | 23.10 | 27.50 | 21.90 | 26.70 | 22.40 | 24.60 | NA | NA | NA | |
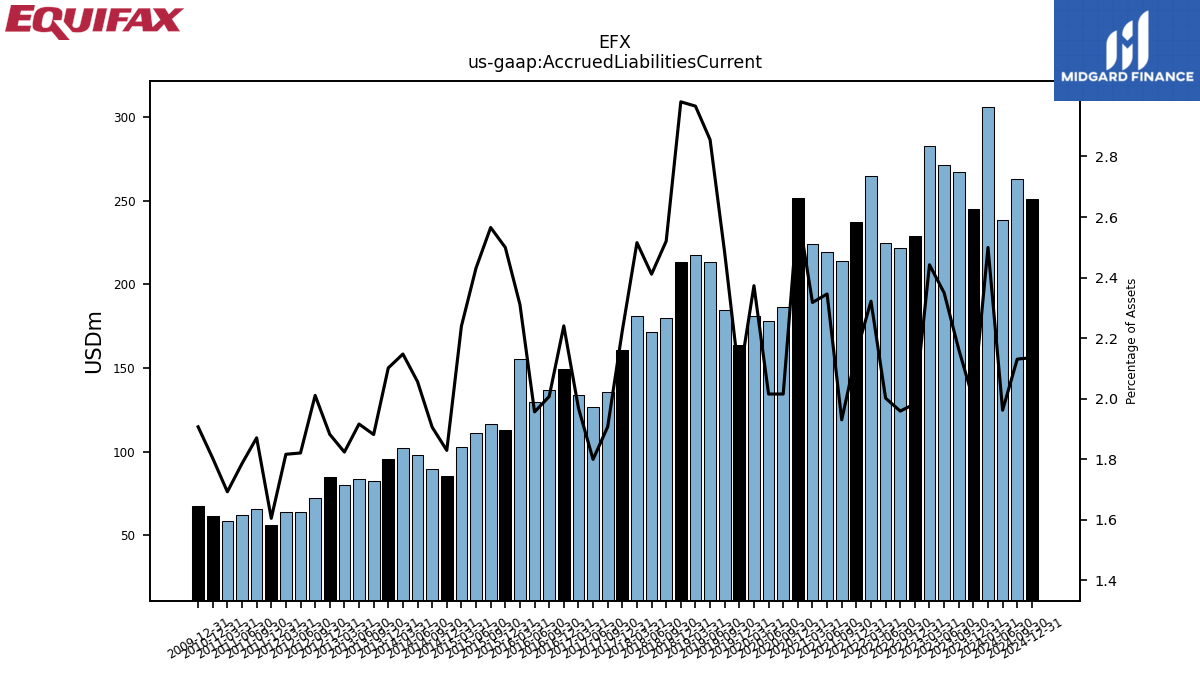
| Accrued Liabilities Current | 245.10 | 267.10 | 271.10 | 282.90 | 229.00 | 221.50 | 224.60 | 264.50 | 237.50 | 213.90 | 219.10 | 224.10 | 251.80 | 186.40 | 178.00 | 180.90 | 163.50 | 184.40 | 213.40 | 217.60 | 213.20 | 179.80 | 171.60 | 181.00 | 160.90 | 135.70 | 127.00 | 133.70 | 149.30 | 136.60 | 129.90 | 155.60 | 112.70 | 116.50 | 111.50 | 102.90 | 85.50 | 89.70 | 98.00 | 102.00 | 95.40 | 82.60 | 83.80 | 80.00 | 84.90 | 72.50 | 64.10 | 63.90 | 56.30 | 65.70 | 62.30 | 58.70 | 61.90 | NA | NA | NA | |
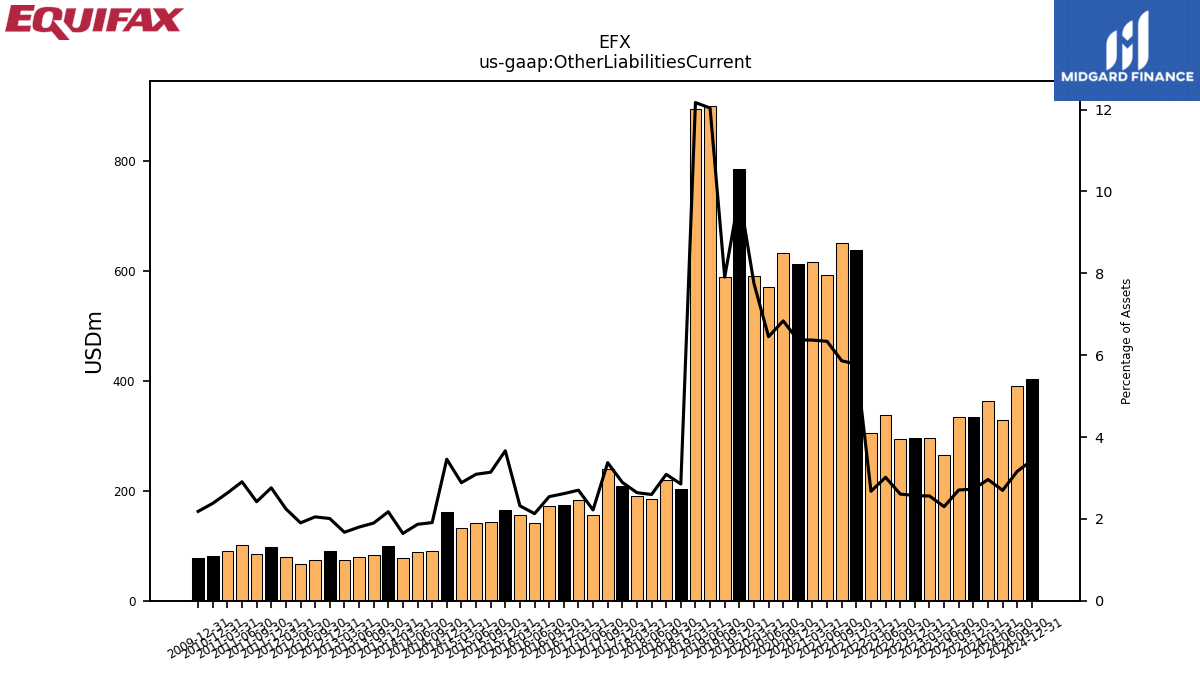
| Other Liabilities Current | 334.70 | 334.10 | 265.20 | 296.50 | 296.60 | 294.70 | 338.40 | 304.70 | 638.20 | 649.70 | 591.90 | 615.70 | 612.50 | 632.40 | 569.80 | 590.90 | 784.10 | 587.50 | 899.60 | 892.80 | 204.00 | 220.30 | 184.70 | 190.00 | 209.20 | 240.00 | 156.60 | 183.40 | 174.40 | 173.10 | 141.30 | 156.10 | 165.20 | 142.60 | 141.70 | 132.50 | 161.60 | 89.90 | 89.00 | 78.10 | 98.70 | 83.30 | 78.70 | 73.40 | 90.60 | 73.90 | 67.00 | 79.00 | 96.80 | 85.00 | 101.40 | 91.30 | 81.70 | NA | NA | NA | |
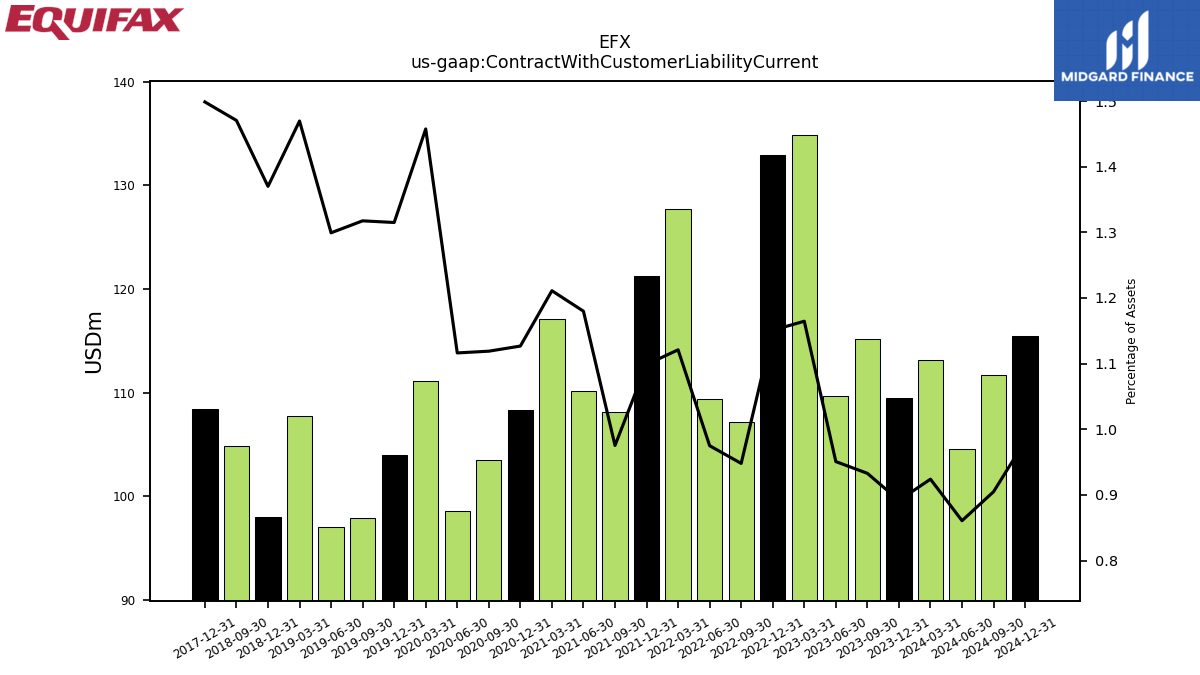
| Contract With Customer Liability Current | 109.50 | 115.20 | 109.70 | 134.90 | 132.90 | 107.20 | 109.40 | 127.70 | 121.30 | 108.10 | 110.20 | 117.10 | 108.30 | 103.50 | 98.60 | 111.10 | 104.00 | 97.90 | 97.10 | 107.80 | 98.00 | 104.90 | NA | NA | 108.40 | NA | NA | NA | NA | NA | NA | NA | NA | NA | NA | NA | NA | NA | NA | NA | NA | NA | NA | NA | NA | NA | NA | NA | NA | NA | NA | NA | NA | NA | NA | NA |
| 2023-12-31 | 2023-09-30 | 2023-06-30 | 2023-03-31 | 2022-12-31 | 2022-09-30 | 2022-06-30 | 2022-03-31 | 2021-12-31 | 2021-09-30 | 2021-06-30 | 2021-03-31 | 2020-12-31 | 2020-09-30 | 2020-06-30 | 2020-03-31 | 2019-12-31 | 2019-09-30 | 2019-06-30 | 2019-03-31 | 2018-12-31 | 2018-09-30 | 2018-06-30 | 2018-03-31 | 2017-12-31 | 2017-09-30 | 2017-06-30 | 2017-03-31 | 2016-12-31 | 2016-09-30 | 2016-06-30 | 2016-03-31 | 2015-12-31 | 2015-09-30 | 2015-06-30 | 2015-03-31 | 2014-12-31 | 2014-09-30 | 2014-06-30 | 2014-03-31 | 2013-12-31 | 2013-09-30 | 2013-06-30 | 2013-03-31 | 2012-12-31 | 2012-09-30 | 2012-06-30 | 2012-03-31 | 2011-12-31 | 2011-09-30 | 2011-06-30 | 2011-03-31 | 2010-12-31 | 2010-09-30 | 2010-06-30 | 2010-03-31 | ||
|---|---|---|---|---|---|---|---|---|---|---|---|---|---|---|---|---|---|---|---|---|---|---|---|---|---|---|---|---|---|---|---|---|---|---|---|---|---|---|---|---|---|---|---|---|---|---|---|---|---|---|---|---|---|---|---|---|---|
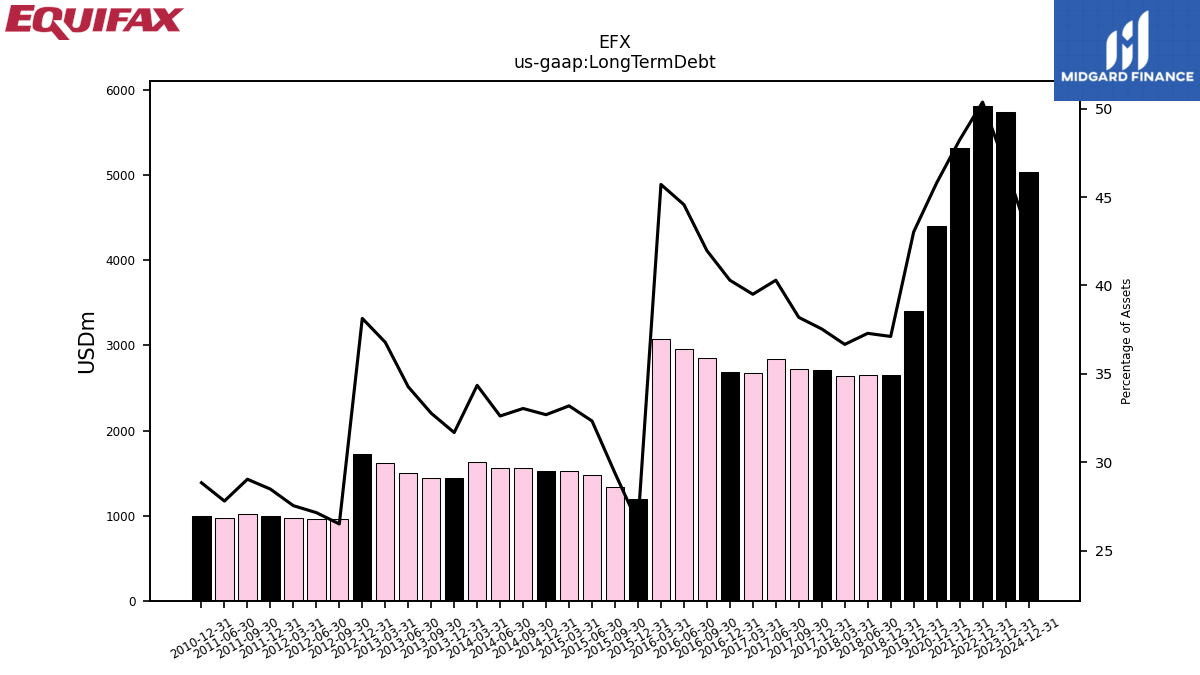
| Long Term Debt | 5741.60 | NA | NA | NA | 5817.20 | NA | NA | NA | 5325.10 | NA | NA | NA | 4402.20 | NA | NA | NA | 3403.10 | NA | NA | NA | 2654.90 | NA | 2654.00 | 2638.50 | 2715.30 | 2717.80 | 2844.20 | 2681.80 | 2685.40 | 2856.90 | 2960.00 | 3077.90 | 1196.80 | 1334.30 | 1482.60 | 1525.00 | 1527.90 | 1555.20 | 1554.50 | 1631.60 | 1438.10 | 1438.80 | 1498.70 | 1613.90 | 1720.40 | 955.80 | 955.90 | 969.00 | 999.20 | 1019.90 | 970.10 | NA | 990.20 | NA | NA | NA | |
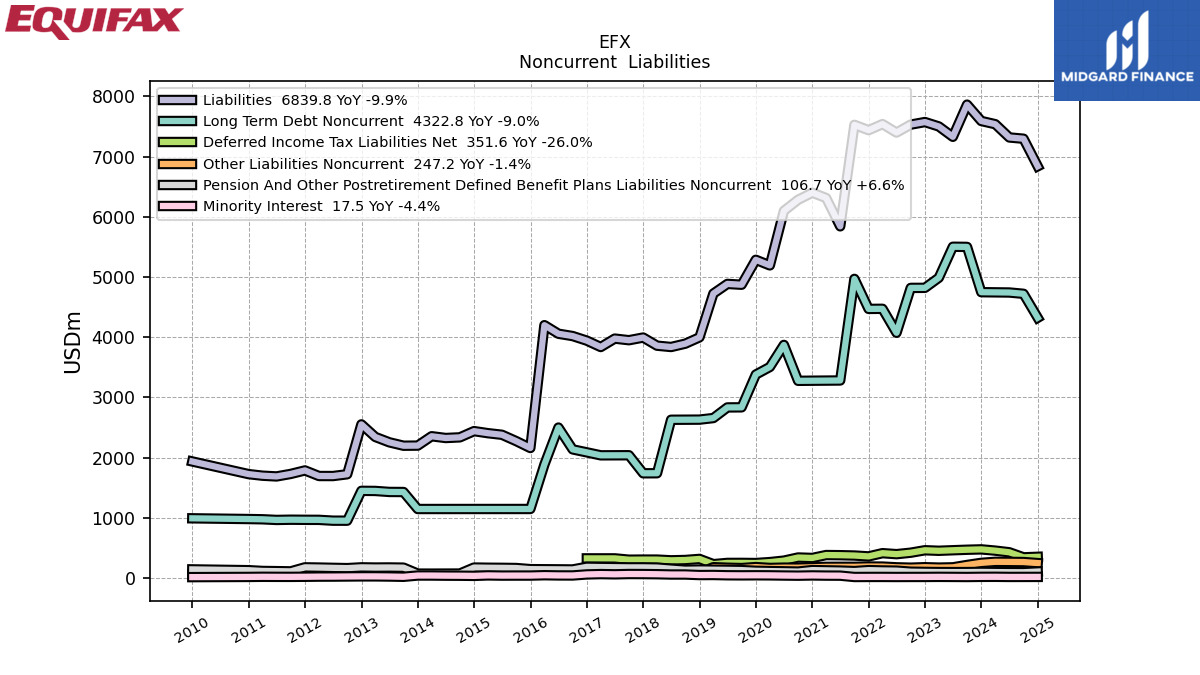
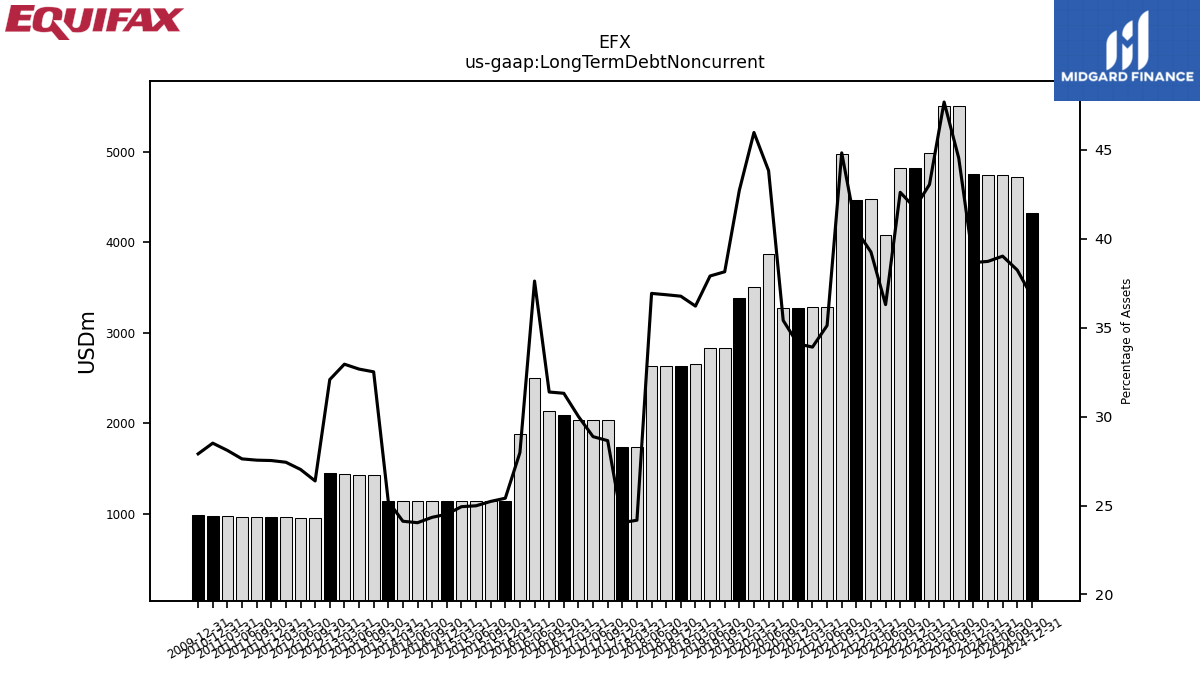
| Long Term Debt Noncurrent | 4747.80 | 5500.40 | 5503.00 | 4987.90 | 4820.10 | 4819.20 | 4073.50 | 4471.90 | 4470.10 | 4969.40 | 3280.90 | 3279.10 | 3277.30 | 3275.30 | 3872.10 | 3505.10 | 3379.50 | 2834.70 | 2833.30 | 2656.90 | 2630.60 | 2629.40 | 2628.40 | 1739.60 | 1739.00 | 2038.70 | 2038.10 | 2037.40 | 2086.80 | 2136.30 | 2498.70 | 1883.80 | 1145.90 | 1145.90 | 1145.80 | 1145.80 | 1145.70 | 1145.70 | 1145.60 | 1145.60 | 1145.50 | 1427.80 | 1429.10 | 1445.60 | 1447.40 | 951.40 | 951.80 | 965.30 | 966.00 | 967.80 | 963.90 | 974.80 | 978.90 | NA | NA | NA | |
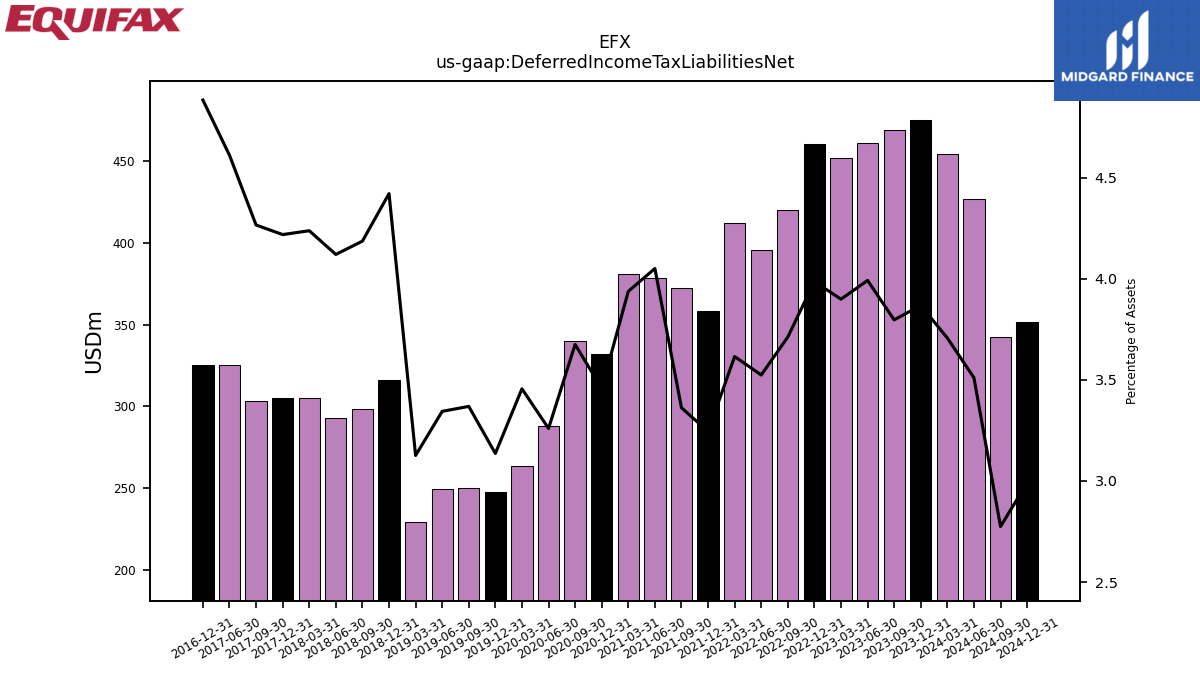
| Deferred Income Tax Liabilities Net | 474.90 | 468.80 | 460.50 | 451.60 | 460.30 | 419.70 | 395.40 | 411.80 | 358.20 | 372.60 | 378.30 | 380.70 | 332.30 | 339.90 | 287.90 | 263.40 | 248.00 | 250.30 | 249.90 | 229.30 | 316.20 | 298.60 | 293.20 | 304.90 | 305.10 | 303.50 | 325.40 | NA | 325.40 | NA | NA | NA | NA | NA | NA | NA | NA | NA | NA | NA | NA | NA | NA | NA | NA | NA | NA | NA | NA | NA | NA | NA | NA | NA | NA | NA | |
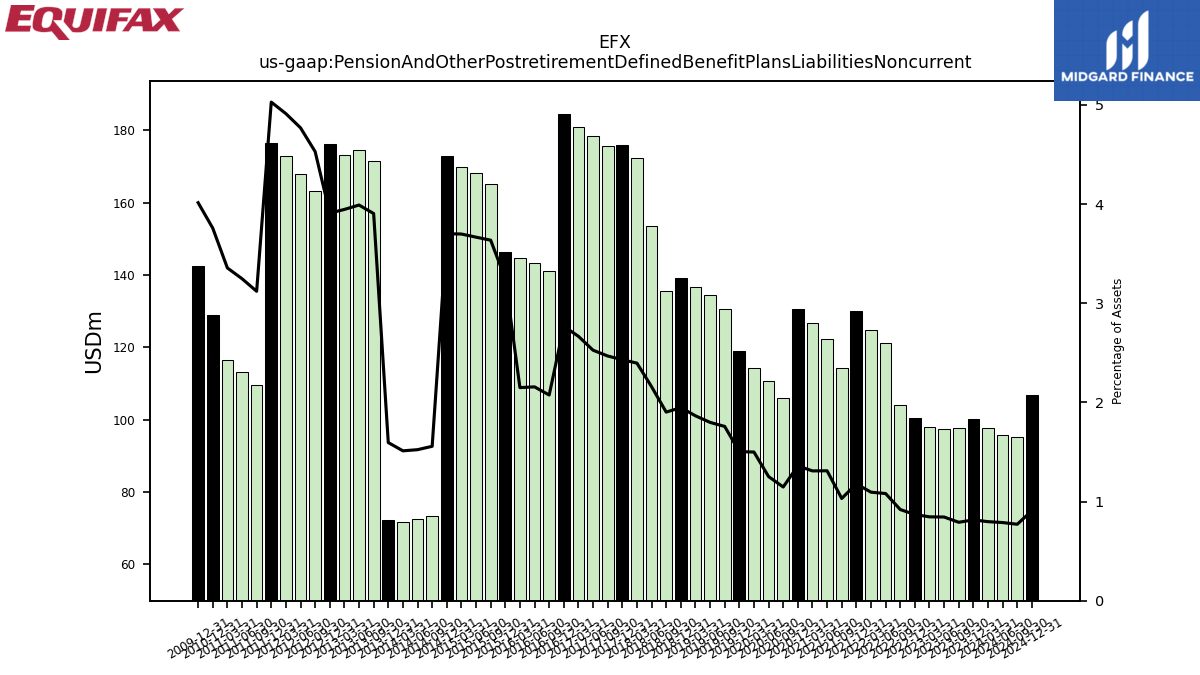
| Pension And Other Postretirement Defined Benefit Plans Liabilities Noncurrent | 100.10 | 97.70 | 97.40 | 98.00 | 100.40 | 104.00 | 121.30 | 124.70 | 130.10 | 114.30 | 122.40 | 126.60 | 130.70 | 106.10 | 110.60 | 114.30 | 118.90 | 130.60 | 134.40 | 136.80 | 139.30 | 135.70 | 153.60 | 172.40 | 175.80 | 175.60 | 178.30 | 181.00 | 184.40 | 141.20 | 143.20 | 144.70 | 146.40 | 165.10 | 168.10 | 169.90 | 173.00 | 73.30 | 72.60 | 71.80 | 72.40 | 171.40 | 174.50 | 173.10 | 176.30 | 163.30 | 167.90 | 172.80 | 176.40 | 109.60 | 113.30 | 116.40 | 129.00 | NA | NA | NA | |
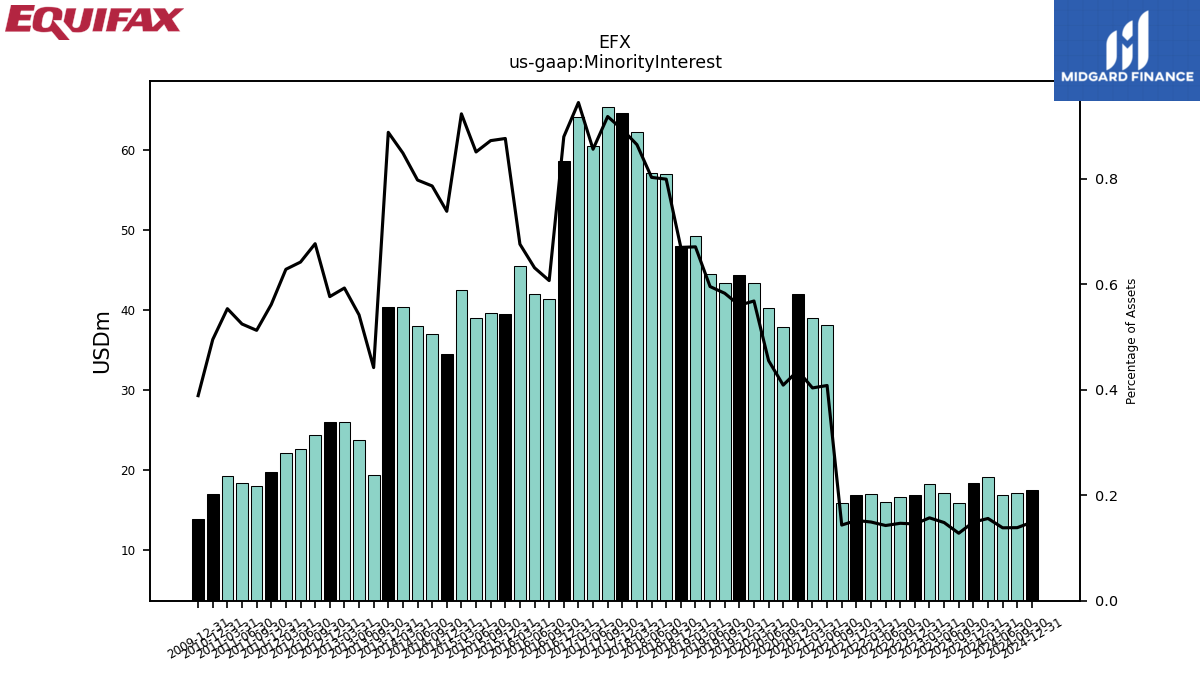
| Minority Interest | 18.30 | 15.80 | 17.10 | 18.20 | 16.80 | 16.60 | 16.00 | 17.00 | 16.80 | 15.90 | 38.10 | 39.00 | 41.90 | 37.80 | 40.20 | 43.30 | 44.30 | 43.30 | 44.50 | 49.20 | 47.90 | 57.00 | 57.10 | 62.20 | 64.60 | 65.30 | 60.40 | 64.10 | 58.60 | 41.30 | 41.90 | 45.50 | 39.50 | 39.60 | 39.00 | 42.40 | 34.50 | 37.00 | 38.00 | 40.30 | 40.30 | 19.40 | 23.70 | 26.00 | 26.00 | 24.40 | 22.60 | 22.10 | 19.70 | 18.00 | 18.30 | 19.20 | 17.00 | NA | NA | NA | |
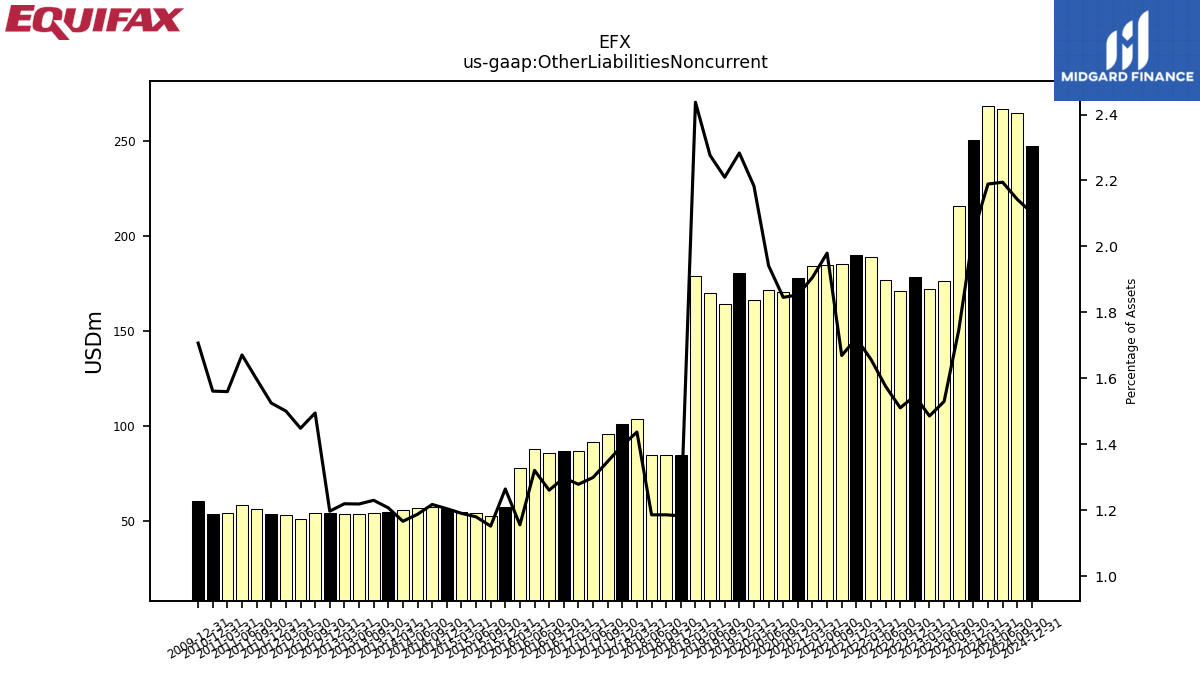
| Other Liabilities Noncurrent | 250.70 | 215.60 | 176.50 | 172.10 | 178.60 | 170.80 | 176.80 | 188.80 | 190.00 | 185.00 | 184.90 | 184.30 | 178.10 | 170.70 | 171.50 | 166.40 | 180.60 | 164.20 | 170.10 | 178.80 | 84.60 | 84.60 | 84.40 | 103.40 | 101.00 | 95.90 | 91.70 | 86.80 | 86.50 | 85.80 | 87.70 | 77.80 | 57.00 | 52.30 | 54.10 | 54.70 | 56.30 | 57.30 | 56.60 | 55.40 | 54.80 | 54.00 | 53.30 | 53.50 | 54.00 | 53.90 | 51.00 | 52.80 | 53.50 | 56.10 | 58.30 | 54.10 | 53.60 | NA | NA | NA |
| 2023-12-31 | 2023-09-30 | 2023-06-30 | 2023-03-31 | 2022-12-31 | 2022-09-30 | 2022-06-30 | 2022-03-31 | 2021-12-31 | 2021-09-30 | 2021-06-30 | 2021-03-31 | 2020-12-31 | 2020-09-30 | 2020-06-30 | 2020-03-31 | 2019-12-31 | 2019-09-30 | 2019-06-30 | 2019-03-31 | 2018-12-31 | 2018-09-30 | 2018-06-30 | 2018-03-31 | 2017-12-31 | 2017-09-30 | 2017-06-30 | 2017-03-31 | 2016-12-31 | 2016-09-30 | 2016-06-30 | 2016-03-31 | 2015-12-31 | 2015-09-30 | 2015-06-30 | 2015-03-31 | 2014-12-31 | 2014-09-30 | 2014-06-30 | 2014-03-31 | 2013-12-31 | 2013-09-30 | 2013-06-30 | 2013-03-31 | 2012-12-31 | 2012-09-30 | 2012-06-30 | 2012-03-31 | 2011-12-31 | 2011-09-30 | 2011-06-30 | 2011-03-31 | 2010-12-31 | 2010-09-30 | 2010-06-30 | 2010-03-31 | ||
|---|---|---|---|---|---|---|---|---|---|---|---|---|---|---|---|---|---|---|---|---|---|---|---|---|---|---|---|---|---|---|---|---|---|---|---|---|---|---|---|---|---|---|---|---|---|---|---|---|---|---|---|---|---|---|---|---|---|
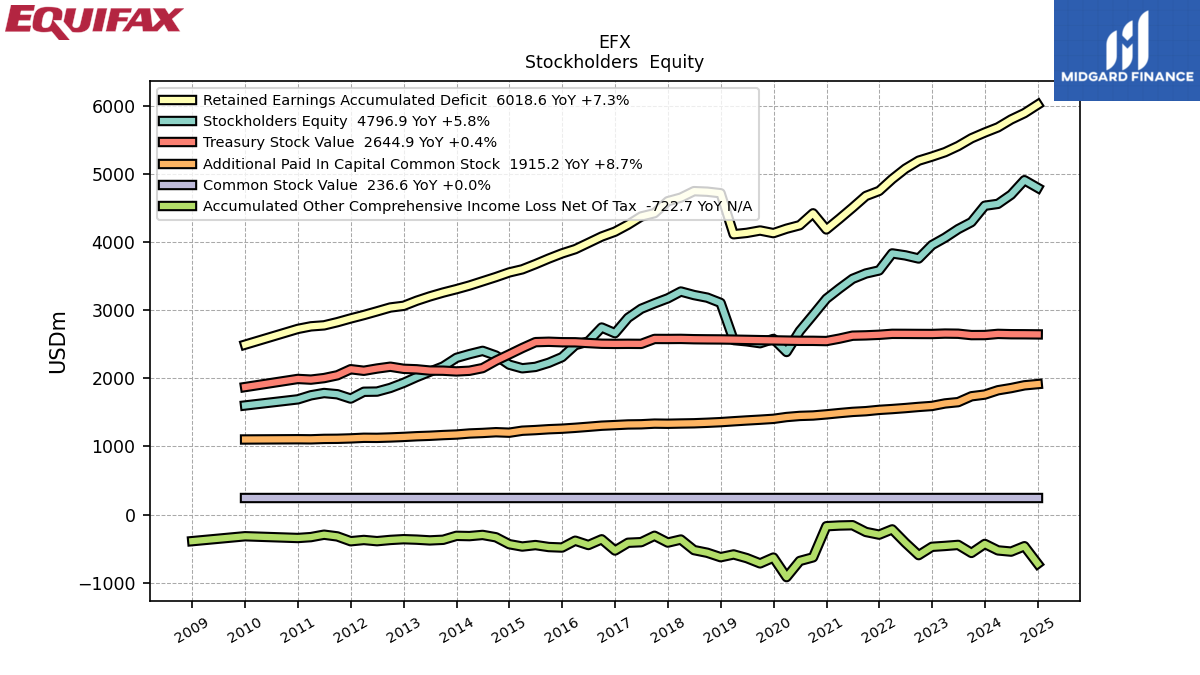
| Stockholders Equity | 4534.10 | 4293.30 | 4191.20 | 4064.00 | 3956.50 | 3759.00 | 3805.00 | 3834.10 | 3584.40 | 3539.20 | 3460.50 | 3318.00 | 3168.40 | 2929.00 | 2694.10 | 2386.50 | 2578.60 | 2515.80 | 2543.40 | 2561.70 | 3107.80 | 3184.50 | 3222.60 | 3274.70 | 3174.40 | 3100.40 | 3021.00 | 2888.10 | 2662.70 | 2746.10 | 2541.50 | 2487.30 | 2310.90 | 2227.90 | 2167.60 | 2147.30 | 2200.10 | 2334.00 | 2403.20 | 2355.20 | 2300.70 | 2174.00 | 2096.30 | 2018.50 | 1933.20 | 1858.80 | 1805.30 | 1802.50 | 1702.40 | 1766.10 | 1784.30 | 1750.60 | 1691.40 | NA | NA | NA | |
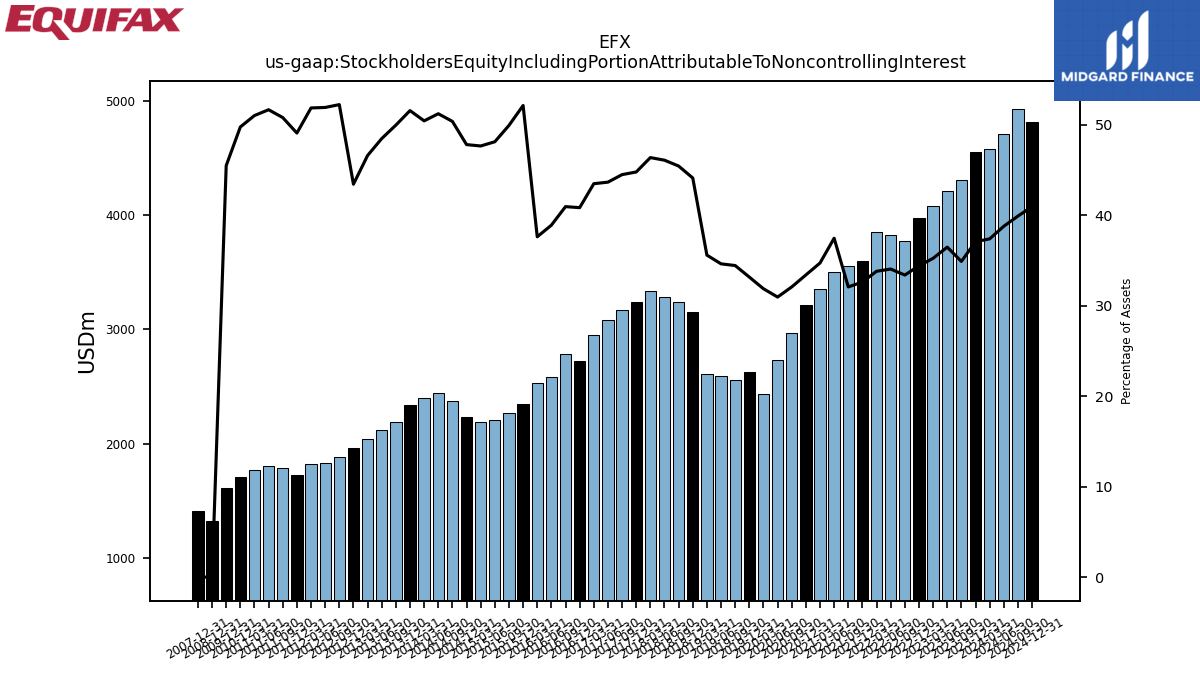
| Stockholders Equity Including Portion Attributable To Noncontrolling Interest | 4552.40 | 4309.10 | 4208.30 | 4082.20 | 3973.30 | 3775.60 | 3821.00 | 3851.10 | 3601.20 | 3555.10 | 3498.60 | 3357.00 | 3210.30 | 2966.80 | 2734.30 | 2429.80 | 2622.90 | 2559.10 | 2587.90 | 2610.90 | 3155.70 | 3241.50 | 3279.70 | 3336.90 | 3239.00 | 3165.70 | 3081.40 | 2952.20 | 2721.30 | 2787.40 | 2583.40 | 2532.80 | 2350.40 | 2267.50 | 2206.60 | 2189.70 | 2234.60 | 2371.00 | 2441.20 | 2395.50 | 2341.00 | 2193.40 | 2120.00 | 2044.50 | 1959.20 | 1883.20 | 1827.90 | 1824.60 | 1722.10 | 1784.10 | 1802.60 | 1769.80 | 1708.40 | NA | NA | NA | |
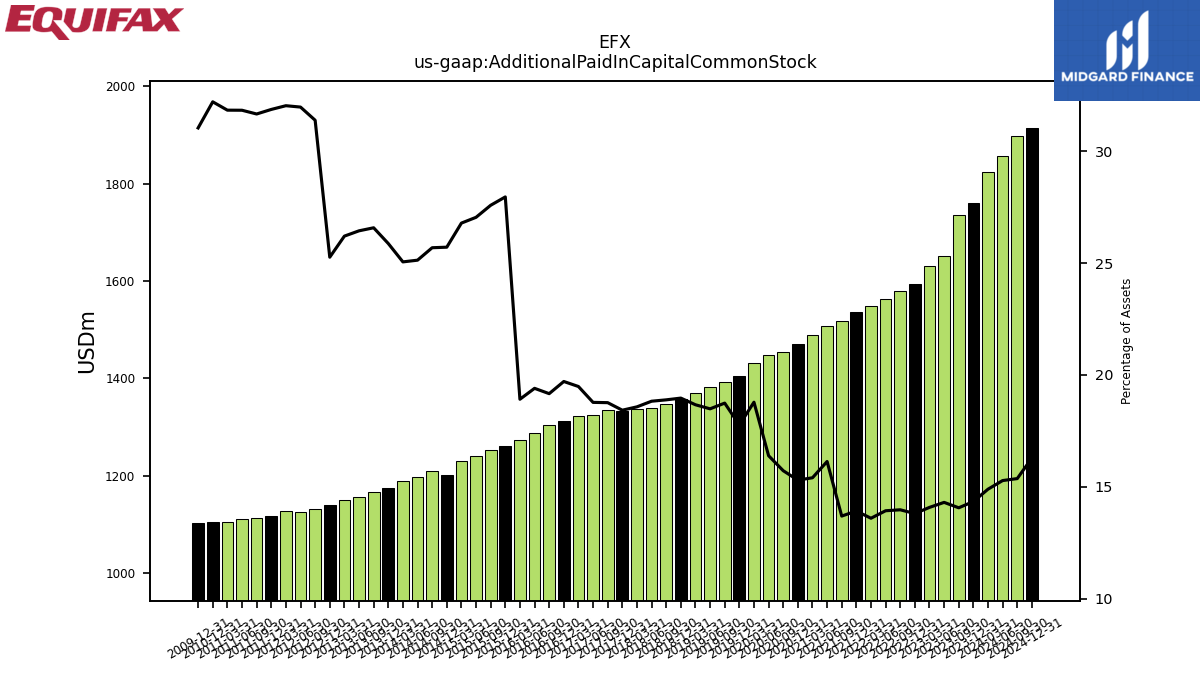
| Additional Paid In Capital Common Stock | 1761.30 | 1736.60 | 1650.50 | 1631.10 | 1594.20 | 1580.10 | 1563.20 | 1548.80 | 1536.70 | 1517.60 | 1506.80 | 1489.50 | 1470.70 | 1454.10 | 1447.80 | 1431.70 | 1405.10 | 1392.60 | 1381.50 | 1369.40 | 1356.60 | 1347.40 | 1339.80 | 1336.60 | 1332.70 | 1335.00 | 1325.10 | 1322.70 | 1313.30 | 1304.40 | 1288.40 | 1273.40 | 1260.50 | 1252.60 | 1240.10 | 1230.80 | 1201.70 | 1209.00 | 1197.70 | 1190.00 | 1174.60 | 1166.80 | 1156.40 | 1149.60 | 1139.60 | 1131.60 | 1125.70 | 1127.00 | 1118.00 | 1112.10 | 1110.60 | 1104.20 | 1105.80 | NA | NA | NA | |
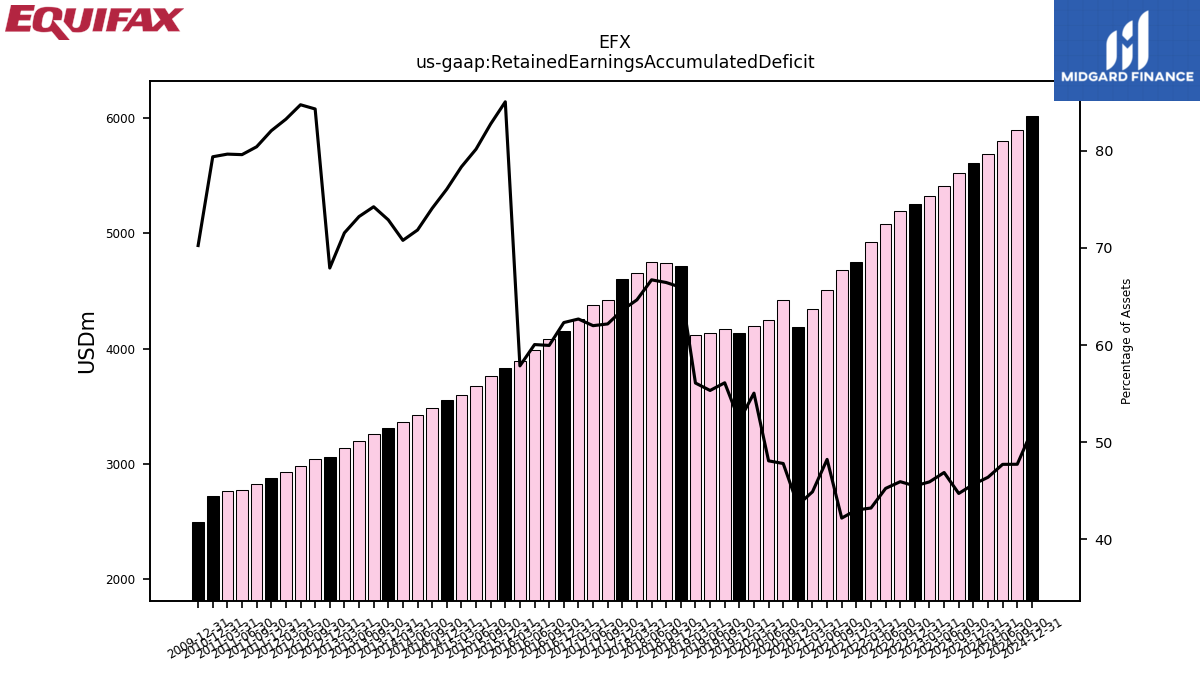
| Retained Earnings Accumulated Deficit | 5608.60 | 5524.50 | 5410.50 | 5320.30 | 5256.00 | 5195.80 | 5078.10 | 4925.50 | 4751.60 | 4677.40 | 4505.70 | 4342.00 | 4185.40 | 4423.10 | 4248.00 | 4196.90 | 4131.80 | 4170.40 | 4135.50 | 4115.40 | 4717.80 | 4740.10 | 4748.30 | 4653.10 | 4600.60 | 4424.70 | 4376.30 | 4255.90 | 4153.20 | 4081.90 | 3988.30 | 3896.20 | 3834.40 | 3758.50 | 3676.10 | 3600.10 | 3554.80 | 3486.90 | 3424.40 | 3362.30 | 3309.20 | 3259.40 | 3202.80 | 3139.10 | 3064.60 | 3039.90 | 2983.60 | 2929.10 | 2879.20 | 2824.50 | 2777.60 | 2763.10 | 2725.70 | NA | NA | NA | |
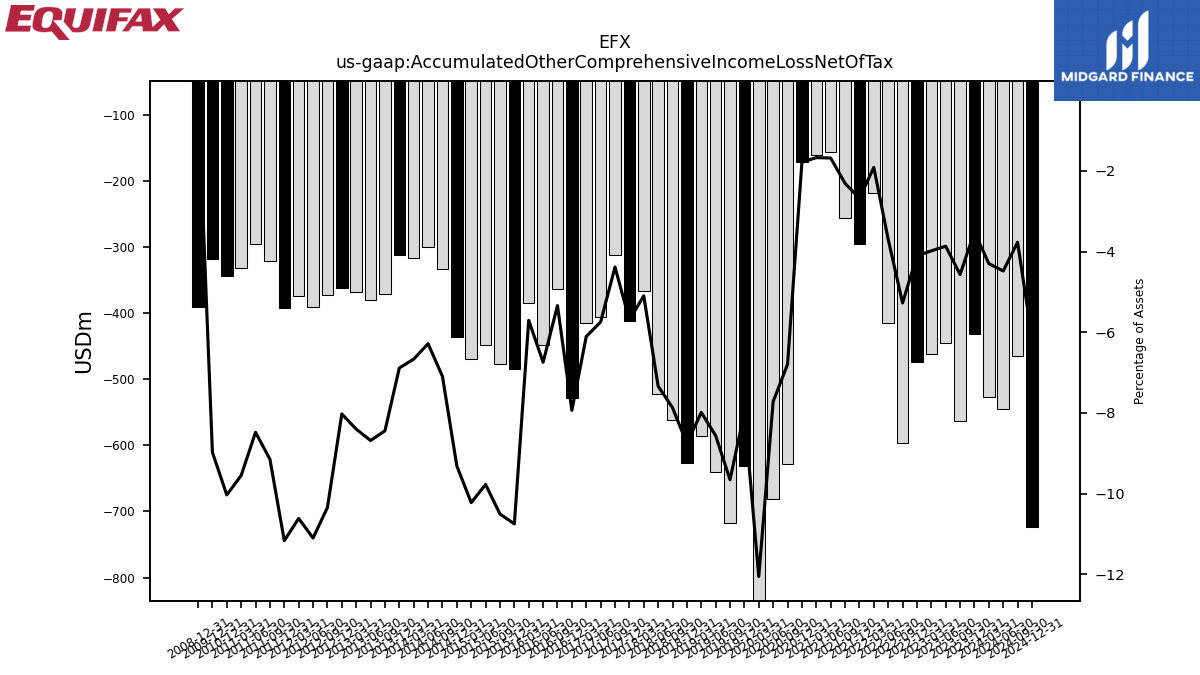
| Accumulated Other Comprehensive Income Loss Net Of Tax | -431.20 | -563.90 | -445.90 | -461.10 | -473.70 | -596.20 | -414.40 | -217.70 | -295.40 | -255.70 | -156.80 | -161.30 | -171.40 | -628.50 | -681.70 | -918.90 | -631.60 | -717.50 | -640.00 | -585.90 | -626.30 | -561.40 | -522.00 | -366.80 | -412.00 | -311.80 | -405.50 | -414.40 | -528.90 | -363.30 | -447.80 | -384.00 | -484.80 | -477.10 | -448.20 | -469.80 | -435.40 | -333.90 | -299.50 | -316.60 | -312.60 | -370.70 | -379.80 | -368.60 | -362.00 | -373.00 | -390.90 | -373.50 | -391.80 | -321.30 | -295.90 | -331.30 | -344.50 | NA | NA | NA | |
| Minority Interest | 18.30 | 15.80 | 17.10 | 18.20 | 16.80 | 16.60 | 16.00 | 17.00 | 16.80 | 15.90 | 38.10 | 39.00 | 41.90 | 37.80 | 40.20 | 43.30 | 44.30 | 43.30 | 44.50 | 49.20 | 47.90 | 57.00 | 57.10 | 62.20 | 64.60 | 65.30 | 60.40 | 64.10 | 58.60 | 41.30 | 41.90 | 45.50 | 39.50 | 39.60 | 39.00 | 42.40 | 34.50 | 37.00 | 38.00 | 40.30 | 40.30 | 19.40 | 23.70 | 26.00 | 26.00 | 24.40 | 22.60 | 22.10 | 19.70 | 18.00 | 18.30 | 19.20 | 17.00 | NA | NA | NA | |
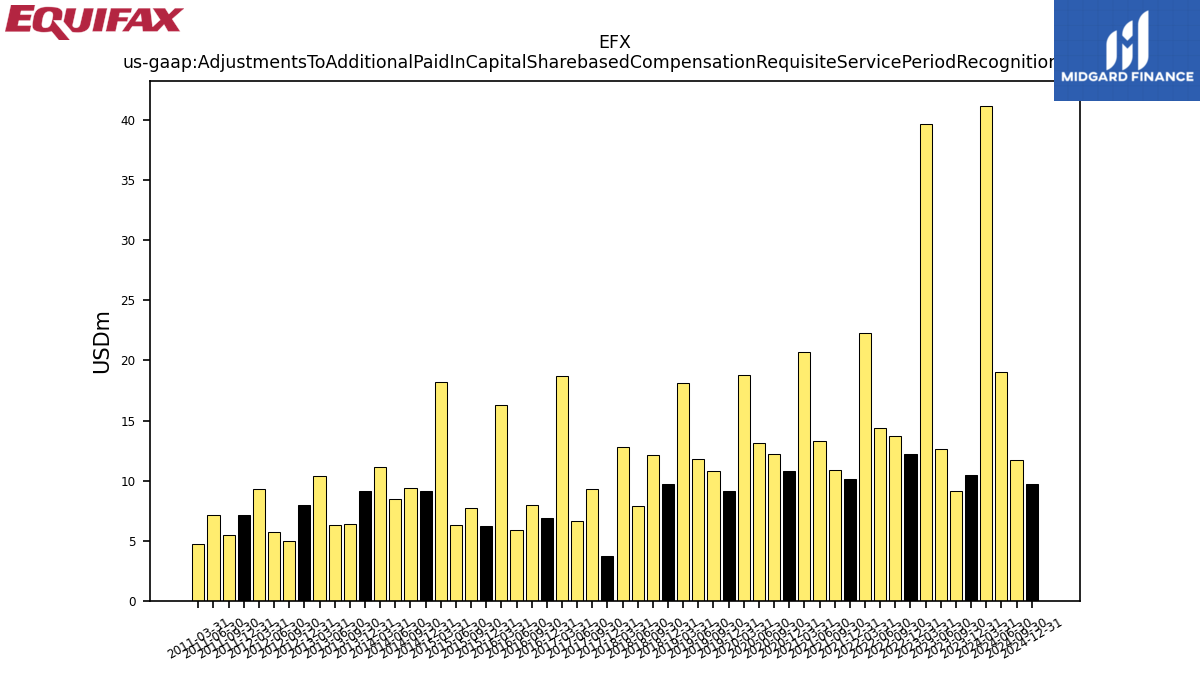
| Adjustments To Additional Paid In Capital Sharebased Compensation Requisite Service Period Recognition Value | 10.50 | 9.10 | 12.60 | 39.70 | 12.20 | 13.70 | 14.40 | 22.30 | 10.10 | 10.90 | 13.30 | 20.70 | 10.80 | 12.20 | 13.10 | 18.80 | 9.10 | 10.80 | 11.80 | 18.10 | 9.70 | 12.10 | 7.90 | 12.80 | 3.70 | 9.30 | 6.60 | 18.70 | 6.90 | 8.00 | 5.90 | 16.30 | 6.20 | 7.70 | 6.30 | 18.20 | 9.10 | 9.40 | 8.50 | 11.10 | 9.10 | 6.40 | 6.30 | 10.40 | 8.00 | 5.00 | 5.70 | 9.30 | 7.10 | 5.50 | 7.10 | 4.70 | NA | NA | NA | NA | |
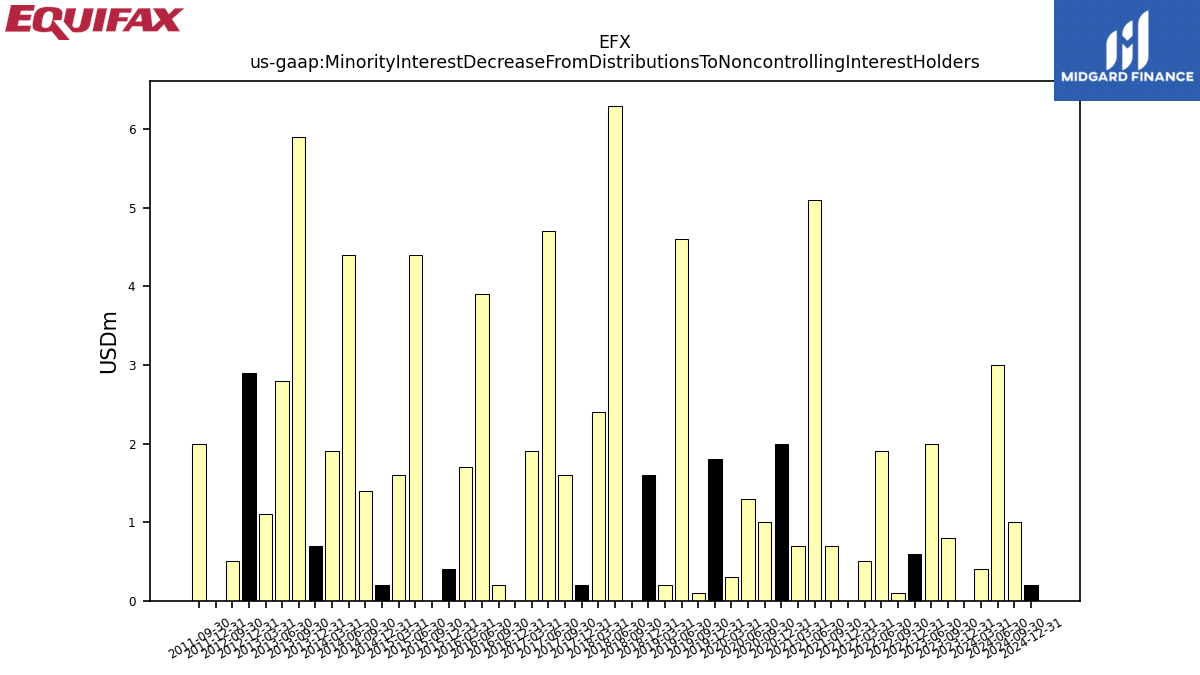
| Minority Interest Decrease From Distributions To Noncontrolling Interest Holders | 0.00 | 0.80 | 2.00 | NA | 0.60 | 0.10 | 1.90 | 0.50 | 0.00 | 0.70 | 5.10 | 0.70 | 2.00 | 1.00 | 1.30 | 0.30 | 1.80 | 0.10 | 4.60 | 0.20 | 1.60 | 0.00 | 6.30 | 2.40 | 0.20 | 1.60 | 4.70 | 1.90 | 0.00 | 0.20 | 3.90 | 1.70 | 0.40 | 0.00 | 4.40 | 1.60 | 0.20 | 1.40 | 4.40 | 1.90 | 0.70 | 5.90 | 2.80 | 1.10 | 2.90 | 0.50 | NA | NA | 0.00 | 2.00 | NA | NA | NA | NA | NA | NA |
| 2023-12-31 | 2023-09-30 | 2023-06-30 | 2023-03-31 | 2022-12-31 | 2022-09-30 | 2022-06-30 | 2022-03-31 | 2021-12-31 | 2021-09-30 | 2021-06-30 | 2021-03-31 | 2020-12-31 | 2020-09-30 | 2020-06-30 | 2020-03-31 | 2019-12-31 | 2019-09-30 | 2019-06-30 | 2019-03-31 | 2018-12-31 | 2018-09-30 | 2018-06-30 | 2018-03-31 | 2017-12-31 | 2017-09-30 | 2017-06-30 | 2017-03-31 | 2016-12-31 | 2016-09-30 | 2016-06-30 | 2016-03-31 | 2015-12-31 | 2015-09-30 | 2015-06-30 | 2015-03-31 | 2014-12-31 | 2014-09-30 | 2014-06-30 | 2014-03-31 | 2013-12-31 | 2013-09-30 | 2013-06-30 | 2013-03-31 | 2012-12-31 | 2012-09-30 | 2012-06-30 | 2012-03-31 | 2011-12-31 | 2011-09-30 | 2011-06-30 | 2011-03-31 | 2010-12-31 | 2010-09-30 | 2010-06-30 | 2010-03-31 | ||
|---|---|---|---|---|---|---|---|---|---|---|---|---|---|---|---|---|---|---|---|---|---|---|---|---|---|---|---|---|---|---|---|---|---|---|---|---|---|---|---|---|---|---|---|---|---|---|---|---|---|---|---|---|---|---|---|---|---|
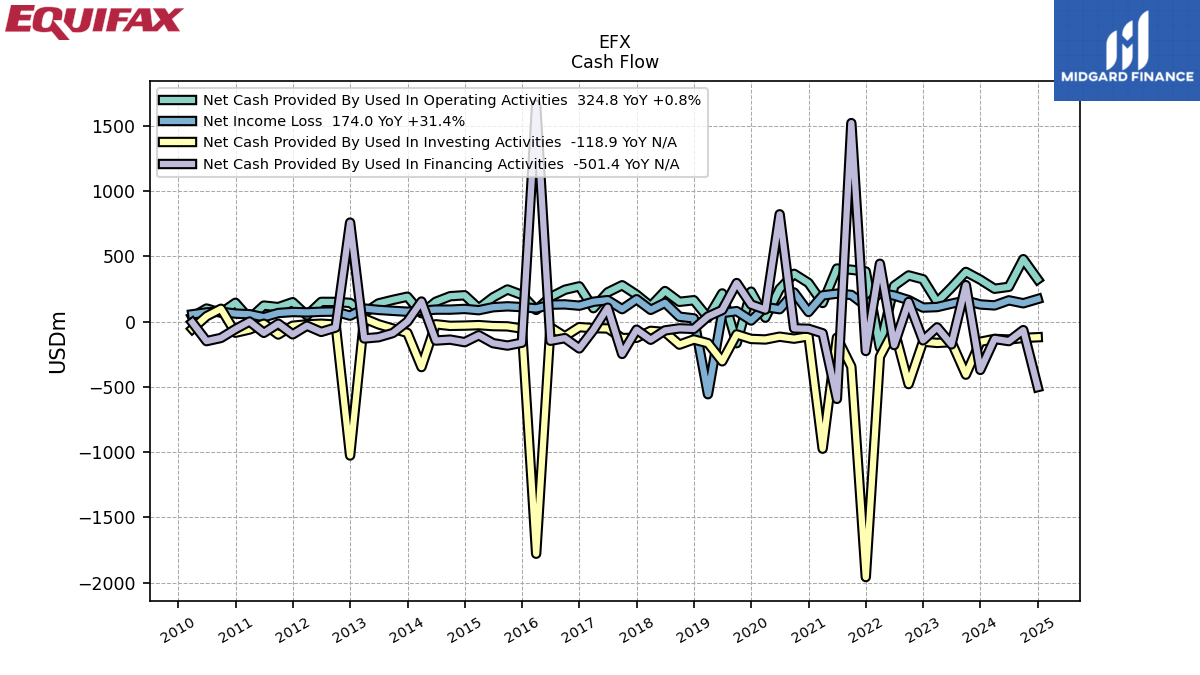
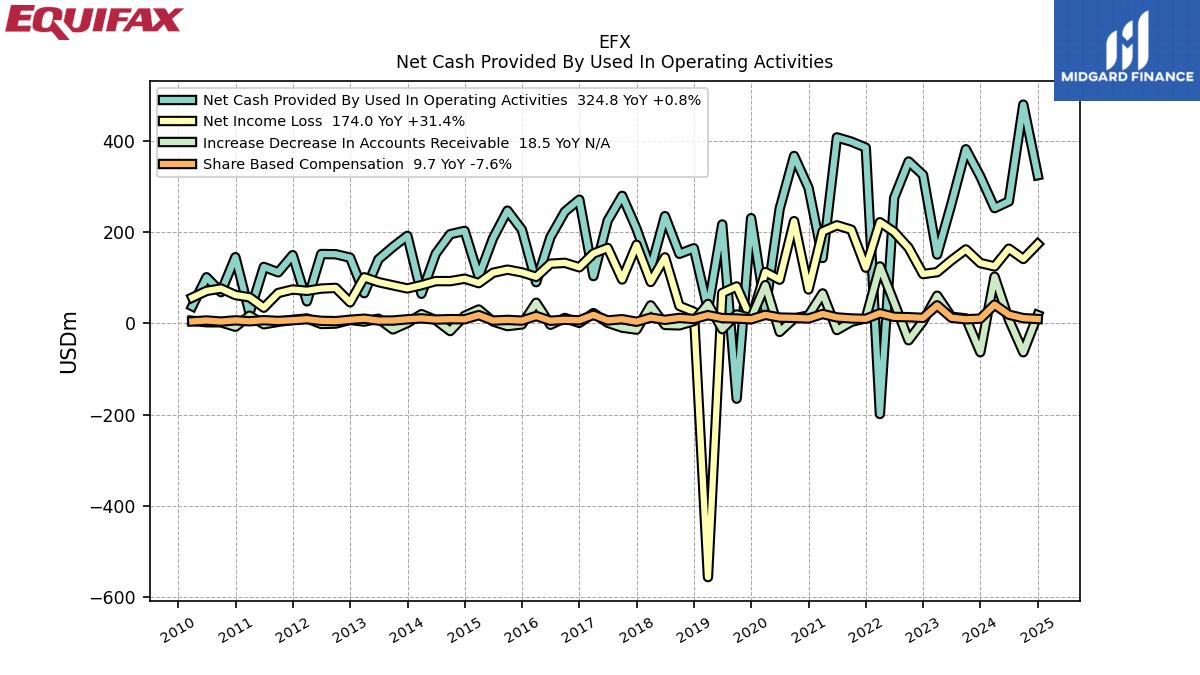
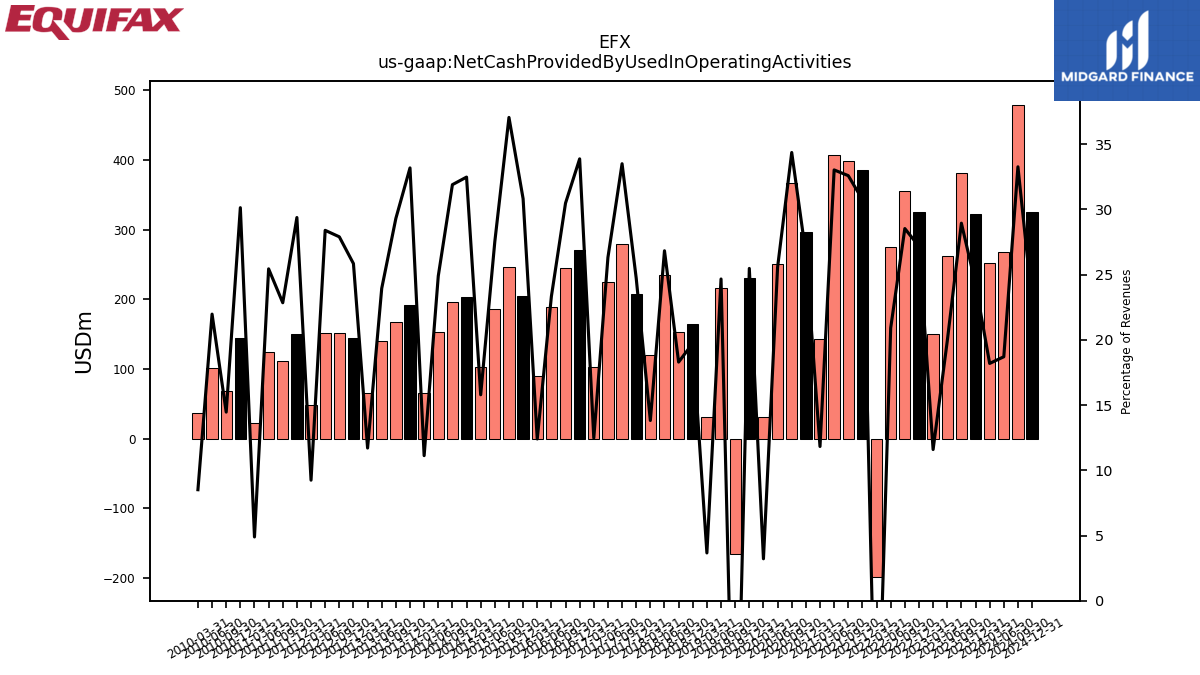
| Net Cash Provided By Used In Operating Activities | 322.10 | 381.70 | 262.10 | 150.90 | 325.40 | 354.90 | 275.30 | -198.50 | 385.30 | 398.40 | 407.70 | 143.40 | 297.20 | 367.00 | 251.20 | 30.80 | 230.70 | -164.90 | 217.00 | 31.00 | 164.80 | 152.60 | 235.20 | 119.60 | 207.30 | 279.60 | 225.40 | 103.70 | 271.30 | 245.00 | 189.20 | 90.30 | 205.30 | 247.20 | 186.70 | 102.90 | 202.80 | 195.60 | 152.80 | 65.00 | 191.90 | 167.60 | 140.50 | 66.30 | 144.20 | 151.70 | 152.10 | 48.30 | 149.70 | 112.00 | 123.90 | 23.10 | 145.20 | 68.50 | 101.20 | 37.70 | |
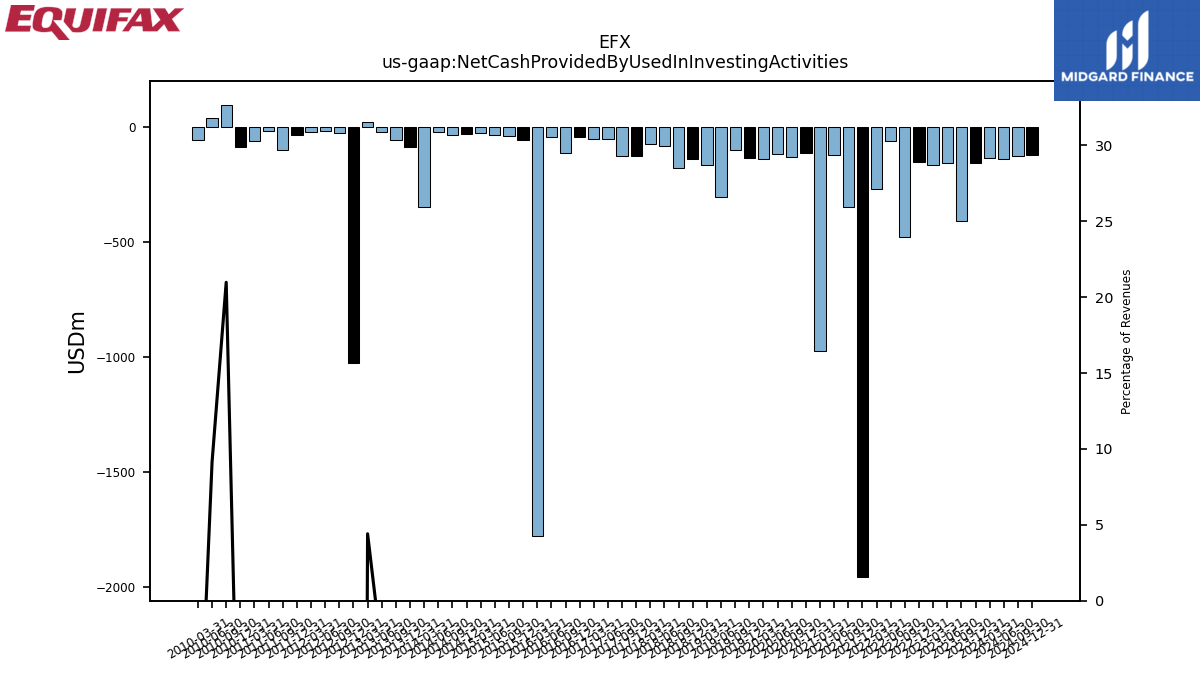
| Net Cash Provided By Used In Investing Activities | -153.50 | -406.00 | -156.10 | -162.60 | -152.40 | -478.40 | -60.50 | -268.20 | -1957.90 | -344.70 | -122.10 | -973.50 | -111.80 | -130.00 | -114.80 | -136.10 | -132.00 | -97.20 | -303.70 | -164.60 | -136.30 | -175.80 | -79.30 | -70.10 | -123.30 | -125.30 | -51.90 | -49.00 | -41.70 | -112.80 | -42.60 | -1778.80 | -52.60 | -35.50 | -33.60 | -26.10 | -29.80 | -31.90 | -19.70 | -347.90 | -85.70 | -52.80 | -20.10 | 25.00 | -1025.80 | -22.20 | -15.40 | -20.20 | -31.00 | -98.30 | -15.20 | -59.60 | -84.50 | 99.40 | 42.10 | -56.00 | |
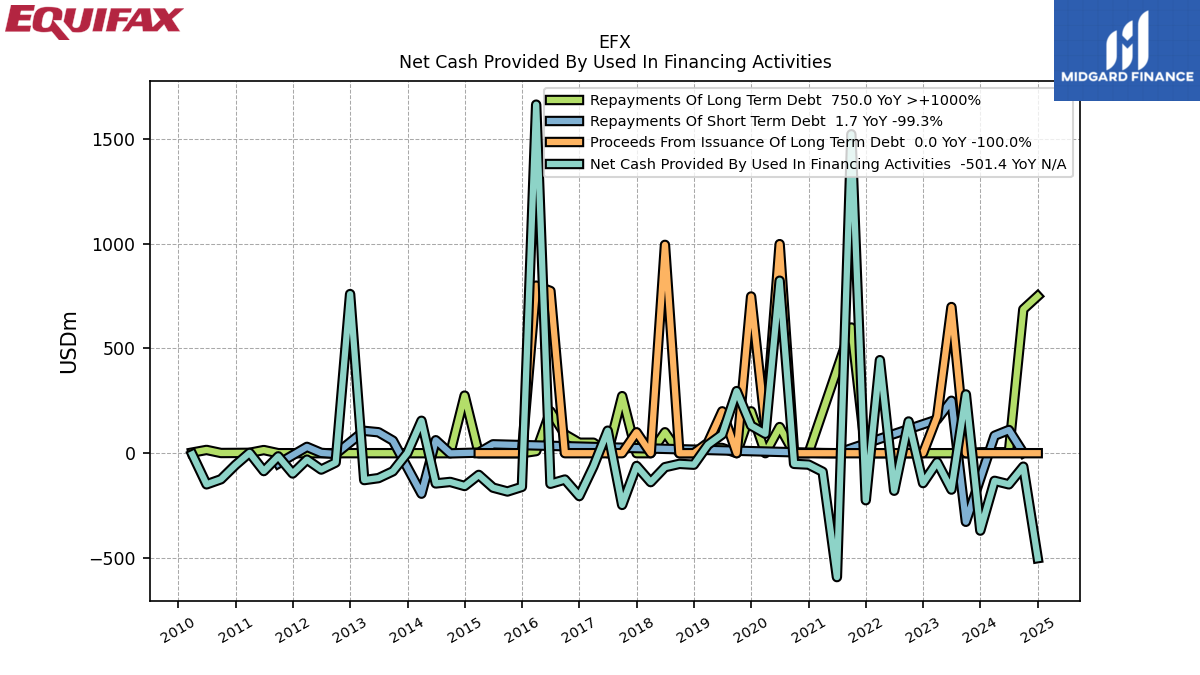
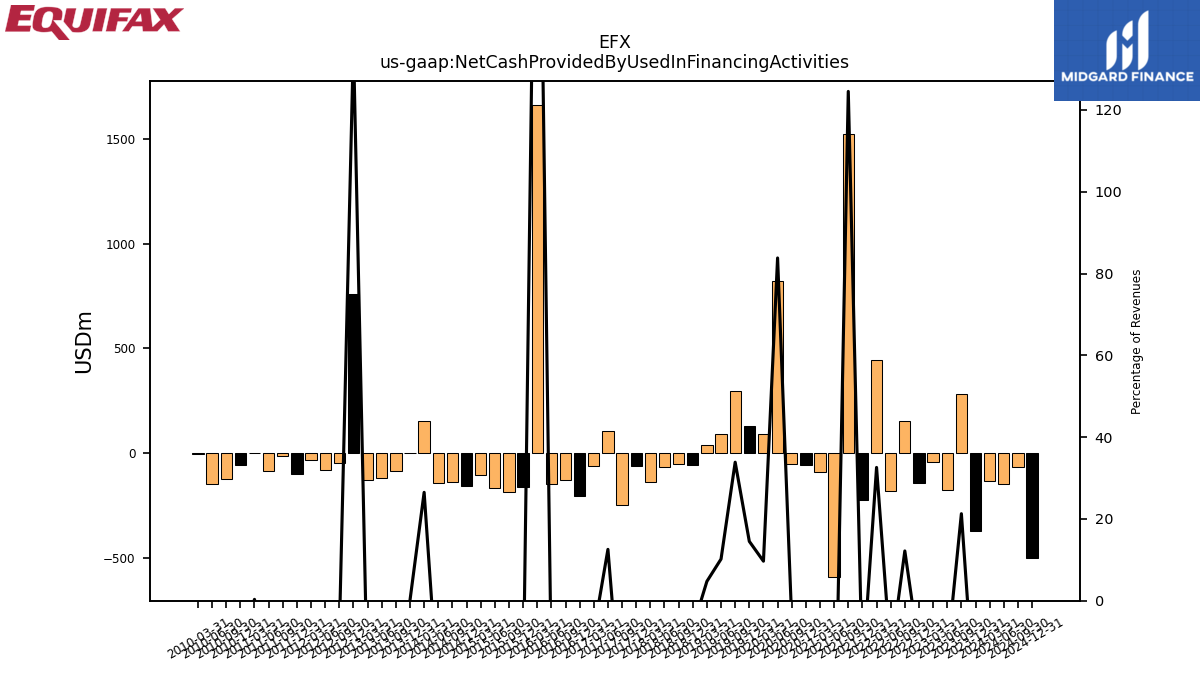
| Net Cash Provided By Used In Financing Activities | -369.70 | 280.70 | -173.90 | -43.30 | -142.80 | 151.50 | -179.30 | 444.30 | -224.70 | 1522.70 | -591.70 | -88.60 | -54.50 | -51.00 | 823.60 | 92.70 | 131.50 | 296.60 | 89.70 | 40.10 | -55.00 | -51.00 | -66.70 | -138.30 | -60.90 | -247.10 | 107.60 | -63.30 | -204.90 | -125.80 | -146.00 | 1664.20 | -161.00 | -182.90 | -164.50 | -103.60 | -156.70 | -137.20 | -144.40 | 154.90 | 0.80 | -86.50 | -119.00 | -128.40 | 759.90 | -44.70 | -78.20 | -30.70 | -97.00 | -15.00 | -85.50 | 1.60 | -56.60 | -124.40 | -148.80 | -5.50 |
| 2023-12-31 | 2023-09-30 | 2023-06-30 | 2023-03-31 | 2022-12-31 | 2022-09-30 | 2022-06-30 | 2022-03-31 | 2021-12-31 | 2021-09-30 | 2021-06-30 | 2021-03-31 | 2020-12-31 | 2020-09-30 | 2020-06-30 | 2020-03-31 | 2019-12-31 | 2019-09-30 | 2019-06-30 | 2019-03-31 | 2018-12-31 | 2018-09-30 | 2018-06-30 | 2018-03-31 | 2017-12-31 | 2017-09-30 | 2017-06-30 | 2017-03-31 | 2016-12-31 | 2016-09-30 | 2016-06-30 | 2016-03-31 | 2015-12-31 | 2015-09-30 | 2015-06-30 | 2015-03-31 | 2014-12-31 | 2014-09-30 | 2014-06-30 | 2014-03-31 | 2013-12-31 | 2013-09-30 | 2013-06-30 | 2013-03-31 | 2012-12-31 | 2012-09-30 | 2012-06-30 | 2012-03-31 | 2011-12-31 | 2011-09-30 | 2011-06-30 | 2011-03-31 | 2010-12-31 | 2010-09-30 | 2010-06-30 | 2010-03-31 | ||
|---|---|---|---|---|---|---|---|---|---|---|---|---|---|---|---|---|---|---|---|---|---|---|---|---|---|---|---|---|---|---|---|---|---|---|---|---|---|---|---|---|---|---|---|---|---|---|---|---|---|---|---|---|---|---|---|---|---|
| Net Cash Provided By Used In Operating Activities | 322.10 | 381.70 | 262.10 | 150.90 | 325.40 | 354.90 | 275.30 | -198.50 | 385.30 | 398.40 | 407.70 | 143.40 | 297.20 | 367.00 | 251.20 | 30.80 | 230.70 | -164.90 | 217.00 | 31.00 | 164.80 | 152.60 | 235.20 | 119.60 | 207.30 | 279.60 | 225.40 | 103.70 | 271.30 | 245.00 | 189.20 | 90.30 | 205.30 | 247.20 | 186.70 | 102.90 | 202.80 | 195.60 | 152.80 | 65.00 | 191.90 | 167.60 | 140.50 | 66.30 | 144.20 | 151.70 | 152.10 | 48.30 | 149.70 | 112.00 | 123.90 | 23.10 | 145.20 | 68.50 | 101.20 | 37.70 | |
| Net Income Loss | 132.40 | 162.20 | 138.30 | 112.40 | 108.20 | 165.70 | 200.60 | 221.80 | 122.10 | 205.40 | 215.10 | 201.60 | 74.50 | 224.20 | 95.90 | 112.60 | 9.20 | 81.10 | 66.80 | -555.90 | 25.60 | 38.40 | 144.80 | 90.90 | 172.30 | 96.30 | 165.40 | 153.30 | 123.00 | 132.80 | 130.90 | 102.10 | 111.90 | 117.90 | 111.00 | 88.30 | 98.00 | 92.70 | 92.80 | 83.90 | 76.70 | 83.50 | 90.50 | 101.10 | 46.30 | 77.90 | 76.40 | 71.50 | 74.40 | 66.70 | 34.50 | 57.30 | 62.20 | 76.50 | 71.30 | 56.70 | |
| Profit Loss | 134.50 | 164.30 | 139.40 | 113.50 | 109.10 | 166.90 | 201.40 | 222.80 | 123.00 | 206.60 | 215.90 | 202.90 | 77.70 | 225.00 | 96.10 | 114.50 | 10.80 | 82.50 | 68.30 | -554.40 | 26.70 | 39.60 | 146.10 | 93.80 | 174.40 | 100.50 | 167.60 | 155.40 | 124.80 | 134.90 | 133.00 | 102.40 | 113.00 | 119.70 | 112.50 | 89.60 | 98.80 | 94.40 | 94.50 | 86.30 | 78.90 | 85.50 | 92.30 | 103.20 | 48.20 | 80.10 | 78.80 | 73.70 | 76.00 | 69.30 | 37.10 | 59.30 | 64.00 | 78.80 | 73.40 | 58.60 | |
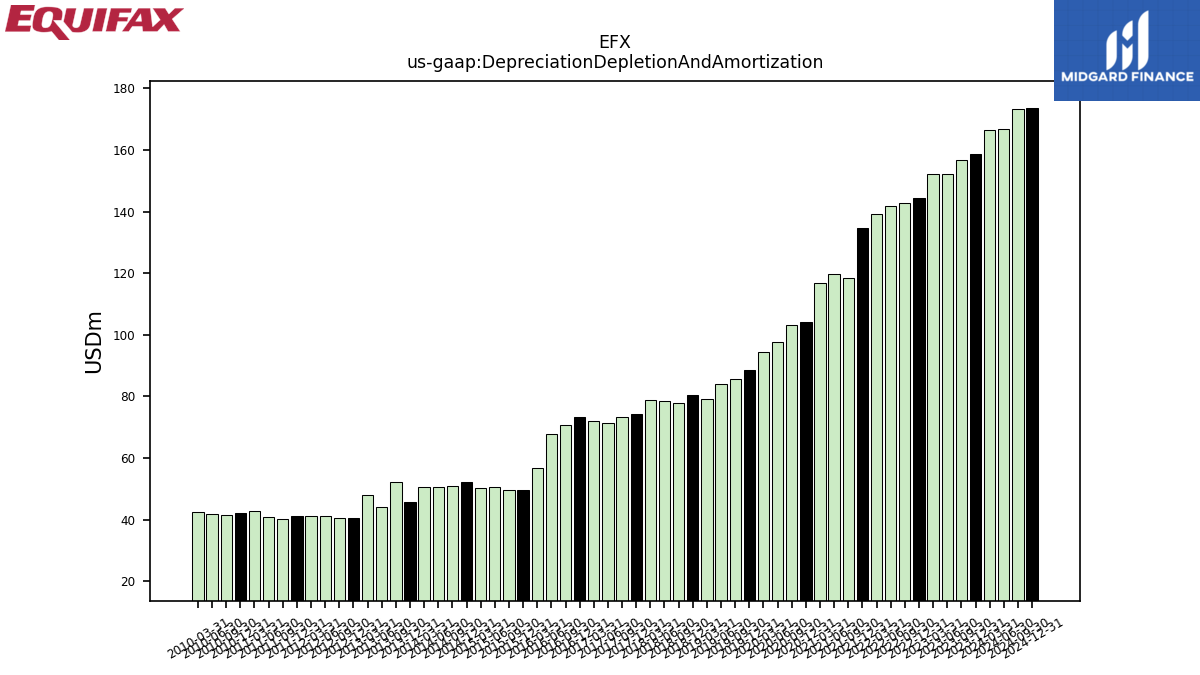
| Depreciation Depletion And Amortization | 158.80 | 156.70 | 152.10 | 152.20 | 144.50 | 142.90 | 141.90 | 139.30 | 134.70 | 118.50 | 119.70 | 116.70 | 104.10 | 103.10 | 97.80 | 94.30 | 88.50 | 85.70 | 83.90 | 79.20 | 80.60 | 77.80 | 78.50 | 79.00 | 74.20 | 73.20 | 71.40 | 72.10 | 73.30 | 70.70 | 67.90 | 56.80 | 49.60 | 49.60 | 50.50 | 50.30 | 52.10 | 50.90 | 50.70 | 50.50 | 45.70 | 52.30 | 44.20 | 48.10 | 40.60 | 40.40 | 41.10 | 41.30 | 41.10 | 40.30 | 40.80 | 42.70 | 42.10 | 41.40 | 41.80 | 42.50 | |
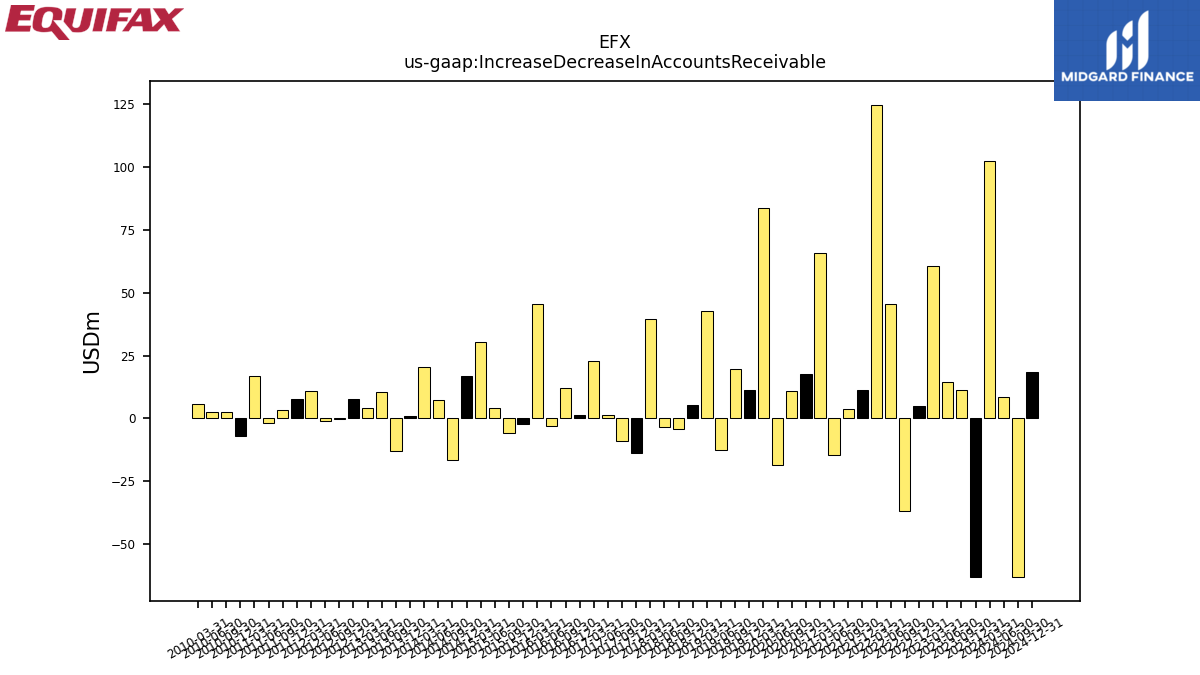
| Increase Decrease In Accounts Receivable | -63.10 | 11.10 | 14.50 | 60.80 | 5.00 | -36.90 | 45.60 | 124.90 | 11.30 | 3.60 | -14.50 | 65.80 | 17.60 | 10.80 | -18.60 | 83.90 | 11.40 | 19.70 | -12.60 | 42.80 | 5.30 | -4.20 | -3.30 | 39.60 | -13.60 | -9.20 | 1.40 | 22.70 | 1.20 | 12.00 | -2.90 | 45.40 | -2.10 | -5.80 | 4.20 | 30.60 | 16.70 | -16.70 | 7.40 | 20.40 | 1.00 | -13.10 | 10.40 | 4.10 | 7.70 | -0.30 | -1.20 | 11.00 | 7.90 | 3.50 | -1.80 | 17.00 | -7.20 | 2.40 | 2.60 | 5.80 | |
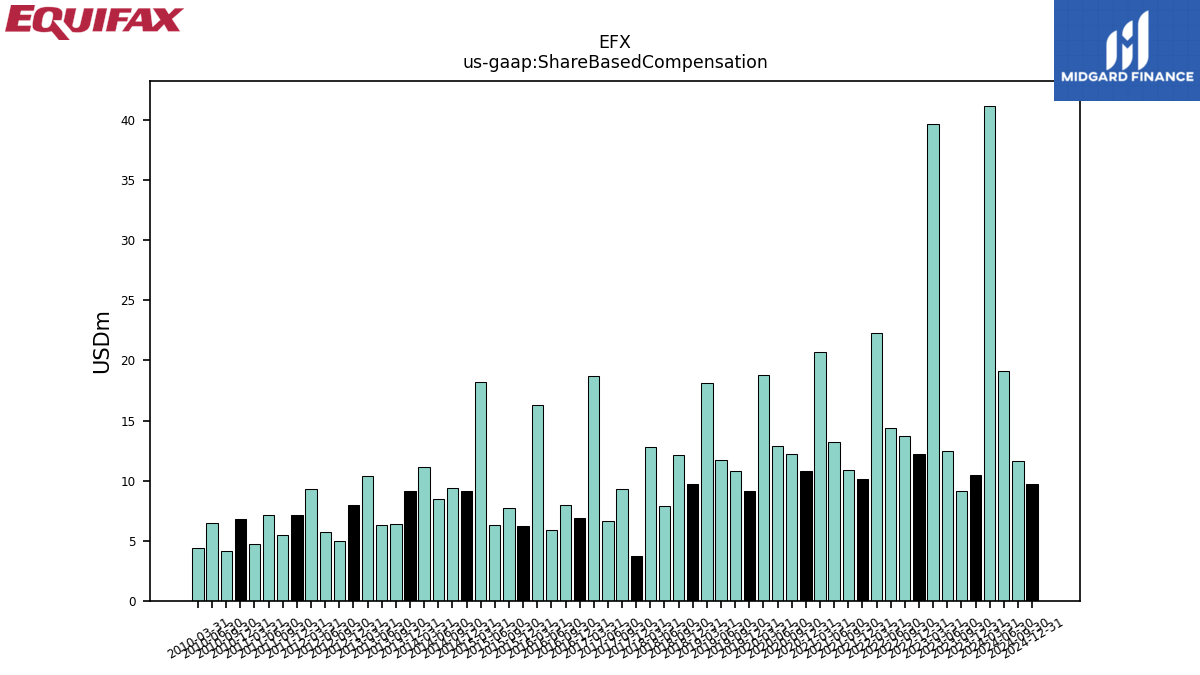
| Share Based Compensation | 10.50 | 9.10 | 12.50 | 39.70 | 12.20 | 13.70 | 14.40 | 22.30 | 10.10 | 10.90 | 13.20 | 20.70 | 10.80 | 12.20 | 12.90 | 18.80 | 9.10 | 10.80 | 11.70 | 18.10 | 9.70 | 12.10 | 7.90 | 12.80 | 3.70 | 9.30 | 6.60 | 18.70 | 6.90 | 8.00 | 5.90 | 16.30 | 6.20 | 7.70 | 6.30 | 18.20 | 9.10 | 9.40 | 8.50 | 11.10 | 9.10 | 6.40 | 6.30 | 10.40 | 8.00 | 5.00 | 5.70 | 9.30 | 7.10 | 5.50 | 7.10 | 4.70 | 6.80 | 4.10 | 6.50 | 4.40 |
| 2023-12-31 | 2023-09-30 | 2023-06-30 | 2023-03-31 | 2022-12-31 | 2022-09-30 | 2022-06-30 | 2022-03-31 | 2021-12-31 | 2021-09-30 | 2021-06-30 | 2021-03-31 | 2020-12-31 | 2020-09-30 | 2020-06-30 | 2020-03-31 | 2019-12-31 | 2019-09-30 | 2019-06-30 | 2019-03-31 | 2018-12-31 | 2018-09-30 | 2018-06-30 | 2018-03-31 | 2017-12-31 | 2017-09-30 | 2017-06-30 | 2017-03-31 | 2016-12-31 | 2016-09-30 | 2016-06-30 | 2016-03-31 | 2015-12-31 | 2015-09-30 | 2015-06-30 | 2015-03-31 | 2014-12-31 | 2014-09-30 | 2014-06-30 | 2014-03-31 | 2013-12-31 | 2013-09-30 | 2013-06-30 | 2013-03-31 | 2012-12-31 | 2012-09-30 | 2012-06-30 | 2012-03-31 | 2011-12-31 | 2011-09-30 | 2011-06-30 | 2011-03-31 | 2010-12-31 | 2010-09-30 | 2010-06-30 | 2010-03-31 | ||
|---|---|---|---|---|---|---|---|---|---|---|---|---|---|---|---|---|---|---|---|---|---|---|---|---|---|---|---|---|---|---|---|---|---|---|---|---|---|---|---|---|---|---|---|---|---|---|---|---|---|---|---|---|---|---|---|---|---|
| Net Cash Provided By Used In Investing Activities | -153.50 | -406.00 | -156.10 | -162.60 | -152.40 | -478.40 | -60.50 | -268.20 | -1957.90 | -344.70 | -122.10 | -973.50 | -111.80 | -130.00 | -114.80 | -136.10 | -132.00 | -97.20 | -303.70 | -164.60 | -136.30 | -175.80 | -79.30 | -70.10 | -123.30 | -125.30 | -51.90 | -49.00 | -41.70 | -112.80 | -42.60 | -1778.80 | -52.60 | -35.50 | -33.60 | -26.10 | -29.80 | -31.90 | -19.70 | -347.90 | -85.70 | -52.80 | -20.10 | 25.00 | -1025.80 | -22.20 | -15.40 | -20.20 | -31.00 | -98.30 | -15.20 | -59.60 | -84.50 | 99.40 | 42.10 | -56.00 | |
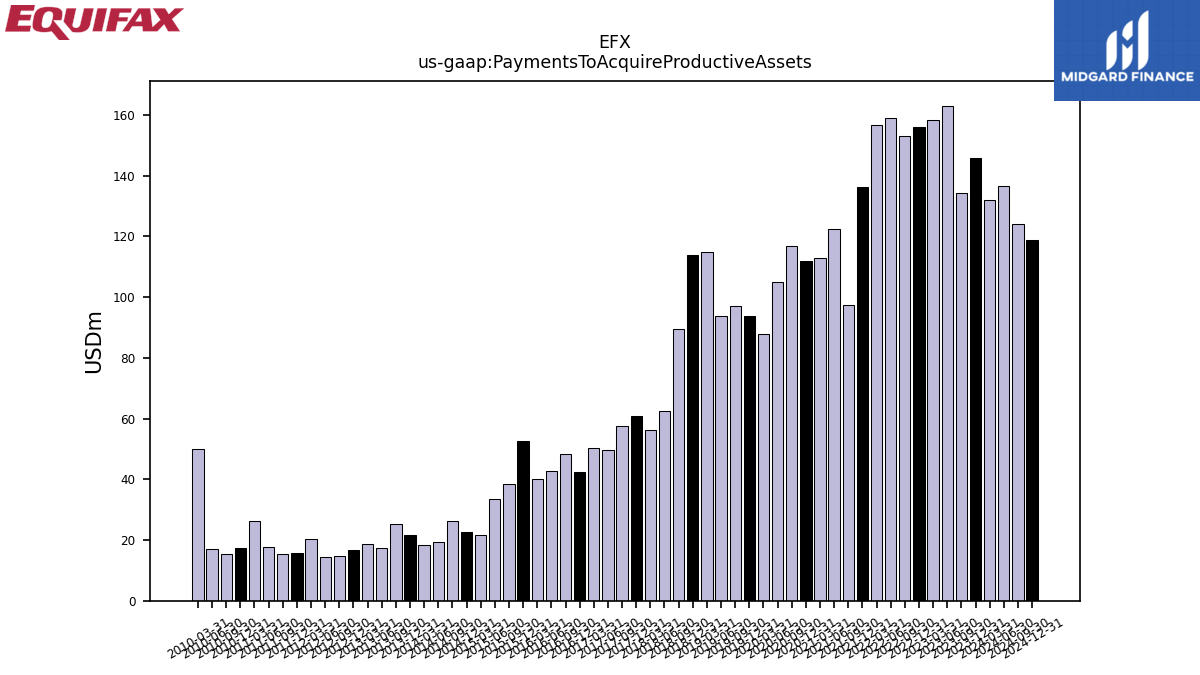
| Payments To Acquire Productive Assets | 145.70 | 134.30 | 163.00 | 158.30 | 156.10 | 153.00 | 158.90 | 156.50 | 136.10 | 97.40 | 122.50 | 113.00 | 111.80 | 116.70 | 104.80 | 88.00 | 93.90 | 97.20 | 93.70 | 114.80 | 113.80 | 89.40 | 62.50 | 56.20 | 60.70 | 57.60 | 49.60 | 50.30 | 42.50 | 48.20 | 42.60 | 40.20 | 52.60 | 38.40 | 33.60 | 21.60 | 22.50 | 26.20 | 19.20 | 18.50 | 21.80 | 25.30 | 17.50 | 18.70 | 16.70 | 14.80 | 14.30 | 20.20 | 15.80 | 15.30 | 17.70 | 26.20 | 17.40 | 15.50 | 16.90 | 50.00 |
| 2023-12-31 | 2023-09-30 | 2023-06-30 | 2023-03-31 | 2022-12-31 | 2022-09-30 | 2022-06-30 | 2022-03-31 | 2021-12-31 | 2021-09-30 | 2021-06-30 | 2021-03-31 | 2020-12-31 | 2020-09-30 | 2020-06-30 | 2020-03-31 | 2019-12-31 | 2019-09-30 | 2019-06-30 | 2019-03-31 | 2018-12-31 | 2018-09-30 | 2018-06-30 | 2018-03-31 | 2017-12-31 | 2017-09-30 | 2017-06-30 | 2017-03-31 | 2016-12-31 | 2016-09-30 | 2016-06-30 | 2016-03-31 | 2015-12-31 | 2015-09-30 | 2015-06-30 | 2015-03-31 | 2014-12-31 | 2014-09-30 | 2014-06-30 | 2014-03-31 | 2013-12-31 | 2013-09-30 | 2013-06-30 | 2013-03-31 | 2012-12-31 | 2012-09-30 | 2012-06-30 | 2012-03-31 | 2011-12-31 | 2011-09-30 | 2011-06-30 | 2011-03-31 | 2010-12-31 | 2010-09-30 | 2010-06-30 | 2010-03-31 | ||
|---|---|---|---|---|---|---|---|---|---|---|---|---|---|---|---|---|---|---|---|---|---|---|---|---|---|---|---|---|---|---|---|---|---|---|---|---|---|---|---|---|---|---|---|---|---|---|---|---|---|---|---|---|---|---|---|---|---|
| Net Cash Provided By Used In Financing Activities | -369.70 | 280.70 | -173.90 | -43.30 | -142.80 | 151.50 | -179.30 | 444.30 | -224.70 | 1522.70 | -591.70 | -88.60 | -54.50 | -51.00 | 823.60 | 92.70 | 131.50 | 296.60 | 89.70 | 40.10 | -55.00 | -51.00 | -66.70 | -138.30 | -60.90 | -247.10 | 107.60 | -63.30 | -204.90 | -125.80 | -146.00 | 1664.20 | -161.00 | -182.90 | -164.50 | -103.60 | -156.70 | -137.20 | -144.40 | 154.90 | 0.80 | -86.50 | -119.00 | -128.40 | 759.90 | -44.70 | -78.20 | -30.70 | -97.00 | -15.00 | -85.50 | 1.60 | -56.60 | -124.40 | -148.80 | -5.50 | |
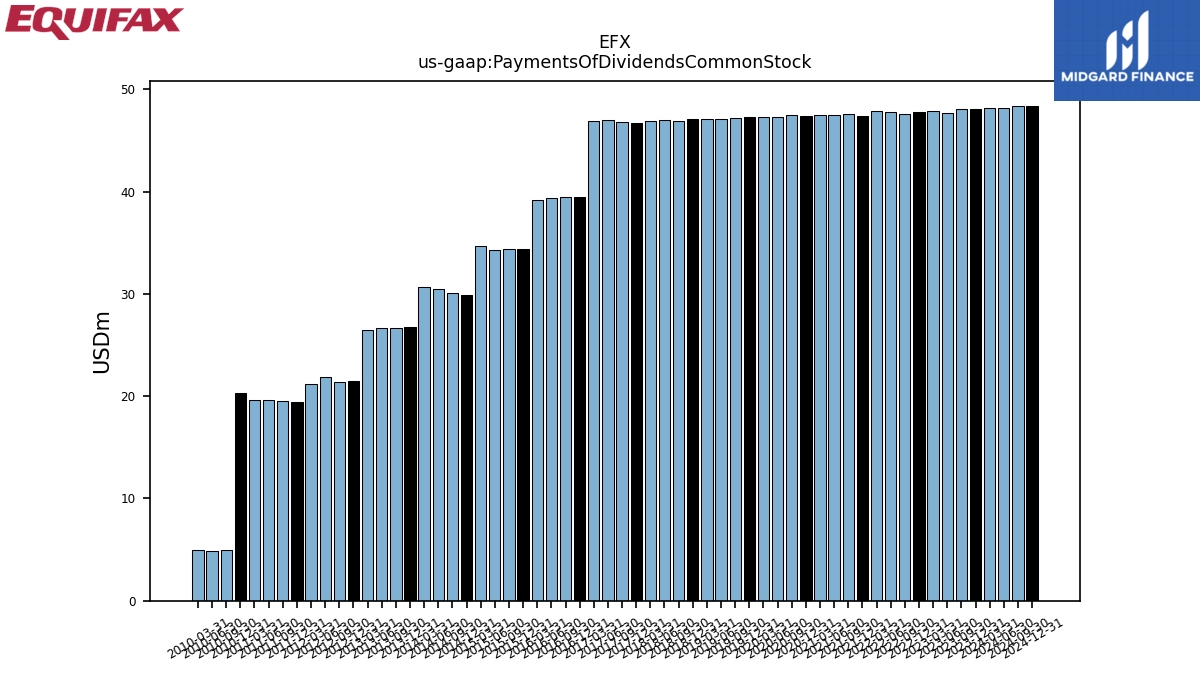
| Payments Of Dividends Common Stock | 48.10 | 48.10 | 47.70 | 47.90 | 47.80 | 47.60 | 47.80 | 47.90 | 47.40 | 47.60 | 47.50 | 47.50 | 47.40 | 47.50 | 47.30 | 47.30 | 47.30 | 47.20 | 47.10 | 47.10 | 47.10 | 46.90 | 47.00 | 46.90 | 46.70 | 46.80 | 47.00 | 46.90 | 39.50 | 39.50 | 39.40 | 39.20 | 34.40 | 34.40 | 34.30 | 34.70 | 29.90 | 30.10 | 30.50 | 30.70 | 26.80 | 26.70 | 26.70 | 26.50 | 21.50 | 21.40 | 21.90 | 21.20 | 19.40 | 19.50 | 19.60 | 19.60 | 20.30 | 5.00 | 4.90 | 5.00 |
| 2023-12-31 | 2023-09-30 | 2023-06-30 | 2023-03-31 | 2022-12-31 | 2022-09-30 | 2022-06-30 | 2022-03-31 | 2021-12-31 | 2021-09-30 | 2021-06-30 | 2021-03-31 | 2020-12-31 | 2020-09-30 | 2020-06-30 | 2020-03-31 | 2019-12-31 | 2019-09-30 | 2019-06-30 | 2019-03-31 | 2018-12-31 | 2018-09-30 | 2018-06-30 | 2018-03-31 | 2017-12-31 | 2017-09-30 | 2017-06-30 | 2017-03-31 | 2016-12-31 | 2016-09-30 | 2016-06-30 | 2016-03-31 | 2015-12-31 | 2015-09-30 | 2015-06-30 | 2015-03-31 | 2014-12-31 | 2014-09-30 | 2014-06-30 | 2014-03-31 | 2013-12-31 | 2013-09-30 | 2013-06-30 | 2013-03-31 | 2012-12-31 | 2012-09-30 | 2012-06-30 | 2012-03-31 | 2011-12-31 | 2011-09-30 | 2011-06-30 | 2011-03-31 | 2010-12-31 | 2010-09-30 | 2010-06-30 | 2010-03-31 | ||
|---|---|---|---|---|---|---|---|---|---|---|---|---|---|---|---|---|---|---|---|---|---|---|---|---|---|---|---|---|---|---|---|---|---|---|---|---|---|---|---|---|---|---|---|---|---|---|---|---|---|---|---|---|---|---|---|---|---|
| Revenues | 1326.50 | 1319.10 | 1317.60 | 1302.00 | 1197.90 | 1244.30 | 1316.70 | 1363.20 | 1253.20 | 1222.90 | 1234.80 | 1213.00 | 1118.50 | 1068.30 | 982.80 | 957.90 | 905.80 | 875.70 | 880.00 | 846.10 | 835.30 | 834.20 | 876.90 | 865.70 | 838.50 | 834.80 | 856.70 | 832.20 | 801.10 | 804.10 | 811.30 | 728.30 | 666.30 | 667.40 | 678.10 | 651.80 | 624.60 | 613.40 | 613.90 | 584.50 | 578.50 | 572.00 | 586.90 | 566.50 | 558.10 | 543.90 | 535.80 | 522.70 | 509.70 | 490.40 | 487.10 | 472.60 | 482.00 | 473.80 | 460.70 | 443.00 | |
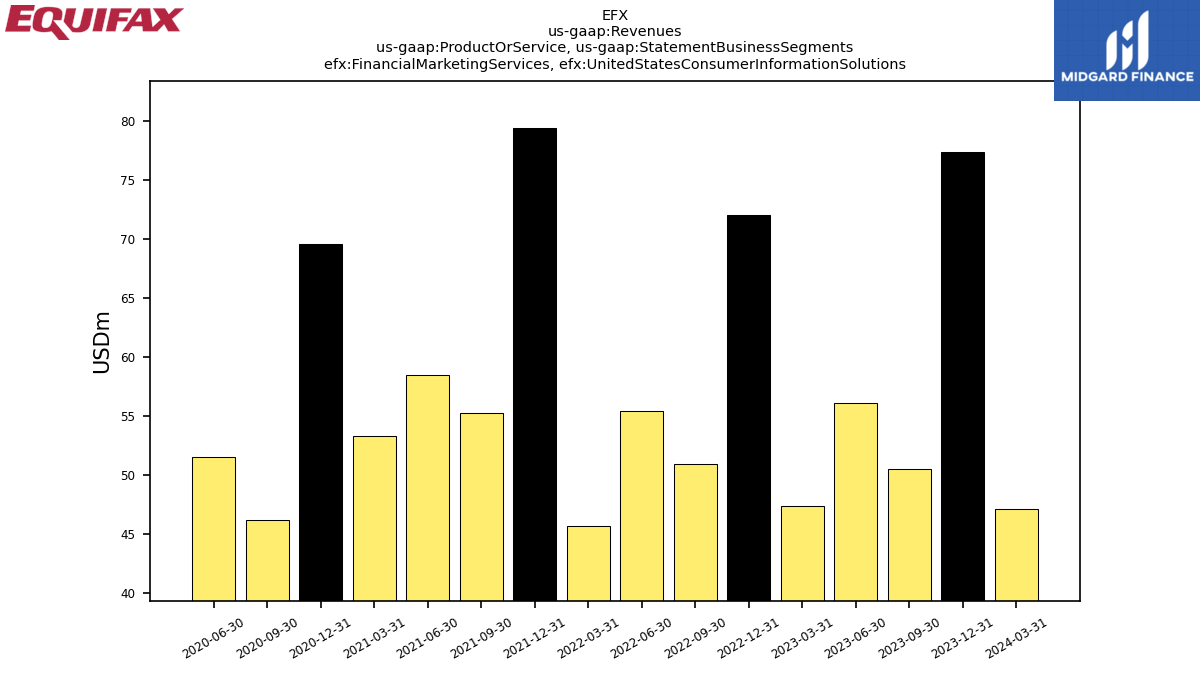
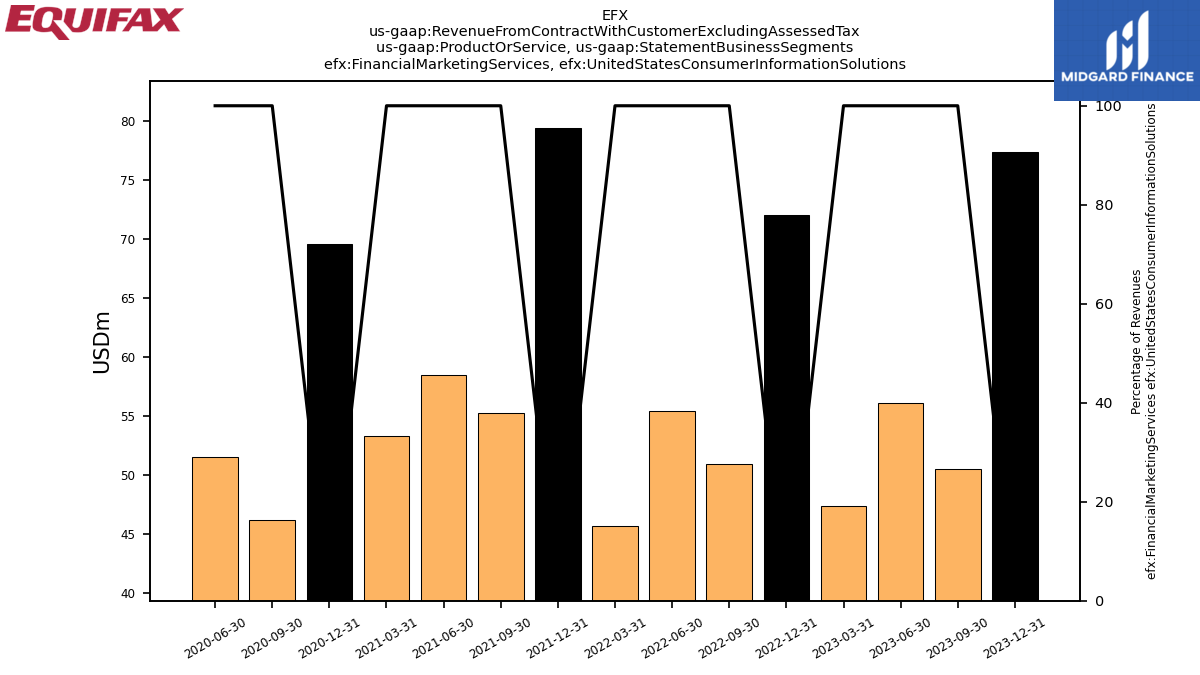
| Financial Marketing Services, United States Consumer Information Solutions | 77.40 | 50.50 | 56.10 | 47.40 | 72.00 | 50.90 | 55.40 | 45.70 | 79.40 | 55.30 | 58.50 | 53.30 | 69.60 | 46.20 | 51.50 | NA | NA | NA | NA | NA | NA | NA | NA | NA | NA | NA | NA | NA | NA | NA | NA | NA | NA | NA | NA | NA | NA | NA | NA | NA | NA | NA | NA | NA | NA | NA | NA | NA | NA | NA | NA | NA | NA | NA | NA | NA | |
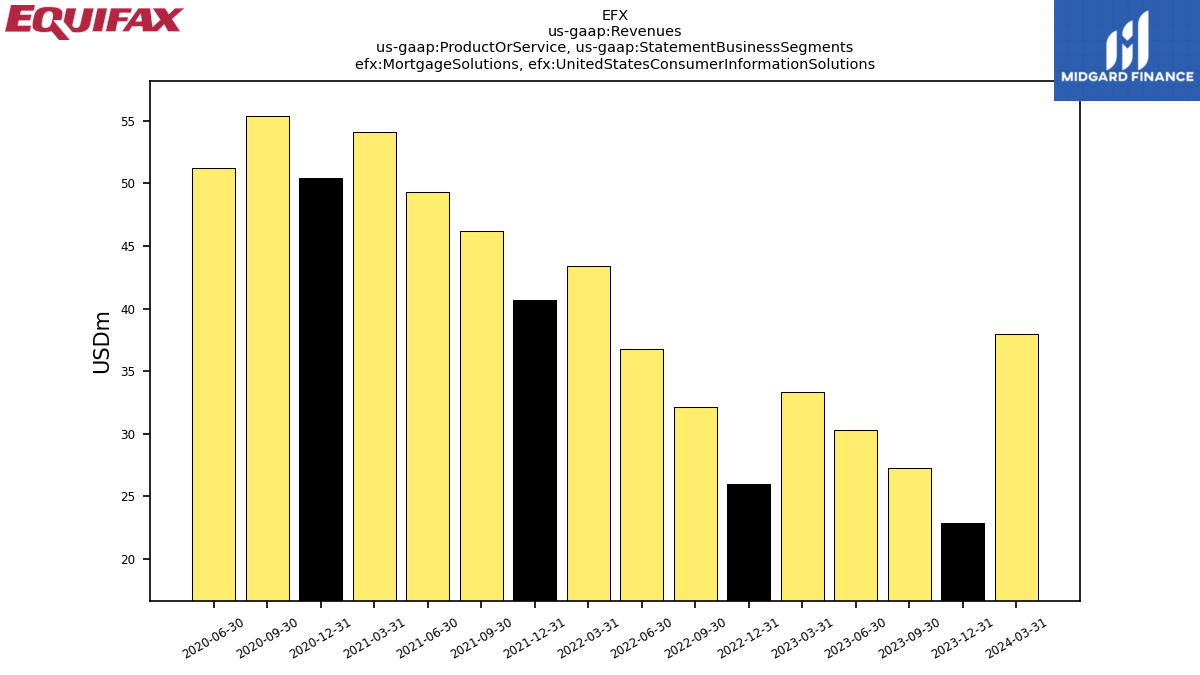
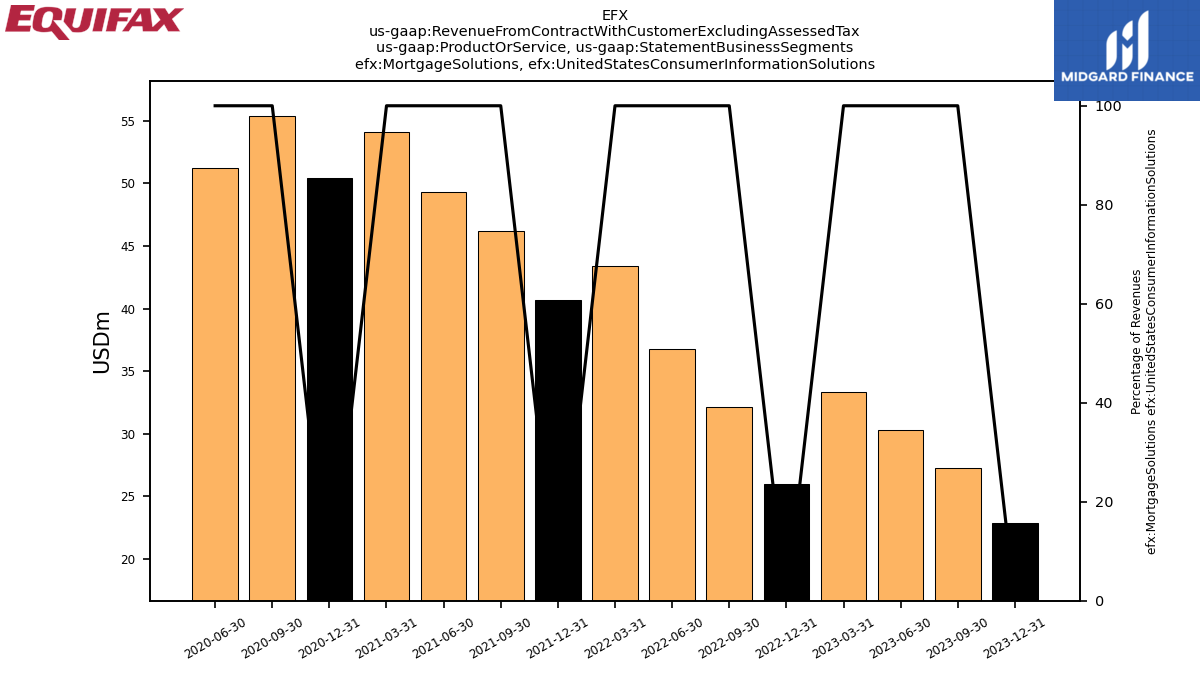
| Mortgage Solutions, United States Consumer Information Solutions | 22.90 | 27.30 | 30.30 | 33.30 | 26.00 | 32.10 | 36.80 | 43.40 | 40.70 | 46.20 | 49.30 | 54.10 | 50.40 | 55.40 | 51.20 | NA | NA | NA | NA | NA | NA | NA | NA | NA | NA | NA | NA | NA | NA | NA | NA | NA | NA | NA | NA | NA | NA | NA | NA | NA | NA | NA | NA | NA | NA | NA | NA | NA | NA | NA | NA | NA | NA | NA | NA | NA | |
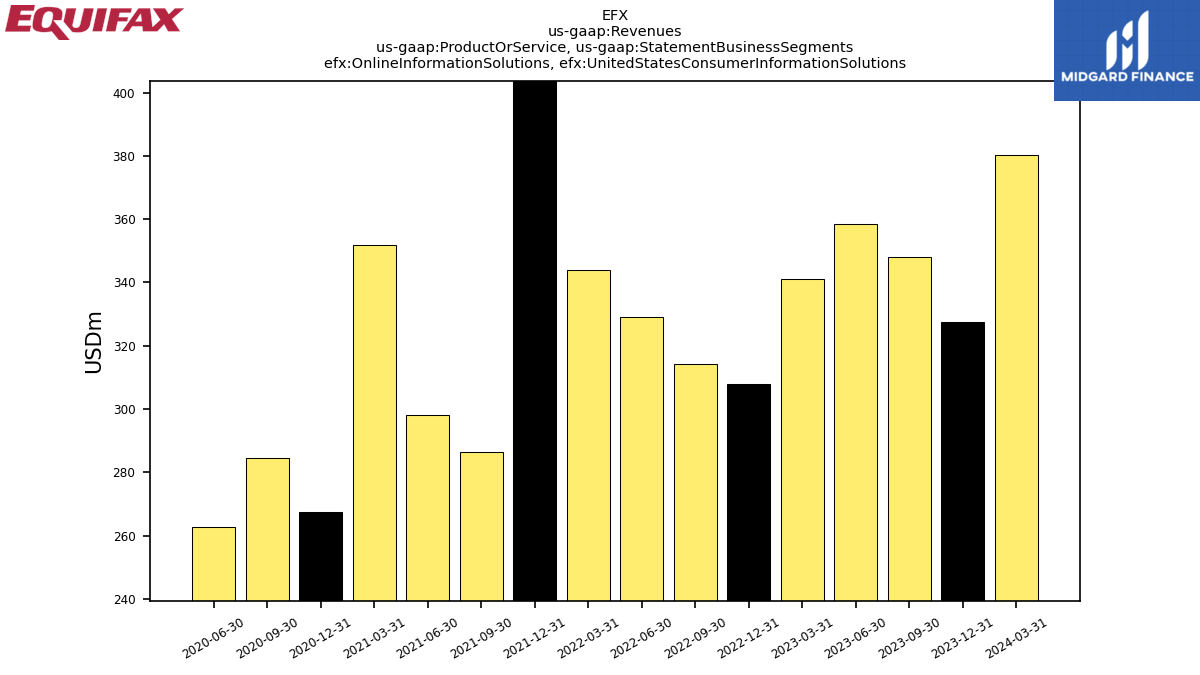
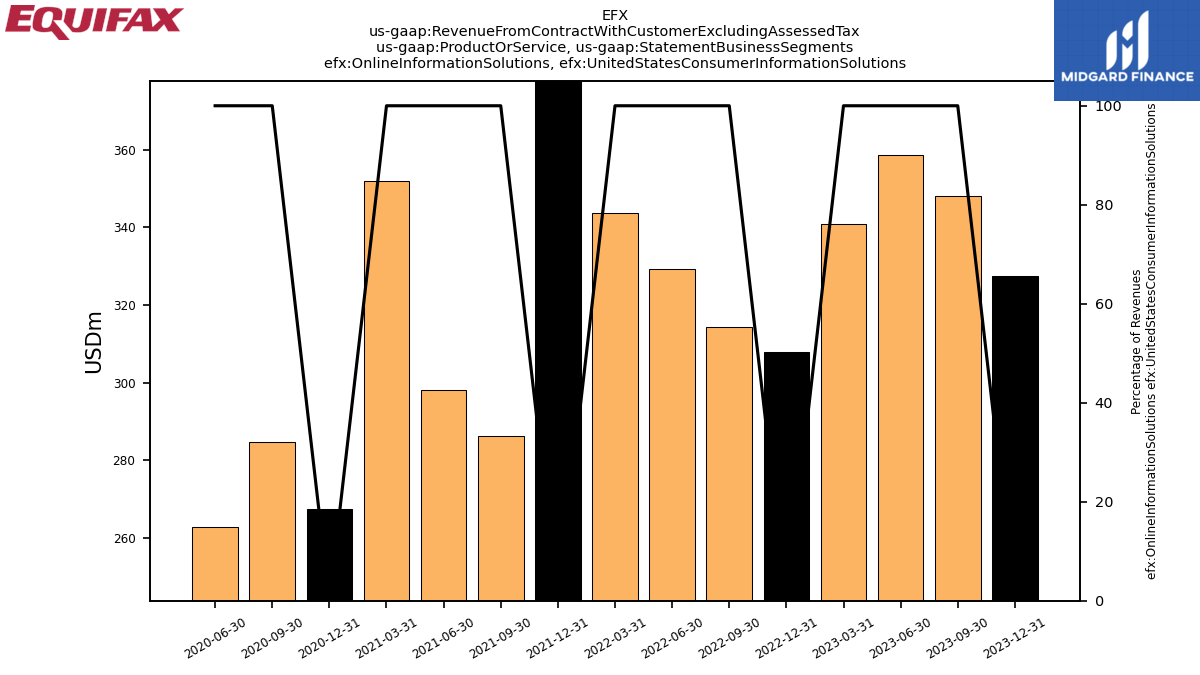
| Online Information Solutions, United States Consumer Information Solutions | 327.40 | 348.20 | 358.60 | 341.00 | 307.90 | 314.40 | 329.20 | 343.80 | 463.60 | 286.30 | 298.00 | 352.00 | 267.40 | 284.70 | 262.90 | NA | NA | NA | NA | NA | NA | NA | NA | NA | NA | NA | NA | NA | NA | NA | NA | NA | NA | NA | NA | NA | NA | NA | NA | NA | NA | NA | NA | NA | NA | NA | NA | NA | NA | NA | NA | NA | NA | NA | NA | NA | |
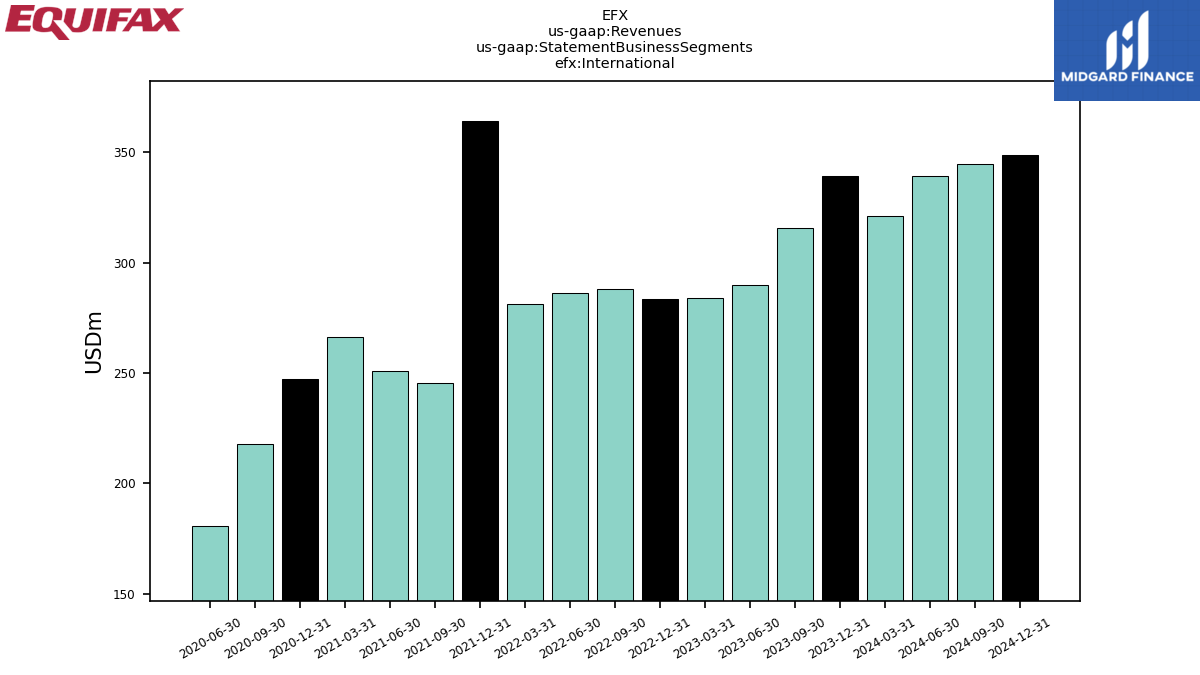
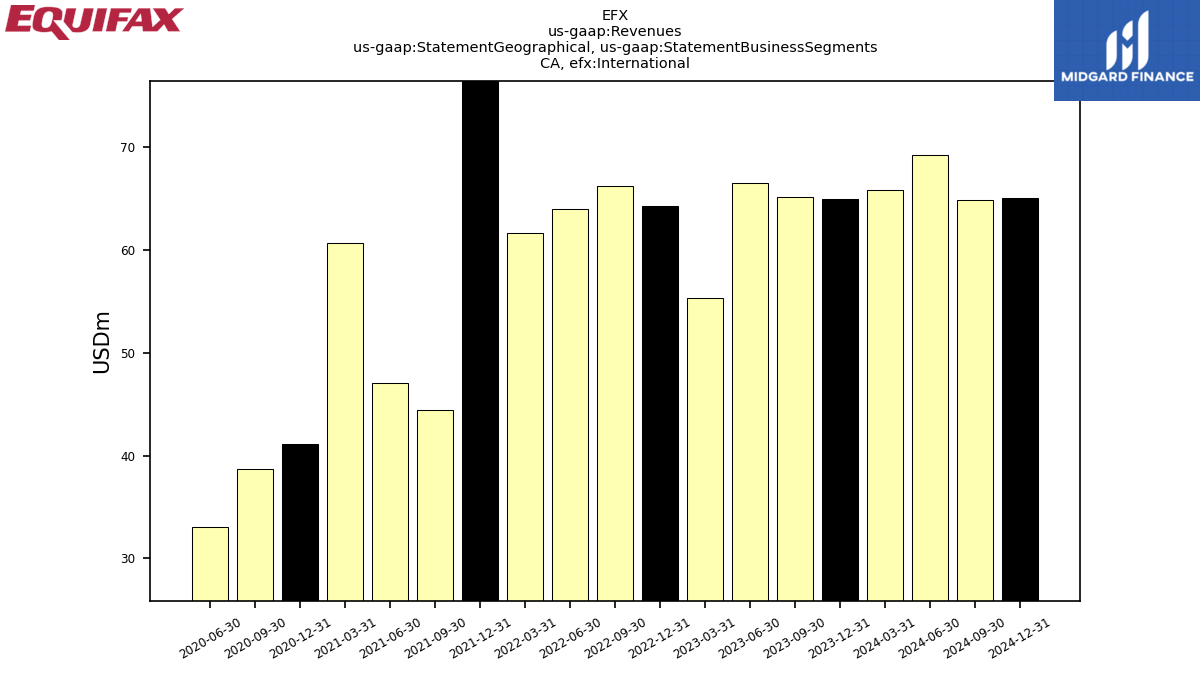
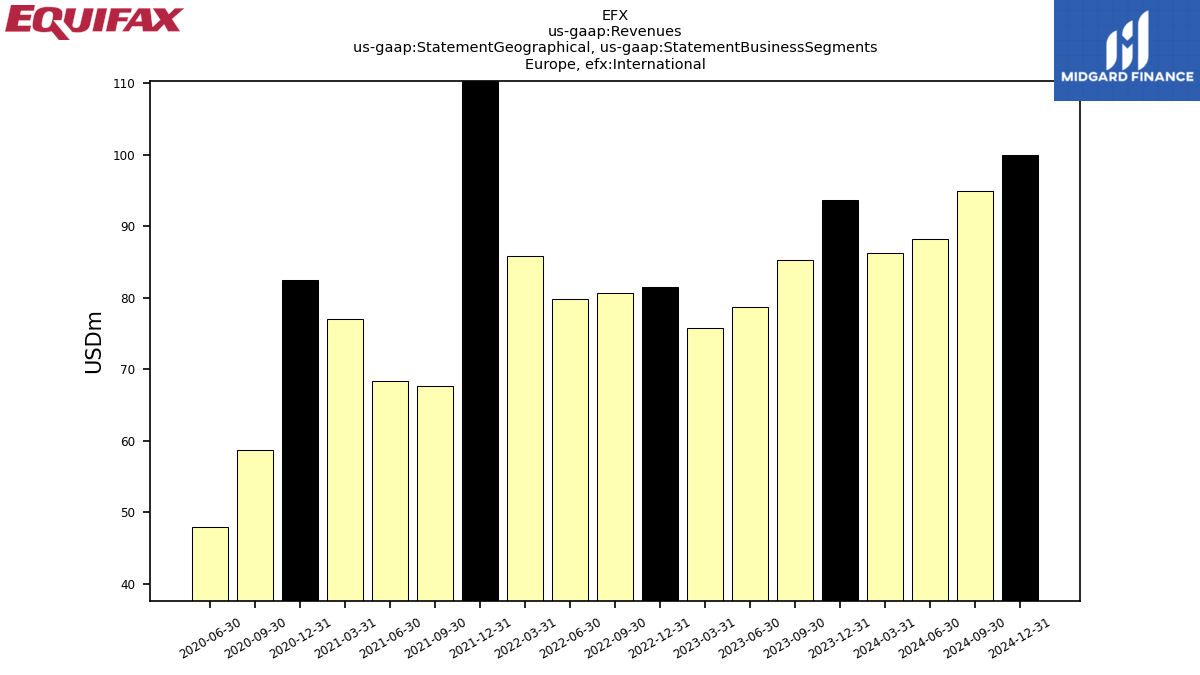
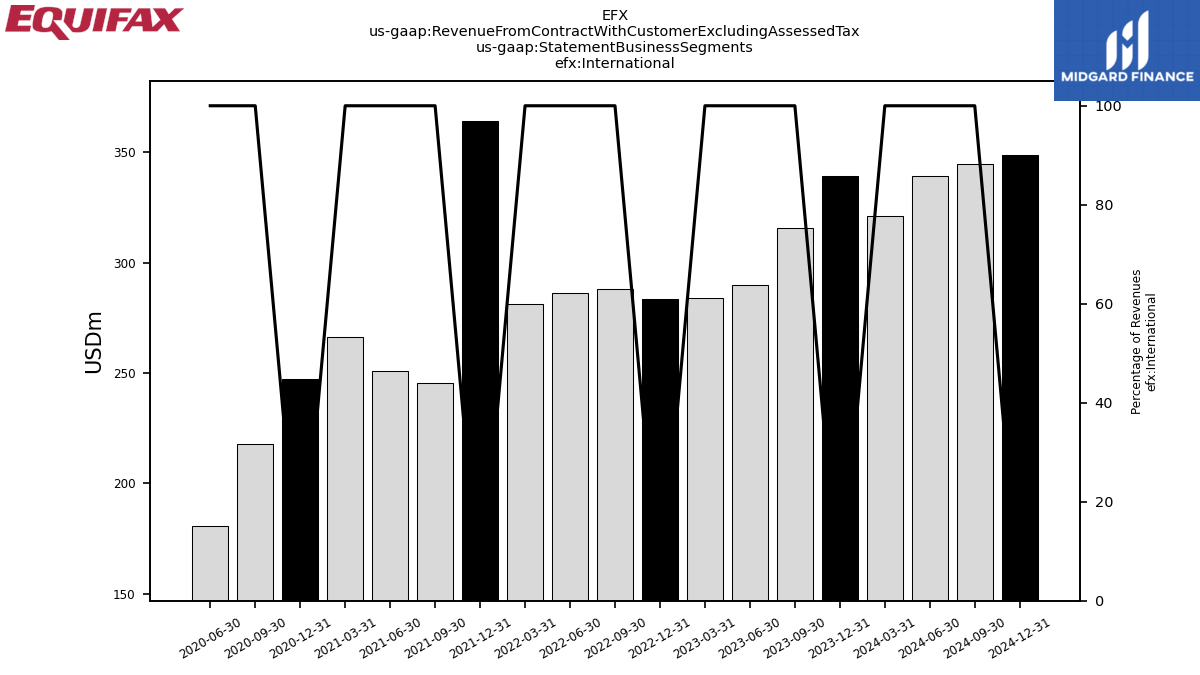
| International | 339.30 | 315.90 | 289.80 | 284.00 | 283.70 | 288.00 | 286.10 | 281.30 | 364.10 | 245.40 | 250.90 | 266.40 | 247.50 | 218.00 | 180.50 | NA | NA | NA | NA | NA | NA | NA | NA | NA | NA | NA | NA | NA | NA | NA | NA | NA | NA | NA | NA | NA | NA | NA | NA | NA | NA | NA | NA | NA | NA | NA | NA | NA | NA | NA | NA | NA | NA | NA | NA | NA | |
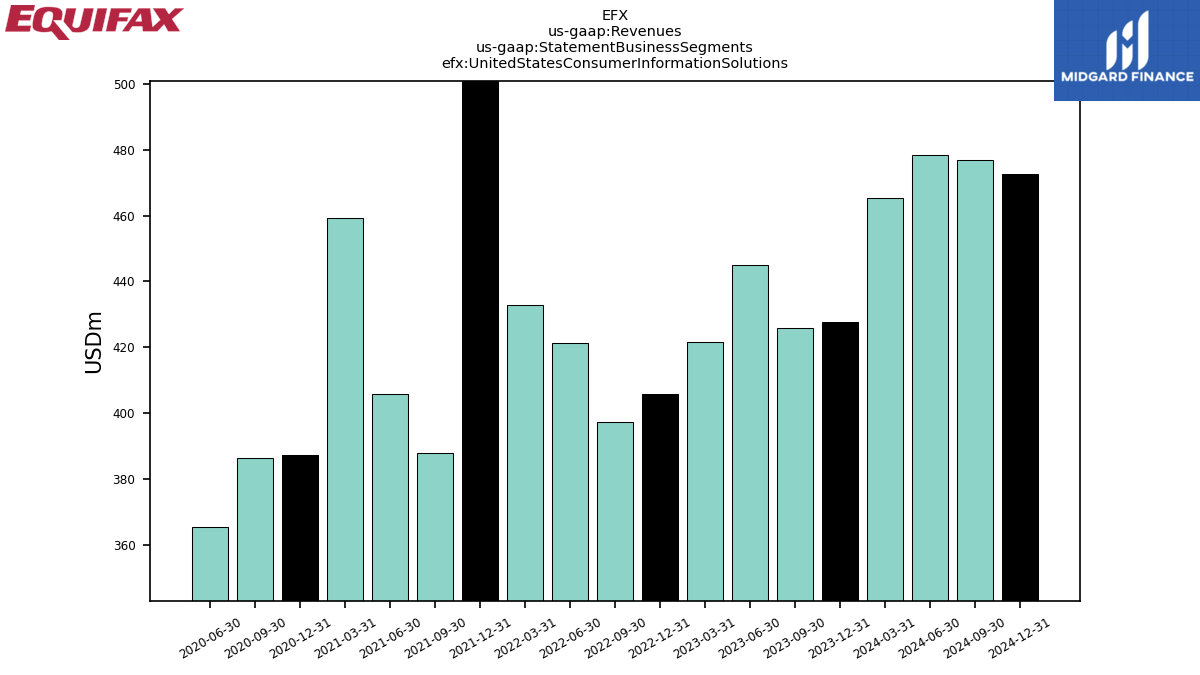
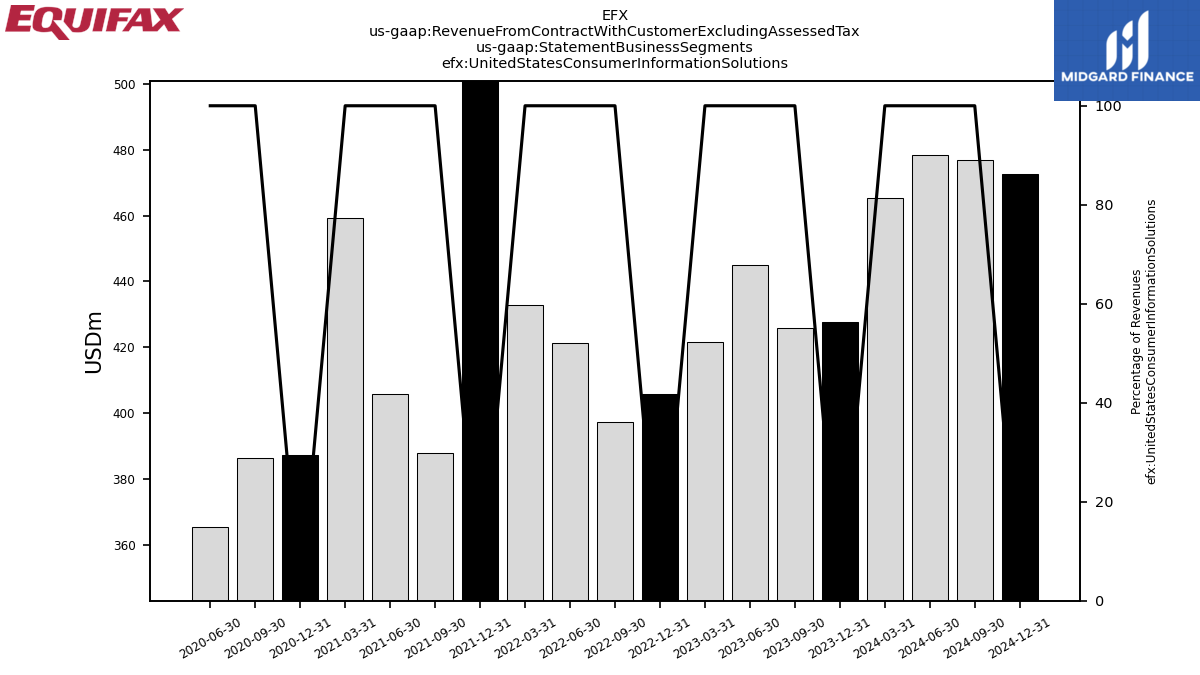
| United States Consumer Information Solutions | 427.70 | 426.00 | 445.00 | 421.70 | 405.90 | 397.40 | 421.40 | 432.90 | 583.70 | 387.80 | 405.80 | 459.40 | 387.40 | 386.30 | 365.60 | NA | NA | NA | NA | NA | NA | NA | NA | NA | NA | NA | NA | NA | NA | NA | NA | NA | NA | NA | NA | NA | NA | NA | NA | NA | NA | NA | NA | NA | NA | NA | NA | NA | NA | NA | NA | NA | NA | NA | NA | NA | |
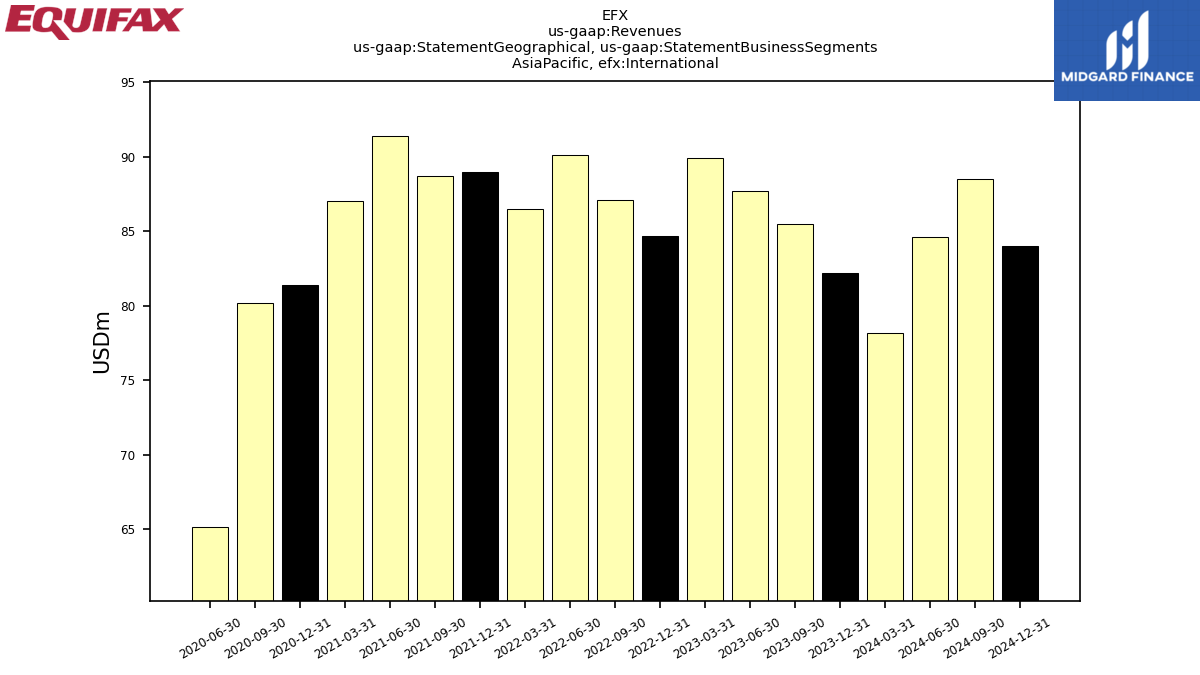
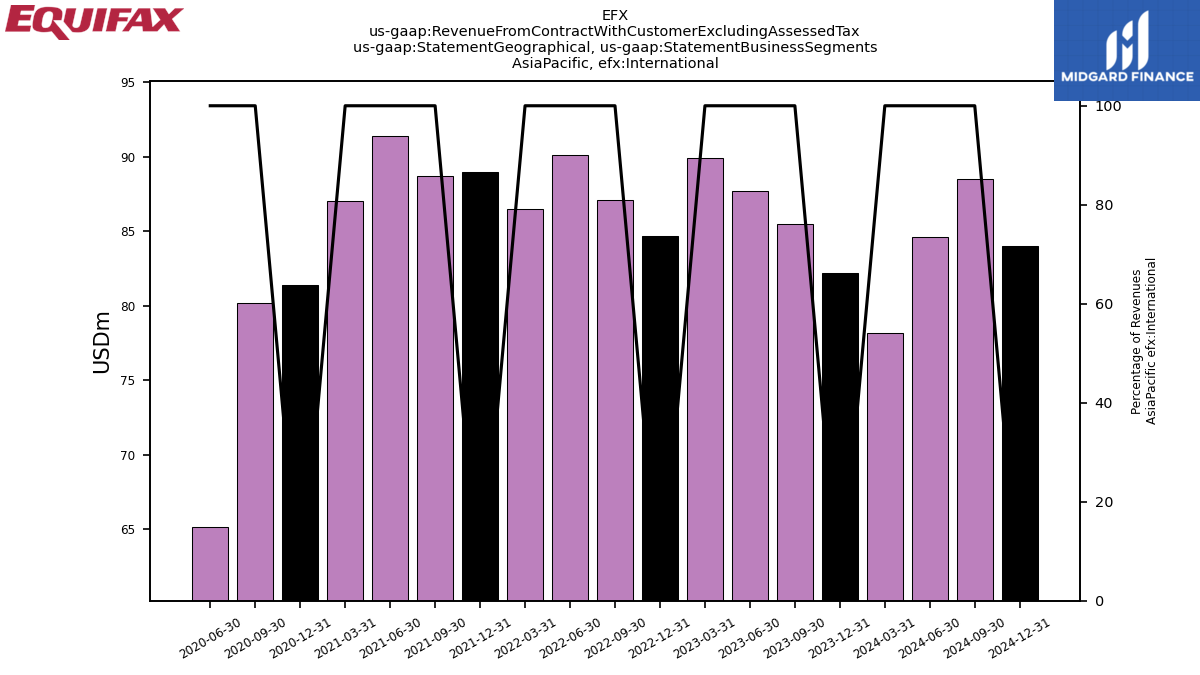
| , International | 82.20 | 85.50 | 87.70 | 89.90 | 84.70 | 87.10 | 90.10 | 86.50 | 89.00 | 88.70 | 91.40 | 87.00 | 81.40 | 80.20 | 65.20 | NA | NA | NA | NA | NA | NA | NA | NA | NA | NA | NA | NA | NA | NA | NA | NA | NA | NA | NA | NA | NA | NA | NA | NA | NA | NA | NA | NA | NA | NA | NA | NA | NA | NA | NA | NA | NA | NA | NA | NA | NA | |
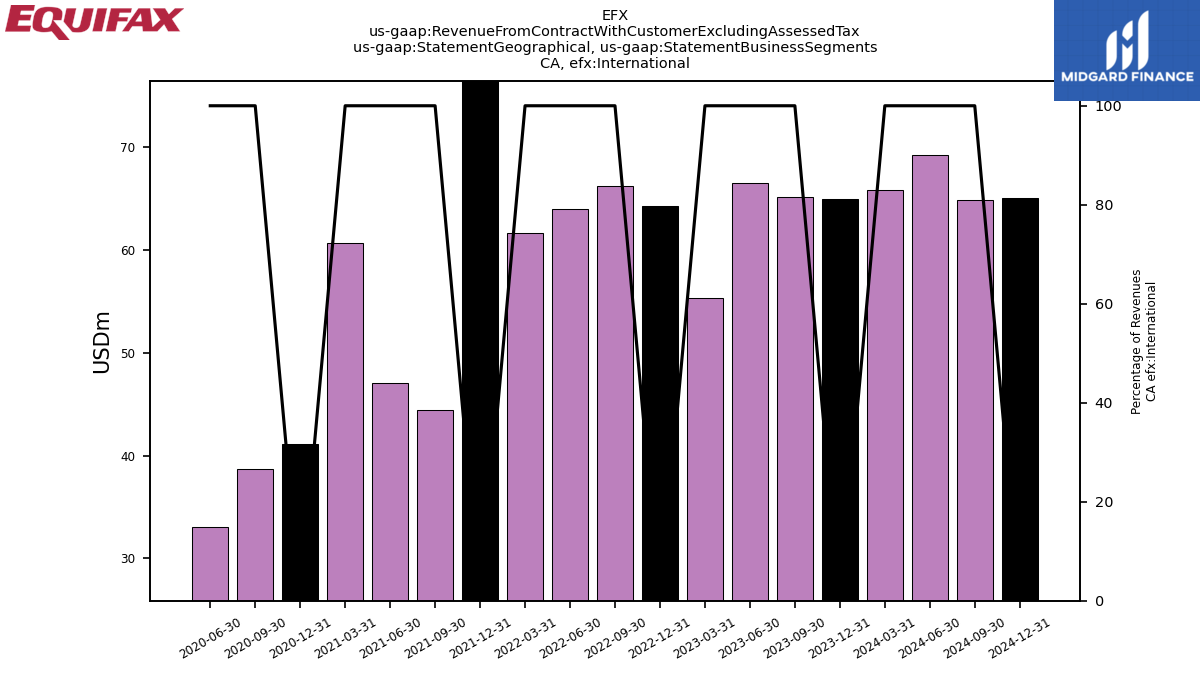
| , International | 64.90 | 65.10 | 66.50 | 55.30 | 64.30 | 66.20 | 64.00 | 61.60 | 114.40 | 44.40 | 47.10 | 60.70 | 41.10 | 38.70 | 33.10 | NA | NA | NA | NA | NA | NA | NA | NA | NA | NA | NA | NA | NA | NA | NA | NA | NA | NA | NA | NA | NA | NA | NA | NA | NA | NA | NA | NA | NA | NA | NA | NA | NA | NA | NA | NA | NA | NA | NA | NA | NA | |
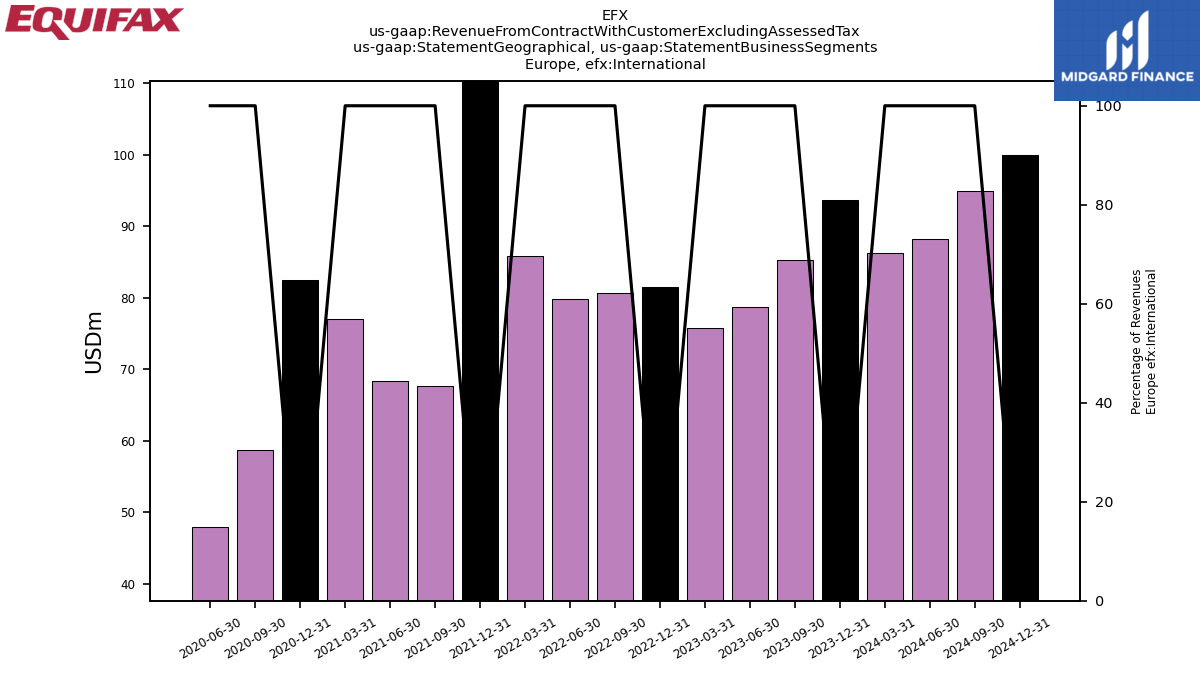
| , International | 93.60 | 85.20 | 78.70 | 75.70 | 81.50 | 80.70 | 79.80 | 85.80 | 115.10 | 67.70 | 68.40 | 77.00 | 82.50 | 58.70 | 48.00 | NA | NA | NA | NA | NA | NA | NA | NA | NA | NA | NA | NA | NA | NA | NA | NA | NA | NA | NA | NA | NA | NA | NA | NA | NA | NA | NA | NA | NA | NA | NA | NA | NA | NA | NA | NA | NA | NA | NA | NA | NA | |
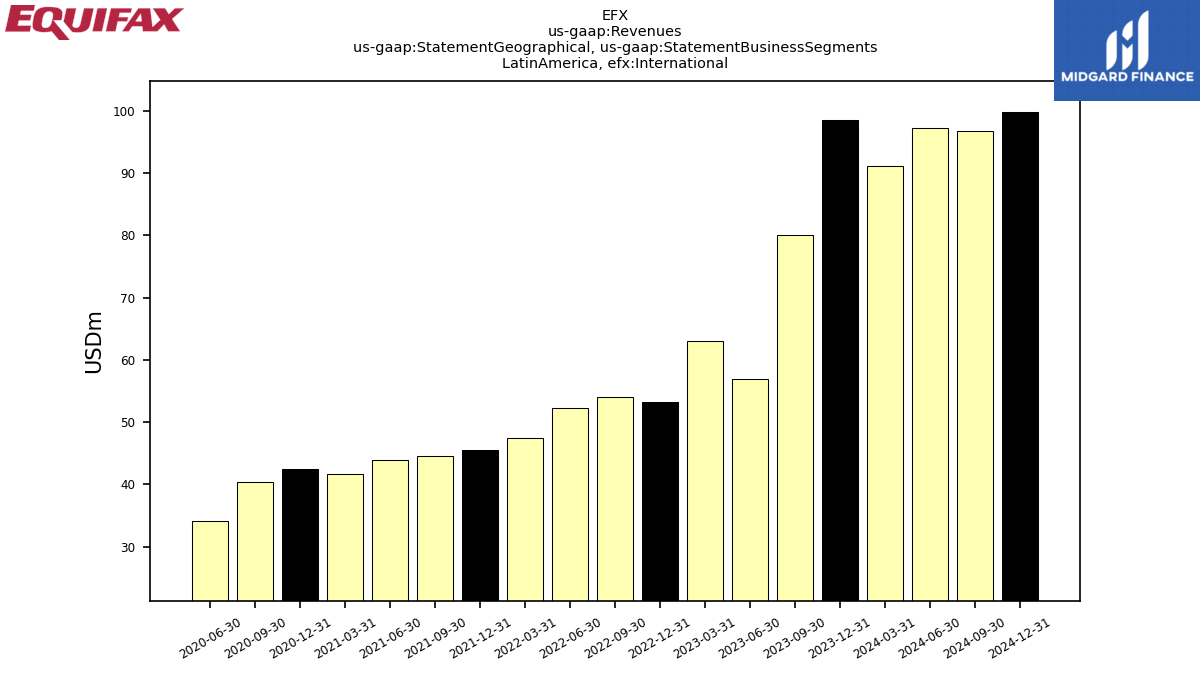
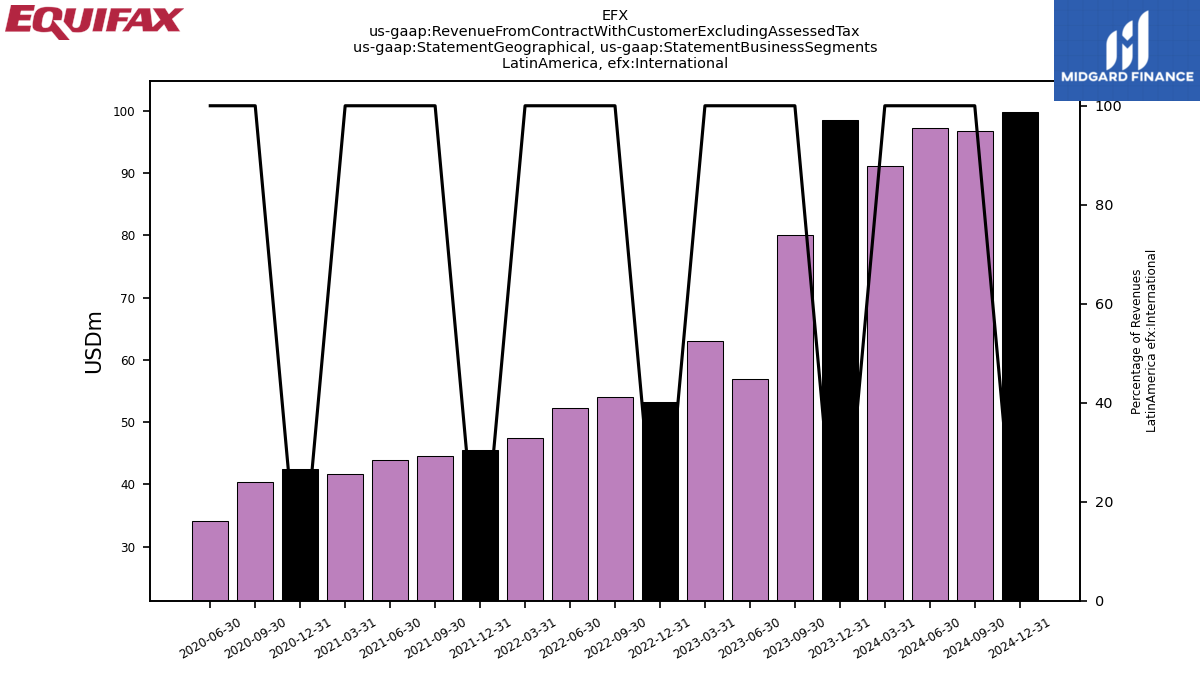
| , International | 98.60 | 80.10 | 56.90 | 63.10 | 53.20 | 54.00 | 52.20 | 47.40 | 45.60 | 44.60 | 44.00 | 41.70 | 42.50 | 40.40 | 34.20 | NA | NA | NA | NA | NA | NA | NA | NA | NA | NA | NA | NA | NA | NA | NA | NA | NA | NA | NA | NA | NA | NA | NA | NA | NA | NA | NA | NA | NA | NA | NA | NA | NA | NA | NA | NA | NA | NA | NA | NA | NA | |
| Revenue From Contract With Customer Excluding Assessed Tax | 1326.50 | 1319.10 | 1317.60 | 1302.00 | 1197.90 | 1244.30 | 1316.70 | 1363.20 | 1253.20 | 1222.90 | 1234.80 | 1213.00 | 1118.50 | 1068.30 | 982.80 | 957.90 | 905.80 | 875.70 | 880.00 | 846.10 | 835.30 | 834.20 | 876.90 | 865.70 | 838.50 | 834.80 | 856.70 | 832.20 | 801.10 | 804.10 | 811.30 | 728.30 | 666.30 | 667.40 | 678.10 | 651.80 | 624.60 | 613.40 | 613.90 | 584.50 | 578.50 | 572.00 | 586.90 | 566.50 | 558.10 | 543.90 | 535.80 | 522.70 | 509.70 | 490.40 | 487.10 | 472.60 | 482.00 | 473.80 | 460.70 | 443.00 | |
| Financial Marketing Services, United States Consumer Information Solutions | 77.40 | 50.50 | 56.10 | 47.40 | 72.00 | 50.90 | 55.40 | 45.70 | 79.40 | 55.30 | 58.50 | 53.30 | 69.60 | 46.20 | 51.50 | NA | NA | NA | NA | NA | NA | NA | NA | NA | NA | NA | NA | NA | NA | NA | NA | NA | NA | NA | NA | NA | NA | NA | NA | NA | NA | NA | NA | NA | NA | NA | NA | NA | NA | NA | NA | NA | NA | NA | NA | NA | |
| Mortgage Solutions, United States Consumer Information Solutions | 22.90 | 27.30 | 30.30 | 33.30 | 26.00 | 32.10 | 36.80 | 43.40 | 40.70 | 46.20 | 49.30 | 54.10 | 50.40 | 55.40 | 51.20 | NA | NA | NA | NA | NA | NA | NA | NA | NA | NA | NA | NA | NA | NA | NA | NA | NA | NA | NA | NA | NA | NA | NA | NA | NA | NA | NA | NA | NA | NA | NA | NA | NA | NA | NA | NA | NA | NA | NA | NA | NA | |
| Online Information Solutions, United States Consumer Information Solutions | 327.40 | 348.20 | 358.60 | 341.00 | 307.90 | 314.40 | 329.20 | 343.80 | 463.60 | 286.30 | 298.00 | 352.00 | 267.40 | 284.70 | 262.90 | NA | NA | NA | NA | NA | NA | NA | NA | NA | NA | NA | NA | NA | NA | NA | NA | NA | NA | NA | NA | NA | NA | NA | NA | NA | NA | NA | NA | NA | NA | NA | NA | NA | NA | NA | NA | NA | NA | NA | NA | NA | |
| International | 339.30 | 315.90 | 289.80 | 284.00 | 283.70 | 288.00 | 286.10 | 281.30 | 364.10 | 245.40 | 250.90 | 266.40 | 247.50 | 218.00 | 180.50 | NA | NA | NA | NA | NA | NA | NA | NA | NA | NA | NA | NA | NA | NA | NA | NA | NA | NA | NA | NA | NA | NA | NA | NA | NA | NA | NA | NA | NA | NA | NA | NA | NA | NA | NA | NA | NA | NA | NA | NA | NA | |
| United States Consumer Information Solutions | 427.70 | 426.00 | 445.00 | 421.70 | 405.90 | 397.40 | 421.40 | 432.90 | 583.70 | 387.80 | 405.80 | 459.40 | 387.40 | 386.30 | 365.60 | NA | NA | NA | NA | NA | NA | NA | NA | NA | NA | NA | NA | NA | NA | NA | NA | NA | NA | NA | NA | NA | NA | NA | NA | NA | NA | NA | NA | NA | NA | NA | NA | NA | NA | NA | NA | NA | NA | NA | NA | NA | |
| , International | 82.20 | 85.50 | 87.70 | 89.90 | 84.70 | 87.10 | 90.10 | 86.50 | 89.00 | 88.70 | 91.40 | 87.00 | 81.40 | 80.20 | 65.20 | NA | NA | NA | NA | NA | NA | NA | NA | NA | NA | NA | NA | NA | NA | NA | NA | NA | NA | NA | NA | NA | NA | NA | NA | NA | NA | NA | NA | NA | NA | NA | NA | NA | NA | NA | NA | NA | NA | NA | NA | NA | |
| , International | 64.90 | 65.10 | 66.50 | 55.30 | 64.30 | 66.20 | 64.00 | 61.60 | 114.40 | 44.40 | 47.10 | 60.70 | 41.10 | 38.70 | 33.10 | NA | NA | NA | NA | NA | NA | NA | NA | NA | NA | NA | NA | NA | NA | NA | NA | NA | NA | NA | NA | NA | NA | NA | NA | NA | NA | NA | NA | NA | NA | NA | NA | NA | NA | NA | NA | NA | NA | NA | NA | NA | |
| , International | 93.60 | 85.20 | 78.70 | 75.70 | 81.50 | 80.70 | 79.80 | 85.80 | 115.10 | 67.70 | 68.40 | 77.00 | 82.50 | 58.70 | 48.00 | NA | NA | NA | NA | NA | NA | NA | NA | NA | NA | NA | NA | NA | NA | NA | NA | NA | NA | NA | NA | NA | NA | NA | NA | NA | NA | NA | NA | NA | NA | NA | NA | NA | NA | NA | NA | NA | NA | NA | NA | NA | |
| , International | 98.60 | 80.10 | 56.90 | 63.10 | 53.20 | 54.00 | 52.20 | 47.40 | 45.60 | 44.60 | 44.00 | 41.70 | 42.50 | 40.40 | 34.20 | NA | NA | NA | NA | NA | NA | NA | NA | NA | NA | NA | NA | NA | NA | NA | NA | NA | NA | NA | NA | NA | NA | NA | NA | NA | NA | NA | NA | NA | NA | NA | NA | NA | NA | NA | NA | NA | NA | NA | NA | NA |
