
| 2023-12-31 | 2023-09-30 | 2023-06-30 | 2023-03-31 | 2022-12-31 | 2022-09-30 | 2022-06-30 | 2022-03-31 | 2021-12-31 | 2021-09-30 | 2021-06-30 | 2021-03-31 | 2020-12-31 | 2020-09-30 | 2020-06-30 | 2020-03-31 | 2019-12-31 | 2019-09-30 | 2019-06-30 | 2019-03-31 | 2018-12-31 | 2018-09-30 | 2018-06-30 | 2018-03-31 | 2017-12-31 | 2017-09-30 | 2017-06-30 | 2017-03-31 | 2016-12-31 | 2016-09-30 | 2016-06-30 | 2016-03-31 | 2015-12-31 | 2015-09-30 | 2015-06-30 | 2015-03-31 | 2014-12-31 | 2014-09-30 | 2014-06-30 | 2014-03-31 | 2013-12-31 | 2013-09-30 | 2013-06-30 | 2013-03-31 | 2012-12-31 | 2012-09-30 | 2012-06-30 | 2012-03-31 | 2011-12-31 | 2011-09-30 | 2011-06-30 | 2011-03-31 | 2010-12-31 | 2010-09-30 | 2010-06-30 | 2010-03-31 | ||
|---|---|---|---|---|---|---|---|---|---|---|---|---|---|---|---|---|---|---|---|---|---|---|---|---|---|---|---|---|---|---|---|---|---|---|---|---|---|---|---|---|---|---|---|---|---|---|---|---|---|---|---|---|---|---|---|---|---|
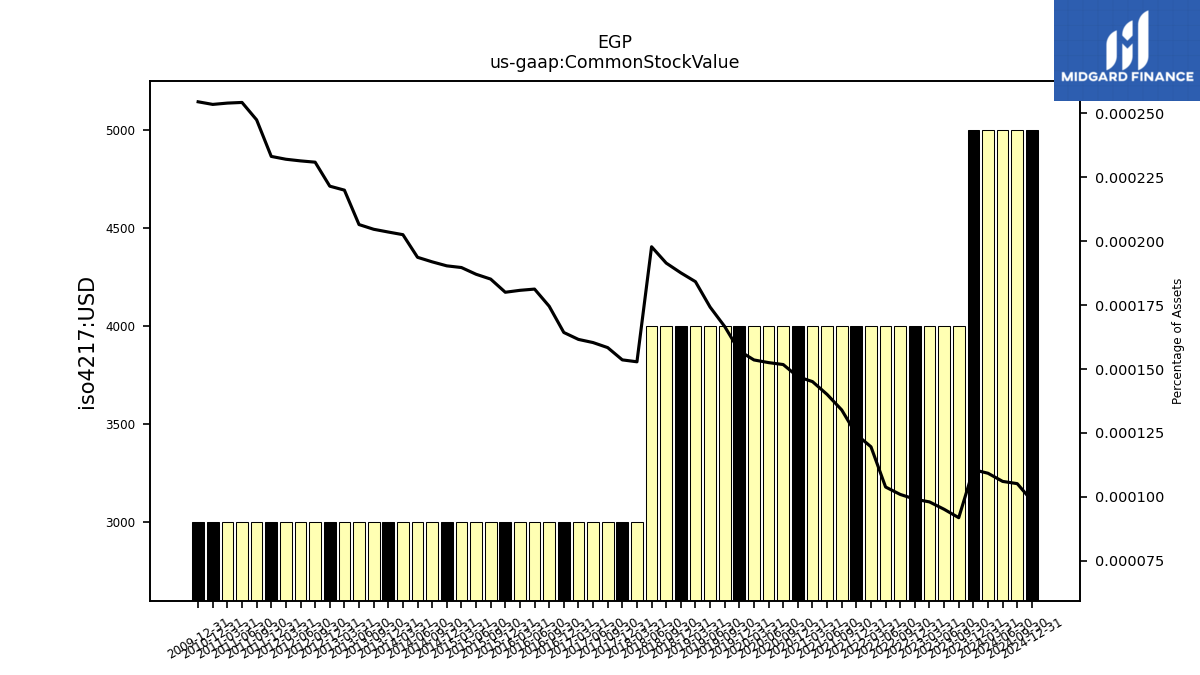
| Common Stock Value | 0.01 | 0.00 | 0.00 | 0.00 | 0.00 | 0.00 | 0.00 | 0.00 | 0.00 | 0.00 | 0.00 | 0.00 | 0.00 | 0.00 | 0.00 | 0.00 | 0.00 | 0.00 | 0.00 | 0.00 | 0.00 | 0.00 | 0.00 | 0.00 | 0.00 | 0.00 | 0.00 | 0.00 | 0.00 | 0.00 | 0.00 | 0.00 | 0.00 | 0.00 | 0.00 | 0.00 | 0.00 | 0.00 | 0.00 | 0.00 | 0.00 | 0.00 | 0.00 | 0.00 | 0.00 | 0.00 | 0.00 | 0.00 | 0.00 | 0.00 | 0.00 | 0.00 | 0.00 | NA | NA | NA | |
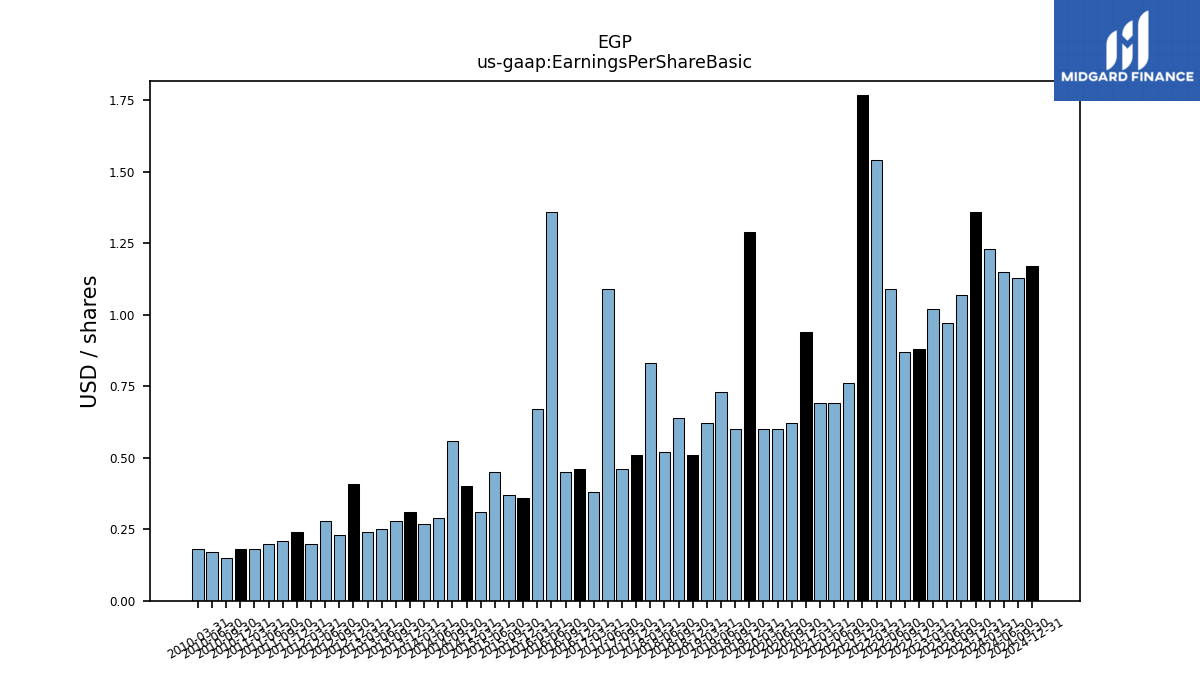
| Earnings Per Share Basic | 1.36 | 1.07 | 0.97 | 1.02 | 0.88 | 0.87 | 1.09 | 1.54 | 1.77 | 0.76 | 0.69 | 0.69 | 0.94 | 0.62 | 0.60 | 0.60 | 1.29 | 0.60 | 0.73 | 0.62 | 0.51 | 0.64 | 0.52 | 0.83 | 0.51 | 0.46 | 1.09 | 0.38 | 0.46 | 0.45 | 1.36 | 0.67 | 0.36 | 0.37 | 0.45 | 0.31 | 0.40 | 0.56 | 0.29 | 0.27 | 0.31 | 0.28 | 0.25 | 0.24 | 0.41 | 0.23 | 0.28 | 0.20 | 0.24 | 0.21 | 0.20 | 0.18 | 0.18 | 0.15 | 0.17 | 0.18 | |
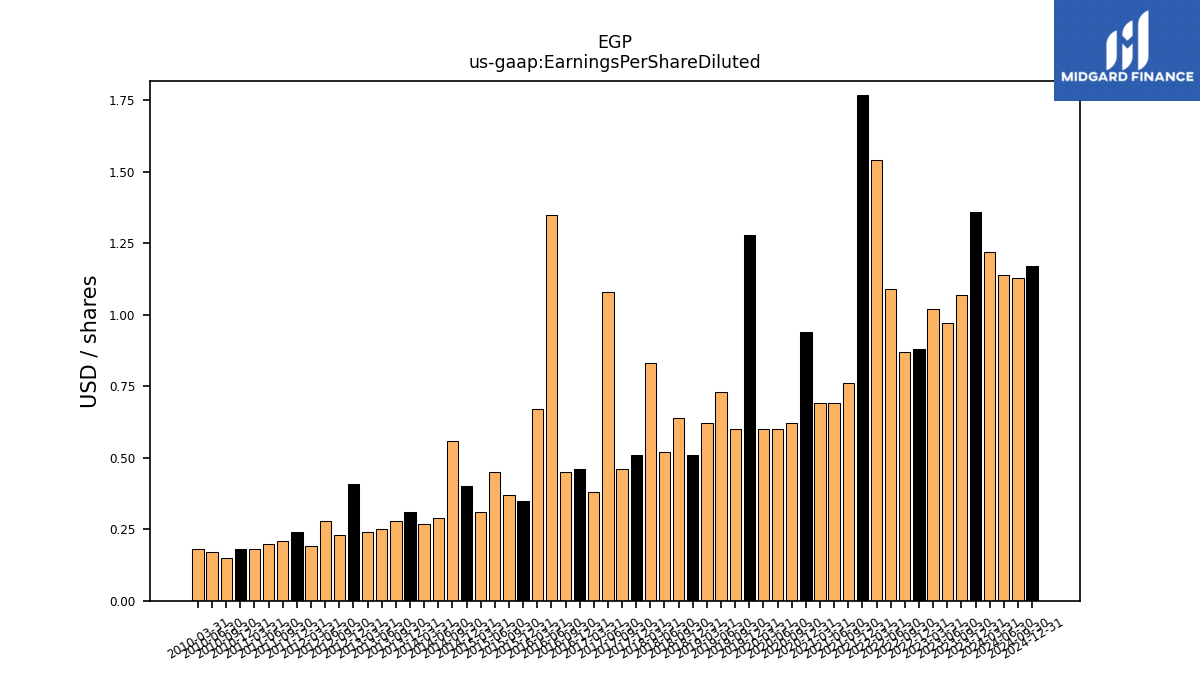
| Earnings Per Share Diluted | 1.36 | 1.07 | 0.97 | 1.02 | 0.88 | 0.87 | 1.09 | 1.54 | 1.77 | 0.76 | 0.69 | 0.69 | 0.94 | 0.62 | 0.60 | 0.60 | 1.28 | 0.60 | 0.73 | 0.62 | 0.51 | 0.64 | 0.52 | 0.83 | 0.51 | 0.46 | 1.08 | 0.38 | 0.46 | 0.45 | 1.35 | 0.67 | 0.35 | 0.37 | 0.45 | 0.31 | 0.40 | 0.56 | 0.29 | 0.27 | 0.31 | 0.28 | 0.25 | 0.24 | 0.41 | 0.23 | 0.28 | 0.19 | 0.24 | 0.21 | 0.20 | 0.18 | 0.18 | 0.15 | 0.17 | 0.18 |
| 2023-12-31 | 2023-09-30 | 2023-06-30 | 2023-03-31 | 2022-12-31 | 2022-09-30 | 2022-06-30 | 2022-03-31 | 2021-12-31 | 2021-09-30 | 2021-06-30 | 2021-03-31 | 2020-12-31 | 2020-09-30 | 2020-06-30 | 2020-03-31 | 2019-12-31 | 2019-09-30 | 2019-06-30 | 2019-03-31 | 2018-12-31 | 2018-09-30 | 2018-06-30 | 2018-03-31 | 2017-12-31 | 2017-09-30 | 2017-06-30 | 2017-03-31 | 2016-12-31 | 2016-09-30 | 2016-06-30 | 2016-03-31 | 2015-12-31 | 2015-09-30 | 2015-06-30 | 2015-03-31 | 2014-12-31 | 2014-09-30 | 2014-06-30 | 2014-03-31 | 2013-12-31 | 2013-09-30 | 2013-06-30 | 2013-03-31 | 2012-12-31 | 2012-09-30 | 2012-06-30 | 2012-03-31 | 2011-12-31 | 2011-09-30 | 2011-06-30 | 2011-03-31 | 2010-12-31 | 2010-09-30 | 2010-06-30 | 2010-03-31 | ||
|---|---|---|---|---|---|---|---|---|---|---|---|---|---|---|---|---|---|---|---|---|---|---|---|---|---|---|---|---|---|---|---|---|---|---|---|---|---|---|---|---|---|---|---|---|---|---|---|---|---|---|---|---|---|---|---|---|---|
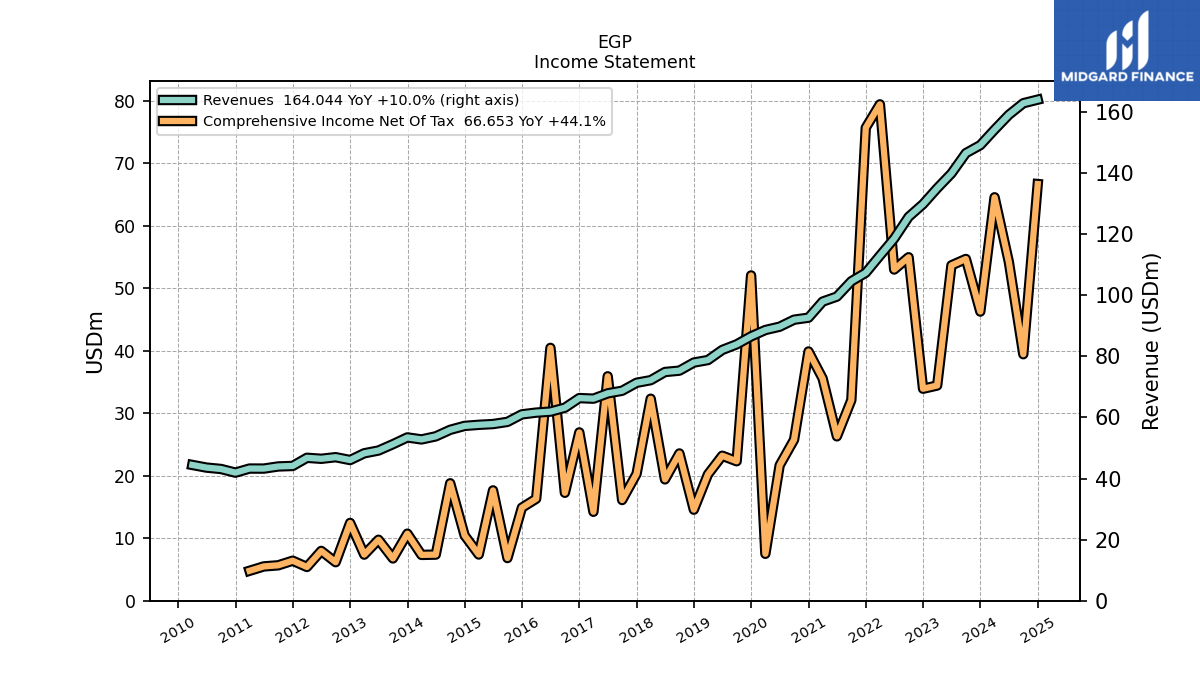
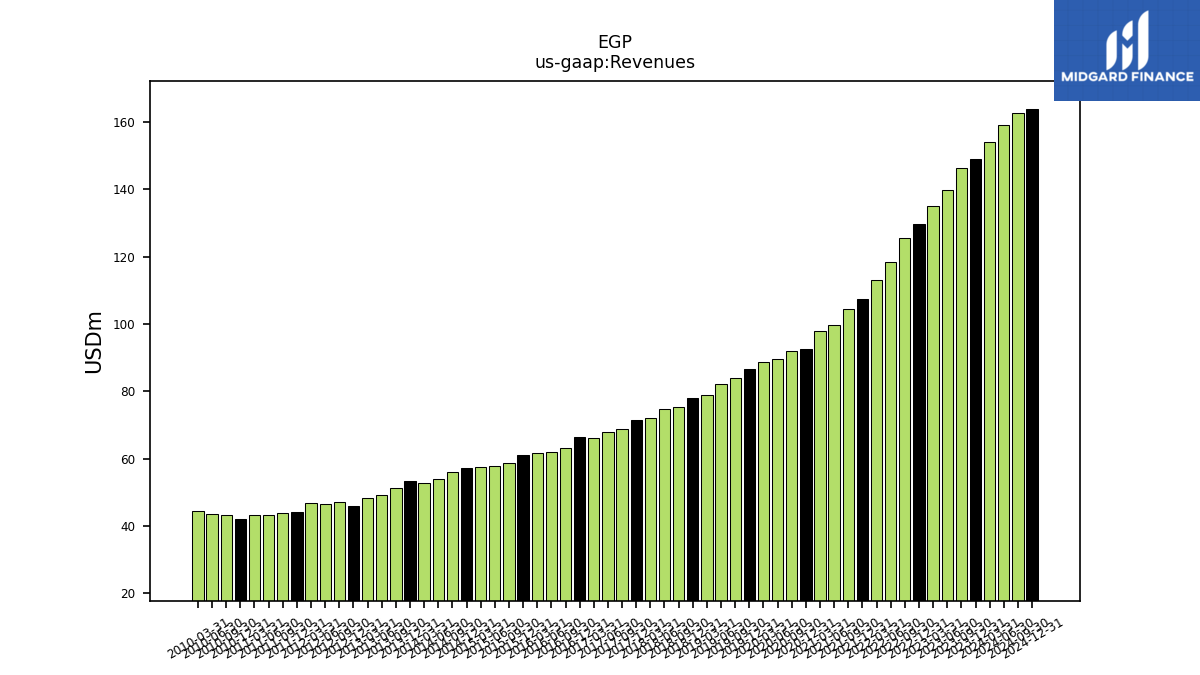
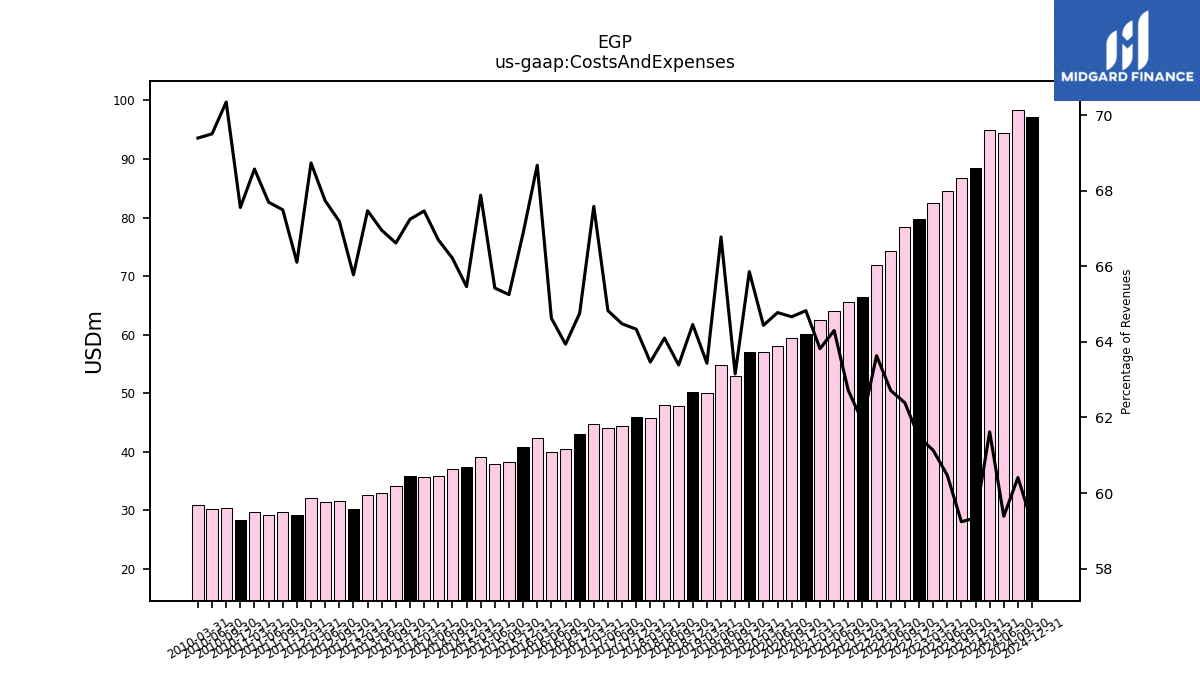
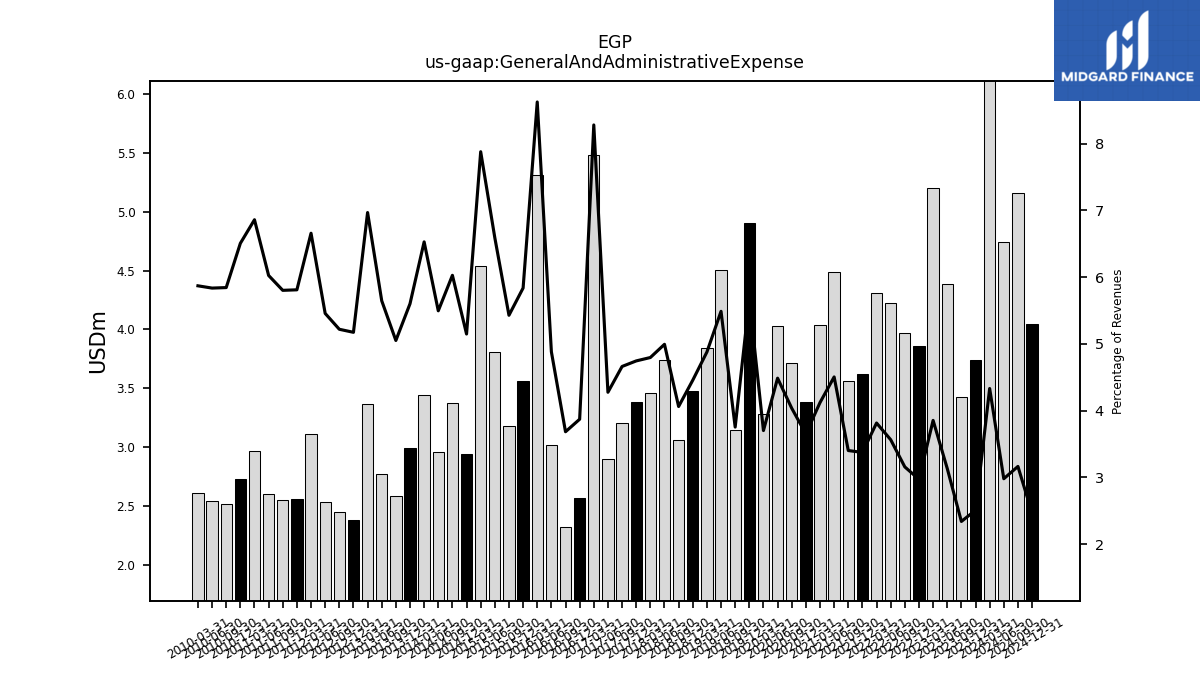
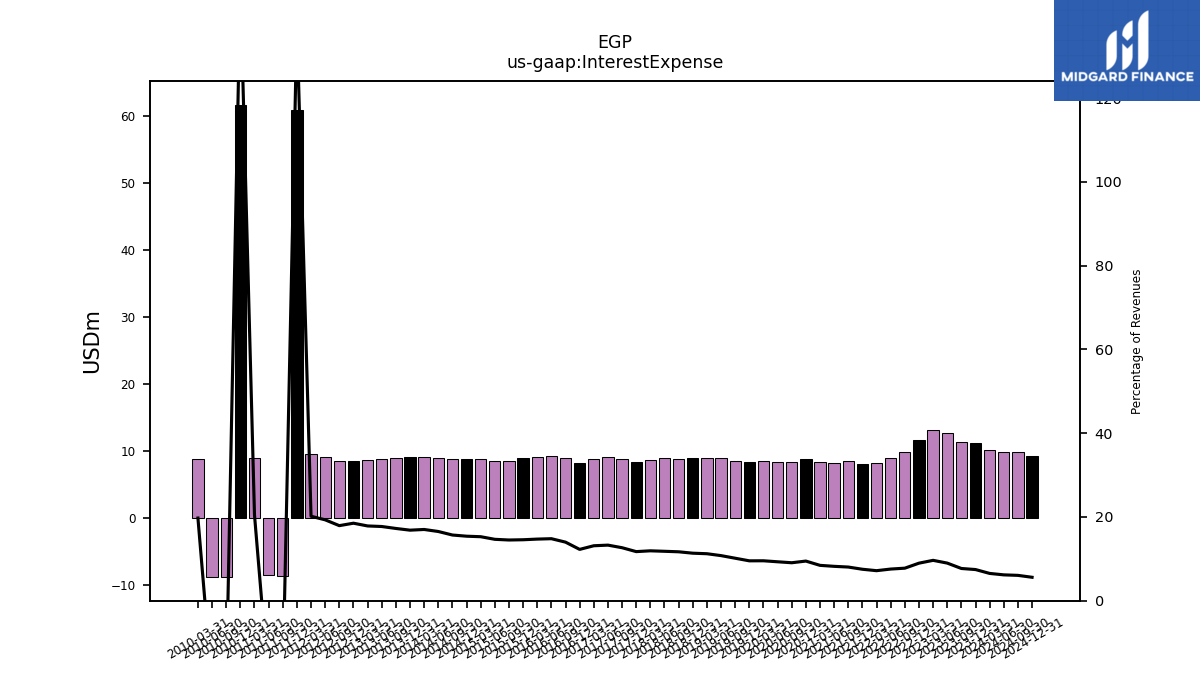
| Revenues | 149.15 | 146.53 | 139.89 | 135.03 | 129.84 | 125.66 | 118.55 | 112.97 | 107.37 | 104.60 | 99.58 | 97.93 | 92.67 | 92.01 | 89.72 | 88.63 | 86.55 | 83.94 | 82.10 | 78.80 | 77.98 | 75.33 | 74.89 | 72.20 | 71.36 | 68.75 | 67.89 | 66.15 | 66.35 | 63.19 | 61.92 | 61.59 | 61.02 | 58.55 | 57.84 | 57.59 | 57.24 | 55.96 | 53.82 | 52.81 | 53.47 | 51.25 | 49.18 | 48.27 | 46.06 | 47.00 | 46.47 | 46.80 | 44.13 | 43.96 | 43.27 | 43.28 | 41.94 | 43.14 | 43.59 | 44.46 | |
| Costs And Expenses | 88.50 | 86.81 | 84.59 | 82.54 | 79.83 | 78.40 | 74.35 | 71.89 | 66.46 | 65.60 | 64.03 | 62.50 | 60.07 | 59.50 | 58.11 | 57.11 | 57.00 | 53.01 | 54.82 | 49.98 | 50.26 | 47.75 | 48.00 | 45.82 | 45.91 | 44.33 | 44.01 | 44.71 | 42.97 | 40.40 | 40.01 | 42.29 | 40.80 | 38.21 | 37.84 | 39.09 | 37.47 | 37.05 | 35.90 | 35.63 | 35.95 | 34.14 | 32.93 | 32.57 | 30.29 | 31.58 | 31.48 | 32.16 | 29.17 | 29.67 | 29.29 | 29.68 | 28.33 | 30.34 | 30.30 | 30.85 | |
| General And Administrative Expense | 3.74 | 3.43 | 4.38 | 5.20 | 3.86 | 3.97 | 4.23 | 4.31 | 3.62 | 3.56 | 4.49 | 4.04 | 3.38 | 3.71 | 4.03 | 3.28 | 4.91 | 3.15 | 4.51 | 3.84 | 3.48 | 3.06 | 3.74 | 3.46 | 3.39 | 3.21 | 2.90 | 5.48 | 2.57 | 2.33 | 3.02 | 5.31 | 3.56 | 3.18 | 3.81 | 4.54 | 2.95 | 3.37 | 2.96 | 3.45 | 3.00 | 2.59 | 2.78 | 3.36 | 2.38 | 2.45 | 2.54 | 3.12 | 2.56 | 2.55 | 2.61 | 2.97 | 2.73 | 2.52 | 2.54 | 2.61 | |
| Interest Expense | 11.11 | 11.29 | 12.57 | 13.03 | 11.65 | 9.77 | 8.97 | 8.11 | 8.07 | 8.42 | 8.18 | 8.28 | 8.78 | 8.35 | 8.35 | 8.46 | 8.25 | 8.52 | 8.85 | 8.85 | 8.85 | 8.80 | 8.84 | 8.61 | 8.37 | 8.70 | 9.02 | 8.69 | 8.13 | 8.84 | 9.17 | 9.06 | 8.89 | 8.49 | 8.48 | 8.80 | 8.82 | 8.78 | 8.90 | 8.99 | 9.01 | 8.85 | 8.72 | 8.62 | 8.53 | 8.43 | 8.98 | 9.44 | 60.81 | -8.68 | -8.54 | 8.88 | 61.69 | -8.85 | -8.89 | 8.78 | |
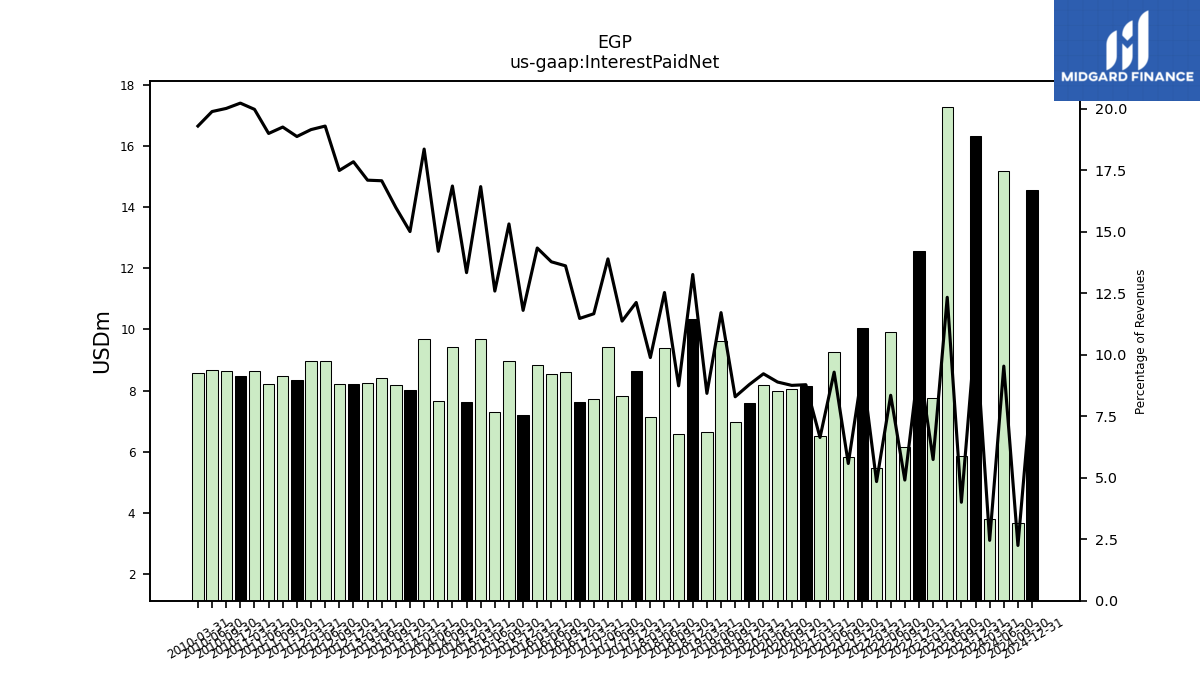
| Interest Paid Net | 16.34 | 5.87 | 17.26 | 7.76 | 12.56 | 6.17 | 9.91 | 5.48 | 10.06 | 5.84 | 9.26 | 6.50 | 8.14 | 8.06 | 7.98 | 8.18 | 7.61 | 6.96 | 9.62 | 6.65 | 10.35 | 6.58 | 9.39 | 7.14 | 8.66 | 7.82 | 9.44 | 7.72 | 7.62 | 8.61 | 8.54 | 8.84 | 7.21 | 8.97 | 7.29 | 9.70 | 7.64 | 9.44 | 7.65 | 9.70 | 8.03 | 8.20 | 8.40 | 8.26 | 8.22 | 8.22 | 8.97 | 8.97 | 8.33 | 8.47 | 8.22 | 8.65 | 8.49 | 8.64 | 8.67 | 8.58 | |
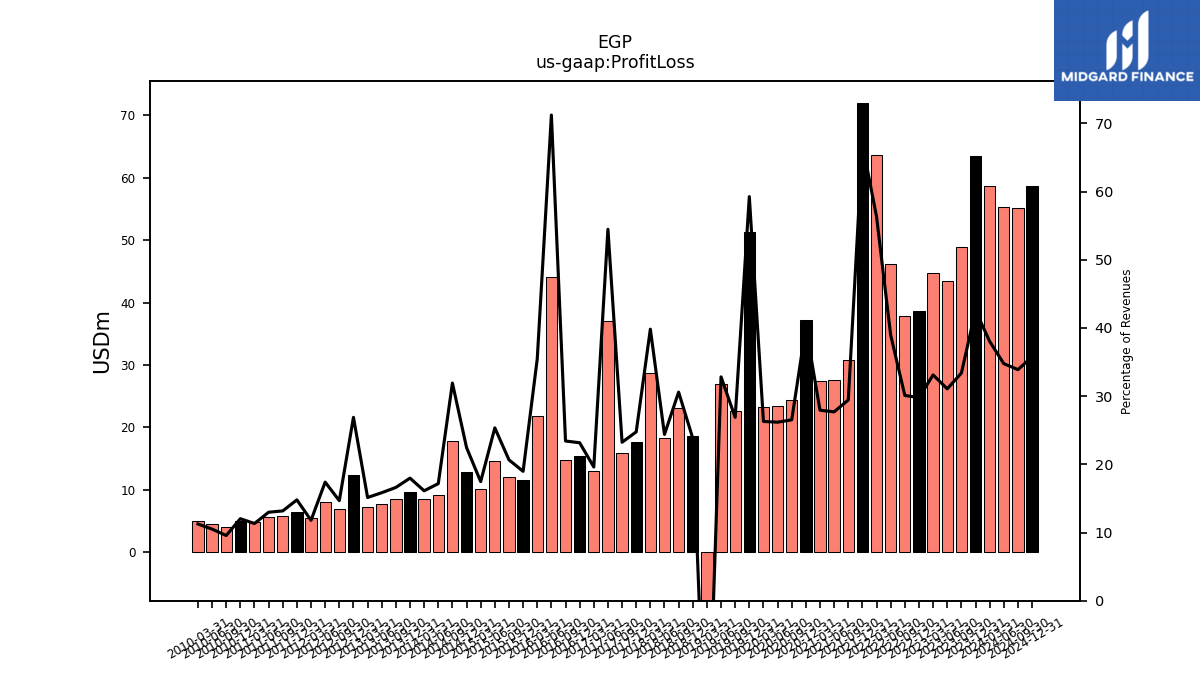
| Profit Loss | 63.47 | 48.91 | 43.47 | 44.70 | 38.69 | 37.82 | 46.16 | 63.60 | 71.91 | 30.79 | 27.58 | 27.36 | 37.20 | 24.41 | 23.49 | 23.30 | 51.28 | 22.57 | 26.95 | -22.53 | 18.58 | 23.04 | 18.26 | 28.75 | 17.67 | 15.97 | 36.98 | 12.97 | 15.37 | 14.80 | 44.09 | 21.83 | 11.58 | 12.10 | 14.66 | 10.06 | 12.86 | 17.86 | 9.24 | 8.51 | 9.61 | 8.51 | 7.79 | 7.31 | 12.38 | 6.90 | 8.08 | 5.52 | 6.53 | 5.79 | 5.62 | 4.90 | 5.04 | 4.13 | 4.58 | 5.01 | |
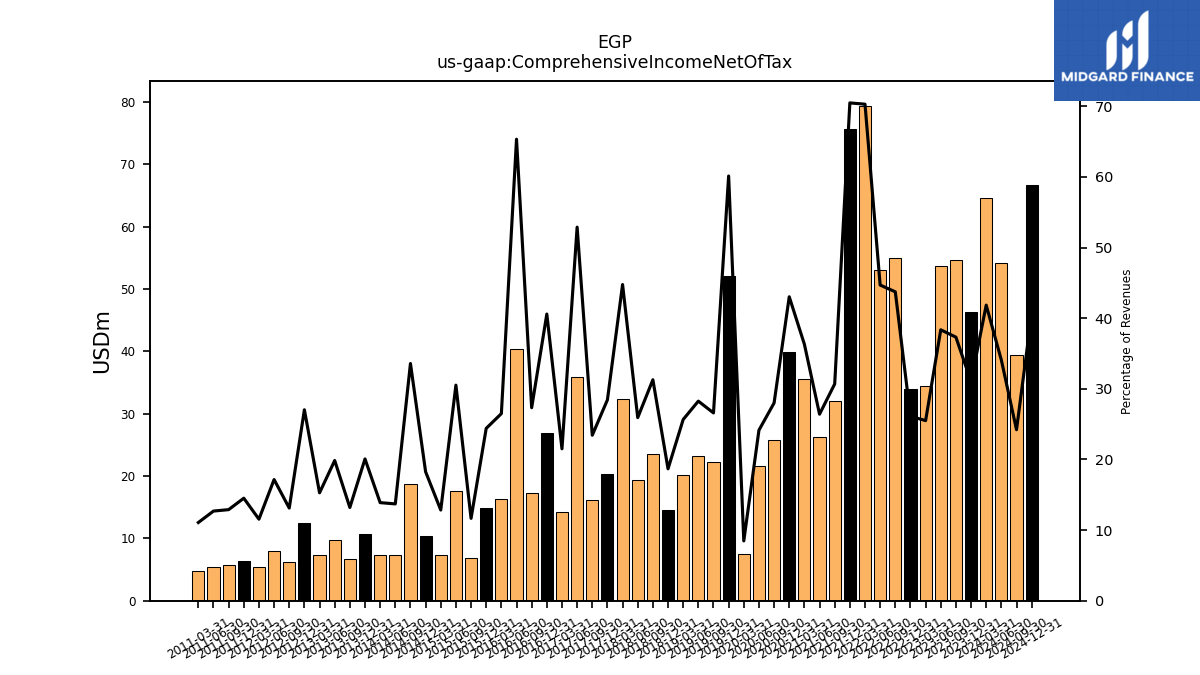
| Comprehensive Income Net Of Tax | 46.26 | 54.67 | 53.65 | 34.43 | 33.91 | 54.95 | 52.98 | 79.41 | 75.67 | 32.10 | 26.30 | 35.55 | 39.87 | 25.76 | 21.66 | 7.51 | 52.04 | 22.32 | 23.20 | 20.22 | 14.56 | 23.56 | 19.41 | 32.32 | 20.29 | 16.11 | 35.91 | 14.23 | 26.93 | 17.27 | 40.45 | 16.31 | 14.89 | 6.83 | 17.66 | 7.39 | 10.45 | 18.79 | 7.38 | 7.33 | 10.73 | 6.77 | 9.76 | 7.38 | 12.45 | 6.17 | 7.97 | 5.40 | 6.41 | 5.67 | 5.49 | 4.79 | NA | NA | NA | NA | |
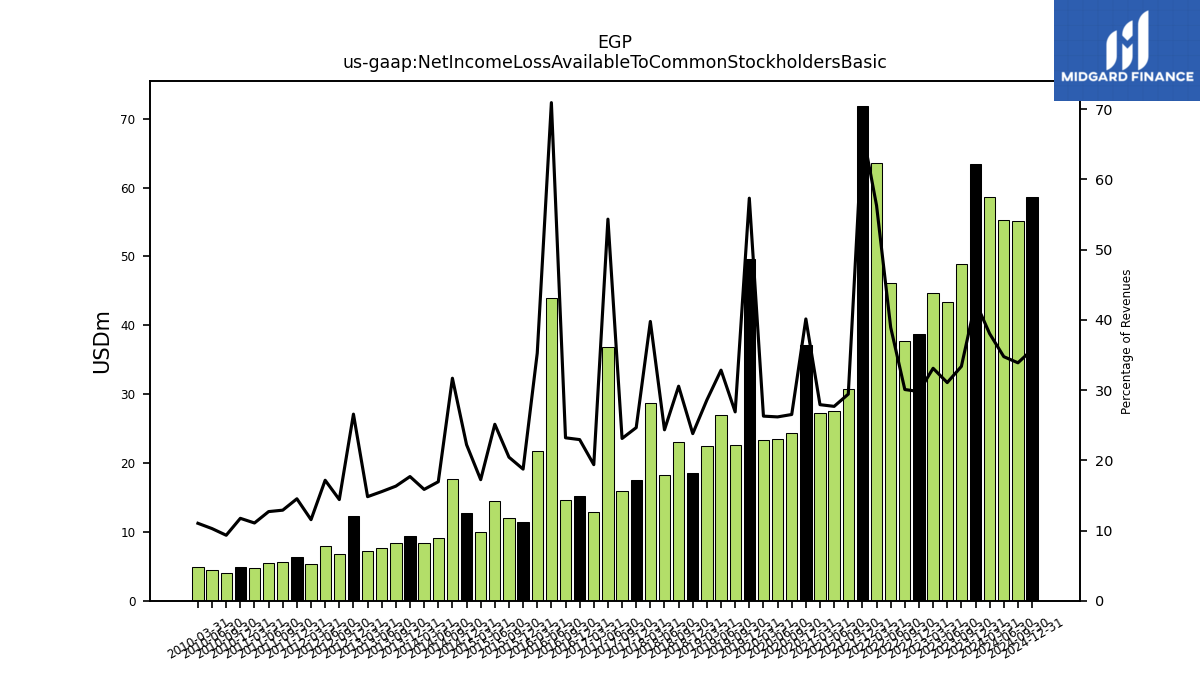
| Net Income Loss Available To Common Stockholders Basic | 63.45 | 48.90 | 43.45 | 44.69 | 38.67 | 37.79 | 46.14 | 63.58 | 71.89 | 30.77 | 27.56 | 27.34 | 37.18 | 24.40 | 23.48 | 23.30 | 49.61 | 22.57 | 26.95 | 22.53 | 18.56 | 23.01 | 18.23 | 28.71 | 17.59 | 15.88 | 36.89 | 12.82 | 15.22 | 14.66 | 43.91 | 21.71 | 11.44 | 11.97 | 14.53 | 9.93 | 12.72 | 17.73 | 9.12 | 8.37 | 9.46 | 8.36 | 7.64 | 7.15 | 12.24 | 6.77 | 7.97 | 5.40 | 6.41 | 5.67 | 5.49 | 4.79 | 4.92 | 4.02 | 4.48 | 4.90 |
| 2023-12-31 | 2023-09-30 | 2023-06-30 | 2023-03-31 | 2022-12-31 | 2022-09-30 | 2022-06-30 | 2022-03-31 | 2021-12-31 | 2021-09-30 | 2021-06-30 | 2021-03-31 | 2020-12-31 | 2020-09-30 | 2020-06-30 | 2020-03-31 | 2019-12-31 | 2019-09-30 | 2019-06-30 | 2019-03-31 | 2018-12-31 | 2018-09-30 | 2018-06-30 | 2018-03-31 | 2017-12-31 | 2017-09-30 | 2017-06-30 | 2017-03-31 | 2016-12-31 | 2016-09-30 | 2016-06-30 | 2016-03-31 | 2015-12-31 | 2015-09-30 | 2015-06-30 | 2015-03-31 | 2014-12-31 | 2014-09-30 | 2014-06-30 | 2014-03-31 | 2013-12-31 | 2013-09-30 | 2013-06-30 | 2013-03-31 | 2012-12-31 | 2012-09-30 | 2012-06-30 | 2012-03-31 | 2011-12-31 | 2011-09-30 | 2011-06-30 | 2011-03-31 | 2010-12-31 | 2010-09-30 | 2010-06-30 | 2010-03-31 | ||
|---|---|---|---|---|---|---|---|---|---|---|---|---|---|---|---|---|---|---|---|---|---|---|---|---|---|---|---|---|---|---|---|---|---|---|---|---|---|---|---|---|---|---|---|---|---|---|---|---|---|---|---|---|---|---|---|---|---|
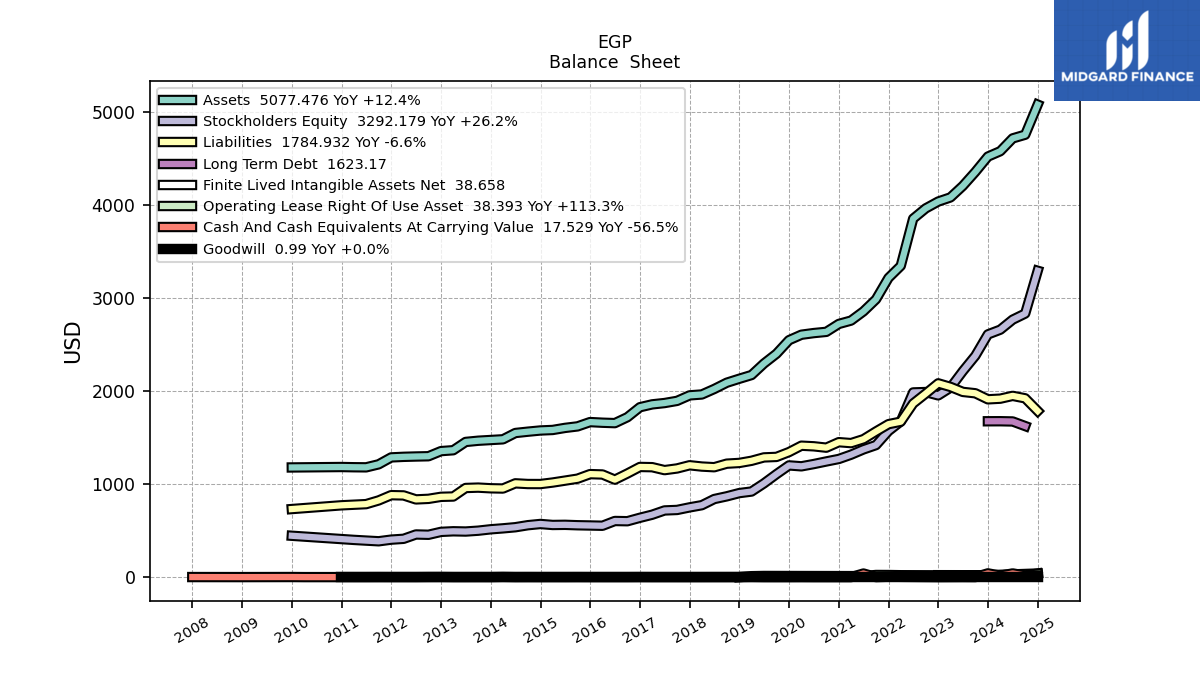
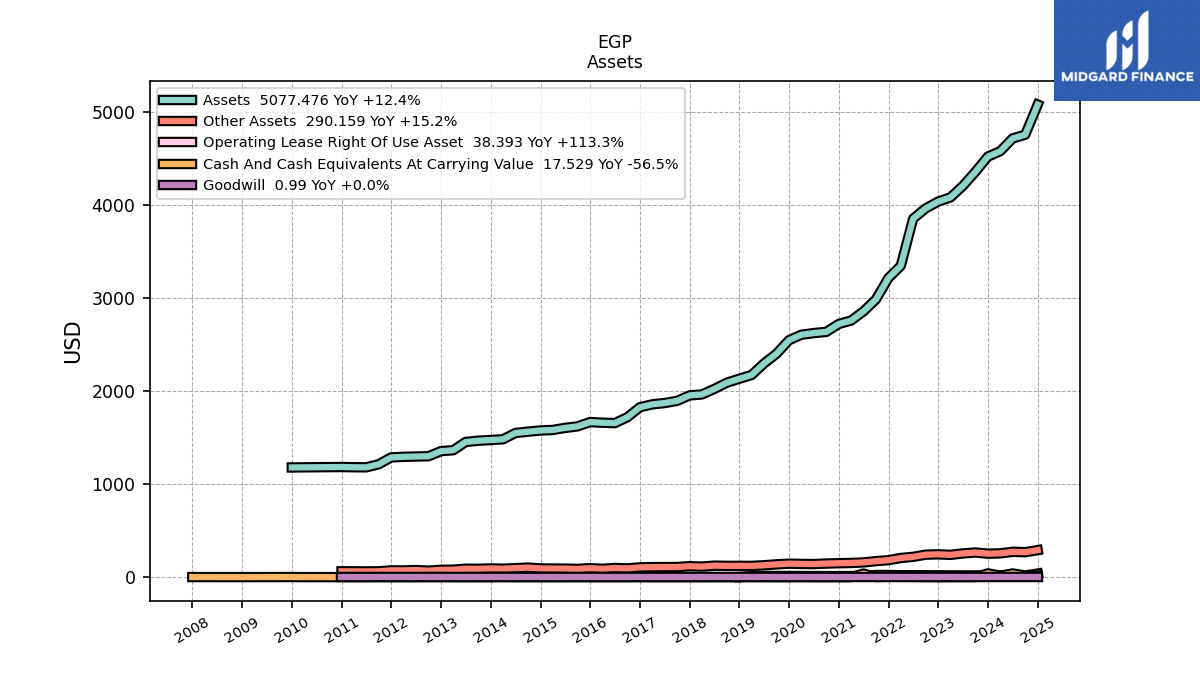
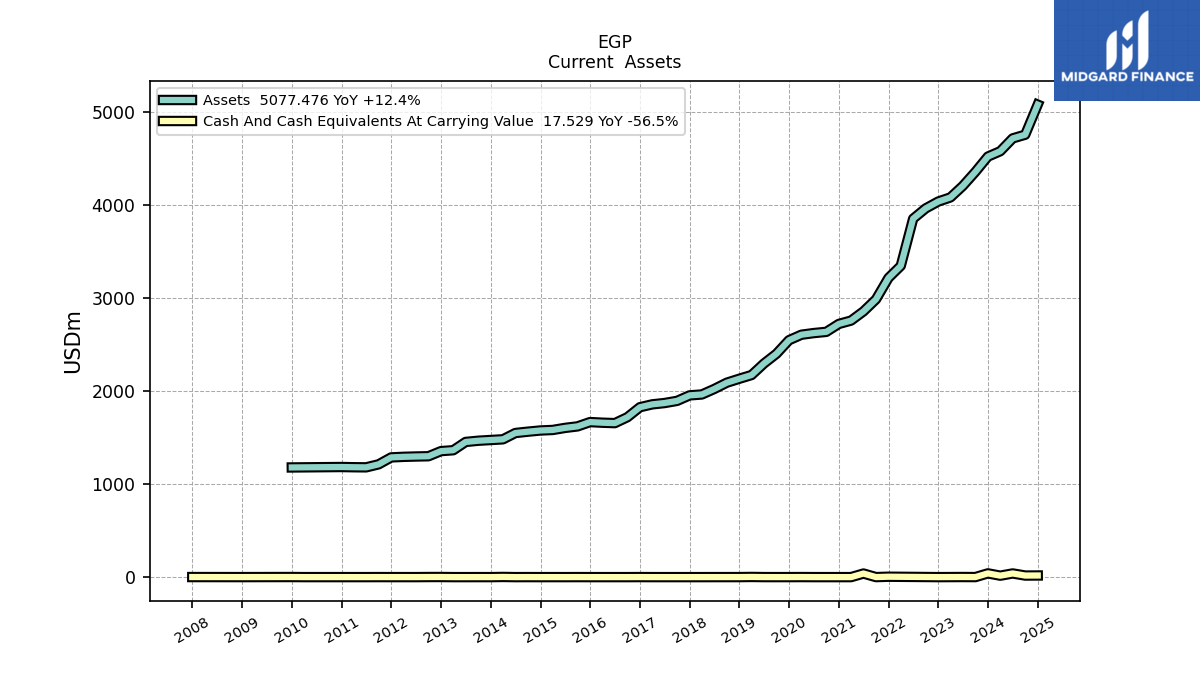
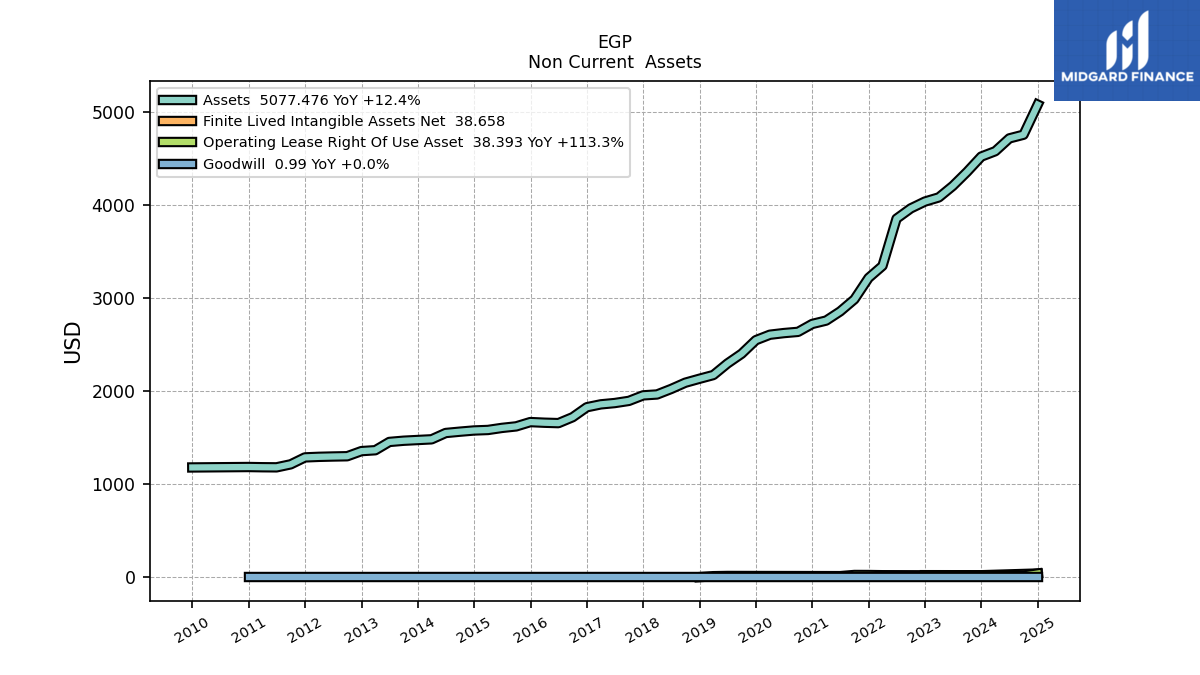
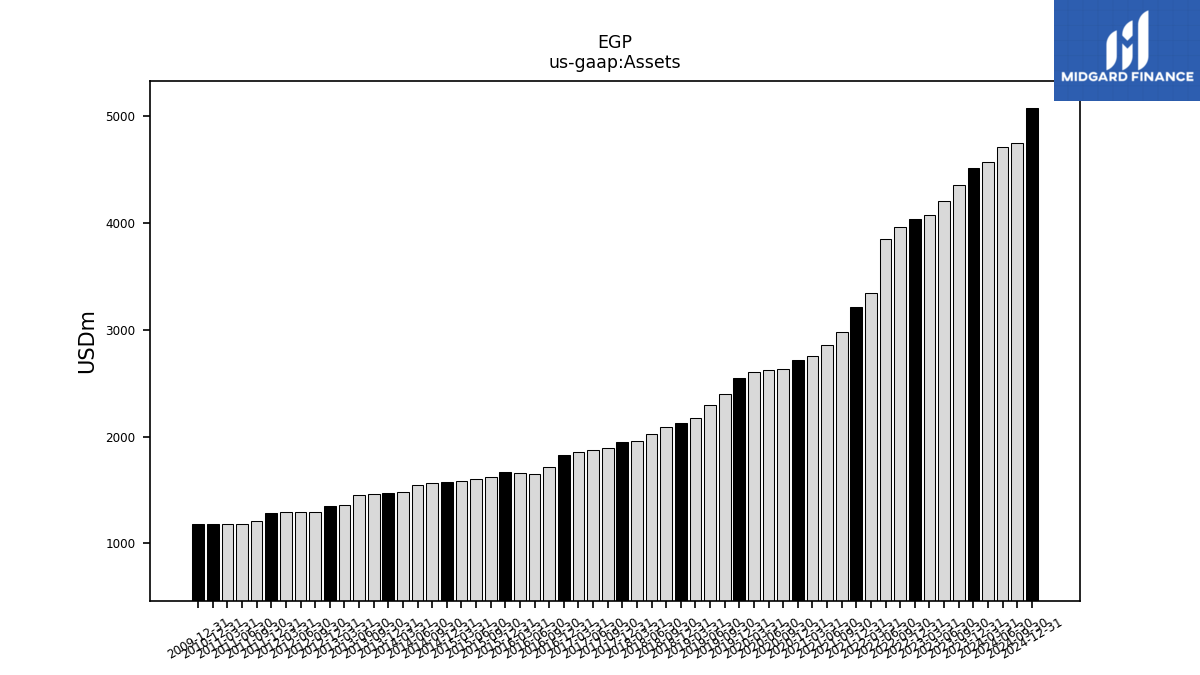
| Assets | 4519.21 | 4354.85 | 4204.13 | 4080.46 | 4035.84 | 3962.32 | 3851.72 | 3344.74 | 3215.34 | 2985.01 | 2855.62 | 2756.92 | 2720.80 | 2635.69 | 2622.52 | 2604.76 | 2546.08 | 2400.44 | 2295.38 | 2171.65 | 2131.70 | 2089.16 | 2021.73 | 1962.79 | 1953.22 | 1893.99 | 1870.71 | 1856.43 | 1825.76 | 1718.44 | 1654.85 | 1659.28 | 1666.23 | 1619.91 | 1603.48 | 1581.28 | 1575.82 | 1562.98 | 1548.61 | 1480.93 | 1473.41 | 1465.65 | 1452.58 | 1363.65 | 1354.10 | 1299.07 | 1296.23 | 1292.64 | 1286.52 | 1212.19 | 1179.70 | 1180.88 | 1183.28 | NA | NA | NA | |
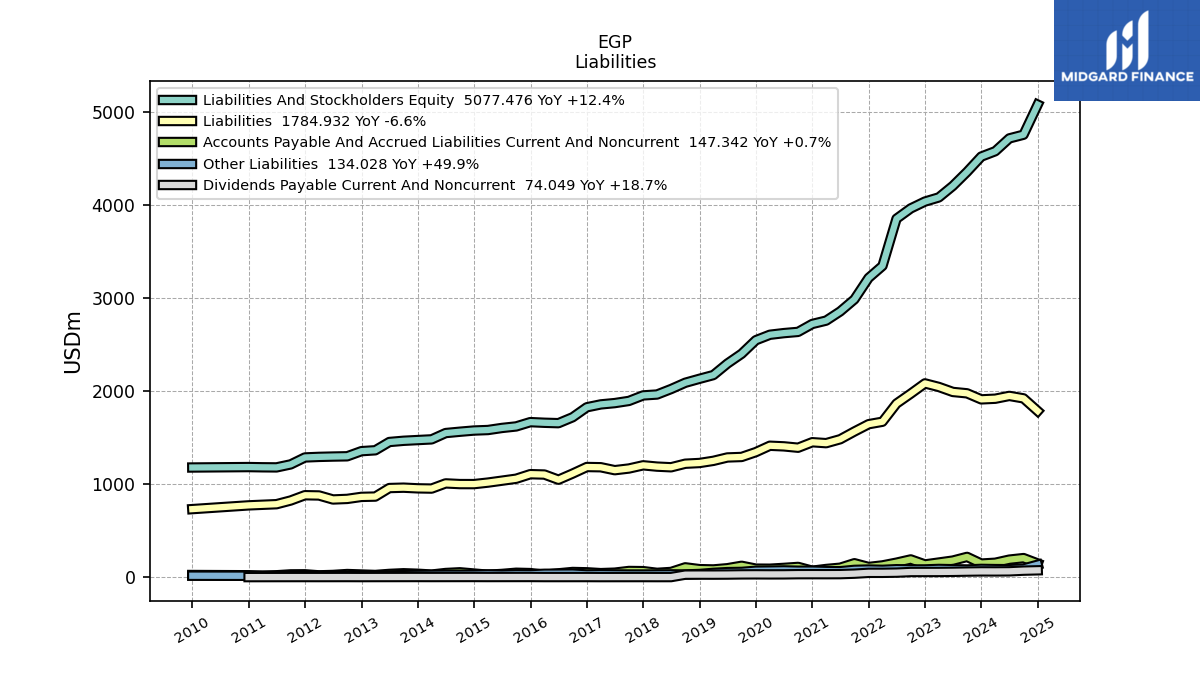
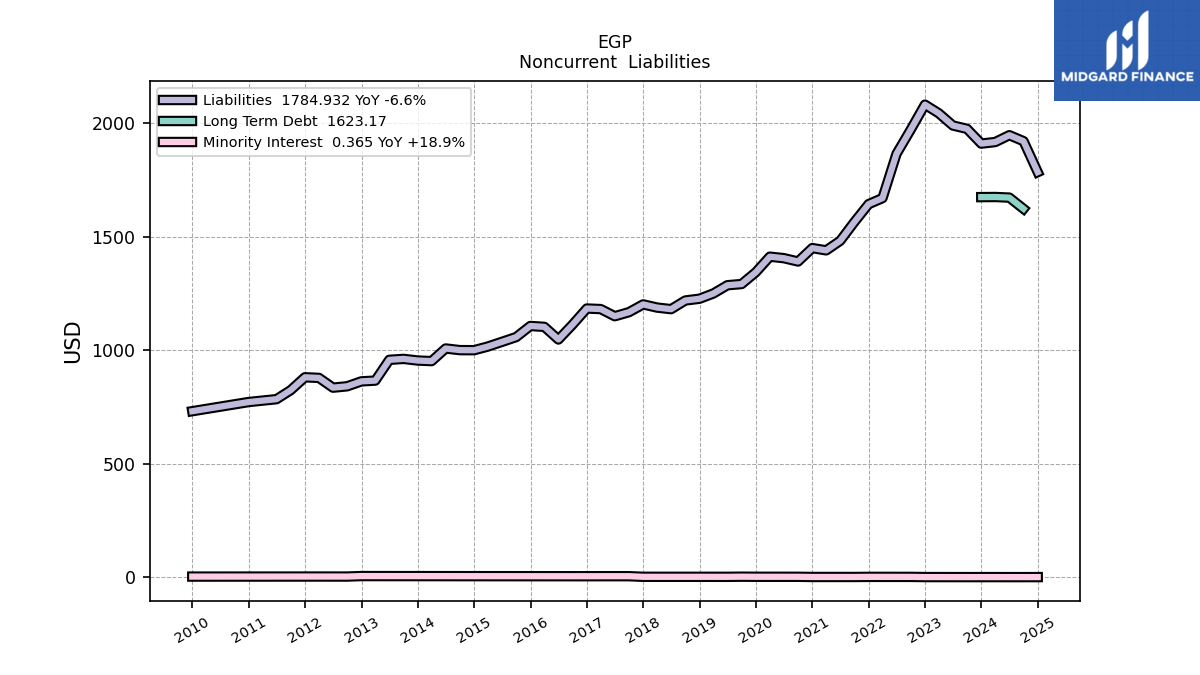
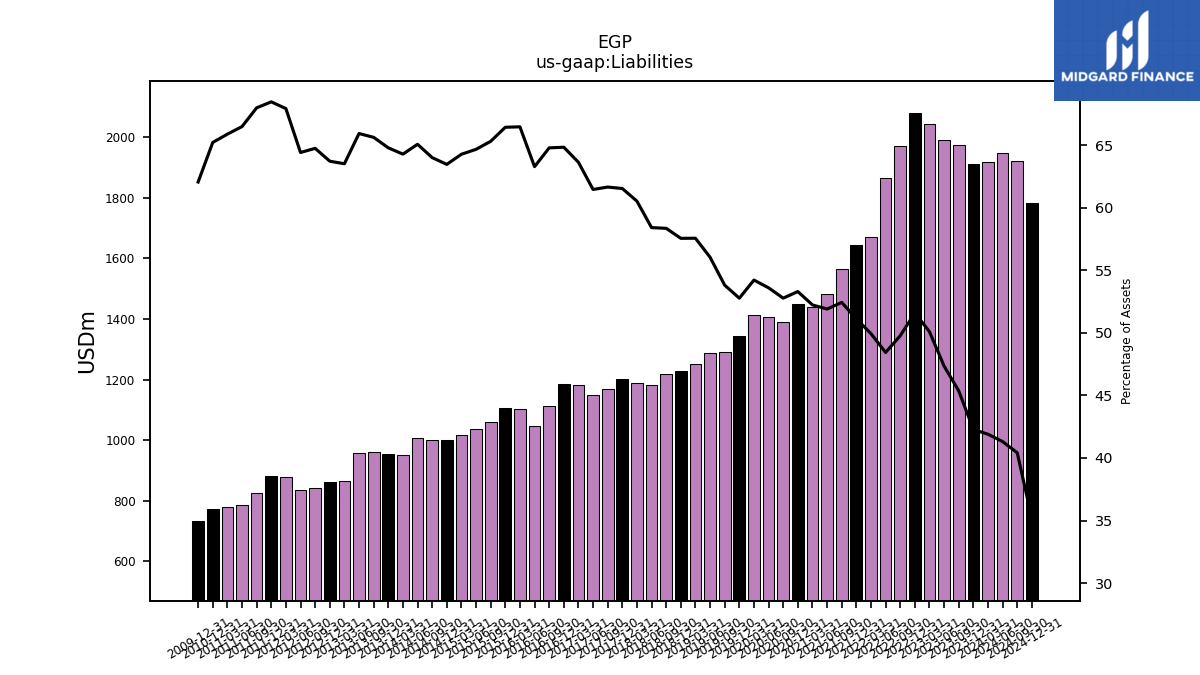
| Liabilities | 1910.58 | 1975.59 | 1990.41 | 2044.08 | 2082.40 | 1972.14 | 1865.64 | 1670.35 | 1643.88 | 1565.27 | 1482.29 | 1440.12 | 1450.29 | 1391.07 | 1405.72 | 1412.40 | 1343.75 | 1291.77 | 1286.48 | 1250.17 | 1227.00 | 1219.23 | 1181.03 | 1188.11 | 1202.09 | 1167.82 | 1149.87 | 1181.45 | 1183.90 | 1113.41 | 1047.36 | 1103.00 | 1107.03 | 1058.04 | 1037.06 | 1016.47 | 1000.21 | 1000.52 | 1007.84 | 952.11 | 954.71 | 961.96 | 957.81 | 866.22 | 862.93 | 841.21 | 835.07 | 878.12 | 880.91 | 824.20 | 784.43 | 778.08 | 771.77 | NA | NA | NA | |
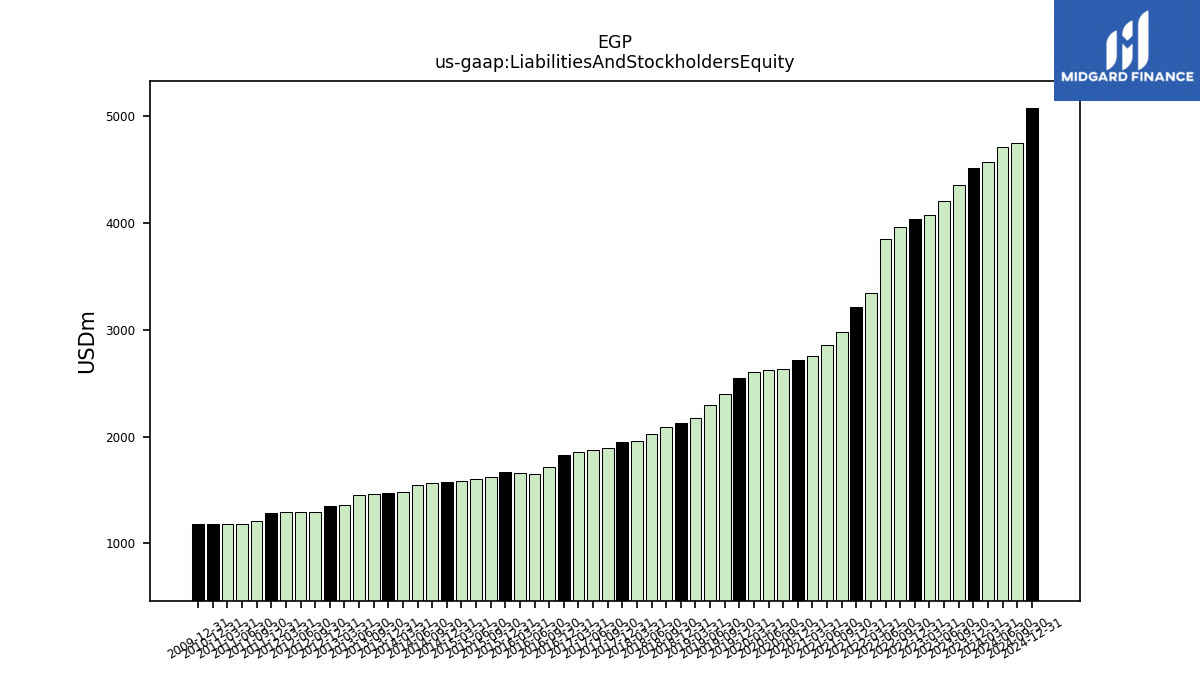
| Liabilities And Stockholders Equity | 4519.21 | 4354.85 | 4204.13 | 4080.46 | 4035.84 | 3962.32 | 3851.72 | 3344.74 | 3215.34 | 2985.01 | 2855.62 | 2756.92 | 2720.80 | 2635.69 | 2622.52 | 2604.76 | 2546.08 | 2400.44 | 2295.38 | 2171.65 | 2131.70 | 2089.16 | 2021.73 | 1962.79 | 1953.22 | 1893.99 | 1870.71 | 1856.43 | 1825.76 | 1718.44 | 1654.85 | 1659.28 | 1666.23 | 1619.91 | 1603.48 | 1581.28 | 1575.82 | 1562.98 | 1548.61 | 1480.93 | 1473.41 | 1465.65 | 1452.58 | 1363.65 | 1354.10 | 1299.07 | 1296.23 | 1292.64 | 1286.52 | 1212.19 | 1179.70 | 1180.88 | 1183.28 | NA | NA | NA | |
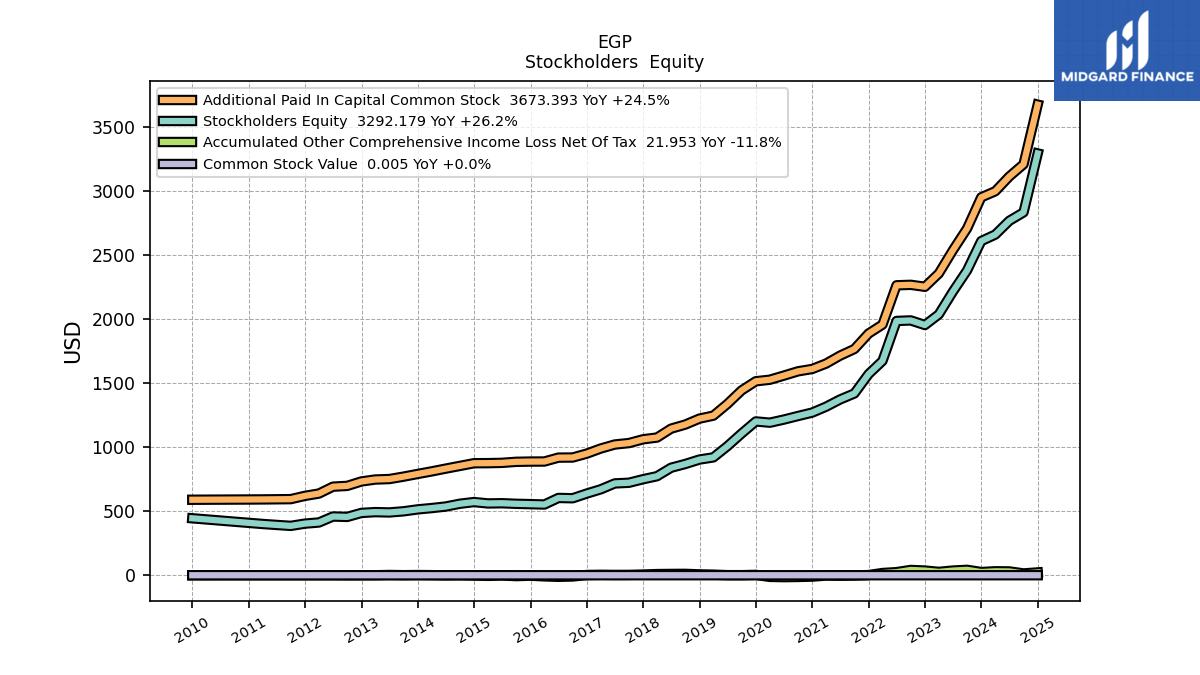
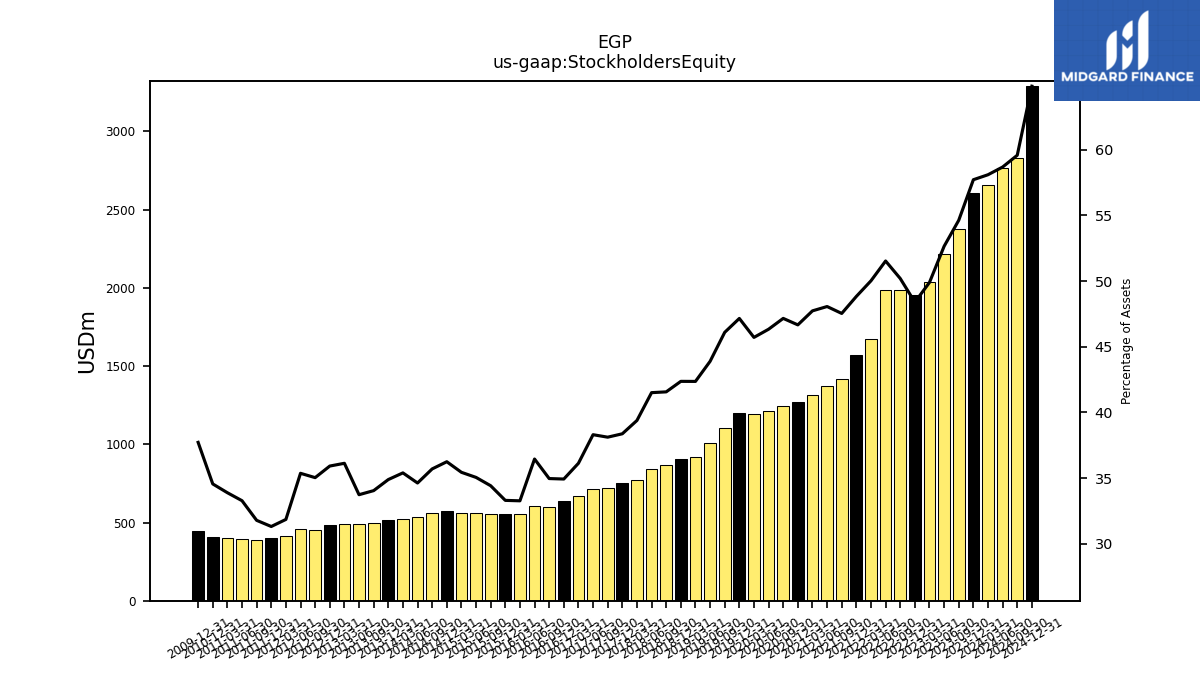
| Stockholders Equity | 2608.33 | 2378.96 | 2213.38 | 2035.97 | 1953.00 | 1988.90 | 1984.72 | 1673.03 | 1570.07 | 1418.90 | 1372.44 | 1315.91 | 1269.64 | 1242.92 | 1215.08 | 1190.63 | 1200.56 | 1106.48 | 1007.34 | 919.87 | 903.06 | 868.32 | 839.08 | 773.05 | 749.47 | 721.85 | 716.51 | 670.64 | 637.66 | 600.80 | 603.19 | 552.00 | 554.86 | 557.50 | 562.02 | 560.37 | 571.13 | 557.91 | 536.17 | 524.16 | 514.00 | 498.95 | 489.99 | 492.62 | 486.31 | 455.09 | 458.37 | 411.71 | 402.83 | 385.25 | 392.56 | 400.12 | 408.86 | NA | NA | NA |
| 2023-12-31 | 2023-09-30 | 2023-06-30 | 2023-03-31 | 2022-12-31 | 2022-09-30 | 2022-06-30 | 2022-03-31 | 2021-12-31 | 2021-09-30 | 2021-06-30 | 2021-03-31 | 2020-12-31 | 2020-09-30 | 2020-06-30 | 2020-03-31 | 2019-12-31 | 2019-09-30 | 2019-06-30 | 2019-03-31 | 2018-12-31 | 2018-09-30 | 2018-06-30 | 2018-03-31 | 2017-12-31 | 2017-09-30 | 2017-06-30 | 2017-03-31 | 2016-12-31 | 2016-09-30 | 2016-06-30 | 2016-03-31 | 2015-12-31 | 2015-09-30 | 2015-06-30 | 2015-03-31 | 2014-12-31 | 2014-09-30 | 2014-06-30 | 2014-03-31 | 2013-12-31 | 2013-09-30 | 2013-06-30 | 2013-03-31 | 2012-12-31 | 2012-09-30 | 2012-06-30 | 2012-03-31 | 2011-12-31 | 2011-09-30 | 2011-06-30 | 2011-03-31 | 2010-12-31 | 2010-09-30 | 2010-06-30 | 2010-03-31 | ||
|---|---|---|---|---|---|---|---|---|---|---|---|---|---|---|---|---|---|---|---|---|---|---|---|---|---|---|---|---|---|---|---|---|---|---|---|---|---|---|---|---|---|---|---|---|---|---|---|---|---|---|---|---|---|---|---|---|---|
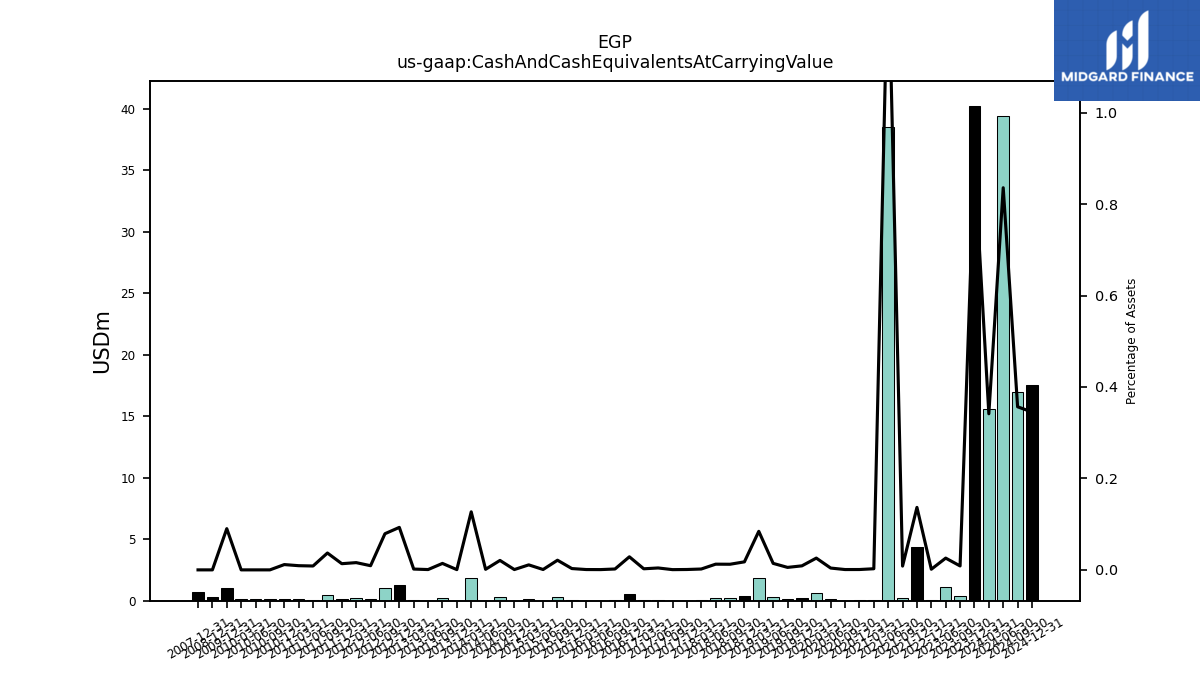
| Cash And Cash Equivalents At Carrying Value | 40.26 | 0.37 | 1.08 | NA | 0.06 | NA | NA | NA | 4.39 | 0.25 | 38.56 | 0.07 | 0.02 | 0.02 | 0.10 | 0.67 | 0.22 | 0.13 | 0.33 | 1.83 | 0.37 | 0.26 | 0.25 | 0.04 | 0.02 | 0.01 | 0.08 | 0.04 | 0.52 | 0.03 | 0.01 | 0.01 | 0.05 | 0.34 | 0.01 | 0.17 | 0.01 | 0.32 | 0.02 | 1.88 | 0.01 | 0.21 | 0.01 | 0.02 | 1.26 | 1.03 | 0.12 | 0.20 | 0.17 | 0.45 | 0.10 | 0.11 | 0.14 | 0.15 | 0.14 | 0.15 | |
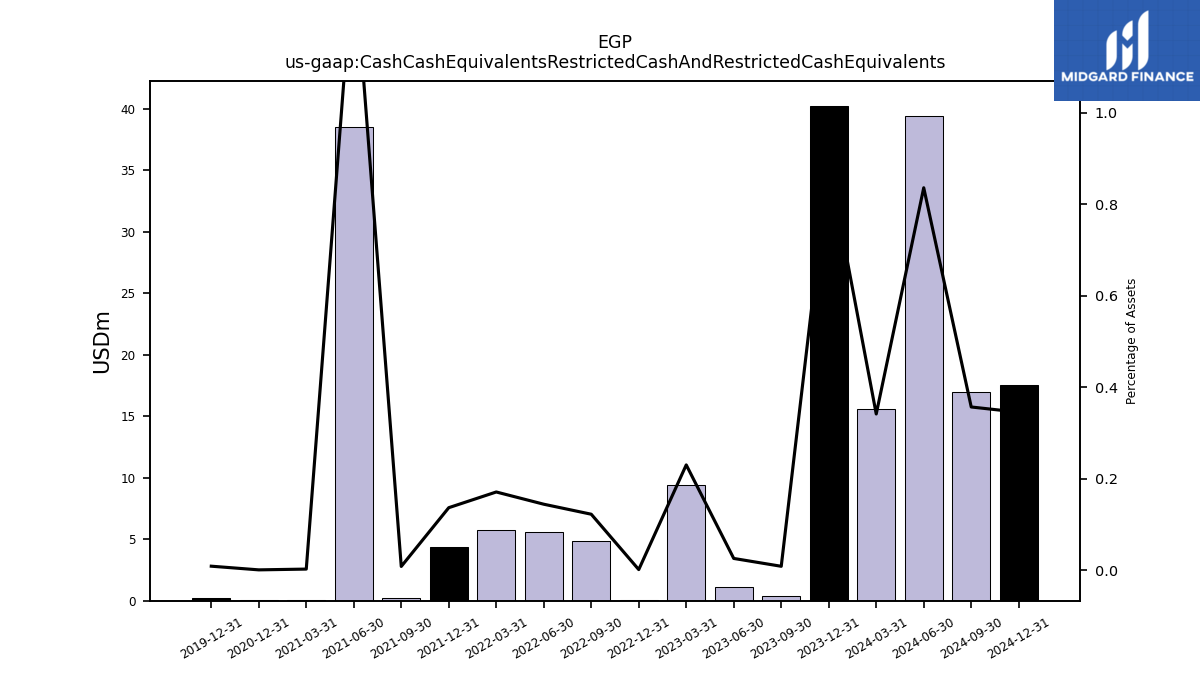
| Cash Cash Equivalents Restricted Cash And Restricted Cash Equivalents | 40.26 | 0.37 | 1.08 | 9.39 | 0.06 | 4.85 | 5.55 | 5.72 | 4.39 | 0.25 | 38.56 | 0.07 | 0.02 | NA | NA | NA | 0.22 | NA | NA | NA | NA | NA | NA | NA | NA | NA | NA | NA | NA | NA | NA | NA | NA | NA | NA | NA | NA | NA | NA | NA | NA | NA | NA | NA | NA | NA | NA | NA | NA | NA | NA | NA | NA | NA | NA | NA | |
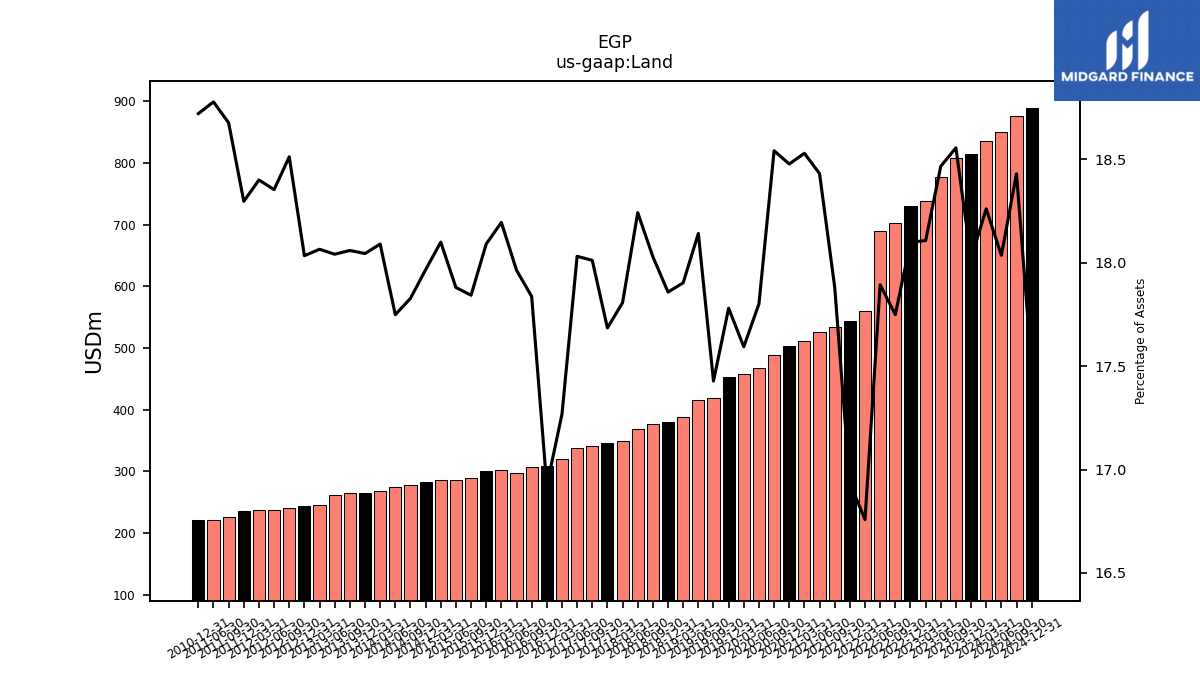
| Land | 814.36 | 808.08 | 776.36 | 738.86 | 730.45 | 703.28 | 689.20 | 560.51 | 544.50 | 533.79 | 526.33 | 510.84 | 502.74 | 488.70 | 466.83 | 458.27 | 452.70 | 418.35 | 416.42 | 388.79 | 380.68 | 376.66 | 368.81 | 349.52 | 345.42 | 341.14 | 337.31 | 320.56 | 308.93 | 306.52 | 297.28 | 301.91 | 301.44 | 289.04 | 286.71 | 286.21 | 283.12 | 278.64 | 274.86 | 267.91 | 265.87 | 264.69 | 262.06 | 246.35 | 244.20 | 240.49 | 237.91 | 237.85 | 235.39 | 226.40 | 221.52 | NA | 221.52 | NA | NA | NA |
| 2023-12-31 | 2023-09-30 | 2023-06-30 | 2023-03-31 | 2022-12-31 | 2022-09-30 | 2022-06-30 | 2022-03-31 | 2021-12-31 | 2021-09-30 | 2021-06-30 | 2021-03-31 | 2020-12-31 | 2020-09-30 | 2020-06-30 | 2020-03-31 | 2019-12-31 | 2019-09-30 | 2019-06-30 | 2019-03-31 | 2018-12-31 | 2018-09-30 | 2018-06-30 | 2018-03-31 | 2017-12-31 | 2017-09-30 | 2017-06-30 | 2017-03-31 | 2016-12-31 | 2016-09-30 | 2016-06-30 | 2016-03-31 | 2015-12-31 | 2015-09-30 | 2015-06-30 | 2015-03-31 | 2014-12-31 | 2014-09-30 | 2014-06-30 | 2014-03-31 | 2013-12-31 | 2013-09-30 | 2013-06-30 | 2013-03-31 | 2012-12-31 | 2012-09-30 | 2012-06-30 | 2012-03-31 | 2011-12-31 | 2011-09-30 | 2011-06-30 | 2011-03-31 | 2010-12-31 | 2010-09-30 | 2010-06-30 | 2010-03-31 | ||
|---|---|---|---|---|---|---|---|---|---|---|---|---|---|---|---|---|---|---|---|---|---|---|---|---|---|---|---|---|---|---|---|---|---|---|---|---|---|---|---|---|---|---|---|---|---|---|---|---|---|---|---|---|---|---|---|---|---|
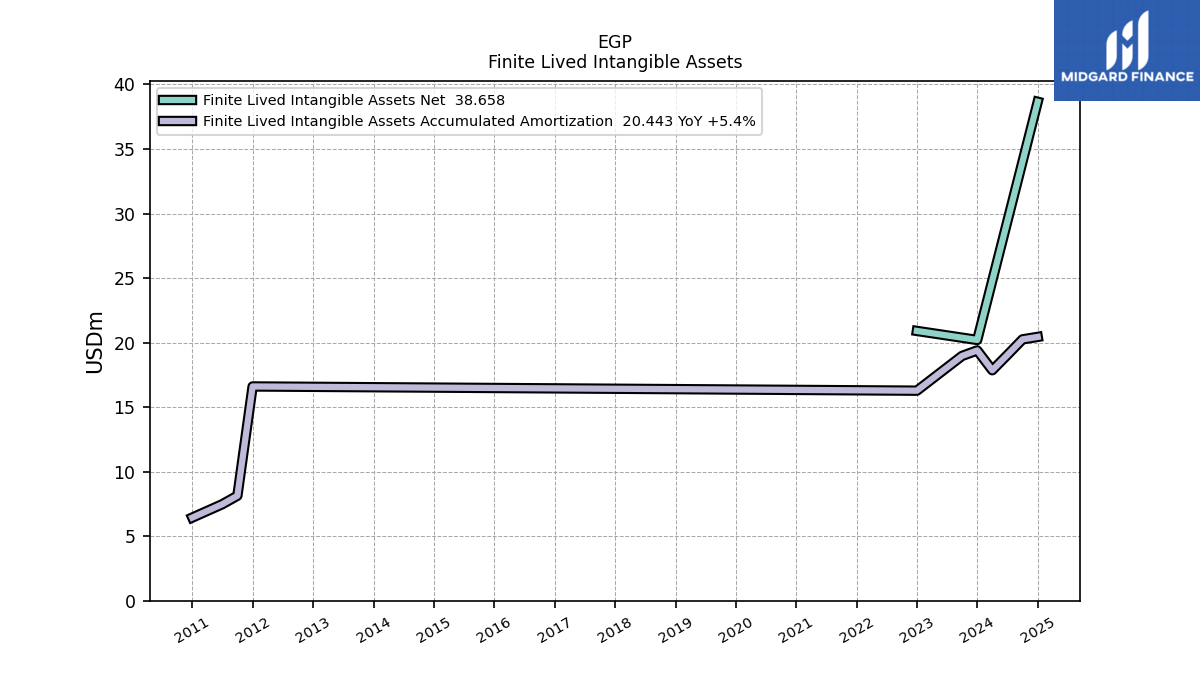
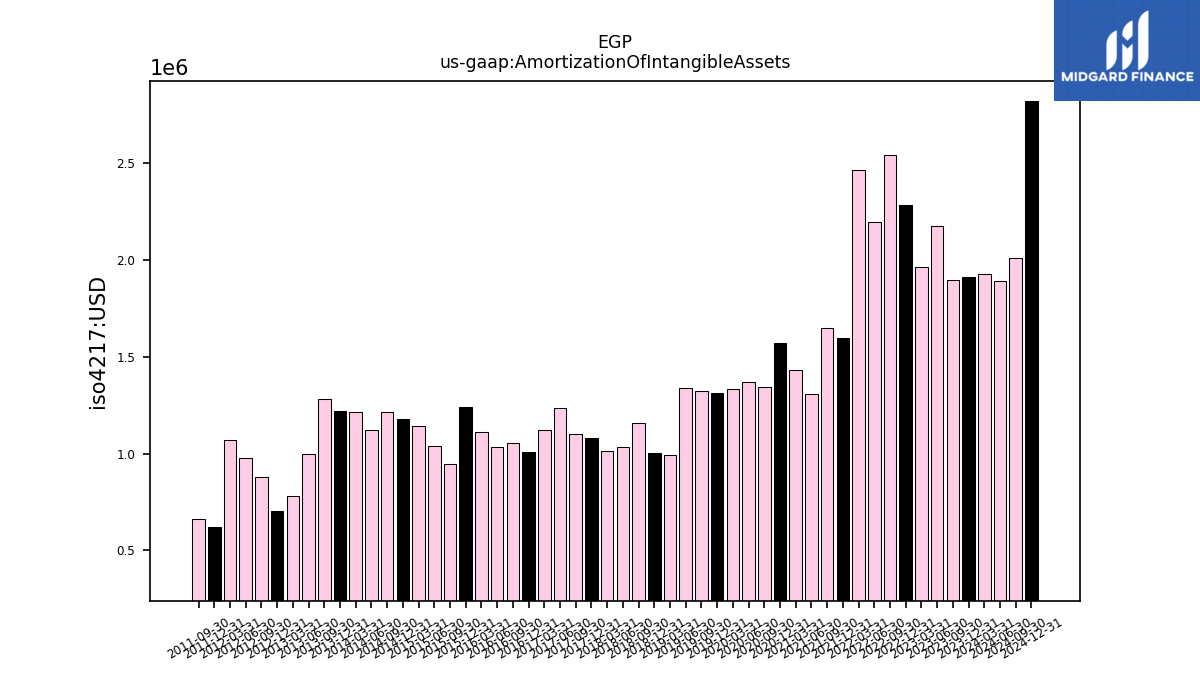
| Amortization Of Intangible Assets | 1.91 | 1.90 | 2.17 | 1.96 | 2.29 | 2.54 | 2.20 | 2.46 | 1.59 | 1.65 | 1.31 | 1.43 | 1.57 | 1.34 | 1.37 | 1.33 | 1.31 | 1.32 | 1.34 | 0.99 | 1.00 | 1.16 | 1.03 | 1.01 | 1.08 | 1.10 | 1.23 | 1.12 | 1.01 | 1.06 | 1.03 | 1.11 | 1.24 | 0.94 | 1.04 | 1.14 | 1.18 | 1.22 | 1.12 | 1.21 | 1.22 | 1.28 | 1.00 | 0.78 | 0.70 | 0.88 | 0.98 | 1.07 | 0.62 | 0.66 | NA | NA | NA | NA | NA | NA | |
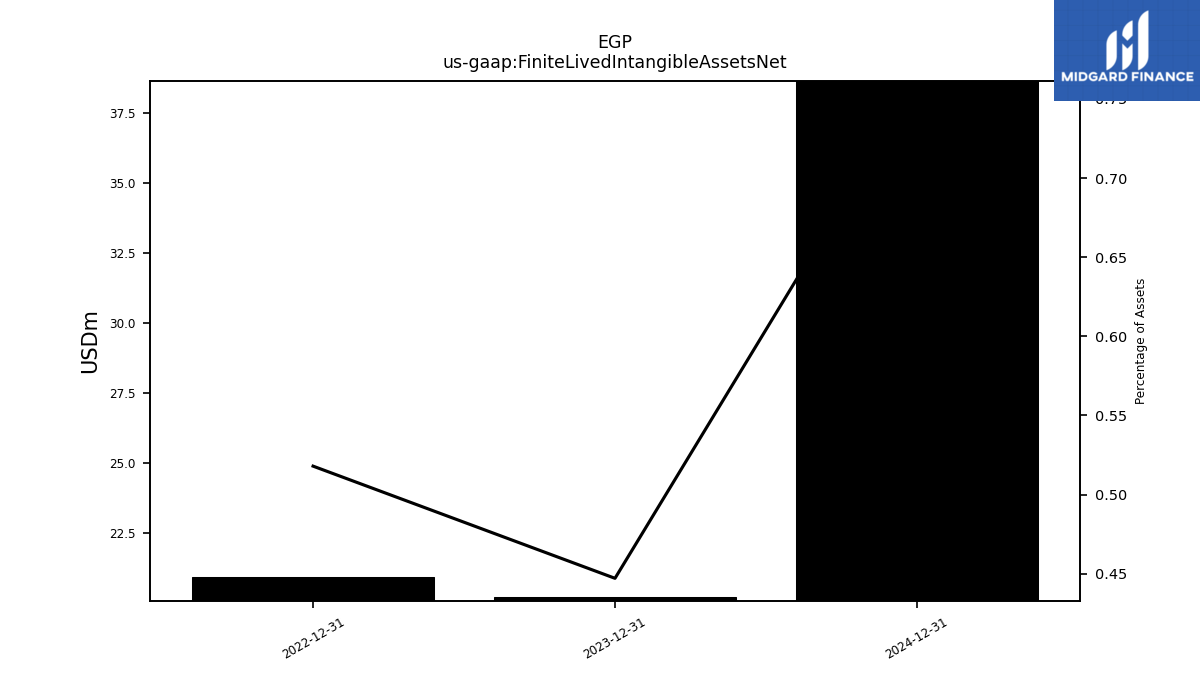
| Finite Lived Intangible Assets Net | 20.20 | NA | NA | NA | 20.91 | NA | NA | NA | NA | NA | NA | NA | NA | NA | NA | NA | NA | NA | NA | NA | NA | NA | NA | NA | NA | NA | NA | NA | NA | NA | NA | NA | NA | NA | NA | NA | NA | NA | NA | NA | NA | NA | NA | NA | NA | NA | NA | NA | NA | NA | NA | NA | NA | NA | NA | NA |
| 2023-12-31 | 2023-09-30 | 2023-06-30 | 2023-03-31 | 2022-12-31 | 2022-09-30 | 2022-06-30 | 2022-03-31 | 2021-12-31 | 2021-09-30 | 2021-06-30 | 2021-03-31 | 2020-12-31 | 2020-09-30 | 2020-06-30 | 2020-03-31 | 2019-12-31 | 2019-09-30 | 2019-06-30 | 2019-03-31 | 2018-12-31 | 2018-09-30 | 2018-06-30 | 2018-03-31 | 2017-12-31 | 2017-09-30 | 2017-06-30 | 2017-03-31 | 2016-12-31 | 2016-09-30 | 2016-06-30 | 2016-03-31 | 2015-12-31 | 2015-09-30 | 2015-06-30 | 2015-03-31 | 2014-12-31 | 2014-09-30 | 2014-06-30 | 2014-03-31 | 2013-12-31 | 2013-09-30 | 2013-06-30 | 2013-03-31 | 2012-12-31 | 2012-09-30 | 2012-06-30 | 2012-03-31 | 2011-12-31 | 2011-09-30 | 2011-06-30 | 2011-03-31 | 2010-12-31 | 2010-09-30 | 2010-06-30 | 2010-03-31 | ||
|---|---|---|---|---|---|---|---|---|---|---|---|---|---|---|---|---|---|---|---|---|---|---|---|---|---|---|---|---|---|---|---|---|---|---|---|---|---|---|---|---|---|---|---|---|---|---|---|---|---|---|---|---|---|---|---|---|---|
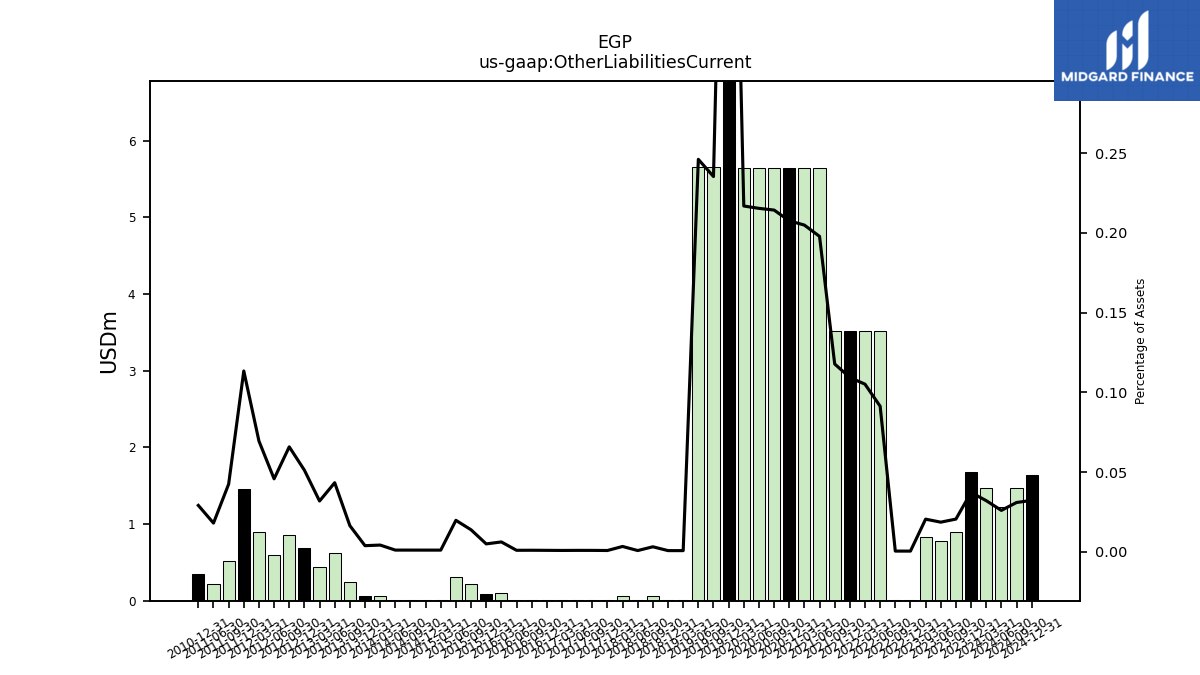
| Other Liabilities Current | 1.68 | 0.89 | 0.78 | 0.83 | 0.02 | 0.02 | 3.52 | 3.52 | 3.52 | 3.52 | 5.65 | 5.65 | 5.65 | 5.65 | 5.65 | 5.65 | 15.87 | 5.65 | 5.65 | 0.01 | 0.01 | 0.07 | 0.01 | 0.07 | 0.01 | 0.02 | 0.02 | 0.01 | 0.02 | 0.02 | 0.01 | 0.10 | 0.08 | 0.22 | 0.32 | 0.02 | 0.02 | 0.02 | 0.02 | 0.06 | 0.06 | 0.24 | 0.63 | 0.43 | 0.69 | 0.85 | 0.59 | 0.90 | 1.46 | 0.51 | 0.21 | NA | 0.34 | NA | NA | NA |
| 2023-12-31 | 2023-09-30 | 2023-06-30 | 2023-03-31 | 2022-12-31 | 2022-09-30 | 2022-06-30 | 2022-03-31 | 2021-12-31 | 2021-09-30 | 2021-06-30 | 2021-03-31 | 2020-12-31 | 2020-09-30 | 2020-06-30 | 2020-03-31 | 2019-12-31 | 2019-09-30 | 2019-06-30 | 2019-03-31 | 2018-12-31 | 2018-09-30 | 2018-06-30 | 2018-03-31 | 2017-12-31 | 2017-09-30 | 2017-06-30 | 2017-03-31 | 2016-12-31 | 2016-09-30 | 2016-06-30 | 2016-03-31 | 2015-12-31 | 2015-09-30 | 2015-06-30 | 2015-03-31 | 2014-12-31 | 2014-09-30 | 2014-06-30 | 2014-03-31 | 2013-12-31 | 2013-09-30 | 2013-06-30 | 2013-03-31 | 2012-12-31 | 2012-09-30 | 2012-06-30 | 2012-03-31 | 2011-12-31 | 2011-09-30 | 2011-06-30 | 2011-03-31 | 2010-12-31 | 2010-09-30 | 2010-06-30 | 2010-03-31 | ||
|---|---|---|---|---|---|---|---|---|---|---|---|---|---|---|---|---|---|---|---|---|---|---|---|---|---|---|---|---|---|---|---|---|---|---|---|---|---|---|---|---|---|---|---|---|---|---|---|---|---|---|---|---|---|---|---|---|---|
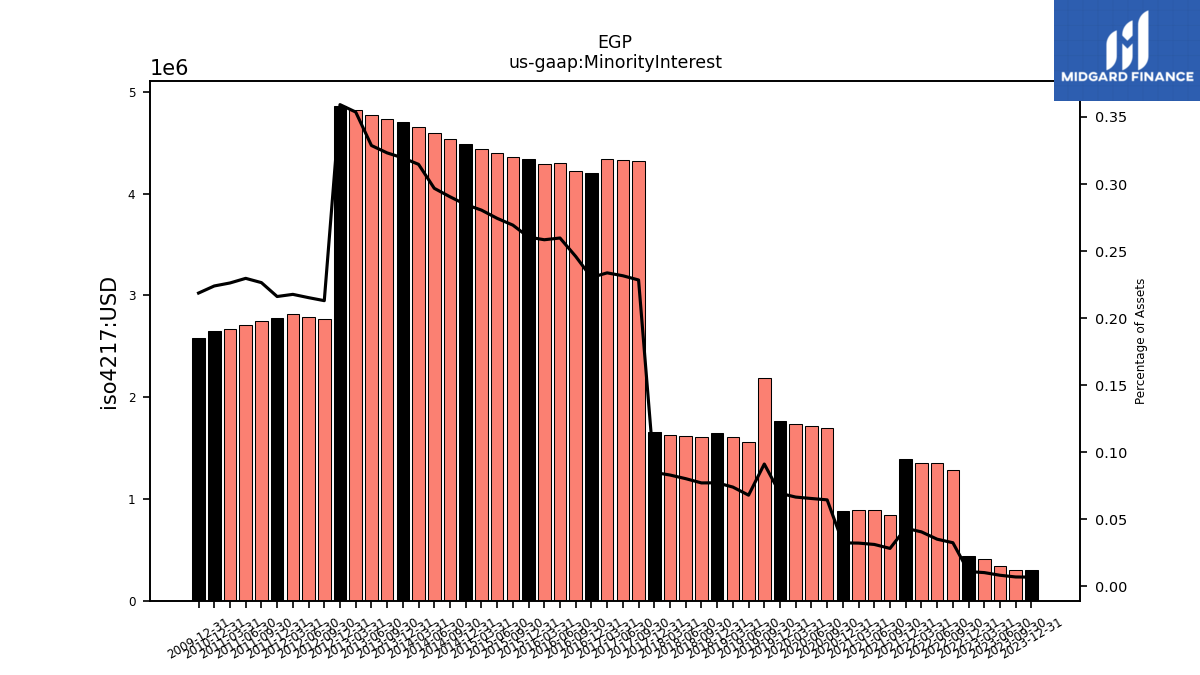
| Minority Interest | 0.31 | 0.30 | 0.34 | 0.41 | 0.44 | 1.29 | 1.35 | 1.36 | 1.39 | 0.84 | 0.89 | 0.89 | 0.88 | 1.70 | 1.72 | 1.73 | 1.76 | 2.19 | 1.56 | 1.61 | 1.64 | 1.61 | 1.62 | 1.63 | 1.66 | 4.33 | 4.33 | 4.34 | 4.21 | 4.23 | 4.30 | 4.29 | 4.34 | 4.36 | 4.40 | 4.44 | 4.49 | 4.54 | 4.60 | 4.66 | 4.71 | 4.74 | 4.78 | 4.82 | 4.86 | 2.77 | 2.79 | 2.81 | 2.78 | 2.75 | 2.71 | 2.67 | 2.65 | NA | NA | NA |
| 2023-12-31 | 2023-09-30 | 2023-06-30 | 2023-03-31 | 2022-12-31 | 2022-09-30 | 2022-06-30 | 2022-03-31 | 2021-12-31 | 2021-09-30 | 2021-06-30 | 2021-03-31 | 2020-12-31 | 2020-09-30 | 2020-06-30 | 2020-03-31 | 2019-12-31 | 2019-09-30 | 2019-06-30 | 2019-03-31 | 2018-12-31 | 2018-09-30 | 2018-06-30 | 2018-03-31 | 2017-12-31 | 2017-09-30 | 2017-06-30 | 2017-03-31 | 2016-12-31 | 2016-09-30 | 2016-06-30 | 2016-03-31 | 2015-12-31 | 2015-09-30 | 2015-06-30 | 2015-03-31 | 2014-12-31 | 2014-09-30 | 2014-06-30 | 2014-03-31 | 2013-12-31 | 2013-09-30 | 2013-06-30 | 2013-03-31 | 2012-12-31 | 2012-09-30 | 2012-06-30 | 2012-03-31 | 2011-12-31 | 2011-09-30 | 2011-06-30 | 2011-03-31 | 2010-12-31 | 2010-09-30 | 2010-06-30 | 2010-03-31 | ||
|---|---|---|---|---|---|---|---|---|---|---|---|---|---|---|---|---|---|---|---|---|---|---|---|---|---|---|---|---|---|---|---|---|---|---|---|---|---|---|---|---|---|---|---|---|---|---|---|---|---|---|---|---|---|---|---|---|---|
| Stockholders Equity | 2608.33 | 2378.96 | 2213.38 | 2035.97 | 1953.00 | 1988.90 | 1984.72 | 1673.03 | 1570.07 | 1418.90 | 1372.44 | 1315.91 | 1269.64 | 1242.92 | 1215.08 | 1190.63 | 1200.56 | 1106.48 | 1007.34 | 919.87 | 903.06 | 868.32 | 839.08 | 773.05 | 749.47 | 721.85 | 716.51 | 670.64 | 637.66 | 600.80 | 603.19 | 552.00 | 554.86 | 557.50 | 562.02 | 560.37 | 571.13 | 557.91 | 536.17 | 524.16 | 514.00 | 498.95 | 489.99 | 492.62 | 486.31 | 455.09 | 458.37 | 411.71 | 402.83 | 385.25 | 392.56 | 400.12 | 408.86 | NA | NA | NA | |
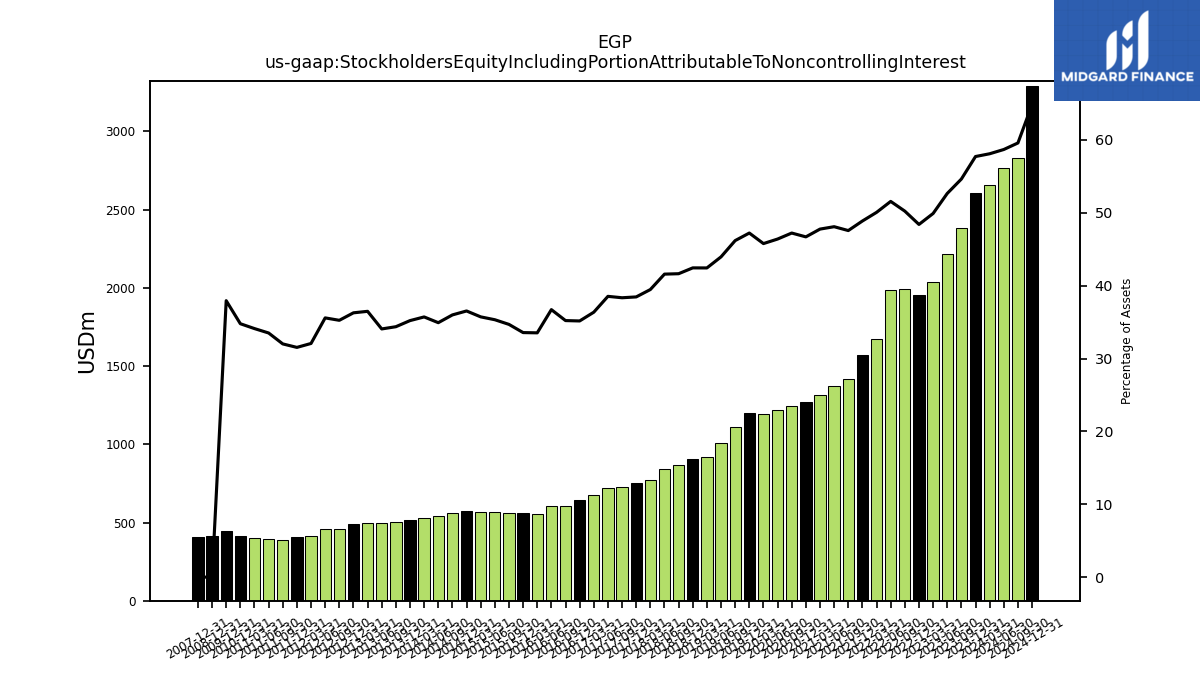
| Stockholders Equity Including Portion Attributable To Noncontrolling Interest | 2608.63 | 2379.26 | 2213.72 | 2036.38 | 1953.44 | 1990.19 | 1986.07 | 1674.39 | 1571.46 | 1419.74 | 1373.33 | 1316.80 | 1270.52 | 1244.62 | 1216.80 | 1192.36 | 1202.33 | 1108.67 | 1008.90 | 921.47 | 904.70 | 869.93 | 840.70 | 774.68 | 751.13 | 726.17 | 720.85 | 674.98 | 641.87 | 605.03 | 607.49 | 556.28 | 559.20 | 561.87 | 566.42 | 564.81 | 575.62 | 562.45 | 540.77 | 528.82 | 518.71 | 503.68 | 494.76 | 497.44 | 491.18 | 457.86 | 461.16 | 414.52 | 405.61 | 387.99 | 395.27 | 402.79 | 411.51 | NA | NA | NA | |
| Common Stock Value | 0.01 | 0.00 | 0.00 | 0.00 | 0.00 | 0.00 | 0.00 | 0.00 | 0.00 | 0.00 | 0.00 | 0.00 | 0.00 | 0.00 | 0.00 | 0.00 | 0.00 | 0.00 | 0.00 | 0.00 | 0.00 | 0.00 | 0.00 | 0.00 | 0.00 | 0.00 | 0.00 | 0.00 | 0.00 | 0.00 | 0.00 | 0.00 | 0.00 | 0.00 | 0.00 | 0.00 | 0.00 | 0.00 | 0.00 | 0.00 | 0.00 | 0.00 | 0.00 | 0.00 | 0.00 | 0.00 | 0.00 | 0.00 | 0.00 | 0.00 | 0.00 | 0.00 | 0.00 | NA | NA | NA | |
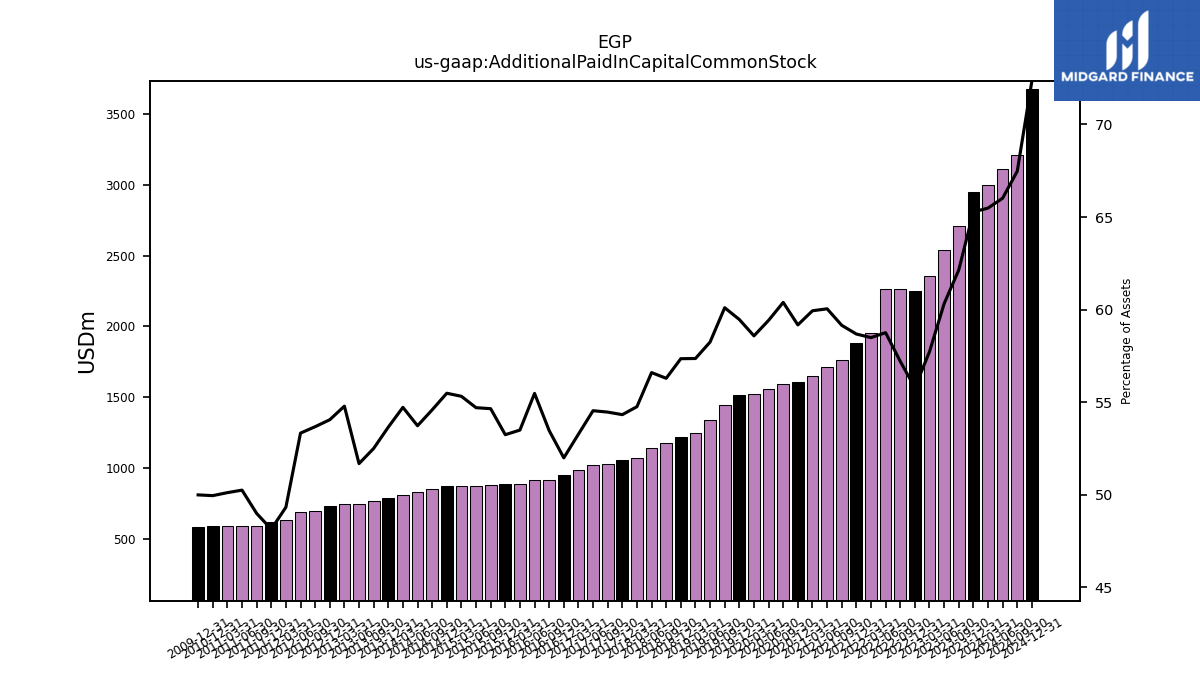
| Additional Paid In Capital Common Stock | 2949.91 | 2706.06 | 2536.00 | 2355.48 | 2251.52 | 2266.83 | 2263.07 | 1956.33 | 1886.82 | 1765.75 | 1714.66 | 1652.44 | 1610.05 | 1591.72 | 1558.32 | 1525.98 | 1514.06 | 1442.74 | 1337.04 | 1245.66 | 1222.55 | 1176.03 | 1144.29 | 1074.80 | 1061.15 | 1031.59 | 1020.31 | 989.01 | 949.32 | 918.81 | 918.04 | 887.63 | 887.21 | 885.28 | 877.18 | 874.75 | 874.34 | 853.20 | 832.06 | 810.41 | 790.53 | 769.51 | 750.76 | 747.11 | 731.95 | 697.31 | 691.29 | 637.63 | 619.39 | 593.92 | 592.82 | 591.81 | 591.11 | NA | NA | NA | |
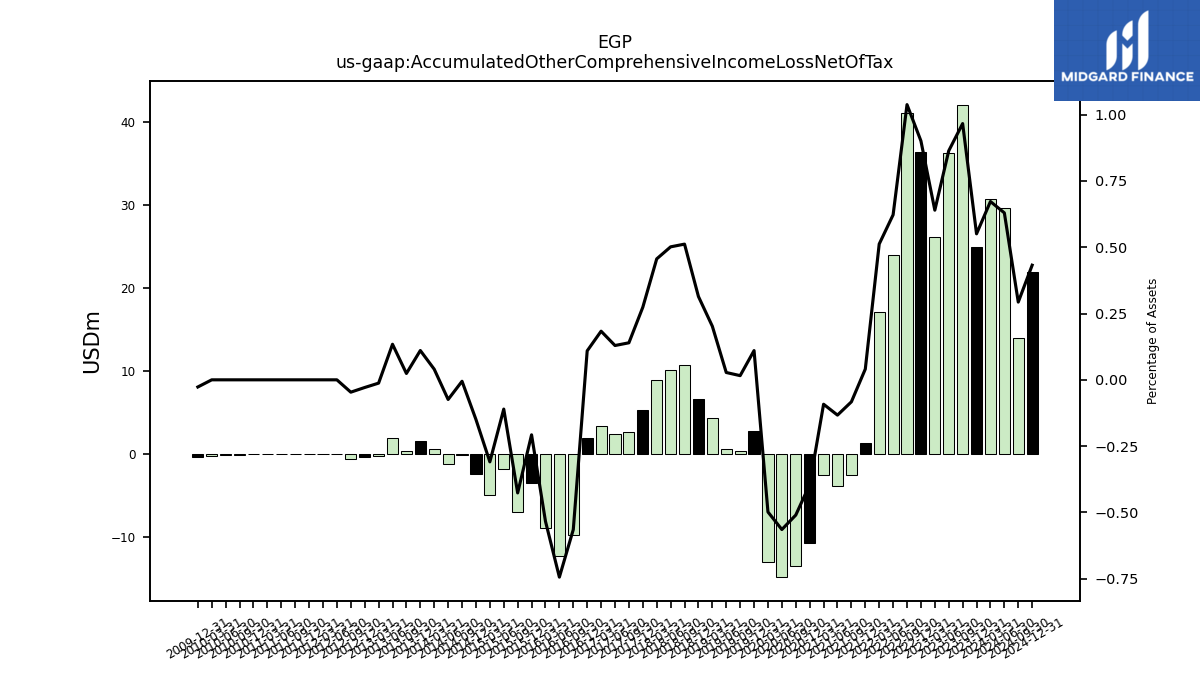
| Accumulated Other Comprehensive Income Loss Net Of Tax | 24.89 | 42.09 | 36.31 | 26.11 | 36.37 | 41.13 | 23.97 | 17.13 | 1.30 | -2.48 | -3.80 | -2.54 | -10.75 | -13.45 | -14.81 | -12.98 | 2.81 | 0.38 | 0.63 | 4.39 | 6.70 | 10.69 | 10.14 | 8.95 | 5.35 | 2.65 | 2.42 | 3.40 | 2.00 | -9.71 | -12.31 | -8.85 | -3.46 | -6.91 | -1.77 | -4.89 | -2.36 | -0.09 | -1.15 | 0.59 | 1.63 | 0.35 | 1.95 | -0.17 | -0.39 | -0.60 | 0.00 | 0.00 | 0.00 | 0.00 | 0.00 | 0.00 | 0.00 | -0.08 | -0.16 | -0.26 | |
| Minority Interest | 0.31 | 0.30 | 0.34 | 0.41 | 0.44 | 1.29 | 1.35 | 1.36 | 1.39 | 0.84 | 0.89 | 0.89 | 0.88 | 1.70 | 1.72 | 1.73 | 1.76 | 2.19 | 1.56 | 1.61 | 1.64 | 1.61 | 1.62 | 1.63 | 1.66 | 4.33 | 4.33 | 4.34 | 4.21 | 4.23 | 4.30 | 4.29 | 4.34 | 4.36 | 4.40 | 4.44 | 4.49 | 4.54 | 4.60 | 4.66 | 4.71 | 4.74 | 4.78 | 4.82 | 4.86 | 2.77 | 2.79 | 2.81 | 2.78 | 2.75 | 2.71 | 2.67 | 2.65 | NA | NA | NA |
| 2023-12-31 | 2023-09-30 | 2023-06-30 | 2023-03-31 | 2022-12-31 | 2022-09-30 | 2022-06-30 | 2022-03-31 | 2021-12-31 | 2021-09-30 | 2021-06-30 | 2021-03-31 | 2020-12-31 | 2020-09-30 | 2020-06-30 | 2020-03-31 | 2019-12-31 | 2019-09-30 | 2019-06-30 | 2019-03-31 | 2018-12-31 | 2018-09-30 | 2018-06-30 | 2018-03-31 | 2017-12-31 | 2017-09-30 | 2017-06-30 | 2017-03-31 | 2016-12-31 | 2016-09-30 | 2016-06-30 | 2016-03-31 | 2015-12-31 | 2015-09-30 | 2015-06-30 | 2015-03-31 | 2014-12-31 | 2014-09-30 | 2014-06-30 | 2014-03-31 | 2013-12-31 | 2013-09-30 | 2013-06-30 | 2013-03-31 | 2012-12-31 | 2012-09-30 | 2012-06-30 | 2012-03-31 | 2011-12-31 | 2011-09-30 | 2011-06-30 | 2011-03-31 | 2010-12-31 | 2010-09-30 | 2010-06-30 | 2010-03-31 | ||
|---|---|---|---|---|---|---|---|---|---|---|---|---|---|---|---|---|---|---|---|---|---|---|---|---|---|---|---|---|---|---|---|---|---|---|---|---|---|---|---|---|---|---|---|---|---|---|---|---|---|---|---|---|---|---|---|---|---|
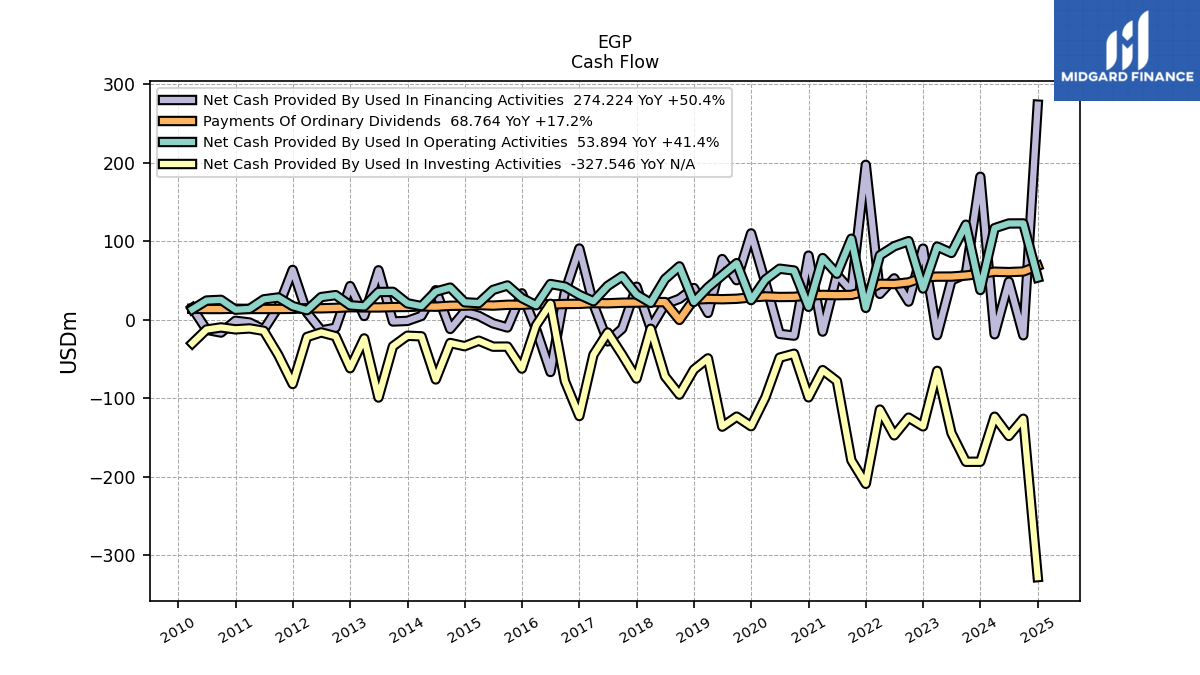
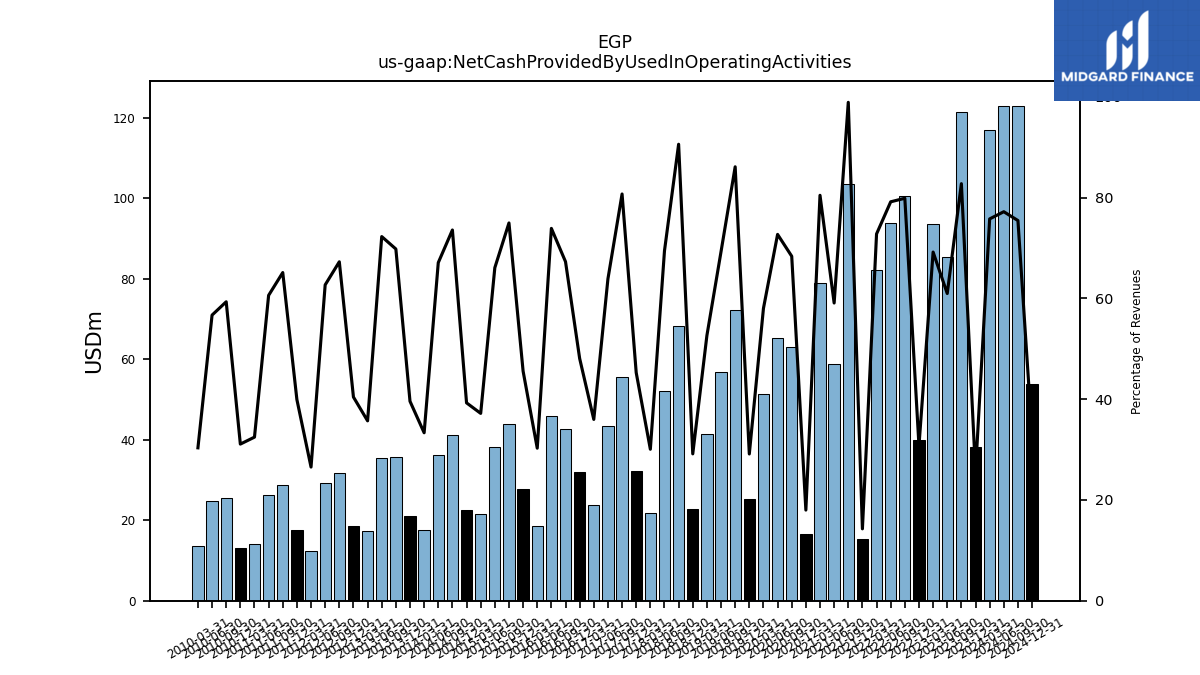
| Net Cash Provided By Used In Operating Activities | 38.10 | 121.32 | 85.32 | 93.46 | 39.95 | 100.40 | 93.89 | 82.26 | 15.33 | 103.49 | 58.85 | 78.82 | 16.68 | 62.92 | 65.24 | 51.44 | 25.22 | 72.31 | 56.91 | 41.48 | 22.74 | 68.26 | 52.02 | 21.71 | 32.31 | 55.51 | 43.38 | 23.81 | 31.91 | 42.53 | 45.77 | 18.65 | 27.81 | 43.91 | 38.24 | 21.42 | 22.49 | 41.18 | 36.12 | 17.61 | 21.17 | 35.78 | 35.55 | 17.24 | 18.62 | 31.62 | 29.14 | 12.42 | 17.62 | 28.64 | 26.23 | 14.06 | 13.04 | 25.60 | 24.72 | 13.50 | |
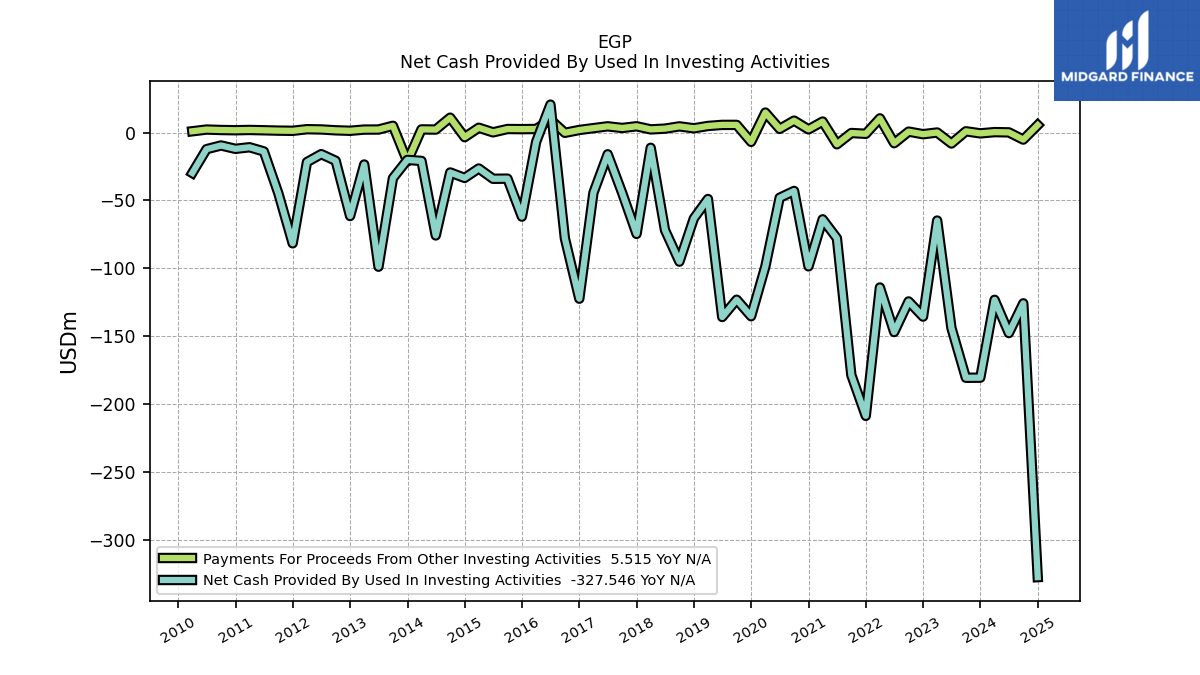
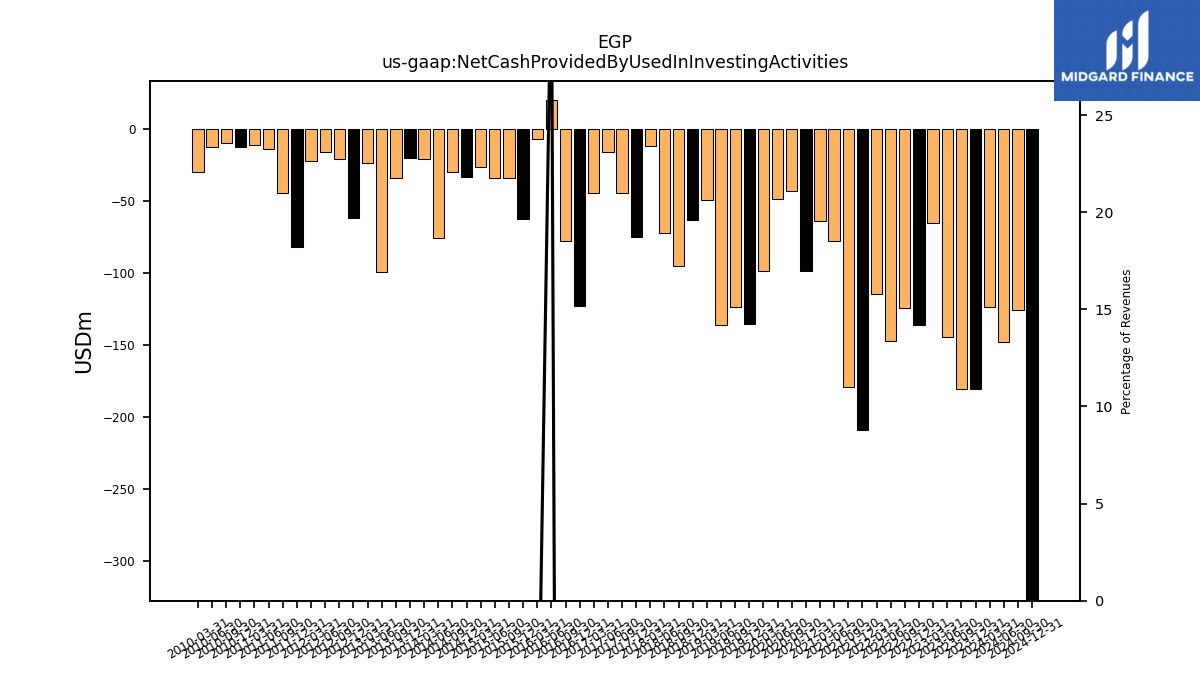
| Net Cash Provided By Used In Investing Activities | -180.60 | -180.66 | -143.98 | -64.82 | -135.59 | -124.42 | -146.99 | -114.14 | -208.75 | -178.71 | -77.89 | -63.92 | -98.57 | -43.02 | -48.04 | -98.62 | -135.35 | -123.14 | -135.91 | -48.93 | -63.29 | -95.12 | -71.81 | -11.22 | -74.67 | -44.40 | -15.99 | -44.37 | -122.42 | -77.88 | 20.59 | -6.76 | -61.97 | -33.96 | -34.05 | -26.45 | -33.42 | -29.39 | -75.81 | -20.89 | -20.14 | -33.60 | -98.85 | -23.53 | -61.50 | -20.77 | -15.90 | -21.74 | -81.61 | -44.51 | -13.89 | -10.82 | -11.98 | -9.51 | -12.22 | -29.78 | |
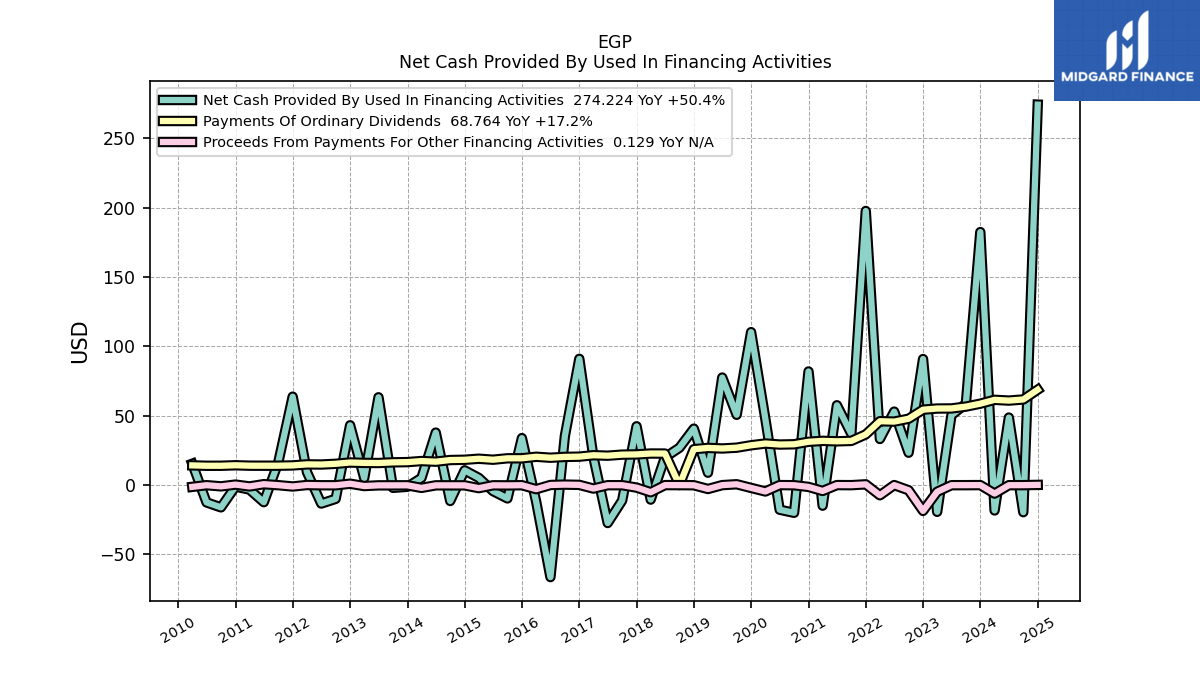
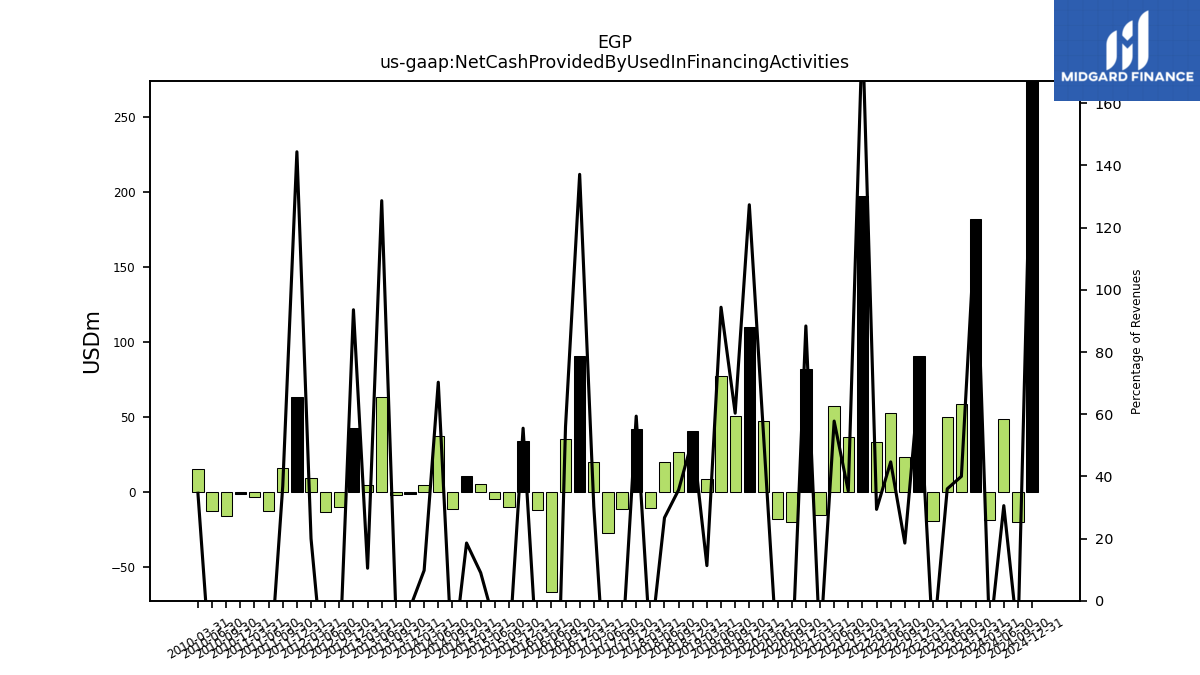
| Net Cash Provided By Used In Financing Activities | 182.38 | 58.63 | 50.35 | -19.30 | 90.85 | 23.31 | 52.94 | 33.21 | 197.57 | 36.90 | 57.53 | -14.86 | 81.90 | -19.99 | -17.77 | 47.63 | 110.23 | 50.64 | 77.50 | 8.90 | 40.67 | 26.86 | 20.00 | -10.48 | 42.37 | -11.18 | -27.36 | 20.08 | 90.99 | 35.37 | -66.36 | -11.93 | 33.86 | -9.62 | -4.35 | 5.19 | 10.63 | -11.49 | 37.83 | 5.15 | -1.23 | -1.99 | 63.28 | 5.05 | 43.10 | -9.94 | -13.33 | 9.35 | 63.72 | 16.21 | -12.35 | -3.26 | -1.07 | -16.08 | -12.50 | 15.37 |
| 2023-12-31 | 2023-09-30 | 2023-06-30 | 2023-03-31 | 2022-12-31 | 2022-09-30 | 2022-06-30 | 2022-03-31 | 2021-12-31 | 2021-09-30 | 2021-06-30 | 2021-03-31 | 2020-12-31 | 2020-09-30 | 2020-06-30 | 2020-03-31 | 2019-12-31 | 2019-09-30 | 2019-06-30 | 2019-03-31 | 2018-12-31 | 2018-09-30 | 2018-06-30 | 2018-03-31 | 2017-12-31 | 2017-09-30 | 2017-06-30 | 2017-03-31 | 2016-12-31 | 2016-09-30 | 2016-06-30 | 2016-03-31 | 2015-12-31 | 2015-09-30 | 2015-06-30 | 2015-03-31 | 2014-12-31 | 2014-09-30 | 2014-06-30 | 2014-03-31 | 2013-12-31 | 2013-09-30 | 2013-06-30 | 2013-03-31 | 2012-12-31 | 2012-09-30 | 2012-06-30 | 2012-03-31 | 2011-12-31 | 2011-09-30 | 2011-06-30 | 2011-03-31 | 2010-12-31 | 2010-09-30 | 2010-06-30 | 2010-03-31 | ||
|---|---|---|---|---|---|---|---|---|---|---|---|---|---|---|---|---|---|---|---|---|---|---|---|---|---|---|---|---|---|---|---|---|---|---|---|---|---|---|---|---|---|---|---|---|---|---|---|---|---|---|---|---|---|---|---|---|---|
| Net Cash Provided By Used In Operating Activities | 38.10 | 121.32 | 85.32 | 93.46 | 39.95 | 100.40 | 93.89 | 82.26 | 15.33 | 103.49 | 58.85 | 78.82 | 16.68 | 62.92 | 65.24 | 51.44 | 25.22 | 72.31 | 56.91 | 41.48 | 22.74 | 68.26 | 52.02 | 21.71 | 32.31 | 55.51 | 43.38 | 23.81 | 31.91 | 42.53 | 45.77 | 18.65 | 27.81 | 43.91 | 38.24 | 21.42 | 22.49 | 41.18 | 36.12 | 17.61 | 21.17 | 35.78 | 35.55 | 17.24 | 18.62 | 31.62 | 29.14 | 12.42 | 17.62 | 28.64 | 26.23 | 14.06 | 13.04 | 25.60 | 24.72 | 13.50 | |
| Profit Loss | 63.47 | 48.91 | 43.47 | 44.70 | 38.69 | 37.82 | 46.16 | 63.60 | 71.91 | 30.79 | 27.58 | 27.36 | 37.20 | 24.41 | 23.49 | 23.30 | 51.28 | 22.57 | 26.95 | -22.53 | 18.58 | 23.04 | 18.26 | 28.75 | 17.67 | 15.97 | 36.98 | 12.97 | 15.37 | 14.80 | 44.09 | 21.83 | 11.58 | 12.10 | 14.66 | 10.06 | 12.86 | 17.86 | 9.24 | 8.51 | 9.61 | 8.51 | 7.79 | 7.31 | 12.38 | 6.90 | 8.08 | 5.52 | 6.53 | 5.79 | 5.62 | 4.90 | 5.04 | 4.13 | 4.58 | 5.01 | |
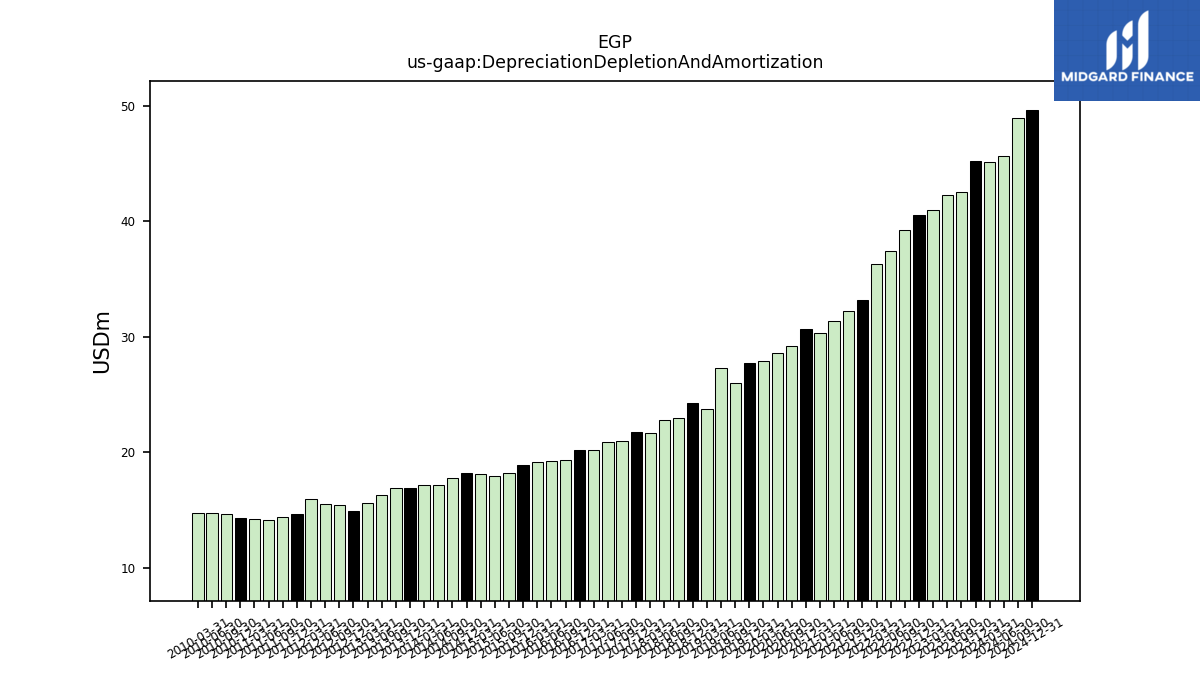
| Depreciation Depletion And Amortization | 45.25 | 42.52 | 42.30 | 41.01 | 40.56 | 39.28 | 37.46 | 36.34 | 33.17 | 32.26 | 31.35 | 30.31 | 30.69 | 29.21 | 28.57 | 27.89 | 27.70 | 25.99 | 27.29 | 23.75 | 24.24 | 22.97 | 22.81 | 21.68 | 21.77 | 21.01 | 20.86 | 20.23 | 20.18 | 19.36 | 19.23 | 19.16 | 18.93 | 18.23 | 17.98 | 18.14 | 18.21 | 17.78 | 17.15 | 17.17 | 16.90 | 16.95 | 16.33 | 15.62 | 14.88 | 15.44 | 15.54 | 15.93 | 14.66 | 14.44 | 14.11 | 14.25 | 14.28 | 14.65 | 14.71 | 14.72 |
| 2023-12-31 | 2023-09-30 | 2023-06-30 | 2023-03-31 | 2022-12-31 | 2022-09-30 | 2022-06-30 | 2022-03-31 | 2021-12-31 | 2021-09-30 | 2021-06-30 | 2021-03-31 | 2020-12-31 | 2020-09-30 | 2020-06-30 | 2020-03-31 | 2019-12-31 | 2019-09-30 | 2019-06-30 | 2019-03-31 | 2018-12-31 | 2018-09-30 | 2018-06-30 | 2018-03-31 | 2017-12-31 | 2017-09-30 | 2017-06-30 | 2017-03-31 | 2016-12-31 | 2016-09-30 | 2016-06-30 | 2016-03-31 | 2015-12-31 | 2015-09-30 | 2015-06-30 | 2015-03-31 | 2014-12-31 | 2014-09-30 | 2014-06-30 | 2014-03-31 | 2013-12-31 | 2013-09-30 | 2013-06-30 | 2013-03-31 | 2012-12-31 | 2012-09-30 | 2012-06-30 | 2012-03-31 | 2011-12-31 | 2011-09-30 | 2011-06-30 | 2011-03-31 | 2010-12-31 | 2010-09-30 | 2010-06-30 | 2010-03-31 | ||
|---|---|---|---|---|---|---|---|---|---|---|---|---|---|---|---|---|---|---|---|---|---|---|---|---|---|---|---|---|---|---|---|---|---|---|---|---|---|---|---|---|---|---|---|---|---|---|---|---|---|---|---|---|---|---|---|---|---|
| Net Cash Provided By Used In Investing Activities | -180.60 | -180.66 | -143.98 | -64.82 | -135.59 | -124.42 | -146.99 | -114.14 | -208.75 | -178.71 | -77.89 | -63.92 | -98.57 | -43.02 | -48.04 | -98.62 | -135.35 | -123.14 | -135.91 | -48.93 | -63.29 | -95.12 | -71.81 | -11.22 | -74.67 | -44.40 | -15.99 | -44.37 | -122.42 | -77.88 | 20.59 | -6.76 | -61.97 | -33.96 | -34.05 | -26.45 | -33.42 | -29.39 | -75.81 | -20.89 | -20.14 | -33.60 | -98.85 | -23.53 | -61.50 | -20.77 | -15.90 | -21.74 | -81.61 | -44.51 | -13.89 | -10.82 | -11.98 | -9.51 | -12.22 | -29.78 |
| 2023-12-31 | 2023-09-30 | 2023-06-30 | 2023-03-31 | 2022-12-31 | 2022-09-30 | 2022-06-30 | 2022-03-31 | 2021-12-31 | 2021-09-30 | 2021-06-30 | 2021-03-31 | 2020-12-31 | 2020-09-30 | 2020-06-30 | 2020-03-31 | 2019-12-31 | 2019-09-30 | 2019-06-30 | 2019-03-31 | 2018-12-31 | 2018-09-30 | 2018-06-30 | 2018-03-31 | 2017-12-31 | 2017-09-30 | 2017-06-30 | 2017-03-31 | 2016-12-31 | 2016-09-30 | 2016-06-30 | 2016-03-31 | 2015-12-31 | 2015-09-30 | 2015-06-30 | 2015-03-31 | 2014-12-31 | 2014-09-30 | 2014-06-30 | 2014-03-31 | 2013-12-31 | 2013-09-30 | 2013-06-30 | 2013-03-31 | 2012-12-31 | 2012-09-30 | 2012-06-30 | 2012-03-31 | 2011-12-31 | 2011-09-30 | 2011-06-30 | 2011-03-31 | 2010-12-31 | 2010-09-30 | 2010-06-30 | 2010-03-31 | ||
|---|---|---|---|---|---|---|---|---|---|---|---|---|---|---|---|---|---|---|---|---|---|---|---|---|---|---|---|---|---|---|---|---|---|---|---|---|---|---|---|---|---|---|---|---|---|---|---|---|---|---|---|---|---|---|---|---|---|
| Net Cash Provided By Used In Financing Activities | 182.38 | 58.63 | 50.35 | -19.30 | 90.85 | 23.31 | 52.94 | 33.21 | 197.57 | 36.90 | 57.53 | -14.86 | 81.90 | -19.99 | -17.77 | 47.63 | 110.23 | 50.64 | 77.50 | 8.90 | 40.67 | 26.86 | 20.00 | -10.48 | 42.37 | -11.18 | -27.36 | 20.08 | 90.99 | 35.37 | -66.36 | -11.93 | 33.86 | -9.62 | -4.35 | 5.19 | 10.63 | -11.49 | 37.83 | 5.15 | -1.23 | -1.99 | 63.28 | 5.05 | 43.10 | -9.94 | -13.33 | 9.35 | 63.72 | 16.21 | -12.35 | -3.26 | -1.07 | -16.08 | -12.50 | 15.37 |
| 2023-12-31 | 2023-09-30 | 2023-06-30 | 2023-03-31 | 2022-12-31 | 2022-09-30 | 2022-06-30 | 2022-03-31 | 2021-12-31 | 2021-09-30 | 2021-06-30 | 2021-03-31 | 2020-12-31 | 2020-09-30 | 2020-06-30 | 2020-03-31 | 2019-12-31 | 2019-09-30 | 2019-06-30 | 2019-03-31 | 2018-12-31 | 2018-09-30 | 2018-06-30 | 2018-03-31 | 2017-12-31 | 2017-09-30 | 2017-06-30 | 2017-03-31 | 2016-12-31 | 2016-09-30 | 2016-06-30 | 2016-03-31 | 2015-12-31 | 2015-09-30 | 2015-06-30 | 2015-03-31 | 2014-12-31 | 2014-09-30 | 2014-06-30 | 2014-03-31 | 2013-12-31 | 2013-09-30 | 2013-06-30 | 2013-03-31 | 2012-12-31 | 2012-09-30 | 2012-06-30 | 2012-03-31 | 2011-12-31 | 2011-09-30 | 2011-06-30 | 2011-03-31 | 2010-12-31 | 2010-09-30 | 2010-06-30 | 2010-03-31 | ||
|---|---|---|---|---|---|---|---|---|---|---|---|---|---|---|---|---|---|---|---|---|---|---|---|---|---|---|---|---|---|---|---|---|---|---|---|---|---|---|---|---|---|---|---|---|---|---|---|---|---|---|---|---|---|---|---|---|---|
| Revenues | 149.15 | 146.53 | 139.89 | 135.03 | 129.84 | 125.66 | 118.55 | 112.97 | 107.37 | 104.60 | 99.58 | 97.93 | 92.67 | 92.01 | 89.72 | 88.63 | 86.55 | 83.94 | 82.10 | 78.80 | 77.98 | 75.33 | 74.89 | 72.20 | 71.36 | 68.75 | 67.89 | 66.15 | 66.35 | 63.19 | 61.92 | 61.59 | 61.02 | 58.55 | 57.84 | 57.59 | 57.24 | 55.96 | 53.82 | 52.81 | 53.47 | 51.25 | 49.18 | 48.27 | 46.06 | 47.00 | 46.47 | 46.80 | 44.13 | 43.96 | 43.27 | 43.28 | 41.94 | 43.14 | 43.59 | 44.46 |