
| 2023-12-31 | 2023-09-30 | 2023-06-30 | 2023-03-31 | 2022-12-31 | 2022-09-30 | 2022-06-30 | 2022-03-31 | 2021-12-31 | 2021-09-30 | 2021-06-30 | 2021-03-31 | 2020-12-31 | 2020-09-30 | 2020-06-30 | 2020-03-31 | 2019-12-31 | 2019-09-30 | 2019-06-30 | 2019-03-31 | 2018-12-31 | 2018-09-30 | 2018-06-30 | 2018-03-31 | 2017-12-31 | 2017-09-30 | 2017-06-30 | 2017-03-31 | 2016-12-31 | 2016-09-30 | 2016-06-30 | 2016-03-31 | 2015-12-31 | 2015-09-30 | 2015-06-30 | 2015-03-31 | 2014-12-31 | 2014-09-30 | 2014-06-30 | 2014-03-31 | 2013-12-31 | 2013-09-30 | 2013-06-30 | 2013-03-31 | 2012-12-31 | 2012-09-30 | 2012-06-30 | 2012-03-31 | 2011-12-31 | 2011-09-30 | 2011-06-30 | 2011-03-31 | 2010-12-31 | 2010-09-30 | 2010-06-30 | 2010-03-31 | ||
|---|---|---|---|---|---|---|---|---|---|---|---|---|---|---|---|---|---|---|---|---|---|---|---|---|---|---|---|---|---|---|---|---|---|---|---|---|---|---|---|---|---|---|---|---|---|---|---|---|---|---|---|---|---|---|---|---|---|
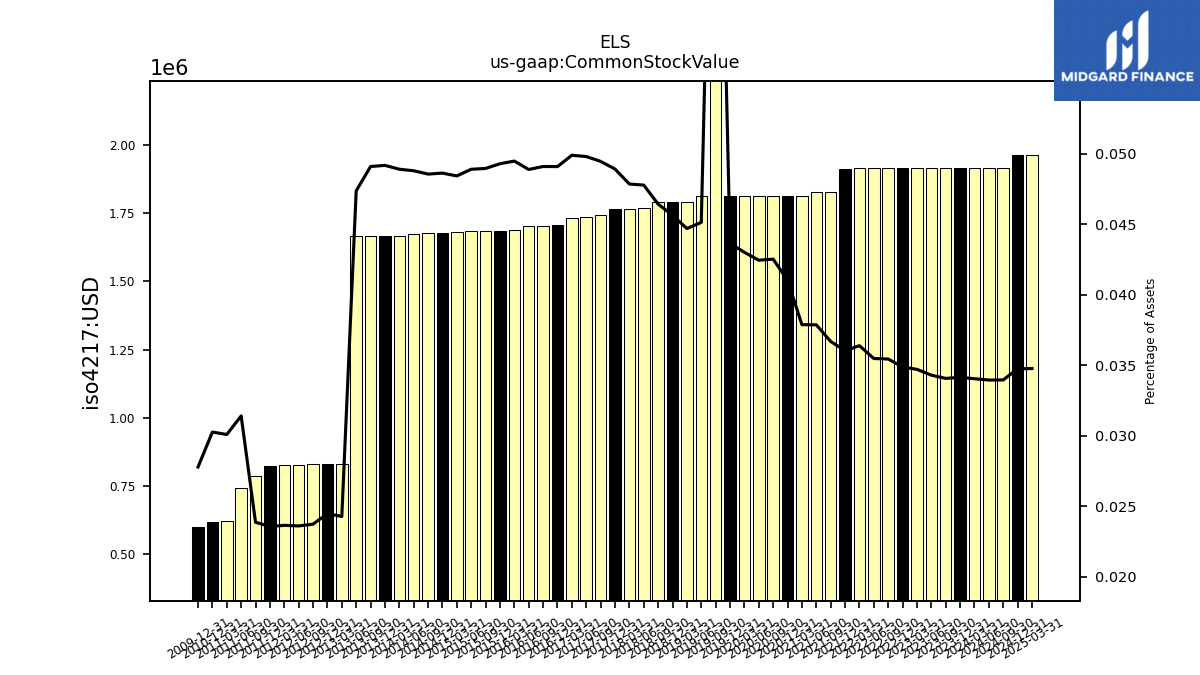
| Common Stock Value | 1.92 | 1.92 | 1.92 | 1.92 | 1.92 | 1.92 | 1.92 | 1.92 | 1.91 | 1.83 | 1.83 | 1.81 | 1.81 | 1.81 | 1.81 | 1.81 | 1.81 | 3.62 | 1.81 | 1.79 | 1.79 | 1.79 | 1.77 | 1.77 | 1.77 | 1.74 | 1.74 | 1.73 | 1.71 | 1.70 | 1.70 | 1.69 | 1.69 | 1.69 | 1.69 | 1.68 | 1.68 | 1.68 | 1.67 | 1.67 | 1.67 | 1.67 | 1.67 | 0.83 | 0.83 | 0.83 | 0.83 | 0.83 | 0.82 | 0.79 | 0.74 | 0.62 | 0.62 | NA | NA | NA | |
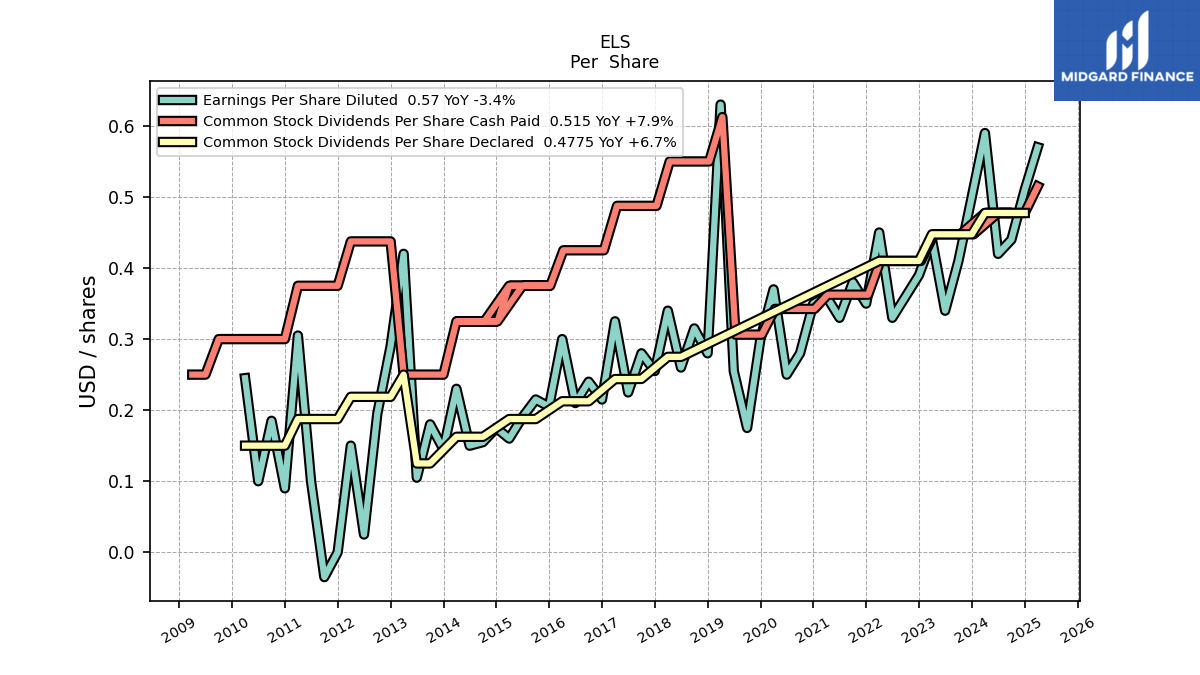
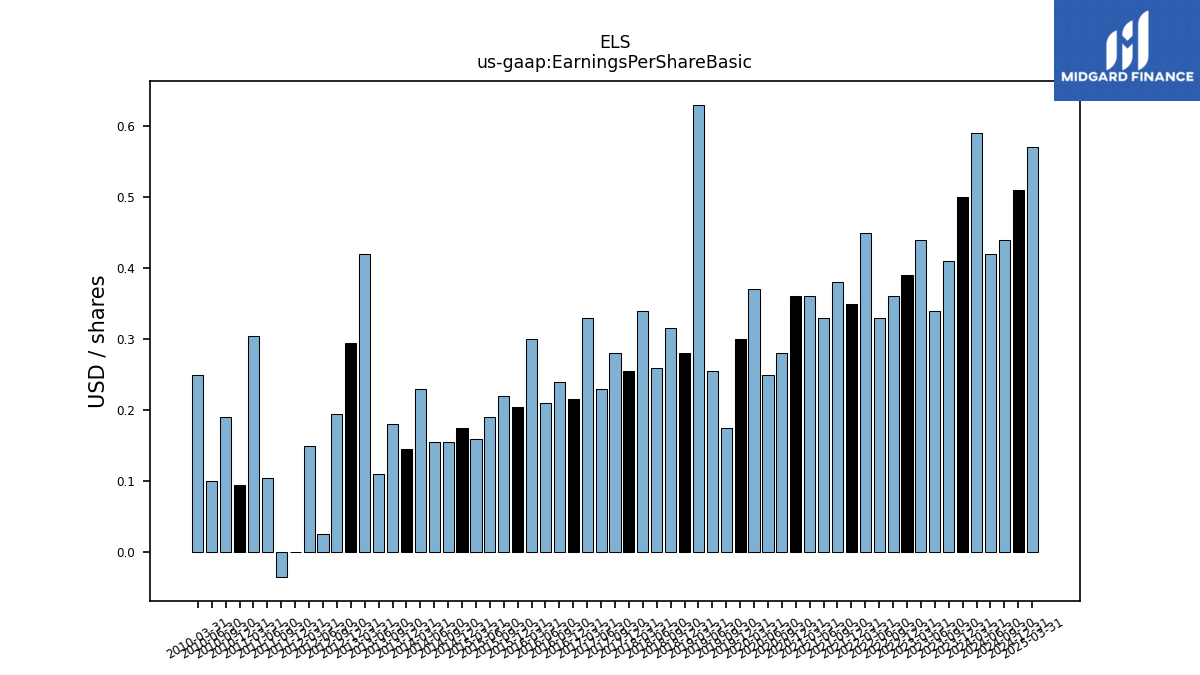
| Earnings Per Share Basic | 0.50 | 0.41 | 0.34 | 0.44 | 0.39 | 0.36 | 0.33 | 0.45 | 0.35 | 0.38 | 0.33 | 0.36 | 0.36 | 0.28 | 0.25 | 0.37 | 0.30 | 0.17 | 0.26 | 0.63 | 0.28 | 0.32 | 0.26 | 0.34 | 0.26 | 0.28 | 0.23 | 0.33 | 0.21 | 0.24 | 0.21 | 0.30 | 0.20 | 0.22 | 0.19 | 0.16 | 0.17 | 0.15 | 0.15 | 0.23 | 0.14 | 0.18 | 0.11 | 0.42 | 0.29 | 0.20 | 0.03 | 0.15 | 0.00 | -0.04 | 0.10 | 0.30 | 0.10 | 0.19 | 0.10 | 0.25 | |
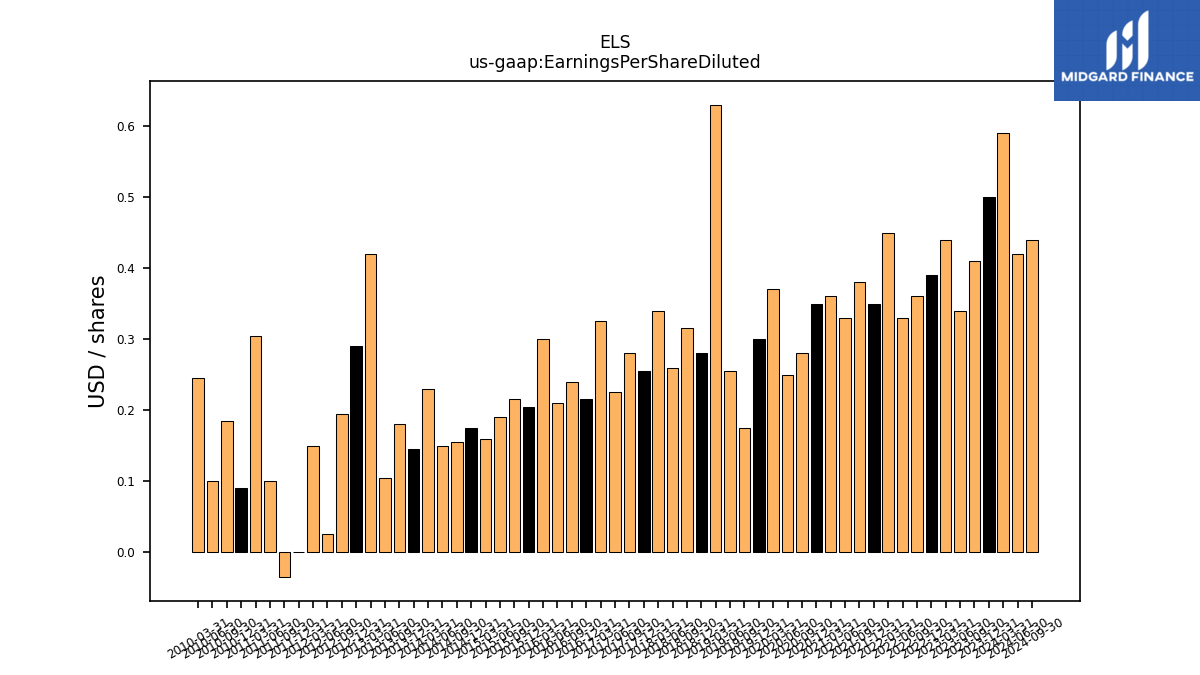
| Earnings Per Share Diluted | 0.50 | 0.41 | 0.34 | 0.44 | 0.39 | 0.36 | 0.33 | 0.45 | 0.35 | 0.38 | 0.33 | 0.36 | 0.35 | 0.28 | 0.25 | 0.37 | 0.30 | 0.17 | 0.26 | 0.63 | 0.28 | 0.32 | 0.26 | 0.34 | 0.26 | 0.28 | 0.23 | 0.33 | 0.21 | 0.24 | 0.21 | 0.30 | 0.20 | 0.21 | 0.19 | 0.16 | 0.17 | 0.15 | 0.15 | 0.23 | 0.14 | 0.18 | 0.10 | 0.42 | 0.29 | 0.20 | 0.03 | 0.15 | 0.00 | -0.04 | 0.10 | 0.30 | 0.09 | 0.18 | 0.10 | 0.24 |
| 2023-12-31 | 2023-09-30 | 2023-06-30 | 2023-03-31 | 2022-12-31 | 2022-09-30 | 2022-06-30 | 2022-03-31 | 2021-12-31 | 2021-09-30 | 2021-06-30 | 2021-03-31 | 2020-12-31 | 2020-09-30 | 2020-06-30 | 2020-03-31 | 2019-12-31 | 2019-09-30 | 2019-06-30 | 2019-03-31 | 2018-12-31 | 2018-09-30 | 2018-06-30 | 2018-03-31 | 2017-12-31 | 2017-09-30 | 2017-06-30 | 2017-03-31 | 2016-12-31 | 2016-09-30 | 2016-06-30 | 2016-03-31 | 2015-12-31 | 2015-09-30 | 2015-06-30 | 2015-03-31 | 2014-12-31 | 2014-09-30 | 2014-06-30 | 2014-03-31 | 2013-12-31 | 2013-09-30 | 2013-06-30 | 2013-03-31 | 2012-12-31 | 2012-09-30 | 2012-06-30 | 2012-03-31 | 2011-12-31 | 2011-09-30 | 2011-06-30 | 2011-03-31 | 2010-12-31 | 2010-09-30 | 2010-06-30 | 2010-03-31 | ||
|---|---|---|---|---|---|---|---|---|---|---|---|---|---|---|---|---|---|---|---|---|---|---|---|---|---|---|---|---|---|---|---|---|---|---|---|---|---|---|---|---|---|---|---|---|---|---|---|---|---|---|---|---|---|---|---|---|---|
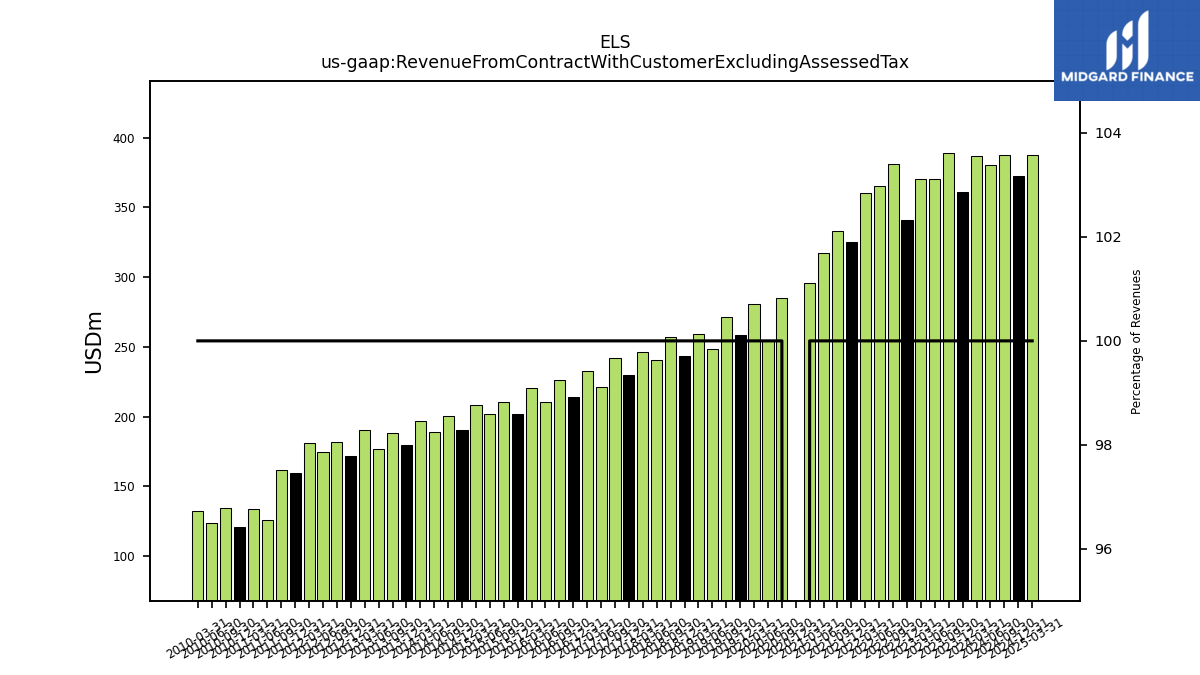
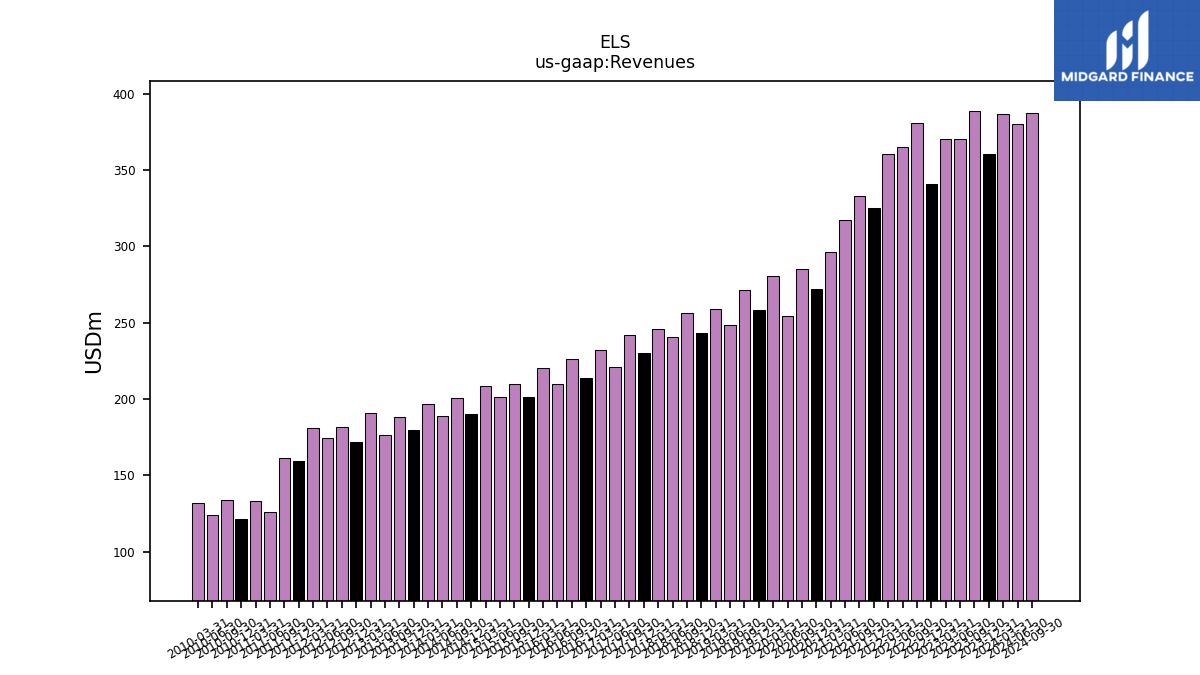
| Revenue From Contract With Customer Excluding Assessed Tax | 360.64 | 388.81 | 370.01 | 369.95 | 340.60 | 380.97 | 365.31 | 360.19 | 325.33 | 332.90 | 317.42 | 296.04 | -797.81 | 284.99 | 254.09 | 280.48 | 258.64 | 271.16 | 248.37 | 259.09 | 243.45 | 256.68 | 240.50 | 246.03 | 229.99 | 241.62 | 221.31 | 232.39 | 214.04 | 226.16 | 210.08 | 220.15 | 201.62 | 210.14 | 201.48 | 208.41 | 190.26 | 200.55 | 188.85 | 196.59 | 179.88 | 187.97 | 176.75 | 190.59 | 171.93 | 181.83 | 174.83 | 181.29 | 159.31 | 161.39 | 125.91 | 133.46 | 121.17 | 134.19 | 123.84 | 132.15 | |
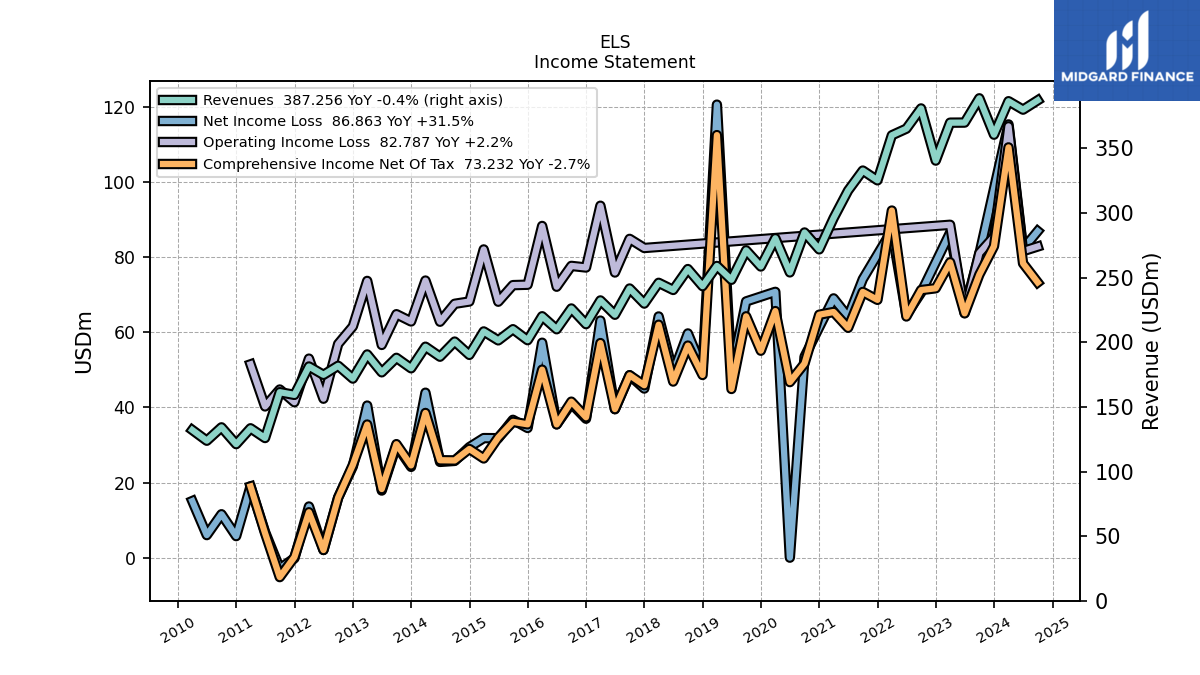
| Revenues | 360.64 | 388.81 | 370.01 | 369.95 | 340.60 | 380.97 | 365.31 | 360.19 | 325.33 | 332.90 | 317.42 | 296.04 | 271.90 | 284.99 | 254.09 | 280.48 | 258.64 | 271.16 | 248.37 | 259.09 | 243.45 | 256.68 | 240.50 | 246.03 | 229.99 | 241.62 | 221.31 | 232.39 | 214.04 | 226.16 | 210.08 | 220.15 | 201.62 | 210.14 | 201.48 | 208.41 | 190.26 | 200.55 | 188.85 | 196.59 | 179.88 | 187.97 | 176.75 | 190.59 | 171.93 | 181.83 | 174.83 | 181.29 | 159.31 | 161.39 | 125.91 | 133.46 | 121.17 | 134.19 | 123.84 | 132.15 | |
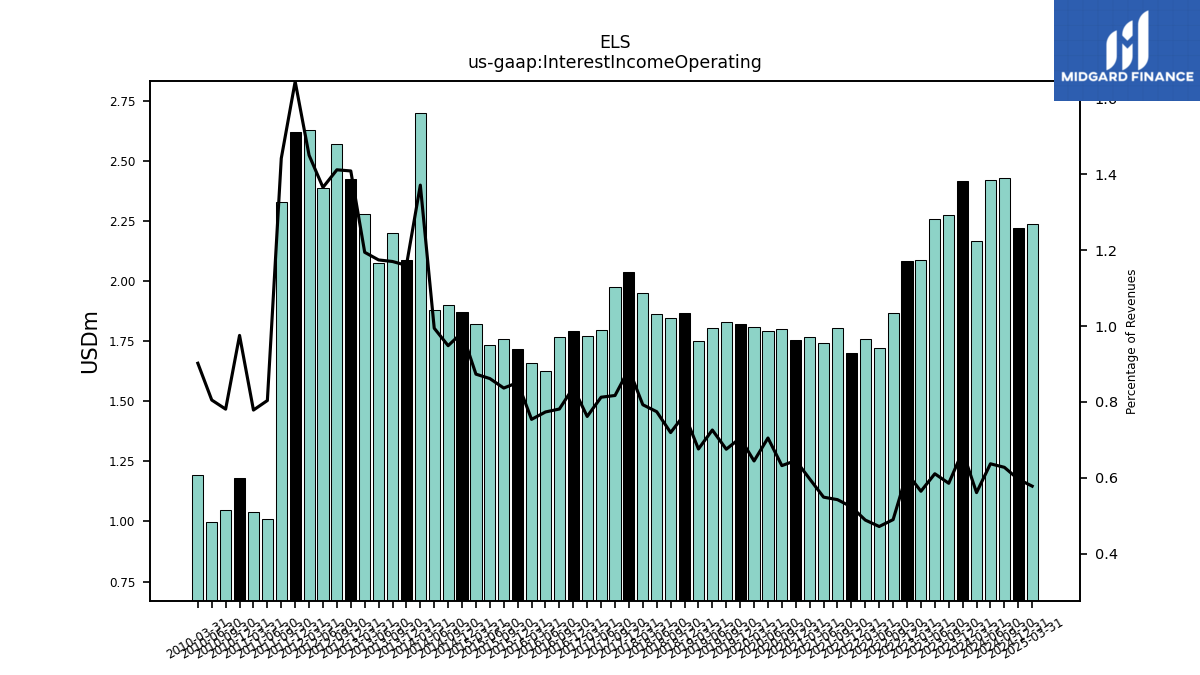
| Interest Income Operating | 2.41 | 2.28 | 2.26 | 2.09 | 2.08 | 1.86 | 1.72 | 1.76 | 1.70 | 1.80 | 1.74 | 1.77 | 1.75 | 1.80 | 1.79 | 1.81 | 1.82 | 1.83 | 1.80 | 1.75 | 1.87 | 1.85 | 1.86 | 1.95 | 2.04 | 1.97 | 1.80 | 1.77 | 1.79 | 1.77 | 1.62 | 1.66 | 1.72 | 1.76 | 1.74 | 1.82 | 1.87 | 1.90 | 1.88 | 2.70 | 2.09 | 2.20 | 2.08 | 2.28 | 2.42 | 2.57 | 2.39 | 2.63 | 2.62 | 2.33 | 1.01 | 1.04 | 1.18 | 1.05 | 1.00 | 1.19 | |
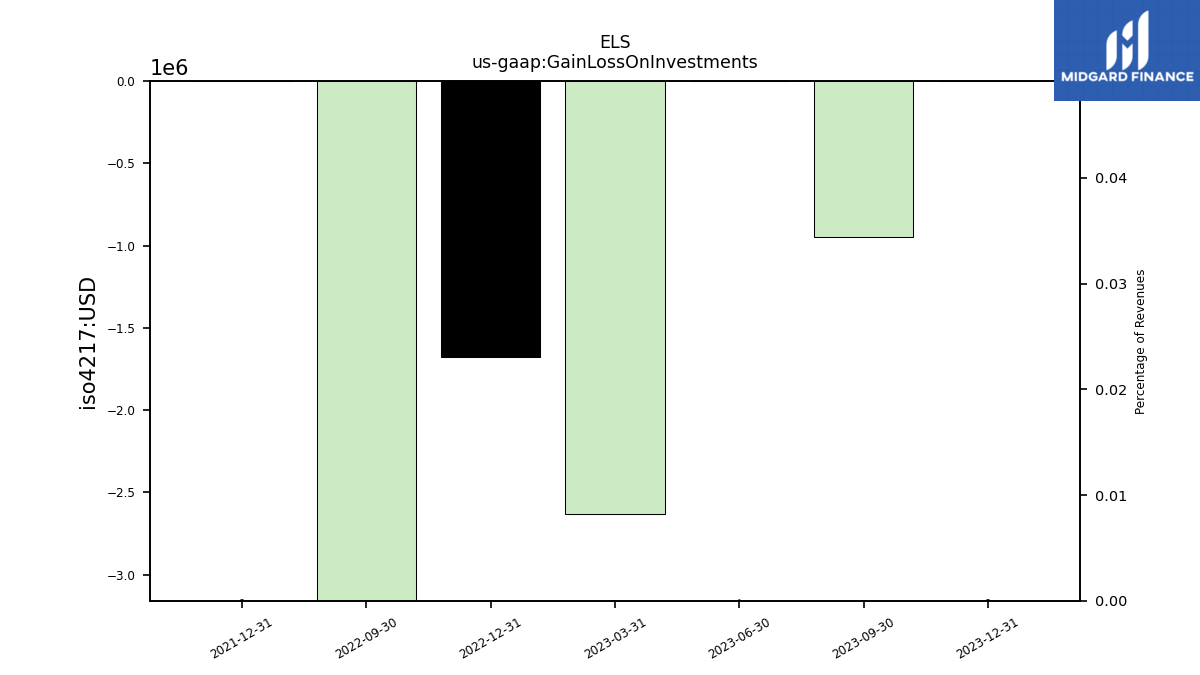
| Gain Loss On Investments | 0.00 | -0.95 | 0.00 | -2.63 | -1.68 | -3.75 | NA | NA | 0.00 | NA | NA | NA | NA | NA | NA | NA | NA | NA | NA | NA | NA | NA | NA | NA | NA | NA | NA | NA | NA | NA | NA | NA | NA | NA | NA | NA | NA | NA | NA | NA | NA | NA | NA | NA | NA | NA | NA | NA | NA | NA | NA | NA | NA | NA | NA | NA | |
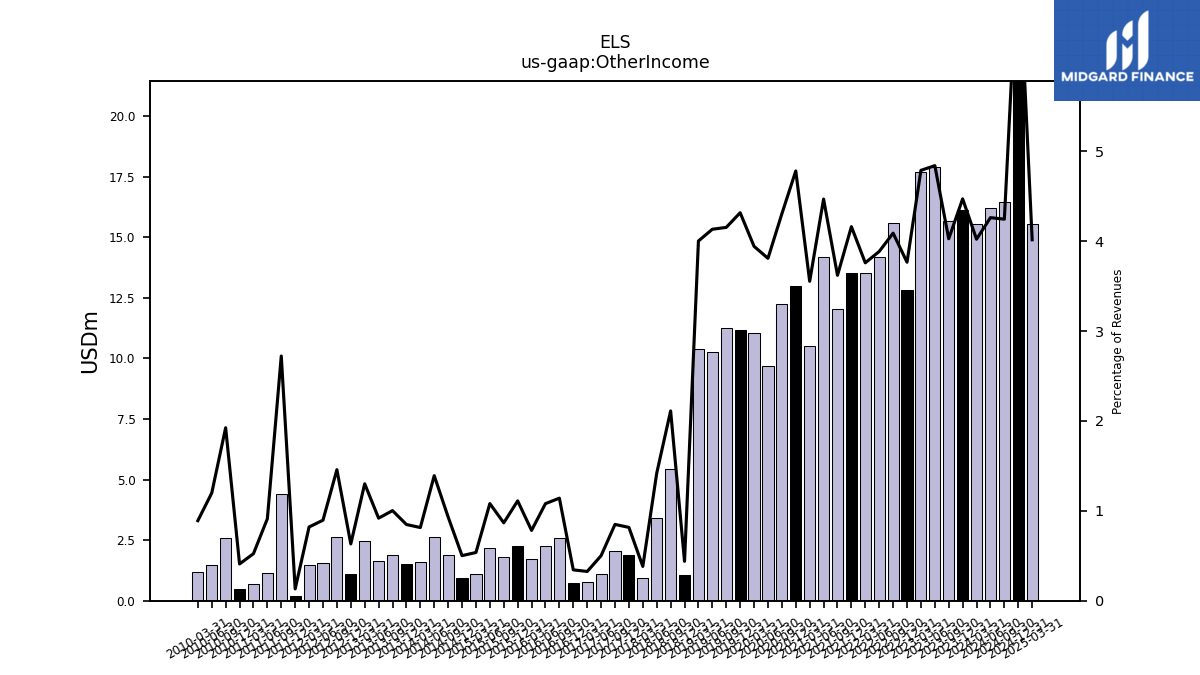
| Other Income | 16.12 | 15.66 | 17.91 | 17.71 | 12.83 | 15.58 | 14.20 | 13.54 | 13.54 | 12.05 | 14.19 | 10.52 | 13.00 | 12.27 | 9.68 | 11.06 | 11.16 | 11.26 | 10.27 | 10.37 | 1.07 | 5.42 | 3.41 | 0.94 | 1.88 | 2.05 | 1.11 | 0.76 | 0.74 | 2.58 | 2.27 | 1.72 | 2.24 | 1.82 | 2.18 | 1.12 | 0.95 | 1.87 | 2.63 | 1.60 | 1.53 | 1.89 | 1.62 | 2.48 | 1.09 | 2.65 | 1.57 | 1.49 | 0.21 | 4.39 | 1.15 | 0.70 | 0.50 | 2.58 | 1.48 | 1.18 | |
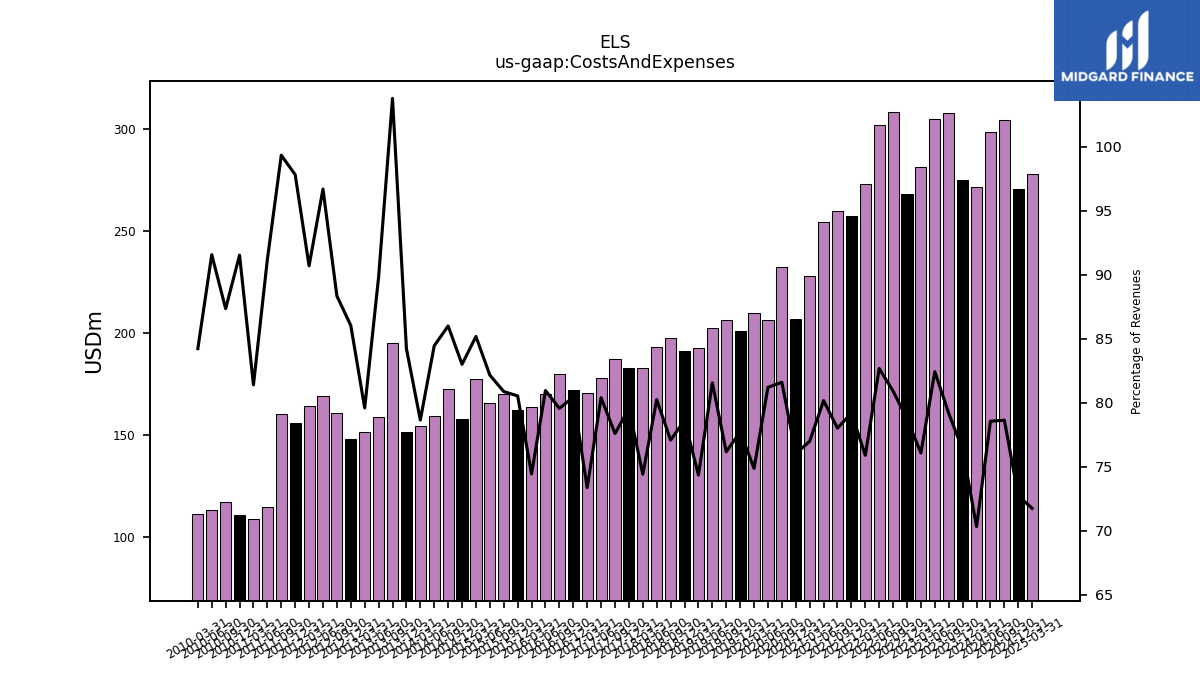
| Costs And Expenses | 275.26 | 307.78 | 304.94 | 281.38 | 268.15 | 308.18 | 301.97 | 273.31 | 257.58 | 259.65 | 254.41 | 227.87 | 206.69 | 232.49 | 206.30 | 209.96 | 200.99 | 206.50 | 202.51 | 192.59 | 191.41 | 197.80 | 192.95 | 183.04 | 182.90 | 187.45 | 177.89 | 170.46 | 172.12 | 179.90 | 170.04 | 163.84 | 162.33 | 169.92 | 165.49 | 177.49 | 157.89 | 172.44 | 159.46 | 154.58 | 151.48 | 195.04 | 158.74 | 151.65 | 147.89 | 160.60 | 169.02 | 164.40 | 155.82 | 160.29 | 114.80 | 108.61 | 110.89 | 117.20 | 113.38 | 111.28 | |
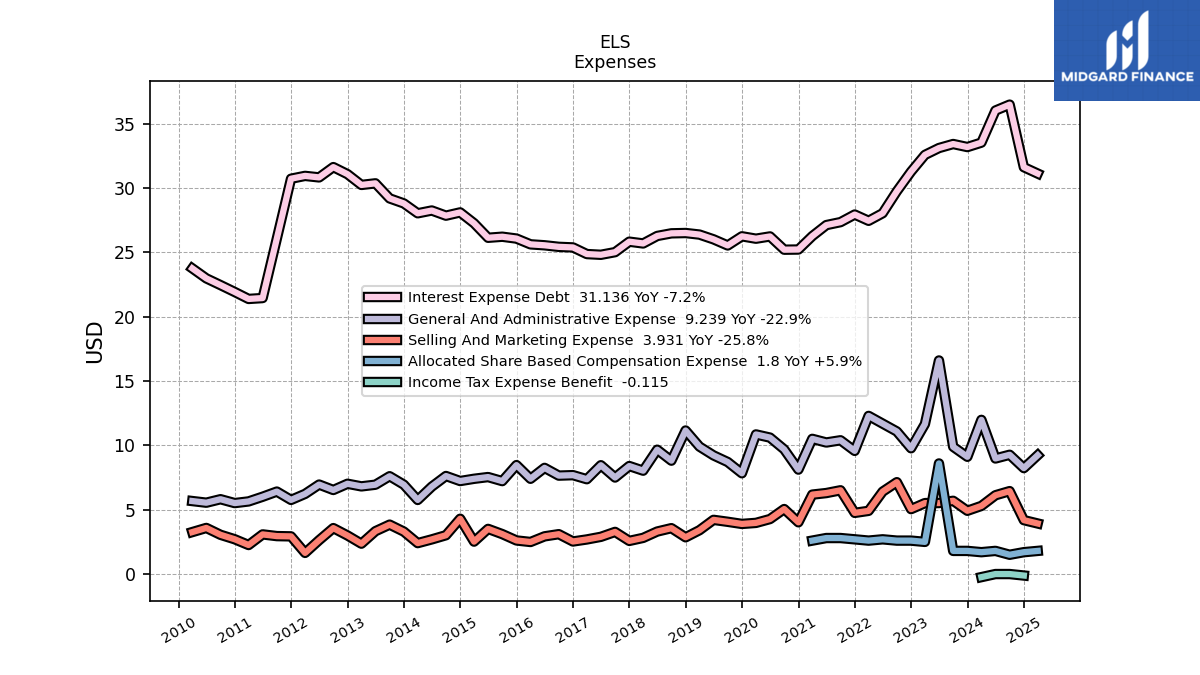
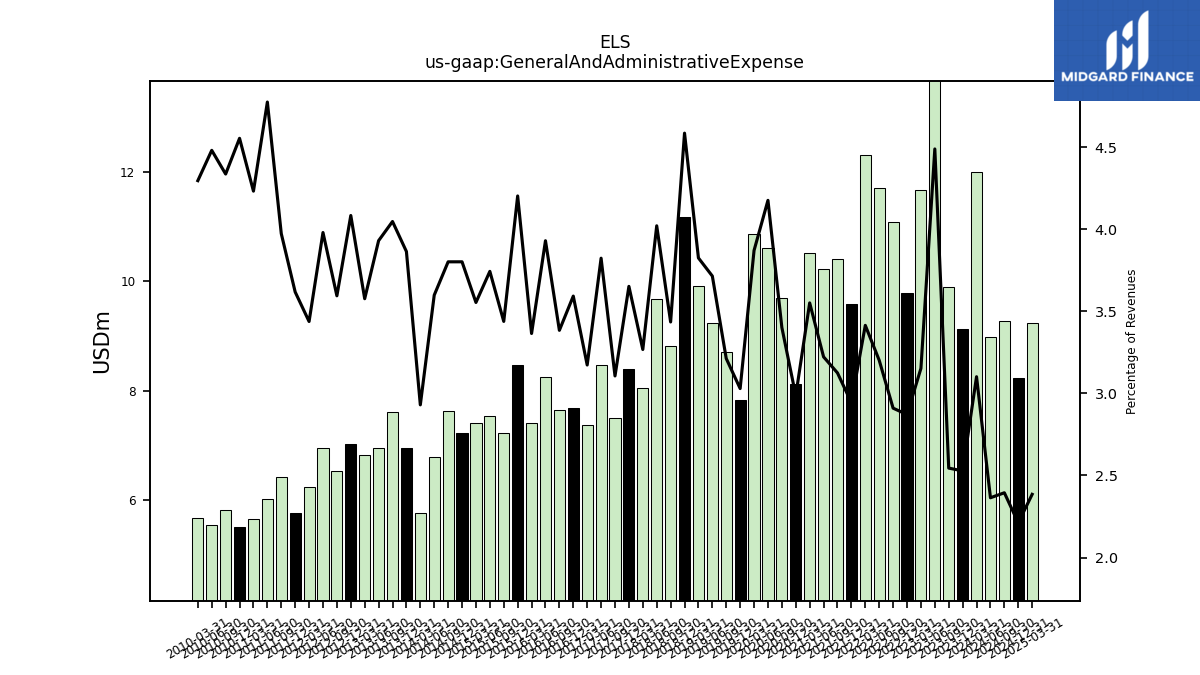
| General And Administrative Expense | 9.12 | 9.89 | 16.61 | 11.66 | 9.78 | 11.09 | 11.70 | 12.30 | 9.58 | 10.40 | 10.23 | 10.51 | 8.12 | 9.69 | 10.61 | 10.86 | 7.83 | 8.71 | 9.22 | 9.91 | 11.16 | 8.82 | 9.67 | 8.04 | 8.40 | 7.50 | 8.46 | 7.37 | 7.69 | 7.65 | 8.26 | 7.41 | 8.47 | 7.22 | 7.54 | 7.41 | 7.23 | 7.62 | 6.79 | 5.76 | 6.95 | 7.61 | 6.95 | 6.82 | 7.02 | 6.54 | 6.96 | 6.23 | 5.76 | 6.41 | 6.01 | 5.65 | 5.52 | 5.82 | 5.55 | 5.68 | |
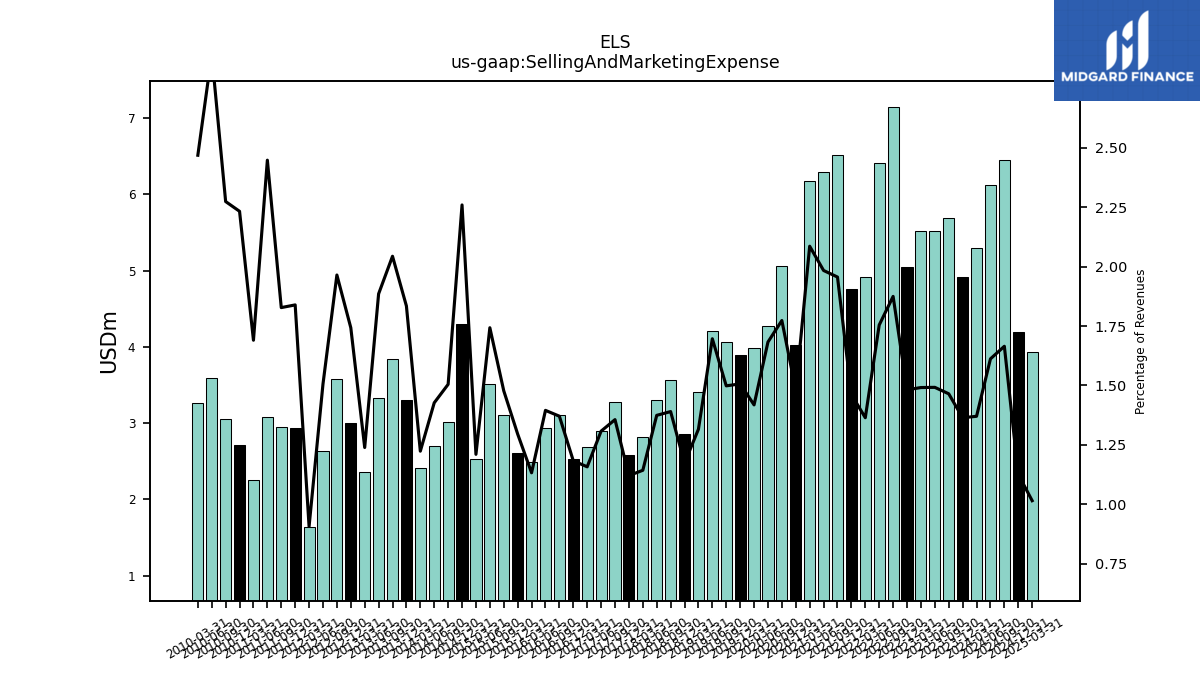
| Selling And Marketing Expense | 4.92 | 5.70 | 5.52 | 5.52 | 5.05 | 7.14 | 6.41 | 4.91 | 4.76 | 6.51 | 6.30 | 6.18 | 4.02 | 5.05 | 4.28 | 3.98 | 3.90 | 4.06 | 4.21 | 3.41 | 2.86 | 3.57 | 3.31 | 2.81 | 2.58 | 3.28 | 2.89 | 2.69 | 2.53 | 3.10 | 2.93 | 2.49 | 2.61 | 3.10 | 3.51 | 2.52 | 4.30 | 3.02 | 2.69 | 2.40 | 3.30 | 3.84 | 3.33 | 2.36 | 3.00 | 3.57 | 2.63 | 1.64 | 2.93 | 2.95 | 3.08 | 2.26 | 2.71 | 3.05 | 3.58 | 3.26 | |
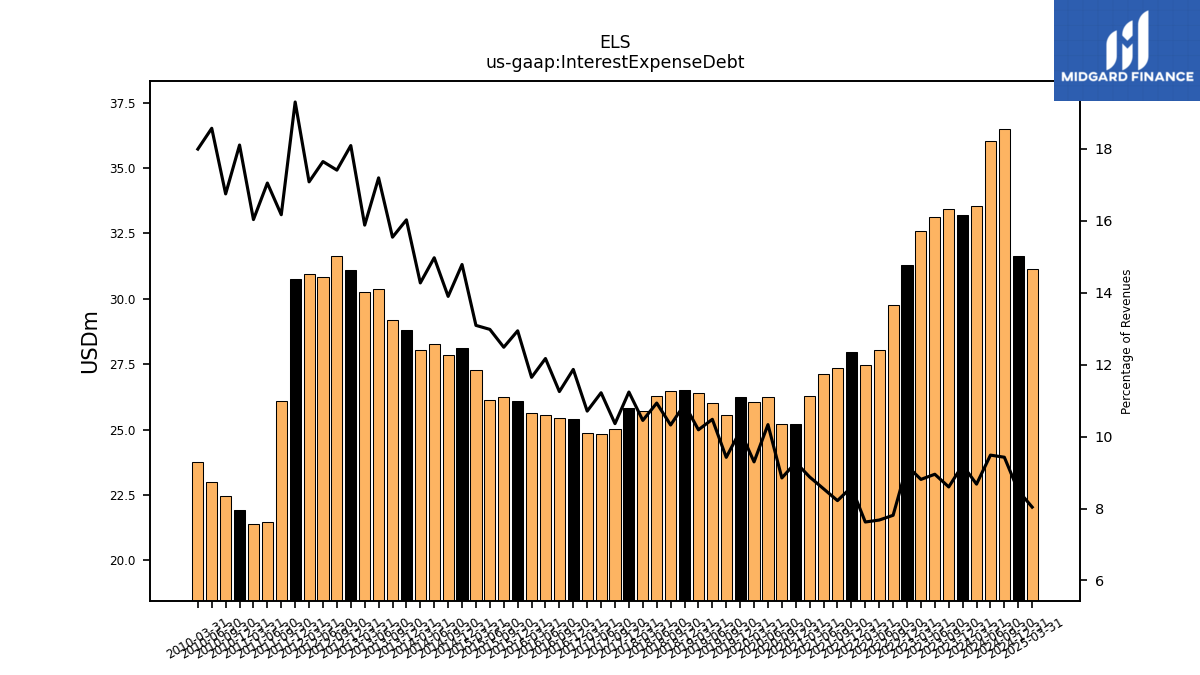
| Interest Expense Debt | 33.20 | 33.43 | 33.12 | 32.59 | 31.29 | 29.76 | 28.05 | 27.46 | 27.95 | 27.36 | 27.13 | 26.27 | 25.23 | 25.22 | 26.25 | 26.07 | 26.26 | 25.55 | 26.02 | 26.39 | 26.52 | 26.49 | 26.29 | 25.70 | 25.84 | 25.03 | 24.82 | 24.88 | 25.39 | 25.44 | 25.56 | 25.63 | 26.08 | 26.23 | 26.14 | 27.28 | 28.12 | 27.86 | 28.27 | 28.05 | 28.82 | 29.21 | 30.38 | 30.25 | 31.09 | 31.64 | 30.84 | 30.96 | 30.74 | 26.08 | 21.46 | 21.39 | 21.93 | 22.46 | 22.99 | 23.77 | |
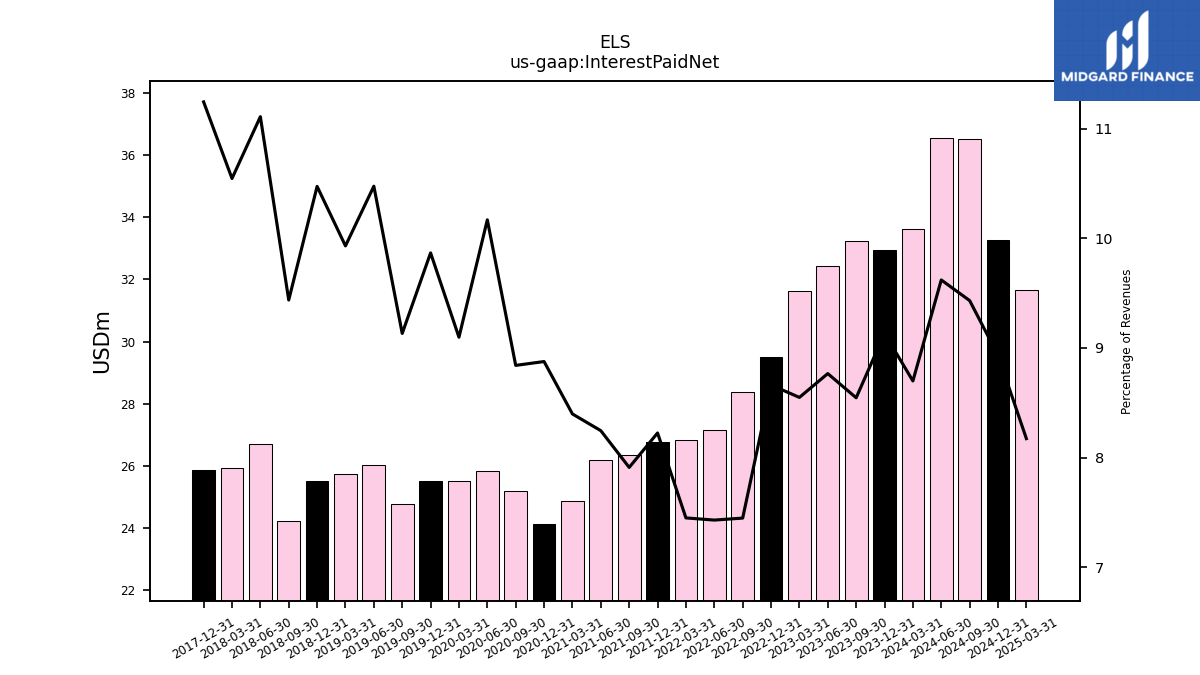
| Interest Paid Net | 32.94 | 33.23 | 32.44 | 31.63 | 29.50 | 28.38 | 27.15 | 26.84 | 26.76 | 26.34 | 26.18 | 24.86 | 24.14 | 25.20 | 25.84 | 25.52 | 25.52 | 24.76 | 26.02 | 25.73 | 25.50 | 24.22 | 26.71 | 25.94 | 25.86 | NA | NA | NA | NA | NA | NA | NA | NA | NA | NA | NA | NA | NA | NA | NA | NA | NA | NA | NA | NA | NA | NA | NA | NA | NA | NA | NA | NA | NA | NA | NA | |
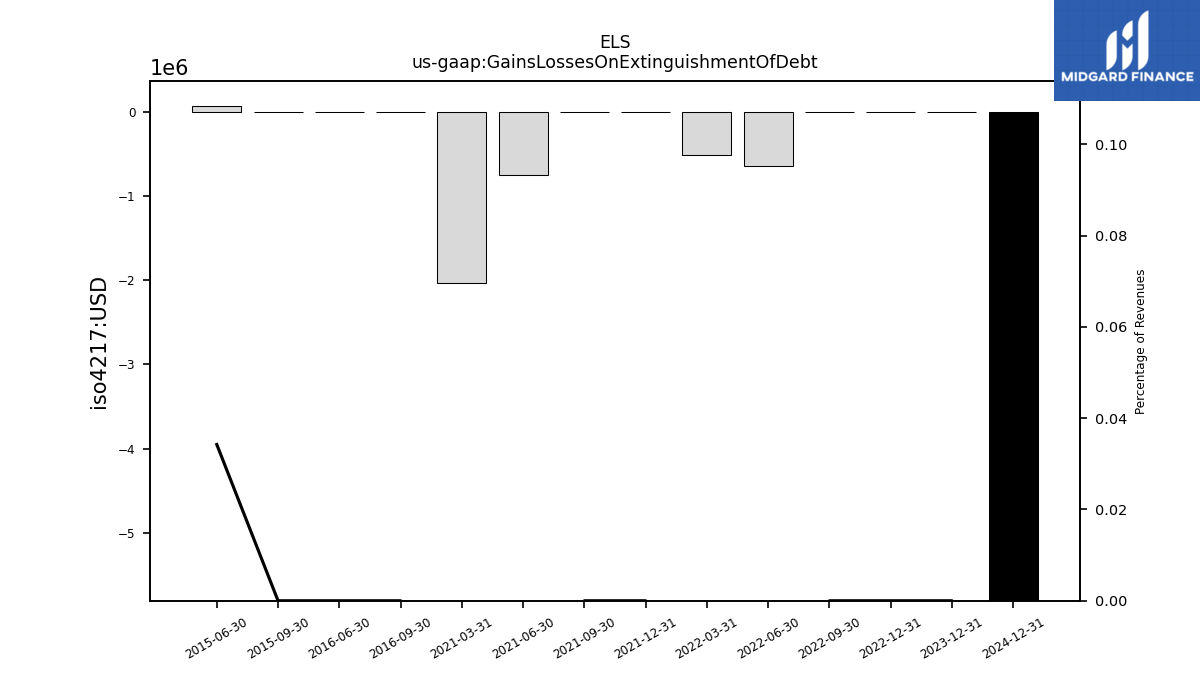
| Gains Losses On Extinguishment Of Debt | 0.00 | NA | NA | NA | 0.00 | 0.00 | -0.64 | -0.52 | 0.00 | 0.00 | -0.76 | -2.03 | NA | NA | NA | NA | NA | NA | NA | NA | NA | NA | NA | NA | NA | NA | NA | NA | NA | 0.00 | 0.00 | NA | NA | 0.00 | 0.07 | NA | NA | NA | NA | NA | NA | NA | NA | NA | NA | NA | NA | NA | NA | NA | NA | NA | NA | NA | NA | NA | |
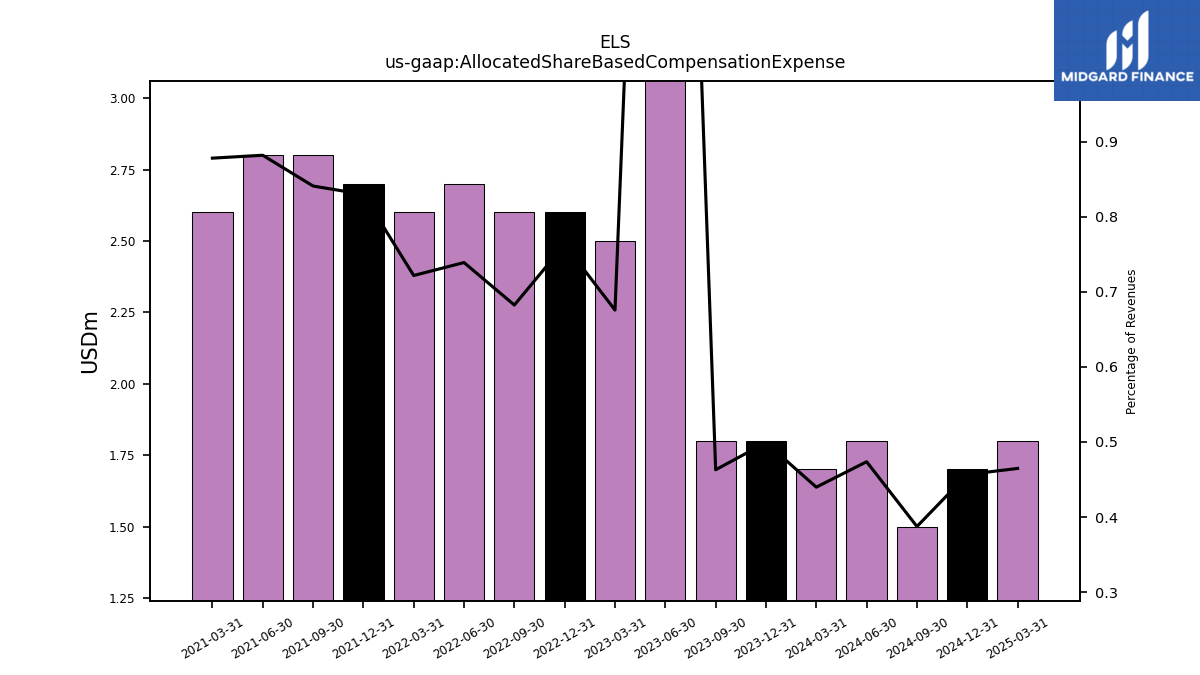
| Allocated Share Based Compensation Expense | 1.80 | 1.80 | 8.60 | 2.50 | 2.60 | 2.60 | 2.70 | 2.60 | 2.70 | 2.80 | 2.80 | 2.60 | NA | NA | NA | NA | NA | NA | NA | NA | NA | NA | NA | NA | NA | NA | NA | NA | NA | NA | NA | NA | NA | NA | NA | NA | NA | NA | NA | NA | NA | NA | NA | NA | NA | NA | NA | NA | NA | NA | NA | NA | NA | NA | NA | NA | |
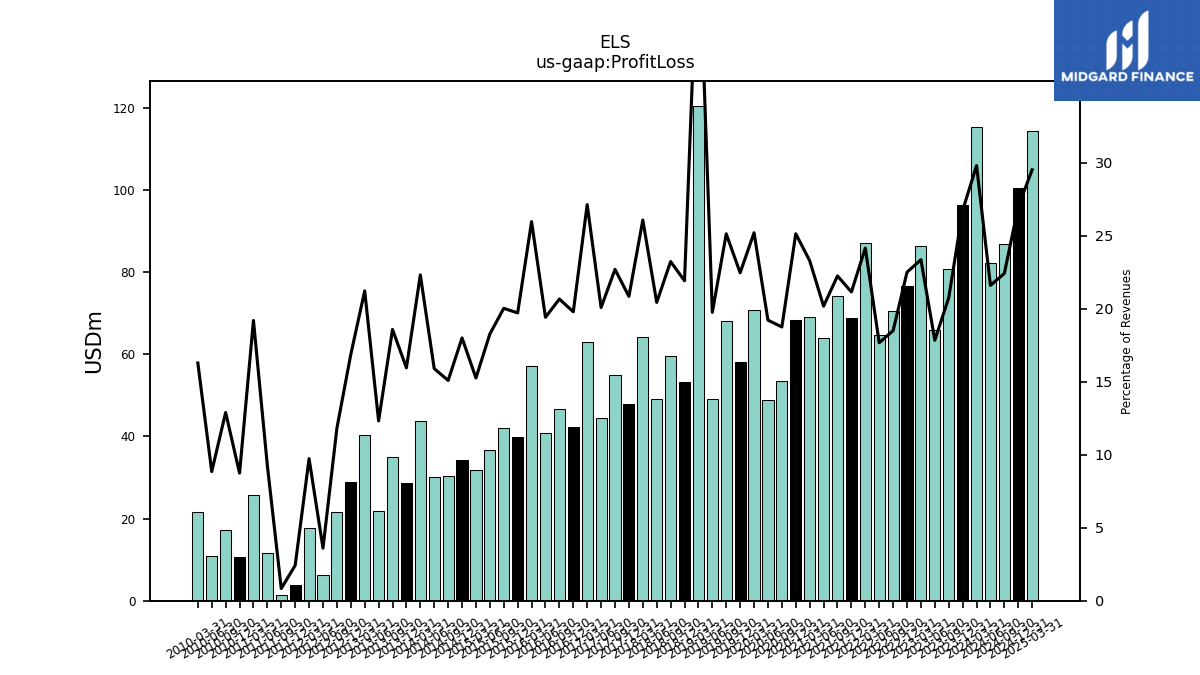
| Profit Loss | 96.43 | 80.74 | 66.05 | 86.46 | 76.68 | 70.51 | 64.59 | 87.05 | 68.84 | 74.09 | 64.08 | 68.99 | 68.37 | 53.47 | 48.85 | 70.72 | 58.13 | 68.18 | 49.09 | 120.53 | 53.38 | 59.66 | 49.17 | 64.18 | 47.97 | 54.87 | 44.46 | 63.08 | 42.38 | 46.76 | 40.80 | 57.19 | 39.77 | 42.11 | 36.83 | 31.81 | 34.26 | 30.28 | 30.04 | 43.89 | 28.72 | 34.94 | 21.79 | 40.47 | 29.01 | 21.49 | 6.30 | 17.65 | 3.86 | 1.35 | 11.65 | 25.63 | 10.60 | 17.31 | 10.97 | 21.53 | |
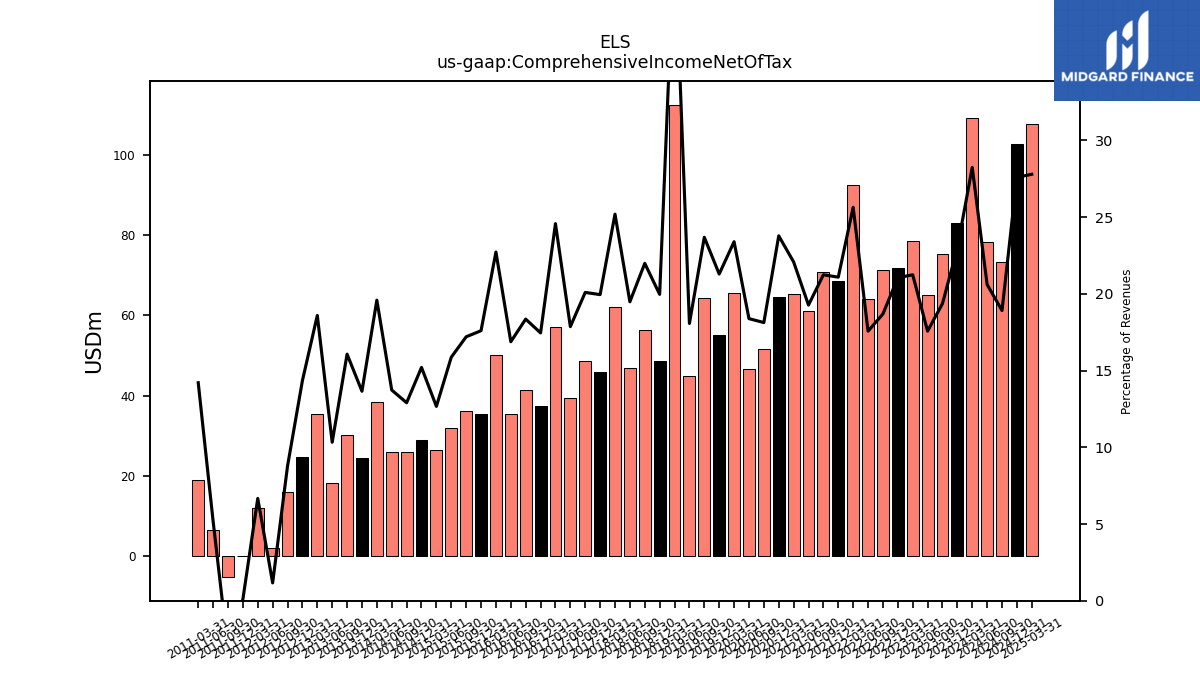
| Comprehensive Income Net Of Tax | 82.87 | 75.29 | 65.00 | 78.58 | 71.68 | 71.20 | 64.17 | 92.36 | 68.59 | 70.71 | 61.16 | 65.36 | 64.64 | 51.66 | 46.71 | 65.61 | 55.06 | 64.22 | 44.88 | 112.43 | 48.60 | 56.43 | 46.85 | 61.98 | 45.88 | 48.54 | 39.53 | 57.10 | 37.35 | 41.51 | 35.46 | 50.02 | 35.48 | 36.14 | 31.97 | 26.40 | 28.93 | 25.88 | 25.93 | 38.51 | 24.56 | 30.20 | 18.25 | 35.43 | 24.66 | 15.96 | 2.03 | 12.09 | 0.16 | -5.17 | 6.53 | 18.96 | NA | NA | NA | NA | |
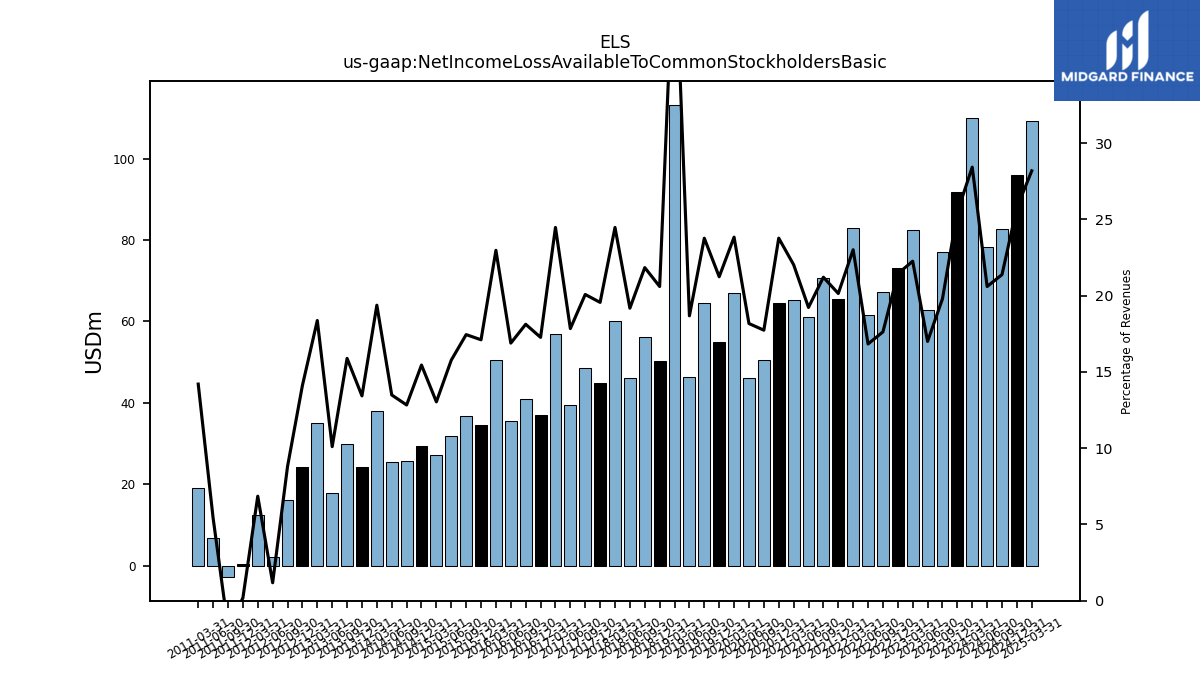
| Net Income Loss Available To Common Stockholders Basic | 91.93 | 76.97 | 62.92 | 82.37 | 73.03 | 67.16 | 61.51 | 82.91 | 65.55 | 70.62 | 61.05 | 65.24 | 64.65 | 50.56 | 46.19 | 66.88 | 54.95 | 64.46 | 46.40 | 113.31 | 50.17 | 56.07 | 46.14 | 60.22 | 44.99 | 48.52 | 39.50 | 56.89 | 36.97 | 41.00 | 35.49 | 50.58 | 34.50 | 36.67 | 31.79 | 27.18 | 29.40 | 25.75 | 25.48 | 38.10 | 24.16 | 29.87 | 17.86 | 35.02 | 24.27 | 16.01 | 2.06 | 12.43 | 0.29 | -2.85 | 6.83 | 18.96 | NA | NA | NA | NA | |
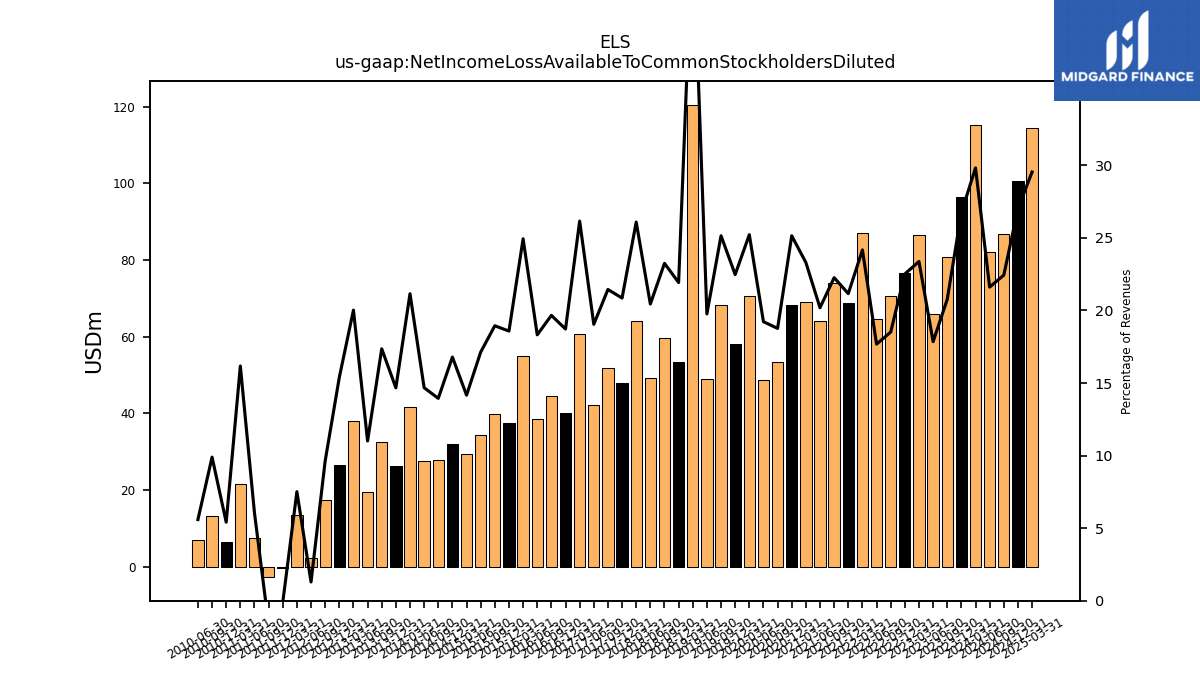
| Net Income Loss Available To Common Stockholders Diluted | 96.42 | 80.74 | 66.04 | 86.46 | 76.67 | 70.51 | 64.58 | 87.05 | 68.83 | 74.09 | 64.07 | 68.99 | 68.36 | 53.47 | 48.84 | 70.72 | 58.12 | 68.18 | 49.08 | 120.53 | 53.37 | 59.66 | 49.16 | 64.18 | 47.96 | 51.81 | 42.15 | 60.78 | 40.06 | 44.46 | 38.49 | 54.89 | 37.45 | 39.81 | 34.51 | 29.52 | 31.94 | 27.96 | 27.71 | 41.58 | 26.39 | 32.62 | 19.46 | 38.16 | 26.45 | 17.51 | 2.26 | 13.62 | -0.17 | -2.68 | 7.62 | 21.58 | 6.56 | 13.28 | 6.93 | NA |
| 2023-12-31 | 2023-09-30 | 2023-06-30 | 2023-03-31 | 2022-12-31 | 2022-09-30 | 2022-06-30 | 2022-03-31 | 2021-12-31 | 2021-09-30 | 2021-06-30 | 2021-03-31 | 2020-12-31 | 2020-09-30 | 2020-06-30 | 2020-03-31 | 2019-12-31 | 2019-09-30 | 2019-06-30 | 2019-03-31 | 2018-12-31 | 2018-09-30 | 2018-06-30 | 2018-03-31 | 2017-12-31 | 2017-09-30 | 2017-06-30 | 2017-03-31 | 2016-12-31 | 2016-09-30 | 2016-06-30 | 2016-03-31 | 2015-12-31 | 2015-09-30 | 2015-06-30 | 2015-03-31 | 2014-12-31 | 2014-09-30 | 2014-06-30 | 2014-03-31 | 2013-12-31 | 2013-09-30 | 2013-06-30 | 2013-03-31 | 2012-12-31 | 2012-09-30 | 2012-06-30 | 2012-03-31 | 2011-12-31 | 2011-09-30 | 2011-06-30 | 2011-03-31 | 2010-12-31 | 2010-09-30 | 2010-06-30 | 2010-03-31 | ||
|---|---|---|---|---|---|---|---|---|---|---|---|---|---|---|---|---|---|---|---|---|---|---|---|---|---|---|---|---|---|---|---|---|---|---|---|---|---|---|---|---|---|---|---|---|---|---|---|---|---|---|---|---|---|---|---|---|---|
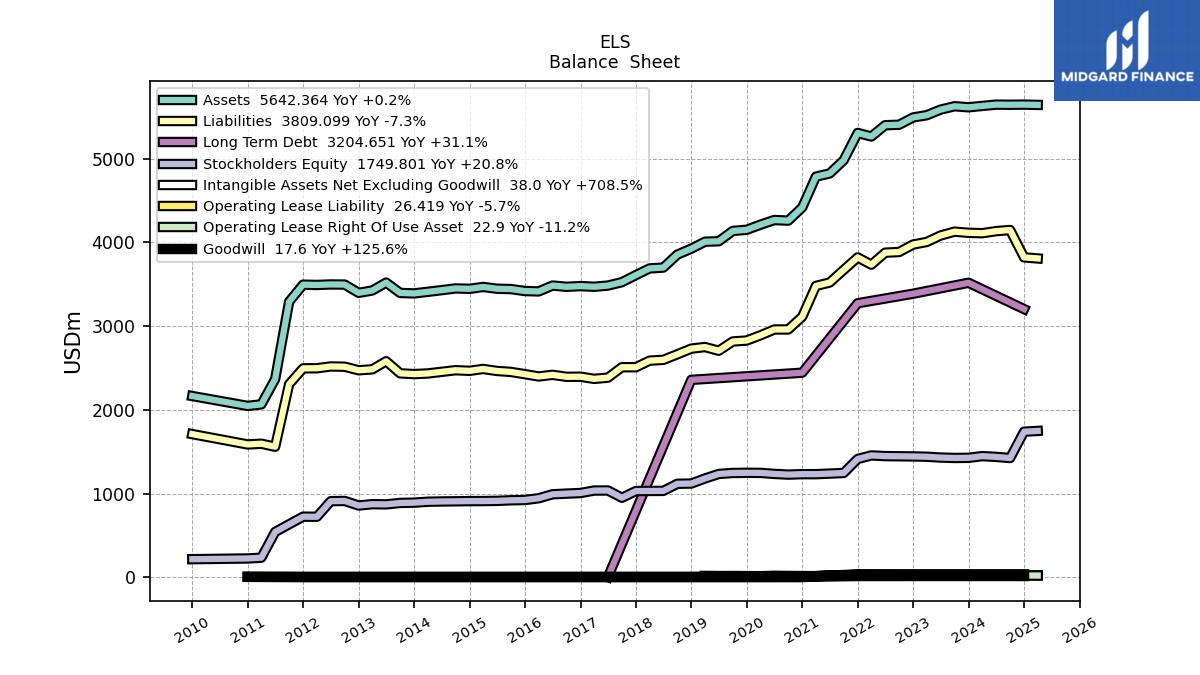
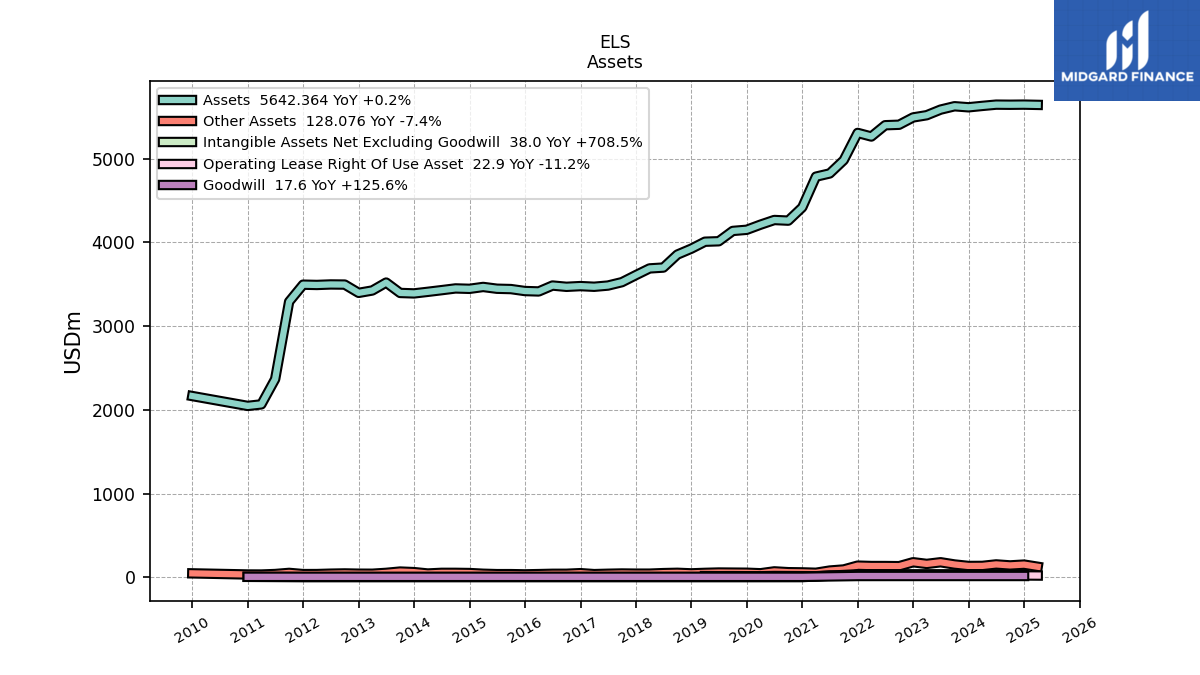
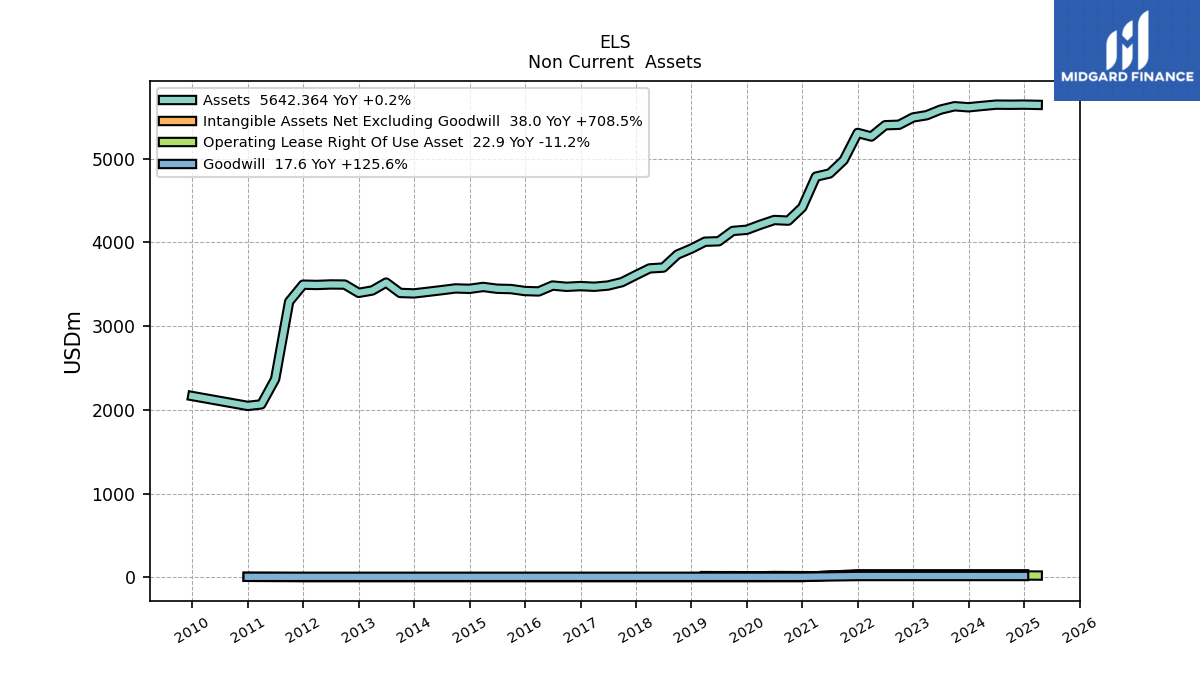
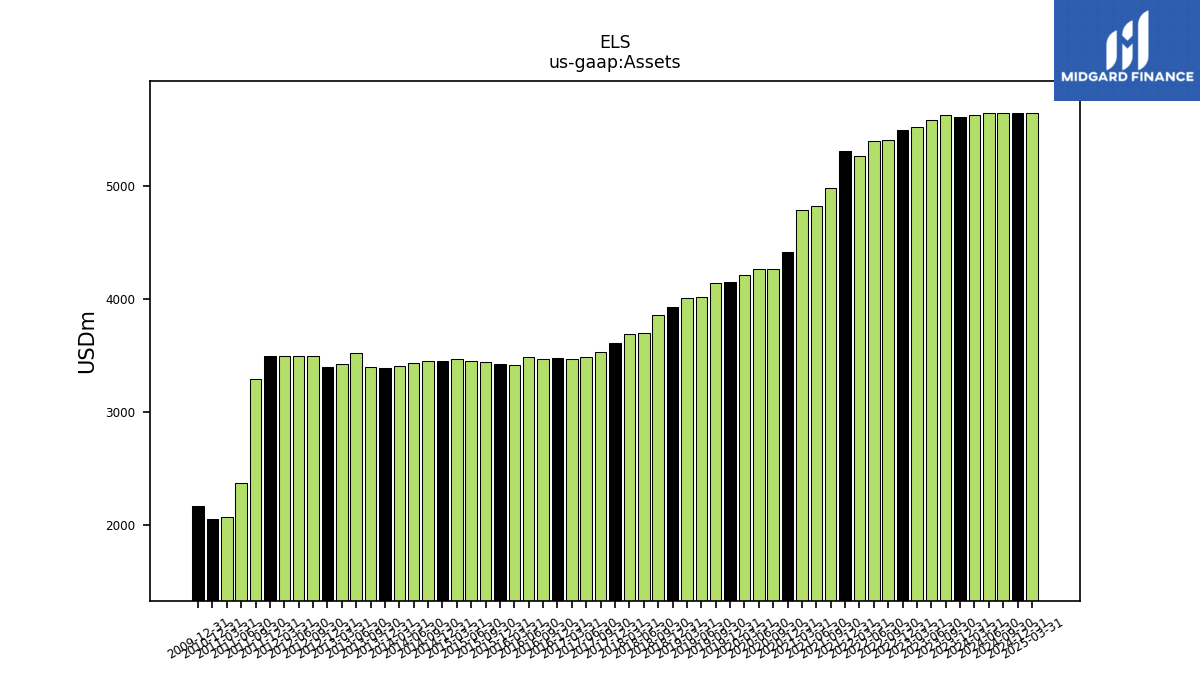
| Assets | 5613.73 | 5626.29 | 5585.99 | 5519.31 | 5492.52 | 5405.45 | 5399.59 | 5264.81 | 5307.87 | 4981.86 | 4824.01 | 4785.72 | 4418.97 | 4260.41 | 4268.17 | 4212.46 | 4151.27 | 4137.47 | 4014.48 | 4008.88 | 3925.81 | 3855.04 | 3700.19 | 3690.08 | 3610.03 | 3525.85 | 3485.36 | 3471.04 | 3478.99 | 3470.38 | 3485.57 | 3415.12 | 3420.06 | 3443.39 | 3447.51 | 3468.79 | 3446.34 | 3451.15 | 3430.42 | 3410.56 | 3391.64 | 3397.13 | 3521.13 | 3426.57 | 3398.23 | 3497.12 | 3498.65 | 3492.57 | 3496.10 | 3292.80 | 2368.55 | 2066.86 | 2048.39 | NA | NA | NA | |
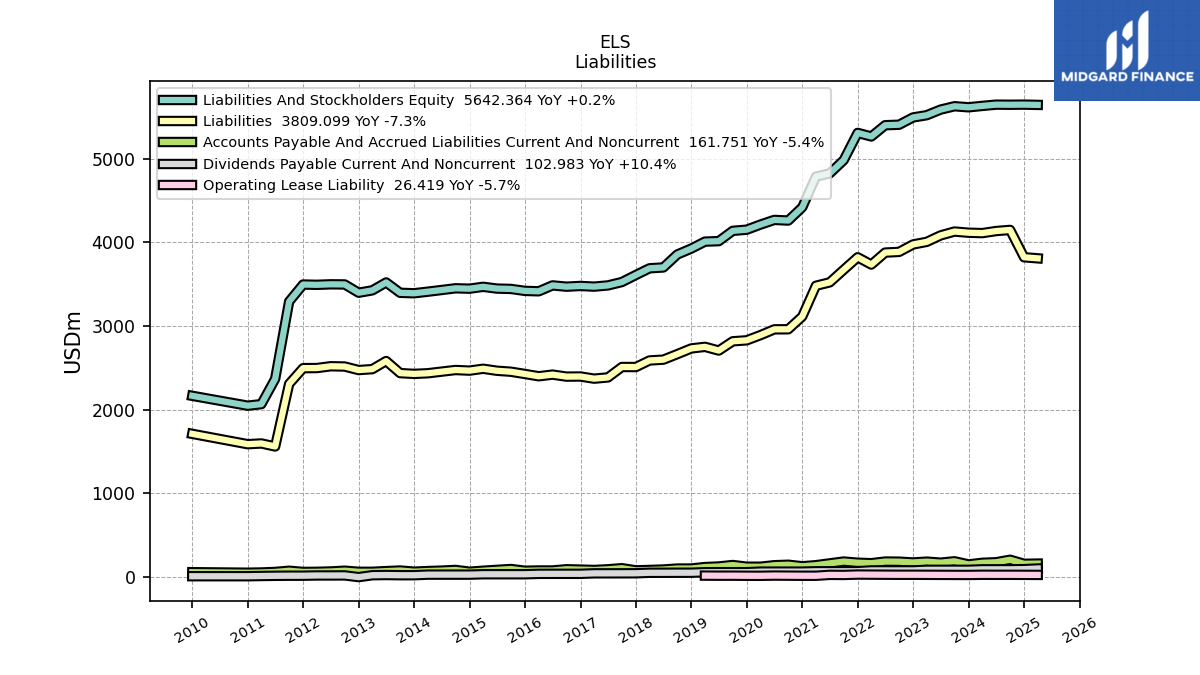
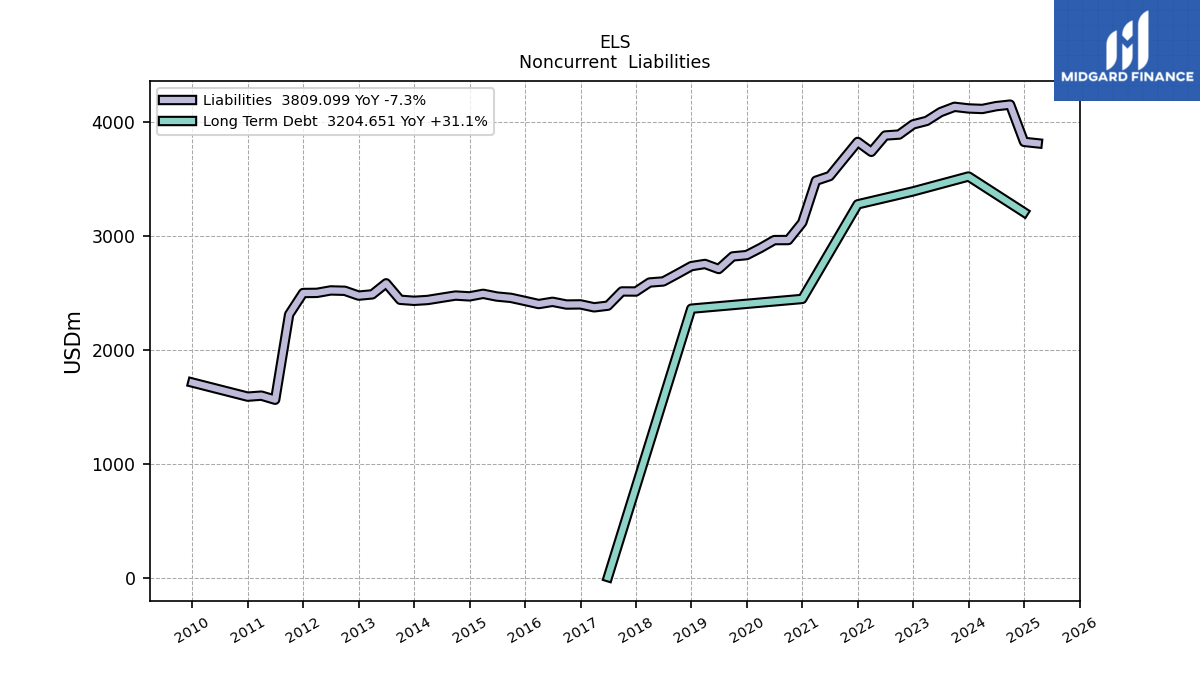
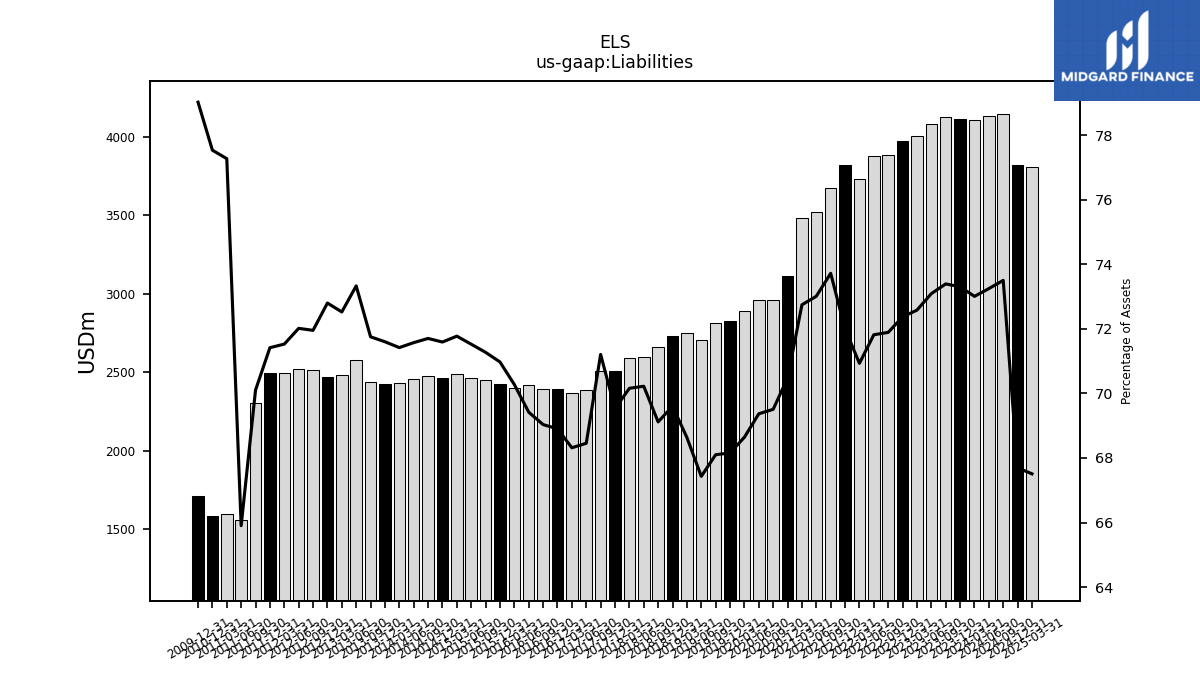
| Liabilities | 4115.11 | 4129.28 | 4082.88 | 4005.93 | 3975.03 | 3886.06 | 3877.85 | 3734.47 | 3821.70 | 3672.64 | 3522.02 | 3481.37 | 3114.21 | 2961.32 | 2960.79 | 2891.56 | 2829.39 | 2817.68 | 2707.00 | 2751.56 | 2732.46 | 2664.52 | 2598.36 | 2588.94 | 2509.99 | 2510.67 | 2385.95 | 2371.30 | 2397.14 | 2395.77 | 2419.66 | 2399.97 | 2427.37 | 2454.21 | 2465.83 | 2489.70 | 2467.31 | 2474.60 | 2455.28 | 2435.83 | 2428.43 | 2437.59 | 2582.09 | 2485.09 | 2473.92 | 2516.35 | 2519.59 | 2498.17 | 2496.82 | 2308.41 | 1560.97 | 1597.12 | 1588.24 | NA | NA | NA | |
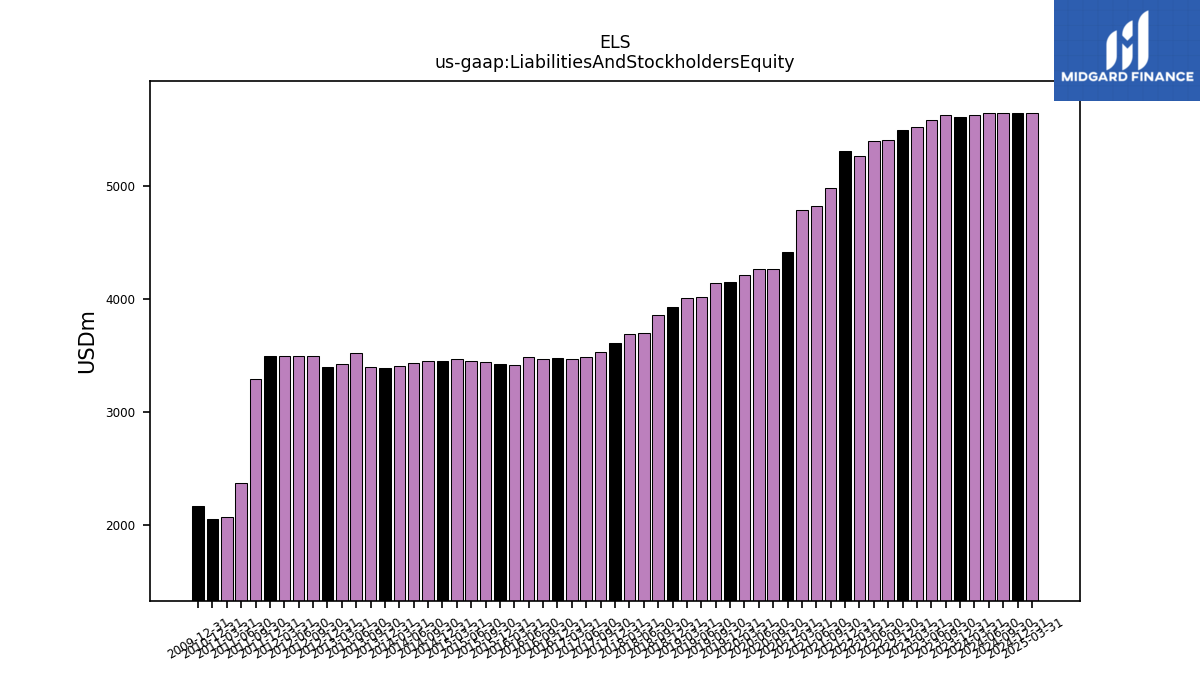
| Liabilities And Stockholders Equity | 5613.73 | 5626.29 | 5585.99 | 5519.31 | 5492.52 | 5405.45 | 5399.59 | 5264.81 | 5307.87 | 4981.86 | 4824.01 | 4785.72 | 4418.97 | 4260.41 | 4268.17 | 4212.46 | 4151.27 | 4137.47 | 4014.48 | 4008.88 | 3925.81 | 3855.04 | 3700.19 | 3690.08 | 3610.03 | 3525.85 | 3485.36 | 3471.04 | 3478.99 | 3470.38 | 3485.57 | 3415.12 | 3420.06 | 3443.39 | 3447.51 | 3468.79 | 3446.34 | 3451.15 | 3430.42 | 3410.56 | 3391.64 | 3397.13 | 3521.13 | 3426.57 | 3398.23 | 3497.12 | 3498.65 | 3492.57 | 3496.10 | 3292.80 | 2368.55 | 2066.86 | 2048.39 | NA | NA | NA | |
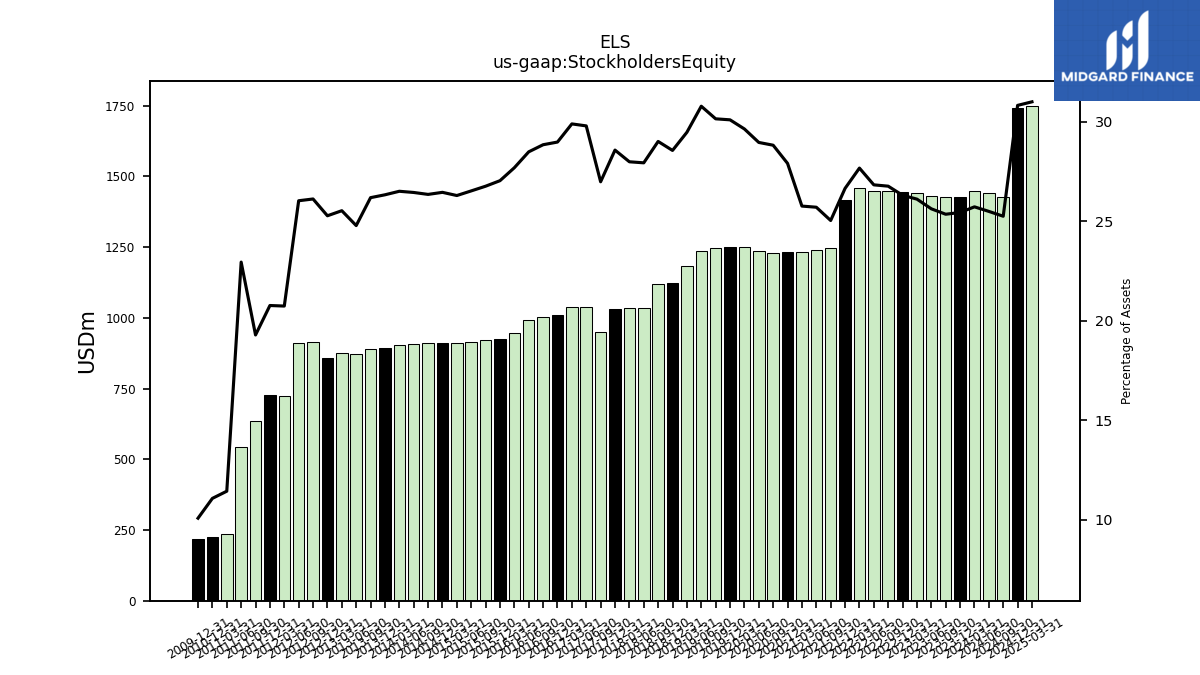
| Stockholders Equity | 1428.72 | 1426.95 | 1431.96 | 1441.72 | 1445.40 | 1447.17 | 1449.20 | 1457.37 | 1415.11 | 1247.82 | 1240.49 | 1233.38 | 1233.69 | 1228.31 | 1236.51 | 1248.91 | 1249.81 | 1247.76 | 1236.07 | 1181.83 | 1121.55 | 1118.76 | 1034.06 | 1033.16 | 1031.95 | 951.76 | 1038.71 | 1037.91 | 1008.54 | 1001.39 | 993.33 | 945.99 | 925.07 | 921.82 | 914.79 | 912.38 | 911.99 | 909.70 | 907.56 | 904.36 | 893.33 | 889.90 | 872.98 | 875.15 | 859.25 | 913.77 | 911.07 | 724.64 | 726.33 | 635.36 | 543.76 | 236.53 | 227.03 | NA | NA | NA |
| 2023-12-31 | 2023-09-30 | 2023-06-30 | 2023-03-31 | 2022-12-31 | 2022-09-30 | 2022-06-30 | 2022-03-31 | 2021-12-31 | 2021-09-30 | 2021-06-30 | 2021-03-31 | 2020-12-31 | 2020-09-30 | 2020-06-30 | 2020-03-31 | 2019-12-31 | 2019-09-30 | 2019-06-30 | 2019-03-31 | 2018-12-31 | 2018-09-30 | 2018-06-30 | 2018-03-31 | 2017-12-31 | 2017-09-30 | 2017-06-30 | 2017-03-31 | 2016-12-31 | 2016-09-30 | 2016-06-30 | 2016-03-31 | 2015-12-31 | 2015-09-30 | 2015-06-30 | 2015-03-31 | 2014-12-31 | 2014-09-30 | 2014-06-30 | 2014-03-31 | 2013-12-31 | 2013-09-30 | 2013-06-30 | 2013-03-31 | 2012-12-31 | 2012-09-30 | 2012-06-30 | 2012-03-31 | 2011-12-31 | 2011-09-30 | 2011-06-30 | 2011-03-31 | 2010-12-31 | 2010-09-30 | 2010-06-30 | 2010-03-31 | ||
|---|---|---|---|---|---|---|---|---|---|---|---|---|---|---|---|---|---|---|---|---|---|---|---|---|---|---|---|---|---|---|---|---|---|---|---|---|---|---|---|---|---|---|---|---|---|---|---|---|---|---|---|---|---|---|---|---|---|
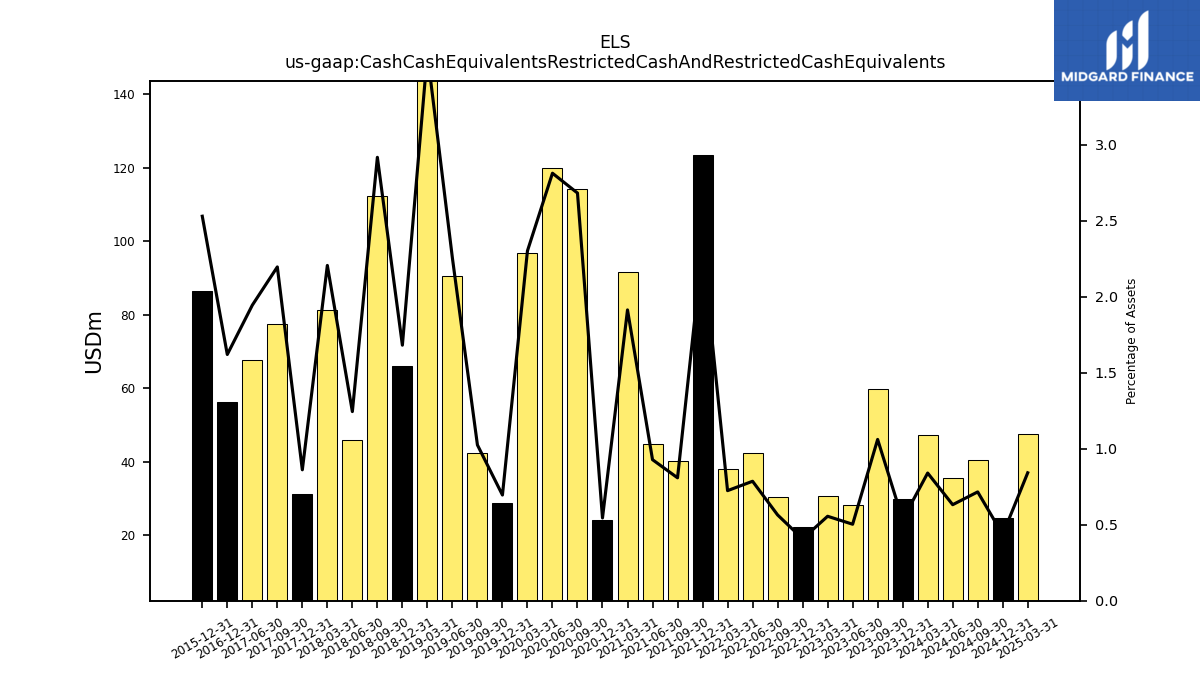
| Cash Cash Equivalents Restricted Cash And Restricted Cash Equivalents | 29.94 | 59.68 | 28.11 | 30.66 | 22.35 | 30.51 | 42.43 | 38.12 | 123.40 | 40.27 | 44.75 | 91.53 | 24.06 | 114.22 | 119.99 | 96.92 | 28.86 | 42.39 | 90.46 | 144.22 | 65.97 | 112.41 | 46.02 | 81.37 | 31.09 | 77.39 | 67.74 | NA | 56.34 | NA | NA | NA | 86.48 | NA | NA | NA | NA | NA | NA | NA | NA | NA | NA | NA | NA | NA | NA | NA | NA | NA | NA | NA | NA | NA | NA | NA | |
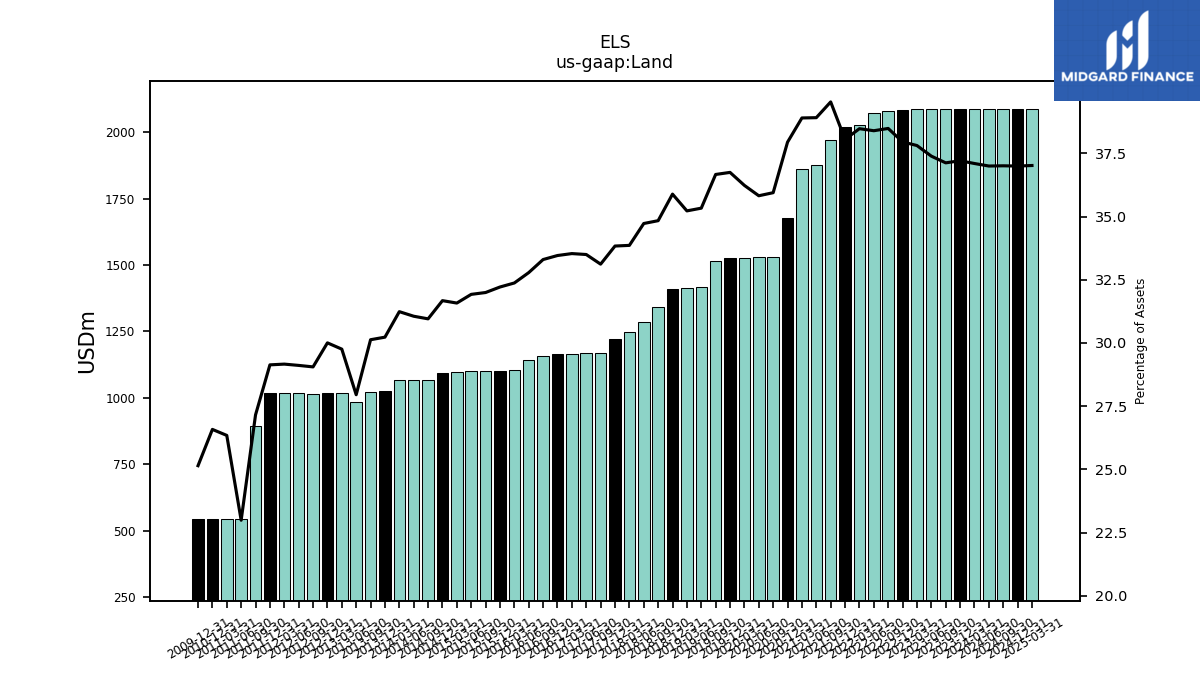
| Land | 2088.66 | 2088.66 | 2088.51 | 2086.72 | 2084.53 | 2080.23 | 2073.11 | 2025.61 | 2019.79 | 1969.49 | 1877.02 | 1861.57 | 1676.64 | 1531.31 | 1528.93 | 1526.22 | 1525.41 | 1516.96 | 1418.35 | 1412.05 | 1408.83 | 1342.92 | 1284.85 | 1249.41 | 1221.38 | 1167.62 | 1167.51 | 1163.99 | 1163.99 | 1155.59 | 1142.65 | 1105.54 | 1101.68 | 1101.68 | 1100.49 | 1095.37 | 1091.55 | 1068.24 | 1065.37 | 1065.37 | 1025.25 | 1023.46 | 984.22 | 1019.58 | 1019.58 | 1016.00 | 1018.51 | 1018.52 | 1018.52 | 894.15 | 544.47 | 544.46 | 544.46 | NA | NA | NA |
| 2023-12-31 | 2023-09-30 | 2023-06-30 | 2023-03-31 | 2022-12-31 | 2022-09-30 | 2022-06-30 | 2022-03-31 | 2021-12-31 | 2021-09-30 | 2021-06-30 | 2021-03-31 | 2020-12-31 | 2020-09-30 | 2020-06-30 | 2020-03-31 | 2019-12-31 | 2019-09-30 | 2019-06-30 | 2019-03-31 | 2018-12-31 | 2018-09-30 | 2018-06-30 | 2018-03-31 | 2017-12-31 | 2017-09-30 | 2017-06-30 | 2017-03-31 | 2016-12-31 | 2016-09-30 | 2016-06-30 | 2016-03-31 | 2015-12-31 | 2015-09-30 | 2015-06-30 | 2015-03-31 | 2014-12-31 | 2014-09-30 | 2014-06-30 | 2014-03-31 | 2013-12-31 | 2013-09-30 | 2013-06-30 | 2013-03-31 | 2012-12-31 | 2012-09-30 | 2012-06-30 | 2012-03-31 | 2011-12-31 | 2011-09-30 | 2011-06-30 | 2011-03-31 | 2010-12-31 | 2010-09-30 | 2010-06-30 | 2010-03-31 | ||
|---|---|---|---|---|---|---|---|---|---|---|---|---|---|---|---|---|---|---|---|---|---|---|---|---|---|---|---|---|---|---|---|---|---|---|---|---|---|---|---|---|---|---|---|---|---|---|---|---|---|---|---|---|---|---|---|---|---|
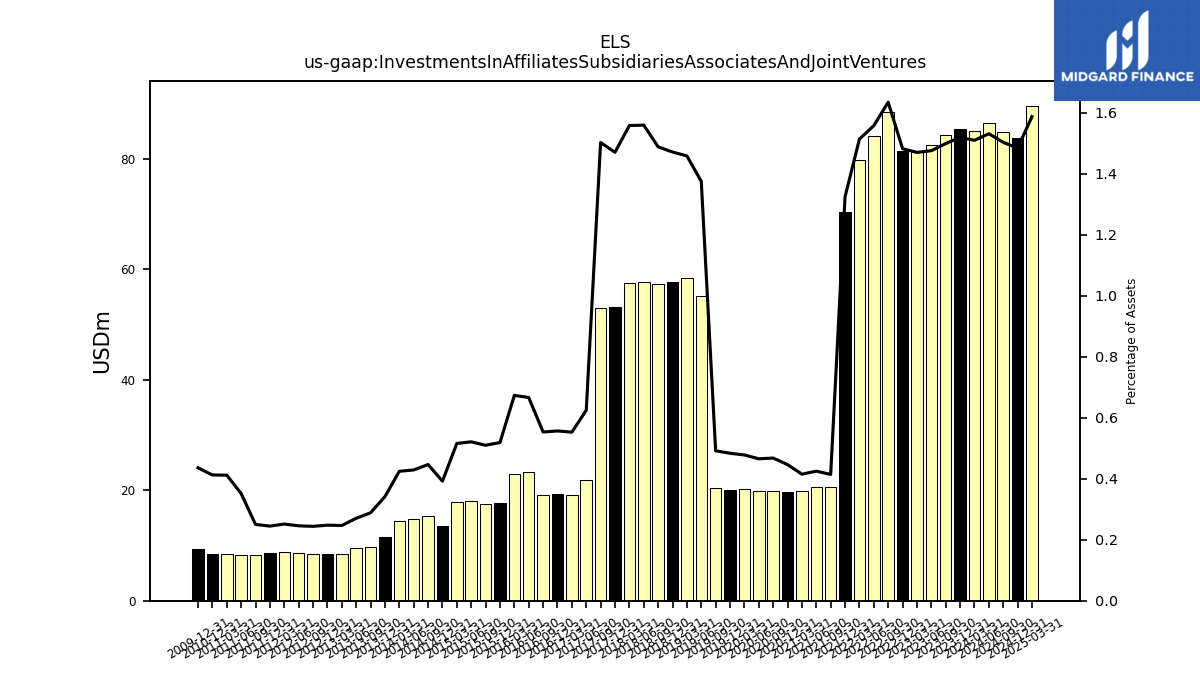
| Investments In Affiliates Subsidiaries Associates And Joint Ventures | 85.30 | 84.33 | 82.42 | 81.14 | 81.40 | 88.35 | 84.11 | 79.69 | 70.31 | 20.63 | 20.50 | 19.86 | 19.73 | 19.93 | 19.86 | 20.13 | 20.07 | 20.34 | 55.20 | 58.47 | 57.76 | 57.37 | 57.70 | 57.49 | 53.08 | 52.97 | 21.77 | 19.19 | 19.37 | 19.20 | 23.22 | 22.99 | 17.74 | 17.55 | 17.96 | 17.89 | 13.51 | 15.41 | 14.71 | 14.48 | 11.58 | 9.79 | 9.52 | 8.45 | 8.42 | 8.53 | 8.60 | 8.78 | 8.56 | 8.24 | 8.32 | 8.51 | 8.45 | NA | NA | NA | |
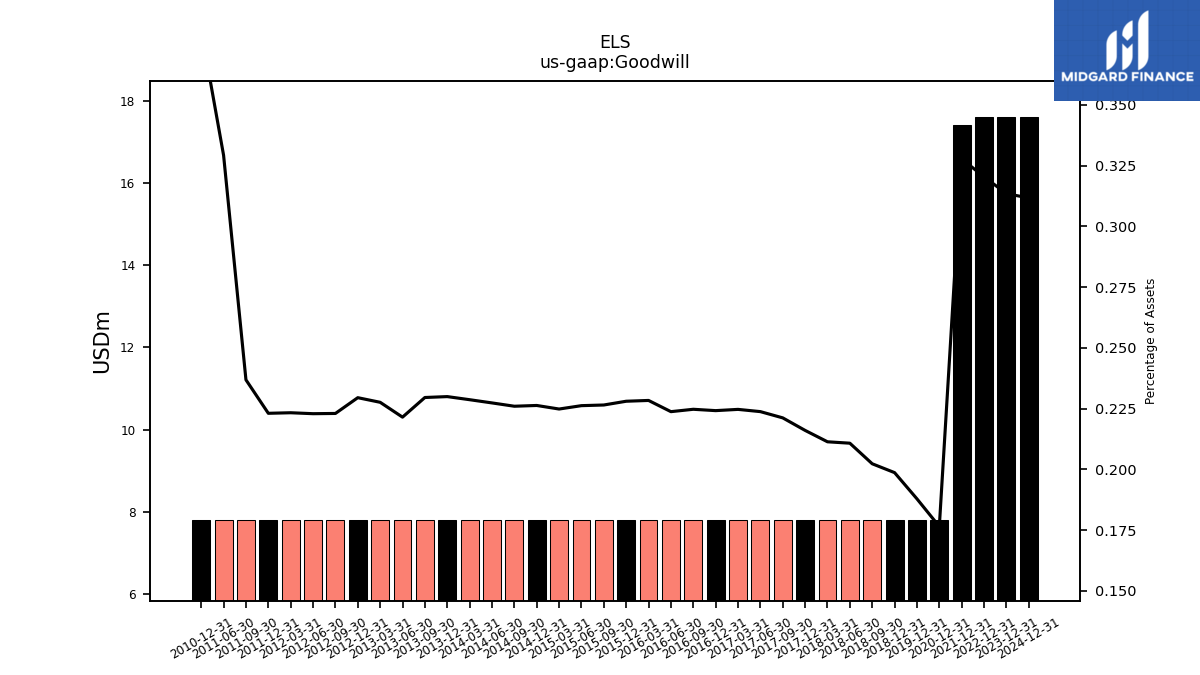
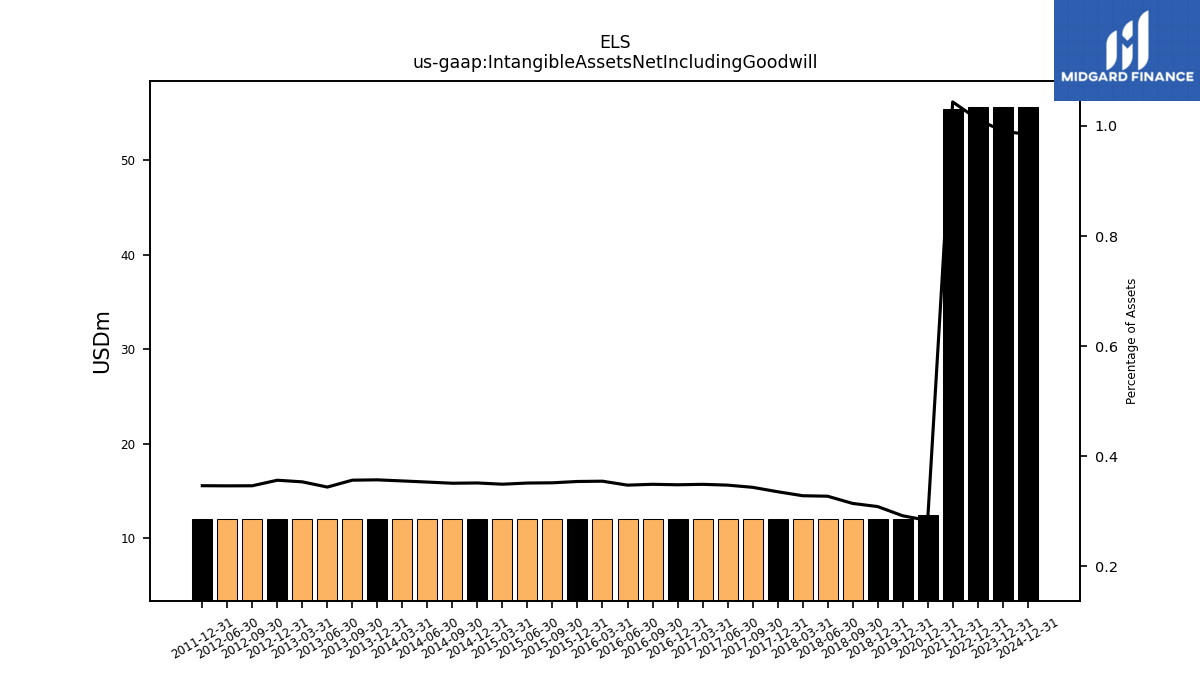
| Goodwill | 17.60 | NA | NA | NA | 17.60 | NA | NA | NA | 17.40 | NA | NA | NA | 7.80 | NA | NA | NA | 7.80 | NA | NA | NA | 7.80 | 7.80 | 7.80 | 7.80 | 7.80 | 7.80 | 7.80 | 7.80 | 7.80 | 7.80 | 7.80 | 7.80 | 7.80 | 7.80 | 7.80 | 7.80 | 7.80 | 7.80 | 7.80 | 7.80 | 7.80 | 7.80 | 7.80 | 7.80 | 7.80 | 7.80 | 7.80 | 7.80 | 7.80 | 7.80 | 7.80 | NA | 7.80 | NA | NA | NA | |
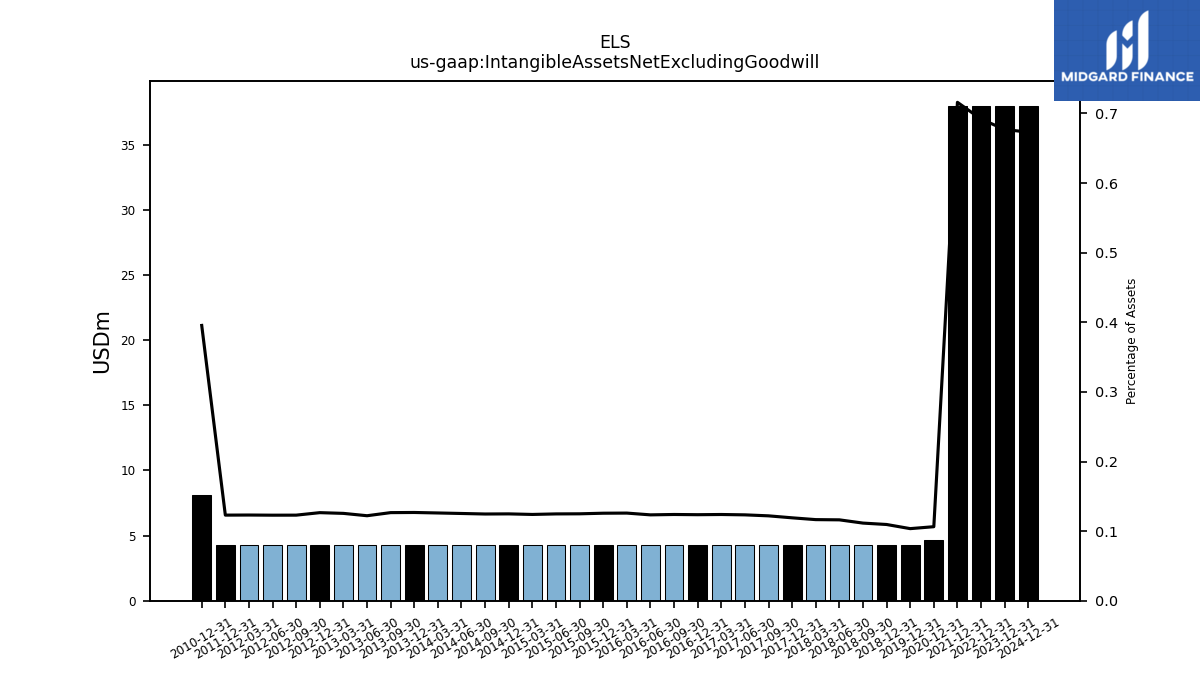
| Intangible Assets Net Excluding Goodwill | 38.00 | NA | NA | NA | 38.00 | NA | NA | NA | 38.00 | NA | NA | NA | 4.70 | NA | NA | NA | 4.30 | NA | NA | NA | 4.30 | 4.30 | 4.30 | 4.30 | 4.30 | 4.30 | 4.30 | 4.30 | 4.30 | 4.30 | 4.30 | 4.30 | 4.30 | 4.30 | 4.30 | 4.30 | 4.30 | 4.30 | 4.30 | 4.30 | 4.30 | 4.30 | 4.30 | 4.30 | 4.30 | 4.30 | 4.30 | 4.30 | 4.30 | NA | NA | NA | 8.10 | NA | NA | NA | |
| Intangible Assets Net Including Goodwill | 55.60 | NA | NA | NA | 55.60 | NA | NA | NA | 55.40 | NA | NA | NA | 12.50 | NA | NA | NA | 12.10 | NA | NA | NA | 12.10 | 12.10 | 12.10 | 12.10 | 12.10 | 12.10 | 12.10 | 12.10 | 12.10 | 12.10 | 12.10 | 12.10 | 12.10 | 12.10 | 12.10 | 12.10 | 12.10 | 12.10 | 12.10 | 12.10 | 12.10 | 12.10 | 12.10 | 12.10 | 12.10 | 12.10 | 12.10 | NA | 12.10 | NA | NA | NA | NA | NA | NA | NA |
| 2023-12-31 | 2023-09-30 | 2023-06-30 | 2023-03-31 | 2022-12-31 | 2022-09-30 | 2022-06-30 | 2022-03-31 | 2021-12-31 | 2021-09-30 | 2021-06-30 | 2021-03-31 | 2020-12-31 | 2020-09-30 | 2020-06-30 | 2020-03-31 | 2019-12-31 | 2019-09-30 | 2019-06-30 | 2019-03-31 | 2018-12-31 | 2018-09-30 | 2018-06-30 | 2018-03-31 | 2017-12-31 | 2017-09-30 | 2017-06-30 | 2017-03-31 | 2016-12-31 | 2016-09-30 | 2016-06-30 | 2016-03-31 | 2015-12-31 | 2015-09-30 | 2015-06-30 | 2015-03-31 | 2014-12-31 | 2014-09-30 | 2014-06-30 | 2014-03-31 | 2013-12-31 | 2013-09-30 | 2013-06-30 | 2013-03-31 | 2012-12-31 | 2012-09-30 | 2012-06-30 | 2012-03-31 | 2011-12-31 | 2011-09-30 | 2011-06-30 | 2011-03-31 | 2010-12-31 | 2010-09-30 | 2010-06-30 | 2010-03-31 | ||
|---|---|---|---|---|---|---|---|---|---|---|---|---|---|---|---|---|---|---|---|---|---|---|---|---|---|---|---|---|---|---|---|---|---|---|---|---|---|---|---|---|---|---|---|---|---|---|---|---|---|---|---|---|---|---|---|---|---|
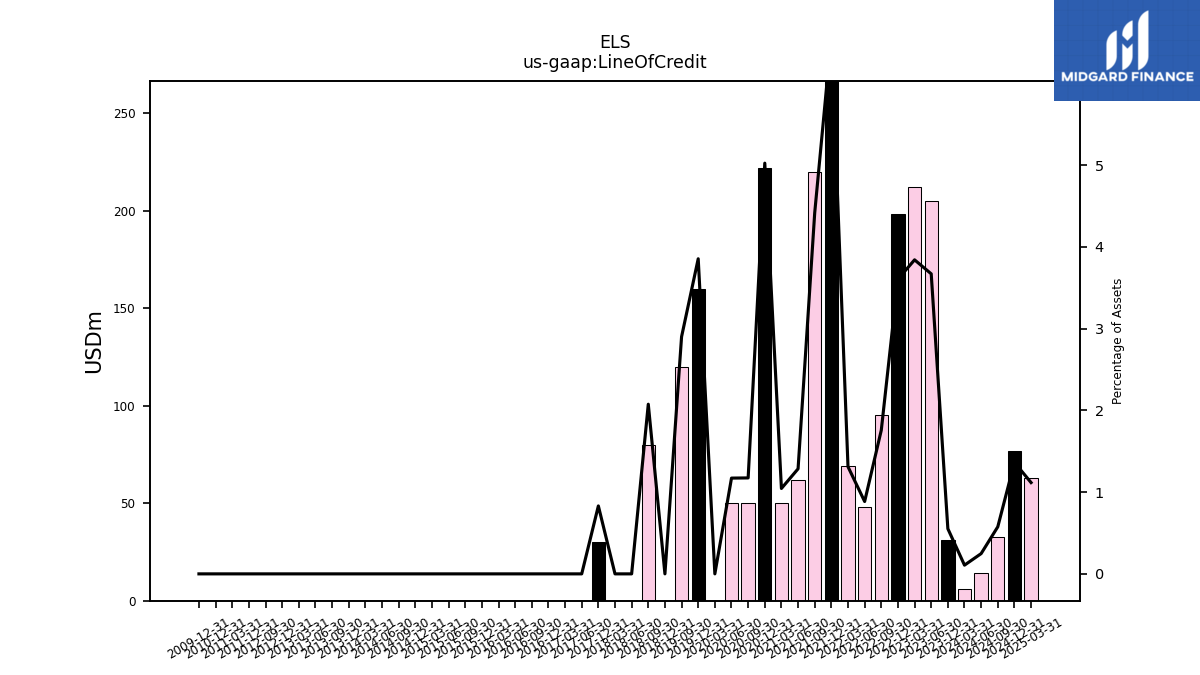
| Line Of Credit | 31.00 | NA | 205.00 | 212.00 | 198.00 | 94.98 | 47.80 | 69.00 | 349.00 | 220.00 | 62.00 | 50.00 | 222.00 | 50.00 | 50.00 | 0.00 | 160.00 | 120.00 | NA | NA | 0.00 | 80.00 | 0.00 | 0.00 | 30.00 | NA | 0.00 | 0.00 | 0.00 | 0.00 | 0.00 | 0.00 | 0.00 | 0.00 | 0.00 | 0.00 | 0.00 | 0.00 | 0.00 | 0.00 | 0.00 | 0.00 | 0.00 | 0.00 | 0.00 | 0.00 | NA | NA | 0.00 | NA | NA | 0.00 | 0.00 | NA | NA | NA |
| 2023-12-31 | 2023-09-30 | 2023-06-30 | 2023-03-31 | 2022-12-31 | 2022-09-30 | 2022-06-30 | 2022-03-31 | 2021-12-31 | 2021-09-30 | 2021-06-30 | 2021-03-31 | 2020-12-31 | 2020-09-30 | 2020-06-30 | 2020-03-31 | 2019-12-31 | 2019-09-30 | 2019-06-30 | 2019-03-31 | 2018-12-31 | 2018-09-30 | 2018-06-30 | 2018-03-31 | 2017-12-31 | 2017-09-30 | 2017-06-30 | 2017-03-31 | 2016-12-31 | 2016-09-30 | 2016-06-30 | 2016-03-31 | 2015-12-31 | 2015-09-30 | 2015-06-30 | 2015-03-31 | 2014-12-31 | 2014-09-30 | 2014-06-30 | 2014-03-31 | 2013-12-31 | 2013-09-30 | 2013-06-30 | 2013-03-31 | 2012-12-31 | 2012-09-30 | 2012-06-30 | 2012-03-31 | 2011-12-31 | 2011-09-30 | 2011-06-30 | 2011-03-31 | 2010-12-31 | 2010-09-30 | 2010-06-30 | 2010-03-31 | ||
|---|---|---|---|---|---|---|---|---|---|---|---|---|---|---|---|---|---|---|---|---|---|---|---|---|---|---|---|---|---|---|---|---|---|---|---|---|---|---|---|---|---|---|---|---|---|---|---|---|---|---|---|---|---|---|---|---|---|
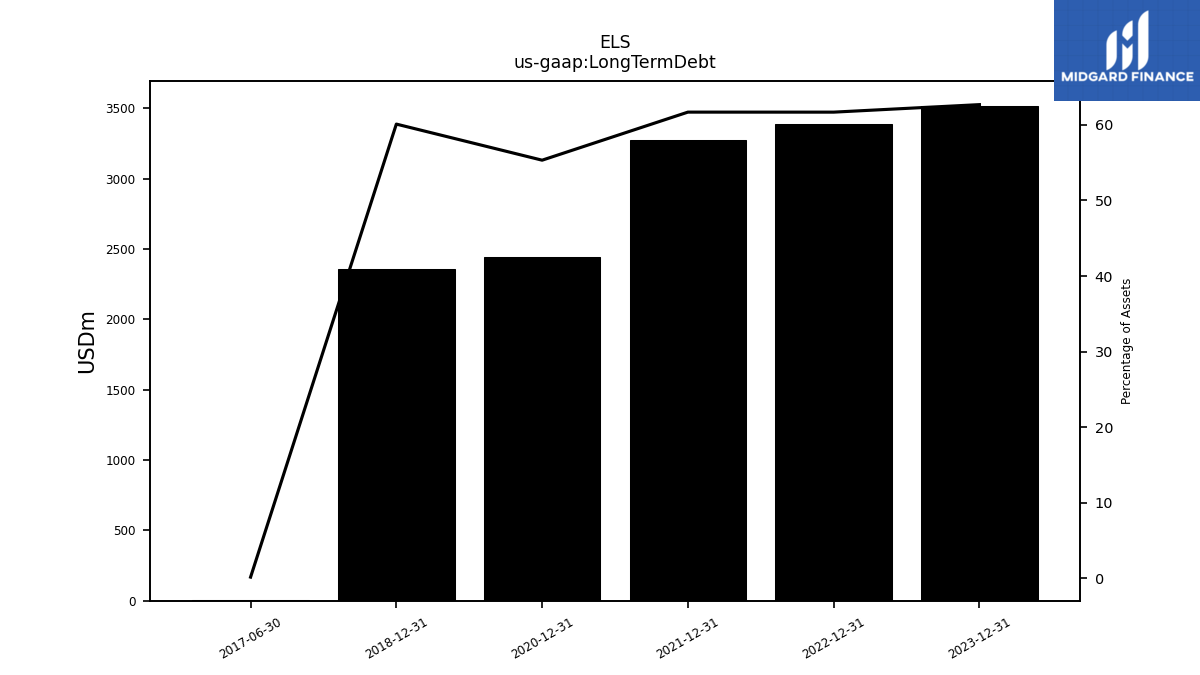
| Long Term Debt | 3518.61 | NA | NA | NA | 3387.98 | NA | NA | NA | 3274.22 | NA | NA | NA | 2444.93 | NA | NA | NA | NA | NA | NA | NA | 2359.53 | NA | NA | NA | NA | NA | 5.90 | NA | NA | NA | NA | NA | NA | NA | NA | NA | NA | NA | NA | NA | NA | NA | NA | NA | NA | NA | NA | NA | NA | NA | NA | NA | NA | NA | NA | NA |
| 2023-12-31 | 2023-09-30 | 2023-06-30 | 2023-03-31 | 2022-12-31 | 2022-09-30 | 2022-06-30 | 2022-03-31 | 2021-12-31 | 2021-09-30 | 2021-06-30 | 2021-03-31 | 2020-12-31 | 2020-09-30 | 2020-06-30 | 2020-03-31 | 2019-12-31 | 2019-09-30 | 2019-06-30 | 2019-03-31 | 2018-12-31 | 2018-09-30 | 2018-06-30 | 2018-03-31 | 2017-12-31 | 2017-09-30 | 2017-06-30 | 2017-03-31 | 2016-12-31 | 2016-09-30 | 2016-06-30 | 2016-03-31 | 2015-12-31 | 2015-09-30 | 2015-06-30 | 2015-03-31 | 2014-12-31 | 2014-09-30 | 2014-06-30 | 2014-03-31 | 2013-12-31 | 2013-09-30 | 2013-06-30 | 2013-03-31 | 2012-12-31 | 2012-09-30 | 2012-06-30 | 2012-03-31 | 2011-12-31 | 2011-09-30 | 2011-06-30 | 2011-03-31 | 2010-12-31 | 2010-09-30 | 2010-06-30 | 2010-03-31 | ||
|---|---|---|---|---|---|---|---|---|---|---|---|---|---|---|---|---|---|---|---|---|---|---|---|---|---|---|---|---|---|---|---|---|---|---|---|---|---|---|---|---|---|---|---|---|---|---|---|---|---|---|---|---|---|---|---|---|---|
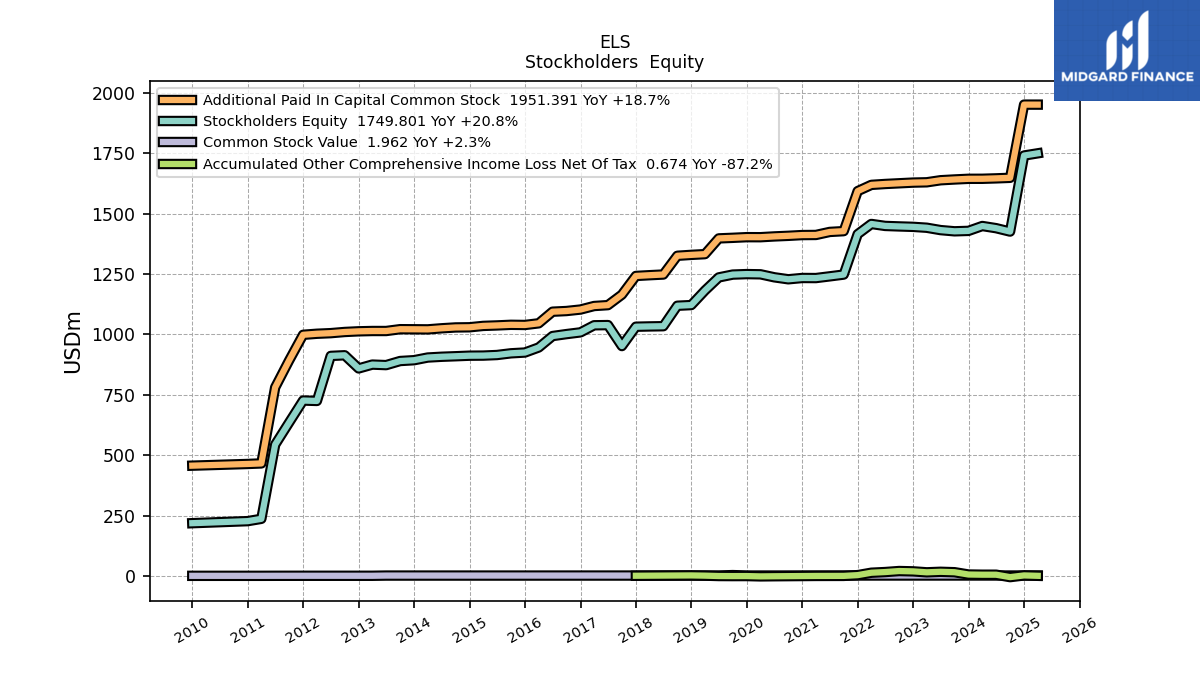
| Stockholders Equity | 1428.72 | 1426.95 | 1431.96 | 1441.72 | 1445.40 | 1447.17 | 1449.20 | 1457.37 | 1415.11 | 1247.82 | 1240.49 | 1233.38 | 1233.69 | 1228.31 | 1236.51 | 1248.91 | 1249.81 | 1247.76 | 1236.07 | 1181.83 | 1121.55 | 1118.76 | 1034.06 | 1033.16 | 1031.95 | 951.76 | 1038.71 | 1037.91 | 1008.54 | 1001.39 | 993.33 | 945.99 | 925.07 | 921.82 | 914.79 | 912.38 | 911.99 | 909.70 | 907.56 | 904.36 | 893.33 | 889.90 | 872.98 | 875.15 | 859.25 | 913.77 | 911.07 | 724.64 | 726.33 | 635.36 | 543.76 | 236.53 | 227.03 | NA | NA | NA | |
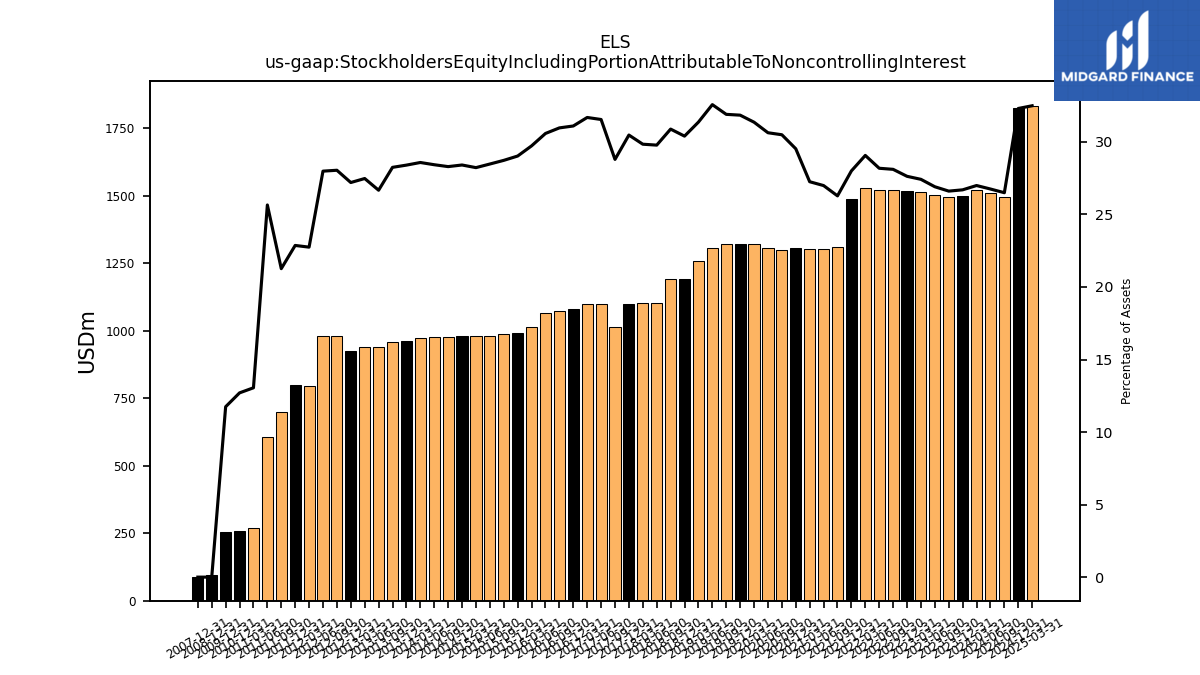
| Stockholders Equity Including Portion Attributable To Noncontrolling Interest | 1498.62 | 1497.01 | 1503.11 | 1513.39 | 1517.48 | 1519.39 | 1521.74 | 1530.34 | 1486.17 | 1309.22 | 1301.99 | 1304.35 | 1304.76 | 1299.09 | 1307.38 | 1320.91 | 1321.89 | 1319.79 | 1307.47 | 1257.32 | 1193.34 | 1190.52 | 1101.83 | 1101.14 | 1100.04 | 1015.17 | 1099.41 | 1099.75 | 1081.85 | 1074.61 | 1065.92 | 1015.16 | 992.69 | 989.18 | 981.68 | 979.09 | 979.03 | 976.54 | 975.15 | 974.73 | 963.21 | 959.53 | 939.04 | 941.47 | 924.30 | 980.78 | 979.06 | 794.40 | 799.28 | 700.16 | 607.59 | 269.74 | 260.16 | NA | NA | NA | |
| Common Stock Value | 1.92 | 1.92 | 1.92 | 1.92 | 1.92 | 1.92 | 1.92 | 1.92 | 1.91 | 1.83 | 1.83 | 1.81 | 1.81 | 1.81 | 1.81 | 1.81 | 1.81 | 3.62 | 1.81 | 1.79 | 1.79 | 1.79 | 1.77 | 1.77 | 1.77 | 1.74 | 1.74 | 1.73 | 1.71 | 1.70 | 1.70 | 1.69 | 1.69 | 1.69 | 1.69 | 1.68 | 1.68 | 1.68 | 1.67 | 1.67 | 1.67 | 1.67 | 1.67 | 0.83 | 0.83 | 0.83 | 0.83 | 0.83 | 0.82 | 0.79 | 0.74 | 0.62 | 0.62 | NA | NA | NA | |
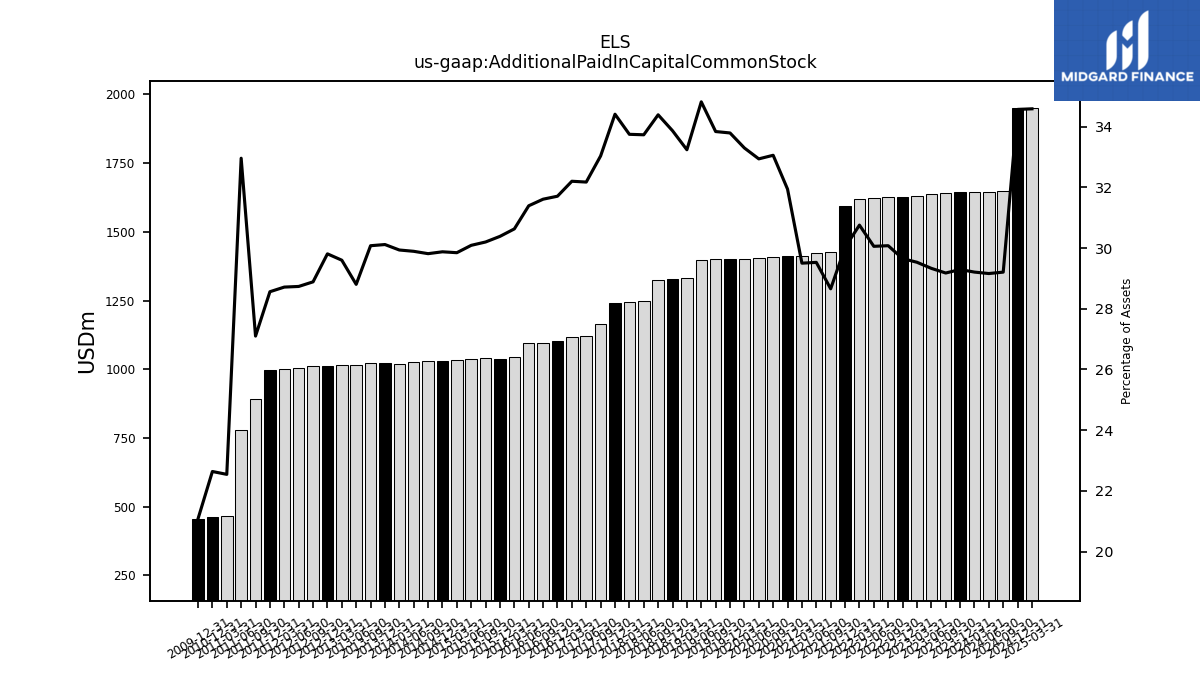
| Additional Paid In Capital Common Stock | 1644.32 | 1641.55 | 1638.35 | 1629.87 | 1628.62 | 1625.75 | 1622.88 | 1619.16 | 1593.36 | 1427.61 | 1424.35 | 1411.81 | 1411.40 | 1408.25 | 1405.76 | 1402.51 | 1402.70 | 1399.95 | 1397.61 | 1332.41 | 1329.39 | 1325.65 | 1248.05 | 1245.21 | 1242.11 | 1164.66 | 1121.31 | 1117.63 | 1103.05 | 1096.92 | 1094.15 | 1046.03 | 1039.14 | 1039.84 | 1037.29 | 1035.28 | 1029.60 | 1028.91 | 1025.40 | 1020.92 | 1021.37 | 1021.69 | 1014.17 | 1014.20 | 1012.93 | 1010.15 | 1005.29 | 1002.81 | 998.48 | 892.32 | 780.62 | 465.96 | 463.72 | NA | NA | NA | |
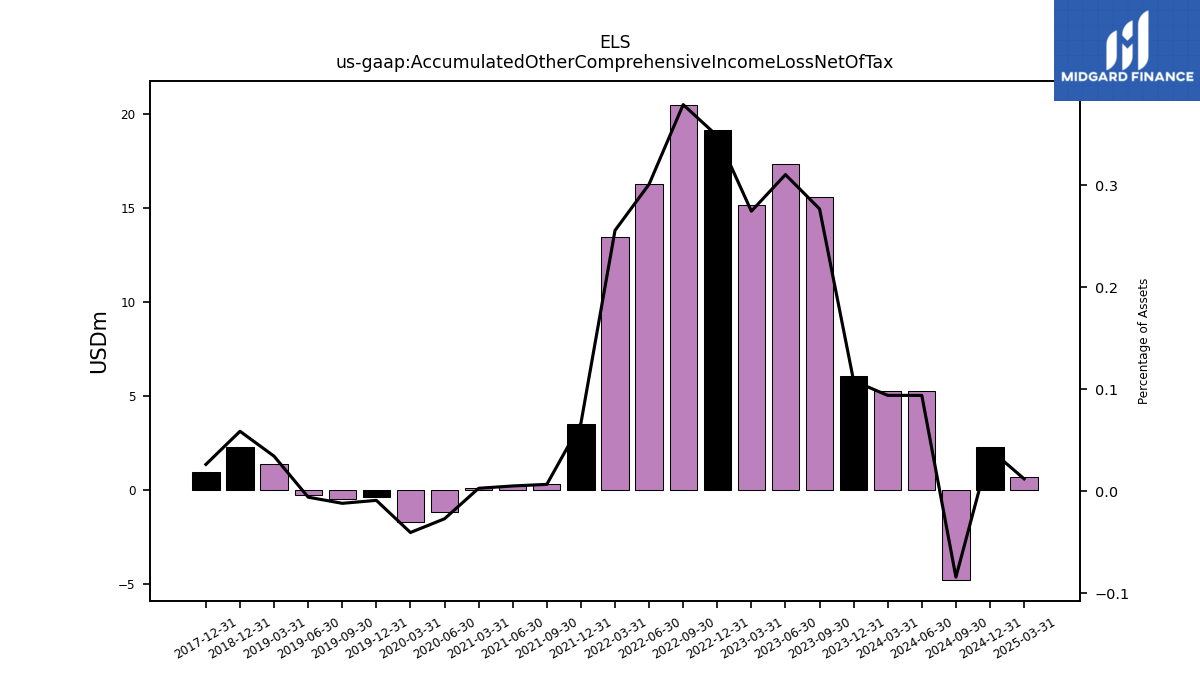
| Accumulated Other Comprehensive Income Loss Net Of Tax | 6.06 | 15.56 | 17.33 | 15.14 | 19.12 | 20.48 | 16.24 | 13.45 | 3.52 | 0.33 | 0.24 | 0.13 | NA | NA | -1.16 | -1.71 | -0.38 | -0.50 | -0.24 | 1.37 | 2.30 | NA | NA | NA | 0.94 | NA | NA | NA | NA | NA | NA | NA | NA | NA | NA | NA | NA | NA | NA | NA | NA | NA | NA | NA | NA | NA | NA | NA | NA | NA | NA | NA | NA | NA | NA | NA |
| 2023-12-31 | 2023-09-30 | 2023-06-30 | 2023-03-31 | 2022-12-31 | 2022-09-30 | 2022-06-30 | 2022-03-31 | 2021-12-31 | 2021-09-30 | 2021-06-30 | 2021-03-31 | 2020-12-31 | 2020-09-30 | 2020-06-30 | 2020-03-31 | 2019-12-31 | 2019-09-30 | 2019-06-30 | 2019-03-31 | 2018-12-31 | 2018-09-30 | 2018-06-30 | 2018-03-31 | 2017-12-31 | 2017-09-30 | 2017-06-30 | 2017-03-31 | 2016-12-31 | 2016-09-30 | 2016-06-30 | 2016-03-31 | 2015-12-31 | 2015-09-30 | 2015-06-30 | 2015-03-31 | 2014-12-31 | 2014-09-30 | 2014-06-30 | 2014-03-31 | 2013-12-31 | 2013-09-30 | 2013-06-30 | 2013-03-31 | 2012-12-31 | 2012-09-30 | 2012-06-30 | 2012-03-31 | 2011-12-31 | 2011-09-30 | 2011-06-30 | 2011-03-31 | 2010-12-31 | 2010-09-30 | 2010-06-30 | 2010-03-31 | ||
|---|---|---|---|---|---|---|---|---|---|---|---|---|---|---|---|---|---|---|---|---|---|---|---|---|---|---|---|---|---|---|---|---|---|---|---|---|---|---|---|---|---|---|---|---|---|---|---|---|---|---|---|---|---|---|---|---|---|
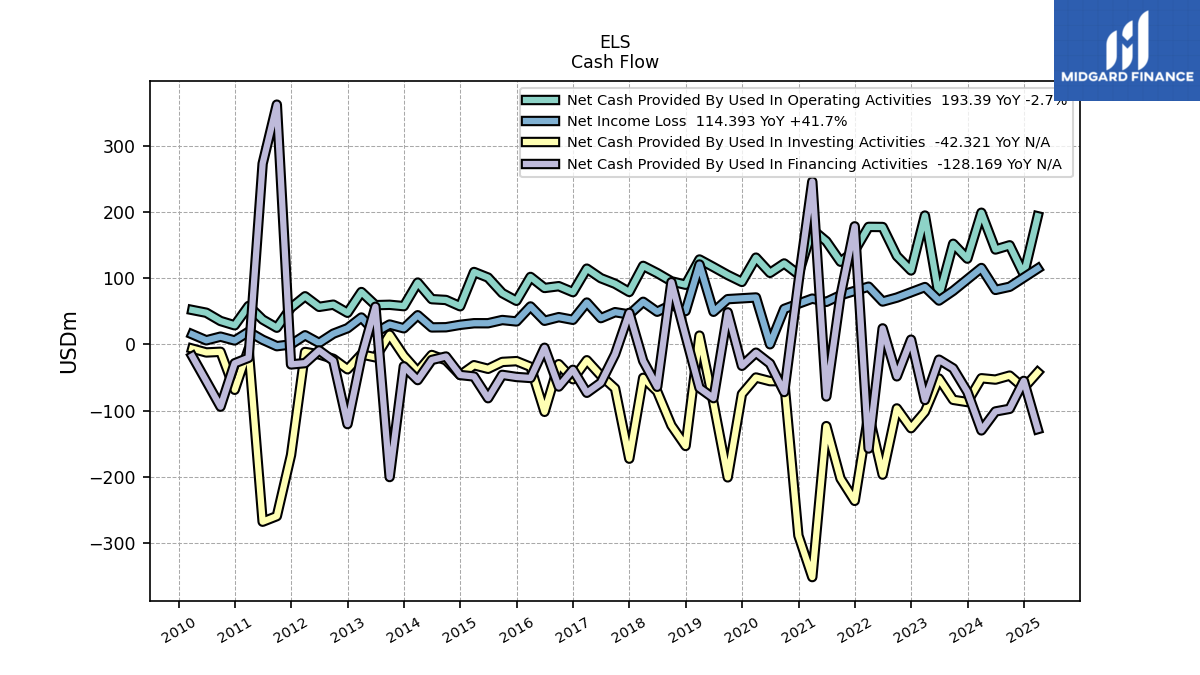
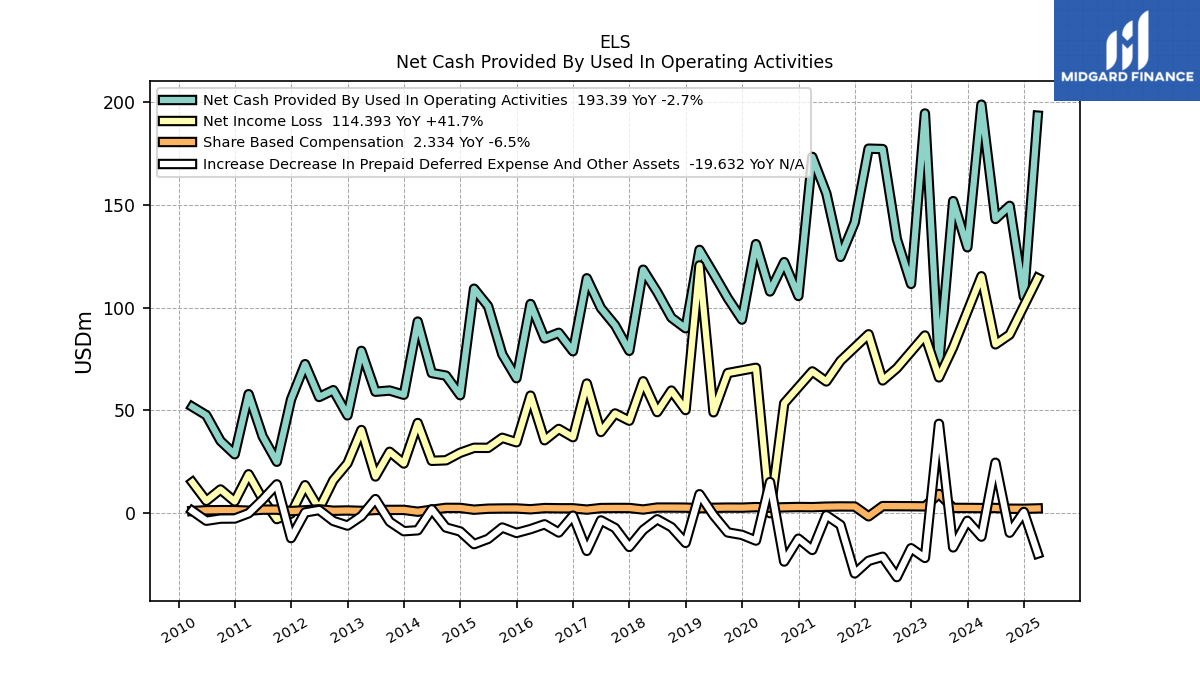
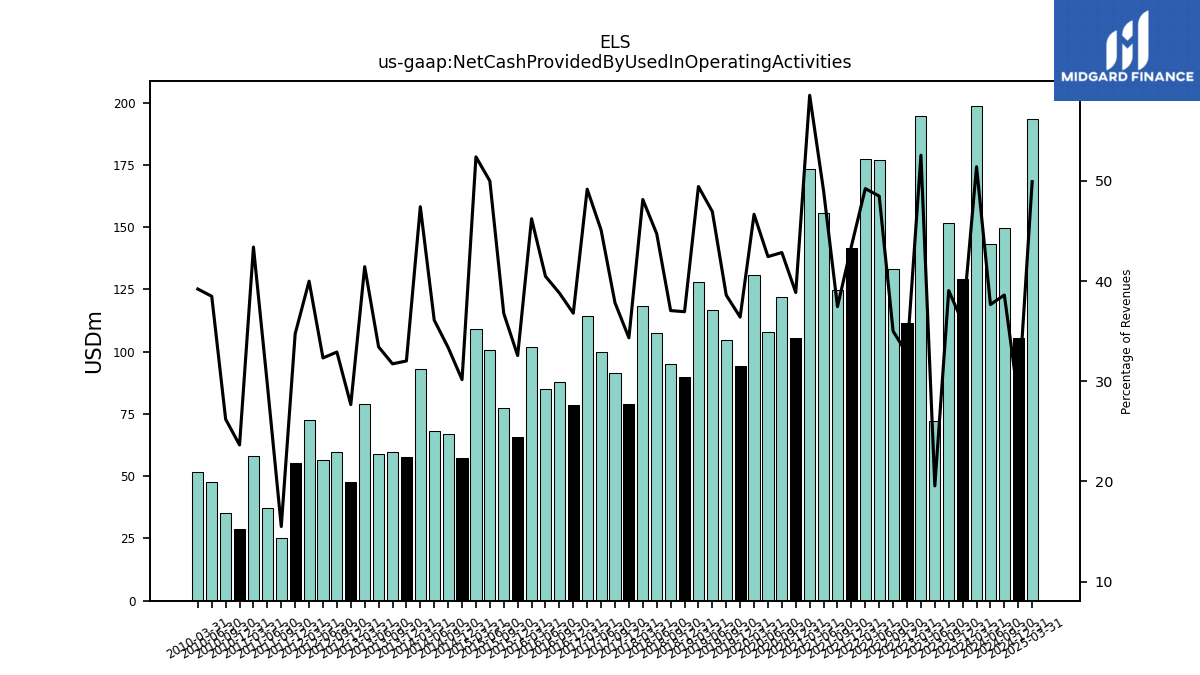
| Net Cash Provided By Used In Operating Activities | 129.35 | 151.83 | 72.36 | 194.46 | 111.52 | 133.36 | 177.13 | 177.33 | 141.44 | 124.68 | 155.59 | 173.33 | 105.67 | 122.12 | 107.85 | 130.89 | 94.17 | 104.66 | 116.59 | 128.10 | 89.94 | 95.12 | 107.57 | 118.45 | 78.98 | 91.41 | 99.82 | 114.29 | 78.77 | 87.78 | 85.04 | 101.77 | 65.66 | 77.27 | 100.73 | 109.22 | 57.40 | 66.93 | 68.18 | 93.23 | 57.61 | 59.66 | 59.10 | 78.98 | 47.58 | 59.86 | 56.52 | 72.50 | 55.35 | 25.02 | 37.35 | 57.92 | 28.65 | 35.18 | 47.66 | 51.82 | |
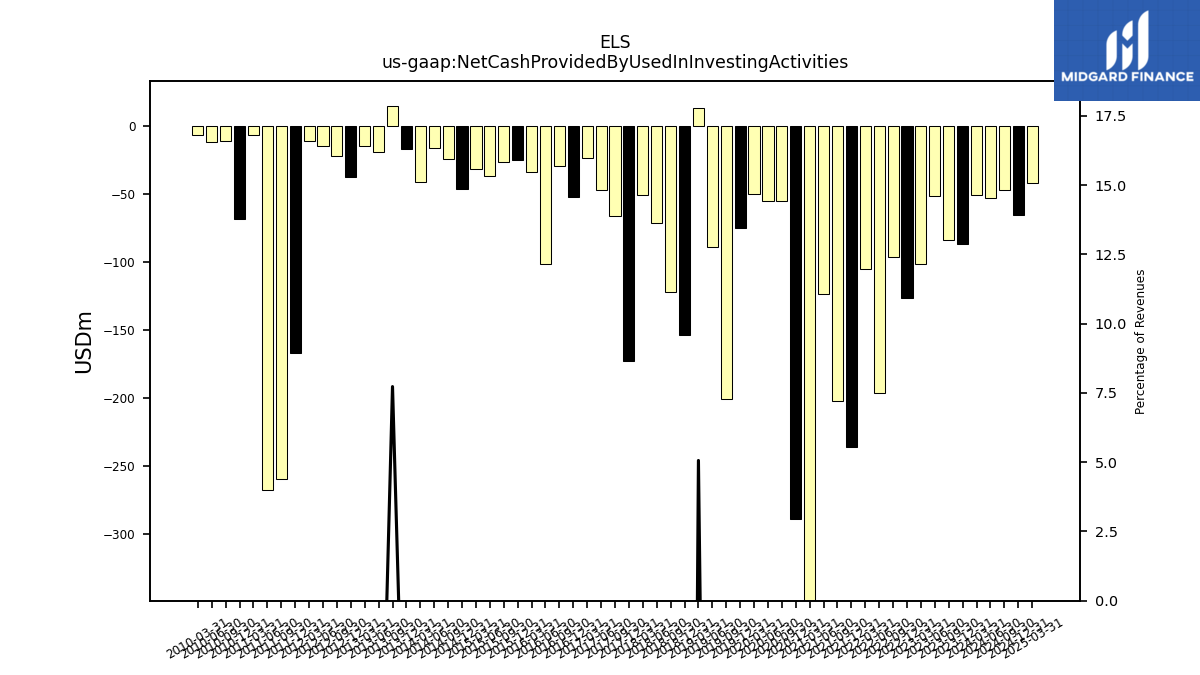
| Net Cash Provided By Used In Investing Activities | -87.23 | -83.91 | -51.68 | -101.93 | -126.70 | -96.83 | -196.87 | -105.18 | -236.50 | -202.74 | -123.56 | -351.65 | -288.85 | -55.73 | -55.64 | -50.16 | -75.19 | -201.02 | -88.99 | 13.11 | -153.60 | -122.58 | -71.26 | -50.63 | -172.78 | -66.75 | -47.32 | -24.11 | -52.75 | -29.98 | -102.05 | -34.04 | -25.45 | -26.64 | -37.04 | -31.58 | -46.45 | -24.17 | -16.10 | -41.16 | -17.47 | 14.53 | -19.71 | -15.20 | -37.73 | -21.95 | -15.31 | -11.57 | -167.25 | -259.55 | -267.97 | -7.08 | -68.75 | -11.32 | -12.34 | -6.52 | |
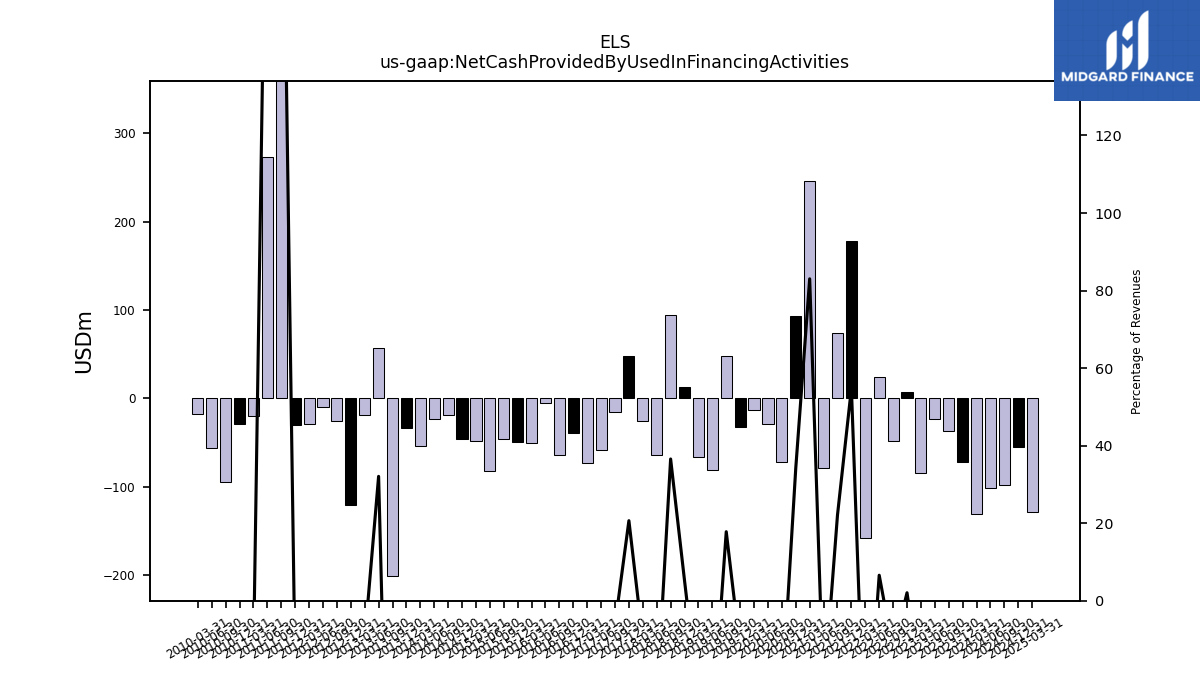
| Net Cash Provided By Used In Financing Activities | -71.86 | -36.35 | -23.24 | -84.22 | 7.03 | -48.44 | 24.04 | -157.43 | 178.18 | 73.58 | -78.81 | 245.79 | 93.02 | -72.17 | -29.14 | -12.67 | -32.51 | 48.28 | -81.36 | -65.96 | 12.67 | 93.84 | -64.17 | -25.02 | 47.48 | -15.01 | -58.00 | -73.27 | -38.49 | -63.85 | -5.23 | -50.87 | -49.35 | -46.18 | -81.45 | -48.65 | -46.38 | -18.43 | -23.70 | -54.06 | -33.24 | -200.56 | 56.70 | -19.10 | -120.57 | -25.00 | -9.22 | -28.42 | -30.43 | 361.98 | 272.82 | -20.36 | -28.66 | -94.25 | -55.83 | -18.12 |
| 2023-12-31 | 2023-09-30 | 2023-06-30 | 2023-03-31 | 2022-12-31 | 2022-09-30 | 2022-06-30 | 2022-03-31 | 2021-12-31 | 2021-09-30 | 2021-06-30 | 2021-03-31 | 2020-12-31 | 2020-09-30 | 2020-06-30 | 2020-03-31 | 2019-12-31 | 2019-09-30 | 2019-06-30 | 2019-03-31 | 2018-12-31 | 2018-09-30 | 2018-06-30 | 2018-03-31 | 2017-12-31 | 2017-09-30 | 2017-06-30 | 2017-03-31 | 2016-12-31 | 2016-09-30 | 2016-06-30 | 2016-03-31 | 2015-12-31 | 2015-09-30 | 2015-06-30 | 2015-03-31 | 2014-12-31 | 2014-09-30 | 2014-06-30 | 2014-03-31 | 2013-12-31 | 2013-09-30 | 2013-06-30 | 2013-03-31 | 2012-12-31 | 2012-09-30 | 2012-06-30 | 2012-03-31 | 2011-12-31 | 2011-09-30 | 2011-06-30 | 2011-03-31 | 2010-12-31 | 2010-09-30 | 2010-06-30 | 2010-03-31 | ||
|---|---|---|---|---|---|---|---|---|---|---|---|---|---|---|---|---|---|---|---|---|---|---|---|---|---|---|---|---|---|---|---|---|---|---|---|---|---|---|---|---|---|---|---|---|---|---|---|---|---|---|---|---|---|---|---|---|---|
| Net Cash Provided By Used In Operating Activities | 129.35 | 151.83 | 72.36 | 194.46 | 111.52 | 133.36 | 177.13 | 177.33 | 141.44 | 124.68 | 155.59 | 173.33 | 105.67 | 122.12 | 107.85 | 130.89 | 94.17 | 104.66 | 116.59 | 128.10 | 89.94 | 95.12 | 107.57 | 118.45 | 78.98 | 91.41 | 99.82 | 114.29 | 78.77 | 87.78 | 85.04 | 101.77 | 65.66 | 77.27 | 100.73 | 109.22 | 57.40 | 66.93 | 68.18 | 93.23 | 57.61 | 59.66 | 59.10 | 78.98 | 47.58 | 59.86 | 56.52 | 72.50 | 55.35 | 25.02 | 37.35 | 57.92 | 28.65 | 35.18 | 47.66 | 51.82 | |
| Profit Loss | 96.43 | 80.74 | 66.05 | 86.46 | 76.68 | 70.51 | 64.59 | 87.05 | 68.84 | 74.09 | 64.08 | 68.99 | 68.37 | 53.47 | 48.85 | 70.72 | 58.13 | 68.18 | 49.09 | 120.53 | 53.38 | 59.66 | 49.17 | 64.18 | 47.97 | 54.87 | 44.46 | 63.08 | 42.38 | 46.76 | 40.80 | 57.19 | 39.77 | 42.11 | 36.83 | 31.81 | 34.26 | 30.28 | 30.04 | 43.89 | 28.72 | 34.94 | 21.79 | 40.47 | 29.01 | 21.49 | 6.30 | 17.65 | 3.86 | 1.35 | 11.65 | 25.63 | 10.60 | 17.31 | 10.97 | 21.53 | |
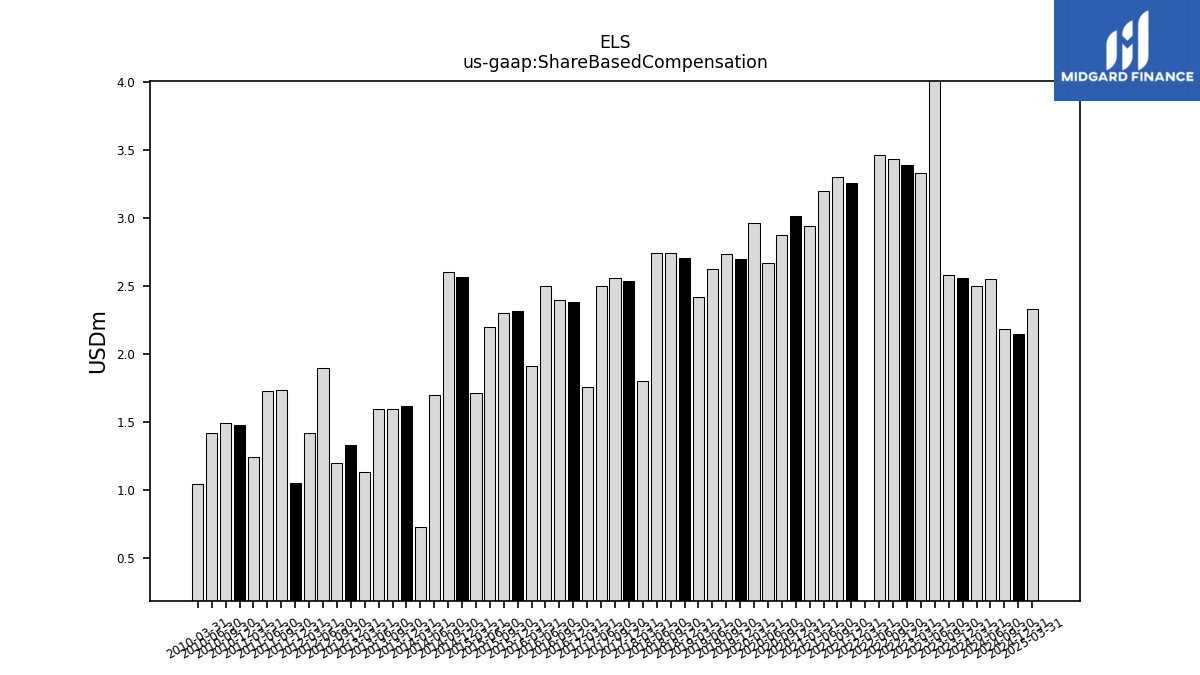
| Share Based Compensation | 2.56 | 2.58 | 9.37 | 3.33 | 3.39 | 3.44 | 3.46 | -1.53 | 3.26 | 3.30 | 3.20 | 2.94 | 3.02 | 2.88 | 2.67 | 2.96 | 2.70 | 2.73 | 2.62 | 2.42 | 2.71 | 2.75 | 2.74 | 1.80 | 2.54 | 2.56 | 2.50 | 1.75 | 2.38 | 2.40 | 2.50 | 1.91 | 2.31 | 2.30 | 2.20 | 1.72 | 2.57 | 2.60 | 1.70 | 0.73 | 1.62 | 1.60 | 1.60 | 1.13 | 1.33 | 1.20 | 1.90 | 1.42 | 1.05 | 1.74 | 1.73 | 1.24 | 1.48 | 1.49 | 1.42 | 1.04 | |
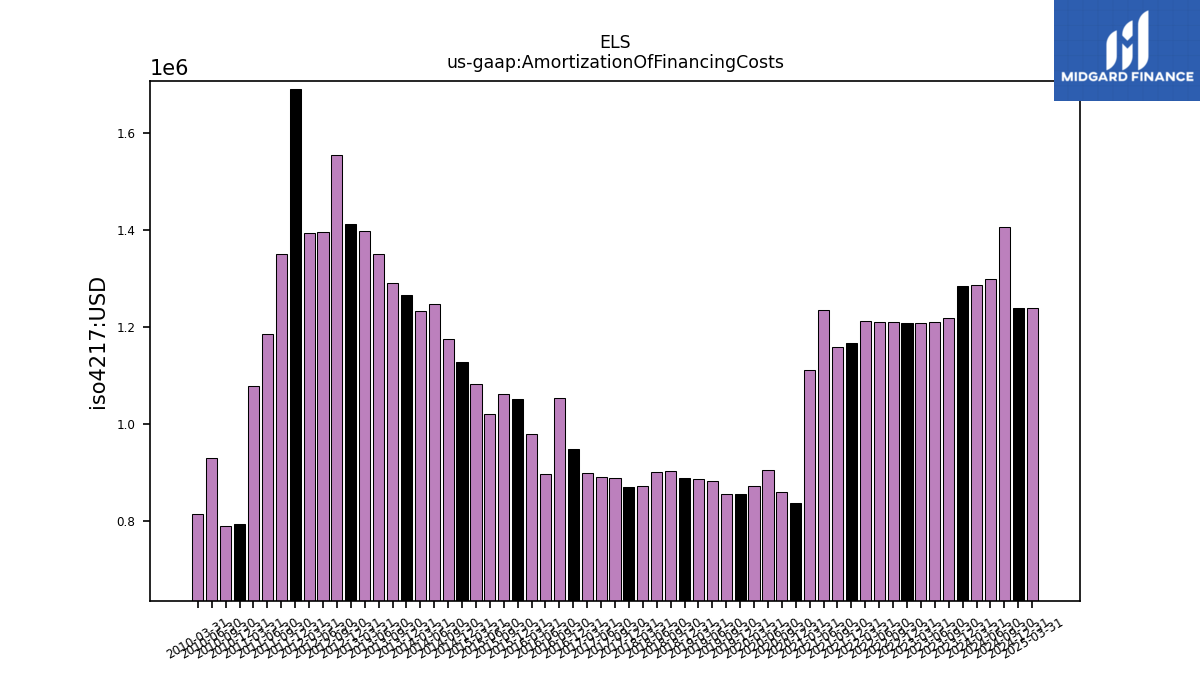
| Amortization Of Financing Costs | 1.28 | 1.22 | 1.21 | 1.21 | 1.21 | 1.21 | 1.21 | 1.21 | 1.17 | 1.16 | 1.24 | 1.11 | 0.84 | 0.86 | 0.91 | 0.87 | 0.86 | 0.85 | 0.88 | 0.89 | 0.89 | 0.90 | 0.90 | 0.87 | 0.87 | 0.89 | 0.89 | 0.90 | 0.95 | 1.05 | 0.90 | 0.98 | 1.05 | 1.06 | 1.02 | 1.08 | 1.13 | 1.18 | 1.25 | 1.23 | 1.26 | 1.29 | 1.35 | 1.40 | 1.41 | 1.55 | 1.40 | 1.39 | 1.69 | 1.35 | 1.19 | 1.08 | 0.79 | 0.79 | 0.93 | 0.81 |
| 2023-12-31 | 2023-09-30 | 2023-06-30 | 2023-03-31 | 2022-12-31 | 2022-09-30 | 2022-06-30 | 2022-03-31 | 2021-12-31 | 2021-09-30 | 2021-06-30 | 2021-03-31 | 2020-12-31 | 2020-09-30 | 2020-06-30 | 2020-03-31 | 2019-12-31 | 2019-09-30 | 2019-06-30 | 2019-03-31 | 2018-12-31 | 2018-09-30 | 2018-06-30 | 2018-03-31 | 2017-12-31 | 2017-09-30 | 2017-06-30 | 2017-03-31 | 2016-12-31 | 2016-09-30 | 2016-06-30 | 2016-03-31 | 2015-12-31 | 2015-09-30 | 2015-06-30 | 2015-03-31 | 2014-12-31 | 2014-09-30 | 2014-06-30 | 2014-03-31 | 2013-12-31 | 2013-09-30 | 2013-06-30 | 2013-03-31 | 2012-12-31 | 2012-09-30 | 2012-06-30 | 2012-03-31 | 2011-12-31 | 2011-09-30 | 2011-06-30 | 2011-03-31 | 2010-12-31 | 2010-09-30 | 2010-06-30 | 2010-03-31 | ||
|---|---|---|---|---|---|---|---|---|---|---|---|---|---|---|---|---|---|---|---|---|---|---|---|---|---|---|---|---|---|---|---|---|---|---|---|---|---|---|---|---|---|---|---|---|---|---|---|---|---|---|---|---|---|---|---|---|---|
| Net Cash Provided By Used In Investing Activities | -87.23 | -83.91 | -51.68 | -101.93 | -126.70 | -96.83 | -196.87 | -105.18 | -236.50 | -202.74 | -123.56 | -351.65 | -288.85 | -55.73 | -55.64 | -50.16 | -75.19 | -201.02 | -88.99 | 13.11 | -153.60 | -122.58 | -71.26 | -50.63 | -172.78 | -66.75 | -47.32 | -24.11 | -52.75 | -29.98 | -102.05 | -34.04 | -25.45 | -26.64 | -37.04 | -31.58 | -46.45 | -24.17 | -16.10 | -41.16 | -17.47 | 14.53 | -19.71 | -15.20 | -37.73 | -21.95 | -15.31 | -11.57 | -167.25 | -259.55 | -267.97 | -7.08 | -68.75 | -11.32 | -12.34 | -6.52 |
| 2023-12-31 | 2023-09-30 | 2023-06-30 | 2023-03-31 | 2022-12-31 | 2022-09-30 | 2022-06-30 | 2022-03-31 | 2021-12-31 | 2021-09-30 | 2021-06-30 | 2021-03-31 | 2020-12-31 | 2020-09-30 | 2020-06-30 | 2020-03-31 | 2019-12-31 | 2019-09-30 | 2019-06-30 | 2019-03-31 | 2018-12-31 | 2018-09-30 | 2018-06-30 | 2018-03-31 | 2017-12-31 | 2017-09-30 | 2017-06-30 | 2017-03-31 | 2016-12-31 | 2016-09-30 | 2016-06-30 | 2016-03-31 | 2015-12-31 | 2015-09-30 | 2015-06-30 | 2015-03-31 | 2014-12-31 | 2014-09-30 | 2014-06-30 | 2014-03-31 | 2013-12-31 | 2013-09-30 | 2013-06-30 | 2013-03-31 | 2012-12-31 | 2012-09-30 | 2012-06-30 | 2012-03-31 | 2011-12-31 | 2011-09-30 | 2011-06-30 | 2011-03-31 | 2010-12-31 | 2010-09-30 | 2010-06-30 | 2010-03-31 | ||
|---|---|---|---|---|---|---|---|---|---|---|---|---|---|---|---|---|---|---|---|---|---|---|---|---|---|---|---|---|---|---|---|---|---|---|---|---|---|---|---|---|---|---|---|---|---|---|---|---|---|---|---|---|---|---|---|---|---|
| Net Cash Provided By Used In Financing Activities | -71.86 | -36.35 | -23.24 | -84.22 | 7.03 | -48.44 | 24.04 | -157.43 | 178.18 | 73.58 | -78.81 | 245.79 | 93.02 | -72.17 | -29.14 | -12.67 | -32.51 | 48.28 | -81.36 | -65.96 | 12.67 | 93.84 | -64.17 | -25.02 | 47.48 | -15.01 | -58.00 | -73.27 | -38.49 | -63.85 | -5.23 | -50.87 | -49.35 | -46.18 | -81.45 | -48.65 | -46.38 | -18.43 | -23.70 | -54.06 | -33.24 | -200.56 | 56.70 | -19.10 | -120.57 | -25.00 | -9.22 | -28.42 | -30.43 | 361.98 | 272.82 | -20.36 | -28.66 | -94.25 | -55.83 | -18.12 | |
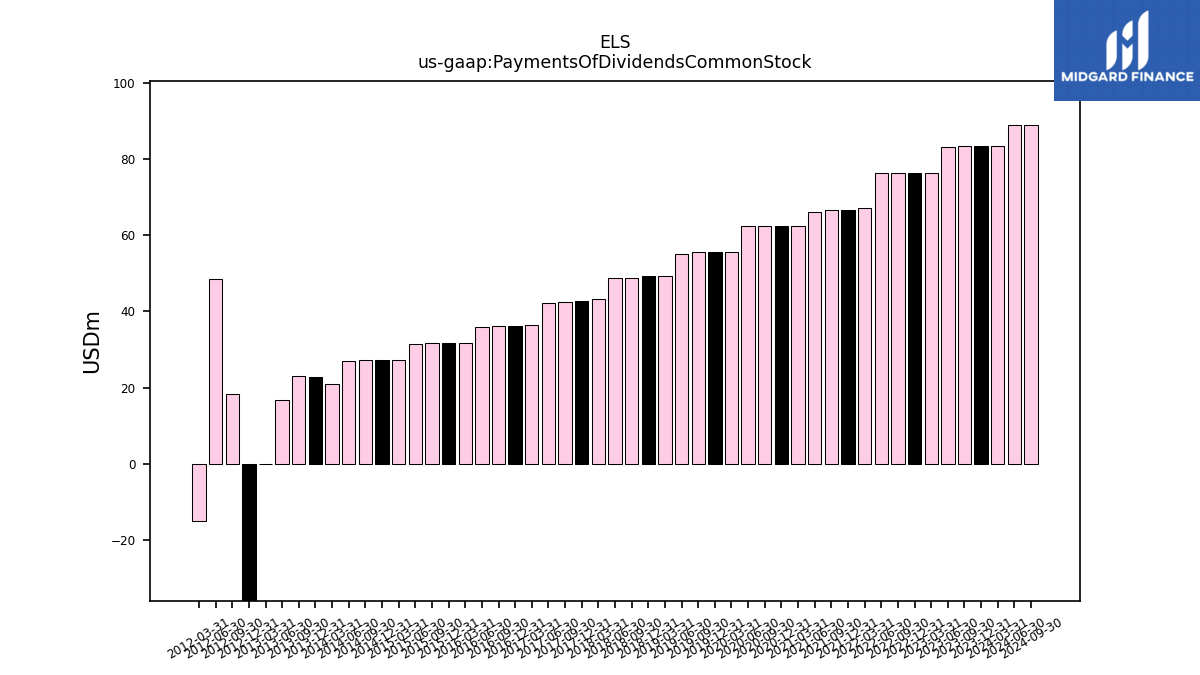
| Payments Of Dividends Common Stock | 83.41 | 83.36 | 83.33 | 76.31 | 76.29 | 76.30 | 76.26 | 67.30 | 66.64 | 66.61 | 66.09 | 62.41 | 62.41 | 62.38 | 62.39 | 55.77 | 55.76 | 55.76 | 55.12 | 49.46 | 49.36 | 48.84 | 48.81 | 43.20 | 42.66 | 42.41 | 42.34 | 36.36 | 36.25 | 36.24 | 35.95 | 31.61 | 31.61 | 31.60 | 31.59 | 27.27 | 27.27 | 27.23 | 27.01 | 20.84 | 22.75 | 23.10 | 16.69 | 0.00 | -141.03 | 18.26 | 48.44 | -15.16 | NA | NA | NA | NA | NA | NA | NA | NA |
| 2023-12-31 | 2023-09-30 | 2023-06-30 | 2023-03-31 | 2022-12-31 | 2022-09-30 | 2022-06-30 | 2022-03-31 | 2021-12-31 | 2021-09-30 | 2021-06-30 | 2021-03-31 | 2020-12-31 | 2020-09-30 | 2020-06-30 | 2020-03-31 | 2019-12-31 | 2019-09-30 | 2019-06-30 | 2019-03-31 | 2018-12-31 | 2018-09-30 | 2018-06-30 | 2018-03-31 | 2017-12-31 | 2017-09-30 | 2017-06-30 | 2017-03-31 | 2016-12-31 | 2016-09-30 | 2016-06-30 | 2016-03-31 | 2015-12-31 | 2015-09-30 | 2015-06-30 | 2015-03-31 | 2014-12-31 | 2014-09-30 | 2014-06-30 | 2014-03-31 | 2013-12-31 | 2013-09-30 | 2013-06-30 | 2013-03-31 | 2012-12-31 | 2012-09-30 | 2012-06-30 | 2012-03-31 | 2011-12-31 | 2011-09-30 | 2011-06-30 | 2011-03-31 | 2010-12-31 | 2010-09-30 | 2010-06-30 | 2010-03-31 | ||
|---|---|---|---|---|---|---|---|---|---|---|---|---|---|---|---|---|---|---|---|---|---|---|---|---|---|---|---|---|---|---|---|---|---|---|---|---|---|---|---|---|---|---|---|---|---|---|---|---|---|---|---|---|---|---|---|---|---|
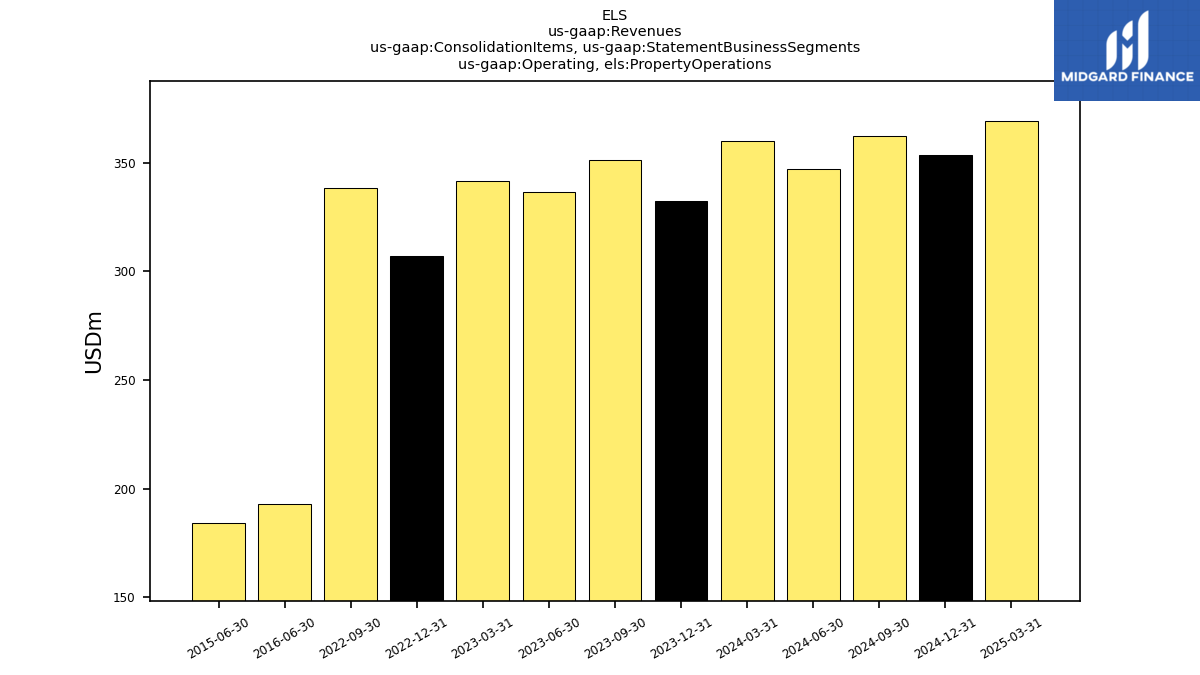
| Revenues | 360.64 | 388.81 | 370.01 | 369.95 | 340.60 | 380.97 | 365.31 | 360.19 | 325.33 | 332.90 | 317.42 | 296.04 | 271.90 | 284.99 | 254.09 | 280.48 | 258.64 | 271.16 | 248.37 | 259.09 | 243.45 | 256.68 | 240.50 | 246.03 | 229.99 | 241.62 | 221.31 | 232.39 | 214.04 | 226.16 | 210.08 | 220.15 | 201.62 | 210.14 | 201.48 | 208.41 | 190.26 | 200.55 | 188.85 | 196.59 | 179.88 | 187.97 | 176.75 | 190.59 | 171.93 | 181.83 | 174.83 | 181.29 | 159.31 | 161.39 | 125.91 | 133.46 | 121.17 | 134.19 | 123.84 | 132.15 | |
| Operating, Property Operations | 332.18 | 351.24 | NA | NA | 306.93 | 338.21 | NA | NA | NA | NA | NA | NA | NA | NA | NA | NA | NA | NA | NA | NA | NA | NA | NA | NA | NA | NA | NA | NA | NA | NA | 193.18 | NA | NA | NA | 184.12 | NA | NA | NA | NA | NA | NA | NA | NA | NA | NA | NA | NA | NA | NA | NA | NA | NA | NA | NA | NA | NA | |
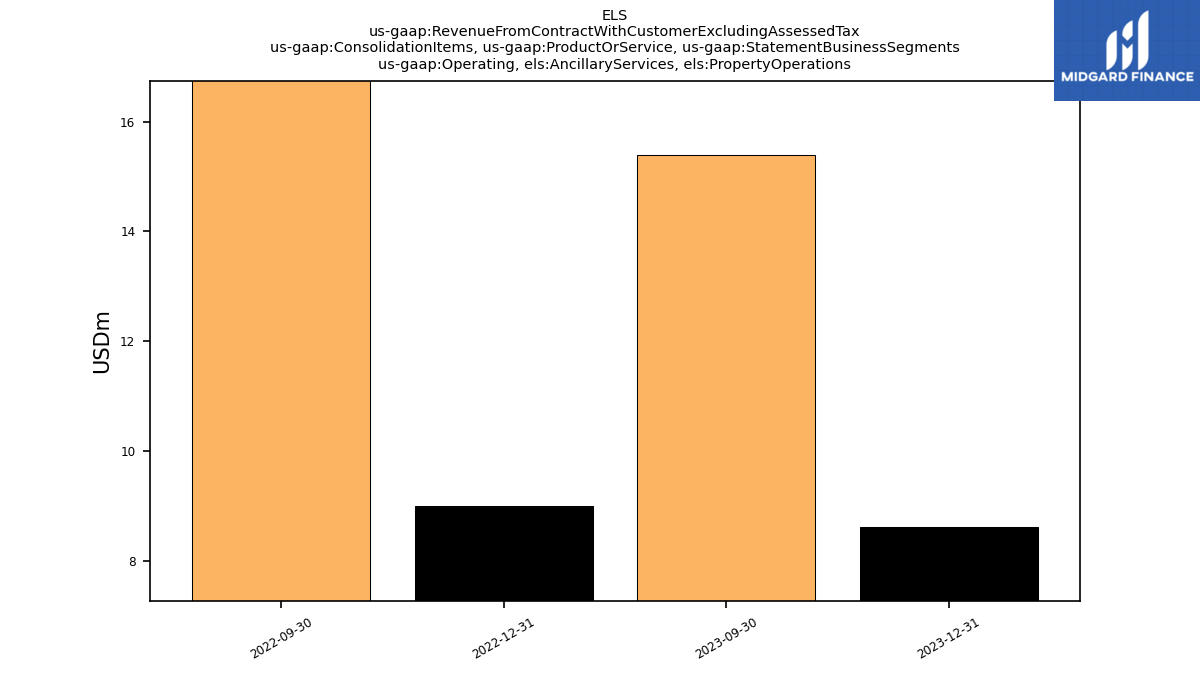
| Revenue From Contract With Customer Excluding Assessed Tax | 360.64 | 388.81 | 370.01 | 369.95 | 340.60 | 380.97 | 365.31 | 360.19 | 325.33 | 332.90 | 317.42 | 296.04 | -797.81 | 284.99 | 254.09 | 280.48 | 258.64 | 271.16 | 248.37 | 259.09 | 243.45 | 256.68 | 240.50 | 246.03 | 229.99 | 241.62 | 221.31 | 232.39 | 214.04 | 226.16 | 210.08 | 220.15 | 201.62 | 210.14 | 201.48 | 208.41 | 190.26 | 200.55 | 188.85 | 196.59 | 179.88 | 187.97 | 176.75 | 190.59 | 171.93 | 181.83 | 174.83 | 181.29 | 159.31 | 161.39 | 125.91 | 133.46 | 121.17 | 134.19 | 123.84 | 132.15 | |
| Operating, Ancillary Services, Property Operations | 8.63 | 15.39 | NA | NA | 9.01 | 17.79 | NA | NA | NA | NA | NA | NA | NA | NA | NA | NA | NA | NA | NA | NA | NA | NA | NA | NA | NA | NA | NA | NA | NA | NA | NA | NA | NA | NA | NA | NA | NA | NA | NA | NA | NA | NA | NA | NA | NA | NA | NA | NA | NA | NA | NA | NA | NA | NA | NA | NA | |
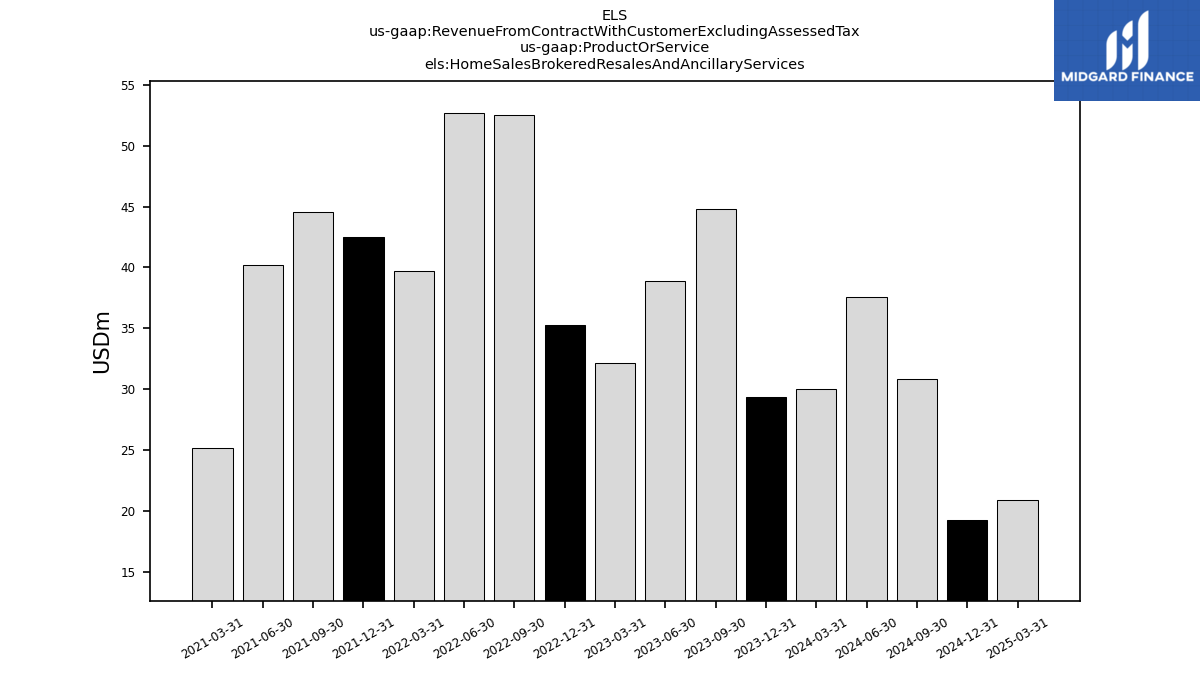
| Home Sales Brokered Resales And Ancillary Services | 29.38 | 44.80 | 38.91 | 32.13 | 35.24 | 52.55 | 52.68 | 39.70 | 42.47 | 44.57 | 40.24 | 25.16 | NA | NA | NA | NA | NA | NA | NA | NA | NA | NA | NA | NA | NA | NA | NA | NA | NA | NA | NA | NA | NA | NA | NA | NA | NA | NA | NA | NA | NA | NA | NA | NA | NA | NA | NA | NA | NA | NA | NA | NA | NA | NA | NA | NA | |
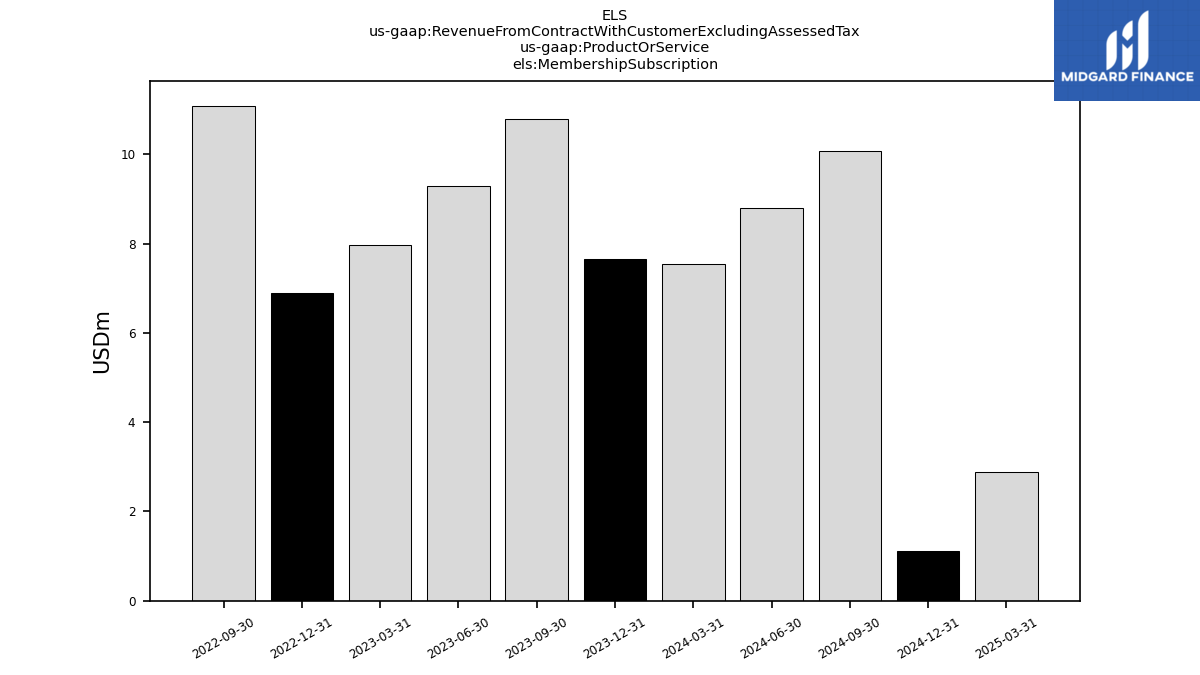
| Membership Subscription | 7.64 | 10.79 | NA | NA | 6.89 | 11.09 | NA | NA | NA | NA | NA | NA | NA | NA | NA | NA | NA | NA | NA | NA | NA | NA | NA | NA | NA | NA | NA | NA | NA | NA | NA | NA | NA | NA | NA | NA | NA | NA | NA | NA | NA | NA | NA | NA | NA | NA | NA | NA | NA | NA | NA | NA | NA | NA | NA | NA | |
| Interest Income Operating | 2.41 | 2.28 | 2.26 | 2.09 | 2.08 | 1.86 | 1.72 | 1.76 | 1.70 | 1.80 | 1.74 | 1.77 | 1.75 | 1.80 | 1.79 | 1.81 | 1.82 | 1.83 | 1.80 | 1.75 | 1.87 | 1.85 | 1.86 | 1.95 | 2.04 | 1.97 | 1.80 | 1.77 | 1.79 | 1.77 | 1.62 | 1.66 | 1.72 | 1.76 | 1.74 | 1.82 | 1.87 | 1.90 | 1.88 | 2.70 | 2.09 | 2.20 | 2.08 | 2.28 | 2.42 | 2.57 | 2.39 | 2.63 | 2.62 | 2.33 | 1.01 | 1.04 | 1.18 | 1.05 | 1.00 | 1.19 |