
| 2023-12-31 | 2023-09-30 | 2023-06-30 | 2023-03-31 | 2022-12-31 | 2022-09-30 | 2022-06-30 | 2022-03-31 | 2021-12-31 | 2021-09-30 | 2021-06-30 | 2021-03-31 | 2020-12-31 | 2020-09-30 | 2020-06-30 | 2020-03-31 | 2019-12-31 | 2019-09-30 | 2019-06-30 | 2019-03-31 | 2018-12-31 | 2018-09-30 | 2018-06-30 | 2018-03-31 | 2017-12-31 | 2017-09-30 | 2017-06-30 | 2017-03-31 | 2016-12-31 | 2016-09-30 | 2016-06-30 | 2016-03-31 | 2015-12-31 | 2015-09-30 | 2015-06-30 | 2015-03-31 | 2014-12-31 | 2014-09-30 | 2014-06-30 | 2014-03-31 | 2013-12-31 | ||
|---|---|---|---|---|---|---|---|---|---|---|---|---|---|---|---|---|---|---|---|---|---|---|---|---|---|---|---|---|---|---|---|---|---|---|---|---|---|---|---|---|---|---|
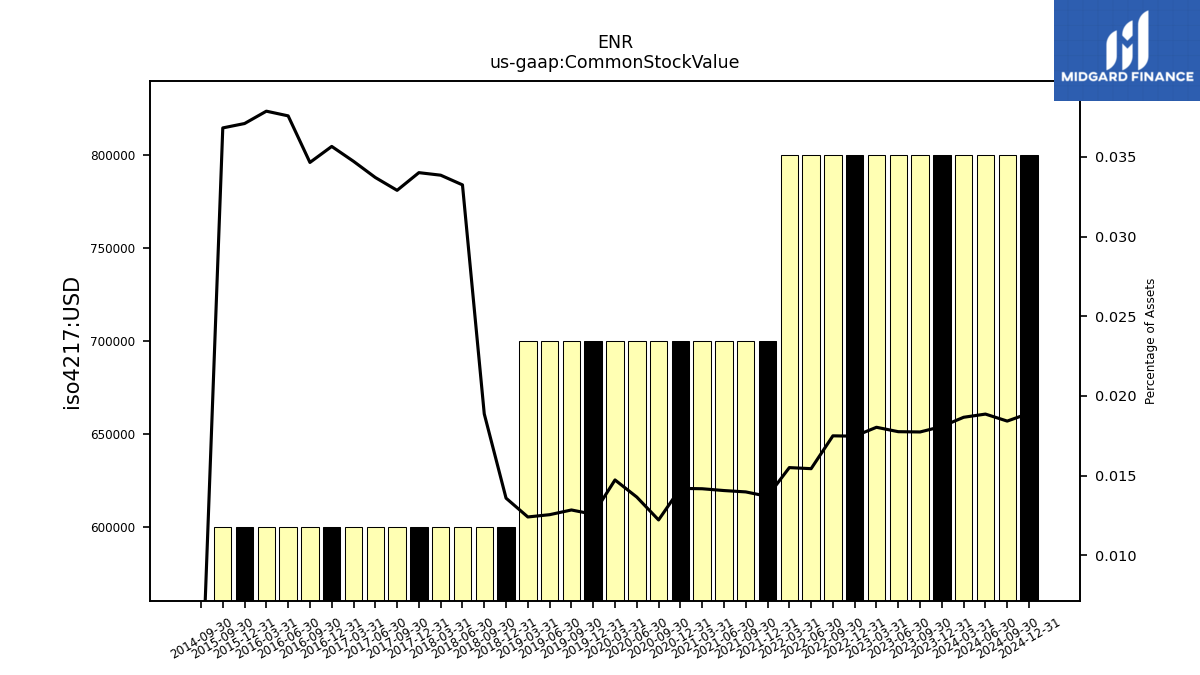
| Common Stock Value | 0.80 | 0.80 | 0.80 | 0.80 | 0.80 | 0.80 | 0.80 | 0.80 | 0.70 | 0.70 | 0.70 | 0.70 | 0.70 | 0.70 | 0.70 | 0.70 | 0.70 | 0.70 | 0.70 | 0.70 | 0.60 | 0.60 | 0.60 | 0.60 | 0.60 | 0.60 | 0.60 | 0.60 | 0.60 | 0.60 | 0.60 | 0.60 | 0.60 | 0.60 | NA | NA | NA | 0.00 | NA | NA | NA | |
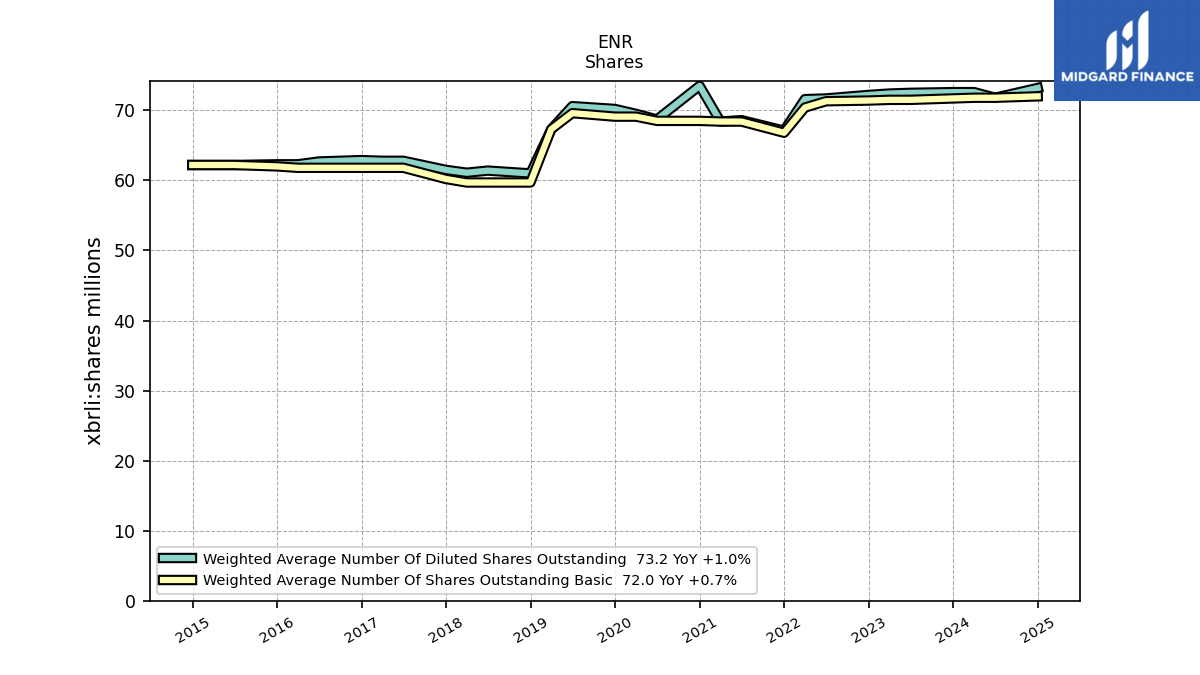
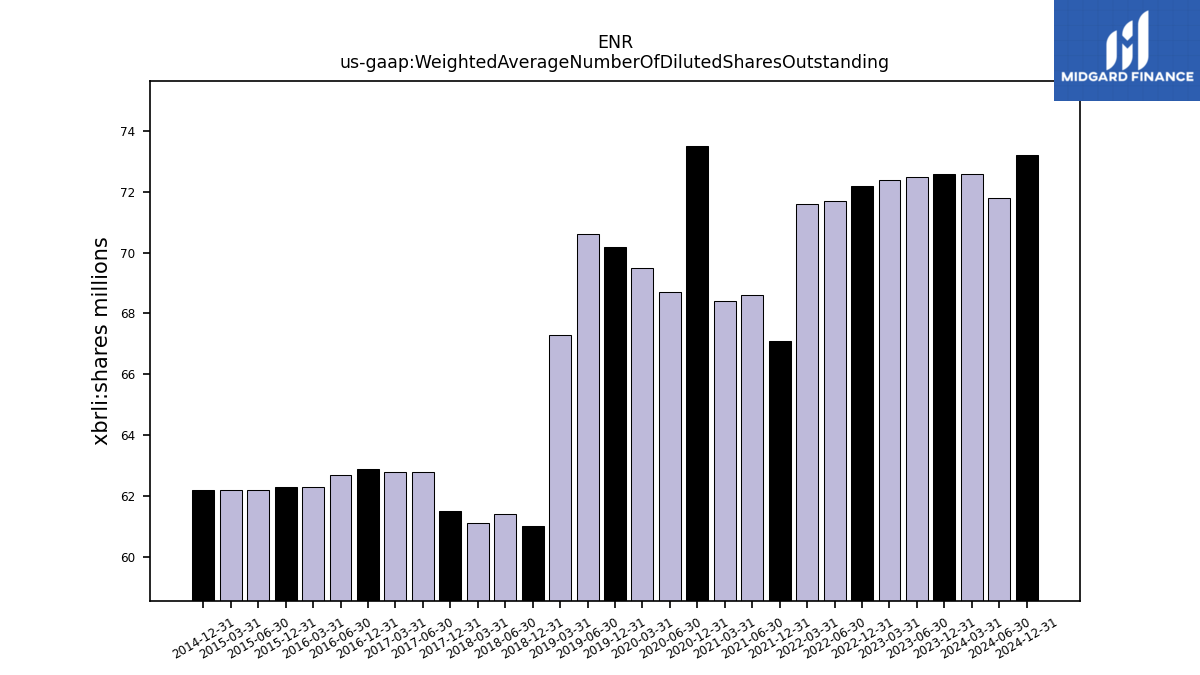
| Weighted Average Number Of Diluted Shares Outstanding | 72.60 | NA | 72.50 | 72.40 | 72.20 | NA | 71.70 | 71.60 | 67.10 | NA | 68.60 | 68.40 | 73.50 | NA | 68.70 | 69.50 | 70.20 | NA | 70.60 | 67.30 | 61.00 | NA | 61.40 | 61.10 | 61.50 | NA | 62.80 | 62.80 | 62.90 | NA | 62.70 | 62.30 | 62.30 | NA | 62.20 | 62.20 | 62.20 | NA | NA | NA | NA | |
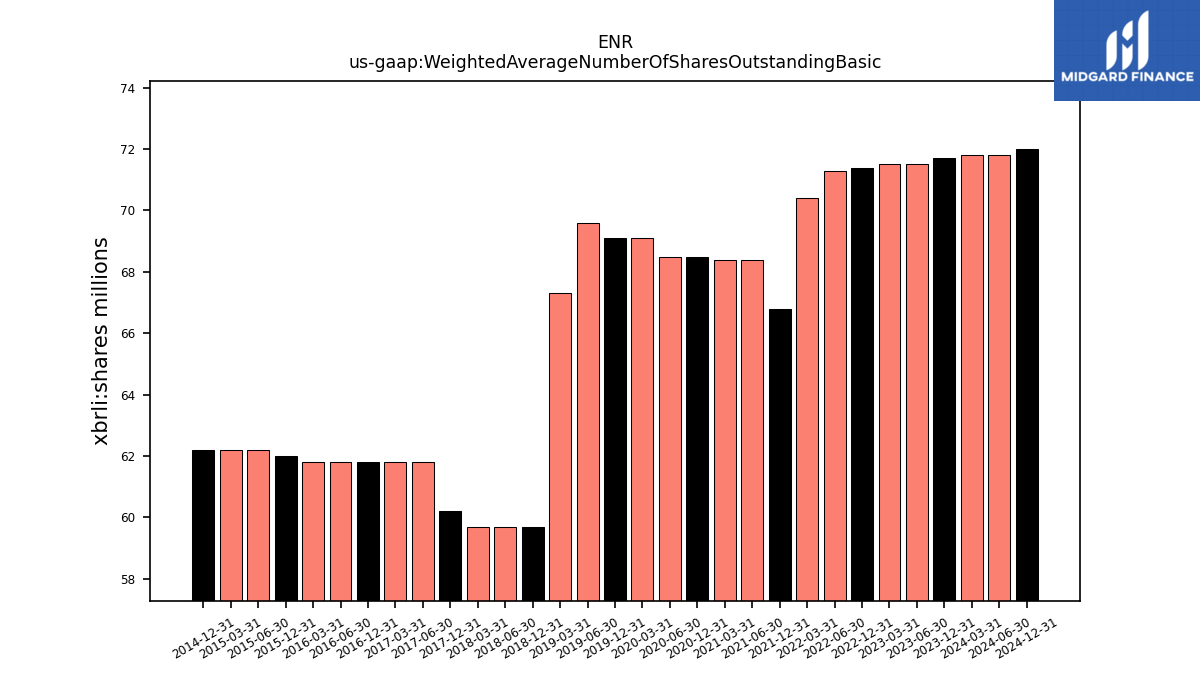
| Weighted Average Number Of Shares Outstanding Basic | 71.70 | NA | 71.50 | 71.50 | 71.40 | NA | 71.30 | 70.40 | 66.80 | NA | 68.40 | 68.40 | 68.50 | NA | 68.50 | 69.10 | 69.10 | NA | 69.60 | 67.30 | 59.70 | NA | 59.70 | 59.70 | 60.20 | NA | 61.80 | 61.80 | 61.80 | NA | 61.80 | 61.80 | 62.00 | NA | 62.20 | 62.20 | 62.20 | NA | NA | NA | NA | |
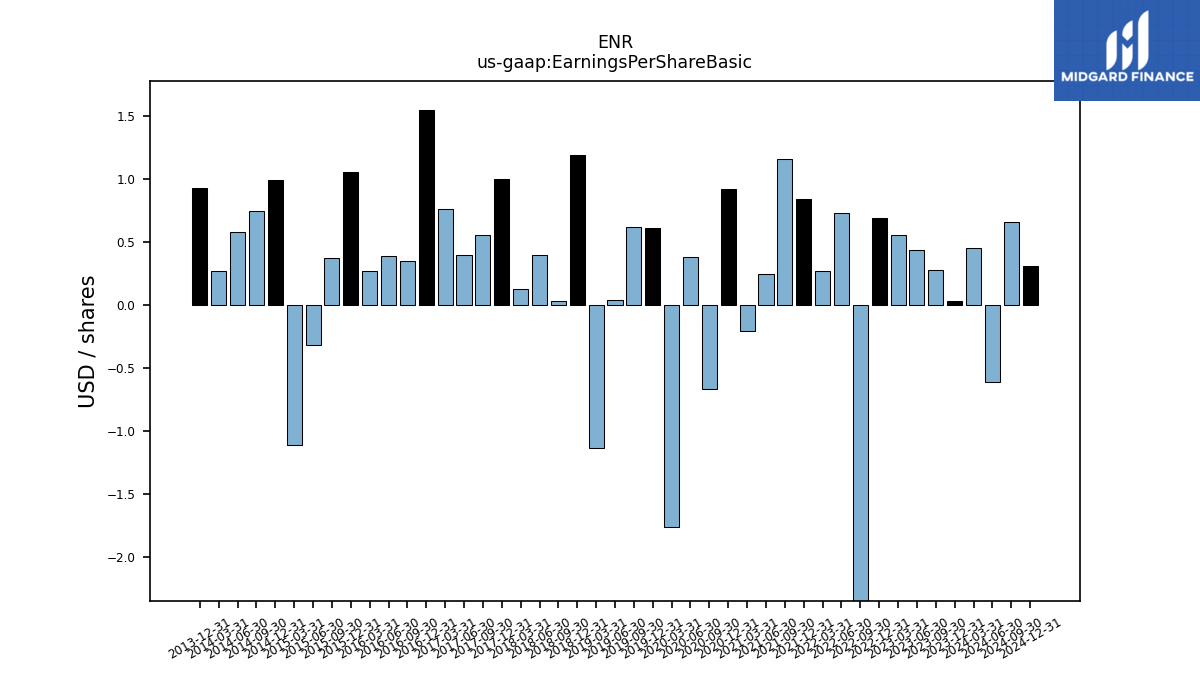
| Earnings Per Share Basic | 0.03 | 0.28 | 0.44 | 0.56 | 0.69 | -5.20 | 0.73 | 0.27 | 0.84 | 1.16 | 0.25 | -0.21 | 0.92 | -0.67 | 0.38 | -1.76 | 0.61 | 0.62 | 0.04 | -1.14 | 1.19 | 0.03 | 0.40 | 0.13 | 1.00 | 0.56 | 0.40 | 0.76 | 1.55 | 0.35 | 0.39 | 0.27 | 1.06 | 0.37 | -0.32 | -1.11 | 0.99 | 0.75 | 0.58 | 0.27 | 0.93 | |
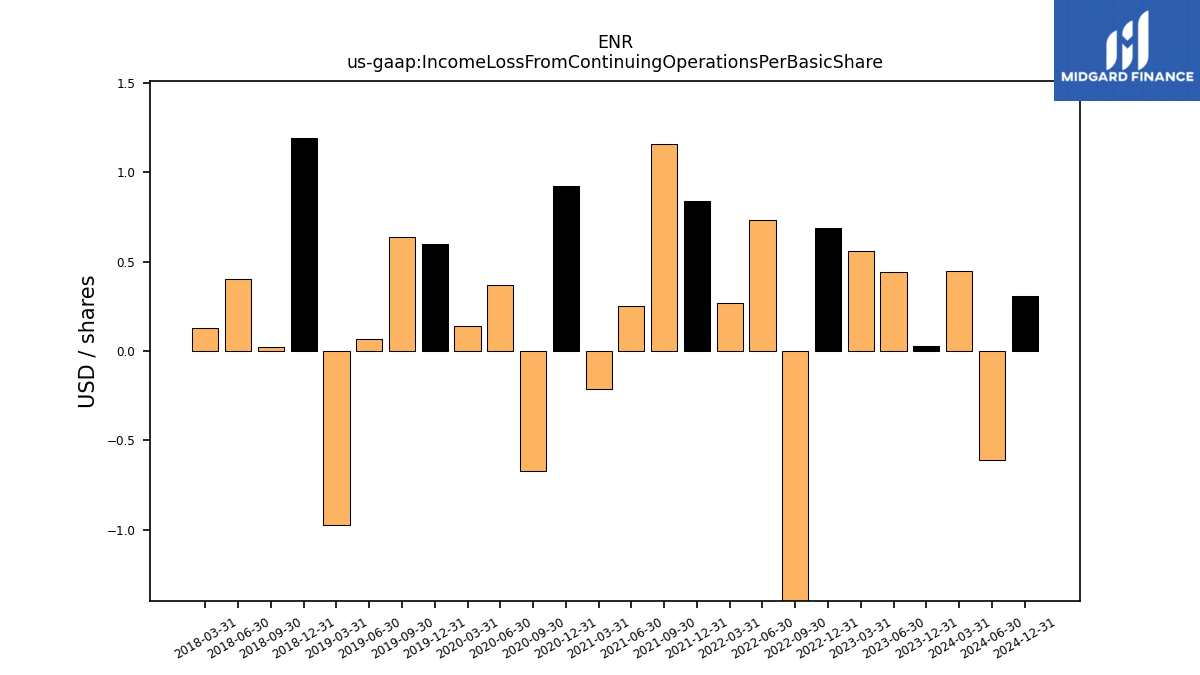
| Income Loss From Continuing Operations Per Basic Share | 0.00 | NA | 0.00 | 0.00 | 0.00 | -0.00 | 0.00 | 0.00 | 0.00 | 0.00 | 0.00 | -0.00 | 0.00 | -0.00 | 0.00 | 0.00 | 0.00 | 0.00 | 0.00 | -0.00 | 0.00 | 0.00 | 0.00 | 0.00 | NA | NA | NA | NA | NA | NA | NA | NA | NA | NA | NA | NA | NA | NA | NA | NA | NA | |
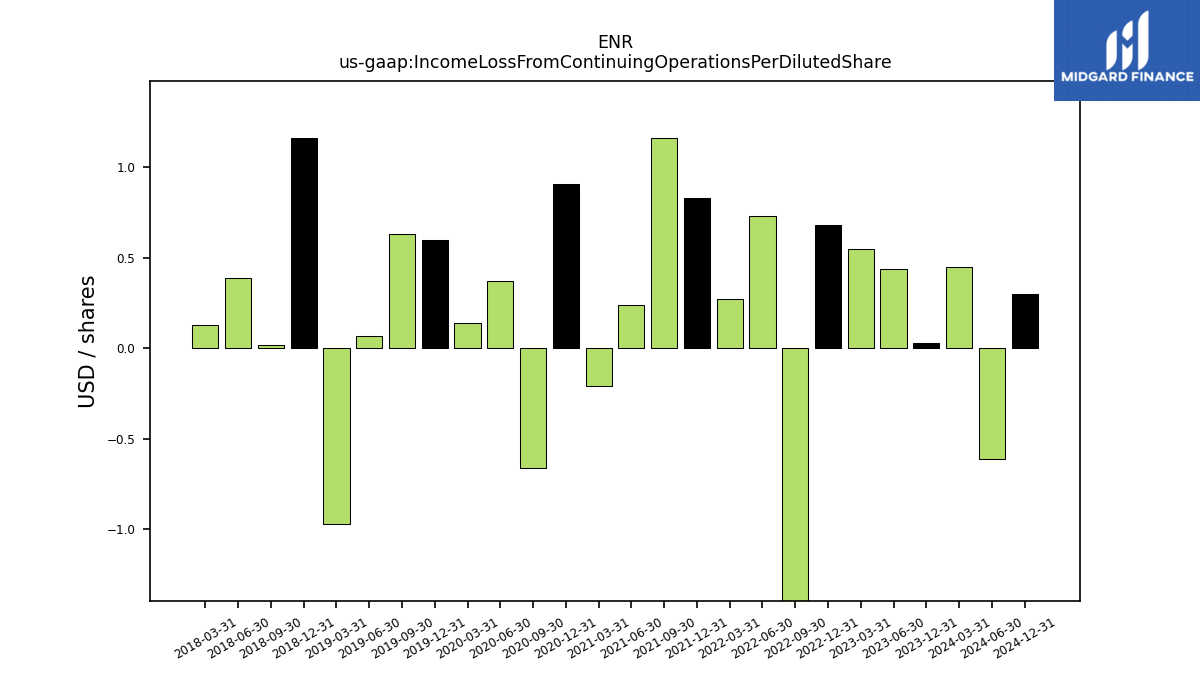
| Income Loss From Continuing Operations Per Diluted Share | 0.00 | NA | 0.00 | 0.00 | 0.00 | -0.00 | 0.00 | 0.00 | 0.00 | 0.00 | 0.00 | -0.00 | 0.00 | -0.00 | 0.00 | 0.00 | 0.00 | 0.00 | 0.00 | -0.00 | 0.00 | 0.00 | 0.00 | 0.00 | NA | NA | NA | NA | NA | NA | NA | NA | NA | NA | NA | NA | NA | NA | NA | NA | NA |
| 2023-12-31 | 2023-09-30 | 2023-06-30 | 2023-03-31 | 2022-12-31 | 2022-09-30 | 2022-06-30 | 2022-03-31 | 2021-12-31 | 2021-09-30 | 2021-06-30 | 2021-03-31 | 2020-12-31 | 2020-09-30 | 2020-06-30 | 2020-03-31 | 2019-12-31 | 2019-09-30 | 2019-06-30 | 2019-03-31 | 2018-12-31 | 2018-09-30 | 2018-06-30 | 2018-03-31 | 2017-12-31 | 2017-09-30 | 2017-06-30 | 2017-03-31 | 2016-12-31 | 2016-09-30 | 2016-06-30 | 2016-03-31 | 2015-12-31 | 2015-09-30 | 2015-06-30 | 2015-03-31 | 2014-12-31 | 2014-09-30 | 2014-06-30 | 2014-03-31 | 2013-12-31 | ||
|---|---|---|---|---|---|---|---|---|---|---|---|---|---|---|---|---|---|---|---|---|---|---|---|---|---|---|---|---|---|---|---|---|---|---|---|---|---|---|---|---|---|---|
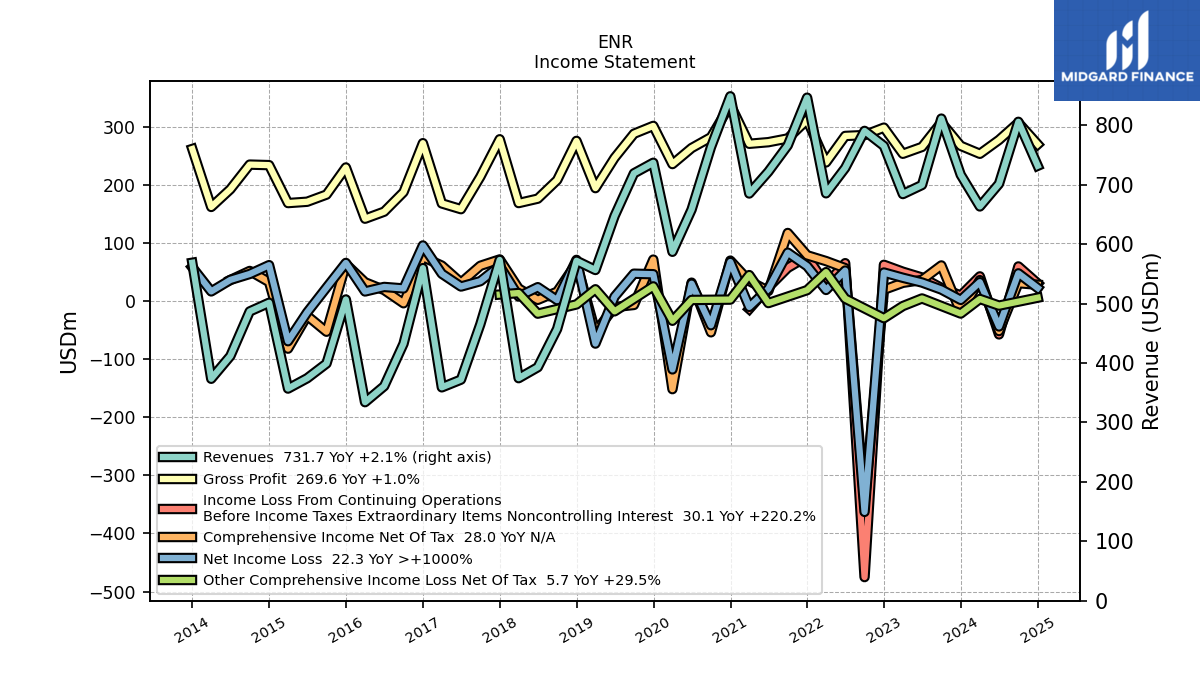
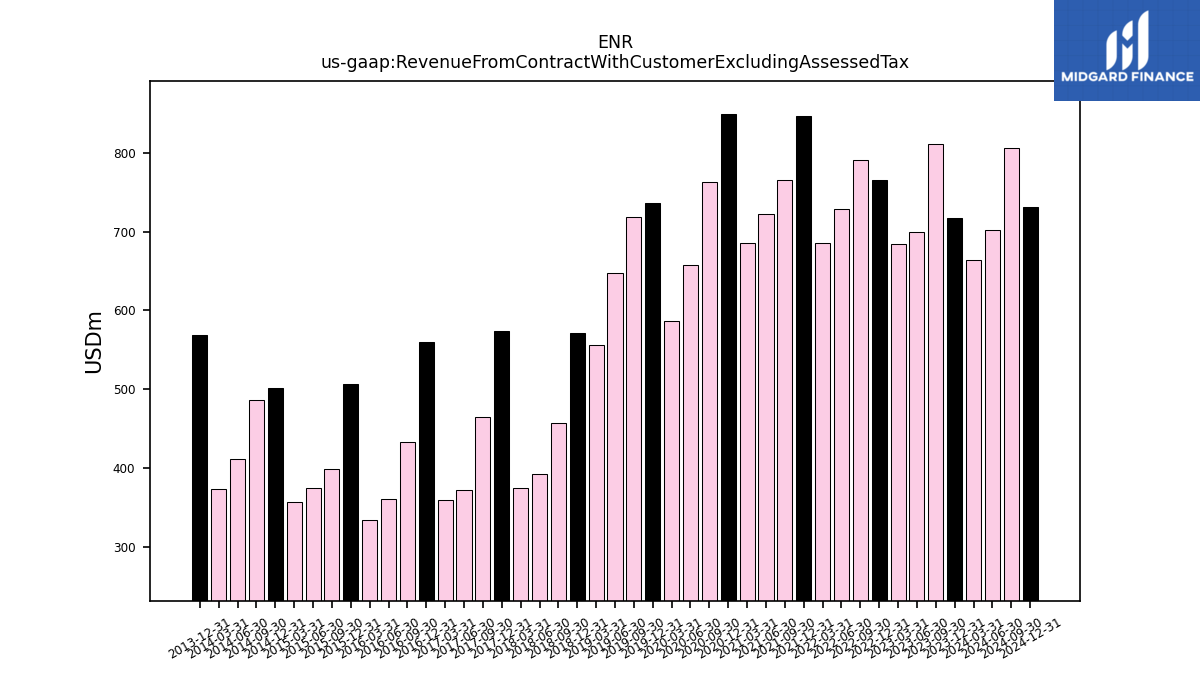
| Revenue From Contract With Customer Excluding Assessed Tax | 716.60 | 811.10 | 699.40 | 684.10 | 765.10 | 790.40 | 728.00 | 685.40 | 846.30 | 766.00 | 721.80 | 685.10 | 848.60 | 763.00 | 658.00 | 587.00 | 736.80 | 719.00 | 647.20 | 556.40 | 571.90 | 457.20 | 392.80 | 374.40 | 573.30 | 465.10 | 372.00 | 359.00 | 559.60 | 432.40 | 361.00 | 334.00 | 506.80 | 399.10 | 374.30 | 356.90 | 501.30 | 486.70 | 411.70 | 373.40 | 568.60 | |
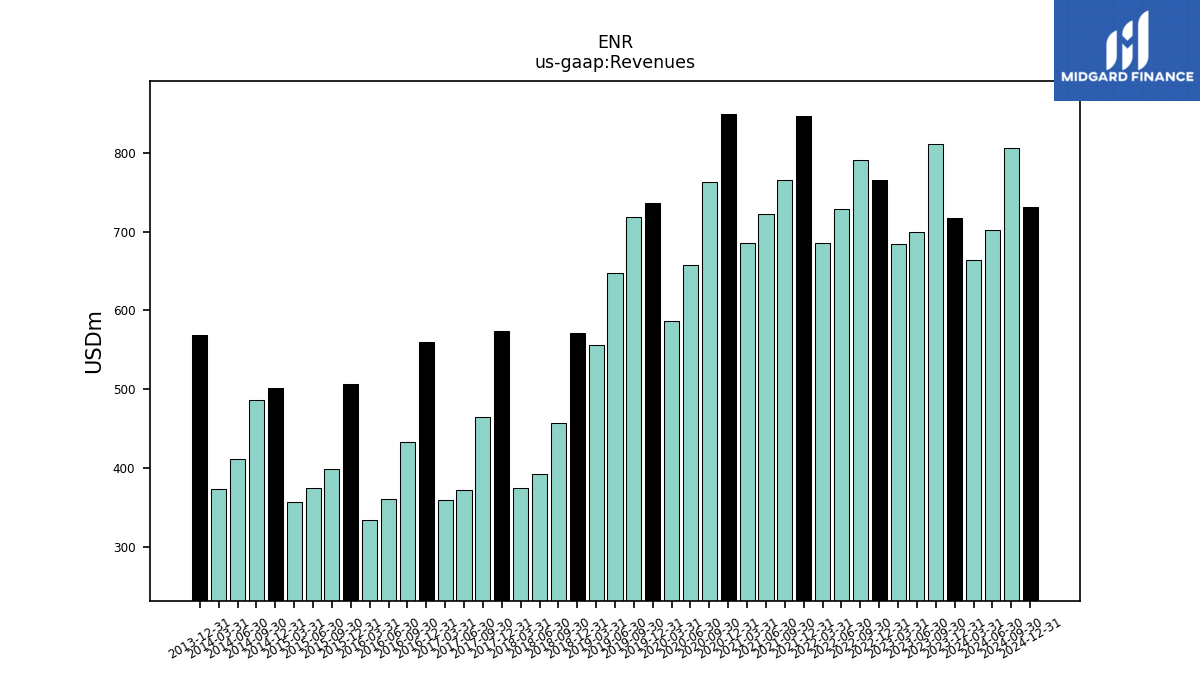
| Revenues | 716.60 | 811.10 | 699.40 | 684.10 | 765.10 | 790.40 | 728.00 | 685.40 | 846.30 | 766.00 | 721.80 | 685.10 | 848.60 | 763.00 | 658.00 | 587.00 | 736.80 | 719.00 | 647.20 | 556.40 | 571.90 | 457.20 | 392.80 | 374.40 | 573.30 | 465.10 | 372.00 | 359.00 | 559.60 | 432.40 | 361.00 | 334.00 | 506.80 | 399.10 | 374.30 | 356.90 | 501.30 | 486.70 | 411.70 | 373.40 | 568.60 | |
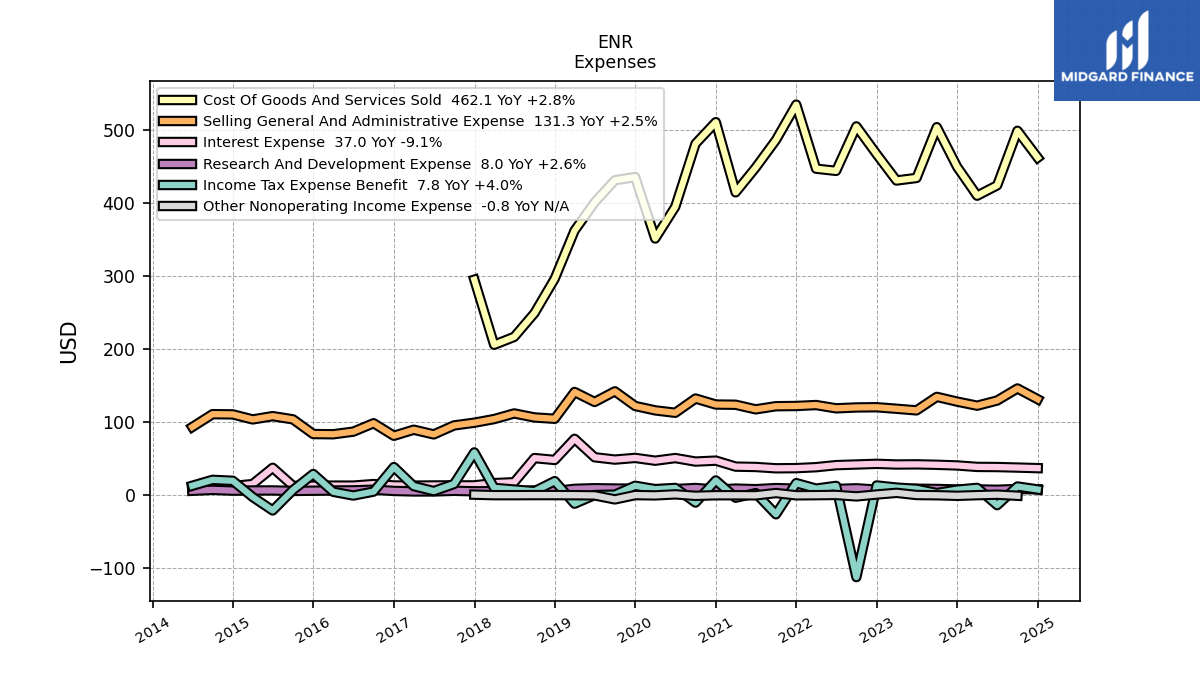
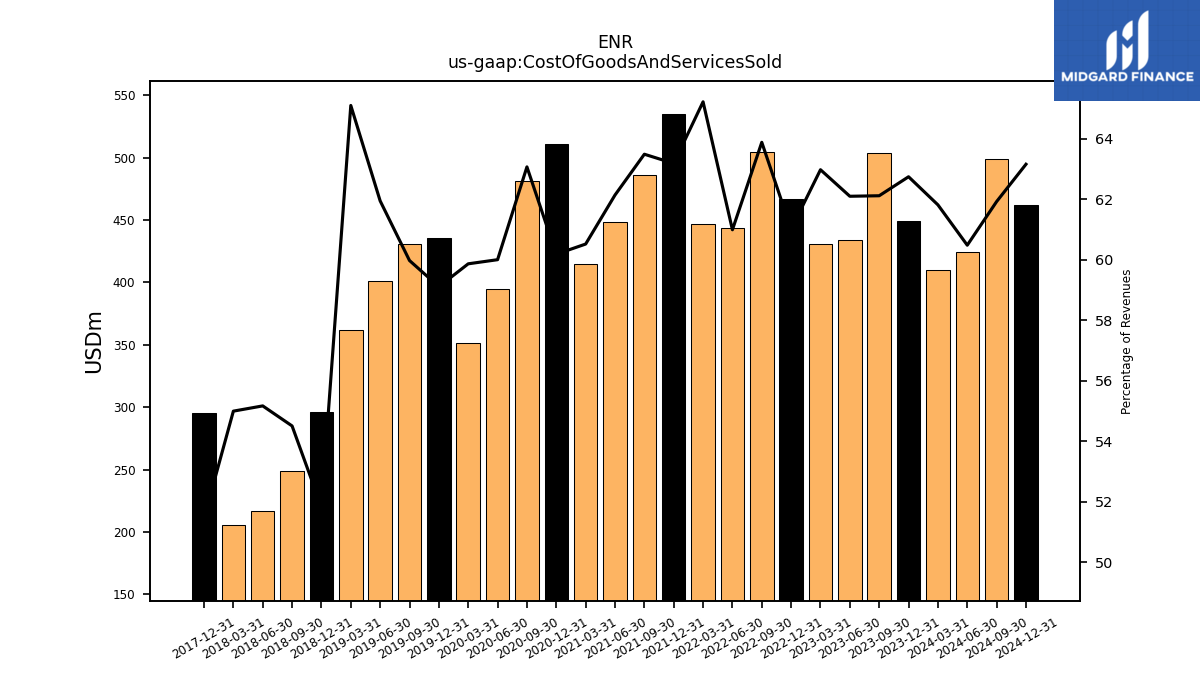
| Cost Of Goods And Services Sold | 449.60 | 503.80 | 434.30 | 430.80 | 466.80 | 504.90 | 444.00 | 447.00 | 534.70 | 486.30 | 448.50 | 414.60 | 510.70 | 481.20 | 394.80 | 351.40 | 435.50 | 431.20 | 400.90 | 362.20 | 296.40 | 249.20 | 216.70 | 205.90 | 295.00 | NA | NA | NA | NA | NA | NA | NA | NA | NA | NA | NA | NA | NA | NA | NA | NA | |
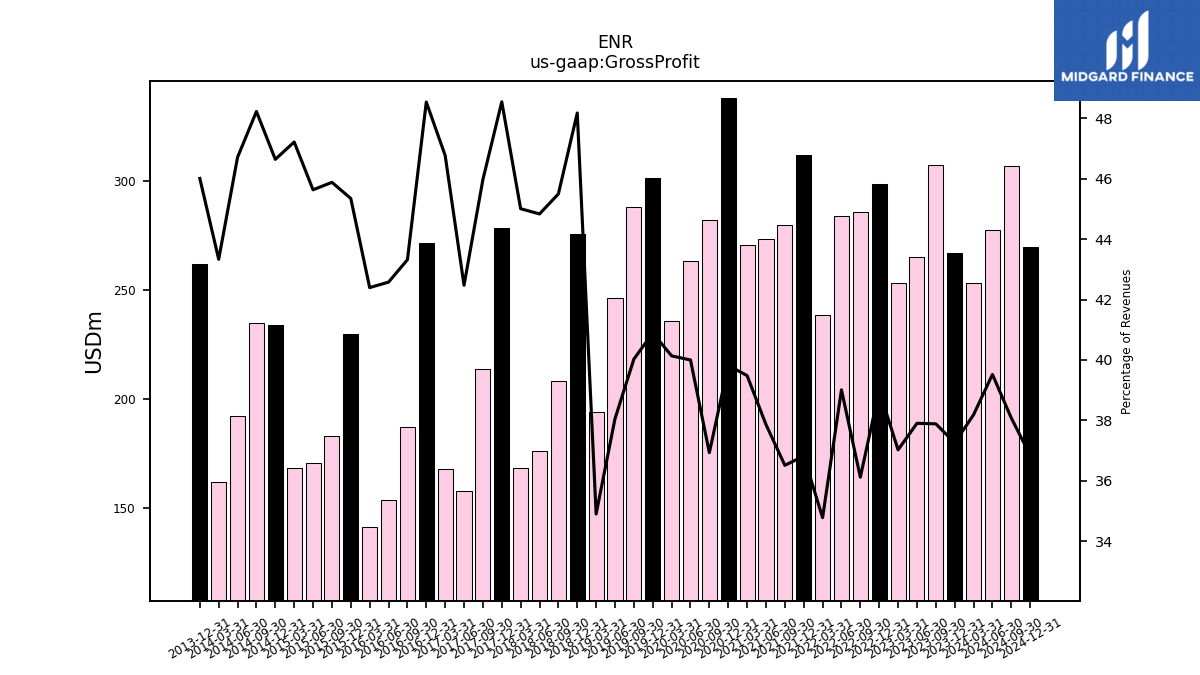
| Gross Profit | 267.00 | 307.30 | 265.10 | 253.30 | 298.30 | 285.50 | 284.00 | 238.40 | 311.60 | 279.70 | 273.30 | 270.50 | 337.90 | 281.80 | 263.20 | 235.60 | 301.30 | 287.80 | 246.30 | 194.20 | 275.50 | 208.00 | 176.10 | 168.50 | 278.30 | 213.80 | 158.00 | 167.90 | 271.60 | 187.30 | 153.70 | 141.60 | 229.80 | 183.10 | 170.80 | 168.50 | 233.80 | 234.70 | 192.30 | 161.80 | 261.60 | |
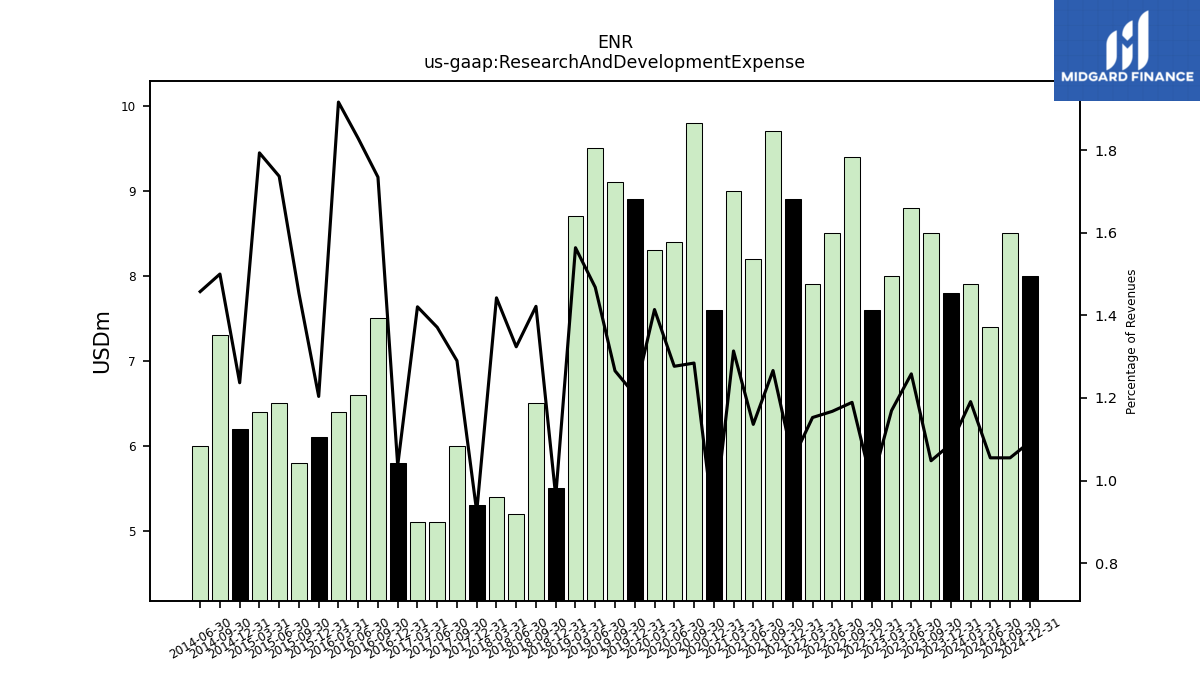
| Research And Development Expense | 7.80 | 8.50 | 8.80 | 8.00 | 7.60 | 9.40 | 8.50 | 7.90 | 8.90 | 9.70 | 8.20 | 9.00 | 7.60 | 9.80 | 8.40 | 8.30 | 8.90 | 9.10 | 9.50 | 8.70 | 5.50 | 6.50 | 5.20 | 5.40 | 5.30 | 6.00 | 5.10 | 5.10 | 5.80 | 7.50 | 6.60 | 6.40 | 6.10 | 5.80 | 6.50 | 6.40 | 6.20 | 7.30 | 6.00 | NA | NA | |
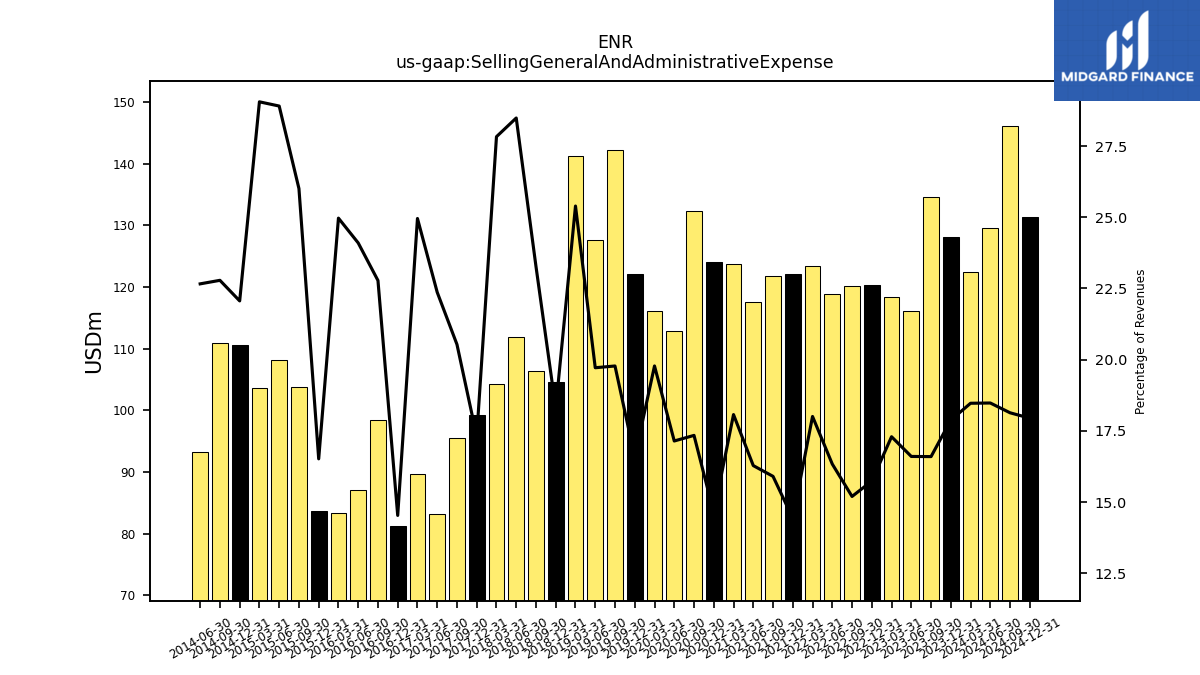
| Selling General And Administrative Expense | 128.10 | 134.60 | 116.10 | 118.30 | 120.40 | 120.10 | 118.90 | 123.40 | 122.10 | 121.80 | 117.50 | 123.80 | 124.10 | 132.30 | 112.80 | 116.10 | 122.10 | 142.20 | 127.60 | 141.30 | 104.60 | 106.40 | 111.90 | 104.20 | 99.20 | 95.50 | 83.20 | 89.60 | 81.30 | 98.50 | 87.00 | 83.40 | 83.70 | 103.80 | 108.20 | 103.70 | 110.60 | 110.90 | 93.30 | NA | NA | |
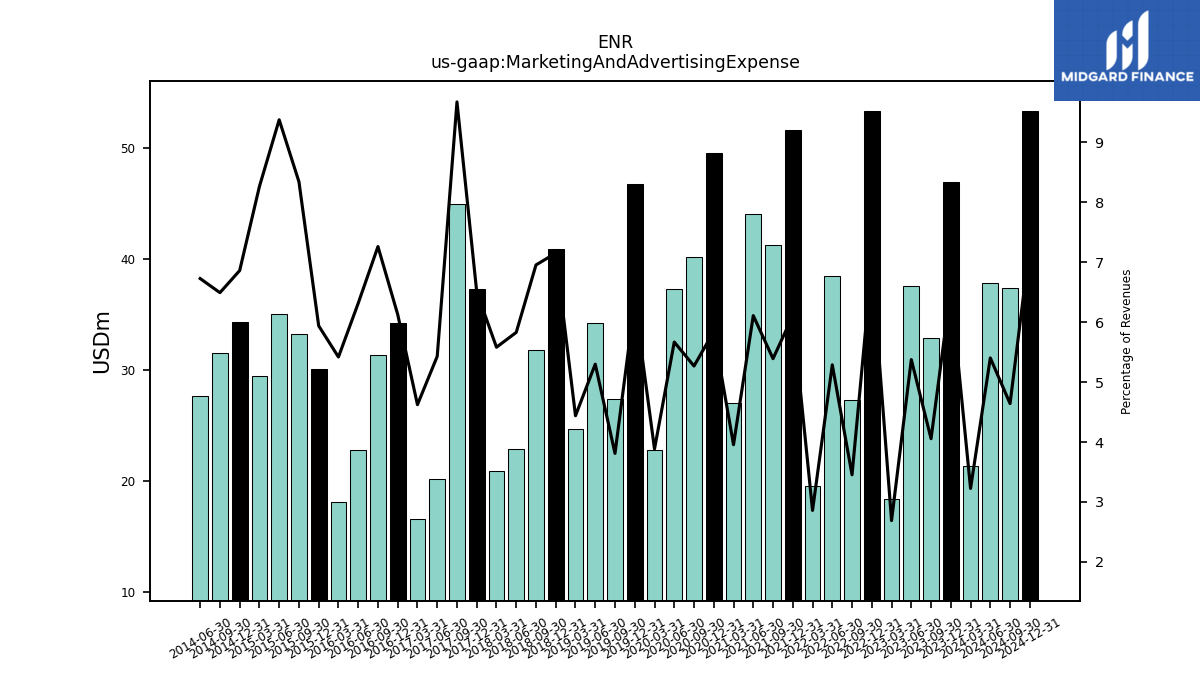
| Marketing And Advertising Expense | 47.00 | 32.90 | 37.60 | 18.40 | 53.40 | 27.30 | 38.50 | 19.60 | 51.70 | 41.30 | 44.10 | 27.10 | 49.60 | 40.20 | 37.30 | 22.80 | 46.80 | 27.40 | 34.30 | 24.70 | 40.90 | 31.80 | 22.90 | 20.90 | 37.30 | 45.00 | 20.20 | 16.60 | 34.30 | 31.40 | 22.80 | 18.10 | 30.10 | 33.30 | 35.10 | 29.50 | 34.40 | 31.60 | 27.70 | NA | NA | |
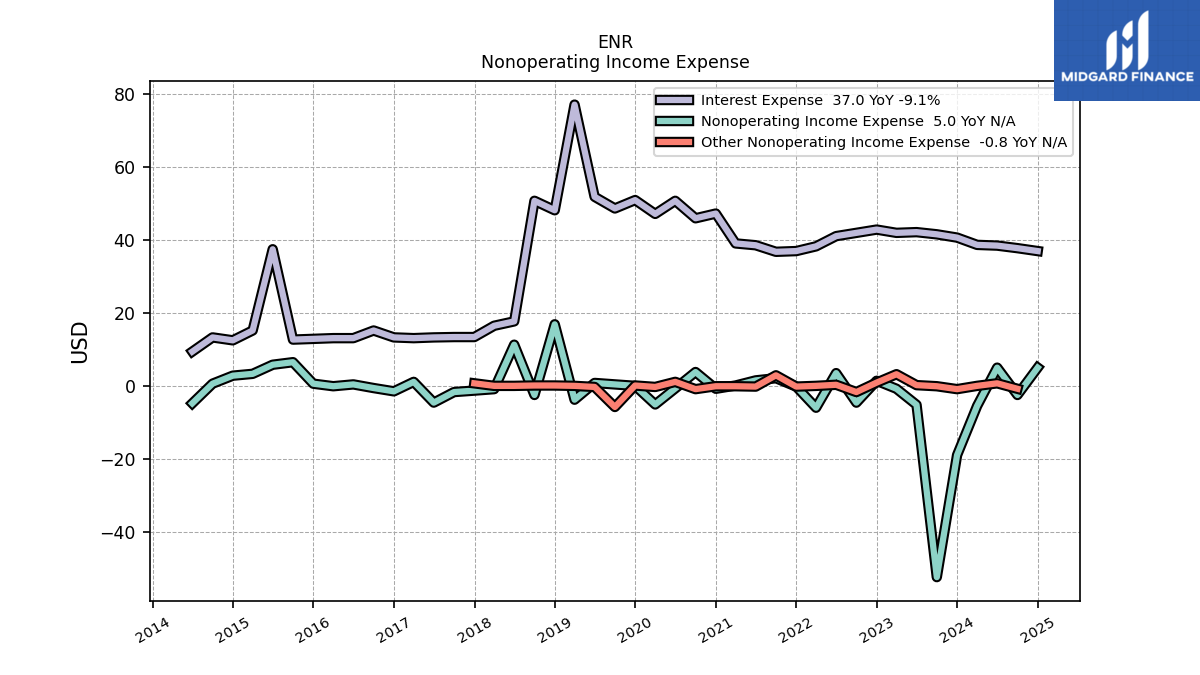
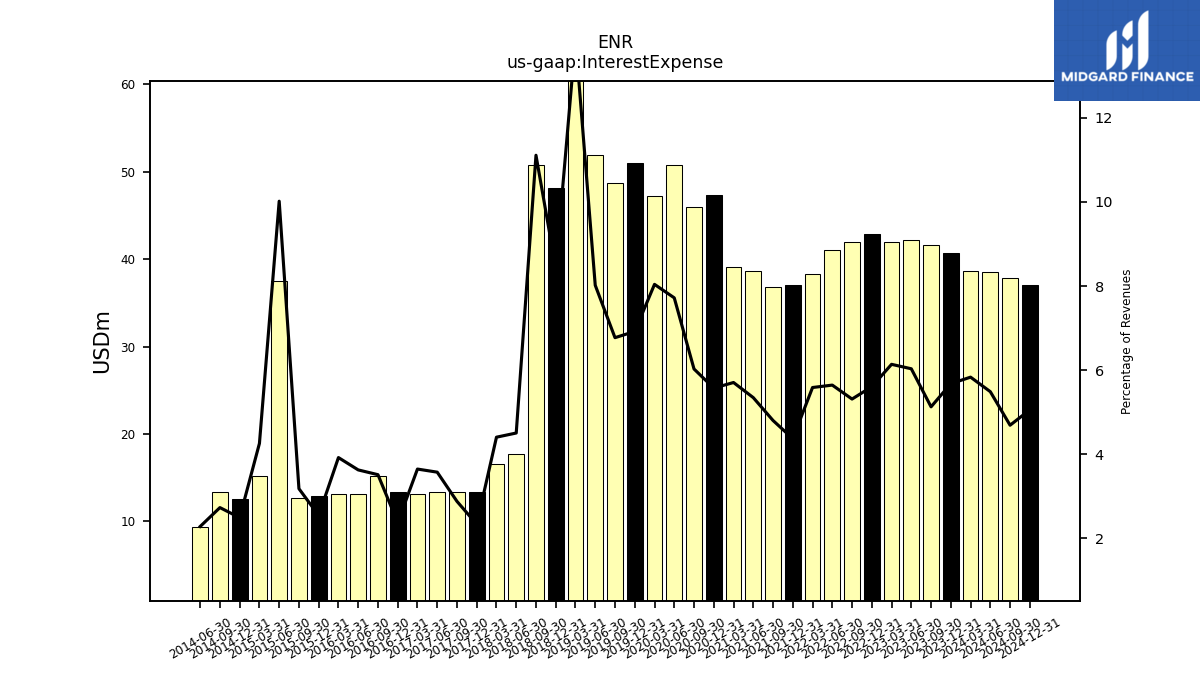
| Interest Expense | 40.70 | 41.60 | 42.20 | 42.00 | 42.90 | 42.00 | 41.10 | 38.30 | 37.00 | 36.80 | 38.60 | 39.10 | 47.30 | 46.00 | 50.80 | 47.20 | 51.00 | 48.70 | 51.90 | 77.20 | 48.20 | 50.80 | 17.70 | 16.50 | 13.40 | 13.40 | 13.30 | 13.10 | 13.30 | 15.20 | 13.10 | 13.10 | 12.90 | 12.70 | 37.50 | 15.20 | 12.50 | 13.30 | 9.40 | NA | NA | |
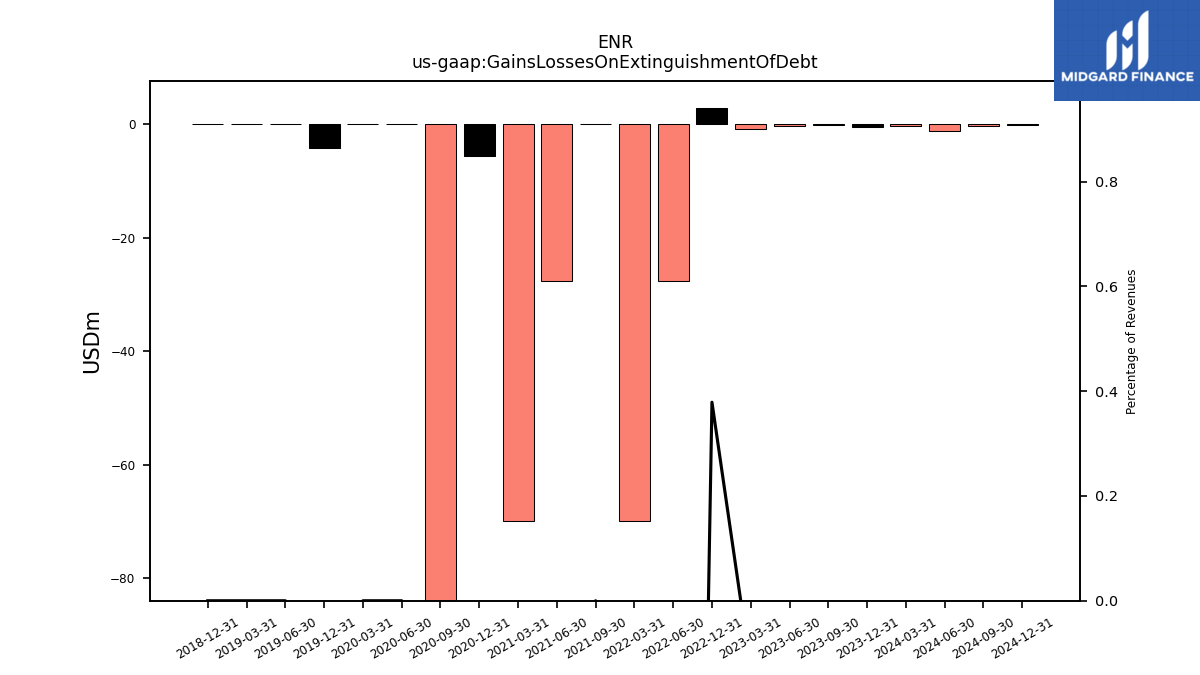
| Gains Losses On Extinguishment Of Debt | -0.50 | -0.20 | -0.30 | -0.90 | 2.90 | NA | -27.60 | -70.00 | NA | 0.00 | -27.60 | -70.00 | -5.70 | -90.70 | 0.00 | 0.00 | -4.20 | NA | 0.00 | 0.00 | 0.00 | NA | NA | NA | NA | NA | NA | NA | NA | NA | NA | NA | NA | NA | NA | NA | NA | NA | NA | NA | NA | |
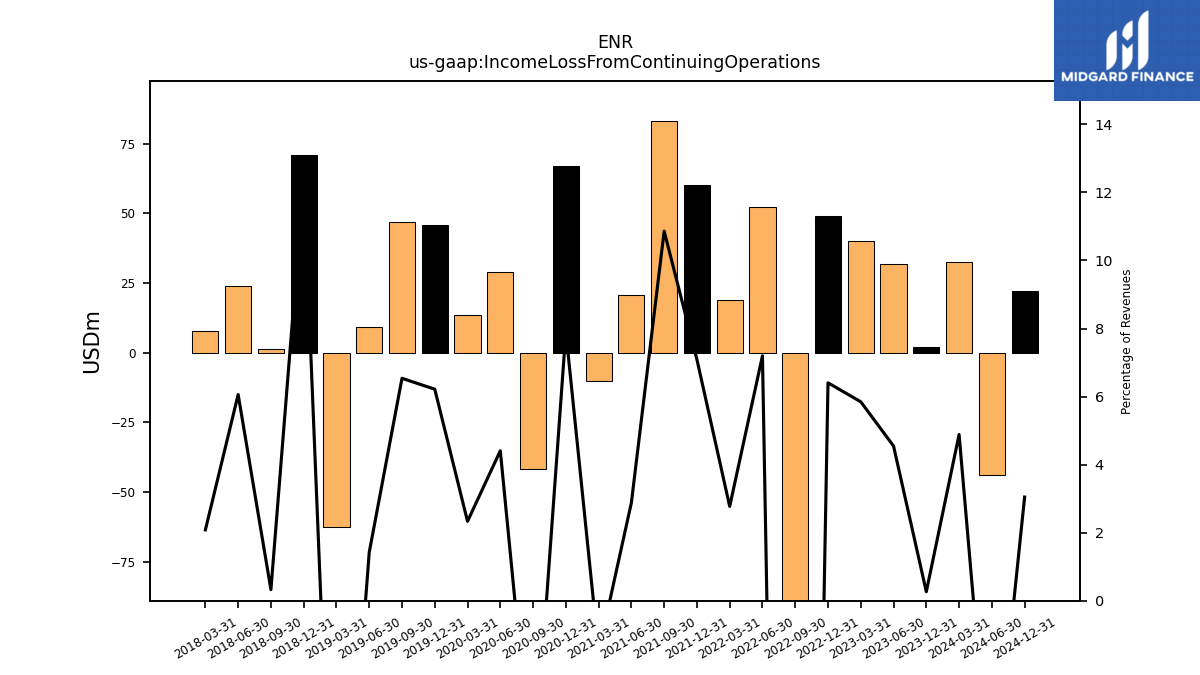
| Income Loss From Continuing Operations | 1.90 | NA | 31.80 | 40.00 | 49.00 | -362.90 | 52.40 | 19.00 | 60.00 | 83.20 | 20.80 | -10.20 | 67.10 | -41.70 | 29.00 | 13.70 | 45.80 | 47.00 | 9.20 | -62.30 | 70.80 | 1.50 | 23.80 | 7.80 | NA | NA | NA | NA | NA | NA | NA | NA | NA | NA | NA | NA | NA | NA | NA | NA | NA | |
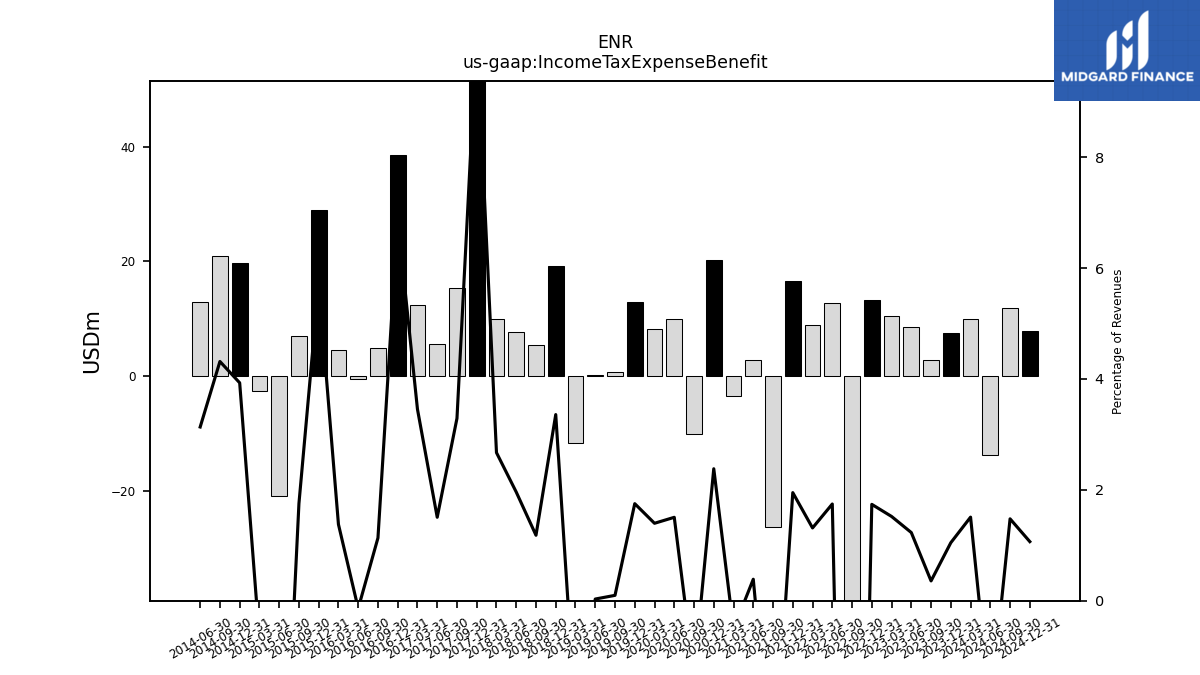
| Income Tax Expense Benefit | 7.50 | 2.90 | 8.60 | 10.40 | 13.30 | -112.20 | 12.70 | 9.00 | 16.50 | -26.20 | 2.80 | -3.50 | 20.20 | -10.10 | 9.90 | 8.20 | 12.90 | 0.70 | 0.20 | -11.70 | 19.20 | 5.40 | 7.70 | 10.00 | 58.60 | 15.30 | 5.60 | 12.40 | 38.50 | 4.90 | -0.50 | 4.60 | 29.00 | 7.00 | -20.90 | -2.50 | 19.70 | 21.00 | 12.90 | NA | NA | |
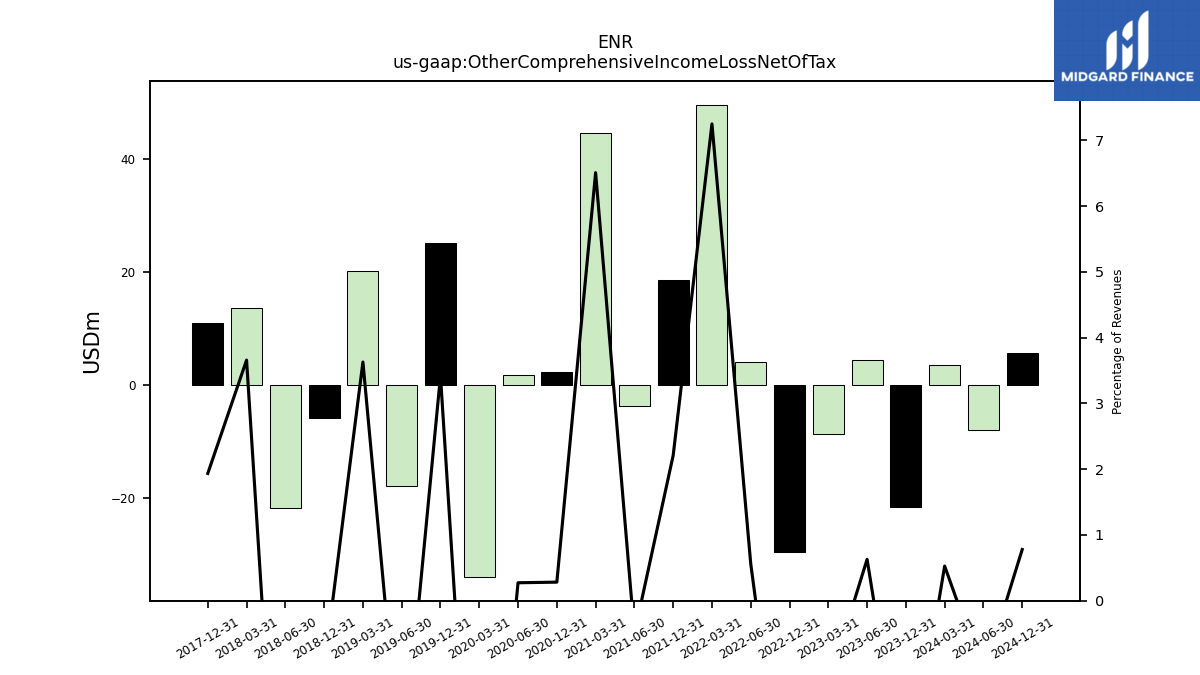
| Other Comprehensive Income Loss Net Of Tax | -21.60 | NA | 4.40 | -8.70 | -29.60 | NA | 4.10 | 49.70 | 18.70 | NA | -3.60 | 44.60 | 2.40 | NA | 1.80 | -34.00 | 25.20 | NA | -17.80 | 20.20 | -5.90 | NA | -21.80 | 13.70 | 11.10 | NA | NA | NA | NA | NA | NA | NA | NA | NA | NA | NA | NA | NA | NA | NA | NA | |
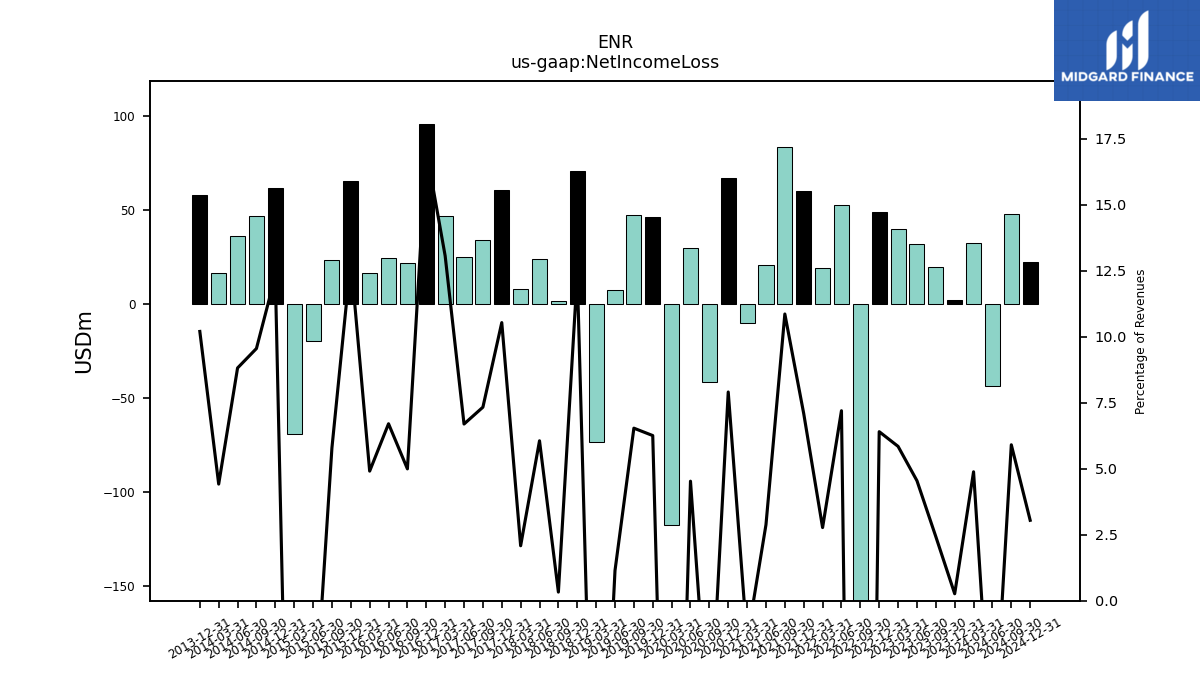
| Net Income Loss | 1.90 | 19.70 | 31.80 | 40.00 | 49.00 | -362.90 | 52.40 | 19.00 | 60.00 | 83.20 | 20.80 | -10.20 | 67.10 | -41.70 | 29.80 | -117.70 | 46.10 | 47.00 | 7.40 | -73.30 | 70.80 | 1.50 | 23.80 | 7.80 | 60.40 | 34.10 | 24.90 | 46.90 | 95.60 | 21.60 | 24.20 | 16.40 | 65.50 | 23.10 | -19.60 | -69.20 | 61.70 | 46.50 | 36.30 | 16.50 | 58.00 | |
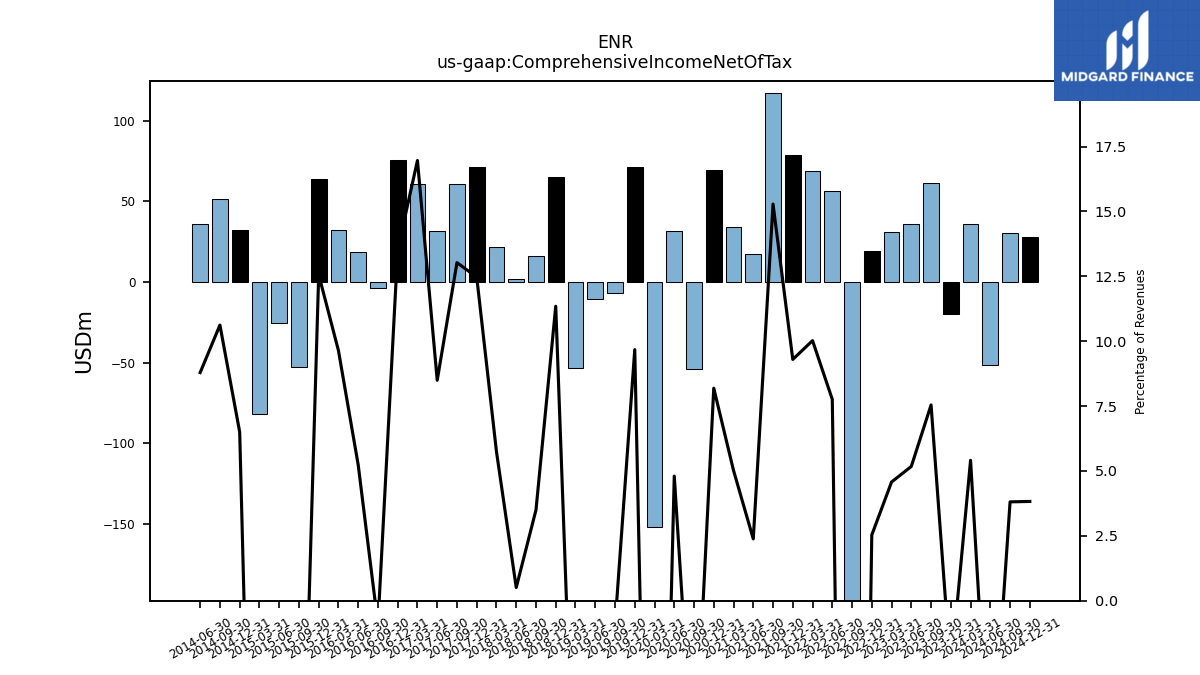
| Comprehensive Income Net Of Tax | -19.70 | 61.20 | 36.20 | 31.30 | 19.40 | -350.30 | 56.50 | 68.70 | 78.70 | 117.10 | 17.20 | 34.40 | 69.50 | -53.90 | 31.60 | -151.70 | 71.30 | -6.80 | -10.40 | -53.10 | 64.90 | 16.00 | 2.00 | 21.50 | 71.50 | 60.60 | 31.60 | 60.90 | 75.70 | -3.90 | 18.90 | 32.20 | 63.70 | -52.90 | -25.40 | -82.00 | 32.60 | 51.70 | 36.20 | NA | NA |
| 2023-12-31 | 2023-09-30 | 2023-06-30 | 2023-03-31 | 2022-12-31 | 2022-09-30 | 2022-06-30 | 2022-03-31 | 2021-12-31 | 2021-09-30 | 2021-06-30 | 2021-03-31 | 2020-12-31 | 2020-09-30 | 2020-06-30 | 2020-03-31 | 2019-12-31 | 2019-09-30 | 2019-06-30 | 2019-03-31 | 2018-12-31 | 2018-09-30 | 2018-06-30 | 2018-03-31 | 2017-12-31 | 2017-09-30 | 2017-06-30 | 2017-03-31 | 2016-12-31 | 2016-09-30 | 2016-06-30 | 2016-03-31 | 2015-12-31 | 2015-09-30 | 2015-06-30 | 2015-03-31 | 2014-12-31 | 2014-09-30 | 2014-06-30 | 2014-03-31 | 2013-12-31 | ||
|---|---|---|---|---|---|---|---|---|---|---|---|---|---|---|---|---|---|---|---|---|---|---|---|---|---|---|---|---|---|---|---|---|---|---|---|---|---|---|---|---|---|---|
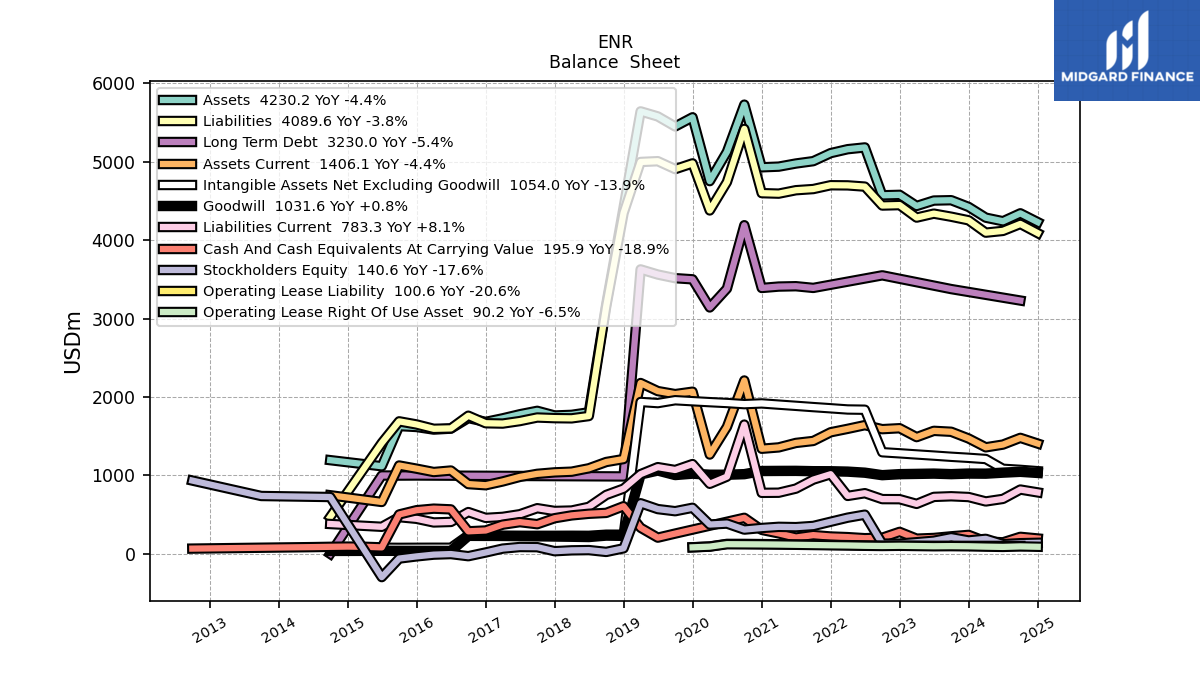
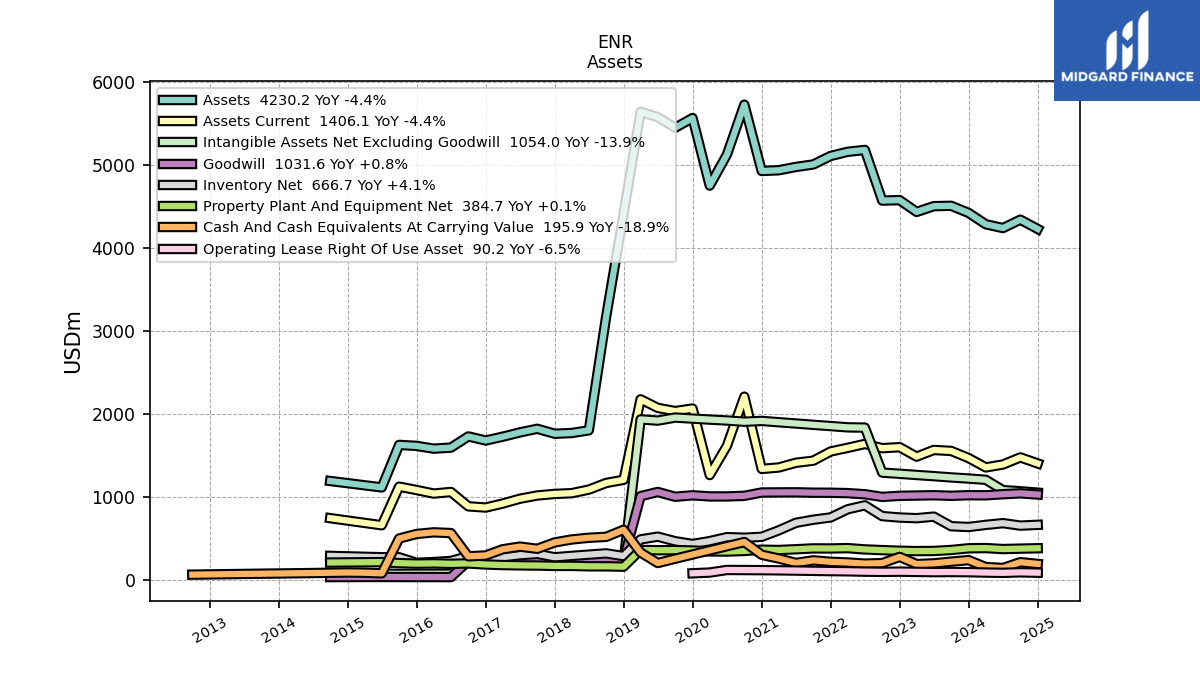
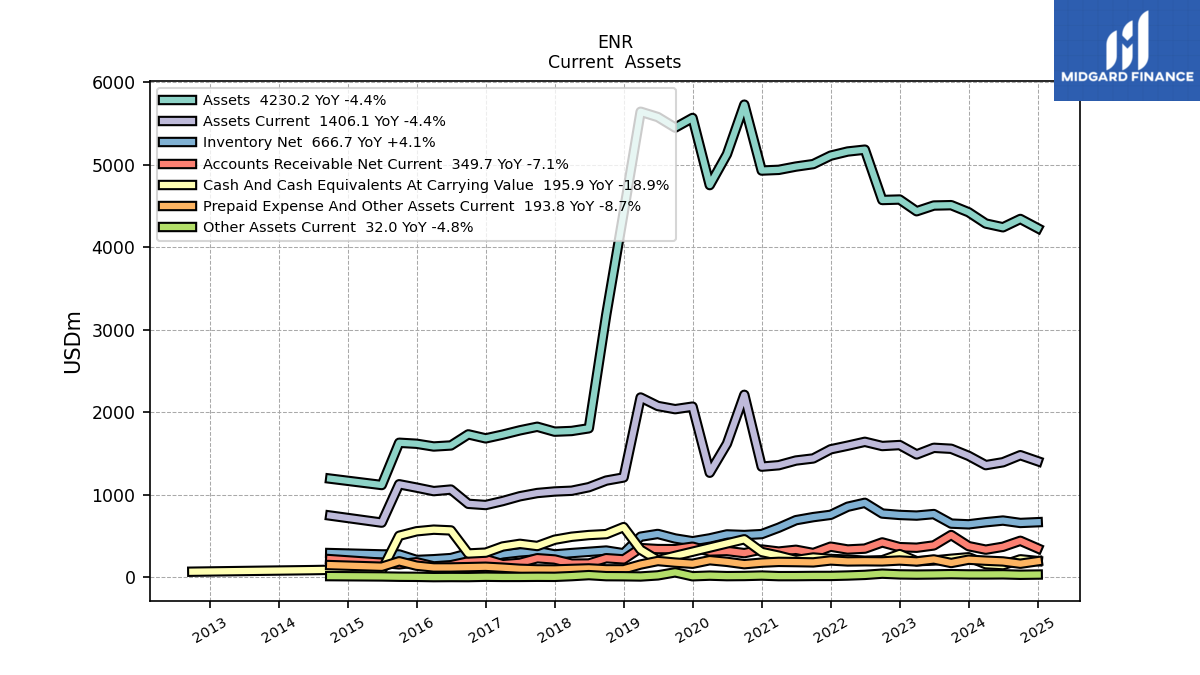
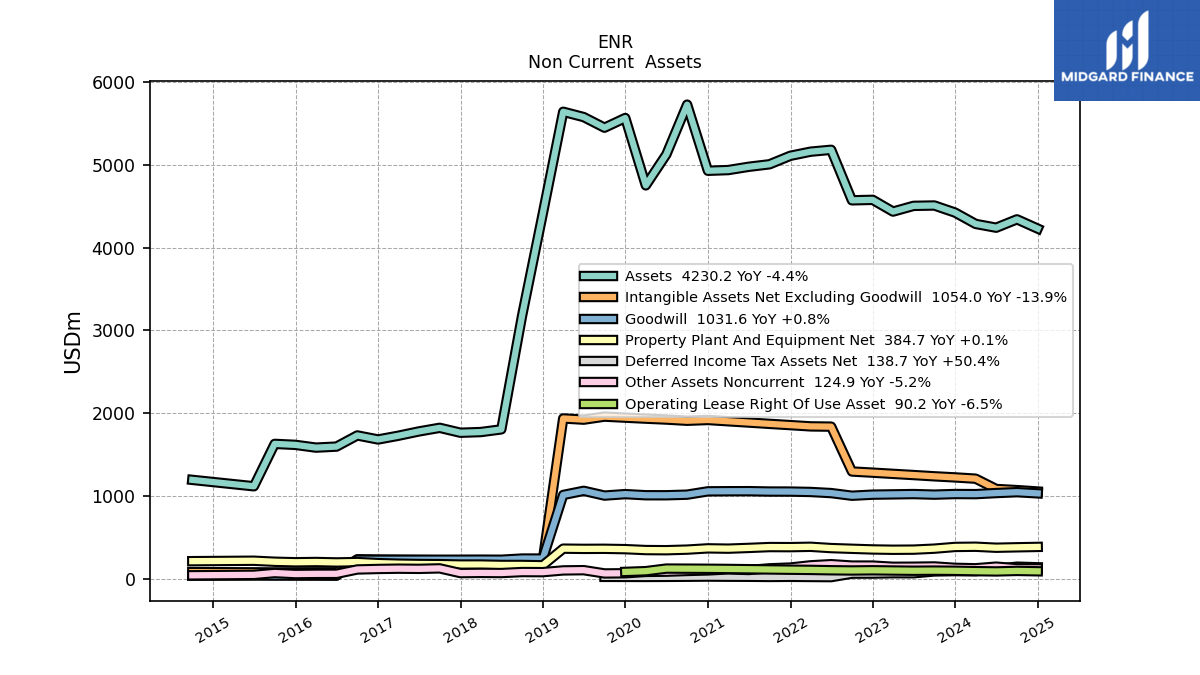
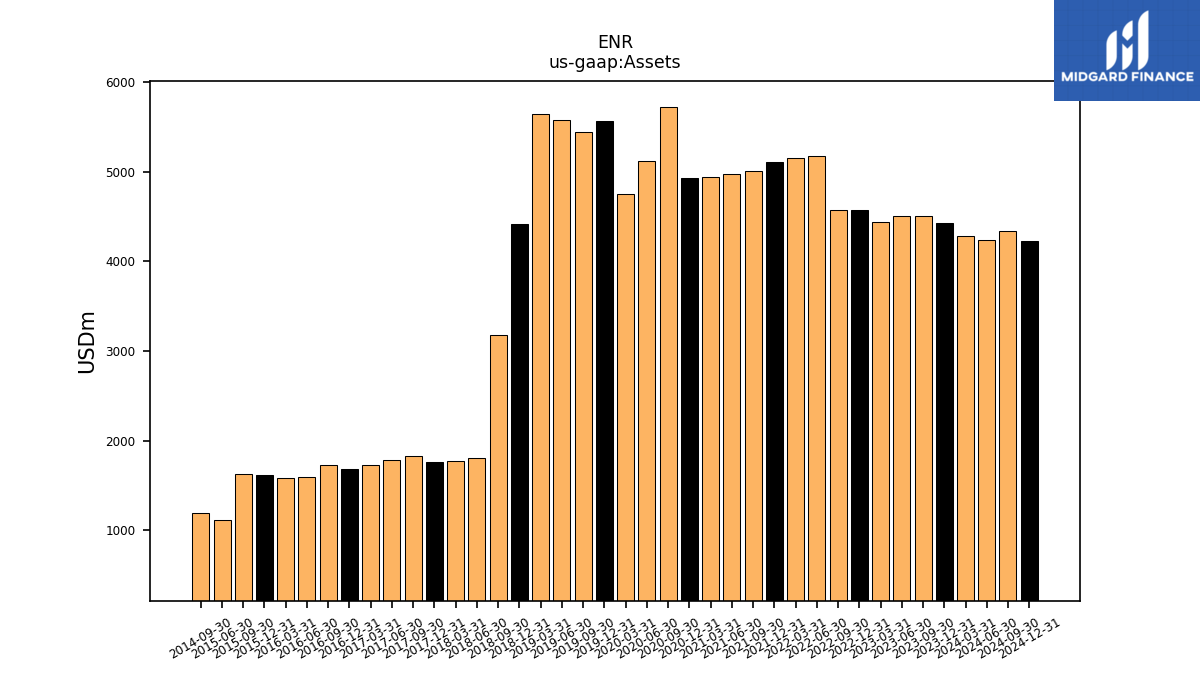
| Assets | 4423.90 | 4509.60 | 4505.10 | 4436.00 | 4577.90 | 4572.10 | 5182.60 | 5159.90 | 5109.90 | 5007.50 | 4977.40 | 4937.60 | 4929.10 | 5728.30 | 5126.50 | 4752.50 | 5566.80 | 5449.60 | 5577.70 | 5642.30 | 4416.10 | 3178.80 | 1804.80 | 1772.40 | 1764.10 | 1823.60 | 1780.00 | 1728.00 | 1682.70 | 1731.50 | 1596.80 | 1584.40 | 1617.50 | 1629.60 | 1117.10 | NA | NA | 1194.70 | NA | NA | NA | |
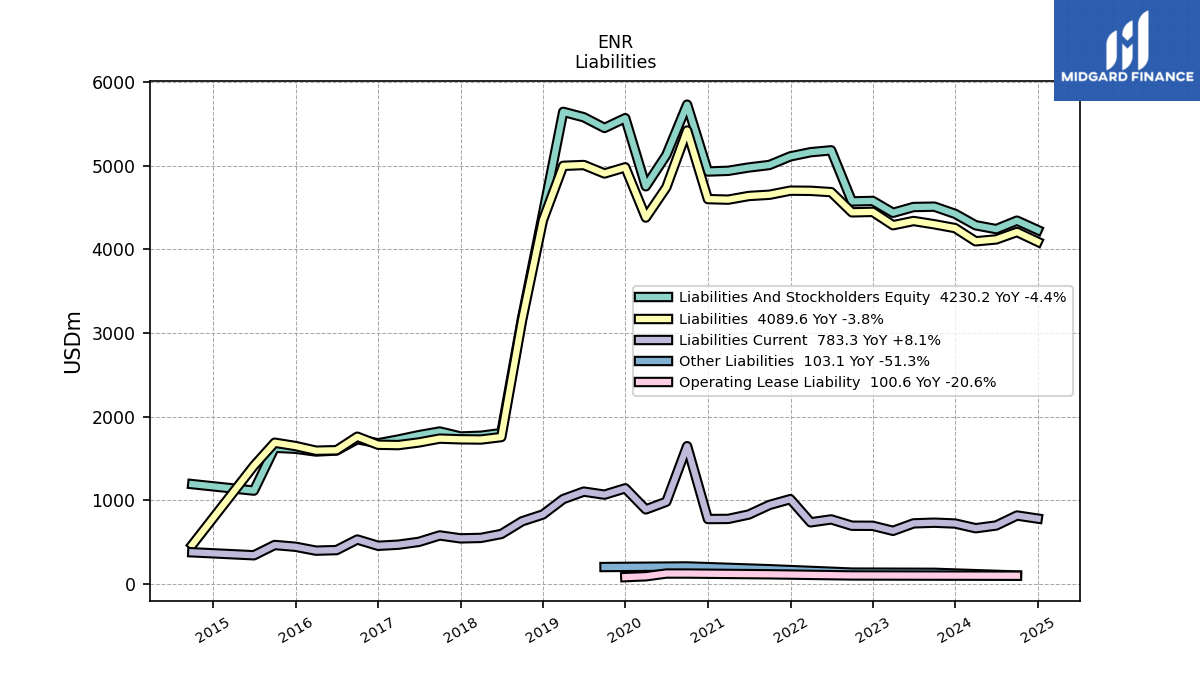
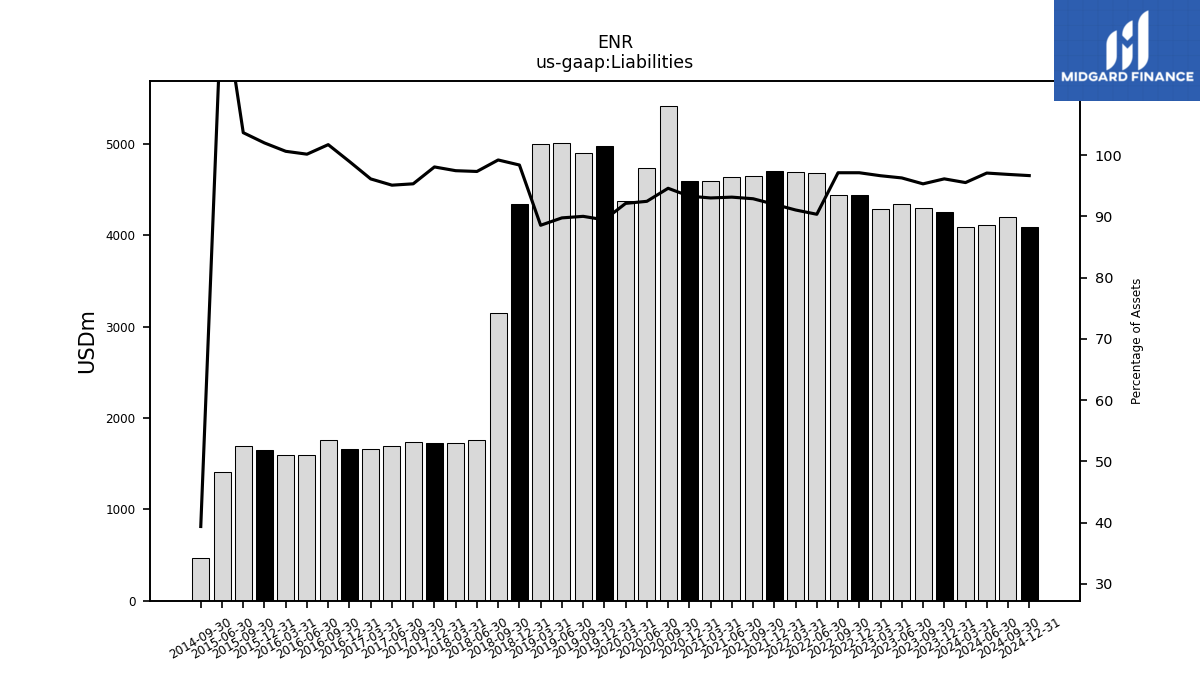
| Liabilities | 4253.30 | 4298.90 | 4338.20 | 4287.60 | 4447.10 | 4441.50 | 4682.90 | 4698.60 | 4700.50 | 4651.80 | 4636.80 | 4593.20 | 4599.50 | 5419.20 | 4740.70 | 4378.80 | 4979.30 | 4905.80 | 5007.00 | 4997.00 | 4345.70 | 3154.30 | 1757.00 | 1727.70 | 1730.40 | 1738.50 | 1693.00 | 1661.20 | 1665.40 | 1761.50 | 1599.60 | 1594.60 | 1650.00 | 1689.70 | 1414.00 | NA | NA | 470.20 | NA | NA | NA | |
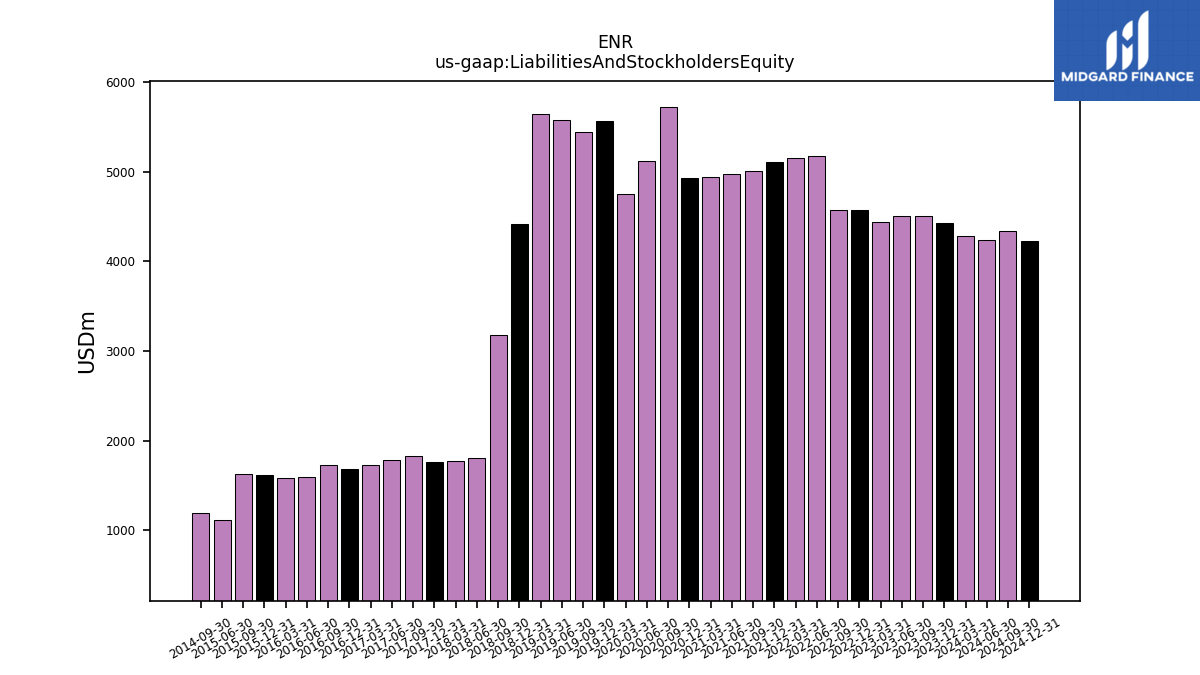
| Liabilities And Stockholders Equity | 4423.90 | 4509.60 | 4505.10 | 4436.00 | 4577.90 | 4572.10 | 5182.60 | 5159.90 | 5109.90 | 5007.50 | 4977.40 | 4937.60 | 4929.10 | 5728.30 | 5126.50 | 4752.50 | 5566.80 | 5449.60 | 5577.70 | 5642.30 | 4416.10 | 3178.80 | 1804.80 | 1772.40 | 1764.10 | 1823.60 | 1780.00 | 1728.00 | 1682.70 | 1731.50 | 1596.80 | 1584.40 | 1617.50 | 1629.60 | 1117.10 | NA | NA | 1194.70 | NA | NA | NA | |
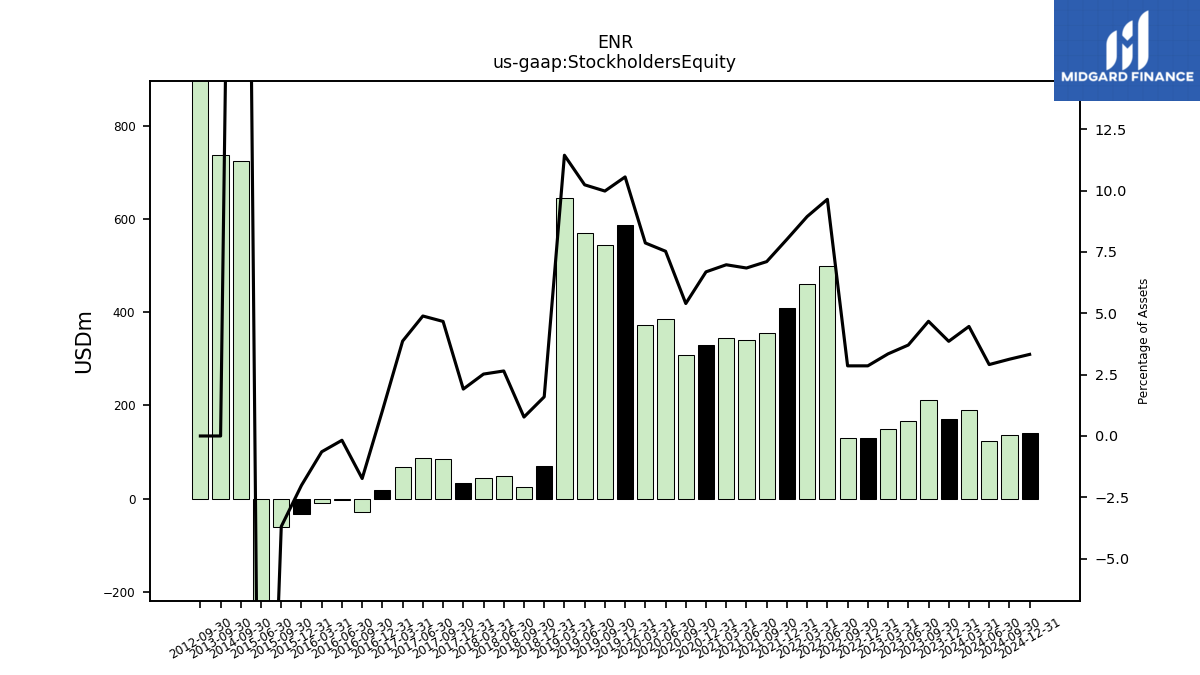
| Stockholders Equity | 170.60 | 210.70 | 166.90 | 148.40 | 130.80 | 130.60 | 499.70 | 461.30 | 409.40 | 355.70 | 340.60 | 344.40 | 329.60 | 309.10 | 385.80 | 373.70 | 587.50 | 543.80 | 570.70 | 645.30 | 70.40 | 24.50 | 47.80 | 44.70 | 33.70 | 85.10 | 87.00 | 66.80 | 17.30 | -30.00 | -2.80 | -10.20 | -32.50 | -60.10 | -296.90 | NA | NA | 724.50 | NA | NA | NA |
| 2023-12-31 | 2023-09-30 | 2023-06-30 | 2023-03-31 | 2022-12-31 | 2022-09-30 | 2022-06-30 | 2022-03-31 | 2021-12-31 | 2021-09-30 | 2021-06-30 | 2021-03-31 | 2020-12-31 | 2020-09-30 | 2020-06-30 | 2020-03-31 | 2019-12-31 | 2019-09-30 | 2019-06-30 | 2019-03-31 | 2018-12-31 | 2018-09-30 | 2018-06-30 | 2018-03-31 | 2017-12-31 | 2017-09-30 | 2017-06-30 | 2017-03-31 | 2016-12-31 | 2016-09-30 | 2016-06-30 | 2016-03-31 | 2015-12-31 | 2015-09-30 | 2015-06-30 | 2015-03-31 | 2014-12-31 | 2014-09-30 | 2014-06-30 | 2014-03-31 | 2013-12-31 | ||
|---|---|---|---|---|---|---|---|---|---|---|---|---|---|---|---|---|---|---|---|---|---|---|---|---|---|---|---|---|---|---|---|---|---|---|---|---|---|---|---|---|---|---|
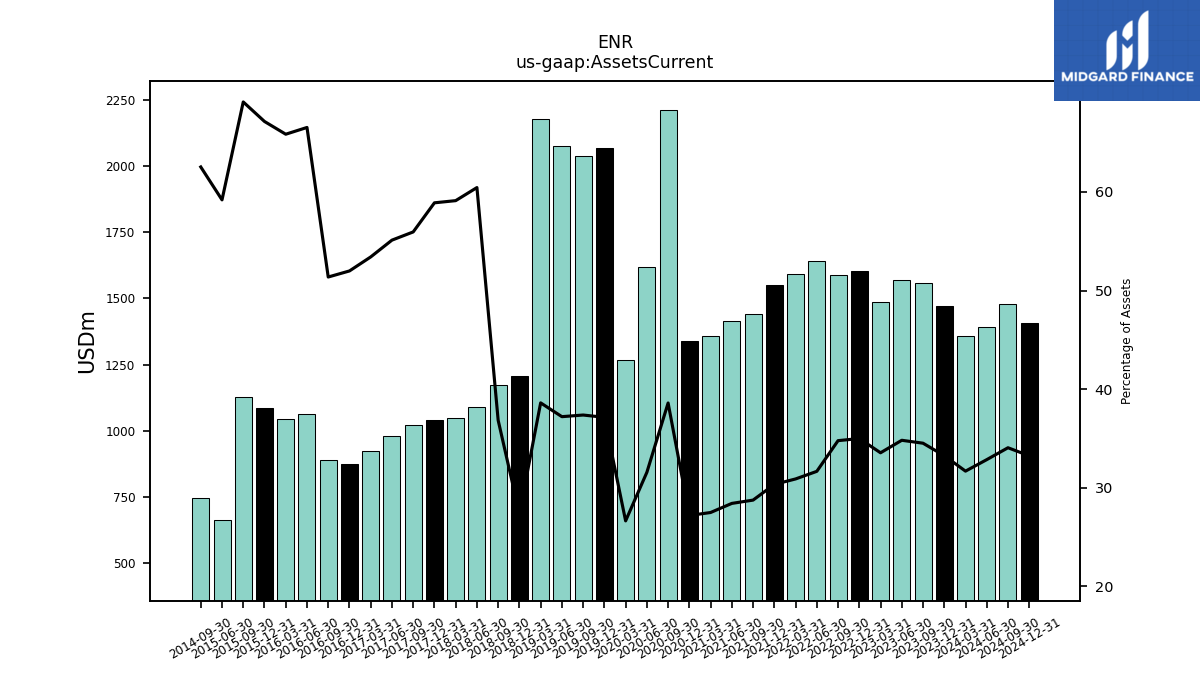
| Assets Current | 1471.00 | 1556.60 | 1568.40 | 1488.10 | 1601.90 | 1590.00 | 1641.00 | 1594.00 | 1550.30 | 1439.50 | 1414.20 | 1357.30 | 1340.00 | 2210.90 | 1618.10 | 1266.10 | 2067.70 | 2036.80 | 2075.40 | 2178.40 | 1208.80 | 1171.10 | 1090.90 | 1047.80 | 1039.00 | 1020.20 | 981.00 | 922.90 | 874.80 | 889.50 | 1062.50 | 1043.40 | 1086.10 | 1126.50 | 661.30 | NA | NA | 747.10 | NA | NA | NA | |
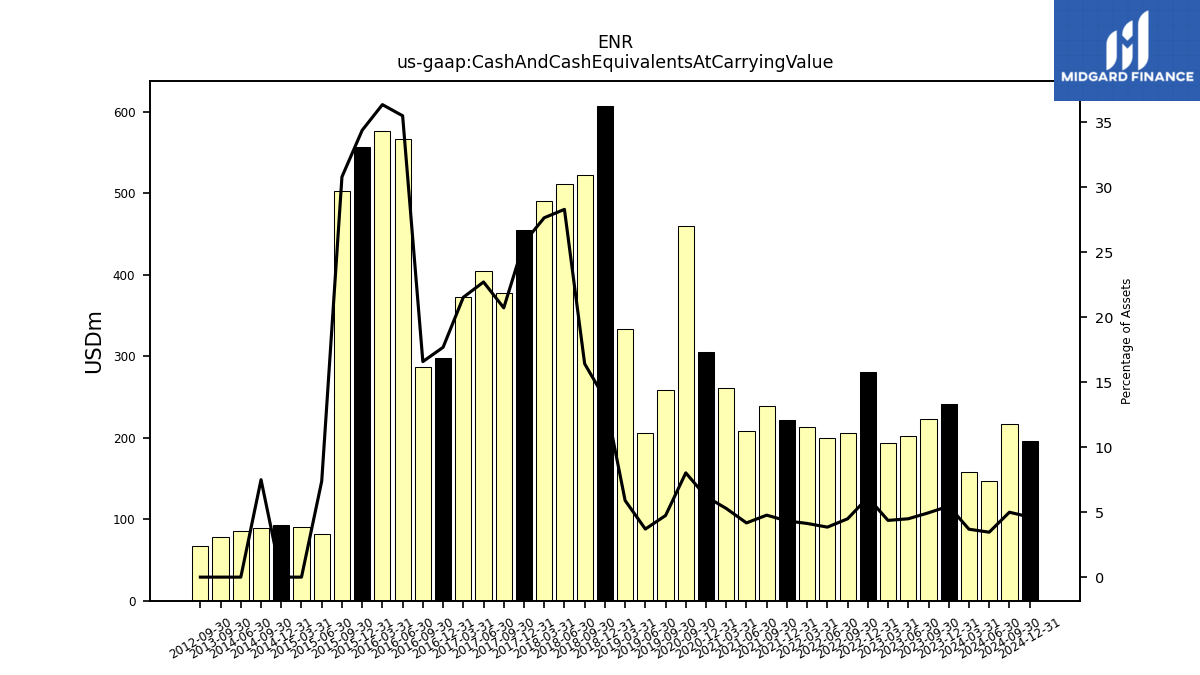
| Cash And Cash Equivalents At Carrying Value | 241.70 | 223.30 | 202.40 | 193.70 | 280.30 | 205.30 | 199.50 | 213.20 | 221.20 | 238.90 | 207.70 | 261.00 | 305.60 | 459.80 | NA | NA | NA | 258.50 | 206.40 | 332.90 | 607.30 | 522.10 | 510.90 | 490.30 | 454.30 | 378.00 | 404.40 | 372.20 | 297.70 | 287.30 | 567.10 | 576.30 | 556.40 | 502.10 | 82.50 | 90.10 | 92.50 | 89.60 | 85.90 | NA | NA | |
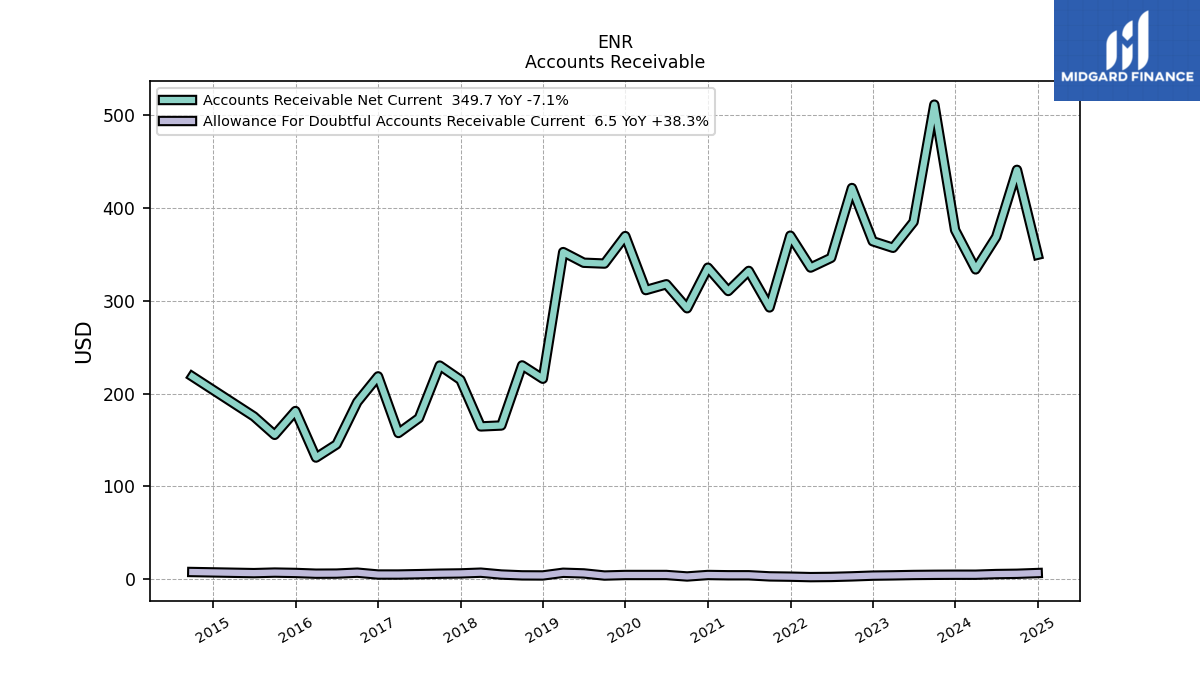
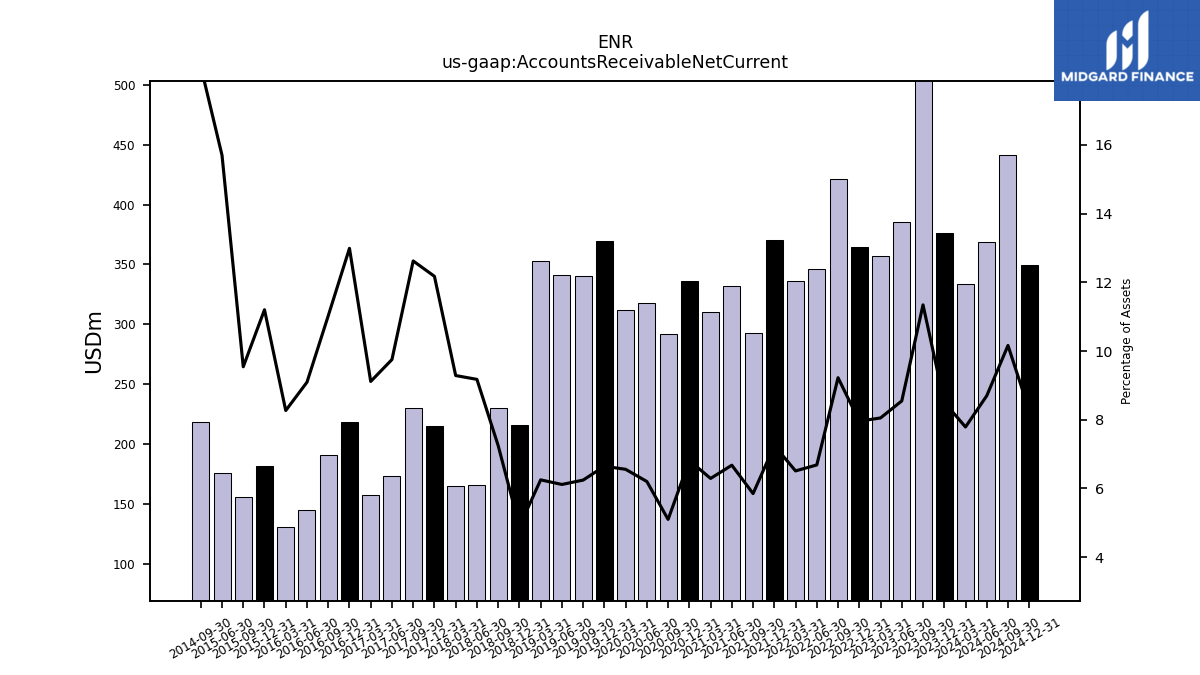
| Accounts Receivable Net Current | 376.40 | 511.60 | 385.10 | 357.20 | 364.30 | 421.70 | 346.40 | 335.90 | 370.30 | 292.90 | 332.30 | 310.60 | 335.80 | 292.00 | 317.90 | 311.60 | 369.90 | 340.20 | 341.10 | 352.60 | 216.00 | 230.40 | 165.60 | 164.60 | 214.80 | 230.20 | 173.60 | 157.50 | 218.60 | 190.90 | 145.20 | 131.00 | 181.20 | 155.50 | 175.40 | NA | NA | 218.50 | NA | NA | NA | |
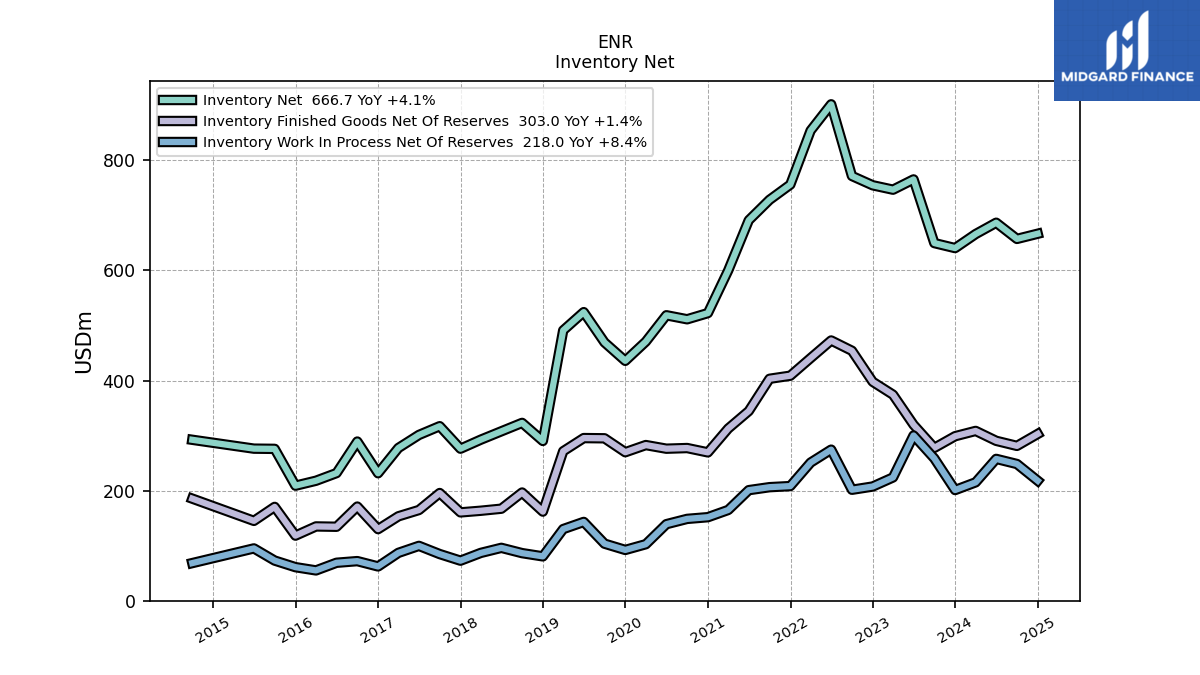
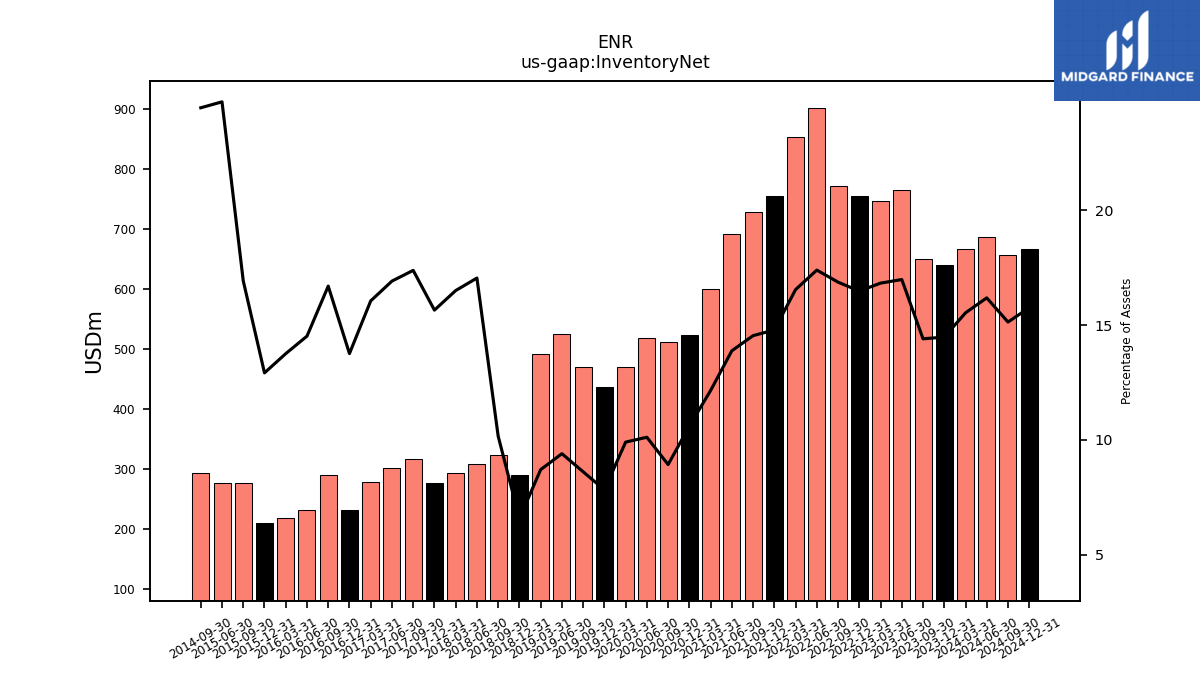
| Inventory Net | 640.60 | 649.70 | 765.40 | 746.70 | 754.70 | 771.60 | 901.80 | 854.00 | 755.90 | 728.30 | 691.10 | 600.00 | 522.50 | 511.30 | 518.60 | 470.70 | 435.80 | 469.30 | 524.30 | 491.10 | 290.20 | 323.10 | 307.80 | 292.60 | 276.20 | 317.10 | 301.20 | 277.50 | 231.60 | 289.20 | 231.90 | 218.00 | 209.00 | 275.90 | 276.30 | NA | NA | 292.40 | NA | NA | NA | |
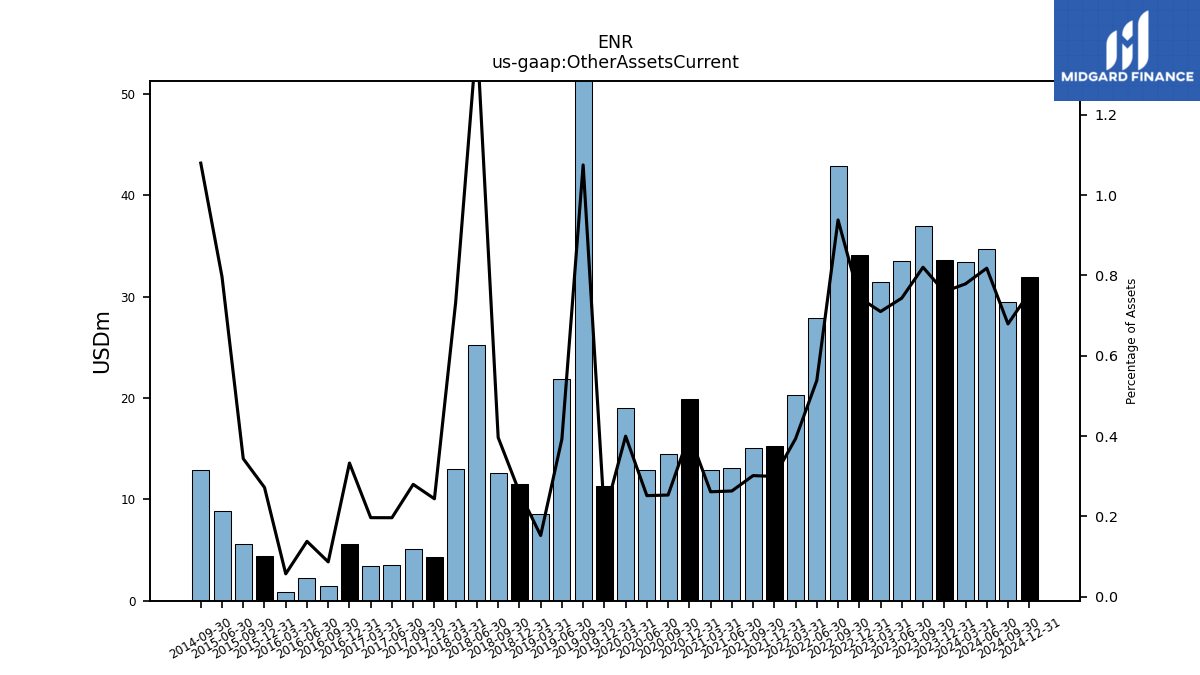
| Other Assets Current | 33.60 | 37.00 | 33.50 | 31.50 | 34.10 | 42.90 | 27.90 | 20.30 | 15.30 | 15.10 | 13.10 | 12.90 | 19.90 | 14.50 | 12.90 | 19.00 | 11.30 | 58.60 | 21.90 | 8.60 | 11.50 | 12.60 | 25.20 | 13.00 | 4.30 | 5.10 | 3.50 | 3.40 | 5.60 | 1.50 | 2.20 | 0.90 | 4.40 | 5.60 | 8.90 | NA | NA | 12.90 | NA | NA | NA | |
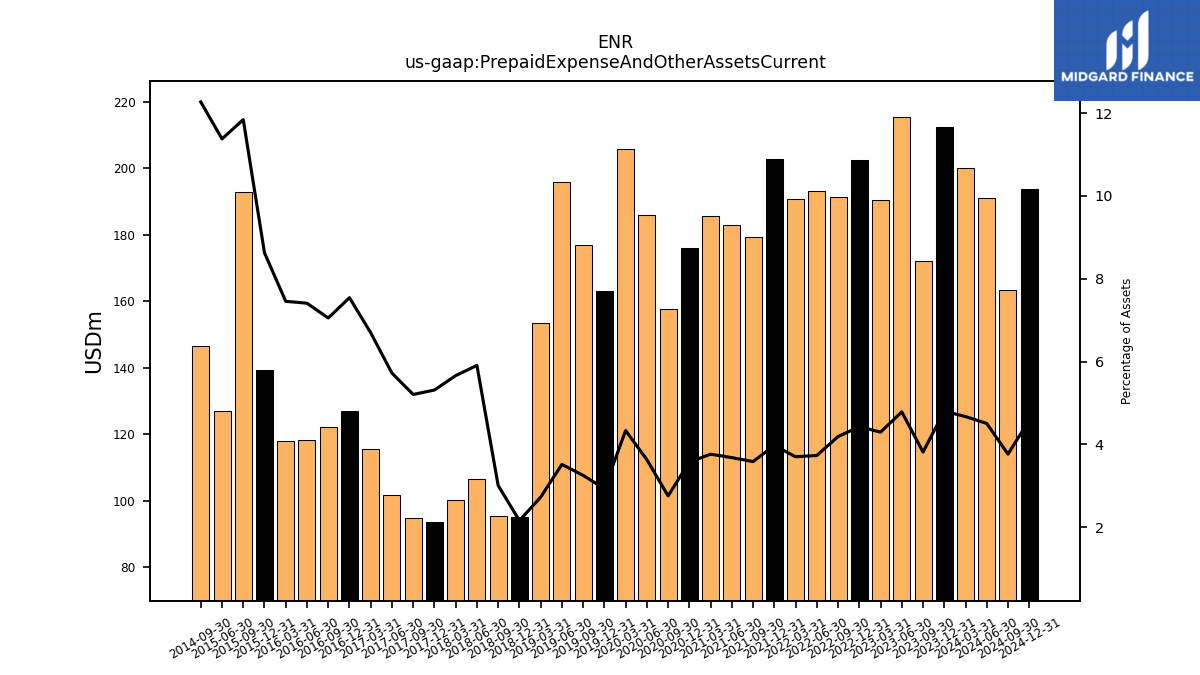
| Prepaid Expense And Other Assets Current | 212.30 | 172.00 | 215.50 | 190.50 | 202.60 | 191.40 | 193.30 | 190.90 | 202.90 | 179.40 | 183.10 | 185.70 | 176.10 | 157.80 | 186.00 | 205.90 | 163.00 | 177.10 | 196.00 | 153.60 | 95.30 | 95.50 | 106.60 | 100.30 | 93.70 | 94.90 | 101.80 | 115.70 | 126.90 | 122.10 | 118.30 | 118.10 | 139.50 | 193.00 | 127.10 | NA | NA | 146.60 | NA | NA | NA | |
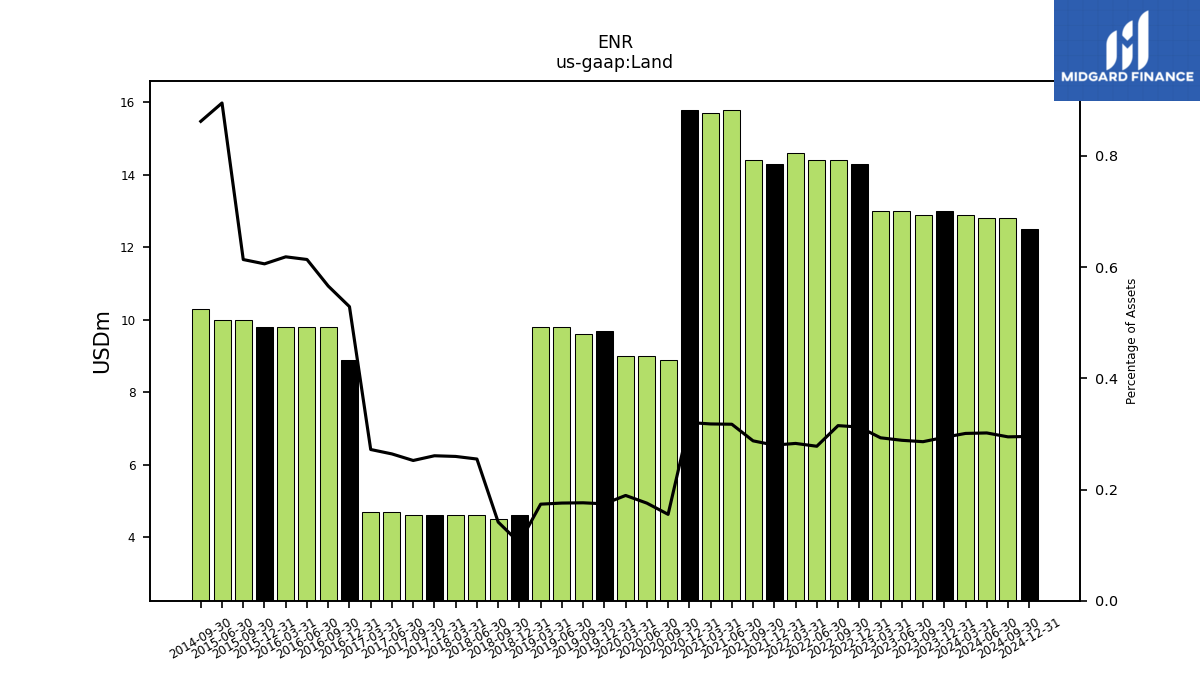
| Land | 13.00 | 12.90 | 13.00 | 13.00 | 14.30 | 14.40 | 14.40 | 14.60 | 14.30 | 14.40 | 15.80 | 15.70 | 15.80 | 8.90 | 9.00 | 9.00 | 9.70 | 9.60 | 9.80 | 9.80 | 4.60 | 4.50 | 4.60 | 4.60 | 4.60 | 4.60 | 4.70 | 4.70 | 8.90 | 9.80 | 9.80 | 9.80 | 9.80 | 10.00 | 10.00 | NA | NA | 10.30 | NA | NA | NA | |
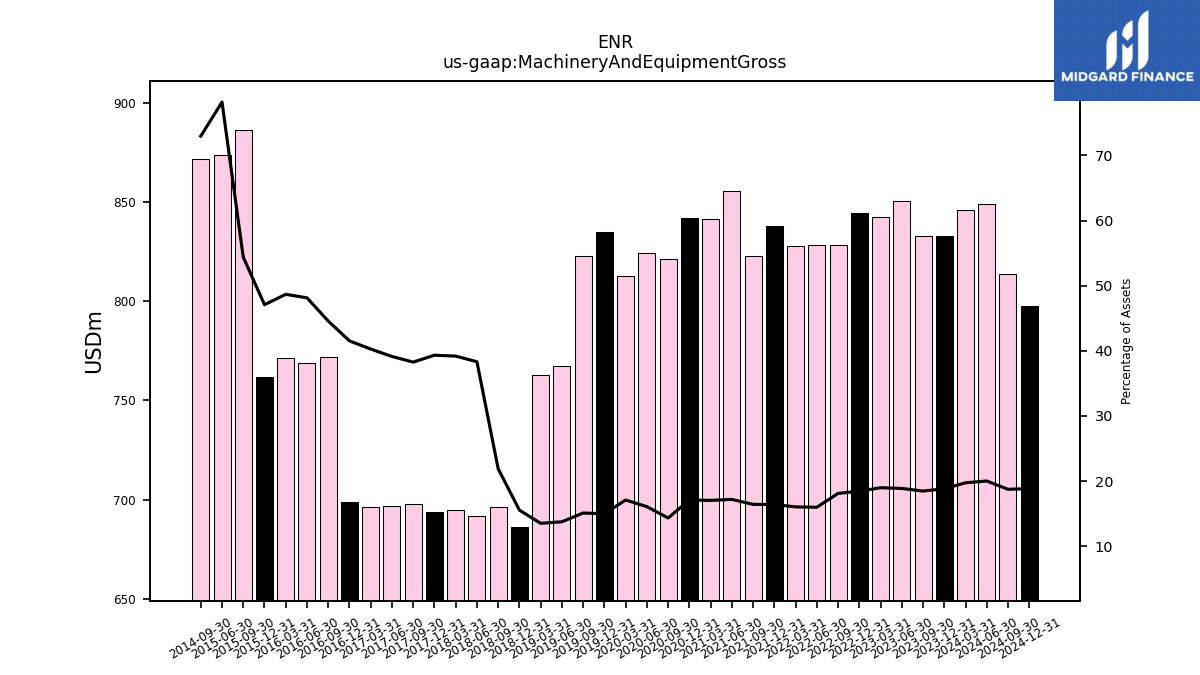
| Machinery And Equipment Gross | 832.80 | 832.90 | 850.40 | 842.30 | 844.30 | 828.20 | 828.40 | 827.90 | 838.10 | 822.90 | 855.80 | 841.50 | 842.20 | 821.40 | 824.20 | 812.70 | 834.80 | 823.00 | 767.20 | 762.90 | 686.40 | 696.20 | 691.80 | 694.70 | 693.90 | 697.90 | 696.70 | 696.00 | 698.80 | 771.90 | 768.80 | 771.30 | 761.70 | 886.20 | 873.60 | NA | NA | 871.80 | NA | NA | NA |
| 2023-12-31 | 2023-09-30 | 2023-06-30 | 2023-03-31 | 2022-12-31 | 2022-09-30 | 2022-06-30 | 2022-03-31 | 2021-12-31 | 2021-09-30 | 2021-06-30 | 2021-03-31 | 2020-12-31 | 2020-09-30 | 2020-06-30 | 2020-03-31 | 2019-12-31 | 2019-09-30 | 2019-06-30 | 2019-03-31 | 2018-12-31 | 2018-09-30 | 2018-06-30 | 2018-03-31 | 2017-12-31 | 2017-09-30 | 2017-06-30 | 2017-03-31 | 2016-12-31 | 2016-09-30 | 2016-06-30 | 2016-03-31 | 2015-12-31 | 2015-09-30 | 2015-06-30 | 2015-03-31 | 2014-12-31 | 2014-09-30 | 2014-06-30 | 2014-03-31 | 2013-12-31 | ||
|---|---|---|---|---|---|---|---|---|---|---|---|---|---|---|---|---|---|---|---|---|---|---|---|---|---|---|---|---|---|---|---|---|---|---|---|---|---|---|---|---|---|---|
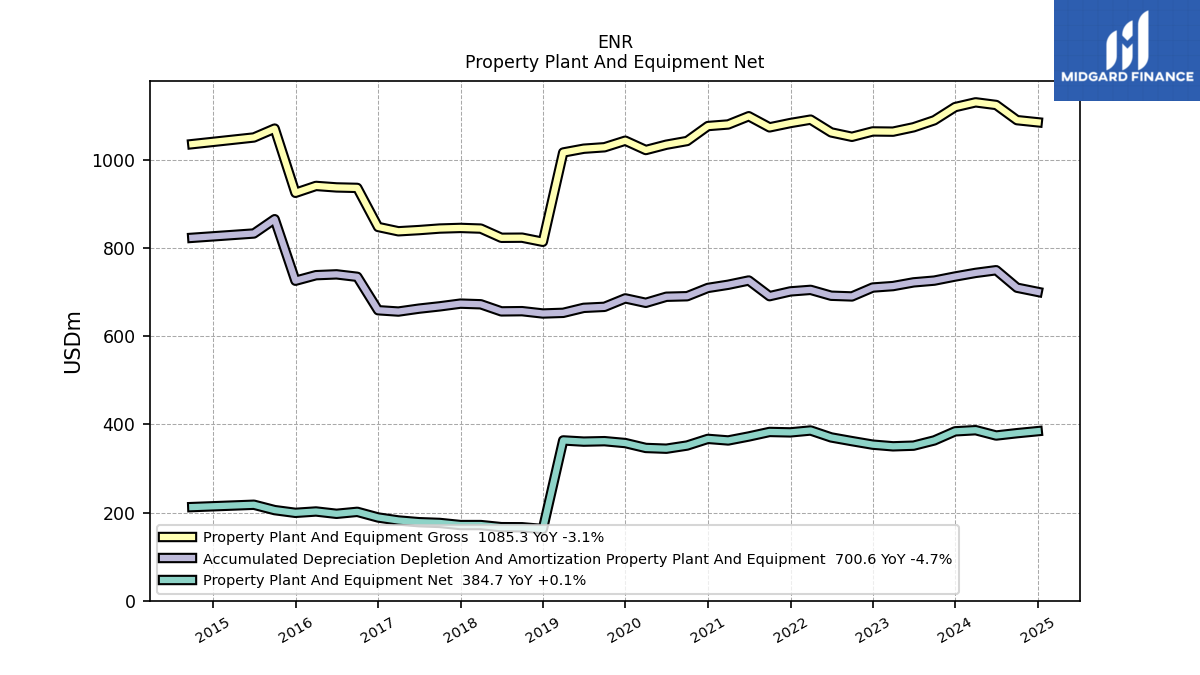
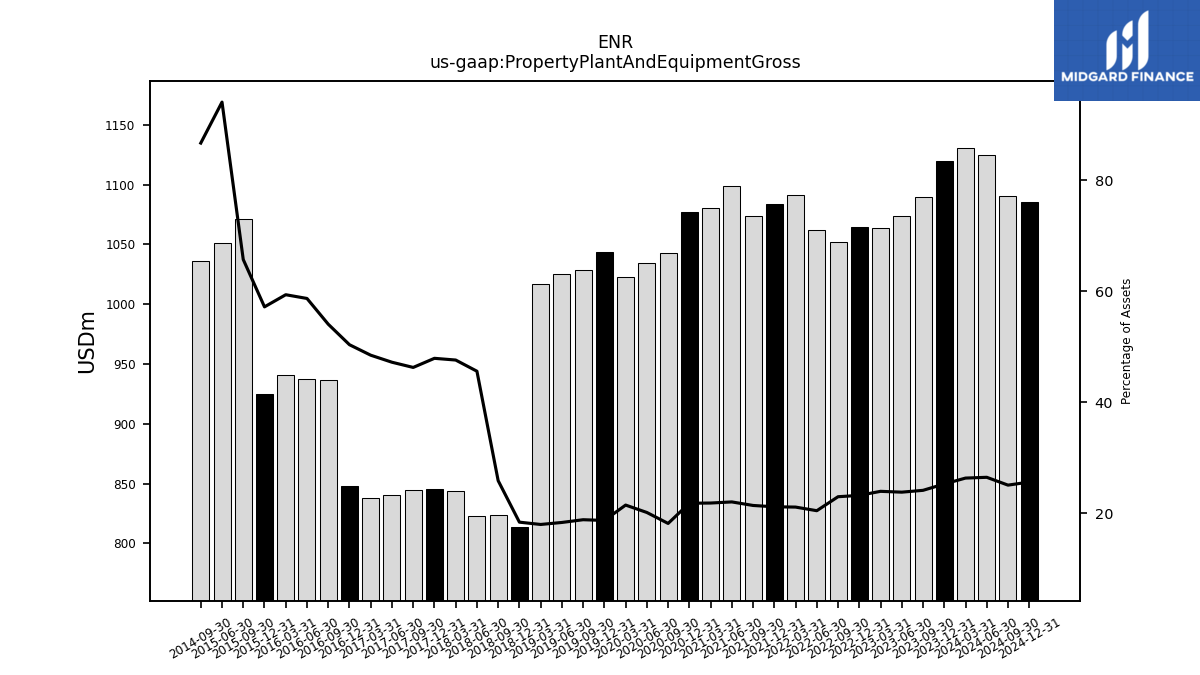
| Property Plant And Equipment Gross | 1119.80 | 1089.90 | 1074.00 | 1064.10 | 1064.60 | 1052.40 | 1062.40 | 1091.40 | 1083.60 | 1073.80 | 1099.10 | 1080.40 | 1076.80 | 1042.90 | 1034.50 | 1022.40 | 1043.60 | 1028.70 | 1025.40 | 1016.80 | 814.20 | 823.60 | 823.30 | 844.20 | 845.70 | 844.30 | 840.80 | 838.10 | 847.90 | 936.50 | 937.60 | 941.00 | 925.30 | 1071.10 | 1050.90 | NA | NA | 1035.80 | NA | NA | NA | |
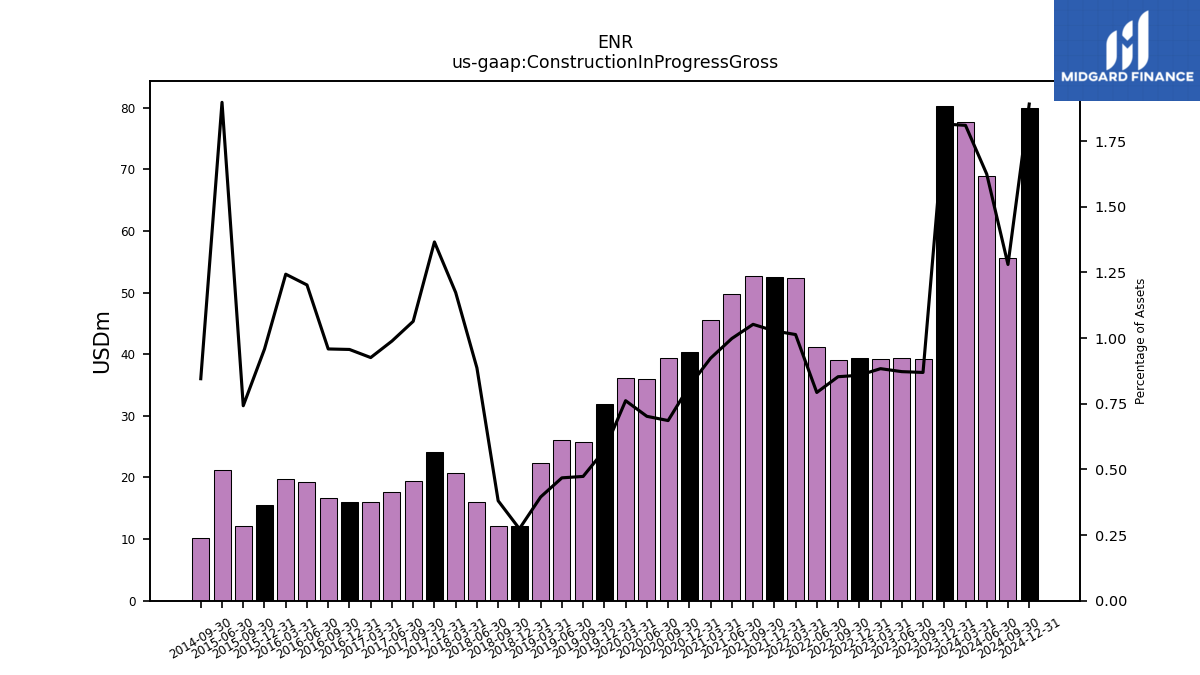
| Construction In Progress Gross | 80.30 | 39.20 | 39.30 | 39.20 | 39.30 | 39.00 | 41.10 | 52.30 | 52.50 | 52.70 | 49.70 | 45.60 | 40.30 | 39.30 | 36.00 | 36.20 | 31.90 | 25.80 | 26.10 | 22.30 | 12.10 | 12.10 | 16.00 | 20.80 | 24.10 | 19.40 | 17.60 | 16.00 | 16.10 | 16.60 | 19.20 | 19.70 | 15.50 | 12.10 | 21.20 | NA | NA | 10.10 | NA | NA | NA | |
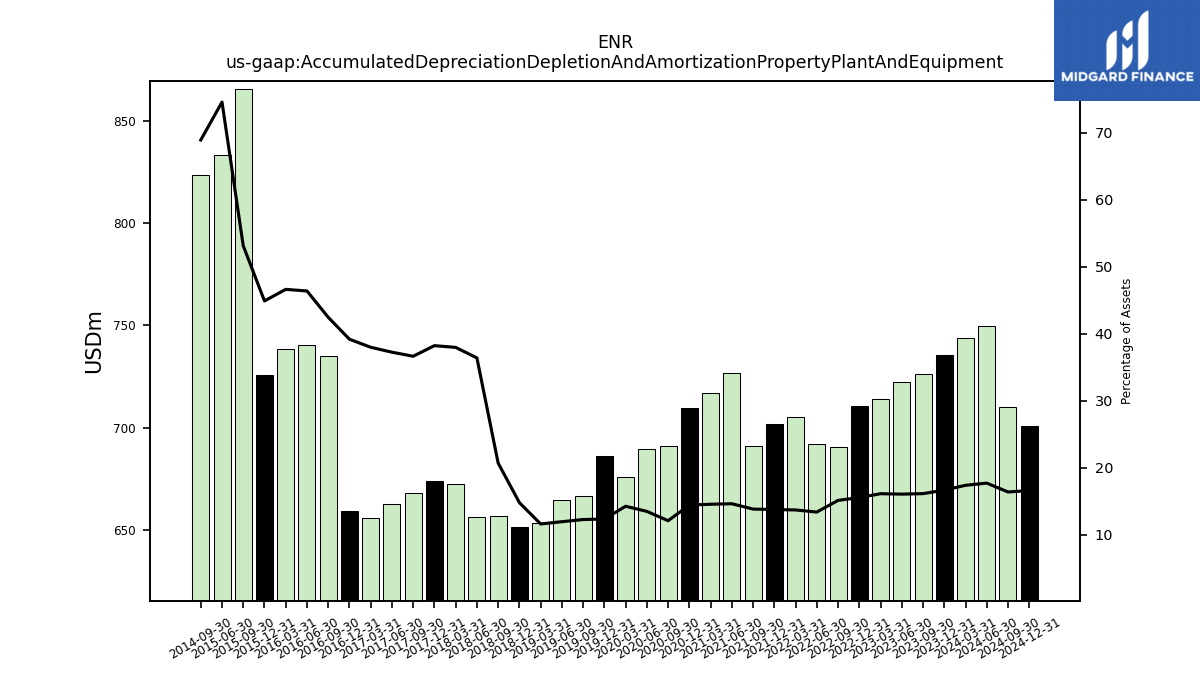
| Accumulated Depreciation Depletion And Amortization Property Plant And Equipment | 735.50 | 726.20 | 722.20 | 713.80 | 710.50 | 690.30 | 691.90 | 705.20 | 701.70 | 690.90 | 726.50 | 716.80 | 709.60 | 690.80 | 689.60 | 675.80 | 685.90 | 666.70 | 664.40 | 653.10 | 651.60 | 656.90 | 656.40 | 672.50 | 674.00 | 667.80 | 662.60 | 656.00 | 659.00 | 734.80 | 740.40 | 738.50 | 725.90 | 865.50 | 833.10 | NA | NA | 823.30 | NA | NA | NA | |
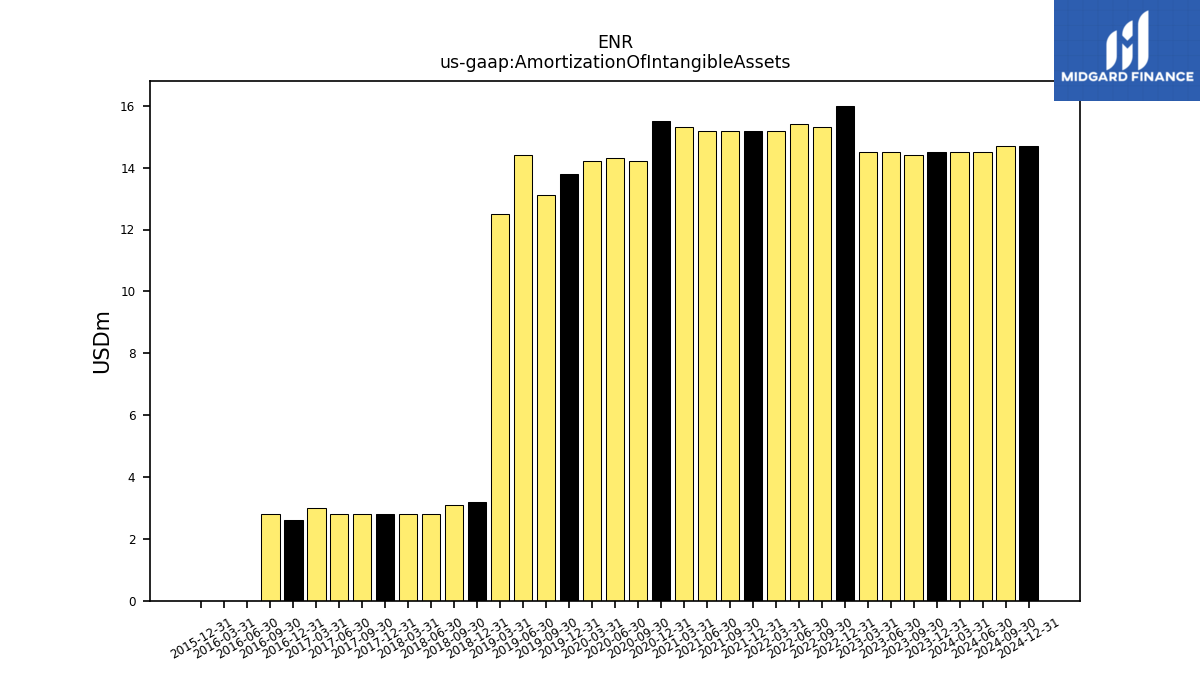
| Amortization Of Intangible Assets | 14.50 | 14.40 | 14.50 | 14.50 | 16.00 | 15.30 | 15.40 | 15.20 | 15.20 | 15.20 | 15.20 | 15.30 | 15.50 | 14.20 | 14.30 | 14.20 | 13.80 | 13.10 | 14.40 | 12.50 | 3.20 | 3.10 | 2.80 | 2.80 | 2.80 | 2.80 | 2.80 | 3.00 | 2.60 | 2.80 | 0.00 | 0.00 | 0.00 | NA | NA | NA | NA | NA | NA | NA | NA | |
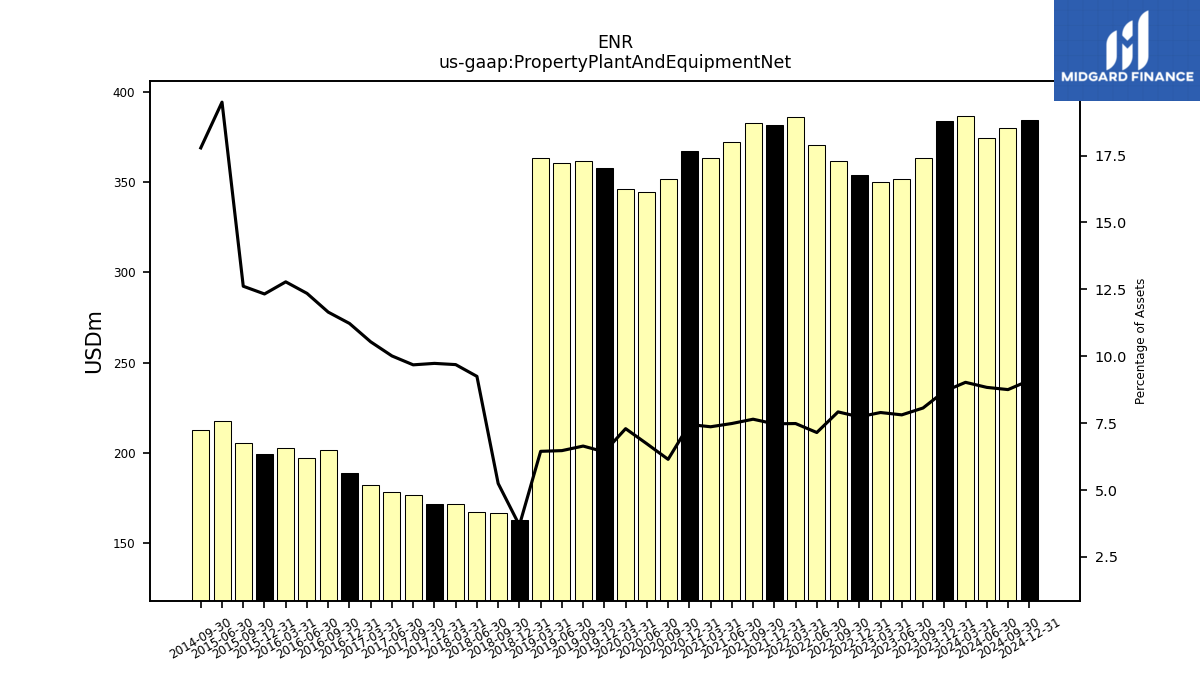
| Property Plant And Equipment Net | 384.30 | 363.70 | 351.80 | 350.30 | 354.10 | 362.10 | 370.50 | 386.20 | 381.90 | 382.90 | 372.60 | 363.60 | 367.20 | 352.10 | 344.90 | 346.60 | 357.70 | 362.00 | 361.00 | 363.70 | 162.60 | 166.70 | 166.90 | 171.70 | 171.70 | 176.50 | 178.20 | 182.10 | 188.90 | 201.70 | 197.20 | 202.50 | 199.40 | 205.60 | 217.80 | NA | NA | 212.50 | NA | NA | NA | |
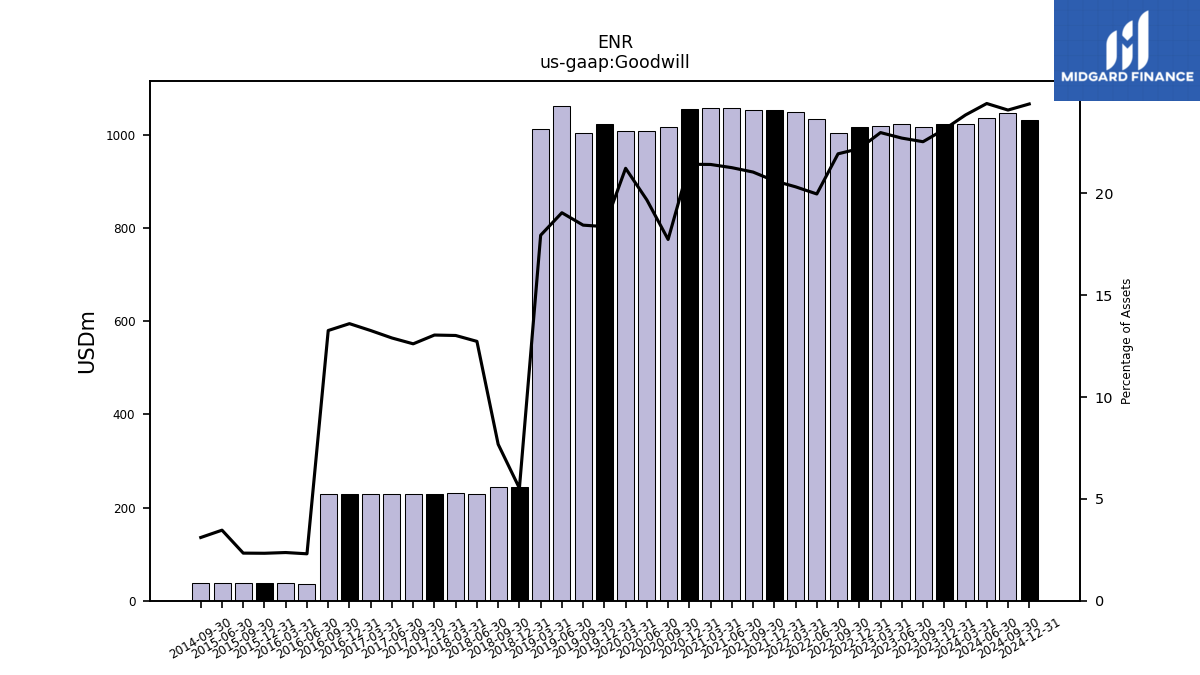
| Goodwill | 1023.70 | 1016.20 | 1023.20 | 1019.50 | 1016.10 | 1003.10 | 1034.90 | 1048.50 | 1053.30 | 1053.80 | 1058.20 | 1057.50 | 1056.20 | 1016.00 | 1008.70 | 1008.90 | 1022.50 | 1004.80 | 1062.40 | 1012.40 | 244.00 | 244.20 | 229.80 | 230.80 | 230.10 | 230.00 | 229.60 | 229.20 | 228.90 | 229.70 | 36.80 | 37.50 | 37.70 | 38.10 | 38.70 | NA | NA | 37.10 | NA | NA | NA | |
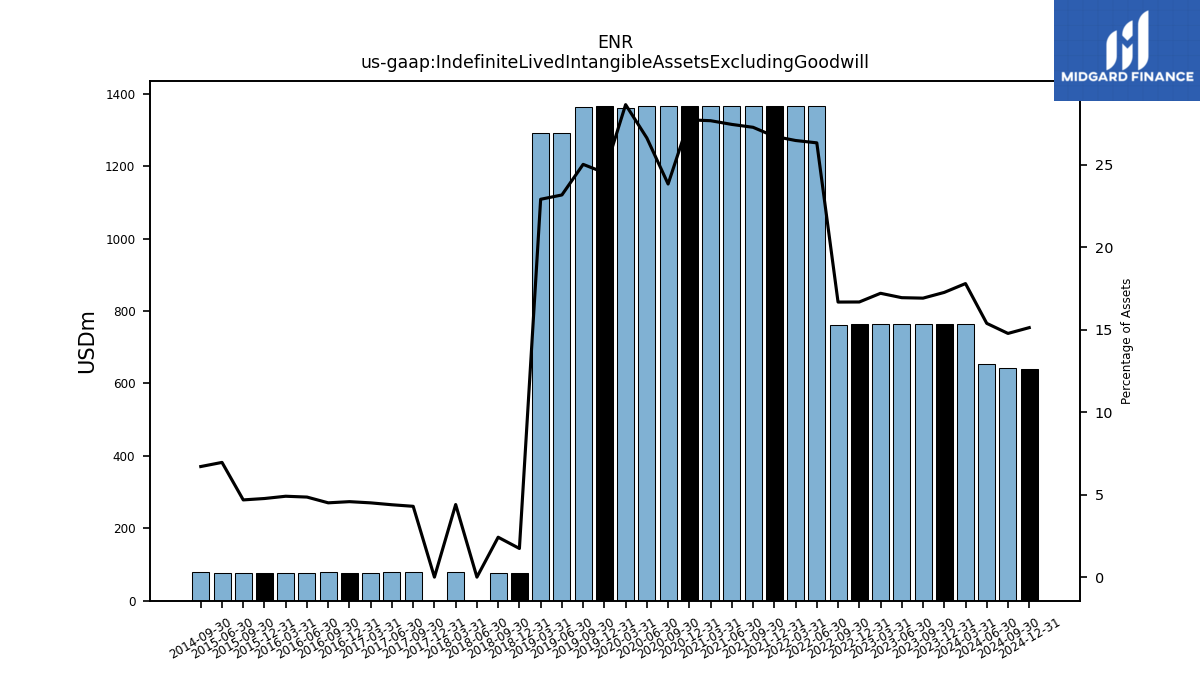
| Indefinite Lived Intangible Assets Excluding Goodwill | 763.70 | 762.80 | 763.30 | 763.40 | 763.70 | 762.50 | 1364.60 | 1366.00 | 1365.60 | 1365.70 | 1366.20 | 1366.40 | 1366.60 | 1365.40 | 1364.90 | 1361.50 | 1365.00 | 1363.80 | 1292.40 | 1292.60 | 76.70 | 76.90 | 0.00 | 78.00 | 0.00 | 78.30 | 78.10 | 77.80 | 77.00 | 78.00 | 77.50 | 77.70 | 77.10 | 76.30 | 77.70 | NA | NA | 80.10 | NA | NA | NA | |
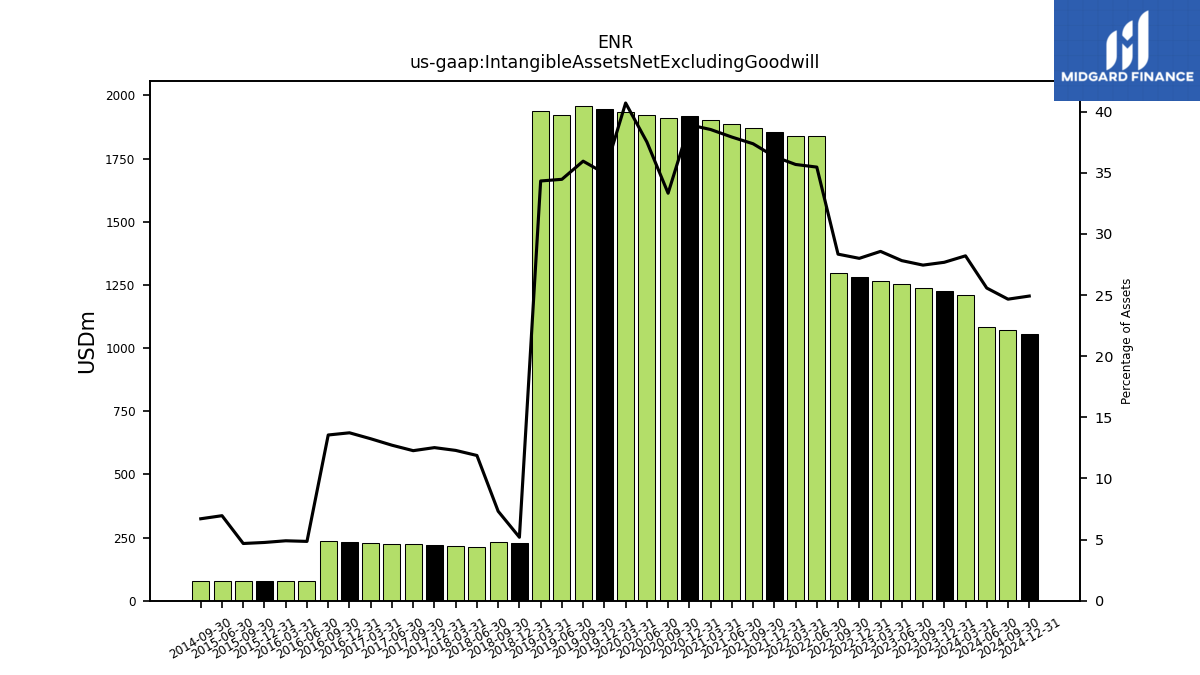
| Intangible Assets Net Excluding Goodwill | 1224.40 | 1237.70 | 1253.00 | 1267.30 | 1281.80 | 1295.80 | 1837.80 | 1840.90 | 1856.20 | 1871.30 | 1887.30 | 1902.70 | 1918.20 | 1909.00 | 1923.40 | 1934.30 | 1946.30 | 1958.90 | 1922.20 | 1936.80 | 229.30 | 232.70 | 214.40 | 217.90 | 220.90 | 223.80 | 226.40 | 228.90 | 231.10 | 234.70 | 77.50 | 77.70 | 77.10 | 76.30 | 77.70 | NA | NA | 80.10 | NA | NA | NA | |
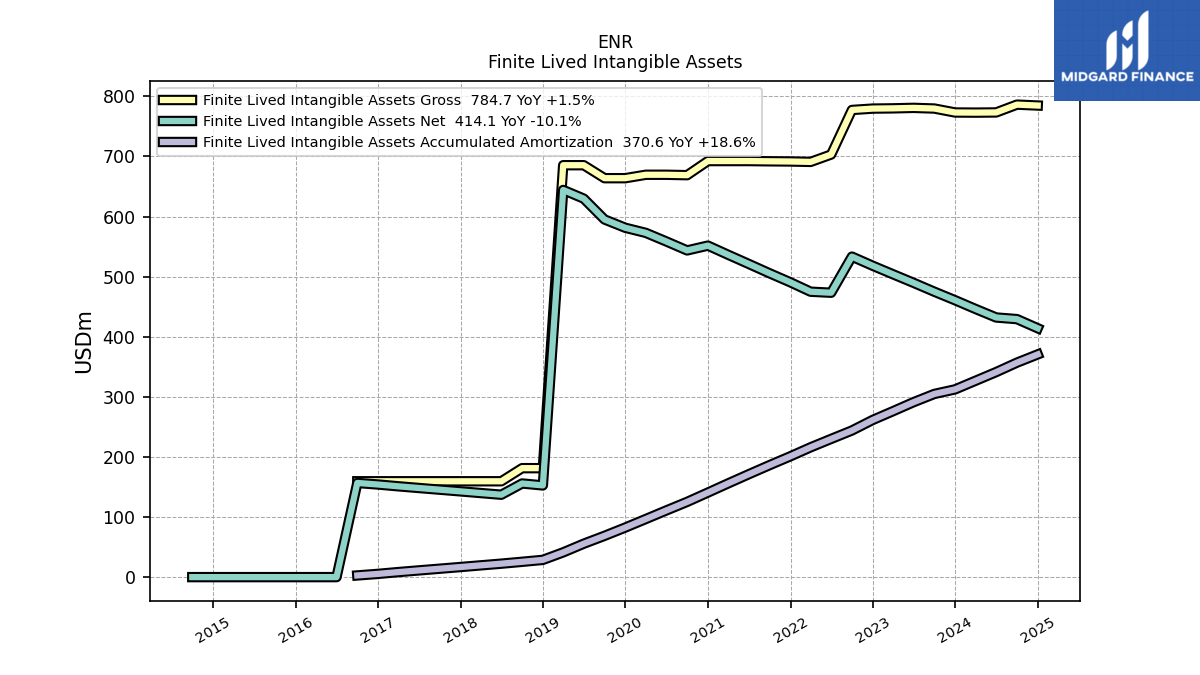
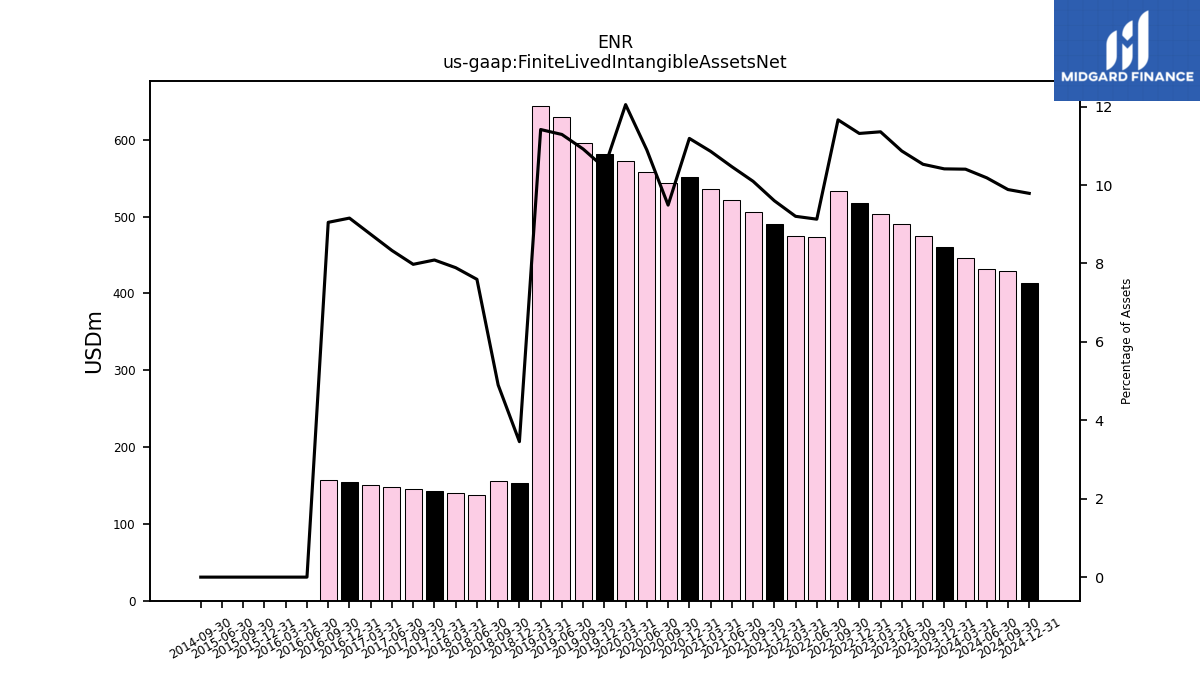
| Finite Lived Intangible Assets Net | 460.70 | 474.90 | 489.70 | 503.90 | 518.10 | 533.30 | 473.20 | 474.90 | 490.60 | 505.60 | 521.10 | 536.30 | 551.60 | 543.60 | 558.50 | 572.80 | 581.30 | 595.10 | 629.80 | 644.20 | 152.60 | 155.80 | 137.10 | 139.90 | 142.70 | 145.50 | 148.30 | 151.10 | 154.10 | 156.70 | 0.00 | 0.00 | 0.00 | 0.00 | 0.00 | NA | NA | 0.00 | NA | NA | NA | |
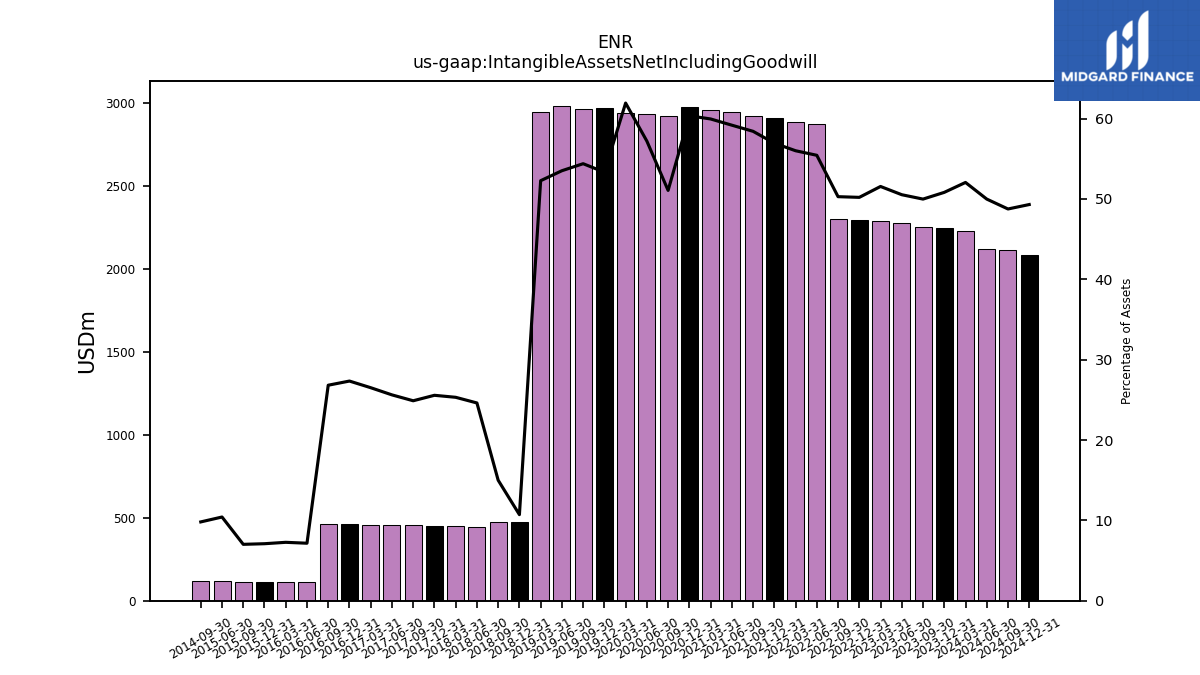
| Intangible Assets Net Including Goodwill | 2248.10 | 2253.90 | 2276.20 | 2286.80 | 2297.90 | 2298.90 | 2872.70 | 2889.40 | 2909.50 | 2925.10 | 2945.50 | 2960.20 | 2974.40 | 2925.00 | 2932.10 | 2943.20 | 2968.80 | 2963.70 | 2984.60 | 2949.20 | 473.20 | 476.80 | 444.20 | 448.70 | 451.00 | 453.80 | 456.00 | 458.10 | 460.00 | 464.40 | 114.30 | 115.20 | 114.80 | 114.40 | 116.40 | NA | NA | 117.20 | NA | NA | NA | |
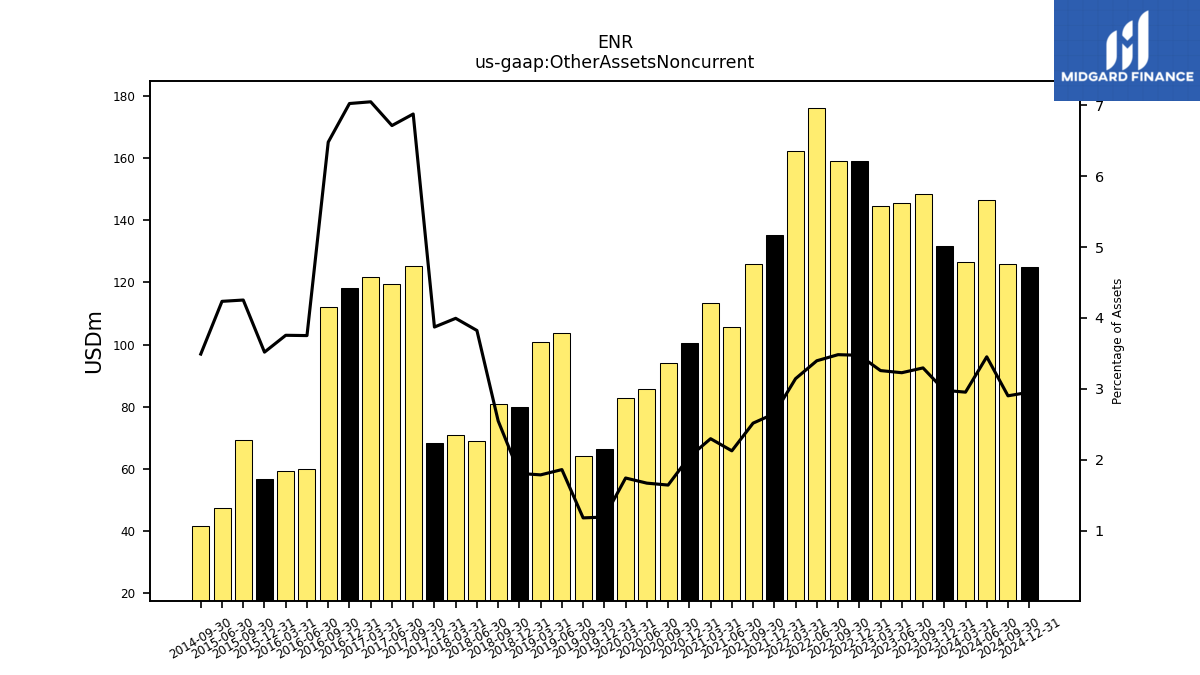
| Other Assets Noncurrent | 131.80 | 148.60 | 145.40 | 144.50 | 159.00 | 159.20 | 176.00 | 162.20 | 135.40 | 126.00 | 105.80 | 113.40 | 100.60 | 94.10 | 85.60 | 82.80 | 66.30 | 64.30 | 103.80 | 100.80 | 79.80 | 81.00 | 69.00 | 70.80 | 68.30 | 125.40 | 119.50 | 121.80 | 118.20 | 112.20 | 59.90 | 59.50 | 56.90 | 69.30 | 47.30 | NA | NA | 41.70 | NA | NA | NA |
| 2023-12-31 | 2023-09-30 | 2023-06-30 | 2023-03-31 | 2022-12-31 | 2022-09-30 | 2022-06-30 | 2022-03-31 | 2021-12-31 | 2021-09-30 | 2021-06-30 | 2021-03-31 | 2020-12-31 | 2020-09-30 | 2020-06-30 | 2020-03-31 | 2019-12-31 | 2019-09-30 | 2019-06-30 | 2019-03-31 | 2018-12-31 | 2018-09-30 | 2018-06-30 | 2018-03-31 | 2017-12-31 | 2017-09-30 | 2017-06-30 | 2017-03-31 | 2016-12-31 | 2016-09-30 | 2016-06-30 | 2016-03-31 | 2015-12-31 | 2015-09-30 | 2015-06-30 | 2015-03-31 | 2014-12-31 | 2014-09-30 | 2014-06-30 | 2014-03-31 | 2013-12-31 | ||
|---|---|---|---|---|---|---|---|---|---|---|---|---|---|---|---|---|---|---|---|---|---|---|---|---|---|---|---|---|---|---|---|---|---|---|---|---|---|---|---|---|---|---|
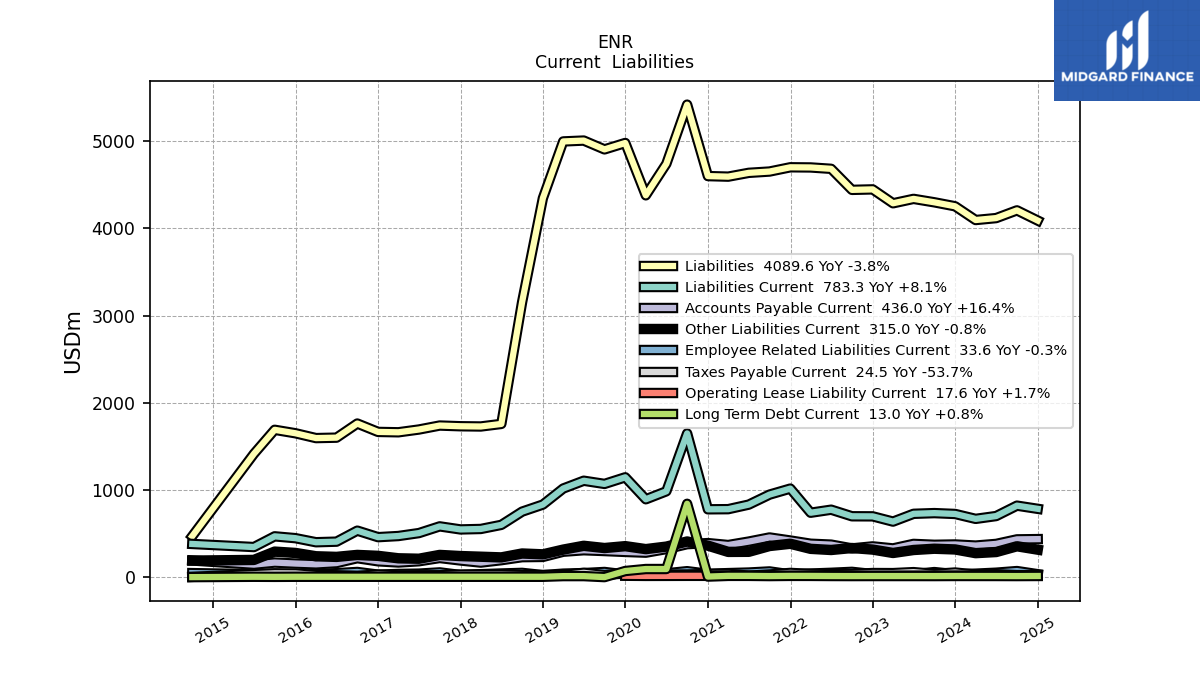
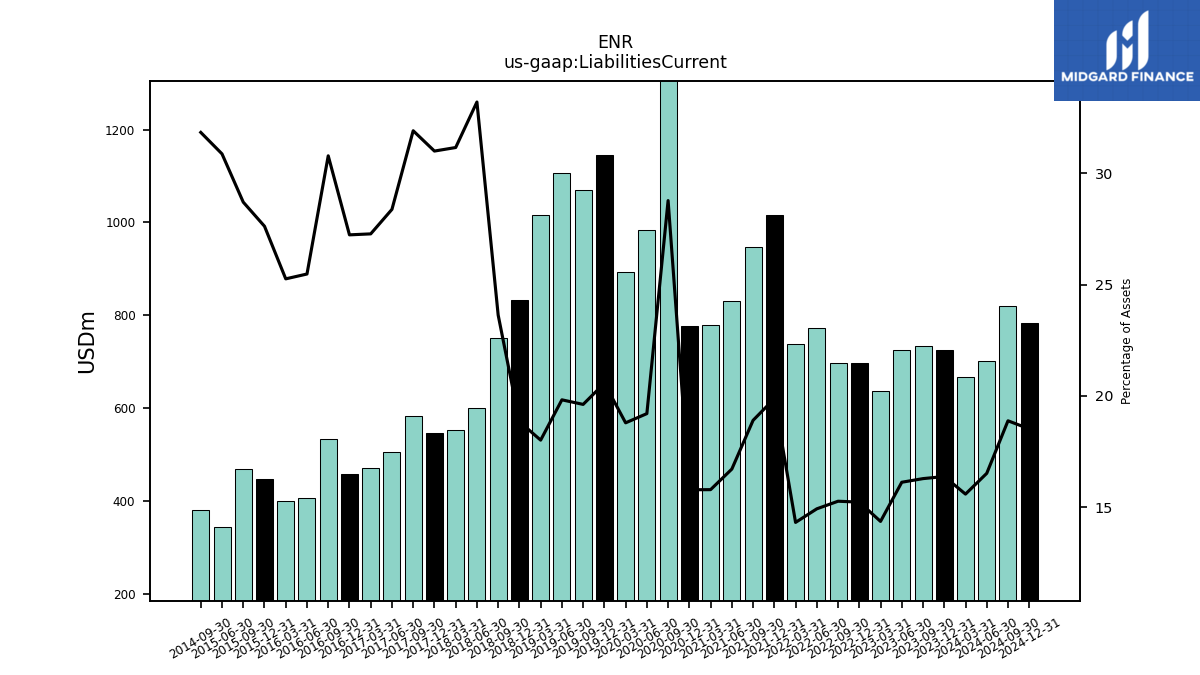
| Liabilities Current | 724.40 | 734.20 | 726.10 | 636.90 | 697.00 | 697.90 | 773.40 | 738.50 | 1015.50 | 946.40 | 831.70 | 779.40 | 777.80 | 1648.40 | 984.40 | 892.90 | 1144.90 | 1069.00 | 1105.60 | 1016.20 | 832.00 | 751.20 | 599.30 | 552.30 | 546.90 | 582.00 | 505.20 | 471.40 | 458.30 | 533.10 | 406.80 | 400.20 | 446.80 | 467.80 | 344.90 | NA | NA | 380.40 | NA | NA | NA | |
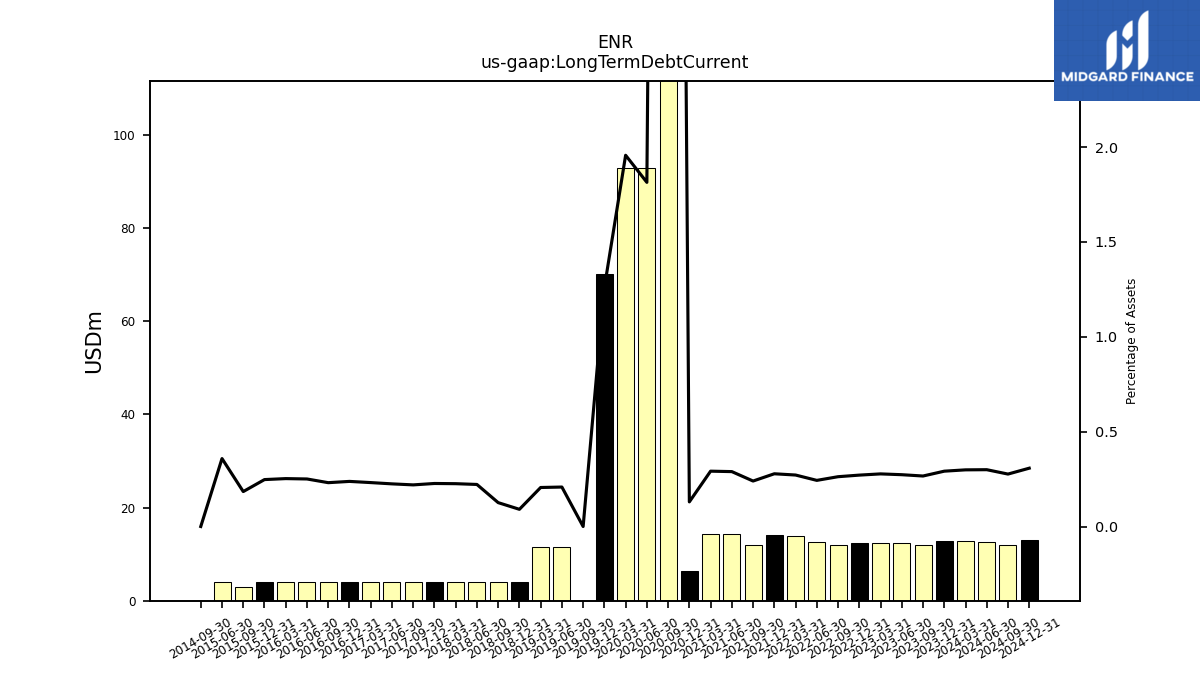
| Long Term Debt Current | 12.90 | 12.00 | 12.30 | 12.30 | 12.40 | 12.00 | 12.60 | 14.00 | 14.20 | 12.00 | 14.40 | 14.40 | 6.40 | 841.30 | 93.00 | 93.00 | 70.10 | 0.00 | 11.60 | 11.60 | 4.00 | 4.00 | 4.00 | 4.00 | 4.00 | 4.00 | 4.00 | 4.00 | 4.00 | 4.00 | 4.00 | 4.00 | 4.00 | 3.00 | 4.00 | NA | NA | 0.00 | NA | NA | NA | |
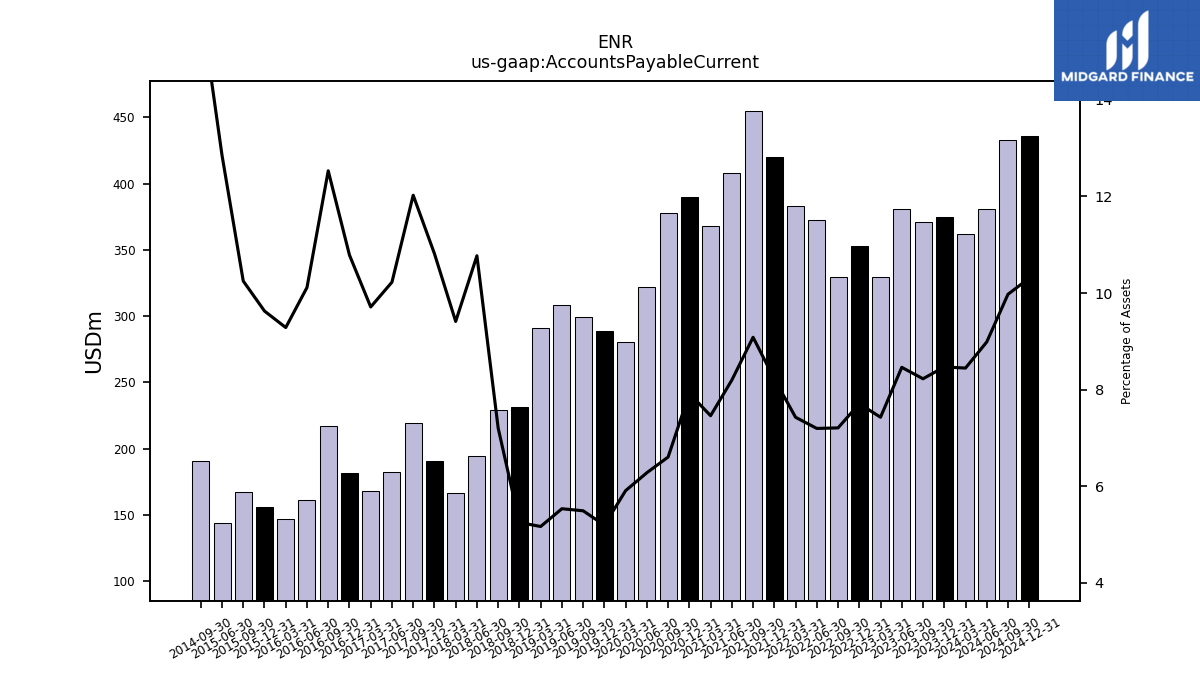
| Accounts Payable Current | 374.60 | 370.80 | 381.10 | 329.40 | 352.70 | 329.40 | 372.80 | 383.10 | 420.00 | 454.80 | 407.90 | 368.20 | 390.20 | 378.10 | 321.70 | 280.60 | 288.90 | 299.00 | 308.40 | 291.20 | 231.60 | 228.90 | 194.40 | 166.80 | 190.80 | 219.30 | 182.00 | 167.80 | 181.50 | 217.00 | 161.50 | 147.10 | 155.70 | 167.00 | 143.60 | NA | NA | 190.90 | NA | NA | NA | |
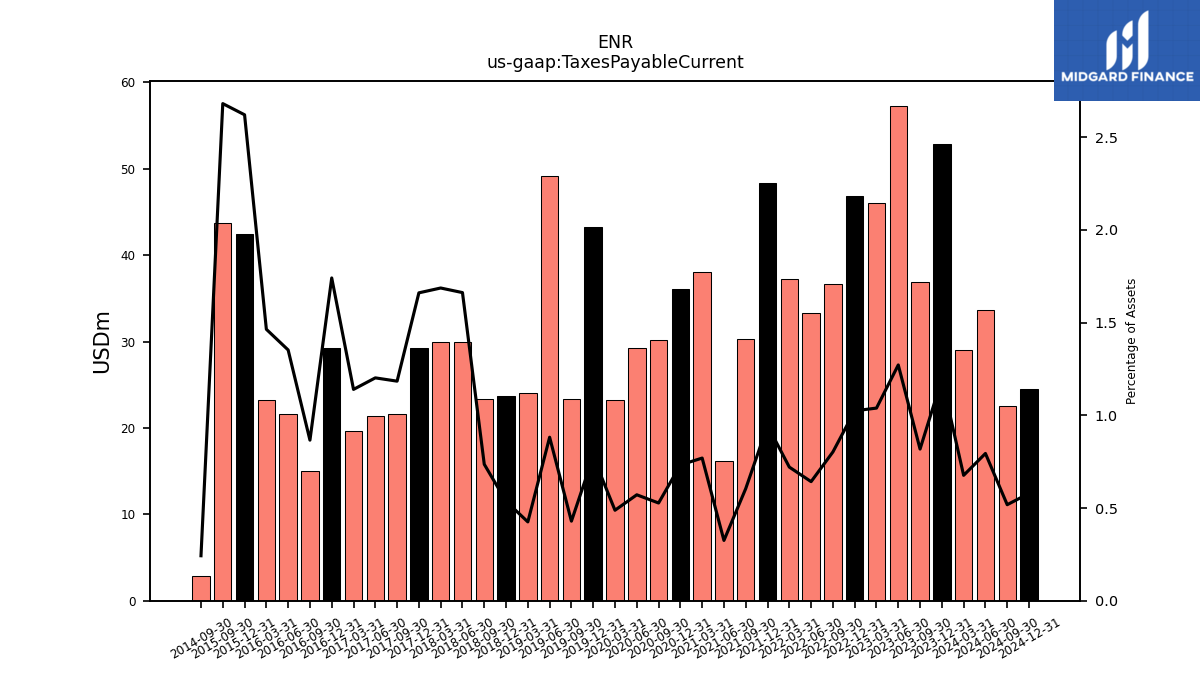
| Taxes Payable Current | 52.90 | 36.90 | 57.30 | 46.10 | 46.90 | 36.70 | 33.30 | 37.20 | 48.30 | 30.30 | 16.20 | 38.00 | 36.10 | 30.20 | 29.30 | 23.20 | 43.30 | 23.40 | 49.20 | 24.00 | 23.70 | 23.40 | 30.00 | 29.90 | 29.30 | 21.60 | 21.40 | 19.70 | 29.30 | 15.00 | 21.60 | 23.20 | 42.40 | 43.70 | NA | NA | NA | 2.90 | NA | NA | NA | |
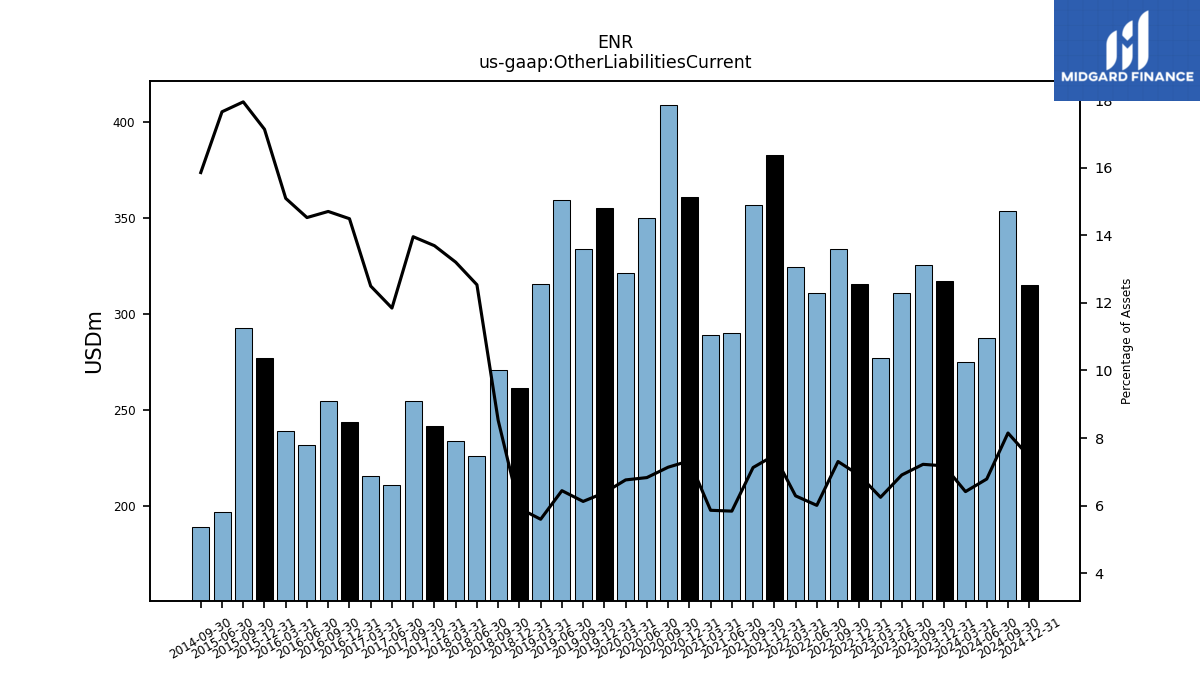
| Other Liabilities Current | 317.40 | 325.60 | 311.10 | 277.00 | 315.80 | 333.90 | 311.20 | 324.40 | 382.60 | 356.80 | 290.40 | 289.30 | 361.00 | 408.70 | 350.00 | 321.20 | 355.10 | 333.60 | 359.20 | 315.60 | 261.30 | 271.00 | 226.30 | 234.10 | 241.60 | 254.60 | 210.90 | 216.00 | 243.90 | 254.70 | 232.00 | 239.20 | 277.30 | 292.60 | 197.30 | NA | NA | 189.50 | NA | NA | NA |
| 2023-12-31 | 2023-09-30 | 2023-06-30 | 2023-03-31 | 2022-12-31 | 2022-09-30 | 2022-06-30 | 2022-03-31 | 2021-12-31 | 2021-09-30 | 2021-06-30 | 2021-03-31 | 2020-12-31 | 2020-09-30 | 2020-06-30 | 2020-03-31 | 2019-12-31 | 2019-09-30 | 2019-06-30 | 2019-03-31 | 2018-12-31 | 2018-09-30 | 2018-06-30 | 2018-03-31 | 2017-12-31 | 2017-09-30 | 2017-06-30 | 2017-03-31 | 2016-12-31 | 2016-09-30 | 2016-06-30 | 2016-03-31 | 2015-12-31 | 2015-09-30 | 2015-06-30 | 2015-03-31 | 2014-12-31 | 2014-09-30 | 2014-06-30 | 2014-03-31 | 2013-12-31 | ||
|---|---|---|---|---|---|---|---|---|---|---|---|---|---|---|---|---|---|---|---|---|---|---|---|---|---|---|---|---|---|---|---|---|---|---|---|---|---|---|---|---|---|---|
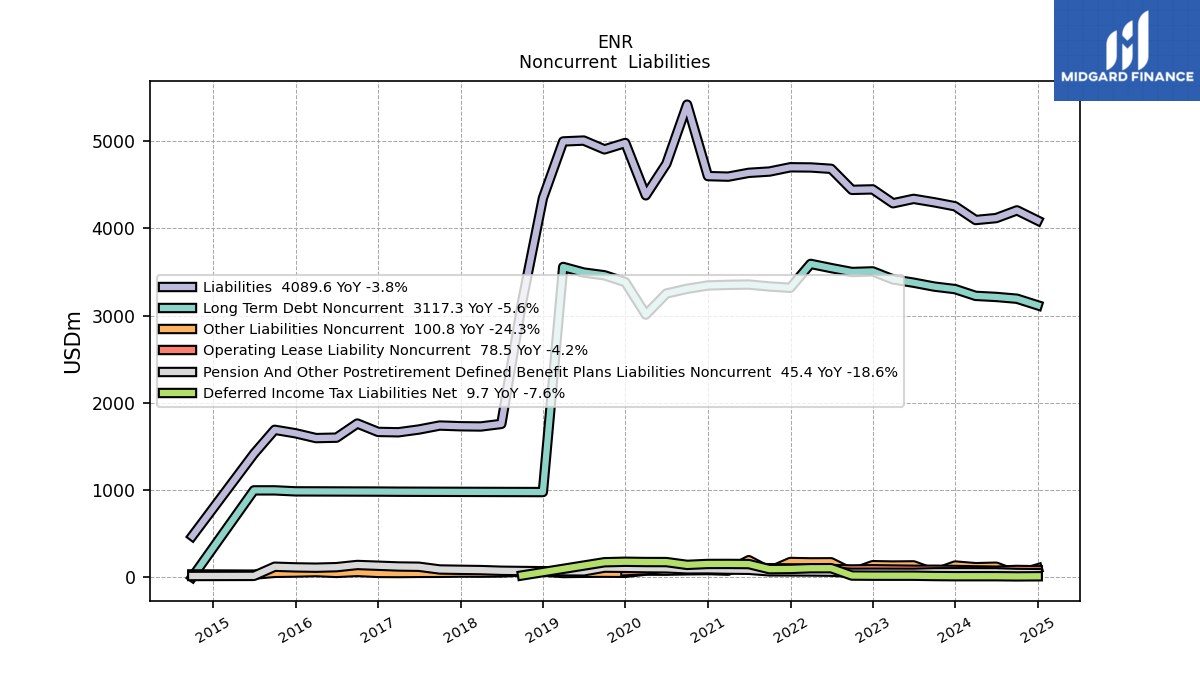
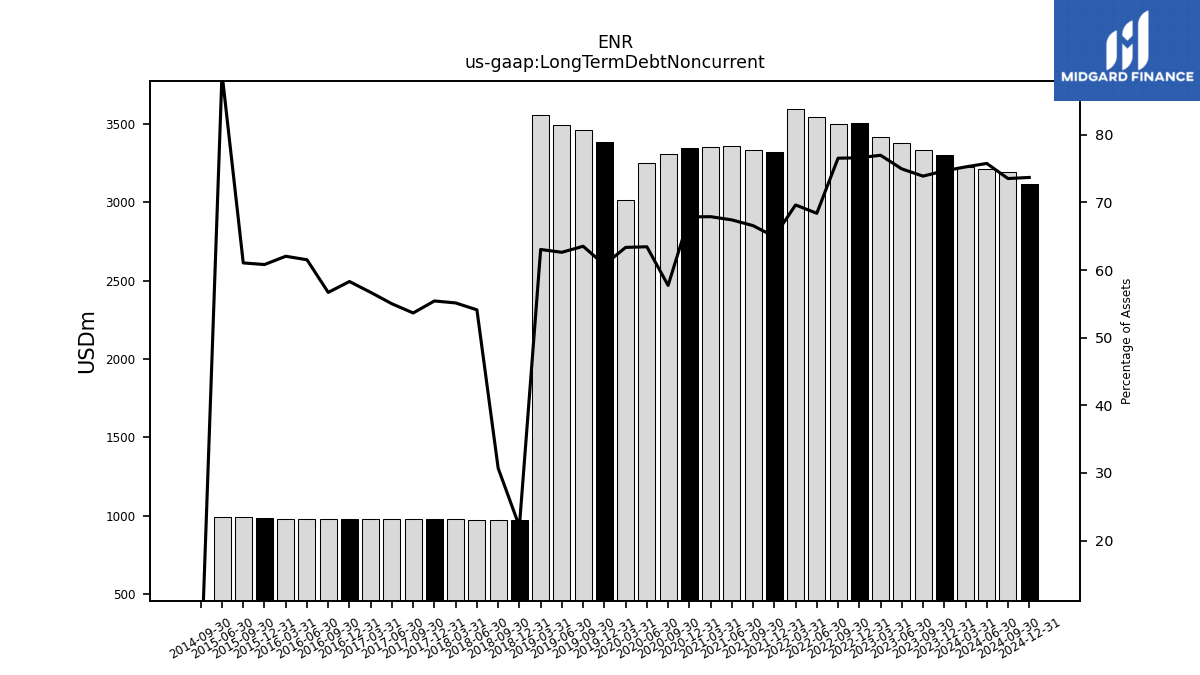
| Long Term Debt Noncurrent | 3303.30 | 3332.10 | 3377.00 | 3414.60 | 3506.60 | 3499.40 | 3544.60 | 3592.60 | 3318.30 | 3333.40 | 3355.60 | 3352.20 | 3345.00 | 3306.90 | 3252.50 | 3010.60 | 3383.60 | 3461.60 | 3493.20 | 3557.10 | 975.40 | 976.10 | 976.70 | 977.30 | 977.90 | 978.50 | 979.20 | 979.80 | 981.10 | 981.70 | 982.40 | 983.00 | 983.70 | 995.00 | 995.00 | NA | NA | 0.00 | NA | NA | NA | |
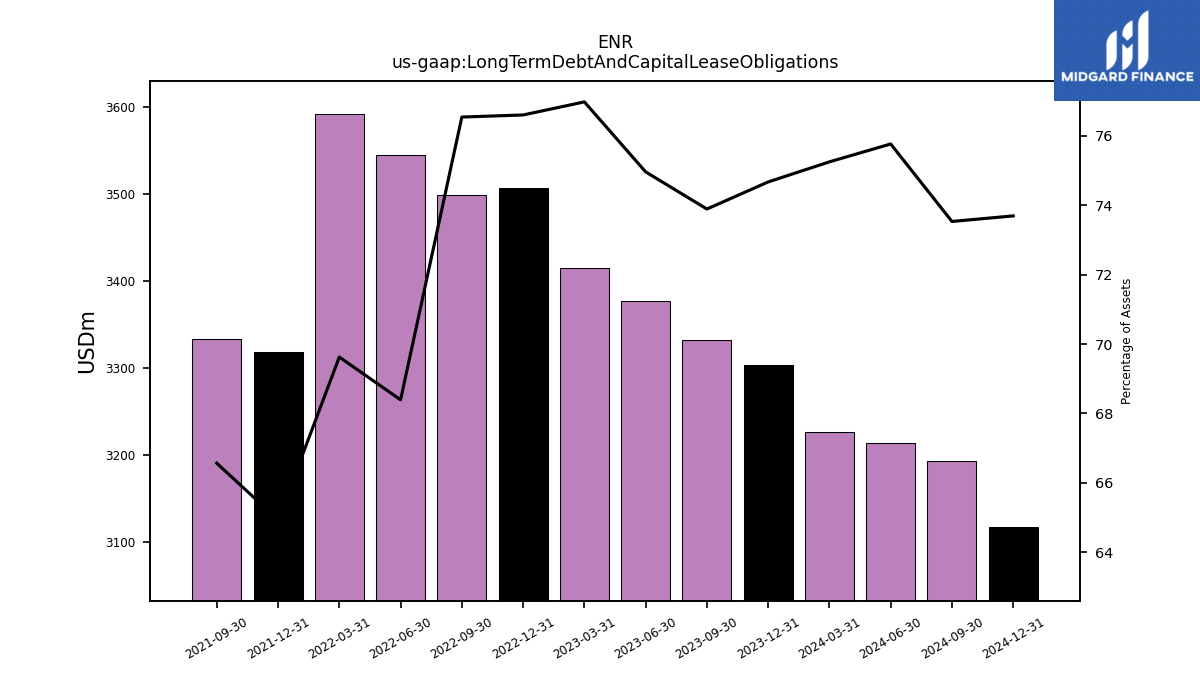
| Long Term Debt And Capital Lease Obligations | 3303.30 | 3332.10 | 3377.00 | 3414.60 | 3506.60 | 3499.40 | 3544.60 | 3592.60 | 3318.30 | 3333.40 | NA | NA | NA | NA | NA | NA | NA | NA | NA | NA | NA | NA | NA | NA | NA | NA | NA | NA | NA | NA | NA | NA | NA | NA | NA | NA | NA | NA | NA | NA | NA | |
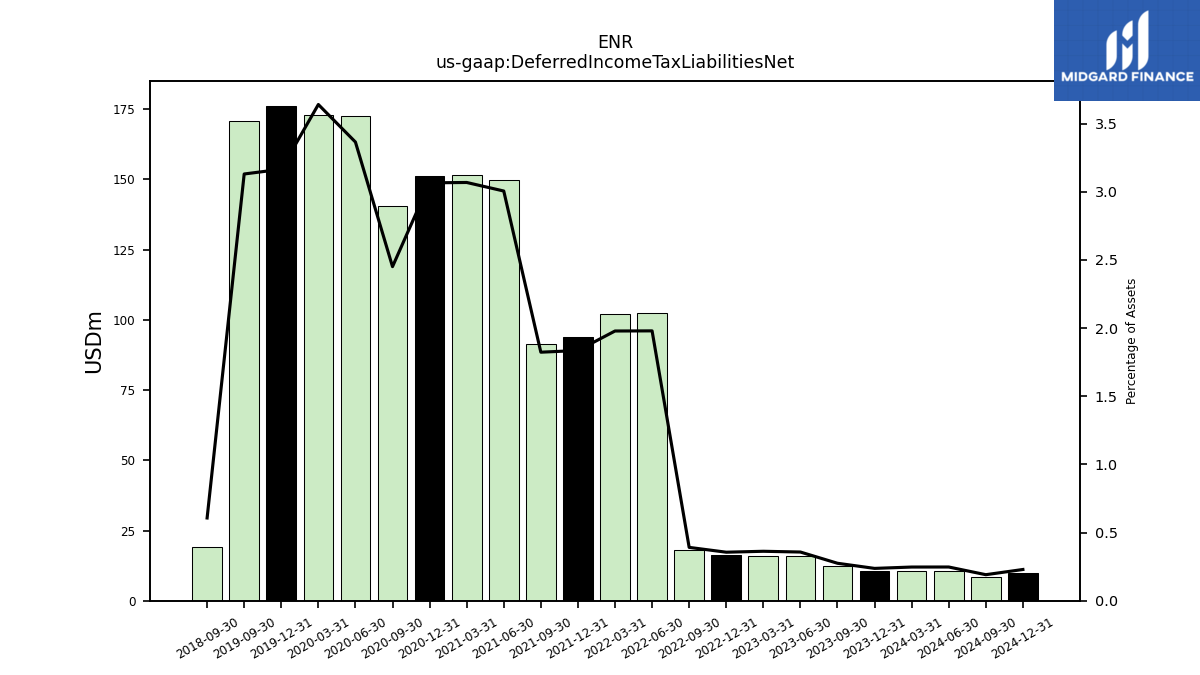
| Deferred Income Tax Liabilities Net | 10.50 | 12.40 | 16.10 | 16.10 | 16.30 | 17.90 | 102.60 | 102.10 | 93.80 | 91.30 | 149.60 | 151.50 | 151.10 | 140.40 | 172.50 | 173.00 | 176.20 | 170.60 | NA | NA | NA | 19.30 | NA | NA | NA | NA | NA | NA | NA | NA | NA | NA | NA | NA | NA | NA | NA | NA | NA | NA | NA | |
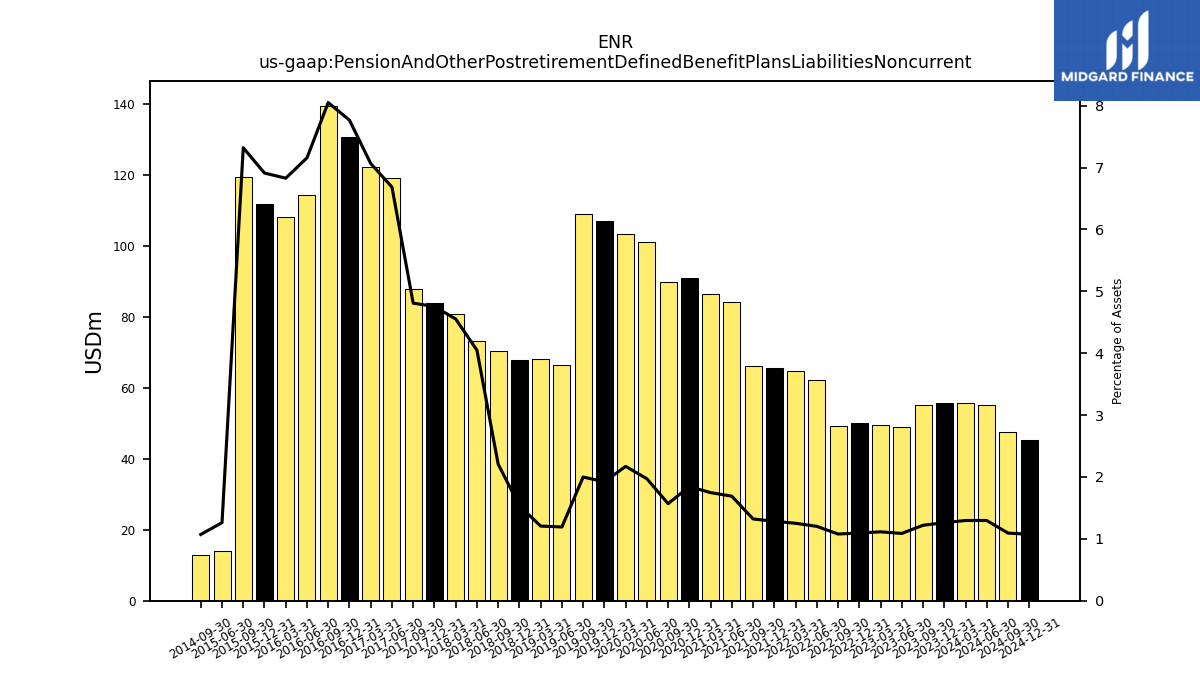
| Pension And Other Postretirement Defined Benefit Plans Liabilities Noncurrent | 55.80 | 55.00 | 49.00 | 49.40 | 50.10 | 49.30 | 62.30 | 64.60 | 65.60 | 66.20 | 84.10 | 86.30 | 90.90 | 89.90 | 101.10 | 103.20 | 107.00 | 109.00 | 66.50 | 68.10 | 67.70 | 70.20 | 73.10 | 80.70 | 83.90 | 87.70 | 119.00 | 122.10 | 130.70 | 139.40 | 114.30 | 108.20 | 111.80 | 119.30 | 14.10 | NA | NA | 12.80 | NA | NA | NA | |
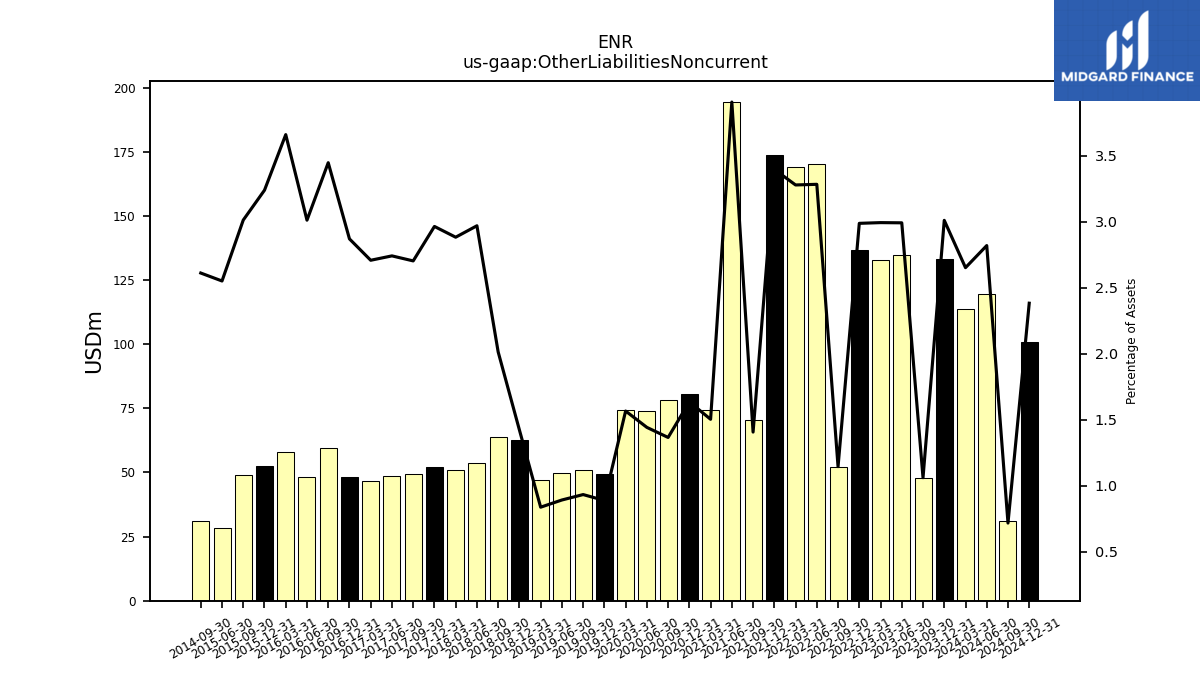
| Other Liabilities Noncurrent | 133.20 | 47.80 | 134.80 | 132.80 | 136.80 | 52.30 | 170.20 | 169.20 | 173.60 | 70.40 | 194.50 | 74.20 | 80.60 | 78.20 | 73.90 | 74.40 | 49.40 | 50.80 | 49.70 | 47.20 | 62.80 | 64.00 | 53.60 | 51.10 | 52.30 | 49.30 | 48.80 | 46.80 | 48.30 | 59.70 | 48.10 | 58.00 | 52.40 | 49.10 | 28.50 | NA | NA | 31.20 | NA | NA | NA | |
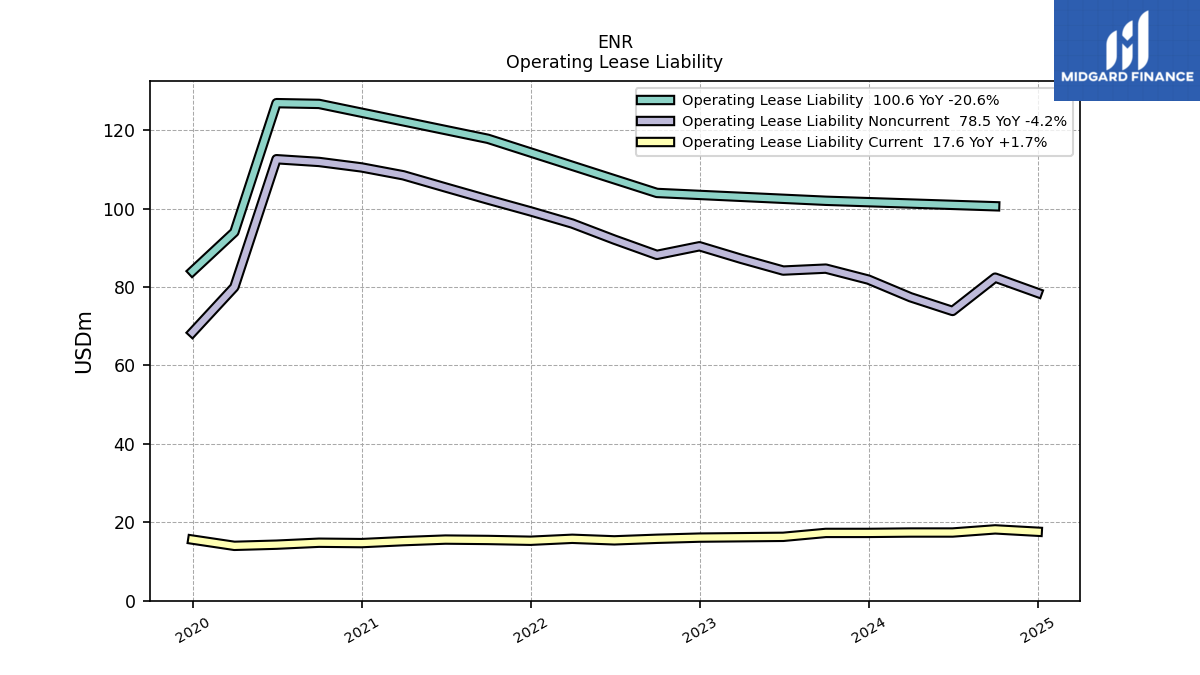
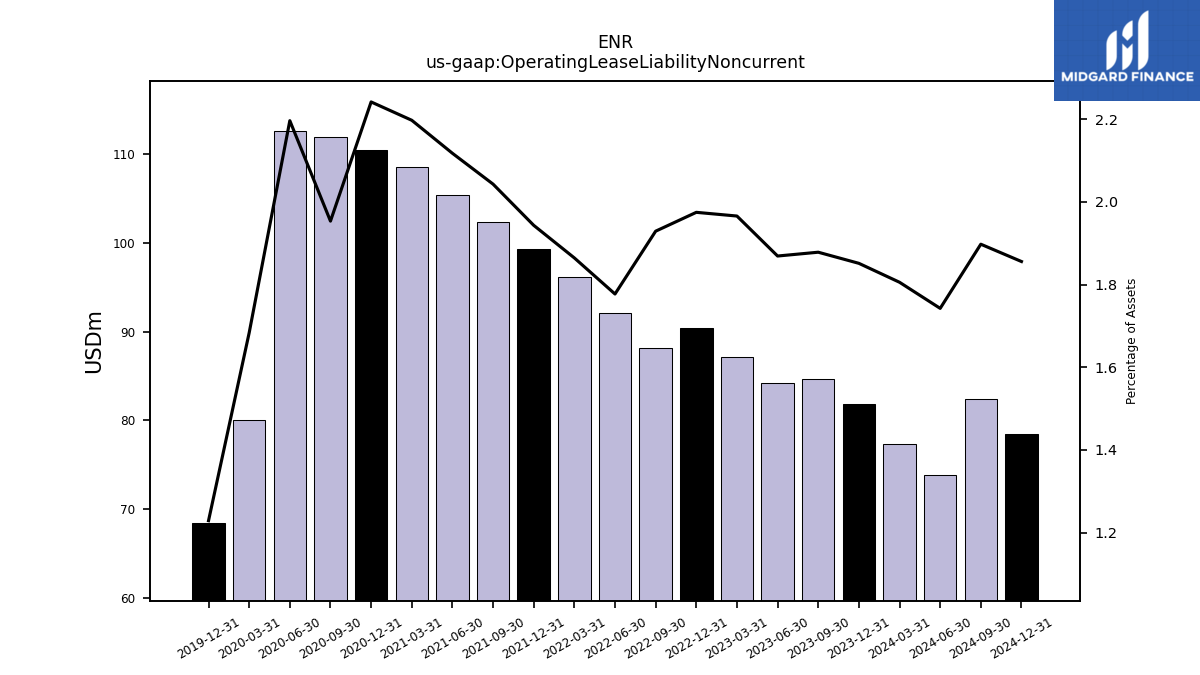
| Operating Lease Liability Noncurrent | 81.90 | 84.70 | 84.20 | 87.20 | 90.40 | 88.20 | 92.10 | 96.20 | 99.30 | 102.30 | 105.40 | 108.50 | 110.50 | 111.90 | 112.60 | 80.00 | 68.40 | NA | NA | NA | NA | NA | NA | NA | NA | NA | NA | NA | NA | NA | NA | NA | NA | NA | NA | NA | NA | NA | NA | NA | NA |
| 2023-12-31 | 2023-09-30 | 2023-06-30 | 2023-03-31 | 2022-12-31 | 2022-09-30 | 2022-06-30 | 2022-03-31 | 2021-12-31 | 2021-09-30 | 2021-06-30 | 2021-03-31 | 2020-12-31 | 2020-09-30 | 2020-06-30 | 2020-03-31 | 2019-12-31 | 2019-09-30 | 2019-06-30 | 2019-03-31 | 2018-12-31 | 2018-09-30 | 2018-06-30 | 2018-03-31 | 2017-12-31 | 2017-09-30 | 2017-06-30 | 2017-03-31 | 2016-12-31 | 2016-09-30 | 2016-06-30 | 2016-03-31 | 2015-12-31 | 2015-09-30 | 2015-06-30 | 2015-03-31 | 2014-12-31 | 2014-09-30 | 2014-06-30 | 2014-03-31 | 2013-12-31 | ||
|---|---|---|---|---|---|---|---|---|---|---|---|---|---|---|---|---|---|---|---|---|---|---|---|---|---|---|---|---|---|---|---|---|---|---|---|---|---|---|---|---|---|---|
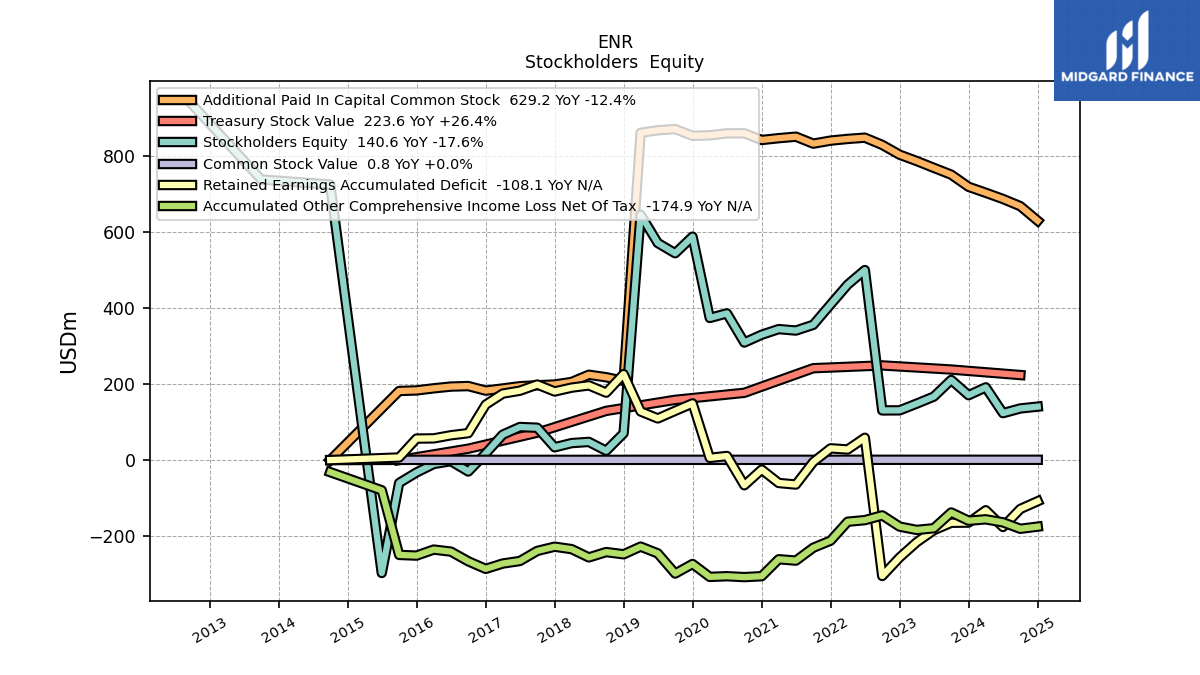
| Stockholders Equity | 170.60 | 210.70 | 166.90 | 148.40 | 130.80 | 130.60 | 499.70 | 461.30 | 409.40 | 355.70 | 340.60 | 344.40 | 329.60 | 309.10 | 385.80 | 373.70 | 587.50 | 543.80 | 570.70 | 645.30 | 70.40 | 24.50 | 47.80 | 44.70 | 33.70 | 85.10 | 87.00 | 66.80 | 17.30 | -30.00 | -2.80 | -10.20 | -32.50 | -60.10 | -296.90 | NA | NA | 724.50 | NA | NA | NA | |
| Common Stock Value | 0.80 | 0.80 | 0.80 | 0.80 | 0.80 | 0.80 | 0.80 | 0.80 | 0.70 | 0.70 | 0.70 | 0.70 | 0.70 | 0.70 | 0.70 | 0.70 | 0.70 | 0.70 | 0.70 | 0.70 | 0.60 | 0.60 | 0.60 | 0.60 | 0.60 | 0.60 | 0.60 | 0.60 | 0.60 | 0.60 | 0.60 | 0.60 | 0.60 | 0.60 | NA | NA | NA | 0.00 | NA | NA | NA | |
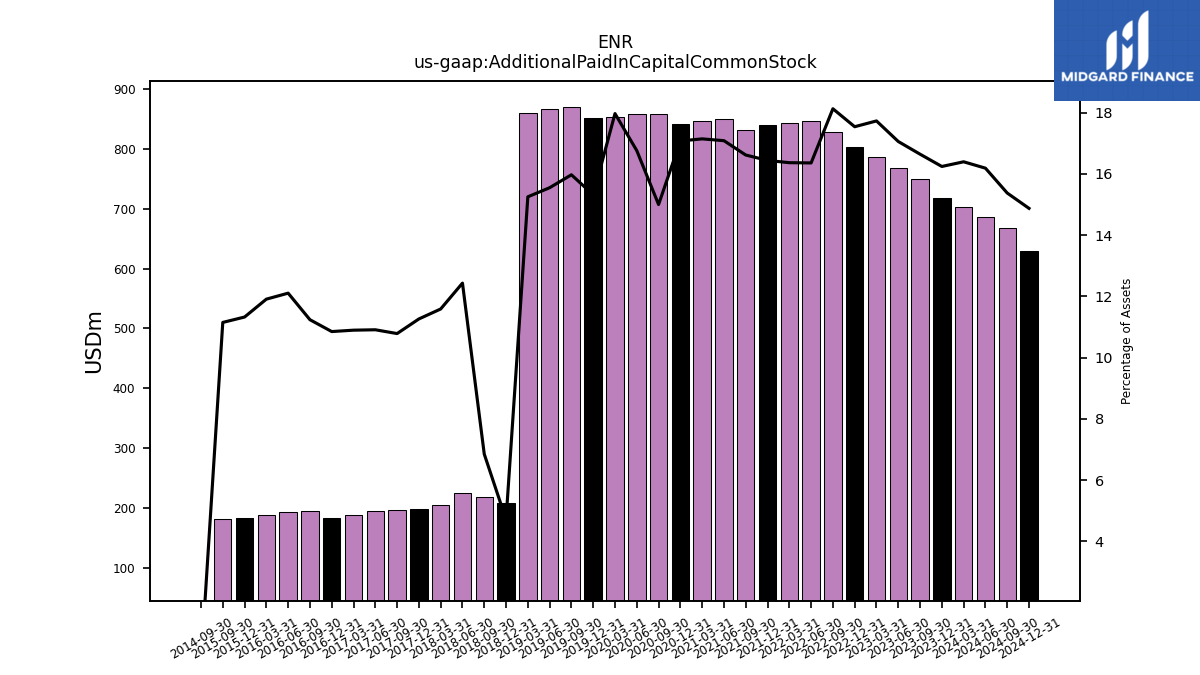
| Additional Paid In Capital Common Stock | 718.50 | 750.50 | 768.40 | 786.40 | 802.90 | 828.70 | 847.70 | 844.40 | 840.00 | 832.00 | 850.30 | 846.40 | 841.60 | 859.20 | 859.10 | 853.90 | 852.60 | 870.30 | 867.20 | 860.50 | 208.20 | 217.80 | 224.40 | 205.40 | 198.70 | 196.70 | 194.20 | 188.30 | 182.60 | 194.60 | 193.30 | 188.70 | 183.20 | 181.70 | NA | NA | NA | 0.00 | NA | NA | NA | |
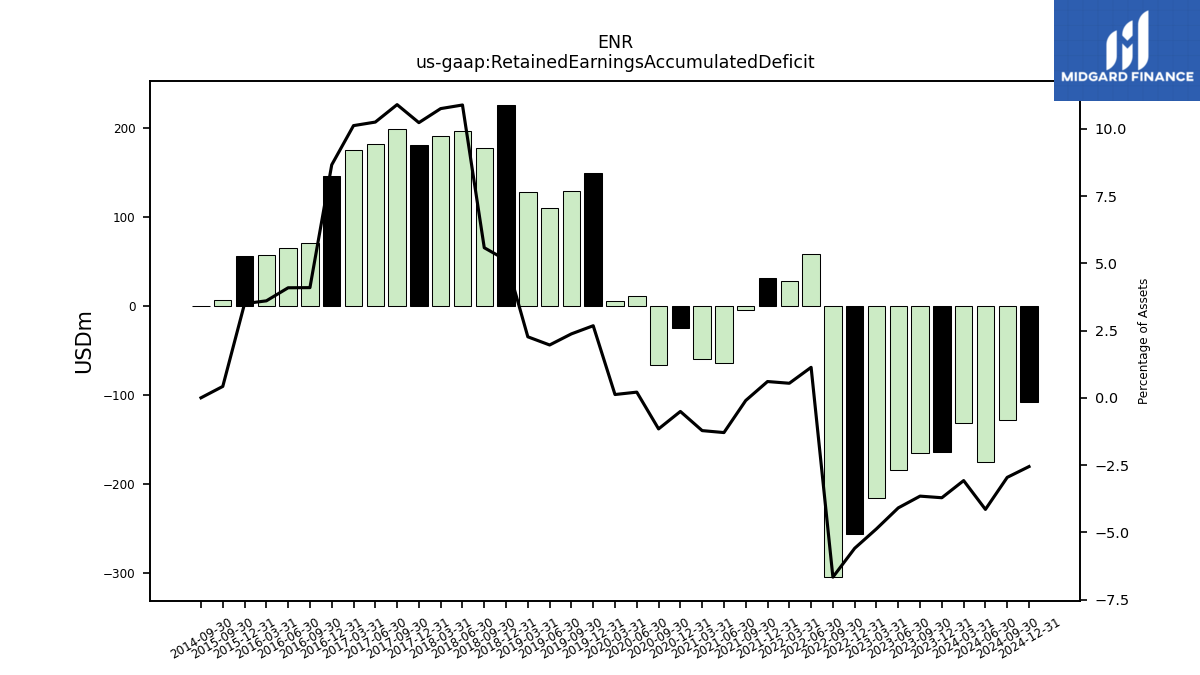
| Retained Earnings Accumulated Deficit | -164.30 | -164.80 | -184.30 | -216.00 | -256.00 | -304.70 | 58.70 | 27.90 | 30.90 | -5.00 | -64.30 | -60.20 | -25.00 | -66.20 | 10.80 | 5.80 | 149.10 | 129.50 | 109.50 | 127.90 | 226.10 | 177.30 | 196.40 | 190.50 | 180.40 | 198.70 | 182.40 | 174.80 | 145.70 | 70.90 | 65.30 | 57.10 | 56.60 | 6.90 | NA | NA | NA | 0.00 | NA | NA | NA | |
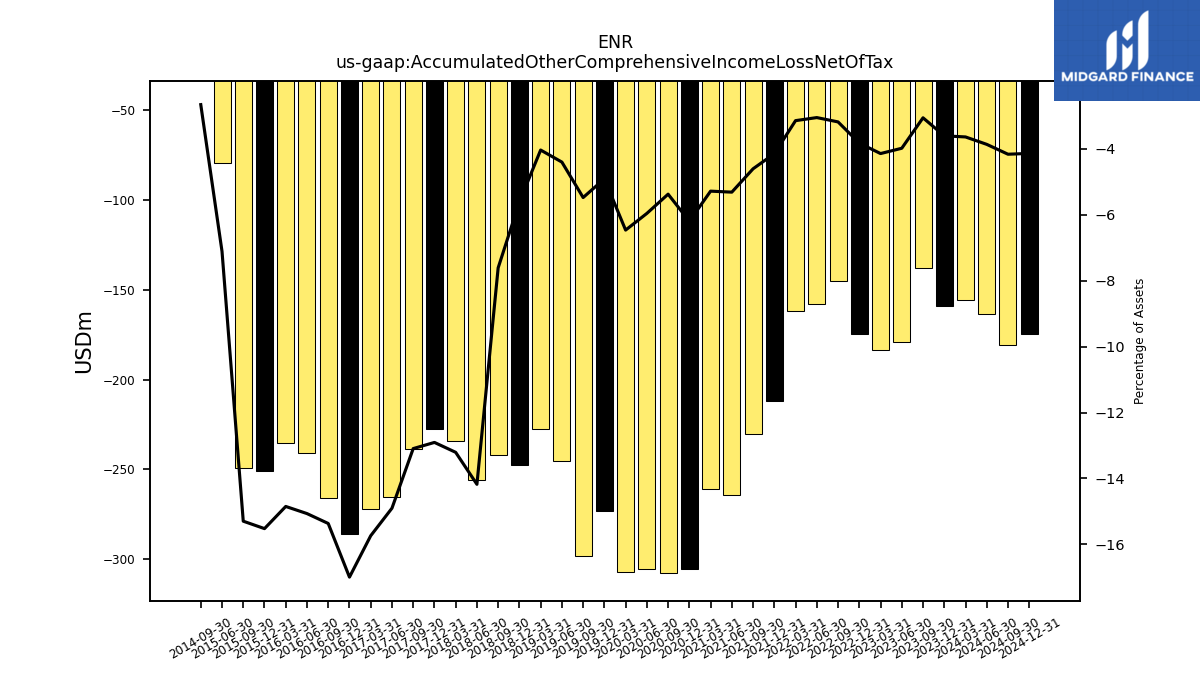
| Accumulated Other Comprehensive Income Loss Net Of Tax | -159.30 | -137.70 | -179.20 | -183.60 | -174.90 | -145.30 | -157.90 | -162.00 | -211.70 | -230.40 | -264.30 | -260.70 | -305.30 | -307.70 | -305.30 | -307.10 | -273.10 | -298.30 | -245.30 | -227.50 | -247.70 | -241.80 | -255.90 | -234.10 | -227.70 | -238.80 | -265.30 | -272.00 | -286.00 | -266.10 | -240.60 | -235.30 | -251.10 | -249.30 | -79.40 | NA | NA | -31.70 | NA | NA | NA | |
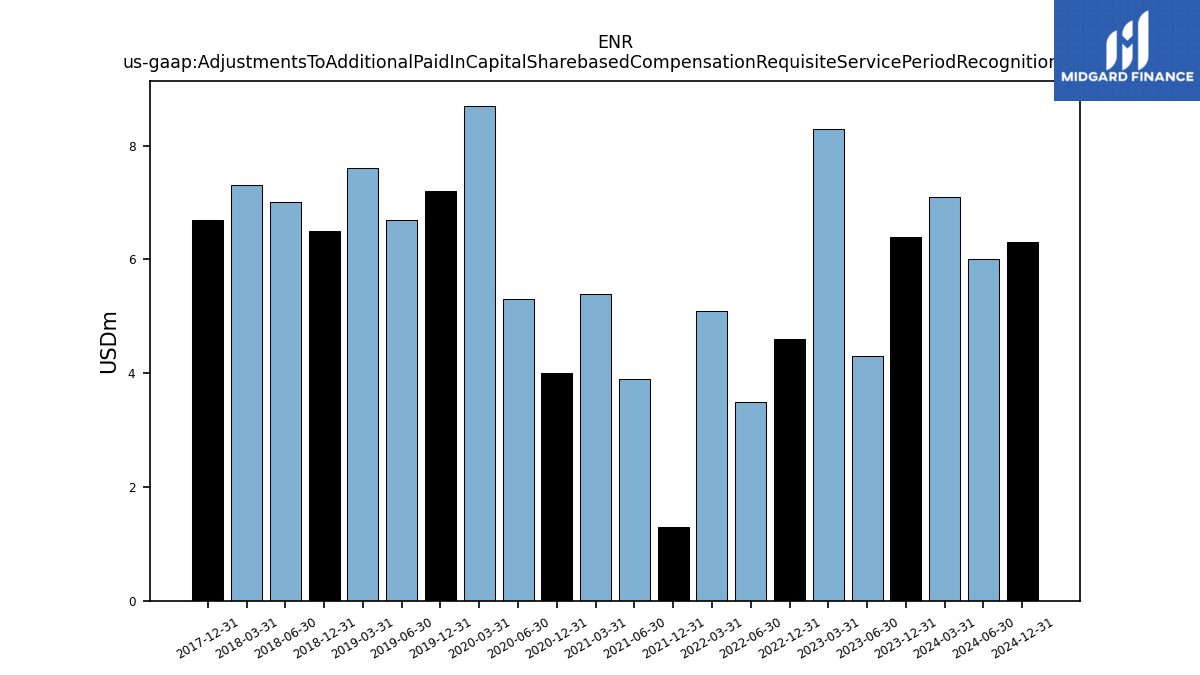
| Adjustments To Additional Paid In Capital Sharebased Compensation Requisite Service Period Recognition Value | 6.40 | NA | 4.30 | 8.30 | 4.60 | NA | 3.50 | 5.10 | 1.30 | NA | 3.90 | 5.40 | 4.00 | NA | 5.30 | 8.70 | 7.20 | NA | 6.70 | 7.60 | 6.50 | NA | 7.00 | 7.30 | 6.70 | NA | NA | NA | NA | NA | NA | NA | NA | NA | NA | NA | NA | NA | NA | NA | NA |
| 2023-12-31 | 2023-09-30 | 2023-06-30 | 2023-03-31 | 2022-12-31 | 2022-09-30 | 2022-06-30 | 2022-03-31 | 2021-12-31 | 2021-09-30 | 2021-06-30 | 2021-03-31 | 2020-12-31 | 2020-09-30 | 2020-06-30 | 2020-03-31 | 2019-12-31 | 2019-09-30 | 2019-06-30 | 2019-03-31 | 2018-12-31 | 2018-09-30 | 2018-06-30 | 2018-03-31 | 2017-12-31 | 2017-09-30 | 2017-06-30 | 2017-03-31 | 2016-12-31 | 2016-09-30 | 2016-06-30 | 2016-03-31 | 2015-12-31 | 2015-09-30 | 2015-06-30 | 2015-03-31 | 2014-12-31 | 2014-09-30 | 2014-06-30 | 2014-03-31 | 2013-12-31 | ||
|---|---|---|---|---|---|---|---|---|---|---|---|---|---|---|---|---|---|---|---|---|---|---|---|---|---|---|---|---|---|---|---|---|---|---|---|---|---|---|---|---|---|---|
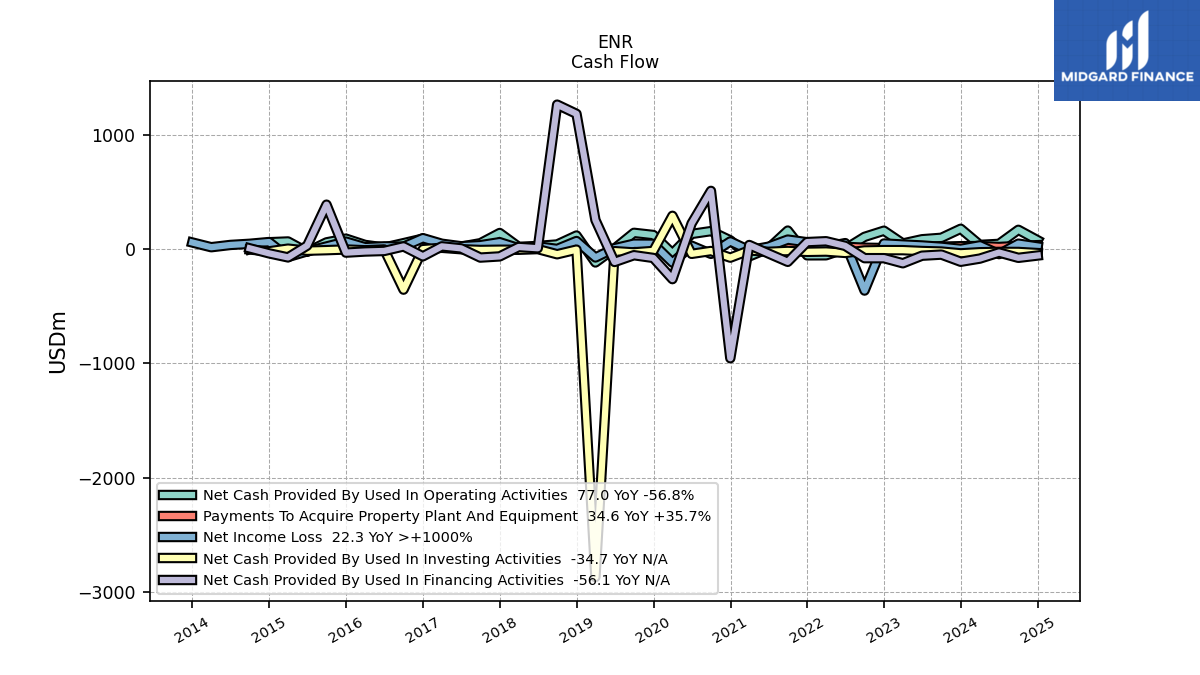
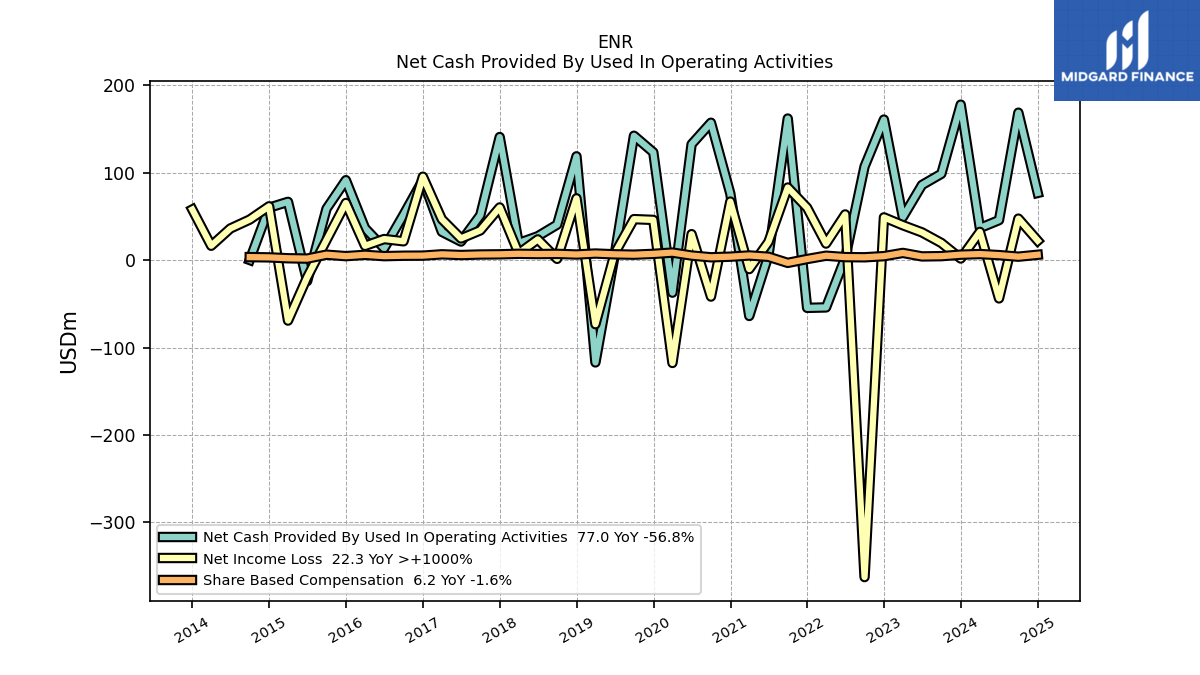
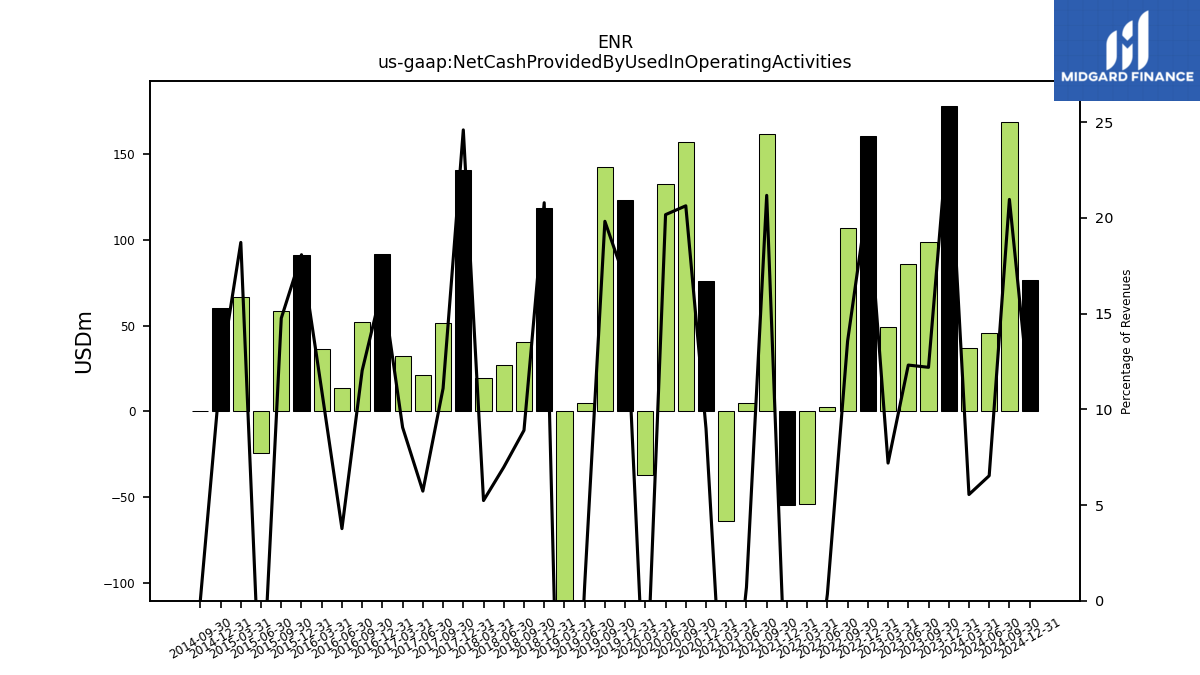
| Net Cash Provided By Used In Operating Activities | 178.10 | 98.90 | 86.10 | 49.20 | 161.00 | 107.20 | 2.50 | -54.10 | -54.60 | 162.20 | 5.10 | -63.90 | 76.30 | 157.40 | 132.70 | -37.20 | 123.50 | 142.50 | 5.20 | -117.10 | 118.90 | 40.70 | 27.40 | 19.60 | 141.00 | 51.60 | 21.30 | 32.50 | 91.80 | 52.00 | 13.60 | 36.70 | 91.60 | 58.90 | -24.00 | 66.80 | 60.10 | 0.20 | NA | NA | NA | |
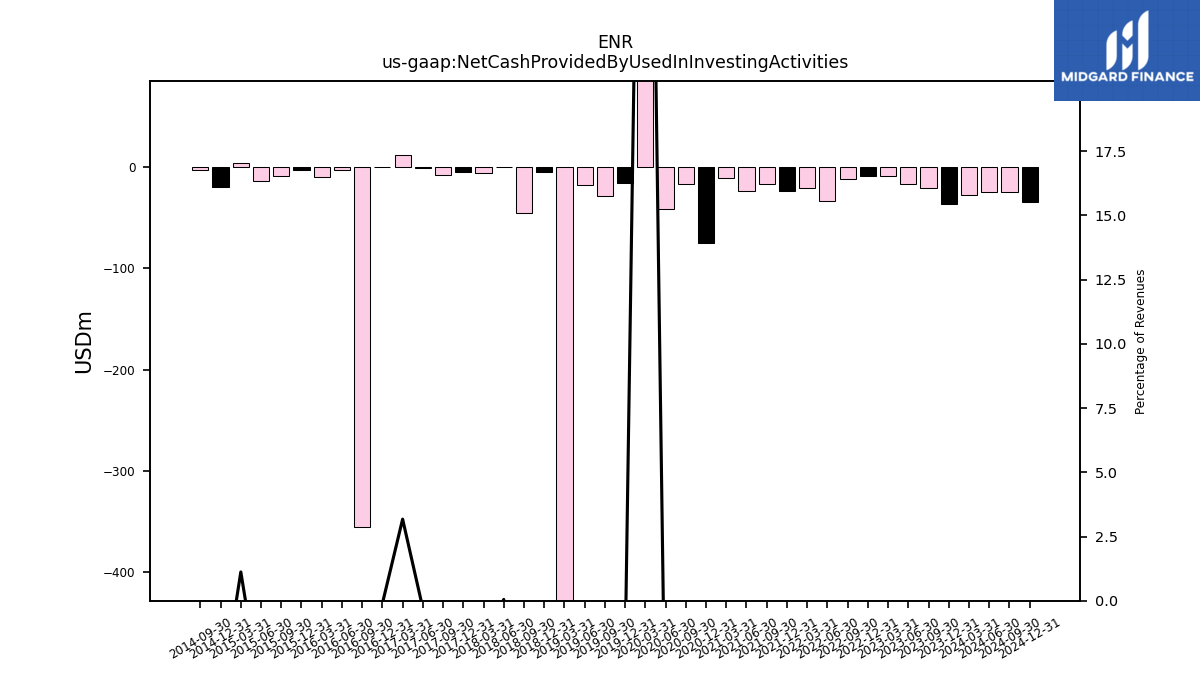
| Net Cash Provided By Used In Investing Activities | -37.10 | -21.40 | -16.70 | -9.20 | -8.80 | -12.00 | -33.50 | -21.40 | -24.00 | -16.50 | -23.70 | -11.40 | -74.80 | -16.60 | -41.70 | 291.40 | -16.20 | -29.10 | -18.20 | -2870.30 | -4.70 | -45.10 | 0.20 | -5.80 | -5.50 | -7.70 | -1.10 | 11.40 | -0.60 | -354.90 | -2.80 | -10.20 | -3.30 | -9.30 | -13.90 | 4.00 | -19.60 | -3.60 | NA | NA | NA | |
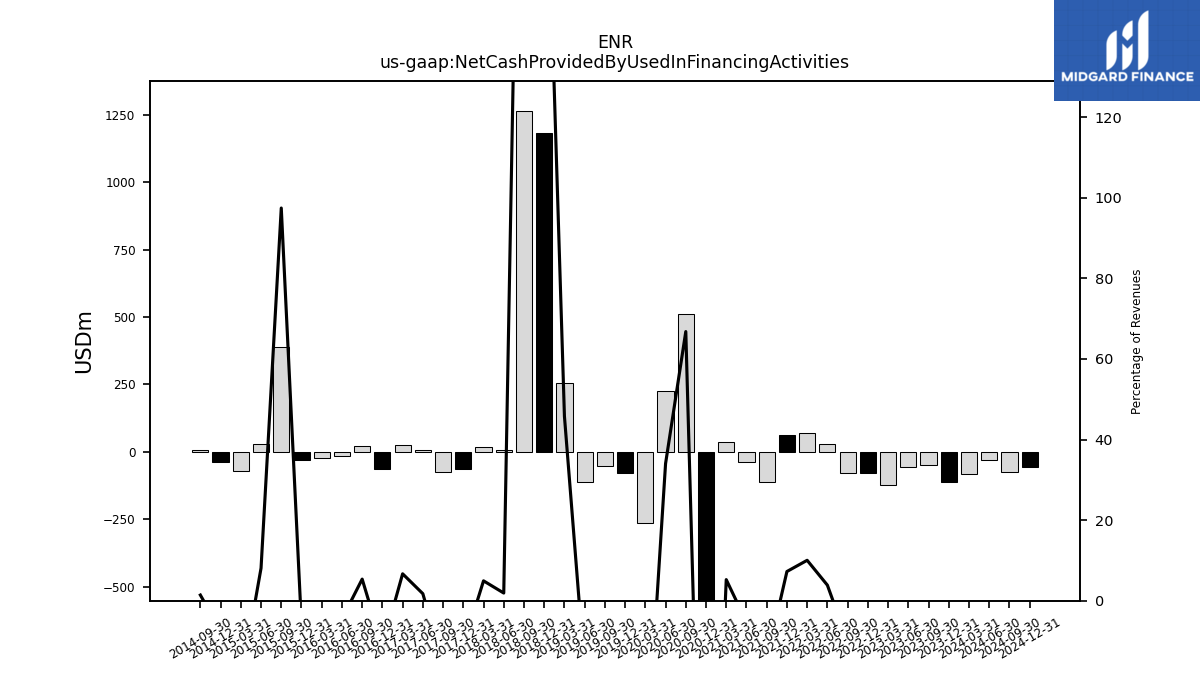
| Net Cash Provided By Used In Financing Activities | -110.80 | -48.20 | -57.80 | -124.00 | -79.40 | -79.30 | 28.20 | 68.80 | 61.40 | -111.60 | -38.20 | 35.90 | -955.20 | 509.60 | 223.90 | -263.00 | -77.40 | -53.50 | -112.70 | 254.70 | 1183.60 | 1264.20 | 7.50 | 18.50 | -63.90 | -74.20 | 6.50 | 24.00 | -63.20 | 23.20 | -16.30 | -21.30 | -31.00 | 388.90 | 30.30 | -72.70 | -37.30 | 6.90 | NA | NA | NA |
| 2023-12-31 | 2023-09-30 | 2023-06-30 | 2023-03-31 | 2022-12-31 | 2022-09-30 | 2022-06-30 | 2022-03-31 | 2021-12-31 | 2021-09-30 | 2021-06-30 | 2021-03-31 | 2020-12-31 | 2020-09-30 | 2020-06-30 | 2020-03-31 | 2019-12-31 | 2019-09-30 | 2019-06-30 | 2019-03-31 | 2018-12-31 | 2018-09-30 | 2018-06-30 | 2018-03-31 | 2017-12-31 | 2017-09-30 | 2017-06-30 | 2017-03-31 | 2016-12-31 | 2016-09-30 | 2016-06-30 | 2016-03-31 | 2015-12-31 | 2015-09-30 | 2015-06-30 | 2015-03-31 | 2014-12-31 | 2014-09-30 | 2014-06-30 | 2014-03-31 | 2013-12-31 | ||
|---|---|---|---|---|---|---|---|---|---|---|---|---|---|---|---|---|---|---|---|---|---|---|---|---|---|---|---|---|---|---|---|---|---|---|---|---|---|---|---|---|---|---|
| Net Cash Provided By Used In Operating Activities | 178.10 | 98.90 | 86.10 | 49.20 | 161.00 | 107.20 | 2.50 | -54.10 | -54.60 | 162.20 | 5.10 | -63.90 | 76.30 | 157.40 | 132.70 | -37.20 | 123.50 | 142.50 | 5.20 | -117.10 | 118.90 | 40.70 | 27.40 | 19.60 | 141.00 | 51.60 | 21.30 | 32.50 | 91.80 | 52.00 | 13.60 | 36.70 | 91.60 | 58.90 | -24.00 | 66.80 | 60.10 | 0.20 | NA | NA | NA | |
| Net Income Loss | 1.90 | 19.70 | 31.80 | 40.00 | 49.00 | -362.90 | 52.40 | 19.00 | 60.00 | 83.20 | 20.80 | -10.20 | 67.10 | -41.70 | 29.80 | -117.70 | 46.10 | 47.00 | 7.40 | -73.30 | 70.80 | 1.50 | 23.80 | 7.80 | 60.40 | 34.10 | 24.90 | 46.90 | 95.60 | 21.60 | 24.20 | 16.40 | 65.50 | 23.10 | -19.60 | -69.20 | 61.70 | 46.50 | 36.30 | 16.50 | 58.00 | |
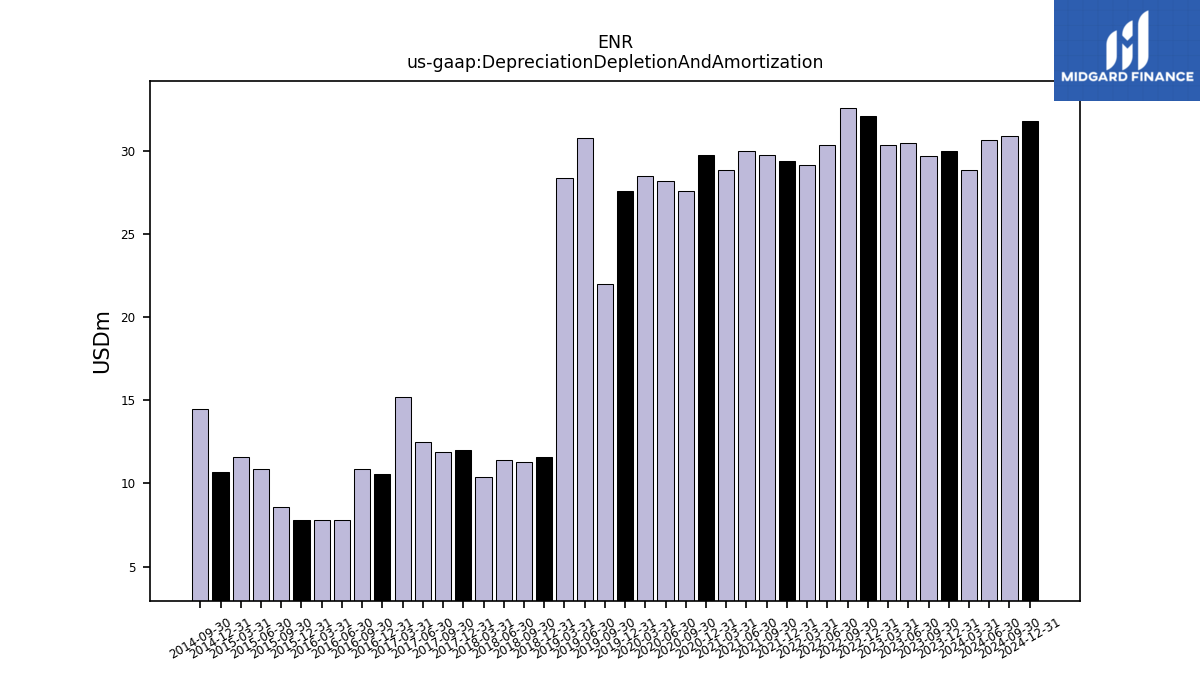
| Depreciation Depletion And Amortization | 30.00 | 29.70 | 30.50 | 30.40 | 32.10 | 32.60 | 30.40 | 29.20 | 29.40 | 29.80 | 30.00 | 28.90 | 29.80 | 27.60 | 28.20 | 28.50 | 27.60 | 22.00 | 30.80 | 28.40 | 11.60 | 11.30 | 11.40 | 10.40 | 12.00 | 11.90 | 12.50 | 15.20 | 10.60 | 10.90 | 7.80 | 7.80 | 7.80 | 8.60 | 10.90 | 11.60 | 10.70 | 14.50 | NA | NA | NA | |
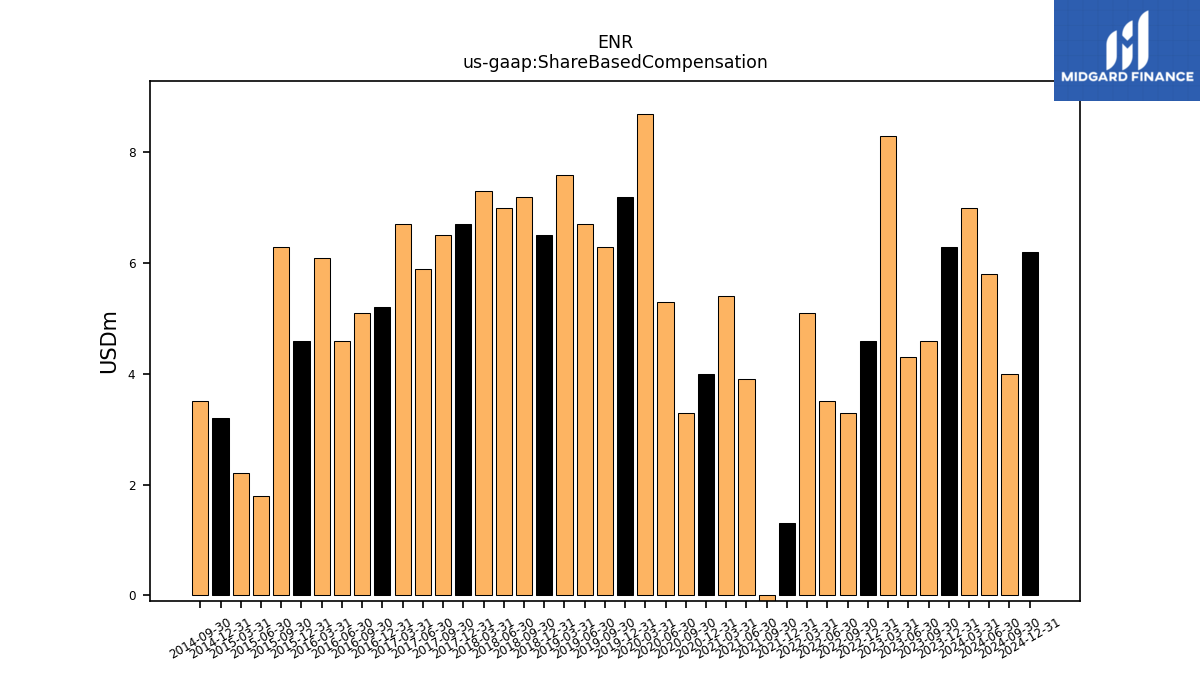
| Share Based Compensation | 6.30 | 4.60 | 4.30 | 8.30 | 4.60 | 3.30 | 3.50 | 5.10 | 1.30 | -3.10 | 3.90 | 5.40 | 4.00 | 3.30 | 5.30 | 8.70 | 7.20 | 6.30 | 6.70 | 7.60 | 6.50 | 7.20 | 7.00 | 7.30 | 6.70 | 6.50 | 5.90 | 6.70 | 5.20 | 5.10 | 4.60 | 6.10 | 4.60 | 6.30 | 1.80 | 2.20 | 3.20 | 3.50 | NA | NA | NA |
| 2023-12-31 | 2023-09-30 | 2023-06-30 | 2023-03-31 | 2022-12-31 | 2022-09-30 | 2022-06-30 | 2022-03-31 | 2021-12-31 | 2021-09-30 | 2021-06-30 | 2021-03-31 | 2020-12-31 | 2020-09-30 | 2020-06-30 | 2020-03-31 | 2019-12-31 | 2019-09-30 | 2019-06-30 | 2019-03-31 | 2018-12-31 | 2018-09-30 | 2018-06-30 | 2018-03-31 | 2017-12-31 | 2017-09-30 | 2017-06-30 | 2017-03-31 | 2016-12-31 | 2016-09-30 | 2016-06-30 | 2016-03-31 | 2015-12-31 | 2015-09-30 | 2015-06-30 | 2015-03-31 | 2014-12-31 | 2014-09-30 | 2014-06-30 | 2014-03-31 | 2013-12-31 | ||
|---|---|---|---|---|---|---|---|---|---|---|---|---|---|---|---|---|---|---|---|---|---|---|---|---|---|---|---|---|---|---|---|---|---|---|---|---|---|---|---|---|---|---|
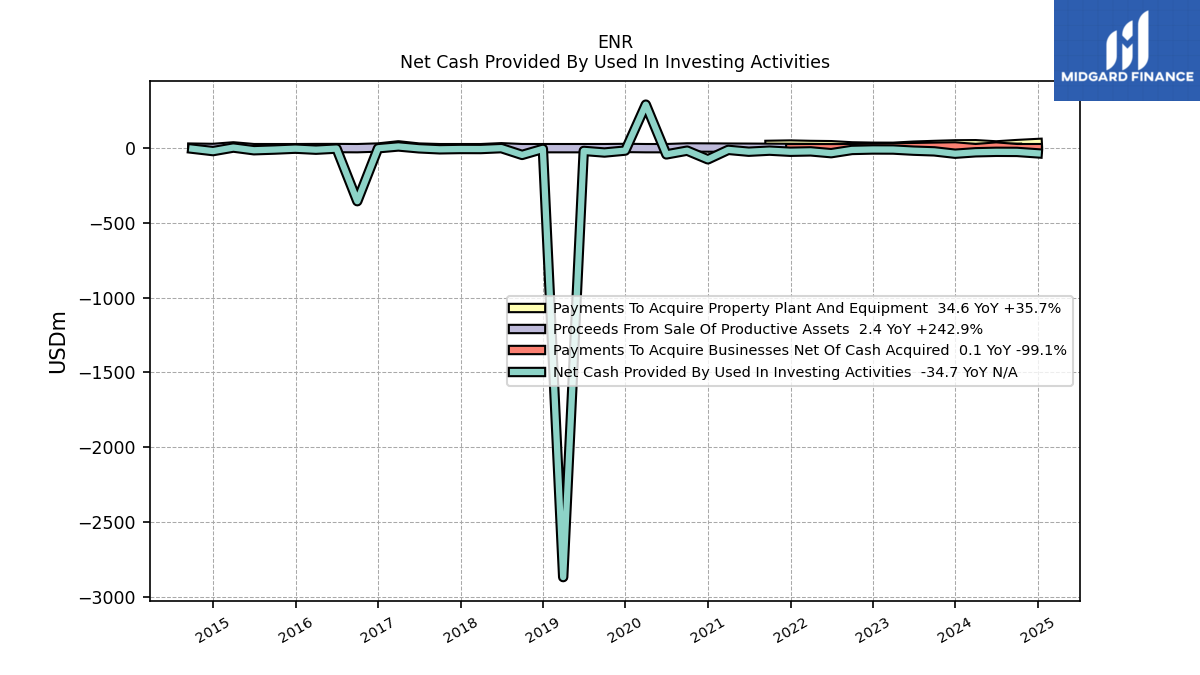
| Net Cash Provided By Used In Investing Activities | -37.10 | -21.40 | -16.70 | -9.20 | -8.80 | -12.00 | -33.50 | -21.40 | -24.00 | -16.50 | -23.70 | -11.40 | -74.80 | -16.60 | -41.70 | 291.40 | -16.20 | -29.10 | -18.20 | -2870.30 | -4.70 | -45.10 | 0.20 | -5.80 | -5.50 | -7.70 | -1.10 | 11.40 | -0.60 | -354.90 | -2.80 | -10.20 | -3.30 | -9.30 | -13.90 | 4.00 | -19.60 | -3.60 | NA | NA | NA | |
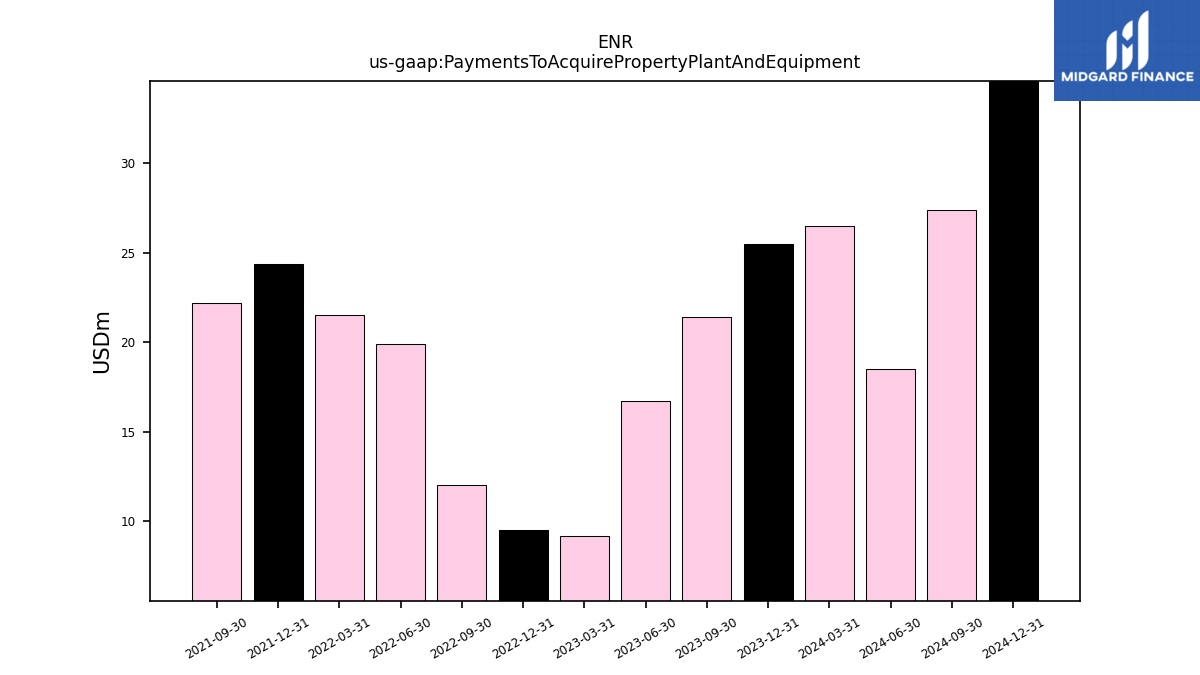
| Payments To Acquire Property Plant And Equipment | 25.50 | 21.40 | 16.70 | 9.20 | 9.50 | 12.00 | 19.90 | 21.50 | 24.40 | 22.20 | NA | NA | NA | NA | NA | NA | NA | NA | NA | NA | NA | NA | NA | NA | NA | NA | NA | NA | NA | NA | NA | NA | NA | NA | NA | NA | NA | NA | NA | NA | NA |
| 2023-12-31 | 2023-09-30 | 2023-06-30 | 2023-03-31 | 2022-12-31 | 2022-09-30 | 2022-06-30 | 2022-03-31 | 2021-12-31 | 2021-09-30 | 2021-06-30 | 2021-03-31 | 2020-12-31 | 2020-09-30 | 2020-06-30 | 2020-03-31 | 2019-12-31 | 2019-09-30 | 2019-06-30 | 2019-03-31 | 2018-12-31 | 2018-09-30 | 2018-06-30 | 2018-03-31 | 2017-12-31 | 2017-09-30 | 2017-06-30 | 2017-03-31 | 2016-12-31 | 2016-09-30 | 2016-06-30 | 2016-03-31 | 2015-12-31 | 2015-09-30 | 2015-06-30 | 2015-03-31 | 2014-12-31 | 2014-09-30 | 2014-06-30 | 2014-03-31 | 2013-12-31 | ||
|---|---|---|---|---|---|---|---|---|---|---|---|---|---|---|---|---|---|---|---|---|---|---|---|---|---|---|---|---|---|---|---|---|---|---|---|---|---|---|---|---|---|---|
| Net Cash Provided By Used In Financing Activities | -110.80 | -48.20 | -57.80 | -124.00 | -79.40 | -79.30 | 28.20 | 68.80 | 61.40 | -111.60 | -38.20 | 35.90 | -955.20 | 509.60 | 223.90 | -263.00 | -77.40 | -53.50 | -112.70 | 254.70 | 1183.60 | 1264.20 | 7.50 | 18.50 | -63.90 | -74.20 | 6.50 | 24.00 | -63.20 | 23.20 | -16.30 | -21.30 | -31.00 | 388.90 | 30.30 | -72.70 | -37.30 | 6.90 | NA | NA | NA | |
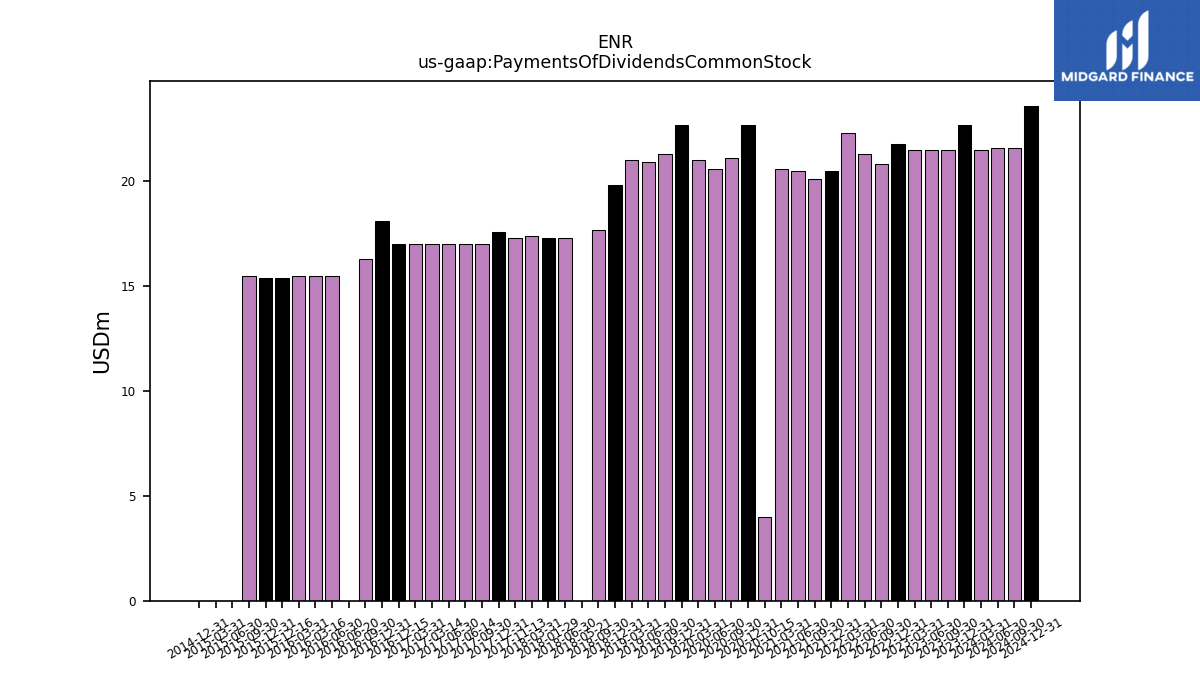
| Payments Of Dividends Common Stock | 22.70 | 21.50 | 21.50 | 21.50 | 21.80 | 20.80 | 21.30 | 22.30 | 20.50 | 20.10 | 20.50 | 20.60 | 22.70 | 21.10 | 20.60 | 21.00 | 22.70 | 21.30 | 20.90 | 21.00 | 19.80 | 17.70 | 17.30 | 17.40 | 17.60 | 17.00 | 17.00 | 17.00 | 18.10 | 16.30 | 15.50 | 15.50 | 15.40 | 15.50 | 0.00 | 0.00 | 0.00 | NA | NA | NA | NA |
| 2023-12-31 | 2023-09-30 | 2023-06-30 | 2023-03-31 | 2022-12-31 | 2022-09-30 | 2022-06-30 | 2022-03-31 | 2021-12-31 | 2021-09-30 | 2021-06-30 | 2021-03-31 | 2020-12-31 | 2020-09-30 | 2020-06-30 | 2020-03-31 | 2019-12-31 | 2019-09-30 | 2019-06-30 | 2019-03-31 | 2018-12-31 | 2018-09-30 | 2018-06-30 | 2018-03-31 | 2017-12-31 | 2017-09-30 | 2017-06-30 | 2017-03-31 | 2016-12-31 | 2016-09-30 | 2016-06-30 | 2016-03-31 | 2015-12-31 | 2015-09-30 | 2015-06-30 | 2015-03-31 | 2014-12-31 | 2014-09-30 | 2014-06-30 | 2014-03-31 | 2013-12-31 | ||
|---|---|---|---|---|---|---|---|---|---|---|---|---|---|---|---|---|---|---|---|---|---|---|---|---|---|---|---|---|---|---|---|---|---|---|---|---|---|---|---|---|---|---|
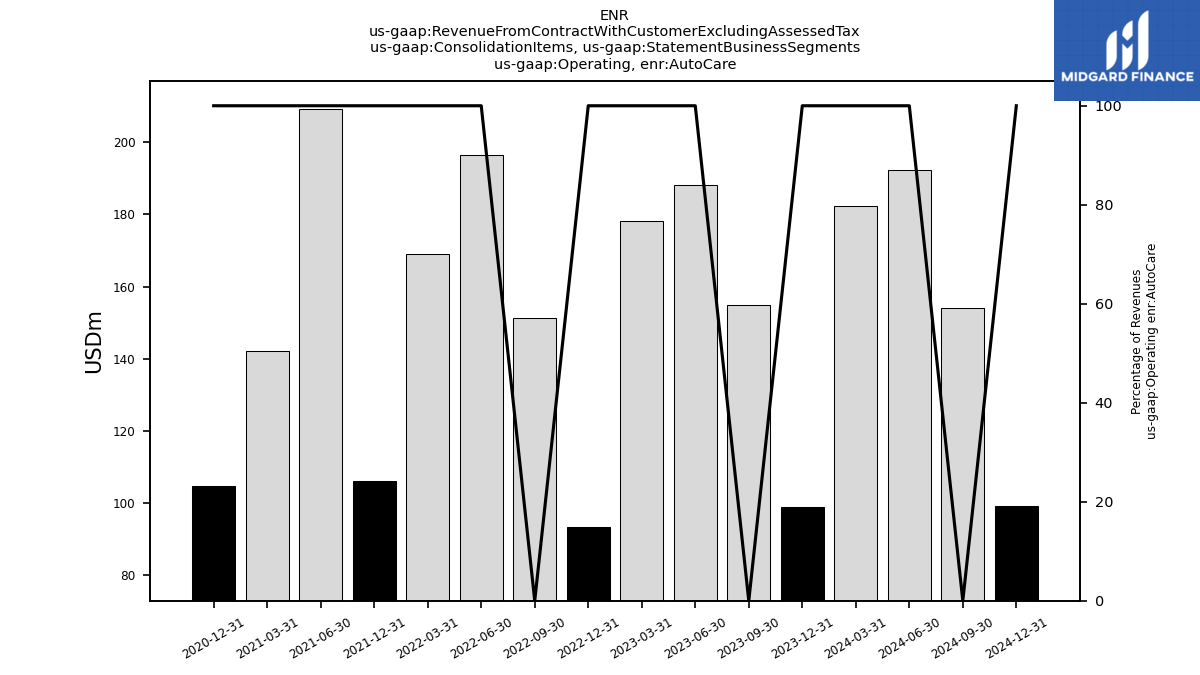
| Revenues | 716.60 | 811.10 | 699.40 | 684.10 | 765.10 | 790.40 | 728.00 | 685.40 | 846.30 | 766.00 | 721.80 | 685.10 | 848.60 | 763.00 | 658.00 | 587.00 | 736.80 | 719.00 | 647.20 | 556.40 | 571.90 | 457.20 | 392.80 | 374.40 | 573.30 | 465.10 | 372.00 | 359.00 | 559.60 | 432.40 | 361.00 | 334.00 | 506.80 | 399.10 | 374.30 | 356.90 | 501.30 | 486.70 | 411.70 | 373.40 | 568.60 | |
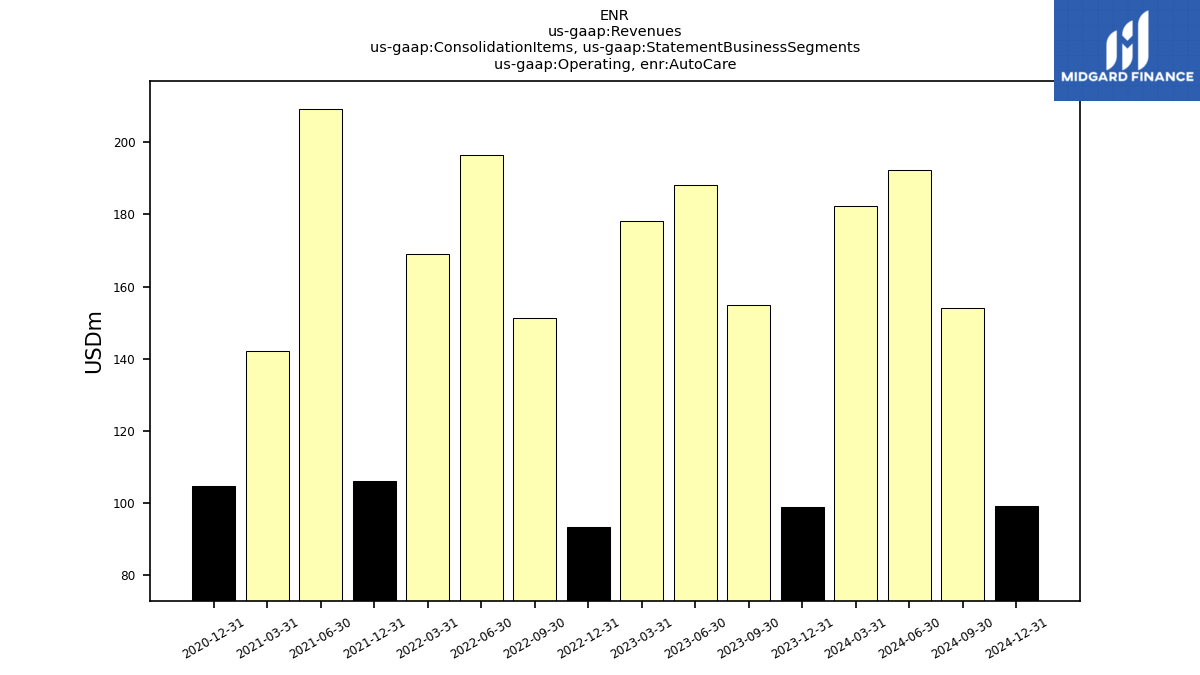
| Operating, Auto Care | 98.80 | NA | 188.10 | 178.20 | 93.50 | NA | 196.40 | 168.90 | 106.10 | NA | 209.10 | 142.20 | 104.70 | NA | NA | NA | NA | NA | NA | NA | NA | NA | NA | NA | NA | NA | NA | NA | NA | NA | NA | NA | NA | NA | NA | NA | NA | NA | NA | NA | NA | |
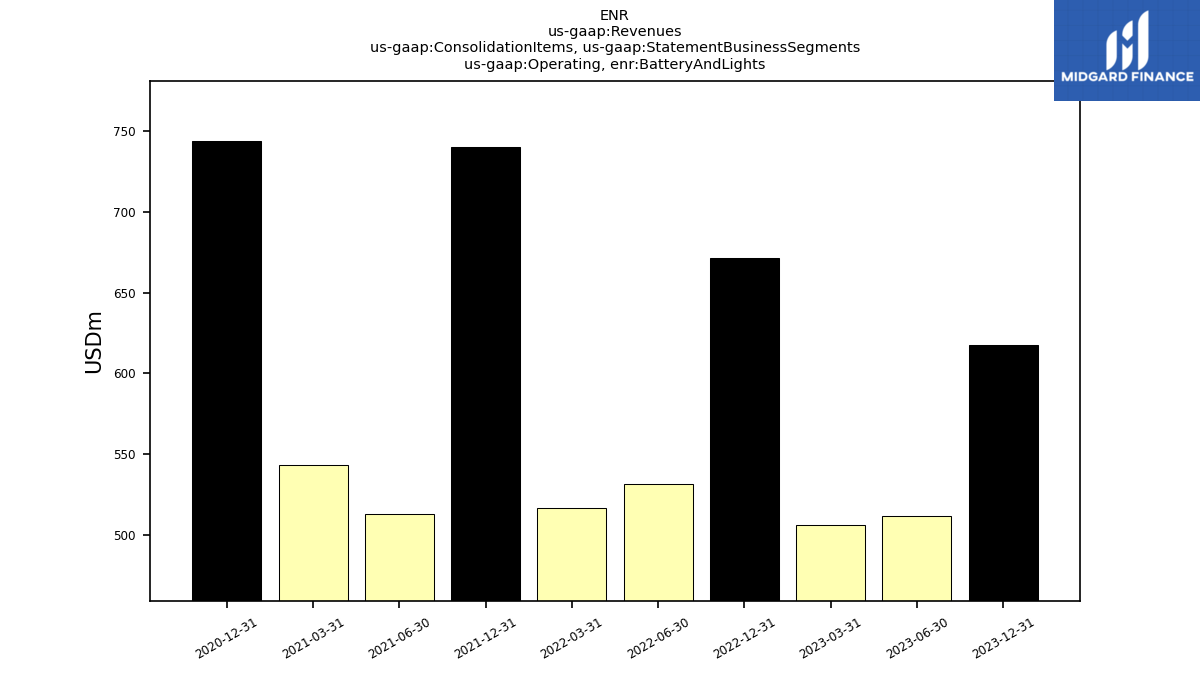
| Operating, Battery And Lights | 617.80 | NA | 511.30 | 505.90 | 671.60 | NA | 531.60 | 516.50 | 740.20 | NA | 512.70 | 542.90 | 743.90 | NA | NA | NA | NA | NA | NA | NA | NA | NA | NA | NA | NA | NA | NA | NA | NA | NA | NA | NA | NA | NA | NA | NA | NA | NA | NA | NA | NA | |
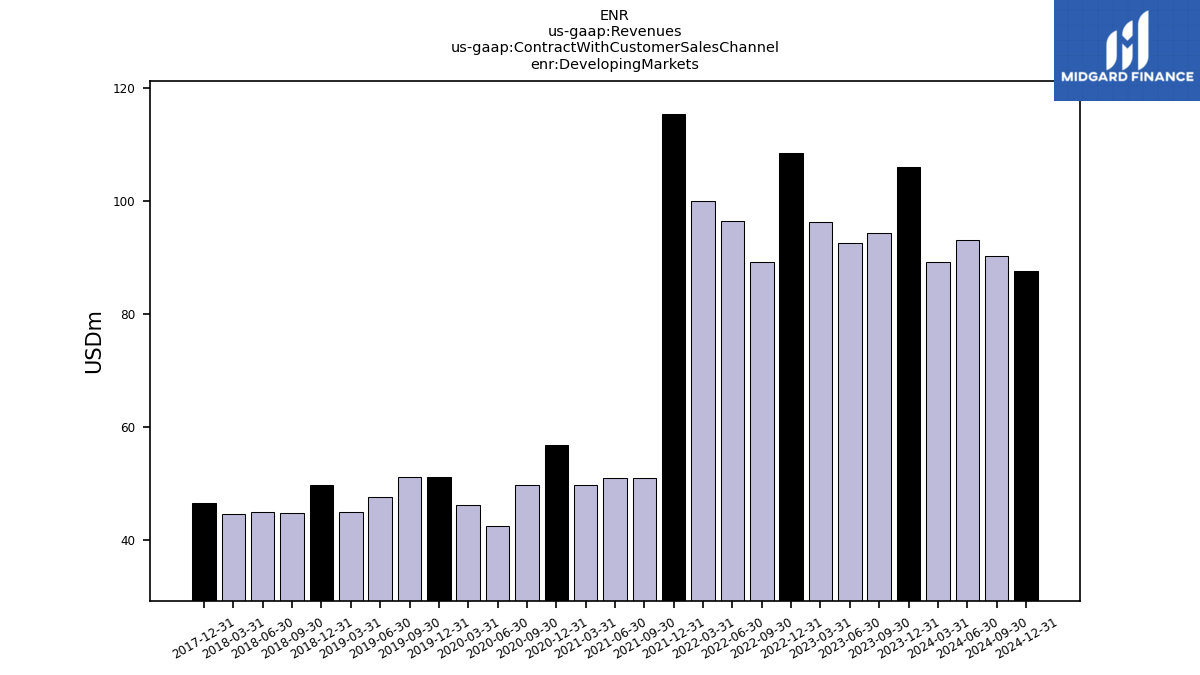
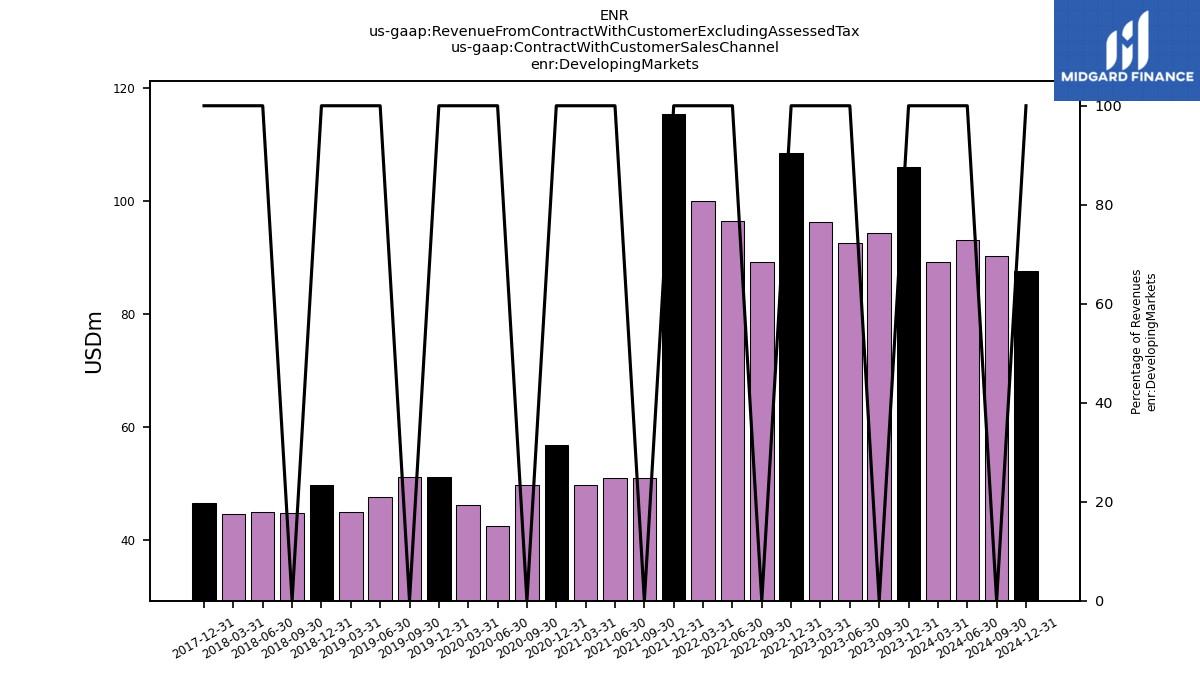
| Developing Markets | 106.00 | 94.30 | 92.50 | 96.30 | 108.50 | 89.20 | 96.40 | 99.90 | 115.40 | 51.00 | 51.00 | 49.80 | 56.90 | 49.70 | 42.50 | 46.20 | 51.20 | 51.20 | 47.60 | 44.90 | 49.70 | 44.80 | 44.90 | 44.70 | 46.60 | NA | NA | NA | NA | NA | NA | NA | NA | NA | NA | NA | NA | NA | NA | NA | NA | |
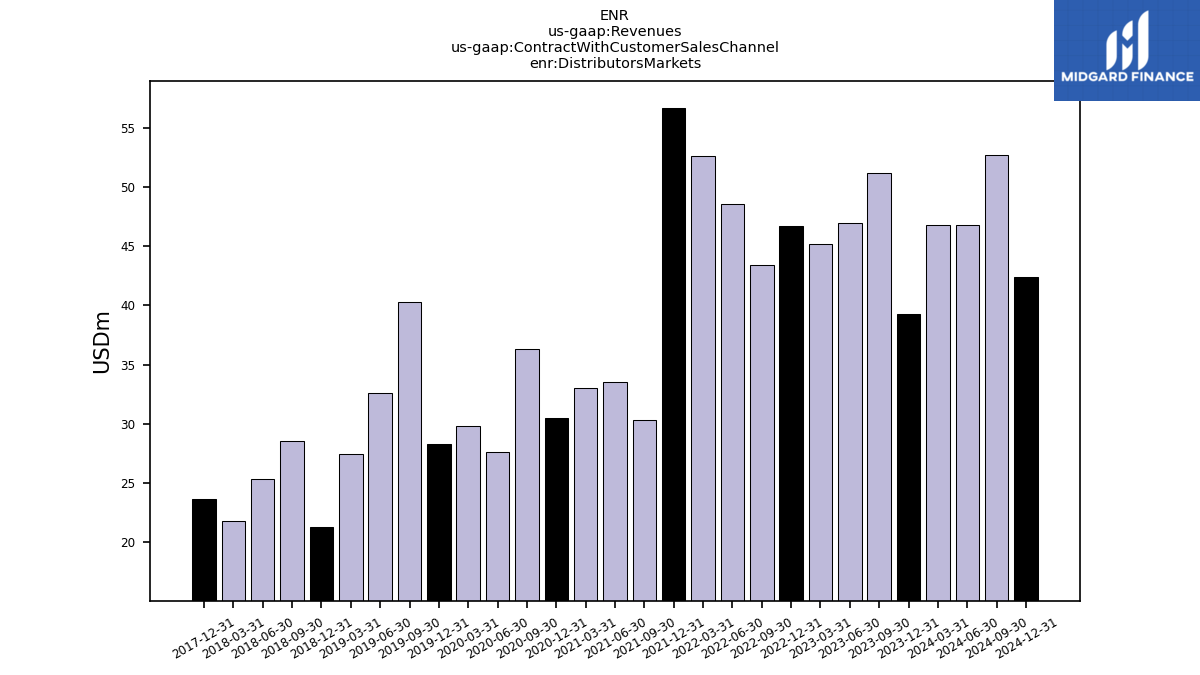
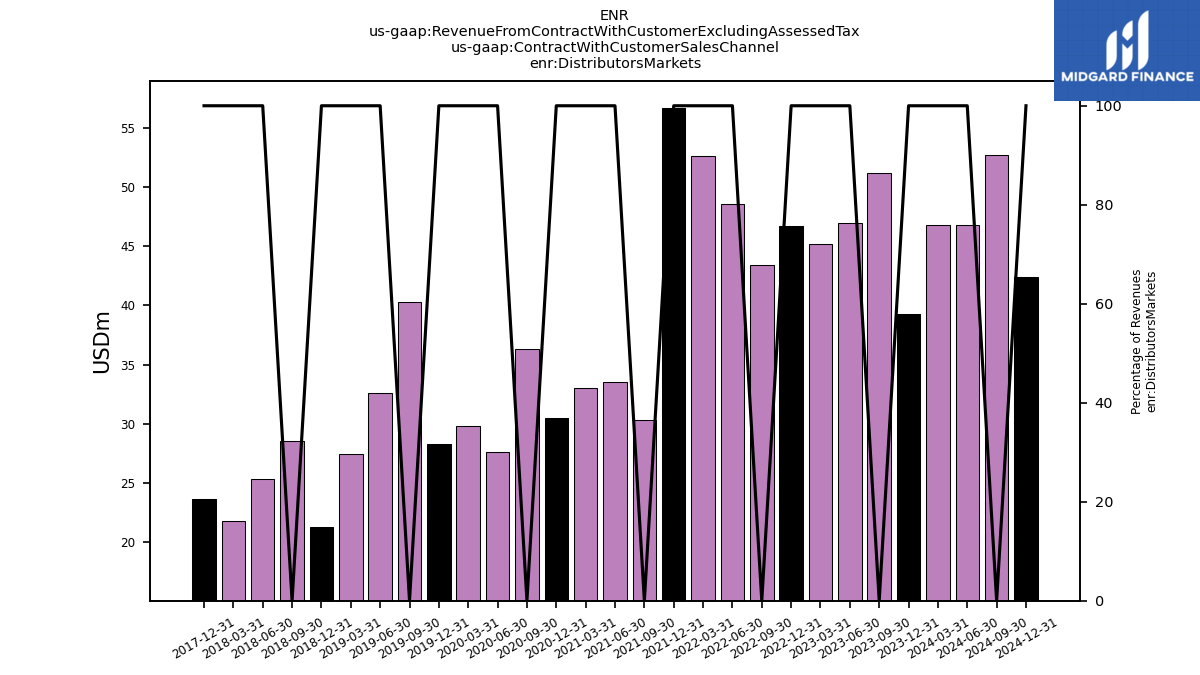
| Distributors Markets | 39.30 | 51.20 | 47.00 | 45.20 | 46.70 | 43.40 | 48.60 | 52.60 | 56.70 | 30.30 | 33.50 | 33.00 | 30.50 | 36.30 | 27.60 | 29.80 | 28.30 | 40.30 | 32.60 | 27.40 | 21.30 | 28.50 | 25.30 | 21.80 | 23.60 | NA | NA | NA | NA | NA | NA | NA | NA | NA | NA | NA | NA | NA | NA | NA | NA | |
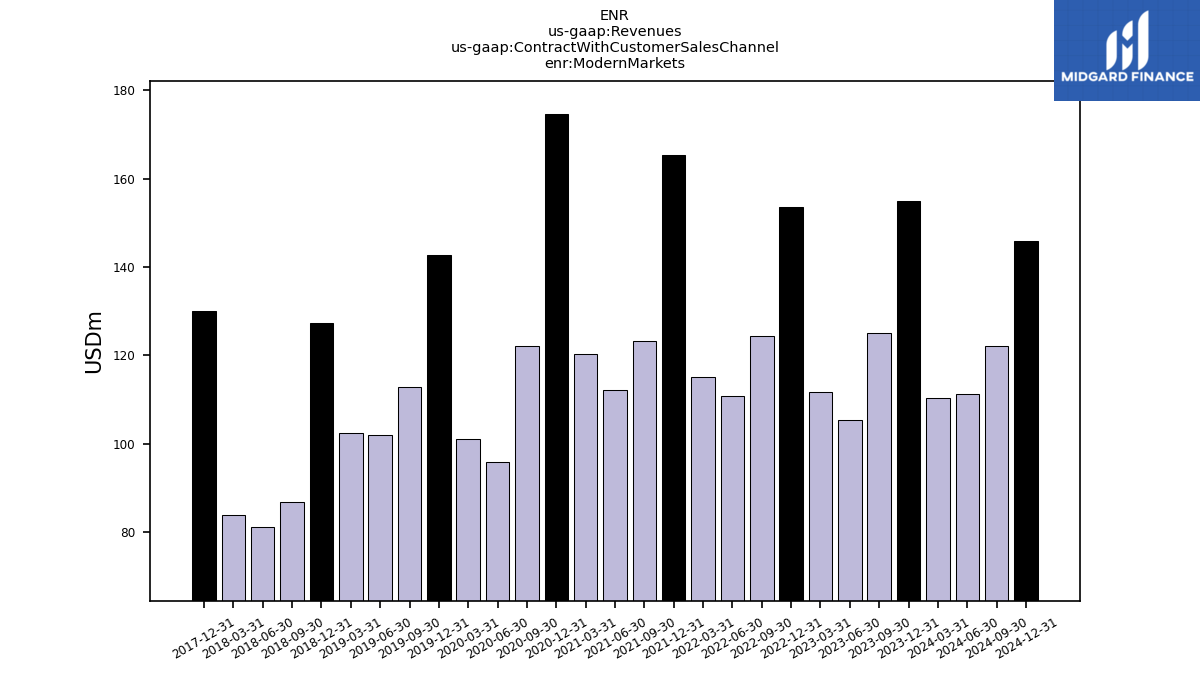
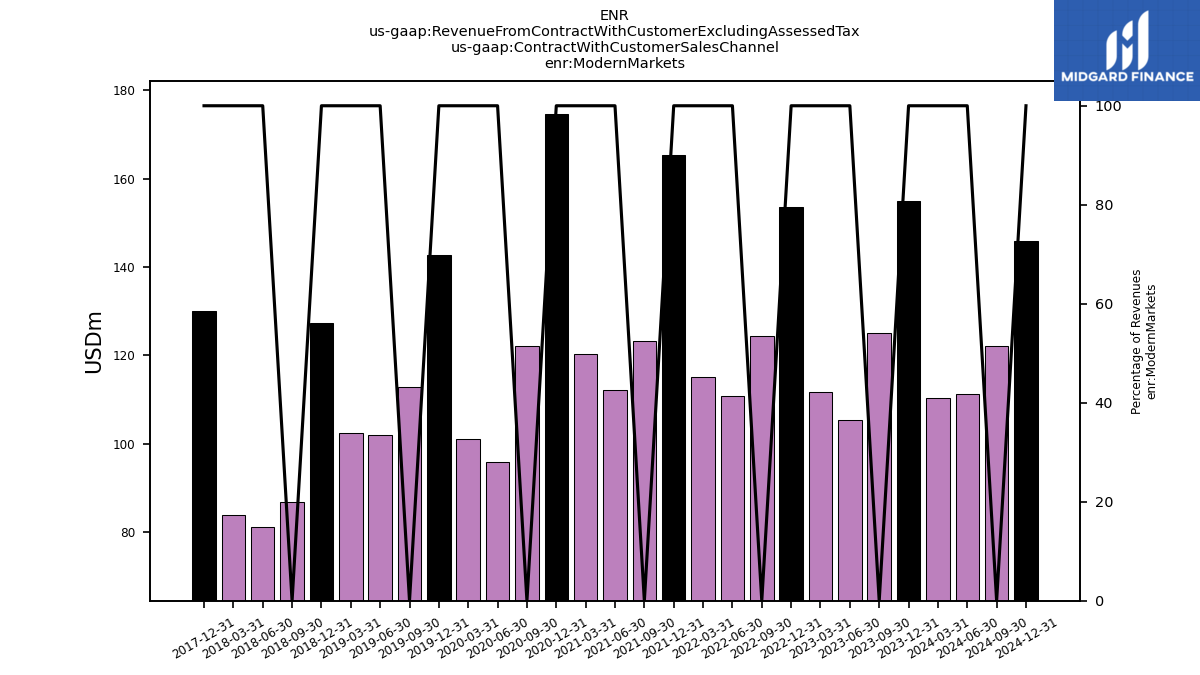
| Modern Markets | 155.00 | 125.10 | 105.50 | 111.70 | 153.60 | 124.50 | 110.90 | 115.20 | 165.30 | 123.20 | 112.10 | 120.30 | 174.60 | 122.10 | 96.00 | 101.10 | 142.80 | 112.90 | 101.90 | 102.50 | 127.40 | 86.80 | 81.30 | 83.80 | 130.00 | NA | NA | NA | NA | NA | NA | NA | NA | NA | NA | NA | NA | NA | NA | NA | NA | |
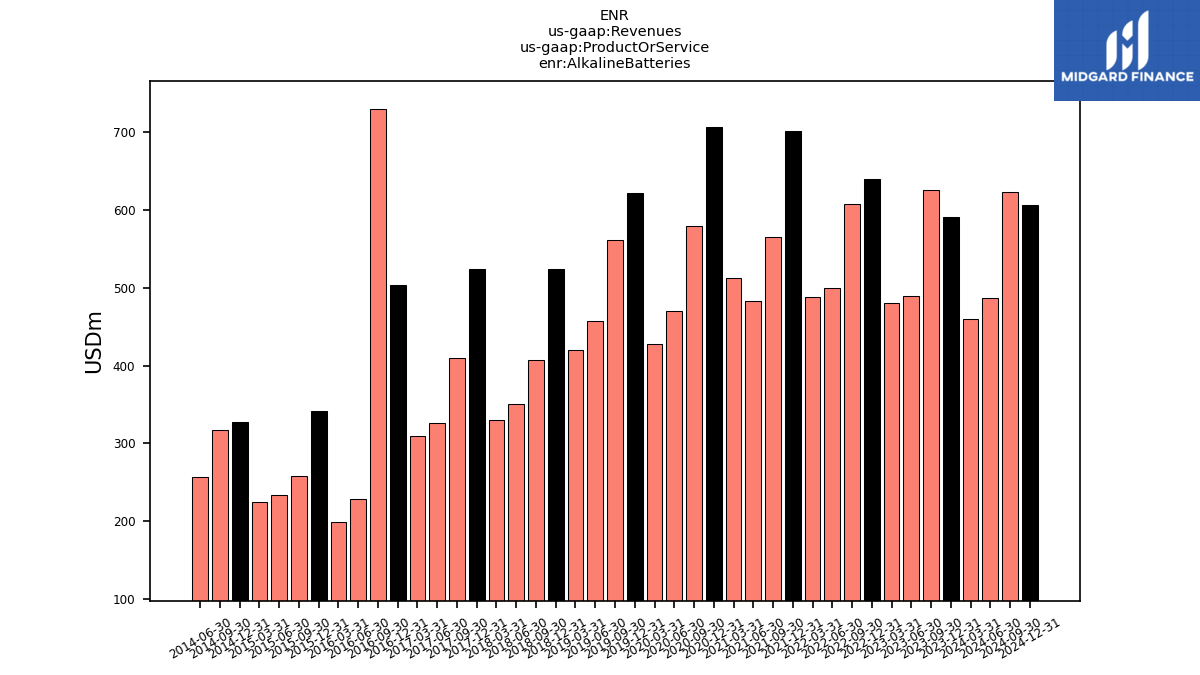
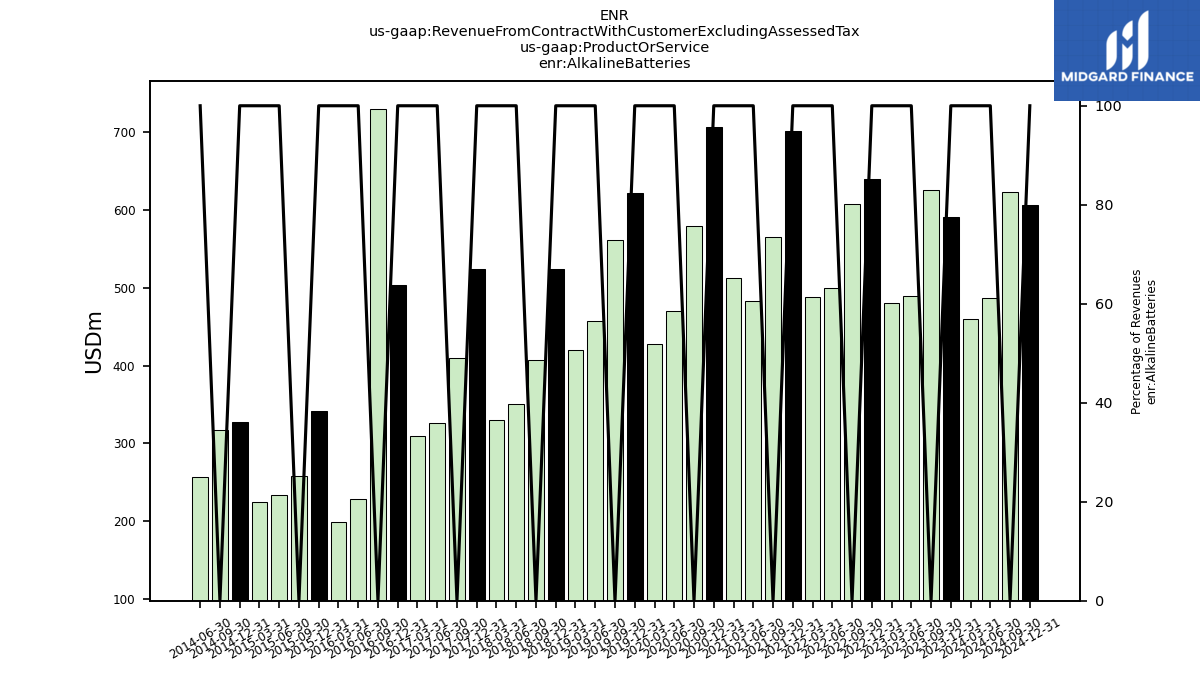
| Alkaline Batteries | 591.40 | 625.50 | 488.80 | 480.10 | 639.50 | 607.90 | 500.10 | 488.50 | 701.70 | 565.60 | 482.90 | 512.80 | 706.10 | 579.50 | 470.70 | 427.70 | 621.90 | 561.40 | 457.20 | 419.40 | 524.30 | 407.80 | 350.10 | 330.30 | 524.50 | 409.40 | 325.80 | 309.90 | 503.10 | 729.20 | 228.60 | 199.20 | 341.00 | 258.70 | 233.90 | 224.40 | 327.90 | 317.80 | 256.50 | NA | NA | |
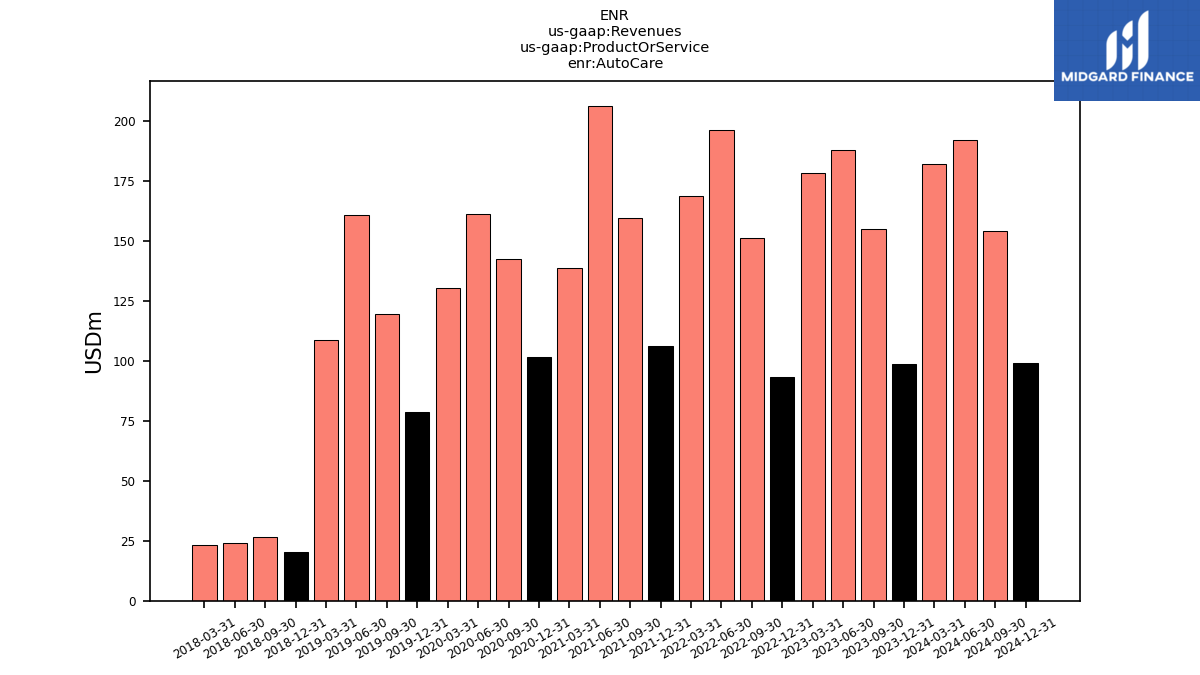
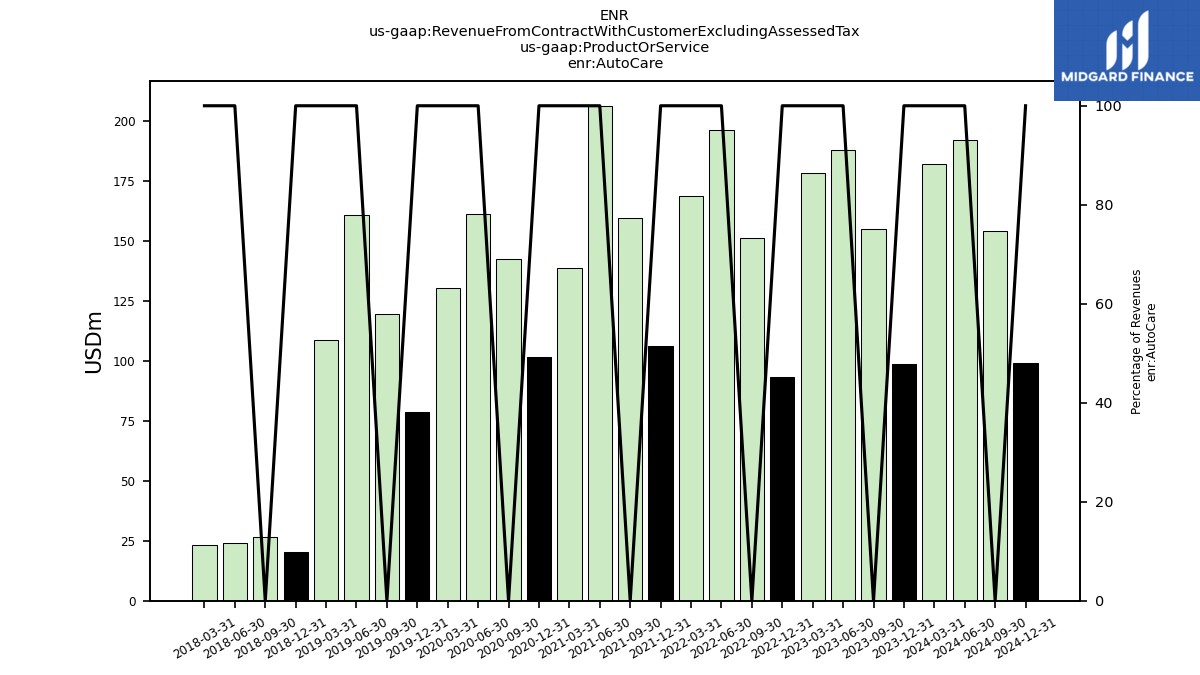
| Auto Care | 98.80 | 155.00 | 188.10 | 178.20 | 93.50 | 151.40 | 196.40 | 168.90 | 106.10 | 159.80 | 206.40 | 138.90 | 101.80 | 142.70 | 161.40 | 130.20 | 78.70 | 119.40 | 160.80 | 108.60 | 20.50 | 26.50 | 24.10 | 23.40 | NA | NA | NA | NA | NA | NA | NA | NA | NA | NA | NA | NA | NA | NA | NA | NA | NA | |
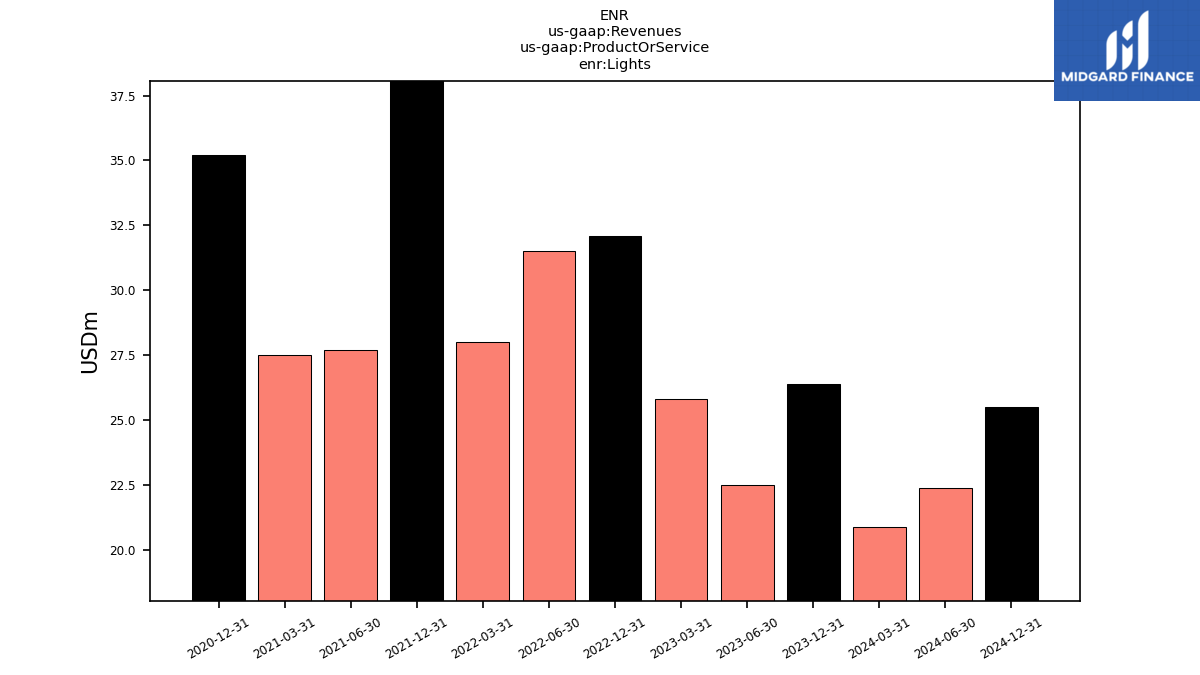
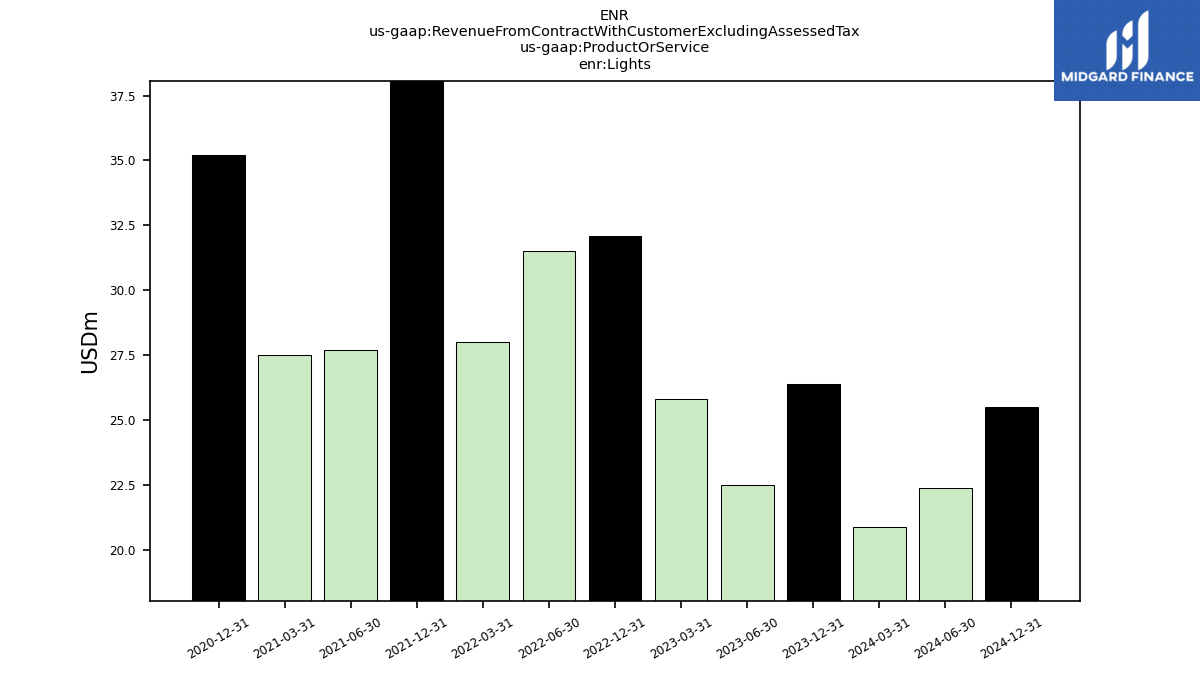
| Lights | 26.40 | NA | 22.50 | 25.80 | 32.10 | NA | 31.50 | 28.00 | 38.50 | NA | 27.70 | 27.50 | 35.20 | NA | NA | NA | NA | NA | NA | NA | NA | NA | NA | NA | NA | NA | NA | NA | NA | NA | NA | NA | NA | NA | NA | NA | NA | NA | NA | NA | NA | |
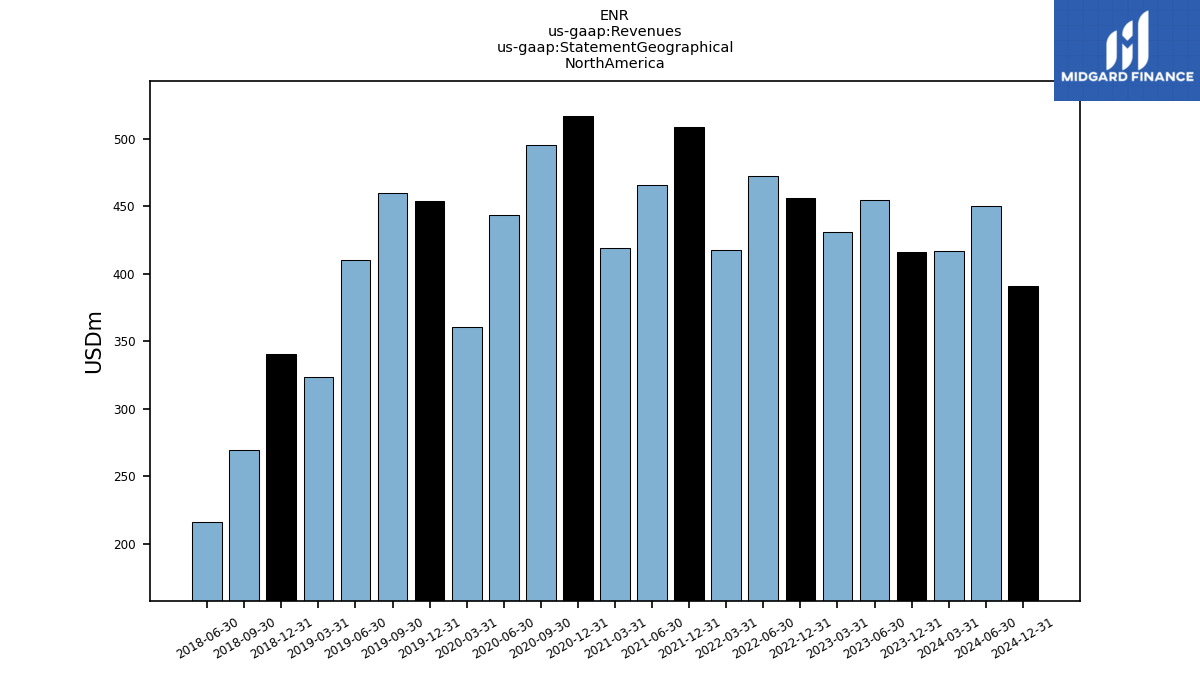
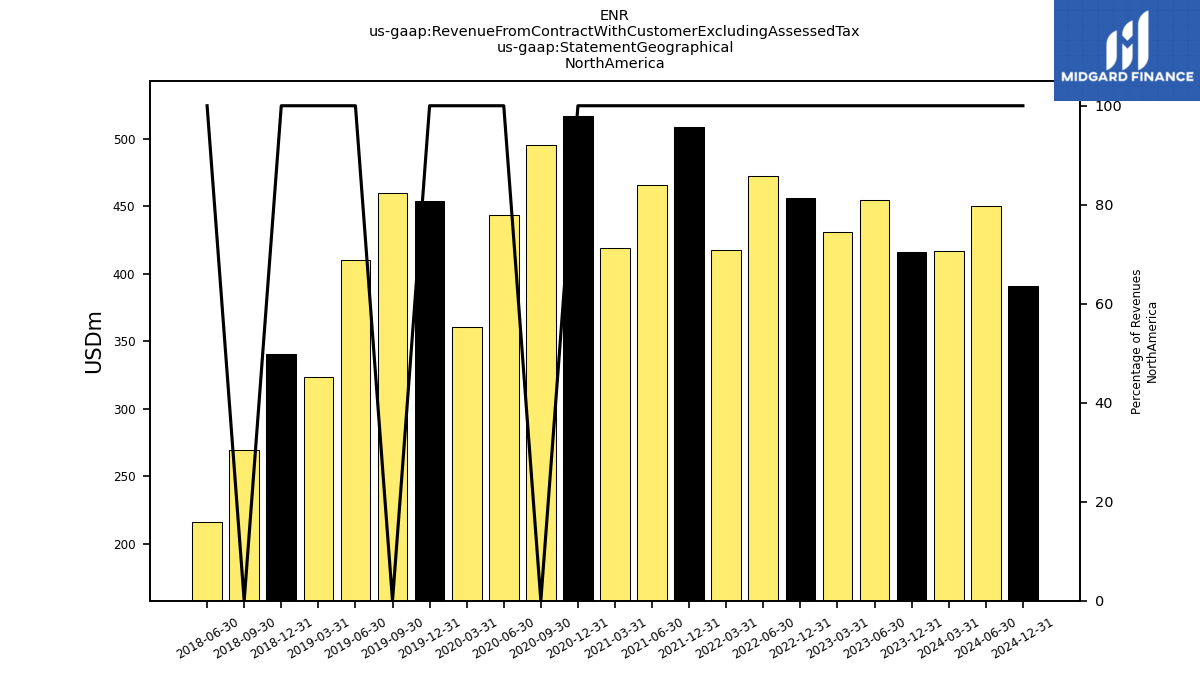
| 416.30 | NA | 454.40 | 430.90 | 456.30 | NA | 472.10 | 417.70 | 508.90 | NA | 465.50 | 419.30 | 516.90 | 495.60 | 443.40 | 360.30 | 453.70 | 459.50 | 410.30 | 323.90 | 341.00 | 269.70 | 216.50 | NA | NA | NA | NA | NA | NA | NA | NA | NA | NA | NA | NA | NA | NA | NA | NA | NA | NA | ||
| Revenue From Contract With Customer Excluding Assessed Tax | 716.60 | 811.10 | 699.40 | 684.10 | 765.10 | 790.40 | 728.00 | 685.40 | 846.30 | 766.00 | 721.80 | 685.10 | 848.60 | 763.00 | 658.00 | 587.00 | 736.80 | 719.00 | 647.20 | 556.40 | 571.90 | 457.20 | 392.80 | 374.40 | 573.30 | 465.10 | 372.00 | 359.00 | 559.60 | 432.40 | 361.00 | 334.00 | 506.80 | 399.10 | 374.30 | 356.90 | 501.30 | 486.70 | 411.70 | 373.40 | 568.60 | |
| Operating, Auto Care | 98.80 | NA | 188.10 | 178.20 | 93.50 | NA | 196.40 | 168.90 | 106.10 | NA | 209.10 | 142.20 | 104.70 | NA | NA | NA | NA | NA | NA | NA | NA | NA | NA | NA | NA | NA | NA | NA | NA | NA | NA | NA | NA | NA | NA | NA | NA | NA | NA | NA | NA | |
| Operating, Battery And Lights | 617.80 | NA | 511.30 | 505.90 | 671.60 | NA | 531.60 | 516.50 | 740.20 | NA | 512.70 | 542.90 | 743.90 | NA | NA | NA | NA | NA | NA | NA | NA | NA | NA | NA | NA | NA | NA | NA | NA | NA | NA | NA | NA | NA | NA | NA | NA | NA | NA | NA | NA | |
| Developing Markets | 106.00 | 94.30 | 92.50 | 96.30 | 108.50 | 89.20 | 96.40 | 99.90 | 115.40 | 51.00 | 51.00 | 49.80 | 56.90 | 49.70 | 42.50 | 46.20 | 51.20 | 51.20 | 47.60 | 44.90 | 49.70 | 44.80 | 44.90 | 44.70 | 46.60 | NA | NA | NA | NA | NA | NA | NA | NA | NA | NA | NA | NA | NA | NA | NA | NA | |
| Distributors Markets | 39.30 | 51.20 | 47.00 | 45.20 | 46.70 | 43.40 | 48.60 | 52.60 | 56.70 | 30.30 | 33.50 | 33.00 | 30.50 | 36.30 | 27.60 | 29.80 | 28.30 | 40.30 | 32.60 | 27.40 | 21.30 | 28.50 | 25.30 | 21.80 | 23.60 | NA | NA | NA | NA | NA | NA | NA | NA | NA | NA | NA | NA | NA | NA | NA | NA | |
| Modern Markets | 155.00 | 125.10 | 105.50 | 111.70 | 153.60 | 124.50 | 110.90 | 115.20 | 165.30 | 123.20 | 112.10 | 120.30 | 174.60 | 122.10 | 96.00 | 101.10 | 142.80 | 112.90 | 101.90 | 102.50 | 127.40 | 86.80 | 81.30 | 83.80 | 130.00 | NA | NA | NA | NA | NA | NA | NA | NA | NA | NA | NA | NA | NA | NA | NA | NA | |
| Alkaline Batteries | 591.40 | 625.50 | 488.80 | 480.10 | 639.50 | 607.90 | 500.10 | 488.50 | 701.70 | 565.60 | 482.90 | 512.80 | 706.10 | 579.50 | 470.70 | 427.70 | 621.90 | 561.40 | 457.20 | 419.40 | 524.30 | 407.80 | 350.10 | 330.30 | 524.50 | 409.40 | 325.80 | 309.90 | 503.10 | 729.20 | 228.60 | 199.20 | 341.00 | 258.70 | 233.90 | 224.40 | 327.90 | 317.80 | 256.50 | NA | NA | |
| Auto Care | 98.80 | 155.00 | 188.10 | 178.20 | 93.50 | 151.40 | 196.40 | 168.90 | 106.10 | 159.80 | 206.40 | 138.90 | 101.80 | 142.70 | 161.40 | 130.20 | 78.70 | 119.40 | 160.80 | 108.60 | 20.50 | 26.50 | 24.10 | 23.40 | NA | NA | NA | NA | NA | NA | NA | NA | NA | NA | NA | NA | NA | NA | NA | NA | NA | |
| Lights | 26.40 | NA | 22.50 | 25.80 | 32.10 | NA | 31.50 | 28.00 | 38.50 | NA | 27.70 | 27.50 | 35.20 | NA | NA | NA | NA | NA | NA | NA | NA | NA | NA | NA | NA | NA | NA | NA | NA | NA | NA | NA | NA | NA | NA | NA | NA | NA | NA | NA | NA | |
| 416.30 | NA | 454.40 | 430.90 | 456.30 | NA | 472.10 | 417.70 | 508.90 | NA | 465.50 | 419.30 | 516.90 | 495.60 | 443.40 | 360.30 | 453.70 | 459.50 | 410.30 | 323.90 | 341.00 | 269.70 | 216.50 | NA | NA | NA | NA | NA | NA | NA | NA | NA | NA | NA | NA | NA | NA | NA | NA | NA | NA |