
| 2023-12-31 | 2023-10-01 | 2023-07-02 | 2023-03-31 | 2023-01-01 | 2022-10-02 | 2022-07-03 | 2022-03-31 | 2022-01-02 | 2021-10-03 | 2021-07-04 | 2021-03-31 | 2021-01-03 | 2020-10-04 | 2020-07-05 | 2020-03-31 | 2019-12-31 | 2019-09-30 | 2019-06-30 | 2019-03-31 | 2018-12-30 | 2018-09-30 | 2018-07-01 | 2018-03-31 | 2017-12-31 | 2017-10-01 | 2017-07-02 | 2017-03-31 | 2017-01-01 | 2016-10-02 | 2016-07-03 | 2016-03-31 | 2015-12-27 | 2015-09-27 | 2015-06-28 | 2015-03-31 | 2014-12-28 | 2014-09-28 | 2014-06-29 | 2014-03-31 | 2013-12-29 | 2013-09-29 | 2013-06-30 | 2013-03-31 | 2012-12-30 | 2012-09-30 | 2012-07-01 | 2012-03-31 | 2012-01-01 | 2011-10-02 | 2011-07-03 | 2011-03-31 | 2011-01-02 | 2010-10-03 | 2010-07-04 | 2010-03-31 | 2009-12-27 | ||
|---|---|---|---|---|---|---|---|---|---|---|---|---|---|---|---|---|---|---|---|---|---|---|---|---|---|---|---|---|---|---|---|---|---|---|---|---|---|---|---|---|---|---|---|---|---|---|---|---|---|---|---|---|---|---|---|---|---|---|
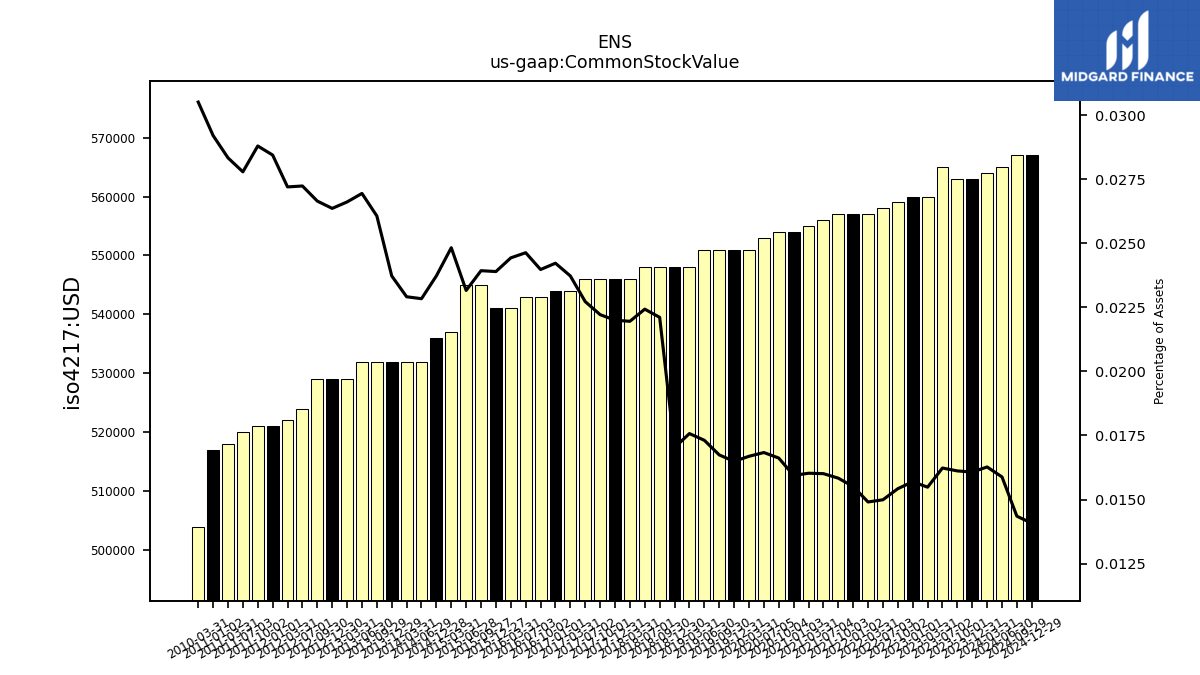
| Common Stock Value | 0.56 | 0.56 | 0.56 | 0.56 | 0.56 | 0.56 | 0.56 | 0.56 | 0.56 | 0.56 | 0.56 | 0.56 | 0.55 | 0.55 | 0.55 | 0.55 | 0.55 | 0.55 | 0.55 | 0.55 | 0.55 | 0.55 | 0.55 | 0.55 | 0.55 | 0.55 | 0.55 | 0.54 | 0.54 | 0.54 | 0.54 | 0.54 | 0.54 | 0.55 | 0.55 | 0.54 | 0.54 | NA | 0.53 | 0.53 | 0.53 | 0.53 | 0.53 | 0.53 | 0.53 | 0.53 | 0.52 | 0.52 | 0.52 | 0.52 | 0.52 | 0.52 | 0.52 | NA | NA | 0.50 | NA | |
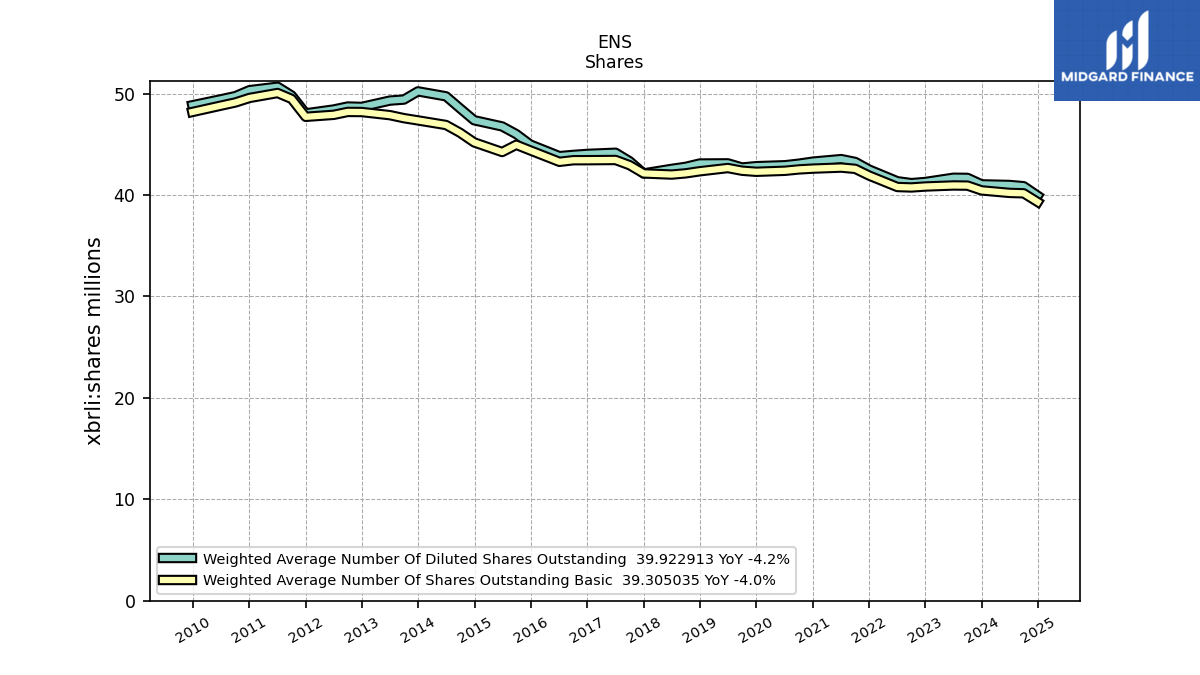
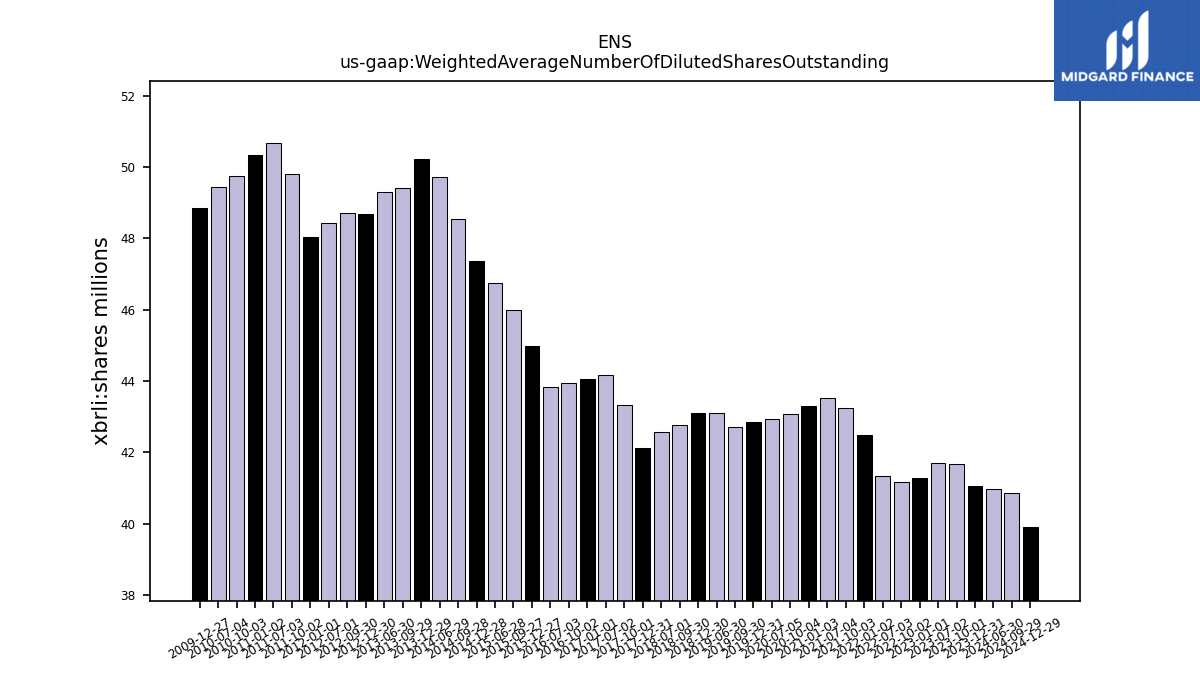
| Weighted Average Number Of Diluted Shares Outstanding | 41.05 | 41.68 | 41.70 | NA | 41.28 | 41.17 | 41.35 | NA | 42.50 | 43.26 | 43.54 | NA | 43.29 | 43.09 | 42.93 | NA | 42.84 | 42.71 | 43.12 | NA | 43.10 | 42.77 | 42.57 | NA | 42.13 | 43.33 | 44.16 | NA | 44.05 | 43.95 | 43.83 | NA | 44.98 | 46.01 | 46.76 | NA | 47.37 | 48.54 | 49.73 | NA | 50.21 | 49.41 | 49.30 | NA | 48.68 | 48.72 | 48.43 | NA | 48.05 | 49.81 | 50.67 | NA | 50.33 | 49.75 | 49.44 | NA | 48.84 | |
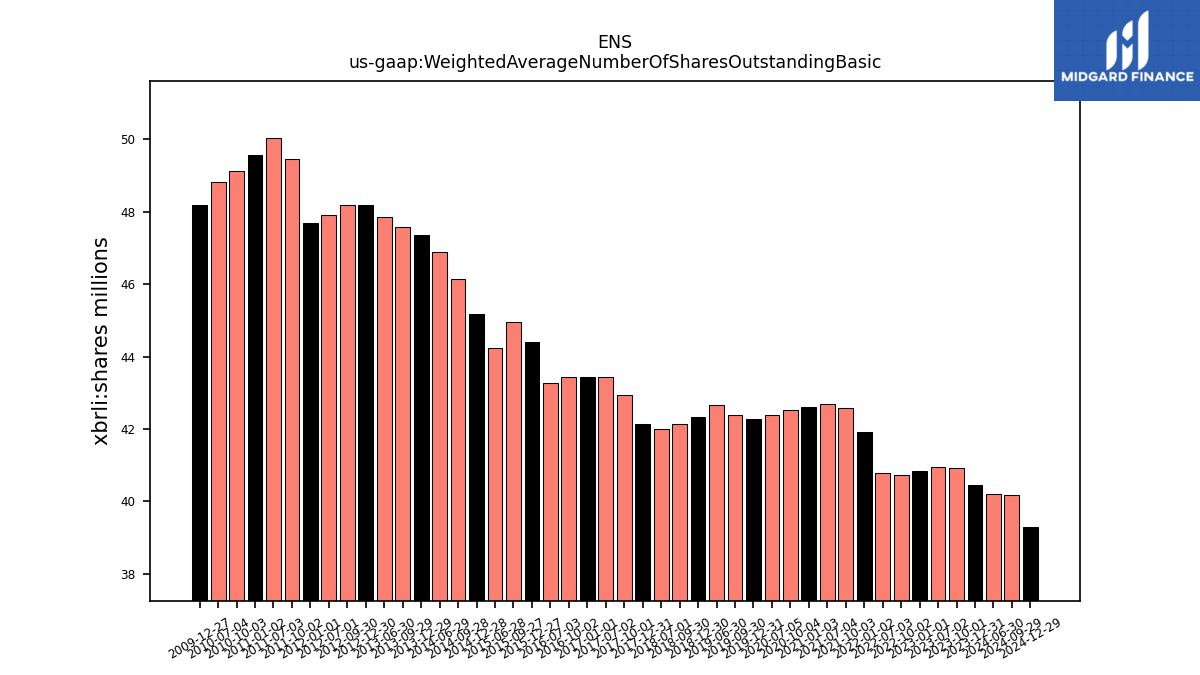
| Weighted Average Number Of Shares Outstanding Basic | 40.45 | 40.92 | 40.94 | NA | 40.84 | 40.74 | 40.79 | NA | 41.91 | 42.58 | 42.70 | NA | 42.60 | 42.52 | 42.39 | NA | 42.29 | 42.39 | 42.66 | NA | 42.34 | 42.13 | 42.01 | NA | 42.13 | 42.94 | 43.45 | NA | 43.43 | 43.43 | 43.27 | NA | 44.39 | 44.94 | 44.23 | NA | 45.19 | 46.13 | 46.90 | NA | 47.35 | 47.57 | 47.87 | NA | 48.18 | 48.19 | 47.90 | NA | 47.70 | 49.47 | 50.05 | NA | 49.56 | 49.12 | 48.82 | NA | 48.18 | |
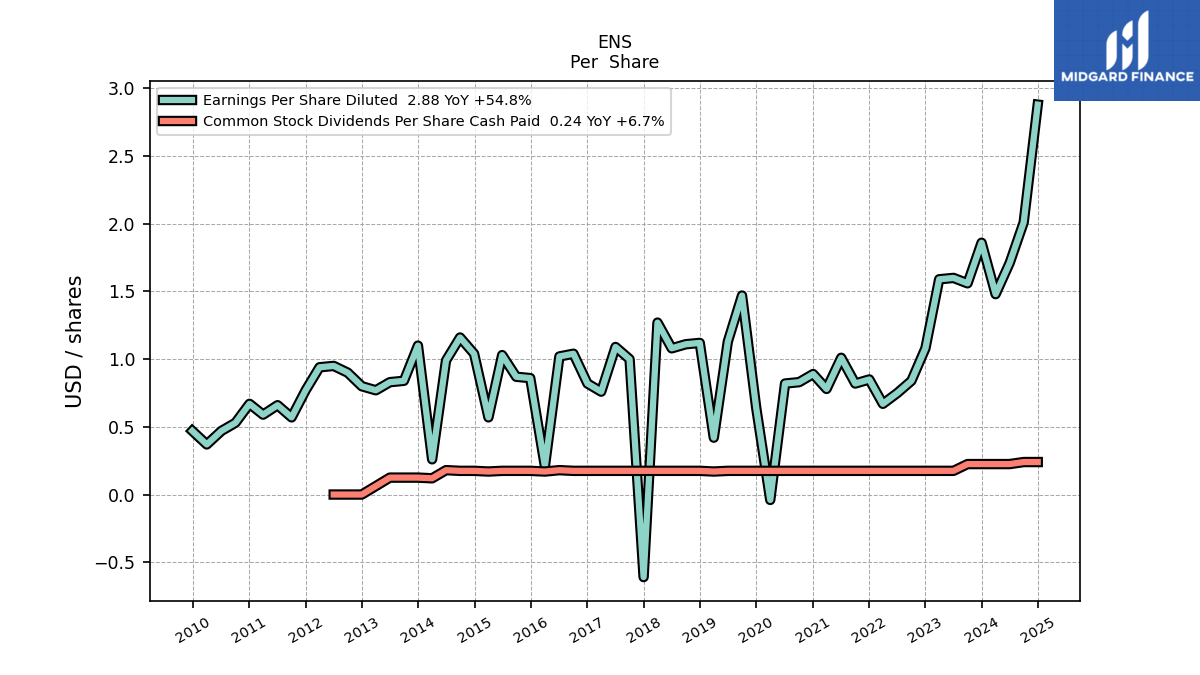
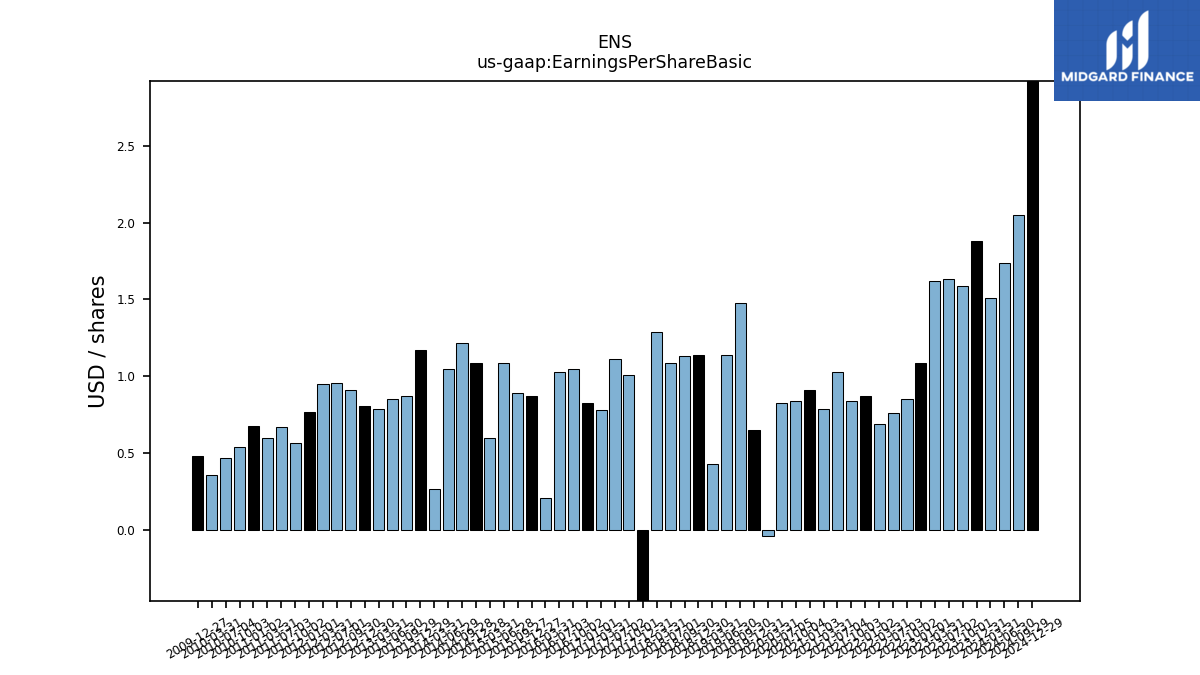
| Earnings Per Share Basic | 1.88 | 1.59 | 1.63 | 1.62 | 1.09 | 0.85 | 0.76 | 0.69 | 0.87 | 0.84 | 1.03 | 0.79 | 0.91 | 0.84 | 0.83 | -0.04 | 0.65 | 1.48 | 1.14 | 0.43 | 1.14 | 1.13 | 1.09 | 1.29 | -0.61 | 1.01 | 1.11 | 0.78 | 0.83 | 1.05 | 1.03 | 0.21 | 0.87 | 0.89 | 1.09 | 0.60 | 1.09 | 1.22 | 1.05 | 0.27 | 1.17 | 0.87 | 0.85 | 0.79 | 0.81 | 0.91 | 0.96 | 0.95 | 0.77 | 0.57 | 0.67 | 0.60 | 0.68 | 0.54 | 0.47 | 0.36 | 0.48 | |
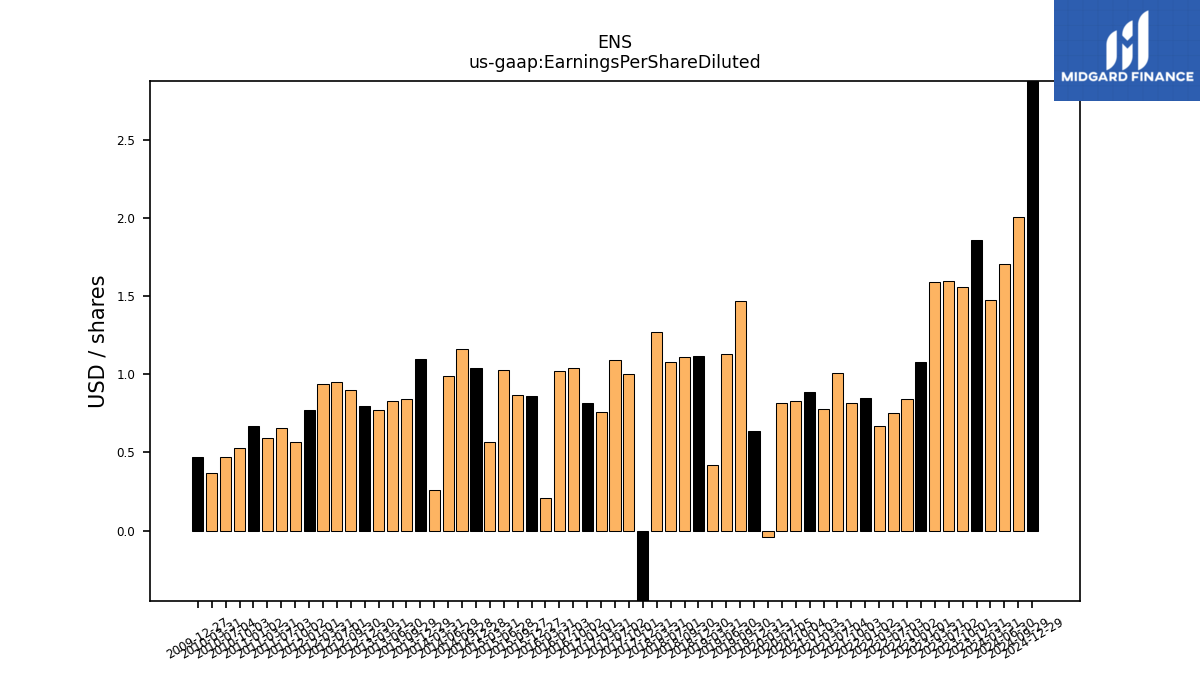
| Earnings Per Share Diluted | 1.86 | 1.56 | 1.60 | 1.59 | 1.08 | 0.84 | 0.75 | 0.67 | 0.85 | 0.82 | 1.01 | 0.78 | 0.89 | 0.83 | 0.82 | -0.04 | 0.64 | 1.47 | 1.13 | 0.42 | 1.12 | 1.11 | 1.08 | 1.27 | -0.61 | 1.00 | 1.09 | 0.76 | 0.82 | 1.04 | 1.02 | 0.21 | 0.86 | 0.87 | 1.03 | 0.57 | 1.04 | 1.16 | 0.99 | 0.26 | 1.10 | 0.84 | 0.83 | 0.77 | 0.80 | 0.90 | 0.95 | 0.94 | 0.77 | 0.57 | 0.66 | 0.59 | 0.67 | 0.53 | 0.47 | 0.37 | 0.47 |
| 2023-12-31 | 2023-10-01 | 2023-07-02 | 2023-03-31 | 2023-01-01 | 2022-10-02 | 2022-07-03 | 2022-03-31 | 2022-01-02 | 2021-10-03 | 2021-07-04 | 2021-03-31 | 2021-01-03 | 2020-10-04 | 2020-07-05 | 2020-03-31 | 2019-12-31 | 2019-09-30 | 2019-06-30 | 2019-03-31 | 2018-12-30 | 2018-09-30 | 2018-07-01 | 2018-03-31 | 2017-12-31 | 2017-10-01 | 2017-07-02 | 2017-03-31 | 2017-01-01 | 2016-10-02 | 2016-07-03 | 2016-03-31 | 2015-12-27 | 2015-09-27 | 2015-06-28 | 2015-03-31 | 2014-12-28 | 2014-09-28 | 2014-06-29 | 2014-03-31 | 2013-12-29 | 2013-09-29 | 2013-06-30 | 2013-03-31 | 2012-12-30 | 2012-09-30 | 2012-07-01 | 2012-03-31 | 2012-01-01 | 2011-10-02 | 2011-07-03 | 2011-03-31 | 2011-01-02 | 2010-10-03 | 2010-07-04 | 2010-03-31 | 2009-12-27 | ||
|---|---|---|---|---|---|---|---|---|---|---|---|---|---|---|---|---|---|---|---|---|---|---|---|---|---|---|---|---|---|---|---|---|---|---|---|---|---|---|---|---|---|---|---|---|---|---|---|---|---|---|---|---|---|---|---|---|---|---|
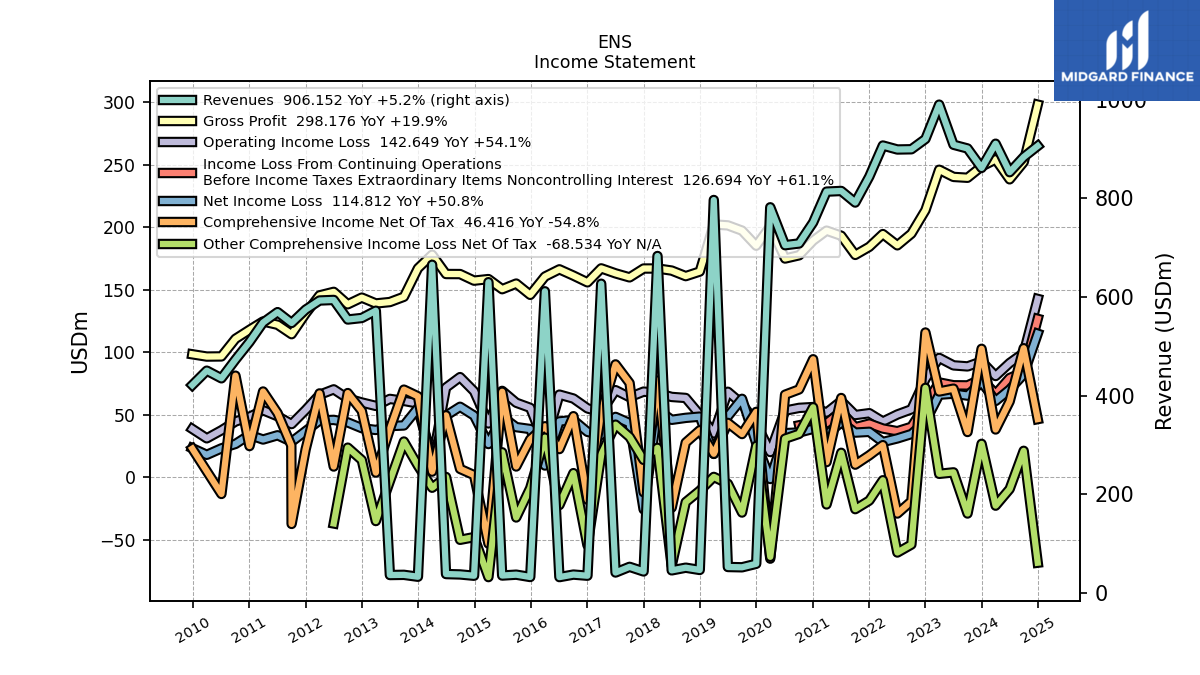
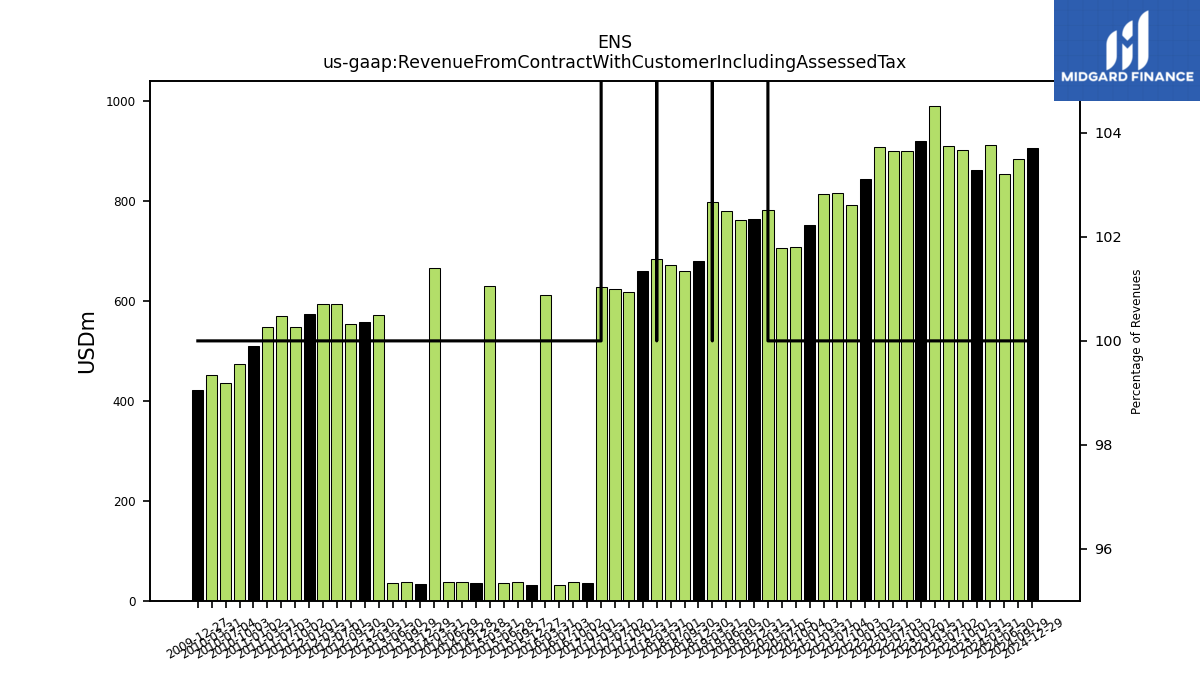
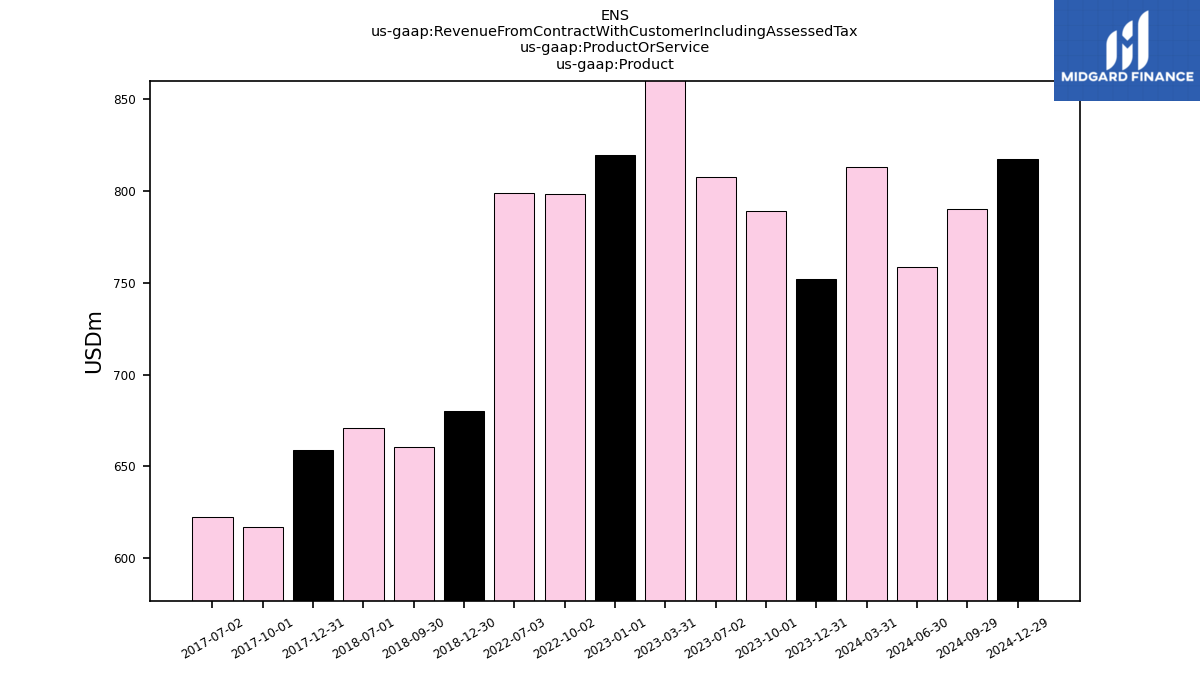
| Revenue From Contract With Customer Including Assessed Tax | 861.55 | 901.03 | 908.57 | 989.94 | 920.23 | 899.44 | 898.97 | 907.02 | 844.01 | 791.39 | 814.89 | 813.54 | 751.07 | 708.40 | 704.92 | 781.80 | 763.70 | 762.14 | 780.23 | 796.60 | 680.02 | 660.46 | 670.93 | 683.04 | 658.93 | 617.29 | 622.62 | 626.80 | 34.69 | 37.01 | 31.86 | 611.47 | 32.08 | 36.84 | 35.06 | 629.90 | 34.65 | 37.29 | 38.08 | 665.26 | 32.62 | 36.50 | 36.10 | 572.12 | 557.32 | 554.21 | 593.91 | 592.75 | 574.25 | 547.14 | 569.23 | 548.05 | 508.60 | 472.84 | 434.97 | 450.54 | 421.26 | |
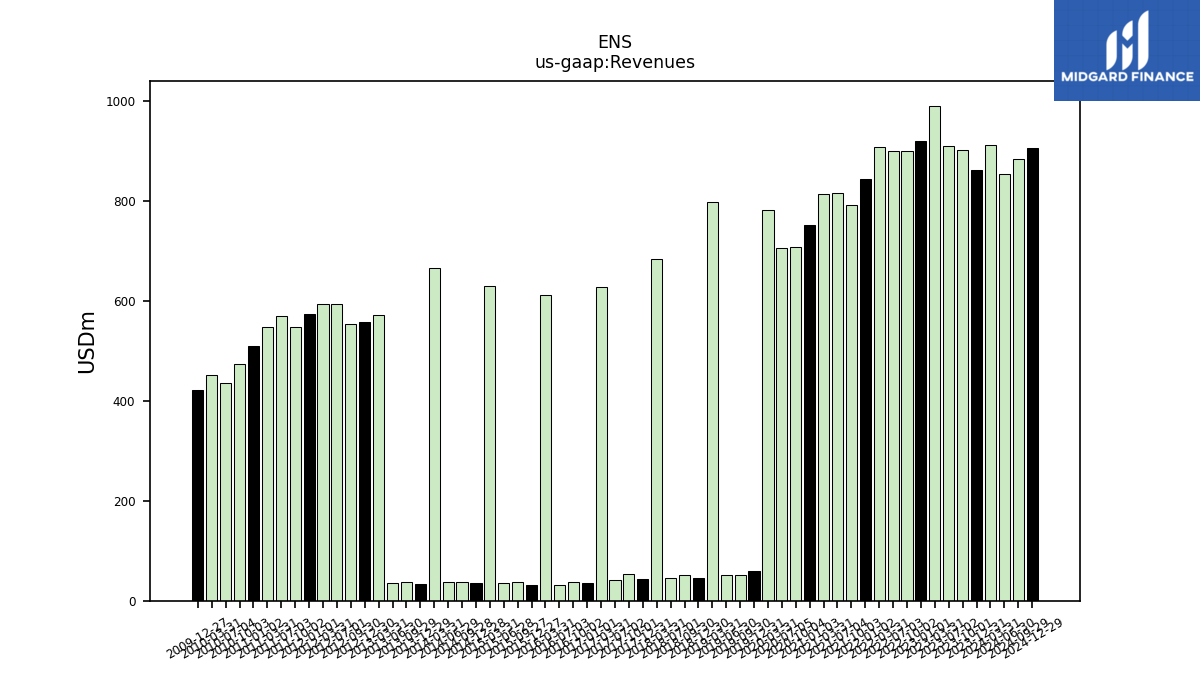
| Revenues | 861.55 | 901.03 | 908.57 | 989.94 | 920.23 | 899.44 | 898.97 | 907.02 | 844.01 | 791.39 | 814.89 | 813.54 | 751.07 | 708.40 | 704.92 | 781.80 | 58.83 | 51.79 | 52.40 | 796.60 | 46.38 | 50.98 | 45.56 | 683.04 | 43.35 | 52.72 | 41.19 | 626.80 | 34.69 | 37.01 | 31.86 | 611.47 | 32.08 | 36.84 | 35.06 | 629.90 | 34.65 | 37.29 | 38.08 | 665.26 | 32.62 | 36.50 | 36.10 | 572.12 | 557.32 | 554.21 | 593.91 | 592.75 | 574.25 | 547.14 | 569.23 | 548.05 | 508.60 | 472.84 | 434.97 | 450.54 | 421.26 | |
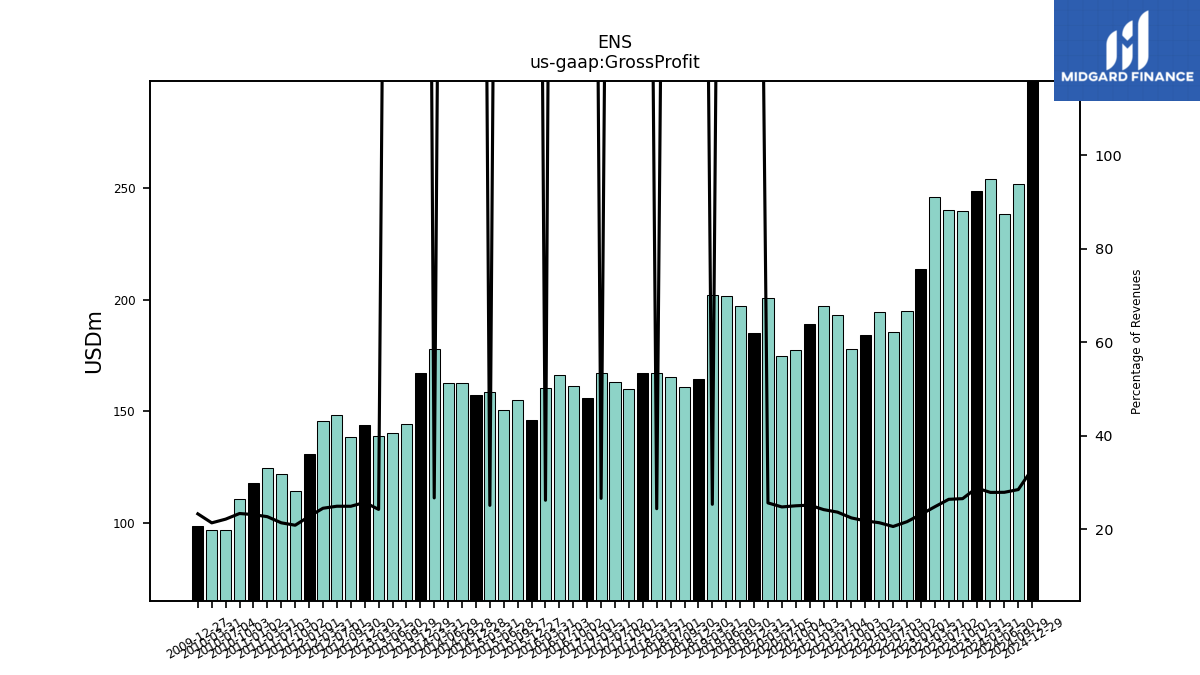
| Gross Profit | 248.65 | 239.62 | 240.31 | 246.06 | 213.65 | 194.89 | 185.53 | 194.55 | 184.34 | 177.86 | 193.22 | 197.30 | 189.31 | 177.56 | 174.98 | 200.80 | 185.24 | 197.32 | 201.51 | 202.27 | 164.55 | 160.88 | 165.33 | 167.00 | 166.97 | 159.87 | 163.10 | 167.11 | 155.88 | 161.29 | 166.33 | 160.54 | 145.88 | 154.94 | 150.41 | 158.53 | 157.26 | 162.54 | 162.58 | 178.01 | 167.12 | 144.35 | 140.14 | 139.01 | 143.70 | 138.34 | 148.31 | 145.46 | 130.88 | 114.39 | 121.97 | 124.61 | 117.90 | 110.72 | 96.61 | 96.50 | 98.33 | |
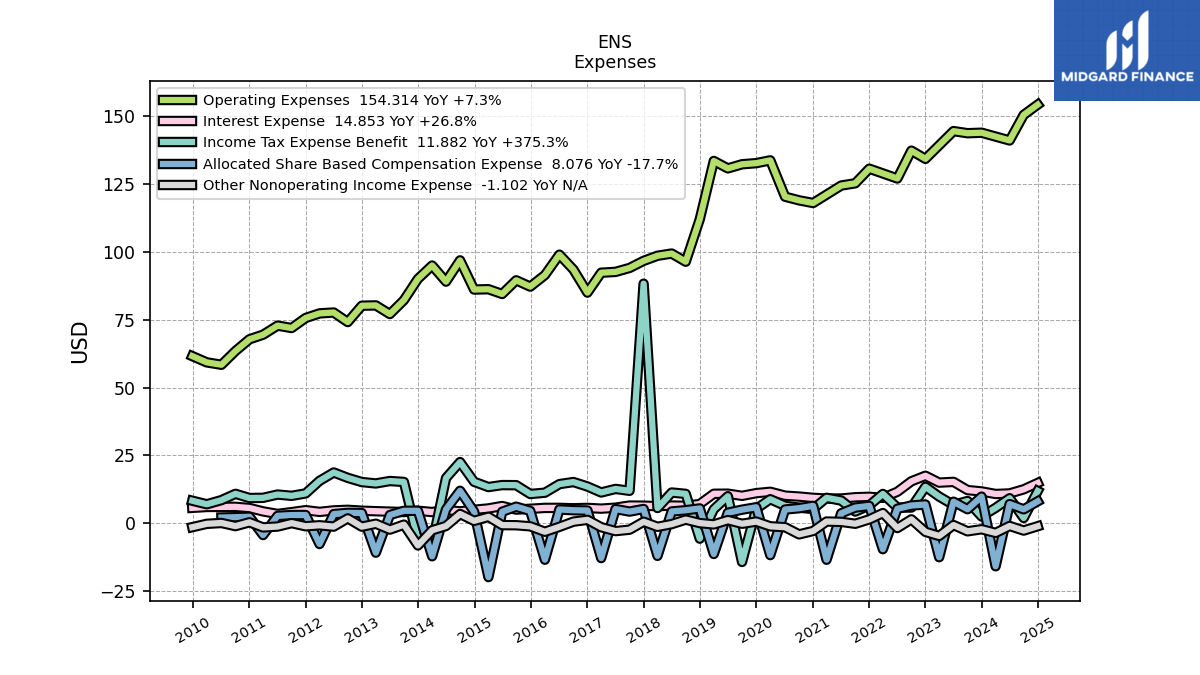
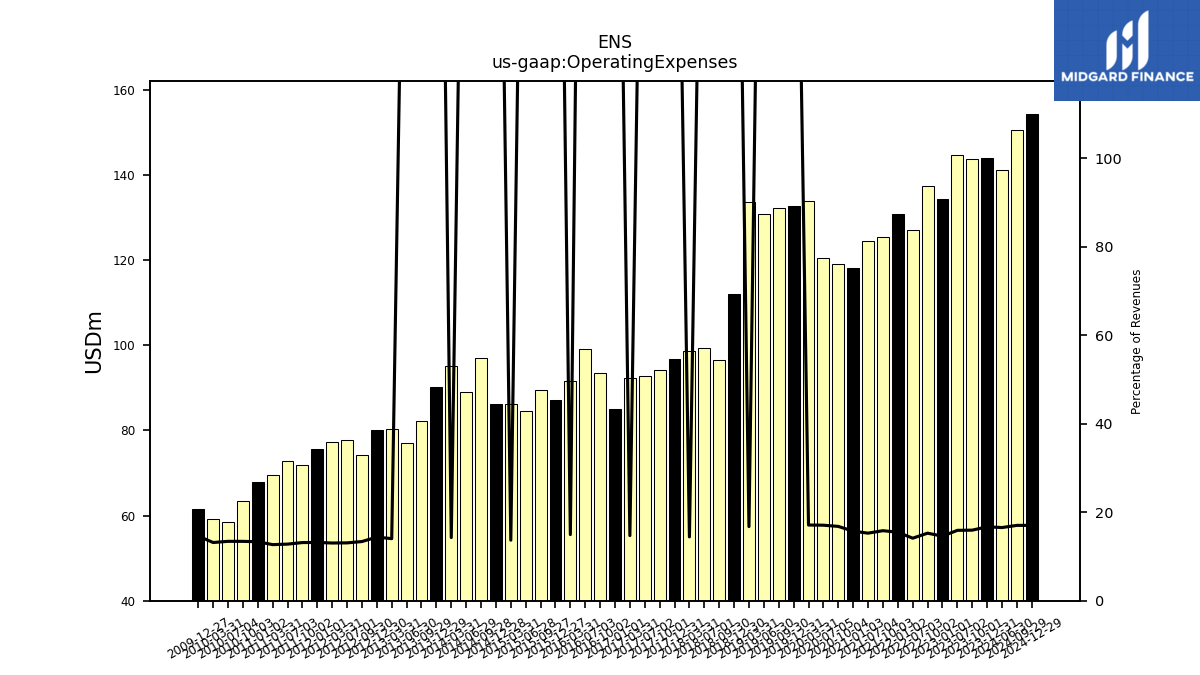
| Operating Expenses | 143.96 | 143.77 | 144.55 | NA | 134.32 | 137.36 | 127.08 | NA | 130.70 | 125.31 | 124.49 | NA | 118.05 | 119.03 | 120.37 | 133.77 | 132.74 | 132.32 | 130.80 | 133.55 | 112.05 | 96.40 | 99.42 | 98.60 | 96.72 | 94.11 | 92.65 | 92.35 | 85.01 | 93.49 | 99.00 | 91.48 | 87.22 | 89.56 | 84.51 | 86.27 | 86.14 | 96.91 | 89.06 | 95.00 | 90.08 | 82.23 | 77.11 | 80.30 | 80.19 | 74.16 | 77.68 | 77.35 | 75.66 | 71.95 | 72.85 | 69.50 | 67.83 | 63.48 | 58.41 | 59.30 | 61.61 | |
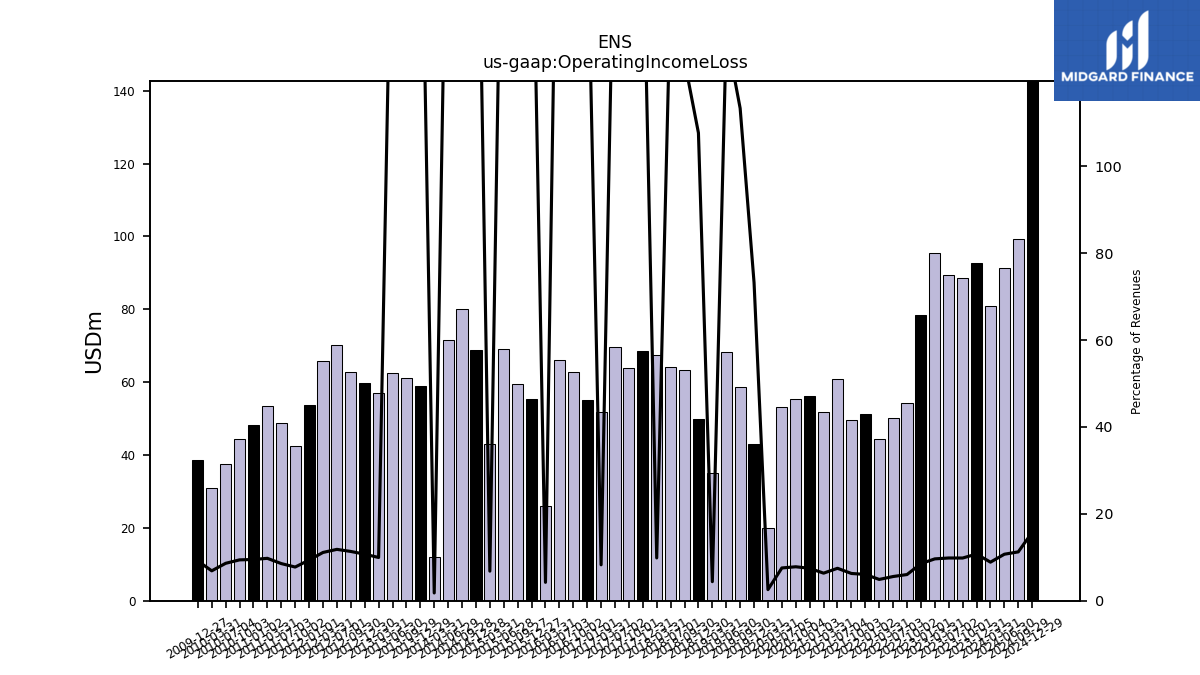
| Operating Income Loss | 92.60 | 88.61 | 89.44 | 95.43 | 78.53 | 54.27 | 50.13 | 44.49 | 51.16 | 49.69 | 60.90 | 51.67 | 56.07 | 55.41 | 53.22 | 20.07 | 43.08 | 58.71 | 68.34 | 34.98 | 49.95 | 63.36 | 64.18 | 67.34 | 68.44 | 63.99 | 69.61 | 51.90 | 55.02 | 62.91 | 66.03 | 25.95 | 55.46 | 59.55 | 69.04 | 42.96 | 68.68 | 80.05 | 71.69 | 11.96 | 58.94 | 61.01 | 62.61 | 56.99 | 59.74 | 62.88 | 70.25 | 65.88 | 53.78 | 42.44 | 48.72 | 53.52 | 48.32 | 44.50 | 37.48 | 31.04 | 38.58 | |
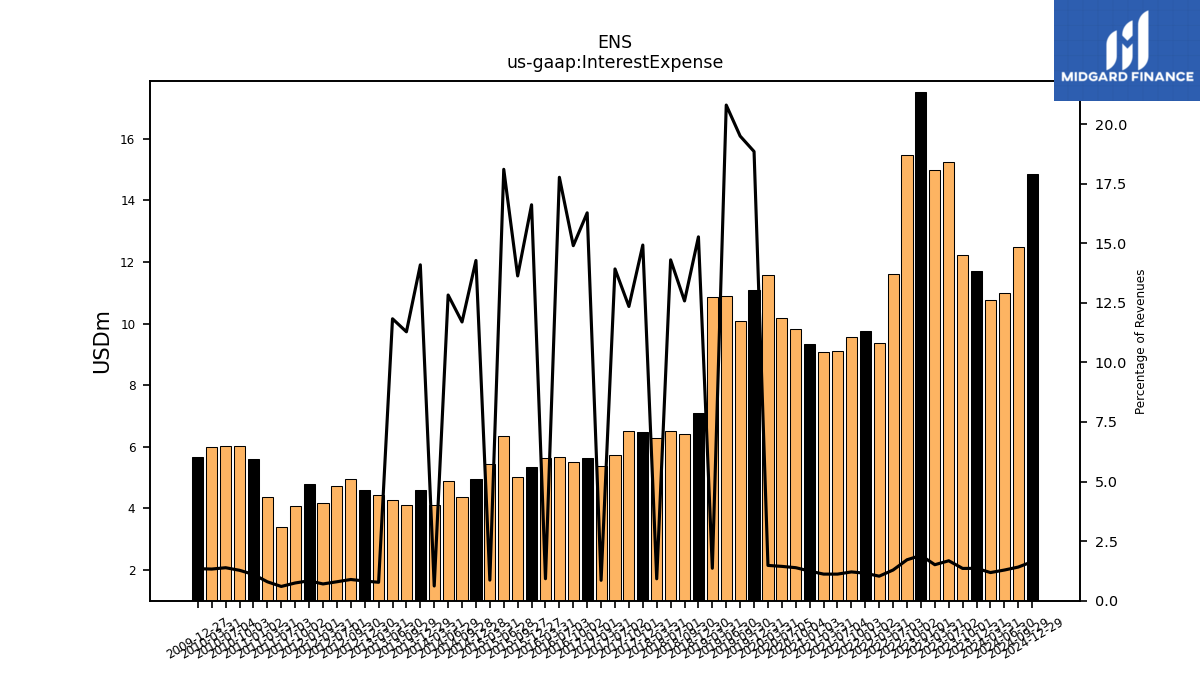
| Interest Expense | 11.72 | 12.22 | 15.24 | 14.97 | 17.50 | 15.46 | 11.60 | 9.35 | 9.74 | 9.57 | 9.11 | 9.09 | 9.35 | 9.83 | 10.16 | 11.59 | 11.09 | 10.10 | 10.90 | 10.86 | 7.08 | 6.41 | 6.52 | 6.29 | 6.47 | 6.51 | 5.73 | 5.38 | 5.65 | 5.51 | 5.66 | 5.65 | 5.33 | 5.02 | 6.35 | 5.45 | 4.95 | 4.36 | 4.88 | 4.12 | 4.60 | 4.12 | 4.27 | 4.43 | 4.61 | 4.94 | 4.73 | 4.18 | 4.81 | 4.08 | 3.41 | 4.36 | 5.61 | 6.04 | 6.03 | 5.99 | 5.67 | |
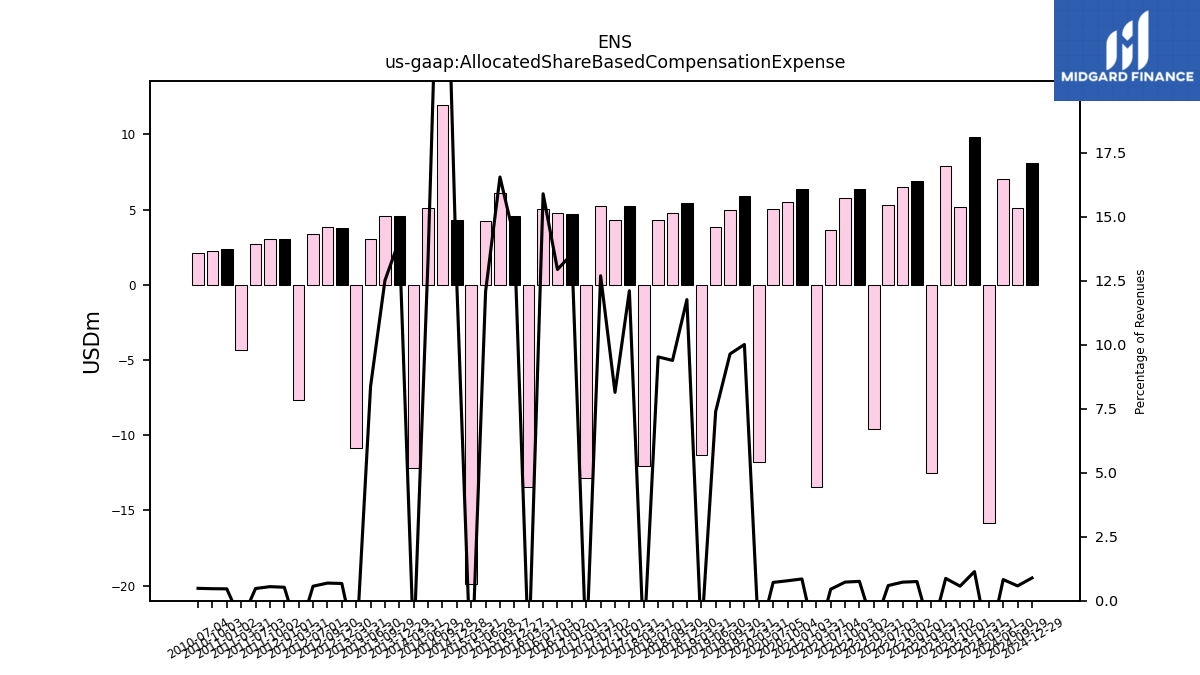
| Allocated Share Based Compensation Expense | 9.82 | 5.14 | 7.93 | -12.54 | 6.91 | 6.53 | 5.33 | -9.58 | 6.39 | 5.76 | 3.66 | -13.47 | 6.40 | 5.53 | 5.05 | -11.76 | 5.89 | 4.99 | 3.87 | -11.34 | 5.46 | 4.79 | 4.34 | -12.03 | 5.25 | 4.29 | 5.23 | -12.85 | 4.70 | 4.79 | 5.07 | -13.46 | 4.54 | 6.10 | 4.24 | -19.87 | 4.28 | 11.96 | 5.10 | -12.19 | 4.59 | 4.57 | 3.02 | -10.86 | 3.76 | 3.83 | 3.37 | -7.67 | 3.03 | 3.02 | 2.72 | -4.36 | 2.37 | 2.23 | 2.11 | NA | NA | |
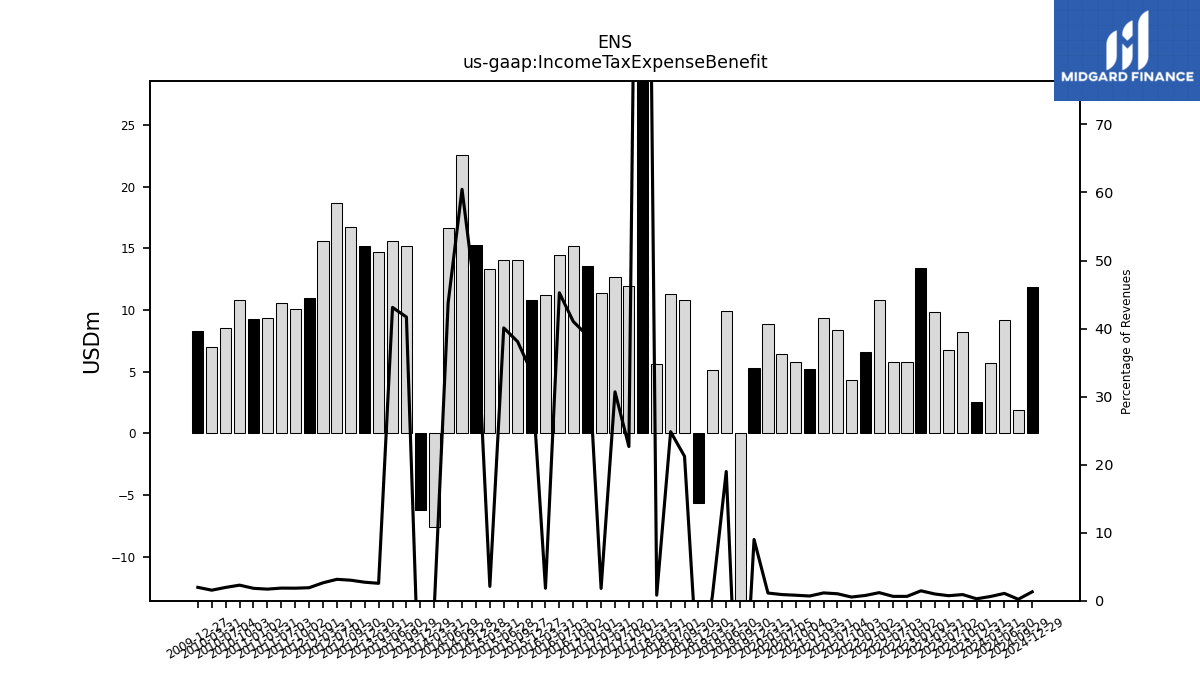
| Income Tax Expense Benefit | 2.50 | 8.19 | 6.74 | 9.83 | 13.44 | 5.78 | 5.78 | 10.80 | 6.57 | 4.30 | 8.36 | 9.37 | 5.24 | 5.75 | 6.41 | 8.86 | 5.30 | -14.28 | 9.95 | 5.14 | -5.69 | 10.82 | 11.31 | 5.59 | 88.31 | 11.95 | 12.64 | 11.34 | 13.53 | 15.19 | 14.42 | 11.25 | 10.78 | 14.02 | 14.06 | 13.33 | 15.27 | 22.55 | 16.66 | -7.56 | -6.24 | 15.22 | 15.56 | 14.66 | 15.18 | 16.73 | 18.71 | 15.62 | 10.99 | 10.10 | 10.58 | 9.37 | 9.29 | 10.84 | 8.52 | 6.99 | 8.30 | |
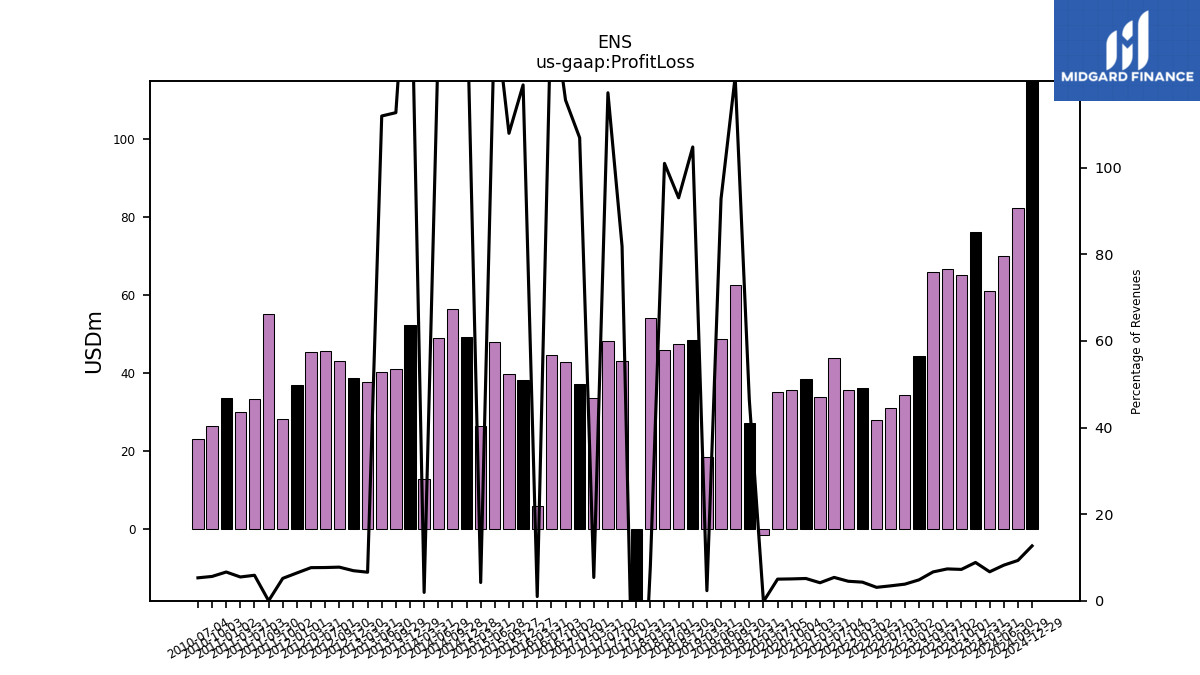
| Profit Loss | 76.16 | 65.23 | 66.80 | 65.95 | 44.41 | 34.47 | 30.98 | 28.09 | 36.26 | 35.63 | 43.93 | 33.84 | 38.62 | 35.73 | 35.18 | -1.52 | 27.30 | 62.70 | 48.64 | 18.55 | 48.61 | 47.45 | 46.02 | 54.14 | -25.78 | 43.15 | 48.32 | 33.72 | 37.09 | 42.79 | 44.62 | 5.91 | 38.21 | 39.77 | 47.93 | 26.53 | 49.33 | 56.55 | 49.12 | 12.81 | 52.39 | 41.15 | 40.42 | 37.71 | 38.68 | 43.01 | 45.56 | 45.32 | 36.86 | 28.29 | 33.50 | 30.09 | 33.76 | 26.55 | 23.03 | NA | NA | |
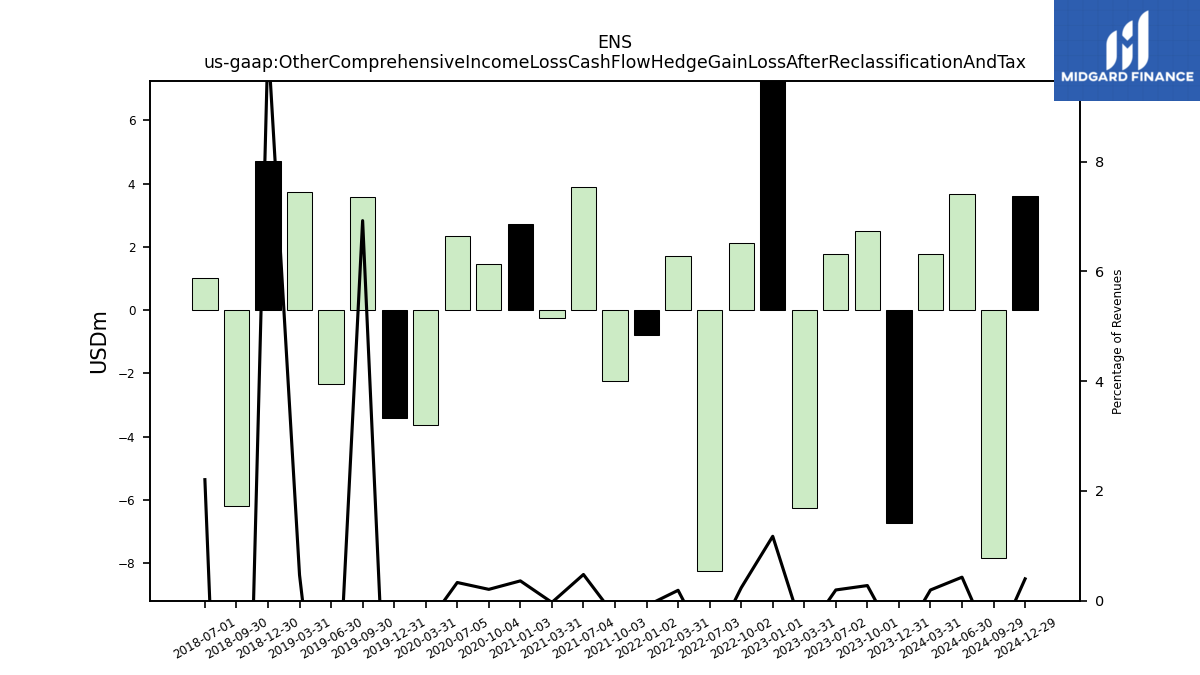
| Other Comprehensive Income Loss Cash Flow Hedge Gain Loss After Reclassification And Tax | -6.72 | 2.50 | 1.79 | -6.24 | 10.81 | 2.12 | -8.23 | 1.73 | -0.79 | -2.23 | 3.90 | -0.25 | 2.72 | 1.47 | 2.34 | -3.64 | -3.41 | 3.59 | -2.33 | 3.74 | 4.73 | -6.18 | 1.00 | NA | NA | NA | NA | NA | NA | NA | NA | NA | NA | NA | NA | NA | NA | NA | NA | NA | NA | NA | NA | NA | NA | NA | NA | NA | NA | NA | NA | NA | NA | NA | NA | NA | NA | |
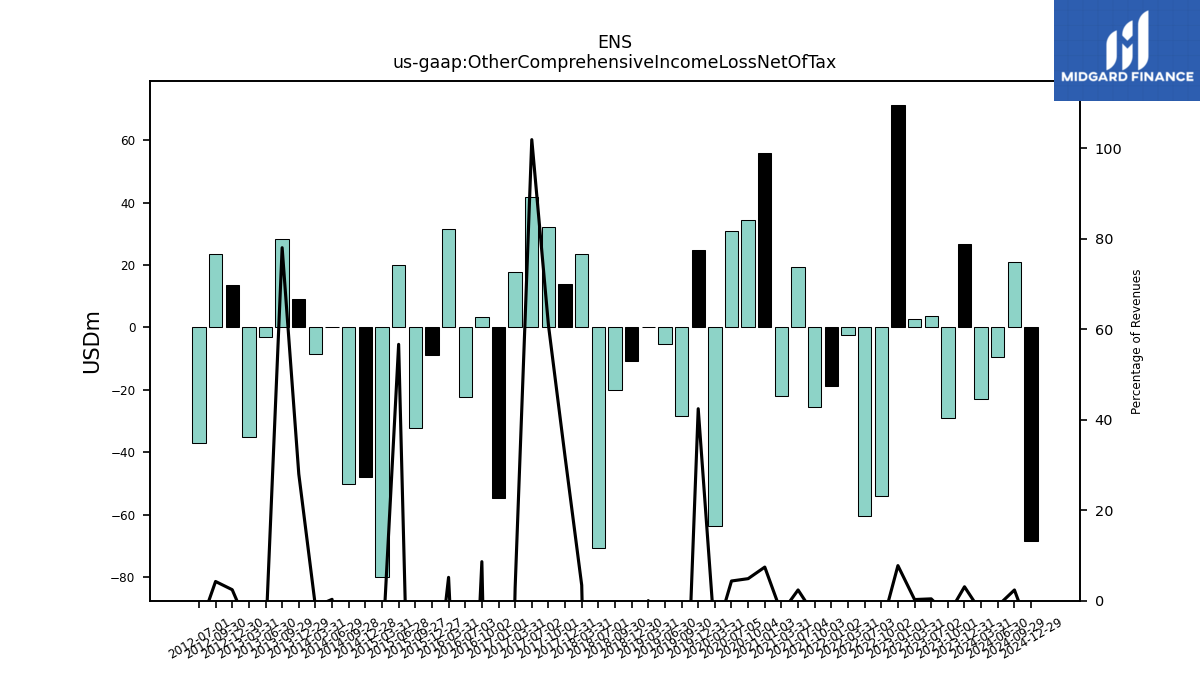
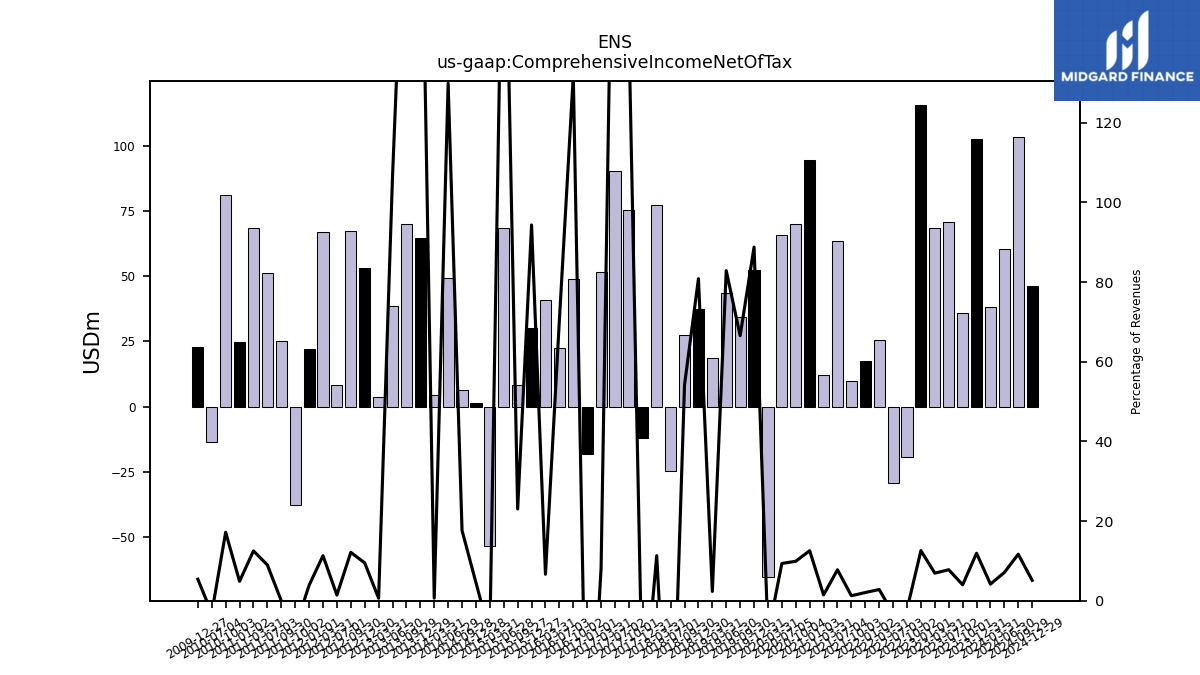
| Other Comprehensive Income Loss Net Of Tax | 26.66 | -29.15 | 3.81 | 2.61 | 71.45 | -53.98 | -60.37 | -2.50 | -18.78 | -25.66 | 19.46 | -21.87 | 55.89 | 34.61 | 30.78 | -63.82 | 24.98 | -28.38 | -5.30 | 0.18 | -10.84 | -20.03 | -70.86 | 23.46 | 13.80 | 32.14 | 41.99 | 17.93 | -54.57 | 3.20 | -22.39 | 31.62 | -8.79 | -32.33 | 19.88 | -80.06 | -48.04 | -50.20 | 0.12 | -8.53 | 9.14 | 28.49 | -3.22 | -35.19 | 13.61 | 23.60 | -37.11 | NA | NA | NA | NA | NA | NA | NA | NA | NA | NA | |
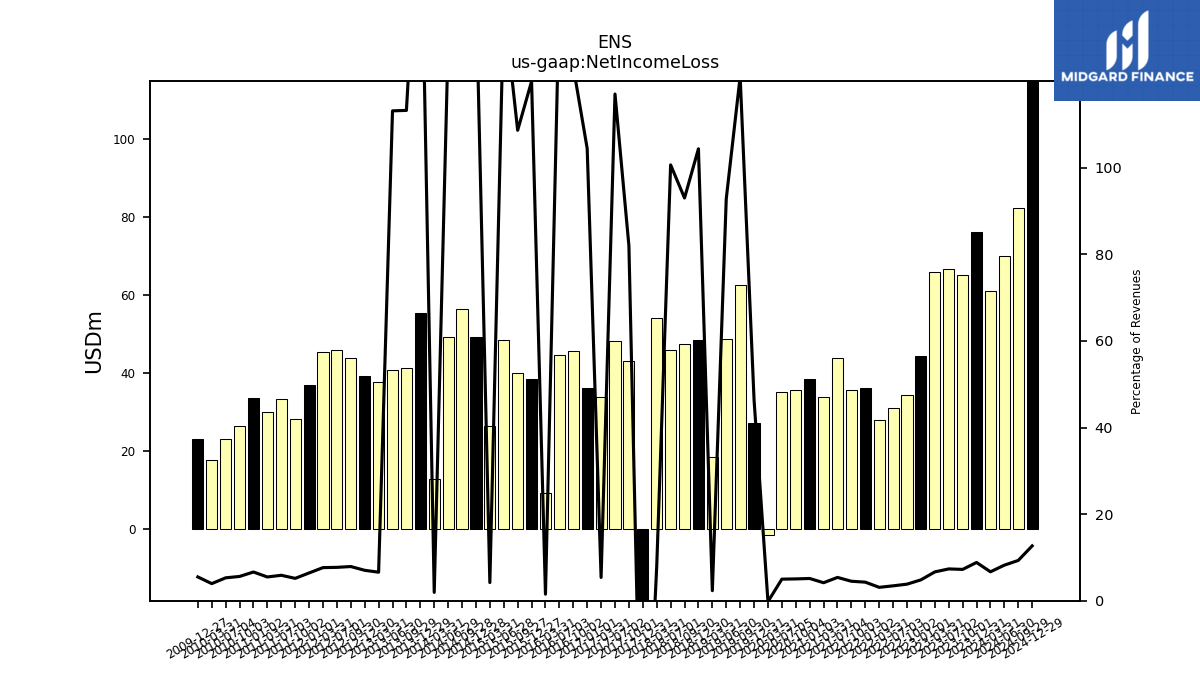
| Net Income Loss | 76.16 | 65.23 | 66.80 | 65.95 | 44.41 | 34.47 | 30.98 | 28.09 | 36.26 | 35.63 | 43.93 | 33.84 | 38.62 | 35.73 | 35.18 | -1.52 | 27.30 | 62.70 | 48.64 | 18.54 | 48.42 | 47.42 | 45.86 | 54.02 | -25.85 | 43.22 | 48.20 | 33.77 | 36.23 | 45.64 | 44.57 | 9.26 | 38.48 | 40.02 | 48.39 | 26.45 | 49.25 | 56.32 | 49.17 | 12.84 | 55.30 | 41.34 | 40.85 | 37.73 | 39.18 | 43.79 | 45.80 | 45.36 | 36.86 | 28.29 | 33.50 | 30.09 | 33.76 | 26.55 | 23.03 | 17.83 | 23.16 | |
| Comprehensive Income Net Of Tax | 102.72 | 36.10 | 70.80 | 68.54 | 115.76 | -19.29 | -29.18 | 25.58 | 17.42 | 9.95 | 63.34 | 11.98 | 94.36 | 70.19 | 65.96 | -65.30 | 52.22 | 34.45 | 43.42 | 18.66 | 37.49 | 27.62 | -24.50 | 77.32 | -12.14 | 75.30 | 90.23 | 51.65 | -18.13 | 48.77 | 22.44 | 40.70 | 30.25 | 8.48 | 68.34 | -53.24 | 1.58 | 6.58 | 49.45 | 4.36 | 64.69 | 70.04 | 38.43 | 3.59 | 52.97 | 67.29 | 8.46 | 67.01 | 22.22 | -37.50 | 51.19 | 68.54 | 24.82 | 81.21 | -13.51 | NA | 22.77 |
| 2023-12-31 | 2023-10-01 | 2023-07-02 | 2023-03-31 | 2023-01-01 | 2022-10-02 | 2022-07-03 | 2022-03-31 | 2022-01-02 | 2021-10-03 | 2021-07-04 | 2021-03-31 | 2021-01-03 | 2020-10-04 | 2020-07-05 | 2020-03-31 | 2019-12-31 | 2019-09-30 | 2019-06-30 | 2019-03-31 | 2018-12-30 | 2018-09-30 | 2018-07-01 | 2018-03-31 | 2017-12-31 | 2017-10-01 | 2017-07-02 | 2017-03-31 | 2017-01-01 | 2016-10-02 | 2016-07-03 | 2016-03-31 | 2015-12-27 | 2015-09-27 | 2015-06-28 | 2015-03-31 | 2014-12-28 | 2014-09-28 | 2014-06-29 | 2014-03-31 | 2013-12-29 | 2013-09-29 | 2013-06-30 | 2013-03-31 | 2012-12-30 | 2012-09-30 | 2012-07-01 | 2012-03-31 | 2012-01-01 | 2011-10-02 | 2011-07-03 | 2011-03-31 | 2011-01-02 | 2010-10-03 | 2010-07-04 | 2010-03-31 | 2009-12-27 | ||
|---|---|---|---|---|---|---|---|---|---|---|---|---|---|---|---|---|---|---|---|---|---|---|---|---|---|---|---|---|---|---|---|---|---|---|---|---|---|---|---|---|---|---|---|---|---|---|---|---|---|---|---|---|---|---|---|---|---|---|
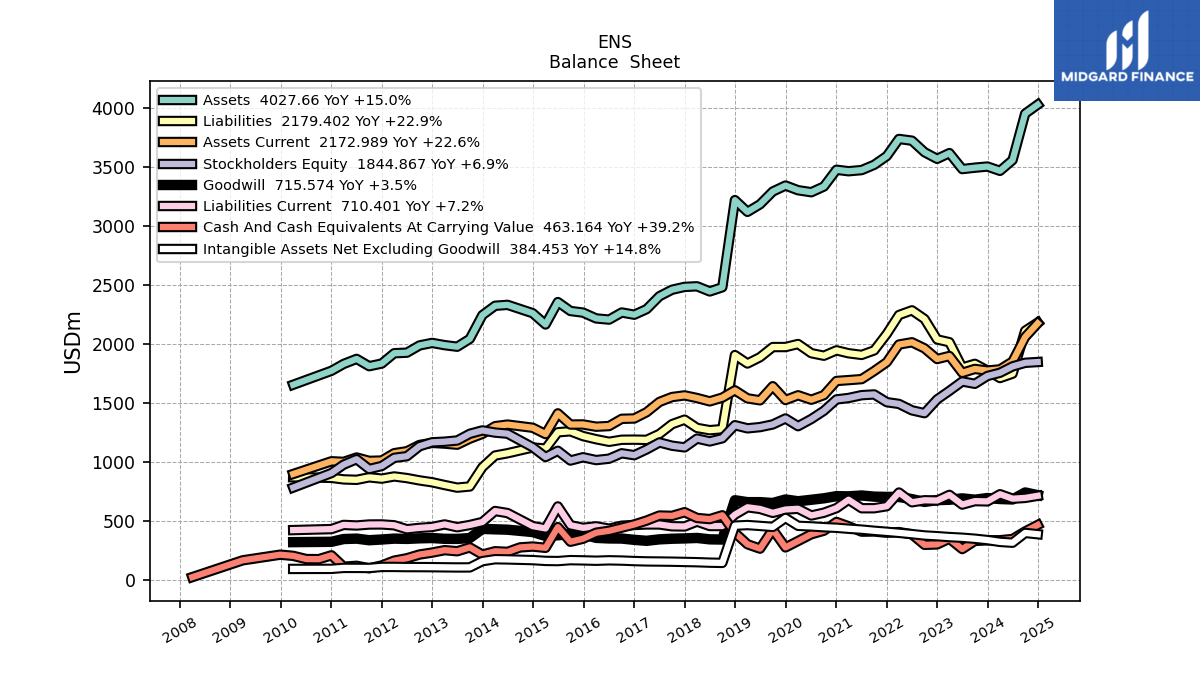
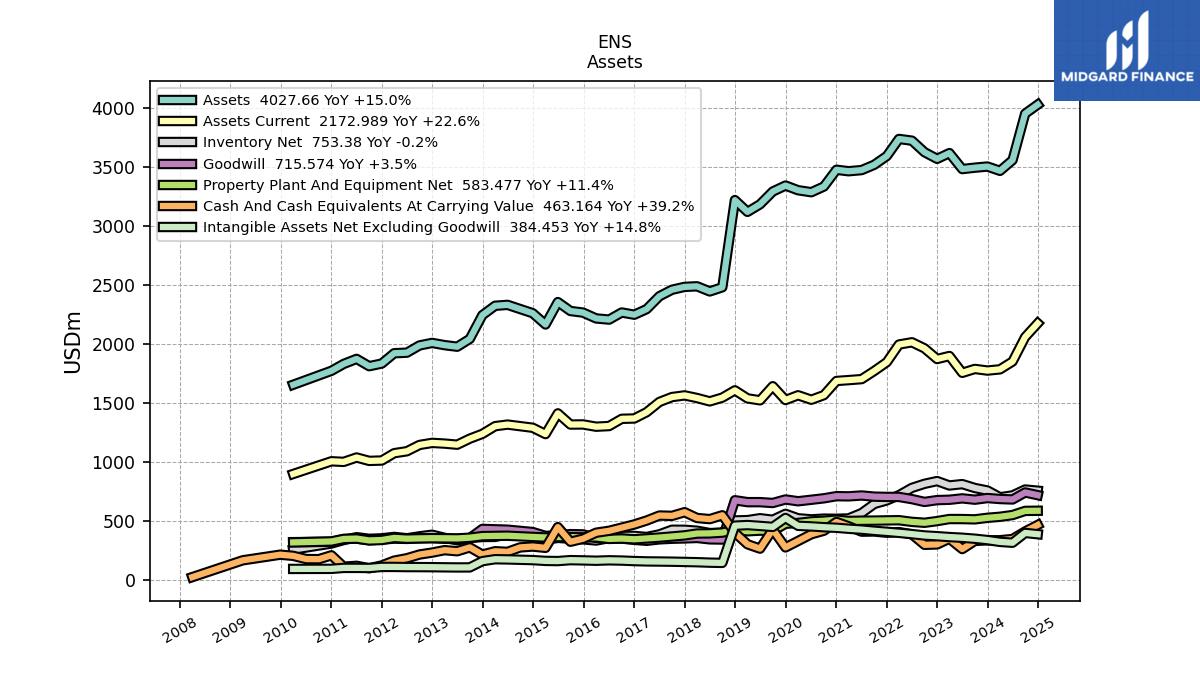
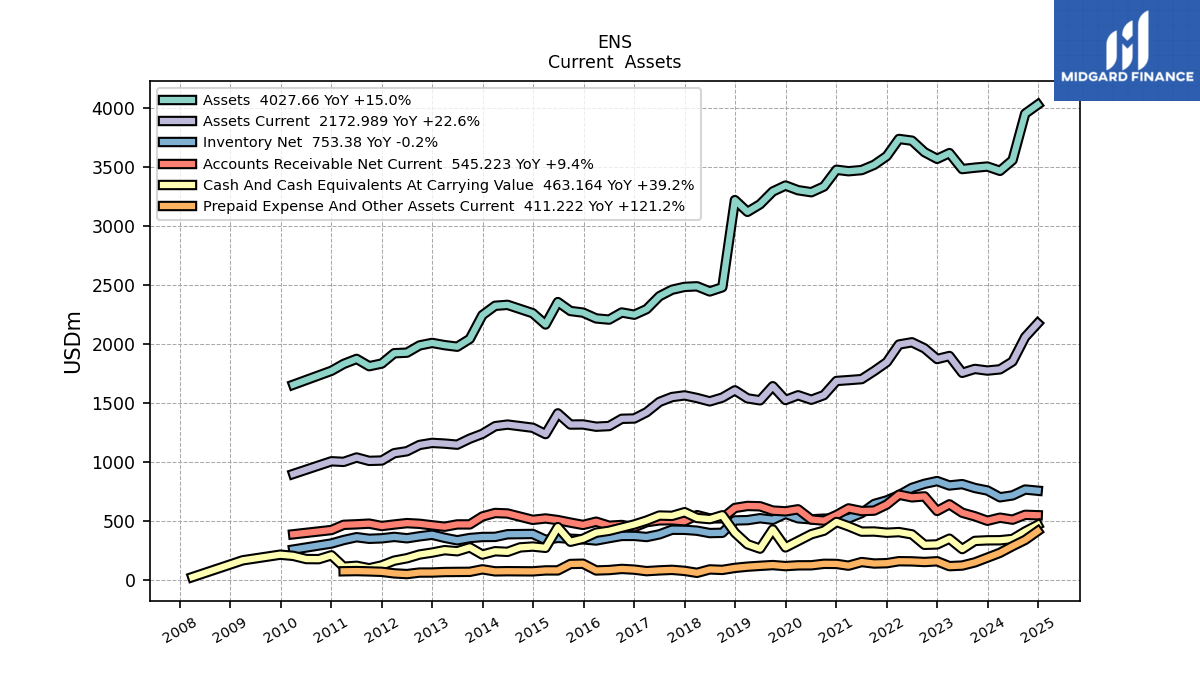
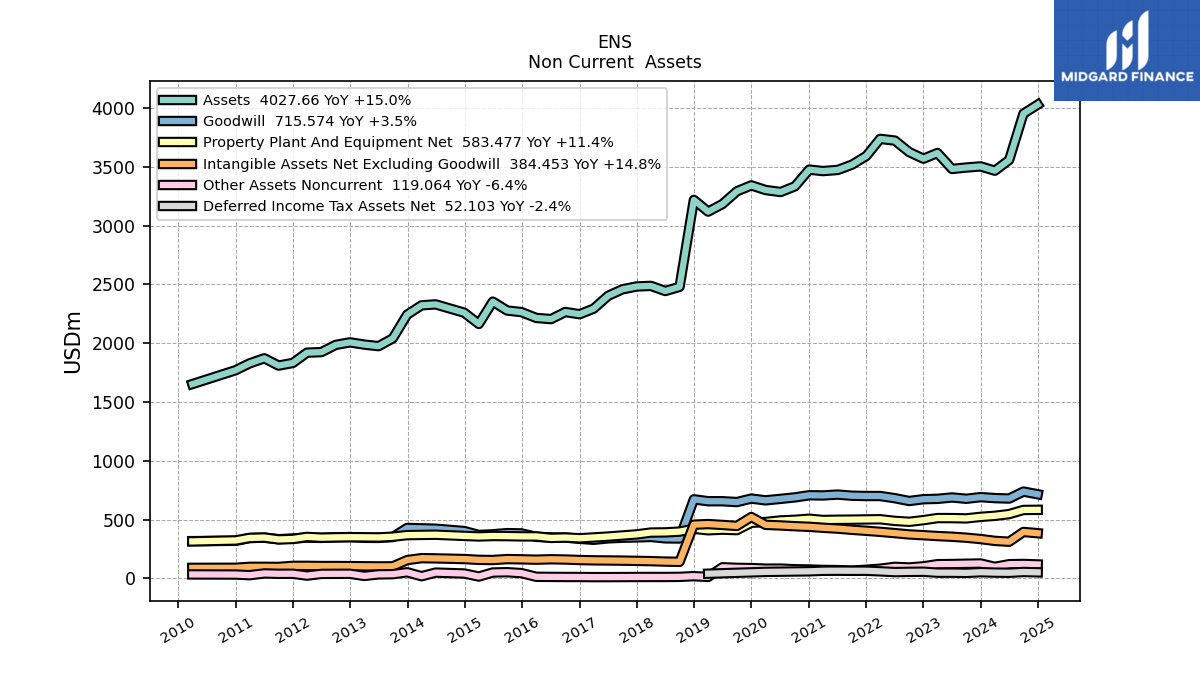
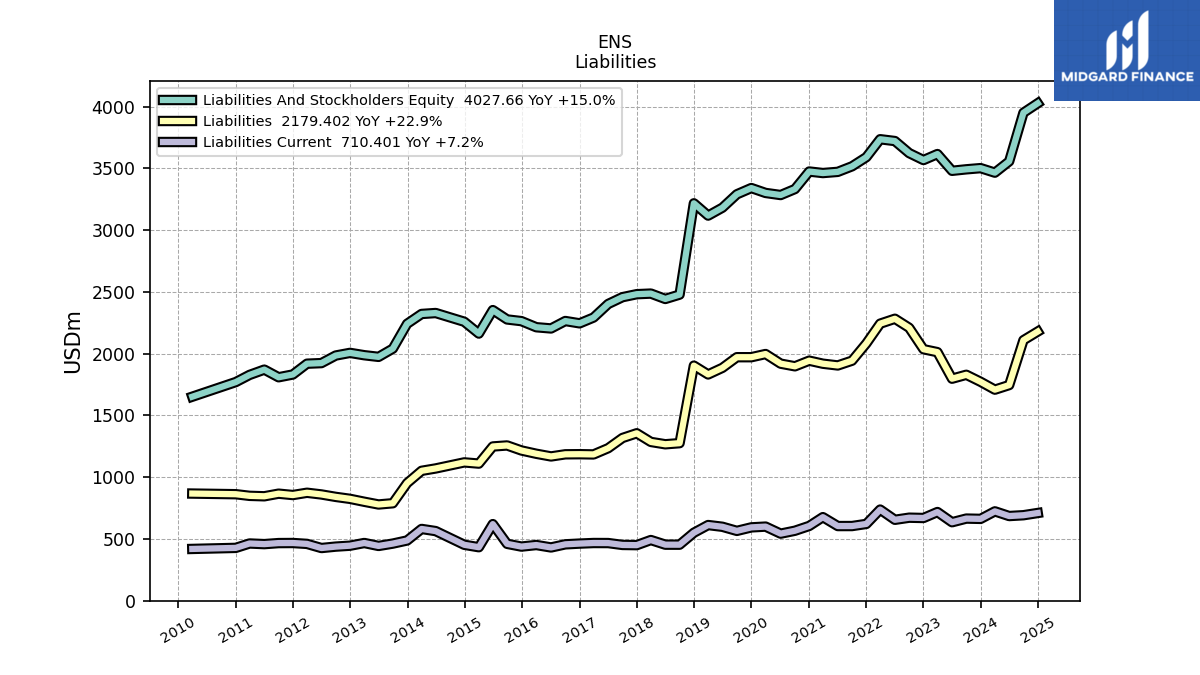
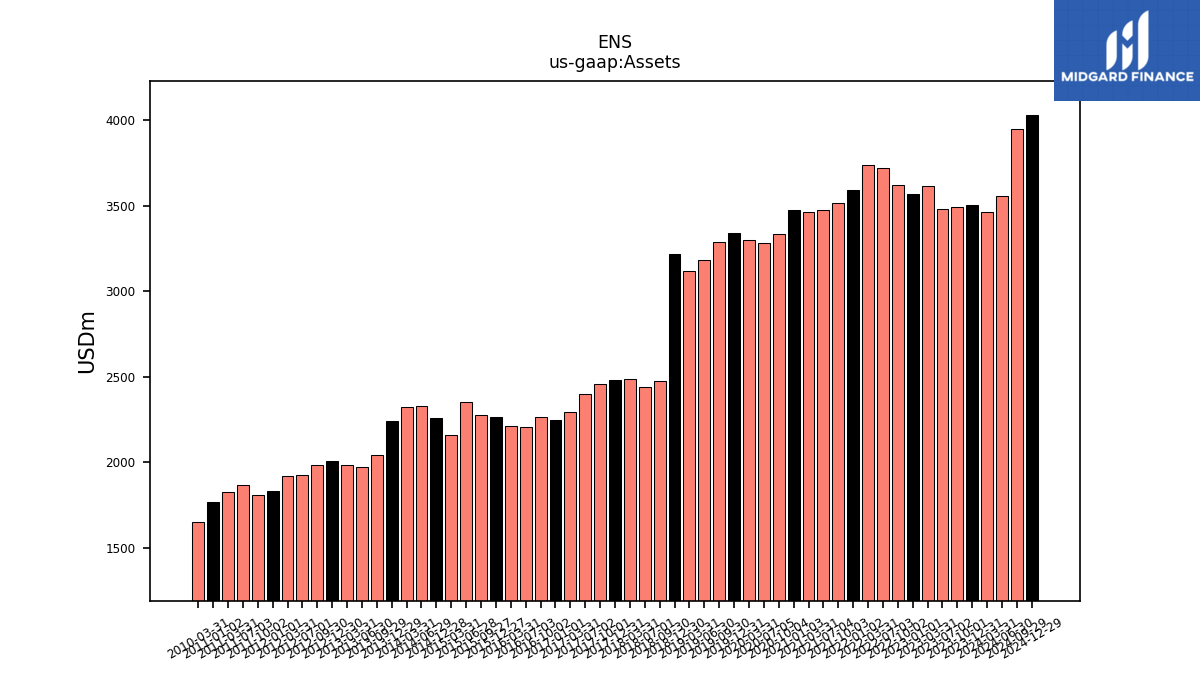
| Assets | 3502.64 | 3492.99 | 3480.98 | 3616.67 | 3567.87 | 3624.16 | 3721.91 | 3736.65 | 3591.40 | 3517.45 | 3472.45 | 3462.80 | 3475.23 | 3333.22 | 3284.74 | 3301.70 | 3341.43 | 3290.81 | 3182.42 | 3118.19 | 3217.94 | 2478.58 | 2443.30 | 2486.93 | 2482.00 | 2457.81 | 2402.85 | 2293.03 | 2246.01 | 2264.84 | 2204.57 | 2214.49 | 2263.98 | 2277.51 | 2353.29 | 2163.05 | 2259.00 | NA | 2329.57 | 2321.86 | 2242.34 | 2041.07 | 1974.53 | 1987.87 | 2006.82 | 1985.39 | 1924.09 | 1919.28 | 1831.88 | 1809.37 | 1871.42 | 1828.39 | 1770.44 | NA | NA | 1652.01 | NA | |
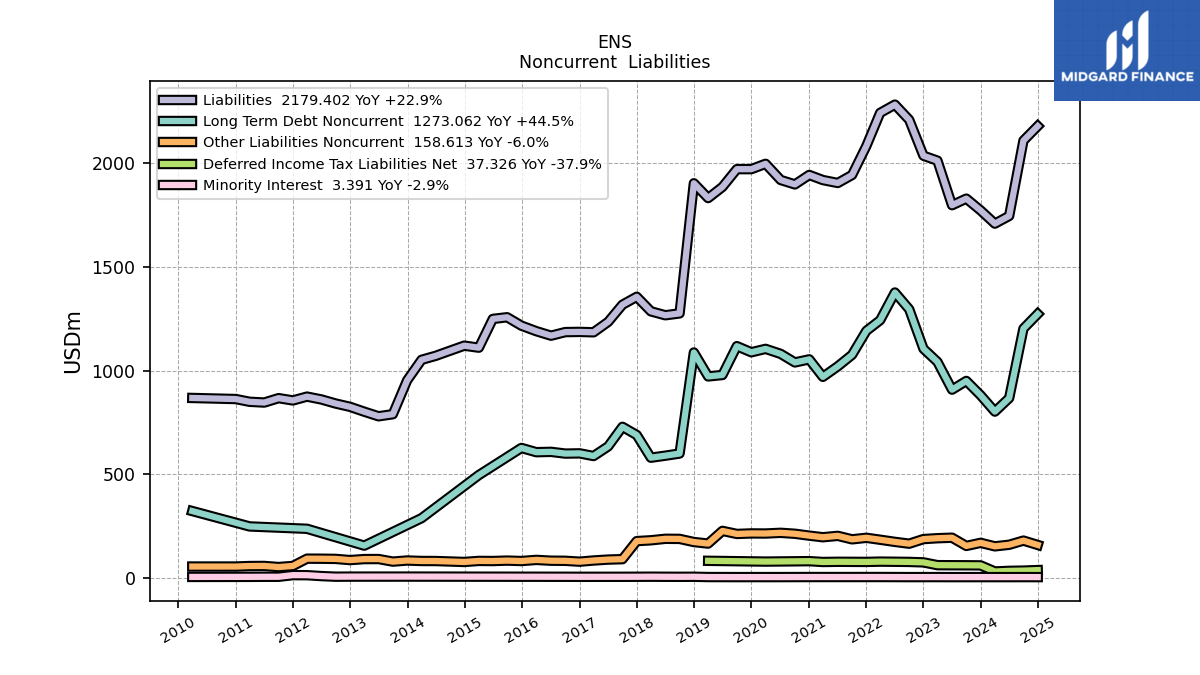
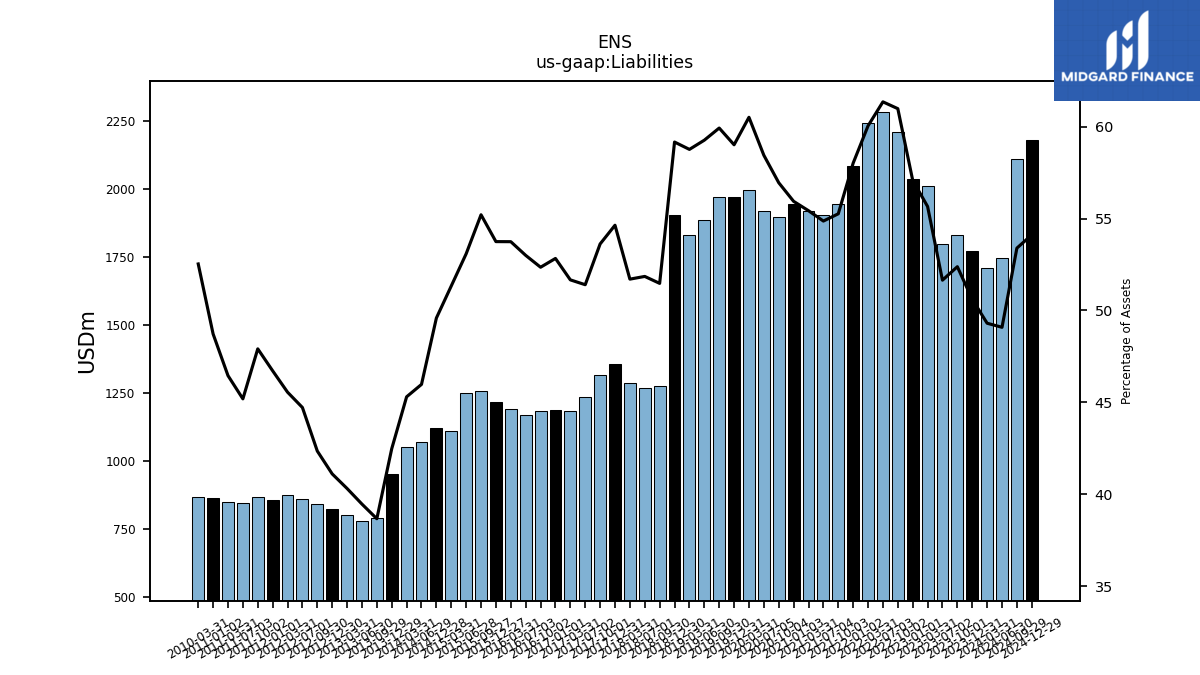
| Liabilities | 1772.61 | 1829.61 | 1797.80 | 2012.79 | 2036.52 | 2209.74 | 2283.14 | 2243.37 | 2083.39 | 1943.60 | 1905.02 | 1919.22 | 1943.81 | 1898.14 | 1919.57 | 1997.64 | 1971.76 | 1971.82 | 1885.85 | 1832.18 | 1903.66 | 1275.78 | 1266.87 | 1285.81 | 1356.03 | 1317.77 | 1235.06 | 1184.66 | 1186.53 | 1185.64 | 1168.34 | 1190.06 | 1216.74 | 1257.28 | 1249.14 | 1110.32 | 1120.20 | NA | 1071.13 | 1051.91 | 952.58 | 789.39 | 779.37 | 801.49 | 825.08 | 840.91 | 860.51 | 874.36 | 855.84 | 866.93 | 845.75 | 849.39 | 862.60 | NA | NA | 867.79 | NA | |
| Liabilities And Stockholders Equity | 3502.64 | 3492.99 | 3480.98 | 3616.67 | 3567.87 | 3624.16 | 3721.91 | 3736.65 | 3591.40 | 3517.45 | 3472.45 | 3462.80 | 3475.23 | 3333.22 | 3284.74 | 3301.70 | 3341.43 | 3290.81 | 3182.42 | 3118.19 | 3217.94 | 2478.58 | 2443.30 | 2486.93 | 2482.00 | 2457.81 | 2402.85 | 2293.03 | 2246.01 | 2264.84 | 2204.57 | 2214.49 | 2263.98 | 2277.51 | 2353.29 | 2163.05 | 2259.00 | NA | 2329.57 | 2321.86 | 2242.34 | 2041.07 | 1974.53 | 1987.87 | 2006.82 | 1985.39 | 1924.09 | 1919.28 | 1831.88 | 1809.37 | 1871.42 | 1828.39 | 1770.44 | NA | NA | 1652.01 | NA | |
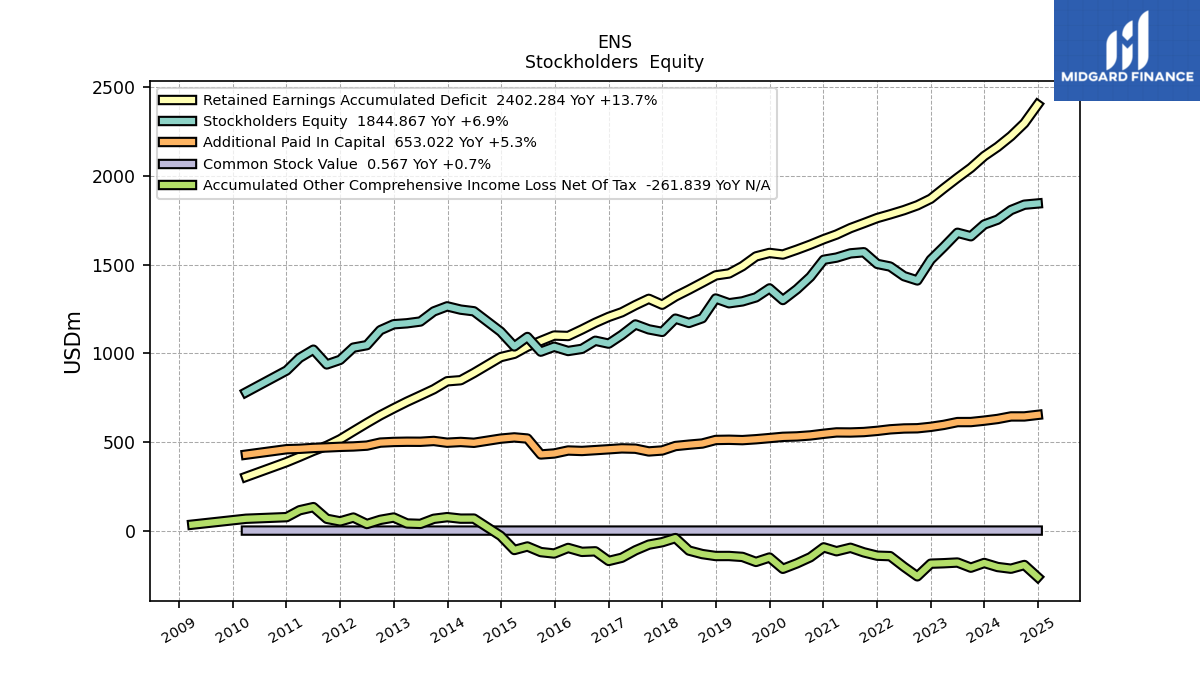
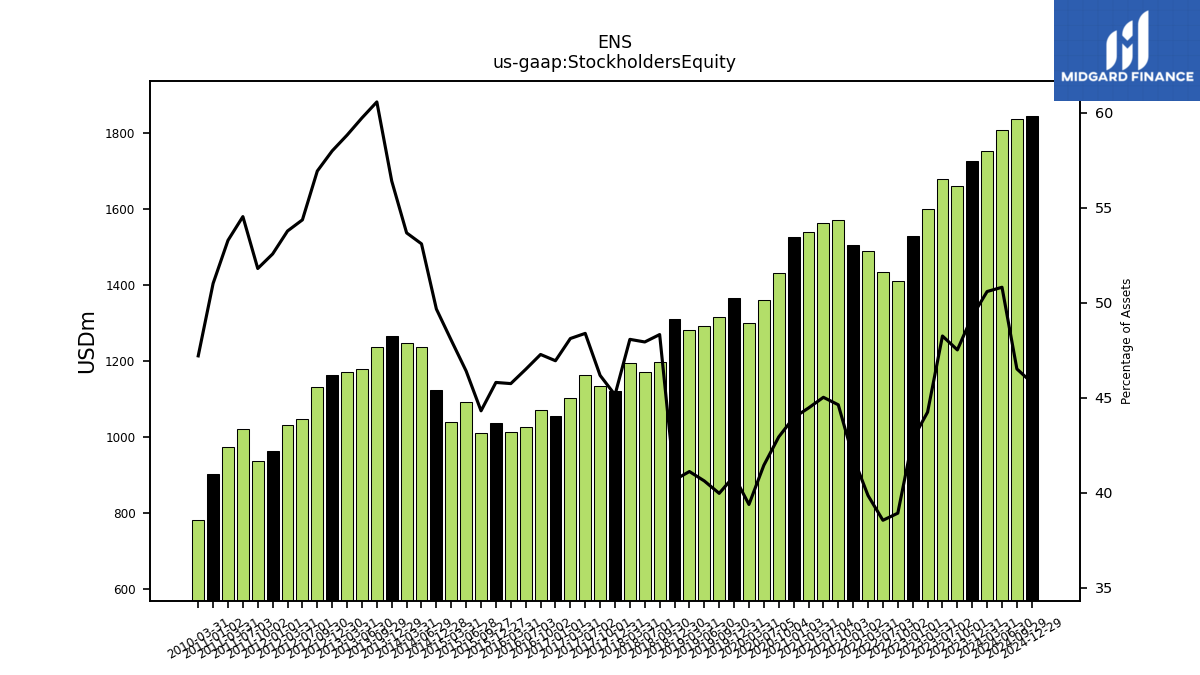
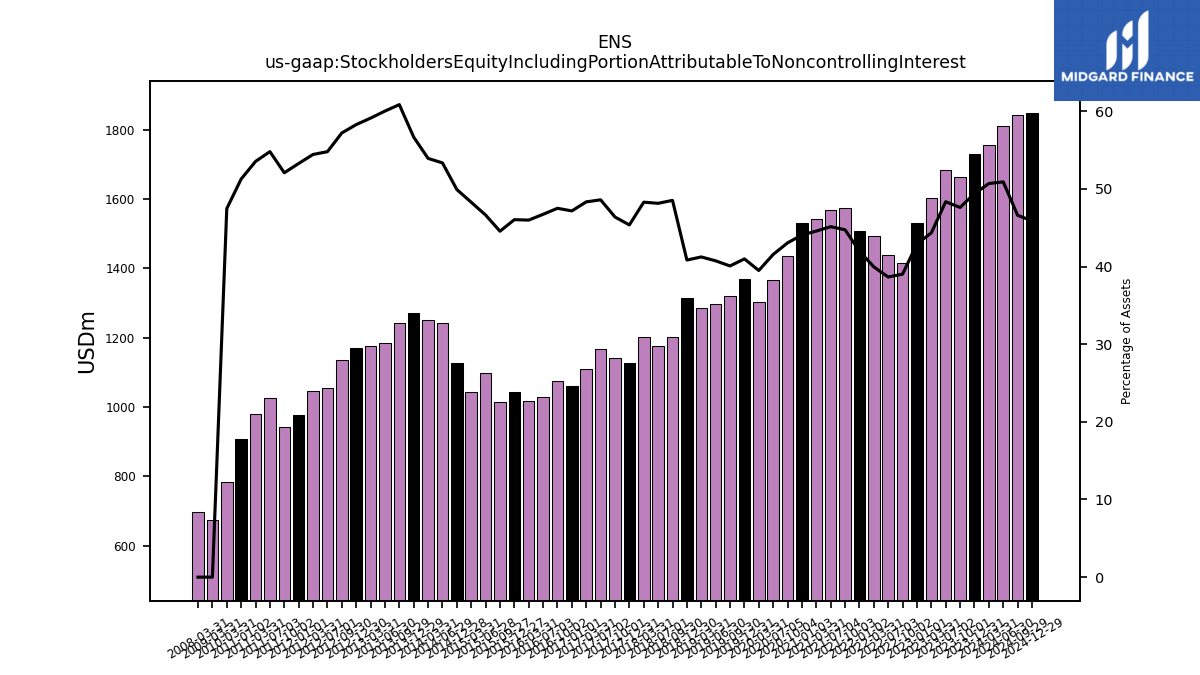
| Stockholders Equity | 1726.53 | 1659.99 | 1679.77 | 1600.28 | 1527.76 | 1410.94 | 1435.08 | 1489.37 | 1504.12 | 1570.02 | 1563.60 | 1539.76 | 1527.56 | 1431.39 | 1361.63 | 1300.53 | 1366.10 | 1315.47 | 1292.93 | 1282.29 | 1309.10 | 1197.90 | 1171.34 | 1195.67 | 1120.82 | 1135.05 | 1162.79 | 1103.46 | 1054.56 | 1070.88 | 1025.14 | 1013.13 | 1037.14 | 1009.31 | 1092.18 | 1038.90 | 1122.14 | NA | 1237.12 | 1246.40 | 1264.91 | 1236.34 | 1179.41 | 1169.40 | 1163.88 | 1130.40 | 1046.08 | 1032.19 | 963.08 | 937.37 | 1020.65 | 974.33 | 903.28 | NA | NA | 779.90 | NA |
| 2023-12-31 | 2023-10-01 | 2023-07-02 | 2023-03-31 | 2023-01-01 | 2022-10-02 | 2022-07-03 | 2022-03-31 | 2022-01-02 | 2021-10-03 | 2021-07-04 | 2021-03-31 | 2021-01-03 | 2020-10-04 | 2020-07-05 | 2020-03-31 | 2019-12-31 | 2019-09-30 | 2019-06-30 | 2019-03-31 | 2018-12-30 | 2018-09-30 | 2018-07-01 | 2018-03-31 | 2017-12-31 | 2017-10-01 | 2017-07-02 | 2017-03-31 | 2017-01-01 | 2016-10-02 | 2016-07-03 | 2016-03-31 | 2015-12-27 | 2015-09-27 | 2015-06-28 | 2015-03-31 | 2014-12-28 | 2014-09-28 | 2014-06-29 | 2014-03-31 | 2013-12-29 | 2013-09-29 | 2013-06-30 | 2013-03-31 | 2012-12-30 | 2012-09-30 | 2012-07-01 | 2012-03-31 | 2012-01-01 | 2011-10-02 | 2011-07-03 | 2011-03-31 | 2011-01-02 | 2010-10-03 | 2010-07-04 | 2010-03-31 | 2009-12-27 | ||
|---|---|---|---|---|---|---|---|---|---|---|---|---|---|---|---|---|---|---|---|---|---|---|---|---|---|---|---|---|---|---|---|---|---|---|---|---|---|---|---|---|---|---|---|---|---|---|---|---|---|---|---|---|---|---|---|---|---|---|
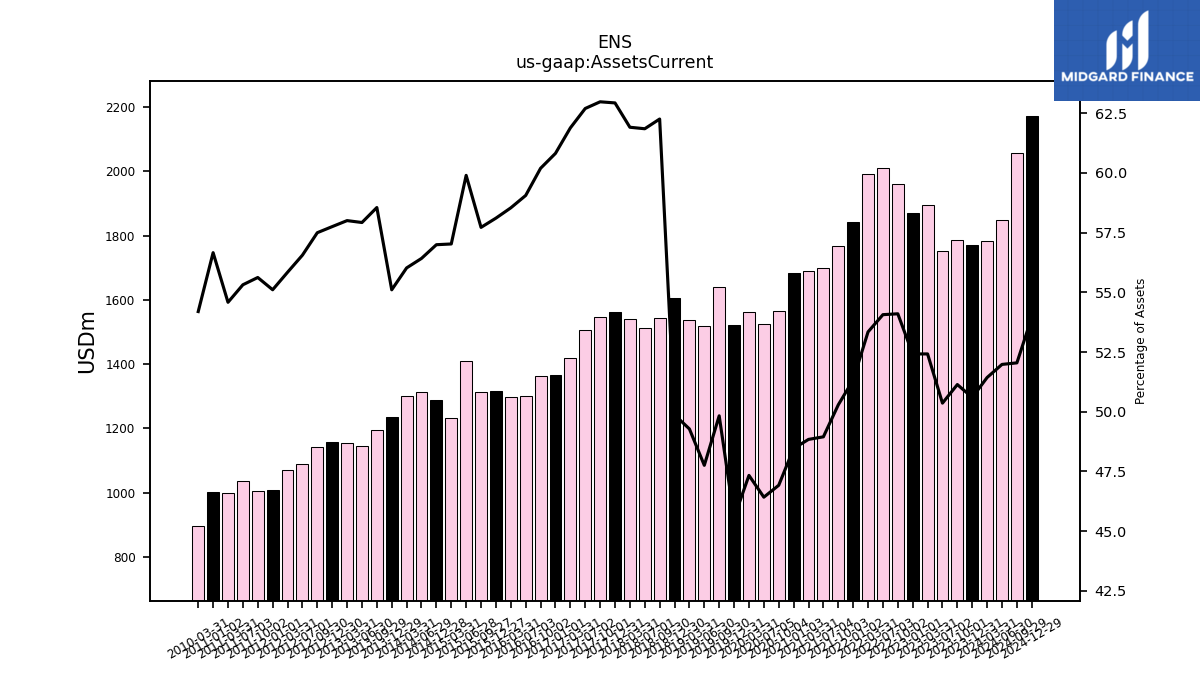
| Assets Current | 1772.28 | 1786.25 | 1753.05 | 1895.88 | 1870.19 | 1960.68 | 2012.19 | 1993.19 | 1843.45 | 1768.86 | 1699.80 | 1691.32 | 1684.15 | 1564.08 | 1524.94 | 1562.90 | 1522.44 | 1639.81 | 1519.87 | 1536.65 | 1604.79 | 1542.95 | 1511.05 | 1539.59 | 1561.81 | 1547.74 | 1506.40 | 1418.91 | 1365.87 | 1363.19 | 1301.86 | 1296.24 | 1315.44 | 1314.50 | 1409.47 | 1233.42 | 1287.43 | NA | 1314.28 | 1300.70 | 1235.62 | 1194.99 | 1143.65 | 1152.96 | 1158.91 | 1141.48 | 1088.15 | 1071.67 | 1009.48 | 1006.36 | 1035.16 | 997.95 | 1003.10 | NA | NA | 895.28 | NA | |
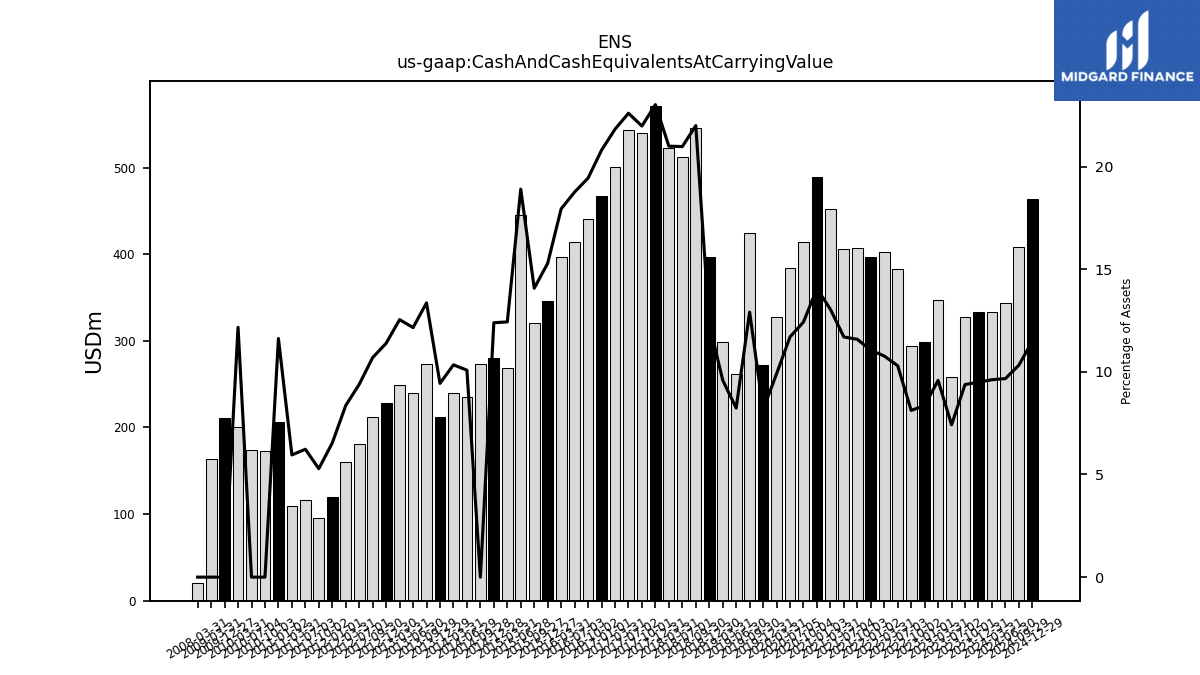
| Cash And Cash Equivalents At Carrying Value | 332.71 | 327.75 | 258.34 | 346.67 | 298.08 | 294.42 | 383.24 | 402.49 | 397.06 | 407.51 | 406.23 | 451.81 | 488.65 | 414.23 | 384.38 | 326.98 | 272.51 | 424.85 | 262.11 | 299.21 | 397.16 | 545.18 | 512.46 | 522.12 | 571.32 | 540.11 | 543.04 | 500.33 | 467.15 | 440.29 | 413.56 | 397.31 | 346.12 | 320.56 | 444.78 | 268.92 | 279.98 | 272.69 | 234.90 | 240.10 | 211.64 | 272.69 | 240.06 | 249.35 | 228.65 | 212.34 | 180.71 | 160.49 | 119.77 | 95.59 | 116.58 | 108.87 | 205.79 | 173.03 | 173.81 | 201.04 | 210.97 | |
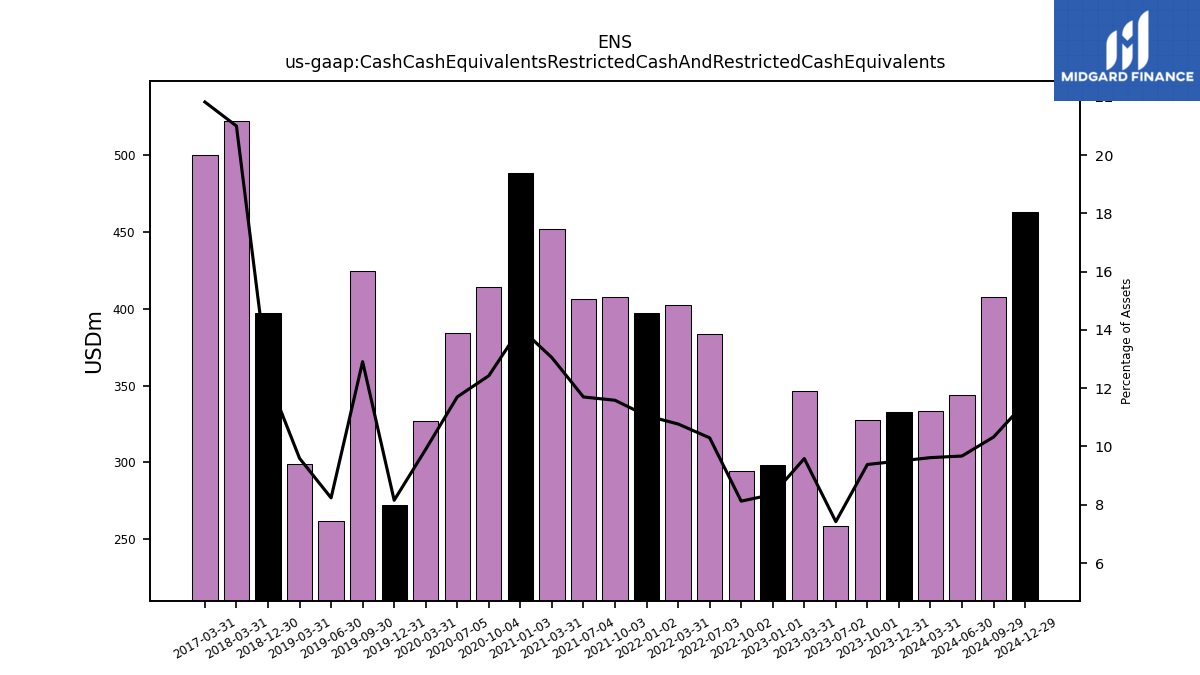
| Cash Cash Equivalents Restricted Cash And Restricted Cash Equivalents | 332.71 | 327.75 | 258.34 | 346.67 | 298.08 | 294.42 | 383.24 | 402.49 | 397.06 | 407.51 | 406.23 | 451.81 | 488.65 | 414.23 | 384.38 | 326.98 | 272.51 | 424.85 | 262.11 | 299.21 | 397.16 | NA | NA | 522.12 | NA | NA | NA | 500.33 | NA | NA | NA | NA | NA | NA | NA | NA | NA | NA | NA | NA | NA | NA | NA | NA | NA | NA | NA | NA | NA | NA | NA | NA | NA | NA | NA | NA | NA | |
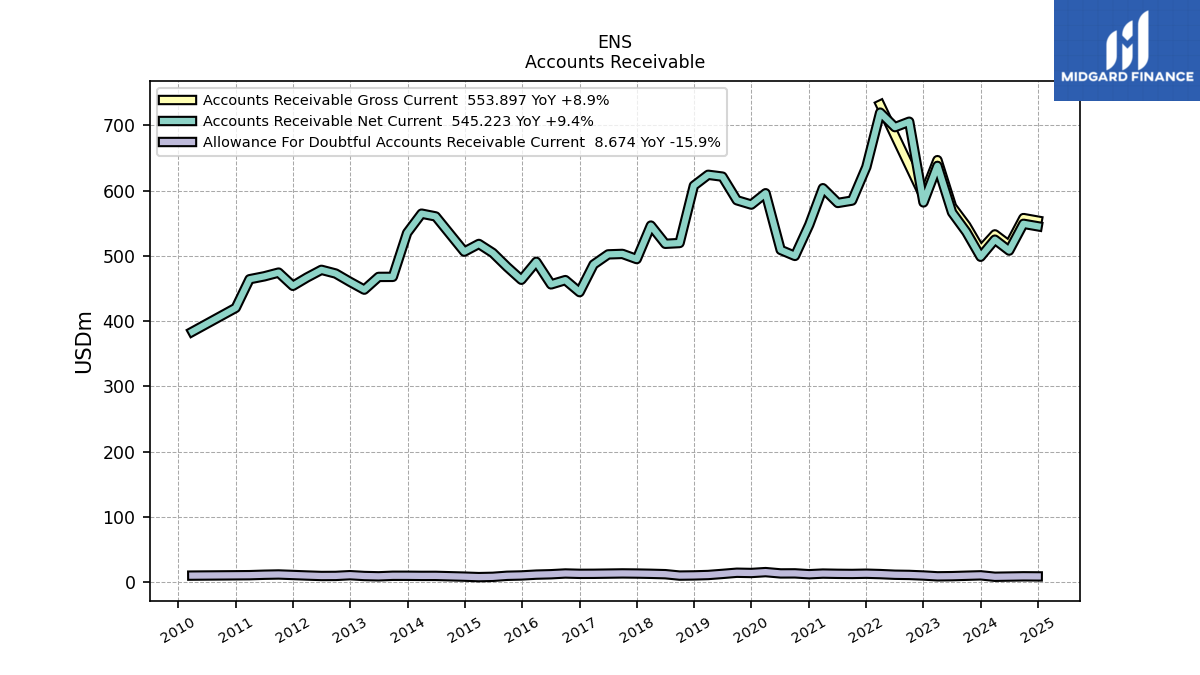
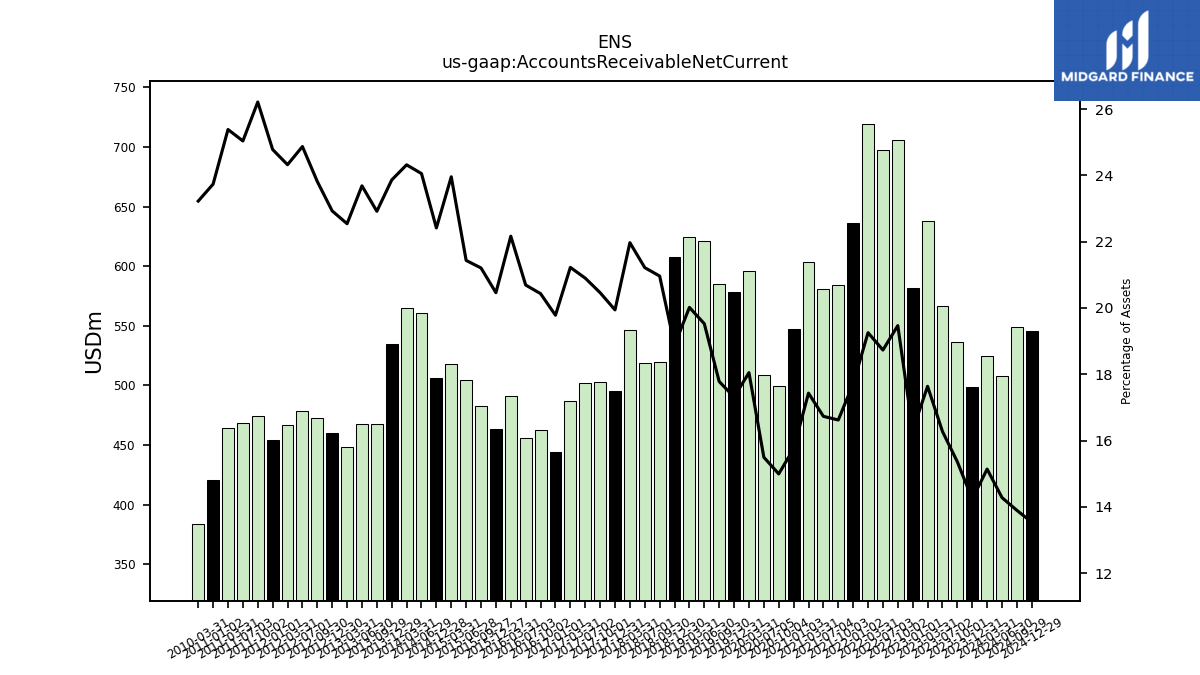
| Accounts Receivable Net Current | 498.50 | 536.50 | 566.50 | 637.82 | 581.75 | 705.48 | 697.12 | 719.43 | 636.05 | 584.58 | 580.96 | 603.58 | 547.46 | 499.78 | 509.01 | 595.87 | 578.44 | 585.11 | 621.32 | 624.14 | 607.44 | 519.54 | 518.36 | 546.33 | 494.93 | 502.87 | 502.16 | 486.65 | 444.26 | 462.72 | 456.13 | 490.80 | 463.22 | 482.93 | 504.38 | 518.16 | 506.30 | NA | 560.31 | 564.58 | 535.02 | 467.70 | 467.62 | 448.07 | 460.07 | 472.77 | 478.48 | 466.77 | 453.90 | 474.25 | 468.53 | 464.07 | 420.20 | NA | NA | 383.64 | NA | |
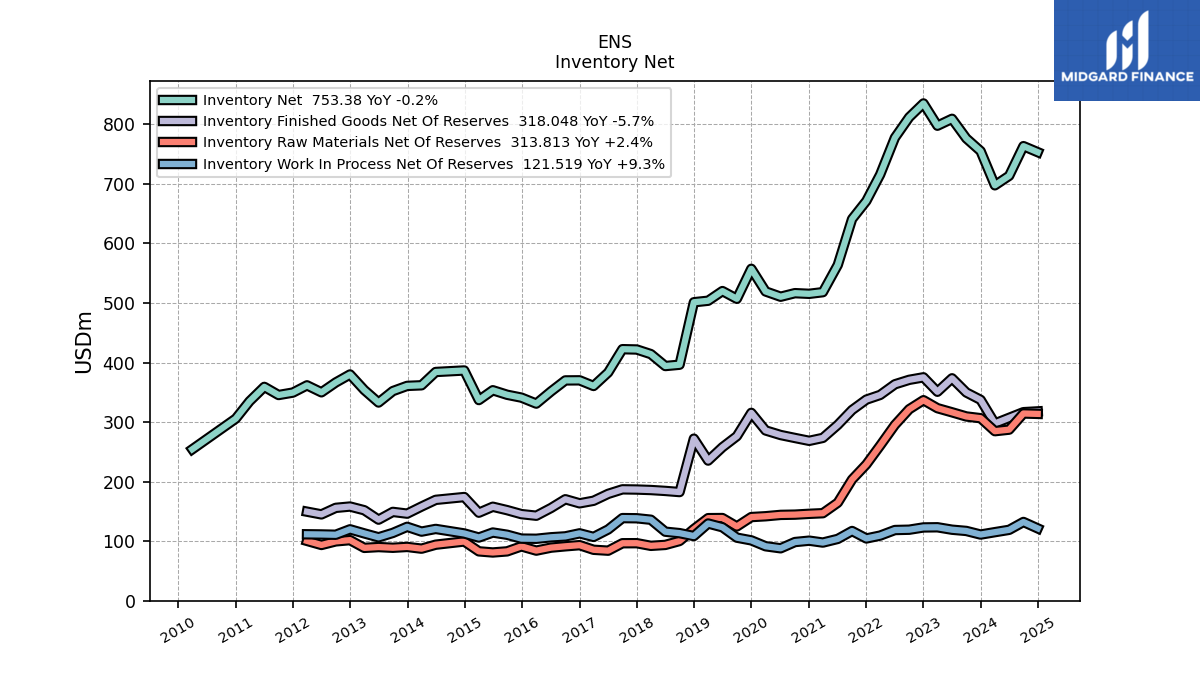
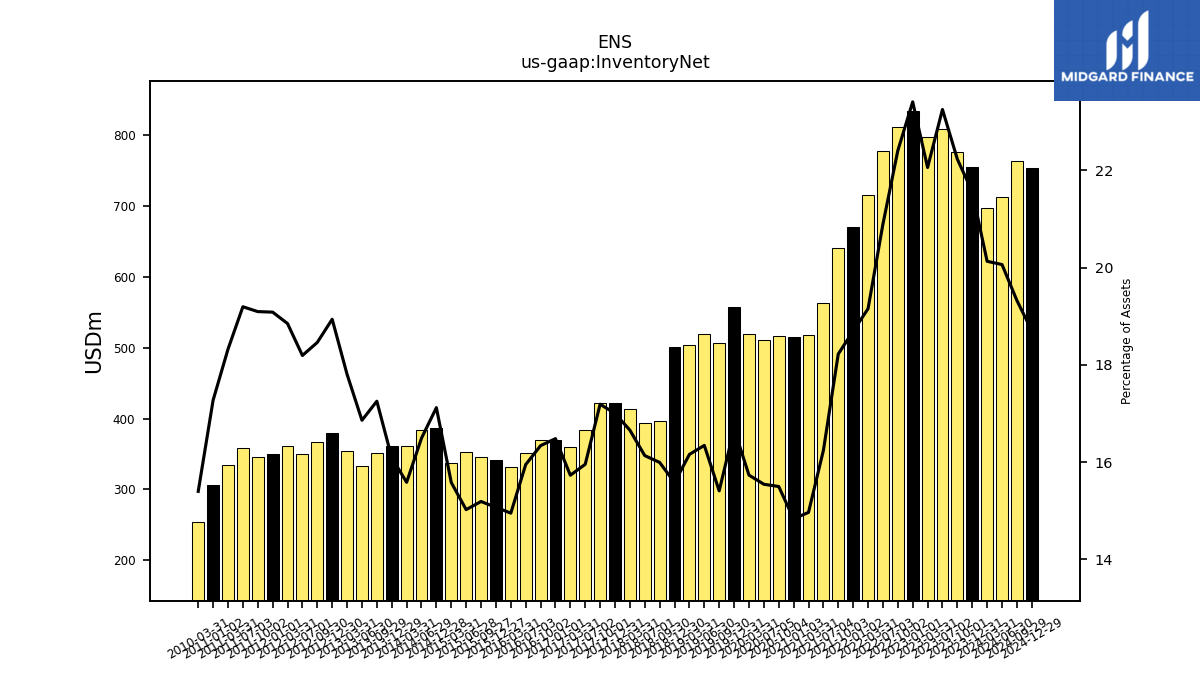
| Inventory Net | 755.16 | 776.50 | 809.40 | 797.80 | 835.20 | 812.00 | 777.66 | 715.71 | 671.40 | 641.00 | 563.91 | 518.25 | 515.47 | 516.59 | 510.60 | 519.46 | 557.51 | 507.08 | 520.12 | 503.87 | 501.34 | 396.40 | 394.19 | 414.23 | 421.97 | 422.51 | 383.37 | 360.69 | 370.20 | 370.04 | 351.60 | 331.08 | 341.17 | 345.95 | 353.54 | 337.01 | 386.74 | NA | 384.19 | 361.85 | 360.84 | 352.13 | 332.92 | 353.94 | 380.05 | 366.54 | 350.05 | 361.77 | 349.61 | 345.50 | 359.22 | 335.00 | 305.82 | NA | NA | 254.37 | NA | |
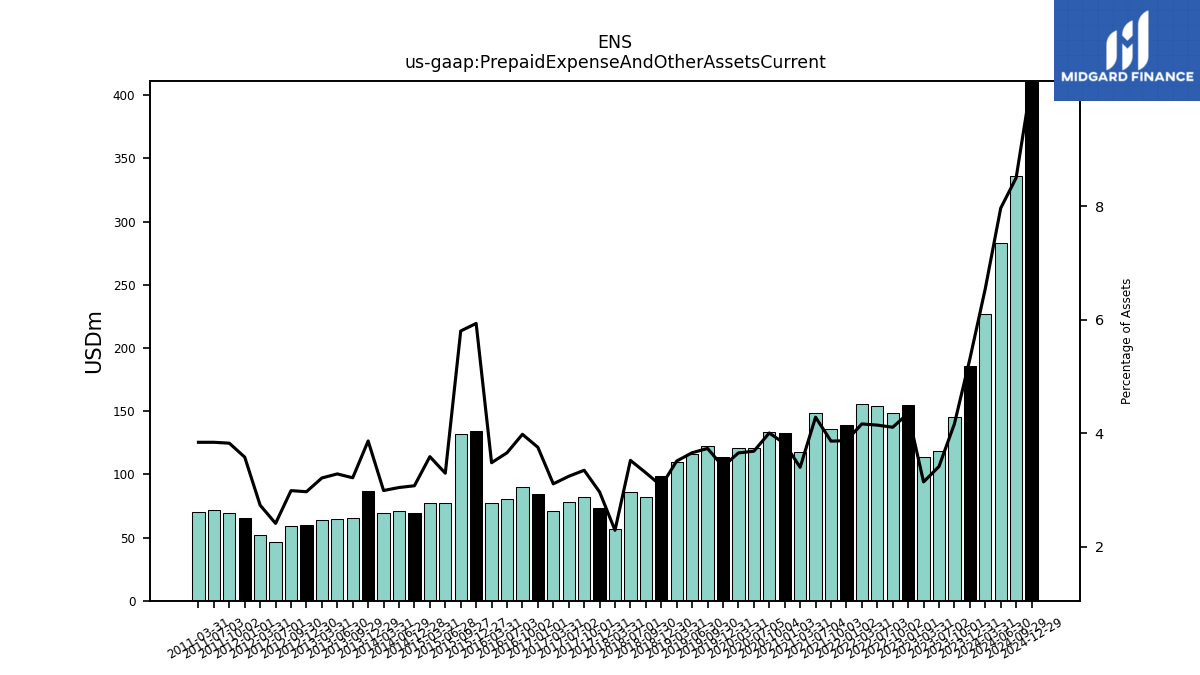
| Prepaid Expense And Other Assets Current | 185.90 | 145.50 | 118.80 | 113.60 | 155.16 | 148.77 | 154.18 | 155.56 | 138.94 | 135.77 | 148.69 | 117.68 | 132.56 | 133.47 | 120.96 | 120.59 | 113.98 | 122.78 | 116.33 | 109.43 | 98.85 | 81.82 | 86.03 | 56.91 | 73.59 | 82.25 | 77.84 | 71.25 | 84.26 | 90.14 | 80.57 | 77.05 | 134.37 | 132.15 | 77.53 | 77.57 | 69.42 | NA | 70.87 | 69.40 | 86.62 | 65.60 | 64.80 | 63.82 | 59.56 | 59.31 | 46.37 | 52.39 | 65.54 | 69.19 | 71.85 | 70.20 | NA | NA | NA | NA | NA |
| 2023-12-31 | 2023-10-01 | 2023-07-02 | 2023-03-31 | 2023-01-01 | 2022-10-02 | 2022-07-03 | 2022-03-31 | 2022-01-02 | 2021-10-03 | 2021-07-04 | 2021-03-31 | 2021-01-03 | 2020-10-04 | 2020-07-05 | 2020-03-31 | 2019-12-31 | 2019-09-30 | 2019-06-30 | 2019-03-31 | 2018-12-30 | 2018-09-30 | 2018-07-01 | 2018-03-31 | 2017-12-31 | 2017-10-01 | 2017-07-02 | 2017-03-31 | 2017-01-01 | 2016-10-02 | 2016-07-03 | 2016-03-31 | 2015-12-27 | 2015-09-27 | 2015-06-28 | 2015-03-31 | 2014-12-28 | 2014-09-28 | 2014-06-29 | 2014-03-31 | 2013-12-29 | 2013-09-29 | 2013-06-30 | 2013-03-31 | 2012-12-30 | 2012-09-30 | 2012-07-01 | 2012-03-31 | 2012-01-01 | 2011-10-02 | 2011-07-03 | 2011-03-31 | 2011-01-02 | 2010-10-03 | 2010-07-04 | 2010-03-31 | 2009-12-27 | ||
|---|---|---|---|---|---|---|---|---|---|---|---|---|---|---|---|---|---|---|---|---|---|---|---|---|---|---|---|---|---|---|---|---|---|---|---|---|---|---|---|---|---|---|---|---|---|---|---|---|---|---|---|---|---|---|---|---|---|---|
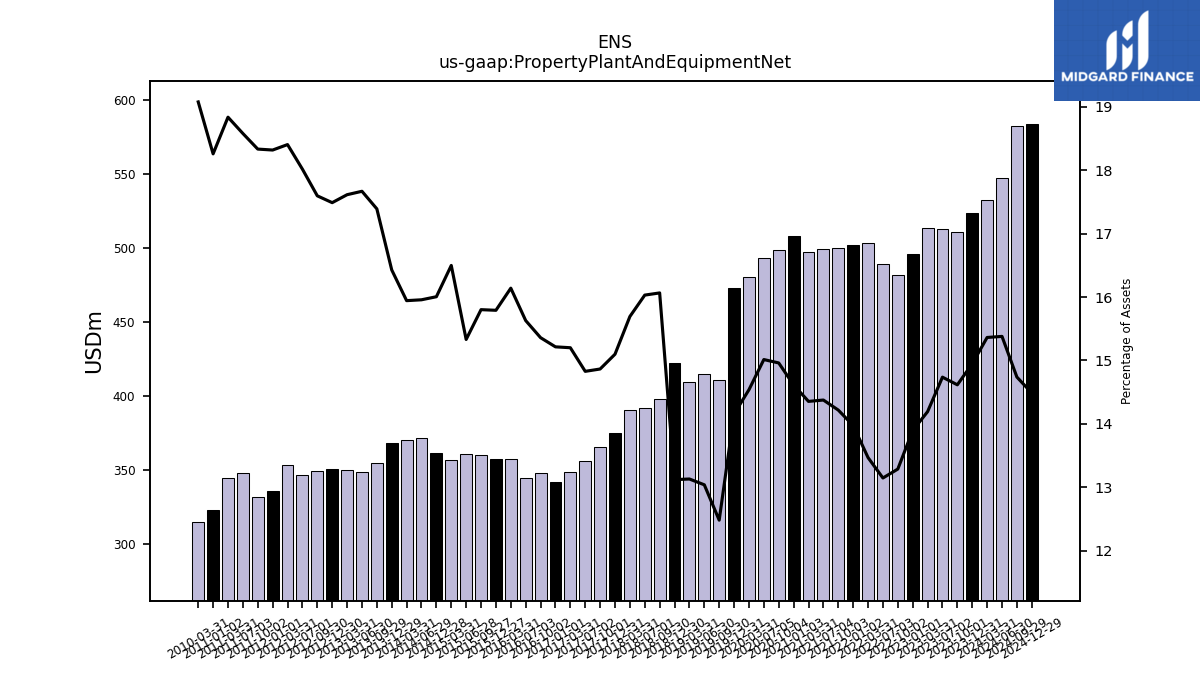
| Property Plant And Equipment Net | 523.56 | 510.52 | 512.97 | 513.28 | 495.75 | 481.55 | 489.29 | 503.26 | 501.89 | 500.09 | 499.19 | 497.06 | 507.86 | 498.66 | 493.17 | 480.01 | 473.03 | 410.75 | 414.96 | 409.44 | 422.21 | 398.17 | 391.67 | 390.26 | 374.74 | 365.35 | 356.30 | 348.55 | 341.71 | 347.85 | 344.54 | 357.41 | 357.50 | 359.86 | 360.78 | 356.85 | 361.54 | NA | 371.71 | 370.17 | 368.36 | 354.94 | 348.84 | 350.13 | 350.95 | 349.34 | 346.64 | 353.21 | 335.55 | 331.70 | 347.68 | 344.38 | 323.24 | NA | NA | 315.14 | NA | |
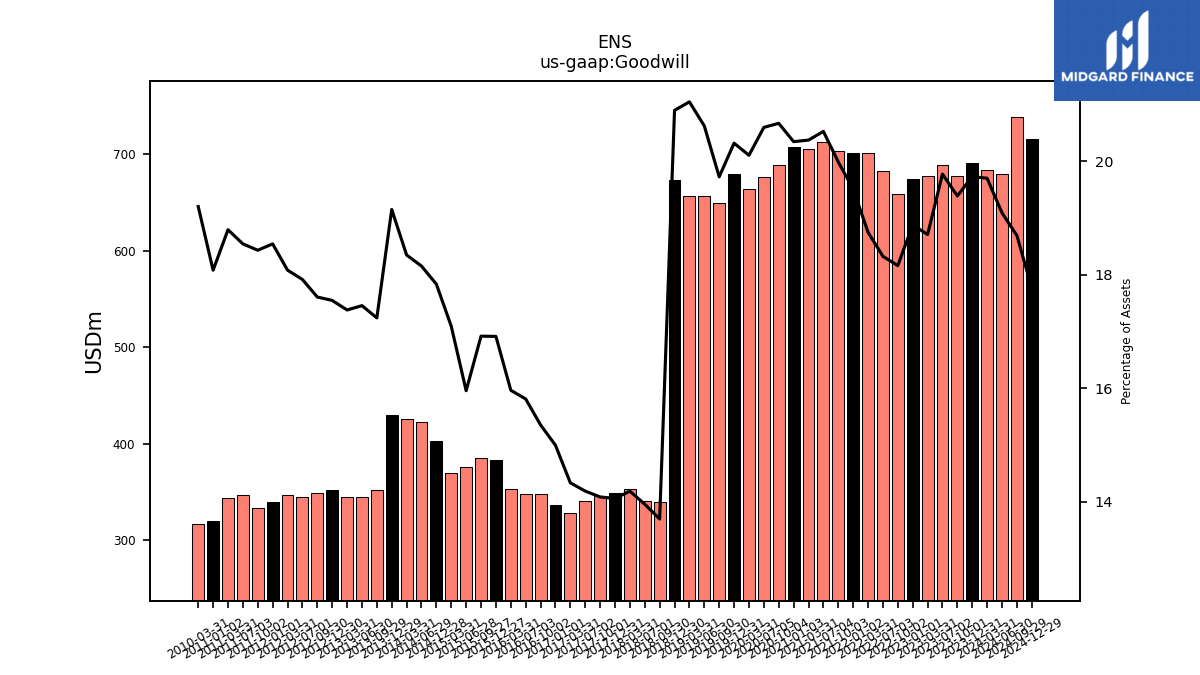
| Goodwill | 691.17 | 677.35 | 688.44 | 676.72 | 673.70 | 658.26 | 682.11 | 700.64 | 700.83 | 703.16 | 712.88 | 705.59 | 707.17 | 689.05 | 676.67 | 663.94 | 679.05 | 649.24 | 656.42 | 656.40 | 672.60 | 339.44 | 340.98 | 352.81 | 348.88 | 346.16 | 340.89 | 328.66 | 336.82 | 347.73 | 348.59 | 353.55 | 382.95 | 385.34 | 375.53 | 369.73 | 402.90 | NA | 422.94 | 426.06 | 429.48 | 351.91 | 344.70 | 345.50 | 352.19 | 349.61 | 344.77 | 347.06 | 339.75 | 333.55 | 347.07 | 343.67 | 320.14 | NA | NA | 317.26 | NA | |
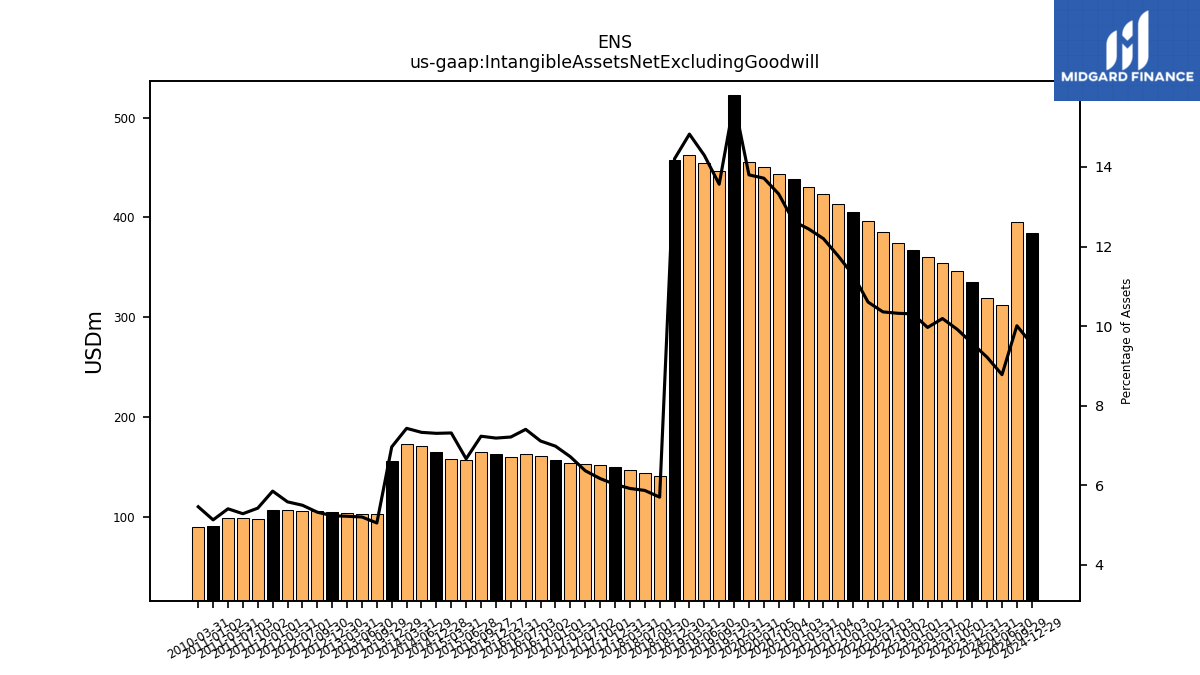
| Intangible Assets Net Excluding Goodwill | 334.97 | 346.32 | 354.66 | 360.41 | 367.71 | 374.05 | 385.45 | 396.20 | 405.13 | 413.65 | 423.59 | 430.90 | 439.00 | 444.00 | 450.61 | 455.69 | 522.36 | 446.46 | 454.88 | 462.32 | 457.14 | 141.23 | 143.34 | 147.14 | 149.37 | 151.53 | 152.88 | 153.96 | 156.77 | 161.01 | 163.19 | 159.66 | 162.62 | 164.66 | 156.76 | 158.16 | 164.96 | NA | 170.69 | 172.47 | 156.09 | 103.04 | 102.66 | 103.70 | 104.97 | 105.61 | 105.71 | 107.08 | 107.16 | 98.08 | 98.83 | 98.82 | 90.76 | NA | NA | 90.14 | NA | |
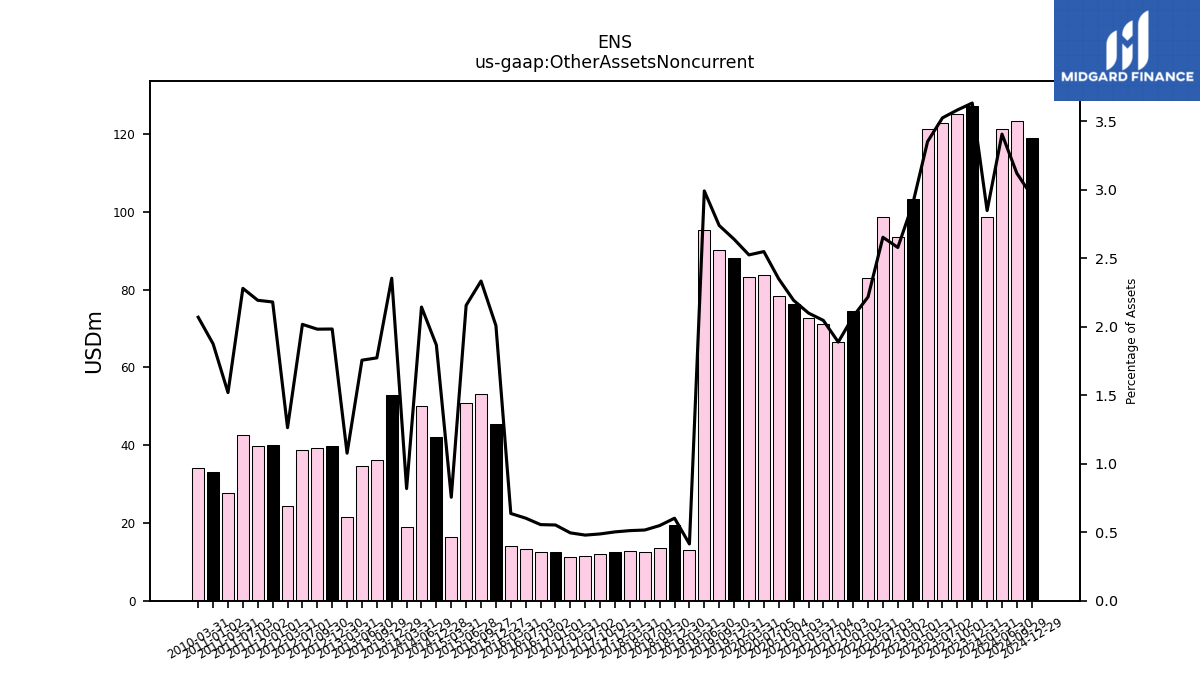
| Other Assets Noncurrent | 127.25 | 125.13 | 122.70 | 121.23 | 103.30 | 93.46 | 98.75 | 82.87 | 74.52 | 66.42 | 71.05 | 72.72 | 76.21 | 78.32 | 83.72 | 83.36 | 88.18 | 90.14 | 95.20 | 12.93 | 19.39 | 13.60 | 12.62 | 12.73 | 12.48 | 11.99 | 11.52 | 11.36 | 12.42 | 12.59 | 13.29 | 14.11 | 45.47 | 53.15 | 50.74 | 16.34 | 42.16 | NA | 49.95 | 19.02 | 52.79 | 36.19 | 34.67 | 21.41 | 39.81 | 39.36 | 38.82 | 24.25 | 39.95 | 39.68 | 42.67 | 27.78 | 33.20 | NA | NA | 34.19 | NA |
| 2023-12-31 | 2023-10-01 | 2023-07-02 | 2023-03-31 | 2023-01-01 | 2022-10-02 | 2022-07-03 | 2022-03-31 | 2022-01-02 | 2021-10-03 | 2021-07-04 | 2021-03-31 | 2021-01-03 | 2020-10-04 | 2020-07-05 | 2020-03-31 | 2019-12-31 | 2019-09-30 | 2019-06-30 | 2019-03-31 | 2018-12-30 | 2018-09-30 | 2018-07-01 | 2018-03-31 | 2017-12-31 | 2017-10-01 | 2017-07-02 | 2017-03-31 | 2017-01-01 | 2016-10-02 | 2016-07-03 | 2016-03-31 | 2015-12-27 | 2015-09-27 | 2015-06-28 | 2015-03-31 | 2014-12-28 | 2014-09-28 | 2014-06-29 | 2014-03-31 | 2013-12-29 | 2013-09-29 | 2013-06-30 | 2013-03-31 | 2012-12-30 | 2012-09-30 | 2012-07-01 | 2012-03-31 | 2012-01-01 | 2011-10-02 | 2011-07-03 | 2011-03-31 | 2011-01-02 | 2010-10-03 | 2010-07-04 | 2010-03-31 | 2009-12-27 | ||
|---|---|---|---|---|---|---|---|---|---|---|---|---|---|---|---|---|---|---|---|---|---|---|---|---|---|---|---|---|---|---|---|---|---|---|---|---|---|---|---|---|---|---|---|---|---|---|---|---|---|---|---|---|---|---|---|---|---|---|
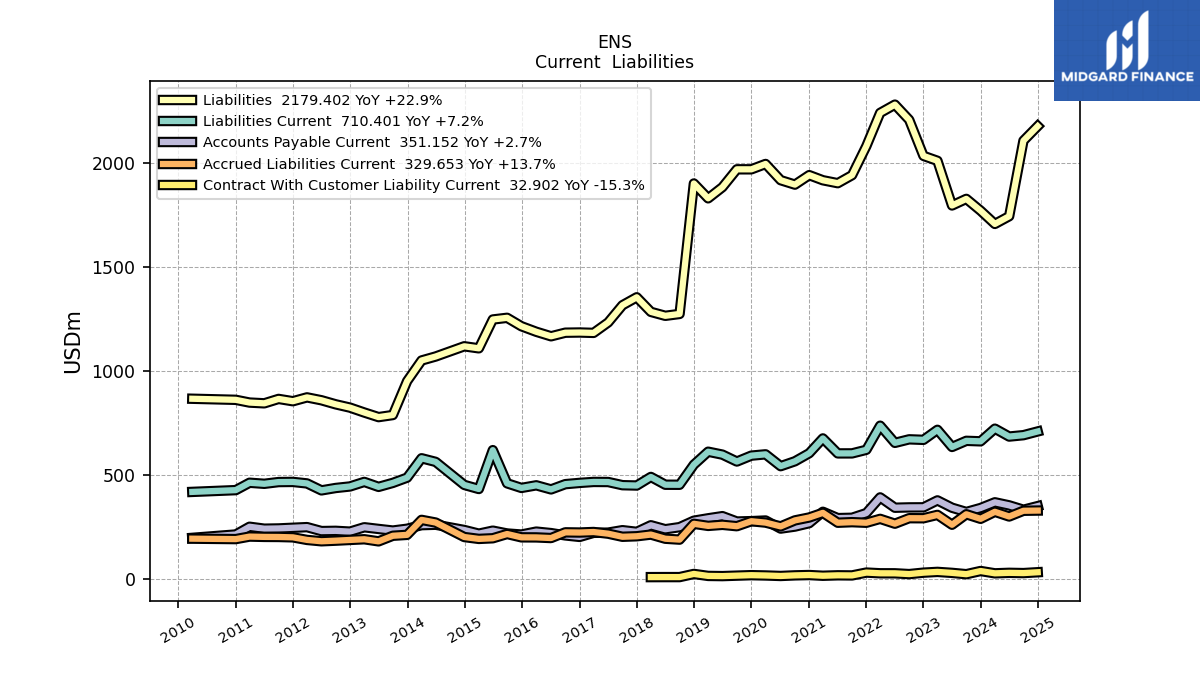
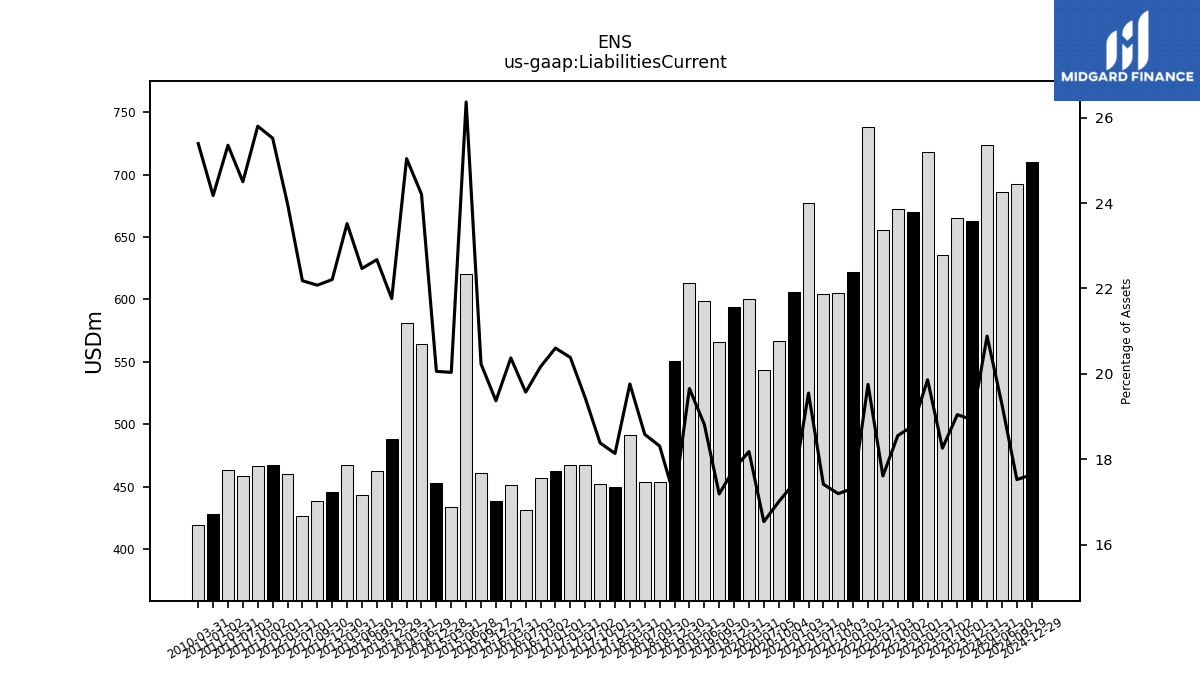
| Liabilities Current | 662.89 | 665.27 | 635.65 | 718.32 | 669.96 | 672.49 | 655.43 | 738.13 | 622.06 | 604.83 | 604.74 | 676.99 | 605.63 | 566.85 | 543.28 | 600.32 | 594.01 | 565.64 | 598.89 | 612.93 | 550.61 | 453.84 | 454.03 | 491.53 | 450.17 | 451.80 | 467.06 | 467.43 | 462.77 | 456.77 | 431.50 | 451.17 | 438.56 | 460.78 | 620.51 | 433.37 | 453.15 | NA | 563.95 | 581.40 | 488.05 | 462.81 | 443.65 | 467.56 | 445.69 | 438.32 | 426.80 | 460.30 | 467.50 | 466.84 | 458.48 | 463.57 | 428.04 | NA | NA | 419.51 | NA | |
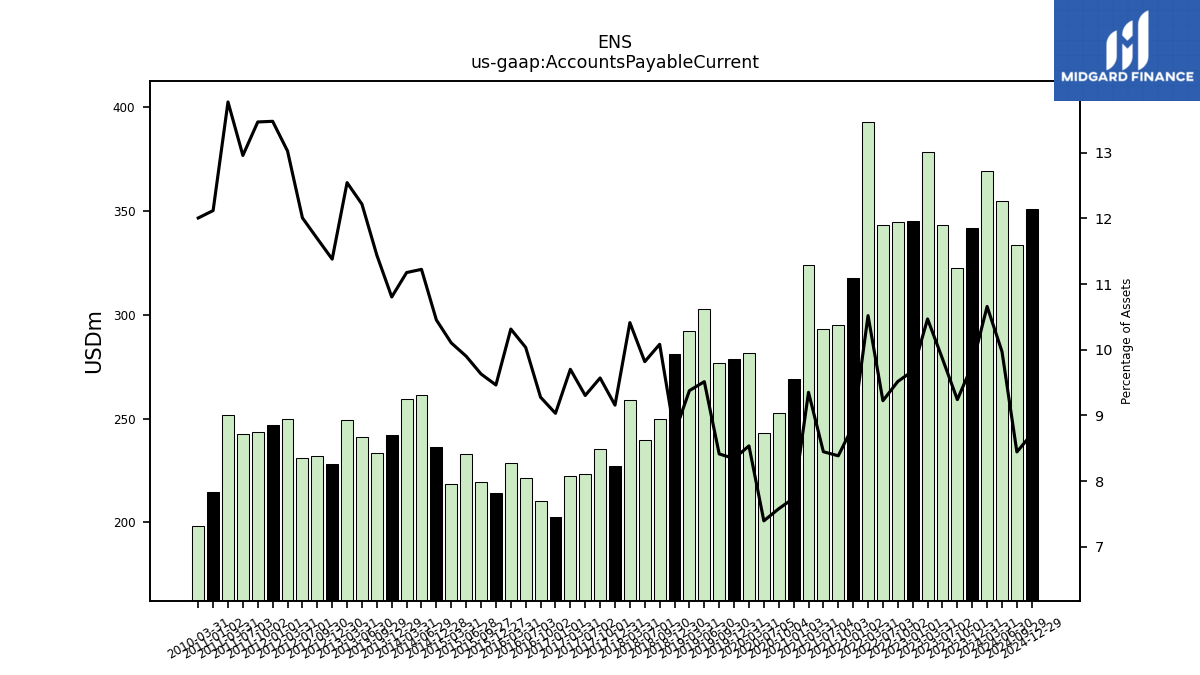
| Accounts Payable Current | 342.07 | 322.81 | 343.34 | 378.64 | 345.25 | 344.94 | 343.34 | 393.10 | 317.58 | 294.98 | 293.38 | 323.88 | 269.02 | 252.67 | 242.96 | 281.87 | 278.82 | 276.93 | 302.81 | 292.45 | 280.96 | 249.93 | 239.92 | 258.98 | 227.29 | 235.24 | 223.58 | 222.49 | 202.88 | 210.13 | 221.25 | 228.44 | 214.27 | 219.37 | 233.03 | 218.57 | 236.15 | NA | 261.48 | 259.48 | 242.26 | 233.50 | 241.22 | 249.36 | 228.37 | 232.13 | 231.05 | 250.00 | 246.90 | 243.68 | 242.51 | 251.81 | 214.56 | NA | NA | 198.34 | NA | |
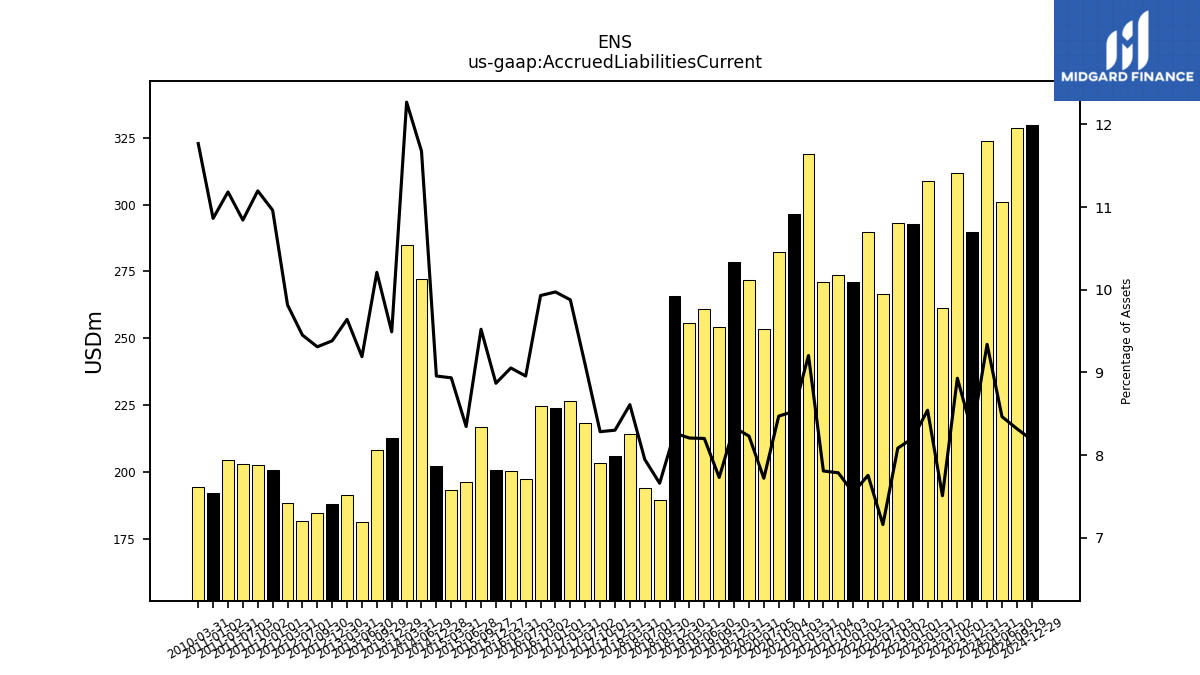
| Accrued Liabilities Current | 289.89 | 311.92 | 261.35 | 308.95 | 292.69 | 292.97 | 266.46 | 289.76 | 270.97 | 273.85 | 271.11 | 318.72 | 296.35 | 282.37 | 253.56 | 271.74 | 278.47 | 254.36 | 261.00 | 255.88 | 266.00 | 189.83 | 194.18 | 214.12 | 206.03 | 203.58 | 218.44 | 226.51 | 224.01 | 224.91 | 197.45 | 200.50 | 200.79 | 216.87 | 196.39 | 193.26 | 202.32 | NA | 272.03 | 284.90 | 212.82 | 208.40 | 181.47 | 191.66 | 188.29 | 184.84 | 181.86 | 188.40 | 200.82 | 202.59 | 202.92 | 204.49 | 192.34 | NA | NA | 194.43 | NA | |
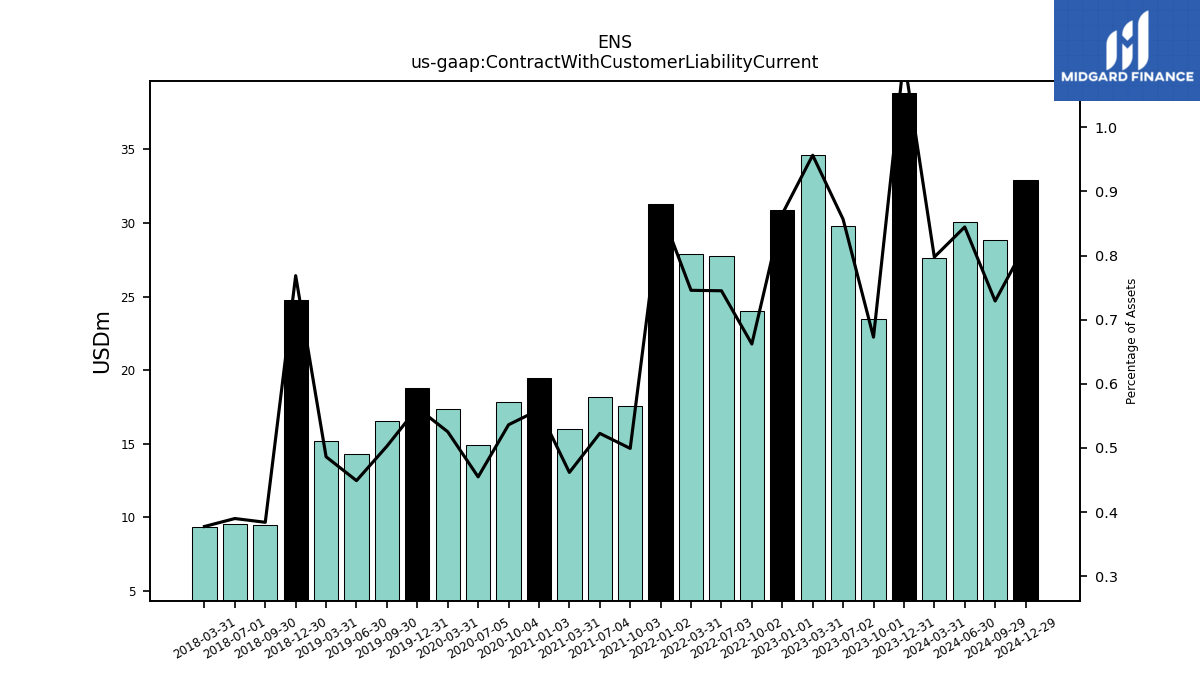
| Contract With Customer Liability Current | 38.83 | 23.50 | 29.82 | 34.59 | 30.86 | 24.00 | 27.73 | 27.87 | 31.29 | 17.56 | 18.15 | 15.99 | 19.45 | 17.87 | 14.94 | 17.34 | 18.79 | 16.54 | 14.29 | 15.16 | 24.74 | 9.52 | 9.53 | 9.39 | NA | NA | NA | NA | NA | NA | NA | NA | NA | NA | NA | NA | NA | NA | NA | NA | NA | NA | NA | NA | NA | NA | NA | NA | NA | NA | NA | NA | NA | NA | NA | NA | NA |
| 2023-12-31 | 2023-10-01 | 2023-07-02 | 2023-03-31 | 2023-01-01 | 2022-10-02 | 2022-07-03 | 2022-03-31 | 2022-01-02 | 2021-10-03 | 2021-07-04 | 2021-03-31 | 2021-01-03 | 2020-10-04 | 2020-07-05 | 2020-03-31 | 2019-12-31 | 2019-09-30 | 2019-06-30 | 2019-03-31 | 2018-12-30 | 2018-09-30 | 2018-07-01 | 2018-03-31 | 2017-12-31 | 2017-10-01 | 2017-07-02 | 2017-03-31 | 2017-01-01 | 2016-10-02 | 2016-07-03 | 2016-03-31 | 2015-12-27 | 2015-09-27 | 2015-06-28 | 2015-03-31 | 2014-12-28 | 2014-09-28 | 2014-06-29 | 2014-03-31 | 2013-12-29 | 2013-09-29 | 2013-06-30 | 2013-03-31 | 2012-12-30 | 2012-09-30 | 2012-07-01 | 2012-03-31 | 2012-01-01 | 2011-10-02 | 2011-07-03 | 2011-03-31 | 2011-01-02 | 2010-10-03 | 2010-07-04 | 2010-03-31 | 2009-12-27 | ||
|---|---|---|---|---|---|---|---|---|---|---|---|---|---|---|---|---|---|---|---|---|---|---|---|---|---|---|---|---|---|---|---|---|---|---|---|---|---|---|---|---|---|---|---|---|---|---|---|---|---|---|---|---|---|---|---|---|---|---|
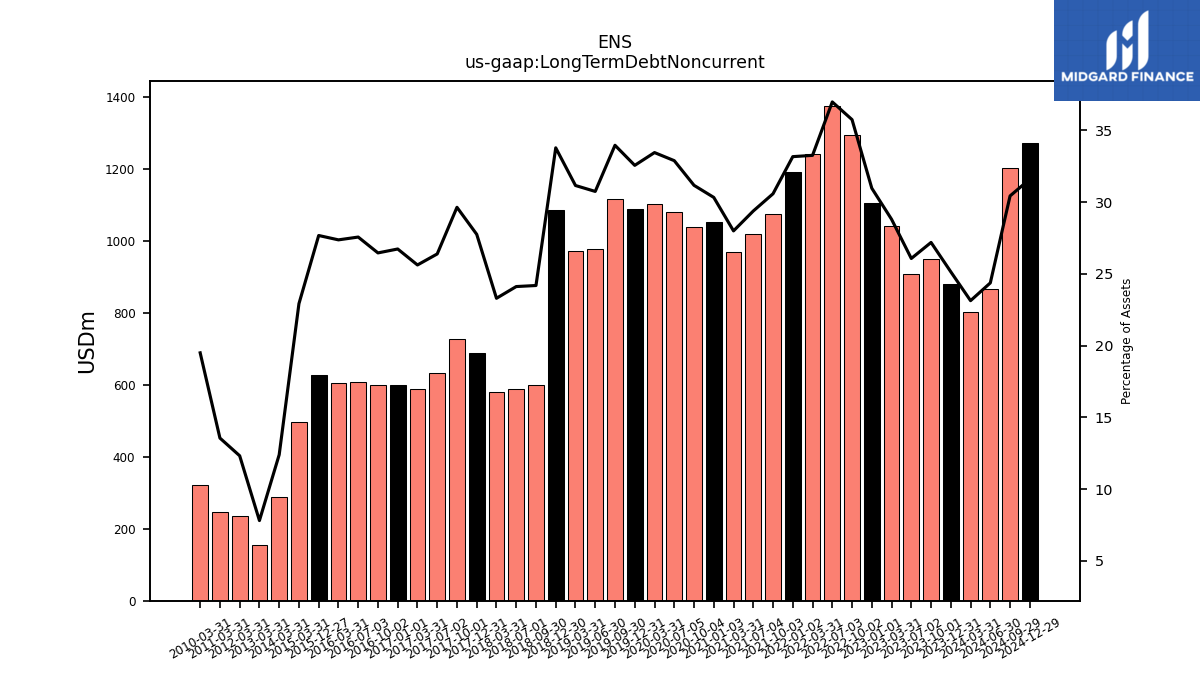
| Long Term Debt Noncurrent | 880.83 | 949.93 | 907.77 | 1041.99 | 1105.12 | 1295.83 | 1376.69 | 1243.00 | 1191.47 | 1075.99 | 1020.42 | 969.62 | 1054.19 | 1039.21 | 1080.51 | 1104.73 | 1088.25 | 1117.82 | 978.63 | 971.76 | 1087.34 | 599.66 | 589.35 | 579.53 | 689.02 | 728.61 | 634.21 | 587.61 | 600.56 | 599.41 | 607.82 | 606.22 | 626.67 | NA | NA | 495.94 | NA | NA | NA | 287.89 | NA | NA | NA | 155.27 | NA | NA | NA | 236.59 | NA | NA | NA | 247.95 | NA | NA | NA | 322.17 | NA | |
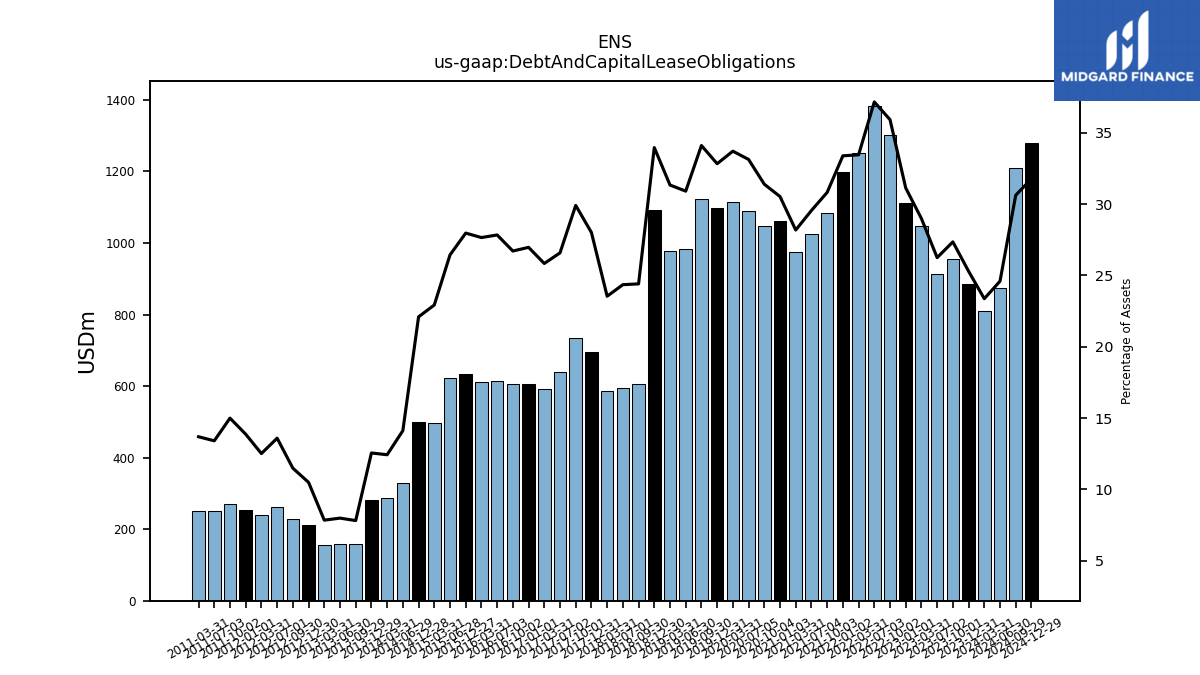
| Debt And Capital Lease Obligations | 886.03 | 955.54 | 913.78 | 1048.41 | 1110.93 | 1302.12 | 1383.47 | 1250.27 | 1199.22 | 1084.23 | 1026.32 | 976.04 | 1061.13 | 1046.66 | 1088.49 | 1113.22 | 1097.26 | 1122.62 | 983.81 | 977.32 | 1093.11 | 605.00 | 595.00 | 585.50 | 695.30 | 735.20 | 638.75 | 592.50 | 605.80 | 605.00 | 613.75 | 612.50 | 633.25 | NA | 622.18 | 495.94 | 499.16 | NA | 328.82 | 288.49 | 281.40 | 159.37 | 157.55 | 155.79 | 210.47 | 227.97 | 261.43 | 240.06 | 254.00 | 271.28 | 250.81 | 250.24 | NA | NA | NA | NA | NA | |
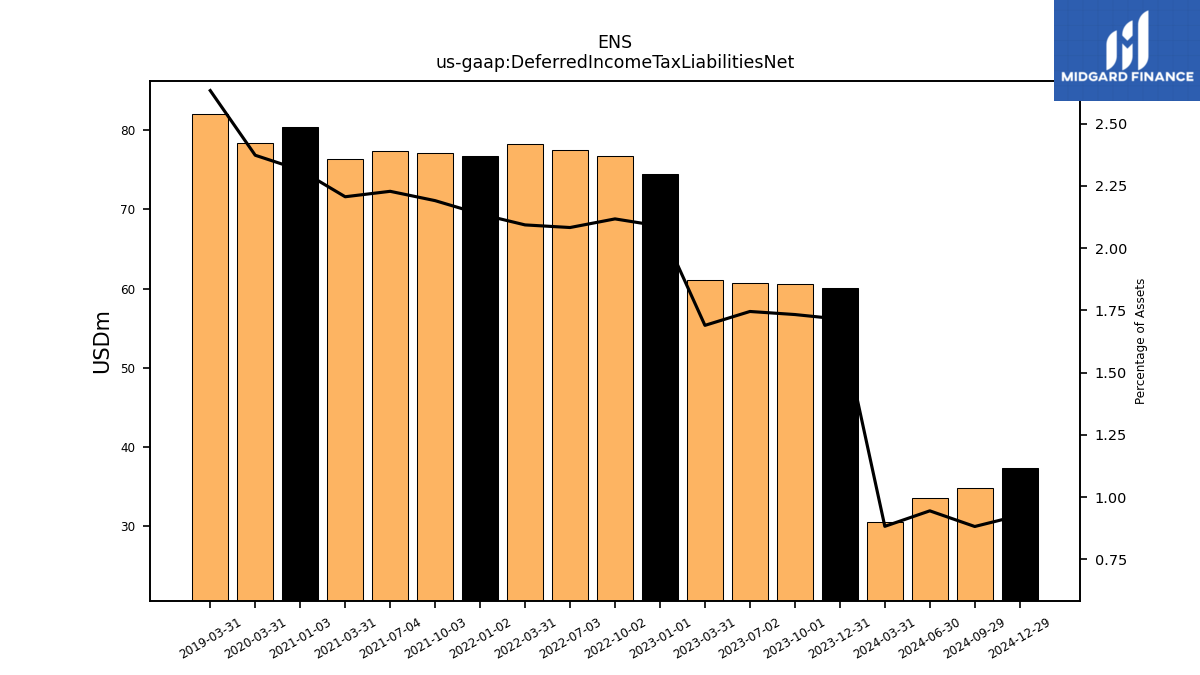
| Deferred Income Tax Liabilities Net | 60.06 | 60.55 | 60.77 | 61.12 | 74.53 | 76.75 | 77.53 | 78.23 | 76.76 | 77.07 | 77.38 | 76.41 | 80.42 | NA | NA | 78.36 | NA | NA | NA | 82.11 | NA | NA | NA | NA | NA | NA | NA | NA | NA | NA | NA | NA | NA | NA | NA | NA | NA | NA | NA | NA | NA | NA | NA | NA | NA | NA | NA | NA | NA | NA | NA | NA | NA | NA | NA | NA | NA | |
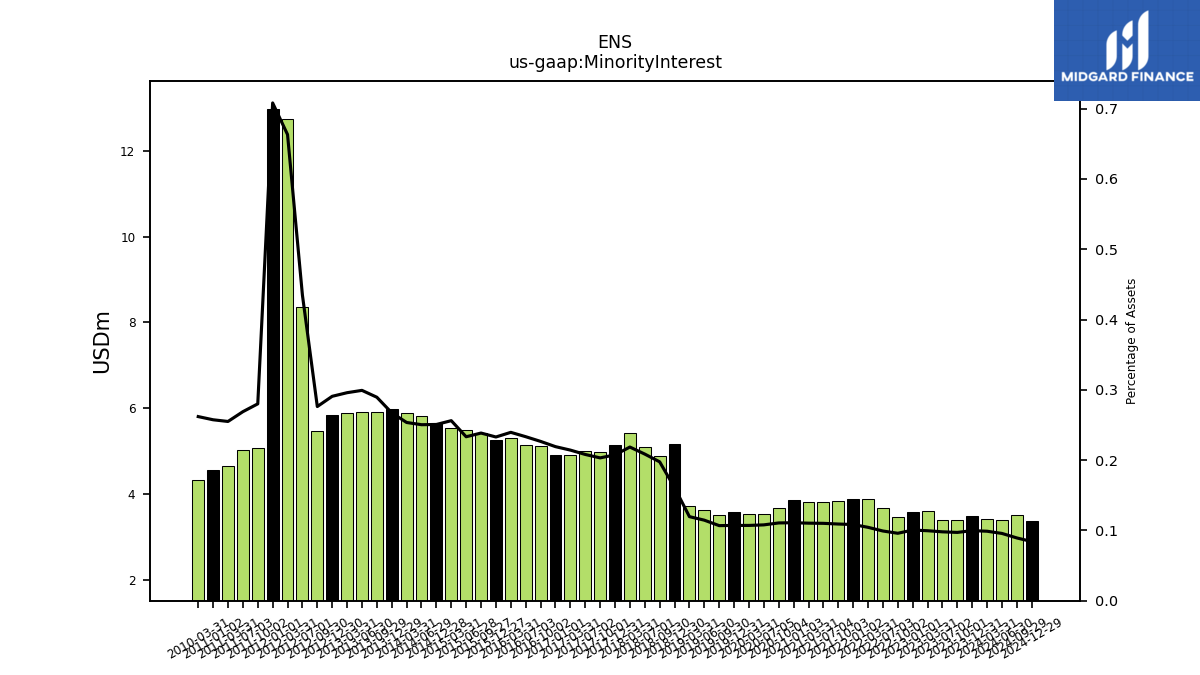
| Minority Interest | 3.49 | 3.40 | 3.41 | 3.60 | 3.59 | 3.48 | 3.69 | 3.90 | 3.89 | 3.84 | 3.82 | 3.82 | 3.86 | 3.69 | 3.54 | 3.54 | 3.58 | 3.52 | 3.65 | 3.73 | 5.18 | 4.90 | 5.10 | 5.44 | 5.15 | 4.99 | 5.00 | 4.91 | 4.92 | 5.13 | 5.14 | 5.30 | 5.27 | 5.43 | 5.49 | 5.54 | 5.66 | NA | 5.83 | 5.89 | 5.99 | 5.91 | 5.91 | 5.88 | 5.83 | 5.48 | 8.37 | 12.73 | 12.97 | 5.07 | 5.03 | 4.66 | 4.56 | NA | NA | 4.33 | NA | |
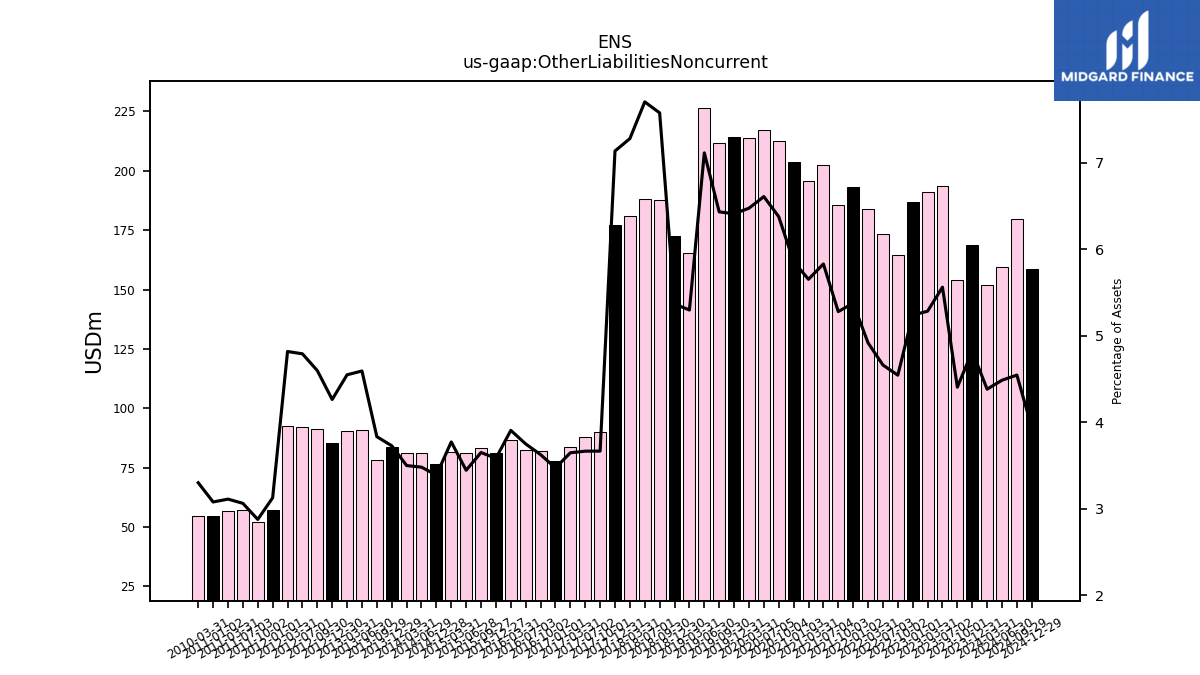
| Other Liabilities Noncurrent | 168.82 | 153.86 | 193.61 | 191.11 | 186.91 | 164.68 | 173.49 | 183.78 | 193.10 | 185.71 | 202.48 | 195.77 | 203.57 | 212.59 | 217.13 | 213.82 | 214.26 | 211.72 | 226.47 | 165.20 | 172.74 | 187.85 | 188.29 | 181.09 | 177.17 | 90.08 | 88.05 | 83.60 | 77.95 | 82.09 | 82.64 | 86.48 | 81.08 | 83.11 | 81.04 | 81.58 | 76.53 | NA | 81.06 | 81.22 | 83.57 | 78.22 | 90.67 | 90.42 | 85.54 | 91.27 | 92.19 | 92.47 | 57.25 | 52.01 | 57.28 | 56.85 | 54.47 | NA | NA | 54.50 | NA |
| 2023-12-31 | 2023-10-01 | 2023-07-02 | 2023-03-31 | 2023-01-01 | 2022-10-02 | 2022-07-03 | 2022-03-31 | 2022-01-02 | 2021-10-03 | 2021-07-04 | 2021-03-31 | 2021-01-03 | 2020-10-04 | 2020-07-05 | 2020-03-31 | 2019-12-31 | 2019-09-30 | 2019-06-30 | 2019-03-31 | 2018-12-30 | 2018-09-30 | 2018-07-01 | 2018-03-31 | 2017-12-31 | 2017-10-01 | 2017-07-02 | 2017-03-31 | 2017-01-01 | 2016-10-02 | 2016-07-03 | 2016-03-31 | 2015-12-27 | 2015-09-27 | 2015-06-28 | 2015-03-31 | 2014-12-28 | 2014-09-28 | 2014-06-29 | 2014-03-31 | 2013-12-29 | 2013-09-29 | 2013-06-30 | 2013-03-31 | 2012-12-30 | 2012-09-30 | 2012-07-01 | 2012-03-31 | 2012-01-01 | 2011-10-02 | 2011-07-03 | 2011-03-31 | 2011-01-02 | 2010-10-03 | 2010-07-04 | 2010-03-31 | 2009-12-27 | ||
|---|---|---|---|---|---|---|---|---|---|---|---|---|---|---|---|---|---|---|---|---|---|---|---|---|---|---|---|---|---|---|---|---|---|---|---|---|---|---|---|---|---|---|---|---|---|---|---|---|---|---|---|---|---|---|---|---|---|---|
| Stockholders Equity | 1726.53 | 1659.99 | 1679.77 | 1600.28 | 1527.76 | 1410.94 | 1435.08 | 1489.37 | 1504.12 | 1570.02 | 1563.60 | 1539.76 | 1527.56 | 1431.39 | 1361.63 | 1300.53 | 1366.10 | 1315.47 | 1292.93 | 1282.29 | 1309.10 | 1197.90 | 1171.34 | 1195.67 | 1120.82 | 1135.05 | 1162.79 | 1103.46 | 1054.56 | 1070.88 | 1025.14 | 1013.13 | 1037.14 | 1009.31 | 1092.18 | 1038.90 | 1122.14 | NA | 1237.12 | 1246.40 | 1264.91 | 1236.34 | 1179.41 | 1169.40 | 1163.88 | 1130.40 | 1046.08 | 1032.19 | 963.08 | 937.37 | 1020.65 | 974.33 | 903.28 | NA | NA | 779.90 | NA | |
| Stockholders Equity Including Portion Attributable To Noncontrolling Interest | 1730.03 | 1663.38 | 1683.18 | 1603.88 | 1531.35 | 1414.42 | 1438.77 | 1493.28 | 1508.01 | 1573.86 | 1567.43 | 1543.58 | 1531.41 | 1435.08 | 1365.17 | 1304.06 | 1369.67 | 1318.99 | 1296.57 | 1286.02 | 1314.28 | 1202.80 | 1176.43 | 1201.11 | 1125.97 | 1140.04 | 1167.79 | 1108.37 | 1059.48 | 1076.02 | 1030.29 | 1018.43 | 1042.41 | 1014.75 | 1097.67 | 1044.44 | 1127.80 | NA | 1242.95 | 1252.29 | 1270.90 | 1242.24 | 1185.31 | 1175.28 | 1169.72 | 1135.88 | 1054.44 | 1044.92 | 976.05 | 942.44 | 1025.68 | 978.99 | 907.84 | NA | NA | 784.22 | NA | |
| Common Stock Value | 0.56 | 0.56 | 0.56 | 0.56 | 0.56 | 0.56 | 0.56 | 0.56 | 0.56 | 0.56 | 0.56 | 0.56 | 0.55 | 0.55 | 0.55 | 0.55 | 0.55 | 0.55 | 0.55 | 0.55 | 0.55 | 0.55 | 0.55 | 0.55 | 0.55 | 0.55 | 0.55 | 0.54 | 0.54 | 0.54 | 0.54 | 0.54 | 0.54 | 0.55 | 0.55 | 0.54 | 0.54 | NA | 0.53 | 0.53 | 0.53 | 0.53 | 0.53 | 0.53 | 0.53 | 0.53 | 0.52 | 0.52 | 0.52 | 0.52 | 0.52 | 0.52 | 0.52 | NA | NA | 0.50 | NA | |
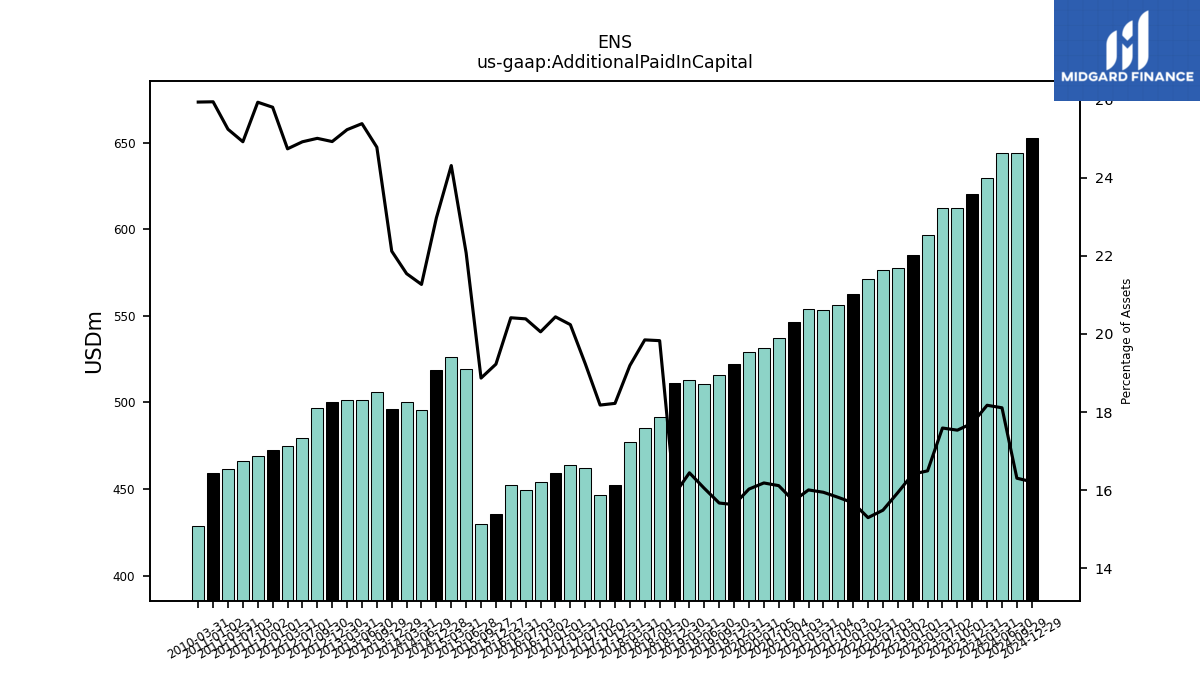
| Additional Paid In Capital | 620.41 | 612.49 | 612.29 | 596.46 | 585.41 | 577.52 | 576.29 | 571.46 | 562.80 | 556.20 | 553.63 | 554.17 | 546.38 | 537.09 | 531.55 | 529.10 | 522.15 | 515.60 | 510.58 | 512.70 | 511.44 | 491.47 | 484.96 | 477.29 | 452.25 | 446.79 | 462.30 | 464.09 | 459.06 | 454.20 | 449.45 | 452.10 | 435.29 | 429.75 | 519.51 | 525.97 | 519.01 | NA | 495.49 | 500.25 | 496.06 | 505.90 | 501.33 | 501.65 | 500.31 | 496.61 | 479.58 | 474.92 | 472.82 | 469.33 | 466.47 | 461.60 | 459.43 | NA | NA | 428.58 | NA | |
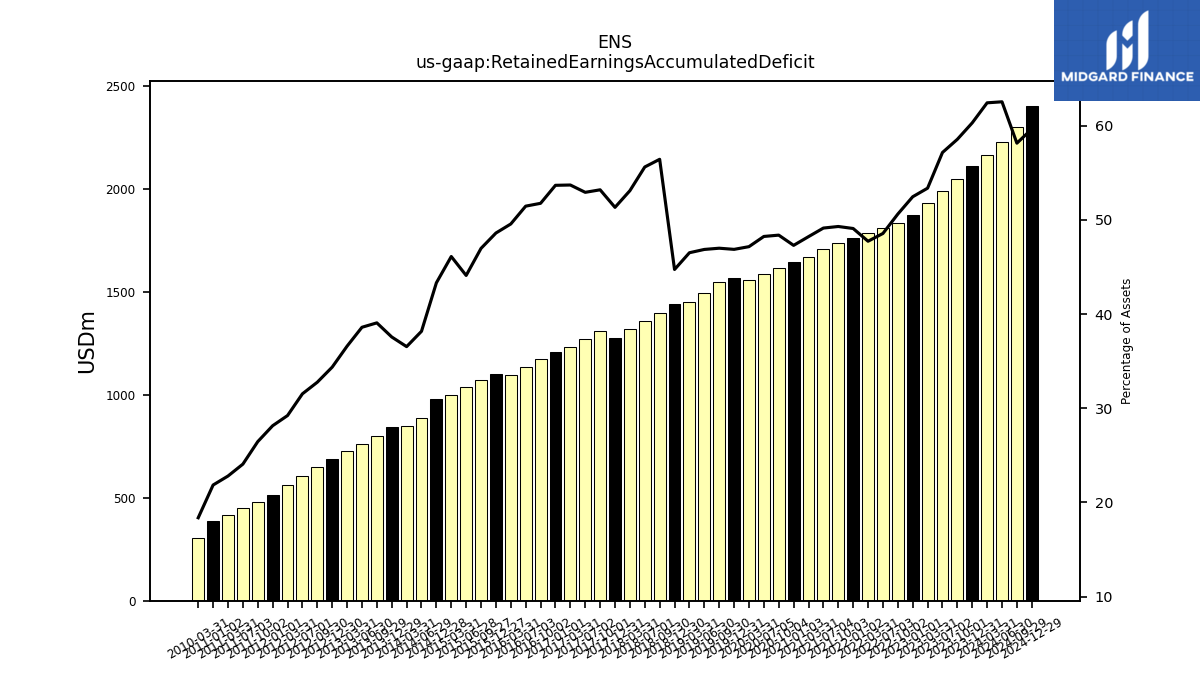
| Retained Earnings Accumulated Deficit | 2112.26 | 2045.42 | 1989.59 | 1930.15 | 1871.52 | 1834.44 | 1807.28 | 1783.59 | 1762.84 | 1734.06 | 1706.07 | 1669.75 | 1643.58 | 1612.64 | 1584.56 | 1556.98 | 1566.12 | 1546.42 | 1491.33 | 1450.33 | 1439.45 | 1398.76 | 1358.90 | 1320.55 | 1274.04 | 1307.42 | 1271.74 | 1231.44 | 1205.46 | 1172.28 | 1134.43 | 1097.64 | 1100.40 | 1069.87 | 1037.80 | 997.38 | 978.54 | NA | 889.19 | 848.41 | 842.34 | 797.33 | 762.08 | 727.35 | 689.62 | 650.43 | 606.64 | 560.84 | 515.48 | 478.62 | 450.33 | 416.84 | 386.75 | NA | NA | 303.41 | NA | |
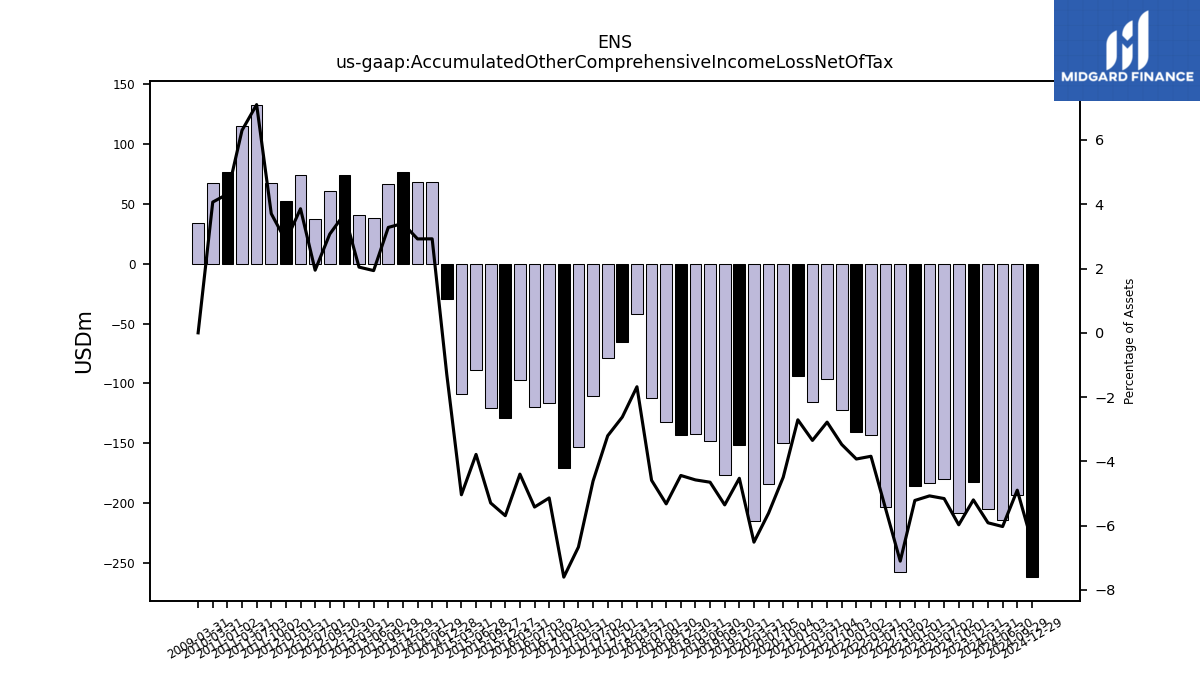
| Accumulated Other Comprehensive Income Loss Net Of Tax | -182.05 | -208.61 | -179.48 | -183.47 | -186.07 | -257.41 | -203.65 | -143.50 | -140.99 | -122.15 | -96.47 | -115.88 | -94.03 | -149.77 | -184.23 | -215.01 | -151.23 | -176.15 | -147.90 | -142.68 | -142.81 | -131.88 | -112.08 | -41.72 | -65.02 | -78.73 | -110.80 | -152.82 | -170.71 | -116.35 | -119.48 | -97.35 | -128.79 | -120.56 | -89.02 | -108.97 | -29.28 | NA | 68.13 | 67.84 | 76.33 | 66.94 | 38.23 | 40.66 | 74.20 | 61.01 | 37.51 | 74.09 | 52.44 | 67.08 | 132.88 | 115.18 | 76.40 | NA | NA | 67.20 | NA | |
| Minority Interest | 3.49 | 3.40 | 3.41 | 3.60 | 3.59 | 3.48 | 3.69 | 3.90 | 3.89 | 3.84 | 3.82 | 3.82 | 3.86 | 3.69 | 3.54 | 3.54 | 3.58 | 3.52 | 3.65 | 3.73 | 5.18 | 4.90 | 5.10 | 5.44 | 5.15 | 4.99 | 5.00 | 4.91 | 4.92 | 5.13 | 5.14 | 5.30 | 5.27 | 5.43 | 5.49 | 5.54 | 5.66 | NA | 5.83 | 5.89 | 5.99 | 5.91 | 5.91 | 5.88 | 5.83 | 5.48 | 8.37 | 12.73 | 12.97 | 5.07 | 5.03 | 4.66 | 4.56 | NA | NA | 4.33 | NA | |
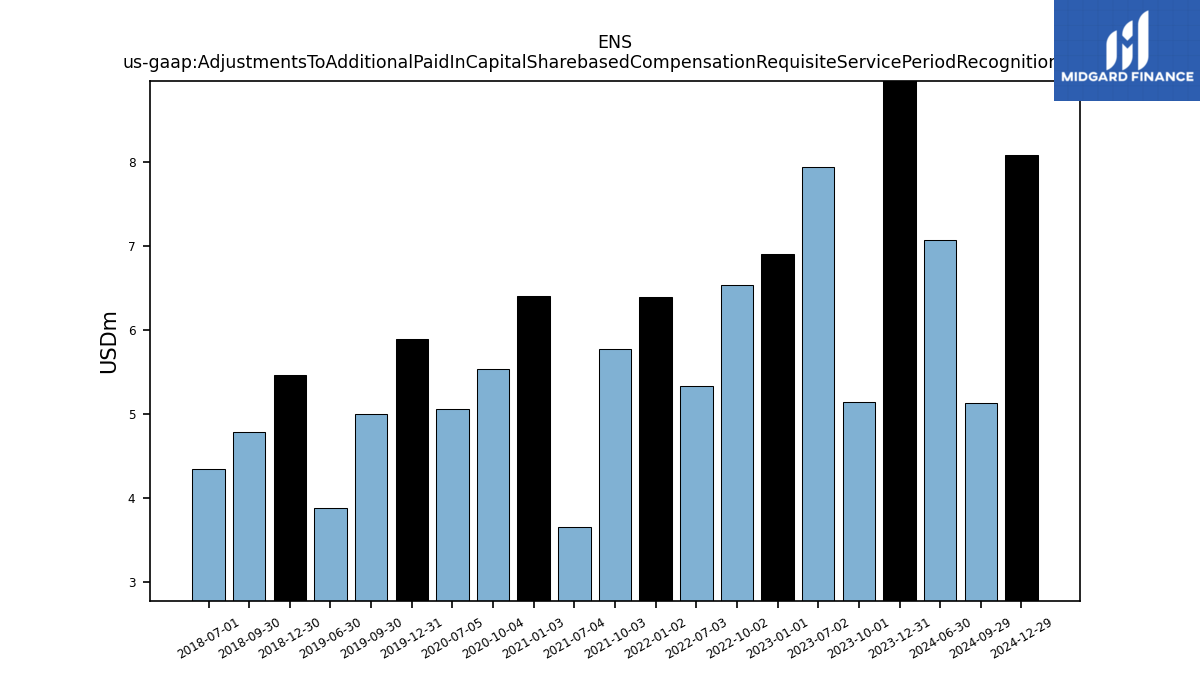
| Adjustments To Additional Paid In Capital Sharebased Compensation Requisite Service Period Recognition Value | 9.82 | 5.14 | 7.93 | NA | 6.91 | 6.53 | 5.33 | NA | 6.39 | 5.76 | 3.66 | NA | 6.40 | 5.53 | 5.05 | NA | 5.89 | 4.99 | 3.87 | NA | 5.46 | 4.79 | 4.34 | NA | NA | NA | NA | NA | NA | NA | NA | NA | NA | NA | NA | NA | NA | NA | NA | NA | NA | NA | NA | NA | NA | NA | NA | NA | NA | NA | NA | NA | NA | NA | NA | NA | NA |
| 2023-12-31 | 2023-10-01 | 2023-07-02 | 2023-03-31 | 2023-01-01 | 2022-10-02 | 2022-07-03 | 2022-03-31 | 2022-01-02 | 2021-10-03 | 2021-07-04 | 2021-03-31 | 2021-01-03 | 2020-10-04 | 2020-07-05 | 2020-03-31 | 2019-12-31 | 2019-09-30 | 2019-06-30 | 2019-03-31 | 2018-12-30 | 2018-09-30 | 2018-07-01 | 2018-03-31 | 2017-12-31 | 2017-10-01 | 2017-07-02 | 2017-03-31 | 2017-01-01 | 2016-10-02 | 2016-07-03 | 2016-03-31 | 2015-12-27 | 2015-09-27 | 2015-06-28 | 2015-03-31 | 2014-12-28 | 2014-09-28 | 2014-06-29 | 2014-03-31 | 2013-12-29 | 2013-09-29 | 2013-06-30 | 2013-03-31 | 2012-12-30 | 2012-09-30 | 2012-07-01 | 2012-03-31 | 2012-01-01 | 2011-10-02 | 2011-07-03 | 2011-03-31 | 2011-01-02 | 2010-10-03 | 2010-07-04 | 2010-03-31 | 2009-12-27 | ||
|---|---|---|---|---|---|---|---|---|---|---|---|---|---|---|---|---|---|---|---|---|---|---|---|---|---|---|---|---|---|---|---|---|---|---|---|---|---|---|---|---|---|---|---|---|---|---|---|---|---|---|---|---|---|---|---|---|---|---|
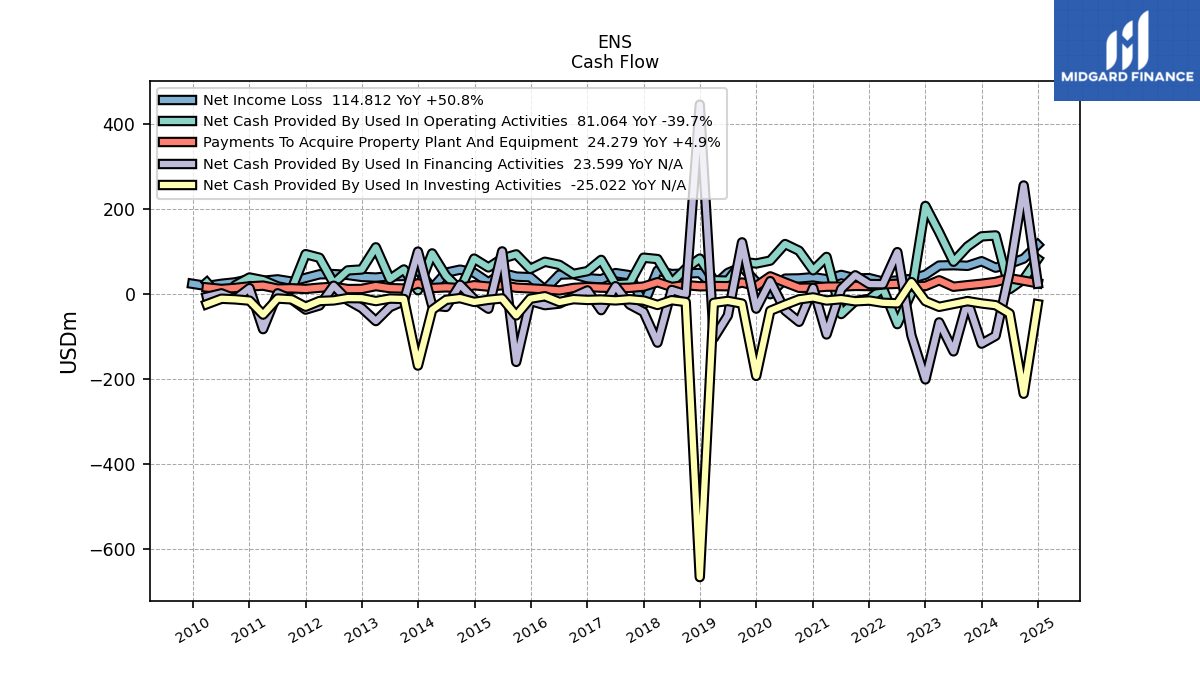
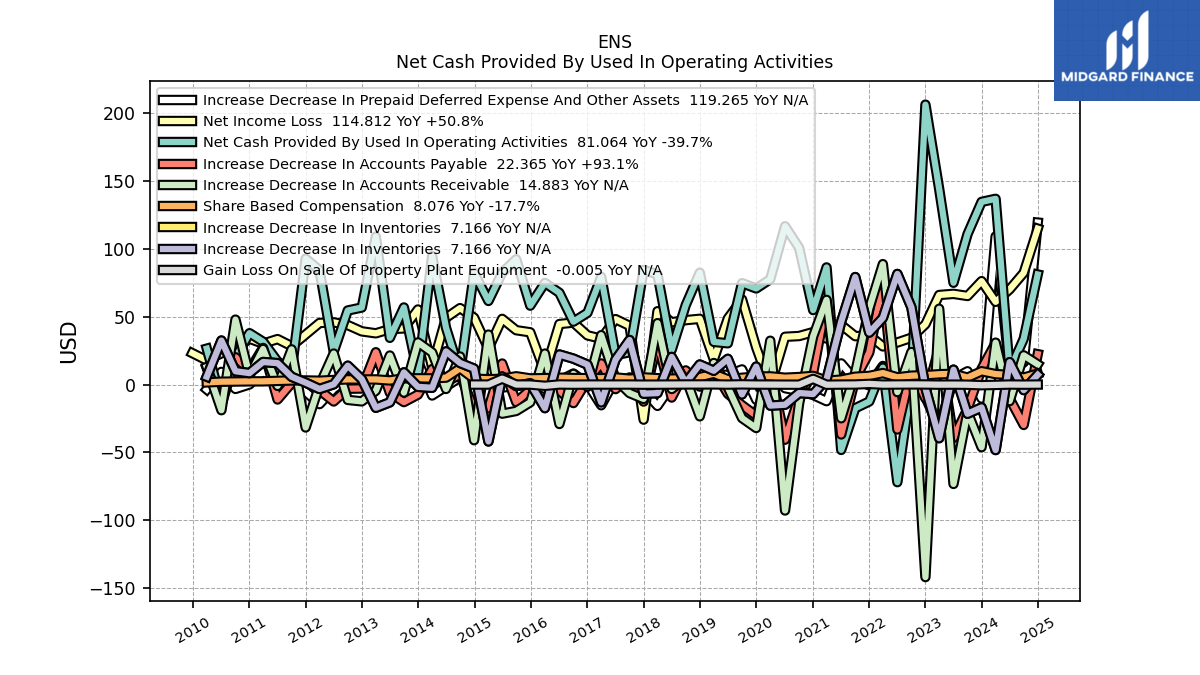
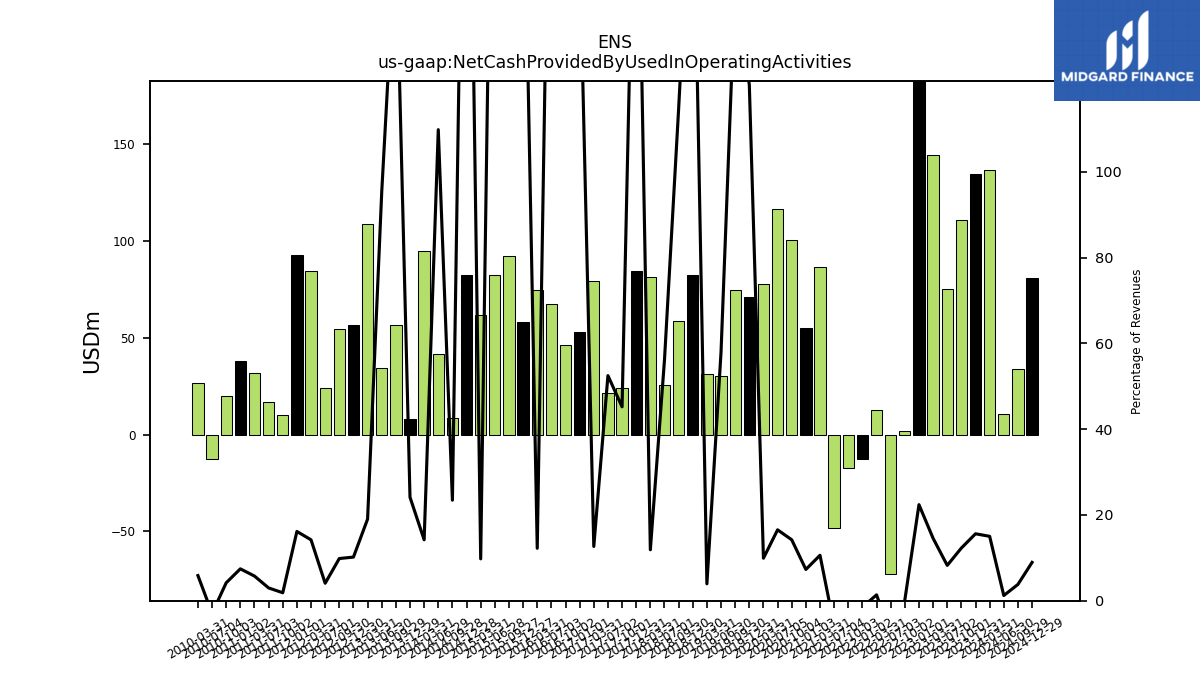
| Net Cash Provided By Used In Operating Activities | 134.52 | 110.78 | 74.95 | 144.09 | 206.14 | 1.59 | -71.89 | 12.45 | -12.46 | -17.43 | -48.14 | 86.28 | 54.83 | 100.71 | 116.56 | 77.57 | 70.77 | 74.68 | 30.38 | 31.43 | 82.39 | 58.46 | 25.58 | 81.15 | 84.44 | 23.84 | 21.62 | 79.32 | 52.83 | 46.32 | 67.56 | 74.86 | 58.09 | 92.29 | 82.33 | 61.56 | 82.35 | 8.74 | 41.82 | 94.57 | 7.87 | 56.78 | 34.39 | 108.90 | 56.73 | 54.55 | 24.21 | 84.21 | 92.76 | 10.22 | 17.00 | 31.55 | 37.84 | 19.81 | -12.74 | 26.45 | NA | |
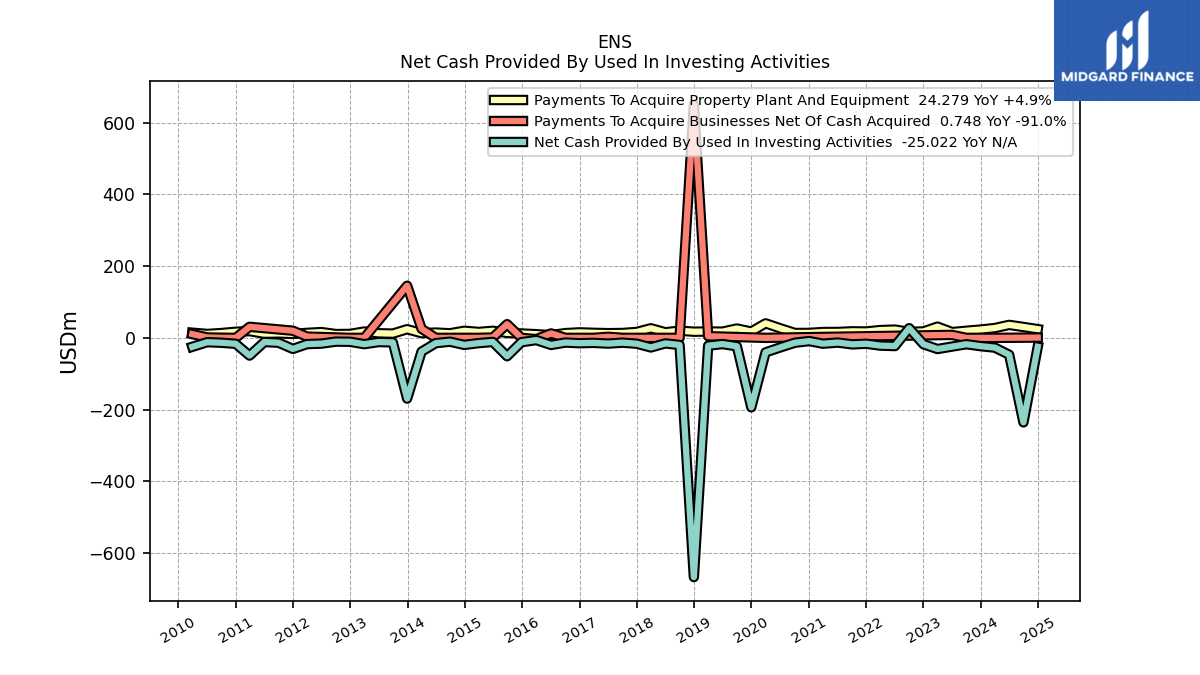
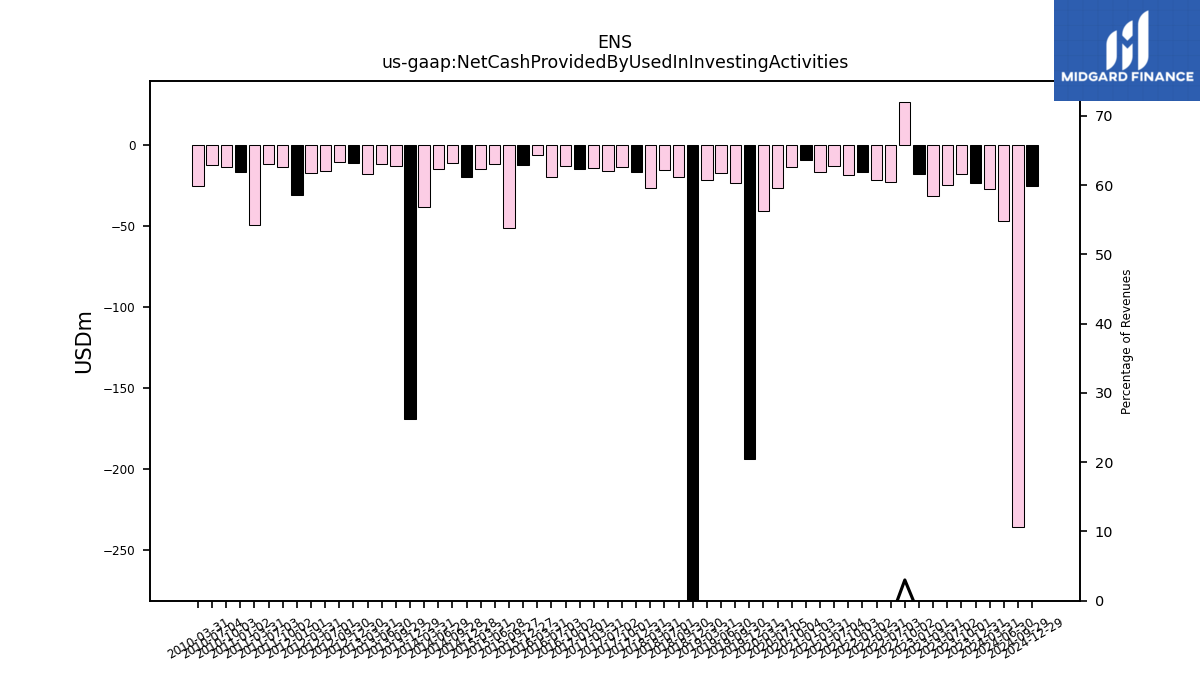
| Net Cash Provided By Used In Investing Activities | -23.12 | -17.80 | -24.32 | -31.13 | -17.78 | 26.98 | -22.88 | -21.58 | -16.43 | -18.10 | -13.12 | -16.25 | -8.97 | -13.54 | -26.28 | -40.46 | -193.63 | -23.46 | -17.27 | -21.76 | -666.81 | -19.78 | -15.53 | -26.70 | -16.29 | -13.36 | -16.00 | -14.00 | -14.92 | -13.11 | -19.80 | -6.19 | -12.09 | -51.27 | -11.37 | -14.61 | -19.60 | -10.68 | -14.73 | -38.33 | -169.35 | -12.63 | -11.70 | -17.58 | -10.93 | -10.54 | -16.05 | -17.44 | -30.79 | -13.56 | -11.63 | -49.42 | -16.55 | -13.63 | -12.07 | -25.00 | NA | |
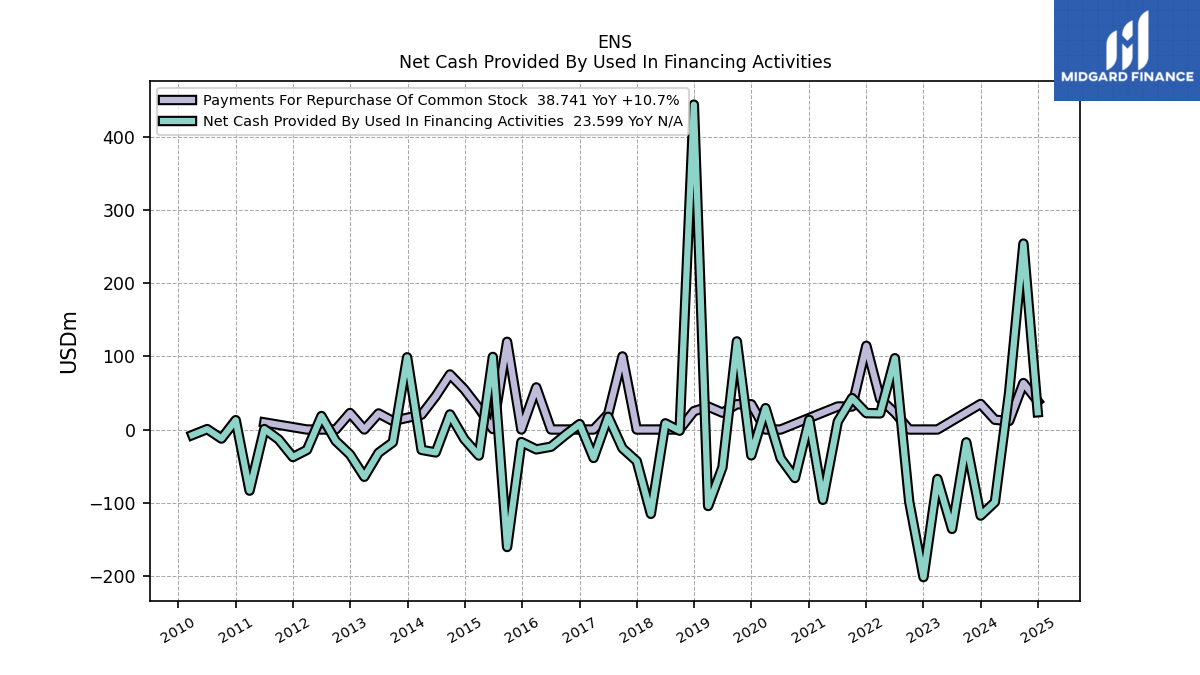
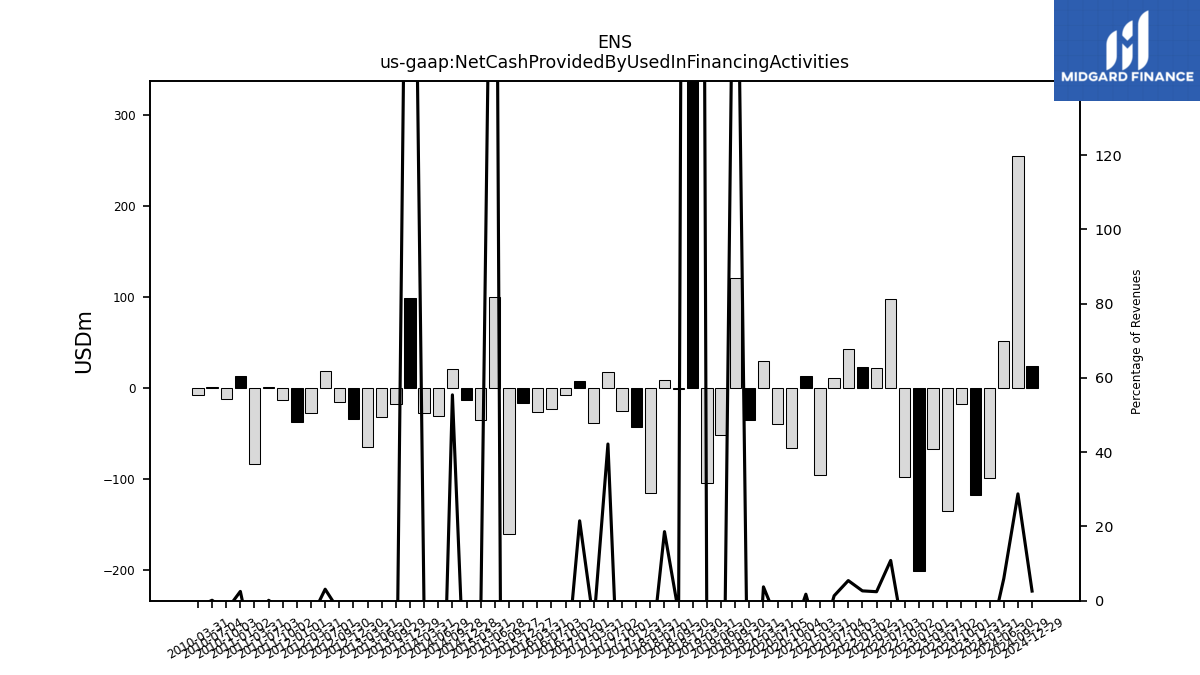
| Net Cash Provided By Used In Financing Activities | -117.76 | -17.52 | -135.95 | -67.65 | -201.91 | -98.43 | 97.54 | 22.09 | 22.44 | 42.99 | 10.91 | -96.15 | 13.22 | -66.34 | -39.46 | 29.25 | -35.38 | 120.56 | -51.74 | -104.64 | 444.41 | -1.67 | 8.48 | -115.37 | -43.26 | -25.65 | 17.38 | -38.94 | 7.47 | -7.55 | -23.52 | -27.16 | -17.17 | -160.71 | 99.31 | -35.63 | -13.01 | 20.68 | -31.35 | -27.86 | 98.79 | -17.51 | -31.86 | -64.66 | -34.16 | -15.60 | 18.46 | -27.84 | -37.67 | -13.55 | 0.68 | -83.65 | 12.81 | -12.41 | 0.58 | -7.57 | NA |
| 2023-12-31 | 2023-10-01 | 2023-07-02 | 2023-03-31 | 2023-01-01 | 2022-10-02 | 2022-07-03 | 2022-03-31 | 2022-01-02 | 2021-10-03 | 2021-07-04 | 2021-03-31 | 2021-01-03 | 2020-10-04 | 2020-07-05 | 2020-03-31 | 2019-12-31 | 2019-09-30 | 2019-06-30 | 2019-03-31 | 2018-12-30 | 2018-09-30 | 2018-07-01 | 2018-03-31 | 2017-12-31 | 2017-10-01 | 2017-07-02 | 2017-03-31 | 2017-01-01 | 2016-10-02 | 2016-07-03 | 2016-03-31 | 2015-12-27 | 2015-09-27 | 2015-06-28 | 2015-03-31 | 2014-12-28 | 2014-09-28 | 2014-06-29 | 2014-03-31 | 2013-12-29 | 2013-09-29 | 2013-06-30 | 2013-03-31 | 2012-12-30 | 2012-09-30 | 2012-07-01 | 2012-03-31 | 2012-01-01 | 2011-10-02 | 2011-07-03 | 2011-03-31 | 2011-01-02 | 2010-10-03 | 2010-07-04 | 2010-03-31 | 2009-12-27 | ||
|---|---|---|---|---|---|---|---|---|---|---|---|---|---|---|---|---|---|---|---|---|---|---|---|---|---|---|---|---|---|---|---|---|---|---|---|---|---|---|---|---|---|---|---|---|---|---|---|---|---|---|---|---|---|---|---|---|---|---|
| Net Cash Provided By Used In Operating Activities | 134.52 | 110.78 | 74.95 | 144.09 | 206.14 | 1.59 | -71.89 | 12.45 | -12.46 | -17.43 | -48.14 | 86.28 | 54.83 | 100.71 | 116.56 | 77.57 | 70.77 | 74.68 | 30.38 | 31.43 | 82.39 | 58.46 | 25.58 | 81.15 | 84.44 | 23.84 | 21.62 | 79.32 | 52.83 | 46.32 | 67.56 | 74.86 | 58.09 | 92.29 | 82.33 | 61.56 | 82.35 | 8.74 | 41.82 | 94.57 | 7.87 | 56.78 | 34.39 | 108.90 | 56.73 | 54.55 | 24.21 | 84.21 | 92.76 | 10.22 | 17.00 | 31.55 | 37.84 | 19.81 | -12.74 | 26.45 | NA | |
| Net Income Loss | 76.16 | 65.23 | 66.80 | 65.95 | 44.41 | 34.47 | 30.98 | 28.09 | 36.26 | 35.63 | 43.93 | 33.84 | 38.62 | 35.73 | 35.18 | -1.52 | 27.30 | 62.70 | 48.64 | 18.54 | 48.42 | 47.42 | 45.86 | 54.02 | -25.85 | 43.22 | 48.20 | 33.77 | 36.23 | 45.64 | 44.57 | 9.26 | 38.48 | 40.02 | 48.39 | 26.45 | 49.25 | 56.32 | 49.17 | 12.84 | 55.30 | 41.34 | 40.85 | 37.73 | 39.18 | 43.79 | 45.80 | 45.36 | 36.86 | 28.29 | 33.50 | 30.09 | 33.76 | 26.55 | 23.03 | 17.83 | 23.16 | |
| Profit Loss | 76.16 | 65.23 | 66.80 | 65.95 | 44.41 | 34.47 | 30.98 | 28.09 | 36.26 | 35.63 | 43.93 | 33.84 | 38.62 | 35.73 | 35.18 | -1.52 | 27.30 | 62.70 | 48.64 | 18.55 | 48.61 | 47.45 | 46.02 | 54.14 | -25.78 | 43.15 | 48.32 | 33.72 | 37.09 | 42.79 | 44.62 | 5.91 | 38.21 | 39.77 | 47.93 | 26.53 | 49.33 | 56.55 | 49.12 | 12.81 | 52.39 | 41.15 | 40.42 | 37.71 | 38.68 | 43.01 | 45.56 | 45.32 | 36.86 | 28.29 | 33.50 | 30.09 | 33.76 | 26.55 | 23.03 | NA | NA | |
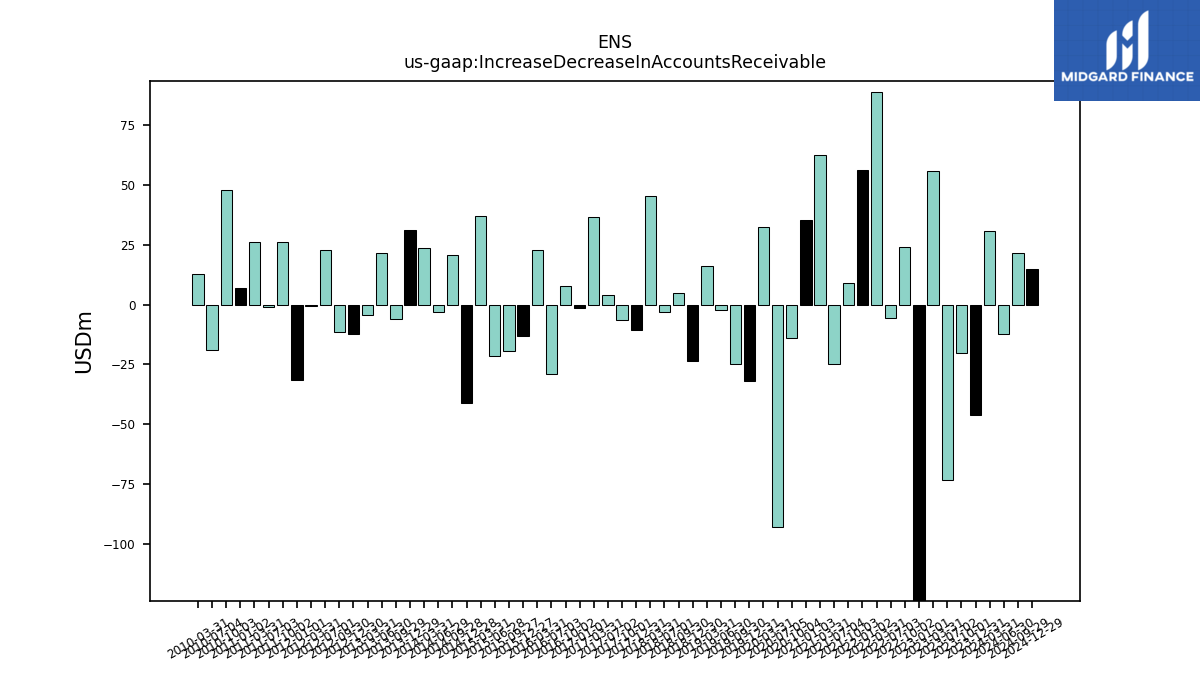
| Increase Decrease In Accounts Receivable | -46.14 | -20.17 | -73.20 | 55.84 | -141.81 | 23.95 | -5.54 | 88.69 | 56.18 | 8.92 | -24.83 | 62.36 | 35.50 | -13.83 | -92.75 | 32.29 | -32.02 | -24.67 | -2.10 | 15.89 | -23.42 | 4.84 | -3.28 | 45.23 | -10.57 | -6.30 | 3.89 | 36.38 | -1.67 | 7.86 | -29.04 | 22.83 | -13.07 | -19.45 | -21.45 | 36.81 | -40.98 | 20.68 | -3.26 | 23.59 | 31.04 | -5.89 | 21.39 | -4.57 | -12.38 | -11.31 | 22.84 | -0.44 | -31.61 | 25.93 | -0.98 | 26.19 | 6.77 | 47.84 | -18.91 | 12.86 | NA | |
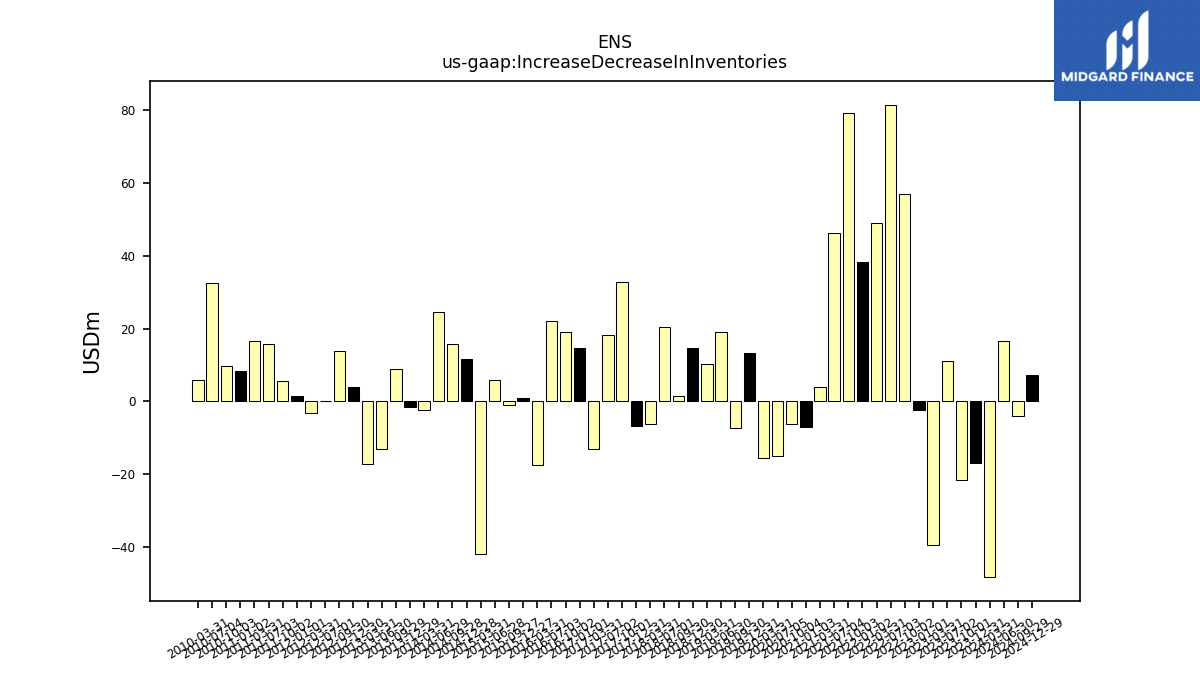
| Increase Decrease In Inventories | -16.87 | -21.49 | 10.96 | -39.49 | -2.42 | 56.87 | 81.45 | 49.09 | 38.27 | 79.17 | 46.31 | 3.89 | -6.99 | -6.23 | -14.85 | -15.51 | 13.20 | -7.25 | 18.94 | 10.17 | 14.75 | 1.35 | 20.34 | -6.31 | -6.70 | 32.81 | 18.28 | -13.10 | 14.68 | 19.09 | 22.12 | -17.37 | 0.91 | -1.12 | 5.92 | -41.90 | 11.75 | 15.88 | 24.42 | -2.37 | -1.67 | 8.98 | -13.08 | -17.10 | 3.94 | 13.89 | 0.19 | -3.25 | 1.43 | 5.72 | 15.75 | 16.61 | 8.42 | 9.81 | 32.40 | 5.82 | NA | |
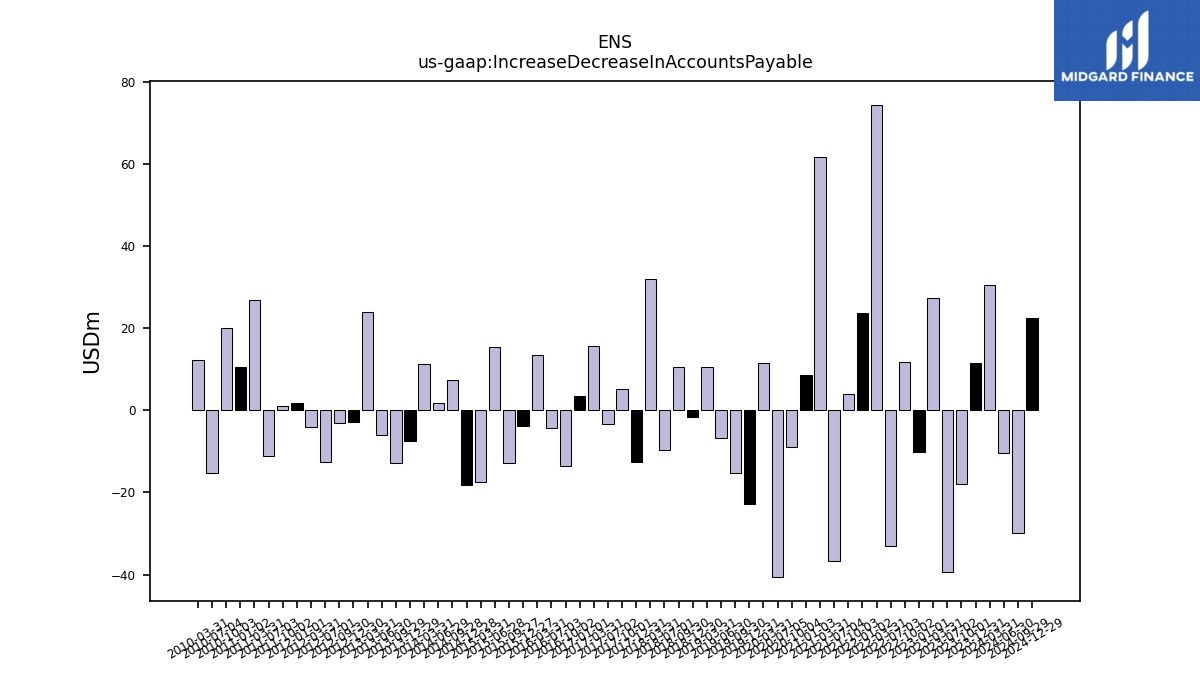
| Increase Decrease In Accounts Payable | 11.58 | -17.93 | -39.31 | 27.38 | -10.20 | 11.66 | -33.07 | 74.40 | 23.61 | 4.05 | -36.75 | 61.73 | 8.62 | -8.95 | -40.61 | 11.39 | -22.88 | -15.21 | -6.80 | 10.59 | -1.51 | 10.44 | -9.58 | 31.89 | -12.53 | 5.26 | -3.35 | 15.55 | 3.36 | -13.63 | -4.43 | 13.42 | -3.82 | -12.93 | 15.50 | -17.44 | -18.21 | 7.39 | 1.76 | 11.37 | -7.41 | -12.92 | -6.02 | 23.81 | -2.91 | -3.06 | -12.47 | -4.14 | 1.69 | 1.10 | -11.02 | 26.96 | 10.51 | 20.12 | -15.16 | 12.24 | NA | |
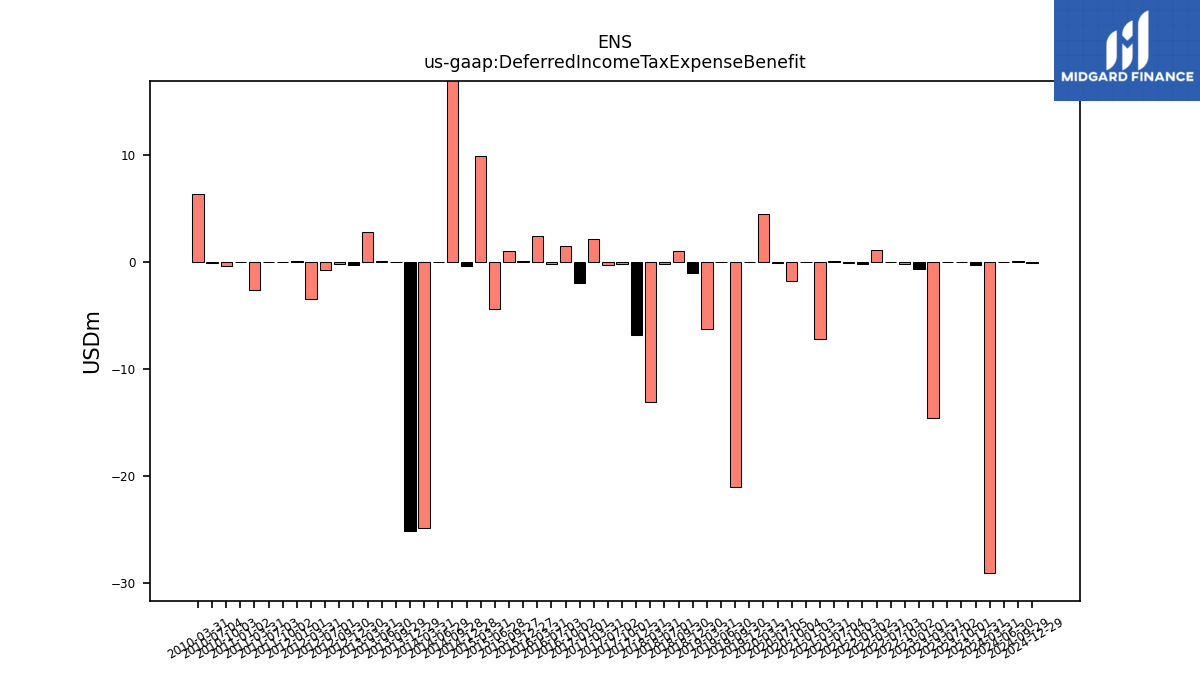
| Deferred Income Tax Expense Benefit | -0.30 | 0.00 | 0.04 | -14.52 | -0.59 | -0.15 | 0.02 | 1.14 | -0.13 | -0.04 | 0.14 | -7.21 | 0.04 | -1.77 | -0.05 | 4.46 | 0.03 | -21.01 | 0.04 | -6.23 | -1.05 | 1.02 | -0.20 | -13.09 | -6.78 | -0.20 | -0.24 | 2.14 | -1.96 | 1.48 | -0.20 | 2.50 | 0.07 | 1.03 | -4.35 | 9.94 | -0.32 | 22.21 | 0.06 | -24.81 | -25.09 | -0.01 | 0.15 | 2.81 | -0.23 | -0.20 | -0.71 | -3.40 | 0.13 | -0.00 | 0.05 | -2.63 | 0.01 | -0.38 | -0.07 | 6.39 | NA | |
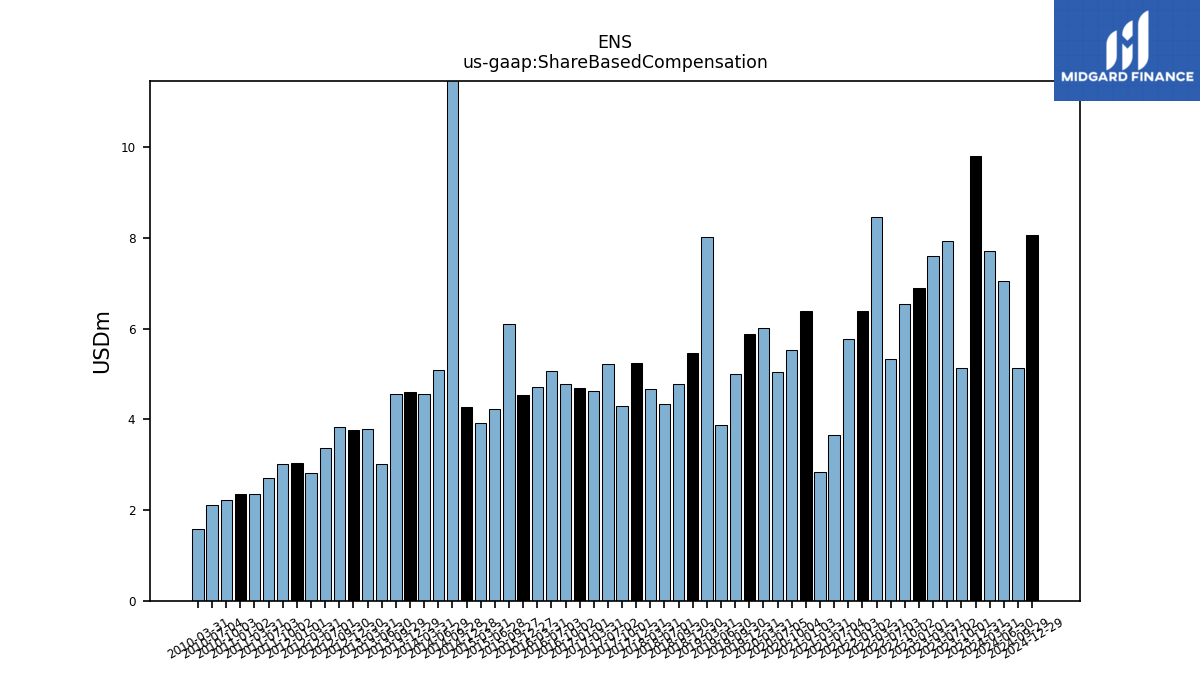
| Share Based Compensation | 9.82 | 5.14 | 7.93 | 7.60 | 6.91 | 6.53 | 5.33 | 8.47 | 6.39 | 5.76 | 3.66 | 2.83 | 6.40 | 5.53 | 5.05 | 6.02 | 5.89 | 4.99 | 3.87 | 8.02 | 5.46 | 4.79 | 4.34 | 4.68 | 5.25 | 4.29 | 5.23 | 4.63 | 4.70 | 4.79 | 5.07 | 4.72 | 4.54 | 6.10 | 4.24 | 3.92 | 4.28 | 11.96 | 5.10 | 4.56 | 4.59 | 4.57 | 3.02 | 3.78 | 3.76 | 3.83 | 3.37 | 2.82 | 3.03 | 3.02 | 2.72 | 2.36 | 2.36 | 2.23 | 2.11 | 1.59 | NA |
| 2023-12-31 | 2023-10-01 | 2023-07-02 | 2023-03-31 | 2023-01-01 | 2022-10-02 | 2022-07-03 | 2022-03-31 | 2022-01-02 | 2021-10-03 | 2021-07-04 | 2021-03-31 | 2021-01-03 | 2020-10-04 | 2020-07-05 | 2020-03-31 | 2019-12-31 | 2019-09-30 | 2019-06-30 | 2019-03-31 | 2018-12-30 | 2018-09-30 | 2018-07-01 | 2018-03-31 | 2017-12-31 | 2017-10-01 | 2017-07-02 | 2017-03-31 | 2017-01-01 | 2016-10-02 | 2016-07-03 | 2016-03-31 | 2015-12-27 | 2015-09-27 | 2015-06-28 | 2015-03-31 | 2014-12-28 | 2014-09-28 | 2014-06-29 | 2014-03-31 | 2013-12-29 | 2013-09-29 | 2013-06-30 | 2013-03-31 | 2012-12-30 | 2012-09-30 | 2012-07-01 | 2012-03-31 | 2012-01-01 | 2011-10-02 | 2011-07-03 | 2011-03-31 | 2011-01-02 | 2010-10-03 | 2010-07-04 | 2010-03-31 | 2009-12-27 | ||
|---|---|---|---|---|---|---|---|---|---|---|---|---|---|---|---|---|---|---|---|---|---|---|---|---|---|---|---|---|---|---|---|---|---|---|---|---|---|---|---|---|---|---|---|---|---|---|---|---|---|---|---|---|---|---|---|---|---|---|
| Net Cash Provided By Used In Investing Activities | -23.12 | -17.80 | -24.32 | -31.13 | -17.78 | 26.98 | -22.88 | -21.58 | -16.43 | -18.10 | -13.12 | -16.25 | -8.97 | -13.54 | -26.28 | -40.46 | -193.63 | -23.46 | -17.27 | -21.76 | -666.81 | -19.78 | -15.53 | -26.70 | -16.29 | -13.36 | -16.00 | -14.00 | -14.92 | -13.11 | -19.80 | -6.19 | -12.09 | -51.27 | -11.37 | -14.61 | -19.60 | -10.68 | -14.73 | -38.33 | -169.35 | -12.63 | -11.70 | -17.58 | -10.93 | -10.54 | -16.05 | -17.44 | -30.79 | -13.56 | -11.63 | -49.42 | -16.55 | -13.63 | -12.07 | -25.00 | NA | |
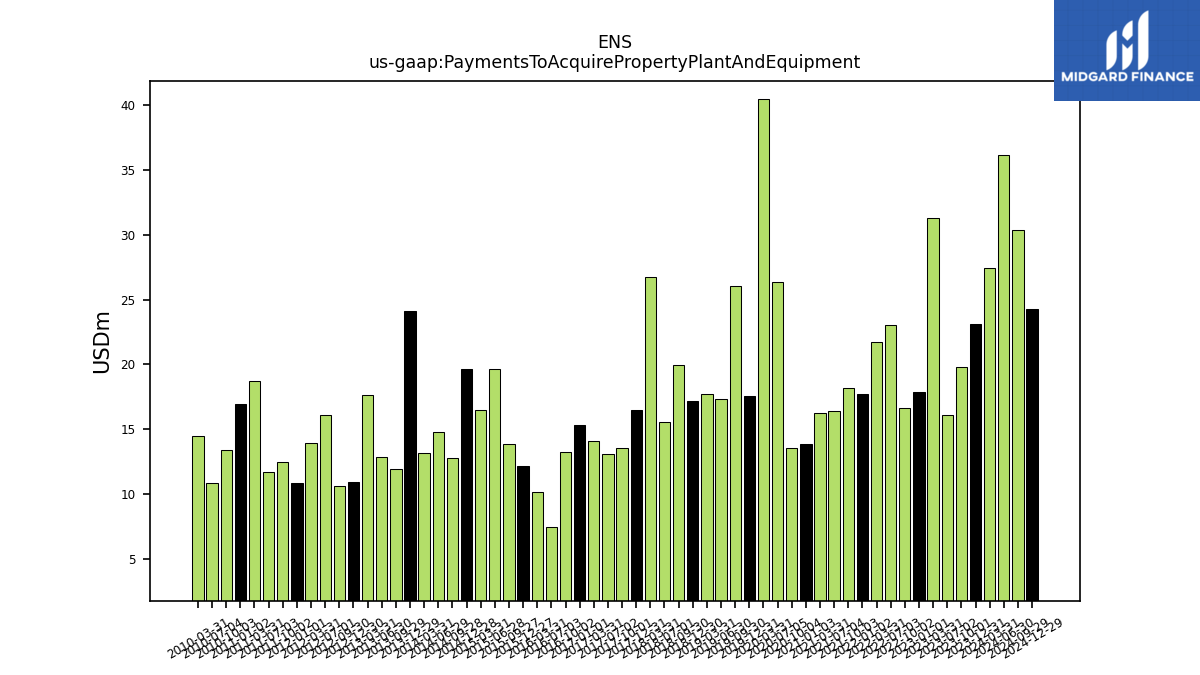
| Payments To Acquire Property Plant And Equipment | 23.15 | 19.76 | 16.09 | 31.26 | 17.86 | 16.64 | 23.01 | 21.69 | 17.73 | 18.19 | 16.43 | 16.28 | 13.84 | 13.57 | 26.33 | 40.49 | 17.56 | 26.06 | 17.32 | 17.70 | 17.17 | 19.96 | 15.54 | 26.75 | 16.45 | 13.54 | 13.10 | 14.06 | 15.29 | 13.23 | 7.49 | 10.19 | 12.18 | 13.85 | 19.67 | 16.44 | 19.67 | 12.75 | 14.76 | 13.14 | 24.12 | 11.91 | 12.83 | 17.66 | 10.95 | 10.61 | 16.06 | 13.91 | 10.88 | 12.48 | 11.67 | 18.74 | 16.95 | 13.38 | 10.87 | 14.45 | NA |
| 2023-12-31 | 2023-10-01 | 2023-07-02 | 2023-03-31 | 2023-01-01 | 2022-10-02 | 2022-07-03 | 2022-03-31 | 2022-01-02 | 2021-10-03 | 2021-07-04 | 2021-03-31 | 2021-01-03 | 2020-10-04 | 2020-07-05 | 2020-03-31 | 2019-12-31 | 2019-09-30 | 2019-06-30 | 2019-03-31 | 2018-12-30 | 2018-09-30 | 2018-07-01 | 2018-03-31 | 2017-12-31 | 2017-10-01 | 2017-07-02 | 2017-03-31 | 2017-01-01 | 2016-10-02 | 2016-07-03 | 2016-03-31 | 2015-12-27 | 2015-09-27 | 2015-06-28 | 2015-03-31 | 2014-12-28 | 2014-09-28 | 2014-06-29 | 2014-03-31 | 2013-12-29 | 2013-09-29 | 2013-06-30 | 2013-03-31 | 2012-12-30 | 2012-09-30 | 2012-07-01 | 2012-03-31 | 2012-01-01 | 2011-10-02 | 2011-07-03 | 2011-03-31 | 2011-01-02 | 2010-10-03 | 2010-07-04 | 2010-03-31 | 2009-12-27 | ||
|---|---|---|---|---|---|---|---|---|---|---|---|---|---|---|---|---|---|---|---|---|---|---|---|---|---|---|---|---|---|---|---|---|---|---|---|---|---|---|---|---|---|---|---|---|---|---|---|---|---|---|---|---|---|---|---|---|---|---|
| Net Cash Provided By Used In Financing Activities | -117.76 | -17.52 | -135.95 | -67.65 | -201.91 | -98.43 | 97.54 | 22.09 | 22.44 | 42.99 | 10.91 | -96.15 | 13.22 | -66.34 | -39.46 | 29.25 | -35.38 | 120.56 | -51.74 | -104.64 | 444.41 | -1.67 | 8.48 | -115.37 | -43.26 | -25.65 | 17.38 | -38.94 | 7.47 | -7.55 | -23.52 | -27.16 | -17.17 | -160.71 | 99.31 | -35.63 | -13.01 | 20.68 | -31.35 | -27.86 | 98.79 | -17.51 | -31.86 | -64.66 | -34.16 | -15.60 | 18.46 | -27.84 | -37.67 | -13.55 | 0.68 | -83.65 | 12.81 | -12.41 | 0.58 | -7.57 | NA | |
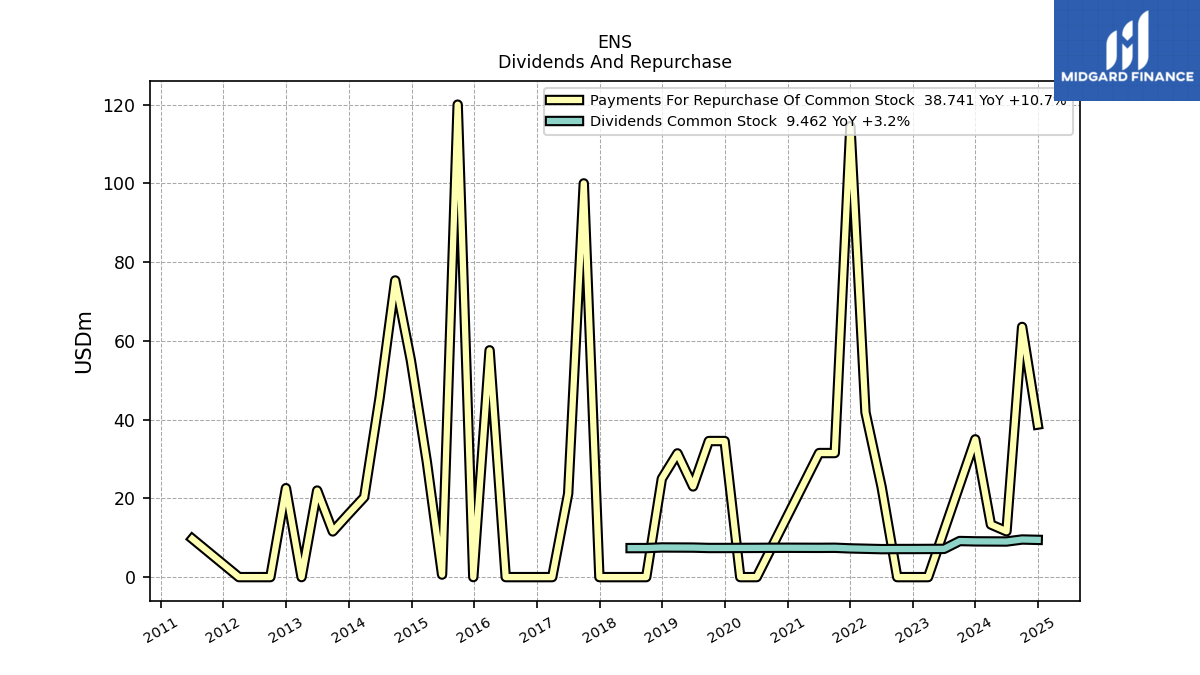
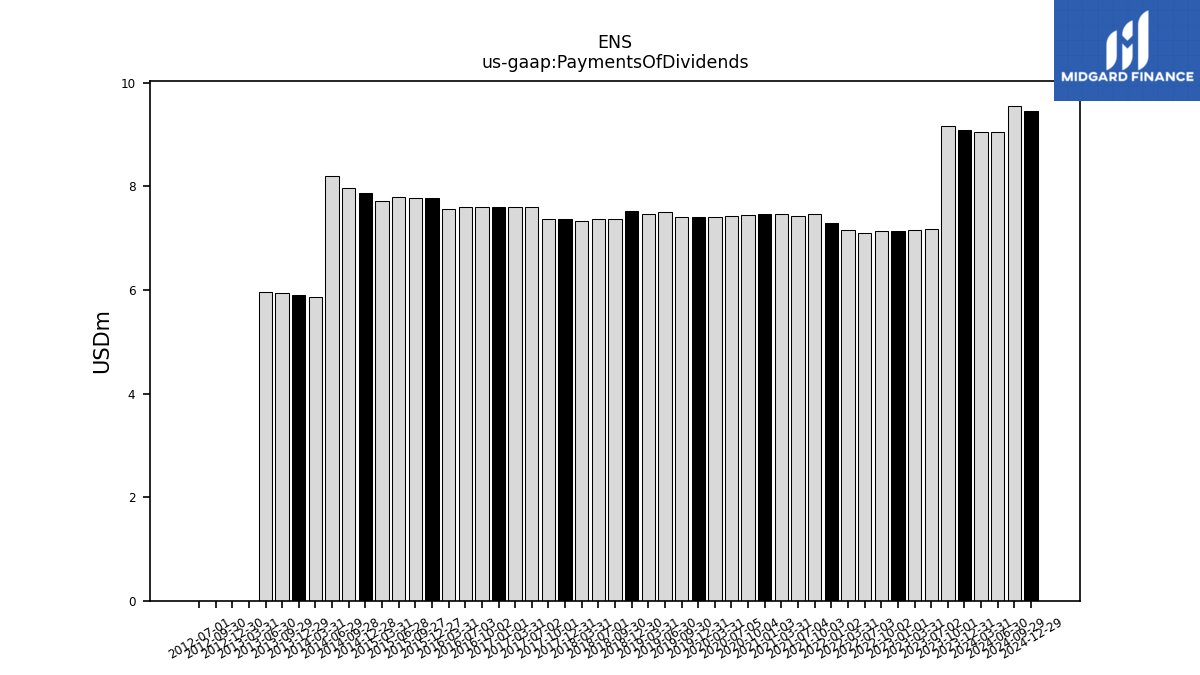
| Payments Of Dividends | 9.08 | 9.17 | 7.17 | 7.15 | 7.14 | 7.14 | 7.11 | 7.17 | 7.30 | 7.46 | 7.43 | 7.47 | 7.46 | 7.45 | 7.43 | 7.41 | 7.40 | 7.40 | 7.50 | 7.46 | 7.53 | 7.38 | 7.37 | 7.33 | 7.37 | 7.37 | 7.59 | 7.60 | 7.60 | 7.60 | 7.60 | 7.56 | 7.77 | 7.77 | 7.79 | 7.72 | 7.87 | 7.96 | 8.20 | 5.87 | 5.91 | 5.94 | 5.96 | 0.00 | 0.00 | 0.00 | 0.00 | NA | NA | NA | NA | NA | NA | NA | NA | NA | NA | |
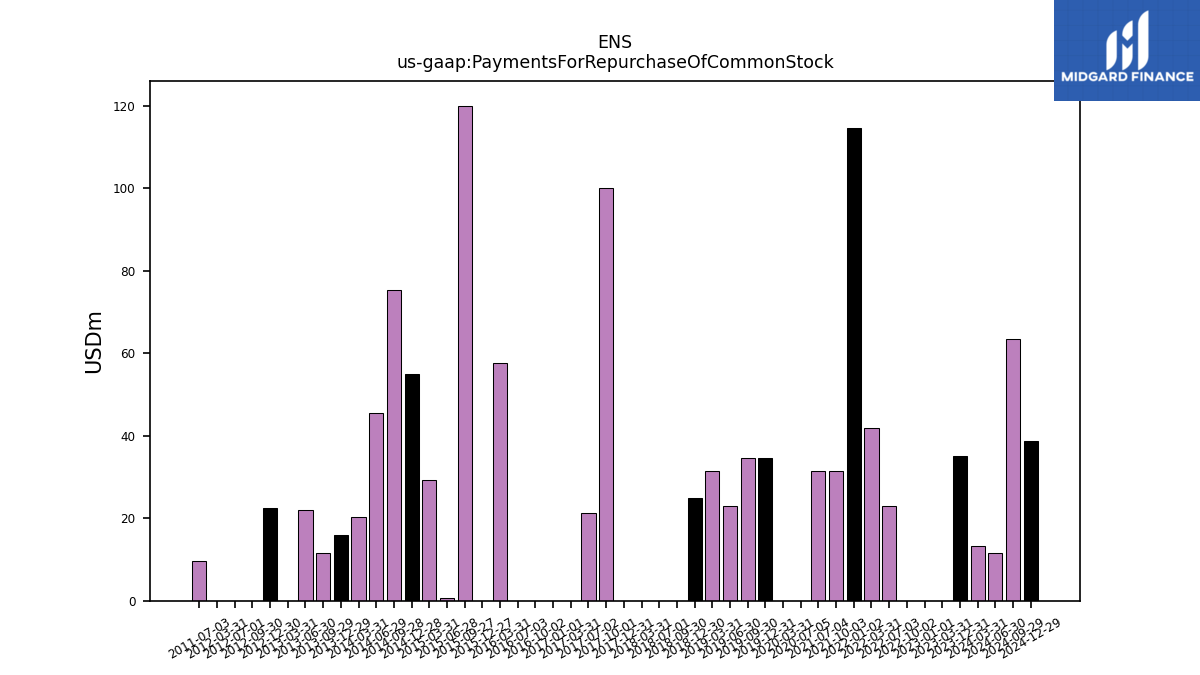
| Payments For Repurchase Of Common Stock | 34.99 | NA | NA | 0.00 | 0.00 | 0.00 | 22.91 | 41.83 | 114.53 | 31.51 | 31.51 | NA | NA | NA | 0.00 | 0.00 | 34.56 | 34.56 | 23.03 | 31.44 | 25.00 | 0.00 | 0.00 | 0.00 | 0.00 | 100.00 | 21.19 | 0.00 | 0.00 | 0.00 | 0.00 | 57.61 | 0.00 | 120.00 | 0.64 | 29.33 | 55.09 | 75.35 | 45.59 | 20.30 | 15.97 | 11.60 | 21.99 | 0.00 | 22.59 | 0.00 | 0.00 | 0.00 | NA | NA | 9.75 | NA | NA | NA | NA | NA | NA |
| 2023-12-31 | 2023-10-01 | 2023-07-02 | 2023-03-31 | 2023-01-01 | 2022-10-02 | 2022-07-03 | 2022-03-31 | 2022-01-02 | 2021-10-03 | 2021-07-04 | 2021-03-31 | 2021-01-03 | 2020-10-04 | 2020-07-05 | 2020-03-31 | 2019-12-31 | 2019-09-30 | 2019-06-30 | 2019-03-31 | 2018-12-30 | 2018-09-30 | 2018-07-01 | 2018-03-31 | 2017-12-31 | 2017-10-01 | 2017-07-02 | 2017-03-31 | 2017-01-01 | 2016-10-02 | 2016-07-03 | 2016-03-31 | 2015-12-27 | 2015-09-27 | 2015-06-28 | 2015-03-31 | 2014-12-28 | 2014-09-28 | 2014-06-29 | 2014-03-31 | 2013-12-29 | 2013-09-29 | 2013-06-30 | 2013-03-31 | 2012-12-30 | 2012-09-30 | 2012-07-01 | 2012-03-31 | 2012-01-01 | 2011-10-02 | 2011-07-03 | 2011-03-31 | 2011-01-02 | 2010-10-03 | 2010-07-04 | 2010-03-31 | 2009-12-27 | ||
|---|---|---|---|---|---|---|---|---|---|---|---|---|---|---|---|---|---|---|---|---|---|---|---|---|---|---|---|---|---|---|---|---|---|---|---|---|---|---|---|---|---|---|---|---|---|---|---|---|---|---|---|---|---|---|---|---|---|---|
| Revenues | 861.55 | 901.03 | 908.57 | 989.94 | 920.23 | 899.44 | 898.97 | 907.02 | 844.01 | 791.39 | 814.89 | 813.54 | 751.07 | 708.40 | 704.92 | 781.80 | 58.83 | 51.79 | 52.40 | 796.60 | 46.38 | 50.98 | 45.56 | 683.04 | 43.35 | 52.72 | 41.19 | 626.80 | 34.69 | 37.01 | 31.86 | 611.47 | 32.08 | 36.84 | 35.06 | 629.90 | 34.65 | 37.29 | 38.08 | 665.26 | 32.62 | 36.50 | 36.10 | 572.12 | 557.32 | 554.21 | 593.91 | 592.75 | 574.25 | 547.14 | 569.23 | 548.05 | 508.60 | 472.84 | 434.97 | 450.54 | 421.26 | |
| Revenue From Contract With Customer Including Assessed Tax | 861.55 | 901.03 | 908.57 | 989.94 | 920.23 | 899.44 | 898.97 | 907.02 | 844.01 | 791.39 | 814.89 | 813.54 | 751.07 | 708.40 | 704.92 | 781.80 | 763.70 | 762.14 | 780.23 | 796.60 | 680.02 | 660.46 | 670.93 | 683.04 | 658.93 | 617.29 | 622.62 | 626.80 | 34.69 | 37.01 | 31.86 | 611.47 | 32.08 | 36.84 | 35.06 | 629.90 | 34.65 | 37.29 | 38.08 | 665.26 | 32.62 | 36.50 | 36.10 | 572.12 | 557.32 | 554.21 | 593.91 | 592.75 | 574.25 | 547.14 | 569.23 | 548.05 | 508.60 | 472.84 | 434.97 | 450.54 | 421.26 | |
| Product | 751.86 | 789.31 | 807.65 | 890.73 | 819.46 | 798.45 | 799.15 | NA | NA | NA | NA | NA | NA | NA | NA | NA | NA | NA | NA | NA | 680.02 | 660.46 | 670.93 | NA | 658.93 | 617.29 | 622.62 | NA | NA | NA | NA | NA | NA | NA | NA | NA | NA | NA | NA | NA | NA | NA | NA | NA | NA | NA | NA | NA | NA | NA | NA | NA | NA | NA | NA | NA | NA | |
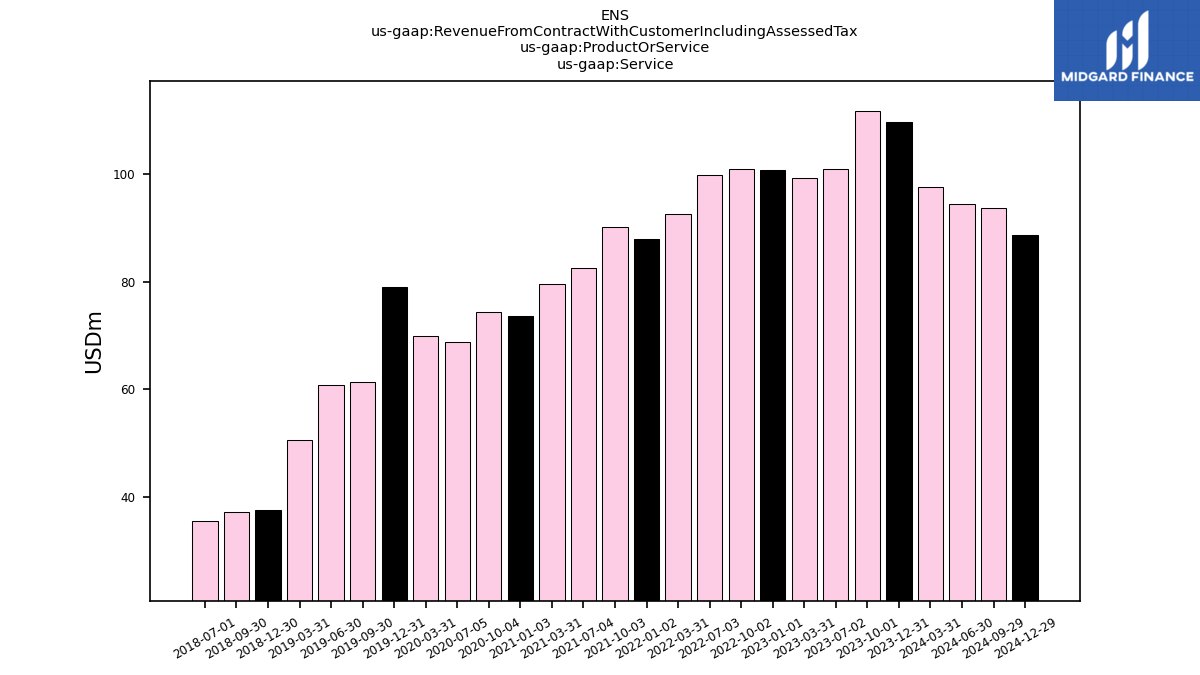
| Service | 109.69 | 111.72 | 100.92 | 99.21 | 100.77 | 100.99 | 99.82 | 92.50 | 87.96 | 90.11 | 82.52 | 79.55 | 73.58 | 74.33 | 68.76 | 69.80 | 78.91 | 61.28 | 60.72 | 50.56 | 37.47 | 37.10 | 35.48 | NA | NA | NA | NA | NA | NA | NA | NA | NA | NA | NA | NA | NA | NA | NA | NA | NA | NA | NA | NA | NA | NA | NA | NA | NA | NA | NA | NA | NA | NA | NA | NA | NA | NA | |
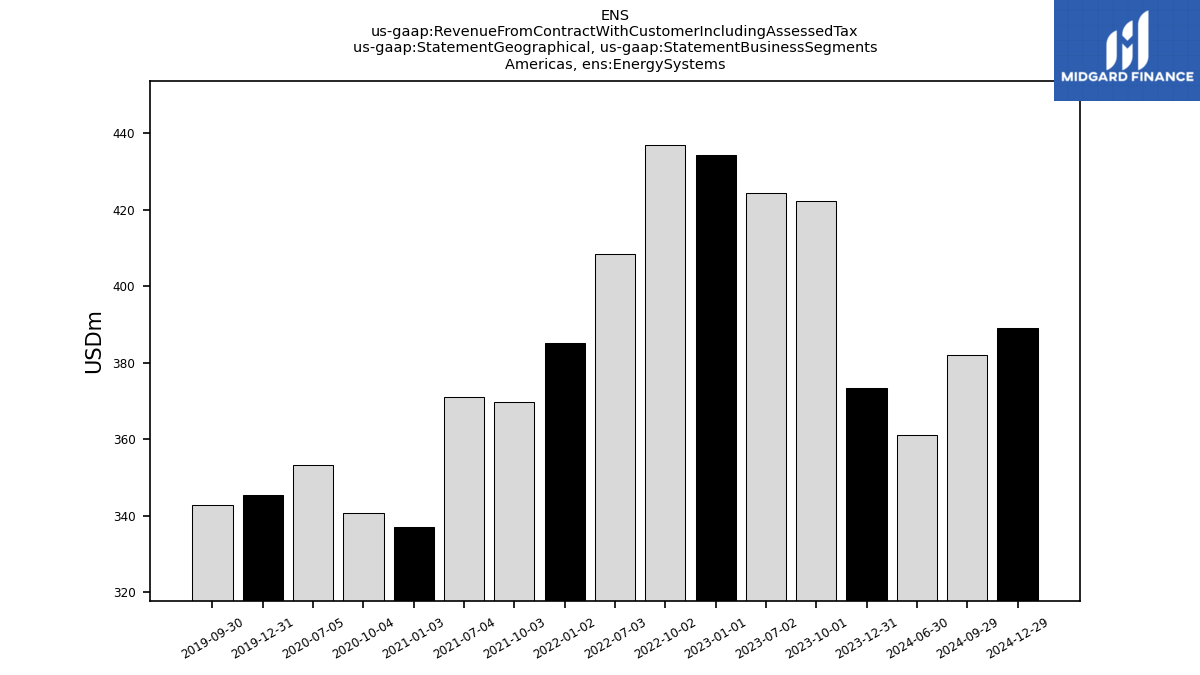
| , Energy Systems | 373.57 | 422.47 | 424.55 | NA | 434.31 | 437.02 | 408.58 | NA | 385.24 | 369.84 | 371.21 | NA | 337.25 | 340.82 | 353.39 | NA | 345.51 | 342.93 | NA | NA | NA | NA | NA | NA | NA | NA | NA | NA | NA | NA | NA | NA | NA | NA | NA | NA | NA | NA | NA | NA | NA | NA | NA | NA | NA | NA | NA | NA | NA | NA | NA | NA | NA | NA | NA | NA | NA | |
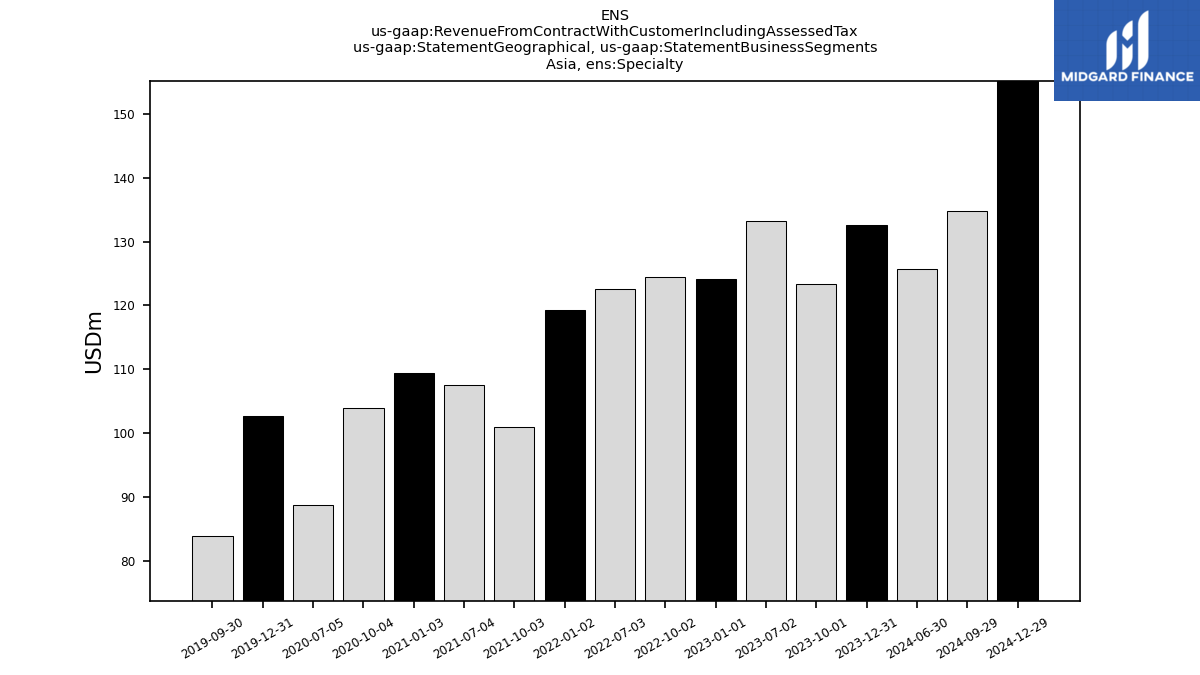
| , Specialty | 132.58 | 123.36 | 133.24 | NA | 124.13 | 124.42 | 122.54 | NA | 119.25 | 100.87 | 107.57 | NA | 109.45 | 103.84 | 88.70 | NA | 102.67 | 83.90 | NA | NA | NA | NA | NA | NA | NA | NA | NA | NA | NA | NA | NA | NA | NA | NA | NA | NA | NA | NA | NA | NA | NA | NA | NA | NA | NA | NA | NA | NA | NA | NA | NA | NA | NA | NA | NA | NA | NA | |
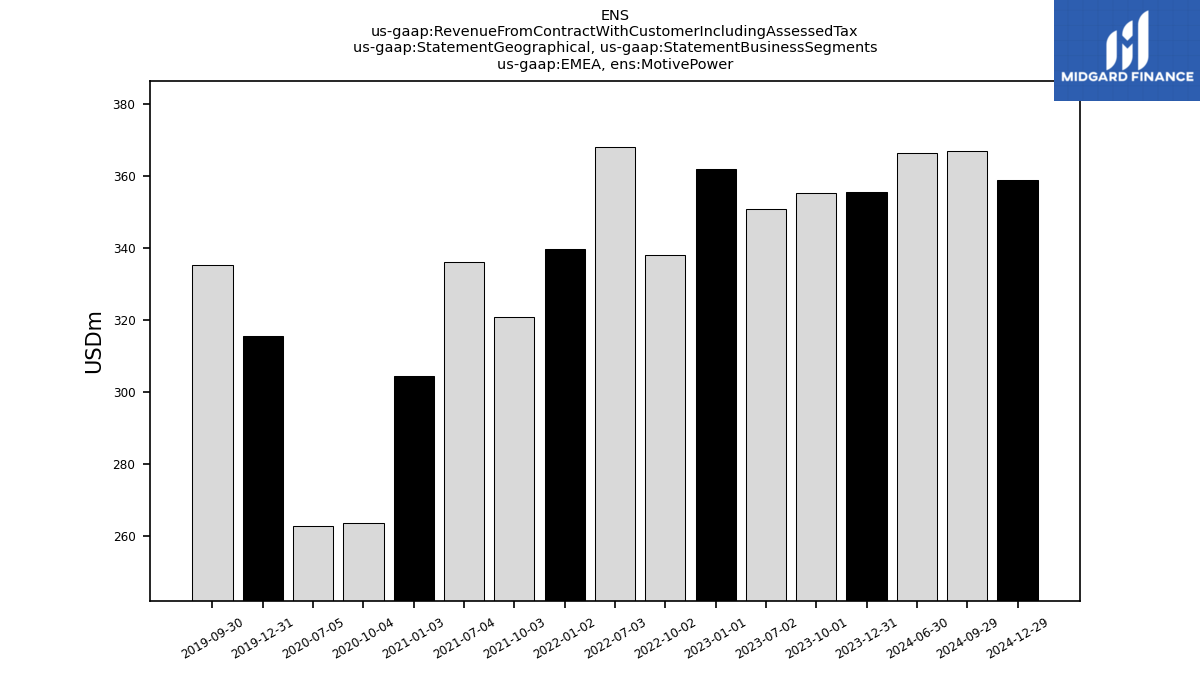
| EMEA, Motive Power | 355.40 | 355.21 | 350.78 | NA | 361.79 | 337.99 | 367.85 | NA | 339.51 | 320.69 | 336.12 | NA | 304.37 | 263.74 | 262.83 | NA | 315.52 | 335.31 | NA | NA | NA | NA | NA | NA | NA | NA | NA | NA | NA | NA | NA | NA | NA | NA | NA | NA | NA | NA | NA | NA | NA | NA | NA | NA | NA | NA | NA | NA | NA | NA | NA | NA | NA | NA | NA | NA | NA | |
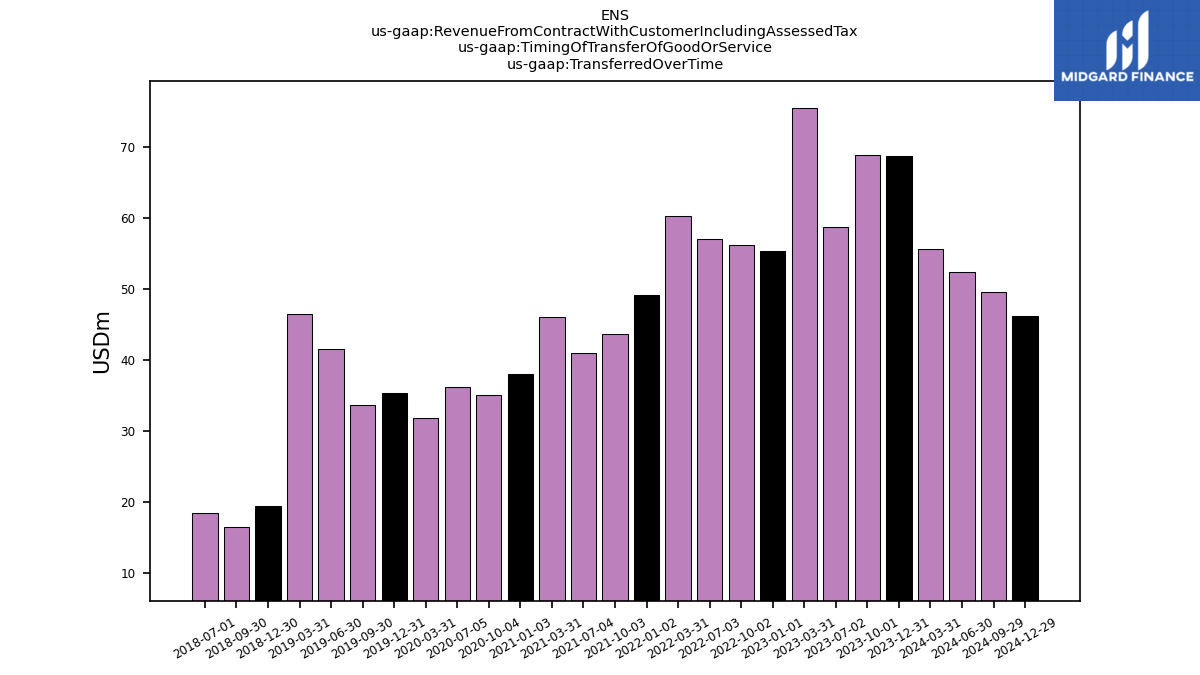
| Transferred Over Time | 68.71 | 68.81 | 58.65 | 75.52 | 55.28 | 56.20 | 57.00 | 60.26 | 49.06 | 43.61 | 40.90 | 46.06 | 37.98 | 35.07 | 36.10 | 31.76 | 35.31 | 33.59 | 41.49 | 46.49 | 19.42 | 16.49 | 18.40 | NA | NA | NA | NA | NA | NA | NA | NA | NA | NA | NA | NA | NA | NA | NA | NA | NA | NA | NA | NA | NA | NA | NA | NA | NA | NA | NA | NA | NA | NA | NA | NA | NA | NA |