
| 2023-12-31 | 2023-09-30 | 2023-07-01 | 2023-04-01 | 2022-12-31 | 2022-10-01 | 2022-07-02 | 2022-04-02 | 2021-12-31 | 2021-10-02 | 2021-07-03 | 2021-04-03 | 2020-12-31 | 2020-09-26 | 2020-06-27 | 2020-03-28 | 2019-12-31 | 2019-09-28 | 2019-06-29 | 2019-03-30 | 2018-12-31 | 2018-09-29 | 2018-06-30 | 2018-03-31 | 2017-12-31 | 2017-09-30 | 2017-07-01 | 2017-04-01 | 2016-12-31 | 2016-10-01 | 2016-07-02 | 2016-04-02 | 2015-12-31 | 2015-09-26 | 2015-06-27 | 2015-03-28 | 2014-12-31 | 2014-09-27 | 2014-06-28 | 2014-03-29 | 2013-12-31 | 2013-09-28 | 2013-06-29 | 2013-03-30 | 2012-12-31 | 2012-09-29 | 2012-06-30 | 2012-03-31 | 2011-12-31 | 2011-10-01 | 2011-07-02 | 2011-04-02 | 2010-12-31 | 2010-10-02 | 2010-07-03 | 2010-04-03 | ||
|---|---|---|---|---|---|---|---|---|---|---|---|---|---|---|---|---|---|---|---|---|---|---|---|---|---|---|---|---|---|---|---|---|---|---|---|---|---|---|---|---|---|---|---|---|---|---|---|---|---|---|---|---|---|---|---|---|---|
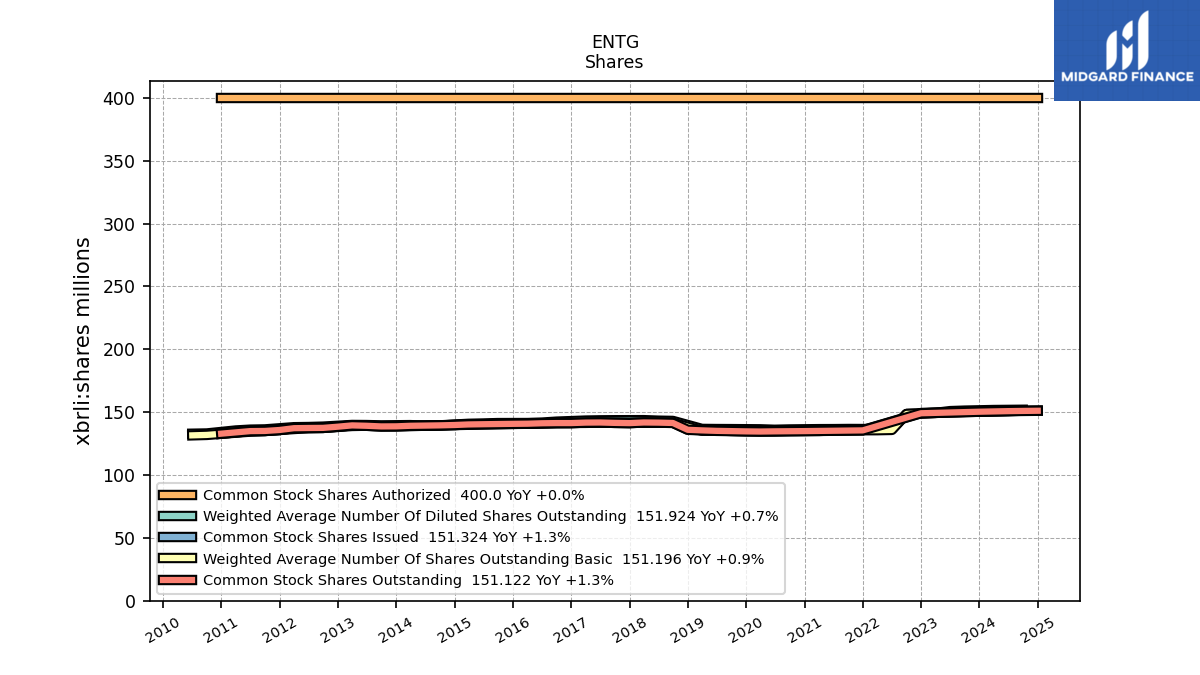
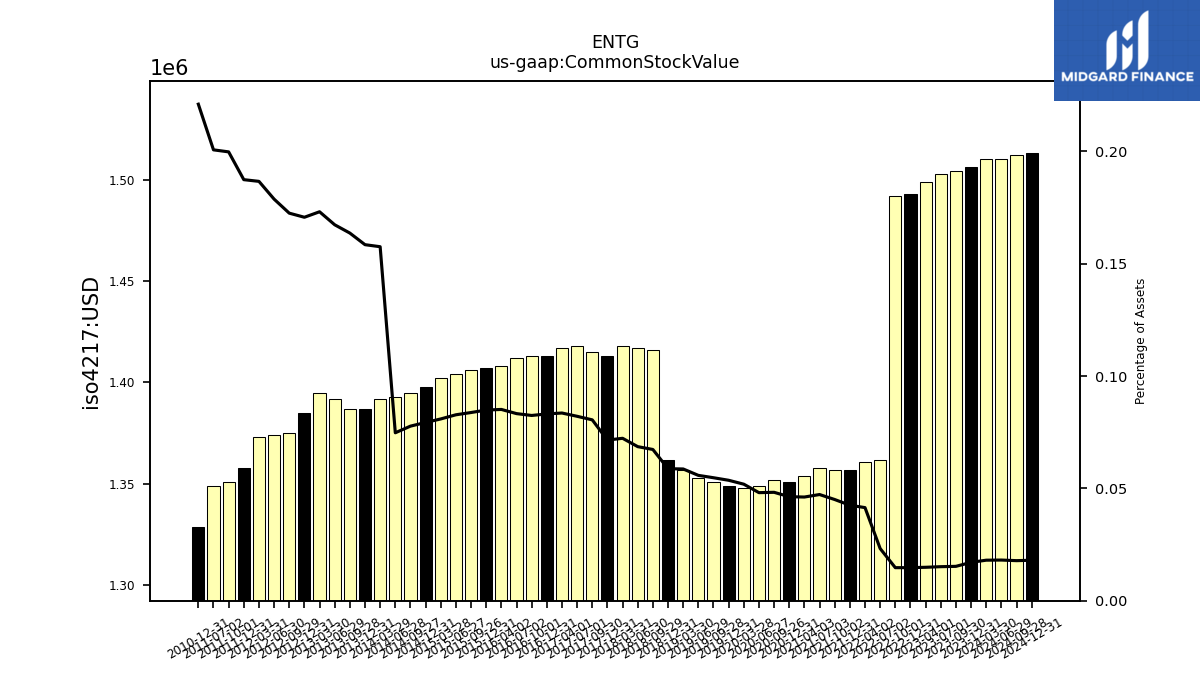
| Common Stock Value | 1.51 | 1.50 | 1.50 | 1.50 | 1.49 | 1.49 | 1.36 | 1.36 | 1.36 | 1.36 | 1.36 | 1.35 | 1.35 | 1.35 | 1.35 | 1.35 | 1.35 | 1.35 | 1.35 | 1.36 | 1.36 | 1.42 | 1.42 | 1.42 | 1.41 | 1.42 | 1.42 | 1.42 | 1.41 | 1.41 | 1.41 | 1.41 | 1.41 | 1.41 | 1.40 | 1.40 | 1.40 | 1.40 | 1.39 | 1.39 | 1.39 | 1.39 | 1.39 | 1.40 | 1.39 | 1.38 | 1.37 | 1.37 | 1.36 | 1.35 | 1.35 | NA | 1.33 | NA | NA | NA | |
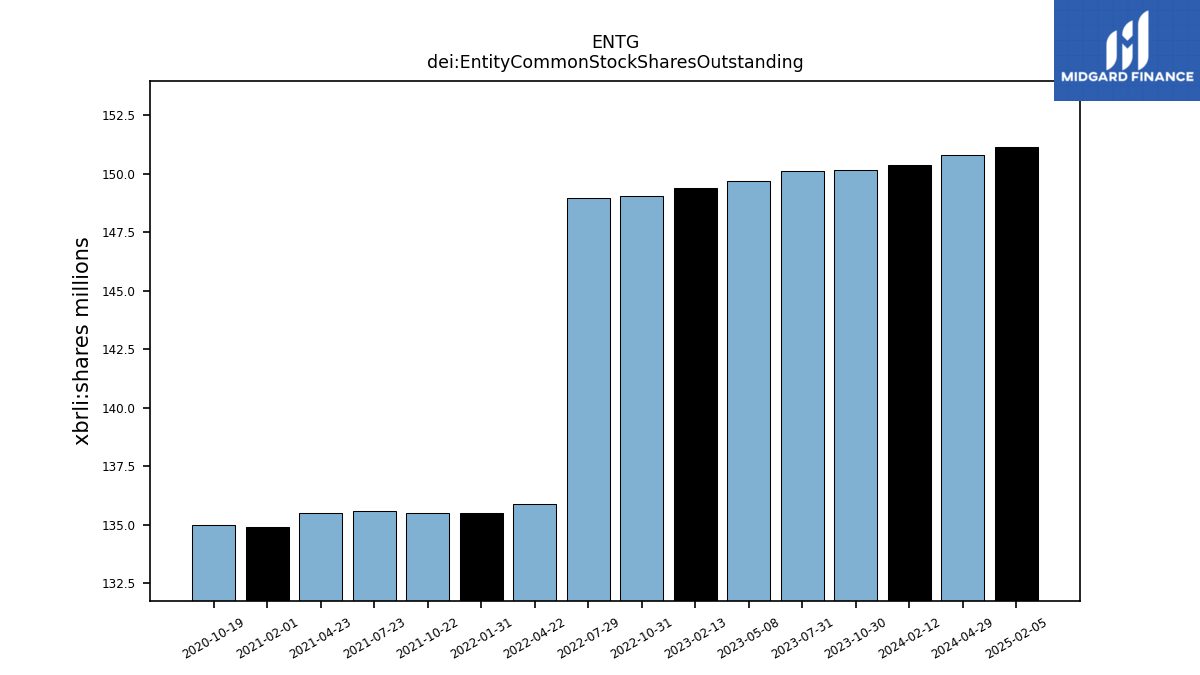
| dei: Entity Common Stock Shares Outstanding | NA | NA | NA | NA | NA | NA | NA | NA | NA | NA | NA | NA | NA | NA | NA | NA | NA | NA | NA | NA | NA | NA | NA | NA | NA | NA | NA | NA | NA | NA | NA | NA | NA | NA | NA | NA | NA | NA | NA | NA | NA | NA | NA | NA | NA | NA | NA | NA | NA | NA | NA | NA | NA | NA | NA | NA | |
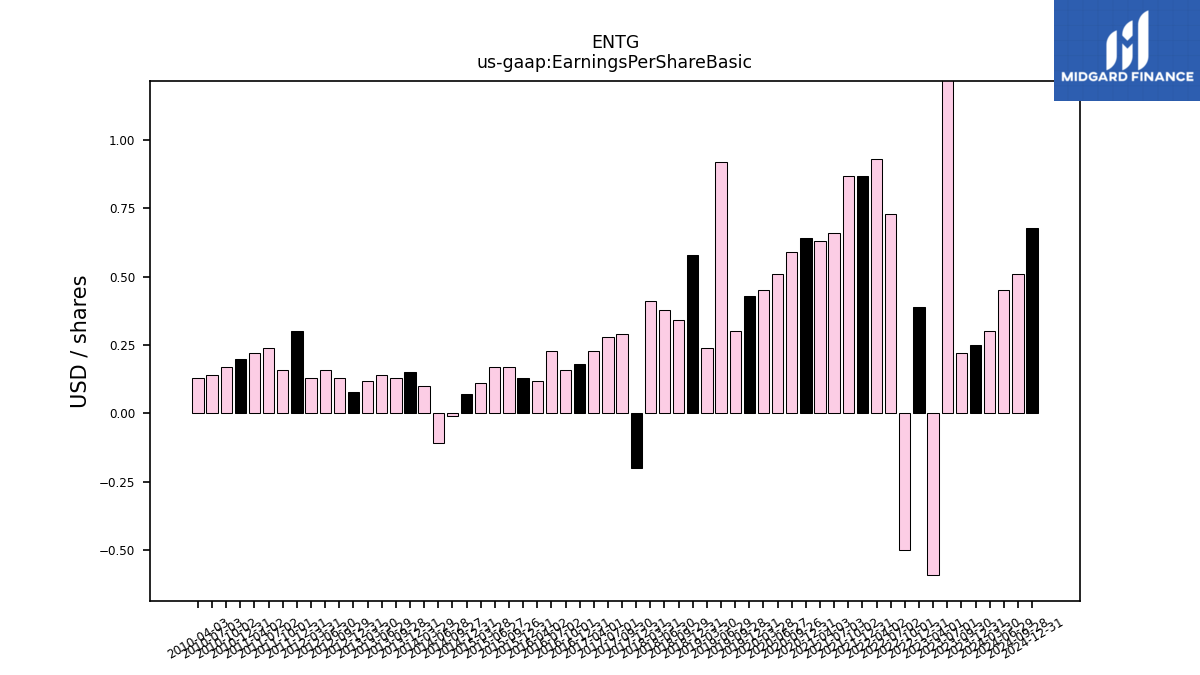
| Earnings Per Share Basic | 0.25 | 0.22 | 1.32 | -0.59 | 0.39 | -0.50 | 0.73 | 0.93 | 0.87 | 0.87 | 0.66 | 0.63 | 0.64 | 0.59 | 0.51 | 0.45 | 0.43 | 0.30 | 0.92 | 0.24 | 0.58 | 0.34 | 0.38 | 0.41 | -0.20 | 0.29 | 0.28 | 0.23 | 0.18 | 0.16 | 0.23 | 0.12 | 0.13 | 0.17 | 0.17 | 0.11 | 0.07 | -0.01 | -0.11 | 0.10 | 0.15 | 0.13 | 0.14 | 0.12 | 0.08 | 0.13 | 0.16 | 0.13 | 0.30 | 0.16 | 0.24 | 0.22 | 0.20 | 0.17 | 0.14 | 0.13 | |
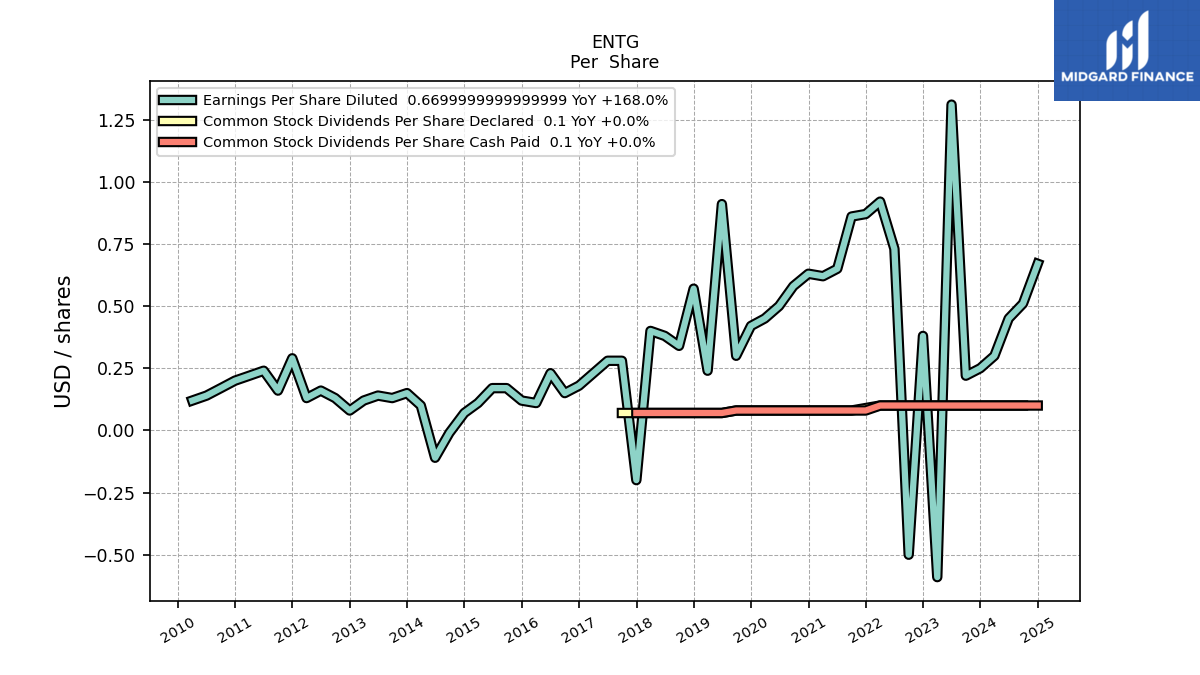
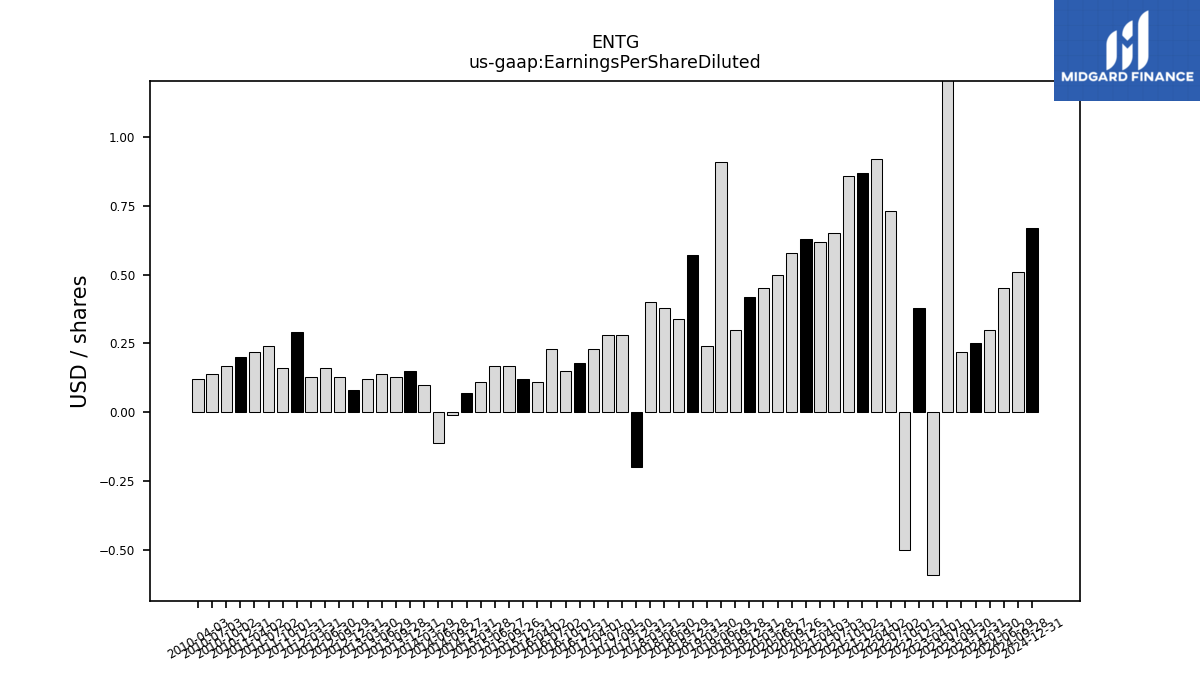
| Earnings Per Share Diluted | 0.25 | 0.22 | 1.31 | -0.59 | 0.38 | -0.50 | 0.73 | 0.92 | 0.87 | 0.86 | 0.65 | 0.62 | 0.63 | 0.58 | 0.50 | 0.45 | 0.42 | 0.30 | 0.91 | 0.24 | 0.57 | 0.34 | 0.38 | 0.40 | -0.20 | 0.28 | 0.28 | 0.23 | 0.18 | 0.15 | 0.23 | 0.11 | 0.12 | 0.17 | 0.17 | 0.11 | 0.07 | -0.01 | -0.11 | 0.10 | 0.15 | 0.13 | 0.14 | 0.12 | 0.08 | 0.13 | 0.16 | 0.13 | 0.29 | 0.16 | 0.24 | 0.22 | 0.20 | 0.17 | 0.14 | 0.12 |
| 2023-12-31 | 2023-09-30 | 2023-07-01 | 2023-04-01 | 2022-12-31 | 2022-10-01 | 2022-07-02 | 2022-04-02 | 2021-12-31 | 2021-10-02 | 2021-07-03 | 2021-04-03 | 2020-12-31 | 2020-09-26 | 2020-06-27 | 2020-03-28 | 2019-12-31 | 2019-09-28 | 2019-06-29 | 2019-03-30 | 2018-12-31 | 2018-09-29 | 2018-06-30 | 2018-03-31 | 2017-12-31 | 2017-09-30 | 2017-07-01 | 2017-04-01 | 2016-12-31 | 2016-10-01 | 2016-07-02 | 2016-04-02 | 2015-12-31 | 2015-09-26 | 2015-06-27 | 2015-03-28 | 2014-12-31 | 2014-09-27 | 2014-06-28 | 2014-03-29 | 2013-12-31 | 2013-09-28 | 2013-06-29 | 2013-03-30 | 2012-12-31 | 2012-09-29 | 2012-06-30 | 2012-03-31 | 2011-12-31 | 2011-10-01 | 2011-07-02 | 2011-04-02 | 2010-12-31 | 2010-10-02 | 2010-07-03 | 2010-04-03 | ||
|---|---|---|---|---|---|---|---|---|---|---|---|---|---|---|---|---|---|---|---|---|---|---|---|---|---|---|---|---|---|---|---|---|---|---|---|---|---|---|---|---|---|---|---|---|---|---|---|---|---|---|---|---|---|---|---|---|---|
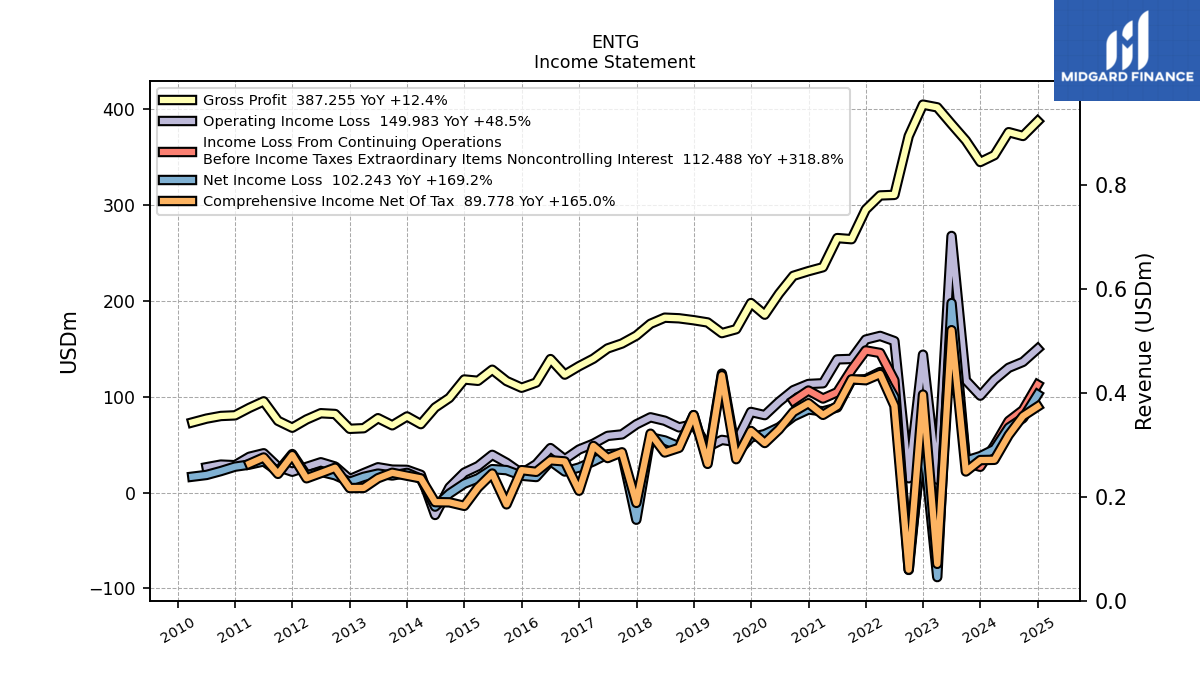
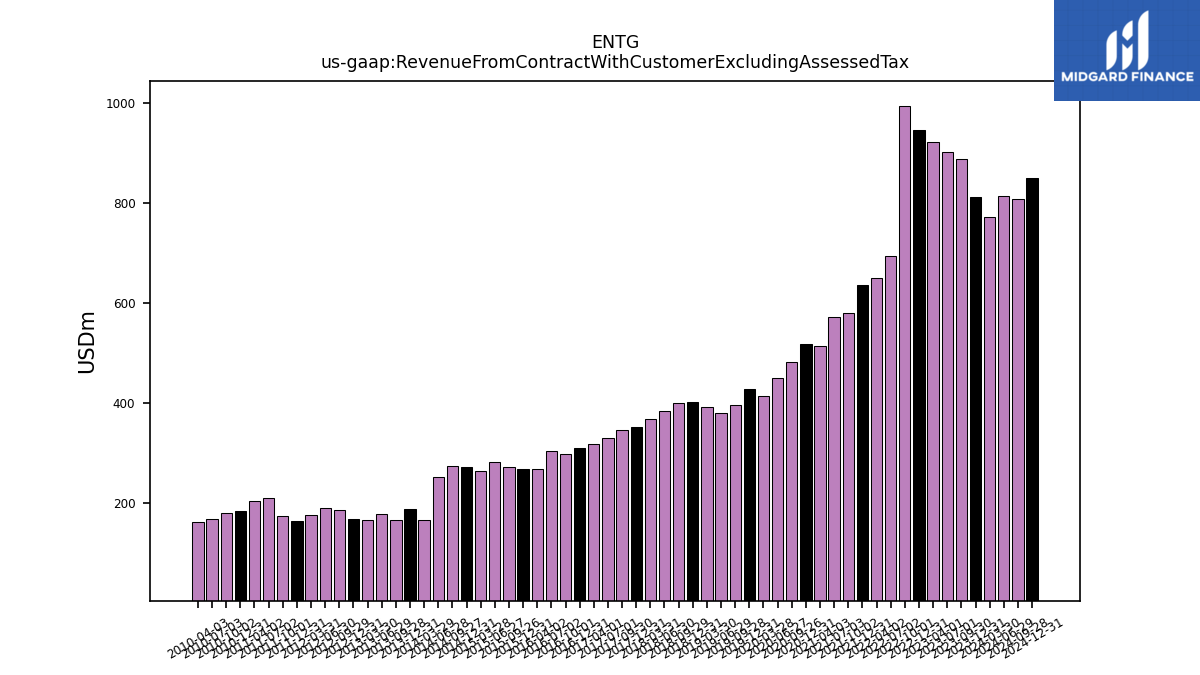
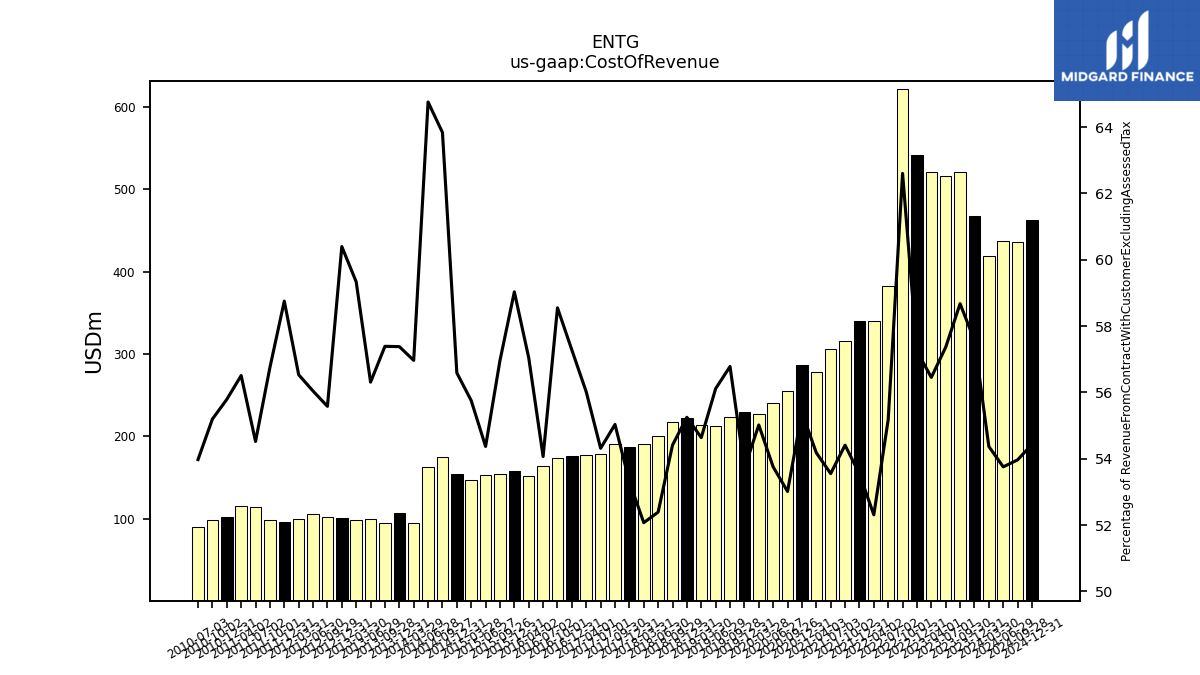
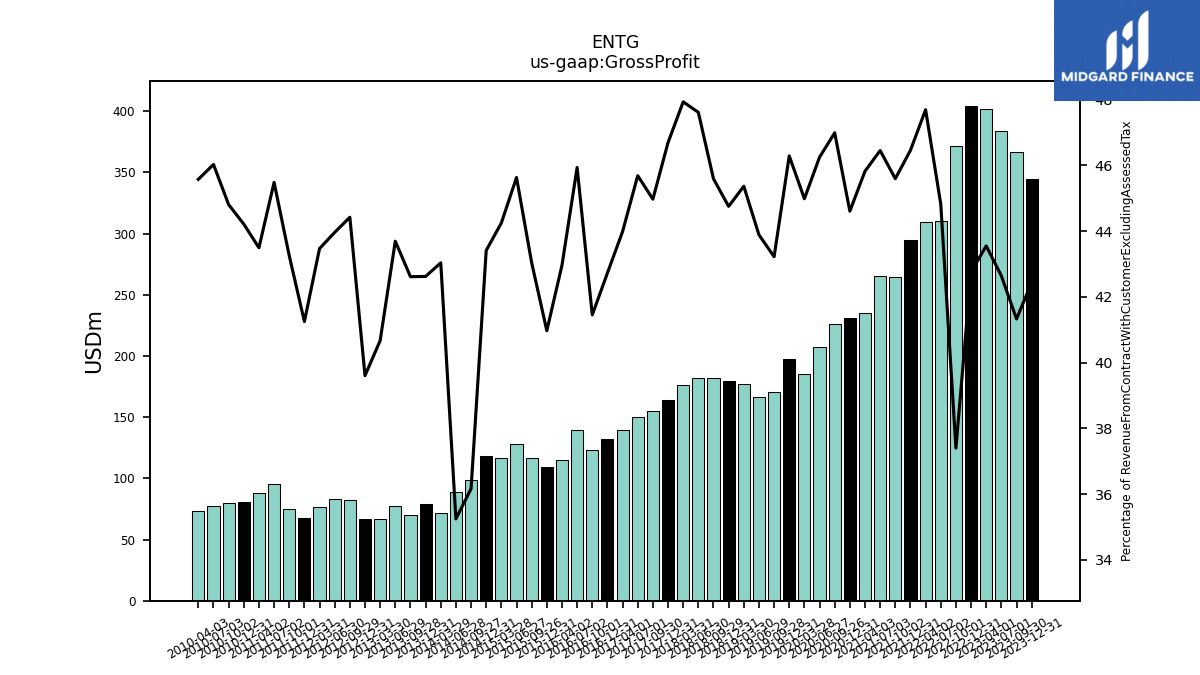
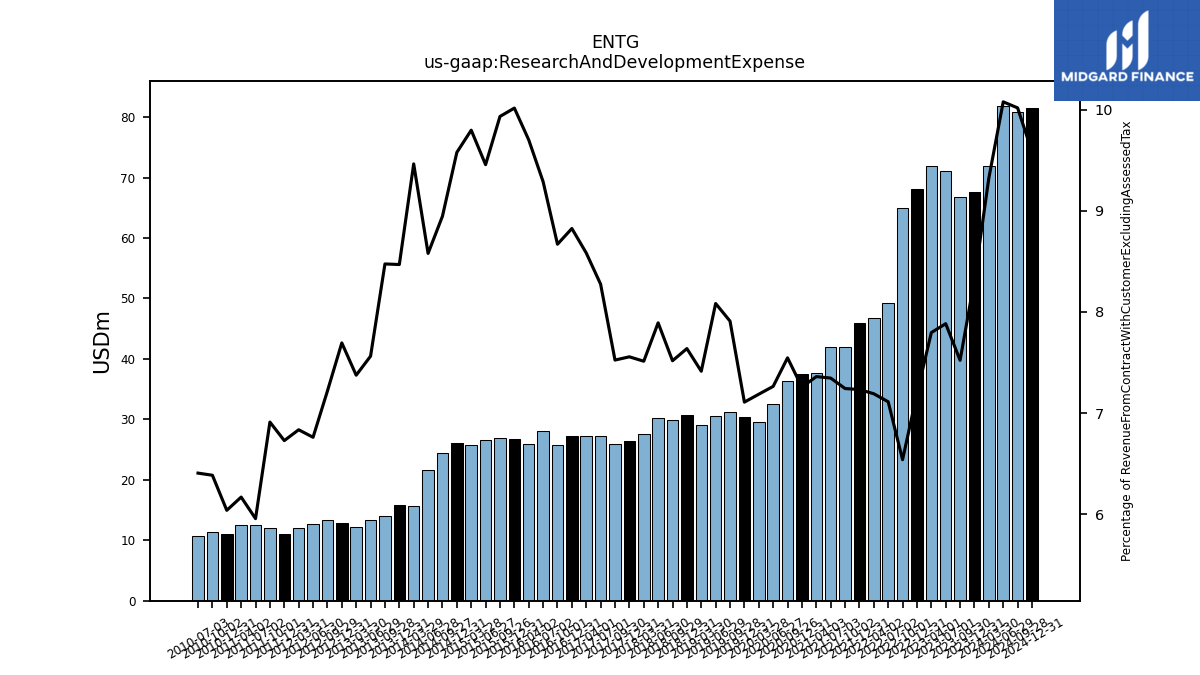
| Revenue From Contract With Customer Excluding Assessed Tax | 812.29 | 888.24 | 901.00 | 922.40 | 946.07 | 993.83 | 692.49 | 649.65 | 635.20 | 579.49 | 571.35 | 512.84 | 517.59 | 480.99 | 448.40 | 412.33 | 427.00 | 394.15 | 378.87 | 391.05 | 401.64 | 398.60 | 383.06 | 367.20 | 350.56 | 345.59 | 329.00 | 317.38 | 308.50 | 296.69 | 303.05 | 267.02 | 266.79 | 270.25 | 280.71 | 263.37 | 271.63 | 273.05 | 251.58 | 165.80 | 186.26 | 164.59 | 177.54 | 165.07 | 167.82 | 184.45 | 188.23 | 175.40 | 163.92 | 173.01 | 209.20 | 203.12 | 182.10 | 178.23 | 167.57 | 160.51 | |
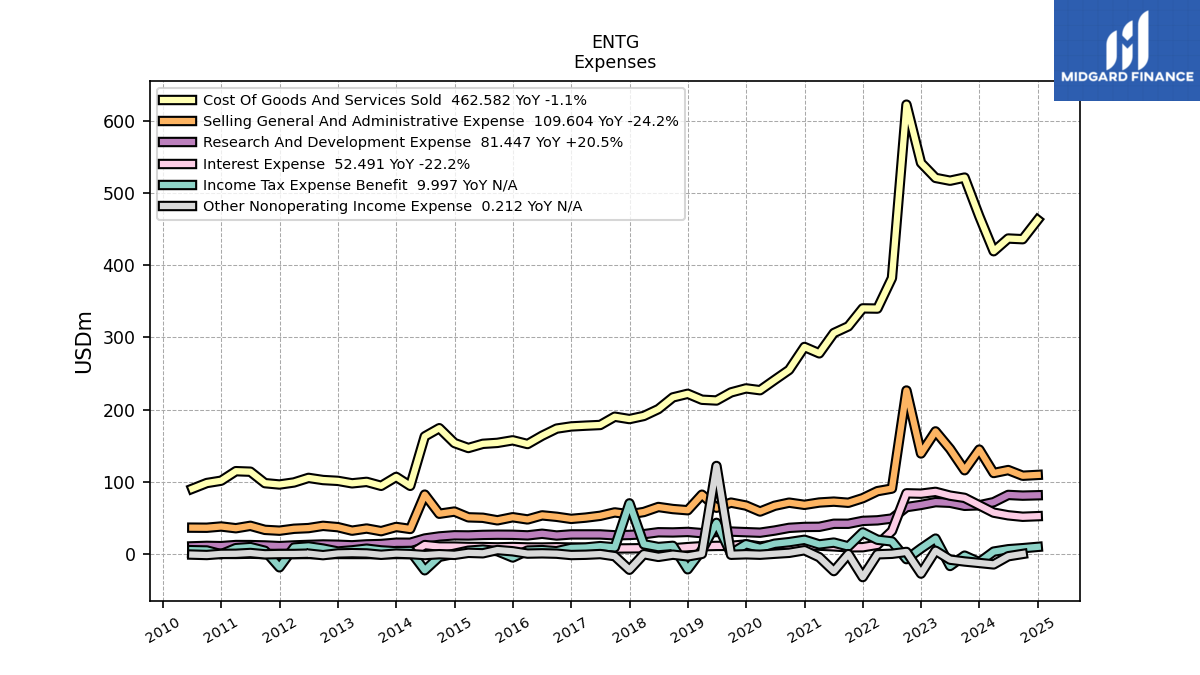
| Cost Of Revenue | 467.61 | 521.16 | 516.83 | 520.71 | 541.54 | 622.16 | 382.09 | 339.83 | 340.11 | 315.29 | 305.97 | 277.86 | 286.72 | 254.99 | 241.03 | 226.85 | 229.36 | 223.80 | 212.60 | 213.65 | 221.90 | 216.88 | 200.68 | 191.20 | 186.88 | 190.18 | 178.70 | 177.78 | 176.70 | 173.71 | 163.85 | 152.32 | 157.49 | 153.94 | 152.62 | 146.84 | 153.71 | 174.31 | 162.91 | 94.45 | 106.88 | 94.45 | 99.97 | 97.94 | 101.36 | 102.52 | 105.49 | 99.16 | 96.31 | 98.19 | 114.06 | 114.78 | 101.59 | 98.37 | 90.45 | NA | |
| Gross Profit | 344.68 | 367.07 | 384.17 | 401.69 | 404.52 | 371.67 | 310.40 | 309.82 | 295.09 | 264.20 | 265.38 | 234.99 | 230.87 | 226.00 | 207.37 | 185.48 | 197.64 | 170.35 | 166.27 | 177.39 | 179.74 | 181.72 | 182.38 | 176.00 | 163.68 | 155.41 | 150.30 | 139.60 | 131.80 | 122.98 | 139.21 | 114.71 | 109.30 | 116.31 | 128.09 | 116.54 | 117.92 | 98.74 | 88.67 | 71.35 | 79.38 | 70.13 | 77.57 | 67.13 | 66.46 | 81.93 | 82.75 | 76.24 | 67.61 | 74.83 | 95.14 | 88.34 | 80.51 | 79.86 | 77.13 | 73.15 | |
| Research And Development Expense | 67.57 | 66.81 | 71.03 | 71.91 | 68.04 | 64.99 | 49.25 | 46.72 | 45.94 | 41.97 | 41.97 | 37.75 | 37.56 | 36.30 | 32.57 | 29.63 | 30.35 | 31.17 | 30.62 | 28.99 | 30.68 | 29.96 | 30.23 | 27.59 | 26.49 | 26.00 | 27.22 | 27.24 | 27.22 | 25.72 | 28.15 | 25.90 | 26.72 | 26.84 | 26.54 | 25.80 | 26.01 | 24.43 | 21.58 | 15.69 | 15.77 | 13.95 | 13.43 | 12.17 | 12.91 | 13.31 | 12.73 | 11.99 | 11.03 | 11.96 | 12.46 | 12.53 | 11.00 | 11.38 | 10.74 | NA | |
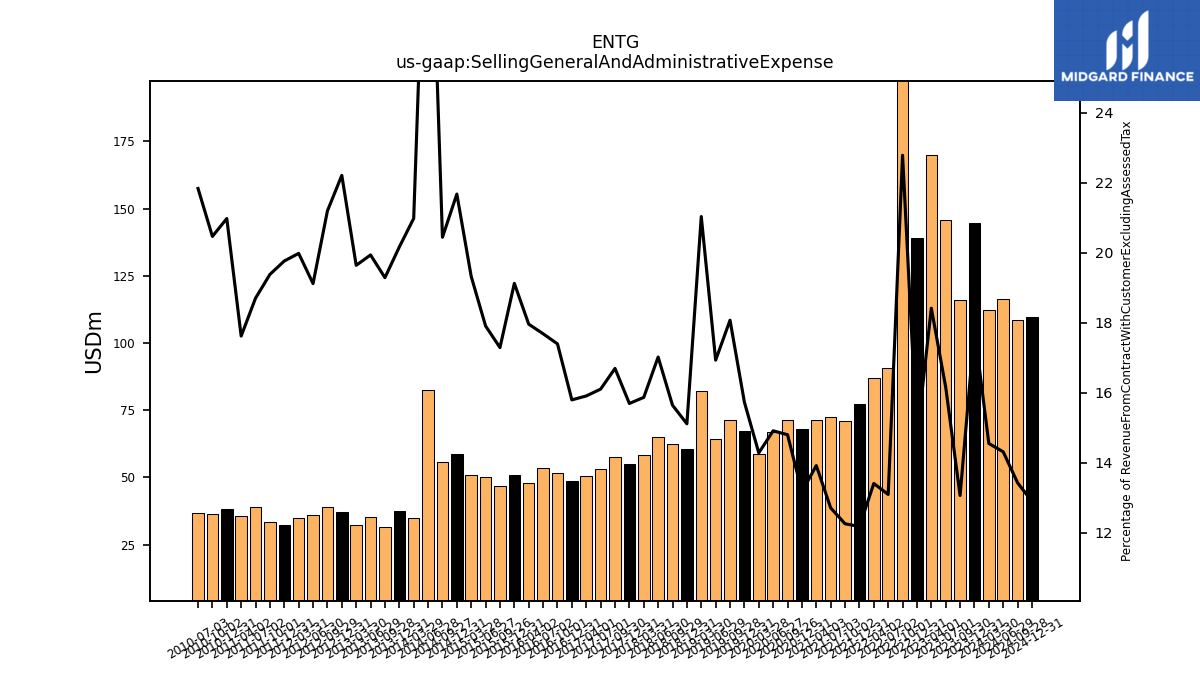
| Selling General And Administrative Expense | 144.68 | 116.05 | 145.60 | 169.87 | 139.25 | 226.45 | 90.69 | 87.11 | 77.37 | 71.03 | 72.62 | 71.39 | 68.17 | 71.19 | 66.87 | 58.89 | 67.17 | 71.23 | 64.15 | 82.25 | 60.71 | 62.36 | 65.20 | 58.27 | 55.02 | 57.70 | 52.98 | 50.49 | 48.73 | 51.61 | 53.60 | 47.96 | 51.02 | 46.73 | 50.27 | 50.89 | 58.88 | 55.82 | 82.35 | 34.79 | 37.56 | 31.75 | 35.40 | 32.42 | 37.27 | 39.09 | 35.99 | 35.05 | 32.40 | 33.53 | 39.13 | 35.79 | 38.20 | 36.48 | 36.59 | NA | |
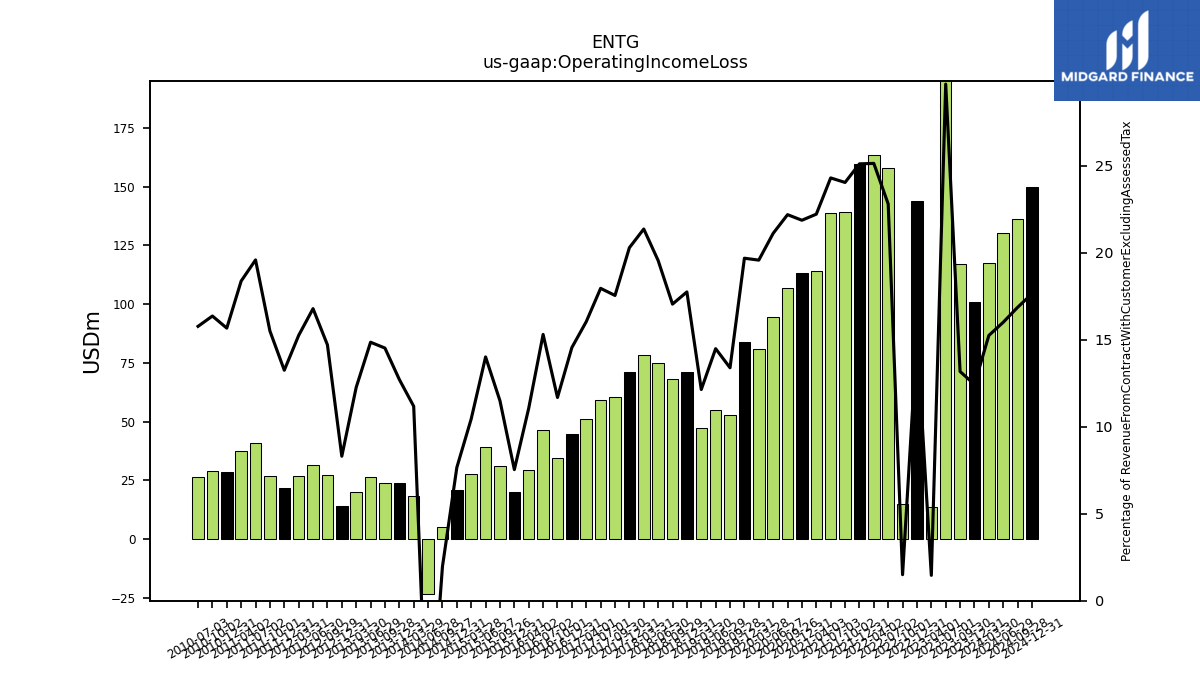
| Operating Income Loss | 101.02 | 117.06 | 267.61 | 13.47 | 143.78 | 14.89 | 157.97 | 163.35 | 159.54 | 139.36 | 138.89 | 113.98 | 113.23 | 106.76 | 94.71 | 80.74 | 84.08 | 52.79 | 54.91 | 47.49 | 71.31 | 67.97 | 74.93 | 78.47 | 71.15 | 60.66 | 59.09 | 50.92 | 44.91 | 34.67 | 46.40 | 29.56 | 20.12 | 31.07 | 39.35 | 27.54 | 20.82 | 5.37 | -23.37 | 18.54 | 23.69 | 23.91 | 26.39 | 20.25 | 13.94 | 27.13 | 31.61 | 26.76 | 21.73 | 26.83 | 40.99 | 37.33 | 28.54 | 29.17 | 26.43 | NA | |
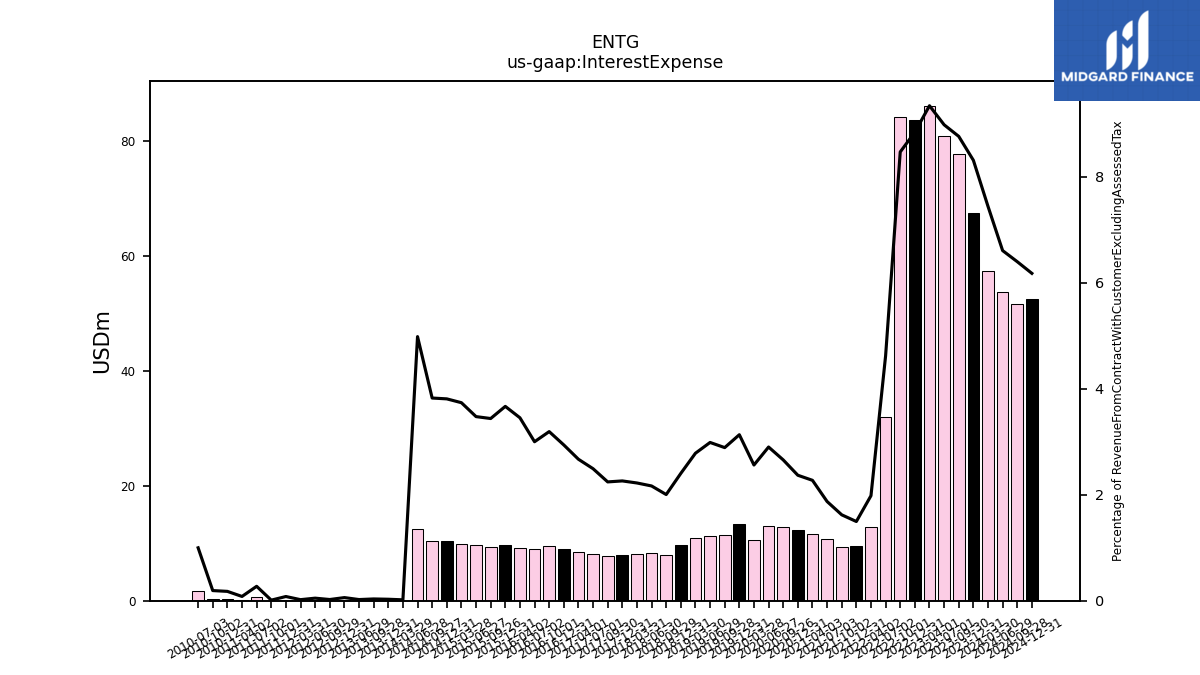
| Interest Expense | 67.50 | 77.82 | 80.91 | 86.15 | 83.64 | 84.15 | 32.00 | 12.88 | 9.50 | 9.39 | 10.70 | 11.65 | 12.26 | 12.78 | 13.01 | 10.56 | 13.38 | 11.39 | 11.31 | 10.88 | 9.65 | 7.99 | 8.30 | 8.16 | 7.92 | 7.75 | 8.20 | 8.47 | 9.07 | 9.47 | 9.09 | 9.22 | 9.78 | 9.29 | 9.75 | 9.84 | 10.35 | 10.44 | 12.54 | 0.03 | 0.05 | 0.06 | 0.04 | NA | 0.10 | 0.04 | 0.09 | 0.04 | 0.13 | 0.02 | 0.57 | 0.17 | 0.32 | 0.34 | 1.67 | NA | |
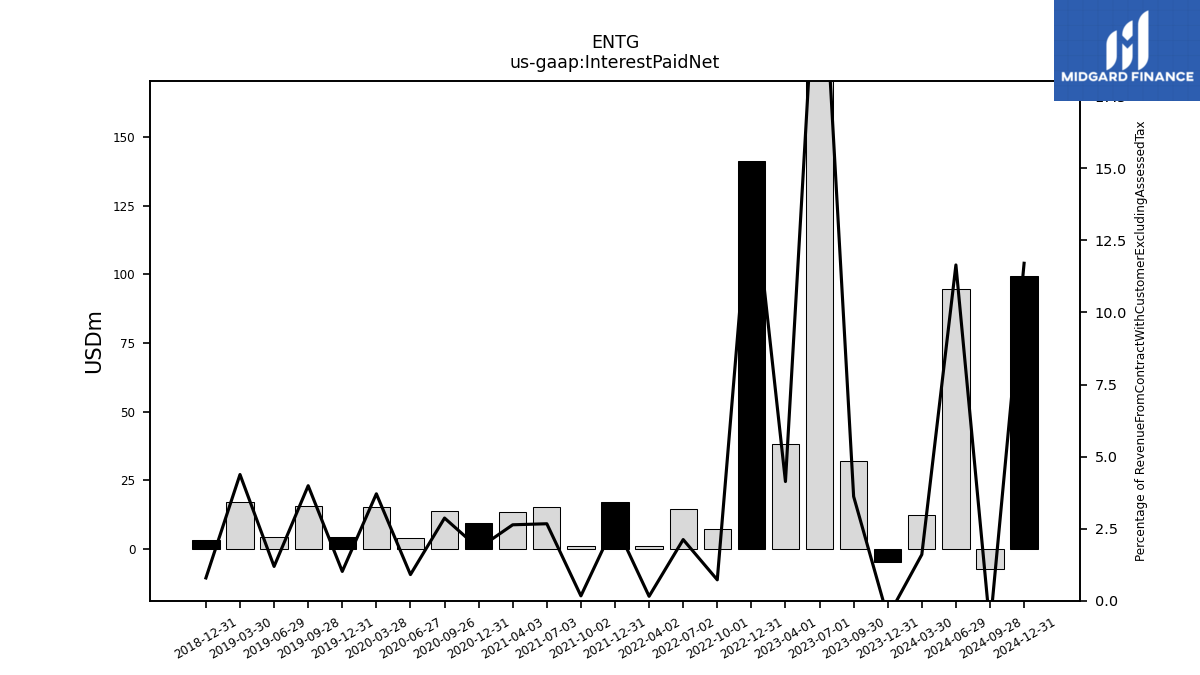
| Interest Paid Net | -4.57 | 32.13 | 222.14 | 38.15 | 141.27 | 7.22 | 14.70 | 1.00 | 17.03 | 0.98 | 15.26 | 13.52 | 9.41 | 13.80 | 4.07 | 15.30 | 4.34 | 15.73 | 4.51 | 17.12 | 3.18 | NA | NA | NA | NA | NA | NA | NA | NA | NA | NA | NA | NA | NA | NA | NA | NA | NA | NA | NA | NA | NA | NA | NA | NA | NA | NA | NA | NA | NA | NA | NA | NA | NA | NA | NA | |
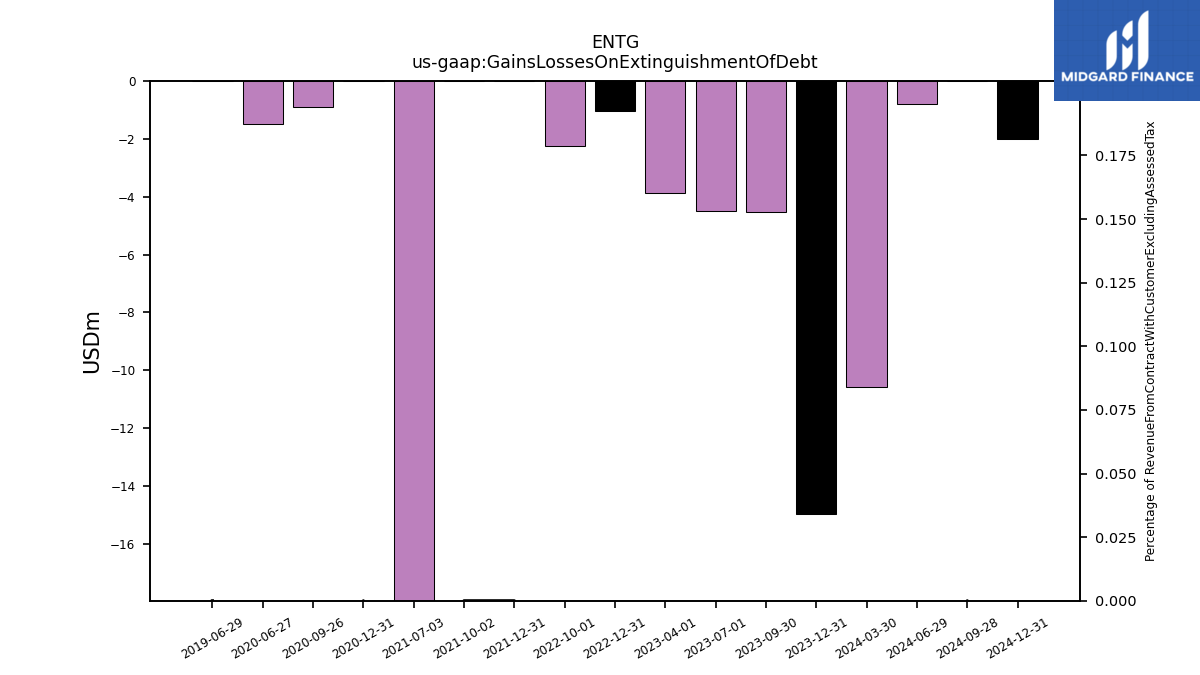
| Gains Losses On Extinguishment Of Debt | -14.97 | -4.53 | -4.48 | -3.88 | -1.05 | -2.23 | NA | NA | 0.00 | 0.00 | -23.34 | NA | 0.00 | -0.91 | -1.47 | NA | NA | NA | 0.00 | NA | NA | NA | NA | NA | NA | NA | NA | NA | NA | NA | NA | NA | NA | NA | NA | NA | NA | NA | NA | NA | NA | NA | NA | NA | NA | NA | NA | NA | NA | NA | NA | NA | NA | NA | NA | NA | |
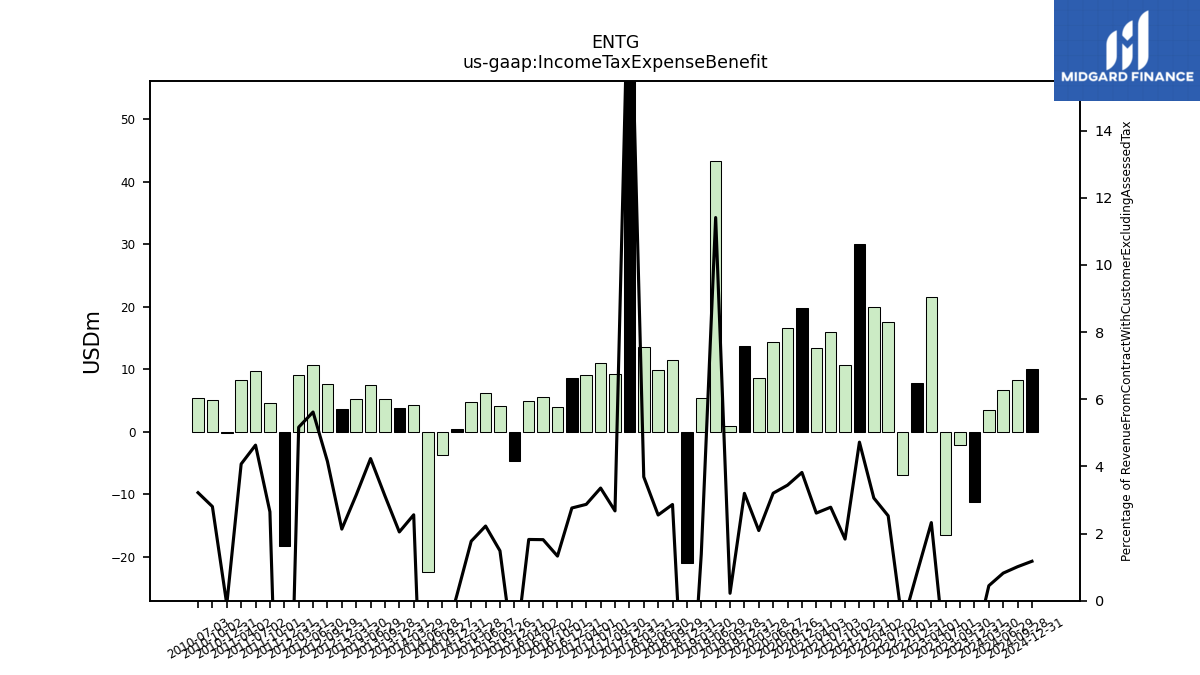
| Income Tax Expense Benefit | -11.26 | -2.13 | -16.49 | 21.47 | 7.78 | -7.01 | 17.52 | 19.88 | 30.00 | 10.64 | 15.92 | 13.39 | 19.78 | 16.56 | 14.36 | 8.62 | 13.66 | 0.88 | 43.23 | 5.42 | -21.08 | 11.43 | 9.78 | 13.55 | 70.26 | 9.25 | 11.04 | 9.11 | 8.52 | 3.94 | 5.51 | 4.87 | -4.73 | 4.02 | 6.25 | 4.67 | 0.44 | -3.81 | -22.45 | 4.24 | 3.82 | 5.14 | 7.52 | 5.20 | 3.58 | 7.66 | 10.58 | 9.06 | -18.33 | 4.58 | 9.70 | 8.27 | -0.20 | 5.00 | 5.39 | NA | |
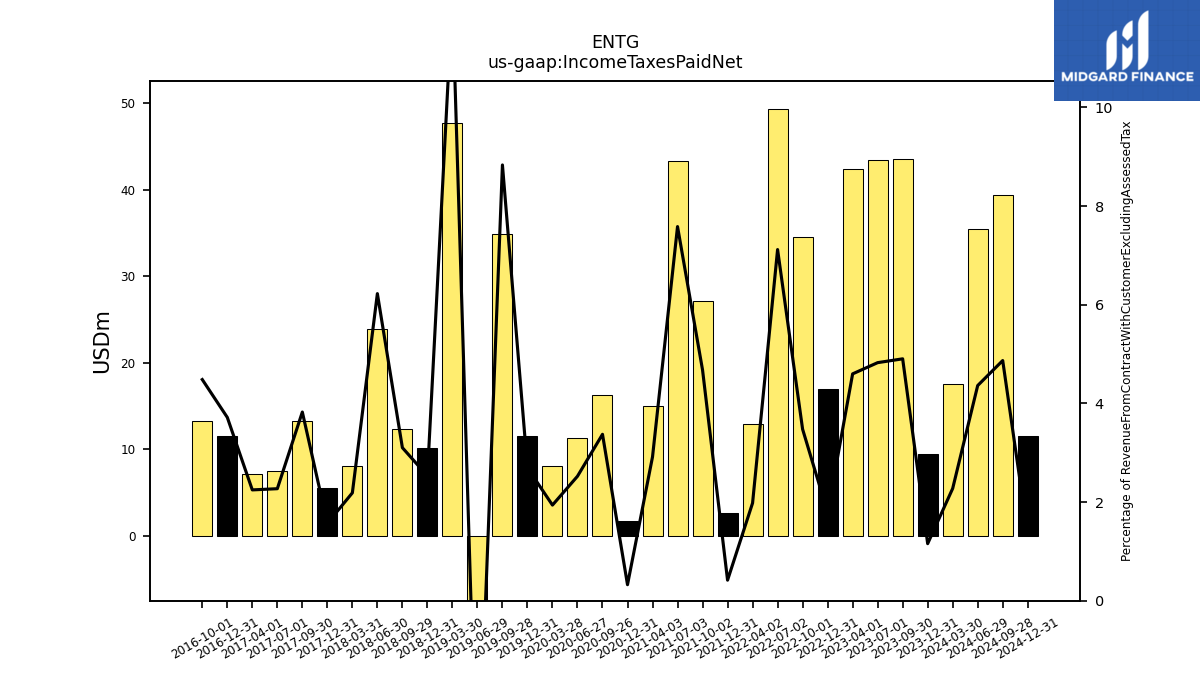
| Income Taxes Paid Net | 9.40 | 43.56 | 43.49 | 42.42 | 16.94 | 34.56 | 49.30 | 12.87 | 2.65 | 27.11 | 43.34 | 14.96 | 1.68 | 16.23 | 11.32 | 8.00 | 11.50 | 34.82 | -16.12 | 47.77 | 10.17 | 12.37 | 23.85 | 8.03 | 5.50 | 13.22 | 7.47 | 7.13 | 11.47 | 13.30 | NA | NA | NA | NA | NA | NA | NA | NA | NA | NA | NA | NA | NA | NA | NA | NA | NA | NA | NA | NA | NA | NA | NA | NA | NA | NA | |
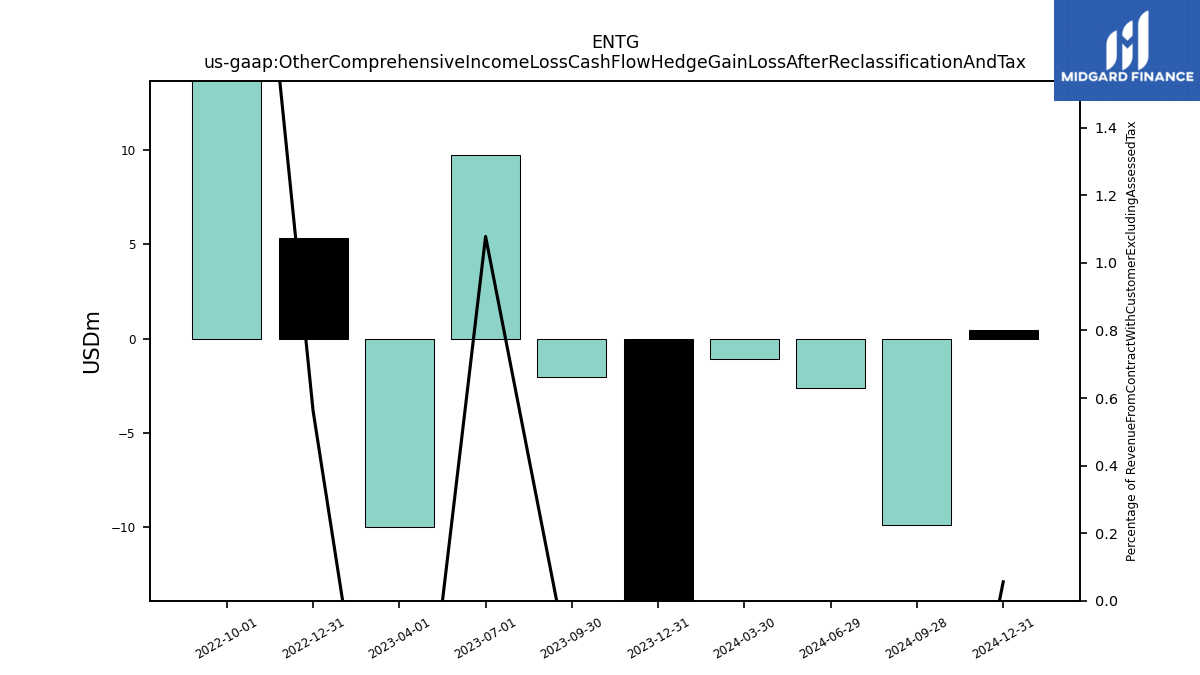
| Other Comprehensive Income Loss Cash Flow Hedge Gain Loss After Reclassification And Tax | -15.15 | -2.05 | 9.72 | -9.96 | 5.33 | 30.74 | NA | NA | NA | NA | NA | NA | NA | NA | NA | NA | NA | NA | NA | NA | NA | NA | NA | NA | NA | NA | NA | NA | NA | NA | NA | NA | NA | NA | NA | NA | NA | NA | NA | NA | NA | NA | NA | NA | NA | NA | NA | NA | NA | NA | NA | NA | NA | NA | NA | NA | |
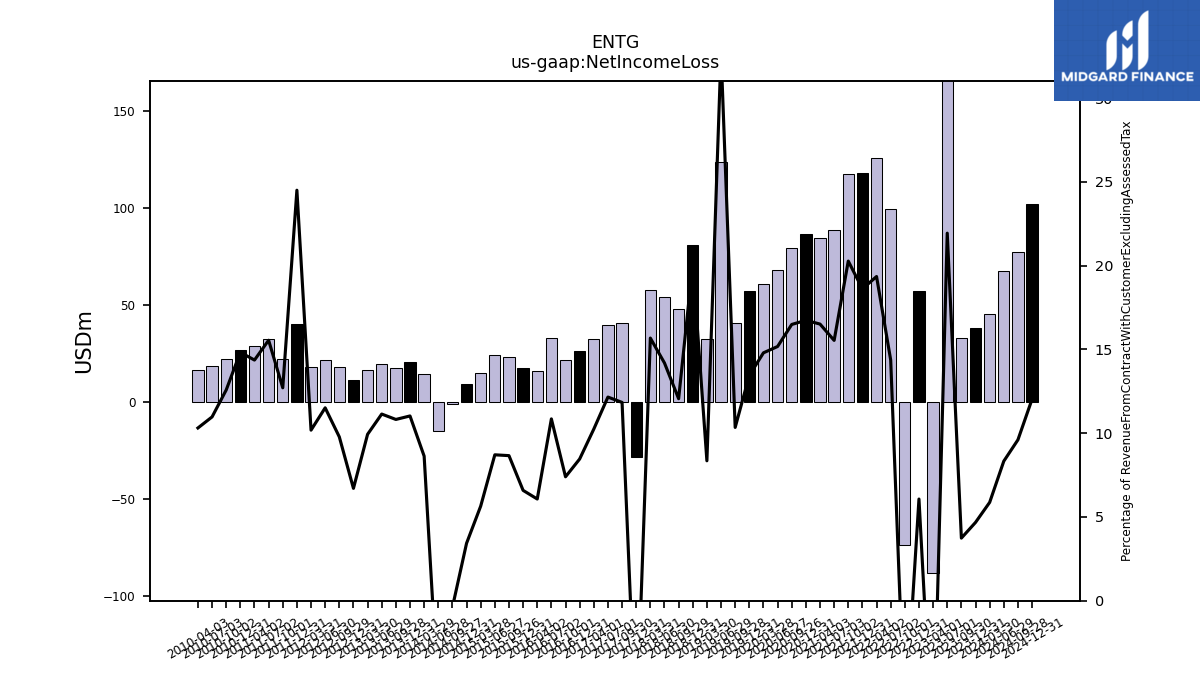
| Net Income Loss | 37.98 | 33.21 | 197.65 | -88.17 | 57.43 | -73.70 | 99.49 | 125.70 | 118.22 | 117.46 | 88.77 | 84.68 | 86.62 | 79.30 | 68.04 | 61.01 | 57.44 | 40.77 | 124.00 | 32.66 | 80.78 | 48.06 | 54.35 | 57.56 | -28.34 | 40.90 | 39.99 | 32.51 | 26.10 | 21.95 | 32.89 | 16.21 | 17.57 | 23.40 | 24.45 | 14.87 | 9.31 | -1.07 | -14.67 | 14.31 | 20.54 | 17.81 | 19.78 | 16.40 | 11.26 | 18.04 | 21.67 | 17.86 | 40.16 | 21.99 | 32.52 | 29.18 | 27.00 | 22.42 | 18.39 | 16.55 | |
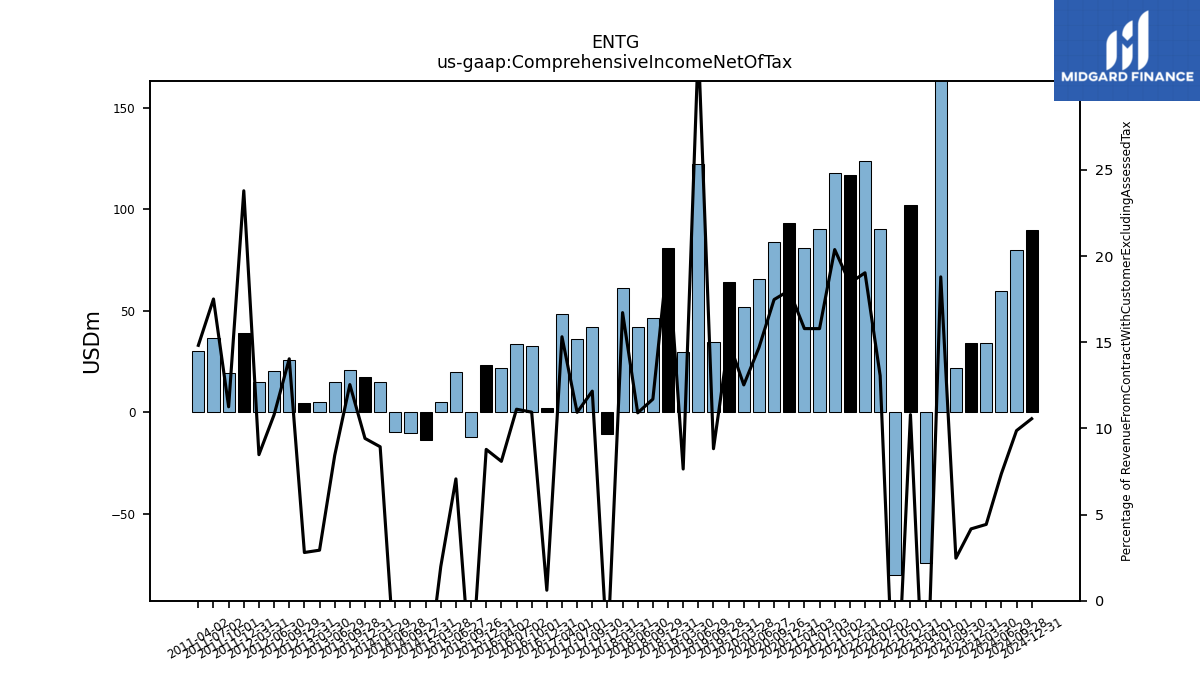
| Comprehensive Income Net Of Tax | 33.88 | 21.95 | 169.35 | -74.35 | 102.20 | -80.42 | 90.48 | 123.65 | 117.14 | 118.10 | 90.23 | 81.00 | 93.20 | 84.08 | 65.87 | 51.66 | 64.29 | 34.78 | 122.27 | 29.89 | 80.81 | 46.65 | 41.77 | 61.40 | -10.80 | 42.04 | 35.97 | 48.63 | 1.89 | 32.48 | 33.69 | 21.60 | 23.44 | -12.31 | 19.85 | 5.21 | -13.88 | -10.18 | -9.97 | 14.82 | 17.55 | 20.65 | 14.97 | 4.84 | 4.70 | 25.90 | 20.32 | 14.87 | 39.00 | 19.48 | 36.63 | 30.11 | NA | NA | NA | NA | |
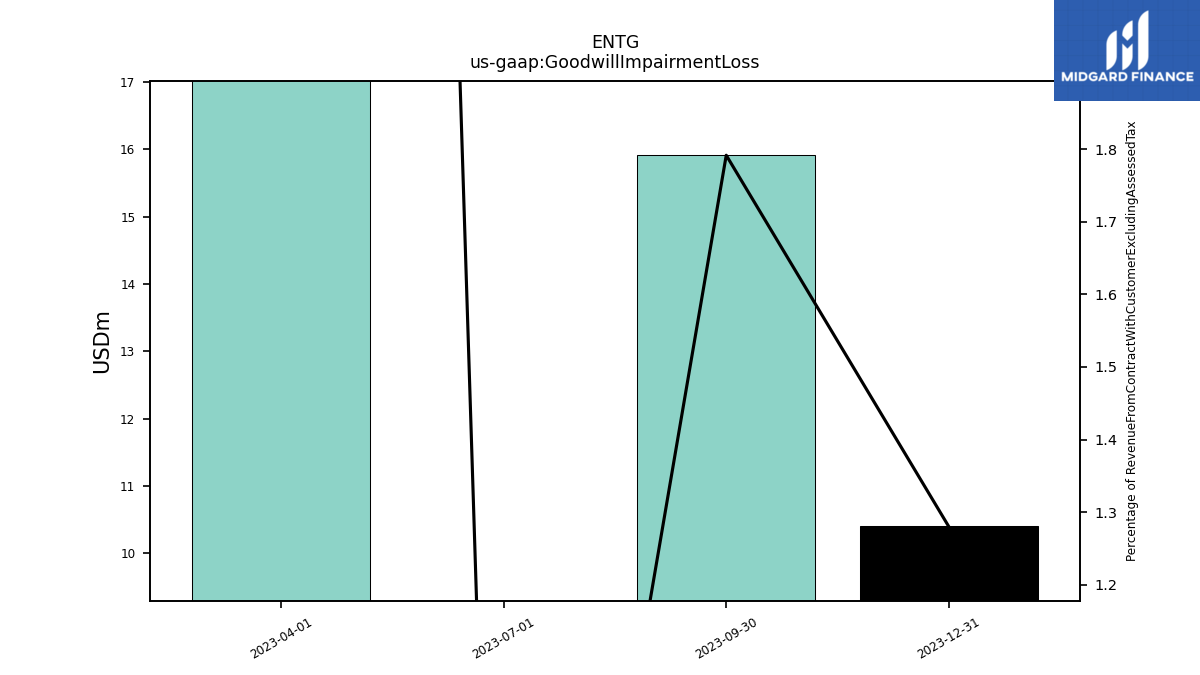
| Goodwill Impairment Loss | 10.40 | 15.91 | 0.00 | 88.87 | NA | NA | NA | NA | NA | NA | NA | NA | NA | NA | NA | NA | NA | NA | NA | NA | NA | NA | NA | NA | NA | NA | NA | NA | NA | NA | NA | NA | NA | NA | NA | NA | NA | NA | NA | NA | NA | NA | NA | NA | NA | NA | NA | NA | NA | NA | NA | NA | NA | NA | NA | NA |
| 2023-12-31 | 2023-09-30 | 2023-07-01 | 2023-04-01 | 2022-12-31 | 2022-10-01 | 2022-07-02 | 2022-04-02 | 2021-12-31 | 2021-10-02 | 2021-07-03 | 2021-04-03 | 2020-12-31 | 2020-09-26 | 2020-06-27 | 2020-03-28 | 2019-12-31 | 2019-09-28 | 2019-06-29 | 2019-03-30 | 2018-12-31 | 2018-09-29 | 2018-06-30 | 2018-03-31 | 2017-12-31 | 2017-09-30 | 2017-07-01 | 2017-04-01 | 2016-12-31 | 2016-10-01 | 2016-07-02 | 2016-04-02 | 2015-12-31 | 2015-09-26 | 2015-06-27 | 2015-03-28 | 2014-12-31 | 2014-09-27 | 2014-06-28 | 2014-03-29 | 2013-12-31 | 2013-09-28 | 2013-06-29 | 2013-03-30 | 2012-12-31 | 2012-09-29 | 2012-06-30 | 2012-03-31 | 2011-12-31 | 2011-10-01 | 2011-07-02 | 2011-04-02 | 2010-12-31 | 2010-10-02 | 2010-07-03 | 2010-04-03 | ||
|---|---|---|---|---|---|---|---|---|---|---|---|---|---|---|---|---|---|---|---|---|---|---|---|---|---|---|---|---|---|---|---|---|---|---|---|---|---|---|---|---|---|---|---|---|---|---|---|---|---|---|---|---|---|---|---|---|---|
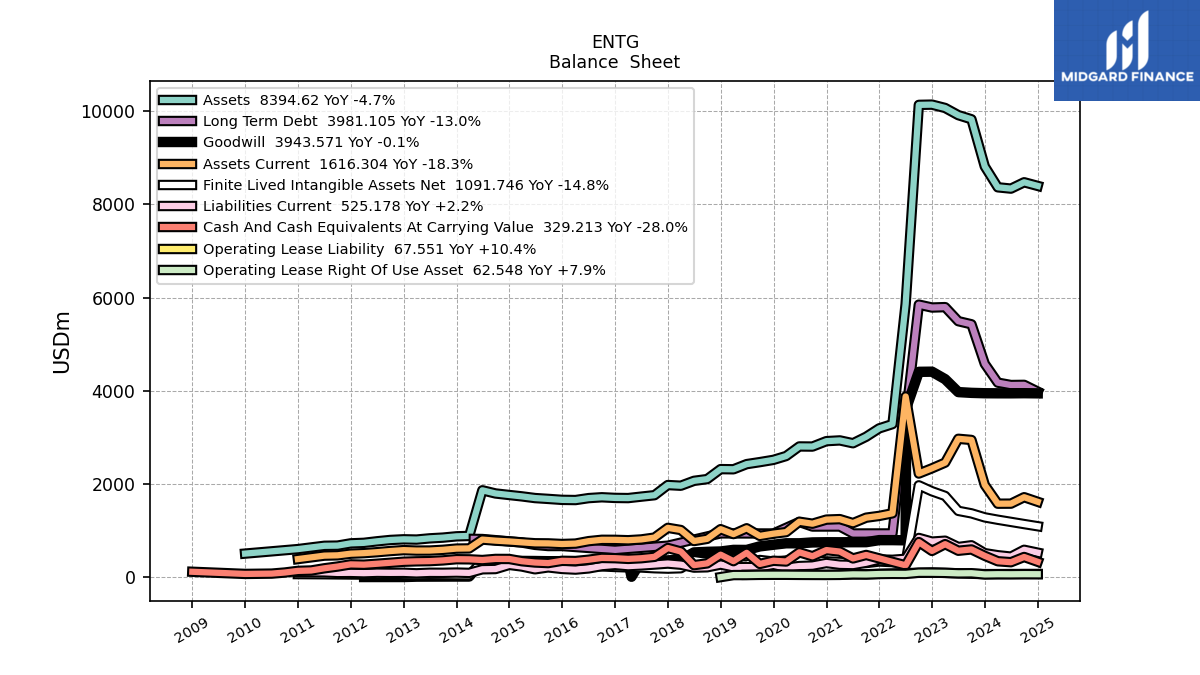
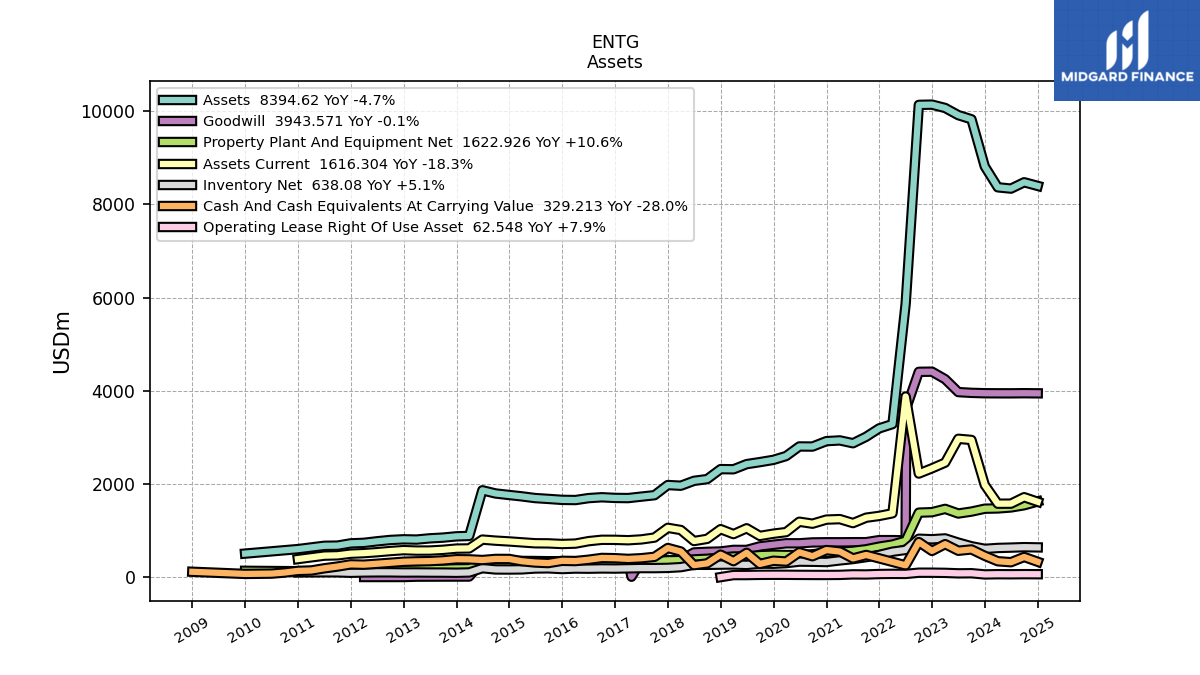
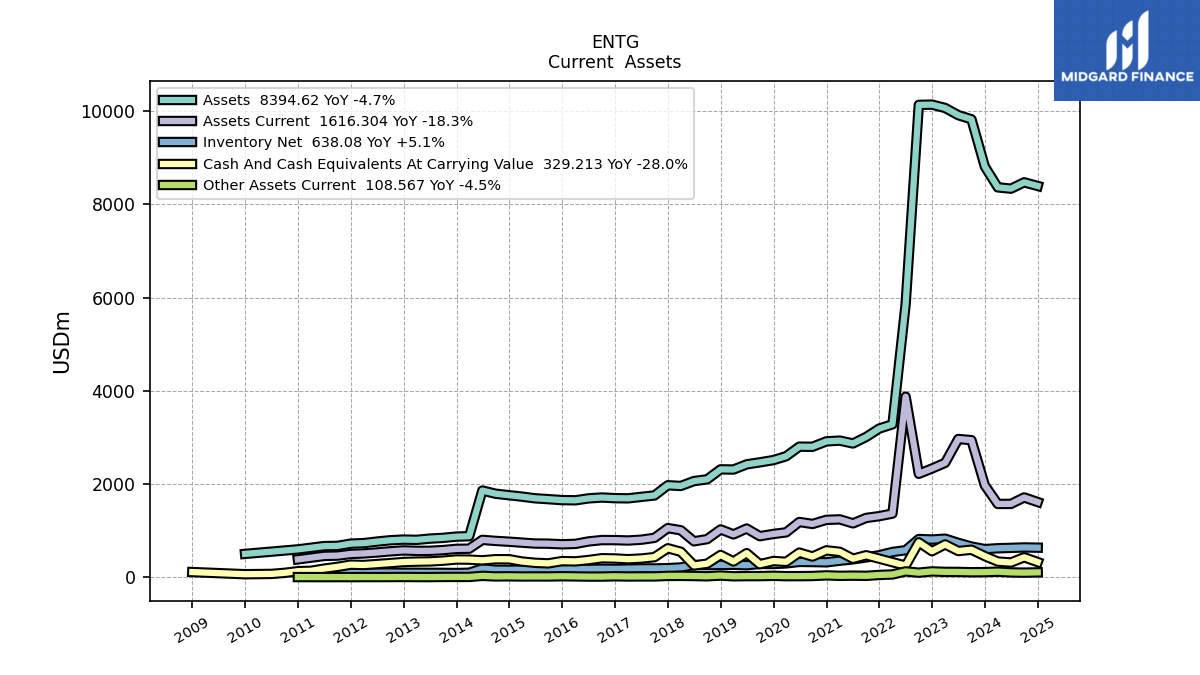
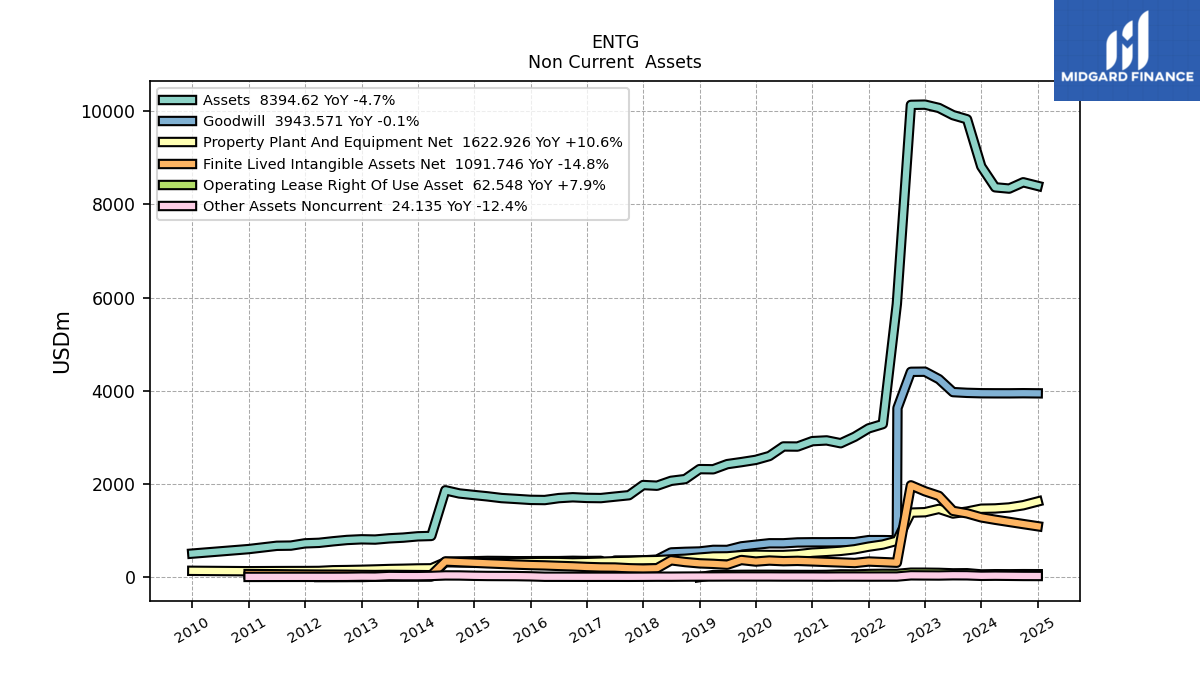
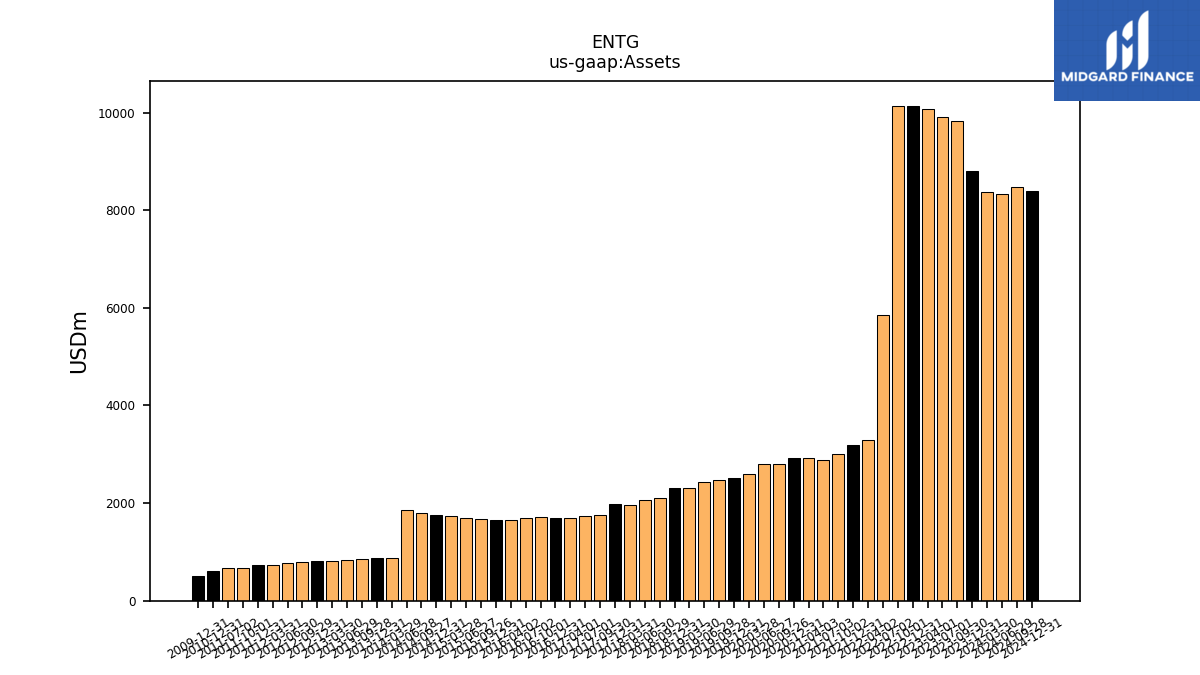
| Assets | 8812.59 | 9824.62 | 9913.02 | 10067.09 | 10138.86 | 10133.40 | 5861.17 | 3283.44 | 3191.90 | 3012.28 | 2872.73 | 2933.54 | 2917.70 | 2801.63 | 2804.04 | 2598.57 | 2516.09 | 2467.68 | 2424.72 | 2314.01 | 2317.64 | 2103.46 | 2066.11 | 1961.33 | 1976.17 | 1757.75 | 1727.44 | 1696.09 | 1699.53 | 1713.59 | 1695.48 | 1653.83 | 1657.94 | 1678.45 | 1696.48 | 1732.80 | 1762.09 | 1795.22 | 1863.53 | 883.50 | 875.29 | 847.66 | 831.94 | 805.85 | 811.54 | 797.15 | 768.73 | 735.65 | 724.66 | 676.31 | 672.27 | NA | 601.38 | NA | NA | NA | |
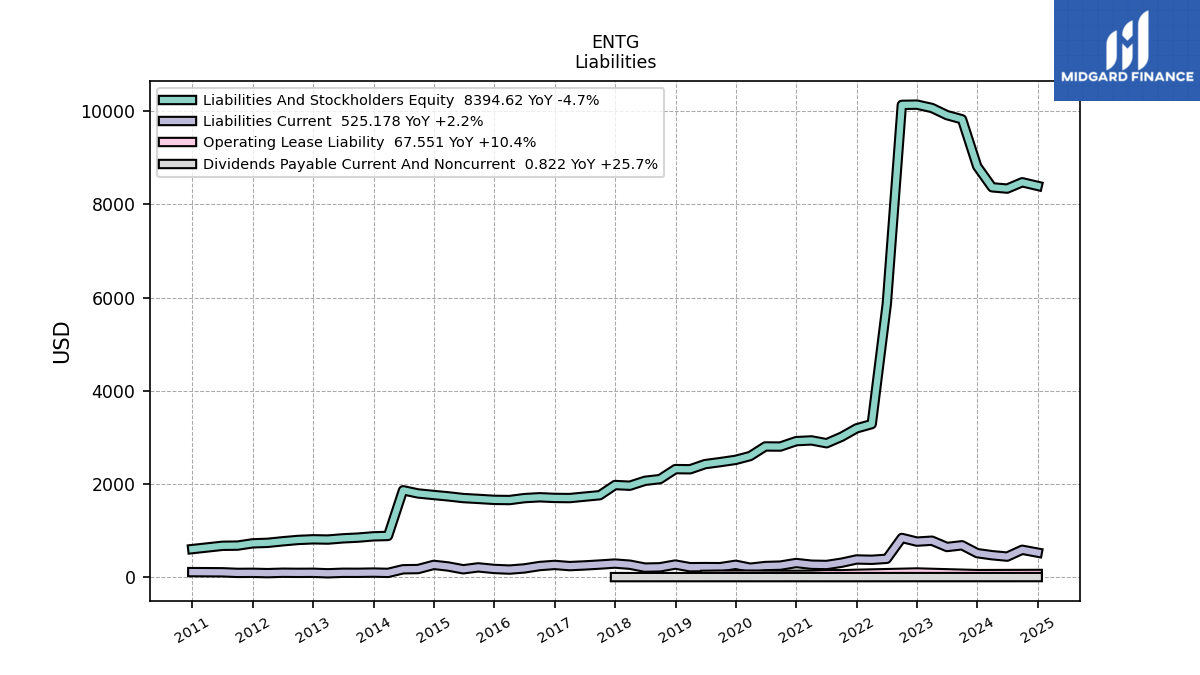
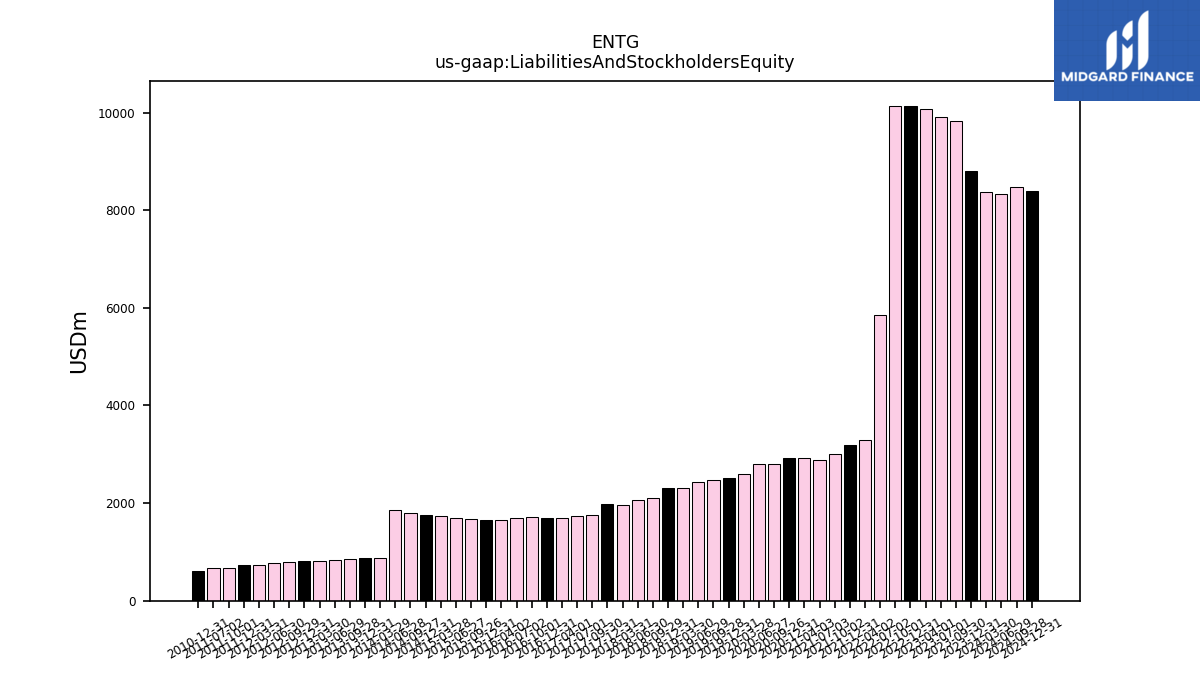
| Liabilities And Stockholders Equity | 8812.59 | 9824.62 | 9913.02 | 10067.09 | 10138.86 | 10133.40 | 5861.17 | 3283.44 | 3191.90 | 3012.28 | 2872.73 | 2933.54 | 2917.70 | 2801.63 | 2804.04 | 2598.57 | 2516.09 | 2467.68 | 2424.72 | 2314.01 | 2317.64 | 2103.46 | 2066.11 | 1961.33 | 1976.17 | 1757.75 | 1727.44 | 1696.09 | 1699.53 | 1713.59 | 1695.48 | 1653.83 | 1657.94 | 1678.45 | 1696.48 | 1732.80 | 1762.09 | 1795.22 | 1863.53 | 883.50 | 875.29 | 847.66 | 831.94 | 805.85 | 811.54 | 797.15 | 768.73 | 735.65 | 724.66 | 676.31 | 672.27 | NA | 601.38 | NA | NA | NA |
| 2023-12-31 | 2023-09-30 | 2023-07-01 | 2023-04-01 | 2022-12-31 | 2022-10-01 | 2022-07-02 | 2022-04-02 | 2021-12-31 | 2021-10-02 | 2021-07-03 | 2021-04-03 | 2020-12-31 | 2020-09-26 | 2020-06-27 | 2020-03-28 | 2019-12-31 | 2019-09-28 | 2019-06-29 | 2019-03-30 | 2018-12-31 | 2018-09-29 | 2018-06-30 | 2018-03-31 | 2017-12-31 | 2017-09-30 | 2017-07-01 | 2017-04-01 | 2016-12-31 | 2016-10-01 | 2016-07-02 | 2016-04-02 | 2015-12-31 | 2015-09-26 | 2015-06-27 | 2015-03-28 | 2014-12-31 | 2014-09-27 | 2014-06-28 | 2014-03-29 | 2013-12-31 | 2013-09-28 | 2013-06-29 | 2013-03-30 | 2012-12-31 | 2012-09-29 | 2012-06-30 | 2012-03-31 | 2011-12-31 | 2011-10-01 | 2011-07-02 | 2011-04-02 | 2010-12-31 | 2010-10-02 | 2010-07-03 | 2010-04-03 | ||
|---|---|---|---|---|---|---|---|---|---|---|---|---|---|---|---|---|---|---|---|---|---|---|---|---|---|---|---|---|---|---|---|---|---|---|---|---|---|---|---|---|---|---|---|---|---|---|---|---|---|---|---|---|---|---|---|---|---|
| Assets Current | 1977.33 | 2943.56 | 2968.55 | 2457.05 | 2335.18 | 2222.28 | 3876.16 | 1369.34 | 1313.37 | 1275.70 | 1159.24 | 1244.61 | 1234.26 | 1146.45 | 1188.85 | 966.31 | 932.40 | 884.24 | 1048.45 | 922.81 | 1029.34 | 820.95 | 774.23 | 1011.05 | 1057.61 | 848.50 | 808.99 | 791.75 | 800.13 | 801.03 | 772.17 | 719.78 | 710.76 | 724.24 | 726.63 | 746.35 | 765.65 | 782.90 | 805.49 | 616.06 | 612.30 | 585.91 | 570.43 | 569.74 | 579.32 | 559.51 | 534.98 | 514.60 | 503.00 | 467.74 | 461.10 | NA | 387.09 | NA | NA | NA | |
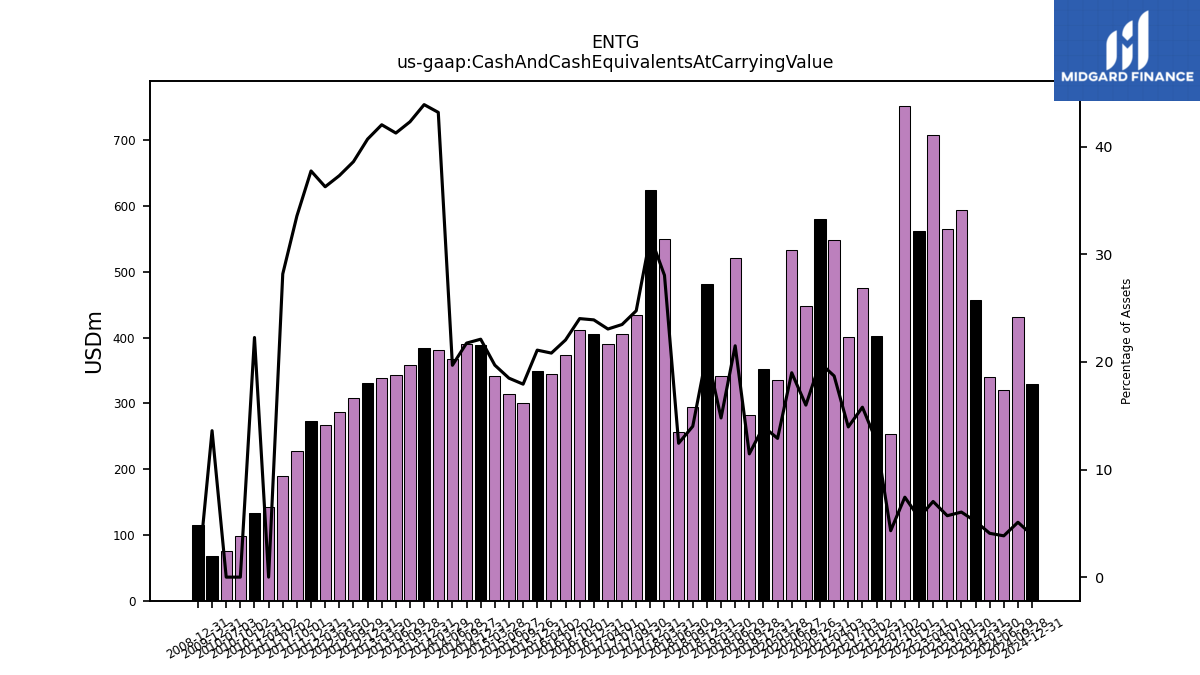
| Cash And Cash Equivalents At Carrying Value | 456.93 | 594.02 | 565.88 | 707.84 | 561.56 | 752.79 | 252.95 | NA | 402.56 | 475.75 | 401.03 | 548.52 | 580.89 | 447.97 | 532.67 | 335.08 | 351.91 | 282.75 | 521.38 | 342.36 | 482.06 | 294.89 | 257.11 | 550.24 | 625.41 | 435.20 | 405.63 | 391.16 | 406.39 | 411.78 | 373.74 | 344.40 | 349.82 | 301.06 | 313.74 | 341.39 | 389.70 | 390.49 | 366.98 | 381.66 | 384.43 | 358.78 | 343.41 | 338.85 | 330.42 | 307.83 | 286.87 | 266.93 | 273.59 | 227.04 | 189.44 | 142.58 | 133.95 | 98.81 | 75.31 | NA | |
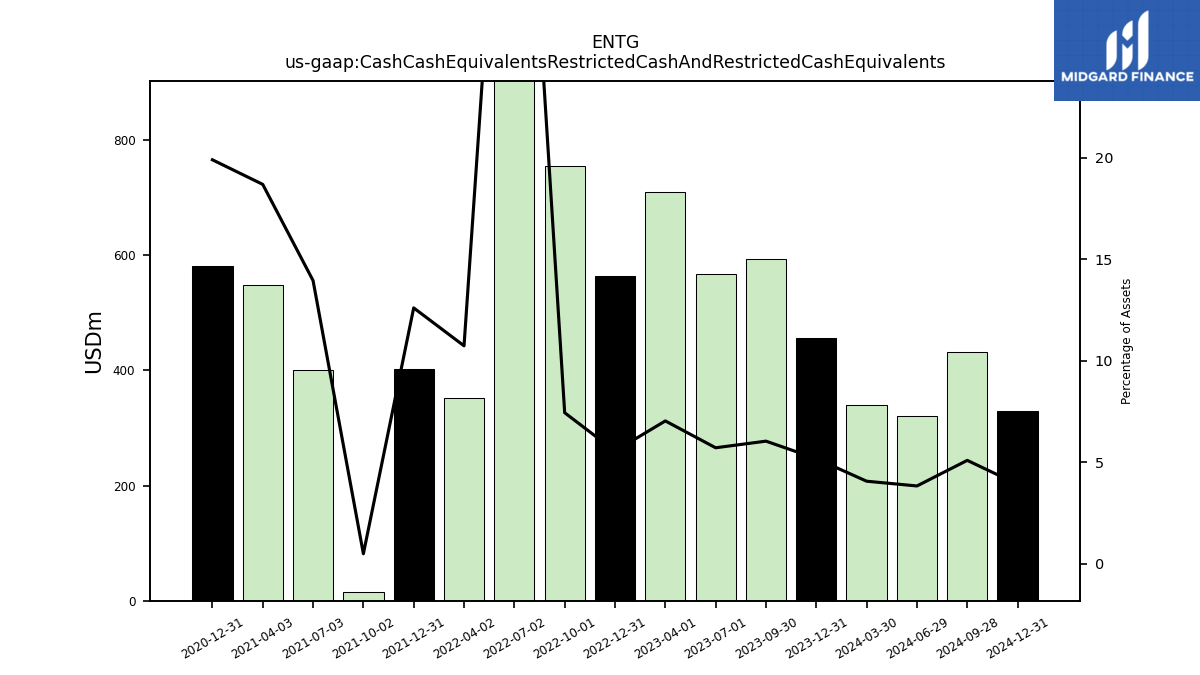
| Cash Cash Equivalents Restricted Cash And Restricted Cash Equivalents | 456.93 | 594.02 | 567.02 | 709.03 | 563.44 | 754.67 | 2743.23 | 352.73 | 402.56 | 15.00 | 401.03 | 548.52 | 580.89 | NA | NA | NA | NA | NA | NA | NA | NA | NA | NA | NA | NA | NA | NA | NA | NA | NA | NA | NA | NA | NA | NA | NA | NA | NA | NA | NA | NA | NA | NA | NA | NA | NA | NA | NA | NA | NA | NA | NA | NA | NA | NA | NA | |
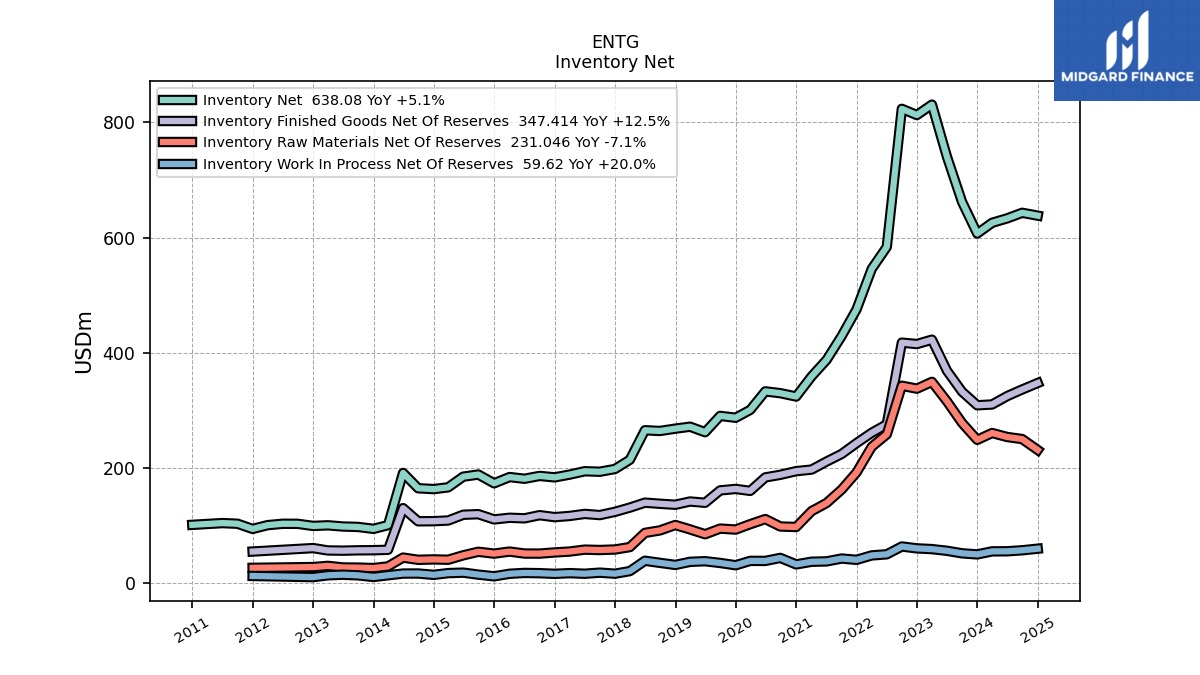
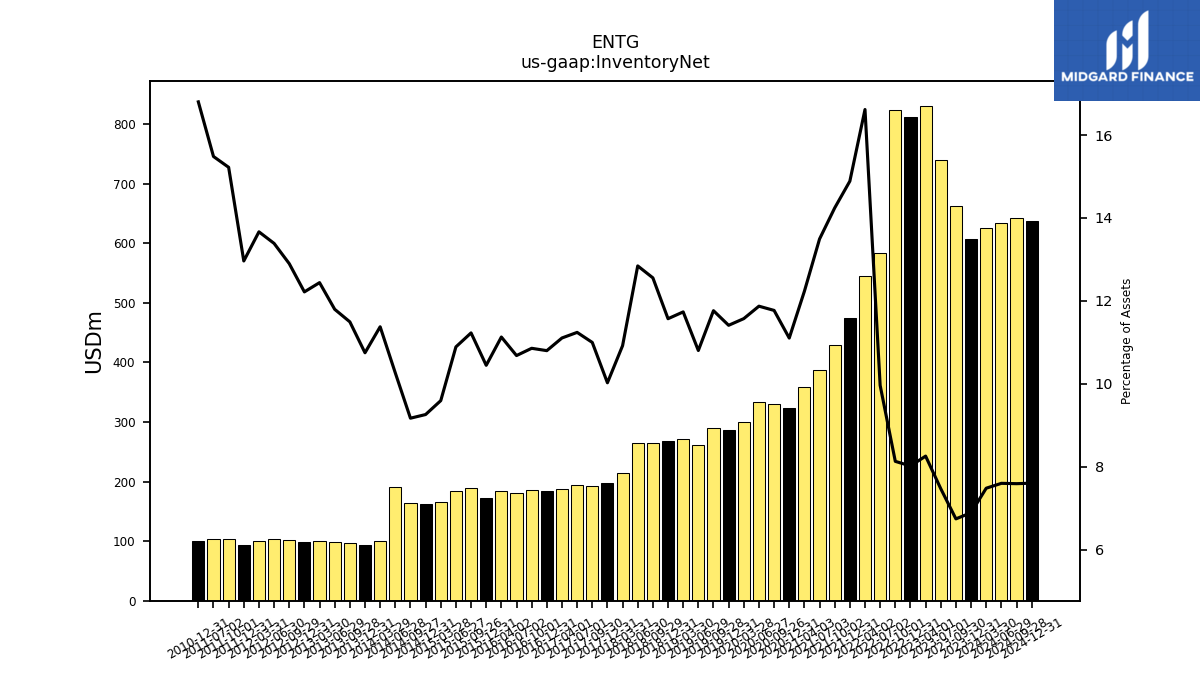
| Inventory Net | 607.05 | 662.17 | 740.35 | 830.94 | 812.82 | 823.64 | 583.77 | 545.61 | 475.21 | 429.02 | 387.61 | 358.82 | 323.94 | 329.74 | 332.88 | 300.69 | 287.10 | 290.27 | 261.93 | 271.51 | 268.14 | 264.09 | 265.36 | 214.15 | 198.09 | 193.30 | 194.16 | 188.34 | 183.53 | 186.02 | 181.09 | 184.03 | 173.18 | 188.44 | 184.74 | 166.23 | 163.12 | 164.60 | 191.22 | 100.50 | 94.07 | 97.43 | 98.14 | 100.25 | 99.14 | 102.82 | 102.91 | 100.53 | 93.94 | 102.95 | 104.09 | NA | 101.04 | NA | NA | NA | |
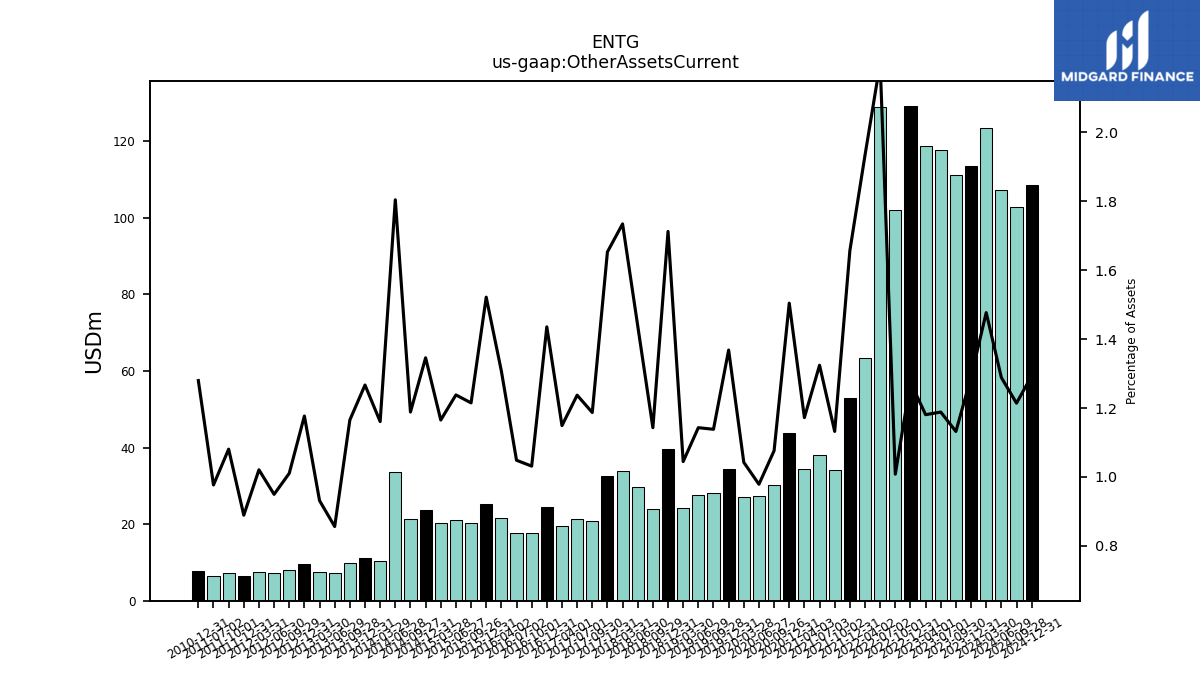
| Other Assets Current | 113.66 | 111.22 | 117.80 | 118.86 | 129.30 | 102.16 | 129.00 | 63.48 | 52.87 | 34.10 | 38.04 | 34.39 | 43.89 | 30.15 | 27.45 | 27.09 | 34.43 | 28.09 | 27.71 | 24.18 | 39.69 | 24.04 | 29.72 | 34.01 | 32.66 | 20.86 | 21.37 | 19.49 | 24.40 | 17.68 | 17.78 | 21.62 | 25.23 | 20.39 | 21.00 | 20.19 | 23.71 | 21.34 | 33.62 | 10.26 | 11.09 | 9.88 | 7.12 | 7.50 | 9.55 | 8.06 | 7.30 | 7.51 | 6.44 | 7.31 | 6.57 | NA | 7.70 | NA | NA | NA | |
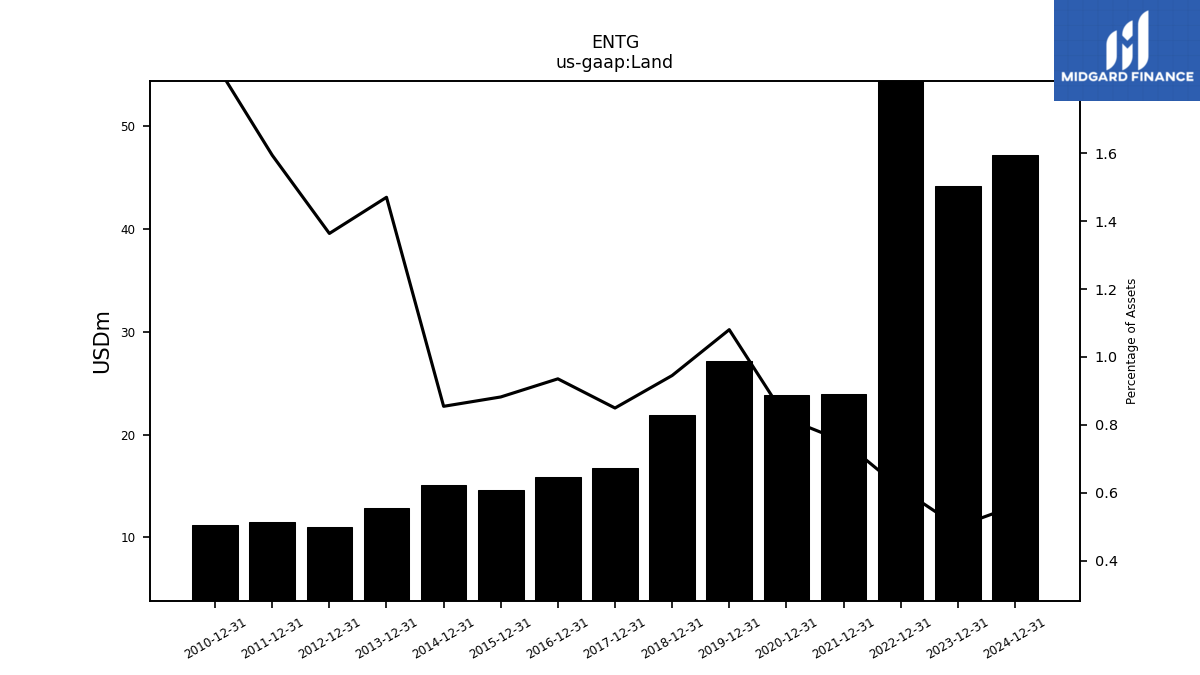
| Land | 44.18 | NA | NA | NA | 62.19 | NA | NA | NA | 24.00 | NA | NA | NA | 23.90 | NA | NA | NA | 27.18 | NA | NA | NA | 21.91 | NA | NA | NA | 16.80 | NA | NA | NA | 15.90 | NA | NA | NA | 14.63 | NA | NA | NA | 15.06 | NA | NA | NA | 12.87 | NA | NA | NA | 11.06 | NA | NA | NA | 11.55 | NA | NA | NA | 11.22 | NA | NA | NA | |
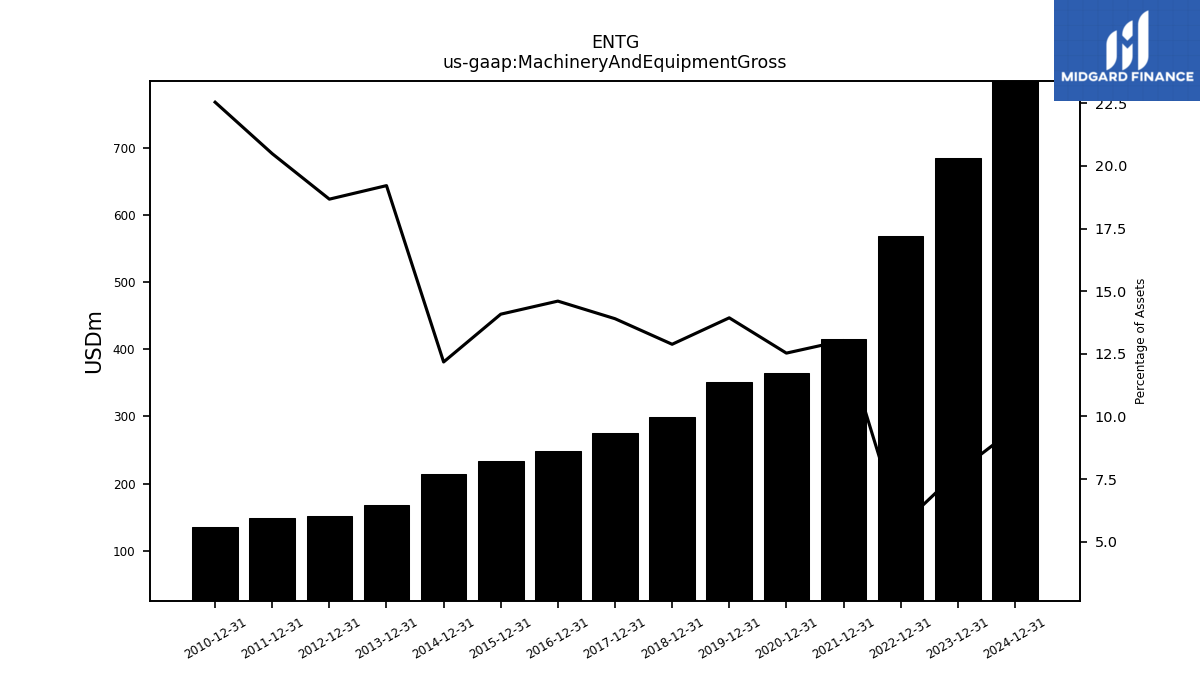
| Machinery And Equipment Gross | 685.50 | NA | NA | NA | 569.22 | NA | NA | NA | 415.99 | NA | NA | NA | 365.51 | NA | NA | NA | 350.66 | NA | NA | NA | 298.53 | NA | NA | NA | 274.72 | NA | NA | NA | 248.20 | NA | NA | NA | 233.47 | NA | NA | NA | 214.51 | NA | NA | NA | 168.20 | NA | NA | NA | 151.56 | NA | NA | NA | 148.49 | NA | NA | NA | 135.59 | NA | NA | NA |
| 2023-12-31 | 2023-09-30 | 2023-07-01 | 2023-04-01 | 2022-12-31 | 2022-10-01 | 2022-07-02 | 2022-04-02 | 2021-12-31 | 2021-10-02 | 2021-07-03 | 2021-04-03 | 2020-12-31 | 2020-09-26 | 2020-06-27 | 2020-03-28 | 2019-12-31 | 2019-09-28 | 2019-06-29 | 2019-03-30 | 2018-12-31 | 2018-09-29 | 2018-06-30 | 2018-03-31 | 2017-12-31 | 2017-09-30 | 2017-07-01 | 2017-04-01 | 2016-12-31 | 2016-10-01 | 2016-07-02 | 2016-04-02 | 2015-12-31 | 2015-09-26 | 2015-06-27 | 2015-03-28 | 2014-12-31 | 2014-09-27 | 2014-06-28 | 2014-03-29 | 2013-12-31 | 2013-09-28 | 2013-06-29 | 2013-03-30 | 2012-12-31 | 2012-09-29 | 2012-06-30 | 2012-03-31 | 2011-12-31 | 2011-10-01 | 2011-07-02 | 2011-04-02 | 2010-12-31 | 2010-10-02 | 2010-07-03 | 2010-04-03 | ||
|---|---|---|---|---|---|---|---|---|---|---|---|---|---|---|---|---|---|---|---|---|---|---|---|---|---|---|---|---|---|---|---|---|---|---|---|---|---|---|---|---|---|---|---|---|---|---|---|---|---|---|---|---|---|---|---|---|---|
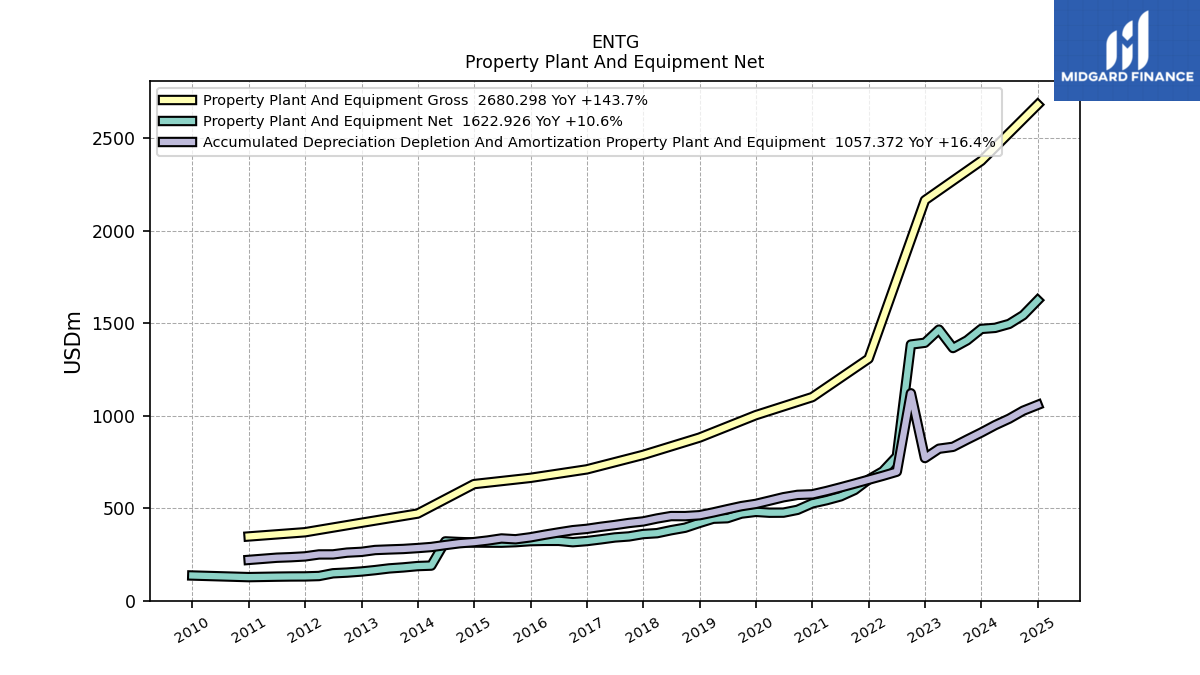
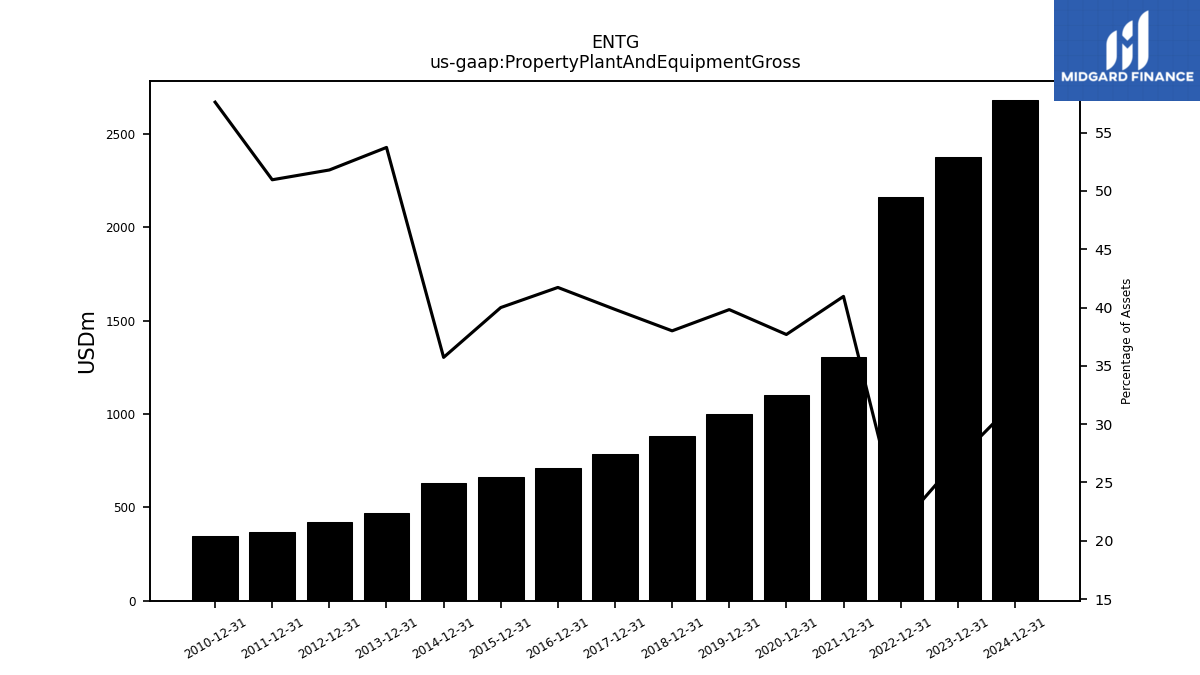
| Property Plant And Equipment Gross | 2376.13 | NA | NA | NA | 2163.43 | NA | NA | NA | 1307.20 | NA | NA | NA | 1099.62 | NA | NA | NA | 1001.97 | NA | NA | NA | 880.75 | NA | NA | NA | 787.29 | NA | NA | NA | 709.09 | NA | NA | NA | 663.14 | NA | NA | NA | 629.52 | NA | NA | NA | 470.26 | NA | NA | NA | 420.32 | NA | NA | NA | 369.24 | NA | NA | NA | 346.45 | NA | NA | NA | |
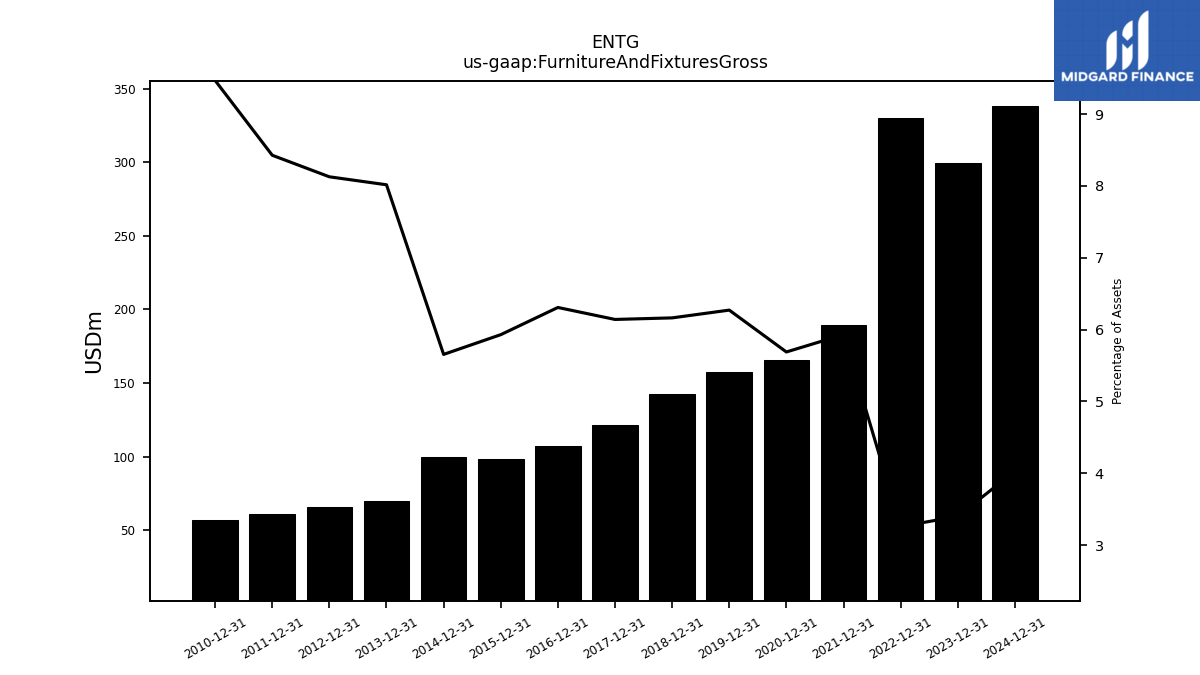
| Furniture And Fixtures Gross | 299.44 | NA | NA | NA | 330.28 | NA | NA | NA | 189.26 | NA | NA | NA | 165.95 | NA | NA | NA | 157.77 | NA | NA | NA | 142.82 | NA | NA | NA | 121.34 | NA | NA | NA | 107.19 | NA | NA | NA | 98.29 | NA | NA | NA | 99.62 | NA | NA | NA | 70.16 | NA | NA | NA | 65.95 | NA | NA | NA | 61.06 | NA | NA | NA | 56.94 | NA | NA | NA | |
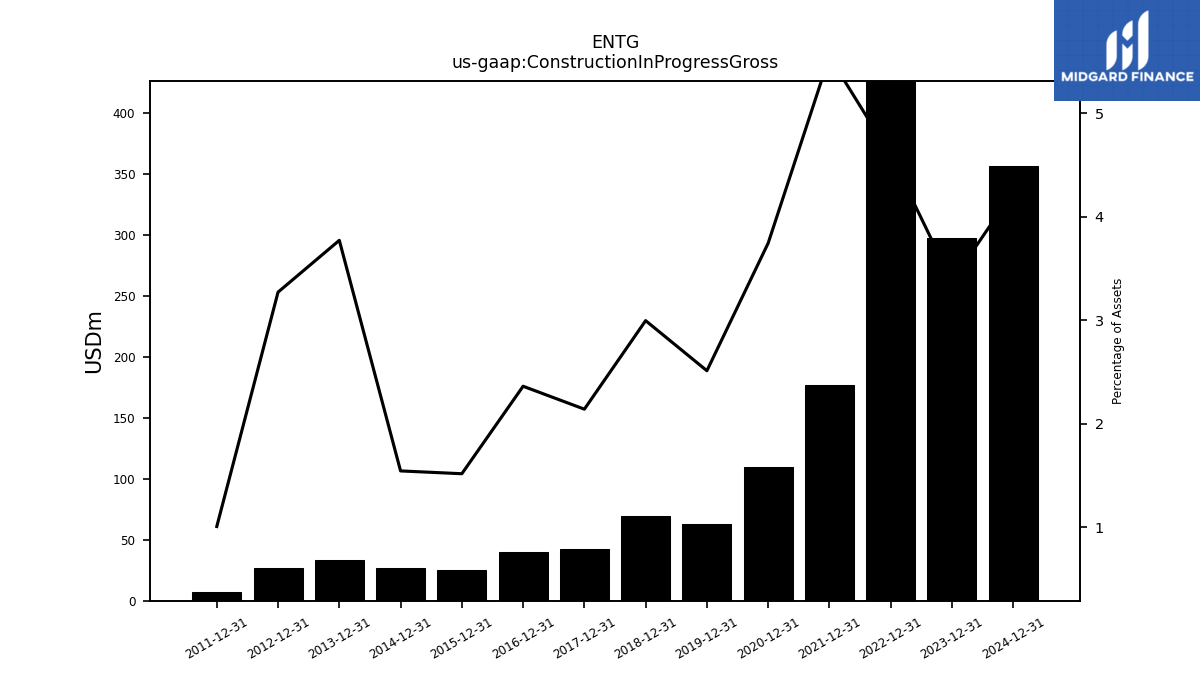
| Construction In Progress Gross | 297.45 | NA | NA | NA | 465.92 | NA | NA | NA | 177.16 | NA | NA | NA | 109.28 | NA | NA | NA | 63.20 | NA | NA | NA | 69.44 | NA | NA | NA | 42.29 | NA | NA | NA | 40.14 | NA | NA | NA | 25.13 | NA | NA | NA | 27.18 | NA | NA | NA | 33.02 | NA | NA | NA | 26.55 | NA | NA | NA | 7.29 | NA | NA | NA | NA | NA | NA | NA | |
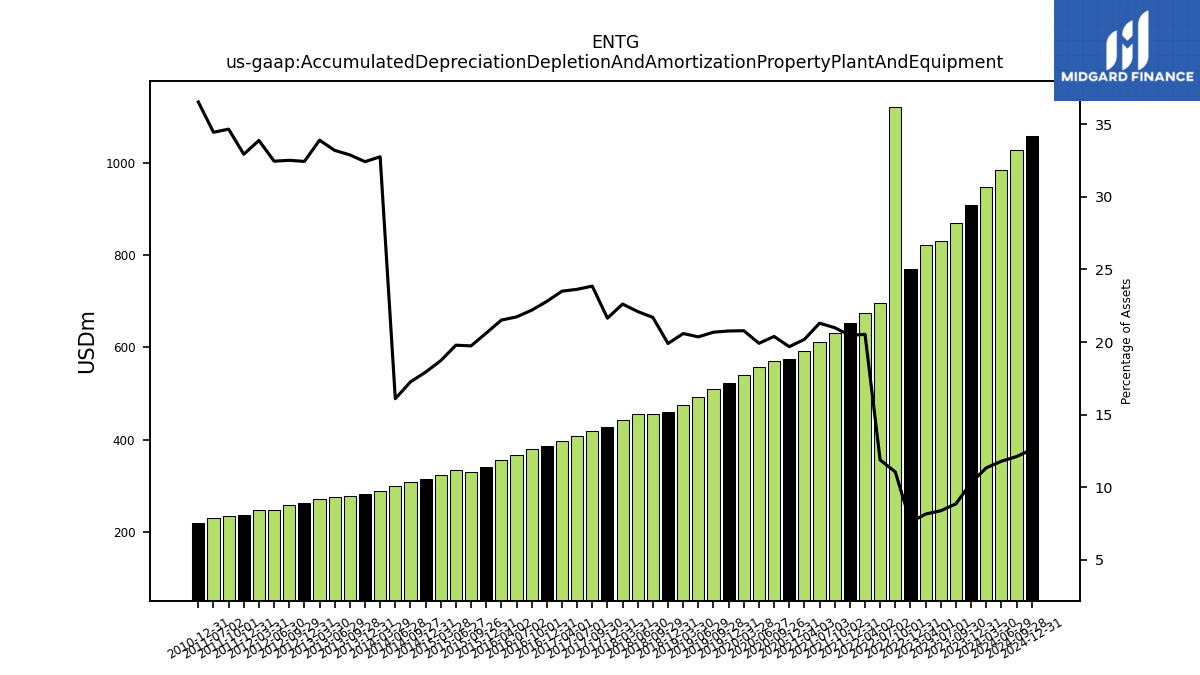
| Accumulated Depreciation Depletion And Amortization Property Plant And Equipment | 908.09 | 869.95 | 830.91 | 820.64 | 770.09 | 1120.34 | 696.50 | 674.24 | 653.10 | 632.24 | 611.89 | 592.15 | 574.26 | 571.20 | 558.43 | 540.01 | 522.42 | 510.32 | 493.64 | 476.37 | 461.22 | 456.41 | 456.67 | 443.61 | 427.77 | 419.28 | 408.26 | 398.67 | 387.52 | 380.34 | 368.47 | 355.81 | 341.84 | 331.26 | 335.66 | 324.38 | 315.95 | 309.82 | 300.04 | 289.47 | 283.82 | 278.83 | 276.23 | 273.24 | 263.30 | 259.22 | 249.53 | 249.30 | 238.69 | 234.44 | 231.61 | NA | 219.72 | NA | NA | NA | |
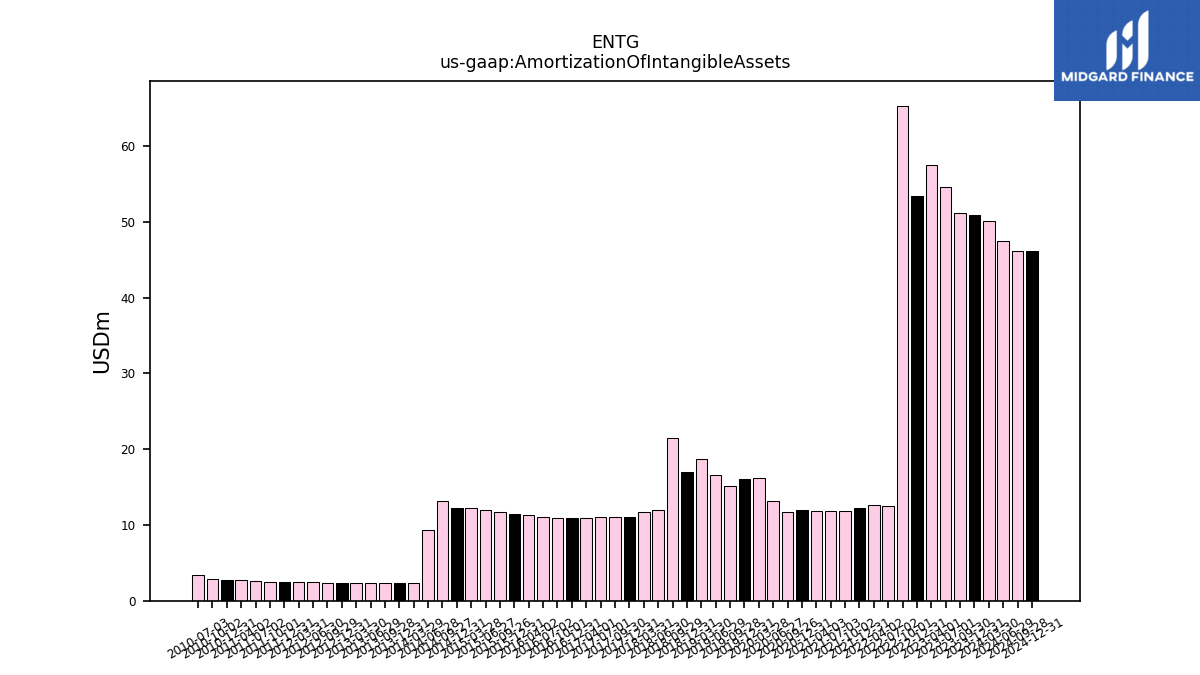
| Amortization Of Intangible Assets | 50.98 | 51.24 | 54.68 | 57.57 | 53.46 | 65.35 | 12.49 | 12.65 | 12.24 | 11.84 | 11.90 | 11.87 | 11.92 | 11.75 | 13.22 | 16.21 | 16.03 | 15.15 | 16.59 | 18.66 | 17.05 | 21.42 | 12.01 | 11.67 | 11.02 | 11.05 | 11.01 | 10.95 | 10.94 | 10.97 | 11.06 | 11.29 | 11.44 | 11.67 | 11.93 | 12.31 | 12.21 | 13.13 | 9.39 | 2.34 | 2.36 | 2.34 | 2.36 | 2.29 | 2.33 | 2.39 | 2.42 | 2.45 | 2.46 | 2.50 | 2.57 | 2.69 | 2.77 | 2.82 | 3.36 | NA | |
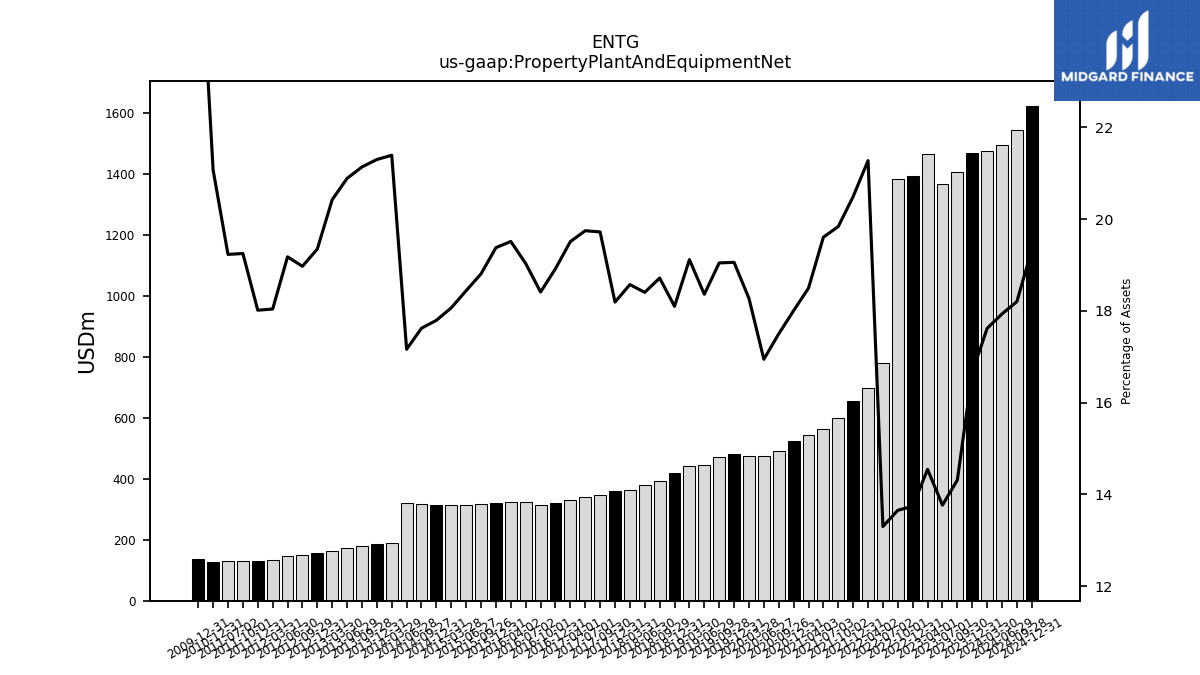
| Property Plant And Equipment Net | 1468.04 | 1406.36 | 1364.76 | 1464.42 | 1393.34 | 1383.69 | 779.63 | 698.57 | 654.10 | 597.63 | 563.26 | 542.61 | 525.37 | 490.30 | 475.20 | 474.84 | 479.54 | 470.00 | 445.25 | 442.39 | 419.53 | 393.71 | 380.26 | 364.30 | 359.52 | 346.66 | 341.15 | 330.93 | 321.56 | 315.51 | 322.72 | 322.73 | 321.30 | 315.69 | 312.86 | 313.08 | 313.57 | 316.38 | 319.87 | 189.01 | 186.44 | 179.18 | 173.79 | 164.59 | 157.02 | 151.25 | 147.44 | 132.72 | 130.55 | 130.21 | 129.29 | NA | 126.72 | NA | NA | NA | |
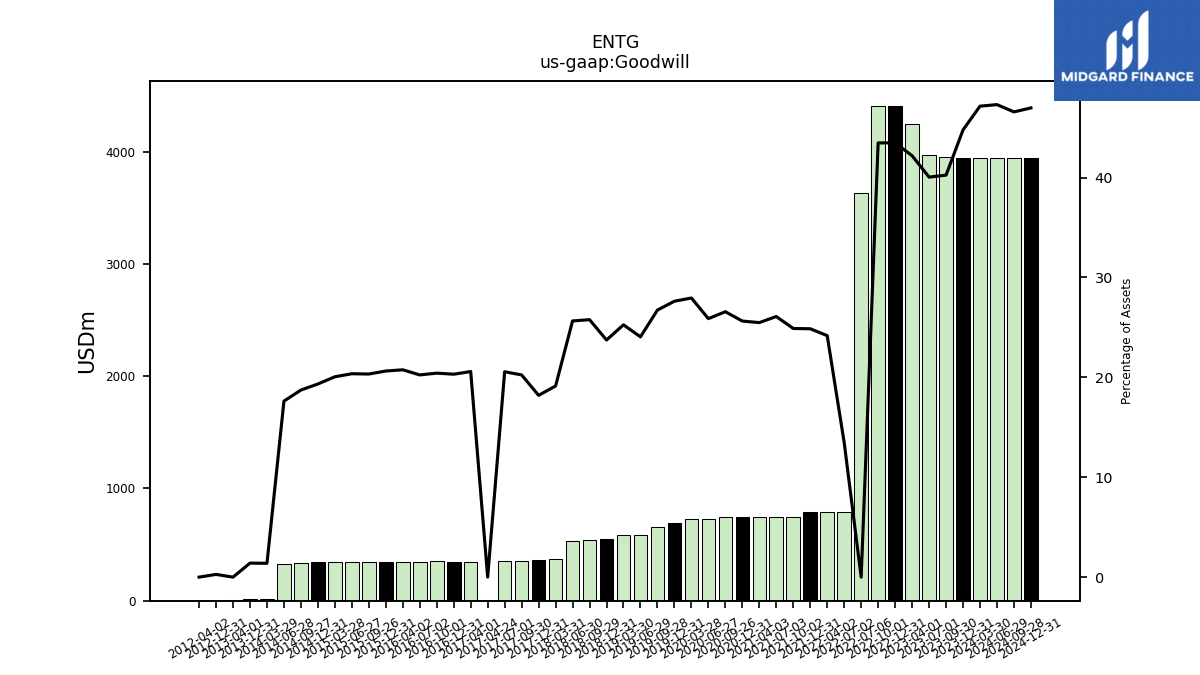
| Goodwill | 3945.86 | 3954.04 | 3970.25 | 4247.50 | 4408.33 | 4405.29 | 789.54 | 793.86 | 793.70 | 749.93 | 749.57 | 747.52 | 748.04 | 744.47 | 725.68 | 726.23 | 695.04 | 659.84 | 583.33 | 584.54 | 550.20 | 542.24 | 529.93 | 375.34 | 359.69 | 355.86 | 355.18 | 349.12 | 345.27 | 349.98 | 343.26 | 343.29 | 342.11 | 341.31 | 345.45 | 347.61 | 340.74 | 336.25 | 328.43 | 12.24 | 12.27 | NA | NA | NA | 2.21 | NA | NA | NA | NA | NA | NA | NA | NA | NA | NA | NA | |
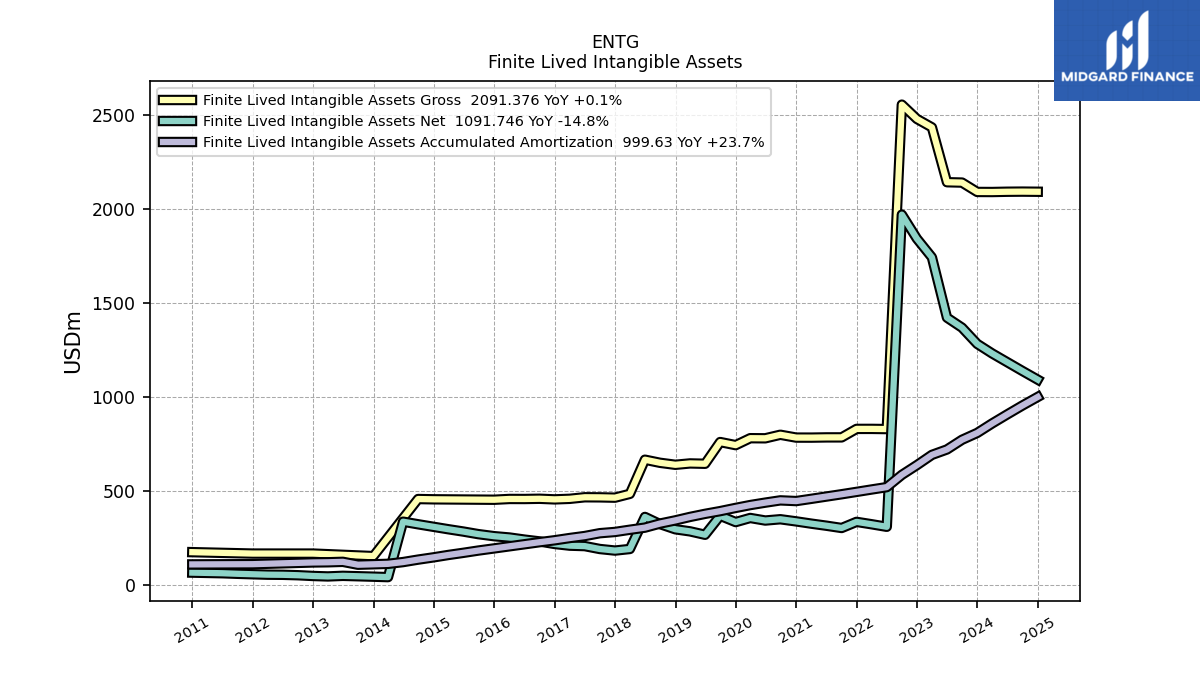
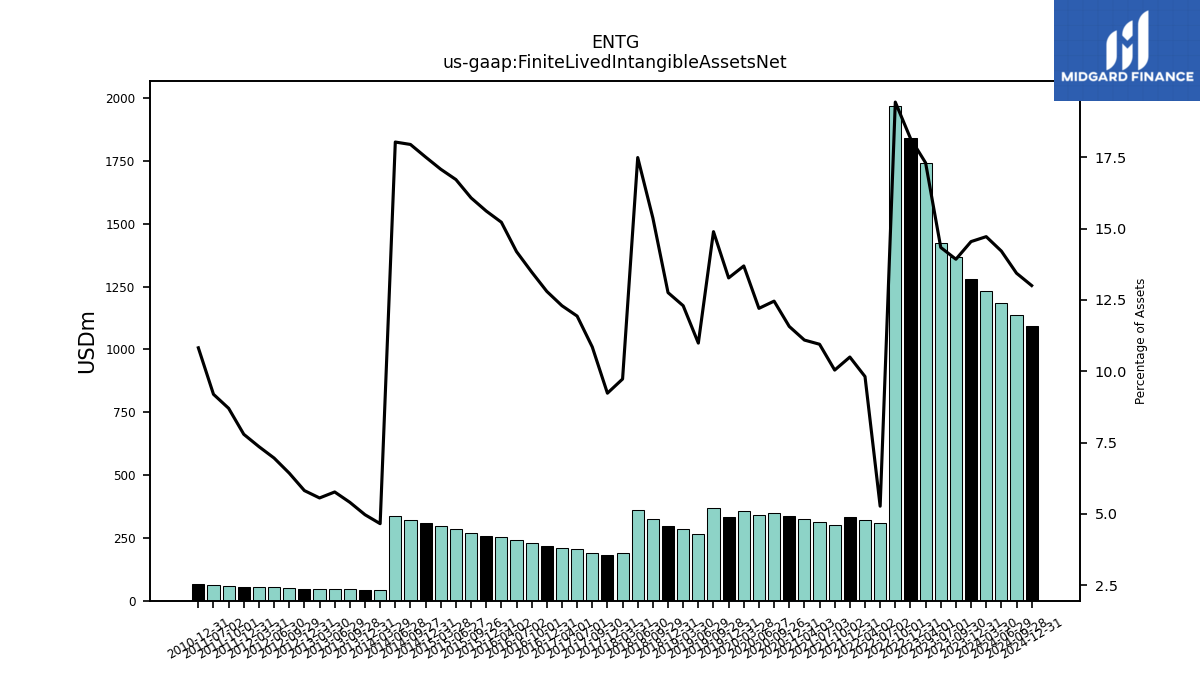
| Finite Lived Intangible Assets Net | 1281.97 | 1368.36 | 1421.71 | 1742.34 | 1841.95 | 1969.73 | 308.87 | 322.29 | 335.11 | 302.49 | 314.50 | 325.45 | 337.63 | 349.07 | 342.26 | 355.81 | 333.95 | 367.56 | 266.43 | 284.58 | 295.69 | 323.38 | 361.43 | 190.81 | 182.43 | 190.75 | 206.18 | 208.59 | 217.55 | 230.99 | 240.69 | 251.80 | 258.94 | 269.89 | 283.68 | 296.02 | 308.55 | 322.28 | 336.13 | 41.14 | 43.51 | 45.82 | 47.99 | 44.79 | 47.21 | 51.24 | 53.48 | 54.13 | 56.45 | 58.85 | 61.80 | NA | 65.09 | NA | NA | NA | |
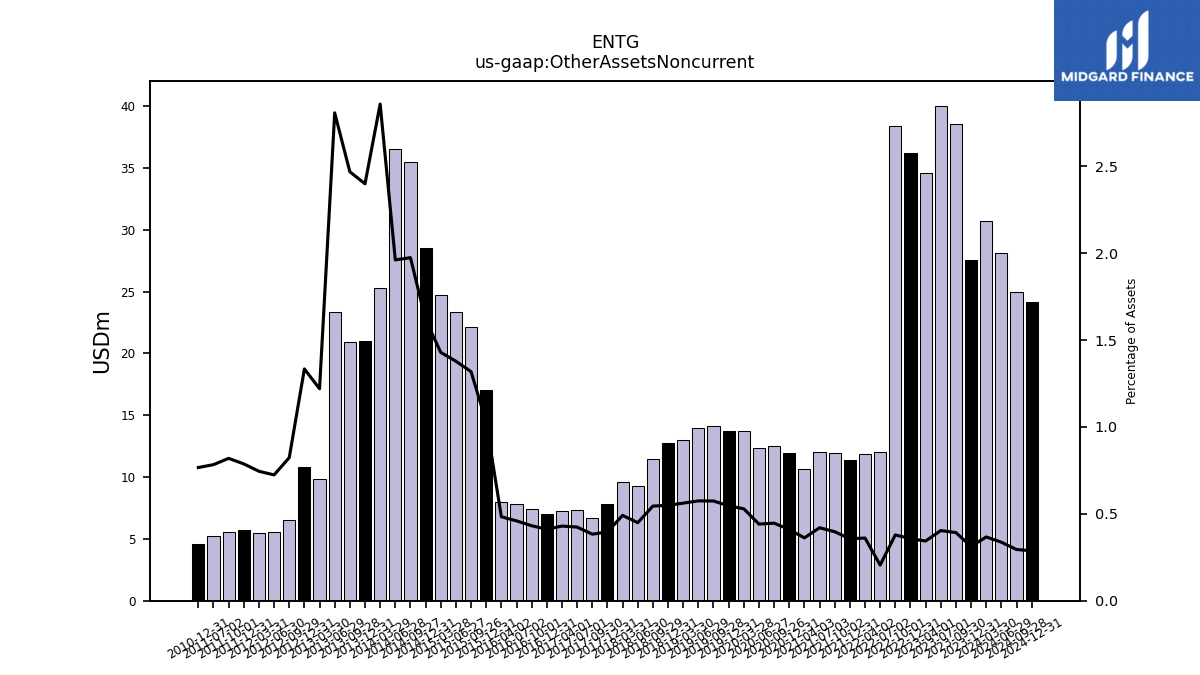
| Other Assets Noncurrent | 27.56 | 38.54 | 40.03 | 34.60 | 36.24 | 38.38 | 12.03 | 11.85 | 11.38 | 11.96 | 12.06 | 10.62 | 11.96 | 12.51 | 12.37 | 13.75 | 13.74 | 14.17 | 13.93 | 13.00 | 12.72 | 11.46 | 9.28 | 9.64 | 7.82 | 6.73 | 7.32 | 7.29 | 7.00 | 7.39 | 7.79 | 7.99 | 17.05 | 22.13 | 23.38 | 24.76 | 28.50 | 35.44 | 36.55 | 25.25 | 21.00 | 20.92 | 23.36 | 9.83 | 10.82 | 6.56 | 5.57 | 5.48 | 5.71 | 5.54 | 5.26 | NA | 4.61 | NA | NA | NA |
| 2023-12-31 | 2023-09-30 | 2023-07-01 | 2023-04-01 | 2022-12-31 | 2022-10-01 | 2022-07-02 | 2022-04-02 | 2021-12-31 | 2021-10-02 | 2021-07-03 | 2021-04-03 | 2020-12-31 | 2020-09-26 | 2020-06-27 | 2020-03-28 | 2019-12-31 | 2019-09-28 | 2019-06-29 | 2019-03-30 | 2018-12-31 | 2018-09-29 | 2018-06-30 | 2018-03-31 | 2017-12-31 | 2017-09-30 | 2017-07-01 | 2017-04-01 | 2016-12-31 | 2016-10-01 | 2016-07-02 | 2016-04-02 | 2015-12-31 | 2015-09-26 | 2015-06-27 | 2015-03-28 | 2014-12-31 | 2014-09-27 | 2014-06-28 | 2014-03-29 | 2013-12-31 | 2013-09-28 | 2013-06-29 | 2013-03-30 | 2012-12-31 | 2012-09-29 | 2012-06-30 | 2012-03-31 | 2011-12-31 | 2011-10-01 | 2011-07-02 | 2011-04-02 | 2010-12-31 | 2010-10-02 | 2010-07-03 | 2010-04-03 | ||
|---|---|---|---|---|---|---|---|---|---|---|---|---|---|---|---|---|---|---|---|---|---|---|---|---|---|---|---|---|---|---|---|---|---|---|---|---|---|---|---|---|---|---|---|---|---|---|---|---|---|---|---|---|---|---|---|---|---|
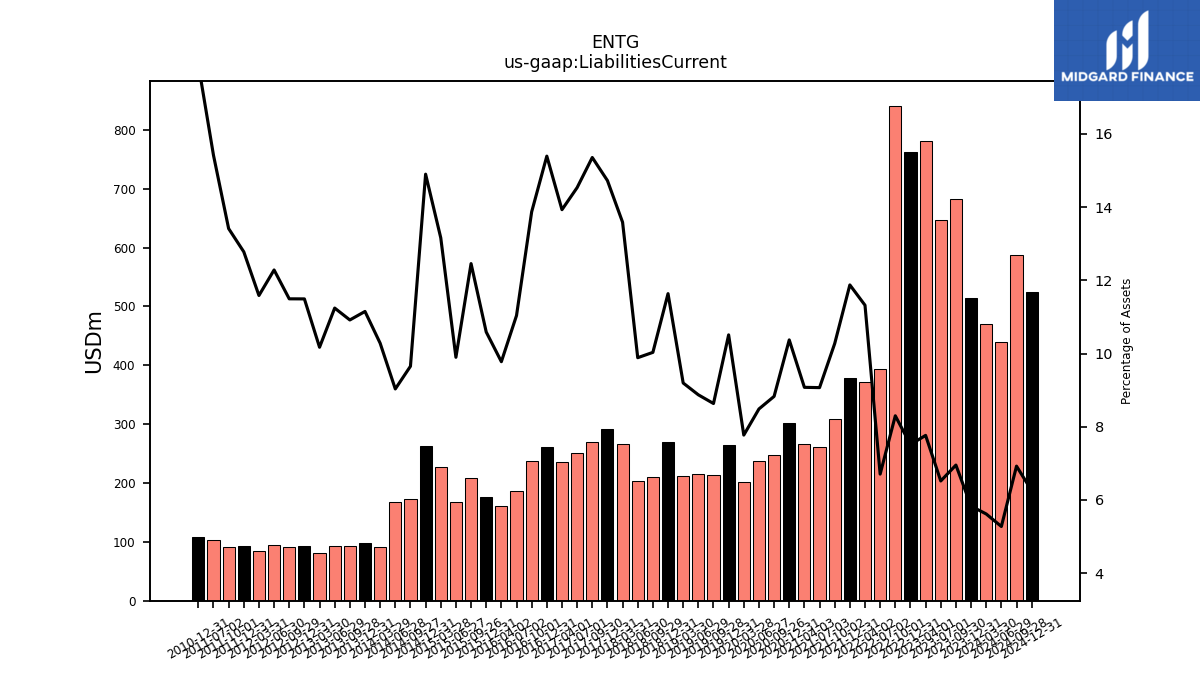
| Liabilities Current | 514.00 | 683.16 | 646.29 | 781.62 | 761.93 | 841.02 | 393.13 | 371.66 | 379.00 | 309.41 | 260.53 | 266.27 | 302.63 | 247.37 | 237.96 | 201.99 | 264.43 | 213.08 | 215.14 | 212.78 | 269.67 | 211.01 | 204.26 | 266.47 | 290.97 | 269.88 | 251.02 | 236.24 | 261.57 | 237.68 | 187.14 | 161.70 | 175.55 | 209.06 | 167.91 | 228.04 | 262.52 | 173.29 | 168.33 | 90.84 | 97.58 | 92.54 | 93.52 | 81.97 | 93.26 | 91.62 | 94.42 | 85.22 | 92.59 | 90.71 | 103.63 | NA | 107.63 | NA | NA | NA | |
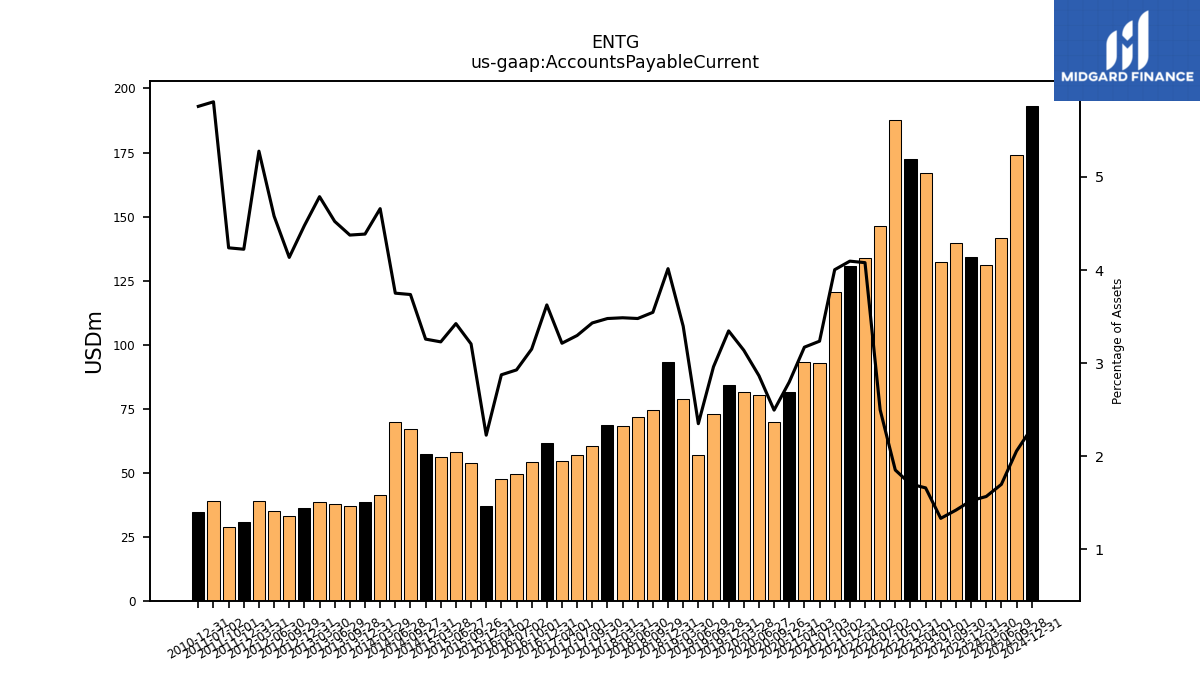
| Accounts Payable Current | 134.21 | 139.64 | 132.16 | 167.18 | 172.49 | 187.70 | 146.44 | 133.96 | 130.73 | 120.61 | 92.97 | 93.05 | 81.62 | 69.92 | 80.36 | 81.56 | 84.21 | 73.07 | 56.99 | 78.62 | 93.06 | 74.59 | 71.89 | 68.41 | 68.76 | 60.33 | 56.96 | 54.52 | 61.62 | 54.00 | 49.64 | 47.55 | 36.92 | 53.82 | 58.10 | 55.95 | 57.42 | 67.09 | 69.92 | 41.17 | 38.40 | 37.09 | 37.63 | 38.59 | 36.34 | 32.97 | 35.20 | 38.82 | 30.61 | 28.67 | 39.04 | NA | 34.63 | NA | NA | NA | |
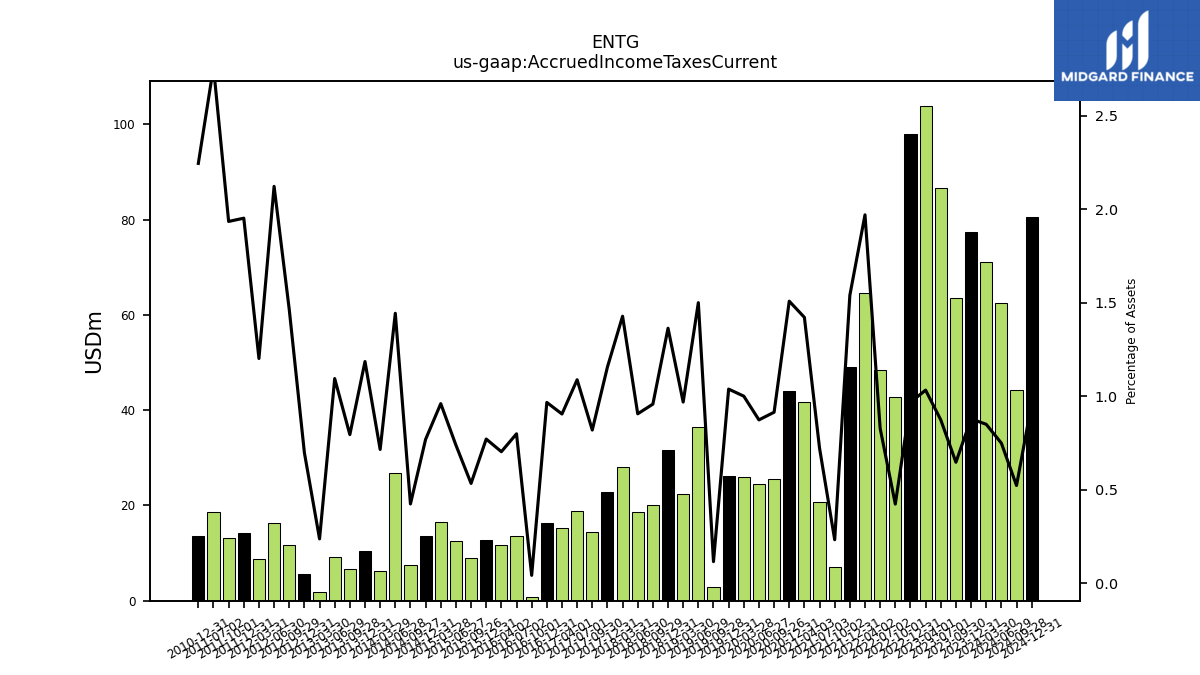
| Accrued Income Taxes Current | 77.40 | 63.52 | 86.56 | 103.90 | 98.06 | 42.83 | 48.52 | 64.67 | 49.14 | 6.99 | 20.73 | 41.69 | 44.00 | 25.61 | 24.48 | 25.98 | 26.11 | 2.83 | 36.37 | 22.41 | 31.59 | 20.14 | 18.71 | 28.00 | 22.84 | 14.39 | 18.79 | 15.34 | 16.42 | 0.71 | 13.54 | 11.62 | 12.78 | 8.95 | 12.52 | 16.63 | 13.55 | 7.60 | 26.89 | 6.32 | 10.37 | 6.73 | 9.10 | 1.91 | 5.66 | 11.67 | 16.31 | 8.84 | 14.14 | 13.08 | 18.55 | NA | 13.50 | NA | NA | NA | |
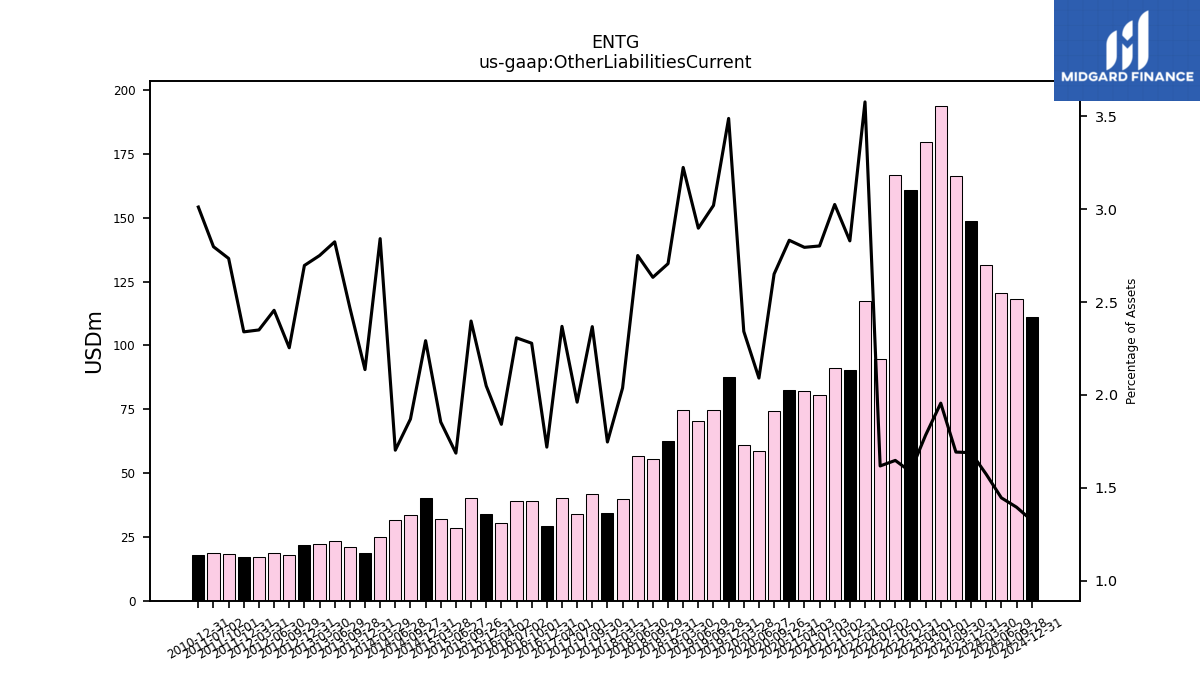
| Other Liabilities Current | 148.84 | 166.26 | 193.85 | 179.53 | 160.87 | 166.92 | 94.81 | 117.47 | 90.31 | 91.13 | 80.50 | 81.98 | 82.65 | 74.26 | 58.63 | 60.86 | 87.78 | 74.53 | 70.26 | 74.62 | 62.73 | 55.39 | 56.83 | 39.96 | 34.51 | 41.62 | 33.87 | 40.18 | 29.21 | 39.04 | 39.12 | 30.46 | 33.97 | 40.25 | 28.61 | 32.12 | 40.39 | 33.57 | 31.73 | 25.10 | 18.70 | 20.94 | 23.50 | 22.16 | 21.89 | 17.97 | 18.88 | 17.29 | 16.95 | 18.50 | 18.81 | NA | 18.11 | NA | NA | NA | |
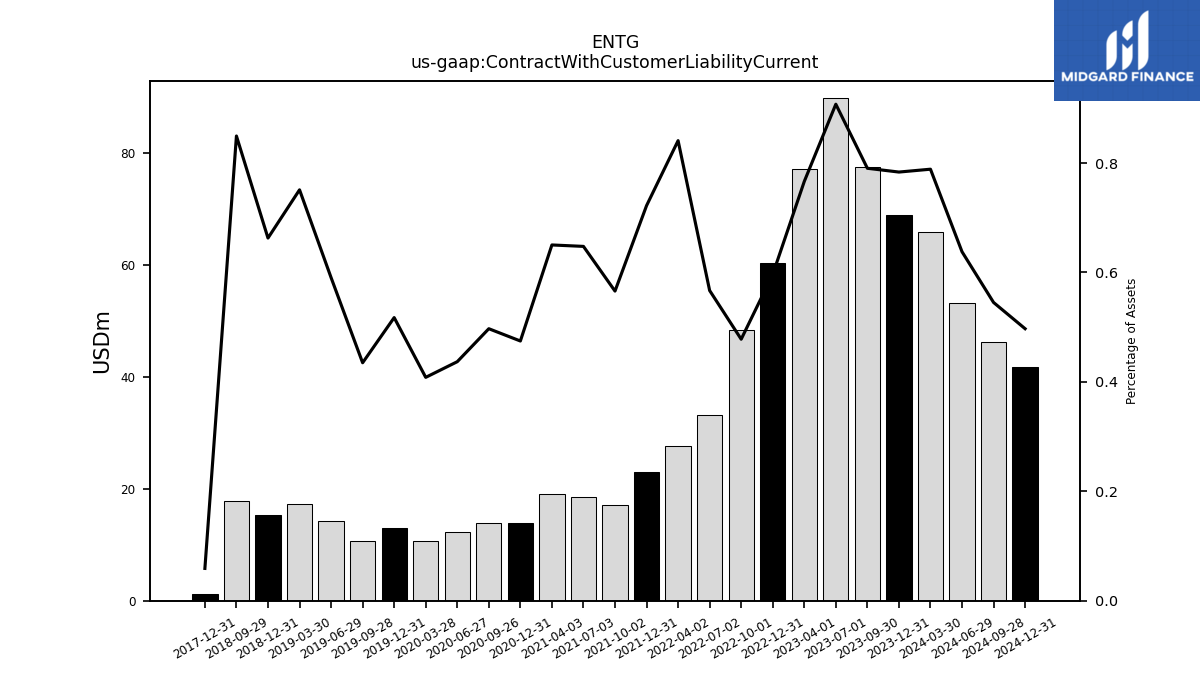
| Contract With Customer Liability Current | 69.05 | 77.66 | 89.97 | 77.15 | 60.48 | 48.44 | 33.23 | 27.61 | 23.05 | 17.05 | 18.61 | 19.08 | 13.85 | 13.93 | 12.25 | 10.61 | 13.02 | 10.73 | 14.32 | 17.38 | 15.36 | 17.87 | NA | NA | 1.17 | NA | NA | NA | NA | NA | NA | NA | NA | NA | NA | NA | NA | NA | NA | NA | NA | NA | NA | NA | NA | NA | NA | NA | NA | NA | NA | NA | NA | NA | NA | NA |
| 2023-12-31 | 2023-09-30 | 2023-07-01 | 2023-04-01 | 2022-12-31 | 2022-10-01 | 2022-07-02 | 2022-04-02 | 2021-12-31 | 2021-10-02 | 2021-07-03 | 2021-04-03 | 2020-12-31 | 2020-09-26 | 2020-06-27 | 2020-03-28 | 2019-12-31 | 2019-09-28 | 2019-06-29 | 2019-03-30 | 2018-12-31 | 2018-09-29 | 2018-06-30 | 2018-03-31 | 2017-12-31 | 2017-09-30 | 2017-07-01 | 2017-04-01 | 2016-12-31 | 2016-10-01 | 2016-07-02 | 2016-04-02 | 2015-12-31 | 2015-09-26 | 2015-06-27 | 2015-03-28 | 2014-12-31 | 2014-09-27 | 2014-06-28 | 2014-03-29 | 2013-12-31 | 2013-09-28 | 2013-06-29 | 2013-03-30 | 2012-12-31 | 2012-09-29 | 2012-06-30 | 2012-03-31 | 2011-12-31 | 2011-10-01 | 2011-07-02 | 2011-04-02 | 2010-12-31 | 2010-10-02 | 2010-07-03 | 2010-04-03 | ||
|---|---|---|---|---|---|---|---|---|---|---|---|---|---|---|---|---|---|---|---|---|---|---|---|---|---|---|---|---|---|---|---|---|---|---|---|---|---|---|---|---|---|---|---|---|---|---|---|---|---|---|---|---|---|---|---|---|---|
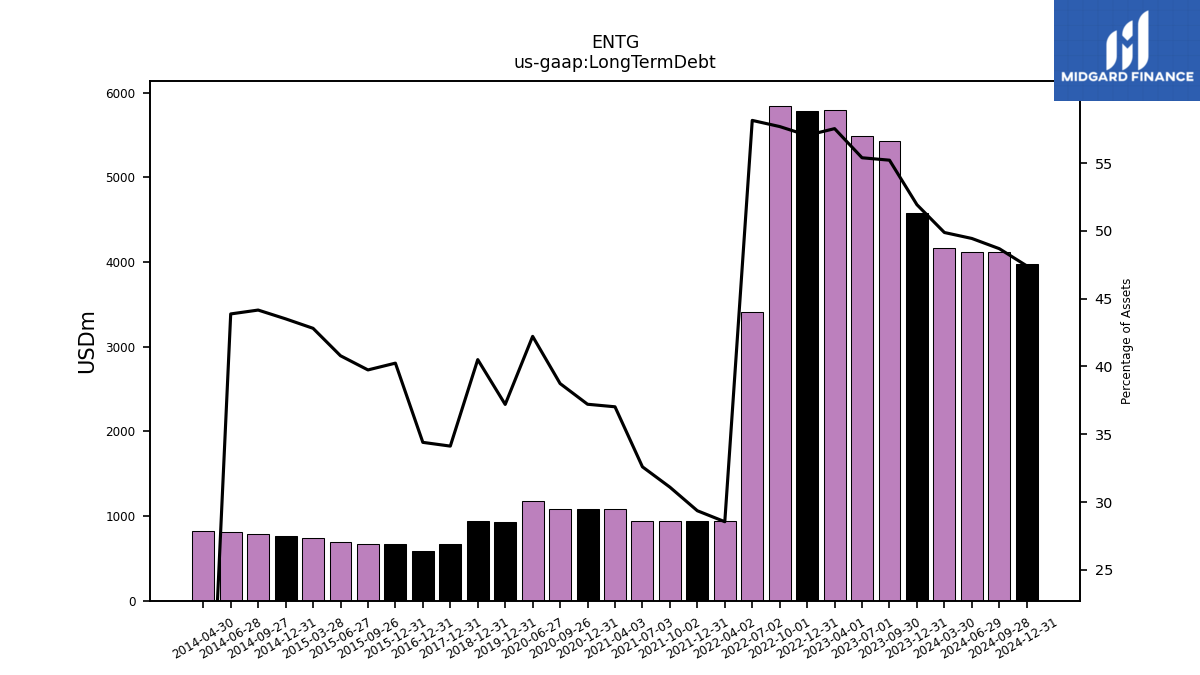
| Long Term Debt | 4577.14 | 5425.50 | 5492.01 | 5793.76 | 5784.89 | 5847.50 | 3408.80 | 937.30 | 937.00 | 936.70 | 936.40 | 1086.20 | 1085.80 | 1085.40 | 1184.00 | NA | 936.00 | NA | NA | NA | 938.86 | NA | NA | NA | 674.38 | NA | NA | NA | 584.68 | NA | NA | NA | 667.29 | 667.13 | 692.05 | 741.95 | 766.80 | 792.85 | 817.70 | NA | NA | NA | NA | NA | NA | NA | NA | NA | NA | NA | NA | NA | NA | NA | NA | NA | |
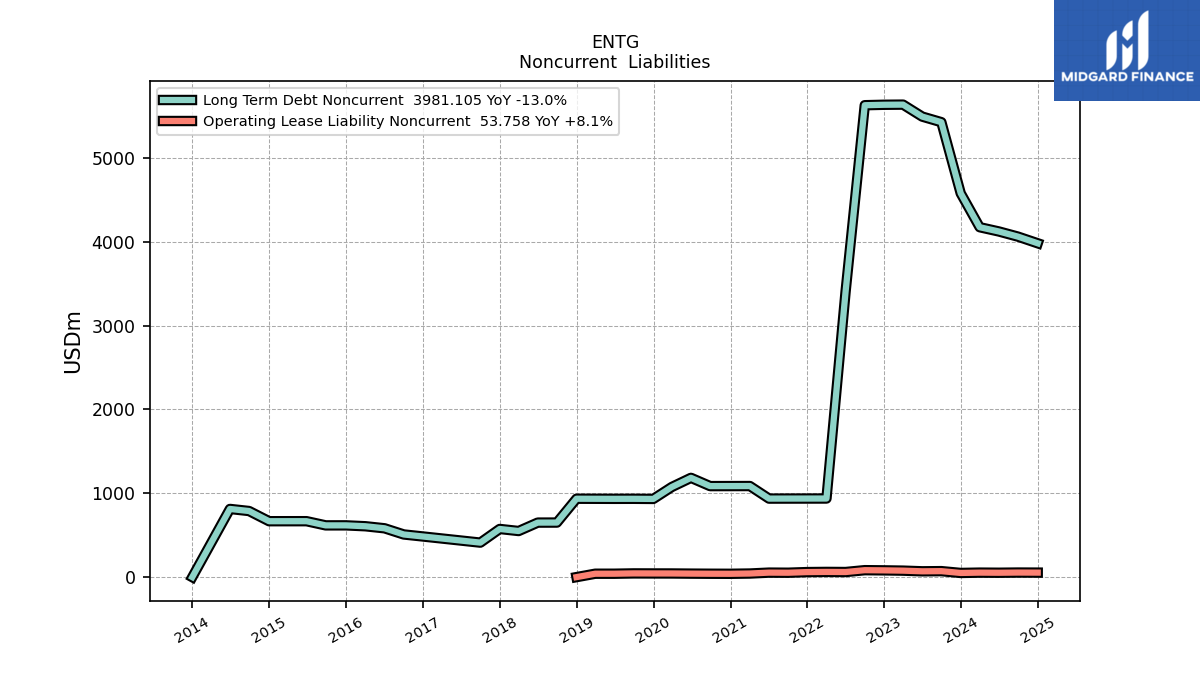
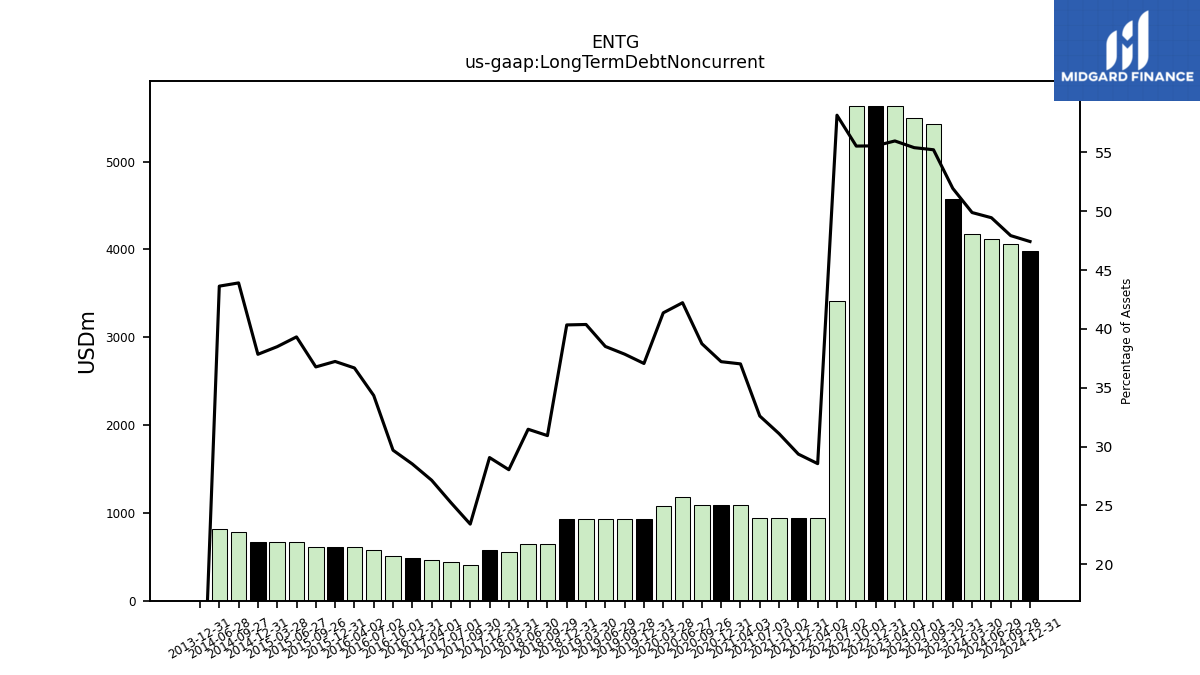
| Long Term Debt Noncurrent | 4577.14 | 5425.50 | 5492.01 | 5634.71 | 5632.93 | 5627.70 | 3408.80 | 937.35 | 937.03 | 936.70 | 936.38 | 1086.19 | 1085.78 | 1085.38 | 1183.99 | 1074.89 | 932.48 | 934.08 | 933.67 | 934.27 | 934.86 | 650.62 | 650.22 | 549.82 | 574.38 | 411.46 | 435.91 | 460.31 | 484.68 | 508.77 | 582.24 | 606.63 | 617.29 | 617.13 | 667.05 | 666.95 | 666.80 | 788.25 | 813.10 | NA | 0.00 | NA | NA | NA | NA | NA | NA | NA | NA | NA | NA | NA | NA | NA | NA | NA | |
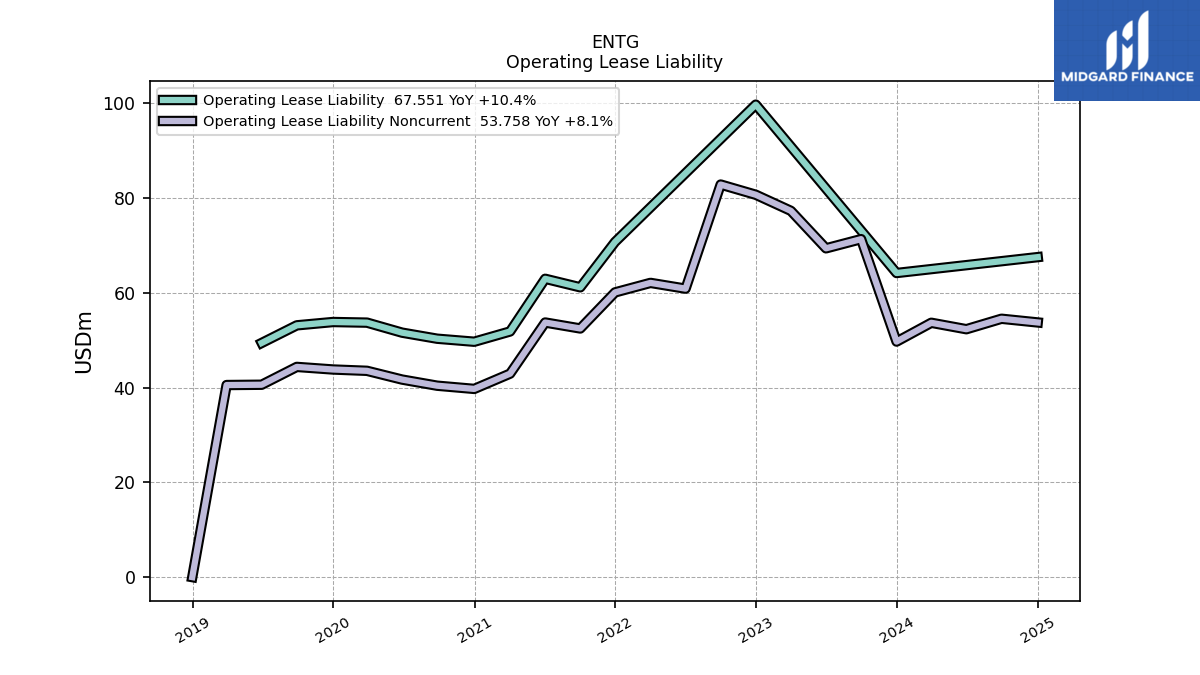
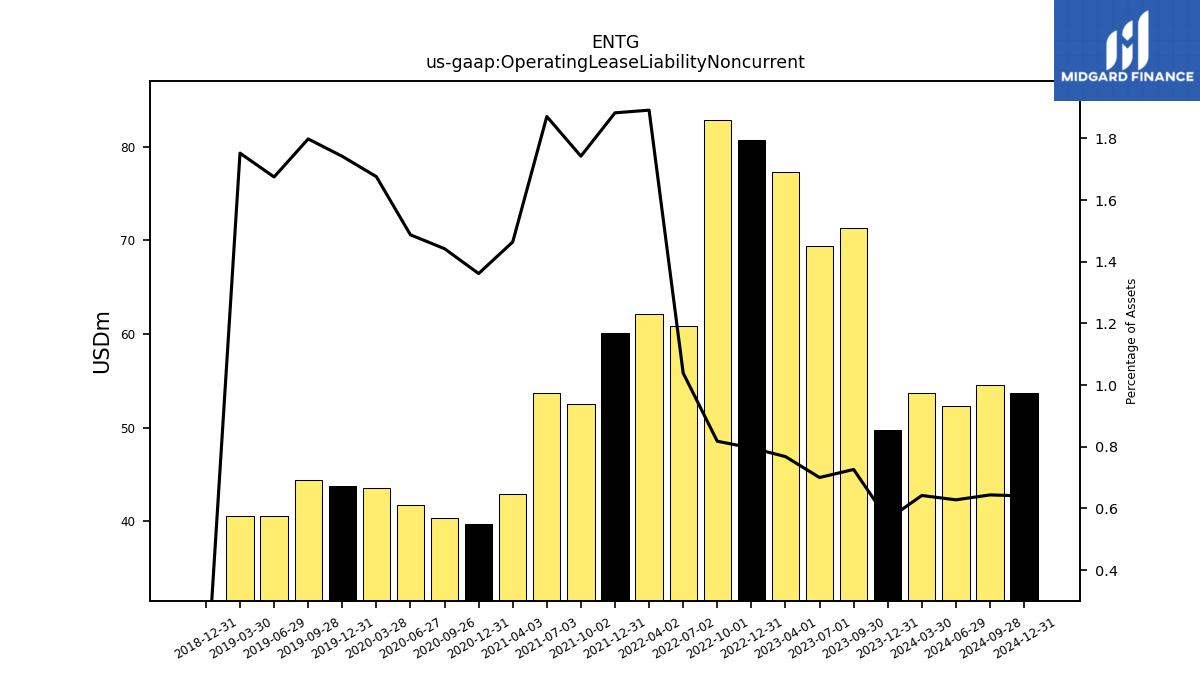
| Operating Lease Liability Noncurrent | 49.72 | 71.35 | 69.41 | 77.32 | 80.72 | 82.87 | 60.89 | 62.11 | 60.10 | 52.49 | 53.75 | 42.95 | 39.73 | 40.41 | 41.70 | 43.55 | 43.83 | 44.38 | 40.61 | 40.55 | 0.00 | NA | NA | NA | NA | NA | NA | NA | NA | NA | NA | NA | NA | NA | NA | NA | NA | NA | NA | NA | NA | NA | NA | NA | NA | NA | NA | NA | NA | NA | NA | NA | NA | NA | NA | NA |
| 2023-12-31 | 2023-09-30 | 2023-07-01 | 2023-04-01 | 2022-12-31 | 2022-10-01 | 2022-07-02 | 2022-04-02 | 2021-12-31 | 2021-10-02 | 2021-07-03 | 2021-04-03 | 2020-12-31 | 2020-09-26 | 2020-06-27 | 2020-03-28 | 2019-12-31 | 2019-09-28 | 2019-06-29 | 2019-03-30 | 2018-12-31 | 2018-09-29 | 2018-06-30 | 2018-03-31 | 2017-12-31 | 2017-09-30 | 2017-07-01 | 2017-04-01 | 2016-12-31 | 2016-10-01 | 2016-07-02 | 2016-04-02 | 2015-12-31 | 2015-09-26 | 2015-06-27 | 2015-03-28 | 2014-12-31 | 2014-09-27 | 2014-06-28 | 2014-03-29 | 2013-12-31 | 2013-09-28 | 2013-06-29 | 2013-03-30 | 2012-12-31 | 2012-09-29 | 2012-06-30 | 2012-03-31 | 2011-12-31 | 2011-10-01 | 2011-07-02 | 2011-04-02 | 2010-12-31 | 2010-10-02 | 2010-07-03 | 2010-04-03 | ||
|---|---|---|---|---|---|---|---|---|---|---|---|---|---|---|---|---|---|---|---|---|---|---|---|---|---|---|---|---|---|---|---|---|---|---|---|---|---|---|---|---|---|---|---|---|---|---|---|---|---|---|---|---|---|---|---|---|---|
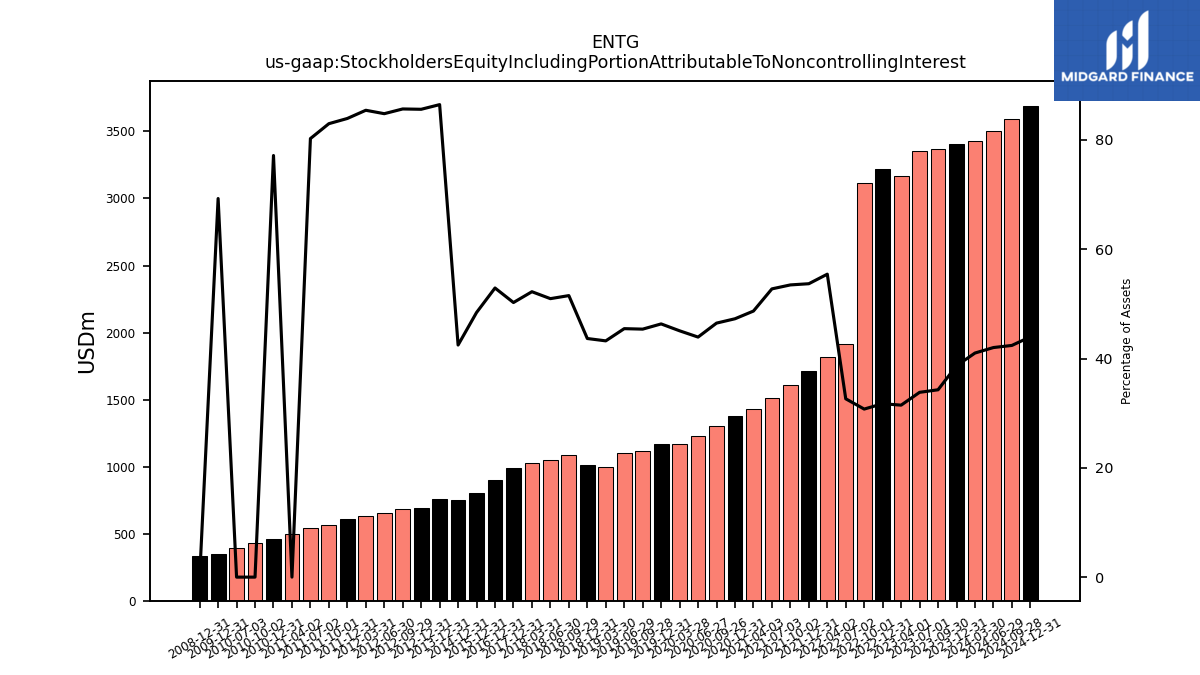
| Stockholders Equity Including Portion Attributable To Noncontrolling Interest | 3408.59 | 3368.29 | 3352.20 | 3168.22 | 3218.00 | 3116.32 | 1912.71 | 1820.32 | 1713.78 | 1610.78 | 1515.33 | 1428.33 | 1379.49 | 1302.30 | 1231.79 | 1171.33 | 1165.89 | 1119.92 | 1102.55 | 1000.46 | 1012.02 | 1083.67 | 1052.90 | 1024.39 | 993.02 | NA | NA | NA | 899.22 | NA | NA | NA | 802.88 | NA | NA | NA | 748.44 | NA | NA | NA | 756.84 | NA | NA | NA | 694.80 | 682.96 | 651.96 | 628.50 | 608.24 | 561.21 | 539.51 | 499.70 | 464.01 | 427.92 | 392.15 | NA | |
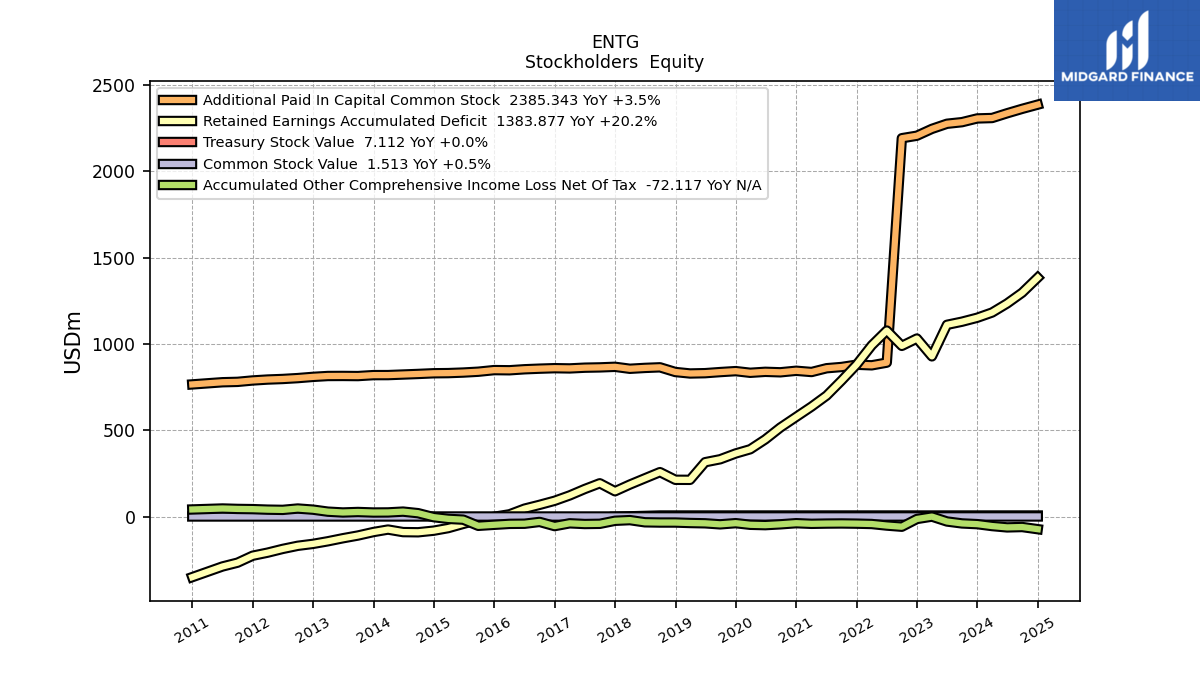
| Common Stock Value | 1.51 | 1.50 | 1.50 | 1.50 | 1.49 | 1.49 | 1.36 | 1.36 | 1.36 | 1.36 | 1.36 | 1.35 | 1.35 | 1.35 | 1.35 | 1.35 | 1.35 | 1.35 | 1.35 | 1.36 | 1.36 | 1.42 | 1.42 | 1.42 | 1.41 | 1.42 | 1.42 | 1.42 | 1.41 | 1.41 | 1.41 | 1.41 | 1.41 | 1.41 | 1.40 | 1.40 | 1.40 | 1.40 | 1.39 | 1.39 | 1.39 | 1.39 | 1.39 | 1.40 | 1.39 | 1.38 | 1.37 | 1.37 | 1.36 | 1.35 | 1.35 | NA | 1.33 | NA | NA | NA | |
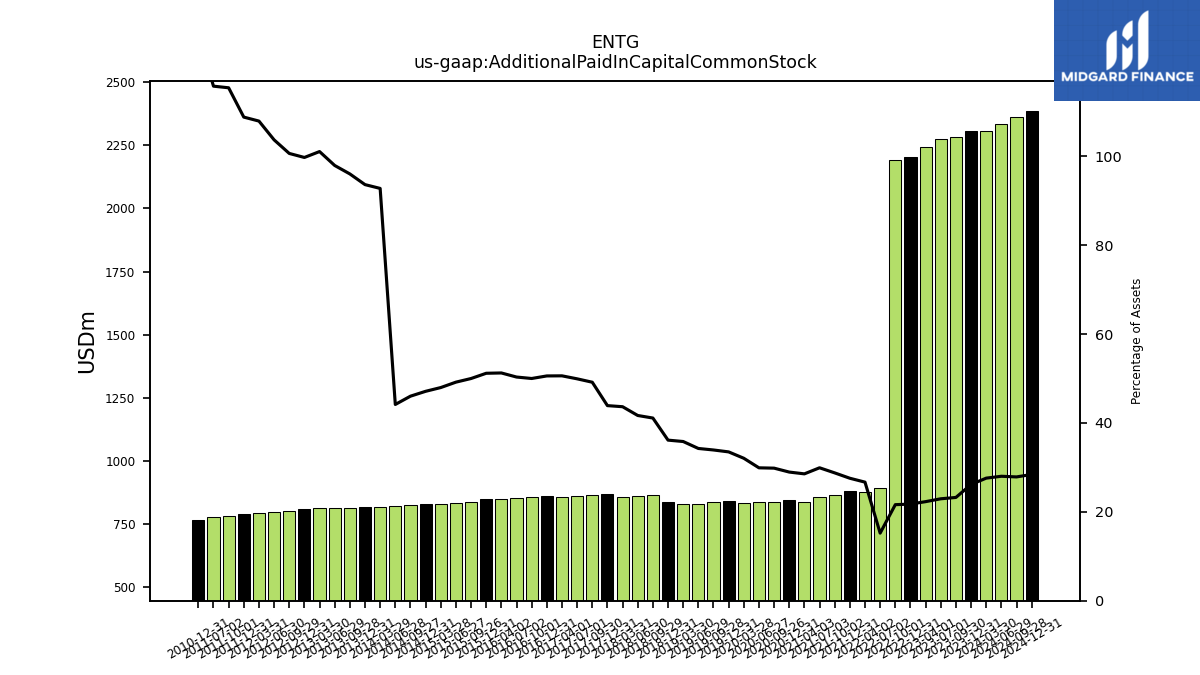
| Additional Paid In Capital Common Stock | 2305.37 | 2283.82 | 2274.57 | 2244.98 | 2205.32 | 2190.96 | 891.97 | 876.39 | 879.85 | 866.72 | 859.52 | 837.62 | 844.85 | 835.95 | 838.74 | 833.16 | 842.78 | 837.21 | 830.92 | 829.14 | 837.66 | 864.81 | 861.36 | 856.37 | 867.70 | 864.34 | 862.66 | 858.43 | 859.78 | 857.02 | 853.53 | 847.74 | 848.67 | 839.36 | 834.49 | 831.29 | 830.43 | 826.39 | 823.09 | 819.76 | 819.63 | 814.15 | 814.87 | 814.54 | 809.51 | 802.38 | 797.28 | 794.05 | 788.67 | 780.65 | 778.44 | NA | 765.87 | NA | NA | NA | |
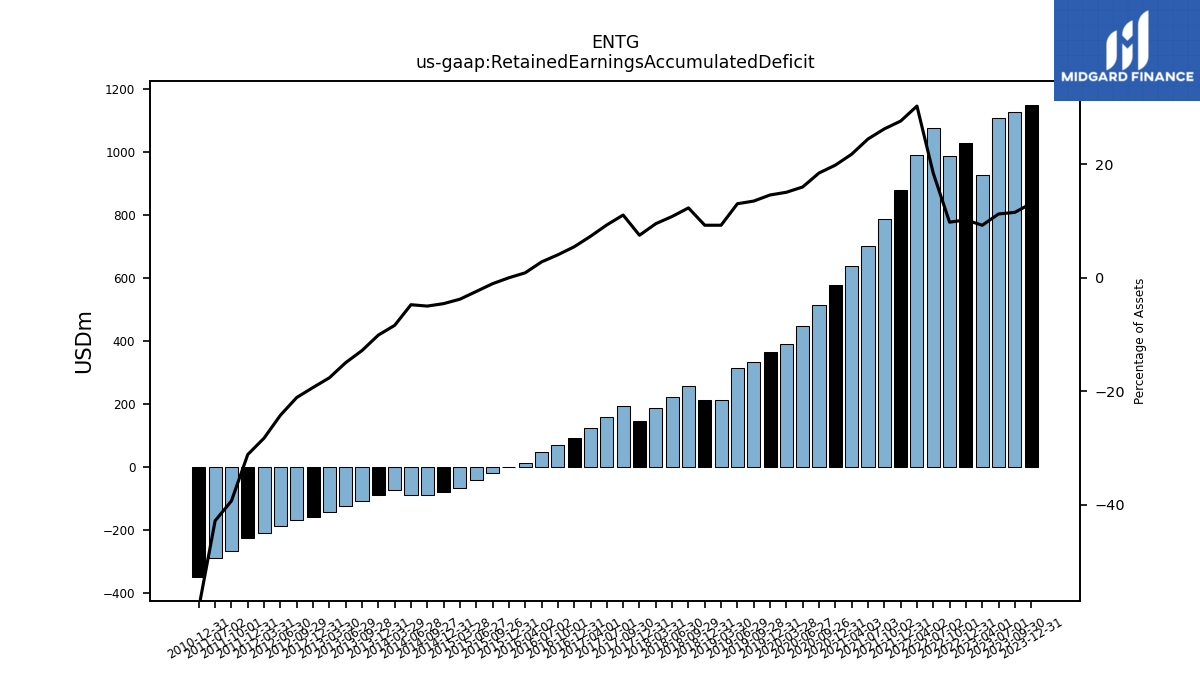
| Retained Earnings Accumulated Deficit | 1151.77 | 1128.91 | 1110.82 | 928.13 | 1031.39 | 988.85 | 1077.65 | 991.82 | 879.78 | 788.83 | 701.21 | 637.57 | 577.83 | 516.11 | 447.59 | 390.54 | 366.13 | 332.58 | 315.51 | 213.48 | 213.75 | 258.22 | 222.38 | 186.28 | 147.42 | 193.66 | 160.38 | 123.38 | 92.30 | 68.83 | 46.88 | 13.99 | -0.42 | -17.99 | -41.39 | -65.84 | -80.71 | -90.02 | -88.96 | -74.29 | -88.60 | -108.87 | -124.57 | -142.15 | -157.04 | -168.29 | -186.33 | -207.91 | -225.77 | -265.93 | -287.92 | NA | -349.61 | NA | NA | NA | |
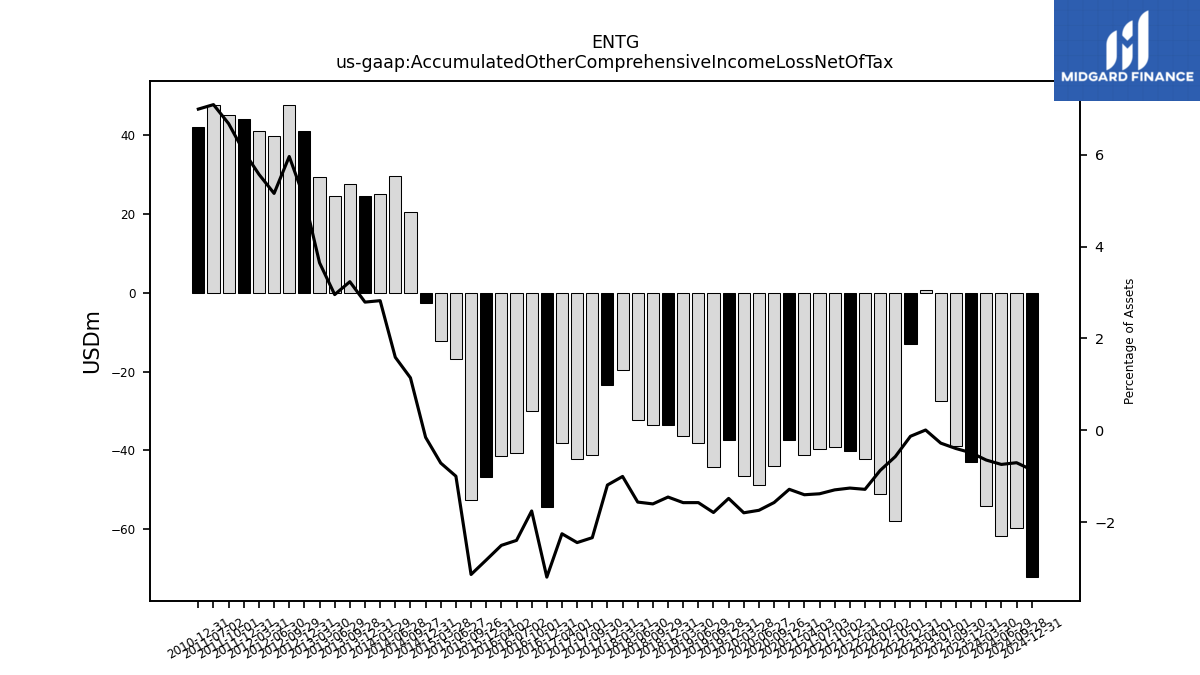
| Accumulated Other Comprehensive Income Loss Net Of Tax | -42.93 | -38.83 | -27.58 | 0.72 | -13.10 | -57.87 | -51.15 | -42.14 | -40.09 | -39.01 | -39.65 | -41.10 | -37.43 | -44.00 | -48.78 | -46.61 | -37.26 | -44.11 | -38.12 | -36.40 | -33.64 | -33.66 | -32.25 | -19.67 | -23.51 | -41.05 | -42.19 | -38.16 | -54.28 | -30.06 | -40.59 | -41.39 | -46.77 | -52.64 | -16.93 | -12.33 | -2.67 | 20.51 | 29.63 | 24.93 | 24.42 | 27.41 | 24.57 | 29.39 | 40.94 | 47.49 | 39.63 | 40.98 | 43.97 | 45.13 | 47.64 | NA | 42.03 | NA | NA | NA | |
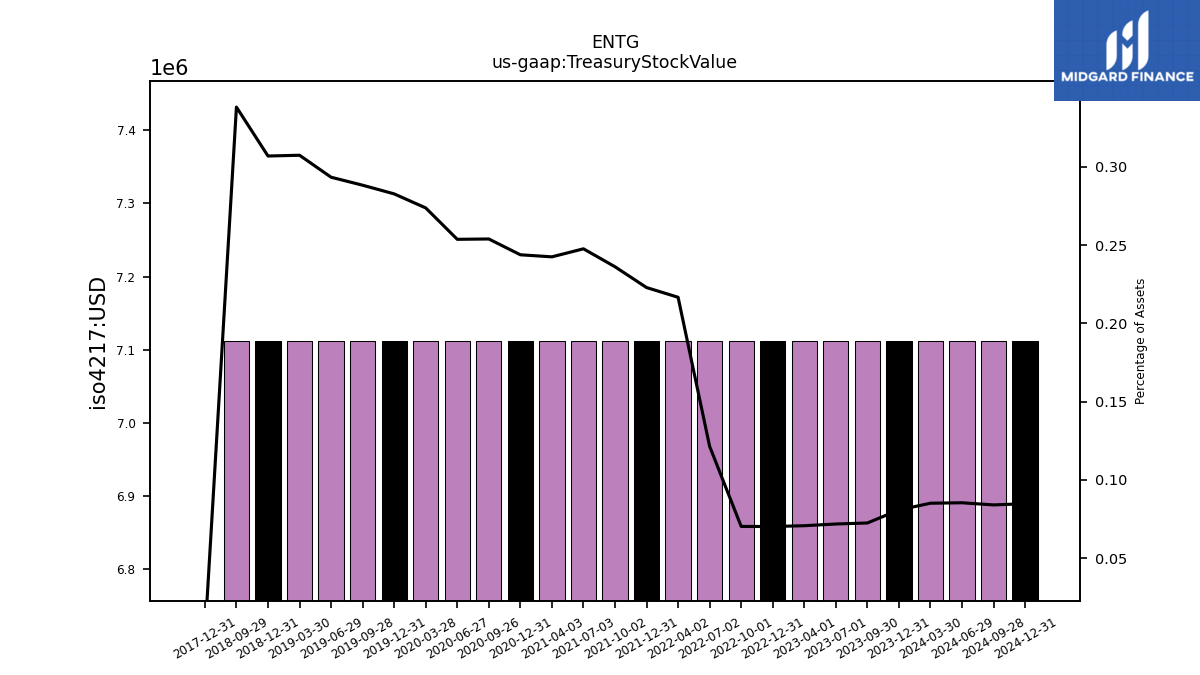
| Treasury Stock Value | 7.11 | 7.11 | 7.11 | 7.11 | 7.11 | 7.11 | 7.11 | 7.11 | 7.11 | 7.11 | 7.11 | 7.11 | 7.11 | 7.11 | 7.11 | 7.11 | 7.11 | 7.11 | 7.11 | 7.11 | 7.11 | 7.11 | NA | NA | 0.00 | NA | NA | NA | NA | NA | NA | NA | NA | NA | NA | NA | NA | NA | NA | NA | NA | NA | NA | NA | NA | NA | NA | NA | NA | NA | NA | NA | NA | NA | NA | NA |
| 2023-12-31 | 2023-09-30 | 2023-07-01 | 2023-04-01 | 2022-12-31 | 2022-10-01 | 2022-07-02 | 2022-04-02 | 2021-12-31 | 2021-10-02 | 2021-07-03 | 2021-04-03 | 2020-12-31 | 2020-09-26 | 2020-06-27 | 2020-03-28 | 2019-12-31 | 2019-09-28 | 2019-06-29 | 2019-03-30 | 2018-12-31 | 2018-09-29 | 2018-06-30 | 2018-03-31 | 2017-12-31 | 2017-09-30 | 2017-07-01 | 2017-04-01 | 2016-12-31 | 2016-10-01 | 2016-07-02 | 2016-04-02 | 2015-12-31 | 2015-09-26 | 2015-06-27 | 2015-03-28 | 2014-12-31 | 2014-09-27 | 2014-06-28 | 2014-03-29 | 2013-12-31 | 2013-09-28 | 2013-06-29 | 2013-03-30 | 2012-12-31 | 2012-09-29 | 2012-06-30 | 2012-03-31 | 2011-12-31 | 2011-10-01 | 2011-07-02 | 2011-04-02 | 2010-12-31 | 2010-10-02 | 2010-07-03 | 2010-04-03 | ||
|---|---|---|---|---|---|---|---|---|---|---|---|---|---|---|---|---|---|---|---|---|---|---|---|---|---|---|---|---|---|---|---|---|---|---|---|---|---|---|---|---|---|---|---|---|---|---|---|---|---|---|---|---|---|---|---|---|---|
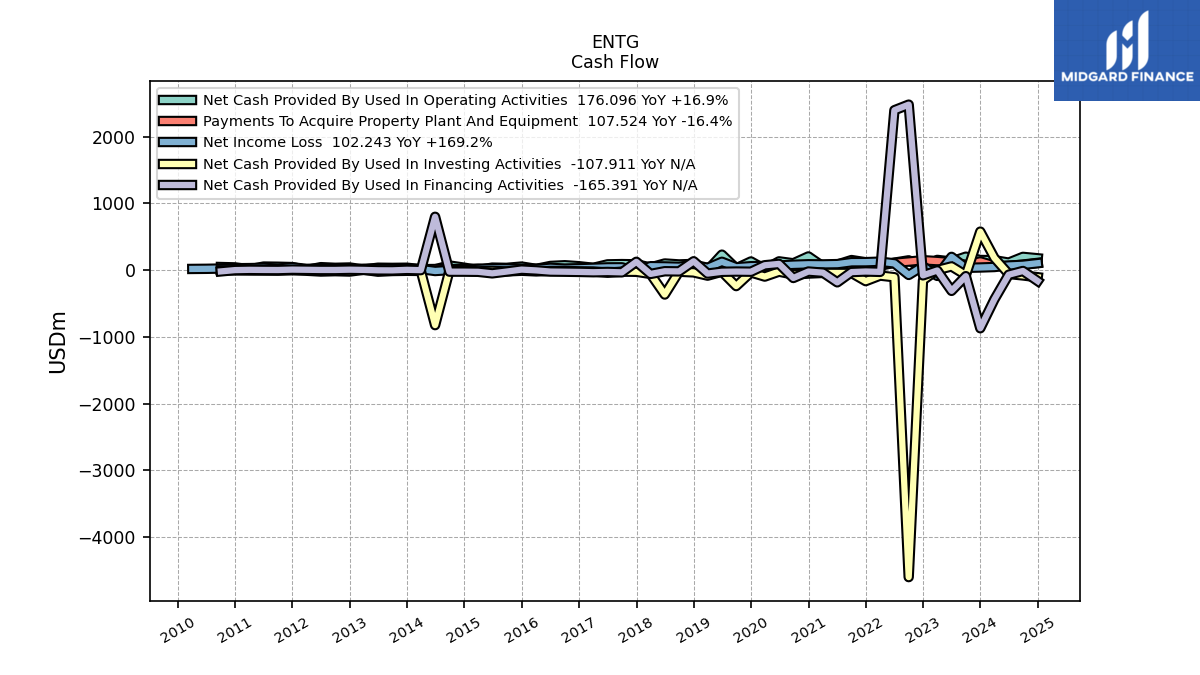
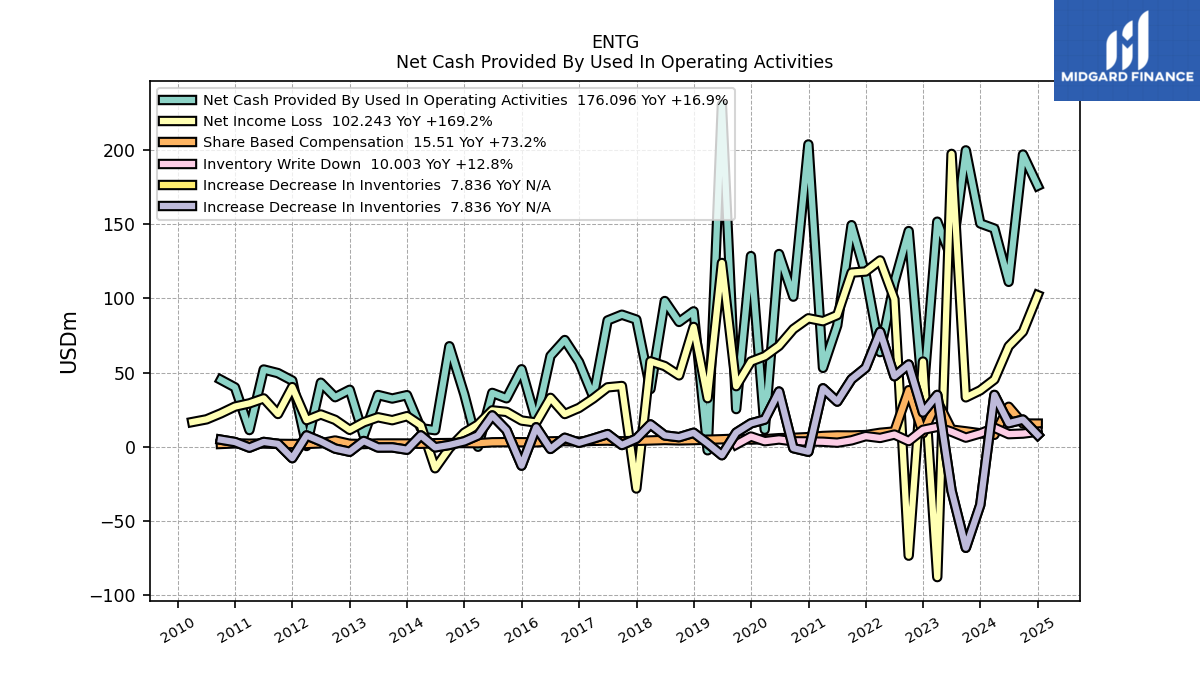
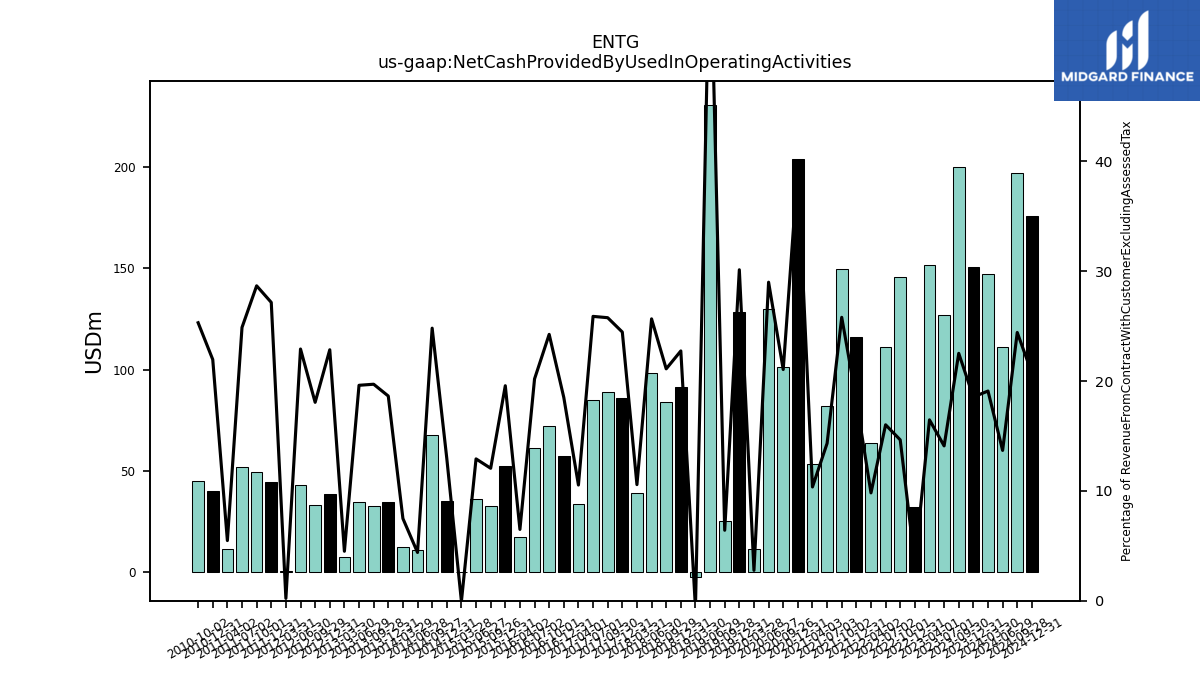
| Net Cash Provided By Used In Operating Activities | 150.65 | 200.02 | 127.02 | 151.87 | 32.05 | 145.53 | 110.91 | 63.79 | 115.98 | 149.50 | 81.86 | 53.12 | 204.02 | 101.23 | 130.02 | 11.40 | 128.64 | 25.29 | 230.90 | -2.54 | 91.33 | 84.14 | 98.29 | 38.82 | 85.74 | 89.04 | 85.16 | 33.43 | 57.08 | 71.94 | 61.20 | 17.34 | 52.22 | 32.59 | 36.25 | -0.13 | 35.20 | 67.75 | 11.06 | 12.41 | 34.71 | 32.44 | 34.82 | 7.43 | 38.34 | 33.31 | 43.13 | 0.37 | 44.52 | 49.60 | 52.05 | 11.13 | 39.98 | 45.10 | NA | NA | |
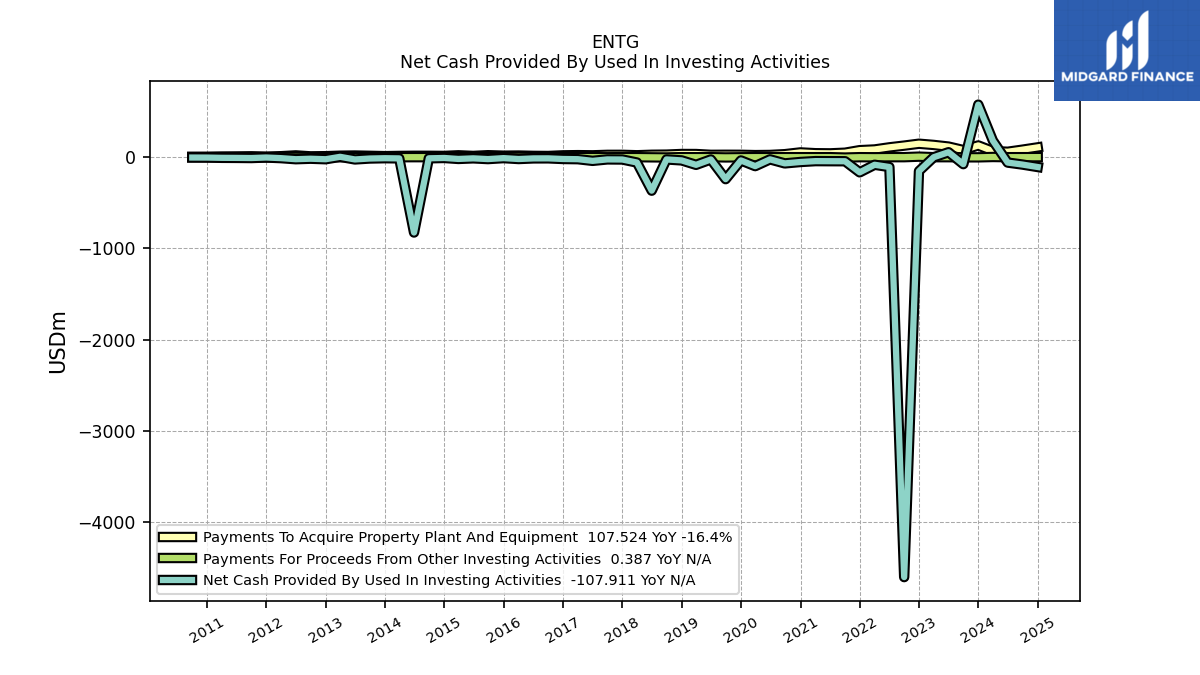
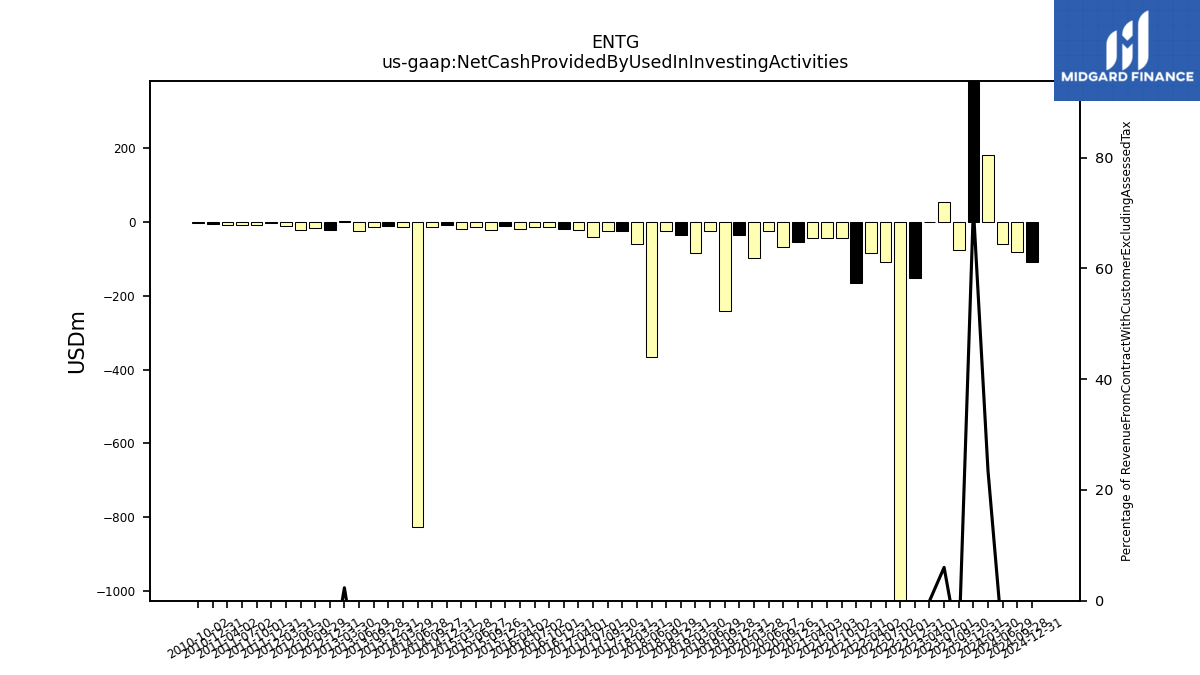
| Net Cash Provided By Used In Investing Activities | 575.80 | -76.59 | 54.22 | -0.36 | -153.07 | -4601.66 | -107.69 | -83.28 | -166.30 | -44.56 | -44.00 | -43.26 | -52.89 | -68.13 | -24.10 | -98.21 | -35.86 | -240.81 | -25.11 | -84.06 | -35.35 | -24.83 | -367.20 | -58.56 | -25.59 | -24.58 | -40.28 | -22.00 | -19.90 | -12.99 | -13.49 | -20.31 | -10.40 | -20.93 | -12.88 | -19.43 | -8.82 | -12.38 | -825.71 | -13.38 | -11.33 | -14.76 | -24.81 | 3.87 | -22.58 | -16.99 | -22.29 | -10.60 | -3.68 | -9.47 | -8.03 | -7.25 | -4.32 | -4.02 | NA | NA | |
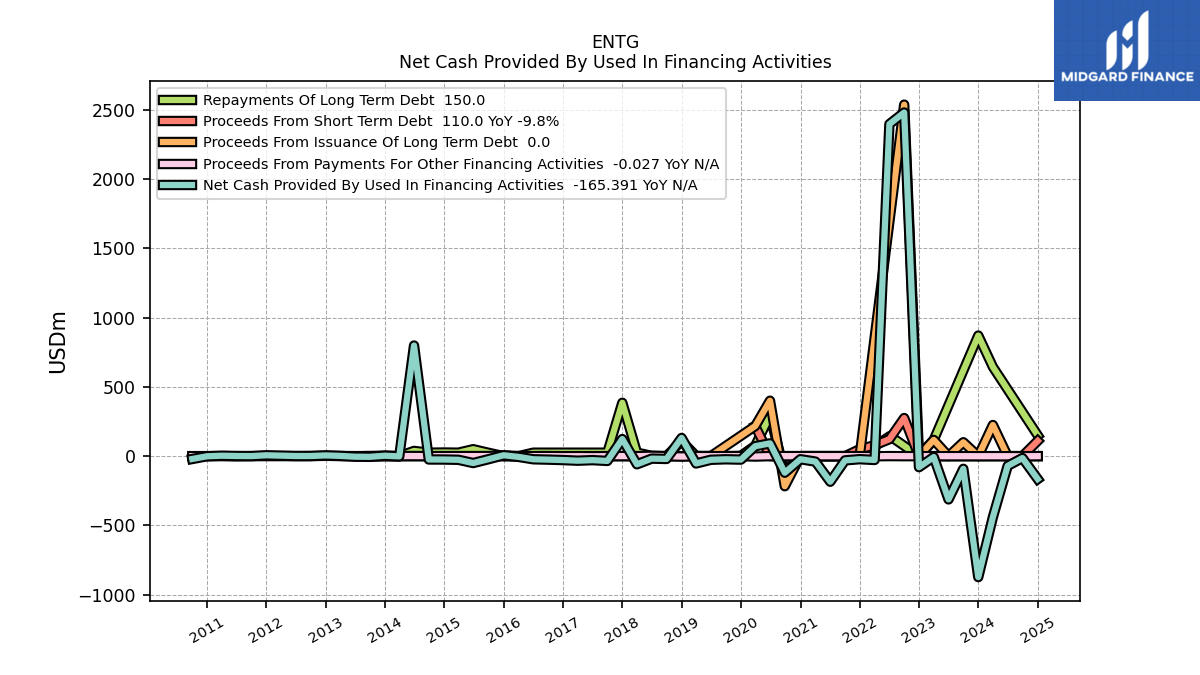
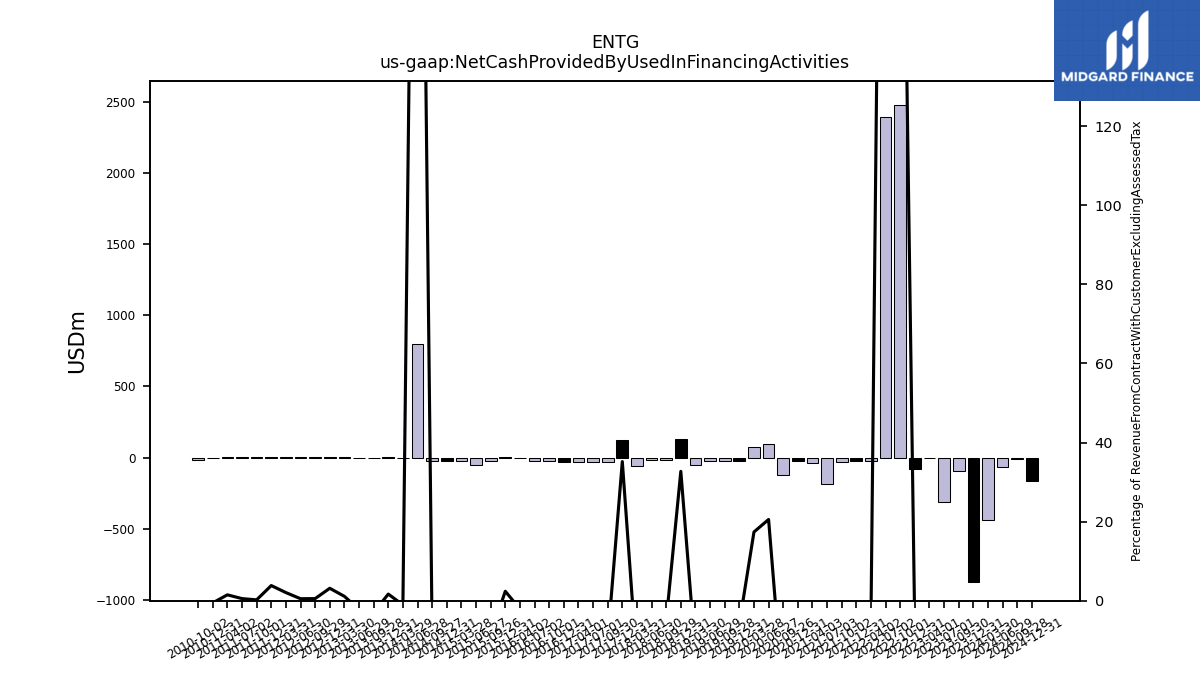
| Net Cash Provided By Used In Financing Activities | -872.62 | -91.42 | -312.10 | -6.48 | -79.81 | 2478.68 | 2394.92 | -27.59 | -21.98 | -30.56 | -184.58 | -39.38 | -22.20 | -119.48 | 92.15 | 71.69 | -24.99 | -22.66 | -26.32 | -52.85 | 131.38 | -20.29 | -17.91 | -58.78 | 123.35 | -34.49 | -28.80 | -32.80 | -28.24 | -25.20 | -22.71 | -5.59 | 6.40 | -23.11 | -49.68 | -26.40 | -24.48 | -24.12 | 798.00 | -1.75 | 3.14 | -4.92 | -3.96 | 1.84 | 5.29 | 1.00 | 0.97 | 3.63 | 6.29 | 0.40 | 1.14 | 3.04 | -0.98 | -20.47 | NA | NA |
| 2023-12-31 | 2023-09-30 | 2023-07-01 | 2023-04-01 | 2022-12-31 | 2022-10-01 | 2022-07-02 | 2022-04-02 | 2021-12-31 | 2021-10-02 | 2021-07-03 | 2021-04-03 | 2020-12-31 | 2020-09-26 | 2020-06-27 | 2020-03-28 | 2019-12-31 | 2019-09-28 | 2019-06-29 | 2019-03-30 | 2018-12-31 | 2018-09-29 | 2018-06-30 | 2018-03-31 | 2017-12-31 | 2017-09-30 | 2017-07-01 | 2017-04-01 | 2016-12-31 | 2016-10-01 | 2016-07-02 | 2016-04-02 | 2015-12-31 | 2015-09-26 | 2015-06-27 | 2015-03-28 | 2014-12-31 | 2014-09-27 | 2014-06-28 | 2014-03-29 | 2013-12-31 | 2013-09-28 | 2013-06-29 | 2013-03-30 | 2012-12-31 | 2012-09-29 | 2012-06-30 | 2012-03-31 | 2011-12-31 | 2011-10-01 | 2011-07-02 | 2011-04-02 | 2010-12-31 | 2010-10-02 | 2010-07-03 | 2010-04-03 | ||
|---|---|---|---|---|---|---|---|---|---|---|---|---|---|---|---|---|---|---|---|---|---|---|---|---|---|---|---|---|---|---|---|---|---|---|---|---|---|---|---|---|---|---|---|---|---|---|---|---|---|---|---|---|---|---|---|---|---|
| Net Cash Provided By Used In Operating Activities | 150.65 | 200.02 | 127.02 | 151.87 | 32.05 | 145.53 | 110.91 | 63.79 | 115.98 | 149.50 | 81.86 | 53.12 | 204.02 | 101.23 | 130.02 | 11.40 | 128.64 | 25.29 | 230.90 | -2.54 | 91.33 | 84.14 | 98.29 | 38.82 | 85.74 | 89.04 | 85.16 | 33.43 | 57.08 | 71.94 | 61.20 | 17.34 | 52.22 | 32.59 | 36.25 | -0.13 | 35.20 | 67.75 | 11.06 | 12.41 | 34.71 | 32.44 | 34.82 | 7.43 | 38.34 | 33.31 | 43.13 | 0.37 | 44.52 | 49.60 | 52.05 | 11.13 | 39.98 | 45.10 | NA | NA | |
| Net Income Loss | 37.98 | 33.21 | 197.65 | -88.17 | 57.43 | -73.70 | 99.49 | 125.70 | 118.22 | 117.46 | 88.77 | 84.68 | 86.62 | 79.30 | 68.04 | 61.01 | 57.44 | 40.77 | 124.00 | 32.66 | 80.78 | 48.06 | 54.35 | 57.56 | -28.34 | 40.90 | 39.99 | 32.51 | 26.10 | 21.95 | 32.89 | 16.21 | 17.57 | 23.40 | 24.45 | 14.87 | 9.31 | -1.07 | -14.67 | 14.31 | 20.54 | 17.81 | 19.78 | 16.40 | 11.26 | 18.04 | 21.67 | 17.86 | 40.16 | 21.99 | 32.52 | 29.18 | 27.00 | 22.42 | 18.39 | 16.55 | |
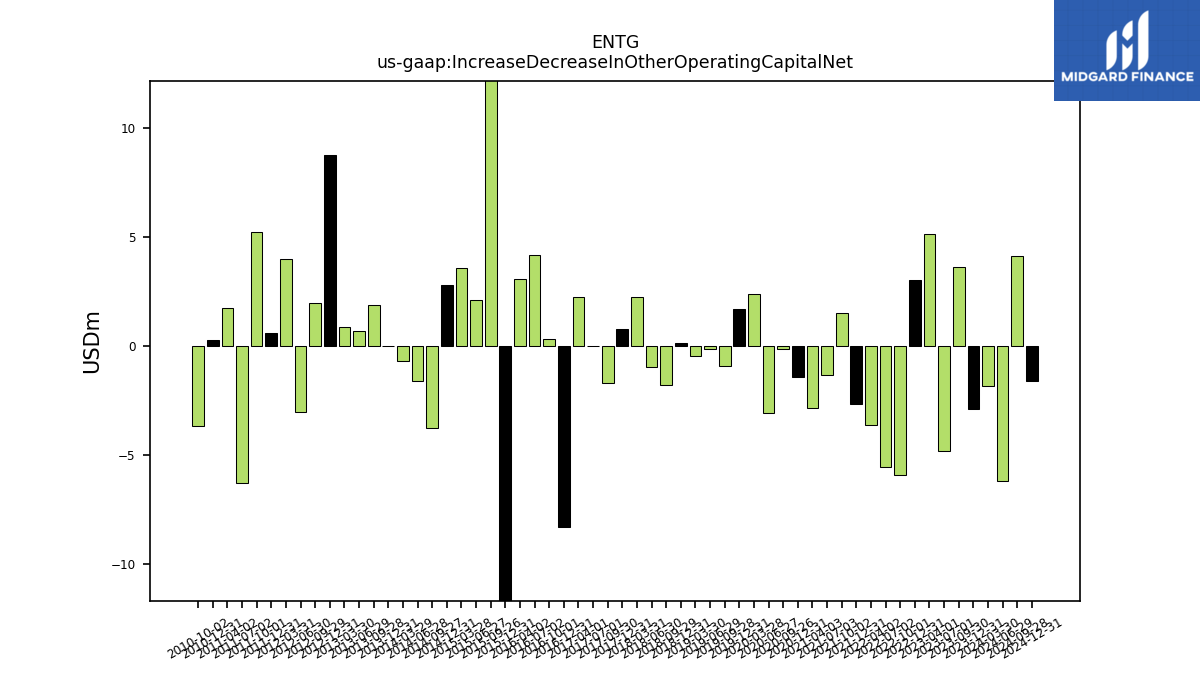
| Increase Decrease In Other Operating Capital Net | -2.86 | 3.63 | -4.78 | 5.17 | 3.07 | -5.89 | -5.53 | -3.63 | -2.63 | 1.53 | -1.30 | -2.85 | -1.40 | -0.14 | -3.05 | 2.40 | 1.72 | -0.90 | -0.12 | -0.43 | 0.15 | -1.78 | -0.94 | 2.28 | 0.78 | -1.68 | 0.00 | 2.29 | -8.27 | 0.36 | 4.17 | 3.07 | -24.38 | 18.79 | 2.12 | 3.58 | 2.81 | -3.73 | -1.57 | -0.69 | 0.01 | 1.88 | 0.70 | 0.90 | 8.77 | 1.98 | -2.99 | 4.00 | 0.62 | 5.26 | -6.27 | 1.76 | 0.27 | -3.63 | NA | NA | |
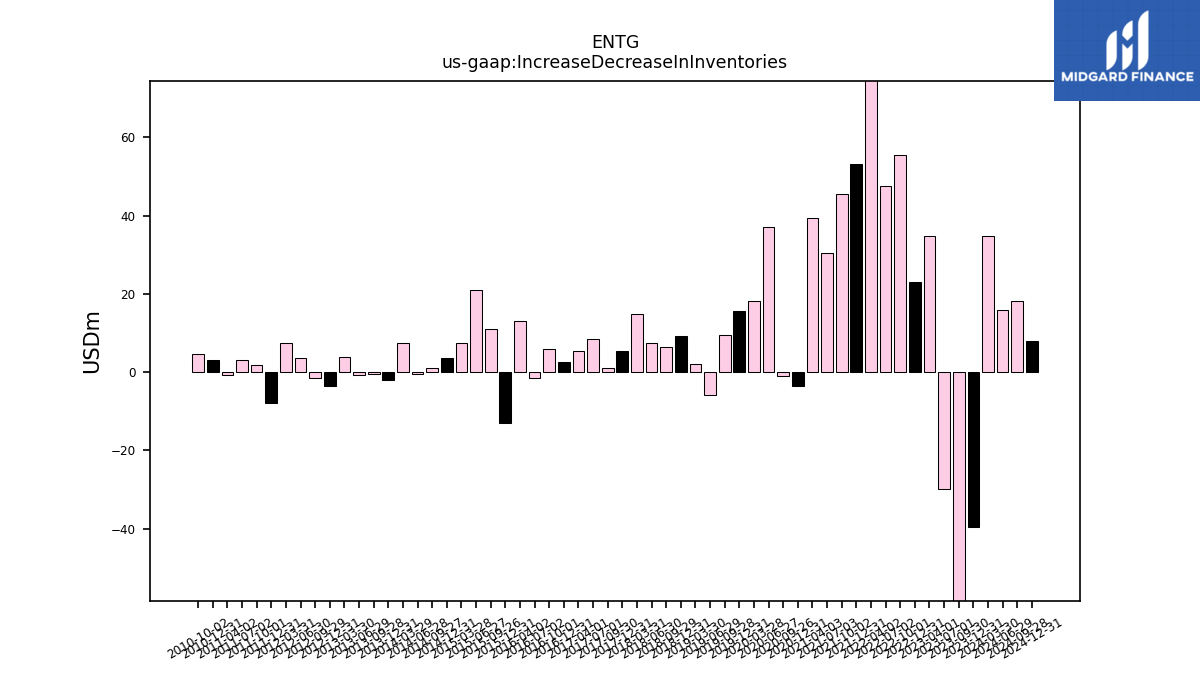
| Increase Decrease In Inventories | -39.41 | -68.35 | -29.84 | 34.85 | 23.00 | 55.39 | 47.47 | 77.48 | 53.19 | 45.46 | 30.39 | 39.34 | -3.51 | -1.08 | 37.16 | 18.20 | 15.66 | 9.40 | -5.84 | 2.13 | 9.31 | 6.32 | 7.52 | 14.96 | 5.33 | 1.05 | 8.42 | 5.42 | 2.58 | 5.91 | -1.61 | 13.00 | -12.88 | 11.05 | 20.99 | 7.51 | 3.53 | 1.07 | -0.54 | 7.54 | -2.11 | -0.58 | -0.62 | 3.76 | -3.50 | -1.37 | 3.49 | 7.51 | -7.84 | 1.81 | 3.11 | -0.72 | 3.06 | 4.63 | NA | NA | |
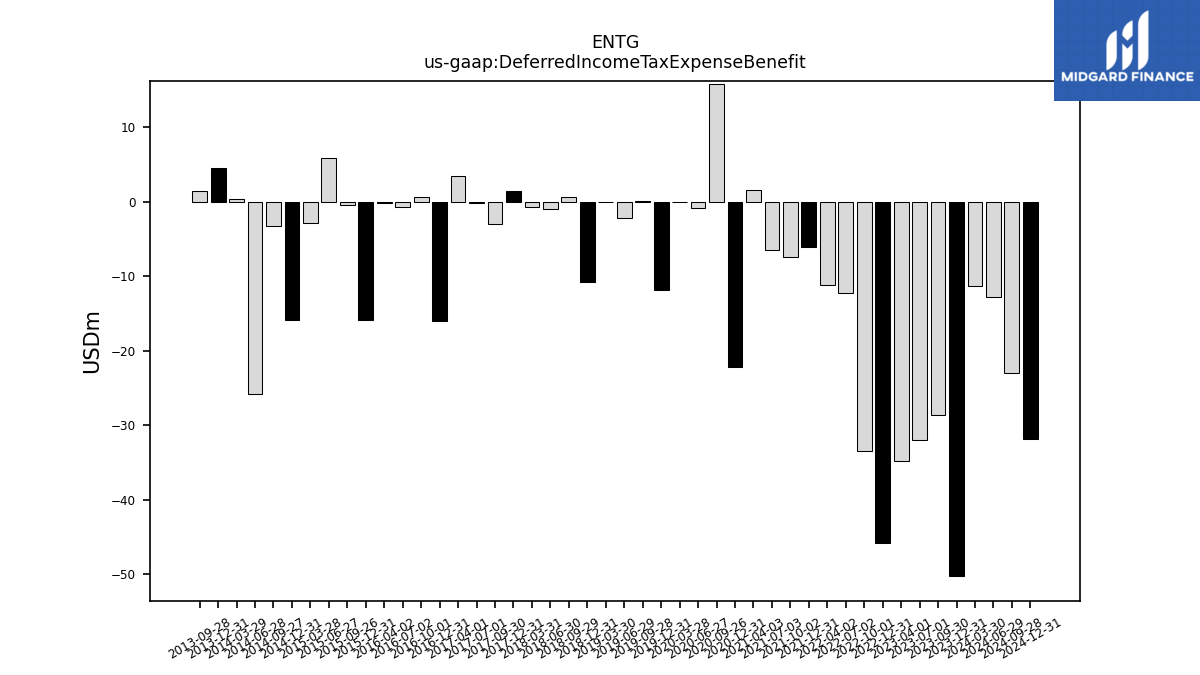
| Deferred Income Tax Expense Benefit | -50.24 | -28.55 | -31.99 | -34.83 | -45.78 | -33.49 | -12.24 | -11.23 | -6.13 | -7.39 | -6.50 | 1.58 | -22.21 | 15.82 | -0.80 | -0.06 | -11.88 | 0.03 | -2.16 | 0.01 | -10.81 | 0.69 | -1.04 | -0.72 | 1.37 | -2.95 | -0.21 | 3.42 | -15.95 | 0.60 | -0.72 | -0.21 | -15.91 | -0.44 | 5.87 | -2.83 | -15.93 | -3.31 | -25.80 | 0.33 | 4.50 | 1.40 | NA | NA | NA | NA | NA | NA | NA | NA | NA | NA | NA | NA | NA | NA | |
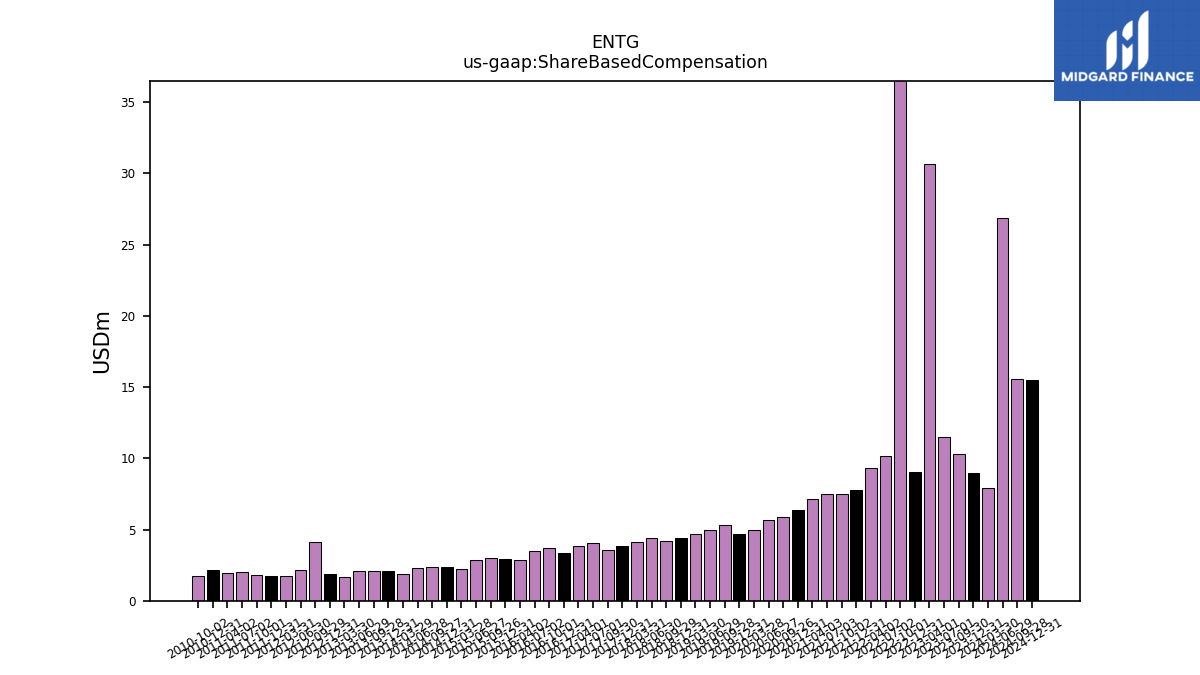
| Share Based Compensation | 8.96 | 10.28 | 11.46 | 30.68 | 9.03 | 38.08 | 10.18 | 9.29 | 7.76 | 7.47 | 7.52 | 7.14 | 6.37 | 5.90 | 5.66 | 4.99 | 4.71 | 5.33 | 4.94 | 4.65 | 4.38 | 4.17 | 4.43 | 4.13 | 3.85 | 3.55 | 4.04 | 3.87 | 3.37 | 3.70 | 3.50 | 2.86 | 2.91 | 2.98 | 2.89 | 2.26 | 2.37 | 2.36 | 2.28 | 1.88 | 2.07 | 2.09 | 2.08 | 1.69 | 1.85 | 4.10 | 2.17 | 1.76 | 1.74 | 1.82 | 2.04 | 1.92 | 2.15 | 1.75 | NA | NA | |
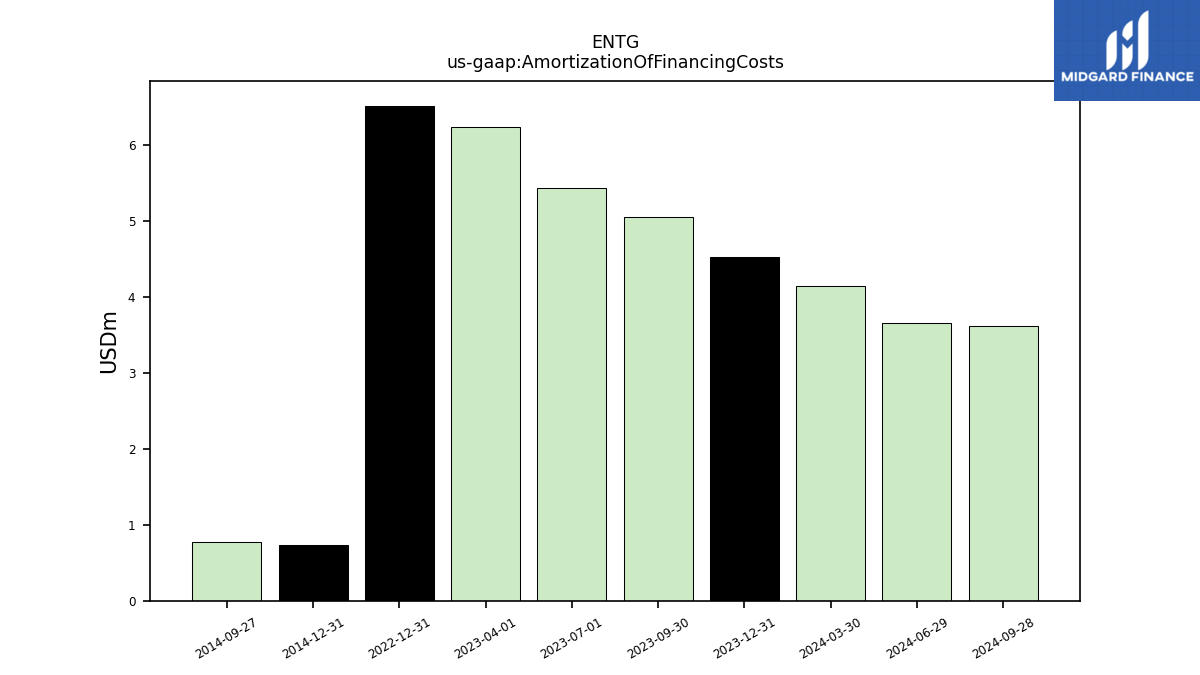
| Amortization Of Financing Costs | 4.53 | NA | NA | NA | 6.51 | NA | NA | NA | NA | NA | NA | NA | NA | NA | NA | NA | NA | NA | NA | NA | NA | NA | NA | NA | NA | NA | NA | NA | NA | NA | NA | NA | NA | NA | NA | NA | 0.73 | 0.77 | NA | NA | NA | NA | NA | NA | NA | NA | NA | NA | NA | NA | NA | NA | NA | NA | NA | NA |
| 2023-12-31 | 2023-09-30 | 2023-07-01 | 2023-04-01 | 2022-12-31 | 2022-10-01 | 2022-07-02 | 2022-04-02 | 2021-12-31 | 2021-10-02 | 2021-07-03 | 2021-04-03 | 2020-12-31 | 2020-09-26 | 2020-06-27 | 2020-03-28 | 2019-12-31 | 2019-09-28 | 2019-06-29 | 2019-03-30 | 2018-12-31 | 2018-09-29 | 2018-06-30 | 2018-03-31 | 2017-12-31 | 2017-09-30 | 2017-07-01 | 2017-04-01 | 2016-12-31 | 2016-10-01 | 2016-07-02 | 2016-04-02 | 2015-12-31 | 2015-09-26 | 2015-06-27 | 2015-03-28 | 2014-12-31 | 2014-09-27 | 2014-06-28 | 2014-03-29 | 2013-12-31 | 2013-09-28 | 2013-06-29 | 2013-03-30 | 2012-12-31 | 2012-09-29 | 2012-06-30 | 2012-03-31 | 2011-12-31 | 2011-10-01 | 2011-07-02 | 2011-04-02 | 2010-12-31 | 2010-10-02 | 2010-07-03 | 2010-04-03 | ||
|---|---|---|---|---|---|---|---|---|---|---|---|---|---|---|---|---|---|---|---|---|---|---|---|---|---|---|---|---|---|---|---|---|---|---|---|---|---|---|---|---|---|---|---|---|---|---|---|---|---|---|---|---|---|---|---|---|---|
| Net Cash Provided By Used In Investing Activities | 575.80 | -76.59 | 54.22 | -0.36 | -153.07 | -4601.66 | -107.69 | -83.28 | -166.30 | -44.56 | -44.00 | -43.26 | -52.89 | -68.13 | -24.10 | -98.21 | -35.86 | -240.81 | -25.11 | -84.06 | -35.35 | -24.83 | -367.20 | -58.56 | -25.59 | -24.58 | -40.28 | -22.00 | -19.90 | -12.99 | -13.49 | -20.31 | -10.40 | -20.93 | -12.88 | -19.43 | -8.82 | -12.38 | -825.71 | -13.38 | -11.33 | -14.76 | -24.81 | 3.87 | -22.58 | -16.99 | -22.29 | -10.60 | -3.68 | -9.47 | -8.03 | -7.25 | -4.32 | -4.02 | NA | NA | |
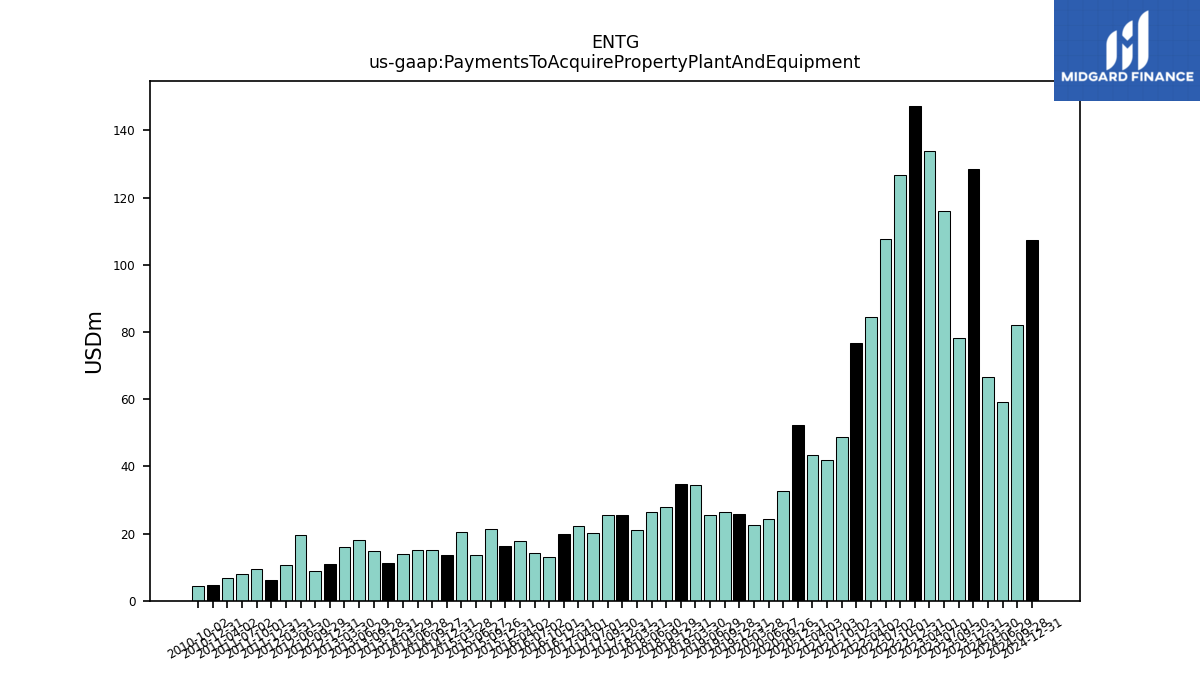
| Payments To Acquire Property Plant And Equipment | 128.66 | 78.14 | 116.05 | 133.99 | 147.36 | 126.74 | 107.69 | 84.41 | 76.64 | 48.88 | 41.77 | 43.33 | 52.19 | 32.69 | 24.29 | 22.59 | 25.93 | 26.32 | 25.64 | 34.47 | 34.82 | 27.90 | 26.39 | 21.05 | 25.66 | 25.45 | 20.30 | 22.19 | 19.99 | 13.12 | 14.32 | 17.82 | 16.28 | 21.47 | 13.74 | 20.49 | 13.72 | 15.07 | 15.16 | 13.78 | 11.33 | 14.90 | 17.99 | 16.14 | 10.81 | 9.00 | 19.51 | 10.61 | 6.12 | 9.56 | 7.84 | 6.74 | 4.63 | 4.50 | NA | NA |
| 2023-12-31 | 2023-09-30 | 2023-07-01 | 2023-04-01 | 2022-12-31 | 2022-10-01 | 2022-07-02 | 2022-04-02 | 2021-12-31 | 2021-10-02 | 2021-07-03 | 2021-04-03 | 2020-12-31 | 2020-09-26 | 2020-06-27 | 2020-03-28 | 2019-12-31 | 2019-09-28 | 2019-06-29 | 2019-03-30 | 2018-12-31 | 2018-09-29 | 2018-06-30 | 2018-03-31 | 2017-12-31 | 2017-09-30 | 2017-07-01 | 2017-04-01 | 2016-12-31 | 2016-10-01 | 2016-07-02 | 2016-04-02 | 2015-12-31 | 2015-09-26 | 2015-06-27 | 2015-03-28 | 2014-12-31 | 2014-09-27 | 2014-06-28 | 2014-03-29 | 2013-12-31 | 2013-09-28 | 2013-06-29 | 2013-03-30 | 2012-12-31 | 2012-09-29 | 2012-06-30 | 2012-03-31 | 2011-12-31 | 2011-10-01 | 2011-07-02 | 2011-04-02 | 2010-12-31 | 2010-10-02 | 2010-07-03 | 2010-04-03 | ||
|---|---|---|---|---|---|---|---|---|---|---|---|---|---|---|---|---|---|---|---|---|---|---|---|---|---|---|---|---|---|---|---|---|---|---|---|---|---|---|---|---|---|---|---|---|---|---|---|---|---|---|---|---|---|---|---|---|---|
| Net Cash Provided By Used In Financing Activities | -872.62 | -91.42 | -312.10 | -6.48 | -79.81 | 2478.68 | 2394.92 | -27.59 | -21.98 | -30.56 | -184.58 | -39.38 | -22.20 | -119.48 | 92.15 | 71.69 | -24.99 | -22.66 | -26.32 | -52.85 | 131.38 | -20.29 | -17.91 | -58.78 | 123.35 | -34.49 | -28.80 | -32.80 | -28.24 | -25.20 | -22.71 | -5.59 | 6.40 | -23.11 | -49.68 | -26.40 | -24.48 | -24.12 | 798.00 | -1.75 | 3.14 | -4.92 | -3.96 | 1.84 | 5.29 | 1.00 | 0.97 | 3.63 | 6.29 | 0.40 | 1.14 | 3.04 | -0.98 | -20.47 | NA | NA | |
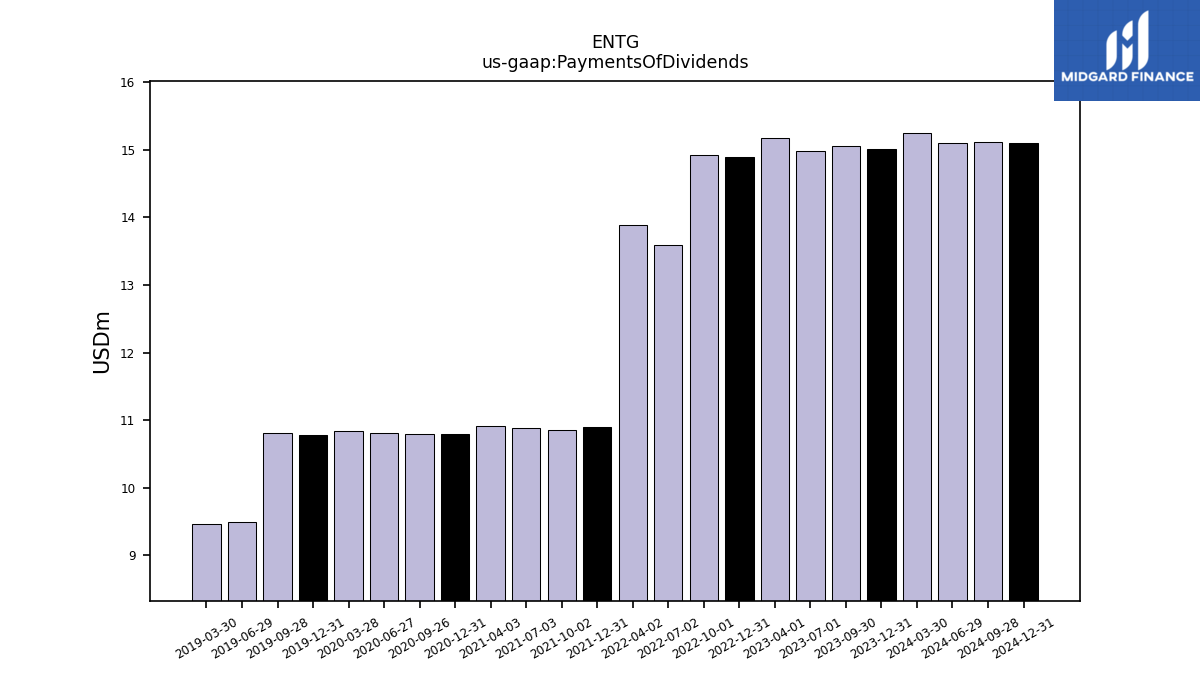
| Payments Of Dividends | 15.02 | 15.05 | 14.98 | 15.17 | 14.90 | 14.93 | 13.59 | 13.89 | 10.89 | 10.85 | 10.89 | 10.91 | 10.80 | 10.79 | 10.80 | 10.85 | 10.79 | 10.81 | 9.49 | 9.47 | NA | NA | NA | NA | NA | NA | NA | NA | NA | NA | NA | NA | NA | NA | NA | NA | NA | NA | NA | NA | NA | NA | NA | NA | NA | NA | NA | NA | NA | NA | NA | NA | NA | NA | NA | NA |
| 2023-12-31 | 2023-09-30 | 2023-07-01 | 2023-04-01 | 2022-12-31 | 2022-10-01 | 2022-07-02 | 2022-04-02 | 2021-12-31 | 2021-10-02 | 2021-07-03 | 2021-04-03 | 2020-12-31 | 2020-09-26 | 2020-06-27 | 2020-03-28 | 2019-12-31 | 2019-09-28 | 2019-06-29 | 2019-03-30 | 2018-12-31 | 2018-09-29 | 2018-06-30 | 2018-03-31 | 2017-12-31 | 2017-09-30 | 2017-07-01 | 2017-04-01 | 2016-12-31 | 2016-10-01 | 2016-07-02 | 2016-04-02 | 2015-12-31 | 2015-09-26 | 2015-06-27 | 2015-03-28 | 2014-12-31 | 2014-09-27 | 2014-06-28 | 2014-03-29 | 2013-12-31 | 2013-09-28 | 2013-06-29 | 2013-03-30 | 2012-12-31 | 2012-09-29 | 2012-06-30 | 2012-03-31 | 2011-12-31 | 2011-10-01 | 2011-07-02 | 2011-04-02 | 2010-12-31 | 2010-10-02 | 2010-07-03 | 2010-04-03 | ||
|---|---|---|---|---|---|---|---|---|---|---|---|---|---|---|---|---|---|---|---|---|---|---|---|---|---|---|---|---|---|---|---|---|---|---|---|---|---|---|---|---|---|---|---|---|---|---|---|---|---|---|---|---|---|---|---|---|---|
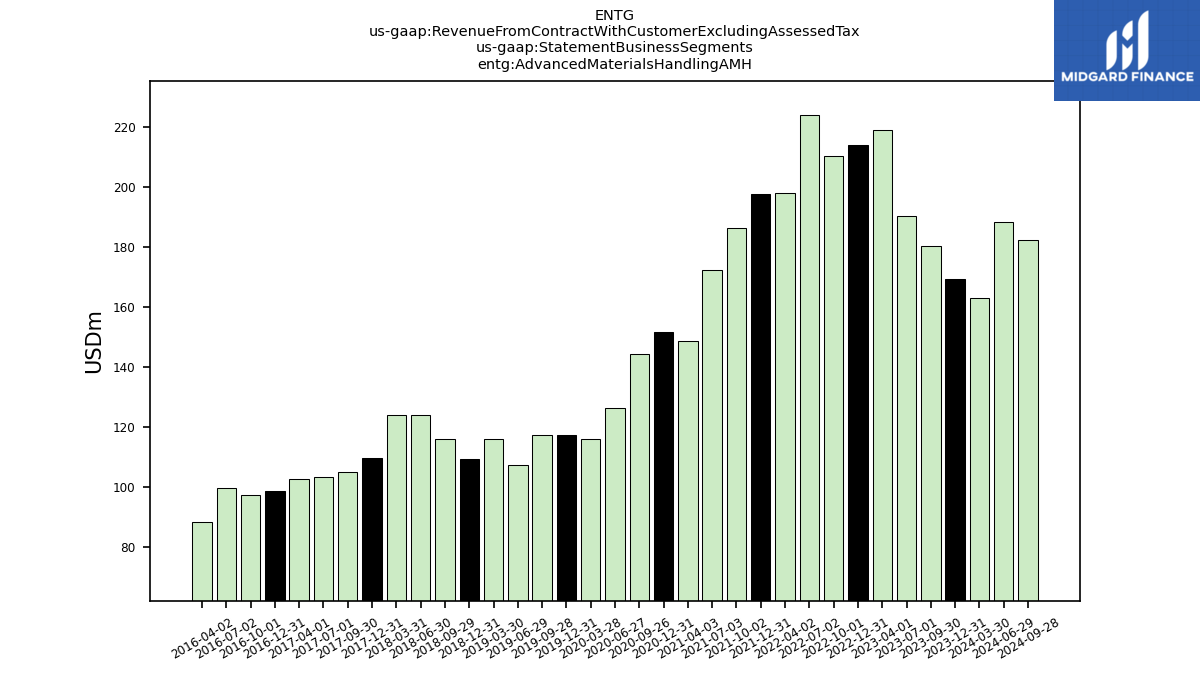
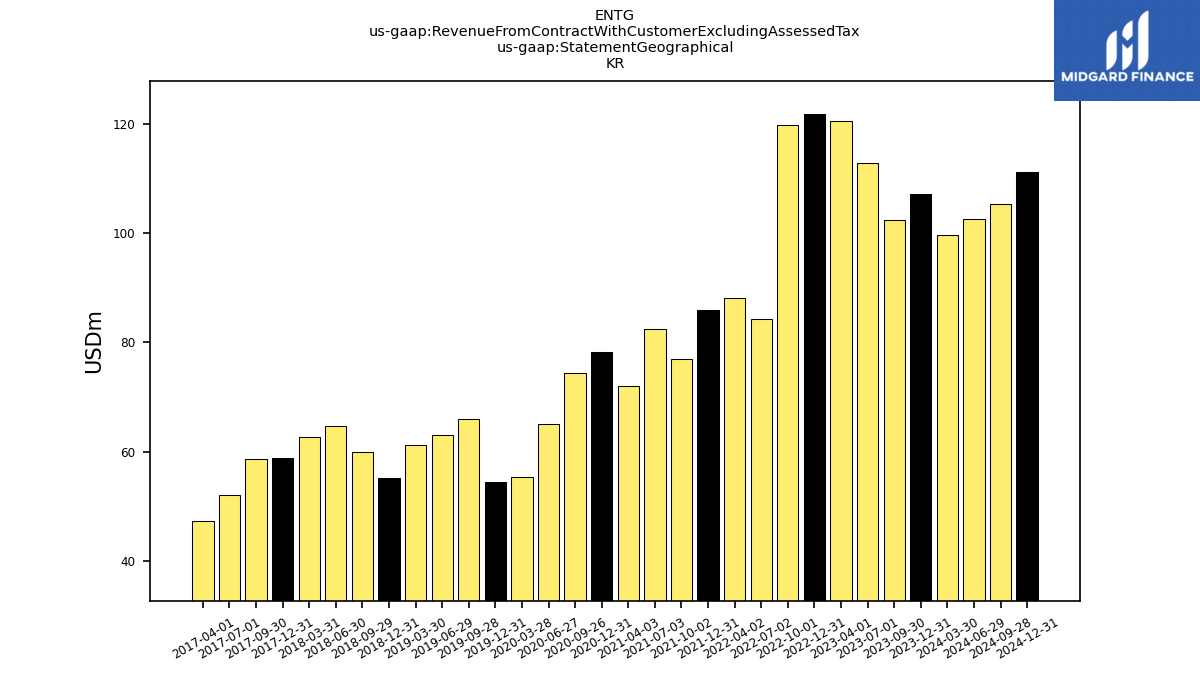
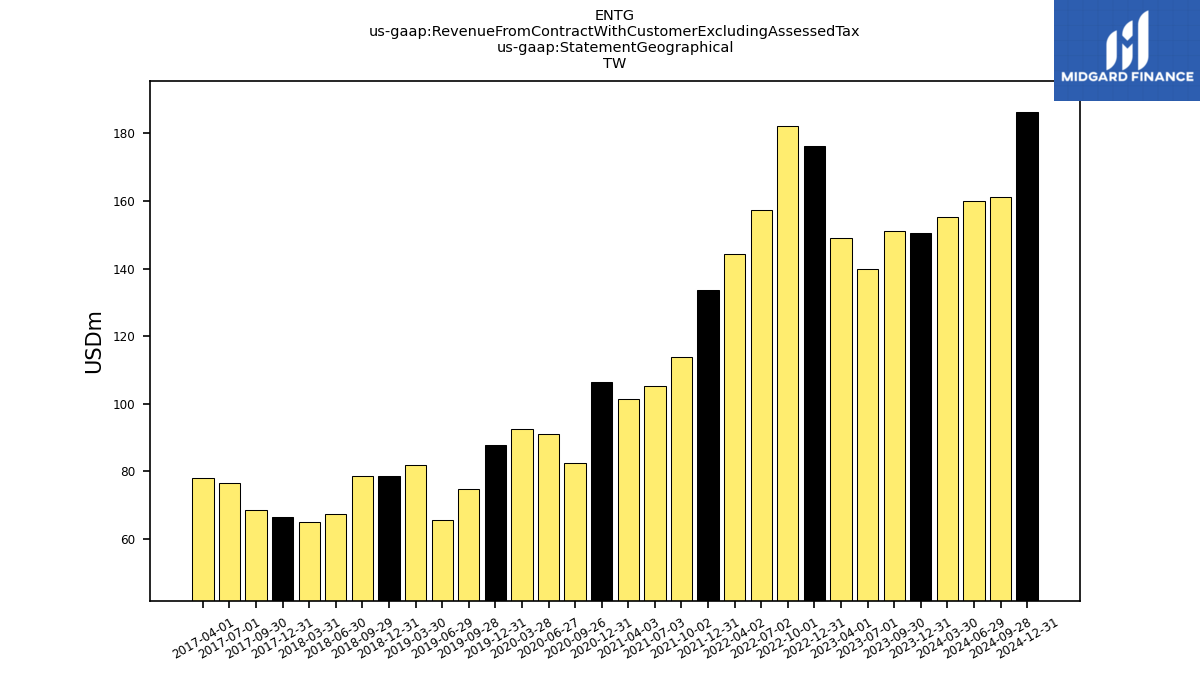
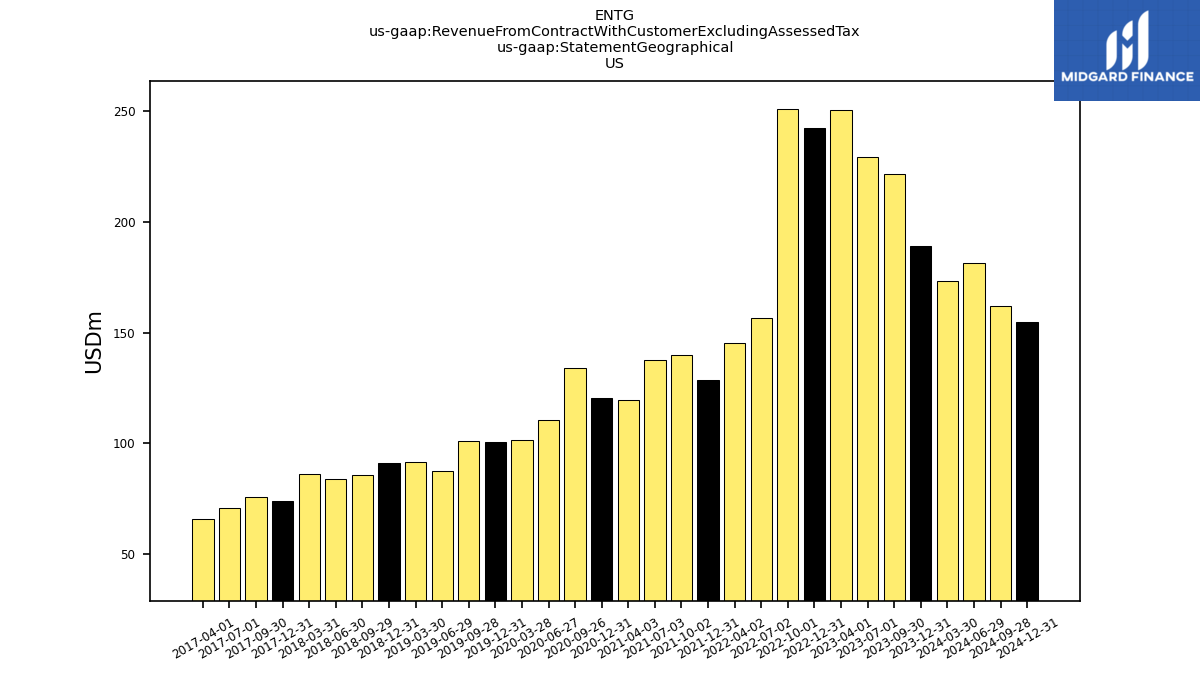
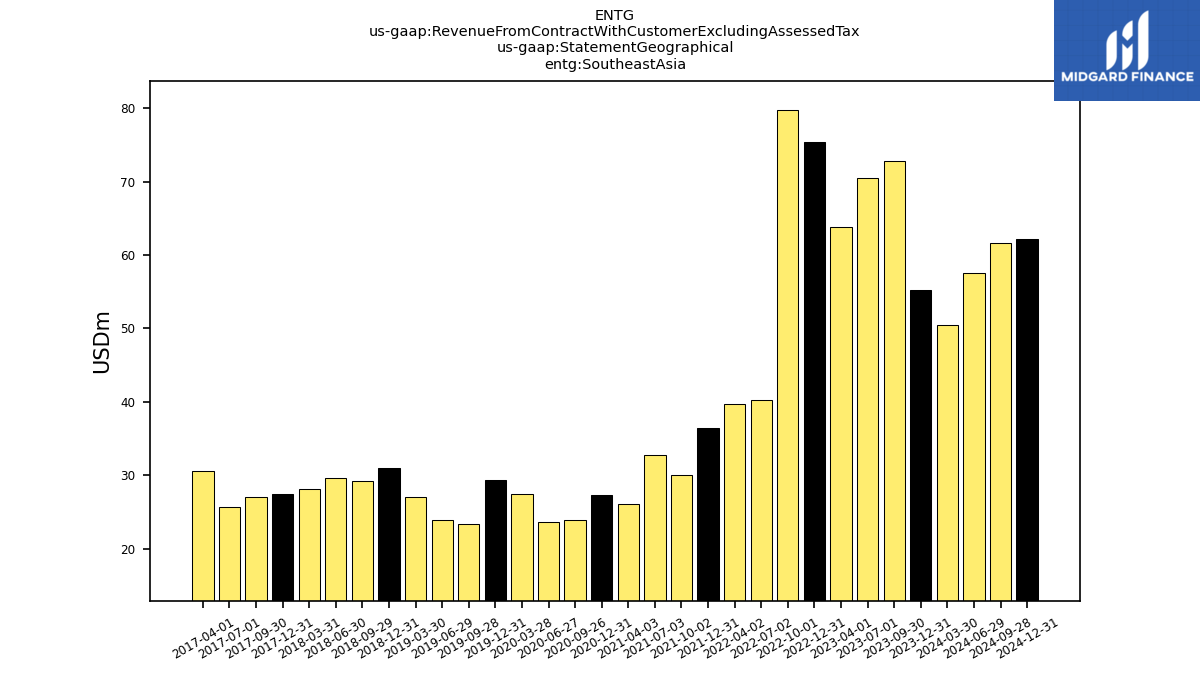
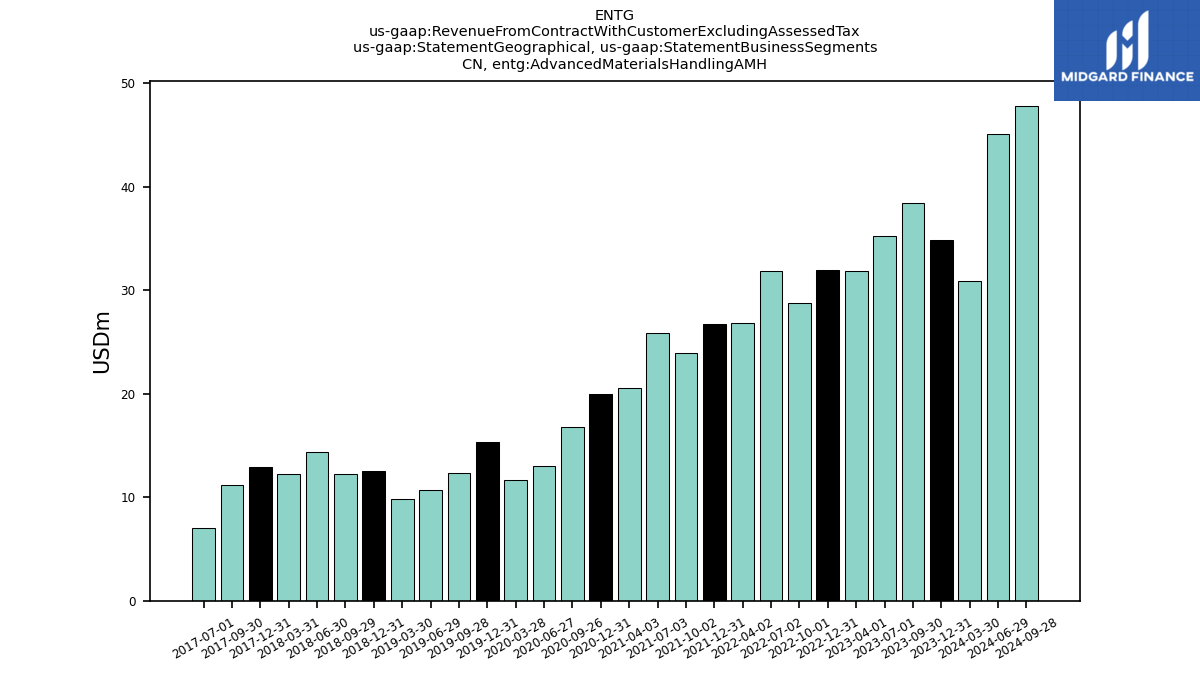
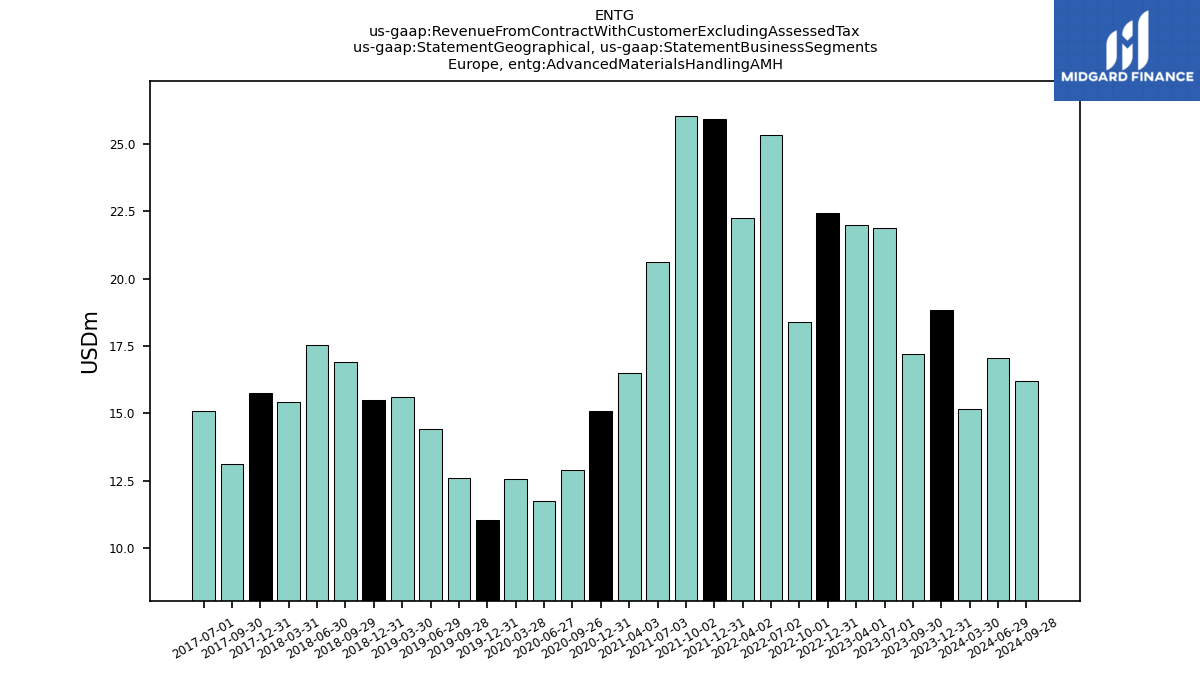
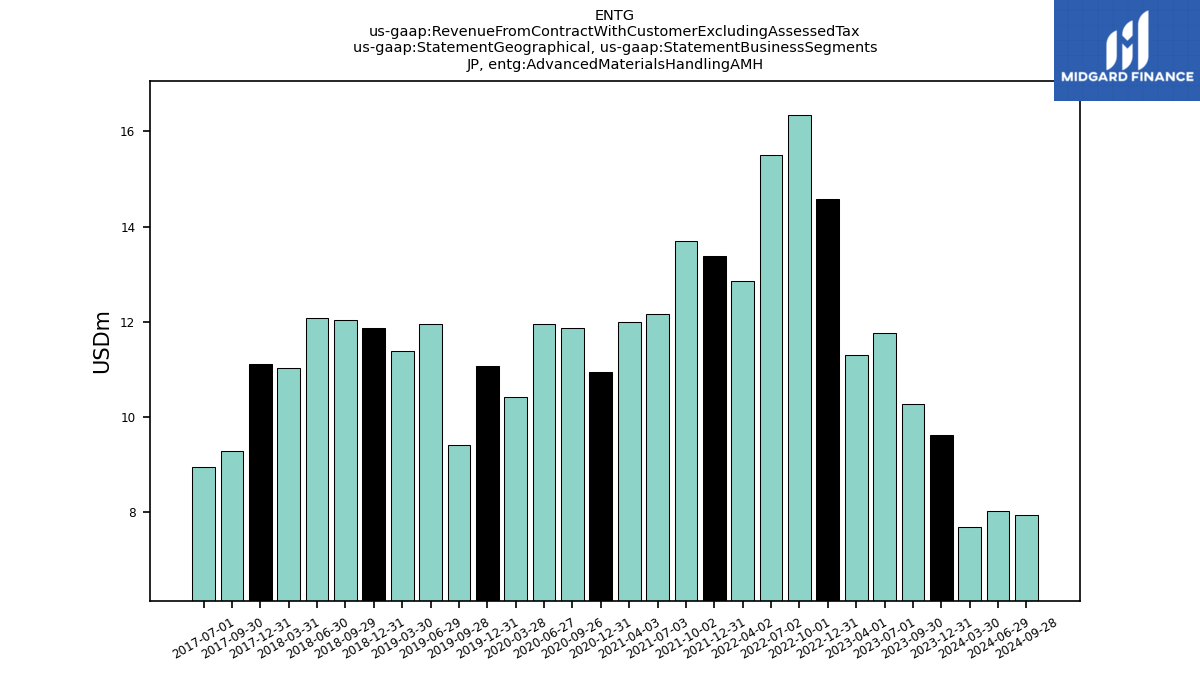
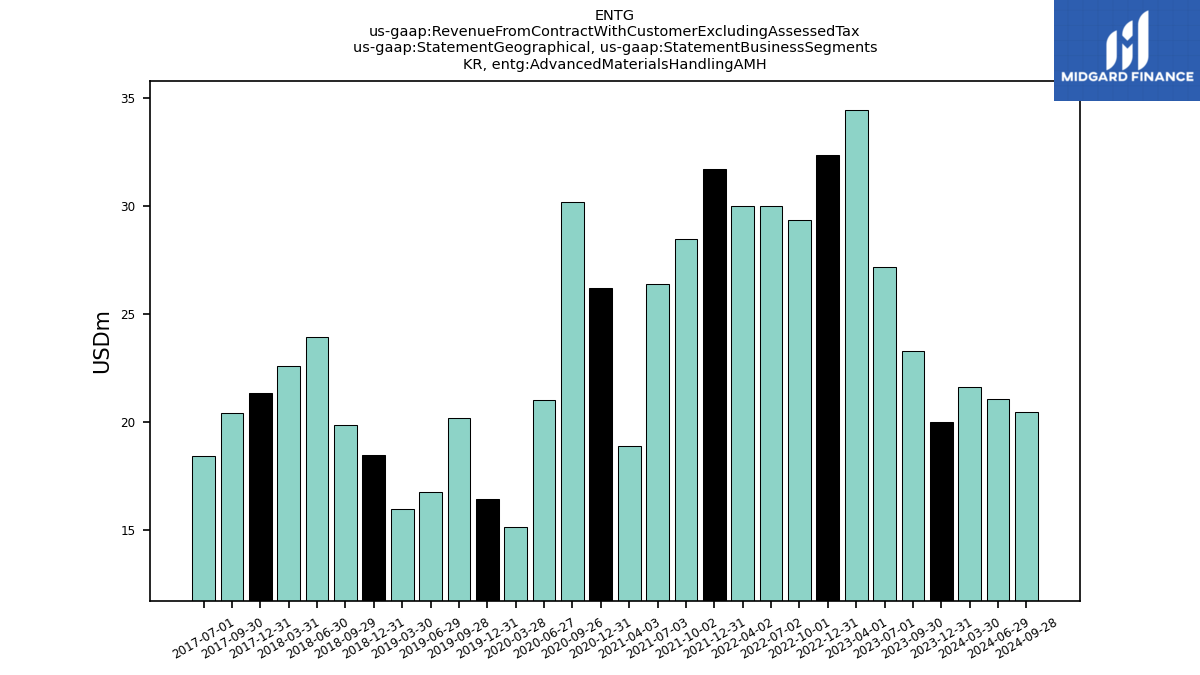
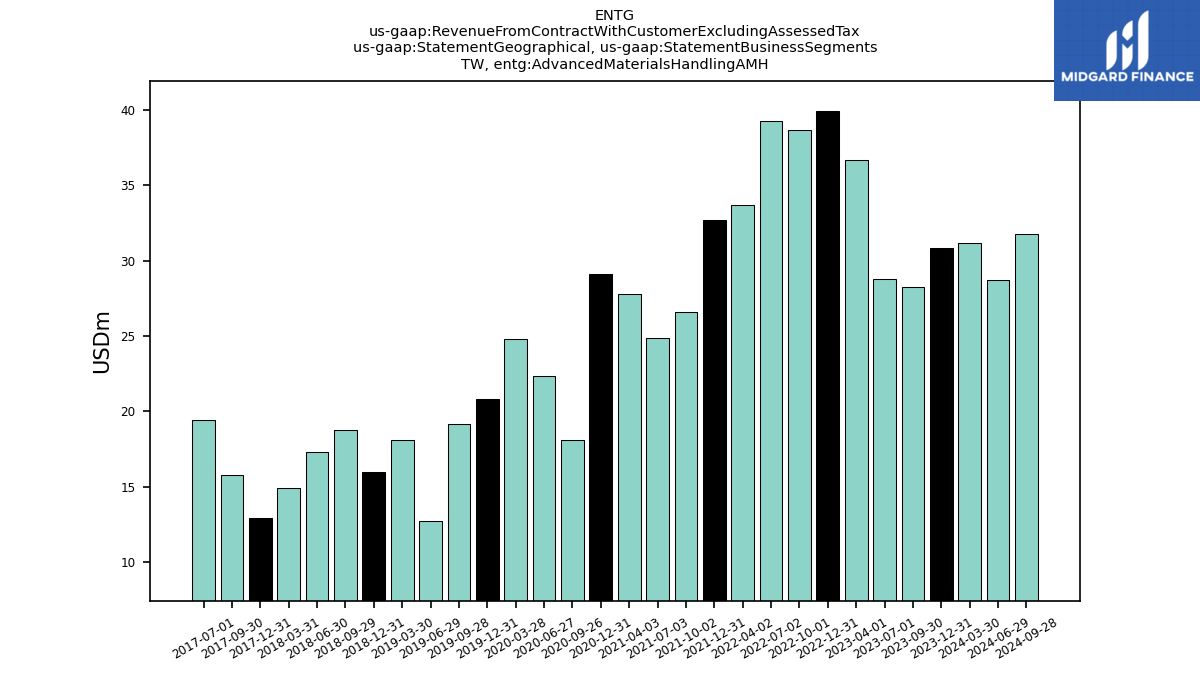
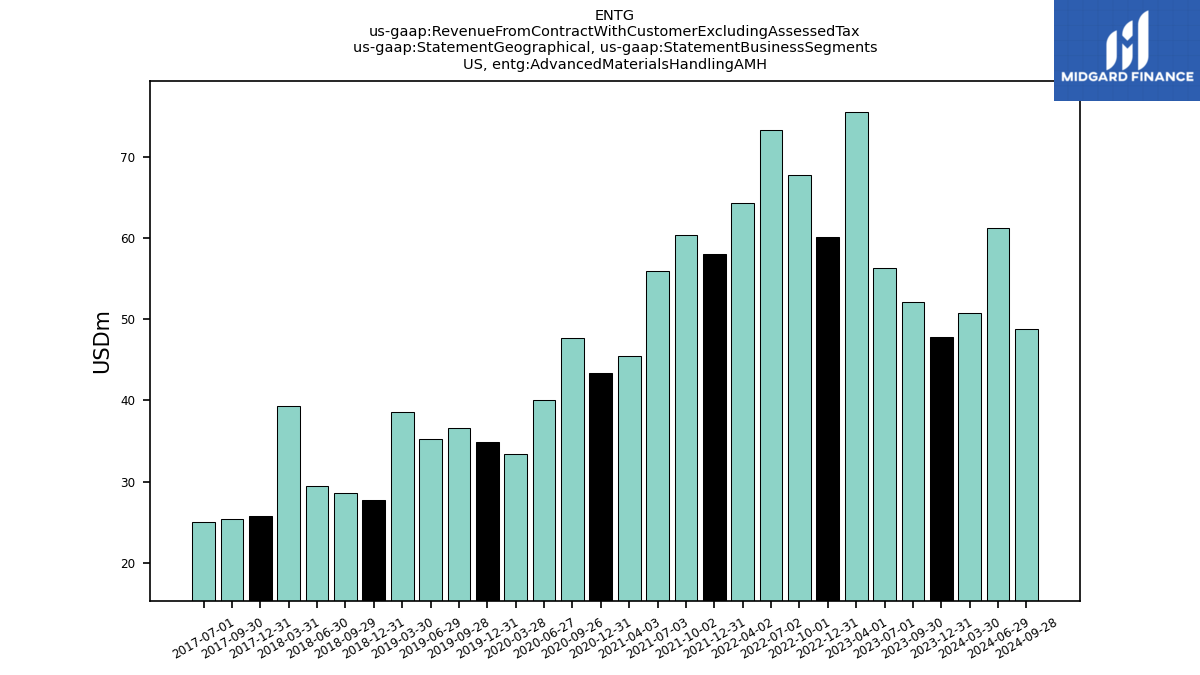
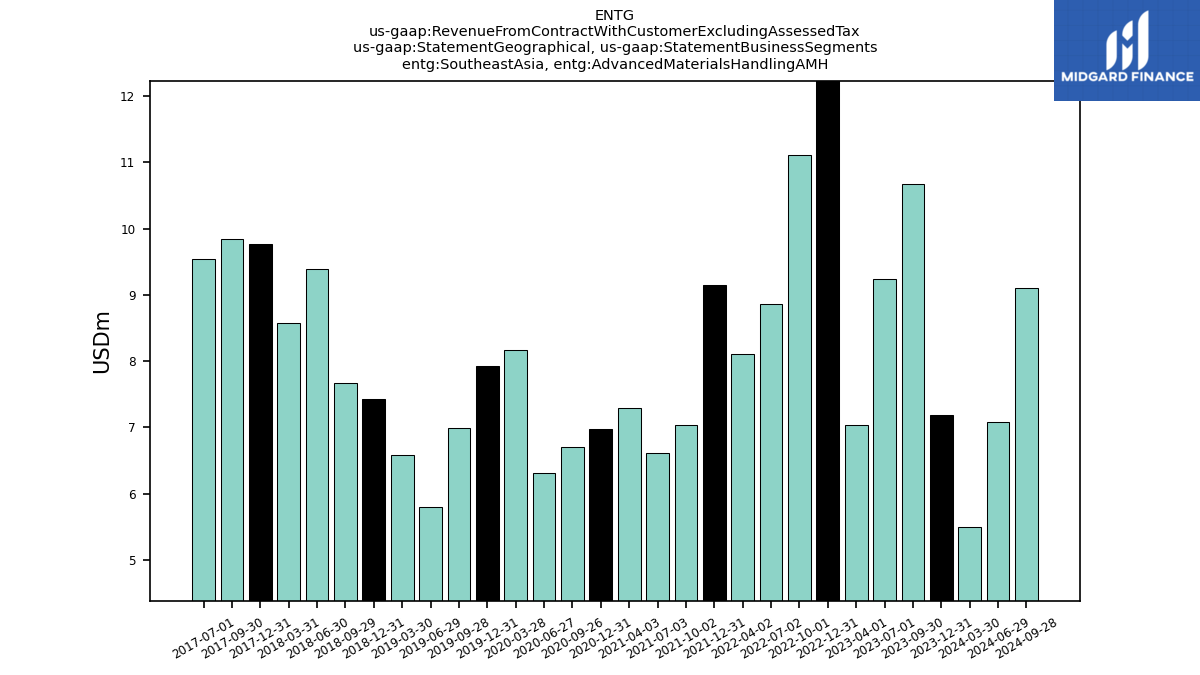
| Revenue From Contract With Customer Excluding Assessed Tax | 812.29 | 888.24 | 901.00 | 922.40 | 946.07 | 993.83 | 692.49 | 649.65 | 635.20 | 579.49 | 571.35 | 512.84 | 517.59 | 480.99 | 448.40 | 412.33 | 427.00 | 394.15 | 378.87 | 391.05 | 401.64 | 398.60 | 383.06 | 367.20 | 350.56 | 345.59 | 329.00 | 317.38 | 308.50 | 296.69 | 303.05 | 267.02 | 266.79 | 270.25 | 280.71 | 263.37 | 271.63 | 273.05 | 251.58 | 165.80 | 186.26 | 164.59 | 177.54 | 165.07 | 167.82 | 184.45 | 188.23 | 175.40 | 163.92 | 173.01 | 209.20 | 203.12 | 182.10 | 178.23 | 167.57 | 160.51 | |
| Advanced Materials Handling A M H | 169.19 | 180.25 | 190.36 | 218.85 | 213.89 | 210.41 | 224.08 | 198.11 | 197.70 | 186.20 | 172.50 | 148.54 | 151.74 | 144.37 | 126.43 | 116.14 | 117.45 | 117.26 | 107.52 | 116.06 | 109.53 | 116.02 | 124.04 | 124.08 | 109.57 | 104.96 | 103.42 | 102.89 | 98.84 | 97.46 | 99.69 | 88.30 | NA | NA | NA | NA | NA | NA | NA | NA | NA | NA | NA | NA | NA | NA | NA | NA | NA | NA | NA | NA | NA | NA | NA | NA | |
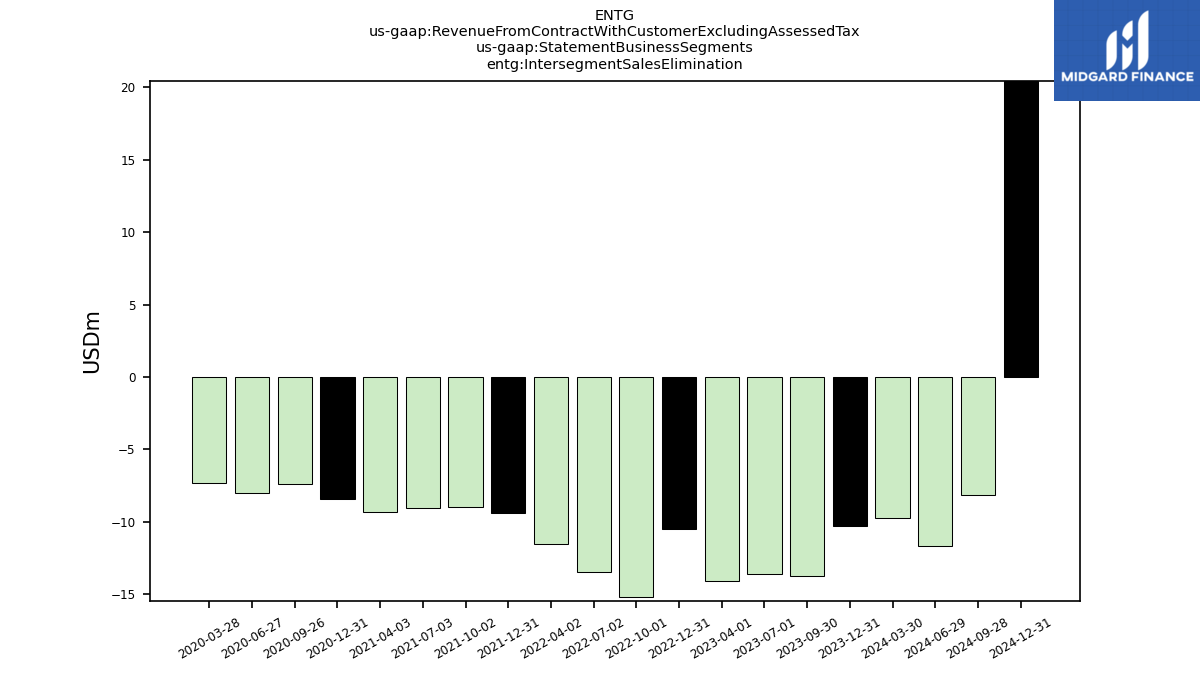
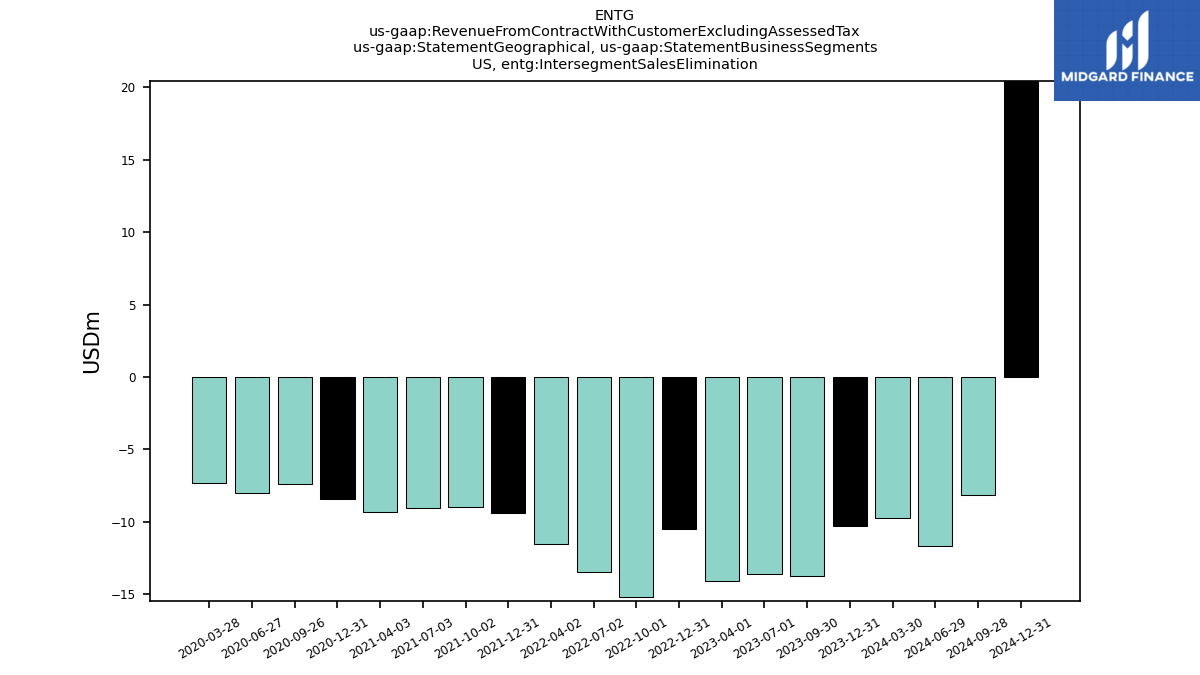
| Intersegment Sales Elimination | -10.29 | -13.76 | -13.60 | -14.08 | -10.51 | -15.17 | -13.46 | -11.53 | -9.37 | -8.96 | -9.04 | -9.34 | -8.40 | -7.40 | -8.00 | -7.29 | NA | NA | NA | NA | NA | NA | NA | NA | NA | NA | NA | NA | NA | NA | NA | NA | NA | NA | NA | NA | NA | NA | NA | NA | NA | NA | NA | NA | NA | NA | NA | NA | NA | NA | NA | NA | NA | NA | NA | NA | |
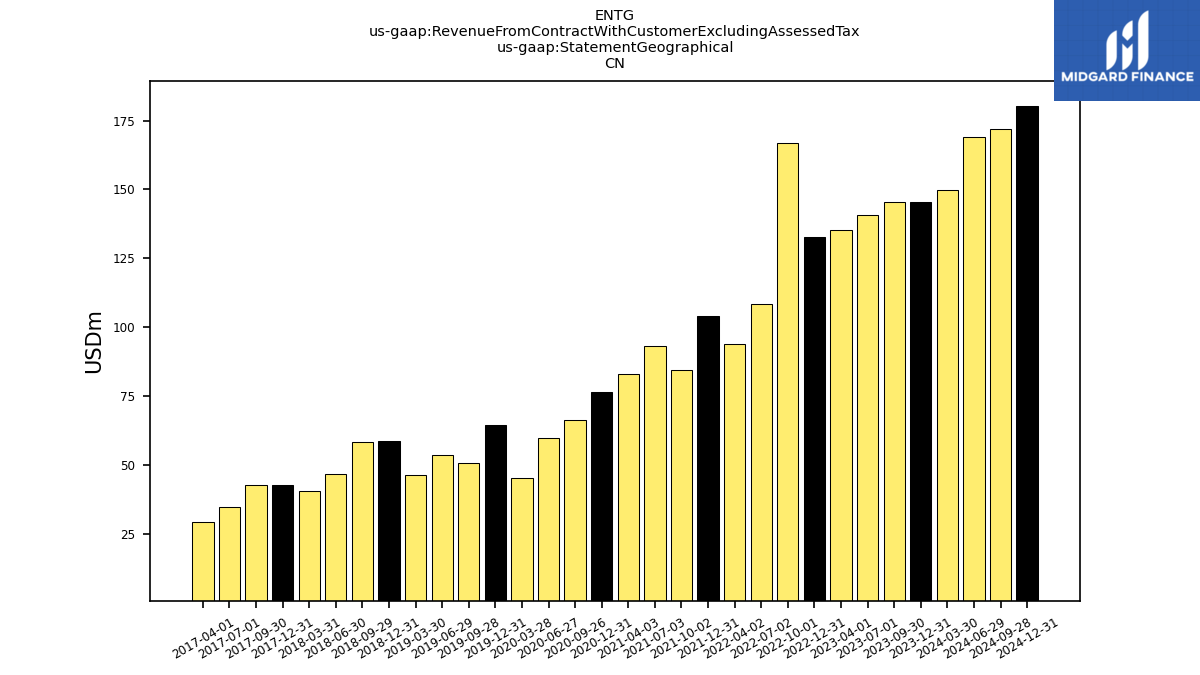
| 145.43 | 145.43 | 140.62 | 135.43 | 132.79 | 166.96 | 108.34 | 93.87 | 104.21 | 84.29 | 92.99 | 82.93 | 76.49 | 66.31 | 59.72 | 45.35 | 64.37 | 50.60 | 53.60 | 46.17 | 58.80 | 58.29 | 46.80 | 40.49 | 42.51 | 42.70 | 34.50 | 29.18 | NA | NA | NA | NA | NA | NA | NA | NA | NA | NA | NA | NA | NA | NA | NA | NA | NA | NA | NA | NA | NA | NA | NA | NA | NA | NA | NA | NA | ||
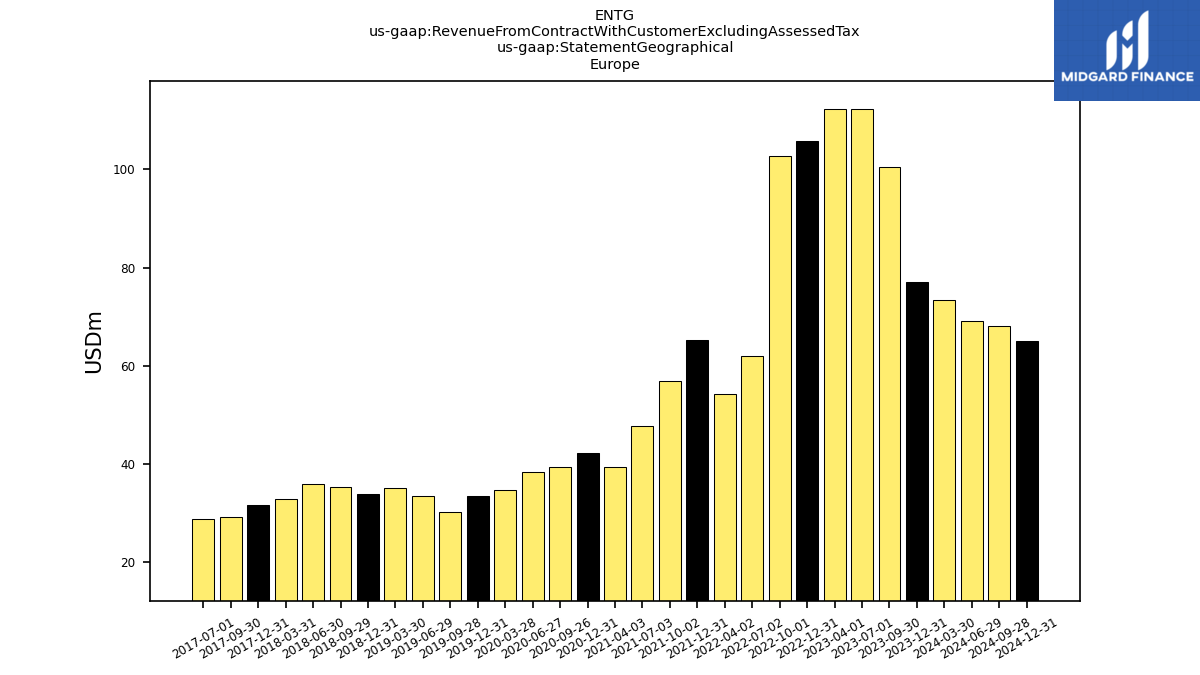
| 77.07 | 100.51 | 112.35 | 112.42 | 105.88 | 102.75 | 62.07 | 54.31 | 65.23 | 56.88 | 47.77 | 39.39 | 42.23 | 39.25 | 38.31 | 34.64 | 33.37 | 30.24 | 33.46 | 35.15 | 33.91 | 35.35 | 35.93 | 32.89 | 31.51 | 29.24 | 28.78 | NA | NA | NA | NA | NA | NA | NA | NA | NA | NA | NA | NA | NA | NA | NA | NA | NA | NA | NA | NA | NA | NA | NA | NA | NA | NA | NA | NA | NA | ||
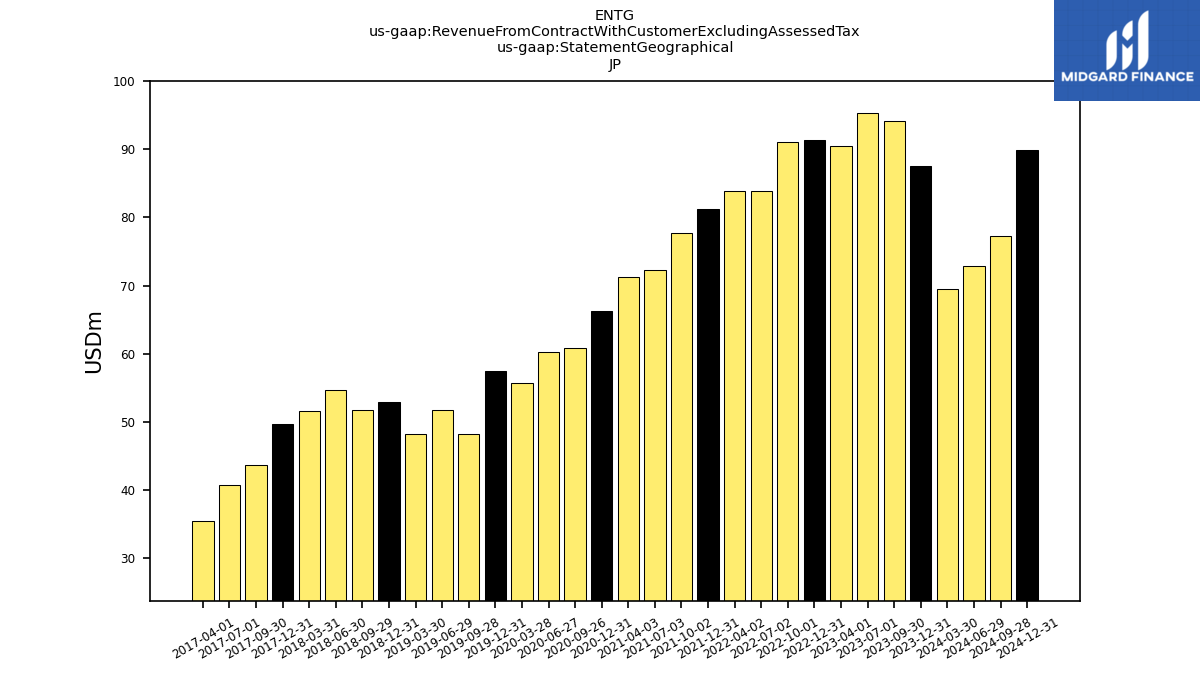
| 87.50 | 94.11 | 95.27 | 90.42 | 91.34 | 91.01 | 83.83 | 83.82 | 81.30 | 77.78 | 72.32 | 71.21 | 66.31 | 60.76 | 60.18 | 55.65 | 57.40 | 48.16 | 51.76 | 48.16 | 52.87 | 51.67 | 54.68 | 51.53 | 49.64 | 43.71 | 40.69 | 35.44 | NA | NA | NA | NA | NA | NA | NA | NA | NA | NA | NA | NA | NA | NA | NA | NA | NA | NA | NA | NA | NA | NA | NA | NA | NA | NA | NA | NA | ||
| 107.27 | 102.37 | 112.89 | 120.66 | 121.82 | 119.85 | 84.25 | 88.16 | 85.89 | 76.91 | 82.40 | 72.09 | 78.31 | 74.37 | 65.11 | 55.41 | 54.38 | 65.88 | 62.99 | 61.12 | 55.09 | 59.84 | 64.73 | 62.74 | 58.89 | 58.66 | 52.00 | 47.32 | NA | NA | NA | NA | NA | NA | NA | NA | NA | NA | NA | NA | NA | NA | NA | NA | NA | NA | NA | NA | NA | NA | NA | NA | NA | NA | NA | NA | ||
| 150.59 | 151.05 | 139.89 | 149.09 | 176.32 | 182.31 | 157.23 | 144.26 | 133.64 | 113.79 | 105.36 | 101.31 | 106.44 | 82.36 | 90.94 | 92.47 | 87.64 | 74.87 | 65.53 | 81.79 | 78.71 | 78.63 | 67.43 | 65.09 | 66.57 | 68.64 | 76.38 | 78.13 | NA | NA | NA | NA | NA | NA | NA | NA | NA | NA | NA | NA | NA | NA | NA | NA | NA | NA | NA | NA | NA | NA | NA | NA | NA | NA | NA | NA | ||
| US | 189.24 | 221.91 | 229.50 | 250.61 | 242.47 | 251.21 | 156.50 | 145.47 | 128.48 | 139.76 | 137.76 | 119.78 | 120.52 | 134.07 | 110.57 | 101.35 | 100.54 | 101.07 | 87.58 | 91.67 | 91.28 | 85.62 | 83.87 | 86.27 | 73.99 | 75.61 | 70.95 | 65.79 | NA | NA | NA | NA | NA | NA | NA | NA | NA | NA | NA | NA | NA | NA | NA | NA | NA | NA | NA | NA | NA | NA | NA | NA | NA | NA | NA | NA | |
| Southeast Asia | 55.20 | 72.86 | 70.47 | 63.77 | 75.46 | 79.72 | 40.26 | 39.75 | 36.45 | 30.08 | 32.76 | 26.14 | 27.29 | 23.87 | 23.57 | 27.46 | 29.30 | 23.33 | 23.94 | 26.99 | 30.98 | 29.19 | 29.62 | 28.19 | 27.46 | 27.04 | 25.70 | 30.56 | NA | NA | NA | NA | NA | NA | NA | NA | NA | NA | NA | NA | NA | NA | NA | NA | NA | NA | NA | NA | NA | NA | NA | NA | NA | NA | NA | NA | |
| , Advanced Materials Handling A M H | 34.82 | 38.41 | 35.21 | 31.80 | 31.98 | 28.72 | 31.80 | 26.83 | 26.74 | 23.98 | 25.87 | 20.58 | 19.95 | 16.83 | 13.04 | 11.64 | 15.32 | 12.35 | 10.65 | 9.85 | 12.57 | 12.26 | 14.32 | 12.21 | 12.96 | 11.17 | 6.98 | NA | NA | NA | NA | NA | NA | NA | NA | NA | NA | NA | NA | NA | NA | NA | NA | NA | NA | NA | NA | NA | NA | NA | NA | NA | NA | NA | NA | NA | |
| , Advanced Materials Handling A M H | 18.82 | 17.21 | 21.90 | 21.98 | 22.43 | 18.40 | 25.33 | 22.25 | 25.95 | 26.04 | 20.64 | 16.49 | 15.11 | 12.90 | 11.77 | 12.55 | 11.03 | 12.59 | 14.41 | 15.60 | 15.49 | 16.90 | 17.55 | 15.41 | 15.76 | 13.13 | 15.07 | NA | NA | NA | NA | NA | NA | NA | NA | NA | NA | NA | NA | NA | NA | NA | NA | NA | NA | NA | NA | NA | NA | NA | NA | NA | NA | NA | NA | NA | |
| , Advanced Materials Handling A M H | 9.63 | 10.28 | 11.77 | 11.32 | 14.58 | 16.34 | 15.50 | 12.86 | 13.39 | 13.70 | 12.17 | 12.01 | 10.95 | 11.88 | 11.96 | 10.42 | 11.07 | 9.42 | 11.95 | 11.39 | 11.87 | 12.05 | 12.08 | 11.03 | 11.11 | 9.29 | 8.96 | NA | NA | NA | NA | NA | NA | NA | NA | NA | NA | NA | NA | NA | NA | NA | NA | NA | NA | NA | NA | NA | NA | NA | NA | NA | NA | NA | NA | NA | |
| , Advanced Materials Handling A M H | 20.01 | 23.30 | 27.18 | 34.46 | 32.36 | 29.34 | 30.02 | 30.01 | 31.72 | 28.49 | 26.38 | 18.91 | 26.23 | 30.20 | 21.04 | 15.16 | 16.41 | 20.20 | 16.77 | 15.98 | 18.48 | 19.86 | 23.96 | 22.59 | 21.36 | 20.42 | 18.45 | NA | NA | NA | NA | NA | NA | NA | NA | NA | NA | NA | NA | NA | NA | NA | NA | NA | NA | NA | NA | NA | NA | NA | NA | NA | NA | NA | NA | NA | |
| , Advanced Materials Handling A M H | 30.88 | 28.25 | 28.78 | 36.66 | 39.94 | 38.71 | 39.29 | 33.72 | 32.68 | 26.61 | 24.86 | 27.81 | 29.10 | 18.11 | 22.33 | 24.80 | 20.84 | 19.16 | 12.74 | 18.12 | 16.01 | 18.75 | 17.28 | 14.92 | 12.90 | 15.78 | 19.45 | NA | NA | NA | NA | NA | NA | NA | NA | NA | NA | NA | NA | NA | NA | NA | NA | NA | NA | NA | NA | NA | NA | NA | NA | NA | NA | NA | NA | NA | |
| US, Advanced Materials Handling A M H | 47.83 | 52.13 | 56.27 | 75.60 | 60.10 | 67.79 | 73.28 | 64.34 | 58.06 | 60.35 | 55.98 | 45.47 | 43.43 | 47.75 | 40.00 | 33.40 | 34.86 | 36.55 | 35.19 | 38.55 | 27.68 | 28.54 | 29.47 | 39.35 | 25.70 | 25.33 | 24.96 | NA | NA | NA | NA | NA | NA | NA | NA | NA | NA | NA | NA | NA | NA | NA | NA | NA | NA | NA | NA | NA | NA | NA | NA | NA | NA | NA | NA | NA | |
| US, Intersegment Sales Elimination | -10.29 | -13.76 | -13.60 | -14.08 | -10.51 | -15.17 | -13.46 | -11.53 | -9.37 | -8.96 | -9.04 | -9.34 | -8.40 | -7.40 | -8.00 | -7.29 | NA | NA | NA | NA | NA | NA | NA | NA | NA | NA | NA | NA | NA | NA | NA | NA | NA | NA | NA | NA | NA | NA | NA | NA | NA | NA | NA | NA | NA | NA | NA | NA | NA | NA | NA | NA | NA | NA | NA | NA | |
| Southeast Asia, Advanced Materials Handling A M H | 7.19 | 10.66 | 9.23 | 7.04 | 12.51 | 11.11 | 8.86 | 8.11 | 9.15 | 7.03 | 6.61 | 7.29 | 6.98 | 6.70 | 6.31 | 8.16 | 7.93 | 6.99 | 5.80 | 6.58 | 7.44 | 7.67 | 9.38 | 8.57 | 9.77 | 9.84 | 9.55 | NA | NA | NA | NA | NA | NA | NA | NA | NA | NA | NA | NA | NA | NA | NA | NA | NA | NA | NA | NA | NA | NA | NA | NA | NA | NA | NA | NA | NA |
