
| 2023-12-31 | 2023-09-30 | 2023-06-30 | 2023-03-31 | 2022-12-31 | 2022-09-30 | 2022-06-30 | 2022-03-31 | 2021-12-31 | 2021-09-30 | 2021-06-30 | 2021-03-31 | 2020-12-31 | 2020-09-30 | 2020-06-30 | 2020-03-31 | 2019-12-31 | 2019-09-30 | 2019-06-30 | 2019-03-31 | 2018-12-31 | 2018-09-30 | 2018-06-30 | 2018-03-31 | 2017-12-31 | 2017-09-30 | 2017-06-30 | 2017-03-31 | 2016-12-31 | 2016-09-30 | 2016-06-30 | 2016-03-31 | 2015-12-31 | 2015-09-30 | 2015-06-30 | 2015-03-31 | 2014-12-31 | 2014-09-30 | 2014-06-30 | 2014-03-31 | 2013-12-31 | 2013-09-30 | 2013-06-30 | 2013-03-31 | 2012-12-31 | 2012-09-30 | 2012-06-30 | 2012-03-31 | 2011-12-31 | 2011-09-30 | 2011-06-30 | 2011-03-31 | 2010-12-31 | 2010-09-30 | 2010-06-30 | ||
|---|---|---|---|---|---|---|---|---|---|---|---|---|---|---|---|---|---|---|---|---|---|---|---|---|---|---|---|---|---|---|---|---|---|---|---|---|---|---|---|---|---|---|---|---|---|---|---|---|---|---|---|---|---|---|---|---|
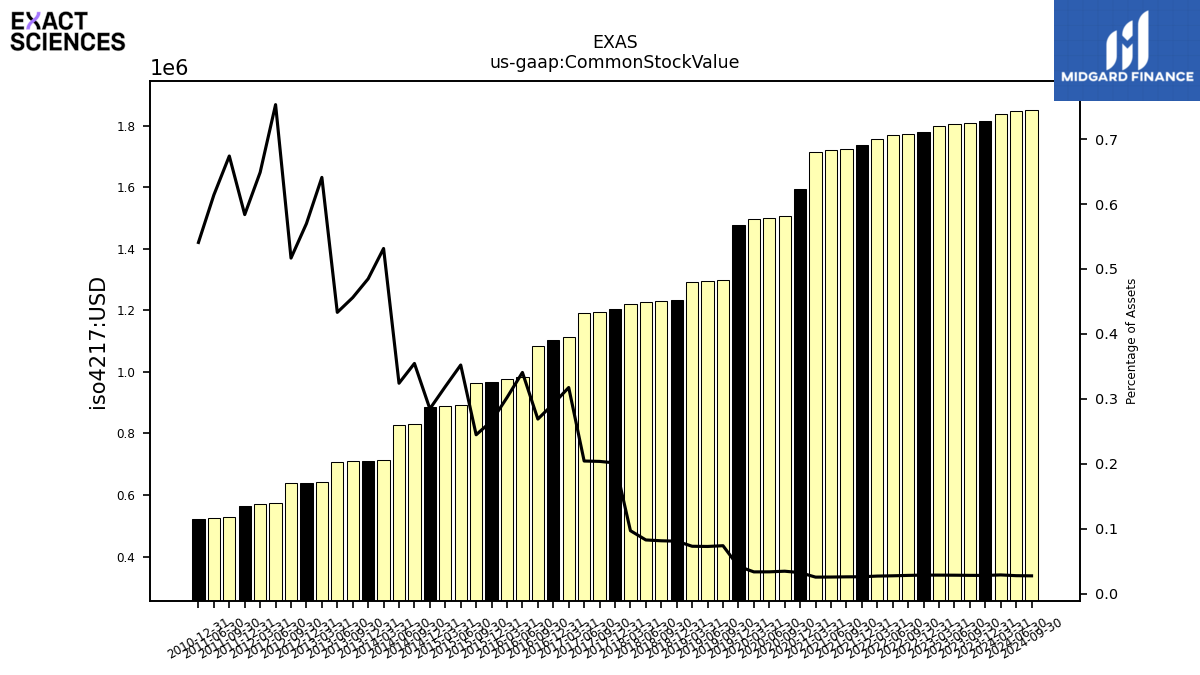
| Common Stock Value | 1.81 | 1.81 | 1.81 | 1.80 | 1.78 | 1.77 | 1.77 | 1.76 | 1.74 | 1.72 | 1.72 | 1.71 | 1.59 | 1.50 | 1.50 | 1.50 | 1.48 | 1.30 | 1.29 | 1.29 | 1.23 | 1.23 | 1.23 | 1.22 | 1.21 | 1.20 | 1.19 | 1.11 | 1.10 | 1.08 | 0.98 | 0.98 | 0.97 | 0.96 | 0.89 | 0.89 | 0.89 | 0.83 | 0.83 | 0.71 | 0.71 | 0.71 | 0.71 | 0.64 | 0.64 | 0.64 | 0.57 | 0.57 | 0.57 | 0.53 | 0.53 | NA | 0.52 | NA | NA | |
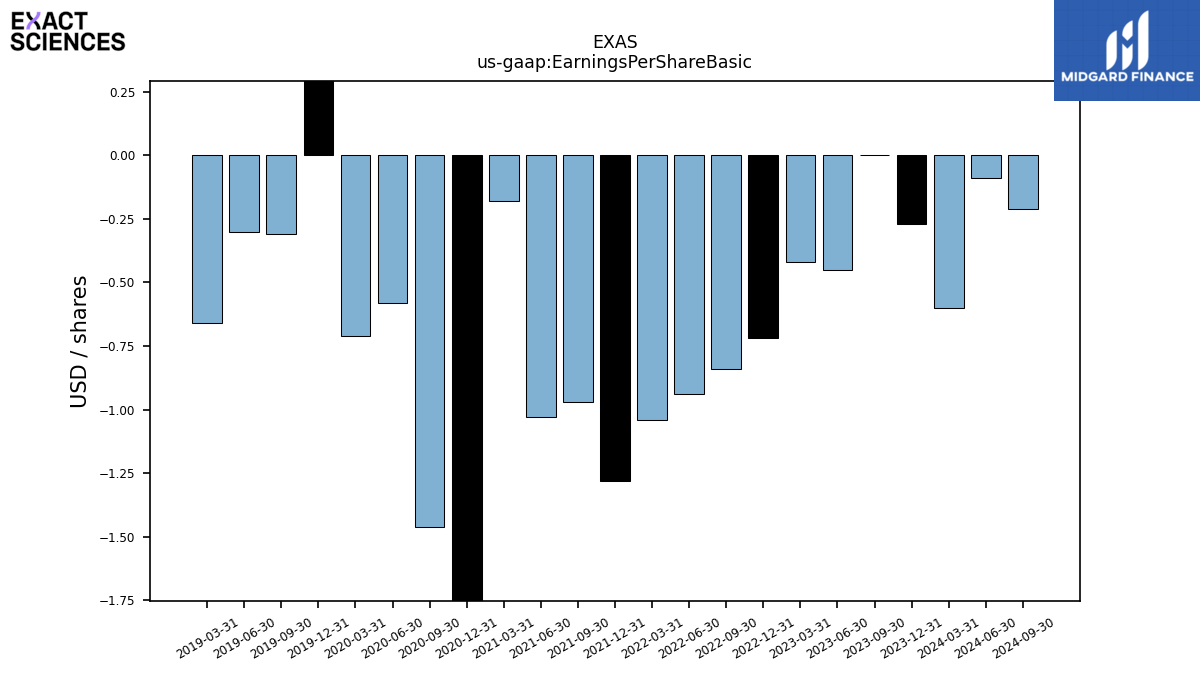
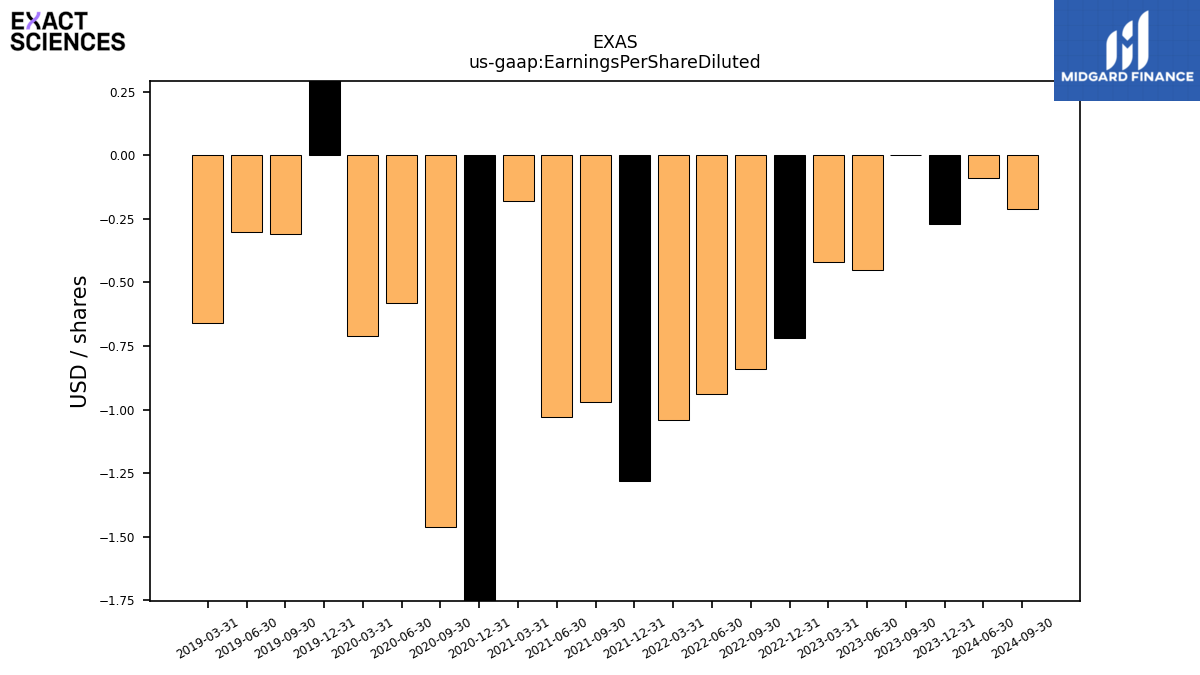
| Earnings Per Share Basic | -0.27 | 0.00 | -0.45 | -0.42 | -0.72 | -0.84 | -0.94 | -1.04 | -1.28 | -0.97 | -1.03 | -0.18 | -2.79 | -1.46 | -0.58 | -0.71 | 0.56 | -0.31 | -0.30 | -0.66 | NA | NA | NA | NA | NA | NA | NA | NA | NA | NA | NA | NA | NA | NA | NA | NA | NA | NA | NA | NA | NA | NA | NA | NA | NA | NA | NA | NA | NA | NA | NA | NA | NA | NA | NA | |
| Earnings Per Share Diluted | -0.27 | 0.00 | -0.45 | -0.42 | -0.72 | -0.84 | -0.94 | -1.04 | -1.28 | -0.97 | -1.03 | -0.18 | -2.79 | -1.46 | -0.58 | -0.71 | 0.54 | -0.31 | -0.30 | -0.66 | NA | NA | NA | NA | NA | NA | NA | NA | NA | NA | NA | NA | NA | NA | NA | NA | NA | NA | NA | NA | NA | NA | NA | NA | NA | NA | NA | NA | NA | NA | NA | NA | NA | NA | NA |
| 2023-12-31 | 2023-09-30 | 2023-06-30 | 2023-03-31 | 2022-12-31 | 2022-09-30 | 2022-06-30 | 2022-03-31 | 2021-12-31 | 2021-09-30 | 2021-06-30 | 2021-03-31 | 2020-12-31 | 2020-09-30 | 2020-06-30 | 2020-03-31 | 2019-12-31 | 2019-09-30 | 2019-06-30 | 2019-03-31 | 2018-12-31 | 2018-09-30 | 2018-06-30 | 2018-03-31 | 2017-12-31 | 2017-09-30 | 2017-06-30 | 2017-03-31 | 2016-12-31 | 2016-09-30 | 2016-06-30 | 2016-03-31 | 2015-12-31 | 2015-09-30 | 2015-06-30 | 2015-03-31 | 2014-12-31 | 2014-09-30 | 2014-06-30 | 2014-03-31 | 2013-12-31 | 2013-09-30 | 2013-06-30 | 2013-03-31 | 2012-12-31 | 2012-09-30 | 2012-06-30 | 2012-03-31 | 2011-12-31 | 2011-09-30 | 2011-06-30 | 2011-03-31 | 2010-12-31 | 2010-09-30 | 2010-06-30 | ||
|---|---|---|---|---|---|---|---|---|---|---|---|---|---|---|---|---|---|---|---|---|---|---|---|---|---|---|---|---|---|---|---|---|---|---|---|---|---|---|---|---|---|---|---|---|---|---|---|---|---|---|---|---|---|---|---|---|
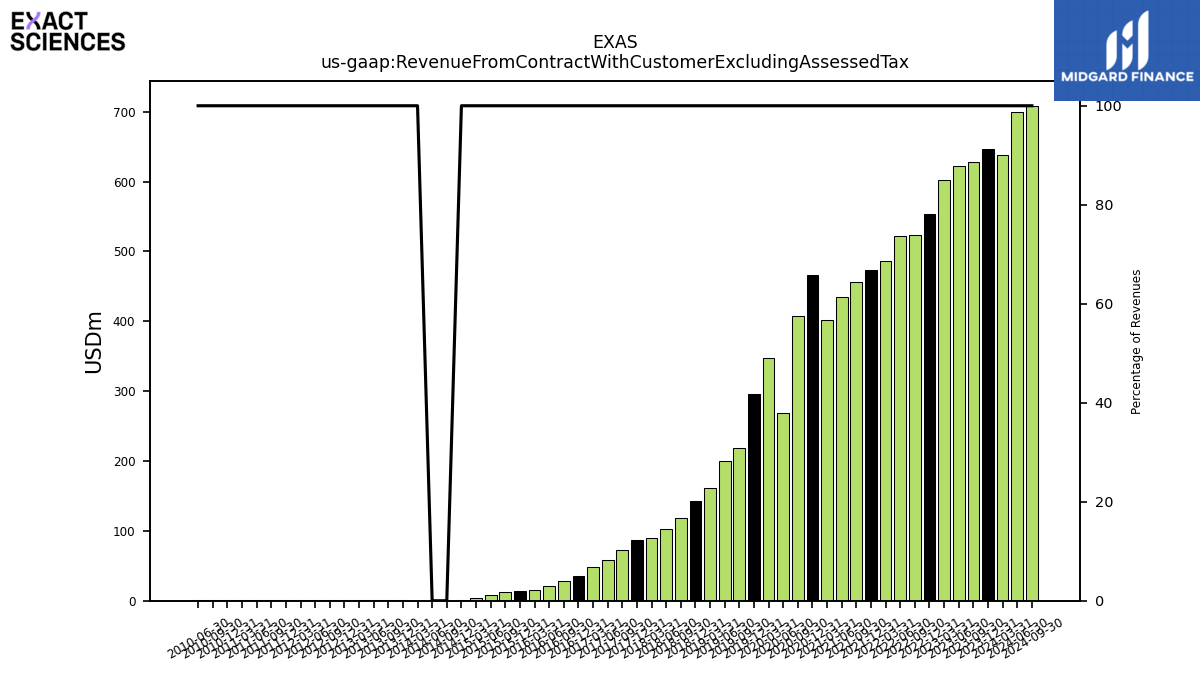
| Revenue From Contract With Customer Excluding Assessed Tax | 646.88 | 628.34 | 622.09 | 602.45 | 553.00 | 523.07 | 521.64 | 486.57 | 473.81 | 456.38 | 434.82 | 402.08 | 466.34 | 408.36 | 268.87 | 347.82 | 295.57 | 218.81 | 199.87 | 162.04 | 142.98 | 118.29 | 102.89 | 90.30 | 87.41 | 72.57 | 57.65 | 48.36 | 35.24 | 28.11 | 21.18 | 14.84 | 14.42 | 12.63 | 8.12 | 4.27 | 1.50 | 0.00 | 0.00 | 0.29 | 1.04 | 1.04 | 1.04 | 1.04 | 1.04 | 1.04 | 1.04 | 1.04 | 1.04 | 1.04 | 1.04 | 1.04 | 1.38 | 1.36 | 1.31 | |
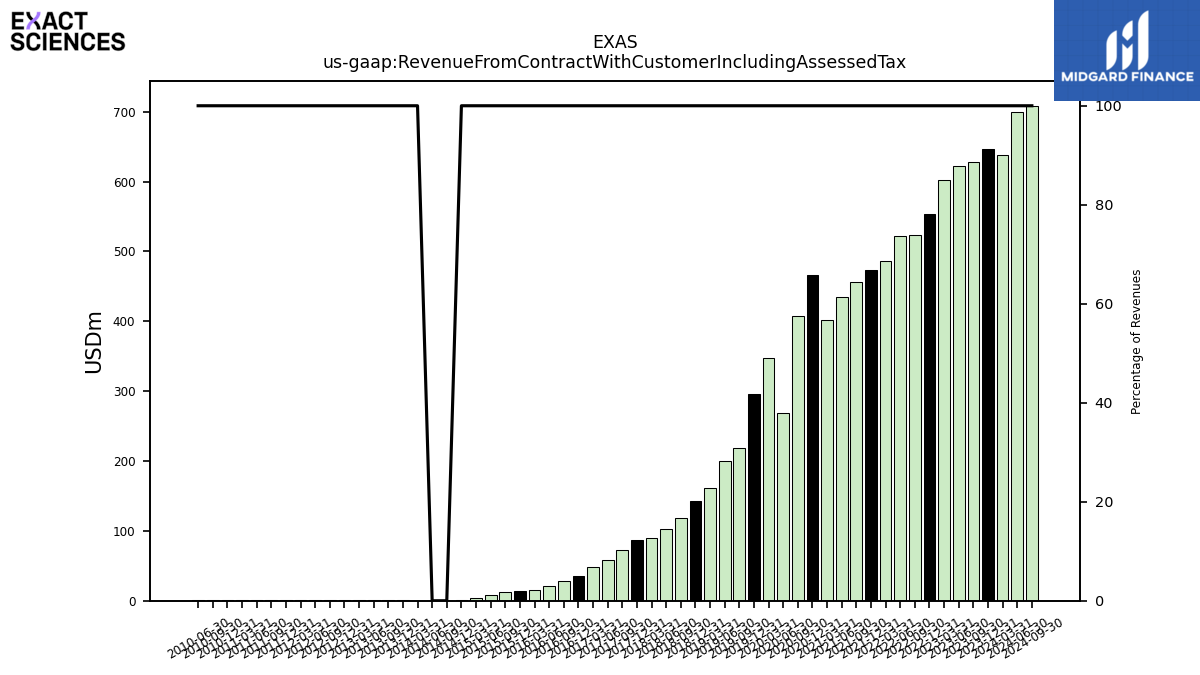
| Revenue From Contract With Customer Including Assessed Tax | 646.88 | 628.34 | 622.09 | 602.45 | 553.00 | 523.07 | 521.64 | 486.57 | 473.81 | 456.38 | 434.82 | 402.08 | 466.34 | 408.36 | 268.87 | 347.82 | 295.57 | 218.81 | 199.87 | 162.04 | 142.98 | 118.29 | 102.89 | 90.30 | 87.41 | 72.57 | 57.65 | 48.36 | 35.24 | 28.11 | 21.18 | 14.84 | 14.42 | 12.63 | 8.12 | 4.27 | 1.50 | 0.00 | 0.00 | 0.29 | 1.04 | 1.04 | 1.04 | 1.04 | 1.04 | 1.04 | 1.04 | 1.04 | 1.04 | 1.04 | 1.04 | 1.04 | 1.38 | 1.36 | 1.31 | |
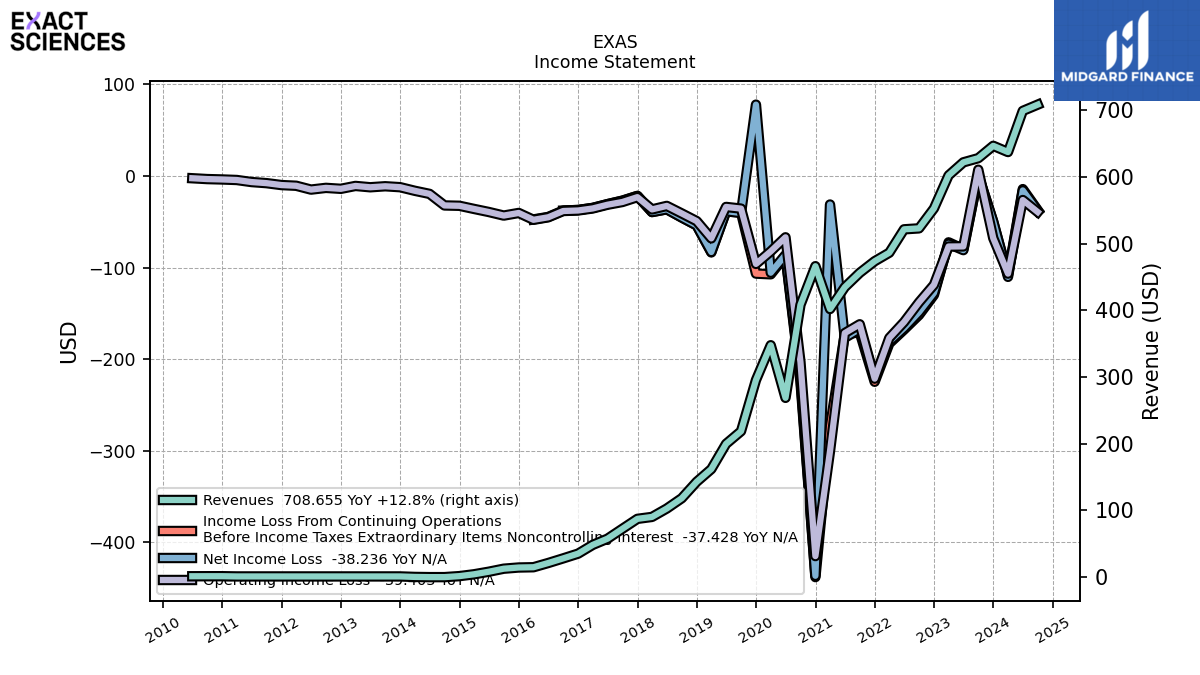
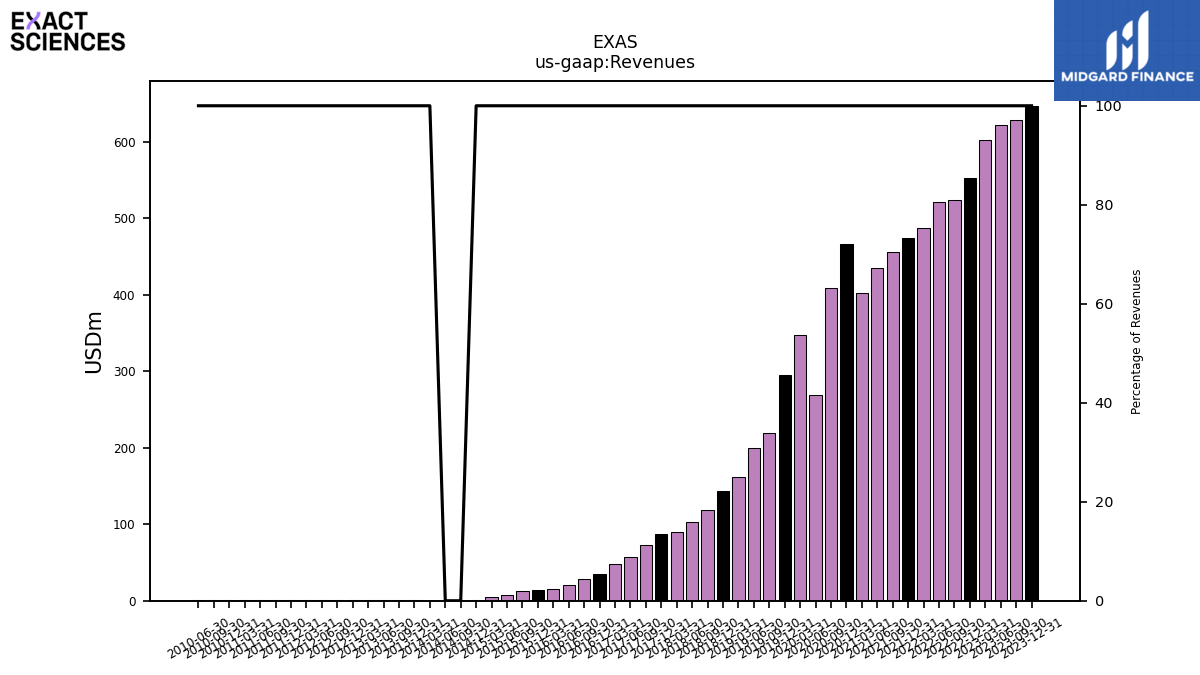
| Revenues | 646.88 | 628.34 | 622.09 | 602.45 | 553.00 | 523.07 | 521.64 | 486.57 | 473.81 | 456.38 | 434.82 | 402.08 | 466.34 | 408.36 | 268.87 | 347.82 | 295.57 | 218.81 | 199.87 | 162.04 | 142.98 | 118.29 | 102.89 | 90.30 | 87.41 | 72.57 | 57.65 | 48.36 | 35.24 | 28.11 | 21.18 | 14.84 | 14.42 | 12.63 | 8.12 | 4.27 | 1.50 | 0.00 | 0.00 | 0.29 | 1.04 | 1.04 | 1.04 | 1.04 | 1.04 | 1.04 | 1.04 | 1.04 | 1.04 | 1.04 | 1.04 | 1.04 | 1.38 | 1.36 | 1.31 | |
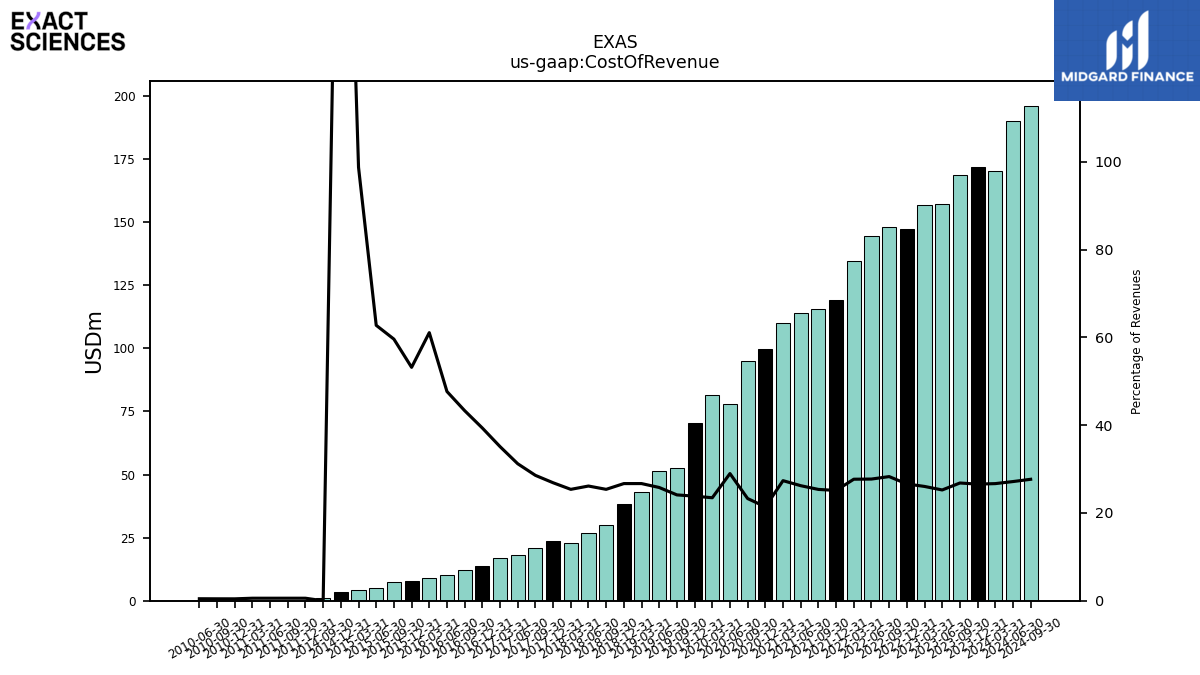
| Cost Of Revenue | 171.87 | 168.53 | 156.99 | 156.87 | 147.15 | 147.94 | 144.60 | 134.71 | 119.06 | 115.74 | 113.97 | 109.99 | 99.77 | 95.06 | 77.89 | 81.61 | 70.42 | 52.76 | 51.56 | 43.25 | 38.16 | 30.02 | 26.89 | 22.91 | 23.50 | 20.73 | 17.99 | 16.98 | 13.87 | 12.17 | 10.10 | 9.06 | 7.67 | 7.53 | 5.09 | 4.21 | 3.40 | 0.92 | NA | NA | NA | NA | NA | NA | NA | NA | NA | NA | 0.01 | 0.01 | 0.01 | 0.01 | 0.01 | 0.01 | 0.01 | |
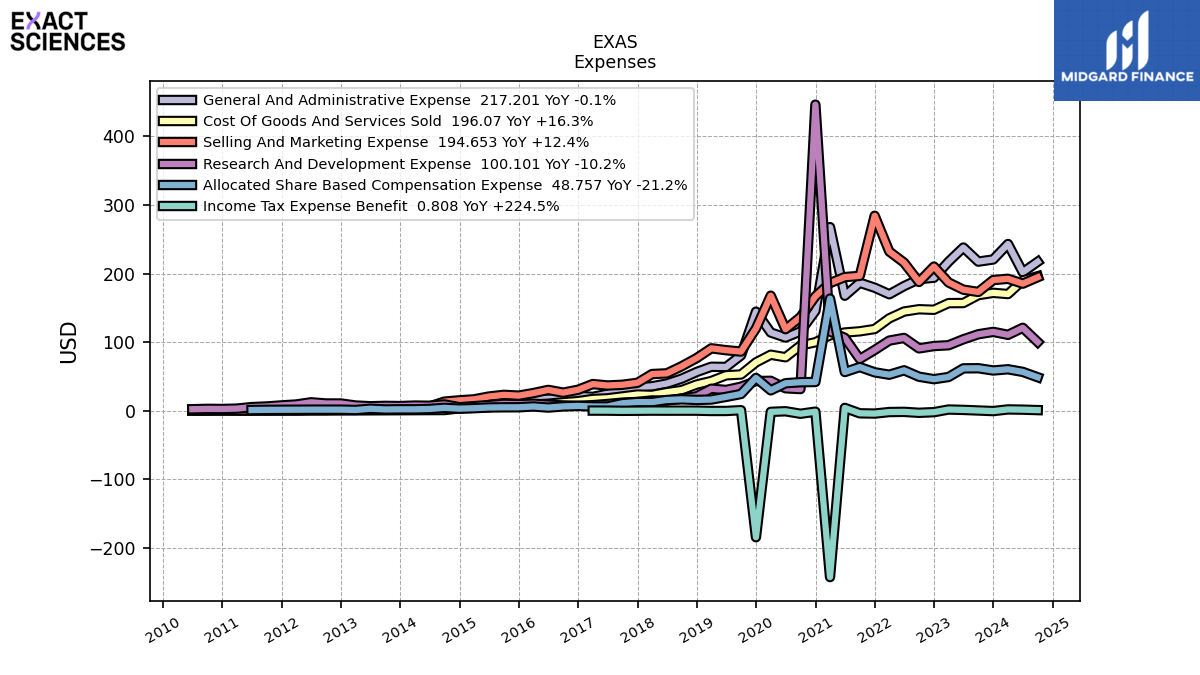
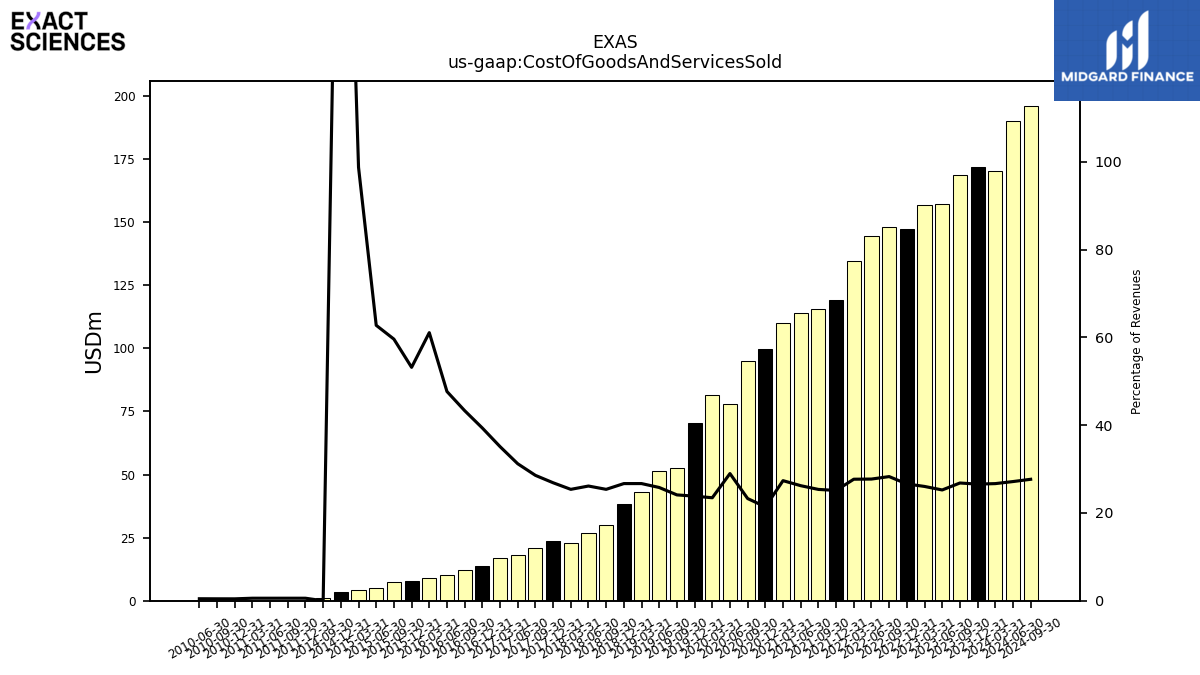
| Cost Of Goods And Services Sold | 171.87 | 168.53 | 156.99 | 156.87 | 147.15 | 147.94 | 144.60 | 134.71 | 119.06 | 115.74 | 113.97 | 109.99 | 99.77 | 95.06 | 77.89 | 81.61 | 70.42 | 52.76 | 51.56 | 43.25 | 38.16 | 30.02 | 26.89 | 22.91 | 23.50 | 20.73 | 17.99 | 16.98 | 13.87 | 12.17 | 10.10 | 9.06 | 7.67 | 7.53 | 5.09 | 4.21 | 3.40 | 0.92 | NA | NA | NA | NA | NA | NA | NA | NA | NA | NA | 0.01 | 0.01 | 0.01 | 0.01 | 0.01 | 0.01 | 0.01 | |
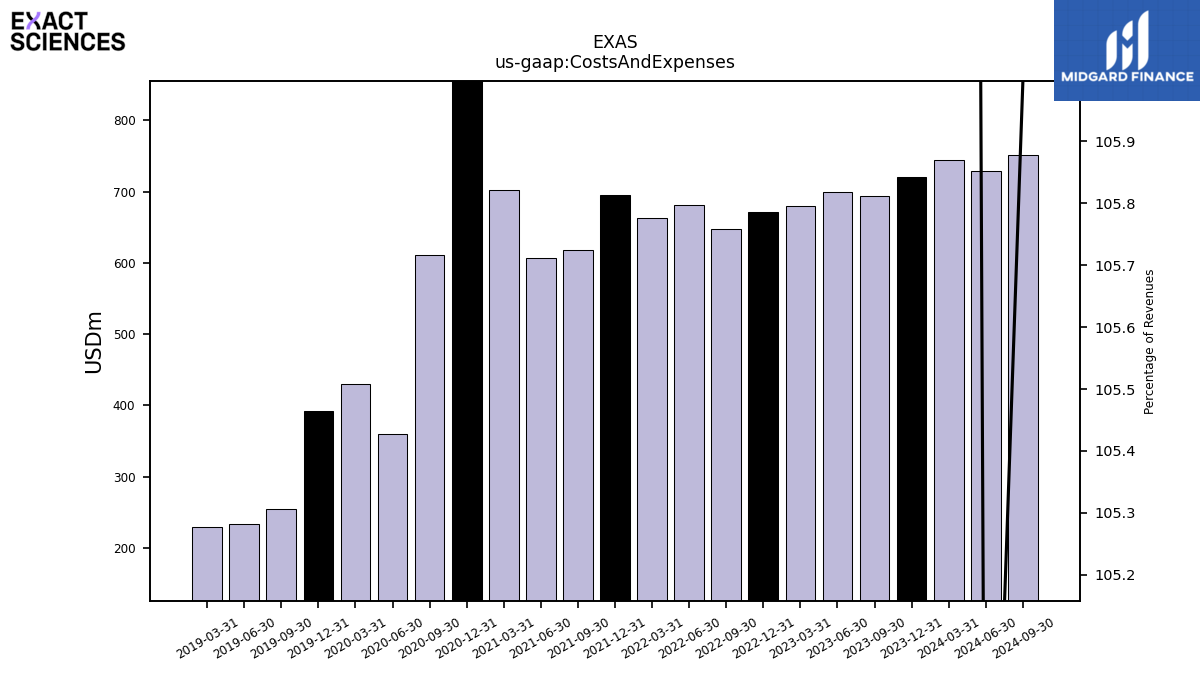
| Costs And Expenses | 721.13 | 693.52 | 699.02 | 679.54 | 671.88 | 647.89 | 681.22 | 663.56 | 695.26 | 618.40 | 606.48 | 702.62 | 881.64 | 611.70 | 359.54 | 430.19 | 391.65 | 254.53 | 233.77 | 230.12 | NA | NA | NA | NA | NA | NA | NA | NA | NA | NA | NA | NA | NA | NA | NA | NA | NA | NA | NA | NA | NA | NA | NA | NA | NA | NA | NA | NA | NA | NA | NA | NA | NA | NA | NA | |
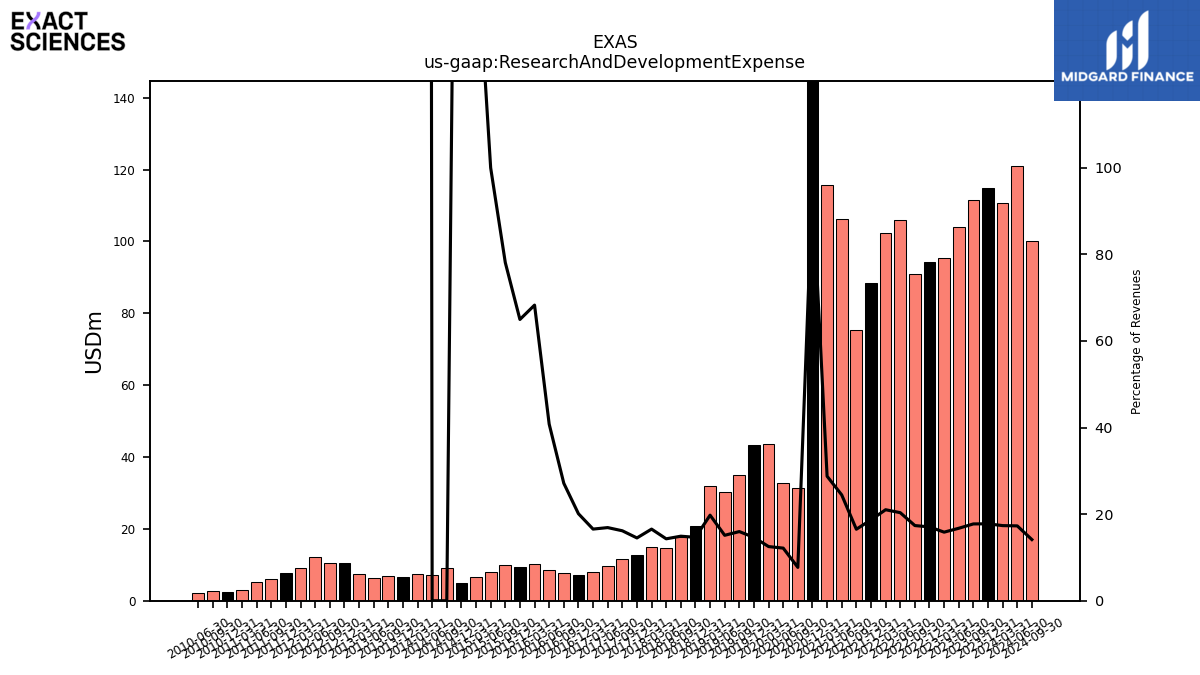
| Research And Development Expense | 114.92 | 111.45 | 104.09 | 95.42 | 94.27 | 90.81 | 106.08 | 102.25 | 88.49 | 75.36 | 106.23 | 115.57 | 446.40 | 31.47 | 32.67 | 43.51 | 43.22 | 34.95 | 30.20 | 32.02 | 20.93 | 17.63 | 14.71 | 14.94 | 12.68 | 11.72 | 9.74 | 8.00 | 7.08 | 7.62 | 8.64 | 10.13 | 9.37 | 9.86 | 8.12 | 6.57 | 4.99 | 9.07 | 7.17 | 7.43 | 6.71 | 6.98 | 6.46 | 7.53 | 10.44 | 10.49 | 12.20 | 9.00 | 7.67 | 6.11 | 5.20 | 2.99 | 2.47 | 2.63 | 2.12 | |
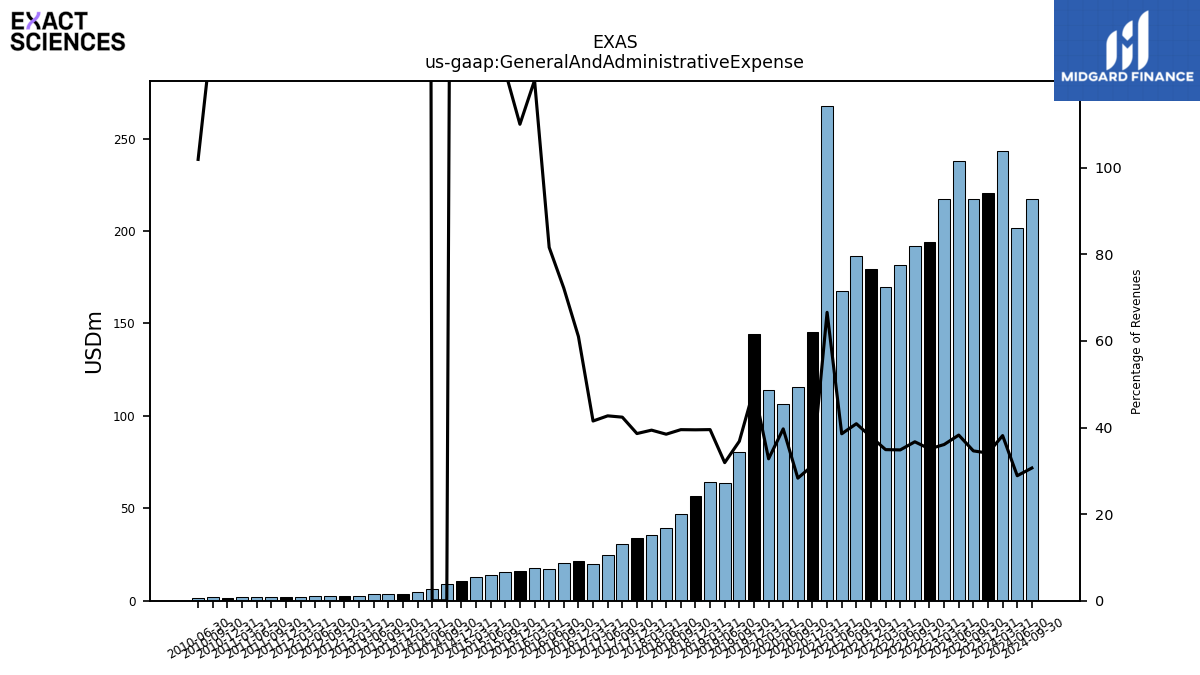
| General And Administrative Expense | 220.55 | 217.39 | 237.97 | 217.29 | 193.89 | 191.97 | 181.67 | 169.77 | 179.37 | 186.54 | 167.63 | 267.73 | 145.45 | 115.59 | 106.69 | 113.99 | 144.41 | 80.56 | 63.73 | 64.03 | 56.43 | 46.73 | 39.56 | 35.57 | 33.74 | 30.76 | 24.61 | 20.07 | 21.50 | 20.29 | 17.28 | 17.82 | 15.86 | 15.43 | 13.68 | 12.97 | 10.62 | 8.99 | 6.23 | 4.59 | 3.69 | 3.69 | 3.63 | 2.65 | 2.81 | 2.55 | 2.39 | 2.15 | 2.21 | 1.95 | 1.83 | 2.15 | 1.68 | 1.80 | 1.34 | |
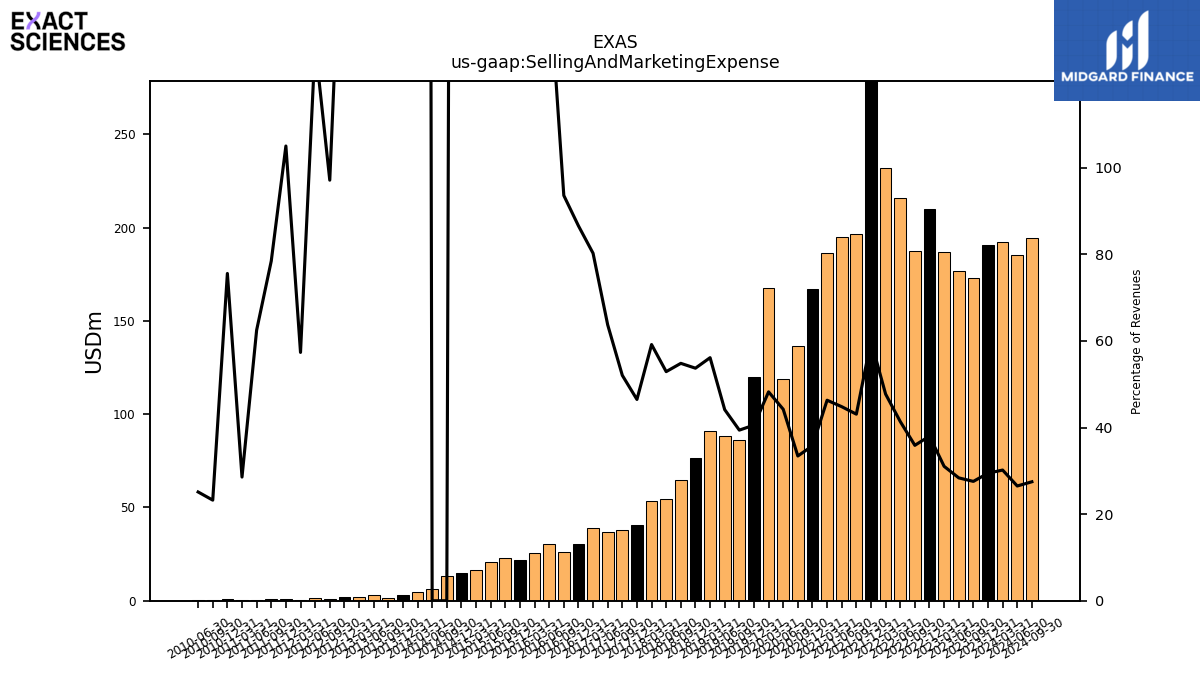
| Selling And Marketing Expense | 190.48 | 173.16 | 176.49 | 186.96 | 210.21 | 187.70 | 215.92 | 232.18 | 284.30 | 196.62 | 194.83 | 186.14 | 166.83 | 136.48 | 118.86 | 167.75 | 119.85 | 86.20 | 88.19 | 90.94 | 76.77 | 64.84 | 54.43 | 53.41 | 40.63 | 37.77 | 36.73 | 38.80 | 30.51 | 26.31 | 30.30 | 25.71 | 21.94 | 23.08 | 20.59 | 16.52 | 15.07 | 13.22 | 6.17 | 4.46 | 2.90 | 1.61 | 3.30 | 1.76 | 1.82 | 1.01 | 1.33 | 0.59 | 1.09 | 0.81 | 0.65 | 0.30 | 1.04 | 0.32 | 0.33 | |
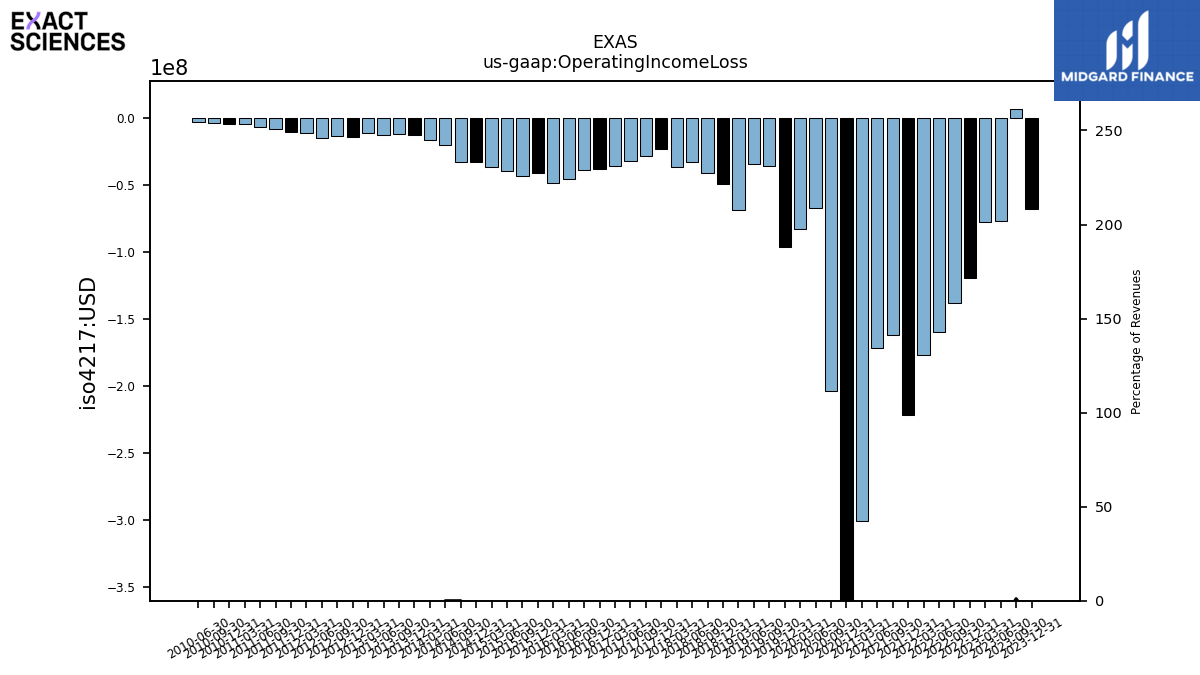
| Operating Income Loss | -67.84 | 6.85 | -76.93 | -77.09 | -118.88 | -138.06 | -159.58 | -176.99 | -221.45 | -162.02 | -171.66 | -300.54 | -415.30 | -203.34 | -67.01 | -82.37 | -96.11 | -35.66 | -33.82 | -68.19 | -49.32 | -40.92 | -32.70 | -36.53 | -23.13 | -28.41 | -31.42 | -35.49 | -37.71 | -38.28 | -45.14 | -47.88 | -40.42 | -43.27 | -39.37 | -36.01 | -32.58 | -32.21 | -19.57 | -16.18 | -12.27 | -11.25 | -12.35 | -10.90 | -14.04 | -13.01 | -14.89 | -10.70 | -9.94 | -7.84 | -6.64 | -4.40 | -3.82 | -3.40 | -2.48 | |
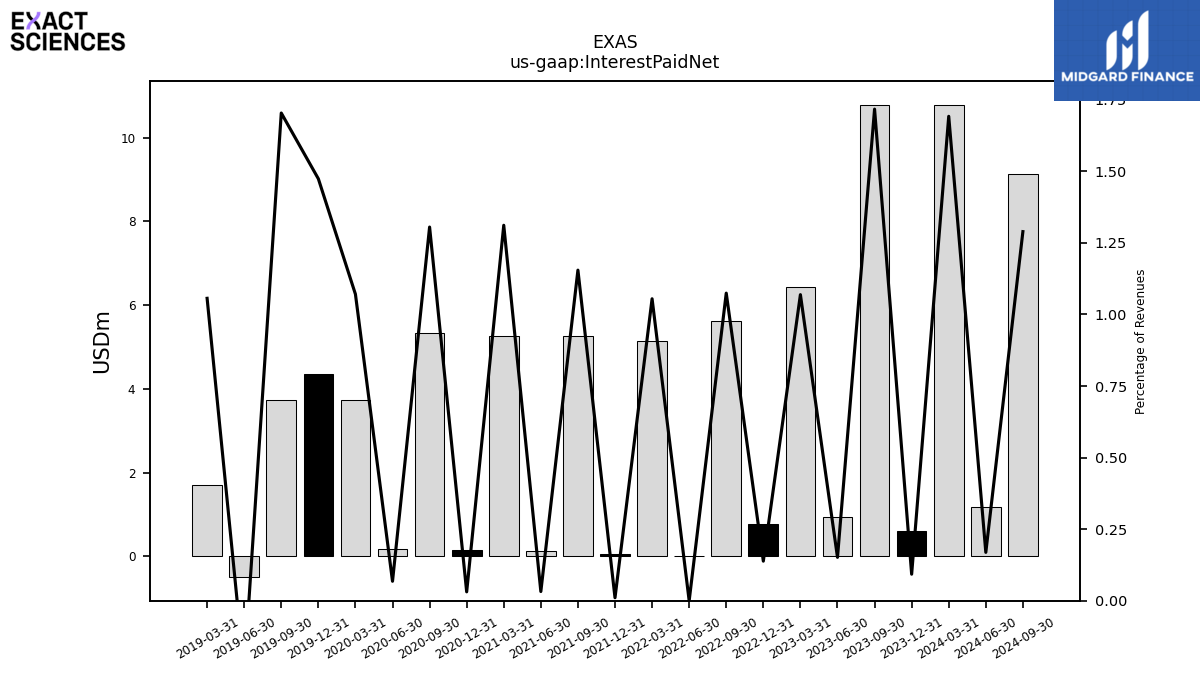
| Interest Paid Net | 0.60 | 10.79 | 0.94 | 6.44 | 0.77 | 5.62 | 0.00 | 5.13 | 0.05 | 5.27 | 0.14 | 5.27 | 0.14 | 5.33 | 0.18 | 3.73 | 4.36 | 3.73 | -0.50 | 1.71 | NA | NA | NA | NA | NA | NA | NA | NA | NA | NA | NA | NA | NA | NA | NA | NA | NA | NA | NA | NA | NA | NA | NA | NA | NA | NA | NA | NA | NA | NA | NA | NA | NA | NA | NA | |
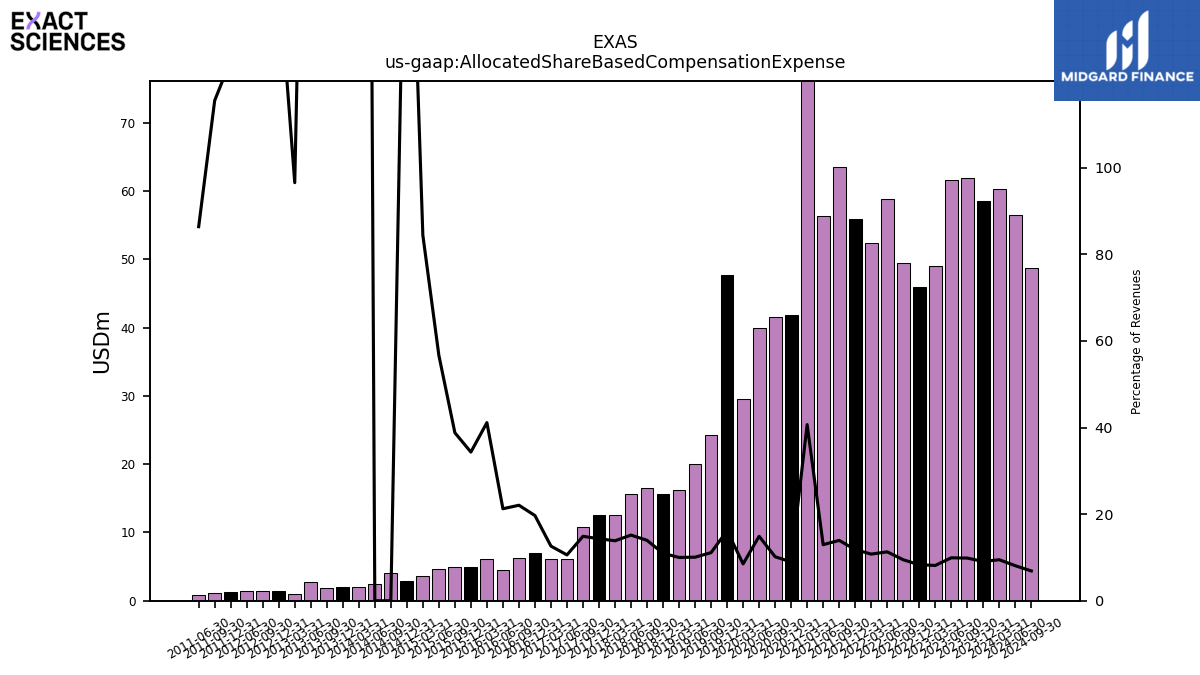
| Allocated Share Based Compensation Expense | 58.61 | 61.90 | 61.70 | 49.10 | 45.92 | 49.50 | 58.90 | 52.40 | 55.93 | 63.60 | 56.30 | 163.50 | 41.81 | 41.50 | 40.00 | 29.60 | 47.78 | 24.30 | 20.10 | 16.20 | 15.66 | 16.50 | 15.60 | 12.50 | 12.51 | 10.80 | 6.10 | 6.10 | 6.93 | 6.20 | 4.50 | 6.10 | 4.95 | 4.90 | 4.60 | 3.60 | 2.92 | 4.10 | 2.50 | 2.00 | 2.00 | 1.80 | 2.80 | 1.00 | 1.50 | 1.50 | 1.50 | NA | 1.30 | 1.20 | 0.90 | NA | NA | NA | NA | |
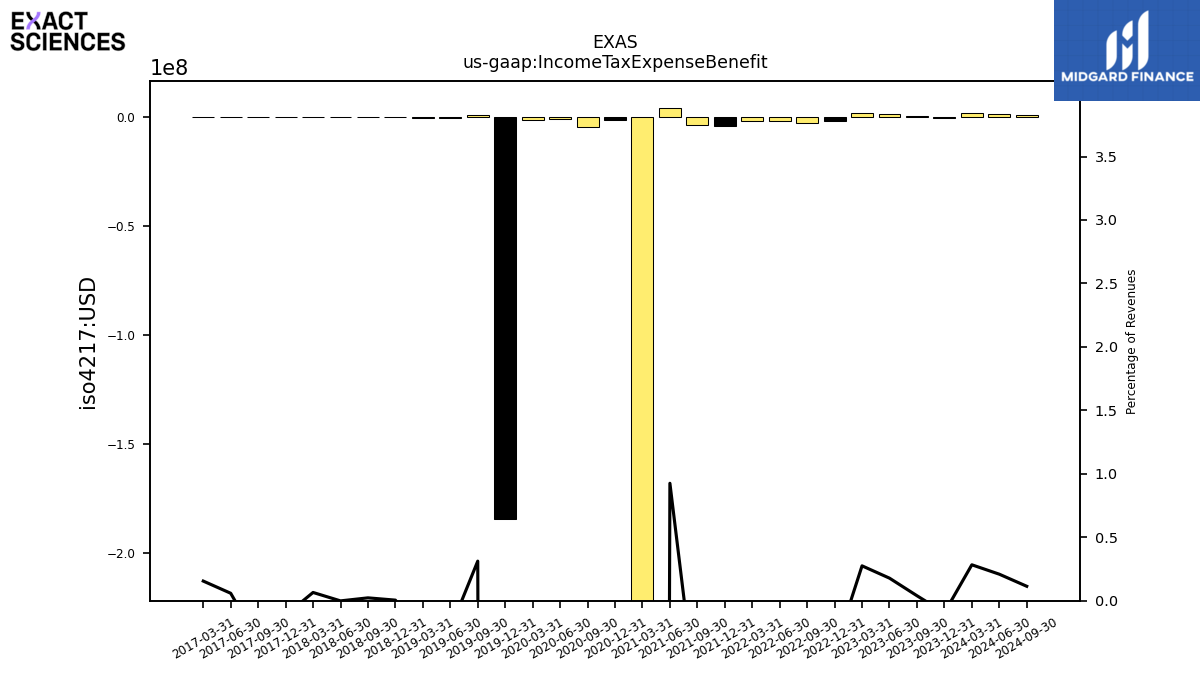
| Income Tax Expense Benefit | -0.61 | 0.25 | 1.11 | 1.66 | -2.18 | -3.12 | -1.75 | -2.02 | -4.24 | -3.86 | 4.03 | -242.81 | -1.46 | -4.51 | -0.87 | -1.73 | -184.63 | 0.68 | -0.44 | -0.47 | 0.01 | 0.03 | -0.00 | 0.06 | -0.10 | -0.23 | 0.03 | 0.07 | NA | NA | NA | NA | NA | NA | NA | NA | NA | NA | NA | NA | NA | NA | NA | NA | NA | NA | NA | NA | NA | NA | NA | NA | NA | NA | NA | |
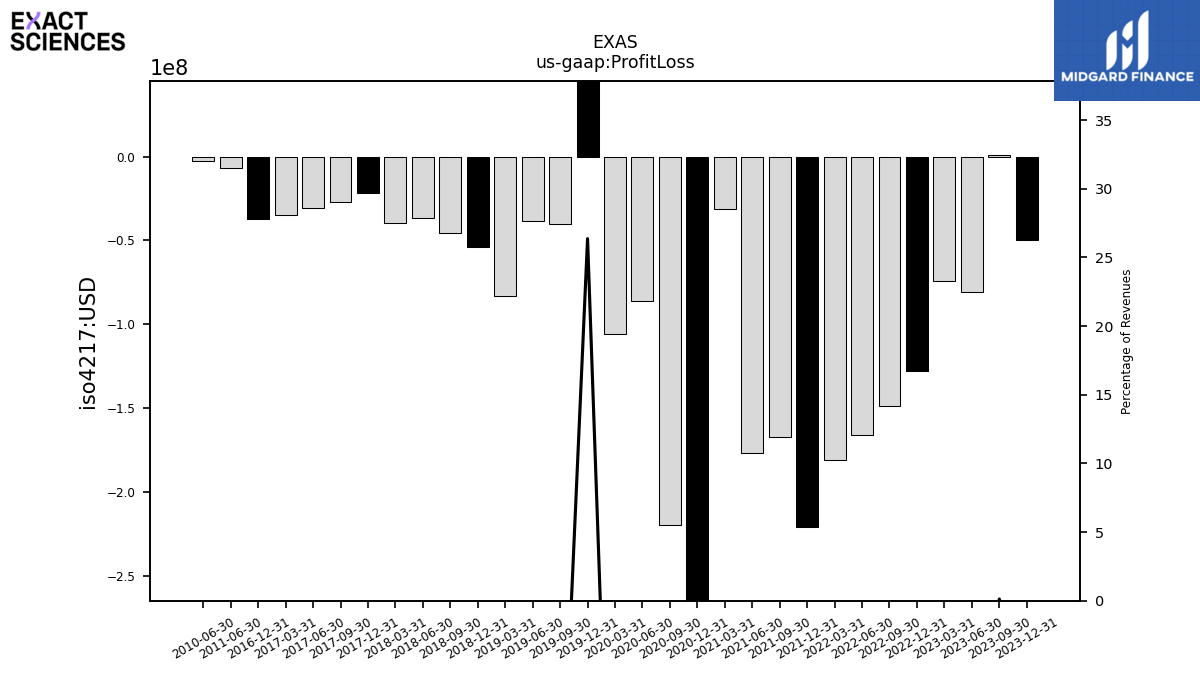
| Profit Loss | -49.77 | 0.79 | -81.03 | -74.15 | -127.75 | -148.76 | -166.06 | -180.94 | -220.61 | -166.94 | -176.91 | -31.16 | -436.81 | -219.88 | -86.14 | -105.70 | 77.94 | -40.46 | -38.42 | -83.06 | -53.97 | -45.36 | -36.39 | -39.42 | -21.76 | -26.90 | -30.79 | -34.95 | -37.17 | NA | NA | NA | NA | NA | NA | NA | NA | NA | NA | NA | NA | NA | NA | NA | NA | NA | NA | NA | NA | NA | -6.62 | NA | NA | NA | -2.48 | |
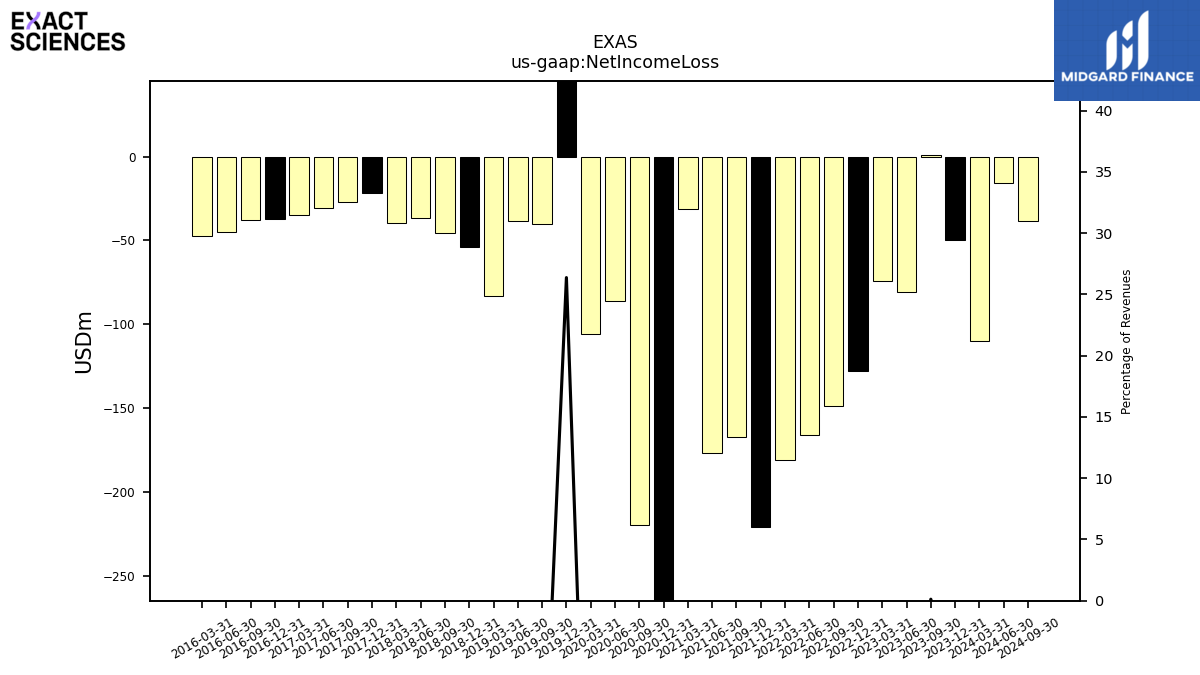
| Net Income Loss | -49.77 | 0.79 | -81.03 | -74.15 | -127.75 | -148.76 | -166.06 | -180.94 | -220.61 | -166.94 | -176.91 | -31.16 | -436.81 | -219.88 | -86.14 | -105.70 | 77.94 | -40.46 | -38.42 | -83.06 | -53.97 | -45.36 | -36.39 | -39.42 | -21.76 | -26.90 | -30.79 | -34.95 | -37.17 | -37.80 | -44.77 | -47.47 | NA | NA | NA | NA | NA | NA | NA | NA | NA | NA | NA | NA | NA | NA | NA | NA | NA | NA | NA | NA | NA | NA | NA |
| 2023-12-31 | 2023-09-30 | 2023-06-30 | 2023-03-31 | 2022-12-31 | 2022-09-30 | 2022-06-30 | 2022-03-31 | 2021-12-31 | 2021-09-30 | 2021-06-30 | 2021-03-31 | 2020-12-31 | 2020-09-30 | 2020-06-30 | 2020-03-31 | 2019-12-31 | 2019-09-30 | 2019-06-30 | 2019-03-31 | 2018-12-31 | 2018-09-30 | 2018-06-30 | 2018-03-31 | 2017-12-31 | 2017-09-30 | 2017-06-30 | 2017-03-31 | 2016-12-31 | 2016-09-30 | 2016-06-30 | 2016-03-31 | 2015-12-31 | 2015-09-30 | 2015-06-30 | 2015-03-31 | 2014-12-31 | 2014-09-30 | 2014-06-30 | 2014-03-31 | 2013-12-31 | 2013-09-30 | 2013-06-30 | 2013-03-31 | 2012-12-31 | 2012-09-30 | 2012-06-30 | 2012-03-31 | 2011-12-31 | 2011-09-30 | 2011-06-30 | 2011-03-31 | 2010-12-31 | 2010-09-30 | 2010-06-30 | ||
|---|---|---|---|---|---|---|---|---|---|---|---|---|---|---|---|---|---|---|---|---|---|---|---|---|---|---|---|---|---|---|---|---|---|---|---|---|---|---|---|---|---|---|---|---|---|---|---|---|---|---|---|---|---|---|---|---|
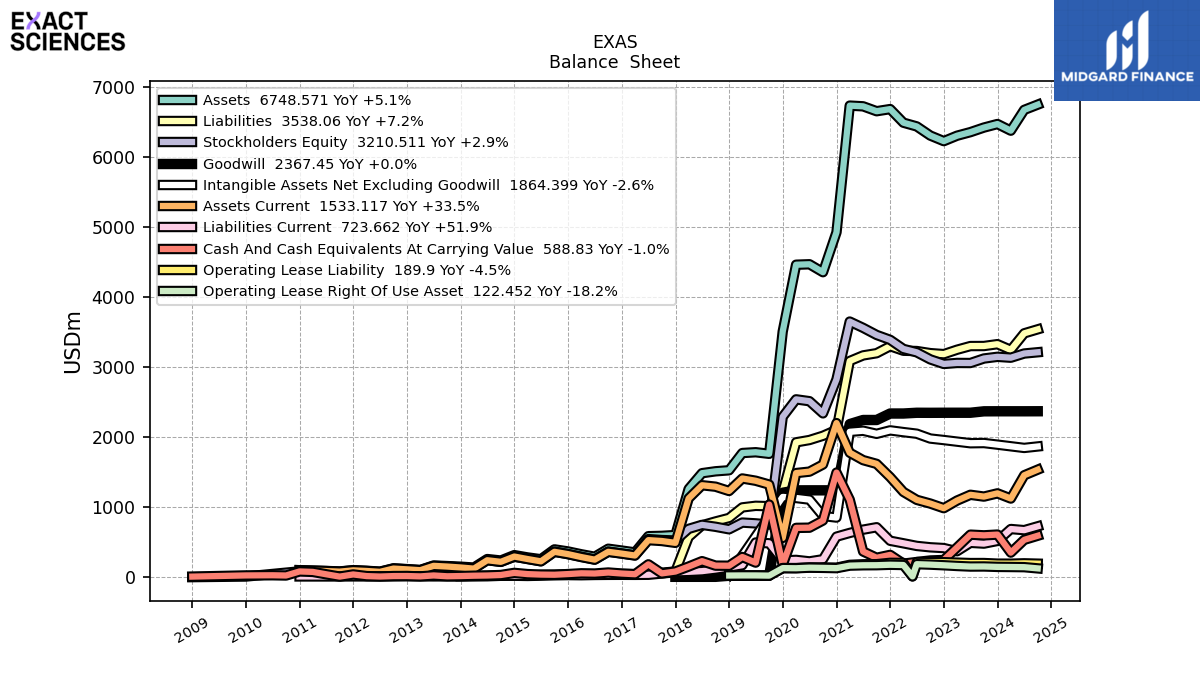
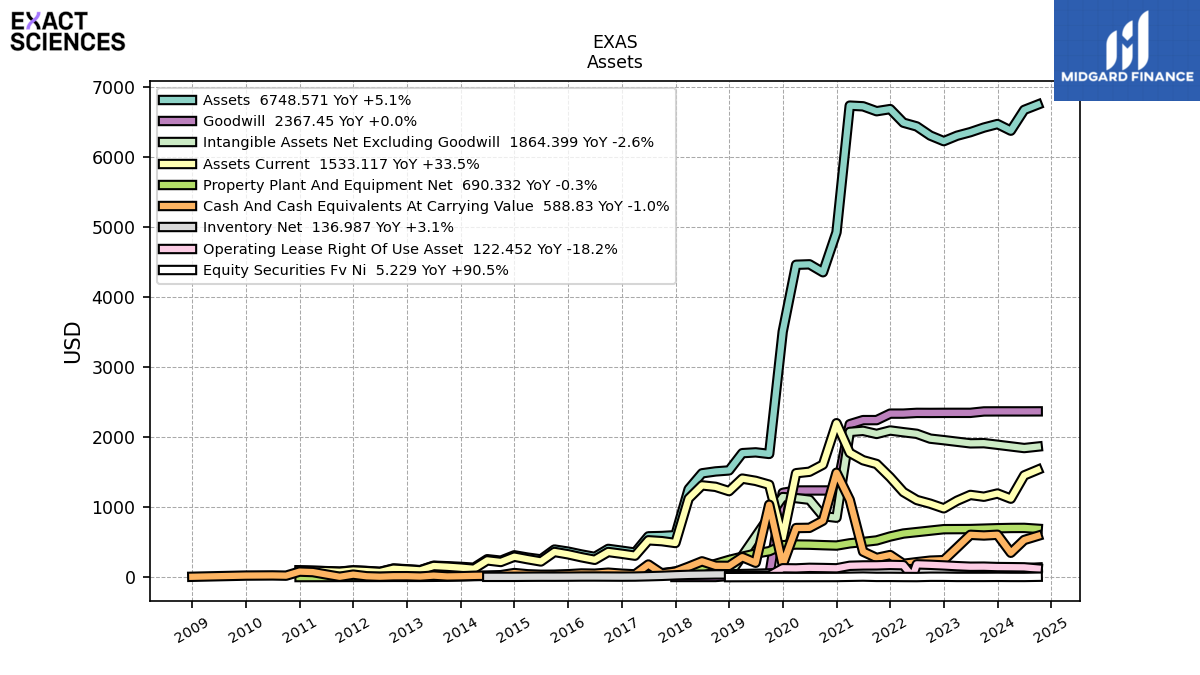
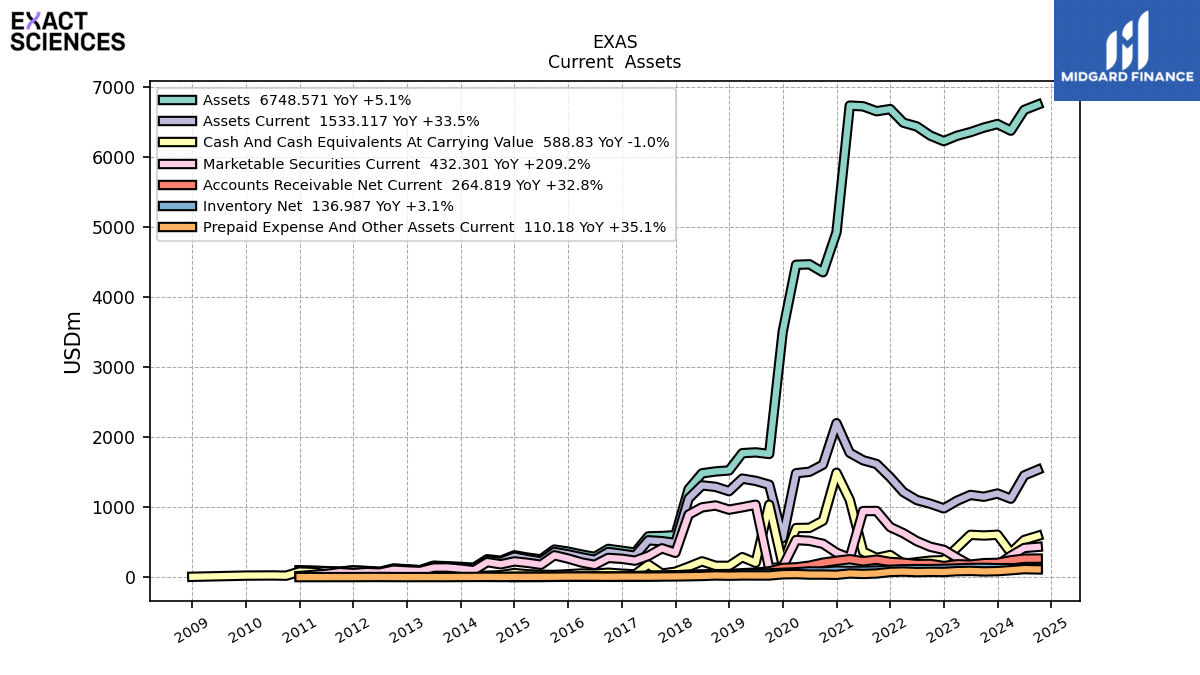
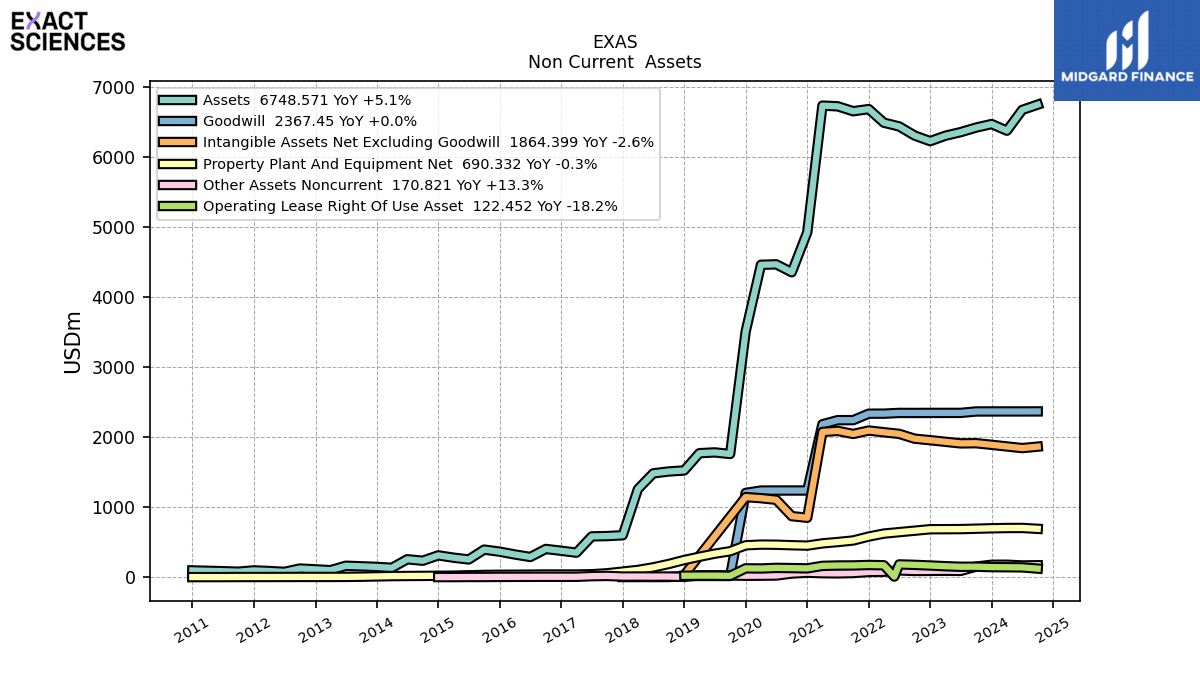
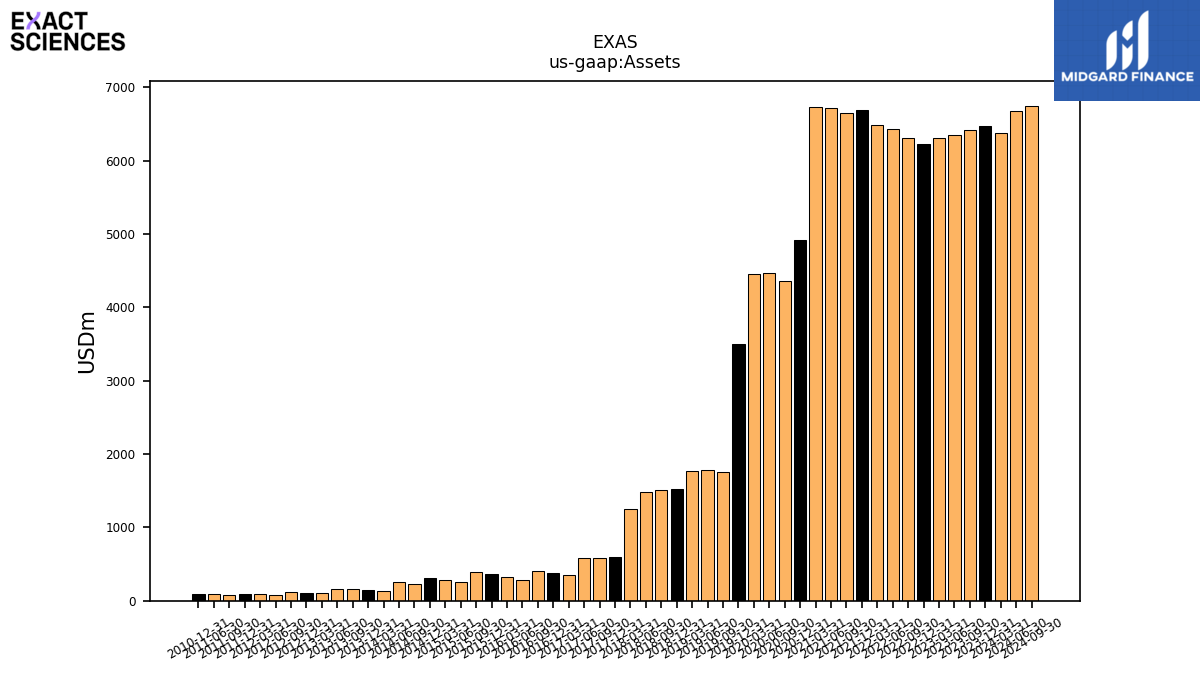
| Assets | 6471.33 | 6420.83 | 6355.56 | 6304.33 | 6226.87 | 6306.57 | 6437.15 | 6490.54 | 6684.88 | 6654.44 | 6724.33 | 6734.52 | 4925.09 | 4354.37 | 4467.73 | 4461.12 | 3505.77 | 1759.27 | 1781.94 | 1770.55 | 1524.02 | 1509.58 | 1482.65 | 1256.92 | 598.56 | 587.18 | 582.60 | 350.26 | 377.04 | 403.21 | 288.53 | 323.79 | 364.30 | 393.99 | 253.02 | 278.81 | 311.62 | 234.67 | 255.81 | 134.13 | 146.63 | 155.50 | 163.21 | 99.99 | 112.12 | 123.45 | 76.08 | 88.00 | 96.95 | 78.49 | 85.50 | NA | 96.52 | NA | NA | |
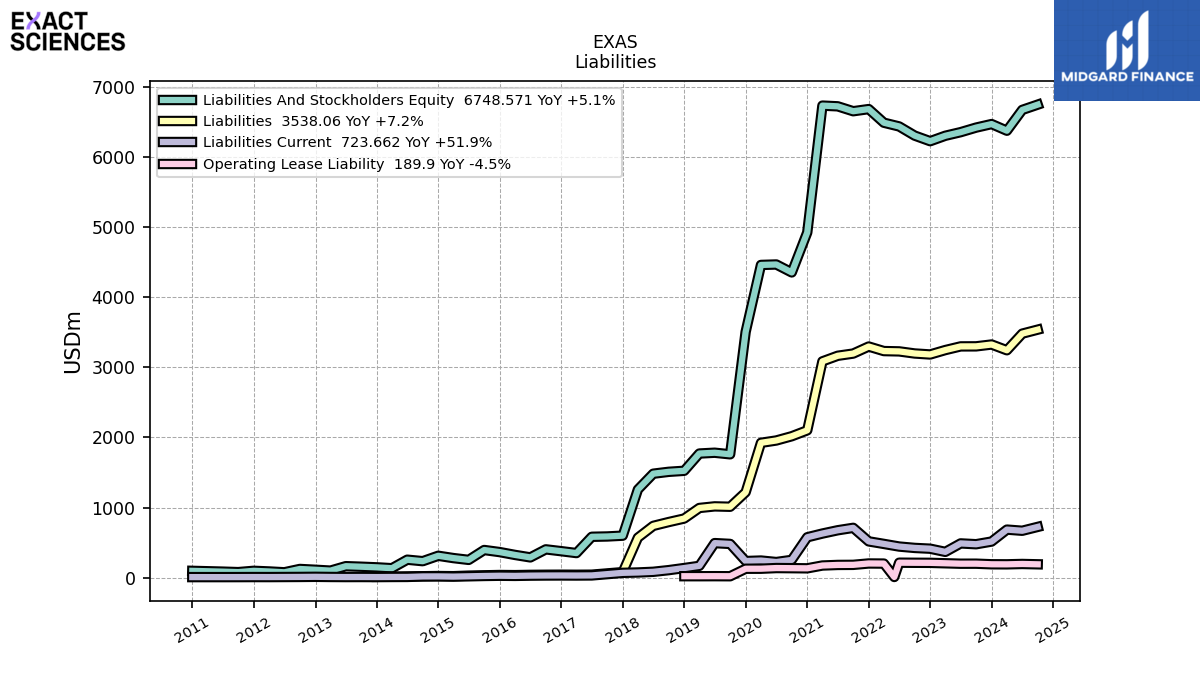
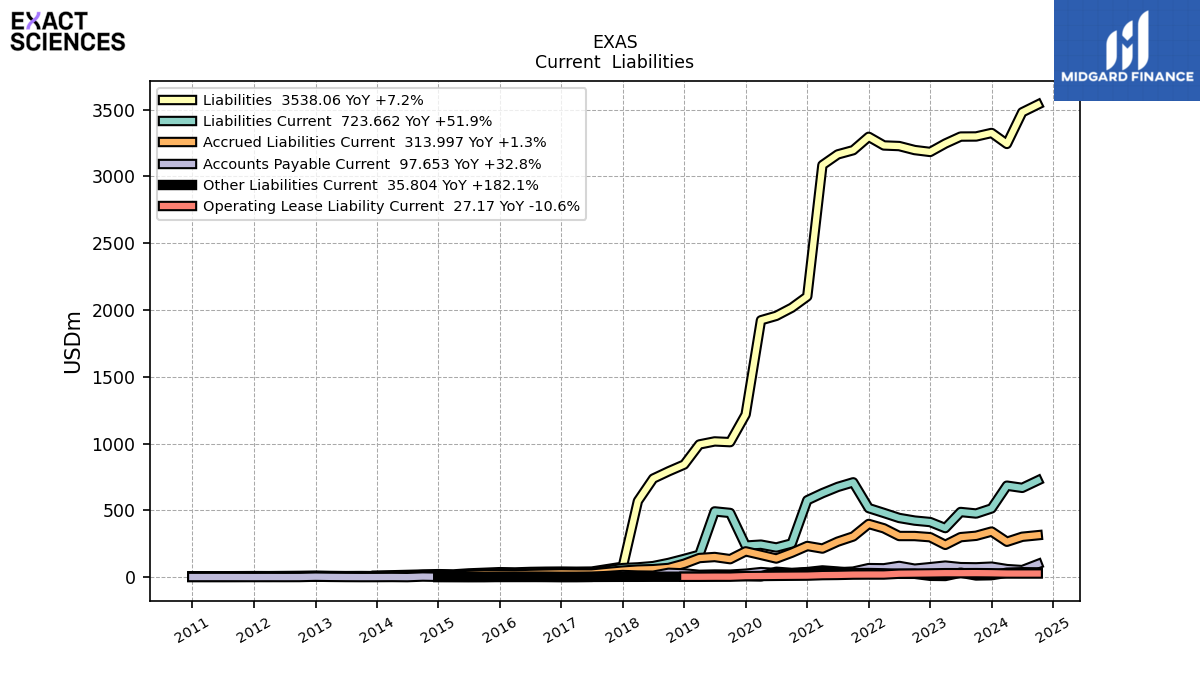
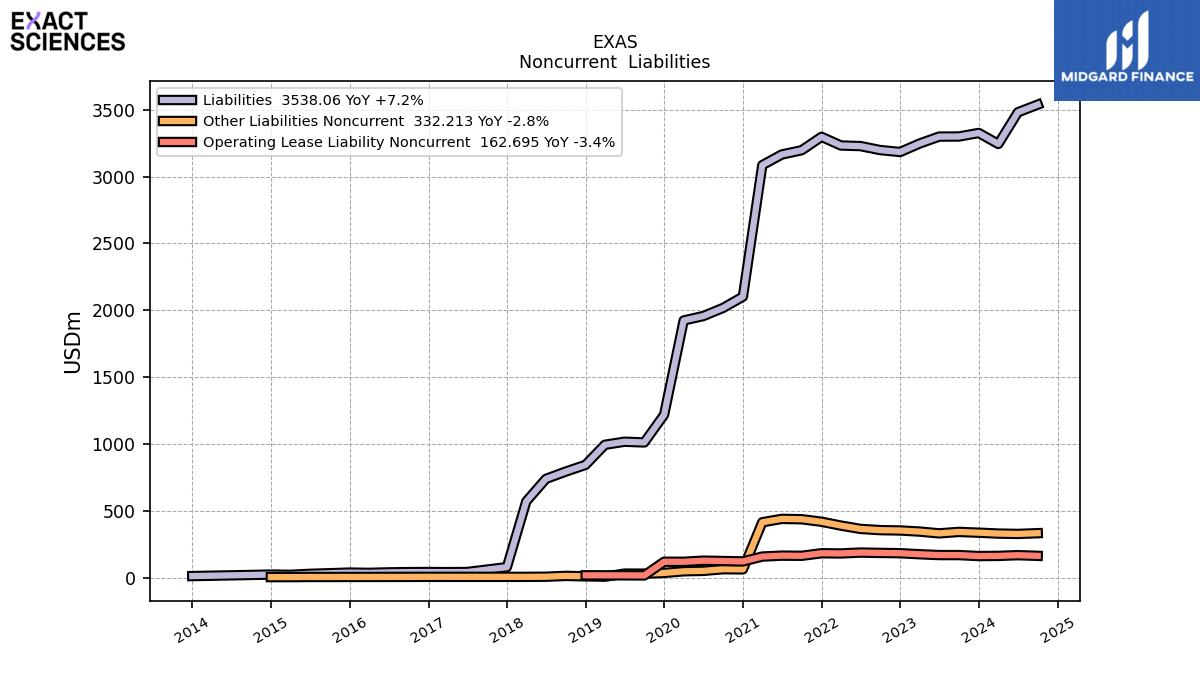
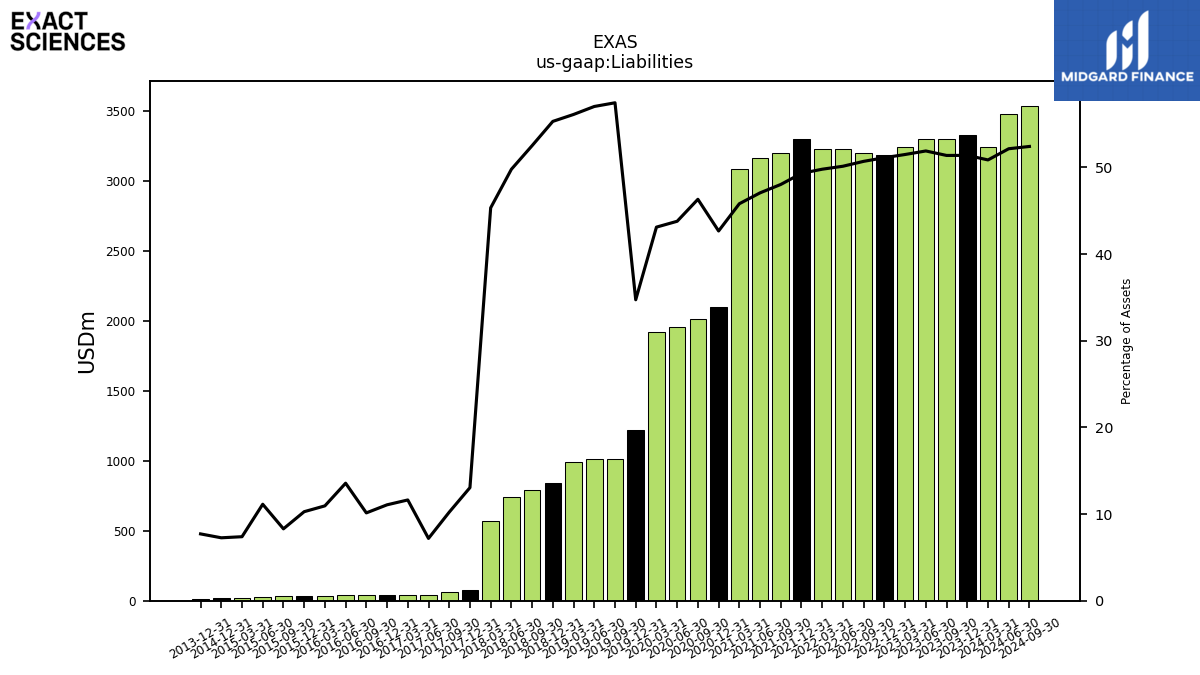
| Liabilities | 3326.03 | 3299.60 | 3298.94 | 3246.62 | 3183.71 | 3197.93 | 3227.81 | 3232.33 | 3297.25 | 3196.85 | 3165.23 | 3085.52 | 2101.60 | 2017.27 | 1956.54 | 1923.47 | 1217.71 | 1010.98 | 1016.41 | 993.61 | 843.08 | 792.85 | 738.26 | 569.90 | 78.14 | 60.03 | 41.91 | 40.74 | 41.74 | 40.88 | 39.14 | 35.45 | 37.44 | 32.70 | 28.18 | 20.61 | 22.64 | NA | NA | NA | 11.31 | NA | NA | NA | NA | NA | NA | NA | NA | NA | NA | NA | NA | NA | NA | |
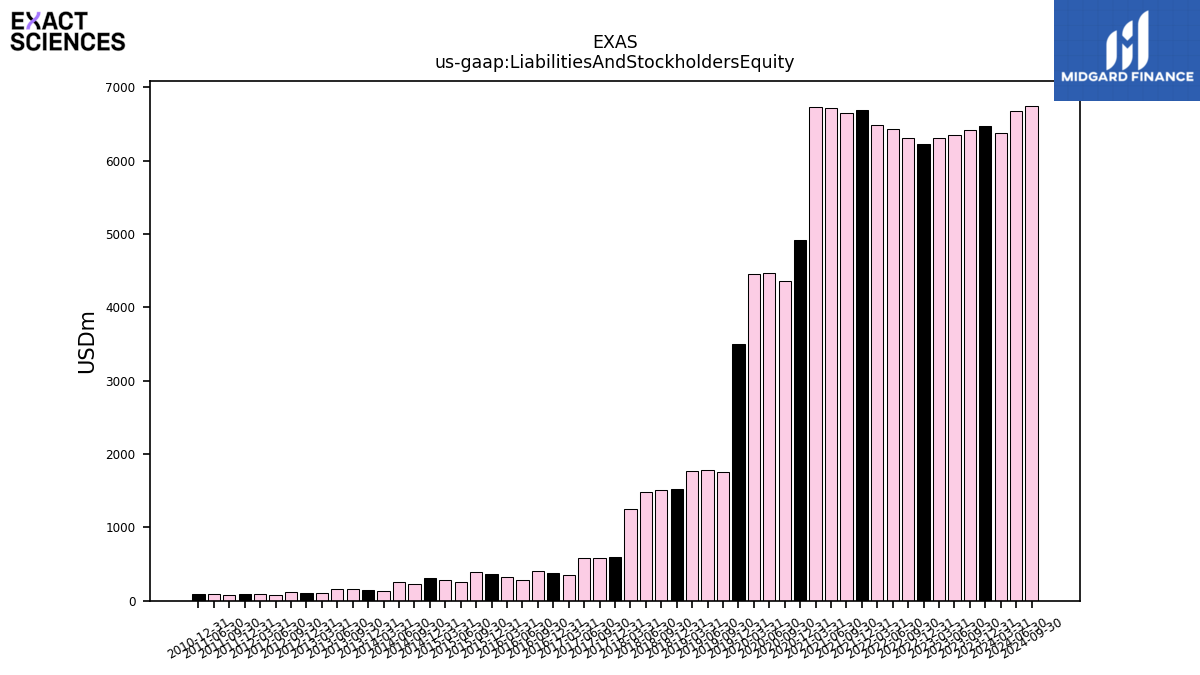
| Liabilities And Stockholders Equity | 6471.33 | 6420.83 | 6355.56 | 6304.33 | 6226.87 | 6306.57 | 6437.15 | 6490.54 | 6684.88 | 6654.44 | 6724.33 | 6734.52 | 4925.09 | 4354.37 | 4467.73 | 4461.12 | 3505.77 | 1759.27 | 1781.94 | 1770.55 | 1524.02 | 1509.58 | 1482.65 | 1256.92 | 598.56 | 587.18 | 582.60 | 350.26 | 377.04 | 403.21 | 288.53 | 323.79 | 364.30 | 393.99 | 253.02 | 278.81 | 311.62 | 234.67 | 255.81 | 134.13 | 146.63 | 155.50 | 163.21 | 99.99 | 112.12 | 123.45 | 76.08 | 88.00 | 96.95 | 78.49 | 85.50 | NA | 96.52 | NA | NA | |
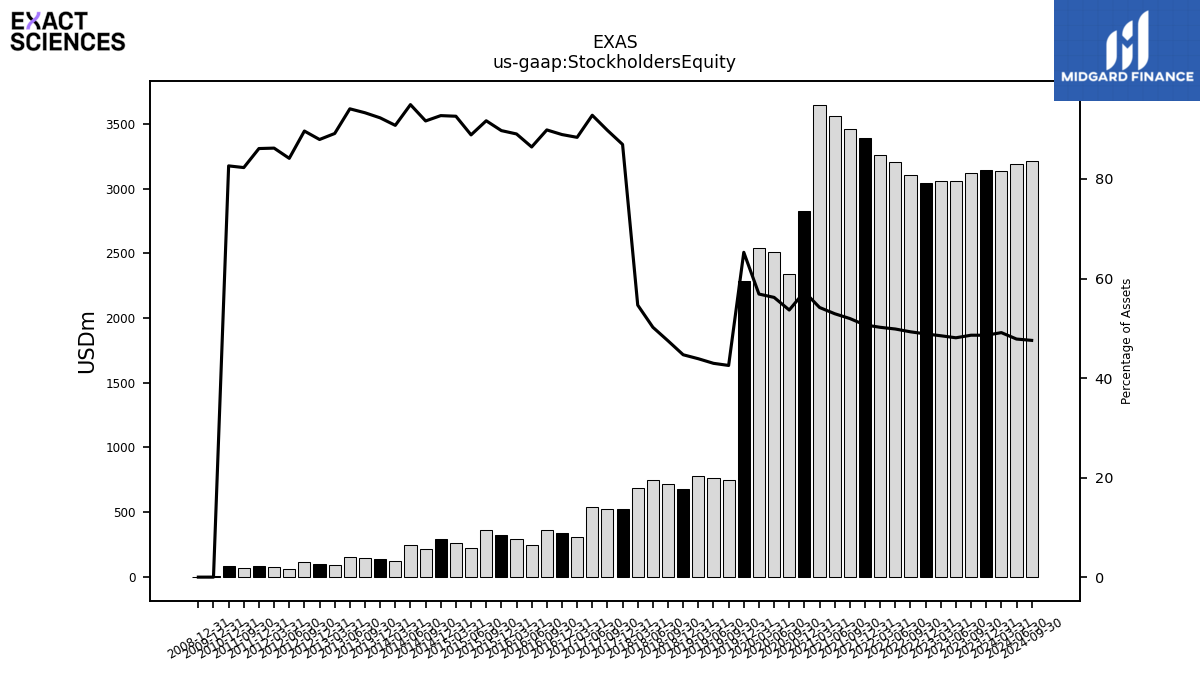
| Stockholders Equity | 3145.30 | 3121.23 | 3056.62 | 3057.71 | 3043.16 | 3108.63 | 3209.35 | 3258.21 | 3387.64 | 3457.59 | 3559.10 | 3648.99 | 2823.49 | 2337.10 | 2511.19 | 2537.65 | 2288.06 | 748.28 | 765.53 | 776.94 | 680.94 | 716.73 | 744.39 | 687.02 | 520.42 | 527.14 | 540.69 | 309.52 | 335.30 | 362.33 | 249.39 | 288.33 | 326.86 | 361.29 | 224.84 | 258.21 | 288.98 | 215.10 | 242.87 | 121.76 | 135.32 | 145.09 | 153.58 | 89.13 | 98.59 | 110.66 | 64.02 | 75.86 | 83.50 | 64.59 | NA | NA | 79.75 | NA | NA |
| 2023-12-31 | 2023-09-30 | 2023-06-30 | 2023-03-31 | 2022-12-31 | 2022-09-30 | 2022-06-30 | 2022-03-31 | 2021-12-31 | 2021-09-30 | 2021-06-30 | 2021-03-31 | 2020-12-31 | 2020-09-30 | 2020-06-30 | 2020-03-31 | 2019-12-31 | 2019-09-30 | 2019-06-30 | 2019-03-31 | 2018-12-31 | 2018-09-30 | 2018-06-30 | 2018-03-31 | 2017-12-31 | 2017-09-30 | 2017-06-30 | 2017-03-31 | 2016-12-31 | 2016-09-30 | 2016-06-30 | 2016-03-31 | 2015-12-31 | 2015-09-30 | 2015-06-30 | 2015-03-31 | 2014-12-31 | 2014-09-30 | 2014-06-30 | 2014-03-31 | 2013-12-31 | 2013-09-30 | 2013-06-30 | 2013-03-31 | 2012-12-31 | 2012-09-30 | 2012-06-30 | 2012-03-31 | 2011-12-31 | 2011-09-30 | 2011-06-30 | 2011-03-31 | 2010-12-31 | 2010-09-30 | 2010-06-30 | ||
|---|---|---|---|---|---|---|---|---|---|---|---|---|---|---|---|---|---|---|---|---|---|---|---|---|---|---|---|---|---|---|---|---|---|---|---|---|---|---|---|---|---|---|---|---|---|---|---|---|---|---|---|---|---|---|---|---|
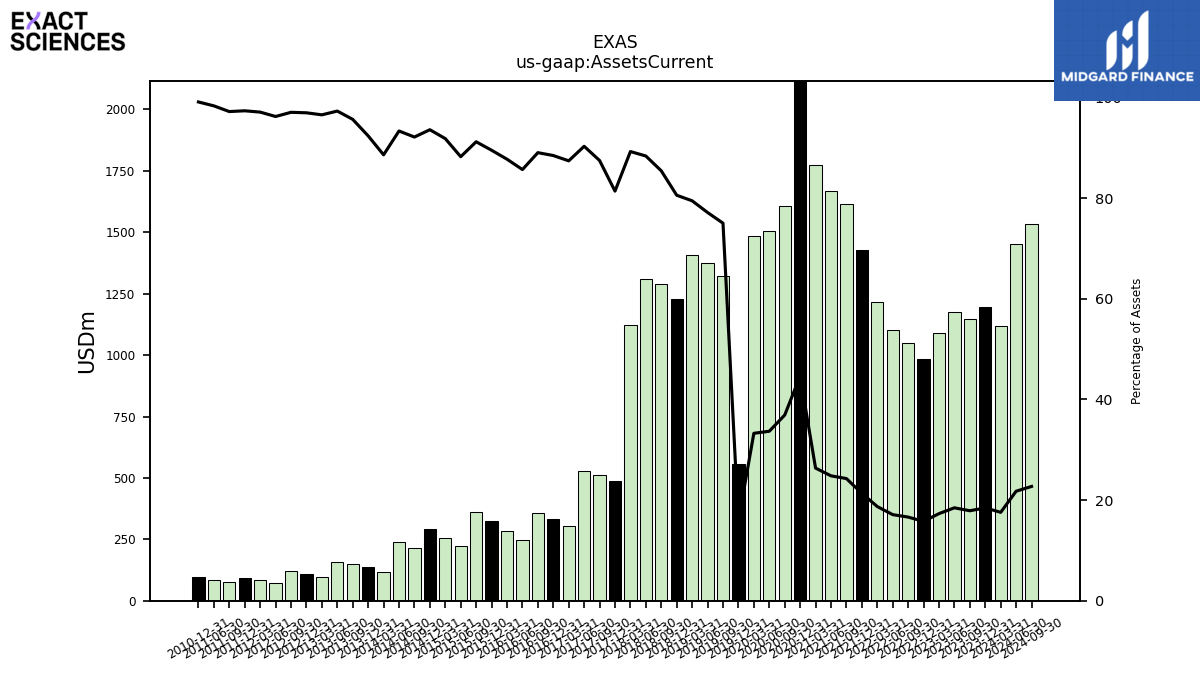
| Assets Current | 1194.37 | 1148.19 | 1173.93 | 1091.38 | 982.26 | 1048.51 | 1101.63 | 1215.14 | 1426.24 | 1615.59 | 1669.21 | 1775.30 | 2198.59 | 1606.63 | 1504.86 | 1484.32 | 556.96 | 1319.98 | 1374.80 | 1407.12 | 1228.07 | 1289.58 | 1310.30 | 1121.99 | 487.22 | 513.69 | 526.13 | 306.19 | 333.57 | 359.03 | 247.22 | 284.09 | 326.13 | 359.35 | 223.26 | 256.05 | 291.68 | 216.24 | 238.78 | 118.85 | 135.46 | 148.75 | 158.82 | 96.55 | 108.71 | 119.82 | 73.21 | 85.45 | 94.39 | 76.30 | 84.08 | NA | 95.66 | NA | NA | |
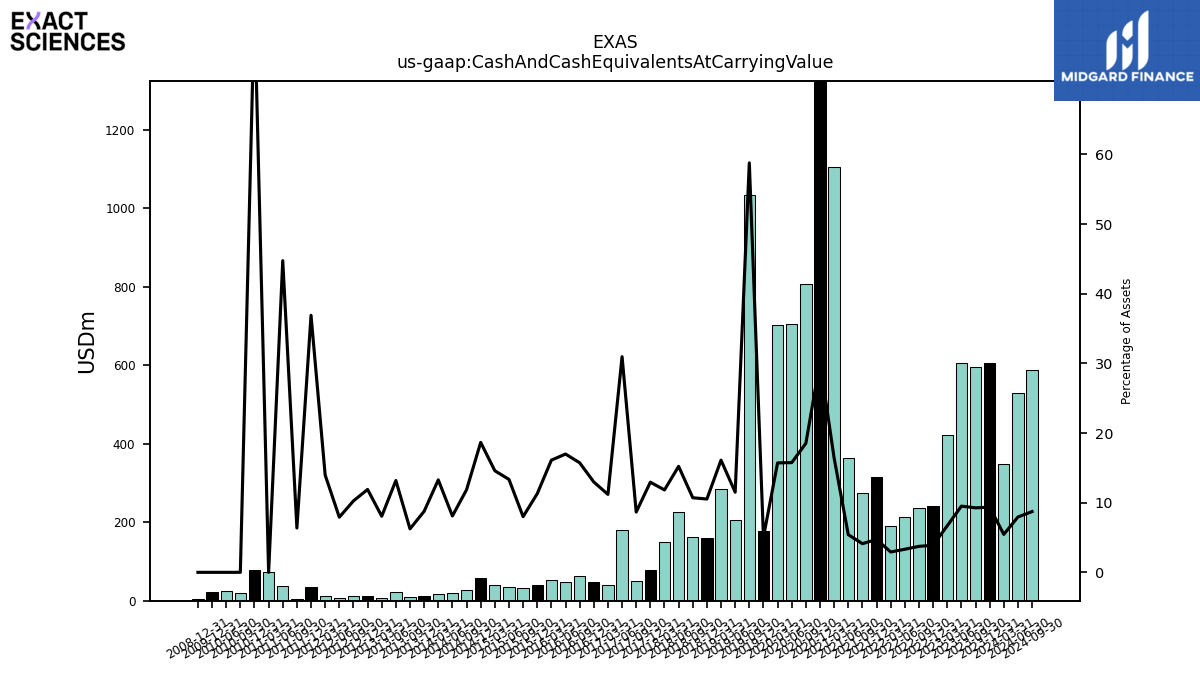
| Cash And Cash Equivalents At Carrying Value | 605.38 | 594.61 | 604.36 | 421.37 | 242.49 | 235.31 | 213.42 | 189.78 | 315.47 | 273.78 | 363.71 | 1103.82 | 1491.29 | 806.68 | 703.93 | 701.05 | 177.25 | 1034.33 | 205.06 | 285.20 | 160.43 | 161.71 | 225.66 | 148.69 | 77.49 | 50.84 | 180.41 | 39.21 | 48.92 | 63.45 | 49.01 | 52.15 | 41.13 | 31.52 | 33.77 | 40.68 | 58.13 | 27.83 | 20.71 | 17.81 | 12.85 | 9.71 | 21.52 | 8.05 | 13.35 | 12.66 | 6.03 | 12.29 | 35.78 | 5.00 | 38.26 | 72.07 | 78.75 | 20.82 | 24.23 | |
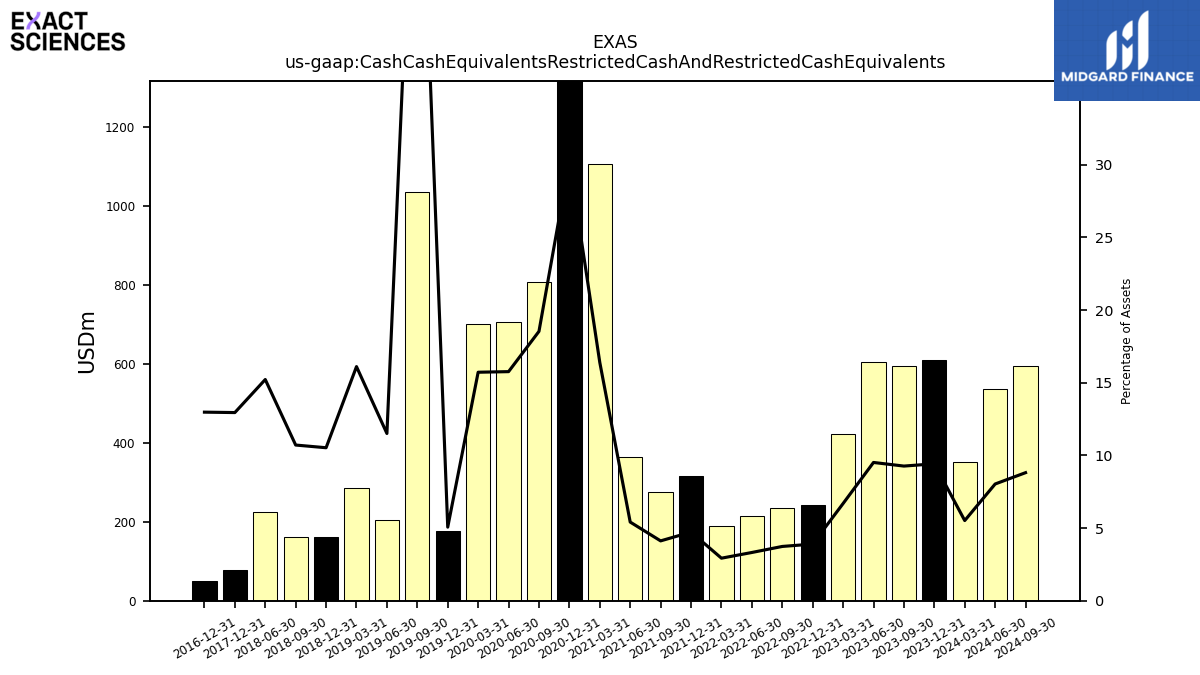
| Cash Cash Equivalents Restricted Cash And Restricted Cash Equivalents | 609.67 | 594.91 | 604.66 | 421.66 | 242.79 | 235.60 | 213.72 | 190.07 | 315.77 | 274.08 | 364.01 | 1104.10 | 1491.59 | 806.97 | 704.21 | 701.33 | 177.53 | 1034.33 | 205.06 | 285.20 | 160.43 | 161.71 | 225.66 | NA | 77.49 | NA | NA | NA | 48.92 | NA | NA | NA | NA | NA | NA | NA | NA | NA | NA | NA | NA | NA | NA | NA | NA | NA | NA | NA | NA | NA | NA | NA | NA | NA | NA | |
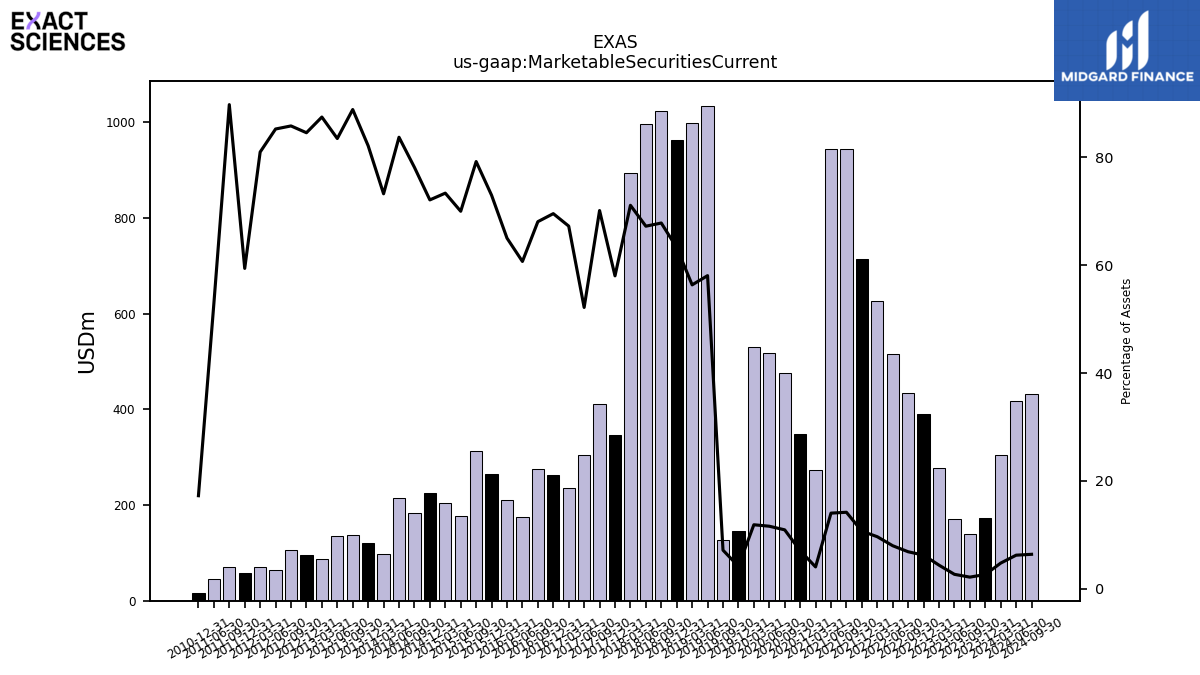
| Marketable Securities Current | 172.27 | 139.79 | 171.35 | 277.28 | 389.56 | 433.81 | 514.62 | 627.20 | 715.00 | 944.69 | 943.86 | 274.15 | 348.70 | 476.32 | 518.73 | 530.06 | 146.40 | 126.21 | 1034.36 | 997.51 | 963.75 | 1023.51 | 996.50 | 893.47 | 347.22 | 411.68 | 303.85 | 235.46 | 262.18 | 274.38 | 175.07 | 210.44 | 265.74 | 311.99 | 177.05 | 204.47 | 224.62 | 183.31 | 214.09 | 98.20 | 120.41 | 138.13 | 136.21 | 87.43 | 94.78 | 105.91 | 64.84 | 71.24 | 57.58 | 70.44 | 45.20 | NA | 16.66 | NA | NA | |
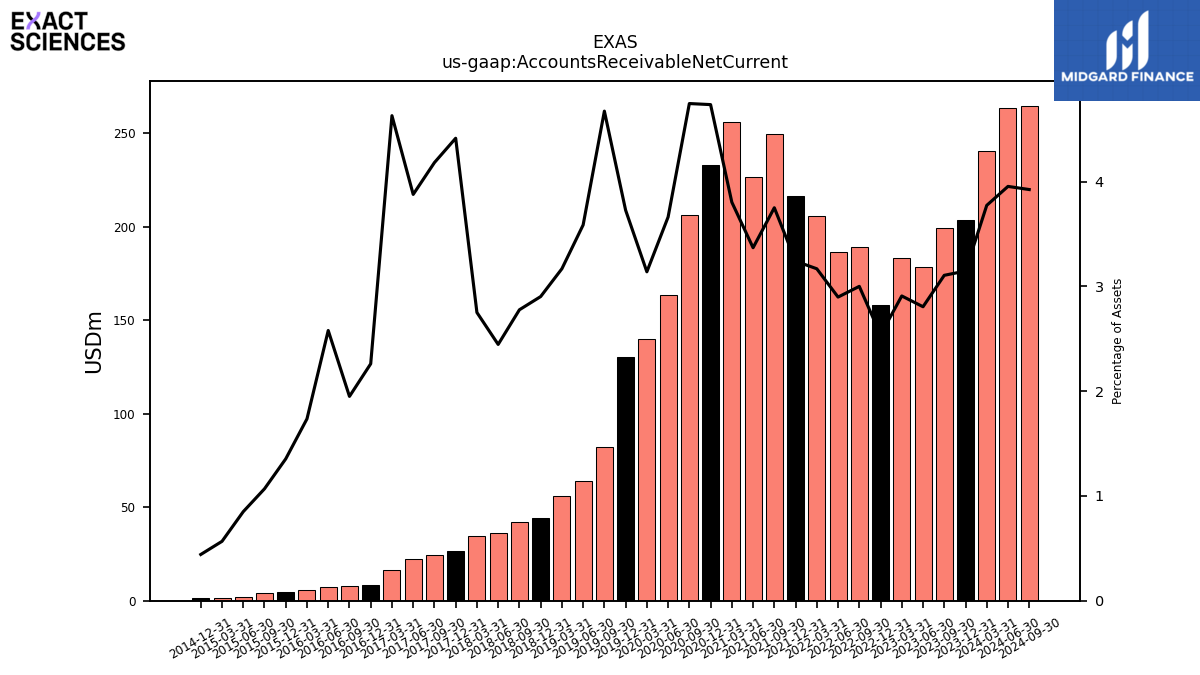
| Accounts Receivable Net Current | 203.62 | 199.40 | 178.32 | 183.37 | 158.04 | 189.21 | 186.54 | 205.62 | 216.65 | 249.57 | 226.54 | 256.13 | 233.19 | 206.61 | 163.61 | 140.05 | 130.67 | 82.20 | 63.90 | 56.09 | 44.24 | 41.92 | 36.27 | 34.58 | 26.42 | 24.55 | 22.59 | 16.21 | 8.53 | 7.86 | 7.44 | 5.62 | 4.93 | 4.21 | 2.15 | 1.58 | 1.38 | NA | NA | NA | NA | NA | NA | NA | NA | NA | NA | NA | NA | NA | NA | NA | NA | NA | NA | |
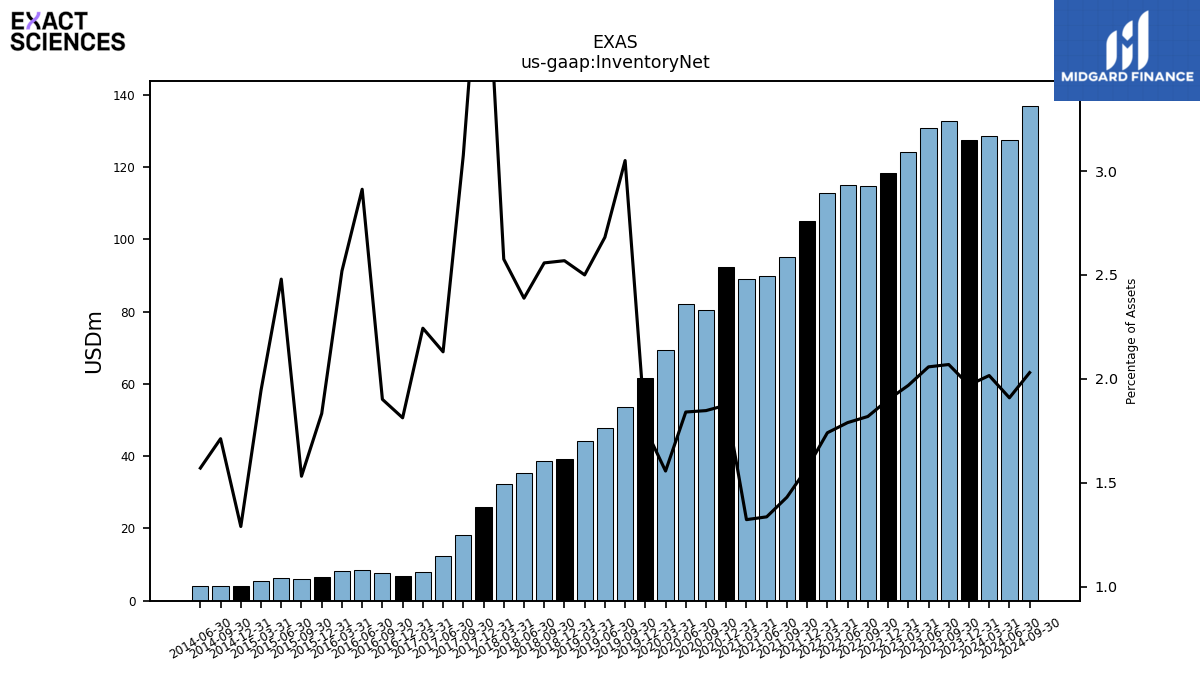
| Inventory Net | 127.47 | 132.84 | 130.77 | 124.09 | 118.26 | 114.70 | 115.17 | 112.96 | 104.99 | 95.17 | 89.81 | 89.03 | 92.27 | 80.43 | 82.22 | 69.42 | 61.72 | 53.67 | 47.78 | 44.27 | 39.15 | 38.62 | 35.41 | 32.38 | 26.03 | 18.06 | 12.41 | 7.86 | 6.83 | 7.67 | 8.40 | 8.16 | 6.68 | 6.03 | 6.28 | 5.42 | 4.02 | 4.02 | 4.02 | NA | NA | NA | NA | NA | NA | NA | NA | NA | NA | NA | NA | NA | NA | NA | NA | |
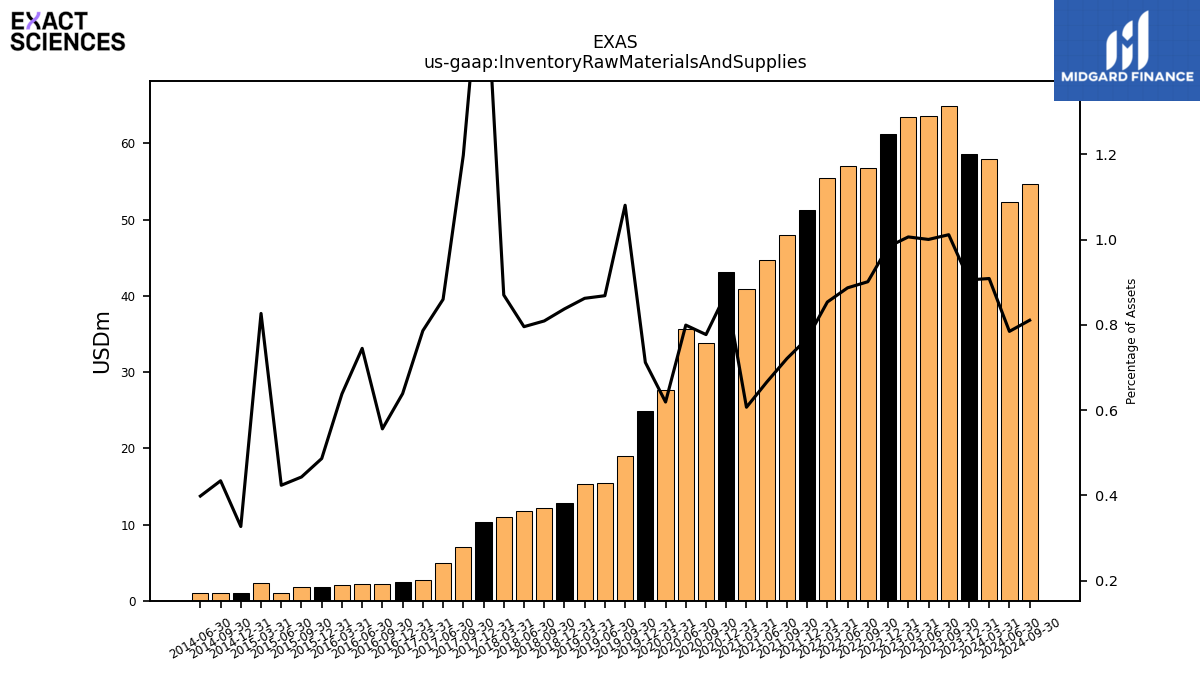
| Inventory Raw Materials And Supplies | 58.59 | 64.94 | 63.57 | 63.43 | 61.21 | 56.83 | 57.09 | 55.40 | 51.32 | 47.97 | 44.76 | 40.86 | 43.08 | 33.84 | 35.71 | 27.61 | 24.96 | 19.01 | 15.47 | 15.27 | 12.76 | 12.21 | 11.80 | 10.94 | 10.34 | 7.03 | 5.01 | 2.75 | 2.41 | 2.24 | 2.15 | 2.07 | 1.77 | 1.75 | 1.07 | 2.31 | 1.02 | 1.02 | 1.02 | NA | NA | NA | NA | NA | NA | NA | NA | NA | NA | NA | NA | NA | NA | NA | NA | |
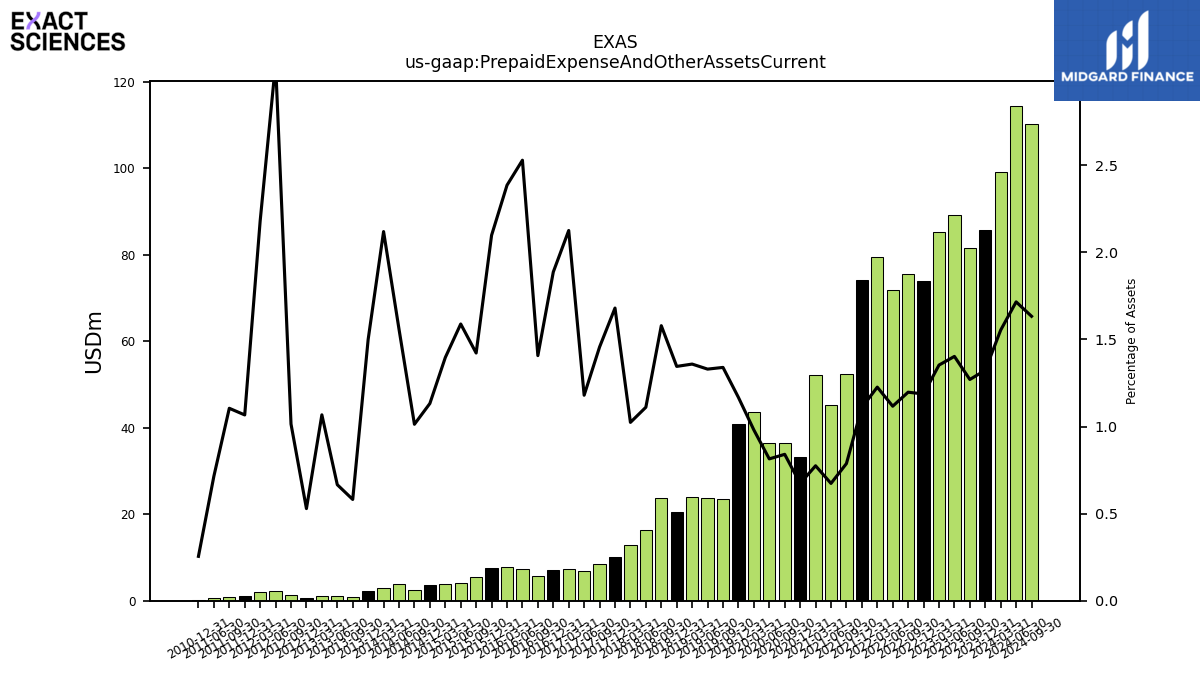
| Prepaid Expense And Other Assets Current | 85.63 | 81.54 | 89.13 | 85.27 | 73.90 | 75.49 | 71.88 | 79.58 | 74.12 | 52.38 | 45.28 | 52.17 | 33.16 | 36.59 | 36.38 | 43.73 | 40.91 | 23.56 | 23.69 | 24.05 | 20.50 | 23.83 | 16.46 | 12.87 | 10.05 | 8.55 | 6.87 | 7.44 | 7.11 | 5.67 | 7.29 | 7.72 | 7.64 | 5.60 | 4.02 | 3.89 | 3.53 | 2.38 | 3.99 | 2.84 | 2.20 | 0.90 | 1.09 | 1.07 | 0.59 | 1.25 | 2.35 | 1.92 | 1.03 | 0.87 | 0.61 | NA | 0.25 | NA | NA | |
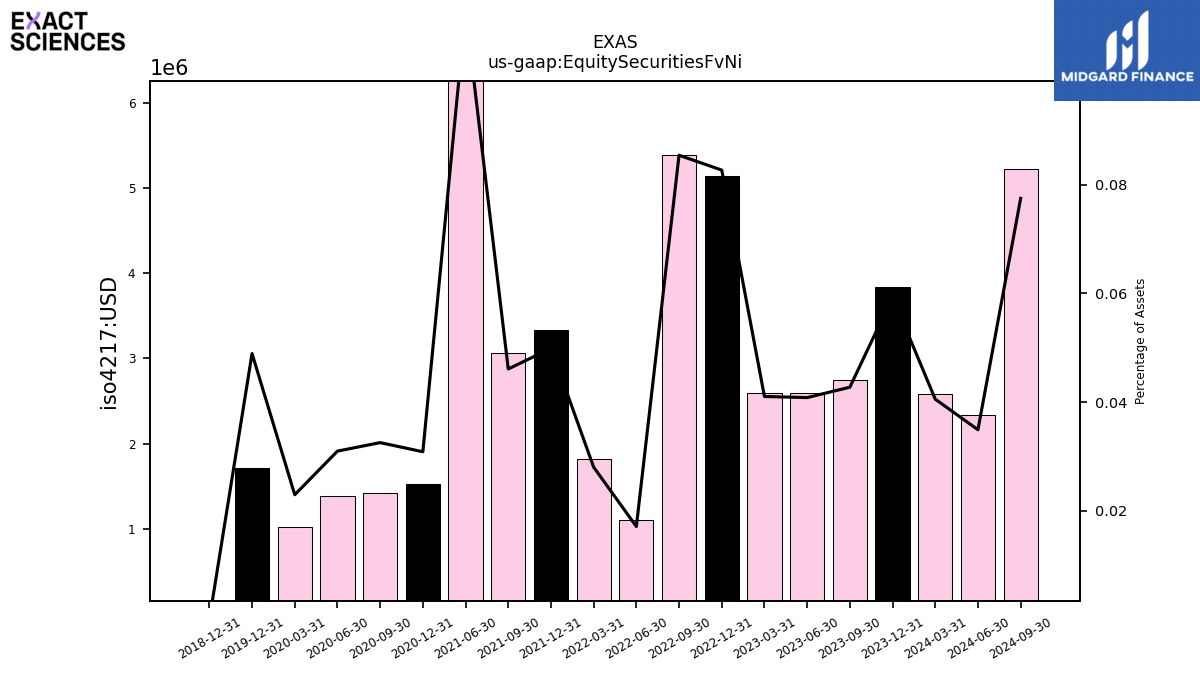
| Equity Securities Fv Ni | 3.84 | 2.75 | 2.60 | 2.59 | 5.15 | 5.39 | 1.10 | 1.82 | 3.34 | 3.07 | 7.53 | NA | 1.52 | 1.42 | 1.39 | 1.02 | 1.72 | NA | NA | NA | 0.00 | NA | NA | NA | NA | NA | NA | NA | NA | NA | NA | NA | NA | NA | NA | NA | NA | NA | NA | NA | NA | NA | NA | NA | NA | NA | NA | NA | NA | NA | NA | NA | NA | NA | NA |
| 2023-12-31 | 2023-09-30 | 2023-06-30 | 2023-03-31 | 2022-12-31 | 2022-09-30 | 2022-06-30 | 2022-03-31 | 2021-12-31 | 2021-09-30 | 2021-06-30 | 2021-03-31 | 2020-12-31 | 2020-09-30 | 2020-06-30 | 2020-03-31 | 2019-12-31 | 2019-09-30 | 2019-06-30 | 2019-03-31 | 2018-12-31 | 2018-09-30 | 2018-06-30 | 2018-03-31 | 2017-12-31 | 2017-09-30 | 2017-06-30 | 2017-03-31 | 2016-12-31 | 2016-09-30 | 2016-06-30 | 2016-03-31 | 2015-12-31 | 2015-09-30 | 2015-06-30 | 2015-03-31 | 2014-12-31 | 2014-09-30 | 2014-06-30 | 2014-03-31 | 2013-12-31 | 2013-09-30 | 2013-06-30 | 2013-03-31 | 2012-12-31 | 2012-09-30 | 2012-06-30 | 2012-03-31 | 2011-12-31 | 2011-09-30 | 2011-06-30 | 2011-03-31 | 2010-12-31 | 2010-09-30 | 2010-06-30 | ||
|---|---|---|---|---|---|---|---|---|---|---|---|---|---|---|---|---|---|---|---|---|---|---|---|---|---|---|---|---|---|---|---|---|---|---|---|---|---|---|---|---|---|---|---|---|---|---|---|---|---|---|---|---|---|---|---|---|
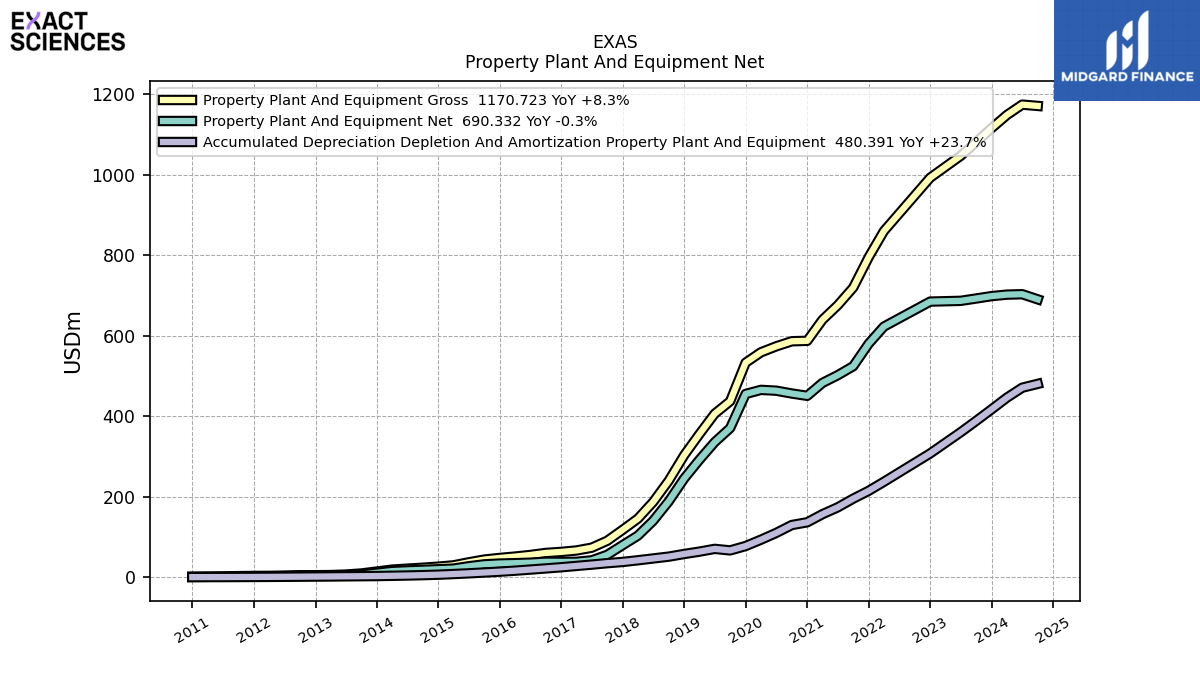
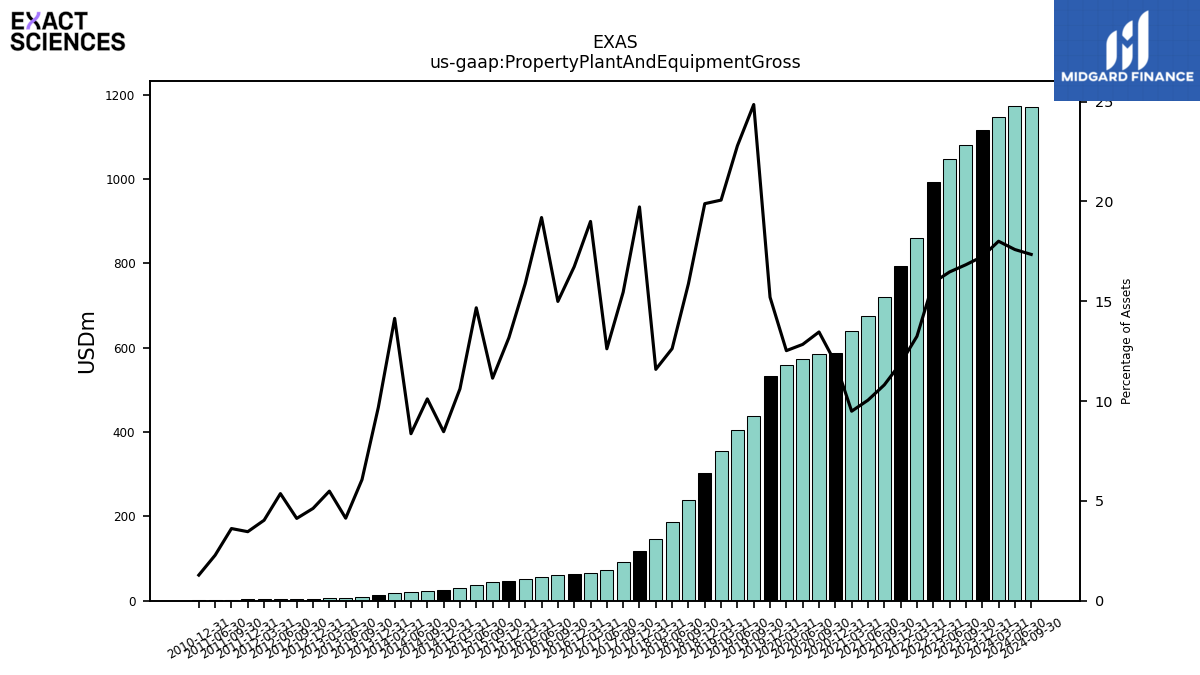
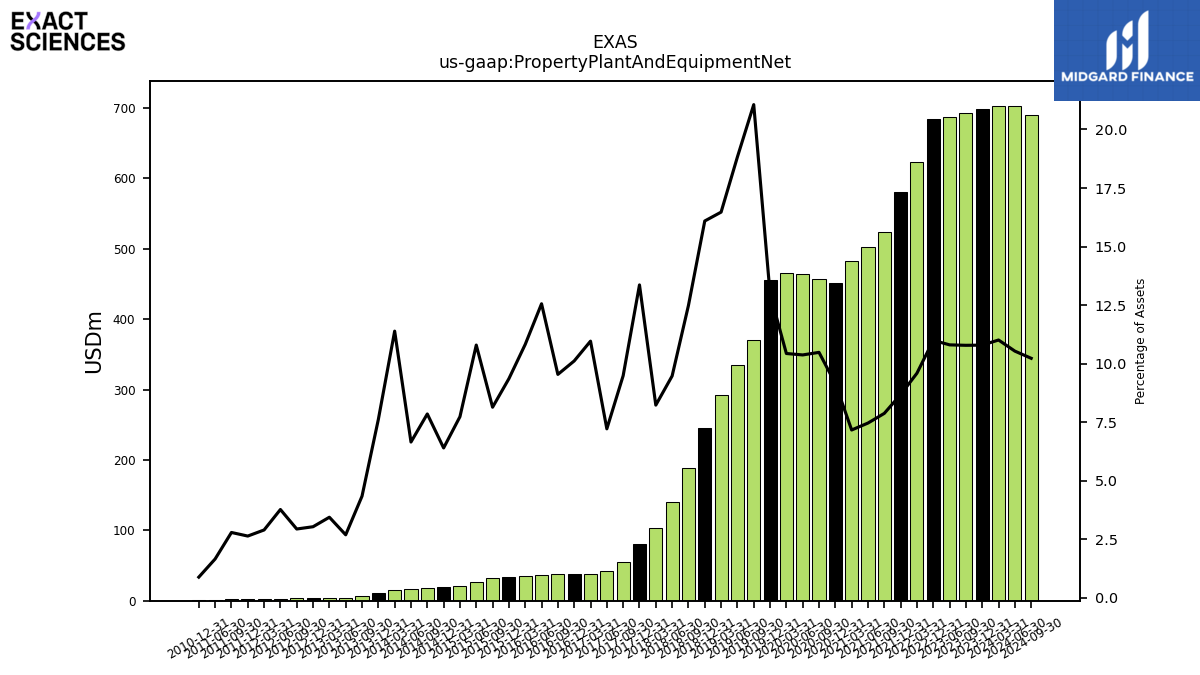
| Property Plant And Equipment Gross | 1115.56 | 1080.74 | 1046.77 | NA | 992.35 | NA | NA | 859.74 | 795.06 | 719.49 | 675.63 | 639.38 | 587.30 | 586.22 | 573.66 | 558.86 | 532.96 | 437.26 | 406.07 | 355.31 | 303.12 | 239.76 | 187.24 | 145.69 | 118.07 | 90.74 | 73.53 | 66.55 | 63.08 | 60.45 | 55.38 | 51.43 | 48.01 | 43.93 | 37.13 | 29.59 | 26.39 | 23.73 | 21.40 | 18.97 | 14.21 | 9.44 | 6.75 | 5.49 | 5.19 | 5.09 | 4.08 | 3.55 | 3.35 | 2.84 | 1.95 | NA | 1.24 | NA | NA | |
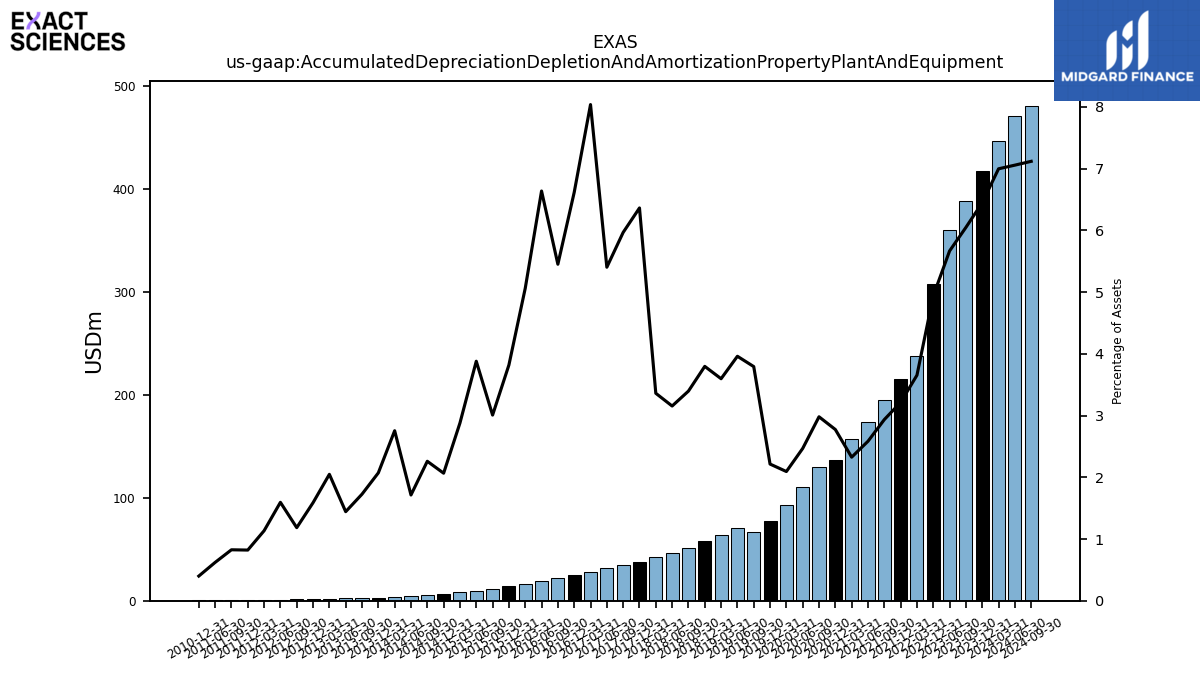
| Accumulated Depreciation Depletion And Amortization Property Plant And Equipment | 417.20 | 388.34 | 360.17 | NA | 307.59 | NA | NA | 237.13 | 214.82 | 195.29 | 173.73 | 156.64 | 136.62 | 129.76 | 110.23 | 93.39 | 77.63 | 66.73 | 70.57 | 63.68 | 57.86 | 51.27 | 46.77 | 42.24 | 38.09 | 35.04 | 31.48 | 28.15 | 24.94 | 21.98 | 19.15 | 16.39 | 13.91 | 11.85 | 9.82 | 8.03 | 6.44 | 5.30 | 4.38 | 3.69 | 3.04 | 2.69 | 2.35 | 2.05 | 1.78 | 1.46 | 1.21 | 1.00 | 0.80 | 0.65 | 0.53 | NA | 0.39 | NA | NA | |
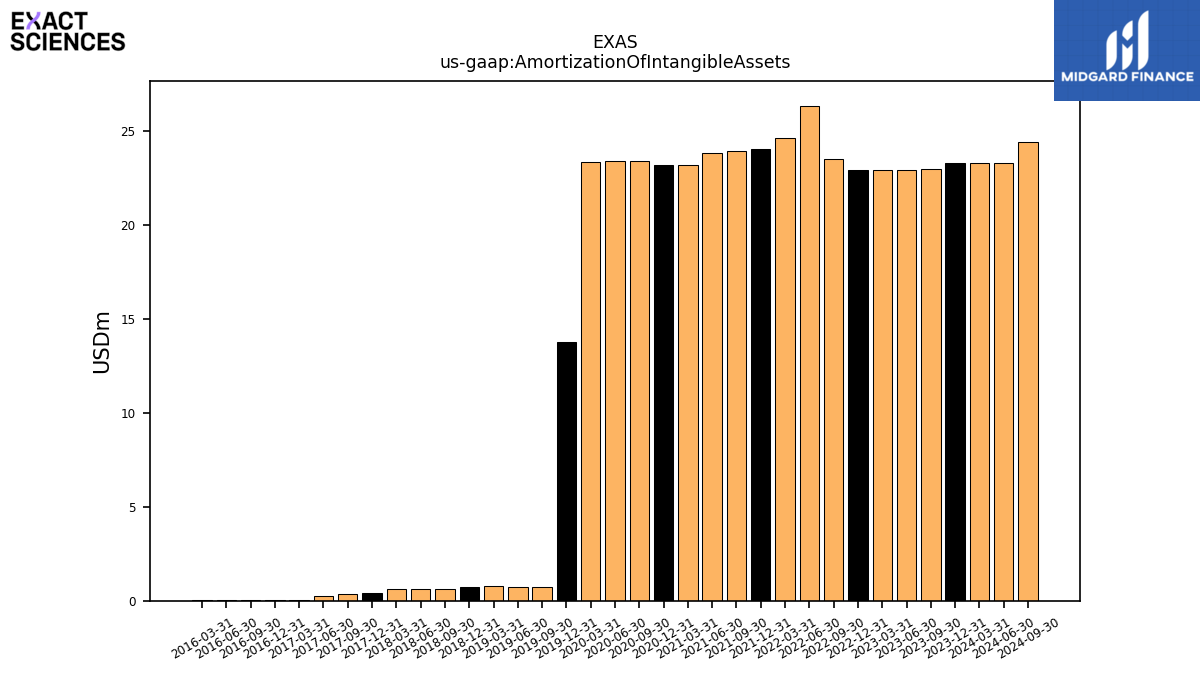
| Amortization Of Intangible Assets | 23.31 | 22.99 | 22.93 | 22.93 | 22.91 | 23.53 | 26.36 | 24.65 | 24.05 | 23.94 | 23.82 | 23.19 | 23.20 | 23.43 | 23.43 | 23.34 | 13.78 | 0.75 | 0.75 | 0.81 | 0.73 | 0.60 | 0.60 | 0.61 | 0.41 | 0.35 | 0.24 | 0.05 | 0.05 | 0.05 | 0.05 | 0.05 | NA | NA | NA | NA | NA | NA | NA | NA | NA | NA | NA | NA | NA | NA | NA | NA | NA | NA | NA | NA | NA | NA | NA | |
| Property Plant And Equipment Net | 698.35 | 692.40 | 686.60 | NA | 684.76 | NA | NA | 622.61 | 580.25 | 524.20 | 501.91 | 482.74 | 450.68 | 456.45 | 463.44 | 465.48 | 455.32 | 370.53 | 335.50 | 291.63 | 245.26 | 188.49 | 140.47 | 103.45 | 79.99 | 55.71 | 42.05 | 38.40 | 38.14 | 38.47 | 36.23 | 35.05 | 34.10 | 32.08 | 27.31 | 21.57 | 19.95 | 18.43 | 17.02 | 15.28 | 11.17 | 6.75 | 4.39 | 3.44 | 3.40 | 3.63 | 2.87 | 2.55 | 2.56 | 2.19 | 1.42 | NA | 0.85 | NA | NA | |
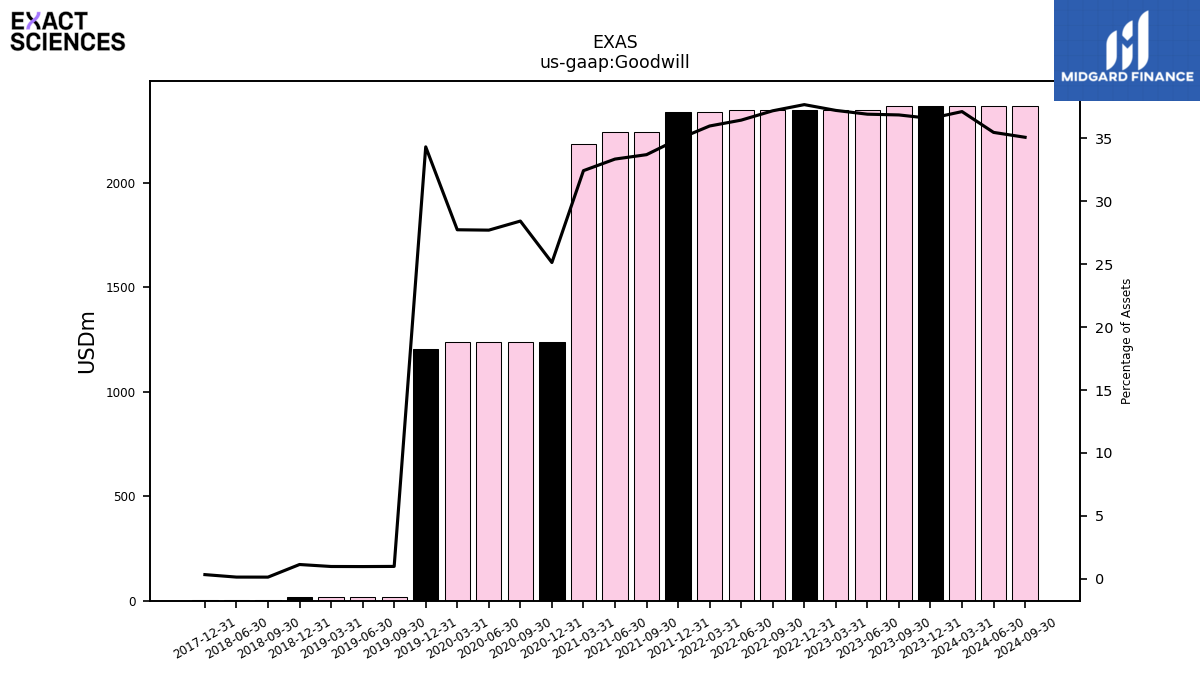
| Goodwill | 2367.12 | 2366.51 | 2346.25 | 2346.24 | 2346.04 | 2345.18 | 2345.92 | 2335.17 | 2335.17 | 2242.53 | 2242.53 | 2183.91 | 1237.67 | 1237.67 | 1237.67 | 1237.16 | 1203.20 | 17.28 | 17.28 | 17.28 | 17.28 | 1.98 | 1.98 | NA | 1.98 | NA | NA | NA | NA | NA | NA | NA | NA | NA | NA | NA | NA | NA | NA | NA | NA | NA | NA | NA | NA | NA | NA | NA | NA | NA | NA | NA | NA | NA | NA | |
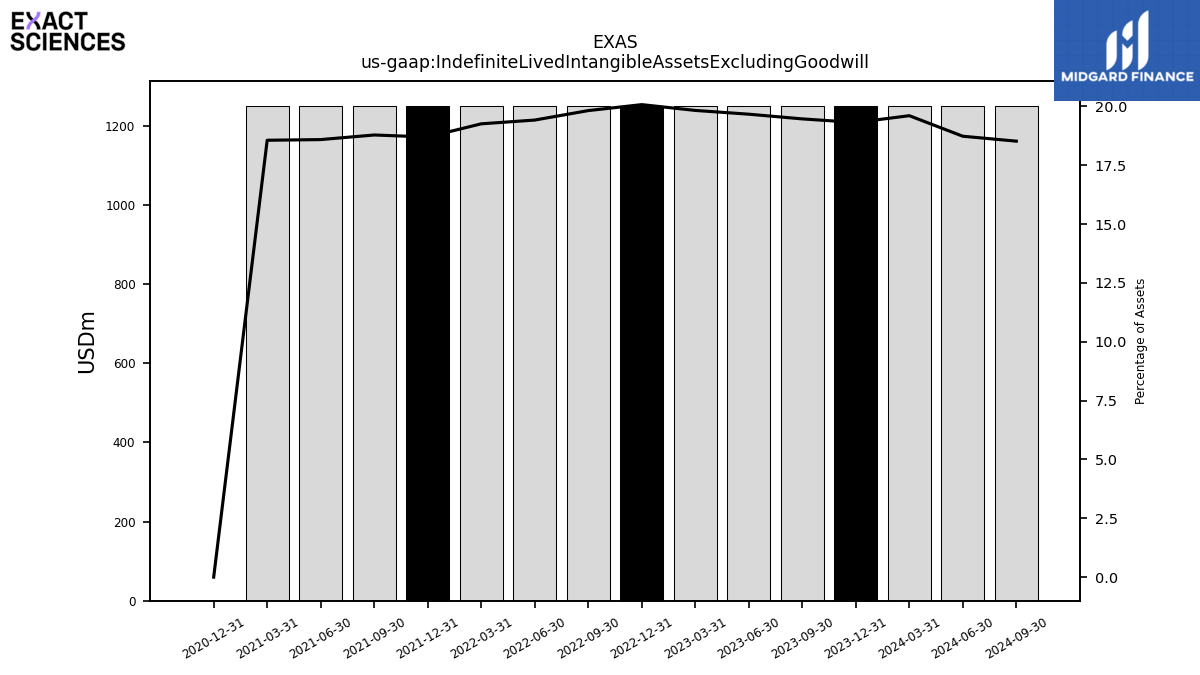
| Indefinite Lived Intangible Assets Excluding Goodwill | 1250.00 | 1250.00 | 1250.00 | 1250.00 | 1250.00 | 1250.00 | 1250.00 | 1250.00 | 1250.00 | 1250.00 | 1250.00 | 1250.00 | 0.10 | NA | NA | NA | NA | NA | NA | NA | NA | NA | NA | NA | NA | NA | NA | NA | NA | NA | NA | NA | NA | NA | NA | NA | NA | NA | NA | NA | NA | NA | NA | NA | NA | NA | NA | NA | NA | NA | NA | NA | NA | NA | NA | |
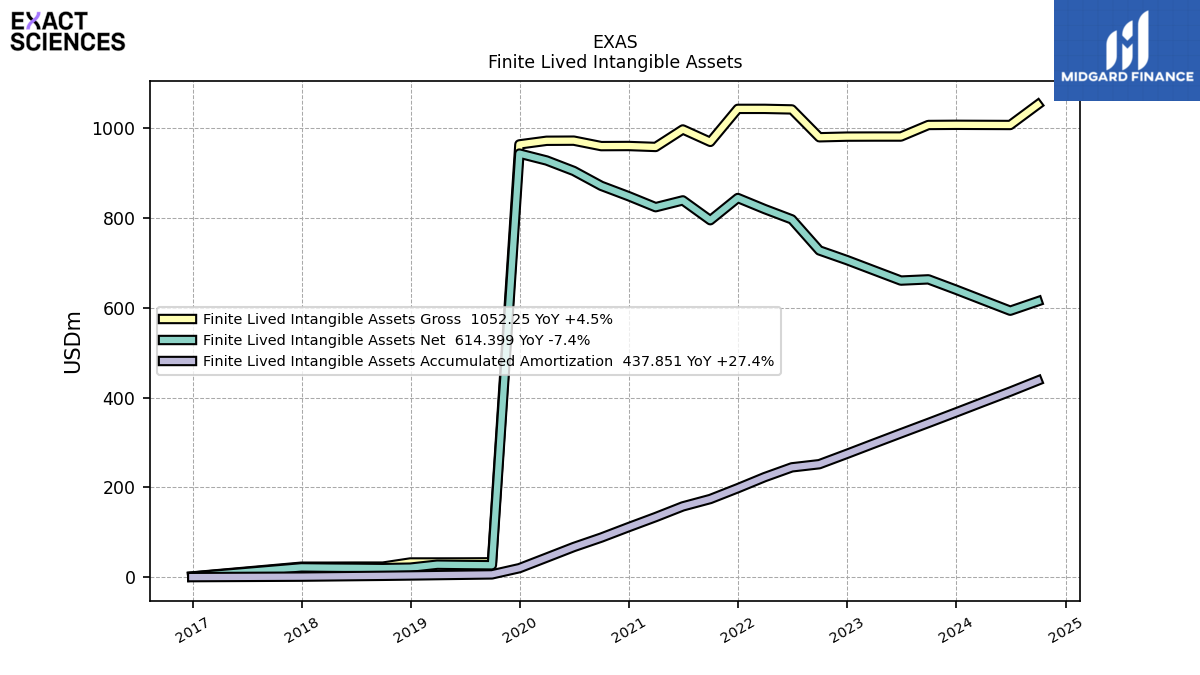
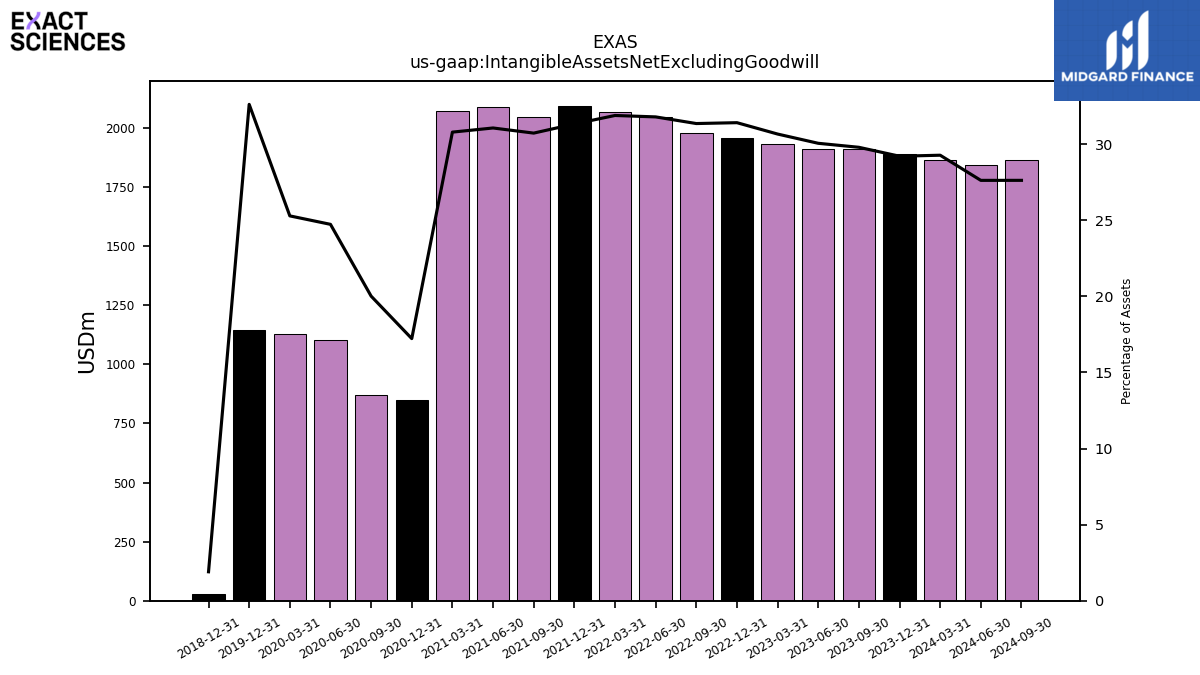
| Intangible Assets Net Excluding Goodwill | 1890.40 | 1913.31 | 1910.56 | 1933.48 | 1956.24 | 1977.69 | 2046.77 | 2069.76 | 2094.41 | 2044.96 | 2089.11 | 2073.93 | 848.43 | 871.66 | 1105.12 | 1128.26 | 1143.55 | NA | NA | NA | 29.00 | NA | NA | NA | NA | NA | NA | NA | NA | NA | NA | NA | NA | NA | NA | NA | NA | NA | NA | NA | NA | NA | NA | NA | NA | NA | NA | NA | NA | NA | NA | NA | NA | NA | NA | |
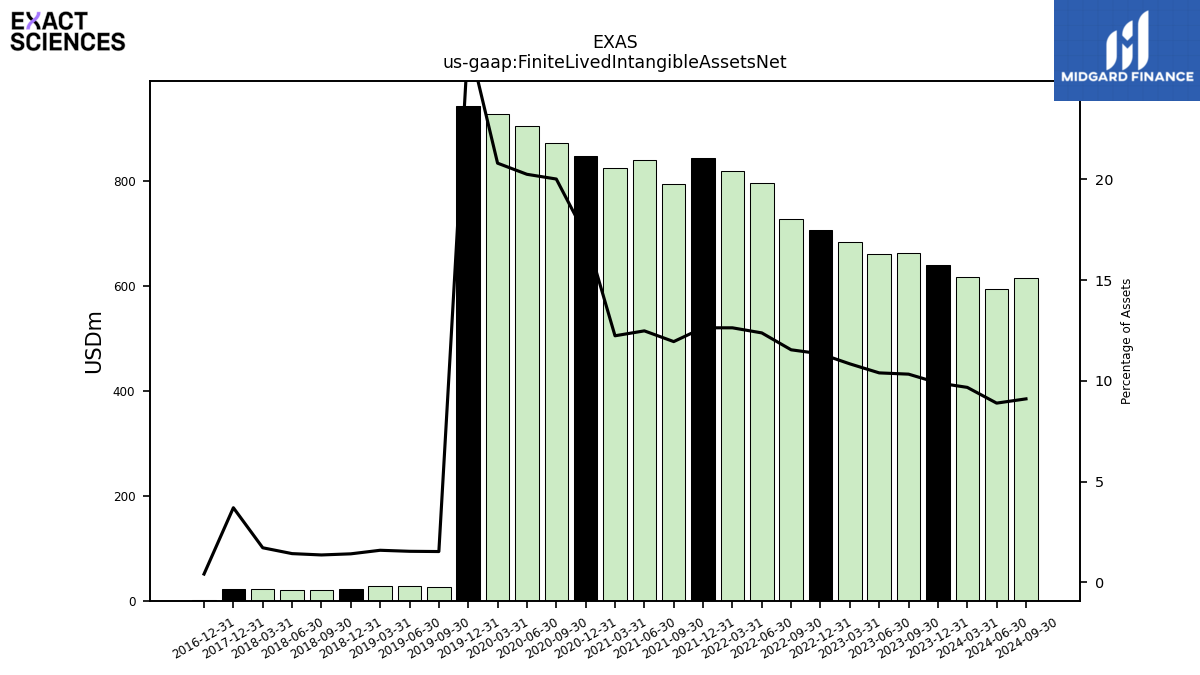
| Finite Lived Intangible Assets Net | 640.40 | 663.31 | 660.56 | 683.48 | 706.24 | 727.69 | 796.77 | 819.76 | 844.41 | 794.96 | 839.11 | 823.93 | 848.32 | 871.45 | 904.62 | 927.91 | 943.28 | 26.88 | 27.45 | 28.17 | 21.56 | 20.51 | 21.13 | 21.56 | 22.16 | NA | NA | NA | 1.55 | NA | NA | NA | NA | NA | NA | NA | NA | NA | NA | NA | NA | NA | NA | NA | NA | NA | NA | NA | NA | NA | NA | NA | NA | NA | NA | |
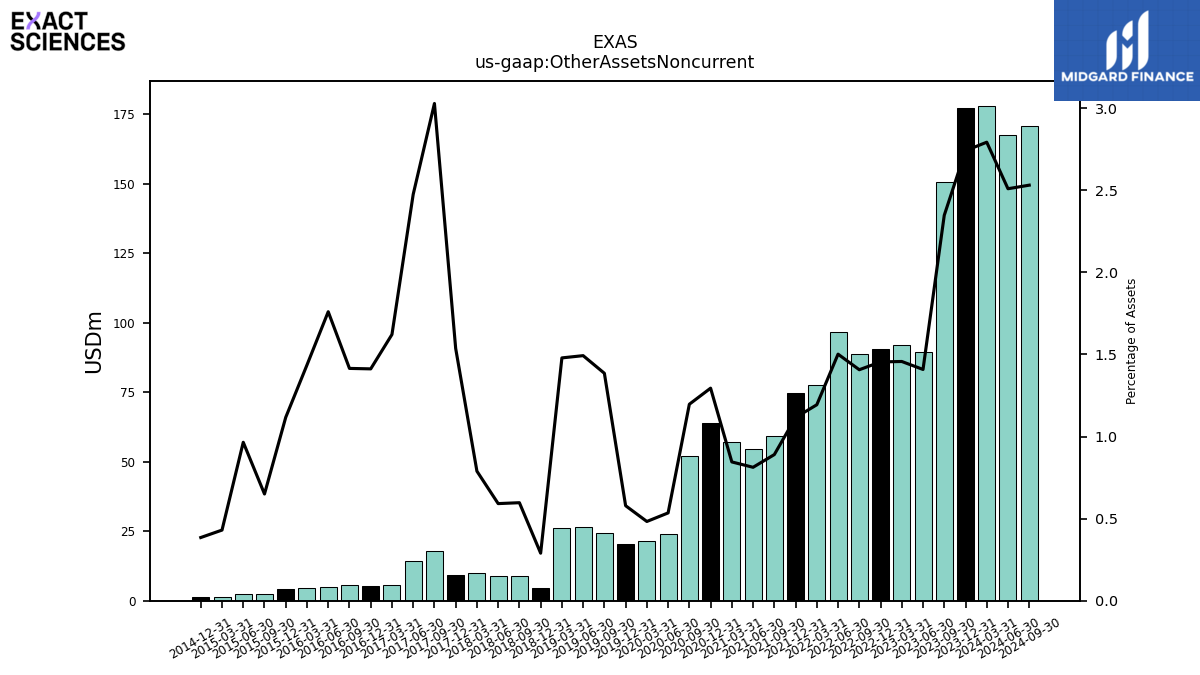
| Other Assets Noncurrent | 177.39 | 150.75 | 89.54 | 91.87 | 90.58 | 88.74 | 96.68 | 77.48 | 74.59 | 59.24 | 54.66 | 56.95 | 63.77 | 52.12 | 23.90 | 21.54 | 20.29 | 24.37 | 26.60 | 26.19 | 4.42 | 9.02 | 8.77 | 9.92 | 9.20 | 17.78 | 14.42 | 5.68 | 5.33 | 5.71 | 5.08 | 4.65 | 4.07 | 2.56 | 2.44 | 1.20 | 1.20 | NA | NA | NA | NA | NA | NA | NA | NA | NA | NA | NA | NA | NA | NA | NA | NA | NA | NA | |
| Equity Securities Fv Ni | 3.84 | 2.75 | 2.60 | 2.59 | 5.15 | 5.39 | 1.10 | 1.82 | 3.34 | 3.07 | 7.53 | NA | 1.52 | 1.42 | 1.39 | 1.02 | 1.72 | NA | NA | NA | 0.00 | NA | NA | NA | NA | NA | NA | NA | NA | NA | NA | NA | NA | NA | NA | NA | NA | NA | NA | NA | NA | NA | NA | NA | NA | NA | NA | NA | NA | NA | NA | NA | NA | NA | NA |
| 2023-12-31 | 2023-09-30 | 2023-06-30 | 2023-03-31 | 2022-12-31 | 2022-09-30 | 2022-06-30 | 2022-03-31 | 2021-12-31 | 2021-09-30 | 2021-06-30 | 2021-03-31 | 2020-12-31 | 2020-09-30 | 2020-06-30 | 2020-03-31 | 2019-12-31 | 2019-09-30 | 2019-06-30 | 2019-03-31 | 2018-12-31 | 2018-09-30 | 2018-06-30 | 2018-03-31 | 2017-12-31 | 2017-09-30 | 2017-06-30 | 2017-03-31 | 2016-12-31 | 2016-09-30 | 2016-06-30 | 2016-03-31 | 2015-12-31 | 2015-09-30 | 2015-06-30 | 2015-03-31 | 2014-12-31 | 2014-09-30 | 2014-06-30 | 2014-03-31 | 2013-12-31 | 2013-09-30 | 2013-06-30 | 2013-03-31 | 2012-12-31 | 2012-09-30 | 2012-06-30 | 2012-03-31 | 2011-12-31 | 2011-09-30 | 2011-06-30 | 2011-03-31 | 2010-12-31 | 2010-09-30 | 2010-06-30 | ||
|---|---|---|---|---|---|---|---|---|---|---|---|---|---|---|---|---|---|---|---|---|---|---|---|---|---|---|---|---|---|---|---|---|---|---|---|---|---|---|---|---|---|---|---|---|---|---|---|---|---|---|---|---|---|---|---|---|
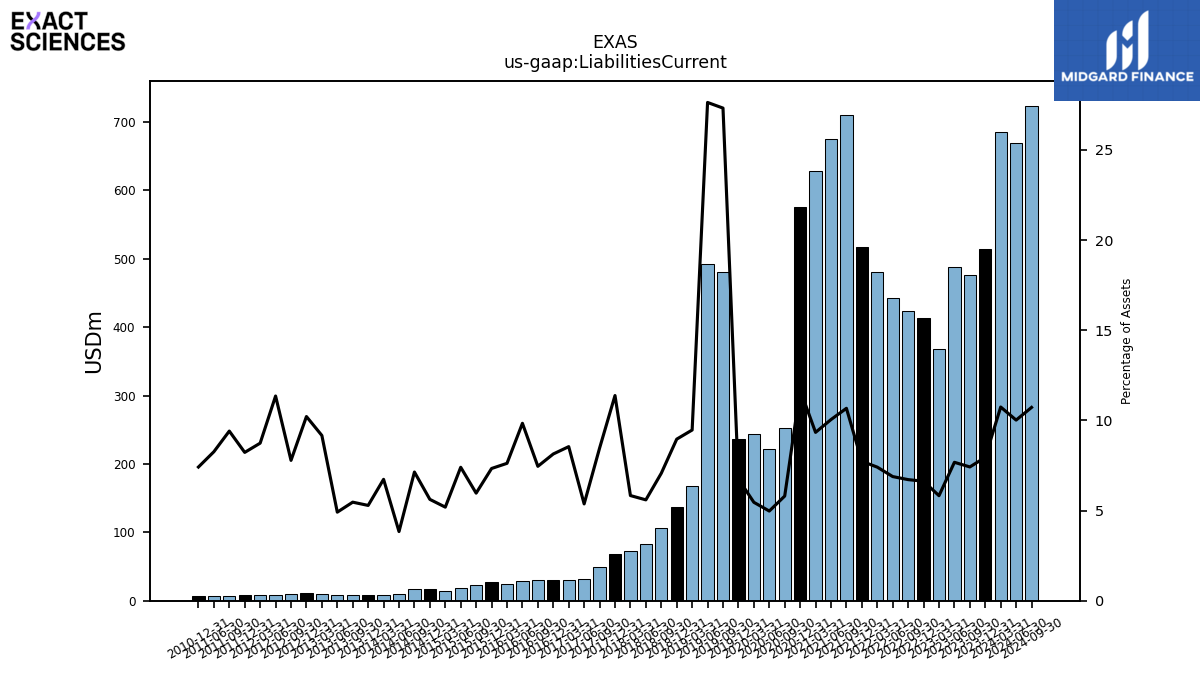
| Liabilities Current | 514.70 | 476.51 | 488.06 | 367.35 | 412.75 | 423.68 | 443.33 | 480.95 | 517.07 | 710.23 | 675.70 | 628.91 | 575.84 | 252.83 | 222.27 | 243.58 | 236.49 | 480.69 | 492.46 | 167.66 | 136.59 | 106.73 | 82.96 | 73.33 | 68.12 | 49.69 | 31.29 | 29.94 | 30.69 | 30.06 | 28.39 | 24.68 | 26.72 | 23.51 | 18.73 | 14.48 | 17.52 | 16.75 | 9.82 | 9.03 | 7.75 | 8.50 | 8.02 | 9.16 | 11.46 | 9.61 | 8.64 | 7.69 | 7.98 | 7.39 | 7.07 | NA | 7.16 | NA | NA | |
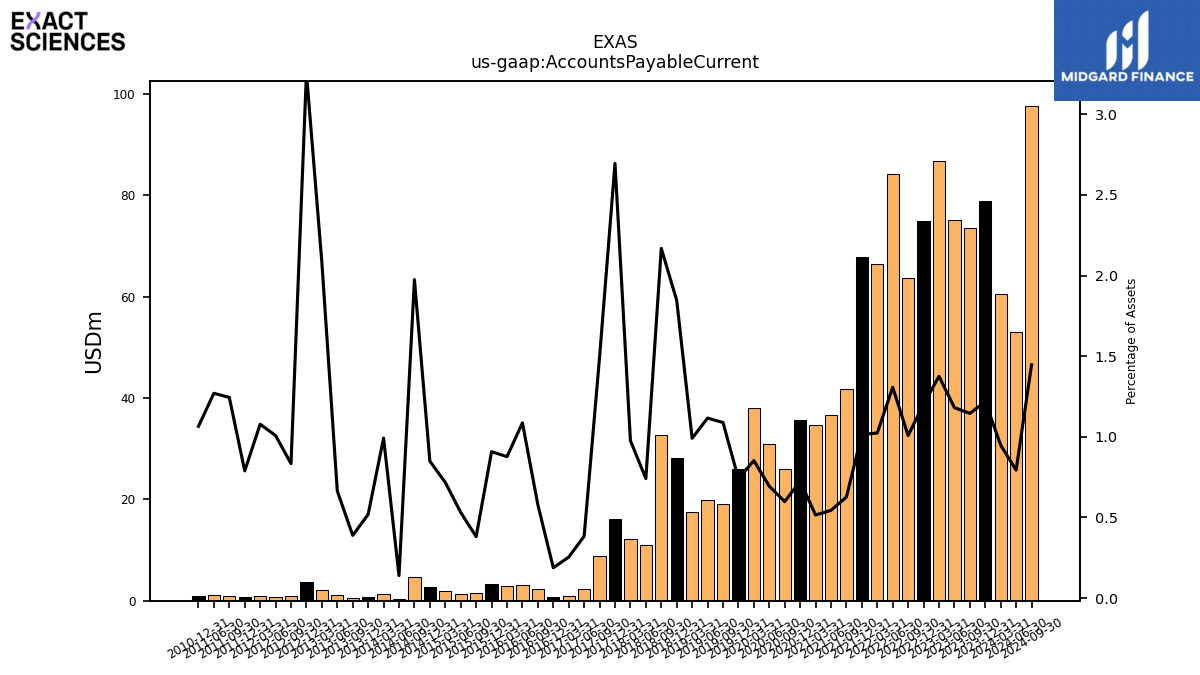
| Accounts Payable Current | 78.82 | 73.56 | 75.08 | 86.71 | 74.92 | 63.58 | 84.17 | 66.47 | 67.83 | 41.72 | 36.59 | 34.70 | 35.71 | 26.06 | 31.00 | 38.05 | 25.97 | 19.16 | 19.90 | 17.55 | 28.14 | 32.74 | 10.99 | 12.27 | 16.14 | 8.77 | 2.24 | 0.89 | 0.71 | 2.33 | 3.13 | 2.84 | 3.31 | 1.50 | 1.34 | 2.00 | 2.65 | 4.63 | 0.36 | 1.33 | 0.76 | 0.60 | 1.08 | 2.08 | 3.65 | 1.03 | 0.77 | 0.95 | 0.77 | 0.98 | 1.09 | NA | 1.03 | NA | NA | |
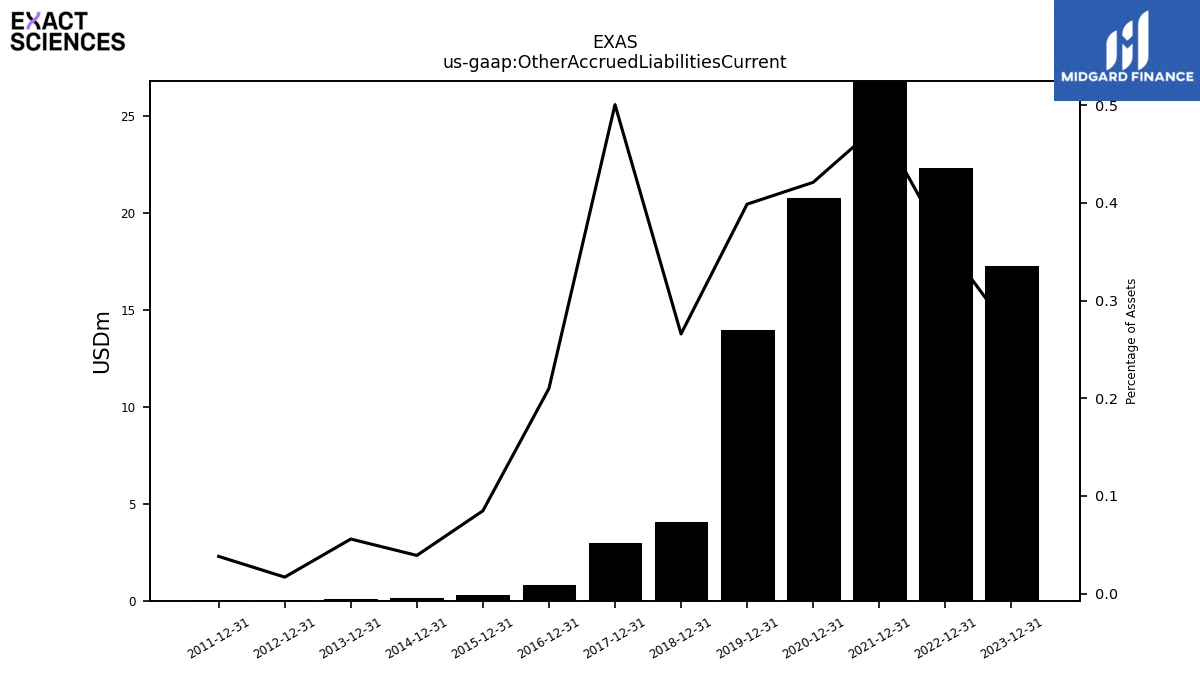
| Other Accrued Liabilities Current | 17.27 | NA | NA | NA | 22.33 | NA | NA | NA | 32.12 | NA | NA | NA | 20.73 | NA | NA | NA | 13.98 | NA | NA | NA | 4.05 | NA | NA | NA | 3.00 | NA | NA | NA | 0.79 | NA | NA | NA | 0.31 | NA | NA | NA | 0.12 | NA | NA | NA | 0.08 | NA | NA | NA | 0.02 | NA | NA | NA | 0.04 | NA | NA | NA | NA | NA | NA | |
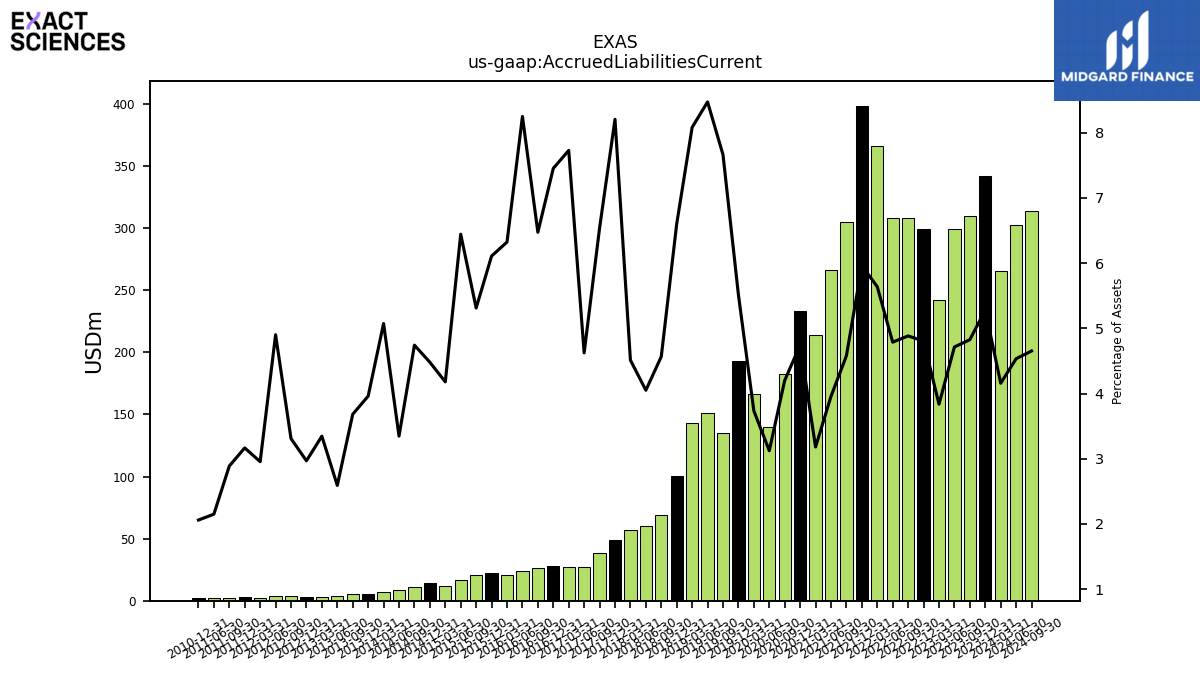
| Accrued Liabilities Current | 341.68 | 309.87 | 299.59 | 241.84 | 299.22 | 307.99 | 308.22 | 365.92 | 398.56 | 304.71 | 266.00 | 214.14 | 233.60 | 182.94 | 139.50 | 166.60 | 193.33 | 134.83 | 151.01 | 143.13 | 100.64 | 68.94 | 60.05 | 56.72 | 49.13 | 38.39 | 26.93 | 27.08 | 28.11 | 26.10 | 23.81 | 20.48 | 22.25 | 20.93 | 16.31 | 11.65 | 13.96 | 11.13 | 8.56 | 6.81 | 5.81 | 5.72 | 4.23 | 3.35 | 3.33 | 4.08 | 3.73 | 2.60 | 3.07 | 2.27 | 1.84 | NA | 1.99 | NA | NA | |
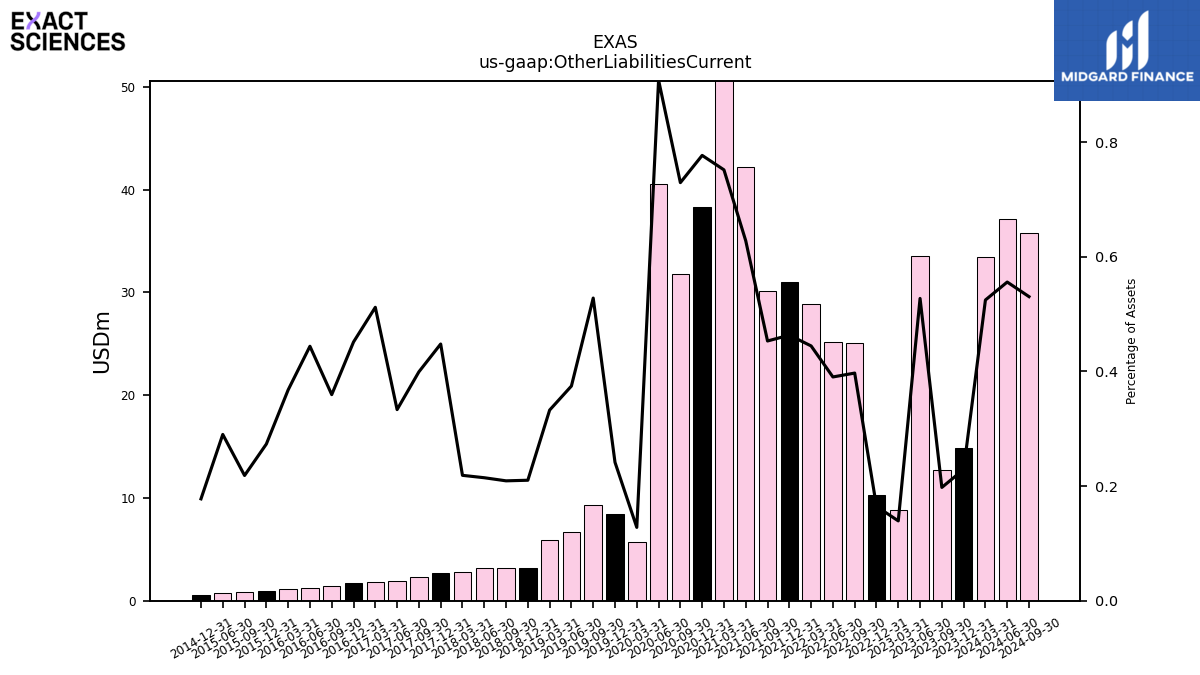
| Other Liabilities Current | 14.82 | 12.69 | 33.52 | 8.78 | 10.25 | 25.05 | 25.13 | 28.85 | 30.97 | 30.16 | 42.23 | 50.63 | 38.27 | 31.76 | 40.58 | 5.71 | 8.47 | 9.29 | 6.67 | 5.89 | 3.20 | 3.16 | 3.18 | 2.75 | 2.68 | 2.35 | 1.94 | 1.79 | 1.70 | 1.45 | 1.28 | 1.19 | 1.00 | 0.86 | 0.73 | NA | 0.55 | NA | NA | NA | NA | NA | NA | NA | NA | NA | NA | NA | NA | NA | NA | NA | NA | NA | NA |
| 2023-12-31 | 2023-09-30 | 2023-06-30 | 2023-03-31 | 2022-12-31 | 2022-09-30 | 2022-06-30 | 2022-03-31 | 2021-12-31 | 2021-09-30 | 2021-06-30 | 2021-03-31 | 2020-12-31 | 2020-09-30 | 2020-06-30 | 2020-03-31 | 2019-12-31 | 2019-09-30 | 2019-06-30 | 2019-03-31 | 2018-12-31 | 2018-09-30 | 2018-06-30 | 2018-03-31 | 2017-12-31 | 2017-09-30 | 2017-06-30 | 2017-03-31 | 2016-12-31 | 2016-09-30 | 2016-06-30 | 2016-03-31 | 2015-12-31 | 2015-09-30 | 2015-06-30 | 2015-03-31 | 2014-12-31 | 2014-09-30 | 2014-06-30 | 2014-03-31 | 2013-12-31 | 2013-09-30 | 2013-06-30 | 2013-03-31 | 2012-12-31 | 2012-09-30 | 2012-06-30 | 2012-03-31 | 2011-12-31 | 2011-09-30 | 2011-06-30 | 2011-03-31 | 2010-12-31 | 2010-09-30 | 2010-06-30 | ||
|---|---|---|---|---|---|---|---|---|---|---|---|---|---|---|---|---|---|---|---|---|---|---|---|---|---|---|---|---|---|---|---|---|---|---|---|---|---|---|---|---|---|---|---|---|---|---|---|---|---|---|---|---|---|---|---|---|
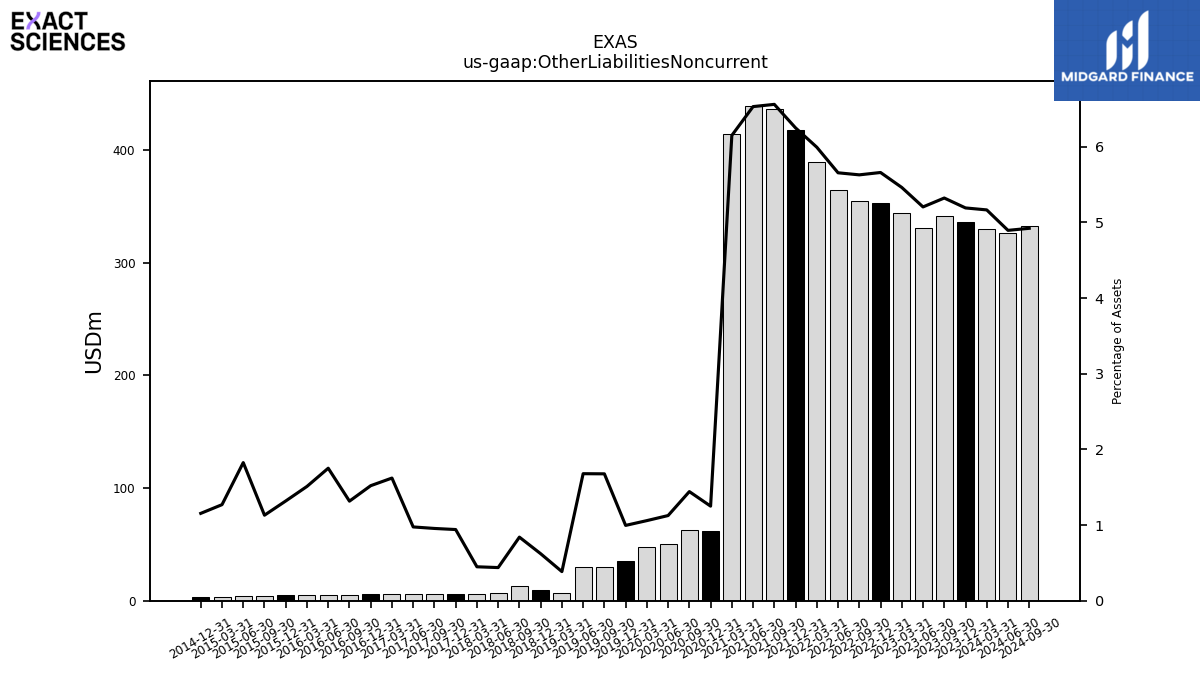
| Other Liabilities Noncurrent | 335.98 | 341.77 | 330.82 | 344.38 | 352.46 | 355.00 | 364.11 | 389.06 | 417.78 | 436.58 | 439.18 | 414.19 | 61.58 | 62.82 | 50.31 | 47.25 | 34.91 | 29.51 | 29.92 | 6.82 | 9.47 | 12.69 | 6.50 | 5.64 | 5.63 | 5.61 | 5.68 | 5.68 | 5.73 | 5.31 | 5.05 | 4.89 | 4.80 | 4.46 | 4.62 | 3.54 | 3.60 | NA | NA | NA | NA | NA | NA | NA | NA | NA | NA | NA | NA | NA | NA | NA | NA | NA | NA | |
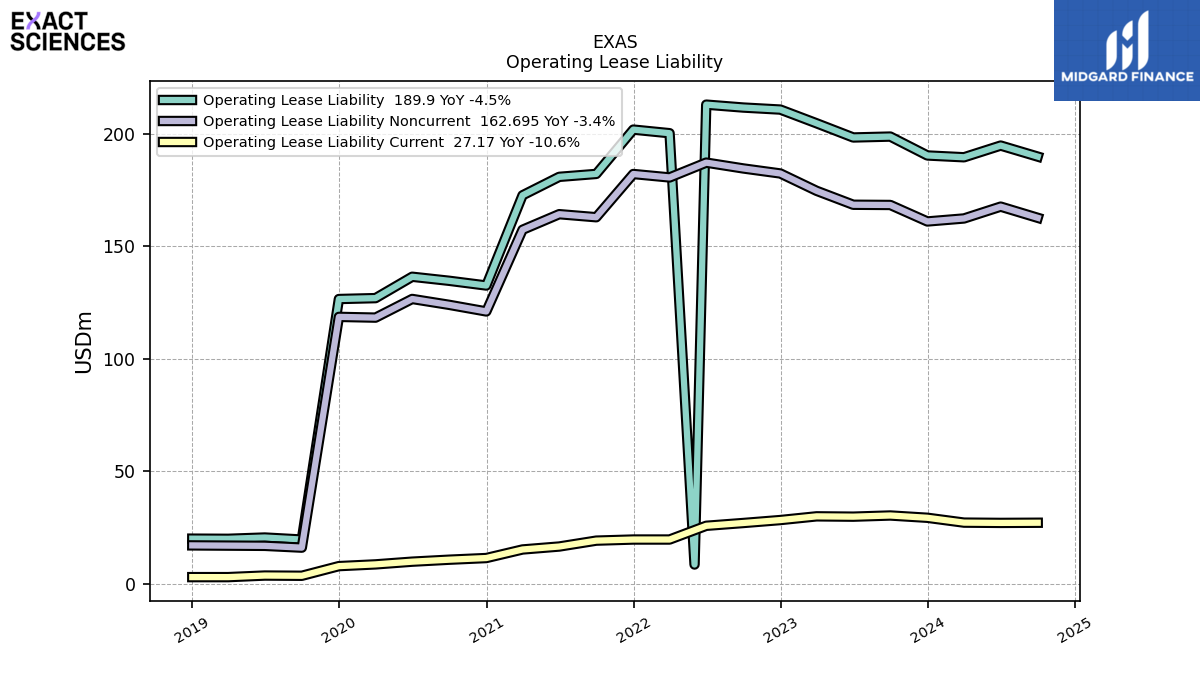
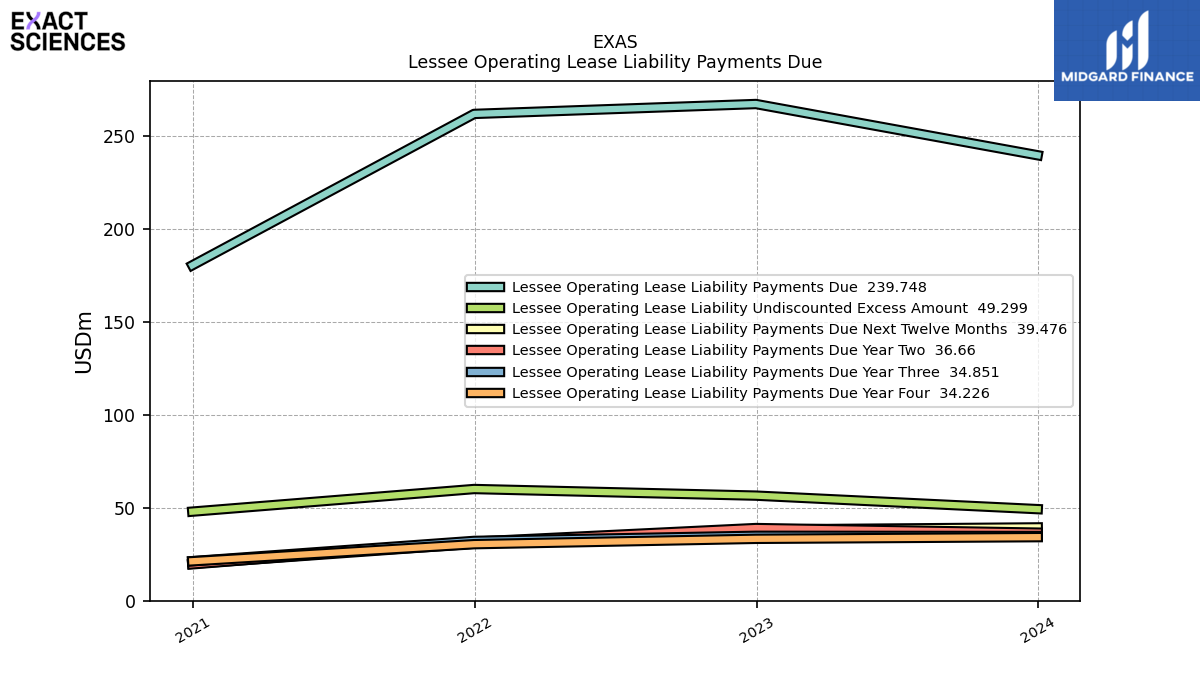
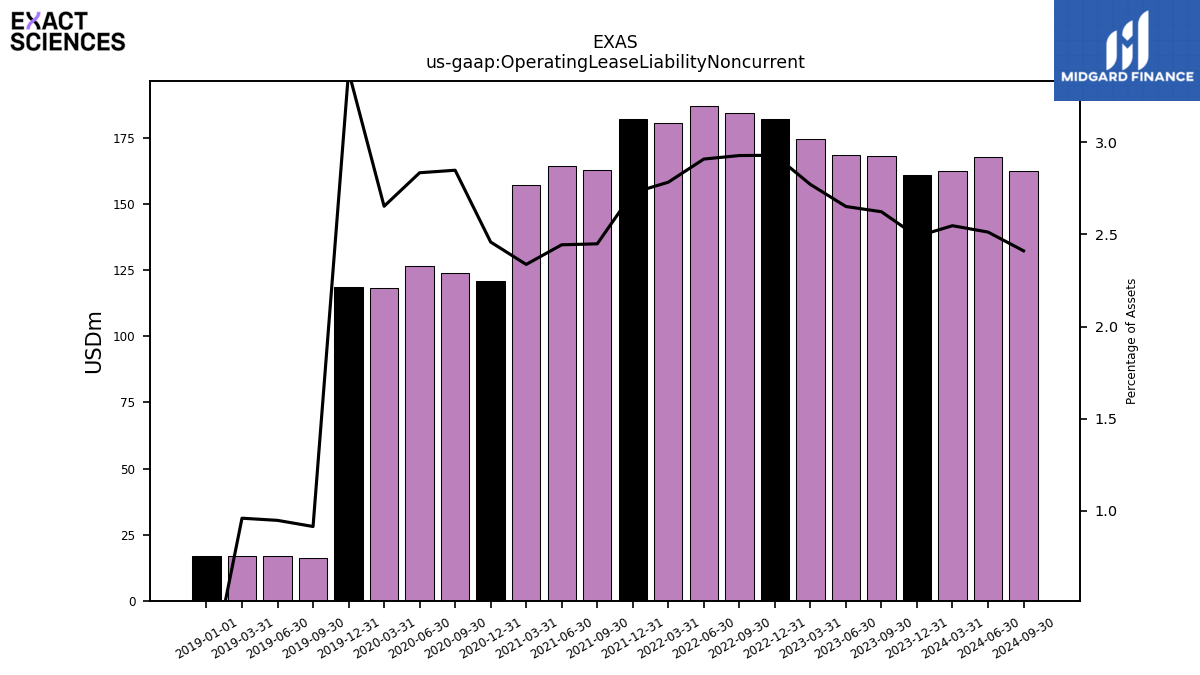
| Operating Lease Liability Noncurrent | 161.07 | 168.40 | 168.50 | 174.69 | 182.40 | 184.63 | 187.23 | 180.63 | 182.17 | 162.95 | 164.31 | 157.38 | 121.08 | 124.01 | 126.63 | 118.33 | 118.67 | 16.10 | 16.90 | 17.00 | NA | NA | NA | NA | NA | NA | NA | NA | NA | NA | NA | NA | NA | NA | NA | NA | NA | NA | NA | NA | NA | NA | NA | NA | NA | NA | NA | NA | NA | NA | NA | NA | NA | NA | NA |
| 2023-12-31 | 2023-09-30 | 2023-06-30 | 2023-03-31 | 2022-12-31 | 2022-09-30 | 2022-06-30 | 2022-03-31 | 2021-12-31 | 2021-09-30 | 2021-06-30 | 2021-03-31 | 2020-12-31 | 2020-09-30 | 2020-06-30 | 2020-03-31 | 2019-12-31 | 2019-09-30 | 2019-06-30 | 2019-03-31 | 2018-12-31 | 2018-09-30 | 2018-06-30 | 2018-03-31 | 2017-12-31 | 2017-09-30 | 2017-06-30 | 2017-03-31 | 2016-12-31 | 2016-09-30 | 2016-06-30 | 2016-03-31 | 2015-12-31 | 2015-09-30 | 2015-06-30 | 2015-03-31 | 2014-12-31 | 2014-09-30 | 2014-06-30 | 2014-03-31 | 2013-12-31 | 2013-09-30 | 2013-06-30 | 2013-03-31 | 2012-12-31 | 2012-09-30 | 2012-06-30 | 2012-03-31 | 2011-12-31 | 2011-09-30 | 2011-06-30 | 2011-03-31 | 2010-12-31 | 2010-09-30 | 2010-06-30 | ||
|---|---|---|---|---|---|---|---|---|---|---|---|---|---|---|---|---|---|---|---|---|---|---|---|---|---|---|---|---|---|---|---|---|---|---|---|---|---|---|---|---|---|---|---|---|---|---|---|---|---|---|---|---|---|---|---|---|
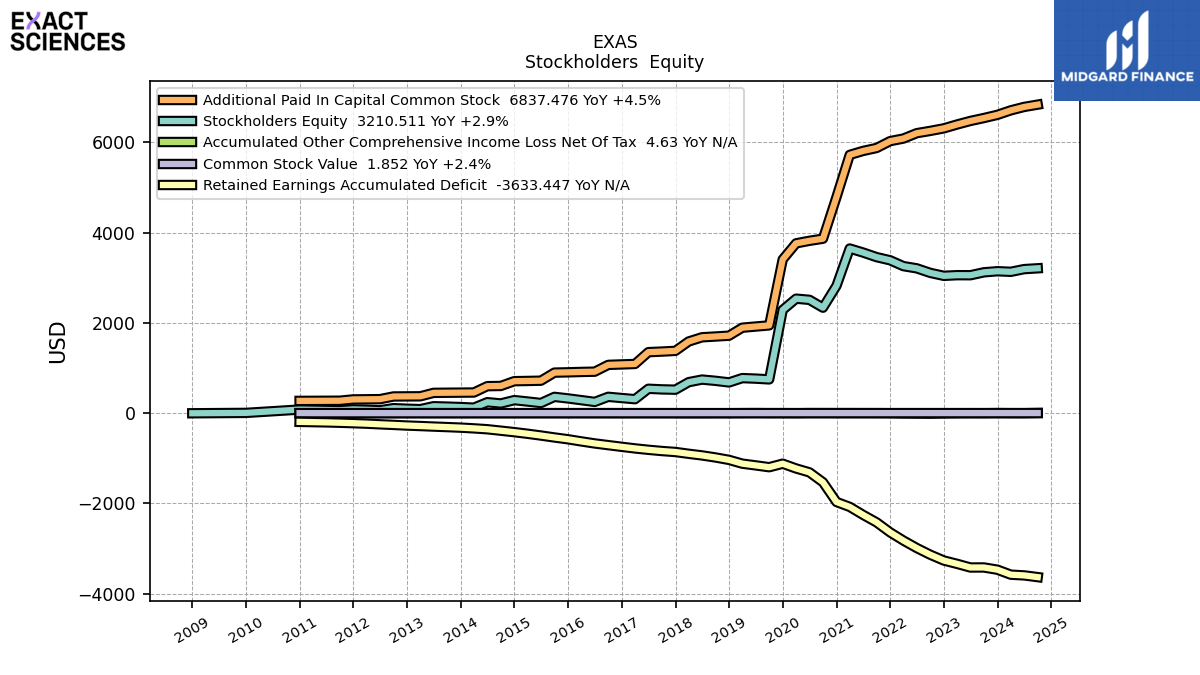
| Stockholders Equity | 3145.30 | 3121.23 | 3056.62 | 3057.71 | 3043.16 | 3108.63 | 3209.35 | 3258.21 | 3387.64 | 3457.59 | 3559.10 | 3648.99 | 2823.49 | 2337.10 | 2511.19 | 2537.65 | 2288.06 | 748.28 | 765.53 | 776.94 | 680.94 | 716.73 | 744.39 | 687.02 | 520.42 | 527.14 | 540.69 | 309.52 | 335.30 | 362.33 | 249.39 | 288.33 | 326.86 | 361.29 | 224.84 | 258.21 | 288.98 | 215.10 | 242.87 | 121.76 | 135.32 | 145.09 | 153.58 | 89.13 | 98.59 | 110.66 | 64.02 | 75.86 | 83.50 | 64.59 | NA | NA | 79.75 | NA | NA | |
| Common Stock Value | 1.81 | 1.81 | 1.81 | 1.80 | 1.78 | 1.77 | 1.77 | 1.76 | 1.74 | 1.72 | 1.72 | 1.71 | 1.59 | 1.50 | 1.50 | 1.50 | 1.48 | 1.30 | 1.29 | 1.29 | 1.23 | 1.23 | 1.23 | 1.22 | 1.21 | 1.20 | 1.19 | 1.11 | 1.10 | 1.08 | 0.98 | 0.98 | 0.97 | 0.96 | 0.89 | 0.89 | 0.89 | 0.83 | 0.83 | 0.71 | 0.71 | 0.71 | 0.71 | 0.64 | 0.64 | 0.64 | 0.57 | 0.57 | 0.57 | 0.53 | 0.53 | NA | 0.52 | NA | NA | |
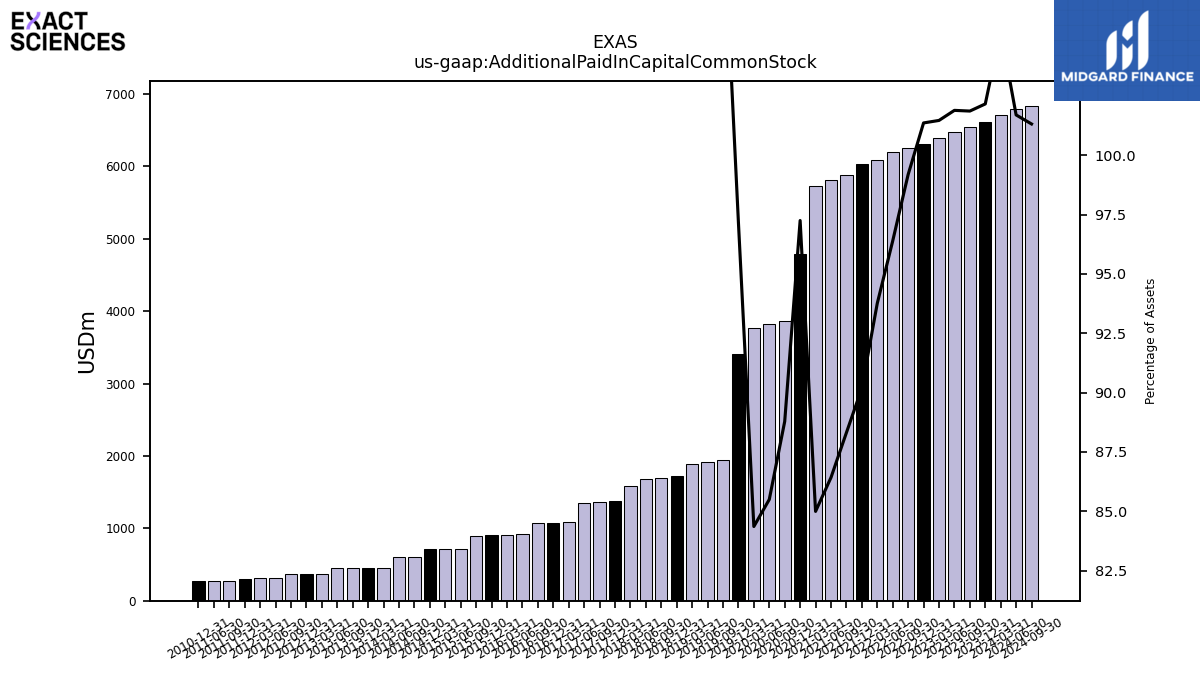
| Additional Paid In Capital Common Stock | 6611.24 | 6540.36 | 6475.74 | 6396.81 | 6311.64 | 6255.21 | 6204.74 | 6085.56 | 6028.86 | 5876.64 | 5811.29 | 5723.98 | 4789.66 | 3865.99 | 3819.80 | 3763.33 | 3406.44 | 1945.05 | 1919.72 | 1894.12 | 1716.89 | 1698.69 | 1681.46 | 1588.17 | 1380.58 | 1365.11 | 1351.84 | 1090.00 | 1080.43 | 1070.08 | 919.27 | 913.46 | 904.93 | 898.79 | 719.63 | 713.86 | 709.02 | 602.64 | 598.25 | 457.78 | 455.24 | 452.84 | 450.27 | 373.52 | 372.12 | 370.18 | 310.70 | 307.74 | 304.77 | 276.03 | 274.52 | NA | 272.38 | NA | NA | |
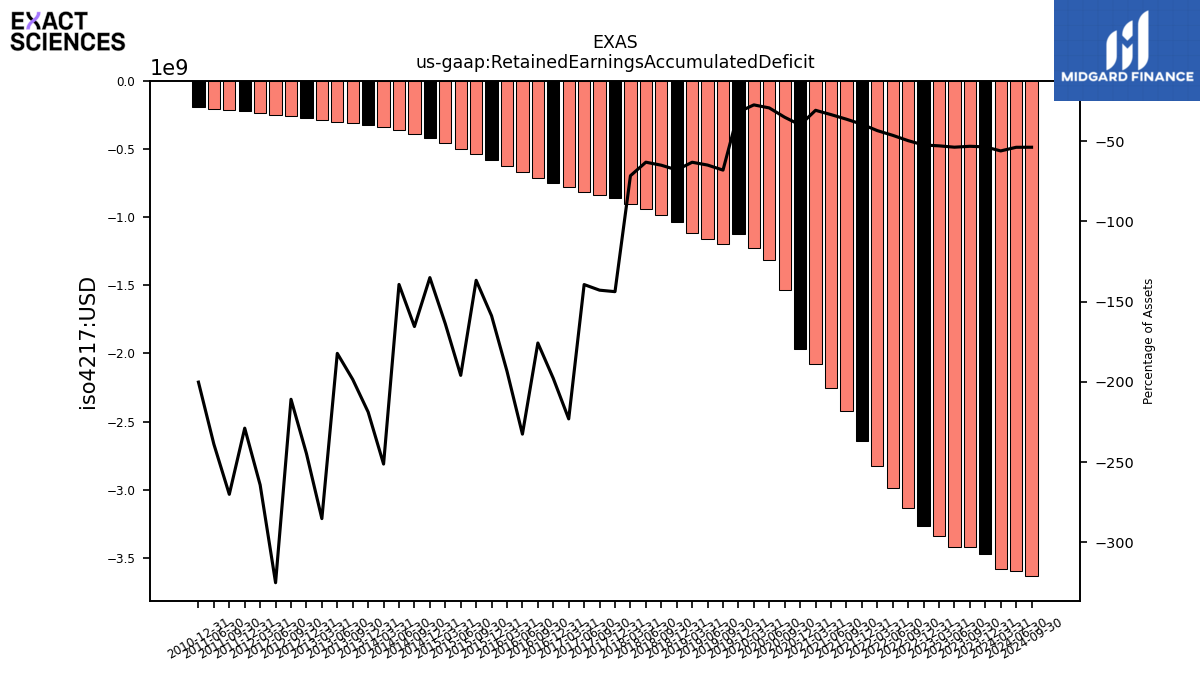
| Retained Earnings Accumulated Deficit | -3469.18 | -3419.41 | -3420.20 | -3339.18 | -3265.03 | -3137.28 | -2988.52 | -2822.46 | -2641.52 | -2420.91 | -2253.97 | -2077.06 | -1968.29 | -1531.48 | -1311.60 | -1225.45 | -1119.76 | -1197.70 | -1157.24 | -1118.82 | -1035.76 | -981.79 | -936.42 | -900.04 | -860.61 | -838.85 | -811.95 | -781.16 | -745.82 | -708.65 | -670.85 | -626.08 | -578.61 | -538.62 | -495.67 | -456.61 | -420.81 | -388.36 | -356.30 | -336.87 | -320.76 | -308.57 | -297.41 | -285.10 | -274.25 | -260.26 | -247.31 | -232.47 | -221.82 | -211.92 | -204.15 | NA | -193.15 | NA | NA | |
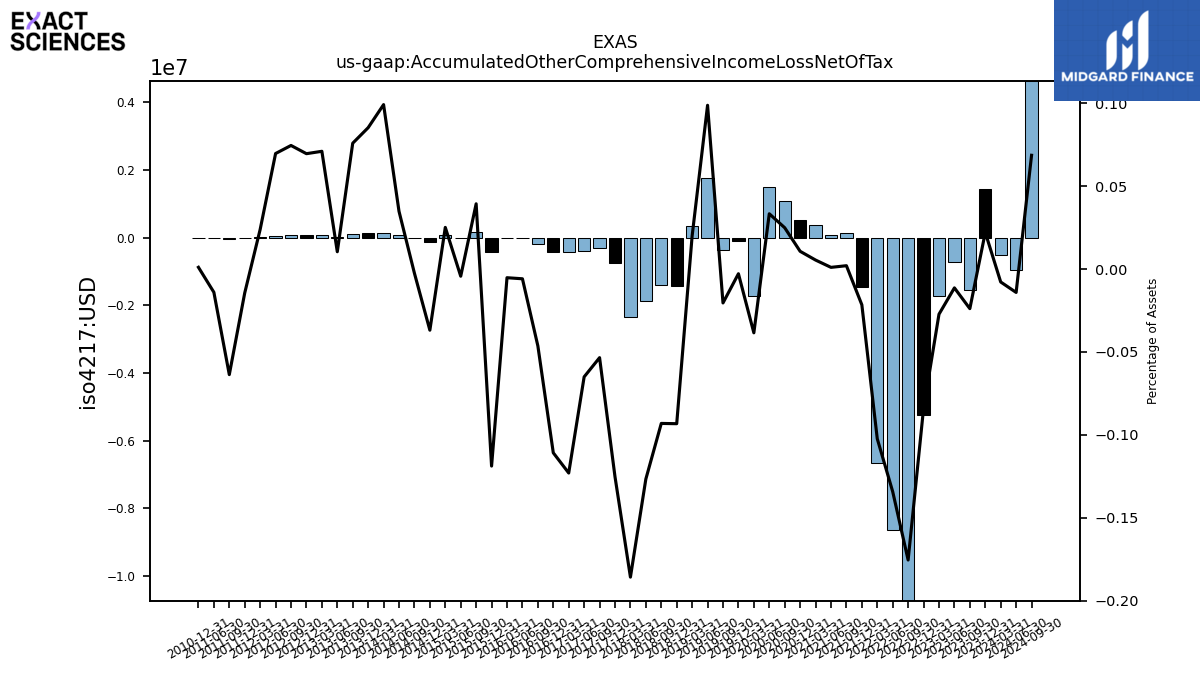
| Accumulated Other Comprehensive Income Loss Net Of Tax | 1.43 | -1.53 | -0.72 | -1.72 | -5.24 | -11.07 | -8.64 | -6.65 | -1.44 | 0.13 | 0.07 | 0.36 | 0.53 | 1.08 | 1.49 | -1.72 | -0.10 | -0.36 | 1.76 | 0.35 | -1.42 | -1.41 | -1.88 | -2.34 | -0.75 | -0.31 | -0.38 | -0.43 | -0.42 | -0.19 | -0.02 | -0.02 | -0.43 | 0.15 | -0.01 | 0.07 | -0.12 | -0.01 | 0.09 | 0.13 | 0.12 | 0.12 | 0.02 | 0.07 | 0.08 | 0.09 | 0.05 | 0.02 | -0.01 | -0.05 | -0.01 | NA | 0.00 | NA | NA |
| 2023-12-31 | 2023-09-30 | 2023-06-30 | 2023-03-31 | 2022-12-31 | 2022-09-30 | 2022-06-30 | 2022-03-31 | 2021-12-31 | 2021-09-30 | 2021-06-30 | 2021-03-31 | 2020-12-31 | 2020-09-30 | 2020-06-30 | 2020-03-31 | 2019-12-31 | 2019-09-30 | 2019-06-30 | 2019-03-31 | 2018-12-31 | 2018-09-30 | 2018-06-30 | 2018-03-31 | 2017-12-31 | 2017-09-30 | 2017-06-30 | 2017-03-31 | 2016-12-31 | 2016-09-30 | 2016-06-30 | 2016-03-31 | 2015-12-31 | 2015-09-30 | 2015-06-30 | 2015-03-31 | 2014-12-31 | 2014-09-30 | 2014-06-30 | 2014-03-31 | 2013-12-31 | 2013-09-30 | 2013-06-30 | 2013-03-31 | 2012-12-31 | 2012-09-30 | 2012-06-30 | 2012-03-31 | 2011-12-31 | 2011-09-30 | 2011-06-30 | 2011-03-31 | 2010-12-31 | 2010-09-30 | 2010-06-30 | ||
|---|---|---|---|---|---|---|---|---|---|---|---|---|---|---|---|---|---|---|---|---|---|---|---|---|---|---|---|---|---|---|---|---|---|---|---|---|---|---|---|---|---|---|---|---|---|---|---|---|---|---|---|---|---|---|---|---|
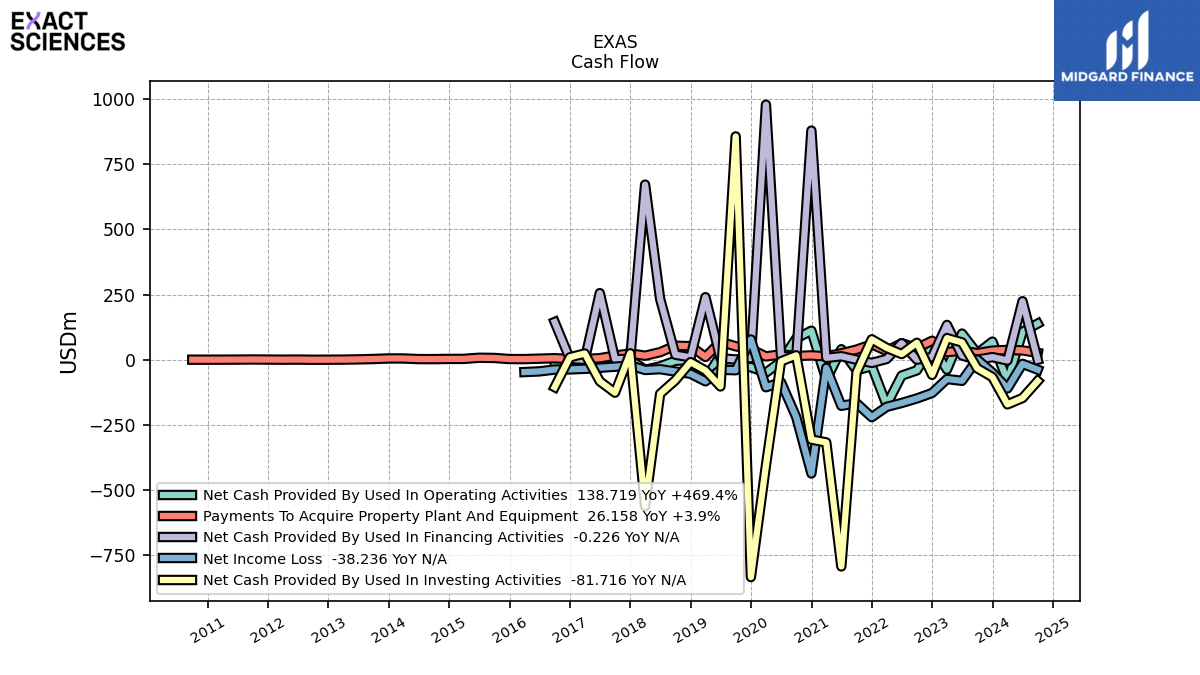
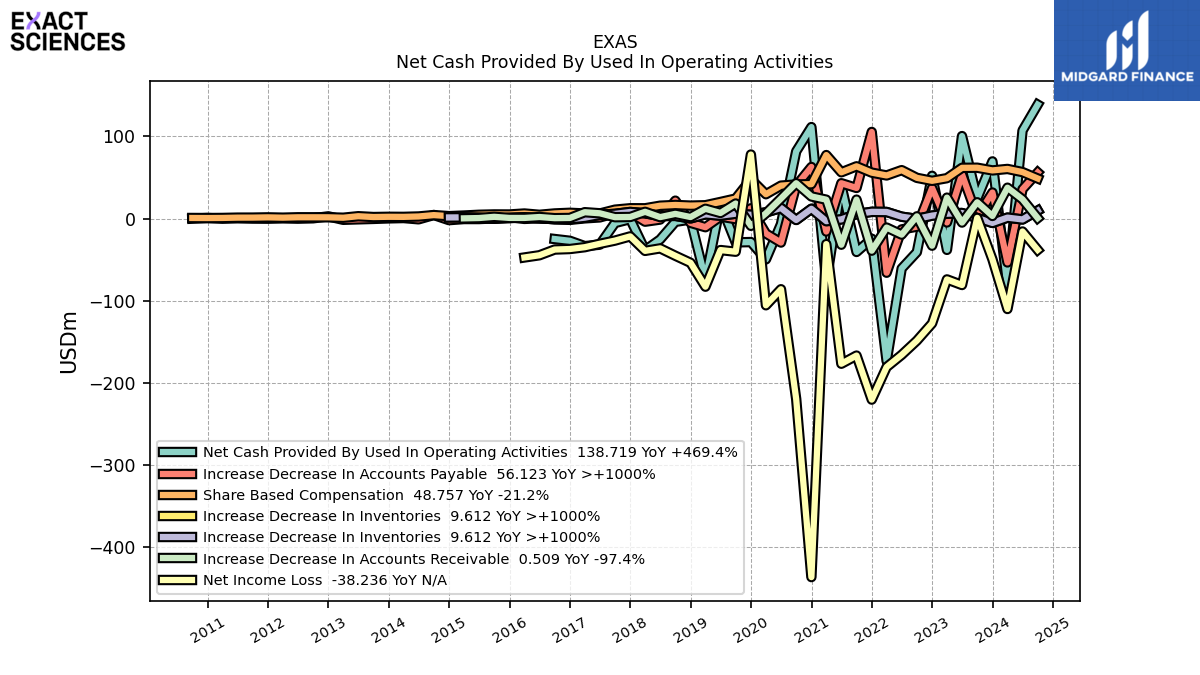
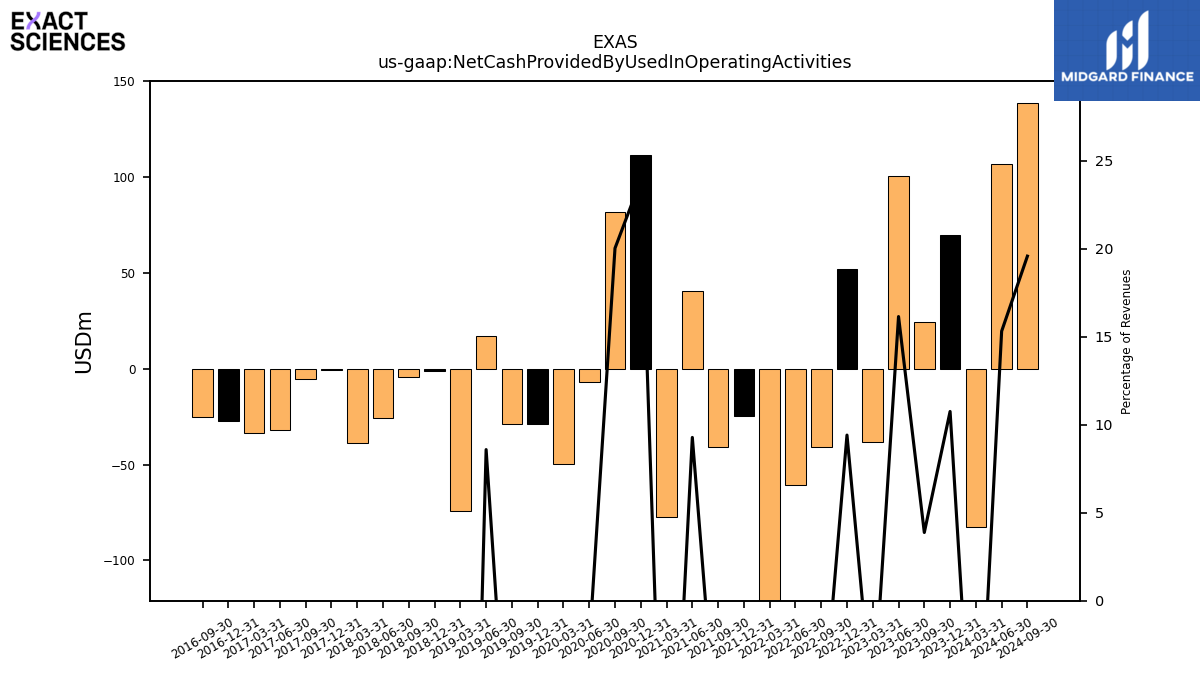
| Net Cash Provided By Used In Operating Activities | 69.55 | 24.36 | 100.42 | -38.22 | 52.04 | -40.93 | -60.92 | -173.75 | -24.57 | -40.77 | 40.34 | -77.23 | 111.40 | 81.78 | -6.87 | -49.83 | -28.68 | -29.08 | 17.16 | -74.41 | -1.24 | -4.05 | -25.51 | -38.52 | -0.76 | -5.45 | -31.87 | -33.64 | -27.13 | -24.97 | NA | NA | NA | NA | NA | NA | NA | NA | NA | NA | NA | NA | NA | NA | NA | NA | NA | NA | NA | NA | NA | NA | NA | NA | NA | |
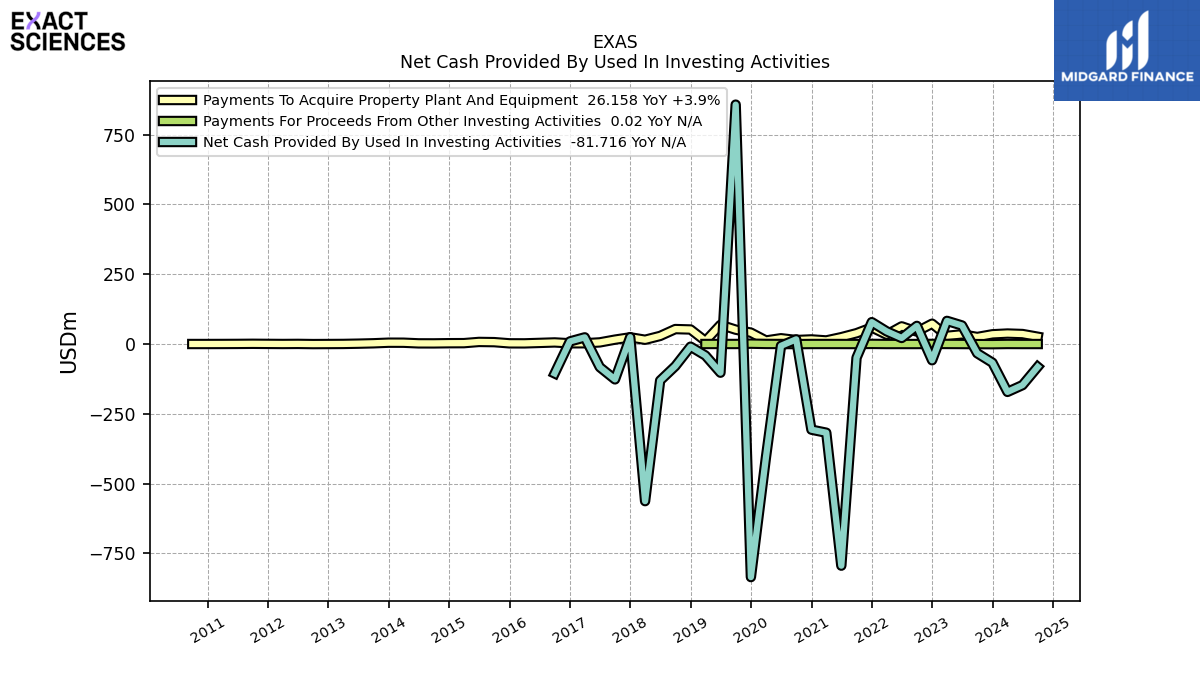
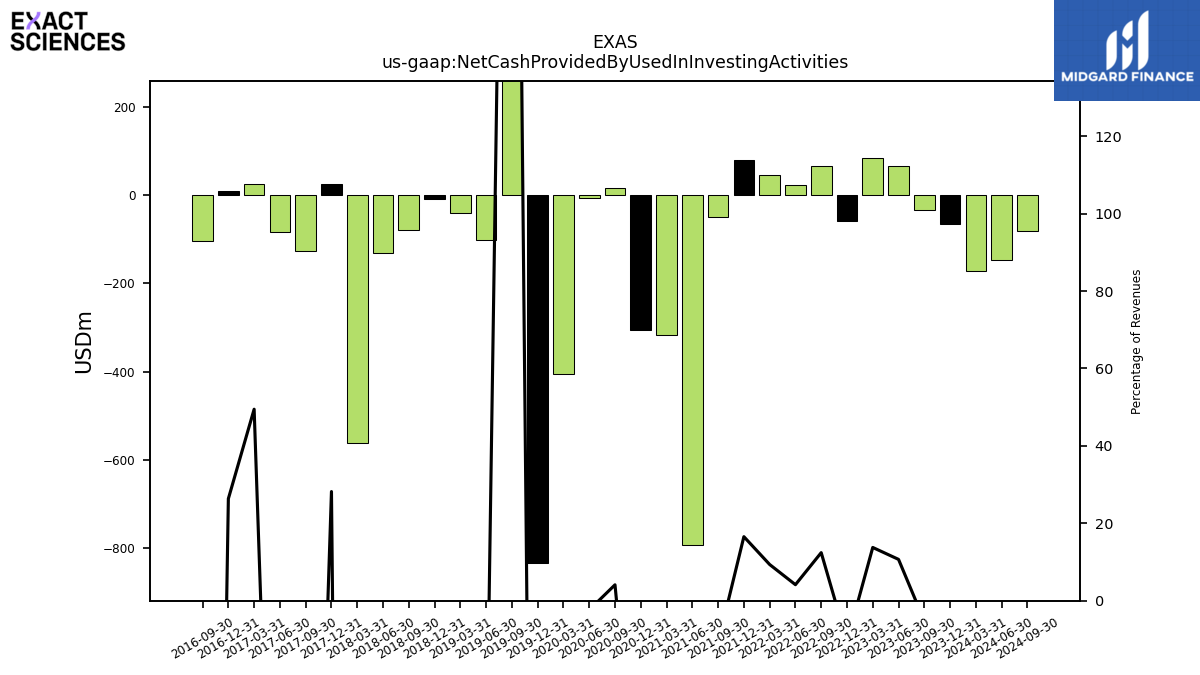
| Net Cash Provided By Used In Investing Activities | -66.77 | -32.97 | 66.47 | 82.94 | -58.16 | 65.00 | 21.66 | 45.56 | 78.44 | -49.24 | -793.77 | -317.51 | -306.64 | 16.83 | -6.38 | -405.85 | -834.77 | 857.44 | -102.67 | -41.07 | -9.42 | -78.99 | -130.78 | -562.73 | 24.65 | -126.60 | -82.79 | 23.93 | 9.29 | -105.28 | NA | NA | NA | NA | NA | NA | NA | NA | NA | NA | NA | NA | NA | NA | NA | NA | NA | NA | NA | NA | NA | NA | NA | NA | NA | |
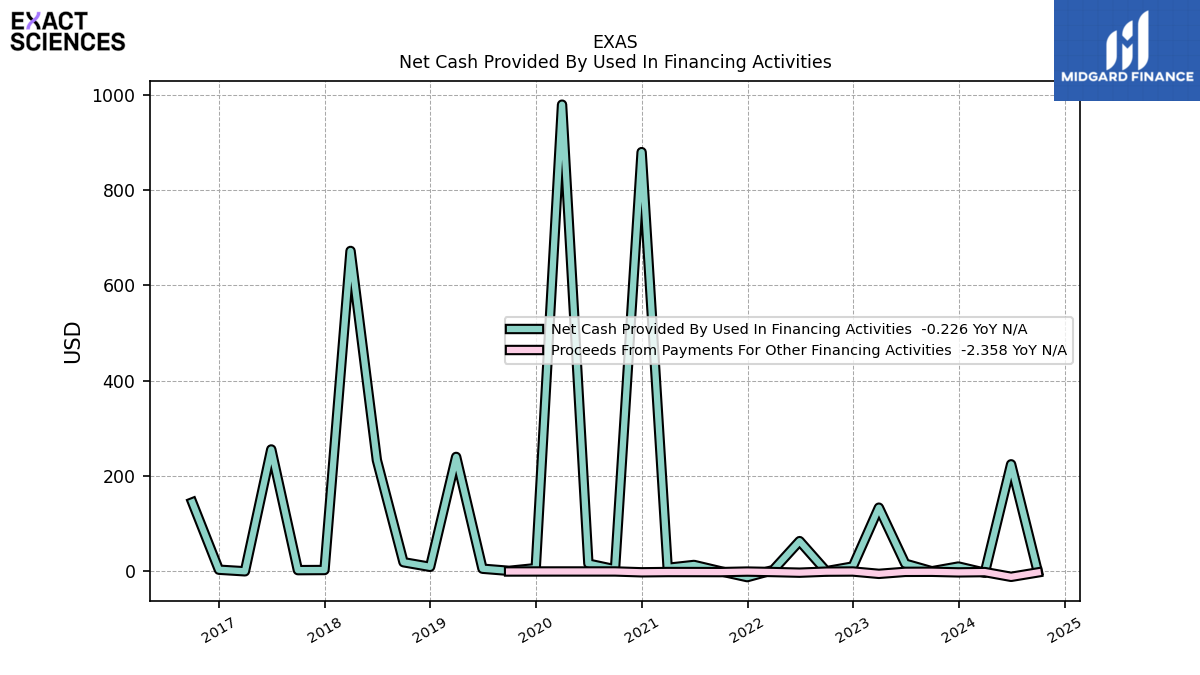
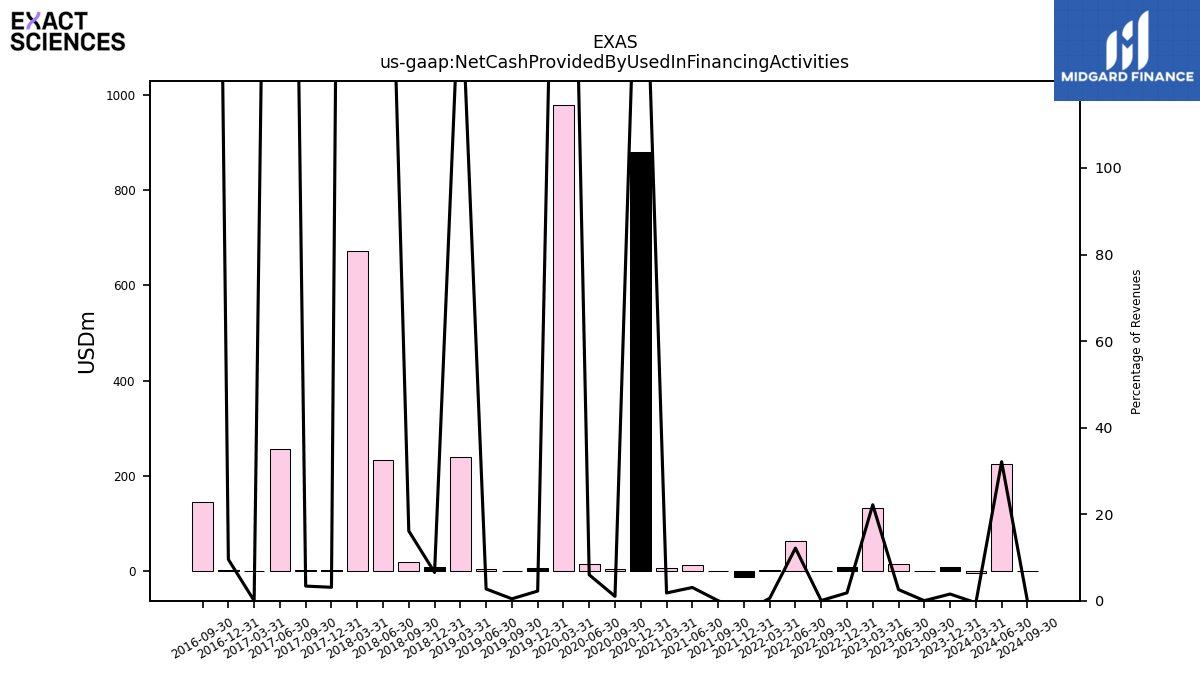
| Net Cash Provided By Used In Financing Activities | 10.04 | 0.09 | 16.04 | 133.60 | 10.10 | 0.23 | 63.41 | 2.73 | -12.20 | 0.08 | 13.34 | 7.25 | 879.86 | 4.16 | 16.12 | 979.48 | 6.62 | 0.98 | 5.45 | 240.13 | 9.35 | 19.07 | 233.28 | 672.44 | 2.72 | 2.46 | 255.78 | 0.00 | 3.37 | 144.71 | NA | NA | NA | NA | NA | NA | NA | NA | NA | NA | NA | NA | NA | NA | NA | NA | NA | NA | NA | NA | NA | NA | NA | NA | NA |
| 2023-12-31 | 2023-09-30 | 2023-06-30 | 2023-03-31 | 2022-12-31 | 2022-09-30 | 2022-06-30 | 2022-03-31 | 2021-12-31 | 2021-09-30 | 2021-06-30 | 2021-03-31 | 2020-12-31 | 2020-09-30 | 2020-06-30 | 2020-03-31 | 2019-12-31 | 2019-09-30 | 2019-06-30 | 2019-03-31 | 2018-12-31 | 2018-09-30 | 2018-06-30 | 2018-03-31 | 2017-12-31 | 2017-09-30 | 2017-06-30 | 2017-03-31 | 2016-12-31 | 2016-09-30 | 2016-06-30 | 2016-03-31 | 2015-12-31 | 2015-09-30 | 2015-06-30 | 2015-03-31 | 2014-12-31 | 2014-09-30 | 2014-06-30 | 2014-03-31 | 2013-12-31 | 2013-09-30 | 2013-06-30 | 2013-03-31 | 2012-12-31 | 2012-09-30 | 2012-06-30 | 2012-03-31 | 2011-12-31 | 2011-09-30 | 2011-06-30 | 2011-03-31 | 2010-12-31 | 2010-09-30 | 2010-06-30 | ||
|---|---|---|---|---|---|---|---|---|---|---|---|---|---|---|---|---|---|---|---|---|---|---|---|---|---|---|---|---|---|---|---|---|---|---|---|---|---|---|---|---|---|---|---|---|---|---|---|---|---|---|---|---|---|---|---|---|
| Net Cash Provided By Used In Operating Activities | 69.55 | 24.36 | 100.42 | -38.22 | 52.04 | -40.93 | -60.92 | -173.75 | -24.57 | -40.77 | 40.34 | -77.23 | 111.40 | 81.78 | -6.87 | -49.83 | -28.68 | -29.08 | 17.16 | -74.41 | -1.24 | -4.05 | -25.51 | -38.52 | -0.76 | -5.45 | -31.87 | -33.64 | -27.13 | -24.97 | NA | NA | NA | NA | NA | NA | NA | NA | NA | NA | NA | NA | NA | NA | NA | NA | NA | NA | NA | NA | NA | NA | NA | NA | NA | |
| Net Income Loss | -49.77 | 0.79 | -81.03 | -74.15 | -127.75 | -148.76 | -166.06 | -180.94 | -220.61 | -166.94 | -176.91 | -31.16 | -436.81 | -219.88 | -86.14 | -105.70 | 77.94 | -40.46 | -38.42 | -83.06 | -53.97 | -45.36 | -36.39 | -39.42 | -21.76 | -26.90 | -30.79 | -34.95 | -37.17 | -37.80 | -44.77 | -47.47 | NA | NA | NA | NA | NA | NA | NA | NA | NA | NA | NA | NA | NA | NA | NA | NA | NA | NA | NA | NA | NA | NA | NA | |
| Profit Loss | -49.77 | 0.79 | -81.03 | -74.15 | -127.75 | -148.76 | -166.06 | -180.94 | -220.61 | -166.94 | -176.91 | -31.16 | -436.81 | -219.88 | -86.14 | -105.70 | 77.94 | -40.46 | -38.42 | -83.06 | -53.97 | -45.36 | -36.39 | -39.42 | -21.76 | -26.90 | -30.79 | -34.95 | -37.17 | NA | NA | NA | NA | NA | NA | NA | NA | NA | NA | NA | NA | NA | NA | NA | NA | NA | NA | NA | NA | NA | -6.62 | NA | NA | NA | -2.48 | |
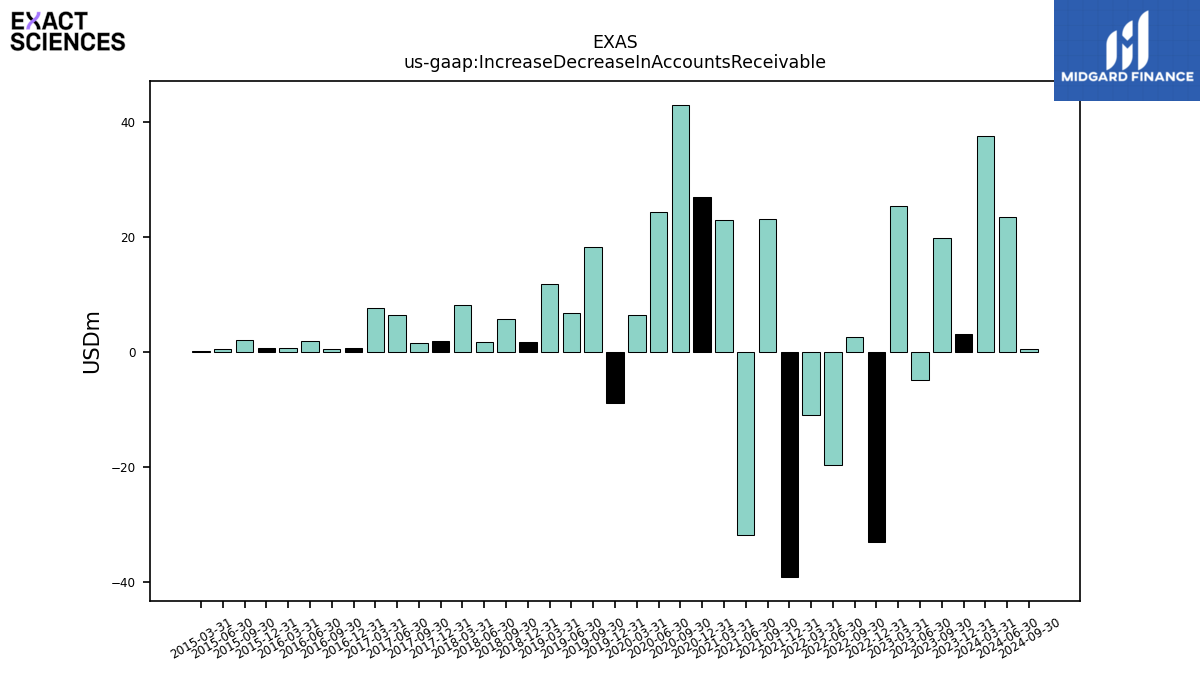
| Increase Decrease In Accounts Receivable | 3.11 | 19.81 | -4.94 | 25.43 | -33.12 | 2.66 | -19.61 | -11.02 | -39.19 | 23.03 | -31.95 | 22.95 | 26.88 | 43.00 | 24.32 | 6.32 | -8.93 | 18.30 | 6.72 | 11.86 | 1.79 | 5.65 | 1.69 | 8.16 | 1.87 | 1.60 | 6.38 | 7.69 | 0.66 | 0.42 | 1.82 | 0.69 | 0.72 | 2.06 | 0.57 | 0.20 | NA | NA | NA | NA | NA | NA | NA | NA | NA | NA | NA | NA | NA | NA | NA | NA | NA | NA | NA | |
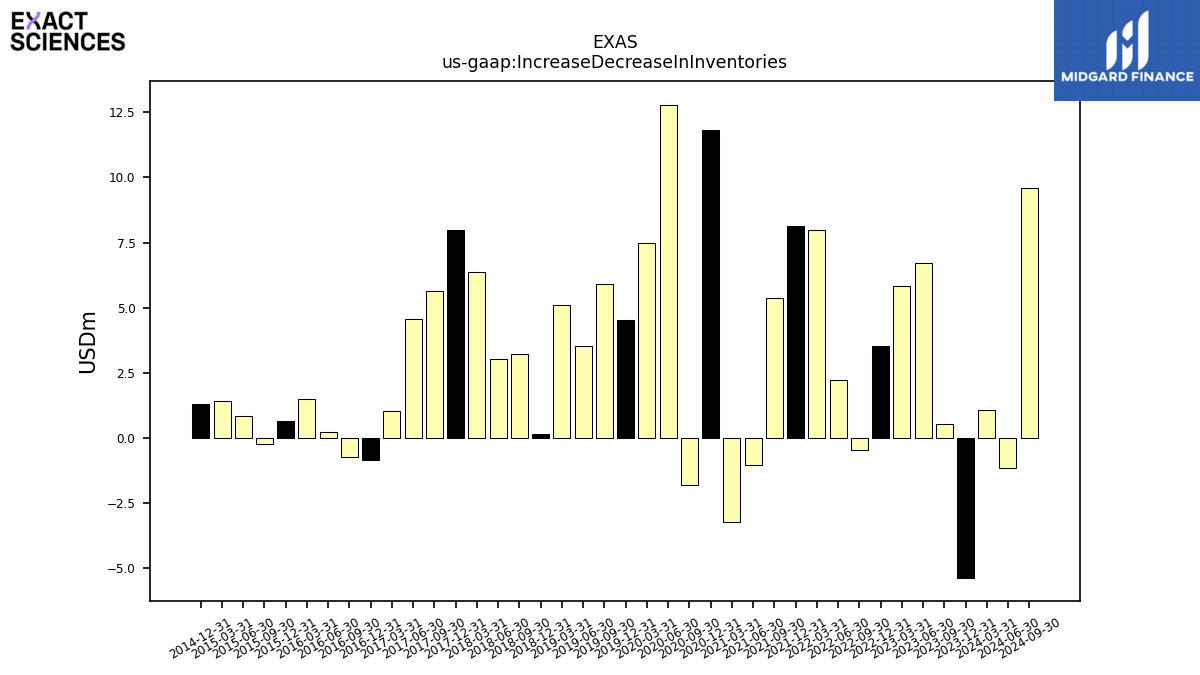
| Increase Decrease In Inventories | -5.38 | 0.54 | 6.70 | 5.83 | 3.53 | -0.47 | 2.21 | 7.96 | 8.13 | 5.36 | -1.03 | -3.23 | 11.84 | -1.79 | 12.79 | 7.47 | 4.52 | 5.89 | 3.51 | 5.12 | 0.14 | 3.21 | 3.03 | 6.35 | 7.96 | 5.65 | 4.55 | 1.03 | -0.83 | -0.74 | 0.25 | 1.48 | 0.65 | -0.24 | 0.85 | 1.41 | 1.30 | NA | NA | NA | NA | NA | NA | NA | NA | NA | NA | NA | NA | NA | NA | NA | NA | NA | NA | |
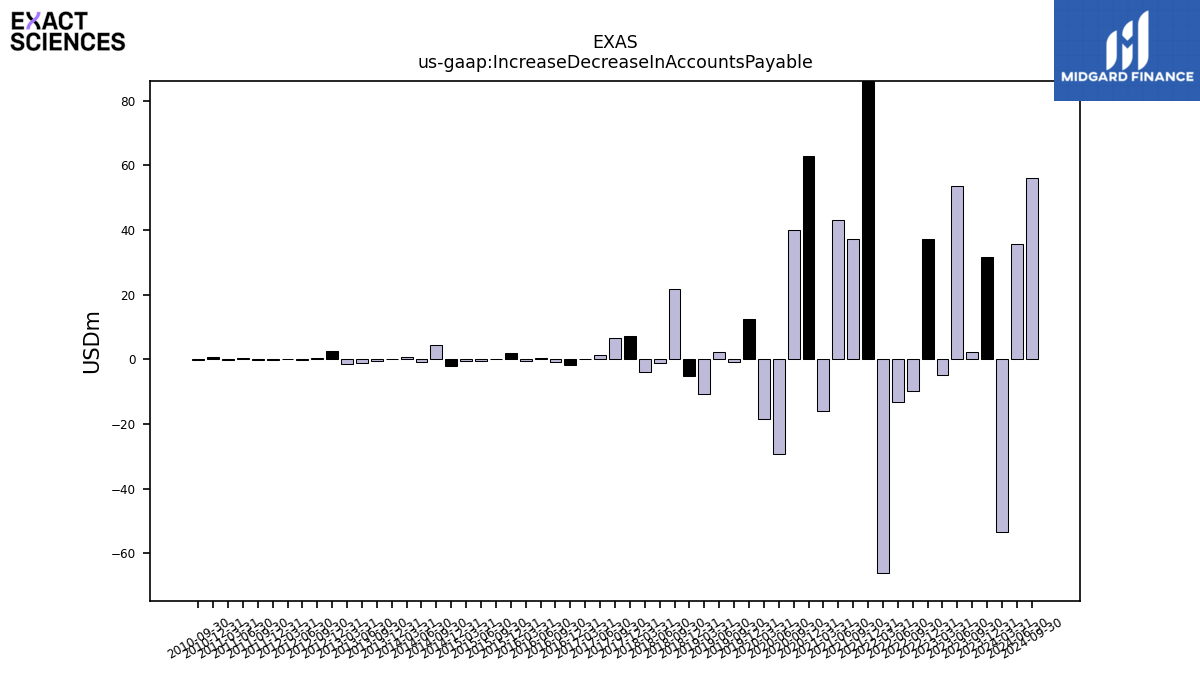
| Increase Decrease In Accounts Payable | 31.67 | 2.33 | 53.57 | -4.82 | 37.09 | -9.93 | -13.29 | -66.05 | 105.46 | 37.21 | 43.00 | -15.86 | 62.77 | 39.98 | -29.29 | -18.30 | 12.45 | -0.74 | 2.34 | -10.59 | -5.27 | 21.75 | -1.28 | -3.86 | 7.36 | 6.50 | 1.35 | 0.18 | -1.62 | -0.80 | 0.29 | -0.47 | 1.80 | 0.16 | -0.66 | -0.65 | -1.99 | 4.28 | -0.97 | 0.57 | 0.16 | -0.48 | -1.00 | -1.57 | 2.62 | 0.26 | -0.18 | 0.18 | -0.21 | -0.11 | 0.27 | -0.21 | 0.65 | -0.18 | NA | |
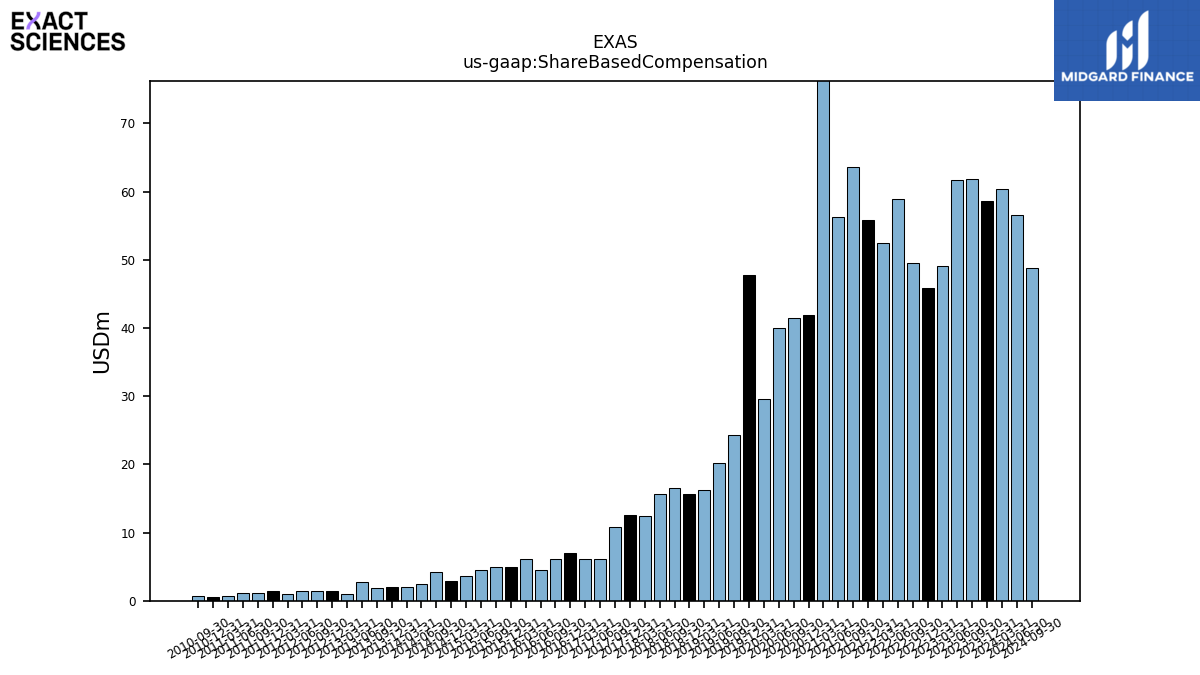
| Share Based Compensation | 58.58 | 61.87 | 61.73 | 49.14 | 45.92 | 49.53 | 58.93 | 52.44 | 55.88 | 63.60 | 56.28 | 77.29 | 41.83 | 41.48 | 40.04 | 29.56 | 47.83 | 24.35 | 20.14 | 16.17 | 15.71 | 16.50 | 15.59 | 12.46 | 12.51 | 10.78 | 6.09 | 6.13 | 6.96 | 6.17 | 4.51 | 6.10 | 4.90 | 4.98 | 4.55 | 3.62 | 2.88 | 4.17 | 2.48 | 2.00 | 2.08 | 1.80 | 2.80 | 0.95 | 1.47 | 1.50 | 1.50 | 1.03 | 1.40 | 1.10 | 1.07 | 0.69 | 0.57 | 0.64 | NA | |
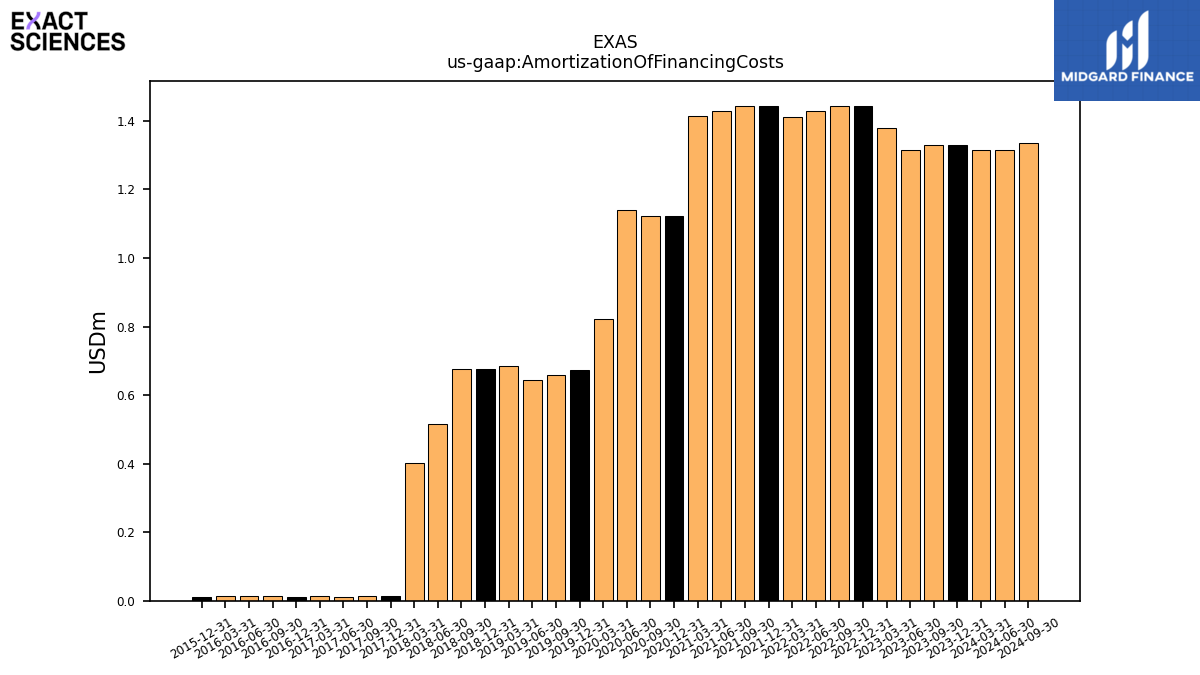
| Amortization Of Financing Costs | 1.33 | 1.33 | 1.31 | 1.38 | 1.44 | 1.44 | 1.43 | 1.41 | 1.44 | 1.44 | 1.43 | 1.41 | 1.12 | 1.12 | 1.14 | 0.82 | 0.67 | 0.66 | 0.65 | 0.69 | 0.68 | 0.68 | 0.52 | 0.40 | 0.01 | 0.01 | 0.01 | 0.01 | 0.01 | 0.01 | 0.01 | 0.01 | 0.01 | NA | NA | NA | NA | NA | NA | NA | NA | NA | NA | NA | NA | NA | NA | NA | NA | NA | NA | NA | NA | NA | NA |
| 2023-12-31 | 2023-09-30 | 2023-06-30 | 2023-03-31 | 2022-12-31 | 2022-09-30 | 2022-06-30 | 2022-03-31 | 2021-12-31 | 2021-09-30 | 2021-06-30 | 2021-03-31 | 2020-12-31 | 2020-09-30 | 2020-06-30 | 2020-03-31 | 2019-12-31 | 2019-09-30 | 2019-06-30 | 2019-03-31 | 2018-12-31 | 2018-09-30 | 2018-06-30 | 2018-03-31 | 2017-12-31 | 2017-09-30 | 2017-06-30 | 2017-03-31 | 2016-12-31 | 2016-09-30 | 2016-06-30 | 2016-03-31 | 2015-12-31 | 2015-09-30 | 2015-06-30 | 2015-03-31 | 2014-12-31 | 2014-09-30 | 2014-06-30 | 2014-03-31 | 2013-12-31 | 2013-09-30 | 2013-06-30 | 2013-03-31 | 2012-12-31 | 2012-09-30 | 2012-06-30 | 2012-03-31 | 2011-12-31 | 2011-09-30 | 2011-06-30 | 2011-03-31 | 2010-12-31 | 2010-09-30 | 2010-06-30 | ||
|---|---|---|---|---|---|---|---|---|---|---|---|---|---|---|---|---|---|---|---|---|---|---|---|---|---|---|---|---|---|---|---|---|---|---|---|---|---|---|---|---|---|---|---|---|---|---|---|---|---|---|---|---|---|---|---|---|
| Net Cash Provided By Used In Investing Activities | -66.77 | -32.97 | 66.47 | 82.94 | -58.16 | 65.00 | 21.66 | 45.56 | 78.44 | -49.24 | -793.77 | -317.51 | -306.64 | 16.83 | -6.38 | -405.85 | -834.77 | 857.44 | -102.67 | -41.07 | -9.42 | -78.99 | -130.78 | -562.73 | 24.65 | -126.60 | -82.79 | 23.93 | 9.29 | -105.28 | NA | NA | NA | NA | NA | NA | NA | NA | NA | NA | NA | NA | NA | NA | NA | NA | NA | NA | NA | NA | NA | NA | NA | NA | NA | |
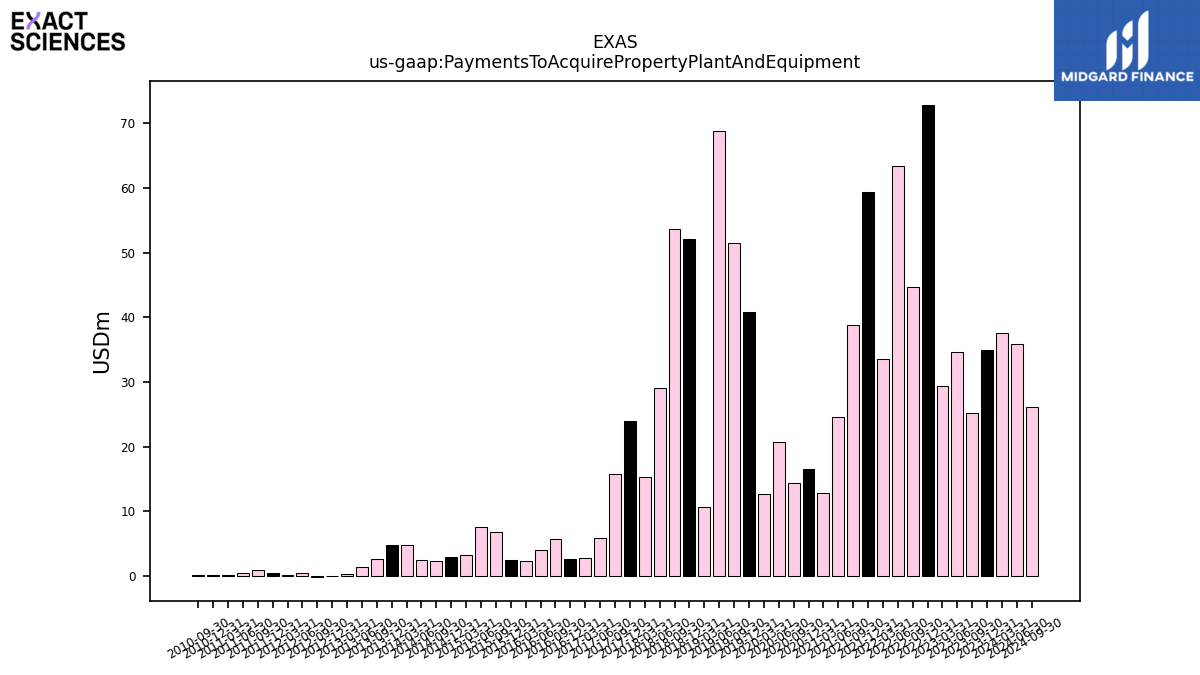
| Payments To Acquire Property Plant And Equipment | 34.92 | 25.19 | 34.72 | 29.36 | 72.88 | 44.64 | 63.33 | 33.62 | 59.39 | 38.87 | 24.58 | 12.92 | 16.57 | 14.33 | 20.77 | 12.69 | 40.83 | 51.52 | 68.79 | 10.66 | 52.11 | 53.62 | 29.04 | 15.33 | 24.04 | 15.79 | 5.90 | 2.75 | 2.69 | 5.75 | 4.03 | 2.39 | 2.54 | 6.80 | 7.54 | 3.21 | 3.02 | 2.33 | 2.43 | 4.76 | 4.87 | 2.69 | 1.35 | 0.38 | 0.10 | -0.14 | 0.53 | 0.20 | 0.52 | 0.89 | 0.47 | 0.24 | 0.12 | 0.12 | NA |
| 2023-12-31 | 2023-09-30 | 2023-06-30 | 2023-03-31 | 2022-12-31 | 2022-09-30 | 2022-06-30 | 2022-03-31 | 2021-12-31 | 2021-09-30 | 2021-06-30 | 2021-03-31 | 2020-12-31 | 2020-09-30 | 2020-06-30 | 2020-03-31 | 2019-12-31 | 2019-09-30 | 2019-06-30 | 2019-03-31 | 2018-12-31 | 2018-09-30 | 2018-06-30 | 2018-03-31 | 2017-12-31 | 2017-09-30 | 2017-06-30 | 2017-03-31 | 2016-12-31 | 2016-09-30 | 2016-06-30 | 2016-03-31 | 2015-12-31 | 2015-09-30 | 2015-06-30 | 2015-03-31 | 2014-12-31 | 2014-09-30 | 2014-06-30 | 2014-03-31 | 2013-12-31 | 2013-09-30 | 2013-06-30 | 2013-03-31 | 2012-12-31 | 2012-09-30 | 2012-06-30 | 2012-03-31 | 2011-12-31 | 2011-09-30 | 2011-06-30 | 2011-03-31 | 2010-12-31 | 2010-09-30 | 2010-06-30 | ||
|---|---|---|---|---|---|---|---|---|---|---|---|---|---|---|---|---|---|---|---|---|---|---|---|---|---|---|---|---|---|---|---|---|---|---|---|---|---|---|---|---|---|---|---|---|---|---|---|---|---|---|---|---|---|---|---|---|
| Net Cash Provided By Used In Financing Activities | 10.04 | 0.09 | 16.04 | 133.60 | 10.10 | 0.23 | 63.41 | 2.73 | -12.20 | 0.08 | 13.34 | 7.25 | 879.86 | 4.16 | 16.12 | 979.48 | 6.62 | 0.98 | 5.45 | 240.13 | 9.35 | 19.07 | 233.28 | 672.44 | 2.72 | 2.46 | 255.78 | 0.00 | 3.37 | 144.71 | NA | NA | NA | NA | NA | NA | NA | NA | NA | NA | NA | NA | NA | NA | NA | NA | NA | NA | NA | NA | NA | NA | NA | NA | NA |
| 2023-12-31 | 2023-09-30 | 2023-06-30 | 2023-03-31 | 2022-12-31 | 2022-09-30 | 2022-06-30 | 2022-03-31 | 2021-12-31 | 2021-09-30 | 2021-06-30 | 2021-03-31 | 2020-12-31 | 2020-09-30 | 2020-06-30 | 2020-03-31 | 2019-12-31 | 2019-09-30 | 2019-06-30 | 2019-03-31 | 2018-12-31 | 2018-09-30 | 2018-06-30 | 2018-03-31 | 2017-12-31 | 2017-09-30 | 2017-06-30 | 2017-03-31 | 2016-12-31 | 2016-09-30 | 2016-06-30 | 2016-03-31 | 2015-12-31 | 2015-09-30 | 2015-06-30 | 2015-03-31 | 2014-12-31 | 2014-09-30 | 2014-06-30 | 2014-03-31 | 2013-12-31 | 2013-09-30 | 2013-06-30 | 2013-03-31 | 2012-12-31 | 2012-09-30 | 2012-06-30 | 2012-03-31 | 2011-12-31 | 2011-09-30 | 2011-06-30 | 2011-03-31 | 2010-12-31 | 2010-09-30 | 2010-06-30 | ||
|---|---|---|---|---|---|---|---|---|---|---|---|---|---|---|---|---|---|---|---|---|---|---|---|---|---|---|---|---|---|---|---|---|---|---|---|---|---|---|---|---|---|---|---|---|---|---|---|---|---|---|---|---|---|---|---|---|
| Revenues | 646.88 | 628.34 | 622.09 | 602.45 | 553.00 | 523.07 | 521.64 | 486.57 | 473.81 | 456.38 | 434.82 | 402.08 | 466.34 | 408.36 | 268.87 | 347.82 | 295.57 | 218.81 | 199.87 | 162.04 | 142.98 | 118.29 | 102.89 | 90.30 | 87.41 | 72.57 | 57.65 | 48.36 | 35.24 | 28.11 | 21.18 | 14.84 | 14.42 | 12.63 | 8.12 | 4.27 | 1.50 | 0.00 | 0.00 | 0.29 | 1.04 | 1.04 | 1.04 | 1.04 | 1.04 | 1.04 | 1.04 | 1.04 | 1.04 | 1.04 | 1.04 | 1.04 | 1.38 | 1.36 | 1.31 | |
| Revenue From Contract With Customer Excluding Assessed Tax | 646.88 | 628.34 | 622.09 | 602.45 | 553.00 | 523.07 | 521.64 | 486.57 | 473.81 | 456.38 | 434.82 | 402.08 | 466.34 | 408.36 | 268.87 | 347.82 | 295.57 | 218.81 | 199.87 | 162.04 | 142.98 | 118.29 | 102.89 | 90.30 | 87.41 | 72.57 | 57.65 | 48.36 | 35.24 | 28.11 | 21.18 | 14.84 | 14.42 | 12.63 | 8.12 | 4.27 | 1.50 | 0.00 | 0.00 | 0.29 | 1.04 | 1.04 | 1.04 | 1.04 | 1.04 | 1.04 | 1.04 | 1.04 | 1.04 | 1.04 | 1.04 | 1.04 | 1.38 | 1.36 | 1.31 | |
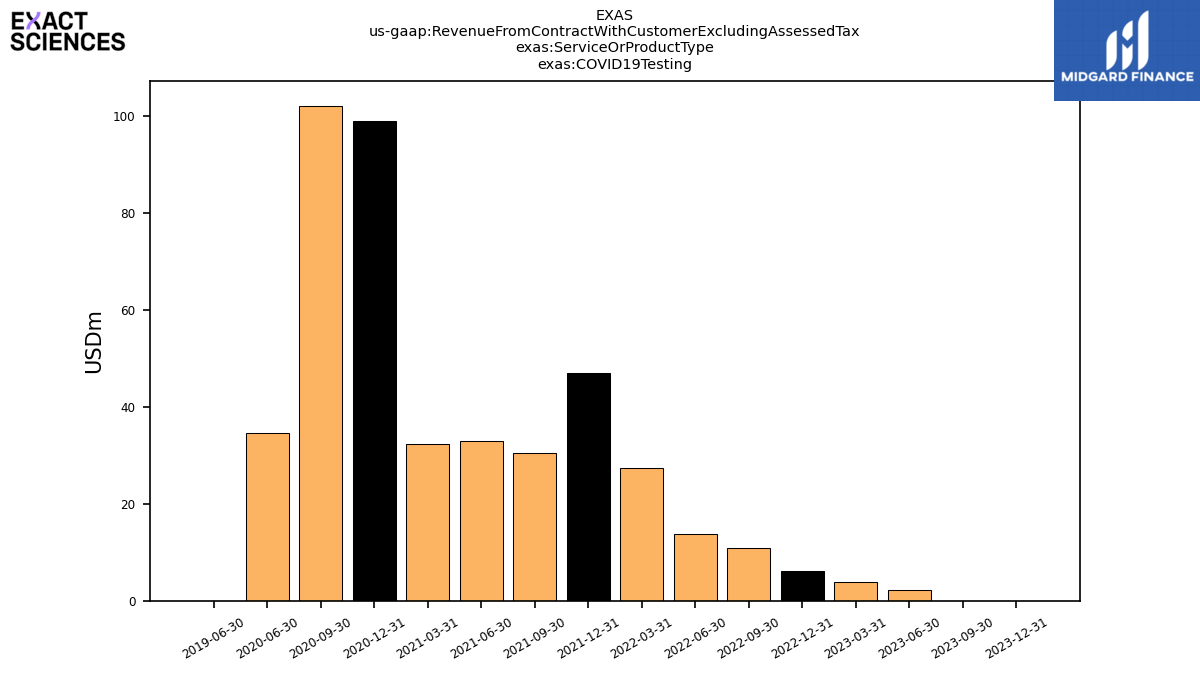
| C O V I D19 Testing | 0.00 | 0.00 | 2.13 | 3.82 | 6.04 | 10.87 | 13.75 | 27.43 | 47.10 | 30.59 | 33.07 | 32.34 | 99.09 | 102.16 | 34.58 | NA | NA | NA | 0.00 | NA | NA | NA | NA | NA | NA | NA | NA | NA | NA | NA | NA | NA | NA | NA | NA | NA | NA | NA | NA | NA | NA | NA | NA | NA | NA | NA | NA | NA | NA | NA | NA | NA | NA | NA | NA | |
| Precision Oncology | 160.18 | 156.32 | 157.17 | 155.43 | 143.43 | 151.44 | 154.00 | 152.62 | 149.05 | 145.41 | 137.81 | 129.41 | 117.59 | 91.58 | 102.96 | 128.37 | NA | NA | 0.00 | 0.00 | NA | NA | NA | NA | NA | NA | NA | NA | NA | NA | NA | NA | NA | NA | NA | NA | NA | NA | NA | NA | NA | NA | NA | NA | NA | NA | NA | NA | NA | NA | NA | NA | NA | NA | NA | |
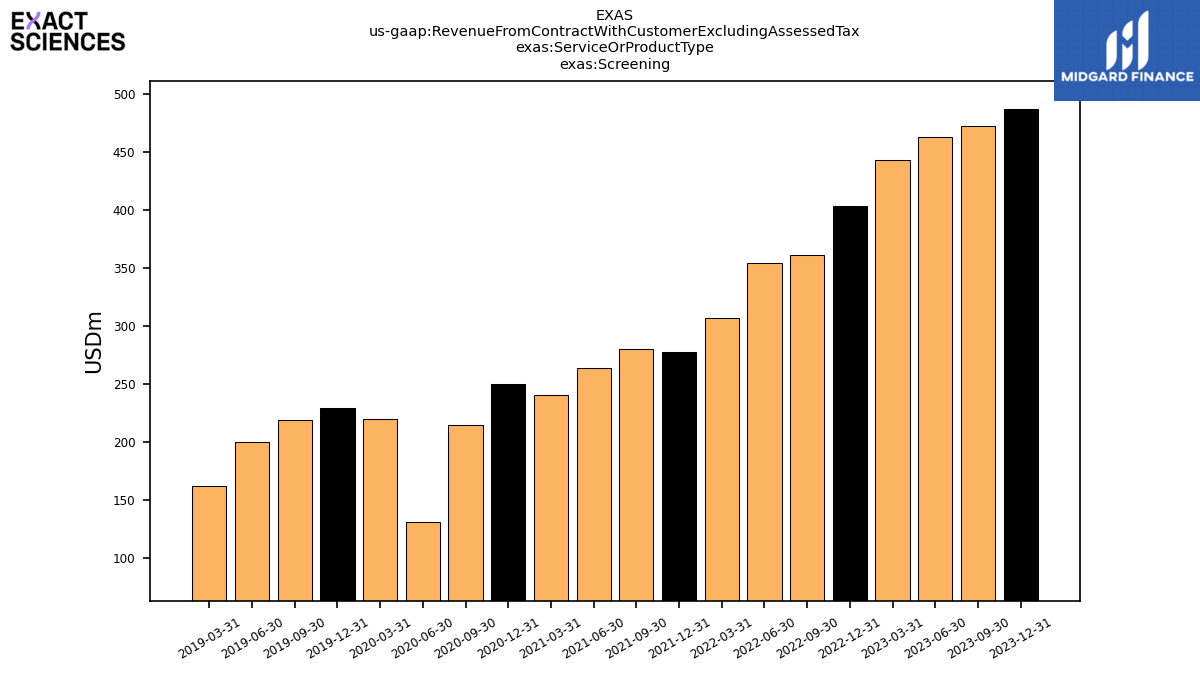
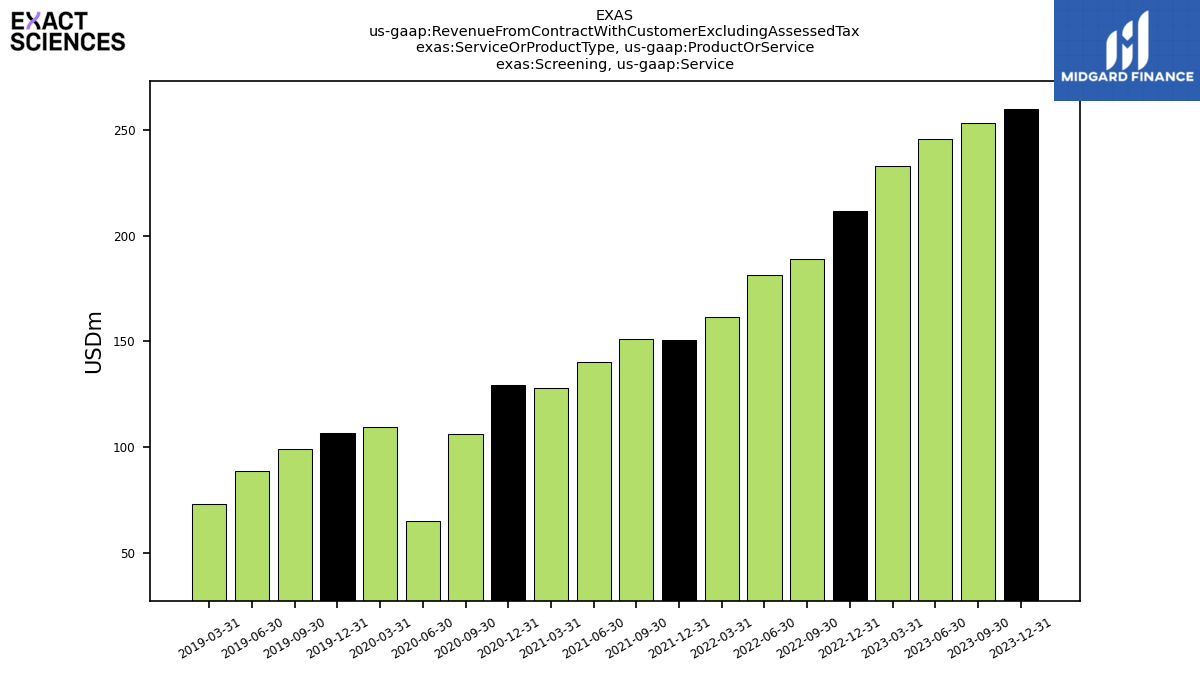
| Screening | 486.71 | 472.01 | 462.79 | 443.19 | 403.53 | 360.76 | 353.89 | 306.52 | 277.67 | 280.38 | 263.94 | 240.33 | 249.66 | 214.62 | 131.33 | 219.45 | 229.40 | 218.81 | 199.87 | 162.04 | NA | NA | NA | NA | NA | NA | NA | NA | NA | NA | NA | NA | NA | NA | NA | NA | NA | NA | NA | NA | NA | NA | NA | NA | NA | NA | NA | NA | NA | NA | NA | NA | NA | NA | NA | |
| Precision Oncology, International Sales | 41.82 | 38.60 | 35.59 | 37.27 | 28.20 | 31.53 | 28.34 | 29.44 | 29.78 | 27.23 | 26.85 | 26.06 | 21.26 | 16.24 | 19.02 | 20.94 | NA | NA | 0.00 | 0.00 | NA | NA | NA | NA | NA | NA | NA | NA | NA | NA | NA | NA | NA | NA | NA | NA | NA | NA | NA | NA | NA | NA | NA | NA | NA | NA | NA | NA | NA | NA | NA | NA | NA | NA | NA | |
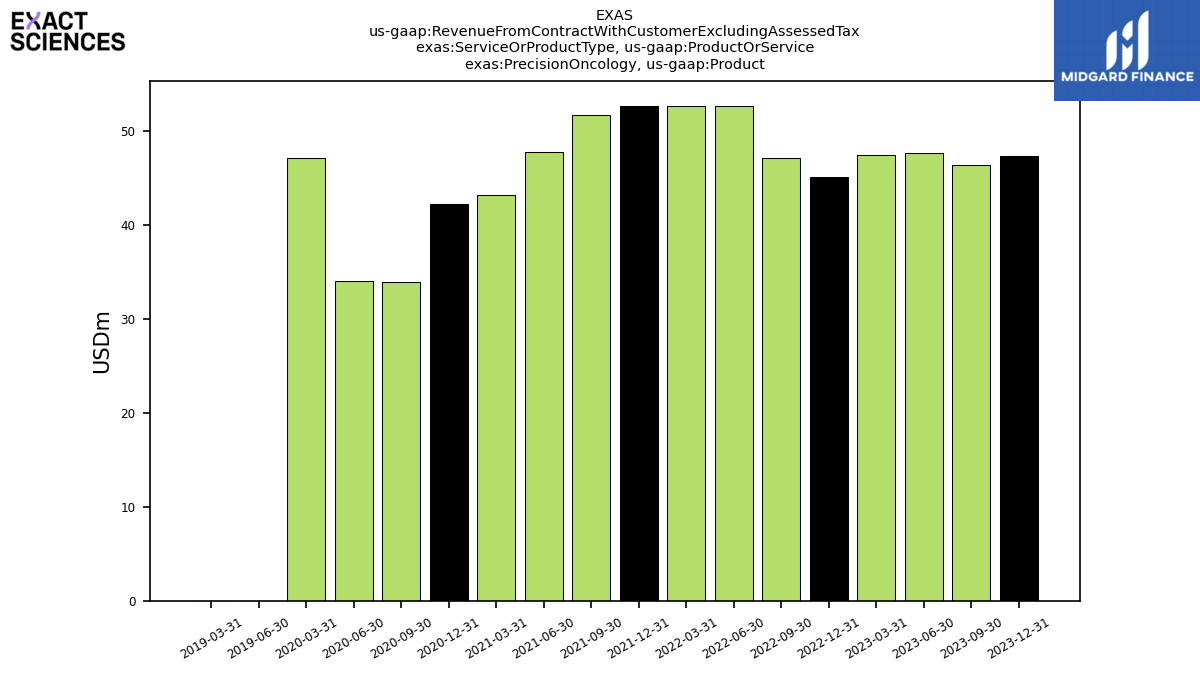
| Precision Oncology, Product | 47.34 | 46.38 | 47.59 | 47.38 | 45.10 | 47.04 | 52.62 | 52.56 | 52.64 | 51.61 | 47.70 | 43.12 | 42.19 | 33.95 | 33.99 | 47.03 | NA | NA | 0.00 | 0.00 | NA | NA | NA | NA | NA | NA | NA | NA | NA | NA | NA | NA | NA | NA | NA | NA | NA | NA | NA | NA | NA | NA | NA | NA | NA | NA | NA | NA | NA | NA | NA | NA | NA | NA | NA | |
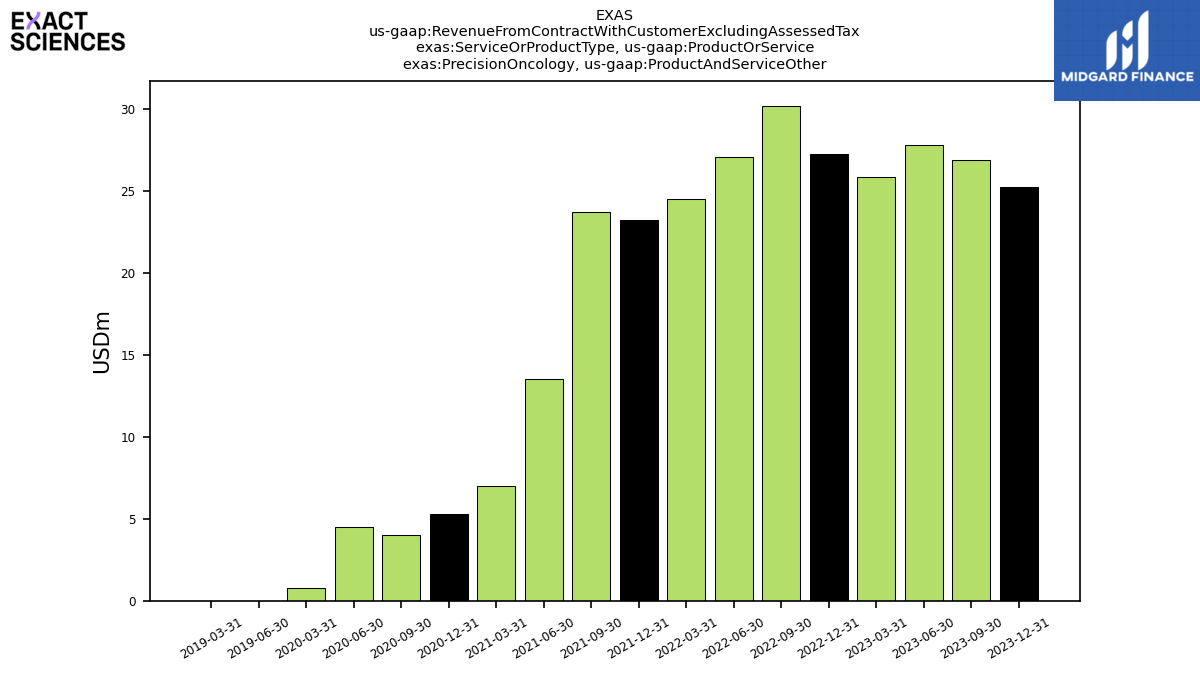
| Precision Oncology, Product And Service Other | 25.27 | 26.91 | 27.79 | 25.85 | 27.27 | 30.21 | 27.09 | 24.55 | 23.25 | 23.73 | 13.53 | 6.98 | 5.31 | 3.99 | 4.52 | 0.79 | NA | NA | 0.00 | 0.00 | NA | NA | NA | NA | NA | NA | NA | NA | NA | NA | NA | NA | NA | NA | NA | NA | NA | NA | NA | NA | NA | NA | NA | NA | NA | NA | NA | NA | NA | NA | NA | NA | NA | NA | NA | |
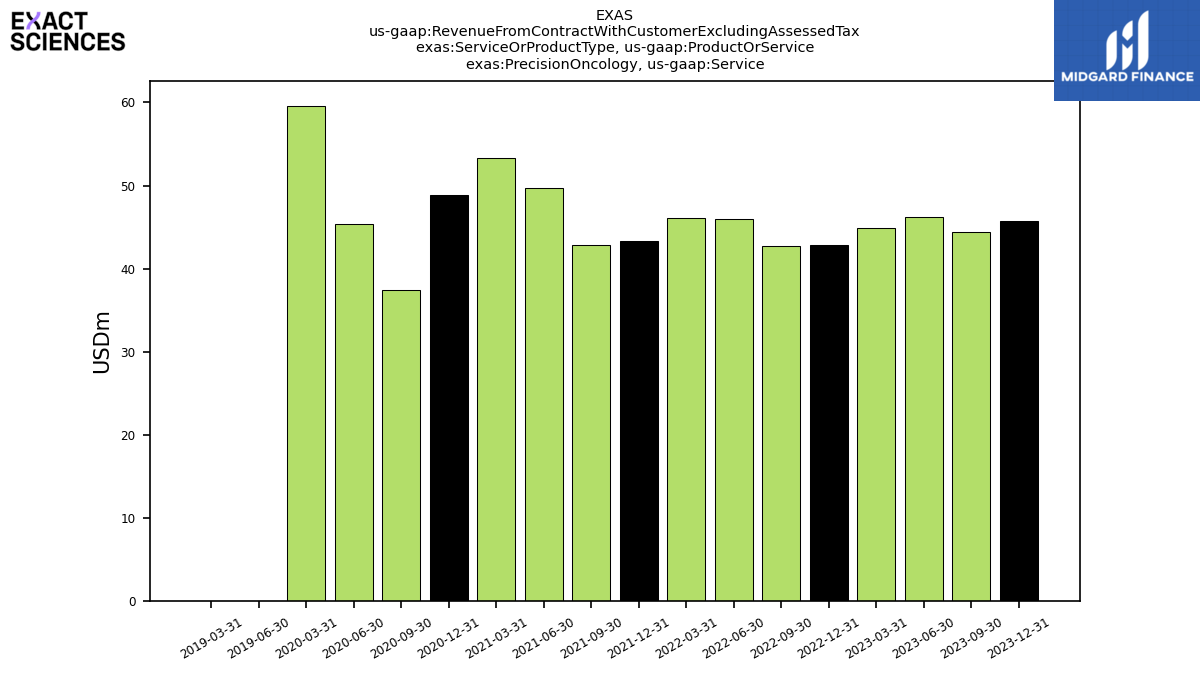
| Precision Oncology, Service | 45.74 | 44.43 | 46.21 | 44.93 | 42.86 | 42.66 | 45.94 | 46.06 | 43.38 | 42.84 | 49.72 | 53.26 | 48.83 | 37.40 | 45.42 | 59.60 | NA | NA | 0.00 | 0.00 | NA | NA | NA | NA | NA | NA | NA | NA | NA | NA | NA | NA | NA | NA | NA | NA | NA | NA | NA | NA | NA | NA | NA | NA | NA | NA | NA | NA | NA | NA | NA | NA | NA | NA | NA | |
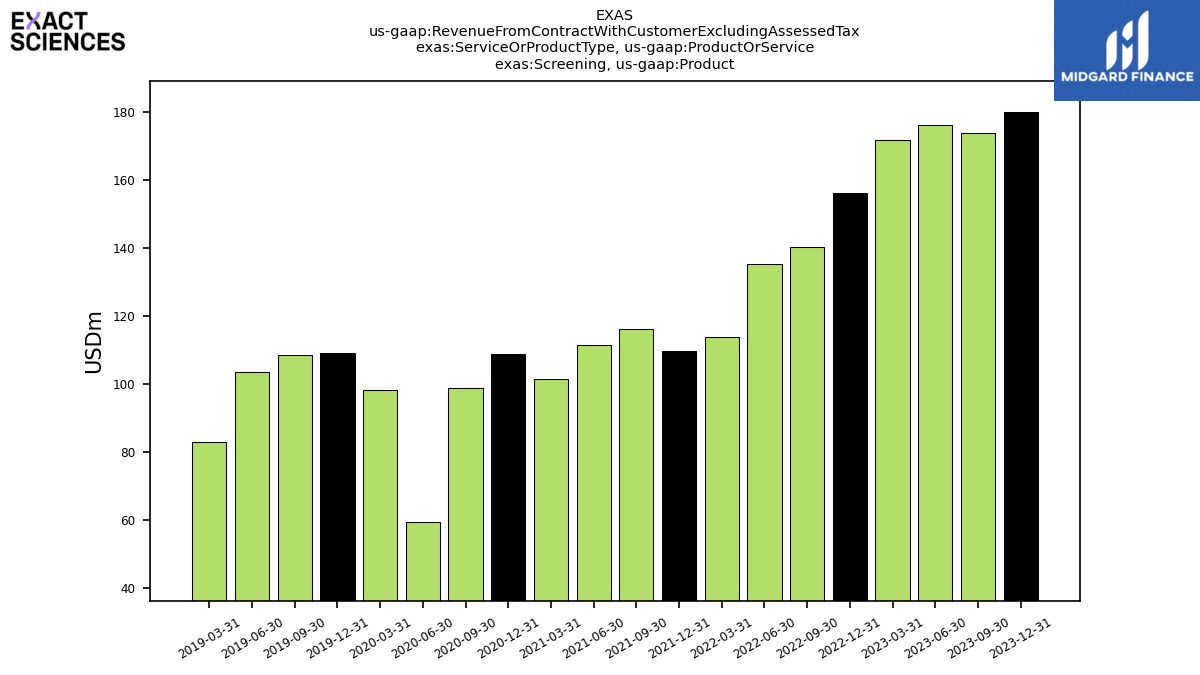
| Screening, Product | 180.03 | 173.62 | 176.02 | 171.73 | 156.09 | 140.37 | 135.25 | 113.75 | 109.61 | 116.09 | 111.39 | 101.56 | 108.88 | 98.85 | 59.58 | 98.16 | 109.23 | 108.62 | 103.57 | 82.92 | NA | NA | NA | NA | NA | NA | NA | NA | NA | NA | NA | NA | NA | NA | NA | NA | NA | NA | NA | NA | NA | NA | NA | NA | NA | NA | NA | NA | NA | NA | NA | NA | NA | NA | NA | |
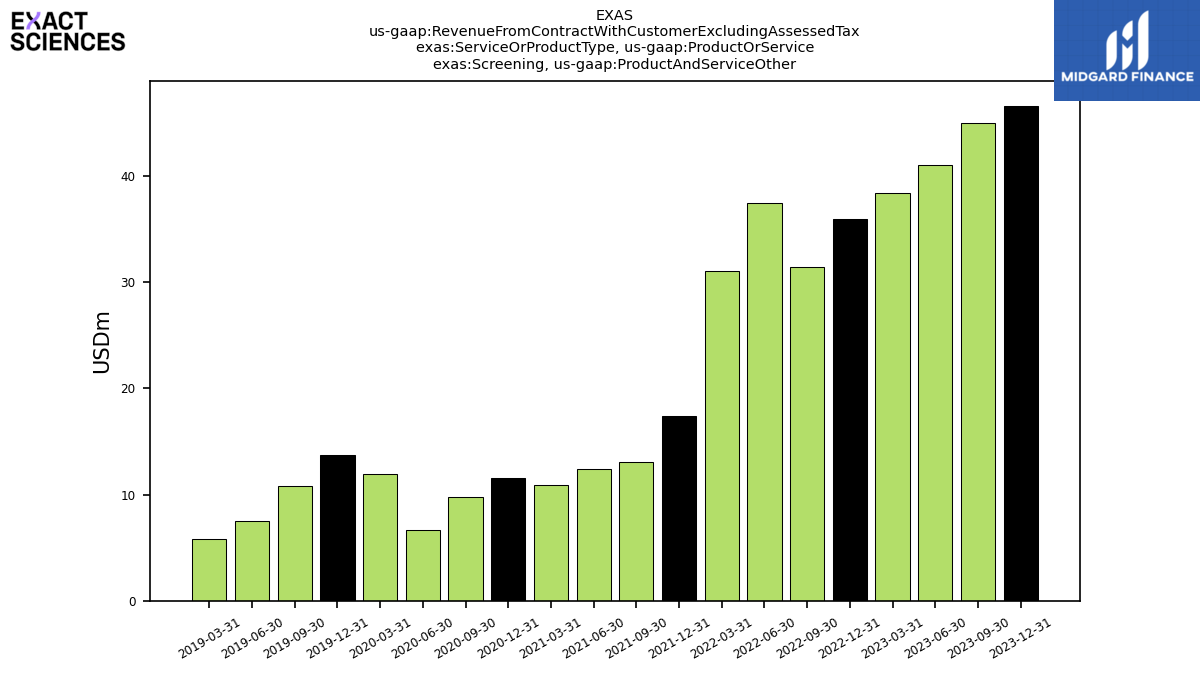
| Screening, Product And Service Other | 46.61 | 44.99 | 41.02 | 38.43 | 35.99 | 31.47 | 37.46 | 31.09 | 17.38 | 13.04 | 12.40 | 10.89 | 11.56 | 9.77 | 6.67 | 11.92 | 13.69 | 10.84 | 7.48 | 5.78 | NA | NA | NA | NA | NA | NA | NA | NA | NA | NA | NA | NA | NA | NA | NA | NA | NA | NA | NA | NA | NA | NA | NA | NA | NA | NA | NA | NA | NA | NA | NA | NA | NA | NA | NA | |
| Screening, Service | 260.06 | 253.40 | 245.75 | 233.03 | 211.45 | 188.92 | 181.19 | 161.68 | 150.68 | 151.25 | 140.15 | 127.87 | 129.22 | 106.00 | 65.08 | 109.37 | 106.48 | 99.35 | 88.82 | 73.35 | NA | NA | NA | NA | NA | NA | NA | NA | NA | NA | NA | NA | NA | NA | NA | NA | NA | NA | NA | NA | NA | NA | NA | NA | NA | NA | NA | NA | NA | NA | NA | NA | NA | NA | NA | |
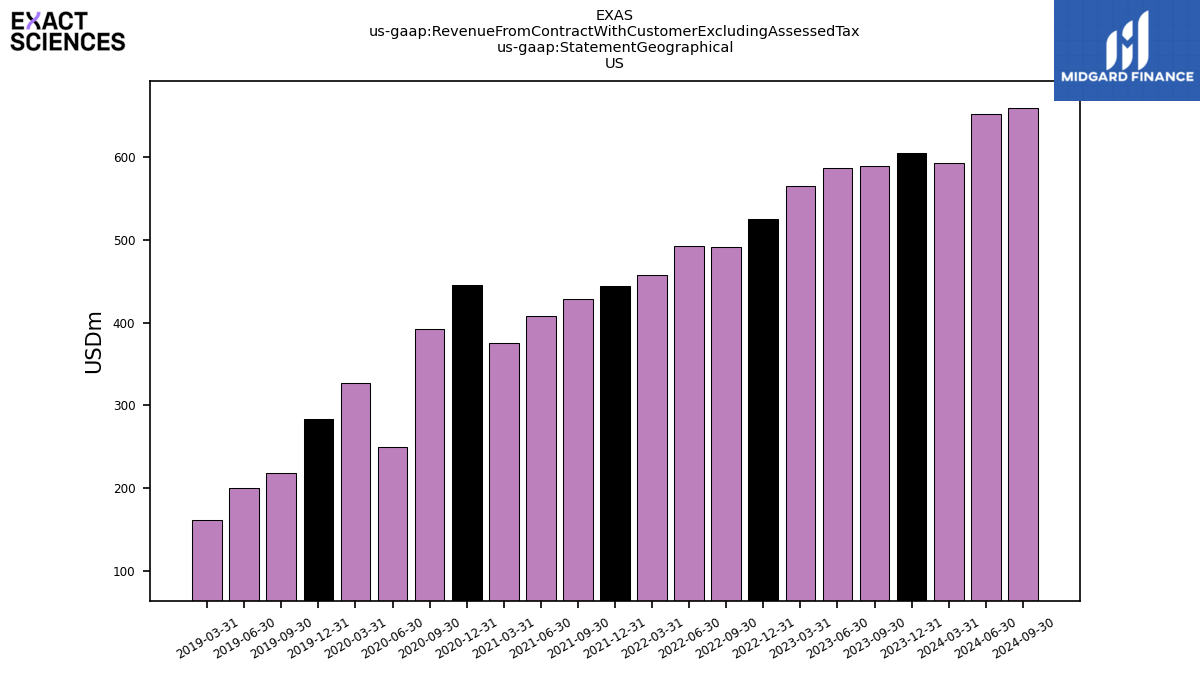
| US | 605.06 | 589.74 | 586.51 | 565.18 | 524.79 | 491.54 | 493.30 | 457.13 | 444.03 | 429.15 | 407.97 | 376.02 | 445.08 | 392.12 | 249.85 | 326.88 | 284.13 | 218.81 | 199.87 | 162.04 | NA | NA | NA | NA | NA | NA | NA | NA | NA | NA | NA | NA | NA | NA | NA | NA | NA | NA | NA | NA | NA | NA | NA | NA | NA | NA | NA | NA | NA | NA | NA | NA | NA | NA | NA | |
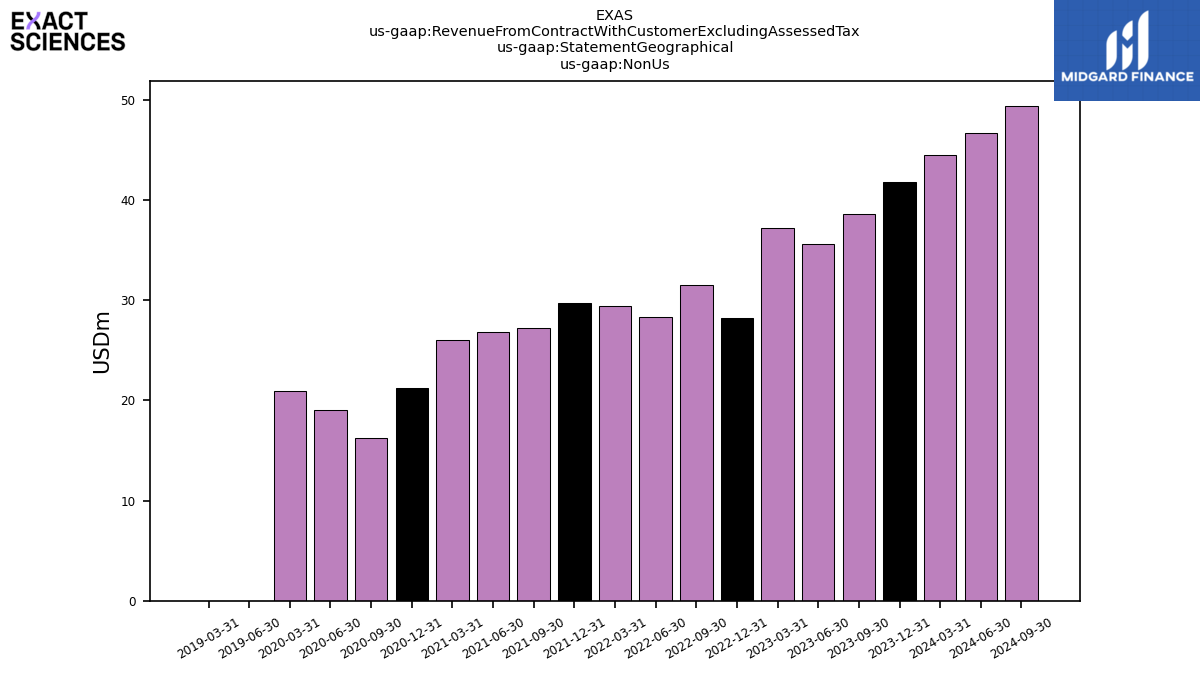
| Non Us | 41.82 | 38.60 | 35.59 | 37.27 | 28.20 | 31.53 | 28.34 | 29.44 | 29.78 | 27.23 | 26.85 | 26.06 | 21.26 | 16.24 | 19.02 | 20.94 | NA | NA | 0.00 | 0.00 | NA | NA | NA | NA | NA | NA | NA | NA | NA | NA | NA | NA | NA | NA | NA | NA | NA | NA | NA | NA | NA | NA | NA | NA | NA | NA | NA | NA | NA | NA | NA | NA | NA | NA | NA | |
| Revenue From Contract With Customer Including Assessed Tax | 646.88 | 628.34 | 622.09 | 602.45 | 553.00 | 523.07 | 521.64 | 486.57 | 473.81 | 456.38 | 434.82 | 402.08 | 466.34 | 408.36 | 268.87 | 347.82 | 295.57 | 218.81 | 199.87 | 162.04 | 142.98 | 118.29 | 102.89 | 90.30 | 87.41 | 72.57 | 57.65 | 48.36 | 35.24 | 28.11 | 21.18 | 14.84 | 14.42 | 12.63 | 8.12 | 4.27 | 1.50 | 0.00 | 0.00 | 0.29 | 1.04 | 1.04 | 1.04 | 1.04 | 1.04 | 1.04 | 1.04 | 1.04 | 1.04 | 1.04 | 1.04 | 1.04 | 1.38 | 1.36 | 1.31 |