
| 2024-01-31 | 2023-10-31 | 2023-07-31 | 2023-04-30 | 2023-01-31 | 2022-10-31 | 2022-07-31 | 2022-04-30 | 2022-01-31 | 2021-10-31 | 2021-07-31 | 2021-04-30 | 2021-01-31 | 2020-10-31 | 2020-07-31 | 2020-04-30 | 2020-01-31 | 2019-10-31 | 2019-07-31 | 2019-04-30 | 2019-01-31 | 2018-10-31 | 2018-07-31 | 2018-04-30 | 2018-01-31 | 2017-10-31 | 2017-07-31 | 2017-04-30 | 2017-01-31 | 2016-10-31 | 2016-07-31 | 2016-04-30 | 2016-01-31 | 2015-10-31 | 2015-07-31 | 2015-04-30 | 2015-01-31 | 2014-10-31 | 2014-07-31 | 2014-04-30 | 2014-01-31 | 2013-10-31 | 2013-07-31 | 2013-04-30 | 2013-01-31 | 2012-10-31 | 2012-07-31 | 2012-04-30 | 2012-01-31 | 2011-10-31 | 2011-07-31 | 2011-04-30 | 2011-01-31 | 2010-10-31 | 2010-07-31 | ||
|---|---|---|---|---|---|---|---|---|---|---|---|---|---|---|---|---|---|---|---|---|---|---|---|---|---|---|---|---|---|---|---|---|---|---|---|---|---|---|---|---|---|---|---|---|---|---|---|---|---|---|---|---|---|---|---|---|
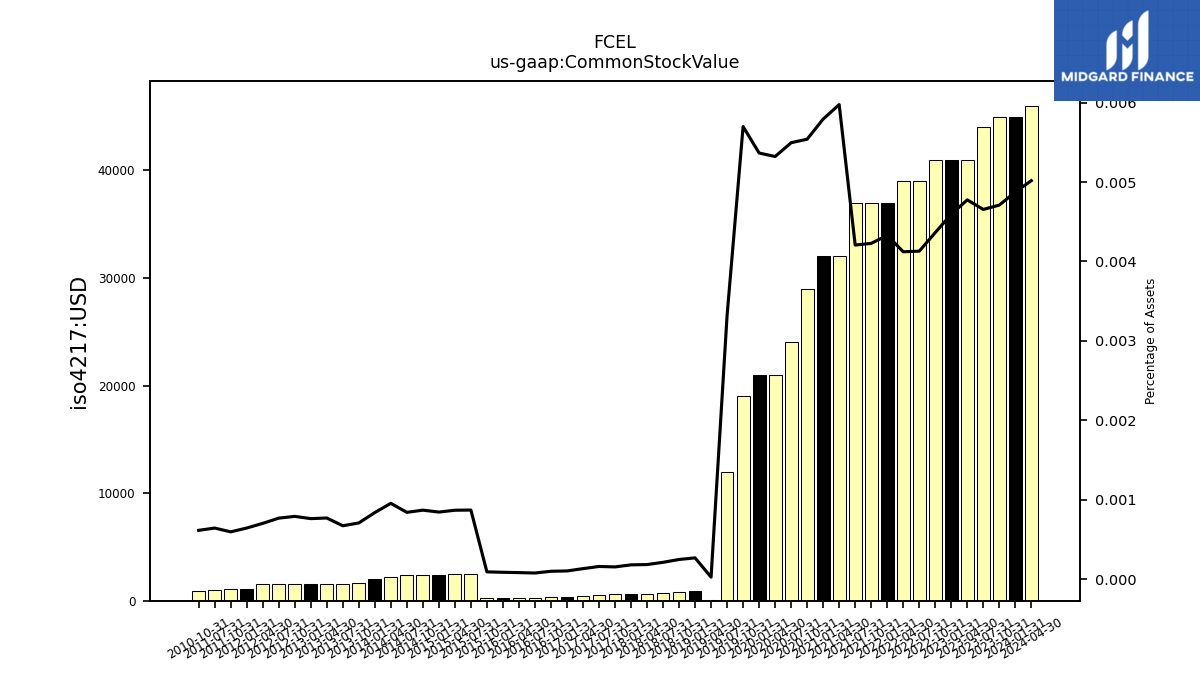
| Common Stock Value | 0.04 | 0.04 | 0.04 | 0.04 | 0.04 | 0.04 | 0.04 | 0.04 | 0.04 | 0.04 | 0.04 | 0.03 | 0.03 | 0.03 | 0.02 | 0.02 | 0.02 | 0.02 | 0.01 | 0.00 | 0.00 | 0.00 | 0.00 | 0.00 | 0.00 | 0.00 | 0.00 | 0.00 | 0.00 | 0.00 | 0.00 | 0.00 | 0.00 | 0.00 | 0.00 | 0.00 | 0.00 | 0.00 | 0.00 | 0.00 | 0.00 | 0.00 | 0.00 | 0.00 | 0.00 | 0.00 | 0.00 | 0.00 | 0.00 | 0.00 | 0.00 | NA | NA | 0.00 | NA | |
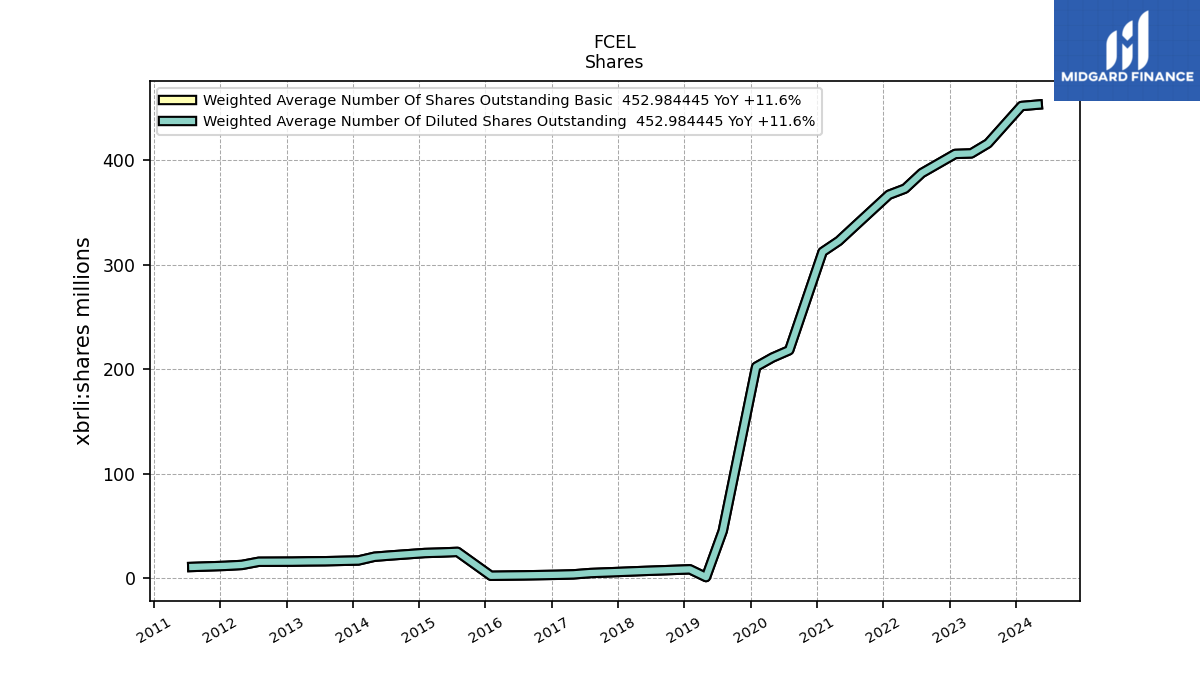
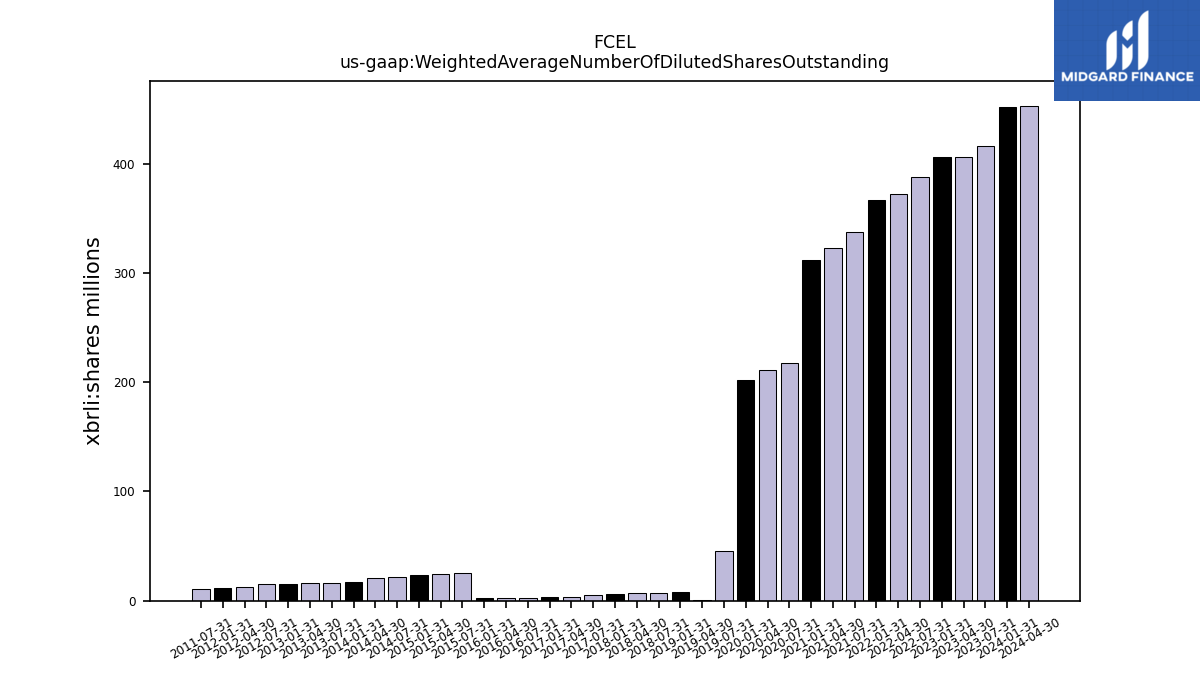
| Weighted Average Number Of Diluted Shares Outstanding | 451.64 | NA | 415.87 | 406.32 | 405.80 | NA | 387.47 | 372.62 | 366.73 | NA | 337.29 | 322.50 | 312.11 | NA | 217.97 | 211.00 | 202.22 | NA | 45.07 | 0.93 | 8.39 | NA | 7.25 | 6.68 | 6.05 | NA | 4.82 | 3.58 | 3.16 | NA | 2.61 | 2.42 | 2.20 | NA | 25.08 | 24.45 | 23.99 | NA | 21.69 | 20.44 | 16.85 | NA | 16.13 | 16.00 | 15.75 | NA | 15.62 | 12.60 | 11.72 | NA | 10.66 | NA | NA | NA | NA | |
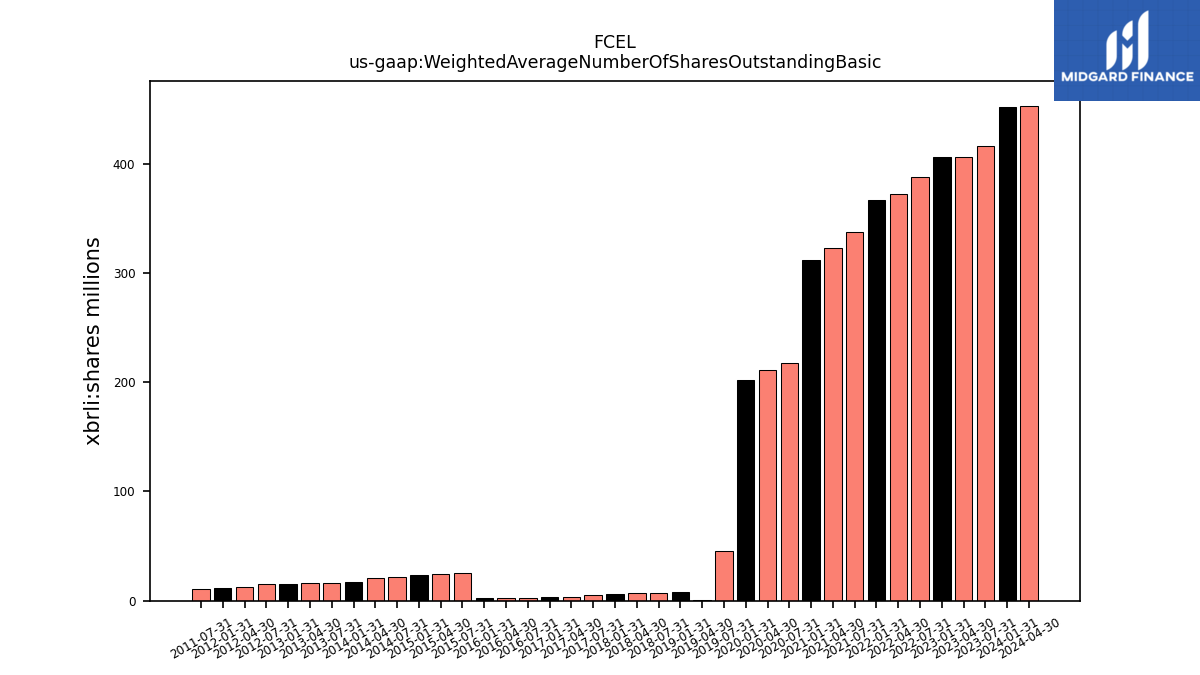
| Weighted Average Number Of Shares Outstanding Basic | 451.64 | NA | 415.87 | 406.32 | 405.80 | NA | 387.47 | 372.62 | 366.73 | NA | 337.29 | 322.50 | 312.11 | NA | 217.97 | 211.00 | 202.22 | NA | 45.07 | 0.93 | 8.39 | NA | 7.25 | 6.68 | 6.05 | NA | 4.82 | 3.58 | 3.16 | NA | 2.61 | 2.42 | 2.20 | NA | 25.08 | 24.45 | 23.99 | NA | 21.69 | 20.44 | 16.85 | NA | 16.13 | 16.00 | 15.75 | NA | 15.62 | 12.60 | 11.72 | NA | 10.66 | NA | NA | NA | NA | |
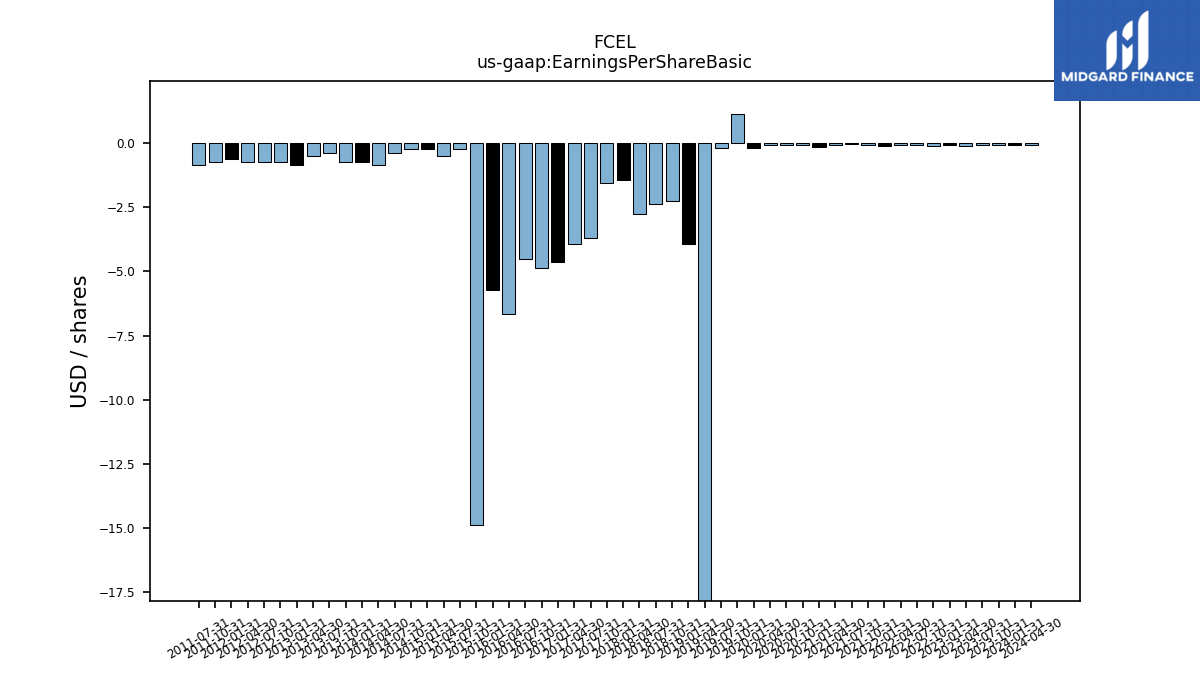
| Earnings Per Share Basic | -0.05 | -0.07 | -0.06 | -0.09 | -0.05 | -0.11 | -0.08 | -0.08 | -0.11 | -0.07 | -0.04 | -0.06 | -0.15 | -0.07 | -0.07 | -0.07 | -0.20 | 1.15 | -0.18 | -24.52 | -3.93 | -2.26 | -2.38 | -2.74 | -1.43 | -1.55 | -3.69 | -3.93 | -4.64 | -4.88 | -4.52 | -6.67 | -5.71 | -14.88 | -0.24 | -0.48 | -0.24 | -0.24 | -0.36 | -0.83 | -0.71 | -0.71 | -0.36 | -0.48 | -0.83 | -0.71 | -0.71 | -0.71 | -0.60 | -0.71 | -0.83 | NA | NA | NA | NA | |
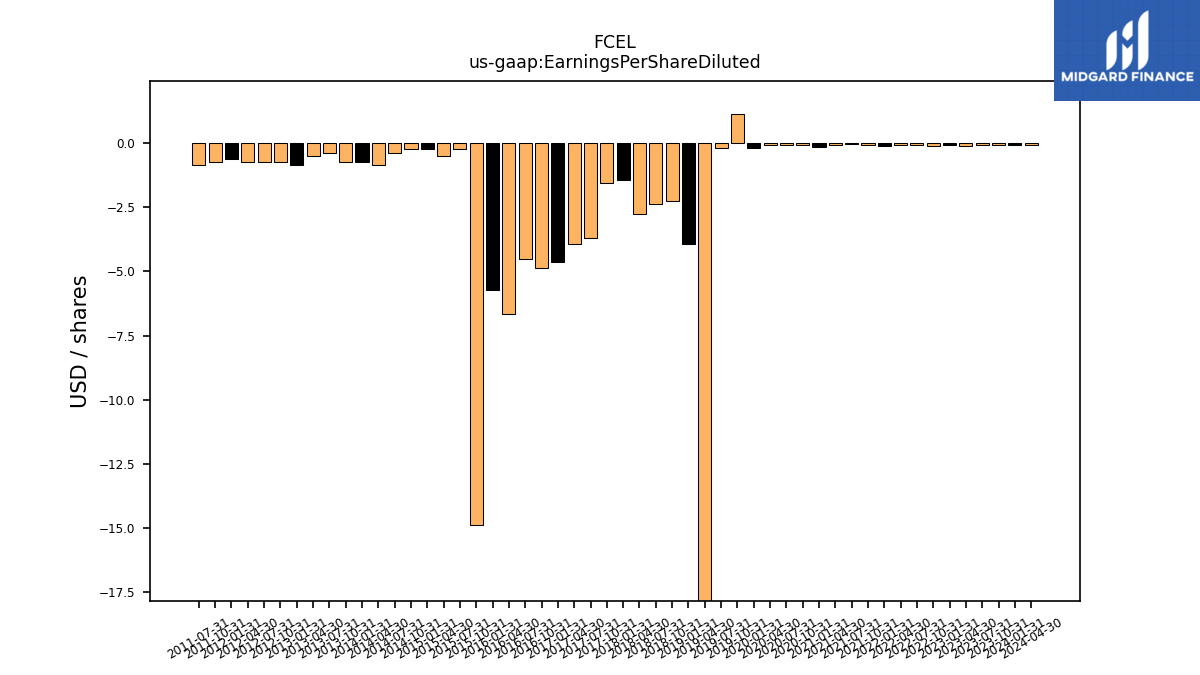
| Earnings Per Share Diluted | -0.05 | -0.07 | -0.06 | -0.09 | -0.05 | -0.11 | -0.08 | -0.08 | -0.11 | -0.07 | -0.04 | -0.06 | -0.15 | -0.07 | -0.07 | -0.07 | -0.20 | 1.15 | -0.18 | -24.52 | -3.93 | -2.26 | -2.38 | -2.74 | -1.43 | -1.55 | -3.69 | -3.93 | -4.64 | -4.88 | -4.52 | -6.67 | -5.71 | -14.88 | -0.24 | -0.48 | -0.24 | -0.24 | -0.36 | -0.83 | -0.71 | -0.71 | -0.36 | -0.48 | -0.83 | -0.71 | -0.71 | -0.71 | -0.60 | -0.71 | -0.83 | NA | NA | NA | NA |
| 2024-01-31 | 2023-10-31 | 2023-07-31 | 2023-04-30 | 2023-01-31 | 2022-10-31 | 2022-07-31 | 2022-04-30 | 2022-01-31 | 2021-10-31 | 2021-07-31 | 2021-04-30 | 2021-01-31 | 2020-10-31 | 2020-07-31 | 2020-04-30 | 2020-01-31 | 2019-10-31 | 2019-07-31 | 2019-04-30 | 2019-01-31 | 2018-10-31 | 2018-07-31 | 2018-04-30 | 2018-01-31 | 2017-10-31 | 2017-07-31 | 2017-04-30 | 2017-01-31 | 2016-10-31 | 2016-07-31 | 2016-04-30 | 2016-01-31 | 2015-10-31 | 2015-07-31 | 2015-04-30 | 2015-01-31 | 2014-10-31 | 2014-07-31 | 2014-04-30 | 2014-01-31 | 2013-10-31 | 2013-07-31 | 2013-04-30 | 2013-01-31 | 2012-10-31 | 2012-07-31 | 2012-04-30 | 2012-01-31 | 2011-10-31 | 2011-07-31 | 2011-04-30 | 2011-01-31 | 2010-10-31 | 2010-07-31 | ||
|---|---|---|---|---|---|---|---|---|---|---|---|---|---|---|---|---|---|---|---|---|---|---|---|---|---|---|---|---|---|---|---|---|---|---|---|---|---|---|---|---|---|---|---|---|---|---|---|---|---|---|---|---|---|---|---|---|
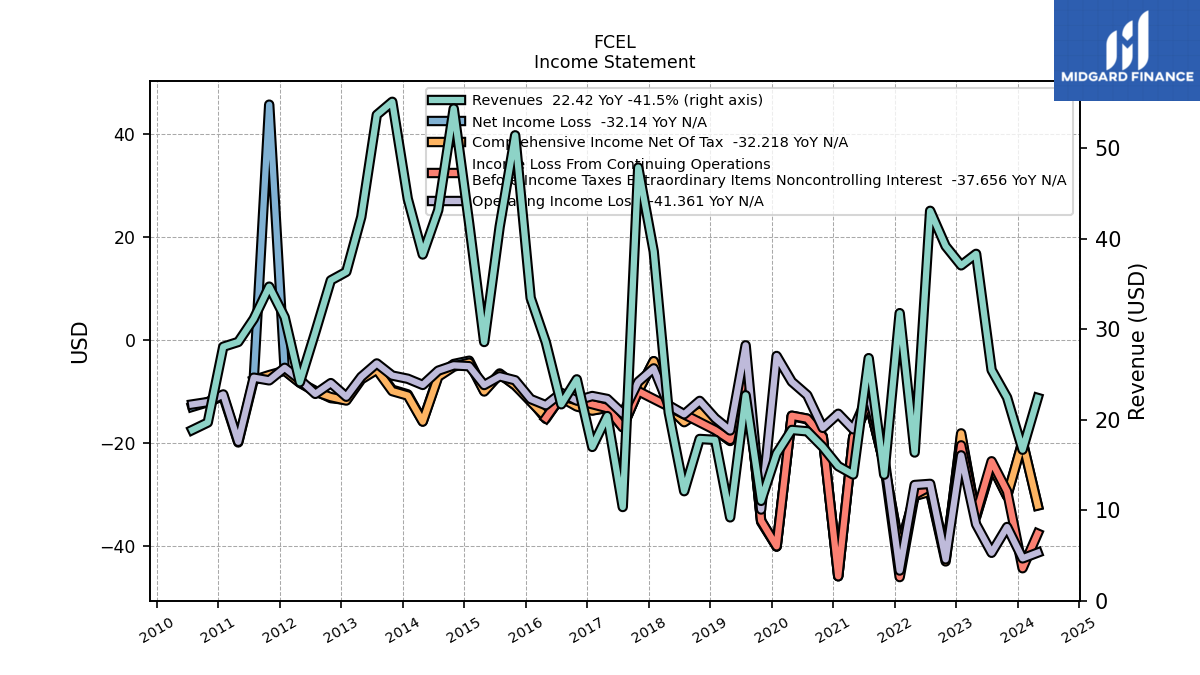
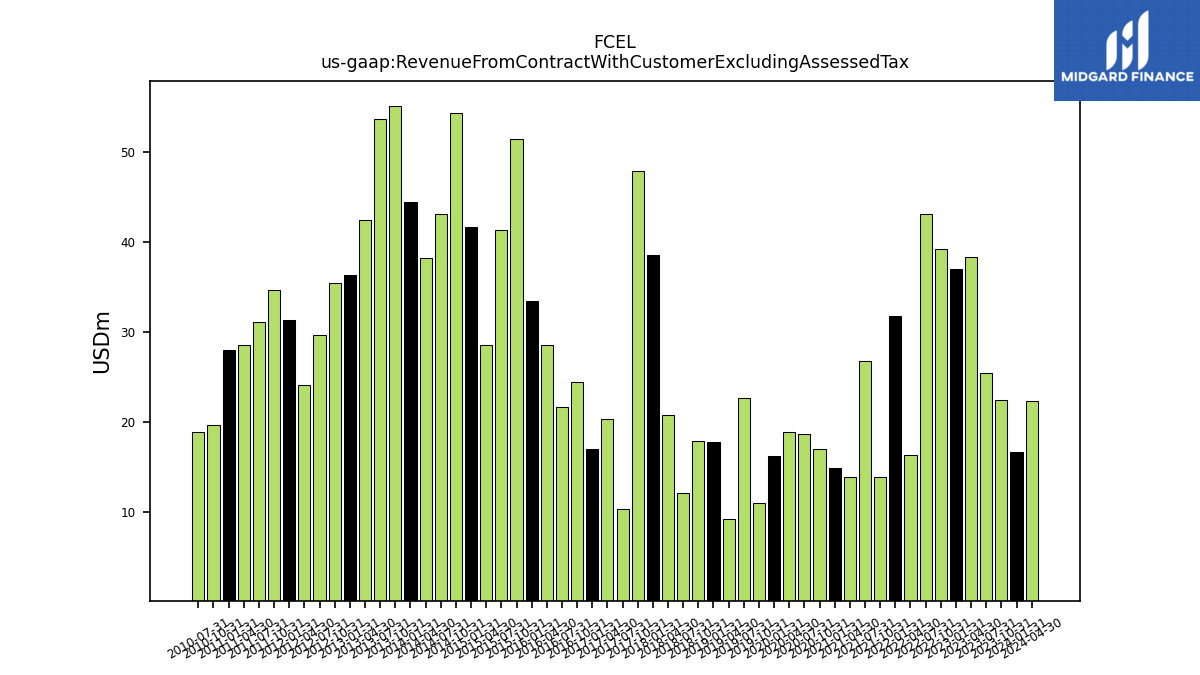
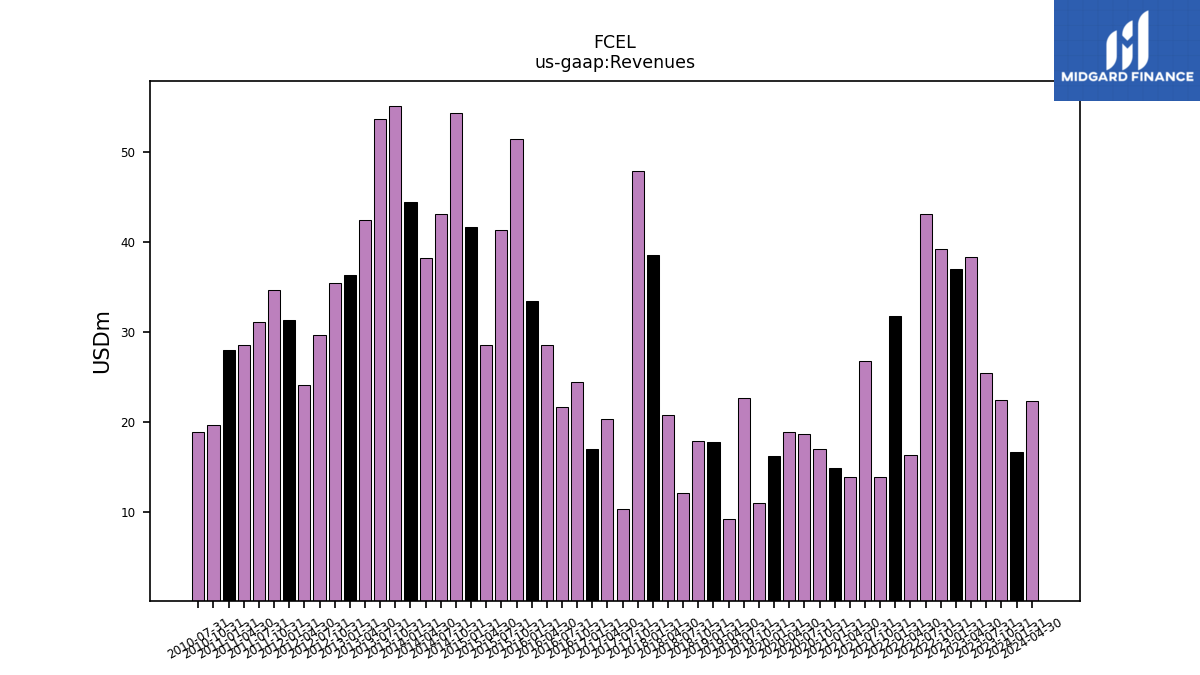
| Revenue From Contract With Customer Excluding Assessed Tax | 16.69 | 22.46 | 25.51 | 38.35 | 37.07 | 39.20 | 43.10 | 16.38 | 31.80 | 13.94 | 26.82 | 13.95 | 14.88 | 17.00 | 18.73 | 18.88 | 16.26 | 11.04 | 22.71 | 9.22 | 17.78 | 17.88 | 12.11 | 20.83 | 38.61 | 47.89 | 10.36 | 20.42 | 17.00 | 24.47 | 21.72 | 28.58 | 33.48 | 51.45 | 41.36 | 28.60 | 41.67 | 54.41 | 43.18 | 38.27 | 44.43 | 55.16 | 53.71 | 42.44 | 36.36 | 35.42 | 29.69 | 24.15 | 31.34 | 34.72 | 31.16 | 28.61 | 28.08 | 19.70 | 18.87 | |
| Revenues | 16.69 | 22.46 | 25.51 | 38.35 | 37.07 | 39.20 | 43.10 | 16.38 | 31.80 | 13.94 | 26.82 | 13.95 | 14.88 | 17.00 | 18.73 | 18.88 | 16.26 | 11.04 | 22.71 | 9.22 | 17.78 | 17.88 | 12.11 | 20.83 | 38.61 | 47.89 | 10.36 | 20.42 | 17.00 | 24.47 | 21.72 | 28.58 | 33.48 | 51.45 | 41.36 | 28.60 | 41.67 | 54.41 | 43.18 | 38.27 | 44.43 | 55.16 | 53.71 | 42.44 | 36.36 | 35.42 | 29.69 | 24.15 | 31.34 | 34.72 | 31.16 | 28.61 | 28.08 | 19.70 | 18.87 | |
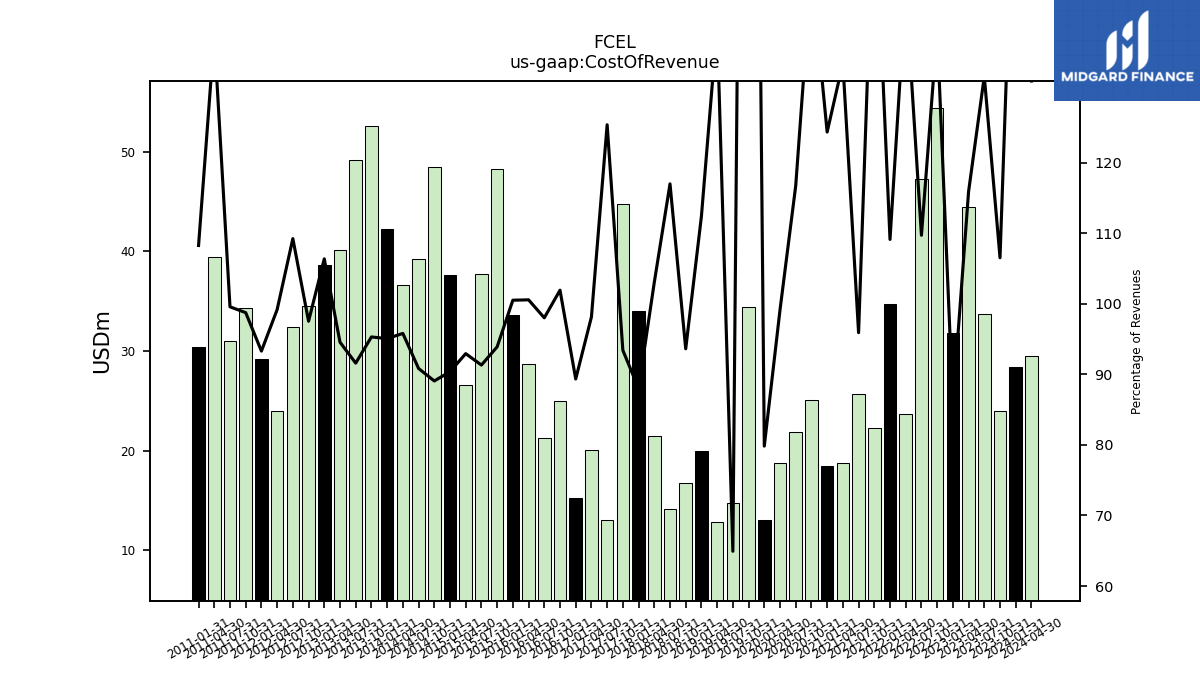
| Cost Of Revenue | 28.42 | 23.93 | 33.73 | 44.44 | 31.84 | 54.39 | 47.28 | 23.69 | 34.69 | 22.30 | 25.72 | 18.71 | 18.50 | 25.04 | 21.86 | 18.71 | 12.98 | 34.43 | 14.75 | 12.86 | 19.99 | 16.74 | 14.17 | 21.46 | 33.98 | 44.73 | 12.98 | 20.03 | 15.19 | 24.94 | 21.28 | 28.74 | 33.65 | 48.31 | 37.76 | 26.58 | 37.66 | 48.45 | 39.22 | 36.66 | 42.23 | 52.56 | 49.19 | 40.12 | 38.67 | 34.54 | 32.43 | 23.95 | 29.23 | 34.28 | 31.02 | 39.48 | 30.40 | NA | NA | |
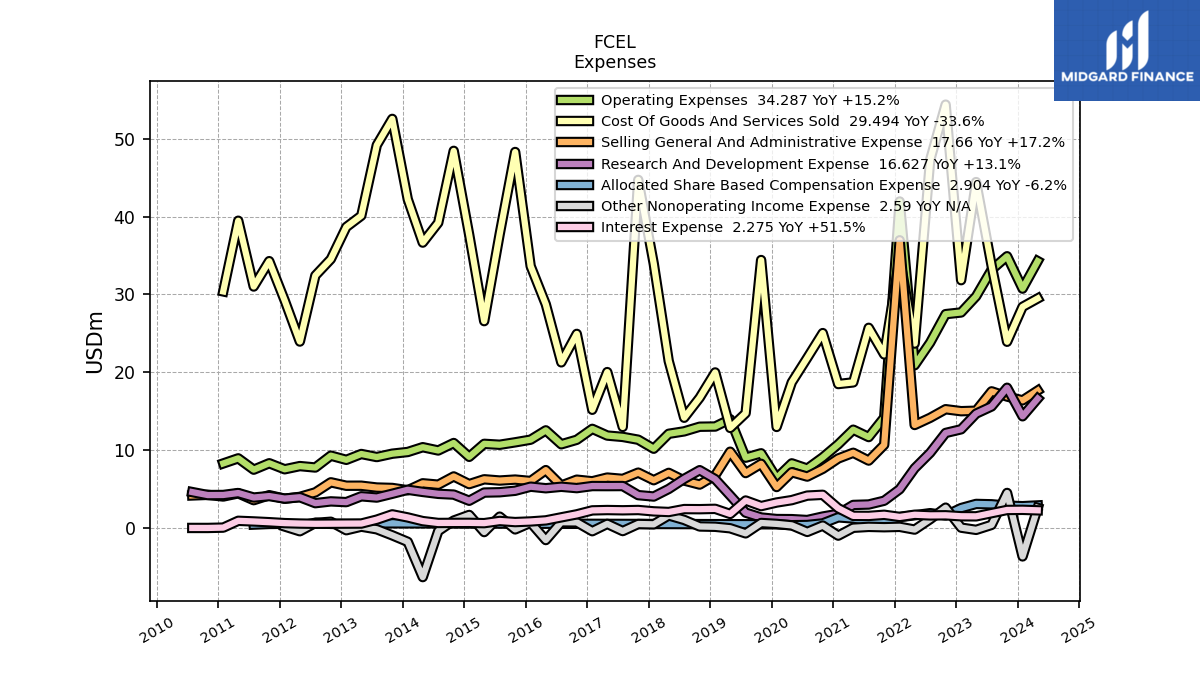
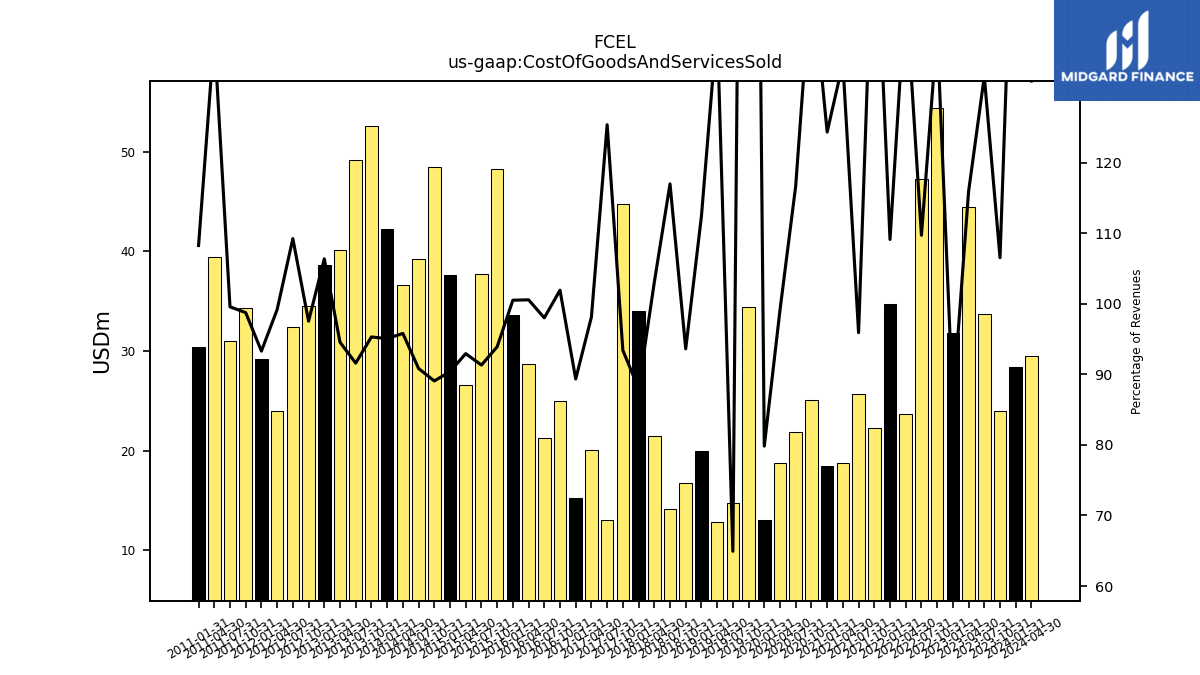
| Cost Of Goods And Services Sold | 28.42 | 23.93 | 33.73 | 44.44 | 31.84 | 54.39 | 47.28 | 23.69 | 34.69 | 22.30 | 25.72 | 18.71 | 18.50 | 25.04 | 21.86 | 18.71 | 12.98 | 34.43 | 14.75 | 12.86 | 19.99 | 16.74 | 14.17 | 21.46 | 33.98 | 44.73 | 12.98 | 20.03 | 15.19 | 24.94 | 21.28 | 28.74 | 33.65 | 48.31 | 37.76 | 26.58 | 37.66 | 48.45 | 39.22 | 36.66 | 42.23 | 52.56 | 49.19 | 40.12 | 38.67 | 34.54 | 32.43 | 23.95 | 29.23 | 34.28 | 31.02 | 39.48 | 30.40 | NA | NA | |
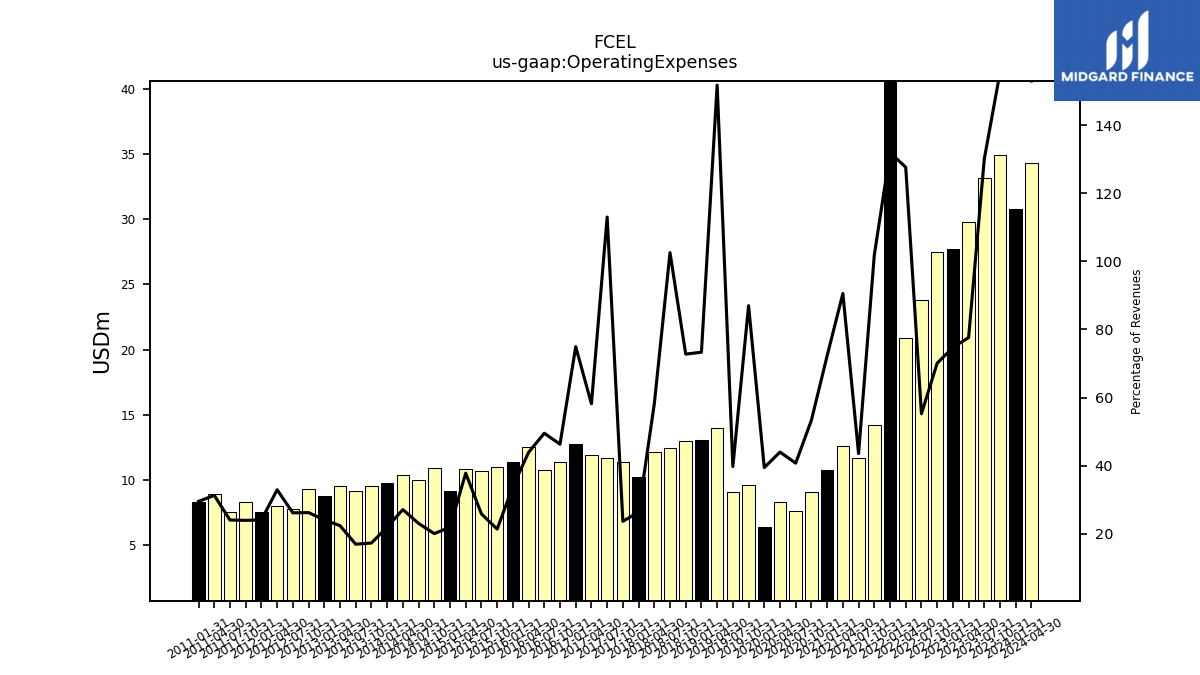
| Operating Expenses | 30.75 | 34.91 | 33.18 | 29.77 | 27.69 | 27.48 | 23.82 | 20.91 | 41.95 | 14.19 | 11.69 | 12.63 | 10.76 | 9.08 | 7.63 | 8.31 | 6.42 | 9.60 | 9.04 | 13.98 | 13.04 | 13.01 | 12.42 | 12.11 | 10.19 | 11.35 | 11.70 | 11.88 | 12.74 | 11.34 | 10.76 | 12.55 | 11.35 | 11.01 | 10.70 | 10.82 | 9.14 | 10.92 | 9.96 | 10.38 | 9.77 | 9.55 | 9.12 | 9.51 | 8.76 | 9.30 | 7.77 | 7.96 | 7.55 | 8.32 | 7.50 | 8.95 | 8.30 | NA | NA | |
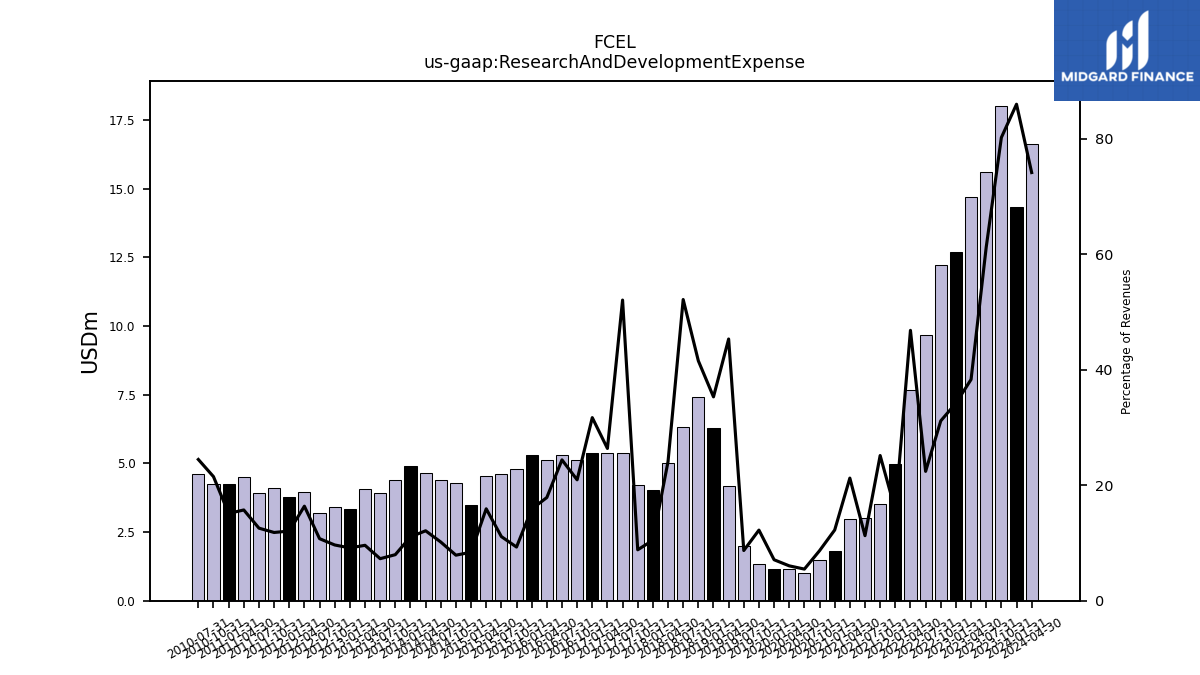
| Research And Development Expense | 14.35 | 18.02 | 15.62 | 14.70 | 12.68 | 12.21 | 9.66 | 7.67 | 4.98 | 3.50 | 3.02 | 2.96 | 1.82 | 1.47 | 1.03 | 1.14 | 1.16 | 1.35 | 1.98 | 4.18 | 6.28 | 7.43 | 6.32 | 5.02 | 4.05 | 4.23 | 5.39 | 5.39 | 5.39 | 5.13 | 5.30 | 5.11 | 5.31 | 4.79 | 4.60 | 4.55 | 3.50 | 4.29 | 4.39 | 4.64 | 4.92 | 4.40 | 3.91 | 4.08 | 3.33 | 3.42 | 3.19 | 3.96 | 3.78 | 4.11 | 3.92 | 4.50 | 4.25 | 4.24 | 4.62 | |
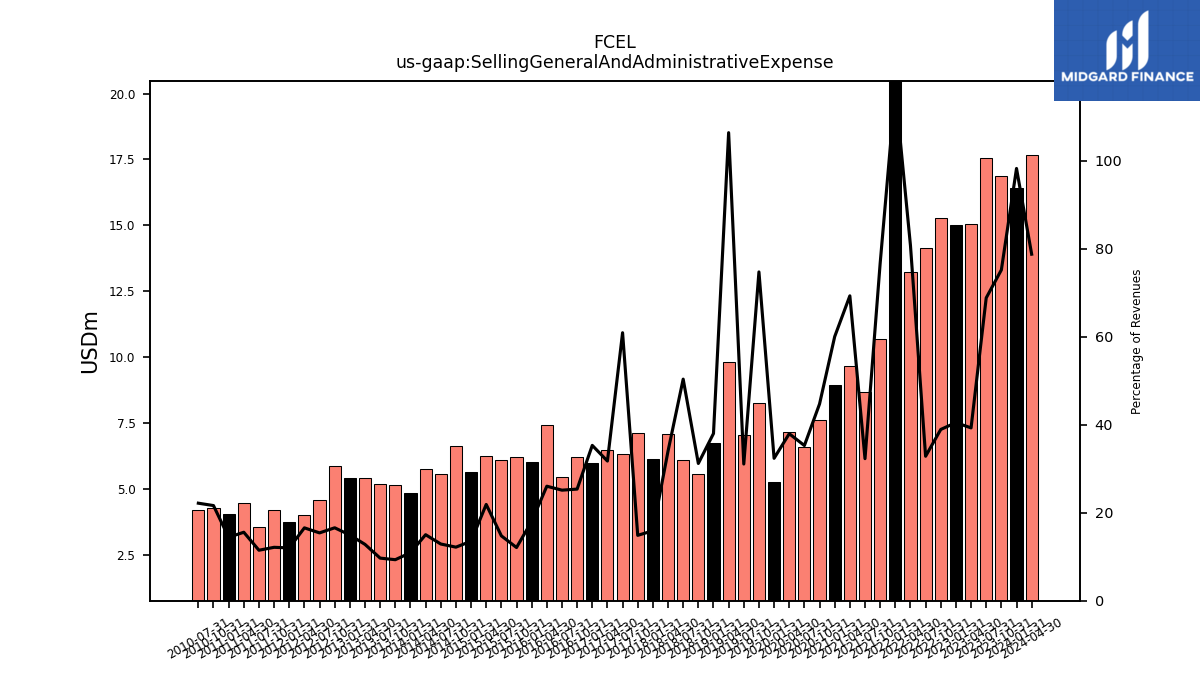
| Selling General And Administrative Expense | 16.40 | 16.89 | 17.56 | 15.07 | 15.01 | 15.26 | 14.16 | 13.23 | 36.97 | 10.68 | 8.66 | 9.67 | 8.93 | 7.60 | 6.61 | 7.17 | 5.27 | 8.25 | 7.06 | 9.80 | 6.76 | 5.58 | 6.10 | 7.08 | 6.14 | 7.12 | 6.31 | 6.48 | 6.00 | 6.21 | 5.46 | 7.44 | 6.04 | 6.22 | 6.10 | 6.26 | 5.64 | 6.63 | 5.57 | 5.75 | 4.85 | 5.15 | 5.20 | 5.44 | 5.43 | 5.87 | 4.58 | 4.00 | 3.76 | 4.22 | 3.58 | 4.45 | 4.05 | 4.26 | 4.18 | |
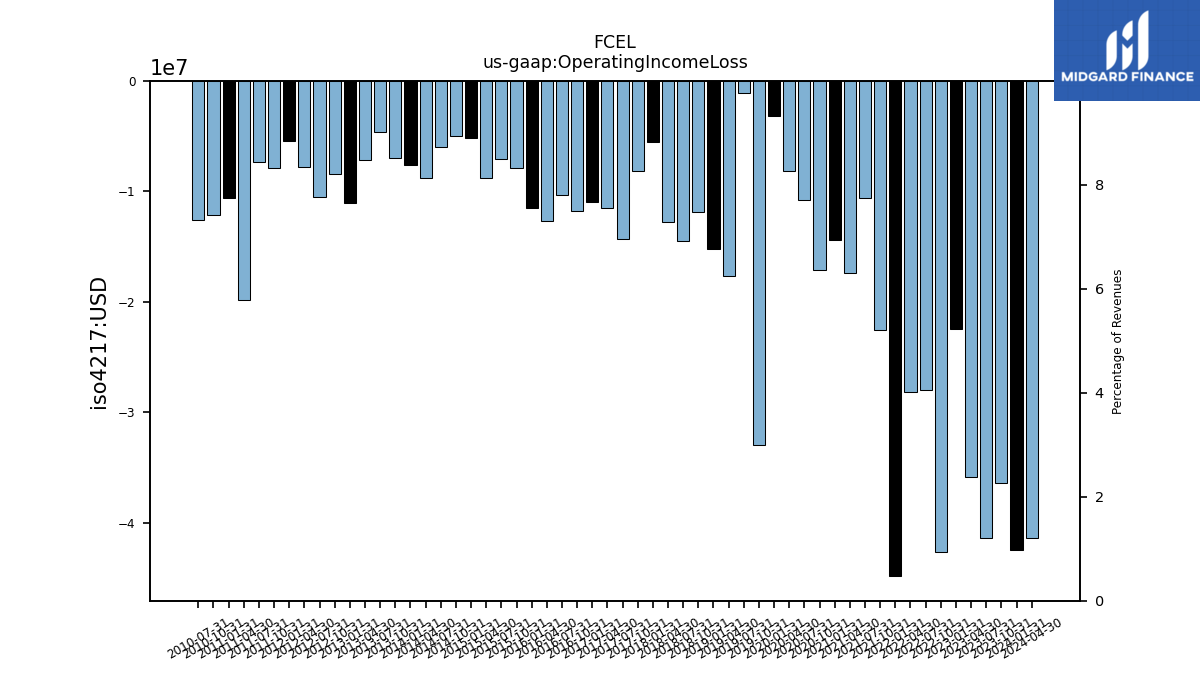
| Operating Income Loss | -42.48 | -36.38 | -41.40 | -35.86 | -22.45 | -42.67 | -28.00 | -28.22 | -44.84 | -22.55 | -10.59 | -17.39 | -14.37 | -17.12 | -10.76 | -8.14 | -3.14 | -32.99 | -1.07 | -17.62 | -15.24 | -11.87 | -14.47 | -12.73 | -5.55 | -8.18 | -14.33 | -11.50 | -10.93 | -11.80 | -10.32 | -12.71 | -11.52 | -7.87 | -7.10 | -8.79 | -5.13 | -4.97 | -6.00 | -8.77 | -7.57 | -6.95 | -4.59 | -7.20 | -11.07 | -8.42 | -10.51 | -7.76 | -5.44 | -7.88 | -7.36 | -19.82 | -10.61 | -12.10 | -12.56 | |
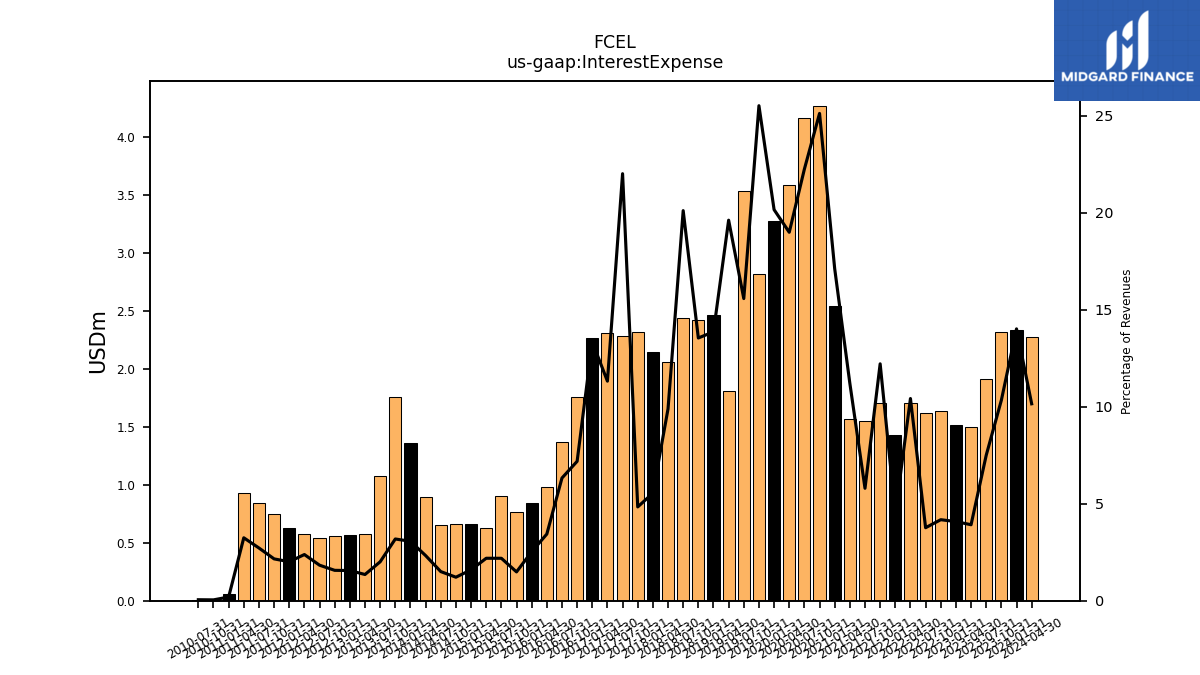
| Interest Expense | 2.34 | 2.32 | 1.91 | 1.50 | 1.51 | 1.64 | 1.62 | 1.71 | 1.43 | 1.70 | 1.55 | 1.56 | 2.54 | 4.27 | 4.17 | 3.58 | 3.28 | 2.82 | 3.54 | 1.81 | 2.46 | 2.42 | 2.43 | 2.06 | 2.14 | 2.31 | 2.28 | 2.31 | 2.27 | 1.76 | 1.37 | 0.98 | 0.84 | 0.77 | 0.91 | 0.63 | 0.66 | 0.66 | 0.65 | 0.89 | 1.36 | 1.75 | 1.08 | 0.57 | 0.57 | 0.56 | 0.54 | 0.57 | 0.63 | 0.75 | 0.85 | 0.93 | 0.05 | 0.01 | 0.01 | |
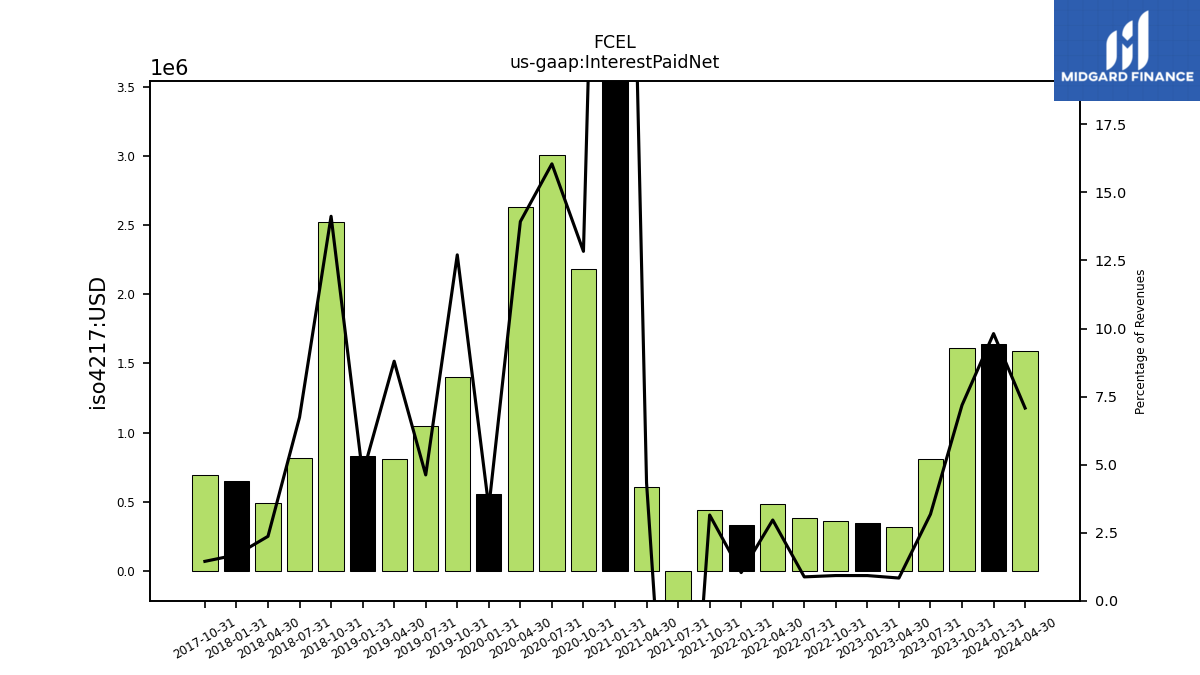
| Interest Paid Net | 1.64 | 1.61 | 0.81 | 0.32 | 0.34 | 0.36 | 0.38 | 0.49 | 0.33 | 0.44 | -3.46 | 0.60 | 8.19 | 2.18 | 3.01 | 2.63 | 0.56 | 1.40 | 1.05 | 0.81 | 0.83 | 2.53 | 0.82 | 0.49 | 0.65 | 0.69 | NA | NA | NA | NA | NA | NA | NA | NA | NA | NA | NA | NA | NA | NA | NA | NA | NA | NA | NA | NA | NA | NA | NA | NA | NA | NA | NA | NA | NA | |
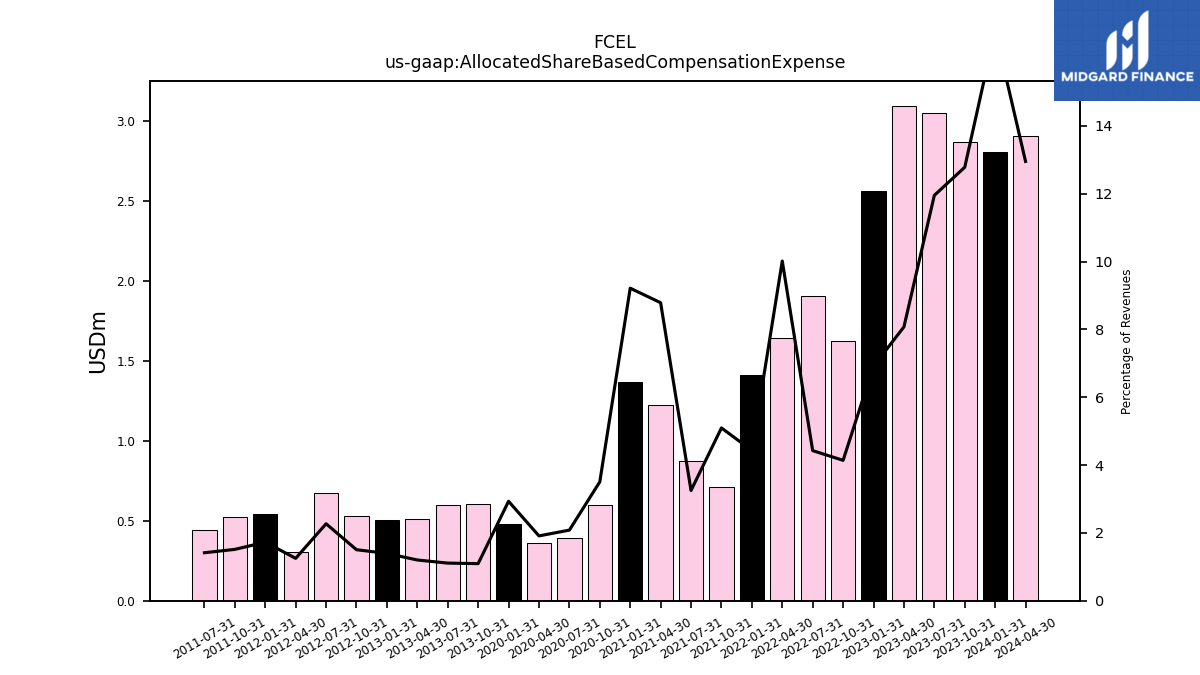
| Allocated Share Based Compensation Expense | 2.81 | 2.87 | 3.05 | 3.10 | 2.56 | 1.62 | 1.91 | 1.64 | 1.41 | 0.71 | 0.87 | 1.23 | 1.37 | 0.60 | 0.39 | 0.36 | 0.48 | NA | NA | NA | NA | NA | NA | NA | NA | NA | NA | NA | NA | NA | NA | NA | NA | NA | NA | NA | NA | NA | NA | NA | NA | 0.60 | 0.60 | 0.51 | 0.51 | 0.53 | 0.67 | 0.30 | 0.54 | 0.53 | 0.44 | NA | NA | NA | NA | |
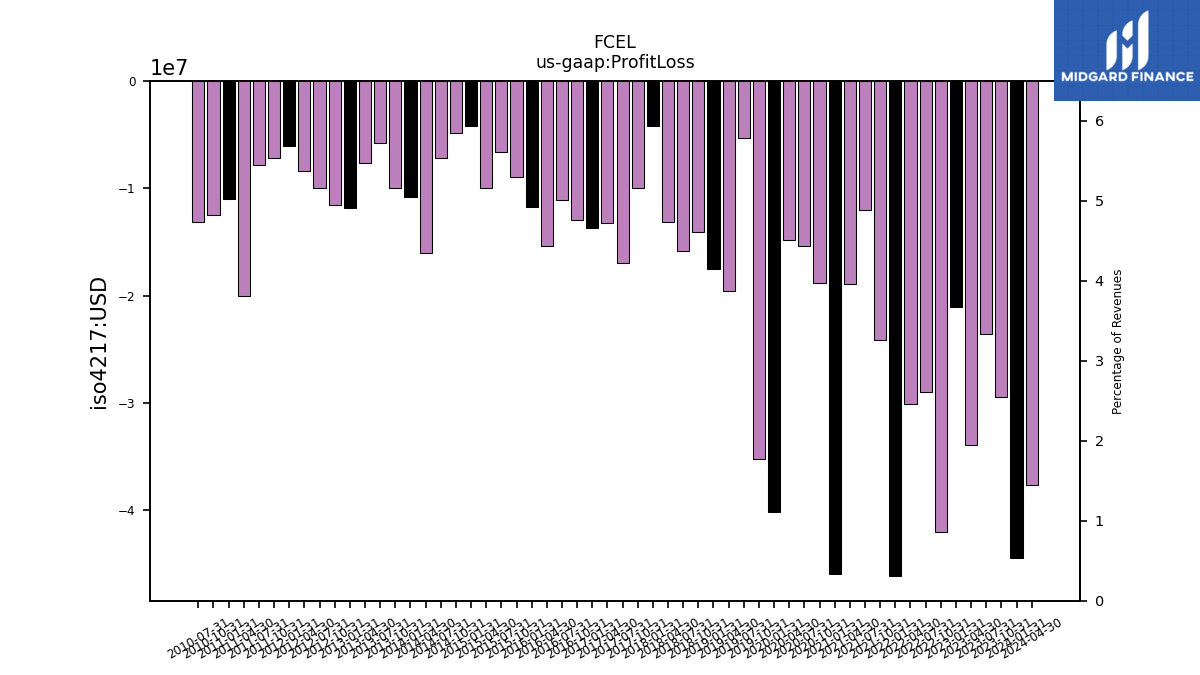
| Profit Loss | -44.40 | -29.46 | -23.60 | -33.91 | -21.09 | -42.01 | -28.98 | -30.13 | -46.12 | -24.15 | -12.00 | -18.92 | -45.96 | -18.86 | -15.33 | -14.77 | -40.15 | -35.18 | -5.31 | -19.53 | -17.55 | -14.10 | -15.88 | -13.17 | -4.18 | -9.98 | -17.00 | -13.24 | -13.69 | -12.95 | -11.07 | -15.41 | -11.78 | -8.90 | -6.63 | -10.00 | -4.15 | -4.89 | -7.14 | -16.04 | -10.81 | -10.00 | -5.81 | -7.63 | -11.88 | -11.52 | -10.01 | -8.36 | -6.01 | -7.13 | -7.83 | -20.01 | -11.01 | -12.52 | -13.11 | |
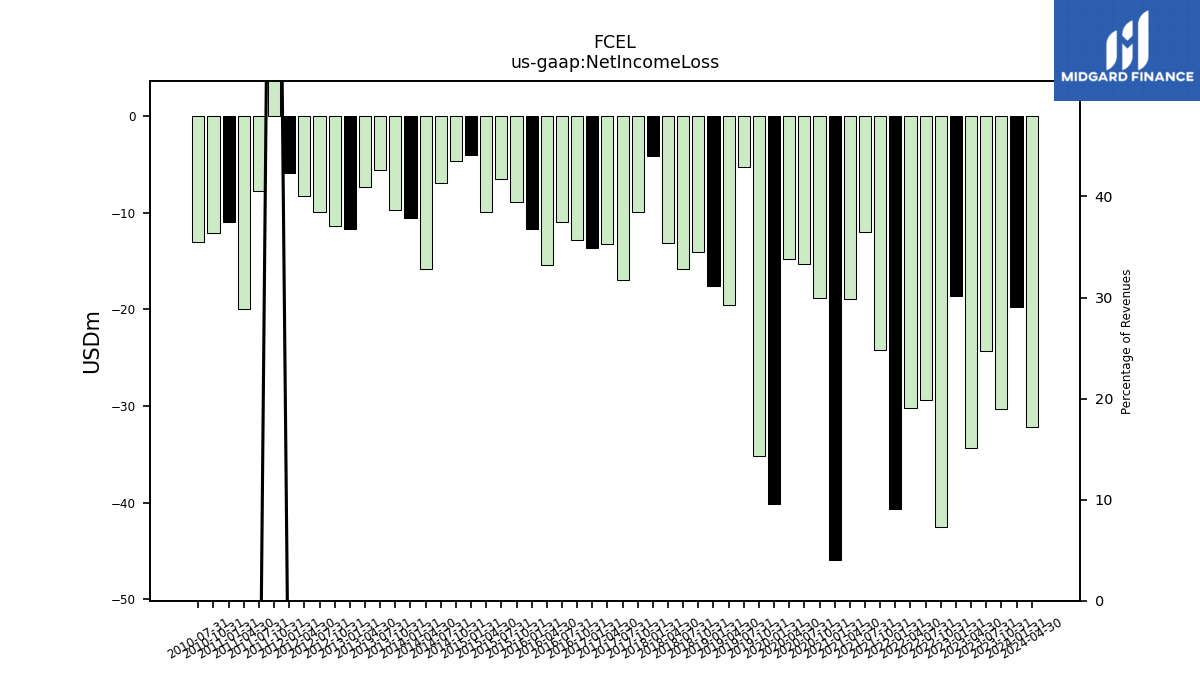
| Net Income Loss | -19.79 | -30.36 | -24.28 | -34.30 | -18.62 | -42.47 | -29.41 | -30.22 | -40.62 | -24.18 | -12.00 | -18.92 | -45.96 | -18.86 | -15.33 | -14.77 | -40.15 | -35.18 | -5.31 | -19.53 | -17.55 | -14.10 | -15.88 | -13.17 | -4.18 | -9.98 | -17.00 | -13.24 | -13.69 | -12.86 | -11.01 | -15.37 | -11.71 | -8.86 | -6.54 | -9.89 | -4.07 | -4.70 | -6.98 | -15.84 | -10.60 | -9.70 | -5.61 | -7.37 | -11.68 | -11.34 | -9.92 | -8.29 | -5.94 | 45.70 | -7.75 | -19.96 | -10.94 | -12.12 | -13.03 | |
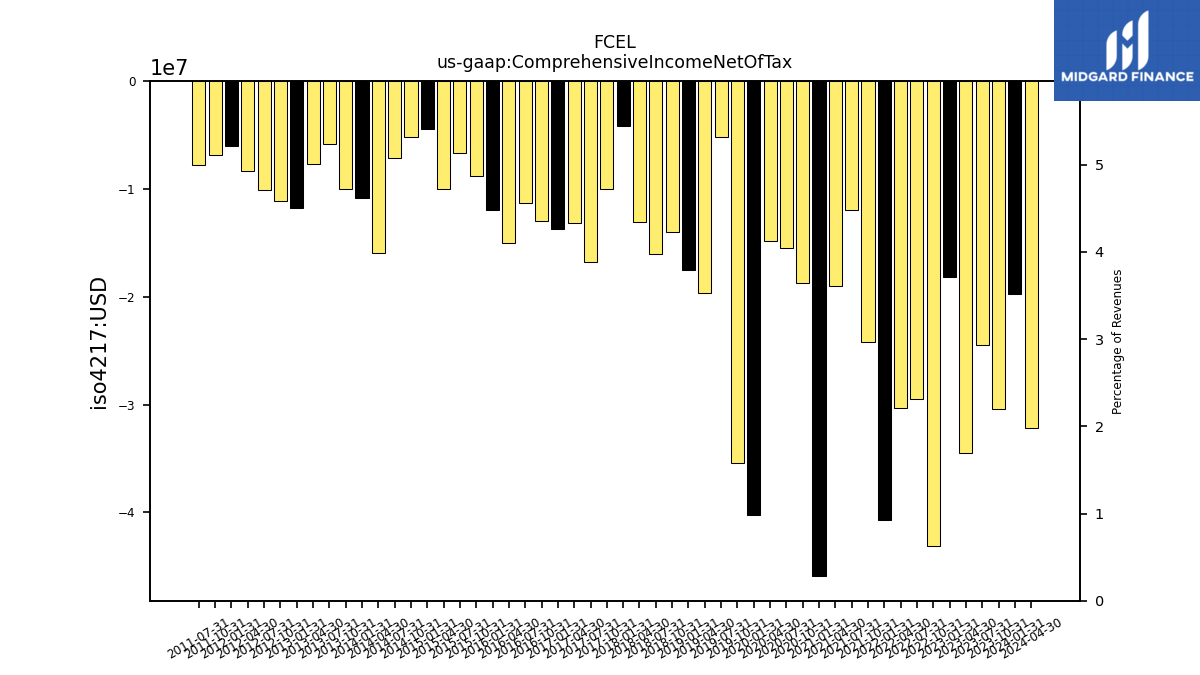
| Comprehensive Income Net Of Tax | -19.76 | -30.42 | -24.44 | -34.45 | -18.18 | -43.07 | -29.50 | -30.37 | -40.72 | -24.22 | -12.00 | -18.98 | -45.90 | -18.72 | -15.47 | -14.81 | -40.20 | -35.40 | -5.21 | -19.67 | -17.54 | -14.04 | -16.01 | -13.12 | -4.15 | -10.01 | -16.80 | -13.21 | -13.76 | -12.96 | -11.29 | -14.99 | -12.00 | -8.85 | -6.69 | -10.05 | -4.44 | -5.22 | -7.18 | -15.91 | -10.84 | -9.97 | -5.82 | -7.68 | -11.80 | -11.13 | -10.09 | -8.36 | -6.02 | -6.86 | -7.83 | NA | NA | NA | NA | |
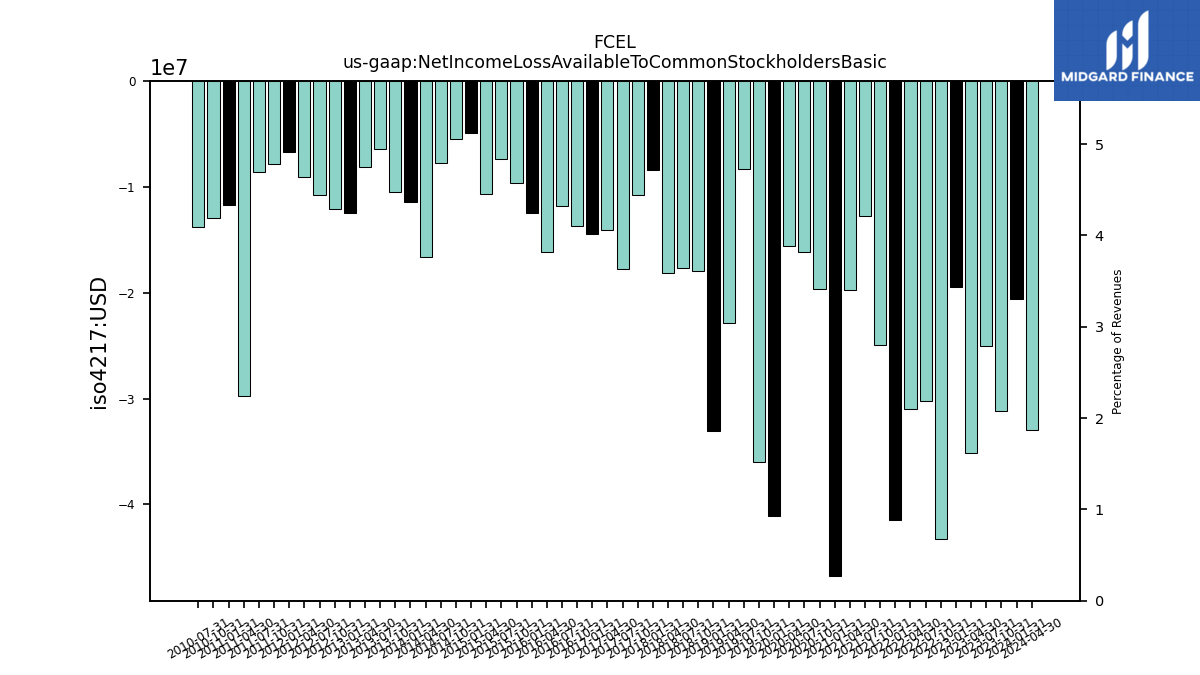
| Net Income Loss Available To Common Stockholders Basic | -20.59 | -31.16 | -25.08 | -35.10 | -19.42 | -43.27 | -30.21 | -31.02 | -41.42 | -24.98 | -12.80 | -19.72 | -46.76 | -19.66 | -16.13 | -15.57 | -41.08 | -36.00 | -8.33 | -22.88 | -33.04 | -17.93 | -17.62 | -18.17 | -8.45 | -10.78 | -17.80 | -14.04 | -14.48 | -13.66 | -11.81 | -16.17 | -12.51 | -9.66 | -7.34 | -10.69 | -4.87 | -5.50 | -7.78 | -16.64 | -11.40 | -10.50 | -6.41 | -8.16 | -12.48 | -12.14 | -10.72 | -9.09 | -6.74 | -7.87 | -8.55 | -29.74 | -11.74 | -12.92 | -13.82 |
| 2024-01-31 | 2023-10-31 | 2023-07-31 | 2023-04-30 | 2023-01-31 | 2022-10-31 | 2022-07-31 | 2022-04-30 | 2022-01-31 | 2021-10-31 | 2021-07-31 | 2021-04-30 | 2021-01-31 | 2020-10-31 | 2020-07-31 | 2020-04-30 | 2020-01-31 | 2019-10-31 | 2019-07-31 | 2019-04-30 | 2019-01-31 | 2018-10-31 | 2018-07-31 | 2018-04-30 | 2018-01-31 | 2017-10-31 | 2017-07-31 | 2017-04-30 | 2017-01-31 | 2016-10-31 | 2016-07-31 | 2016-04-30 | 2016-01-31 | 2015-10-31 | 2015-07-31 | 2015-04-30 | 2015-01-31 | 2014-10-31 | 2014-07-31 | 2014-04-30 | 2014-01-31 | 2013-10-31 | 2013-07-31 | 2013-04-30 | 2013-01-31 | 2012-10-31 | 2012-07-31 | 2012-04-30 | 2012-01-31 | 2011-10-31 | 2011-07-31 | 2011-04-30 | 2011-01-31 | 2010-10-31 | 2010-07-31 | ||
|---|---|---|---|---|---|---|---|---|---|---|---|---|---|---|---|---|---|---|---|---|---|---|---|---|---|---|---|---|---|---|---|---|---|---|---|---|---|---|---|---|---|---|---|---|---|---|---|---|---|---|---|---|---|---|---|---|
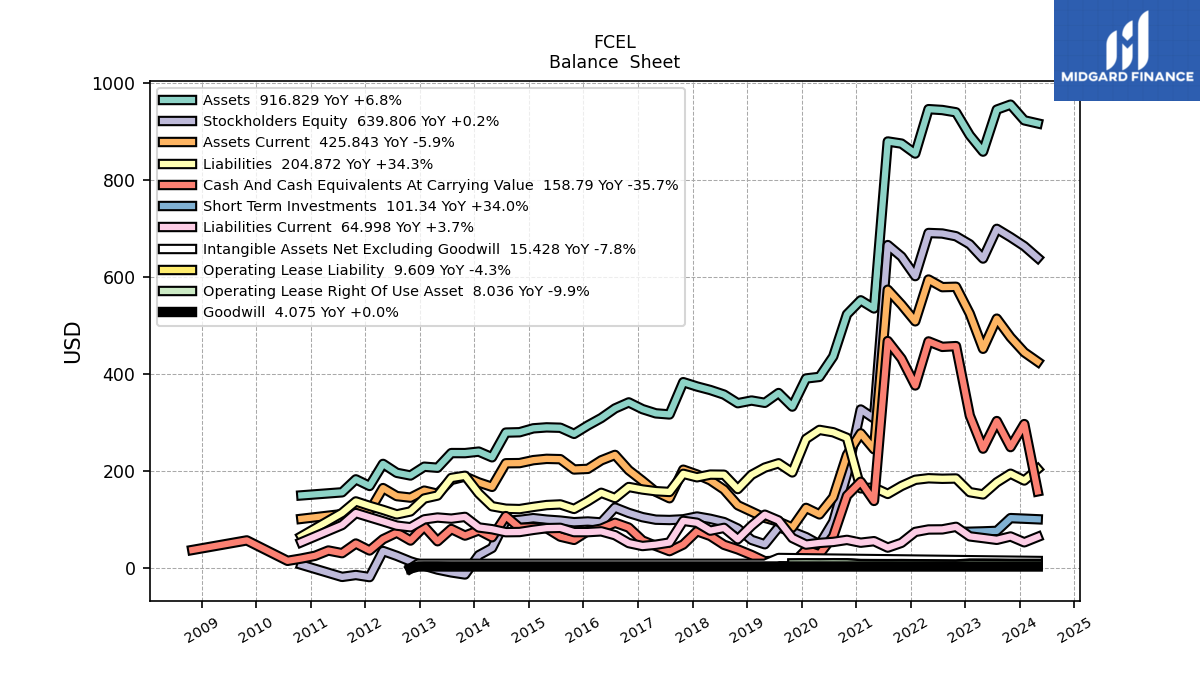
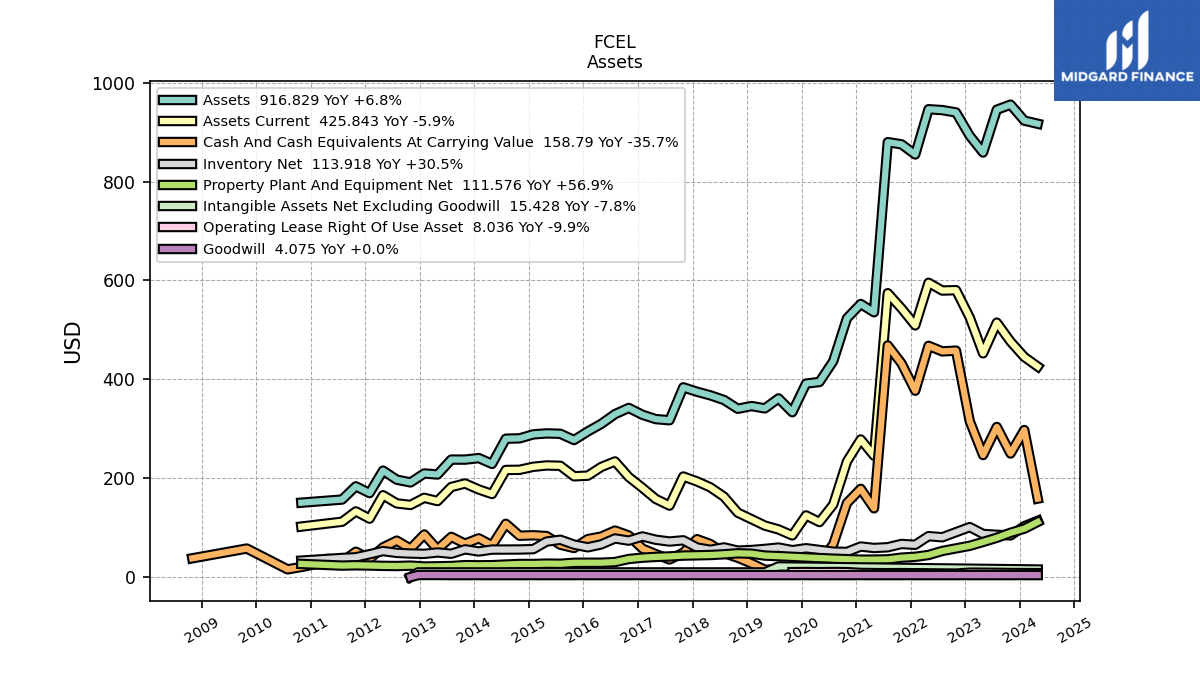
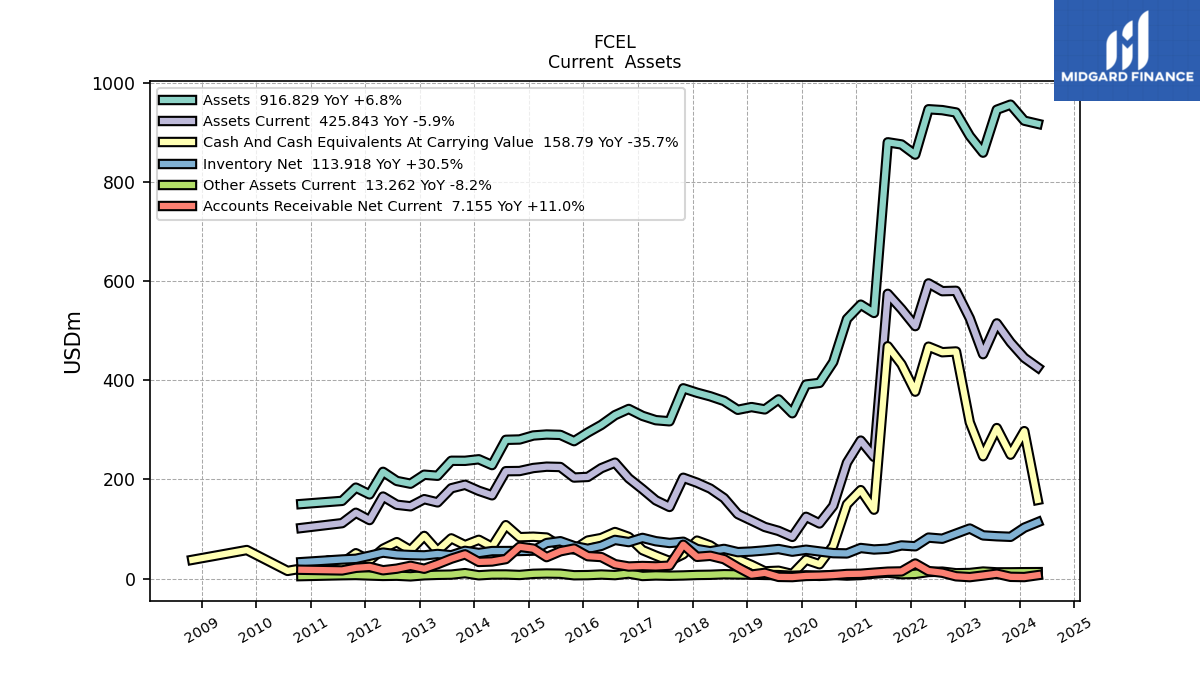
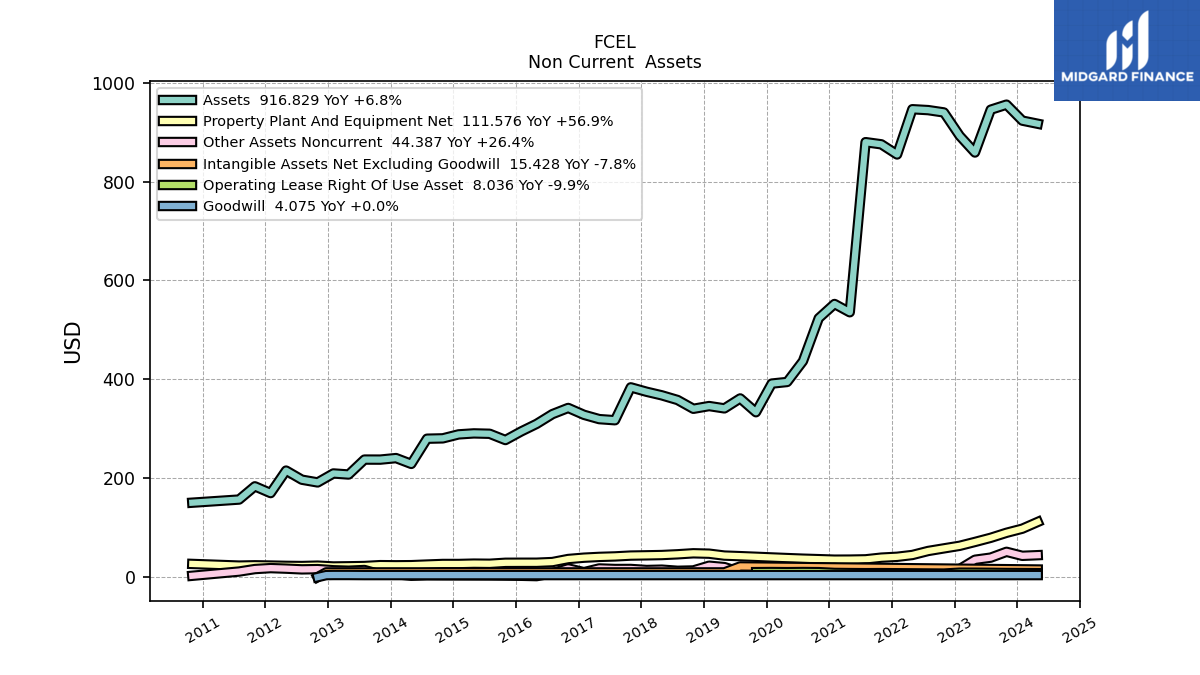
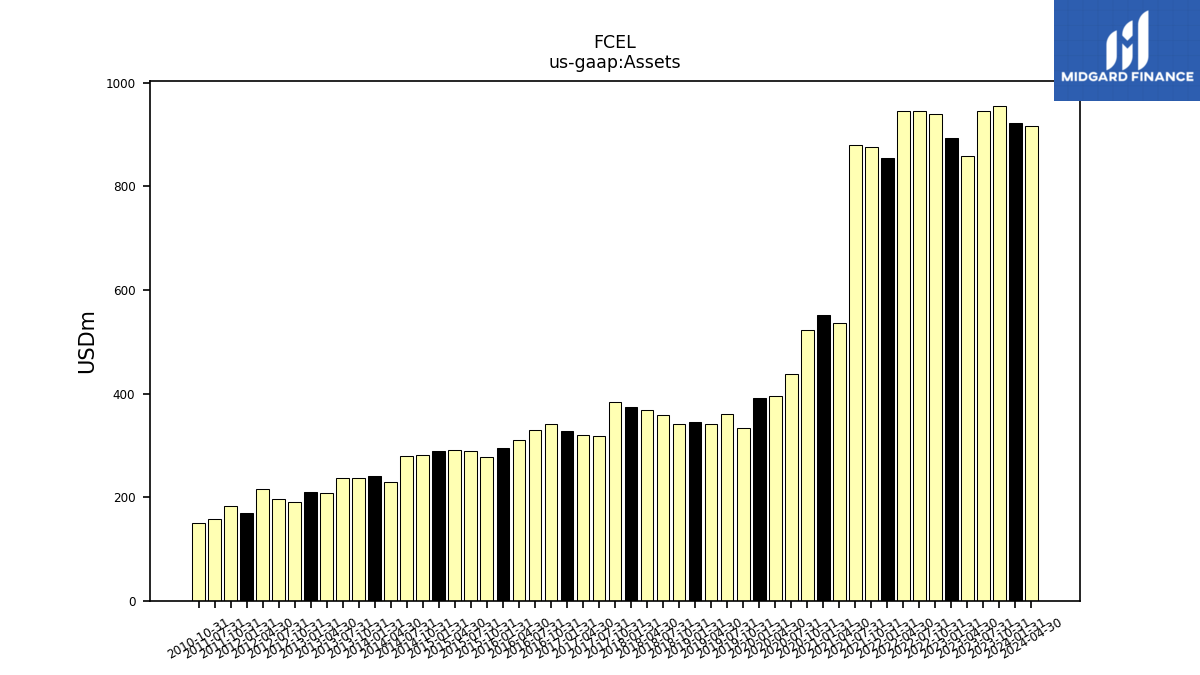
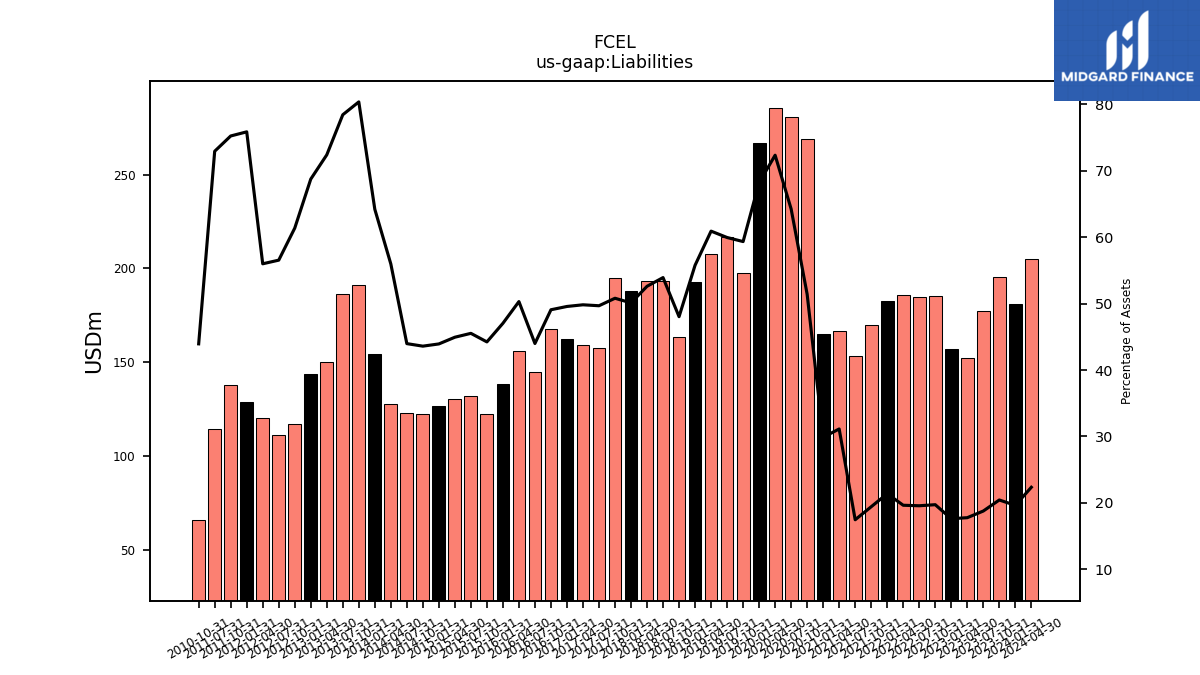
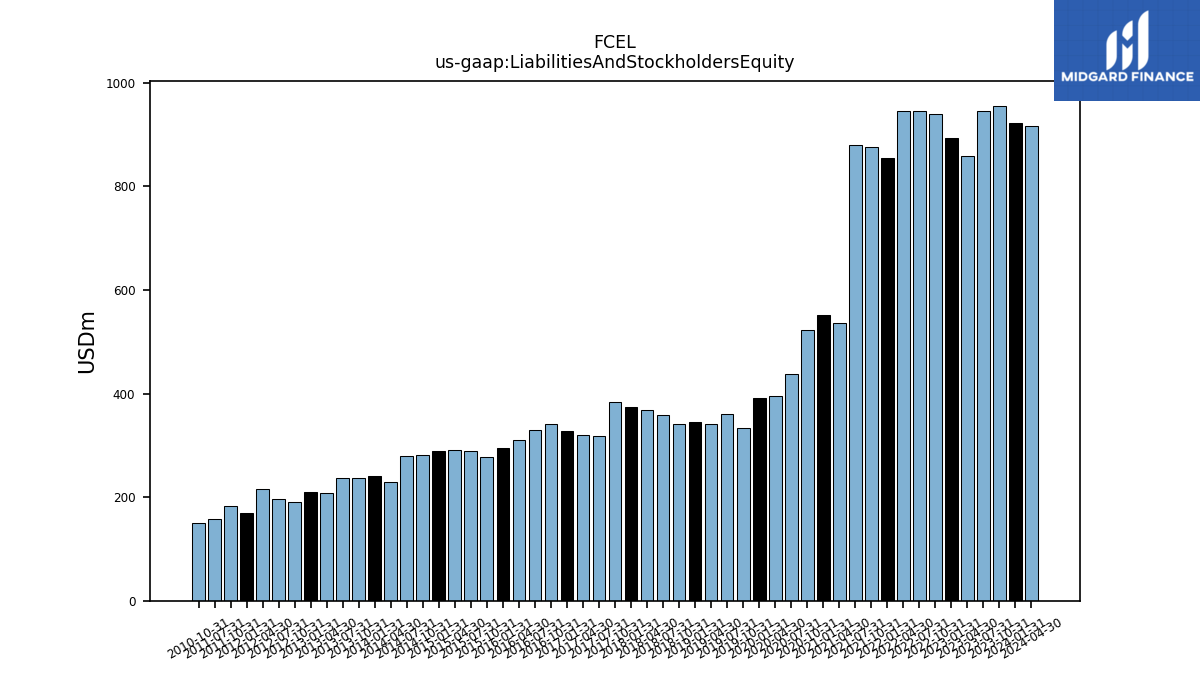
| Assets | 923.18 | 955.52 | 945.25 | 858.64 | 892.38 | 939.72 | 944.42 | 946.22 | 854.69 | 875.25 | 879.63 | 535.59 | 552.39 | 523.54 | 436.77 | 394.64 | 391.40 | 333.45 | 361.43 | 341.23 | 345.95 | 340.42 | 358.20 | 367.62 | 374.87 | 383.79 | 317.27 | 319.54 | 328.22 | 342.14 | 329.63 | 309.91 | 294.62 | 277.23 | 289.88 | 290.66 | 288.66 | 280.64 | 279.92 | 228.96 | 240.72 | 237.64 | 237.72 | 207.49 | 209.64 | 191.49 | 197.03 | 215.47 | 169.92 | 183.63 | 156.88 | NA | NA | 150.53 | NA | |
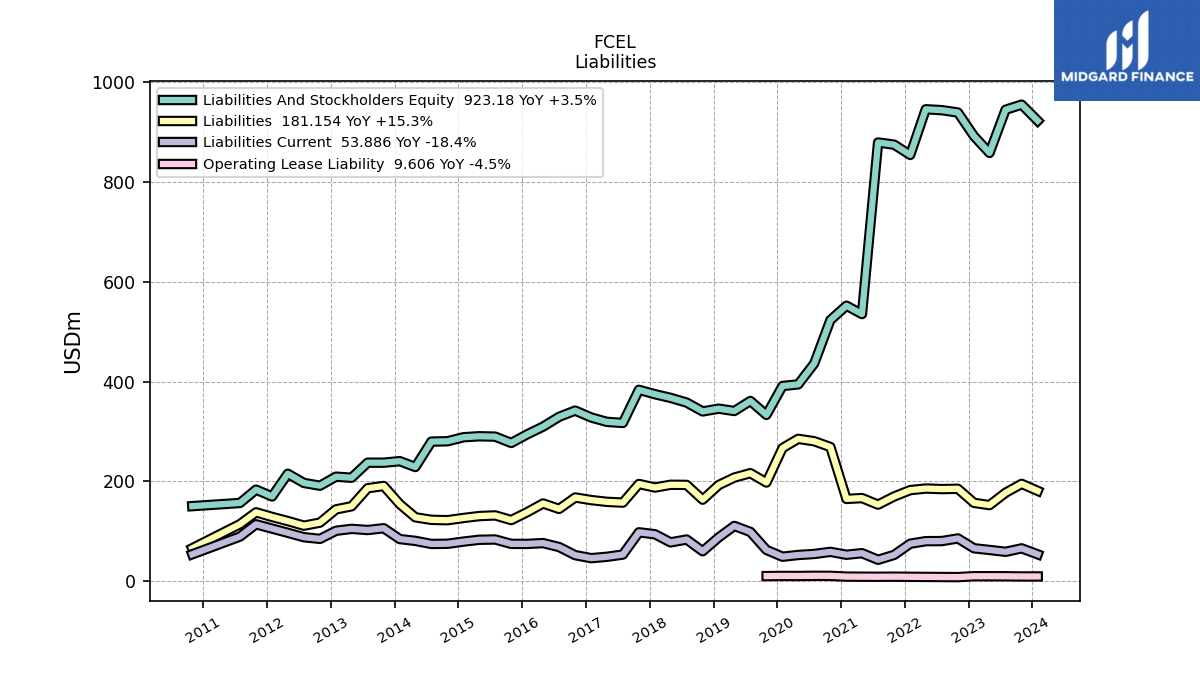
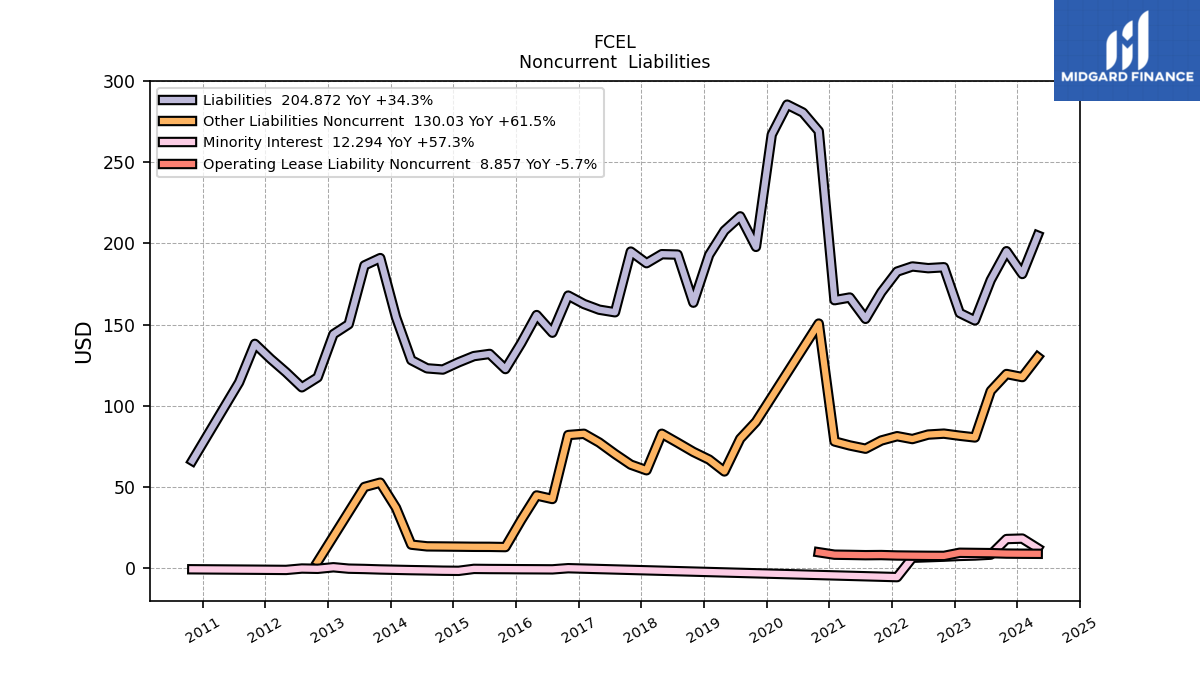
| Liabilities | 181.15 | 195.22 | 177.40 | 152.56 | 157.15 | 185.33 | 184.75 | 185.81 | 182.65 | 169.92 | 153.54 | 166.69 | 165.03 | 269.13 | 280.59 | 285.47 | 266.96 | 197.85 | 216.67 | 207.83 | 192.92 | 163.50 | 193.11 | 193.37 | 187.82 | 194.97 | 157.60 | 159.18 | 162.69 | 167.88 | 145.01 | 155.89 | 138.56 | 122.62 | 131.95 | 130.61 | 126.79 | 122.33 | 123.08 | 128.13 | 154.53 | 190.97 | 186.43 | 150.20 | 144.10 | 117.50 | 111.40 | 120.64 | 128.89 | 138.15 | 114.42 | NA | NA | 66.14 | NA | |
| Liabilities And Stockholders Equity | 923.18 | 955.52 | 945.25 | 858.64 | 892.38 | 939.72 | 944.42 | 946.22 | 854.69 | 875.25 | 879.63 | 535.59 | 552.39 | 523.54 | 436.77 | 394.64 | 391.40 | 333.45 | 361.43 | 341.23 | 345.95 | 340.42 | 358.20 | 367.62 | 374.87 | 383.79 | 317.27 | 319.54 | 328.22 | 342.14 | 329.63 | 309.91 | 294.62 | 277.23 | 289.88 | 290.66 | 288.66 | 280.64 | 279.92 | 228.96 | 240.72 | 237.64 | 237.72 | 207.49 | 209.64 | 191.49 | 197.03 | 215.47 | 169.92 | 183.63 | 156.88 | NA | NA | 150.53 | NA | |
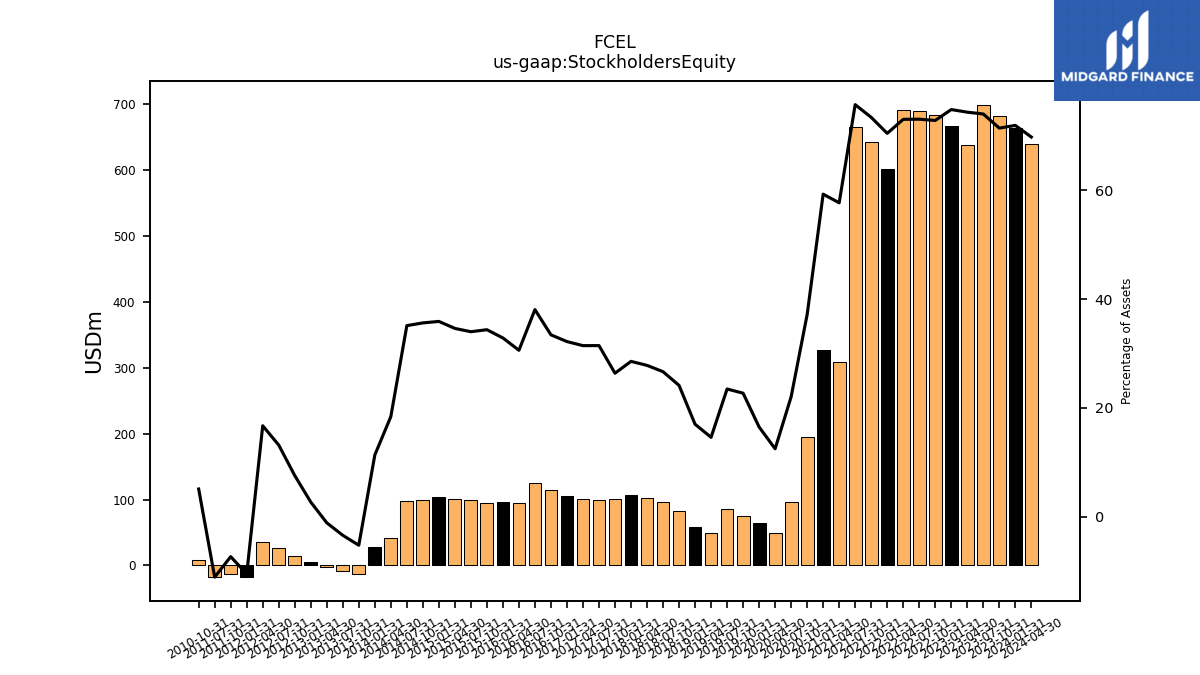
| Stockholders Equity | 663.93 | 682.49 | 699.65 | 638.41 | 667.81 | 684.39 | 690.01 | 691.09 | 602.23 | 642.44 | 666.23 | 309.05 | 327.51 | 194.55 | 96.33 | 49.32 | 64.58 | 75.74 | 84.88 | 49.84 | 58.85 | 82.19 | 95.51 | 102.29 | 107.06 | 101.26 | 99.81 | 100.50 | 105.68 | 114.40 | 125.48 | 94.83 | 96.82 | 95.31 | 98.59 | 100.62 | 103.64 | 99.99 | 98.33 | 42.16 | 27.32 | -12.41 | -8.09 | -2.29 | 5.67 | 14.51 | 25.98 | 36.04 | -17.83 | -13.45 | -17.39 | NA | NA | 7.69 | NA |
| 2024-01-31 | 2023-10-31 | 2023-07-31 | 2023-04-30 | 2023-01-31 | 2022-10-31 | 2022-07-31 | 2022-04-30 | 2022-01-31 | 2021-10-31 | 2021-07-31 | 2021-04-30 | 2021-01-31 | 2020-10-31 | 2020-07-31 | 2020-04-30 | 2020-01-31 | 2019-10-31 | 2019-07-31 | 2019-04-30 | 2019-01-31 | 2018-10-31 | 2018-07-31 | 2018-04-30 | 2018-01-31 | 2017-10-31 | 2017-07-31 | 2017-04-30 | 2017-01-31 | 2016-10-31 | 2016-07-31 | 2016-04-30 | 2016-01-31 | 2015-10-31 | 2015-07-31 | 2015-04-30 | 2015-01-31 | 2014-10-31 | 2014-07-31 | 2014-04-30 | 2014-01-31 | 2013-10-31 | 2013-07-31 | 2013-04-30 | 2013-01-31 | 2012-10-31 | 2012-07-31 | 2012-04-30 | 2012-01-31 | 2011-10-31 | 2011-07-31 | 2011-04-30 | 2011-01-31 | 2010-10-31 | 2010-07-31 | ||
|---|---|---|---|---|---|---|---|---|---|---|---|---|---|---|---|---|---|---|---|---|---|---|---|---|---|---|---|---|---|---|---|---|---|---|---|---|---|---|---|---|---|---|---|---|---|---|---|---|---|---|---|---|---|---|---|---|
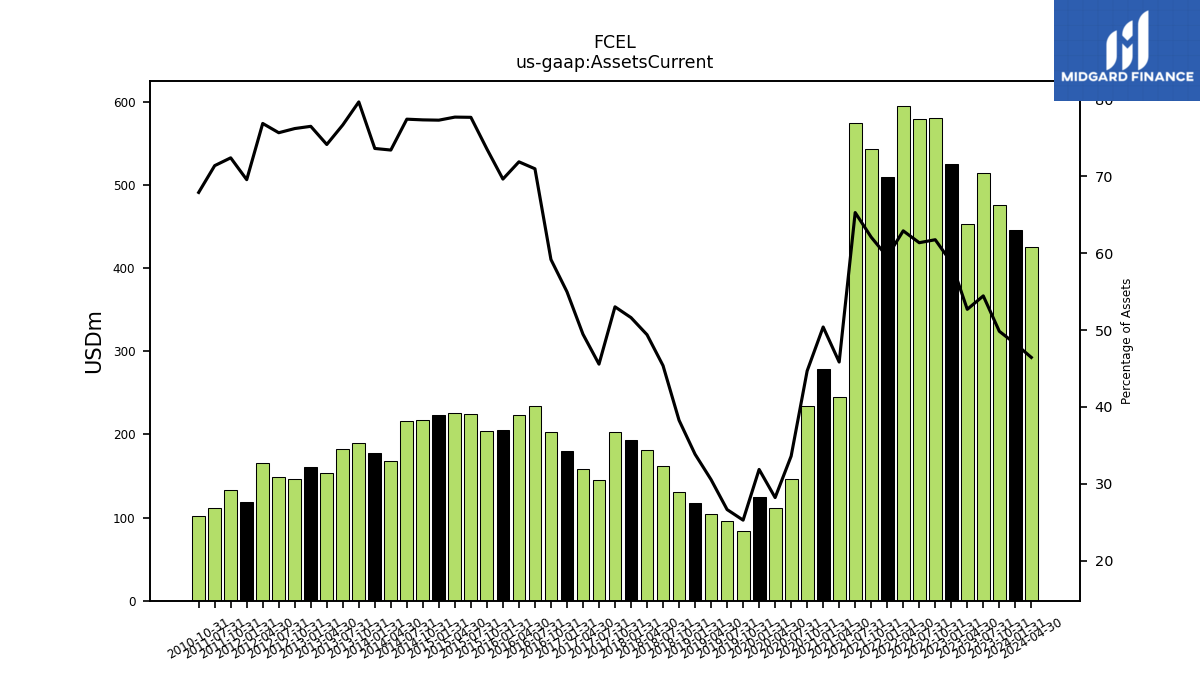
| Assets Current | 445.23 | 476.31 | 514.67 | 452.51 | 524.92 | 580.28 | 579.53 | 595.23 | 509.02 | 543.39 | 574.23 | 245.56 | 278.41 | 233.98 | 146.79 | 111.38 | 124.79 | 84.32 | 96.37 | 104.26 | 117.13 | 130.30 | 162.55 | 181.60 | 193.52 | 203.51 | 144.60 | 158.05 | 180.48 | 202.47 | 233.96 | 222.77 | 205.17 | 203.90 | 225.15 | 225.83 | 223.13 | 217.03 | 216.73 | 168.08 | 177.22 | 189.33 | 182.28 | 153.82 | 160.37 | 145.93 | 149.09 | 165.63 | 118.19 | 132.95 | 111.99 | NA | NA | 102.21 | NA | |
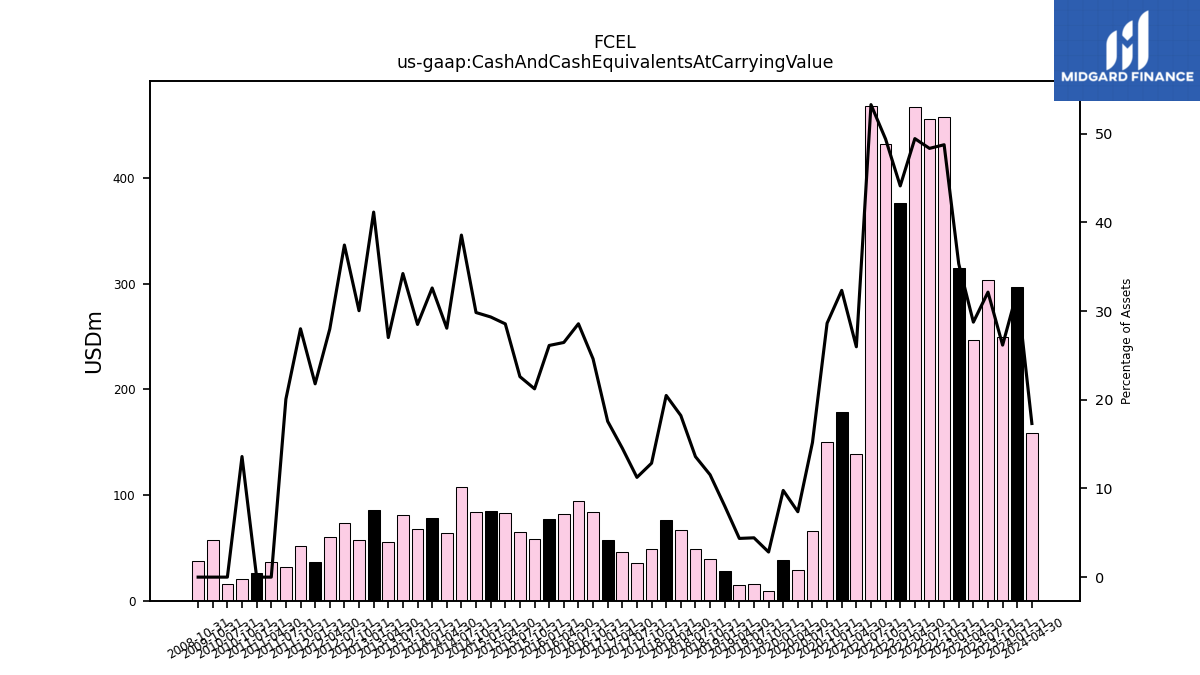
| Cash And Cash Equivalents At Carrying Value | 297.47 | 249.95 | 303.68 | 246.84 | 315.17 | 458.06 | 456.48 | 467.77 | 376.96 | 432.21 | 468.56 | 139.09 | 178.57 | 149.87 | 66.30 | 29.10 | 38.25 | 9.43 | 16.02 | 14.89 | 27.75 | 39.29 | 48.66 | 66.97 | 76.78 | 49.29 | 35.68 | 46.45 | 57.65 | 84.19 | 94.15 | 81.98 | 76.94 | 58.85 | 65.52 | 82.98 | 84.66 | 83.71 | 107.94 | 64.25 | 78.47 | 67.70 | 81.36 | 56.04 | 86.27 | 57.51 | 73.77 | 60.26 | 37.03 | 51.41 | 31.48 | 36.98 | 26.09 | 20.47 | 15.73 | |
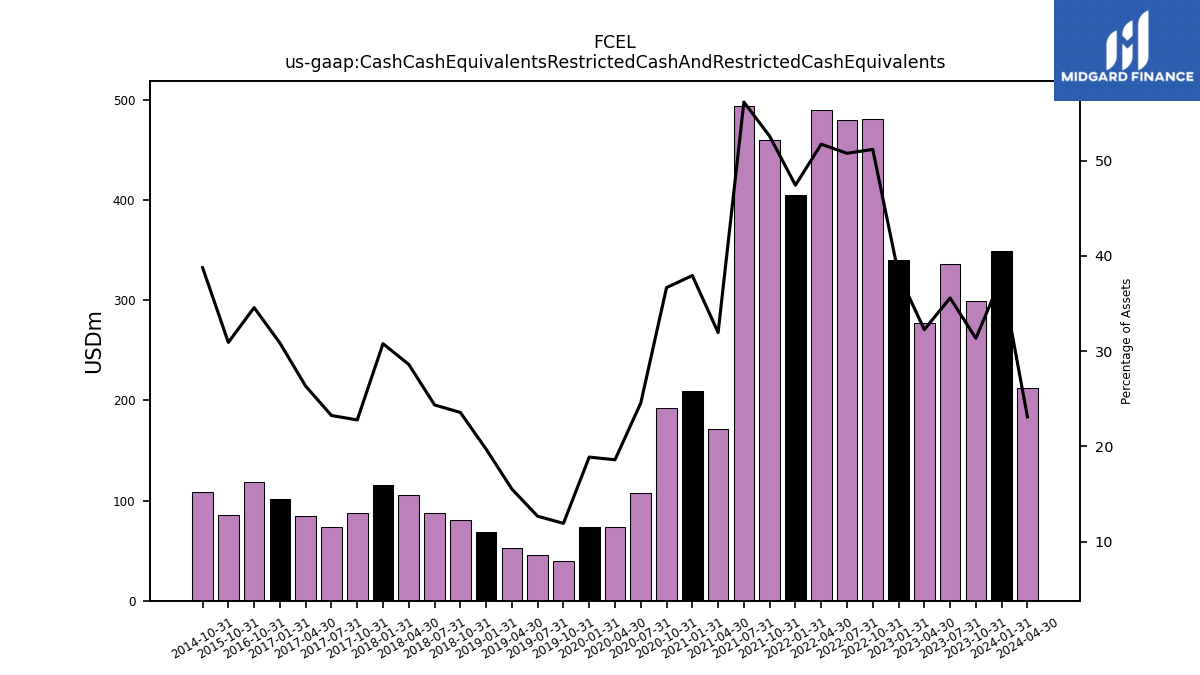
| Cash Cash Equivalents Restricted Cash And Restricted Cash Equivalents | 348.80 | 299.58 | 336.42 | 277.07 | 339.78 | 481.04 | 479.64 | 489.55 | 405.43 | 460.21 | 494.02 | 171.18 | 209.59 | 192.05 | 107.28 | 73.42 | 73.91 | 39.78 | 45.80 | 52.98 | 68.21 | 80.24 | 87.25 | 105.19 | 115.43 | 87.45 | 73.77 | 84.13 | 101.30 | 118.32 | NA | NA | NA | 85.74 | NA | NA | NA | 108.83 | NA | NA | NA | NA | NA | NA | NA | NA | NA | NA | NA | NA | NA | NA | NA | NA | NA | |
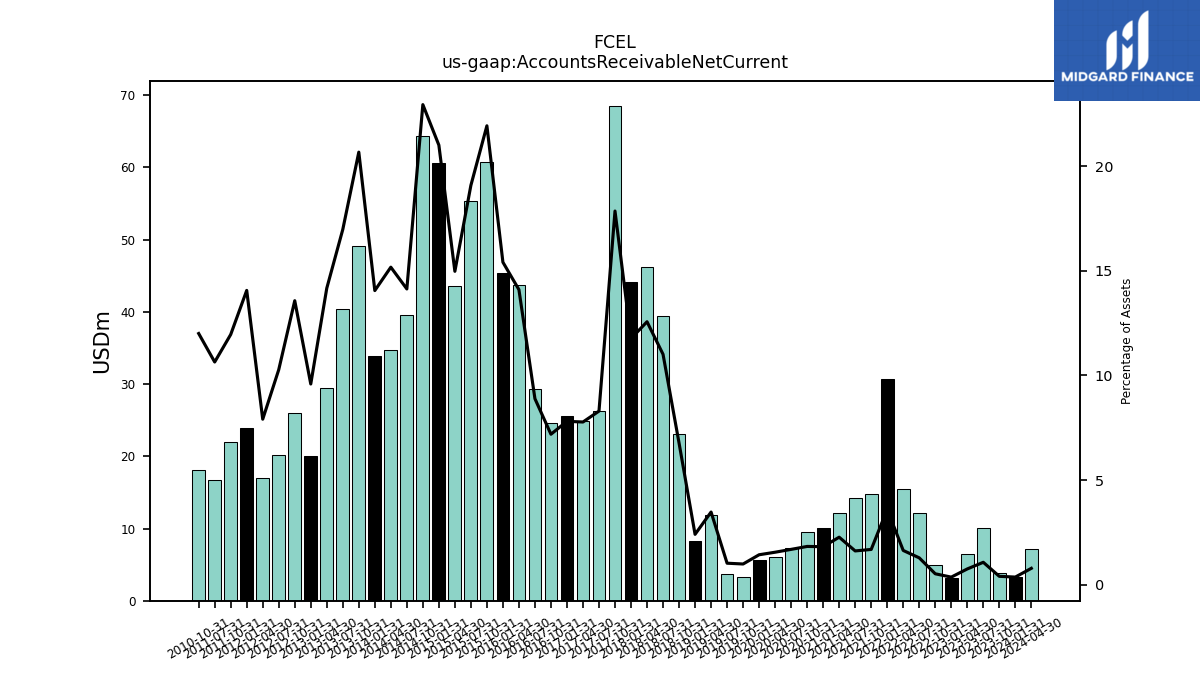
| Accounts Receivable Net Current | 3.35 | 3.81 | 10.10 | 6.45 | 3.21 | 4.88 | 12.10 | 15.47 | 30.70 | 14.73 | 14.18 | 12.15 | 10.02 | 9.56 | 7.36 | 6.12 | 5.59 | 3.29 | 3.71 | 11.84 | 8.32 | 23.04 | 39.43 | 46.19 | 44.08 | 68.52 | 26.32 | 24.84 | 25.62 | 24.59 | 29.29 | 43.69 | 45.40 | 60.79 | 55.31 | 43.52 | 60.63 | 64.38 | 39.55 | 34.73 | 33.83 | 49.12 | 40.35 | 29.39 | 20.10 | 25.98 | 20.24 | 17.04 | 23.89 | 21.95 | 16.69 | NA | NA | 18.07 | NA | |
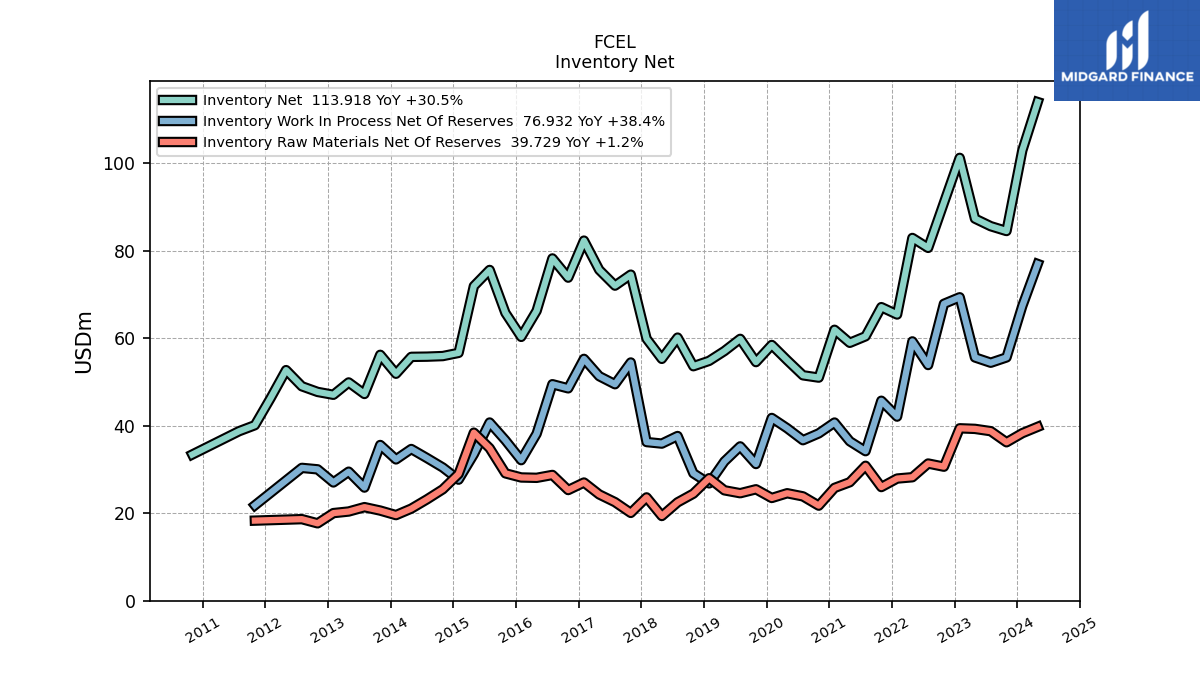
| Inventory Net | 102.86 | 84.46 | 85.56 | 87.29 | 101.18 | 90.91 | 80.61 | 82.88 | 65.39 | 67.07 | 60.41 | 58.92 | 61.90 | 50.97 | 51.50 | 54.95 | 58.43 | 54.52 | 59.83 | 57.04 | 54.80 | 53.58 | 60.11 | 55.26 | 59.87 | 74.50 | 71.98 | 75.58 | 82.27 | 73.81 | 78.20 | 66.22 | 60.28 | 65.75 | 75.57 | 71.88 | 56.62 | 55.90 | 55.76 | 55.71 | 51.85 | 56.19 | 47.23 | 49.87 | 47.05 | 47.70 | 48.99 | 52.69 | 46.30 | 40.10 | 38.73 | NA | NA | 33.40 | NA | |
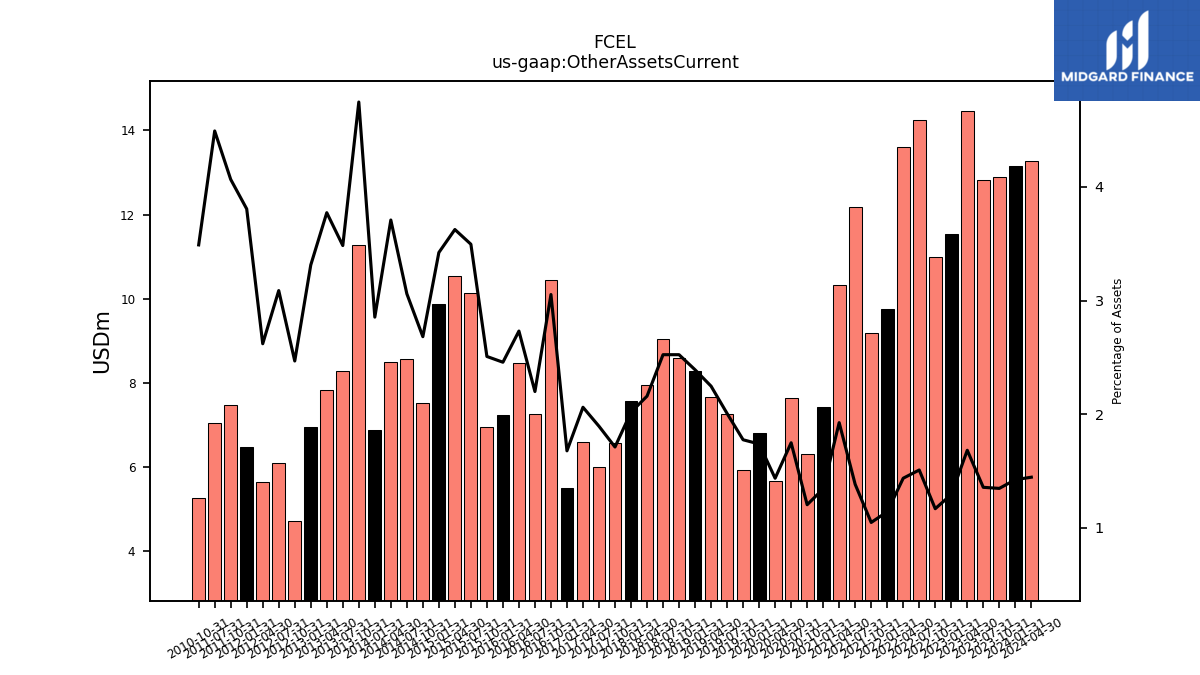
| Other Assets Current | 13.15 | 12.88 | 12.83 | 14.45 | 11.54 | 10.99 | 14.26 | 13.60 | 9.76 | 9.18 | 12.17 | 10.32 | 7.42 | 6.31 | 7.64 | 5.67 | 6.80 | 5.92 | 7.25 | 7.67 | 8.27 | 8.59 | 9.04 | 7.94 | 7.57 | 6.57 | 6.01 | 6.59 | 5.51 | 10.45 | 7.25 | 8.47 | 7.24 | 6.95 | 10.13 | 10.54 | 9.88 | 7.53 | 8.56 | 8.49 | 6.87 | 11.28 | 8.28 | 7.83 | 6.95 | 4.73 | 6.08 | 5.65 | 6.47 | 7.47 | 7.05 | NA | NA | 5.25 | NA |
| 2024-01-31 | 2023-10-31 | 2023-07-31 | 2023-04-30 | 2023-01-31 | 2022-10-31 | 2022-07-31 | 2022-04-30 | 2022-01-31 | 2021-10-31 | 2021-07-31 | 2021-04-30 | 2021-01-31 | 2020-10-31 | 2020-07-31 | 2020-04-30 | 2020-01-31 | 2019-10-31 | 2019-07-31 | 2019-04-30 | 2019-01-31 | 2018-10-31 | 2018-07-31 | 2018-04-30 | 2018-01-31 | 2017-10-31 | 2017-07-31 | 2017-04-30 | 2017-01-31 | 2016-10-31 | 2016-07-31 | 2016-04-30 | 2016-01-31 | 2015-10-31 | 2015-07-31 | 2015-04-30 | 2015-01-31 | 2014-10-31 | 2014-07-31 | 2014-04-30 | 2014-01-31 | 2013-10-31 | 2013-07-31 | 2013-04-30 | 2013-01-31 | 2012-10-31 | 2012-07-31 | 2012-04-30 | 2012-01-31 | 2011-10-31 | 2011-07-31 | 2011-04-30 | 2011-01-31 | 2010-10-31 | 2010-07-31 | ||
|---|---|---|---|---|---|---|---|---|---|---|---|---|---|---|---|---|---|---|---|---|---|---|---|---|---|---|---|---|---|---|---|---|---|---|---|---|---|---|---|---|---|---|---|---|---|---|---|---|---|---|---|---|---|---|---|---|
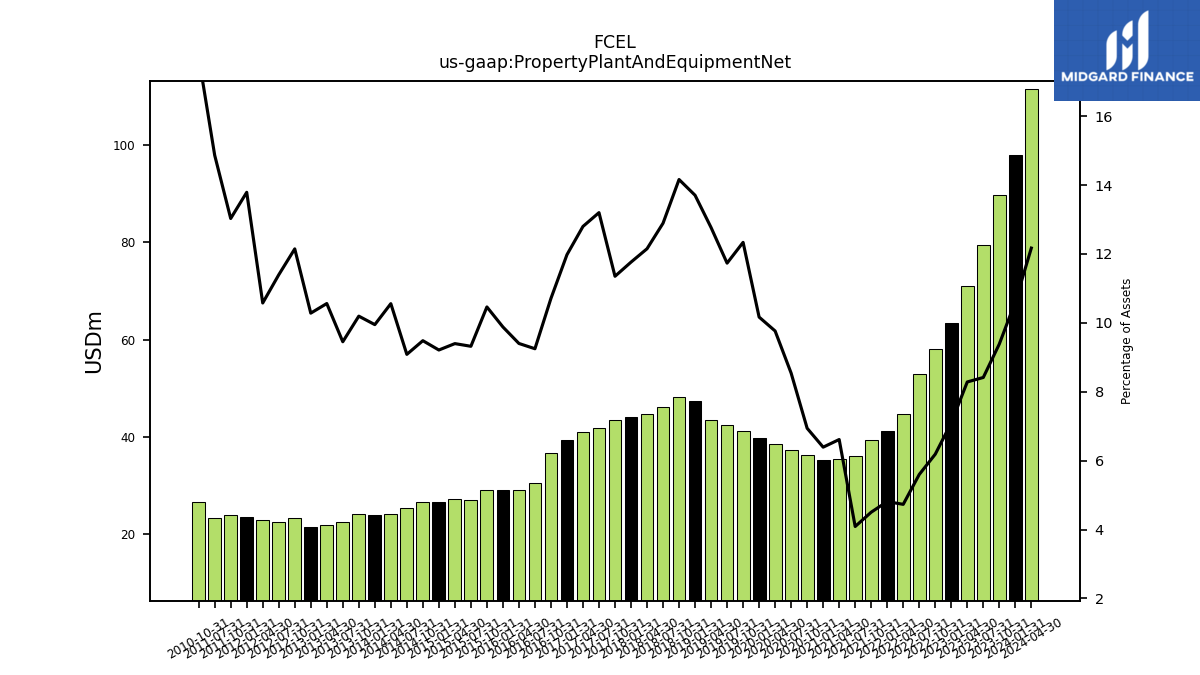
| Property Plant And Equipment Net | 97.94 | 89.67 | 79.53 | 71.13 | 63.34 | 58.14 | 52.87 | 44.77 | 41.12 | 39.42 | 35.96 | 35.42 | 35.30 | 36.33 | 37.30 | 38.53 | 39.79 | 41.13 | 42.41 | 43.56 | 47.41 | 48.20 | 46.18 | 44.67 | 44.09 | 43.56 | 41.88 | 40.90 | 39.31 | 36.64 | 30.48 | 29.14 | 29.11 | 29.00 | 27.02 | 27.31 | 26.59 | 26.61 | 25.43 | 24.17 | 23.95 | 24.23 | 22.47 | 21.91 | 21.55 | 23.26 | 22.45 | 22.79 | 23.43 | 23.93 | 23.32 | NA | NA | 26.68 | NA | |
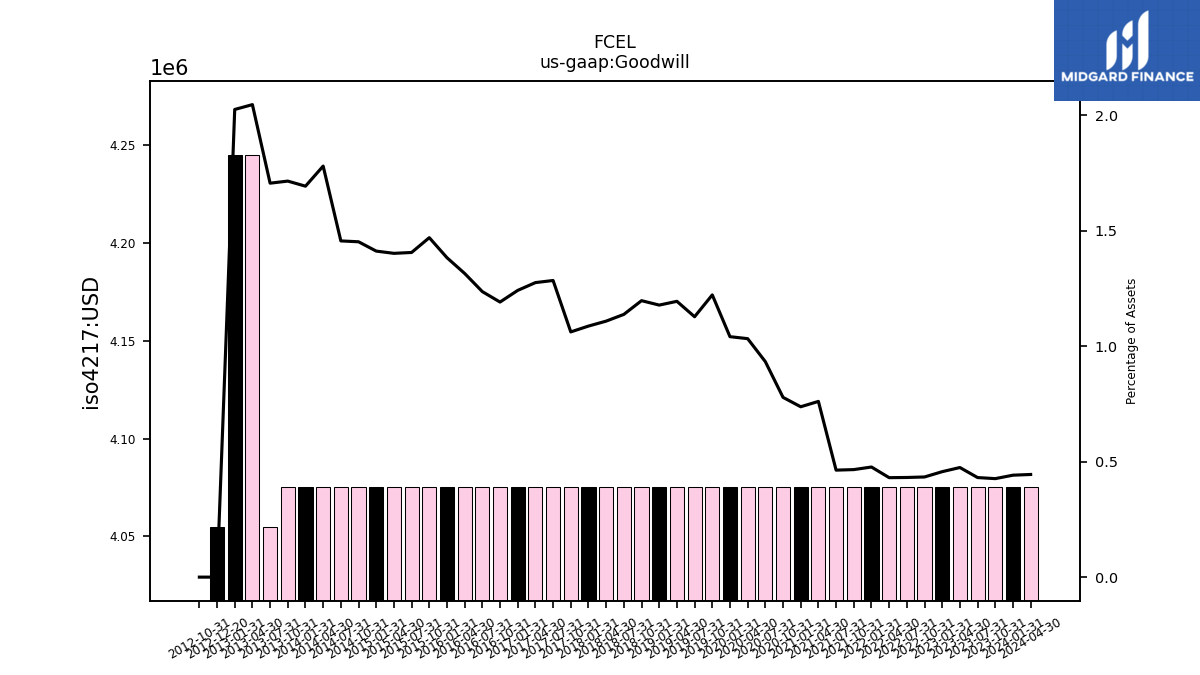
| Goodwill | 4.08 | 4.08 | 4.08 | 4.08 | 4.08 | 4.08 | 4.08 | 4.08 | 4.08 | 4.08 | 4.08 | 4.08 | 4.08 | 4.08 | 4.08 | 4.08 | 4.08 | 4.08 | 4.08 | 4.08 | 4.08 | 4.08 | 4.08 | 4.08 | 4.08 | 4.08 | 4.08 | 4.08 | 4.08 | 4.08 | 4.08 | 4.08 | 4.08 | 4.08 | 4.08 | 4.08 | 4.08 | 4.08 | 4.08 | 4.08 | 4.08 | 4.08 | 4.05 | 4.25 | 4.25 | 0.00 | NA | NA | NA | NA | NA | NA | NA | NA | NA | |
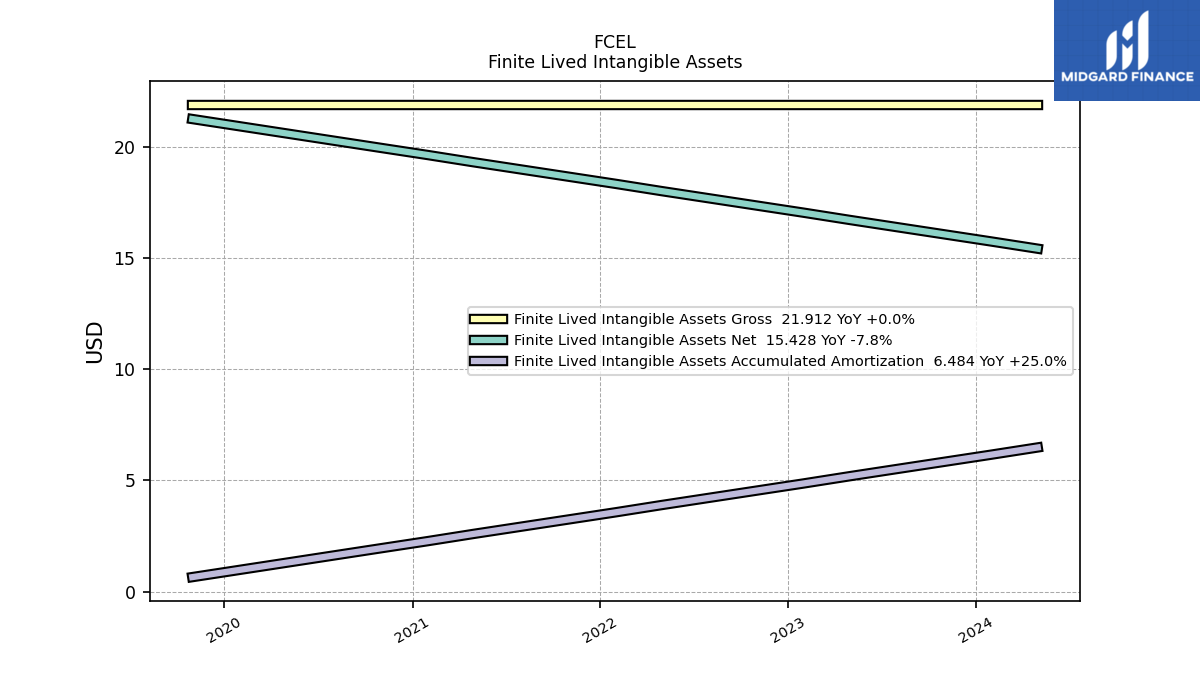
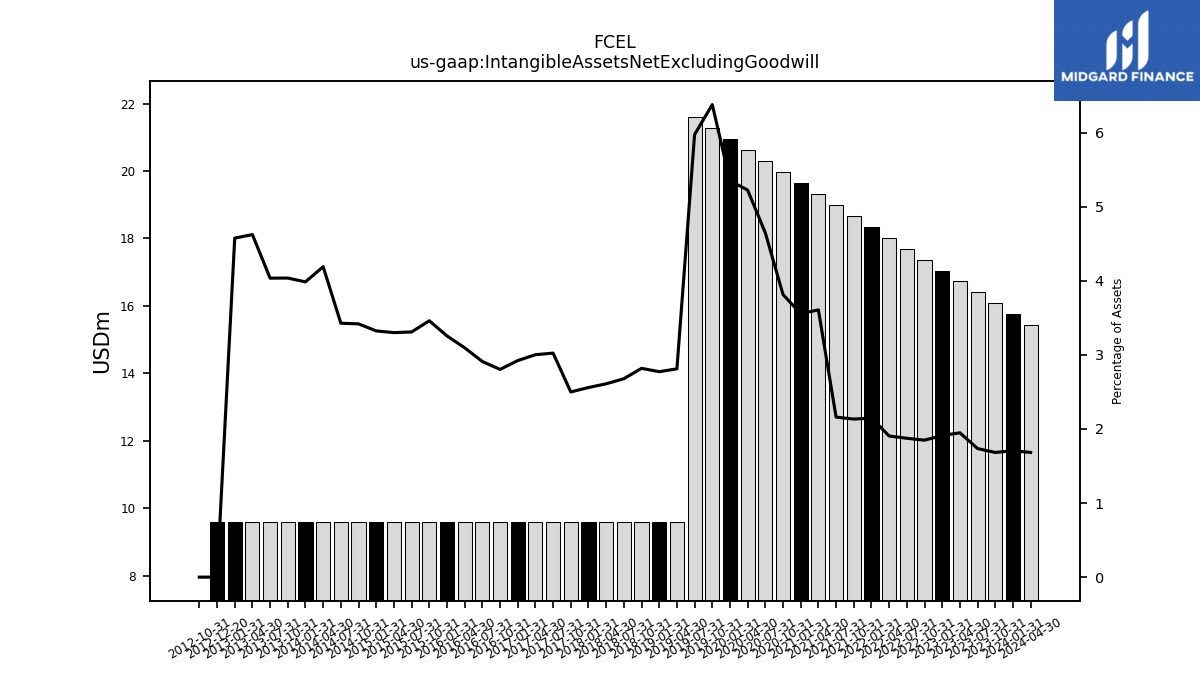
| Intangible Assets Net Excluding Goodwill | 15.75 | 16.08 | 16.40 | 16.73 | 17.05 | 17.37 | 17.70 | 18.02 | 18.35 | 18.67 | 18.99 | 19.32 | 19.64 | 19.97 | 20.29 | 20.61 | 20.94 | 21.26 | 21.59 | 9.59 | 9.59 | 9.59 | 9.59 | 9.59 | 9.59 | 9.59 | 9.59 | 9.59 | 9.59 | 9.59 | 9.59 | 9.59 | 9.59 | 9.59 | 9.59 | 9.59 | 9.59 | 9.59 | 9.59 | 9.59 | 9.59 | 9.59 | 9.59 | 9.59 | 9.59 | 0.00 | NA | NA | NA | NA | NA | NA | NA | NA | NA | |
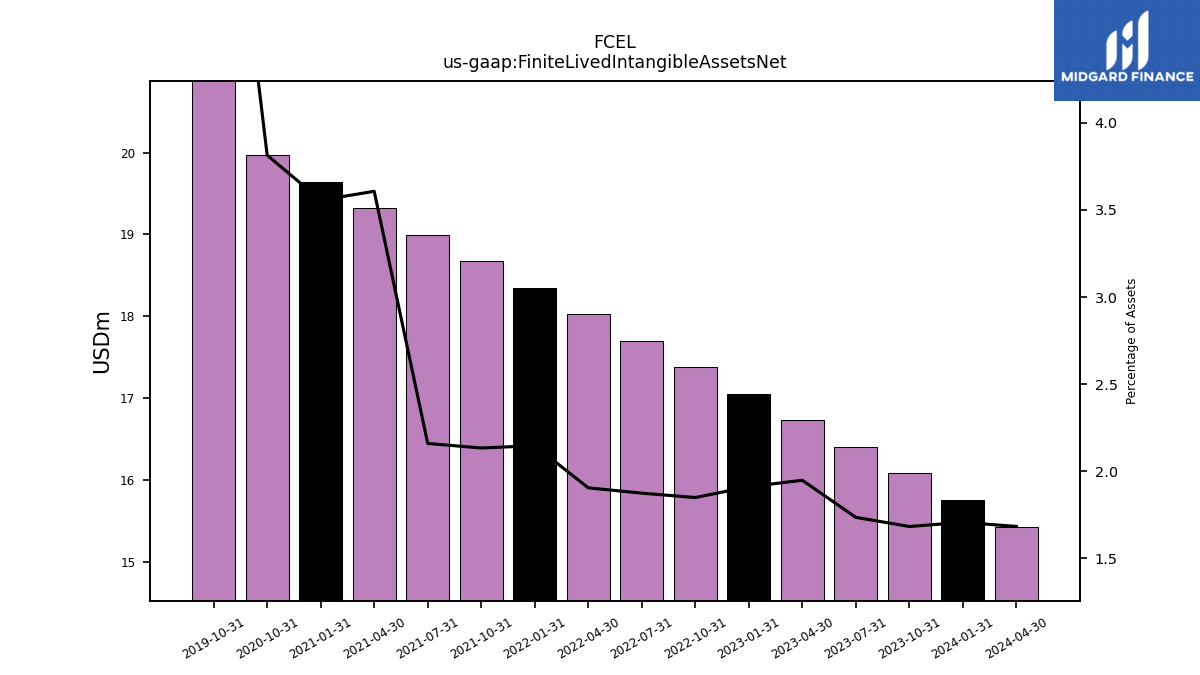
| Finite Lived Intangible Assets Net | 15.75 | 16.08 | 16.40 | 16.73 | 17.05 | 17.37 | 17.70 | 18.02 | 18.35 | 18.67 | 18.99 | 19.32 | 19.64 | 19.97 | NA | NA | NA | 21.26 | NA | NA | NA | NA | NA | NA | NA | NA | NA | NA | NA | NA | NA | NA | NA | NA | NA | NA | NA | NA | NA | NA | NA | NA | NA | NA | NA | NA | NA | NA | NA | NA | NA | NA | NA | NA | NA | |
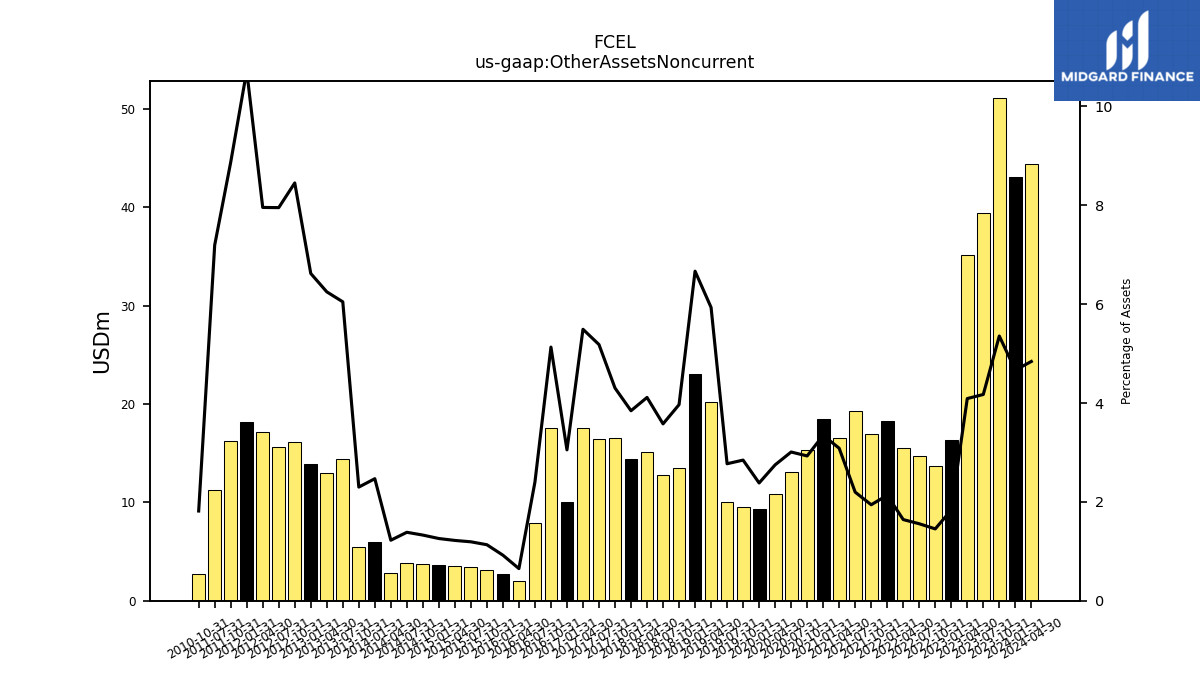
| Other Assets Noncurrent | 43.08 | 51.18 | 39.45 | 35.13 | 16.39 | 13.66 | 14.71 | 15.54 | 18.24 | 17.00 | 19.33 | 16.53 | 18.49 | 15.34 | 13.14 | 10.85 | 9.33 | 9.49 | 10.02 | 20.25 | 23.07 | 13.51 | 12.82 | 15.12 | 14.41 | 16.52 | 16.45 | 17.55 | 10.02 | 17.56 | 7.92 | 2.02 | 2.72 | 3.14 | 3.46 | 3.55 | 3.63 | 3.73 | 3.88 | 2.80 | 5.94 | 5.46 | 14.38 | 12.97 | 13.88 | 16.19 | 15.67 | 17.15 | 18.22 | 16.29 | 11.29 | NA | NA | 2.73 | NA |
| 2024-01-31 | 2023-10-31 | 2023-07-31 | 2023-04-30 | 2023-01-31 | 2022-10-31 | 2022-07-31 | 2022-04-30 | 2022-01-31 | 2021-10-31 | 2021-07-31 | 2021-04-30 | 2021-01-31 | 2020-10-31 | 2020-07-31 | 2020-04-30 | 2020-01-31 | 2019-10-31 | 2019-07-31 | 2019-04-30 | 2019-01-31 | 2018-10-31 | 2018-07-31 | 2018-04-30 | 2018-01-31 | 2017-10-31 | 2017-07-31 | 2017-04-30 | 2017-01-31 | 2016-10-31 | 2016-07-31 | 2016-04-30 | 2016-01-31 | 2015-10-31 | 2015-07-31 | 2015-04-30 | 2015-01-31 | 2014-10-31 | 2014-07-31 | 2014-04-30 | 2014-01-31 | 2013-10-31 | 2013-07-31 | 2013-04-30 | 2013-01-31 | 2012-10-31 | 2012-07-31 | 2012-04-30 | 2012-01-31 | 2011-10-31 | 2011-07-31 | 2011-04-30 | 2011-01-31 | 2010-10-31 | 2010-07-31 | ||
|---|---|---|---|---|---|---|---|---|---|---|---|---|---|---|---|---|---|---|---|---|---|---|---|---|---|---|---|---|---|---|---|---|---|---|---|---|---|---|---|---|---|---|---|---|---|---|---|---|---|---|---|---|---|---|---|---|
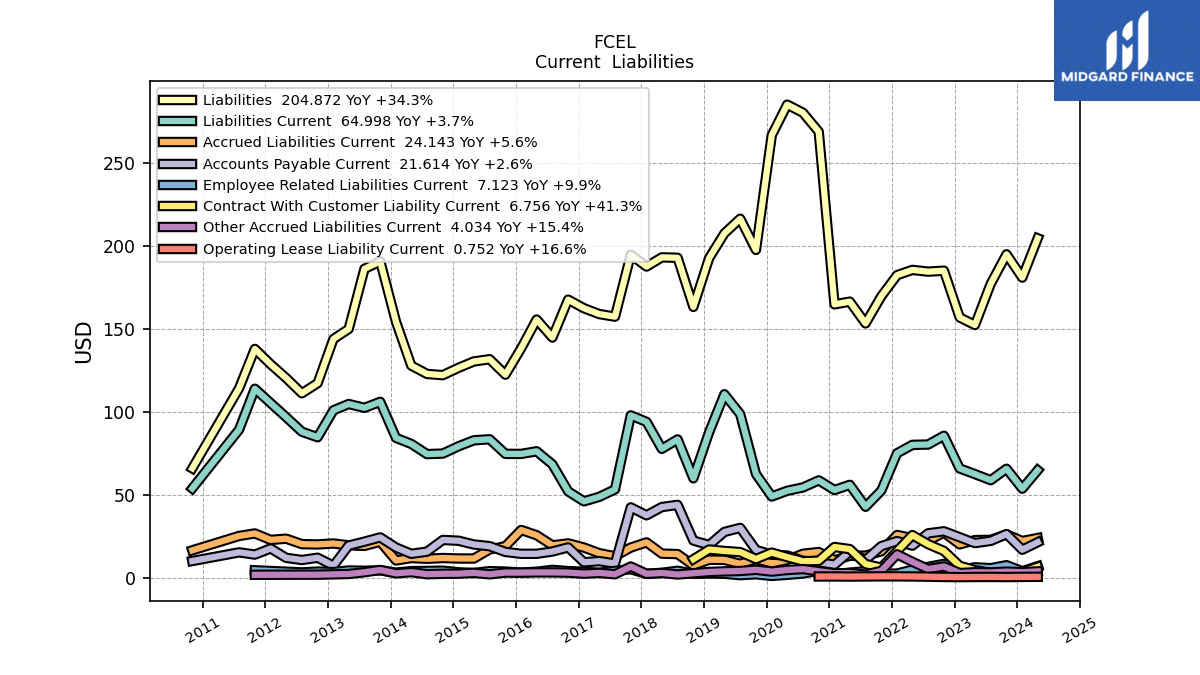
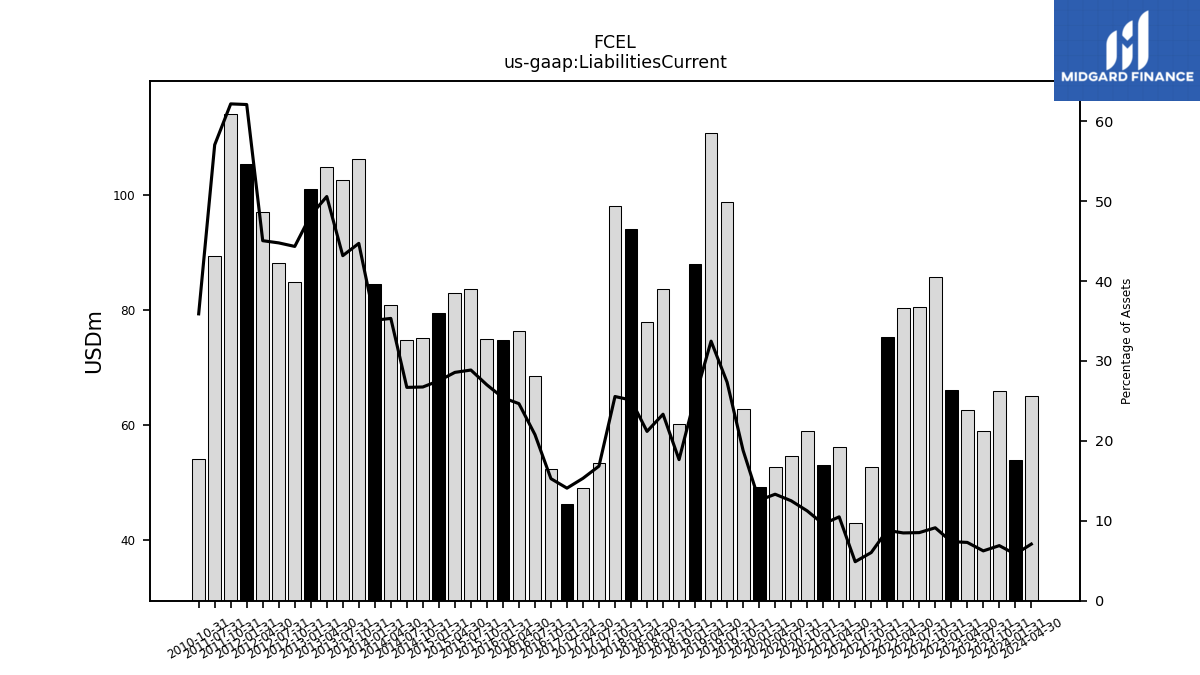
| Liabilities Current | 53.89 | 65.90 | 58.99 | 62.66 | 66.08 | 85.80 | 80.51 | 80.30 | 75.26 | 52.77 | 42.98 | 56.22 | 53.07 | 58.90 | 54.64 | 52.60 | 49.17 | 62.73 | 98.85 | 110.84 | 87.99 | 60.12 | 83.61 | 77.90 | 94.15 | 98.08 | 53.45 | 48.96 | 46.25 | 52.26 | 68.54 | 76.44 | 74.85 | 74.89 | 83.68 | 83.06 | 79.47 | 75.06 | 74.73 | 80.88 | 84.50 | 106.26 | 102.64 | 104.95 | 101.14 | 84.90 | 88.23 | 97.07 | 105.50 | 114.17 | 89.50 | NA | NA | 54.04 | NA | |
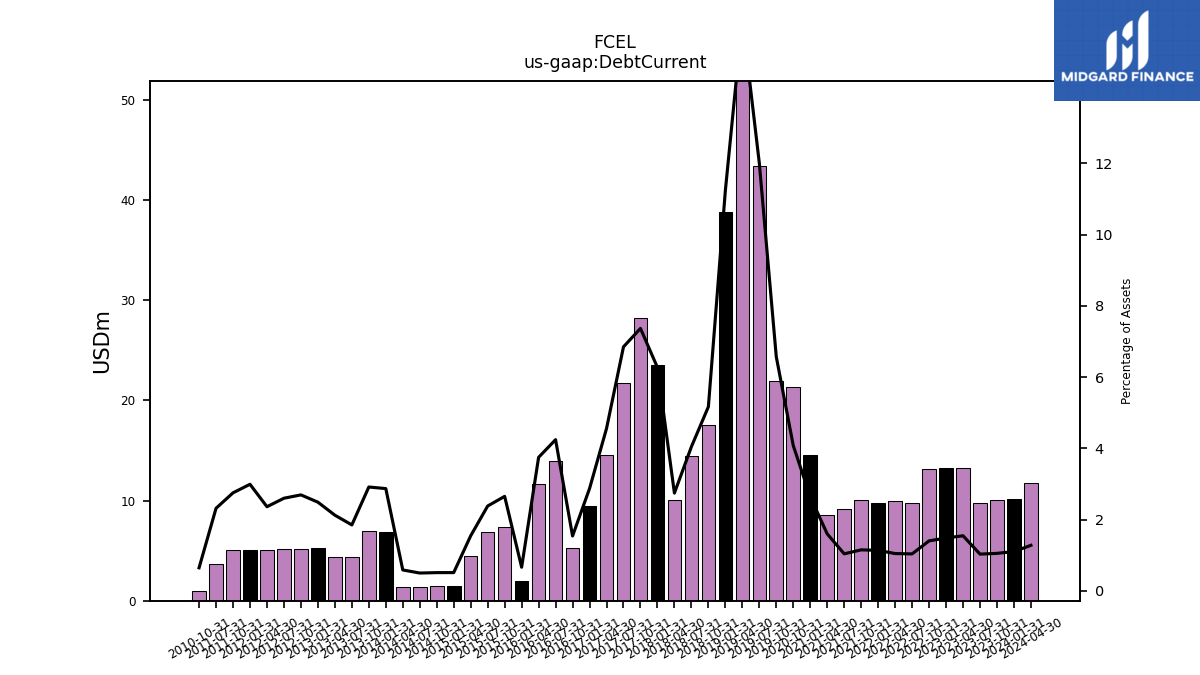
| Debt Current | 10.20 | 10.07 | 9.76 | 13.29 | 13.25 | 13.20 | 9.81 | 9.92 | 9.72 | 10.09 | 9.15 | 8.57 | 14.59 | 21.37 | NA | NA | NA | 21.92 | 43.42 | 54.81 | 38.87 | 17.60 | 14.49 | 10.09 | 23.51 | 28.28 | 21.74 | 14.56 | 9.43 | 5.28 | 13.99 | 11.62 | 1.96 | 7.36 | 6.91 | 4.50 | 1.48 | 1.44 | 1.40 | 1.35 | 6.91 | 6.93 | 4.40 | 4.41 | 5.22 | 5.16 | 5.13 | 5.09 | 5.08 | 5.06 | 3.64 | NA | NA | 0.98 | NA | |
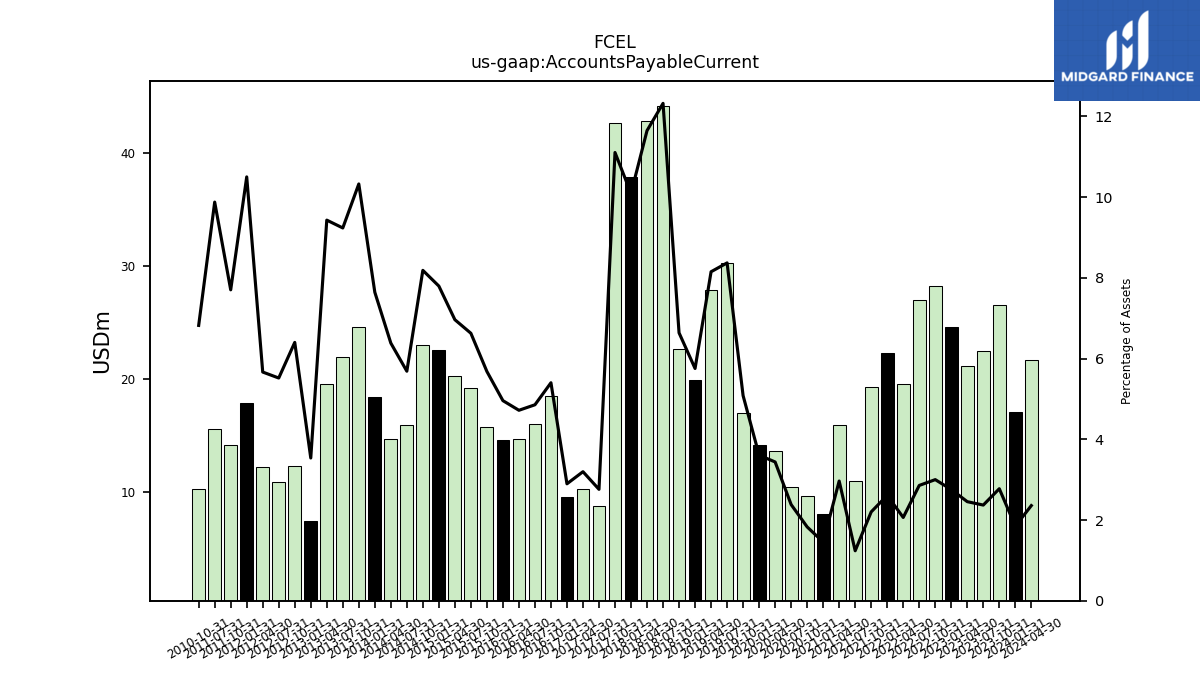
| Accounts Payable Current | 17.05 | 26.52 | 22.40 | 21.07 | 24.59 | 28.20 | 26.98 | 19.52 | 22.30 | 19.27 | 10.89 | 15.88 | 8.03 | 9.58 | 10.41 | 13.57 | 14.12 | 16.94 | 30.25 | 27.81 | 19.91 | 22.59 | 44.13 | 42.81 | 37.83 | 42.62 | 8.76 | 10.21 | 9.51 | 18.48 | 16.00 | 14.62 | 14.60 | 15.74 | 19.21 | 20.24 | 22.50 | 22.97 | 15.92 | 14.61 | 18.40 | 24.54 | 21.95 | 19.56 | 7.41 | 12.25 | 10.87 | 12.21 | 17.84 | 14.14 | 15.49 | NA | NA | 10.27 | NA | |
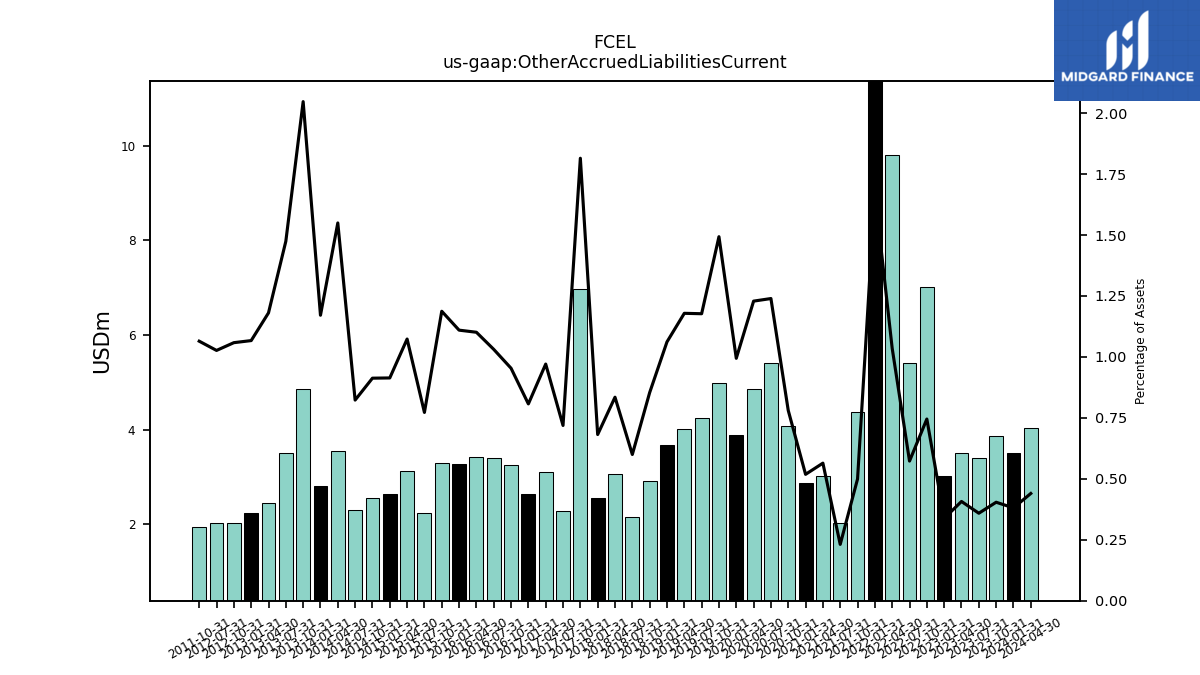
| Other Accrued Liabilities Current | 3.52 | 3.86 | 3.39 | 3.50 | 3.02 | 7.00 | 5.41 | 9.79 | 14.30 | 4.37 | 2.03 | 3.02 | 2.86 | 4.09 | 5.41 | 4.85 | 3.89 | 4.98 | 4.25 | 4.02 | 3.67 | 2.91 | 2.15 | 3.07 | 2.56 | 6.97 | 2.28 | 3.10 | 2.65 | 3.26 | 3.40 | 3.41 | 3.27 | 3.29 | 2.24 | 3.12 | 2.64 | 2.56 | 2.30 | 3.55 | 2.82 | 4.87 | 3.50 | 2.45 | 2.24 | 2.03 | 2.02 | NA | NA | 1.96 | NA | NA | NA | NA | NA | |
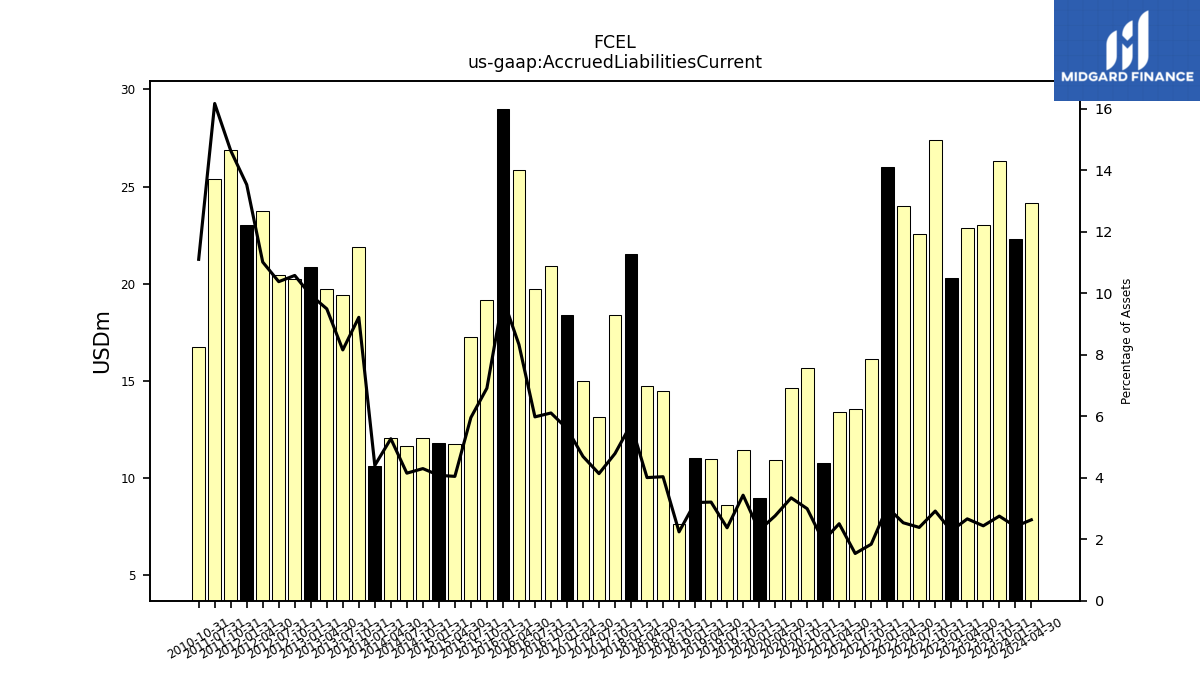
| Accrued Liabilities Current | 22.32 | 26.31 | 23.05 | 22.87 | 20.31 | 27.41 | 22.54 | 24.01 | 25.99 | 16.10 | 13.53 | 13.42 | 10.76 | 15.68 | 14.62 | 10.90 | 8.96 | 11.45 | 8.58 | 10.95 | 11.05 | 7.63 | 14.45 | 14.73 | 21.51 | 18.38 | 13.12 | 15.00 | 18.39 | 20.90 | 19.72 | 25.84 | 28.99 | 19.18 | 17.28 | 11.76 | 11.78 | 12.07 | 11.62 | 12.07 | 10.60 | 21.91 | 19.40 | 19.71 | 20.84 | 20.27 | 20.45 | 23.74 | 23.00 | 26.89 | 25.38 | NA | NA | 16.72 | NA | |
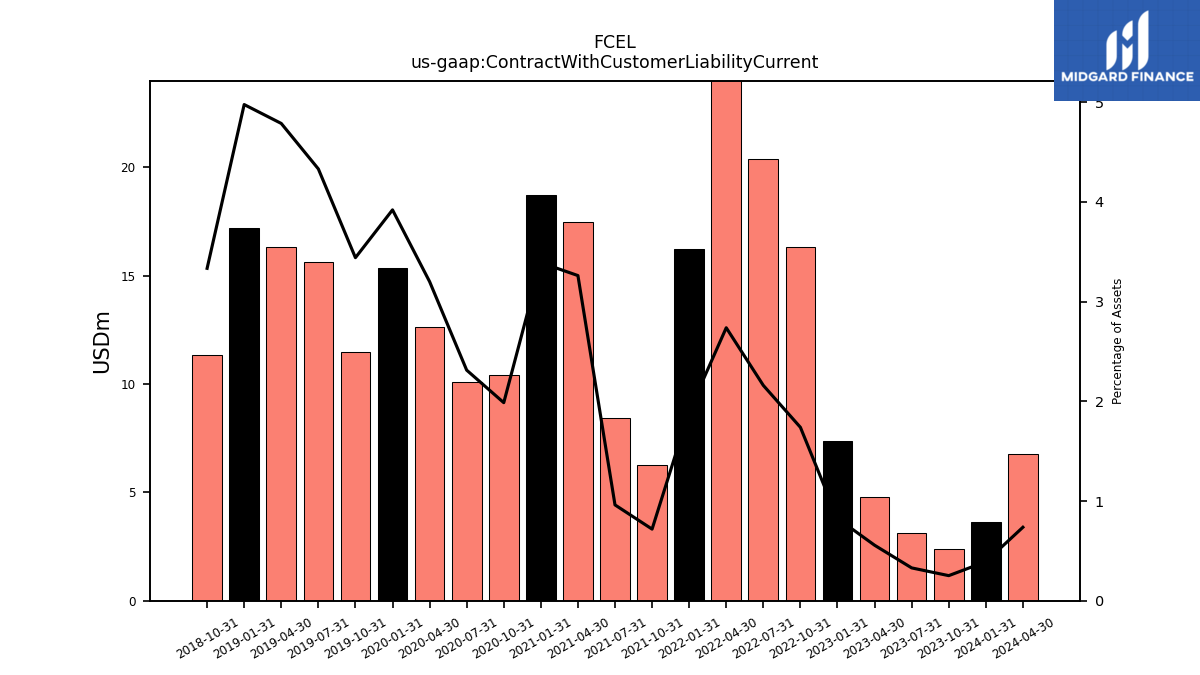
| Contract With Customer Liability Current | 3.62 | 2.41 | 3.11 | 4.78 | 7.37 | 16.34 | 20.39 | 25.90 | 16.24 | 6.29 | 8.45 | 17.46 | 18.73 | 10.40 | 10.10 | 12.63 | 15.34 | 11.47 | 15.65 | 16.33 | 17.21 | 11.35 | NA | NA | NA | NA | NA | NA | NA | NA | NA | NA | NA | NA | NA | NA | NA | NA | NA | NA | NA | NA | NA | NA | NA | NA | NA | NA | NA | NA | NA | NA | NA | NA | NA |
| 2024-01-31 | 2023-10-31 | 2023-07-31 | 2023-04-30 | 2023-01-31 | 2022-10-31 | 2022-07-31 | 2022-04-30 | 2022-01-31 | 2021-10-31 | 2021-07-31 | 2021-04-30 | 2021-01-31 | 2020-10-31 | 2020-07-31 | 2020-04-30 | 2020-01-31 | 2019-10-31 | 2019-07-31 | 2019-04-30 | 2019-01-31 | 2018-10-31 | 2018-07-31 | 2018-04-30 | 2018-01-31 | 2017-10-31 | 2017-07-31 | 2017-04-30 | 2017-01-31 | 2016-10-31 | 2016-07-31 | 2016-04-30 | 2016-01-31 | 2015-10-31 | 2015-07-31 | 2015-04-30 | 2015-01-31 | 2014-10-31 | 2014-07-31 | 2014-04-30 | 2014-01-31 | 2013-10-31 | 2013-07-31 | 2013-04-30 | 2013-01-31 | 2012-10-31 | 2012-07-31 | 2012-04-30 | 2012-01-31 | 2011-10-31 | 2011-07-31 | 2011-04-30 | 2011-01-31 | 2010-10-31 | 2010-07-31 | ||
|---|---|---|---|---|---|---|---|---|---|---|---|---|---|---|---|---|---|---|---|---|---|---|---|---|---|---|---|---|---|---|---|---|---|---|---|---|---|---|---|---|---|---|---|---|---|---|---|---|---|---|---|---|---|---|---|---|
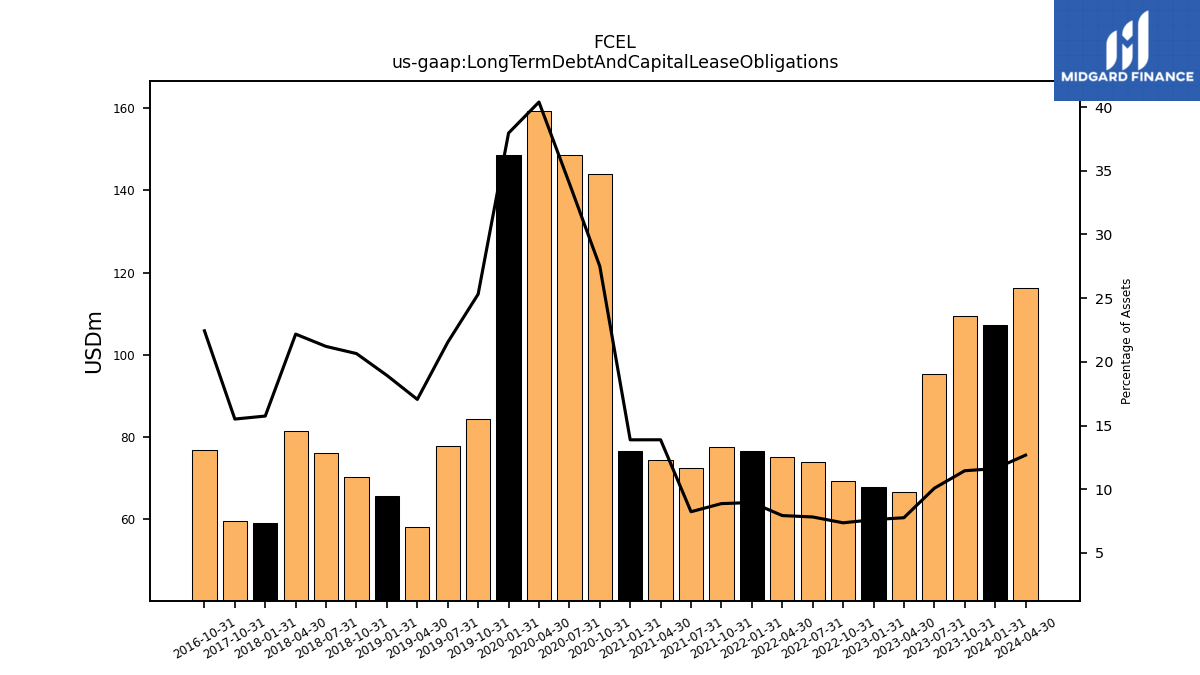
| Long Term Debt And Capital Lease Obligations | 107.22 | 109.40 | 95.25 | 66.63 | 67.89 | 69.18 | 73.85 | 75.03 | 76.52 | 77.62 | 72.40 | 74.33 | 76.66 | 143.99 | 148.55 | 159.41 | 148.56 | 84.40 | 77.82 | 58.18 | 65.51 | 70.28 | 75.96 | 81.51 | 59.01 | 59.51 | NA | NA | NA | 76.76 | NA | NA | NA | NA | NA | NA | NA | NA | NA | NA | NA | NA | NA | NA | NA | NA | NA | NA | NA | NA | NA | NA | NA | NA | NA | |
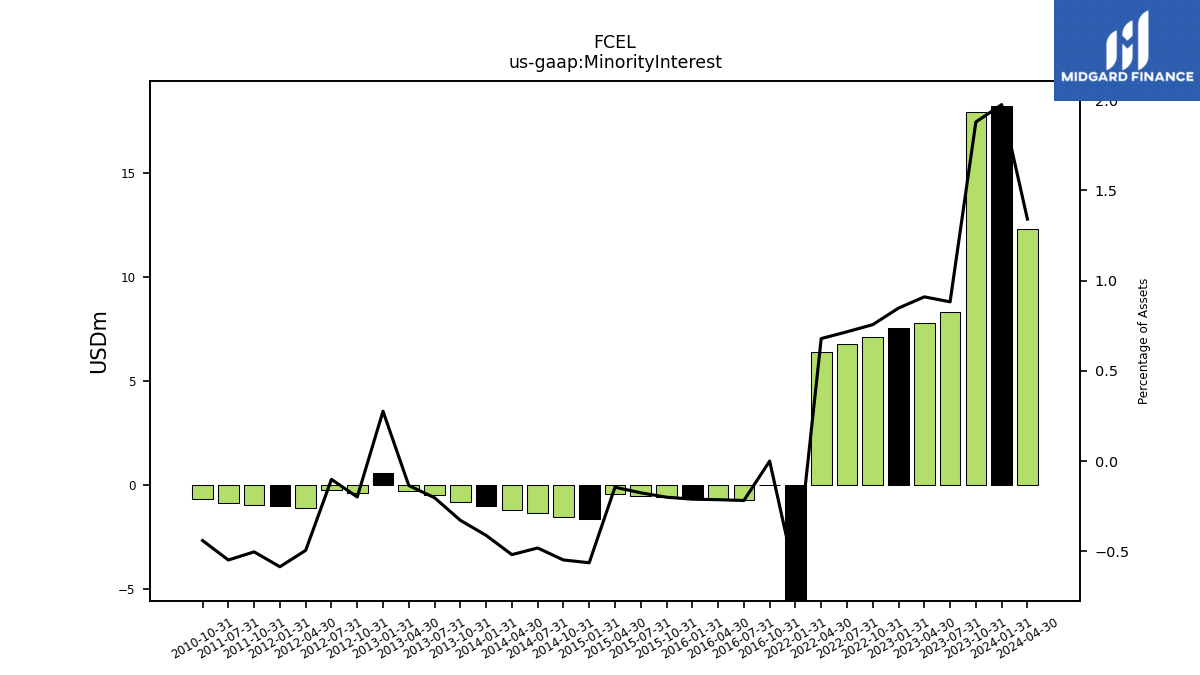
| Minority Interest | 18.23 | 17.95 | 8.34 | 7.81 | 7.57 | 7.11 | 6.77 | 6.42 | -5.50 | NA | NA | NA | NA | NA | NA | NA | NA | NA | NA | NA | NA | NA | NA | NA | NA | NA | NA | NA | NA | 0.00 | -0.72 | -0.66 | -0.62 | -0.56 | -0.51 | -0.42 | -1.63 | -1.54 | -1.35 | -1.19 | -0.99 | -0.78 | -0.48 | -0.28 | 0.58 | -0.38 | -0.20 | -1.07 | -0.99 | -0.92 | -0.86 | NA | NA | -0.66 | NA | |
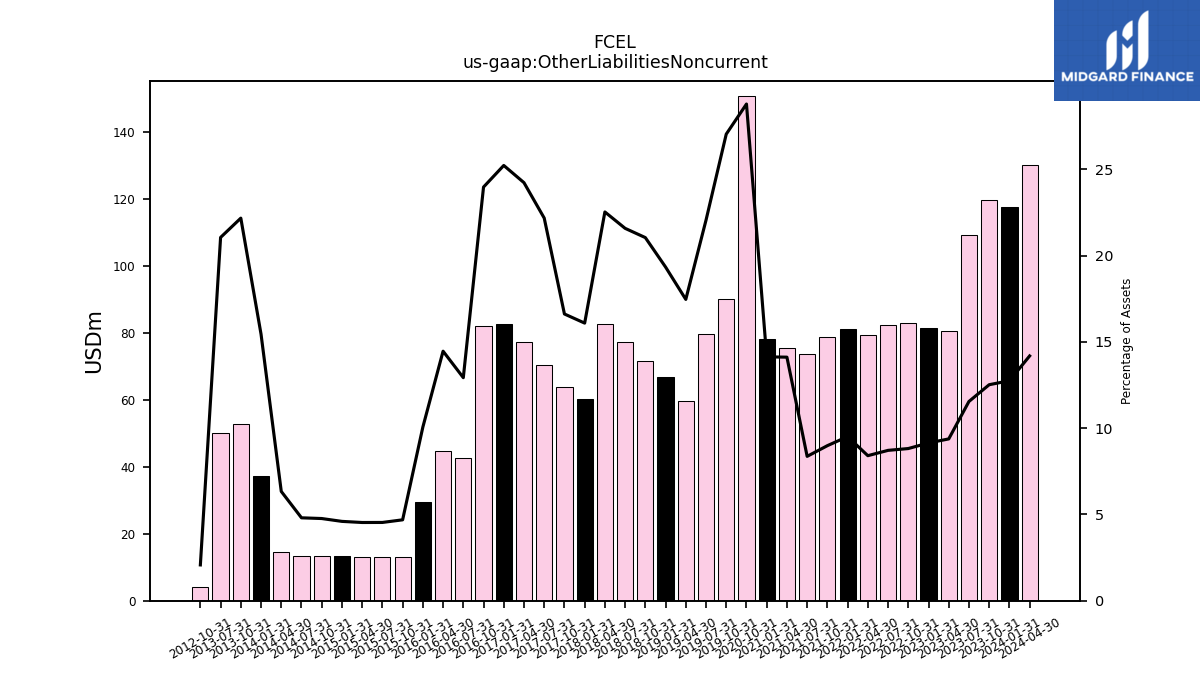
| Other Liabilities Noncurrent | 117.67 | 119.59 | 109.13 | 80.50 | 81.58 | 82.86 | 82.28 | 79.52 | 81.29 | 78.63 | 73.58 | 75.58 | 78.05 | 150.65 | NA | NA | NA | 90.14 | 79.70 | 59.58 | 66.88 | 71.62 | 77.28 | 82.80 | 60.30 | 63.76 | 70.34 | 77.39 | 82.77 | 82.00 | 42.60 | 44.81 | 29.64 | 13.00 | 13.15 | 13.18 | 13.27 | 13.37 | 13.45 | 14.50 | 37.17 | 52.67 | 50.04 | NA | NA | 3.98 | NA | NA | NA | NA | NA | NA | NA | NA | NA | |
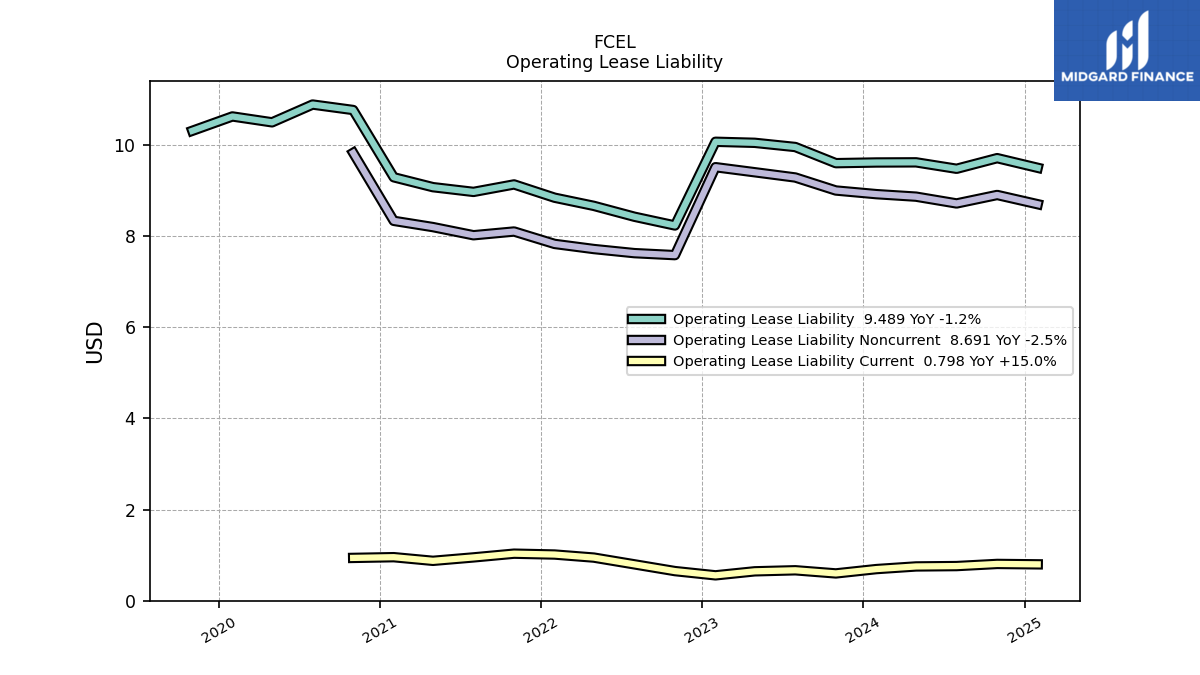
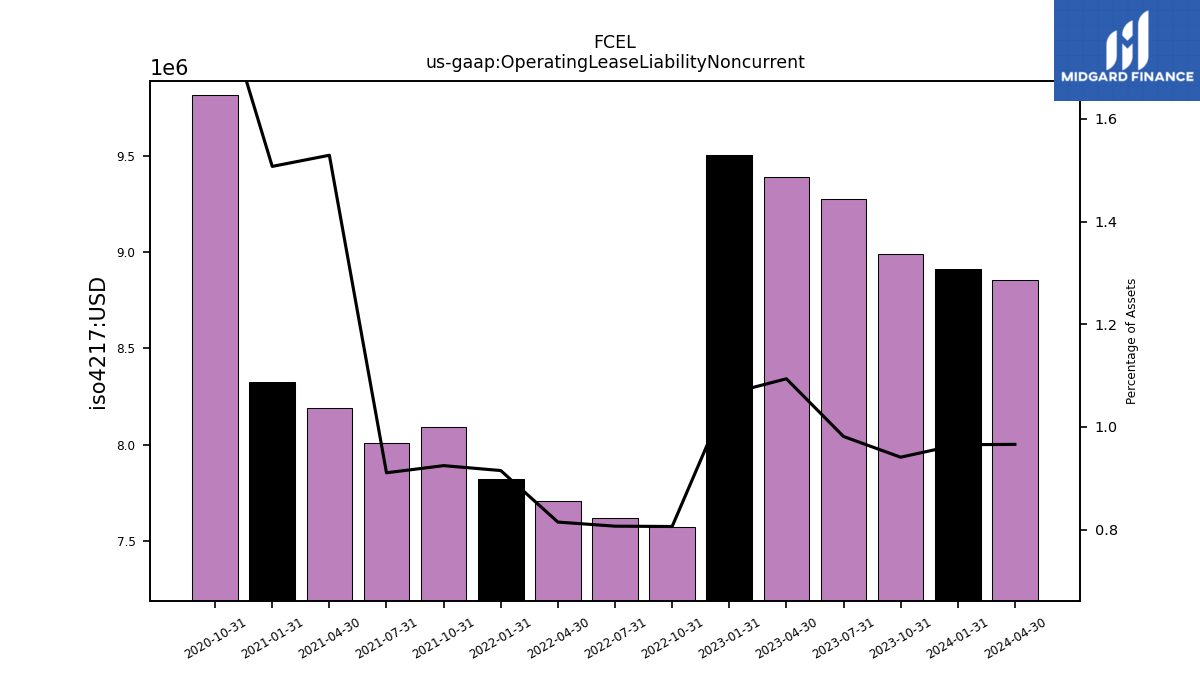
| Operating Lease Liability Noncurrent | 8.91 | 8.99 | 9.28 | 9.39 | 9.50 | 7.58 | 7.62 | 7.71 | 7.82 | 8.09 | 8.01 | 8.19 | 8.33 | 9.82 | NA | NA | NA | NA | NA | NA | NA | NA | NA | NA | NA | NA | NA | NA | NA | NA | NA | NA | NA | NA | NA | NA | NA | NA | NA | NA | NA | NA | NA | NA | NA | NA | NA | NA | NA | NA | NA | NA | NA | NA | NA |
| 2024-01-31 | 2023-10-31 | 2023-07-31 | 2023-04-30 | 2023-01-31 | 2022-10-31 | 2022-07-31 | 2022-04-30 | 2022-01-31 | 2021-10-31 | 2021-07-31 | 2021-04-30 | 2021-01-31 | 2020-10-31 | 2020-07-31 | 2020-04-30 | 2020-01-31 | 2019-10-31 | 2019-07-31 | 2019-04-30 | 2019-01-31 | 2018-10-31 | 2018-07-31 | 2018-04-30 | 2018-01-31 | 2017-10-31 | 2017-07-31 | 2017-04-30 | 2017-01-31 | 2016-10-31 | 2016-07-31 | 2016-04-30 | 2016-01-31 | 2015-10-31 | 2015-07-31 | 2015-04-30 | 2015-01-31 | 2014-10-31 | 2014-07-31 | 2014-04-30 | 2014-01-31 | 2013-10-31 | 2013-07-31 | 2013-04-30 | 2013-01-31 | 2012-10-31 | 2012-07-31 | 2012-04-30 | 2012-01-31 | 2011-10-31 | 2011-07-31 | 2011-04-30 | 2011-01-31 | 2010-10-31 | 2010-07-31 | ||
|---|---|---|---|---|---|---|---|---|---|---|---|---|---|---|---|---|---|---|---|---|---|---|---|---|---|---|---|---|---|---|---|---|---|---|---|---|---|---|---|---|---|---|---|---|---|---|---|---|---|---|---|---|---|---|---|---|
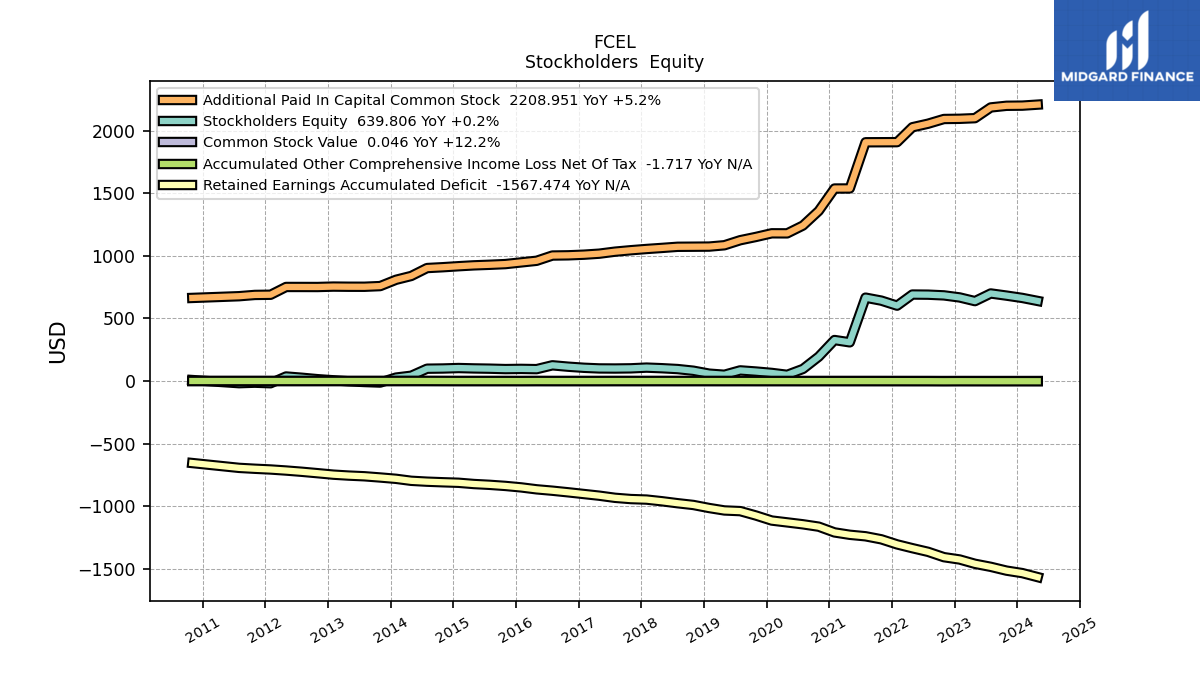
| Stockholders Equity | 663.93 | 682.49 | 699.65 | 638.41 | 667.81 | 684.39 | 690.01 | 691.09 | 602.23 | 642.44 | 666.23 | 309.05 | 327.51 | 194.55 | 96.33 | 49.32 | 64.58 | 75.74 | 84.88 | 49.84 | 58.85 | 82.19 | 95.51 | 102.29 | 107.06 | 101.26 | 99.81 | 100.50 | 105.68 | 114.40 | 125.48 | 94.83 | 96.82 | 95.31 | 98.59 | 100.62 | 103.64 | 99.99 | 98.33 | 42.16 | 27.32 | -12.41 | -8.09 | -2.29 | 5.67 | 14.51 | 25.98 | 36.04 | -17.83 | -13.45 | -17.39 | NA | NA | 7.69 | NA | |
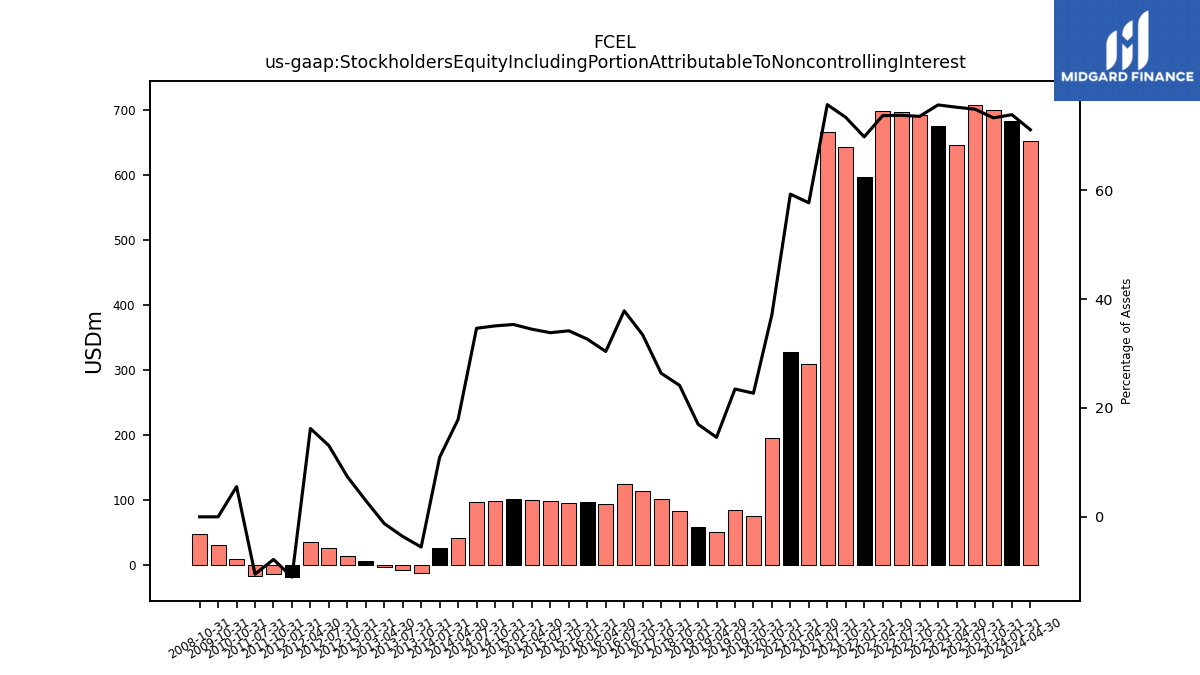
| Stockholders Equity Including Portion Attributable To Noncontrolling Interest | 682.17 | 700.45 | 707.99 | 646.23 | 675.37 | 691.50 | 696.78 | 697.52 | 596.74 | 642.44 | 666.23 | 309.05 | 327.51 | 194.55 | NA | NA | NA | 75.74 | 84.88 | 49.84 | 58.85 | 82.19 | NA | NA | NA | 101.26 | NA | NA | NA | 114.40 | 124.76 | 94.17 | 96.20 | 94.75 | 98.08 | 100.20 | 102.01 | 98.45 | 96.98 | 40.97 | 26.33 | -13.19 | -8.57 | -2.57 | 6.25 | 14.13 | 25.78 | 34.97 | -18.83 | -14.38 | -16.53 | NA | NA | 8.35 | NA | |
| Common Stock Value | 0.04 | 0.04 | 0.04 | 0.04 | 0.04 | 0.04 | 0.04 | 0.04 | 0.04 | 0.04 | 0.04 | 0.03 | 0.03 | 0.03 | 0.02 | 0.02 | 0.02 | 0.02 | 0.01 | 0.00 | 0.00 | 0.00 | 0.00 | 0.00 | 0.00 | 0.00 | 0.00 | 0.00 | 0.00 | 0.00 | 0.00 | 0.00 | 0.00 | 0.00 | 0.00 | 0.00 | 0.00 | 0.00 | 0.00 | 0.00 | 0.00 | 0.00 | 0.00 | 0.00 | 0.00 | 0.00 | 0.00 | 0.00 | 0.00 | 0.00 | 0.00 | NA | NA | 0.00 | NA | |
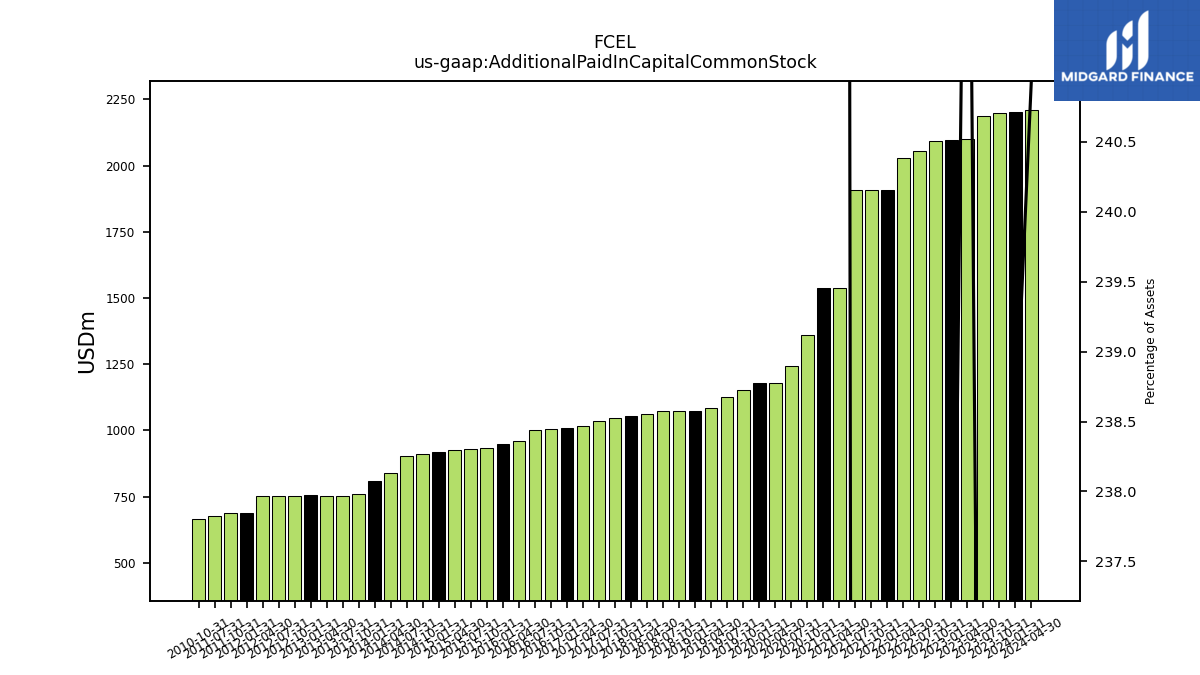
| Additional Paid In Capital Common Stock | 2200.86 | 2199.66 | 2186.41 | 2100.72 | 2095.67 | 2094.08 | 2056.63 | 2028.21 | 1908.98 | 1908.47 | 1908.01 | 1538.83 | 1538.31 | 1359.45 | 1242.52 | 1180.04 | 1180.50 | 1151.45 | 1125.21 | 1084.97 | 1074.31 | 1073.45 | 1072.73 | 1063.50 | 1055.15 | 1045.20 | 1033.74 | 1017.63 | 1009.61 | 1004.57 | 1002.78 | 960.89 | 947.93 | 934.49 | 928.93 | 924.36 | 917.44 | 909.43 | 902.75 | 839.56 | 809.01 | 758.66 | 753.30 | 753.48 | 754.61 | 751.26 | 751.52 | 751.58 | 689.42 | 687.86 | 677.71 | NA | NA | 663.95 | NA | |
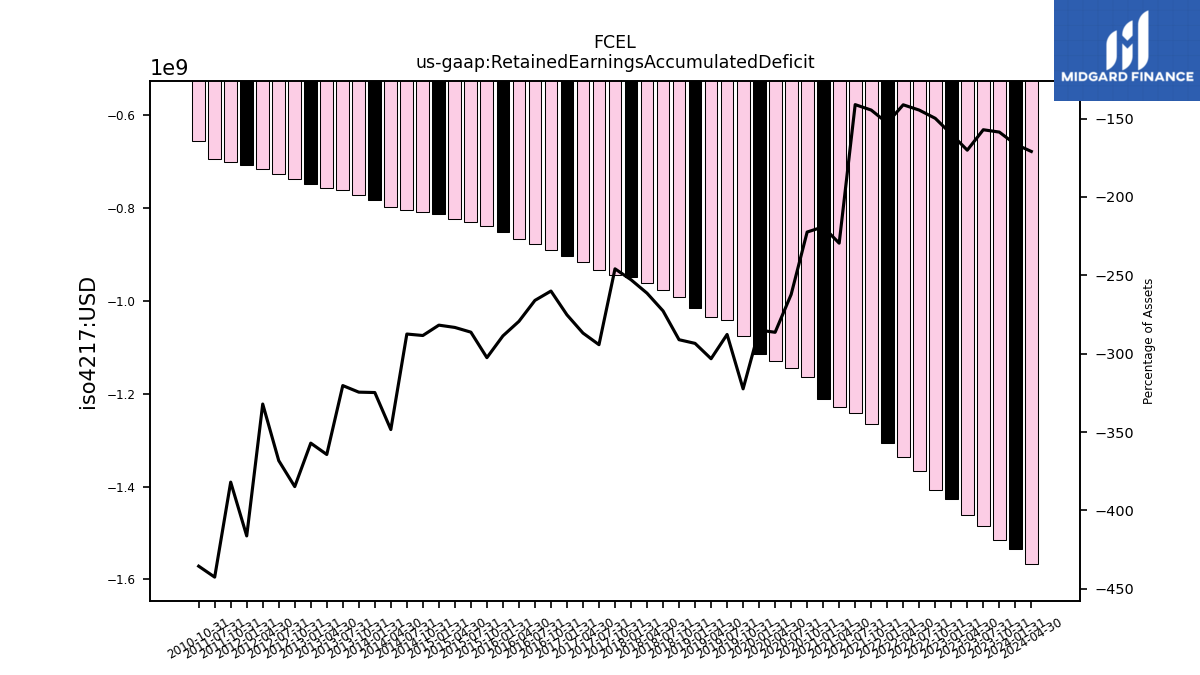
| Retained Earnings Accumulated Deficit | -1535.33 | -1515.54 | -1485.18 | -1460.90 | -1426.60 | -1407.97 | -1365.51 | -1336.09 | -1305.88 | -1265.25 | -1241.07 | -1229.07 | -1210.16 | -1164.20 | -1145.34 | -1130.01 | -1115.24 | -1075.09 | -1039.91 | -1034.60 | -1015.07 | -990.87 | -976.77 | -960.89 | -947.72 | -943.53 | -933.55 | -916.55 | -903.32 | -889.63 | -876.77 | -865.76 | -850.38 | -838.67 | -829.81 | -823.27 | -813.38 | -809.31 | -804.61 | -797.64 | -781.79 | -771.19 | -761.49 | -755.88 | -748.51 | -736.83 | -725.49 | -715.57 | -707.28 | -701.34 | -694.27 | NA | NA | -655.62 | NA | |
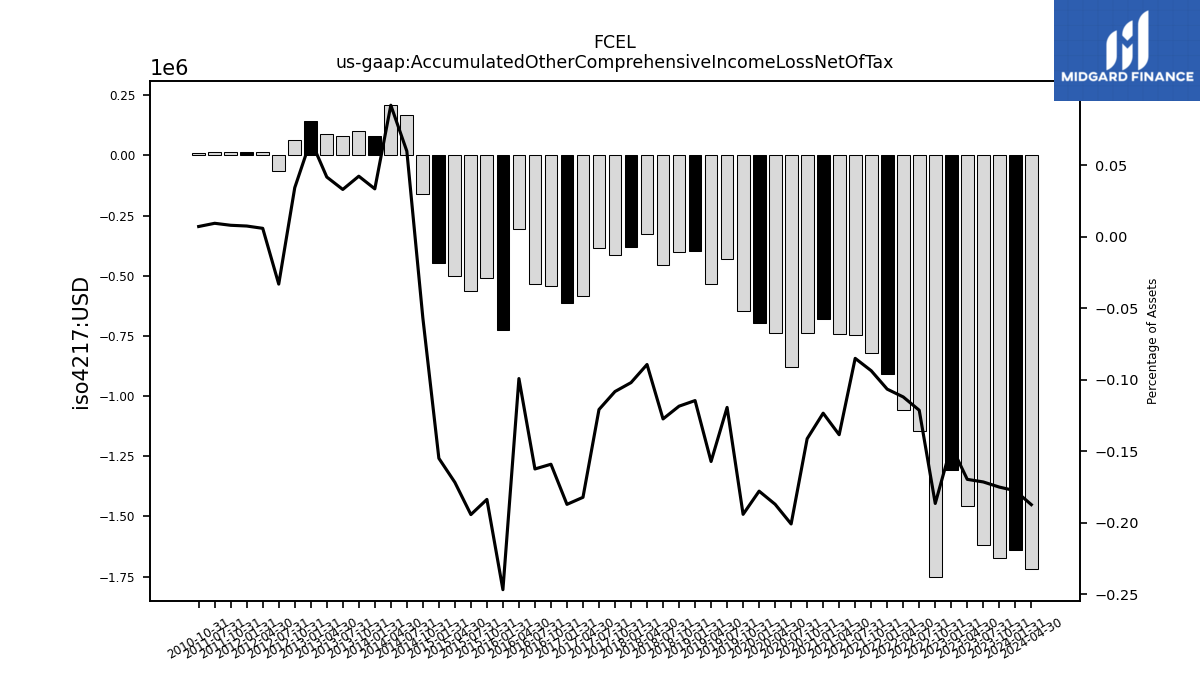
| Accumulated Other Comprehensive Income Loss Net Of Tax | -1.64 | -1.67 | -1.62 | -1.46 | -1.30 | -1.75 | -1.15 | -1.06 | -0.91 | -0.82 | -0.75 | -0.74 | -0.68 | -0.74 | -0.88 | -0.74 | -0.70 | -0.65 | -0.43 | -0.54 | -0.40 | -0.40 | -0.46 | -0.33 | -0.38 | -0.41 | -0.38 | -0.58 | -0.61 | -0.54 | -0.54 | -0.31 | -0.73 | -0.51 | -0.56 | -0.50 | -0.45 | -0.16 | 0.17 | 0.21 | 0.08 | 0.10 | 0.08 | 0.09 | 0.14 | 0.07 | -0.07 | 0.01 | 0.01 | 0.01 | 0.01 | NA | NA | 0.01 | NA | |
| Minority Interest | 18.23 | 17.95 | 8.34 | 7.81 | 7.57 | 7.11 | 6.77 | 6.42 | -5.50 | NA | NA | NA | NA | NA | NA | NA | NA | NA | NA | NA | NA | NA | NA | NA | NA | NA | NA | NA | NA | 0.00 | -0.72 | -0.66 | -0.62 | -0.56 | -0.51 | -0.42 | -1.63 | -1.54 | -1.35 | -1.19 | -0.99 | -0.78 | -0.48 | -0.28 | 0.58 | -0.38 | -0.20 | -1.07 | -0.99 | -0.92 | -0.86 | NA | NA | -0.66 | NA | |
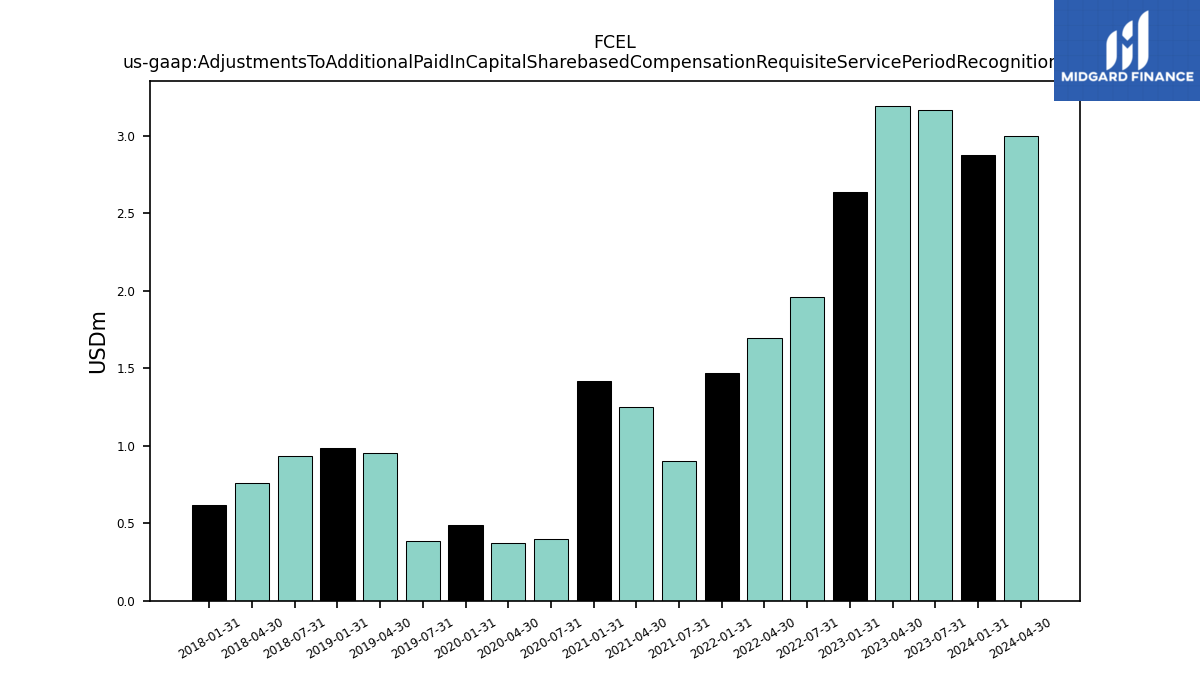
| Adjustments To Additional Paid In Capital Sharebased Compensation Requisite Service Period Recognition Value | 2.88 | NA | 3.17 | 3.19 | 2.64 | NA | 1.96 | 1.70 | 1.47 | NA | 0.90 | 1.25 | 1.42 | NA | 0.40 | 0.38 | 0.49 | NA | 0.38 | 0.95 | 0.99 | NA | 0.93 | 0.76 | 0.62 | NA | NA | NA | NA | NA | NA | NA | NA | NA | NA | NA | NA | NA | NA | NA | NA | NA | NA | NA | NA | NA | NA | NA | NA | NA | NA | NA | NA | NA | NA | |
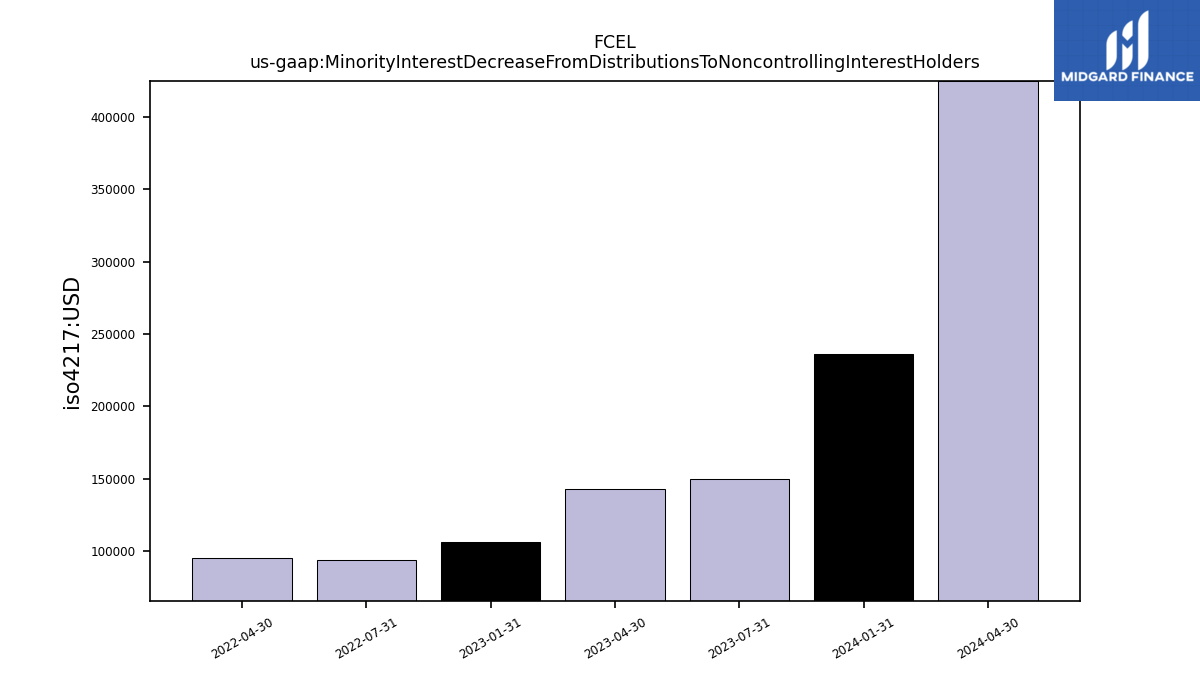
| Minority Interest Decrease From Distributions To Noncontrolling Interest Holders | 0.24 | NA | 0.15 | 0.14 | 0.11 | NA | 0.09 | 0.10 | NA | NA | NA | NA | NA | NA | NA | NA | NA | NA | NA | NA | NA | NA | NA | NA | NA | NA | NA | NA | NA | NA | NA | NA | NA | NA | NA | NA | NA | NA | NA | NA | NA | NA | NA | NA | NA | NA | NA | NA | NA | NA | NA | NA | NA | NA | NA |
| 2024-01-31 | 2023-10-31 | 2023-07-31 | 2023-04-30 | 2023-01-31 | 2022-10-31 | 2022-07-31 | 2022-04-30 | 2022-01-31 | 2021-10-31 | 2021-07-31 | 2021-04-30 | 2021-01-31 | 2020-10-31 | 2020-07-31 | 2020-04-30 | 2020-01-31 | 2019-10-31 | 2019-07-31 | 2019-04-30 | 2019-01-31 | 2018-10-31 | 2018-07-31 | 2018-04-30 | 2018-01-31 | 2017-10-31 | 2017-07-31 | 2017-04-30 | 2017-01-31 | 2016-10-31 | 2016-07-31 | 2016-04-30 | 2016-01-31 | 2015-10-31 | 2015-07-31 | 2015-04-30 | 2015-01-31 | 2014-10-31 | 2014-07-31 | 2014-04-30 | 2014-01-31 | 2013-10-31 | 2013-07-31 | 2013-04-30 | 2013-01-31 | 2012-10-31 | 2012-07-31 | 2012-04-30 | 2012-01-31 | 2011-10-31 | 2011-07-31 | 2011-04-30 | 2011-01-31 | 2010-10-31 | 2010-07-31 | ||
|---|---|---|---|---|---|---|---|---|---|---|---|---|---|---|---|---|---|---|---|---|---|---|---|---|---|---|---|---|---|---|---|---|---|---|---|---|---|---|---|---|---|---|---|---|---|---|---|---|---|---|---|---|---|---|---|---|
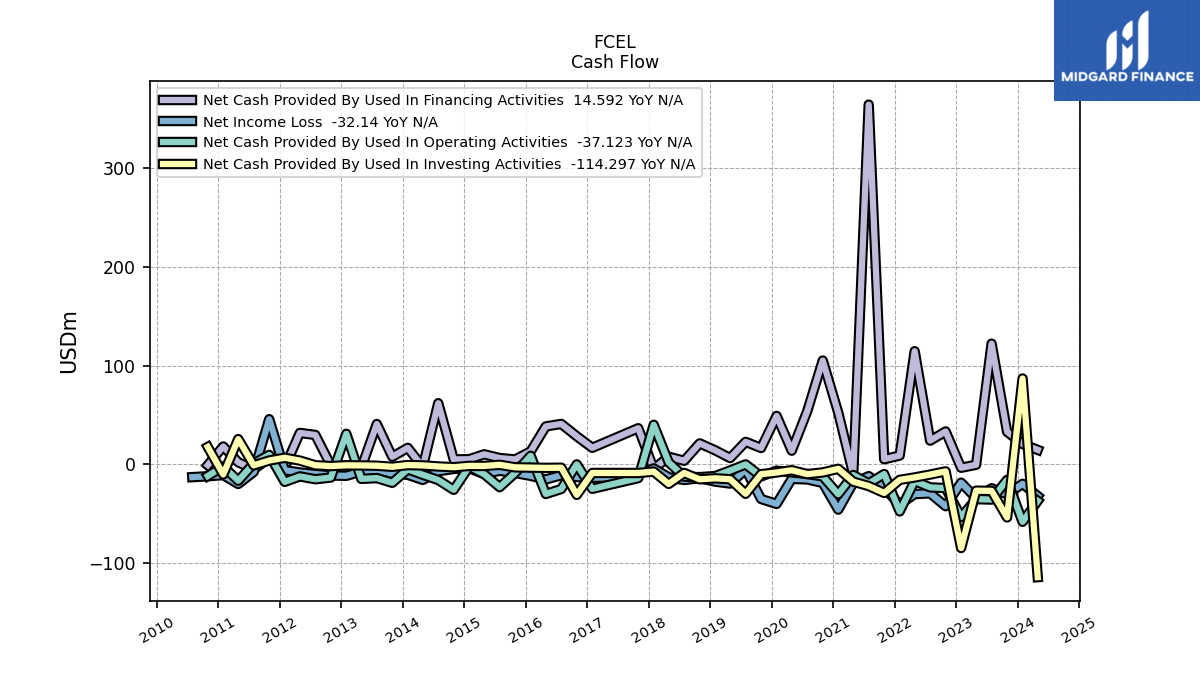
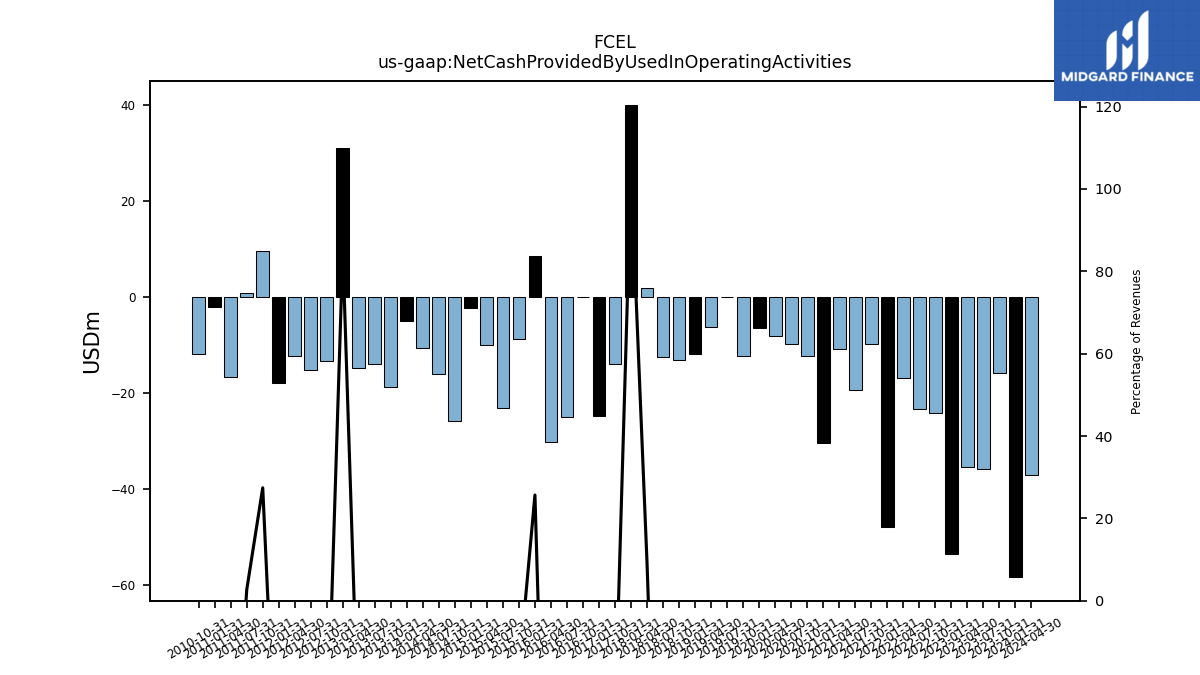
| Net Cash Provided By Used In Operating Activities | -58.27 | -15.83 | -35.75 | -35.29 | -53.38 | -24.08 | -23.38 | -16.95 | -47.75 | -9.85 | -19.42 | -10.85 | -30.32 | -12.20 | -9.86 | -8.21 | -6.51 | -12.27 | -0.11 | -6.24 | -11.96 | -13.02 | -12.57 | 1.92 | 40.00 | -14.02 | NA | NA | -24.85 | -0.08 | -25.01 | -30.09 | 8.60 | -8.79 | -23.17 | -10.04 | -2.27 | -25.87 | -15.92 | -10.60 | -5.07 | -18.77 | -13.99 | -14.79 | 30.90 | -13.41 | -15.16 | -12.29 | -17.80 | 9.53 | 0.82 | -16.68 | -2.15 | -11.89 | NA | |
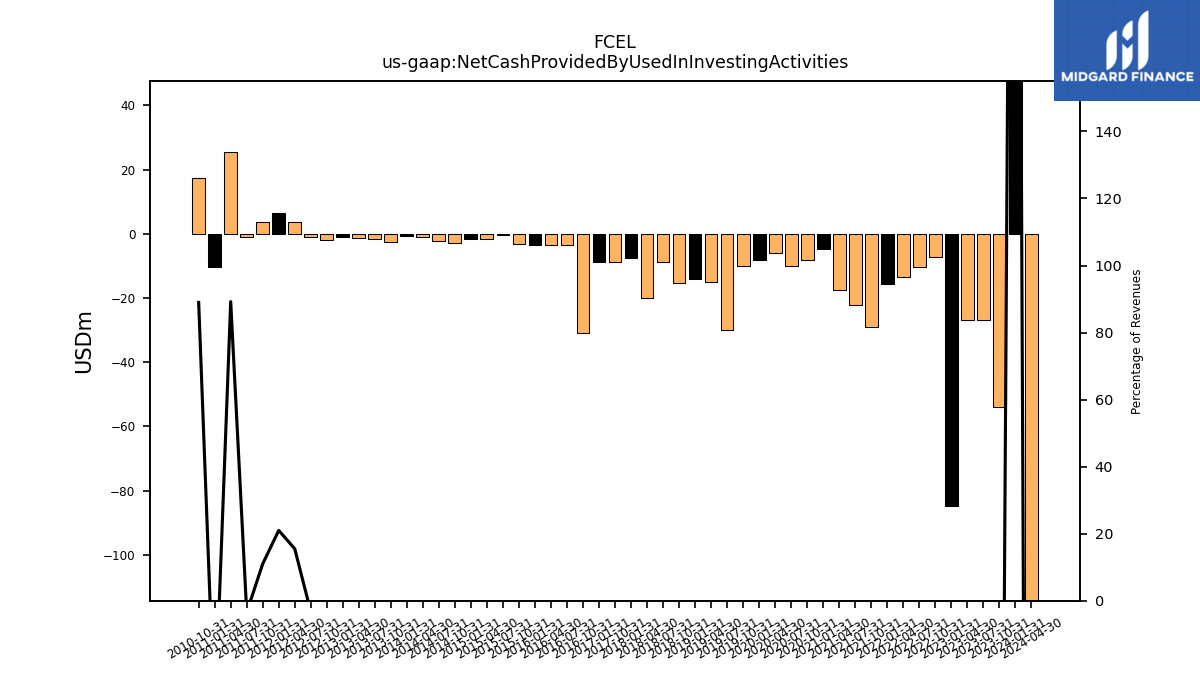
| Net Cash Provided By Used In Investing Activities | 86.89 | -53.87 | -26.92 | -26.75 | -84.82 | -7.17 | -10.39 | -13.32 | -15.77 | -29.02 | -22.04 | -17.58 | -4.59 | -8.26 | -9.96 | -6.00 | -8.30 | -10.03 | -29.91 | -15.14 | -14.22 | -15.22 | -8.78 | -19.86 | -7.39 | -8.81 | NA | NA | -8.80 | -30.98 | -3.47 | -3.64 | -3.36 | -3.09 | -0.52 | -1.71 | -1.62 | -2.96 | -2.20 | -1.13 | -0.79 | -2.53 | -1.46 | -1.16 | -1.04 | -1.81 | -0.96 | 3.75 | 6.57 | 3.83 | -1.07 | 25.53 | -10.25 | 17.53 | NA | |
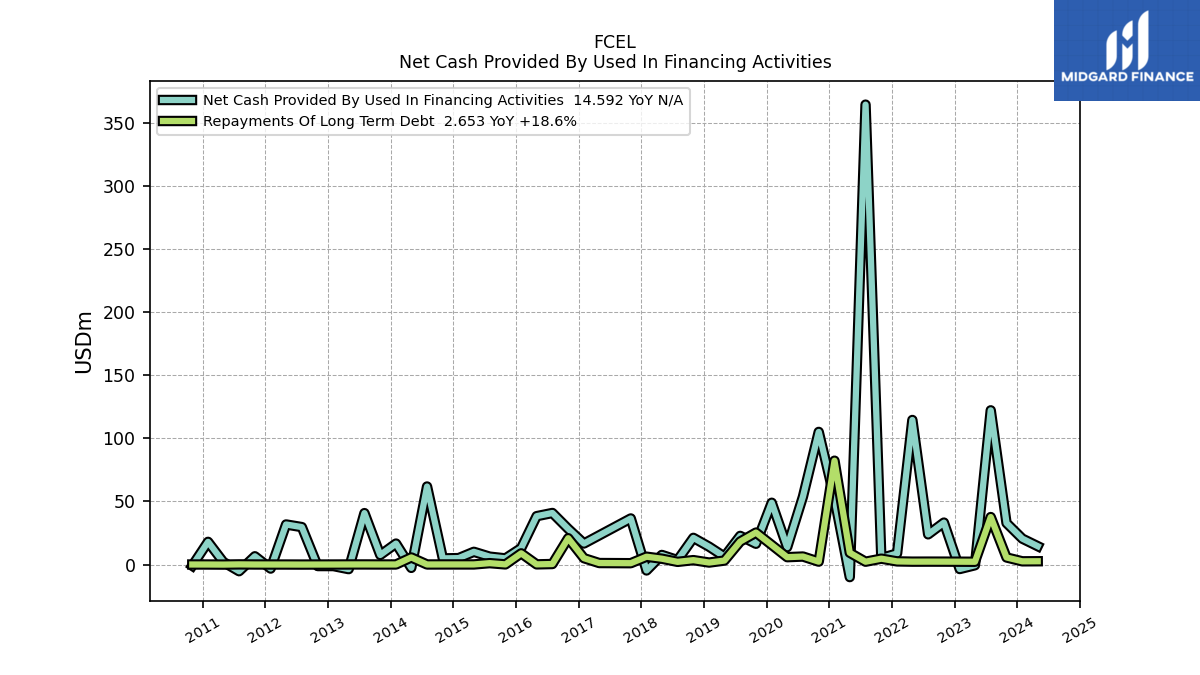
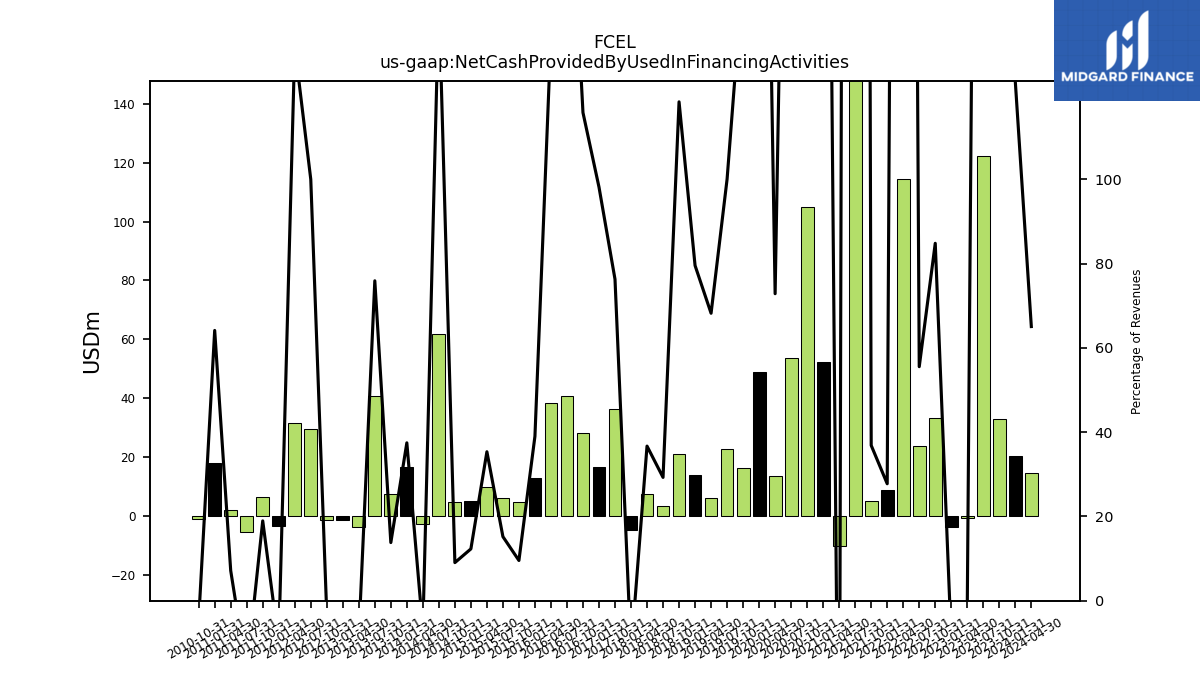
| Net Cash Provided By Used In Financing Activities | 20.56 | 32.91 | 122.19 | -0.51 | -3.51 | 33.26 | 23.95 | 114.55 | 8.83 | 5.14 | 364.30 | -9.93 | 52.39 | 105.09 | 53.82 | 13.76 | 48.99 | 16.49 | 22.73 | 6.29 | 14.15 | 21.18 | 3.55 | 7.65 | -4.65 | 36.55 | NA | NA | 16.69 | 28.36 | 40.88 | 38.35 | 13.07 | 4.92 | 6.29 | 10.12 | 5.13 | 4.92 | 61.85 | -2.61 | 16.66 | 7.62 | 40.79 | -3.60 | -1.18 | -1.16 | 29.70 | 31.78 | -3.15 | 6.58 | -5.25 | 2.05 | 18.02 | -0.90 | NA |
| 2024-01-31 | 2023-10-31 | 2023-07-31 | 2023-04-30 | 2023-01-31 | 2022-10-31 | 2022-07-31 | 2022-04-30 | 2022-01-31 | 2021-10-31 | 2021-07-31 | 2021-04-30 | 2021-01-31 | 2020-10-31 | 2020-07-31 | 2020-04-30 | 2020-01-31 | 2019-10-31 | 2019-07-31 | 2019-04-30 | 2019-01-31 | 2018-10-31 | 2018-07-31 | 2018-04-30 | 2018-01-31 | 2017-10-31 | 2017-07-31 | 2017-04-30 | 2017-01-31 | 2016-10-31 | 2016-07-31 | 2016-04-30 | 2016-01-31 | 2015-10-31 | 2015-07-31 | 2015-04-30 | 2015-01-31 | 2014-10-31 | 2014-07-31 | 2014-04-30 | 2014-01-31 | 2013-10-31 | 2013-07-31 | 2013-04-30 | 2013-01-31 | 2012-10-31 | 2012-07-31 | 2012-04-30 | 2012-01-31 | 2011-10-31 | 2011-07-31 | 2011-04-30 | 2011-01-31 | 2010-10-31 | 2010-07-31 | ||
|---|---|---|---|---|---|---|---|---|---|---|---|---|---|---|---|---|---|---|---|---|---|---|---|---|---|---|---|---|---|---|---|---|---|---|---|---|---|---|---|---|---|---|---|---|---|---|---|---|---|---|---|---|---|---|---|---|
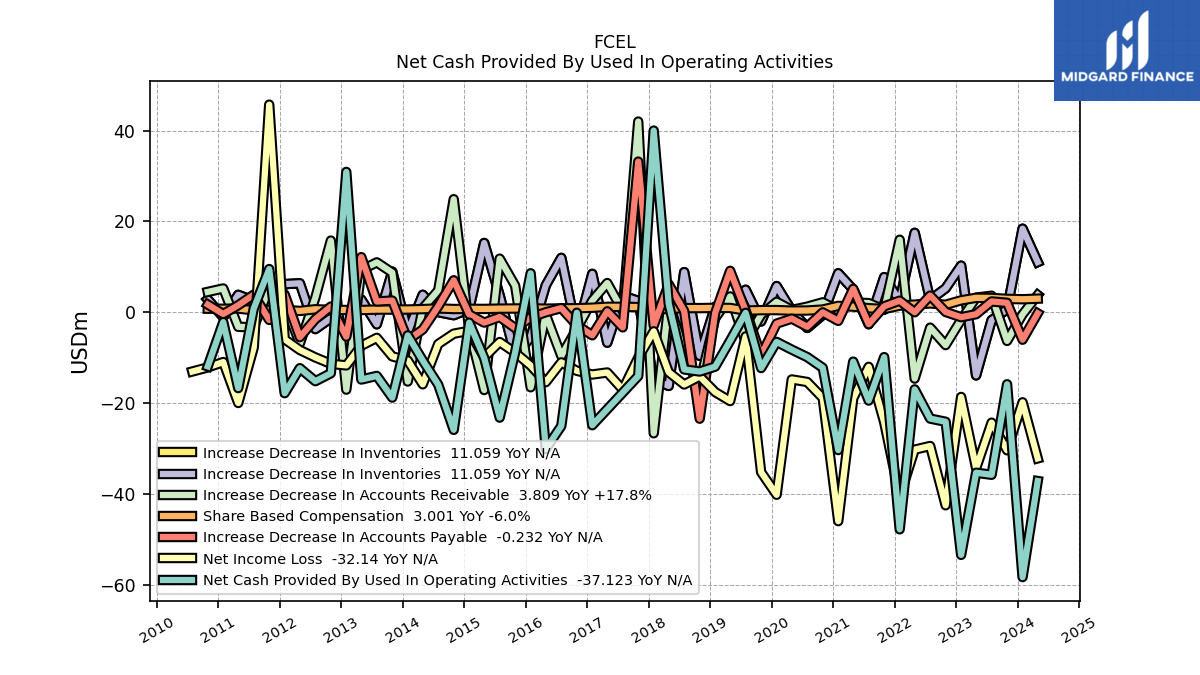
| Net Cash Provided By Used In Operating Activities | -58.27 | -15.83 | -35.75 | -35.29 | -53.38 | -24.08 | -23.38 | -16.95 | -47.75 | -9.85 | -19.42 | -10.85 | -30.32 | -12.20 | -9.86 | -8.21 | -6.51 | -12.27 | -0.11 | -6.24 | -11.96 | -13.02 | -12.57 | 1.92 | 40.00 | -14.02 | NA | NA | -24.85 | -0.08 | -25.01 | -30.09 | 8.60 | -8.79 | -23.17 | -10.04 | -2.27 | -25.87 | -15.92 | -10.60 | -5.07 | -18.77 | -13.99 | -14.79 | 30.90 | -13.41 | -15.16 | -12.29 | -17.80 | 9.53 | 0.82 | -16.68 | -2.15 | -11.89 | NA | |
| Net Income Loss | -19.79 | -30.36 | -24.28 | -34.30 | -18.62 | -42.47 | -29.41 | -30.22 | -40.62 | -24.18 | -12.00 | -18.92 | -45.96 | -18.86 | -15.33 | -14.77 | -40.15 | -35.18 | -5.31 | -19.53 | -17.55 | -14.10 | -15.88 | -13.17 | -4.18 | -9.98 | -17.00 | -13.24 | -13.69 | -12.86 | -11.01 | -15.37 | -11.71 | -8.86 | -6.54 | -9.89 | -4.07 | -4.70 | -6.98 | -15.84 | -10.60 | -9.70 | -5.61 | -7.37 | -11.68 | -11.34 | -9.92 | -8.29 | -5.94 | 45.70 | -7.75 | -19.96 | -10.94 | -12.12 | -13.03 | |
| Profit Loss | -44.40 | -29.46 | -23.60 | -33.91 | -21.09 | -42.01 | -28.98 | -30.13 | -46.12 | -24.15 | -12.00 | -18.92 | -45.96 | -18.86 | -15.33 | -14.77 | -40.15 | -35.18 | -5.31 | -19.53 | -17.55 | -14.10 | -15.88 | -13.17 | -4.18 | -9.98 | -17.00 | -13.24 | -13.69 | -12.95 | -11.07 | -15.41 | -11.78 | -8.90 | -6.63 | -10.00 | -4.15 | -4.89 | -7.14 | -16.04 | -10.81 | -10.00 | -5.81 | -7.63 | -11.88 | -11.52 | -10.01 | -8.36 | -6.01 | -7.13 | -7.83 | -20.01 | -11.01 | -12.52 | -13.11 | |
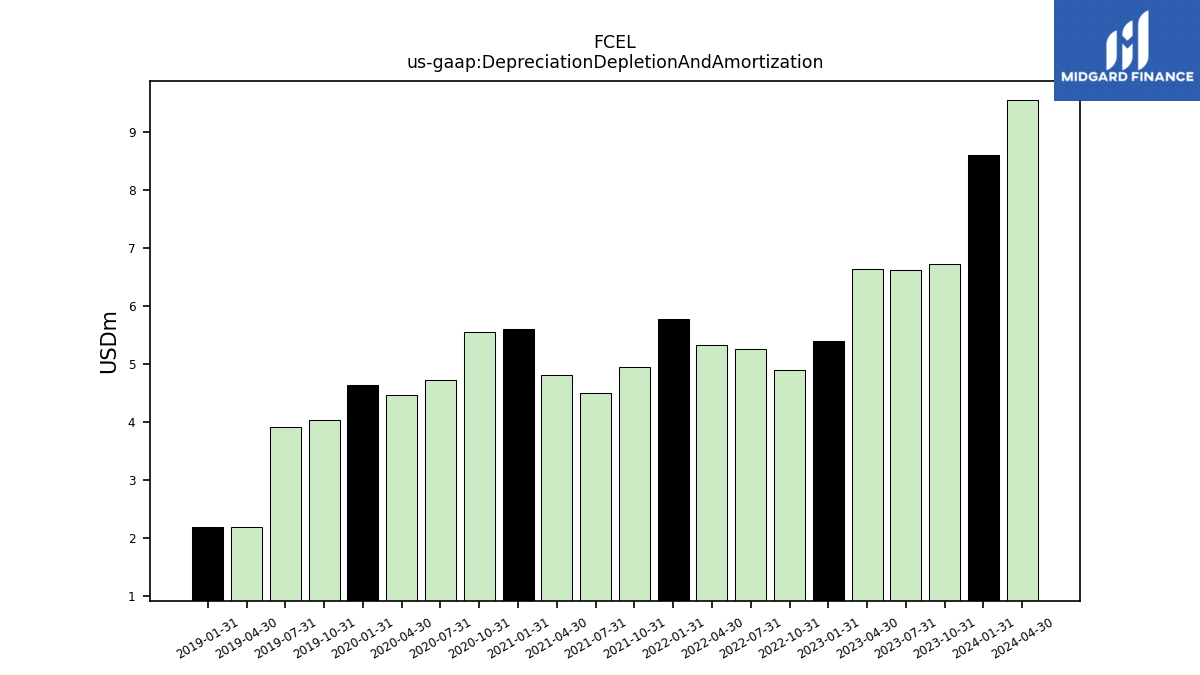
| Depreciation Depletion And Amortization | 8.60 | 6.72 | 6.62 | 6.63 | 5.41 | 4.91 | 5.27 | 5.33 | 5.77 | 4.95 | 4.51 | 4.81 | 5.60 | 5.55 | 4.73 | 4.47 | 4.63 | 4.03 | 3.92 | 2.20 | 2.20 | NA | NA | NA | NA | NA | NA | NA | NA | NA | NA | NA | NA | NA | NA | NA | NA | NA | NA | NA | NA | NA | NA | NA | NA | NA | NA | NA | NA | NA | NA | NA | NA | NA | NA | |
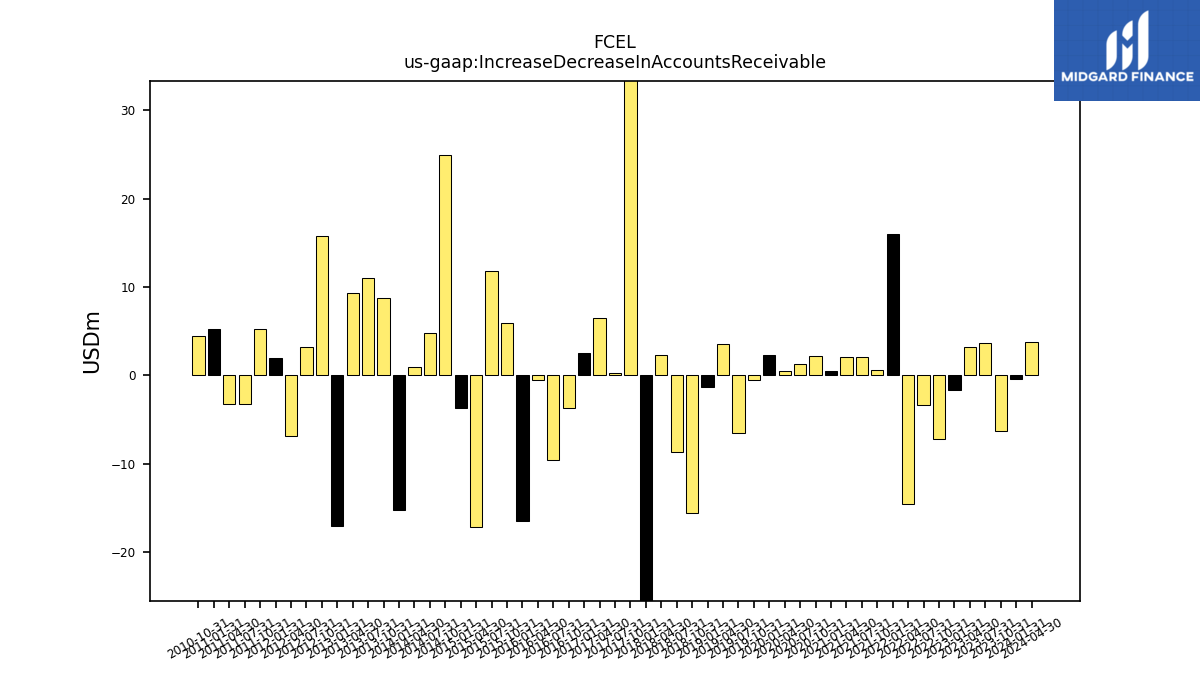
| Increase Decrease In Accounts Receivable | -0.46 | -6.29 | 3.65 | 3.23 | -1.67 | -7.22 | -3.37 | -14.59 | 15.97 | 0.55 | 2.04 | 2.13 | 0.46 | 2.20 | 1.25 | 0.52 | 2.30 | -0.53 | -6.48 | 3.50 | -1.33 | -15.62 | -8.73 | 2.25 | -26.62 | 41.98 | 0.28 | 6.45 | 2.58 | -3.65 | -9.59 | -0.51 | -16.49 | 5.87 | 11.81 | -17.11 | -3.75 | 24.89 | 4.82 | 0.89 | -15.23 | 8.73 | 10.99 | 9.30 | -17.02 | 15.79 | 3.20 | -6.87 | 1.94 | 5.27 | -3.27 | -3.20 | 5.25 | 4.49 | NA | |
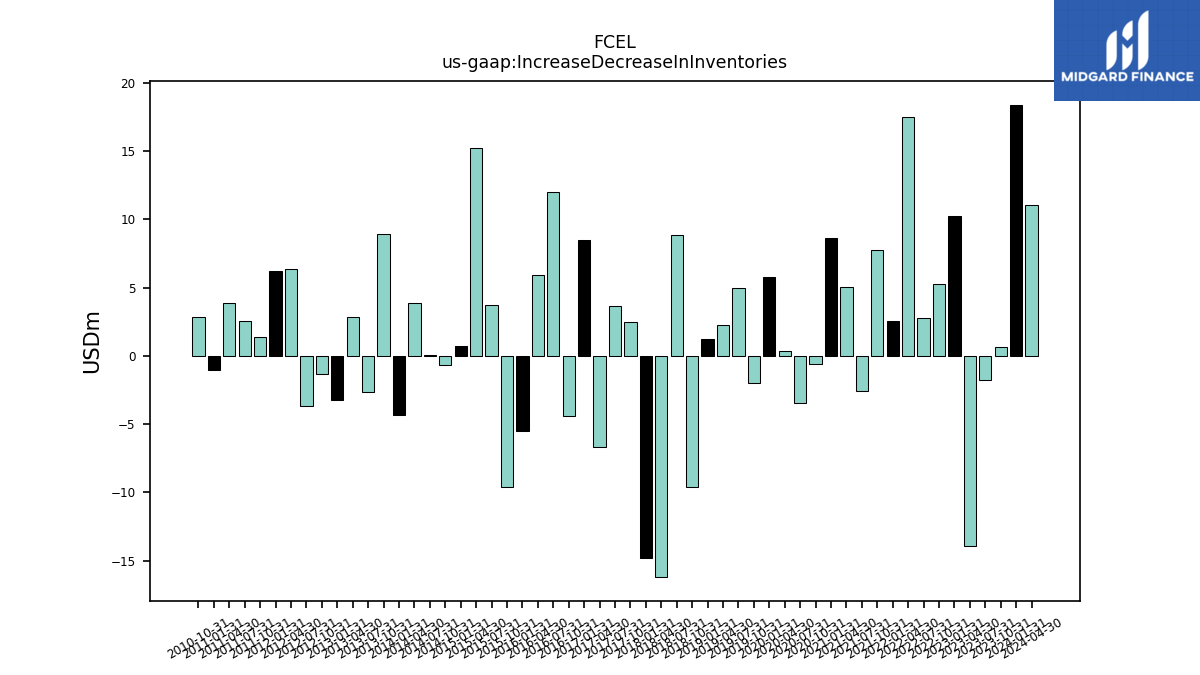
| Increase Decrease In Inventories | 18.40 | 0.66 | -1.73 | -13.88 | 10.27 | 5.28 | 2.76 | 17.49 | 2.53 | 7.74 | -2.60 | 5.01 | 8.60 | -0.56 | -3.44 | 0.34 | 5.78 | -2.01 | 4.97 | 2.24 | 1.23 | -9.58 | 8.84 | -16.20 | -14.78 | 2.51 | 3.68 | -6.68 | 8.46 | -4.40 | 11.98 | 5.95 | -5.48 | -9.58 | 3.69 | 15.26 | 0.72 | -0.64 | 0.05 | 3.86 | -4.33 | 8.95 | -2.64 | 2.82 | -3.24 | -1.29 | -3.69 | 6.38 | 6.20 | 1.37 | 2.53 | 3.85 | -1.05 | 2.83 | NA | |
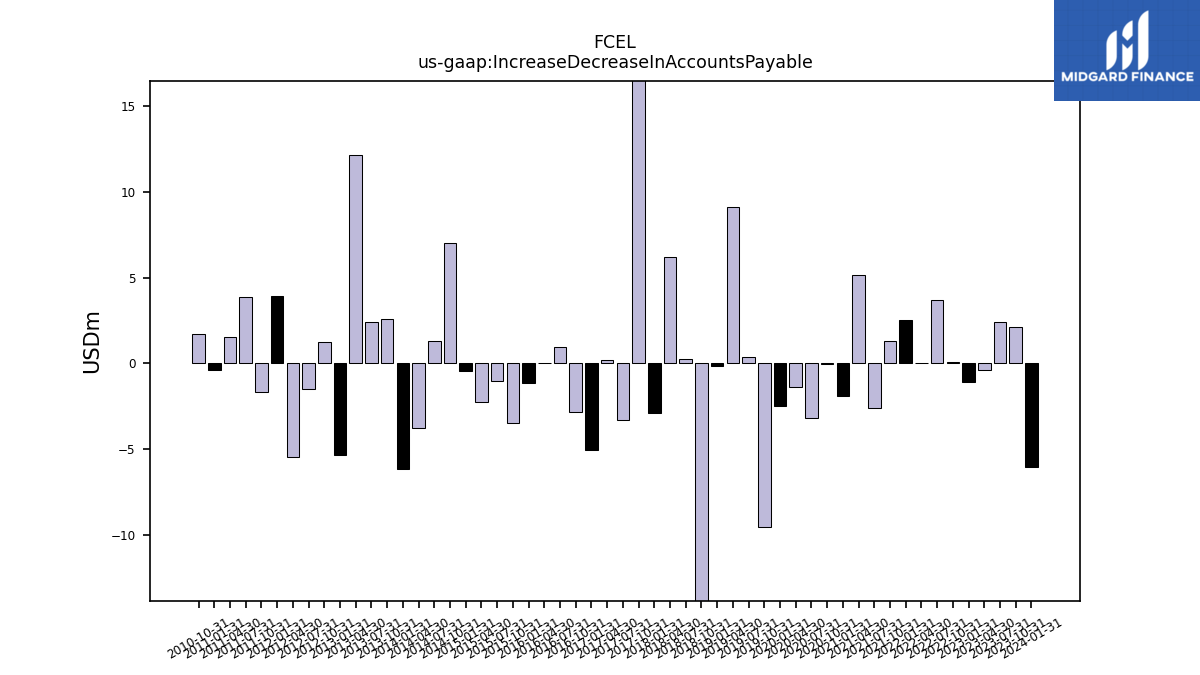
| Increase Decrease In Accounts Payable | -6.03 | 2.09 | 2.39 | -0.41 | -1.07 | 0.08 | 3.69 | 0.01 | 2.56 | 1.32 | -2.61 | 5.17 | -1.89 | -0.01 | -3.18 | -1.39 | -2.48 | -9.52 | 0.37 | 9.13 | -0.15 | -23.41 | 0.27 | 6.19 | -2.90 | 33.17 | -3.31 | 0.22 | -5.06 | -2.82 | 0.93 | 0.02 | -1.14 | -3.46 | -1.03 | -2.27 | -0.47 | 7.05 | 1.30 | -3.78 | -6.14 | 2.58 | 2.39 | 12.15 | -5.34 | 1.26 | -1.50 | -5.47 | 3.92 | -1.68 | 3.88 | 1.57 | -0.37 | 1.71 | NA | |
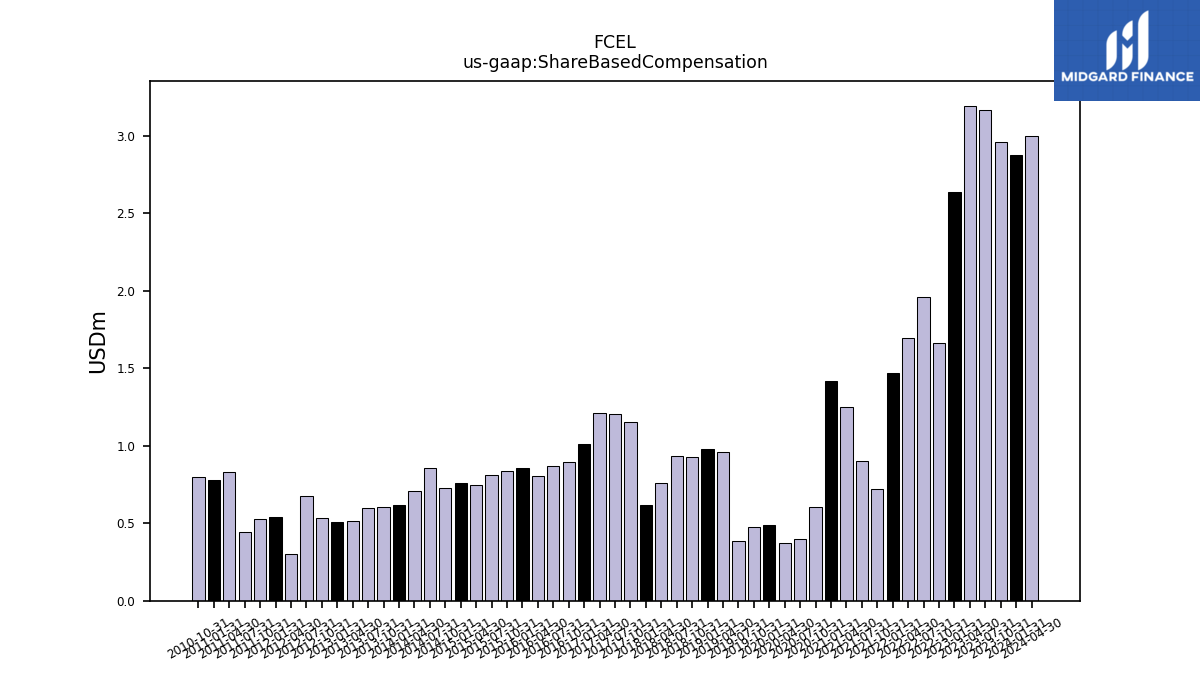
| Share Based Compensation | 2.88 | 2.96 | 3.17 | 3.19 | 2.64 | 1.67 | 1.96 | 1.70 | 1.47 | 0.72 | 0.90 | 1.25 | 1.42 | 0.61 | 0.40 | 0.38 | 0.49 | 0.48 | 0.39 | 0.96 | 0.98 | 0.93 | 0.93 | 0.76 | 0.62 | 1.15 | 1.21 | 1.21 | 1.01 | 0.90 | 0.87 | 0.81 | 0.86 | 0.84 | 0.81 | 0.75 | 0.76 | 0.73 | 0.85 | 0.71 | 0.62 | 0.61 | 0.60 | 0.51 | 0.51 | 0.54 | 0.67 | 0.30 | 0.54 | 0.53 | 0.44 | 0.83 | 0.78 | 0.80 | NA |
| 2024-01-31 | 2023-10-31 | 2023-07-31 | 2023-04-30 | 2023-01-31 | 2022-10-31 | 2022-07-31 | 2022-04-30 | 2022-01-31 | 2021-10-31 | 2021-07-31 | 2021-04-30 | 2021-01-31 | 2020-10-31 | 2020-07-31 | 2020-04-30 | 2020-01-31 | 2019-10-31 | 2019-07-31 | 2019-04-30 | 2019-01-31 | 2018-10-31 | 2018-07-31 | 2018-04-30 | 2018-01-31 | 2017-10-31 | 2017-07-31 | 2017-04-30 | 2017-01-31 | 2016-10-31 | 2016-07-31 | 2016-04-30 | 2016-01-31 | 2015-10-31 | 2015-07-31 | 2015-04-30 | 2015-01-31 | 2014-10-31 | 2014-07-31 | 2014-04-30 | 2014-01-31 | 2013-10-31 | 2013-07-31 | 2013-04-30 | 2013-01-31 | 2012-10-31 | 2012-07-31 | 2012-04-30 | 2012-01-31 | 2011-10-31 | 2011-07-31 | 2011-04-30 | 2011-01-31 | 2010-10-31 | 2010-07-31 | ||
|---|---|---|---|---|---|---|---|---|---|---|---|---|---|---|---|---|---|---|---|---|---|---|---|---|---|---|---|---|---|---|---|---|---|---|---|---|---|---|---|---|---|---|---|---|---|---|---|---|---|---|---|---|---|---|---|---|
| Net Cash Provided By Used In Investing Activities | 86.89 | -53.87 | -26.92 | -26.75 | -84.82 | -7.17 | -10.39 | -13.32 | -15.77 | -29.02 | -22.04 | -17.58 | -4.59 | -8.26 | -9.96 | -6.00 | -8.30 | -10.03 | -29.91 | -15.14 | -14.22 | -15.22 | -8.78 | -19.86 | -7.39 | -8.81 | NA | NA | -8.80 | -30.98 | -3.47 | -3.64 | -3.36 | -3.09 | -0.52 | -1.71 | -1.62 | -2.96 | -2.20 | -1.13 | -0.79 | -2.53 | -1.46 | -1.16 | -1.04 | -1.81 | -0.96 | 3.75 | 6.57 | 3.83 | -1.07 | 25.53 | -10.25 | 17.53 | NA | |
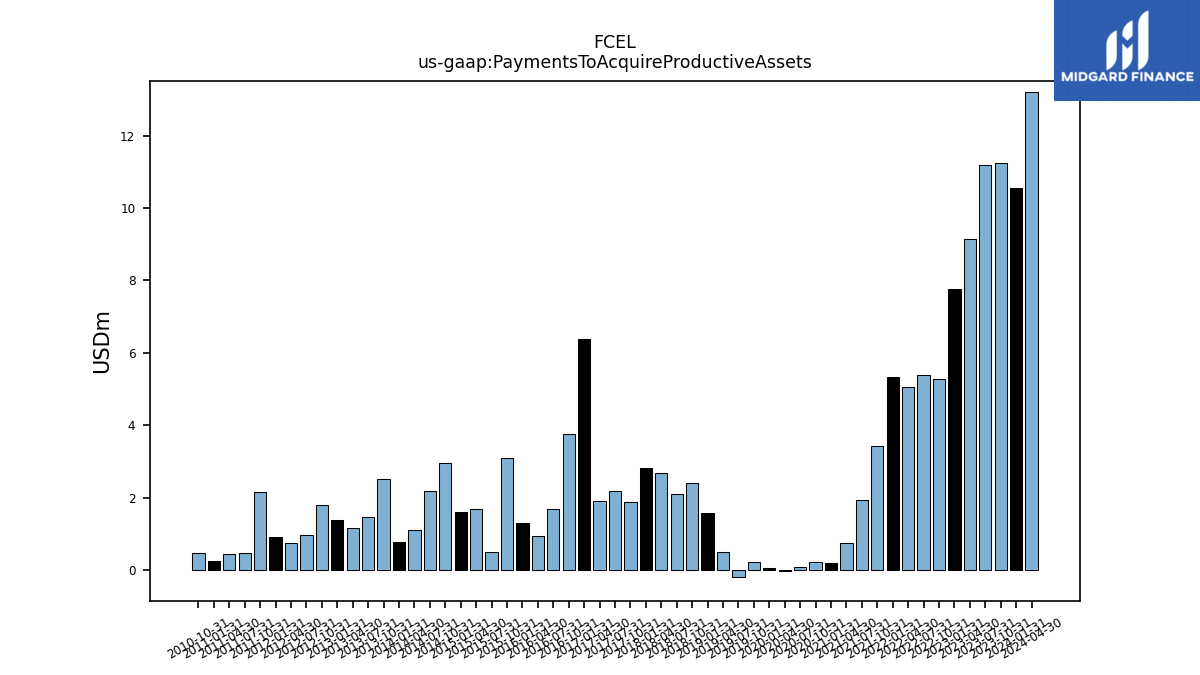
| Payments To Acquire Productive Assets | 10.56 | 11.25 | 11.20 | 9.14 | 7.76 | 5.29 | 5.39 | 5.06 | 5.33 | 3.45 | 1.95 | 0.76 | 0.20 | 0.22 | 0.10 | -0.01 | 0.06 | 0.23 | -0.17 | 0.50 | 1.59 | 2.40 | 2.12 | 2.69 | 2.82 | 1.88 | 2.18 | 1.91 | 6.38 | 3.76 | 1.69 | 0.96 | 1.31 | 3.09 | 0.52 | 1.71 | 1.62 | 2.96 | 2.20 | 1.13 | 0.79 | 2.53 | 1.46 | 1.16 | 1.40 | 1.81 | 0.96 | 0.76 | 0.93 | 2.17 | 0.47 | 0.45 | 0.25 | 0.47 | NA |
| 2024-01-31 | 2023-10-31 | 2023-07-31 | 2023-04-30 | 2023-01-31 | 2022-10-31 | 2022-07-31 | 2022-04-30 | 2022-01-31 | 2021-10-31 | 2021-07-31 | 2021-04-30 | 2021-01-31 | 2020-10-31 | 2020-07-31 | 2020-04-30 | 2020-01-31 | 2019-10-31 | 2019-07-31 | 2019-04-30 | 2019-01-31 | 2018-10-31 | 2018-07-31 | 2018-04-30 | 2018-01-31 | 2017-10-31 | 2017-07-31 | 2017-04-30 | 2017-01-31 | 2016-10-31 | 2016-07-31 | 2016-04-30 | 2016-01-31 | 2015-10-31 | 2015-07-31 | 2015-04-30 | 2015-01-31 | 2014-10-31 | 2014-07-31 | 2014-04-30 | 2014-01-31 | 2013-10-31 | 2013-07-31 | 2013-04-30 | 2013-01-31 | 2012-10-31 | 2012-07-31 | 2012-04-30 | 2012-01-31 | 2011-10-31 | 2011-07-31 | 2011-04-30 | 2011-01-31 | 2010-10-31 | 2010-07-31 | ||
|---|---|---|---|---|---|---|---|---|---|---|---|---|---|---|---|---|---|---|---|---|---|---|---|---|---|---|---|---|---|---|---|---|---|---|---|---|---|---|---|---|---|---|---|---|---|---|---|---|---|---|---|---|---|---|---|---|
| Net Cash Provided By Used In Financing Activities | 20.56 | 32.91 | 122.19 | -0.51 | -3.51 | 33.26 | 23.95 | 114.55 | 8.83 | 5.14 | 364.30 | -9.93 | 52.39 | 105.09 | 53.82 | 13.76 | 48.99 | 16.49 | 22.73 | 6.29 | 14.15 | 21.18 | 3.55 | 7.65 | -4.65 | 36.55 | NA | NA | 16.69 | 28.36 | 40.88 | 38.35 | 13.07 | 4.92 | 6.29 | 10.12 | 5.13 | 4.92 | 61.85 | -2.61 | 16.66 | 7.62 | 40.79 | -3.60 | -1.18 | -1.16 | 29.70 | 31.78 | -3.15 | 6.58 | -5.25 | 2.05 | 18.02 | -0.90 | NA |
| 2024-01-31 | 2023-10-31 | 2023-07-31 | 2023-04-30 | 2023-01-31 | 2022-10-31 | 2022-07-31 | 2022-04-30 | 2022-01-31 | 2021-10-31 | 2021-07-31 | 2021-04-30 | 2021-01-31 | 2020-10-31 | 2020-07-31 | 2020-04-30 | 2020-01-31 | 2019-10-31 | 2019-07-31 | 2019-04-30 | 2019-01-31 | 2018-10-31 | 2018-07-31 | 2018-04-30 | 2018-01-31 | 2017-10-31 | 2017-07-31 | 2017-04-30 | 2017-01-31 | 2016-10-31 | 2016-07-31 | 2016-04-30 | 2016-01-31 | 2015-10-31 | 2015-07-31 | 2015-04-30 | 2015-01-31 | 2014-10-31 | 2014-07-31 | 2014-04-30 | 2014-01-31 | 2013-10-31 | 2013-07-31 | 2013-04-30 | 2013-01-31 | 2012-10-31 | 2012-07-31 | 2012-04-30 | 2012-01-31 | 2011-10-31 | 2011-07-31 | 2011-04-30 | 2011-01-31 | 2010-10-31 | 2010-07-31 | ||
|---|---|---|---|---|---|---|---|---|---|---|---|---|---|---|---|---|---|---|---|---|---|---|---|---|---|---|---|---|---|---|---|---|---|---|---|---|---|---|---|---|---|---|---|---|---|---|---|---|---|---|---|---|---|---|---|---|
| Revenues | 16.69 | 22.46 | 25.51 | 38.35 | 37.07 | 39.20 | 43.10 | 16.38 | 31.80 | 13.94 | 26.82 | 13.95 | 14.88 | 17.00 | 18.73 | 18.88 | 16.26 | 11.04 | 22.71 | 9.22 | 17.78 | 17.88 | 12.11 | 20.83 | 38.61 | 47.89 | 10.36 | 20.42 | 17.00 | 24.47 | 21.72 | 28.58 | 33.48 | 51.45 | 41.36 | 28.60 | 41.67 | 54.41 | 43.18 | 38.27 | 44.43 | 55.16 | 53.71 | 42.44 | 36.36 | 35.42 | 29.69 | 24.15 | 31.34 | 34.72 | 31.16 | 28.61 | 28.08 | 19.70 | 18.87 | |
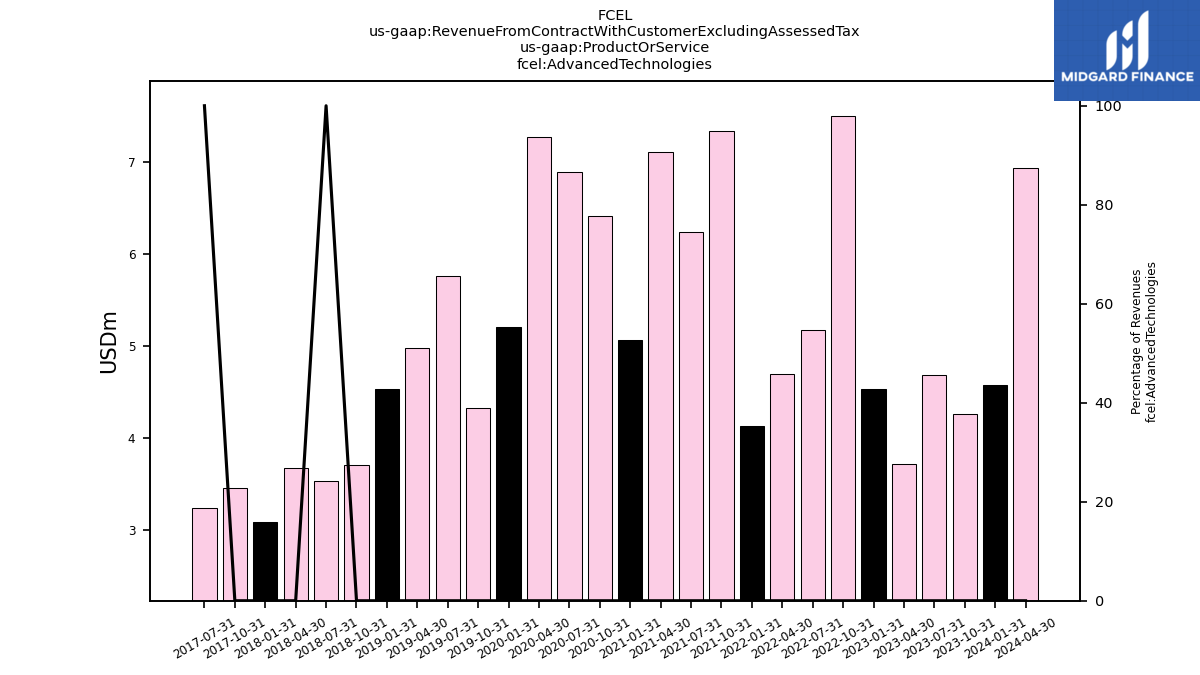
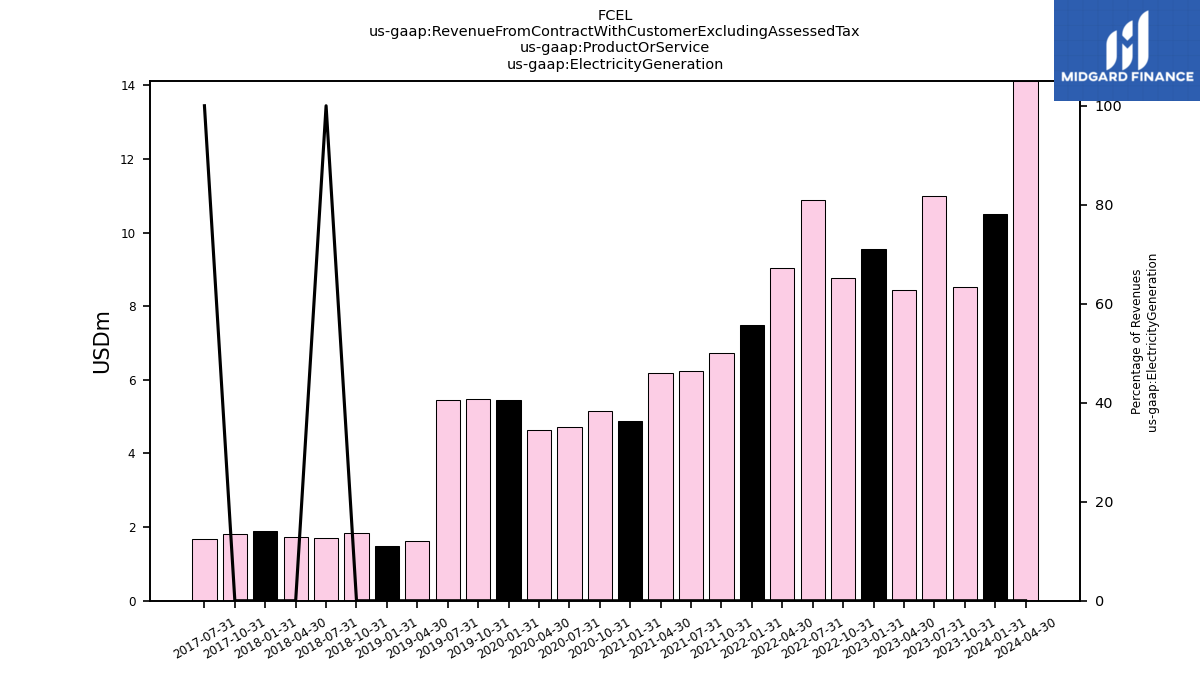
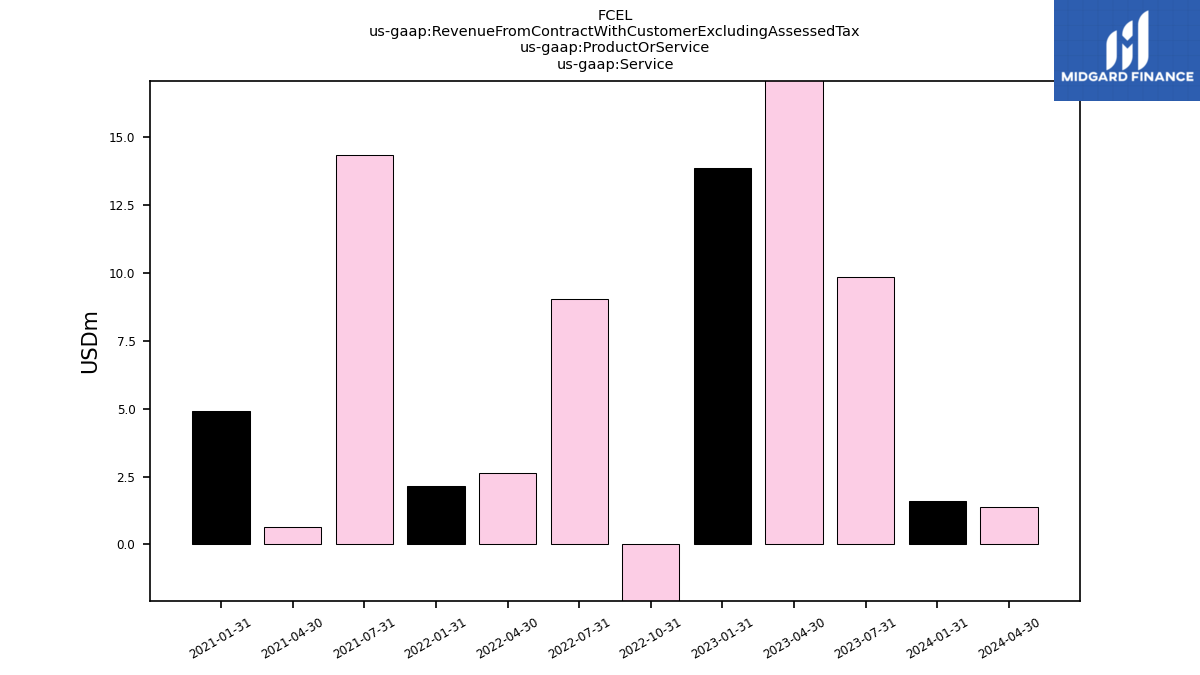
| Revenue From Contract With Customer Excluding Assessed Tax | 16.69 | 22.46 | 25.51 | 38.35 | 37.07 | 39.20 | 43.10 | 16.38 | 31.80 | 13.94 | 26.82 | 13.95 | 14.88 | 17.00 | 18.73 | 18.88 | 16.26 | 11.04 | 22.71 | 9.22 | 17.78 | 17.88 | 12.11 | 20.83 | 38.61 | 47.89 | 10.36 | 20.42 | 17.00 | 24.47 | 21.72 | 28.58 | 33.48 | 51.45 | 41.36 | 28.60 | 41.67 | 54.41 | 43.18 | 38.27 | 44.43 | 55.16 | 53.71 | 42.44 | 36.36 | 35.42 | 29.69 | 24.15 | 31.34 | 34.72 | 31.16 | 28.61 | 28.08 | 19.70 | 18.87 | |
| Advanced Technologies | 4.58 | 4.27 | 4.69 | 3.72 | 4.54 | 7.51 | 5.18 | 4.70 | 4.13 | 7.34 | 6.25 | 7.11 | 5.07 | 6.42 | 6.89 | 7.28 | 5.21 | 4.33 | 5.77 | 4.99 | 4.53 | 3.71 | 3.54 | 3.68 | 3.09 | 3.46 | 3.25 | NA | NA | NA | NA | NA | NA | NA | NA | NA | NA | NA | NA | NA | NA | NA | NA | NA | NA | NA | NA | NA | NA | NA | NA | NA | NA | NA | NA | |
| Electricity Generation | 10.49 | 8.53 | 10.98 | 8.44 | 9.56 | 8.76 | 10.88 | 9.05 | 7.50 | 6.72 | 6.23 | 6.18 | 4.89 | 5.15 | 4.72 | 4.63 | 5.44 | 5.47 | 5.45 | 1.63 | 1.48 | 1.84 | 1.70 | 1.74 | 1.89 | 1.82 | 1.69 | NA | NA | NA | NA | NA | NA | NA | NA | NA | NA | NA | NA | NA | NA | NA | NA | NA | NA | NA | NA | NA | NA | NA | NA | NA | NA | NA | NA | |
| Service | 1.62 | NA | 9.84 | 26.19 | 13.88 | -11.69 | 9.05 | 2.64 | 2.17 | NA | 14.34 | 0.66 | 4.91 | NA | NA | NA | NA | NA | NA | NA | NA | NA | NA | NA | NA | NA | NA | NA | NA | NA | NA | NA | NA | NA | NA | NA | NA | NA | NA | NA | NA | NA | NA | NA | NA | NA | NA | NA | NA | NA | NA | NA | NA | NA | NA | |
| Emtec Joint Development Agreement | 0.50 | NA | NA | NA | NA | NA | NA | NA | NA | NA | NA | NA | NA | NA | NA | NA | NA | NA | NA | NA | NA | NA | NA | NA | NA | NA | NA | NA | NA | NA | NA | NA | NA | NA | NA | NA | NA | NA | NA | NA | NA | NA | NA | NA | NA | NA | NA | NA | NA | NA | NA | NA | NA | NA | NA |