
| 2023-12-31 | 2023-09-30 | 2023-06-30 | 2023-03-31 | 2022-12-31 | 2022-09-30 | 2022-06-30 | 2022-03-31 | 2021-12-31 | 2021-09-30 | 2021-06-30 | 2021-03-31 | 2020-12-31 | 2020-09-30 | 2020-06-30 | 2020-03-31 | ||
|---|---|---|---|---|---|---|---|---|---|---|---|---|---|---|---|---|---|
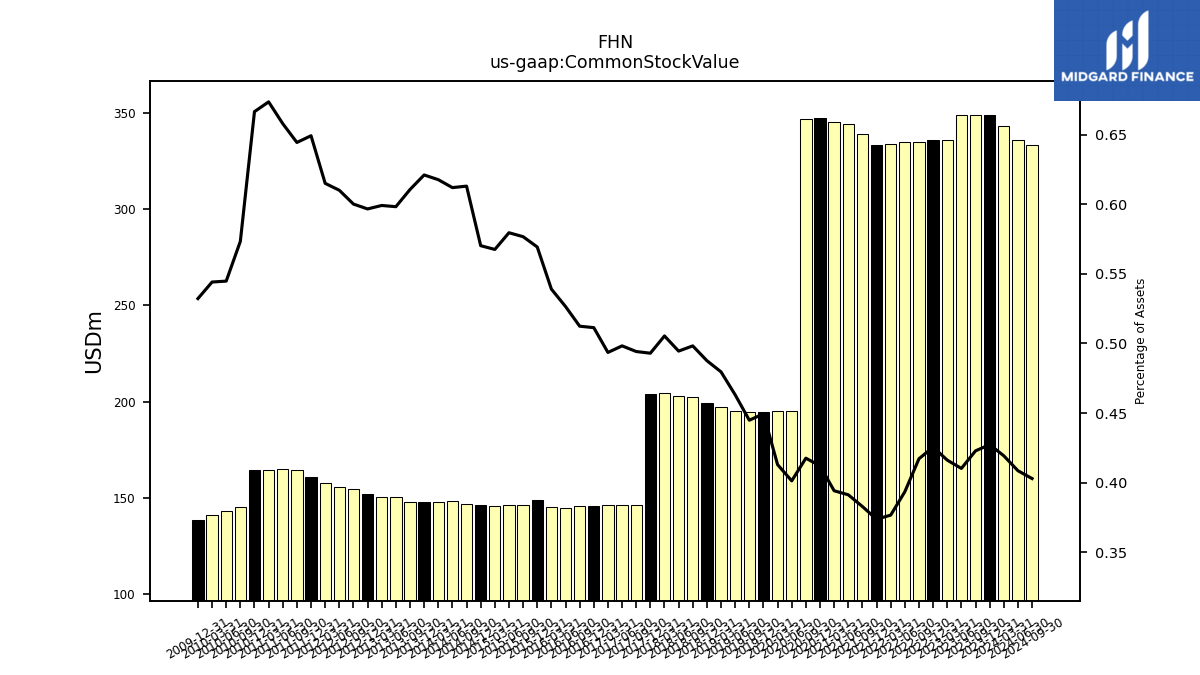
| Common Stock Value | 349.00 | 349.00 | 349.00 | 336.00 | 336.00 | 335.00 | 335.00 | 334.00 | 333.00 | 339.00 | 344.00 | 345.00 | 347.00 | 346.74 | 195.22 | 194.91 | |
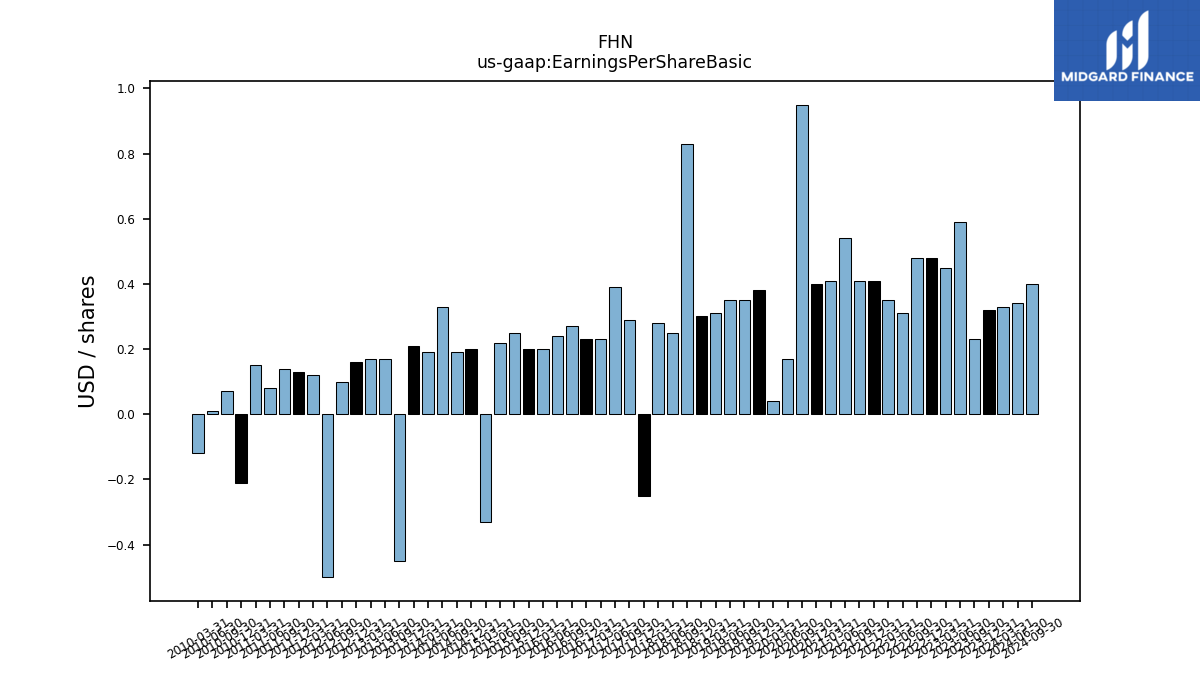
| Earnings Per Share Basic | 0.32 | 0.23 | 0.59 | 0.45 | 0.48 | 0.48 | 0.31 | 0.35 | 0.41 | 0.41 | 0.54 | 0.41 | 0.40 | 0.95 | 0.17 | 0.04 | |
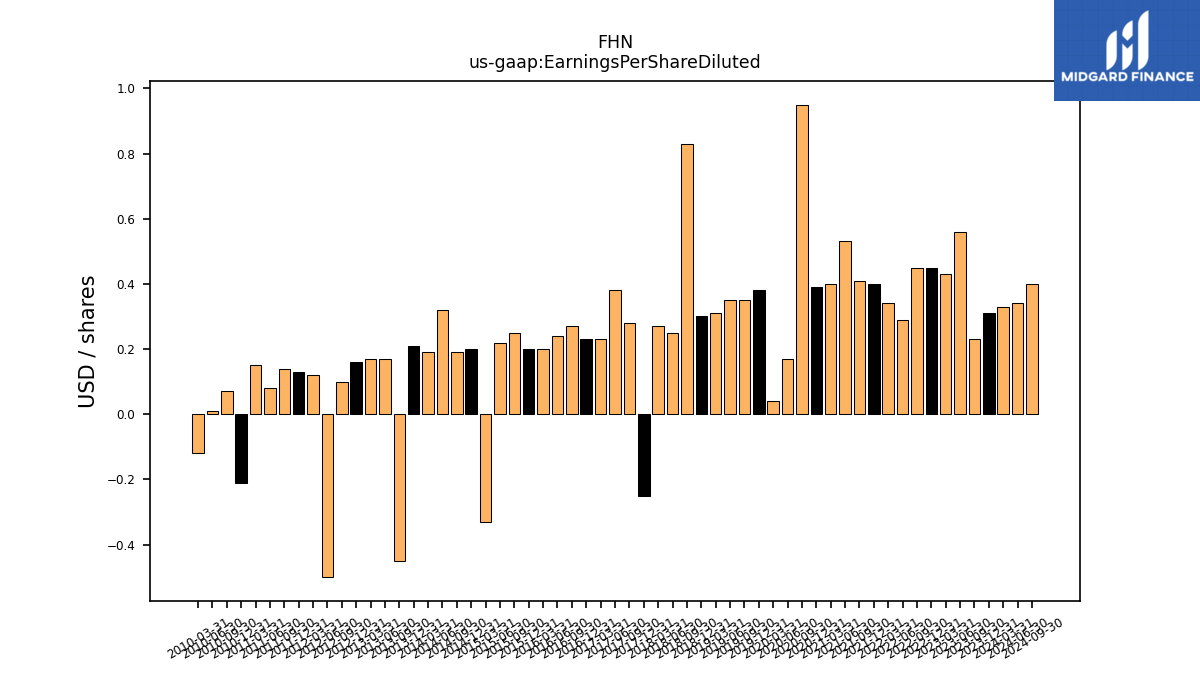
| Earnings Per Share Diluted | 0.31 | 0.23 | 0.56 | 0.43 | 0.45 | 0.45 | 0.29 | 0.34 | 0.40 | 0.41 | 0.53 | 0.40 | 0.39 | 0.95 | 0.17 | 0.04 |
| 2023-12-31 | 2023-09-30 | 2023-06-30 | 2023-03-31 | 2022-12-31 | 2022-09-30 | 2022-06-30 | 2022-03-31 | 2021-12-31 | 2021-09-30 | 2021-06-30 | 2021-03-31 | 2020-12-31 | 2020-09-30 | 2020-06-30 | 2020-03-31 | ||
|---|---|---|---|---|---|---|---|---|---|---|---|---|---|---|---|---|---|
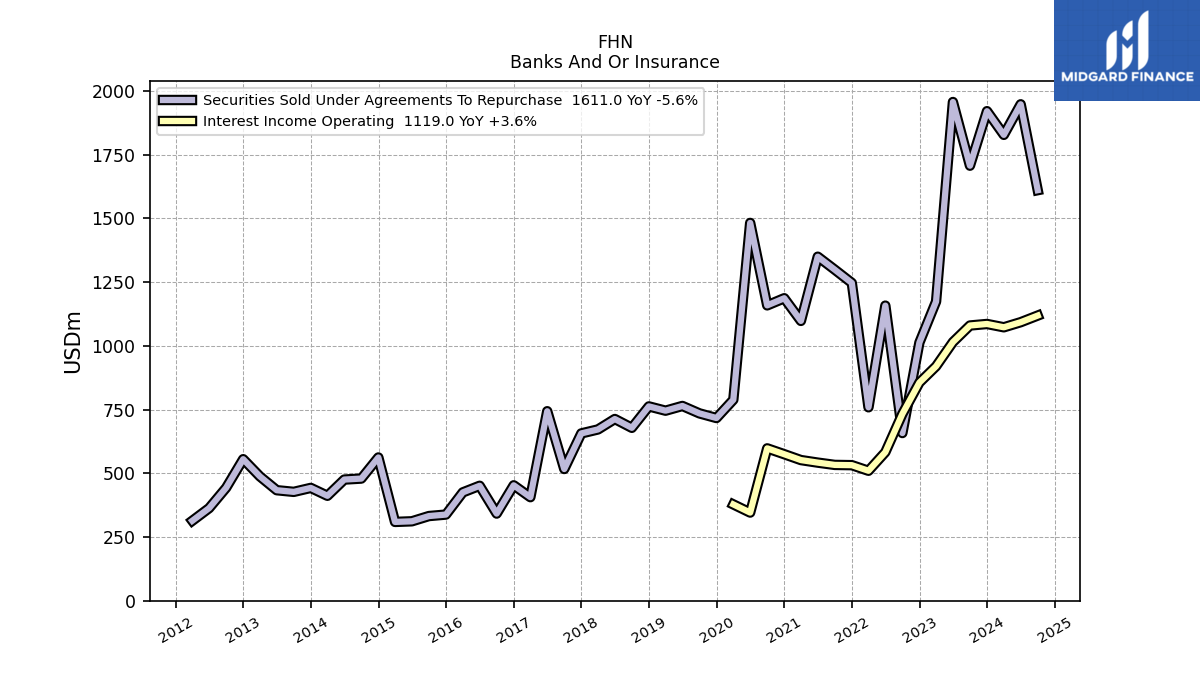
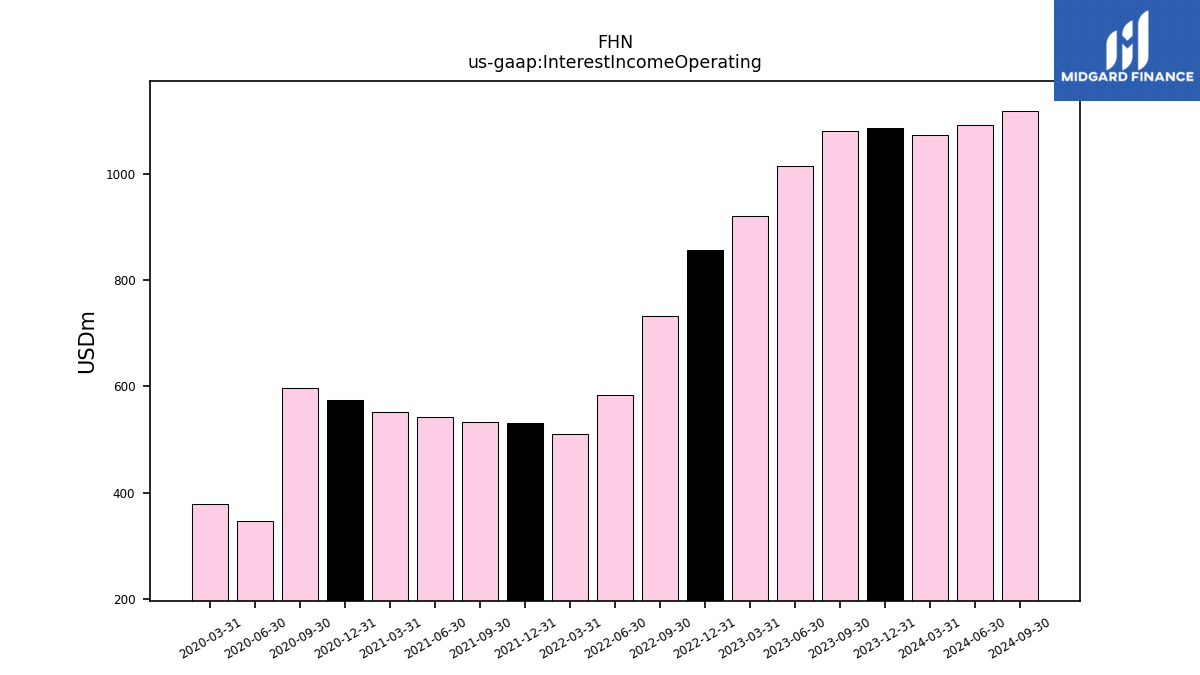
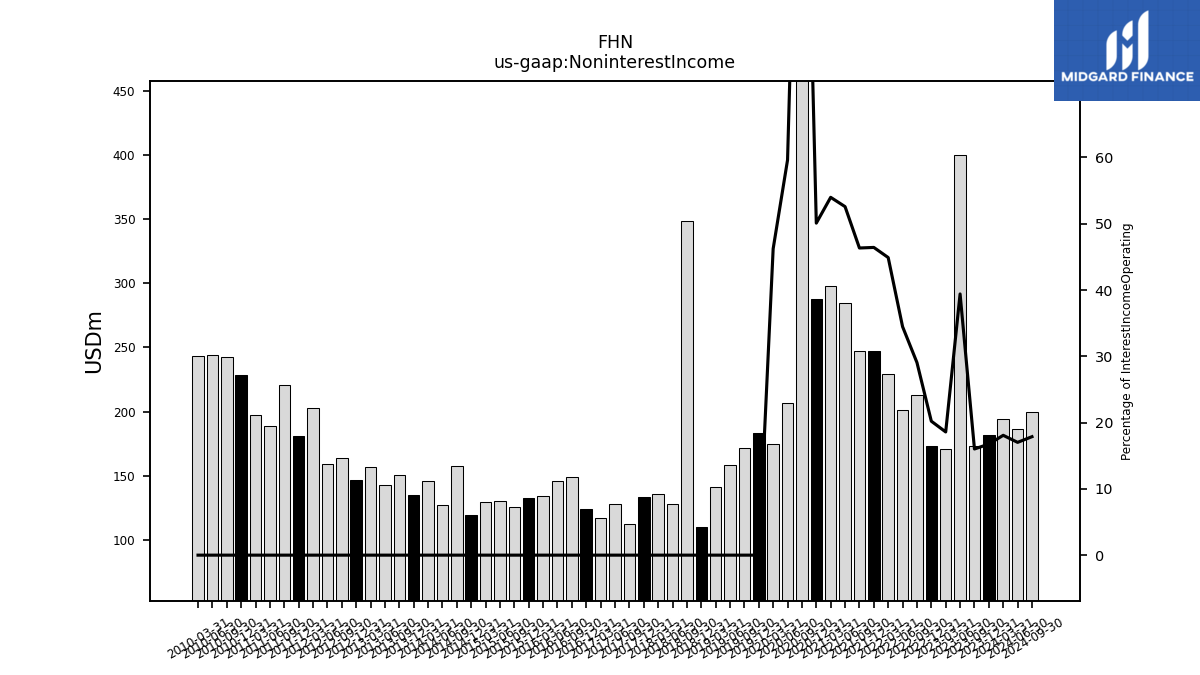
| Interest Income Operating | 1086.00 | 1080.00 | 1015.00 | 920.00 | 856.00 | 733.00 | 583.00 | 510.00 | 532.00 | 533.00 | 542.00 | 552.00 | 575.00 | 598.00 | 346.00 | 378.00 | |
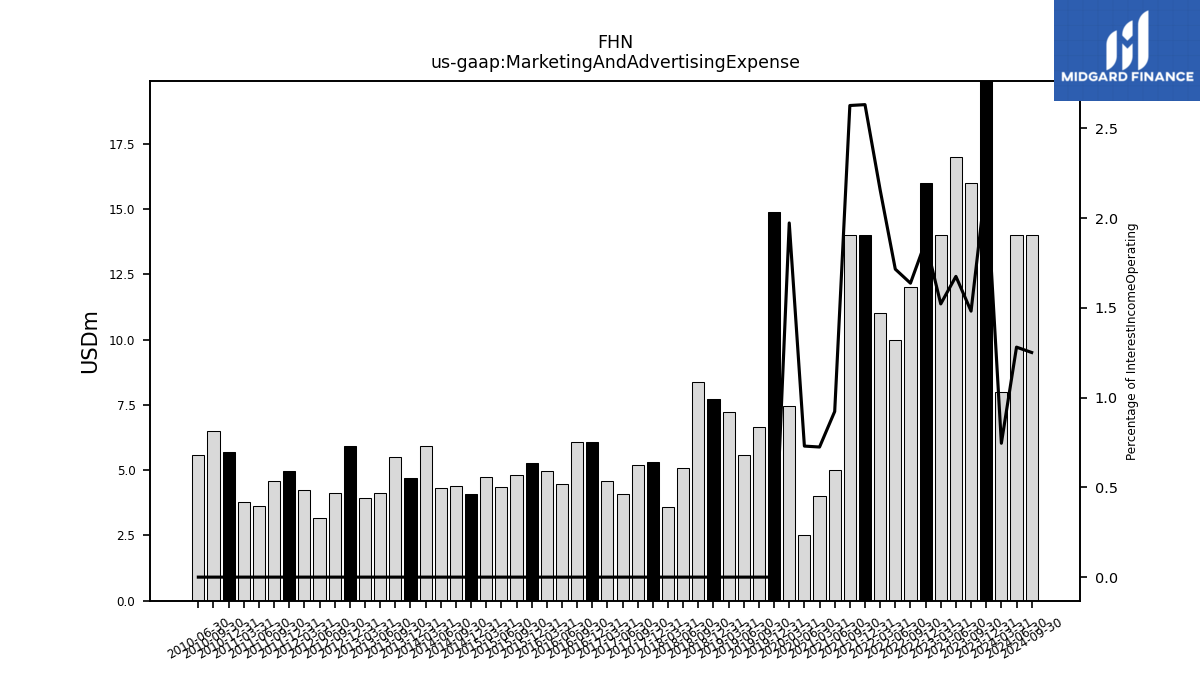
| Marketing And Advertising Expense | 24.00 | 16.00 | 17.00 | 14.00 | 16.00 | 12.00 | 10.00 | 11.00 | 14.00 | 14.00 | 5.00 | 4.00 | NA | NA | 2.52 | 7.46 | |
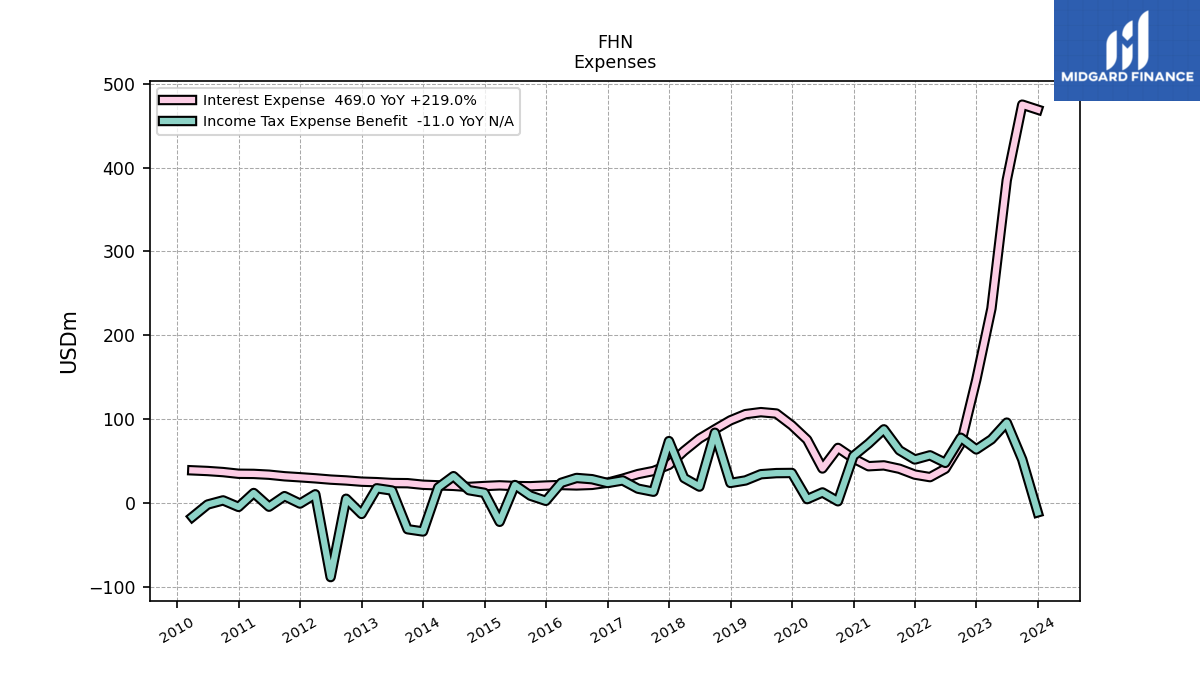
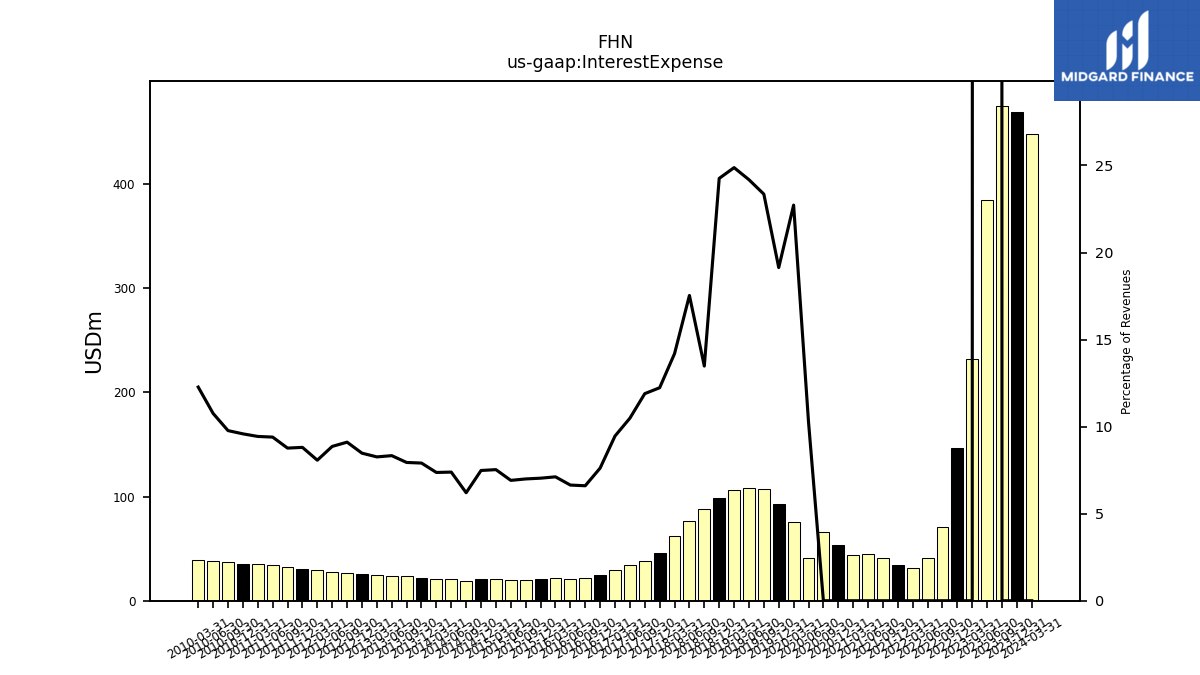
| Interest Expense | 469.00 | 475.00 | 385.00 | 232.00 | 147.00 | 71.00 | 41.00 | 31.00 | 34.00 | 41.00 | 45.00 | 44.00 | 53.31 | 65.85 | 41.28 | 75.57 | |
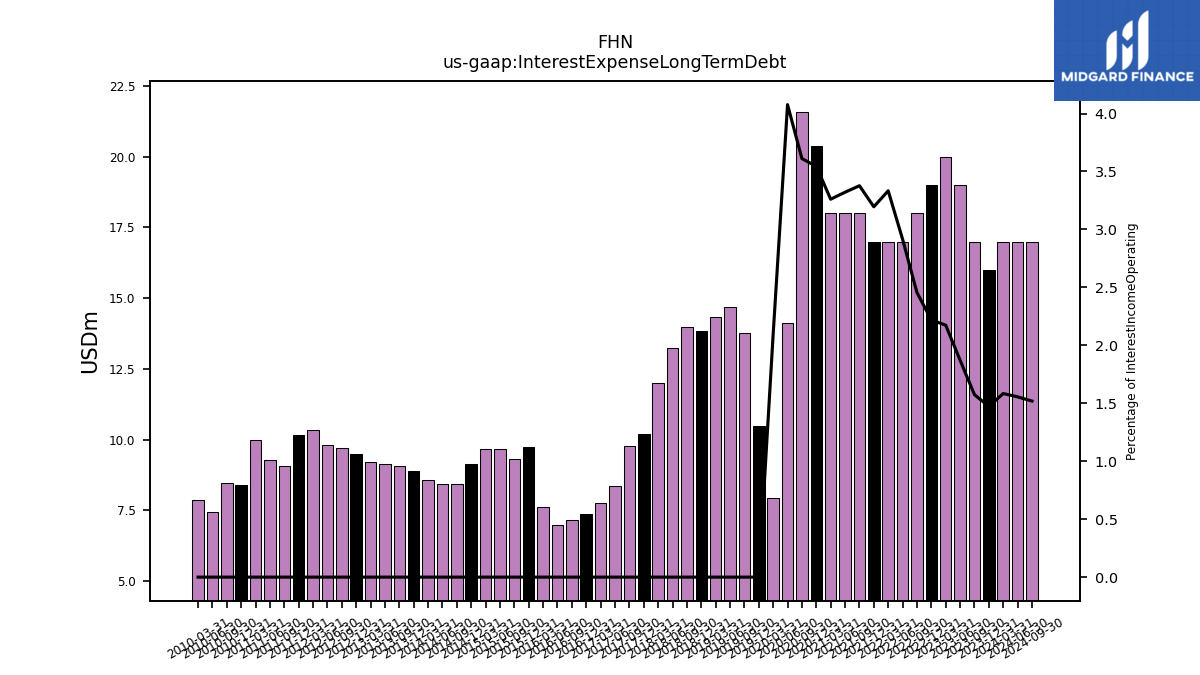
| Interest Expense Long Term Debt | 16.00 | 17.00 | 19.00 | 20.00 | 19.00 | 18.00 | 17.00 | 17.00 | 17.00 | 18.00 | 18.00 | 18.00 | 20.38 | 21.59 | 14.11 | 7.92 | |
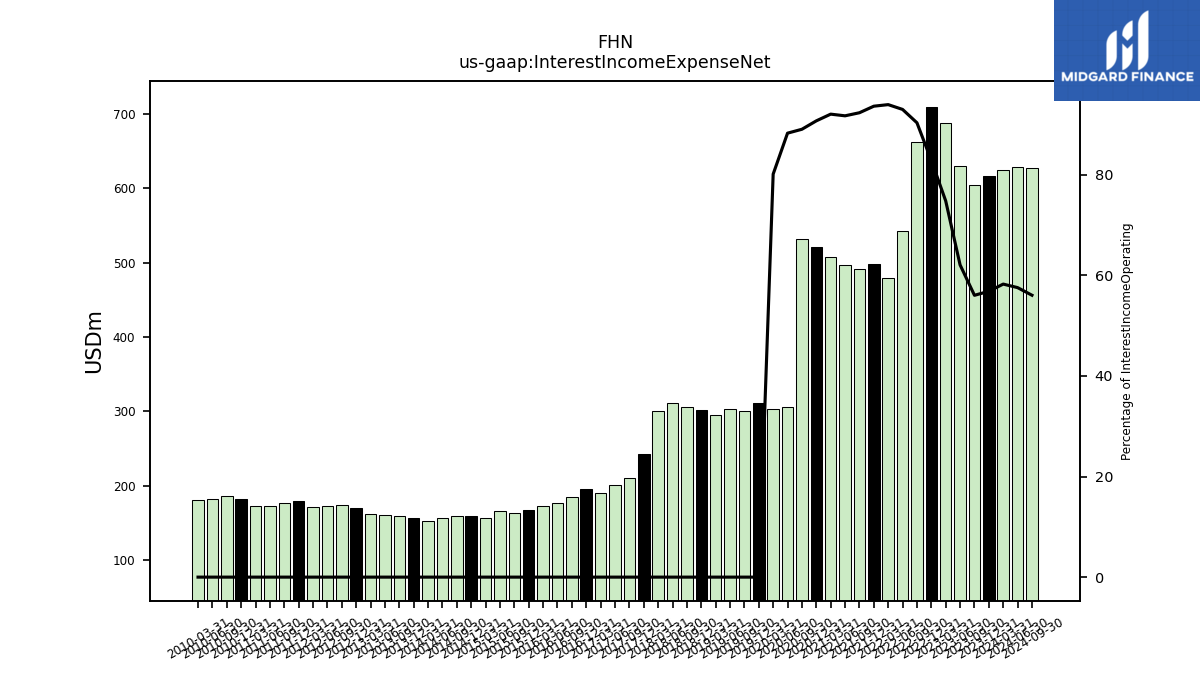
| Interest Income Expense Net | 617.00 | 605.00 | 630.00 | 688.00 | 709.00 | 662.00 | 542.00 | 479.00 | 498.00 | 492.00 | 497.00 | 508.00 | 521.49 | 532.37 | 305.34 | 302.80 | |
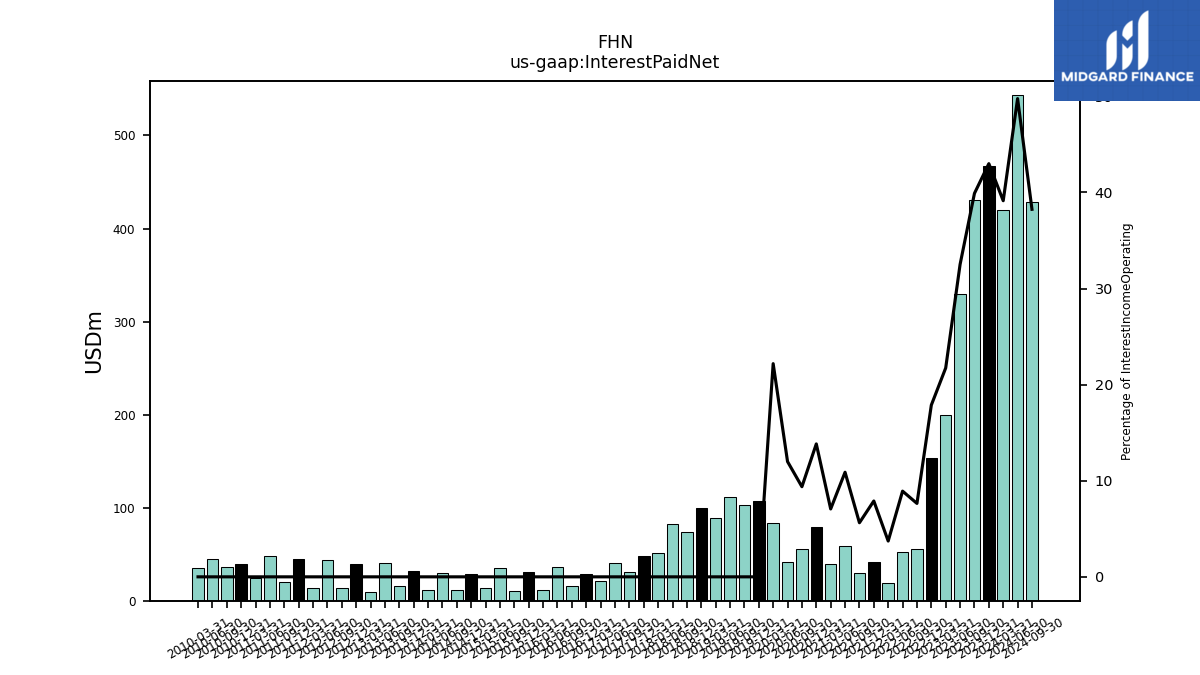
| Interest Paid Net | 467.00 | 431.00 | 330.00 | 200.00 | 153.00 | 56.00 | 52.00 | 19.00 | 42.00 | 30.00 | 59.00 | 39.00 | 79.55 | 56.09 | 41.50 | 83.87 | |
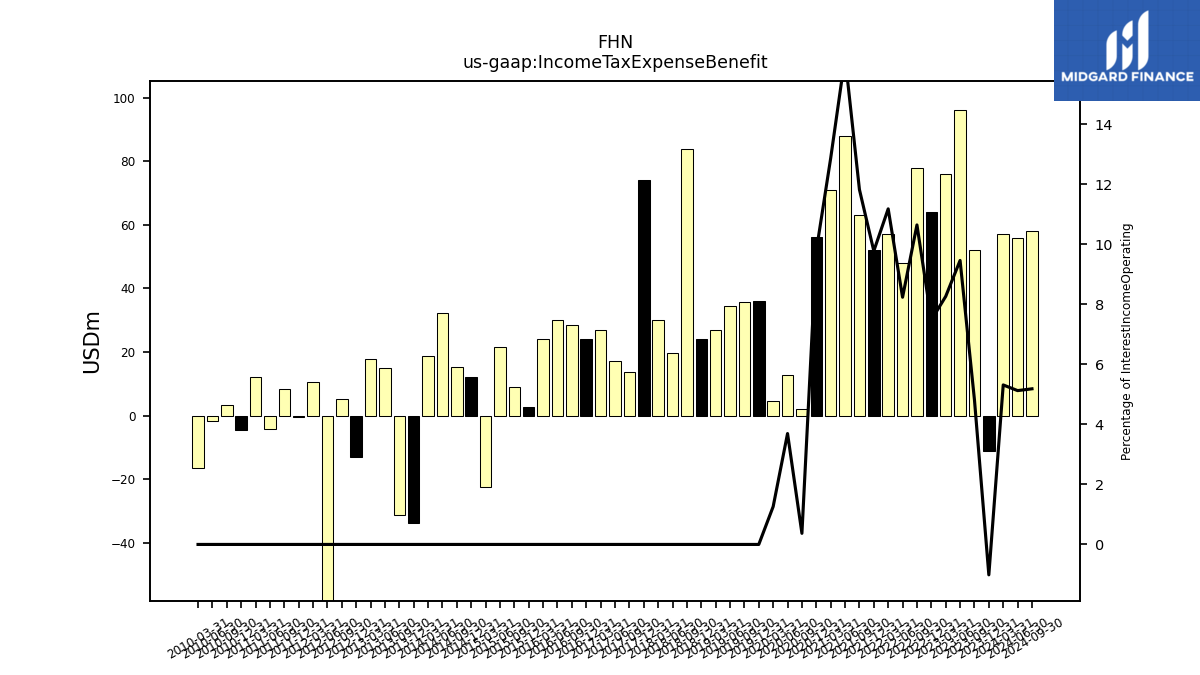
| Income Tax Expense Benefit | -11.00 | 52.00 | 96.00 | 76.00 | 64.00 | 78.00 | 48.00 | 57.00 | 52.00 | 63.00 | 88.00 | 71.00 | 56.24 | 2.21 | 12.78 | 4.77 | |
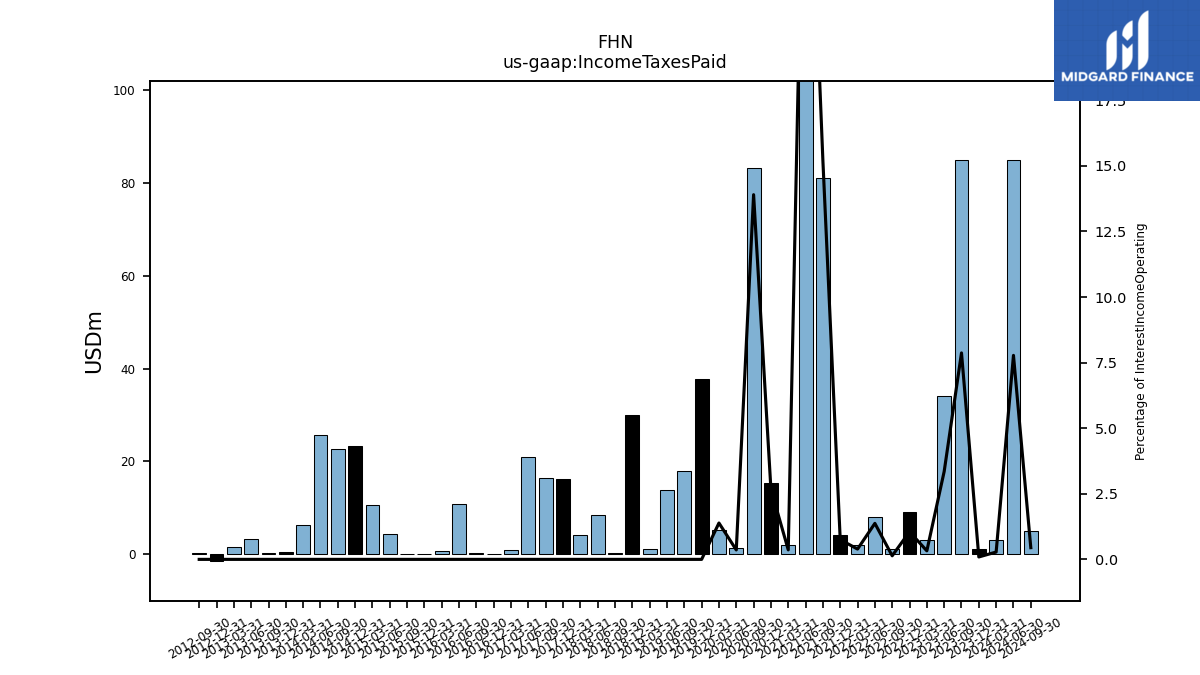
| Income Taxes Paid | 1.00 | 85.00 | 34.00 | 3.00 | 9.00 | 1.00 | 8.00 | 2.00 | 4.00 | 81.00 | 171.00 | 2.00 | 15.38 | 83.14 | 1.25 | 5.24 | |
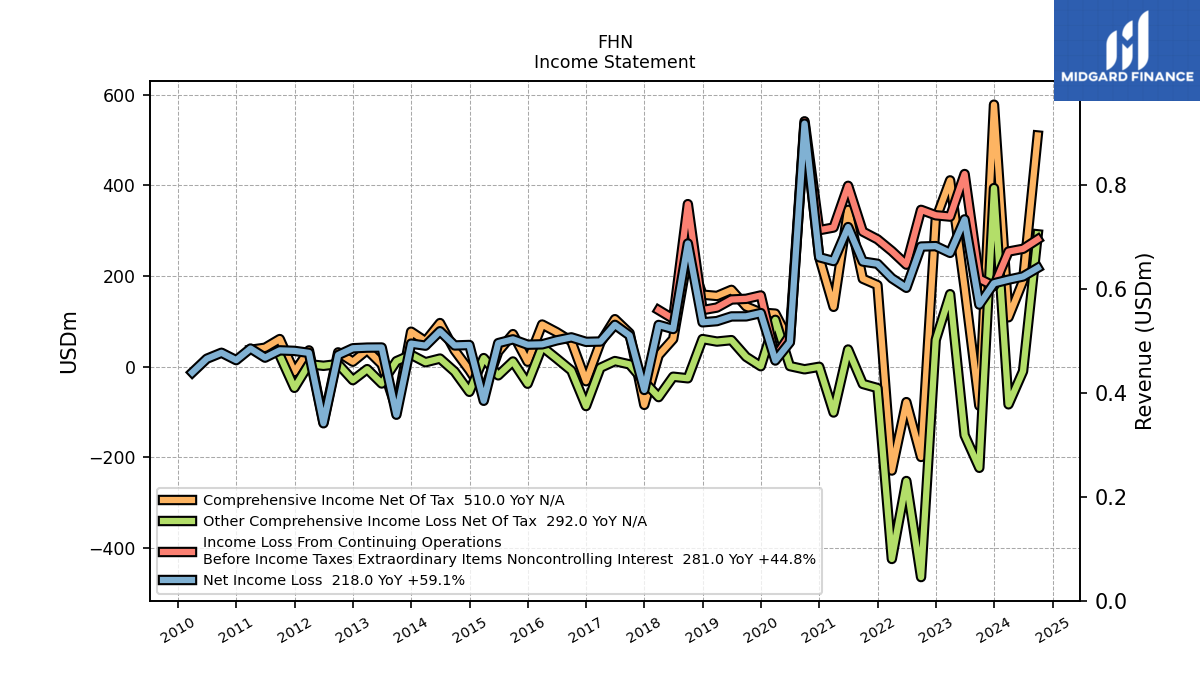
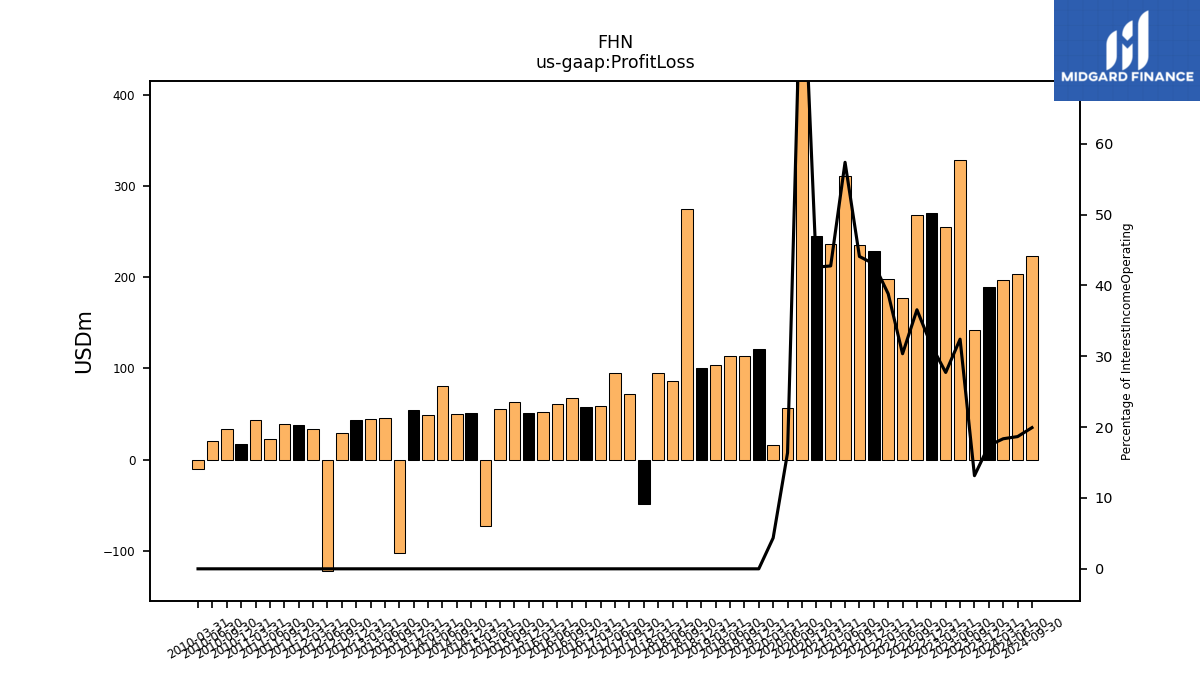
| Profit Loss | 189.00 | 142.00 | 329.00 | 255.00 | 270.00 | 268.00 | 177.00 | 198.00 | 229.00 | 235.00 | 311.00 | 236.00 | 244.82 | 539.04 | 56.66 | 16.47 | |
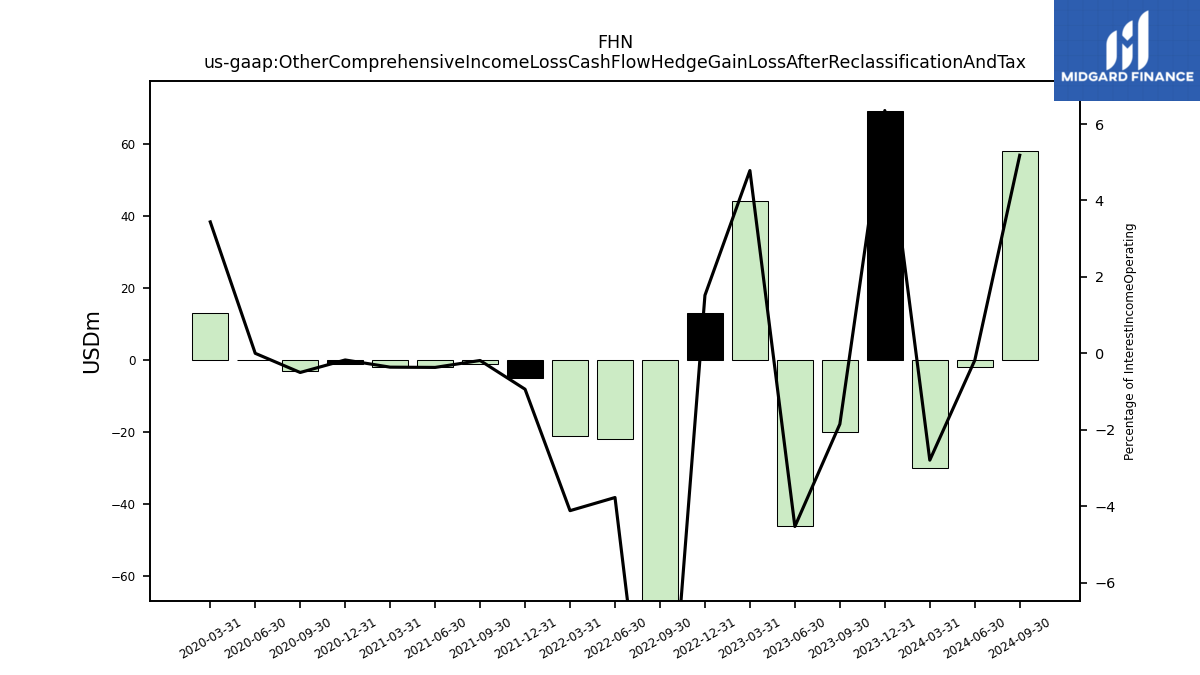
| Other Comprehensive Income Loss Cash Flow Hedge Gain Loss After Reclassification And Tax | 69.00 | -20.00 | -46.00 | 44.00 | 13.00 | -99.00 | -22.00 | -21.00 | -5.00 | -1.00 | -2.00 | -2.00 | -1.00 | -3.00 | 0.00 | 13.00 | |
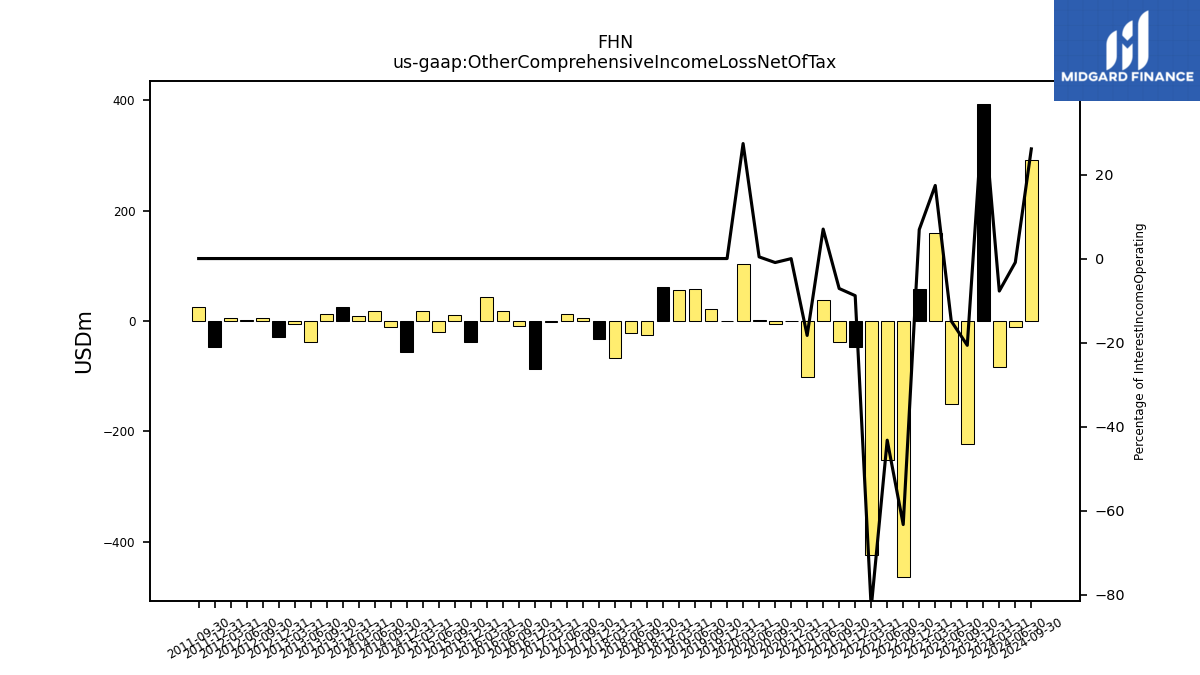
| Other Comprehensive Income Loss Net Of Tax | 394.00 | -223.00 | -151.00 | 160.00 | 59.00 | -464.00 | -252.00 | -424.00 | -47.00 | -38.00 | 38.00 | -101.00 | -0.14 | -5.67 | 1.37 | 103.44 | |
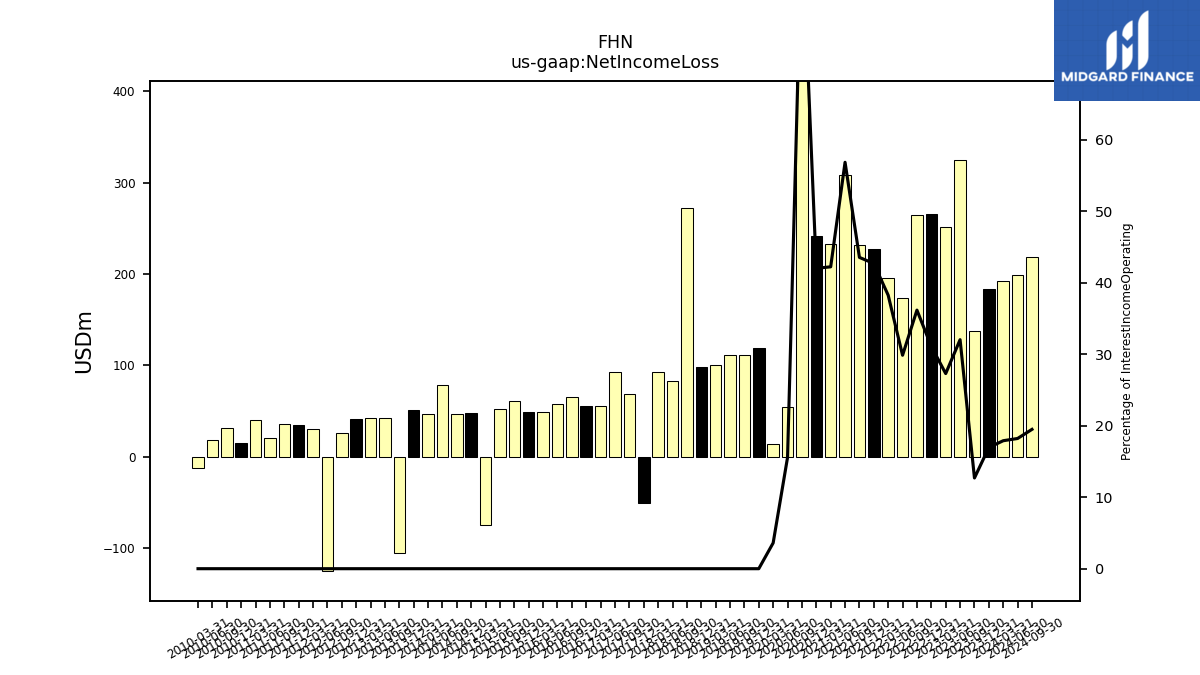
| Net Income Loss | 184.00 | 137.00 | 325.00 | 251.00 | 266.00 | 265.00 | 174.00 | 195.00 | 227.00 | 232.00 | 308.00 | 233.00 | 241.50 | 536.06 | 53.81 | 13.62 | |
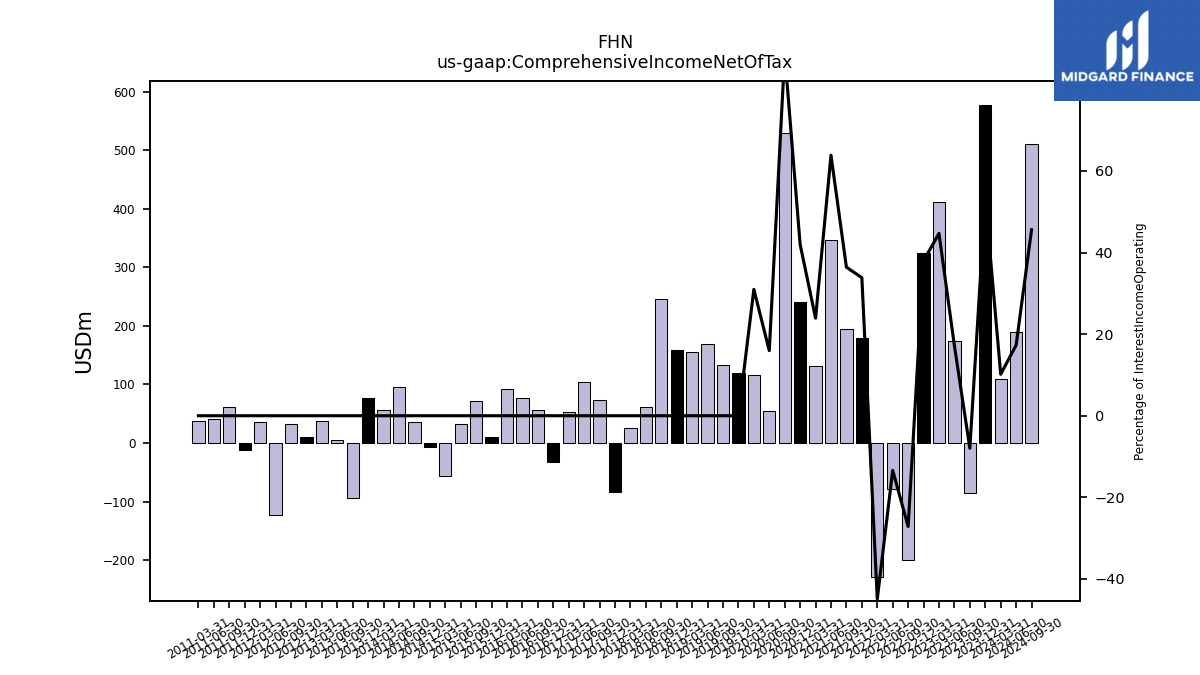
| Comprehensive Income Net Of Tax | 578.00 | -86.00 | 174.00 | 411.00 | 325.00 | -199.00 | -78.00 | -229.00 | 180.00 | 194.00 | 346.00 | 132.00 | 241.37 | 530.39 | 55.18 | 117.06 | |
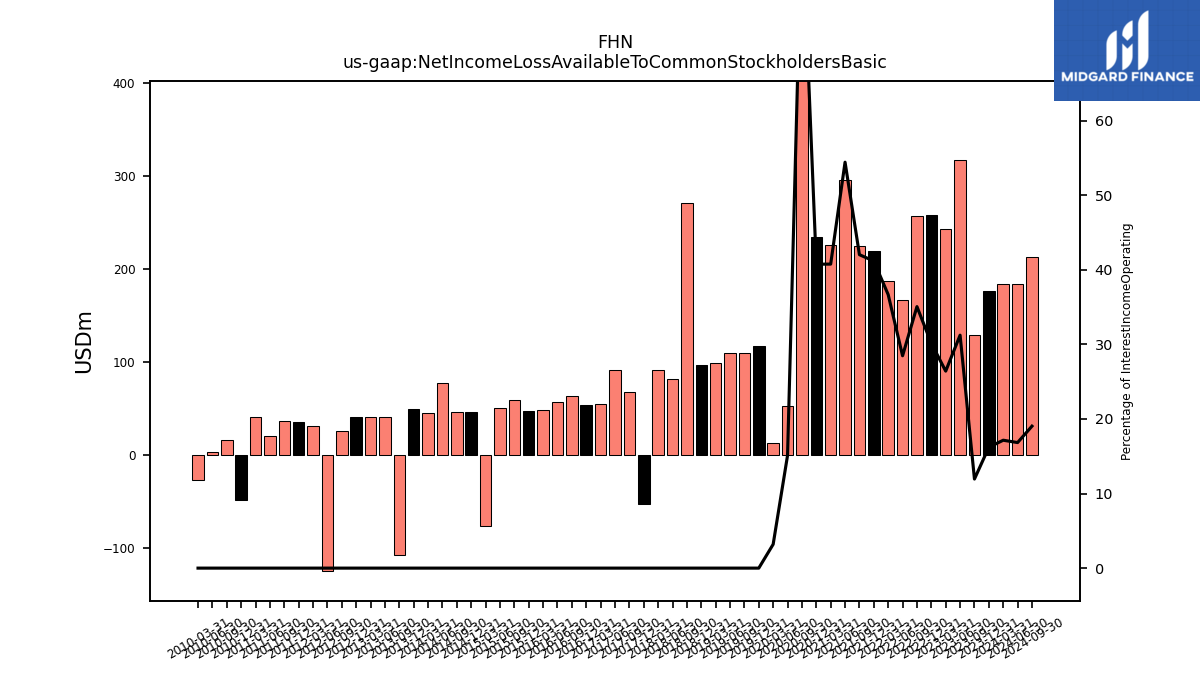
| Net Income Loss Available To Common Stockholders Basic | 176.00 | 129.00 | 317.00 | 243.00 | 258.00 | 257.00 | 166.00 | 187.00 | 219.00 | 224.00 | 295.00 | 225.00 | 234.33 | 523.34 | 52.26 | 12.07 | |
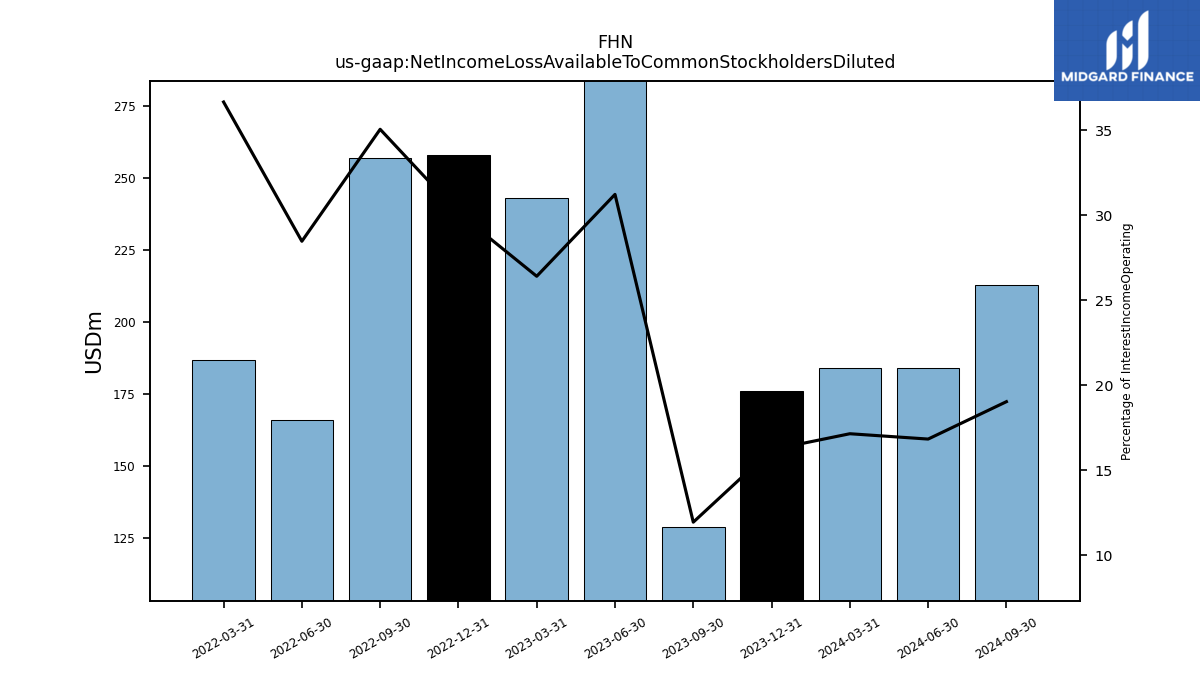
| Net Income Loss Available To Common Stockholders Diluted | 176.00 | 129.00 | 317.00 | 243.00 | 258.00 | 257.00 | 166.00 | 187.00 | NA | NA | NA | NA | NA | NA | NA | NA | |
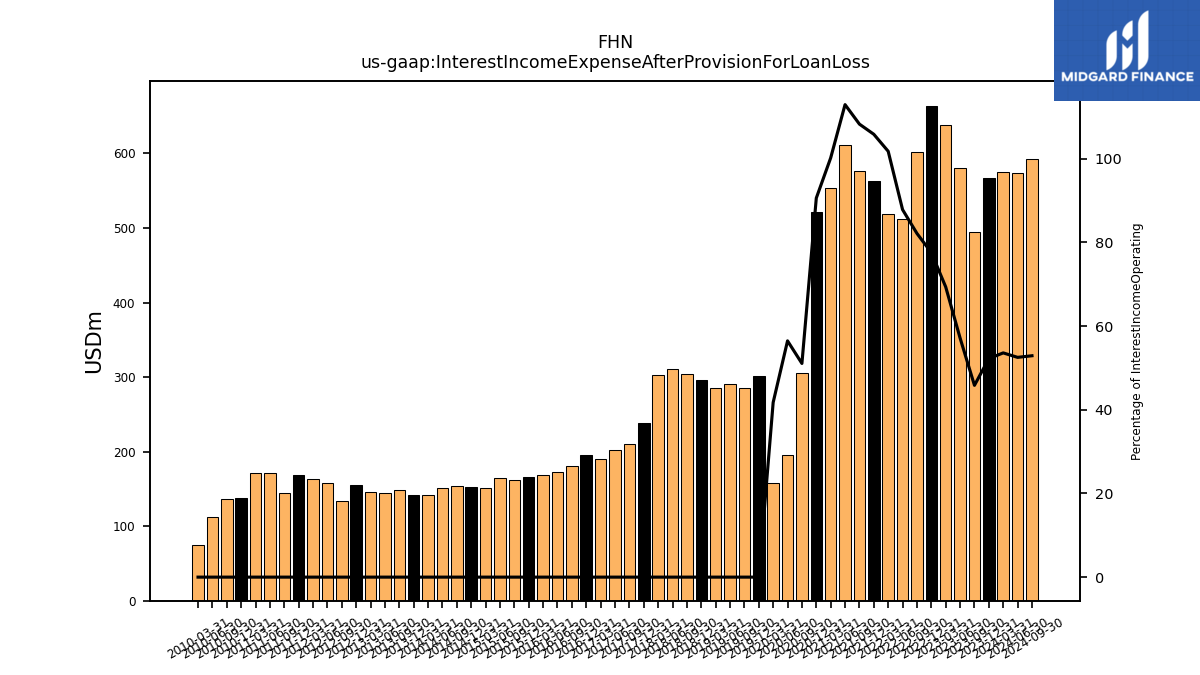
| Interest Income Expense After Provision For Loan Loss | 567.00 | 495.00 | 580.00 | 638.00 | 664.00 | 602.00 | 512.00 | 519.00 | 563.00 | 577.00 | 612.00 | 553.00 | 520.88 | 305.37 | 195.34 | 157.80 | |
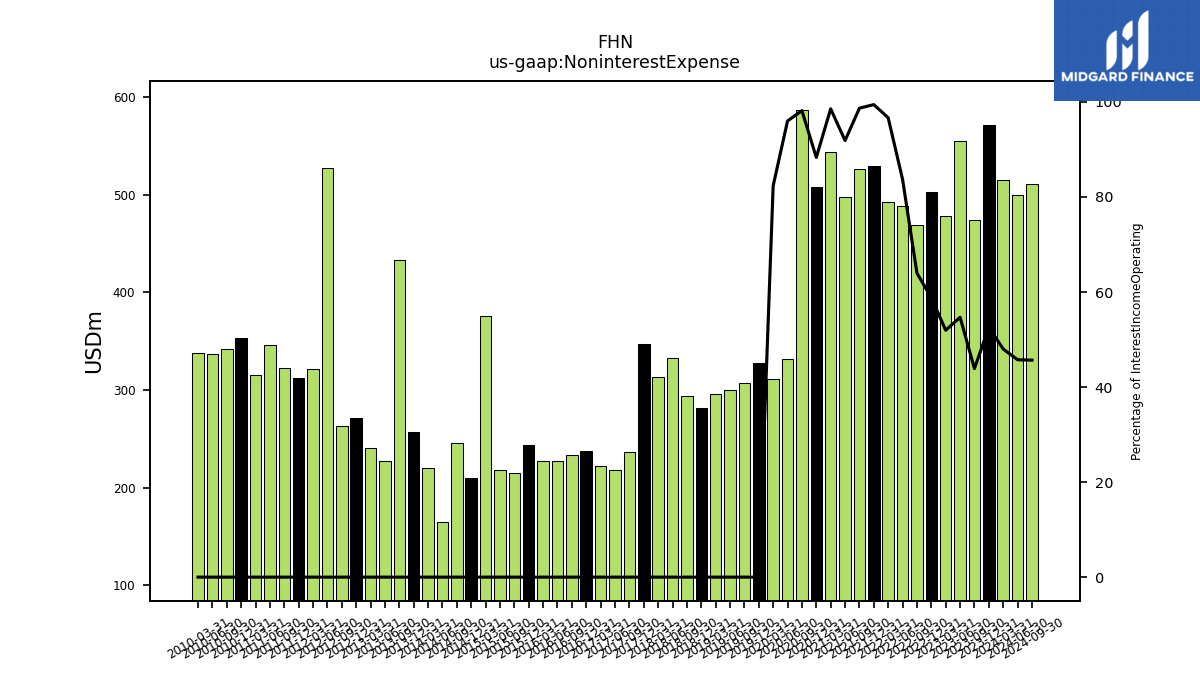
| Noninterest Expense | 571.00 | 474.00 | 555.00 | 478.00 | 503.00 | 469.00 | 488.00 | 493.00 | 529.00 | 526.00 | 498.00 | 544.00 | 507.86 | 587.04 | 332.17 | 311.32 | |
| Noninterest Income | 182.00 | 173.00 | 400.00 | 171.00 | 173.00 | 213.00 | 201.00 | 229.00 | 247.00 | 247.00 | 285.00 | 298.00 | 288.05 | 822.92 | 206.27 | 174.76 |
| 2023-12-31 | 2023-09-30 | 2023-06-30 | 2023-03-31 | 2022-12-31 | 2022-09-30 | 2022-06-30 | 2022-03-31 | 2021-12-31 | 2021-09-30 | 2021-06-30 | 2021-03-31 | 2020-12-31 | 2020-09-30 | 2020-06-30 | 2020-03-31 | ||
|---|---|---|---|---|---|---|---|---|---|---|---|---|---|---|---|---|---|
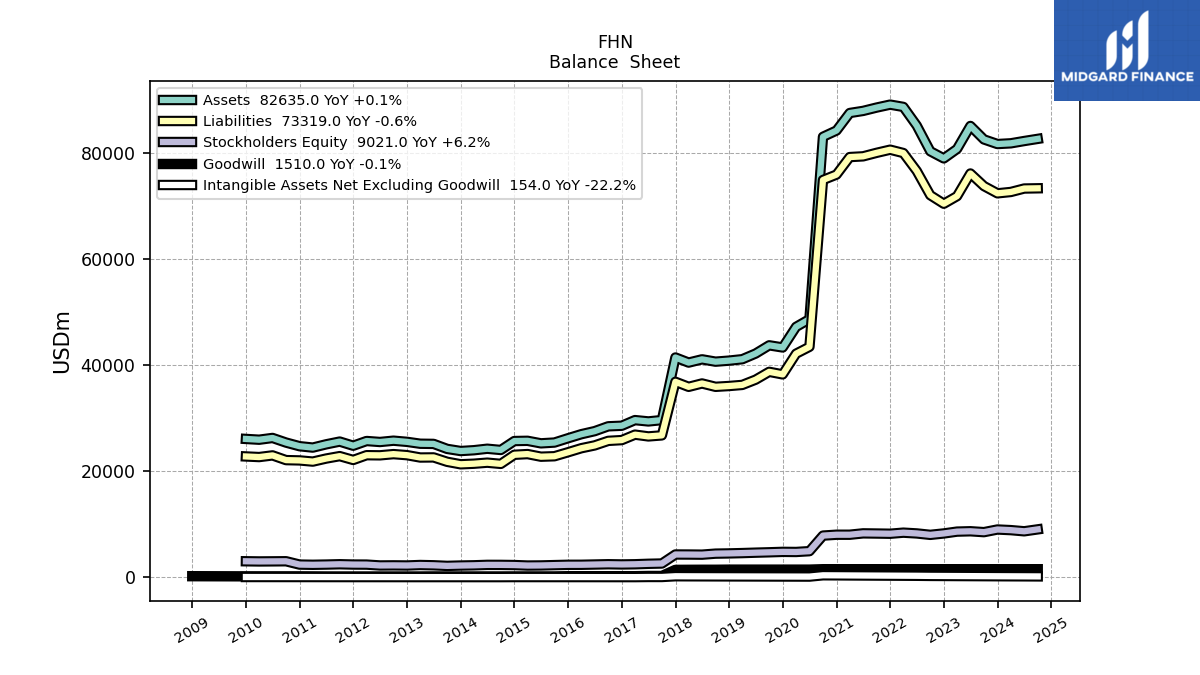
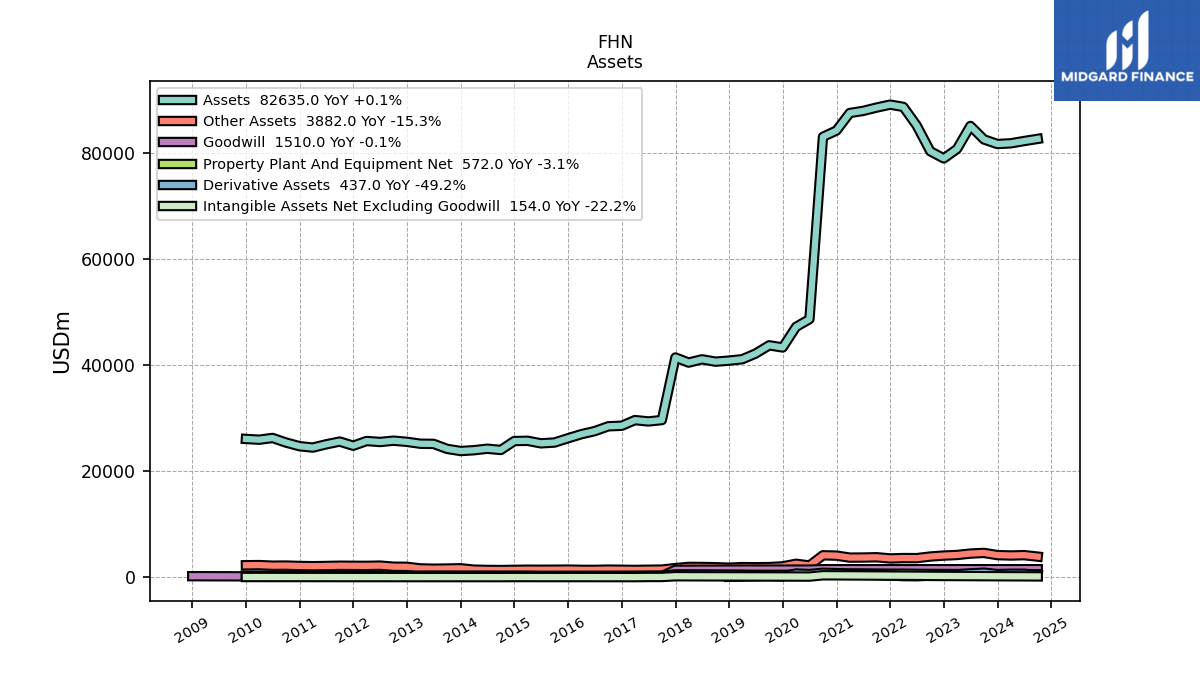
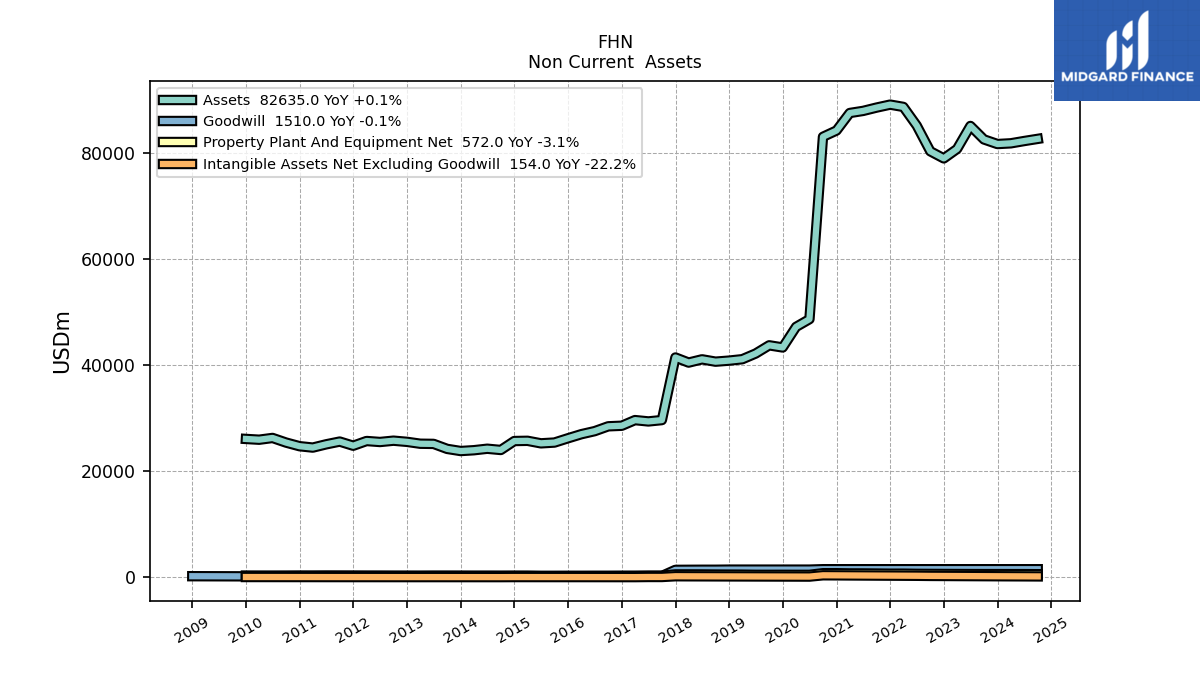
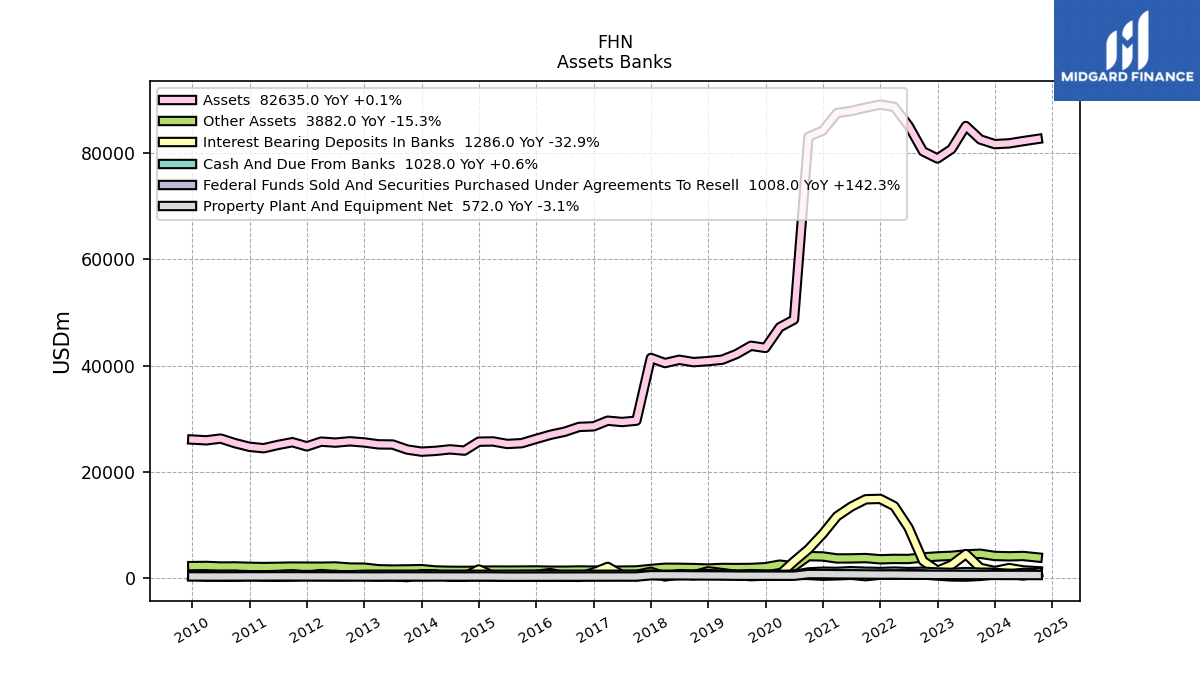
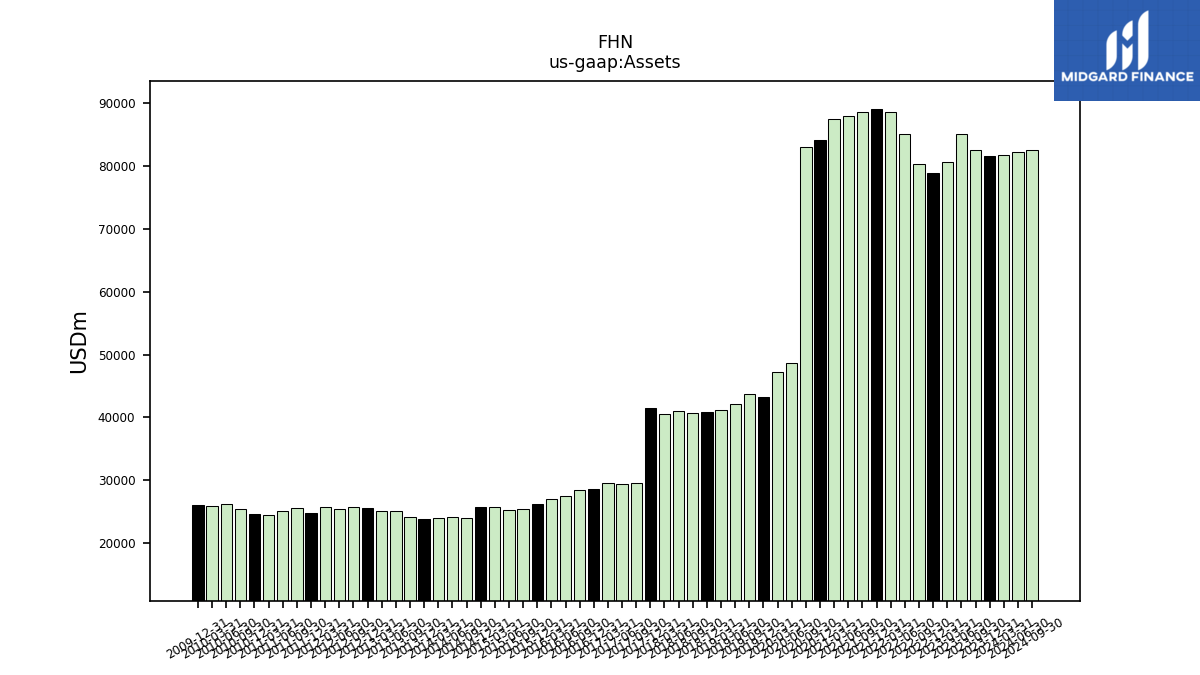
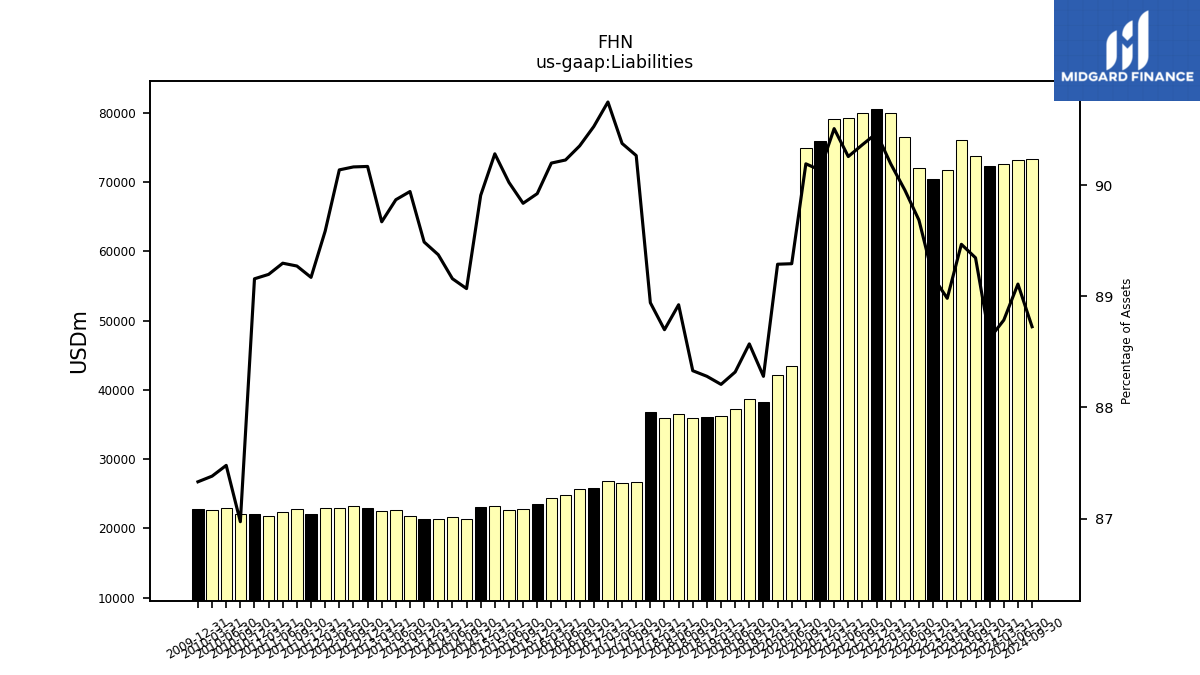
| Assets | 81661.00 | 82533.00 | 85071.00 | 80729.00 | 78953.00 | 80299.00 | 85132.00 | 88660.00 | 89092.00 | 88537.00 | 87908.00 | 87513.00 | 84209.00 | 83029.58 | 48644.66 | 47197.38 | |
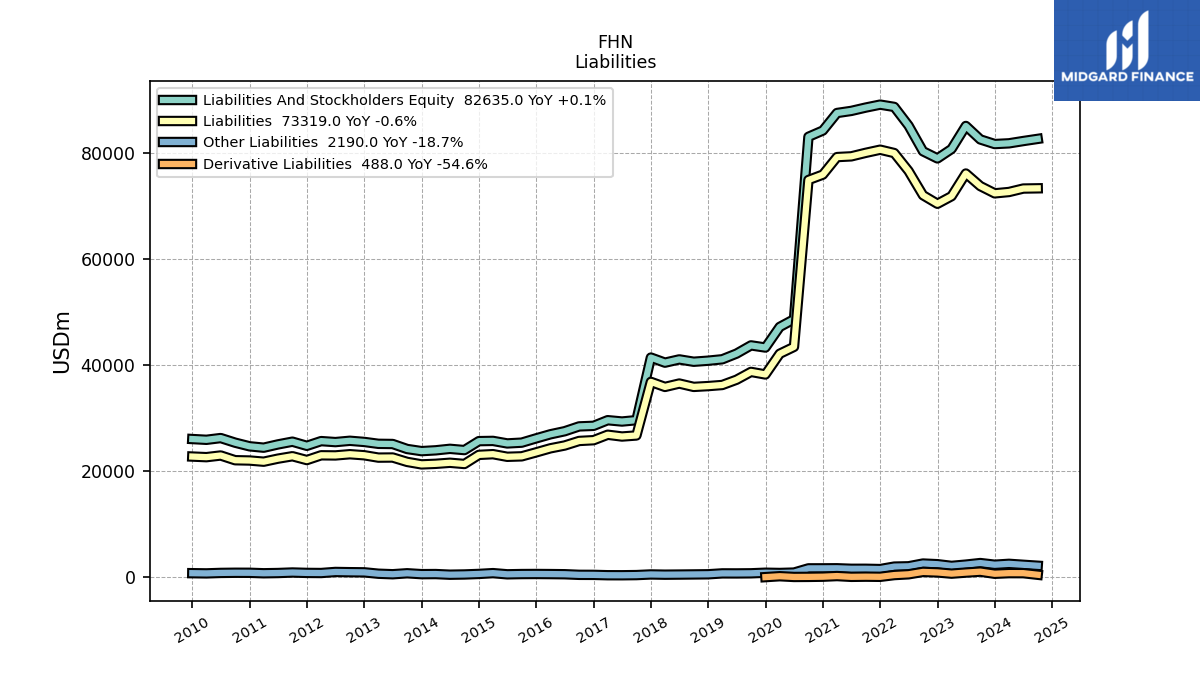
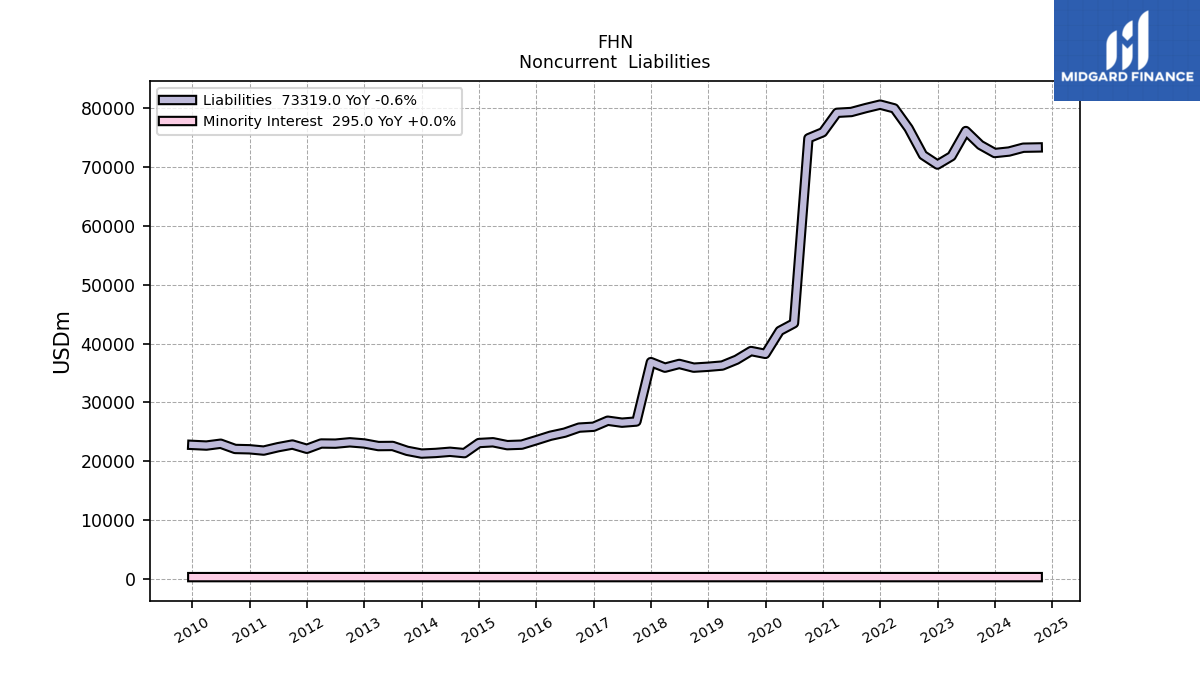
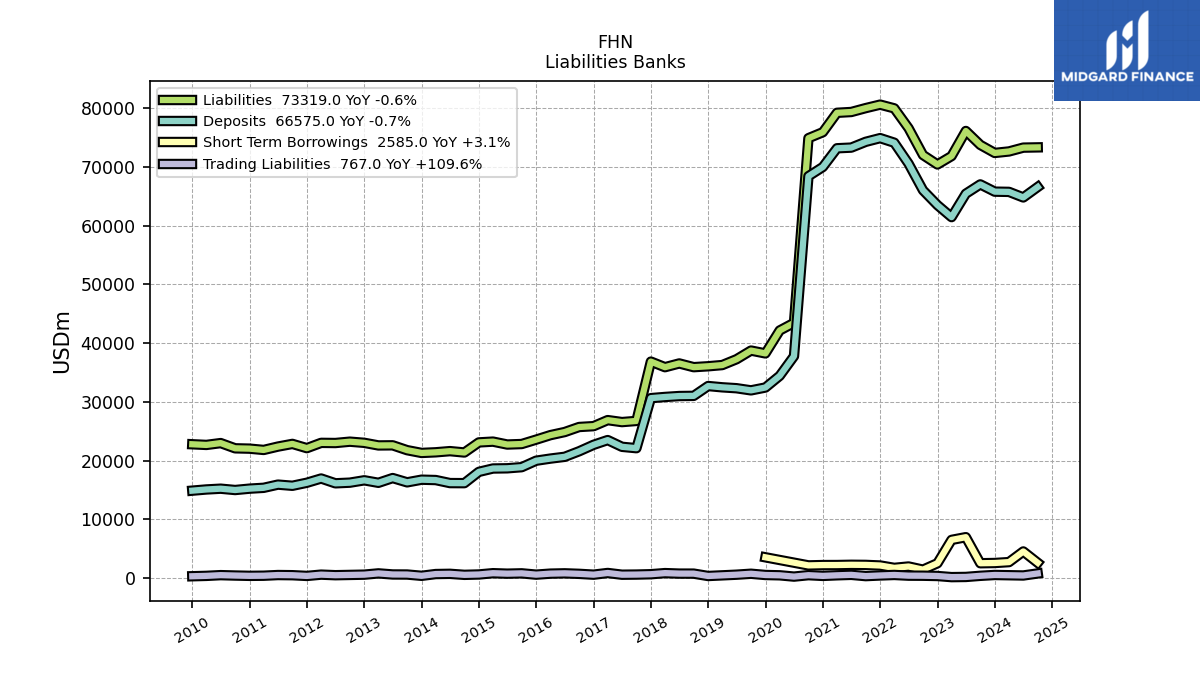
| Liabilities | 72370.00 | 73740.00 | 76111.00 | 71834.00 | 70406.00 | 72016.00 | 76581.00 | 79964.00 | 80598.00 | 80005.00 | 79343.00 | 79206.00 | 75902.00 | 74885.44 | 43436.27 | 42141.80 | |
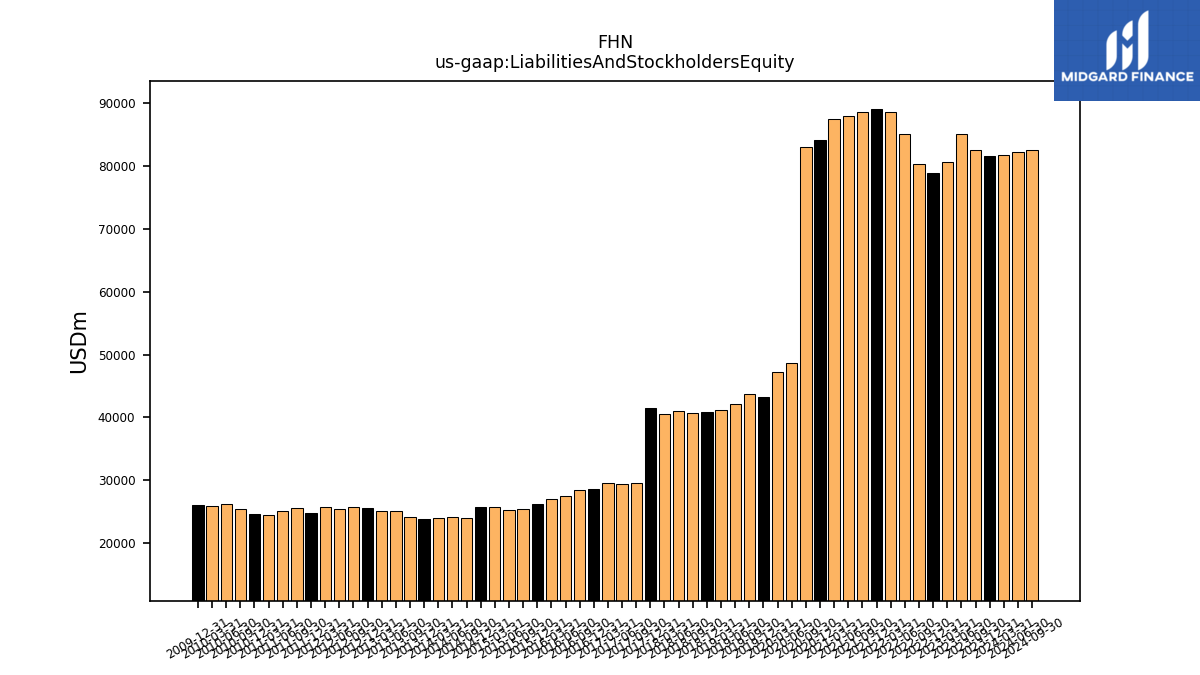
| Liabilities And Stockholders Equity | 81661.00 | 82533.00 | 85071.00 | 80729.00 | 78953.00 | 80299.00 | 85132.00 | 88660.00 | 89092.00 | 88537.00 | 87908.00 | 87513.00 | 84209.00 | 83029.58 | 48644.66 | 47197.38 | |
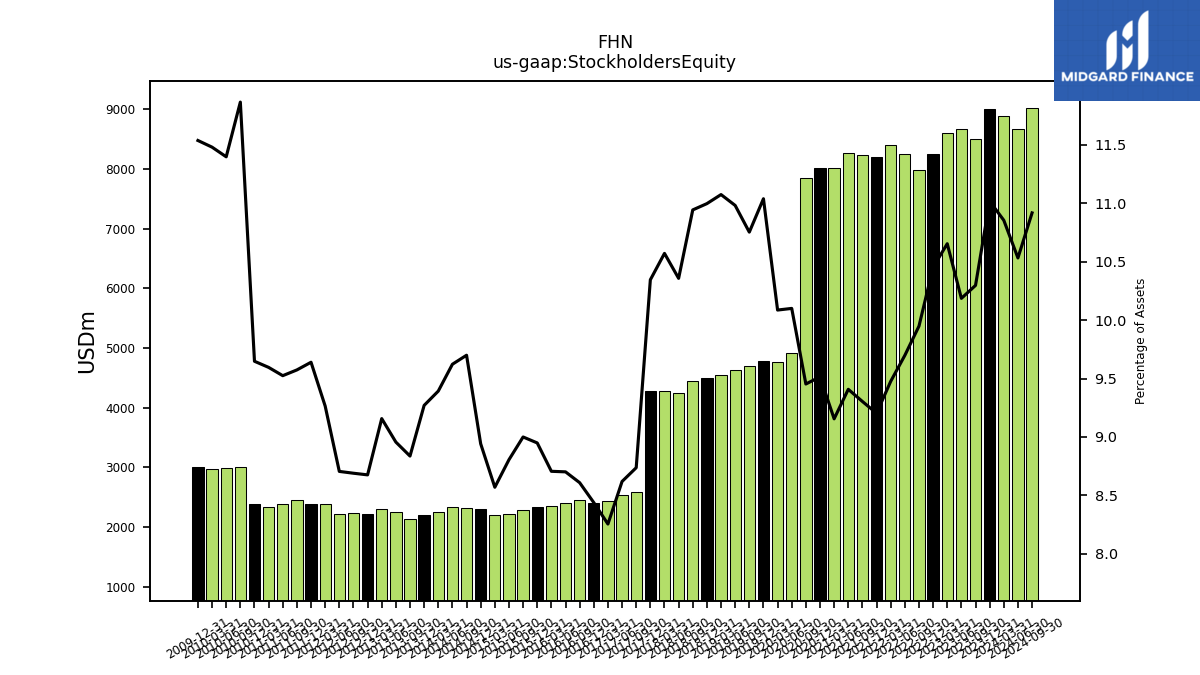
| Stockholders Equity | 8996.00 | 8498.00 | 8665.00 | 8600.00 | 8252.00 | 7988.00 | 8256.00 | 8401.00 | 8199.00 | 8237.00 | 8270.00 | 8012.00 | 8012.00 | 7848.71 | 4912.95 | 4760.15 |
| 2023-12-31 | 2023-09-30 | 2023-06-30 | 2023-03-31 | 2022-12-31 | 2022-09-30 | 2022-06-30 | 2022-03-31 | 2021-12-31 | 2021-09-30 | 2021-06-30 | 2021-03-31 | 2020-12-31 | 2020-09-30 | 2020-06-30 | 2020-03-31 | ||
|---|---|---|---|---|---|---|---|---|---|---|---|---|---|---|---|---|---|
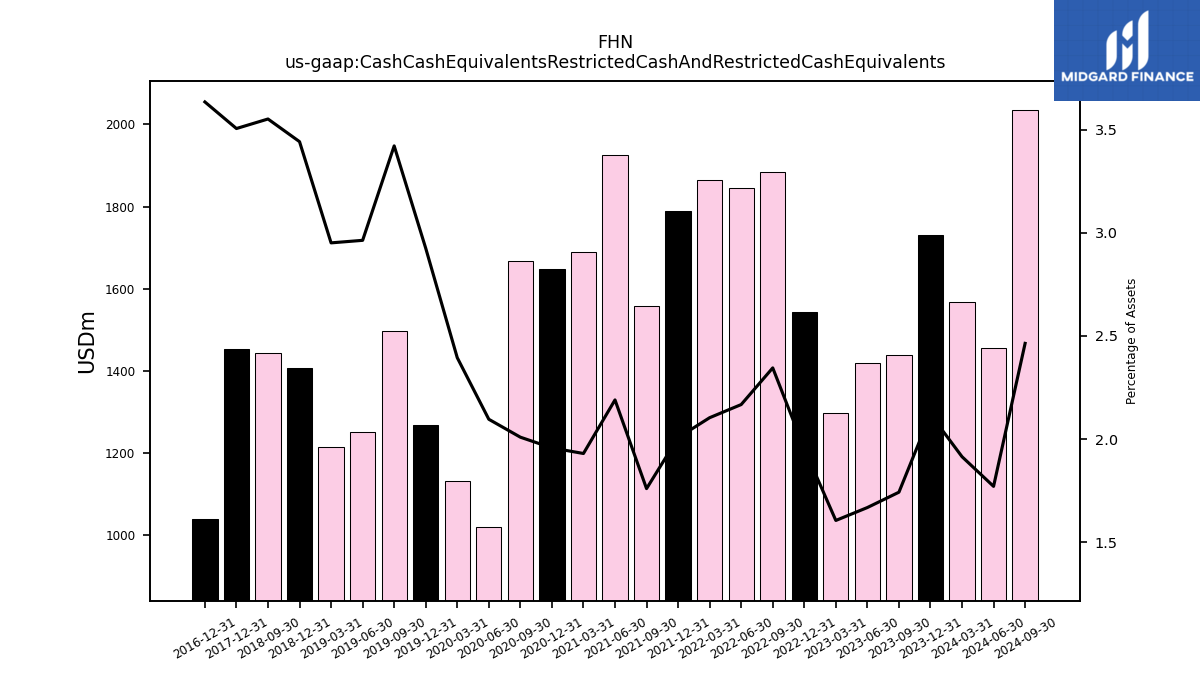
| Cash Cash Equivalents Restricted Cash And Restricted Cash Equivalents | 1731.00 | 1438.00 | 1419.00 | 1296.00 | 1543.00 | 1883.00 | 1845.00 | 1865.00 | 1788.00 | 1558.00 | 1925.00 | 1689.00 | 1648.00 | 1668.11 | 1019.55 | 1130.05 | |
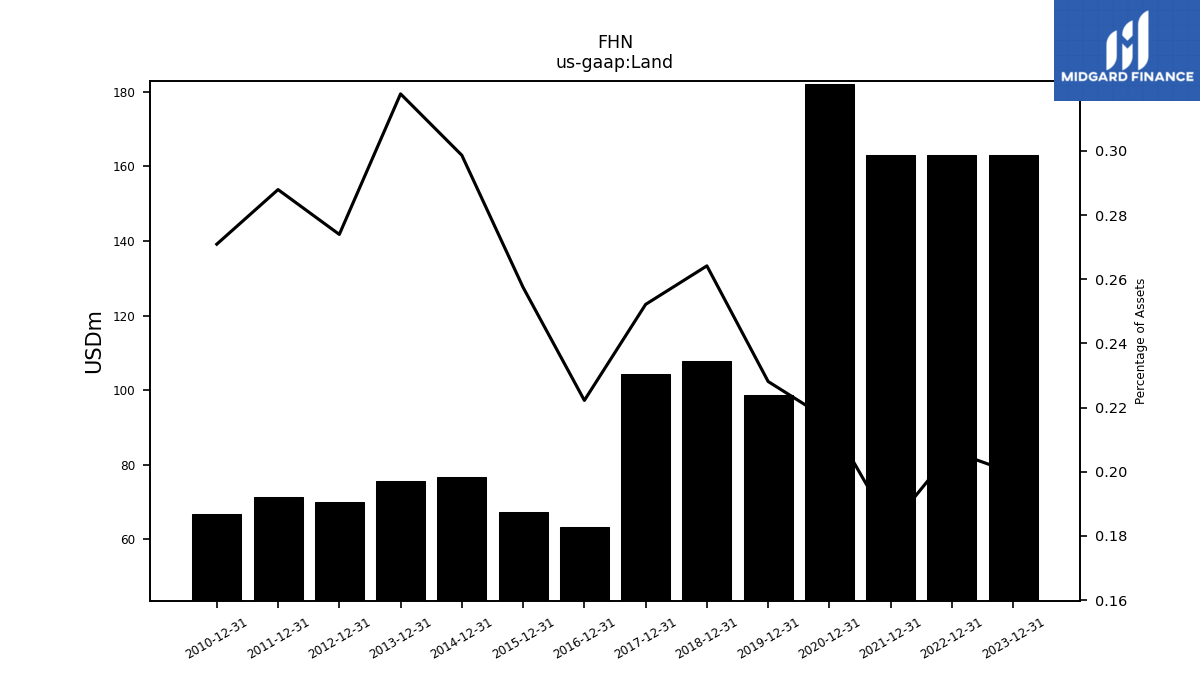
| Land | 163.00 | NA | NA | NA | 163.00 | NA | NA | NA | 163.00 | NA | NA | NA | 182.00 | NA | NA | NA |
| 2023-12-31 | 2023-09-30 | 2023-06-30 | 2023-03-31 | 2022-12-31 | 2022-09-30 | 2022-06-30 | 2022-03-31 | 2021-12-31 | 2021-09-30 | 2021-06-30 | 2021-03-31 | 2020-12-31 | 2020-09-30 | 2020-06-30 | 2020-03-31 | ||
|---|---|---|---|---|---|---|---|---|---|---|---|---|---|---|---|---|---|
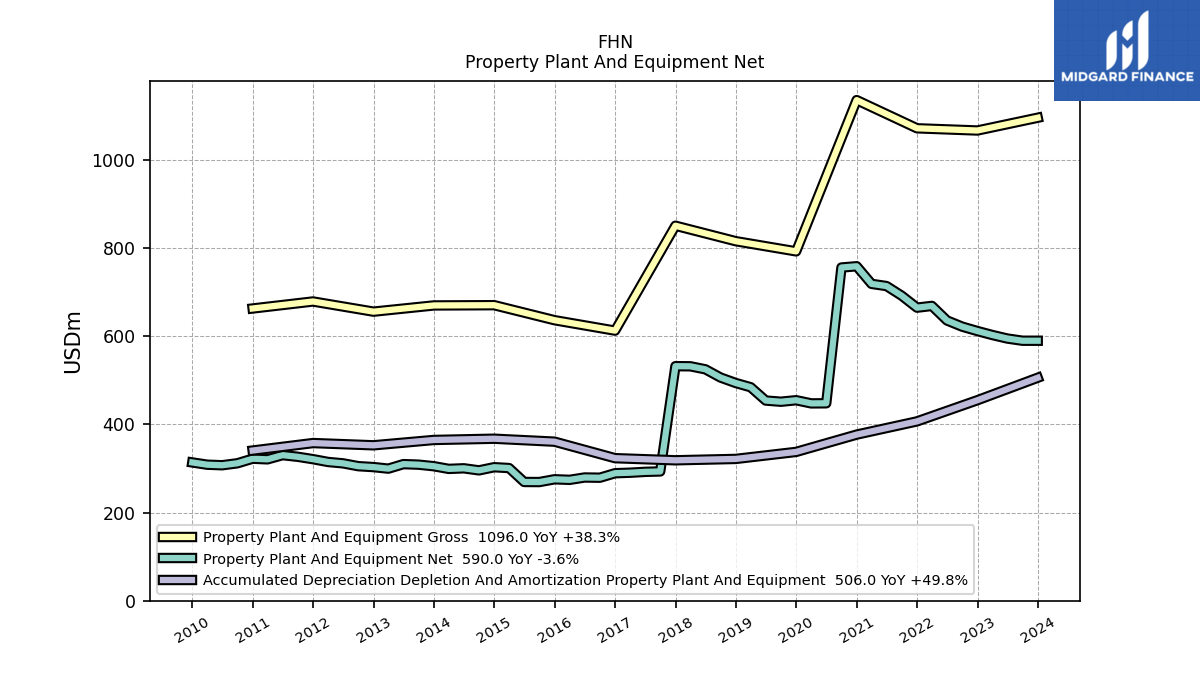
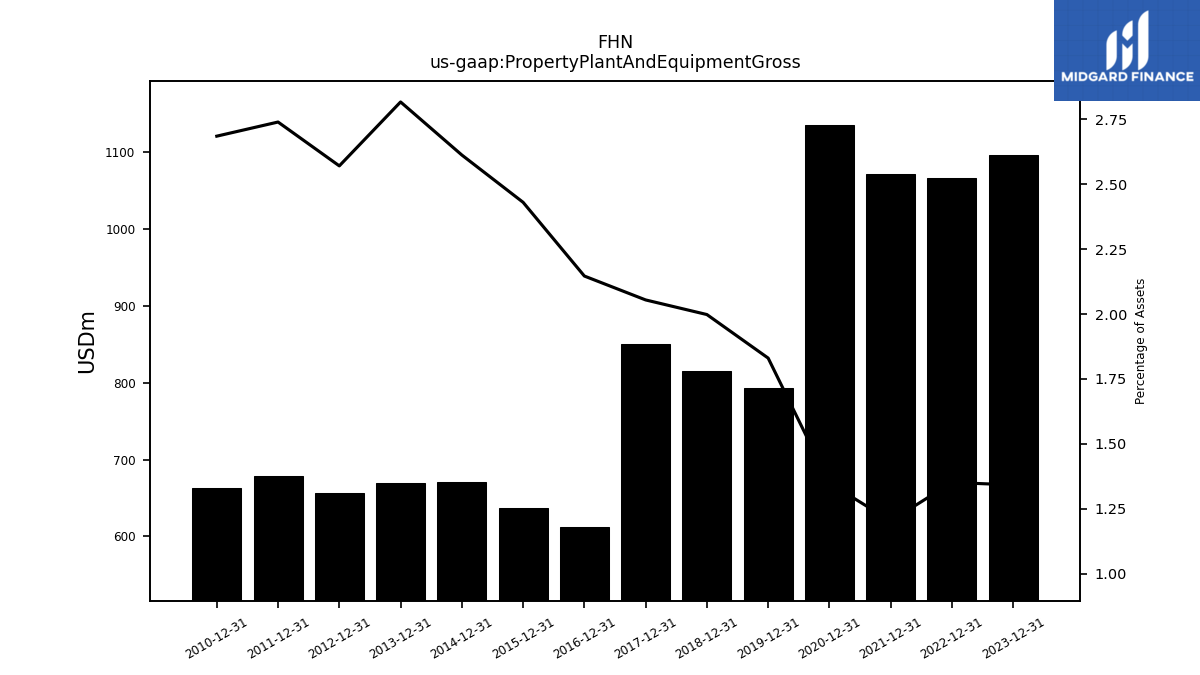
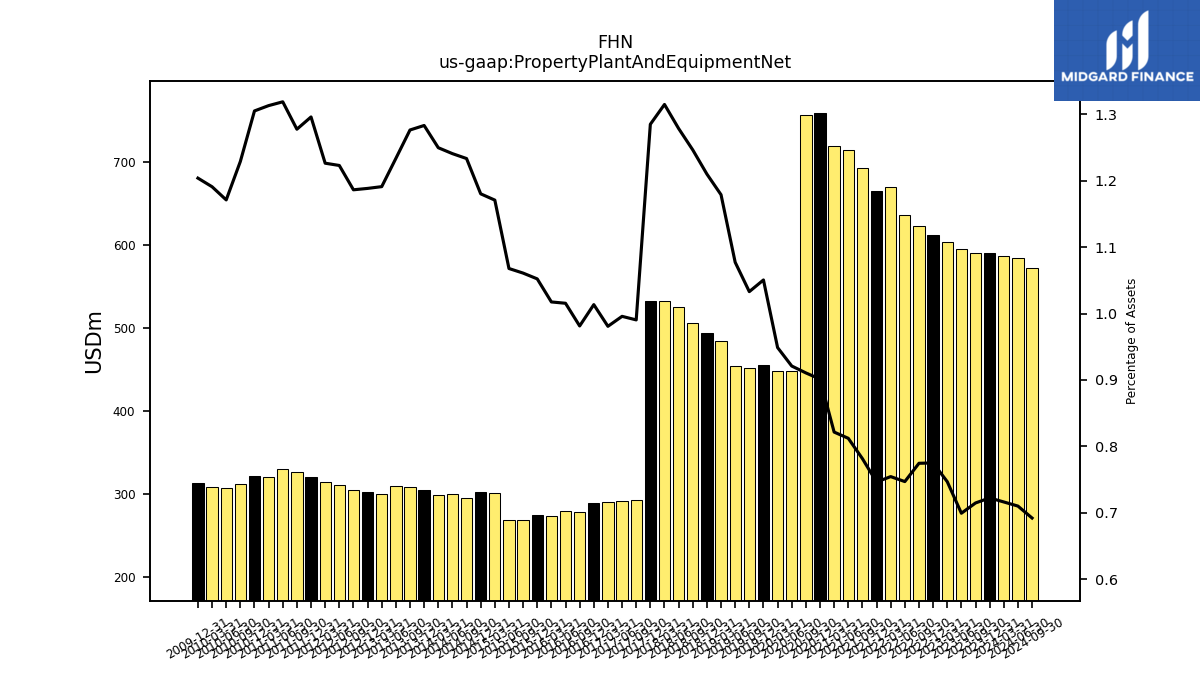
| Property Plant And Equipment Gross | 1096.00 | NA | NA | NA | 1067.00 | NA | NA | NA | 1072.00 | NA | NA | NA | 1136.00 | NA | NA | NA | |
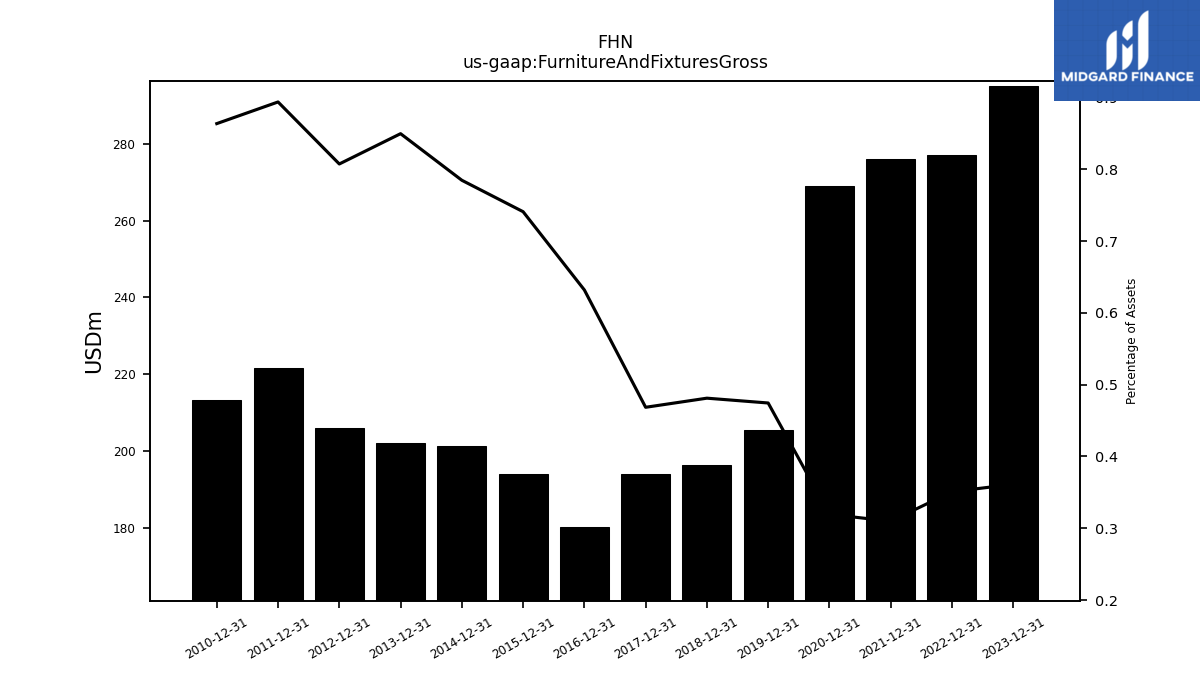
| Furniture And Fixtures Gross | 295.00 | NA | NA | NA | 277.00 | NA | NA | NA | 276.00 | NA | NA | NA | 269.00 | NA | NA | NA | |
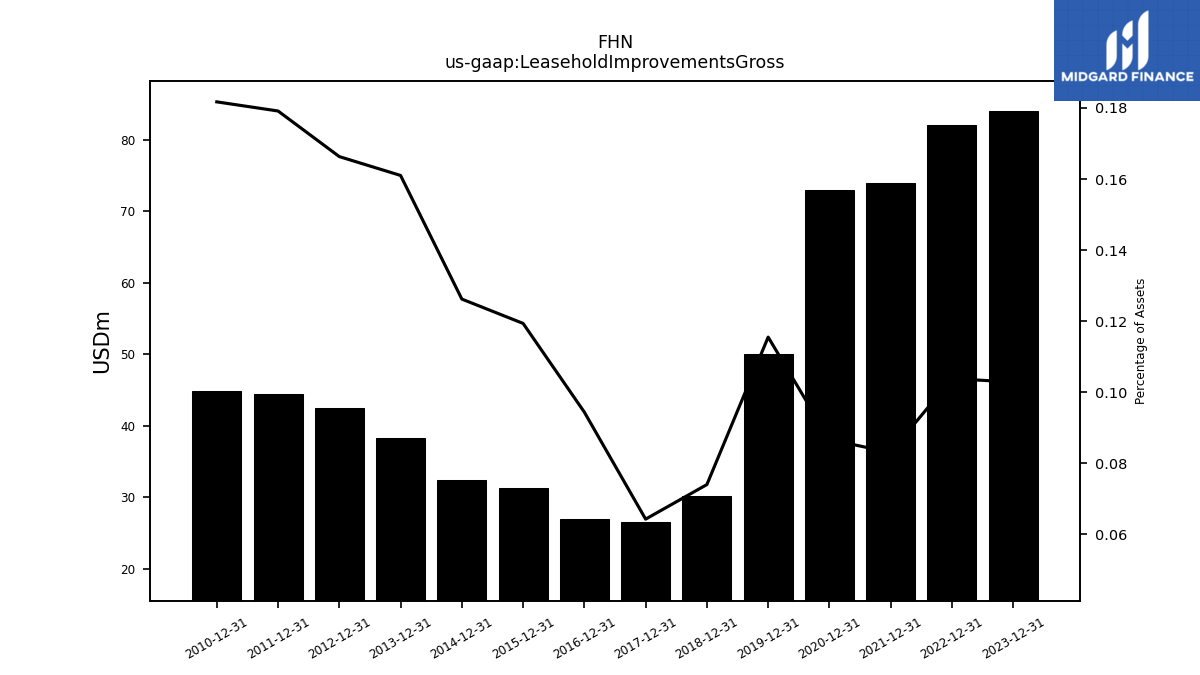
| Leasehold Improvements Gross | 84.00 | NA | NA | NA | 82.00 | NA | NA | NA | 74.00 | NA | NA | NA | 73.00 | NA | NA | NA | |
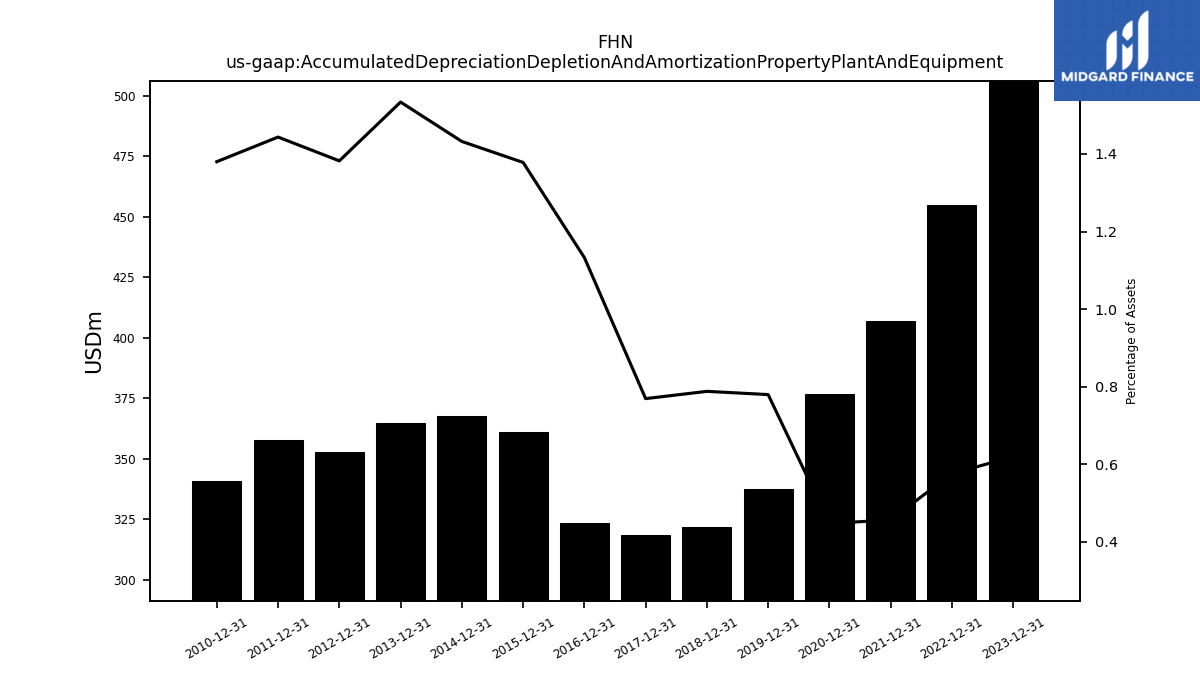
| Accumulated Depreciation Depletion And Amortization Property Plant And Equipment | 506.00 | NA | NA | NA | 455.00 | NA | NA | NA | 407.00 | NA | NA | NA | 377.00 | NA | NA | NA | |
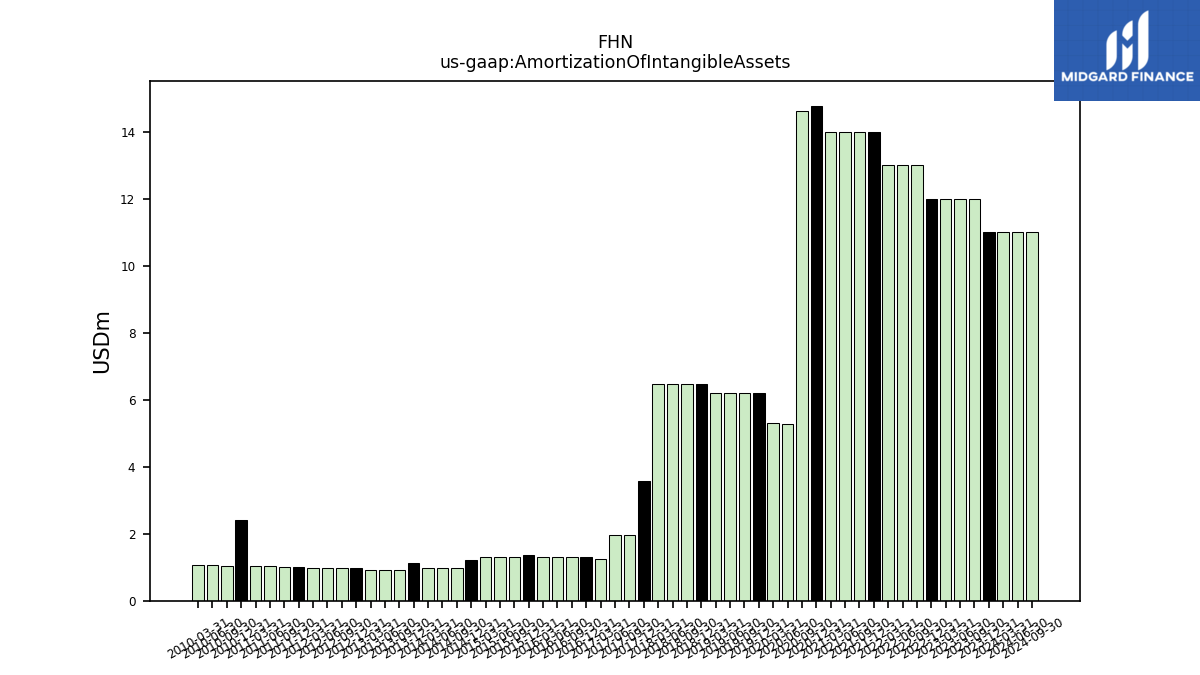
| Amortization Of Intangible Assets | 11.00 | 12.00 | 12.00 | 12.00 | 12.00 | 13.00 | 13.00 | 13.00 | 14.00 | 14.00 | 14.00 | 14.00 | 14.78 | 14.63 | 5.28 | 5.31 | |
| Property Plant And Equipment Net | 590.00 | 590.00 | 595.00 | 603.00 | 612.00 | 622.00 | 636.00 | 669.00 | 665.00 | 692.00 | 714.00 | 719.00 | 759.00 | 756.11 | 448.03 | 447.81 | |
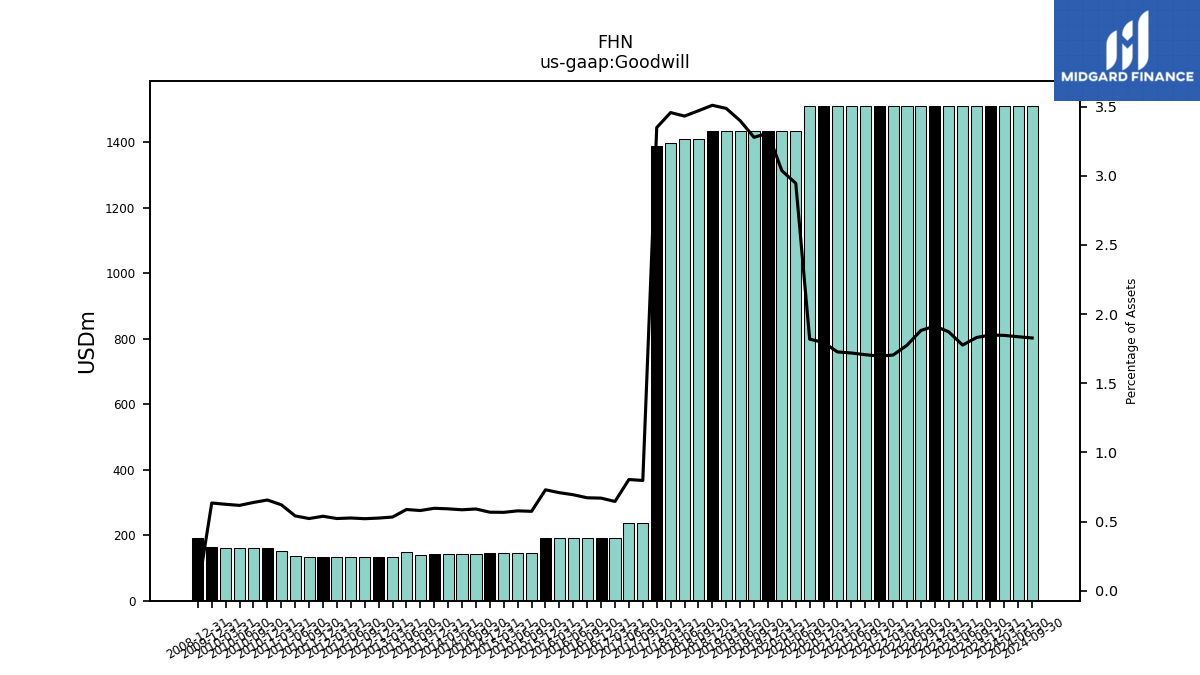
| Goodwill | 1510.00 | 1511.00 | 1511.00 | 1511.00 | 1511.00 | 1511.00 | 1511.00 | 1511.00 | 1511.00 | 1511.00 | 1511.00 | 1511.00 | 1511.00 | 1510.43 | 1432.79 | 1432.79 | |
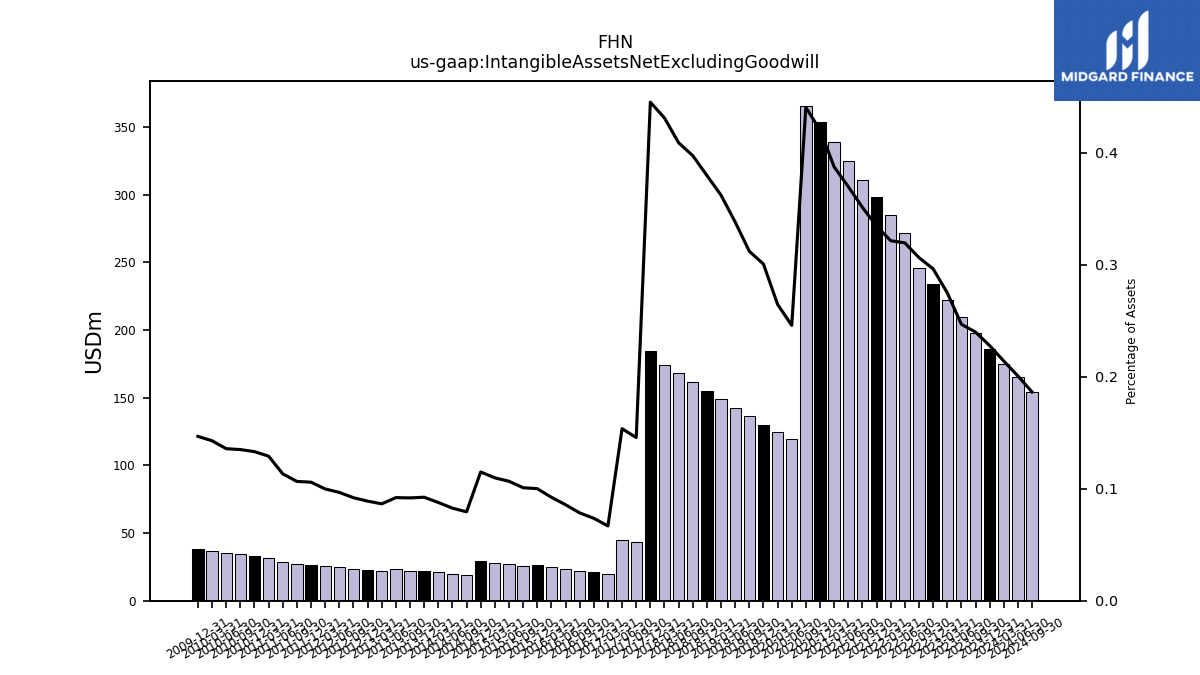
| Intangible Assets Net Excluding Goodwill | 186.00 | 198.00 | 210.00 | 222.00 | 234.00 | 246.00 | 272.00 | 285.00 | 298.00 | 311.00 | 325.00 | 339.00 | 354.00 | 365.70 | 119.61 | 124.89 | |
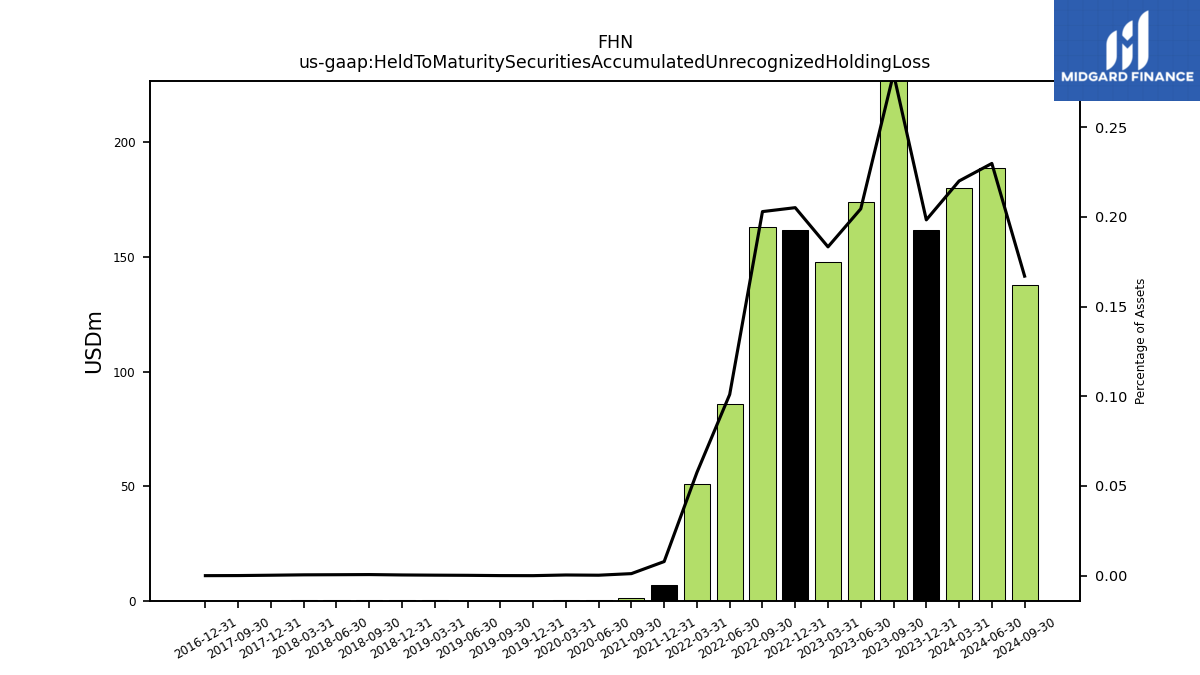
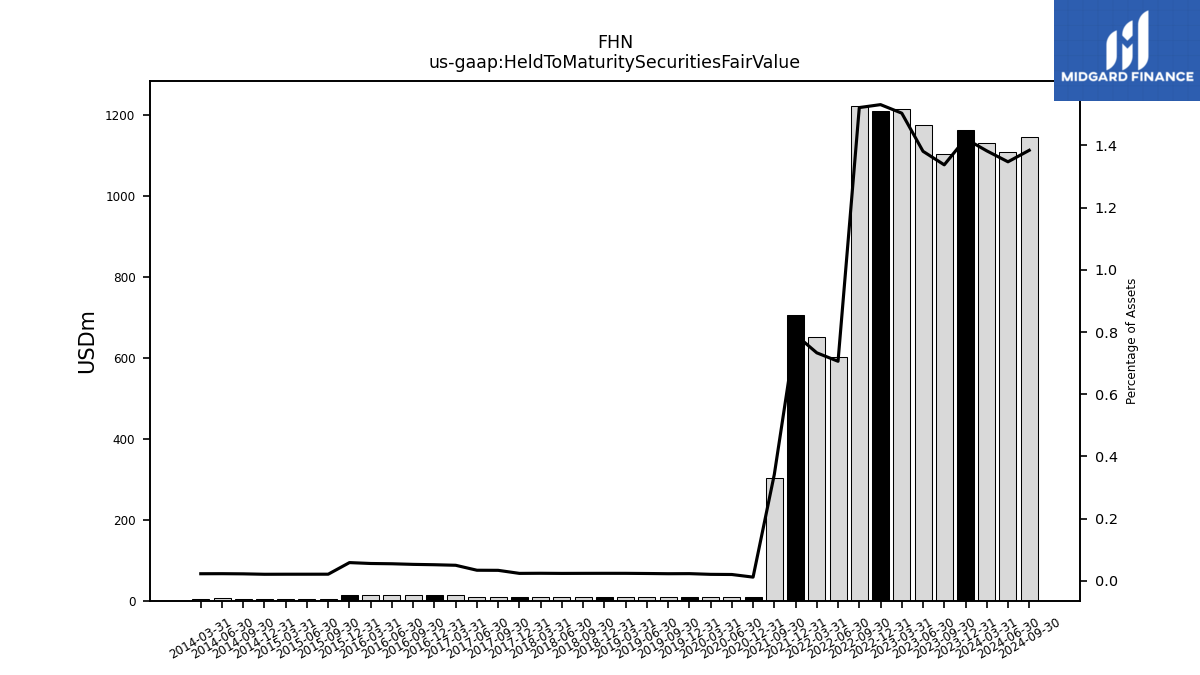
| Held To Maturity Securities Accumulated Unrecognized Holding Loss | 162.00 | 231.00 | 174.00 | 148.00 | 162.00 | 163.00 | 86.00 | 51.00 | 7.00 | 1.00 | NA | NA | NA | NA | 0.12 | 0.18 | |
| Held To Maturity Securities Fair Value | 1161.00 | 1104.00 | 1175.00 | 1214.00 | 1209.00 | 1222.00 | 601.00 | 650.00 | 705.00 | 303.00 | NA | NA | 10.00 | NA | 9.88 | 9.82 | |
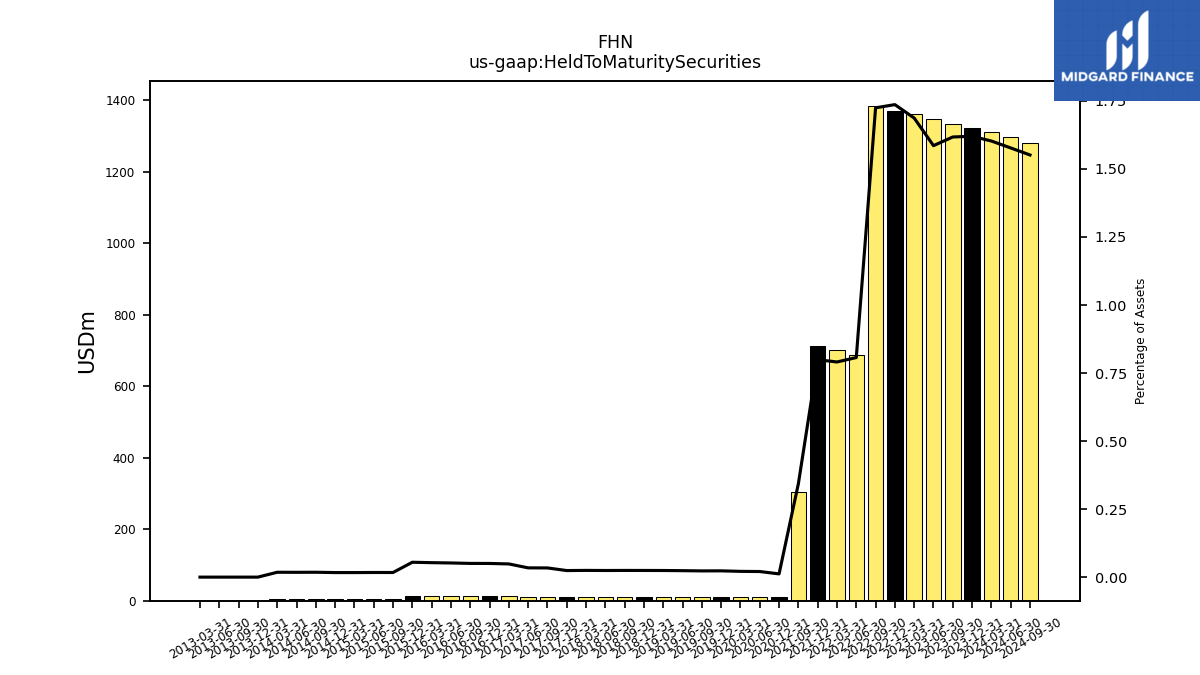
| Held To Maturity Securities | 1323.00 | 1335.00 | 1349.00 | 1362.00 | 1371.00 | 1385.00 | 687.00 | 701.00 | 712.00 | 304.00 | NA | NA | 10.00 | NA | 10.00 | 10.00 | |
| Held To Maturity Securities Accumulated Unrecognized Holding Loss | 162.00 | 231.00 | 174.00 | 148.00 | 162.00 | 163.00 | 86.00 | 51.00 | 7.00 | 1.00 | NA | NA | NA | NA | 0.12 | 0.18 |
| 2023-12-31 | 2023-09-30 | 2023-06-30 | 2023-03-31 | 2022-12-31 | 2022-09-30 | 2022-06-30 | 2022-03-31 | 2021-12-31 | 2021-09-30 | 2021-06-30 | 2021-03-31 | 2020-12-31 | 2020-09-30 | 2020-06-30 | 2020-03-31 | ||
|---|---|---|---|---|---|---|---|---|---|---|---|---|---|---|---|---|---|
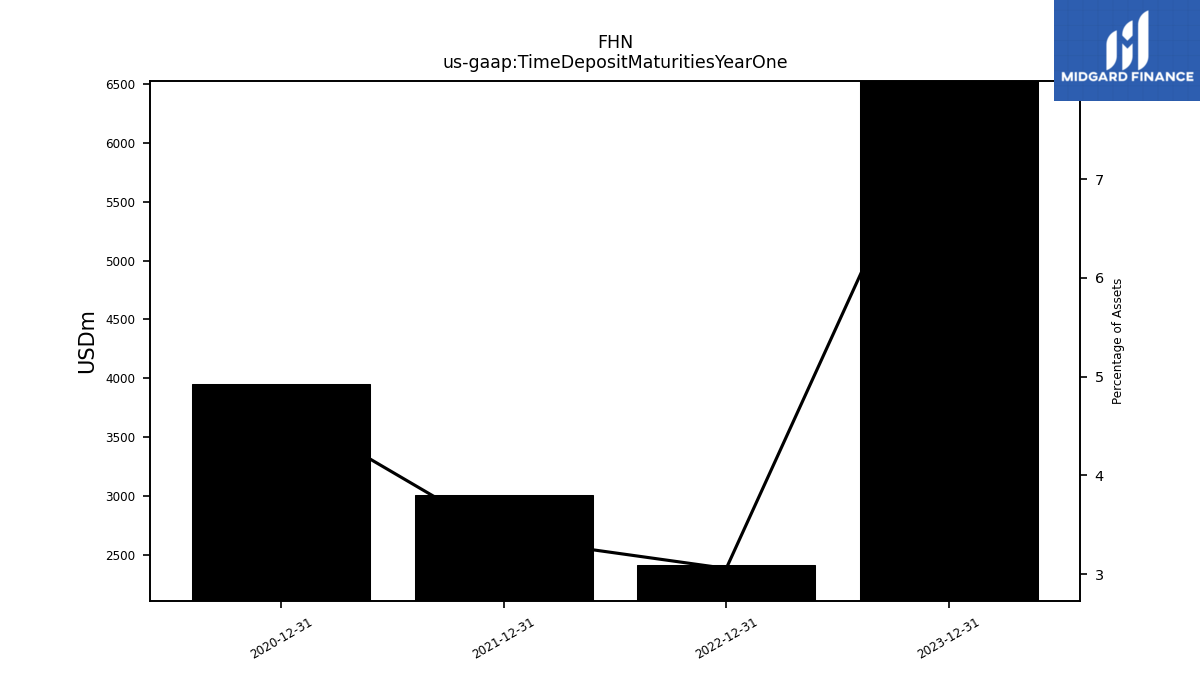
| Time Deposit Maturities Year One | 6528.00 | NA | NA | NA | 2415.00 | NA | NA | NA | 3006.00 | NA | NA | NA | 3952.00 | NA | NA | NA | |
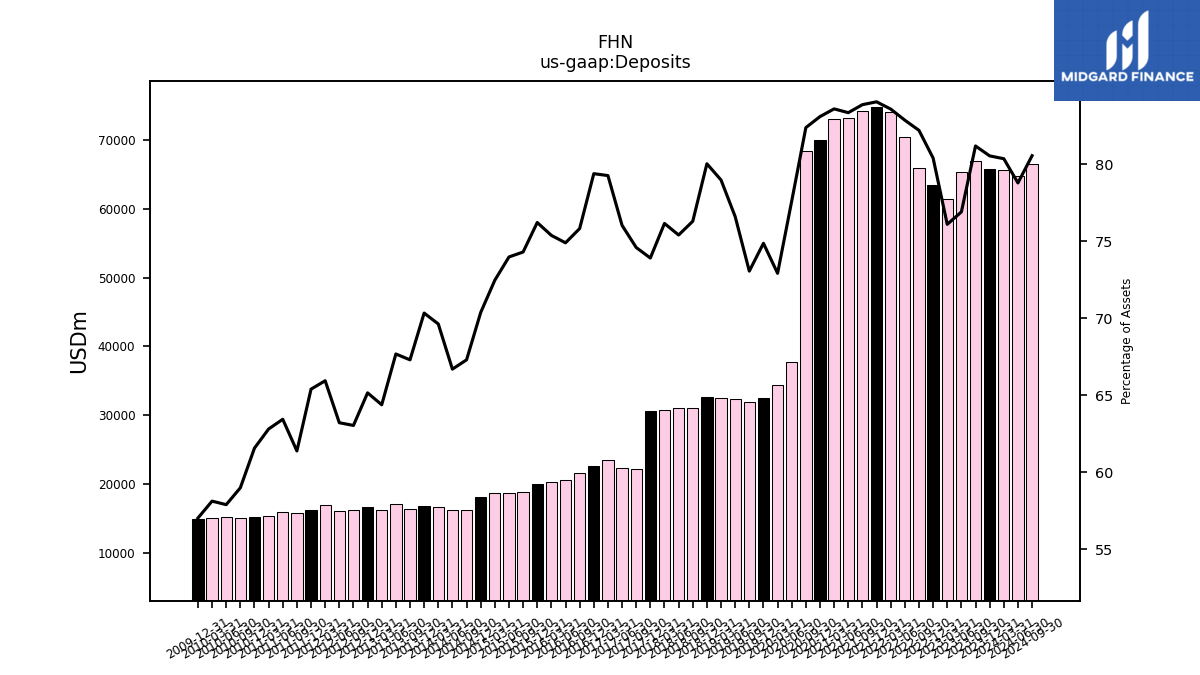
| Deposits | 65780.00 | 67015.00 | 65433.00 | 61440.00 | 63489.00 | 66015.00 | 70550.00 | 74114.00 | 74895.00 | 74264.00 | 73280.00 | 73166.00 | 69982.00 | 68408.91 | 37759.35 | 34419.65 |
| 2023-12-31 | 2023-09-30 | 2023-06-30 | 2023-03-31 | 2022-12-31 | 2022-09-30 | 2022-06-30 | 2022-03-31 | 2021-12-31 | 2021-09-30 | 2021-06-30 | 2021-03-31 | 2020-12-31 | 2020-09-30 | 2020-06-30 | 2020-03-31 | ||
|---|---|---|---|---|---|---|---|---|---|---|---|---|---|---|---|---|---|
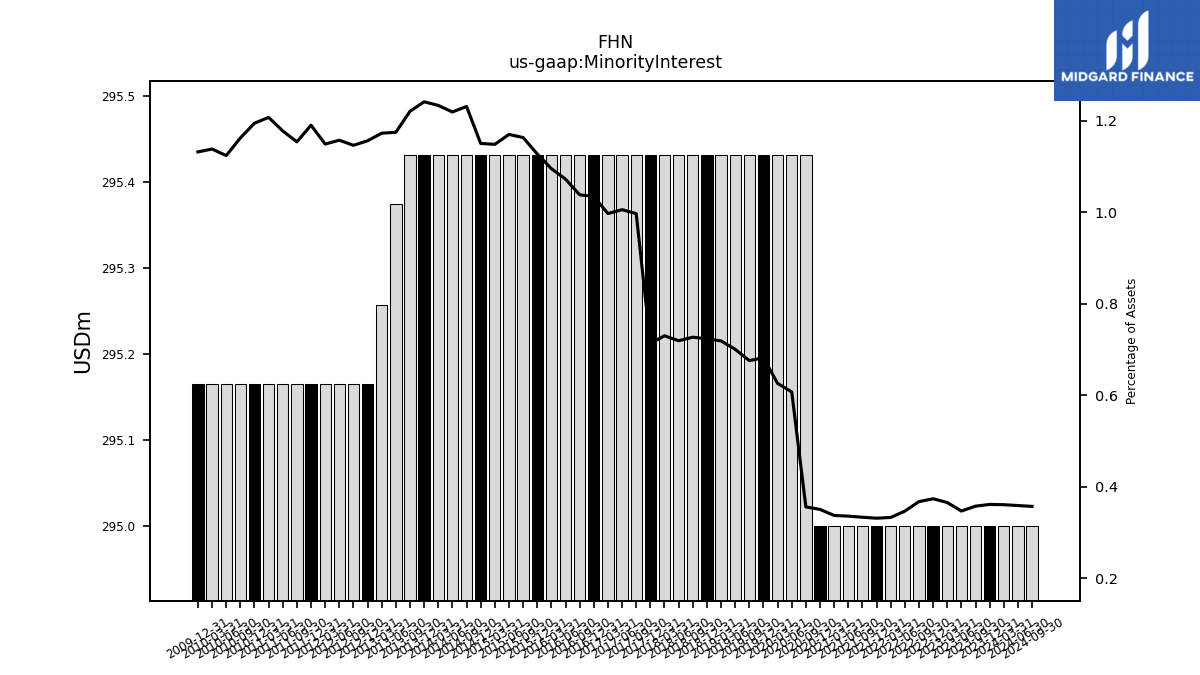
| Minority Interest | 295.00 | 295.00 | 295.00 | 295.00 | 295.00 | 295.00 | 295.00 | 295.00 | 295.00 | 295.00 | 295.00 | 295.00 | 295.00 | 295.43 | 295.43 | 295.43 |
| 2023-12-31 | 2023-09-30 | 2023-06-30 | 2023-03-31 | 2022-12-31 | 2022-09-30 | 2022-06-30 | 2022-03-31 | 2021-12-31 | 2021-09-30 | 2021-06-30 | 2021-03-31 | 2020-12-31 | 2020-09-30 | 2020-06-30 | 2020-03-31 | ||
|---|---|---|---|---|---|---|---|---|---|---|---|---|---|---|---|---|---|
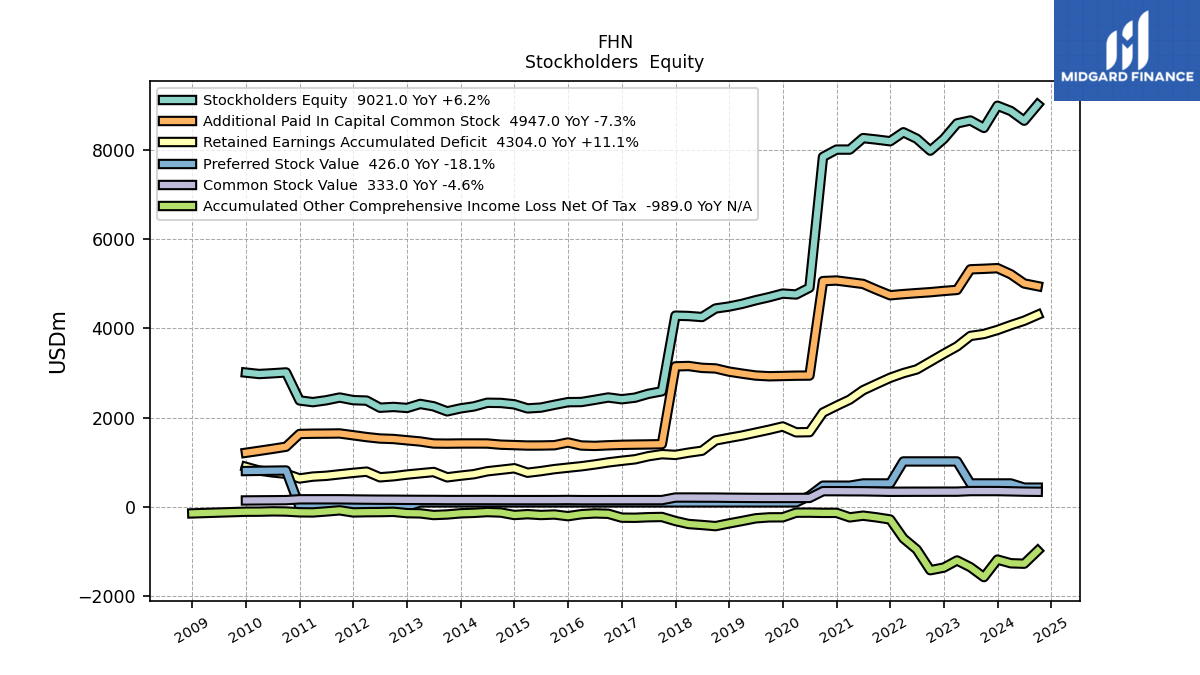
| Stockholders Equity | 8996.00 | 8498.00 | 8665.00 | 8600.00 | 8252.00 | 7988.00 | 8256.00 | 8401.00 | 8199.00 | 8237.00 | 8270.00 | 8012.00 | 8012.00 | 7848.71 | 4912.95 | 4760.15 | |
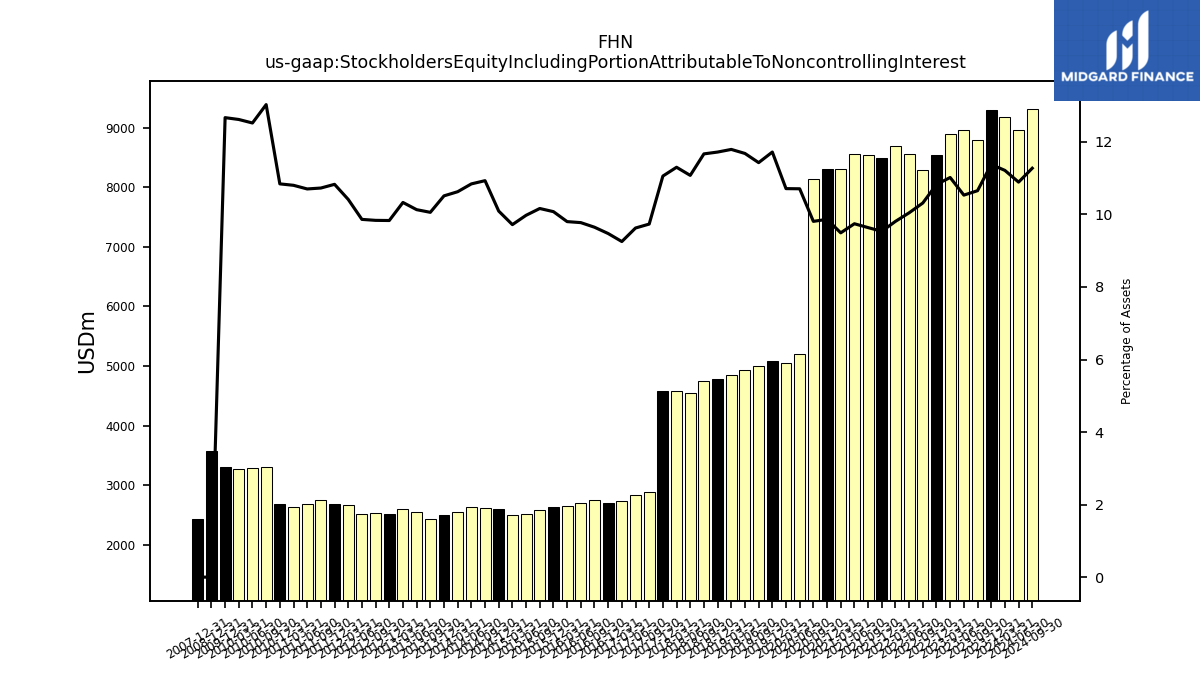
| Stockholders Equity Including Portion Attributable To Noncontrolling Interest | 9291.00 | 8793.00 | 8960.00 | 8895.00 | 8547.00 | 8283.00 | 8551.00 | 8696.00 | 8494.00 | 8532.00 | 8565.00 | 8307.00 | 8307.00 | 8144.14 | 5208.39 | 5055.58 | |
| Common Stock Value | 349.00 | 349.00 | 349.00 | 336.00 | 336.00 | 335.00 | 335.00 | 334.00 | 333.00 | 339.00 | 344.00 | 345.00 | 347.00 | 346.74 | 195.22 | 194.91 | |
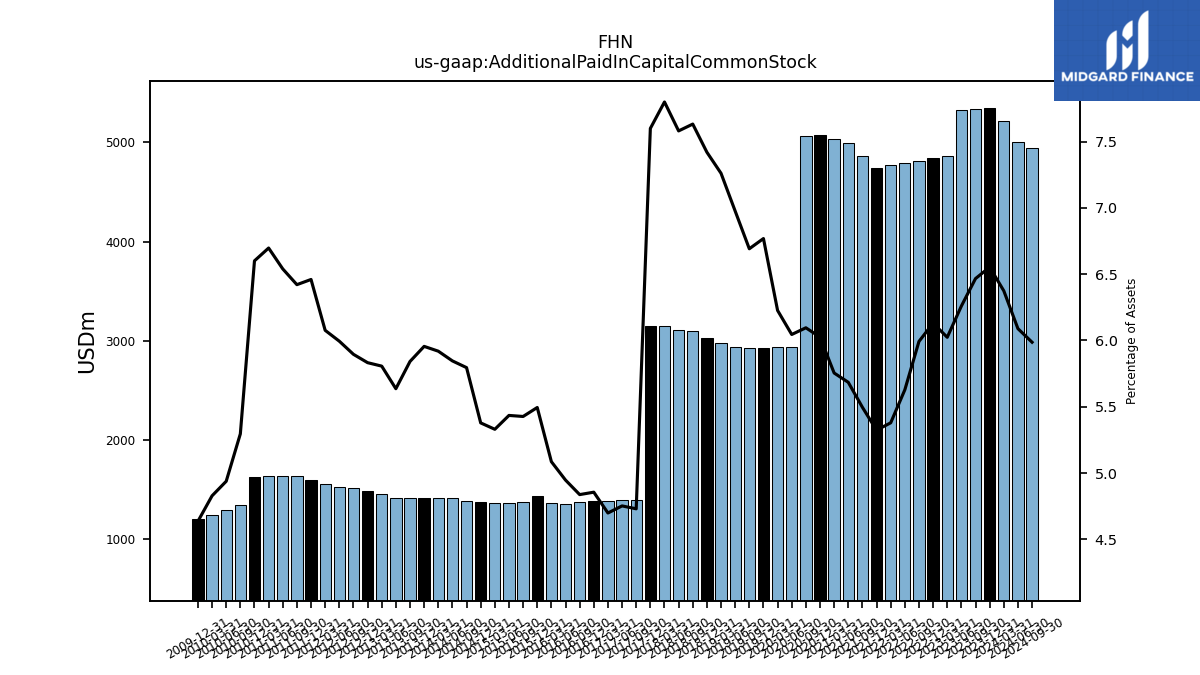
| Additional Paid In Capital Common Stock | 5351.00 | 5337.00 | 5325.00 | 4863.00 | 4840.00 | 4812.00 | 4791.00 | 4769.00 | 4743.00 | 4866.00 | 4997.00 | 5036.00 | 5074.00 | 5061.08 | 2940.61 | 2938.67 | |
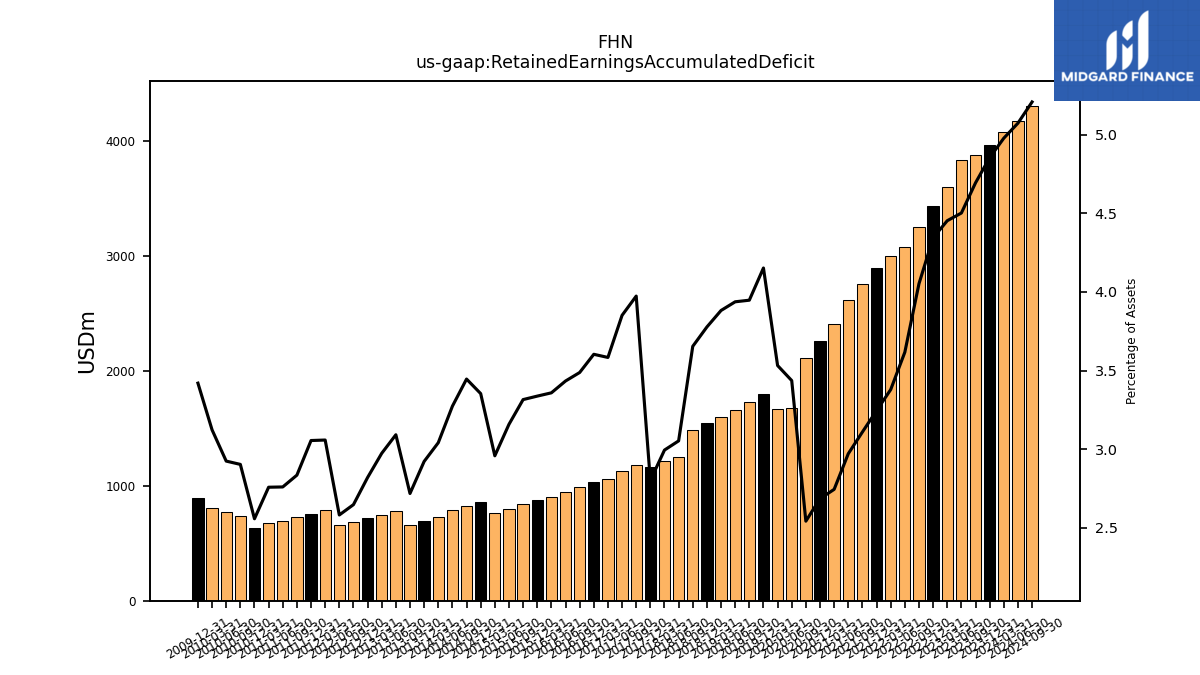
| Retained Earnings Accumulated Deficit | 3964.00 | 3874.00 | 3830.00 | 3595.00 | 3430.00 | 3254.00 | 3079.00 | 2996.00 | 2891.00 | 2753.00 | 2612.00 | 2402.00 | 2261.00 | 2110.99 | 1671.63 | 1667.11 | |
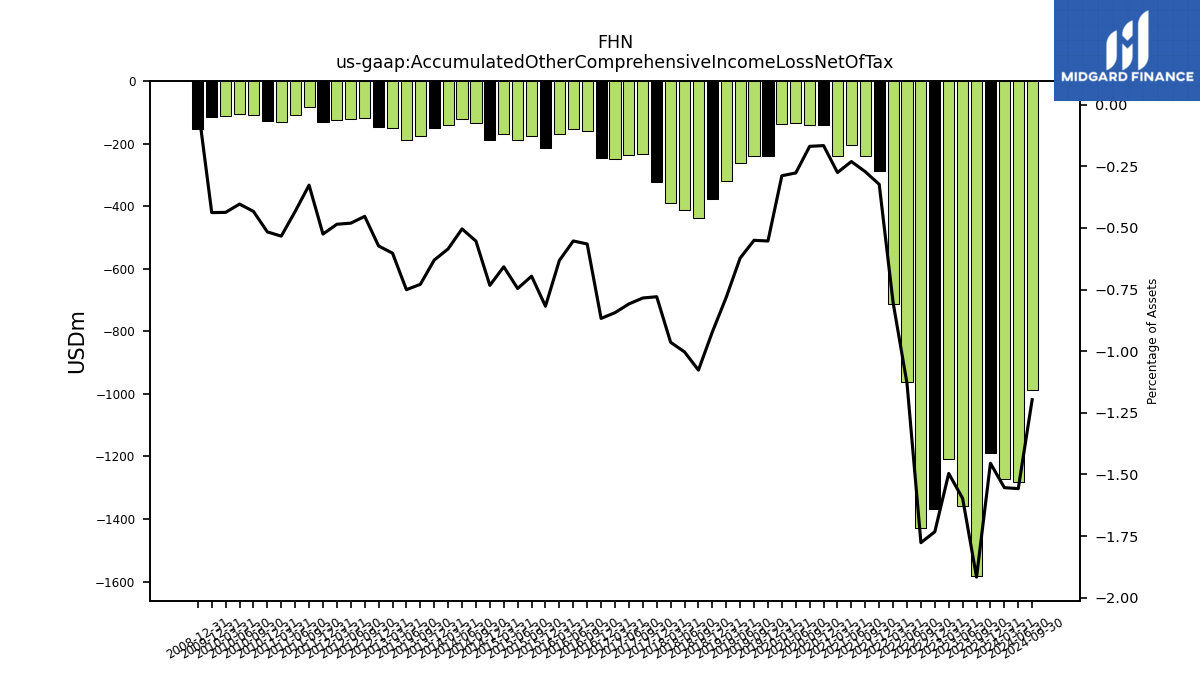
| Accumulated Other Comprehensive Income Loss Net Of Tax | -1188.00 | -1582.00 | -1359.00 | -1208.00 | -1368.00 | -1427.00 | -963.00 | -712.00 | -288.00 | -241.00 | -203.00 | -241.00 | -140.00 | -140.47 | -134.80 | -136.16 | |
| Minority Interest | 295.00 | 295.00 | 295.00 | 295.00 | 295.00 | 295.00 | 295.00 | 295.00 | 295.00 | 295.00 | 295.00 | 295.00 | 295.00 | 295.43 | 295.43 | 295.43 |
| 2023-12-31 | 2023-09-30 | 2023-06-30 | 2023-03-31 | 2022-12-31 | 2022-09-30 | 2022-06-30 | 2022-03-31 | 2021-12-31 | 2021-09-30 | 2021-06-30 | 2021-03-31 | 2020-12-31 | 2020-09-30 | 2020-06-30 | 2020-03-31 | ||
|---|---|---|---|---|---|---|---|---|---|---|---|---|---|---|---|---|---|
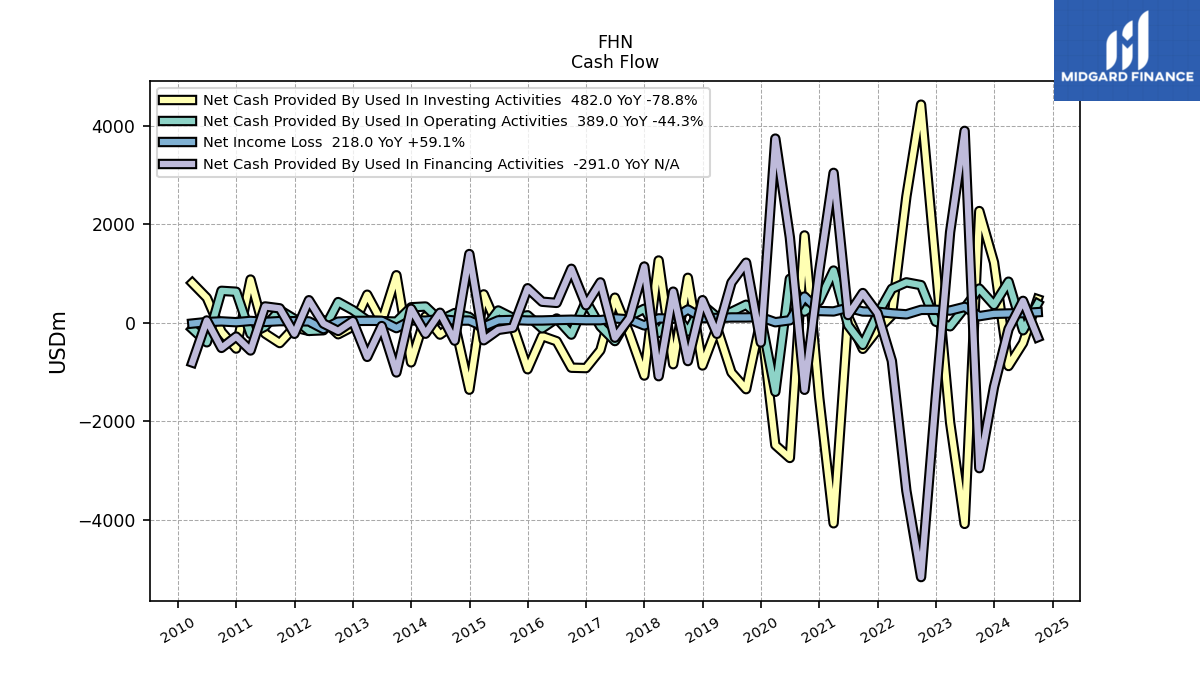
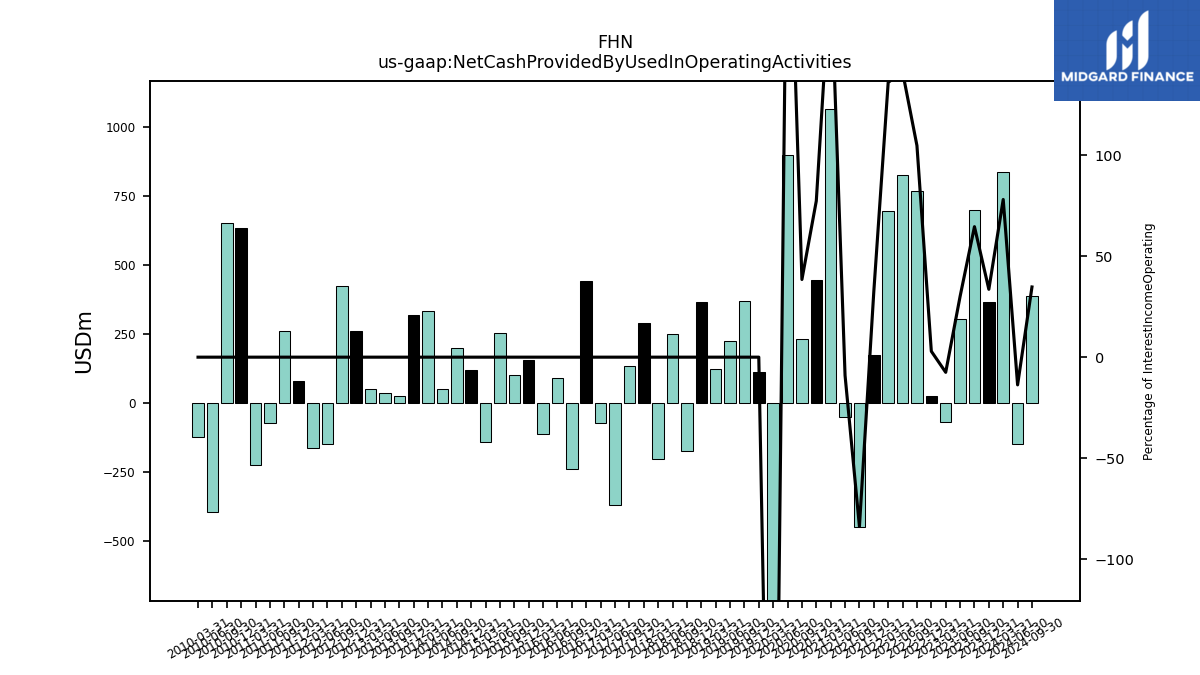
| Net Cash Provided By Used In Operating Activities | 365.00 | 698.00 | 305.00 | -69.00 | 25.00 | 768.00 | 824.00 | 694.00 | 173.00 | -447.00 | -49.00 | 1064.00 | 444.90 | 230.06 | 897.05 | -1400.01 | |
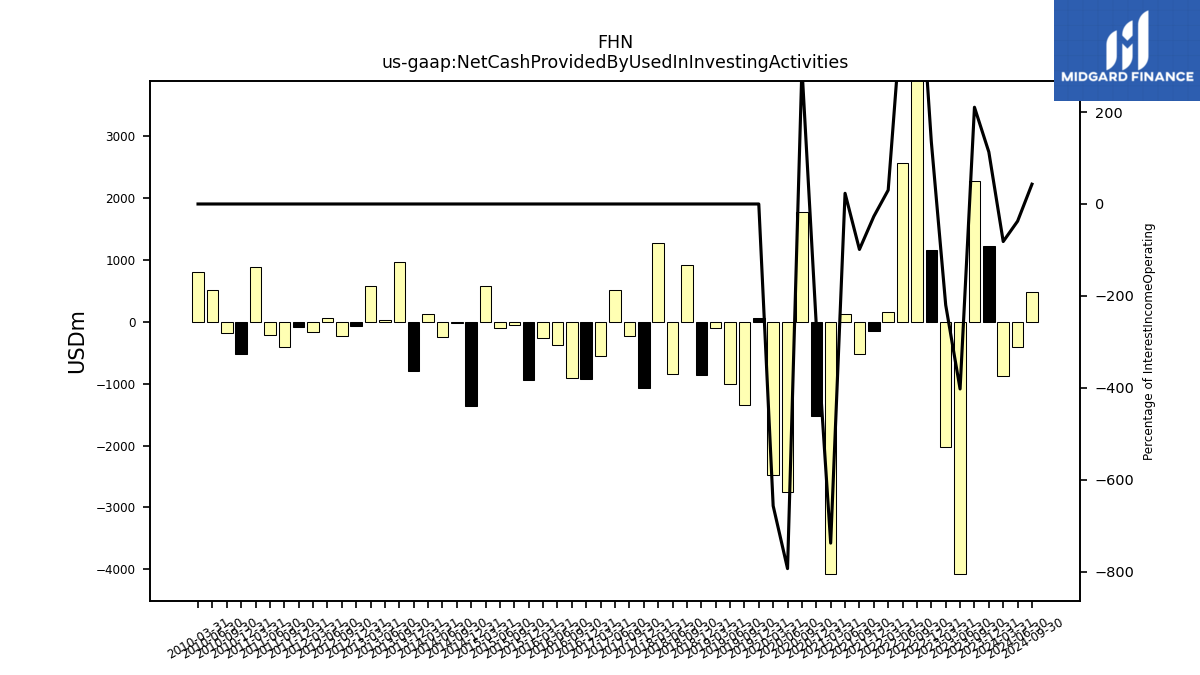
| Net Cash Provided By Used In Investing Activities | 1228.00 | 2273.00 | -4084.00 | -2022.00 | 1158.00 | 4435.00 | 2566.00 | 154.00 | -144.00 | -527.00 | 126.00 | -4072.00 | -1518.36 | 1777.62 | -2744.31 | -2481.94 | |
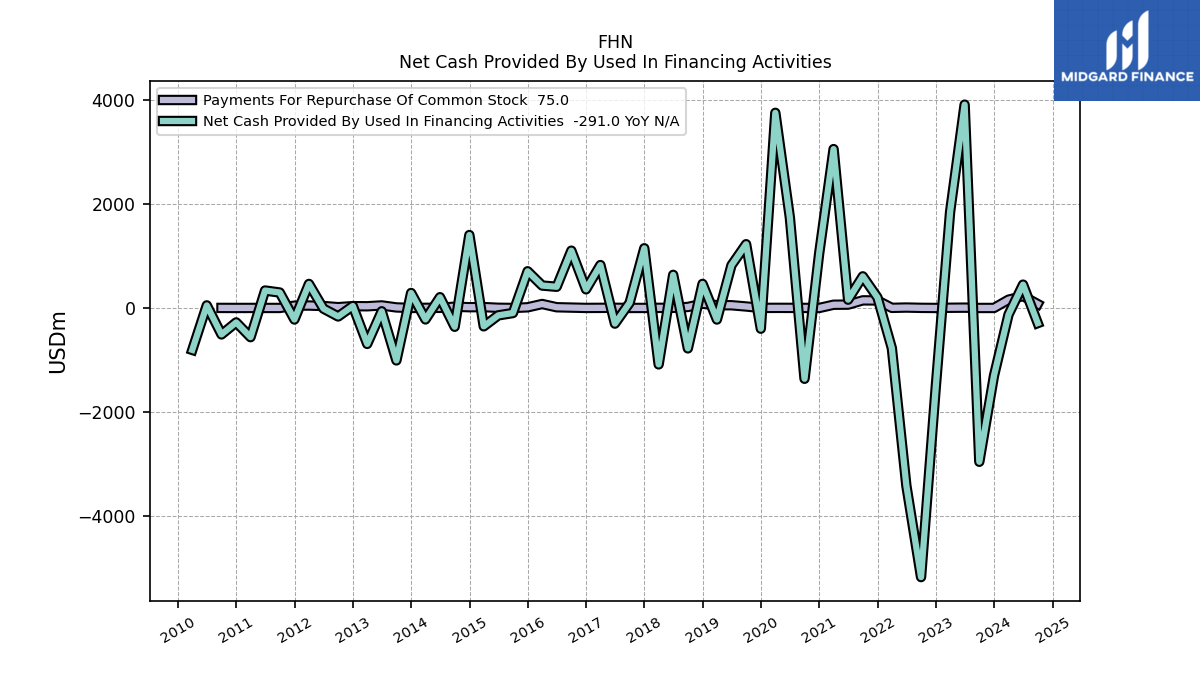
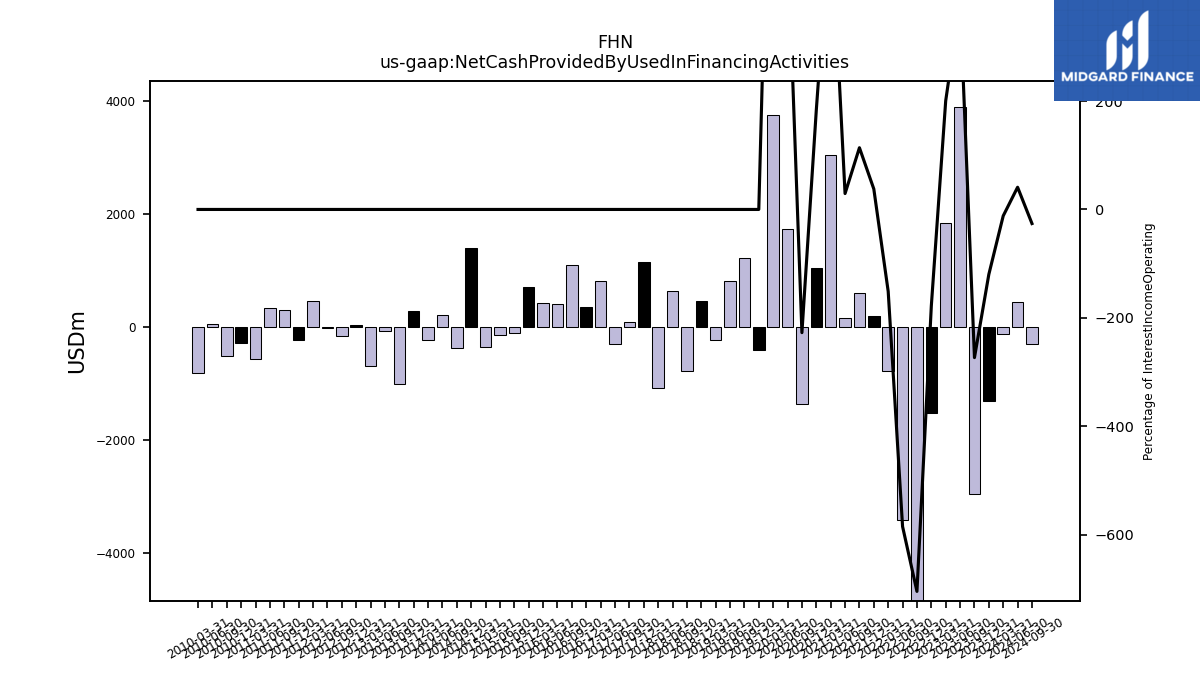
| Net Cash Provided By Used In Financing Activities | -1300.00 | -2952.00 | 3902.00 | 1844.00 | -1523.00 | -5165.00 | -3410.00 | -771.00 | 201.00 | 607.00 | 159.00 | 3049.00 | 1053.24 | -1359.11 | 1736.76 | 3745.10 |
| 2023-12-31 | 2023-09-30 | 2023-06-30 | 2023-03-31 | 2022-12-31 | 2022-09-30 | 2022-06-30 | 2022-03-31 | 2021-12-31 | 2021-09-30 | 2021-06-30 | 2021-03-31 | 2020-12-31 | 2020-09-30 | 2020-06-30 | 2020-03-31 | ||
|---|---|---|---|---|---|---|---|---|---|---|---|---|---|---|---|---|---|
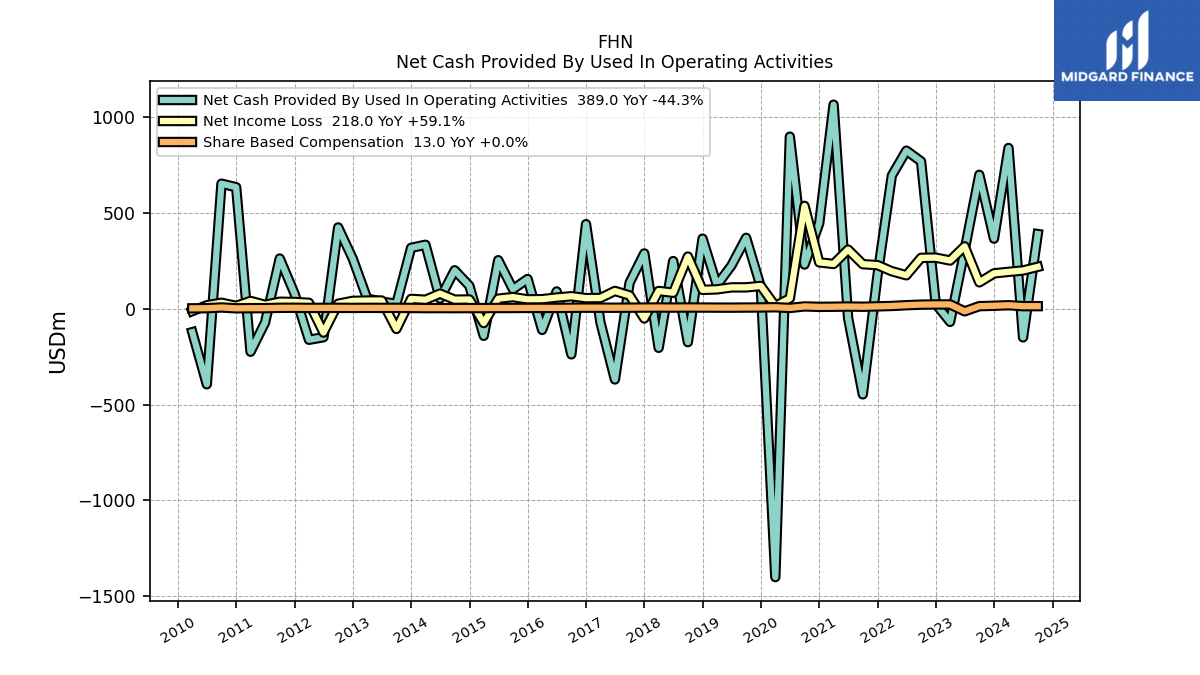
| Net Cash Provided By Used In Operating Activities | 365.00 | 698.00 | 305.00 | -69.00 | 25.00 | 768.00 | 824.00 | 694.00 | 173.00 | -447.00 | -49.00 | 1064.00 | 444.90 | 230.06 | 897.05 | -1400.01 | |
| Net Income Loss | 184.00 | 137.00 | 325.00 | 251.00 | 266.00 | 265.00 | 174.00 | 195.00 | 227.00 | 232.00 | 308.00 | 233.00 | 241.50 | 536.06 | 53.81 | 13.62 | |
| Profit Loss | 189.00 | 142.00 | 329.00 | 255.00 | 270.00 | 268.00 | 177.00 | 198.00 | 229.00 | 235.00 | 311.00 | 236.00 | 244.82 | 539.04 | 56.66 | 16.47 | |
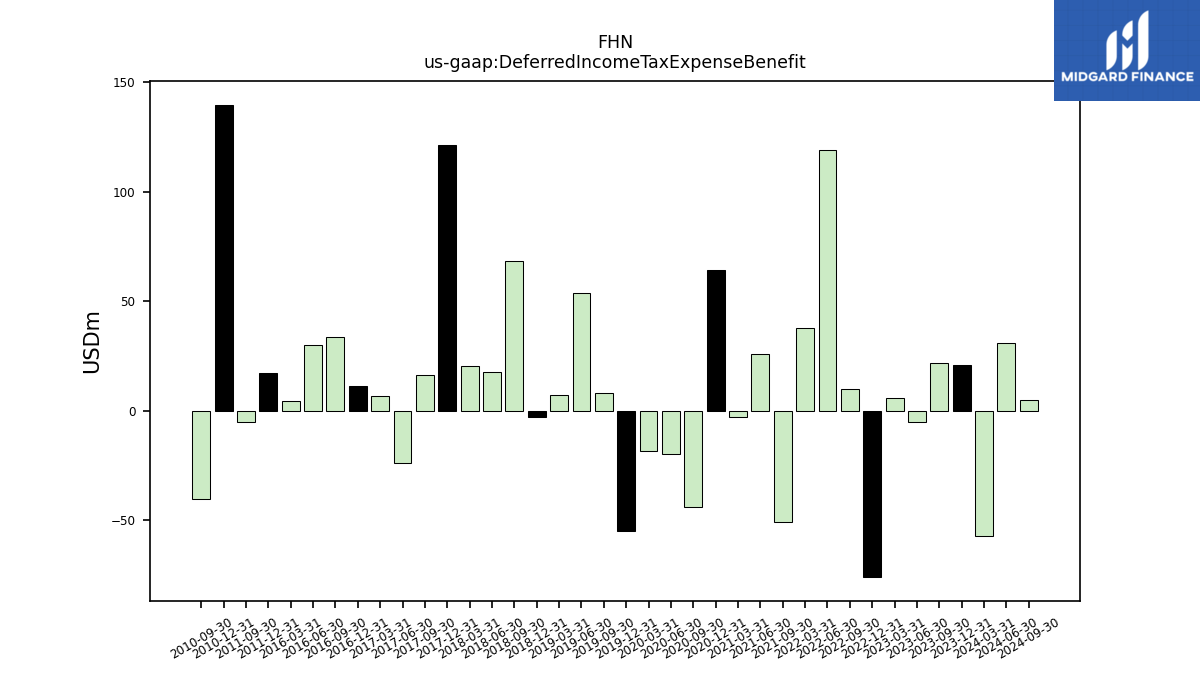
| Deferred Income Tax Expense Benefit | 21.00 | 22.00 | -5.00 | 6.00 | -76.00 | 10.00 | 119.00 | 38.00 | NA | -51.00 | 26.00 | -3.00 | 64.44 | -43.92 | -19.93 | -18.60 | |
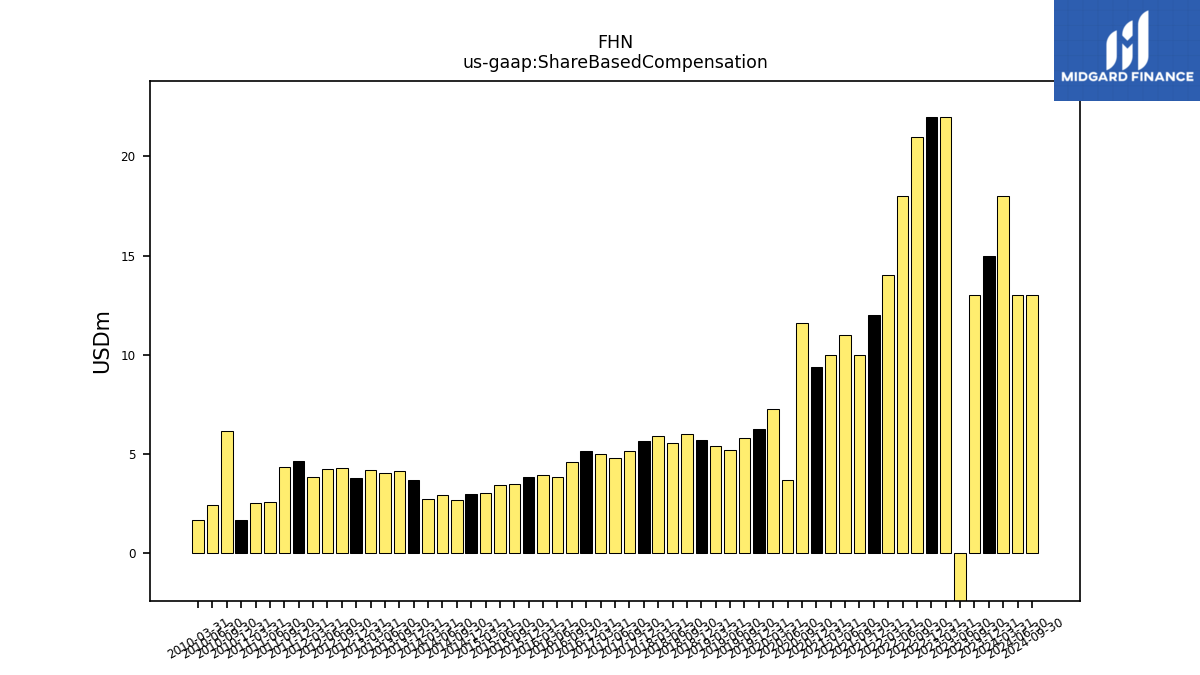
| Share Based Compensation | 15.00 | 13.00 | -14.00 | 22.00 | 22.00 | 21.00 | 18.00 | 14.00 | 12.00 | 10.00 | 11.00 | 10.00 | 9.41 | 11.59 | 3.72 | 7.28 |
| 2023-12-31 | 2023-09-30 | 2023-06-30 | 2023-03-31 | 2022-12-31 | 2022-09-30 | 2022-06-30 | 2022-03-31 | 2021-12-31 | 2021-09-30 | 2021-06-30 | 2021-03-31 | 2020-12-31 | 2020-09-30 | 2020-06-30 | 2020-03-31 | ||
|---|---|---|---|---|---|---|---|---|---|---|---|---|---|---|---|---|---|
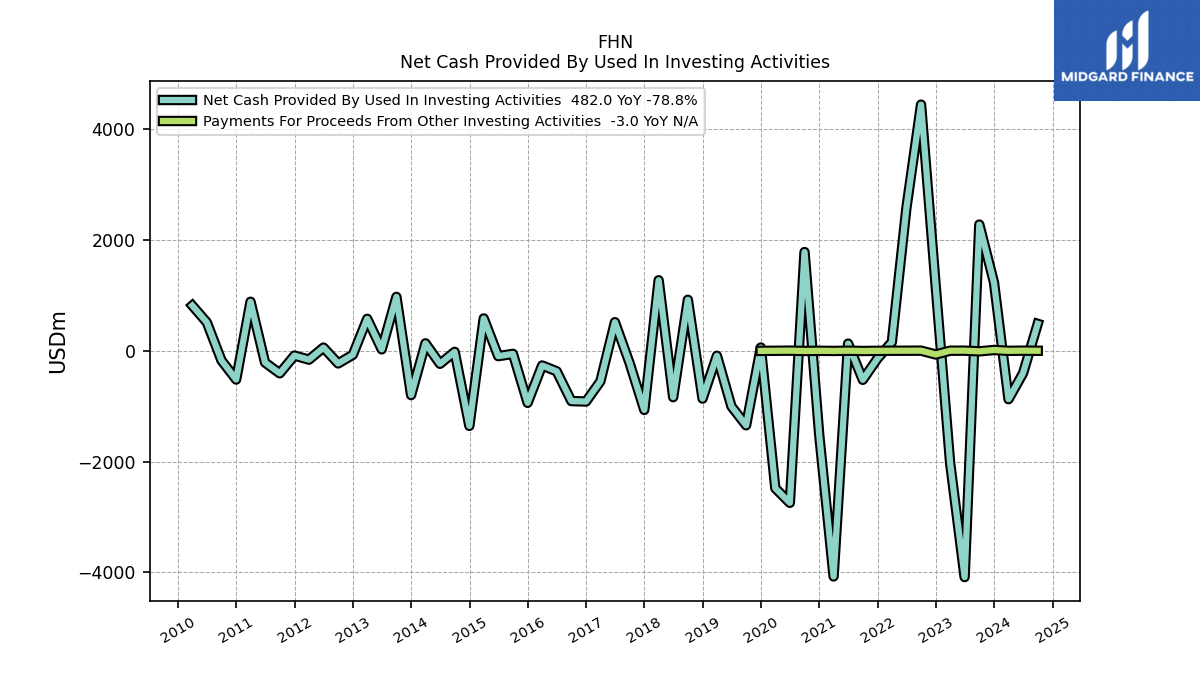
| Net Cash Provided By Used In Investing Activities | 1228.00 | 2273.00 | -4084.00 | -2022.00 | 1158.00 | 4435.00 | 2566.00 | 154.00 | -144.00 | -527.00 | 126.00 | -4072.00 | -1518.36 | 1777.62 | -2744.31 | -2481.94 |
| 2023-12-31 | 2023-09-30 | 2023-06-30 | 2023-03-31 | 2022-12-31 | 2022-09-30 | 2022-06-30 | 2022-03-31 | 2021-12-31 | 2021-09-30 | 2021-06-30 | 2021-03-31 | 2020-12-31 | 2020-09-30 | 2020-06-30 | 2020-03-31 | ||
|---|---|---|---|---|---|---|---|---|---|---|---|---|---|---|---|---|---|
| Net Cash Provided By Used In Financing Activities | -1300.00 | -2952.00 | 3902.00 | 1844.00 | -1523.00 | -5165.00 | -3410.00 | -771.00 | 201.00 | 607.00 | 159.00 | 3049.00 | 1053.24 | -1359.11 | 1736.76 | 3745.10 | |
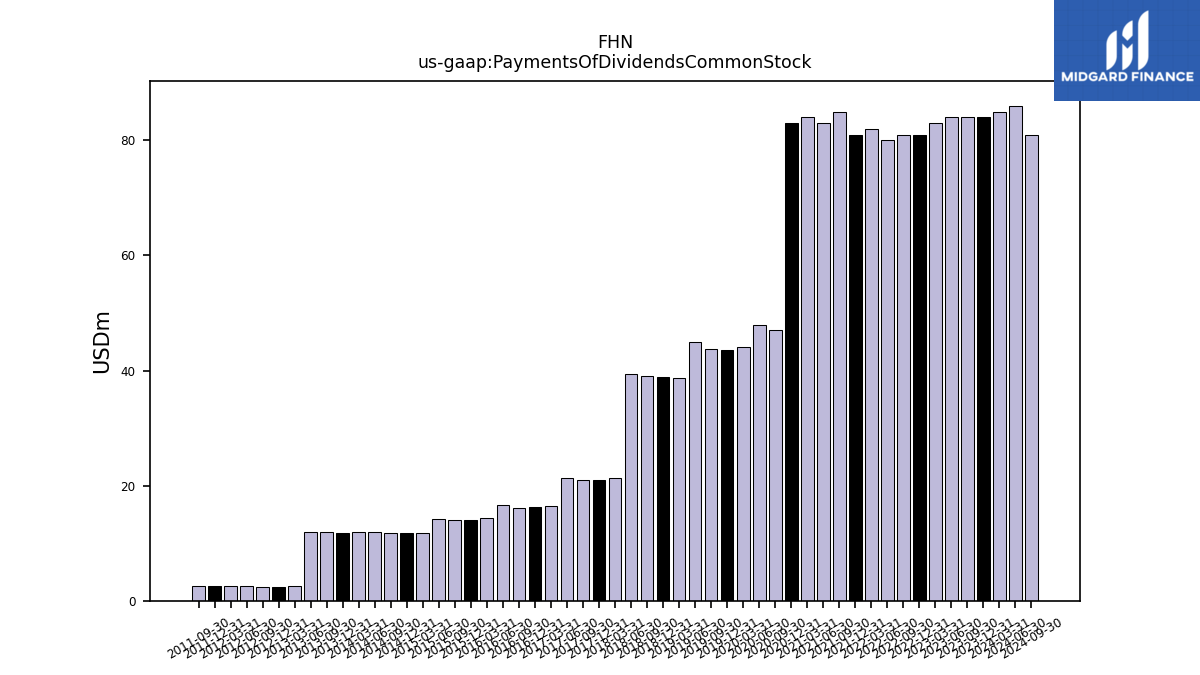
| Payments Of Dividends Common Stock | 84.00 | 84.00 | 84.00 | 83.00 | 81.00 | 81.00 | 80.00 | 82.00 | 81.00 | 85.00 | 83.00 | 84.00 | 83.06 | 47.02 | 47.85 | 44.08 | |
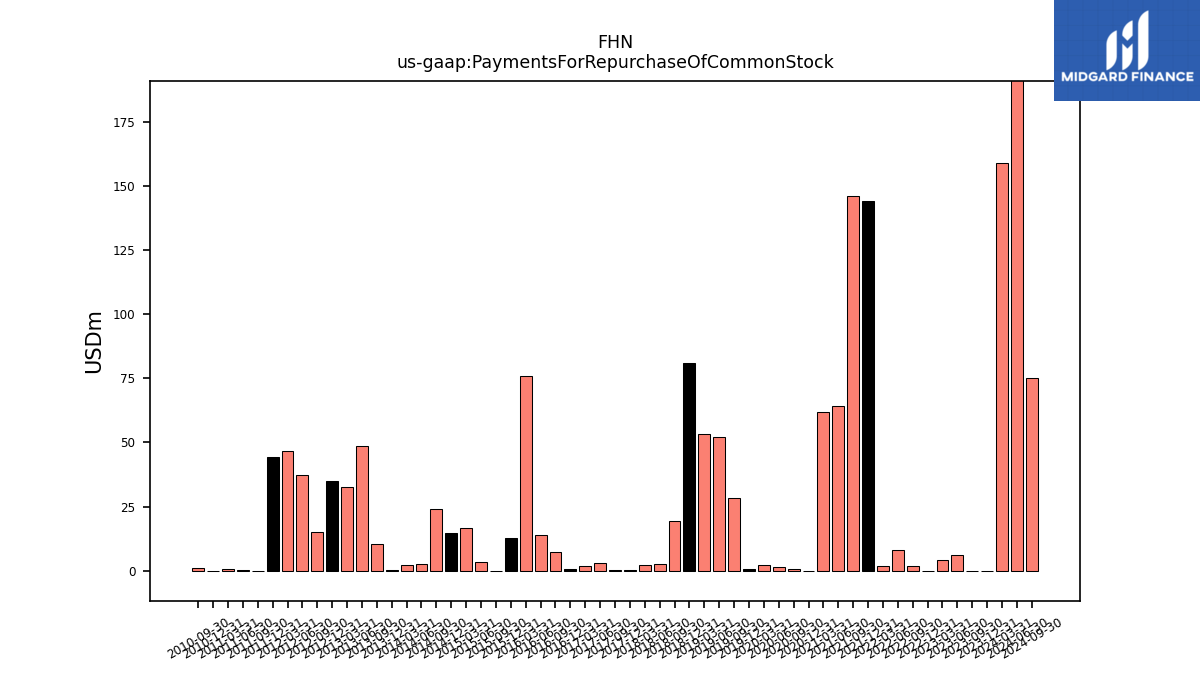
| Payments For Repurchase Of Common Stock | 0.00 | 0.00 | 6.00 | 4.00 | 0.00 | 2.00 | 8.00 | 2.00 | 144.00 | 146.00 | 64.00 | 62.00 | -0.29 | 0.75 | 1.48 | 2.06 |
| 2023-12-31 | 2023-09-30 | 2023-06-30 | 2023-03-31 | 2022-12-31 | 2022-09-30 | 2022-06-30 | 2022-03-31 | 2021-12-31 | 2021-09-30 | 2021-06-30 | 2021-03-31 | 2020-12-31 | 2020-09-30 | 2020-06-30 | 2020-03-31 | ||
|---|---|---|---|---|---|---|---|---|---|---|---|---|---|---|---|---|---|
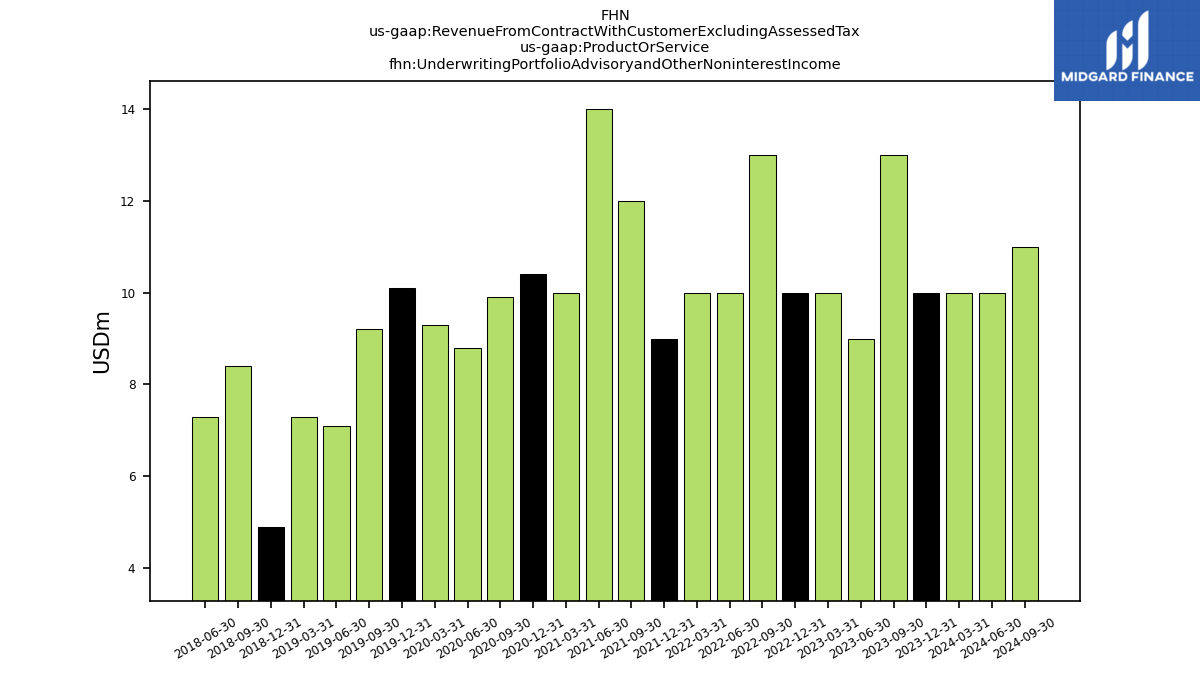
| Underwriting Portfolio Advisoryand Other Noninterest Income | 10.00 | 13.00 | 9.00 | 10.00 | 10.00 | 13.00 | 10.00 | 10.00 | 9.00 | 12.00 | 14.00 | 10.00 | 10.40 | 9.90 | 8.80 | 9.30 | |
| Interest Income Operating | 1086.00 | 1080.00 | 1015.00 | 920.00 | 856.00 | 733.00 | 583.00 | 510.00 | 532.00 | 533.00 | 542.00 | 552.00 | 575.00 | 598.00 | 346.00 | 378.00 |