
| 2024-02-03 | 2023-10-28 | 2023-07-29 | 2023-04-29 | 2023-01-28 | 2022-10-29 | 2022-07-30 | 2022-04-30 | 2022-01-29 | 2021-10-30 | 2021-07-31 | 2021-05-01 | 2021-01-30 | 2020-10-31 | 2020-08-01 | 2020-05-02 | 2020-02-01 | 2019-11-02 | 2019-08-03 | 2019-05-04 | 2019-02-02 | 2018-11-03 | 2018-08-04 | 2018-05-05 | 2018-02-03 | 2017-10-28 | 2017-07-29 | 2017-04-29 | 2017-01-28 | 2016-10-29 | 2016-07-30 | 2016-04-30 | 2016-01-30 | 2015-10-31 | 2015-08-01 | 2015-05-02 | 2015-01-31 | 2014-11-01 | 2014-08-02 | 2014-05-03 | 2014-02-01 | 2013-11-02 | 2013-08-03 | 2013-05-04 | 2013-02-02 | 2012-10-27 | 2012-07-28 | 2012-04-28 | 2012-01-28 | 2011-10-29 | 2011-07-30 | 2011-04-30 | ||
|---|---|---|---|---|---|---|---|---|---|---|---|---|---|---|---|---|---|---|---|---|---|---|---|---|---|---|---|---|---|---|---|---|---|---|---|---|---|---|---|---|---|---|---|---|---|---|---|---|---|---|---|---|---|
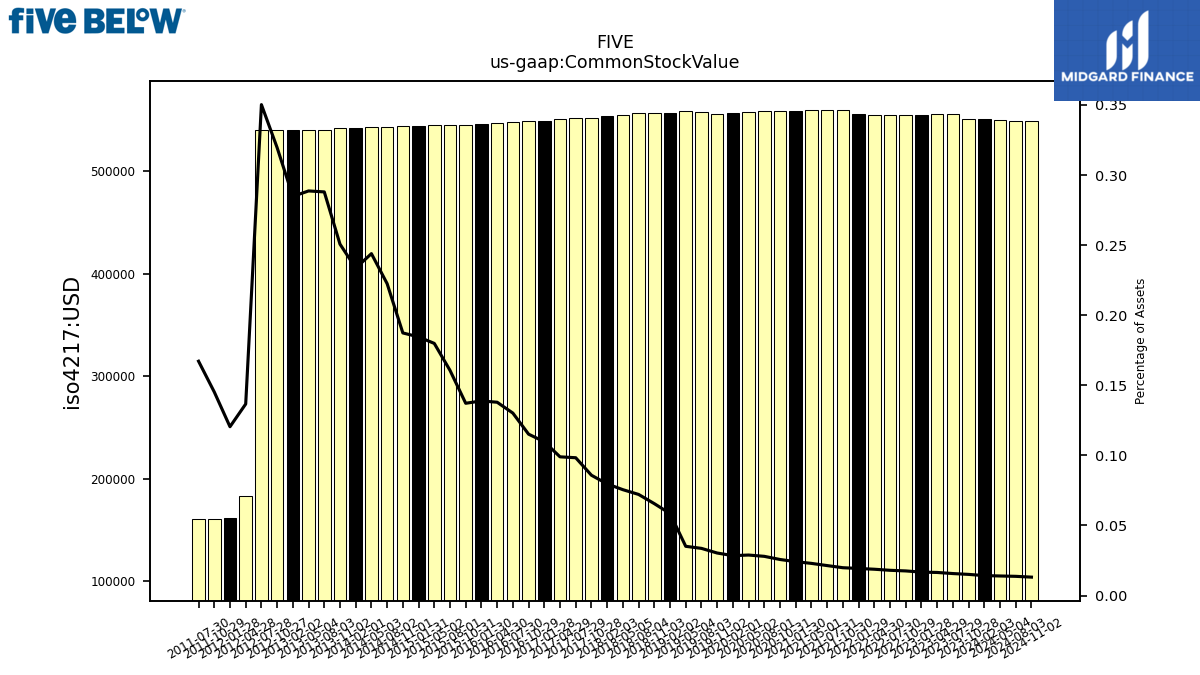
| Common Stock Value | 0.55 | 0.55 | 0.56 | 0.56 | 0.56 | 0.56 | 0.56 | 0.56 | 0.56 | 0.56 | 0.56 | 0.56 | 0.56 | 0.56 | 0.56 | 0.56 | 0.56 | 0.56 | 0.56 | 0.56 | 0.56 | 0.56 | 0.56 | 0.56 | 0.55 | 0.55 | 0.55 | 0.55 | 0.55 | 0.55 | 0.55 | 0.55 | 0.55 | 0.55 | 0.55 | 0.55 | 0.54 | 0.54 | 0.54 | 0.54 | 0.54 | 0.54 | 0.54 | 0.54 | 0.54 | 0.54 | 0.54 | 0.18 | 0.16 | 0.16 | 0.16 | NA | |
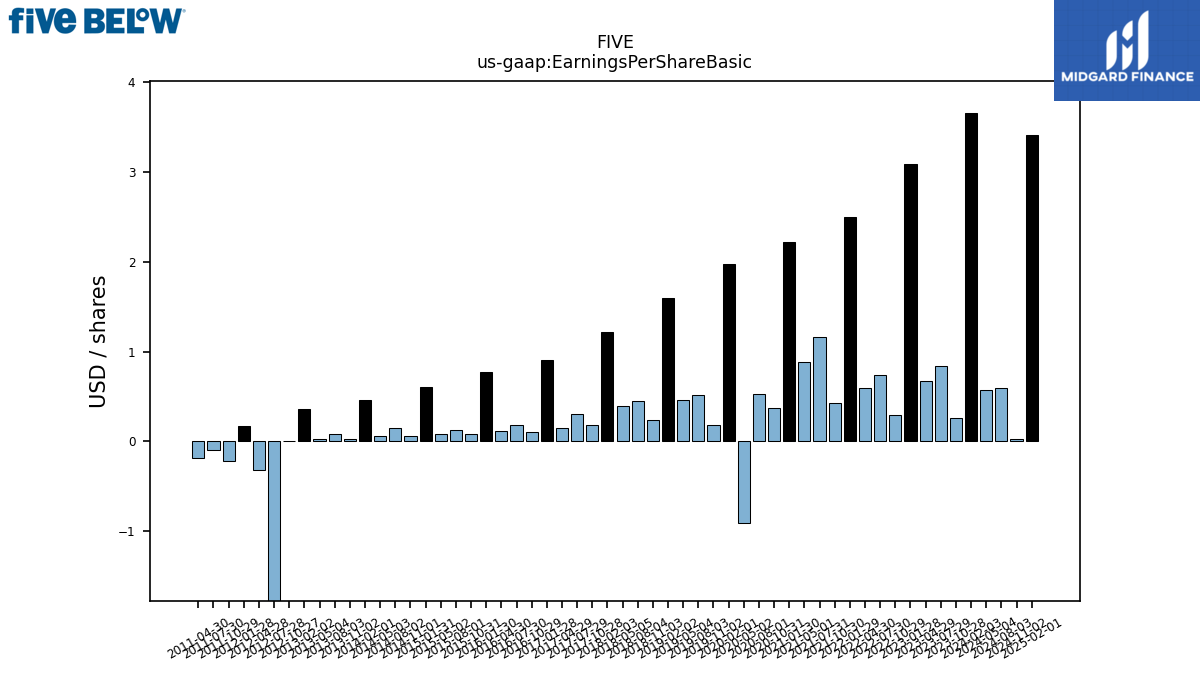
| Earnings Per Share Basic | 3.66 | 0.26 | 0.84 | 0.67 | 3.09 | 0.29 | 0.74 | 0.59 | 2.50 | 0.43 | 1.16 | 0.89 | 2.22 | 0.37 | 0.53 | -0.91 | 1.98 | 0.18 | 0.52 | 0.46 | 1.60 | 0.24 | 0.45 | 0.39 | 1.22 | 0.18 | 0.30 | 0.15 | 0.91 | 0.10 | 0.18 | 0.12 | 0.77 | 0.08 | 0.13 | 0.08 | 0.61 | 0.06 | 0.15 | 0.06 | 0.46 | 0.03 | 0.08 | 0.03 | 0.36 | 0.01 | -3.41 | -0.32 | 0.17 | -0.22 | -0.10 | -0.18 | |
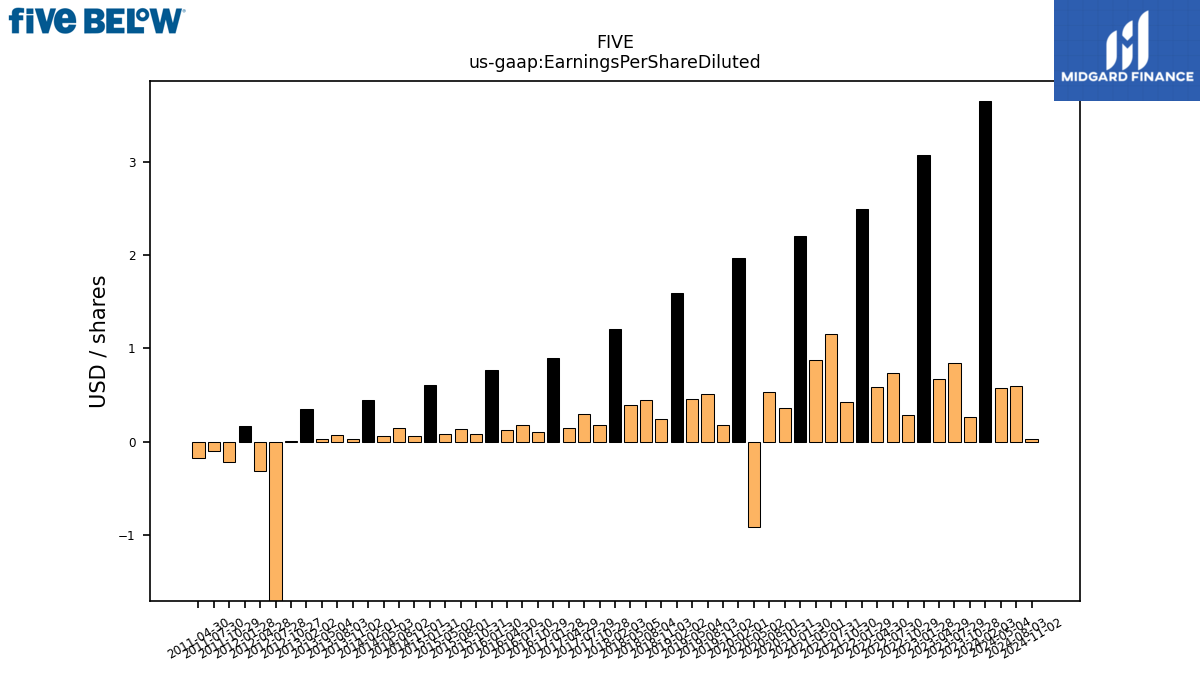
| Earnings Per Share Diluted | 3.65 | 0.26 | 0.84 | 0.67 | 3.07 | 0.29 | 0.74 | 0.59 | 2.49 | 0.43 | 1.15 | 0.88 | 2.20 | 0.36 | 0.53 | -0.91 | 1.97 | 0.18 | 0.51 | 0.46 | 1.59 | 0.24 | 0.45 | 0.39 | 1.21 | 0.18 | 0.30 | 0.15 | 0.90 | 0.10 | 0.18 | 0.12 | 0.77 | 0.08 | 0.13 | 0.08 | 0.61 | 0.06 | 0.15 | 0.06 | 0.45 | 0.03 | 0.07 | 0.03 | 0.35 | 0.01 | -3.41 | -0.32 | 0.17 | -0.22 | -0.10 | -0.18 |
| 2024-02-03 | 2023-10-28 | 2023-07-29 | 2023-04-29 | 2023-01-28 | 2022-10-29 | 2022-07-30 | 2022-04-30 | 2022-01-29 | 2021-10-30 | 2021-07-31 | 2021-05-01 | 2021-01-30 | 2020-10-31 | 2020-08-01 | 2020-05-02 | 2020-02-01 | 2019-11-02 | 2019-08-03 | 2019-05-04 | 2019-02-02 | 2018-11-03 | 2018-08-04 | 2018-05-05 | 2018-02-03 | 2017-10-28 | 2017-07-29 | 2017-04-29 | 2017-01-28 | 2016-10-29 | 2016-07-30 | 2016-04-30 | 2016-01-30 | 2015-10-31 | 2015-08-01 | 2015-05-02 | 2015-01-31 | 2014-11-01 | 2014-08-02 | 2014-05-03 | 2014-02-01 | 2013-11-02 | 2013-08-03 | 2013-05-04 | 2013-02-02 | 2012-10-27 | 2012-07-28 | 2012-04-28 | 2012-01-28 | 2011-10-29 | 2011-07-30 | 2011-04-30 | ||
|---|---|---|---|---|---|---|---|---|---|---|---|---|---|---|---|---|---|---|---|---|---|---|---|---|---|---|---|---|---|---|---|---|---|---|---|---|---|---|---|---|---|---|---|---|---|---|---|---|---|---|---|---|---|
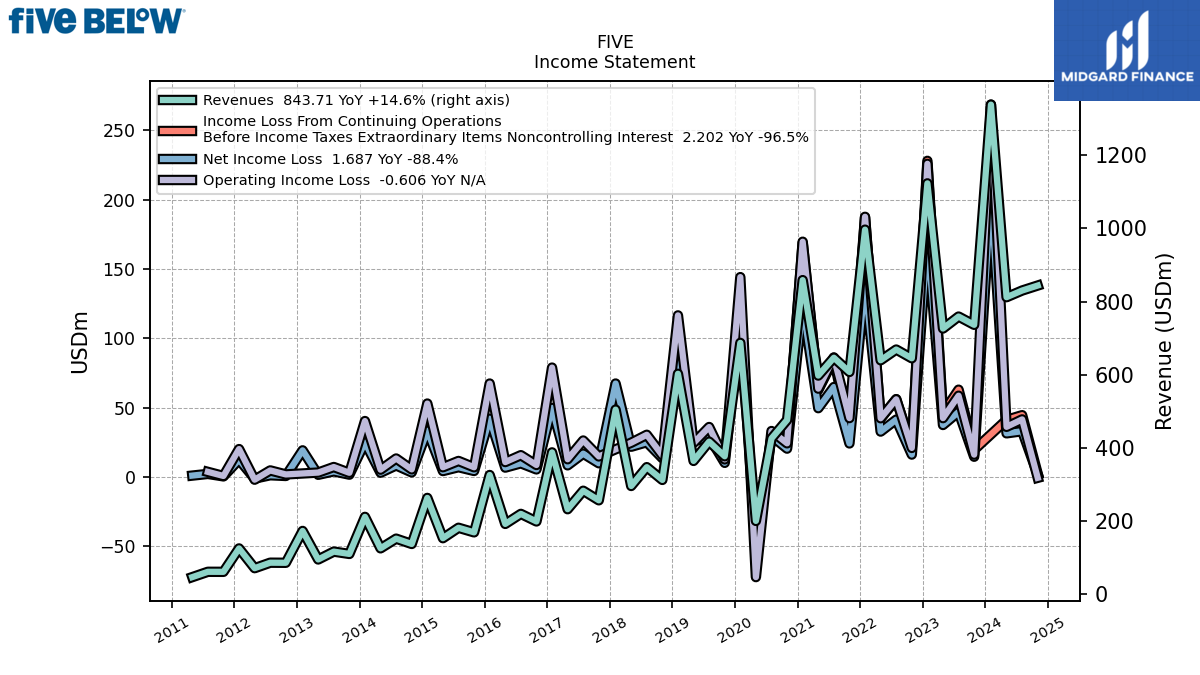
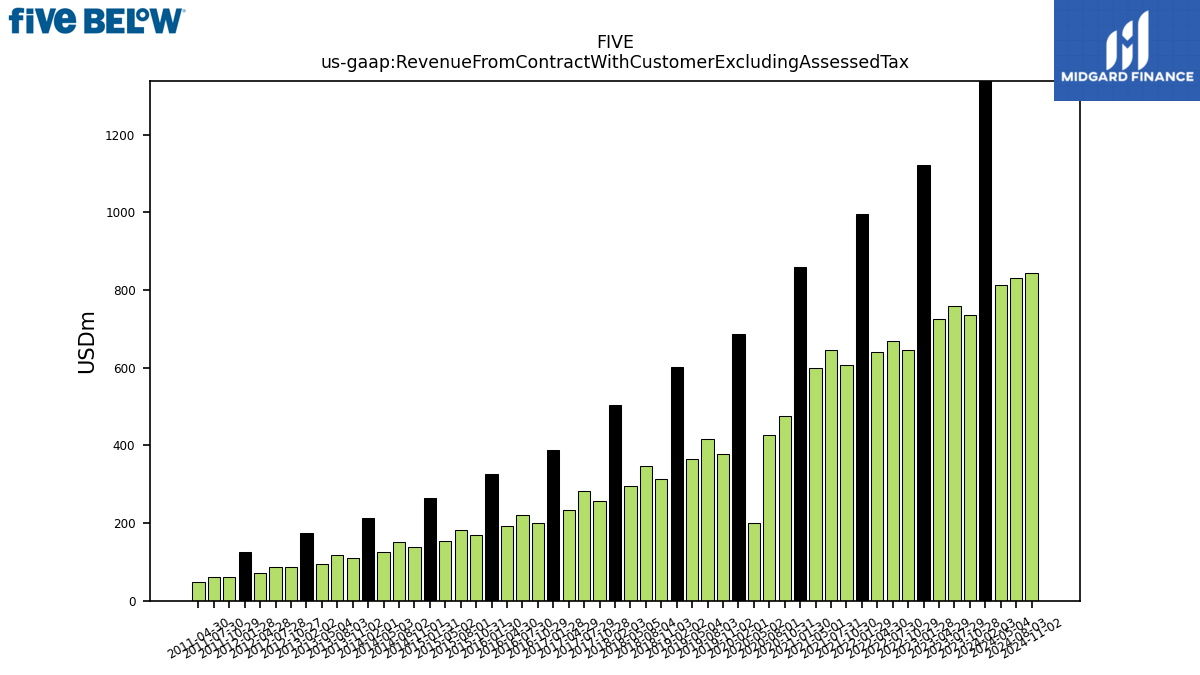
| Revenue From Contract With Customer Excluding Assessed Tax | 1337.74 | 736.40 | 758.98 | 726.25 | 1122.75 | 645.03 | 668.93 | 639.60 | 996.33 | 607.64 | 646.55 | 597.82 | 858.51 | 476.61 | 426.11 | 200.90 | 687.13 | 377.44 | 417.40 | 364.76 | 602.68 | 312.82 | 347.73 | 296.32 | 504.83 | 257.18 | 283.32 | 232.88 | 388.09 | 199.47 | 220.13 | 192.72 | 326.35 | 169.69 | 182.19 | 153.73 | 263.76 | 137.98 | 152.48 | 126.00 | 211.96 | 110.75 | 117.09 | 95.60 | 173.59 | 86.59 | 86.82 | 71.83 | 125.83 | 61.90 | 61.97 | 47.43 | |
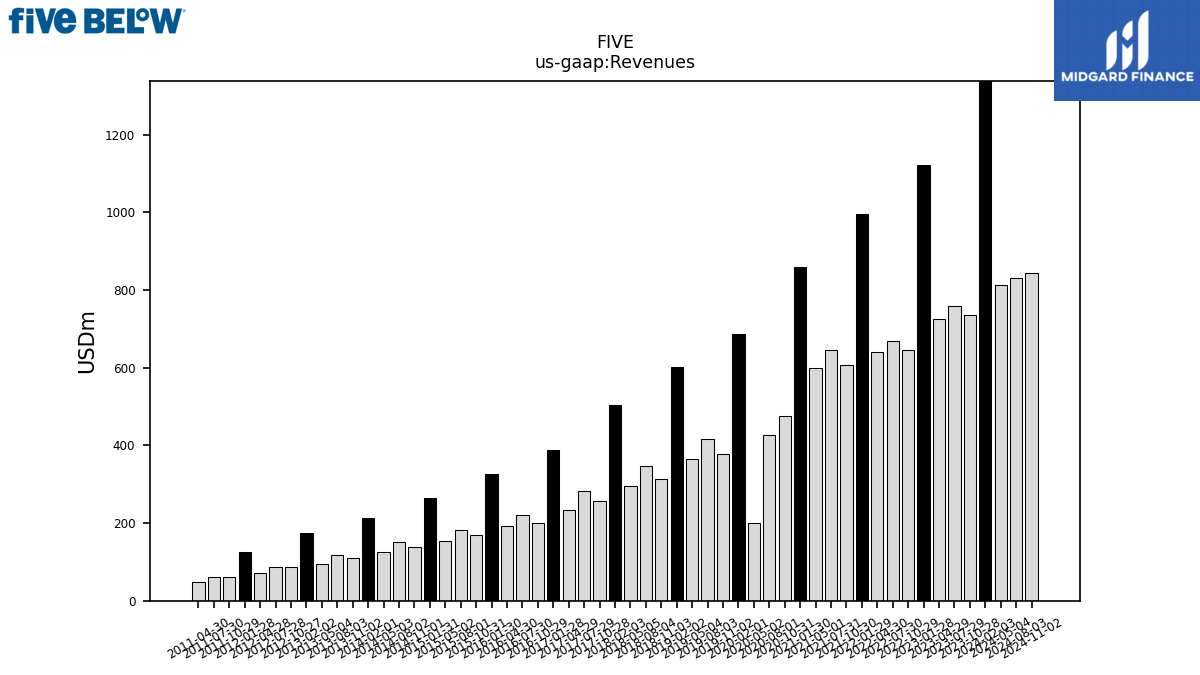
| Revenues | 1337.74 | 736.40 | 758.98 | 726.25 | 1122.75 | 645.03 | 668.93 | 639.60 | 996.33 | 607.64 | 646.55 | 597.82 | 858.51 | 476.61 | 426.11 | 200.90 | 687.13 | 377.44 | 417.40 | 364.76 | 602.68 | 312.82 | 347.73 | 296.32 | 504.83 | 257.18 | 283.32 | 232.88 | 388.09 | 199.47 | 220.13 | 192.72 | 326.35 | 169.69 | 182.19 | 153.73 | 263.76 | 137.98 | 152.48 | 126.00 | 211.96 | 110.75 | 117.09 | 95.60 | 173.59 | 86.59 | 86.82 | 71.83 | 125.83 | 61.90 | 61.97 | 47.43 | |
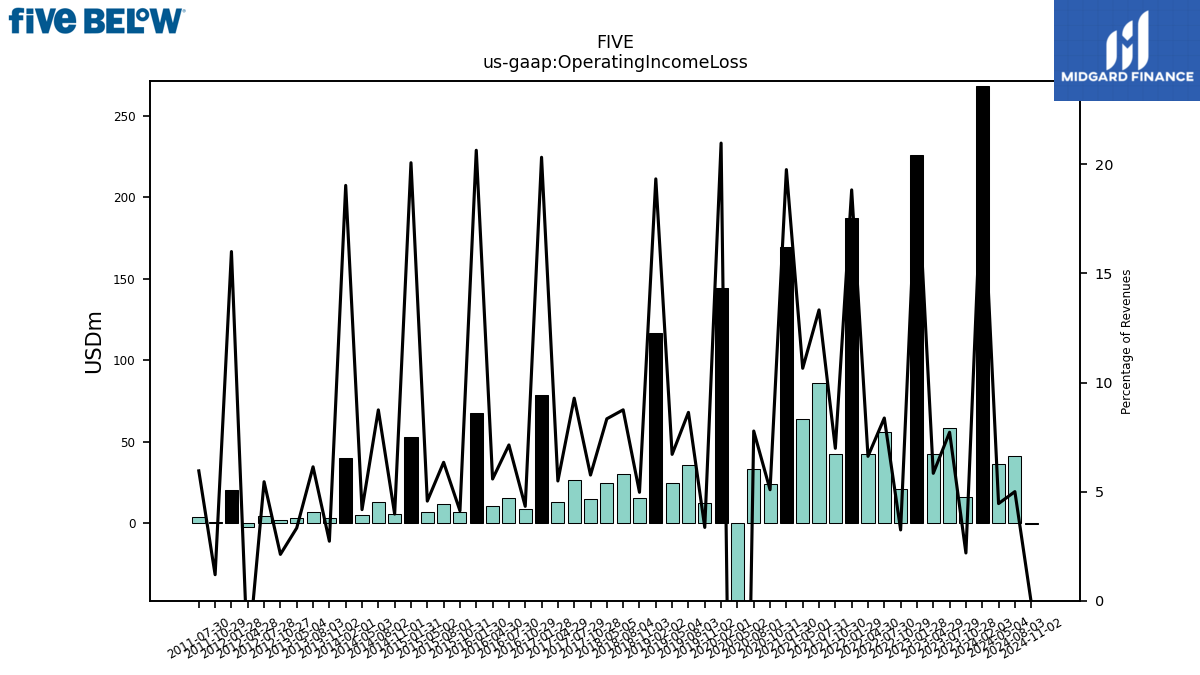
| Operating Income Loss | 268.44 | 16.12 | 58.59 | 42.41 | 225.77 | 20.93 | 56.01 | 42.33 | 187.58 | 42.45 | 86.17 | 63.69 | 169.61 | 24.25 | 33.14 | -72.20 | 144.10 | 12.69 | 36.03 | 24.47 | 116.51 | 15.55 | 30.42 | 24.71 | NA | 14.81 | 26.30 | 12.78 | 78.86 | 8.63 | 15.71 | 10.75 | 67.37 | 7.00 | 11.56 | 7.02 | 52.94 | 5.48 | 13.34 | 5.26 | 40.34 | 3.02 | 7.19 | 3.19 | NA | 1.84 | 4.74 | -1.97 | 20.13 | 0.74 | 3.69 | NA | |
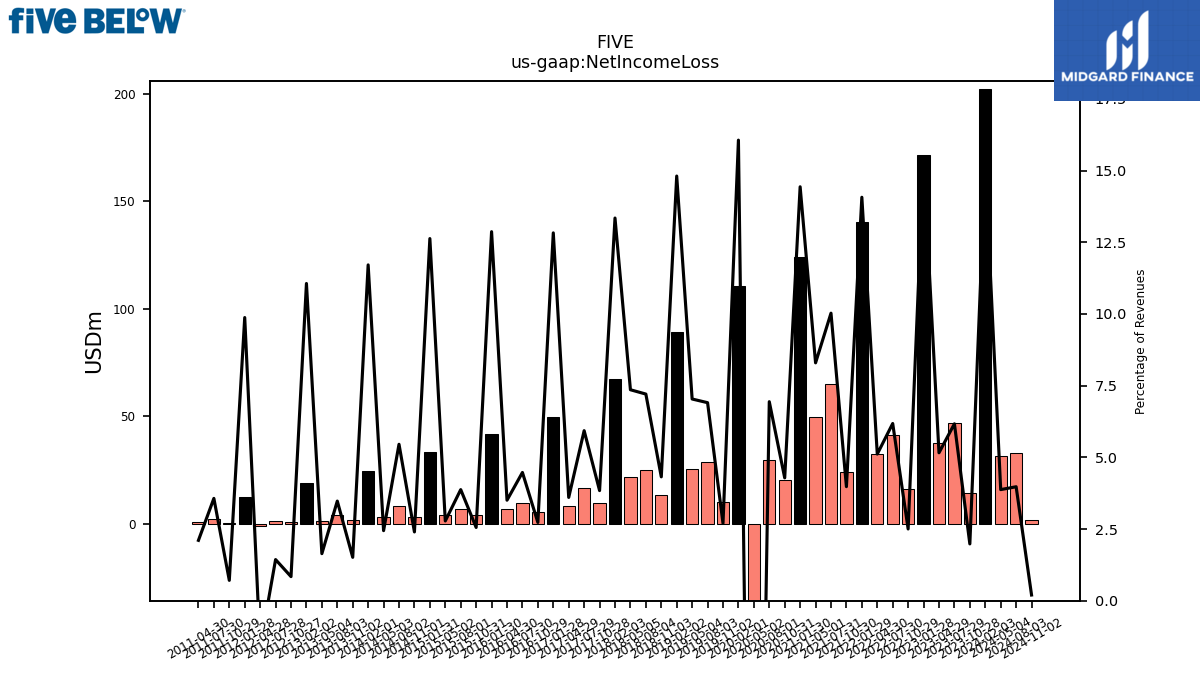
| Net Income Loss | 202.20 | 14.59 | 46.84 | 37.48 | 171.32 | 16.15 | 41.34 | 32.72 | 140.20 | 24.18 | 64.84 | 49.60 | 123.94 | 20.43 | 29.58 | -50.58 | 110.37 | 10.19 | 28.83 | 25.66 | 89.26 | 13.52 | 25.06 | 21.80 | 67.38 | 9.88 | 16.80 | 8.39 | 49.79 | 5.45 | 9.85 | 6.76 | 42.00 | 4.34 | 7.06 | 4.28 | 33.31 | 3.31 | 8.32 | 3.08 | 24.83 | 1.68 | 4.07 | 1.57 | 19.21 | 0.73 | 1.25 | -1.16 | 12.43 | 0.44 | 2.21 | 1.00 |
| 2024-02-03 | 2023-10-28 | 2023-07-29 | 2023-04-29 | 2023-01-28 | 2022-10-29 | 2022-07-30 | 2022-04-30 | 2022-01-29 | 2021-10-30 | 2021-07-31 | 2021-05-01 | 2021-01-30 | 2020-10-31 | 2020-08-01 | 2020-05-02 | 2020-02-01 | 2019-11-02 | 2019-08-03 | 2019-05-04 | 2019-02-02 | 2018-11-03 | 2018-08-04 | 2018-05-05 | 2018-02-03 | 2017-10-28 | 2017-07-29 | 2017-04-29 | 2017-01-28 | 2016-10-29 | 2016-07-30 | 2016-04-30 | 2016-01-30 | 2015-10-31 | 2015-08-01 | 2015-05-02 | 2015-01-31 | 2014-11-01 | 2014-08-02 | 2014-05-03 | 2014-02-01 | 2013-11-02 | 2013-08-03 | 2013-05-04 | 2013-02-02 | 2012-10-27 | 2012-07-28 | 2012-04-28 | 2012-01-28 | 2011-10-29 | 2011-07-30 | 2011-04-30 | ||
|---|---|---|---|---|---|---|---|---|---|---|---|---|---|---|---|---|---|---|---|---|---|---|---|---|---|---|---|---|---|---|---|---|---|---|---|---|---|---|---|---|---|---|---|---|---|---|---|---|---|---|---|---|---|
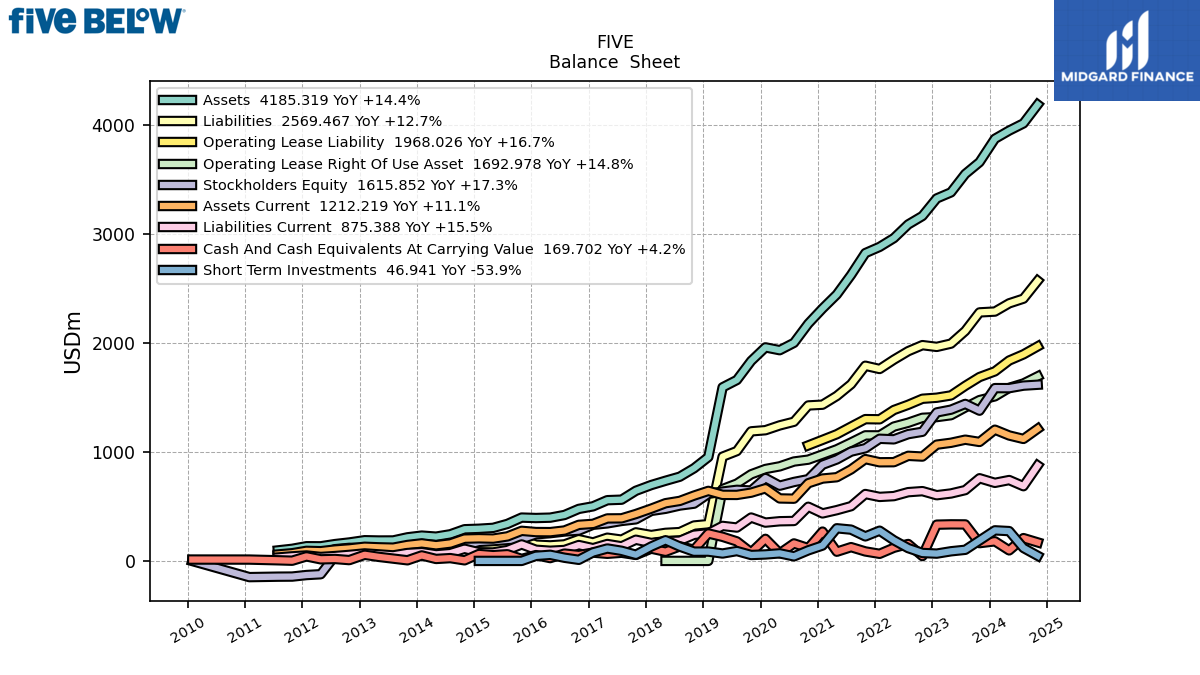
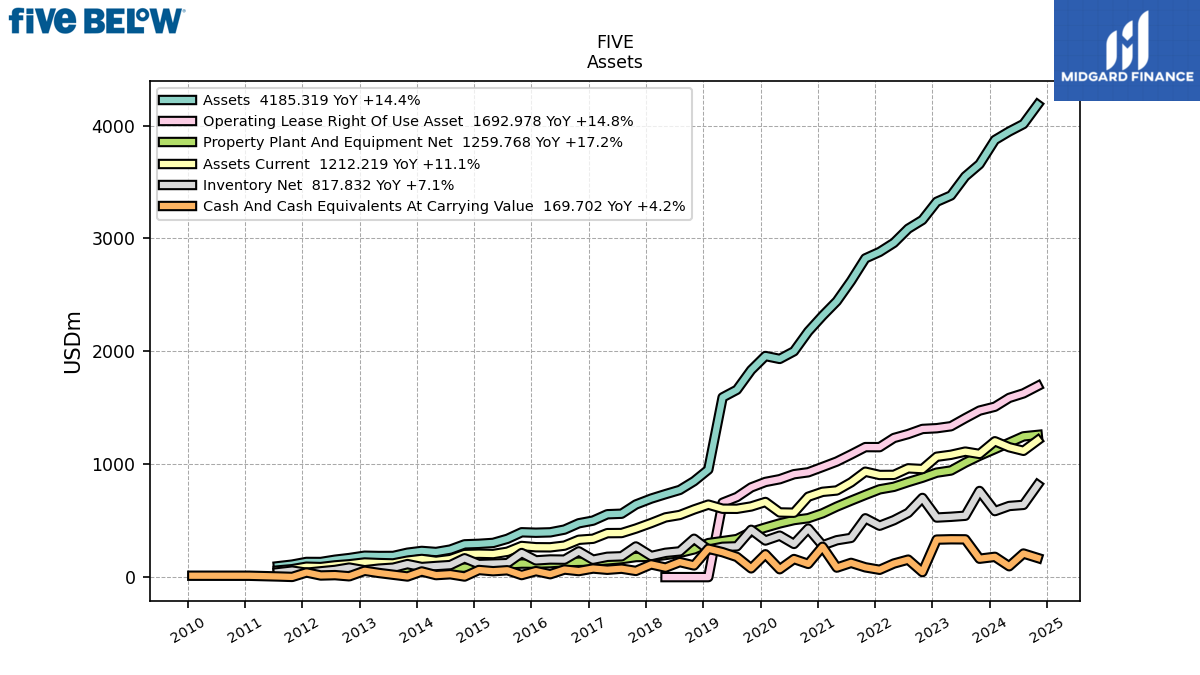
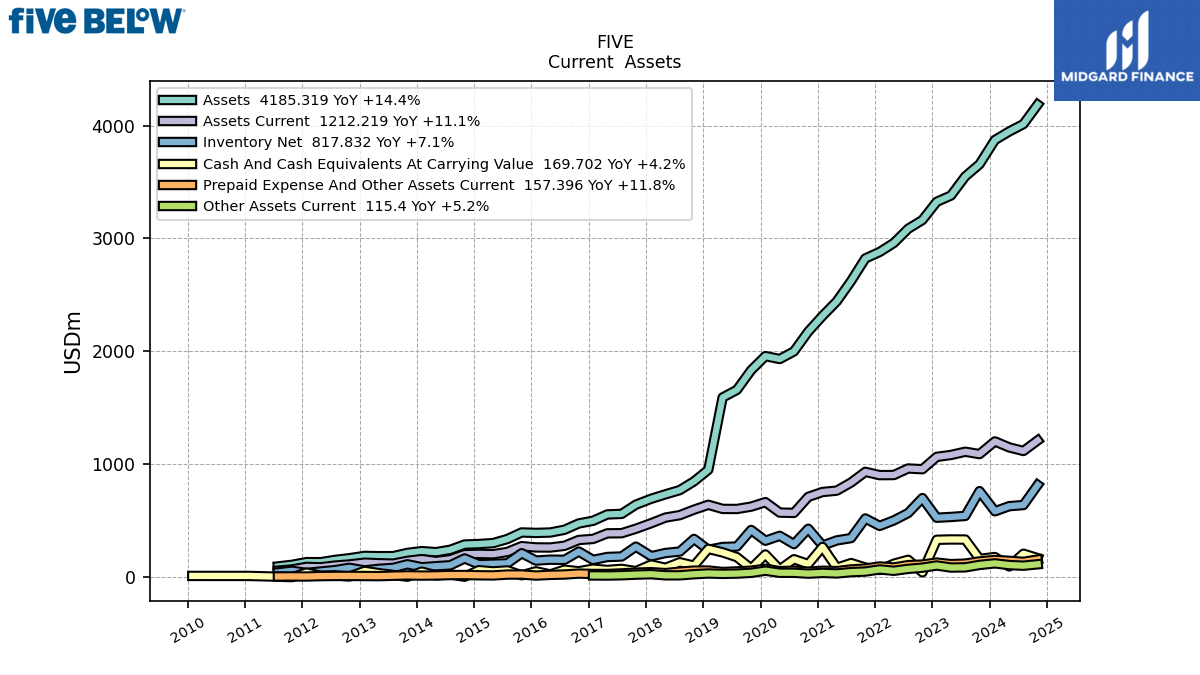
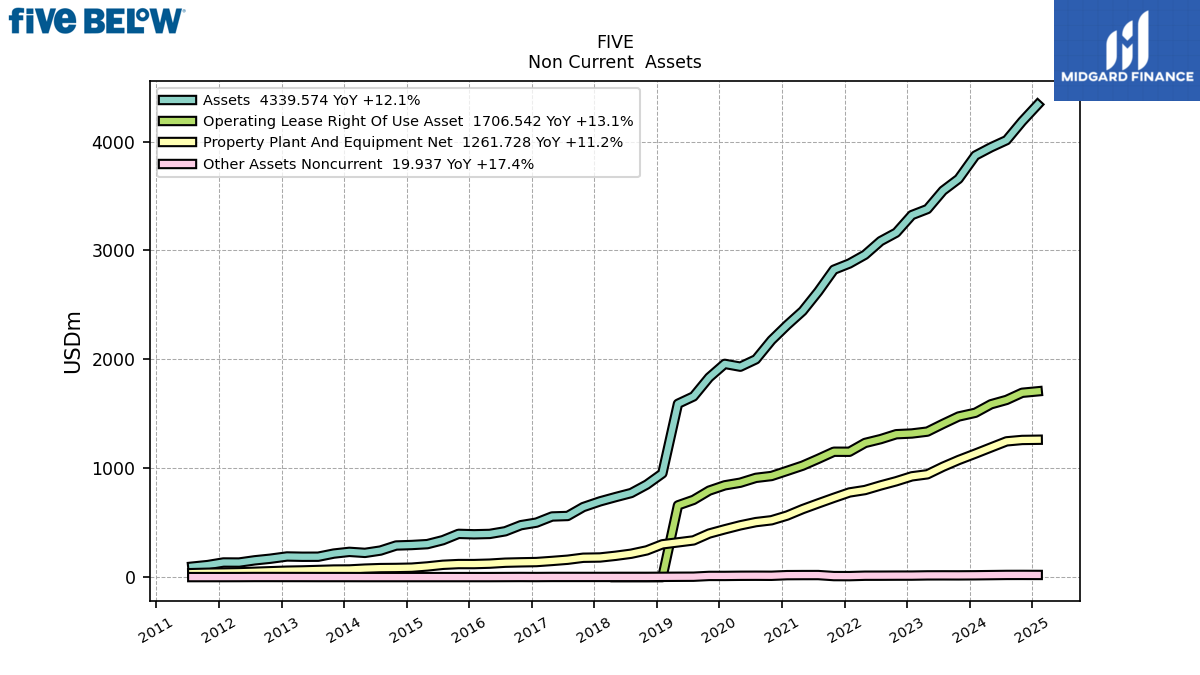
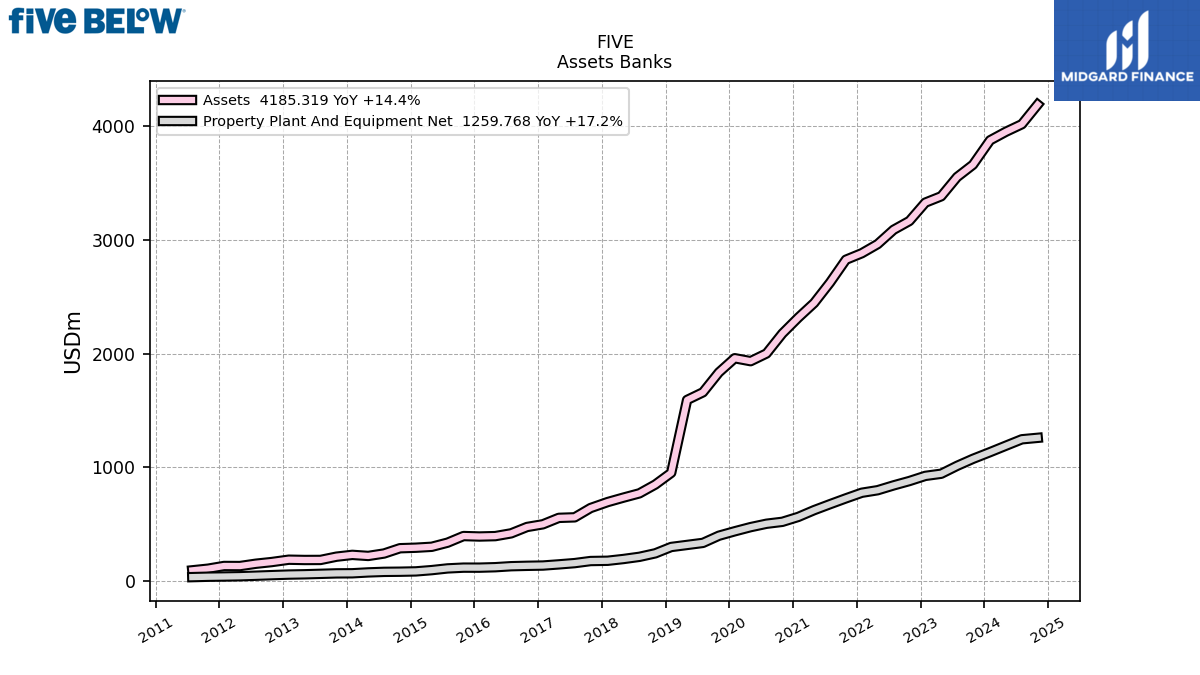
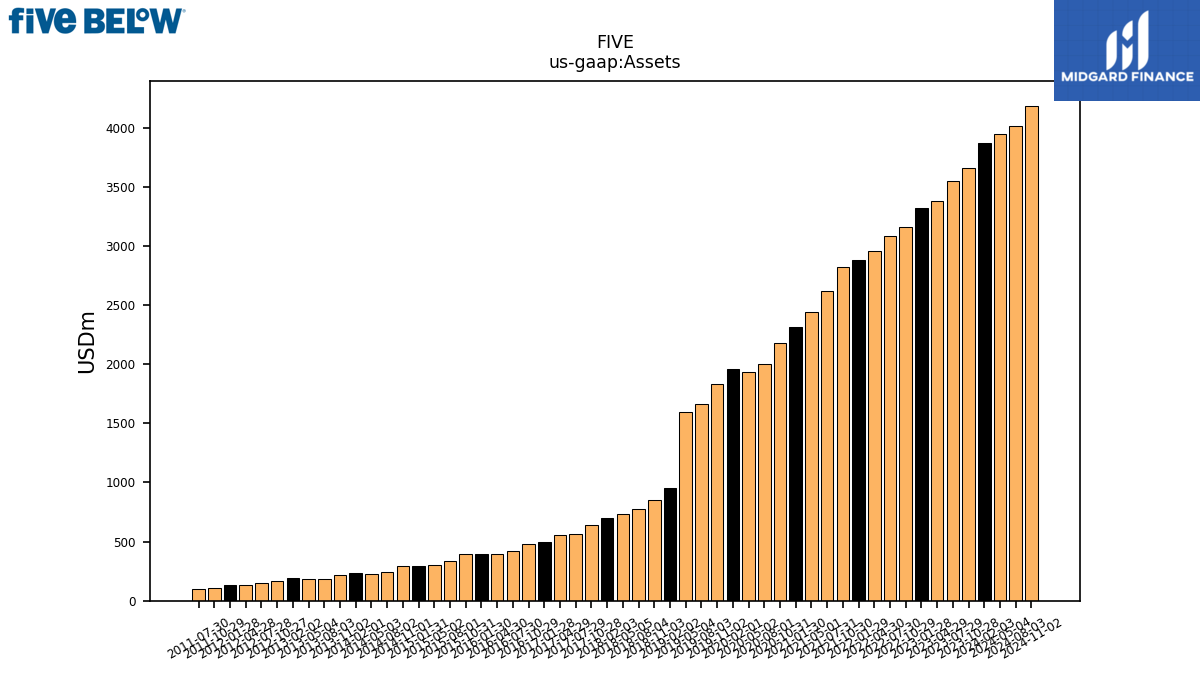
| Assets | 3872.04 | 3657.44 | 3549.41 | 3380.51 | 3324.91 | 3163.72 | 3086.23 | 2960.78 | 2880.46 | 2823.45 | 2622.93 | 2443.73 | 2314.77 | 2175.50 | 2000.25 | 1932.72 | 1958.66 | 1833.75 | 1659.42 | 1592.28 | 952.26 | 849.74 | 772.34 | 735.04 | 695.71 | 643.32 | 561.58 | 556.93 | 500.54 | 476.91 | 421.07 | 396.72 | 393.29 | 397.38 | 339.30 | 303.02 | 294.86 | 290.40 | 244.08 | 222.63 | 232.05 | 216.22 | 187.54 | 187.09 | 189.66 | 169.01 | 154.19 | 133.94 | 134.53 | 110.88 | 96.32 | NA | |
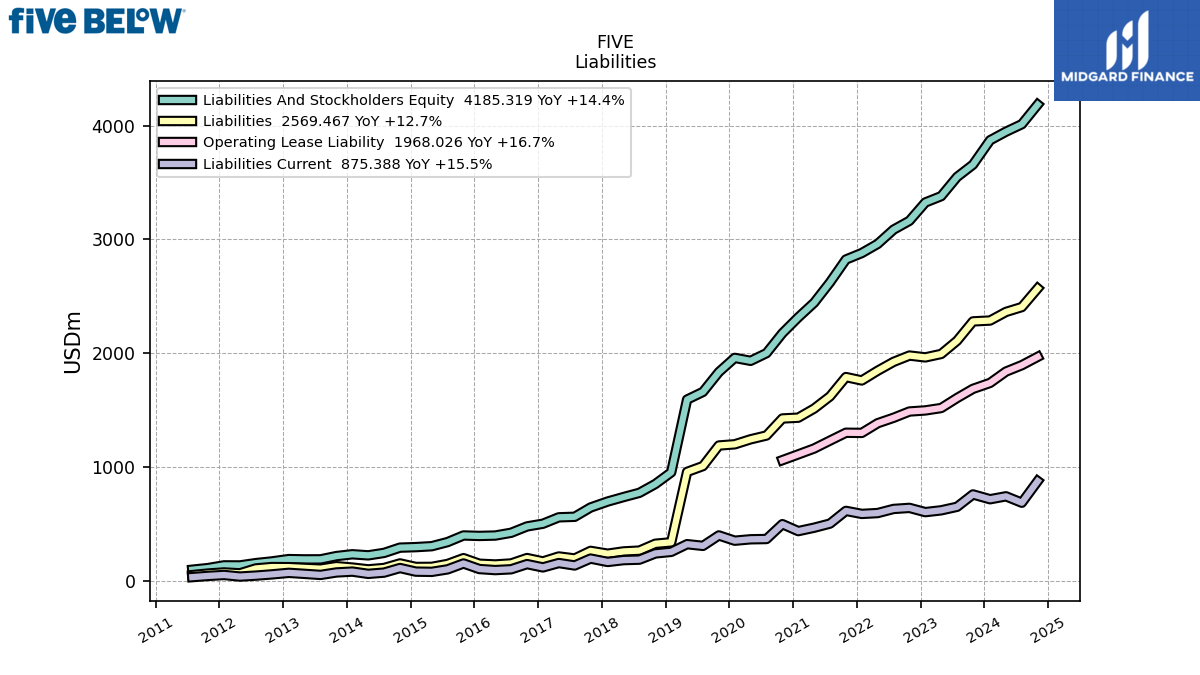
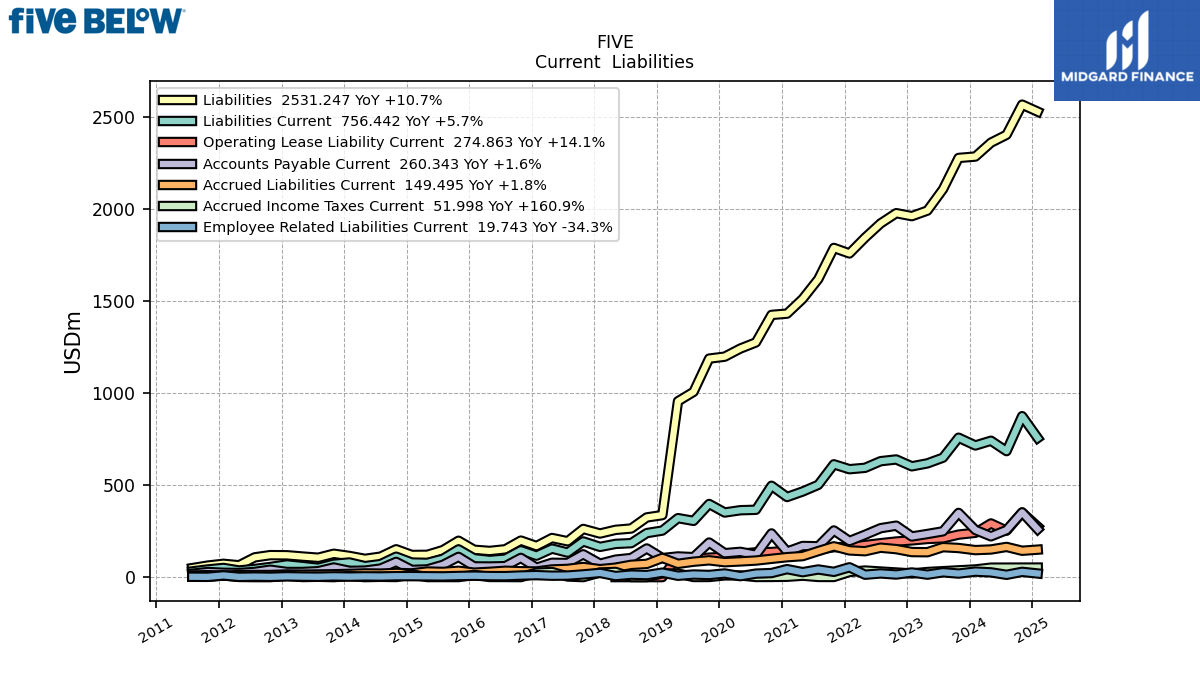
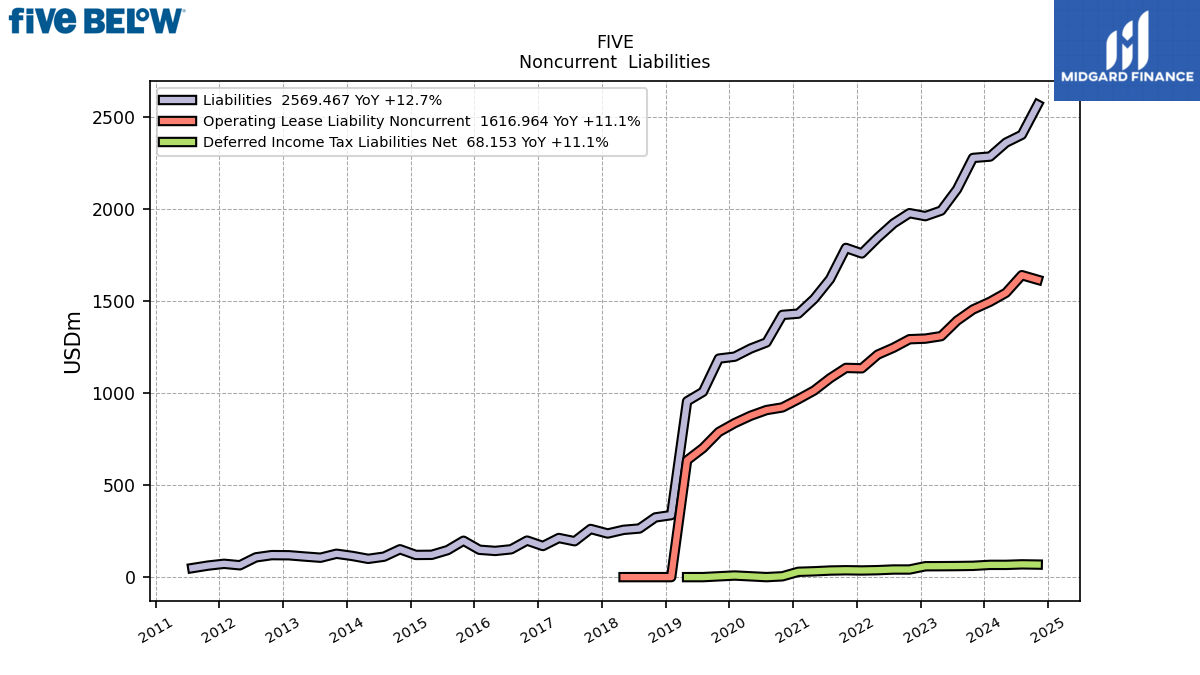
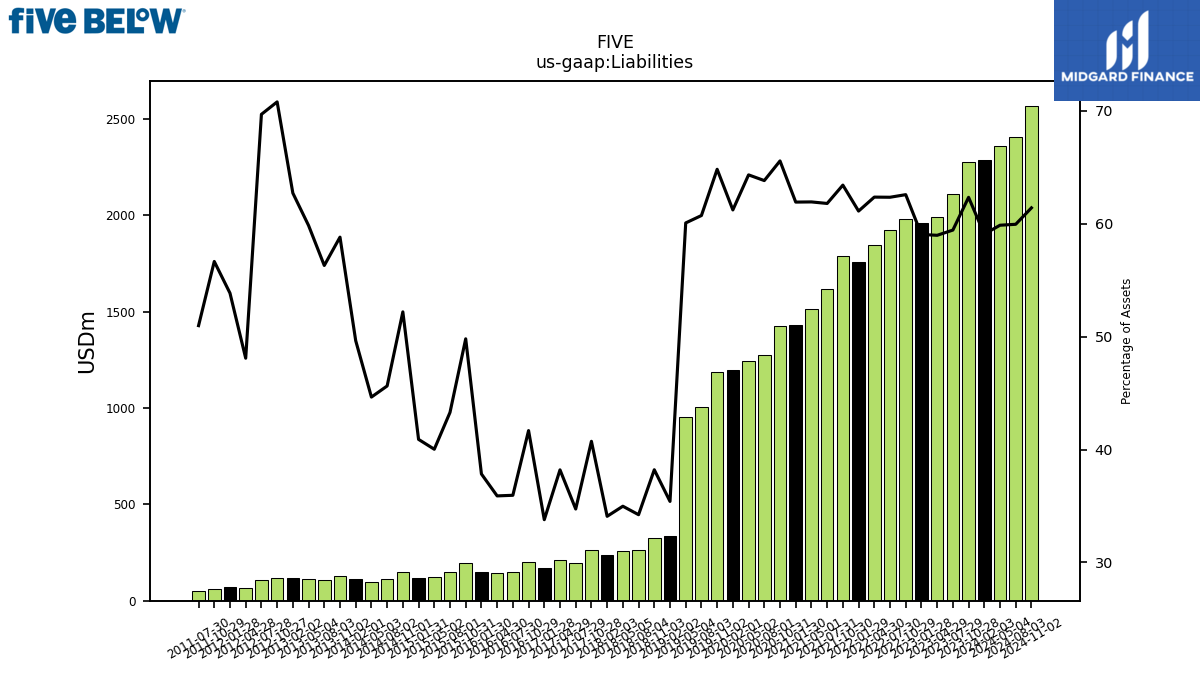
| Liabilities | 2287.08 | 2279.51 | 2109.26 | 1993.21 | 1962.98 | 1979.23 | 1923.64 | 1845.84 | 1760.18 | 1790.20 | 1620.47 | 1513.09 | 1432.88 | 1425.95 | 1276.29 | 1242.96 | 1198.88 | 1188.36 | 1007.48 | 956.28 | 337.17 | 324.67 | 264.38 | 257.12 | 237.15 | 262.00 | 195.06 | 212.74 | 169.13 | 198.76 | 151.37 | 142.40 | 148.81 | 197.90 | 146.86 | 121.28 | 120.59 | 151.54 | 111.36 | 99.39 | 115.18 | 127.13 | 105.57 | 111.94 | 118.92 | 119.61 | 107.43 | 64.40 | 72.43 | 62.81 | 49.09 | NA | |
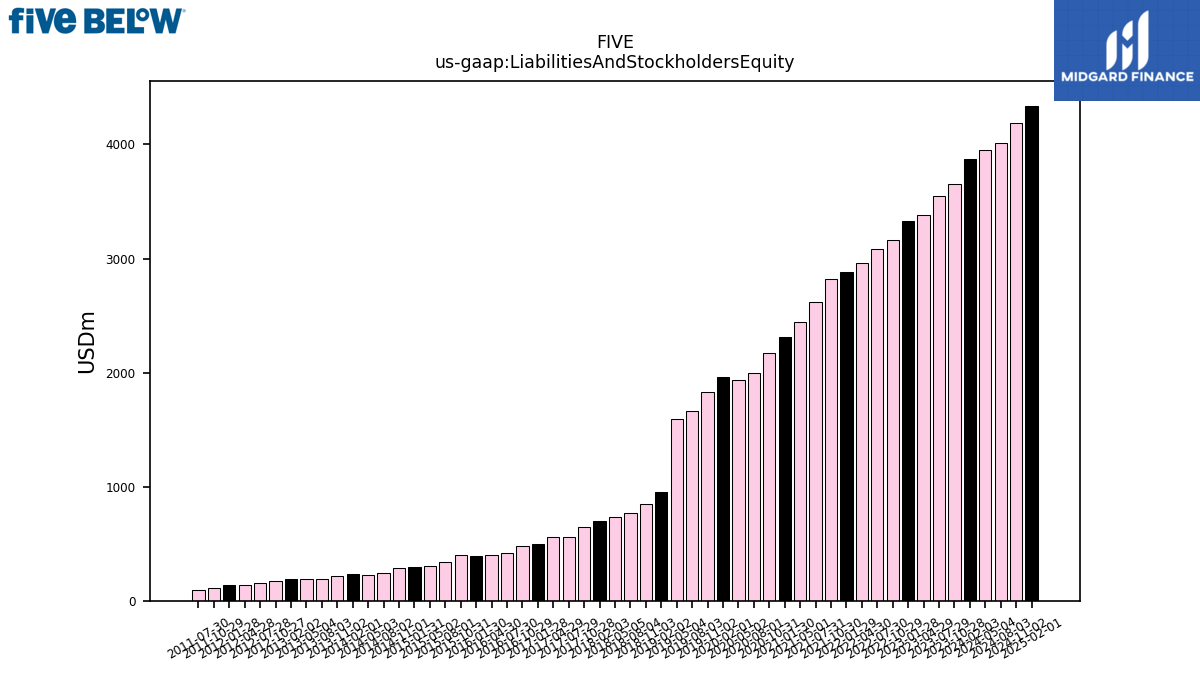
| Liabilities And Stockholders Equity | 3872.04 | 3657.44 | 3549.41 | 3380.51 | 3324.91 | 3163.72 | 3086.23 | 2960.78 | 2880.46 | 2823.45 | 2622.93 | 2443.73 | 2314.77 | 2175.50 | 2000.25 | 1932.72 | 1958.66 | 1833.75 | 1659.42 | 1592.28 | 952.26 | 849.74 | 772.34 | 735.04 | 695.71 | 643.32 | 561.58 | 556.93 | 500.54 | 476.91 | 421.07 | 396.72 | 393.29 | 397.38 | 339.30 | 303.02 | 294.86 | 290.40 | 244.08 | 222.63 | 232.05 | 216.22 | 187.54 | 187.09 | 189.66 | 169.01 | 154.19 | 133.94 | 134.53 | 110.88 | 96.32 | NA | |
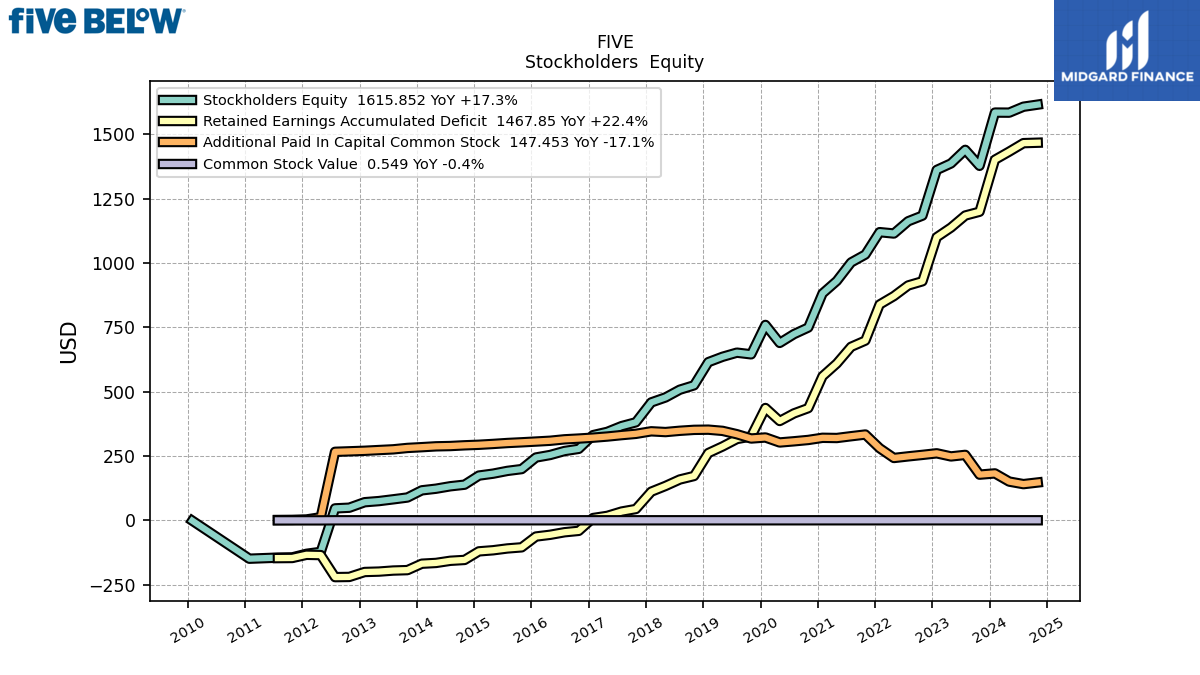
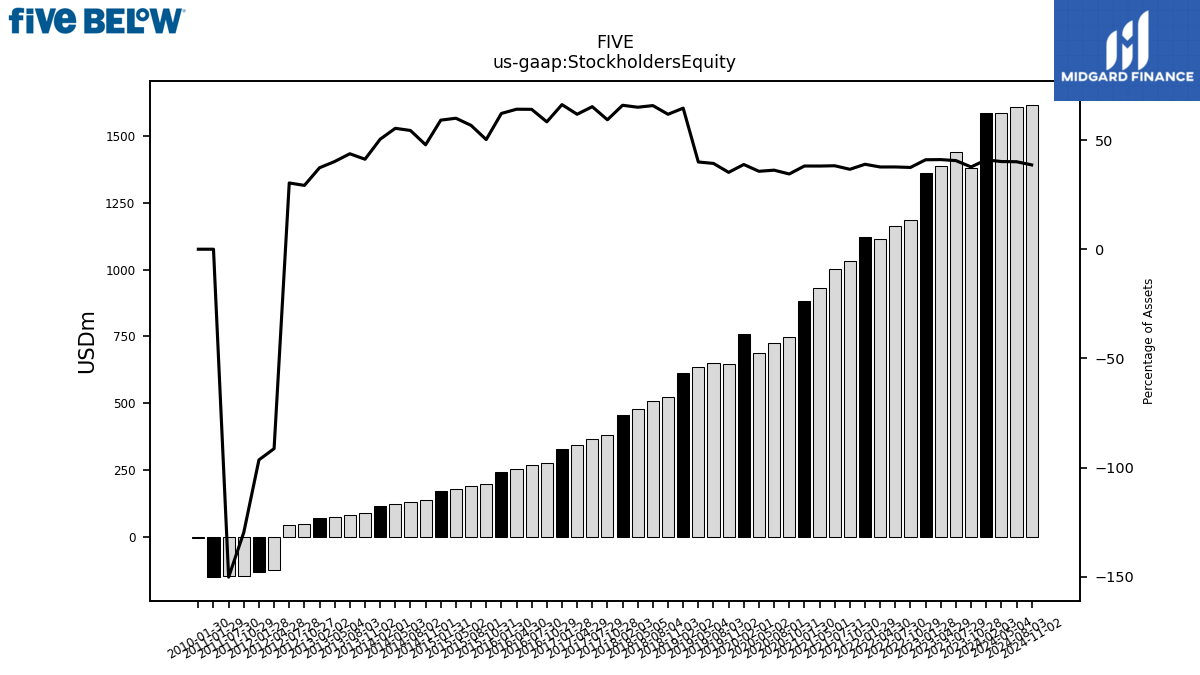
| Stockholders Equity | 1584.96 | 1377.92 | 1440.15 | 1387.30 | 1361.93 | 1184.49 | 1162.58 | 1114.94 | 1120.28 | 1033.25 | 1002.46 | 930.64 | 881.89 | 749.54 | 723.96 | 689.76 | 759.78 | 645.39 | 651.94 | 636.00 | 615.09 | 525.07 | 507.96 | 477.92 | 458.56 | 381.31 | 366.51 | 344.19 | 331.40 | 278.15 | 269.70 | 254.32 | 244.48 | 199.49 | 192.44 | 181.74 | 174.27 | 138.85 | 132.72 | 123.25 | 116.87 | 89.08 | 81.97 | 75.15 | 70.74 | 49.40 | 46.77 | -122.32 | -129.76 | -143.78 | -144.63 | NA |
| 2024-02-03 | 2023-10-28 | 2023-07-29 | 2023-04-29 | 2023-01-28 | 2022-10-29 | 2022-07-30 | 2022-04-30 | 2022-01-29 | 2021-10-30 | 2021-07-31 | 2021-05-01 | 2021-01-30 | 2020-10-31 | 2020-08-01 | 2020-05-02 | 2020-02-01 | 2019-11-02 | 2019-08-03 | 2019-05-04 | 2019-02-02 | 2018-11-03 | 2018-08-04 | 2018-05-05 | 2018-02-03 | 2017-10-28 | 2017-07-29 | 2017-04-29 | 2017-01-28 | 2016-10-29 | 2016-07-30 | 2016-04-30 | 2016-01-30 | 2015-10-31 | 2015-08-01 | 2015-05-02 | 2015-01-31 | 2014-11-01 | 2014-08-02 | 2014-05-03 | 2014-02-01 | 2013-11-02 | 2013-08-03 | 2013-05-04 | 2013-02-02 | 2012-10-27 | 2012-07-28 | 2012-04-28 | 2012-01-28 | 2011-10-29 | 2011-07-30 | 2011-04-30 | ||
|---|---|---|---|---|---|---|---|---|---|---|---|---|---|---|---|---|---|---|---|---|---|---|---|---|---|---|---|---|---|---|---|---|---|---|---|---|---|---|---|---|---|---|---|---|---|---|---|---|---|---|---|---|---|
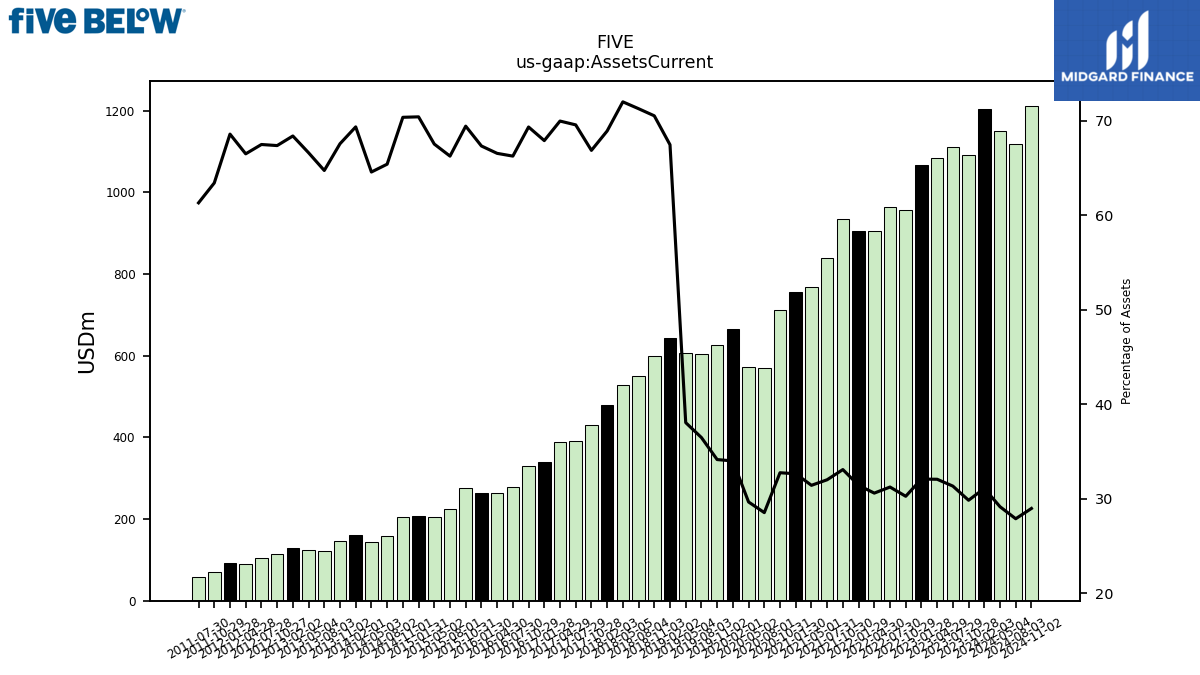
| Assets Current | 1203.54 | 1091.00 | 1111.93 | 1083.50 | 1066.38 | 957.05 | 963.76 | 905.61 | 904.74 | 933.92 | 839.34 | 767.59 | 755.41 | 712.28 | 570.53 | 573.03 | 665.71 | 625.97 | 605.10 | 605.77 | 642.26 | 599.13 | 550.37 | 529.12 | 479.36 | 430.06 | 390.57 | 389.58 | 339.79 | 330.61 | 278.94 | 263.96 | 264.75 | 275.84 | 224.76 | 204.59 | 207.58 | 204.30 | 159.60 | 143.74 | 160.90 | 146.06 | 121.38 | 124.60 | 129.68 | 113.84 | 104.04 | 89.05 | 92.25 | 70.30 | 59.04 | NA | |
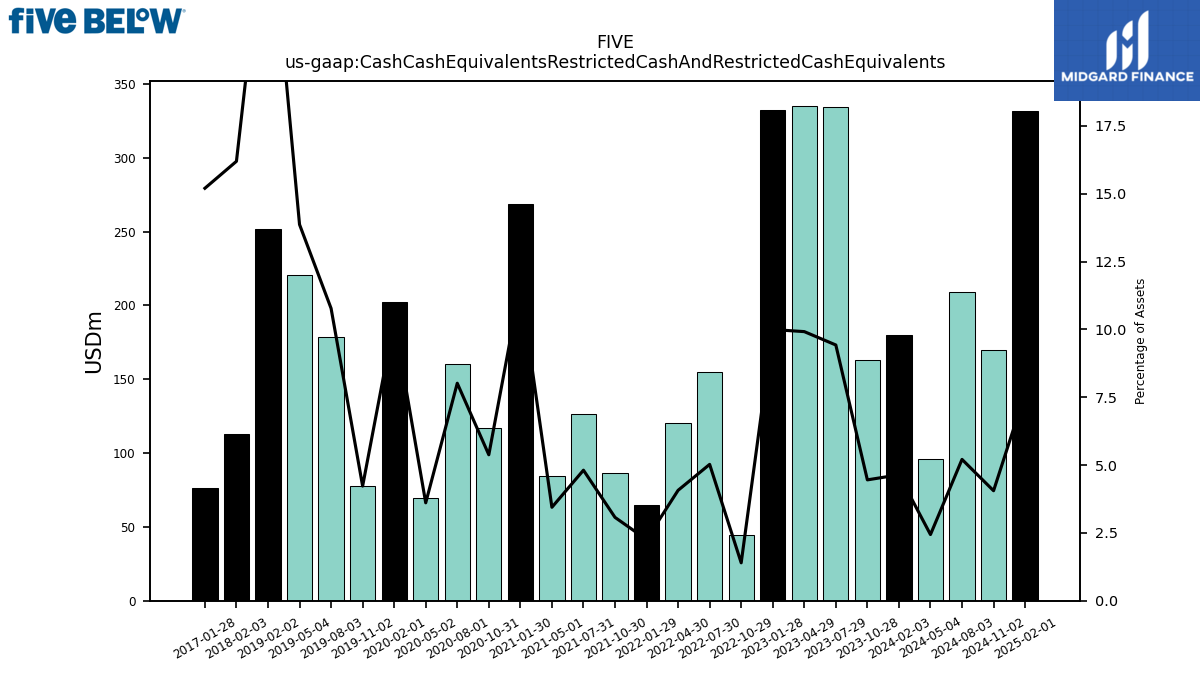
| Cash Cash Equivalents Restricted Cash And Restricted Cash Equivalents | 179.75 | 162.93 | 334.54 | 335.29 | 332.32 | 44.23 | 155.10 | 120.50 | 64.97 | 86.75 | 126.19 | 84.17 | 268.78 | 117.05 | 160.34 | 69.76 | 202.49 | 77.50 | 178.80 | 220.78 | 251.75 | NA | NA | NA | 112.67 | NA | NA | NA | 76.09 | NA | NA | NA | NA | NA | NA | NA | NA | NA | NA | NA | NA | NA | NA | NA | NA | NA | NA | NA | NA | NA | NA | NA | |
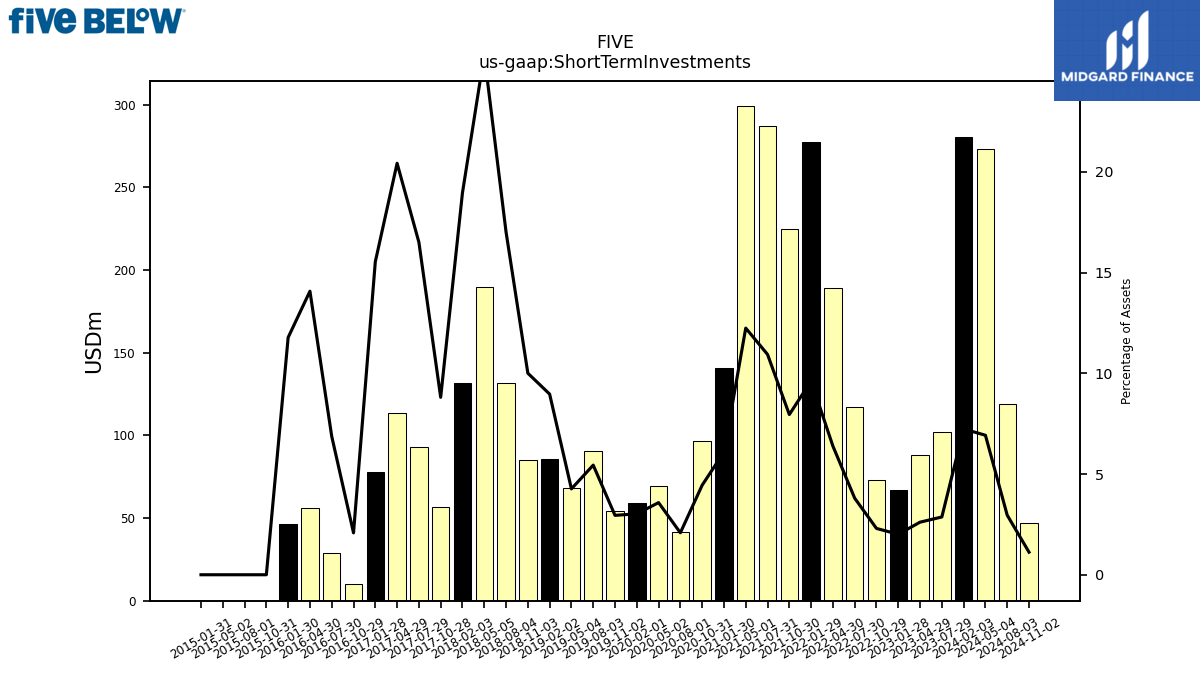
| Short Term Investments | 280.34 | NA | 101.81 | 88.24 | 66.84 | 72.72 | 117.31 | 189.14 | 277.14 | 224.56 | 286.93 | 299.29 | 140.93 | 96.75 | 41.67 | 69.22 | 59.23 | 54.07 | 90.33 | 67.88 | 85.41 | 85.03 | 131.44 | 189.80 | 131.96 | 56.68 | 92.72 | 113.78 | 77.79 | 9.91 | 28.93 | 55.85 | 46.34 | 0.00 | 0.00 | 0.00 | 0.00 | NA | NA | NA | NA | NA | NA | NA | NA | NA | NA | NA | NA | NA | NA | NA | |
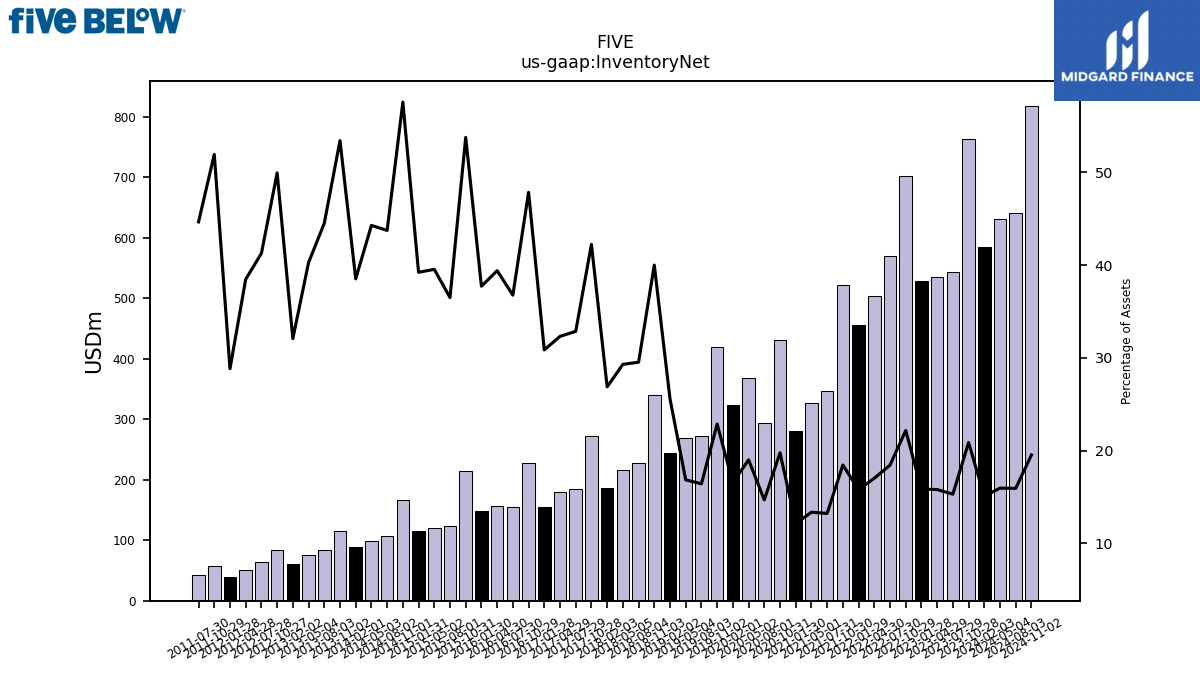
| Inventory Net | 584.63 | 763.35 | 543.62 | 534.39 | 527.72 | 701.56 | 569.20 | 504.18 | 455.10 | 521.11 | 347.30 | 326.71 | 281.27 | 430.20 | 294.06 | 367.52 | 324.03 | 419.34 | 272.69 | 268.44 | 243.64 | 339.90 | 228.11 | 215.38 | 187.04 | 271.69 | 184.52 | 180.00 | 154.45 | 228.18 | 154.81 | 156.30 | 148.37 | 213.63 | 123.85 | 119.82 | 115.65 | 167.17 | 106.75 | 98.58 | 89.38 | 115.48 | 83.47 | 75.34 | 60.83 | 84.40 | 63.63 | 51.53 | 38.79 | 57.57 | 43.01 | NA | |
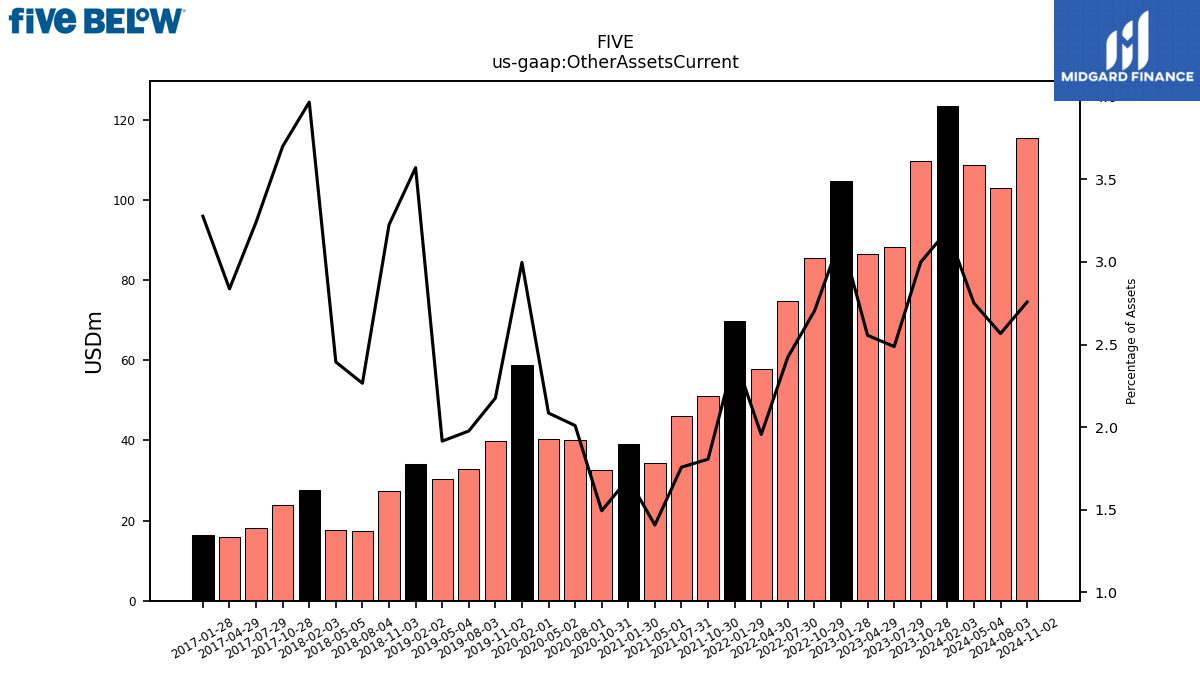
| Other Assets Current | 123.50 | 109.70 | 88.30 | 86.40 | 104.70 | 85.50 | 74.80 | 57.90 | 69.80 | 51.00 | 46.10 | 34.40 | 39.10 | 32.50 | 40.20 | 40.30 | 58.70 | 39.90 | 32.80 | 30.50 | 34.00 | 27.40 | 17.50 | 17.60 | 27.60 | 23.80 | 18.20 | 15.80 | 16.40 | NA | NA | NA | NA | NA | NA | NA | NA | NA | NA | NA | NA | NA | NA | NA | NA | NA | NA | NA | NA | NA | NA | NA | |
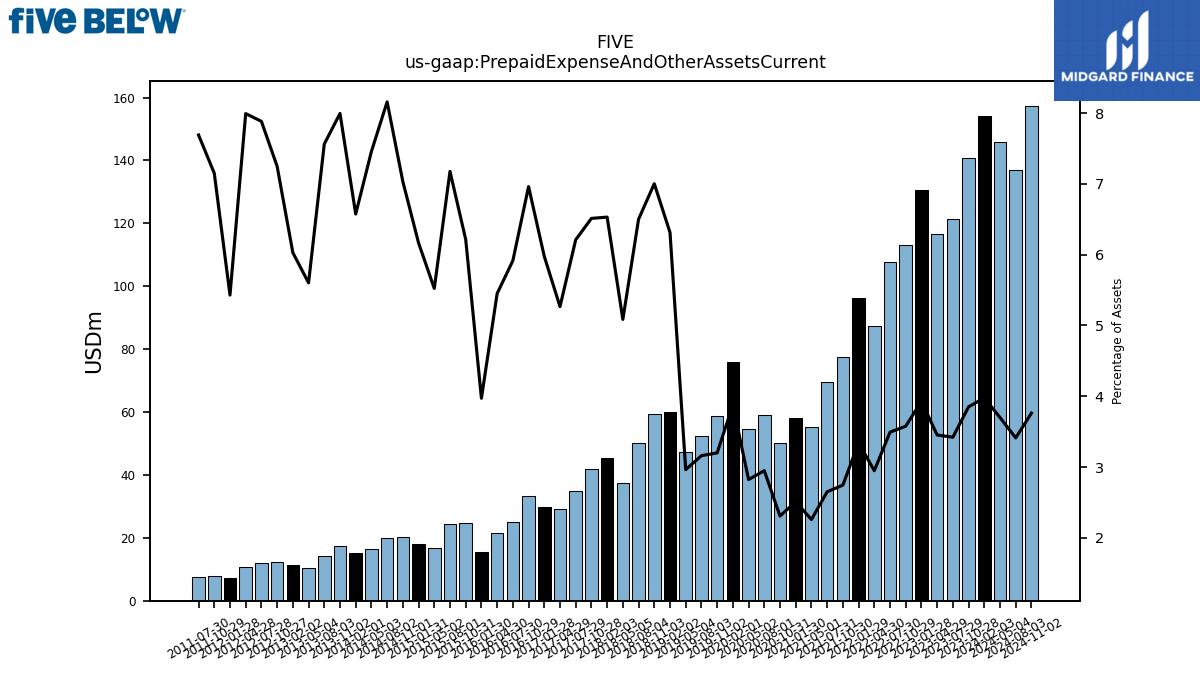
| Prepaid Expense And Other Assets Current | 153.99 | 140.82 | 121.42 | 116.69 | 130.59 | 113.15 | 107.77 | 87.28 | 96.20 | 77.48 | 69.50 | 55.17 | 58.09 | 50.19 | 58.97 | 54.56 | 75.90 | 58.67 | 52.44 | 47.17 | 60.12 | 59.50 | 50.21 | 37.38 | 45.43 | 41.89 | 34.88 | 29.33 | 29.91 | 33.20 | 24.91 | 21.62 | 15.62 | 24.70 | 24.35 | 16.74 | 18.18 | 20.42 | 19.91 | 16.61 | 15.26 | 17.29 | 14.18 | 10.48 | 11.43 | 12.25 | 12.15 | 10.71 | 7.30 | 7.93 | 7.41 | NA |
| 2024-02-03 | 2023-10-28 | 2023-07-29 | 2023-04-29 | 2023-01-28 | 2022-10-29 | 2022-07-30 | 2022-04-30 | 2022-01-29 | 2021-10-30 | 2021-07-31 | 2021-05-01 | 2021-01-30 | 2020-10-31 | 2020-08-01 | 2020-05-02 | 2020-02-01 | 2019-11-02 | 2019-08-03 | 2019-05-04 | 2019-02-02 | 2018-11-03 | 2018-08-04 | 2018-05-05 | 2018-02-03 | 2017-10-28 | 2017-07-29 | 2017-04-29 | 2017-01-28 | 2016-10-29 | 2016-07-30 | 2016-04-30 | 2016-01-30 | 2015-10-31 | 2015-08-01 | 2015-05-02 | 2015-01-31 | 2014-11-01 | 2014-08-02 | 2014-05-03 | 2014-02-01 | 2013-11-02 | 2013-08-03 | 2013-05-04 | 2013-02-02 | 2012-10-27 | 2012-07-28 | 2012-04-28 | 2012-01-28 | 2011-10-29 | 2011-07-30 | 2011-04-30 | ||
|---|---|---|---|---|---|---|---|---|---|---|---|---|---|---|---|---|---|---|---|---|---|---|---|---|---|---|---|---|---|---|---|---|---|---|---|---|---|---|---|---|---|---|---|---|---|---|---|---|---|---|---|---|---|
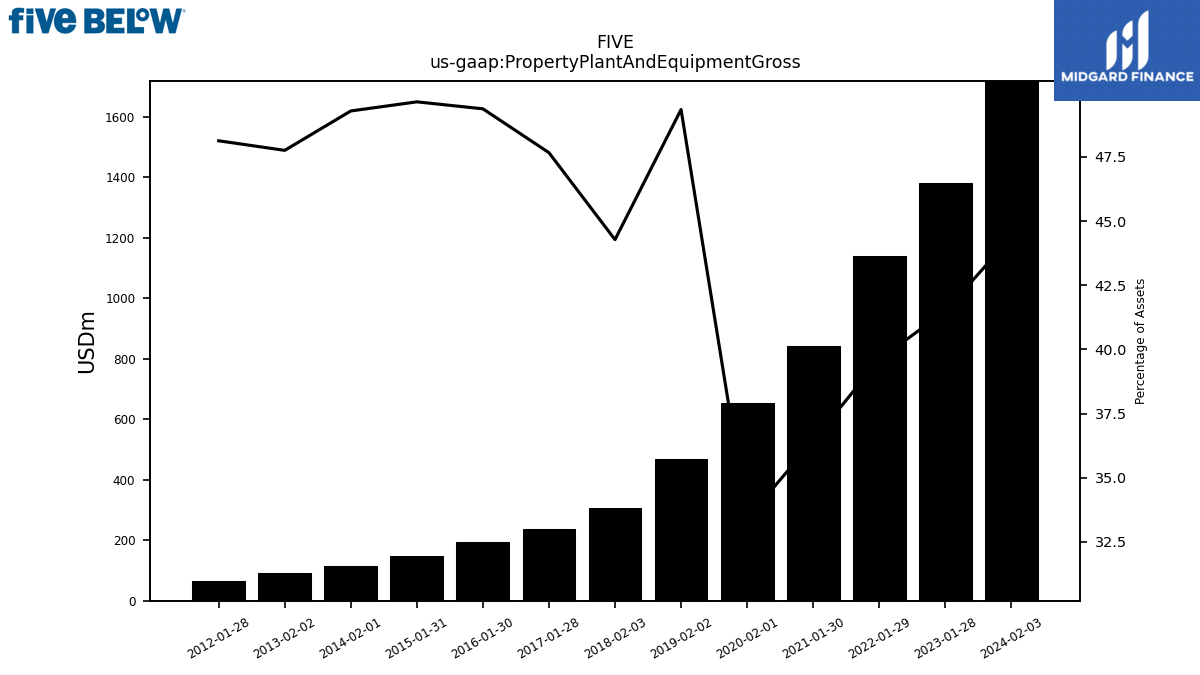
| Property Plant And Equipment Gross | 1718.40 | NA | NA | NA | 1379.56 | NA | NA | NA | 1140.75 | NA | NA | NA | 843.37 | NA | NA | NA | 654.16 | NA | NA | NA | 469.88 | NA | NA | NA | 308.03 | NA | NA | NA | 238.58 | NA | NA | NA | 194.18 | NA | NA | NA | 146.38 | NA | NA | NA | 114.38 | NA | NA | NA | 90.57 | NA | NA | NA | 64.74 | NA | NA | NA | |
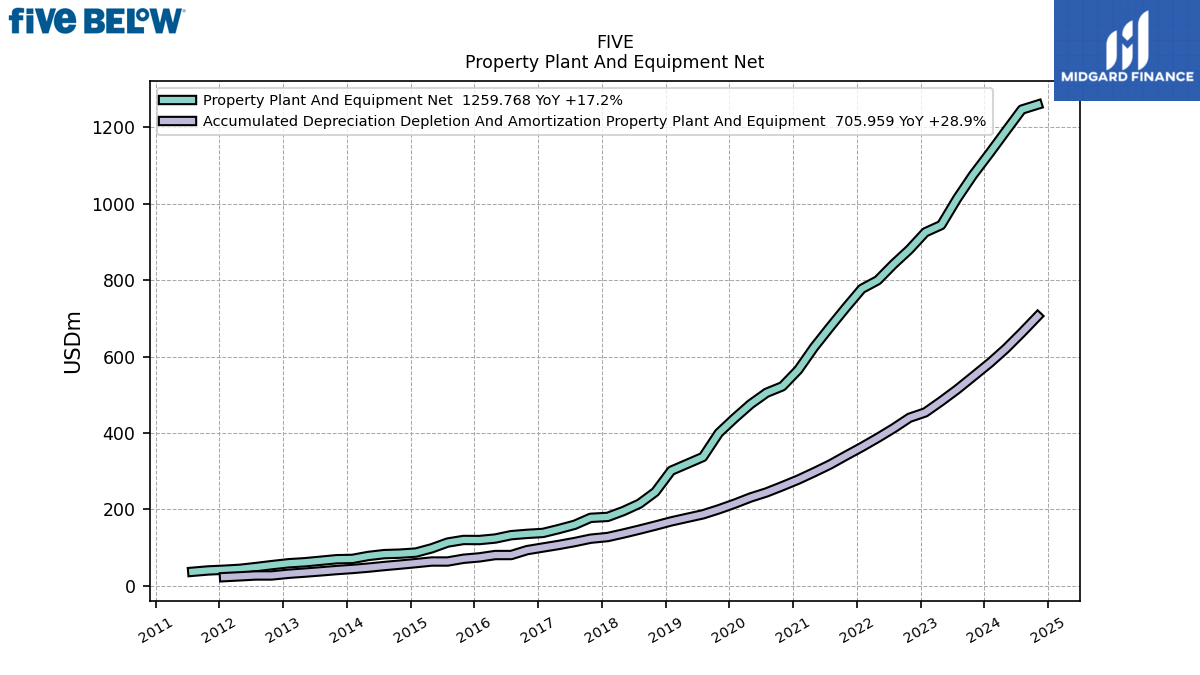
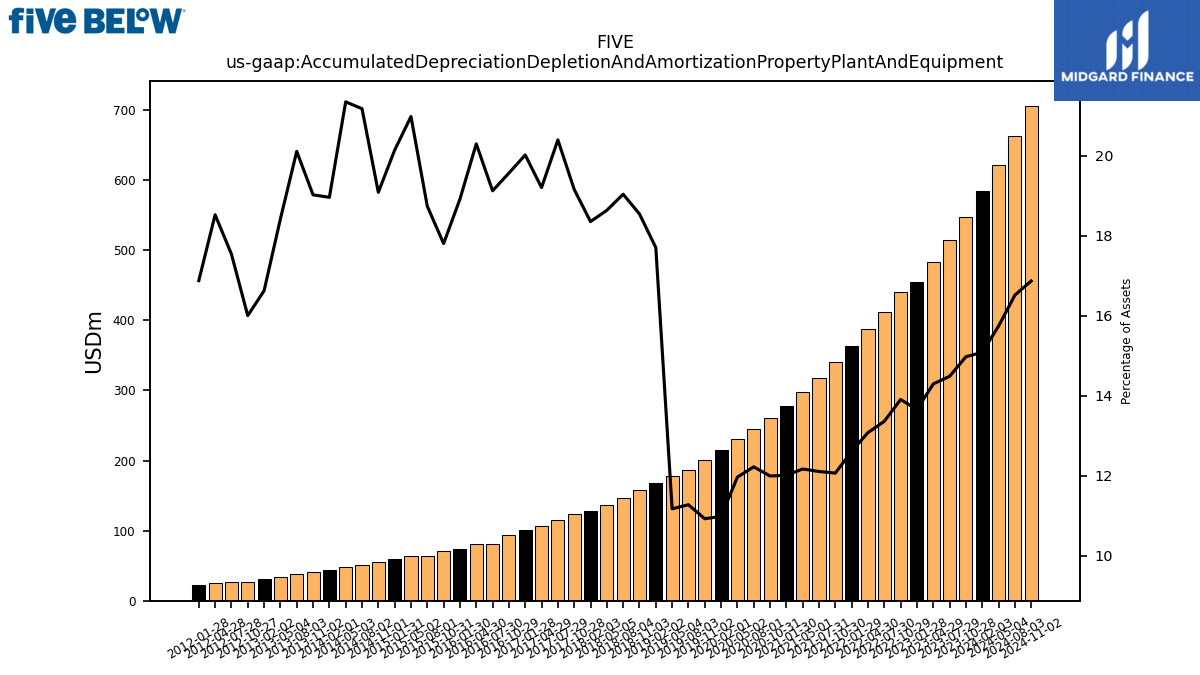
| Accumulated Depreciation Depletion And Amortization Property Plant And Equipment | 584.09 | 547.68 | 514.10 | 483.21 | 454.03 | 439.89 | 412.31 | 387.17 | 363.25 | 340.64 | 317.50 | 297.32 | 278.02 | 260.89 | 244.45 | 231.23 | 215.07 | 200.31 | 187.07 | 177.88 | 168.59 | 157.57 | 147.03 | 136.98 | 127.68 | 123.25 | 114.53 | 106.95 | 100.20 | 93.31 | 80.52 | 80.52 | 74.39 | 70.75 | 63.57 | 63.57 | 59.38 | 55.42 | 51.69 | 47.53 | 44.00 | 41.13 | 37.71 | 34.46 | 31.53 | 27.05 | 27.05 | 24.81 | 22.70 | NA | NA | NA | |
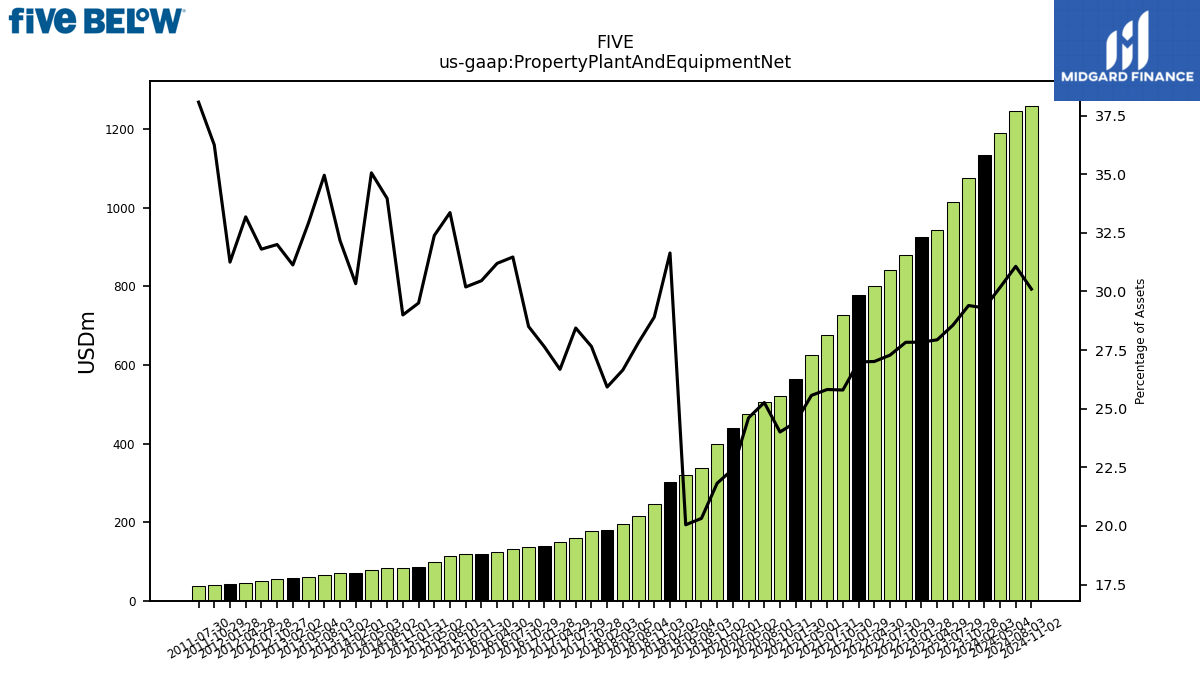
| Property Plant And Equipment Net | 1134.31 | 1075.28 | 1013.69 | 944.38 | 925.53 | 880.47 | 842.00 | 799.76 | 777.50 | 728.32 | 677.18 | 624.77 | 565.35 | 522.21 | 505.30 | 475.65 | 439.09 | 400.13 | 337.19 | 319.22 | 301.30 | 245.63 | 214.92 | 195.88 | 180.35 | 177.90 | 159.72 | 148.56 | 138.38 | 135.94 | 132.50 | 123.77 | 119.78 | 119.97 | 113.20 | 98.13 | 87.00 | 84.21 | 82.90 | 78.05 | 70.38 | 69.56 | 65.56 | 61.61 | 59.04 | 54.09 | 49.04 | 44.44 | 42.04 | 40.19 | 36.67 | NA | |
| Long Term Investments | 7.79 | NA | NA | NA | NA | NA | NA | 10.18 | 37.72 | NA | 1.10 | 8.68 | NA | NA | 0.00 | NA | 0.00 | NA | 1.04 | 0.00 | 0.00 | 0.00 | 1.40 | 2.93 | 27.70 | 23.18 | 0.00 | 6.67 | 10.51 | 0.00 | 0.00 | 0.00 | 0.00 | NA | NA | NA | NA | NA | NA | NA | NA | NA | NA | NA | NA | NA | NA | NA | NA | NA | NA | NA | |
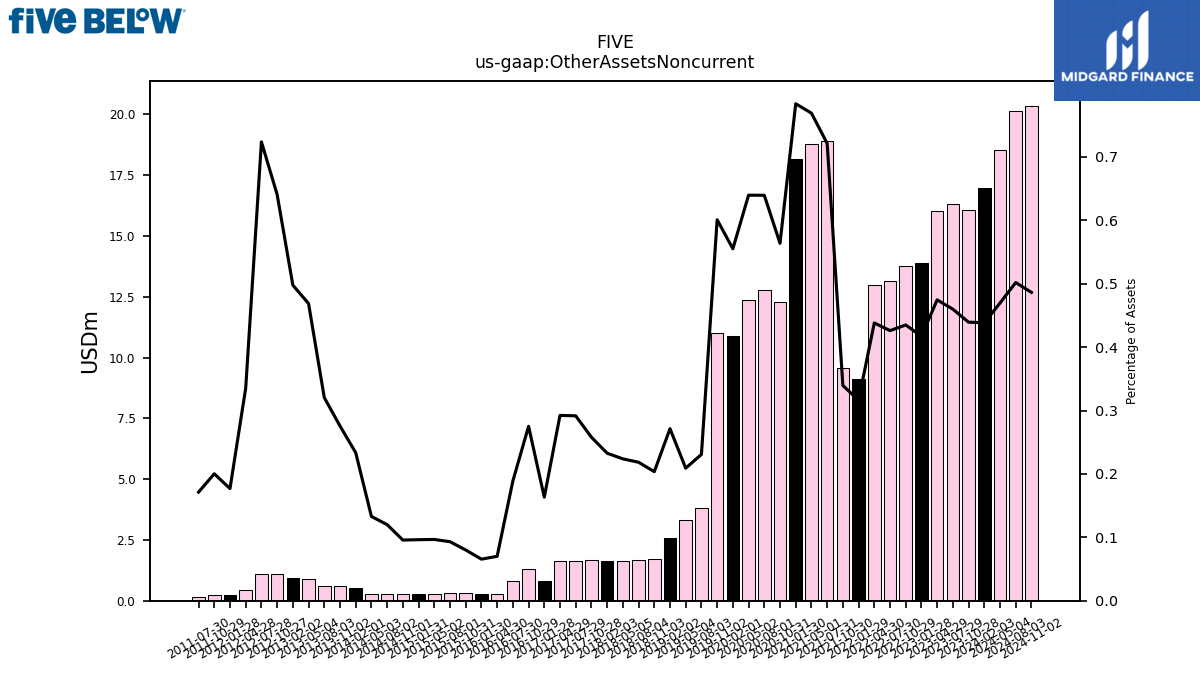
| Other Assets Noncurrent | 16.98 | 16.07 | 16.32 | 16.04 | 13.87 | 13.76 | 13.15 | 12.97 | 9.11 | 9.59 | 18.92 | 18.79 | 18.14 | 12.27 | 12.79 | 12.36 | 10.87 | 11.02 | 3.83 | 3.33 | 2.58 | 1.73 | 1.69 | 1.65 | 1.62 | 1.66 | 1.64 | 1.63 | 0.82 | 1.31 | 0.80 | 0.28 | 0.26 | 0.32 | 0.32 | 0.29 | 0.28 | 0.28 | 0.29 | 0.30 | 0.54 | 0.60 | 0.60 | 0.88 | 0.94 | 1.08 | 1.12 | 0.45 | 0.24 | 0.22 | 0.17 | NA |
| 2024-02-03 | 2023-10-28 | 2023-07-29 | 2023-04-29 | 2023-01-28 | 2022-10-29 | 2022-07-30 | 2022-04-30 | 2022-01-29 | 2021-10-30 | 2021-07-31 | 2021-05-01 | 2021-01-30 | 2020-10-31 | 2020-08-01 | 2020-05-02 | 2020-02-01 | 2019-11-02 | 2019-08-03 | 2019-05-04 | 2019-02-02 | 2018-11-03 | 2018-08-04 | 2018-05-05 | 2018-02-03 | 2017-10-28 | 2017-07-29 | 2017-04-29 | 2017-01-28 | 2016-10-29 | 2016-07-30 | 2016-04-30 | 2016-01-30 | 2015-10-31 | 2015-08-01 | 2015-05-02 | 2015-01-31 | 2014-11-01 | 2014-08-02 | 2014-05-03 | 2014-02-01 | 2013-11-02 | 2013-08-03 | 2013-05-04 | 2013-02-02 | 2012-10-27 | 2012-07-28 | 2012-04-28 | 2012-01-28 | 2011-10-29 | 2011-07-30 | 2011-04-30 | ||
|---|---|---|---|---|---|---|---|---|---|---|---|---|---|---|---|---|---|---|---|---|---|---|---|---|---|---|---|---|---|---|---|---|---|---|---|---|---|---|---|---|---|---|---|---|---|---|---|---|---|---|---|---|---|
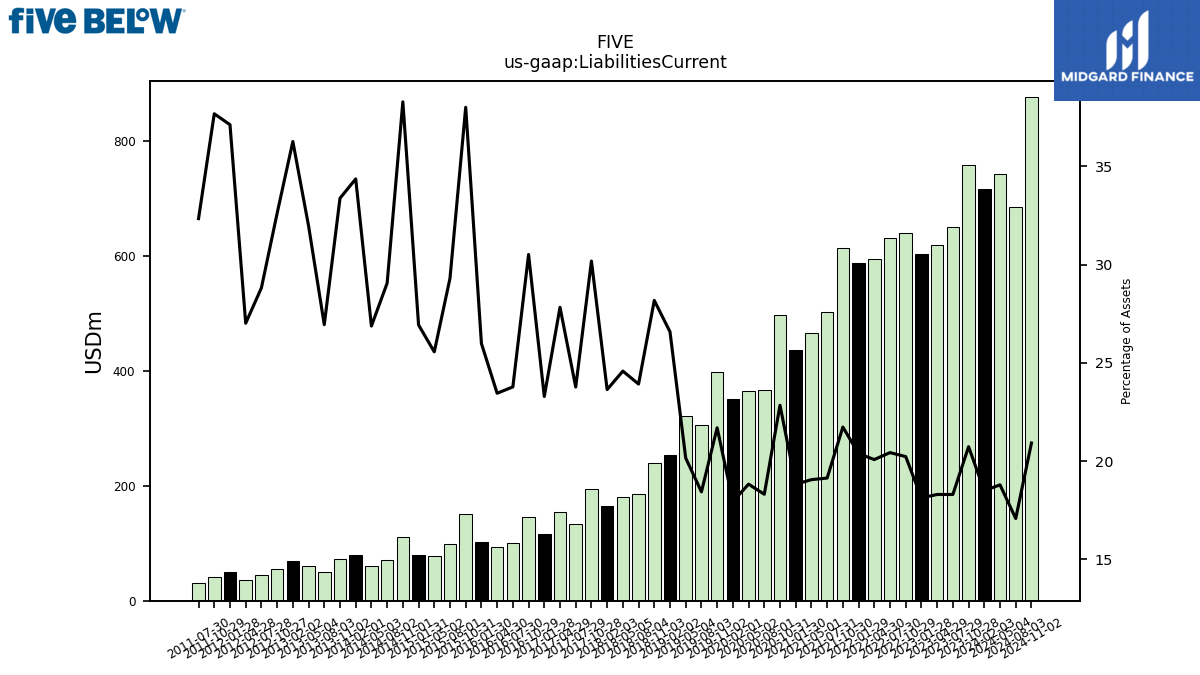
| Liabilities Current | 715.93 | 758.17 | 649.47 | 618.55 | 602.56 | 639.85 | 630.52 | 594.39 | 586.90 | 613.60 | 501.85 | 465.59 | 435.67 | 496.84 | 366.19 | 363.79 | 351.35 | 397.80 | 305.86 | 320.88 | 253.10 | 239.43 | 184.74 | 180.66 | 164.46 | 194.17 | 133.47 | 154.98 | 116.56 | 145.54 | 100.11 | 93.03 | 102.20 | 151.05 | 99.44 | 77.45 | 79.40 | 111.19 | 70.92 | 59.83 | 79.74 | 72.17 | 50.53 | 59.82 | 68.78 | 55.12 | 44.44 | 36.19 | 49.94 | 41.78 | 31.15 | NA | |
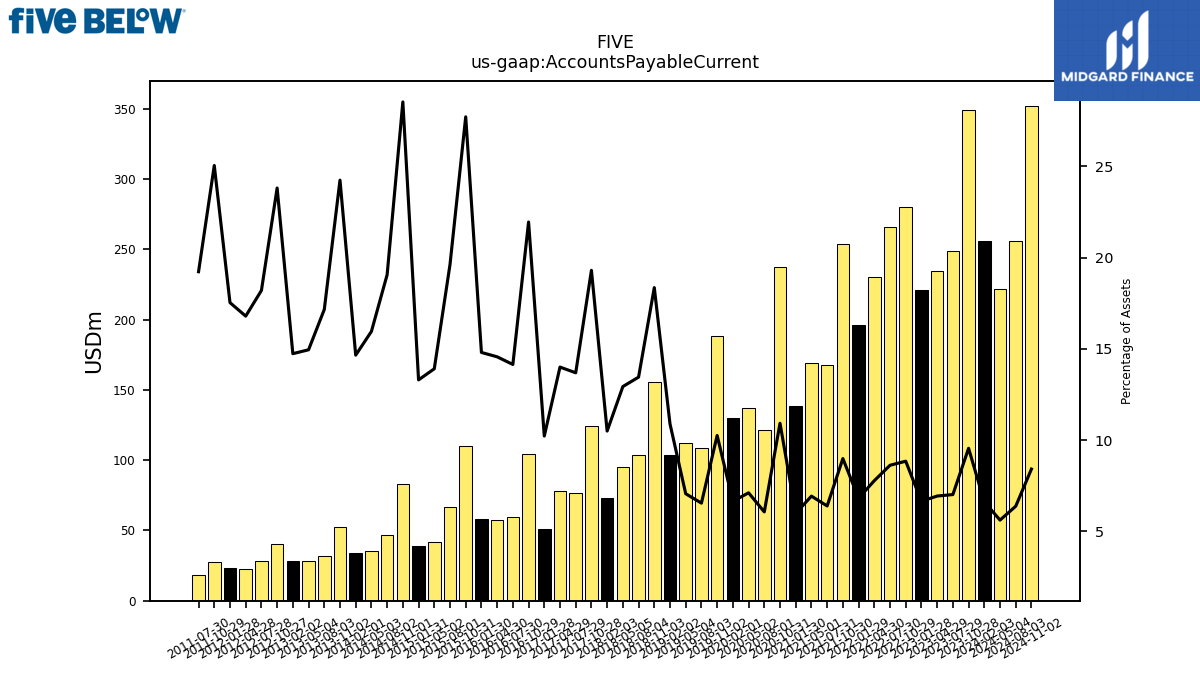
| Accounts Payable Current | 256.27 | 349.34 | 249.09 | 234.49 | 221.12 | 279.84 | 266.11 | 230.28 | 196.46 | 253.82 | 167.70 | 169.39 | 138.62 | 237.65 | 121.37 | 137.48 | 130.24 | 188.06 | 108.67 | 112.46 | 103.69 | 155.99 | 103.89 | 95.08 | 73.03 | 124.19 | 76.88 | 77.99 | 51.18 | 104.68 | 59.56 | 57.78 | 58.23 | 110.14 | 66.56 | 42.15 | 39.22 | 82.86 | 46.53 | 35.52 | 34.01 | 52.42 | 32.17 | 27.97 | 27.95 | 40.25 | 28.06 | 22.50 | 23.59 | 27.77 | 18.52 | NA | |
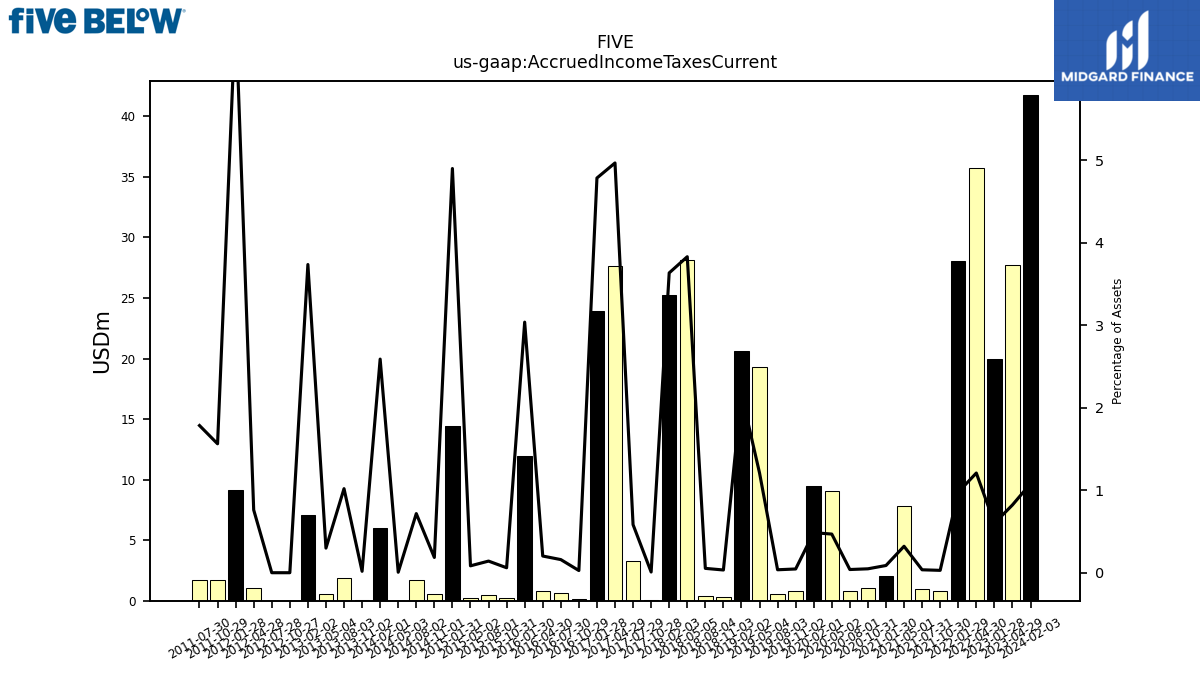
| Accrued Income Taxes Current | 41.77 | NA | NA | 27.75 | 19.93 | NA | NA | 35.77 | 28.10 | 0.81 | 0.93 | 7.83 | 2.02 | 1.03 | 0.78 | 9.05 | 9.51 | 0.83 | 0.59 | 19.26 | 20.63 | 0.28 | 0.41 | 28.15 | 25.27 | 0.06 | 3.27 | 27.65 | 23.94 | 0.13 | 0.67 | 0.80 | 11.94 | 0.24 | 0.48 | 0.25 | 14.44 | 0.54 | 1.75 | 0.01 | 6.01 | 0.04 | 1.91 | 0.56 | 7.08 | 0.00 | 0.00 | 1.02 | 9.14 | 1.73 | 1.72 | NA | |
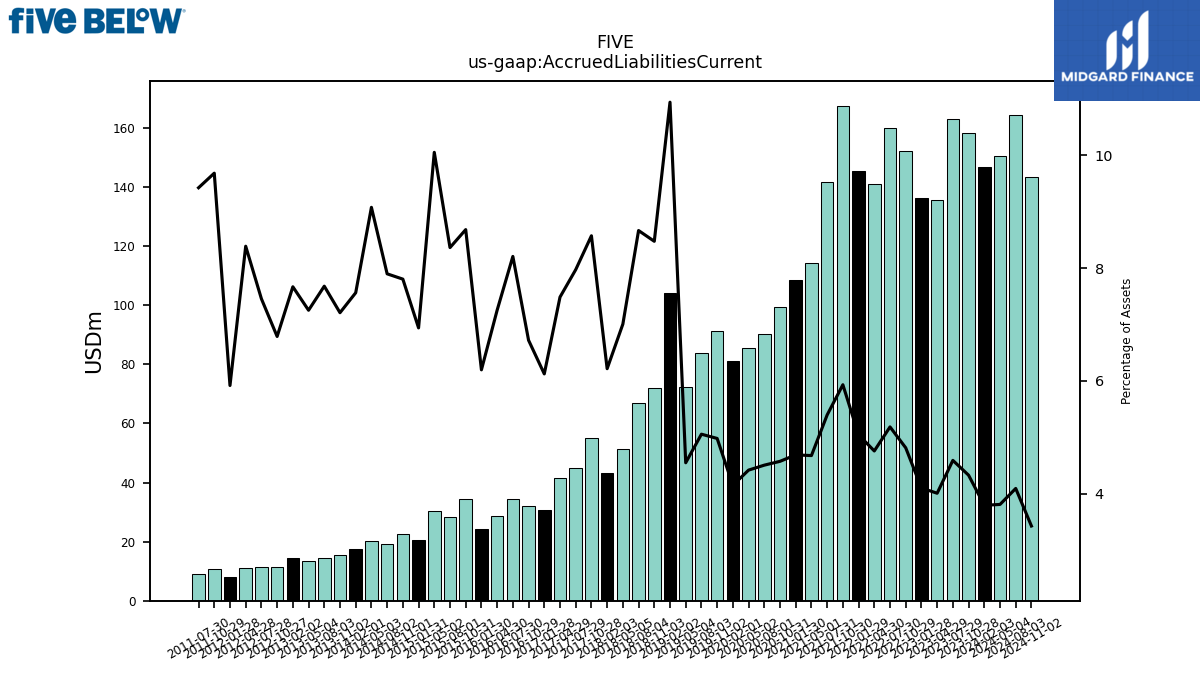
| Accrued Liabilities Current | 146.89 | 158.27 | 162.92 | 135.46 | 136.32 | 152.26 | 159.98 | 140.85 | 145.27 | 167.47 | 141.52 | 114.25 | 108.50 | 99.49 | 90.12 | 85.38 | 81.25 | 91.30 | 83.88 | 72.42 | 104.20 | 72.02 | 66.93 | 51.50 | 43.25 | 55.15 | 44.77 | 41.69 | 30.65 | 32.05 | 34.56 | 28.78 | 24.37 | 34.50 | 28.38 | 30.46 | 20.46 | 22.66 | 19.28 | 20.21 | 17.55 | 15.59 | 14.40 | 13.57 | 14.54 | 11.47 | 11.50 | 11.23 | 7.96 | 10.74 | 9.08 | NA |
| 2024-02-03 | 2023-10-28 | 2023-07-29 | 2023-04-29 | 2023-01-28 | 2022-10-29 | 2022-07-30 | 2022-04-30 | 2022-01-29 | 2021-10-30 | 2021-07-31 | 2021-05-01 | 2021-01-30 | 2020-10-31 | 2020-08-01 | 2020-05-02 | 2020-02-01 | 2019-11-02 | 2019-08-03 | 2019-05-04 | 2019-02-02 | 2018-11-03 | 2018-08-04 | 2018-05-05 | 2018-02-03 | 2017-10-28 | 2017-07-29 | 2017-04-29 | 2017-01-28 | 2016-10-29 | 2016-07-30 | 2016-04-30 | 2016-01-30 | 2015-10-31 | 2015-08-01 | 2015-05-02 | 2015-01-31 | 2014-11-01 | 2014-08-02 | 2014-05-03 | 2014-02-01 | 2013-11-02 | 2013-08-03 | 2013-05-04 | 2013-02-02 | 2012-10-27 | 2012-07-28 | 2012-04-28 | 2012-01-28 | 2011-10-29 | 2011-07-30 | 2011-04-30 | ||
|---|---|---|---|---|---|---|---|---|---|---|---|---|---|---|---|---|---|---|---|---|---|---|---|---|---|---|---|---|---|---|---|---|---|---|---|---|---|---|---|---|---|---|---|---|---|---|---|---|---|---|---|---|---|
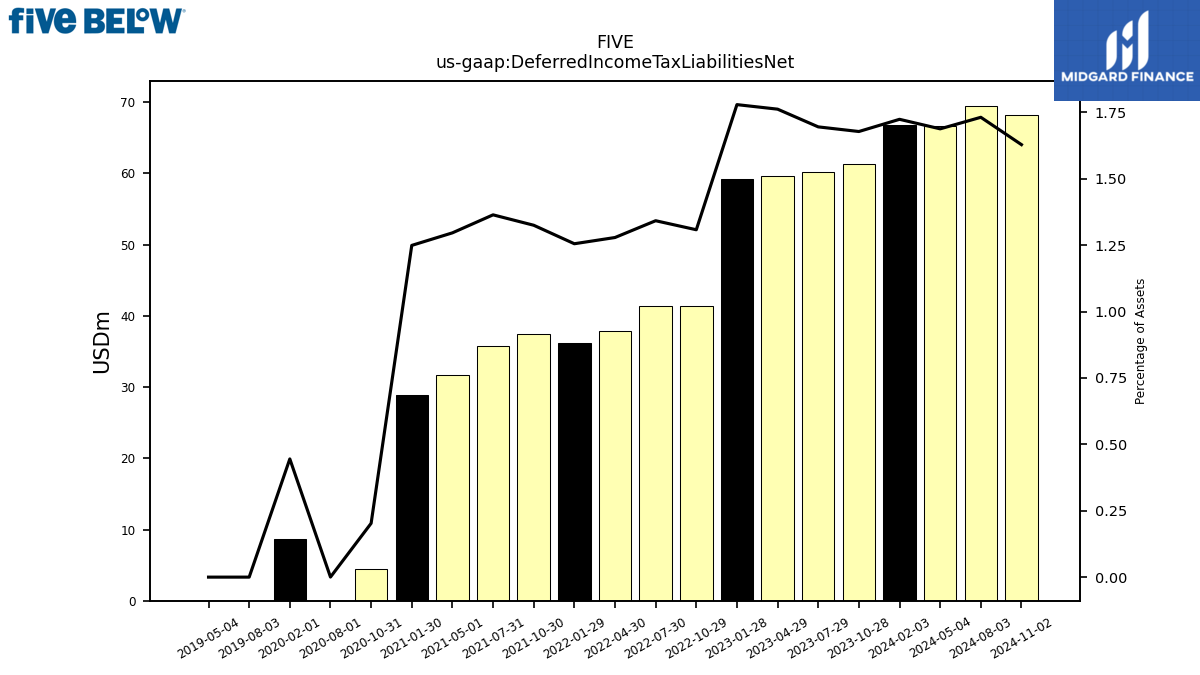
| Deferred Income Tax Liabilities Net | 66.74 | 61.36 | 60.17 | 59.56 | 59.15 | 41.38 | 41.41 | 37.86 | 36.16 | 37.41 | 35.78 | 31.68 | 28.91 | 4.41 | 0.01 | NA | 8.72 | NA | 0.00 | 0.00 | NA | NA | NA | NA | NA | NA | NA | NA | NA | NA | NA | NA | NA | NA | NA | NA | NA | NA | NA | NA | NA | NA | NA | NA | NA | NA | NA | NA | NA | NA | NA | NA | |
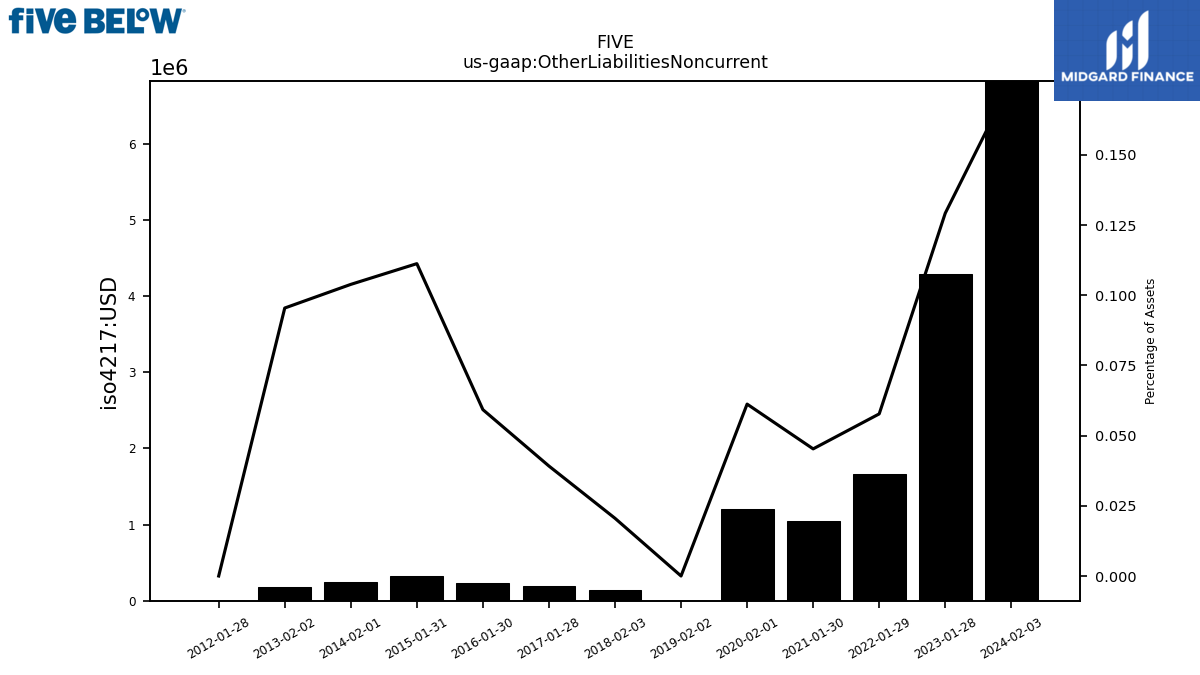
| Other Liabilities Noncurrent | 6.83 | NA | NA | NA | 4.30 | NA | NA | NA | 1.66 | NA | NA | NA | 1.05 | NA | NA | NA | 1.20 | NA | NA | NA | 0.00 | NA | NA | NA | 0.14 | NA | NA | NA | 0.20 | NA | NA | NA | 0.23 | NA | NA | NA | 0.33 | NA | NA | NA | 0.24 | NA | NA | NA | 0.18 | NA | NA | NA | 0.00 | NA | NA | NA | |
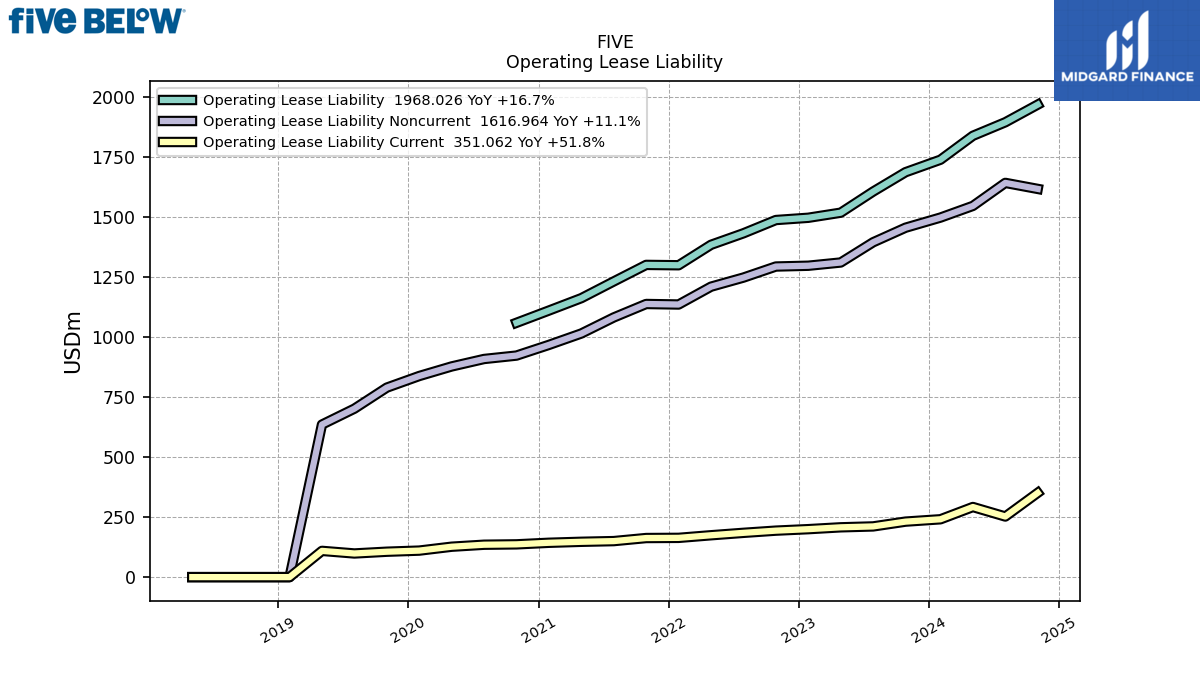
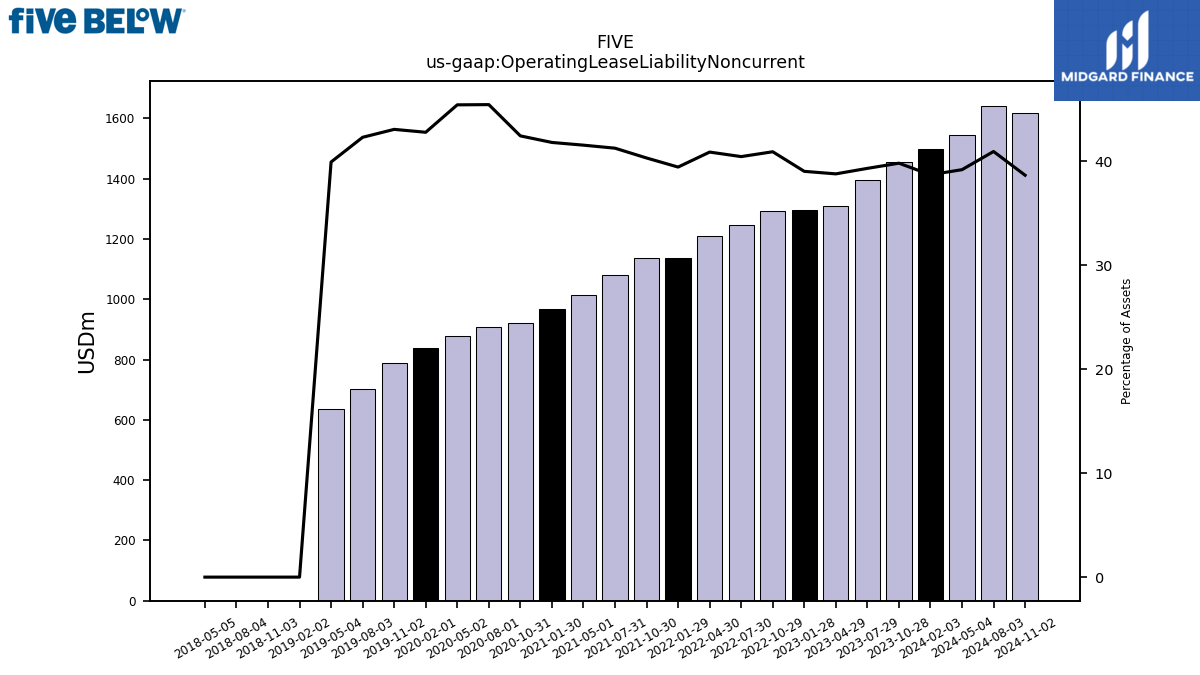
| Operating Lease Liability Noncurrent | 1497.59 | 1455.36 | 1394.70 | 1310.46 | 1296.97 | 1293.69 | 1247.63 | 1209.79 | 1135.46 | 1137.66 | 1081.56 | 1014.77 | 967.25 | 922.78 | 908.55 | 877.50 | 837.62 | 789.31 | 701.62 | 635.40 | 0.00 | 0.00 | 0.00 | 0.00 | NA | NA | NA | NA | NA | NA | NA | NA | NA | NA | NA | NA | NA | NA | NA | NA | NA | NA | NA | NA | NA | NA | NA | NA | NA | NA | NA | NA |
| 2024-02-03 | 2023-10-28 | 2023-07-29 | 2023-04-29 | 2023-01-28 | 2022-10-29 | 2022-07-30 | 2022-04-30 | 2022-01-29 | 2021-10-30 | 2021-07-31 | 2021-05-01 | 2021-01-30 | 2020-10-31 | 2020-08-01 | 2020-05-02 | 2020-02-01 | 2019-11-02 | 2019-08-03 | 2019-05-04 | 2019-02-02 | 2018-11-03 | 2018-08-04 | 2018-05-05 | 2018-02-03 | 2017-10-28 | 2017-07-29 | 2017-04-29 | 2017-01-28 | 2016-10-29 | 2016-07-30 | 2016-04-30 | 2016-01-30 | 2015-10-31 | 2015-08-01 | 2015-05-02 | 2015-01-31 | 2014-11-01 | 2014-08-02 | 2014-05-03 | 2014-02-01 | 2013-11-02 | 2013-08-03 | 2013-05-04 | 2013-02-02 | 2012-10-27 | 2012-07-28 | 2012-04-28 | 2012-01-28 | 2011-10-29 | 2011-07-30 | 2011-04-30 | ||
|---|---|---|---|---|---|---|---|---|---|---|---|---|---|---|---|---|---|---|---|---|---|---|---|---|---|---|---|---|---|---|---|---|---|---|---|---|---|---|---|---|---|---|---|---|---|---|---|---|---|---|---|---|---|
| Stockholders Equity | 1584.96 | 1377.92 | 1440.15 | 1387.30 | 1361.93 | 1184.49 | 1162.58 | 1114.94 | 1120.28 | 1033.25 | 1002.46 | 930.64 | 881.89 | 749.54 | 723.96 | 689.76 | 759.78 | 645.39 | 651.94 | 636.00 | 615.09 | 525.07 | 507.96 | 477.92 | 458.56 | 381.31 | 366.51 | 344.19 | 331.40 | 278.15 | 269.70 | 254.32 | 244.48 | 199.49 | 192.44 | 181.74 | 174.27 | 138.85 | 132.72 | 123.25 | 116.87 | 89.08 | 81.97 | 75.15 | 70.74 | 49.40 | 46.77 | -122.32 | -129.76 | -143.78 | -144.63 | NA | |
| Common Stock Value | 0.55 | 0.55 | 0.56 | 0.56 | 0.56 | 0.56 | 0.56 | 0.56 | 0.56 | 0.56 | 0.56 | 0.56 | 0.56 | 0.56 | 0.56 | 0.56 | 0.56 | 0.56 | 0.56 | 0.56 | 0.56 | 0.56 | 0.56 | 0.56 | 0.55 | 0.55 | 0.55 | 0.55 | 0.55 | 0.55 | 0.55 | 0.55 | 0.55 | 0.55 | 0.55 | 0.55 | 0.54 | 0.54 | 0.54 | 0.54 | 0.54 | 0.54 | 0.54 | 0.54 | 0.54 | 0.54 | 0.54 | 0.18 | 0.16 | 0.16 | 0.16 | NA | |
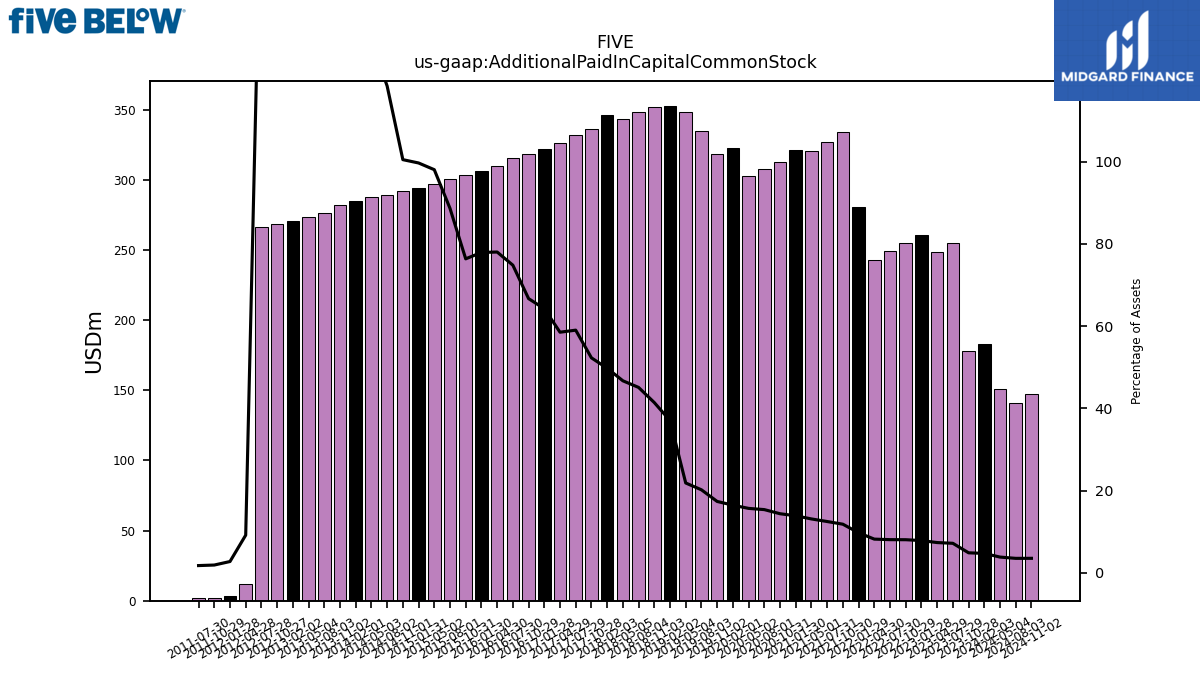
| Additional Paid In Capital Common Stock | 182.71 | 177.88 | 254.69 | 248.68 | 260.78 | 254.66 | 248.90 | 242.61 | 280.67 | 333.82 | 327.21 | 320.23 | 321.07 | 312.67 | 307.51 | 302.90 | 322.33 | 318.32 | 335.05 | 347.94 | 352.70 | 351.94 | 348.34 | 343.37 | 346.30 | 336.43 | 331.51 | 325.99 | 321.60 | 318.14 | 315.13 | 309.60 | 306.52 | 303.53 | 300.82 | 297.18 | 293.99 | 291.89 | 289.07 | 287.91 | 284.62 | 281.66 | 276.23 | 273.47 | 270.64 | 268.50 | 266.59 | 12.27 | 3.69 | 2.09 | 1.69 | NA | |
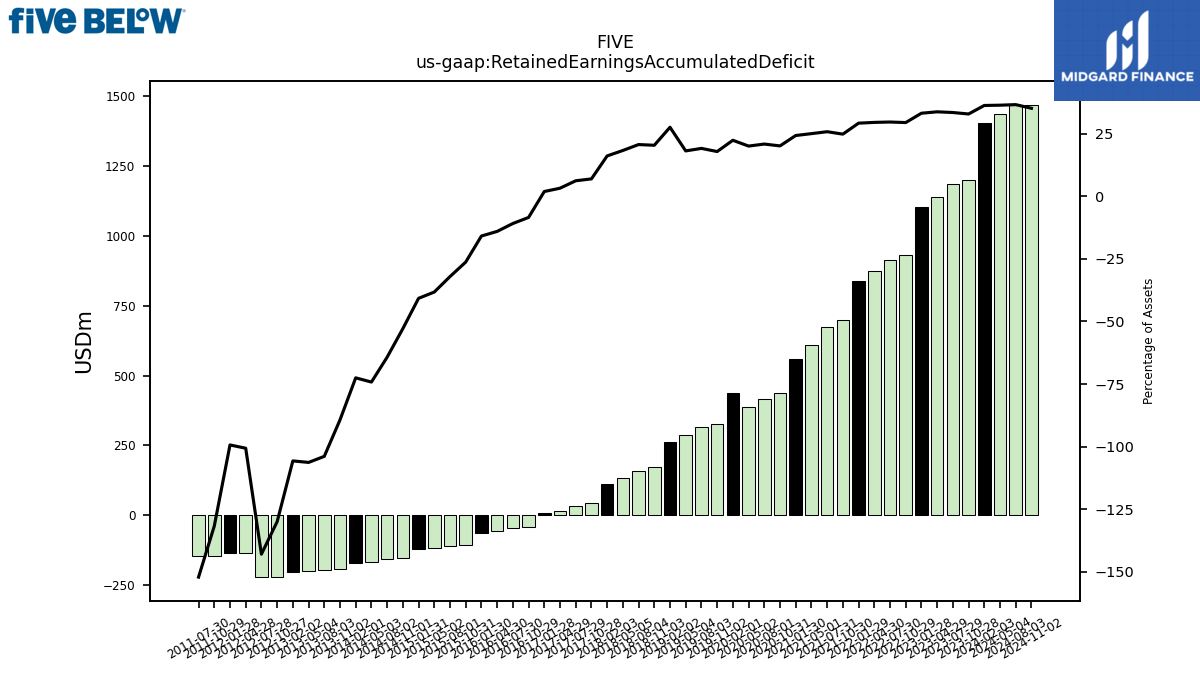
| Retained Earnings Accumulated Deficit | 1401.70 | 1199.50 | 1184.90 | 1138.07 | 1100.59 | 929.27 | 913.12 | 871.78 | 839.06 | 698.87 | 674.69 | 609.85 | 560.25 | 436.31 | 415.89 | 386.31 | 436.89 | 326.52 | 316.33 | 287.50 | 261.83 | 172.57 | 159.06 | 133.99 | 111.70 | 44.33 | 34.45 | 17.64 | 9.25 | -40.53 | -45.98 | -55.83 | -62.59 | -104.59 | -108.93 | -115.99 | -120.27 | -153.58 | -156.89 | -165.21 | -168.29 | -193.12 | -194.79 | -198.86 | -200.43 | -219.64 | -220.37 | -134.77 | -133.61 | -146.04 | -146.48 | NA |
| 2024-02-03 | 2023-10-28 | 2023-07-29 | 2023-04-29 | 2023-01-28 | 2022-10-29 | 2022-07-30 | 2022-04-30 | 2022-01-29 | 2021-10-30 | 2021-07-31 | 2021-05-01 | 2021-01-30 | 2020-10-31 | 2020-08-01 | 2020-05-02 | 2020-02-01 | 2019-11-02 | 2019-08-03 | 2019-05-04 | 2019-02-02 | 2018-11-03 | 2018-08-04 | 2018-05-05 | 2018-02-03 | 2017-10-28 | 2017-07-29 | 2017-04-29 | 2017-01-28 | 2016-10-29 | 2016-07-30 | 2016-04-30 | 2016-01-30 | 2015-10-31 | 2015-08-01 | 2015-05-02 | 2015-01-31 | 2014-11-01 | 2014-08-02 | 2014-05-03 | 2014-02-01 | 2013-11-02 | 2013-08-03 | 2013-05-04 | 2013-02-02 | 2012-10-27 | 2012-07-28 | 2012-04-28 | 2012-01-28 | 2011-10-29 | 2011-07-30 | 2011-04-30 | ||
|---|---|---|---|---|---|---|---|---|---|---|---|---|---|---|---|---|---|---|---|---|---|---|---|---|---|---|---|---|---|---|---|---|---|---|---|---|---|---|---|---|---|---|---|---|---|---|---|---|---|---|---|---|---|
| Net Income Loss | 202.20 | 14.59 | 46.84 | 37.48 | 171.32 | 16.15 | 41.34 | 32.72 | 140.20 | 24.18 | 64.84 | 49.60 | 123.94 | 20.43 | 29.58 | -50.58 | 110.37 | 10.19 | 28.83 | 25.66 | 89.26 | 13.52 | 25.06 | 21.80 | 67.38 | 9.88 | 16.80 | 8.39 | 49.79 | 5.45 | 9.85 | 6.76 | 42.00 | 4.34 | 7.06 | 4.28 | 33.31 | 3.31 | 8.32 | 3.08 | 24.83 | 1.68 | 4.07 | 1.57 | 19.21 | 0.73 | 1.25 | -1.16 | 12.43 | 0.44 | 2.21 | 1.00 |
| 2024-02-03 | 2023-10-28 | 2023-07-29 | 2023-04-29 | 2023-01-28 | 2022-10-29 | 2022-07-30 | 2022-04-30 | 2022-01-29 | 2021-10-30 | 2021-07-31 | 2021-05-01 | 2021-01-30 | 2020-10-31 | 2020-08-01 | 2020-05-02 | 2020-02-01 | 2019-11-02 | 2019-08-03 | 2019-05-04 | 2019-02-02 | 2018-11-03 | 2018-08-04 | 2018-05-05 | 2018-02-03 | 2017-10-28 | 2017-07-29 | 2017-04-29 | 2017-01-28 | 2016-10-29 | 2016-07-30 | 2016-04-30 | 2016-01-30 | 2015-10-31 | 2015-08-01 | 2015-05-02 | 2015-01-31 | 2014-11-01 | 2014-08-02 | 2014-05-03 | 2014-02-01 | 2013-11-02 | 2013-08-03 | 2013-05-04 | 2013-02-02 | 2012-10-27 | 2012-07-28 | 2012-04-28 | 2012-01-28 | 2011-10-29 | 2011-07-30 | 2011-04-30 | ||
|---|---|---|---|---|---|---|---|---|---|---|---|---|---|---|---|---|---|---|---|---|---|---|---|---|---|---|---|---|---|---|---|---|---|---|---|---|---|---|---|---|---|---|---|---|---|---|---|---|---|---|---|---|---|
| Revenues | 1337.74 | 736.40 | 758.98 | 726.25 | 1122.75 | 645.03 | 668.93 | 639.60 | 996.33 | 607.64 | 646.55 | 597.82 | 858.51 | 476.61 | 426.11 | 200.90 | 687.13 | 377.44 | 417.40 | 364.76 | 602.68 | 312.82 | 347.73 | 296.32 | 504.83 | 257.18 | 283.32 | 232.88 | 388.09 | 199.47 | 220.13 | 192.72 | 326.35 | 169.69 | 182.19 | 153.73 | 263.76 | 137.98 | 152.48 | 126.00 | 211.96 | 110.75 | 117.09 | 95.60 | 173.59 | 86.59 | 86.82 | 71.83 | 125.83 | 61.90 | 61.97 | 47.43 | |
| Revenue From Contract With Customer Excluding Assessed Tax | 1337.74 | 736.40 | 758.98 | 726.25 | 1122.75 | 645.03 | 668.93 | 639.60 | 996.33 | 607.64 | 646.55 | 597.82 | 858.51 | 476.61 | 426.11 | 200.90 | 687.13 | 377.44 | 417.40 | 364.76 | 602.68 | 312.82 | 347.73 | 296.32 | 504.83 | 257.18 | 283.32 | 232.88 | 388.09 | 199.47 | 220.13 | 192.72 | 326.35 | 169.69 | 182.19 | 153.73 | 263.76 | 137.98 | 152.48 | 126.00 | 211.96 | 110.75 | 117.09 | 95.60 | 173.59 | 86.59 | 86.82 | 71.83 | 125.83 | 61.90 | 61.97 | 47.43 |