
| 2024-02-03 | 2023-10-28 | 2023-07-29 | 2023-04-29 | 2023-01-28 | 2022-10-29 | 2022-07-30 | 2022-04-30 | 2022-01-29 | 2021-10-30 | 2021-07-31 | 2021-05-01 | 2021-01-30 | 2020-10-31 | 2020-08-01 | 2020-05-02 | 2020-02-01 | 2019-11-02 | 2019-08-03 | 2019-05-04 | 2019-02-02 | 2018-11-03 | 2018-08-04 | 2018-05-05 | 2018-02-03 | 2017-10-28 | 2017-07-29 | 2017-04-29 | 2017-01-28 | 2016-10-29 | 2016-07-30 | 2016-04-30 | 2016-01-30 | 2015-10-31 | 2015-08-01 | 2015-05-02 | 2015-01-31 | 2014-11-01 | 2014-08-02 | 2014-05-03 | 2014-02-01 | 2013-11-02 | 2013-08-03 | 2013-05-04 | 2013-02-02 | 2012-10-27 | 2012-07-28 | 2012-04-28 | 2012-01-28 | 2011-10-29 | 2011-07-30 | 2011-04-30 | 2011-01-29 | 2010-10-30 | 2010-07-31 | 2010-05-01 | 2010-01-30 | ||
|---|---|---|---|---|---|---|---|---|---|---|---|---|---|---|---|---|---|---|---|---|---|---|---|---|---|---|---|---|---|---|---|---|---|---|---|---|---|---|---|---|---|---|---|---|---|---|---|---|---|---|---|---|---|---|---|---|---|---|
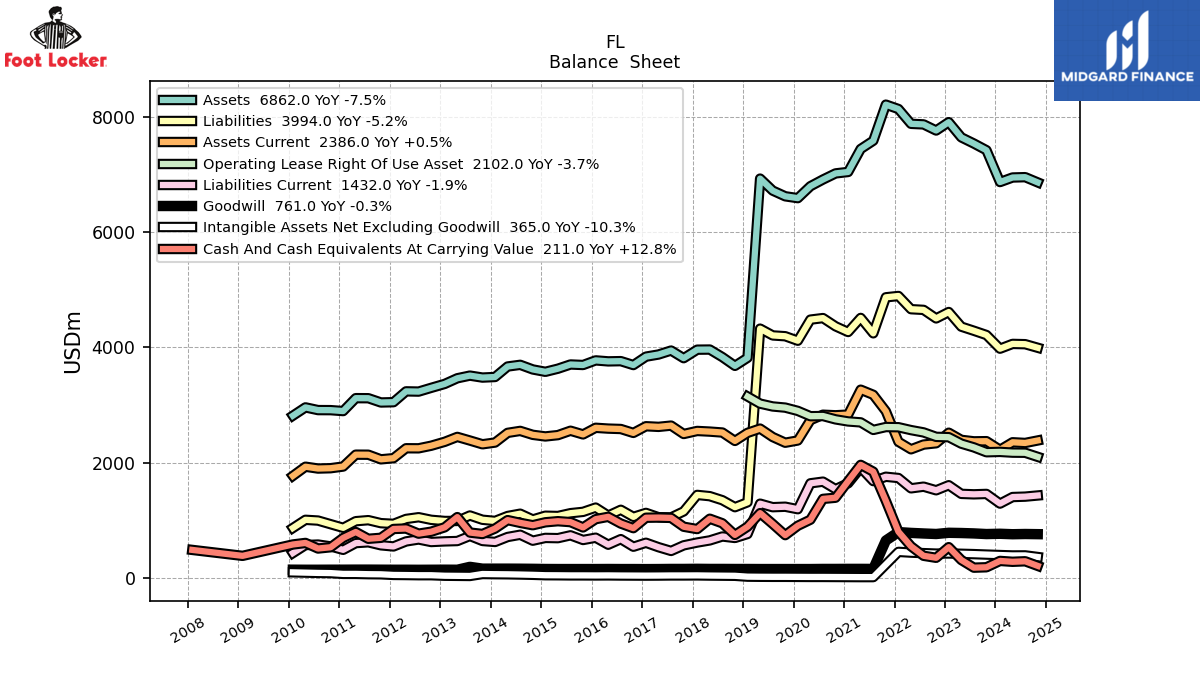
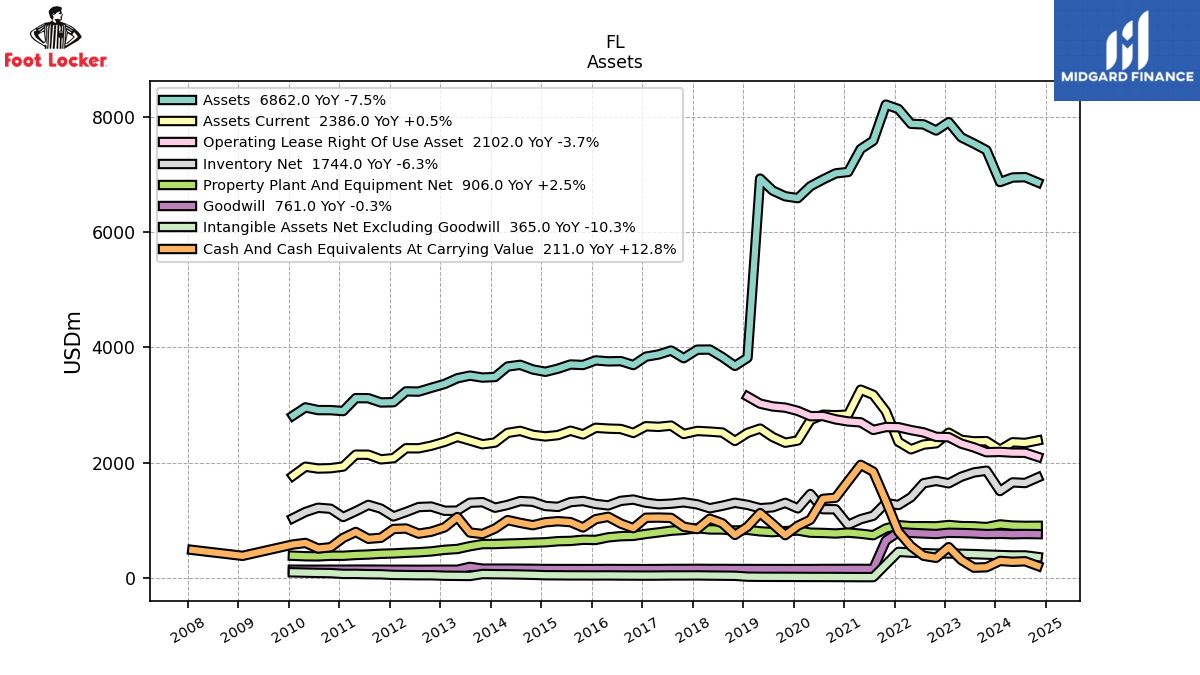
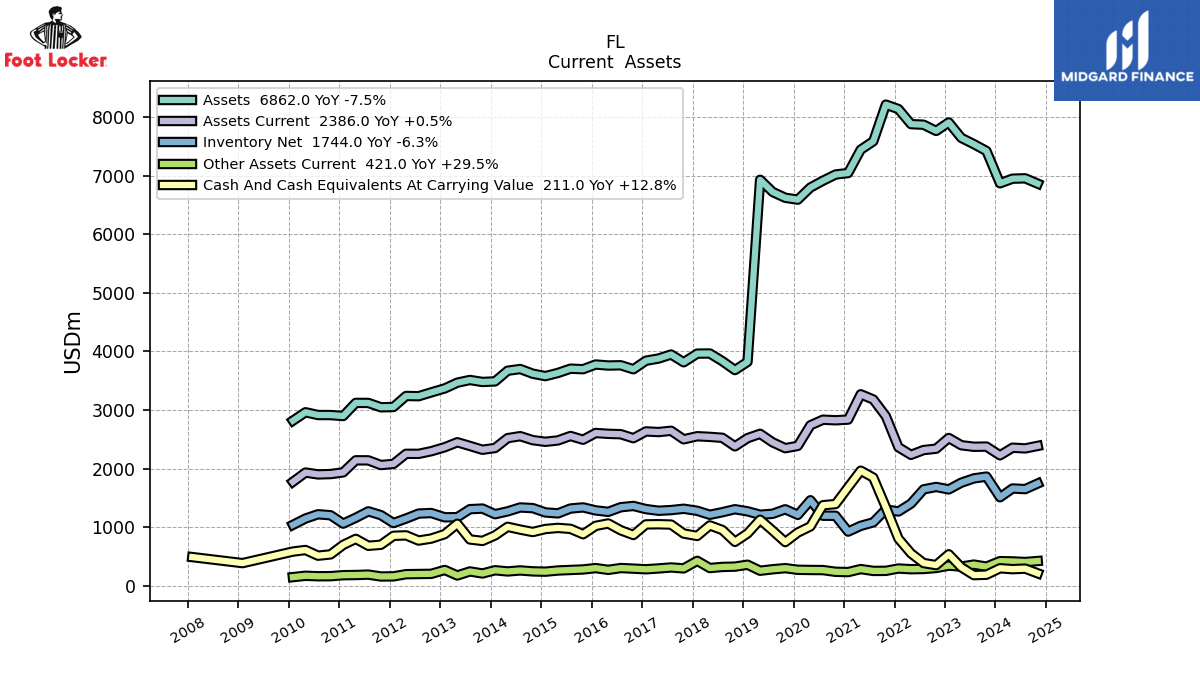
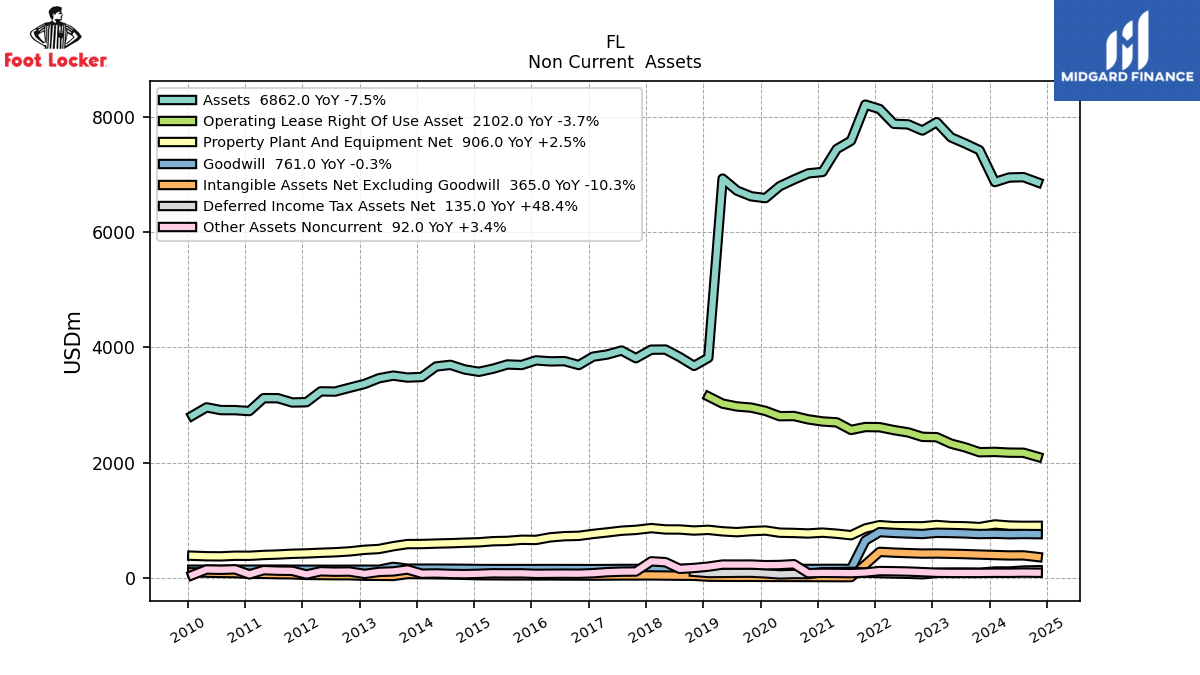
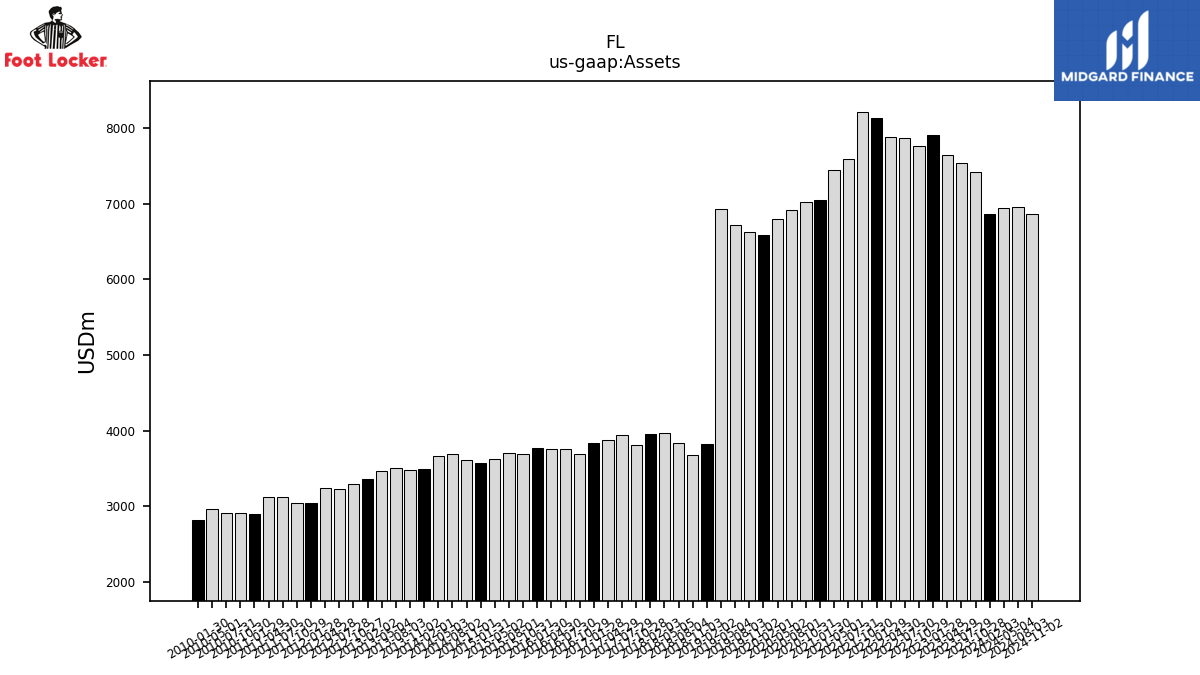
| Assets | 6868.00 | 7420.00 | 7536.00 | 7643.00 | 7907.00 | 7762.00 | 7868.00 | 7878.00 | 8135.00 | 8211.00 | 7585.00 | 7442.00 | 7043.00 | 7018.00 | 6912.00 | 6796.00 | 6589.00 | 6621.00 | 6720.00 | 6928.00 | 3820.00 | 3680.00 | 3832.00 | 3963.00 | 3961.00 | 3813.00 | 3946.00 | 3877.00 | 3840.00 | 3694.00 | 3762.00 | 3758.00 | 3775.00 | 3695.00 | 3704.00 | 3631.00 | 3577.00 | 3618.00 | 3698.00 | 3669.00 | 3487.00 | 3477.00 | 3511.00 | 3465.00 | 3367.00 | 3299.00 | 3234.00 | 3238.00 | 3050.00 | 3045.00 | 3119.00 | 3120.00 | 2896.00 | 2912.00 | 2913.00 | 2960.00 | 2816.00 | |
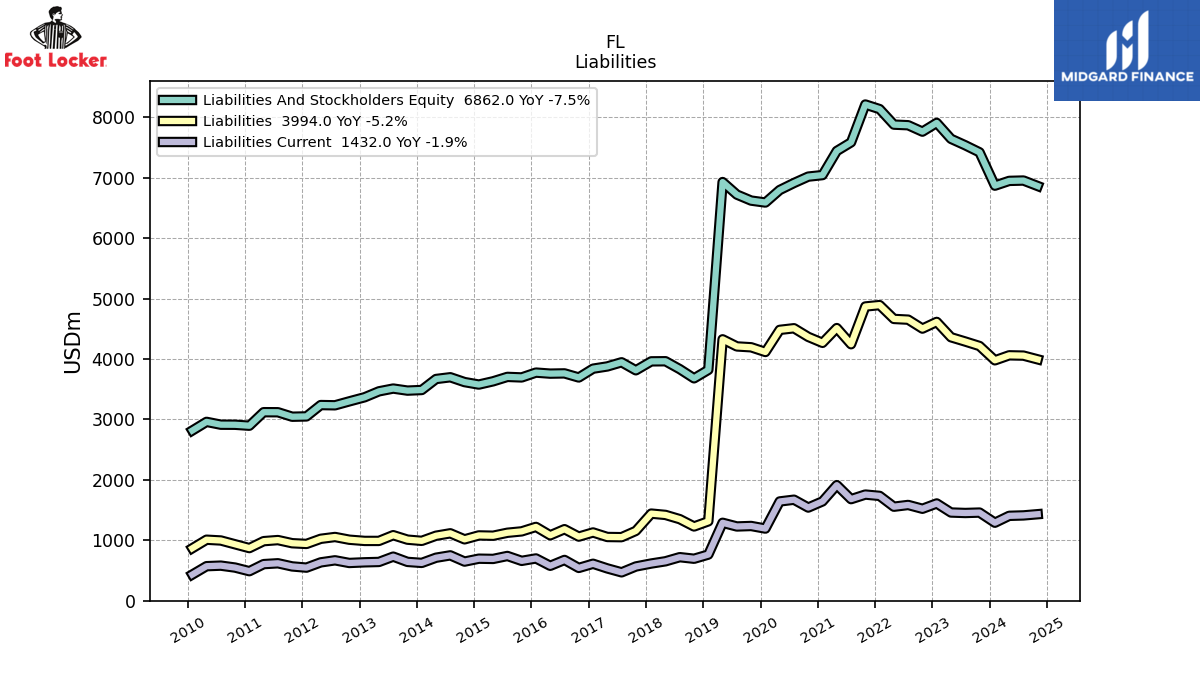
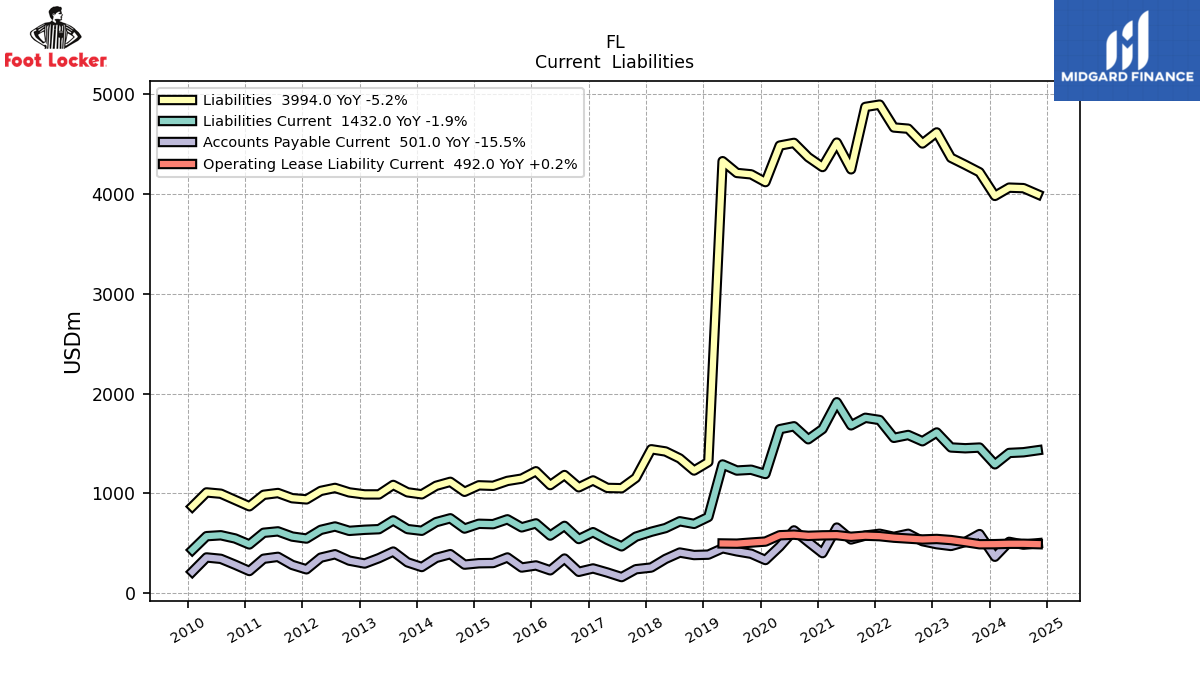
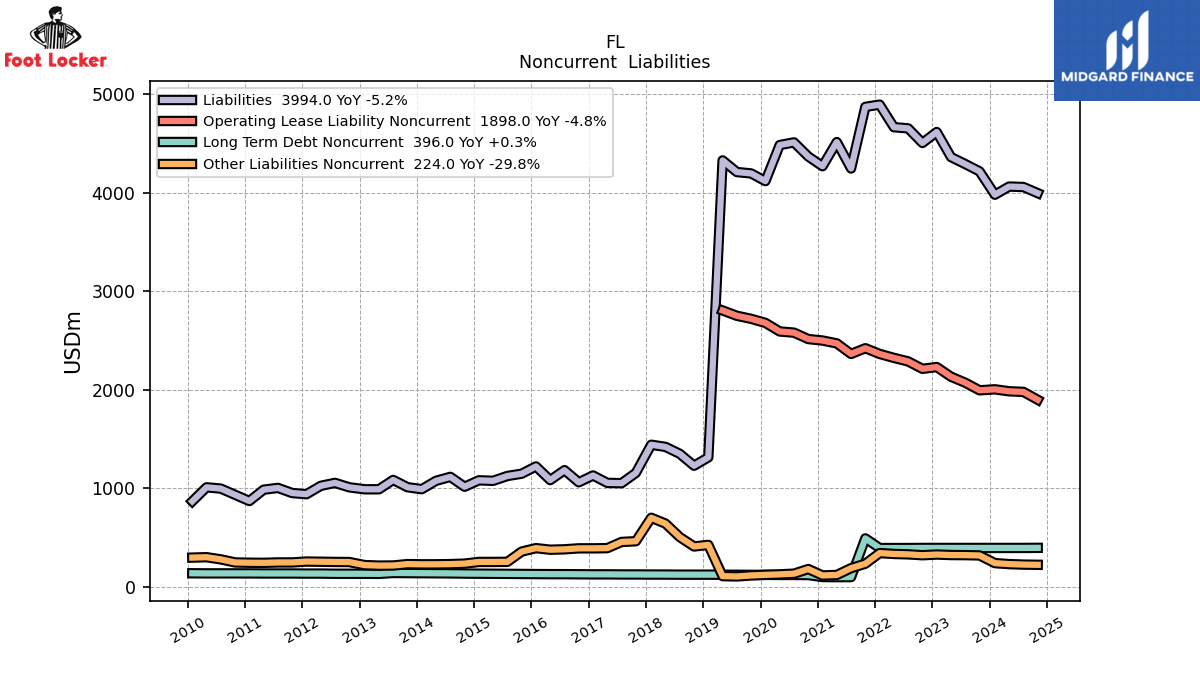
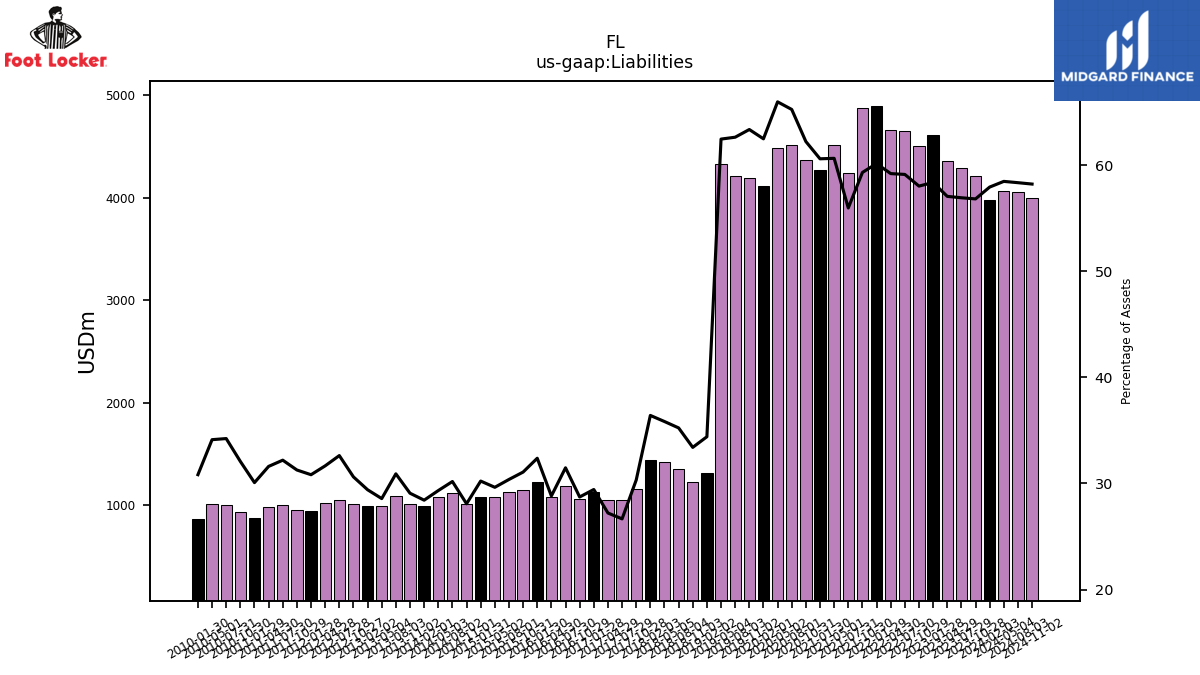
| Liabilities | 3978.00 | 4215.00 | 4289.00 | 4360.00 | 4614.00 | 4503.00 | 4651.00 | 4663.00 | 4892.00 | 4869.00 | 4244.00 | 4512.00 | 4267.00 | 4366.00 | 4509.00 | 4482.00 | 4116.00 | 4194.00 | 4208.00 | 4326.00 | 1314.00 | 1229.00 | 1350.00 | 1420.00 | 1442.00 | 1156.00 | 1052.00 | 1055.00 | 1130.00 | 1061.00 | 1184.00 | 1083.00 | 1222.00 | 1148.00 | 1125.00 | 1076.00 | 1081.00 | 1016.00 | 1116.00 | 1076.00 | 991.00 | 1011.00 | 1085.00 | 990.00 | 990.00 | 1010.00 | 1055.00 | 1025.00 | 940.00 | 952.00 | 1004.00 | 986.00 | 871.00 | 934.00 | 997.00 | 1010.00 | 868.00 | |
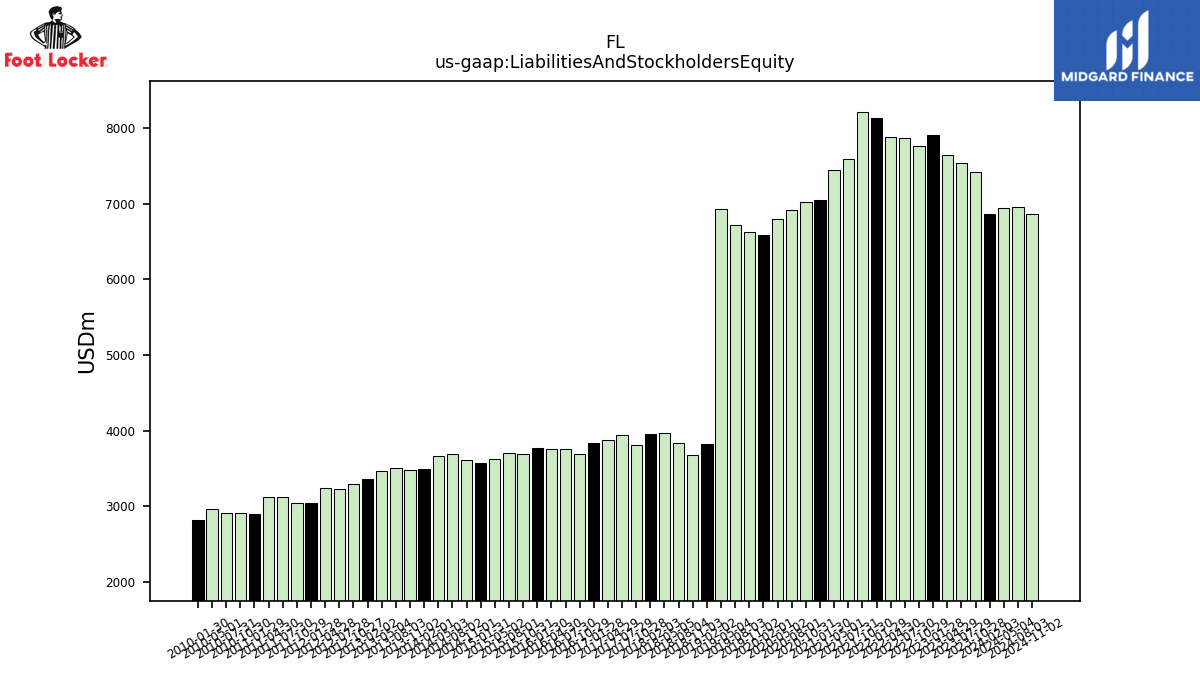
| Liabilities And Stockholders Equity | 6868.00 | 7420.00 | 7536.00 | 7643.00 | 7907.00 | 7762.00 | 7868.00 | 7878.00 | 8135.00 | 8211.00 | 7585.00 | 7442.00 | 7043.00 | 7018.00 | 6912.00 | 6796.00 | 6589.00 | 6621.00 | 6720.00 | 6928.00 | 3820.00 | 3680.00 | 3832.00 | 3963.00 | 3961.00 | 3813.00 | 3946.00 | 3877.00 | 3840.00 | 3694.00 | 3762.00 | 3758.00 | 3775.00 | 3695.00 | 3704.00 | 3631.00 | 3577.00 | 3618.00 | 3698.00 | 3669.00 | 3487.00 | 3477.00 | 3511.00 | 3465.00 | 3367.00 | 3299.00 | 3234.00 | 3238.00 | 3050.00 | 3045.00 | 3119.00 | 3120.00 | 2896.00 | 2912.00 | 2913.00 | 2960.00 | 2816.00 |
| 2024-02-03 | 2023-10-28 | 2023-07-29 | 2023-04-29 | 2023-01-28 | 2022-10-29 | 2022-07-30 | 2022-04-30 | 2022-01-29 | 2021-10-30 | 2021-07-31 | 2021-05-01 | 2021-01-30 | 2020-10-31 | 2020-08-01 | 2020-05-02 | 2020-02-01 | 2019-11-02 | 2019-08-03 | 2019-05-04 | 2019-02-02 | 2018-11-03 | 2018-08-04 | 2018-05-05 | 2018-02-03 | 2017-10-28 | 2017-07-29 | 2017-04-29 | 2017-01-28 | 2016-10-29 | 2016-07-30 | 2016-04-30 | 2016-01-30 | 2015-10-31 | 2015-08-01 | 2015-05-02 | 2015-01-31 | 2014-11-01 | 2014-08-02 | 2014-05-03 | 2014-02-01 | 2013-11-02 | 2013-08-03 | 2013-05-04 | 2013-02-02 | 2012-10-27 | 2012-07-28 | 2012-04-28 | 2012-01-28 | 2011-10-29 | 2011-07-30 | 2011-04-30 | 2011-01-29 | 2010-10-30 | 2010-07-31 | 2010-05-01 | 2010-01-30 | ||
|---|---|---|---|---|---|---|---|---|---|---|---|---|---|---|---|---|---|---|---|---|---|---|---|---|---|---|---|---|---|---|---|---|---|---|---|---|---|---|---|---|---|---|---|---|---|---|---|---|---|---|---|---|---|---|---|---|---|---|
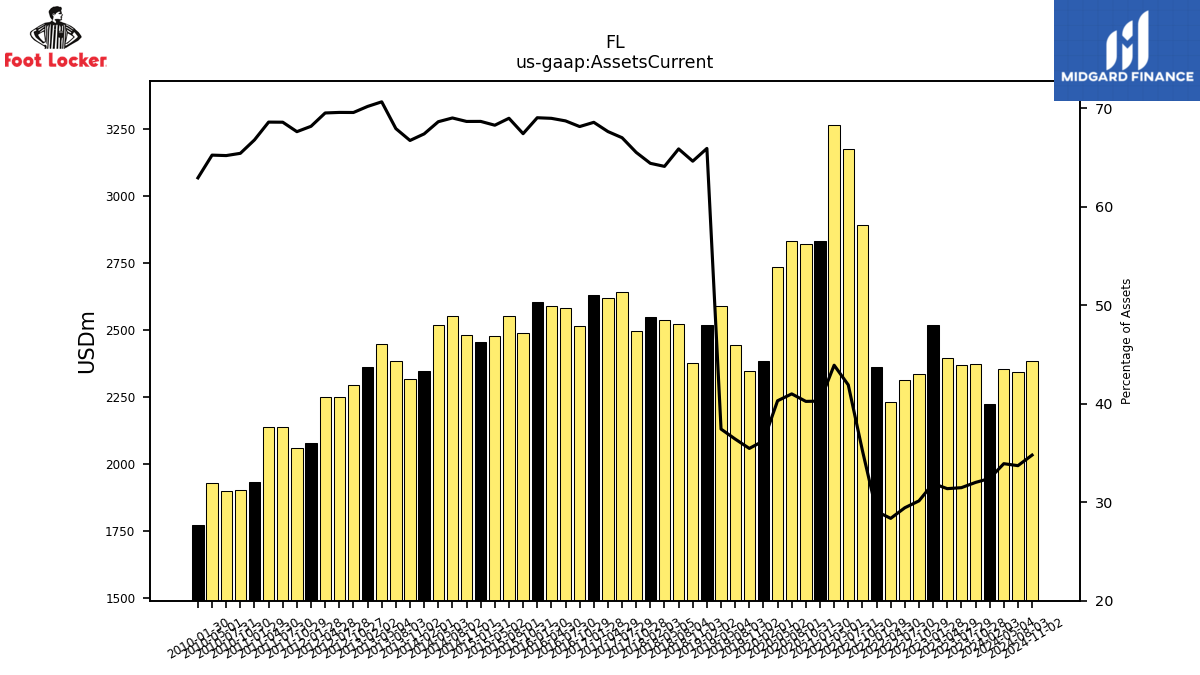
| Assets Current | 2225.00 | 2374.00 | 2371.00 | 2397.00 | 2521.00 | 2338.00 | 2315.00 | 2233.00 | 2363.00 | 2893.00 | 3178.00 | 3267.00 | 2835.00 | 2823.00 | 2833.00 | 2738.00 | 2386.00 | 2347.00 | 2446.00 | 2592.00 | 2518.00 | 2378.00 | 2524.00 | 2540.00 | 2551.00 | 2498.00 | 2644.00 | 2622.00 | 2633.00 | 2517.00 | 2585.00 | 2592.00 | 2606.00 | 2491.00 | 2555.00 | 2479.00 | 2456.00 | 2484.00 | 2552.00 | 2518.00 | 2350.00 | 2320.00 | 2385.00 | 2448.00 | 2363.00 | 2295.00 | 2250.00 | 2251.00 | 2079.00 | 2059.00 | 2139.00 | 2140.00 | 1934.00 | 1905.00 | 1899.00 | 1931.00 | 1772.00 | |
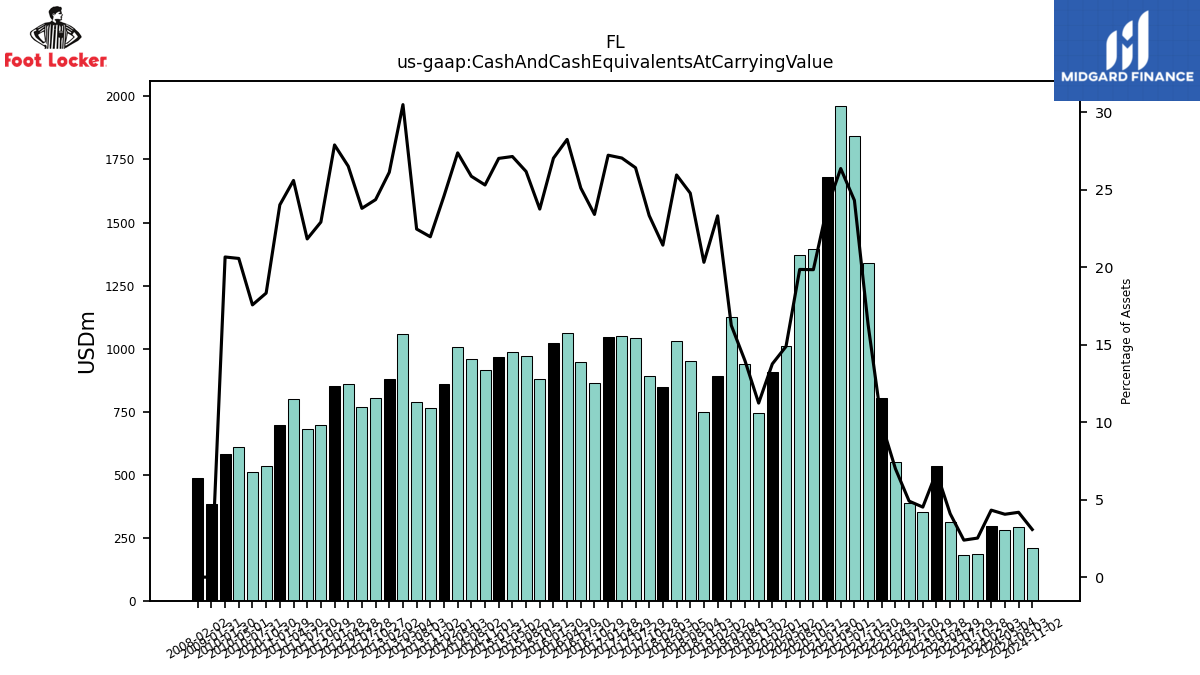
| Cash And Cash Equivalents At Carrying Value | 297.00 | 187.00 | 180.00 | 313.00 | 536.00 | 351.00 | 386.00 | 551.00 | 804.00 | 1339.00 | 1845.00 | 1963.00 | 1680.00 | 1393.00 | 1373.00 | 1012.00 | 907.00 | 744.00 | 939.00 | 1126.00 | 891.00 | 748.00 | 950.00 | 1029.00 | 849.00 | 890.00 | 1043.00 | 1049.00 | 1046.00 | 865.00 | 945.00 | 1062.00 | 1021.00 | 878.00 | 970.00 | 986.00 | 967.00 | 916.00 | 957.00 | 1005.00 | 858.00 | 764.00 | 789.00 | 1057.00 | 880.00 | 804.00 | 770.00 | 859.00 | 851.00 | 698.00 | 681.00 | 799.00 | 696.00 | 534.00 | 512.00 | 609.00 | 582.00 | |
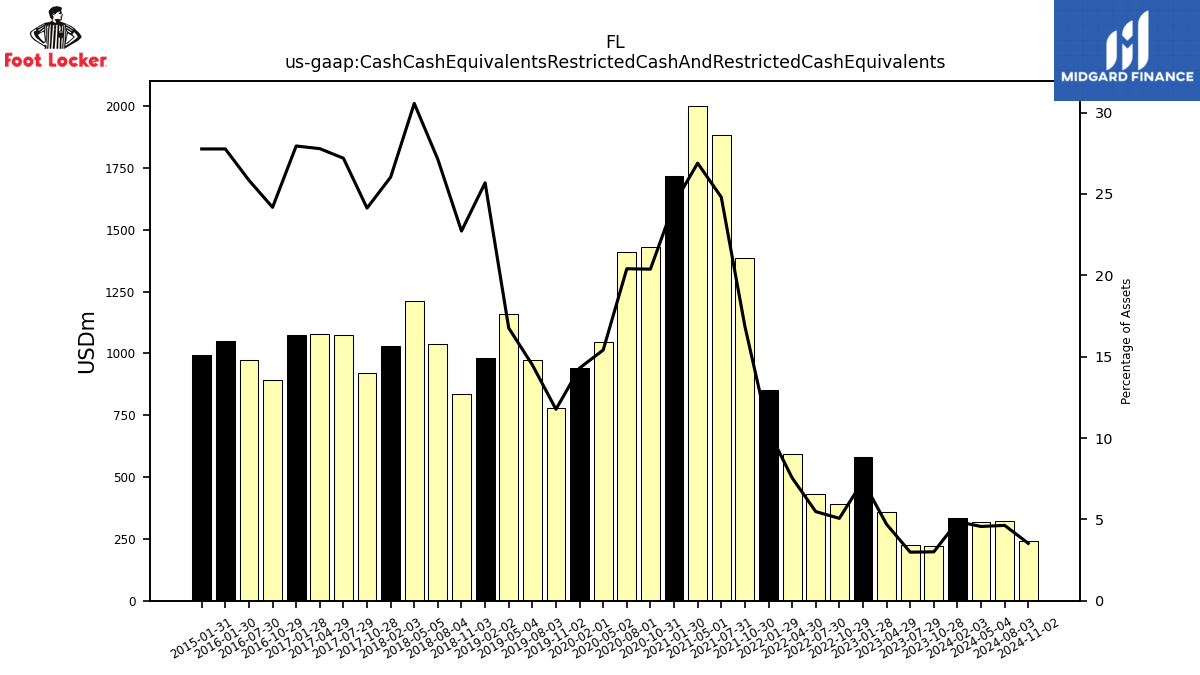
| Cash Cash Equivalents Restricted Cash And Restricted Cash Equivalents | 334.00 | 223.00 | 225.00 | 359.00 | 582.00 | 393.00 | 431.00 | 595.00 | 850.00 | 1385.00 | 1881.00 | 2001.00 | 1718.00 | 1430.00 | 1410.00 | 1047.00 | 942.00 | 779.00 | 974.00 | 1161.00 | 981.00 | 836.00 | 1039.00 | 1211.00 | 1031.00 | 920.00 | 1073.00 | 1077.00 | 1073.00 | 893.00 | 972.00 | NA | 1048.00 | NA | NA | NA | 993.00 | NA | NA | NA | NA | NA | NA | NA | NA | NA | NA | NA | NA | NA | NA | NA | NA | NA | NA | NA | NA | |
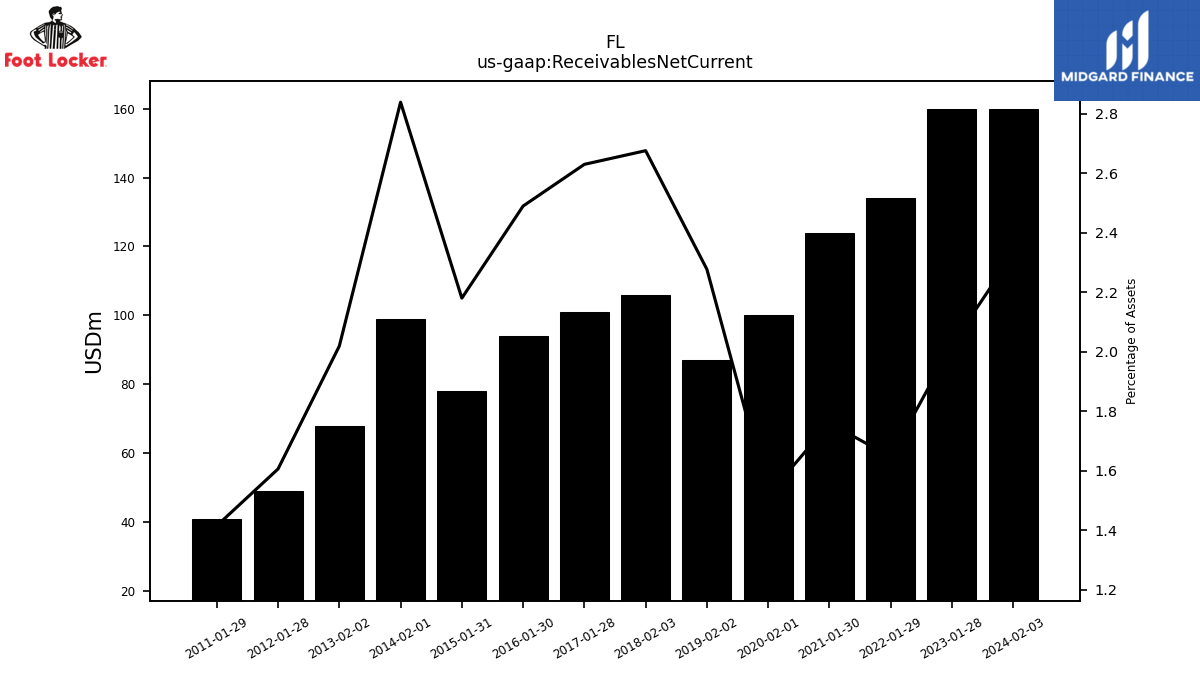
| Receivables Net Current | 160.00 | NA | NA | NA | 160.00 | NA | NA | NA | 134.00 | NA | NA | NA | 124.00 | NA | NA | NA | 100.00 | NA | NA | NA | 87.00 | NA | NA | NA | 106.00 | NA | NA | NA | 101.00 | NA | NA | NA | 94.00 | NA | NA | NA | 78.00 | NA | NA | NA | 99.00 | NA | NA | NA | 68.00 | NA | NA | NA | 49.00 | NA | NA | NA | 41.00 | NA | NA | NA | NA | |
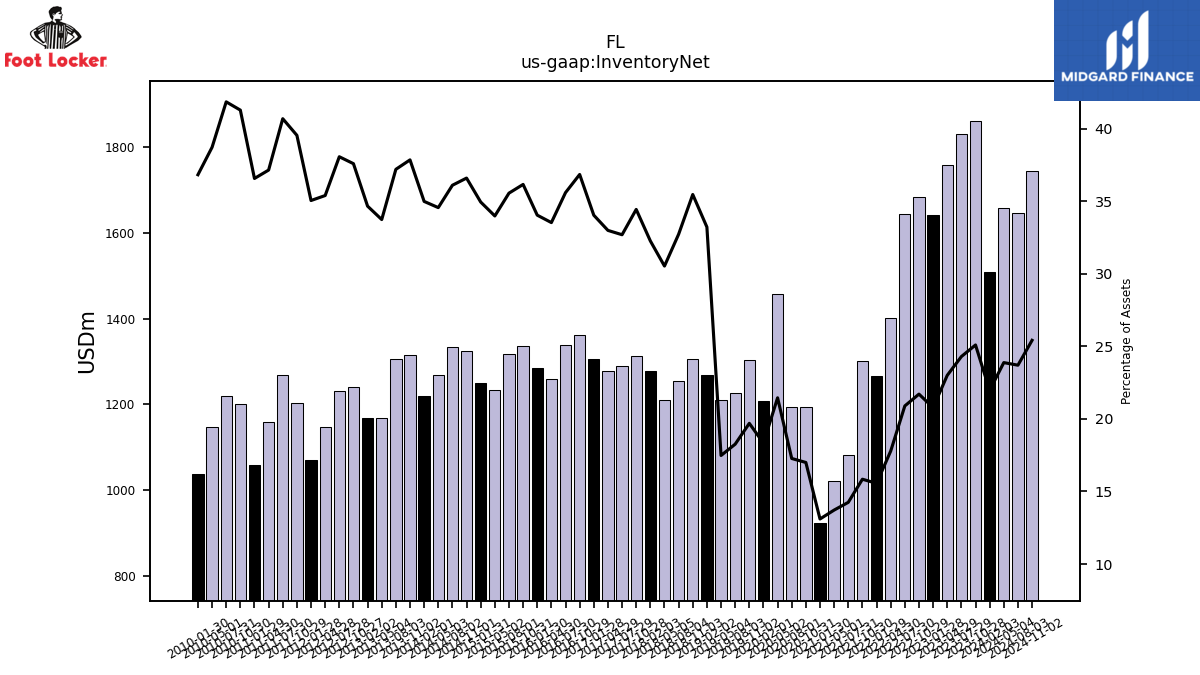
| Inventory Net | 1509.00 | 1862.00 | 1831.00 | 1758.00 | 1643.00 | 1685.00 | 1644.00 | 1401.00 | 1266.00 | 1301.00 | 1081.00 | 1021.00 | 923.00 | 1193.00 | 1194.00 | 1458.00 | 1208.00 | 1304.00 | 1227.00 | 1211.00 | 1269.00 | 1305.00 | 1254.00 | 1210.00 | 1278.00 | 1313.00 | 1290.00 | 1279.00 | 1307.00 | 1361.00 | 1339.00 | 1260.00 | 1285.00 | 1336.00 | 1317.00 | 1234.00 | 1250.00 | 1324.00 | 1335.00 | 1268.00 | 1220.00 | 1316.00 | 1306.00 | 1169.00 | 1167.00 | 1240.00 | 1231.00 | 1146.00 | 1069.00 | 1204.00 | 1269.00 | 1159.00 | 1059.00 | 1202.00 | 1219.00 | 1146.00 | 1037.00 | |
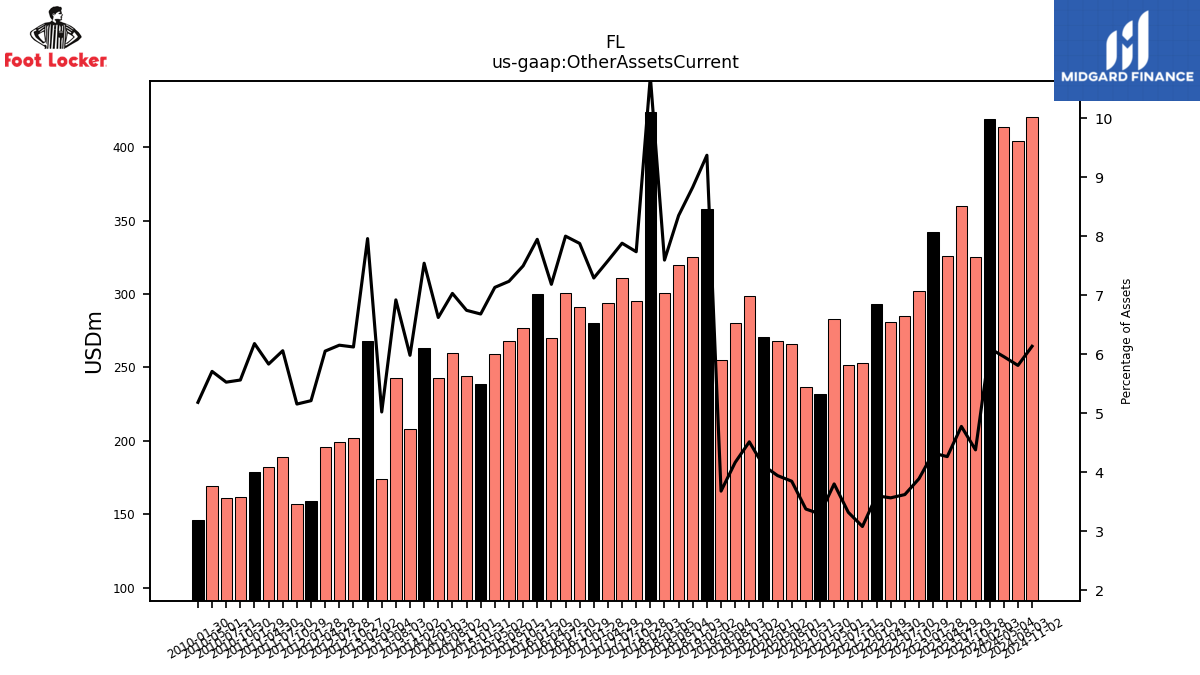
| Other Assets Current | 419.00 | 325.00 | 360.00 | 326.00 | 342.00 | 302.00 | 285.00 | 281.00 | 293.00 | 253.00 | 252.00 | 283.00 | 232.00 | 237.00 | 266.00 | 268.00 | 271.00 | 299.00 | 280.00 | 255.00 | 358.00 | 325.00 | 320.00 | 301.00 | 424.00 | 295.00 | 311.00 | 294.00 | 280.00 | 291.00 | 301.00 | 270.00 | 300.00 | 277.00 | 268.00 | 259.00 | 239.00 | 244.00 | 260.00 | 243.00 | 263.00 | 208.00 | 243.00 | 174.00 | 268.00 | 202.00 | 199.00 | 196.00 | 159.00 | 157.00 | 189.00 | 182.00 | 179.00 | 162.00 | 161.00 | 169.00 | 146.00 | |
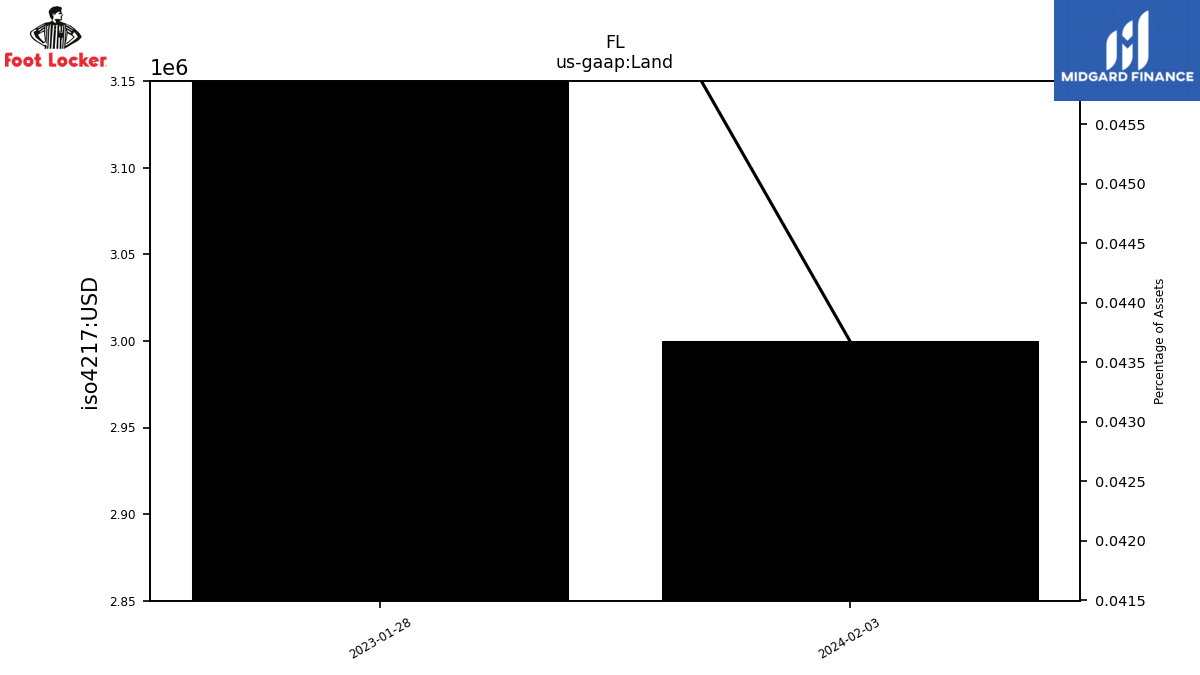
| Land | 3.00 | NA | NA | NA | 4.00 | NA | NA | NA | NA | NA | NA | NA | NA | NA | NA | NA | NA | NA | NA | NA | NA | NA | NA | NA | NA | NA | NA | NA | NA | NA | NA | NA | NA | NA | NA | NA | NA | NA | NA | NA | NA | NA | NA | NA | NA | NA | NA | NA | NA | NA | NA | NA | NA | NA | NA | NA | NA |
| 2024-02-03 | 2023-10-28 | 2023-07-29 | 2023-04-29 | 2023-01-28 | 2022-10-29 | 2022-07-30 | 2022-04-30 | 2022-01-29 | 2021-10-30 | 2021-07-31 | 2021-05-01 | 2021-01-30 | 2020-10-31 | 2020-08-01 | 2020-05-02 | 2020-02-01 | 2019-11-02 | 2019-08-03 | 2019-05-04 | 2019-02-02 | 2018-11-03 | 2018-08-04 | 2018-05-05 | 2018-02-03 | 2017-10-28 | 2017-07-29 | 2017-04-29 | 2017-01-28 | 2016-10-29 | 2016-07-30 | 2016-04-30 | 2016-01-30 | 2015-10-31 | 2015-08-01 | 2015-05-02 | 2015-01-31 | 2014-11-01 | 2014-08-02 | 2014-05-03 | 2014-02-01 | 2013-11-02 | 2013-08-03 | 2013-05-04 | 2013-02-02 | 2012-10-27 | 2012-07-28 | 2012-04-28 | 2012-01-28 | 2011-10-29 | 2011-07-30 | 2011-04-30 | 2011-01-29 | 2010-10-30 | 2010-07-31 | 2010-05-01 | 2010-01-30 | ||
|---|---|---|---|---|---|---|---|---|---|---|---|---|---|---|---|---|---|---|---|---|---|---|---|---|---|---|---|---|---|---|---|---|---|---|---|---|---|---|---|---|---|---|---|---|---|---|---|---|---|---|---|---|---|---|---|---|---|---|
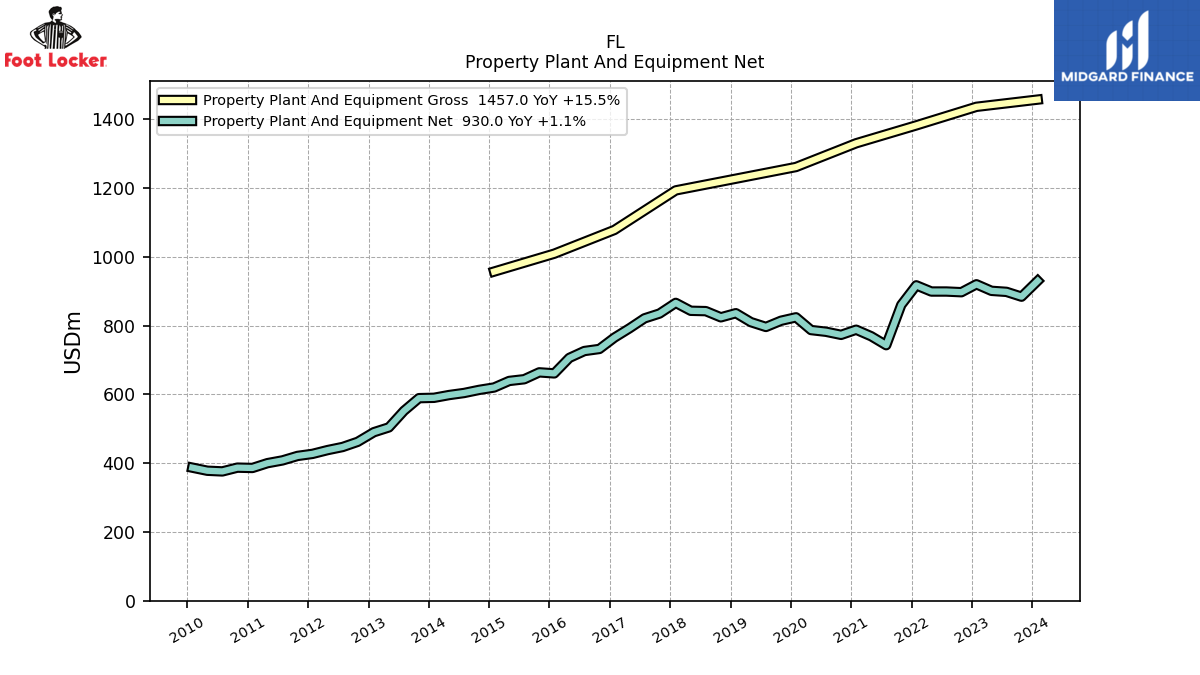
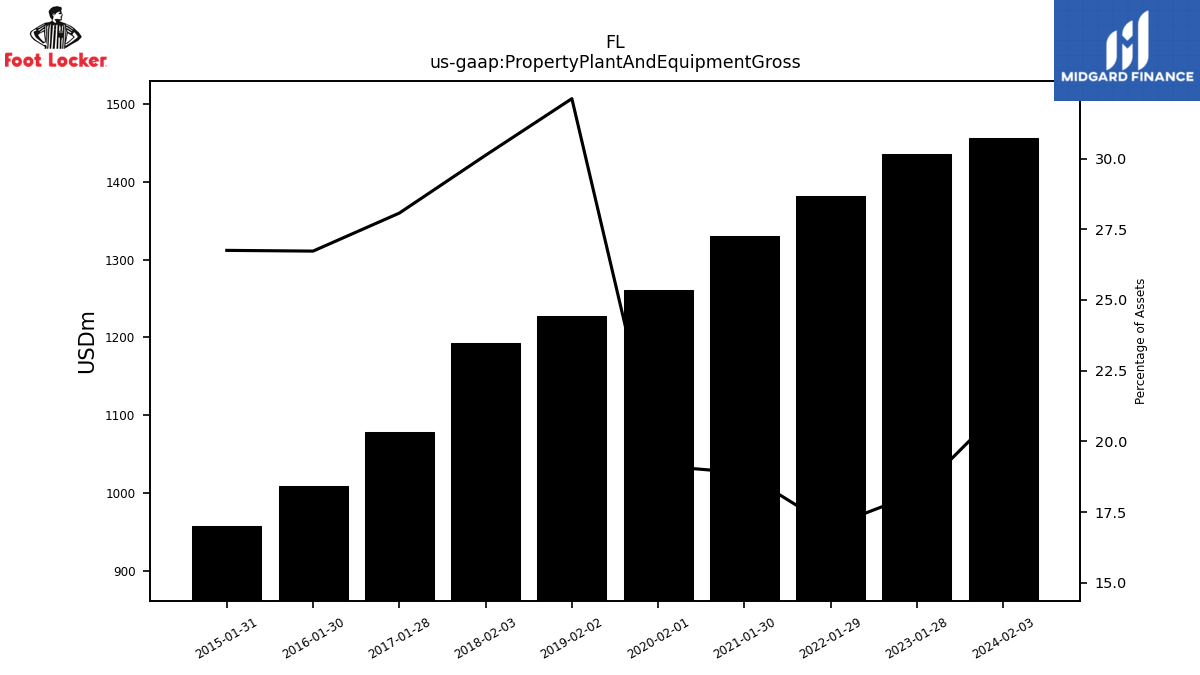
| Property Plant And Equipment Gross | 1457.00 | NA | NA | NA | 1436.00 | NA | NA | NA | 1382.00 | NA | NA | NA | 1330.00 | NA | NA | NA | 1261.00 | NA | NA | NA | 1227.00 | NA | NA | NA | 1193.00 | NA | NA | NA | 1078.00 | NA | NA | NA | 1009.00 | NA | NA | NA | 957.00 | NA | NA | NA | NA | NA | NA | NA | NA | NA | NA | NA | NA | NA | NA | NA | NA | NA | NA | NA | NA | |
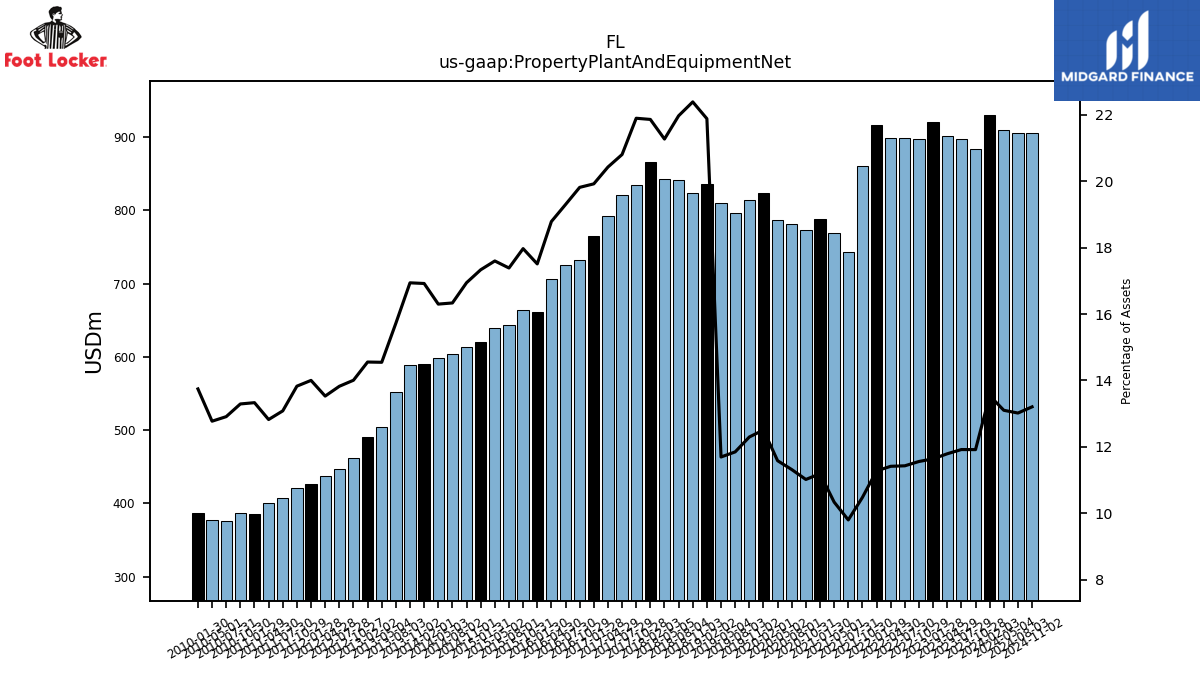
| Property Plant And Equipment Net | 930.00 | 884.00 | 898.00 | 901.00 | 920.00 | 897.00 | 899.00 | 899.00 | 917.00 | 860.00 | 743.00 | 769.00 | 788.00 | 773.00 | 782.00 | 787.00 | 824.00 | 814.00 | 796.00 | 810.00 | 836.00 | 824.00 | 842.00 | 843.00 | 866.00 | 835.00 | 821.00 | 792.00 | 765.00 | 732.00 | 726.00 | 706.00 | 661.00 | 664.00 | 644.00 | 639.00 | 620.00 | 613.00 | 604.00 | 598.00 | 590.00 | 589.00 | 552.00 | 504.00 | 490.00 | 462.00 | 447.00 | 438.00 | 427.00 | 421.00 | 408.00 | 400.00 | 386.00 | 387.00 | 376.00 | 378.00 | 387.00 | |
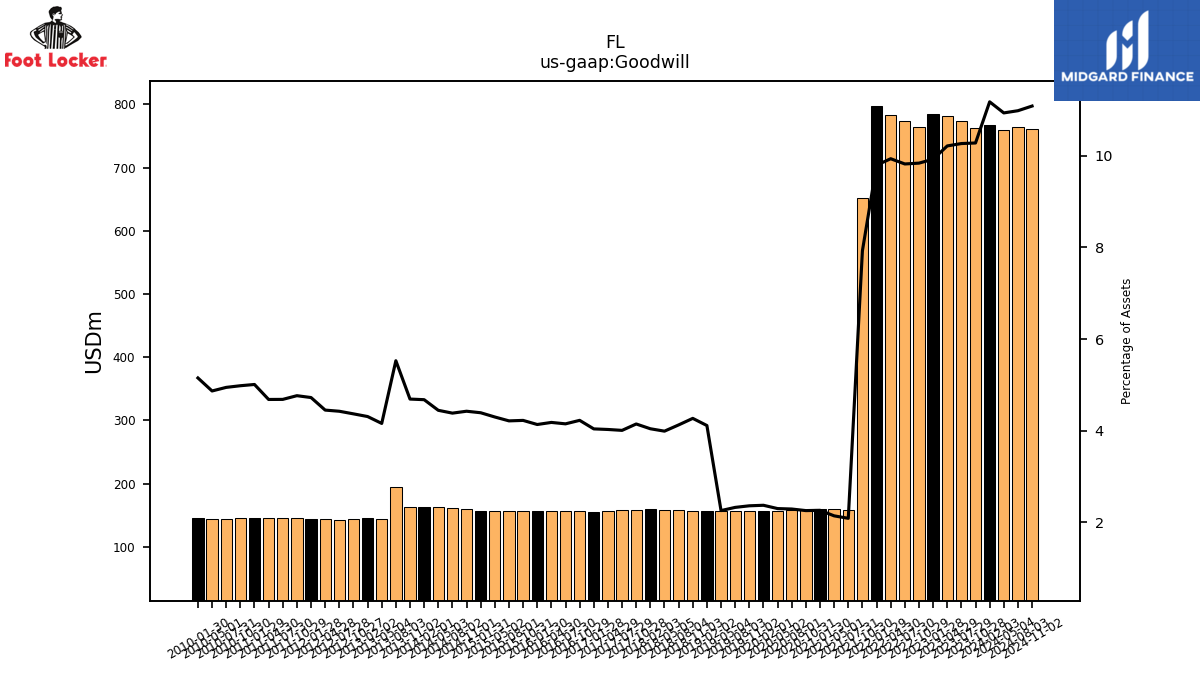
| Goodwill | 768.00 | 763.00 | 774.00 | 781.00 | 785.00 | 764.00 | 773.00 | 783.00 | 797.00 | 651.00 | 158.00 | 159.00 | 159.00 | 158.00 | 158.00 | 156.00 | 156.00 | 156.00 | 156.00 | 156.00 | 157.00 | 157.00 | 158.00 | 158.00 | 160.00 | 158.00 | 158.00 | 156.00 | 155.00 | 156.00 | 156.00 | 157.00 | 156.00 | 156.00 | 156.00 | 156.00 | 157.00 | 160.00 | 162.00 | 163.00 | 163.00 | 163.00 | 194.00 | 144.00 | 145.00 | 144.00 | 143.00 | 144.00 | 144.00 | 145.00 | 146.00 | 146.00 | 145.00 | 145.00 | 144.00 | 144.00 | 145.00 | |
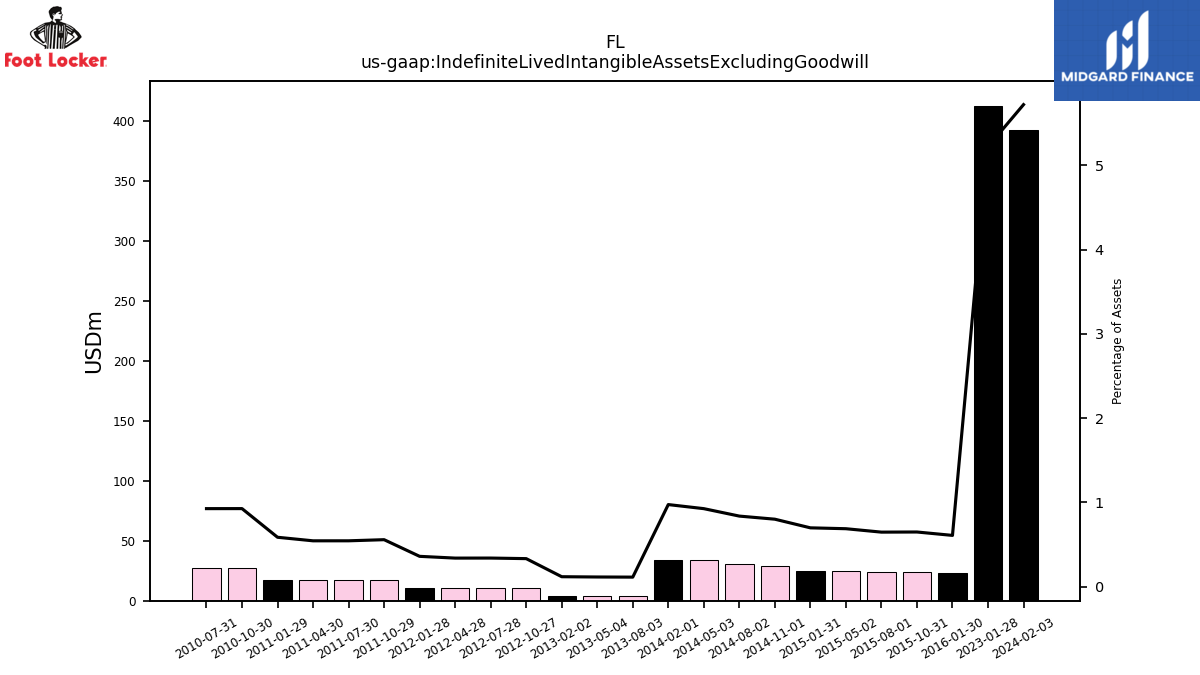
| Indefinite Lived Intangible Assets Excluding Goodwill | 393.00 | NA | NA | NA | 413.00 | NA | NA | NA | NA | NA | NA | NA | NA | NA | NA | NA | NA | NA | NA | NA | NA | NA | NA | NA | NA | NA | NA | NA | NA | NA | NA | NA | 23.00 | 24.00 | 24.00 | 25.00 | 25.00 | 29.00 | 31.00 | 34.00 | 34.00 | NA | 4.00 | 4.00 | 4.00 | 11.00 | 11.00 | 11.00 | 11.00 | 17.00 | 17.00 | 17.00 | 17.00 | 27.00 | 27.00 | NA | NA | |
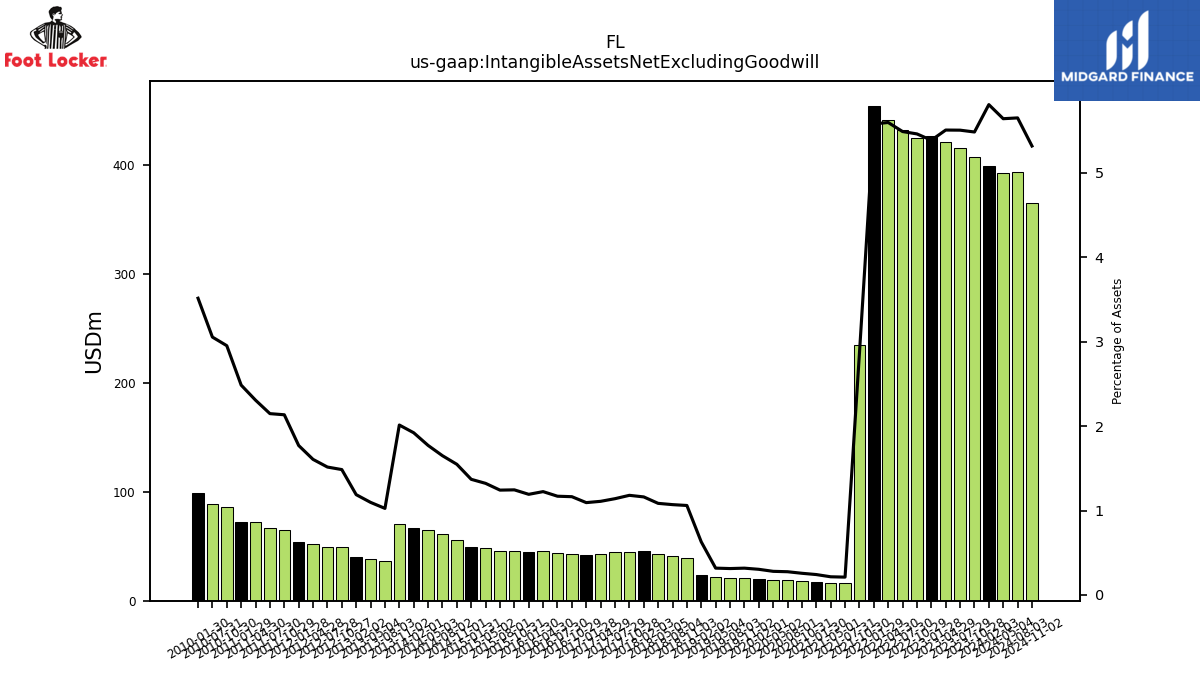
| Intangible Assets Net Excluding Goodwill | 399.00 | 407.00 | 415.00 | 421.00 | 426.00 | 424.00 | 432.00 | 441.00 | 454.00 | 235.00 | 16.00 | 16.00 | 17.00 | 18.00 | 19.00 | 19.00 | 20.00 | 21.00 | 21.00 | 22.00 | 24.00 | 39.00 | 41.00 | 43.00 | 46.00 | 45.00 | 45.00 | 43.00 | 42.00 | 43.00 | 44.00 | 46.00 | 45.00 | 46.00 | 46.00 | 48.00 | 49.00 | 56.00 | 61.00 | 65.00 | 67.00 | 70.00 | 36.00 | 38.00 | 40.00 | 49.00 | 49.00 | 52.00 | 54.00 | 65.00 | 67.00 | 72.00 | 72.00 | 86.00 | 89.00 | NA | 99.00 | |
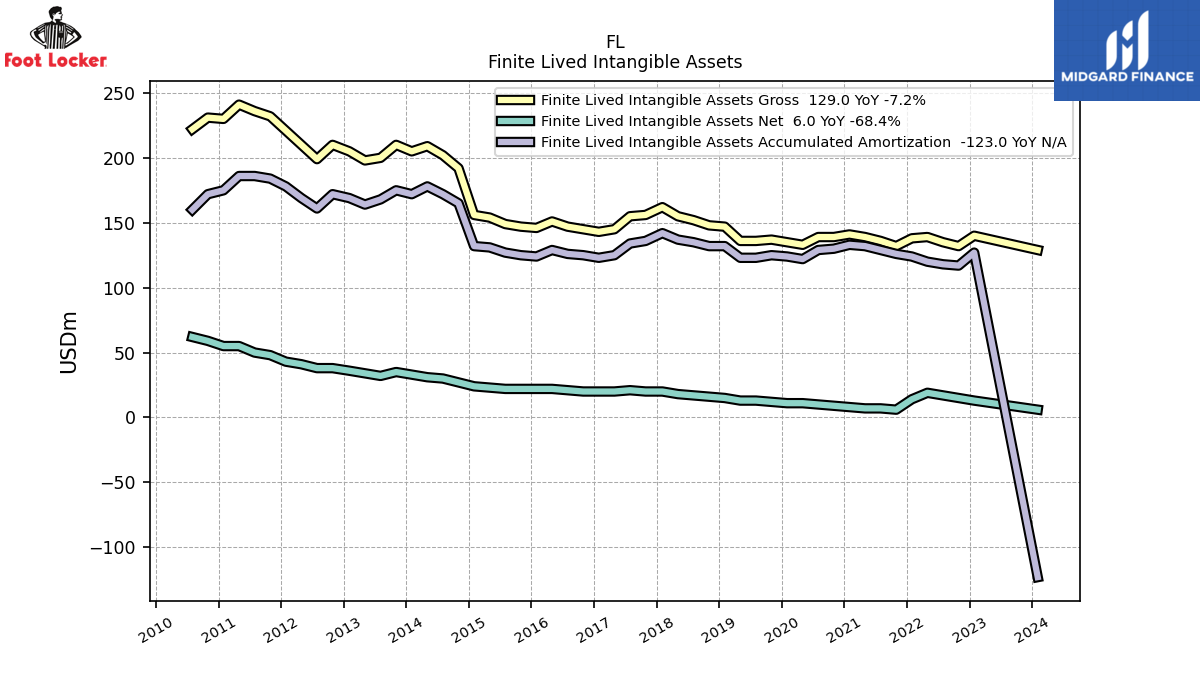
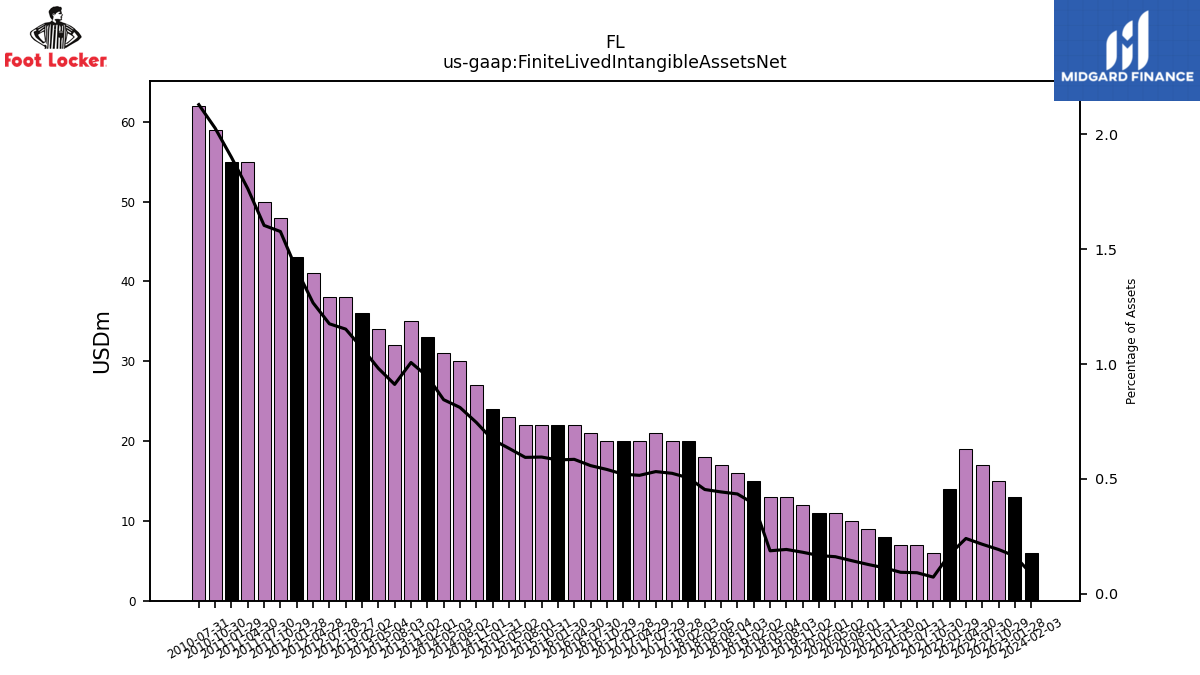
| Finite Lived Intangible Assets Net | 6.00 | NA | NA | NA | 13.00 | 15.00 | 17.00 | 19.00 | 14.00 | 6.00 | 7.00 | 7.00 | 8.00 | 9.00 | 10.00 | 11.00 | 11.00 | 12.00 | 13.00 | 13.00 | 15.00 | 16.00 | 17.00 | 18.00 | 20.00 | 20.00 | 21.00 | 20.00 | 20.00 | 20.00 | 21.00 | 22.00 | 22.00 | 22.00 | 22.00 | 23.00 | 24.00 | 27.00 | 30.00 | 31.00 | 33.00 | 35.00 | 32.00 | 34.00 | 36.00 | 38.00 | 38.00 | 41.00 | 43.00 | 48.00 | 50.00 | 55.00 | 55.00 | 59.00 | 62.00 | NA | NA | |
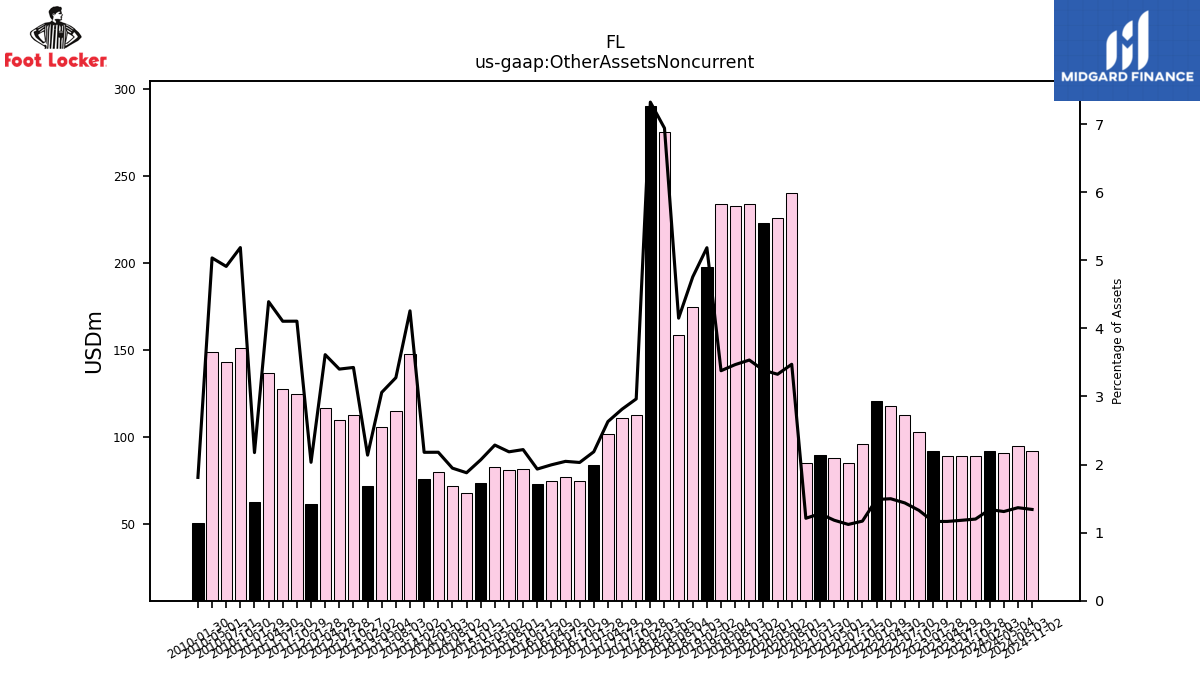
| Other Assets Noncurrent | 92.00 | 89.00 | 89.00 | 89.00 | 92.00 | 103.00 | 113.00 | 118.00 | 121.00 | 96.00 | 85.00 | 88.00 | 90.00 | 85.00 | 240.00 | 226.00 | 223.00 | 234.00 | 233.00 | 234.00 | 198.00 | 175.00 | 159.00 | 275.00 | 290.00 | 113.00 | 111.00 | 102.00 | 84.00 | 75.00 | 77.00 | 75.00 | 73.00 | 82.00 | 81.00 | 83.00 | 74.00 | 68.00 | 72.00 | 80.00 | 76.00 | 148.00 | 115.00 | 106.00 | 72.00 | 113.00 | 110.00 | 117.00 | 62.00 | 125.00 | 128.00 | 137.00 | 63.00 | 151.00 | 143.00 | 149.00 | 51.00 |
| 2024-02-03 | 2023-10-28 | 2023-07-29 | 2023-04-29 | 2023-01-28 | 2022-10-29 | 2022-07-30 | 2022-04-30 | 2022-01-29 | 2021-10-30 | 2021-07-31 | 2021-05-01 | 2021-01-30 | 2020-10-31 | 2020-08-01 | 2020-05-02 | 2020-02-01 | 2019-11-02 | 2019-08-03 | 2019-05-04 | 2019-02-02 | 2018-11-03 | 2018-08-04 | 2018-05-05 | 2018-02-03 | 2017-10-28 | 2017-07-29 | 2017-04-29 | 2017-01-28 | 2016-10-29 | 2016-07-30 | 2016-04-30 | 2016-01-30 | 2015-10-31 | 2015-08-01 | 2015-05-02 | 2015-01-31 | 2014-11-01 | 2014-08-02 | 2014-05-03 | 2014-02-01 | 2013-11-02 | 2013-08-03 | 2013-05-04 | 2013-02-02 | 2012-10-27 | 2012-07-28 | 2012-04-28 | 2012-01-28 | 2011-10-29 | 2011-07-30 | 2011-04-30 | 2011-01-29 | 2010-10-30 | 2010-07-31 | 2010-05-01 | 2010-01-30 | ||
|---|---|---|---|---|---|---|---|---|---|---|---|---|---|---|---|---|---|---|---|---|---|---|---|---|---|---|---|---|---|---|---|---|---|---|---|---|---|---|---|---|---|---|---|---|---|---|---|---|---|---|---|---|---|---|---|---|---|---|
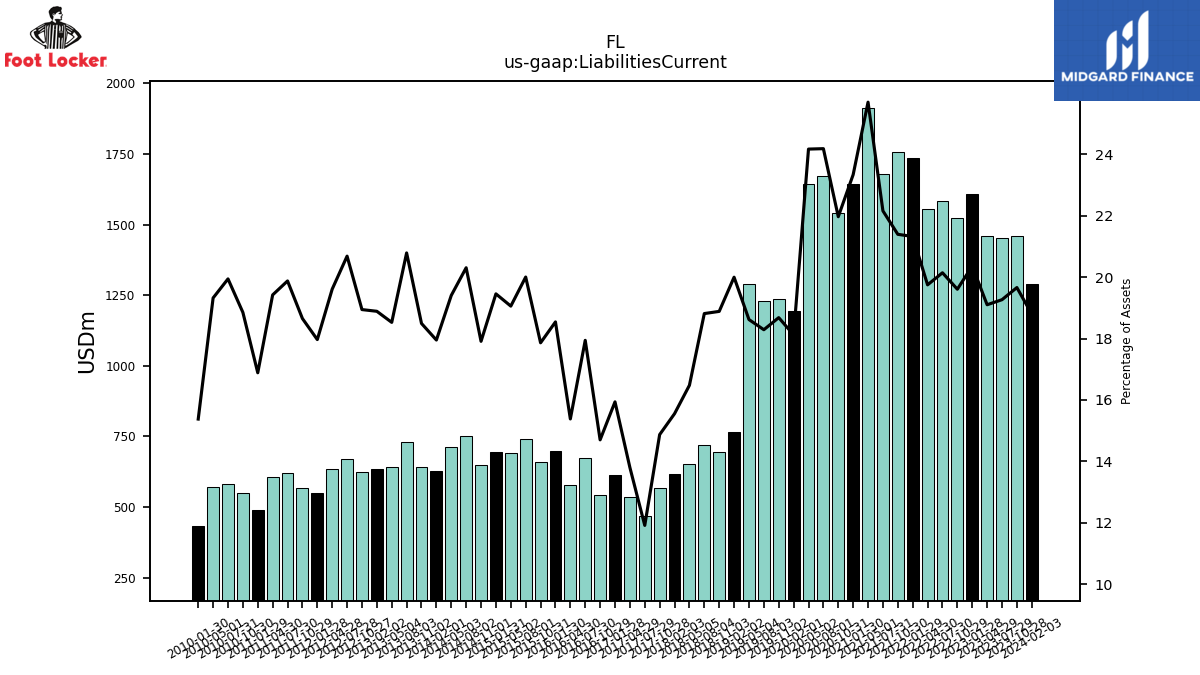
| Liabilities Current | 1291.00 | 1459.00 | 1452.00 | 1460.00 | 1610.00 | 1522.00 | 1585.00 | 1556.00 | 1735.00 | 1757.00 | 1681.00 | 1913.00 | 1644.00 | 1542.00 | 1672.00 | 1643.00 | 1194.00 | 1237.00 | 1229.00 | 1290.00 | 764.00 | 695.00 | 721.00 | 653.00 | 616.00 | 567.00 | 470.00 | 535.00 | 612.00 | 543.00 | 675.00 | 578.00 | 700.00 | 660.00 | 741.00 | 692.00 | 696.00 | 648.00 | 751.00 | 712.00 | 626.00 | 643.00 | 730.00 | 642.00 | 636.00 | 625.00 | 669.00 | 635.00 | 548.00 | 568.00 | 620.00 | 606.00 | 489.00 | 549.00 | 581.00 | 572.00 | 433.00 | |
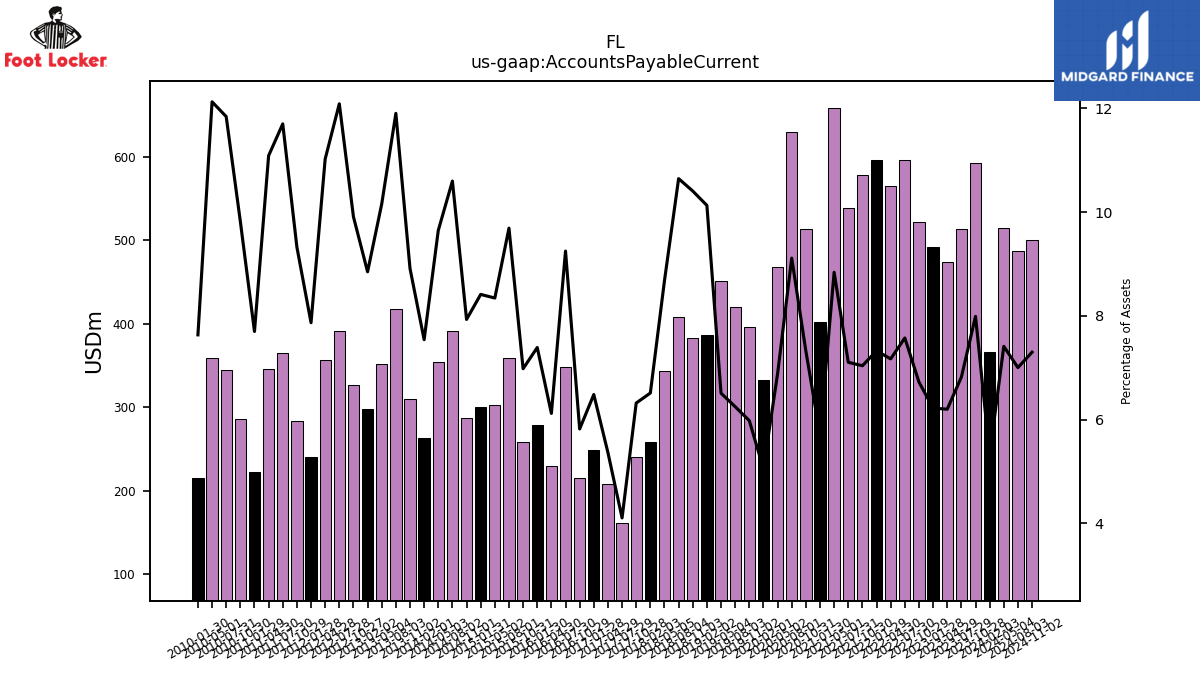
| Accounts Payable Current | 366.00 | 593.00 | 514.00 | 474.00 | 492.00 | 522.00 | 596.00 | 565.00 | 596.00 | 578.00 | 539.00 | 658.00 | 402.00 | 514.00 | 630.00 | 468.00 | 333.00 | 396.00 | 420.00 | 451.00 | 387.00 | 383.00 | 408.00 | 344.00 | 258.00 | 241.00 | 162.00 | 208.00 | 249.00 | 215.00 | 348.00 | 230.00 | 279.00 | 258.00 | 359.00 | 303.00 | 301.00 | 287.00 | 392.00 | 354.00 | 263.00 | 310.00 | 418.00 | 352.00 | 298.00 | 327.00 | 391.00 | 357.00 | 240.00 | 284.00 | 365.00 | 346.00 | 223.00 | 286.00 | 345.00 | 359.00 | 215.00 | |
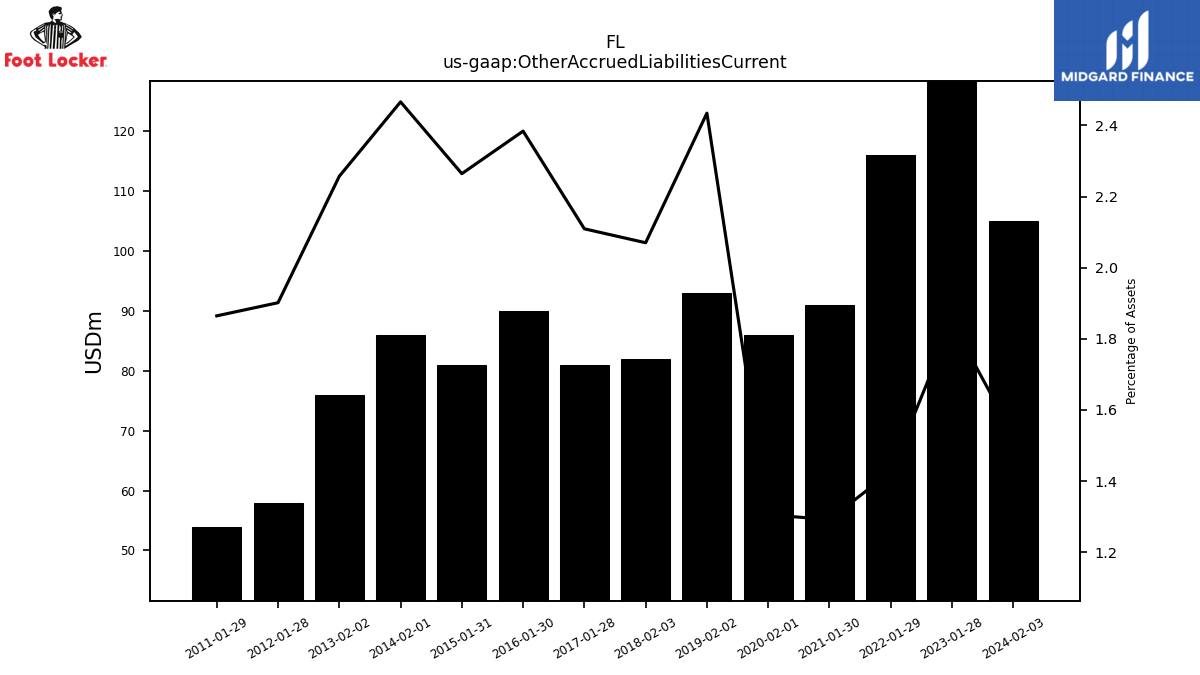
| Other Accrued Liabilities Current | 105.00 | NA | NA | NA | 146.00 | NA | NA | NA | 116.00 | NA | NA | NA | 91.00 | NA | NA | NA | 86.00 | NA | NA | NA | 93.00 | NA | NA | NA | 82.00 | NA | NA | NA | 81.00 | NA | NA | NA | 90.00 | NA | NA | NA | 81.00 | NA | NA | NA | 86.00 | NA | NA | NA | 76.00 | NA | NA | NA | 58.00 | NA | NA | NA | 54.00 | NA | NA | NA | NA | |
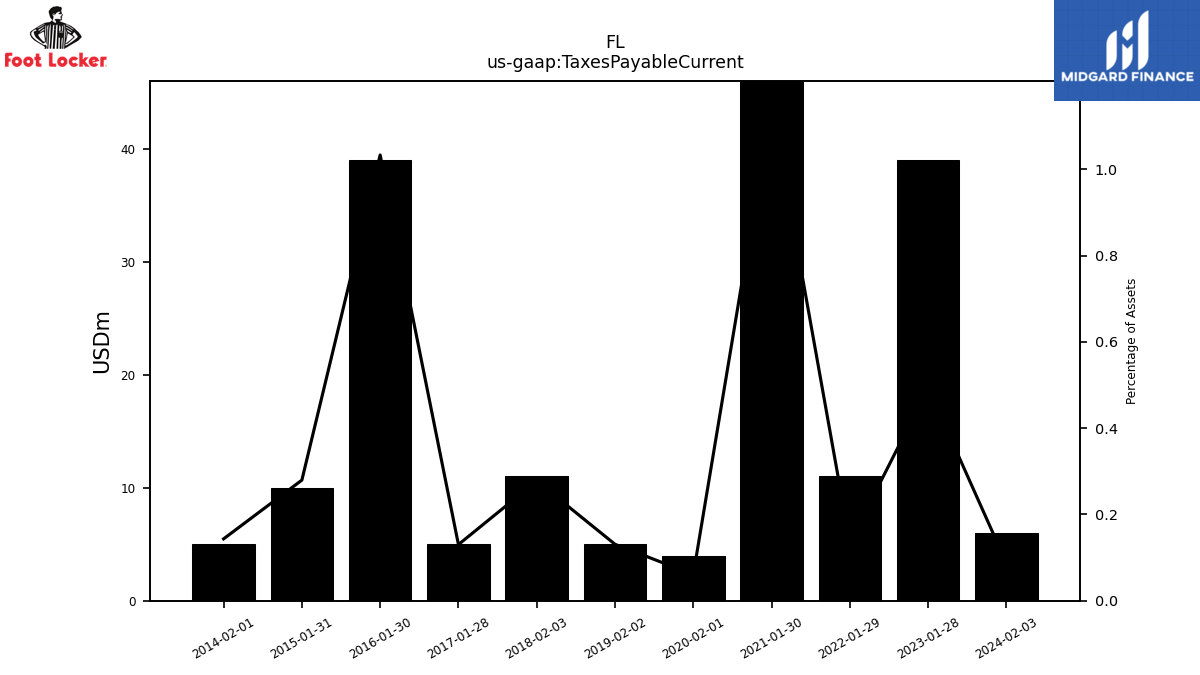
| Taxes Payable Current | 6.00 | NA | NA | NA | 39.00 | NA | NA | NA | 11.00 | NA | NA | NA | 81.00 | NA | NA | NA | 4.00 | NA | NA | NA | 5.00 | NA | NA | NA | 11.00 | NA | NA | NA | 5.00 | NA | NA | NA | 39.00 | NA | NA | NA | 10.00 | NA | NA | NA | 5.00 | NA | NA | NA | NA | NA | NA | NA | NA | NA | NA | NA | NA | NA | NA | NA | NA | |
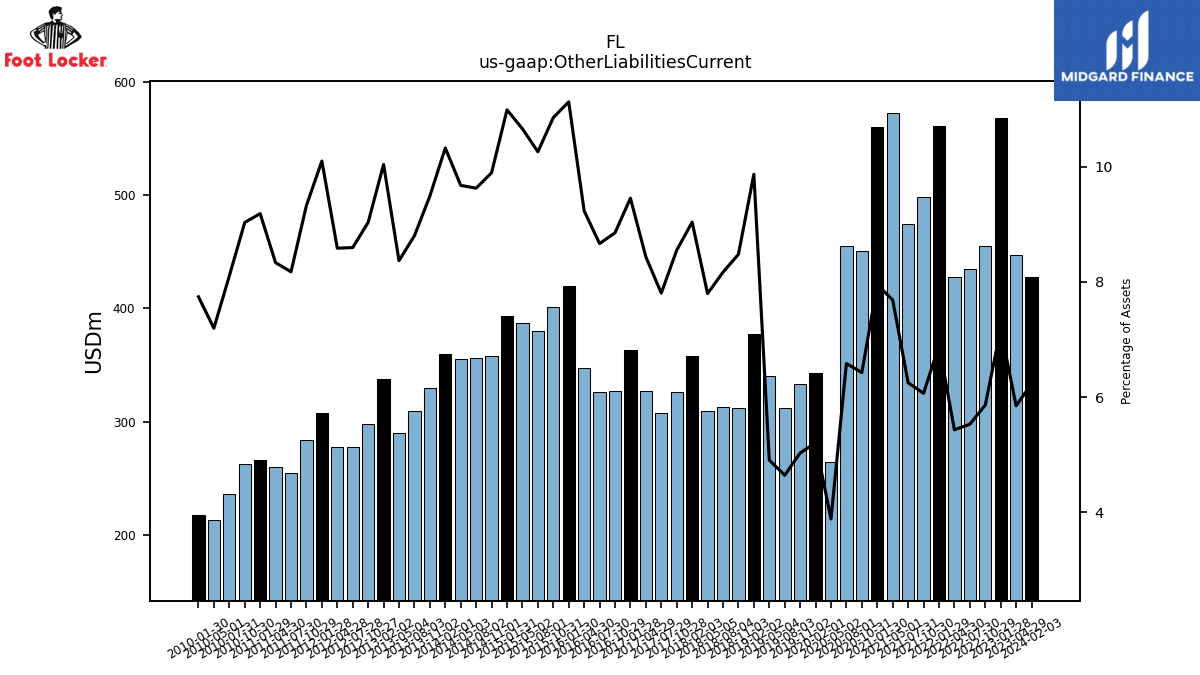
| Other Liabilities Current | 428.00 | NA | NA | 447.00 | 568.00 | 455.00 | 435.00 | 428.00 | 561.00 | 498.00 | 474.00 | 572.00 | 560.00 | 451.00 | 455.00 | 264.00 | 343.00 | 333.00 | 312.00 | 340.00 | 377.00 | 312.00 | 313.00 | 309.00 | 358.00 | 326.00 | 308.00 | 327.00 | 363.00 | 327.00 | 326.00 | 347.00 | 420.00 | 401.00 | 380.00 | 387.00 | 393.00 | 358.00 | 356.00 | 355.00 | 360.00 | 330.00 | 309.00 | 290.00 | 338.00 | 298.00 | 278.00 | 278.00 | 308.00 | 284.00 | 255.00 | 260.00 | 266.00 | 263.00 | 236.00 | 213.00 | 218.00 |
| 2024-02-03 | 2023-10-28 | 2023-07-29 | 2023-04-29 | 2023-01-28 | 2022-10-29 | 2022-07-30 | 2022-04-30 | 2022-01-29 | 2021-10-30 | 2021-07-31 | 2021-05-01 | 2021-01-30 | 2020-10-31 | 2020-08-01 | 2020-05-02 | 2020-02-01 | 2019-11-02 | 2019-08-03 | 2019-05-04 | 2019-02-02 | 2018-11-03 | 2018-08-04 | 2018-05-05 | 2018-02-03 | 2017-10-28 | 2017-07-29 | 2017-04-29 | 2017-01-28 | 2016-10-29 | 2016-07-30 | 2016-04-30 | 2016-01-30 | 2015-10-31 | 2015-08-01 | 2015-05-02 | 2015-01-31 | 2014-11-01 | 2014-08-02 | 2014-05-03 | 2014-02-01 | 2013-11-02 | 2013-08-03 | 2013-05-04 | 2013-02-02 | 2012-10-27 | 2012-07-28 | 2012-04-28 | 2012-01-28 | 2011-10-29 | 2011-07-30 | 2011-04-30 | 2011-01-29 | 2010-10-30 | 2010-07-31 | 2010-05-01 | 2010-01-30 | ||
|---|---|---|---|---|---|---|---|---|---|---|---|---|---|---|---|---|---|---|---|---|---|---|---|---|---|---|---|---|---|---|---|---|---|---|---|---|---|---|---|---|---|---|---|---|---|---|---|---|---|---|---|---|---|---|---|---|---|---|
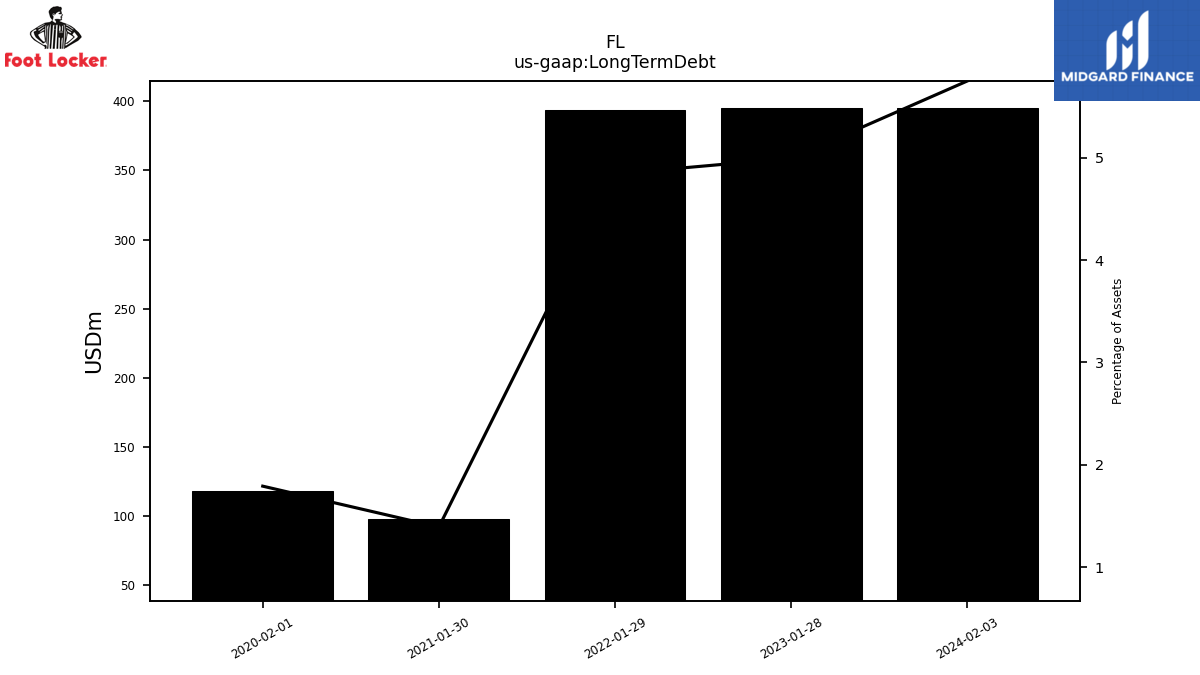
| Long Term Debt | 395.00 | NA | NA | NA | 395.00 | NA | NA | NA | 394.00 | NA | NA | NA | 98.00 | NA | NA | NA | 118.00 | NA | NA | NA | NA | NA | NA | NA | NA | NA | NA | NA | NA | NA | NA | NA | NA | NA | NA | NA | NA | NA | NA | NA | NA | NA | NA | NA | NA | NA | NA | NA | NA | NA | NA | NA | NA | NA | NA | NA | NA | |
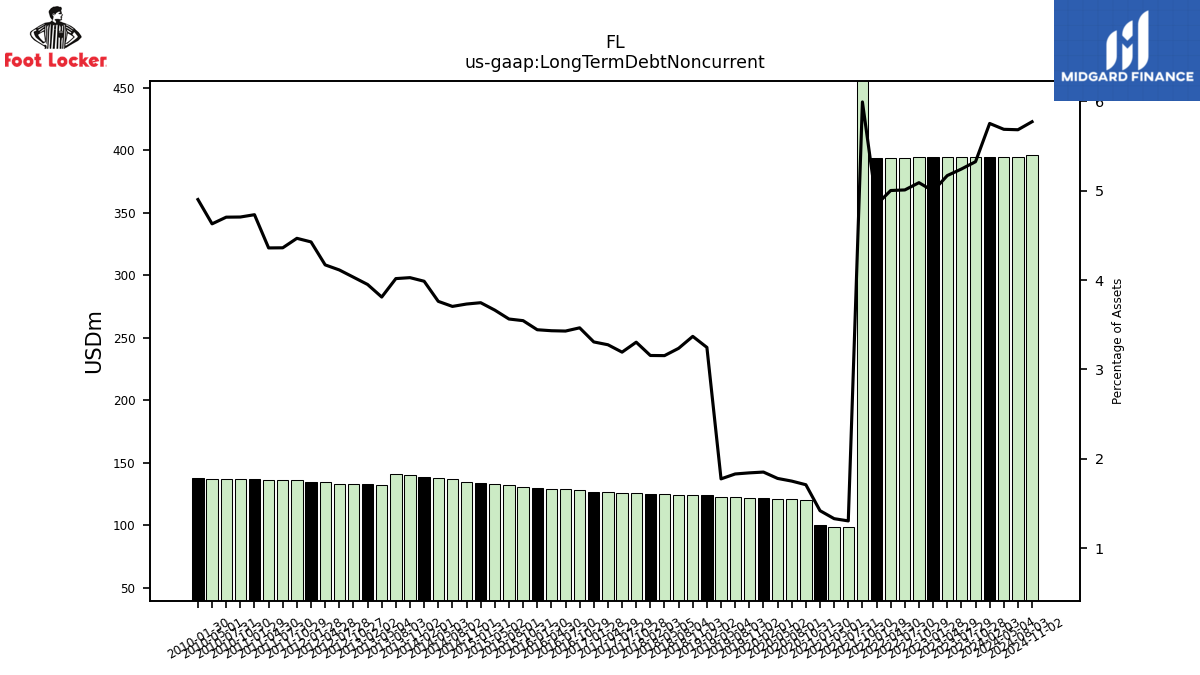
| Long Term Debt Noncurrent | 395.00 | 395.00 | 395.00 | 395.00 | 395.00 | 395.00 | 394.00 | 394.00 | 394.00 | 492.00 | 99.00 | 99.00 | 100.00 | 120.00 | 121.00 | 121.00 | 122.00 | 122.00 | 123.00 | 123.00 | 124.00 | 124.00 | 124.00 | 125.00 | 125.00 | 126.00 | 126.00 | 127.00 | 127.00 | 128.00 | 129.00 | 129.00 | 130.00 | 131.00 | 132.00 | 133.00 | 134.00 | 135.00 | 137.00 | 138.00 | 139.00 | 140.00 | 141.00 | 132.00 | 133.00 | 133.00 | 133.00 | 135.00 | 135.00 | 136.00 | 136.00 | 136.00 | 137.00 | 137.00 | 137.00 | 137.00 | 138.00 | |
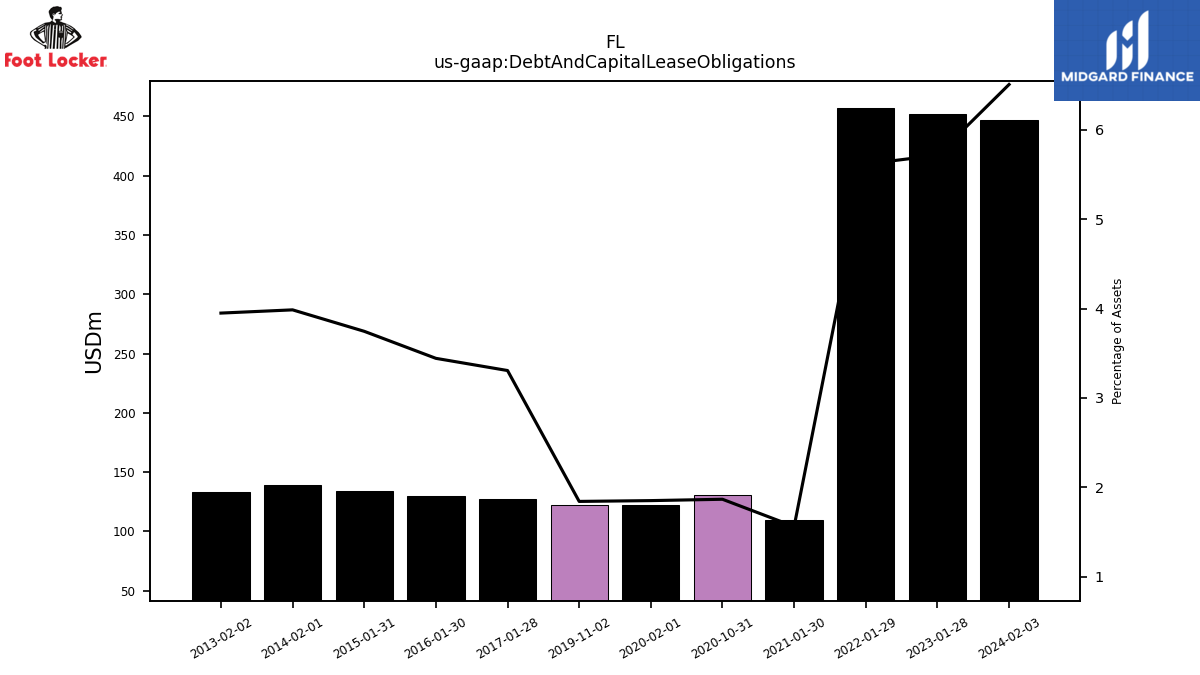
| Debt And Capital Lease Obligations | 447.00 | NA | NA | NA | 452.00 | NA | NA | NA | 457.00 | NA | NA | NA | 110.00 | 131.00 | NA | NA | 122.00 | 122.00 | NA | NA | NA | NA | NA | NA | NA | NA | NA | NA | 127.00 | NA | NA | NA | 130.00 | NA | NA | NA | 134.00 | NA | NA | NA | 139.00 | NA | NA | NA | 133.00 | NA | NA | NA | NA | NA | NA | NA | NA | NA | NA | NA | NA | |
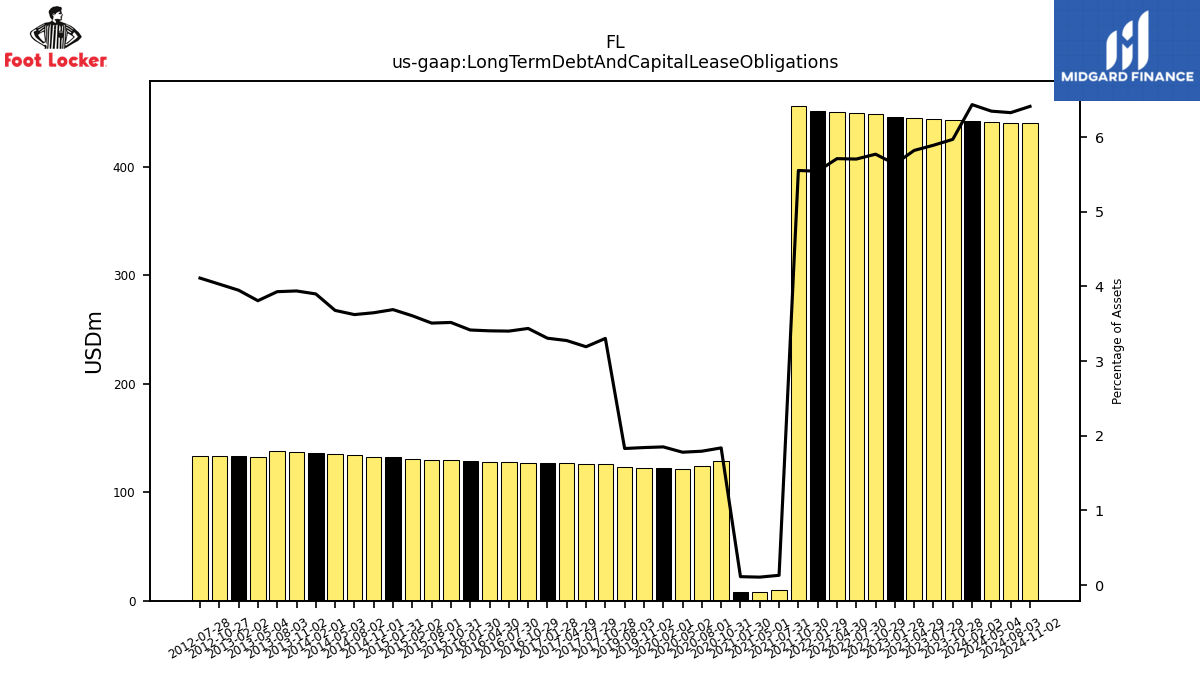
| Long Term Debt And Capital Lease Obligations | 442.00 | 443.00 | 444.00 | 445.00 | 446.00 | 448.00 | 449.00 | 450.00 | 451.00 | 456.00 | 10.00 | 8.00 | 8.00 | 129.00 | 124.00 | 121.00 | 122.00 | 122.00 | 123.00 | NA | NA | NA | NA | NA | NA | 126.00 | 126.00 | 127.00 | 127.00 | 127.00 | 128.00 | 128.00 | 129.00 | 130.00 | 130.00 | 131.00 | 132.00 | 132.00 | 134.00 | 135.00 | 136.00 | 137.00 | 138.00 | 132.00 | 133.00 | 133.00 | 133.00 | NA | NA | NA | NA | NA | NA | NA | NA | NA | NA | |
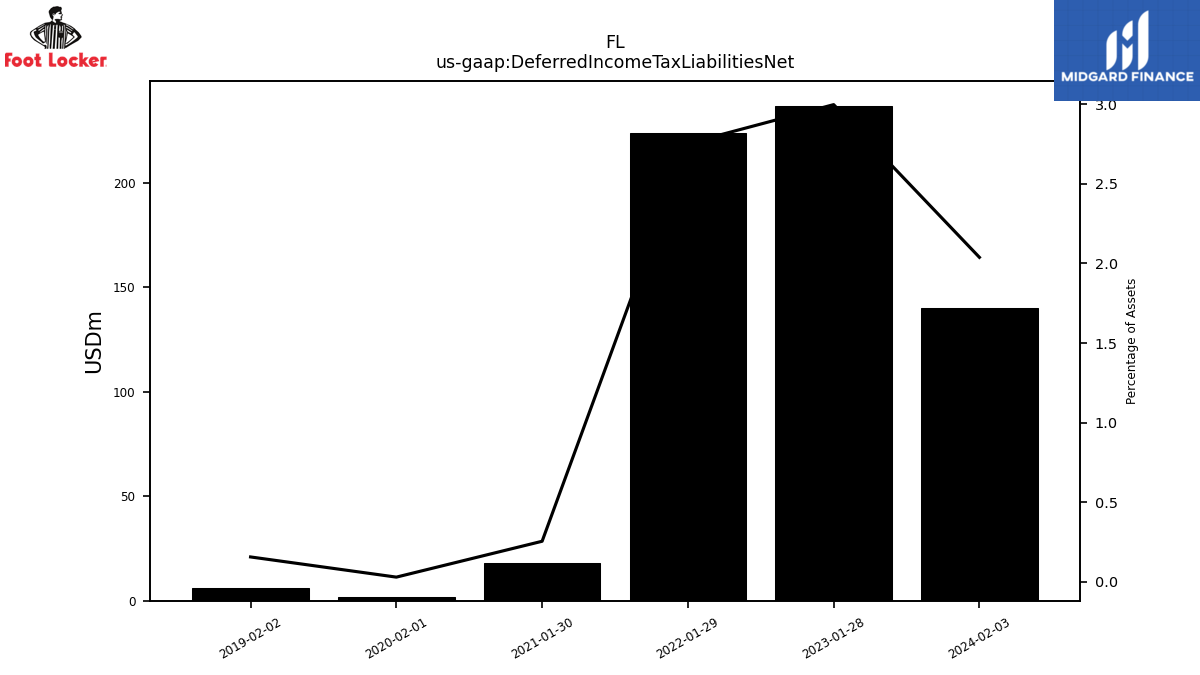
| Deferred Income Tax Liabilities Net | 140.00 | NA | NA | NA | 237.00 | NA | NA | NA | 224.00 | NA | NA | NA | 18.00 | NA | NA | NA | 2.00 | NA | NA | NA | 6.00 | NA | NA | NA | NA | NA | NA | NA | NA | NA | NA | NA | NA | NA | NA | NA | NA | NA | NA | NA | NA | NA | NA | NA | NA | NA | NA | NA | NA | NA | NA | NA | NA | NA | NA | NA | NA | |
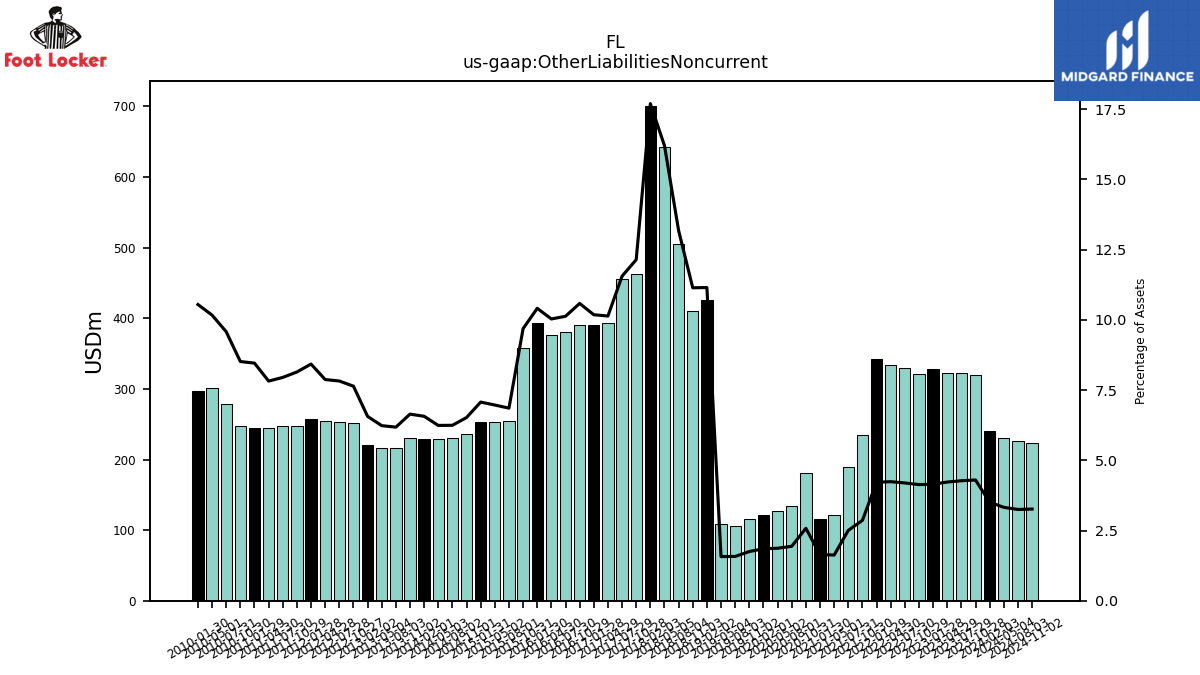
| Other Liabilities Noncurrent | 241.00 | 319.00 | 322.00 | 323.00 | 328.00 | 321.00 | 330.00 | 334.00 | 343.00 | 235.00 | 190.00 | 121.00 | 116.00 | 181.00 | 134.00 | 127.00 | 122.00 | 116.00 | 106.00 | 109.00 | 426.00 | 410.00 | 505.00 | 642.00 | 701.00 | 463.00 | 456.00 | 393.00 | 391.00 | 391.00 | 381.00 | 377.00 | 393.00 | 358.00 | 254.00 | 253.00 | 253.00 | 236.00 | 231.00 | 229.00 | 229.00 | 231.00 | 217.00 | 216.00 | 221.00 | 252.00 | 253.00 | 255.00 | 257.00 | 248.00 | 248.00 | 244.00 | 245.00 | 248.00 | 279.00 | 301.00 | 297.00 | |
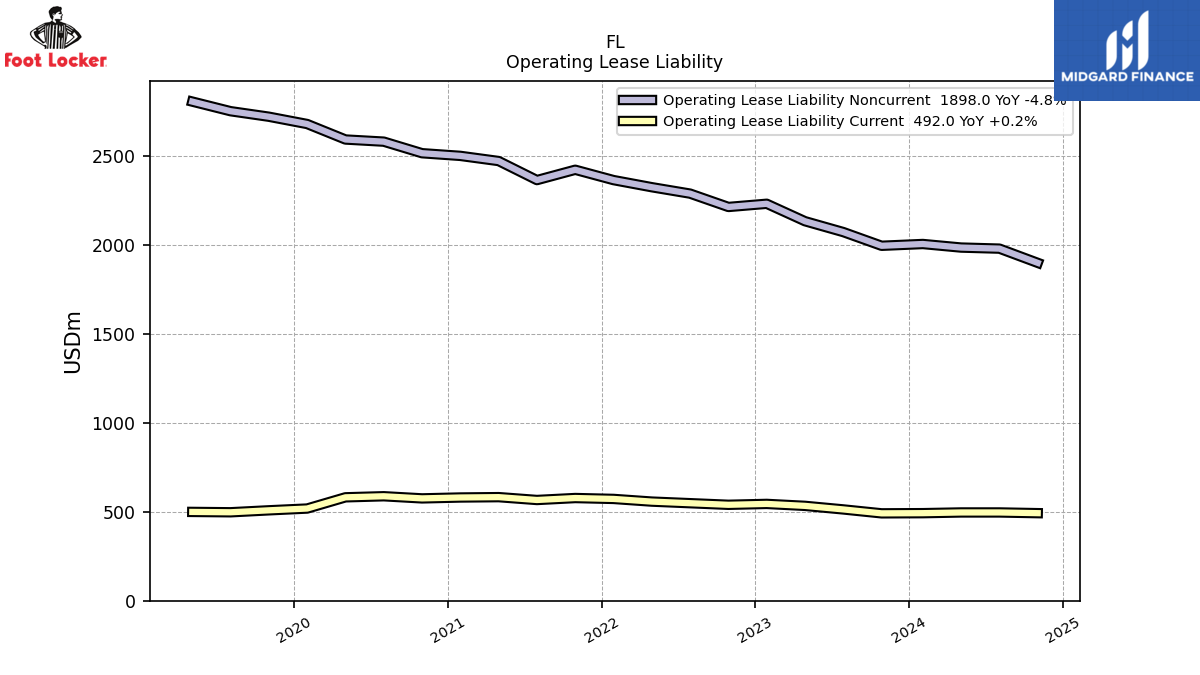
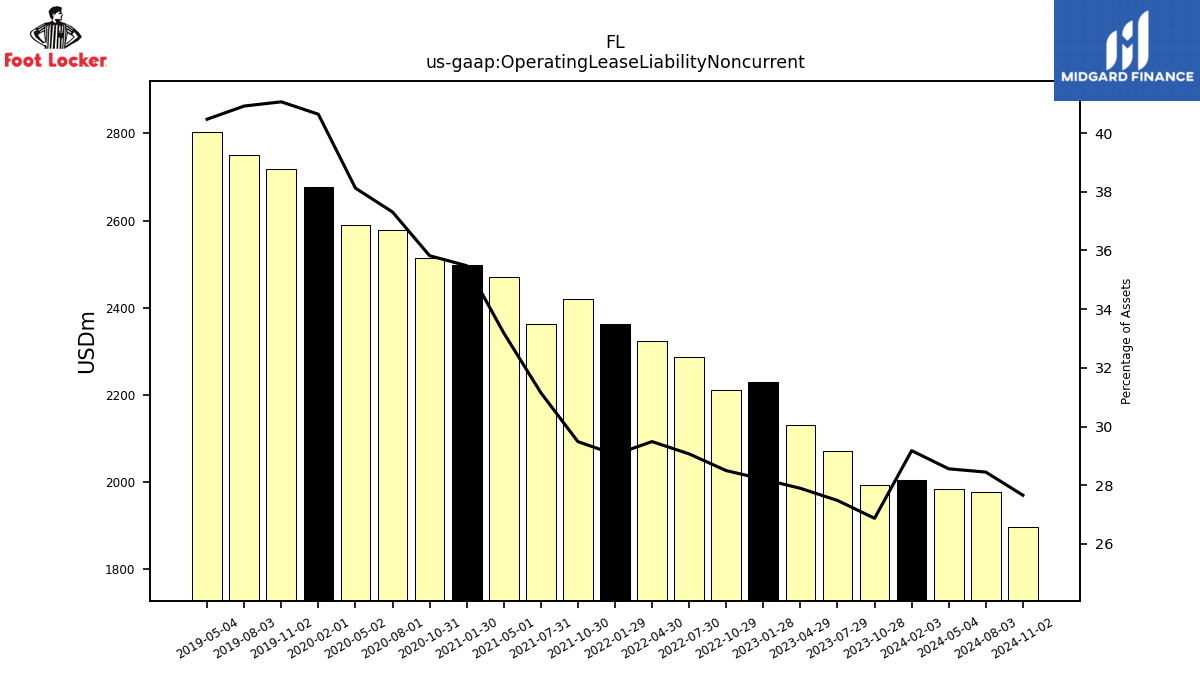
| Operating Lease Liability Noncurrent | 2004.00 | 1994.00 | 2071.00 | 2132.00 | 2230.00 | 2212.00 | 2287.00 | 2323.00 | 2363.00 | 2421.00 | 2363.00 | 2470.00 | 2499.00 | 2514.00 | 2579.00 | 2591.00 | 2678.00 | 2719.00 | 2750.00 | 2804.00 | NA | NA | NA | NA | NA | NA | NA | NA | NA | NA | NA | NA | NA | NA | NA | NA | NA | NA | NA | NA | NA | NA | NA | NA | NA | NA | NA | NA | NA | NA | NA | NA | NA | NA | NA | NA | NA |
| 2024-02-03 | 2023-10-28 | 2023-07-29 | 2023-04-29 | 2023-01-28 | 2022-10-29 | 2022-07-30 | 2022-04-30 | 2022-01-29 | 2021-10-30 | 2021-07-31 | 2021-05-01 | 2021-01-30 | 2020-10-31 | 2020-08-01 | 2020-05-02 | 2020-02-01 | 2019-11-02 | 2019-08-03 | 2019-05-04 | 2019-02-02 | 2018-11-03 | 2018-08-04 | 2018-05-05 | 2018-02-03 | 2017-10-28 | 2017-07-29 | 2017-04-29 | 2017-01-28 | 2016-10-29 | 2016-07-30 | 2016-04-30 | 2016-01-30 | 2015-10-31 | 2015-08-01 | 2015-05-02 | 2015-01-31 | 2014-11-01 | 2014-08-02 | 2014-05-03 | 2014-02-01 | 2013-11-02 | 2013-08-03 | 2013-05-04 | 2013-02-02 | 2012-10-27 | 2012-07-28 | 2012-04-28 | 2012-01-28 | 2011-10-29 | 2011-07-30 | 2011-04-30 | 2011-01-29 | 2010-10-30 | 2010-07-31 | 2010-05-01 | 2010-01-30 | ||
|---|---|---|---|---|---|---|---|---|---|---|---|---|---|---|---|---|---|---|---|---|---|---|---|---|---|---|---|---|---|---|---|---|---|---|---|---|---|---|---|---|---|---|---|---|---|---|---|---|---|---|---|---|---|---|---|---|---|---|
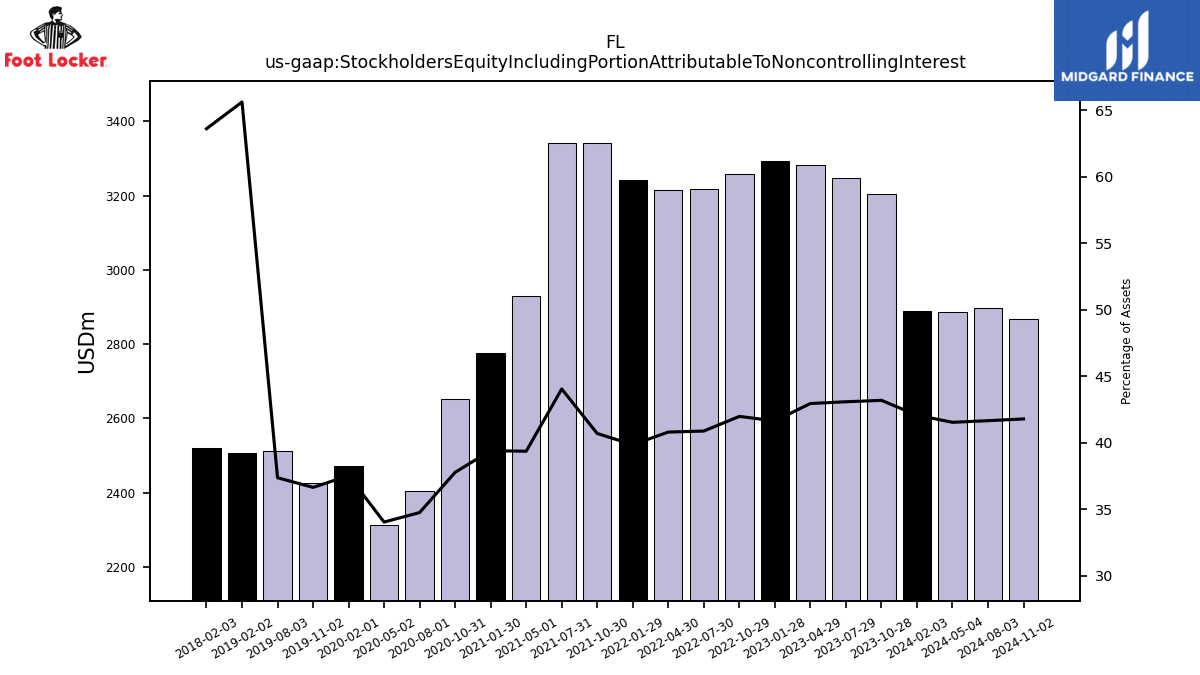
| Stockholders Equity Including Portion Attributable To Noncontrolling Interest | 2890.00 | 3205.00 | 3247.00 | 3283.00 | 3293.00 | 3259.00 | 3217.00 | 3215.00 | 3243.00 | 3342.00 | 3341.00 | 2930.00 | 2776.00 | 2652.00 | 2403.00 | 2314.00 | 2473.00 | 2427.00 | 2512.00 | NA | 2506.00 | NA | NA | NA | 2519.00 | NA | NA | NA | NA | NA | NA | NA | NA | NA | NA | NA | NA | NA | NA | NA | NA | NA | NA | NA | NA | NA | NA | NA | NA | NA | NA | NA | NA | NA | NA | NA | NA | |
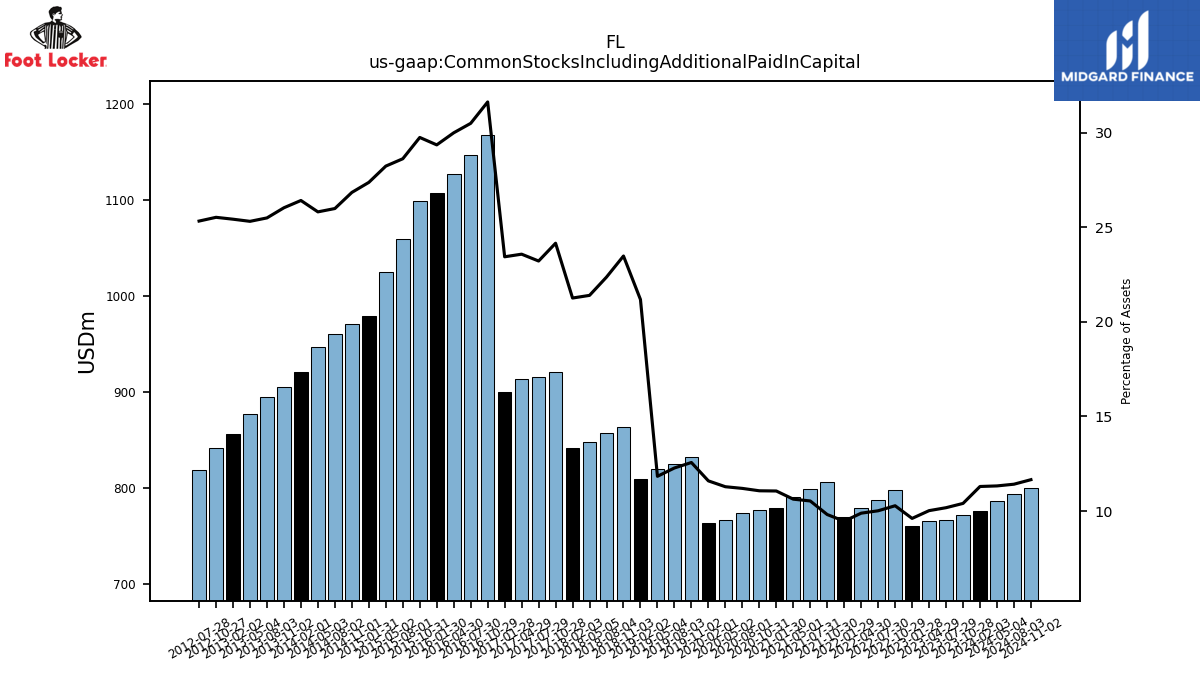
| Common Stocks Including Additional Paid In Capital | 776.00 | 772.00 | 767.00 | 766.00 | 760.00 | 798.00 | 788.00 | 779.00 | 770.00 | 806.00 | 799.00 | 791.00 | 779.00 | 777.00 | 774.00 | 767.00 | 764.00 | 832.00 | 825.00 | 820.00 | 809.00 | 864.00 | 857.00 | 848.00 | 842.00 | 921.00 | 916.00 | 914.00 | 900.00 | 1168.00 | 1147.00 | 1127.00 | 1108.00 | 1099.00 | 1060.00 | 1025.00 | 979.00 | 971.00 | 961.00 | 947.00 | 921.00 | 905.00 | 895.00 | 877.00 | 856.00 | 842.00 | 819.00 | NA | NA | NA | NA | NA | NA | NA | NA | NA | NA | |
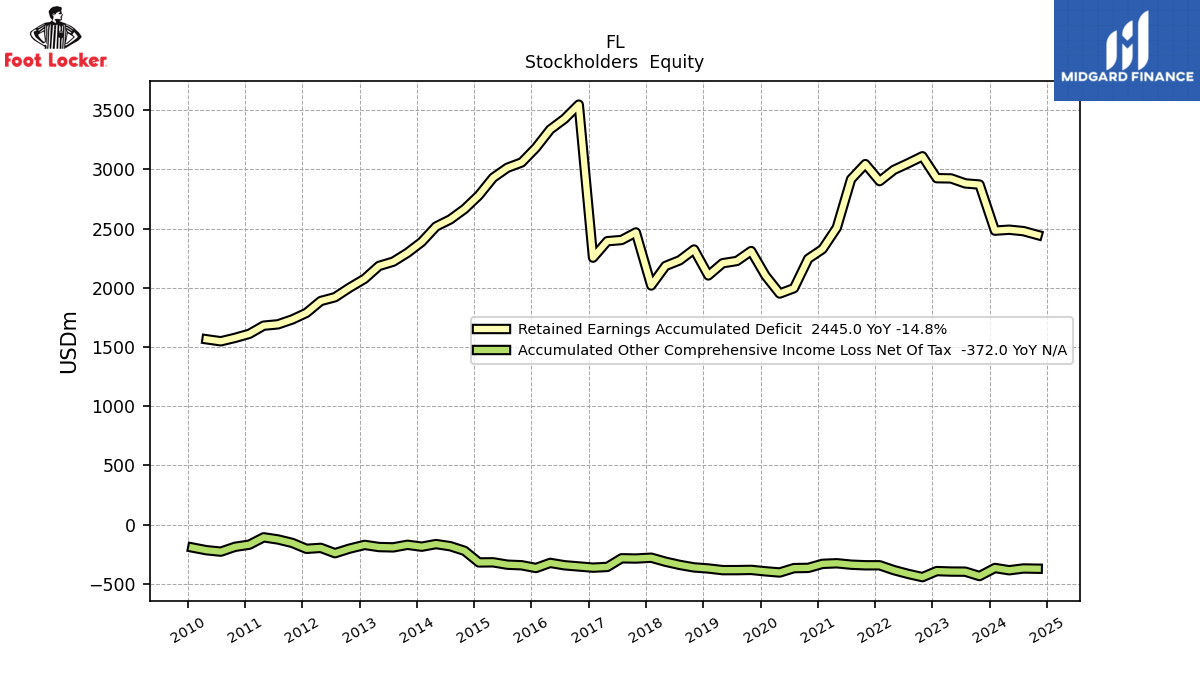
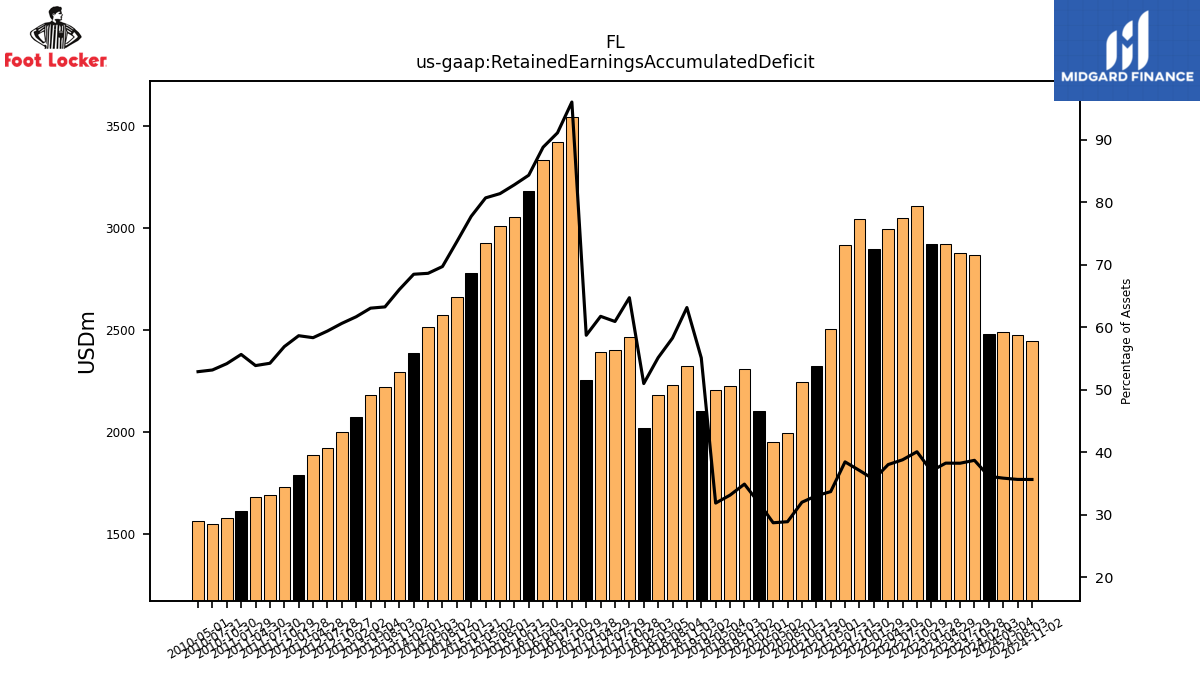
| Retained Earnings Accumulated Deficit | 2482.00 | 2871.00 | 2881.00 | 2923.00 | 2925.00 | 3110.00 | 3051.00 | 2995.00 | 2900.00 | 3044.00 | 2916.00 | 2507.00 | 2326.00 | 2245.00 | 1996.00 | 1951.00 | 2103.00 | 2310.00 | 2226.00 | 2207.00 | 2104.00 | 2323.00 | 2232.00 | 2184.00 | 2019.00 | 2467.00 | 2403.00 | 2393.00 | 2254.00 | 3546.00 | 3426.00 | 3336.00 | 3182.00 | 3058.00 | 3013.00 | 2929.00 | 2780.00 | 2665.00 | 2577.00 | 2517.00 | 2387.00 | 2295.00 | 2220.00 | 2184.00 | 2076.00 | 1999.00 | 1920.00 | 1888.00 | 1788.00 | 1732.00 | 1691.00 | 1680.00 | 1611.00 | 1577.00 | 1548.00 | 1565.00 | NA | |
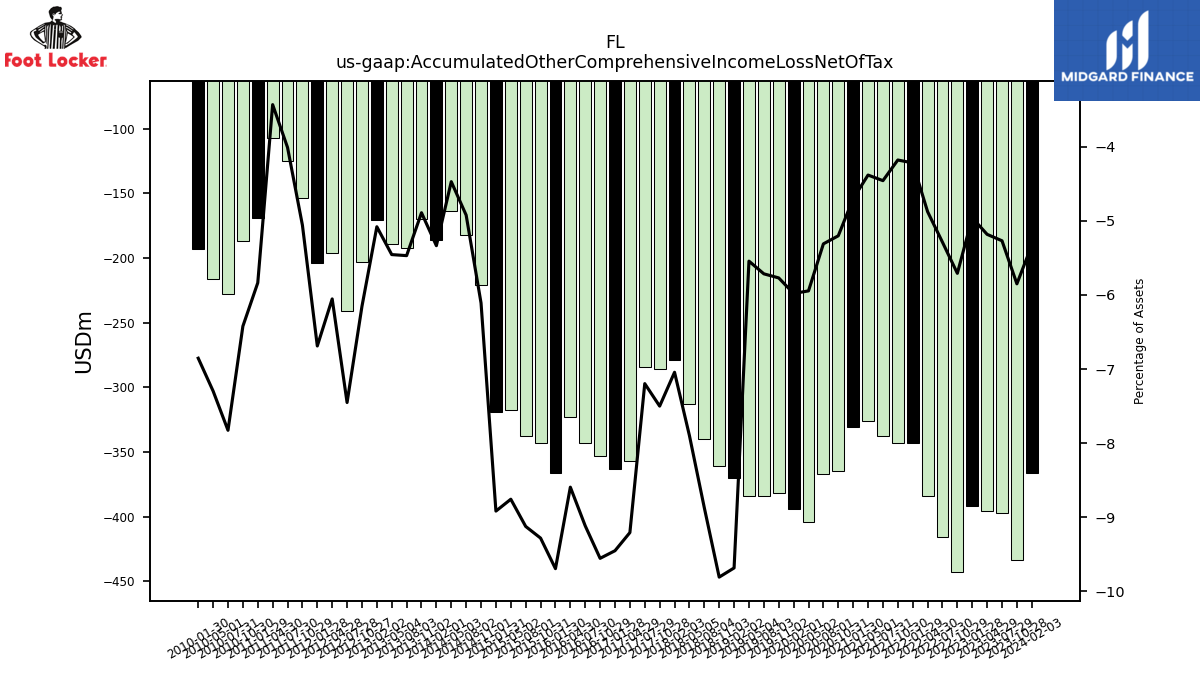
| Accumulated Other Comprehensive Income Loss Net Of Tax | -366.00 | -434.00 | -397.00 | -396.00 | -392.00 | -443.00 | -416.00 | -384.00 | -343.00 | -343.00 | -338.00 | -326.00 | -331.00 | -365.00 | -367.00 | -404.00 | -394.00 | -382.00 | -384.00 | -384.00 | -370.00 | -361.00 | -340.00 | -313.00 | -279.00 | -286.00 | -284.00 | -357.00 | -363.00 | -353.00 | -343.00 | -323.00 | -366.00 | -343.00 | -338.00 | -318.00 | -319.00 | -221.00 | -182.00 | -164.00 | -186.00 | -170.00 | -192.00 | -189.00 | -171.00 | -203.00 | -241.00 | -196.00 | -204.00 | -154.00 | -125.00 | -107.00 | -169.00 | -187.00 | -228.00 | -216.00 | -193.00 |