
| 2023-12-31 | 2023-09-30 | 2023-06-30 | 2023-03-31 | 2022-12-31 | 2022-09-30 | 2022-06-30 | 2022-03-31 | 2021-12-31 | 2021-09-30 | 2021-06-30 | 2021-03-31 | 2020-12-31 | 2020-09-30 | 2020-06-30 | 2020-03-31 | 2019-12-31 | 2019-09-30 | 2019-06-30 | 2019-03-31 | 2018-12-31 | 2018-09-30 | 2018-06-30 | 2018-03-31 | 2017-12-31 | 2017-09-30 | 2017-06-30 | 2017-03-31 | 2016-12-31 | 2016-09-30 | 2016-06-30 | 2016-03-31 | 2015-12-31 | 2015-09-30 | 2015-06-30 | 2015-03-31 | 2014-12-31 | 2014-09-30 | 2014-06-30 | 2014-03-31 | 2013-12-31 | 2013-09-30 | 2013-06-30 | 2013-03-31 | 2012-12-31 | 2012-09-30 | 2012-06-30 | 2012-03-31 | 2011-12-31 | 2011-09-30 | 2011-06-30 | 2011-03-31 | 2010-12-31 | 2010-09-30 | 2010-06-30 | ||
|---|---|---|---|---|---|---|---|---|---|---|---|---|---|---|---|---|---|---|---|---|---|---|---|---|---|---|---|---|---|---|---|---|---|---|---|---|---|---|---|---|---|---|---|---|---|---|---|---|---|---|---|---|---|---|---|---|
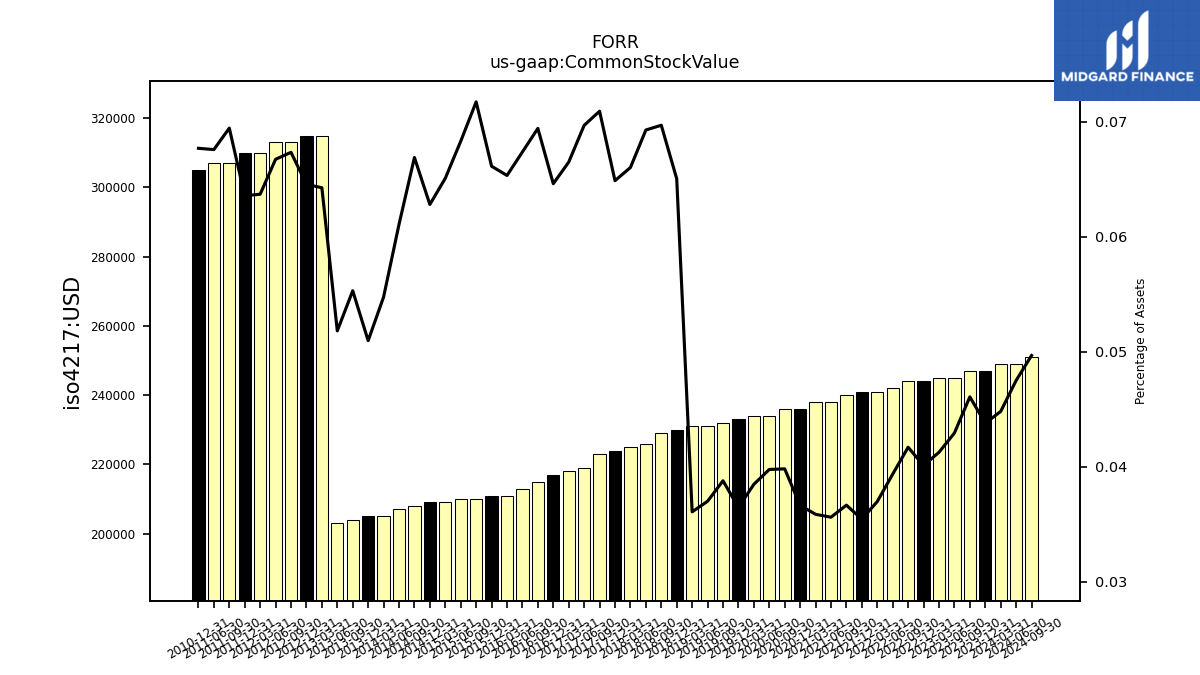
| Common Stock Value | 0.25 | 0.25 | 0.24 | 0.24 | 0.24 | 0.24 | 0.24 | 0.24 | 0.24 | 0.24 | 0.24 | 0.24 | 0.24 | 0.24 | 0.23 | 0.23 | 0.23 | 0.23 | 0.23 | 0.23 | 0.23 | 0.23 | 0.23 | 0.23 | 0.22 | 0.22 | 0.22 | 0.22 | 0.22 | 0.21 | 0.21 | 0.21 | 0.21 | 0.21 | 0.21 | 0.21 | 0.21 | 0.21 | 0.21 | 0.20 | 0.20 | 0.20 | 0.20 | 0.32 | 0.32 | 0.31 | 0.31 | 0.31 | 0.31 | 0.31 | 0.31 | NA | 0.30 | NA | NA | |
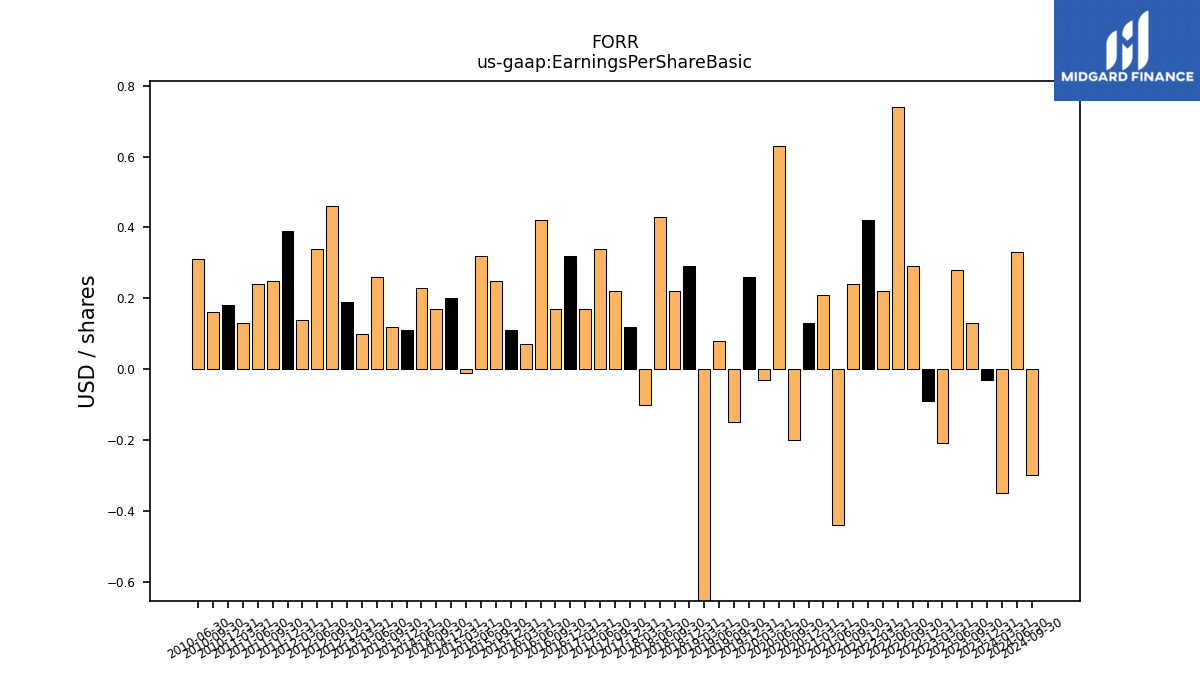
| Earnings Per Share Basic | -0.03 | 0.13 | 0.28 | -0.21 | -0.09 | 0.29 | 0.74 | 0.22 | 0.42 | 0.24 | -0.44 | 0.21 | 0.13 | -0.20 | 0.63 | -0.03 | 0.26 | -0.15 | 0.08 | -0.73 | 0.29 | 0.22 | 0.43 | -0.10 | 0.12 | 0.22 | 0.34 | 0.17 | 0.32 | 0.17 | 0.42 | 0.07 | 0.11 | 0.25 | 0.32 | -0.01 | 0.20 | 0.17 | 0.23 | NA | 0.11 | 0.12 | 0.26 | 0.10 | 0.19 | 0.46 | 0.34 | 0.14 | 0.39 | 0.25 | 0.24 | 0.13 | 0.18 | 0.16 | 0.31 | |
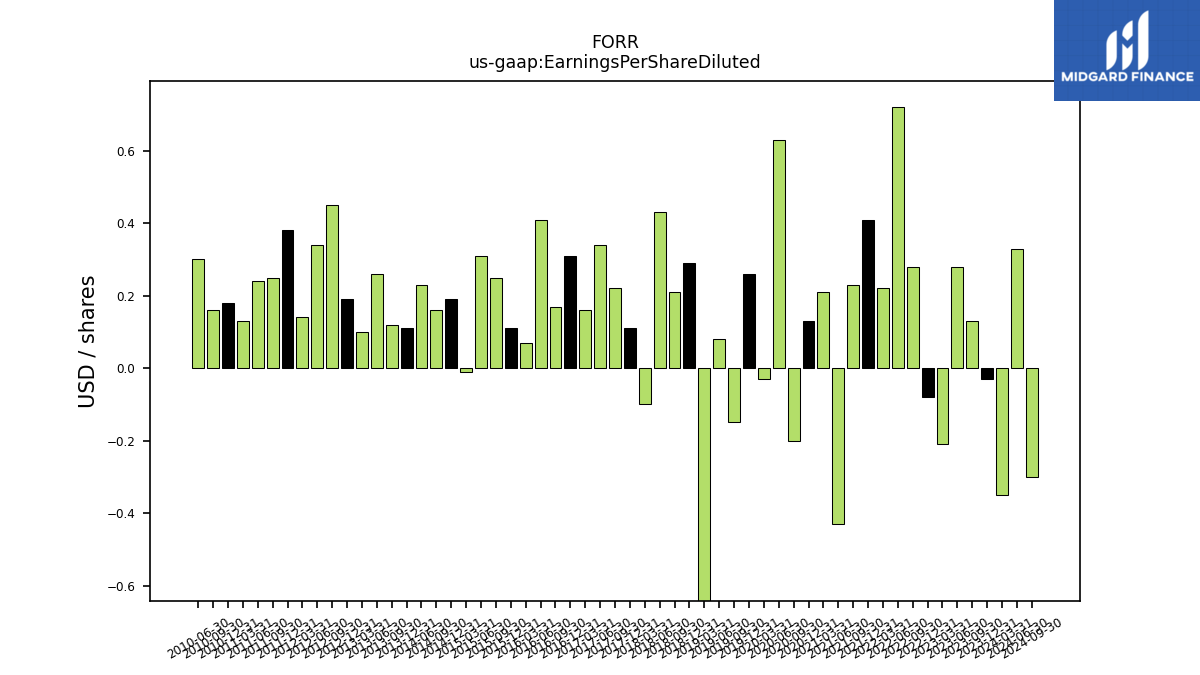
| Earnings Per Share Diluted | -0.03 | 0.13 | 0.28 | -0.21 | -0.08 | 0.28 | 0.72 | 0.22 | 0.41 | 0.23 | -0.43 | 0.21 | 0.13 | -0.20 | 0.63 | -0.03 | 0.26 | -0.15 | 0.08 | -0.73 | 0.29 | 0.21 | 0.43 | -0.10 | 0.11 | 0.22 | 0.34 | 0.16 | 0.31 | 0.17 | 0.41 | 0.07 | 0.11 | 0.25 | 0.31 | -0.01 | 0.19 | 0.16 | 0.23 | NA | 0.11 | 0.12 | 0.26 | 0.10 | 0.19 | 0.45 | 0.34 | 0.14 | 0.38 | 0.25 | 0.24 | 0.13 | 0.18 | 0.16 | 0.30 |
| 2023-12-31 | 2023-09-30 | 2023-06-30 | 2023-03-31 | 2022-12-31 | 2022-09-30 | 2022-06-30 | 2022-03-31 | 2021-12-31 | 2021-09-30 | 2021-06-30 | 2021-03-31 | 2020-12-31 | 2020-09-30 | 2020-06-30 | 2020-03-31 | 2019-12-31 | 2019-09-30 | 2019-06-30 | 2019-03-31 | 2018-12-31 | 2018-09-30 | 2018-06-30 | 2018-03-31 | 2017-12-31 | 2017-09-30 | 2017-06-30 | 2017-03-31 | 2016-12-31 | 2016-09-30 | 2016-06-30 | 2016-03-31 | 2015-12-31 | 2015-09-30 | 2015-06-30 | 2015-03-31 | 2014-12-31 | 2014-09-30 | 2014-06-30 | 2014-03-31 | 2013-12-31 | 2013-09-30 | 2013-06-30 | 2013-03-31 | 2012-12-31 | 2012-09-30 | 2012-06-30 | 2012-03-31 | 2011-12-31 | 2011-09-30 | 2011-06-30 | 2011-03-31 | 2010-12-31 | 2010-09-30 | 2010-06-30 | ||
|---|---|---|---|---|---|---|---|---|---|---|---|---|---|---|---|---|---|---|---|---|---|---|---|---|---|---|---|---|---|---|---|---|---|---|---|---|---|---|---|---|---|---|---|---|---|---|---|---|---|---|---|---|---|---|---|---|
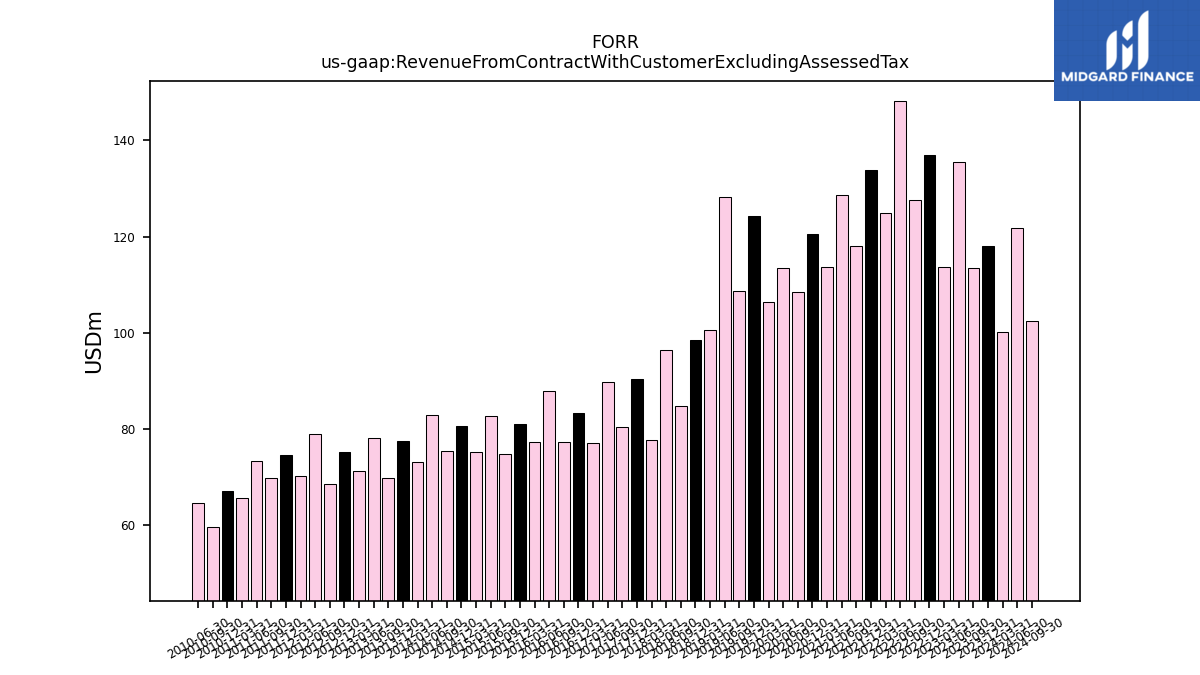
| Revenue From Contract With Customer Excluding Assessed Tax | 118.09 | 113.43 | 135.59 | 113.67 | 136.89 | 127.68 | 148.25 | 124.97 | 133.73 | 118.14 | 128.67 | 113.78 | 120.52 | 108.58 | 113.54 | 106.34 | 124.27 | 108.60 | 128.18 | 100.65 | 98.58 | 84.89 | 96.35 | 77.75 | 90.38 | 80.37 | 89.73 | 77.19 | 83.45 | 77.43 | 87.82 | 77.40 | 80.97 | 74.75 | 82.81 | 75.19 | 80.68 | 75.36 | 82.95 | 73.07 | 77.52 | 69.81 | 78.16 | 71.36 | 75.16 | 68.51 | 79.09 | 70.17 | 74.65 | 69.77 | 73.45 | 65.74 | 67.12 | 59.78 | 64.65 | |
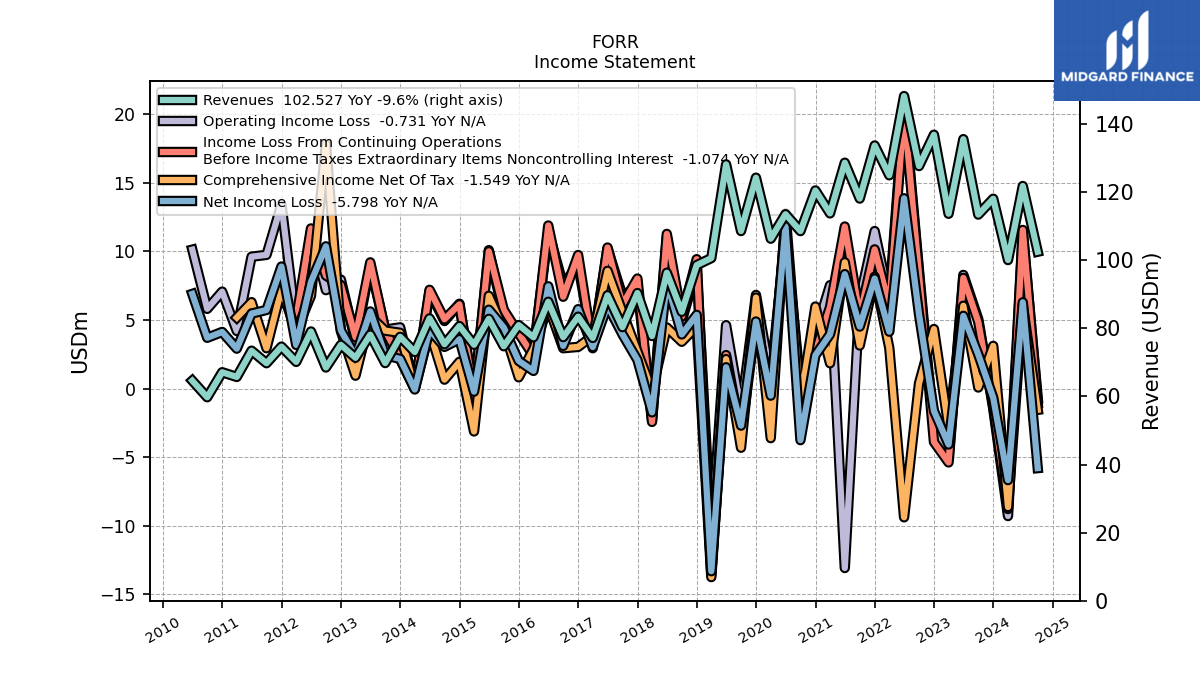
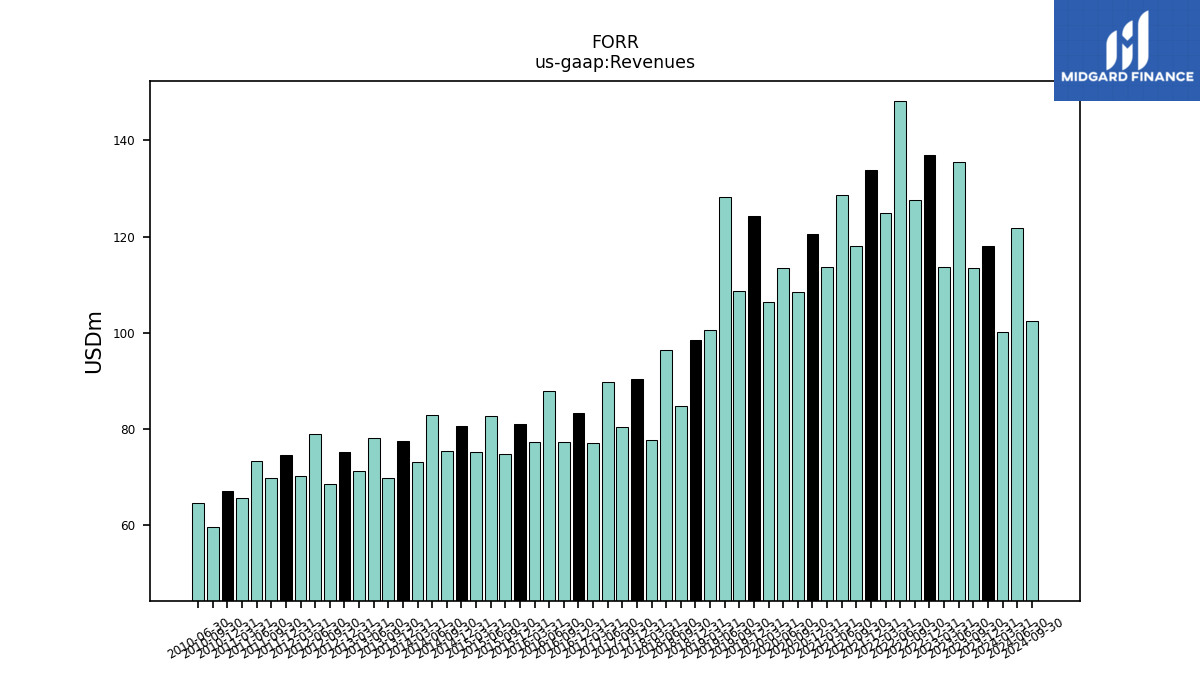
| Revenues | 118.09 | 113.43 | 135.59 | 113.67 | 136.89 | 127.68 | 148.25 | 124.97 | 133.73 | 118.14 | 128.67 | 113.78 | 120.52 | 108.58 | 113.54 | 106.34 | 124.27 | 108.60 | 128.18 | 100.65 | 98.58 | 84.89 | 96.35 | 77.75 | 90.38 | 80.37 | 89.73 | 77.19 | 83.45 | 77.43 | 87.82 | 77.40 | 80.97 | 74.75 | 82.81 | 75.19 | 80.68 | 75.36 | 82.95 | 73.07 | 77.52 | 69.81 | 78.16 | 71.36 | 75.16 | 68.51 | 79.09 | 70.17 | 74.65 | 69.77 | 73.45 | 65.74 | 67.12 | 59.78 | 64.65 | |
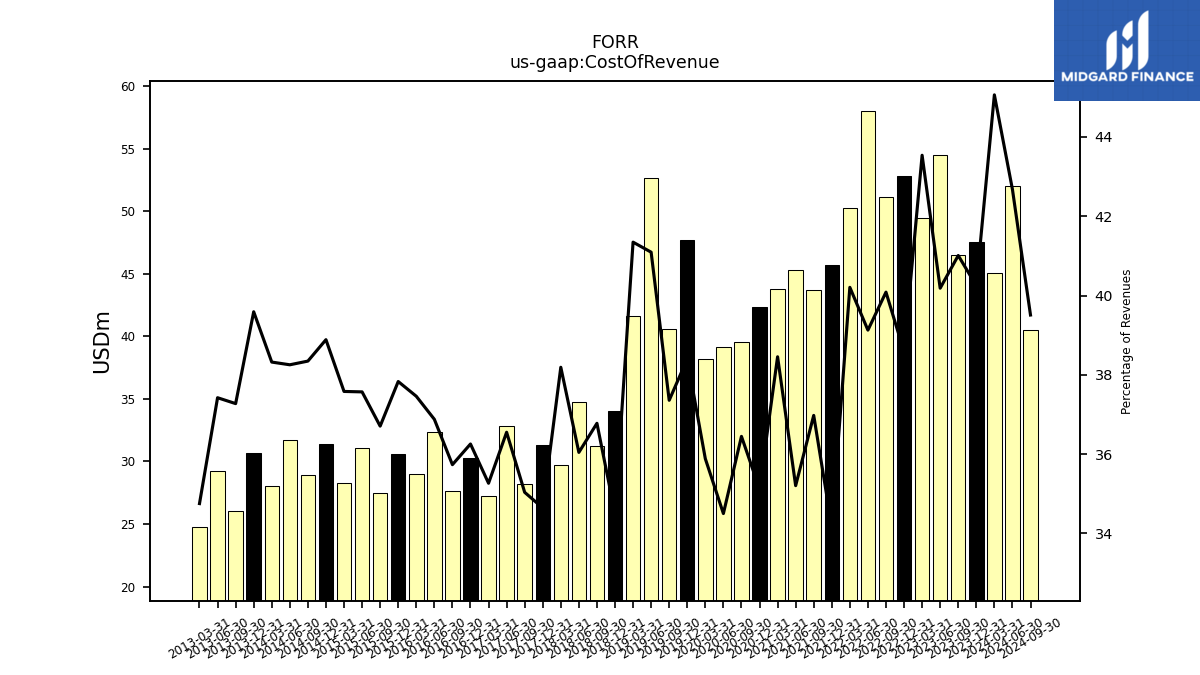
| Cost Of Revenue | 47.53 | 46.52 | 54.49 | 49.49 | 52.82 | 51.18 | 58.01 | 50.25 | 45.70 | 43.68 | 45.30 | 43.76 | 42.33 | 39.58 | 39.17 | 38.16 | 47.72 | 40.57 | 52.68 | 41.62 | 34.02 | 31.22 | 34.73 | 29.69 | 31.31 | 28.16 | 32.80 | 27.22 | 30.25 | 27.67 | 32.39 | 29.00 | 30.64 | 27.44 | 31.11 | 28.26 | 31.38 | 28.90 | 31.73 | 28.00 | 30.69 | 26.02 | 29.25 | 24.80 | NA | NA | NA | NA | NA | NA | NA | NA | NA | NA | NA | |
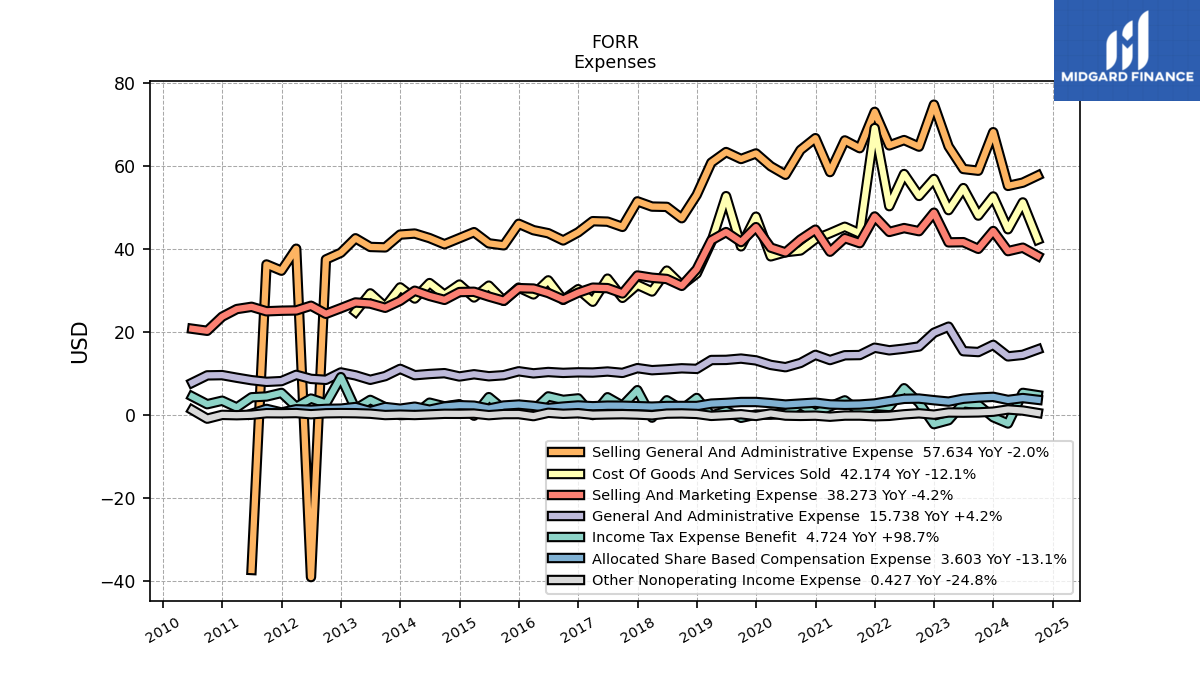
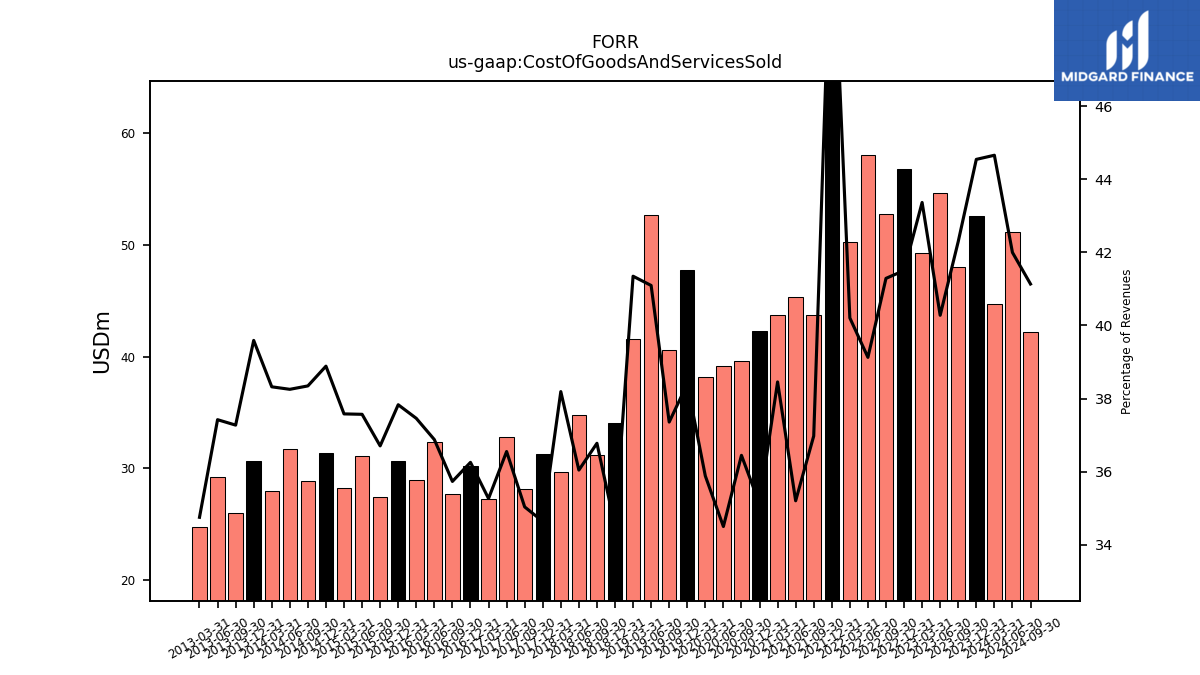
| Cost Of Goods And Services Sold | 52.60 | 47.98 | 54.49 | 49.49 | 56.81 | 52.72 | 58.01 | 50.25 | 69.08 | 43.68 | 45.30 | 43.76 | 42.33 | 39.58 | 39.17 | 38.16 | 47.72 | 40.57 | 52.68 | 41.62 | 34.02 | 31.22 | 34.73 | 29.69 | 31.31 | 28.16 | 32.80 | 27.22 | 30.25 | 27.67 | 32.39 | 29.00 | 30.64 | 27.44 | 31.11 | 28.26 | 31.38 | 28.90 | 31.73 | 28.00 | 30.69 | 26.02 | 29.25 | 24.80 | NA | NA | NA | NA | NA | NA | NA | NA | NA | NA | NA | |
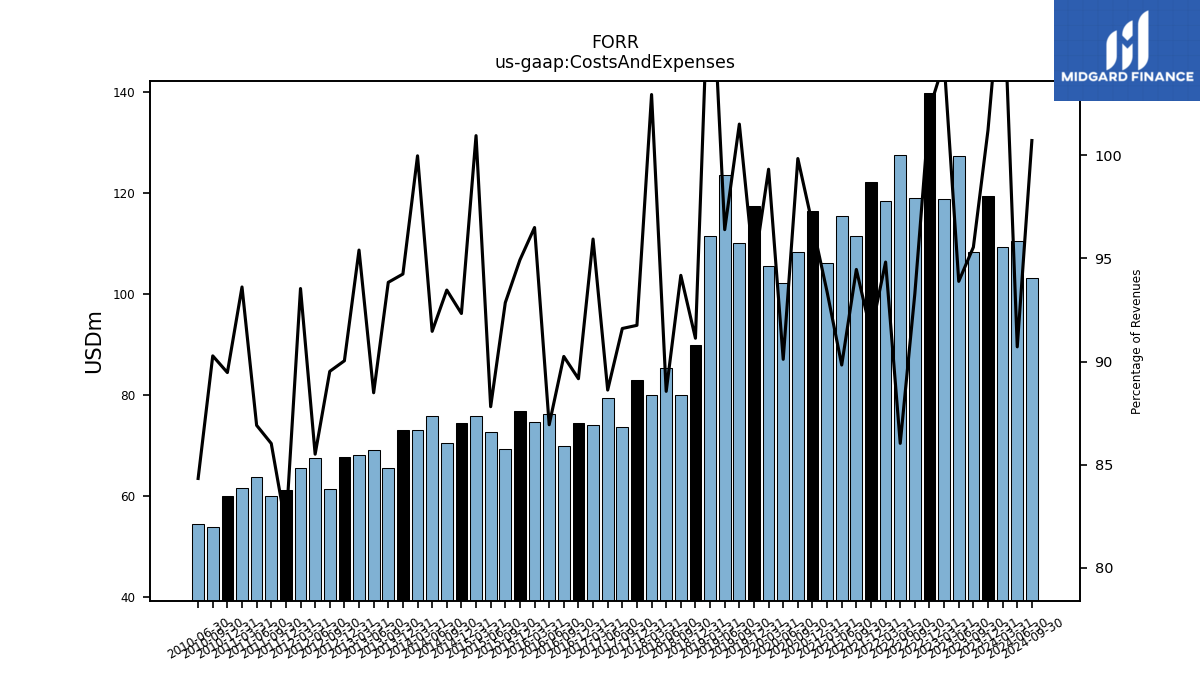
| Costs And Expenses | 119.53 | 108.38 | 127.30 | 118.81 | 139.97 | 119.12 | 127.54 | 118.50 | 122.24 | 111.60 | 115.59 | 106.25 | 116.47 | 108.40 | 102.31 | 105.62 | 117.44 | 110.24 | 123.56 | 111.53 | 89.84 | 79.95 | 85.33 | 80.04 | 82.93 | 73.62 | 79.52 | 74.06 | 74.41 | 69.88 | 76.35 | 74.69 | 76.87 | 69.41 | 72.72 | 75.90 | 74.49 | 70.44 | 75.87 | 73.05 | 73.06 | 65.51 | 69.17 | 68.08 | 67.67 | 61.33 | 67.63 | 65.63 | 61.22 | 60.02 | 63.83 | 61.54 | 60.05 | 53.96 | 54.52 | |
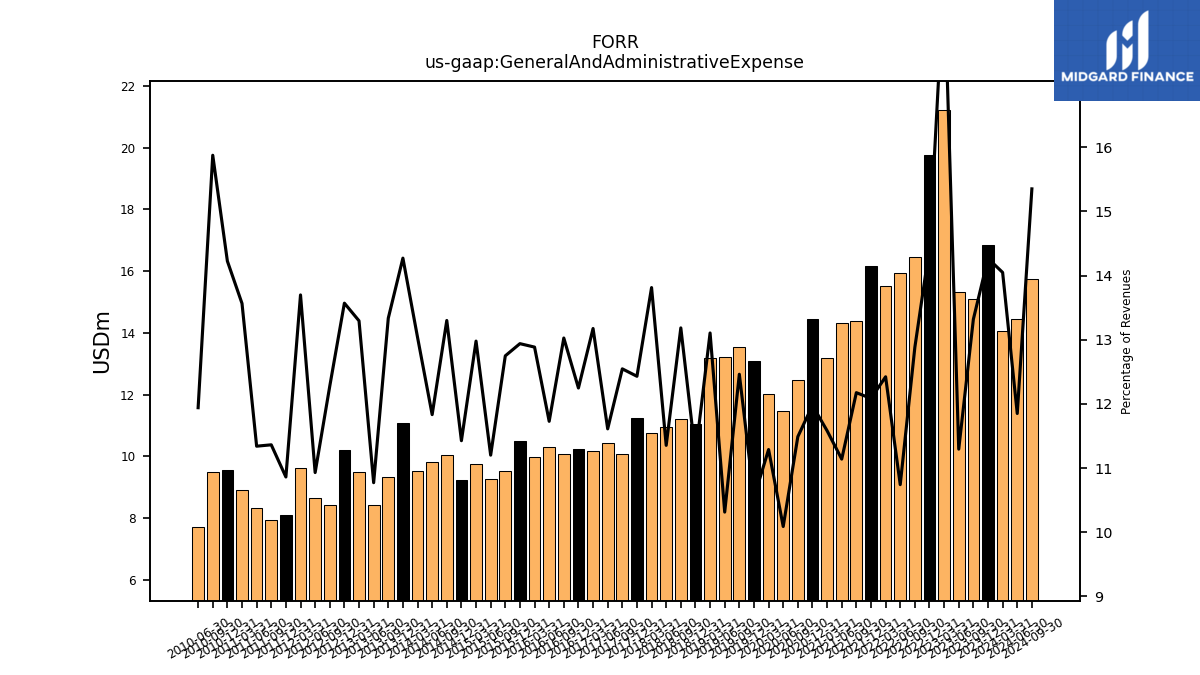
| General And Administrative Expense | 16.85 | 15.11 | 15.31 | 21.23 | 19.76 | 16.45 | 15.93 | 15.52 | 16.16 | 14.38 | 14.33 | 13.18 | 14.43 | 12.47 | 11.46 | 12.01 | 13.10 | 13.53 | 13.22 | 13.19 | 11.05 | 11.19 | 10.94 | 10.74 | 11.23 | 10.08 | 10.42 | 10.17 | 10.22 | 10.09 | 10.30 | 9.97 | 10.48 | 9.53 | 9.28 | 9.76 | 9.22 | 10.02 | 9.81 | 9.53 | 11.06 | 9.31 | 8.42 | 9.49 | 10.20 | 8.41 | 8.64 | 9.61 | 8.11 | 7.93 | 8.33 | 8.92 | 9.55 | 9.49 | 7.72 | |
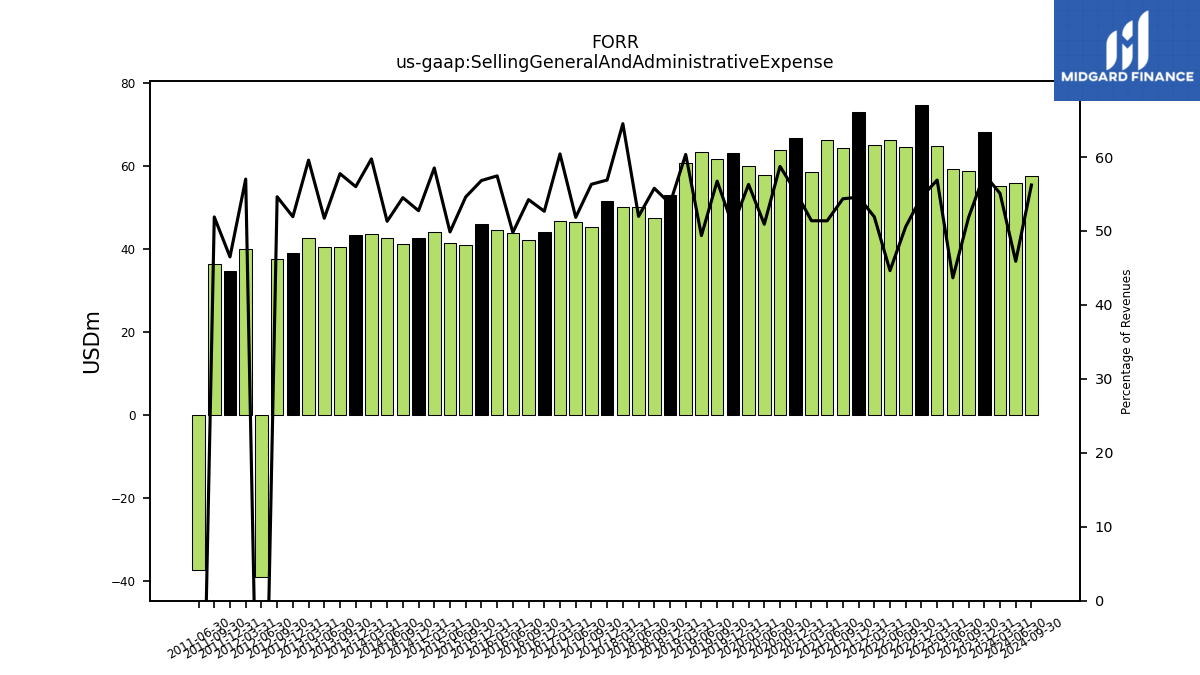
| Selling General And Administrative Expense | 68.08 | 58.80 | 59.21 | 64.66 | 74.72 | 64.59 | 66.18 | 64.89 | 72.98 | 64.22 | 66.10 | 58.47 | 66.64 | 63.78 | 57.81 | 59.88 | 62.97 | 61.62 | 63.30 | 60.74 | 52.95 | 47.35 | 50.08 | 50.16 | 51.42 | 45.26 | 46.52 | 46.64 | 43.95 | 42.00 | 43.74 | 44.47 | 46.01 | 40.82 | 41.30 | 44.00 | 42.55 | 41.08 | 42.56 | 43.66 | 43.41 | 40.32 | 40.43 | 42.52 | 39.03 | 37.42 | -39.12 | 40.01 | 34.71 | 36.21 | -37.40 | NA | NA | NA | NA | |
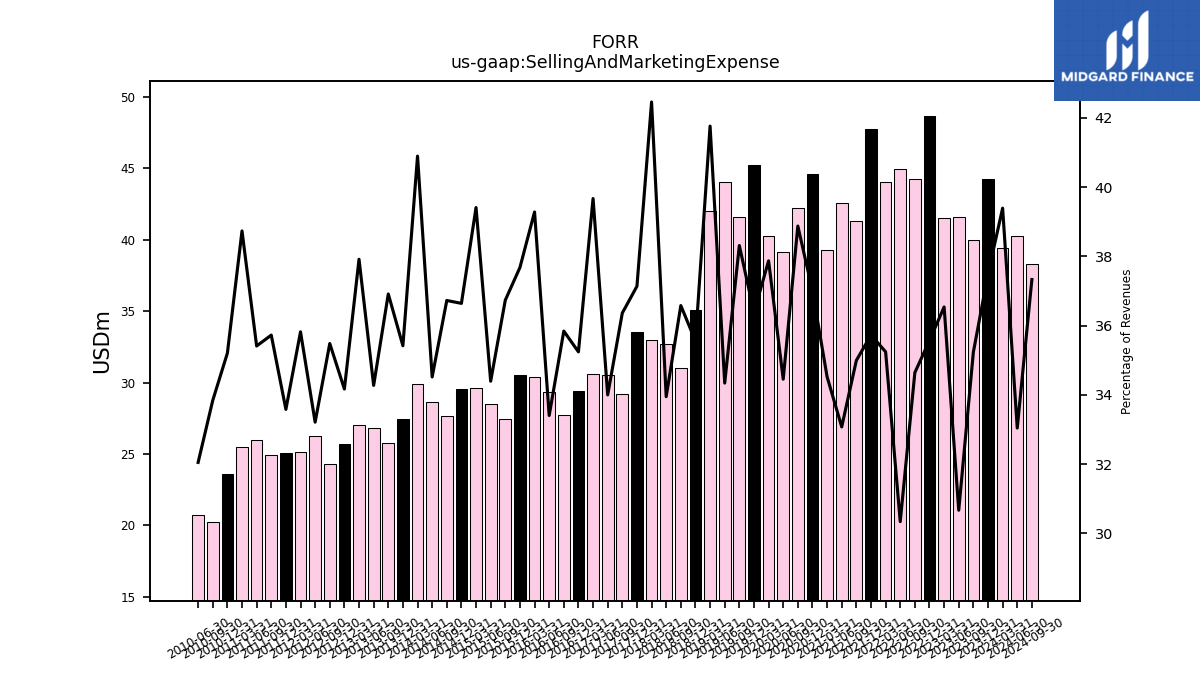
| Selling And Marketing Expense | 44.27 | 39.97 | 41.58 | 41.53 | 48.69 | 44.23 | 44.97 | 44.04 | 47.77 | 41.34 | 42.56 | 39.28 | 44.60 | 42.21 | 39.12 | 40.27 | 45.21 | 41.60 | 44.02 | 42.03 | 35.05 | 31.05 | 32.71 | 33.01 | 33.56 | 29.23 | 30.51 | 30.62 | 29.41 | 27.75 | 29.34 | 30.40 | 30.51 | 27.46 | 28.48 | 29.63 | 29.56 | 27.68 | 28.63 | 29.88 | 27.46 | 25.77 | 26.79 | 27.06 | 25.68 | 24.31 | 26.27 | 25.13 | 25.07 | 24.93 | 26.01 | 25.46 | 23.63 | 20.23 | 20.72 | |
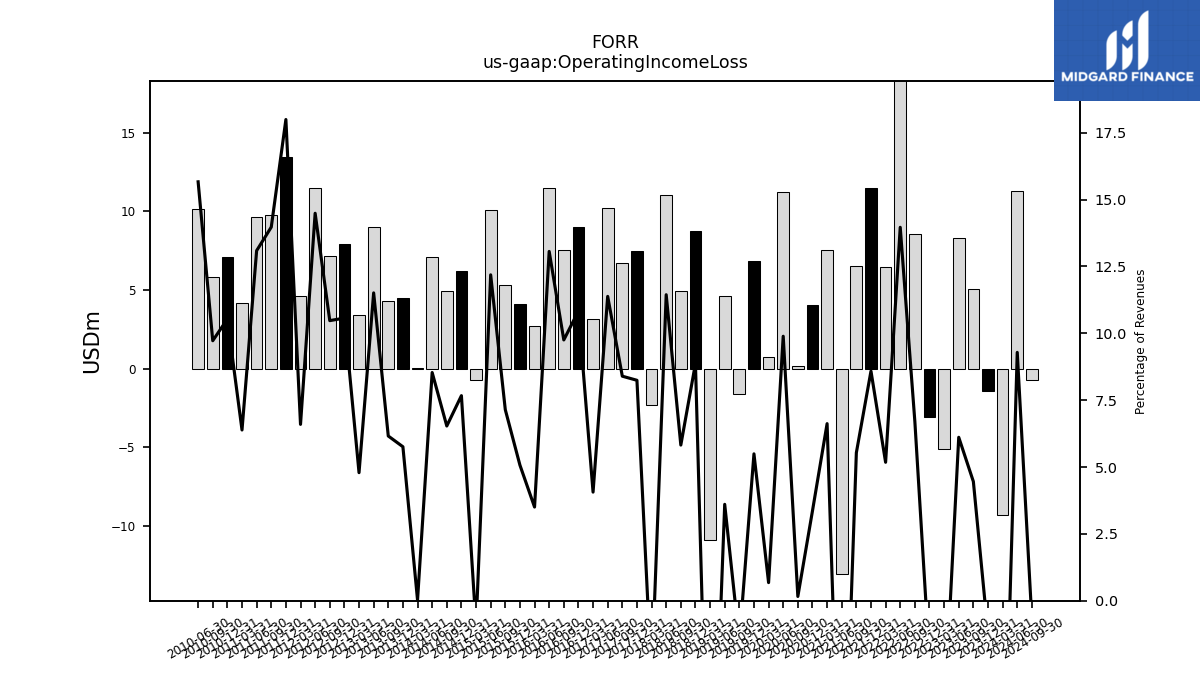
| Operating Income Loss | -1.44 | 5.06 | 8.29 | -5.14 | -3.08 | 8.56 | 20.70 | 6.47 | 11.48 | 6.54 | -13.08 | 7.54 | 4.05 | 0.17 | 11.23 | 0.72 | 6.83 | -1.64 | 4.62 | -10.88 | 8.74 | 4.94 | 11.03 | -2.29 | 7.45 | 6.75 | 10.21 | 3.14 | 9.04 | 7.55 | 11.47 | 2.71 | 4.11 | 5.34 | 10.09 | -0.71 | 6.19 | 4.92 | 7.08 | 0.02 | 4.46 | 4.30 | 9.00 | 3.42 | 7.95 | 7.18 | 11.46 | 4.63 | 13.43 | 9.75 | 9.62 | 4.20 | 7.07 | 5.81 | 10.13 | |
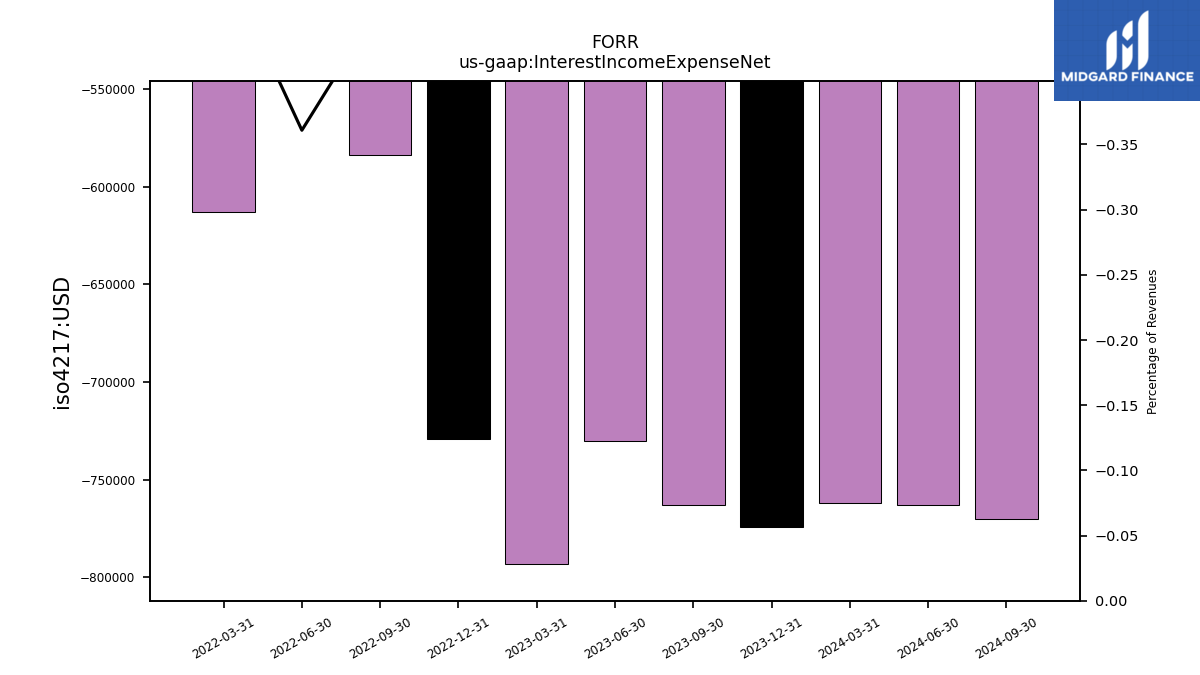
| Interest Income Expense Net | -0.77 | -0.76 | -0.73 | -0.79 | -0.73 | -0.58 | -0.54 | -0.61 | NA | NA | NA | NA | NA | NA | NA | NA | NA | NA | NA | NA | NA | NA | NA | NA | NA | NA | NA | NA | NA | NA | NA | NA | NA | NA | NA | NA | NA | NA | NA | NA | NA | NA | NA | NA | NA | NA | NA | NA | NA | NA | NA | NA | NA | NA | NA | |
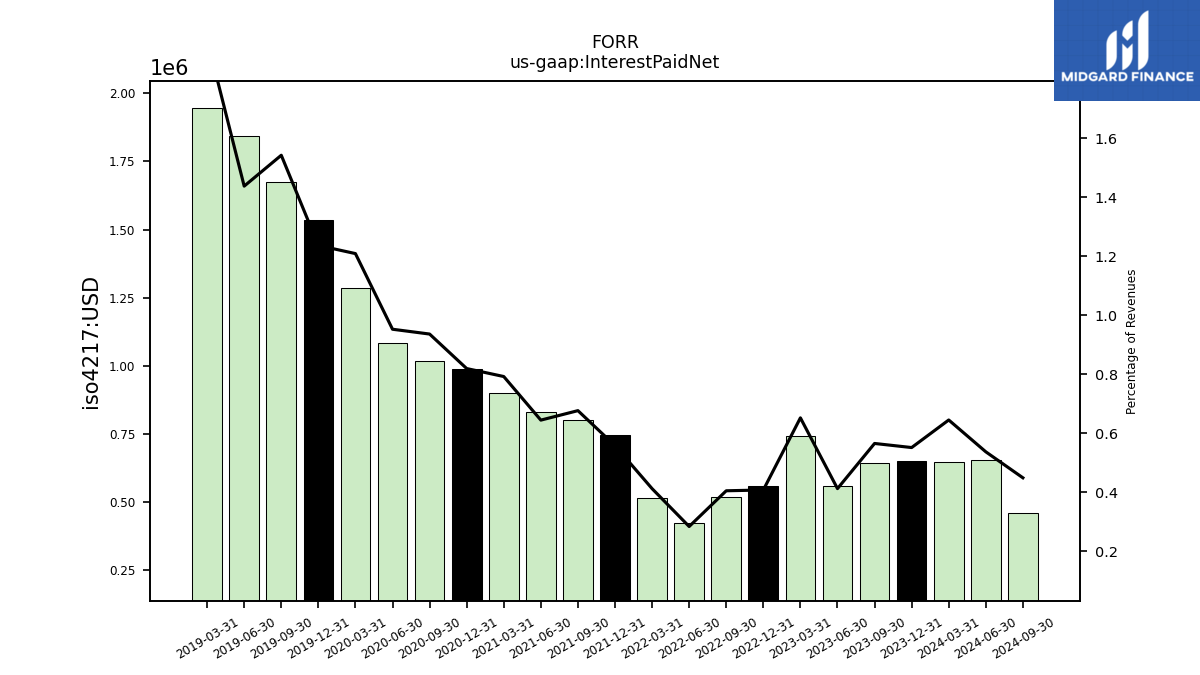
| Interest Paid Net | 0.65 | 0.64 | 0.56 | 0.74 | 0.56 | 0.52 | 0.42 | 0.52 | 0.75 | 0.80 | 0.83 | 0.90 | 0.99 | 1.02 | 1.08 | 1.29 | 1.54 | 1.68 | 1.84 | 1.95 | NA | NA | NA | NA | NA | NA | NA | NA | NA | NA | NA | NA | NA | NA | NA | NA | NA | NA | NA | NA | NA | NA | NA | NA | NA | NA | NA | NA | NA | NA | NA | NA | NA | NA | NA | |
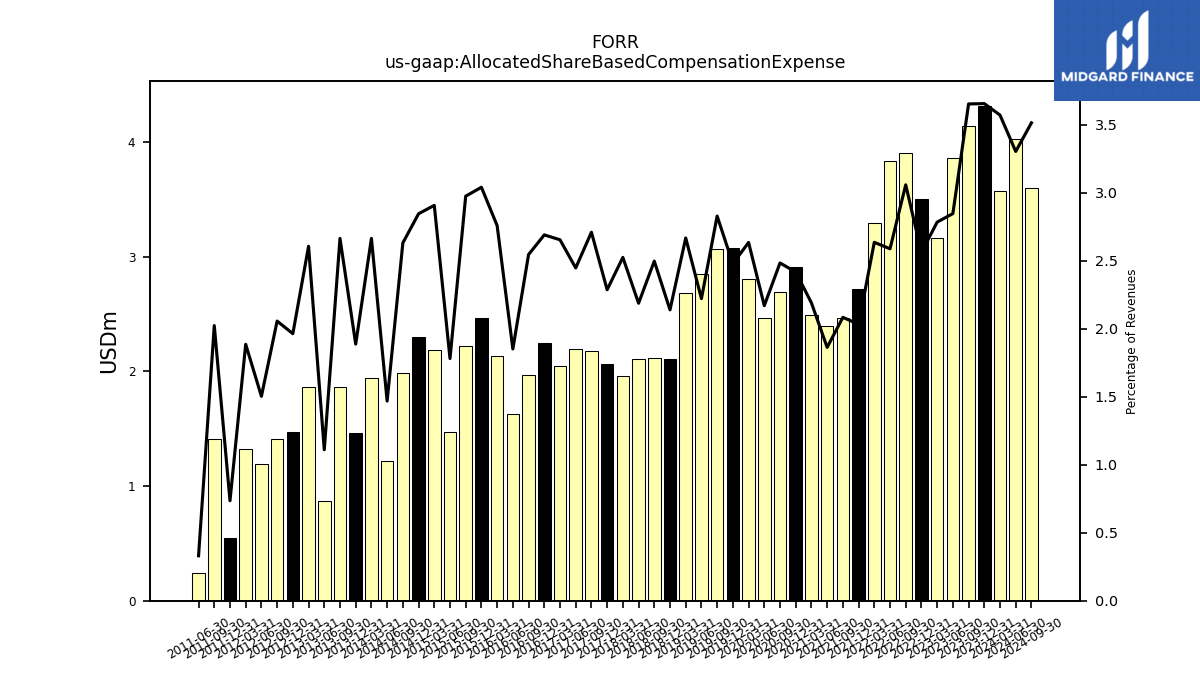
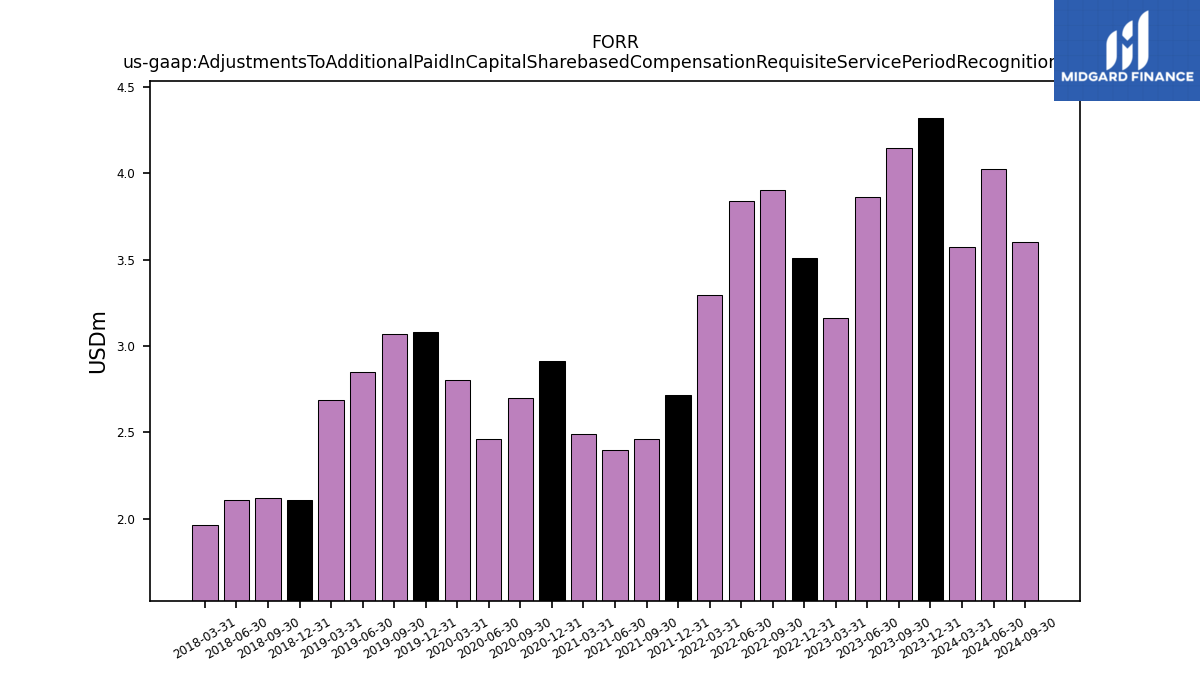
| Allocated Share Based Compensation Expense | 4.32 | 4.14 | 3.86 | 3.17 | 3.51 | 3.90 | 3.84 | 3.29 | 2.72 | 2.46 | 2.40 | 2.49 | 2.91 | 2.70 | 2.46 | 2.80 | 3.08 | 3.07 | 2.85 | 2.69 | 2.11 | 2.12 | 2.11 | 1.96 | 2.07 | 2.18 | 2.20 | 2.05 | 2.25 | 1.97 | 1.63 | 2.13 | 2.46 | 2.22 | 1.48 | 2.19 | 2.30 | 1.98 | 1.22 | 1.95 | 1.46 | 1.86 | 0.87 | 1.86 | 1.48 | 1.41 | 1.19 | 1.32 | 0.55 | 1.41 | 0.24 | NA | NA | NA | NA | |
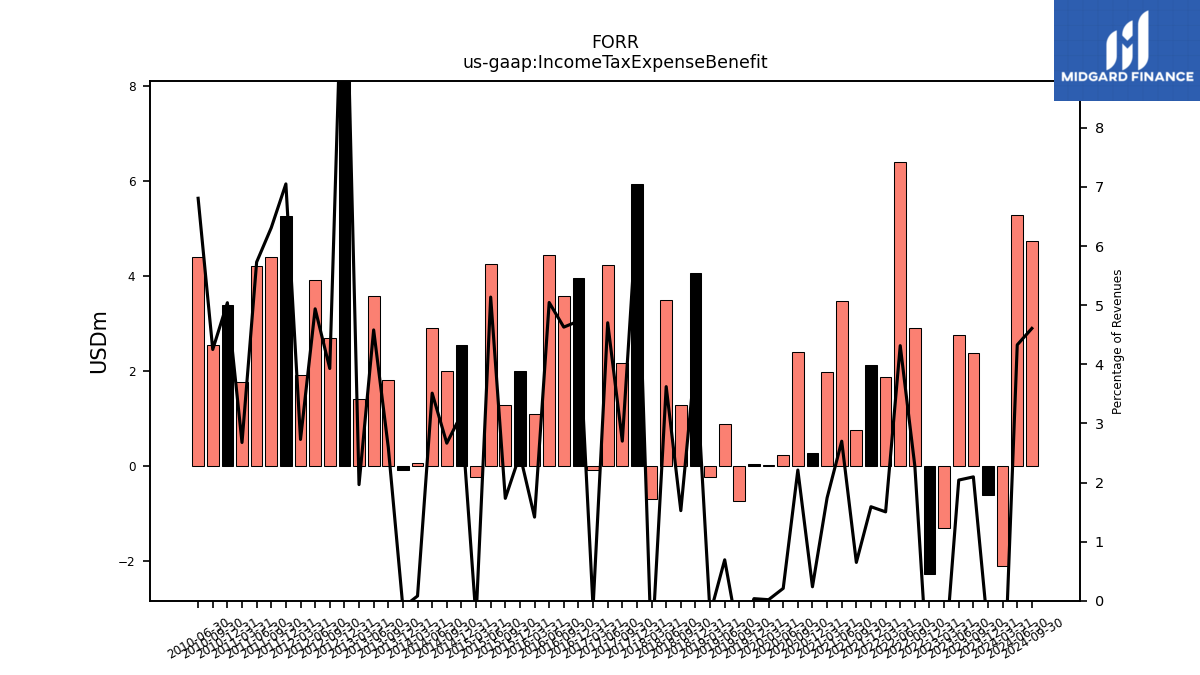
| Income Tax Expense Benefit | -0.60 | 2.38 | 2.77 | -1.31 | -2.26 | 2.90 | 6.40 | 1.88 | 2.13 | 0.77 | 3.47 | 1.98 | 0.28 | 2.40 | 0.24 | 0.02 | 0.04 | -0.73 | 0.89 | -0.23 | 4.06 | 1.29 | 3.49 | -0.70 | 5.93 | 2.17 | 4.22 | -0.09 | 3.95 | 3.58 | 4.43 | 1.09 | 2.00 | 1.29 | 4.25 | -0.23 | 2.54 | 2.01 | 2.91 | 0.06 | -0.09 | 1.81 | 3.58 | 1.40 | 9.06 | 2.69 | 3.91 | 1.92 | 5.26 | 4.40 | 4.21 | 1.76 | 3.38 | 2.54 | 4.40 | |
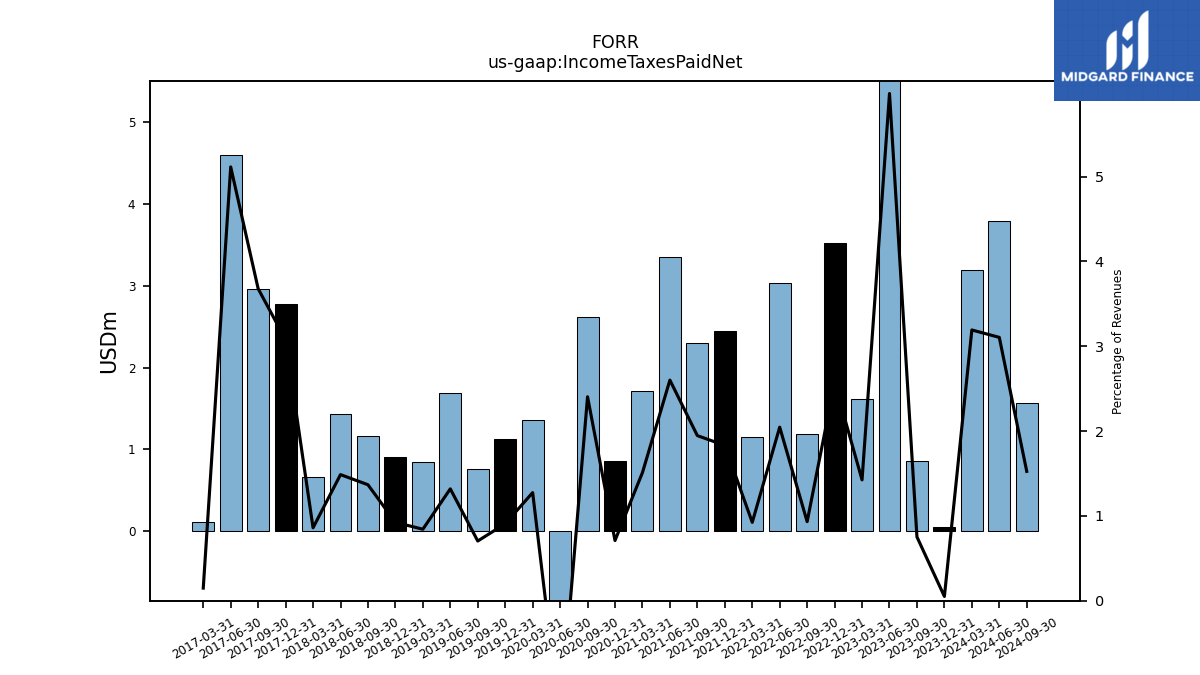
| Income Taxes Paid Net | 0.06 | 0.85 | 8.11 | 1.62 | 3.52 | 1.19 | 3.03 | 1.16 | 2.45 | 2.30 | 3.35 | 1.72 | 0.86 | 2.61 | -1.63 | 1.36 | 1.13 | 0.77 | 1.69 | 0.85 | 0.91 | 1.16 | 1.43 | 0.67 | 2.78 | 2.96 | 4.59 | 0.12 | NA | NA | NA | NA | NA | NA | NA | NA | NA | NA | NA | NA | NA | NA | NA | NA | NA | NA | NA | NA | NA | NA | NA | NA | NA | NA | NA | |
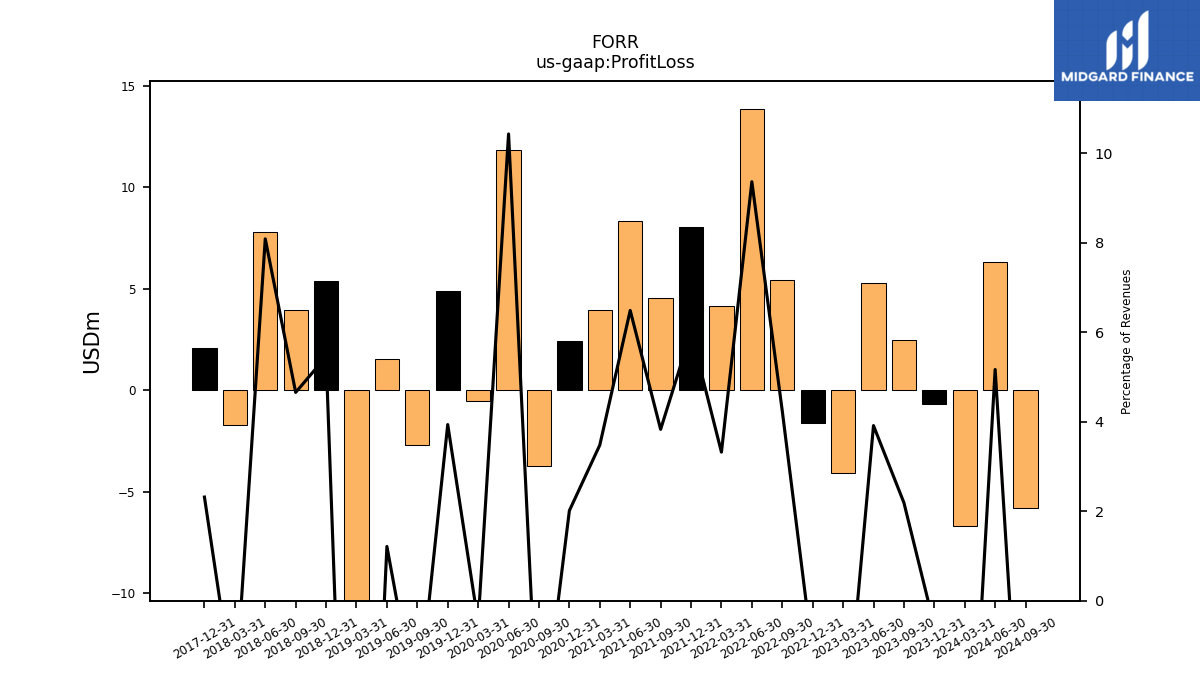
| Profit Loss | -0.66 | 2.48 | 5.30 | -4.08 | -1.63 | 5.41 | 13.87 | 4.15 | 8.02 | 4.52 | 8.34 | 3.96 | 2.43 | -3.76 | 11.84 | -0.51 | 4.89 | -2.70 | 1.55 | -13.32 | 5.38 | 3.95 | 7.79 | -1.73 | 2.09 | NA | NA | NA | NA | NA | NA | NA | NA | NA | NA | NA | NA | NA | NA | NA | NA | NA | NA | NA | NA | NA | NA | NA | NA | NA | NA | NA | NA | NA | NA | |
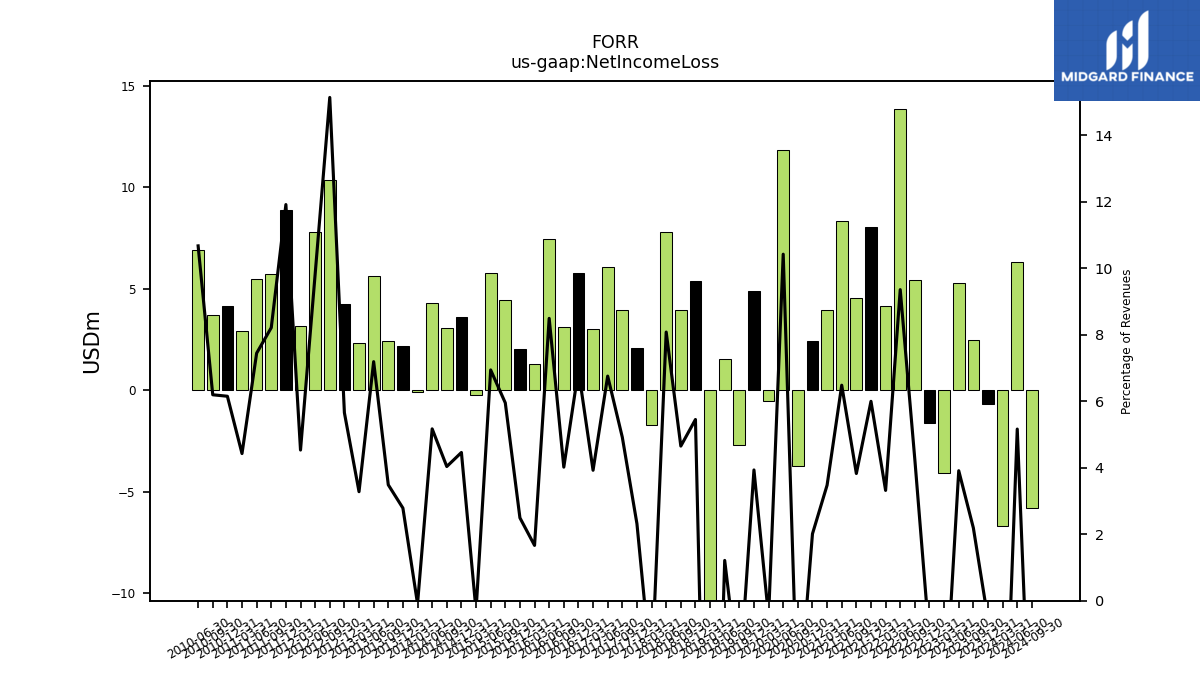
| Net Income Loss | -0.66 | 2.48 | 5.30 | -4.08 | -1.63 | 5.41 | 13.87 | 4.15 | 8.02 | 4.52 | 8.34 | 3.96 | 2.43 | -3.76 | 11.84 | -0.51 | 4.89 | -2.70 | 1.55 | -13.32 | 5.38 | 3.95 | 7.79 | -1.73 | 2.09 | 3.95 | 6.06 | 3.03 | 5.79 | 3.11 | 7.46 | 1.29 | 2.02 | 4.45 | 5.75 | -0.22 | 3.60 | 3.04 | 4.29 | -0.07 | 2.16 | 2.44 | 5.62 | 2.34 | 4.25 | 10.37 | 7.77 | 3.18 | 8.90 | 5.73 | 5.47 | 2.91 | 4.13 | 3.70 | 6.90 | |
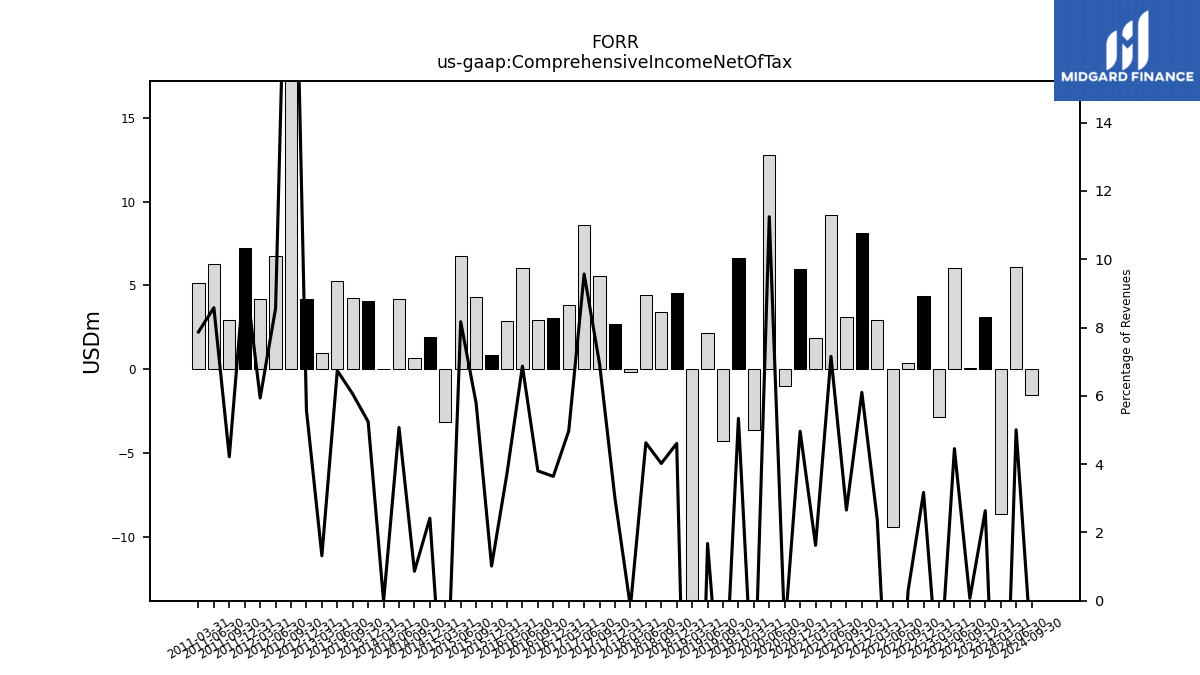
| Comprehensive Income Net Of Tax | 3.12 | 0.08 | 6.04 | -2.84 | 4.34 | 0.38 | -9.38 | 2.97 | 8.16 | 3.14 | 9.21 | 1.84 | 5.98 | -0.98 | 12.77 | -3.61 | 6.64 | -4.31 | 2.15 | -13.75 | 4.54 | 3.41 | 4.46 | -0.14 | 2.70 | 5.58 | 8.59 | 3.84 | 3.04 | 2.94 | 6.03 | 2.89 | 0.82 | 4.32 | 6.77 | -3.13 | 1.95 | 0.65 | 4.21 | -0.01 | 4.07 | 4.23 | 5.27 | 0.94 | 4.20 | 17.86 | 6.77 | 4.17 | 7.24 | 2.94 | 6.30 | 5.17 | NA | NA | NA |
| 2023-12-31 | 2023-09-30 | 2023-06-30 | 2023-03-31 | 2022-12-31 | 2022-09-30 | 2022-06-30 | 2022-03-31 | 2021-12-31 | 2021-09-30 | 2021-06-30 | 2021-03-31 | 2020-12-31 | 2020-09-30 | 2020-06-30 | 2020-03-31 | 2019-12-31 | 2019-09-30 | 2019-06-30 | 2019-03-31 | 2018-12-31 | 2018-09-30 | 2018-06-30 | 2018-03-31 | 2017-12-31 | 2017-09-30 | 2017-06-30 | 2017-03-31 | 2016-12-31 | 2016-09-30 | 2016-06-30 | 2016-03-31 | 2015-12-31 | 2015-09-30 | 2015-06-30 | 2015-03-31 | 2014-12-31 | 2014-09-30 | 2014-06-30 | 2014-03-31 | 2013-12-31 | 2013-09-30 | 2013-06-30 | 2013-03-31 | 2012-12-31 | 2012-09-30 | 2012-06-30 | 2012-03-31 | 2011-12-31 | 2011-09-30 | 2011-06-30 | 2011-03-31 | 2010-12-31 | 2010-09-30 | 2010-06-30 | ||
|---|---|---|---|---|---|---|---|---|---|---|---|---|---|---|---|---|---|---|---|---|---|---|---|---|---|---|---|---|---|---|---|---|---|---|---|---|---|---|---|---|---|---|---|---|---|---|---|---|---|---|---|---|---|---|---|---|
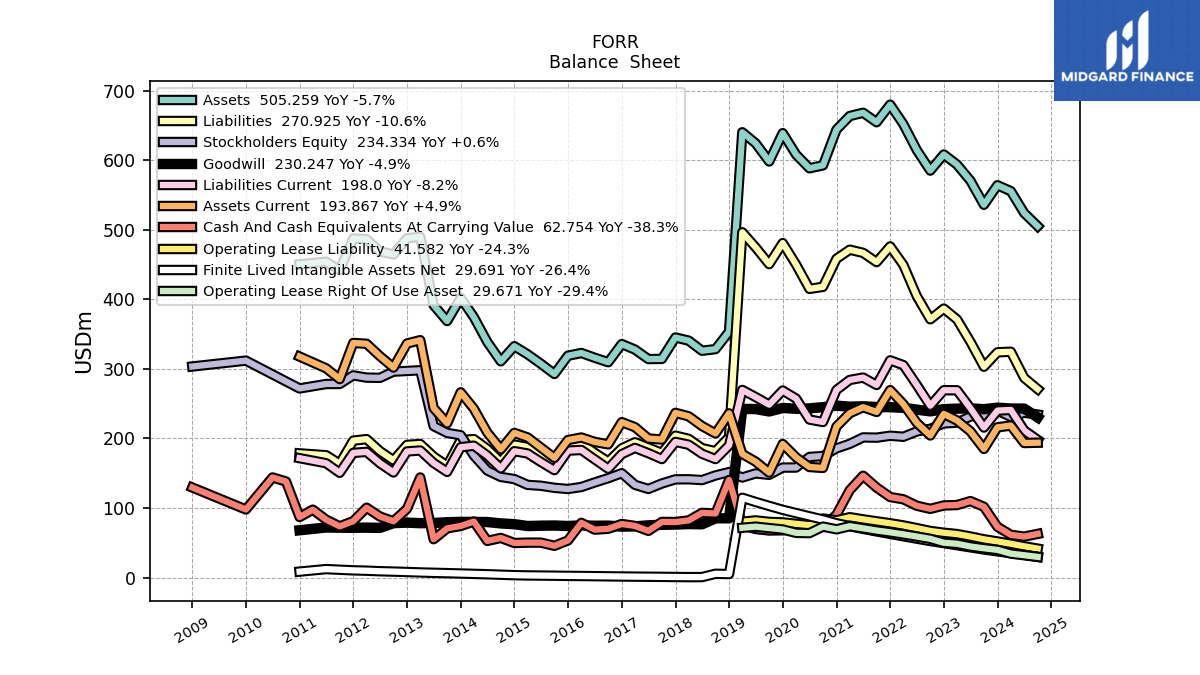
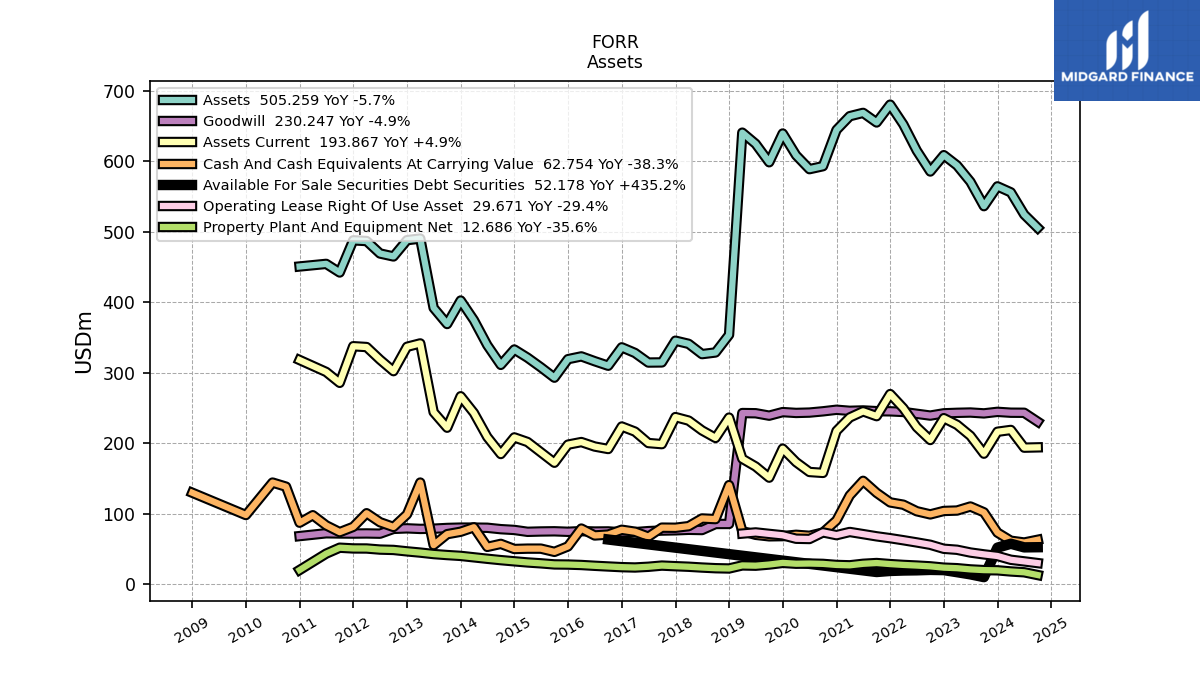
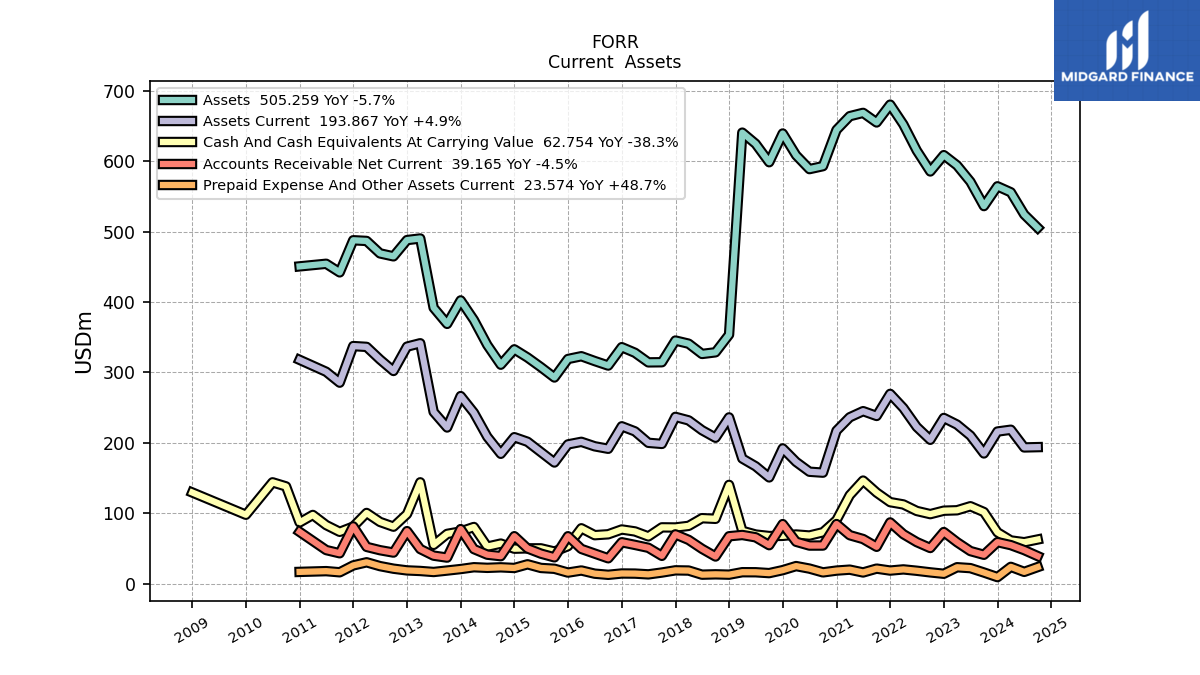
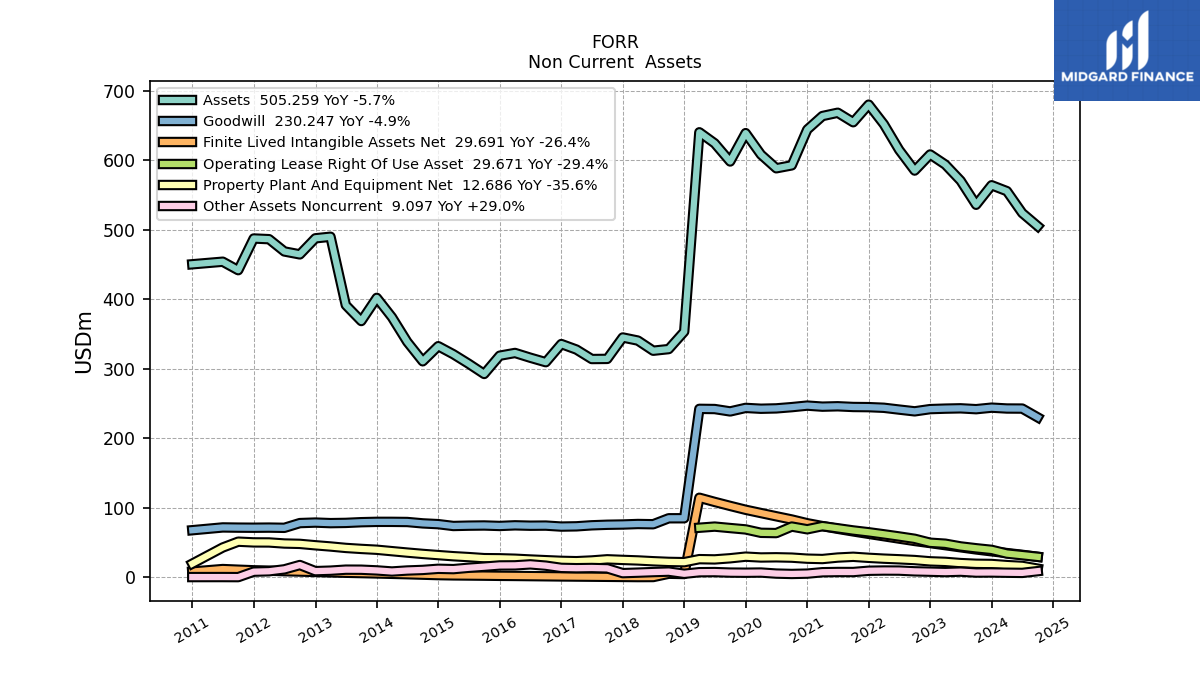
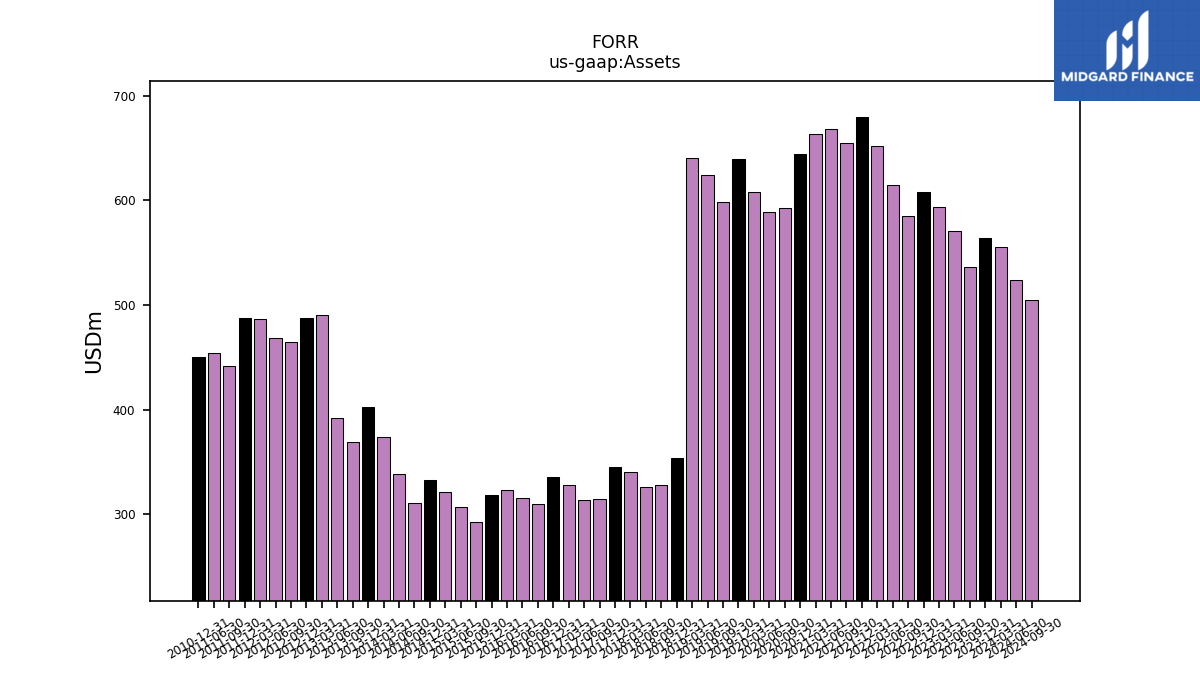
| Assets | 564.17 | 536.06 | 570.67 | 593.89 | 608.44 | 585.24 | 614.93 | 651.90 | 680.13 | 654.79 | 668.45 | 663.72 | 644.22 | 592.77 | 588.56 | 608.30 | 639.16 | 598.33 | 624.47 | 640.38 | 353.52 | 328.49 | 326.14 | 340.74 | 345.20 | 314.39 | 314.19 | 327.80 | 335.79 | 309.64 | 316.07 | 322.92 | 318.99 | 292.70 | 307.39 | 321.06 | 332.71 | 310.89 | 338.88 | 374.36 | 402.20 | 368.83 | 391.75 | 490.10 | 487.83 | 464.71 | 468.92 | 486.59 | 487.58 | 441.97 | 454.18 | NA | 450.48 | NA | NA | |
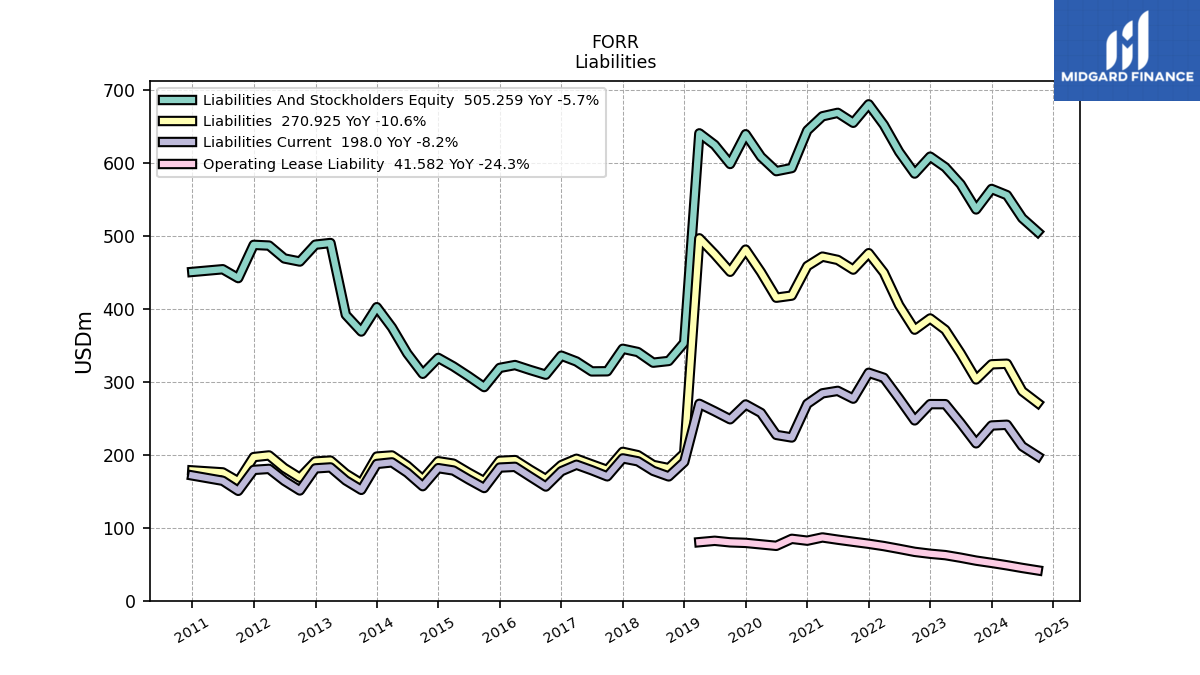
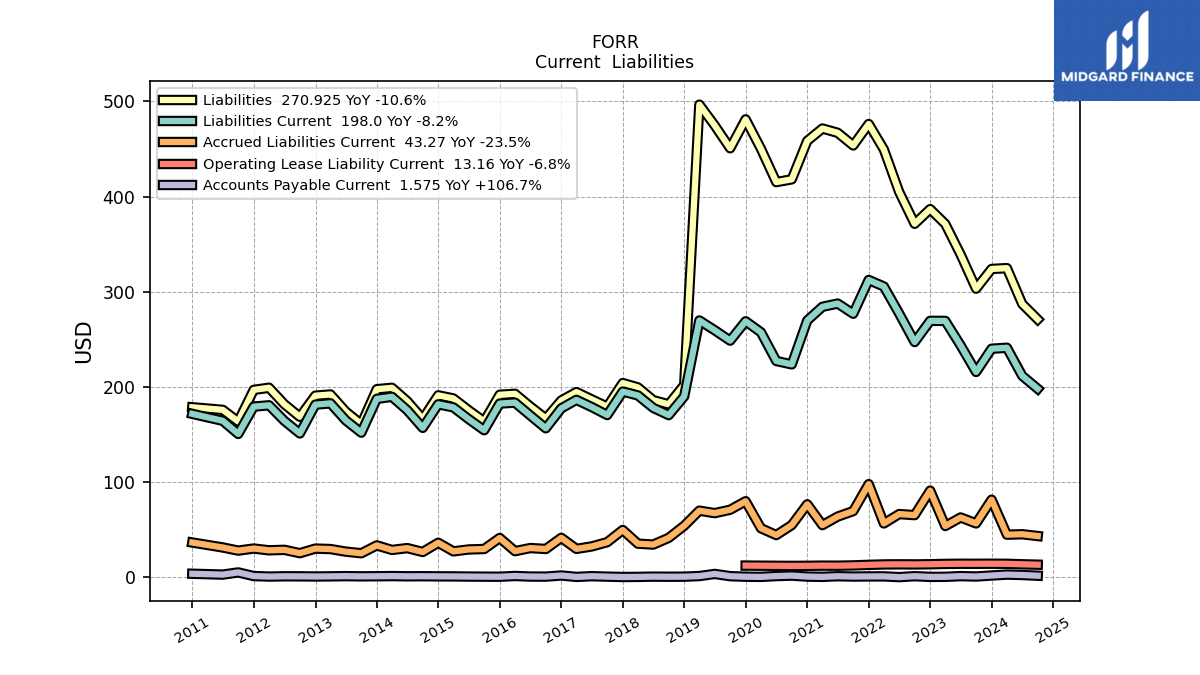
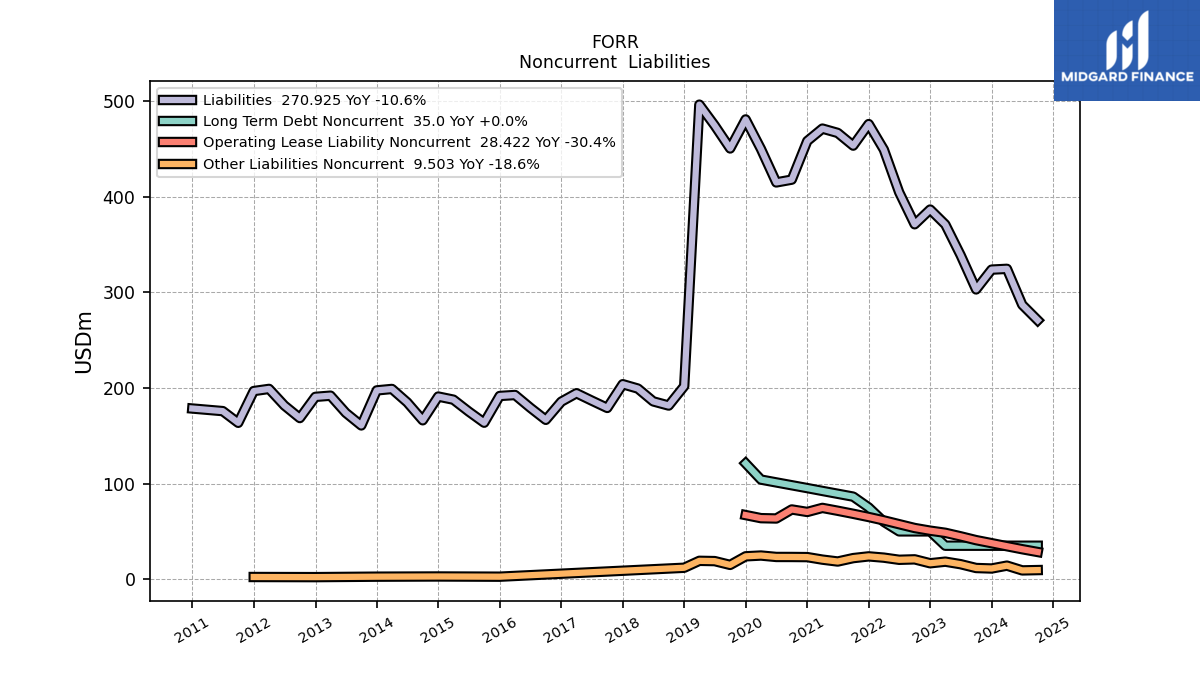
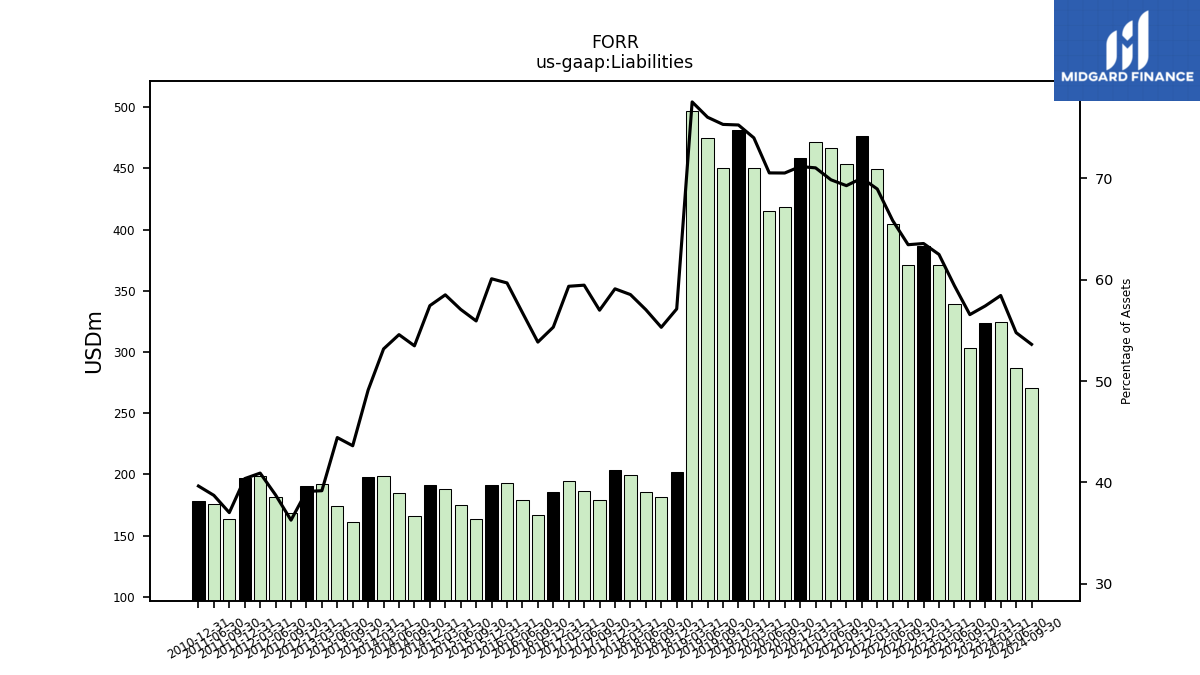
| Liabilities | 323.91 | 303.17 | 339.03 | 371.14 | 386.78 | 371.35 | 404.83 | 449.47 | 476.22 | 453.64 | 466.95 | 471.48 | 458.45 | 418.07 | 415.15 | 450.13 | 481.07 | 450.68 | 474.78 | 496.56 | 201.92 | 181.66 | 186.03 | 199.44 | 204.01 | 179.17 | 186.82 | 194.55 | 185.75 | 166.72 | 179.38 | 192.72 | 191.69 | 163.71 | 175.41 | 187.84 | 191.10 | 166.25 | 184.95 | 199.05 | 197.54 | 160.86 | 174.03 | 192.01 | 190.76 | 168.56 | 181.75 | 199.10 | 196.84 | 163.60 | 175.86 | NA | 178.57 | NA | NA | |
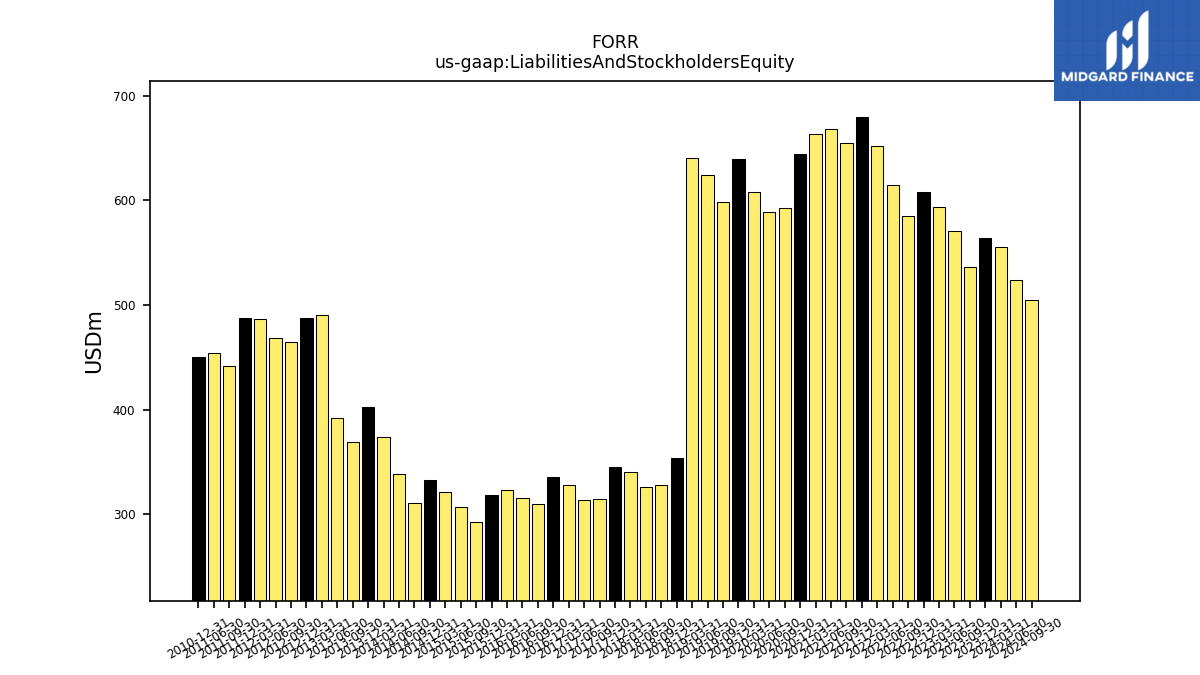
| Liabilities And Stockholders Equity | 564.17 | 536.06 | 570.67 | 593.89 | 608.44 | 585.24 | 614.93 | 651.90 | 680.13 | 654.79 | 668.45 | 663.72 | 644.22 | 592.77 | 588.56 | 608.30 | 639.16 | 598.33 | 624.47 | 640.38 | 353.52 | 328.49 | 326.14 | 340.74 | 345.20 | 314.39 | 314.19 | 327.80 | 335.79 | 309.64 | 316.07 | 322.92 | 318.99 | 292.70 | 307.39 | 321.06 | 332.71 | 310.89 | 338.88 | 374.36 | 402.20 | 368.83 | 391.75 | 490.10 | 487.83 | 464.71 | 468.92 | 486.59 | 487.58 | 441.97 | 454.18 | NA | 450.48 | NA | NA | |
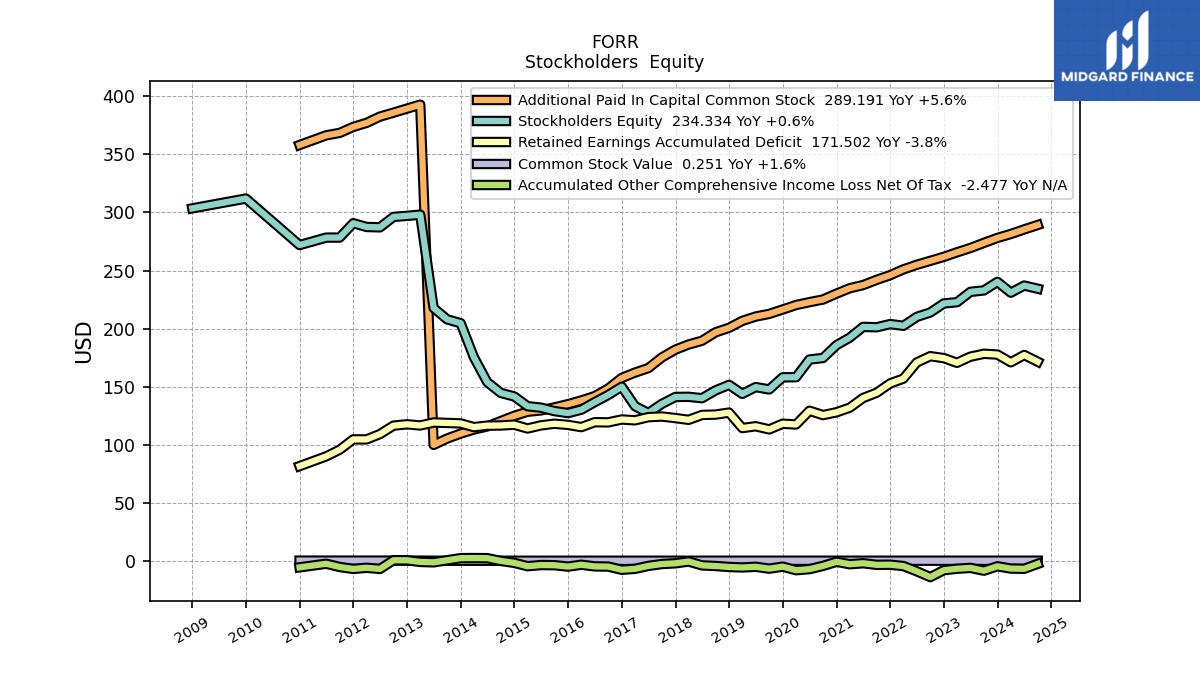
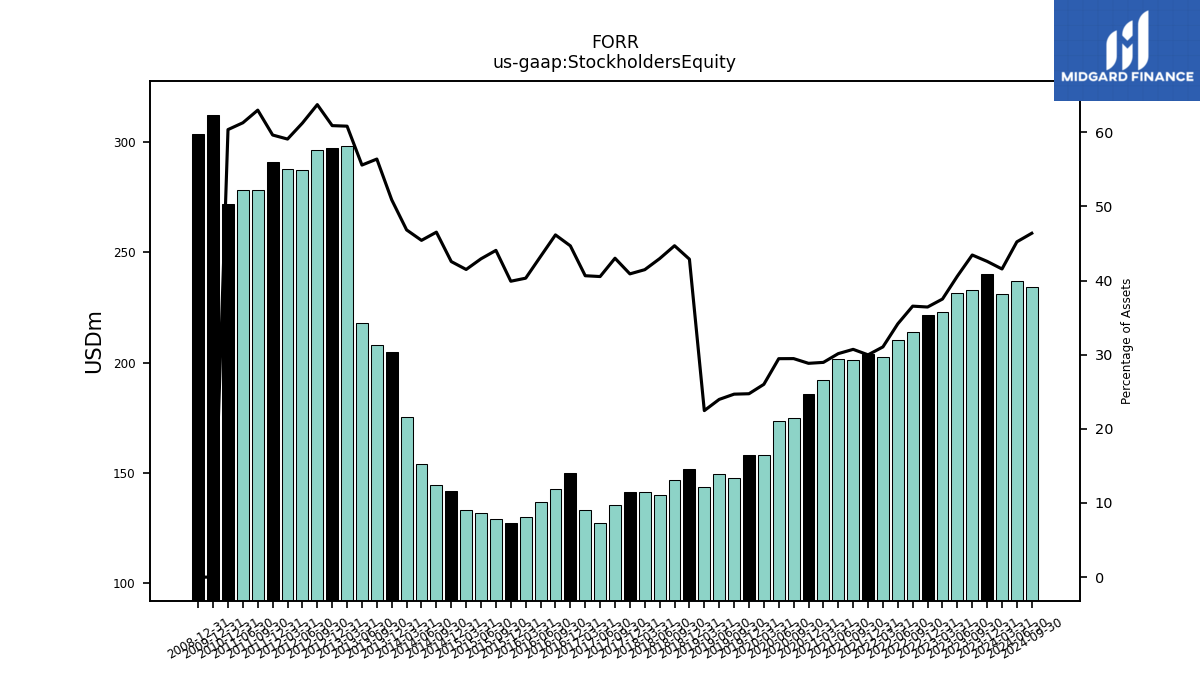
| Stockholders Equity | 240.26 | 232.89 | 231.65 | 222.75 | 221.66 | 213.89 | 210.10 | 202.43 | 203.91 | 201.15 | 201.50 | 192.24 | 185.77 | 174.71 | 173.41 | 158.17 | 158.09 | 147.65 | 149.69 | 143.81 | 151.60 | 146.83 | 140.11 | 141.29 | 141.19 | 135.22 | 127.37 | 133.25 | 150.04 | 142.92 | 136.70 | 130.20 | 127.30 | 128.99 | 131.98 | 133.22 | 141.60 | 144.64 | 153.92 | 175.31 | 204.66 | 207.97 | 217.72 | 298.09 | 297.07 | 296.15 | 287.17 | 287.49 | 290.74 | 278.37 | 278.33 | NA | 271.91 | NA | NA |
| 2023-12-31 | 2023-09-30 | 2023-06-30 | 2023-03-31 | 2022-12-31 | 2022-09-30 | 2022-06-30 | 2022-03-31 | 2021-12-31 | 2021-09-30 | 2021-06-30 | 2021-03-31 | 2020-12-31 | 2020-09-30 | 2020-06-30 | 2020-03-31 | 2019-12-31 | 2019-09-30 | 2019-06-30 | 2019-03-31 | 2018-12-31 | 2018-09-30 | 2018-06-30 | 2018-03-31 | 2017-12-31 | 2017-09-30 | 2017-06-30 | 2017-03-31 | 2016-12-31 | 2016-09-30 | 2016-06-30 | 2016-03-31 | 2015-12-31 | 2015-09-30 | 2015-06-30 | 2015-03-31 | 2014-12-31 | 2014-09-30 | 2014-06-30 | 2014-03-31 | 2013-12-31 | 2013-09-30 | 2013-06-30 | 2013-03-31 | 2012-12-31 | 2012-09-30 | 2012-06-30 | 2012-03-31 | 2011-12-31 | 2011-09-30 | 2011-06-30 | 2011-03-31 | 2010-12-31 | 2010-09-30 | 2010-06-30 | ||
|---|---|---|---|---|---|---|---|---|---|---|---|---|---|---|---|---|---|---|---|---|---|---|---|---|---|---|---|---|---|---|---|---|---|---|---|---|---|---|---|---|---|---|---|---|---|---|---|---|---|---|---|---|---|---|---|---|
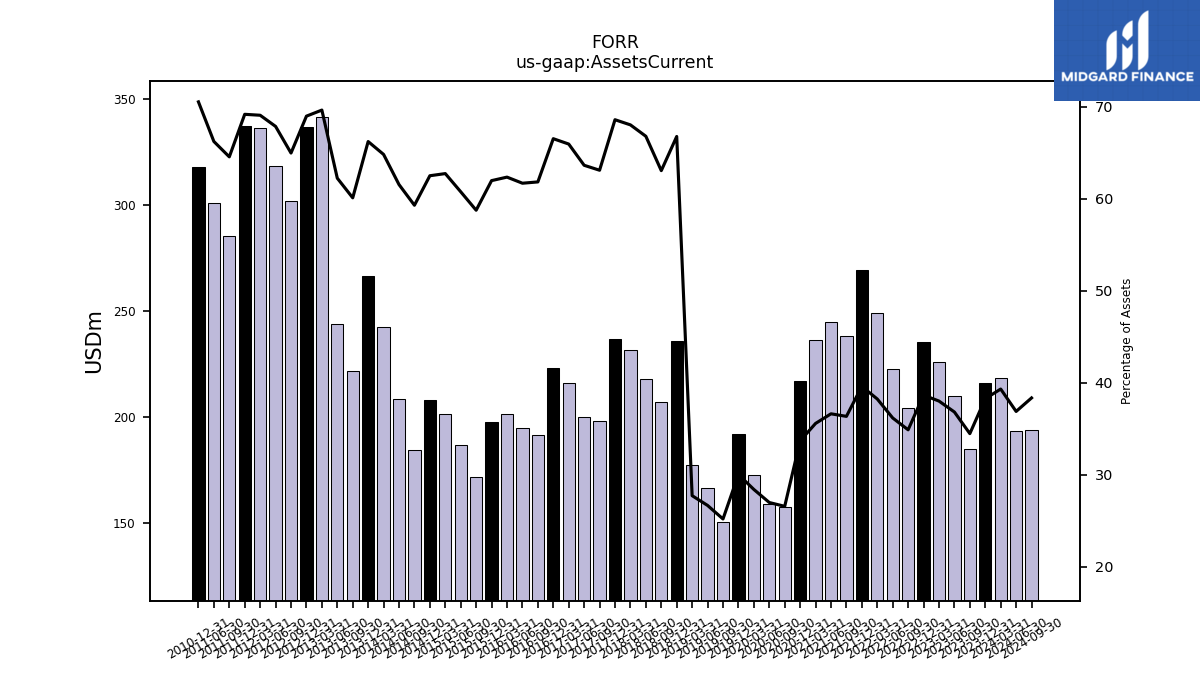
| Assets Current | 216.00 | 184.88 | 210.22 | 225.84 | 235.29 | 204.28 | 222.55 | 249.37 | 269.49 | 238.12 | 244.95 | 236.27 | 217.16 | 157.62 | 158.93 | 172.90 | 192.04 | 150.87 | 166.65 | 177.69 | 236.09 | 207.18 | 217.88 | 231.85 | 236.82 | 198.42 | 199.99 | 216.22 | 223.44 | 191.49 | 195.03 | 201.39 | 197.73 | 172.02 | 186.81 | 201.46 | 208.00 | 184.39 | 208.60 | 242.71 | 266.39 | 221.72 | 243.86 | 341.36 | 336.56 | 301.98 | 318.29 | 336.18 | 337.36 | 285.37 | 300.85 | NA | 317.79 | NA | NA | |
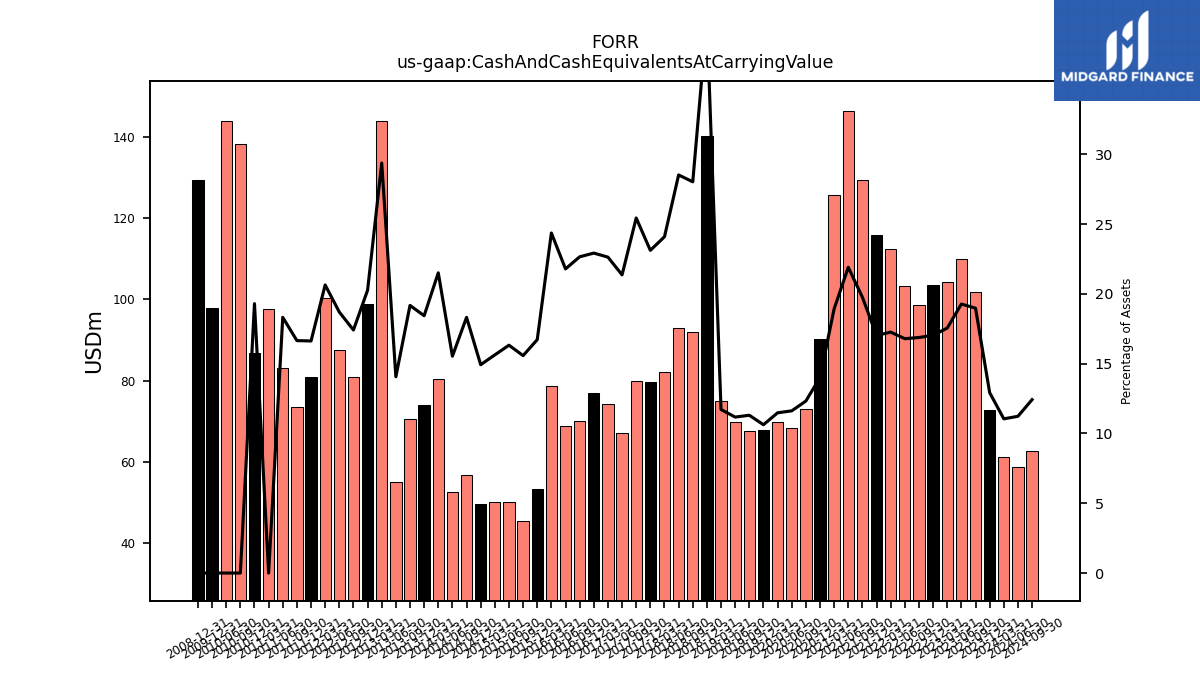
| Cash And Cash Equivalents At Carrying Value | 72.91 | 101.71 | 109.95 | 104.22 | 103.63 | 98.73 | 103.22 | 112.50 | 115.77 | 129.33 | 146.39 | 125.60 | 90.26 | 73.03 | 68.38 | 69.81 | 67.90 | 67.63 | 69.76 | 75.01 | 140.30 | 92.06 | 93.00 | 82.07 | 79.79 | 79.96 | 67.11 | 74.18 | 76.96 | 70.14 | 68.86 | 78.65 | 53.33 | 45.59 | 50.16 | 50.17 | 49.65 | 56.93 | 52.63 | 80.50 | 74.13 | 70.70 | 55.08 | 143.94 | 98.81 | 80.90 | 87.66 | 100.41 | 81.05 | 73.59 | 83.19 | 97.60 | 86.93 | 138.10 | 143.91 | |
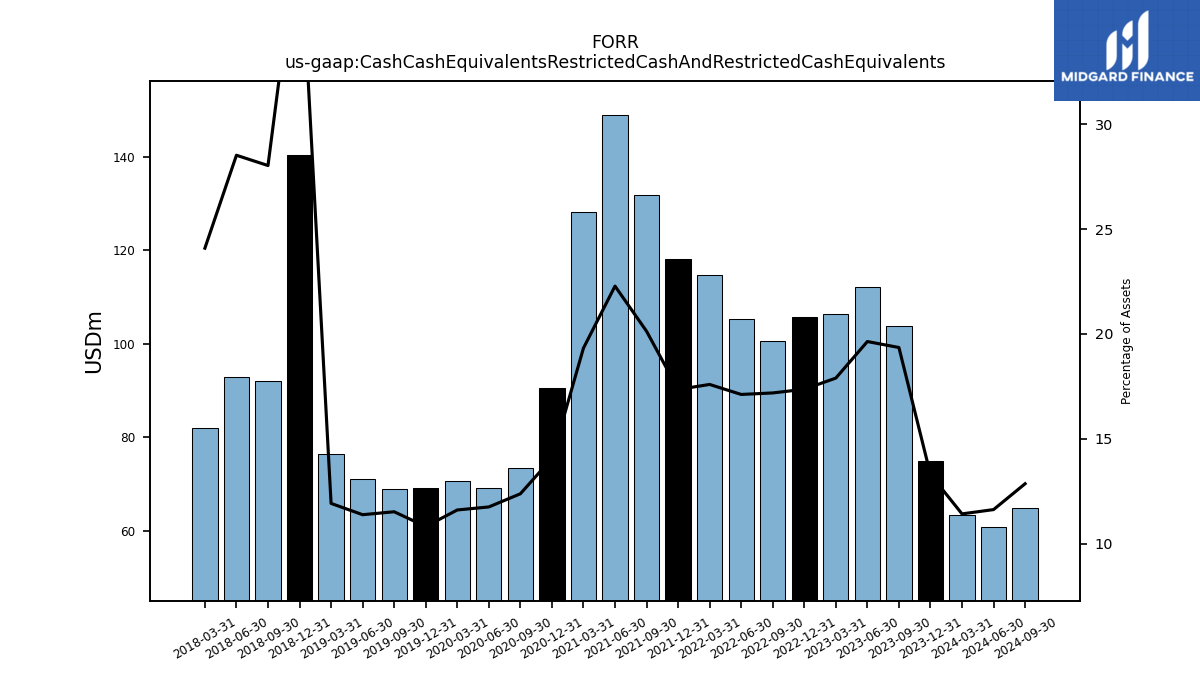
| Cash Cash Equivalents Restricted Cash And Restricted Cash Equivalents | 75.04 | 103.75 | 112.07 | 106.29 | 105.65 | 100.60 | 105.26 | 114.69 | 118.03 | 131.80 | 148.93 | 128.27 | 90.65 | 73.41 | 69.20 | 70.64 | 69.19 | 68.97 | 71.11 | 76.37 | 140.30 | 92.06 | 93.00 | 82.07 | NA | NA | NA | NA | NA | NA | NA | NA | NA | NA | NA | NA | NA | NA | NA | NA | NA | NA | NA | NA | NA | NA | NA | NA | NA | NA | NA | NA | NA | NA | NA | |
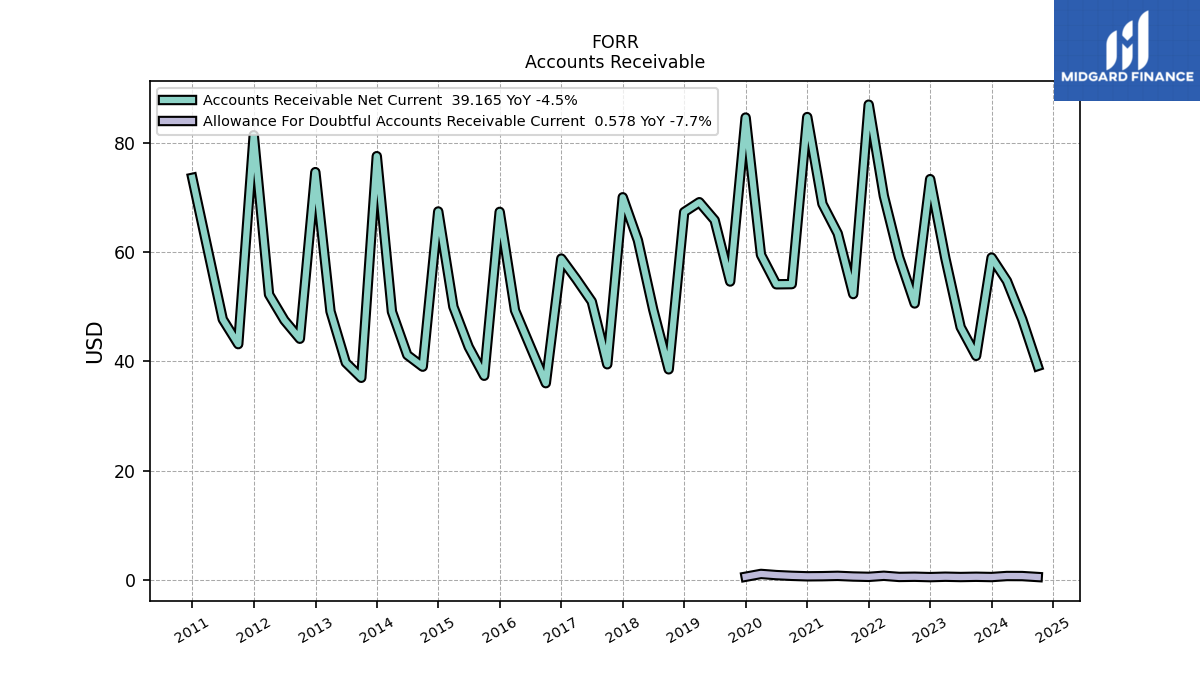
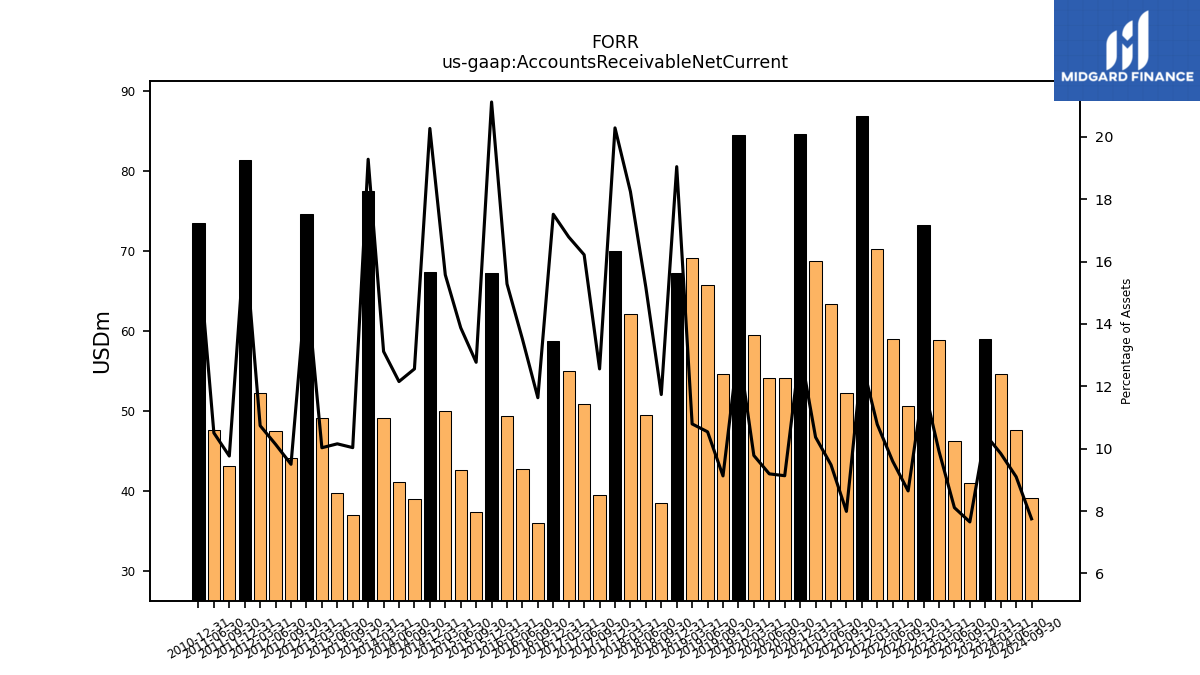
| Accounts Receivable Net Current | 59.00 | 41.02 | 46.28 | 58.91 | 73.34 | 50.60 | 59.01 | 70.26 | 86.97 | 52.32 | 63.40 | 68.82 | 84.69 | 54.14 | 54.11 | 59.51 | 84.61 | 54.61 | 65.82 | 69.12 | 67.32 | 38.55 | 49.49 | 62.15 | 70.02 | 39.48 | 50.95 | 55.03 | 58.81 | 36.02 | 42.71 | 49.35 | 67.36 | 37.38 | 42.66 | 50.00 | 67.43 | 39.04 | 41.18 | 49.10 | 77.54 | 37.01 | 39.78 | 49.16 | 74.62 | 44.15 | 47.55 | 52.25 | 81.38 | 43.16 | 47.71 | NA | 73.57 | NA | NA | |
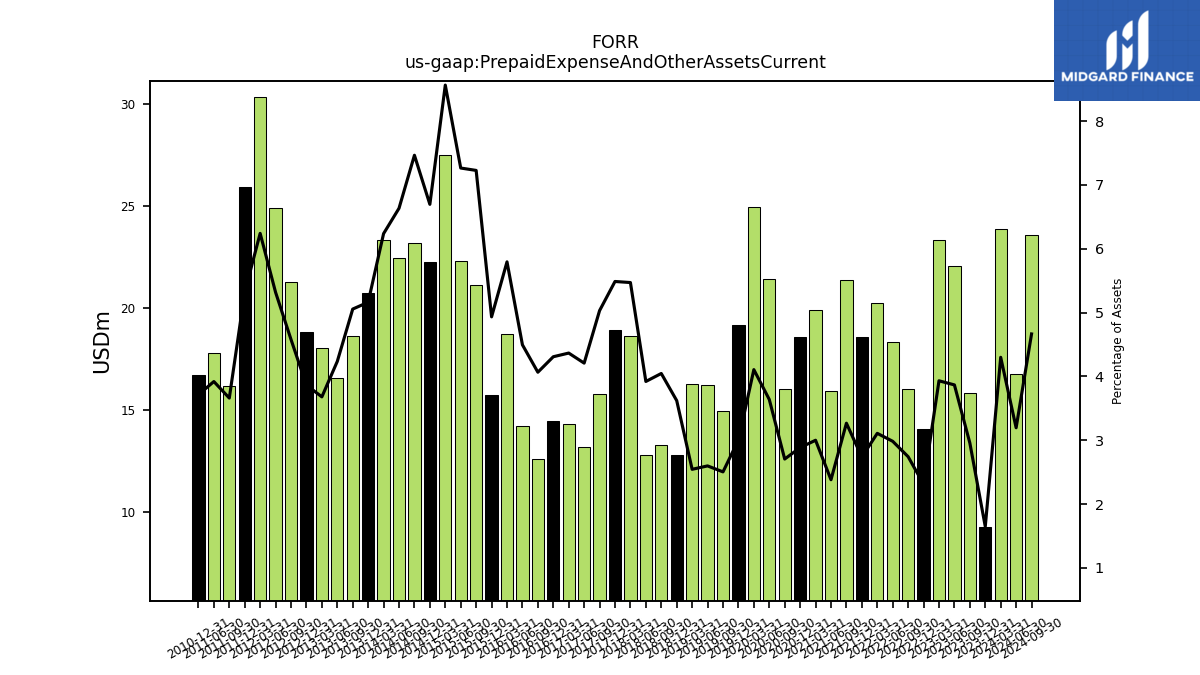
| Prepaid Expense And Other Assets Current | 9.30 | 15.86 | 22.07 | 23.35 | 14.07 | 16.05 | 18.35 | 20.27 | 18.61 | 21.39 | 15.92 | 19.91 | 18.59 | 16.04 | 21.42 | 24.98 | 19.20 | 14.99 | 16.23 | 16.30 | 12.80 | 13.29 | 12.79 | 18.64 | 18.94 | 15.82 | 13.22 | 14.31 | 14.47 | 12.59 | 14.21 | 18.71 | 15.74 | 21.15 | 22.33 | 27.50 | 22.28 | 23.21 | 22.48 | 23.35 | 20.76 | 18.64 | 16.59 | 18.04 | 18.85 | 21.28 | 24.93 | 30.37 | 25.93 | 16.18 | 17.80 | NA | 16.73 | NA | NA | |
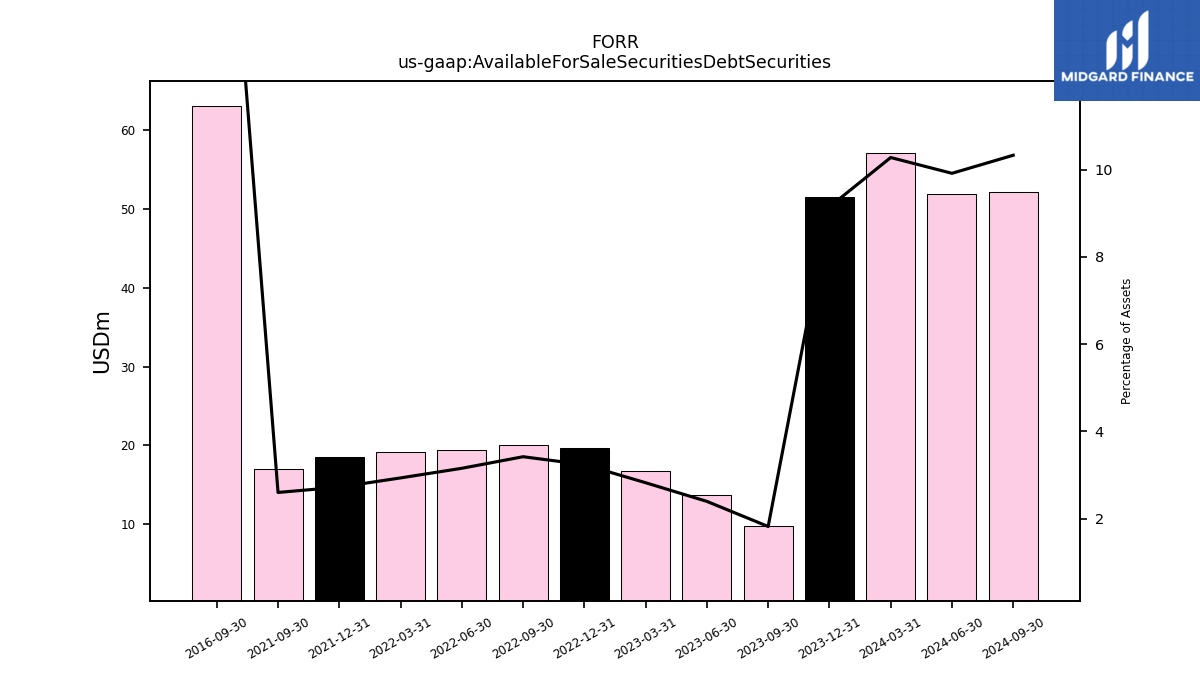
| Available For Sale Securities Debt Securities | 51.58 | 9.75 | 13.66 | 16.76 | 19.69 | 20.00 | 19.39 | 19.12 | 18.51 | 17.02 | NA | NA | NA | NA | NA | NA | NA | NA | NA | NA | NA | NA | NA | NA | NA | NA | NA | NA | NA | 63.10 | NA | NA | NA | NA | NA | NA | NA | NA | NA | NA | NA | NA | NA | NA | NA | NA | NA | NA | NA | NA | NA | NA | NA | NA | NA |
| 2023-12-31 | 2023-09-30 | 2023-06-30 | 2023-03-31 | 2022-12-31 | 2022-09-30 | 2022-06-30 | 2022-03-31 | 2021-12-31 | 2021-09-30 | 2021-06-30 | 2021-03-31 | 2020-12-31 | 2020-09-30 | 2020-06-30 | 2020-03-31 | 2019-12-31 | 2019-09-30 | 2019-06-30 | 2019-03-31 | 2018-12-31 | 2018-09-30 | 2018-06-30 | 2018-03-31 | 2017-12-31 | 2017-09-30 | 2017-06-30 | 2017-03-31 | 2016-12-31 | 2016-09-30 | 2016-06-30 | 2016-03-31 | 2015-12-31 | 2015-09-30 | 2015-06-30 | 2015-03-31 | 2014-12-31 | 2014-09-30 | 2014-06-30 | 2014-03-31 | 2013-12-31 | 2013-09-30 | 2013-06-30 | 2013-03-31 | 2012-12-31 | 2012-09-30 | 2012-06-30 | 2012-03-31 | 2011-12-31 | 2011-09-30 | 2011-06-30 | 2011-03-31 | 2010-12-31 | 2010-09-30 | 2010-06-30 | ||
|---|---|---|---|---|---|---|---|---|---|---|---|---|---|---|---|---|---|---|---|---|---|---|---|---|---|---|---|---|---|---|---|---|---|---|---|---|---|---|---|---|---|---|---|---|---|---|---|---|---|---|---|---|---|---|---|---|
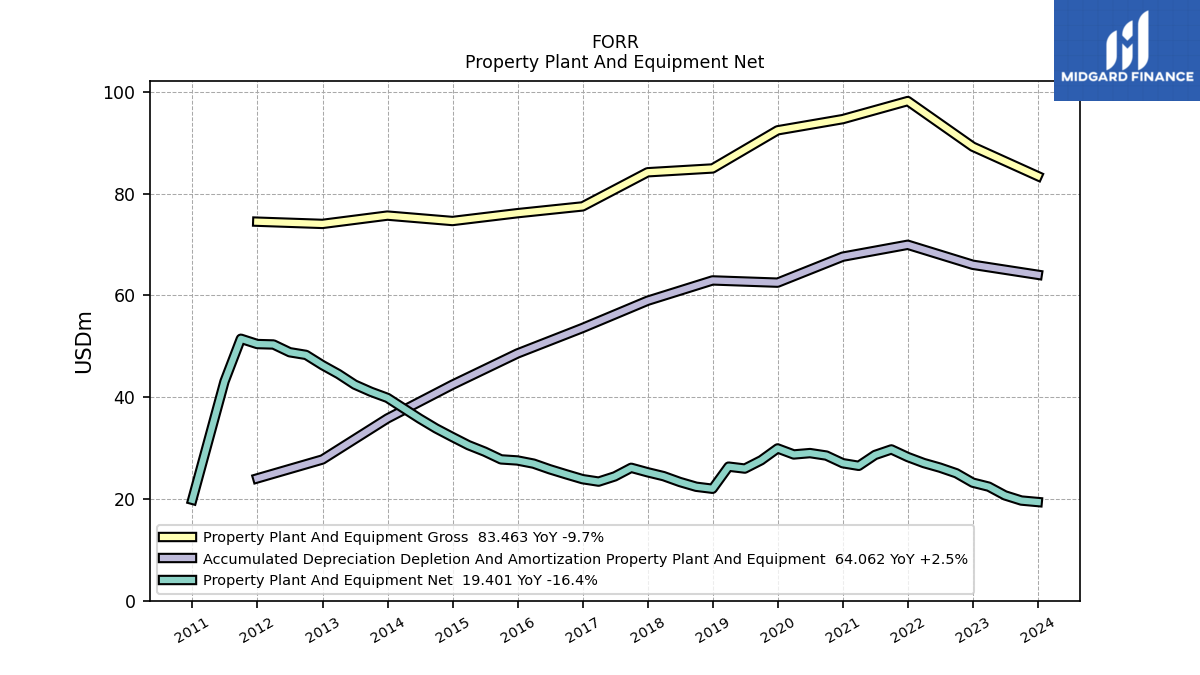
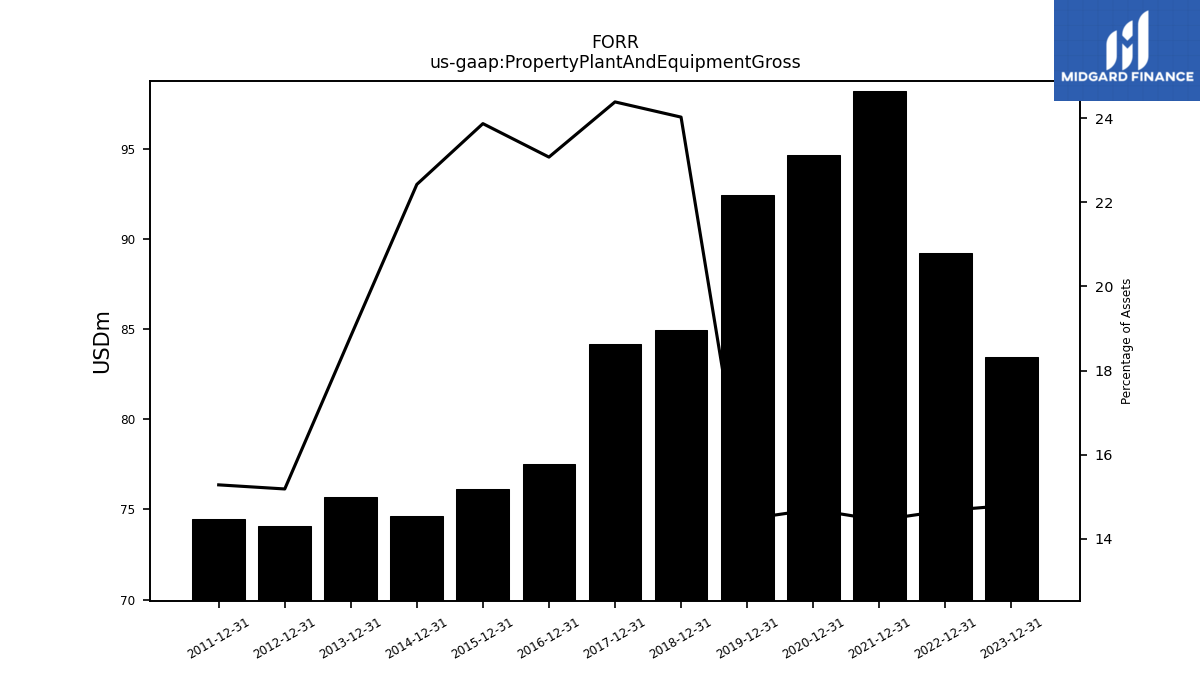
| Property Plant And Equipment Gross | 83.46 | NA | NA | NA | 89.24 | NA | NA | NA | 98.20 | NA | NA | NA | 94.65 | NA | NA | NA | 92.45 | NA | NA | NA | 84.96 | NA | NA | NA | 84.20 | NA | NA | NA | 77.50 | NA | NA | NA | 76.16 | NA | NA | NA | 74.63 | NA | NA | NA | 75.69 | NA | NA | NA | 74.06 | NA | NA | NA | 74.50 | NA | NA | NA | NA | NA | NA | |
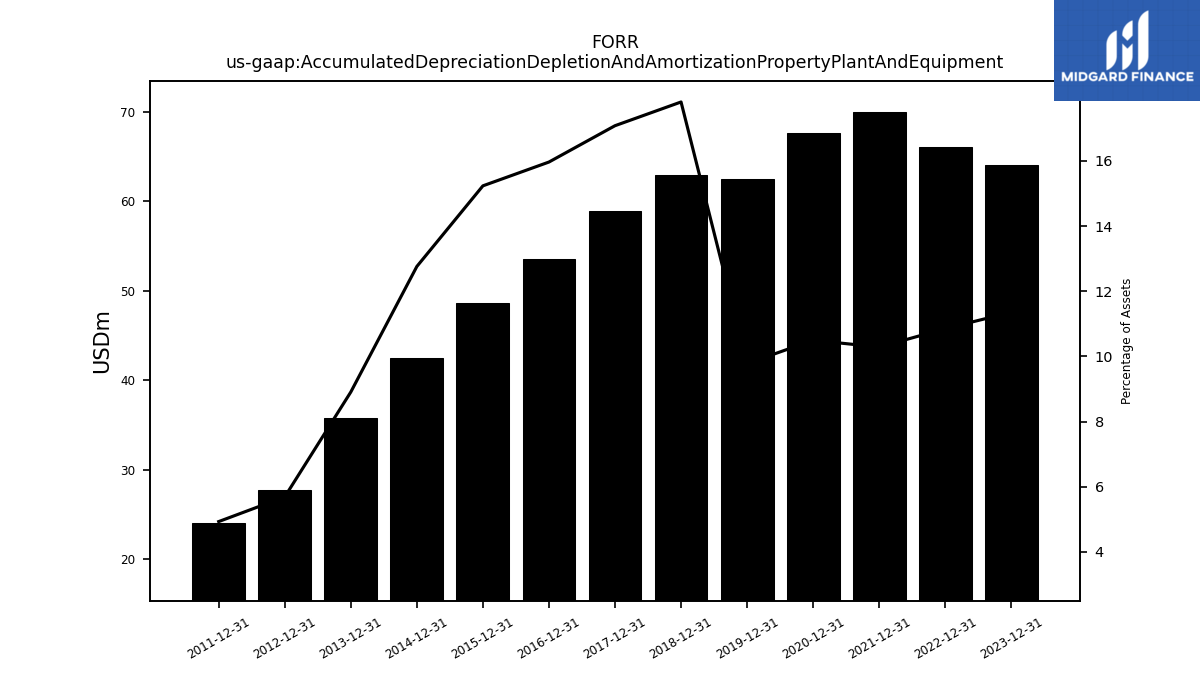
| Accumulated Depreciation Depletion And Amortization Property Plant And Equipment | 64.06 | NA | NA | NA | 66.03 | NA | NA | NA | 69.96 | NA | NA | NA | 67.62 | NA | NA | NA | 62.51 | NA | NA | NA | 62.95 | NA | NA | NA | 58.96 | NA | NA | NA | 53.60 | NA | NA | NA | 48.59 | NA | NA | NA | 42.45 | NA | NA | NA | 35.82 | NA | NA | NA | 27.76 | NA | NA | NA | 24.05 | NA | NA | NA | NA | NA | NA | |
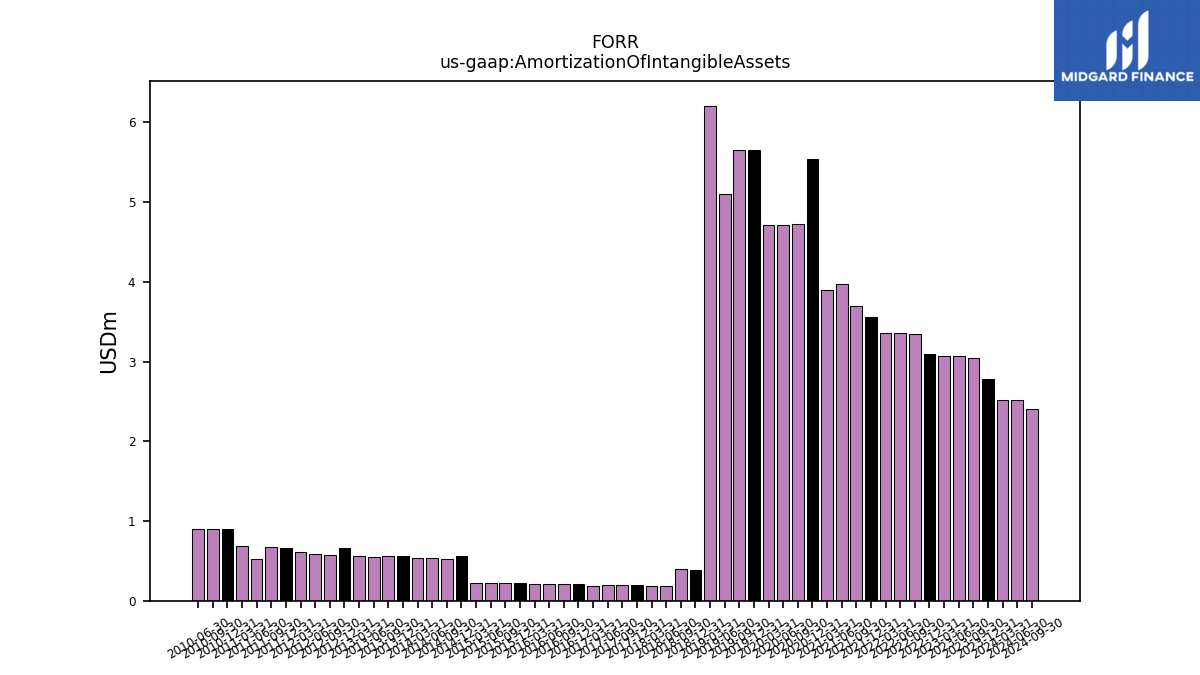
| Amortization Of Intangible Assets | 2.78 | 3.04 | 3.07 | 3.07 | 3.09 | 3.35 | 3.35 | 3.36 | 3.56 | 3.70 | 3.97 | 3.90 | 5.54 | 4.72 | 4.71 | 4.71 | 5.66 | 5.65 | 5.10 | 6.21 | 0.39 | 0.40 | 0.18 | 0.19 | 0.20 | 0.20 | 0.19 | 0.19 | 0.20 | 0.21 | 0.21 | 0.21 | 0.22 | 0.22 | 0.22 | 0.22 | 0.57 | 0.53 | 0.54 | 0.54 | 0.56 | 0.56 | 0.55 | 0.56 | 0.67 | 0.58 | 0.59 | 0.61 | 0.66 | 0.68 | 0.53 | 0.69 | 0.91 | 0.91 | 0.91 | |
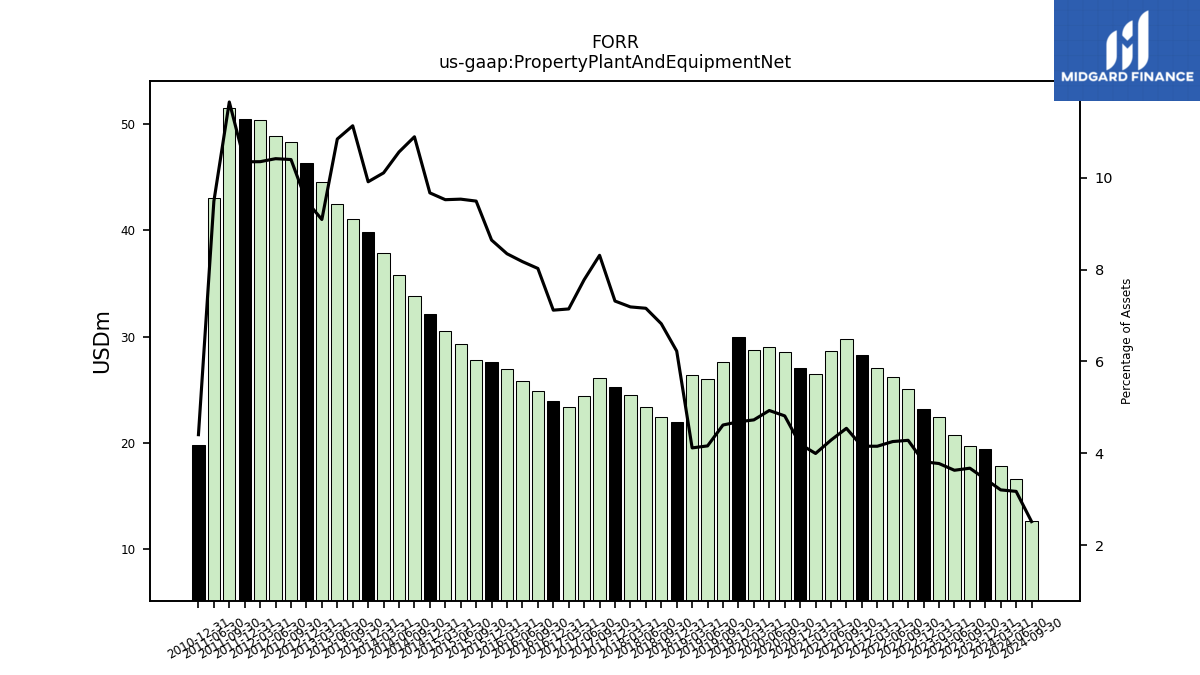
| Property Plant And Equipment Net | 19.40 | 19.69 | 20.71 | 22.42 | 23.21 | 25.05 | 26.16 | 27.06 | 28.25 | 29.74 | 28.64 | 26.51 | 27.03 | 28.53 | 29.02 | 28.75 | 29.94 | 27.61 | 25.97 | 26.36 | 22.00 | 22.40 | 23.34 | 24.49 | 25.25 | 26.13 | 24.44 | 23.41 | 23.89 | 24.85 | 25.83 | 26.95 | 27.57 | 27.78 | 29.30 | 30.57 | 32.17 | 33.86 | 35.79 | 37.83 | 39.87 | 41.06 | 42.48 | 44.55 | 46.30 | 48.31 | 48.84 | 50.36 | 50.45 | 51.49 | 43.09 | NA | 19.84 | NA | NA | |
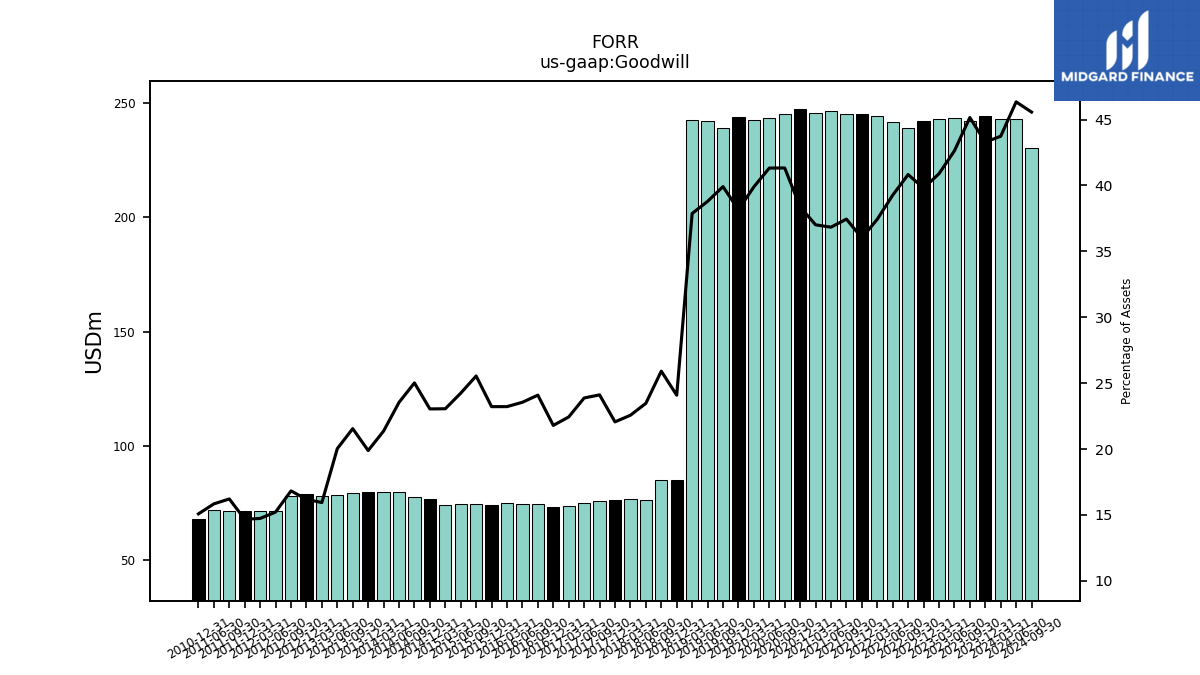
| Goodwill | 244.26 | 242.06 | 243.29 | 242.85 | 242.15 | 238.95 | 241.47 | 244.07 | 244.99 | 245.21 | 246.24 | 245.69 | 247.21 | 244.99 | 243.20 | 242.69 | 243.90 | 238.83 | 242.26 | 242.54 | 85.17 | 85.13 | 76.55 | 76.90 | 76.17 | 75.81 | 75.02 | 73.55 | 73.19 | 74.61 | 74.44 | 74.99 | 74.07 | 74.77 | 74.53 | 74.04 | 76.68 | 77.79 | 79.78 | 79.99 | 80.00 | 79.49 | 78.48 | 78.15 | 78.95 | 78.21 | 71.39 | 71.72 | 71.54 | 71.68 | 71.96 | NA | 67.96 | NA | NA | |
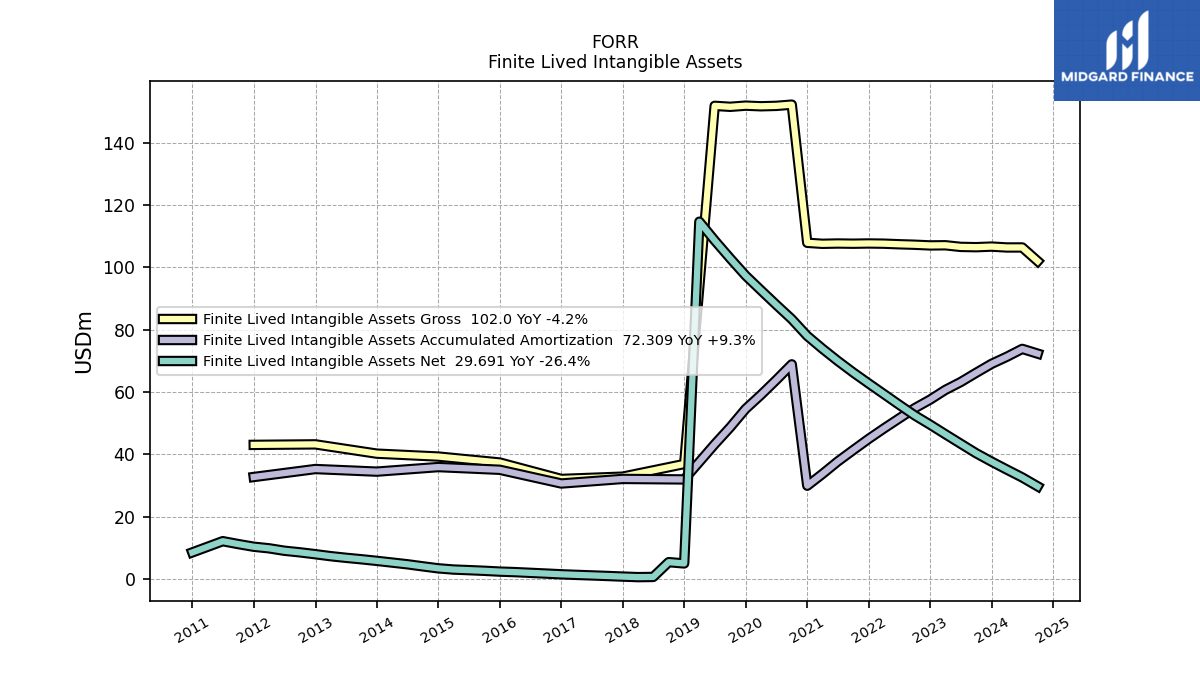
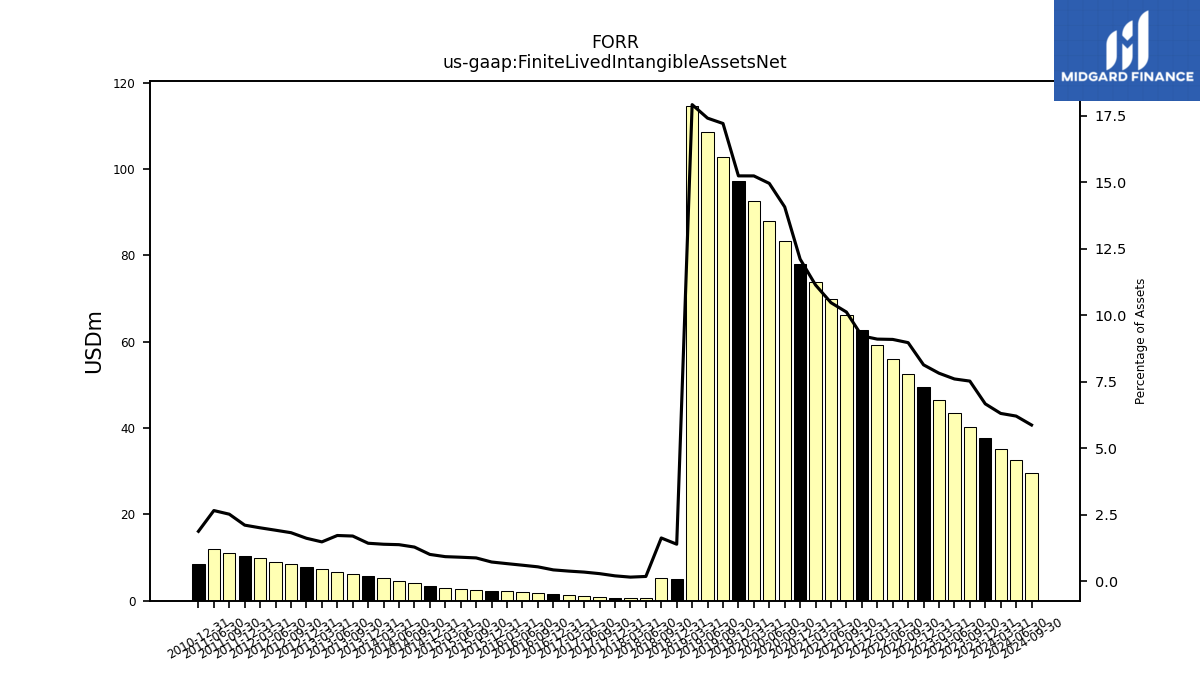
| Finite Lived Intangible Assets Net | 37.64 | 40.34 | 43.41 | 46.45 | 49.50 | 52.50 | 55.90 | 59.34 | 62.73 | 66.26 | 69.99 | 73.90 | 78.00 | 83.39 | 87.99 | 92.66 | 97.36 | 102.92 | 108.66 | 114.68 | 4.95 | 5.37 | 0.62 | 0.56 | 0.73 | 0.93 | 1.11 | 1.28 | 1.46 | 1.71 | 1.93 | 2.17 | 2.33 | 2.59 | 2.80 | 3.00 | 3.38 | 4.02 | 4.69 | 5.24 | 5.78 | 6.30 | 6.77 | 7.29 | 7.92 | 8.52 | 9.03 | 9.81 | 10.32 | 11.17 | 12.10 | NA | 8.49 | NA | NA | |
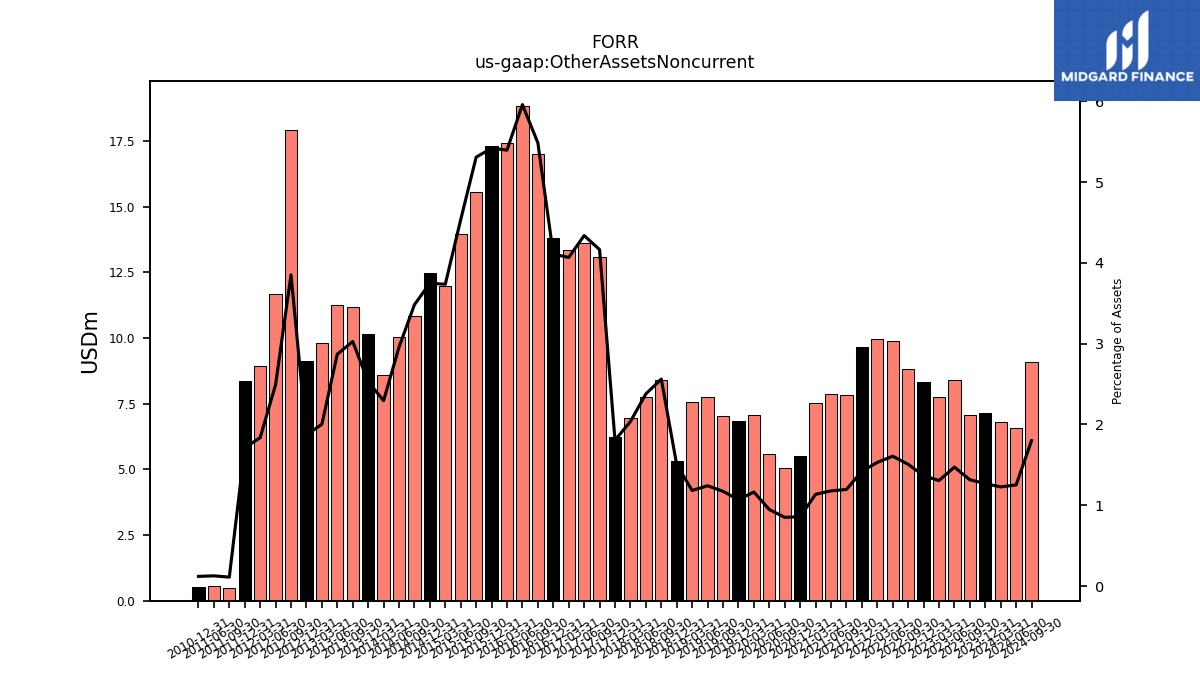
| Other Assets Noncurrent | 7.16 | 7.05 | 8.40 | 7.75 | 8.32 | 8.82 | 9.88 | 9.98 | 9.66 | 7.83 | 7.87 | 7.54 | 5.52 | 5.04 | 5.58 | 7.08 | 6.83 | 7.02 | 7.75 | 7.58 | 5.31 | 8.42 | 7.76 | 6.94 | 6.23 | 13.10 | 13.63 | 13.34 | 13.80 | 16.99 | 18.84 | 17.43 | 17.29 | 15.54 | 13.94 | 11.99 | 12.47 | 10.83 | 10.02 | 8.59 | 10.17 | 11.17 | 11.24 | 9.81 | 9.12 | 17.90 | 11.69 | 8.94 | 8.34 | 0.49 | 0.57 | NA | 0.54 | NA | NA | |
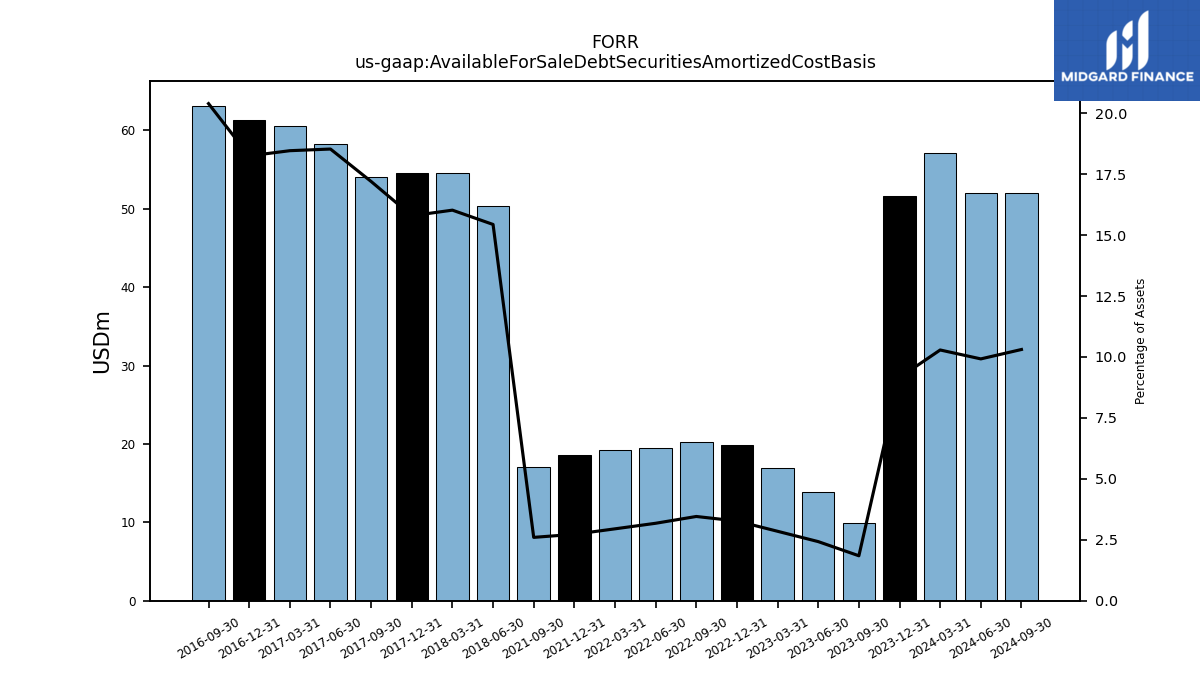
| Available For Sale Debt Securities Amortized Cost Basis | 51.66 | 9.89 | 13.85 | 16.92 | 19.90 | 20.23 | 19.55 | 19.23 | 18.54 | 17.02 | NA | NA | NA | NA | NA | NA | NA | NA | NA | NA | NA | NA | 50.35 | 54.60 | 54.52 | 54.08 | 58.22 | 60.52 | 61.28 | 63.15 | NA | NA | NA | NA | NA | NA | NA | NA | NA | NA | NA | NA | NA | NA | NA | NA | NA | NA | NA | NA | NA | NA | NA | NA | NA |
| 2023-12-31 | 2023-09-30 | 2023-06-30 | 2023-03-31 | 2022-12-31 | 2022-09-30 | 2022-06-30 | 2022-03-31 | 2021-12-31 | 2021-09-30 | 2021-06-30 | 2021-03-31 | 2020-12-31 | 2020-09-30 | 2020-06-30 | 2020-03-31 | 2019-12-31 | 2019-09-30 | 2019-06-30 | 2019-03-31 | 2018-12-31 | 2018-09-30 | 2018-06-30 | 2018-03-31 | 2017-12-31 | 2017-09-30 | 2017-06-30 | 2017-03-31 | 2016-12-31 | 2016-09-30 | 2016-06-30 | 2016-03-31 | 2015-12-31 | 2015-09-30 | 2015-06-30 | 2015-03-31 | 2014-12-31 | 2014-09-30 | 2014-06-30 | 2014-03-31 | 2013-12-31 | 2013-09-30 | 2013-06-30 | 2013-03-31 | 2012-12-31 | 2012-09-30 | 2012-06-30 | 2012-03-31 | 2011-12-31 | 2011-09-30 | 2011-06-30 | 2011-03-31 | 2010-12-31 | 2010-09-30 | 2010-06-30 | ||
|---|---|---|---|---|---|---|---|---|---|---|---|---|---|---|---|---|---|---|---|---|---|---|---|---|---|---|---|---|---|---|---|---|---|---|---|---|---|---|---|---|---|---|---|---|---|---|---|---|---|---|---|---|---|---|---|---|
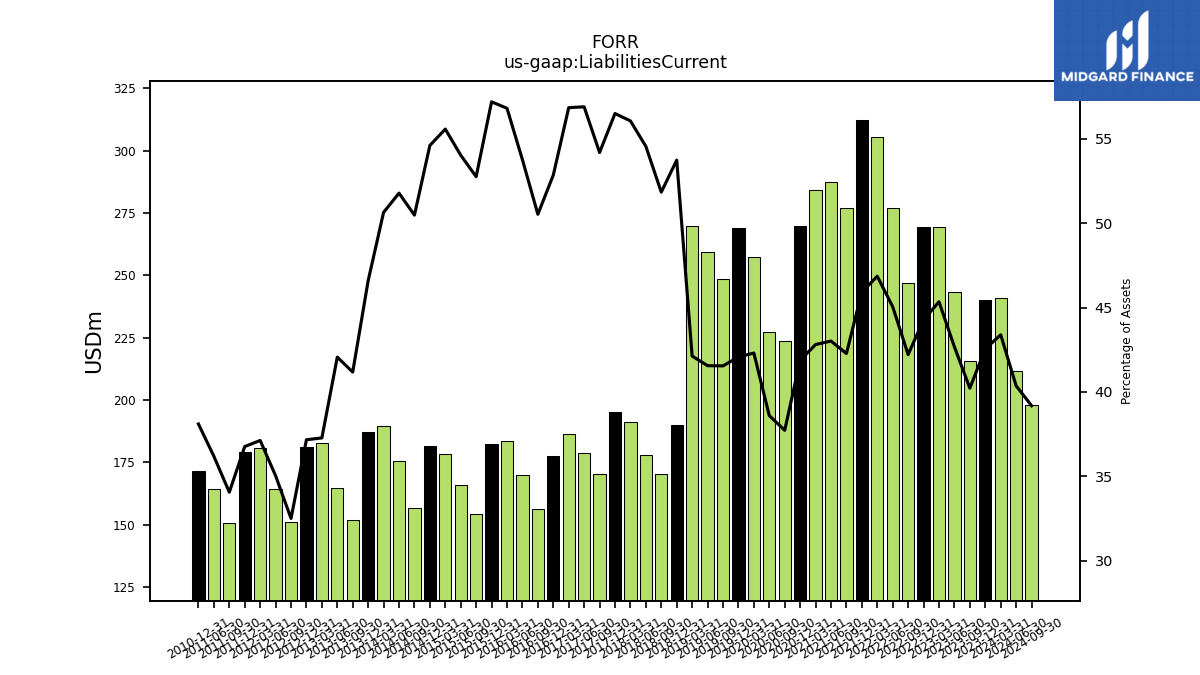
| Liabilities Current | 240.08 | 215.64 | 243.53 | 269.31 | 269.39 | 247.07 | 277.04 | 305.48 | 312.34 | 276.85 | 287.56 | 284.15 | 269.75 | 223.65 | 227.19 | 257.36 | 268.93 | 248.58 | 259.52 | 269.80 | 189.99 | 170.31 | 177.94 | 191.04 | 195.05 | 170.38 | 178.78 | 186.36 | 177.47 | 156.47 | 169.94 | 183.47 | 182.45 | 154.43 | 166.09 | 178.45 | 181.70 | 156.94 | 175.49 | 189.59 | 187.40 | 151.89 | 164.79 | 182.70 | 181.33 | 151.06 | 164.31 | 180.66 | 179.26 | 150.54 | 164.37 | NA | 171.65 | NA | NA | |
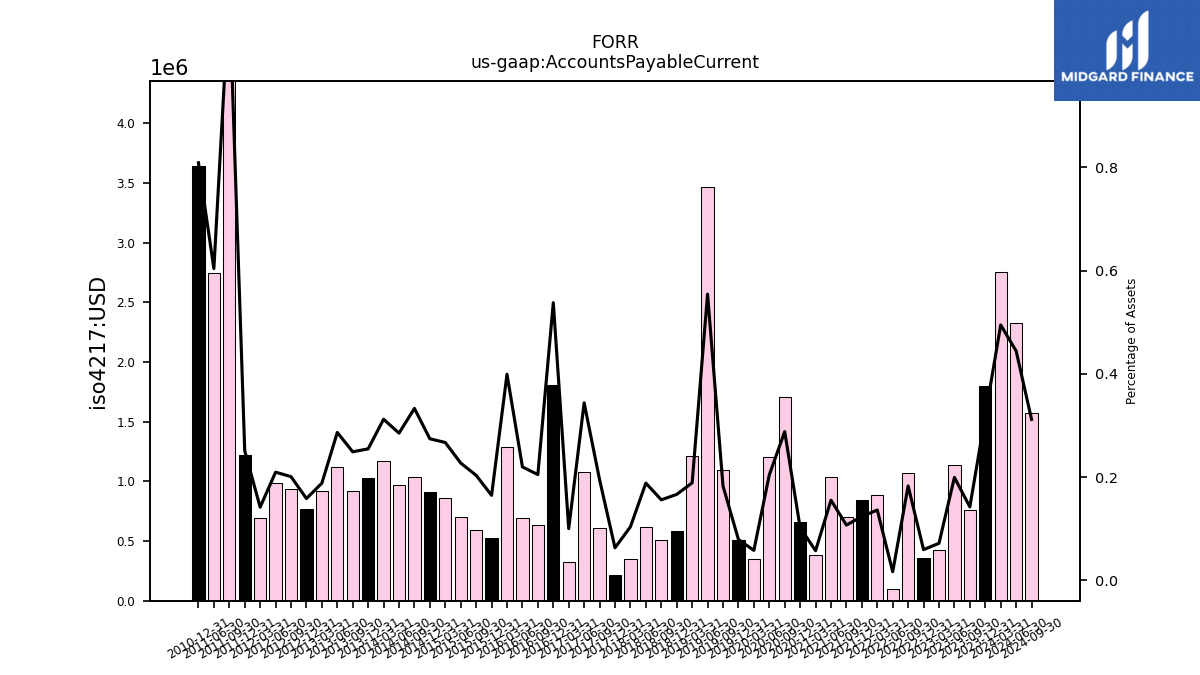
| Accounts Payable Current | 1.80 | 0.76 | 1.14 | 0.42 | 0.36 | 1.07 | 0.10 | 0.89 | 0.84 | 0.70 | 1.04 | 0.38 | 0.66 | 1.71 | 1.20 | 0.35 | 0.51 | 1.09 | 3.46 | 1.21 | 0.59 | 0.51 | 0.61 | 0.35 | 0.22 | 0.61 | 1.08 | 0.33 | 1.81 | 0.63 | 0.69 | 1.29 | 0.53 | 0.59 | 0.70 | 0.86 | 0.91 | 1.03 | 0.97 | 1.17 | 1.02 | 0.92 | 1.12 | 0.92 | 0.77 | 0.93 | 0.98 | 0.69 | 1.22 | 5.04 | 2.74 | NA | 3.64 | NA | NA | |
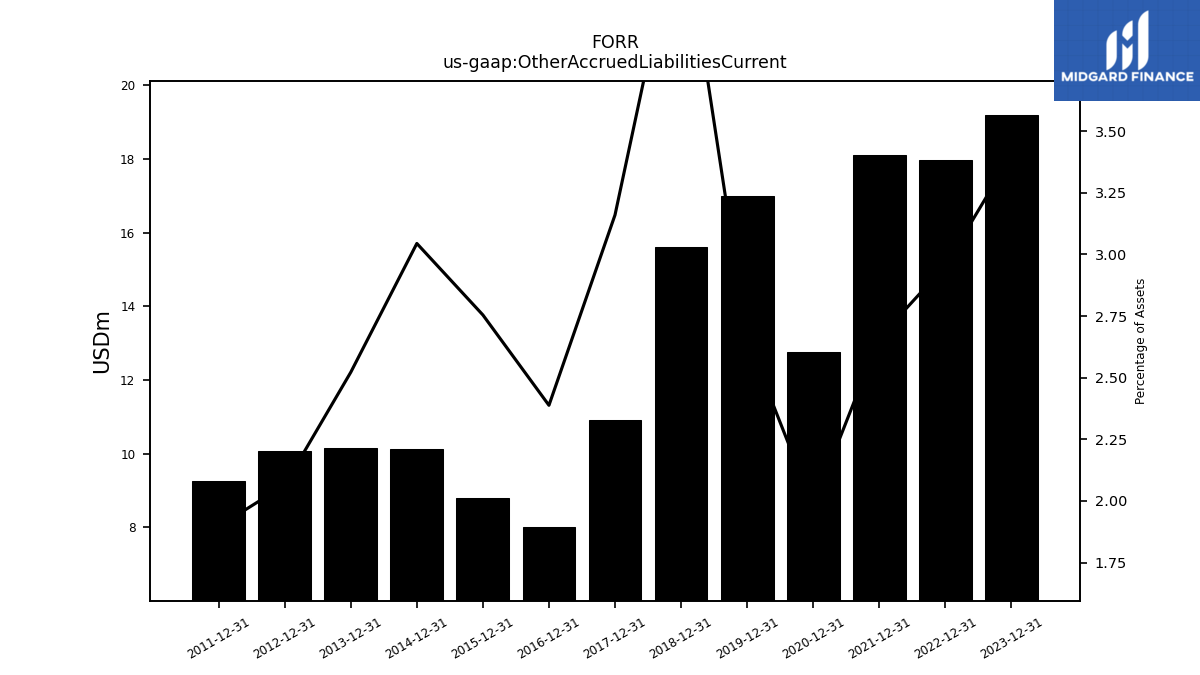
| Other Accrued Liabilities Current | 19.20 | NA | NA | NA | 17.97 | NA | NA | NA | 18.10 | NA | NA | NA | 12.75 | NA | NA | NA | 16.99 | NA | NA | NA | 15.61 | NA | NA | NA | 10.91 | NA | NA | NA | 8.02 | NA | NA | NA | 8.79 | NA | NA | NA | 10.13 | NA | NA | NA | 10.14 | NA | NA | NA | 10.07 | NA | NA | NA | 9.24 | NA | NA | NA | NA | NA | NA | |
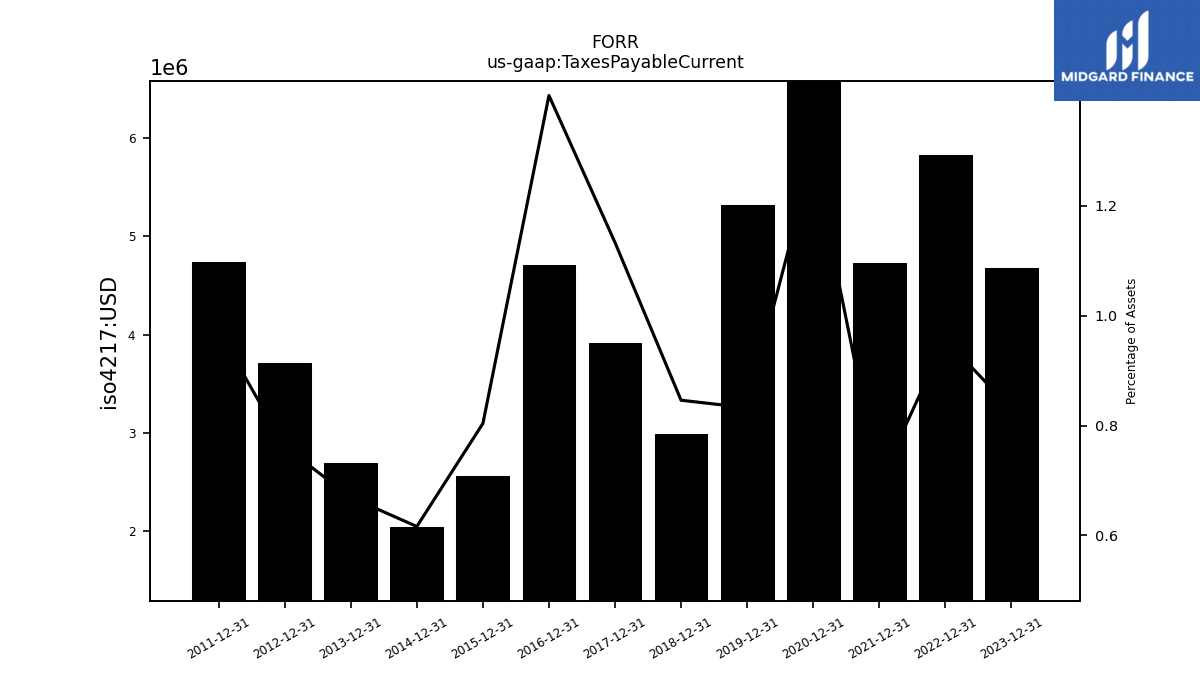
| Taxes Payable Current | 4.68 | NA | NA | NA | 5.82 | NA | NA | NA | 4.73 | NA | NA | NA | 8.32 | NA | NA | NA | 5.32 | NA | NA | NA | 2.99 | NA | NA | NA | 3.91 | NA | NA | NA | 4.70 | NA | NA | NA | 2.56 | NA | NA | NA | 2.05 | NA | NA | NA | 2.69 | NA | NA | NA | 3.71 | NA | NA | NA | 4.74 | NA | NA | NA | NA | NA | NA | |
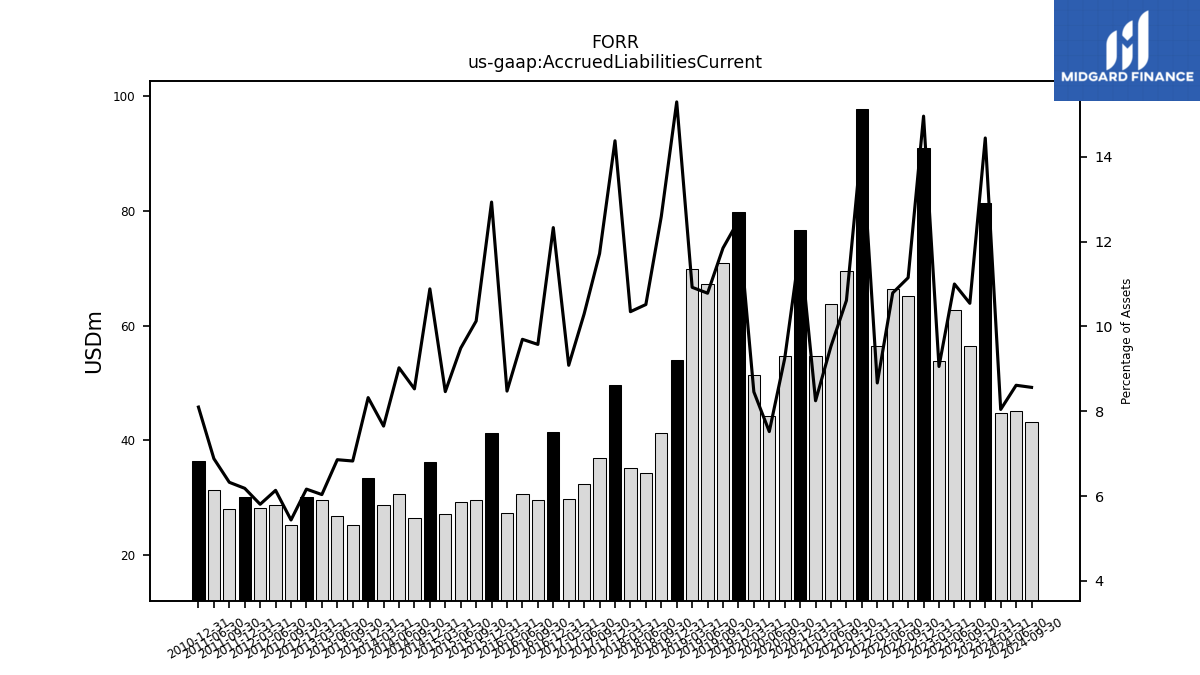
| Accrued Liabilities Current | 81.48 | 56.53 | 62.78 | 53.79 | 91.01 | 65.25 | 66.35 | 56.51 | 97.80 | 69.48 | 63.73 | 54.75 | 76.62 | 54.80 | 44.27 | 51.45 | 79.86 | 70.89 | 67.34 | 69.95 | 54.06 | 41.36 | 34.30 | 35.26 | 49.63 | 36.84 | 32.35 | 29.78 | 41.40 | 29.65 | 30.65 | 27.37 | 41.25 | 29.64 | 29.17 | 27.17 | 36.22 | 26.52 | 30.59 | 28.64 | 33.47 | 25.18 | 26.87 | 29.59 | 30.08 | 25.27 | 28.77 | 28.26 | 30.15 | 27.96 | 31.27 | NA | 36.48 | NA | NA |
| 2023-12-31 | 2023-09-30 | 2023-06-30 | 2023-03-31 | 2022-12-31 | 2022-09-30 | 2022-06-30 | 2022-03-31 | 2021-12-31 | 2021-09-30 | 2021-06-30 | 2021-03-31 | 2020-12-31 | 2020-09-30 | 2020-06-30 | 2020-03-31 | 2019-12-31 | 2019-09-30 | 2019-06-30 | 2019-03-31 | 2018-12-31 | 2018-09-30 | 2018-06-30 | 2018-03-31 | 2017-12-31 | 2017-09-30 | 2017-06-30 | 2017-03-31 | 2016-12-31 | 2016-09-30 | 2016-06-30 | 2016-03-31 | 2015-12-31 | 2015-09-30 | 2015-06-30 | 2015-03-31 | 2014-12-31 | 2014-09-30 | 2014-06-30 | 2014-03-31 | 2013-12-31 | 2013-09-30 | 2013-06-30 | 2013-03-31 | 2012-12-31 | 2012-09-30 | 2012-06-30 | 2012-03-31 | 2011-12-31 | 2011-09-30 | 2011-06-30 | 2011-03-31 | 2010-12-31 | 2010-09-30 | 2010-06-30 | ||
|---|---|---|---|---|---|---|---|---|---|---|---|---|---|---|---|---|---|---|---|---|---|---|---|---|---|---|---|---|---|---|---|---|---|---|---|---|---|---|---|---|---|---|---|---|---|---|---|---|---|---|---|---|---|---|---|---|
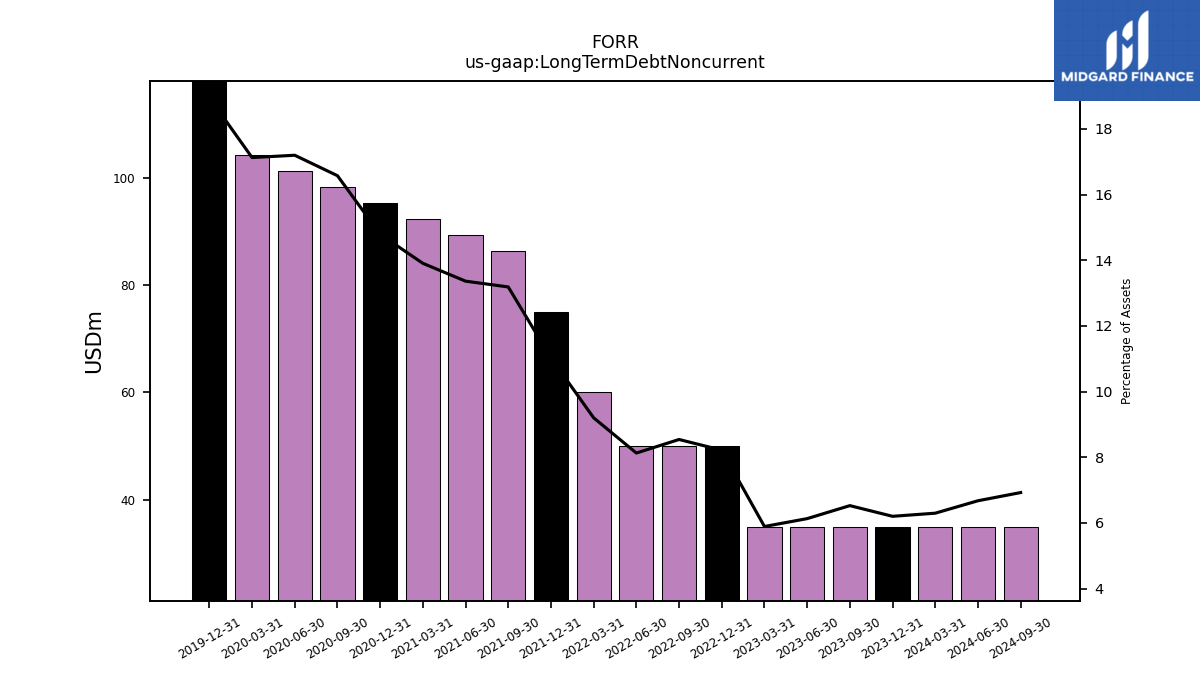
| Long Term Debt Noncurrent | 35.00 | 35.00 | 35.00 | 35.00 | 50.00 | 50.00 | 50.00 | 60.00 | 75.00 | 86.36 | 89.34 | 92.32 | 95.30 | 98.27 | 101.23 | 104.20 | 121.17 | NA | NA | NA | NA | NA | NA | NA | NA | NA | NA | NA | NA | NA | NA | NA | NA | NA | NA | NA | NA | NA | NA | NA | NA | NA | NA | NA | NA | NA | NA | NA | NA | NA | NA | NA | NA | NA | NA | |
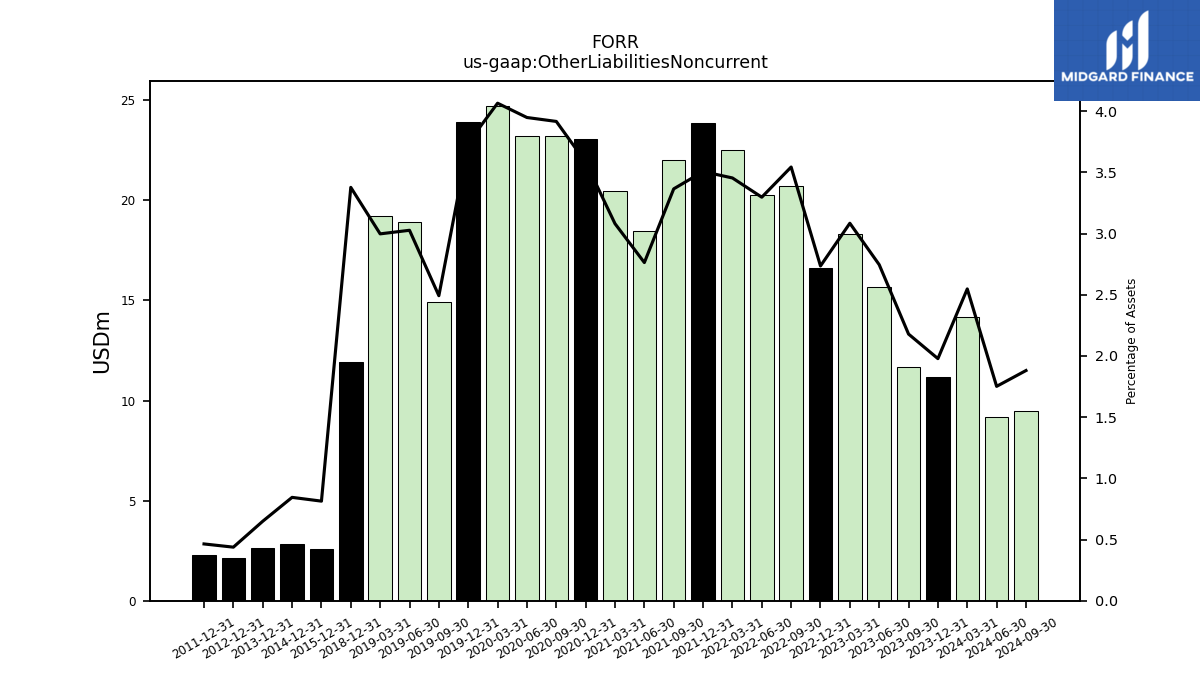
| Other Liabilities Noncurrent | 11.16 | 11.68 | 15.67 | 18.32 | 16.64 | 20.74 | 20.27 | 22.52 | 23.85 | 22.03 | 18.47 | 20.45 | 23.09 | 23.21 | 23.24 | 24.73 | 23.91 | 14.91 | 18.90 | 19.20 | 11.94 | NA | NA | NA | NA | NA | NA | NA | NA | NA | NA | NA | 2.60 | NA | NA | NA | 2.81 | NA | NA | NA | 2.61 | NA | NA | NA | 2.14 | NA | NA | NA | 2.26 | NA | NA | NA | NA | NA | NA | |
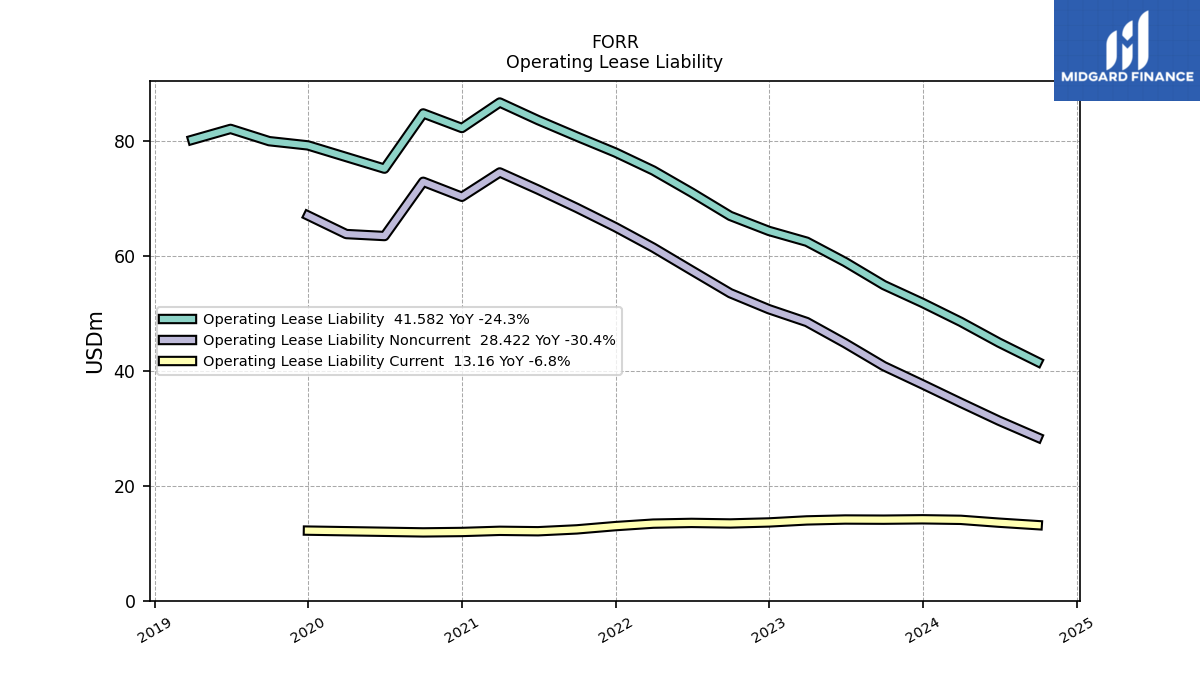
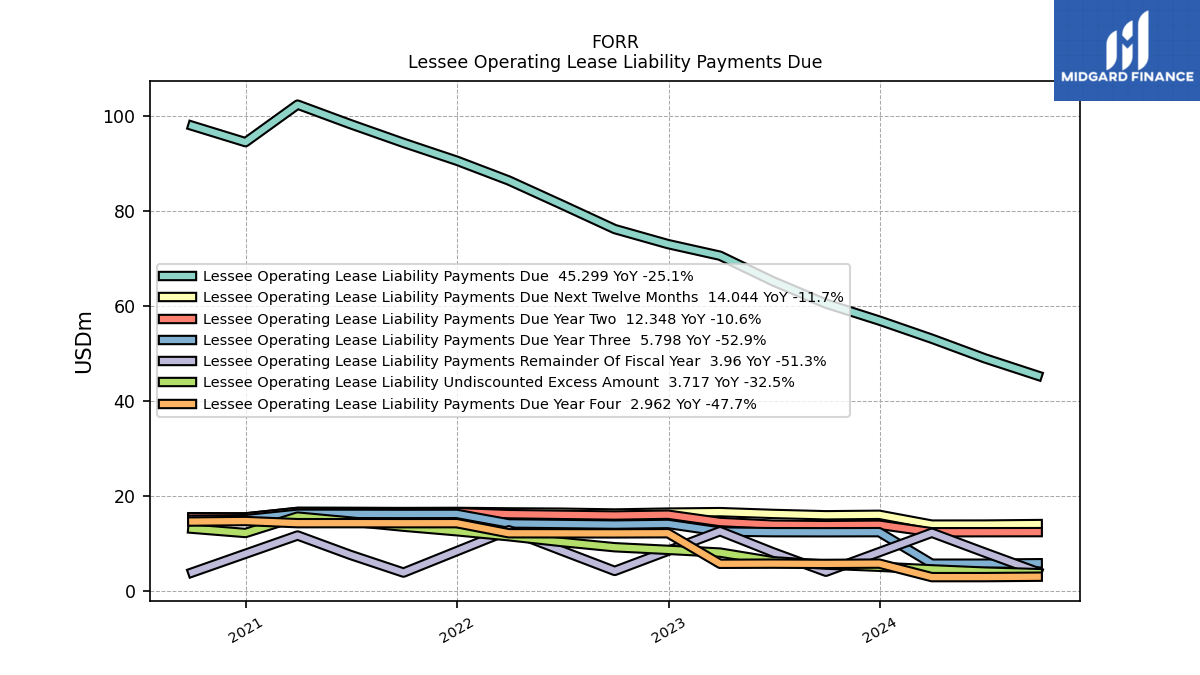
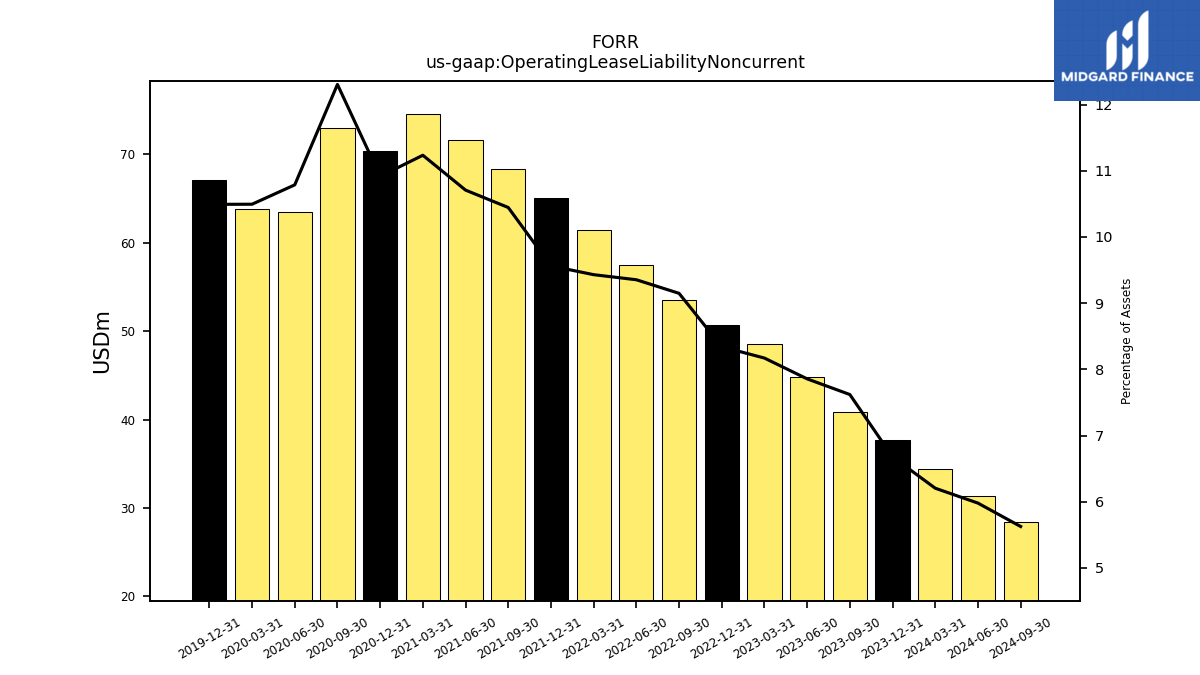
| Operating Lease Liability Noncurrent | 37.67 | 40.84 | 44.83 | 48.52 | 50.75 | 53.54 | 57.52 | 61.48 | 65.04 | 68.39 | 71.58 | 74.57 | 70.32 | 72.94 | 63.49 | 63.84 | 67.06 | NA | NA | NA | NA | NA | NA | NA | NA | NA | NA | NA | NA | NA | NA | NA | NA | NA | NA | NA | NA | NA | NA | NA | NA | NA | NA | NA | NA | NA | NA | NA | NA | NA | NA | NA | NA | NA | NA |
| 2023-12-31 | 2023-09-30 | 2023-06-30 | 2023-03-31 | 2022-12-31 | 2022-09-30 | 2022-06-30 | 2022-03-31 | 2021-12-31 | 2021-09-30 | 2021-06-30 | 2021-03-31 | 2020-12-31 | 2020-09-30 | 2020-06-30 | 2020-03-31 | 2019-12-31 | 2019-09-30 | 2019-06-30 | 2019-03-31 | 2018-12-31 | 2018-09-30 | 2018-06-30 | 2018-03-31 | 2017-12-31 | 2017-09-30 | 2017-06-30 | 2017-03-31 | 2016-12-31 | 2016-09-30 | 2016-06-30 | 2016-03-31 | 2015-12-31 | 2015-09-30 | 2015-06-30 | 2015-03-31 | 2014-12-31 | 2014-09-30 | 2014-06-30 | 2014-03-31 | 2013-12-31 | 2013-09-30 | 2013-06-30 | 2013-03-31 | 2012-12-31 | 2012-09-30 | 2012-06-30 | 2012-03-31 | 2011-12-31 | 2011-09-30 | 2011-06-30 | 2011-03-31 | 2010-12-31 | 2010-09-30 | 2010-06-30 | ||
|---|---|---|---|---|---|---|---|---|---|---|---|---|---|---|---|---|---|---|---|---|---|---|---|---|---|---|---|---|---|---|---|---|---|---|---|---|---|---|---|---|---|---|---|---|---|---|---|---|---|---|---|---|---|---|---|---|
| Stockholders Equity | 240.26 | 232.89 | 231.65 | 222.75 | 221.66 | 213.89 | 210.10 | 202.43 | 203.91 | 201.15 | 201.50 | 192.24 | 185.77 | 174.71 | 173.41 | 158.17 | 158.09 | 147.65 | 149.69 | 143.81 | 151.60 | 146.83 | 140.11 | 141.29 | 141.19 | 135.22 | 127.37 | 133.25 | 150.04 | 142.92 | 136.70 | 130.20 | 127.30 | 128.99 | 131.98 | 133.22 | 141.60 | 144.64 | 153.92 | 175.31 | 204.66 | 207.97 | 217.72 | 298.09 | 297.07 | 296.15 | 287.17 | 287.49 | 290.74 | 278.37 | 278.33 | NA | 271.91 | NA | NA | |
| Common Stock Value | 0.25 | 0.25 | 0.24 | 0.24 | 0.24 | 0.24 | 0.24 | 0.24 | 0.24 | 0.24 | 0.24 | 0.24 | 0.24 | 0.24 | 0.23 | 0.23 | 0.23 | 0.23 | 0.23 | 0.23 | 0.23 | 0.23 | 0.23 | 0.23 | 0.22 | 0.22 | 0.22 | 0.22 | 0.22 | 0.21 | 0.21 | 0.21 | 0.21 | 0.21 | 0.21 | 0.21 | 0.21 | 0.21 | 0.21 | 0.20 | 0.20 | 0.20 | 0.20 | 0.32 | 0.32 | 0.31 | 0.31 | 0.31 | 0.31 | 0.31 | 0.31 | NA | 0.30 | NA | NA | |
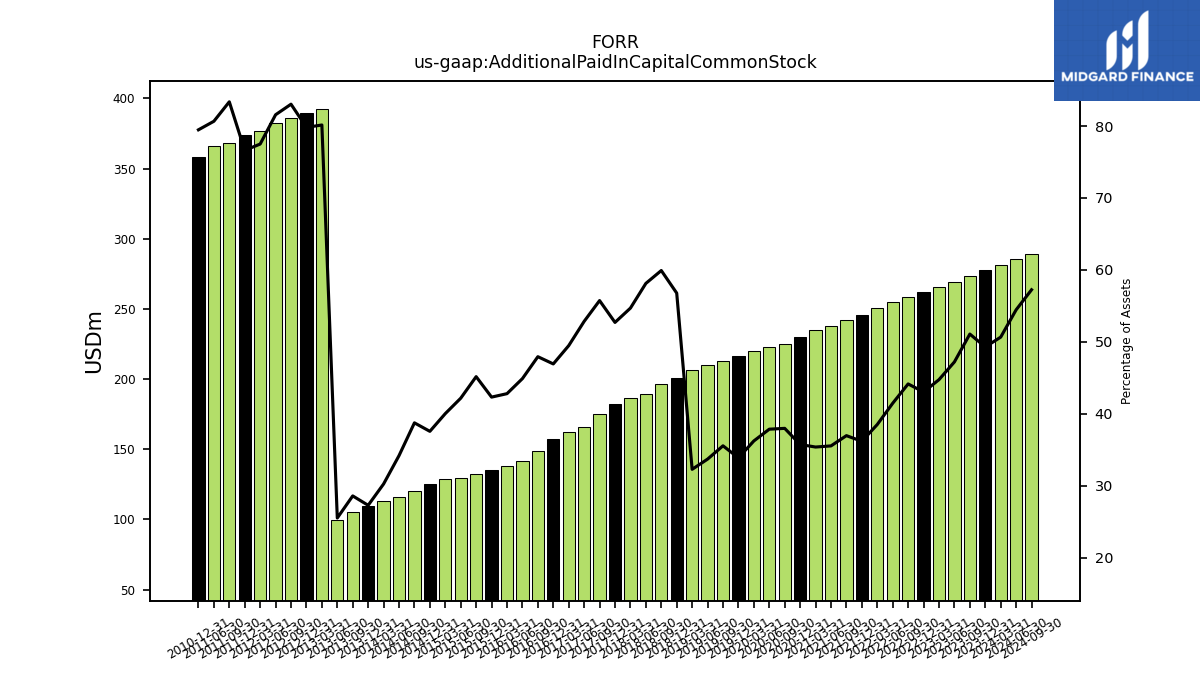
| Additional Paid In Capital Common Stock | 278.06 | 273.80 | 269.37 | 265.69 | 261.77 | 258.34 | 254.94 | 251.00 | 245.99 | 241.97 | 237.49 | 234.75 | 230.13 | 225.05 | 222.78 | 220.31 | 216.45 | 212.66 | 210.38 | 206.66 | 200.70 | 196.80 | 189.55 | 186.34 | 181.91 | 175.22 | 166.02 | 162.16 | 157.57 | 148.41 | 141.87 | 138.18 | 134.97 | 132.17 | 129.59 | 128.48 | 124.94 | 120.42 | 115.80 | 113.18 | 109.68 | 105.40 | 99.91 | 392.79 | 389.36 | 385.87 | 382.49 | 377.08 | 373.59 | 368.46 | 366.35 | NA | 358.02 | NA | NA | |
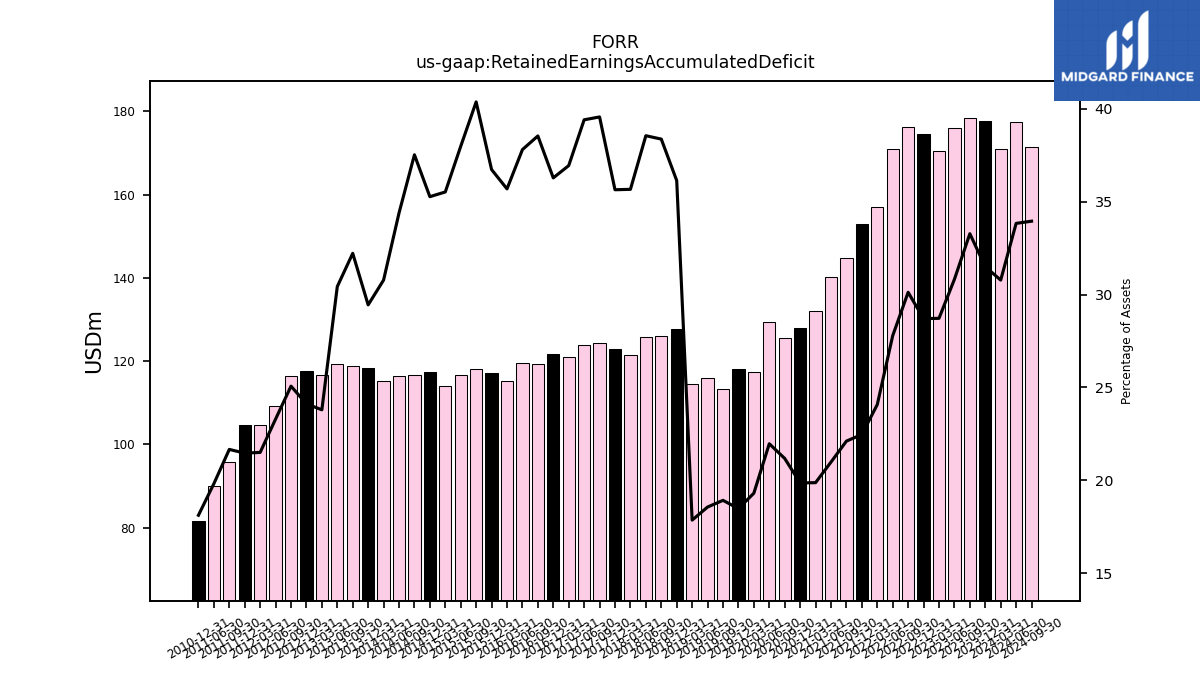
| Retained Earnings Accumulated Deficit | 177.68 | 178.34 | 175.86 | 170.56 | 174.63 | 176.26 | 170.85 | 156.97 | 152.82 | 144.80 | 140.28 | 131.94 | 127.98 | 125.55 | 129.31 | 117.48 | 118.15 | 113.26 | 115.96 | 114.40 | 127.72 | 126.01 | 125.70 | 121.50 | 123.01 | 124.34 | 123.78 | 121.07 | 121.80 | 119.30 | 119.46 | 115.22 | 117.14 | 118.13 | 116.72 | 114.03 | 117.32 | 116.63 | 116.51 | 115.21 | 118.42 | 118.81 | 119.20 | 116.64 | 117.65 | 116.50 | 109.26 | 104.65 | 104.66 | 95.77 | 90.03 | NA | 81.65 | NA | NA | |
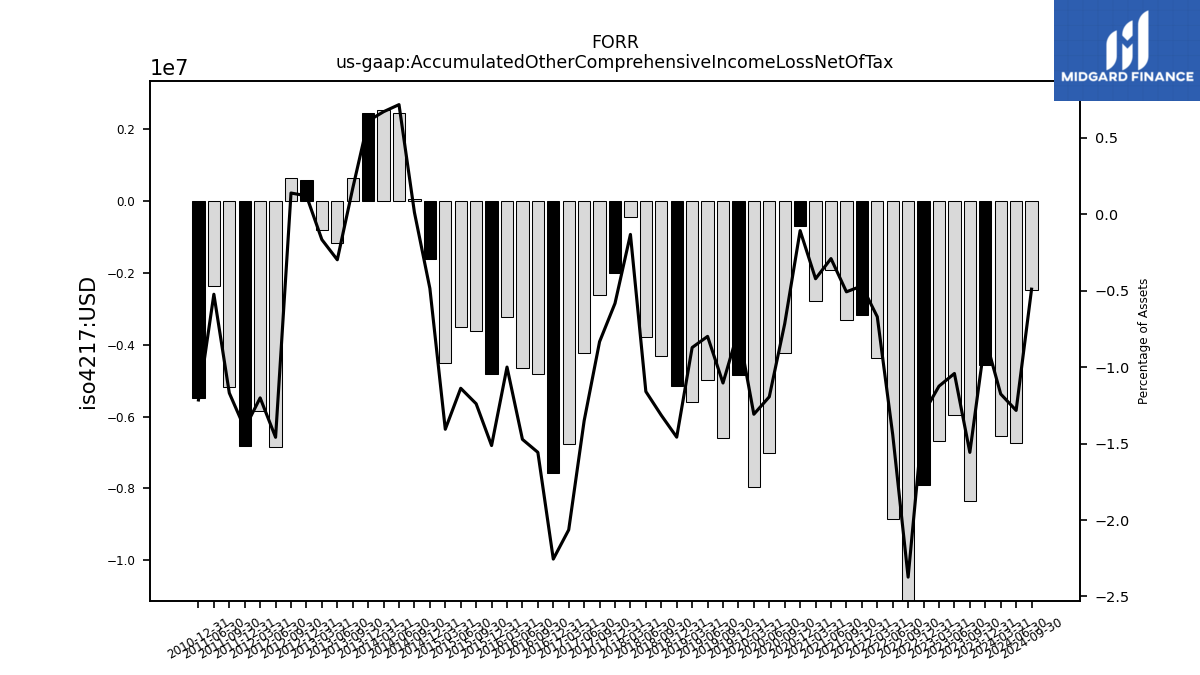
| Accumulated Other Comprehensive Income Loss Net Of Tax | -4.57 | -8.35 | -5.94 | -6.68 | -7.92 | -13.89 | -8.86 | -4.37 | -3.19 | -3.32 | -1.94 | -2.80 | -0.69 | -4.25 | -7.03 | -7.96 | -4.86 | -6.60 | -4.99 | -5.58 | -5.15 | -4.32 | -3.78 | -0.45 | -2.01 | -2.62 | -4.25 | -6.77 | -7.57 | -4.82 | -4.65 | -3.23 | -4.83 | -3.63 | -3.50 | -4.51 | -1.61 | 0.04 | 2.43 | 2.51 | 2.45 | 0.62 | -1.17 | -0.81 | 0.59 | 0.64 | -6.84 | -5.84 | -6.83 | -5.17 | -2.38 | NA | -5.47 | NA | NA | |
| Adjustments To Additional Paid In Capital Sharebased Compensation Requisite Service Period Recognition Value | 4.32 | 4.14 | 3.86 | 3.17 | 3.51 | 3.90 | 3.84 | 3.29 | 2.72 | 2.46 | 2.40 | 2.49 | 2.91 | 2.70 | 2.46 | 2.80 | 3.08 | 3.07 | 2.85 | 2.69 | 2.11 | 2.12 | 2.11 | 1.96 | NA | NA | NA | NA | NA | NA | NA | NA | NA | NA | NA | NA | NA | NA | NA | NA | NA | NA | NA | NA | NA | NA | NA | NA | NA | NA | NA | NA | NA | NA | NA |
| 2023-12-31 | 2023-09-30 | 2023-06-30 | 2023-03-31 | 2022-12-31 | 2022-09-30 | 2022-06-30 | 2022-03-31 | 2021-12-31 | 2021-09-30 | 2021-06-30 | 2021-03-31 | 2020-12-31 | 2020-09-30 | 2020-06-30 | 2020-03-31 | 2019-12-31 | 2019-09-30 | 2019-06-30 | 2019-03-31 | 2018-12-31 | 2018-09-30 | 2018-06-30 | 2018-03-31 | 2017-12-31 | 2017-09-30 | 2017-06-30 | 2017-03-31 | 2016-12-31 | 2016-09-30 | 2016-06-30 | 2016-03-31 | 2015-12-31 | 2015-09-30 | 2015-06-30 | 2015-03-31 | 2014-12-31 | 2014-09-30 | 2014-06-30 | 2014-03-31 | 2013-12-31 | 2013-09-30 | 2013-06-30 | 2013-03-31 | 2012-12-31 | 2012-09-30 | 2012-06-30 | 2012-03-31 | 2011-12-31 | 2011-09-30 | 2011-06-30 | 2011-03-31 | 2010-12-31 | 2010-09-30 | 2010-06-30 | ||
|---|---|---|---|---|---|---|---|---|---|---|---|---|---|---|---|---|---|---|---|---|---|---|---|---|---|---|---|---|---|---|---|---|---|---|---|---|---|---|---|---|---|---|---|---|---|---|---|---|---|---|---|---|---|---|---|---|
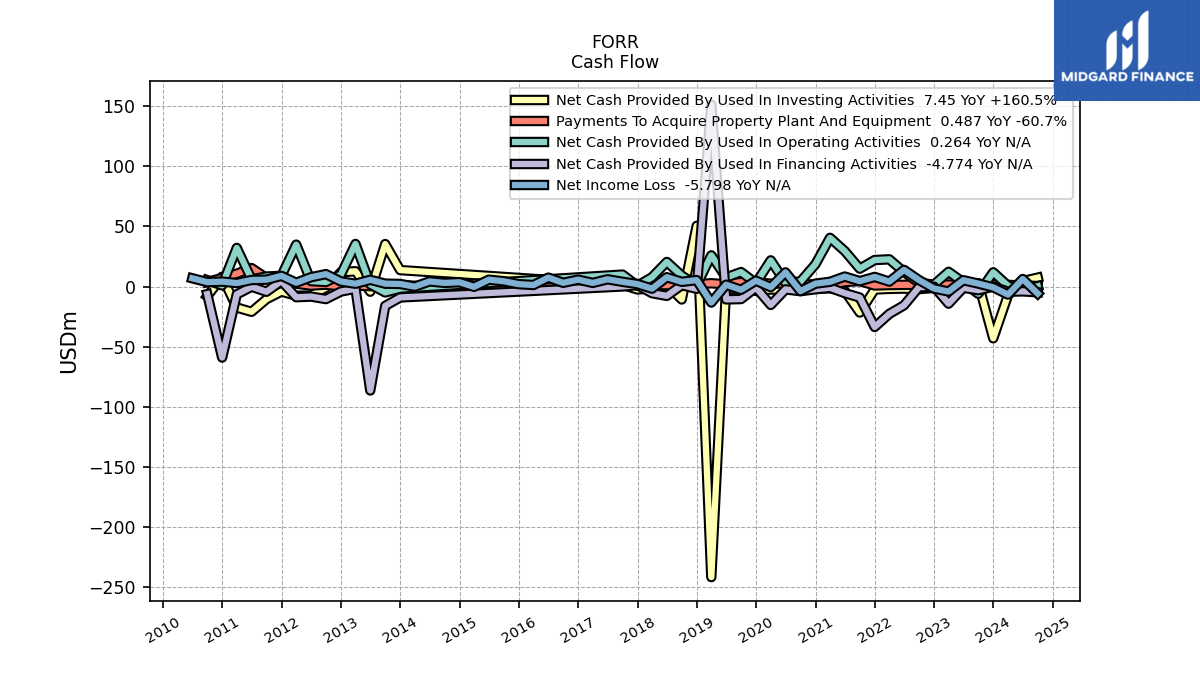
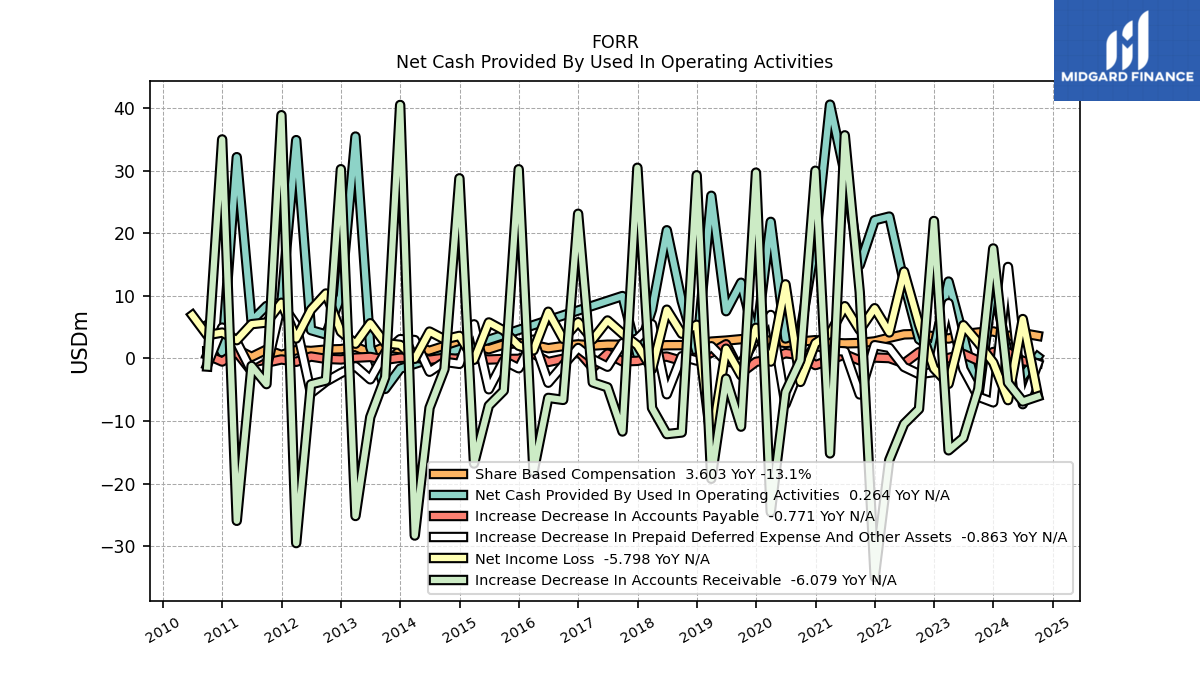
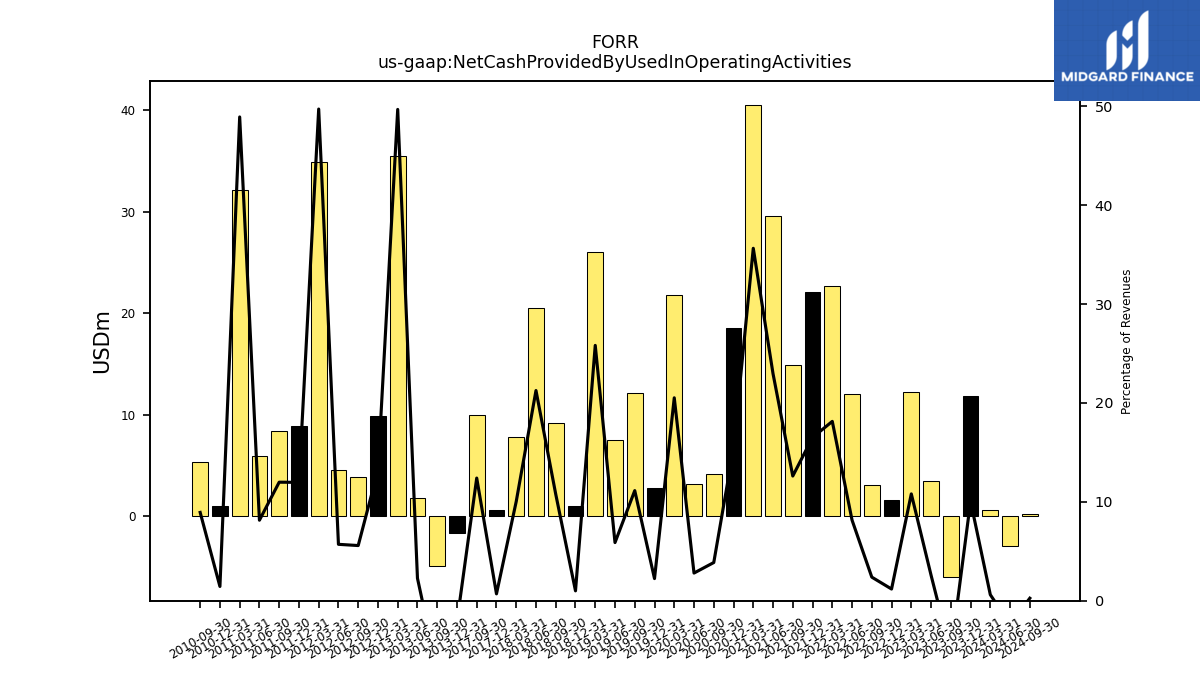
| Net Cash Provided By Used In Operating Activities | 11.88 | -6.00 | 3.51 | 12.28 | 1.62 | 3.05 | 12.09 | 22.67 | 22.07 | 14.90 | 29.54 | 40.55 | 18.55 | 4.20 | 3.18 | 21.82 | 2.78 | 12.09 | 7.54 | 25.99 | 0.99 | 9.15 | 20.48 | 7.80 | 0.63 | 9.97 | NA | NA | NA | NA | NA | NA | NA | NA | NA | NA | NA | NA | NA | NA | -1.64 | -4.88 | 1.78 | 35.45 | 9.92 | 3.82 | 4.51 | 34.89 | 8.94 | 8.36 | 5.98 | 32.16 | 0.97 | 5.34 | NA | |
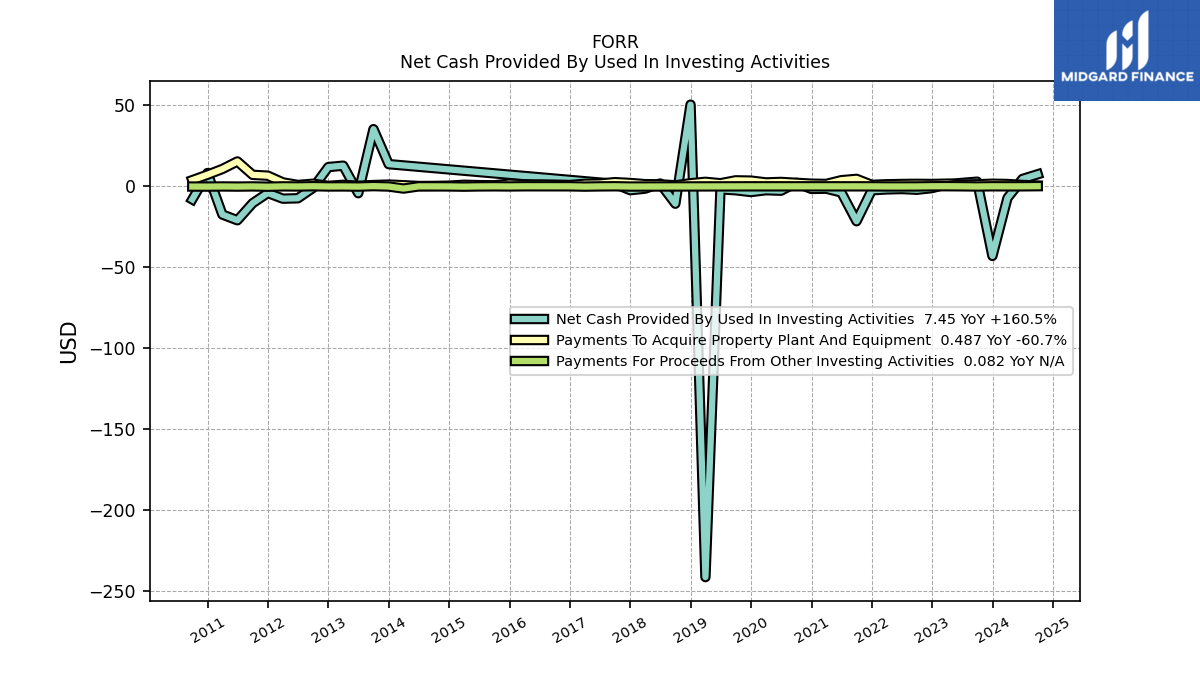
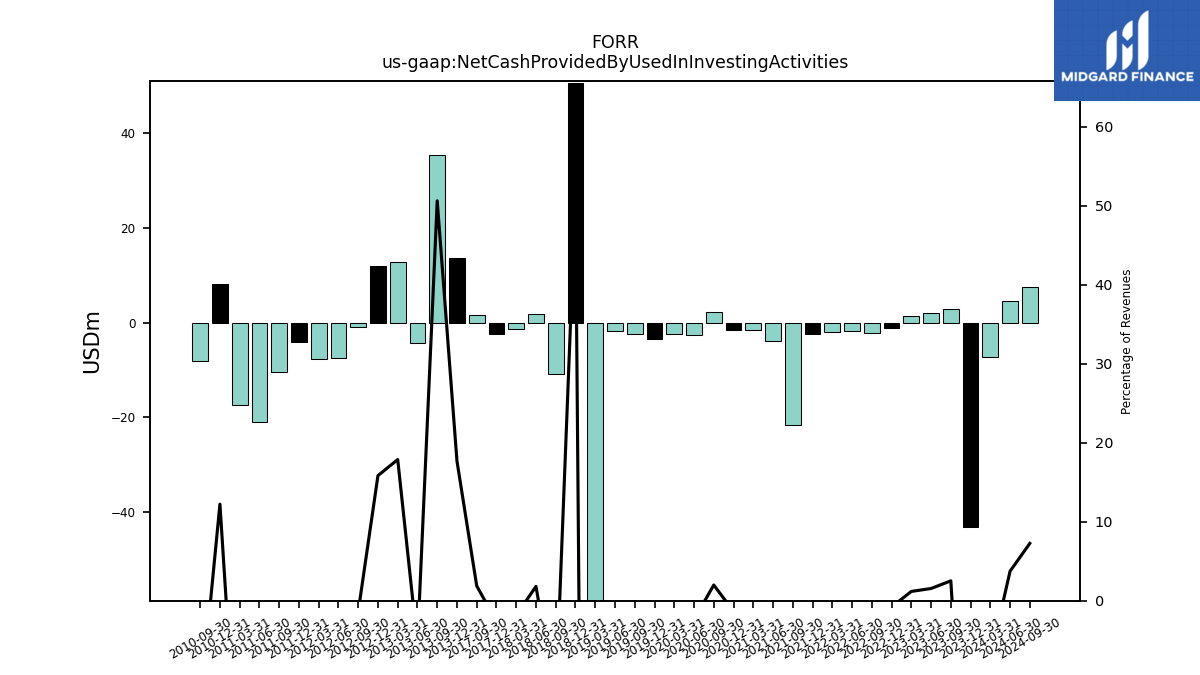
| Net Cash Provided By Used In Investing Activities | -43.06 | 2.86 | 2.10 | 1.34 | -1.09 | -2.13 | -1.68 | -1.91 | -2.45 | -21.61 | -3.77 | -1.47 | -1.63 | 2.17 | -2.71 | -2.40 | -3.53 | -2.44 | -1.86 | -241.72 | 50.53 | -10.76 | 1.75 | -1.43 | -2.39 | 1.51 | NA | NA | NA | NA | NA | NA | NA | NA | NA | NA | NA | NA | NA | NA | 13.71 | 35.36 | -4.27 | 12.76 | 11.91 | -0.95 | -7.39 | -7.65 | -4.14 | -10.45 | -21.00 | -17.45 | 8.21 | -8.11 | NA | |
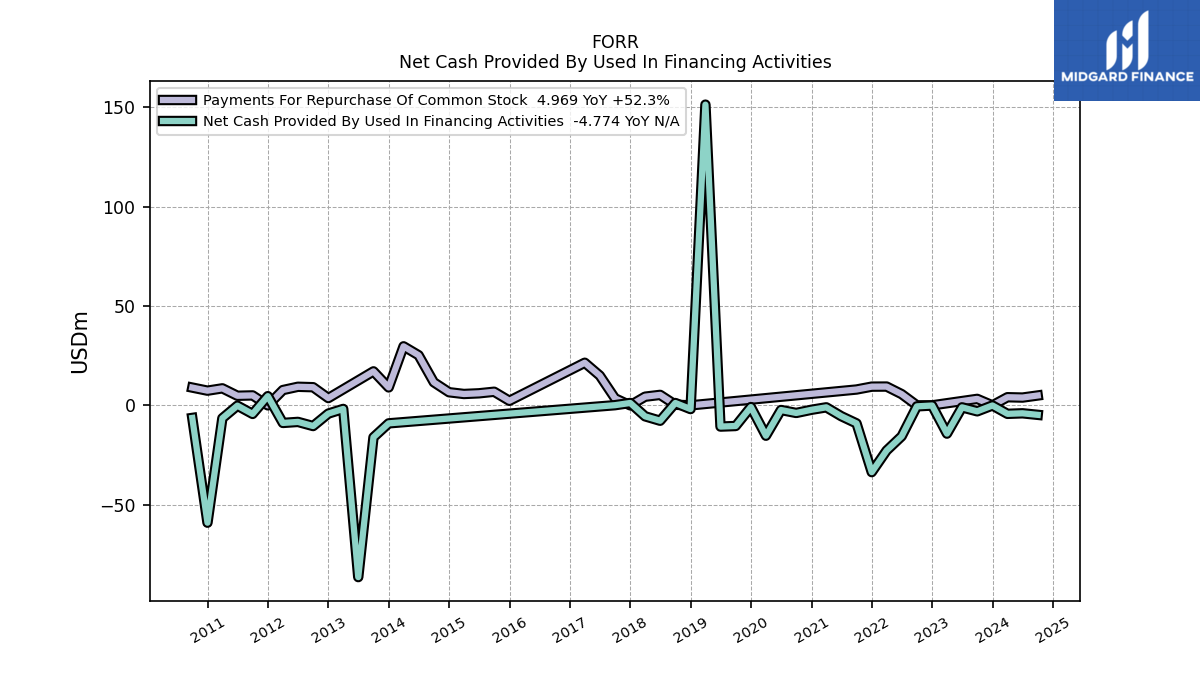
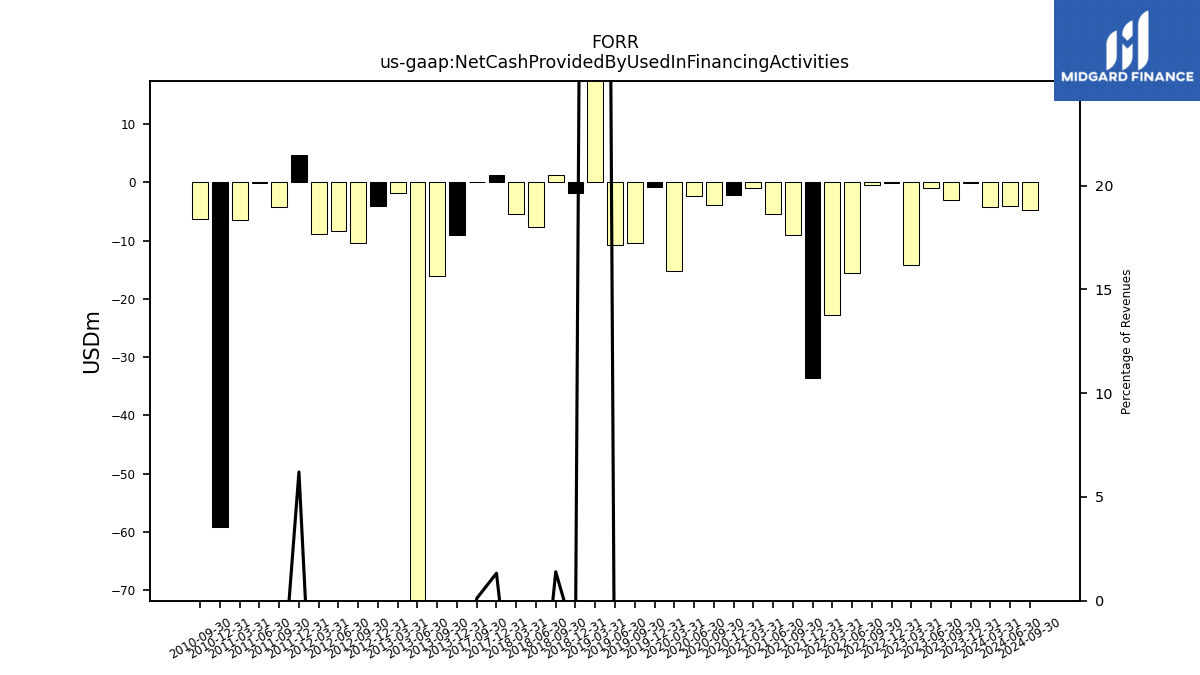
| Net Cash Provided By Used In Financing Activities | -0.06 | -3.00 | -1.00 | -14.24 | -0.08 | -0.50 | -15.55 | -22.74 | -33.62 | -9.07 | -5.46 | -0.99 | -2.23 | -3.83 | -2.34 | -15.29 | -0.85 | -10.39 | -10.68 | 151.36 | -1.88 | 1.19 | -7.75 | -5.51 | 1.20 | 0.09 | NA | NA | NA | NA | NA | NA | NA | NA | NA | NA | NA | NA | NA | NA | -9.05 | -16.08 | -86.45 | -1.79 | -4.14 | -10.41 | -8.33 | -8.85 | 4.63 | -4.32 | -0.16 | -6.48 | -59.06 | -6.33 | NA |
| 2023-12-31 | 2023-09-30 | 2023-06-30 | 2023-03-31 | 2022-12-31 | 2022-09-30 | 2022-06-30 | 2022-03-31 | 2021-12-31 | 2021-09-30 | 2021-06-30 | 2021-03-31 | 2020-12-31 | 2020-09-30 | 2020-06-30 | 2020-03-31 | 2019-12-31 | 2019-09-30 | 2019-06-30 | 2019-03-31 | 2018-12-31 | 2018-09-30 | 2018-06-30 | 2018-03-31 | 2017-12-31 | 2017-09-30 | 2017-06-30 | 2017-03-31 | 2016-12-31 | 2016-09-30 | 2016-06-30 | 2016-03-31 | 2015-12-31 | 2015-09-30 | 2015-06-30 | 2015-03-31 | 2014-12-31 | 2014-09-30 | 2014-06-30 | 2014-03-31 | 2013-12-31 | 2013-09-30 | 2013-06-30 | 2013-03-31 | 2012-12-31 | 2012-09-30 | 2012-06-30 | 2012-03-31 | 2011-12-31 | 2011-09-30 | 2011-06-30 | 2011-03-31 | 2010-12-31 | 2010-09-30 | 2010-06-30 | ||
|---|---|---|---|---|---|---|---|---|---|---|---|---|---|---|---|---|---|---|---|---|---|---|---|---|---|---|---|---|---|---|---|---|---|---|---|---|---|---|---|---|---|---|---|---|---|---|---|---|---|---|---|---|---|---|---|---|
| Net Cash Provided By Used In Operating Activities | 11.88 | -6.00 | 3.51 | 12.28 | 1.62 | 3.05 | 12.09 | 22.67 | 22.07 | 14.90 | 29.54 | 40.55 | 18.55 | 4.20 | 3.18 | 21.82 | 2.78 | 12.09 | 7.54 | 25.99 | 0.99 | 9.15 | 20.48 | 7.80 | 0.63 | 9.97 | NA | NA | NA | NA | NA | NA | NA | NA | NA | NA | NA | NA | NA | NA | -1.64 | -4.88 | 1.78 | 35.45 | 9.92 | 3.82 | 4.51 | 34.89 | 8.94 | 8.36 | 5.98 | 32.16 | 0.97 | 5.34 | NA | |
| Net Income Loss | -0.66 | 2.48 | 5.30 | -4.08 | -1.63 | 5.41 | 13.87 | 4.15 | 8.02 | 4.52 | 8.34 | 3.96 | 2.43 | -3.76 | 11.84 | -0.51 | 4.89 | -2.70 | 1.55 | -13.32 | 5.38 | 3.95 | 7.79 | -1.73 | 2.09 | 3.95 | 6.06 | 3.03 | 5.79 | 3.11 | 7.46 | 1.29 | 2.02 | 4.45 | 5.75 | -0.22 | 3.60 | 3.04 | 4.29 | -0.07 | 2.16 | 2.44 | 5.62 | 2.34 | 4.25 | 10.37 | 7.77 | 3.18 | 8.90 | 5.73 | 5.47 | 2.91 | 4.13 | 3.70 | 6.90 | |
| Profit Loss | -0.66 | 2.48 | 5.30 | -4.08 | -1.63 | 5.41 | 13.87 | 4.15 | 8.02 | 4.52 | 8.34 | 3.96 | 2.43 | -3.76 | 11.84 | -0.51 | 4.89 | -2.70 | 1.55 | -13.32 | 5.38 | 3.95 | 7.79 | -1.73 | 2.09 | NA | NA | NA | NA | NA | NA | NA | NA | NA | NA | NA | NA | NA | NA | NA | NA | NA | NA | NA | NA | NA | NA | NA | NA | NA | NA | NA | NA | NA | NA | |
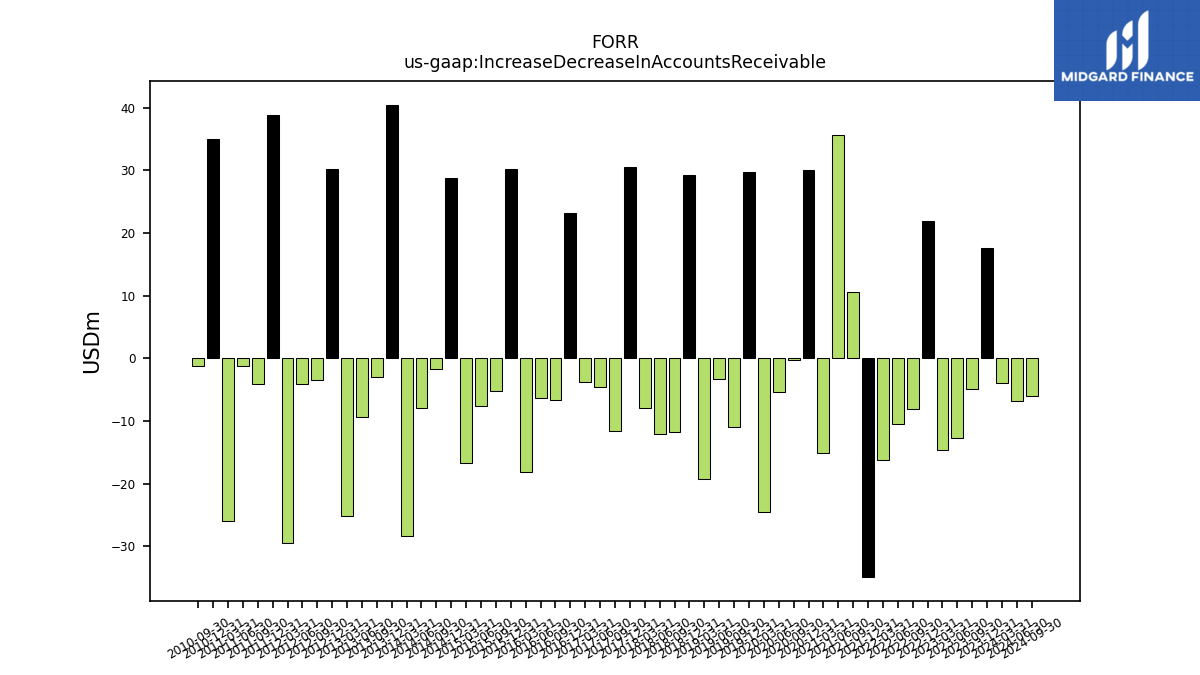
| Increase Decrease In Accounts Receivable | 17.57 | -4.90 | -12.70 | -14.69 | 21.97 | -8.10 | -10.47 | -16.24 | -34.95 | 10.58 | 35.65 | -15.18 | 29.99 | -0.27 | -5.40 | -24.56 | 29.69 | -10.91 | -3.24 | -19.24 | 29.27 | -11.84 | -12.10 | -7.92 | 30.47 | -11.68 | -4.62 | -3.84 | 23.11 | -6.63 | -6.31 | -18.14 | 30.23 | -5.16 | -7.55 | -16.80 | 28.78 | -1.71 | -7.90 | -28.31 | 40.50 | -3.01 | -9.38 | -25.19 | 30.24 | -3.54 | -4.14 | -29.52 | 38.87 | -4.11 | -1.20 | -25.96 | 34.99 | -1.30 | NA | |
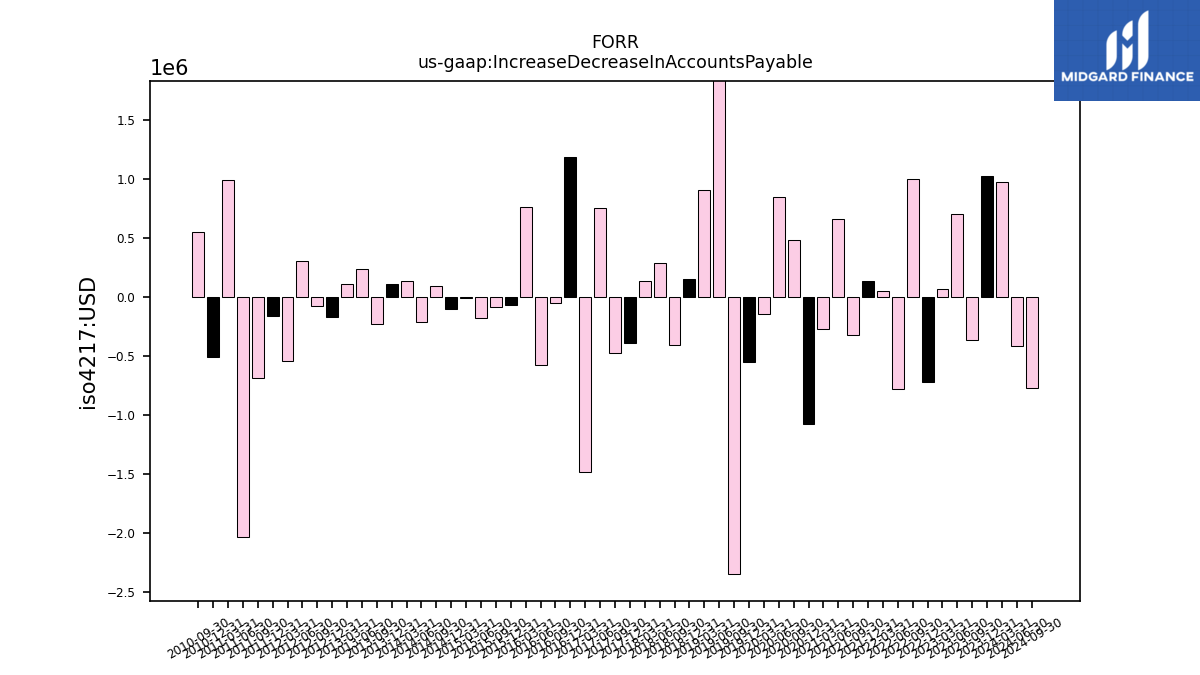
| Increase Decrease In Accounts Payable | 1.02 | -0.36 | 0.70 | 0.06 | -0.72 | 1.00 | -0.78 | 0.05 | 0.14 | -0.32 | 0.66 | -0.28 | -1.07 | 0.48 | 0.85 | -0.14 | -0.55 | -2.34 | 2.27 | 0.90 | 0.15 | -0.40 | 0.29 | 0.13 | -0.39 | -0.48 | 0.76 | -1.49 | 1.18 | -0.06 | -0.57 | 0.76 | -0.07 | -0.09 | -0.18 | -0.01 | -0.10 | 0.09 | -0.21 | 0.14 | 0.11 | -0.23 | 0.23 | 0.11 | -0.17 | -0.07 | 0.30 | -0.54 | -0.17 | -0.69 | -2.03 | 0.99 | -0.51 | 0.55 | NA | |
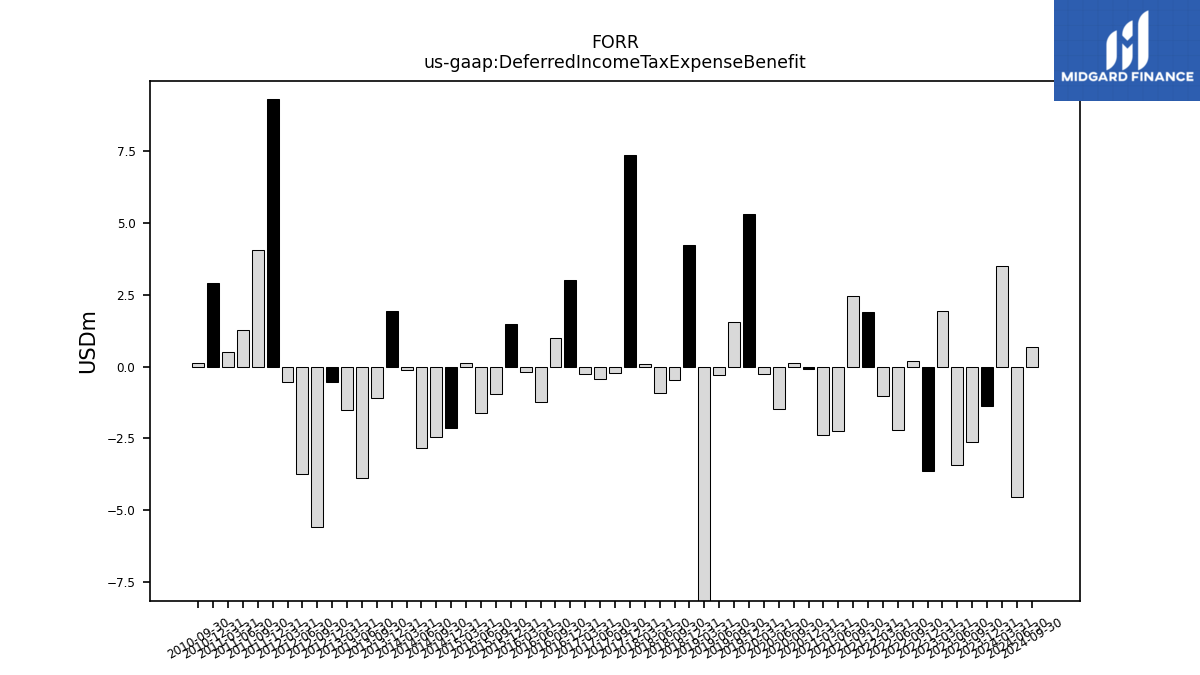
| Deferred Income Tax Expense Benefit | -1.35 | -2.63 | -3.40 | 1.93 | -3.63 | 0.20 | -2.21 | -1.01 | 1.88 | 2.46 | -2.23 | -2.40 | -0.08 | 0.14 | -1.49 | -0.25 | 5.30 | 1.56 | -0.28 | -10.53 | 4.24 | -0.47 | -0.92 | 0.09 | 7.35 | -0.23 | -0.43 | -0.26 | 3.02 | 1.00 | -1.23 | -0.18 | 1.48 | -0.95 | -1.62 | 0.11 | -2.12 | -2.44 | -2.83 | -0.13 | 1.93 | -1.08 | -3.86 | -1.52 | -0.53 | -5.56 | -3.74 | -0.55 | 9.32 | 4.07 | 1.26 | 0.49 | 2.89 | 0.12 | NA | |
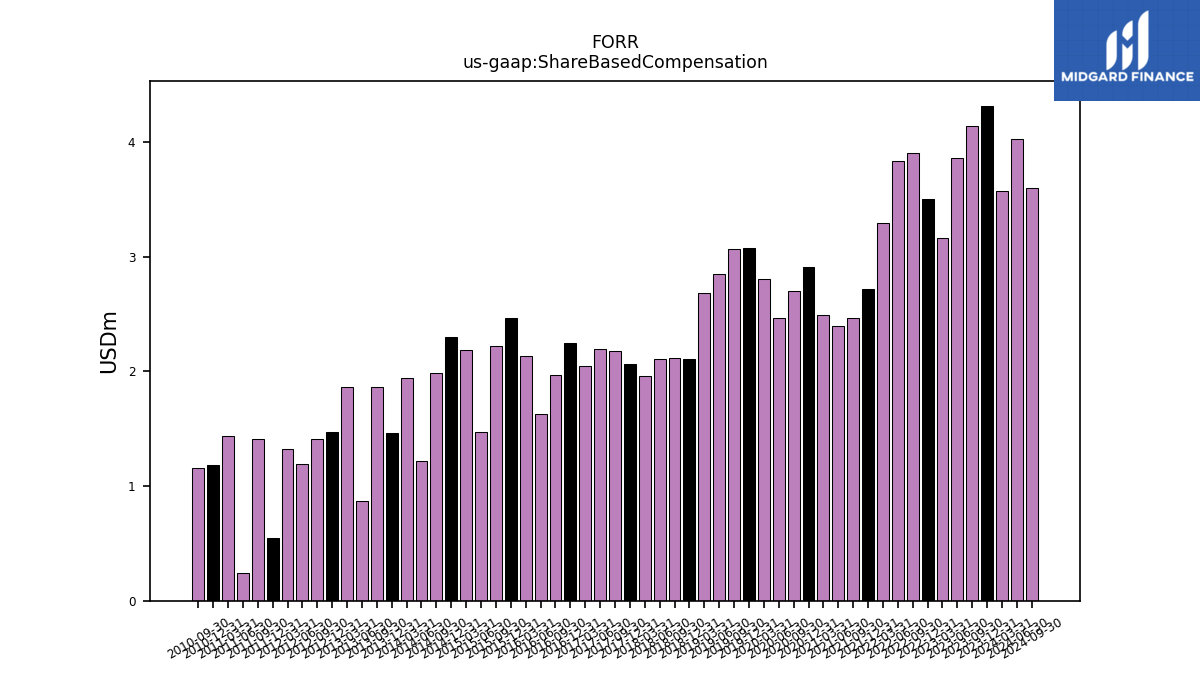
| Share Based Compensation | 4.32 | 4.14 | 3.86 | 3.17 | 3.51 | 3.90 | 3.84 | 3.29 | 2.72 | 2.46 | 2.40 | 2.49 | 2.91 | 2.70 | 2.46 | 2.80 | 3.08 | 3.07 | 2.85 | 2.69 | 2.11 | 2.12 | 2.11 | 1.96 | 2.07 | 2.18 | 2.20 | 2.05 | 2.25 | 1.97 | 1.63 | 2.13 | 2.46 | 2.22 | 1.48 | 2.19 | 2.30 | 1.98 | 1.22 | 1.95 | 1.46 | 1.86 | 0.87 | 1.86 | 1.48 | 1.41 | 1.19 | 1.32 | 0.55 | 1.41 | 0.24 | 1.44 | 1.19 | 1.16 | NA | |
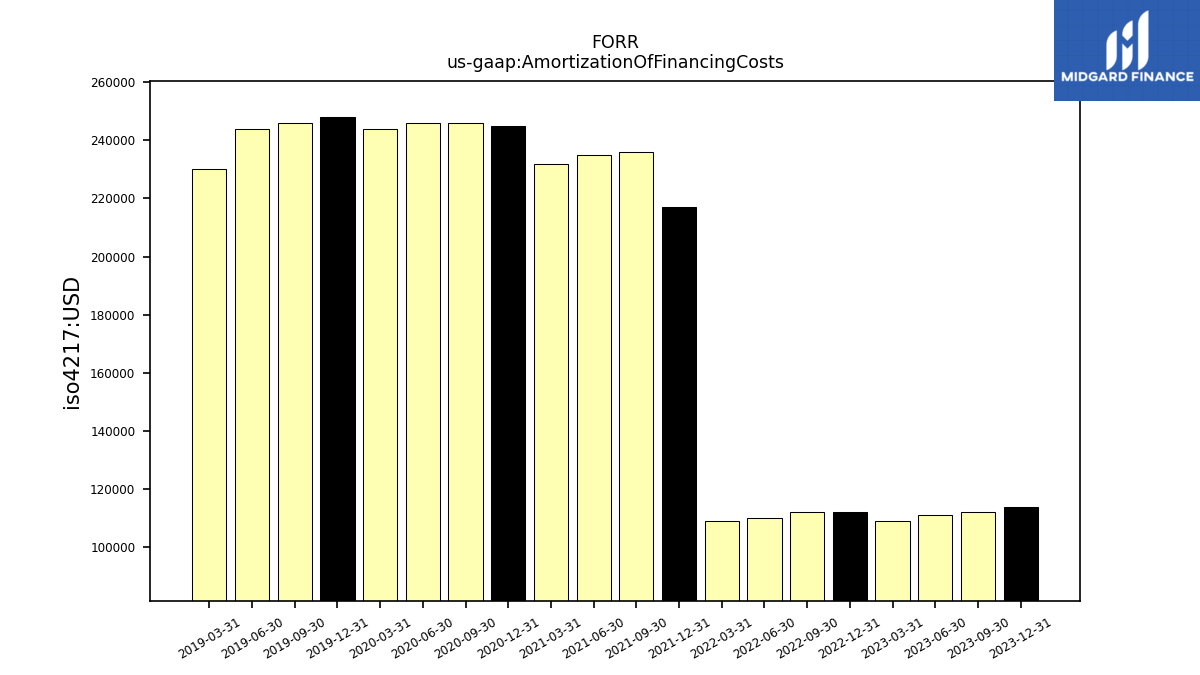
| Amortization Of Financing Costs | 0.11 | 0.11 | 0.11 | 0.11 | 0.11 | 0.11 | 0.11 | 0.11 | 0.22 | 0.24 | 0.23 | 0.23 | 0.24 | 0.25 | 0.25 | 0.24 | 0.25 | 0.25 | 0.24 | 0.23 | NA | NA | NA | NA | NA | NA | NA | NA | NA | NA | NA | NA | NA | NA | NA | NA | NA | NA | NA | NA | NA | NA | NA | NA | NA | NA | NA | NA | NA | NA | NA | NA | NA | NA | NA |
| 2023-12-31 | 2023-09-30 | 2023-06-30 | 2023-03-31 | 2022-12-31 | 2022-09-30 | 2022-06-30 | 2022-03-31 | 2021-12-31 | 2021-09-30 | 2021-06-30 | 2021-03-31 | 2020-12-31 | 2020-09-30 | 2020-06-30 | 2020-03-31 | 2019-12-31 | 2019-09-30 | 2019-06-30 | 2019-03-31 | 2018-12-31 | 2018-09-30 | 2018-06-30 | 2018-03-31 | 2017-12-31 | 2017-09-30 | 2017-06-30 | 2017-03-31 | 2016-12-31 | 2016-09-30 | 2016-06-30 | 2016-03-31 | 2015-12-31 | 2015-09-30 | 2015-06-30 | 2015-03-31 | 2014-12-31 | 2014-09-30 | 2014-06-30 | 2014-03-31 | 2013-12-31 | 2013-09-30 | 2013-06-30 | 2013-03-31 | 2012-12-31 | 2012-09-30 | 2012-06-30 | 2012-03-31 | 2011-12-31 | 2011-09-30 | 2011-06-30 | 2011-03-31 | 2010-12-31 | 2010-09-30 | 2010-06-30 | ||
|---|---|---|---|---|---|---|---|---|---|---|---|---|---|---|---|---|---|---|---|---|---|---|---|---|---|---|---|---|---|---|---|---|---|---|---|---|---|---|---|---|---|---|---|---|---|---|---|---|---|---|---|---|---|---|---|---|
| Net Cash Provided By Used In Investing Activities | -43.06 | 2.86 | 2.10 | 1.34 | -1.09 | -2.13 | -1.68 | -1.91 | -2.45 | -21.61 | -3.77 | -1.47 | -1.63 | 2.17 | -2.71 | -2.40 | -3.53 | -2.44 | -1.86 | -241.72 | 50.53 | -10.76 | 1.75 | -1.43 | -2.39 | 1.51 | NA | NA | NA | NA | NA | NA | NA | NA | NA | NA | NA | NA | NA | NA | 13.71 | 35.36 | -4.27 | 12.76 | 11.91 | -0.95 | -7.39 | -7.65 | -4.14 | -10.45 | -21.00 | -17.45 | 8.21 | -8.11 | NA | |
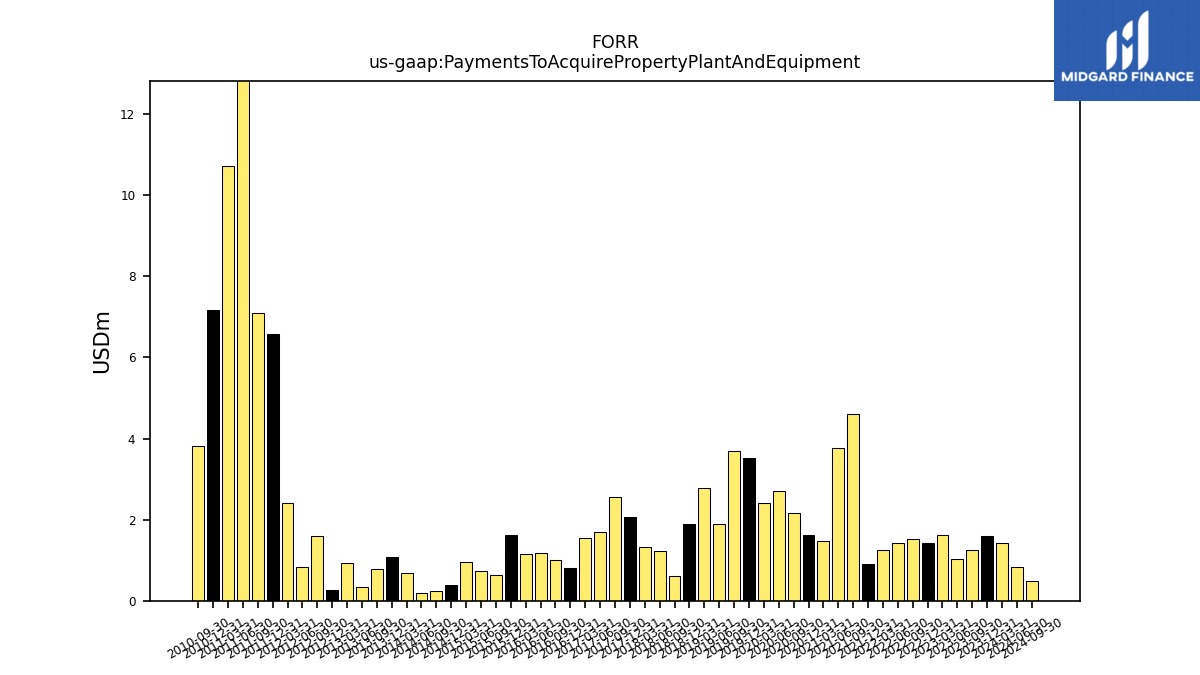
| Payments To Acquire Property Plant And Equipment | 1.59 | 1.24 | 1.03 | 1.63 | 1.44 | 1.53 | 1.44 | 1.26 | 0.90 | 4.60 | 3.77 | 1.47 | 1.63 | 2.17 | 2.71 | 2.40 | 3.53 | 3.70 | 1.89 | 2.77 | 1.89 | 0.62 | 1.22 | 1.32 | 2.06 | 2.57 | 1.70 | 1.54 | 0.81 | 1.02 | 1.17 | 1.14 | 1.61 | 0.64 | 0.73 | 0.95 | 0.39 | 0.24 | 0.19 | 0.68 | 1.08 | 0.78 | 0.33 | 0.94 | 0.26 | 1.60 | 0.83 | 2.42 | 6.58 | 7.09 | 15.39 | 10.71 | 7.18 | 3.81 | NA |
| 2023-12-31 | 2023-09-30 | 2023-06-30 | 2023-03-31 | 2022-12-31 | 2022-09-30 | 2022-06-30 | 2022-03-31 | 2021-12-31 | 2021-09-30 | 2021-06-30 | 2021-03-31 | 2020-12-31 | 2020-09-30 | 2020-06-30 | 2020-03-31 | 2019-12-31 | 2019-09-30 | 2019-06-30 | 2019-03-31 | 2018-12-31 | 2018-09-30 | 2018-06-30 | 2018-03-31 | 2017-12-31 | 2017-09-30 | 2017-06-30 | 2017-03-31 | 2016-12-31 | 2016-09-30 | 2016-06-30 | 2016-03-31 | 2015-12-31 | 2015-09-30 | 2015-06-30 | 2015-03-31 | 2014-12-31 | 2014-09-30 | 2014-06-30 | 2014-03-31 | 2013-12-31 | 2013-09-30 | 2013-06-30 | 2013-03-31 | 2012-12-31 | 2012-09-30 | 2012-06-30 | 2012-03-31 | 2011-12-31 | 2011-09-30 | 2011-06-30 | 2011-03-31 | 2010-12-31 | 2010-09-30 | 2010-06-30 | ||
|---|---|---|---|---|---|---|---|---|---|---|---|---|---|---|---|---|---|---|---|---|---|---|---|---|---|---|---|---|---|---|---|---|---|---|---|---|---|---|---|---|---|---|---|---|---|---|---|---|---|---|---|---|---|---|---|---|
| Net Cash Provided By Used In Financing Activities | -0.06 | -3.00 | -1.00 | -14.24 | -0.08 | -0.50 | -15.55 | -22.74 | -33.62 | -9.07 | -5.46 | -0.99 | -2.23 | -3.83 | -2.34 | -15.29 | -0.85 | -10.39 | -10.68 | 151.36 | -1.88 | 1.19 | -7.75 | -5.51 | 1.20 | 0.09 | NA | NA | NA | NA | NA | NA | NA | NA | NA | NA | NA | NA | NA | NA | -9.05 | -16.08 | -86.45 | -1.79 | -4.14 | -10.41 | -8.33 | -8.85 | 4.63 | -4.32 | -0.16 | -6.48 | -59.06 | -6.33 | NA | |
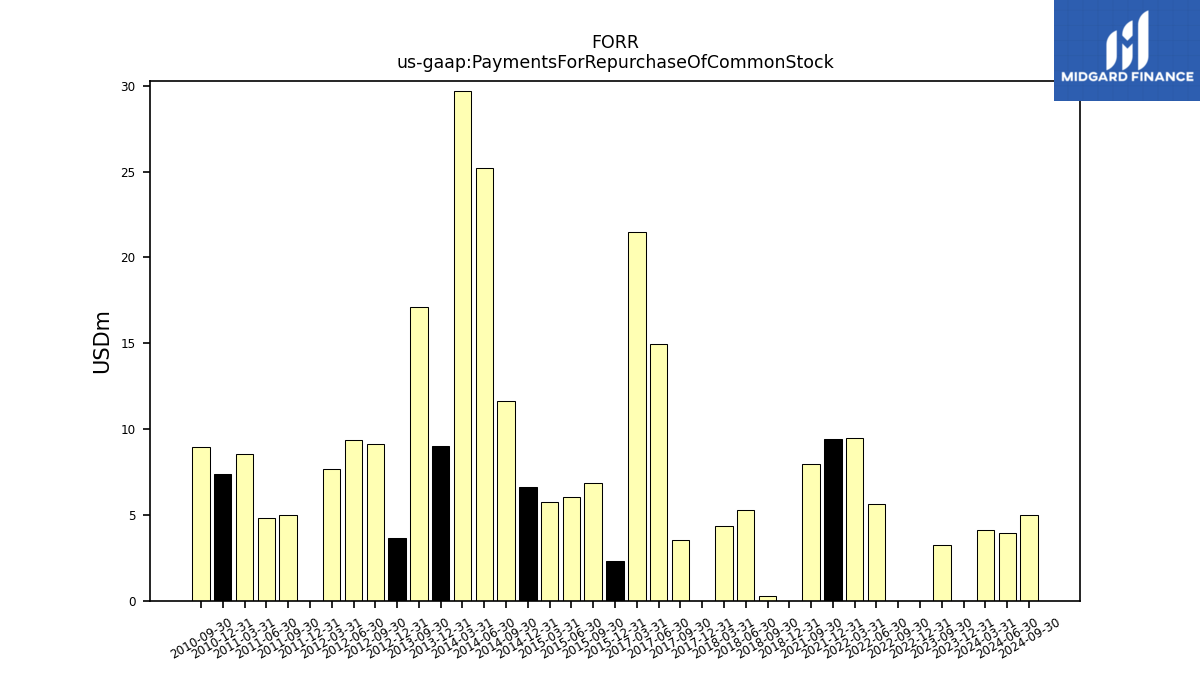
| Payments For Repurchase Of Common Stock | 0.00 | 3.26 | NA | NA | 0.00 | 0.00 | 5.65 | 9.46 | 9.42 | 7.97 | NA | NA | NA | NA | NA | NA | NA | NA | NA | NA | 0.00 | 0.30 | 5.28 | 4.37 | 0.00 | 3.54 | 14.97 | 21.45 | NA | NA | NA | NA | 2.29 | 6.85 | 6.06 | 5.72 | 6.61 | 11.62 | 25.23 | 29.71 | 9.02 | 17.11 | NA | NA | 3.66 | 9.13 | 9.35 | 7.70 | 0.00 | 5.01 | 4.83 | 8.57 | 7.39 | 8.95 | NA |
| 2023-12-31 | 2023-09-30 | 2023-06-30 | 2023-03-31 | 2022-12-31 | 2022-09-30 | 2022-06-30 | 2022-03-31 | 2021-12-31 | 2021-09-30 | 2021-06-30 | 2021-03-31 | 2020-12-31 | 2020-09-30 | 2020-06-30 | 2020-03-31 | 2019-12-31 | 2019-09-30 | 2019-06-30 | 2019-03-31 | 2018-12-31 | 2018-09-30 | 2018-06-30 | 2018-03-31 | 2017-12-31 | 2017-09-30 | 2017-06-30 | 2017-03-31 | 2016-12-31 | 2016-09-30 | 2016-06-30 | 2016-03-31 | 2015-12-31 | 2015-09-30 | 2015-06-30 | 2015-03-31 | 2014-12-31 | 2014-09-30 | 2014-06-30 | 2014-03-31 | 2013-12-31 | 2013-09-30 | 2013-06-30 | 2013-03-31 | 2012-12-31 | 2012-09-30 | 2012-06-30 | 2012-03-31 | 2011-12-31 | 2011-09-30 | 2011-06-30 | 2011-03-31 | 2010-12-31 | 2010-09-30 | 2010-06-30 | ||
|---|---|---|---|---|---|---|---|---|---|---|---|---|---|---|---|---|---|---|---|---|---|---|---|---|---|---|---|---|---|---|---|---|---|---|---|---|---|---|---|---|---|---|---|---|---|---|---|---|---|---|---|---|---|---|---|---|
| Revenues | 118.09 | 113.43 | 135.59 | 113.67 | 136.89 | 127.68 | 148.25 | 124.97 | 133.73 | 118.14 | 128.67 | 113.78 | 120.52 | 108.58 | 113.54 | 106.34 | 124.27 | 108.60 | 128.18 | 100.65 | 98.58 | 84.89 | 96.35 | 77.75 | 90.38 | 80.37 | 89.73 | 77.19 | 83.45 | 77.43 | 87.82 | 77.40 | 80.97 | 74.75 | 82.81 | 75.19 | 80.68 | 75.36 | 82.95 | 73.07 | 77.52 | 69.81 | 78.16 | 71.36 | 75.16 | 68.51 | 79.09 | 70.17 | 74.65 | 69.77 | 73.45 | 65.74 | 67.12 | 59.78 | 64.65 | |
| Revenue From Contract With Customer Excluding Assessed Tax | 118.09 | 113.43 | 135.59 | 113.67 | 136.89 | 127.68 | 148.25 | 124.97 | 133.73 | 118.14 | 128.67 | 113.78 | 120.52 | 108.58 | 113.54 | 106.34 | 124.27 | 108.60 | 128.18 | 100.65 | 98.58 | 84.89 | 96.35 | 77.75 | 90.38 | 80.37 | 89.73 | 77.19 | 83.45 | 77.43 | 87.82 | 77.40 | 80.97 | 74.75 | 82.81 | 75.19 | 80.68 | 75.36 | 82.95 | 73.07 | 77.52 | 69.81 | 78.16 | 71.36 | 75.16 | 68.51 | 79.09 | 70.17 | 74.65 | 69.77 | 73.45 | 65.74 | 67.12 | 59.78 | 64.65 | |
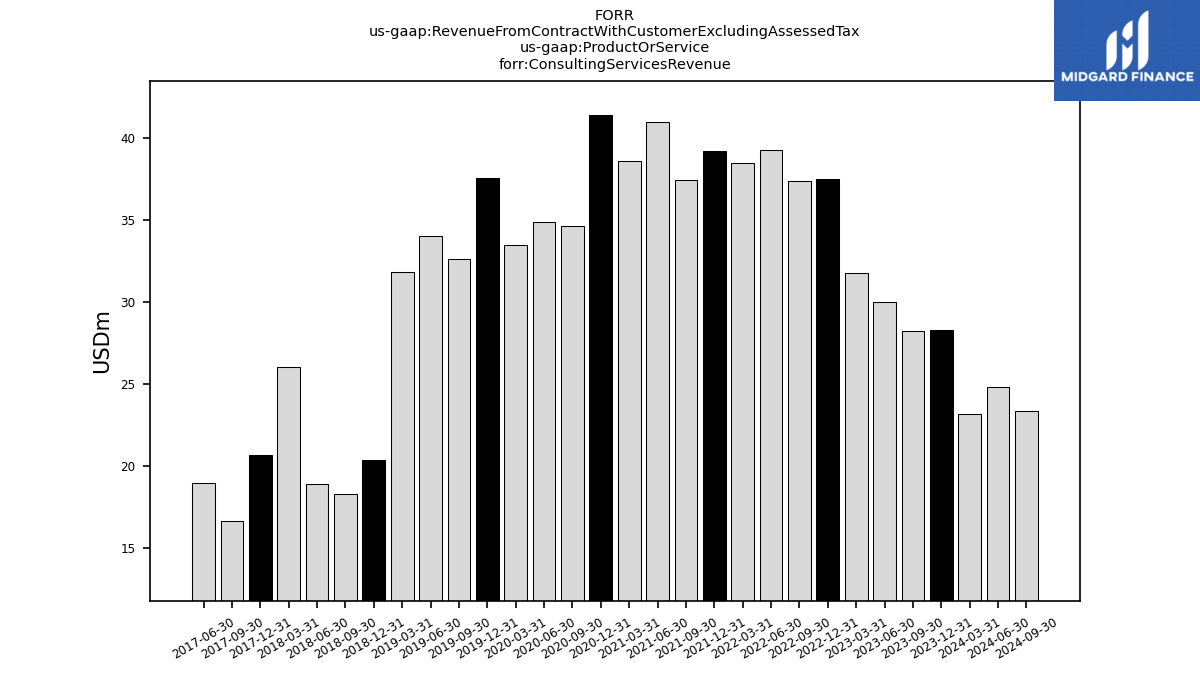
| Consulting Services Revenue | 28.27 | 28.24 | 29.97 | 31.75 | 37.51 | 37.38 | 39.26 | 38.43 | 39.21 | 37.39 | 40.96 | 38.55 | 41.38 | 34.63 | 34.89 | 33.46 | 37.53 | 32.62 | 34.02 | 31.79 | 20.36 | 18.32 | 18.93 | 26.05 | 20.67 | 16.65 | 18.97 | NA | NA | NA | NA | NA | NA | NA | NA | NA | NA | NA | NA | NA | NA | NA | NA | NA | NA | NA | NA | NA | NA | NA | NA | NA | NA | NA | NA | |
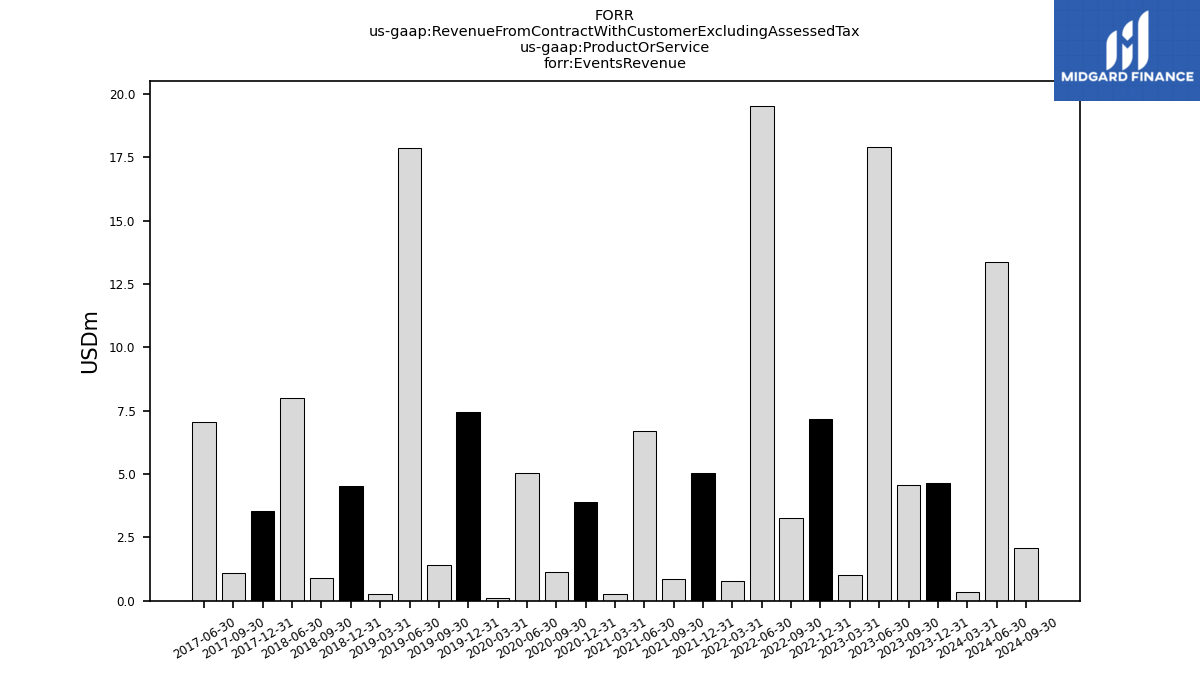
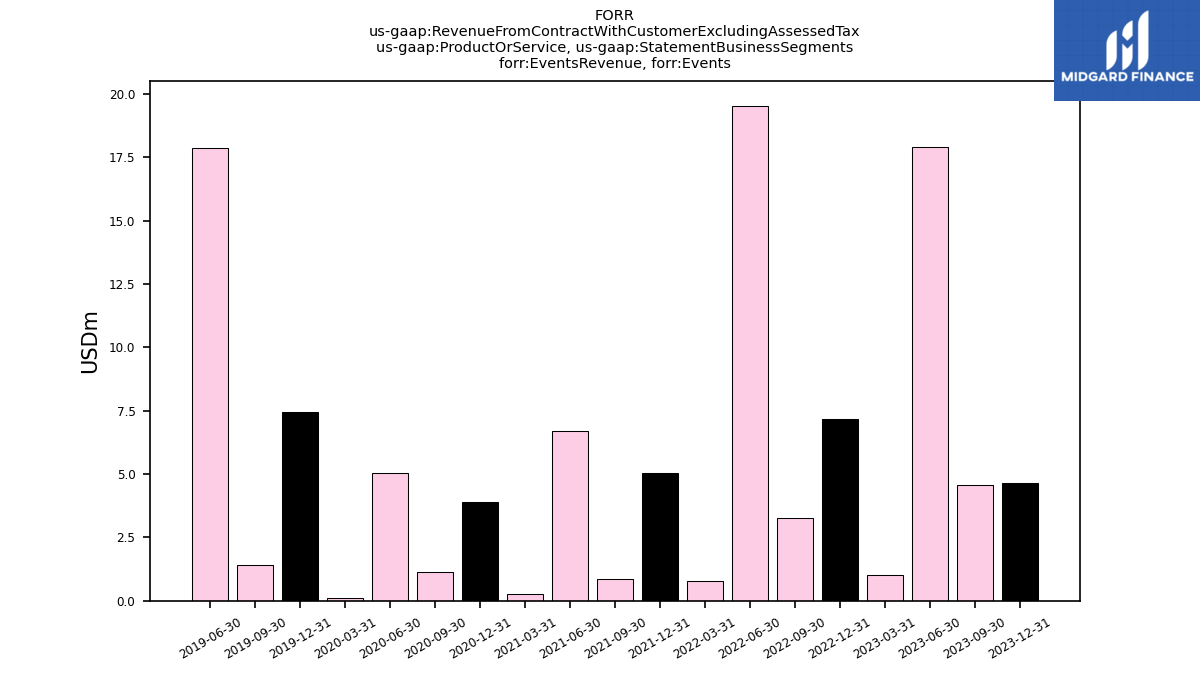
| Events Revenue | 4.63 | 4.59 | 17.92 | 1.01 | 7.19 | 3.26 | 19.54 | 0.76 | 5.02 | 0.87 | 6.71 | 0.26 | 3.88 | 1.13 | 5.03 | 0.09 | 7.44 | 1.43 | 17.89 | 0.25 | 4.55 | 0.92 | 8.01 | NA | 3.54 | 1.10 | 7.04 | NA | NA | NA | NA | NA | NA | NA | NA | NA | NA | NA | NA | NA | NA | NA | NA | NA | NA | NA | NA | NA | NA | NA | NA | NA | NA | NA | NA | |
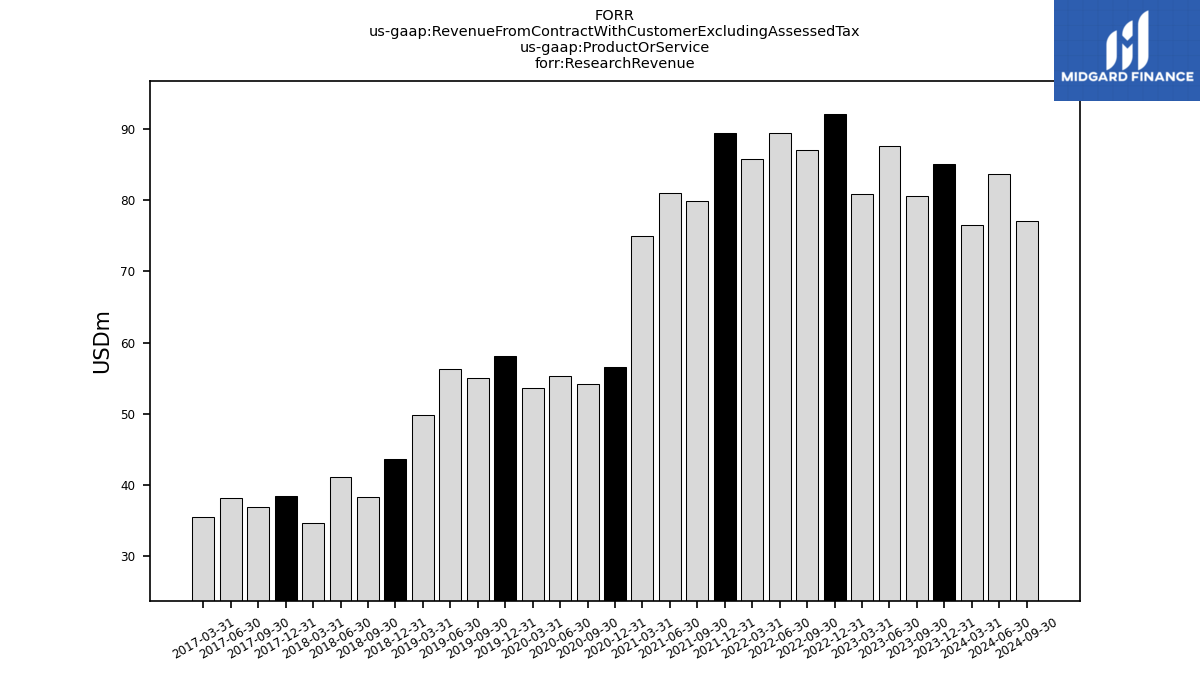
| Research Revenue | 85.19 | 80.61 | 87.70 | 80.91 | 92.19 | 87.04 | 89.45 | 85.78 | 89.49 | 79.88 | 81.00 | 74.97 | 56.60 | 54.11 | 55.36 | 53.61 | 58.08 | 55.02 | 56.30 | 49.78 | 43.66 | 38.31 | 41.05 | 34.64 | 38.38 | 36.89 | 38.13 | 35.52 | NA | NA | NA | NA | NA | NA | NA | NA | NA | NA | NA | NA | NA | NA | NA | NA | NA | NA | NA | NA | NA | NA | NA | NA | NA | NA | NA | |
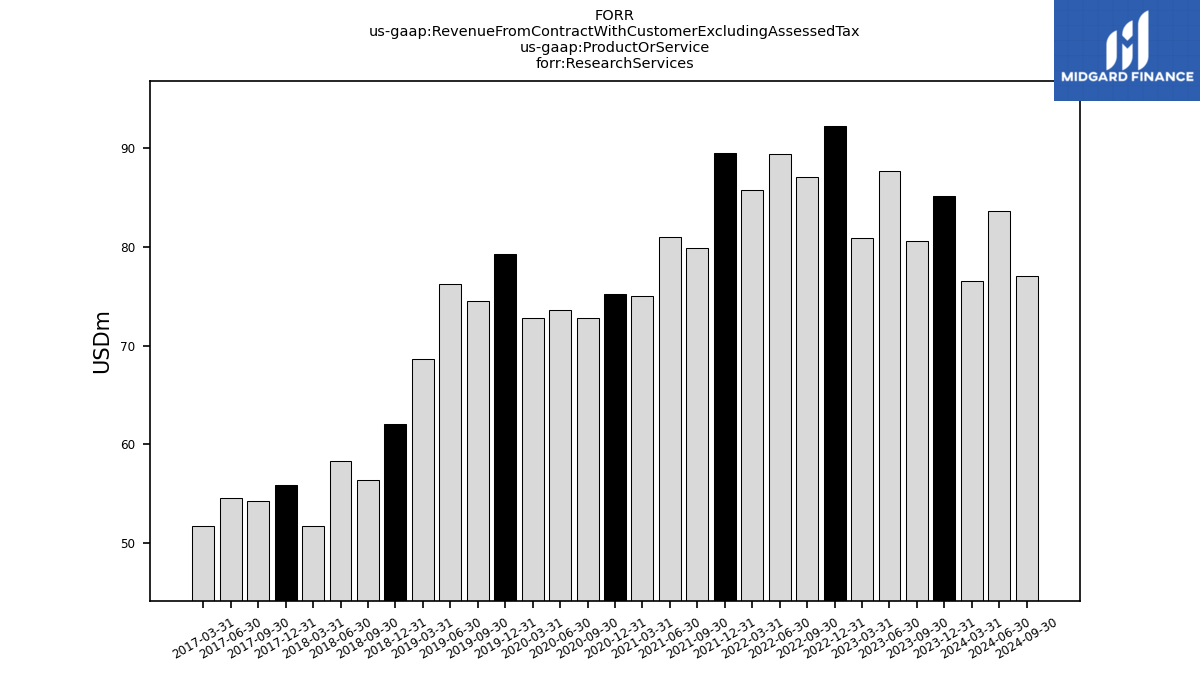
| Research Services | 85.19 | 80.61 | 87.70 | 80.91 | 92.19 | 87.04 | 89.45 | 85.78 | 89.49 | 79.88 | 81.00 | 74.97 | 75.25 | 72.81 | 73.62 | 72.80 | 79.30 | 74.55 | 76.28 | 68.61 | 62.07 | 56.33 | 58.30 | 51.70 | 55.92 | 54.23 | 54.58 | 51.74 | NA | NA | NA | NA | NA | NA | NA | NA | NA | NA | NA | NA | NA | NA | NA | NA | NA | NA | NA | NA | NA | NA | NA | NA | NA | NA | NA | |
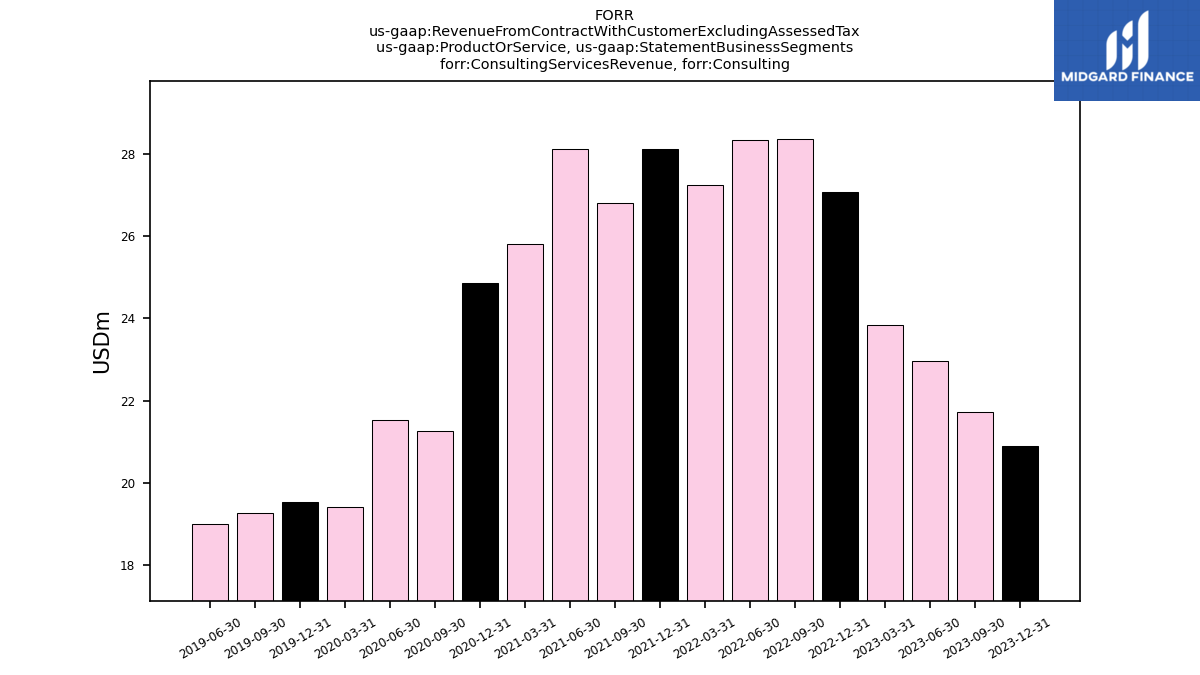
| Consulting Services Revenue, Consulting | 20.88 | 21.72 | 22.97 | 23.83 | 27.08 | 28.37 | 28.34 | 27.24 | 28.12 | 26.81 | 28.12 | 25.82 | 24.86 | 21.26 | 21.54 | 19.41 | 19.54 | 19.26 | 18.99 | NA | NA | NA | NA | NA | NA | NA | NA | NA | NA | NA | NA | NA | NA | NA | NA | NA | NA | NA | NA | NA | NA | NA | NA | NA | NA | NA | NA | NA | NA | NA | NA | NA | NA | NA | NA | |
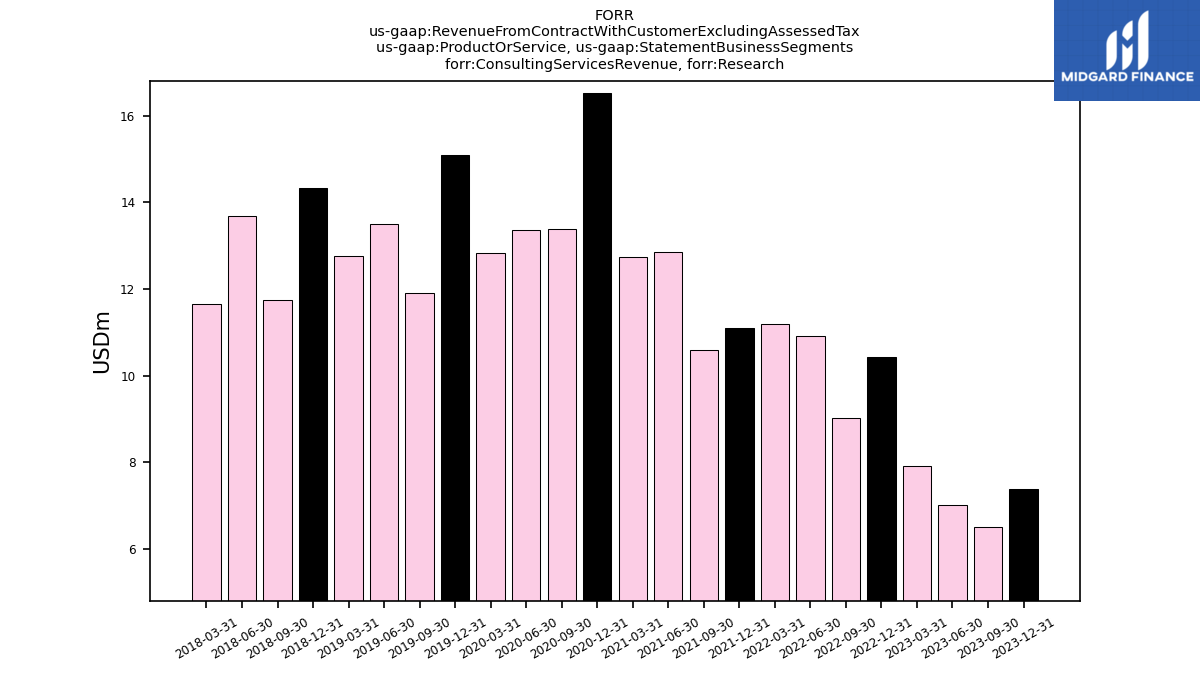
| Consulting Services Revenue, Research | 7.39 | 6.52 | 7.00 | 7.92 | 10.43 | 9.02 | 10.92 | 11.19 | 11.09 | 10.59 | 12.84 | 12.73 | 16.53 | 13.37 | 13.35 | 12.82 | 15.09 | 11.90 | 13.50 | 12.77 | 14.32 | 11.76 | 13.68 | 11.64 | NA | NA | NA | NA | NA | NA | NA | NA | NA | NA | NA | NA | NA | NA | NA | NA | NA | NA | NA | NA | NA | NA | NA | NA | NA | NA | NA | NA | NA | NA | NA | |
| Events Revenue, Events | 4.63 | 4.59 | 17.92 | 1.01 | 7.19 | 3.26 | 19.54 | 0.76 | 5.02 | 0.87 | 6.71 | 0.26 | 3.88 | 1.13 | 5.03 | 0.09 | 7.44 | 1.43 | 17.89 | NA | NA | NA | NA | NA | NA | NA | NA | NA | NA | NA | NA | NA | NA | NA | NA | NA | NA | NA | NA | NA | NA | NA | NA | NA | NA | NA | NA | NA | NA | NA | NA | NA | NA | NA | NA | |
| Research Revenue, Research | 85.19 | 80.61 | 87.70 | 80.91 | 92.19 | 87.04 | 89.45 | 85.78 | 89.49 | 79.88 | 81.00 | 74.97 | 56.60 | 54.11 | 55.36 | 53.61 | 43.23 | 40.31 | 41.51 | 36.44 | 43.22 | 38.20 | 41.05 | 34.64 | NA | NA | NA | NA | NA | NA | NA | NA | NA | NA | NA | NA | NA | NA | NA | NA | NA | NA | NA | NA | NA | NA | NA | NA | NA | NA | NA | NA | NA | NA | NA | |
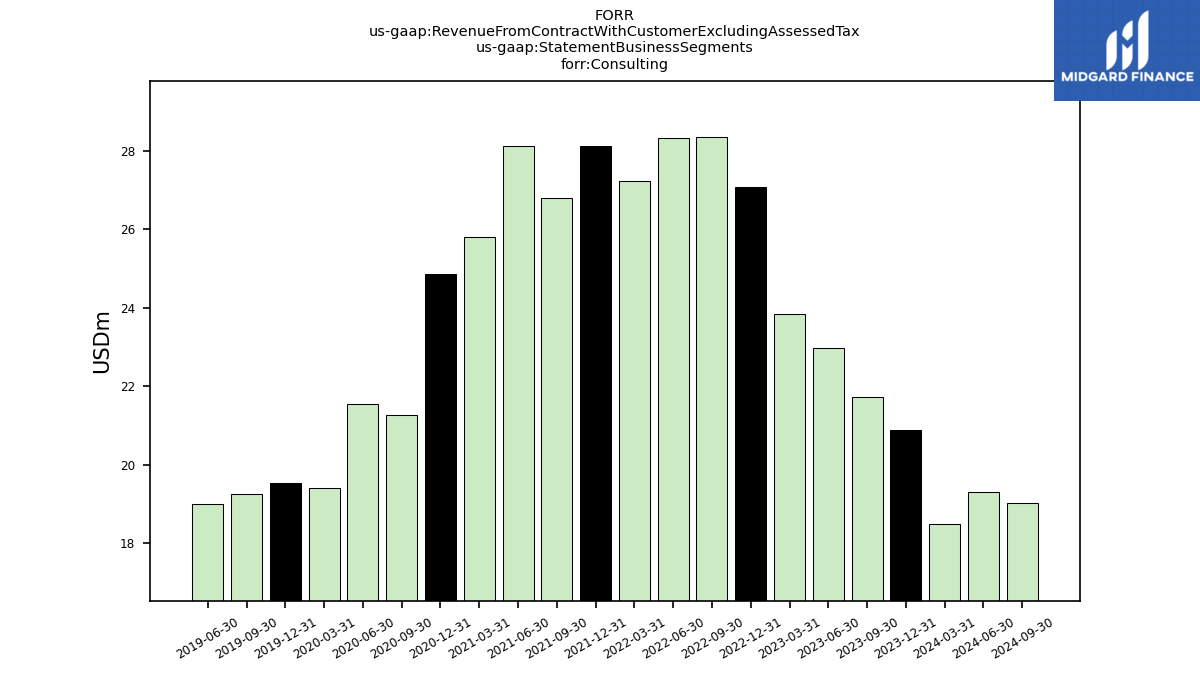
| Consulting | 20.88 | 21.72 | 22.97 | 23.83 | 27.08 | 28.37 | 28.34 | 27.24 | 28.12 | 26.81 | 28.12 | 25.82 | 24.86 | 21.26 | 21.54 | 19.41 | 19.54 | 19.26 | 18.99 | NA | NA | NA | NA | NA | NA | NA | NA | NA | NA | NA | NA | NA | NA | NA | NA | NA | NA | NA | NA | NA | NA | NA | NA | NA | NA | NA | NA | NA | NA | NA | NA | NA | NA | NA | NA | |
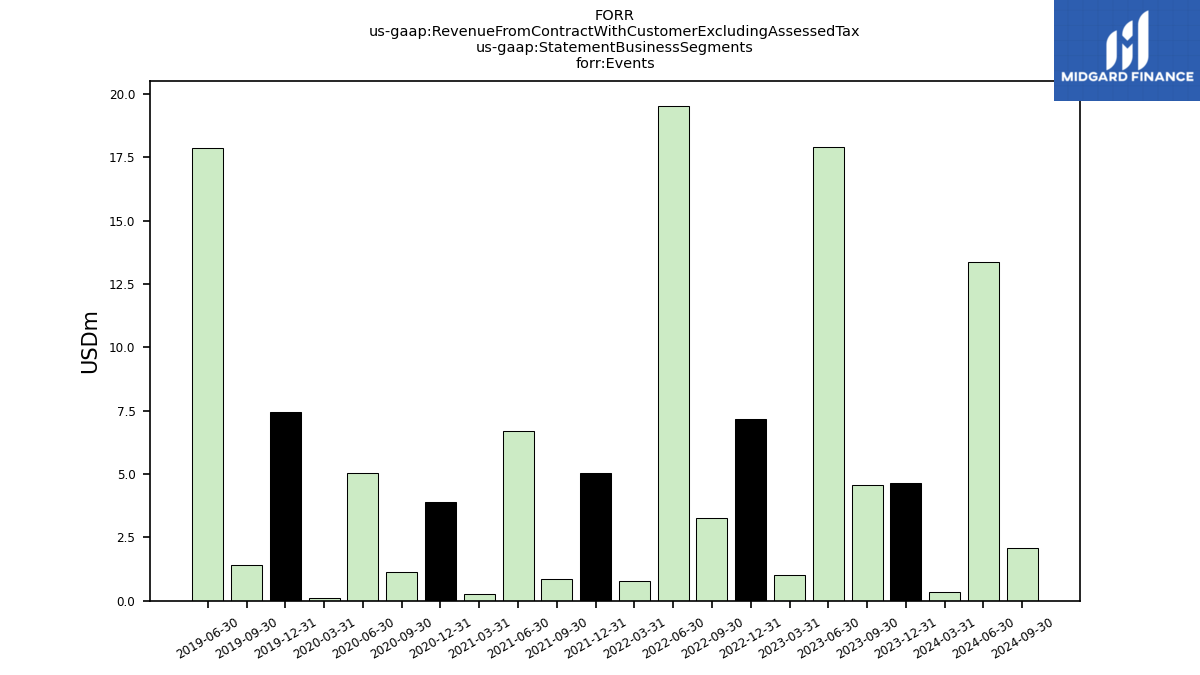
| Events | 4.63 | 4.59 | 17.92 | 1.01 | 7.19 | 3.26 | 19.54 | 0.76 | 5.02 | 0.87 | 6.71 | 0.26 | 3.88 | 1.13 | 5.03 | 0.09 | 7.44 | 1.43 | 17.89 | NA | NA | NA | NA | NA | NA | NA | NA | NA | NA | NA | NA | NA | NA | NA | NA | NA | NA | NA | NA | NA | NA | NA | NA | NA | NA | NA | NA | NA | NA | NA | NA | NA | NA | NA | NA | |
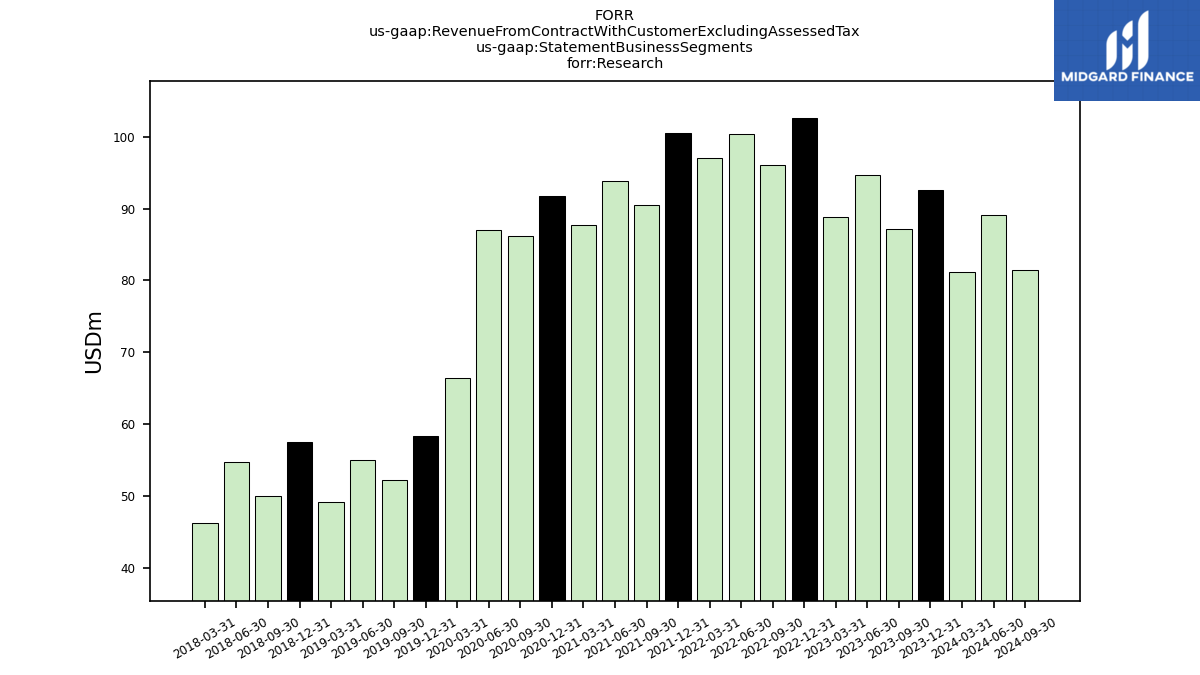
| Research | 92.57 | 87.12 | 94.70 | 88.83 | 102.62 | 96.05 | 100.37 | 96.97 | 100.58 | 90.46 | 93.84 | 87.70 | 91.78 | 86.19 | 86.97 | 66.43 | 58.31 | 52.22 | 55.01 | 49.20 | 57.53 | 49.95 | 54.74 | 46.28 | NA | NA | NA | NA | NA | NA | NA | NA | NA | NA | NA | NA | NA | NA | NA | NA | NA | NA | NA | NA | NA | NA | NA | NA | NA | NA | NA | NA | NA | NA | NA | |
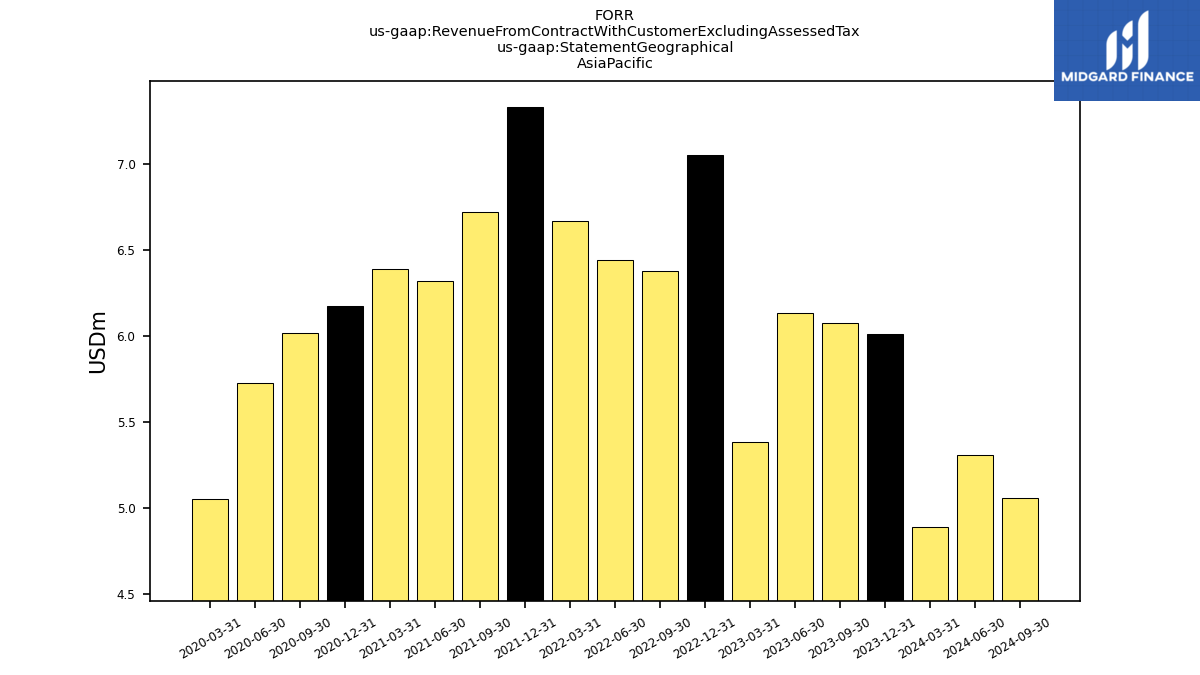
| 6.01 | 6.07 | 6.14 | 5.38 | 7.05 | 6.38 | 6.45 | 6.67 | 7.33 | 6.72 | 6.32 | 6.39 | 6.18 | 6.01 | 5.73 | 5.05 | NA | NA | NA | NA | NA | NA | NA | NA | NA | NA | NA | NA | NA | NA | NA | NA | NA | NA | NA | NA | NA | NA | NA | NA | NA | NA | NA | NA | NA | NA | NA | NA | NA | NA | NA | NA | NA | NA | NA | ||
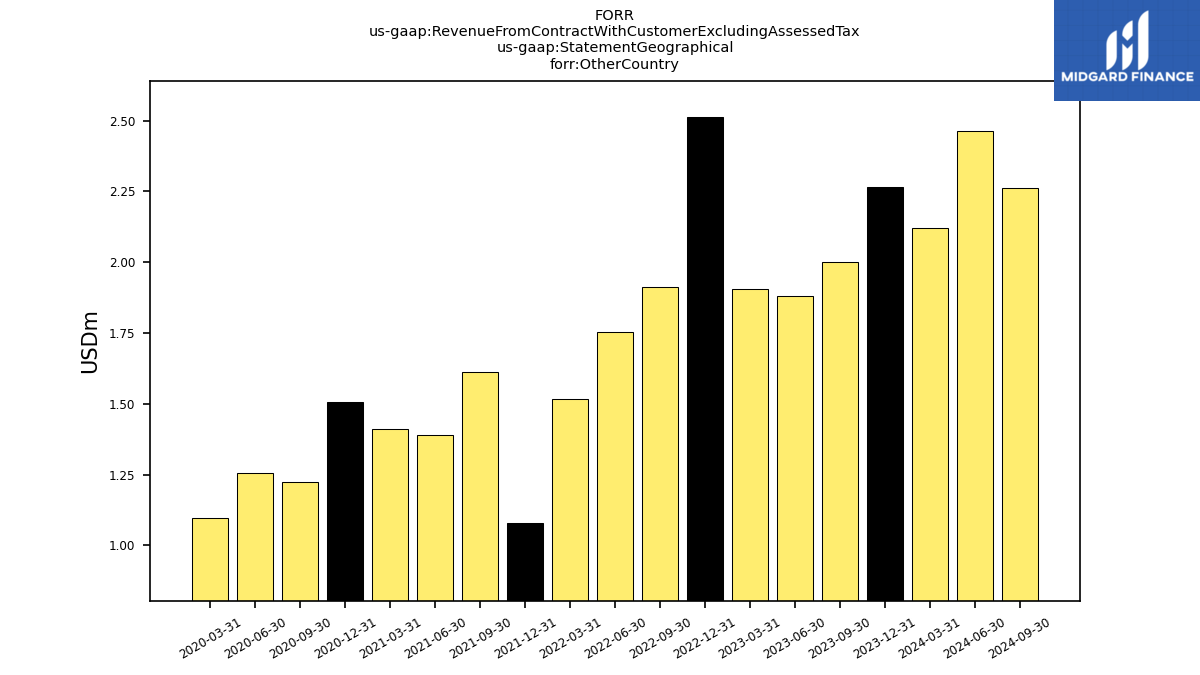
| Other Country | 2.27 | 2.00 | 1.88 | 1.91 | 2.51 | 1.91 | 1.75 | 1.52 | 1.08 | 1.61 | 1.39 | 1.41 | 1.51 | 1.22 | 1.26 | 1.10 | NA | NA | NA | NA | NA | NA | NA | NA | NA | NA | NA | NA | NA | NA | NA | NA | NA | NA | NA | NA | NA | NA | NA | NA | NA | NA | NA | NA | NA | NA | NA | NA | NA | NA | NA | NA | NA | NA | NA |