
| 2023-12-31 | 2023-09-30 | 2023-06-30 | 2023-03-31 | 2022-12-31 | 2022-09-30 | 2022-06-30 | 2022-03-31 | 2021-12-31 | 2021-09-30 | 2021-06-30 | 2021-03-31 | 2020-12-31 | 2020-09-30 | 2020-06-30 | 2020-03-31 | 2019-12-31 | 2019-09-30 | ||
|---|---|---|---|---|---|---|---|---|---|---|---|---|---|---|---|---|---|---|---|
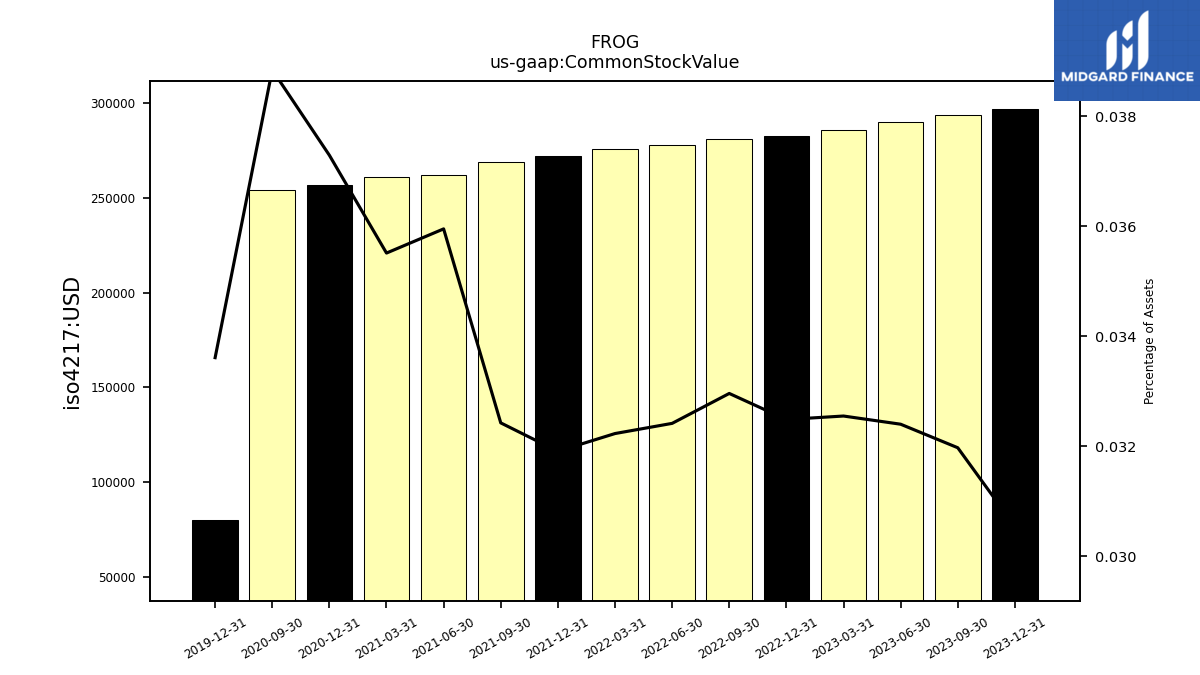
| Common Stock Value | 0.30 | 0.29 | 0.29 | 0.29 | 0.28 | 0.28 | 0.28 | 0.28 | 0.27 | 0.27 | 0.26 | 0.26 | 0.26 | 0.25 | NA | NA | 0.08 | NA |
| 2023-12-31 | 2023-09-30 | 2023-06-30 | 2023-03-31 | 2022-12-31 | 2022-09-30 | 2022-06-30 | 2022-03-31 | 2021-12-31 | 2021-09-30 | 2021-06-30 | 2021-03-31 | 2020-12-31 | 2020-09-30 | 2020-06-30 | 2020-03-31 | 2019-12-31 | 2019-09-30 | ||
|---|---|---|---|---|---|---|---|---|---|---|---|---|---|---|---|---|---|---|---|
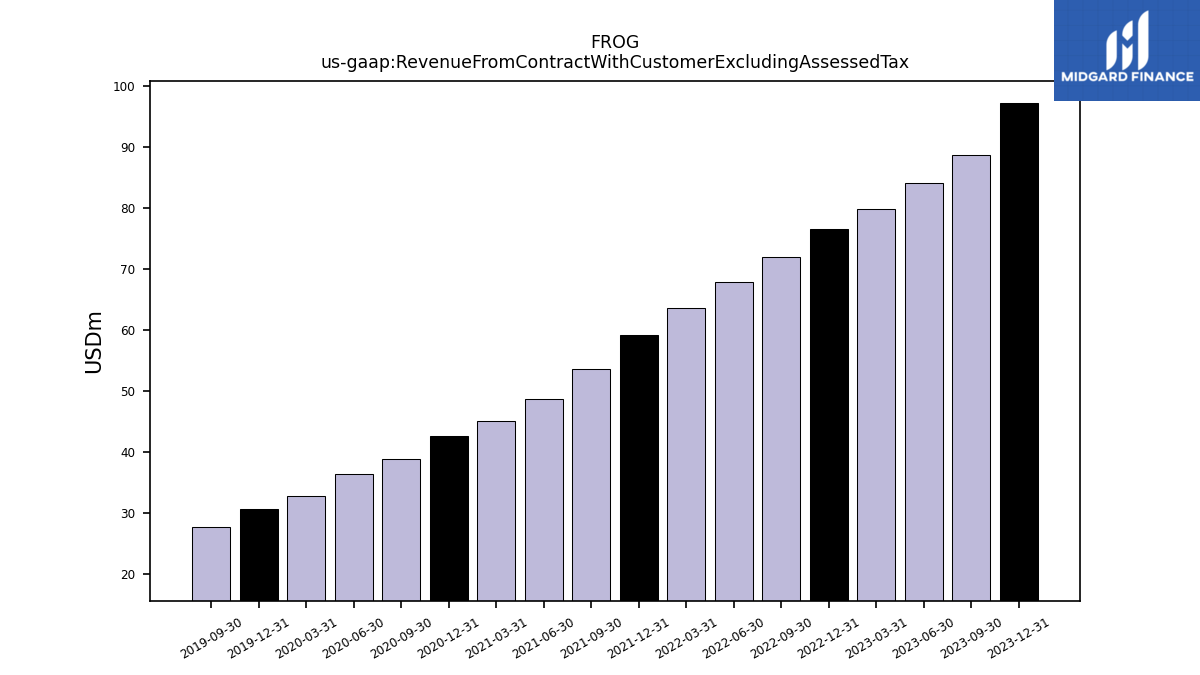
| Revenue From Contract With Customer Excluding Assessed Tax | 97.26 | 88.64 | 84.17 | 79.82 | 76.55 | 71.99 | 67.81 | 63.70 | 59.24 | 53.70 | 48.66 | 45.09 | 42.69 | 38.89 | 36.43 | 32.82 | 30.76 | 27.84 | |
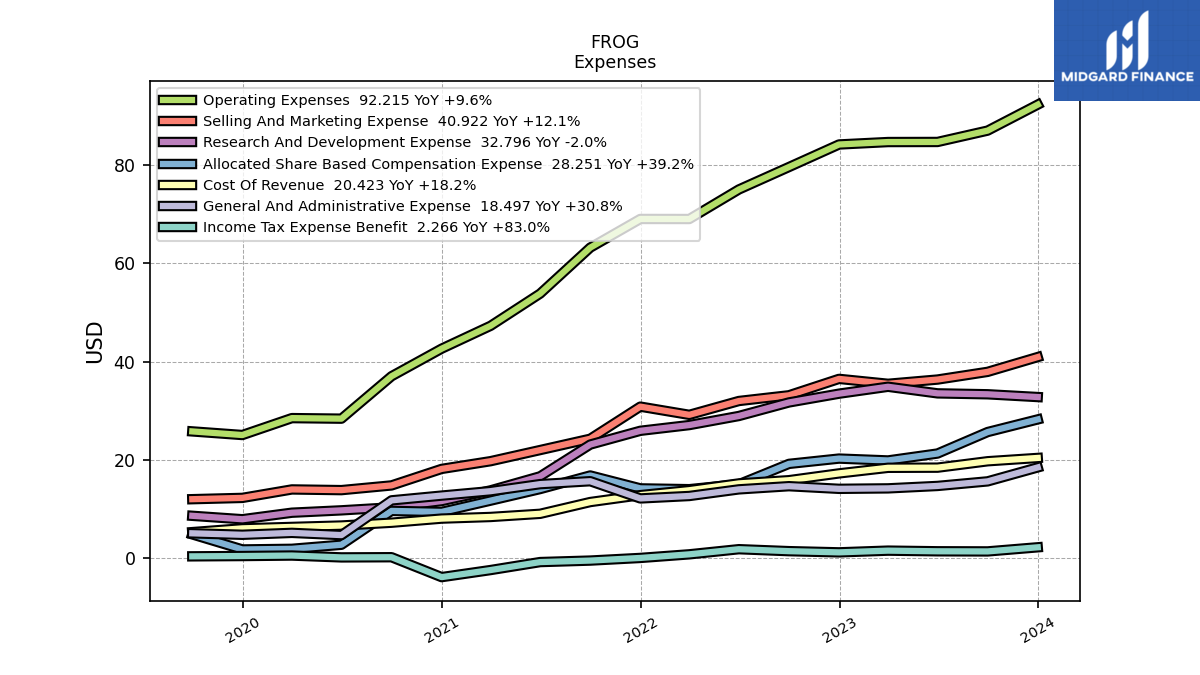
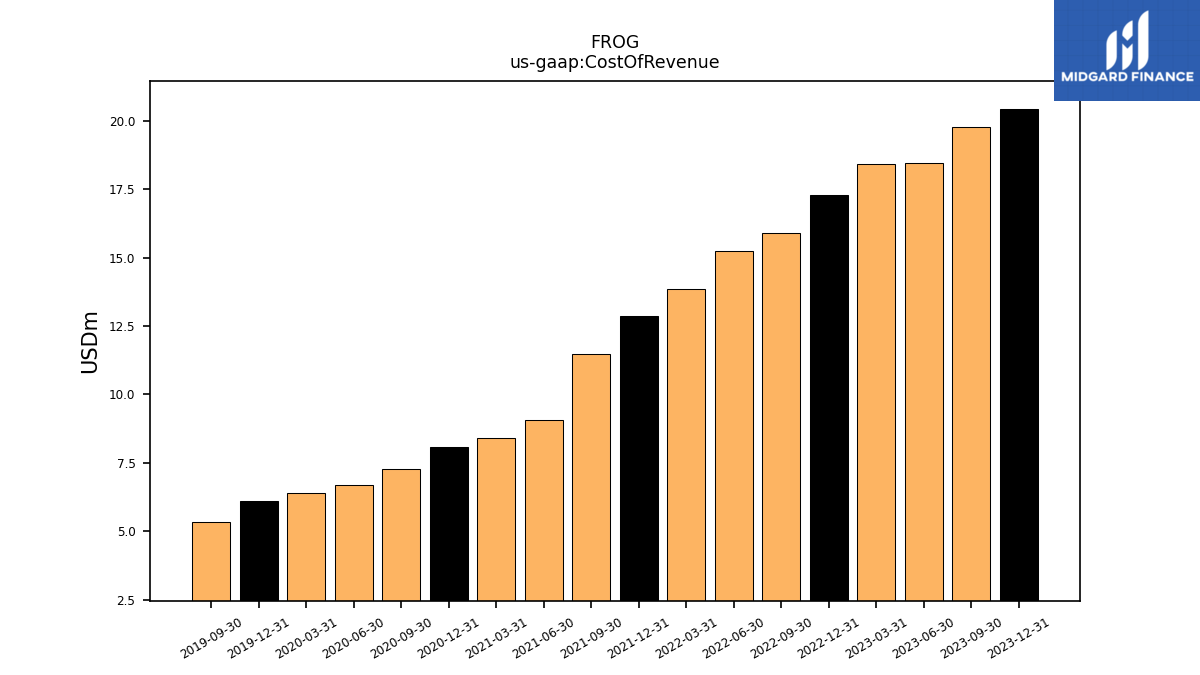
| Cost Of Revenue | 20.42 | 19.75 | 18.45 | 18.42 | 17.28 | 15.90 | 15.24 | 13.86 | 12.86 | 11.46 | 9.07 | 8.43 | 8.10 | 7.26 | 6.69 | 6.40 | 6.11 | 5.35 | |
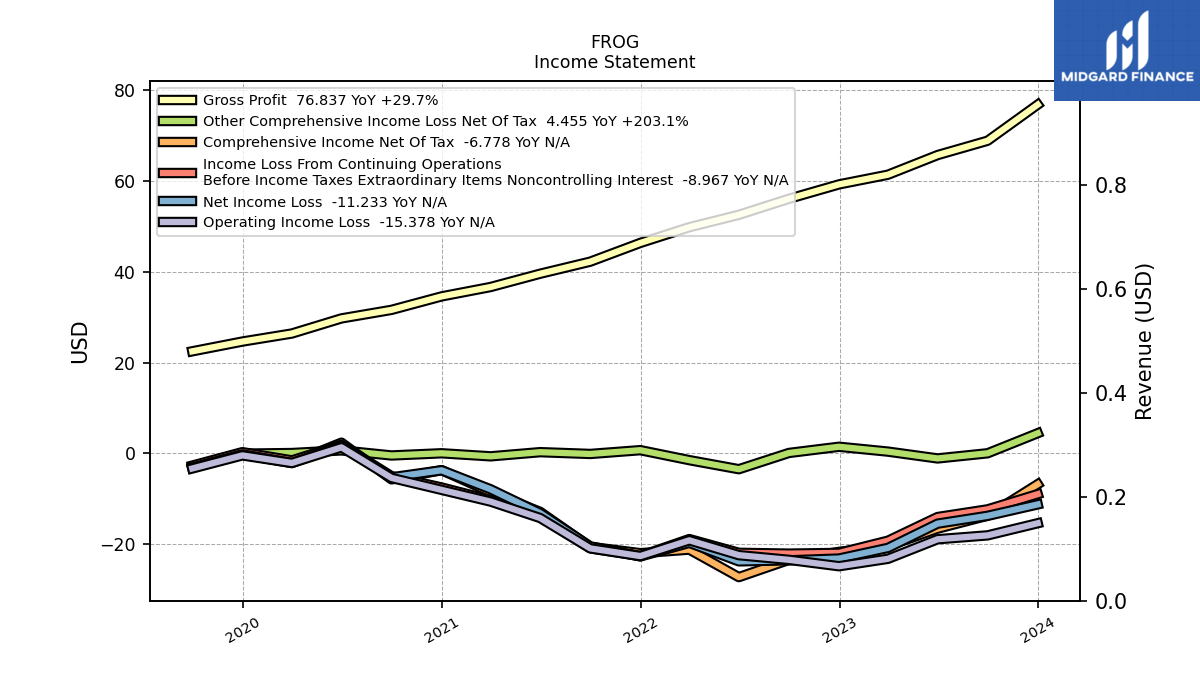
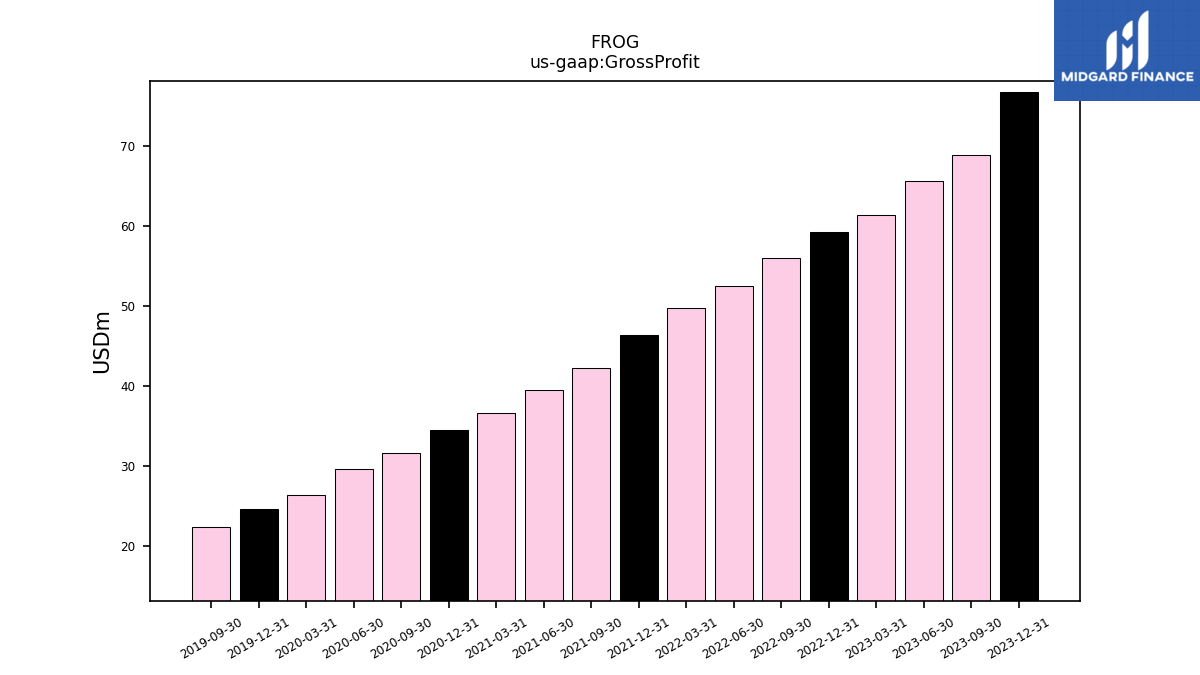
| Gross Profit | 76.84 | 68.89 | 65.72 | 61.40 | 59.26 | 56.09 | 52.56 | 49.83 | 46.37 | 42.24 | 39.59 | 36.66 | 34.59 | 31.62 | 29.74 | 26.42 | 24.64 | 22.50 | |
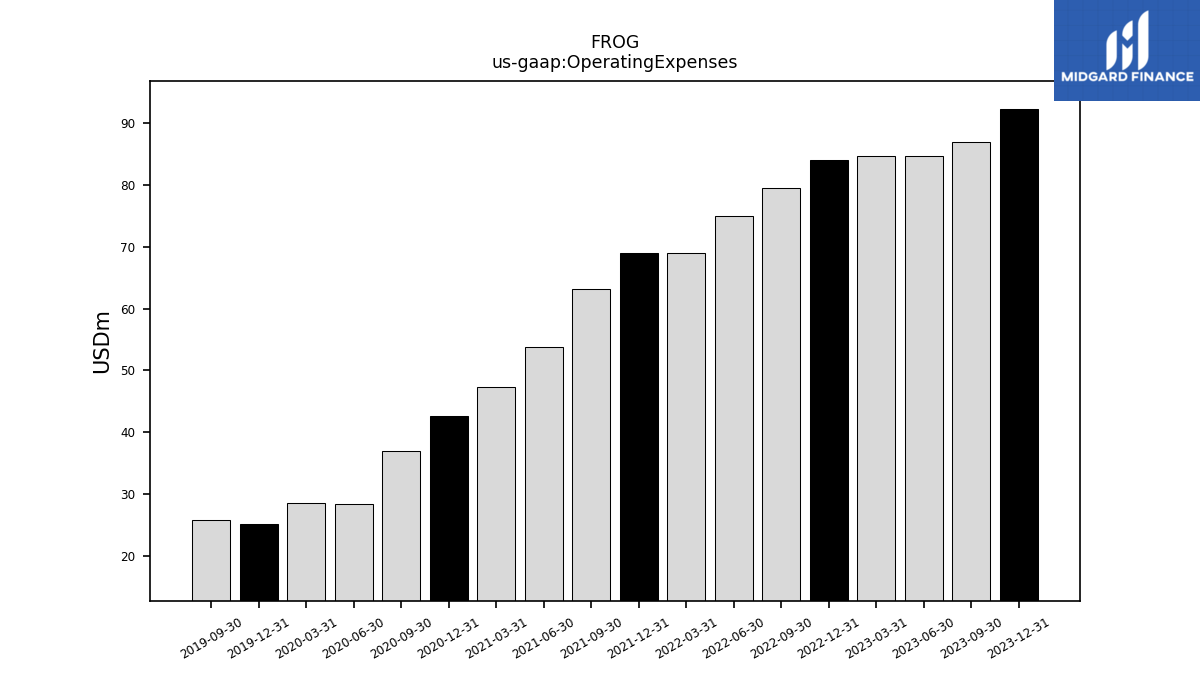
| Operating Expenses | 92.22 | 86.94 | 84.63 | 84.61 | 84.12 | 79.53 | 74.97 | 68.97 | 68.98 | 63.16 | 53.82 | 47.27 | 42.62 | 37.02 | 28.40 | 28.52 | 25.08 | 25.82 | |
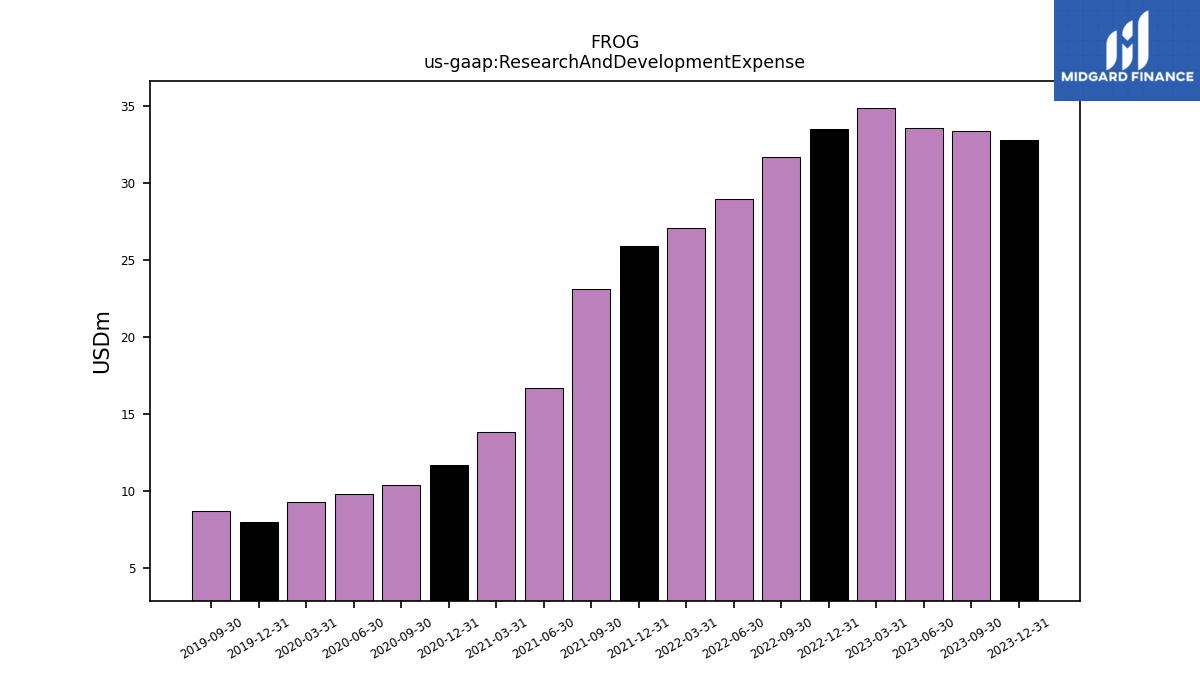
| Research And Development Expense | 32.80 | 33.36 | 33.54 | 34.89 | 33.48 | 31.70 | 28.95 | 27.10 | 25.94 | 23.14 | 16.69 | 13.84 | 11.66 | 10.38 | 9.78 | 9.29 | 7.97 | 8.66 | |
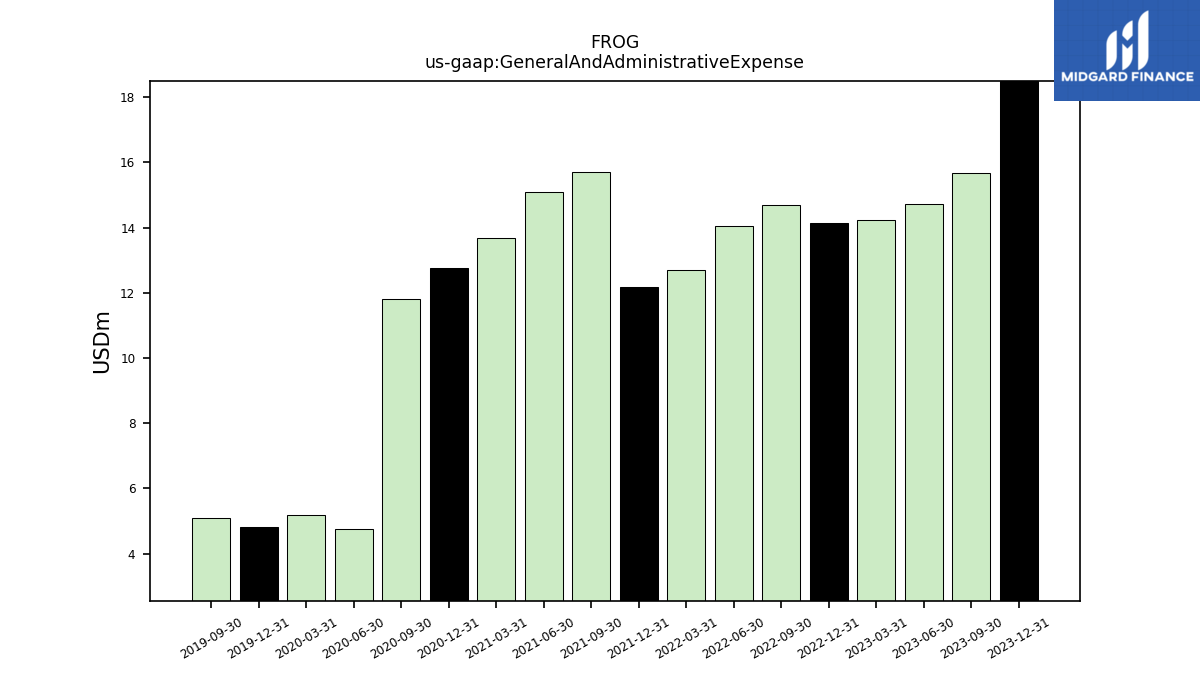
| General And Administrative Expense | 18.50 | 15.66 | 14.73 | 14.24 | 14.15 | 14.68 | 14.04 | 12.69 | 12.19 | 15.70 | 15.10 | 13.67 | 12.77 | 11.80 | 4.75 | 5.20 | 4.81 | 5.11 | |
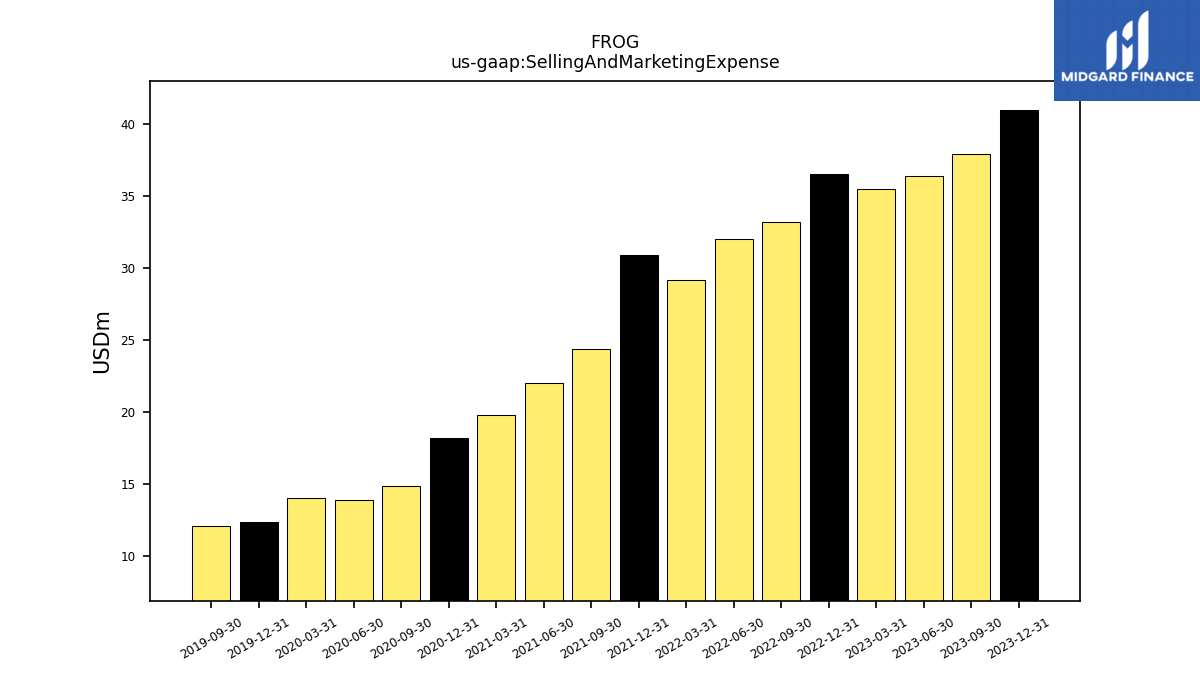
| Selling And Marketing Expense | 40.92 | 37.91 | 36.35 | 35.49 | 36.49 | 33.15 | 31.99 | 29.18 | 30.85 | 24.32 | 22.03 | 19.77 | 18.19 | 14.84 | 13.88 | 14.02 | 12.30 | 12.04 | |
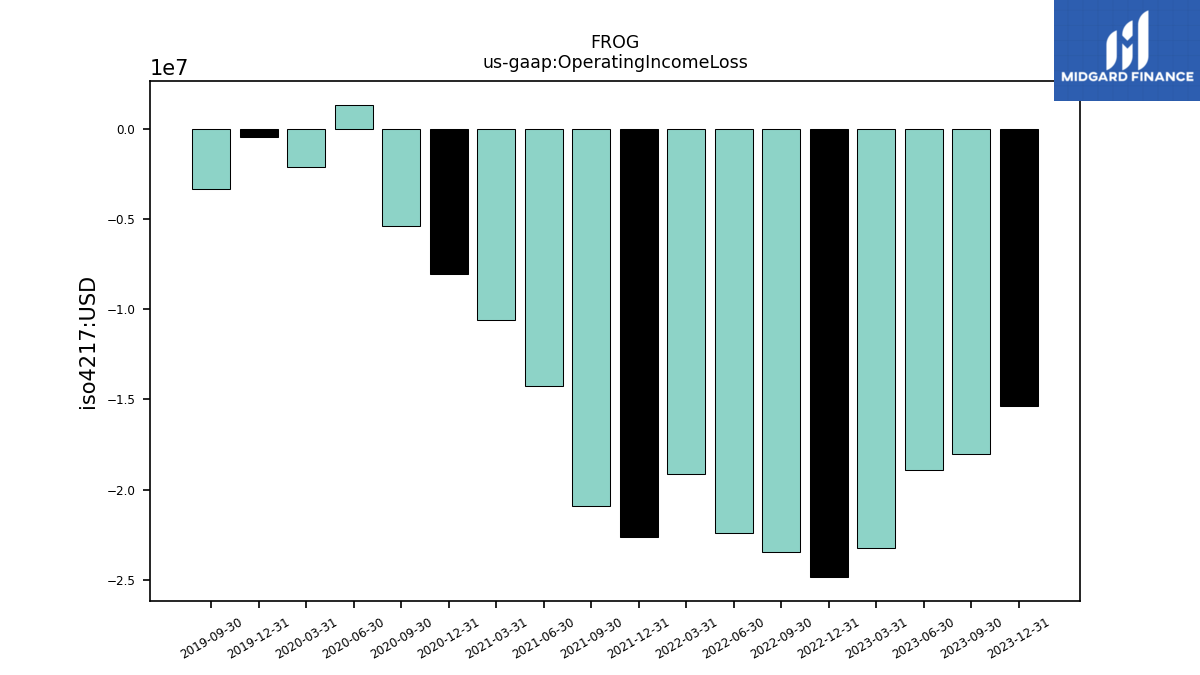
| Operating Income Loss | -15.38 | -18.05 | -18.91 | -23.21 | -24.85 | -23.44 | -22.41 | -19.14 | -22.61 | -20.92 | -14.23 | -10.61 | -8.03 | -5.40 | 1.34 | -2.10 | -0.43 | -3.32 | |
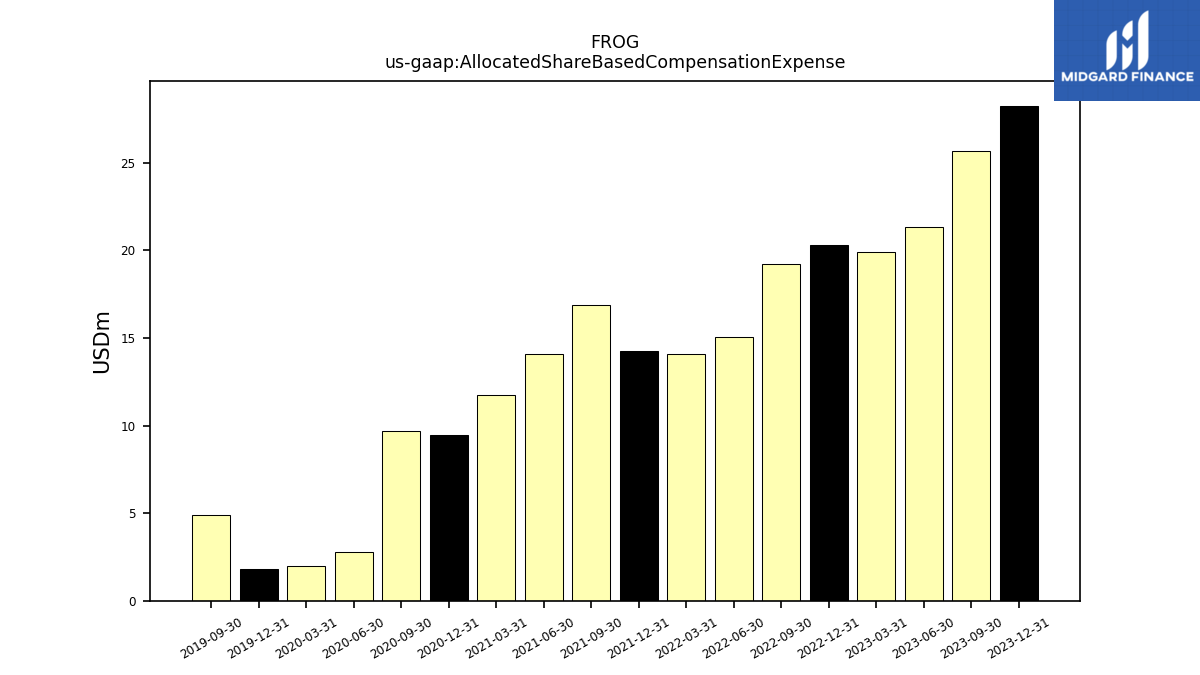
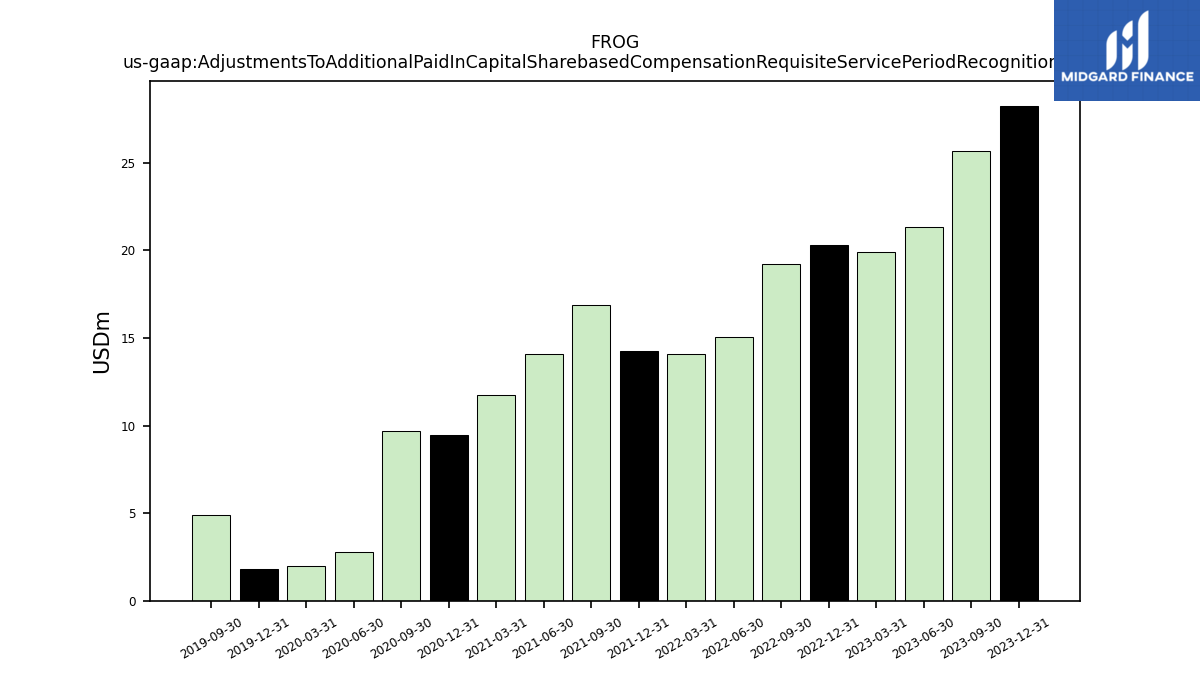
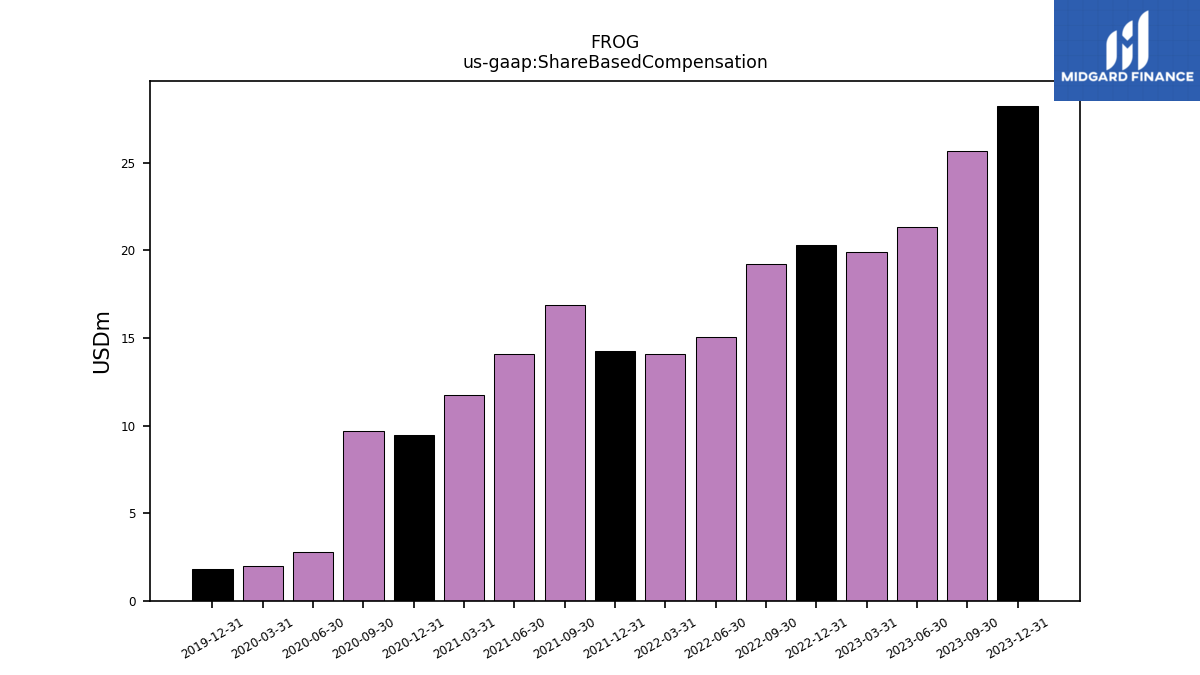
| Allocated Share Based Compensation Expense | 28.25 | 25.69 | 21.32 | 19.91 | 20.29 | 19.22 | 15.08 | 14.07 | 14.24 | 16.86 | 14.10 | 11.75 | 9.45 | 9.66 | 2.78 | 1.96 | 1.83 | 4.89 | |
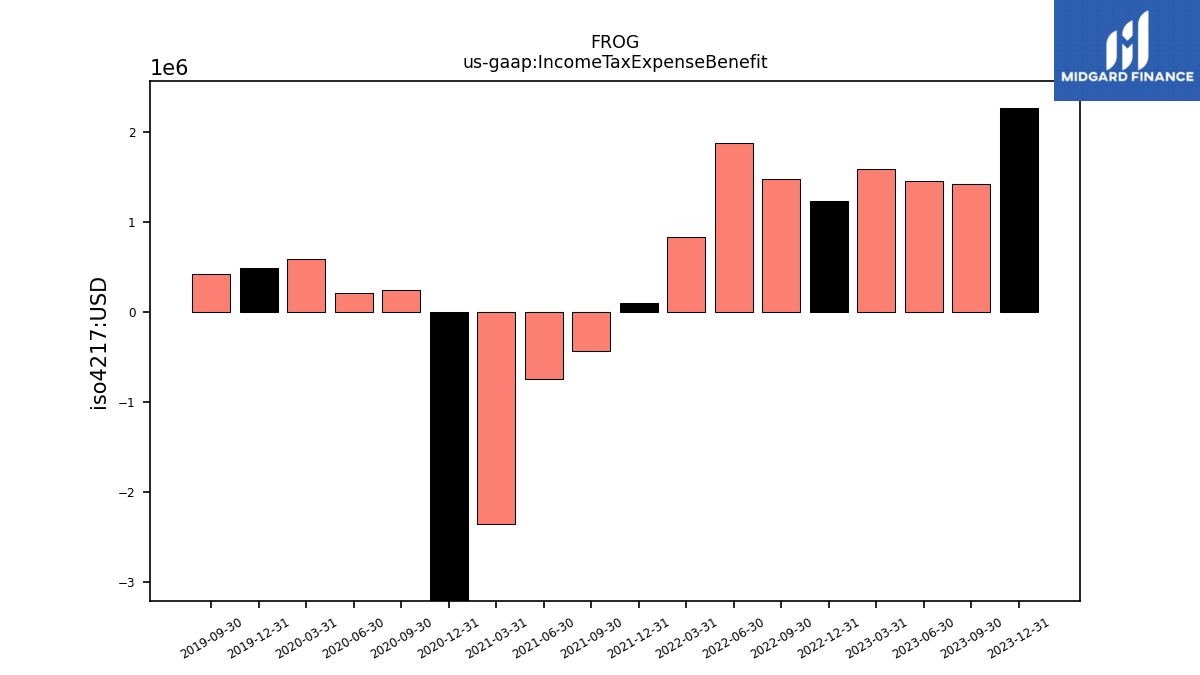
| Income Tax Expense Benefit | 2.27 | 1.43 | 1.46 | 1.59 | 1.24 | 1.48 | 1.88 | 0.84 | 0.10 | -0.43 | -0.74 | -2.36 | -3.79 | 0.25 | 0.21 | 0.59 | 0.49 | 0.43 | |
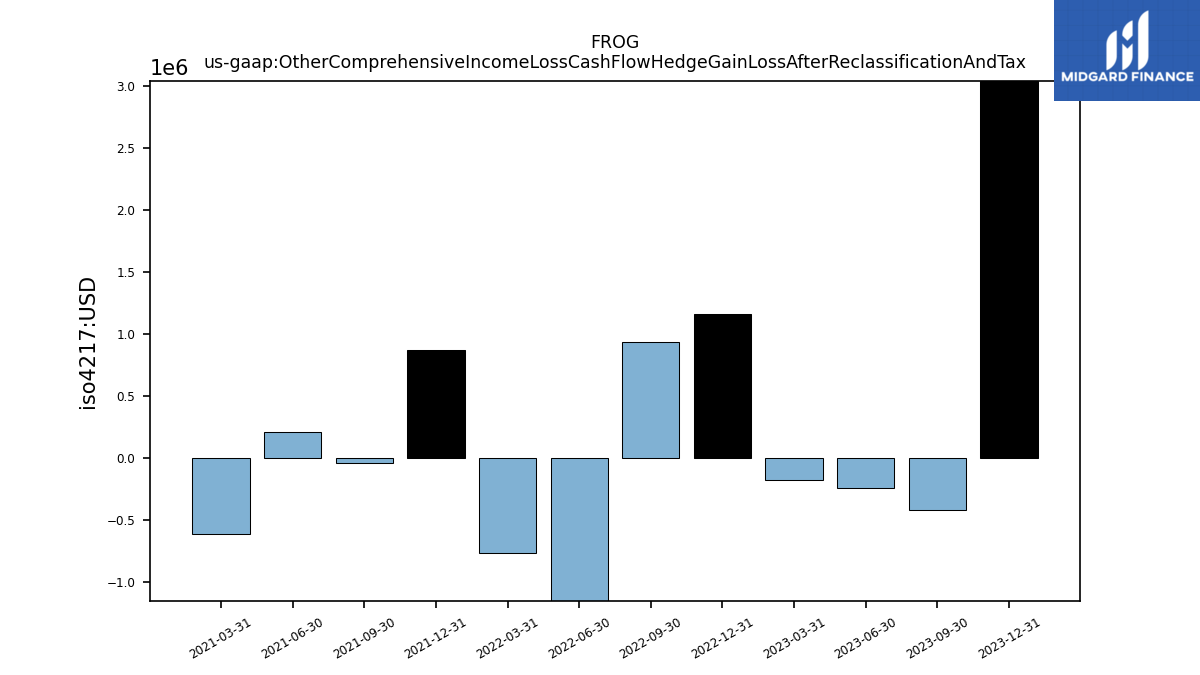
| Other Comprehensive Income Loss Cash Flow Hedge Gain Loss After Reclassification And Tax | 3.04 | -0.41 | -0.24 | -0.17 | 1.16 | 0.93 | -3.28 | -0.76 | 0.87 | -0.04 | 0.21 | -0.61 | NA | NA | NA | NA | NA | NA | |
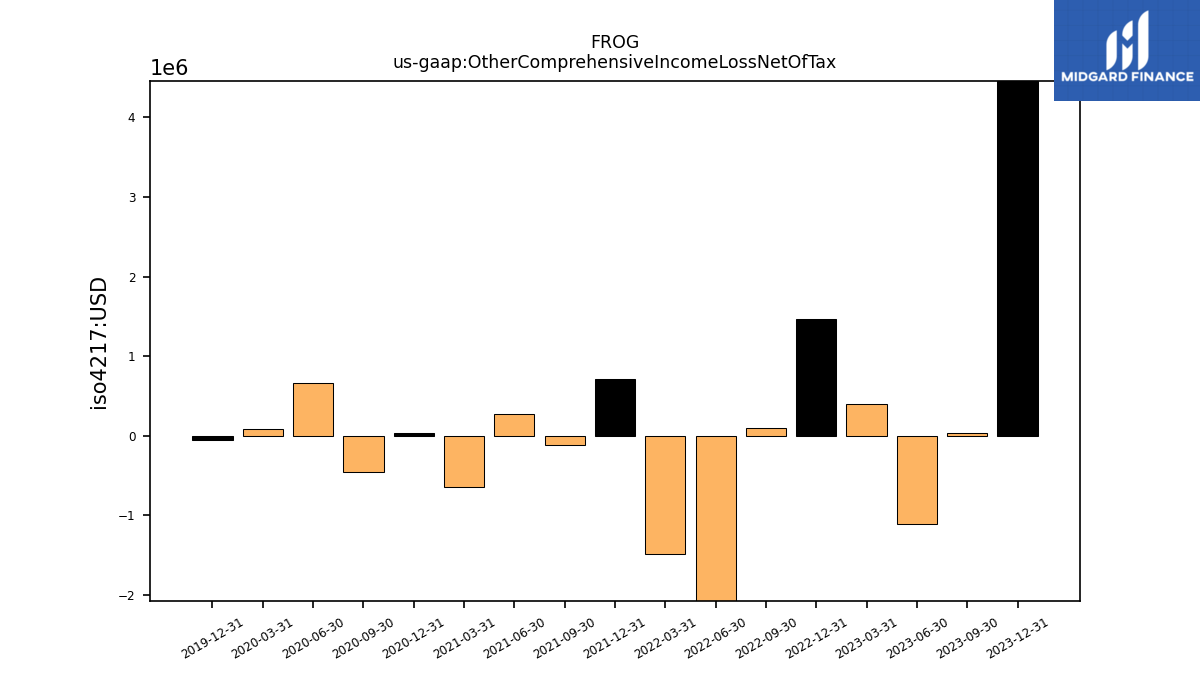
| Other Comprehensive Income Loss Net Of Tax | 4.46 | 0.04 | -1.10 | 0.40 | 1.47 | 0.10 | -3.48 | -1.48 | 0.72 | -0.12 | 0.28 | -0.64 | 0.03 | -0.45 | 0.67 | 0.09 | -0.05 | NA | |
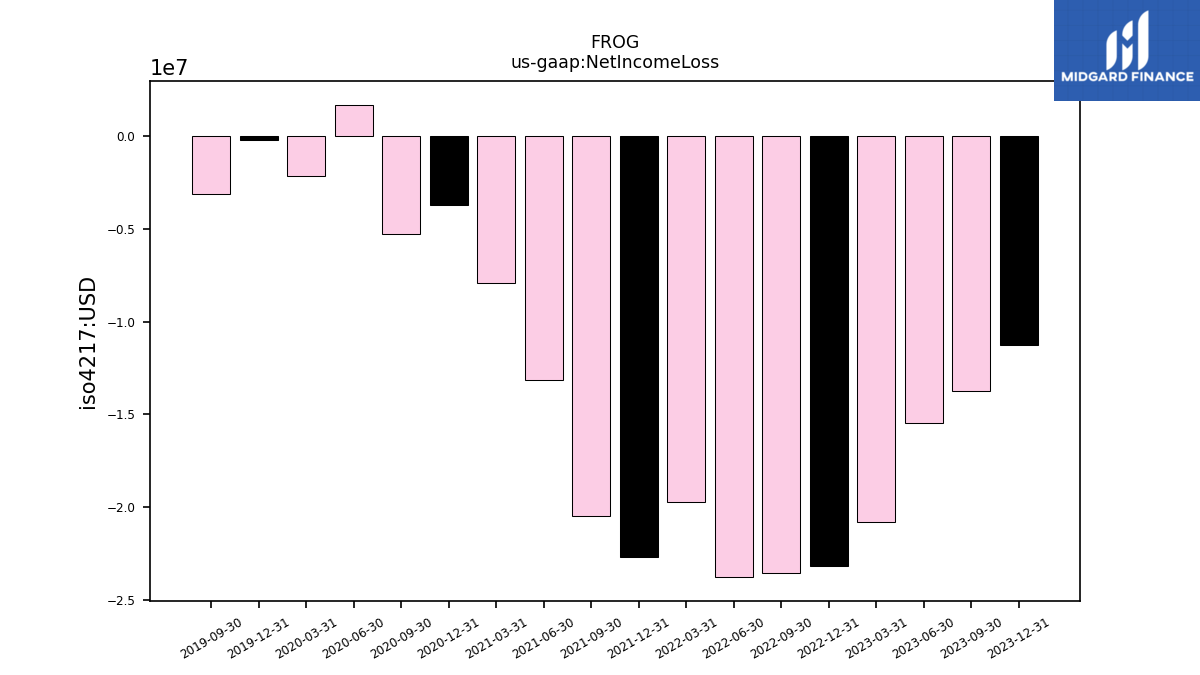
| Net Income Loss | -11.23 | -13.75 | -15.47 | -20.81 | -23.16 | -23.55 | -23.77 | -19.70 | -22.70 | -20.46 | -13.15 | -7.89 | -3.71 | -5.26 | 1.70 | -2.12 | -0.21 | -3.11 | |
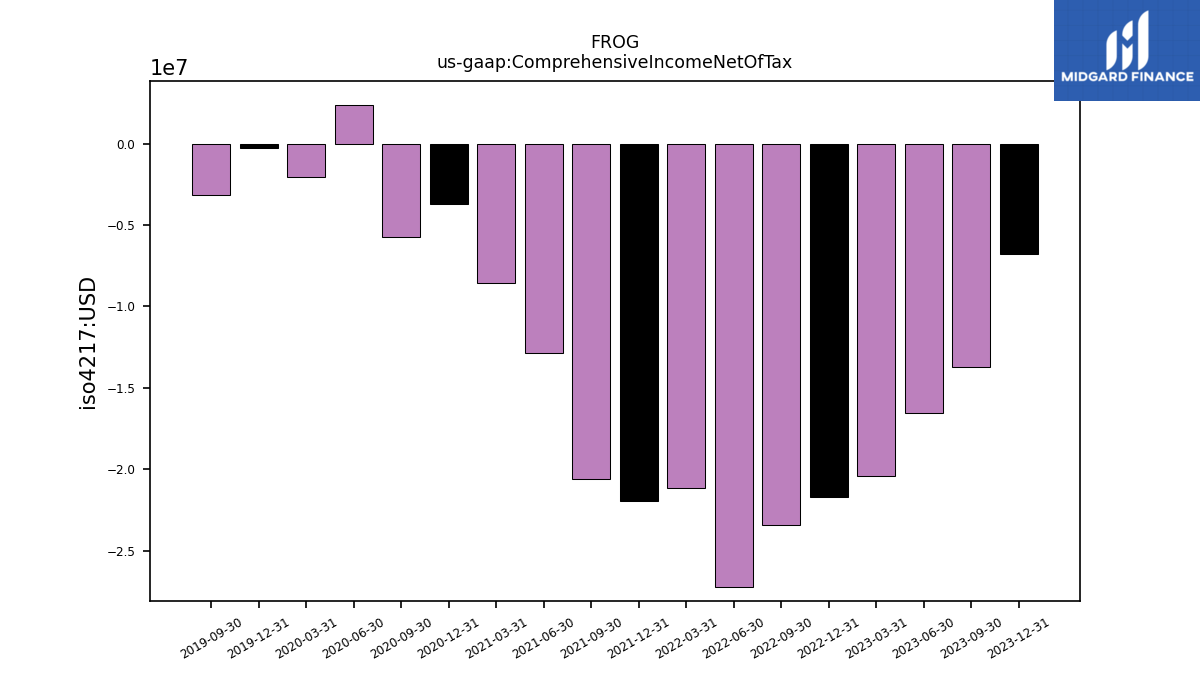
| Comprehensive Income Net Of Tax | -6.78 | -13.71 | -16.57 | -20.41 | -21.68 | -23.45 | -27.25 | -21.18 | -21.98 | -20.58 | -12.87 | -8.54 | -3.68 | -5.71 | 2.37 | -2.04 | -0.26 | -3.13 |
| 2023-12-31 | 2023-09-30 | 2023-06-30 | 2023-03-31 | 2022-12-31 | 2022-09-30 | 2022-06-30 | 2022-03-31 | 2021-12-31 | 2021-09-30 | 2021-06-30 | 2021-03-31 | 2020-12-31 | 2020-09-30 | 2020-06-30 | 2020-03-31 | 2019-12-31 | 2019-09-30 | ||
|---|---|---|---|---|---|---|---|---|---|---|---|---|---|---|---|---|---|---|---|
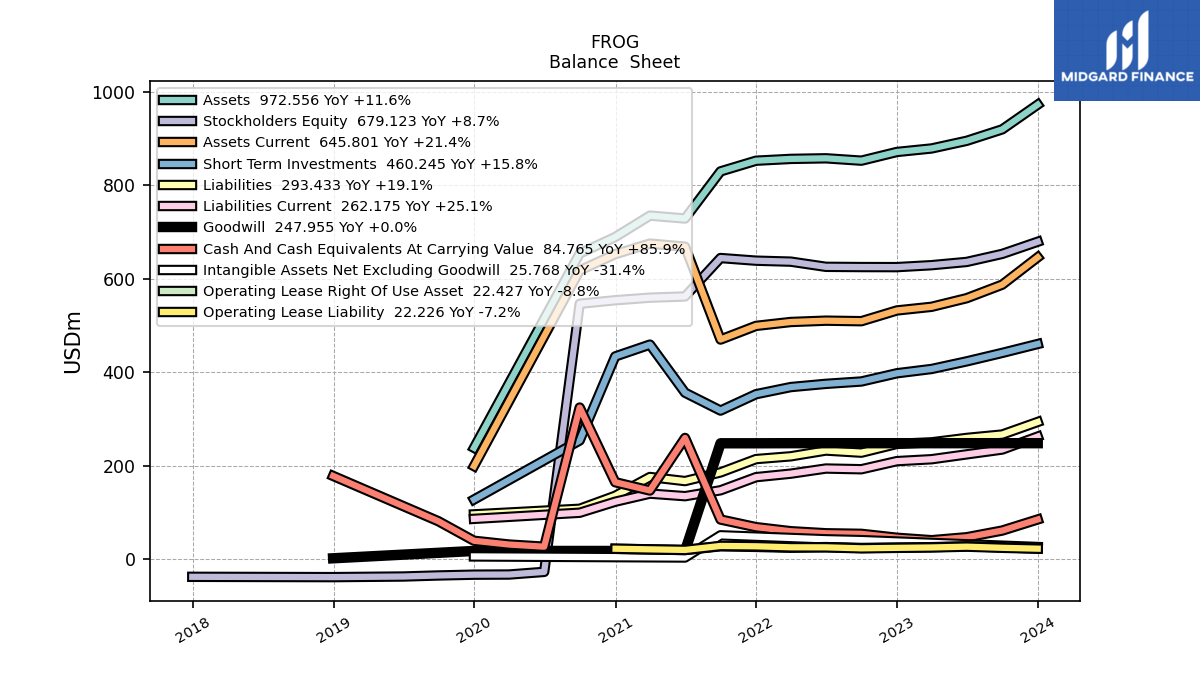
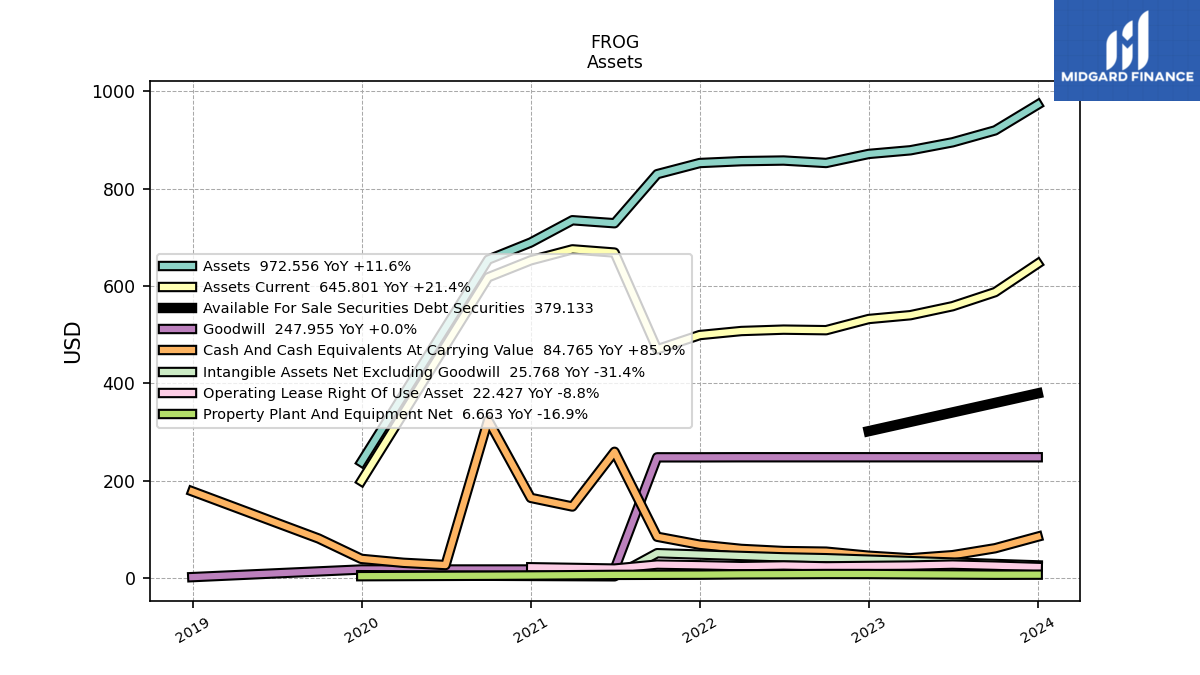
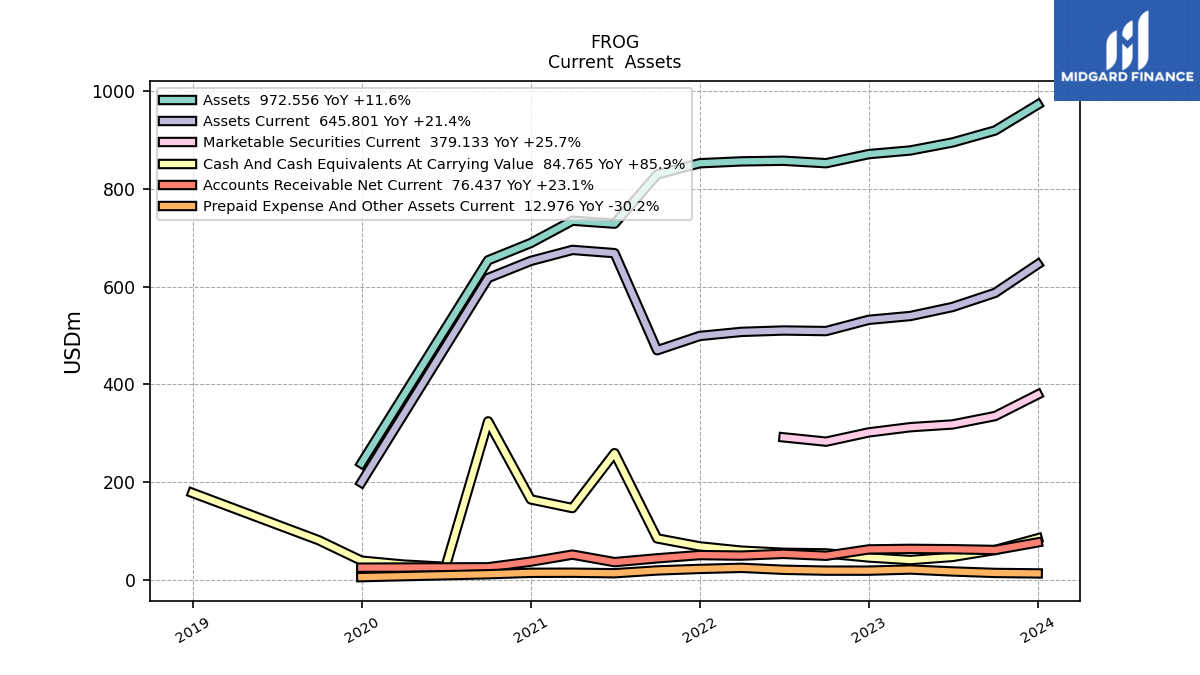
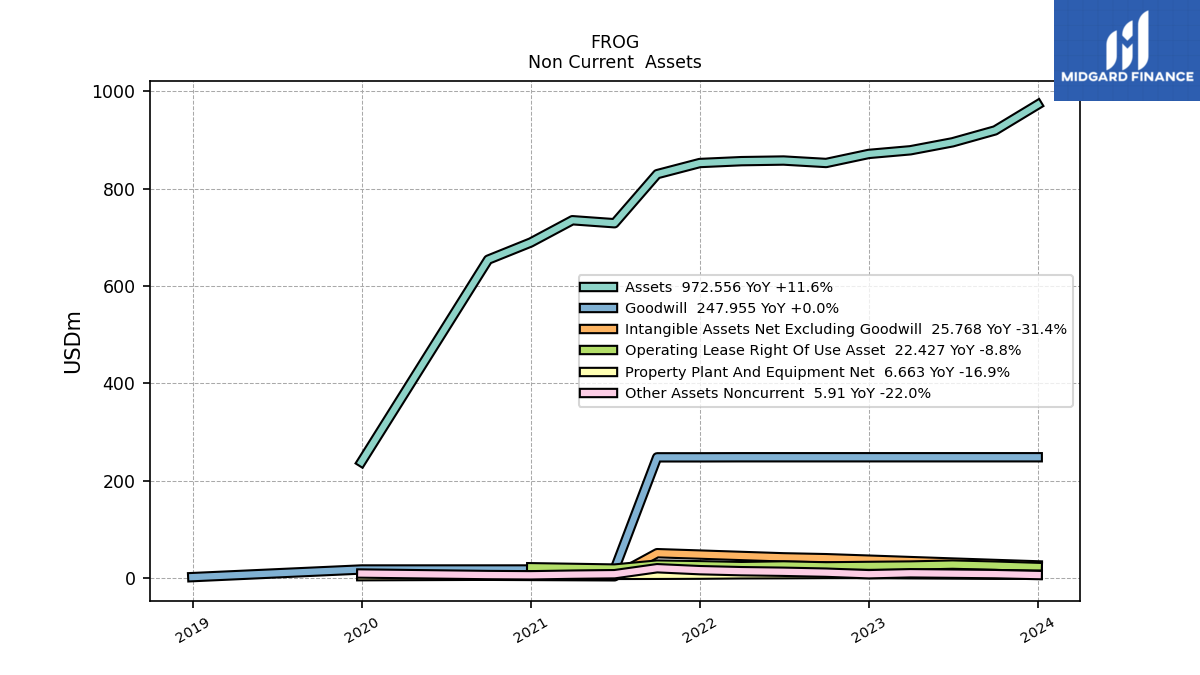
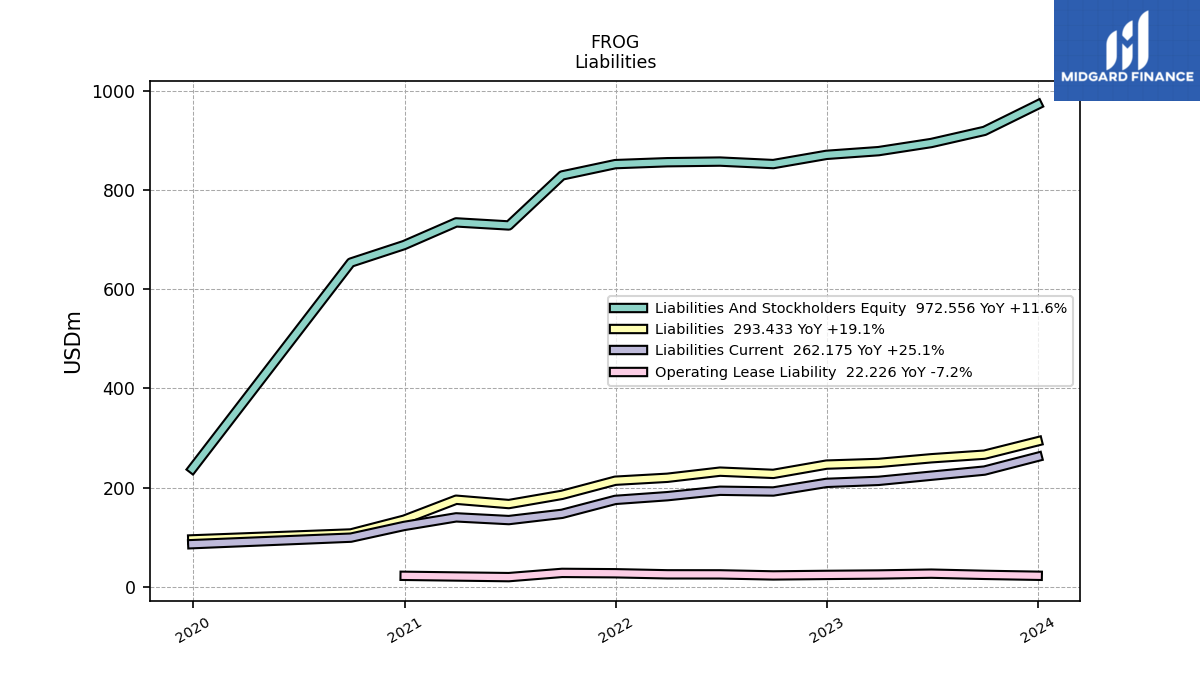
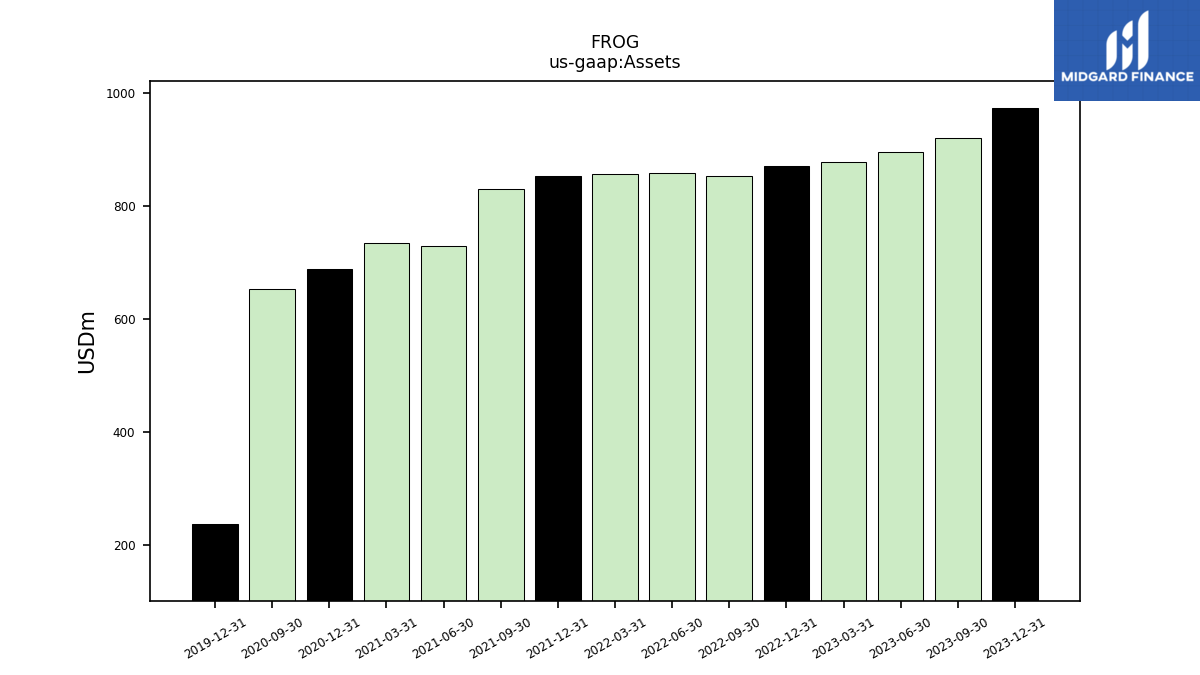
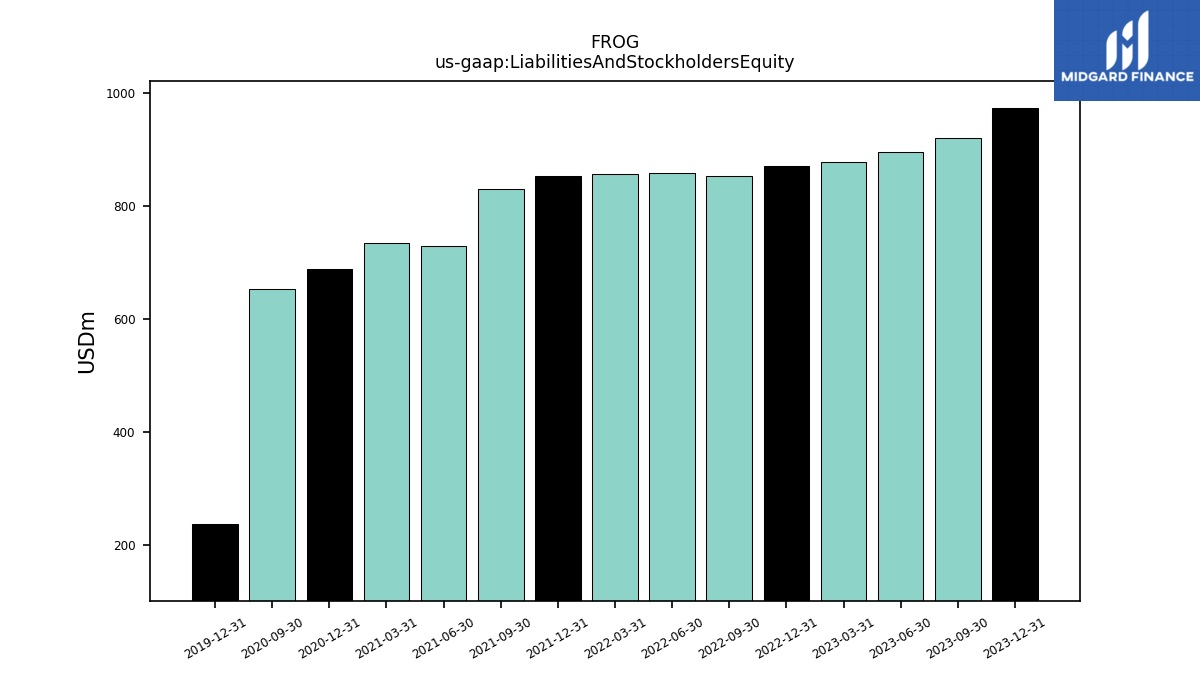
| Assets | 972.56 | 919.61 | 895.12 | 878.74 | 871.22 | 852.62 | 857.68 | 856.40 | 852.53 | 829.68 | 728.81 | 735.01 | 689.23 | 653.97 | NA | NA | 238.04 | NA | |
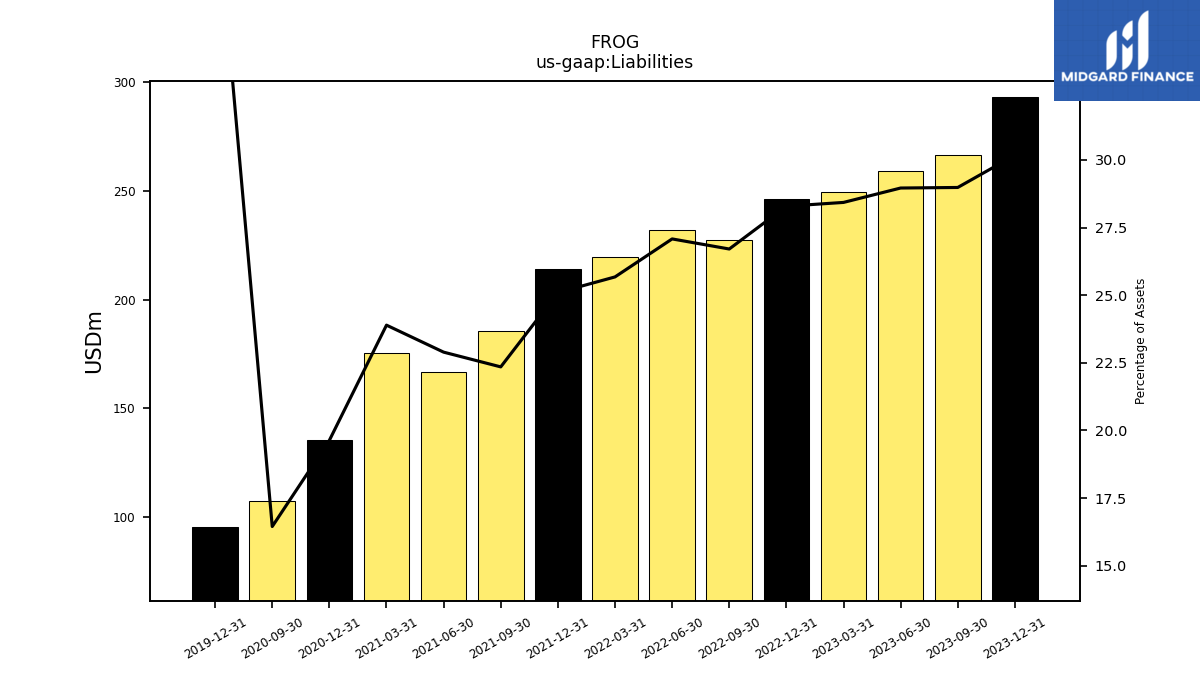
| Liabilities | 293.43 | 266.51 | 259.23 | 249.81 | 246.45 | 227.71 | 232.25 | 219.88 | 213.95 | 185.44 | 166.86 | 175.61 | 135.34 | 107.59 | NA | NA | 95.63 | NA | |
| Liabilities And Stockholders Equity | 972.56 | 919.61 | 895.12 | 878.74 | 871.22 | 852.62 | 857.68 | 856.40 | 852.53 | 829.68 | 728.81 | 735.01 | 689.23 | 653.97 | NA | NA | 238.04 | NA | |
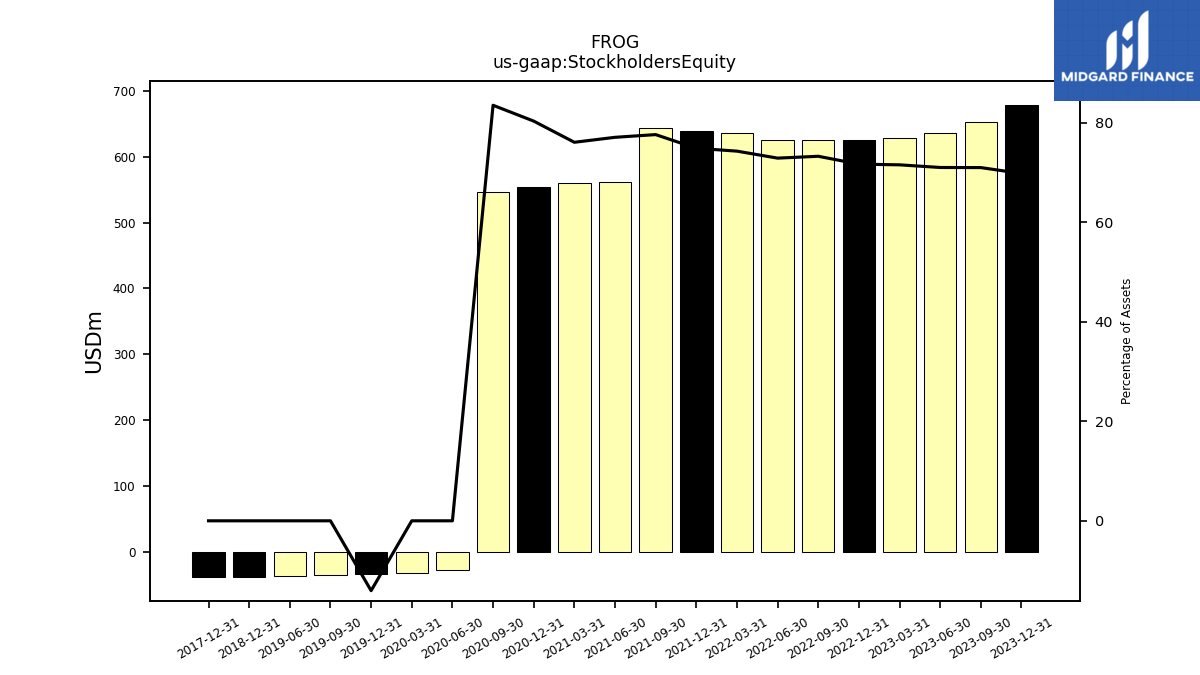
| Stockholders Equity | 679.12 | 653.10 | 635.89 | 628.93 | 624.77 | 624.92 | 625.42 | 636.52 | 638.58 | 644.24 | 561.95 | 559.40 | 553.89 | 546.38 | -27.46 | -33.12 | -33.43 | -35.11 |
| 2023-12-31 | 2023-09-30 | 2023-06-30 | 2023-03-31 | 2022-12-31 | 2022-09-30 | 2022-06-30 | 2022-03-31 | 2021-12-31 | 2021-09-30 | 2021-06-30 | 2021-03-31 | 2020-12-31 | 2020-09-30 | 2020-06-30 | 2020-03-31 | 2019-12-31 | 2019-09-30 | ||
|---|---|---|---|---|---|---|---|---|---|---|---|---|---|---|---|---|---|---|---|
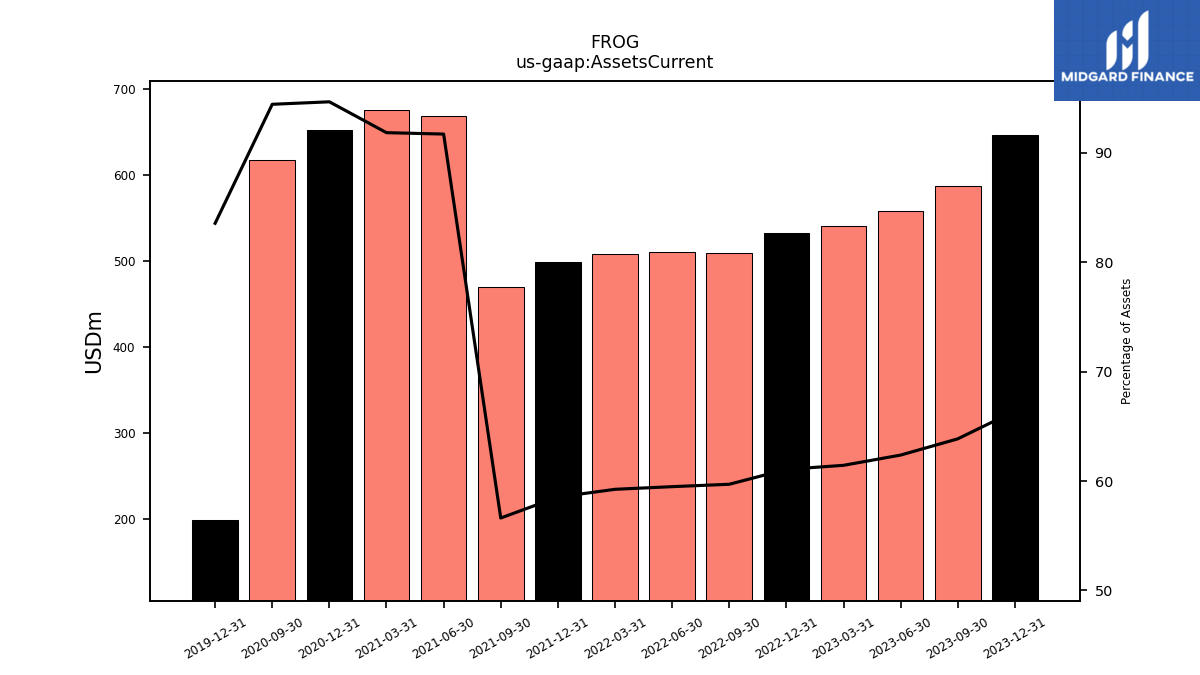
| Assets Current | 645.80 | 587.24 | 558.31 | 539.86 | 532.02 | 509.05 | 510.19 | 507.35 | 499.02 | 469.75 | 668.53 | 675.16 | 652.56 | 617.69 | NA | NA | 198.93 | NA | |
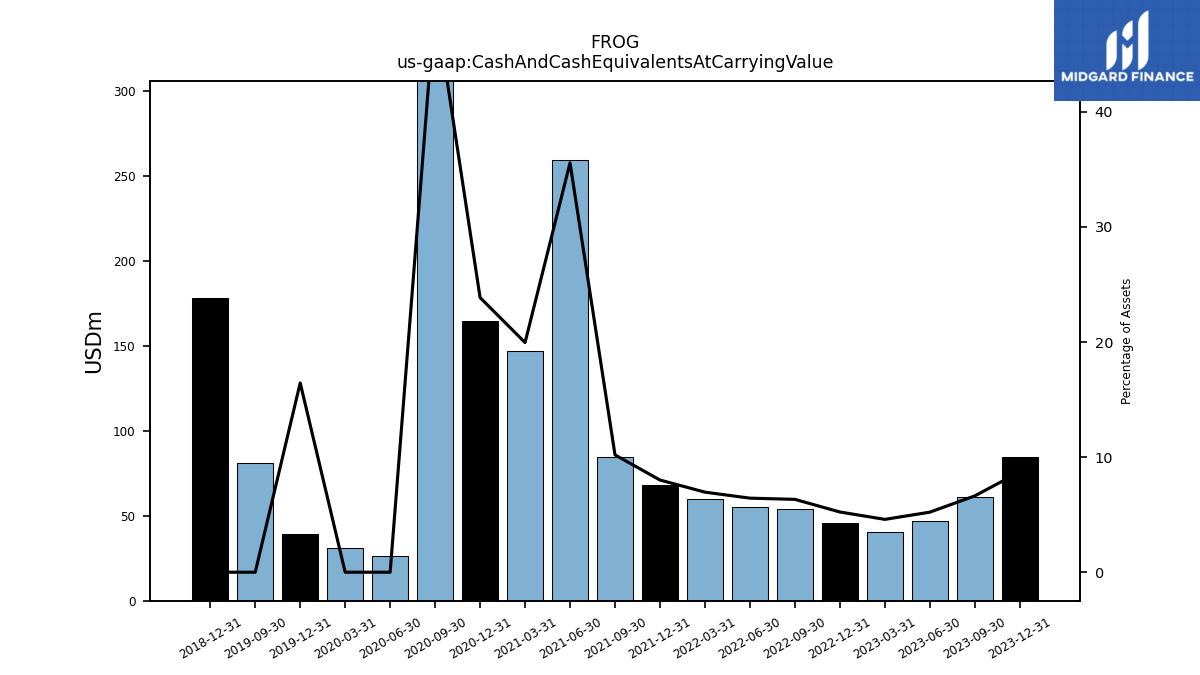
| Cash And Cash Equivalents At Carrying Value | 84.77 | 60.98 | 46.69 | 40.35 | 45.59 | 53.97 | 55.19 | 59.58 | 68.28 | 84.61 | 259.22 | 146.68 | 164.46 | 324.29 | 26.46 | 31.06 | 39.15 | 80.91 | |
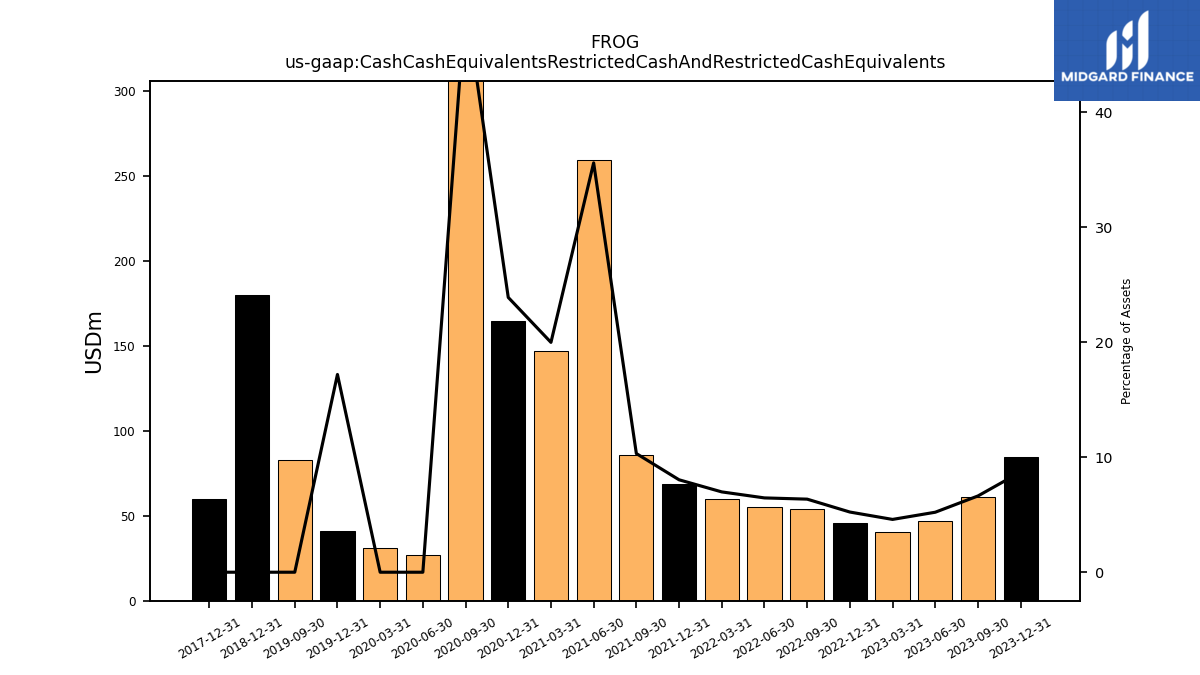
| Cash Cash Equivalents Restricted Cash And Restricted Cash Equivalents | 84.78 | 61.00 | 46.71 | 40.36 | 45.61 | 54.19 | 55.43 | 59.83 | 68.54 | 85.64 | 259.49 | 146.94 | 164.74 | 324.56 | 26.75 | 31.34 | 40.94 | 82.98 | |
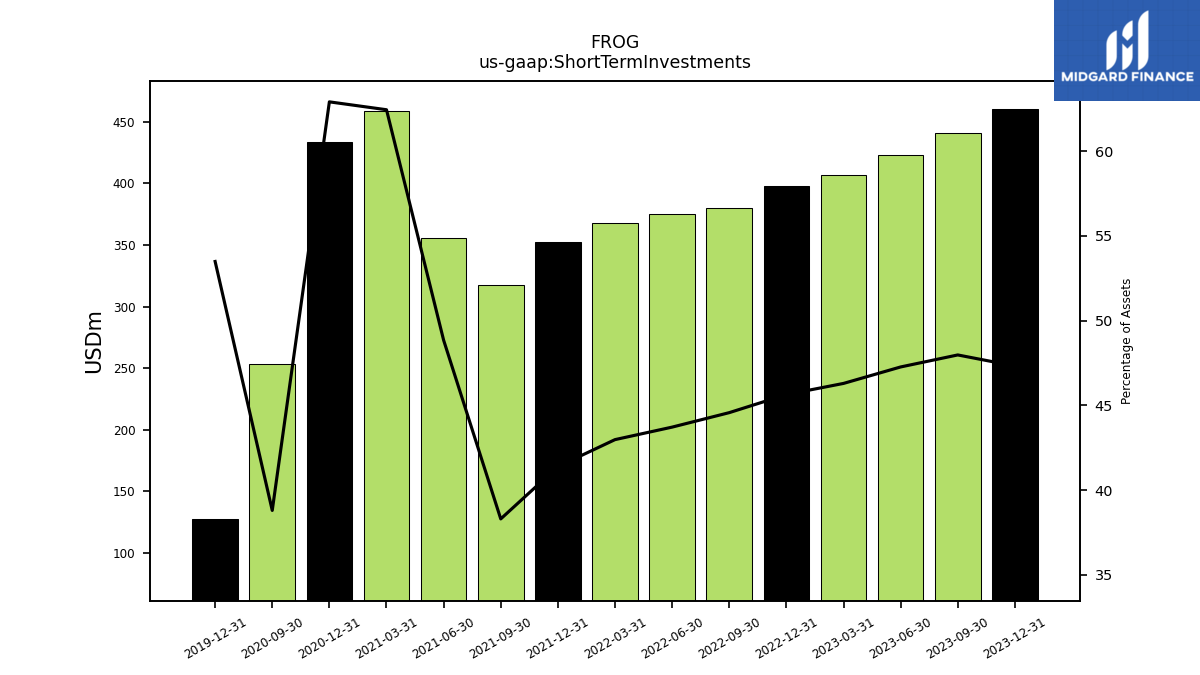
| Short Term Investments | 460.25 | 441.19 | 423.10 | 406.82 | 397.61 | 380.03 | 374.96 | 368.07 | 352.84 | 317.78 | 356.00 | 458.98 | 433.60 | 253.75 | NA | NA | 127.33 | NA | |
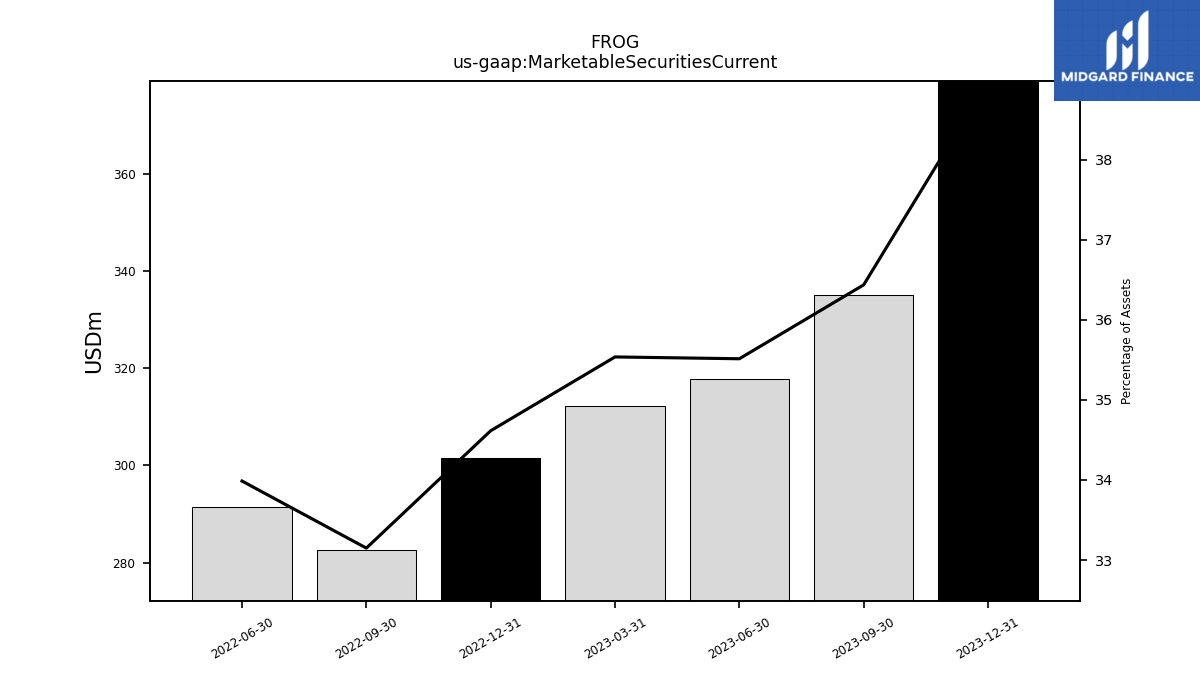
| Marketable Securities Current | 379.13 | 335.08 | 317.89 | 312.28 | 301.57 | 282.64 | 291.50 | NA | NA | NA | NA | NA | NA | NA | NA | NA | NA | NA | |
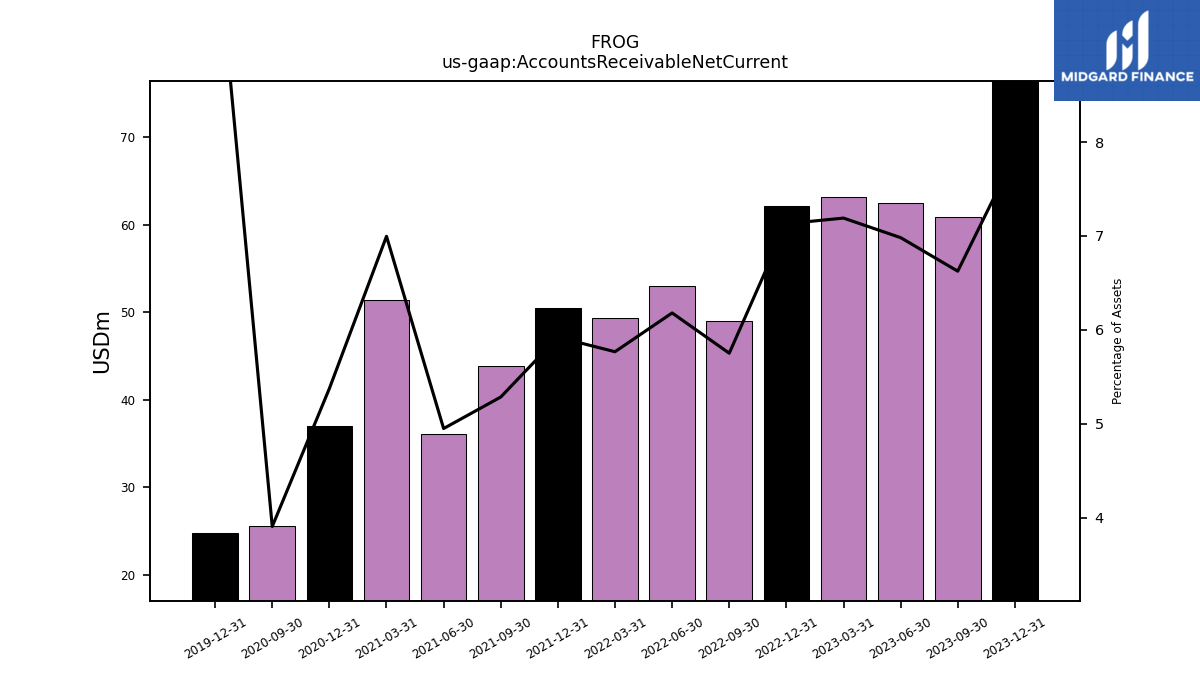
| Accounts Receivable Net Current | 76.44 | 60.92 | 62.50 | 63.18 | 62.12 | 49.04 | 53.00 | 49.39 | 50.48 | 43.84 | 36.07 | 51.42 | 37.05 | 25.54 | NA | NA | 24.74 | NA | |
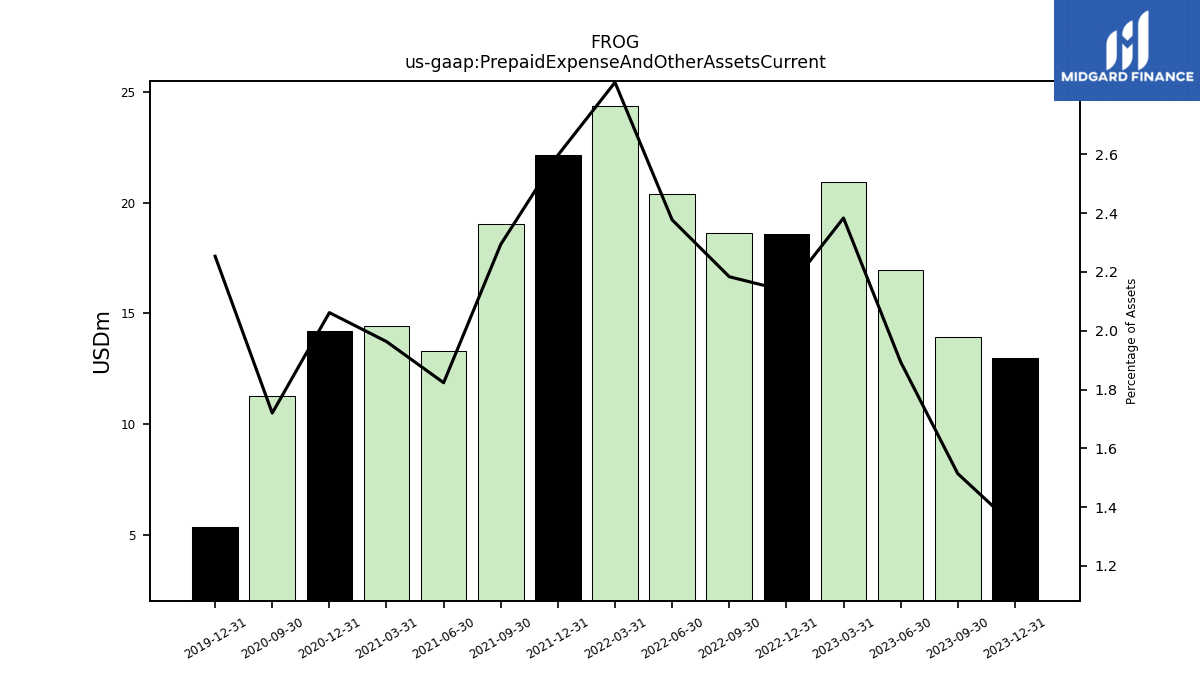
| Prepaid Expense And Other Assets Current | 12.98 | 13.92 | 16.95 | 20.94 | 18.60 | 18.62 | 20.39 | 24.36 | 22.14 | 19.03 | 13.29 | 14.43 | 14.21 | 11.25 | NA | NA | 5.36 | NA | |
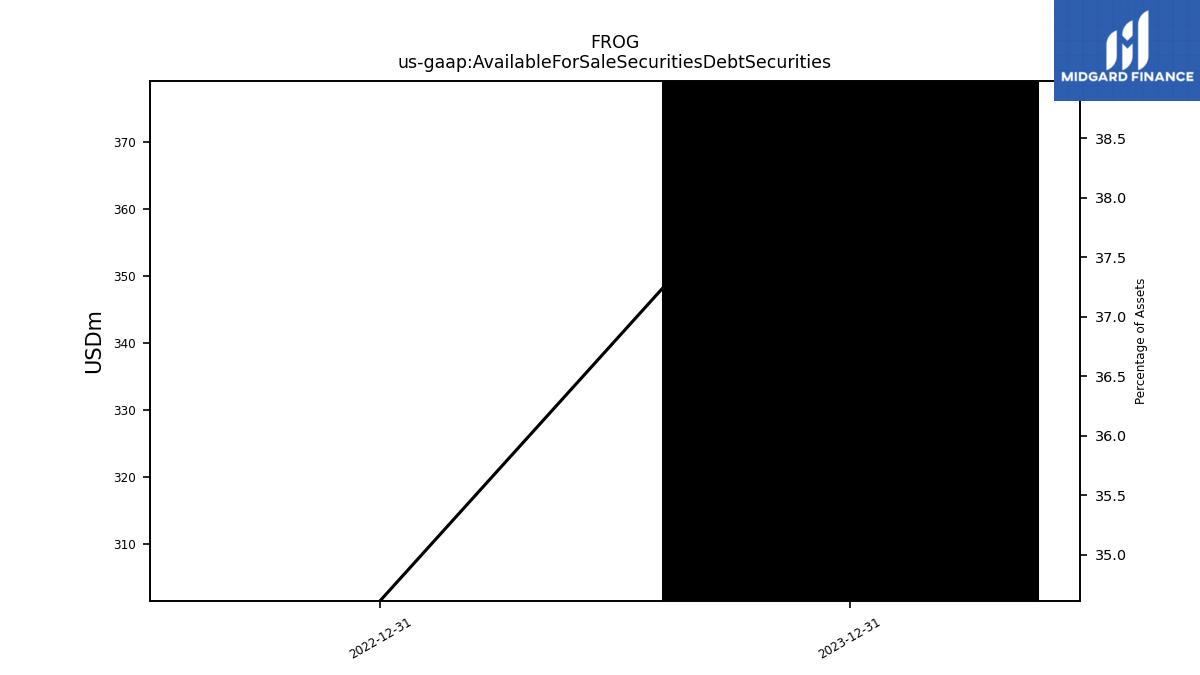
| Available For Sale Securities Debt Securities | 379.13 | NA | NA | NA | 301.57 | NA | NA | NA | NA | NA | NA | NA | NA | NA | NA | NA | NA | NA |
| 2023-12-31 | 2023-09-30 | 2023-06-30 | 2023-03-31 | 2022-12-31 | 2022-09-30 | 2022-06-30 | 2022-03-31 | 2021-12-31 | 2021-09-30 | 2021-06-30 | 2021-03-31 | 2020-12-31 | 2020-09-30 | 2020-06-30 | 2020-03-31 | 2019-12-31 | 2019-09-30 | ||
|---|---|---|---|---|---|---|---|---|---|---|---|---|---|---|---|---|---|---|---|
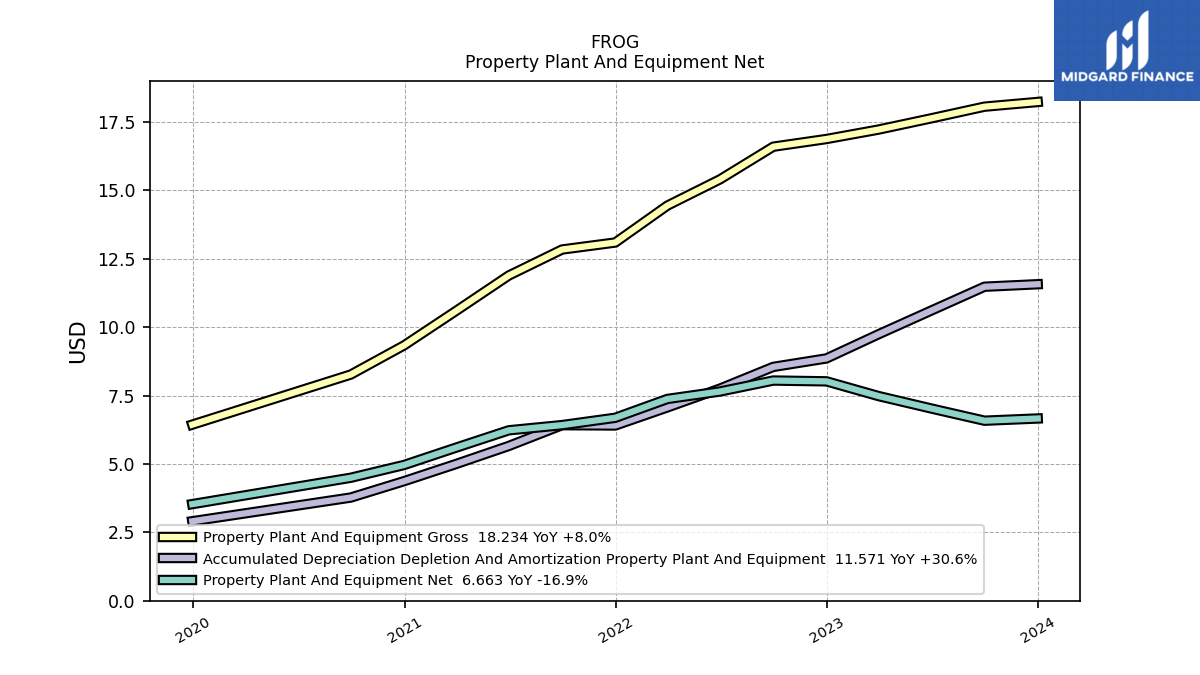
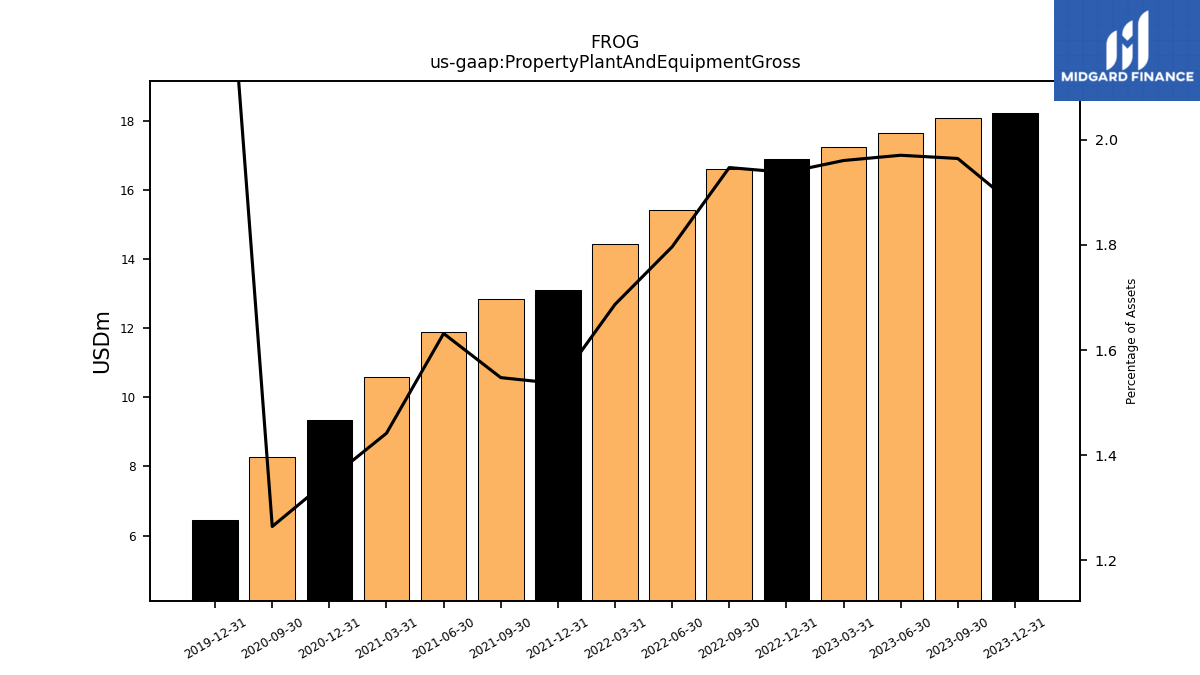
| Property Plant And Equipment Gross | 18.23 | 18.06 | 17.64 | 17.23 | 16.88 | 16.60 | 15.41 | 14.45 | 13.10 | 12.84 | 11.89 | 10.60 | 9.34 | 8.27 | NA | NA | 6.44 | NA | |
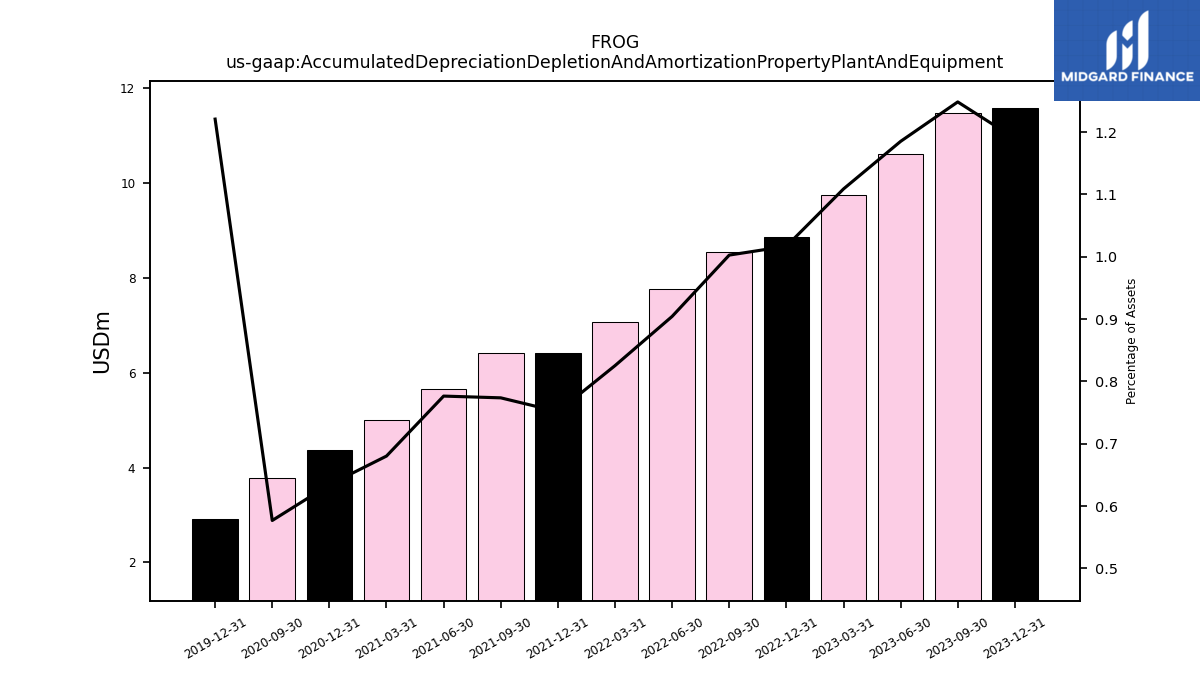
| Accumulated Depreciation Depletion And Amortization Property Plant And Equipment | 11.57 | 11.48 | 10.61 | 9.74 | 8.86 | 8.55 | 7.76 | 7.07 | 6.41 | 6.42 | 5.66 | 5.00 | 4.37 | 3.77 | NA | NA | 2.91 | NA | |
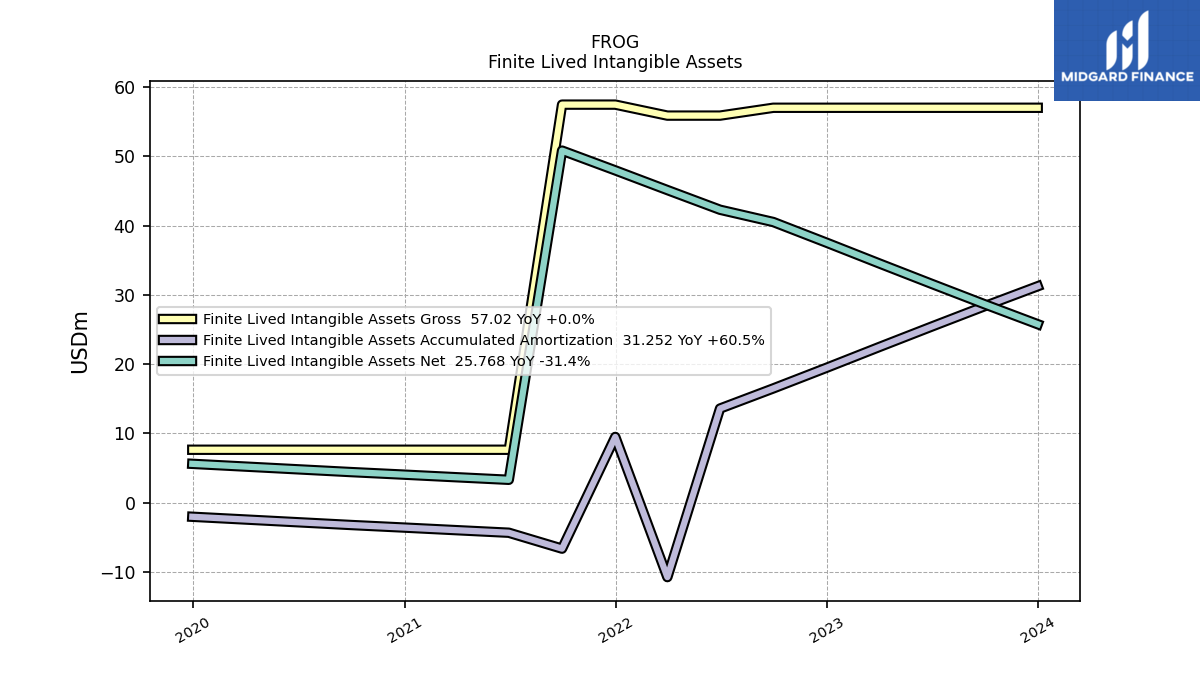
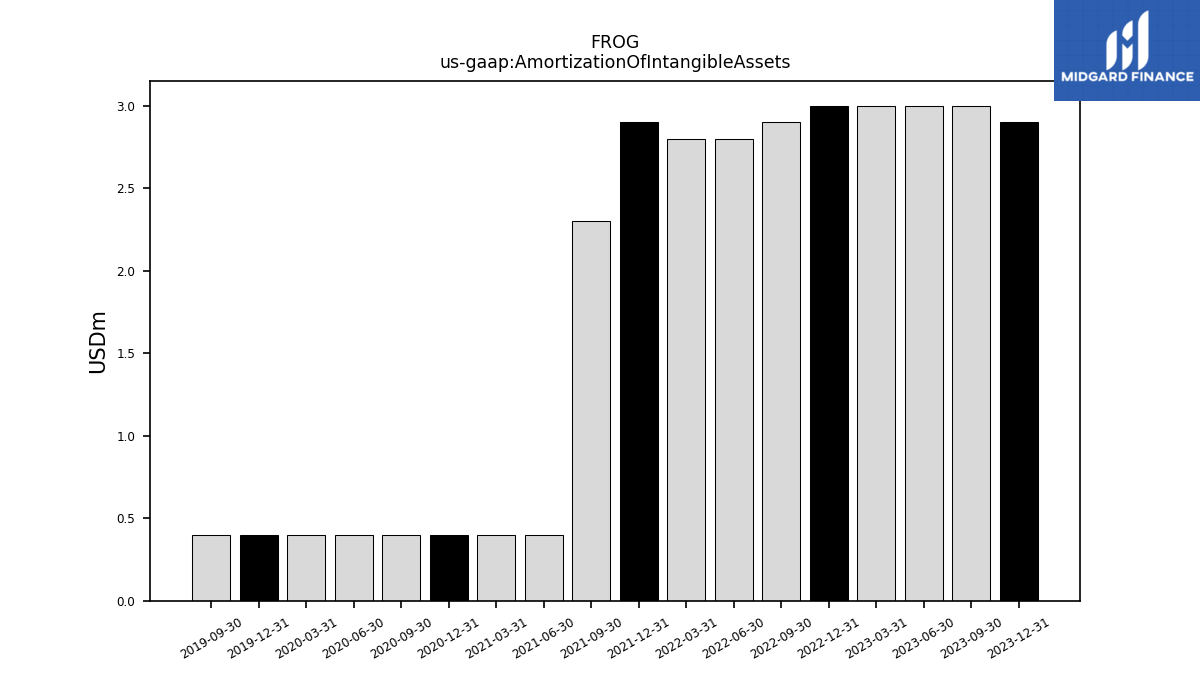
| Amortization Of Intangible Assets | 2.90 | 3.00 | 3.00 | 3.00 | 3.00 | 2.90 | 2.80 | 2.80 | 2.90 | 2.30 | 0.40 | 0.40 | 0.40 | 0.40 | 0.40 | 0.40 | 0.40 | 0.40 | |
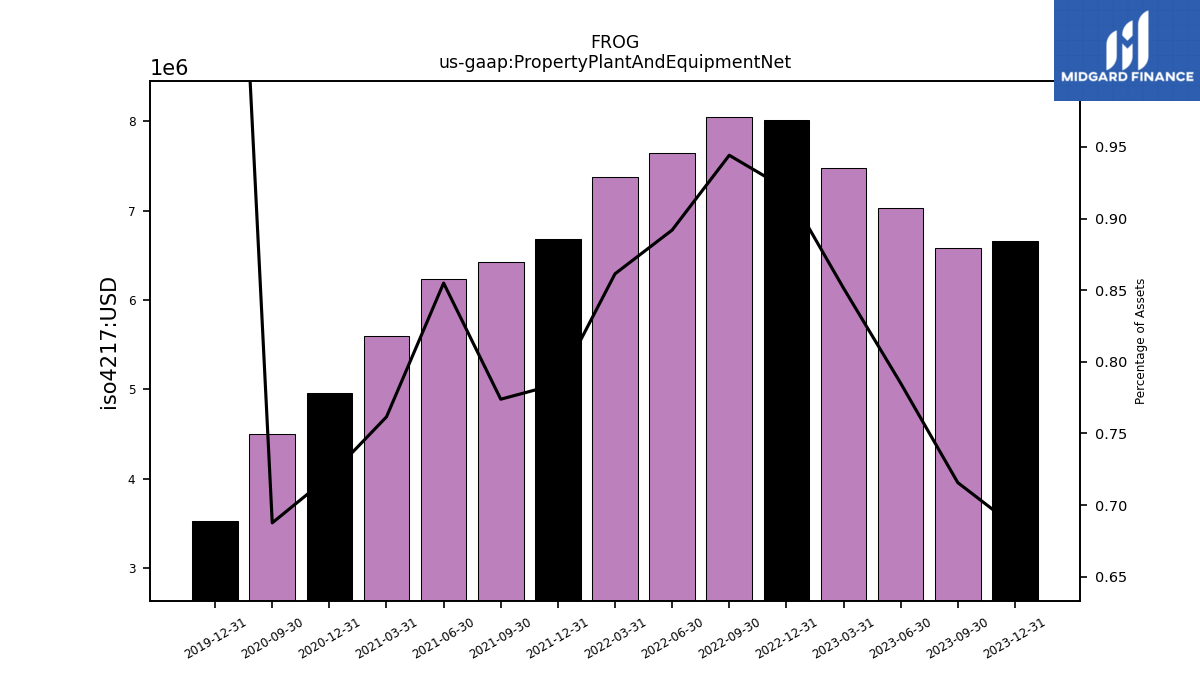
| Property Plant And Equipment Net | 6.66 | 6.58 | 7.03 | 7.48 | 8.02 | 8.05 | 7.65 | 7.38 | 6.69 | 6.42 | 6.23 | 5.60 | 4.96 | 4.50 | NA | NA | 3.53 | NA | |
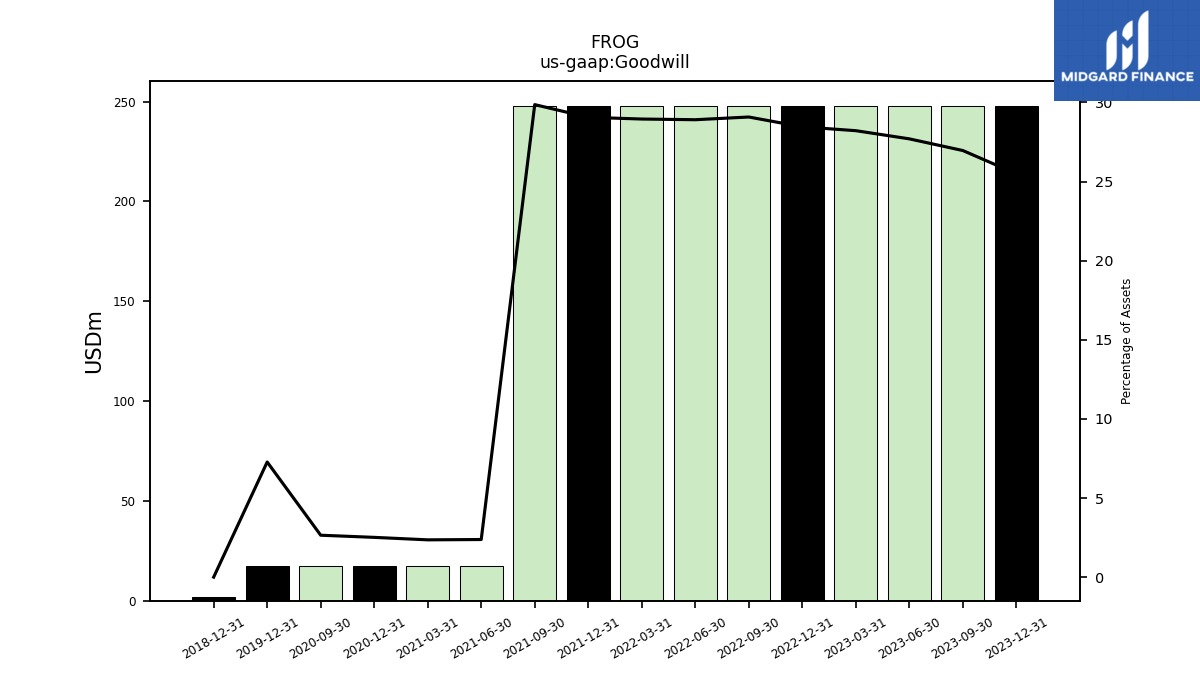
| Goodwill | 247.96 | 247.96 | 247.96 | 247.96 | 247.96 | 247.96 | 247.96 | 247.96 | 247.78 | 247.78 | 17.32 | 17.32 | 17.32 | 17.32 | NA | NA | 17.32 | NA | |
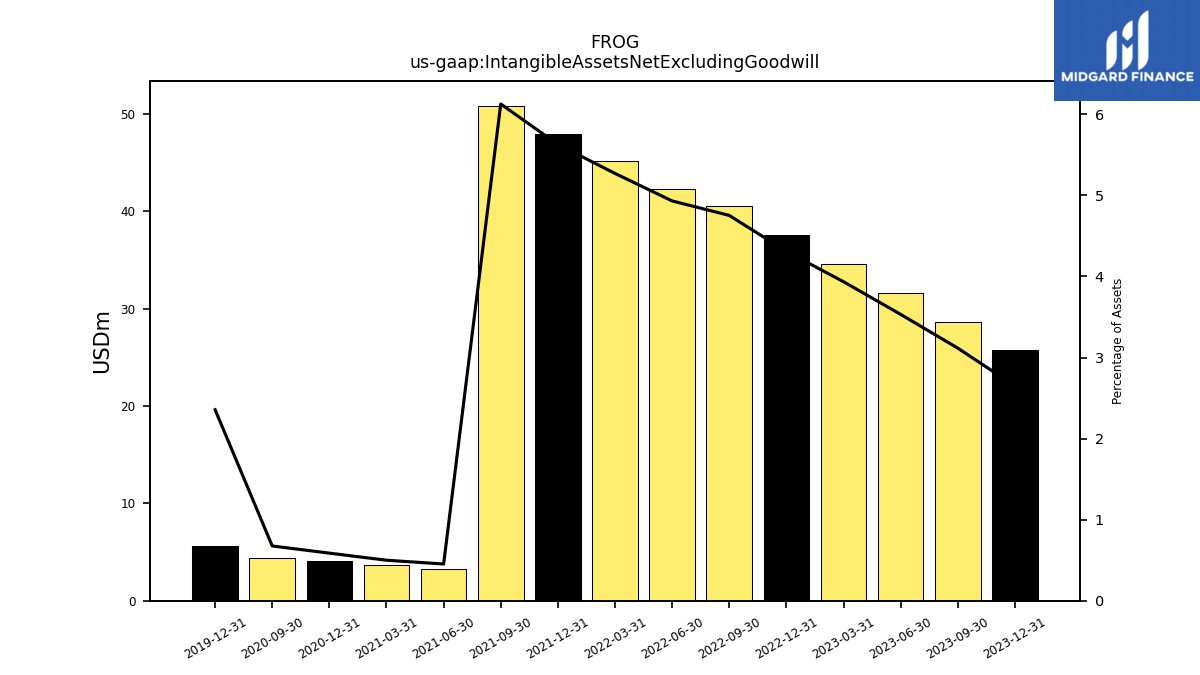
| Intangible Assets Net Excluding Goodwill | 25.77 | 28.66 | 31.62 | 34.58 | 37.54 | 40.52 | 42.30 | 45.14 | 47.98 | 50.84 | 3.30 | 3.67 | 4.05 | 4.42 | NA | NA | 5.61 | NA | |
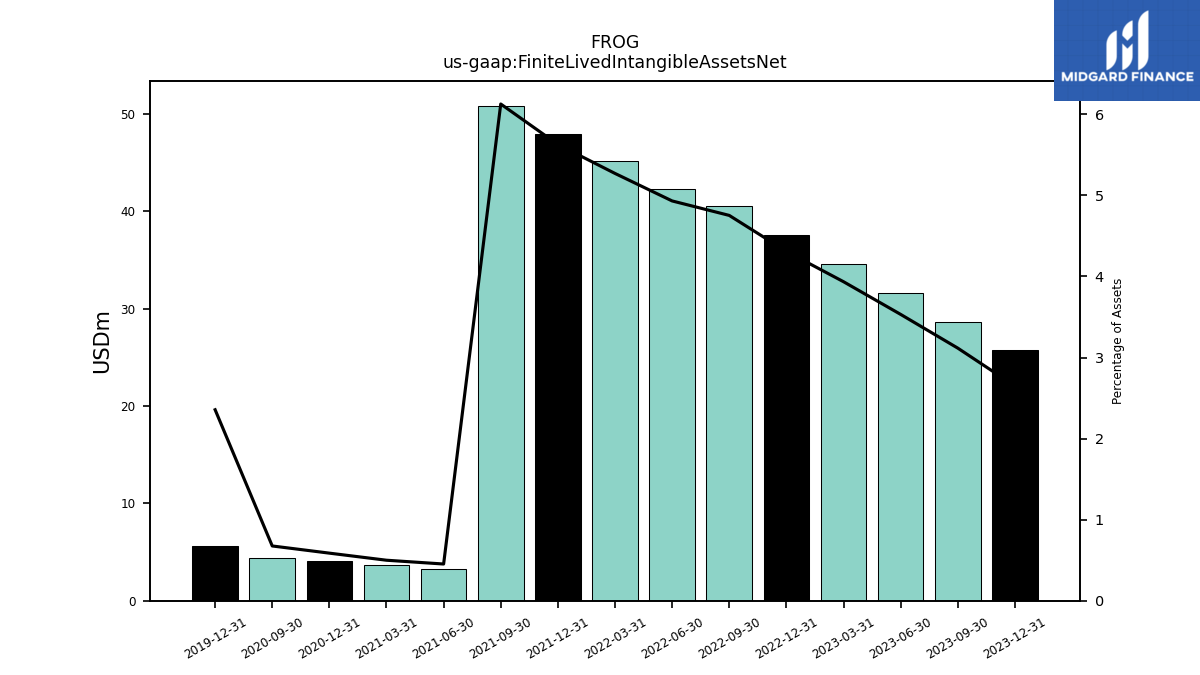
| Finite Lived Intangible Assets Net | 25.77 | 28.66 | 31.62 | 34.58 | 37.54 | 40.52 | 42.30 | 45.14 | 47.98 | 50.84 | 3.30 | 3.67 | 4.05 | 4.42 | NA | NA | 5.61 | NA | |
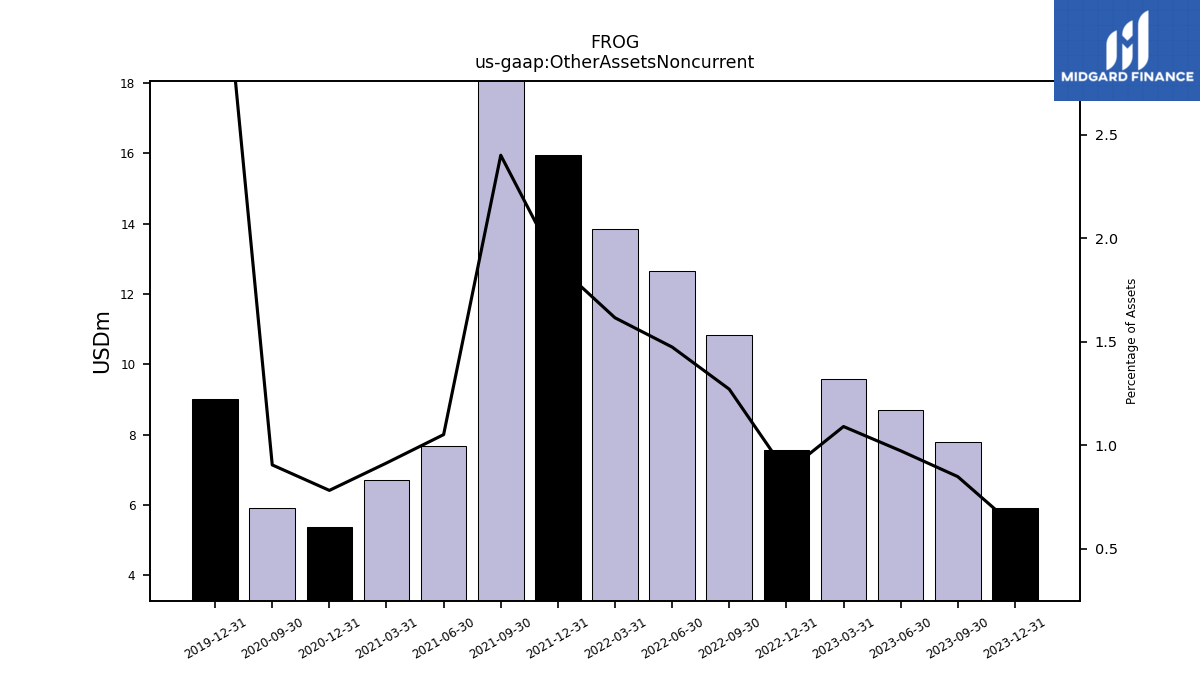
| Other Assets Noncurrent | 5.91 | 7.80 | 8.71 | 9.59 | 7.58 | 10.84 | 12.65 | 13.84 | 15.94 | 19.93 | 7.67 | 6.72 | 5.39 | 5.92 | NA | NA | 9.01 | NA | |
| Available For Sale Debt Securities Amortized Cost Basis | 379.25 | NA | NA | NA | 303.25 | NA | NA | NA | NA | NA | NA | NA | NA | NA | NA | NA | NA | NA |
| 2023-12-31 | 2023-09-30 | 2023-06-30 | 2023-03-31 | 2022-12-31 | 2022-09-30 | 2022-06-30 | 2022-03-31 | 2021-12-31 | 2021-09-30 | 2021-06-30 | 2021-03-31 | 2020-12-31 | 2020-09-30 | 2020-06-30 | 2020-03-31 | 2019-12-31 | 2019-09-30 | ||
|---|---|---|---|---|---|---|---|---|---|---|---|---|---|---|---|---|---|---|---|
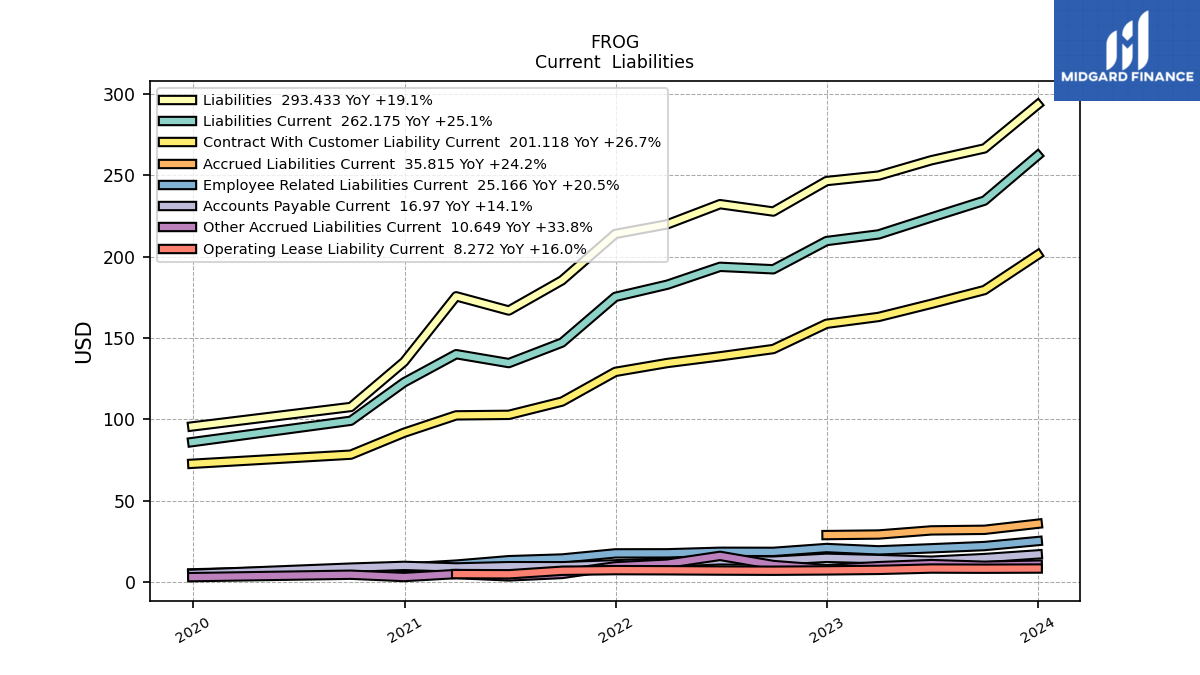
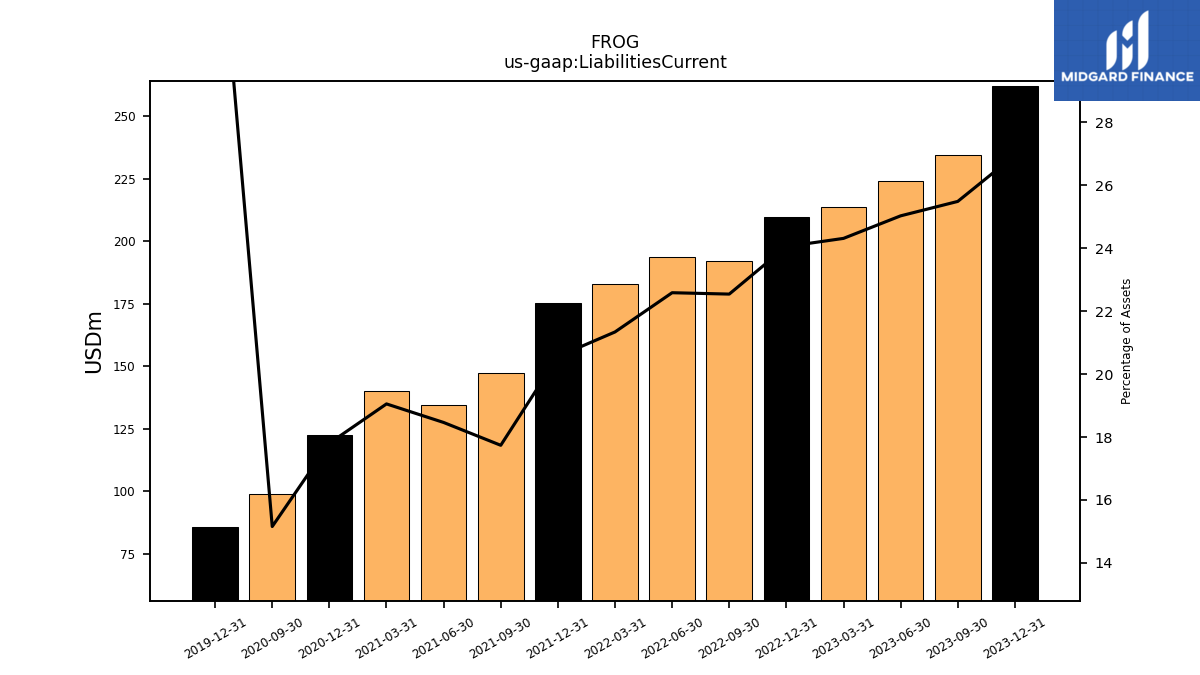
| Liabilities Current | 262.18 | 234.40 | 224.06 | 213.66 | 209.57 | 192.22 | 193.73 | 182.76 | 175.26 | 147.16 | 134.56 | 140.04 | 122.70 | 99.12 | NA | NA | 86.00 | NA | |
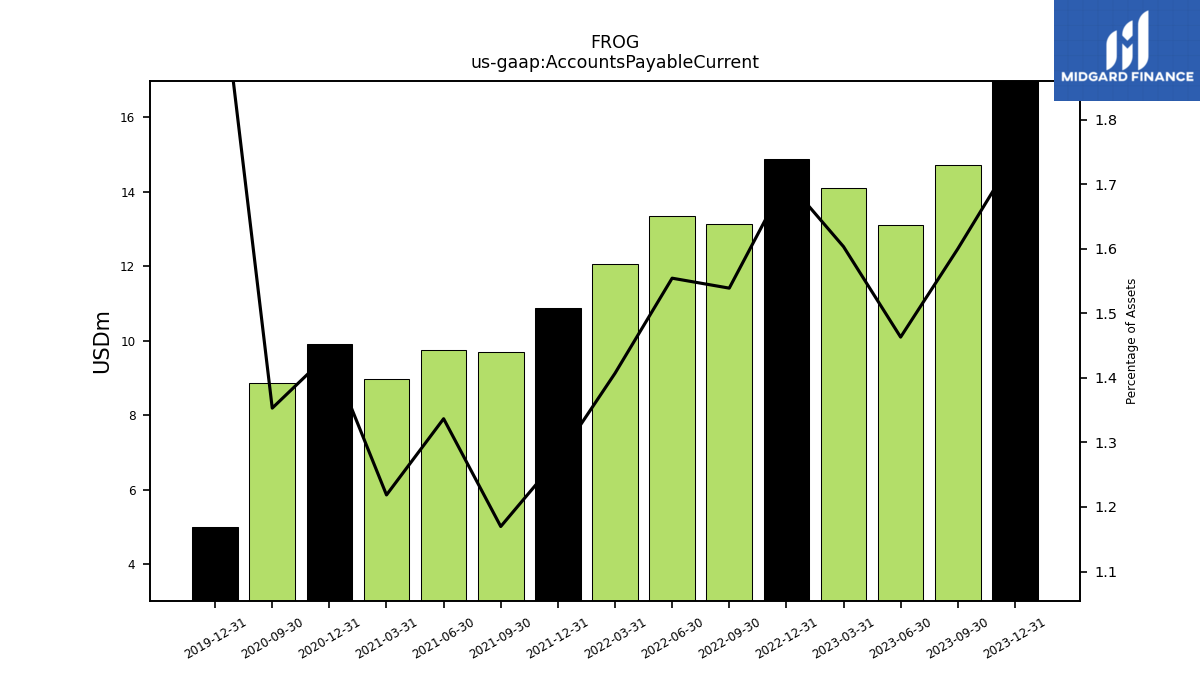
| Accounts Payable Current | 16.97 | 14.71 | 13.10 | 14.09 | 14.87 | 13.12 | 13.33 | 12.05 | 10.87 | 9.71 | 9.74 | 8.96 | 9.91 | 8.85 | NA | NA | 4.99 | NA | |
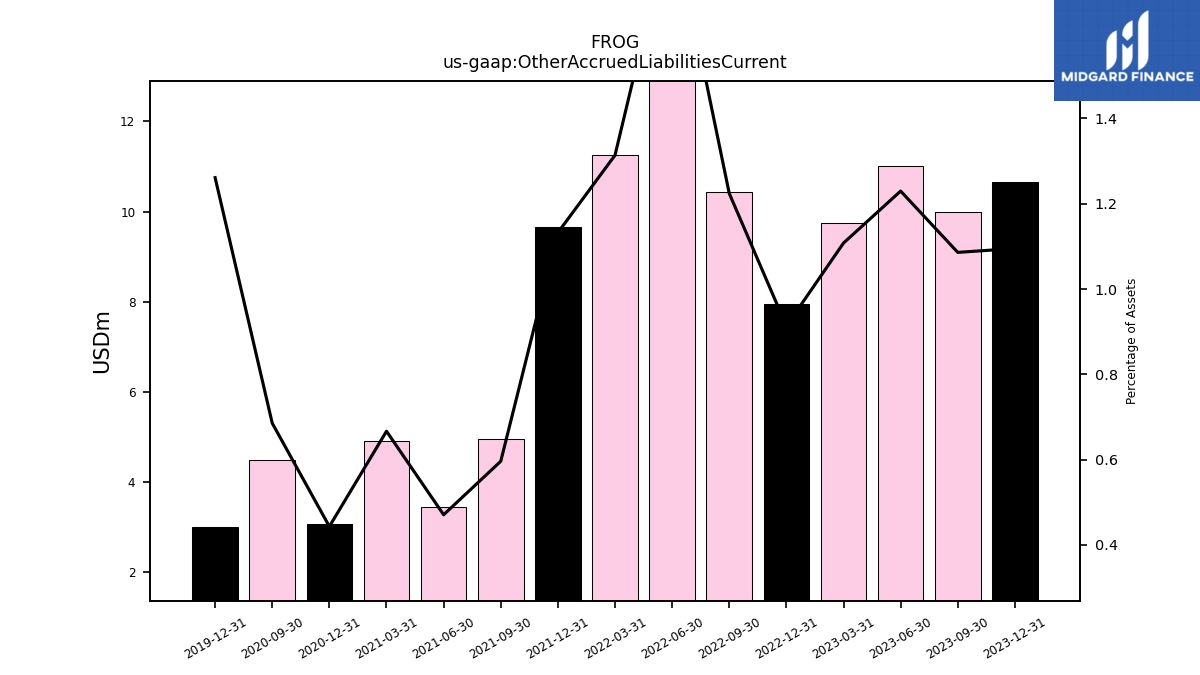
| Other Accrued Liabilities Current | 10.65 | 9.99 | 11.01 | 9.73 | 7.96 | 10.44 | 16.07 | 11.25 | 9.65 | 4.95 | 3.43 | 4.90 | 3.05 | 4.48 | NA | NA | 3.00 | NA | |
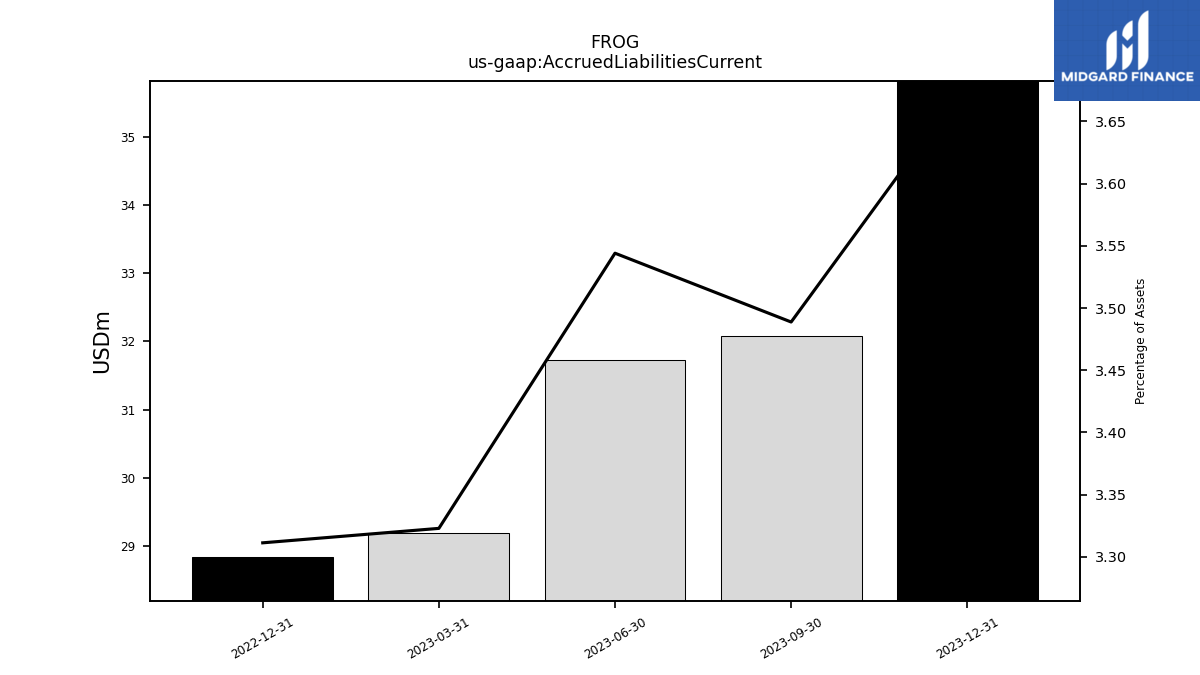
| Accrued Liabilities Current | 35.81 | 32.08 | 31.72 | 29.20 | 28.85 | NA | NA | NA | NA | NA | NA | NA | NA | NA | NA | NA | NA | NA | |
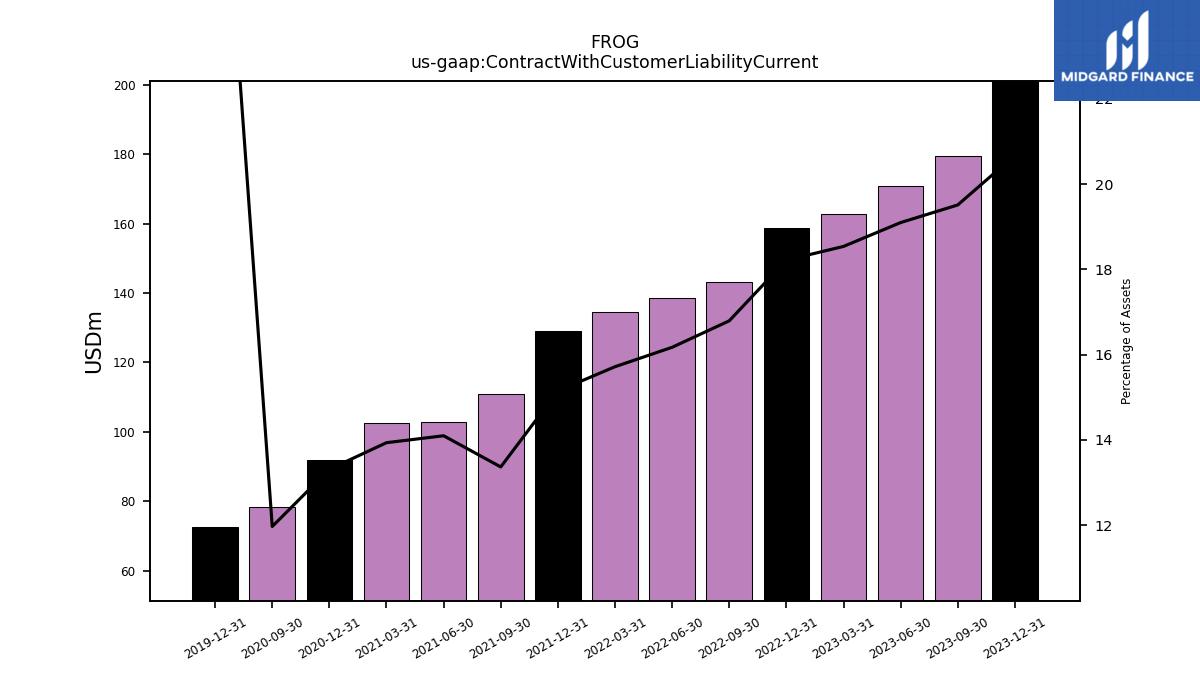
| Contract With Customer Liability Current | 201.12 | 179.45 | 170.97 | 162.92 | 158.72 | 143.20 | 138.72 | 134.61 | 129.15 | 110.91 | 102.75 | 102.43 | 91.75 | 78.28 | NA | NA | 72.68 | NA |
| 2023-12-31 | 2023-09-30 | 2023-06-30 | 2023-03-31 | 2022-12-31 | 2022-09-30 | 2022-06-30 | 2022-03-31 | 2021-12-31 | 2021-09-30 | 2021-06-30 | 2021-03-31 | 2020-12-31 | 2020-09-30 | 2020-06-30 | 2020-03-31 | 2019-12-31 | 2019-09-30 | ||
|---|---|---|---|---|---|---|---|---|---|---|---|---|---|---|---|---|---|---|---|
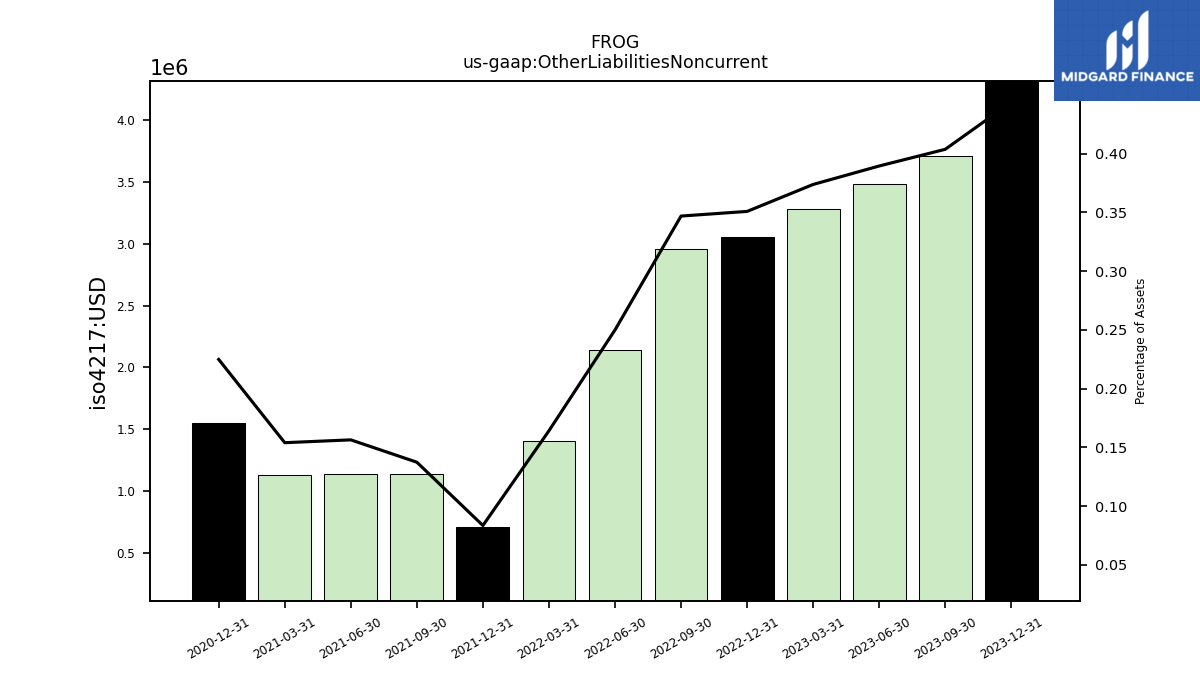
| Other Liabilities Noncurrent | 4.32 | 3.71 | 3.49 | 3.29 | 3.06 | 2.96 | 2.14 | 1.41 | 0.71 | 1.14 | 1.14 | 1.13 | 1.55 | NA | NA | NA | NA | NA | |
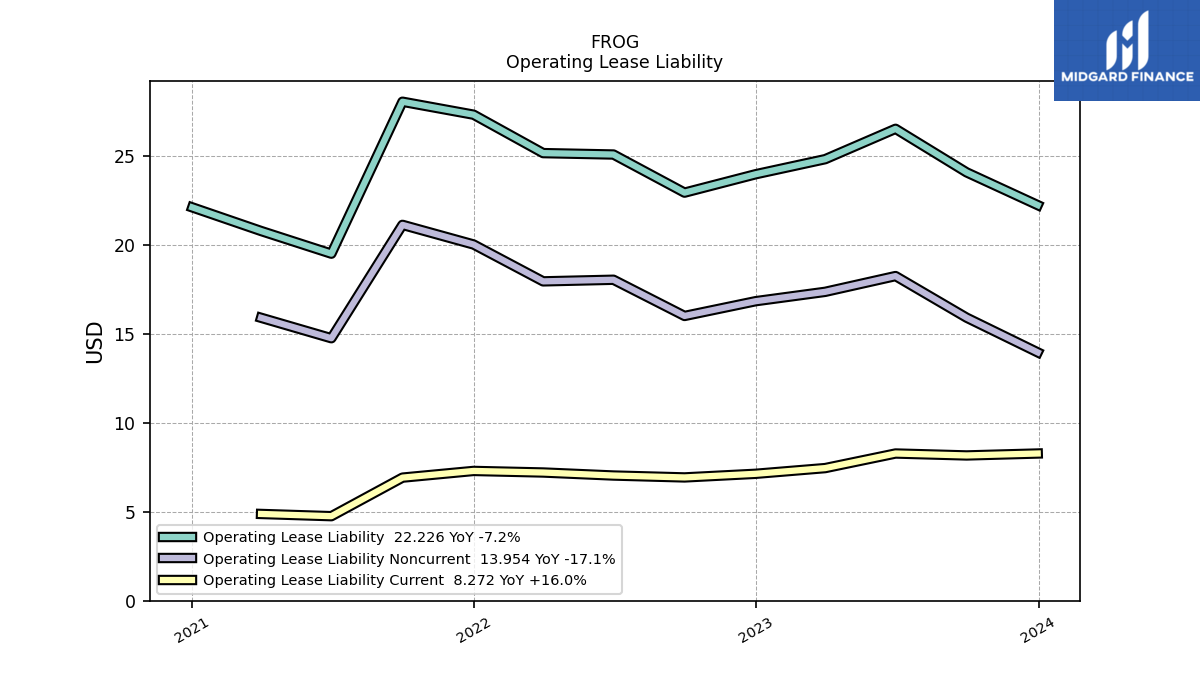
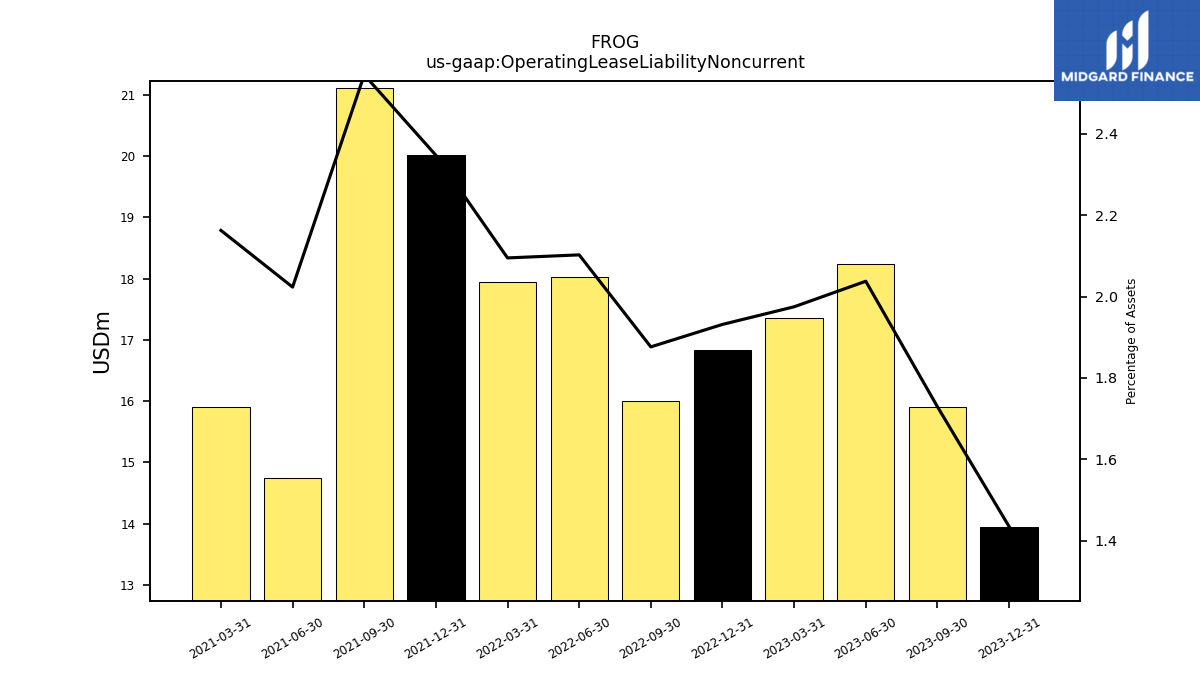
| Operating Lease Liability Noncurrent | 13.95 | 15.90 | 18.24 | 17.36 | 16.83 | 16.00 | 18.03 | 17.94 | 20.01 | 21.12 | 14.75 | 15.90 | NA | NA | NA | NA | NA | NA |
| 2023-12-31 | 2023-09-30 | 2023-06-30 | 2023-03-31 | 2022-12-31 | 2022-09-30 | 2022-06-30 | 2022-03-31 | 2021-12-31 | 2021-09-30 | 2021-06-30 | 2021-03-31 | 2020-12-31 | 2020-09-30 | 2020-06-30 | 2020-03-31 | 2019-12-31 | 2019-09-30 | ||
|---|---|---|---|---|---|---|---|---|---|---|---|---|---|---|---|---|---|---|---|
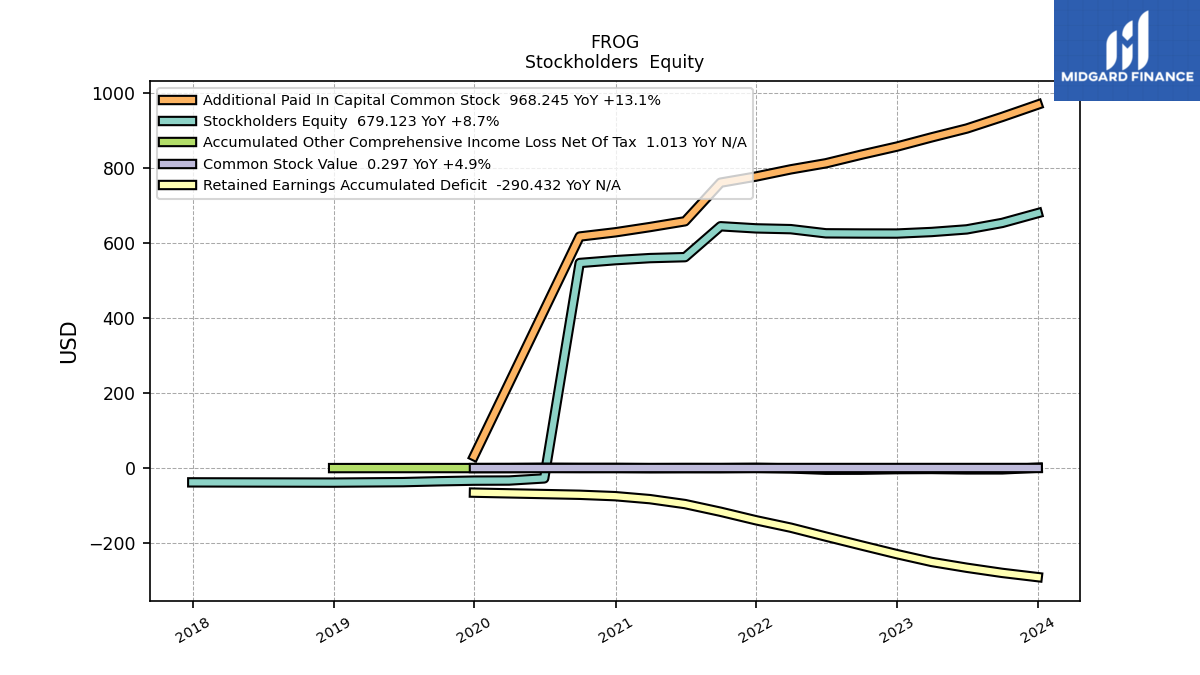
| Stockholders Equity | 679.12 | 653.10 | 635.89 | 628.93 | 624.77 | 624.92 | 625.42 | 636.52 | 638.58 | 644.24 | 561.95 | 559.40 | 553.89 | 546.38 | -27.46 | -33.12 | -33.43 | -35.11 | |
| Common Stock Value | 0.30 | 0.29 | 0.29 | 0.29 | 0.28 | 0.28 | 0.28 | 0.28 | 0.27 | 0.27 | 0.26 | 0.26 | 0.26 | 0.25 | NA | NA | 0.08 | NA | |
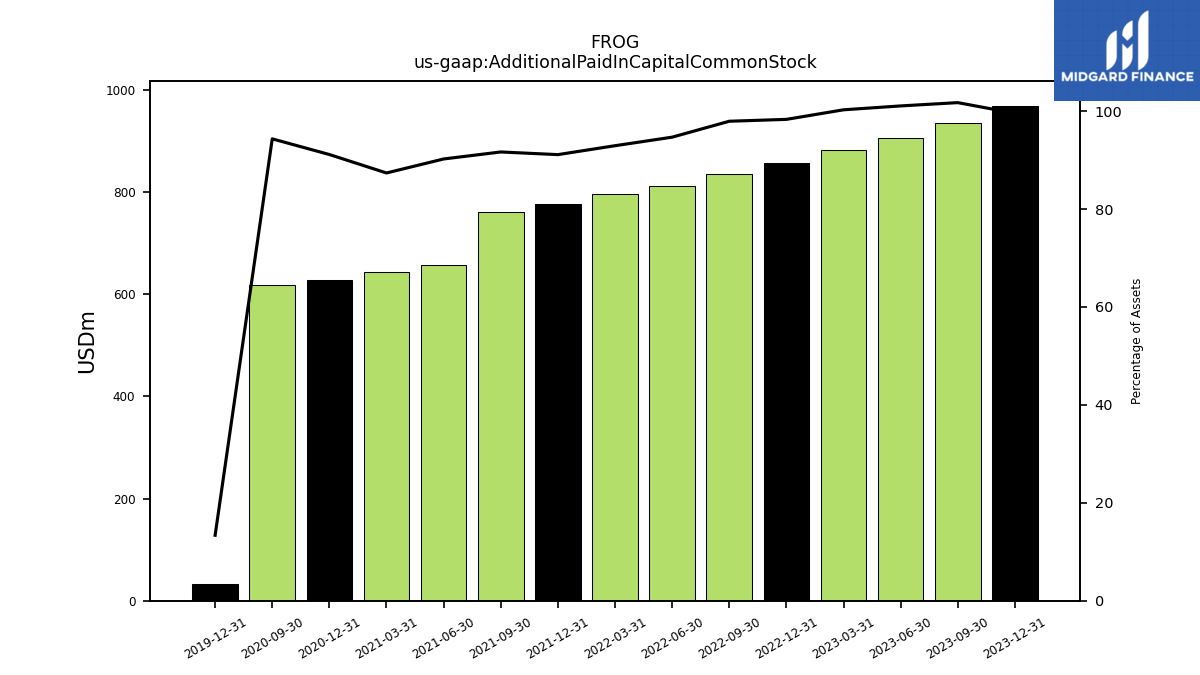
| Additional Paid In Capital Common Stock | 968.25 | 935.45 | 904.53 | 881.00 | 856.44 | 834.90 | 811.96 | 795.81 | 776.69 | 760.38 | 657.51 | 642.09 | 628.05 | 616.86 | NA | NA | 31.84 | NA | |
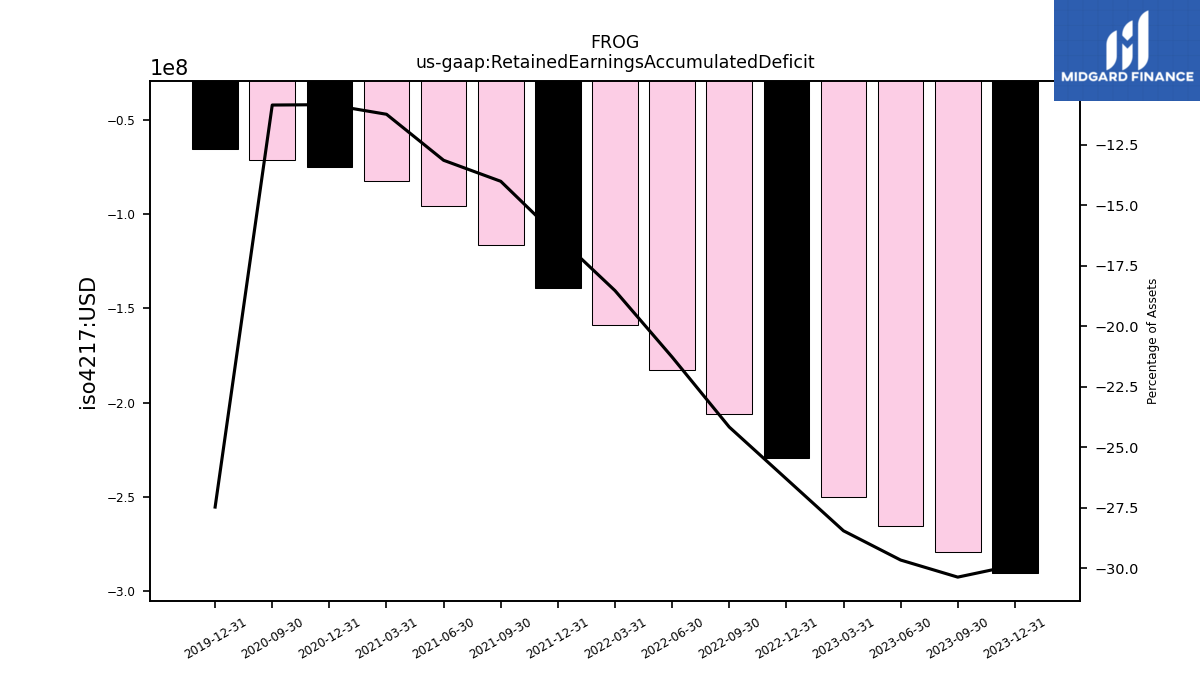
| Retained Earnings Accumulated Deficit | -290.43 | -279.20 | -265.45 | -249.99 | -229.18 | -206.02 | -182.47 | -158.70 | -138.99 | -116.30 | -95.83 | -82.68 | -74.79 | -71.08 | NA | NA | -65.38 | NA | |
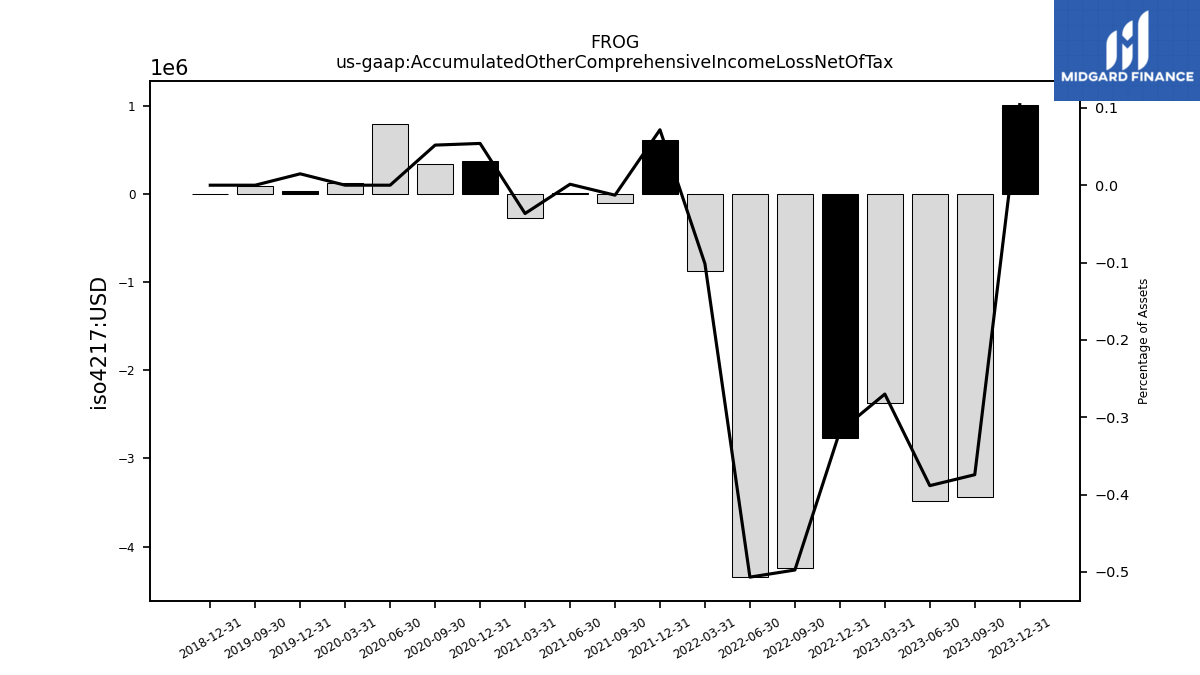
| Accumulated Other Comprehensive Income Loss Net Of Tax | 1.01 | -3.44 | -3.48 | -2.37 | -2.77 | -4.24 | -4.35 | -0.87 | 0.61 | -0.11 | 0.01 | -0.27 | 0.37 | 0.34 | 0.79 | 0.12 | 0.04 | 0.09 | |
| Adjustments To Additional Paid In Capital Sharebased Compensation Requisite Service Period Recognition Value | 28.25 | 25.69 | 21.32 | 19.91 | 20.29 | 19.22 | 15.08 | 14.07 | 14.24 | 16.86 | 14.10 | 11.75 | 9.45 | 9.66 | 2.78 | 1.96 | 1.83 | 4.89 |
| 2023-12-31 | 2023-09-30 | 2023-06-30 | 2023-03-31 | 2022-12-31 | 2022-09-30 | 2022-06-30 | 2022-03-31 | 2021-12-31 | 2021-09-30 | 2021-06-30 | 2021-03-31 | 2020-12-31 | 2020-09-30 | 2020-06-30 | 2020-03-31 | 2019-12-31 | 2019-09-30 | ||
|---|---|---|---|---|---|---|---|---|---|---|---|---|---|---|---|---|---|---|---|
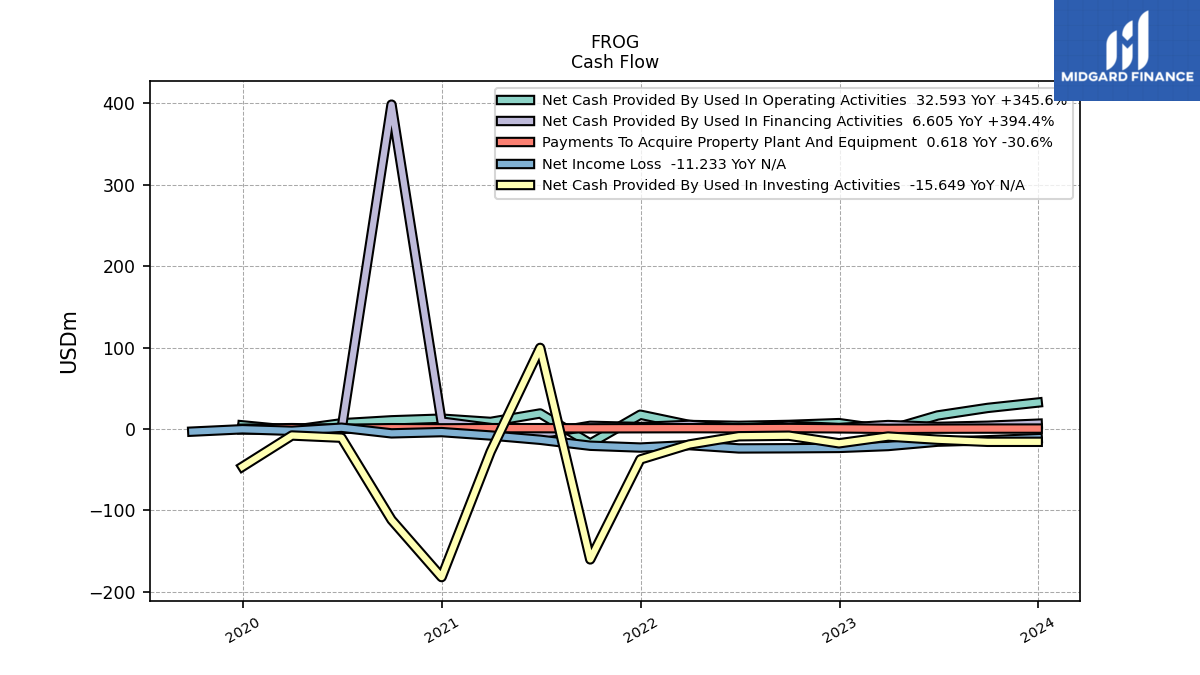
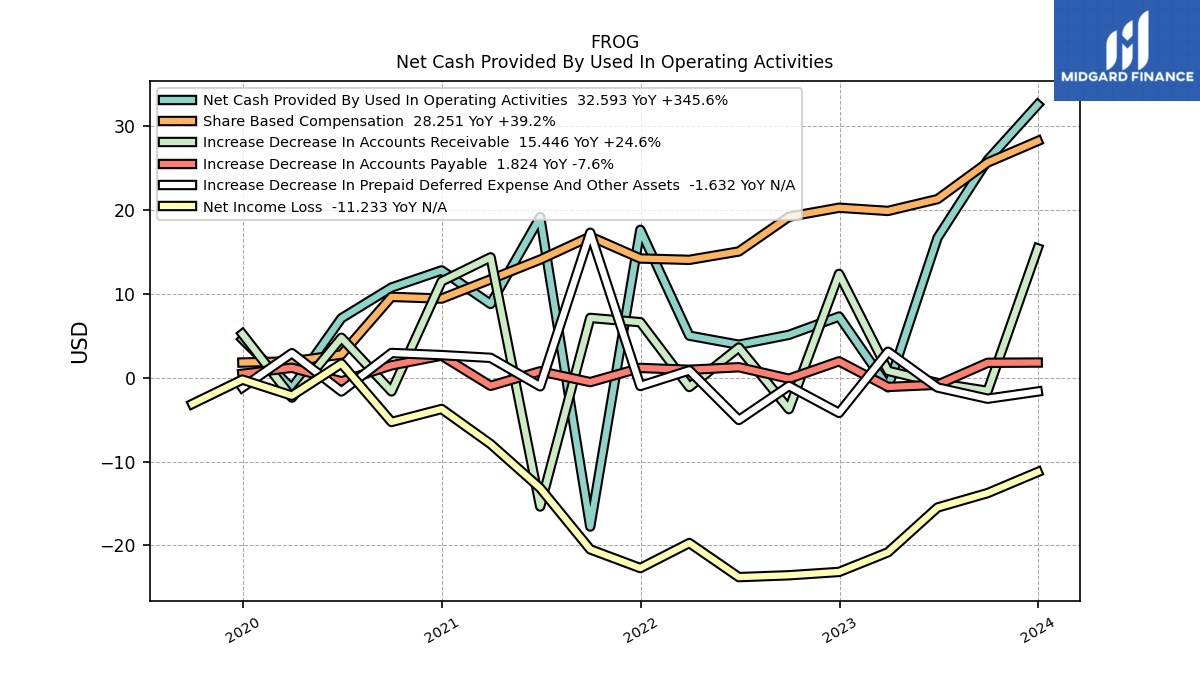
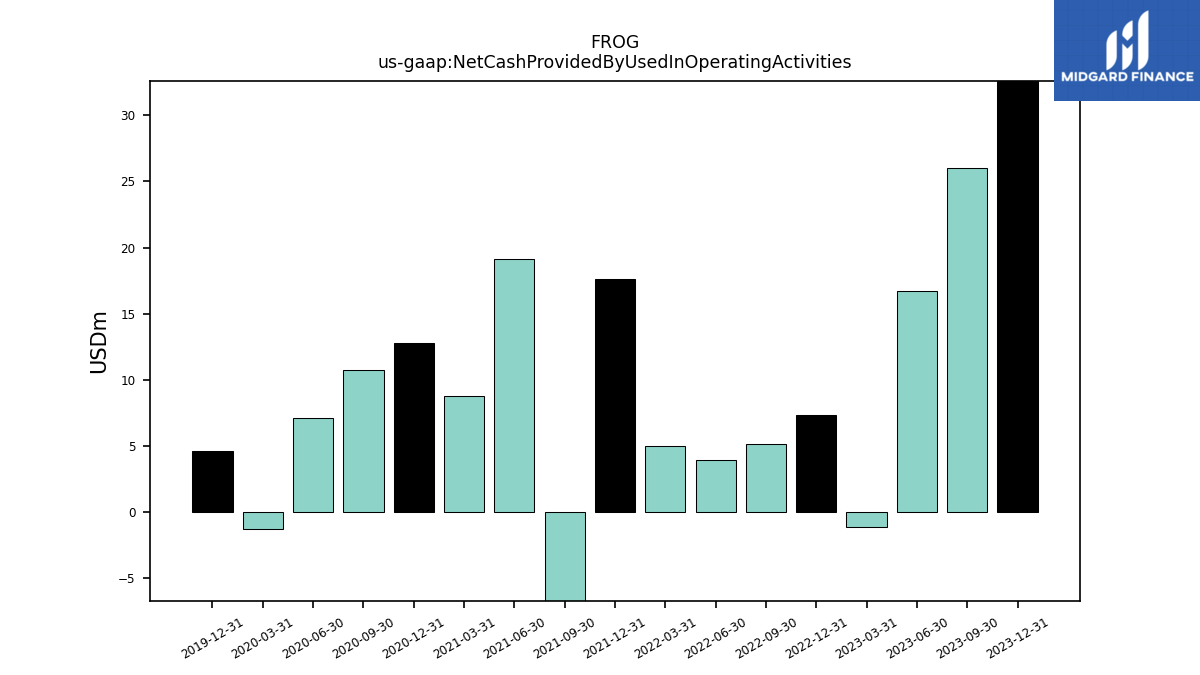
| Net Cash Provided By Used In Operating Activities | 32.59 | 25.98 | 16.71 | -1.13 | 7.31 | 5.13 | 3.95 | 5.03 | 17.66 | -17.74 | 19.17 | 8.81 | 12.82 | 10.78 | 7.11 | -1.25 | 4.61 | NA | |
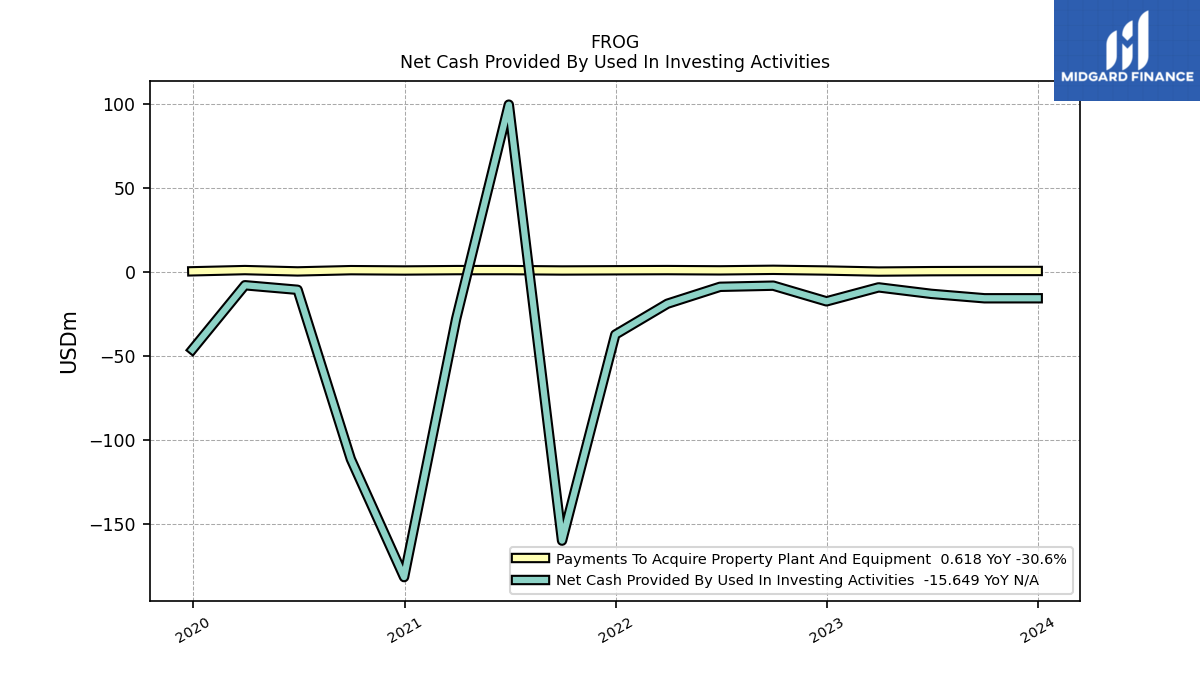
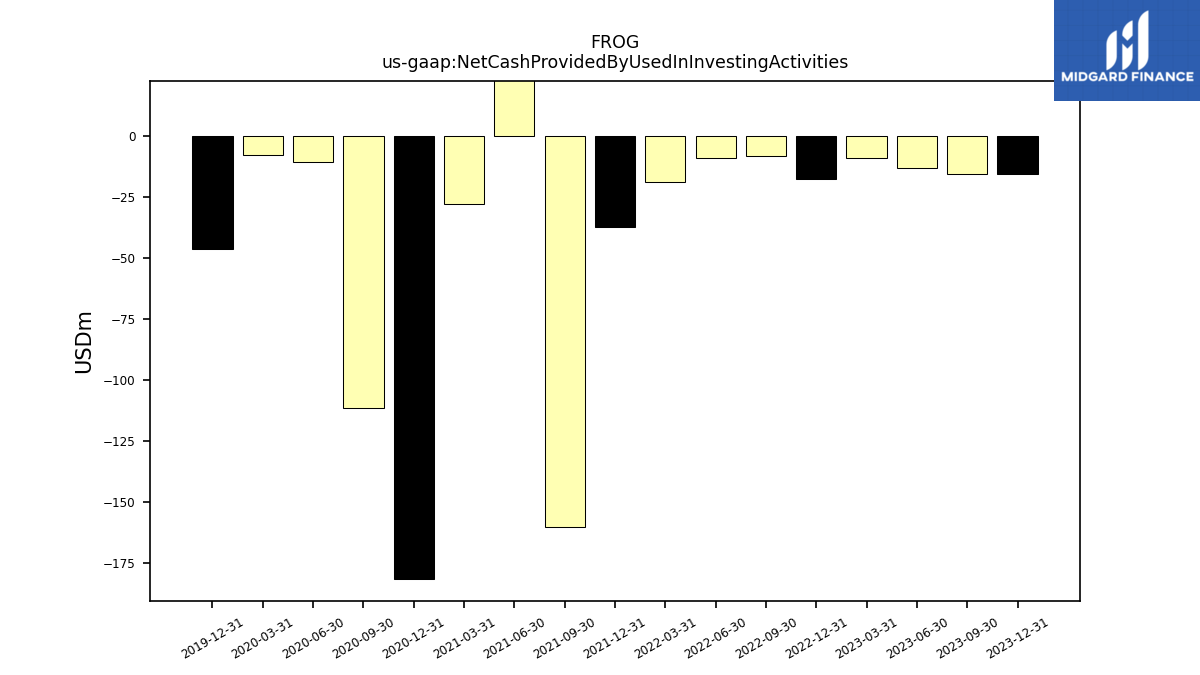
| Net Cash Provided By Used In Investing Activities | -15.65 | -15.65 | -13.02 | -9.16 | -17.48 | -8.14 | -8.82 | -18.90 | -37.30 | -160.11 | 99.76 | -27.89 | -181.83 | -111.48 | -10.60 | -7.89 | -46.27 | NA | |
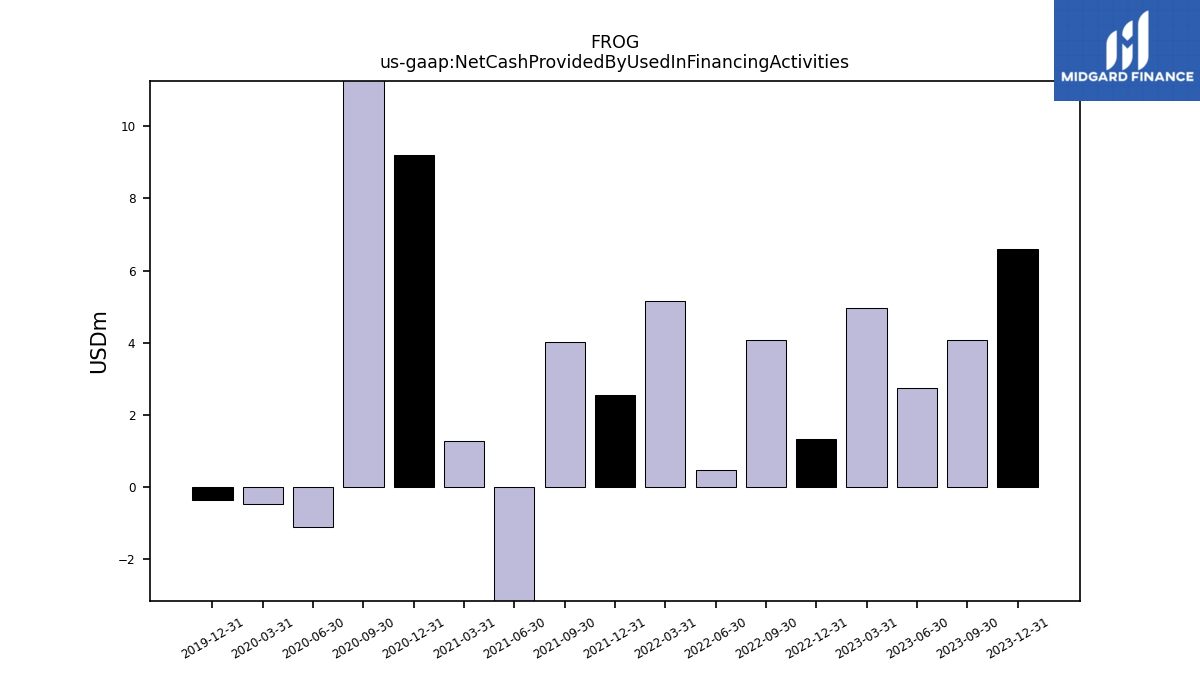
| Net Cash Provided By Used In Financing Activities | 6.61 | 4.08 | 2.73 | 4.95 | 1.34 | 4.06 | 0.48 | 5.16 | 2.54 | 4.01 | -6.38 | 1.28 | 9.20 | 398.50 | -1.10 | -0.47 | -0.37 | NA |
| 2023-12-31 | 2023-09-30 | 2023-06-30 | 2023-03-31 | 2022-12-31 | 2022-09-30 | 2022-06-30 | 2022-03-31 | 2021-12-31 | 2021-09-30 | 2021-06-30 | 2021-03-31 | 2020-12-31 | 2020-09-30 | 2020-06-30 | 2020-03-31 | 2019-12-31 | 2019-09-30 | ||
|---|---|---|---|---|---|---|---|---|---|---|---|---|---|---|---|---|---|---|---|
| Net Cash Provided By Used In Operating Activities | 32.59 | 25.98 | 16.71 | -1.13 | 7.31 | 5.13 | 3.95 | 5.03 | 17.66 | -17.74 | 19.17 | 8.81 | 12.82 | 10.78 | 7.11 | -1.25 | 4.61 | NA | |
| Net Income Loss | -11.23 | -13.75 | -15.47 | -20.81 | -23.16 | -23.55 | -23.77 | -19.70 | -22.70 | -20.46 | -13.15 | -7.89 | -3.71 | -5.26 | 1.70 | -2.12 | -0.21 | -3.11 | |
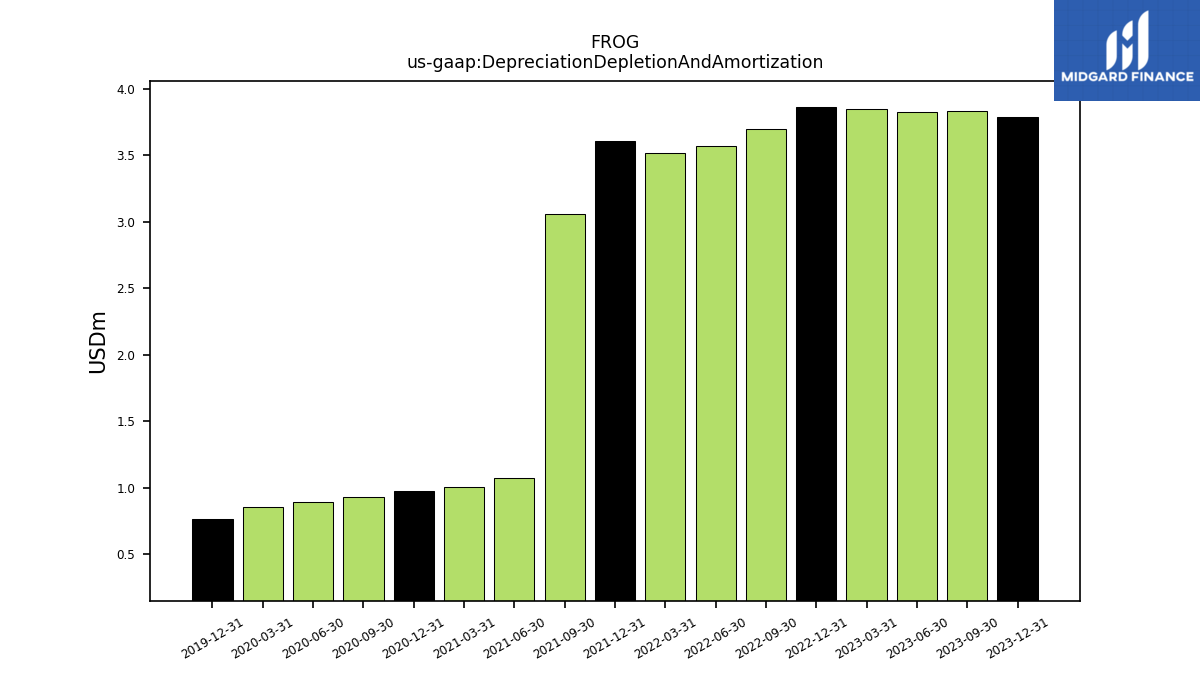
| Depreciation Depletion And Amortization | 3.79 | 3.84 | 3.83 | 3.85 | 3.87 | 3.70 | 3.57 | 3.52 | 3.61 | 3.06 | 1.08 | 1.01 | 0.98 | 0.93 | 0.90 | 0.86 | 0.77 | NA | |
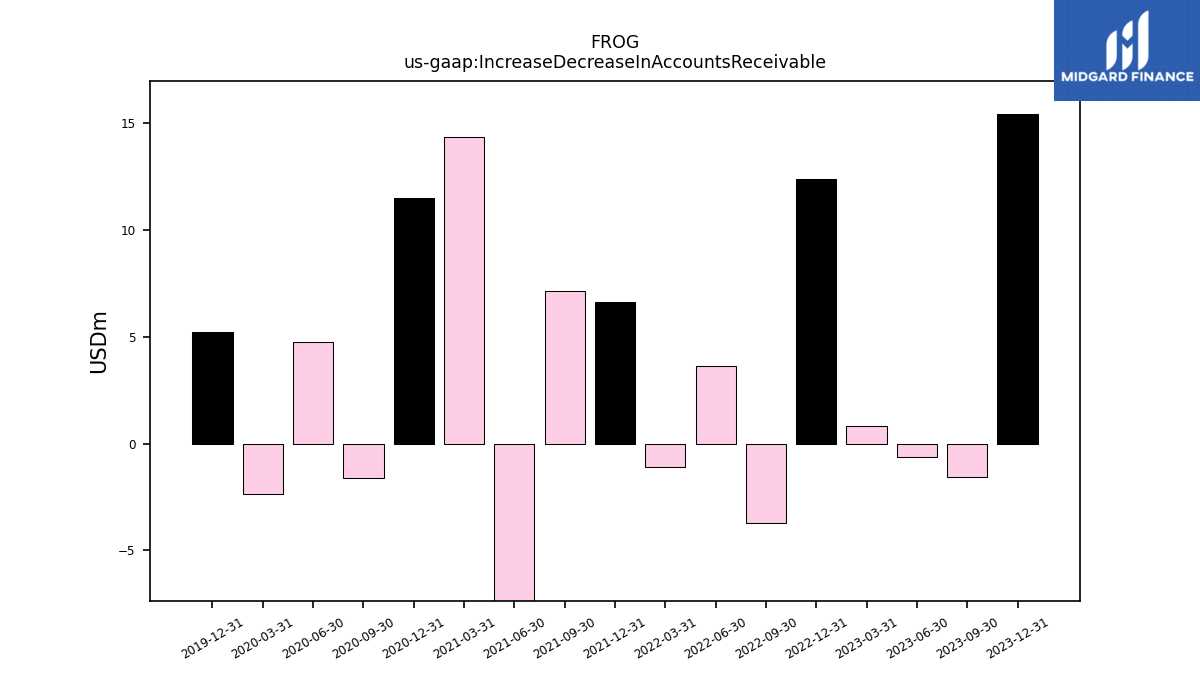
| Increase Decrease In Accounts Receivable | 15.45 | -1.56 | -0.62 | 0.84 | 12.40 | -3.74 | 3.62 | -1.09 | 6.64 | 7.15 | -15.35 | 14.38 | 11.51 | -1.62 | 4.78 | -2.36 | 5.24 | NA | |
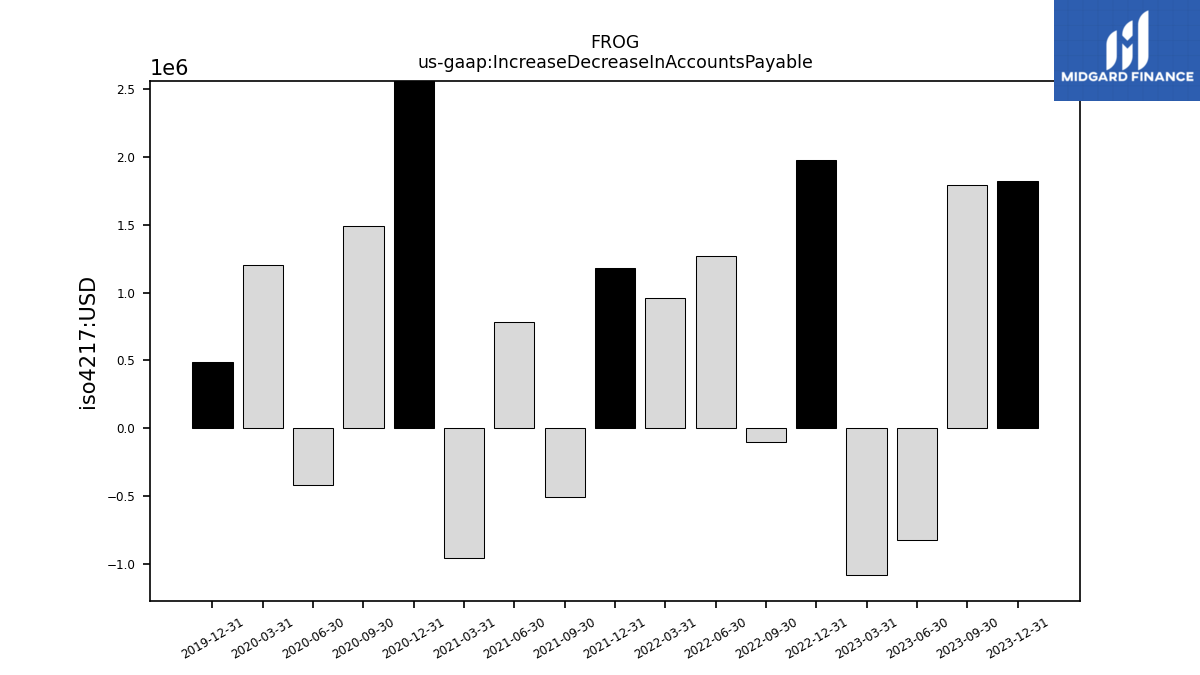
| Increase Decrease In Accounts Payable | 1.82 | 1.79 | -0.83 | -1.09 | 1.97 | -0.10 | 1.27 | 0.96 | 1.18 | -0.51 | 0.79 | -0.95 | 2.65 | 1.49 | -0.42 | 1.20 | 0.49 | NA | |
| Share Based Compensation | 28.25 | 25.69 | 21.32 | 19.91 | 20.29 | 19.22 | 15.08 | 14.07 | 14.24 | 16.86 | 14.10 | 11.75 | 9.45 | 9.66 | 2.78 | 1.96 | 1.83 | NA |
| 2023-12-31 | 2023-09-30 | 2023-06-30 | 2023-03-31 | 2022-12-31 | 2022-09-30 | 2022-06-30 | 2022-03-31 | 2021-12-31 | 2021-09-30 | 2021-06-30 | 2021-03-31 | 2020-12-31 | 2020-09-30 | 2020-06-30 | 2020-03-31 | 2019-12-31 | 2019-09-30 | ||
|---|---|---|---|---|---|---|---|---|---|---|---|---|---|---|---|---|---|---|---|
| Net Cash Provided By Used In Investing Activities | -15.65 | -15.65 | -13.02 | -9.16 | -17.48 | -8.14 | -8.82 | -18.90 | -37.30 | -160.11 | 99.76 | -27.89 | -181.83 | -111.48 | -10.60 | -7.89 | -46.27 | NA | |
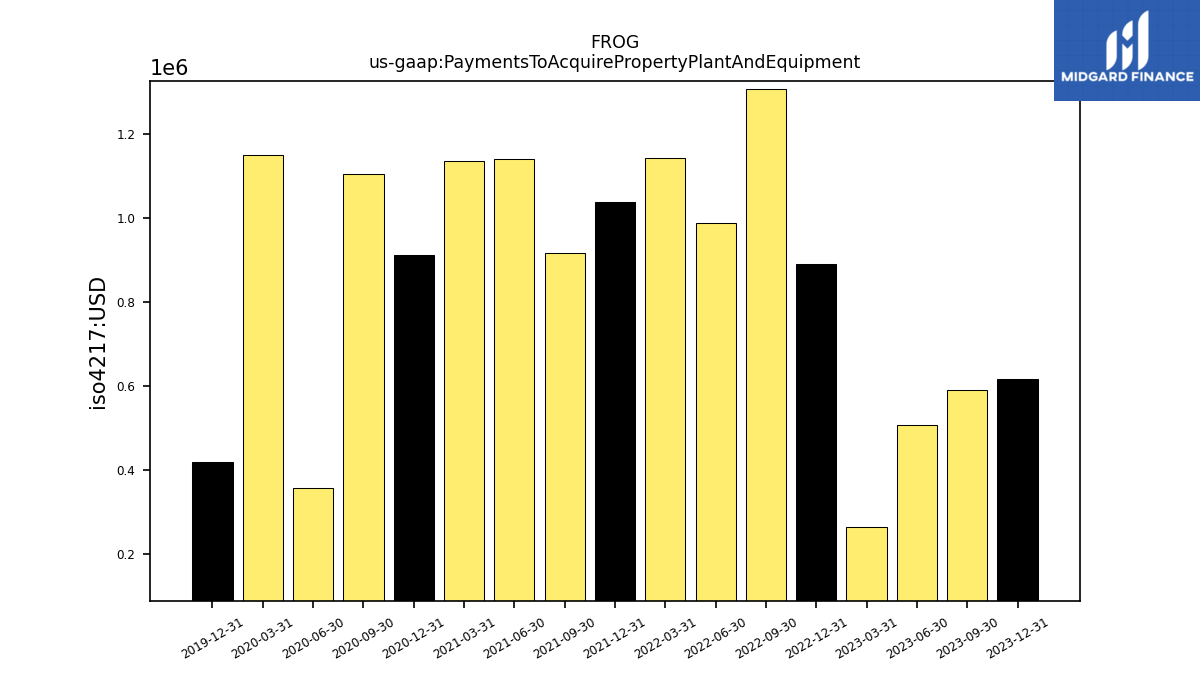
| Payments To Acquire Property Plant And Equipment | 0.62 | 0.59 | 0.51 | 0.27 | 0.89 | 1.31 | 0.99 | 1.14 | 1.04 | 0.92 | 1.14 | 1.14 | 0.91 | 1.10 | 0.36 | 1.15 | 0.42 | NA |
| 2023-12-31 | 2023-09-30 | 2023-06-30 | 2023-03-31 | 2022-12-31 | 2022-09-30 | 2022-06-30 | 2022-03-31 | 2021-12-31 | 2021-09-30 | 2021-06-30 | 2021-03-31 | 2020-12-31 | 2020-09-30 | 2020-06-30 | 2020-03-31 | 2019-12-31 | 2019-09-30 | ||
|---|---|---|---|---|---|---|---|---|---|---|---|---|---|---|---|---|---|---|---|
| Net Cash Provided By Used In Financing Activities | 6.61 | 4.08 | 2.73 | 4.95 | 1.34 | 4.06 | 0.48 | 5.16 | 2.54 | 4.01 | -6.38 | 1.28 | 9.20 | 398.50 | -1.10 | -0.47 | -0.37 | NA |
| 2023-12-31 | 2023-09-30 | 2023-06-30 | 2023-03-31 | 2022-12-31 | 2022-09-30 | 2022-06-30 | 2022-03-31 | 2021-12-31 | 2021-09-30 | 2021-06-30 | 2021-03-31 | 2020-12-31 | 2020-09-30 | 2020-06-30 | 2020-03-31 | 2019-12-31 | 2019-09-30 | ||
|---|---|---|---|---|---|---|---|---|---|---|---|---|---|---|---|---|---|---|---|
| Revenue From Contract With Customer Excluding Assessed Tax | 97.26 | 88.64 | 84.17 | 79.82 | 76.55 | 71.99 | 67.81 | 63.70 | 59.24 | 53.70 | 48.66 | 45.09 | 42.69 | 38.89 | 36.43 | 32.82 | 30.76 | 27.84 | |
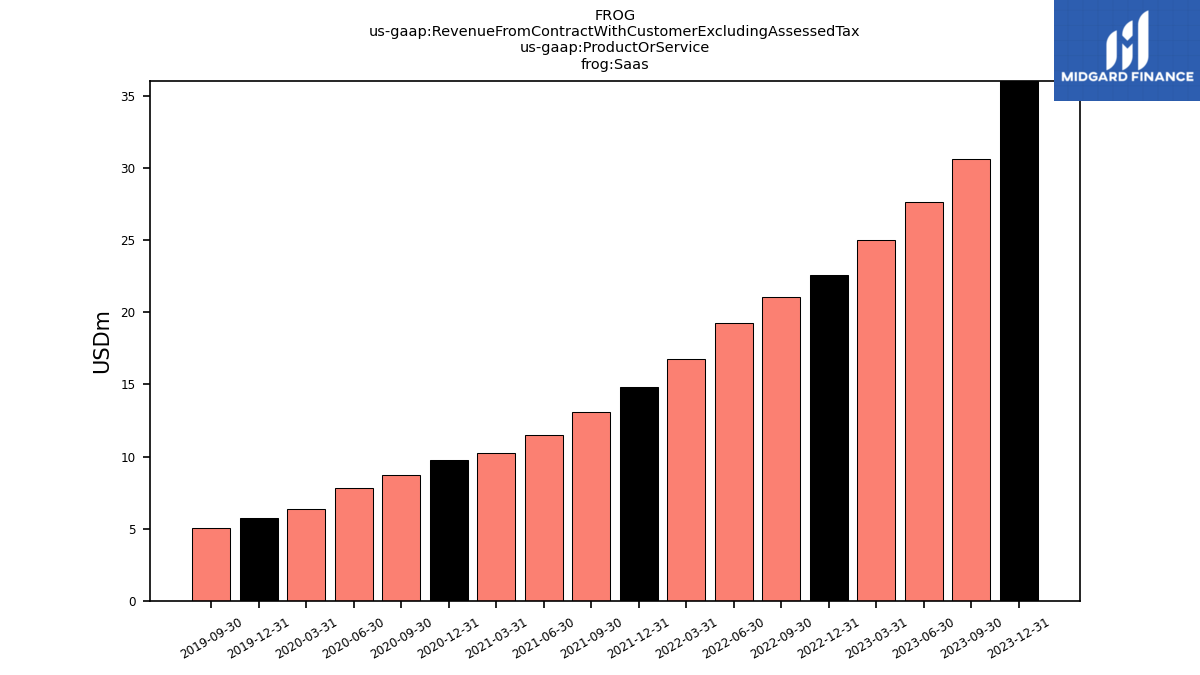
| Saas | 36.03 | 30.61 | 27.64 | 25.04 | 22.61 | 21.02 | 19.24 | 16.77 | 14.80 | 13.11 | 11.47 | 10.26 | 9.75 | 8.72 | 7.80 | 6.35 | 5.76 | 5.02 | |
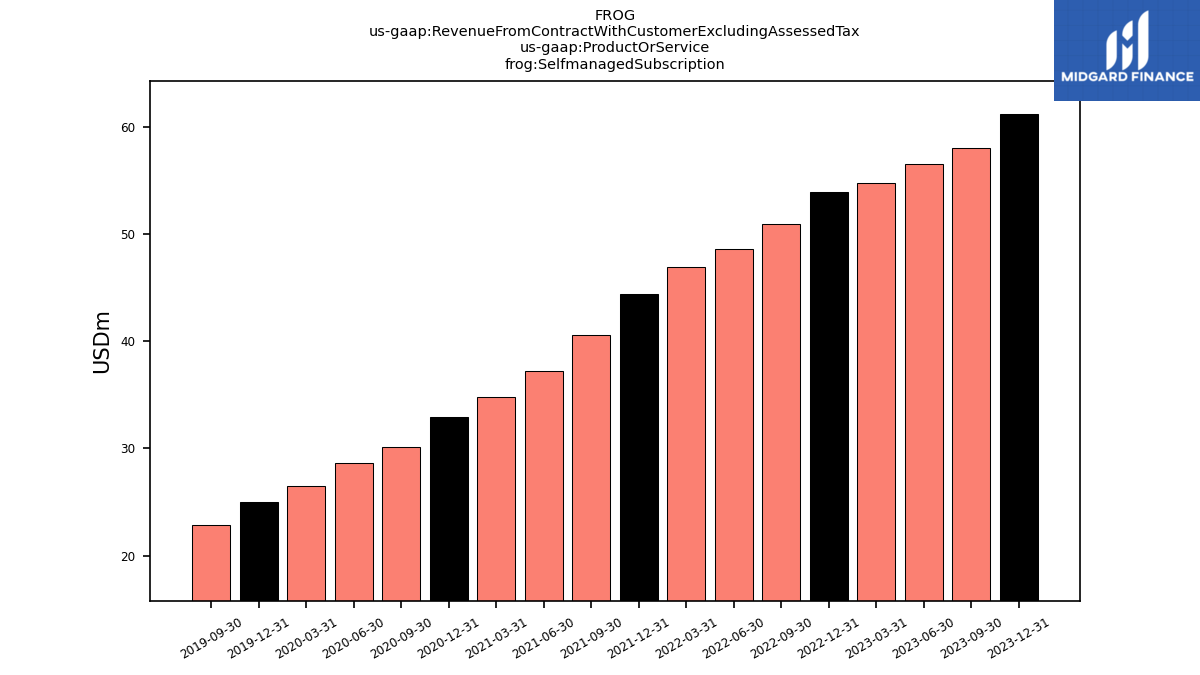
| Selfmanaged Subscription | 61.23 | 58.02 | 56.53 | 54.78 | 53.93 | 50.97 | 48.57 | 46.92 | 44.43 | 40.59 | 37.19 | 34.82 | 32.94 | 30.16 | 28.64 | 26.47 | 25.00 | 22.82 | |
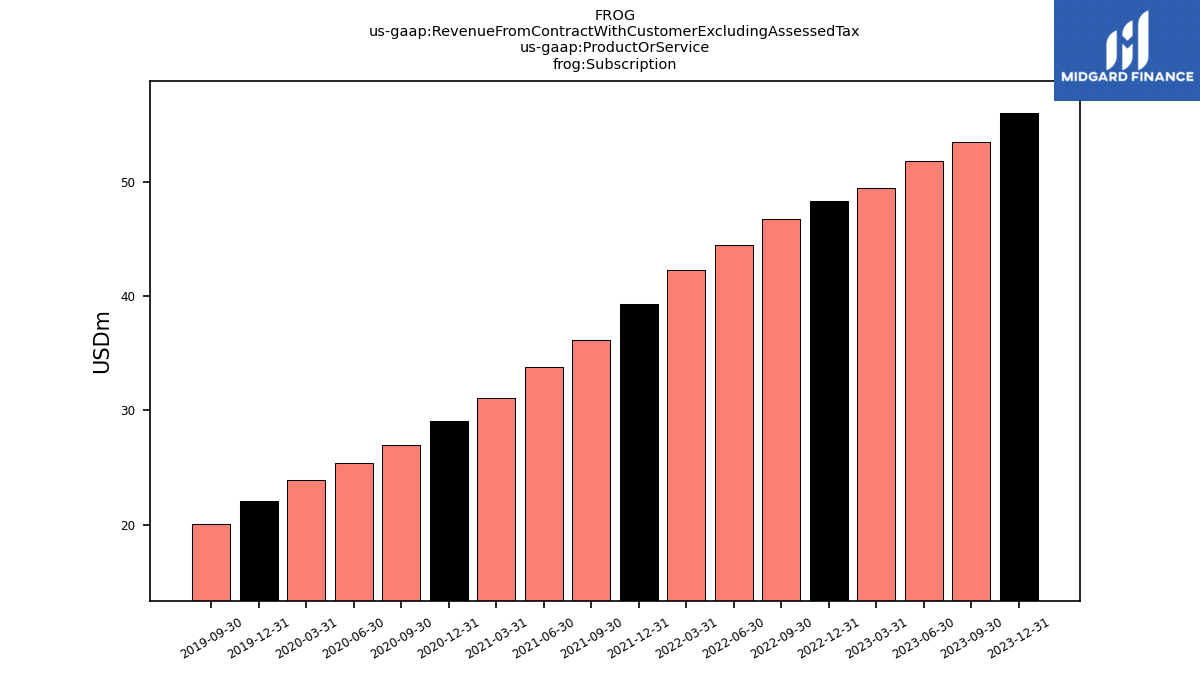
| Subscription | 56.02 | 53.52 | 51.83 | 49.50 | 48.34 | 46.73 | 44.44 | 42.30 | 39.34 | 36.14 | 33.84 | 31.07 | 29.05 | 26.99 | 25.36 | 23.95 | 22.10 | 20.05 | |
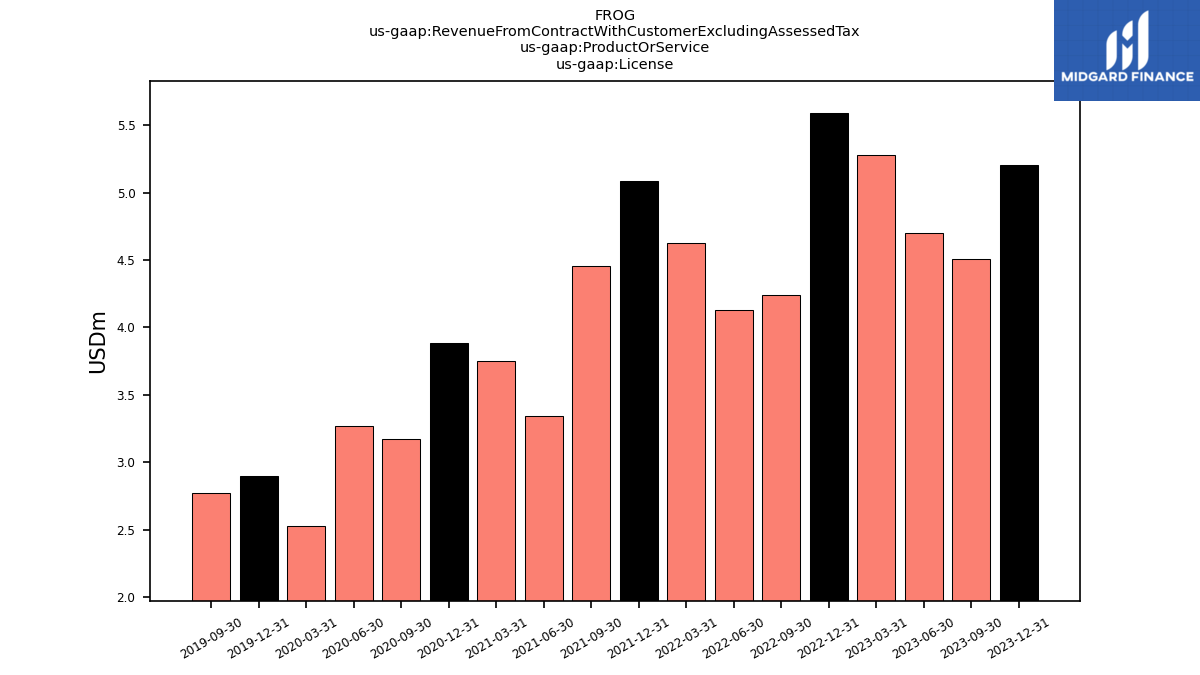
| License | 5.21 | 4.50 | 4.70 | 5.28 | 5.59 | 4.24 | 4.13 | 4.63 | 5.09 | 4.46 | 3.35 | 3.75 | 3.88 | 3.17 | 3.27 | 2.52 | 2.90 | 2.77 | |
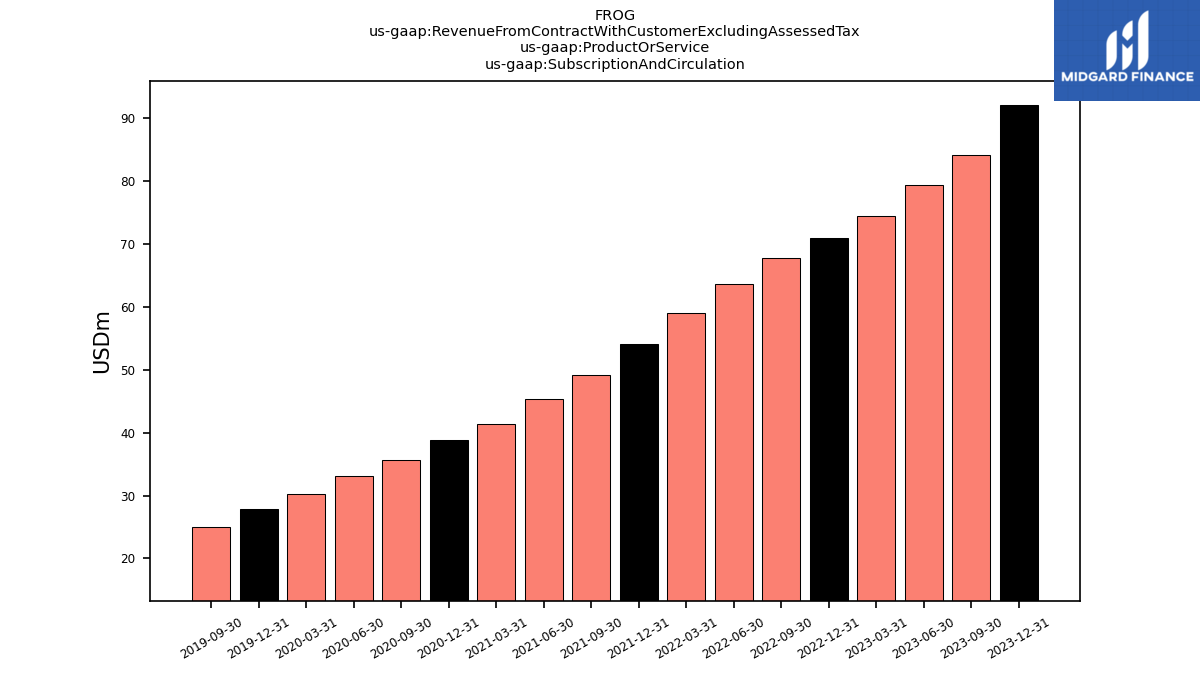
| Subscription And Circulation | 92.05 | 84.13 | 79.47 | 74.54 | 70.95 | 67.75 | 63.68 | 59.07 | 54.15 | 49.25 | 45.31 | 41.34 | 38.81 | 35.71 | 33.16 | 30.30 | 27.86 | 25.07 | |
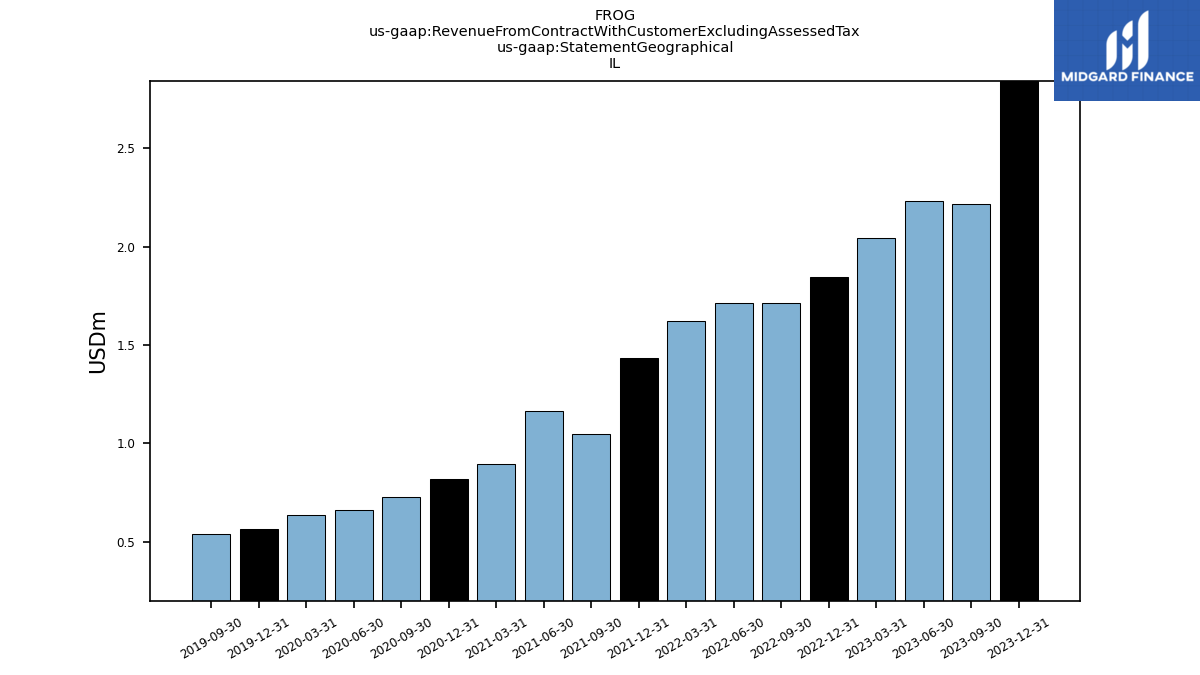
| 2.84 | 2.22 | 2.23 | 2.04 | 1.84 | 1.71 | 1.71 | 1.62 | 1.44 | 1.05 | 1.17 | 0.89 | 0.82 | 0.73 | 0.66 | 0.63 | 0.57 | 0.54 | ||
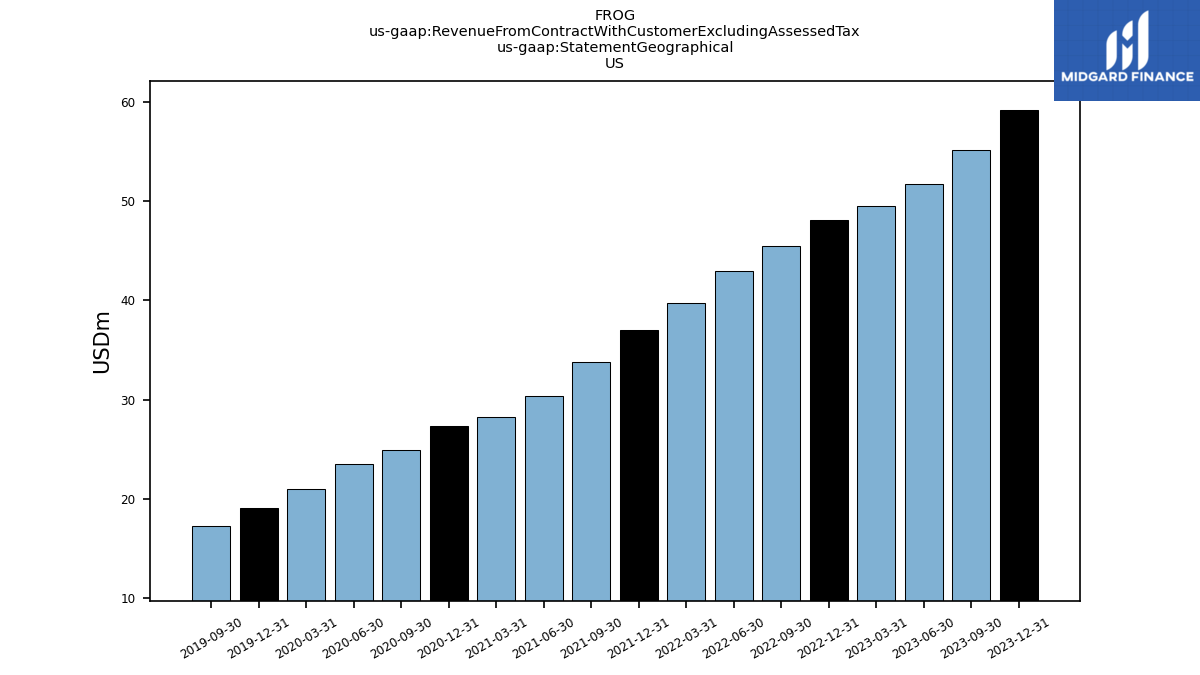
| US | 59.16 | 55.16 | 51.74 | 49.54 | 48.15 | 45.45 | 43.02 | 39.72 | 37.05 | 33.77 | 30.39 | 28.29 | 27.36 | 24.92 | 23.55 | 20.95 | 19.09 | 17.30 | |
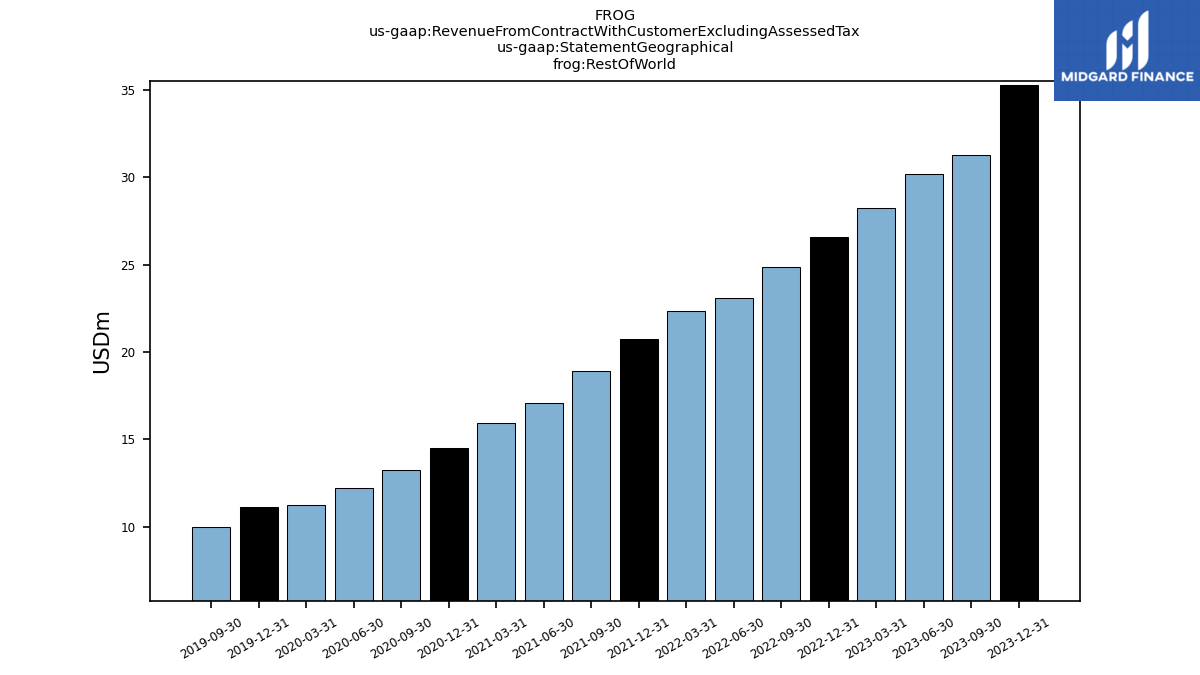
| Rest Of World | 35.25 | 31.26 | 30.20 | 28.24 | 26.55 | 24.83 | 23.07 | 22.36 | 20.75 | 18.89 | 17.10 | 15.90 | 14.52 | 13.24 | 12.22 | 11.24 | 11.10 | 10.00 |