
| 2023-09-30 | 2023-06-30 | 2023-03-31 | 2022-12-31 | 2022-09-30 | 2022-06-30 | 2022-03-31 | 2021-12-31 | 2021-09-30 | 2021-06-30 | 2021-03-31 | 2020-12-31 | 2020-09-30 | 2020-06-30 | 2020-03-31 | ||
|---|---|---|---|---|---|---|---|---|---|---|---|---|---|---|---|---|
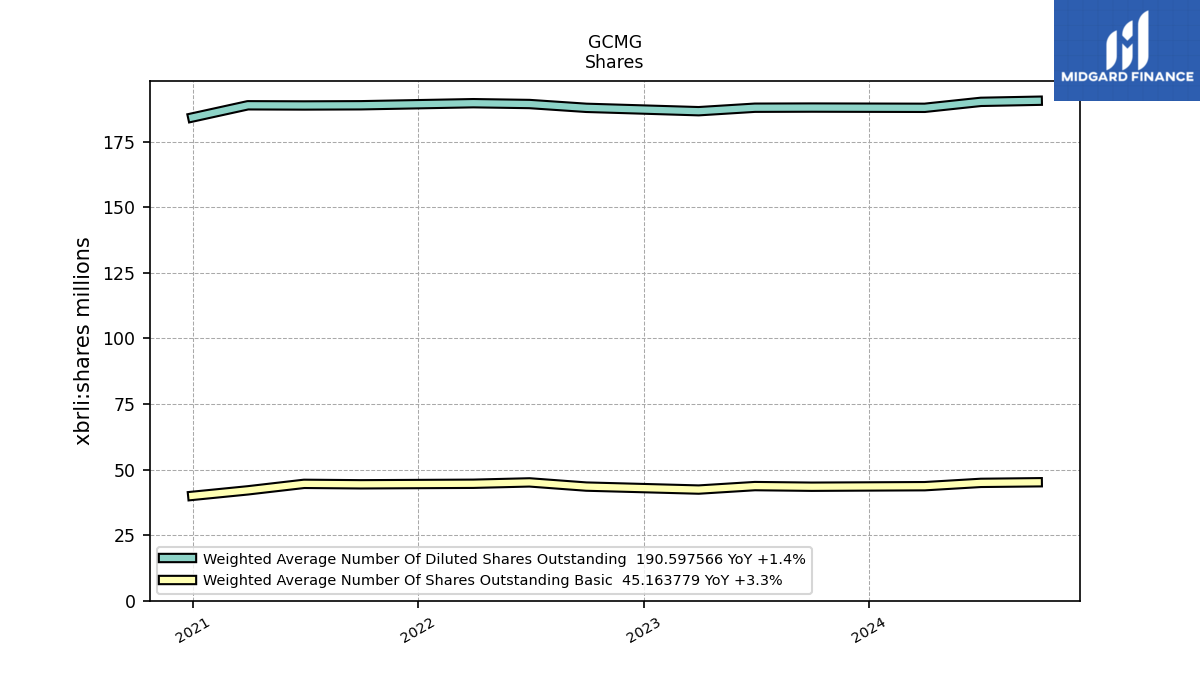
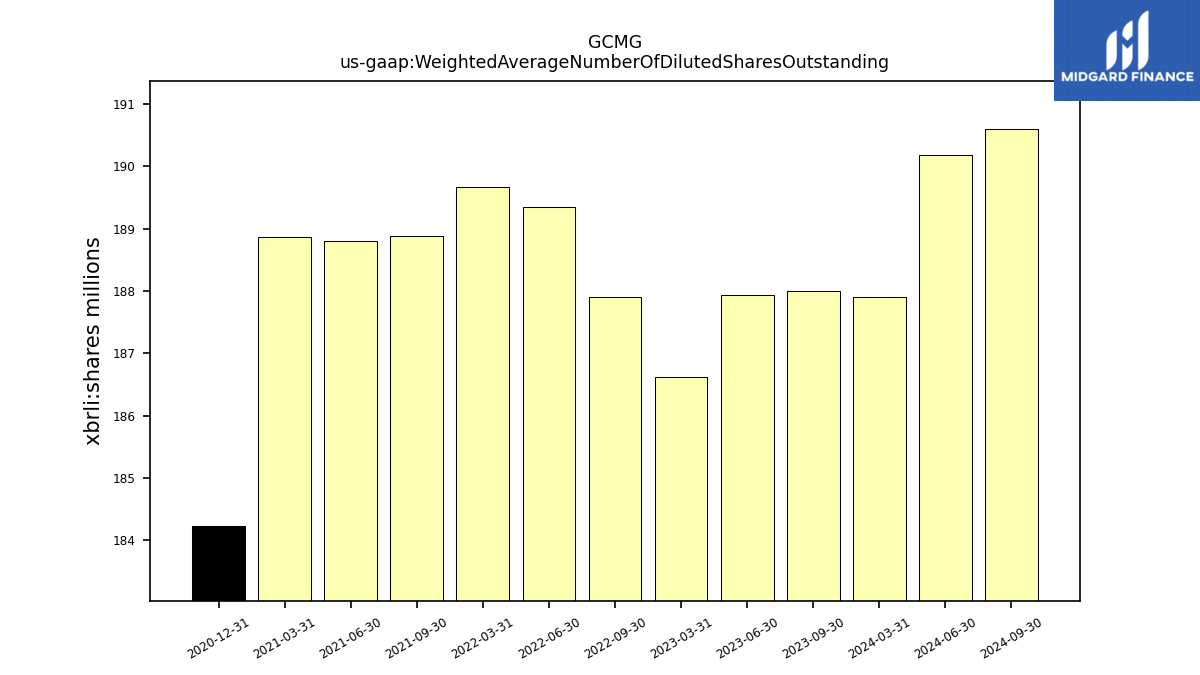
| Weighted Average Number Of Diluted Shares Outstanding | 188.00 | 187.94 | 186.62 | NA | 187.90 | 189.35 | 189.67 | NA | 188.88 | 188.80 | 188.87 | 184.22 | NA | NA | NA | |
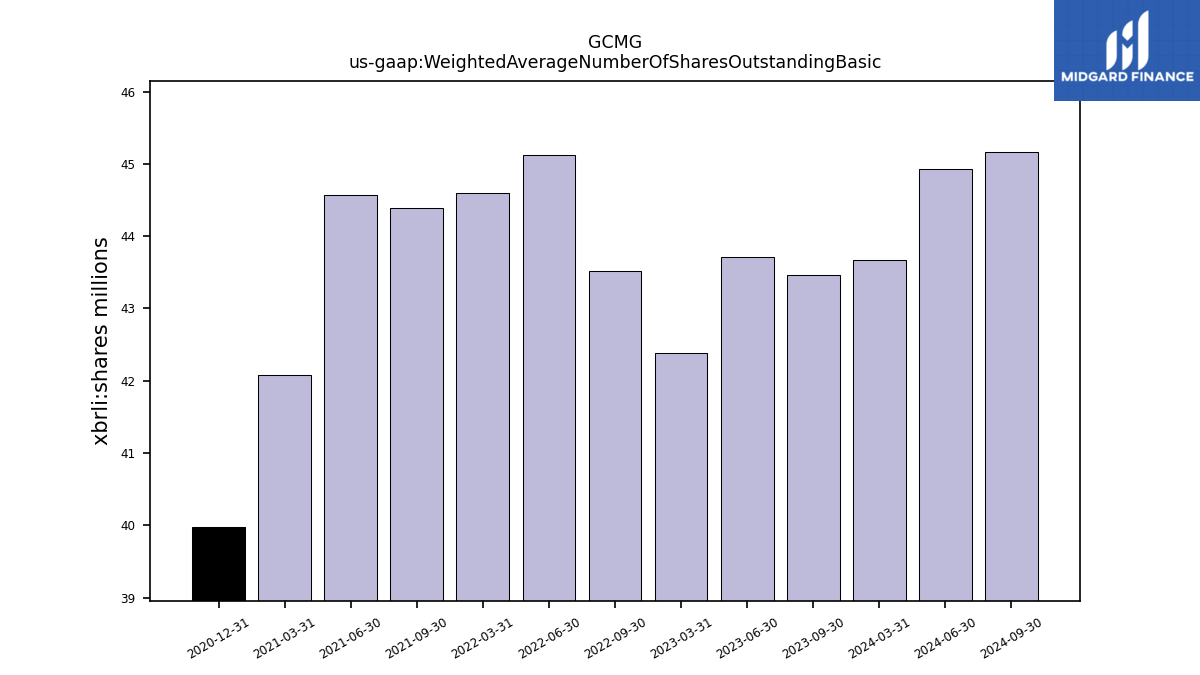
| Weighted Average Number Of Shares Outstanding Basic | 43.47 | 43.71 | 42.38 | NA | 43.52 | 45.12 | 44.59 | NA | 44.39 | 44.56 | 42.08 | 39.98 | NA | NA | NA | |
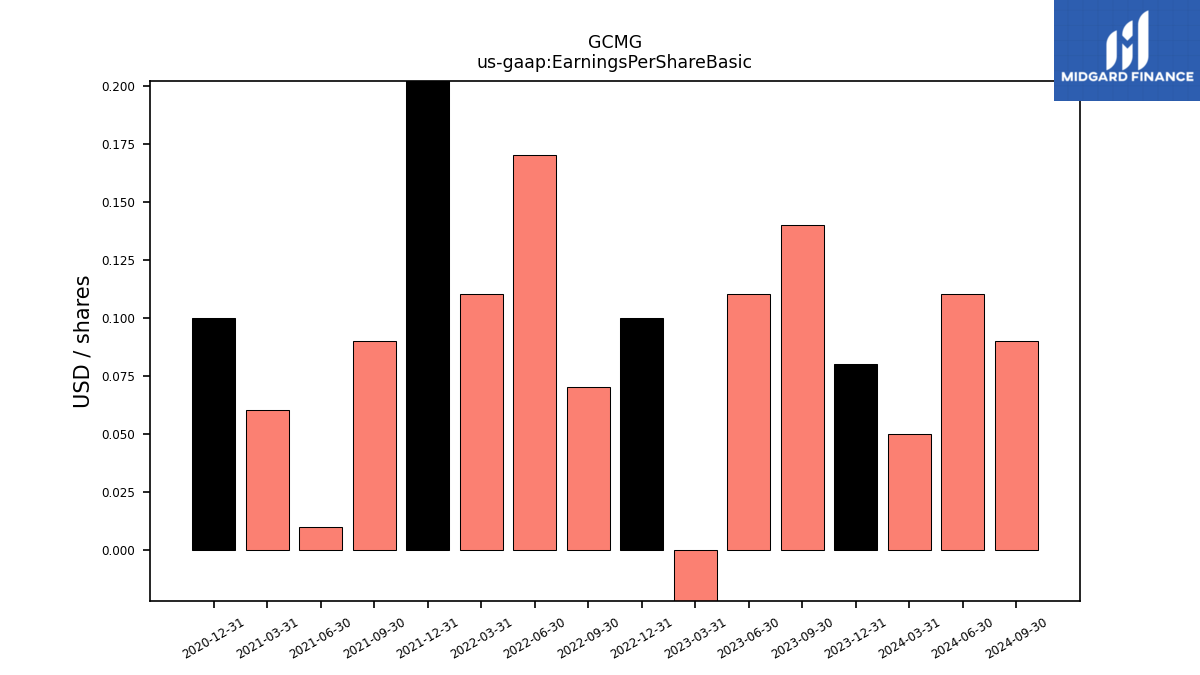
| Earnings Per Share Basic | 0.14 | 0.11 | -0.03 | 0.10 | 0.07 | 0.17 | 0.11 | 0.32 | 0.09 | 0.01 | 0.06 | 0.10 | NA | NA | NA | |
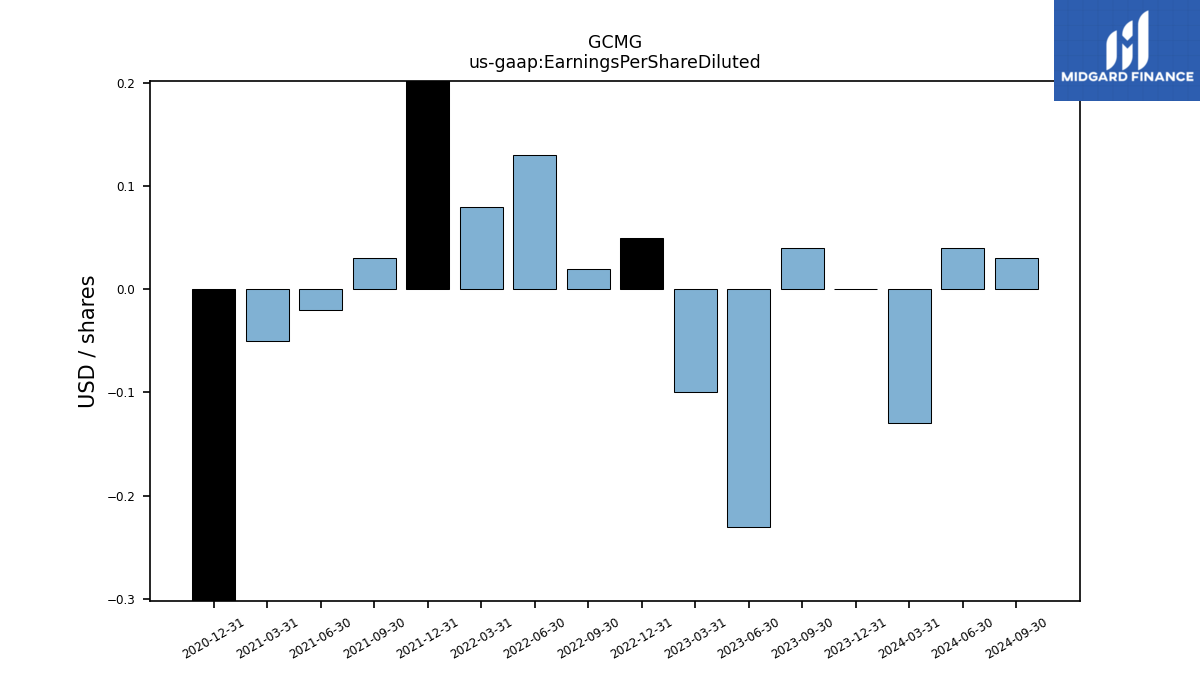
| Earnings Per Share Diluted | 0.04 | -0.23 | -0.10 | 0.05 | 0.02 | 0.13 | 0.08 | 0.25 | 0.03 | -0.02 | -0.05 | -0.58 | NA | NA | NA |
| 2023-09-30 | 2023-06-30 | 2023-03-31 | 2022-12-31 | 2022-09-30 | 2022-06-30 | 2022-03-31 | 2021-12-31 | 2021-09-30 | 2021-06-30 | 2021-03-31 | 2020-12-31 | 2020-09-30 | 2020-06-30 | 2020-03-31 | ||
|---|---|---|---|---|---|---|---|---|---|---|---|---|---|---|---|---|
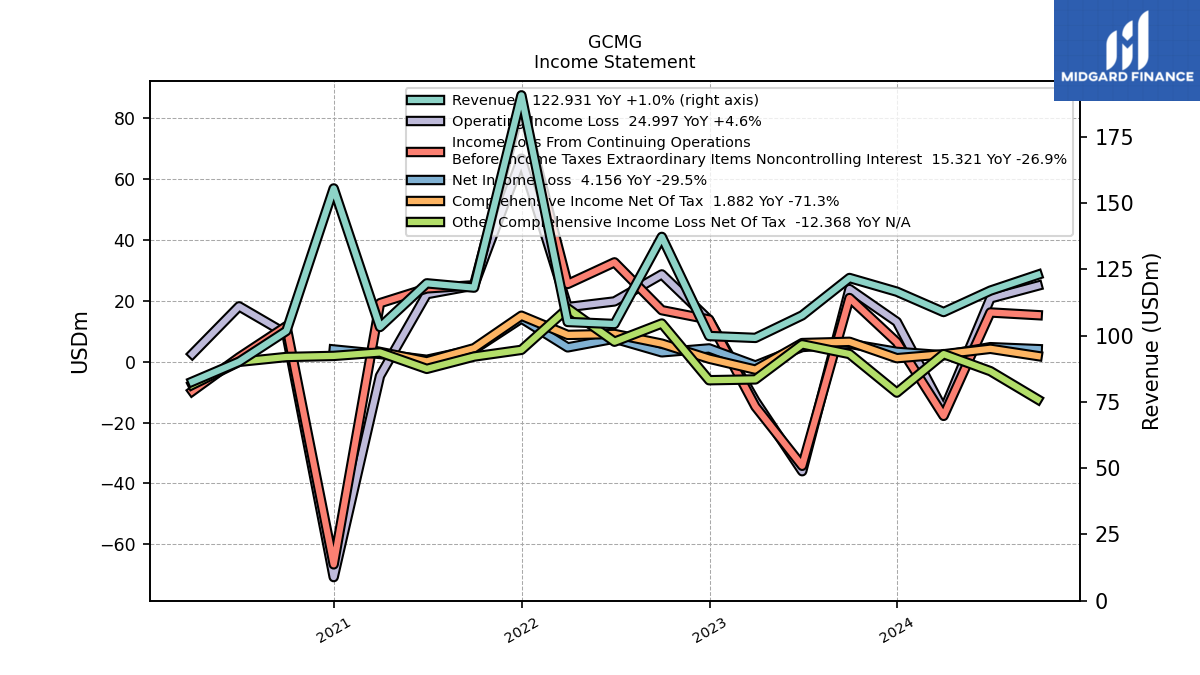
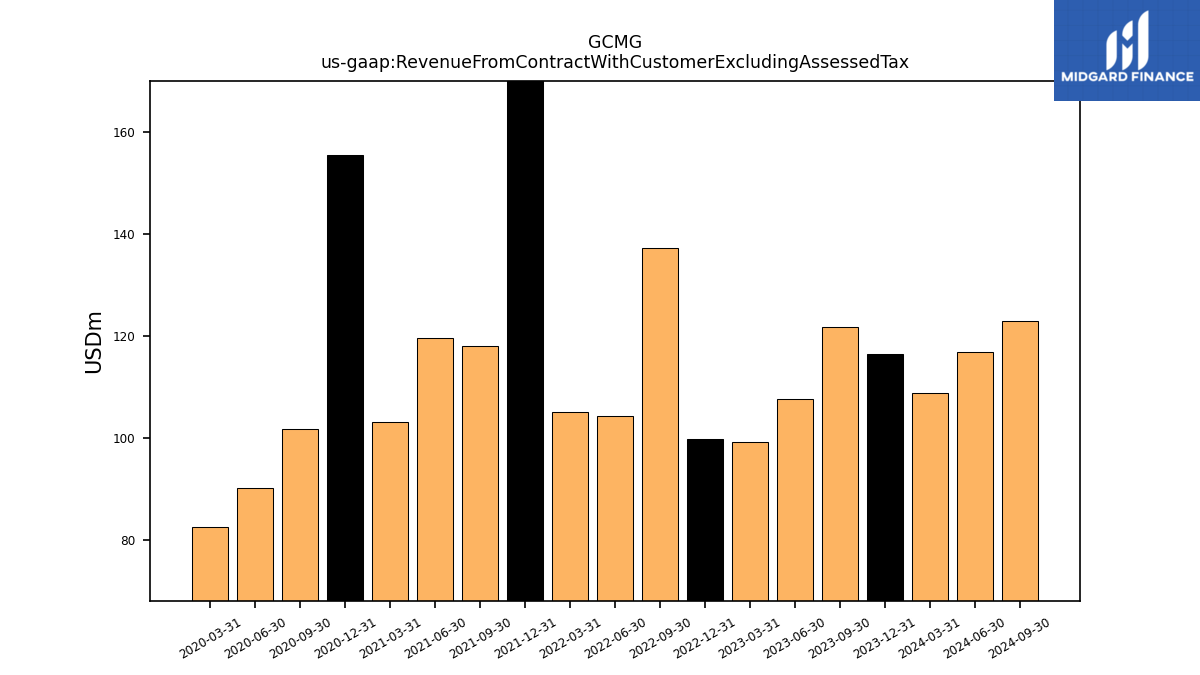
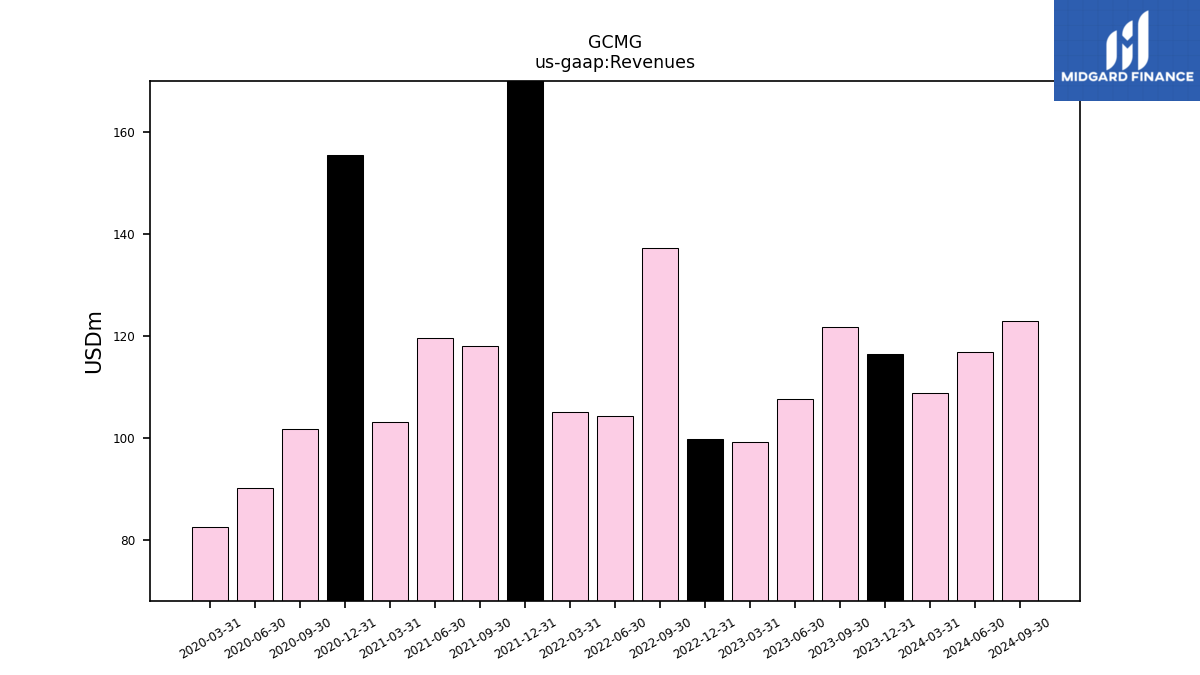
| Revenue From Contract With Customer Excluding Assessed Tax | 121.71 | 107.61 | 99.12 | 99.83 | 137.21 | 104.36 | 105.13 | 190.59 | 118.08 | 119.70 | 103.22 | 155.49 | 101.75 | 90.13 | 82.62 | |
| Revenues | 121.71 | 107.61 | 99.12 | 99.83 | 137.21 | 104.36 | 105.13 | 190.59 | 118.08 | 119.70 | 103.22 | 155.49 | 101.75 | 90.13 | 82.62 | |
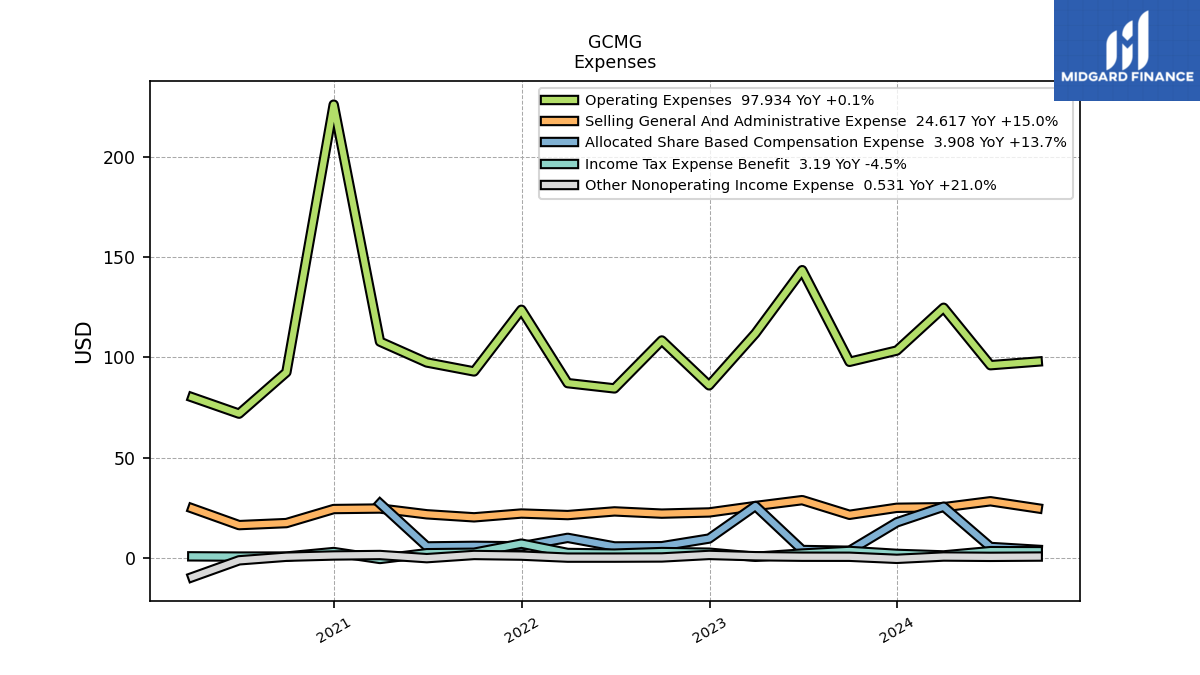
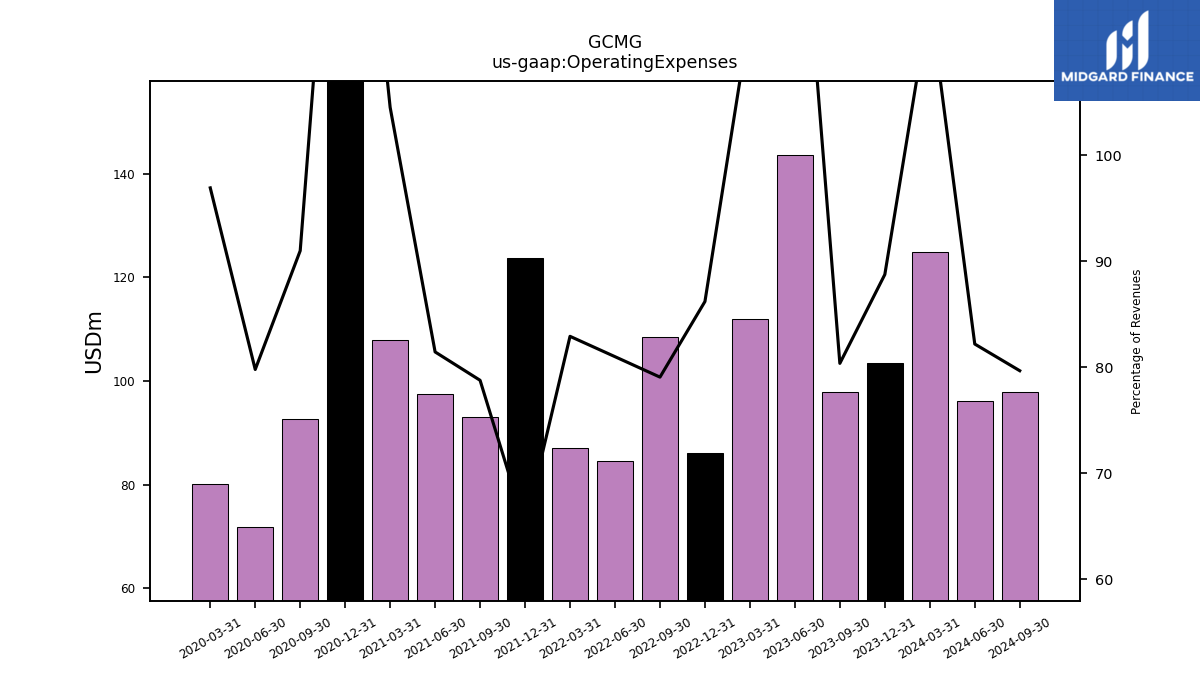
| Operating Expenses | 97.81 | 143.59 | 112.00 | 86.05 | 108.48 | 84.52 | 87.16 | 123.82 | 93.00 | 97.48 | 107.89 | 226.28 | 92.58 | 71.91 | 80.07 | |
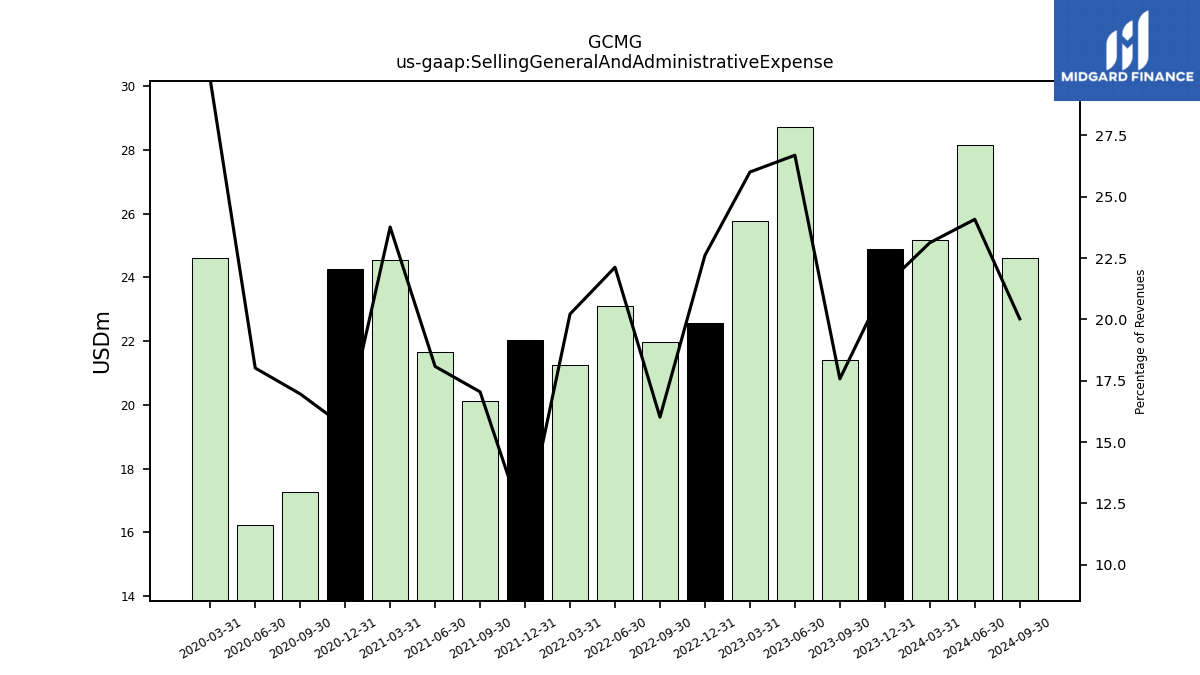
| Selling General And Administrative Expense | 21.40 | 28.73 | 25.78 | 22.57 | 21.98 | 23.09 | 21.26 | 22.04 | 20.13 | 21.65 | 24.53 | 24.27 | 17.26 | 16.24 | 24.60 | |
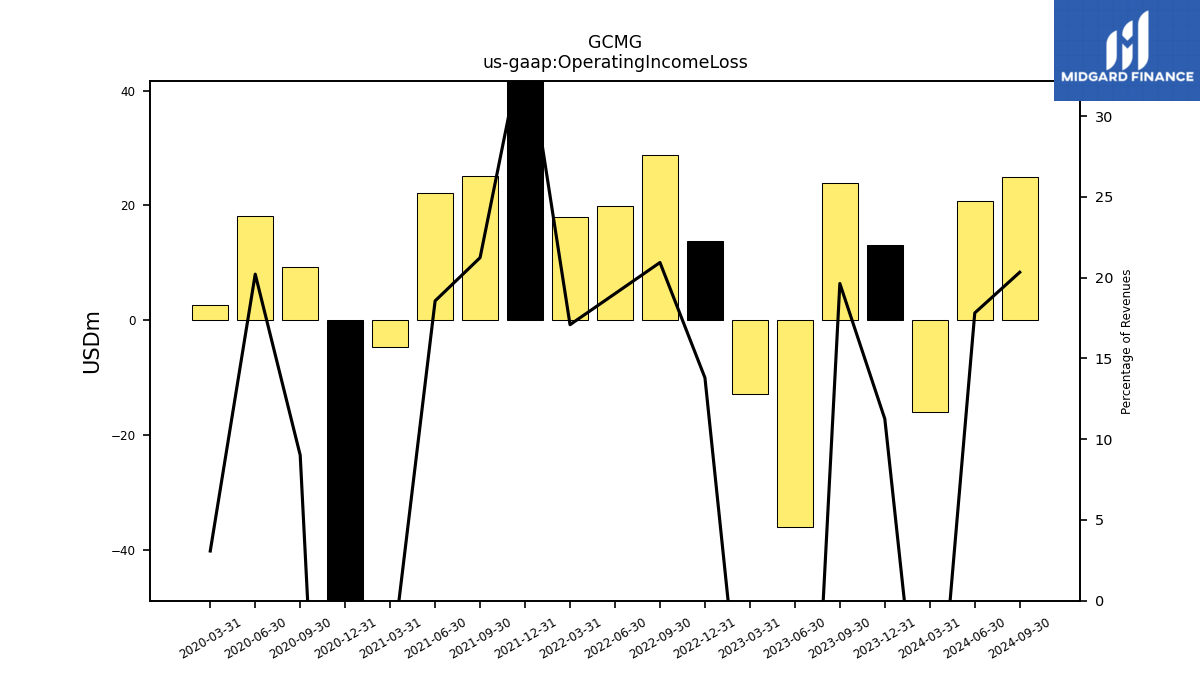
| Operating Income Loss | 23.90 | -35.98 | -12.89 | 13.78 | 28.73 | 19.84 | 17.96 | 66.78 | 25.08 | 22.22 | -4.67 | -70.79 | 9.17 | 18.22 | 2.54 | |
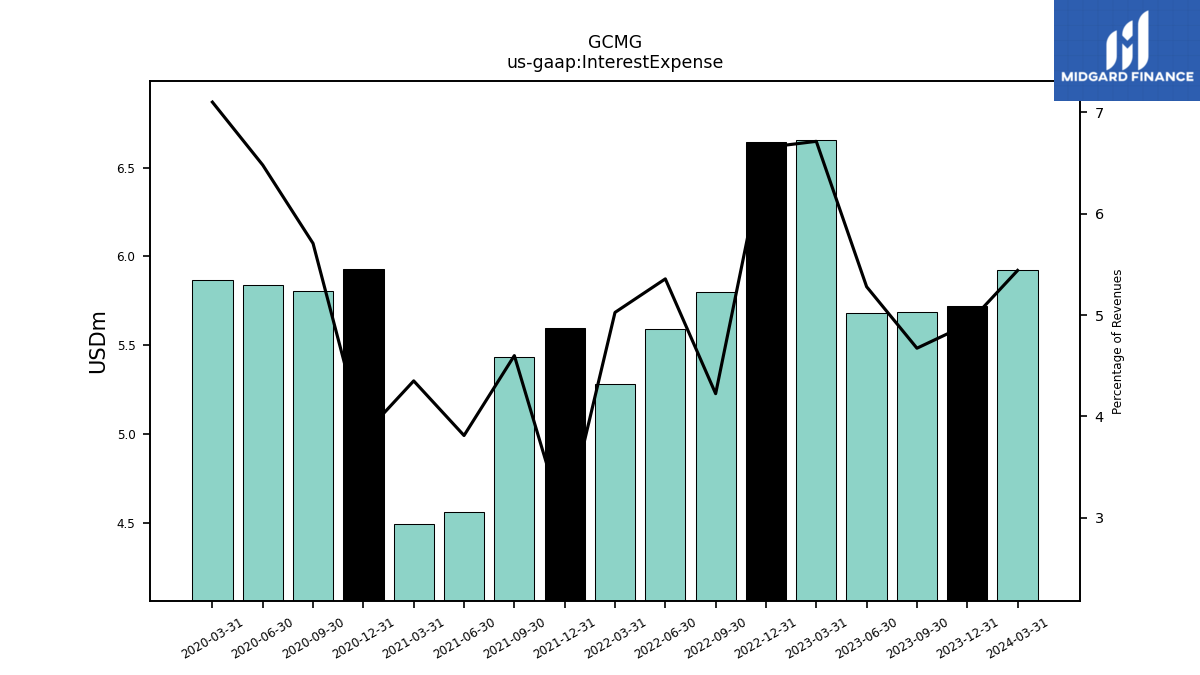
| Interest Expense | 5.69 | 5.68 | 6.66 | 6.64 | 5.80 | 5.59 | 5.28 | 5.60 | 5.43 | 4.56 | 4.49 | 5.93 | 5.81 | 5.84 | 5.87 | |
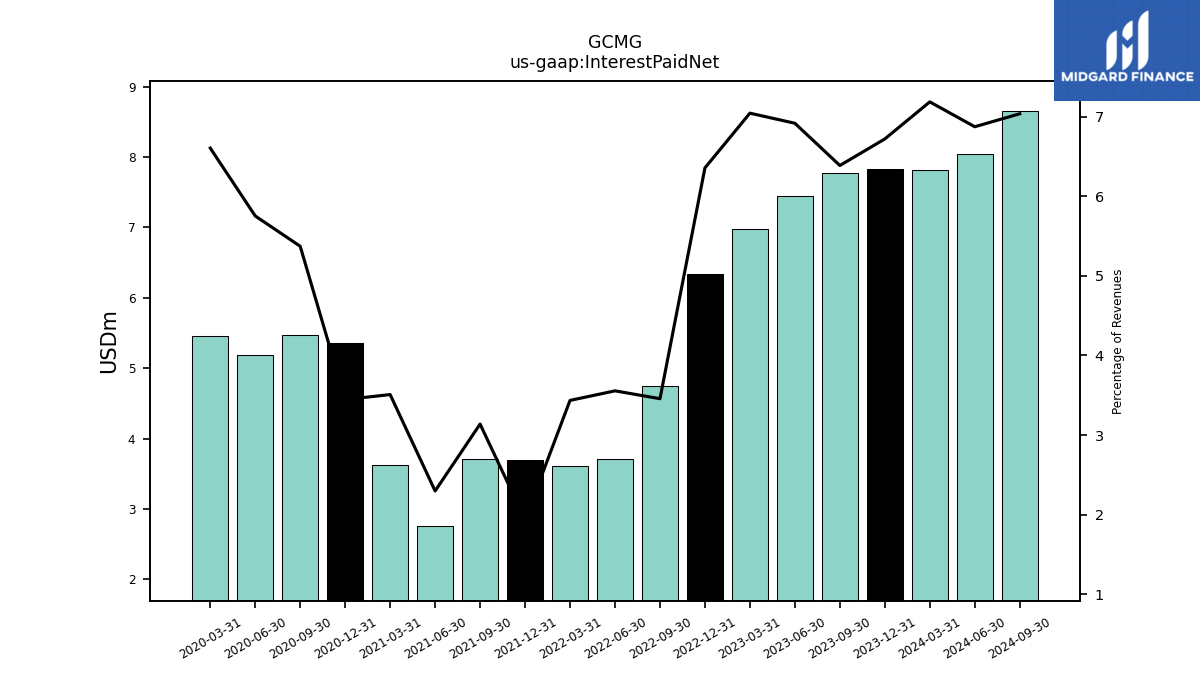
| Interest Paid Net | 7.77 | 7.44 | 6.98 | 6.34 | 4.74 | 3.71 | 3.61 | 3.70 | 3.71 | 2.75 | 3.62 | 5.36 | 5.46 | 5.18 | 5.46 | |
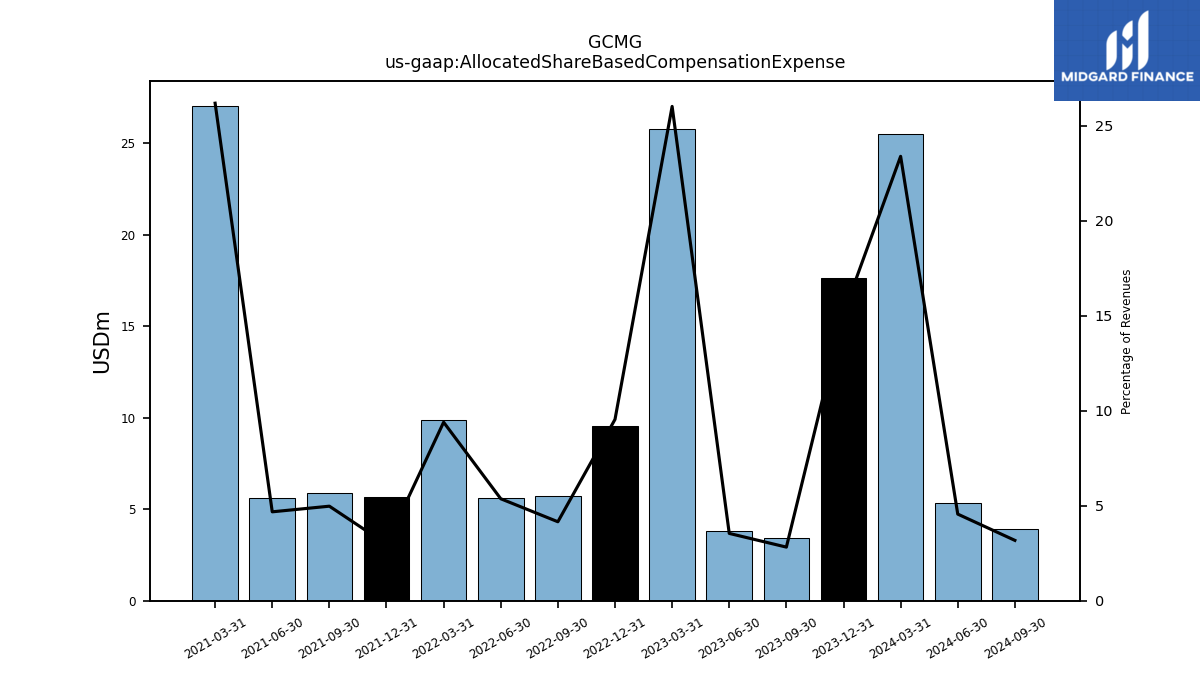
| Allocated Share Based Compensation Expense | 3.44 | 3.81 | 25.79 | 9.53 | 5.71 | 5.60 | 9.88 | 5.67 | 5.88 | 5.60 | 27.04 | NA | NA | NA | NA | |
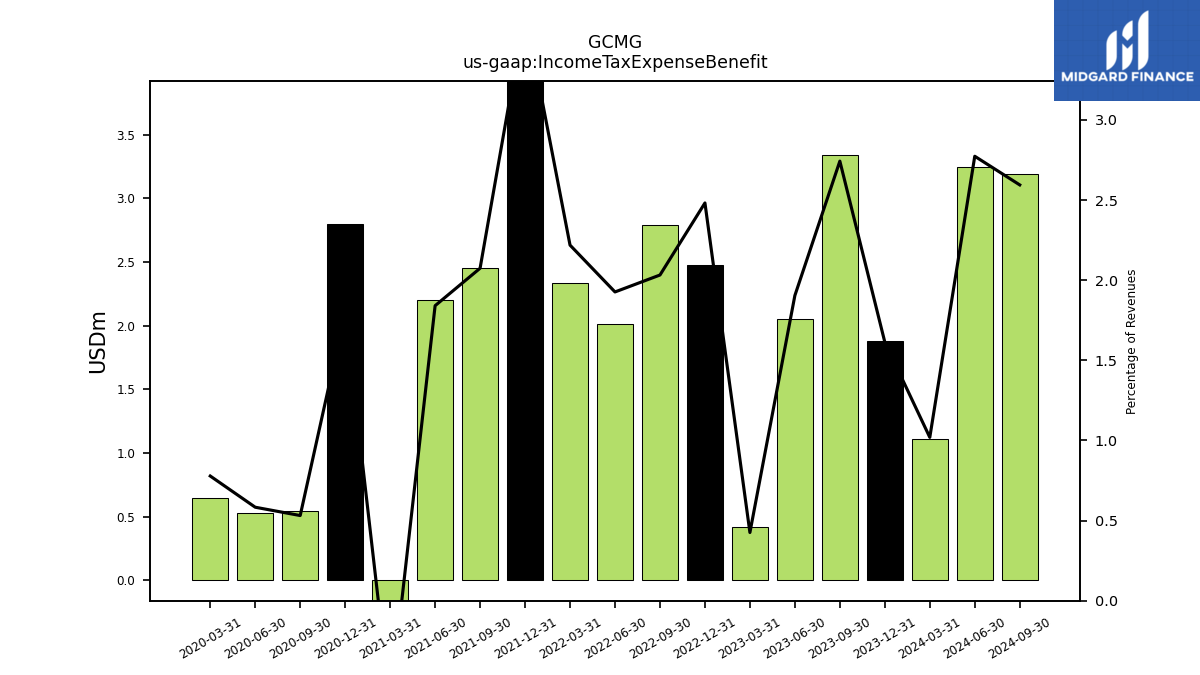
| Income Tax Expense Benefit | 3.34 | 2.05 | 0.42 | 2.48 | 2.79 | 2.01 | 2.33 | 7.00 | 2.45 | 2.20 | -0.66 | 2.80 | 0.54 | 0.53 | 0.64 | |
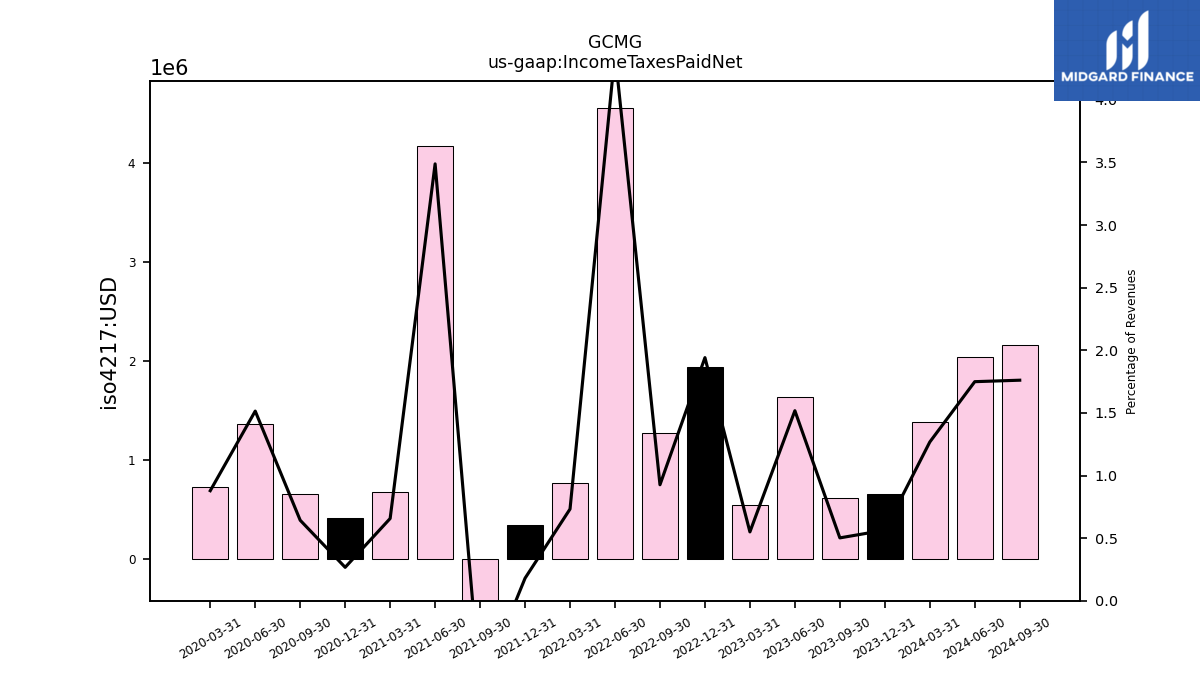
| Income Taxes Paid Net | 0.61 | 1.63 | 0.55 | 1.94 | 1.27 | 4.56 | 0.77 | 0.34 | -0.83 | 4.18 | 0.68 | 0.41 | 0.65 | 1.36 | 0.73 | |
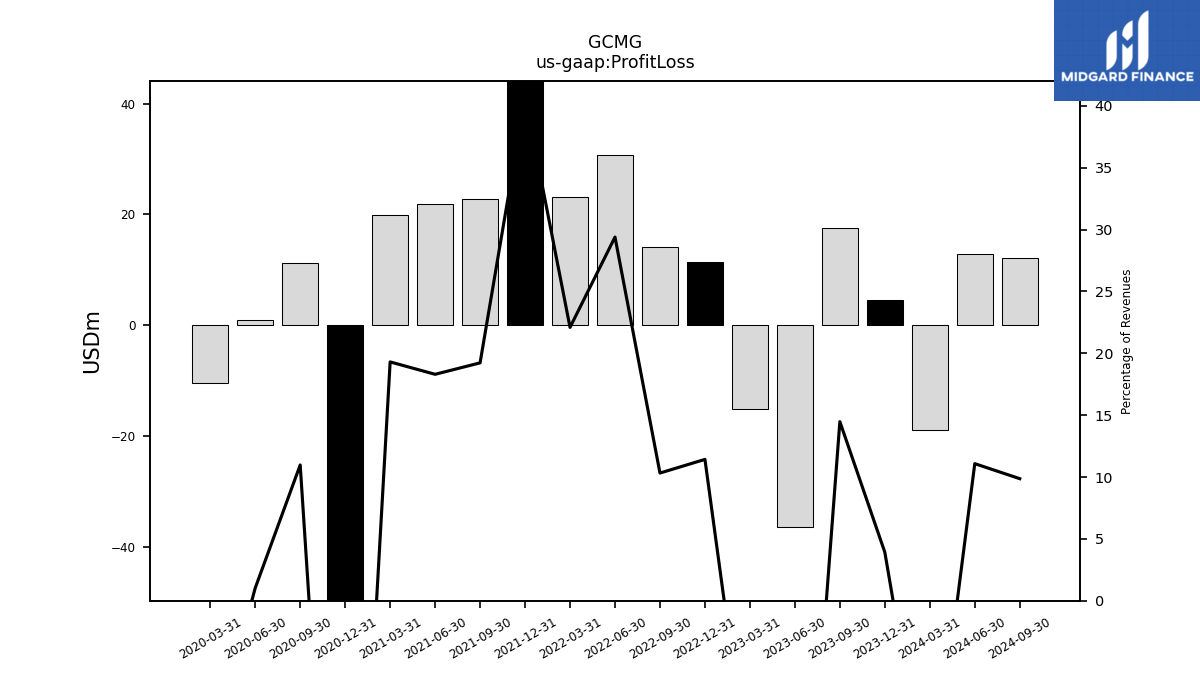
| Profit Loss | 17.62 | -36.25 | -15.15 | 11.41 | 14.16 | 30.68 | 23.23 | 77.52 | 22.71 | 21.91 | 19.93 | -69.40 | 11.17 | 0.93 | -10.33 | |
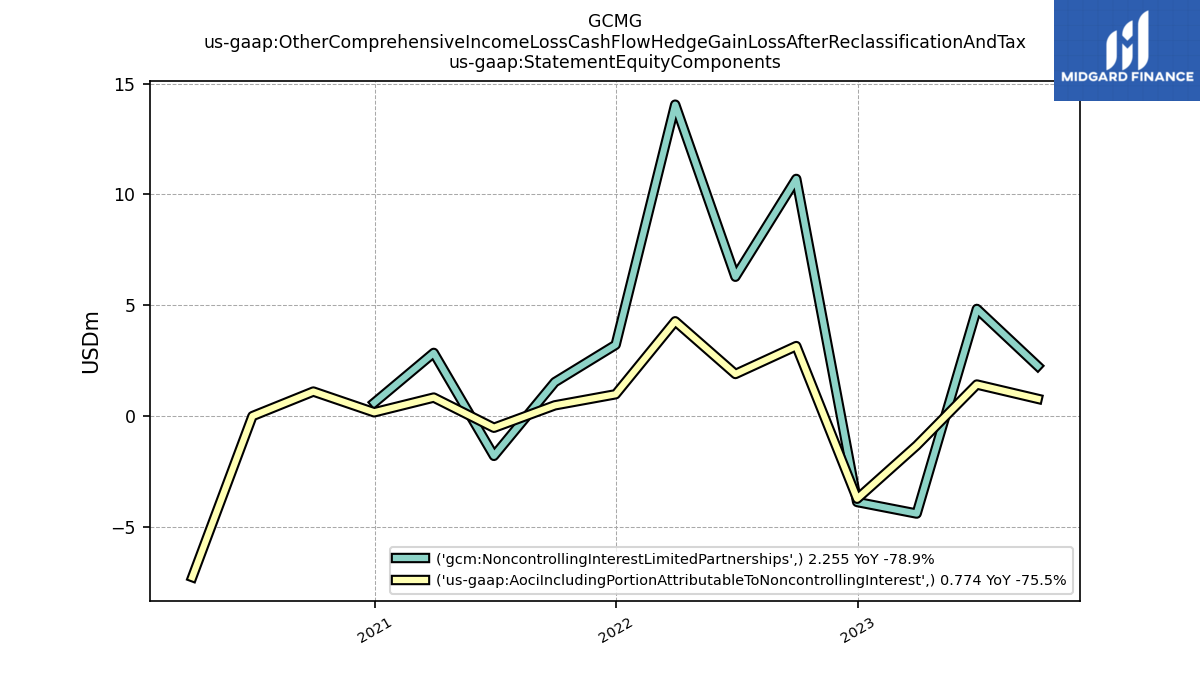
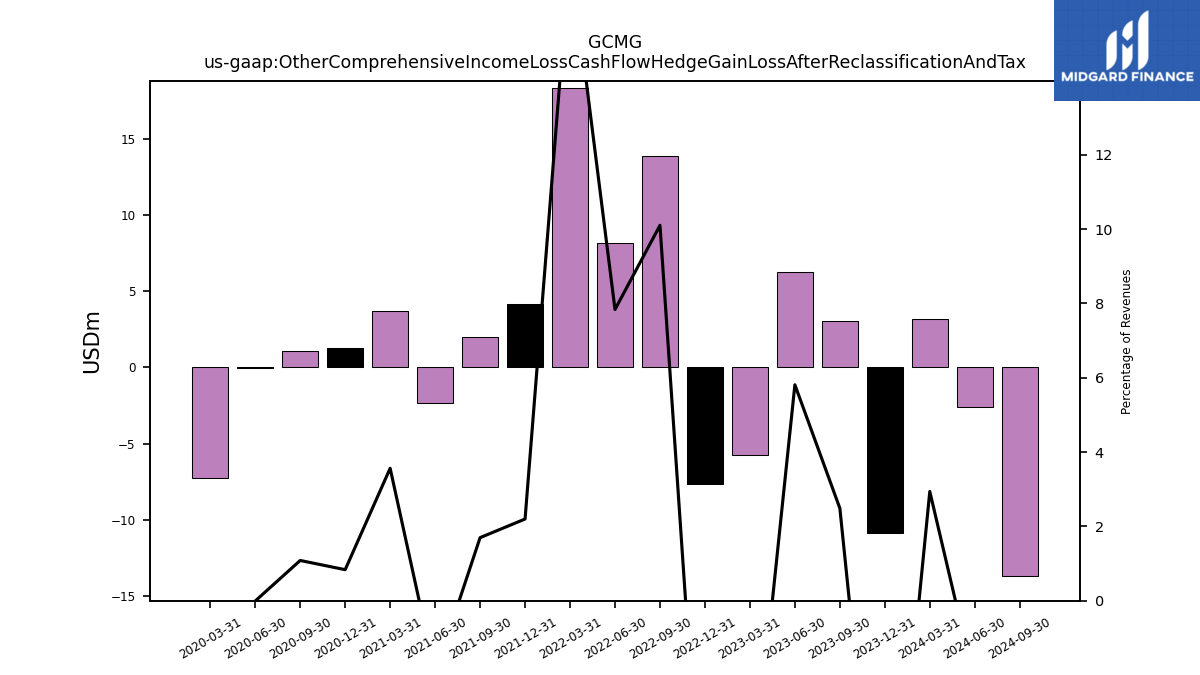
| Other Comprehensive Income Loss Cash Flow Hedge Gain Loss After Reclassification And Tax | 3.03 | 6.25 | -5.74 | -7.62 | 13.86 | 8.18 | 18.33 | 4.19 | 2.00 | -2.33 | 3.68 | 1.30 | 1.10 | -0.01 | -7.28 | |
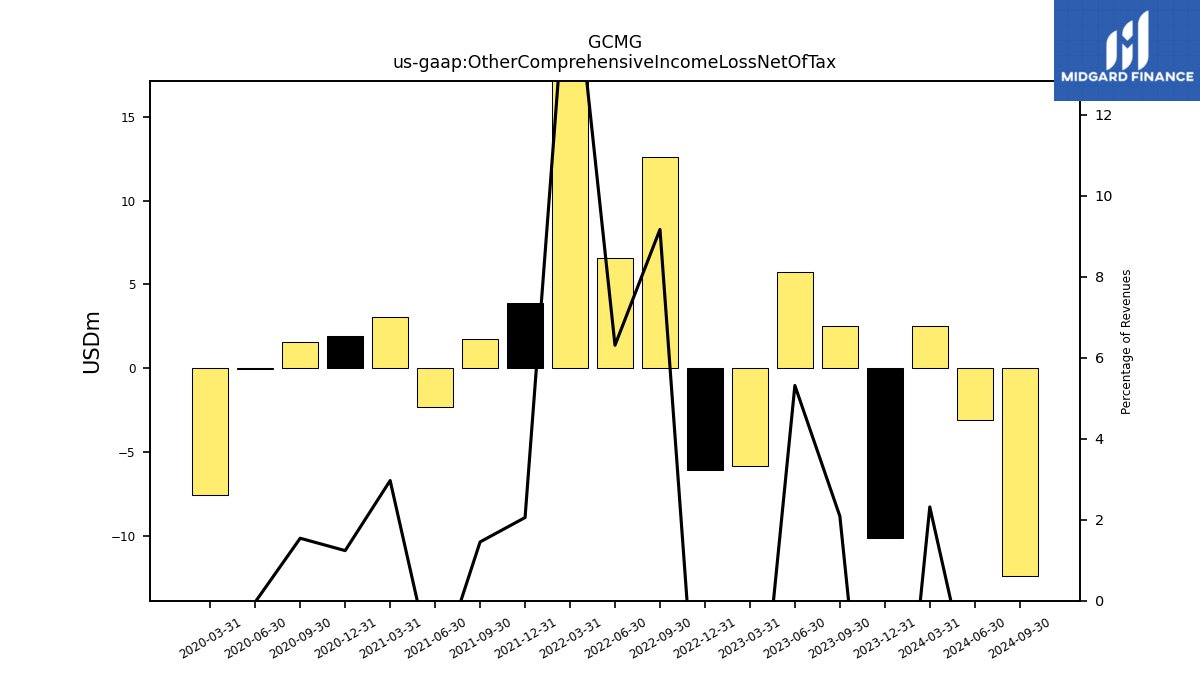
| Other Comprehensive Income Loss Net Of Tax | 2.54 | 5.72 | -5.80 | -6.07 | 12.58 | 6.59 | 17.57 | 3.92 | 1.72 | -2.34 | 3.06 | 1.93 | 1.57 | -0.03 | -7.57 | |
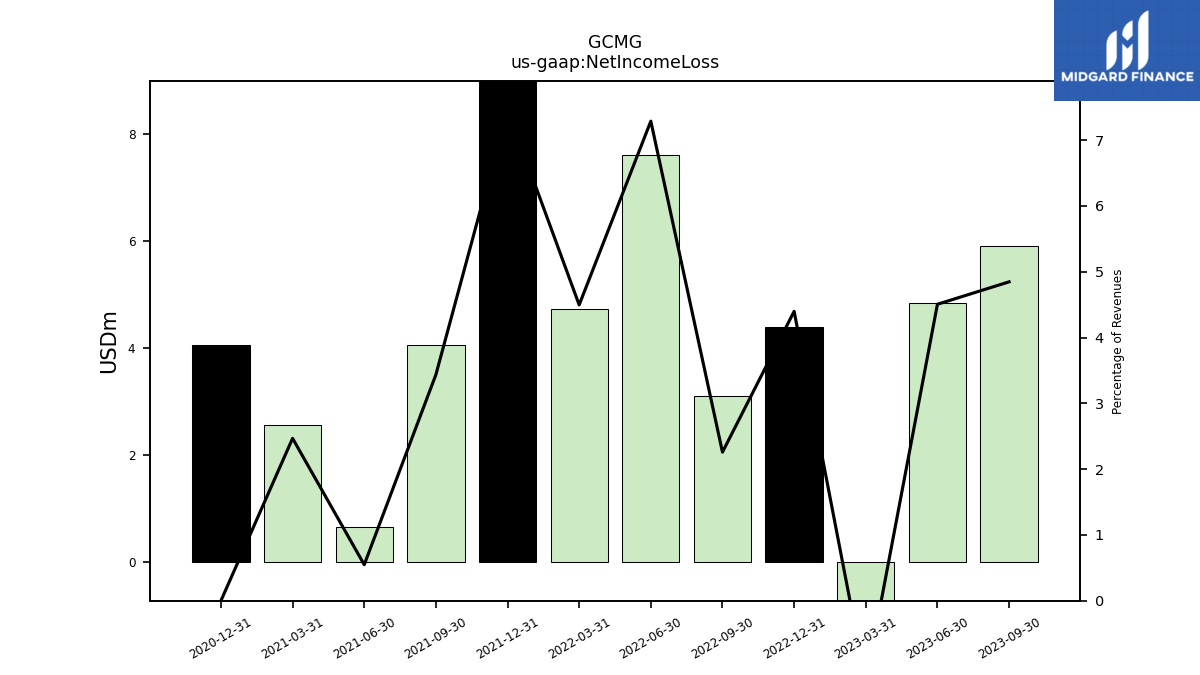
| Net Income Loss | 5.90 | 4.85 | -1.23 | 4.39 | 3.10 | 7.61 | 4.73 | 14.22 | 4.06 | 0.66 | 2.55 | 4.05 | NA | NA | NA | |
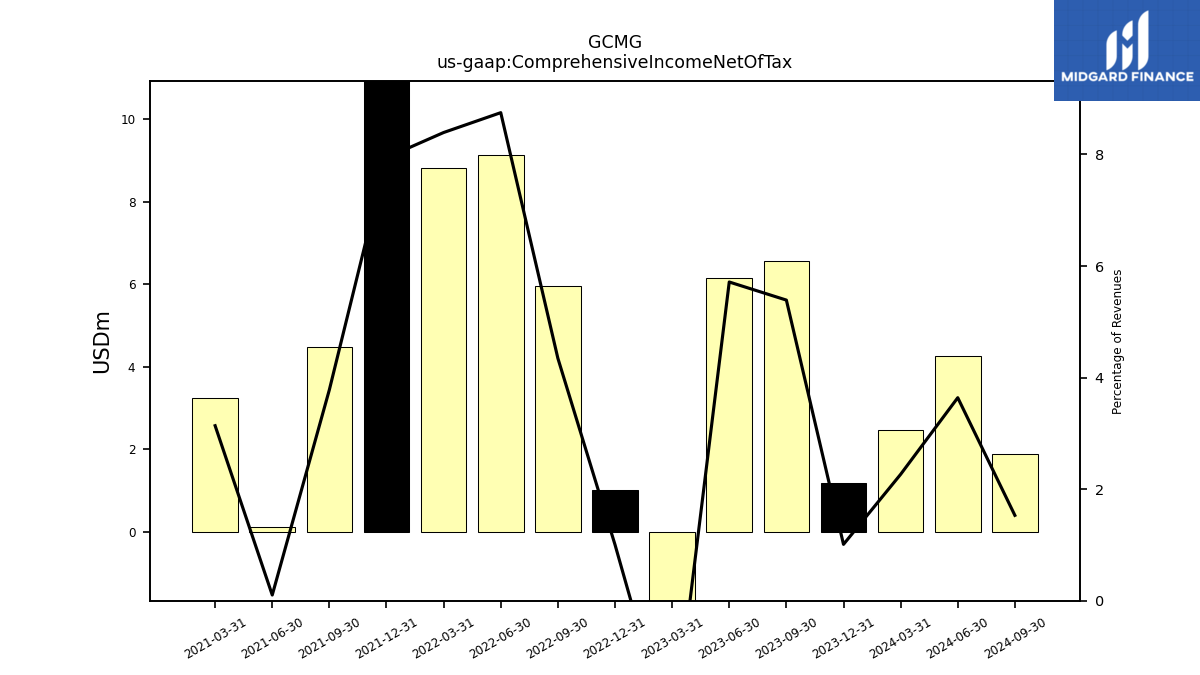
| Comprehensive Income Net Of Tax | 6.56 | 6.15 | -2.58 | 1.00 | 5.96 | 9.13 | 8.82 | 15.14 | 4.47 | 0.12 | 3.24 | NA | NA | NA | NA | |
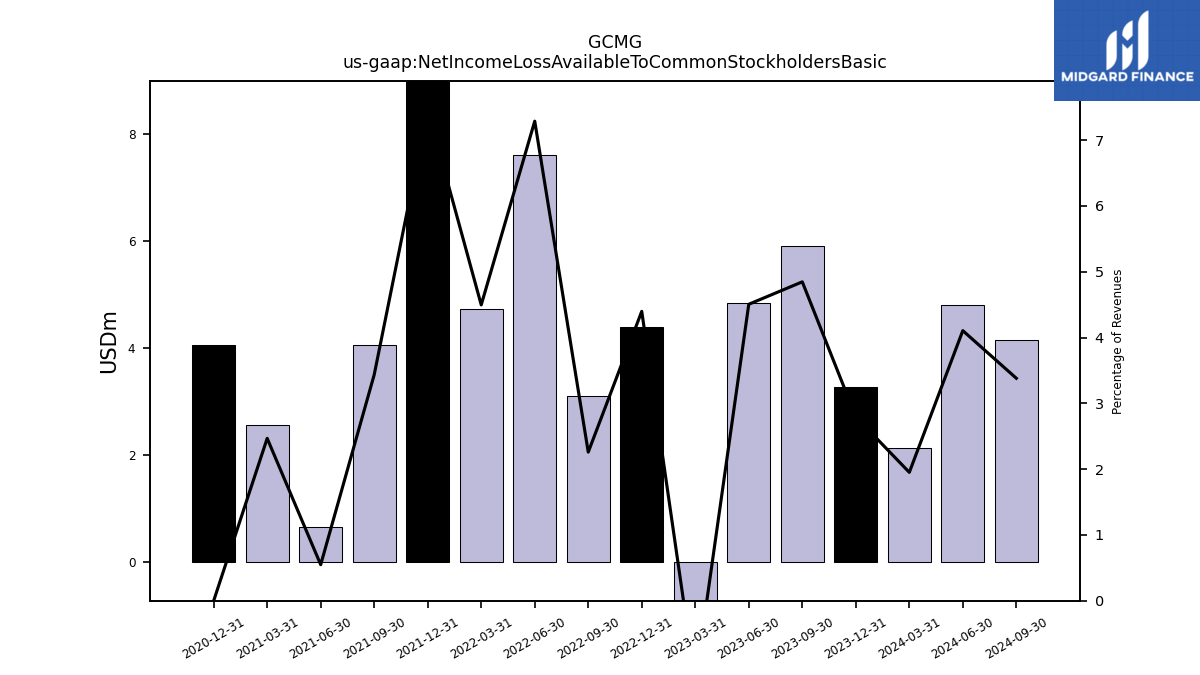
| Net Income Loss Available To Common Stockholders Basic | 5.90 | 4.85 | -1.23 | 4.39 | 3.10 | 7.61 | 4.73 | 14.22 | 4.06 | 0.66 | 2.55 | 4.05 | NA | NA | NA | |
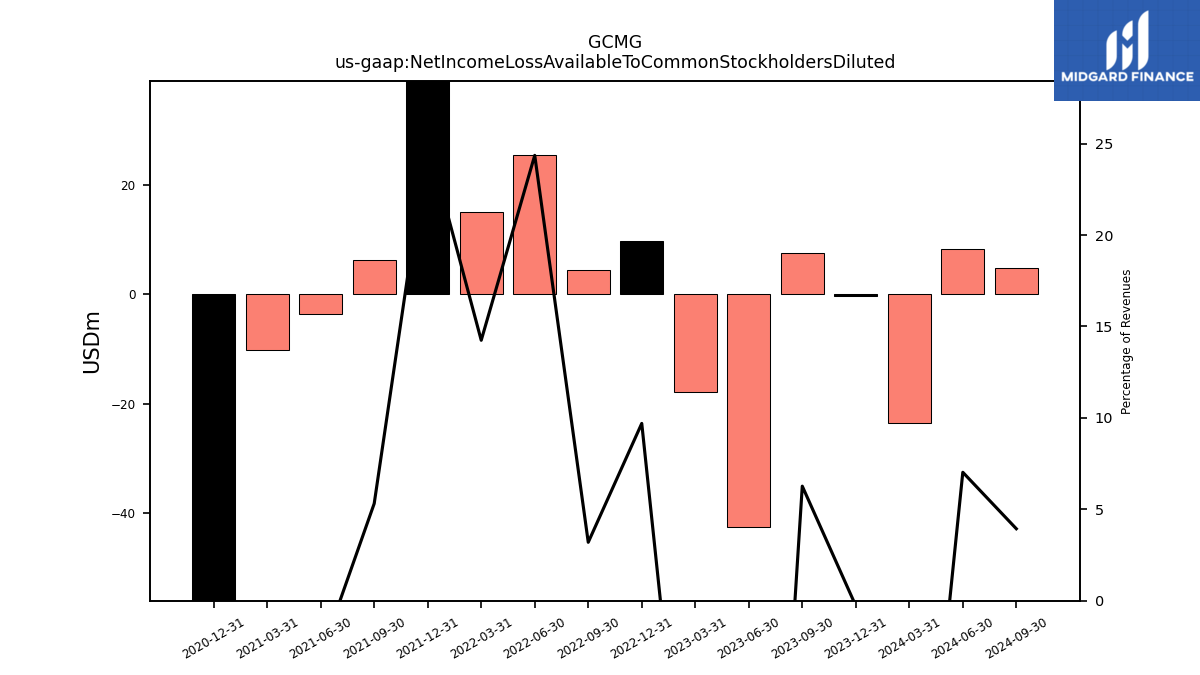
| Net Income Loss Available To Common Stockholders Diluted | 7.63 | -42.43 | -17.91 | 9.68 | 4.39 | 25.42 | 14.98 | 48.02 | 6.28 | -3.58 | -10.15 | -106.99 | NA | NA | NA |
| 2023-09-30 | 2023-06-30 | 2023-03-31 | 2022-12-31 | 2022-09-30 | 2022-06-30 | 2022-03-31 | 2021-12-31 | 2021-09-30 | 2021-06-30 | 2021-03-31 | 2020-12-31 | 2020-09-30 | 2020-06-30 | 2020-03-31 | ||
|---|---|---|---|---|---|---|---|---|---|---|---|---|---|---|---|---|
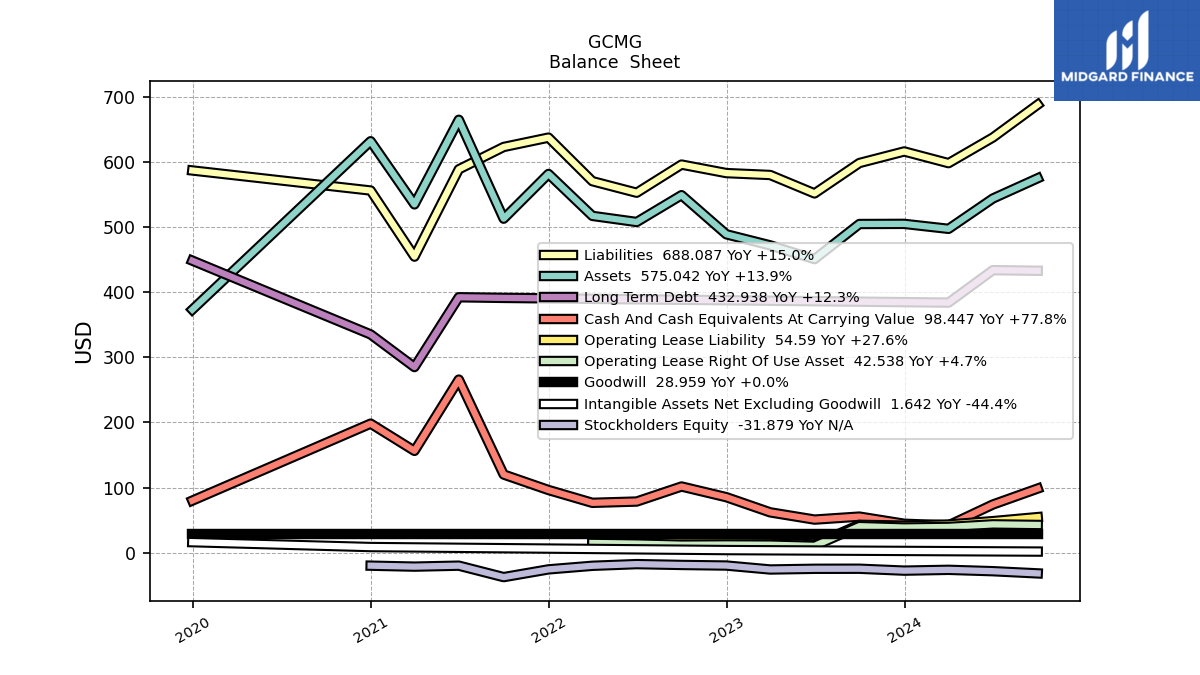
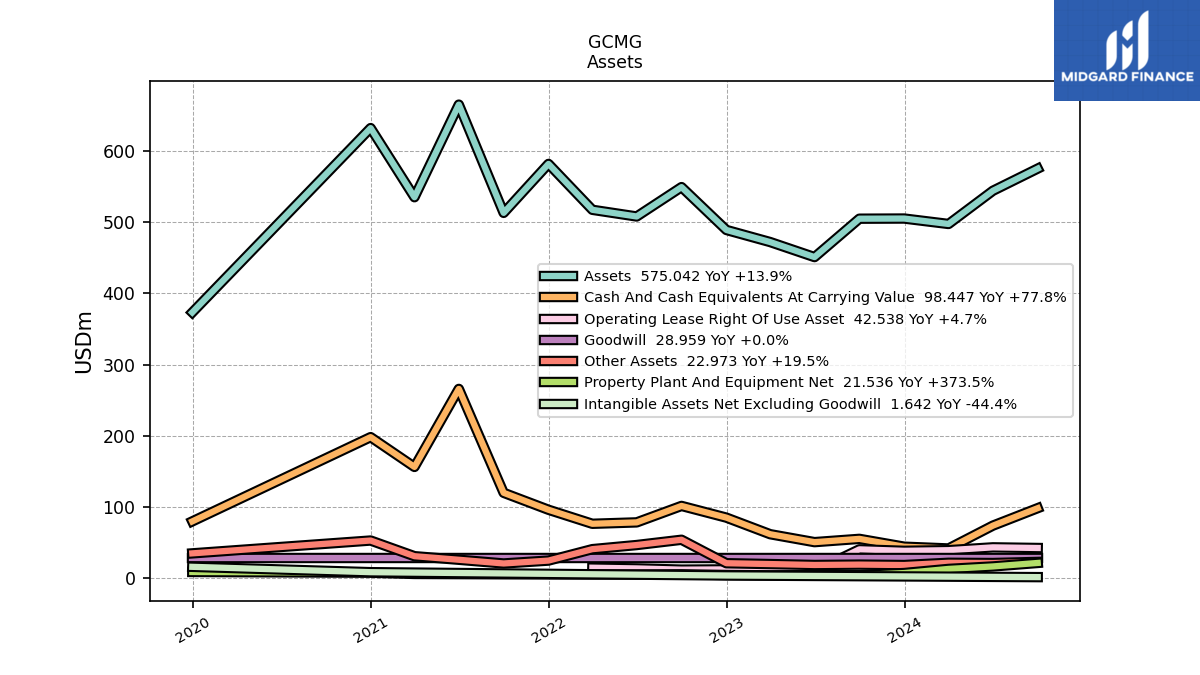
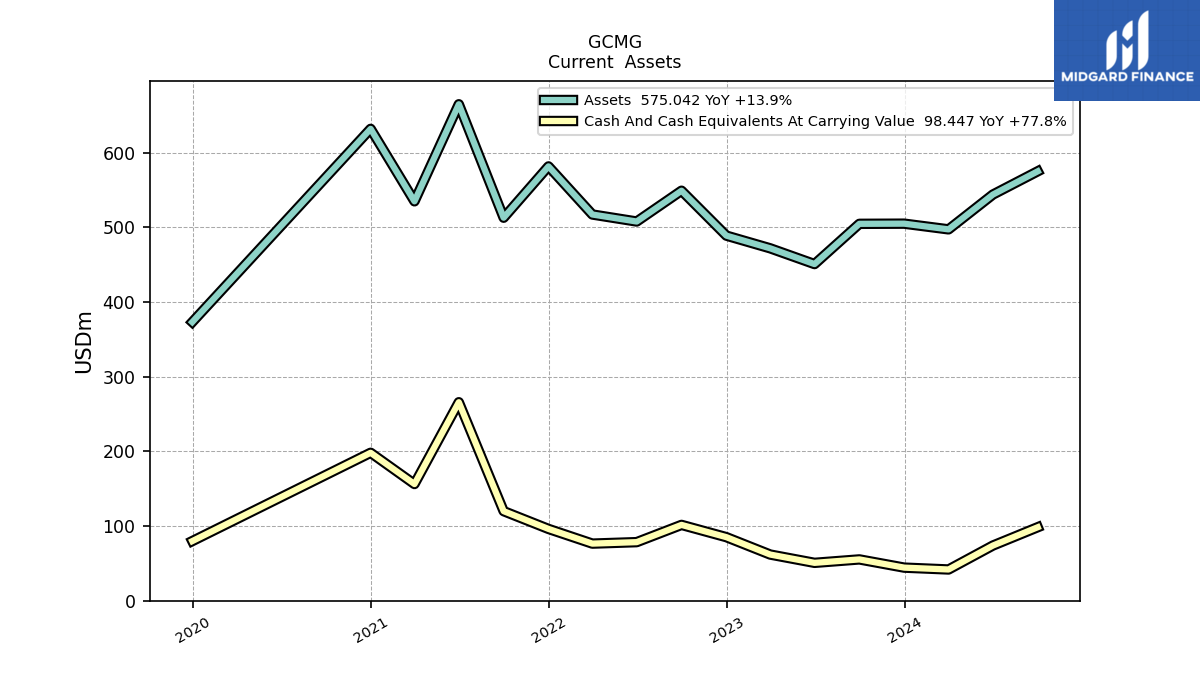
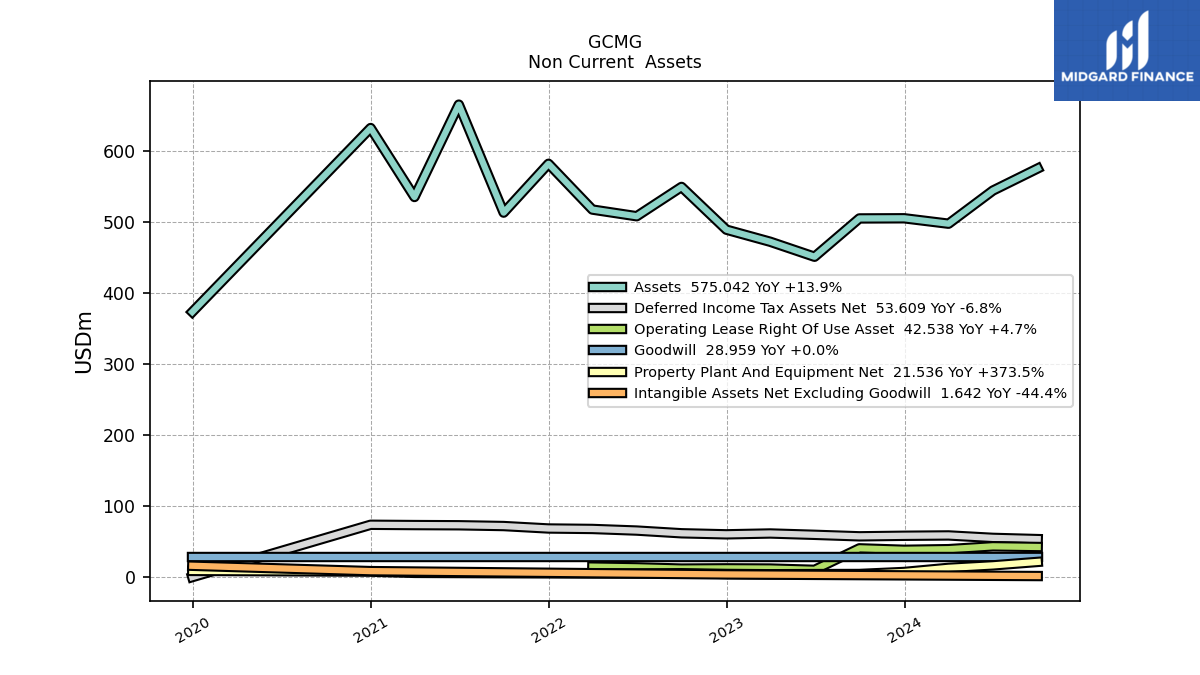
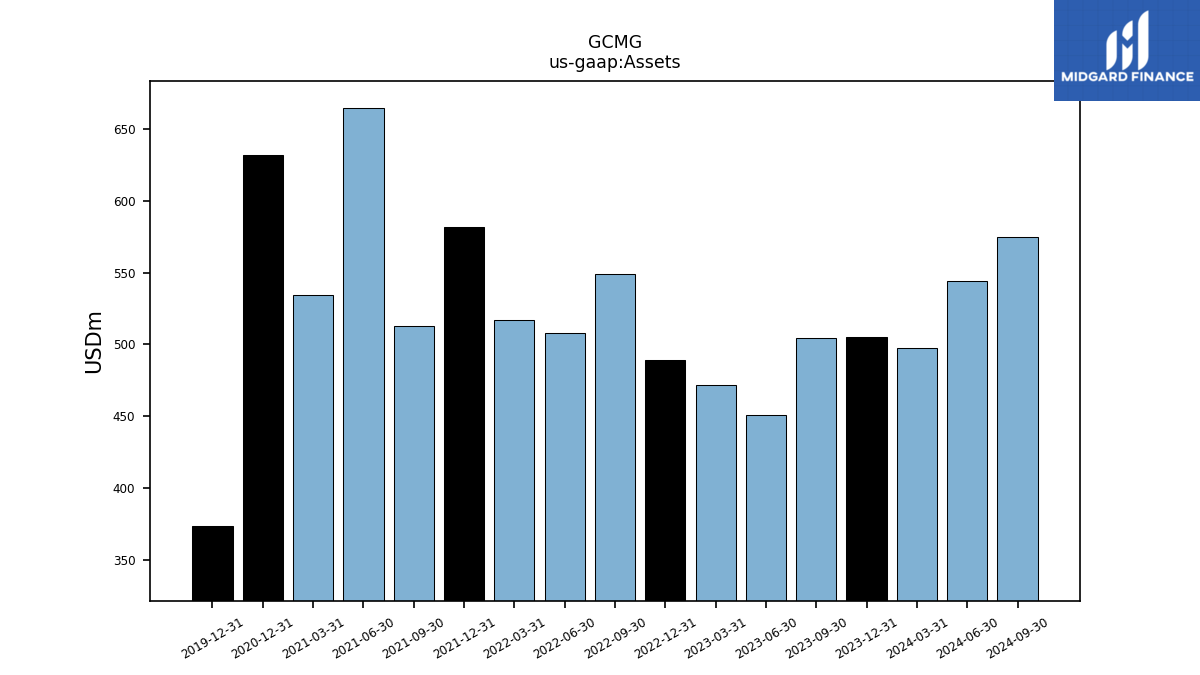
| Assets | 504.72 | 450.82 | 471.93 | 488.93 | 549.05 | 507.81 | 517.21 | 581.62 | 512.88 | 664.83 | 534.84 | 631.89 | NA | NA | NA | |
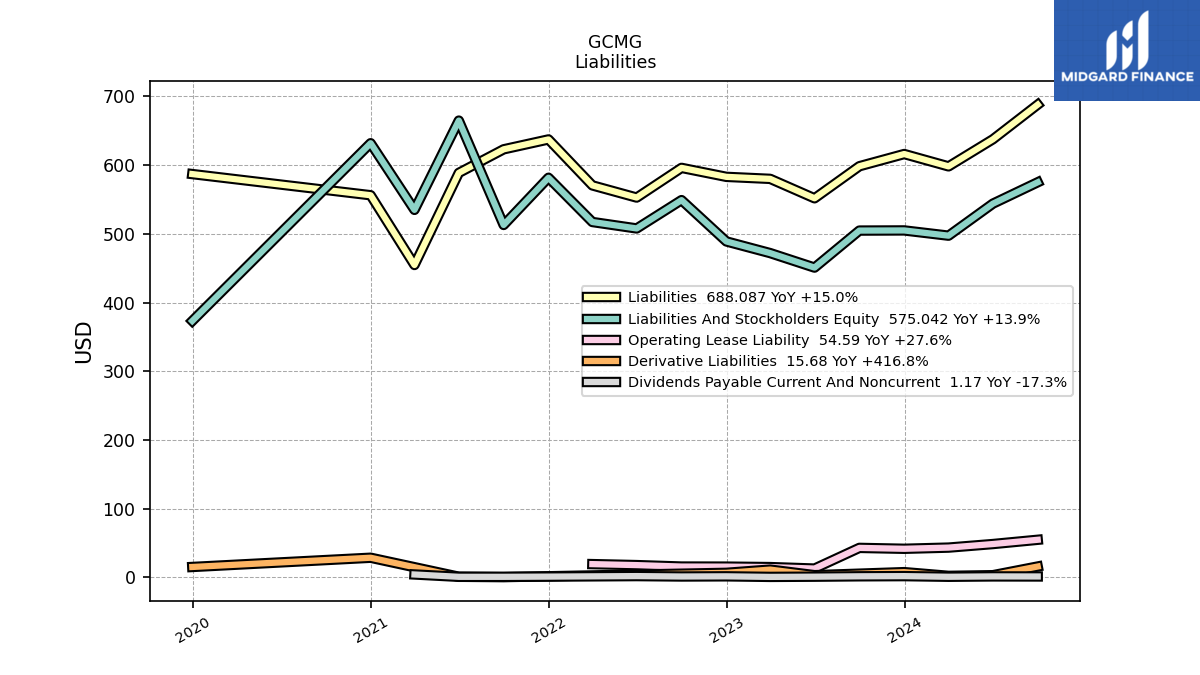
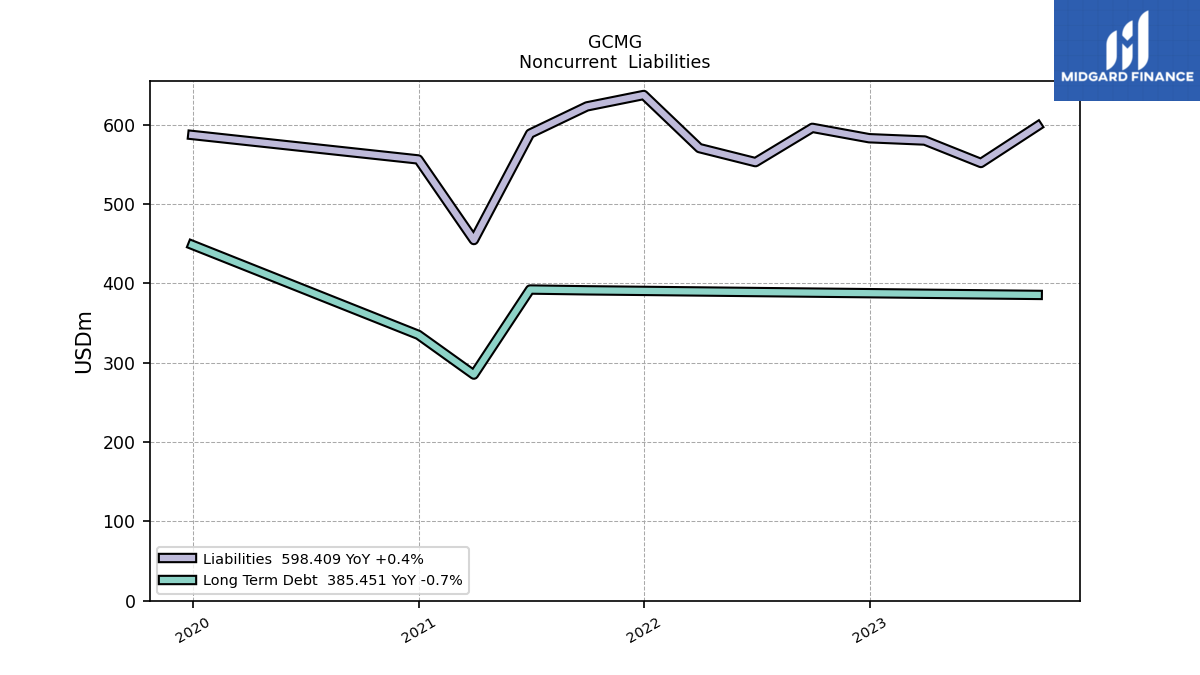
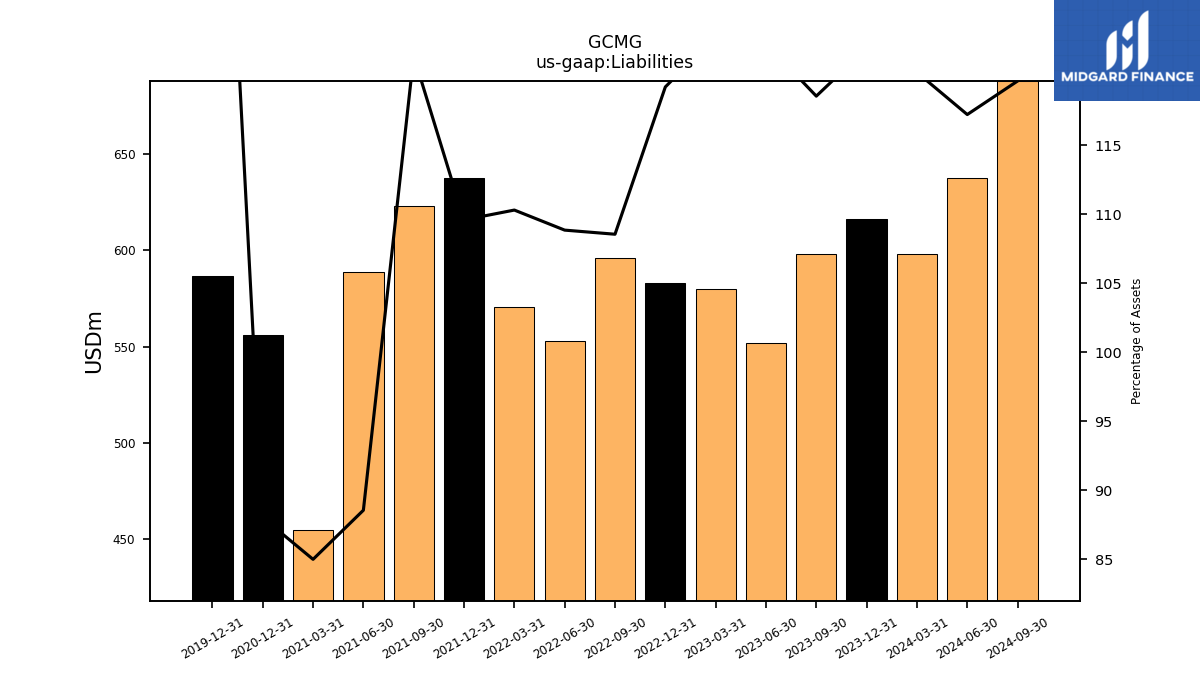
| Liabilities | 598.41 | 551.71 | 580.00 | 582.94 | 596.02 | 552.76 | 570.51 | 637.42 | 623.03 | 588.73 | 454.59 | 556.17 | NA | NA | NA | |
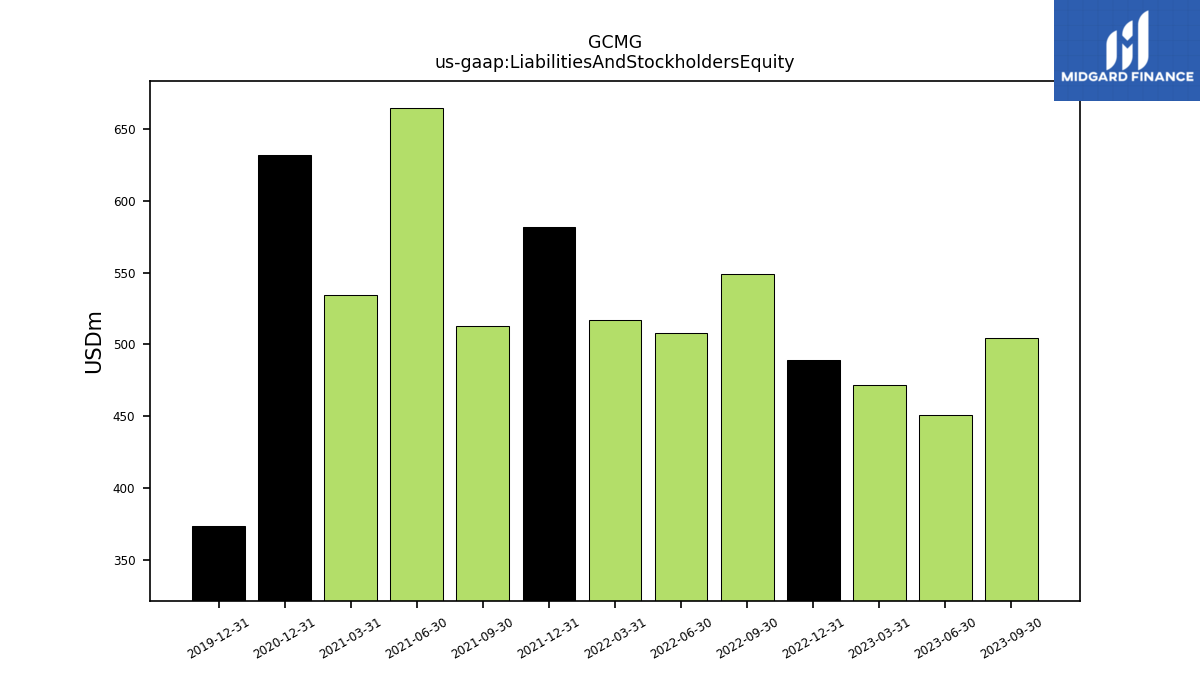
| Liabilities And Stockholders Equity | 504.72 | 450.82 | 471.93 | 488.93 | 549.05 | 507.81 | 517.21 | 581.62 | 512.88 | 664.83 | 534.84 | 631.89 | NA | NA | NA | |
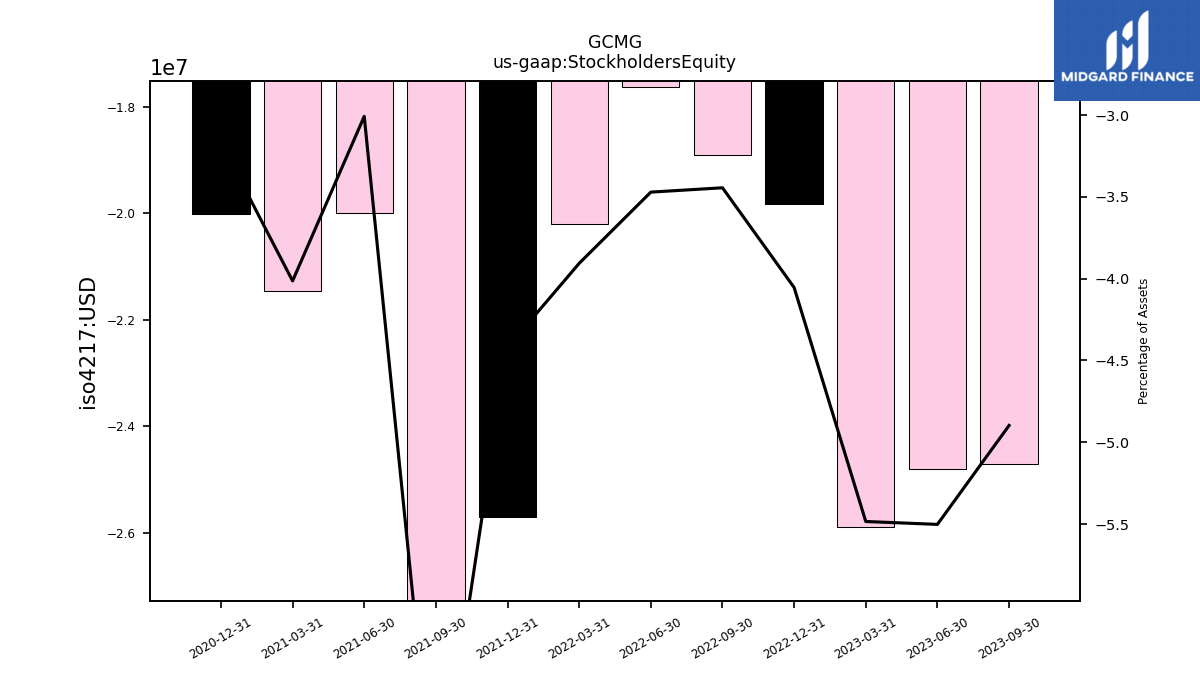
| Stockholders Equity | -24.72 | -24.80 | -25.88 | -19.82 | -18.91 | -17.62 | -20.20 | -25.71 | -37.60 | -19.99 | -21.46 | -20.02 | NA | NA | NA |
| 2023-09-30 | 2023-06-30 | 2023-03-31 | 2022-12-31 | 2022-09-30 | 2022-06-30 | 2022-03-31 | 2021-12-31 | 2021-09-30 | 2021-06-30 | 2021-03-31 | 2020-12-31 | 2020-09-30 | 2020-06-30 | 2020-03-31 | ||
|---|---|---|---|---|---|---|---|---|---|---|---|---|---|---|---|---|
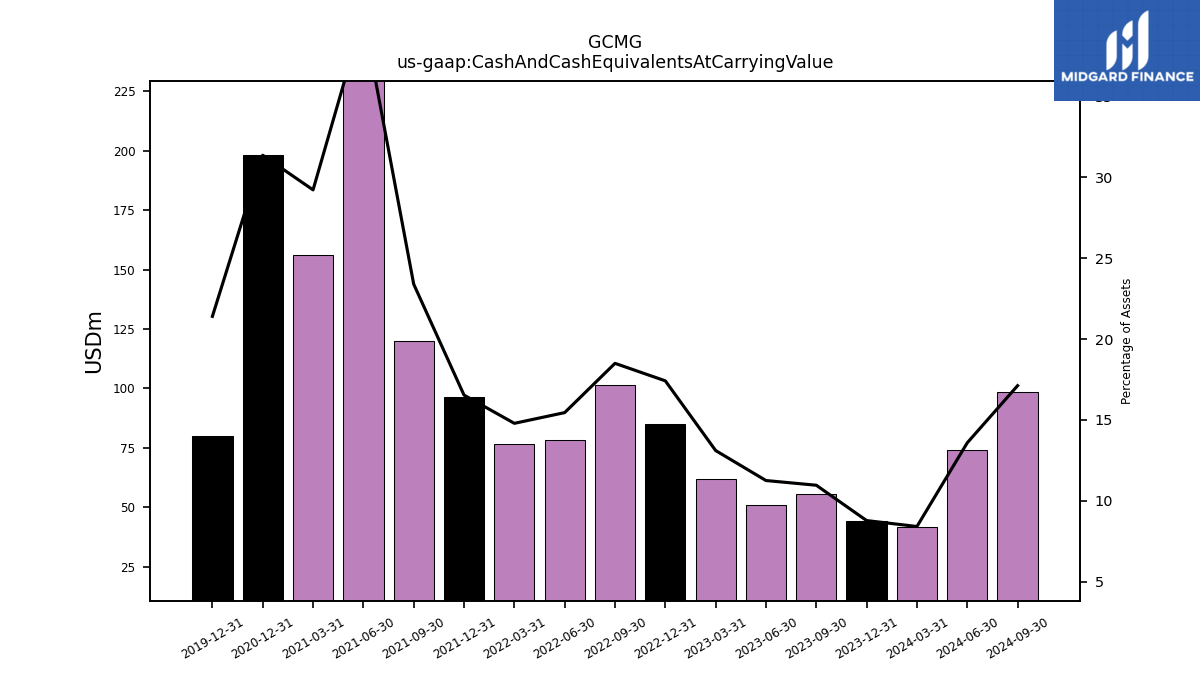
| Cash And Cash Equivalents At Carrying Value | 55.35 | 50.76 | 61.87 | 85.16 | 101.58 | 78.48 | 76.51 | 96.19 | 119.98 | 265.83 | 156.27 | 198.15 | NA | NA | NA | |
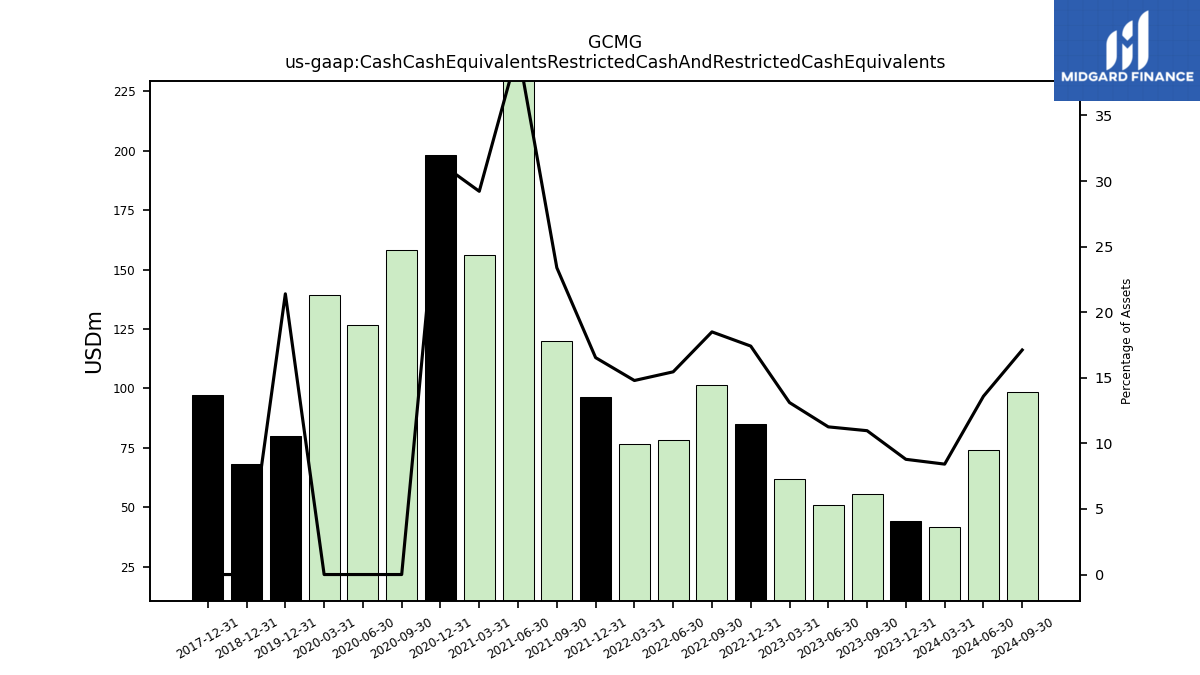
| Cash Cash Equivalents Restricted Cash And Restricted Cash Equivalents | 55.35 | 50.76 | 61.87 | 85.16 | 101.58 | 78.48 | 76.51 | 96.19 | 119.98 | 265.83 | 156.27 | 198.15 | 158.19 | 126.58 | 139.36 |
| 2023-09-30 | 2023-06-30 | 2023-03-31 | 2022-12-31 | 2022-09-30 | 2022-06-30 | 2022-03-31 | 2021-12-31 | 2021-09-30 | 2021-06-30 | 2021-03-31 | 2020-12-31 | 2020-09-30 | 2020-06-30 | 2020-03-31 | ||
|---|---|---|---|---|---|---|---|---|---|---|---|---|---|---|---|---|
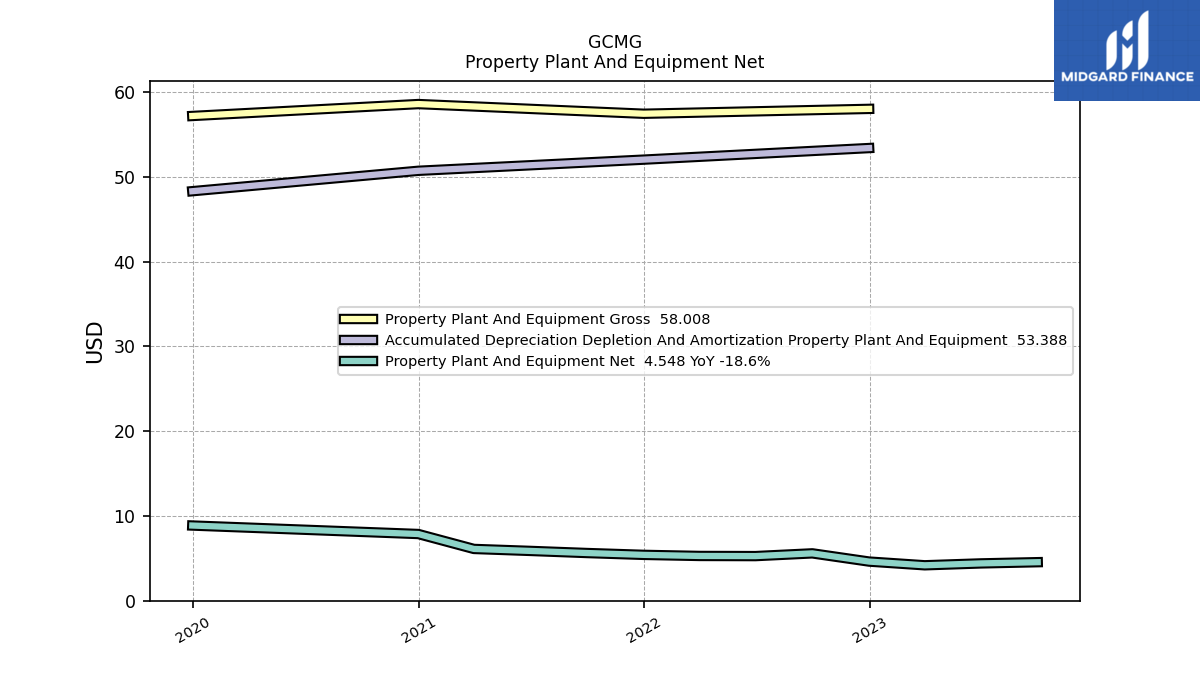
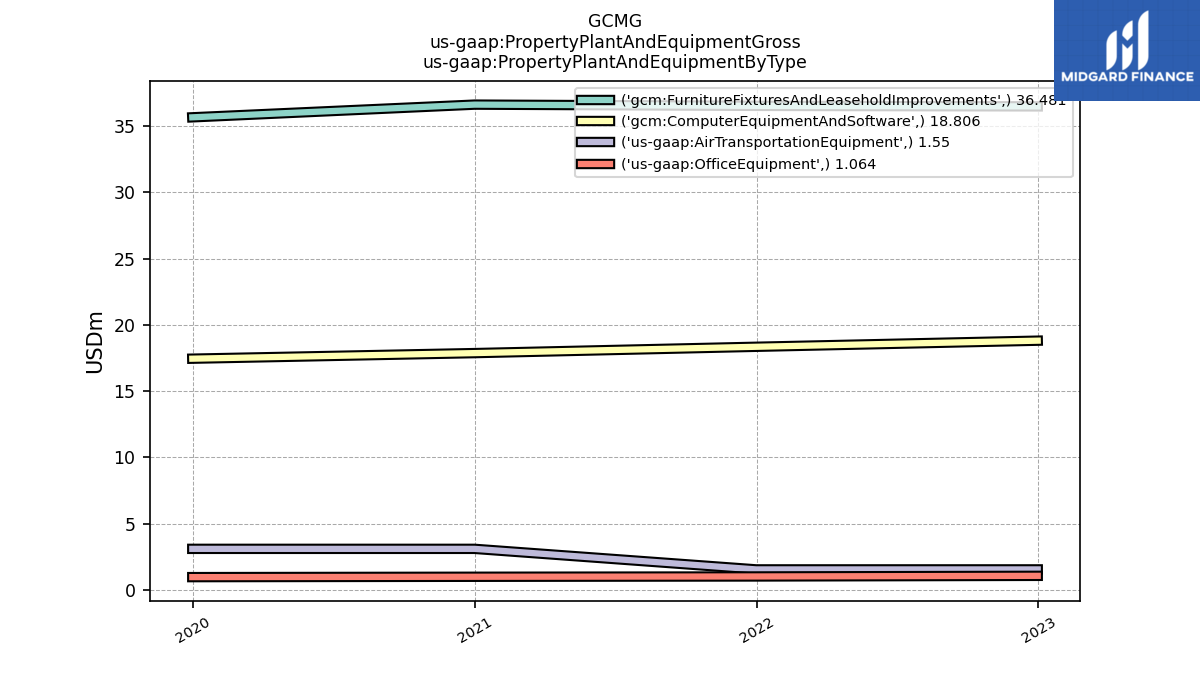
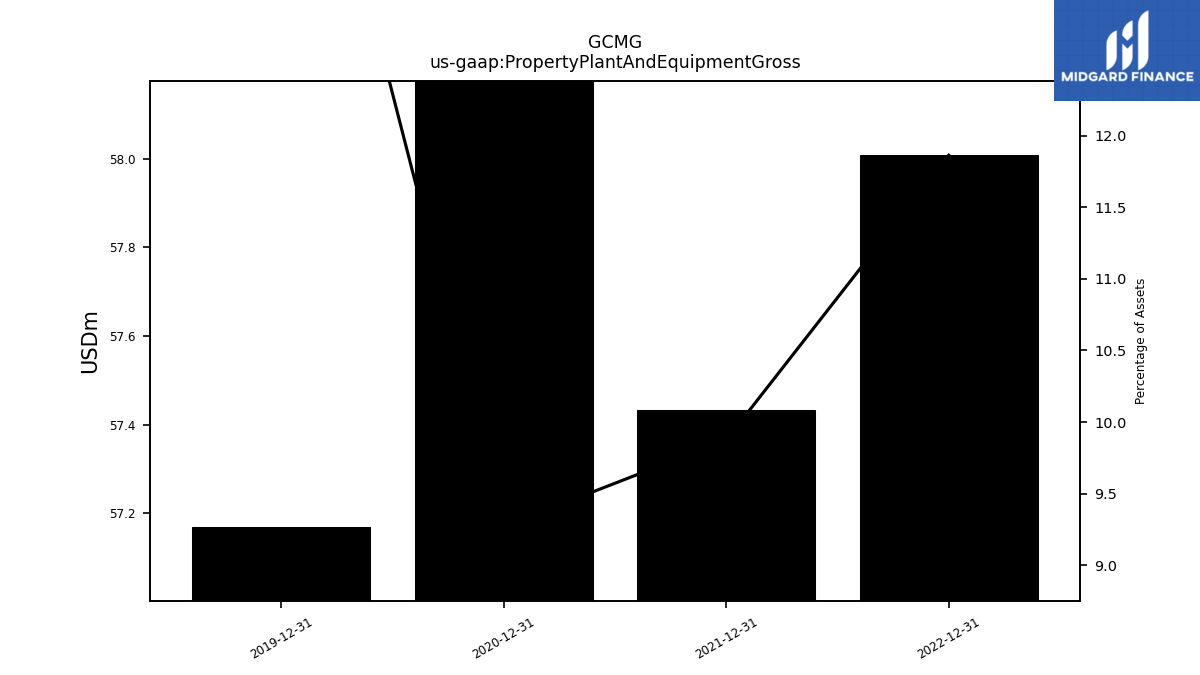
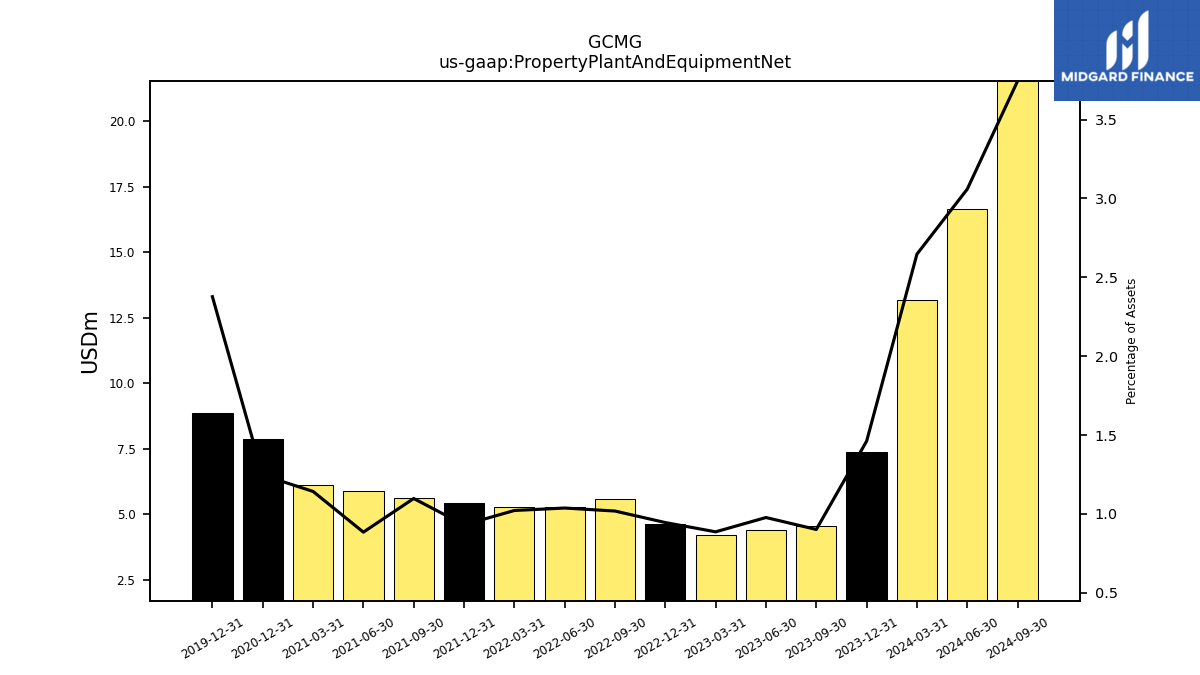
| Property Plant And Equipment Gross | NA | NA | NA | 58.01 | NA | NA | NA | 57.43 | NA | NA | NA | 58.58 | NA | NA | NA | |
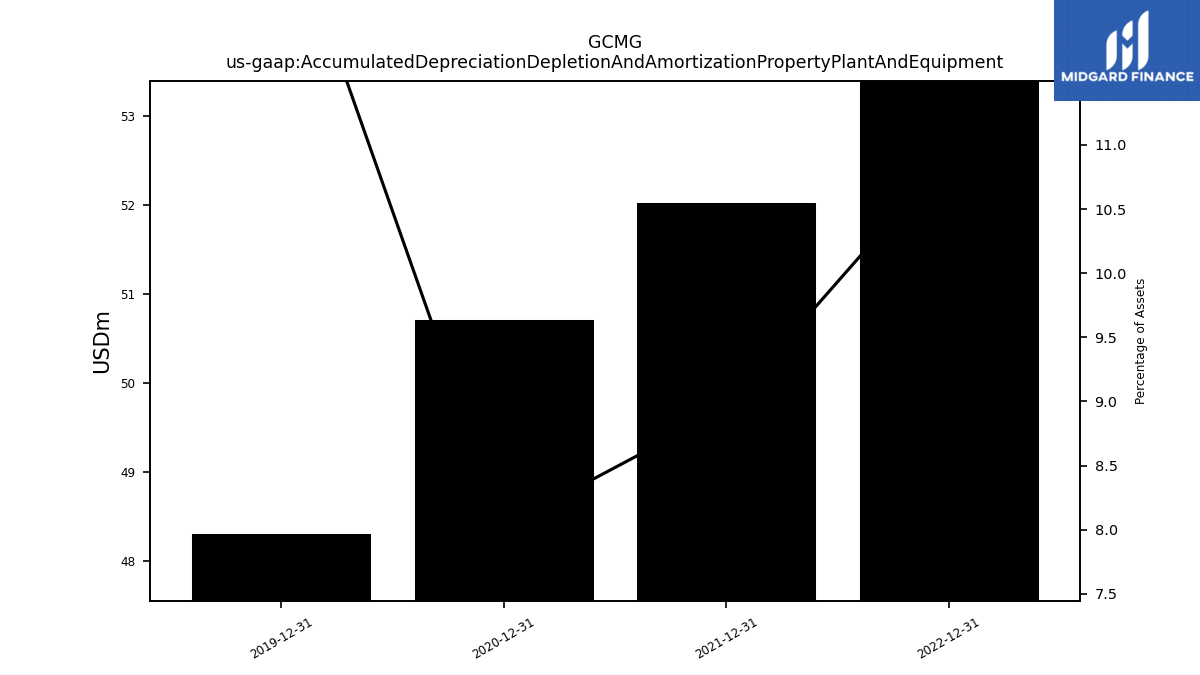
| Accumulated Depreciation Depletion And Amortization Property Plant And Equipment | NA | NA | NA | 53.39 | NA | NA | NA | 52.02 | NA | NA | NA | 50.71 | NA | NA | NA | |
| Property Plant And Equipment Net | 4.55 | 4.40 | 4.18 | 4.62 | 5.59 | 5.27 | 5.28 | 5.41 | 5.63 | 5.88 | 6.11 | 7.87 | NA | NA | NA | |
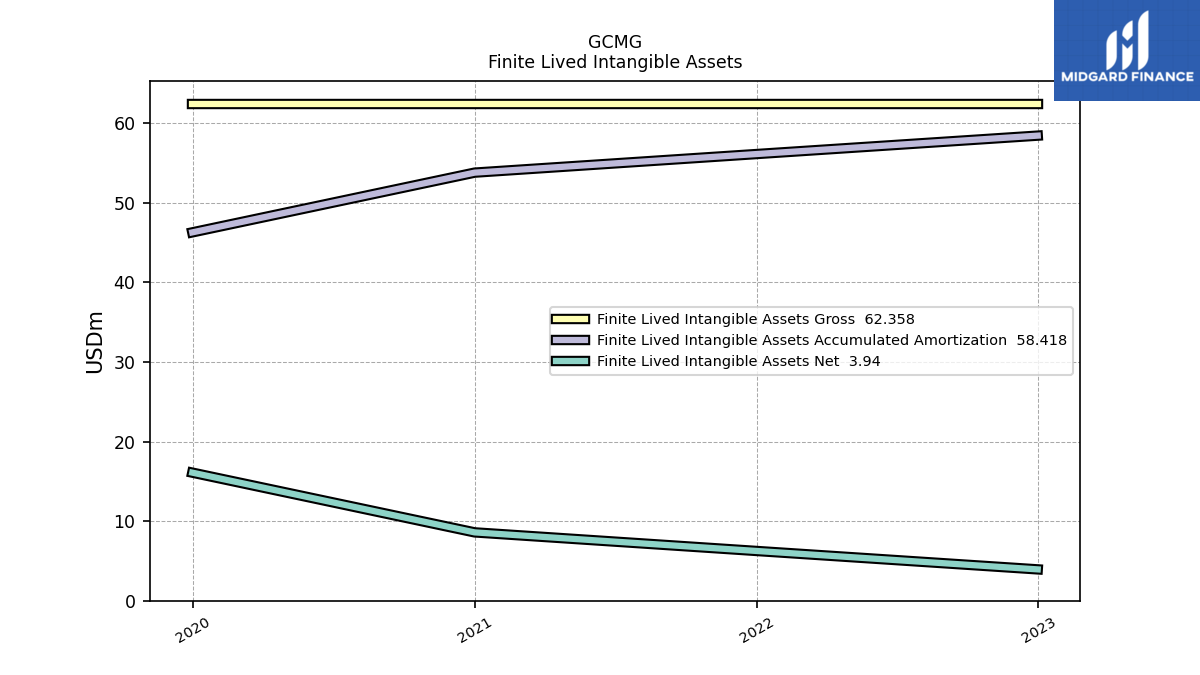
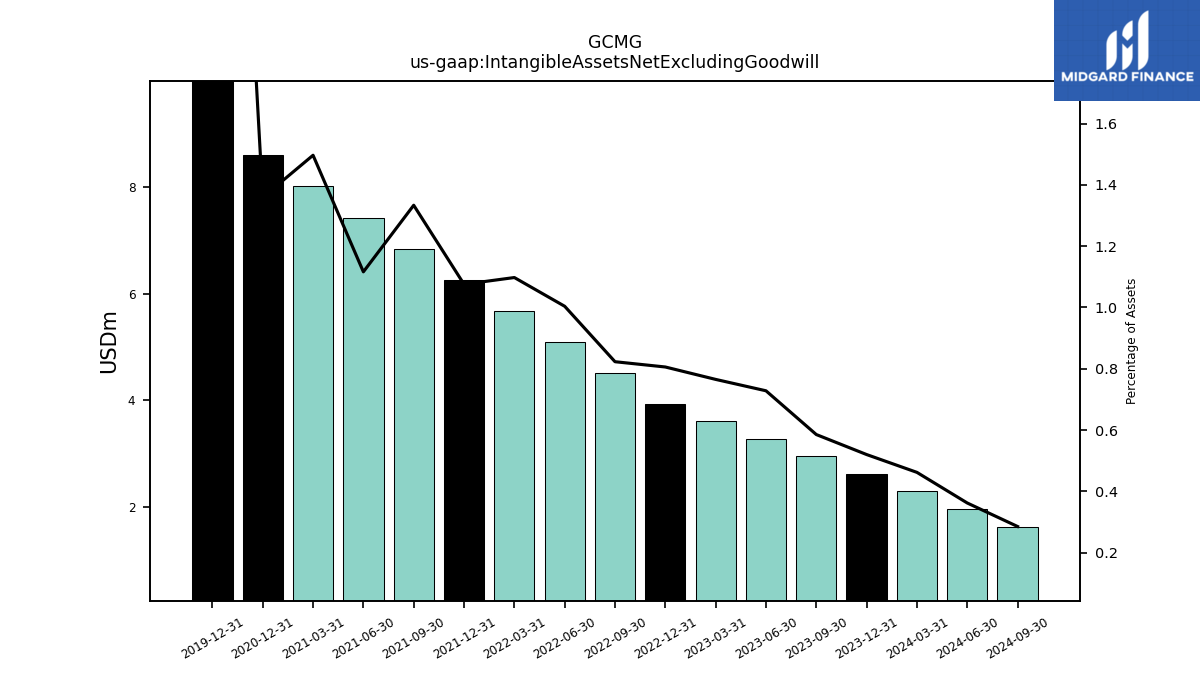
| Intangible Assets Net Excluding Goodwill | 2.96 | 3.28 | 3.61 | 3.94 | 4.52 | 5.10 | 5.68 | 6.26 | 6.84 | 7.42 | 8.00 | 8.59 | NA | NA | NA | |
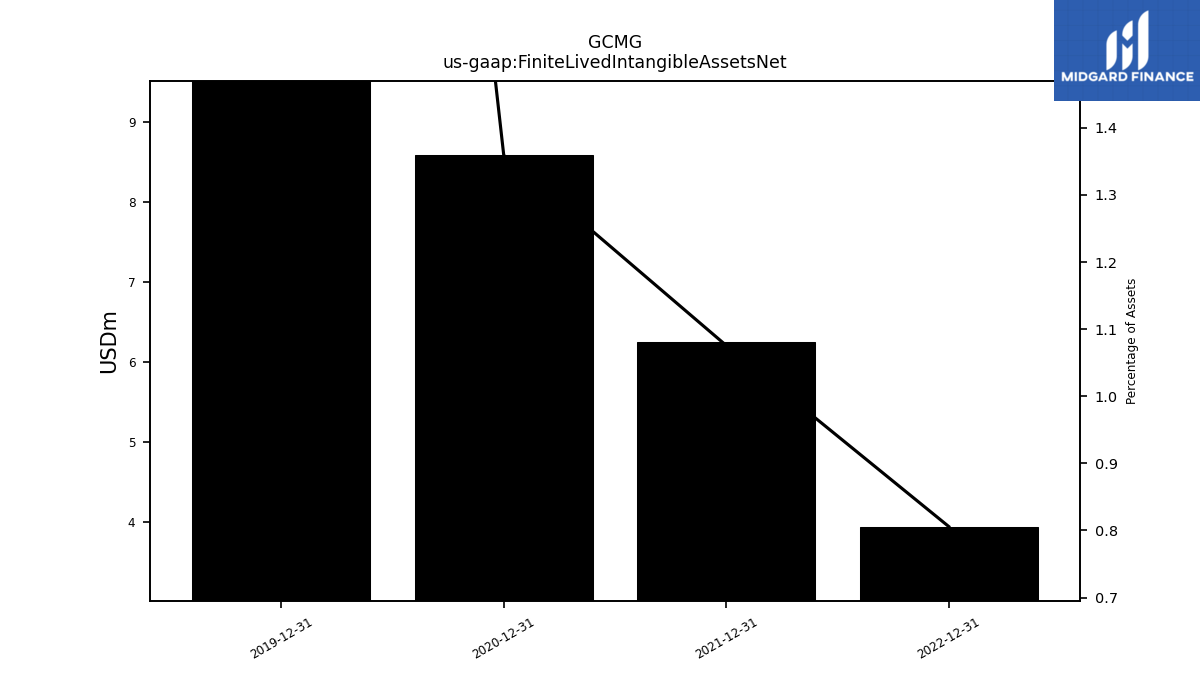
| Finite Lived Intangible Assets Net | NA | NA | NA | 3.94 | NA | NA | NA | 6.26 | NA | NA | NA | 8.59 | NA | NA | NA |
| 2023-09-30 | 2023-06-30 | 2023-03-31 | 2022-12-31 | 2022-09-30 | 2022-06-30 | 2022-03-31 | 2021-12-31 | 2021-09-30 | 2021-06-30 | 2021-03-31 | 2020-12-31 | 2020-09-30 | 2020-06-30 | 2020-03-31 | ||
|---|---|---|---|---|---|---|---|---|---|---|---|---|---|---|---|---|
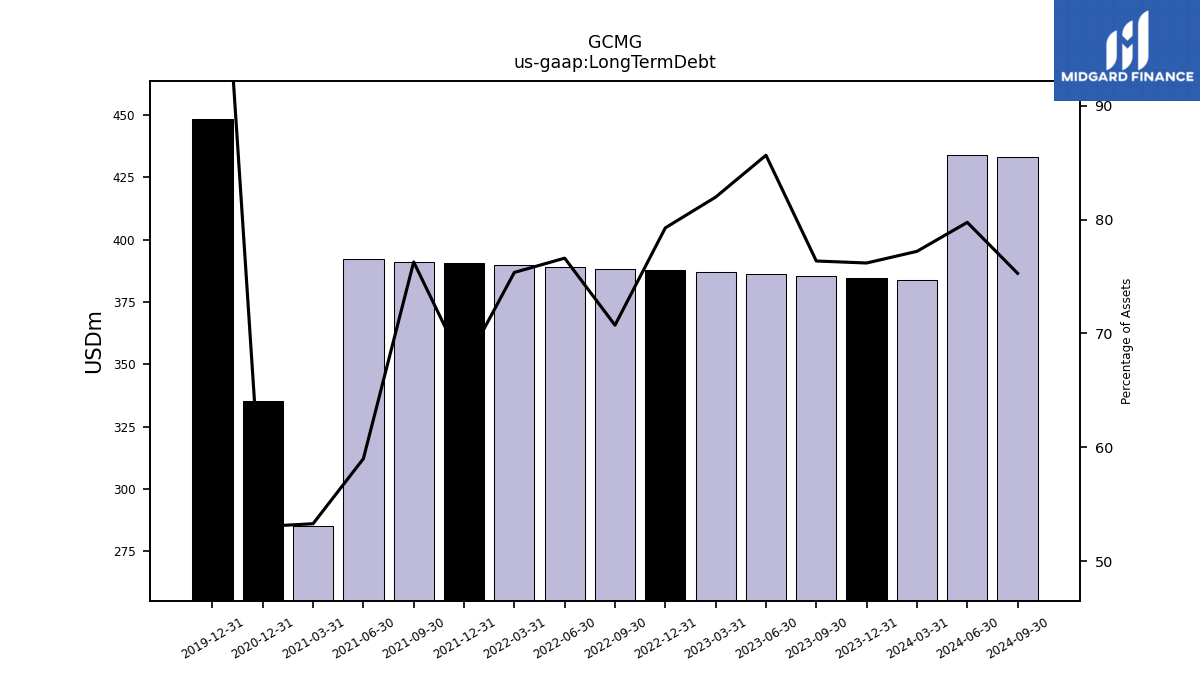
| Long Term Debt | 385.45 | 386.17 | 386.90 | 387.63 | 388.35 | 389.07 | 389.79 | 390.52 | 391.23 | 392.23 | 284.98 | 335.15 | NA | NA | NA |
| 2023-09-30 | 2023-06-30 | 2023-03-31 | 2022-12-31 | 2022-09-30 | 2022-06-30 | 2022-03-31 | 2021-12-31 | 2021-09-30 | 2021-06-30 | 2021-03-31 | 2020-12-31 | 2020-09-30 | 2020-06-30 | 2020-03-31 | ||
|---|---|---|---|---|---|---|---|---|---|---|---|---|---|---|---|---|
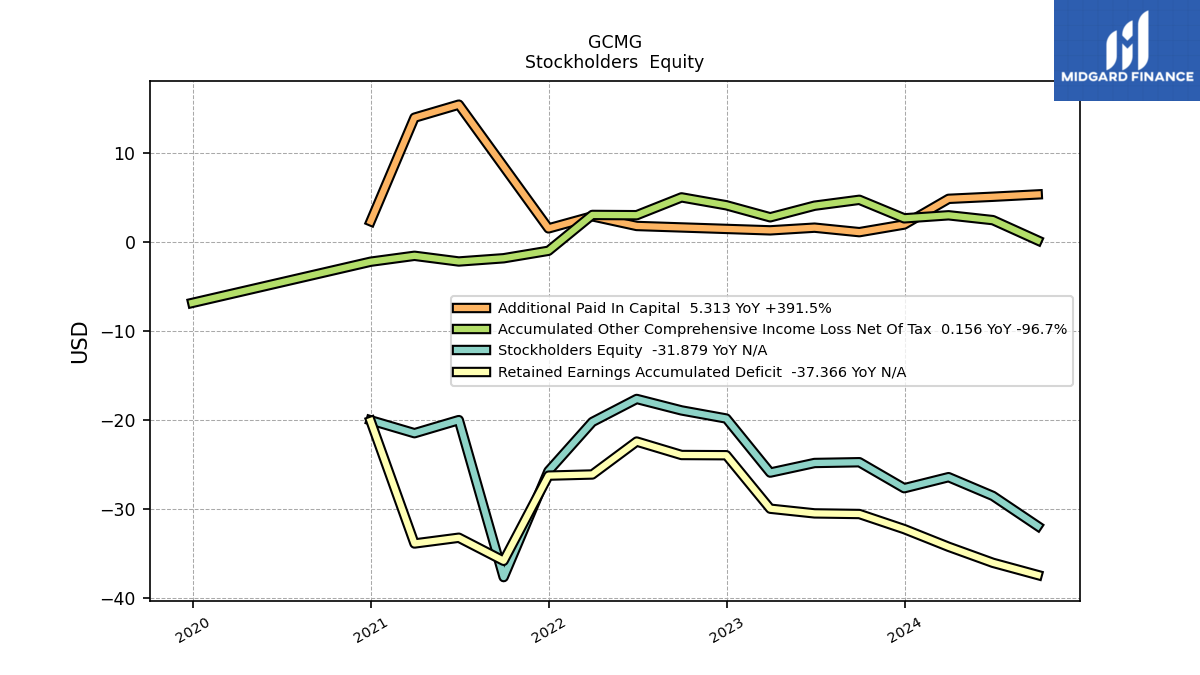
| Stockholders Equity | -24.72 | -24.80 | -25.88 | -19.82 | -18.91 | -17.62 | -20.20 | -25.71 | -37.60 | -19.99 | -21.46 | -20.02 | NA | NA | NA | |
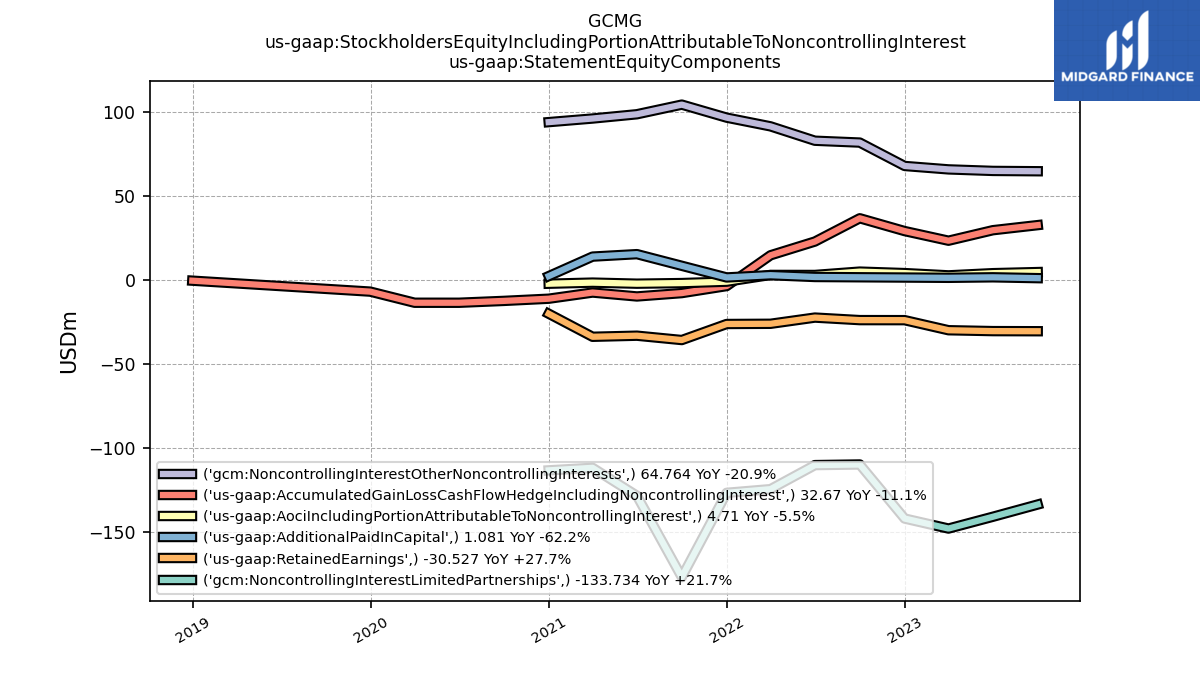
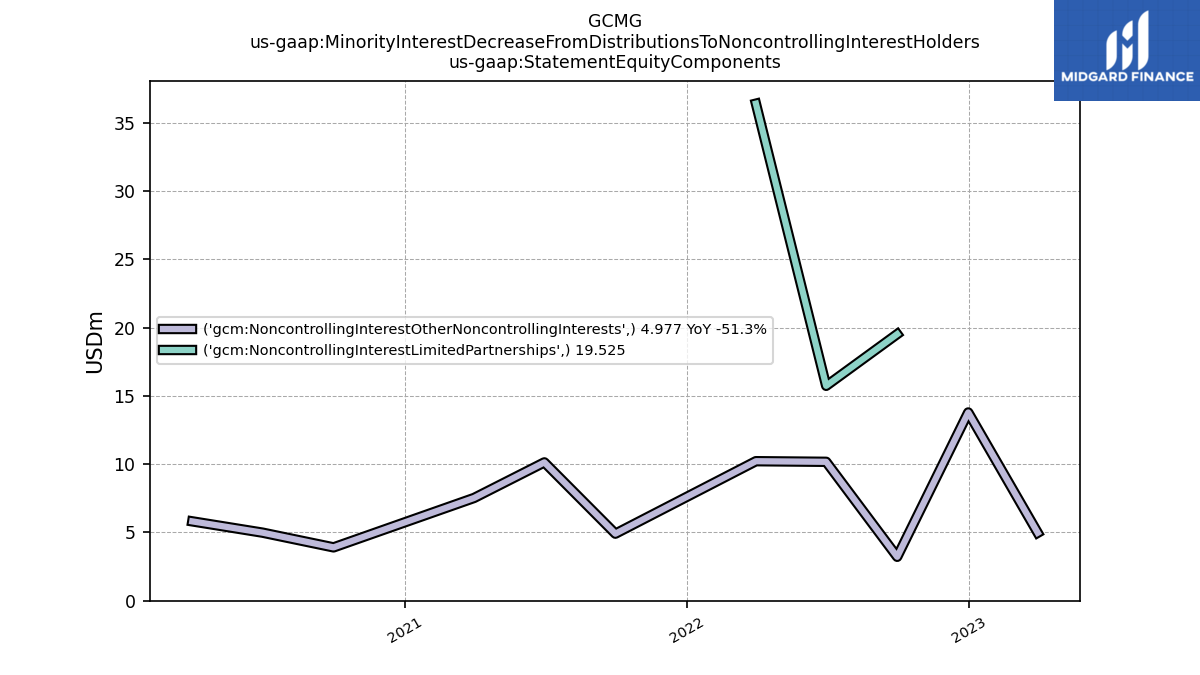
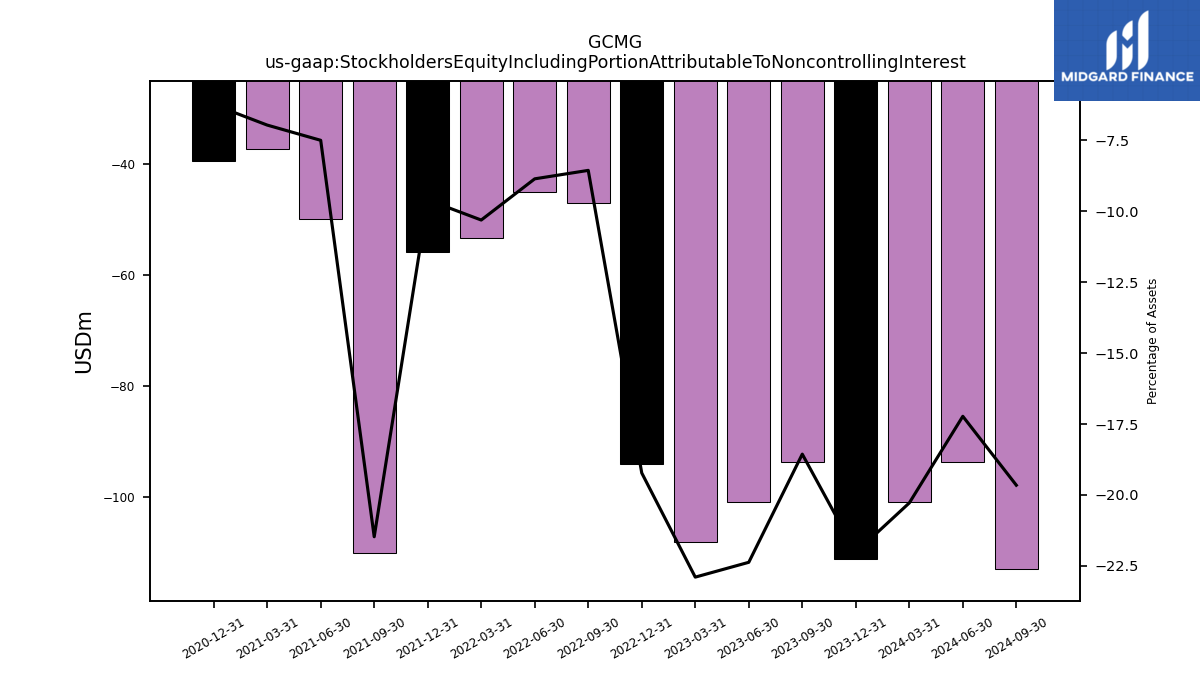
| Stockholders Equity Including Portion Attributable To Noncontrolling Interest | -93.69 | -100.88 | -108.07 | -94.01 | -46.97 | -44.95 | -53.30 | -55.80 | -110.15 | -49.82 | -37.20 | -39.40 | NA | NA | NA | |
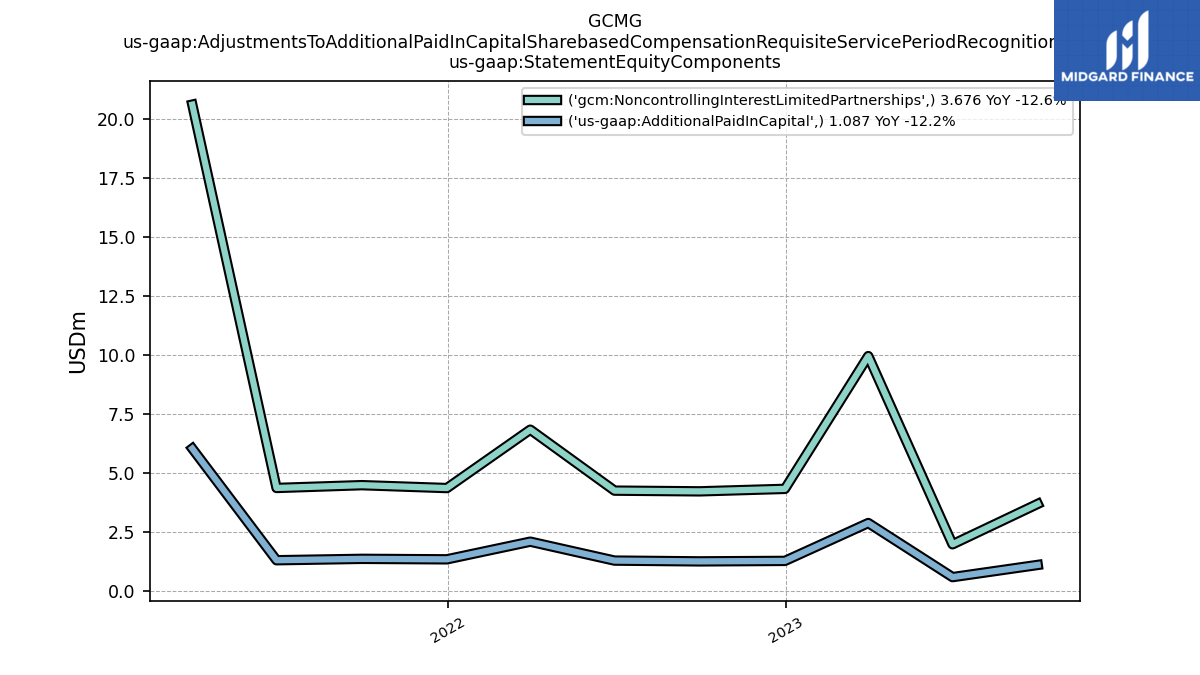
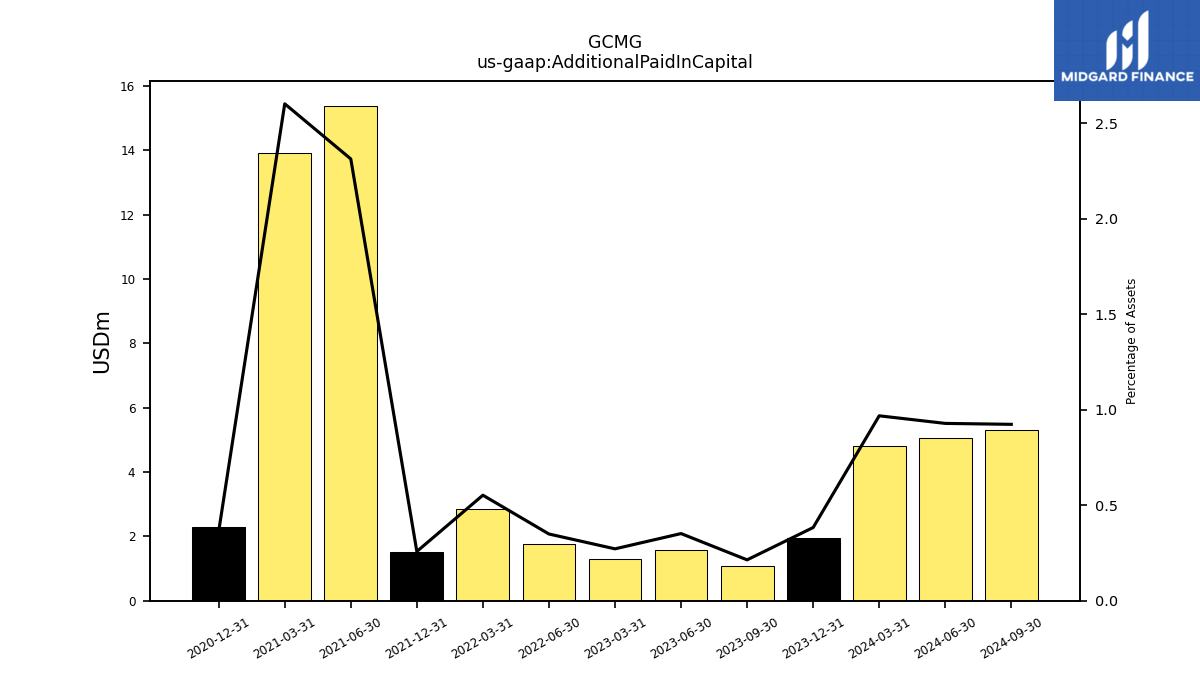
| Additional Paid In Capital | 1.08 | 1.59 | 1.28 | NA | NA | 1.77 | 2.86 | 1.50 | NA | 15.38 | 13.92 | 2.30 | NA | NA | NA | |
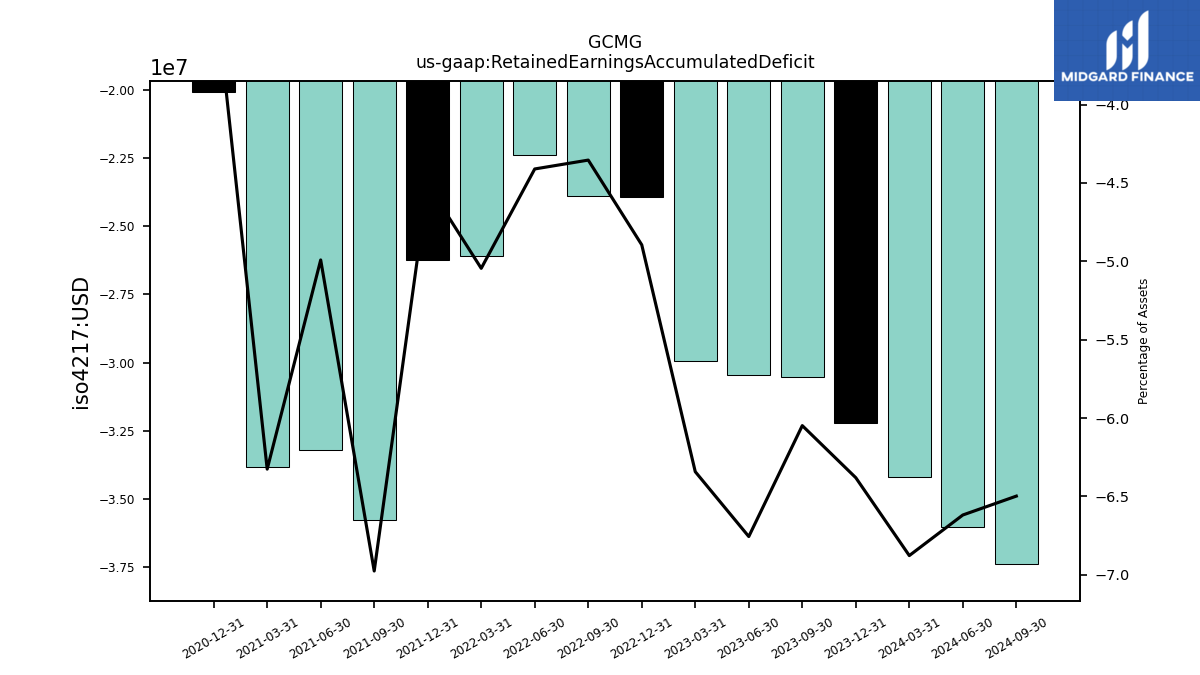
| Retained Earnings Accumulated Deficit | -30.53 | -30.46 | -29.93 | -23.93 | -23.91 | -22.40 | -26.09 | -26.22 | -35.78 | -33.19 | -33.83 | -20.10 | NA | NA | NA | |
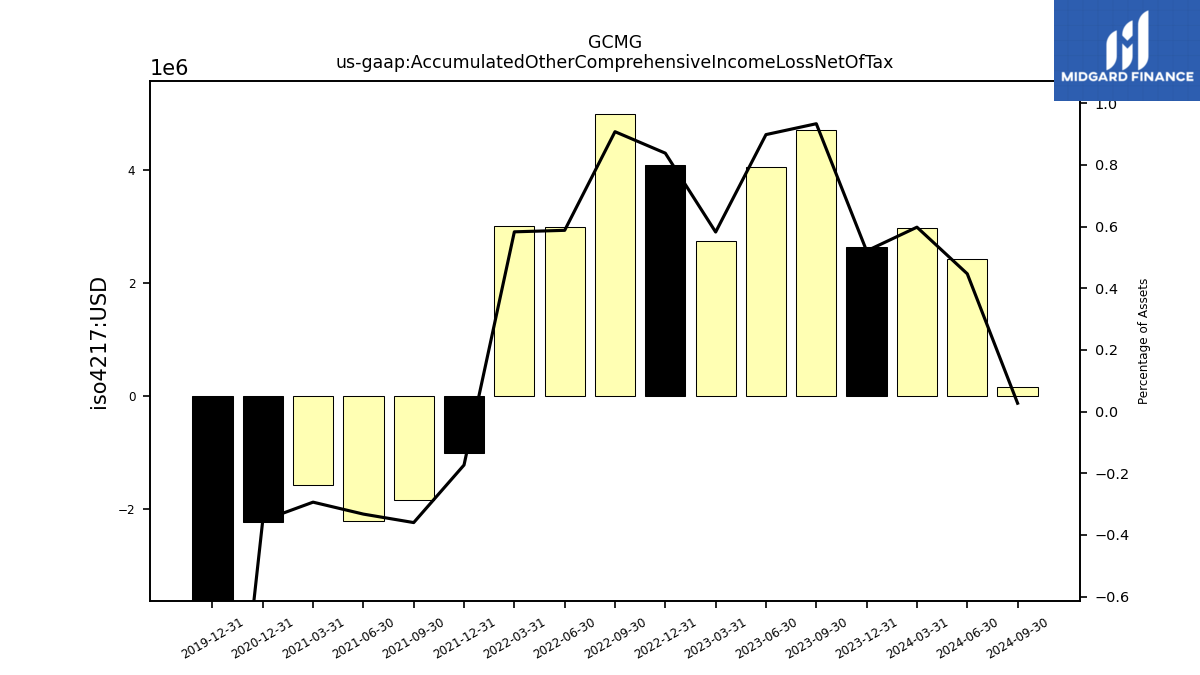
| Accumulated Other Comprehensive Income Loss Net Of Tax | 4.71 | 4.05 | 2.75 | 4.10 | 4.98 | 2.98 | 3.01 | -1.01 | -1.84 | -2.21 | -1.57 | -2.23 | NA | NA | NA | |
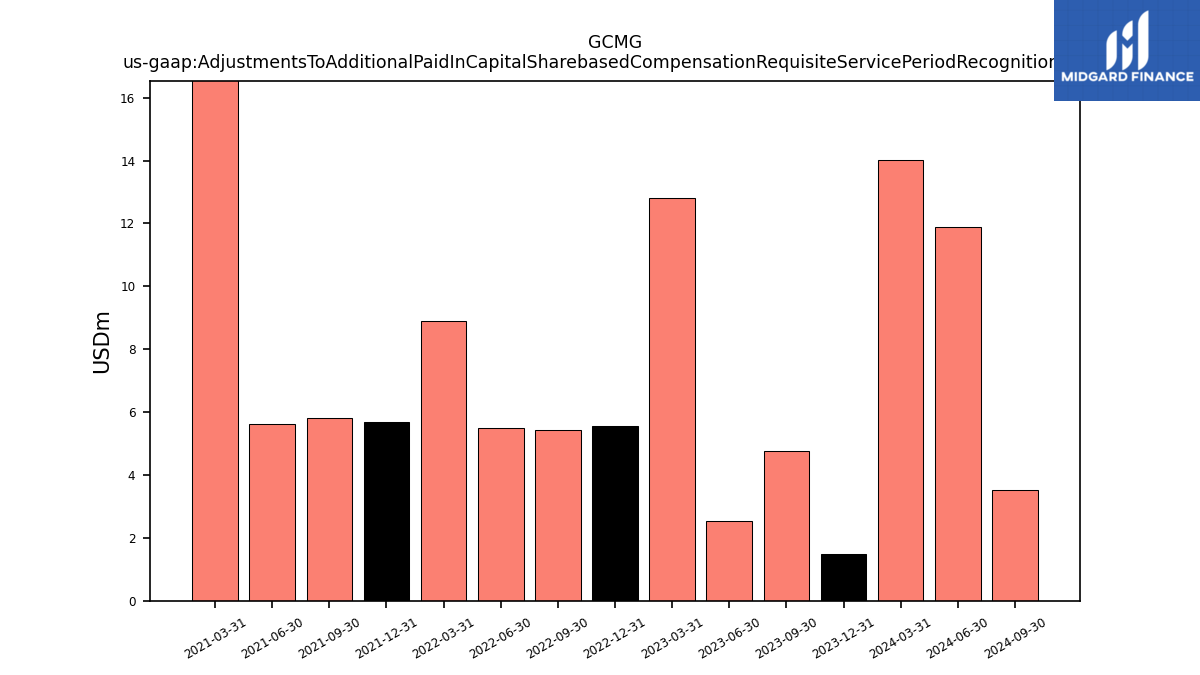
| Adjustments To Additional Paid In Capital Sharebased Compensation Requisite Service Period Recognition Value | 4.76 | 2.53 | 12.81 | 5.57 | 5.45 | 5.51 | 8.90 | 5.67 | 5.82 | 5.64 | 26.63 | NA | NA | NA | NA |
| 2023-09-30 | 2023-06-30 | 2023-03-31 | 2022-12-31 | 2022-09-30 | 2022-06-30 | 2022-03-31 | 2021-12-31 | 2021-09-30 | 2021-06-30 | 2021-03-31 | 2020-12-31 | 2020-09-30 | 2020-06-30 | 2020-03-31 | ||
|---|---|---|---|---|---|---|---|---|---|---|---|---|---|---|---|---|
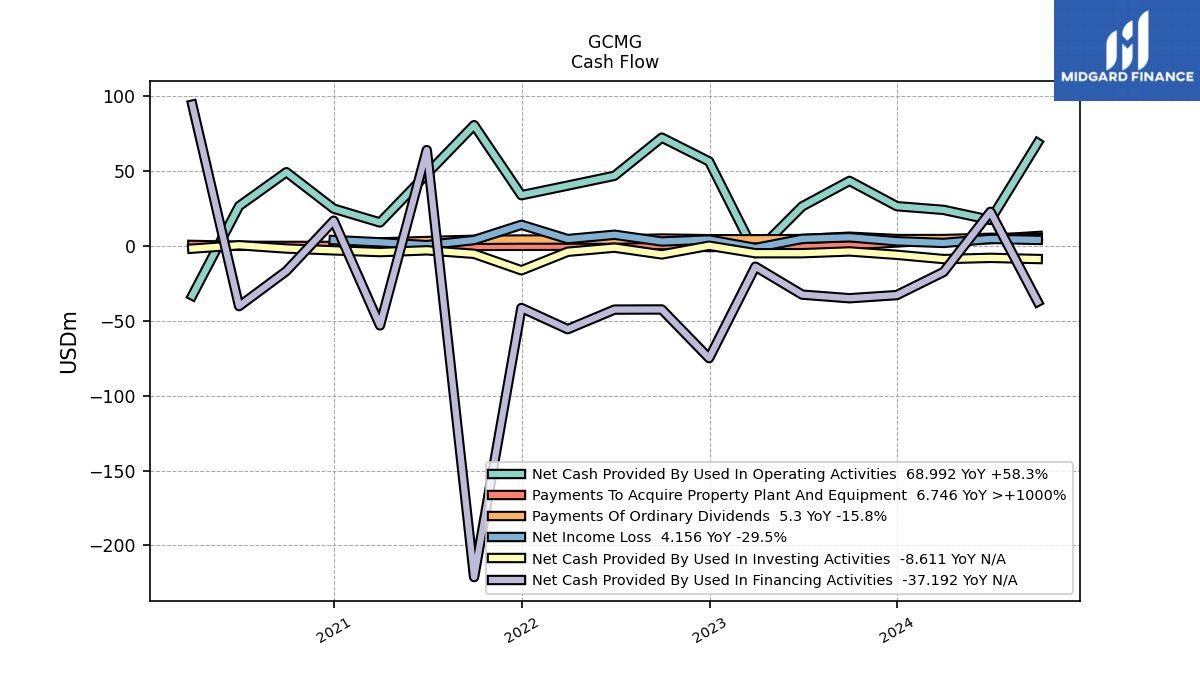
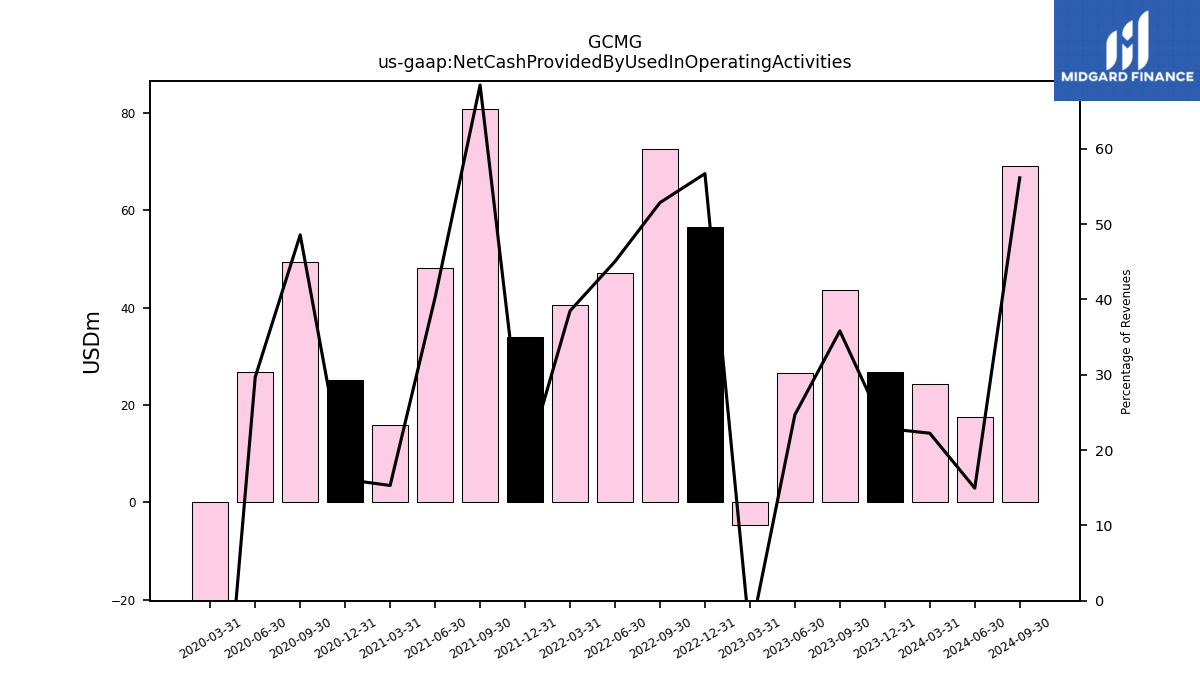
| Net Cash Provided By Used In Operating Activities | 43.58 | 26.57 | -4.76 | 56.58 | 72.50 | 46.99 | 40.44 | 34.01 | 80.81 | 48.19 | 15.79 | 25.04 | 49.40 | 26.77 | -33.04 | |
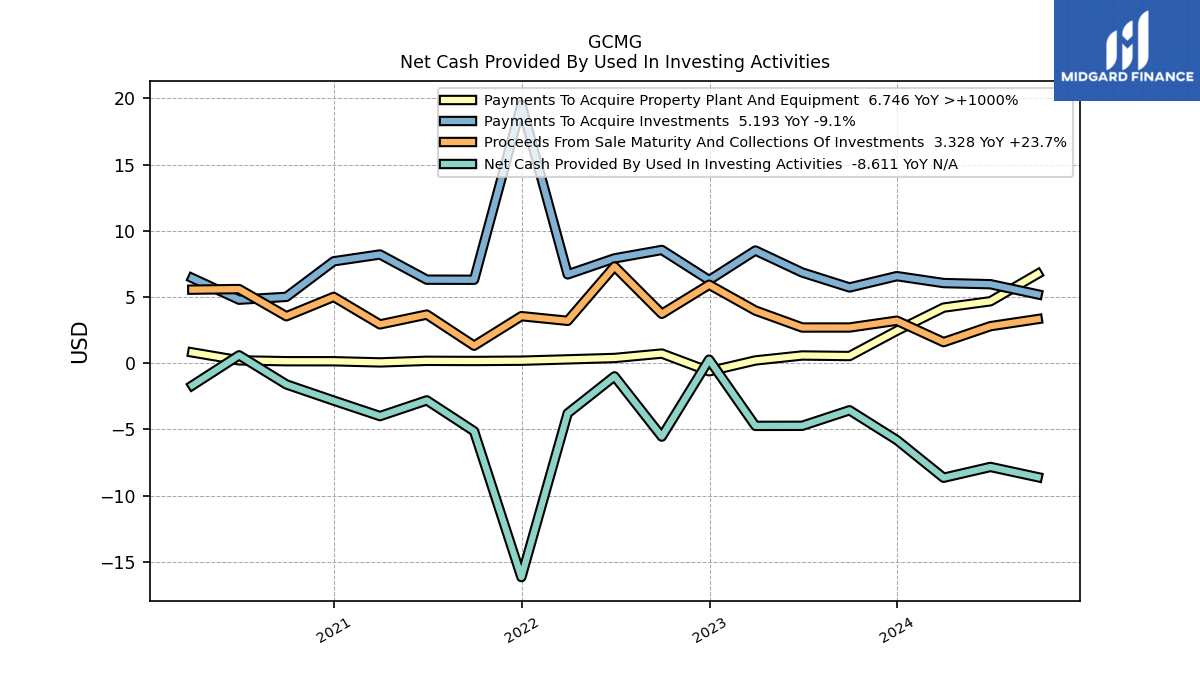
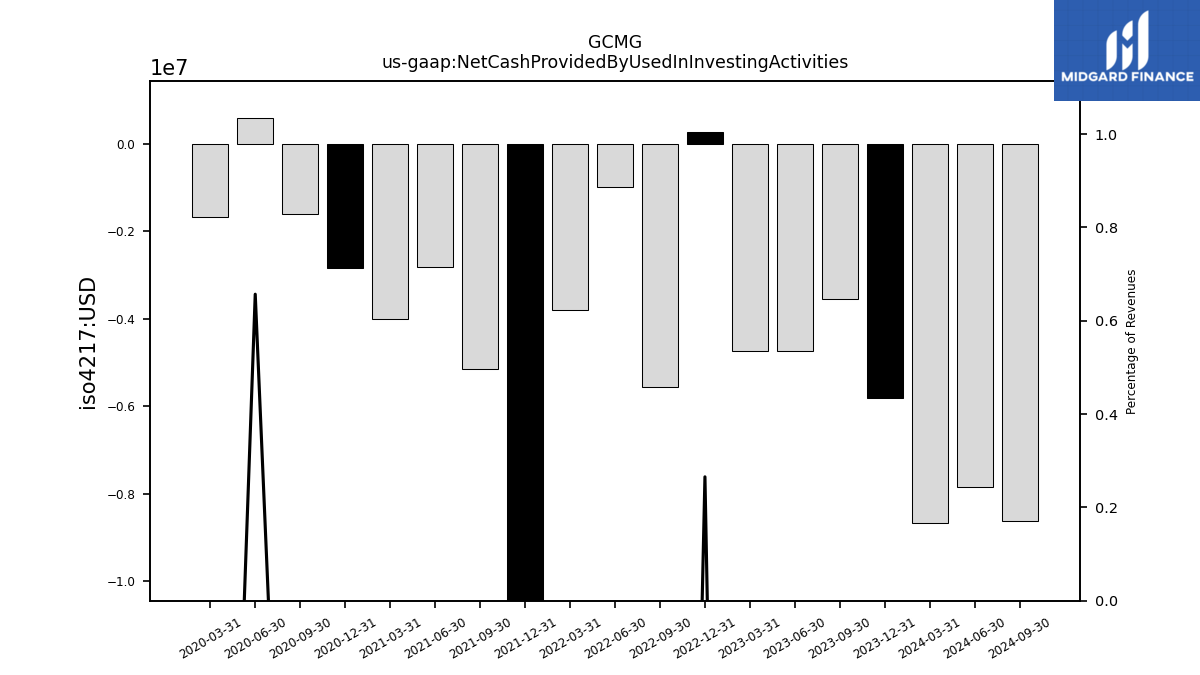
| Net Cash Provided By Used In Investing Activities | -3.56 | -4.73 | -4.74 | 0.27 | -5.55 | -1.00 | -3.79 | -16.16 | -5.14 | -2.81 | -4.00 | -2.83 | -1.61 | 0.59 | -1.68 | |
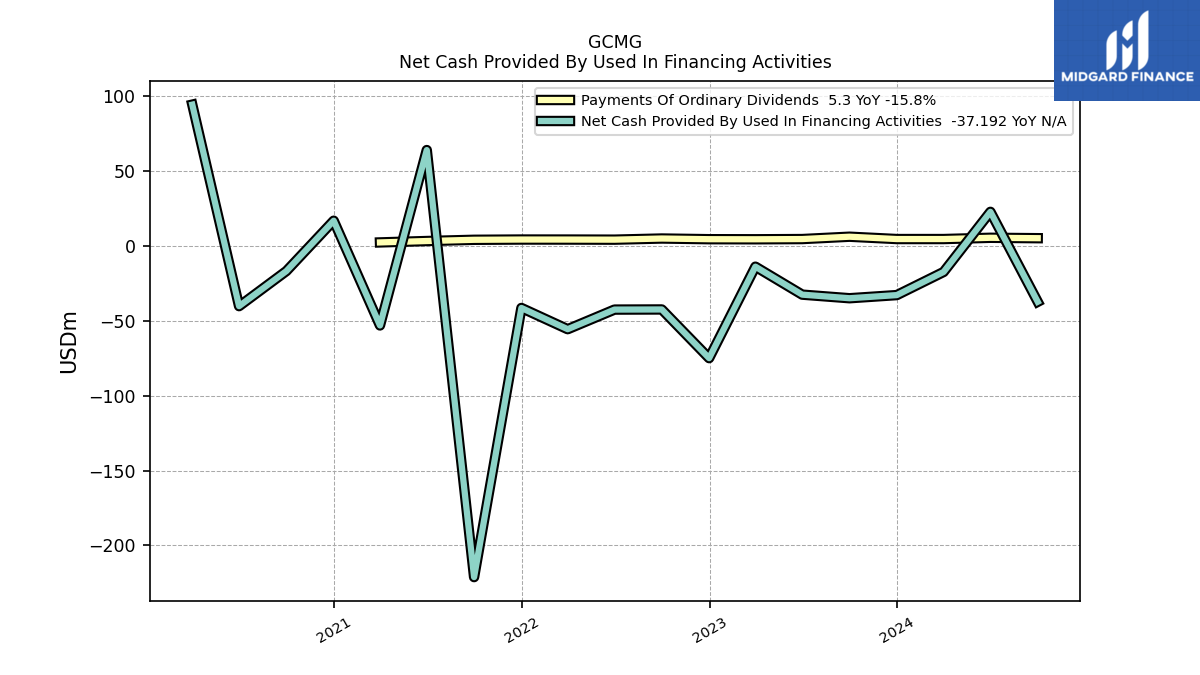
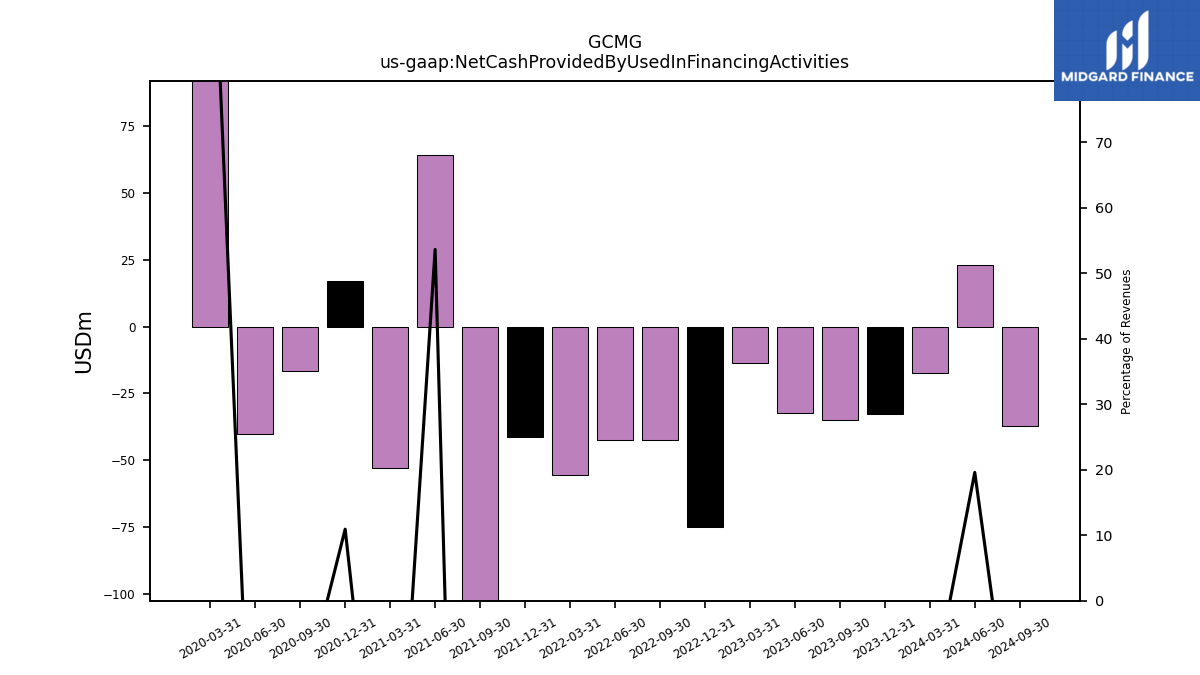
| Net Cash Provided By Used In Financing Activities | -34.81 | -32.41 | -13.72 | -74.85 | -42.32 | -42.40 | -55.50 | -41.31 | -221.15 | 64.19 | -53.00 | 16.99 | -16.66 | -40.11 | 94.54 |
| 2023-09-30 | 2023-06-30 | 2023-03-31 | 2022-12-31 | 2022-09-30 | 2022-06-30 | 2022-03-31 | 2021-12-31 | 2021-09-30 | 2021-06-30 | 2021-03-31 | 2020-12-31 | 2020-09-30 | 2020-06-30 | 2020-03-31 | ||
|---|---|---|---|---|---|---|---|---|---|---|---|---|---|---|---|---|
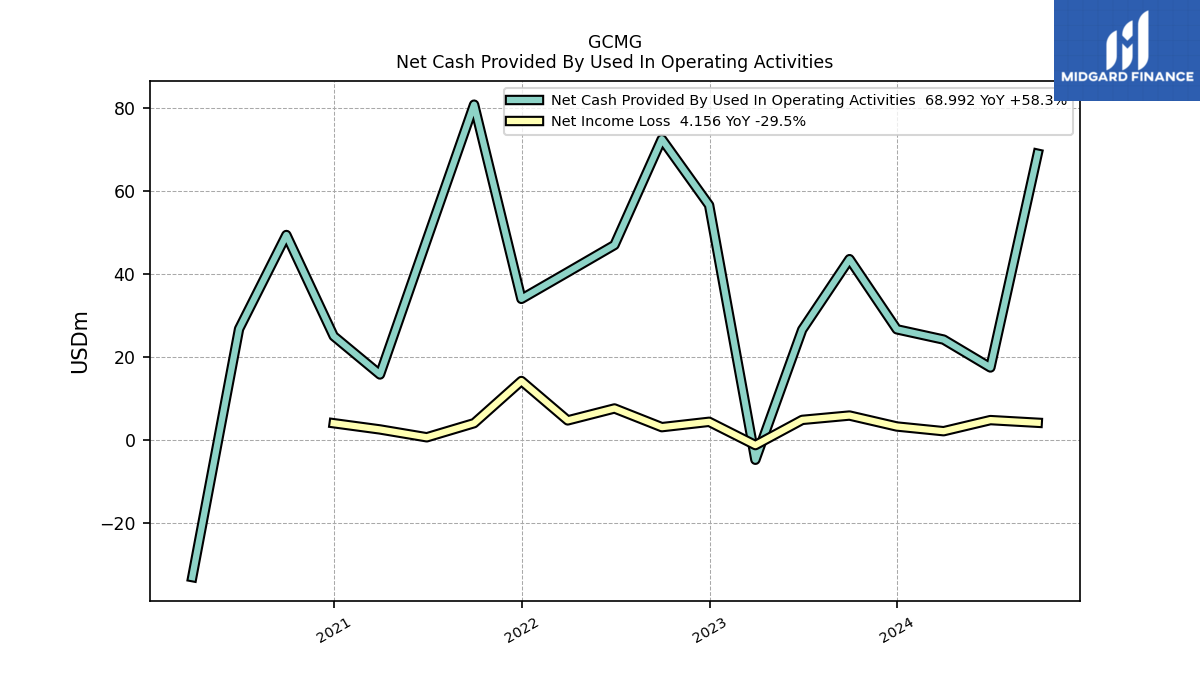
| Net Cash Provided By Used In Operating Activities | 43.58 | 26.57 | -4.76 | 56.58 | 72.50 | 46.99 | 40.44 | 34.01 | 80.81 | 48.19 | 15.79 | 25.04 | 49.40 | 26.77 | -33.04 | |
| Net Income Loss | 5.90 | 4.85 | -1.23 | 4.39 | 3.10 | 7.61 | 4.73 | 14.22 | 4.06 | 0.66 | 2.55 | 4.05 | NA | NA | NA | |
| Profit Loss | 17.62 | -36.25 | -15.15 | 11.41 | 14.16 | 30.68 | 23.23 | 77.52 | 22.71 | 21.91 | 19.93 | -69.40 | 11.17 | 0.93 | -10.33 | |
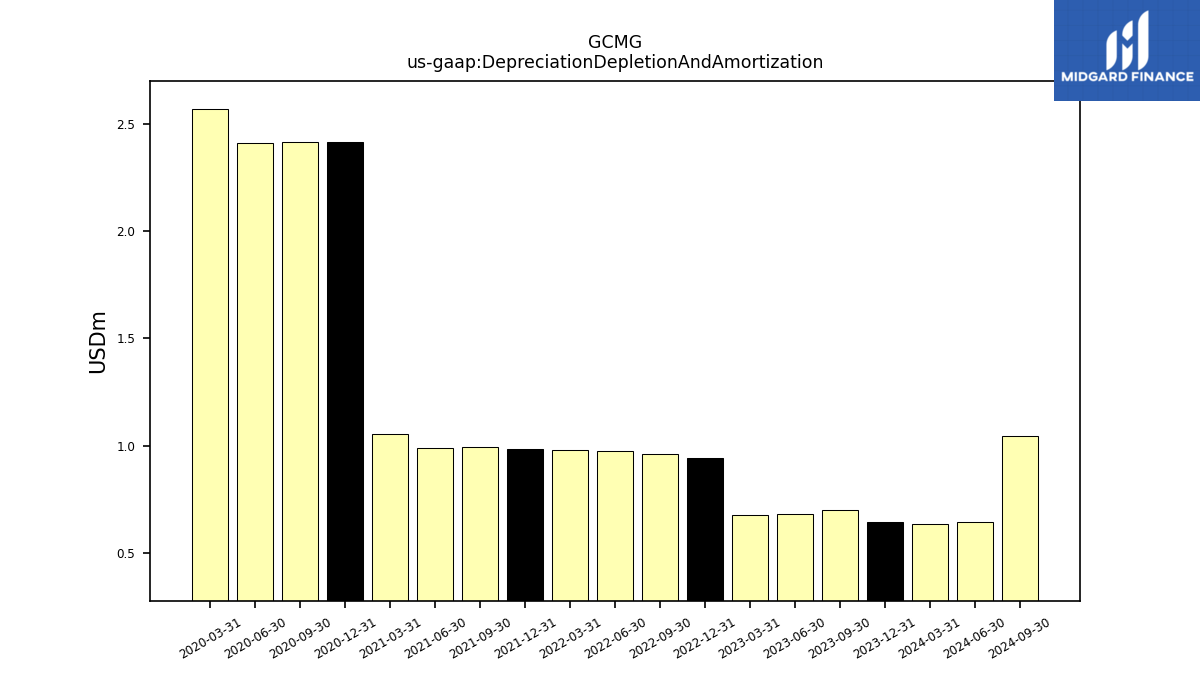
| Depreciation Depletion And Amortization | 0.70 | 0.68 | 0.68 | 0.94 | 0.96 | 0.97 | 0.98 | 0.98 | 0.99 | 0.99 | 1.06 | 2.42 | 2.42 | 2.41 | 2.57 | |
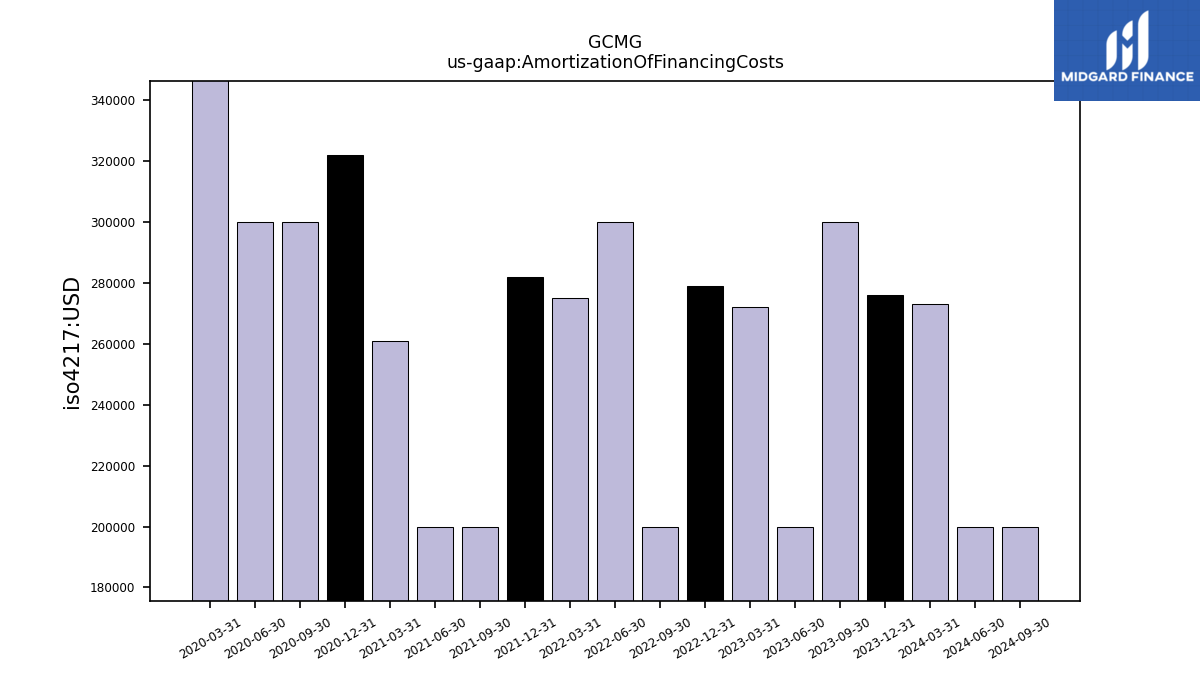
| Amortization Of Financing Costs | 0.30 | 0.20 | 0.27 | 0.28 | 0.20 | 0.30 | 0.28 | 0.28 | 0.20 | 0.20 | 0.26 | 0.32 | 0.30 | 0.30 | 0.85 |
| 2023-09-30 | 2023-06-30 | 2023-03-31 | 2022-12-31 | 2022-09-30 | 2022-06-30 | 2022-03-31 | 2021-12-31 | 2021-09-30 | 2021-06-30 | 2021-03-31 | 2020-12-31 | 2020-09-30 | 2020-06-30 | 2020-03-31 | ||
|---|---|---|---|---|---|---|---|---|---|---|---|---|---|---|---|---|
| Net Cash Provided By Used In Investing Activities | -3.56 | -4.73 | -4.74 | 0.27 | -5.55 | -1.00 | -3.79 | -16.16 | -5.14 | -2.81 | -4.00 | -2.83 | -1.61 | 0.59 | -1.68 | |
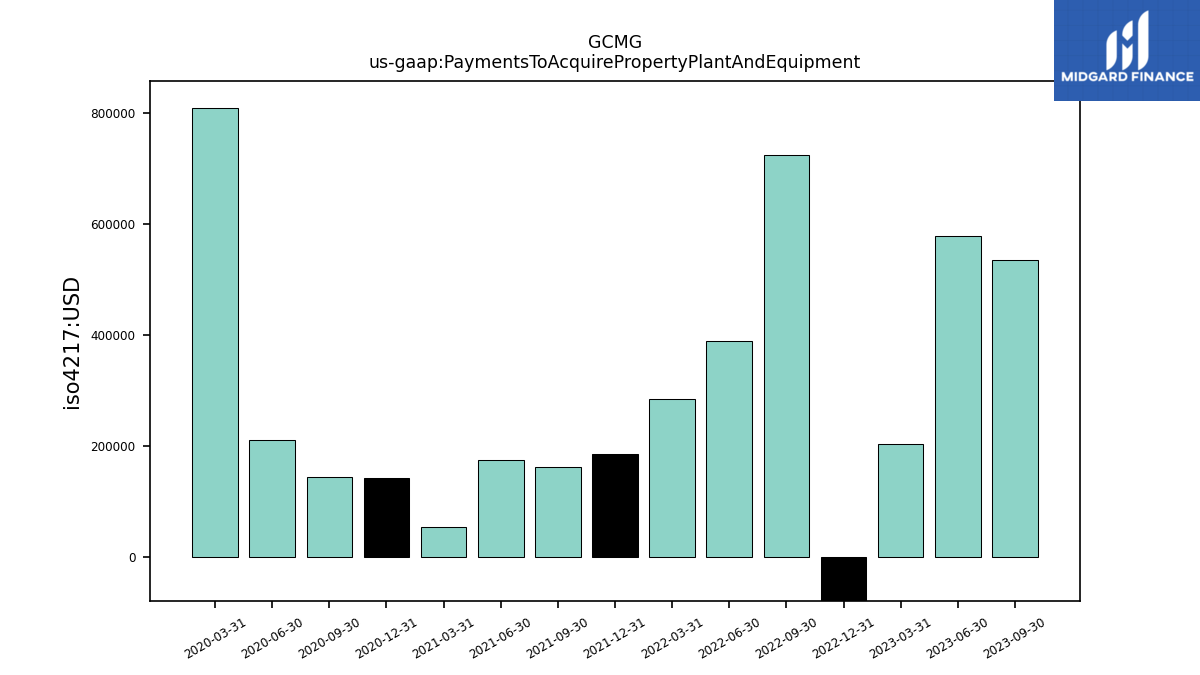
| Payments To Acquire Property Plant And Equipment | 0.54 | 0.58 | 0.20 | -0.62 | 0.72 | 0.39 | 0.28 | 0.18 | 0.16 | 0.17 | 0.06 | 0.14 | 0.14 | 0.21 | 0.81 | |
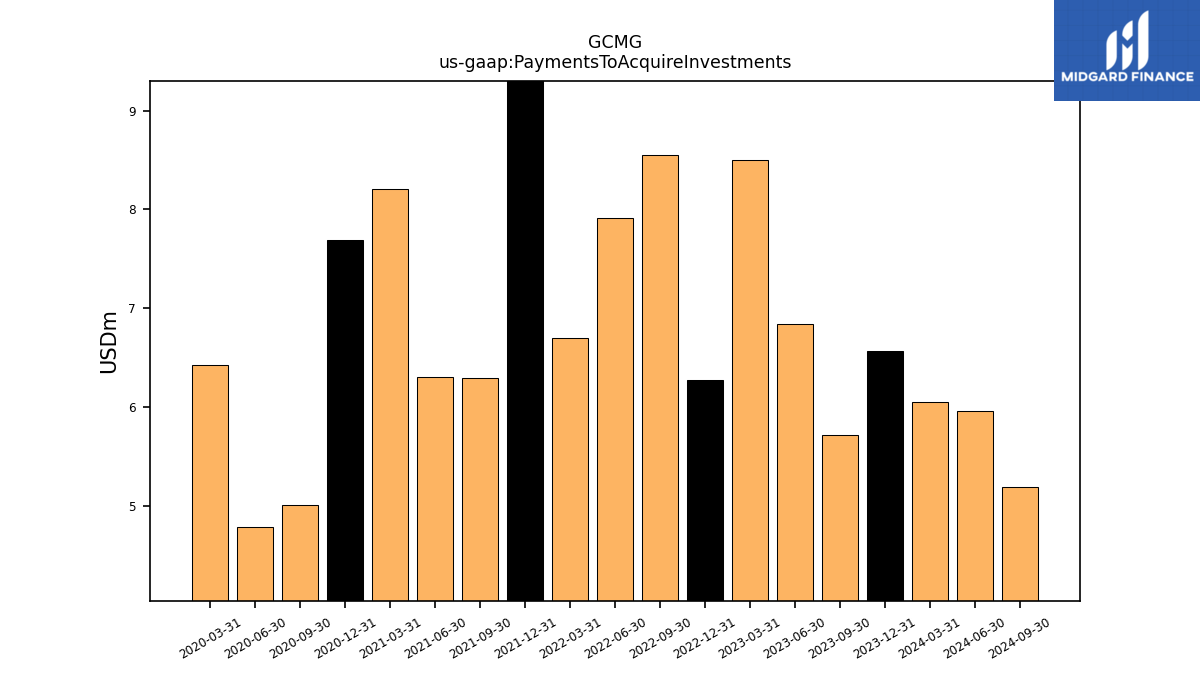
| Payments To Acquire Investments | 5.71 | 6.84 | 8.51 | 6.27 | 8.55 | 7.91 | 6.70 | 19.52 | 6.30 | 6.30 | 8.21 | 7.69 | 5.00 | 4.79 | 6.42 |
| 2023-09-30 | 2023-06-30 | 2023-03-31 | 2022-12-31 | 2022-09-30 | 2022-06-30 | 2022-03-31 | 2021-12-31 | 2021-09-30 | 2021-06-30 | 2021-03-31 | 2020-12-31 | 2020-09-30 | 2020-06-30 | 2020-03-31 | ||
|---|---|---|---|---|---|---|---|---|---|---|---|---|---|---|---|---|
| Net Cash Provided By Used In Financing Activities | -34.81 | -32.41 | -13.72 | -74.85 | -42.32 | -42.40 | -55.50 | -41.31 | -221.15 | 64.19 | -53.00 | 16.99 | -16.66 | -40.11 | 94.54 | |
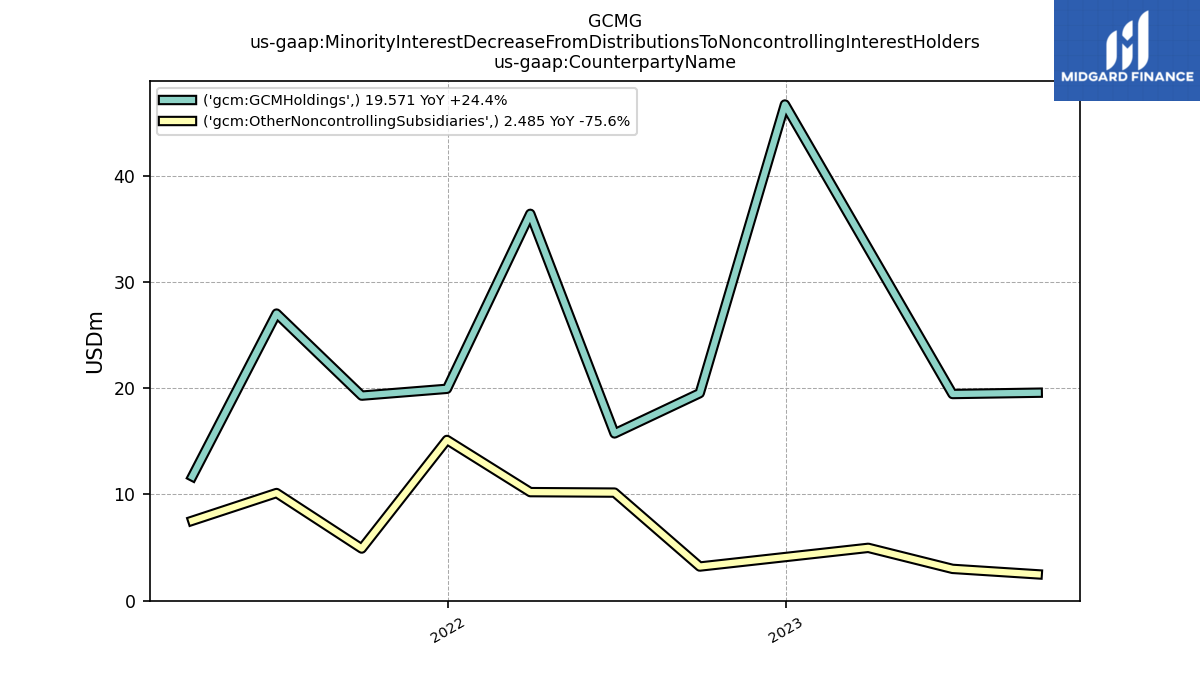
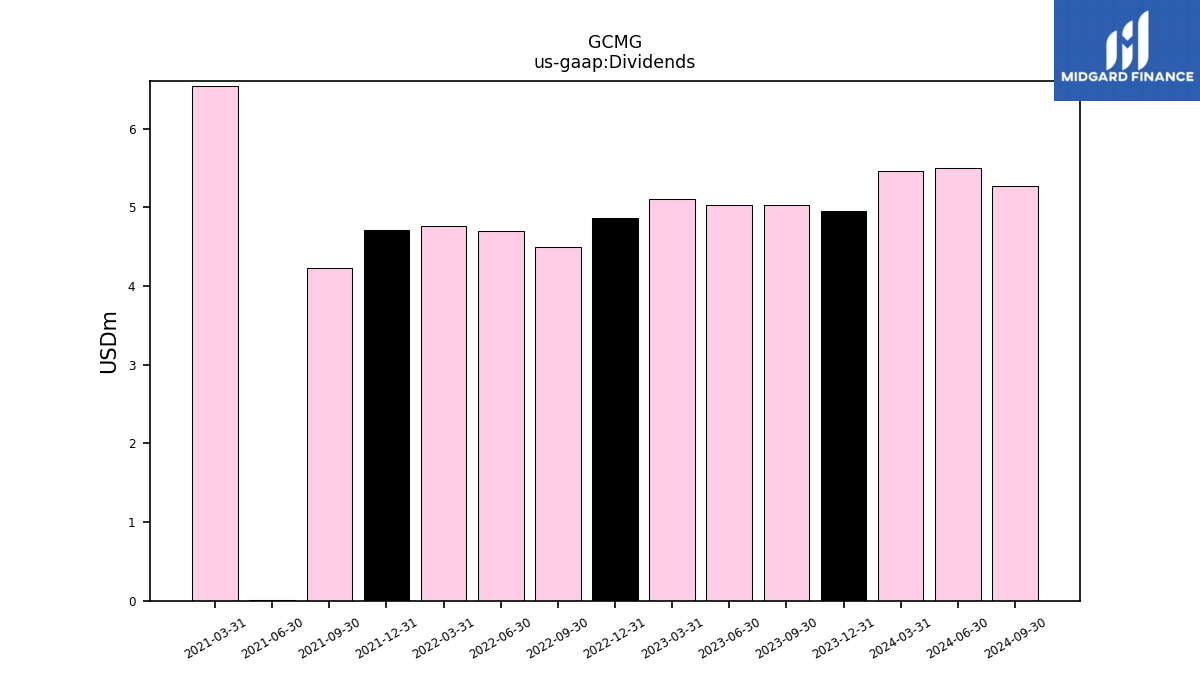
| Dividends | 5.03 | 5.03 | 5.10 | 4.87 | 4.50 | 4.70 | 4.76 | 4.71 | 4.24 | 0.01 | 6.55 | NA | NA | NA | NA | |
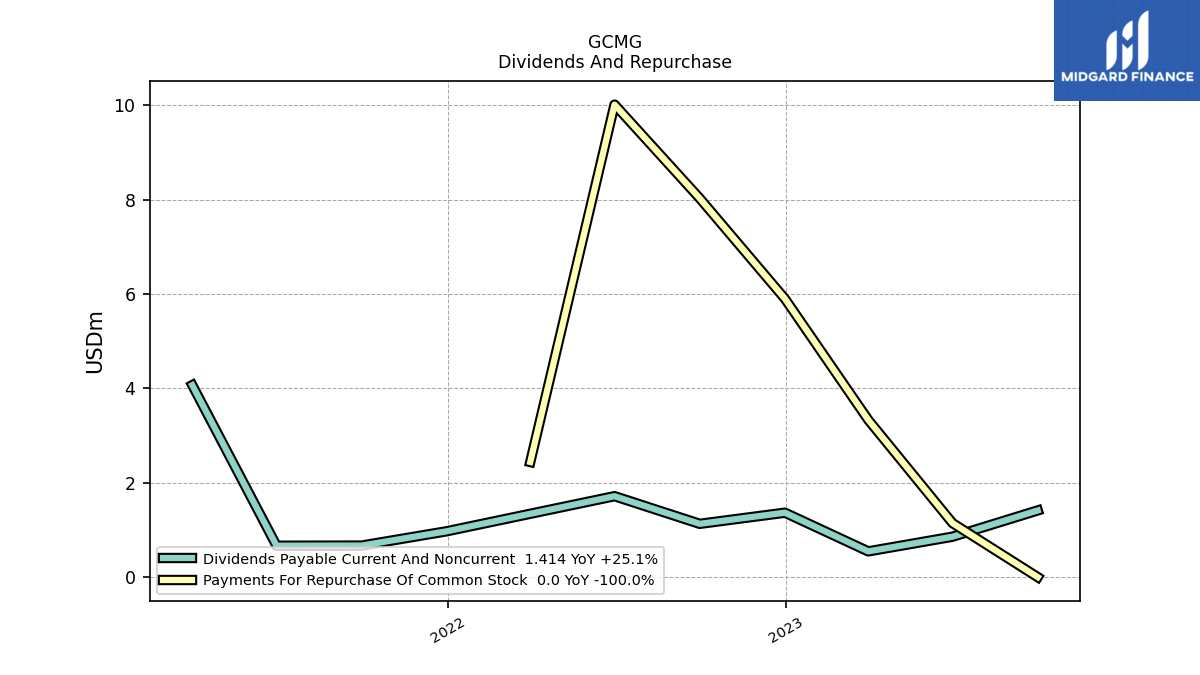
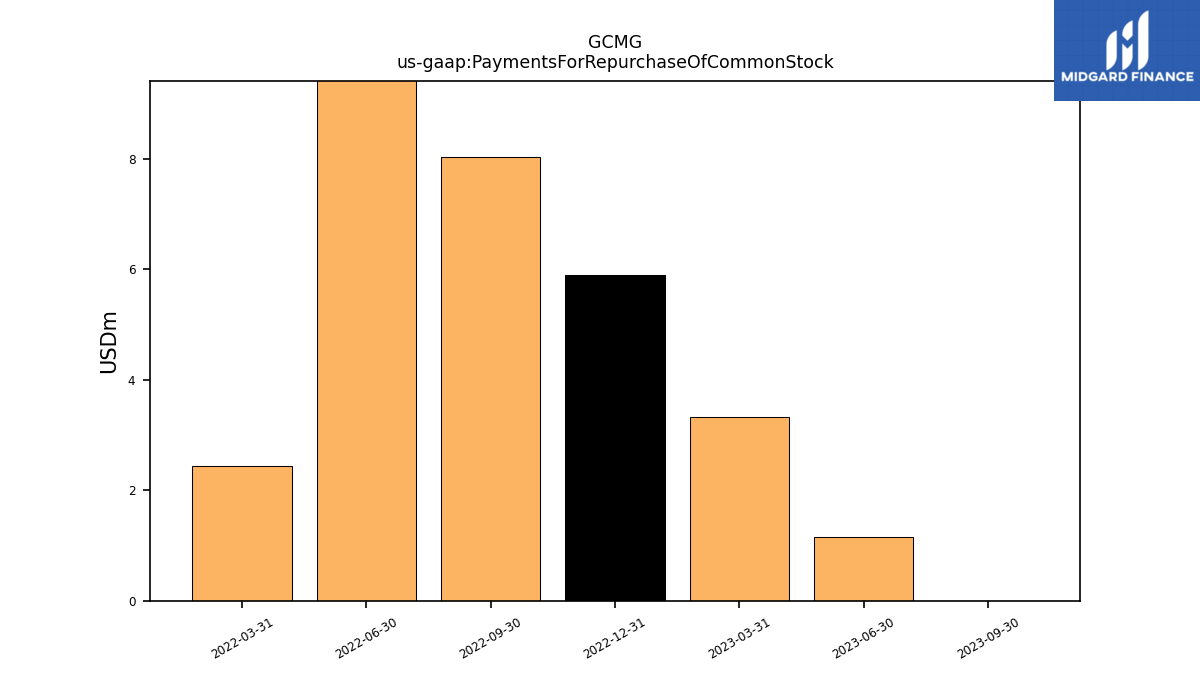
| Payments For Repurchase Of Common Stock | 0.00 | 1.15 | 3.33 | 5.90 | 8.03 | 10.02 | 2.44 | NA | NA | NA | NA | NA | NA | NA | NA |
| 2023-09-30 | 2023-06-30 | 2023-03-31 | 2022-12-31 | 2022-09-30 | 2022-06-30 | 2022-03-31 | 2021-12-31 | 2021-09-30 | 2021-06-30 | 2021-03-31 | 2020-12-31 | 2020-09-30 | 2020-06-30 | 2020-03-31 | ||
|---|---|---|---|---|---|---|---|---|---|---|---|---|---|---|---|---|
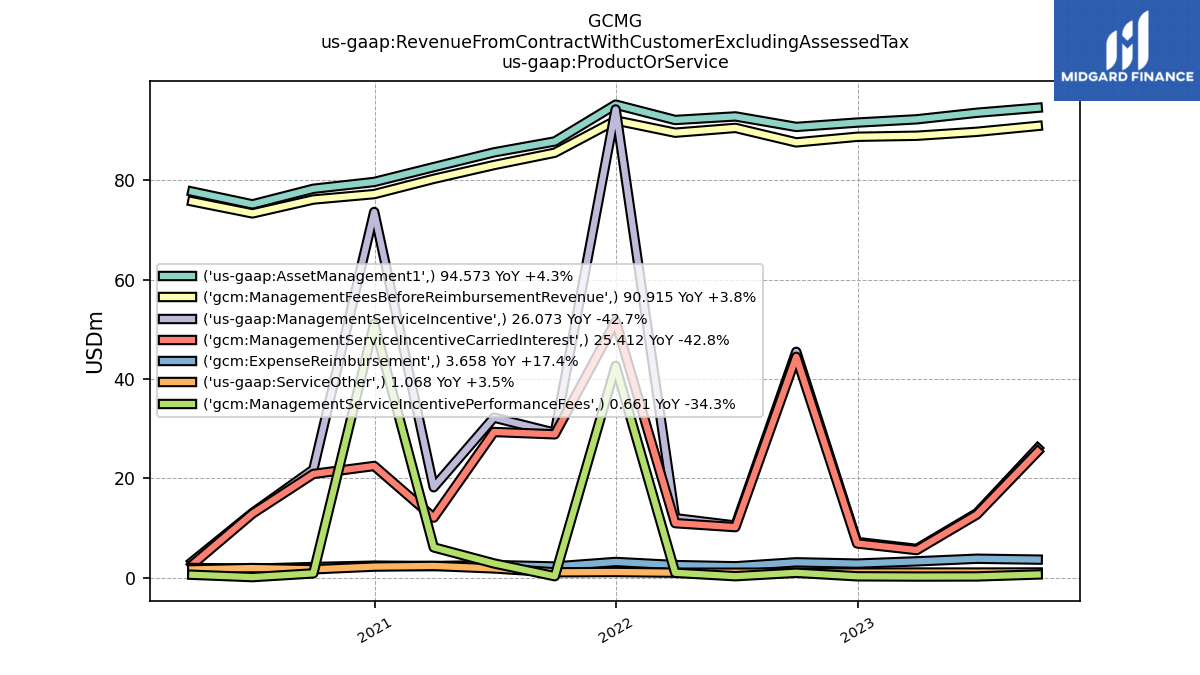
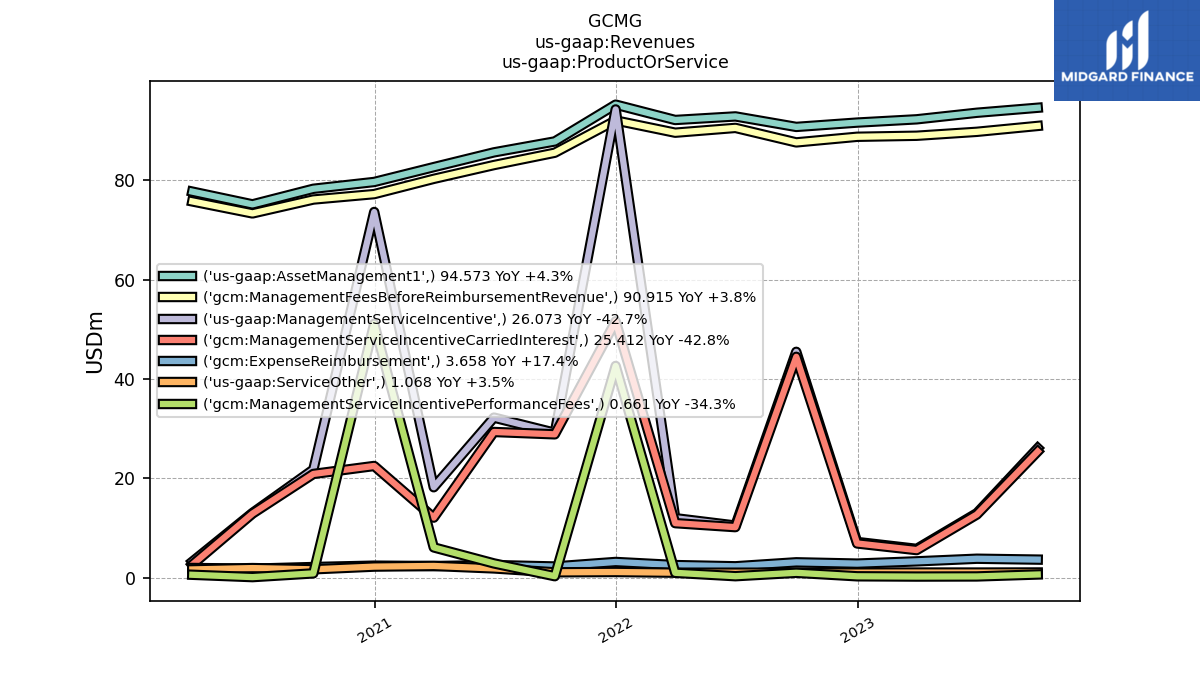
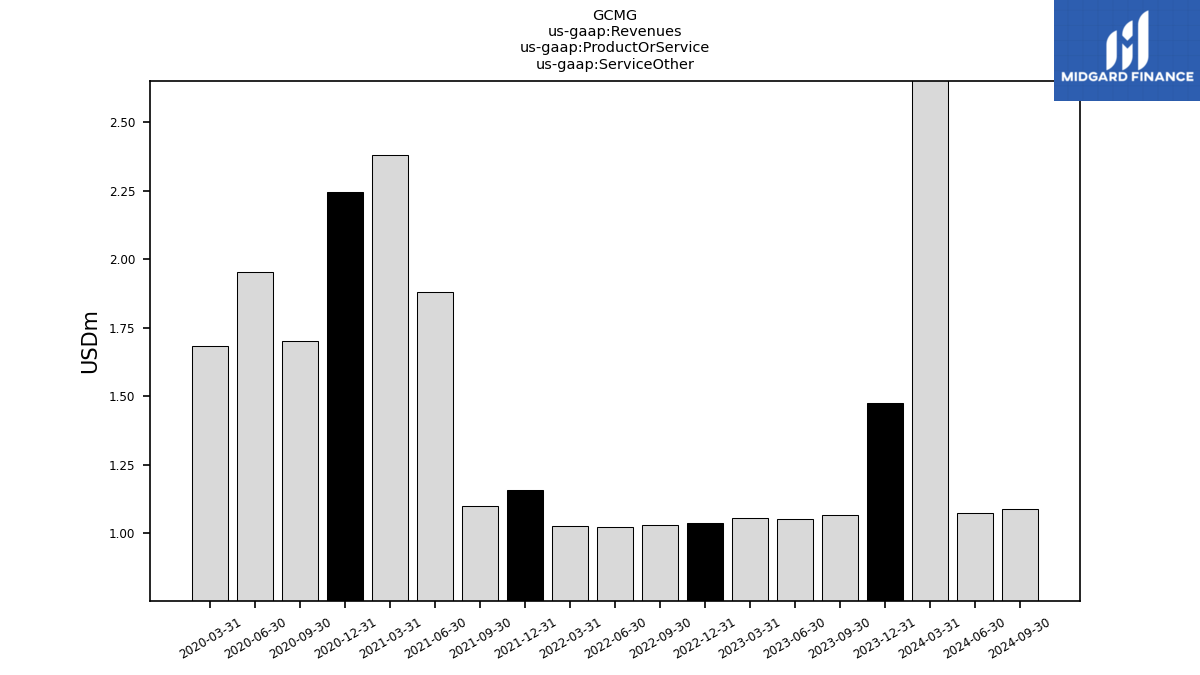
| Revenues | 121.71 | 107.61 | 99.12 | 99.83 | 137.21 | 104.36 | 105.13 | 190.59 | 118.08 | 119.70 | 103.22 | 155.49 | 101.75 | 90.13 | 82.62 | |
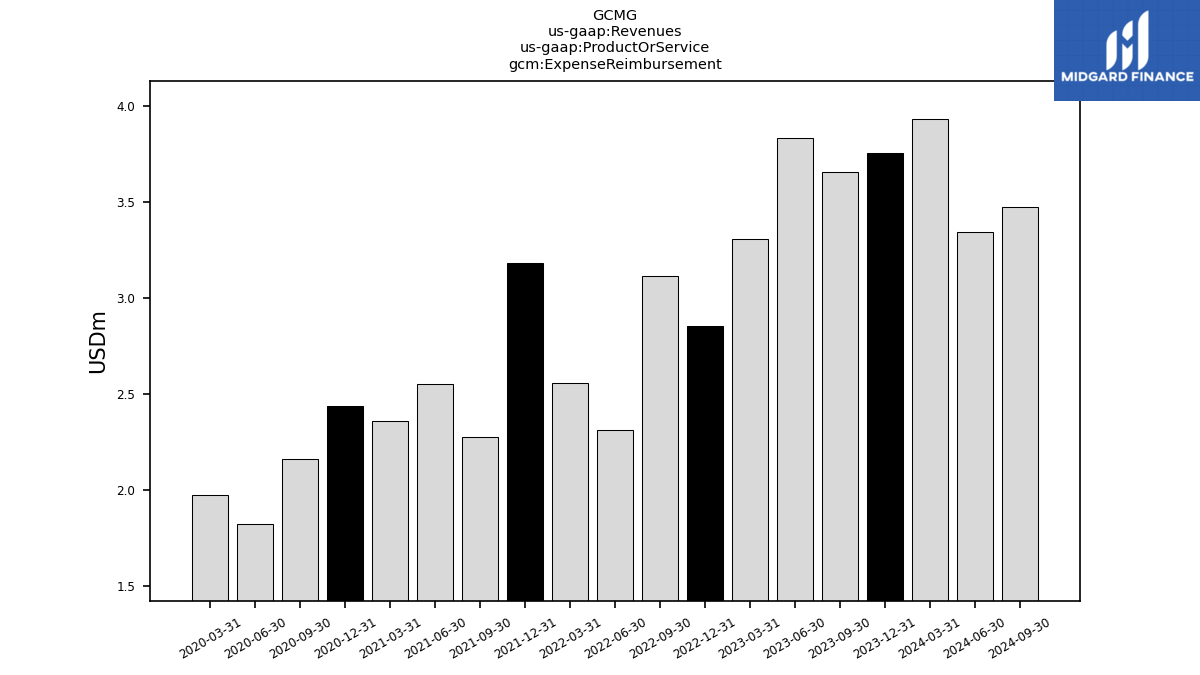
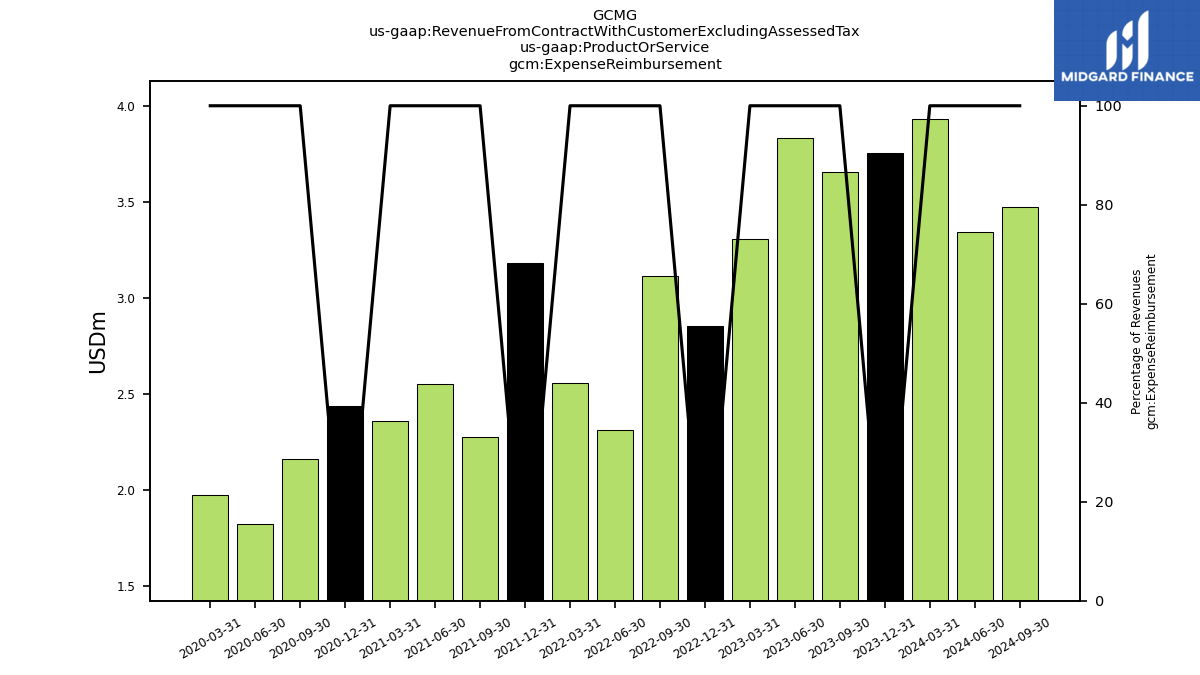
| Expense Reimbursement | 3.66 | 3.83 | 3.31 | 2.85 | 3.12 | 2.31 | 2.56 | 3.18 | 2.27 | 2.55 | 2.36 | 2.44 | 2.16 | 1.83 | 1.97 | |
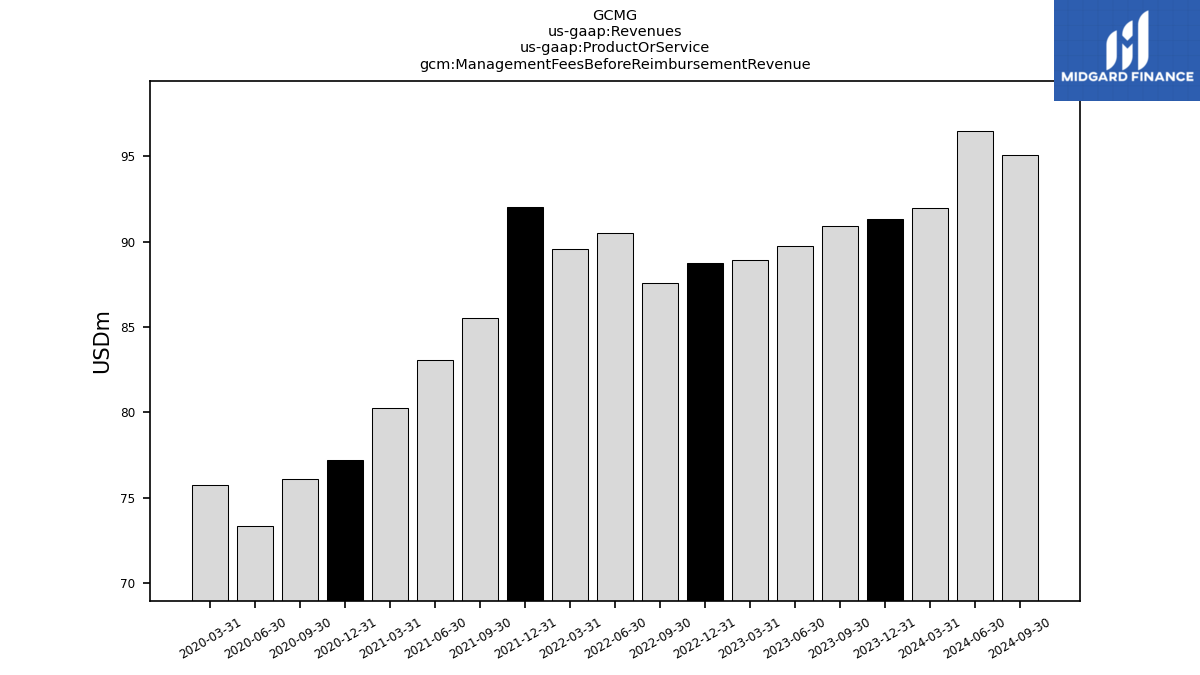
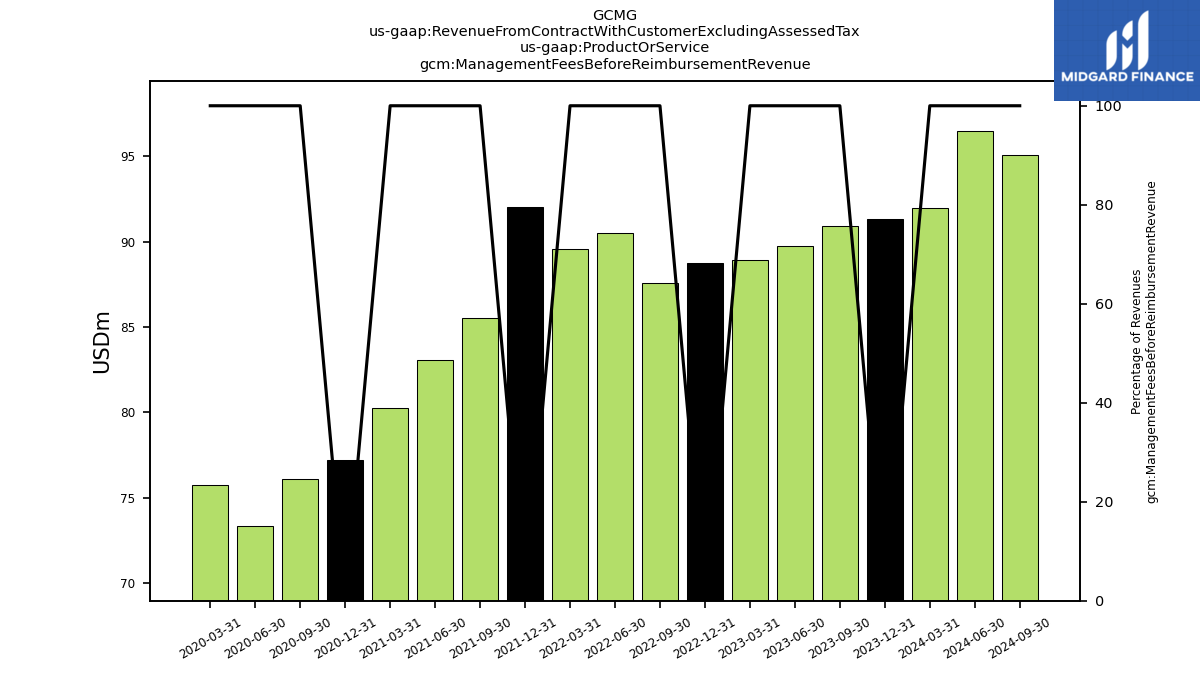
| Management Fees Before Reimbursement Revenue | 90.92 | 89.73 | 88.94 | 88.73 | 87.60 | 90.52 | 89.55 | 92.02 | 85.52 | 83.04 | 80.27 | 77.20 | 76.11 | 73.31 | 75.73 | |
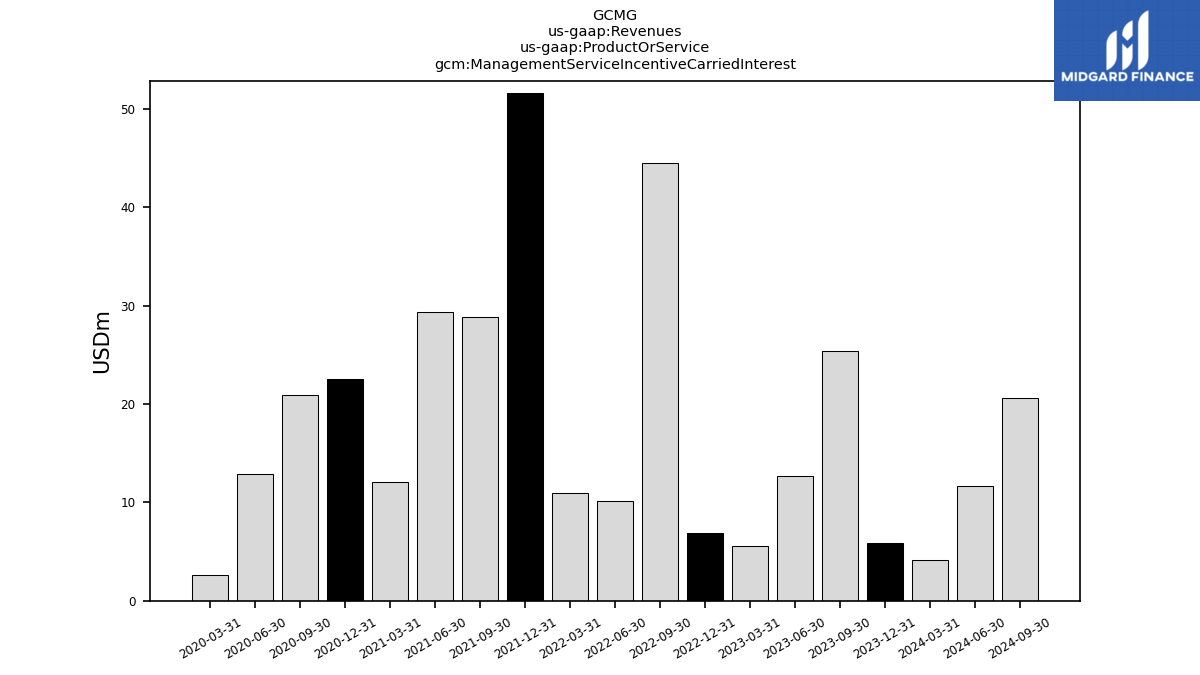
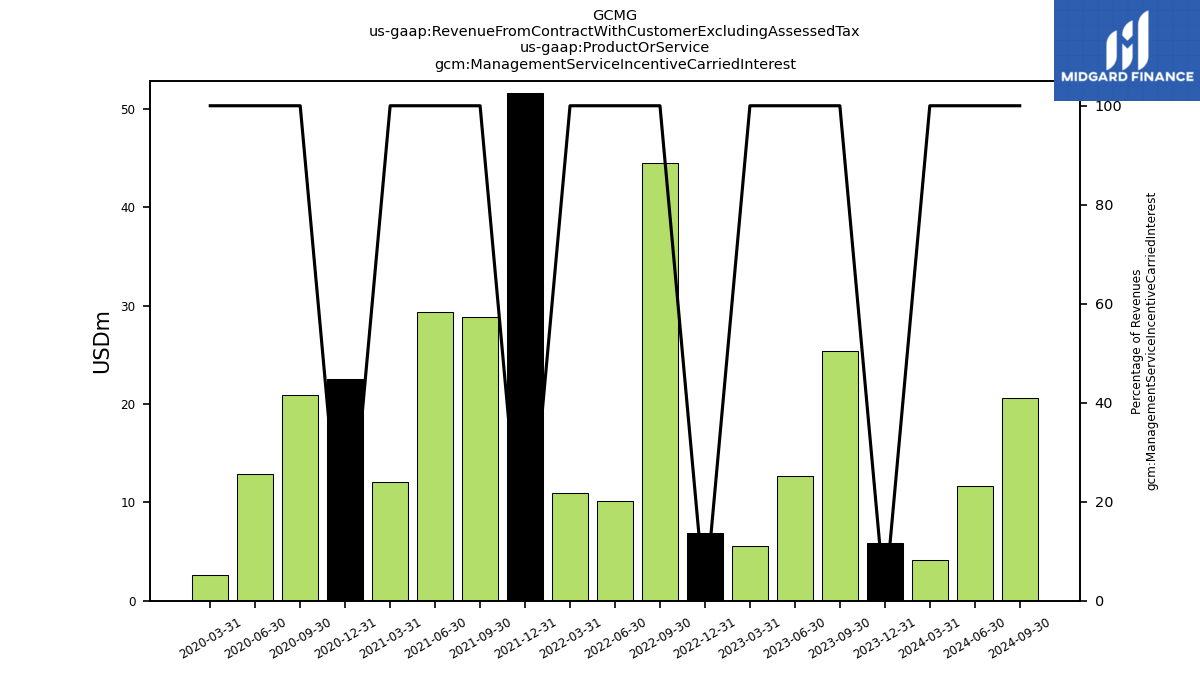
| Management Service Incentive Carried Interest | 25.41 | 12.73 | 5.57 | 6.90 | 44.46 | 10.19 | 10.99 | 51.61 | 28.86 | 29.34 | 12.10 | 22.50 | 20.89 | 12.91 | 2.63 | |
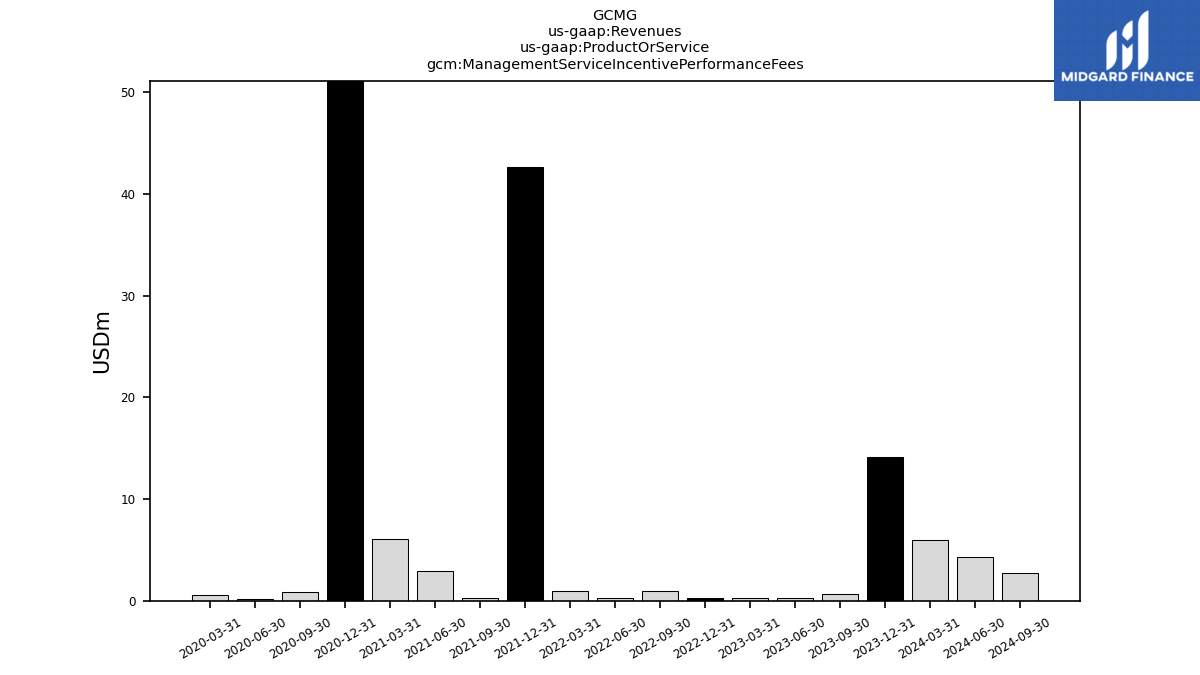
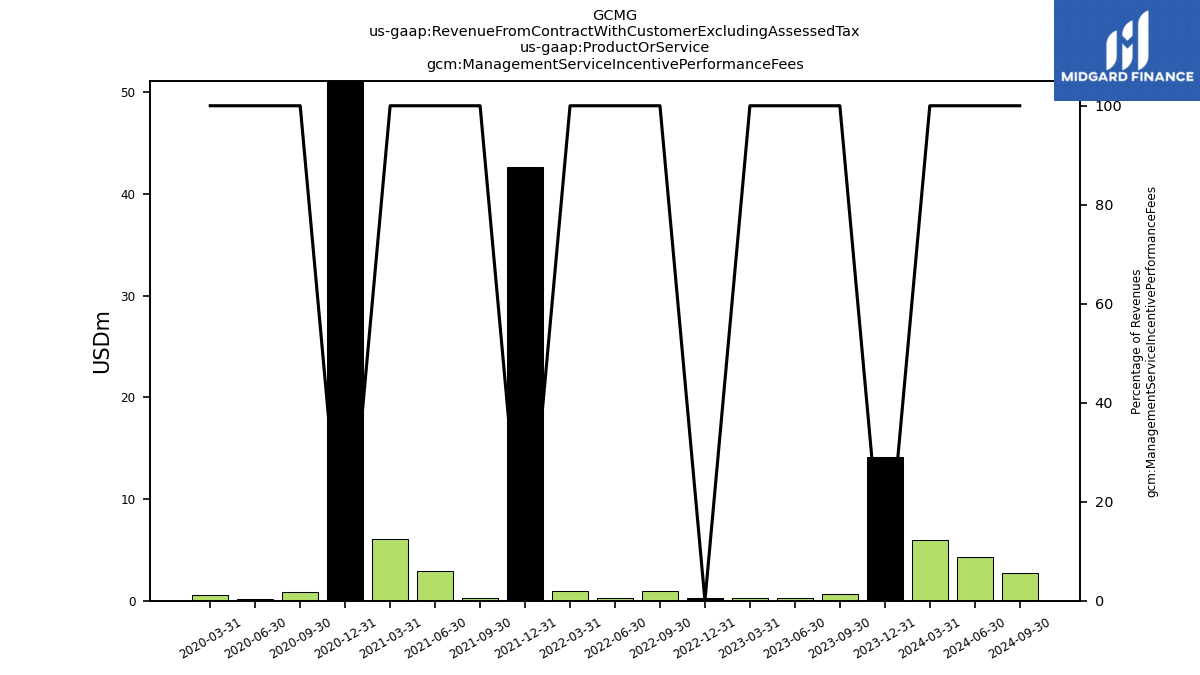
| Management Service Incentive Performance Fees | 0.66 | 0.27 | 0.24 | 0.30 | 1.01 | 0.32 | 1.00 | 42.63 | 0.32 | 2.89 | 6.11 | 51.10 | 0.88 | 0.13 | 0.60 | |
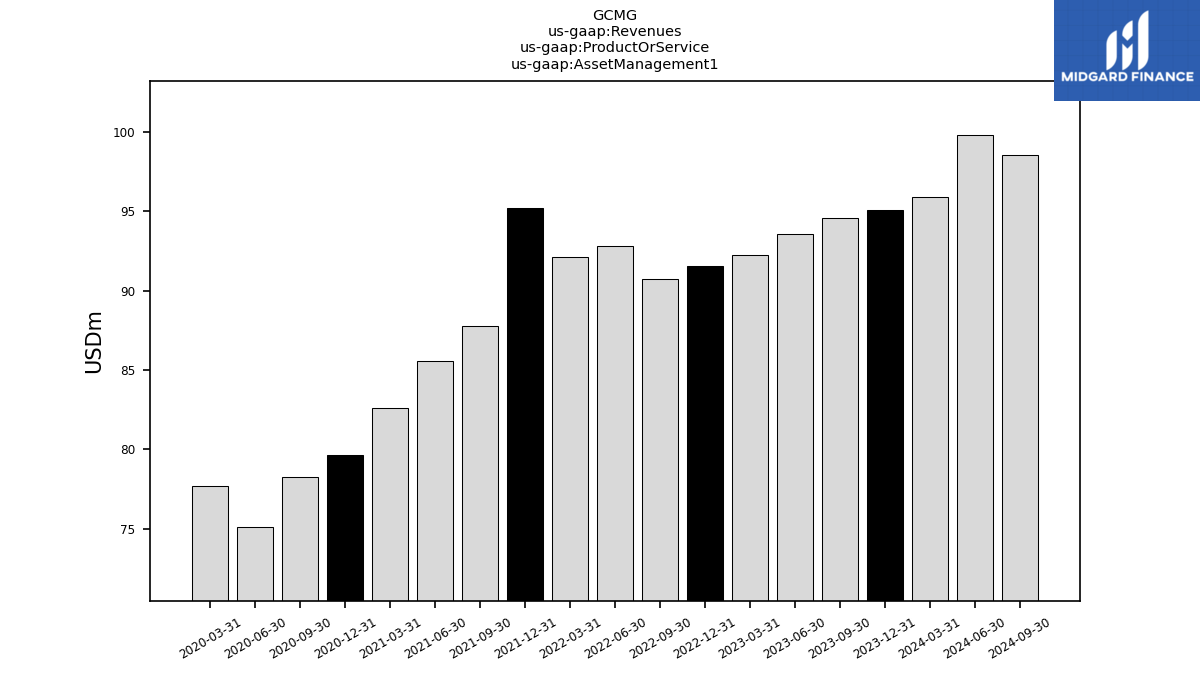
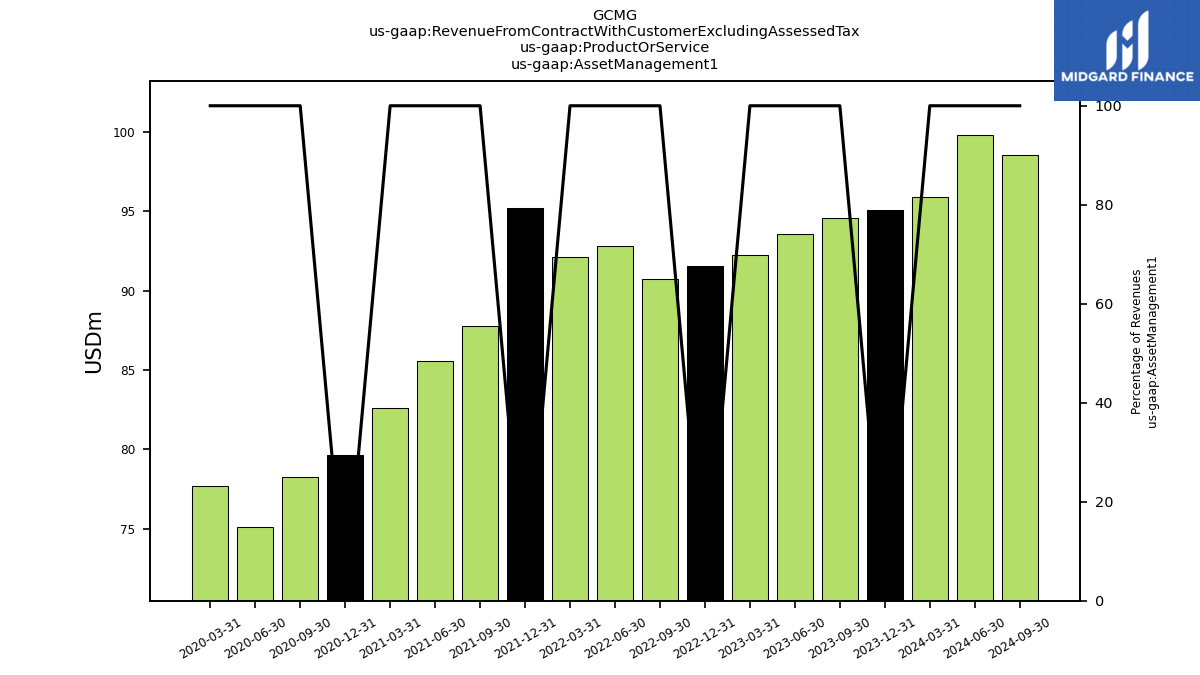
| Asset Management1 | 94.57 | 93.56 | 92.25 | 91.59 | 90.72 | 92.83 | 92.11 | 95.20 | 87.80 | 85.59 | 82.62 | 79.64 | 78.27 | 75.14 | 77.70 | |
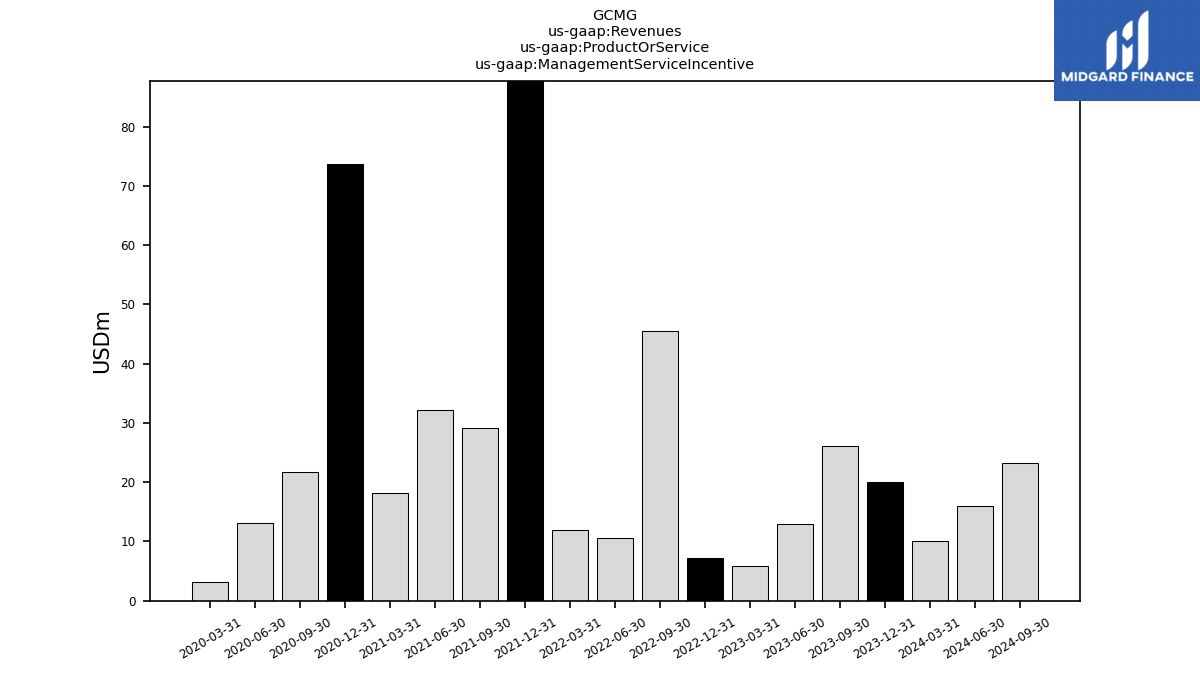
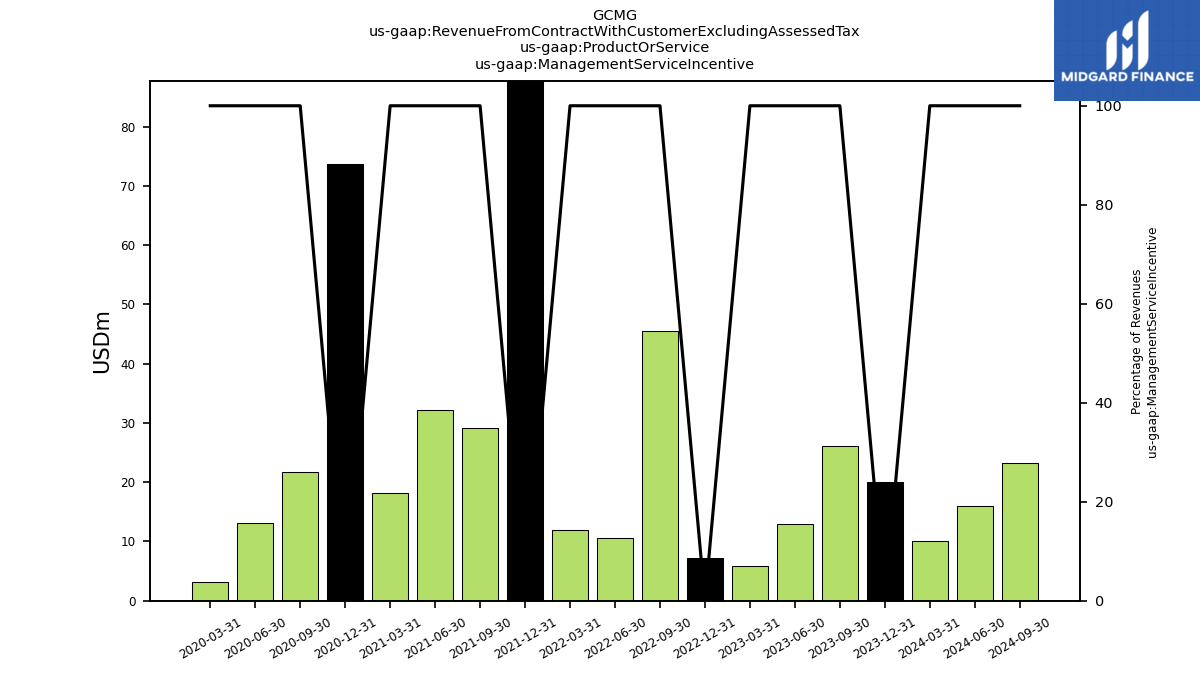
| Management Service Incentive | 26.07 | 13.00 | 5.82 | 7.20 | 45.47 | 10.51 | 11.99 | 94.23 | 29.18 | 32.23 | 18.21 | 73.60 | 21.77 | 13.04 | 3.23 | |
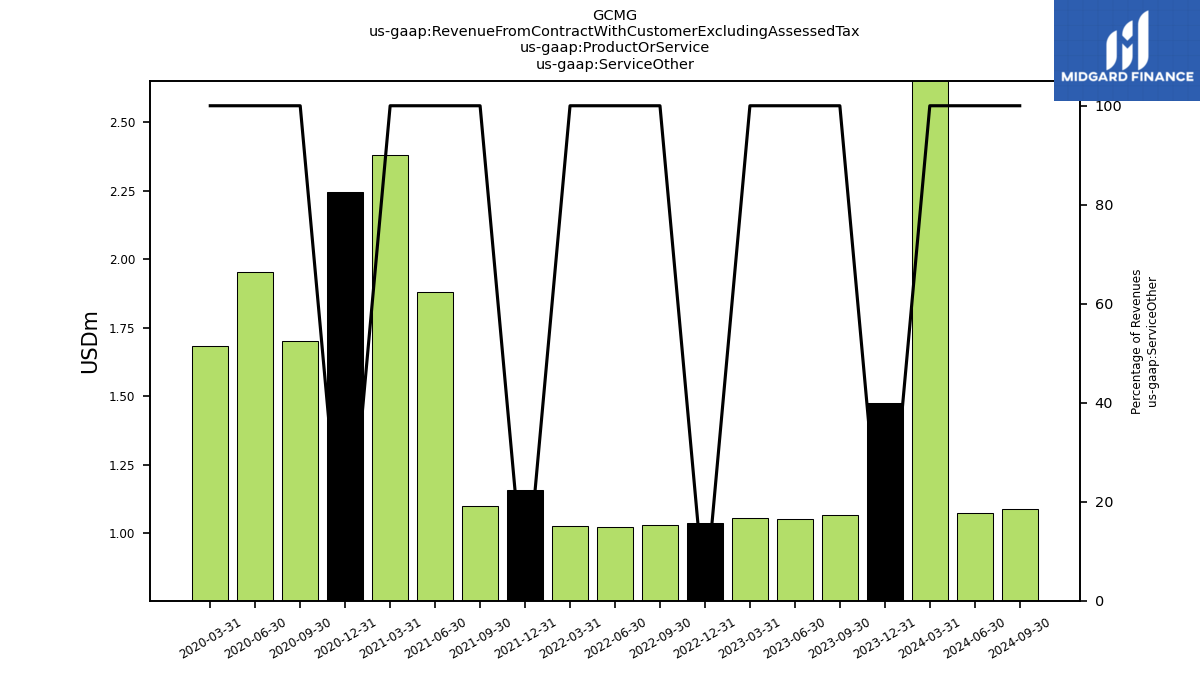
| Service Other | 1.07 | 1.05 | 1.06 | 1.04 | 1.03 | 1.02 | 1.03 | 1.16 | 1.10 | 1.88 | 2.38 | 2.25 | 1.70 | 1.95 | 1.68 | |
| Revenue From Contract With Customer Excluding Assessed Tax | 121.71 | 107.61 | 99.12 | 99.83 | 137.21 | 104.36 | 105.13 | 190.59 | 118.08 | 119.70 | 103.22 | 155.49 | 101.75 | 90.13 | 82.62 | |
| Expense Reimbursement | 3.66 | 3.83 | 3.31 | 2.85 | 3.12 | 2.31 | 2.56 | 3.18 | 2.27 | 2.55 | 2.36 | 2.44 | 2.16 | 1.83 | 1.97 | |
| Management Fees Before Reimbursement Revenue | 90.92 | 89.73 | 88.94 | 88.73 | 87.60 | 90.52 | 89.55 | 92.02 | 85.52 | 83.04 | 80.27 | 77.20 | 76.11 | 73.31 | 75.73 | |
| Management Service Incentive Carried Interest | 25.41 | 12.73 | 5.57 | 6.90 | 44.46 | 10.19 | 10.99 | 51.61 | 28.86 | 29.34 | 12.10 | 22.50 | 20.89 | 12.91 | 2.63 | |
| Management Service Incentive Performance Fees | 0.66 | 0.27 | 0.24 | 0.30 | 1.01 | 0.32 | 1.00 | 42.63 | 0.32 | 2.89 | 6.11 | 51.10 | 0.88 | 0.13 | 0.60 | |
| Asset Management1 | 94.57 | 93.56 | 92.25 | 91.59 | 90.72 | 92.83 | 92.11 | 95.20 | 87.80 | 85.59 | 82.62 | 79.64 | 78.27 | 75.14 | 77.70 | |
| Management Service Incentive | 26.07 | 13.00 | 5.82 | 7.20 | 45.47 | 10.51 | 11.99 | 94.23 | 29.18 | 32.23 | 18.21 | 73.60 | 21.77 | 13.04 | 3.23 | |
| Service Other | 1.07 | 1.05 | 1.06 | 1.04 | 1.03 | 1.02 | 1.03 | 1.16 | 1.10 | 1.88 | 2.38 | 2.25 | 1.70 | 1.95 | 1.68 |