
| 2022-12-31 | 2022-09-30 | 2022-06-30 | 2022-03-31 | 2021-12-31 | 2021-09-30 | 2021-06-30 | 2021-03-31 | 2020-12-31 | 2020-09-30 | 2020-06-30 | 2020-03-31 | 2019-12-31 | 2019-09-30 | ||
|---|---|---|---|---|---|---|---|---|---|---|---|---|---|---|---|
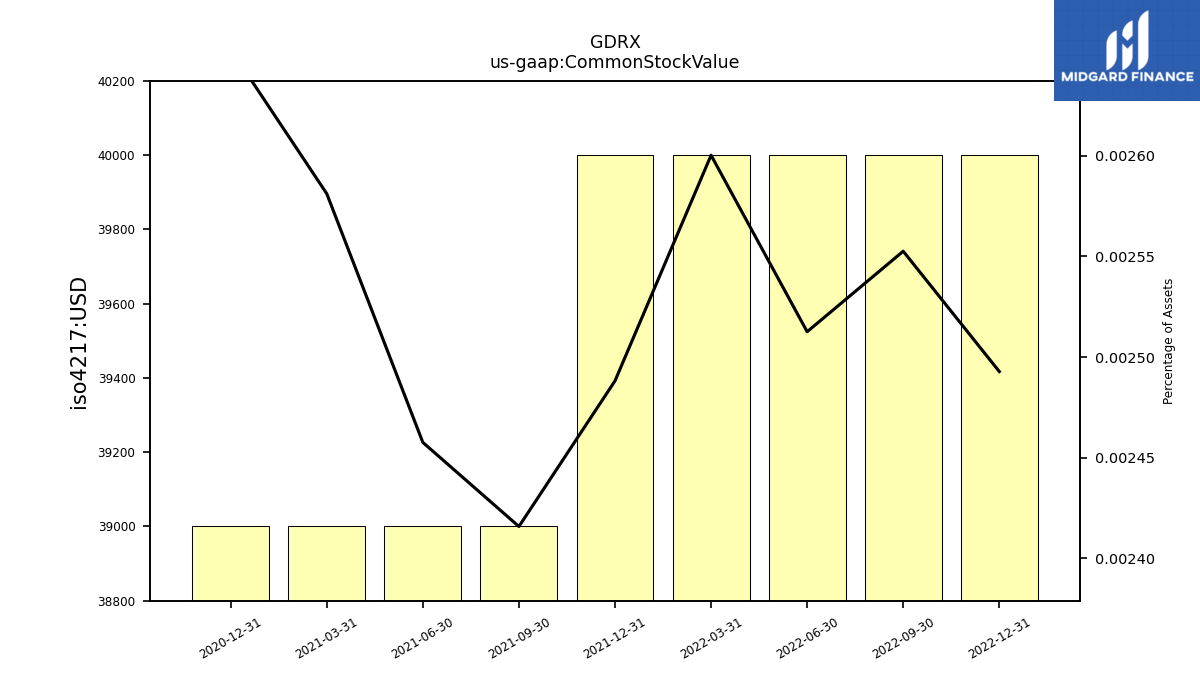
| Common Stock Value | 0.04 | 0.04 | 0.04 | 0.04 | 0.04 | 0.04 | 0.04 | 0.04 | 0.04 | NA | NA | NA | NA | NA | |
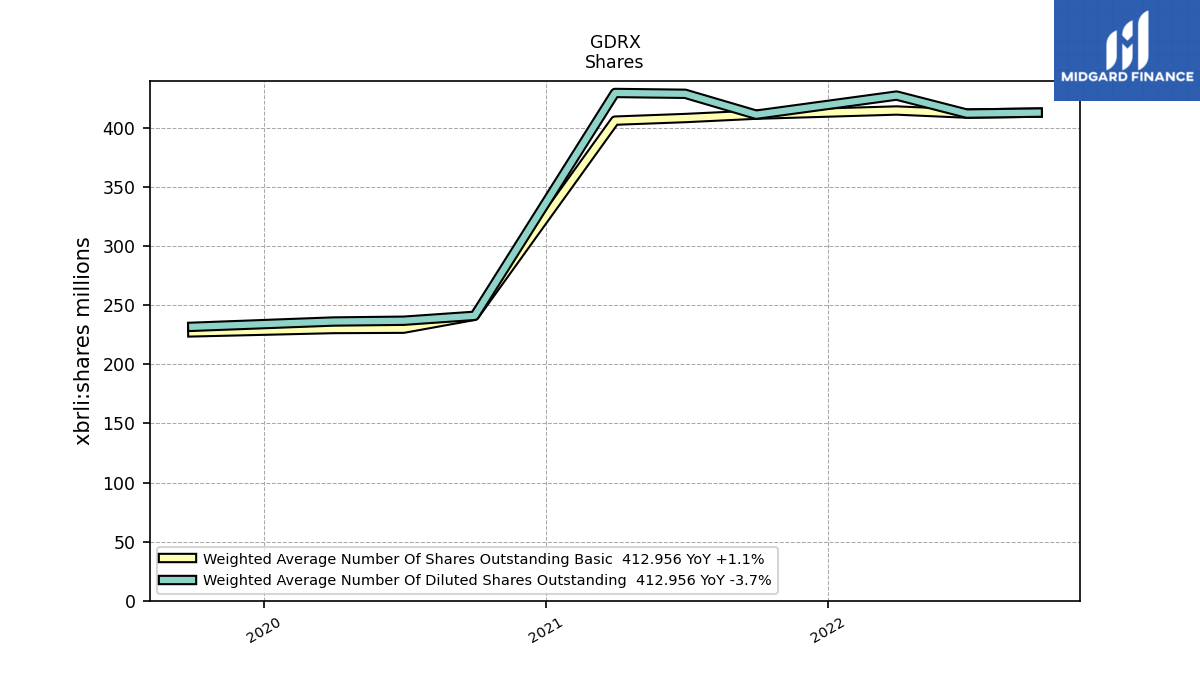
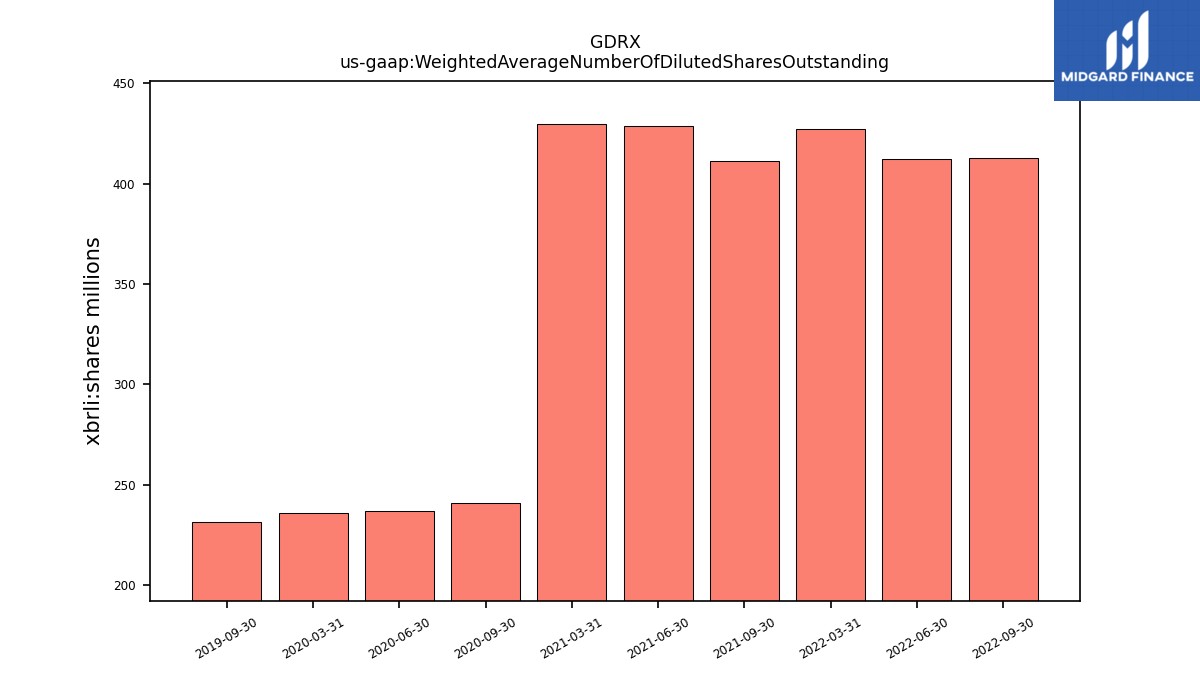
| Weighted Average Number Of Diluted Shares Outstanding | NA | 412.96 | 412.13 | 427.38 | NA | 411.22 | 428.87 | 429.58 | NA | 241.06 | 236.89 | 236.22 | NA | 231.77 | |
| Weighted Average Number Of Shares Outstanding Basic | NA | 412.96 | 412.13 | 414.74 | NA | 411.22 | 408.36 | 406.17 | NA | 241.06 | 230.16 | 229.88 | NA | 227.06 | |
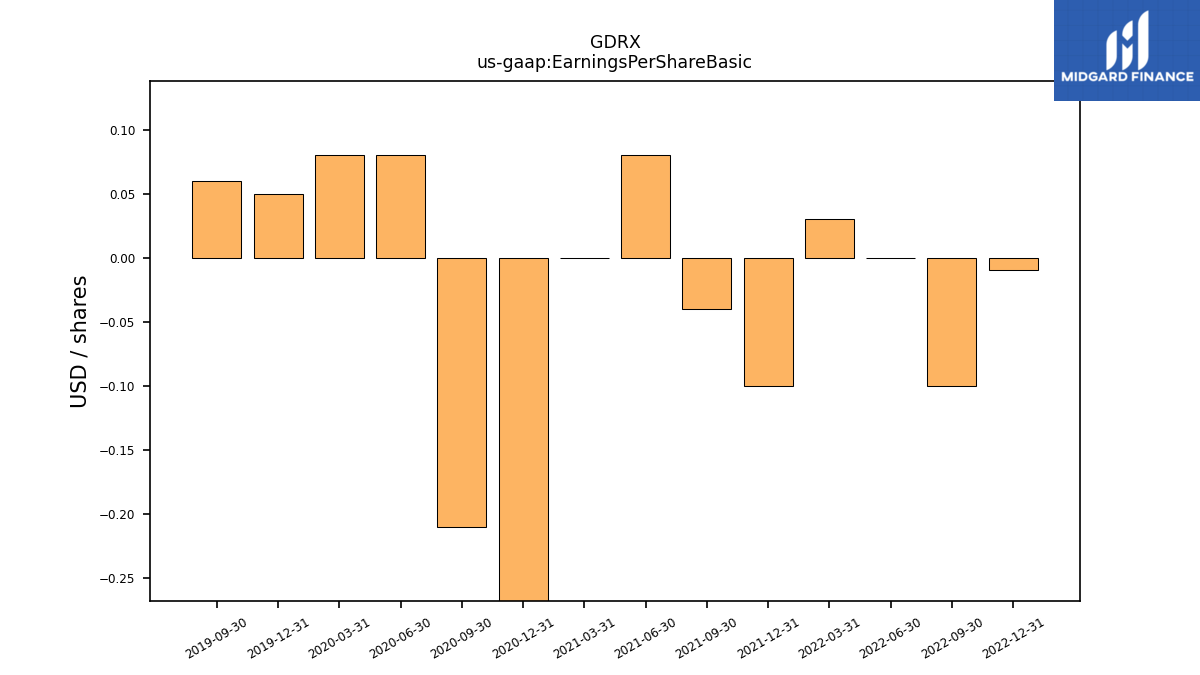
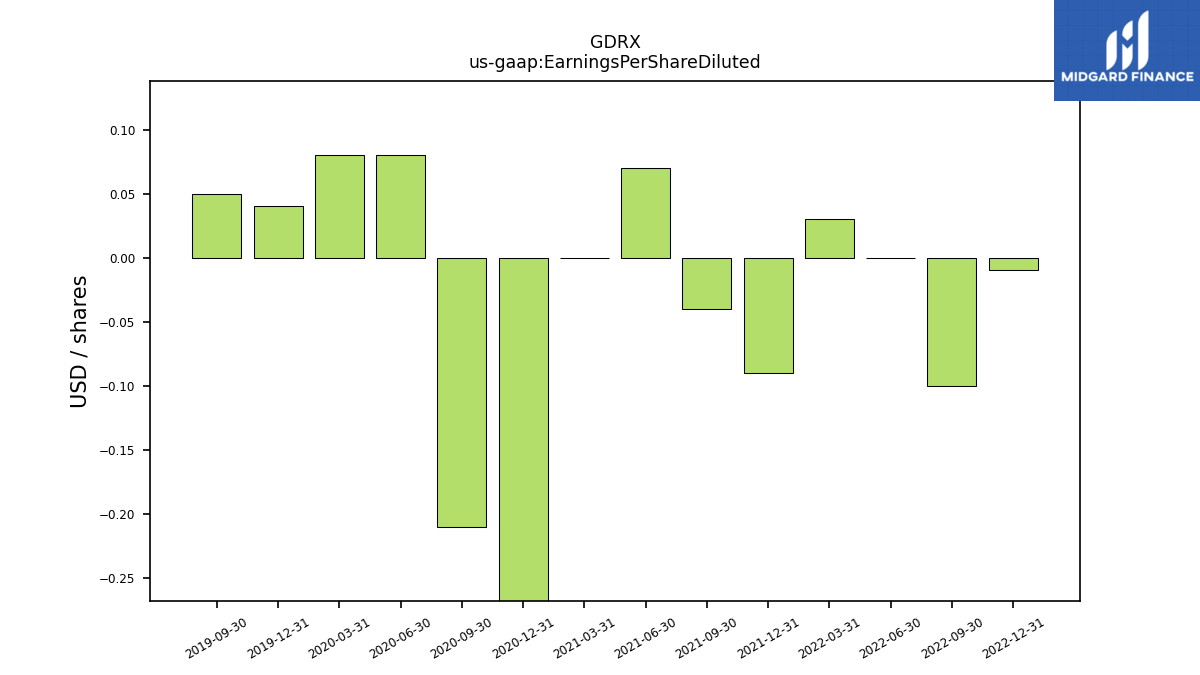
| Earnings Per Share Basic | -0.01 | -0.10 | -0.00 | 0.03 | -0.10 | -0.04 | 0.08 | 0.00 | -1.08 | -0.21 | 0.08 | 0.08 | 0.05 | 0.06 | |
| Earnings Per Share Diluted | -0.01 | -0.10 | -0.00 | 0.03 | -0.09 | -0.04 | 0.07 | 0.00 | -1.08 | -0.21 | 0.08 | 0.08 | 0.04 | 0.05 |
| 2022-12-31 | 2022-09-30 | 2022-06-30 | 2022-03-31 | 2021-12-31 | 2021-09-30 | 2021-06-30 | 2021-03-31 | 2020-12-31 | 2020-09-30 | 2020-06-30 | 2020-03-31 | 2019-12-31 | 2019-09-30 | ||
|---|---|---|---|---|---|---|---|---|---|---|---|---|---|---|---|
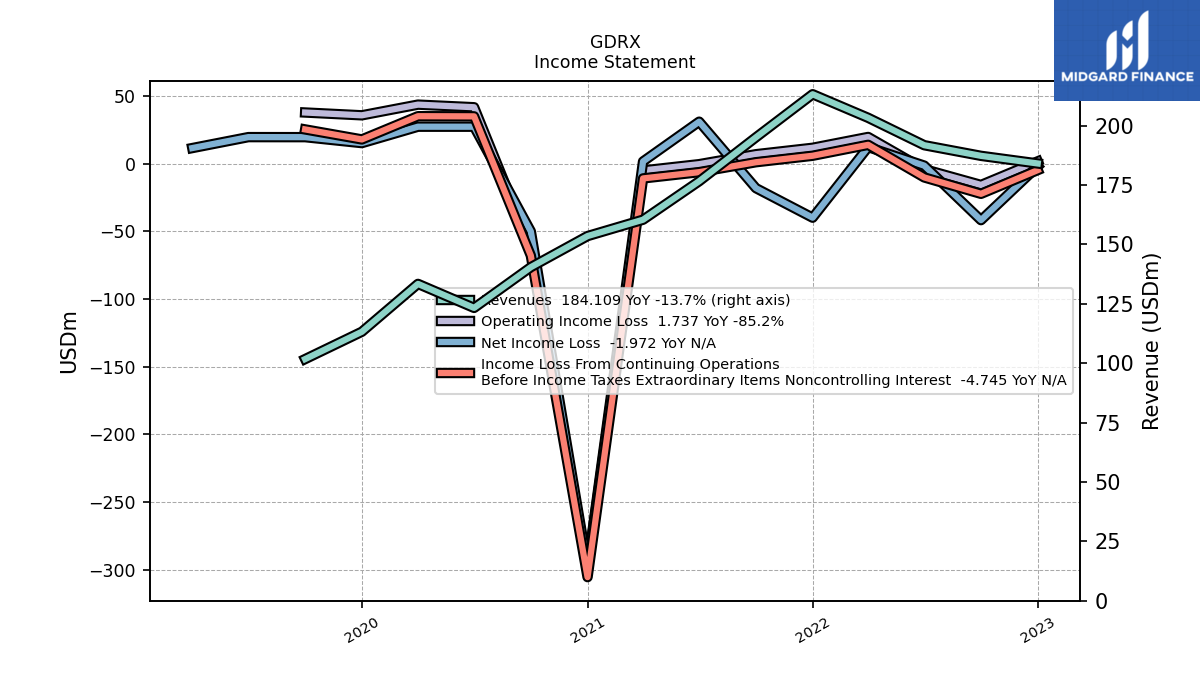
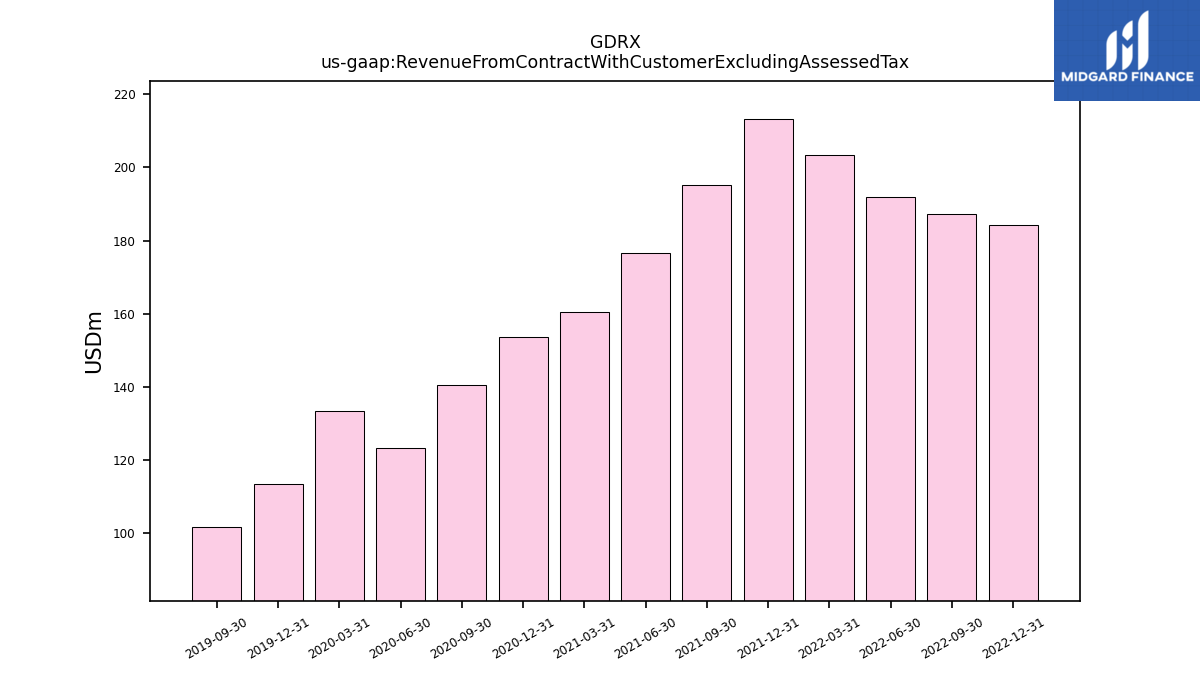
| Revenue From Contract With Customer Excluding Assessed Tax | 184.11 | 187.32 | 191.80 | 203.33 | 213.26 | 195.10 | 176.63 | 160.43 | 153.54 | 140.45 | 123.30 | 133.41 | 113.26 | 101.75 | |
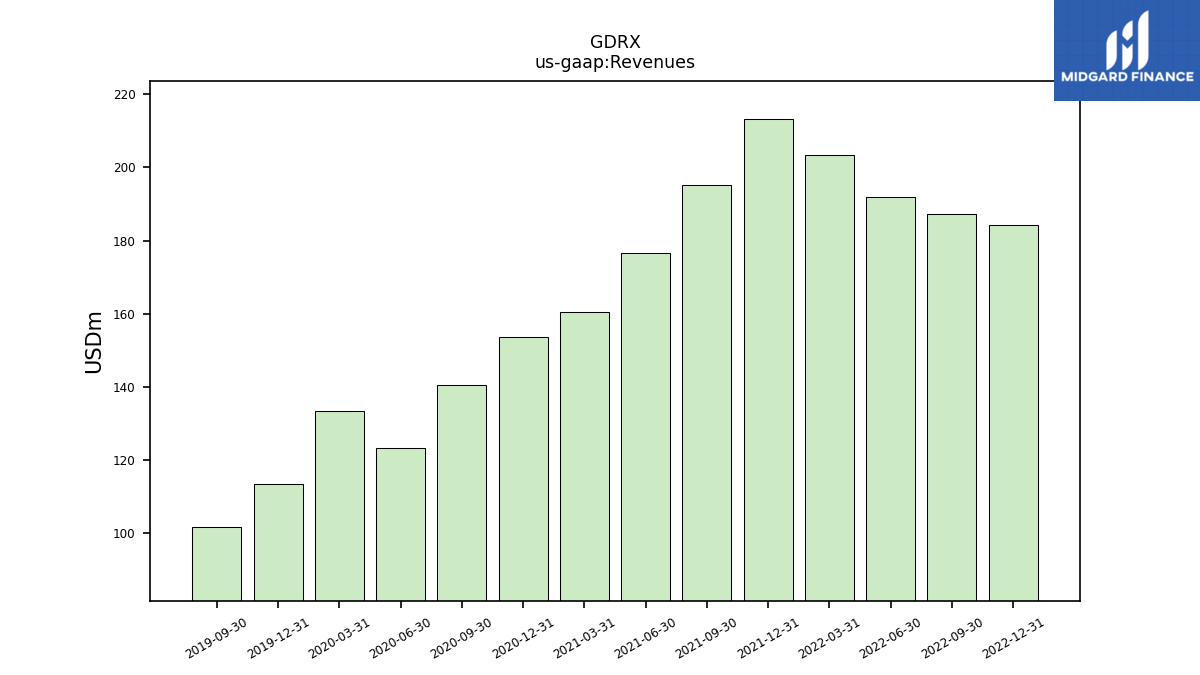
| Revenues | 184.11 | 187.32 | 191.80 | 203.33 | 213.26 | 195.10 | 176.63 | 160.43 | 153.54 | 140.45 | 123.30 | 133.41 | 113.26 | 101.75 | |
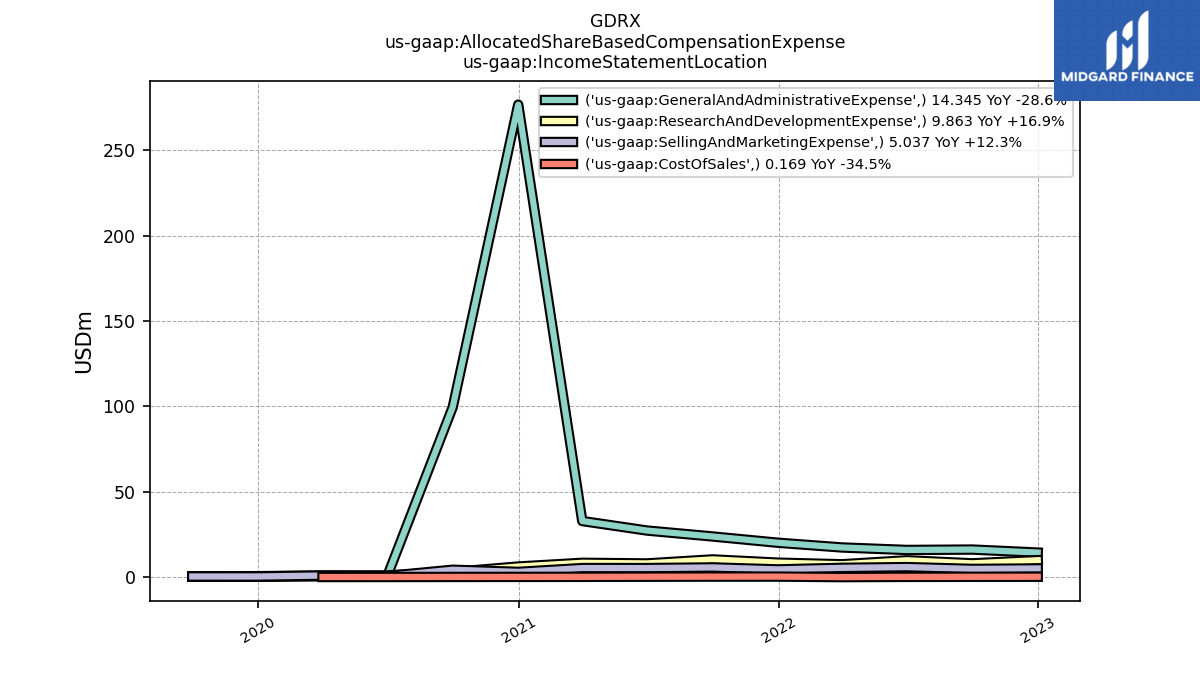
| Cost Of Goods And Service Excluding Depreciation Depletion And Amortization | 17.36 | 17.39 | 18.04 | 12.28 | 13.93 | 11.27 | 11.09 | 10.43 | 9.20 | 7.54 | 6.82 | 6.02 | 4.60 | 3.40 | |
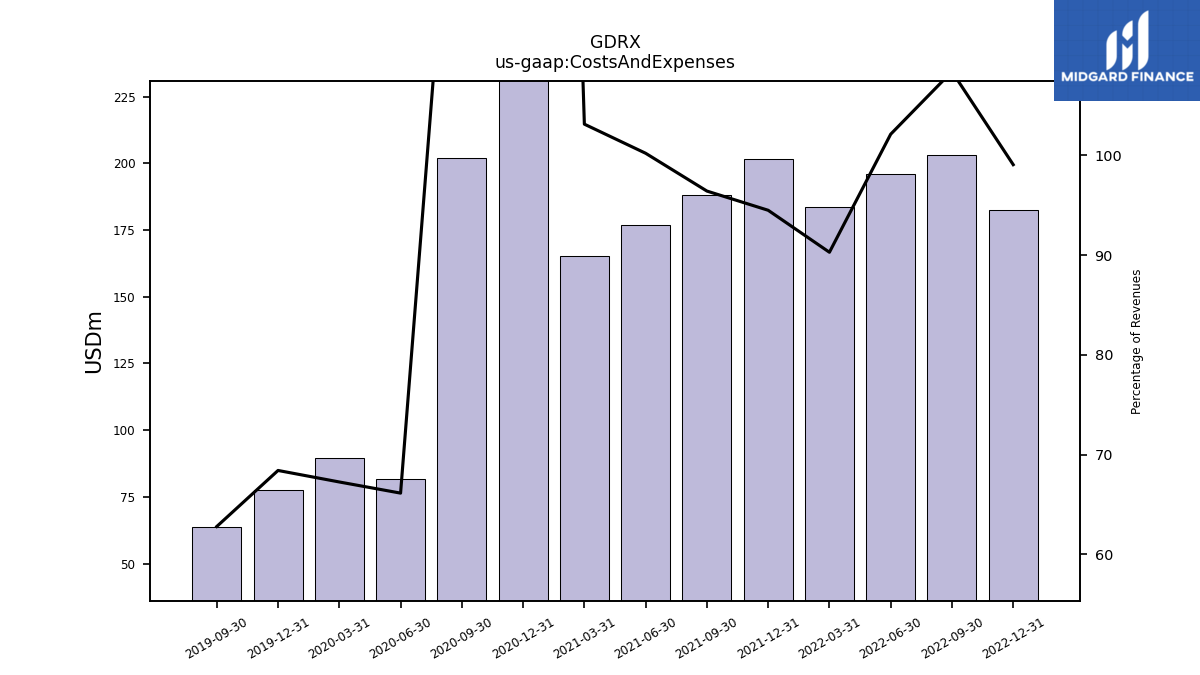
| Costs And Expenses | 182.37 | 203.03 | 195.84 | 183.57 | 201.50 | 188.10 | 176.99 | 165.43 | 452.98 | 202.14 | 81.56 | 89.74 | 77.49 | 63.90 | |
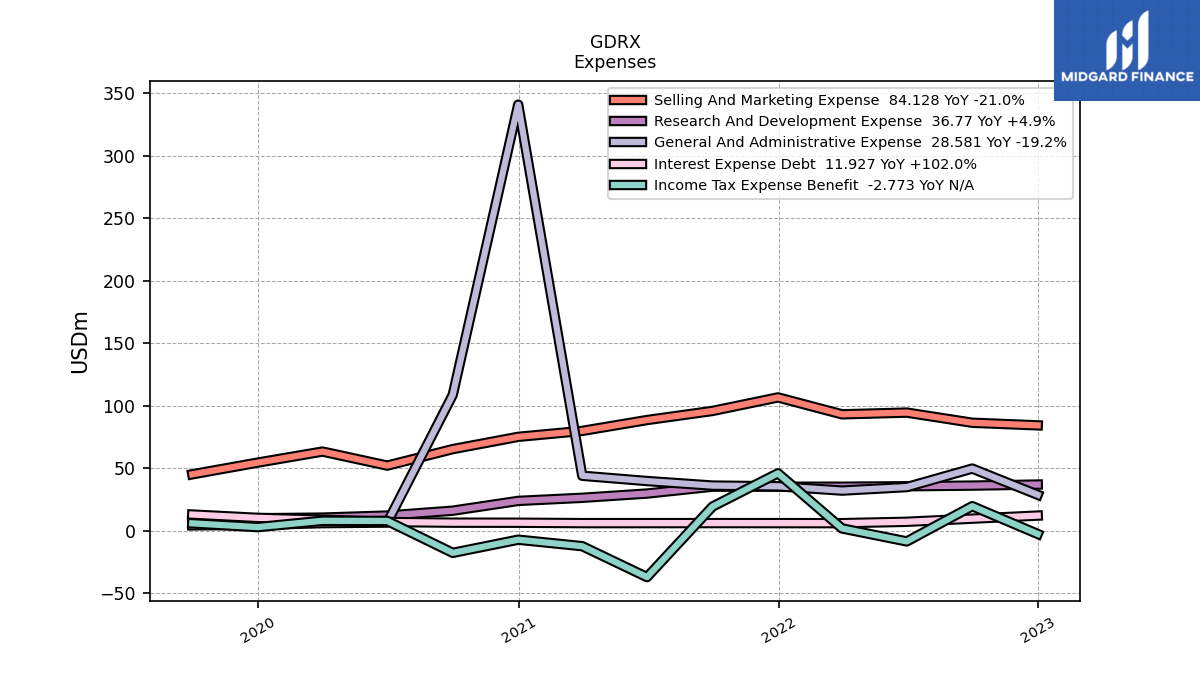
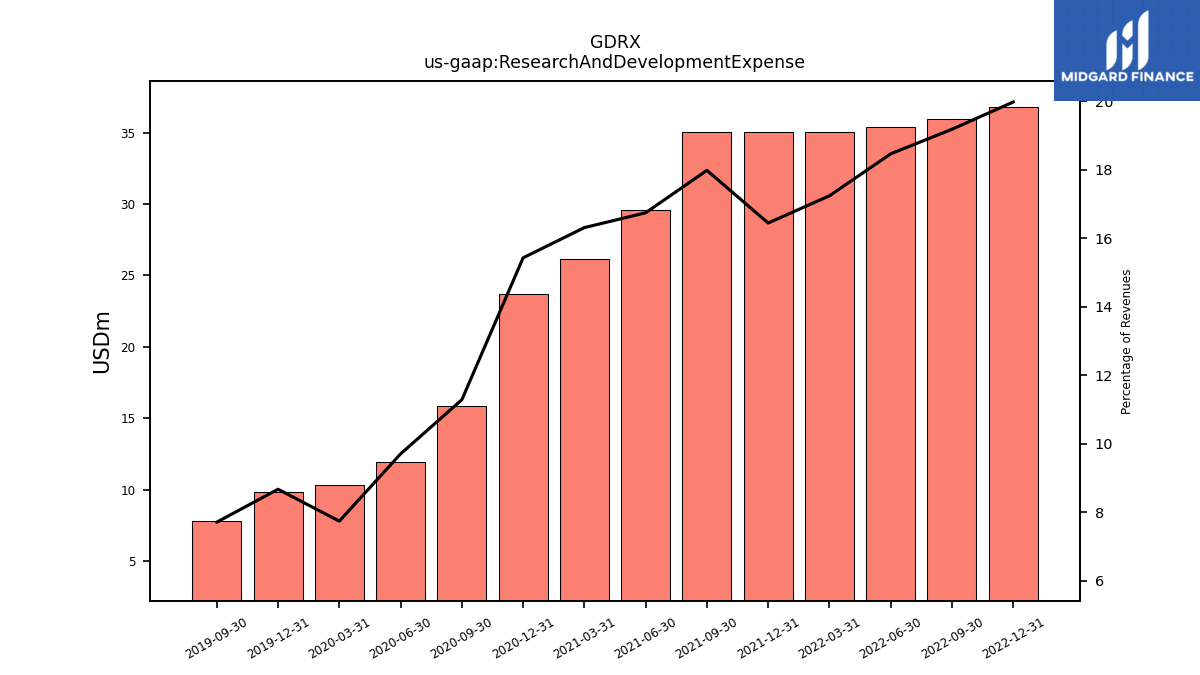
| Research And Development Expense | 36.77 | 35.92 | 35.40 | 35.04 | 35.06 | 35.07 | 29.57 | 26.16 | 23.68 | 15.85 | 11.96 | 10.32 | 9.82 | 7.84 | |
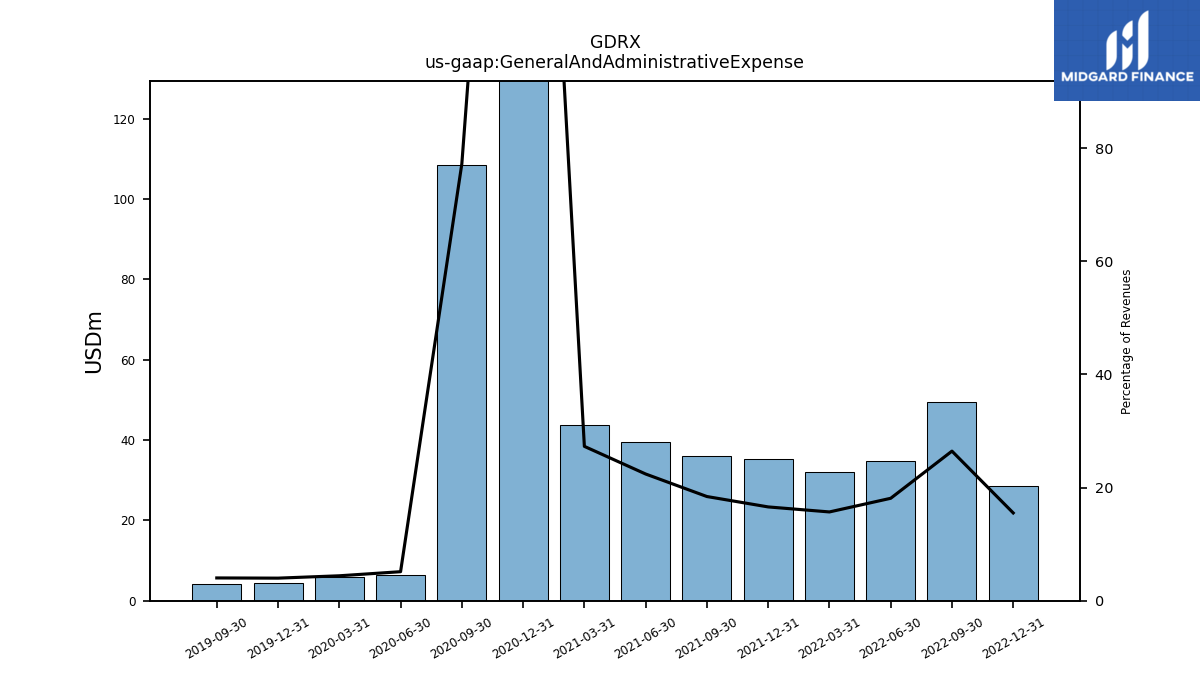
| General And Administrative Expense | 28.58 | 49.55 | 34.74 | 31.92 | 35.37 | 35.95 | 39.58 | 43.79 | 340.75 | 108.48 | 6.33 | 5.89 | 4.53 | 4.10 | |
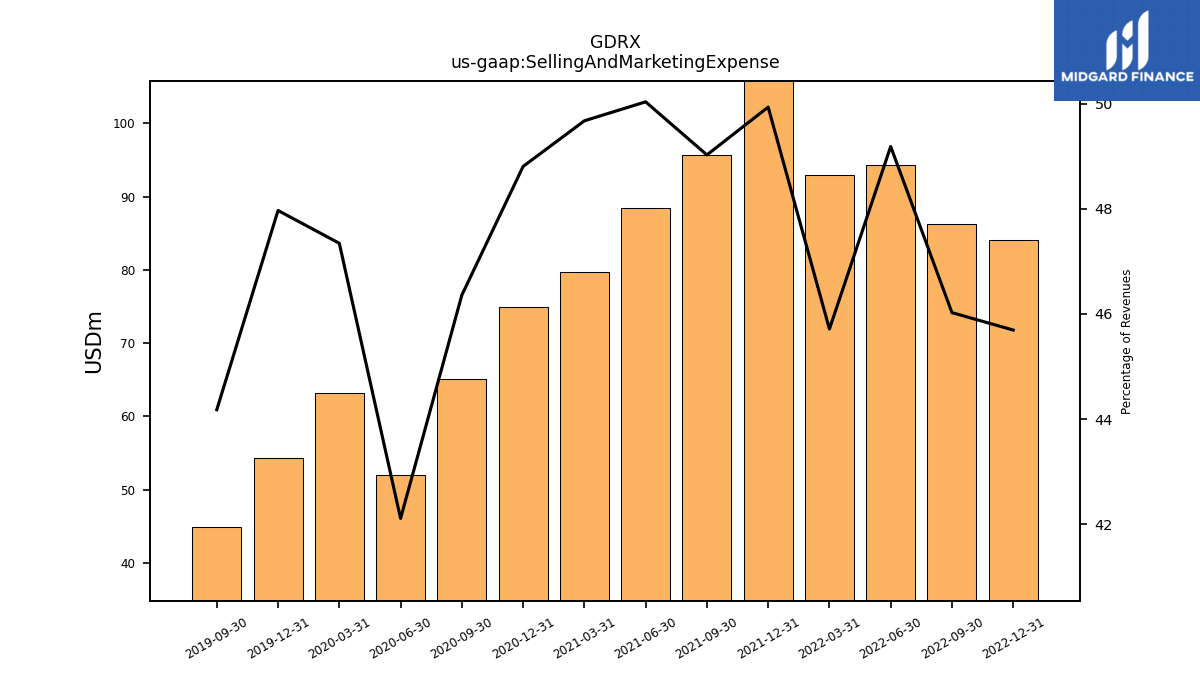
| Selling And Marketing Expense | 84.13 | 86.22 | 94.34 | 92.95 | 106.49 | 95.65 | 88.38 | 79.69 | 74.94 | 65.11 | 51.92 | 63.16 | 54.33 | 44.95 | |
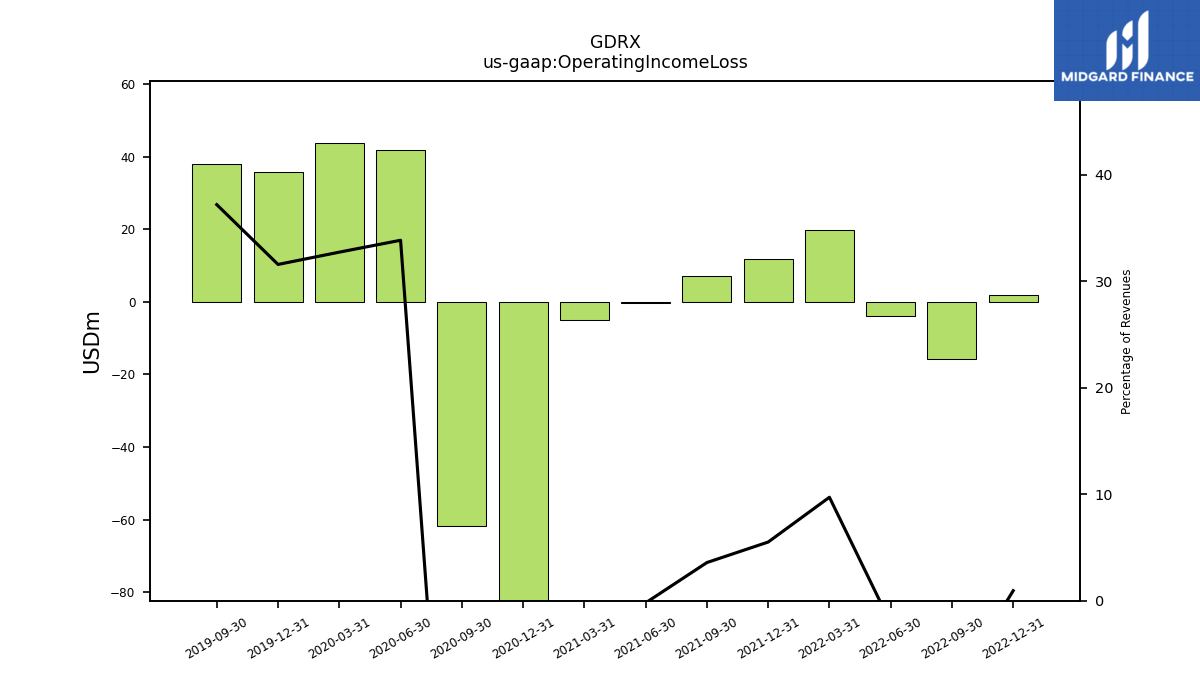
| Operating Income Loss | 1.74 | -15.71 | -4.05 | 19.76 | 11.76 | 7.00 | -0.35 | -5.00 | -299.44 | -61.69 | 41.74 | 43.67 | 35.77 | 37.84 | |
| Interest Expense Debt | 11.93 | 9.48 | 6.97 | 5.87 | 5.90 | 5.93 | 5.91 | 5.91 | 6.22 | 6.26 | 6.79 | 8.64 | 10.12 | 12.77 | |
| Income Tax Expense Benefit | -2.77 | 19.46 | -8.74 | 1.65 | 45.78 | 19.15 | -37.30 | -12.55 | -7.36 | -17.89 | 7.66 | 7.77 | 2.71 | 5.73 | |
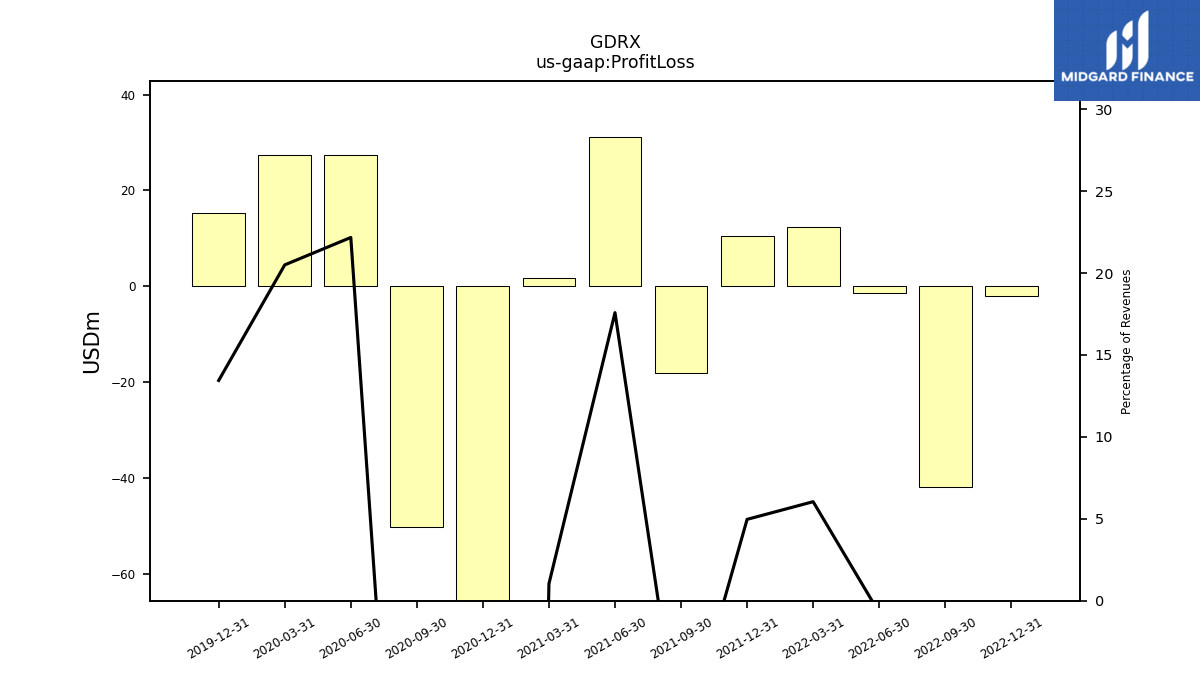
| Profit Loss | -1.97 | -41.73 | -1.42 | 12.29 | 10.59 | -18.07 | 31.06 | 1.67 | -298.27 | -50.03 | 27.34 | 27.35 | 15.23 | NA | |
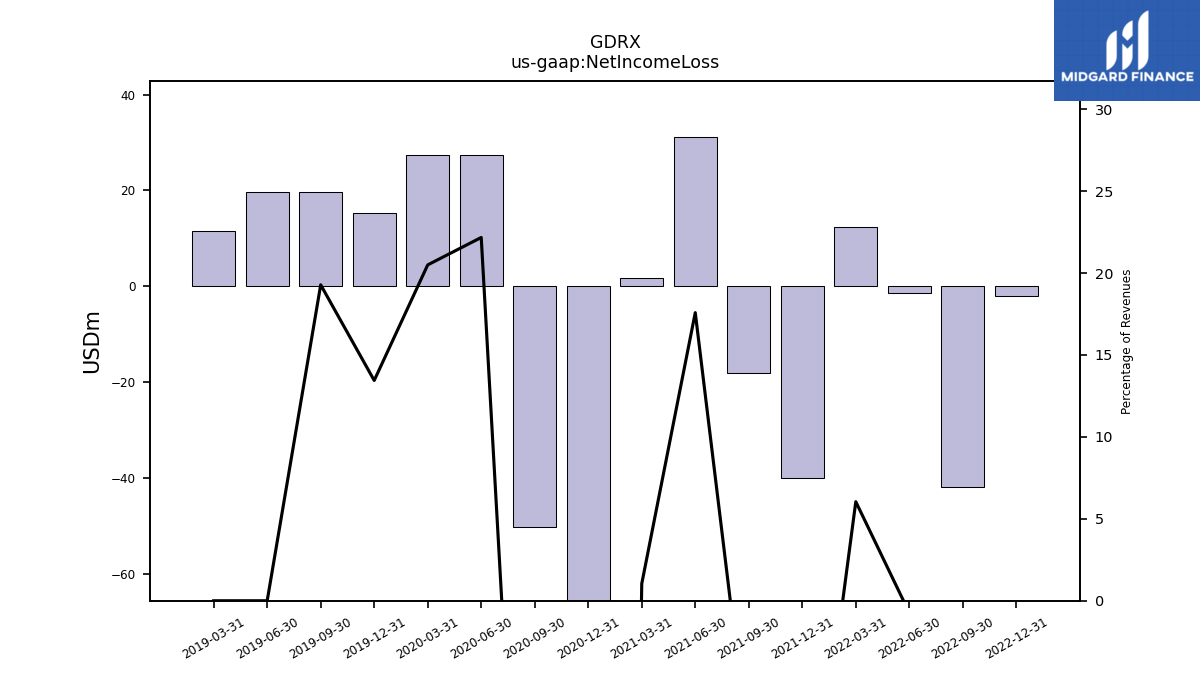
| Net Income Loss | -1.97 | -41.73 | -1.42 | 12.29 | -39.91 | -18.07 | 31.06 | 1.67 | -298.27 | -50.03 | 27.34 | 27.35 | 15.23 | 19.62 |
| 2022-12-31 | 2022-09-30 | 2022-06-30 | 2022-03-31 | 2021-12-31 | 2021-09-30 | 2021-06-30 | 2021-03-31 | 2020-12-31 | 2020-09-30 | 2020-06-30 | 2020-03-31 | 2019-12-31 | 2019-09-30 | ||
|---|---|---|---|---|---|---|---|---|---|---|---|---|---|---|---|
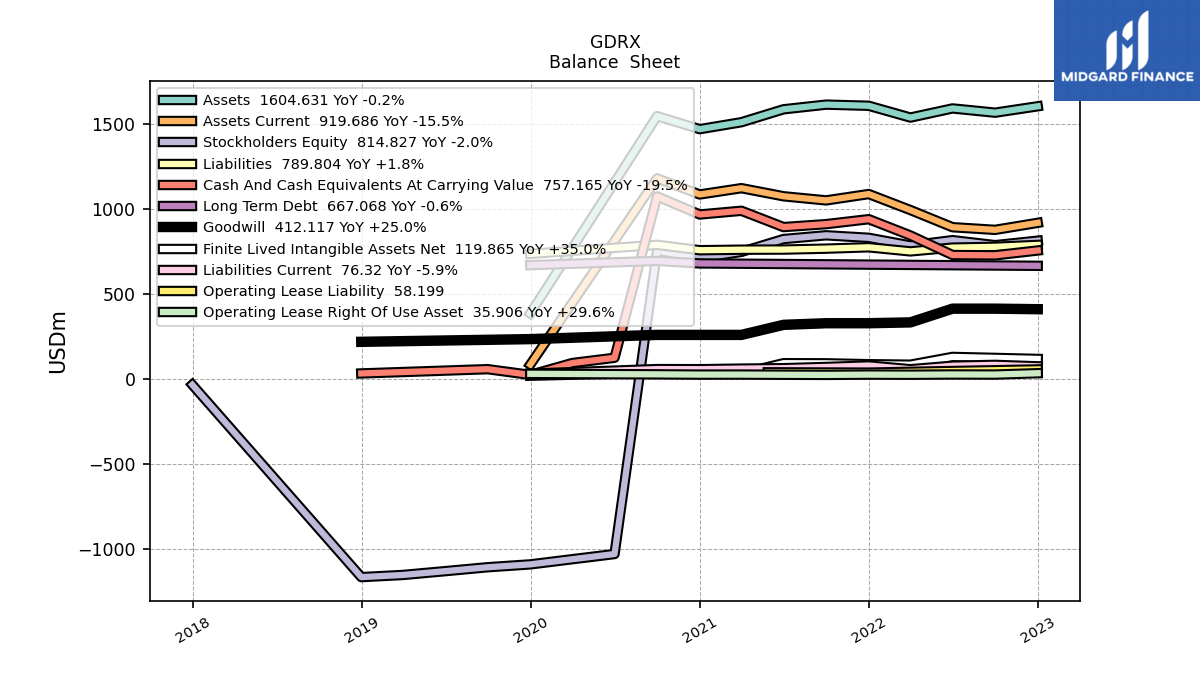
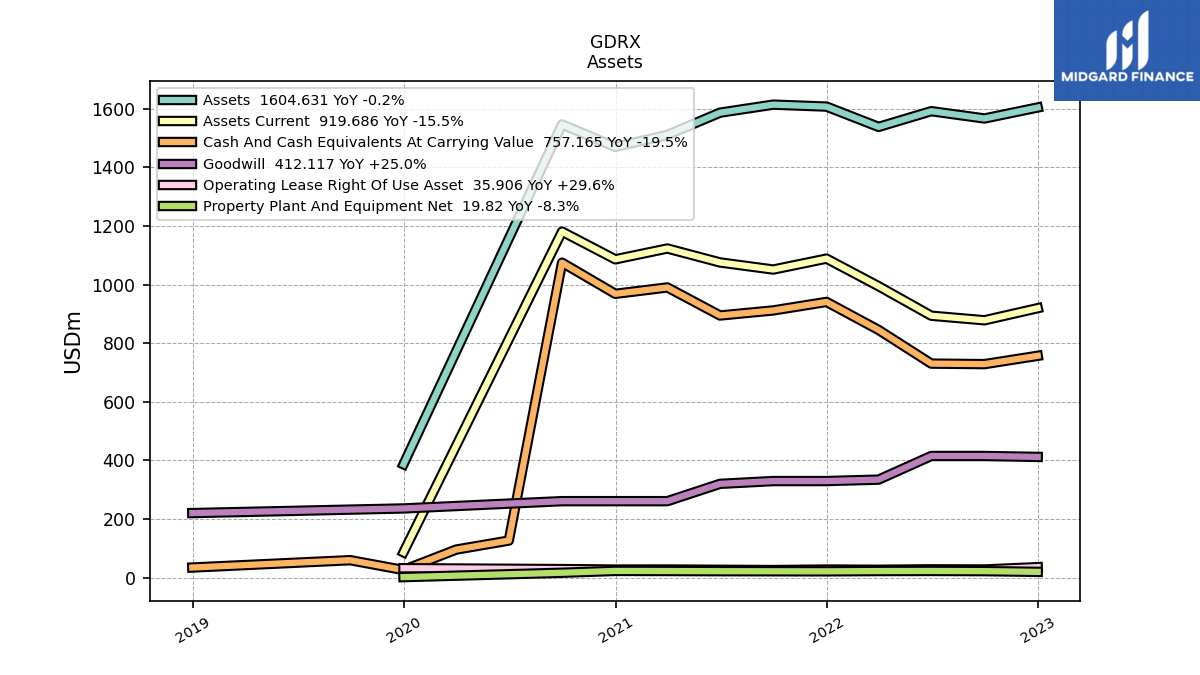
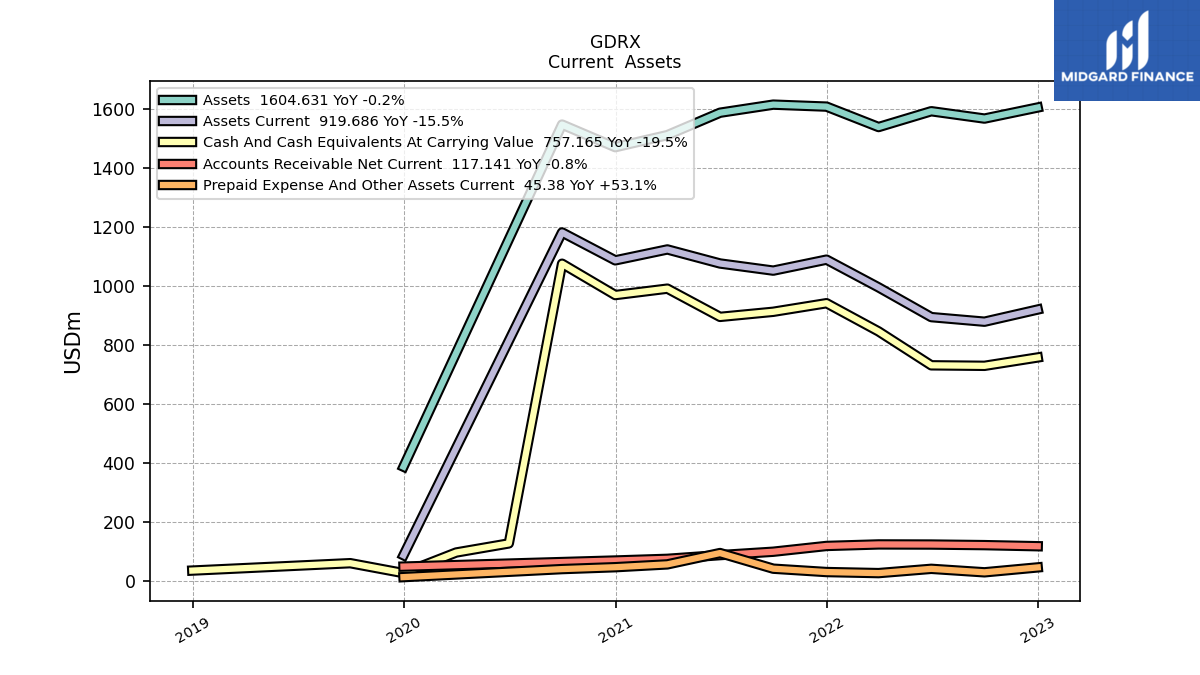
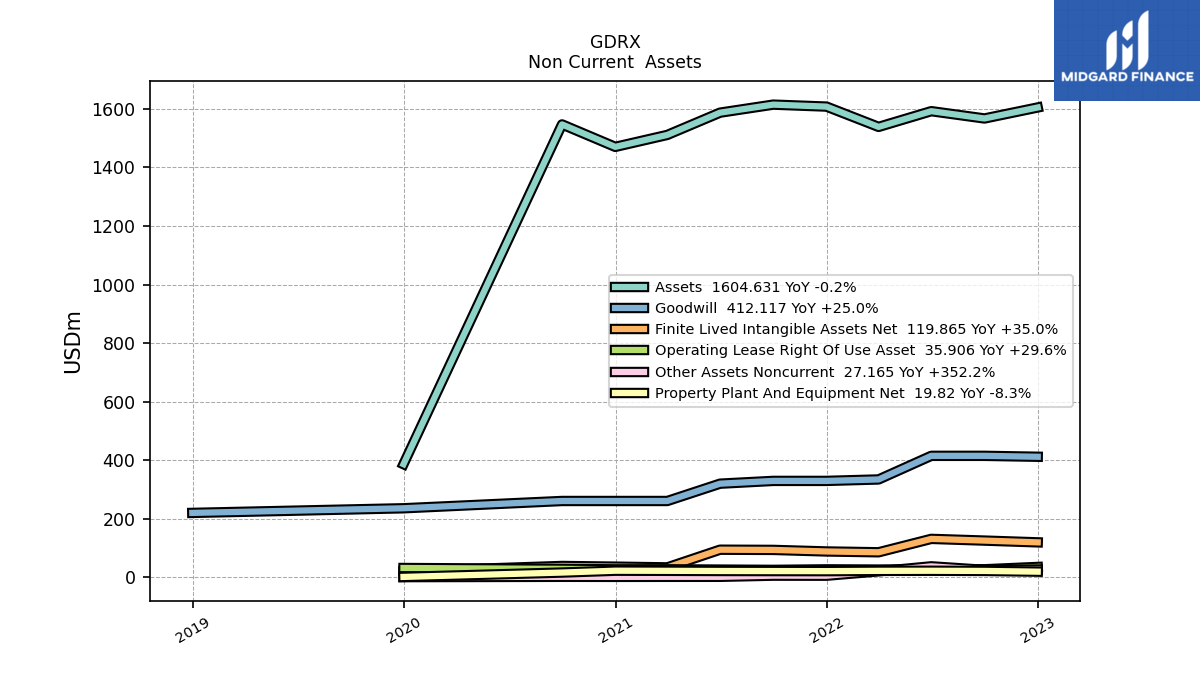
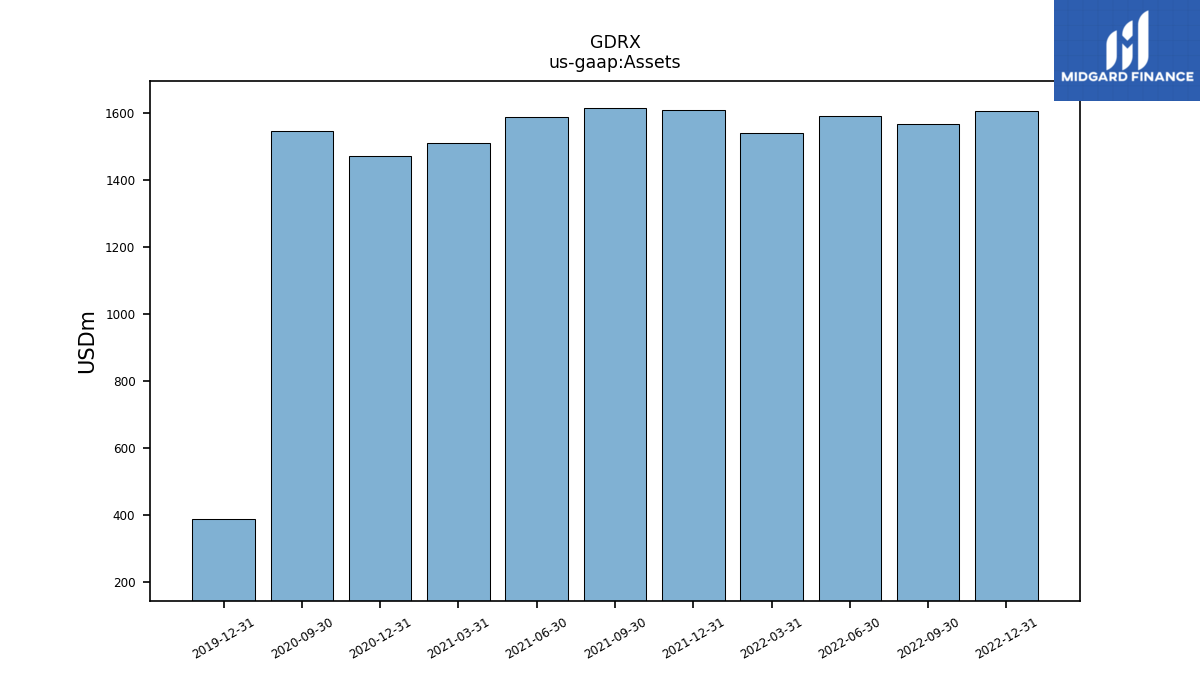
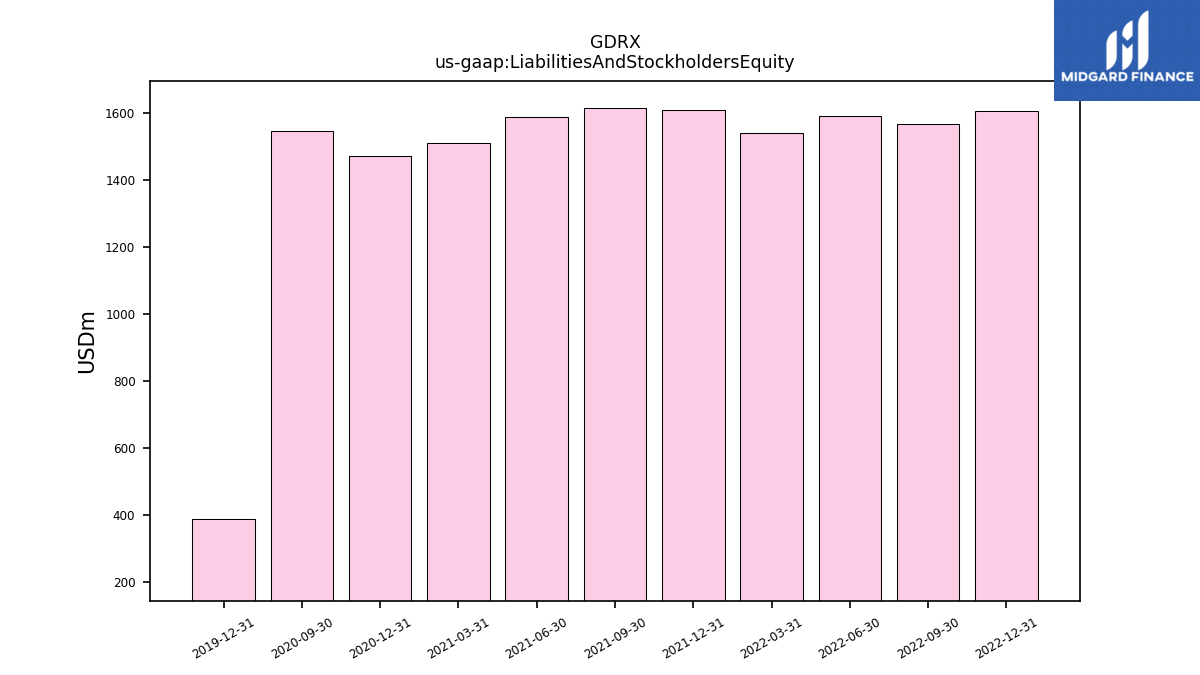
| Assets | 1604.63 | 1567.06 | 1592.00 | 1538.33 | 1607.62 | 1614.37 | 1586.93 | 1510.97 | 1470.11 | 1546.81 | NA | NA | 386.80 | NA | |
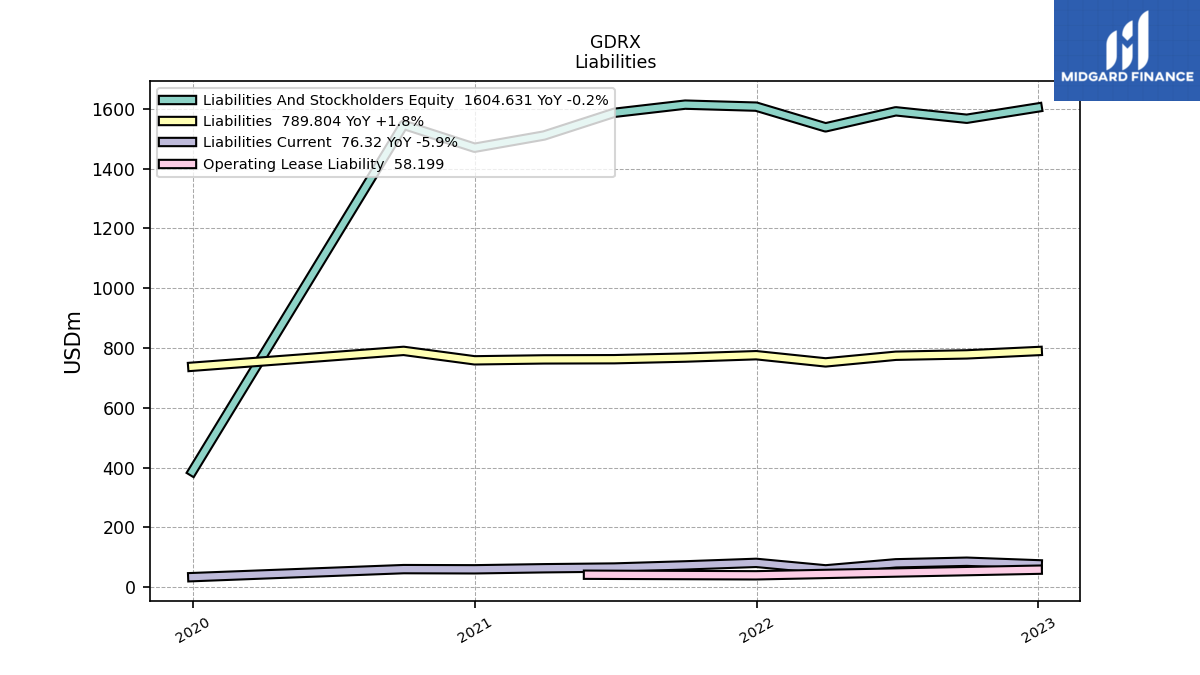
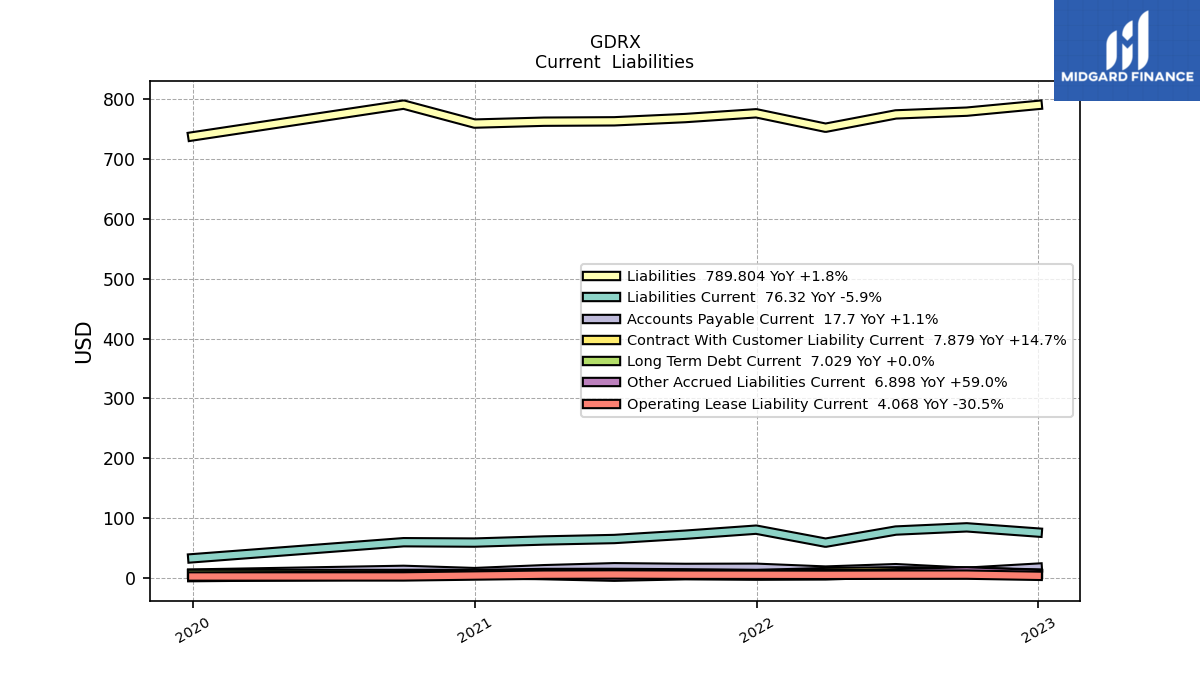
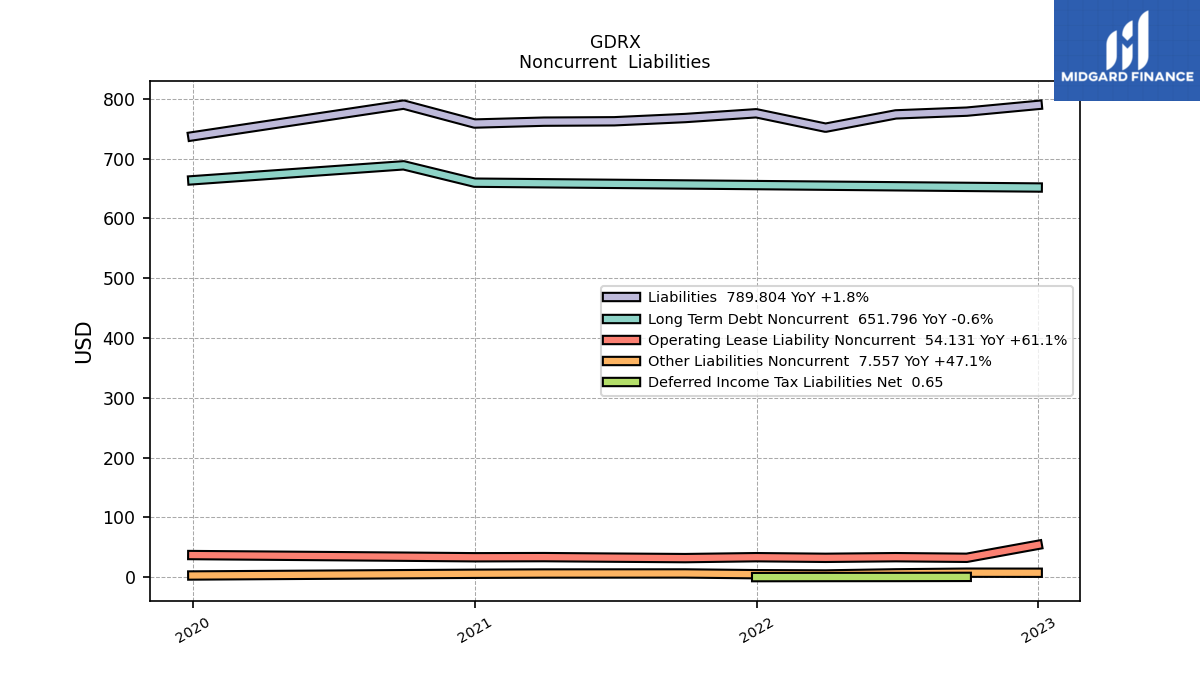
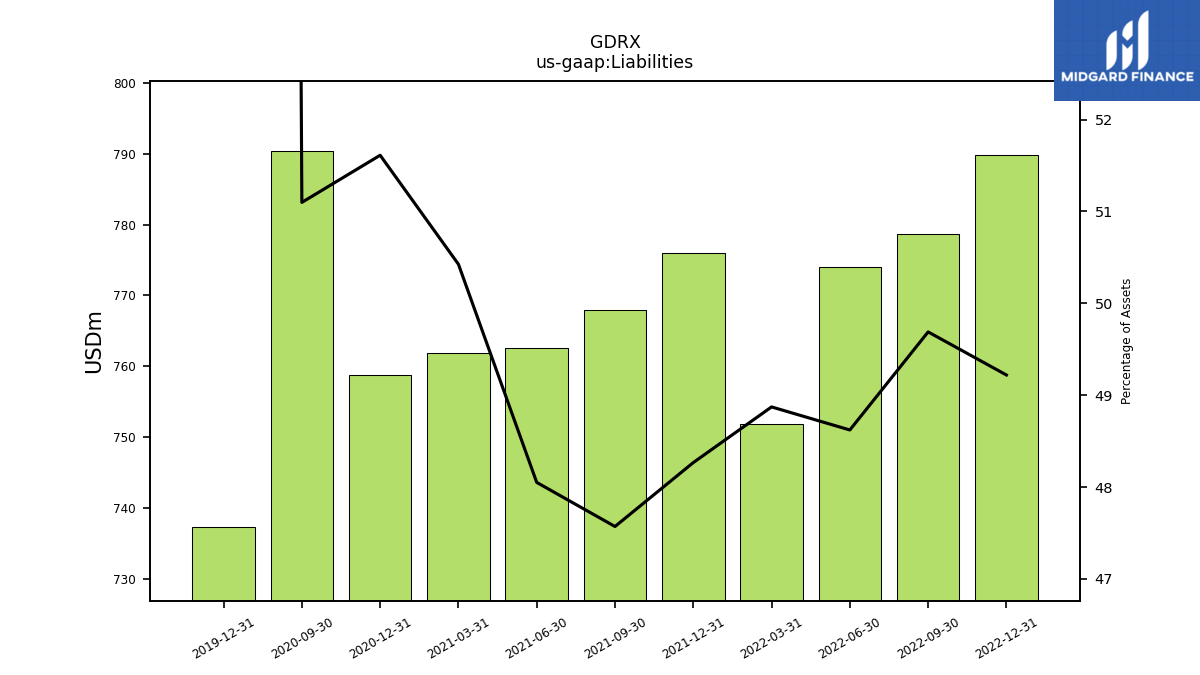
| Liabilities | 789.80 | 778.66 | 774.06 | 751.82 | 775.95 | 767.97 | 762.53 | 761.91 | 758.75 | 790.40 | NA | NA | 737.37 | NA | |
| Liabilities And Stockholders Equity | 1604.63 | 1567.06 | 1592.00 | 1538.33 | 1607.62 | 1614.37 | 1586.93 | 1510.97 | 1470.11 | 1546.81 | NA | NA | 386.80 | NA | |
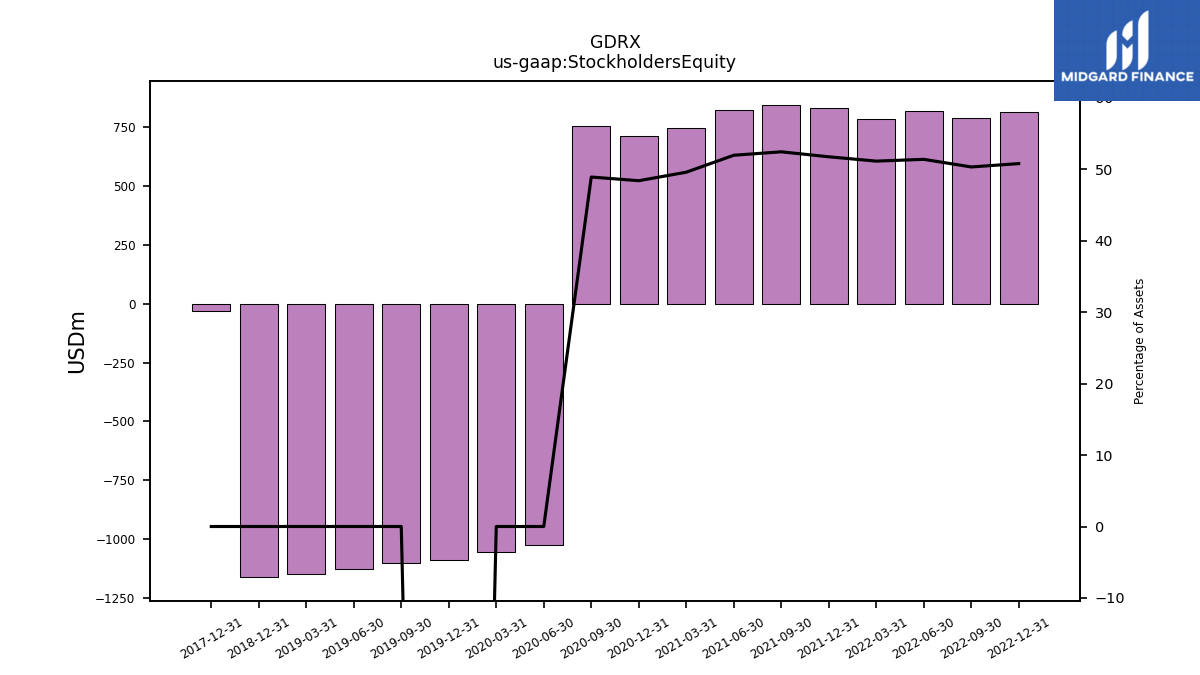
| Stockholders Equity | 814.83 | 788.40 | 817.94 | 786.51 | 831.68 | 846.40 | 824.39 | 749.06 | 711.36 | 756.41 | -1026.73 | -1057.04 | -1087.58 | -1104.35 |
| 2022-12-31 | 2022-09-30 | 2022-06-30 | 2022-03-31 | 2021-12-31 | 2021-09-30 | 2021-06-30 | 2021-03-31 | 2020-12-31 | 2020-09-30 | 2020-06-30 | 2020-03-31 | 2019-12-31 | 2019-09-30 | ||
|---|---|---|---|---|---|---|---|---|---|---|---|---|---|---|---|
| Assets Current | 919.69 | 878.39 | 893.96 | 994.72 | 1088.83 | 1051.54 | 1075.75 | 1123.38 | 1086.37 | 1181.07 | NA | NA | 86.58 | NA | |
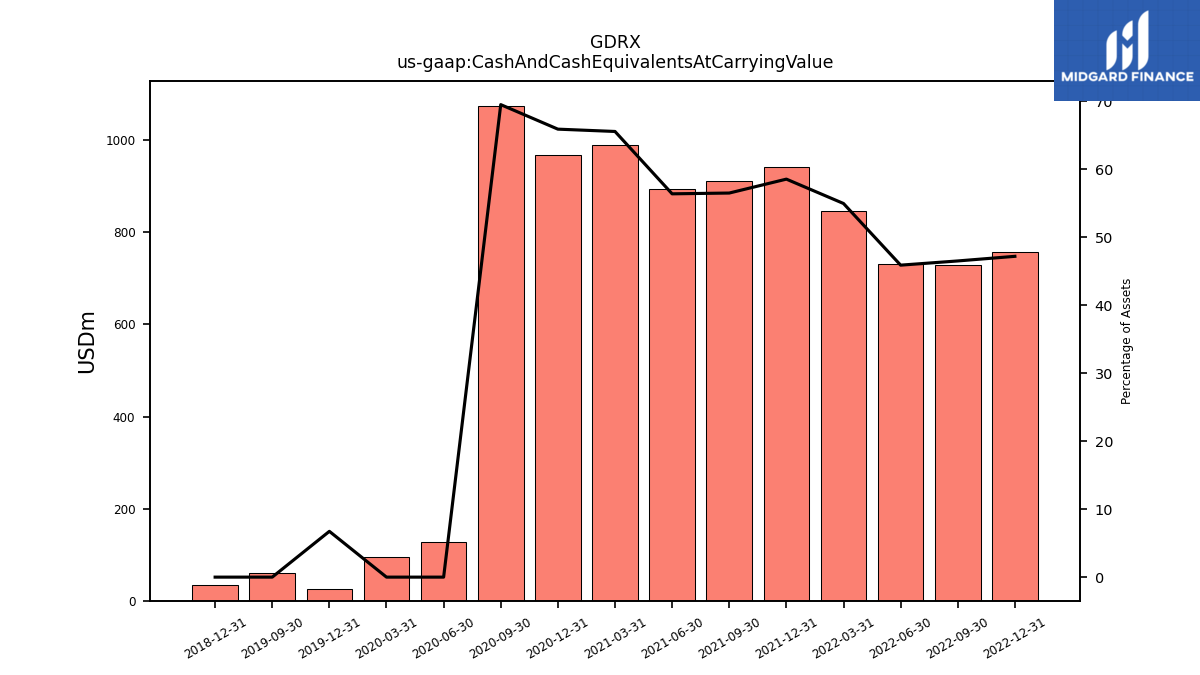
| Cash And Cash Equivalents At Carrying Value | 757.16 | 728.79 | 730.54 | 845.43 | 941.11 | 912.02 | 894.70 | 990.46 | 968.69 | 1075.02 | 126.62 | 95.84 | 26.05 | 59.69 | |
| Accounts Receivable Net Current | 117.14 | 120.89 | 122.88 | 123.28 | 118.08 | 98.51 | 87.00 | 74.40 | 68.73 | 63.52 | NA | NA | 48.13 | NA | |
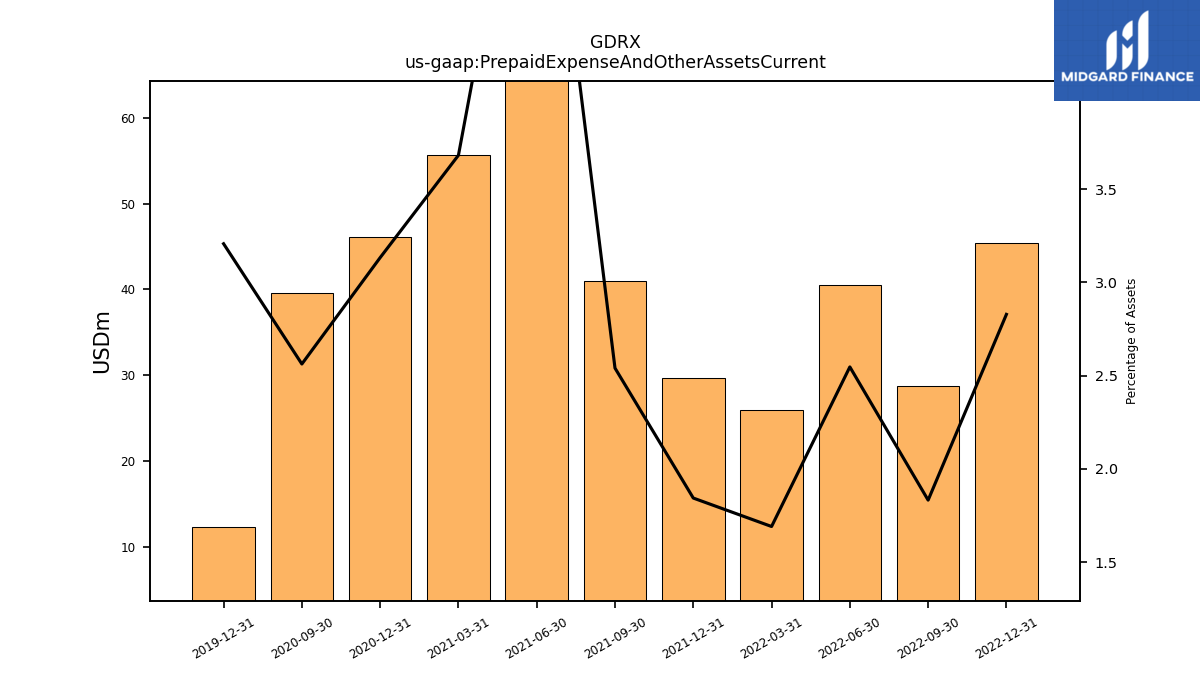
| Prepaid Expense And Other Assets Current | 45.38 | 28.72 | 40.54 | 26.02 | 29.64 | 41.01 | 94.04 | 55.62 | 46.05 | 39.63 | NA | NA | 12.40 | NA |
| 2022-12-31 | 2022-09-30 | 2022-06-30 | 2022-03-31 | 2021-12-31 | 2021-09-30 | 2021-06-30 | 2021-03-31 | 2020-12-31 | 2020-09-30 | 2020-06-30 | 2020-03-31 | 2019-12-31 | 2019-09-30 | ||
|---|---|---|---|---|---|---|---|---|---|---|---|---|---|---|---|
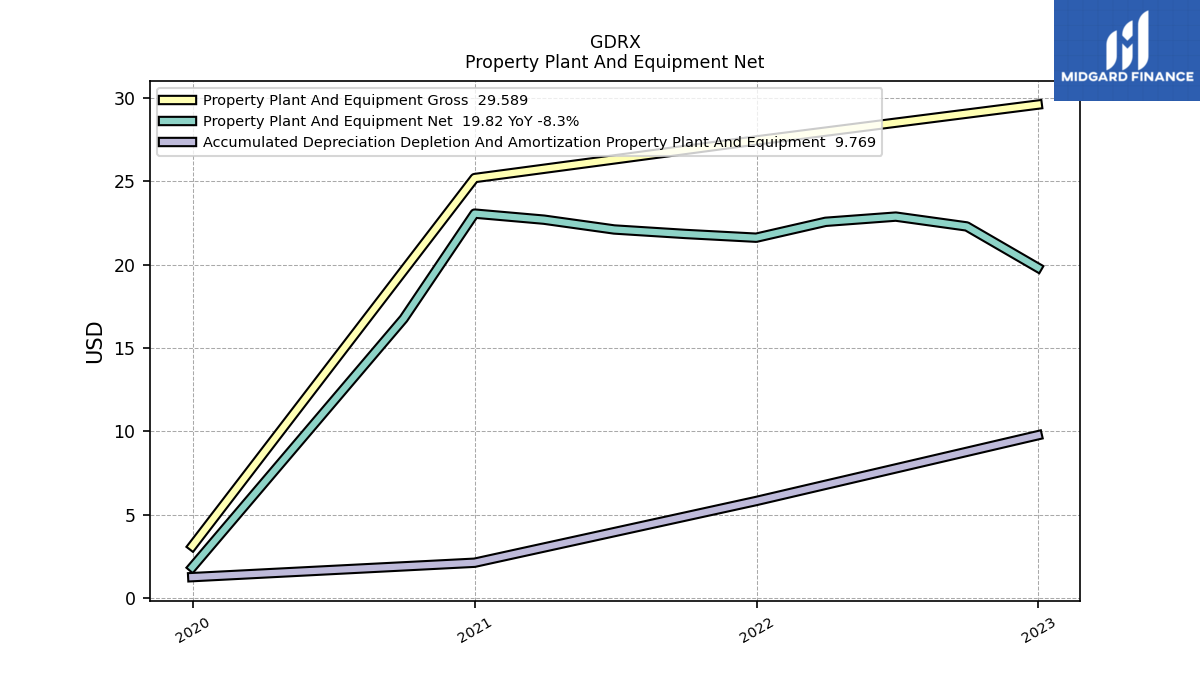
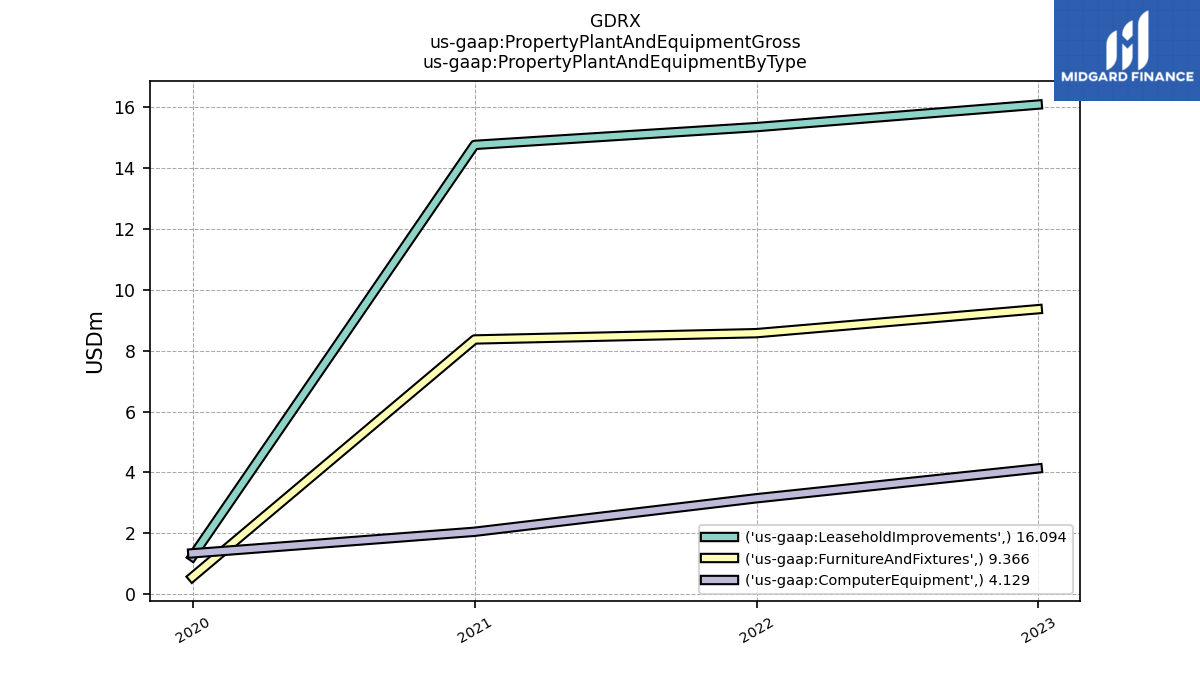
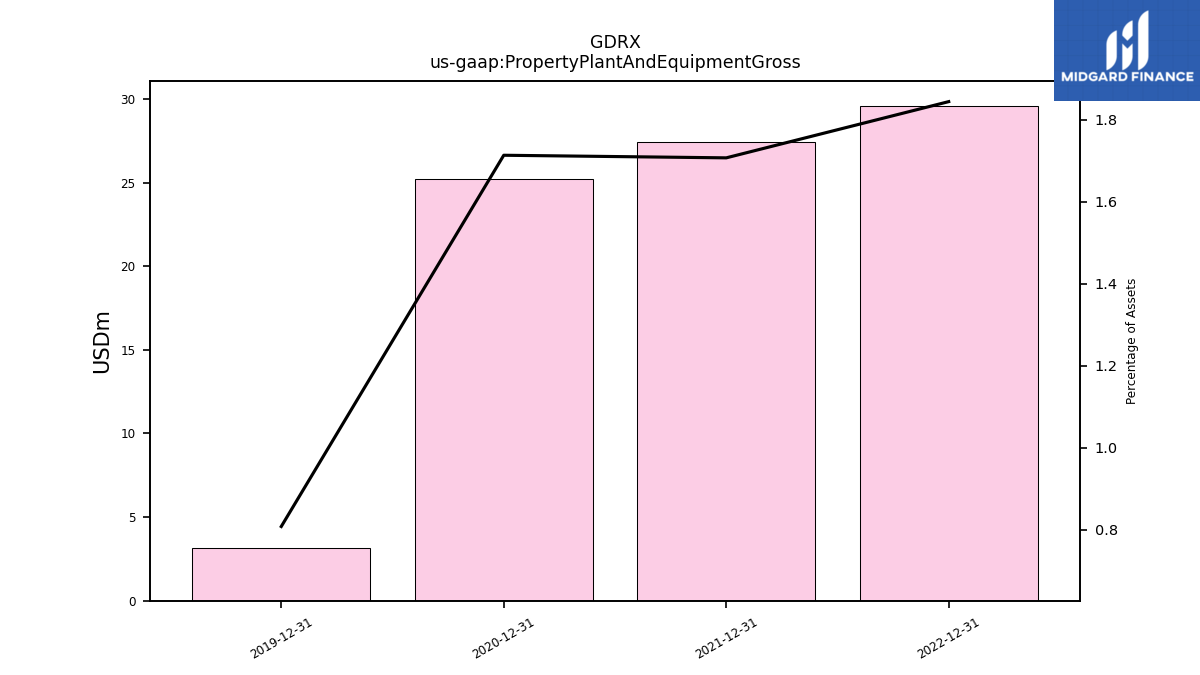
| Property Plant And Equipment Gross | 29.59 | NA | NA | NA | 27.44 | NA | NA | NA | 25.19 | NA | NA | NA | 3.13 | NA | |
| Accumulated Depreciation Depletion And Amortization Property Plant And Equipment | 9.77 | NA | NA | NA | 5.83 | NA | NA | NA | 2.13 | NA | NA | NA | 1.27 | NA | |
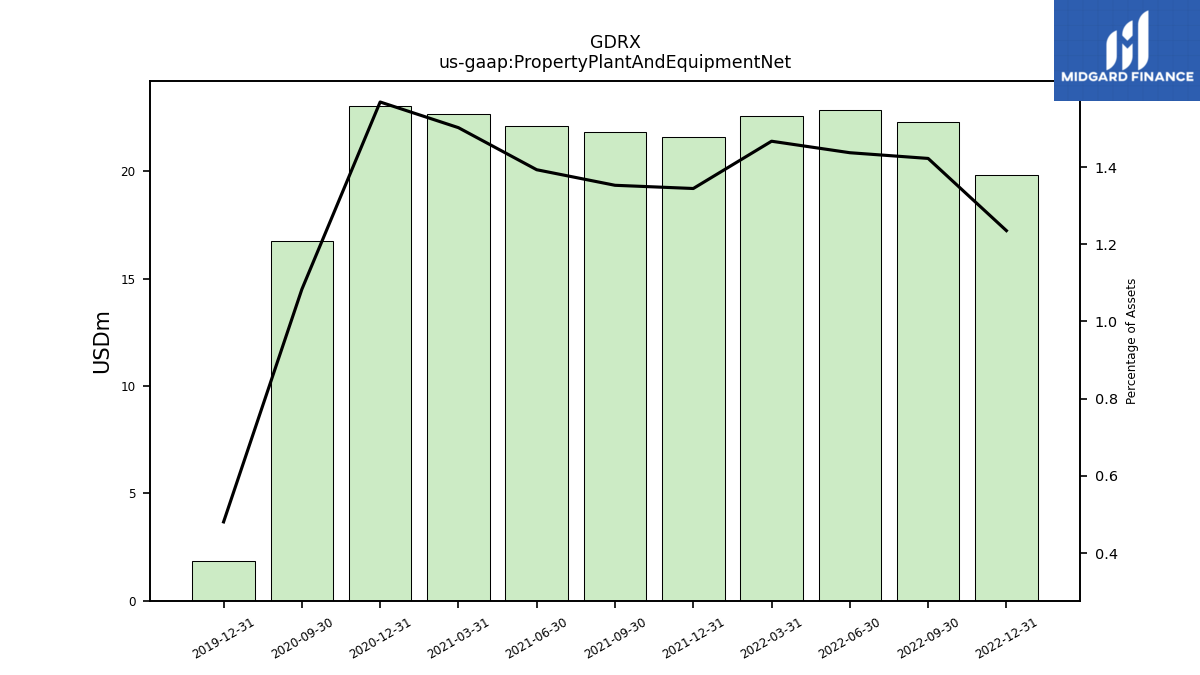
| Property Plant And Equipment Net | 19.82 | 22.29 | 22.88 | 22.56 | 21.61 | 21.84 | 22.11 | 22.69 | 23.06 | 16.76 | NA | NA | 1.86 | NA | |
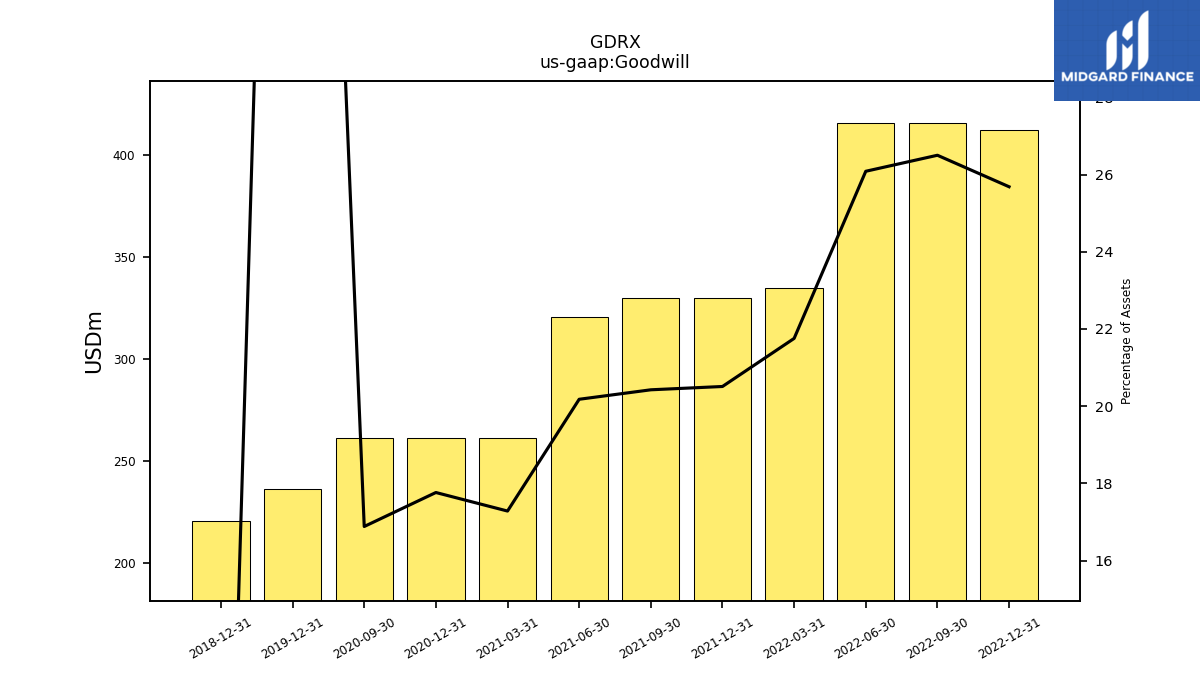
| Goodwill | 412.12 | 415.26 | 415.26 | 334.64 | 329.70 | 329.70 | 320.20 | 261.12 | 261.12 | 261.12 | NA | NA | 236.22 | NA | |
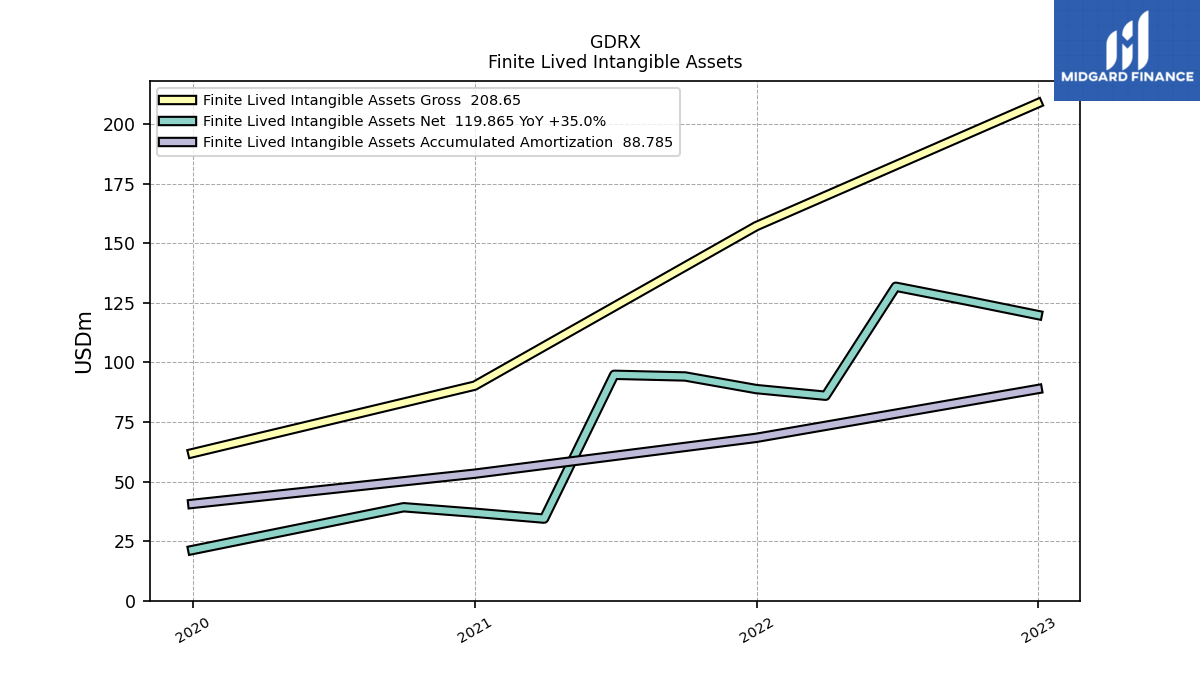
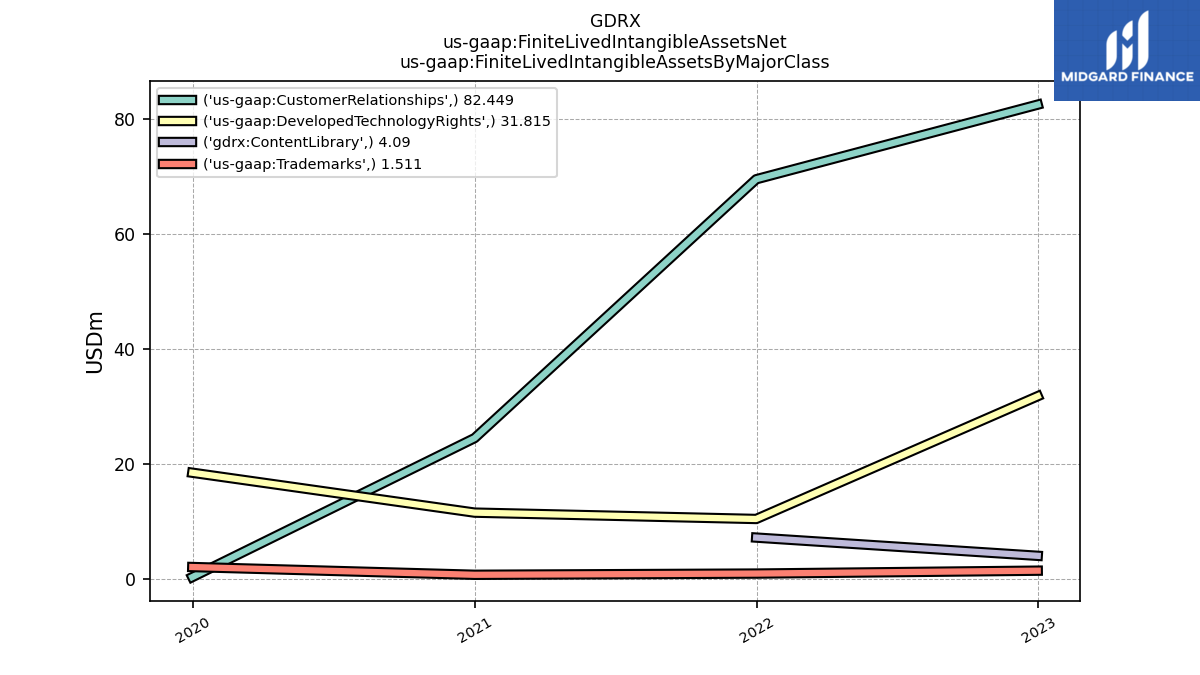
| Finite Lived Intangible Assets Net | 119.86 | 125.90 | 131.72 | 85.99 | 88.79 | 94.08 | 94.78 | 34.44 | 36.92 | 39.23 | NA | NA | 21.27 | NA | |
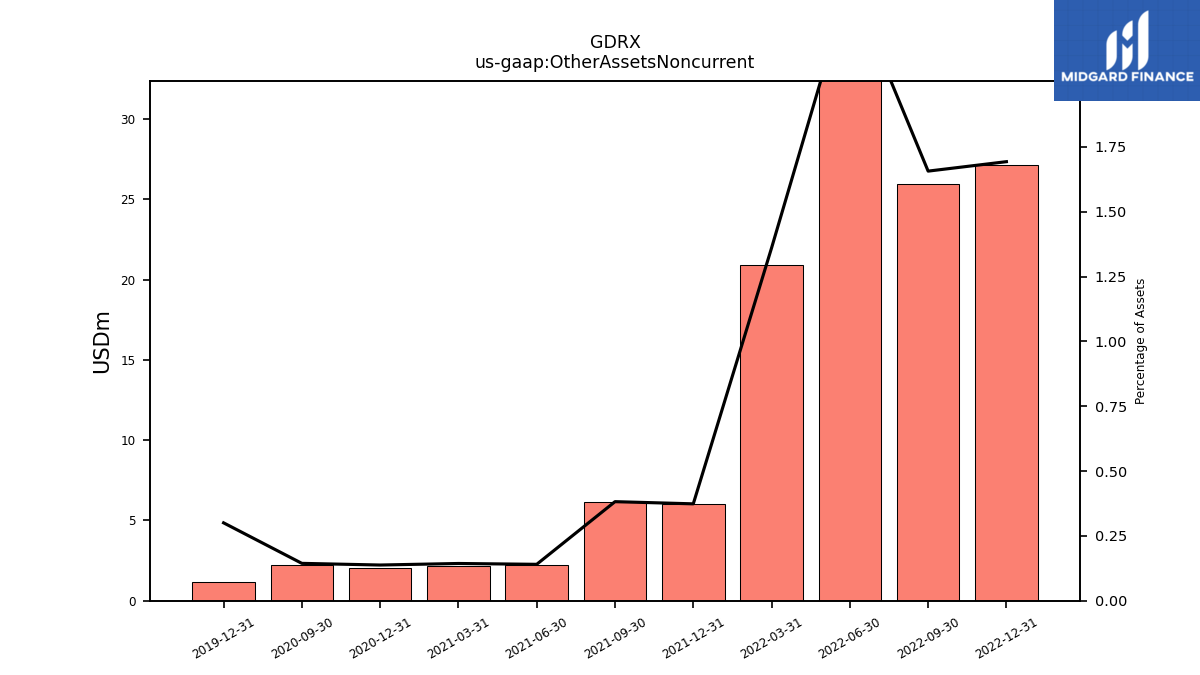
| Other Assets Noncurrent | 27.16 | 25.96 | 37.98 | 20.93 | 6.01 | 6.17 | 2.23 | 2.17 | 2.02 | 2.23 | NA | NA | 1.16 | NA |
| 2022-12-31 | 2022-09-30 | 2022-06-30 | 2022-03-31 | 2021-12-31 | 2021-09-30 | 2021-06-30 | 2021-03-31 | 2020-12-31 | 2020-09-30 | 2020-06-30 | 2020-03-31 | 2019-12-31 | 2019-09-30 | ||
|---|---|---|---|---|---|---|---|---|---|---|---|---|---|---|---|
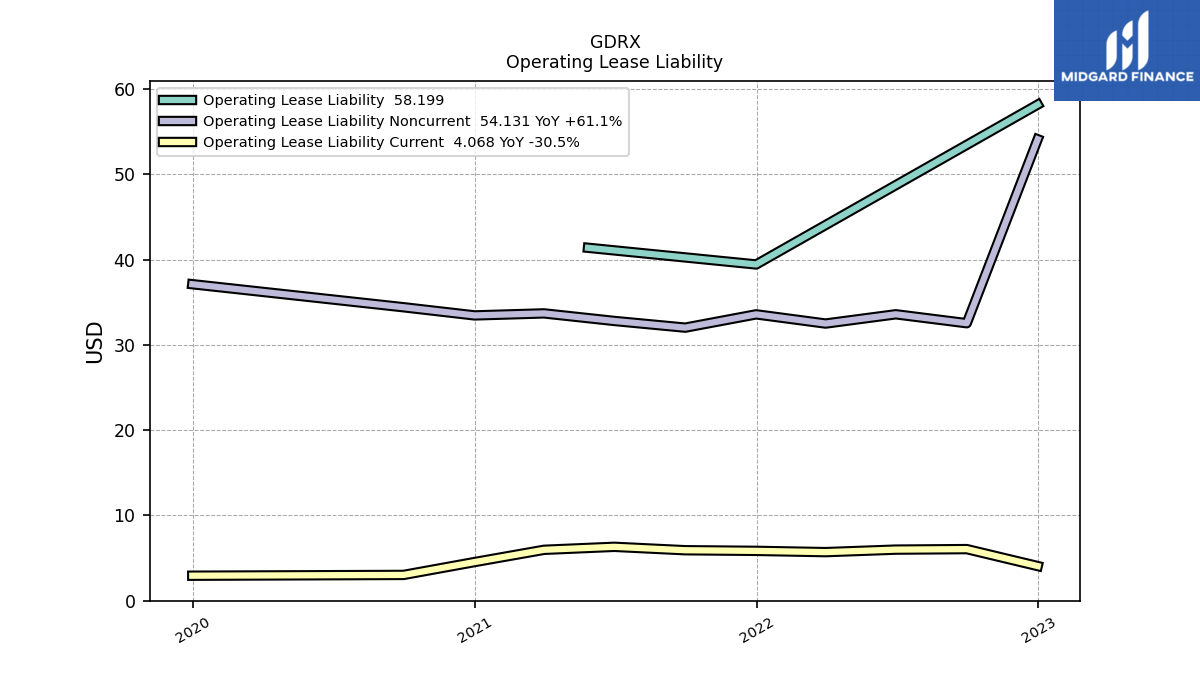
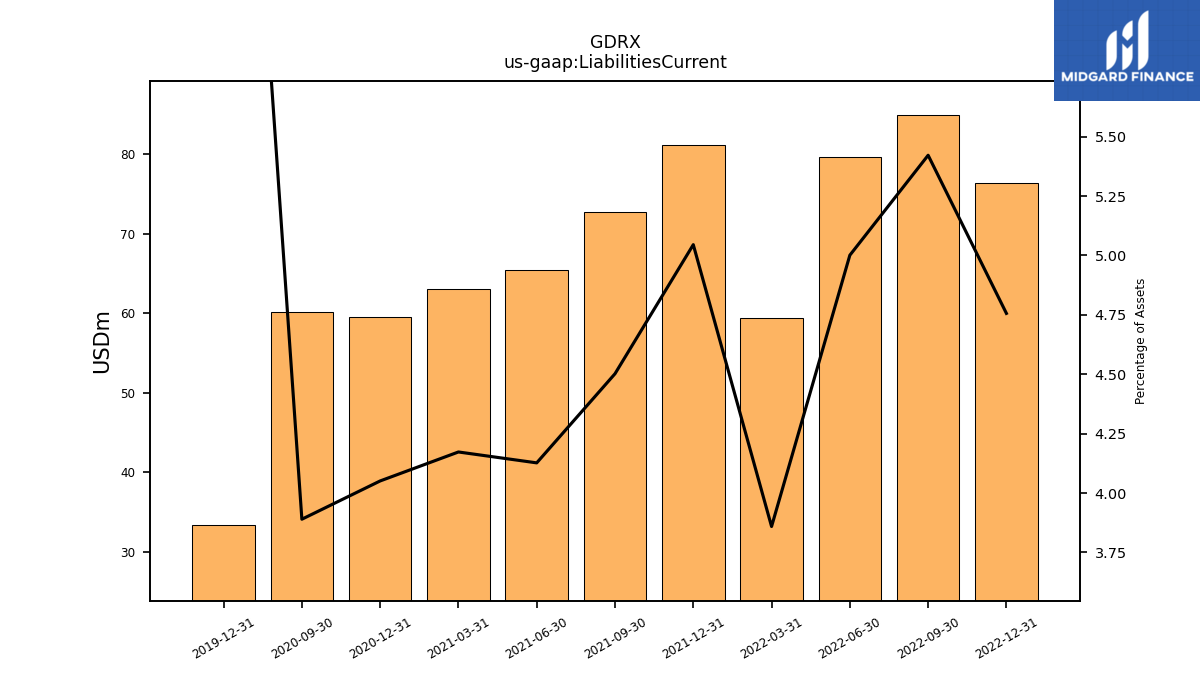
| Liabilities Current | 76.32 | 84.97 | 79.62 | 59.36 | 81.11 | 72.68 | 65.49 | 63.05 | 59.55 | 60.16 | NA | NA | 33.37 | NA | |
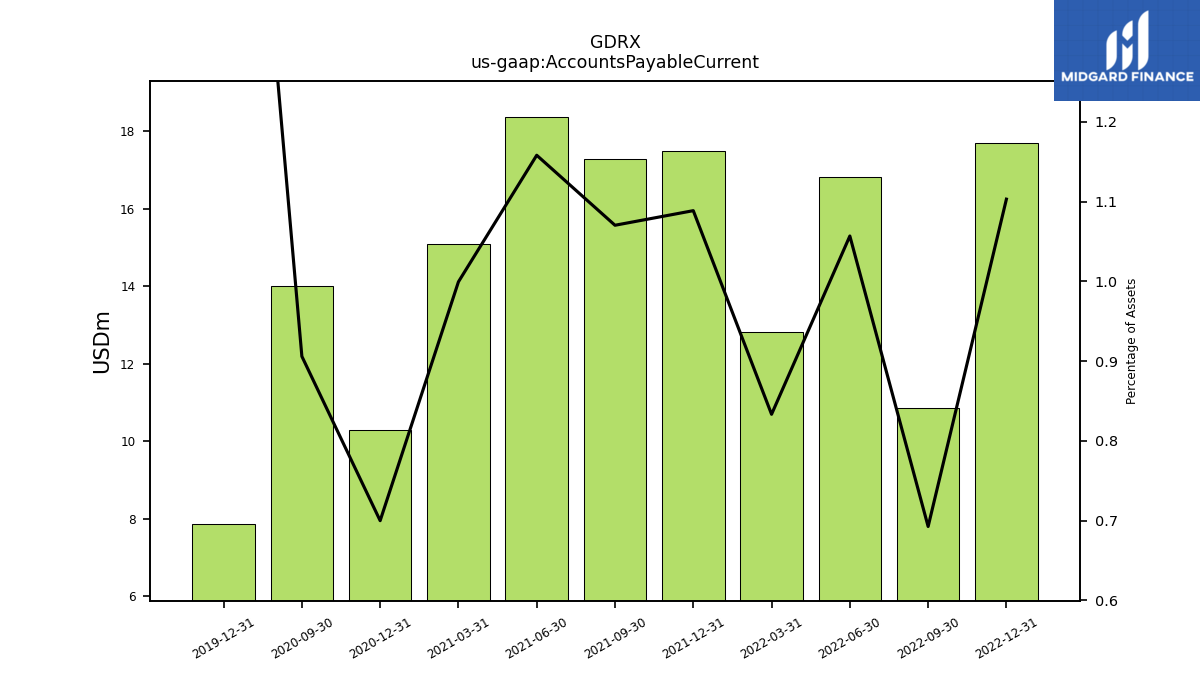
| Accounts Payable Current | 17.70 | 10.86 | 16.82 | 12.82 | 17.50 | 17.28 | 18.38 | 15.10 | 10.29 | 14.01 | NA | NA | 7.85 | NA | |
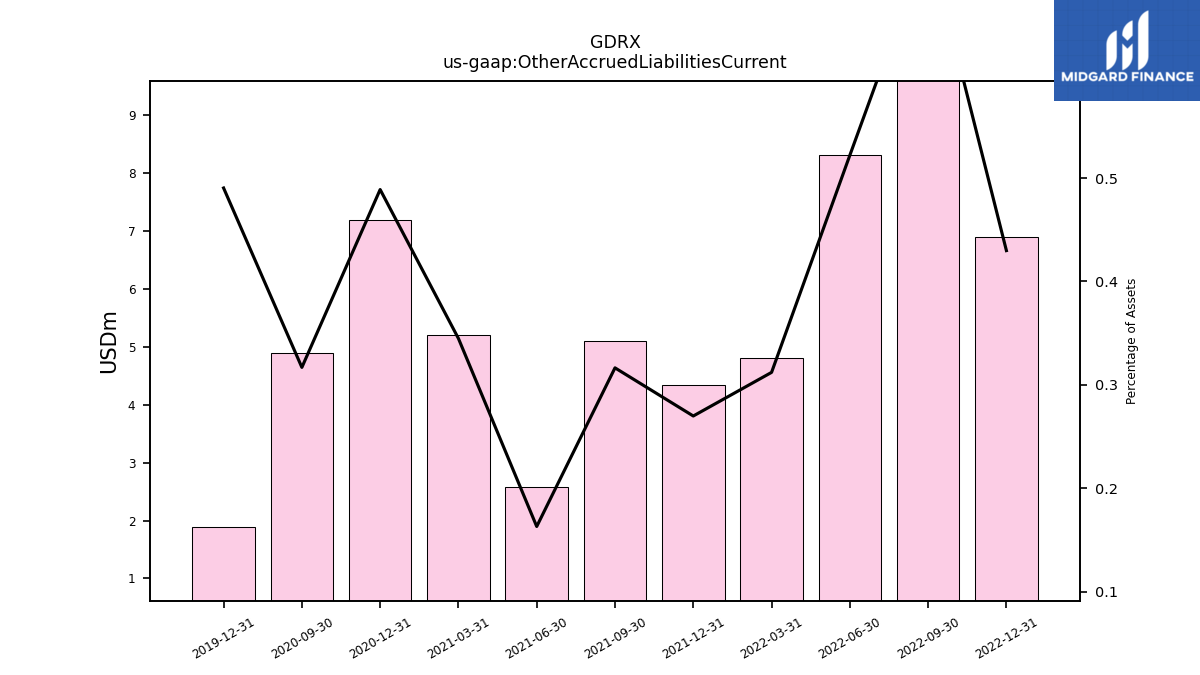
| Other Accrued Liabilities Current | 6.90 | 11.44 | 8.31 | 4.80 | 4.34 | 5.11 | 2.59 | 5.21 | 7.19 | 4.90 | NA | NA | 1.90 | NA | |
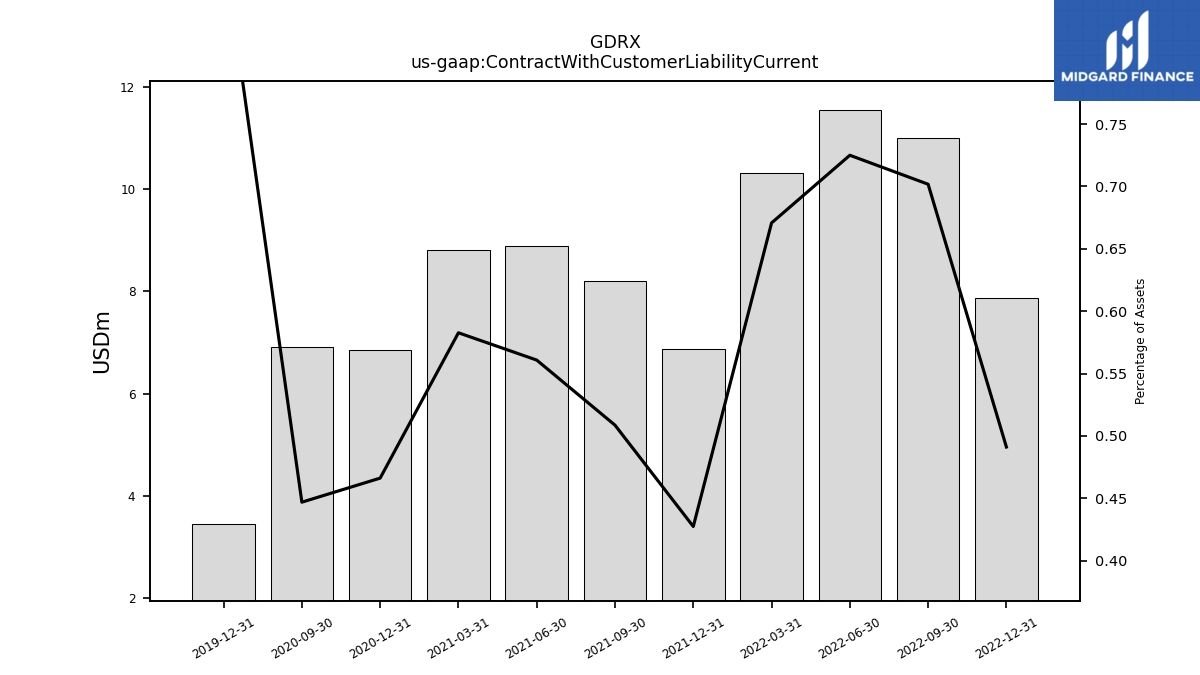
| Contract With Customer Liability Current | 7.88 | 11.00 | 11.54 | 10.32 | 6.87 | 8.21 | 8.90 | 8.80 | 6.85 | 6.91 | NA | NA | 3.45 | NA |
| 2022-12-31 | 2022-09-30 | 2022-06-30 | 2022-03-31 | 2021-12-31 | 2021-09-30 | 2021-06-30 | 2021-03-31 | 2020-12-31 | 2020-09-30 | 2020-06-30 | 2020-03-31 | 2019-12-31 | 2019-09-30 | ||
|---|---|---|---|---|---|---|---|---|---|---|---|---|---|---|---|
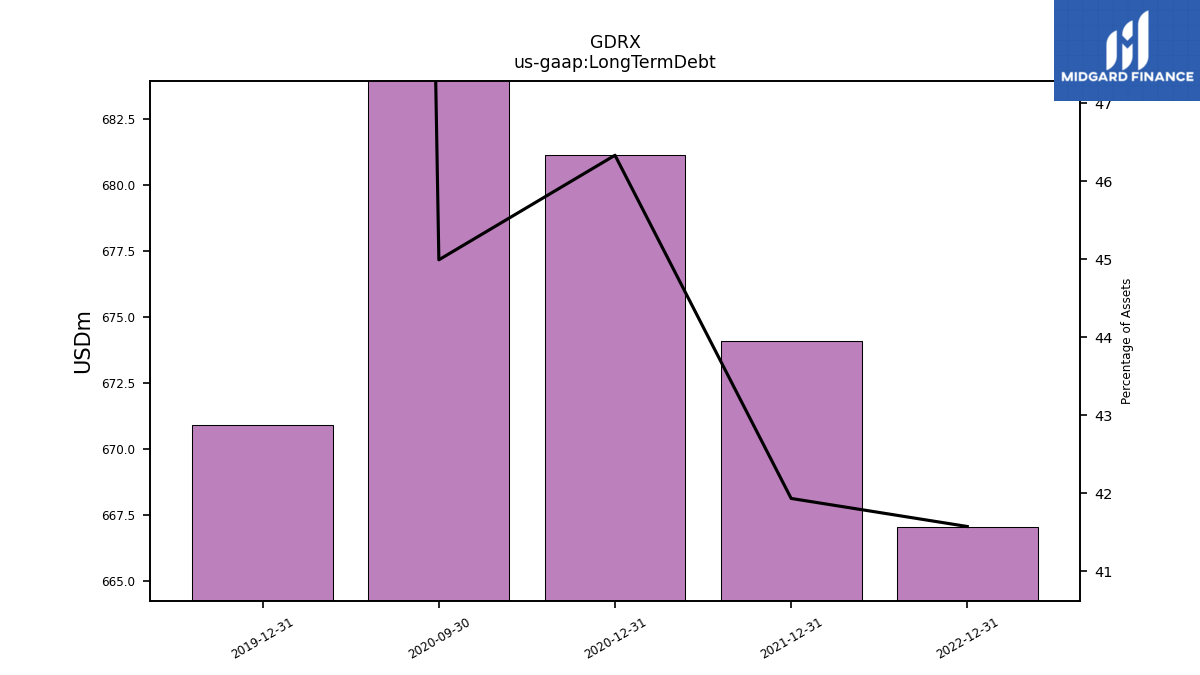
| Long Term Debt | 667.07 | NA | NA | NA | 674.10 | NA | NA | NA | 681.13 | 695.92 | NA | NA | 670.92 | NA | |
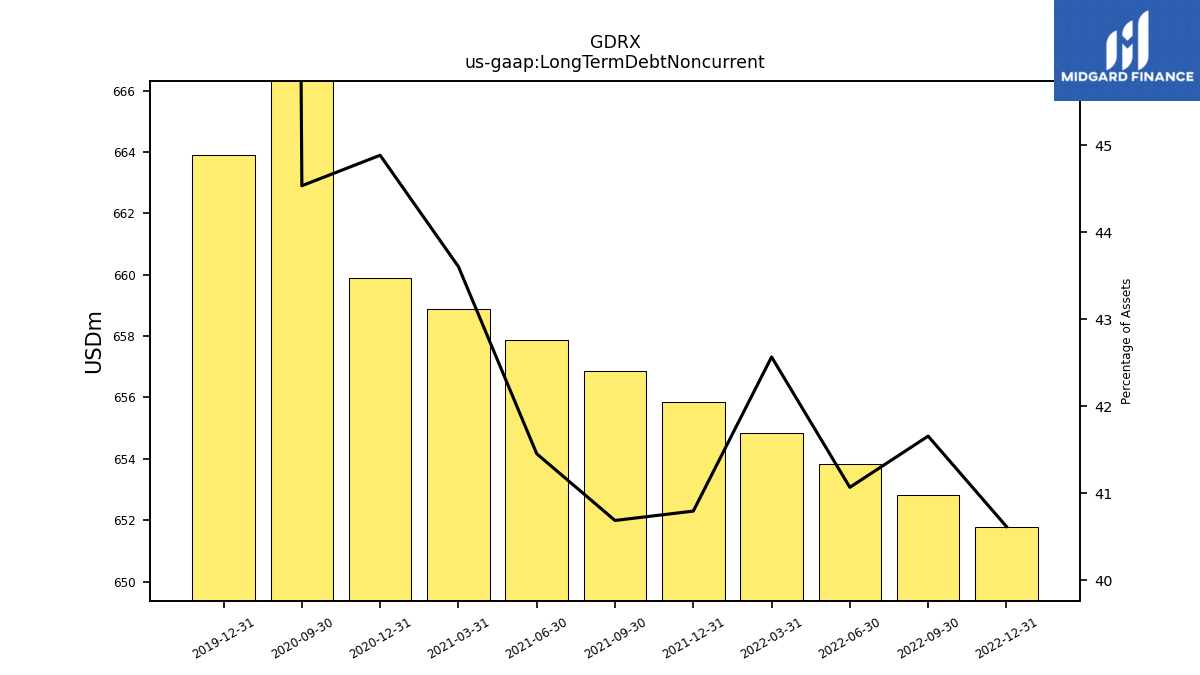
| Long Term Debt Noncurrent | 651.80 | 652.81 | 653.83 | 654.85 | 655.86 | 656.87 | 657.88 | 658.88 | 659.89 | 688.89 | NA | NA | 663.89 | NA | |
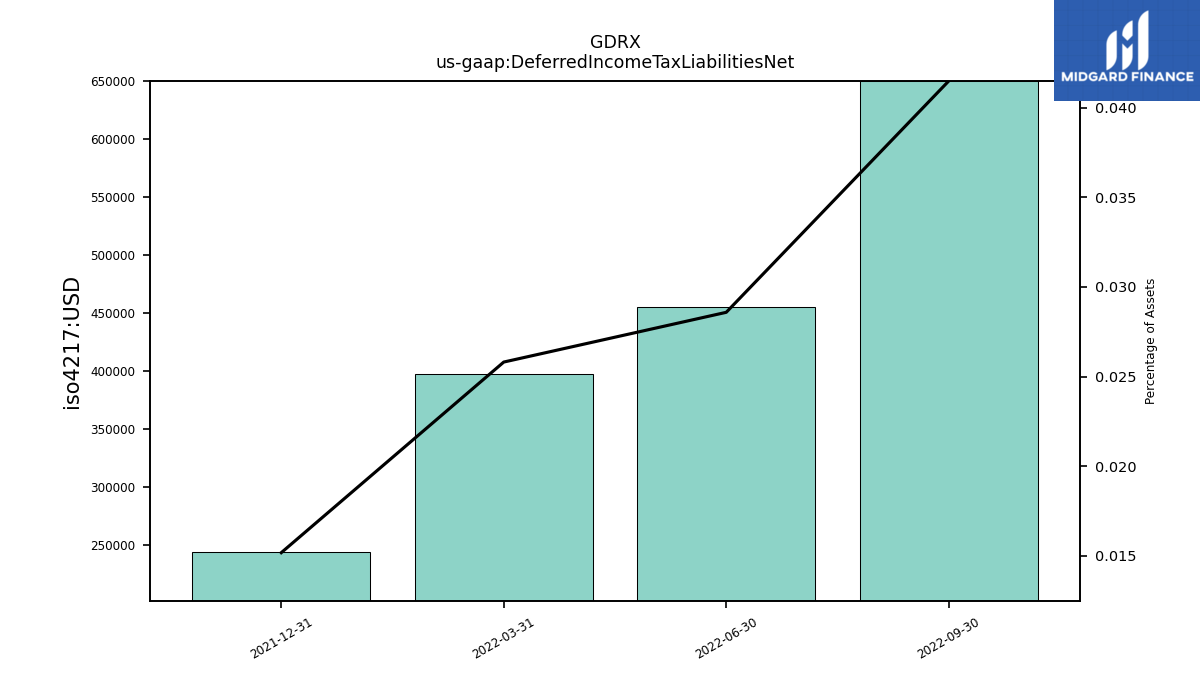
| Deferred Income Tax Liabilities Net | NA | 0.65 | 0.46 | 0.40 | 0.24 | NA | NA | NA | NA | NA | NA | NA | NA | NA | |
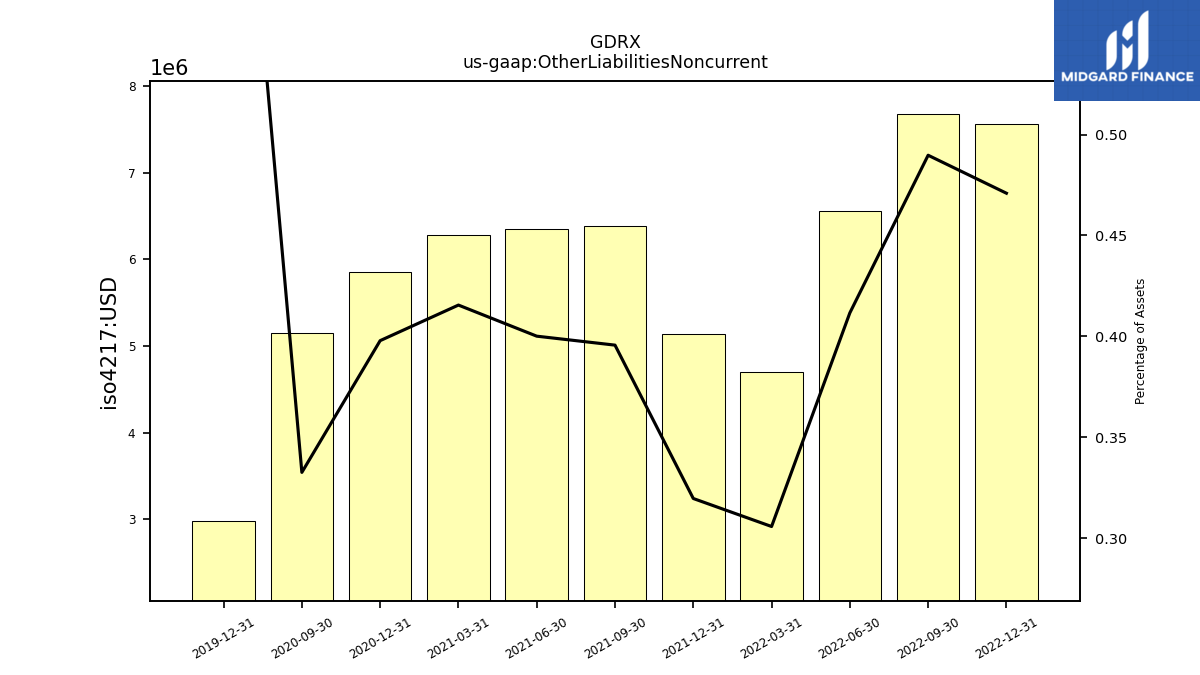
| Other Liabilities Noncurrent | 7.56 | 7.67 | 6.55 | 4.70 | 5.14 | 6.39 | 6.35 | 6.28 | 5.85 | 5.14 | NA | NA | 2.97 | NA | |
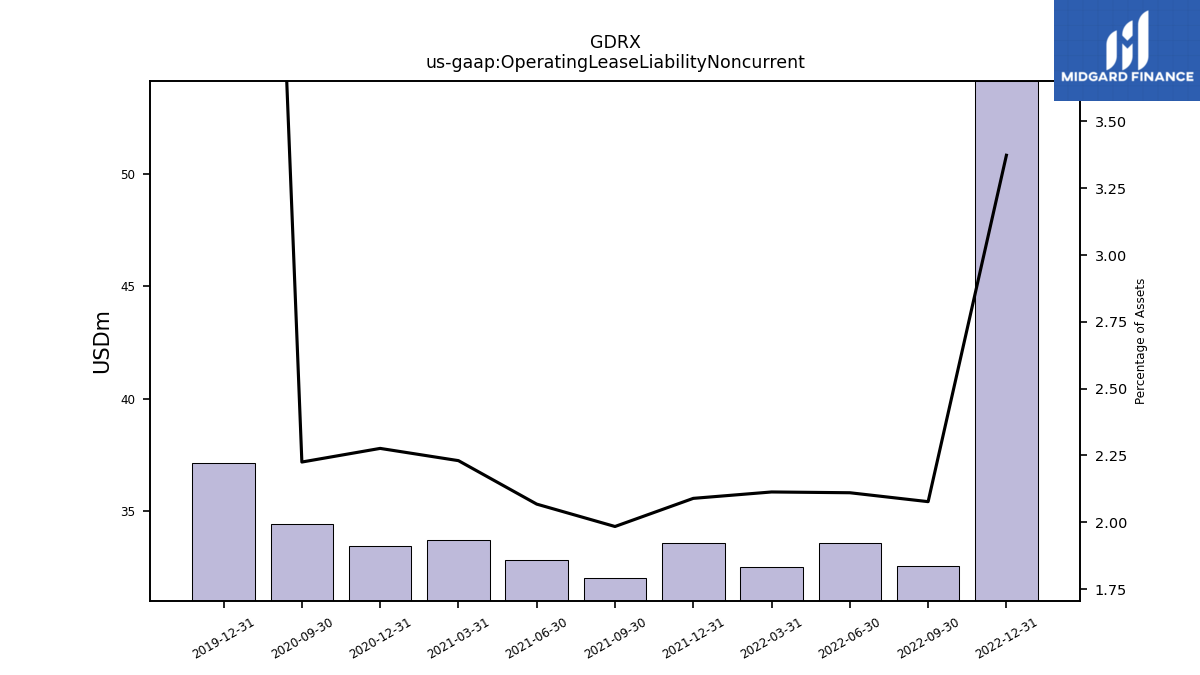
| Operating Lease Liability Noncurrent | 54.13 | 32.55 | 33.60 | 32.51 | 33.59 | 32.03 | 32.82 | 33.70 | 33.47 | 34.42 | NA | NA | 37.13 | NA |
| 2022-12-31 | 2022-09-30 | 2022-06-30 | 2022-03-31 | 2021-12-31 | 2021-09-30 | 2021-06-30 | 2021-03-31 | 2020-12-31 | 2020-09-30 | 2020-06-30 | 2020-03-31 | 2019-12-31 | 2019-09-30 | ||
|---|---|---|---|---|---|---|---|---|---|---|---|---|---|---|---|
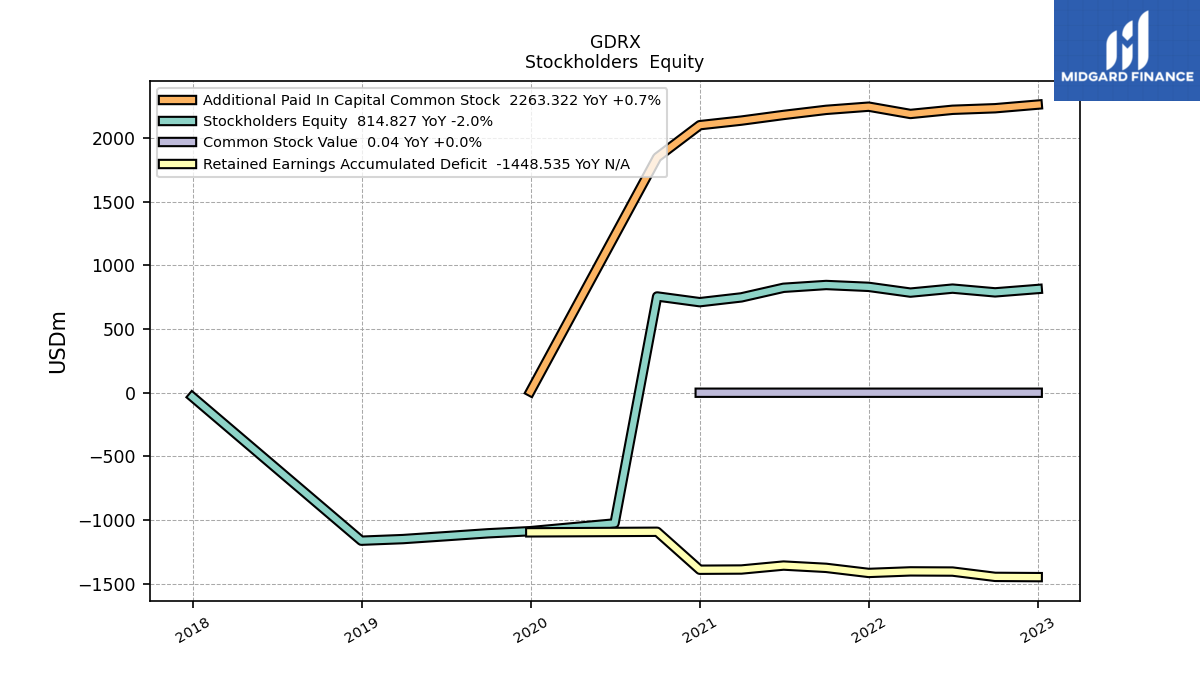
| Stockholders Equity | 814.83 | 788.40 | 817.94 | 786.51 | 831.68 | 846.40 | 824.39 | 749.06 | 711.36 | 756.41 | -1026.73 | -1057.04 | -1087.58 | -1104.35 | |
| Common Stock Value | 0.04 | 0.04 | 0.04 | 0.04 | 0.04 | 0.04 | 0.04 | 0.04 | 0.04 | NA | NA | NA | NA | NA | |
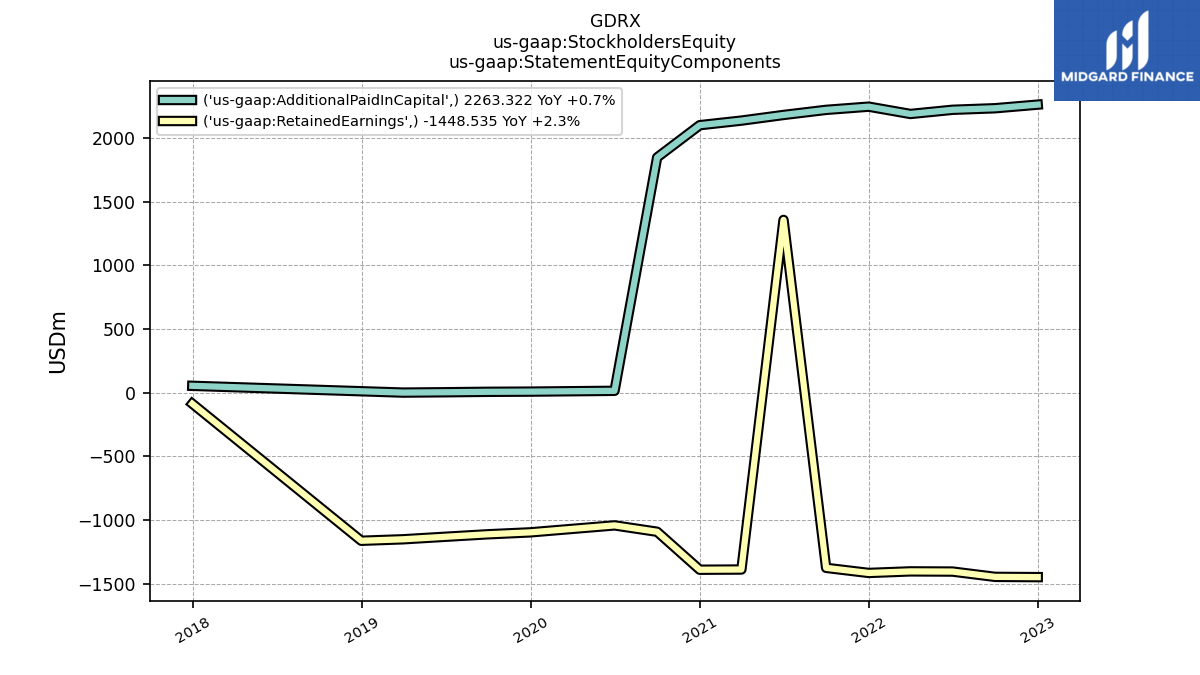
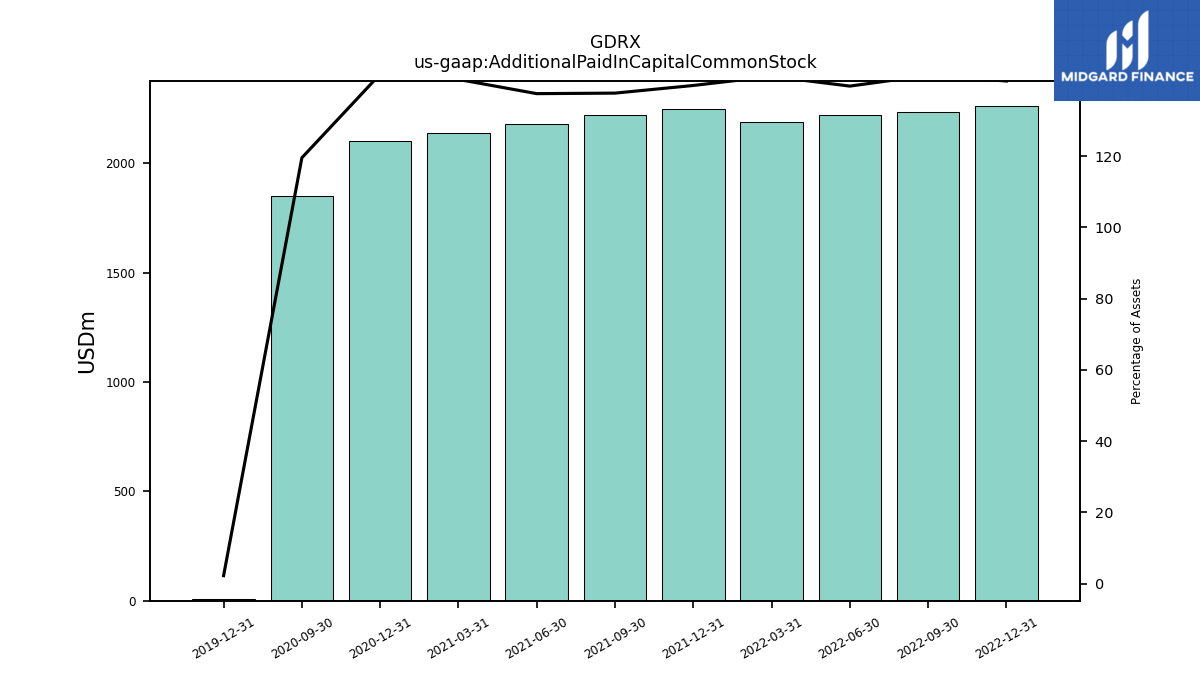
| Additional Paid In Capital Common Stock | 2263.32 | 2234.93 | 2222.73 | 2189.88 | 2247.35 | 2222.15 | 2182.08 | 2137.80 | 2101.77 | 1848.55 | NA | NA | 8.79 | NA | |
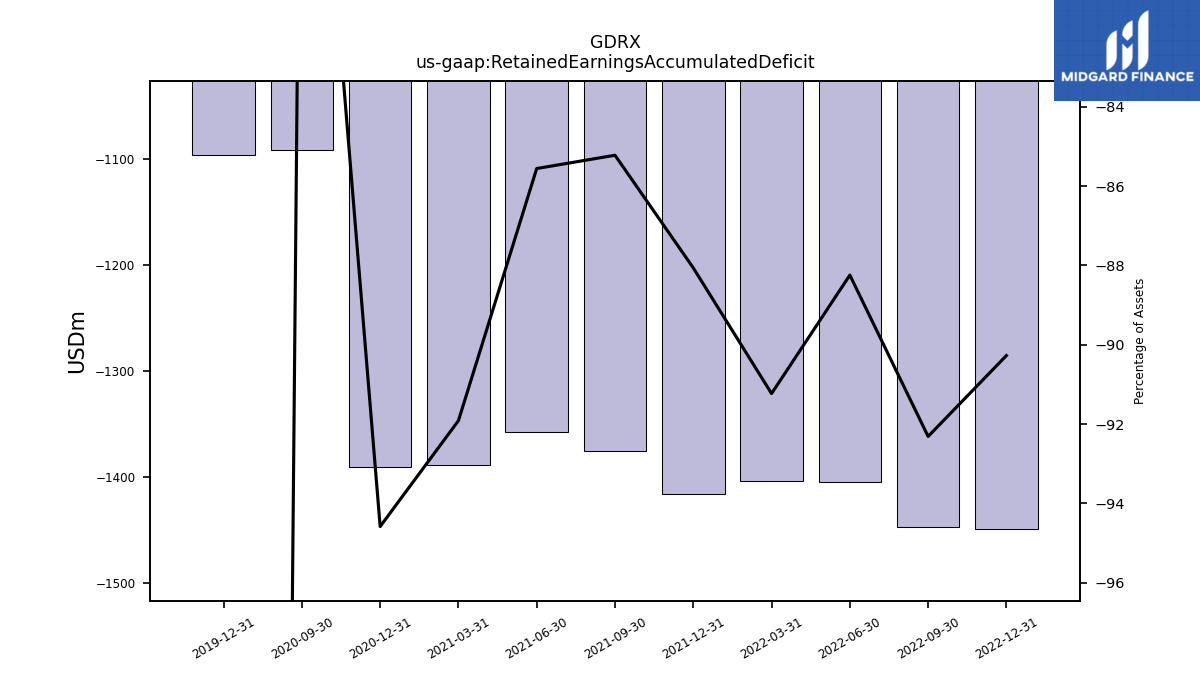
| Retained Earnings Accumulated Deficit | -1448.54 | -1446.56 | -1404.83 | -1403.41 | -1415.71 | -1375.79 | -1357.72 | -1388.79 | -1390.45 | -1092.18 | NA | NA | -1096.83 | NA | |
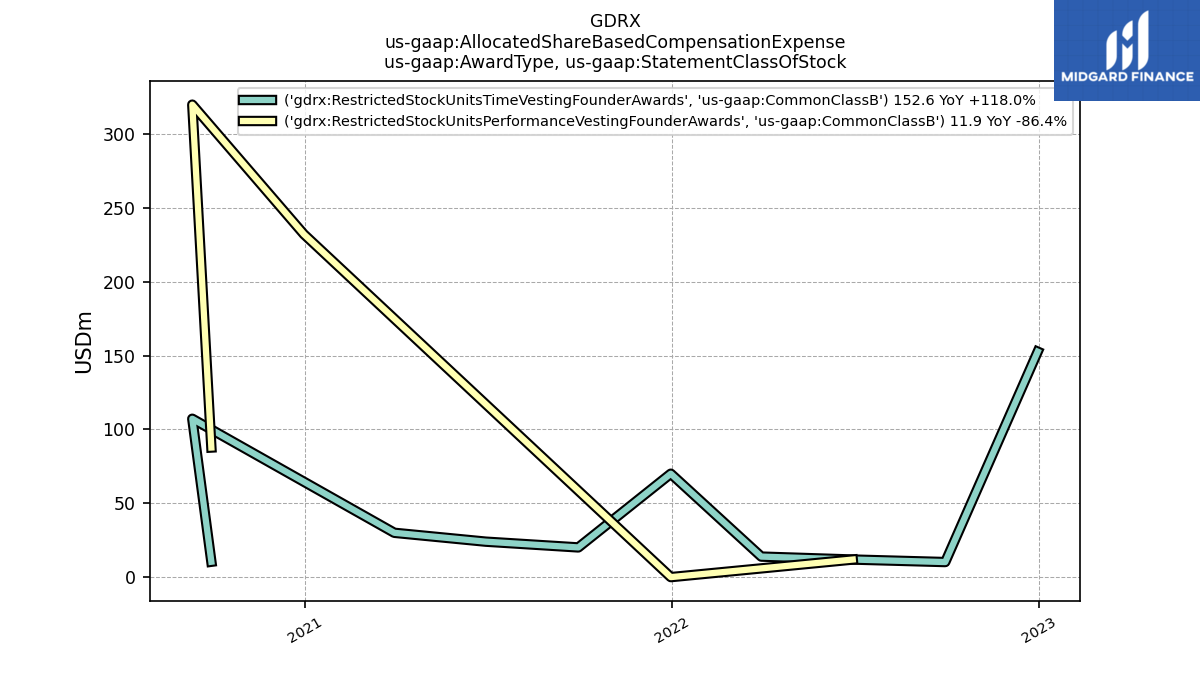
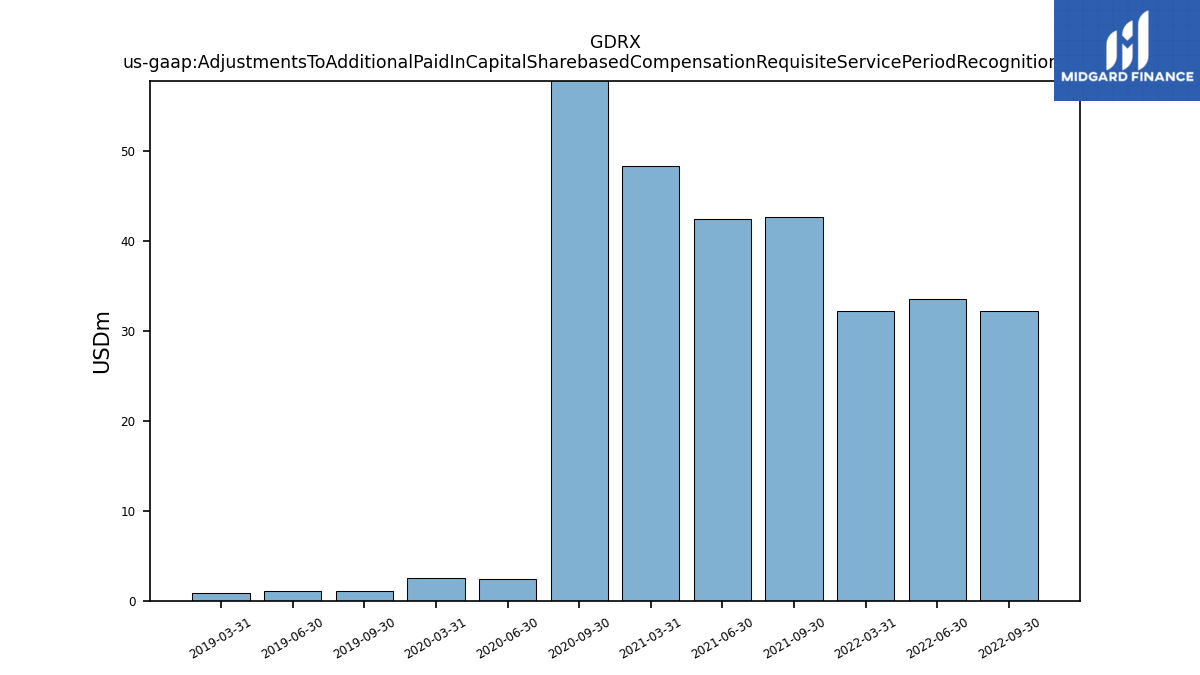
| Adjustments To Additional Paid In Capital Sharebased Compensation Requisite Service Period Recognition Value | NA | 32.15 | 33.47 | 32.16 | NA | 42.59 | 42.37 | 48.25 | NA | 107.83 | 2.44 | 2.50 | NA | 1.07 |
| 2022-12-31 | 2022-09-30 | 2022-06-30 | 2022-03-31 | 2021-12-31 | 2021-09-30 | 2021-06-30 | 2021-03-31 | 2020-12-31 | 2020-09-30 | 2020-06-30 | 2020-03-31 | 2019-12-31 | 2019-09-30 | ||
|---|---|---|---|---|---|---|---|---|---|---|---|---|---|---|---|
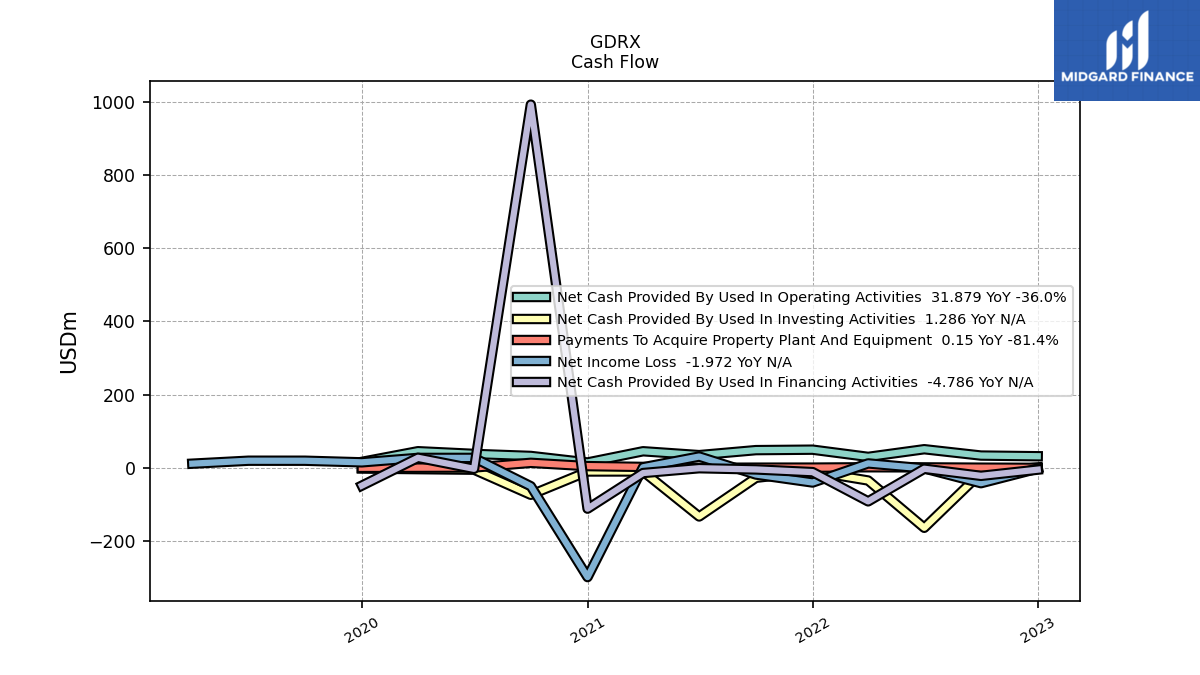
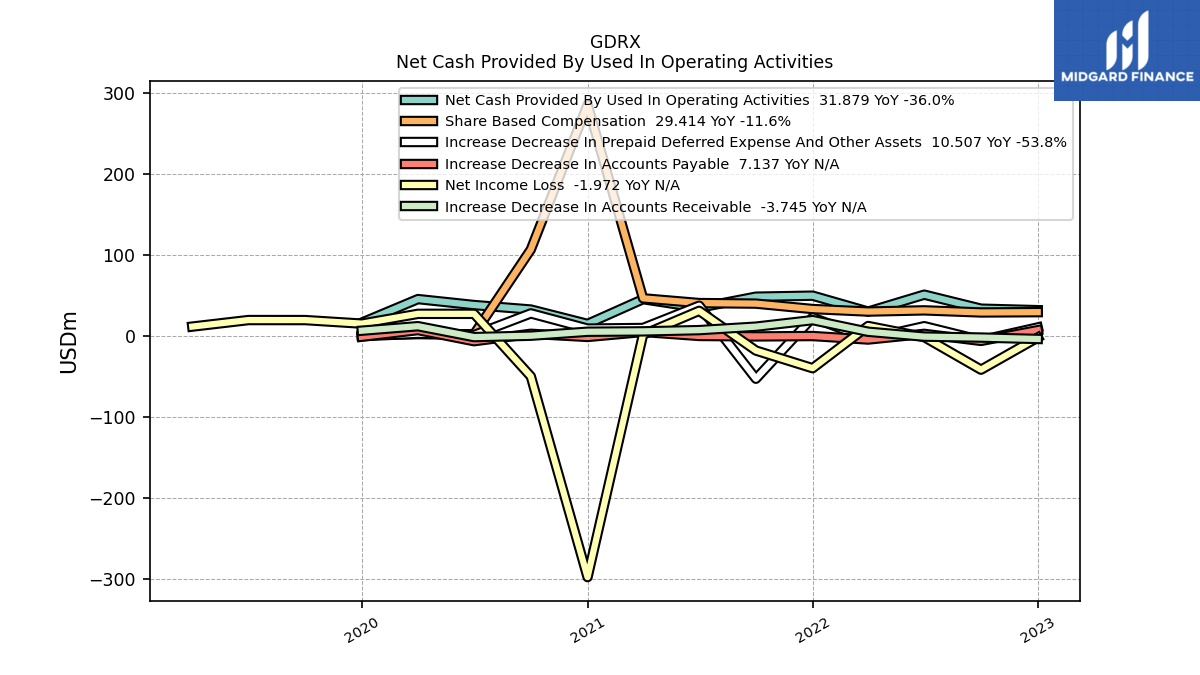
| Net Cash Provided By Used In Operating Activities | 31.88 | 33.73 | 51.05 | 30.12 | 49.81 | 48.56 | 34.93 | 45.48 | 14.85 | 32.67 | 38.23 | 45.59 | 16.52 | NA | |
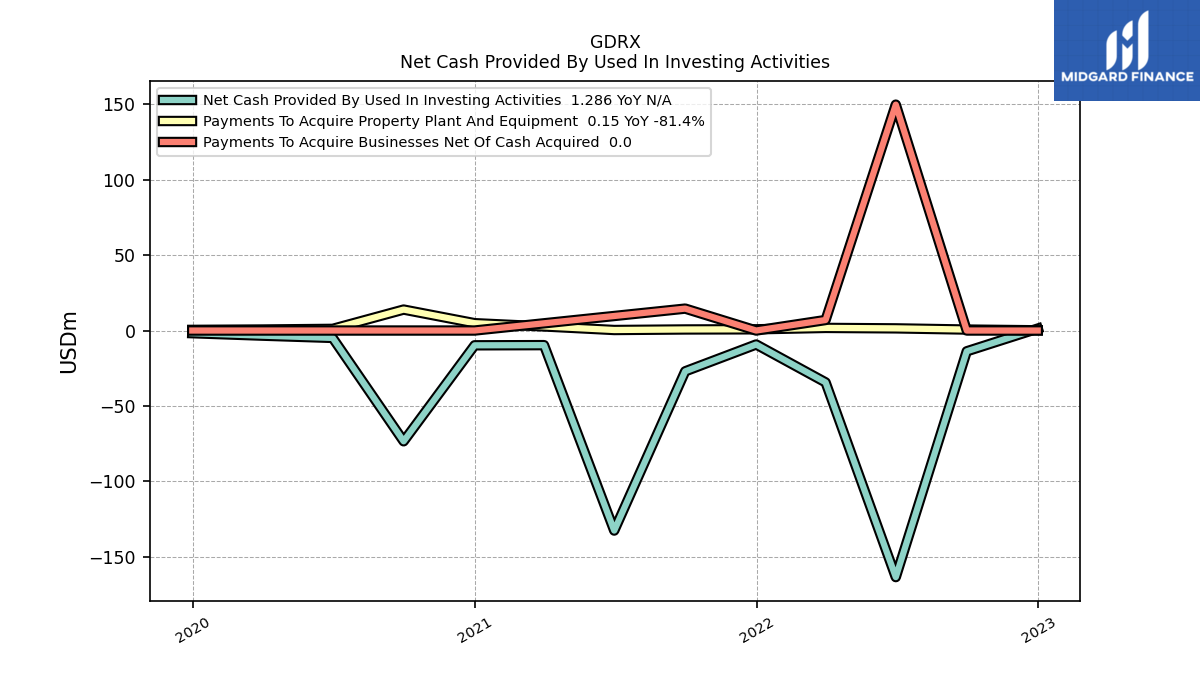
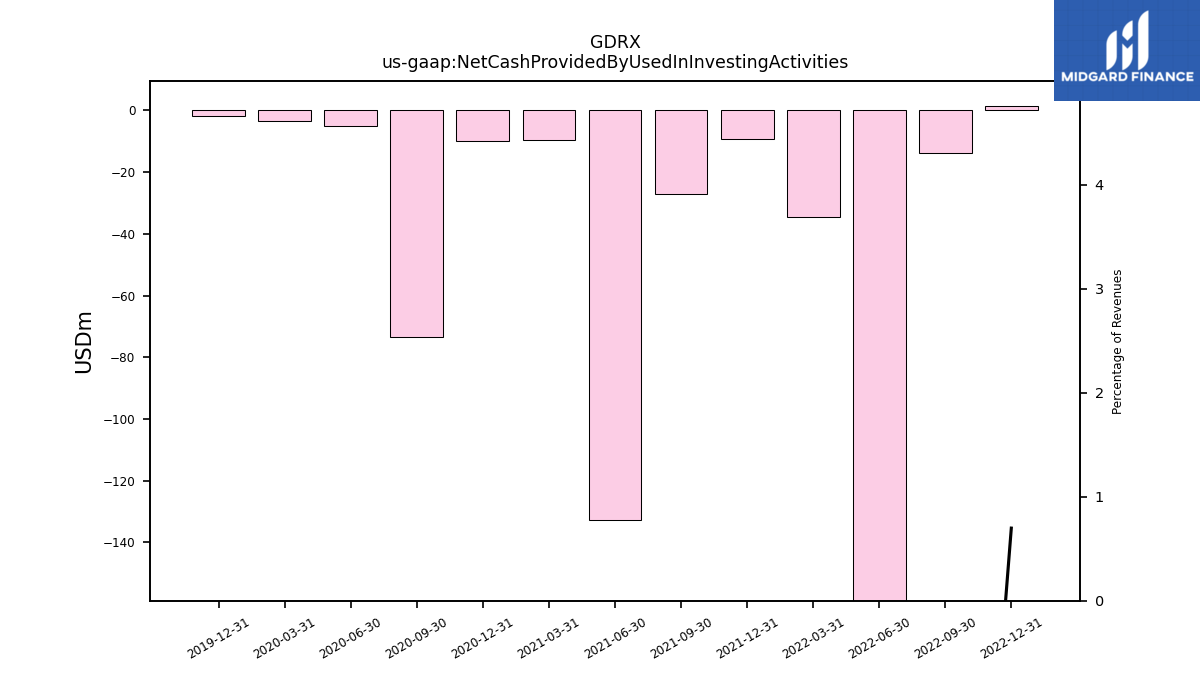
| Net Cash Provided By Used In Investing Activities | 1.29 | -13.78 | -163.61 | -34.40 | -9.26 | -27.06 | -132.72 | -9.70 | -9.81 | -73.49 | -4.91 | -3.41 | -1.77 | NA | |
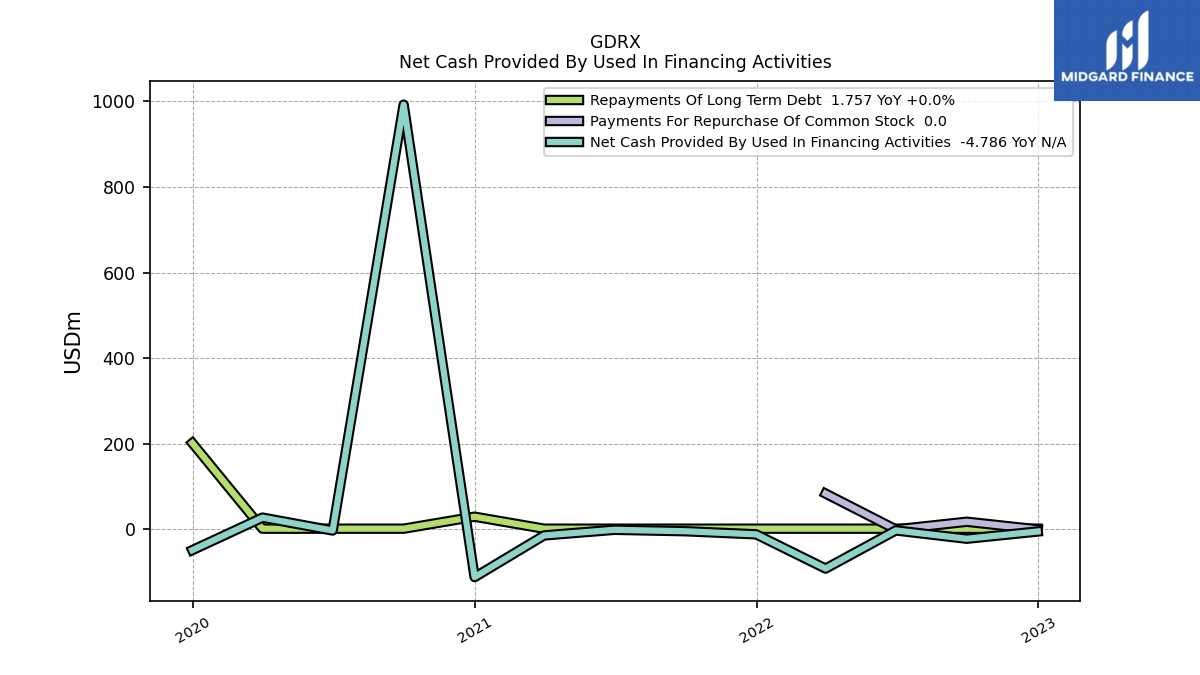
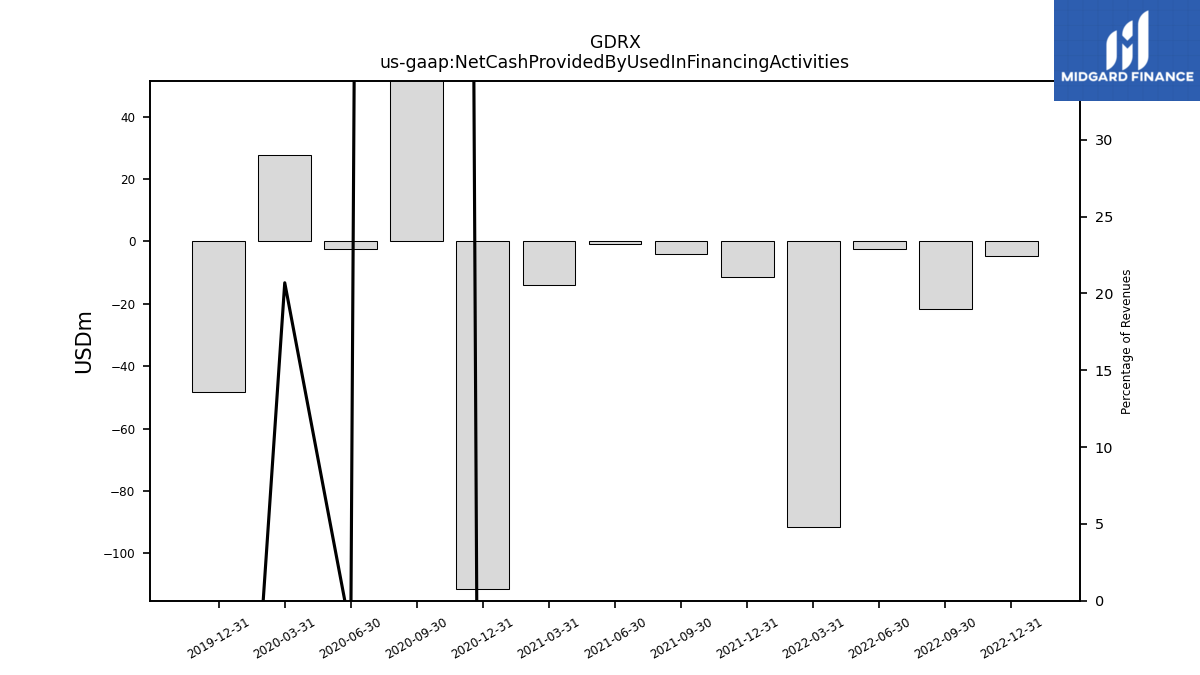
| Net Cash Provided By Used In Financing Activities | -4.79 | -21.71 | -2.33 | -91.40 | -11.46 | -4.18 | -0.86 | -14.02 | -111.37 | 992.12 | -2.53 | 27.60 | -48.38 | NA |
| 2022-12-31 | 2022-09-30 | 2022-06-30 | 2022-03-31 | 2021-12-31 | 2021-09-30 | 2021-06-30 | 2021-03-31 | 2020-12-31 | 2020-09-30 | 2020-06-30 | 2020-03-31 | 2019-12-31 | 2019-09-30 | ||
|---|---|---|---|---|---|---|---|---|---|---|---|---|---|---|---|
| Net Cash Provided By Used In Operating Activities | 31.88 | 33.73 | 51.05 | 30.12 | 49.81 | 48.56 | 34.93 | 45.48 | 14.85 | 32.67 | 38.23 | 45.59 | 16.52 | NA | |
| Net Income Loss | -1.97 | -41.73 | -1.42 | 12.29 | -39.91 | -18.07 | 31.06 | 1.67 | -298.27 | -50.03 | 27.34 | 27.35 | 15.23 | 19.62 | |
| Profit Loss | -1.97 | -41.73 | -1.42 | 12.29 | 10.59 | -18.07 | 31.06 | 1.67 | -298.27 | -50.03 | 27.34 | 27.35 | 15.23 | NA | |
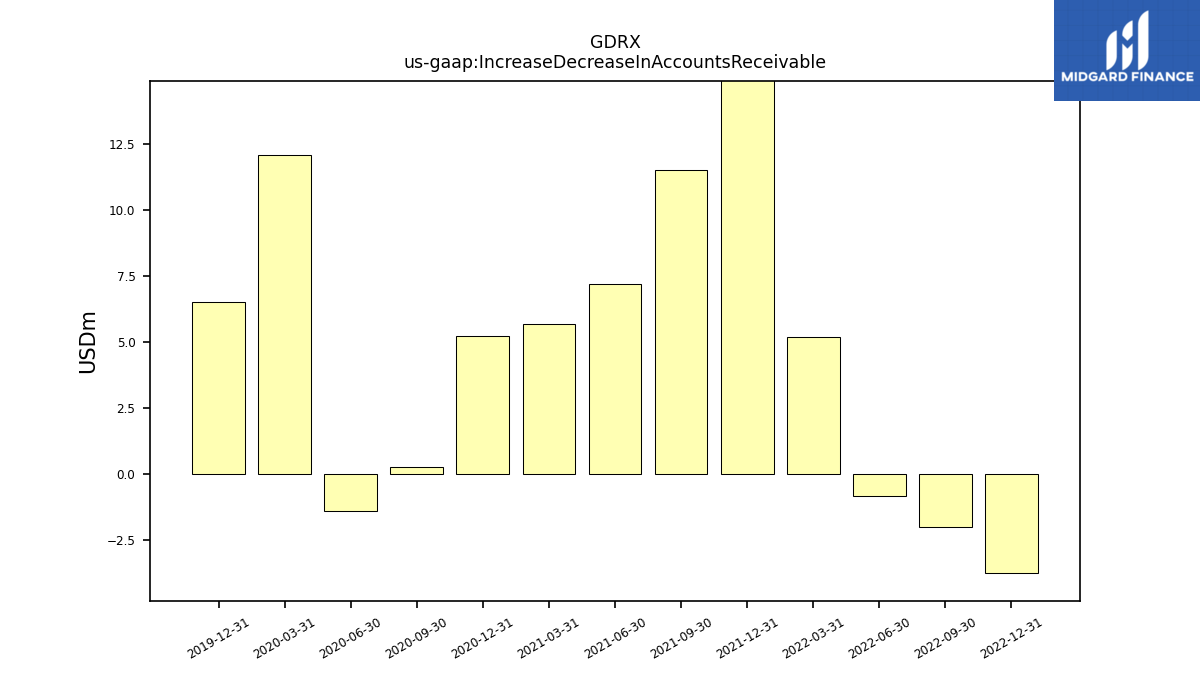
| Increase Decrease In Accounts Receivable | -3.75 | -1.99 | -0.84 | 5.20 | 19.57 | 11.51 | 7.20 | 5.67 | 5.21 | 0.28 | -1.41 | 12.06 | 6.50 | NA | |
| Increase Decrease In Accounts Payable | 7.14 | -6.15 | 2.58 | -4.44 | -0.12 | -0.59 | -0.03 | 4.94 | -1.26 | 2.66 | -6.50 | 7.25 | -0.95 | NA | |
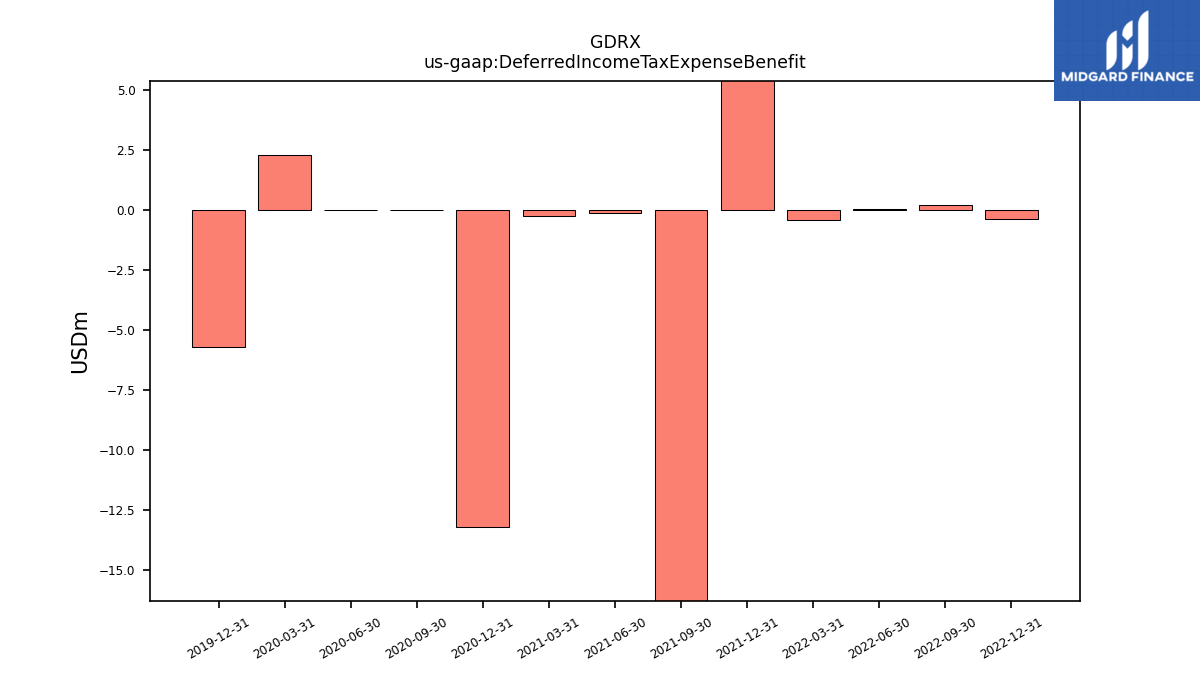
| Deferred Income Tax Expense Benefit | -0.36 | 0.20 | 0.06 | -0.39 | 46.07 | -32.85 | -0.14 | -0.23 | -13.20 | 0.00 | 0.00 | 2.29 | -5.70 | NA | |
| Share Based Compensation | 29.41 | 29.04 | 31.63 | 30.15 | 33.28 | 39.98 | 40.68 | 46.53 | 286.08 | 106.87 | 2.12 | 2.21 | 1.05 | NA | |
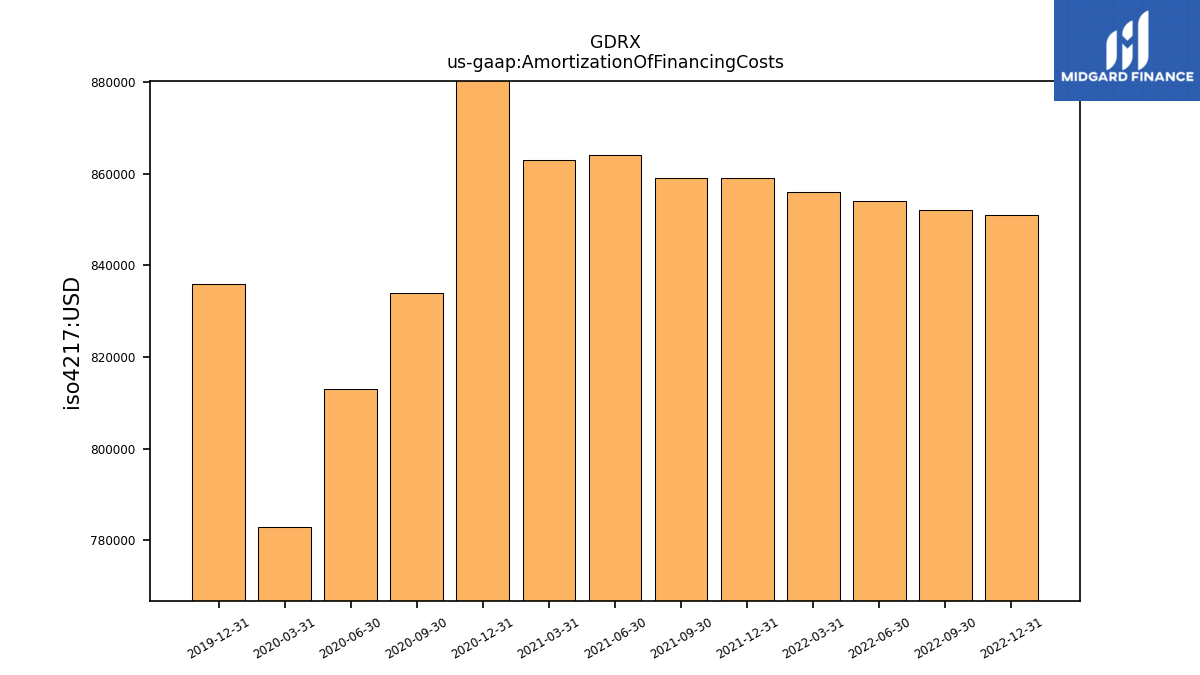
| Amortization Of Financing Costs | 0.85 | 0.85 | 0.85 | 0.86 | 0.86 | 0.86 | 0.86 | 0.86 | 0.96 | 0.83 | 0.81 | 0.78 | 0.84 | NA |
| 2022-12-31 | 2022-09-30 | 2022-06-30 | 2022-03-31 | 2021-12-31 | 2021-09-30 | 2021-06-30 | 2021-03-31 | 2020-12-31 | 2020-09-30 | 2020-06-30 | 2020-03-31 | 2019-12-31 | 2019-09-30 | ||
|---|---|---|---|---|---|---|---|---|---|---|---|---|---|---|---|
| Net Cash Provided By Used In Investing Activities | 1.29 | -13.78 | -163.61 | -34.40 | -9.26 | -27.06 | -132.72 | -9.70 | -9.81 | -73.49 | -4.91 | -3.41 | -1.77 | NA | |
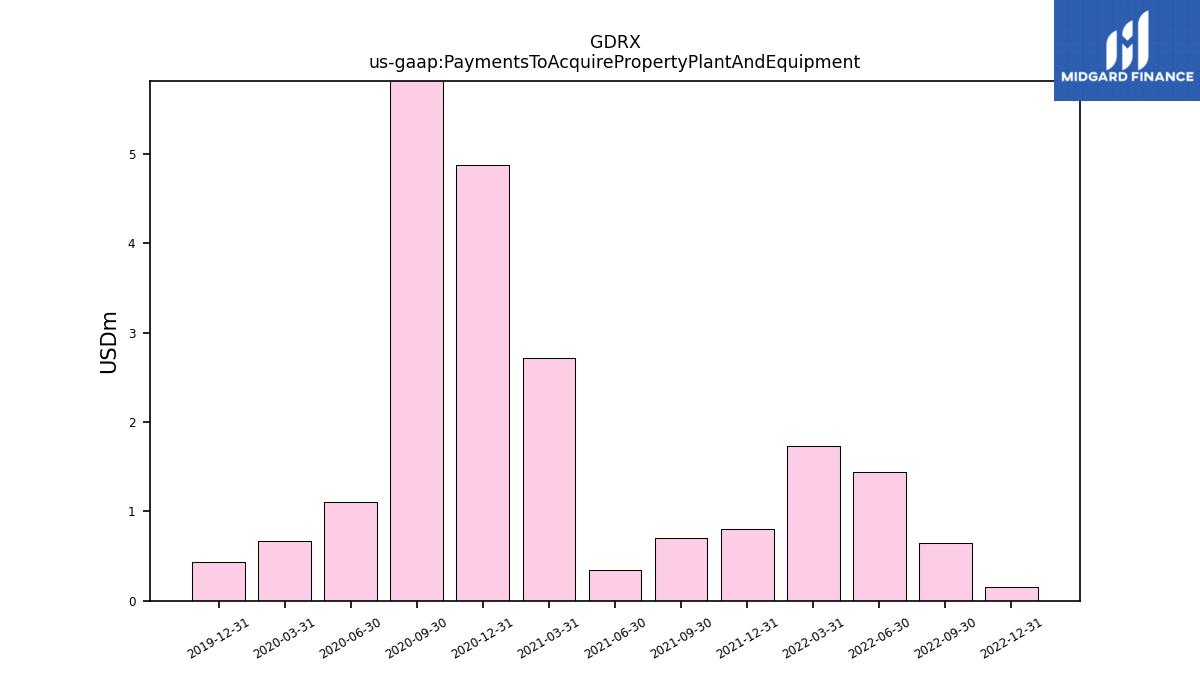
| Payments To Acquire Property Plant And Equipment | 0.15 | 0.65 | 1.44 | 1.74 | 0.81 | 0.71 | 0.34 | 2.71 | 4.87 | 13.90 | 1.10 | 0.67 | 0.43 | NA |
| 2022-12-31 | 2022-09-30 | 2022-06-30 | 2022-03-31 | 2021-12-31 | 2021-09-30 | 2021-06-30 | 2021-03-31 | 2020-12-31 | 2020-09-30 | 2020-06-30 | 2020-03-31 | 2019-12-31 | 2019-09-30 | ||
|---|---|---|---|---|---|---|---|---|---|---|---|---|---|---|---|
| Net Cash Provided By Used In Financing Activities | -4.79 | -21.71 | -2.33 | -91.40 | -11.46 | -4.18 | -0.86 | -14.02 | -111.37 | 992.12 | -2.53 | 27.60 | -48.38 | NA | |
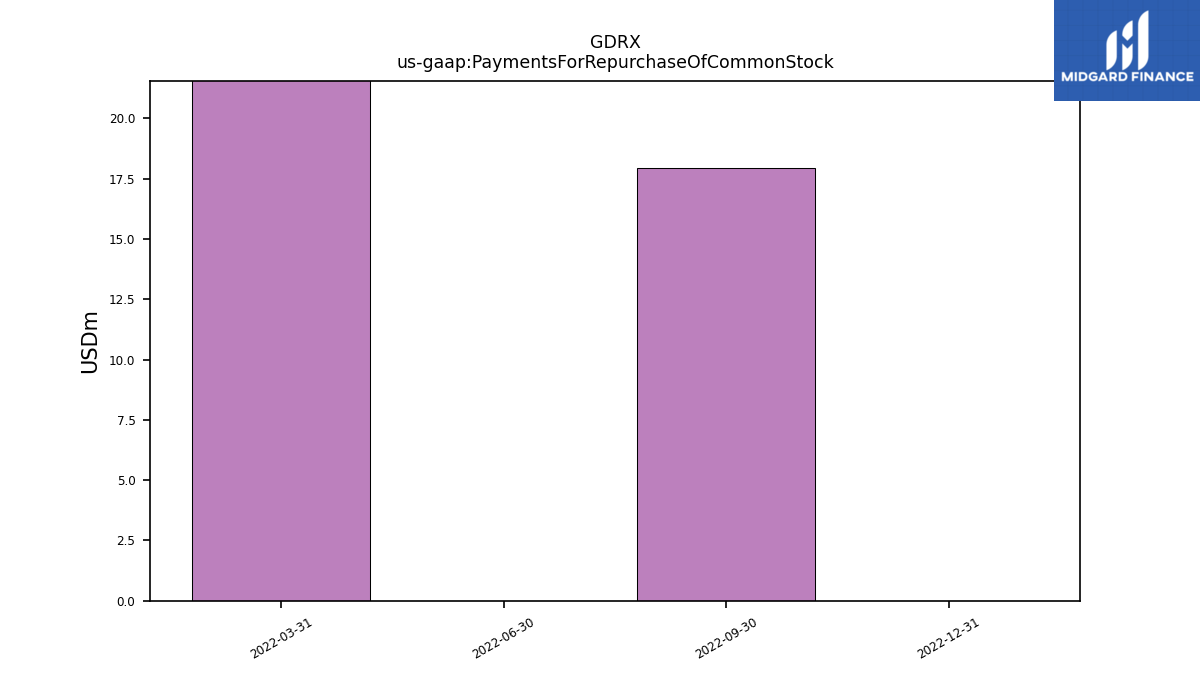
| Payments For Repurchase Of Common Stock | 0.00 | 17.96 | 0.00 | 83.77 | NA | NA | NA | NA | NA | NA | NA | NA | NA | NA |
| 2022-12-31 | 2022-09-30 | 2022-06-30 | 2022-03-31 | 2021-12-31 | 2021-09-30 | 2021-06-30 | 2021-03-31 | 2020-12-31 | 2020-09-30 | 2020-06-30 | 2020-03-31 | 2019-12-31 | 2019-09-30 | ||
|---|---|---|---|---|---|---|---|---|---|---|---|---|---|---|---|
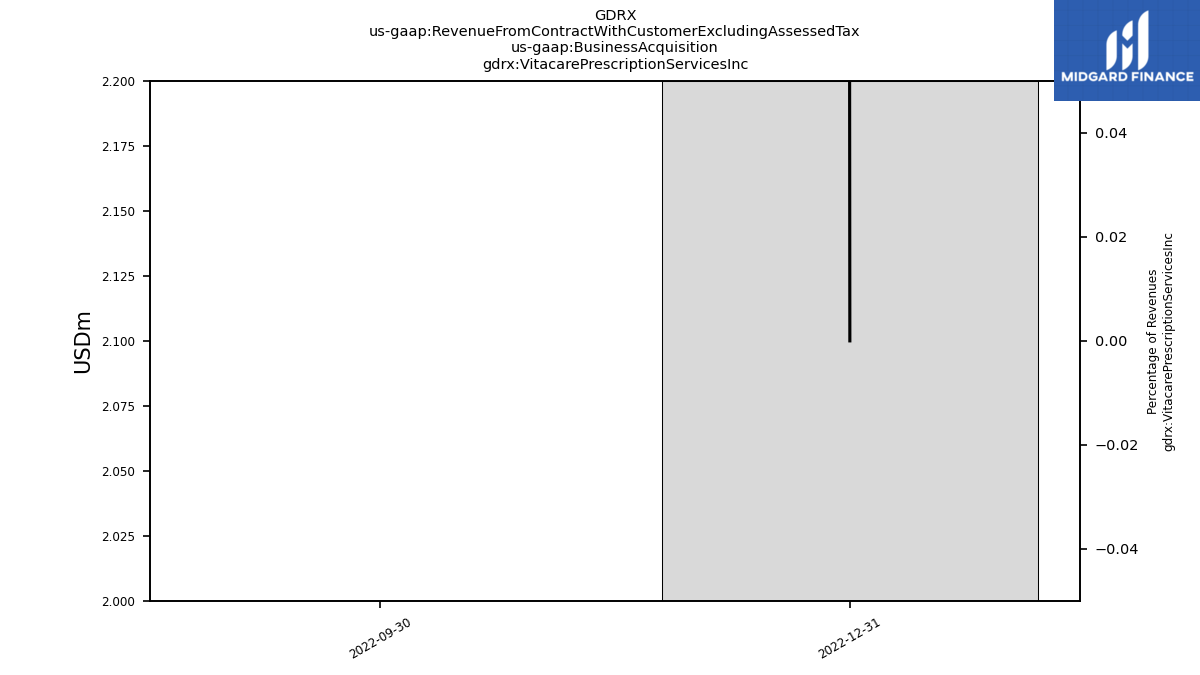
| Revenues | 184.11 | 187.32 | 191.80 | 203.33 | 213.26 | 195.10 | 176.63 | 160.43 | 153.54 | 140.45 | 123.30 | 133.41 | 113.26 | 101.75 | |
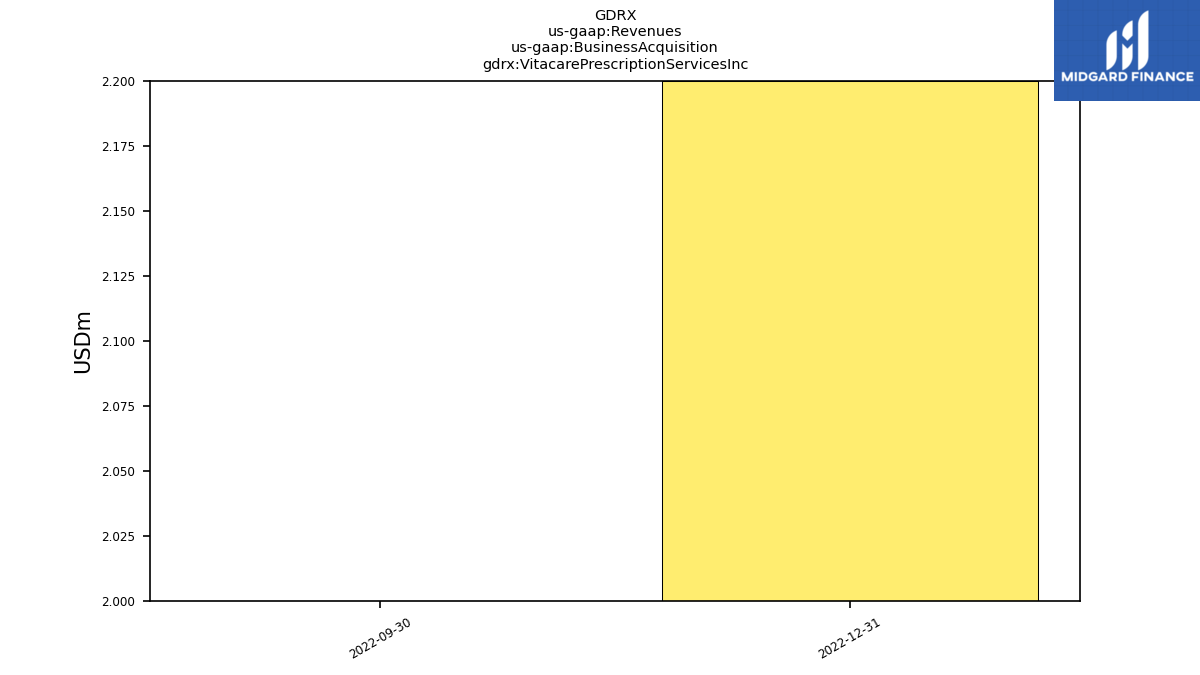
| Vitacare Prescription Services Inc | 2.20 | 2.00 | NA | NA | NA | NA | NA | NA | NA | NA | NA | NA | NA | NA | |
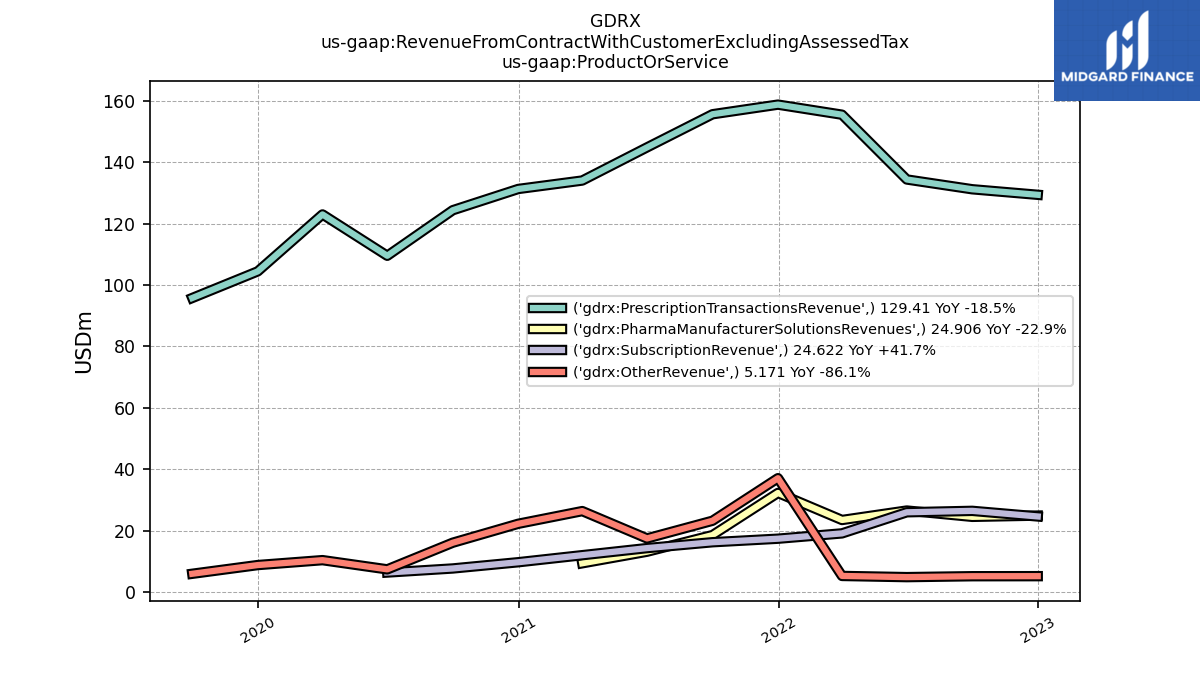
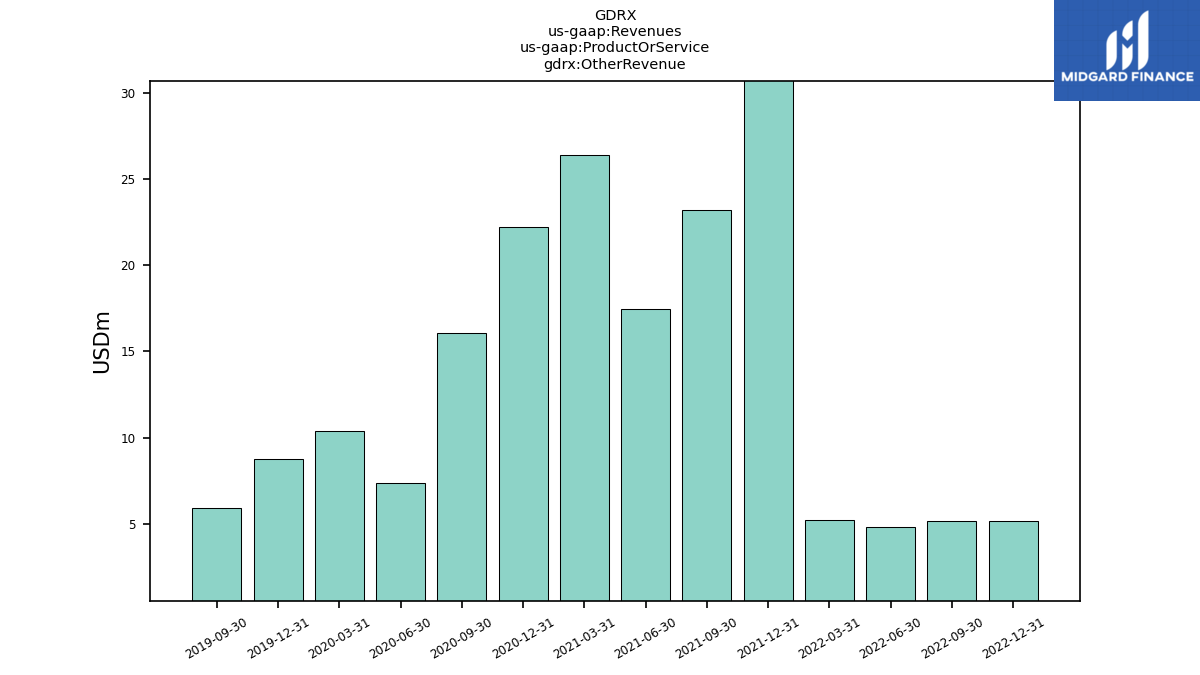
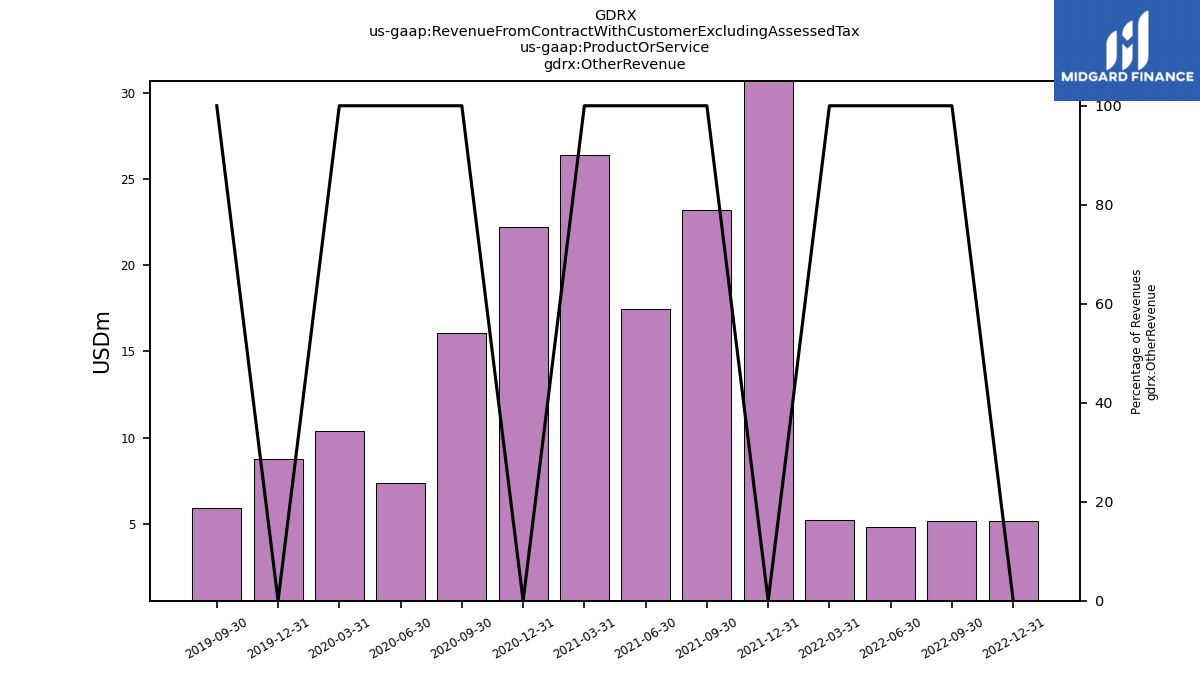
| Other Revenue | 5.17 | 5.15 | 4.86 | 5.24 | 37.09 | 23.22 | 17.46 | 26.37 | 22.24 | 16.07 | 7.39 | 10.39 | 8.79 | 5.95 | |
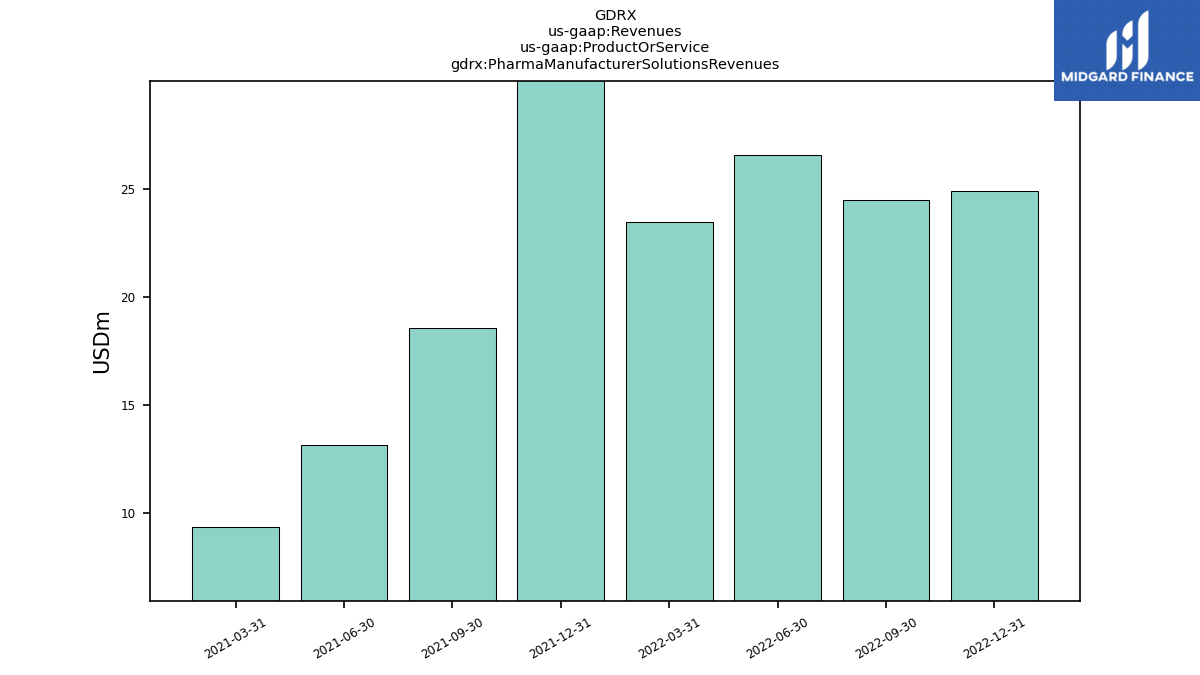
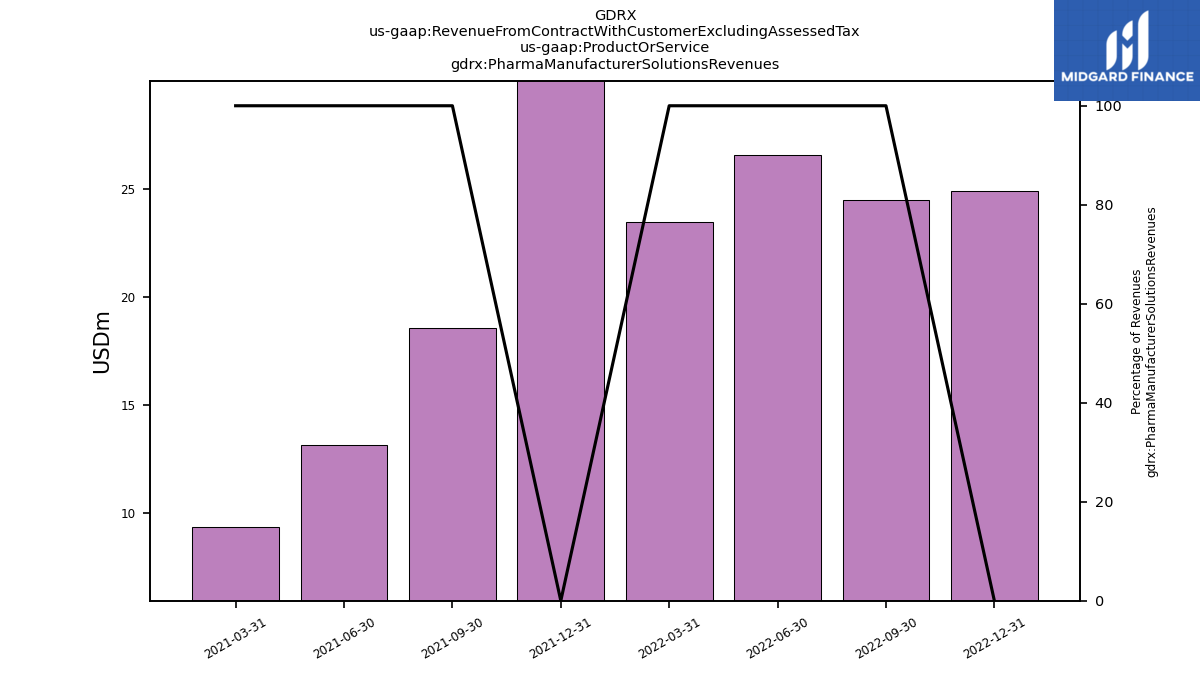
| Pharma Manufacturer Solutions Revenues | 24.91 | 24.50 | 26.55 | 23.47 | 32.29 | 18.55 | 13.14 | 9.37 | NA | NA | NA | NA | NA | NA | |
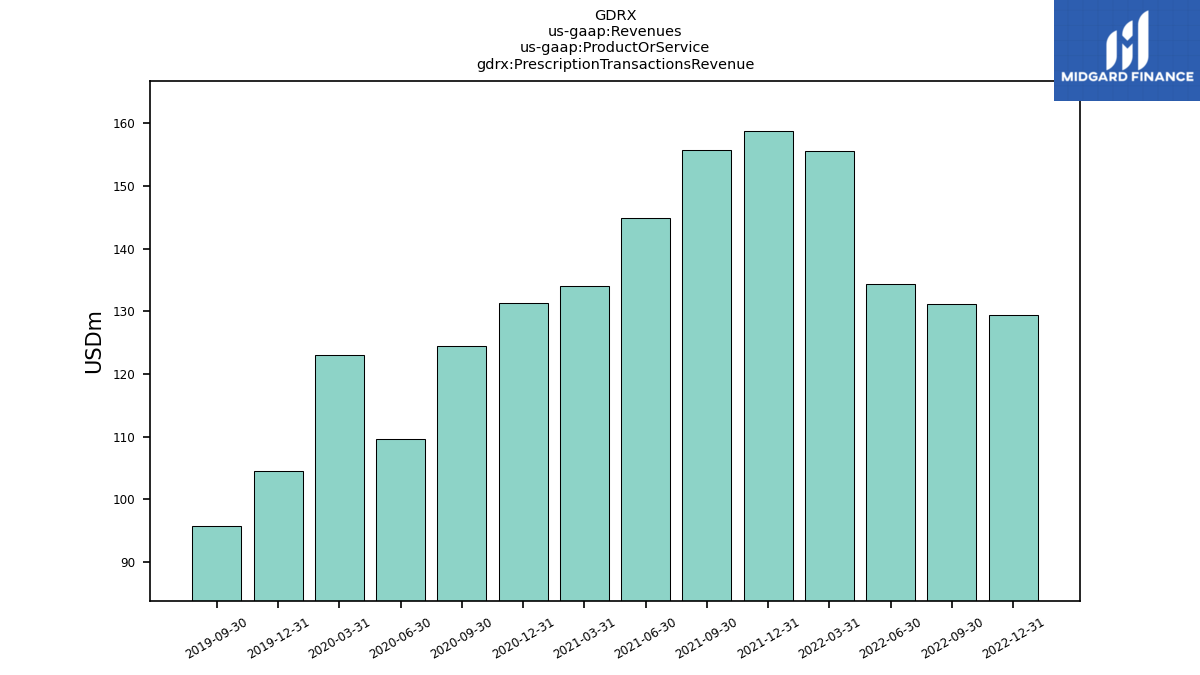
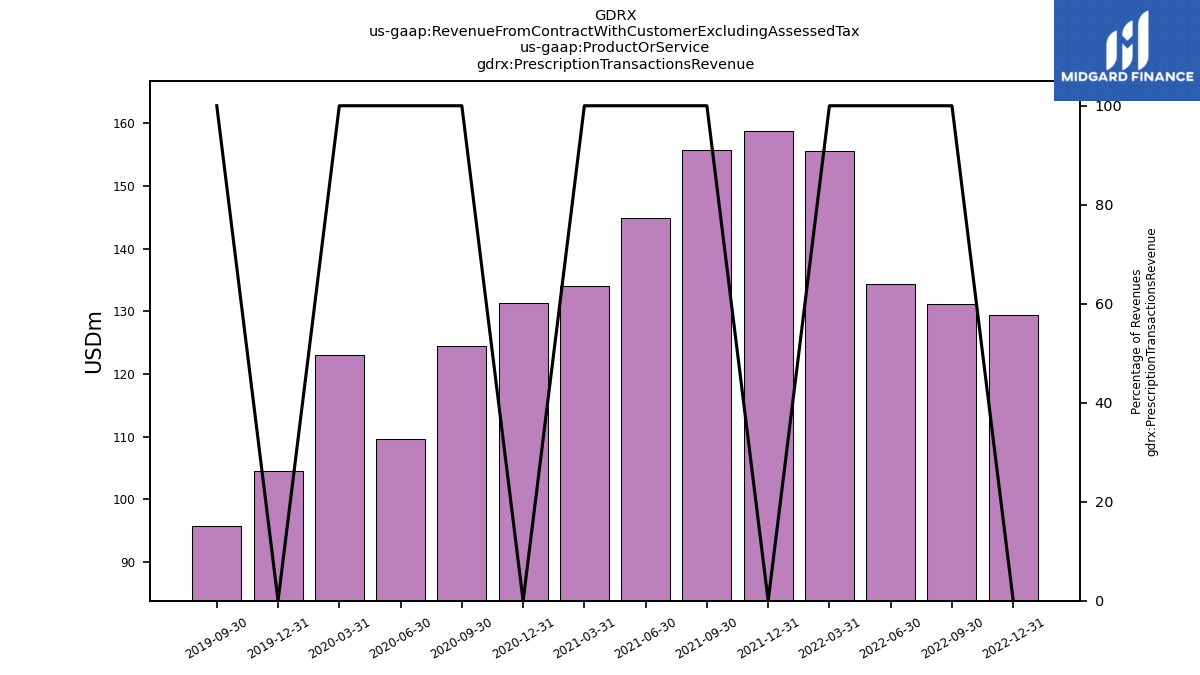
| Prescription Transactions Revenue | 129.41 | 131.22 | 134.40 | 155.51 | 158.79 | 155.65 | 144.86 | 134.06 | 131.31 | 124.39 | 109.55 | 123.02 | 104.47 | 95.80 | |
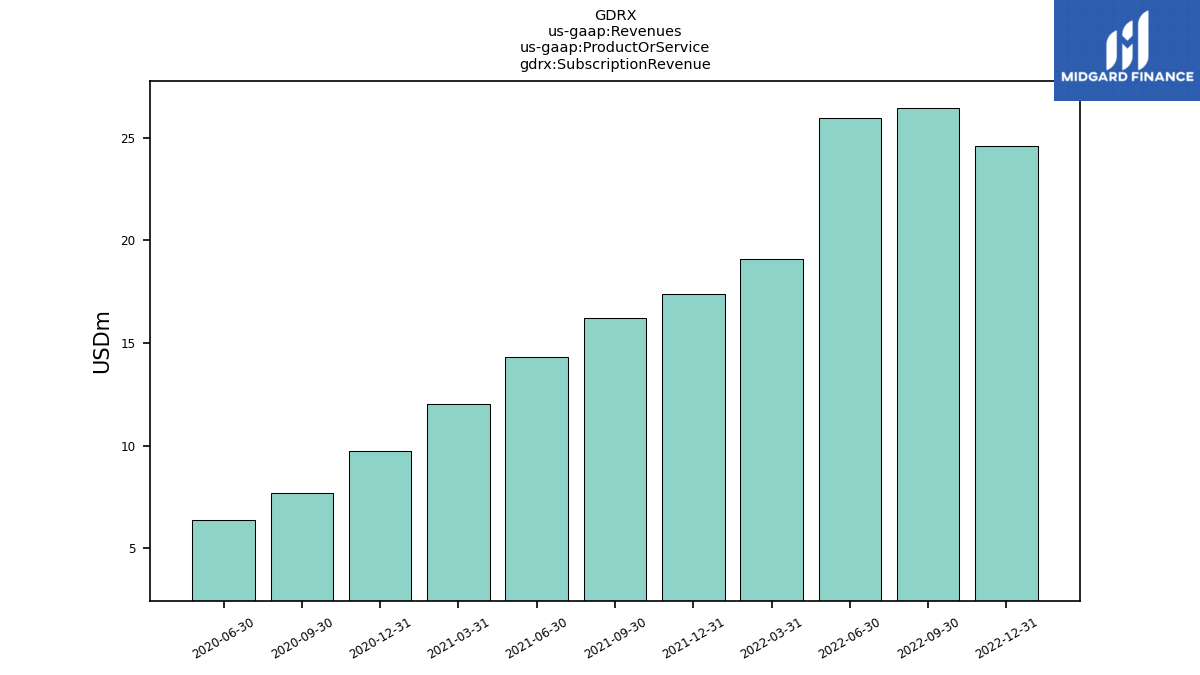
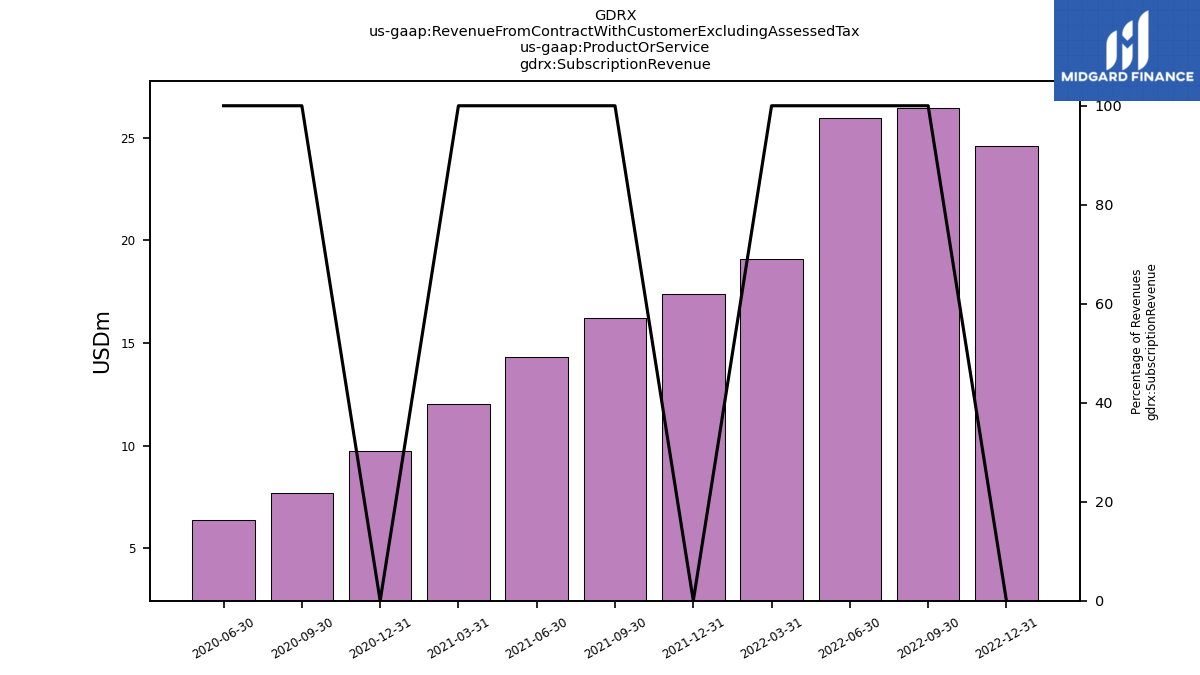
| Subscription Revenue | 24.62 | 26.45 | 25.98 | 19.11 | 17.38 | 16.23 | 14.32 | 12.01 | 9.71 | 7.68 | 6.36 | NA | NA | NA | |
| Revenue From Contract With Customer Excluding Assessed Tax | 184.11 | 187.32 | 191.80 | 203.33 | 213.26 | 195.10 | 176.63 | 160.43 | 153.54 | 140.45 | 123.30 | 133.41 | 113.26 | 101.75 | |
| Vitacare Prescription Services Inc | 2.20 | 2.00 | NA | NA | NA | NA | NA | NA | NA | NA | NA | NA | NA | NA | |
| Other Revenue | 5.17 | 5.15 | 4.86 | 5.24 | 37.09 | 23.22 | 17.46 | 26.37 | 22.24 | 16.07 | 7.39 | 10.39 | 8.79 | 5.95 | |
| Pharma Manufacturer Solutions Revenues | 24.91 | 24.50 | 26.55 | 23.47 | 32.29 | 18.55 | 13.14 | 9.37 | NA | NA | NA | NA | NA | NA | |
| Prescription Transactions Revenue | 129.41 | 131.22 | 134.40 | 155.51 | 158.79 | 155.65 | 144.86 | 134.06 | 131.31 | 124.39 | 109.55 | 123.02 | 104.47 | 95.80 | |
| Subscription Revenue | 24.62 | 26.45 | 25.98 | 19.11 | 17.38 | 16.23 | 14.32 | 12.01 | 9.71 | 7.68 | 6.36 | NA | NA | NA |

