
| 2024-01-31 | 2023-10-31 | 2023-07-31 | 2023-04-30 | 2023-01-31 | 2022-10-31 | 2022-07-31 | 2022-04-30 | 2022-01-31 | 2021-10-31 | 2021-07-31 | 2021-04-30 | 2021-01-31 | 2020-10-31 | 2020-07-31 | 2020-04-30 | 2020-01-31 | 2019-10-31 | 2019-07-31 | 2019-04-30 | 2019-01-31 | 2018-10-31 | 2018-07-31 | 2018-04-30 | 2018-01-31 | 2017-10-31 | 2017-07-31 | 2017-04-30 | 2017-01-31 | 2016-10-31 | 2016-07-31 | 2016-04-30 | 2016-01-31 | 2015-10-31 | 2015-07-31 | 2015-04-30 | 2015-01-31 | 2014-10-31 | 2014-07-31 | 2014-04-30 | 2014-01-31 | 2013-10-31 | 2013-07-31 | 2013-04-30 | 2013-01-31 | 2012-10-31 | 2012-07-31 | 2012-04-30 | 2012-01-31 | 2011-10-31 | 2011-07-31 | 2011-04-30 | 2011-01-31 | 2010-10-31 | 2010-07-31 | 2010-04-30 | 2010-01-31 | ||
|---|---|---|---|---|---|---|---|---|---|---|---|---|---|---|---|---|---|---|---|---|---|---|---|---|---|---|---|---|---|---|---|---|---|---|---|---|---|---|---|---|---|---|---|---|---|---|---|---|---|---|---|---|---|---|---|---|---|---|
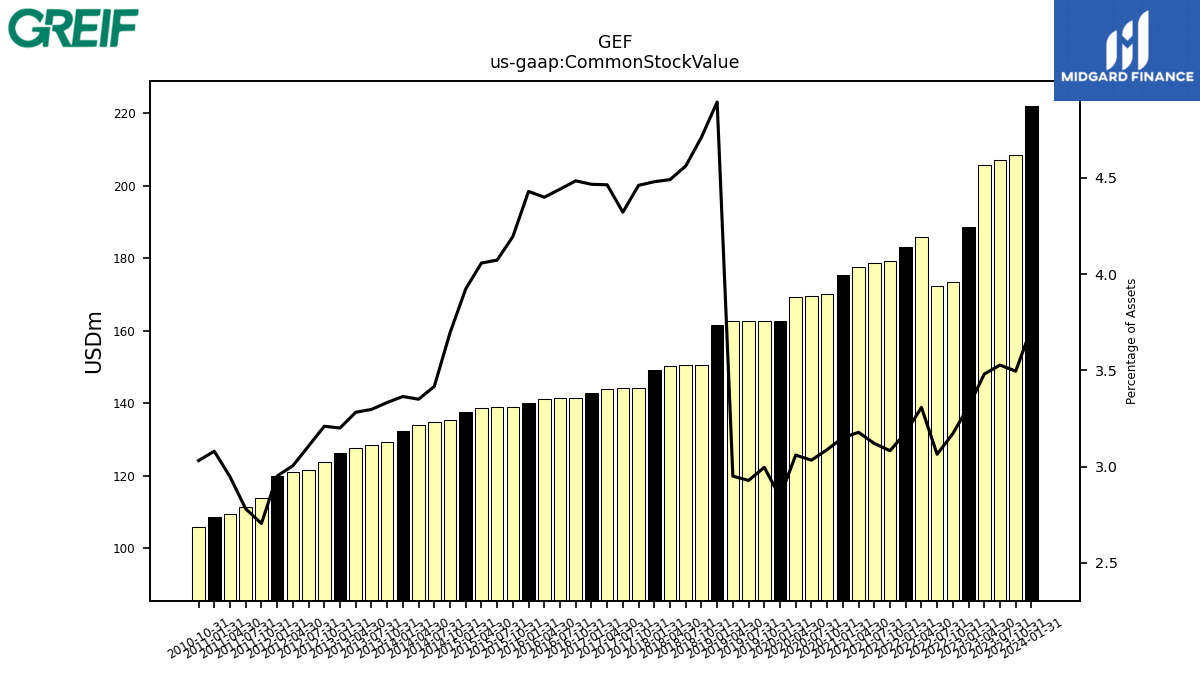
| Common Stock Value | 222.10 | 208.40 | 207.20 | 205.80 | 188.50 | 173.50 | 172.40 | 186.00 | 183.20 | 179.30 | 178.60 | 177.60 | 175.40 | 170.20 | 169.70 | 169.20 | 162.70 | 162.60 | 162.60 | 162.60 | 161.50 | 150.50 | 150.50 | 150.30 | 149.10 | 144.20 | 144.20 | 144.00 | 142.90 | 141.40 | 141.40 | 141.10 | 140.10 | 139.10 | 139.10 | 138.80 | 137.60 | 135.50 | 135.00 | 133.90 | 132.30 | 129.40 | 128.40 | 127.80 | 126.20 | 123.80 | 121.60 | 121.10 | 120.00 | 113.80 | 111.35 | 109.47 | 108.66 | 106.06 | NA | NA | NA |
| 2024-01-31 | 2023-10-31 | 2023-07-31 | 2023-04-30 | 2023-01-31 | 2022-10-31 | 2022-07-31 | 2022-04-30 | 2022-01-31 | 2021-10-31 | 2021-07-31 | 2021-04-30 | 2021-01-31 | 2020-10-31 | 2020-07-31 | 2020-04-30 | 2020-01-31 | 2019-10-31 | 2019-07-31 | 2019-04-30 | 2019-01-31 | 2018-10-31 | 2018-07-31 | 2018-04-30 | 2018-01-31 | 2017-10-31 | 2017-07-31 | 2017-04-30 | 2017-01-31 | 2016-10-31 | 2016-07-31 | 2016-04-30 | 2016-01-31 | 2015-10-31 | 2015-07-31 | 2015-04-30 | 2015-01-31 | 2014-10-31 | 2014-07-31 | 2014-04-30 | 2014-01-31 | 2013-10-31 | 2013-07-31 | 2013-04-30 | 2013-01-31 | 2012-10-31 | 2012-07-31 | 2012-04-30 | 2012-01-31 | 2011-10-31 | 2011-07-31 | 2011-04-30 | 2011-01-31 | 2010-10-31 | 2010-07-31 | 2010-04-30 | 2010-01-31 | ||
|---|---|---|---|---|---|---|---|---|---|---|---|---|---|---|---|---|---|---|---|---|---|---|---|---|---|---|---|---|---|---|---|---|---|---|---|---|---|---|---|---|---|---|---|---|---|---|---|---|---|---|---|---|---|---|---|---|---|---|
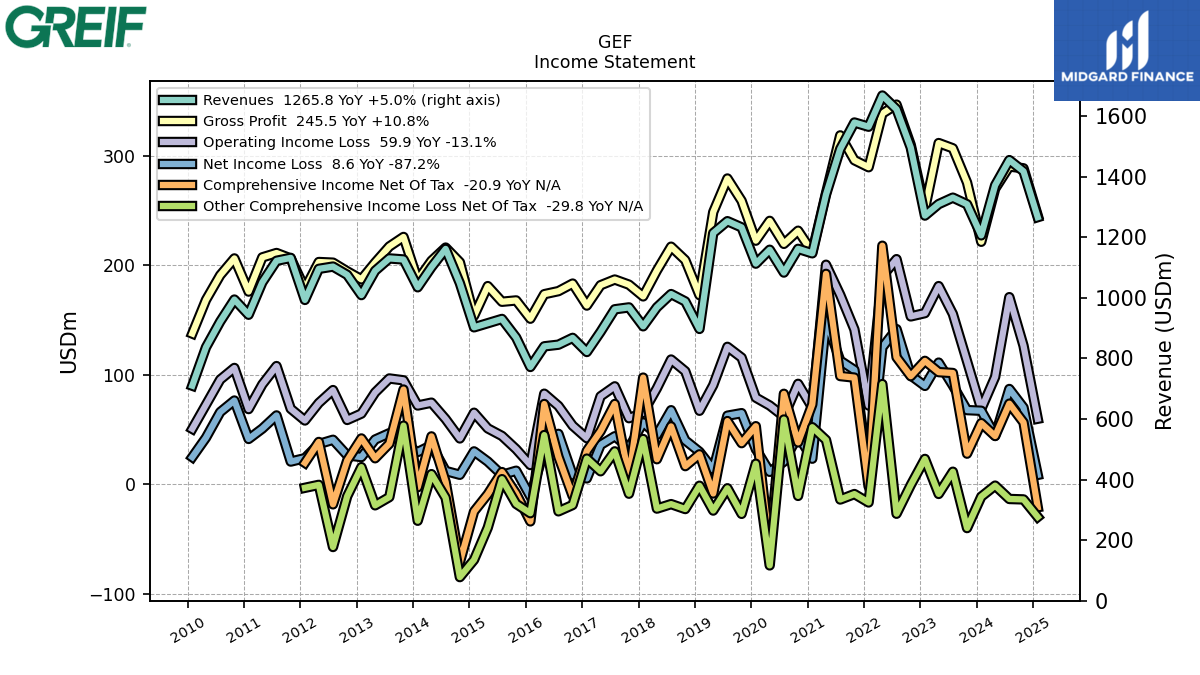
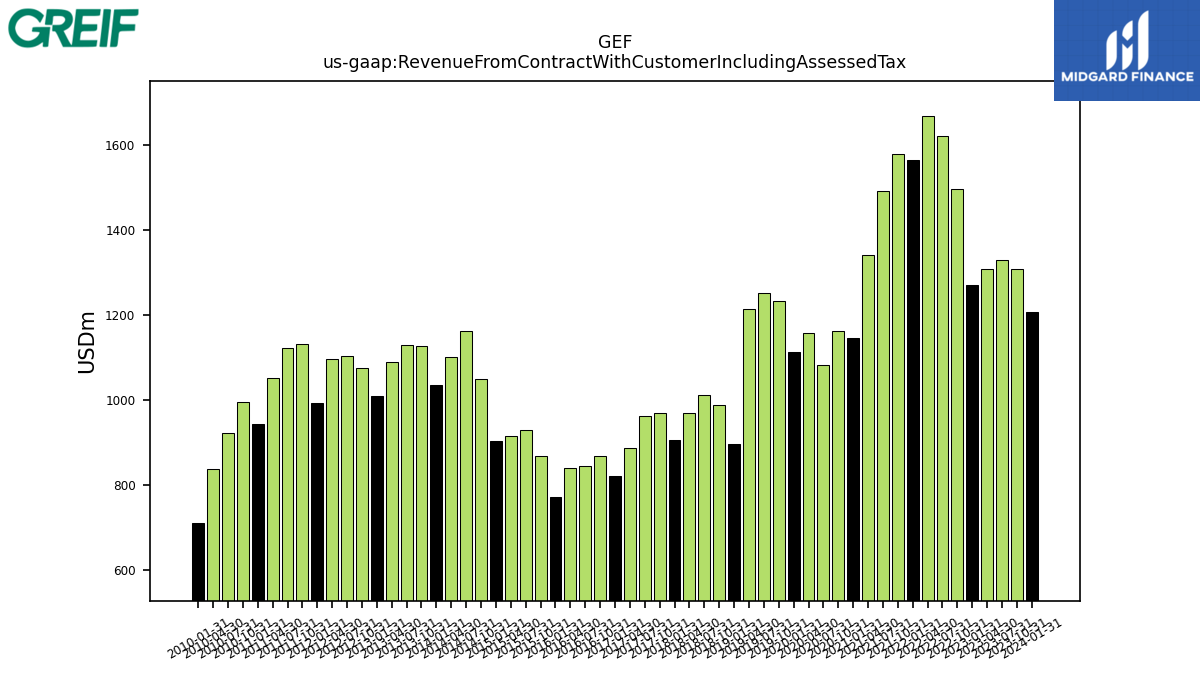
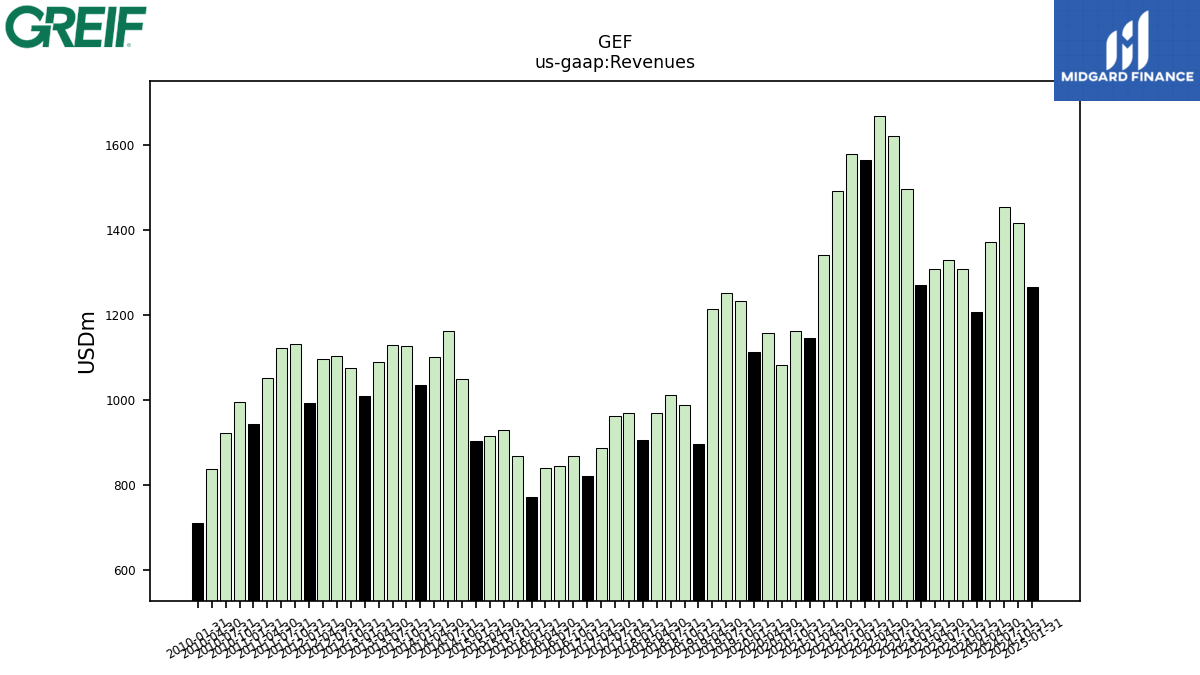
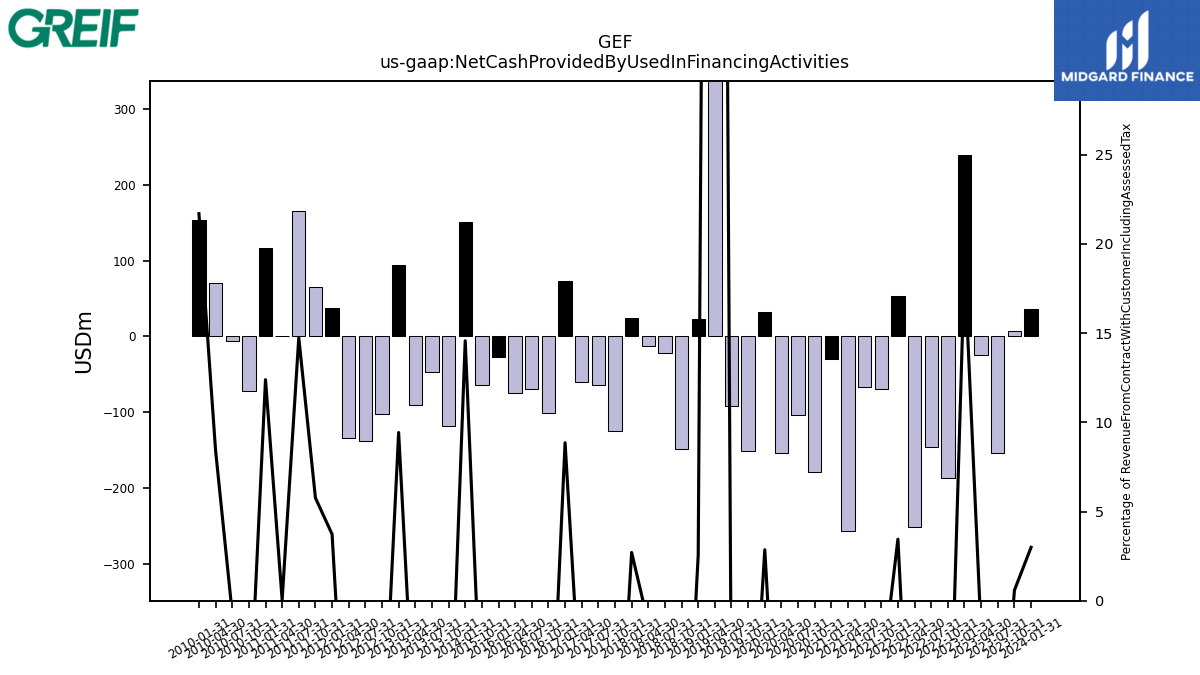
| Revenue From Contract With Customer Including Assessed Tax | 1205.80 | 1308.40 | 1330.30 | 1308.90 | 1271.00 | 1495.80 | 1622.10 | 1667.30 | 1564.30 | 1578.20 | 1490.80 | 1340.60 | 1146.50 | 1161.30 | 1083.00 | 1158.30 | 1112.40 | 1232.10 | 1252.60 | 1213.30 | 897.00 | 987.70 | 1012.10 | 968.30 | 905.70 | 968.10 | 961.80 | 887.40 | 820.90 | 867.60 | 845.00 | 839.60 | 771.40 | 868.50 | 930.00 | 915.90 | 902.30 | 1048.10 | 1161.10 | 1100.70 | 1034.40 | 1126.20 | 1129.70 | 1088.90 | 1008.60 | 1075.60 | 1102.80 | 1095.30 | 992.70 | 1131.49 | 1121.90 | 1050.77 | 943.79 | 993.94 | 921.33 | 836.58 | 709.68 | |
| Revenues | 1205.80 | 1308.40 | 1330.30 | 1308.90 | 1271.00 | 1495.80 | 1622.10 | 1667.30 | 1564.30 | 1578.20 | 1490.80 | 1340.60 | 1146.50 | 1161.30 | 1083.00 | 1158.30 | 1112.40 | 1232.10 | 1252.60 | 1213.30 | 897.00 | 987.70 | 1012.10 | 968.30 | 905.70 | 968.10 | 961.80 | 887.40 | 820.90 | 867.60 | 845.00 | 839.60 | 771.40 | 868.50 | 930.00 | 915.90 | 902.30 | 1048.10 | 1161.10 | 1100.70 | 1034.40 | 1126.20 | 1129.70 | 1088.90 | 1008.60 | 1075.60 | 1102.80 | 1095.30 | 992.70 | 1131.49 | 1121.90 | 1050.77 | 943.79 | 993.94 | 921.33 | 836.58 | 709.68 | |
| Cost Of Goods And Services Sold | 984.20 | 1032.70 | 1023.30 | 997.10 | 1019.40 | 1185.70 | 1275.20 | 1328.60 | 1274.60 | 1282.10 | 1172.00 | 1074.70 | 934.30 | 929.60 | 863.30 | 917.60 | 889.80 | 973.10 | 973.20 | 964.60 | 724.20 | 782.90 | 795.00 | 773.00 | 734.00 | 785.70 | 774.70 | 705.50 | 657.60 | 684.20 | 668.50 | 665.90 | 620.10 | 700.50 | 763.20 | 734.80 | 748.40 | 739.00 | 944.80 | 896.50 | 847.80 | 900.20 | 912.40 | 886.30 | 821.30 | 883.30 | 900.30 | 892.20 | 814.00 | 925.14 | 910.57 | 843.41 | 767.71 | 787.55 | 730.29 | 668.06 | 571.97 | |
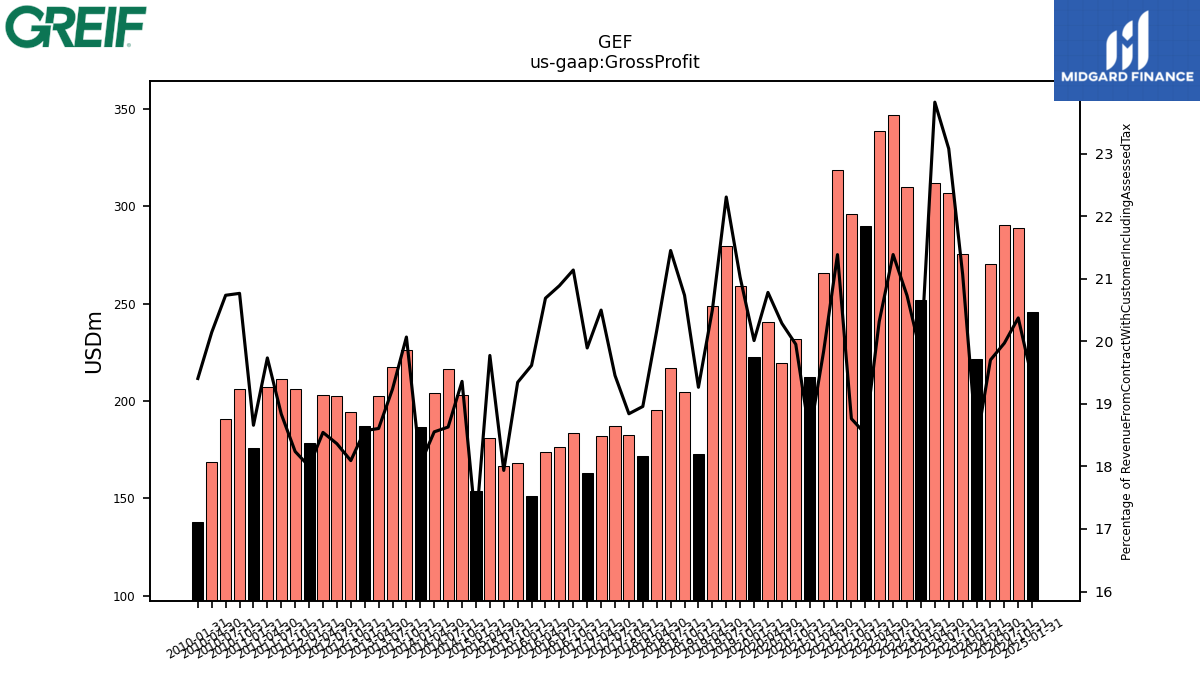
| Gross Profit | 221.60 | 275.70 | 307.00 | 311.80 | 251.60 | 310.10 | 346.90 | 338.70 | 289.70 | 296.10 | 318.80 | 265.90 | 212.20 | 231.70 | 219.70 | 240.70 | 222.60 | 259.00 | 279.40 | 248.70 | 172.80 | 204.80 | 217.10 | 195.30 | 171.70 | 182.40 | 187.10 | 181.90 | 163.30 | 183.40 | 176.50 | 173.70 | 151.30 | 168.00 | 166.80 | 181.10 | 153.90 | 202.90 | 216.30 | 204.20 | 186.60 | 226.00 | 217.30 | 202.60 | 187.30 | 194.60 | 202.50 | 203.10 | 178.70 | 206.35 | 211.33 | 207.35 | 176.09 | 206.40 | 191.04 | 168.52 | 137.71 | |
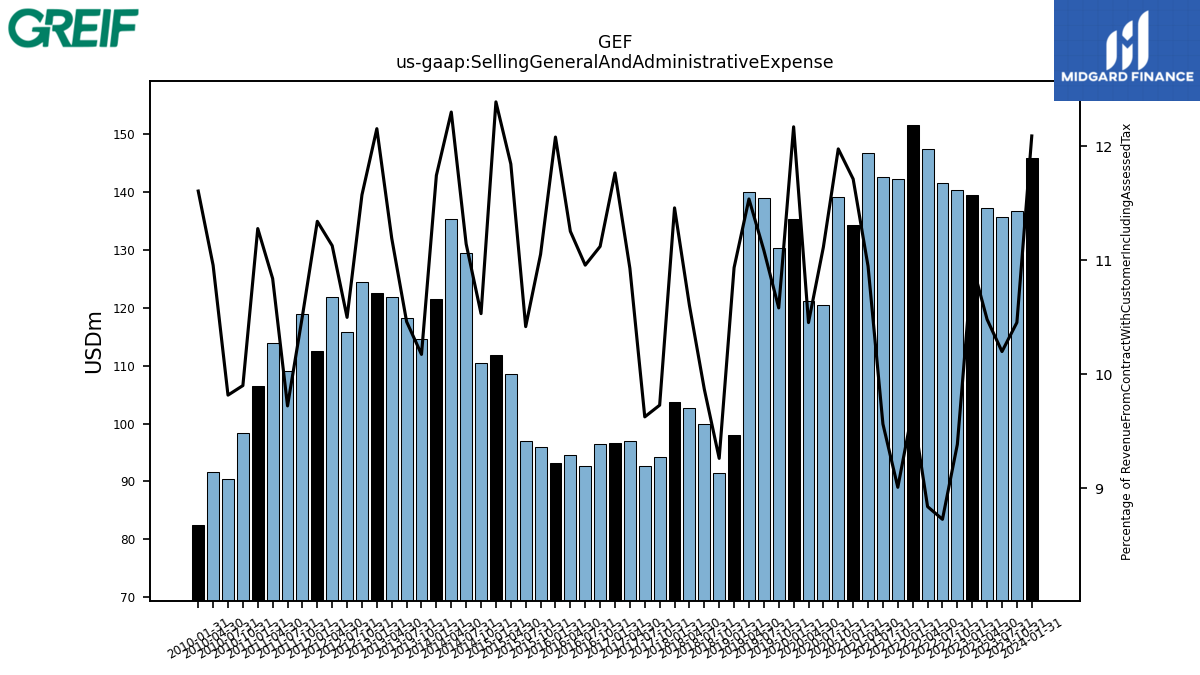
| Selling General And Administrative Expense | 145.80 | 136.80 | 135.70 | 137.20 | 139.40 | 140.40 | 141.60 | 147.40 | 151.60 | 142.20 | 142.60 | 146.80 | 134.30 | 139.10 | 120.40 | 121.10 | 135.40 | 130.40 | 138.90 | 140.00 | 98.10 | 91.50 | 99.90 | 102.70 | 103.80 | 94.20 | 92.60 | 97.00 | 96.60 | 96.50 | 92.60 | 94.50 | 93.20 | 96.00 | 96.90 | 108.50 | 111.80 | 110.40 | 129.40 | 135.40 | 121.50 | 114.60 | 118.20 | 121.90 | 122.60 | 124.50 | 115.80 | 121.90 | 112.60 | 118.94 | 109.09 | 113.91 | 106.45 | 98.42 | 90.46 | 91.67 | 82.38 | |
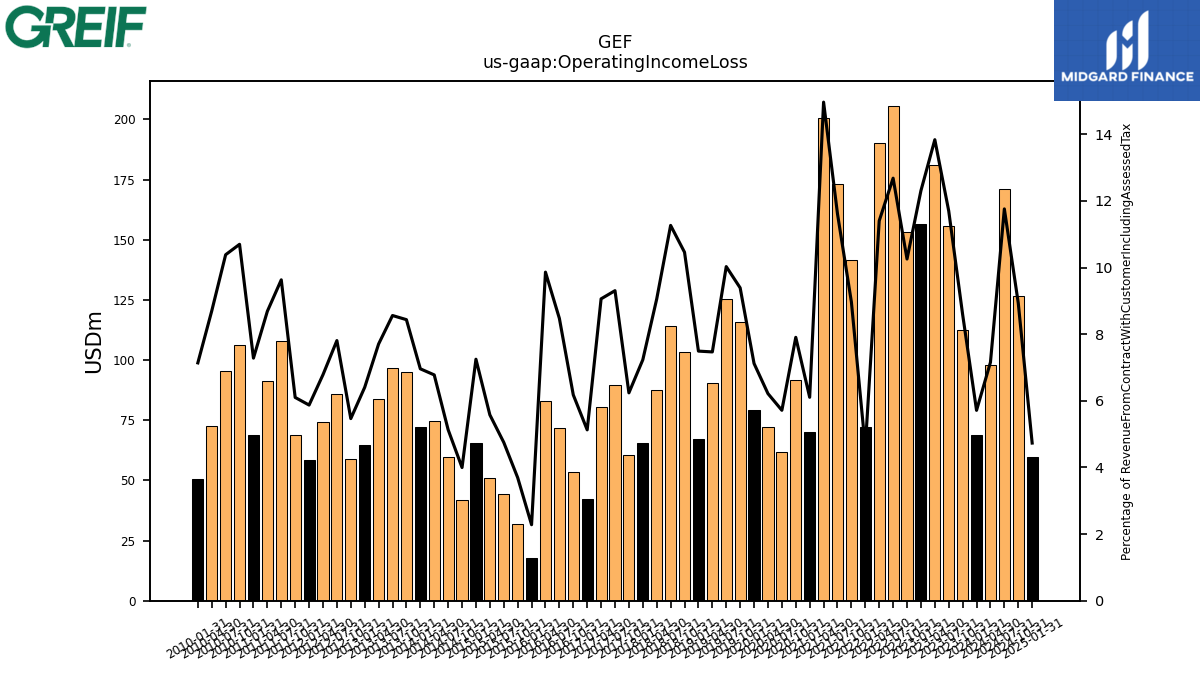
| Operating Income Loss | 68.90 | 112.40 | 155.60 | 181.10 | 156.40 | 153.40 | 205.70 | 190.10 | 72.00 | 141.50 | 173.10 | 200.60 | 70.00 | 91.80 | 61.90 | 72.00 | 79.20 | 115.70 | 125.60 | 90.60 | 67.20 | 103.30 | 114.00 | 87.70 | 65.50 | 60.40 | 89.50 | 80.40 | 42.10 | 53.60 | 71.60 | 82.80 | 17.60 | 32.10 | 44.20 | 51.10 | 65.40 | 41.90 | 59.60 | 74.60 | 72.00 | 95.00 | 96.70 | 83.90 | 64.60 | 58.80 | 86.10 | 74.30 | 58.30 | 69.04 | 108.05 | 91.28 | 68.72 | 106.32 | 95.67 | 72.76 | 50.66 | |
| Interest Income Expense Nonoperating Net | -24.20 | -24.80 | -25.30 | -23.40 | -22.80 | -16.90 | -14.00 | -13.20 | -17.10 | -16.90 | -23.90 | -26.70 | -25.20 | -26.00 | -29.80 | -29.30 | -30.70 | -32.40 | -34.50 | -33.90 | -11.70 | -12.60 | -12.10 | -13.00 | -13.30 | -13.40 | -13.70 | -14.30 | -18.70 | -17.20 | -19.80 | -19.90 | -18.50 | -18.60 | -18.40 | -18.20 | -19.60 | -20.30 | -20.70 | -20.40 | -20.40 | -21.60 | -19.20 | -21.40 | -21.60 | NA | NA | NA | NA | NA | NA | NA | NA | NA | NA | NA | NA | |
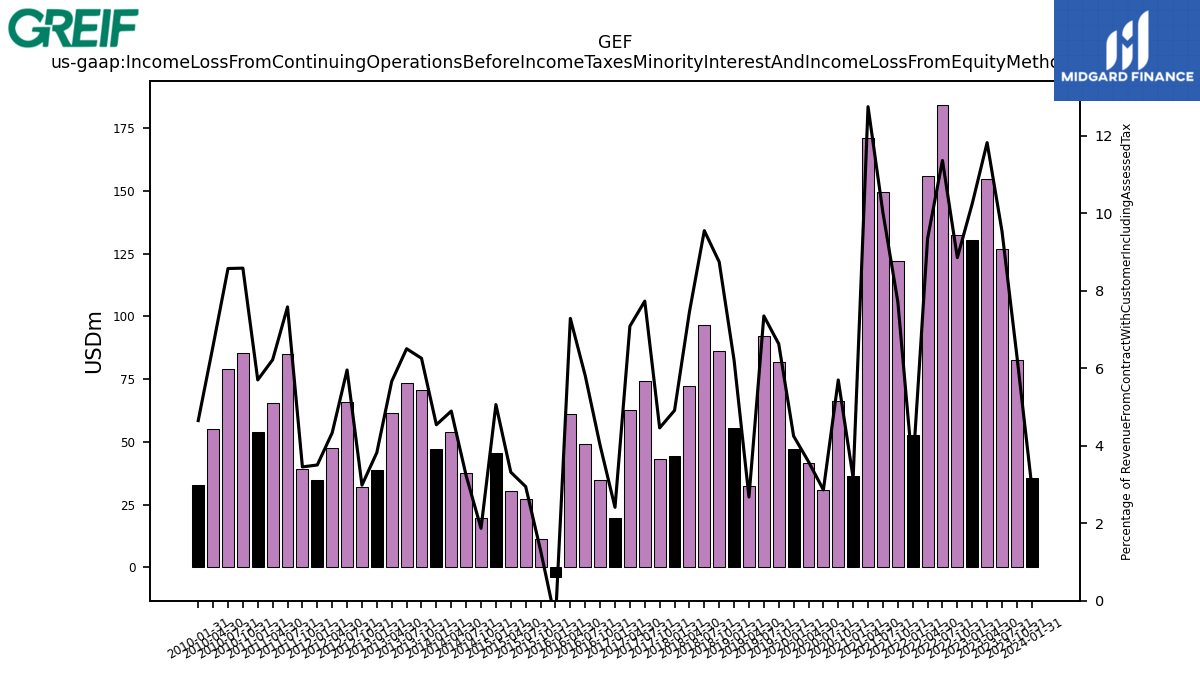
| Income Loss From Continuing Operations Before Income Taxes Minority Interest And Income Loss From Equity Method Investments | 35.60 | 82.70 | 126.90 | 154.80 | 130.30 | 132.50 | 184.40 | 155.90 | 52.90 | 121.90 | 149.40 | 171.00 | 36.30 | 66.20 | 31.00 | 41.60 | 47.30 | 81.70 | 92.10 | 32.50 | 55.70 | 86.40 | 96.70 | 72.20 | 44.50 | 43.20 | 74.40 | 62.90 | 19.80 | 34.80 | 49.10 | 61.20 | -3.90 | 11.30 | 27.40 | 30.40 | 45.70 | 19.60 | 37.50 | 53.90 | 47.00 | 70.50 | 73.50 | 61.70 | 38.60 | 32.10 | 65.70 | 47.50 | 34.80 | 39.09 | 85.12 | 65.39 | 53.81 | 85.35 | 79.03 | 55.10 | 33.01 | |
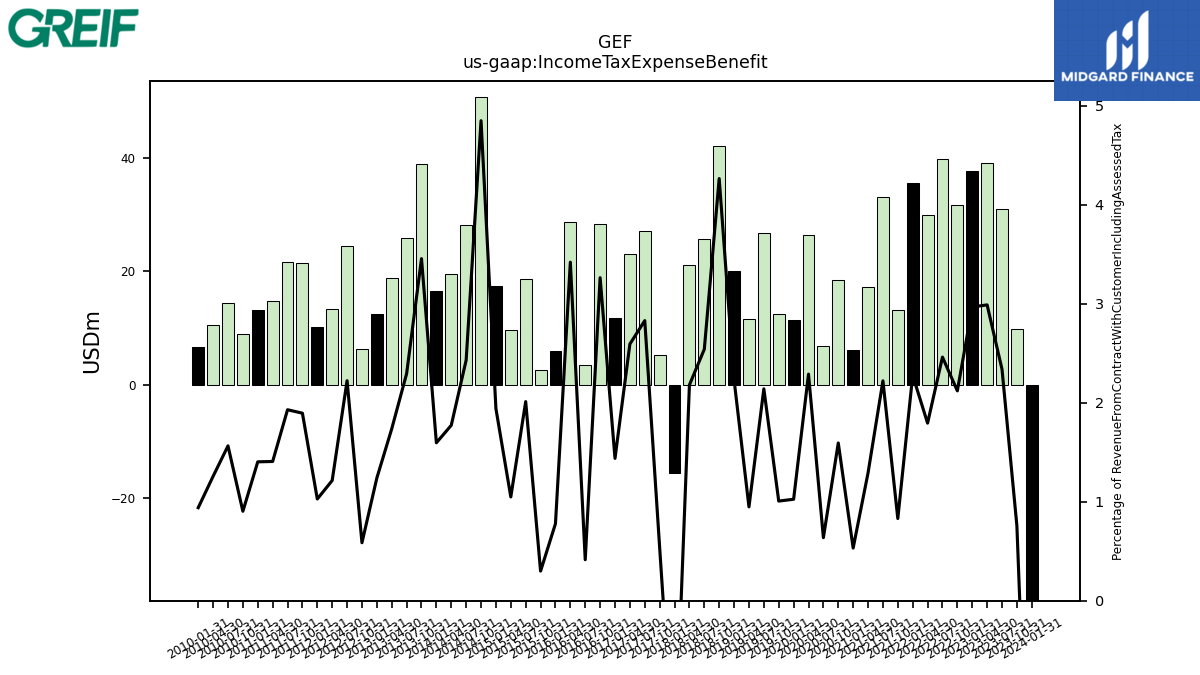
| Income Tax Expense Benefit | -38.20 | 9.90 | 31.10 | 39.10 | 37.70 | 31.70 | 39.90 | 29.90 | 35.60 | 13.10 | 33.10 | 17.30 | 6.10 | 18.50 | 6.90 | 26.50 | 11.40 | 12.40 | 26.80 | 11.50 | 20.00 | 42.10 | 25.70 | 21.10 | -15.60 | 5.20 | 27.20 | 23.00 | 11.80 | 28.30 | 3.50 | 28.70 | 6.00 | 2.60 | 18.70 | 9.60 | 17.50 | 50.80 | 28.20 | 19.50 | 16.50 | 38.90 | 25.90 | 18.90 | 12.50 | 6.30 | 24.50 | 13.30 | 10.20 | 21.43 | 21.64 | 14.78 | 13.24 | 8.98 | 14.41 | 10.51 | 6.67 | |
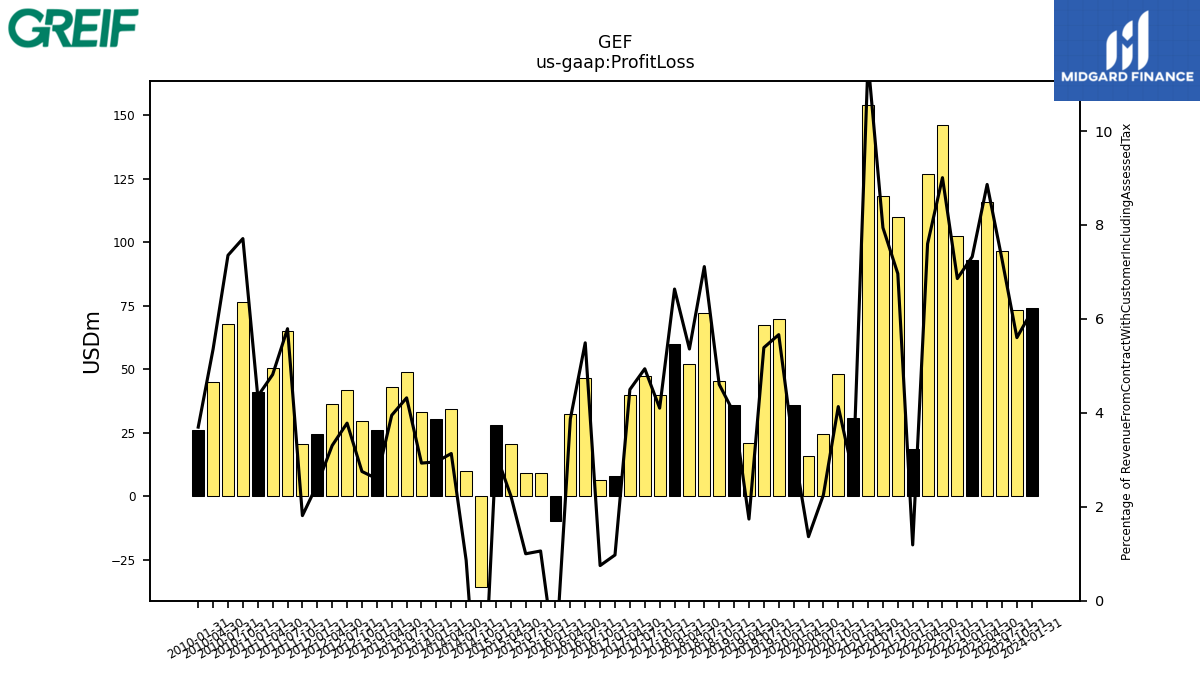
| Profit Loss | 74.30 | 73.30 | 96.70 | 116.00 | 93.10 | 102.60 | 146.10 | 126.70 | 18.60 | 109.90 | 118.40 | 154.00 | 30.90 | 48.00 | 24.40 | 15.80 | 36.10 | 69.80 | 67.50 | 21.10 | 35.80 | 45.50 | 72.00 | 51.90 | 60.10 | 39.70 | 47.50 | 39.90 | 8.00 | 6.50 | 46.40 | 32.50 | -9.90 | 9.20 | 9.30 | 20.50 | 28.20 | -35.50 | 10.00 | 34.50 | 30.60 | 33.00 | 48.80 | 43.00 | 26.20 | 29.60 | 41.70 | 36.20 | 24.60 | 20.51 | 64.97 | 50.59 | 41.10 | 76.64 | 67.76 | 44.83 | 26.23 | |
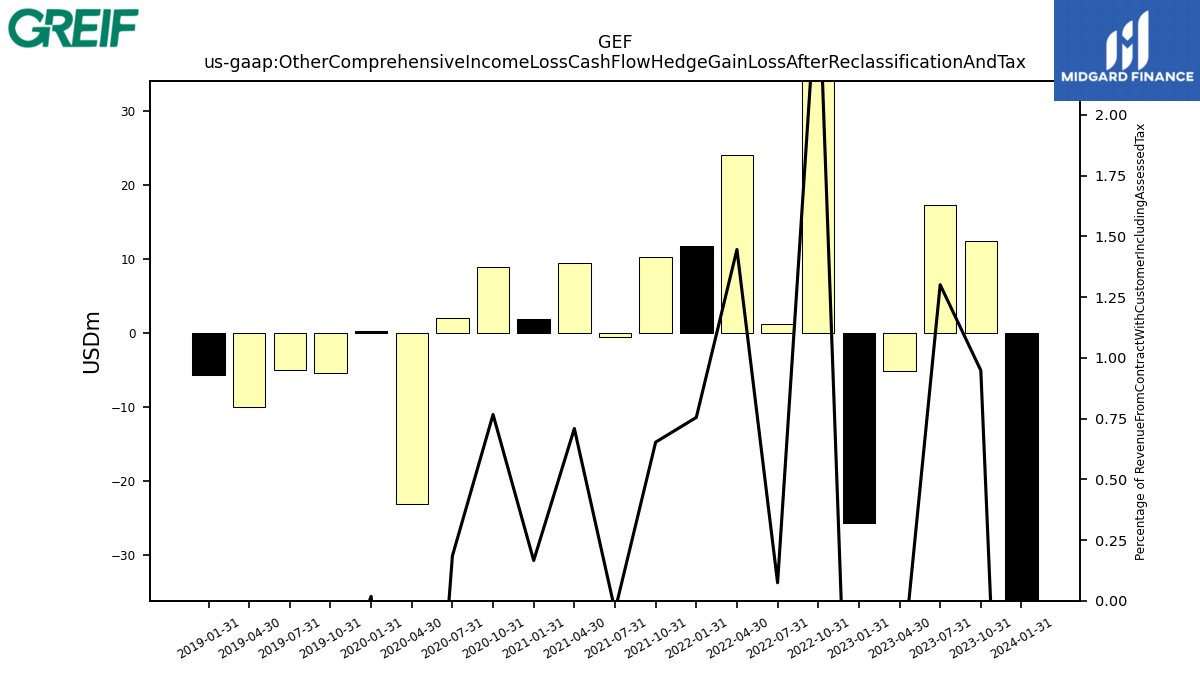
| Other Comprehensive Income Loss Cash Flow Hedge Gain Loss After Reclassification And Tax | -36.20 | 12.40 | 17.30 | -5.10 | -25.70 | 39.30 | 1.20 | 24.10 | 11.80 | 10.30 | -0.60 | 9.50 | 1.90 | 8.90 | 2.00 | -23.10 | 0.20 | -5.40 | -5.00 | -10.00 | -5.70 | NA | NA | NA | NA | NA | NA | NA | NA | NA | NA | NA | NA | NA | NA | NA | NA | NA | NA | NA | NA | NA | NA | NA | NA | NA | NA | NA | NA | NA | NA | NA | NA | NA | NA | NA | NA | |
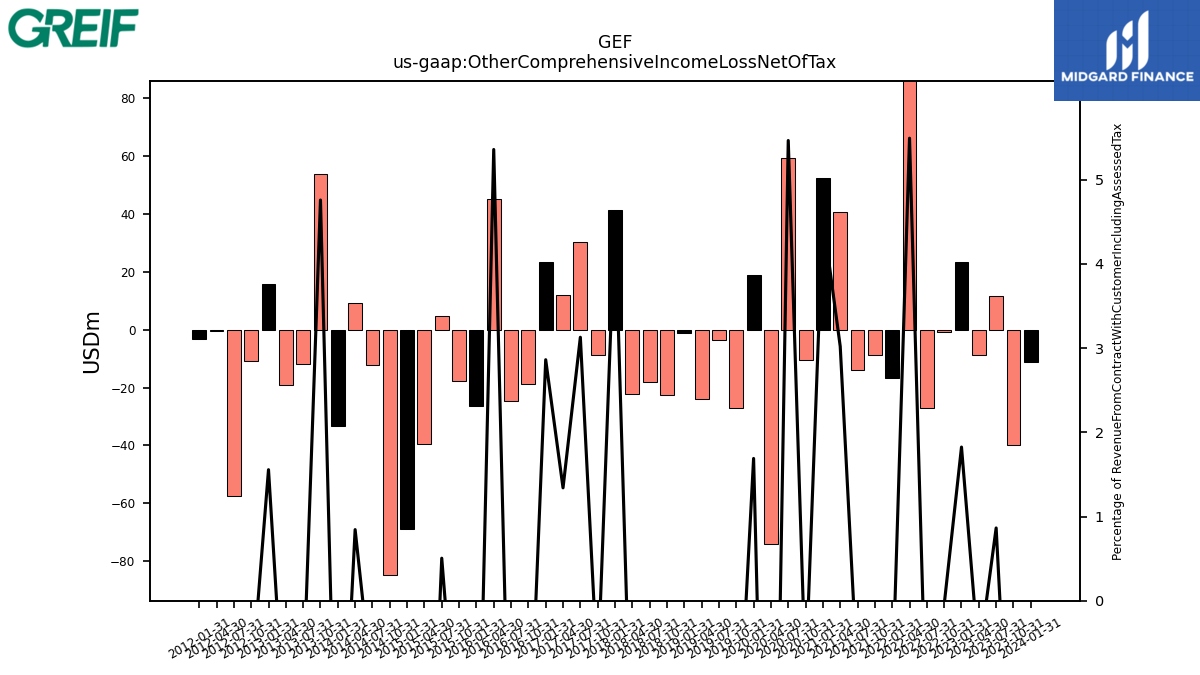
| Other Comprehensive Income Loss Net Of Tax | -11.30 | -40.00 | 11.50 | -8.80 | 23.20 | -0.70 | -26.90 | 91.60 | -16.60 | -8.90 | -13.90 | 40.50 | 52.20 | -10.60 | 59.20 | -74.10 | 18.80 | -27.00 | -3.60 | -24.00 | -1.30 | -22.60 | -18.10 | -22.20 | 41.40 | -8.60 | 30.10 | 11.90 | 23.50 | -18.90 | -24.70 | 45.00 | -26.40 | -17.90 | 4.70 | -39.60 | -69.00 | -84.80 | -12.30 | 9.30 | -33.30 | 53.60 | -11.70 | -19.20 | 15.70 | -10.90 | -57.30 | -0.50 | -3.20 | NA | NA | NA | NA | NA | NA | NA | NA | |
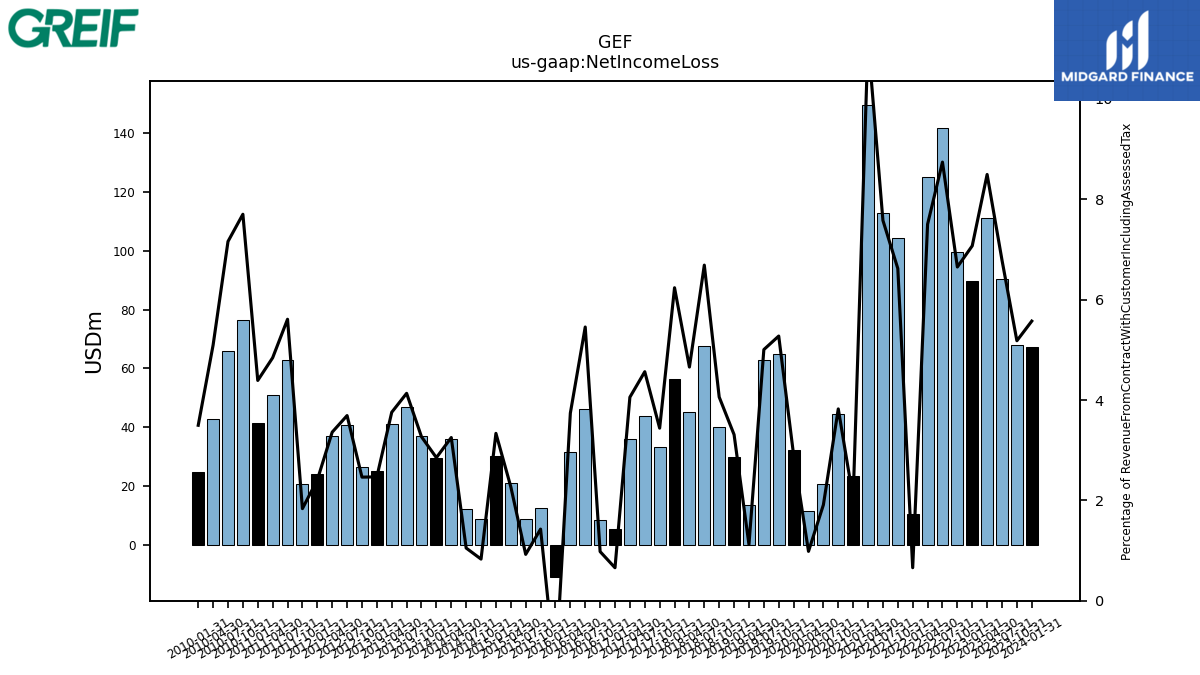
| Net Income Loss | 67.20 | 67.80 | 90.30 | 111.20 | 89.90 | 99.50 | 141.80 | 125.10 | 10.30 | 104.50 | 113.00 | 149.80 | 23.40 | 44.40 | 20.70 | 11.40 | 32.30 | 65.00 | 62.70 | 13.60 | 29.70 | 40.10 | 67.70 | 45.10 | 56.50 | 33.30 | 43.90 | 36.00 | 5.40 | 8.50 | 46.10 | 31.40 | -11.10 | 12.40 | 8.60 | 20.80 | 30.10 | 8.70 | 12.20 | 35.80 | 29.50 | 36.80 | 46.70 | 40.90 | 24.90 | 26.50 | 40.70 | 36.80 | 23.90 | 20.77 | 62.94 | 50.88 | 41.44 | 76.56 | 65.97 | 42.63 | 24.82 | |
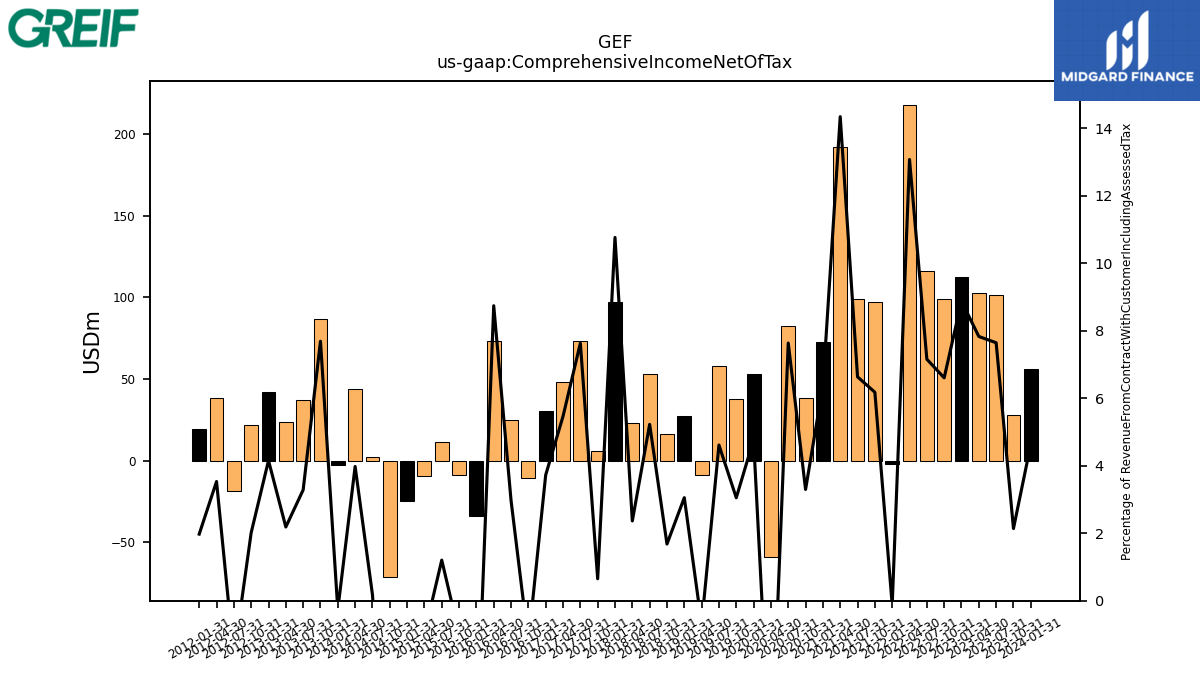
| Comprehensive Income Net Of Tax | 55.90 | 28.00 | 101.70 | 102.50 | 112.80 | 98.80 | 116.10 | 218.00 | -2.00 | 97.50 | 98.90 | 192.30 | 73.00 | 38.30 | 82.70 | -59.10 | 53.10 | 37.60 | 57.80 | -8.40 | 27.40 | 16.60 | 52.90 | 22.90 | 97.50 | 6.30 | 73.40 | 48.50 | 30.60 | -10.70 | 25.10 | 73.40 | -33.90 | -8.50 | 11.20 | -9.00 | -24.80 | -71.20 | 2.10 | 43.80 | -2.70 | 86.60 | 37.10 | 23.80 | 41.90 | 21.70 | -18.30 | 38.70 | 19.60 | NA | NA | NA | NA | NA | NA | NA | NA |
| 2024-01-31 | 2023-10-31 | 2023-07-31 | 2023-04-30 | 2023-01-31 | 2022-10-31 | 2022-07-31 | 2022-04-30 | 2022-01-31 | 2021-10-31 | 2021-07-31 | 2021-04-30 | 2021-01-31 | 2020-10-31 | 2020-07-31 | 2020-04-30 | 2020-01-31 | 2019-10-31 | 2019-07-31 | 2019-04-30 | 2019-01-31 | 2018-10-31 | 2018-07-31 | 2018-04-30 | 2018-01-31 | 2017-10-31 | 2017-07-31 | 2017-04-30 | 2017-01-31 | 2016-10-31 | 2016-07-31 | 2016-04-30 | 2016-01-31 | 2015-10-31 | 2015-07-31 | 2015-04-30 | 2015-01-31 | 2014-10-31 | 2014-07-31 | 2014-04-30 | 2014-01-31 | 2013-10-31 | 2013-07-31 | 2013-04-30 | 2013-01-31 | 2012-10-31 | 2012-07-31 | 2012-04-30 | 2012-01-31 | 2011-10-31 | 2011-07-31 | 2011-04-30 | 2011-01-31 | 2010-10-31 | 2010-07-31 | 2010-04-30 | 2010-01-31 | ||
|---|---|---|---|---|---|---|---|---|---|---|---|---|---|---|---|---|---|---|---|---|---|---|---|---|---|---|---|---|---|---|---|---|---|---|---|---|---|---|---|---|---|---|---|---|---|---|---|---|---|---|---|---|---|---|---|---|---|---|
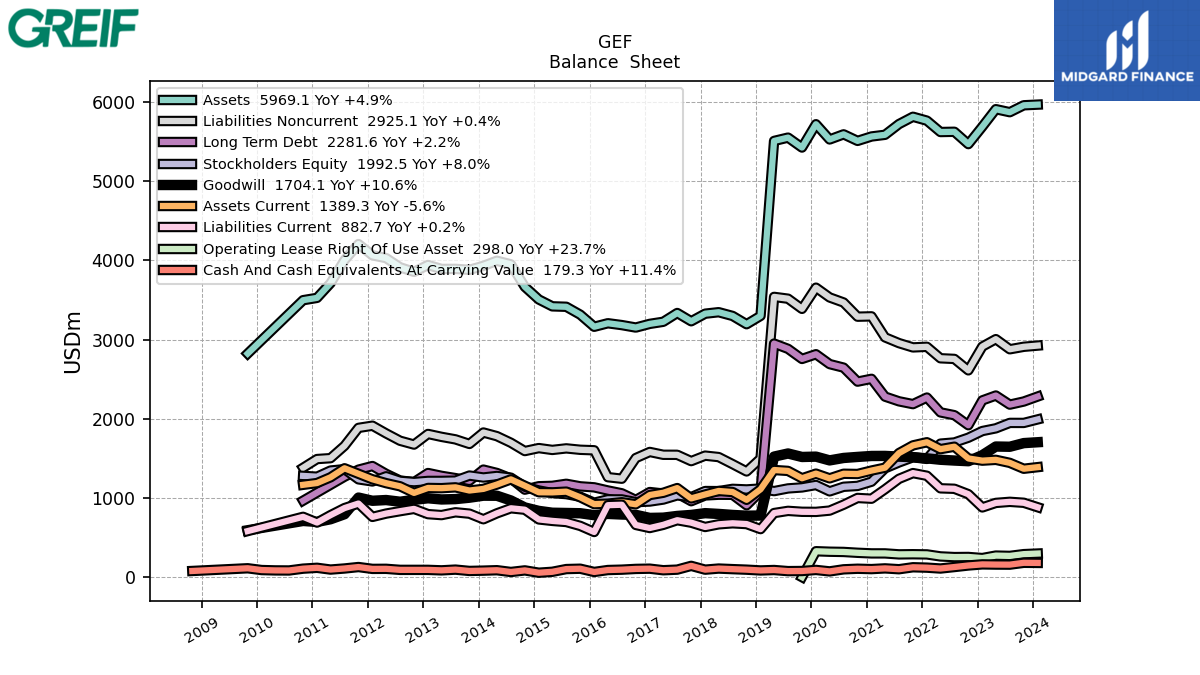
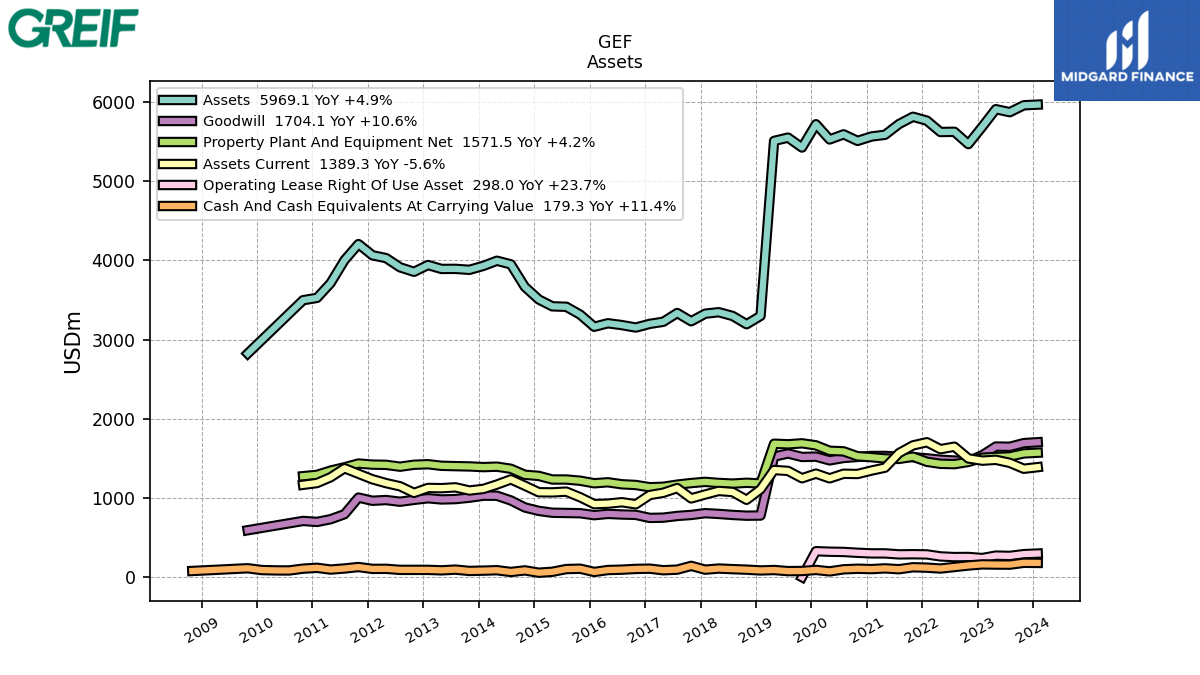
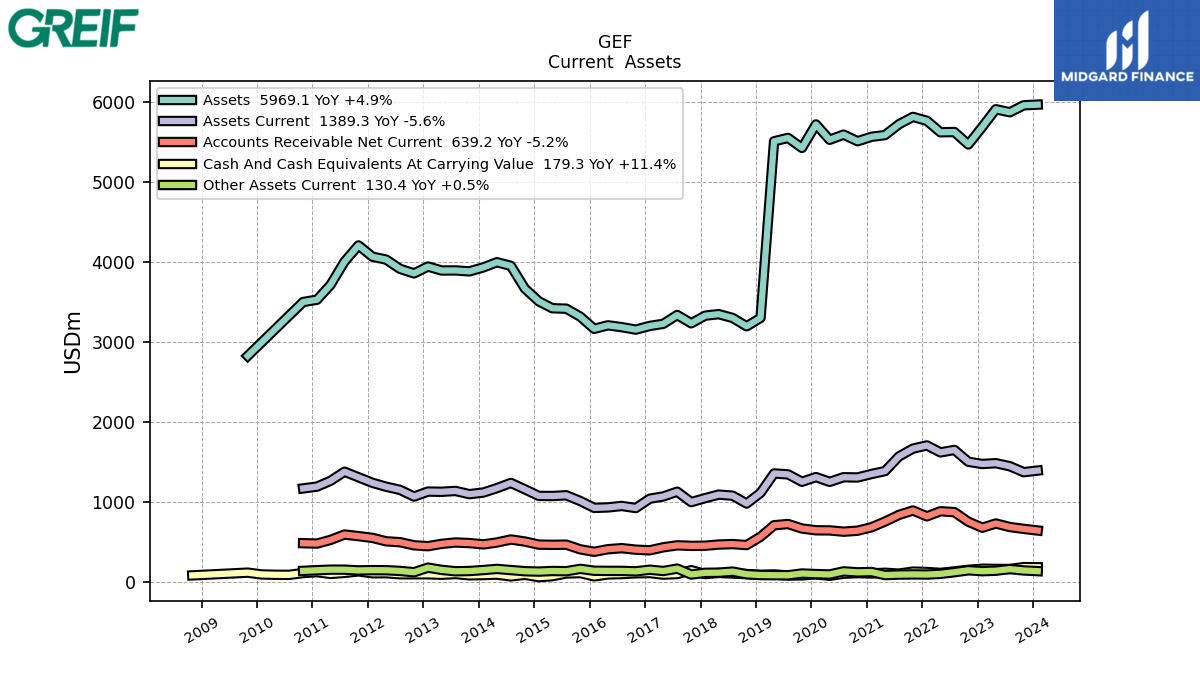
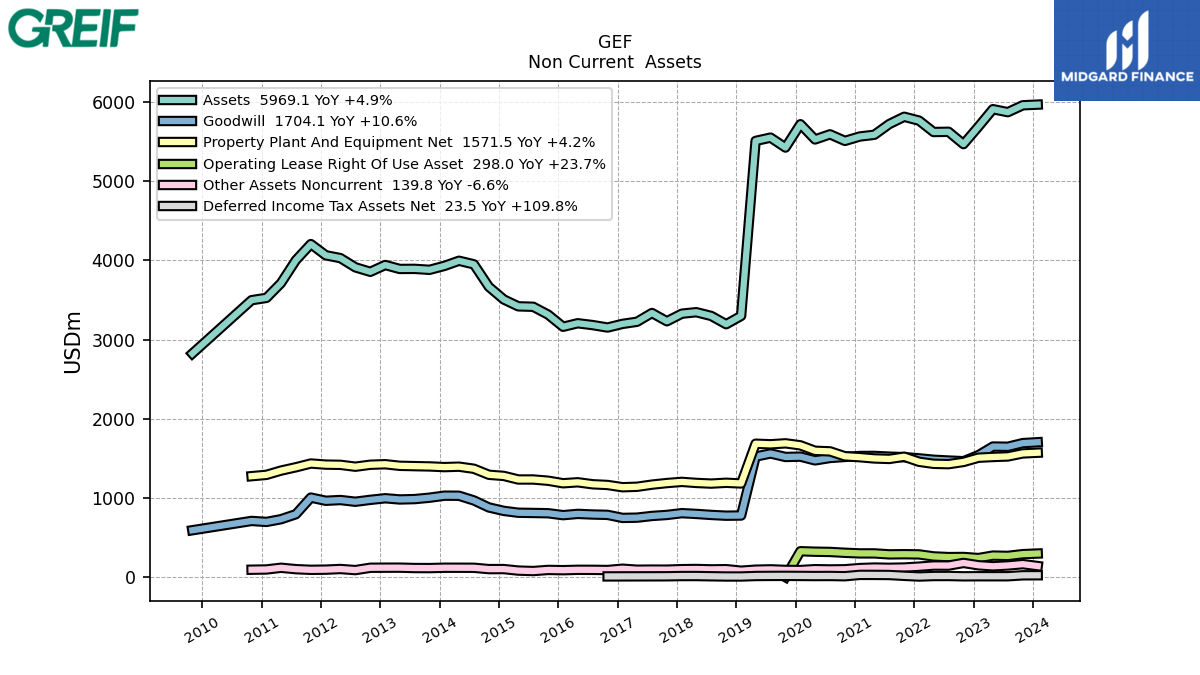
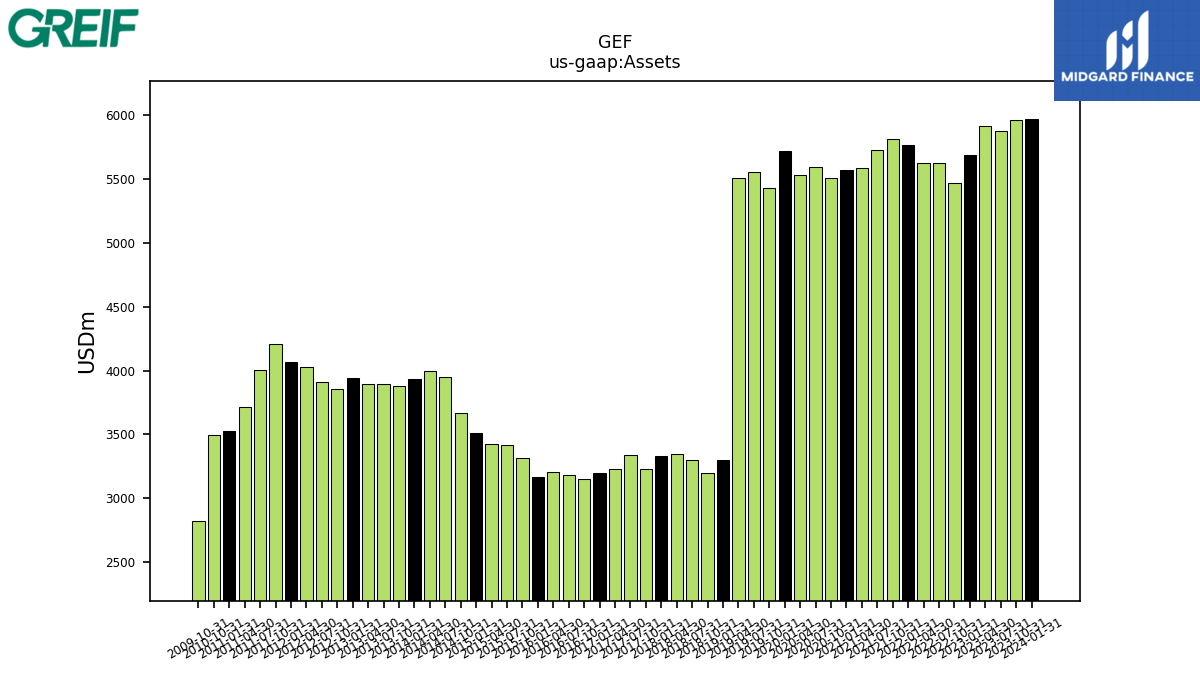
| Assets | 5969.10 | 5960.80 | 5873.50 | 5911.50 | 5690.60 | 5469.90 | 5626.10 | 5622.90 | 5766.60 | 5815.80 | 5723.60 | 5587.90 | 5566.60 | 5510.90 | 5593.80 | 5529.00 | 5721.50 | 5426.70 | 5552.40 | 5510.40 | 3300.20 | 3194.80 | 3299.40 | 3346.80 | 3328.10 | 3232.30 | 3336.70 | 3225.80 | 3199.30 | 3153.00 | 3183.90 | 3207.20 | 3162.80 | 3315.70 | 3415.30 | 3420.80 | 3507.50 | 3667.40 | 3951.40 | 3996.60 | 3932.30 | 3882.20 | 3894.20 | 3893.20 | 3942.90 | 3856.90 | 3913.70 | 4030.20 | 4065.60 | 4207.28 | 4003.89 | 3713.52 | 3527.77 | 3498.45 | NA | NA | NA | |
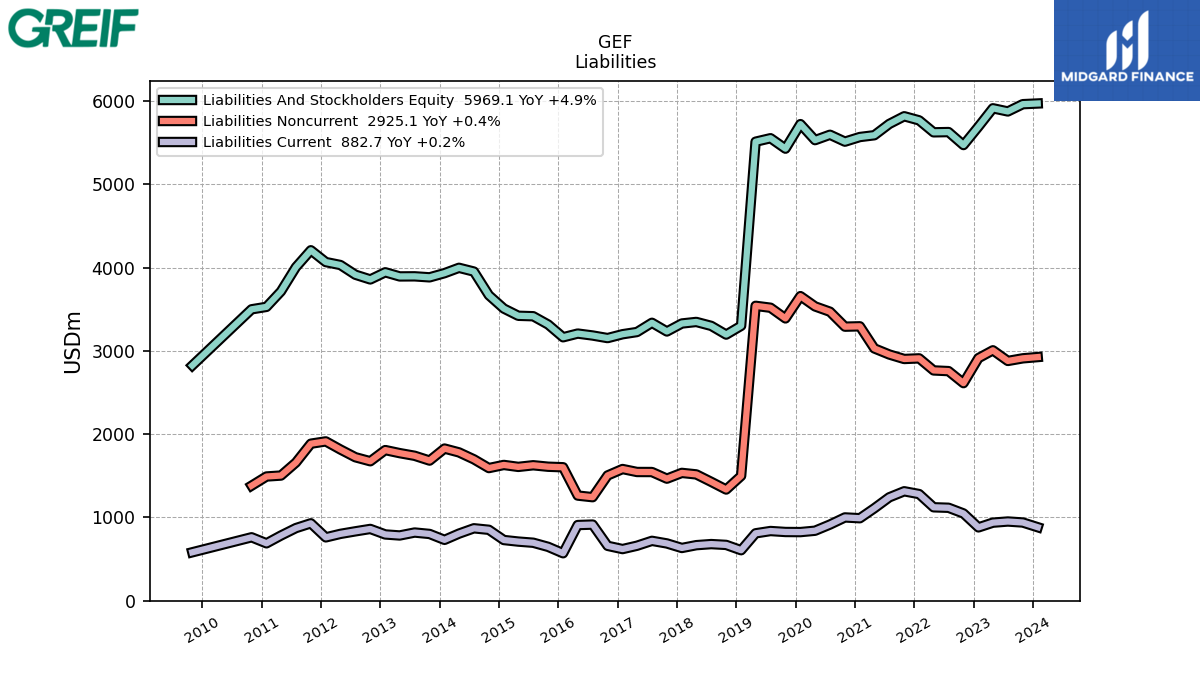
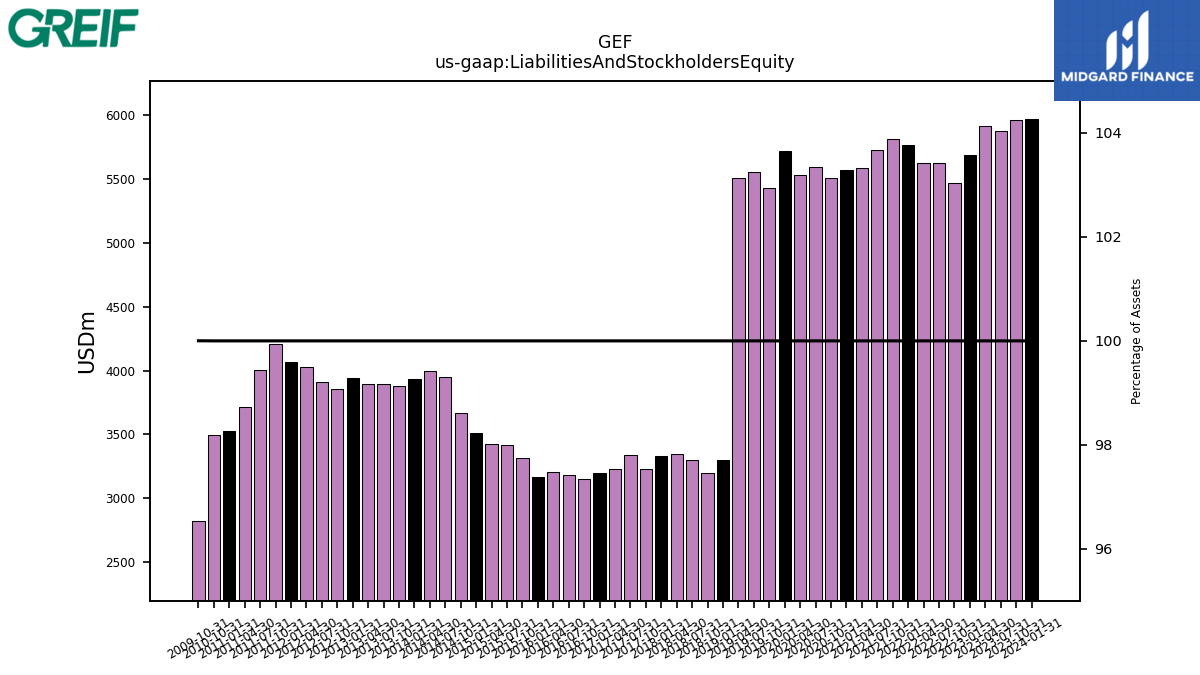
| Liabilities And Stockholders Equity | 5969.10 | 5960.80 | 5873.50 | 5911.50 | 5690.60 | 5469.90 | 5626.10 | 5622.90 | 5766.60 | 5815.80 | 5723.60 | 5587.90 | 5566.60 | 5510.90 | 5593.80 | 5529.00 | 5721.50 | 5426.70 | 5552.40 | 5510.40 | 3300.20 | 3194.80 | 3299.40 | 3346.80 | 3328.10 | 3232.30 | 3336.70 | 3225.80 | 3199.30 | 3153.00 | 3183.90 | 3207.20 | 3162.80 | 3315.70 | 3415.30 | 3420.80 | 3507.50 | 3667.40 | 3951.40 | 3996.60 | 3932.30 | 3882.20 | 3894.20 | 3893.20 | 3942.90 | 3856.90 | 3913.70 | 4030.20 | 4065.60 | 4207.28 | 4003.89 | 3713.52 | 3527.77 | 3498.45 | NA | NA | NA | |
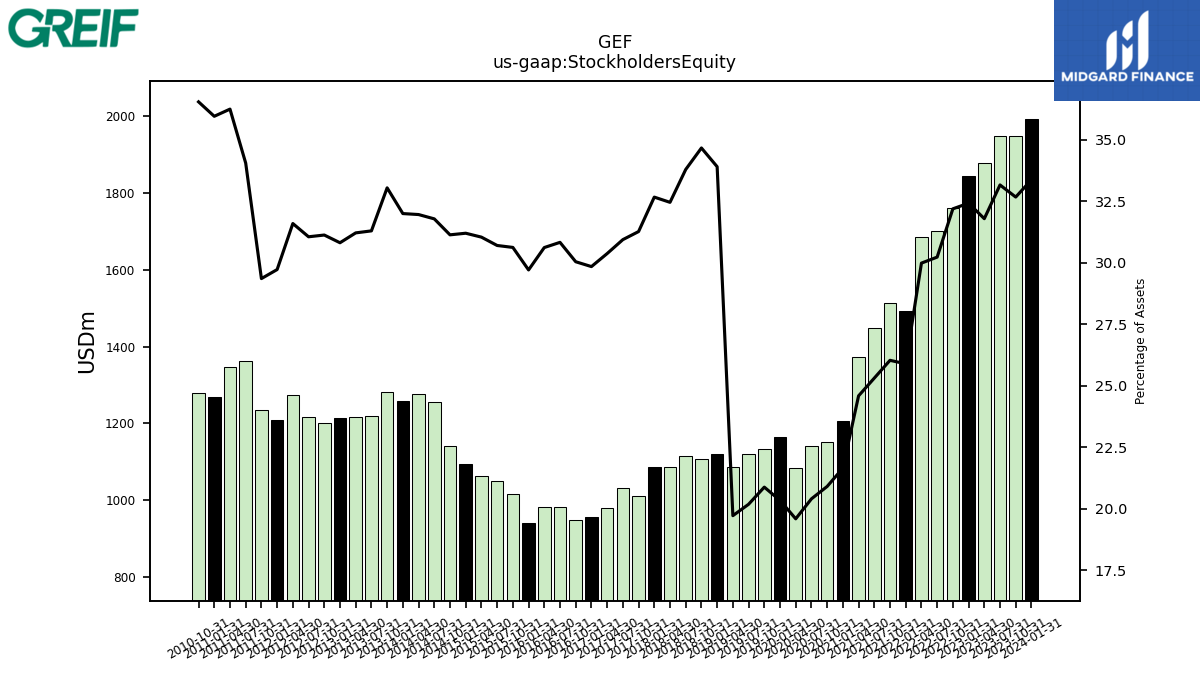
| Stockholders Equity | 1992.50 | 1947.90 | 1948.30 | 1879.80 | 1845.40 | 1761.30 | 1701.10 | 1686.40 | 1493.30 | 1514.30 | 1448.90 | 1374.20 | 1205.30 | 1152.20 | 1141.30 | 1083.20 | 1163.80 | 1133.10 | 1120.60 | 1086.60 | 1119.20 | 1107.80 | 1115.20 | 1086.50 | 1087.50 | 1010.90 | 1032.60 | 980.00 | 955.00 | 947.40 | 981.80 | 982.20 | 939.80 | 1015.60 | 1048.80 | 1062.10 | 1094.60 | 1142.10 | 1256.20 | 1277.60 | 1258.60 | 1283.20 | 1219.00 | 1215.50 | 1215.20 | 1200.80 | 1215.70 | 1273.60 | 1208.70 | 1235.35 | 1363.69 | 1346.35 | 1268.72 | 1278.72 | NA | NA | NA |
| 2024-01-31 | 2023-10-31 | 2023-07-31 | 2023-04-30 | 2023-01-31 | 2022-10-31 | 2022-07-31 | 2022-04-30 | 2022-01-31 | 2021-10-31 | 2021-07-31 | 2021-04-30 | 2021-01-31 | 2020-10-31 | 2020-07-31 | 2020-04-30 | 2020-01-31 | 2019-10-31 | 2019-07-31 | 2019-04-30 | 2019-01-31 | 2018-10-31 | 2018-07-31 | 2018-04-30 | 2018-01-31 | 2017-10-31 | 2017-07-31 | 2017-04-30 | 2017-01-31 | 2016-10-31 | 2016-07-31 | 2016-04-30 | 2016-01-31 | 2015-10-31 | 2015-07-31 | 2015-04-30 | 2015-01-31 | 2014-10-31 | 2014-07-31 | 2014-04-30 | 2014-01-31 | 2013-10-31 | 2013-07-31 | 2013-04-30 | 2013-01-31 | 2012-10-31 | 2012-07-31 | 2012-04-30 | 2012-01-31 | 2011-10-31 | 2011-07-31 | 2011-04-30 | 2011-01-31 | 2010-10-31 | 2010-07-31 | 2010-04-30 | 2010-01-31 | ||
|---|---|---|---|---|---|---|---|---|---|---|---|---|---|---|---|---|---|---|---|---|---|---|---|---|---|---|---|---|---|---|---|---|---|---|---|---|---|---|---|---|---|---|---|---|---|---|---|---|---|---|---|---|---|---|---|---|---|---|
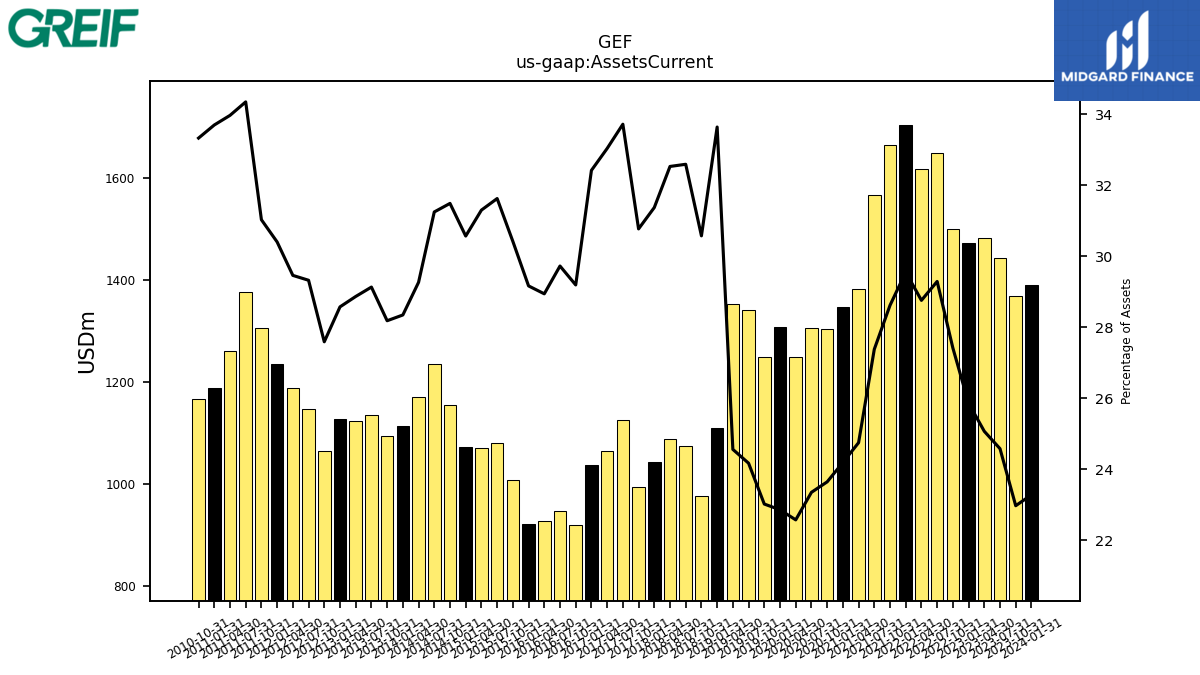
| Assets Current | 1389.30 | 1369.10 | 1443.40 | 1481.70 | 1471.50 | 1499.40 | 1647.70 | 1616.80 | 1704.00 | 1664.10 | 1566.90 | 1382.70 | 1346.30 | 1302.80 | 1305.90 | 1247.90 | 1307.60 | 1249.00 | 1341.80 | 1353.10 | 1110.10 | 976.70 | 1075.20 | 1088.60 | 1044.00 | 994.50 | 1125.00 | 1065.60 | 1037.10 | 920.30 | 946.30 | 928.10 | 922.30 | 1008.50 | 1080.00 | 1070.60 | 1072.10 | 1154.70 | 1234.60 | 1169.50 | 1114.50 | 1094.00 | 1134.30 | 1123.70 | 1126.50 | 1064.00 | 1147.50 | 1187.20 | 1235.90 | 1305.34 | 1375.15 | 1261.31 | 1188.66 | 1165.89 | NA | NA | NA | |
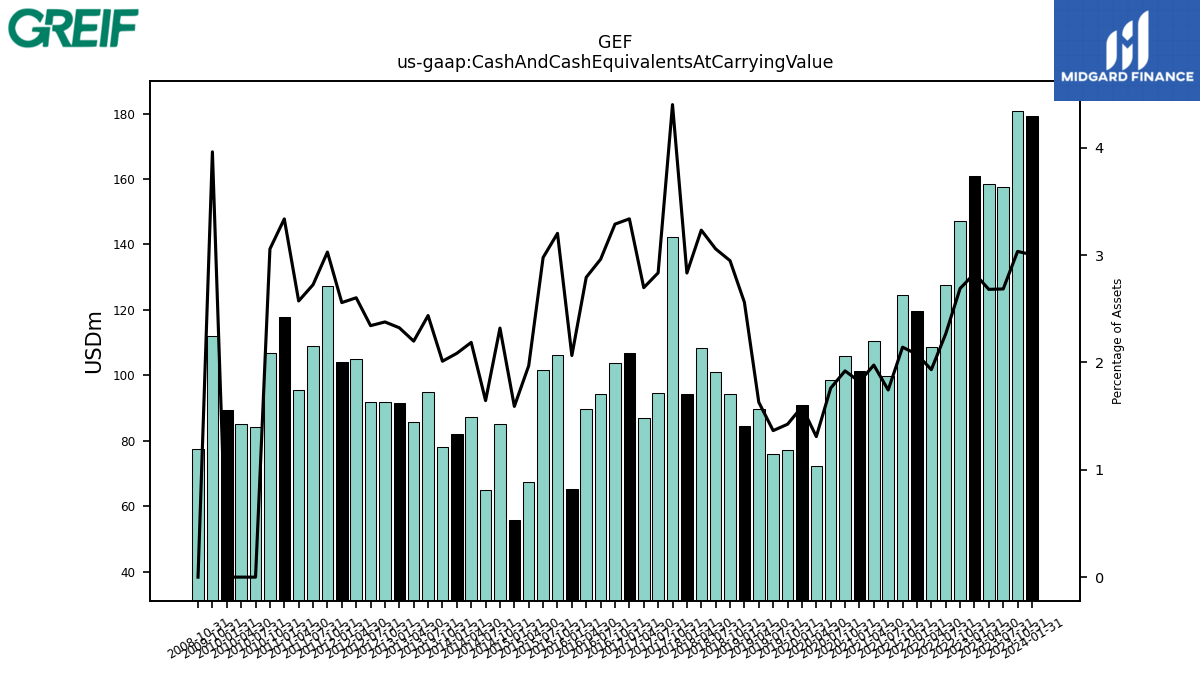
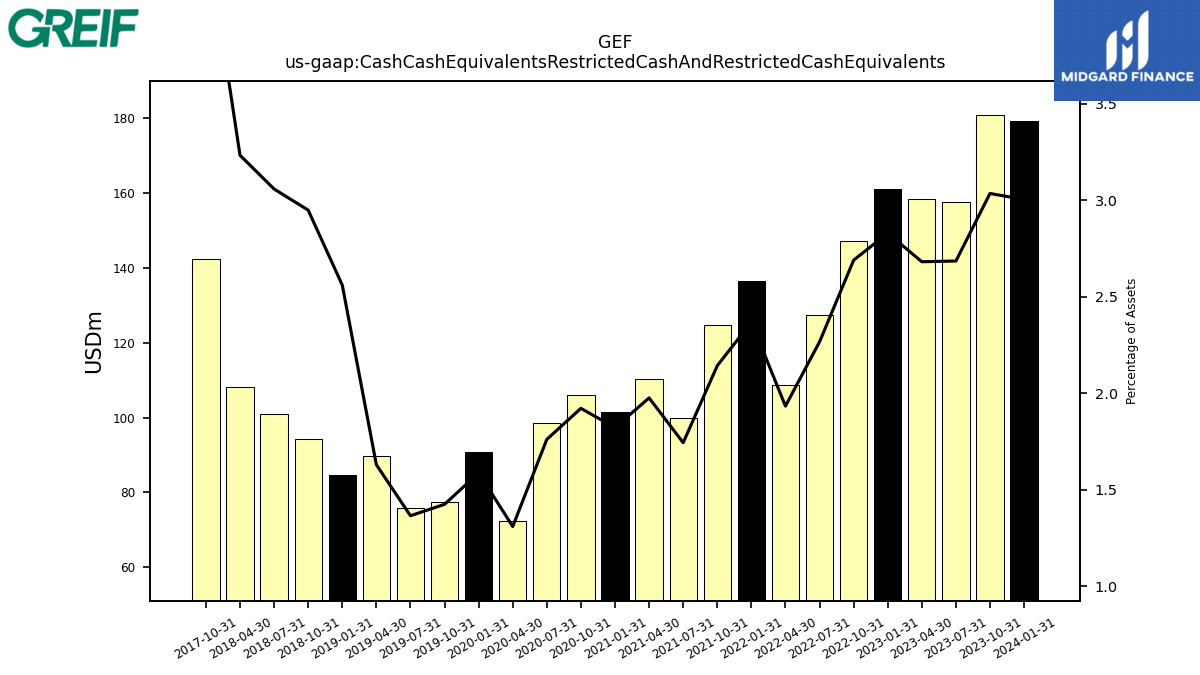
| Cash And Cash Equivalents At Carrying Value | 179.30 | 180.90 | 157.70 | 158.50 | 161.00 | 147.10 | 127.50 | 108.70 | 119.70 | 124.60 | 99.80 | 110.40 | 101.40 | 105.90 | 98.50 | 72.40 | 90.80 | 77.30 | 75.80 | 89.80 | 84.50 | 94.20 | 100.90 | 108.20 | 94.30 | 142.30 | 94.60 | 87.00 | 106.80 | 103.70 | 94.30 | 89.60 | 65.30 | 106.20 | 101.70 | 67.40 | 55.80 | 85.10 | 65.00 | 87.40 | 82.00 | 78.10 | 94.90 | 85.60 | 91.60 | 91.70 | 91.70 | 104.90 | 104.00 | 127.41 | 109.09 | 95.55 | 117.74 | 106.96 | 84.17 | 85.03 | 89.41 | |
| Cash Cash Equivalents Restricted Cash And Restricted Cash Equivalents | 179.30 | 180.90 | 157.70 | 158.50 | 161.00 | 147.10 | 127.50 | 108.70 | 136.60 | 124.60 | 99.80 | 110.40 | 101.40 | 105.90 | 98.50 | 72.40 | 90.80 | 77.30 | 75.80 | 89.80 | 84.50 | 94.20 | 100.90 | 108.20 | NA | 142.30 | NA | NA | NA | NA | NA | NA | NA | NA | NA | NA | NA | NA | NA | NA | NA | NA | NA | NA | NA | NA | NA | NA | NA | NA | NA | NA | NA | NA | NA | NA | NA | |
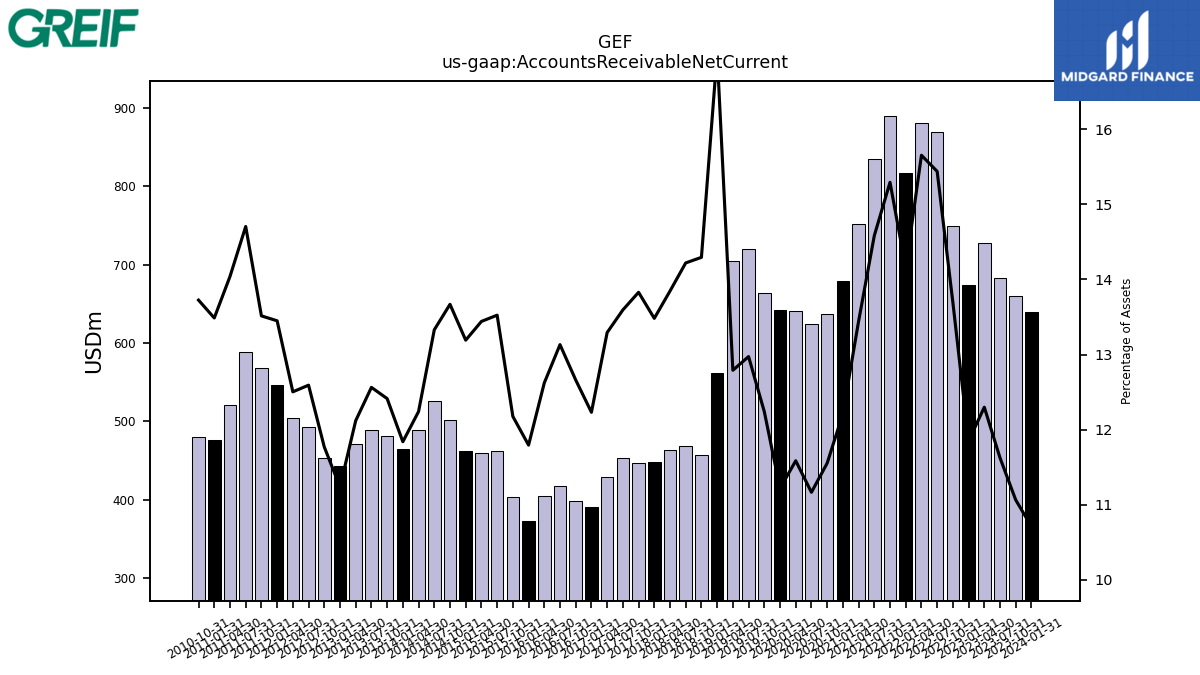
| Accounts Receivable Net Current | 639.20 | 659.40 | 682.70 | 727.00 | 674.20 | 749.10 | 868.70 | 880.30 | 816.10 | 889.50 | 834.70 | 751.10 | 679.70 | 636.60 | 624.50 | 640.50 | 641.70 | 664.20 | 720.30 | 704.80 | 561.40 | 456.70 | 469.20 | 463.40 | 448.70 | 447.00 | 453.60 | 428.80 | 391.30 | 399.20 | 418.10 | 404.80 | 373.00 | 403.70 | 461.90 | 459.80 | 462.70 | 501.30 | 526.70 | 489.20 | 465.50 | 481.90 | 489.20 | 471.80 | 443.00 | 453.90 | 492.80 | 503.90 | 546.80 | 568.62 | 588.82 | 521.40 | 475.80 | 480.16 | NA | NA | NA | |
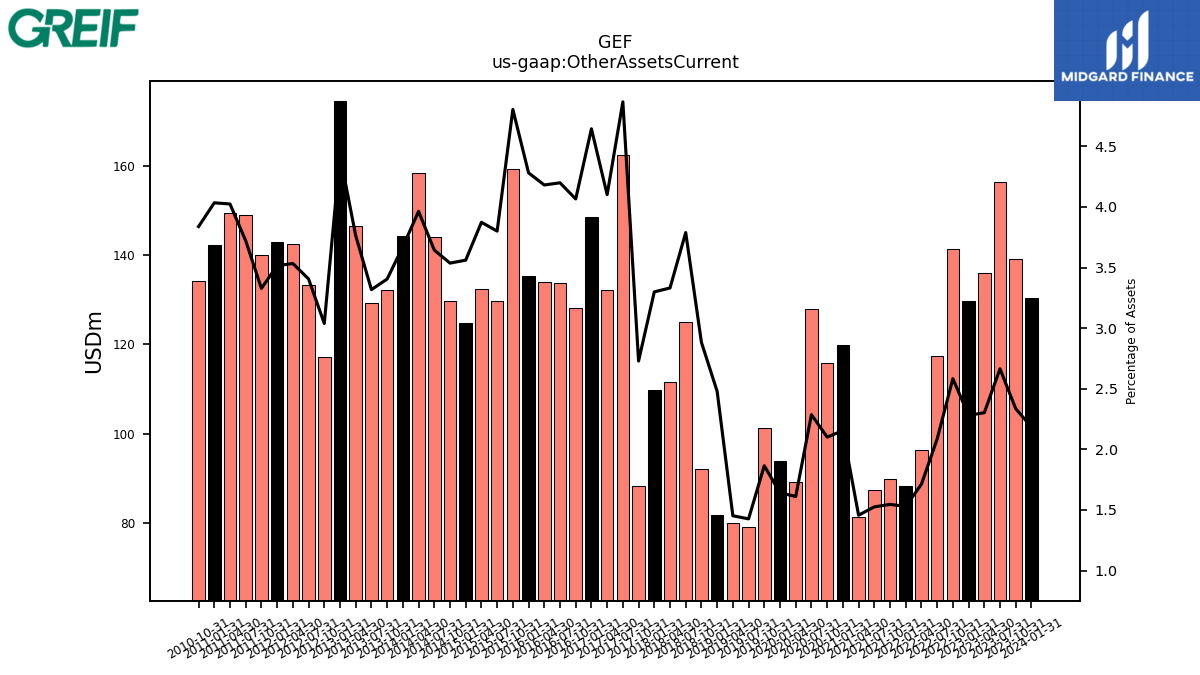
| Other Assets Current | 130.40 | 139.20 | 156.50 | 136.10 | 129.80 | 141.30 | 117.30 | 96.30 | 88.20 | 89.90 | 87.30 | 81.40 | 119.90 | 115.80 | 127.90 | 89.10 | 93.90 | 101.20 | 79.20 | 80.00 | 81.80 | 92.10 | 125.00 | 111.50 | 109.80 | 88.20 | 162.40 | 132.30 | 148.60 | 128.20 | 133.70 | 134.10 | 135.40 | 159.30 | 129.80 | 132.50 | 124.90 | 129.70 | 144.00 | 158.40 | 144.40 | 132.20 | 129.20 | 146.50 | 174.60 | 117.20 | 133.30 | 142.40 | 142.90 | 140.03 | 148.99 | 149.45 | 142.31 | 134.27 | NA | NA | NA | |
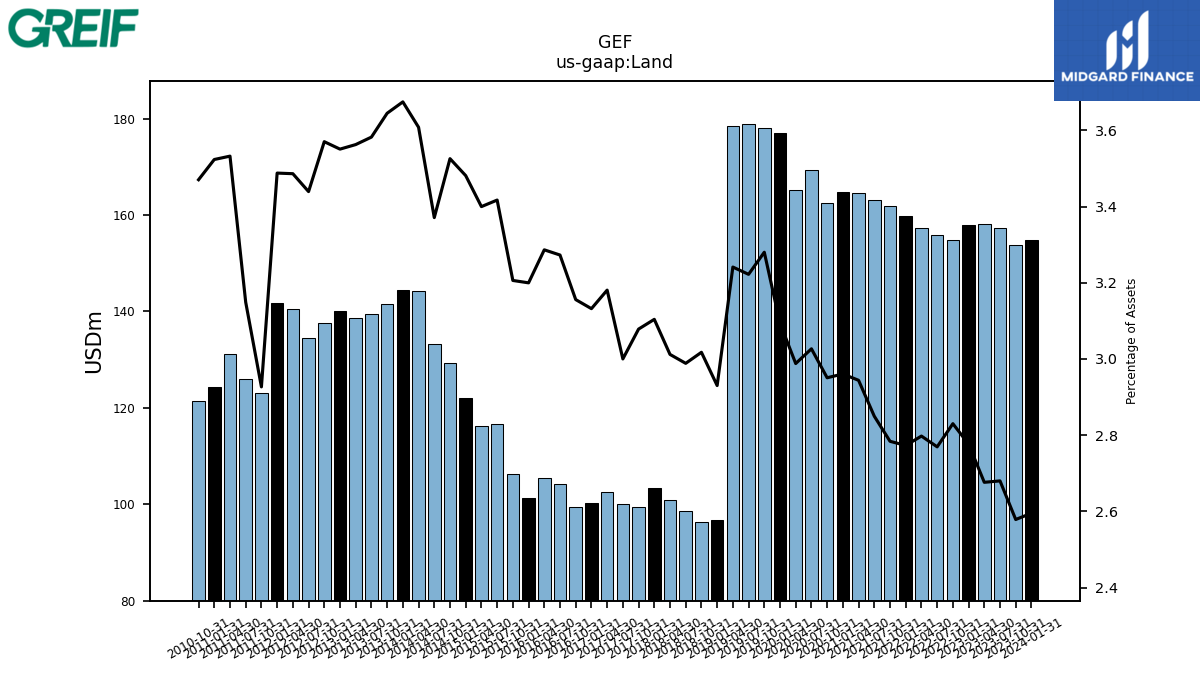
| Land | 154.90 | 153.70 | 157.40 | 158.20 | 158.00 | 154.80 | 155.80 | 157.30 | 159.90 | 161.90 | 163.10 | 164.50 | 164.80 | 162.60 | 169.30 | 165.20 | 177.00 | 178.00 | 178.90 | 178.60 | 96.70 | 96.40 | 98.60 | 100.80 | 103.30 | 99.50 | 100.10 | 102.60 | 100.20 | 99.50 | 104.20 | 105.40 | 101.20 | 106.30 | 116.70 | 116.30 | 122.10 | 129.30 | 133.20 | 144.20 | 144.50 | 141.50 | 139.50 | 138.70 | 140.00 | 137.70 | 134.60 | 140.50 | 141.80 | 123.13 | 126.08 | 131.17 | 124.30 | 121.41 | NA | NA | NA | |
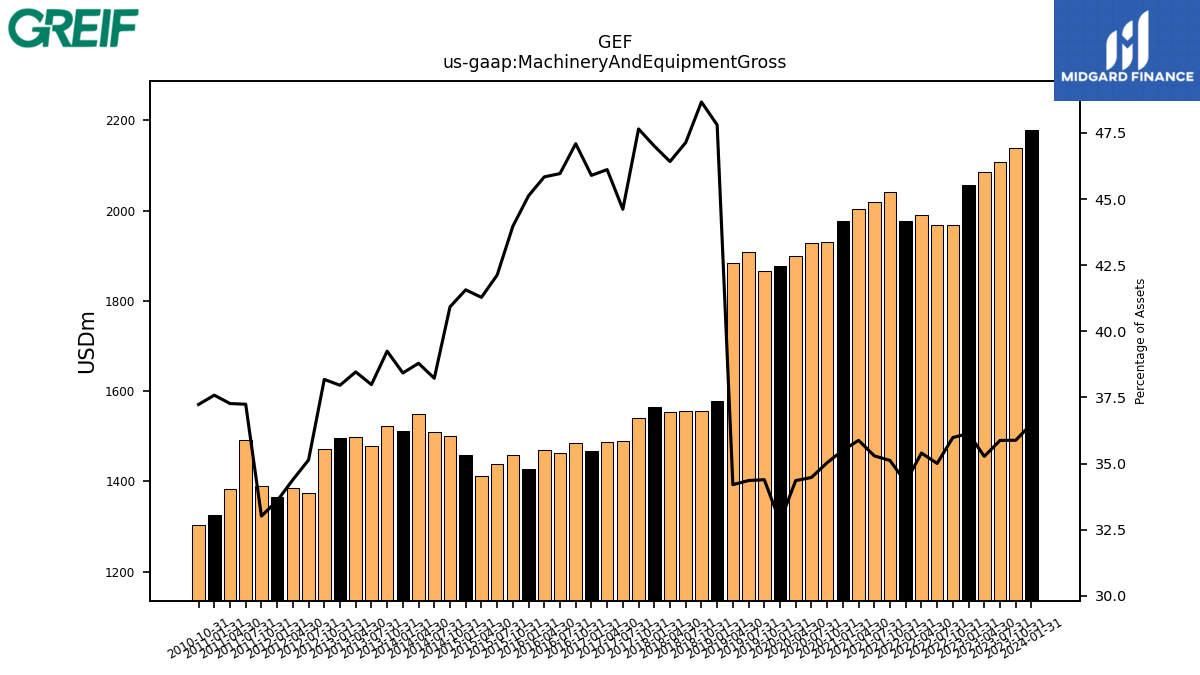
| Machinery And Equipment Gross | 2178.60 | 2138.80 | 2107.00 | 2085.10 | 2056.20 | 1968.30 | 1969.40 | 1990.30 | 1977.80 | 2042.30 | 2019.90 | 2004.80 | 1976.10 | 1930.60 | 1928.40 | 1899.50 | 1877.30 | 1866.20 | 1907.70 | 1884.60 | 1577.60 | 1554.90 | 1555.20 | 1553.50 | 1564.30 | 1540.20 | 1488.60 | 1487.50 | 1468.30 | 1484.80 | 1463.40 | 1470.10 | 1427.20 | 1457.90 | 1438.70 | 1412.20 | 1458.00 | 1500.80 | 1510.40 | 1550.30 | 1511.00 | 1523.70 | 1479.20 | 1497.50 | 1496.70 | 1472.60 | 1375.10 | 1385.90 | 1365.60 | 1388.94 | 1491.13 | 1383.99 | 1325.89 | 1302.60 | NA | NA | NA |
| 2024-01-31 | 2023-10-31 | 2023-07-31 | 2023-04-30 | 2023-01-31 | 2022-10-31 | 2022-07-31 | 2022-04-30 | 2022-01-31 | 2021-10-31 | 2021-07-31 | 2021-04-30 | 2021-01-31 | 2020-10-31 | 2020-07-31 | 2020-04-30 | 2020-01-31 | 2019-10-31 | 2019-07-31 | 2019-04-30 | 2019-01-31 | 2018-10-31 | 2018-07-31 | 2018-04-30 | 2018-01-31 | 2017-10-31 | 2017-07-31 | 2017-04-30 | 2017-01-31 | 2016-10-31 | 2016-07-31 | 2016-04-30 | 2016-01-31 | 2015-10-31 | 2015-07-31 | 2015-04-30 | 2015-01-31 | 2014-10-31 | 2014-07-31 | 2014-04-30 | 2014-01-31 | 2013-10-31 | 2013-07-31 | 2013-04-30 | 2013-01-31 | 2012-10-31 | 2012-07-31 | 2012-04-30 | 2012-01-31 | 2011-10-31 | 2011-07-31 | 2011-04-30 | 2011-01-31 | 2010-10-31 | 2010-07-31 | 2010-04-30 | 2010-01-31 | ||
|---|---|---|---|---|---|---|---|---|---|---|---|---|---|---|---|---|---|---|---|---|---|---|---|---|---|---|---|---|---|---|---|---|---|---|---|---|---|---|---|---|---|---|---|---|---|---|---|---|---|---|---|---|---|---|---|---|---|---|
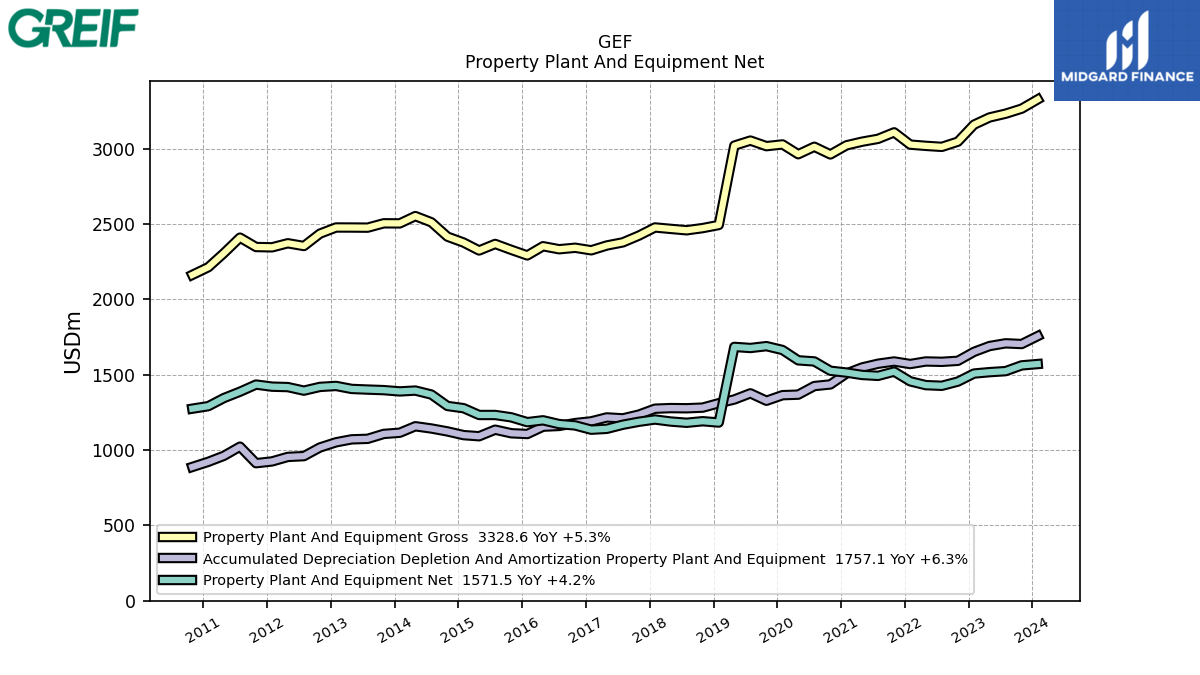
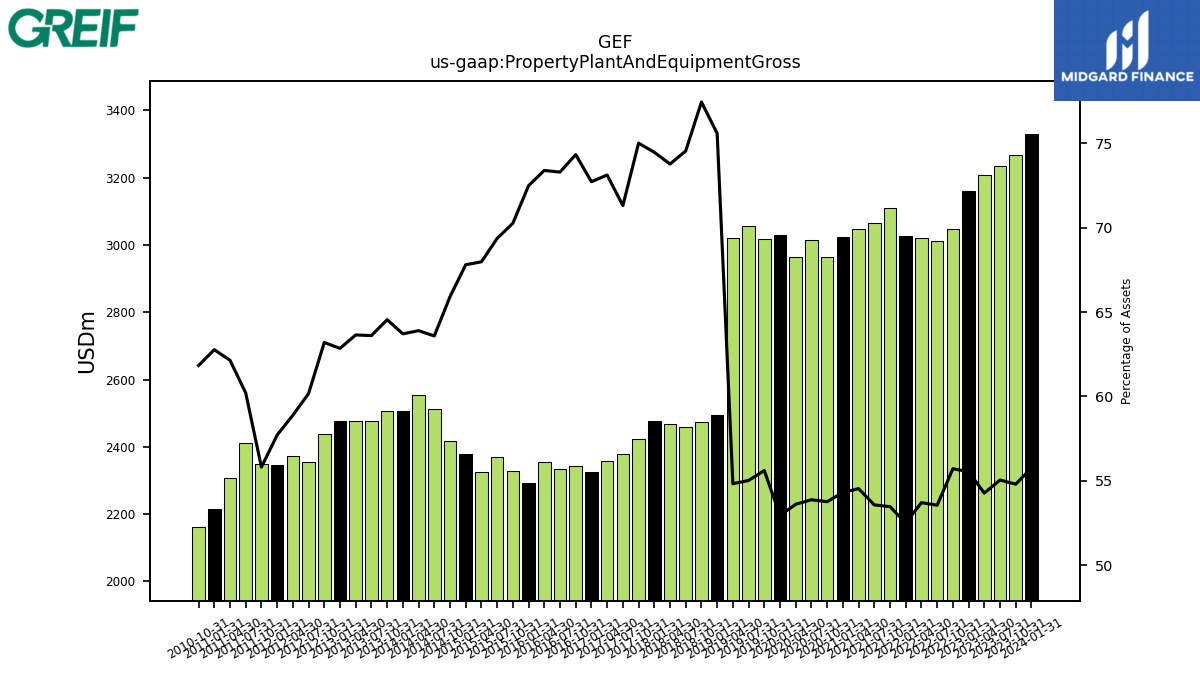
| Property Plant And Equipment Gross | 3328.60 | 3266.90 | 3233.50 | 3208.60 | 3160.70 | 3047.90 | 3013.30 | 3020.10 | 3028.30 | 3109.80 | 3066.60 | 3047.60 | 3023.50 | 2963.00 | 3014.10 | 2964.40 | 3029.60 | 3018.00 | 3055.10 | 3021.60 | 2494.50 | 2474.10 | 2459.50 | 2468.90 | 2478.30 | 2424.40 | 2379.30 | 2358.60 | 2326.60 | 2343.50 | 2333.60 | 2353.70 | 2292.60 | 2329.70 | 2368.90 | 2325.40 | 2378.20 | 2417.10 | 2512.50 | 2553.80 | 2505.30 | 2505.80 | 2477.00 | 2477.80 | 2478.10 | 2437.40 | 2355.00 | 2373.40 | 2346.40 | 2348.46 | 2410.84 | 2307.78 | 2214.46 | 2163.28 | NA | NA | NA | |
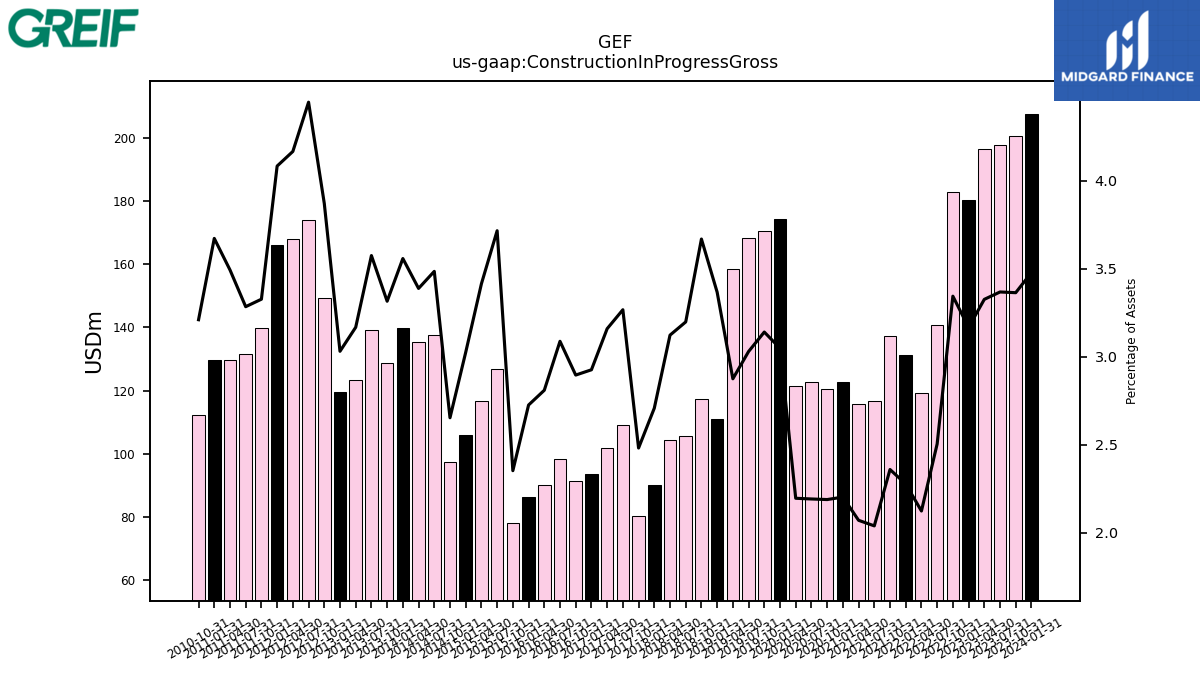
| Construction In Progress Gross | 207.60 | 200.50 | 197.80 | 196.60 | 180.20 | 182.90 | 140.90 | 119.40 | 131.30 | 137.20 | 116.70 | 115.70 | 122.60 | 120.60 | 122.60 | 121.40 | 174.40 | 170.40 | 168.20 | 158.40 | 111.10 | 117.20 | 105.50 | 104.50 | 90.10 | 80.20 | 109.00 | 101.90 | 93.60 | 91.30 | 98.30 | 90.10 | 86.20 | 78.00 | 126.90 | 116.80 | 106.10 | 97.30 | 137.70 | 135.40 | 139.90 | 128.70 | 139.20 | 123.30 | 119.50 | 149.30 | 174.00 | 167.90 | 166.00 | 139.96 | 131.49 | 129.71 | 129.54 | 112.30 | NA | NA | NA | |
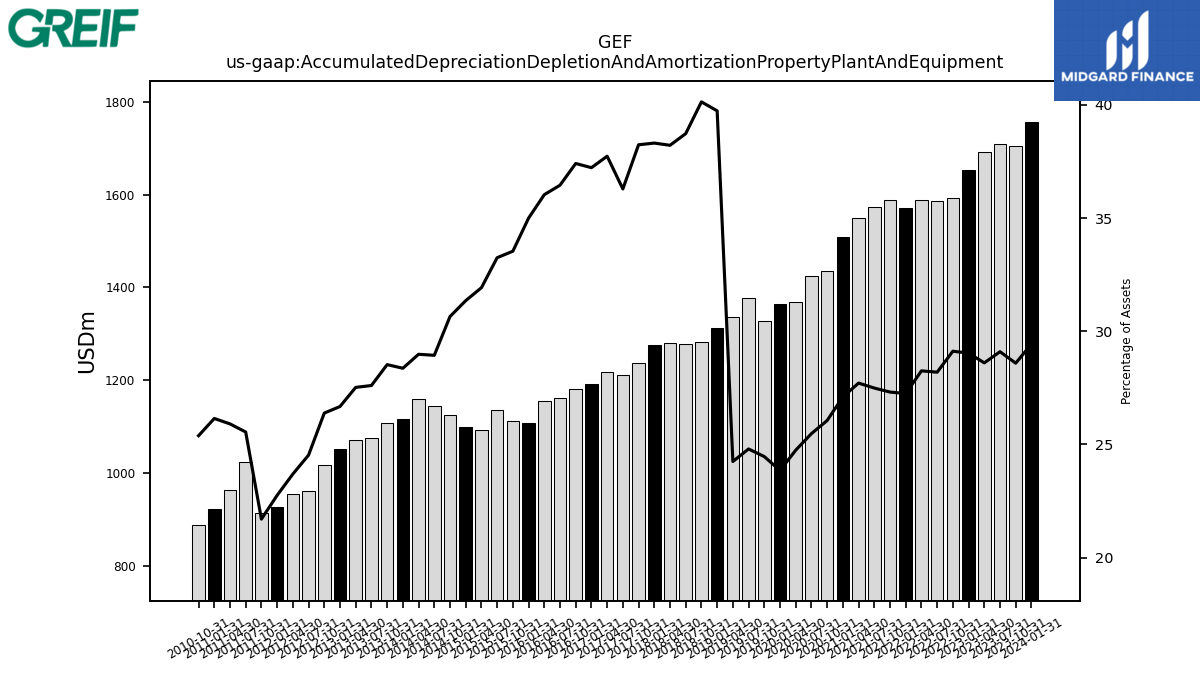
| Accumulated Depreciation Depletion And Amortization Property Plant And Equipment | 1757.10 | 1704.30 | 1709.10 | 1691.00 | 1652.30 | 1592.90 | 1586.20 | 1588.60 | 1571.50 | 1588.60 | 1573.60 | 1548.50 | 1508.60 | 1436.10 | 1425.30 | 1368.30 | 1364.80 | 1327.70 | 1377.10 | 1336.20 | 1311.40 | 1282.20 | 1277.90 | 1279.00 | 1275.10 | 1236.00 | 1210.80 | 1217.20 | 1191.00 | 1179.60 | 1160.60 | 1155.70 | 1106.90 | 1112.00 | 1135.60 | 1092.10 | 1099.70 | 1124.10 | 1143.50 | 1158.40 | 1115.50 | 1107.50 | 1075.00 | 1071.50 | 1051.90 | 1017.70 | 960.10 | 954.90 | 925.10 | 913.17 | 1023.01 | 962.16 | 922.48 | 888.16 | NA | NA | NA | |
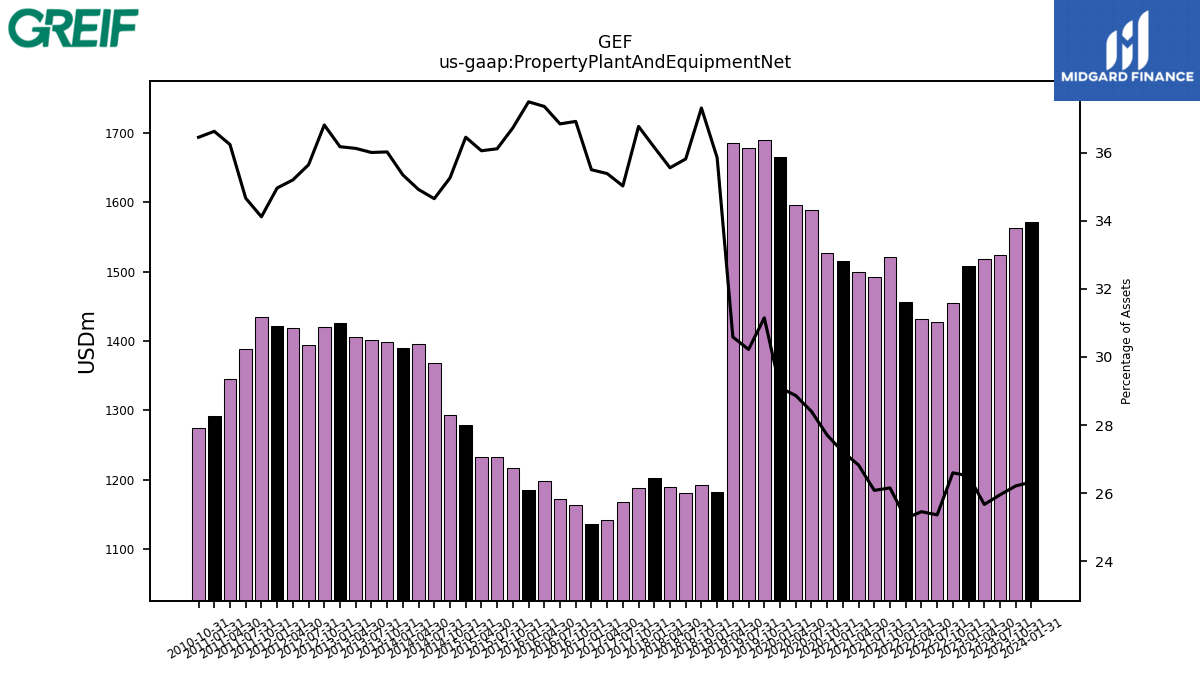
| Property Plant And Equipment Net | 1571.50 | 1562.60 | 1524.40 | 1517.60 | 1508.40 | 1455.00 | 1427.10 | 1431.50 | 1456.80 | 1521.20 | 1493.00 | 1499.10 | 1514.90 | 1526.90 | 1588.80 | 1596.10 | 1664.80 | 1690.30 | 1678.00 | 1685.40 | 1183.10 | 1191.90 | 1181.60 | 1189.90 | 1203.20 | 1188.40 | 1168.50 | 1141.40 | 1135.60 | 1163.90 | 1173.00 | 1198.00 | 1185.70 | 1217.70 | 1233.30 | 1233.30 | 1278.50 | 1293.00 | 1369.00 | 1395.40 | 1389.80 | 1398.30 | 1402.00 | 1406.30 | 1426.20 | 1419.70 | 1394.90 | 1418.50 | 1421.30 | 1435.29 | 1387.83 | 1345.61 | 1291.98 | 1275.12 | NA | NA | NA | |
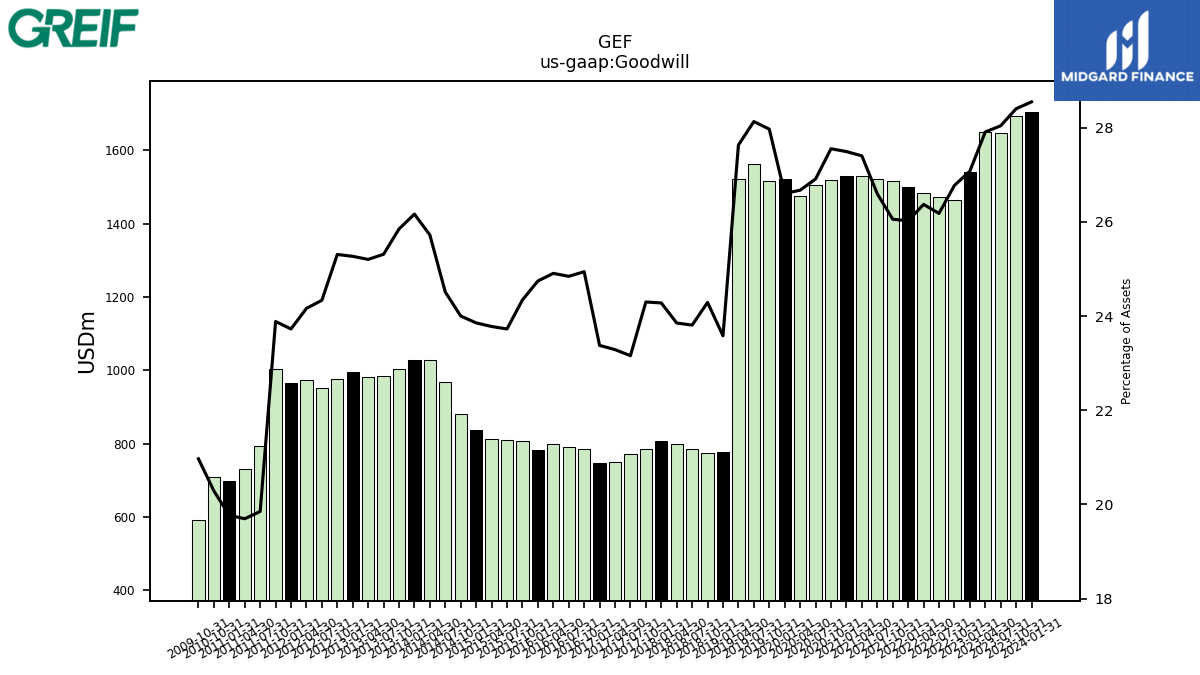
| Goodwill | 1704.10 | 1693.00 | 1647.00 | 1649.80 | 1540.80 | 1464.50 | 1472.90 | 1482.80 | 1500.50 | 1515.40 | 1522.30 | 1531.20 | 1530.40 | 1518.40 | 1505.30 | 1474.70 | 1522.10 | 1517.80 | 1561.90 | 1522.60 | 778.20 | 776.00 | 785.50 | 798.30 | 808.00 | 785.40 | 772.70 | 751.20 | 747.90 | 786.40 | 791.00 | 798.80 | 782.60 | 807.10 | 810.30 | 813.40 | 836.70 | 880.20 | 968.50 | 1028.00 | 1028.90 | 1003.50 | 985.70 | 981.20 | 996.30 | 976.10 | 952.40 | 973.80 | 964.60 | 1004.88 | 794.79 | 731.40 | 697.37 | 709.73 | NA | NA | NA | |
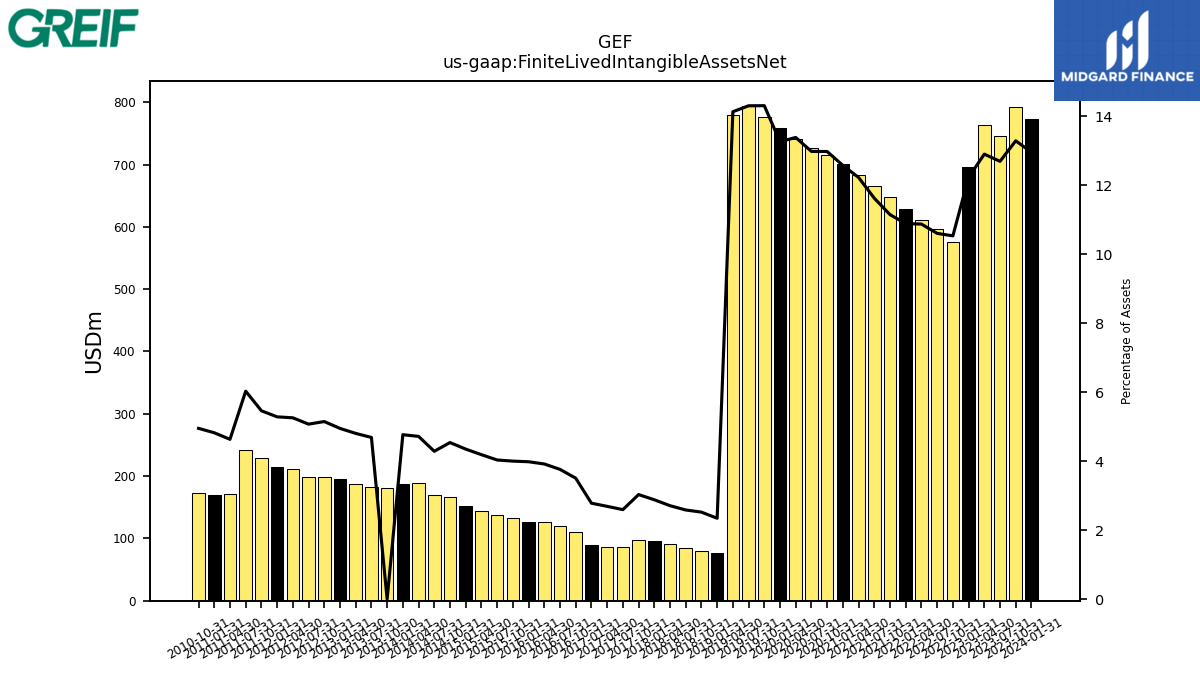
| Finite Lived Intangible Assets Net | 773.50 | 792.20 | 745.60 | 762.80 | 695.90 | 576.20 | 596.70 | 611.50 | 628.00 | 648.40 | 665.40 | 683.20 | 700.10 | 715.30 | 726.20 | 740.20 | 758.90 | 776.50 | 794.30 | 778.80 | 77.40 | 80.60 | 85.30 | 90.70 | 95.90 | 98.00 | 86.60 | 86.80 | 89.00 | 110.60 | 119.80 | 125.70 | 126.00 | 132.70 | 137.80 | 143.30 | 152.60 | 166.50 | 169.40 | 188.60 | 187.50 | NA | 182.60 | 187.10 | 195.20 | 198.60 | 198.60 | 211.90 | 214.90 | 229.79 | 241.44 | 172.09 | 170.19 | 173.24 | NA | NA | NA | |
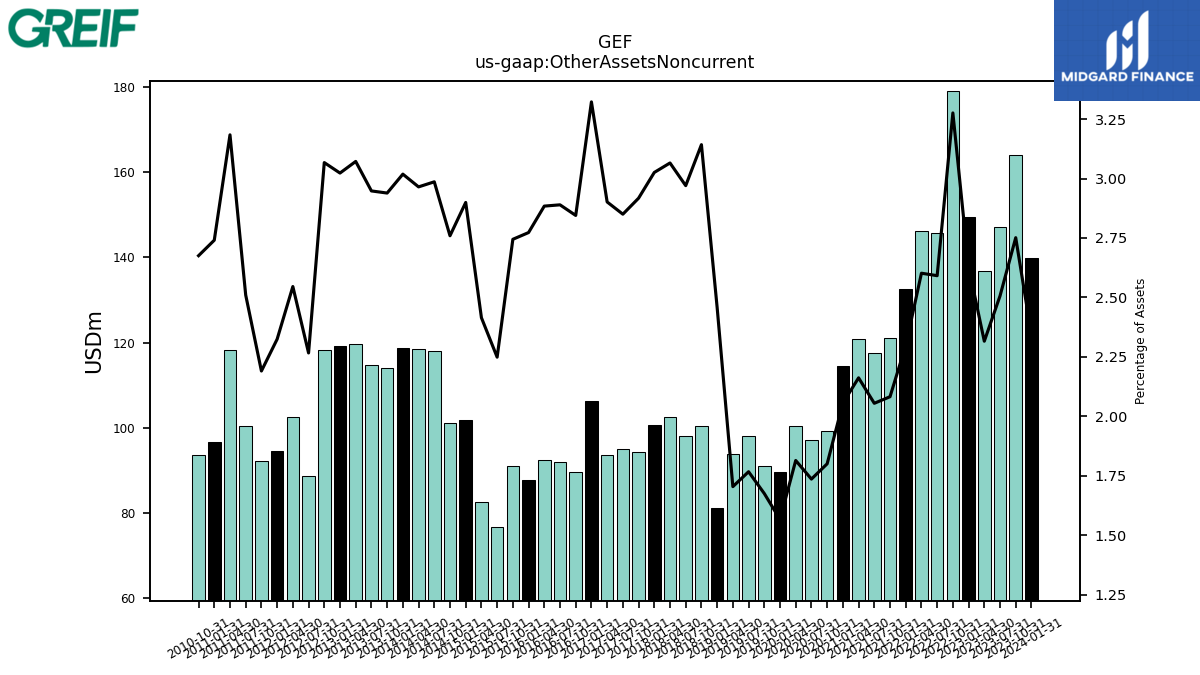
| Other Assets Noncurrent | 139.80 | 164.00 | 147.20 | 136.90 | 149.60 | 179.20 | 145.80 | 146.30 | 132.50 | 121.10 | 117.60 | 120.80 | 114.40 | 99.20 | 97.10 | 100.30 | 89.60 | 90.90 | 98.10 | 93.90 | 81.10 | 100.40 | 98.00 | 102.60 | 100.70 | 94.30 | 95.10 | 93.60 | 106.30 | 89.70 | 92.00 | 92.50 | 87.70 | 91.00 | 76.80 | 82.60 | 101.70 | 101.20 | 118.00 | 118.50 | 118.70 | 114.10 | 114.80 | 119.60 | 119.20 | 118.30 | 88.70 | 102.60 | 94.50 | 92.16 | 100.50 | 118.24 | 96.69 | 93.60 | NA | NA | NA |
| 2024-01-31 | 2023-10-31 | 2023-07-31 | 2023-04-30 | 2023-01-31 | 2022-10-31 | 2022-07-31 | 2022-04-30 | 2022-01-31 | 2021-10-31 | 2021-07-31 | 2021-04-30 | 2021-01-31 | 2020-10-31 | 2020-07-31 | 2020-04-30 | 2020-01-31 | 2019-10-31 | 2019-07-31 | 2019-04-30 | 2019-01-31 | 2018-10-31 | 2018-07-31 | 2018-04-30 | 2018-01-31 | 2017-10-31 | 2017-07-31 | 2017-04-30 | 2017-01-31 | 2016-10-31 | 2016-07-31 | 2016-04-30 | 2016-01-31 | 2015-10-31 | 2015-07-31 | 2015-04-30 | 2015-01-31 | 2014-10-31 | 2014-07-31 | 2014-04-30 | 2014-01-31 | 2013-10-31 | 2013-07-31 | 2013-04-30 | 2013-01-31 | 2012-10-31 | 2012-07-31 | 2012-04-30 | 2012-01-31 | 2011-10-31 | 2011-07-31 | 2011-04-30 | 2011-01-31 | 2010-10-31 | 2010-07-31 | 2010-04-30 | 2010-01-31 | ||
|---|---|---|---|---|---|---|---|---|---|---|---|---|---|---|---|---|---|---|---|---|---|---|---|---|---|---|---|---|---|---|---|---|---|---|---|---|---|---|---|---|---|---|---|---|---|---|---|---|---|---|---|---|---|---|---|---|---|---|
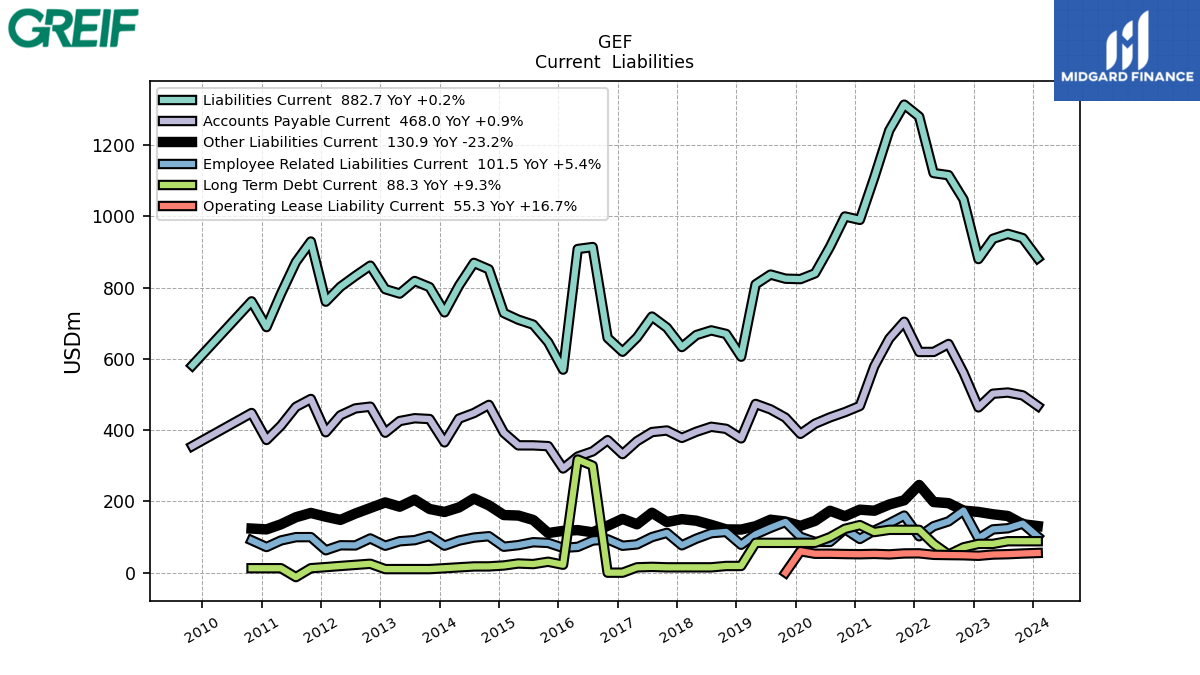
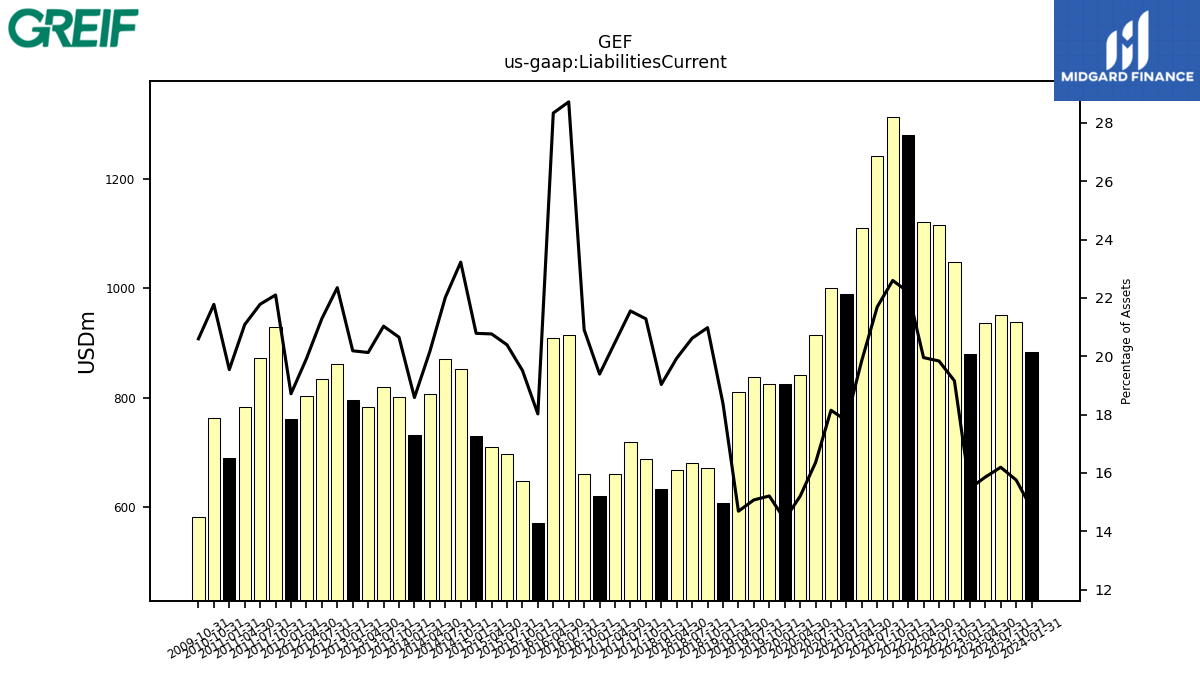
| Liabilities Current | 882.70 | 939.30 | 951.20 | 937.40 | 880.50 | 1047.90 | 1116.00 | 1121.90 | 1280.50 | 1314.10 | 1241.70 | 1109.90 | 990.50 | 1000.10 | 914.90 | 840.50 | 824.20 | 825.40 | 837.00 | 809.40 | 606.40 | 670.20 | 680.20 | 667.10 | 633.40 | 687.90 | 719.10 | 660.40 | 620.30 | 659.20 | 914.30 | 908.70 | 570.00 | 647.00 | 696.40 | 710.30 | 729.00 | 851.70 | 869.80 | 805.90 | 730.80 | 801.70 | 818.90 | 783.60 | 795.90 | 862.00 | 833.20 | 802.70 | 760.80 | 929.77 | 872.13 | 783.00 | 689.41 | 761.81 | NA | NA | NA | |
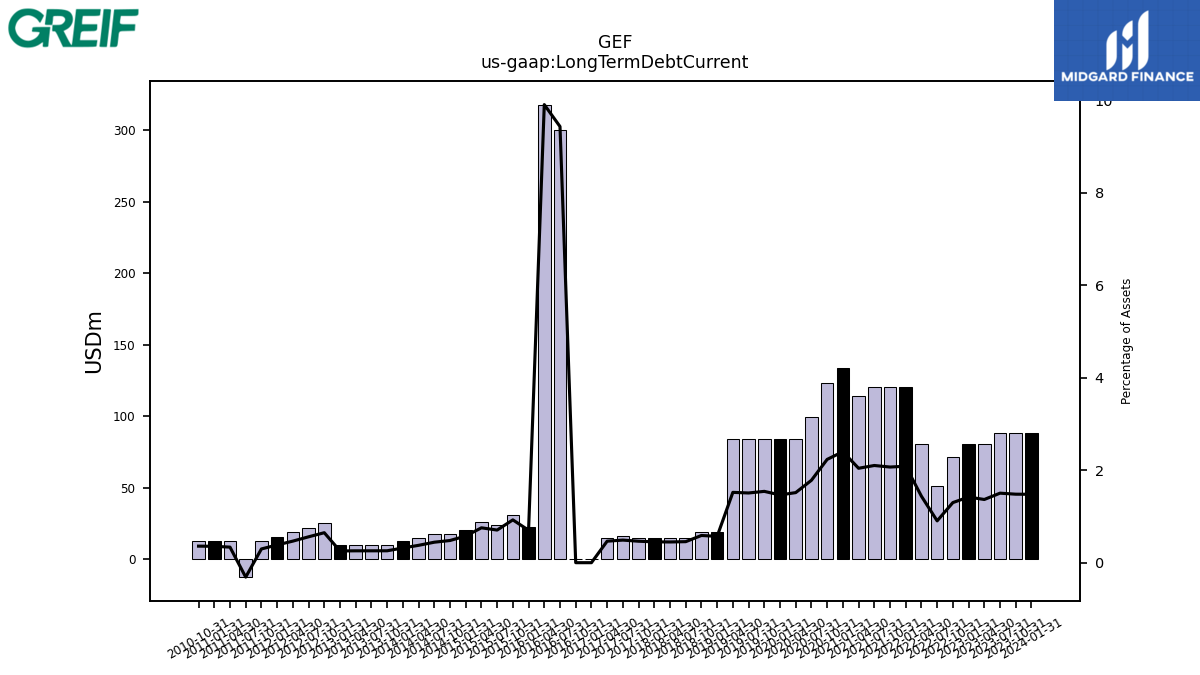
| Long Term Debt Current | 88.30 | 88.30 | 88.30 | 80.80 | 80.80 | 71.10 | 50.90 | 80.80 | 120.30 | 120.30 | 120.30 | 114.10 | 133.60 | 123.10 | 99.70 | 83.80 | 83.80 | 83.70 | 83.70 | 83.80 | 18.80 | 18.80 | 15.00 | 15.00 | 15.00 | 15.00 | 16.30 | 15.00 | 0.00 | 0.00 | 300.30 | 317.70 | 22.20 | 30.70 | 24.10 | 25.80 | 20.20 | 17.60 | 17.50 | 15.00 | 12.50 | 10.00 | 10.00 | 10.00 | 10.00 | 25.00 | 21.90 | 18.80 | 15.60 | 12.50 | -12.50 | 12.50 | 12.50 | 12.52 | NA | NA | NA | |
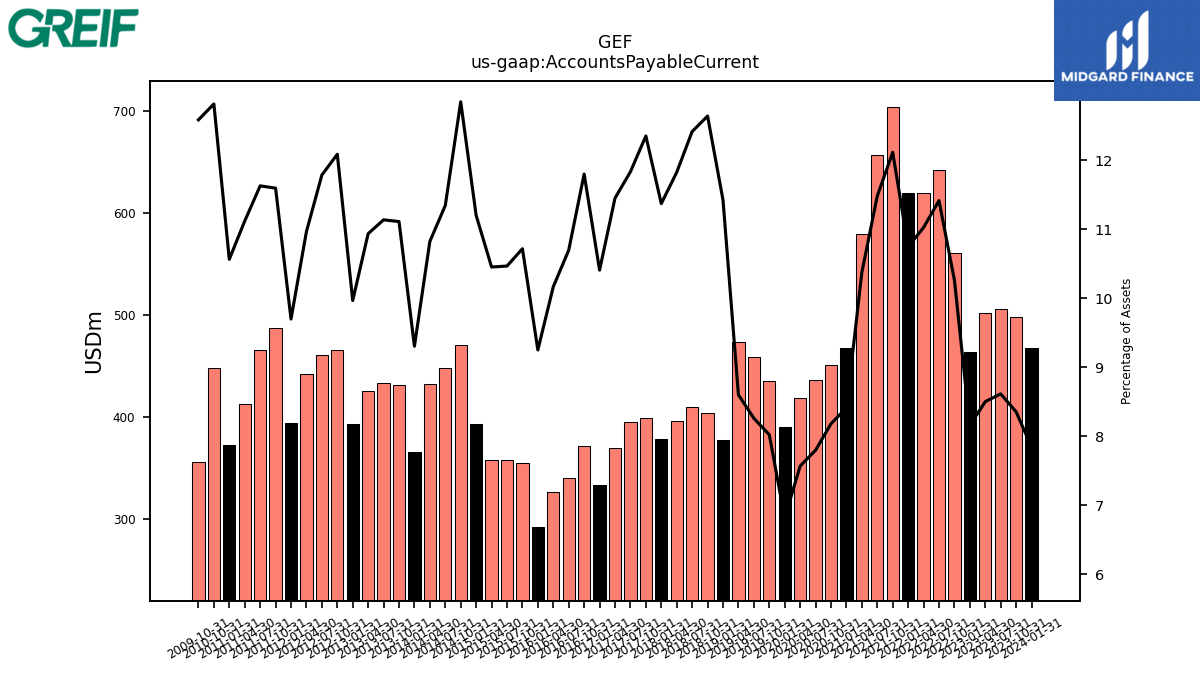
| Accounts Payable Current | 468.00 | 497.80 | 505.80 | 502.40 | 464.00 | 561.30 | 642.10 | 619.80 | 619.60 | 704.50 | 657.00 | 579.60 | 468.00 | 450.70 | 436.00 | 418.30 | 389.80 | 435.20 | 458.50 | 473.80 | 377.00 | 403.80 | 409.60 | 395.70 | 378.40 | 399.20 | 394.80 | 369.30 | 332.90 | 372.00 | 340.50 | 326.00 | 292.50 | 355.30 | 357.40 | 357.50 | 392.80 | 471.10 | 448.20 | 432.50 | 365.80 | 431.30 | 433.60 | 425.70 | 392.90 | 466.10 | 461.20 | 441.90 | 394.20 | 487.78 | 465.54 | 412.83 | 372.63 | 448.31 | NA | NA | NA | |
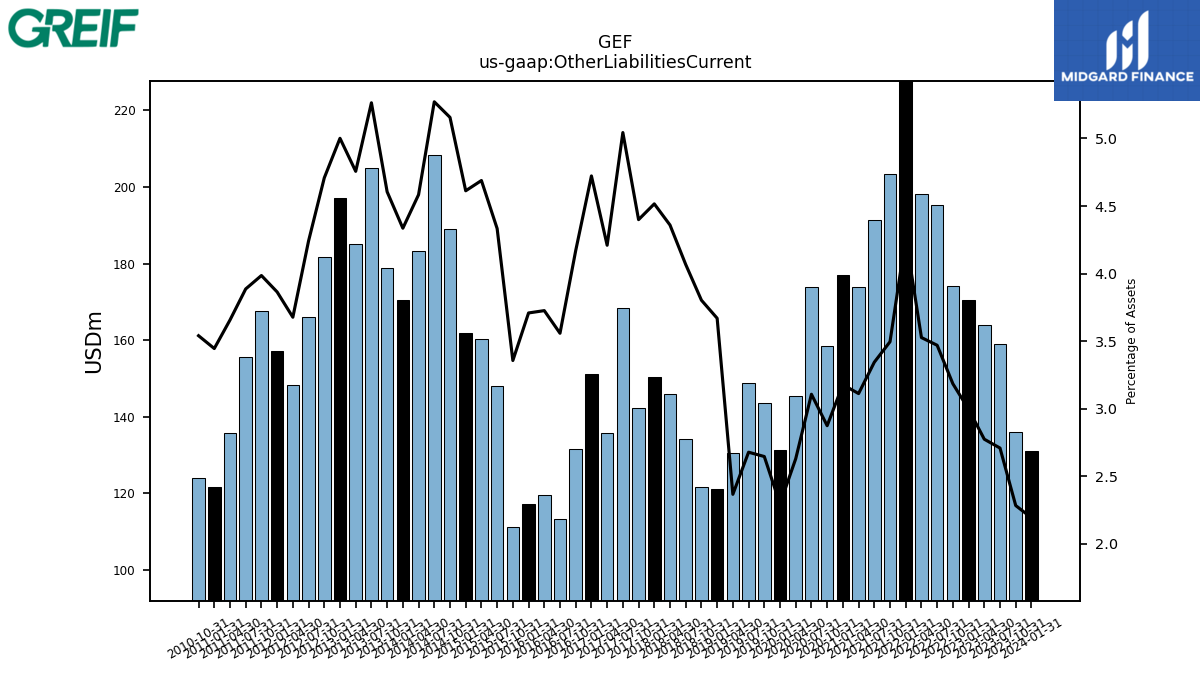
| Other Liabilities Current | 130.90 | 136.10 | 159.10 | 164.00 | 170.50 | 174.20 | 195.20 | 198.30 | 246.30 | 203.30 | 191.40 | 173.90 | 176.90 | 158.40 | 173.80 | 145.40 | 131.30 | 143.60 | 148.70 | 130.40 | 121.10 | 121.50 | 134.20 | 145.90 | 150.30 | 142.20 | 168.30 | 135.80 | 151.10 | 131.50 | 113.30 | 119.50 | 117.30 | 111.30 | 148.00 | 160.40 | 161.80 | 189.10 | 208.30 | 183.20 | 170.50 | 178.80 | 205.00 | 185.20 | 197.20 | 181.60 | 166.00 | 148.20 | 157.10 | 167.69 | 155.61 | 135.78 | 121.55 | 123.85 | NA | NA | NA |
| 2024-01-31 | 2023-10-31 | 2023-07-31 | 2023-04-30 | 2023-01-31 | 2022-10-31 | 2022-07-31 | 2022-04-30 | 2022-01-31 | 2021-10-31 | 2021-07-31 | 2021-04-30 | 2021-01-31 | 2020-10-31 | 2020-07-31 | 2020-04-30 | 2020-01-31 | 2019-10-31 | 2019-07-31 | 2019-04-30 | 2019-01-31 | 2018-10-31 | 2018-07-31 | 2018-04-30 | 2018-01-31 | 2017-10-31 | 2017-07-31 | 2017-04-30 | 2017-01-31 | 2016-10-31 | 2016-07-31 | 2016-04-30 | 2016-01-31 | 2015-10-31 | 2015-07-31 | 2015-04-30 | 2015-01-31 | 2014-10-31 | 2014-07-31 | 2014-04-30 | 2014-01-31 | 2013-10-31 | 2013-07-31 | 2013-04-30 | 2013-01-31 | 2012-10-31 | 2012-07-31 | 2012-04-30 | 2012-01-31 | 2011-10-31 | 2011-07-31 | 2011-04-30 | 2011-01-31 | 2010-10-31 | 2010-07-31 | 2010-04-30 | 2010-01-31 | ||
|---|---|---|---|---|---|---|---|---|---|---|---|---|---|---|---|---|---|---|---|---|---|---|---|---|---|---|---|---|---|---|---|---|---|---|---|---|---|---|---|---|---|---|---|---|---|---|---|---|---|---|---|---|---|---|---|---|---|---|
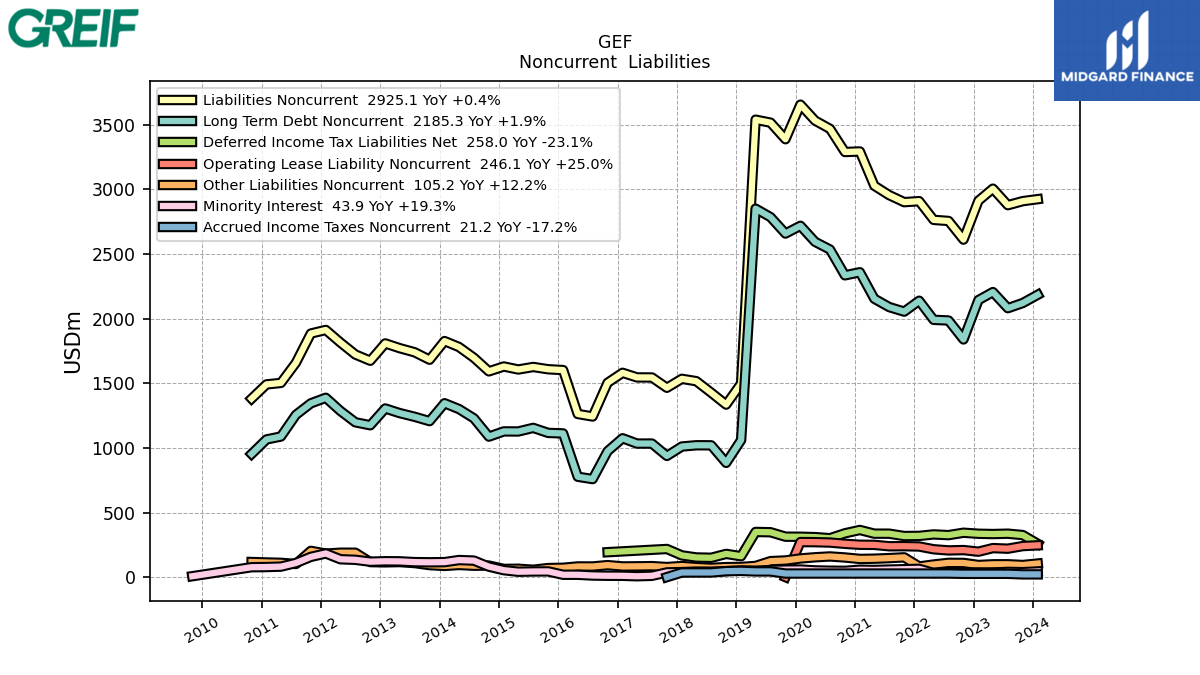
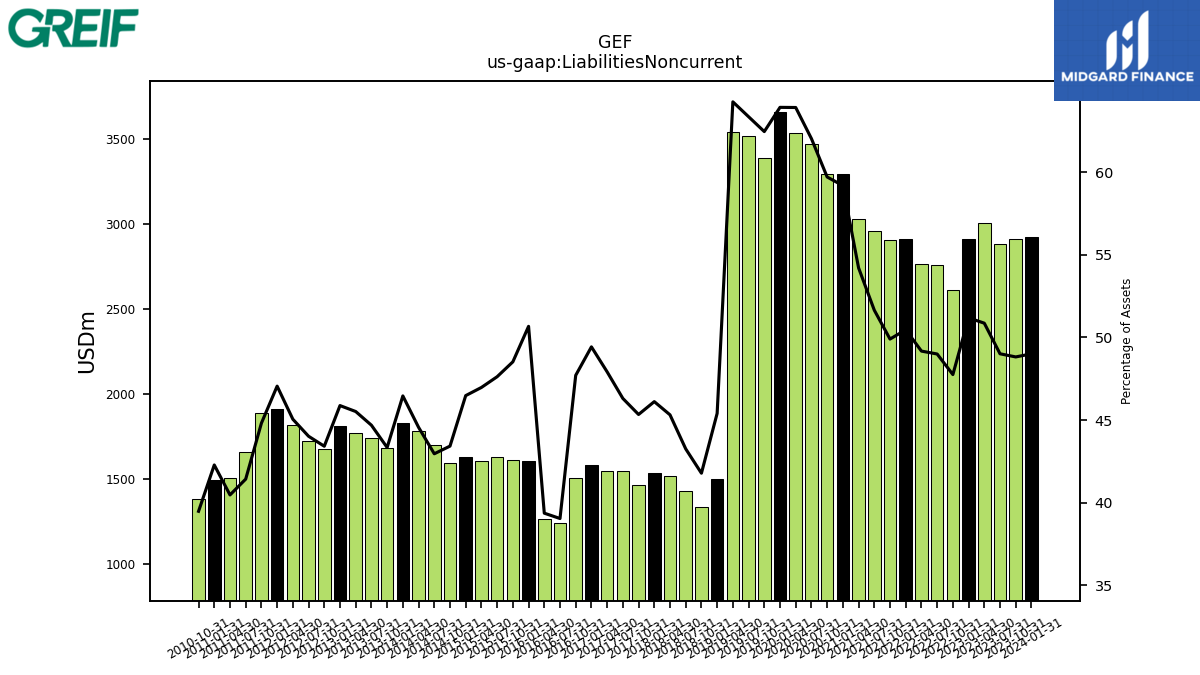
| Liabilities Noncurrent | 2925.10 | 2909.90 | 2878.50 | 3006.50 | 2912.60 | 2611.90 | 2756.50 | 2764.80 | 2909.70 | 2902.00 | 2956.00 | 3029.00 | 3294.30 | 3290.10 | 3469.40 | 3533.30 | 3656.80 | 3388.90 | 3517.30 | 3540.30 | 1498.40 | 1334.90 | 1427.20 | 1516.60 | 1534.70 | 1465.40 | 1545.10 | 1545.60 | 1581.30 | 1504.10 | 1243.10 | 1262.60 | 1602.50 | 1608.80 | 1626.40 | 1606.80 | 1630.20 | 1592.50 | 1697.50 | 1780.90 | 1826.90 | 1682.50 | 1740.20 | 1772.00 | 1808.80 | 1674.50 | 1722.80 | 1815.60 | 1912.90 | 1885.34 | 1658.73 | 1502.88 | 1491.58 | 1381.20 | NA | NA | NA | |
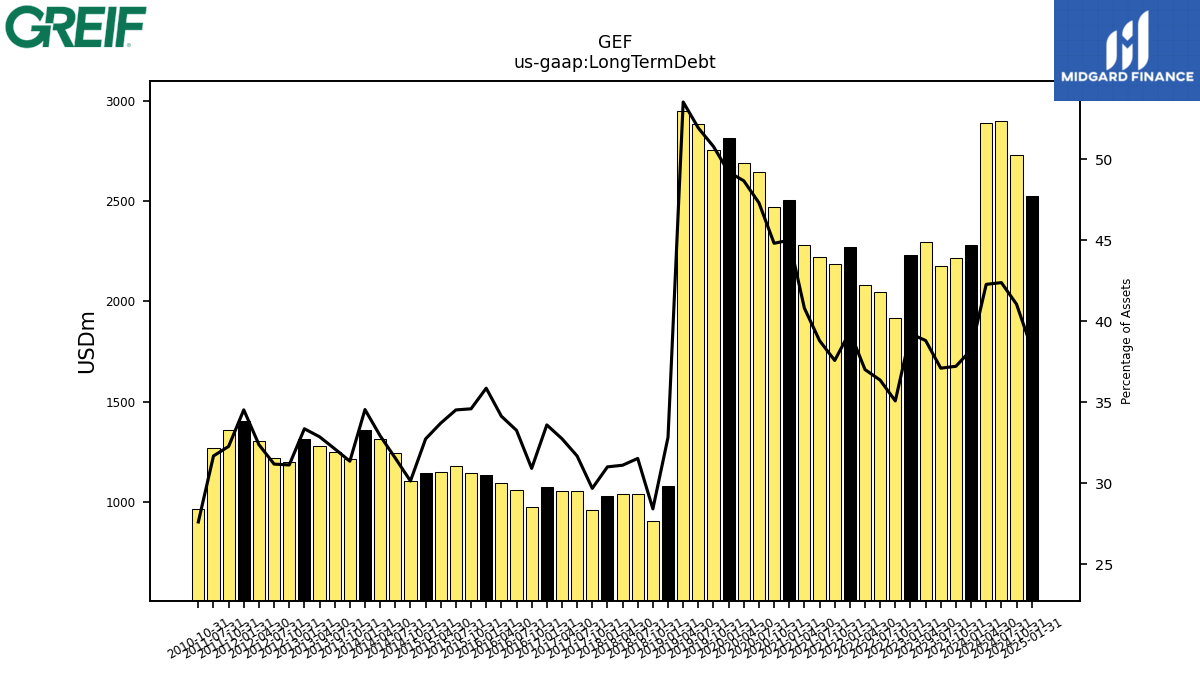
| Long Term Debt | 2281.60 | 2218.40 | 2179.10 | 2294.20 | 2232.40 | 1918.70 | 2045.80 | 2081.30 | 2268.80 | 2185.40 | 2220.90 | 2280.30 | 2505.30 | 2469.70 | 2646.60 | 2691.20 | 2815.90 | 2756.30 | 2883.80 | 2950.40 | 1083.50 | 907.60 | 1040.10 | 1041.00 | 1031.80 | 959.20 | 1056.90 | 1056.20 | 1074.80 | 974.60 | 1058.90 | 1094.70 | 1134.30 | 1146.90 | 1179.00 | 1153.00 | 1148.00 | 1105.00 | 1246.40 | 1315.80 | 1358.30 | 1217.20 | 1250.80 | 1279.40 | 1315.20 | 1200.30 | 1220.10 | 1304.80 | 1403.60 | 1357.64 | 1268.32 | NA | NA | 965.59 | NA | NA | NA | |
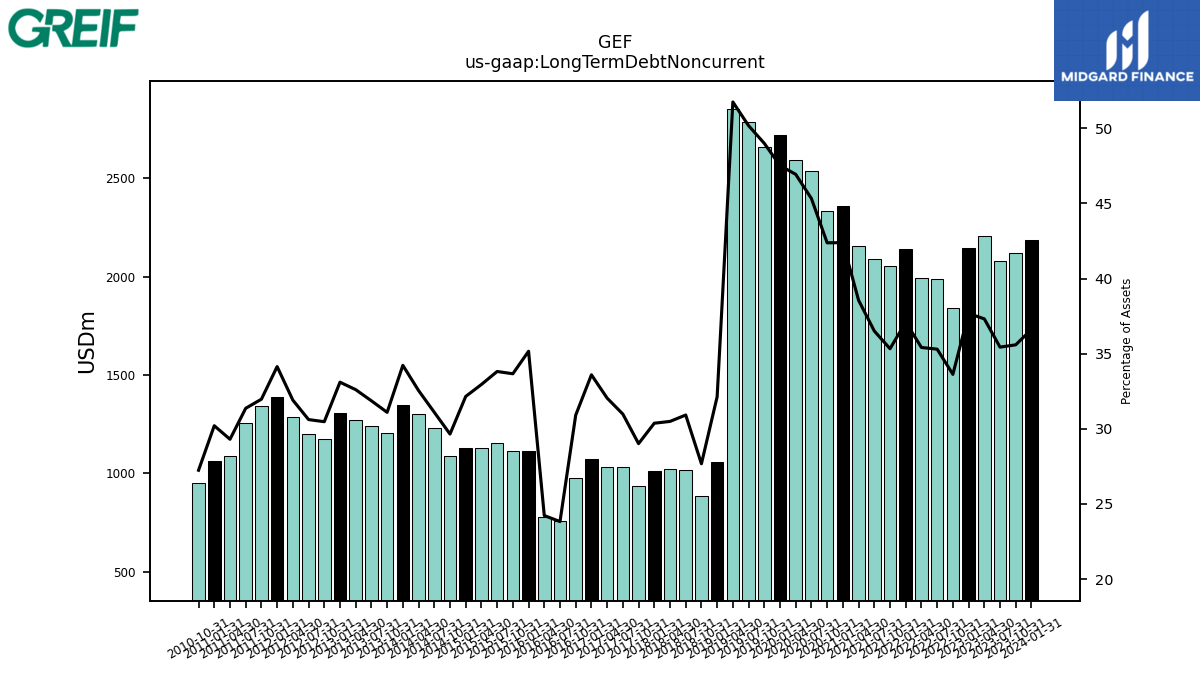
| Long Term Debt Noncurrent | 2185.30 | 2121.40 | 2081.40 | 2206.10 | 2143.90 | 1839.30 | 1986.10 | 1991.30 | 2139.10 | 2054.80 | 2089.70 | 2154.60 | 2359.60 | 2335.50 | 2535.30 | 2595.10 | 2719.00 | 2659.00 | 2786.00 | 2851.80 | 1060.50 | 884.10 | 1020.10 | 1020.50 | 1010.80 | 937.80 | 1033.70 | 1033.60 | 1074.80 | 974.60 | 758.60 | 777.00 | 1112.10 | 1116.20 | 1154.90 | 1127.20 | 1127.80 | 1087.40 | 1228.90 | 1300.80 | 1345.80 | 1207.20 | 1240.80 | 1269.40 | 1305.20 | 1175.30 | 1198.20 | 1286.00 | 1388.00 | 1345.14 | 1255.82 | 1088.21 | 1065.57 | 953.07 | NA | NA | NA | |
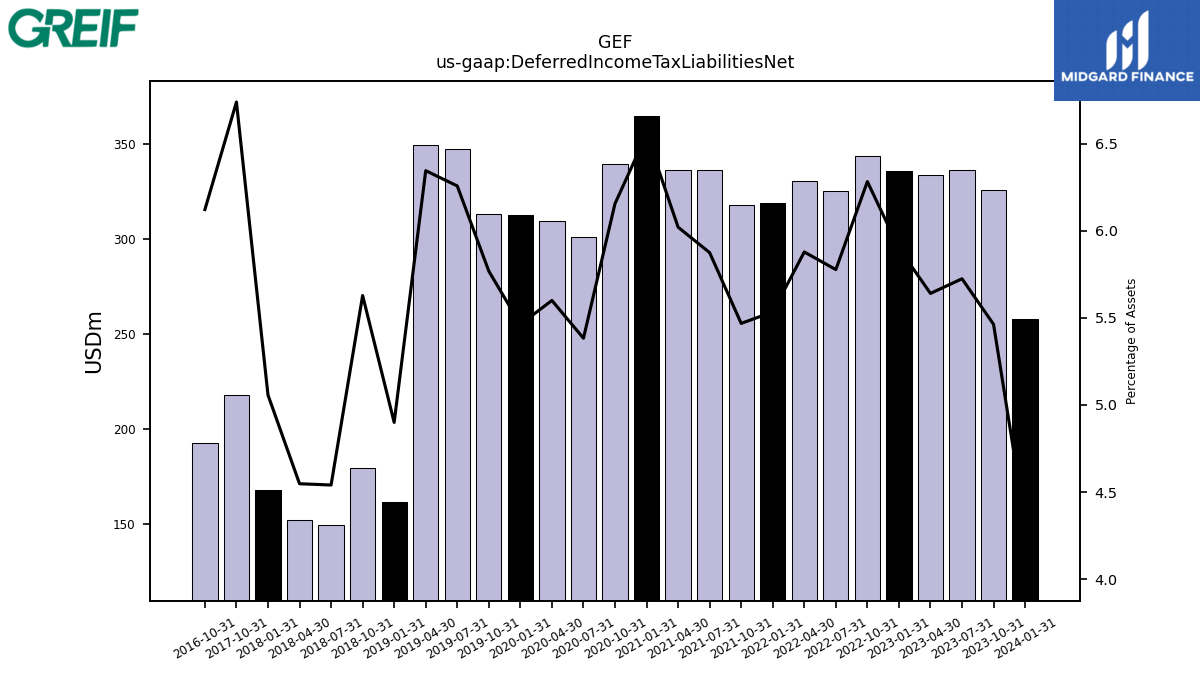
| Deferred Income Tax Liabilities Net | 258.00 | 325.60 | 336.20 | 333.40 | 335.70 | 343.60 | 325.00 | 330.50 | 319.10 | 318.00 | 336.20 | 336.40 | 364.80 | 339.20 | 301.10 | 309.60 | 312.50 | 313.00 | 347.40 | 349.60 | 161.70 | 179.80 | 149.80 | 152.20 | 168.30 | 217.80 | NA | NA | NA | 193.00 | NA | NA | NA | NA | NA | NA | NA | NA | NA | NA | NA | NA | NA | NA | NA | NA | NA | NA | NA | NA | NA | NA | NA | NA | NA | NA | NA | |
| Minority Interest | 43.90 | 38.40 | 40.50 | 35.10 | 36.80 | 33.00 | 35.50 | 32.00 | 64.00 | 61.30 | 58.60 | 55.50 | 57.30 | 48.50 | 49.60 | 52.00 | 58.90 | 58.00 | 55.00 | 49.80 | 52.30 | 46.40 | 42.20 | 42.80 | 39.00 | 36.60 | 10.10 | 6.80 | 10.20 | 10.50 | 12.40 | 18.30 | 18.30 | 44.30 | 43.70 | 41.60 | 53.70 | 81.10 | 127.90 | 132.20 | 116.00 | 114.80 | 116.10 | 122.10 | 123.00 | 119.60 | 134.00 | 138.30 | 183.20 | 156.82 | 109.34 | 81.30 | 78.06 | 76.71 | NA | NA | NA | |
| Other Liabilities Noncurrent | 105.20 | 93.80 | 99.40 | 99.20 | 93.80 | 109.80 | 110.40 | 97.60 | 82.40 | 153.10 | 147.20 | 142.60 | 140.80 | 152.00 | 160.00 | 153.60 | 144.30 | 128.90 | 123.80 | 86.50 | 78.70 | 77.50 | 71.70 | 77.50 | 85.80 | 78.10 | 85.10 | 83.60 | 82.80 | 92.90 | 82.40 | 82.70 | 72.30 | 70.20 | 57.00 | 64.90 | 63.50 | 89.50 | 88.30 | 94.00 | 86.80 | 92.90 | 108.80 | 116.50 | 114.40 | 116.20 | 188.90 | 188.90 | 182.00 | 203.26 | 101.58 | 110.48 | 113.45 | 116.93 | NA | NA | NA | |
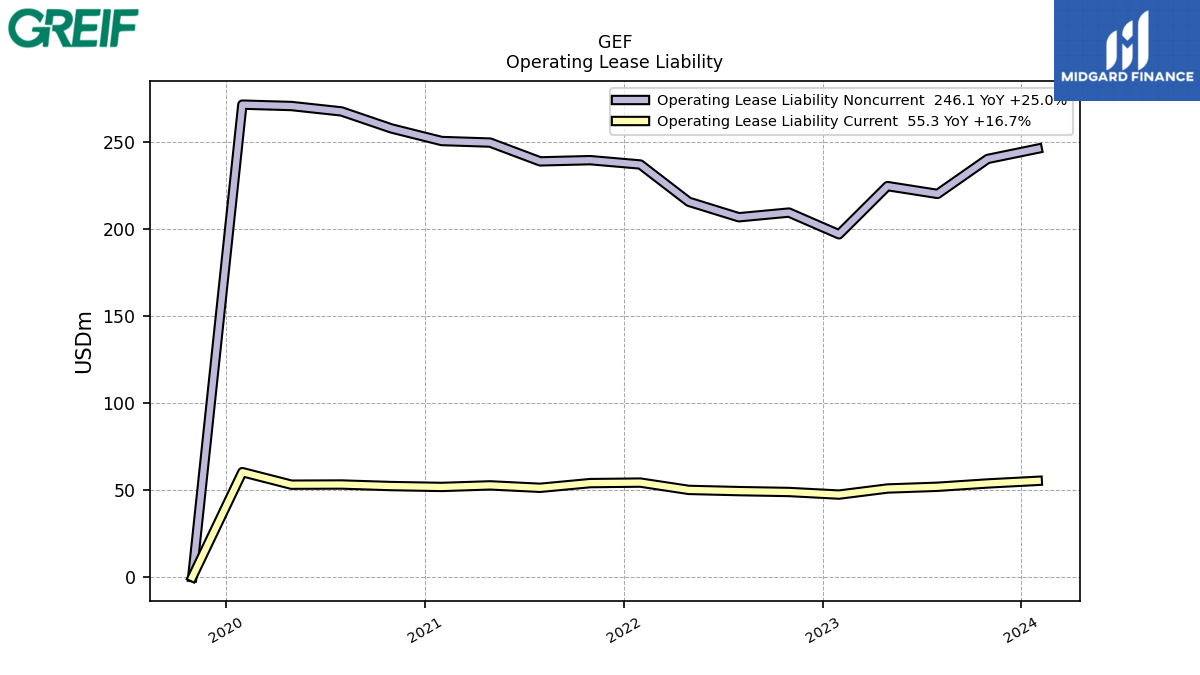
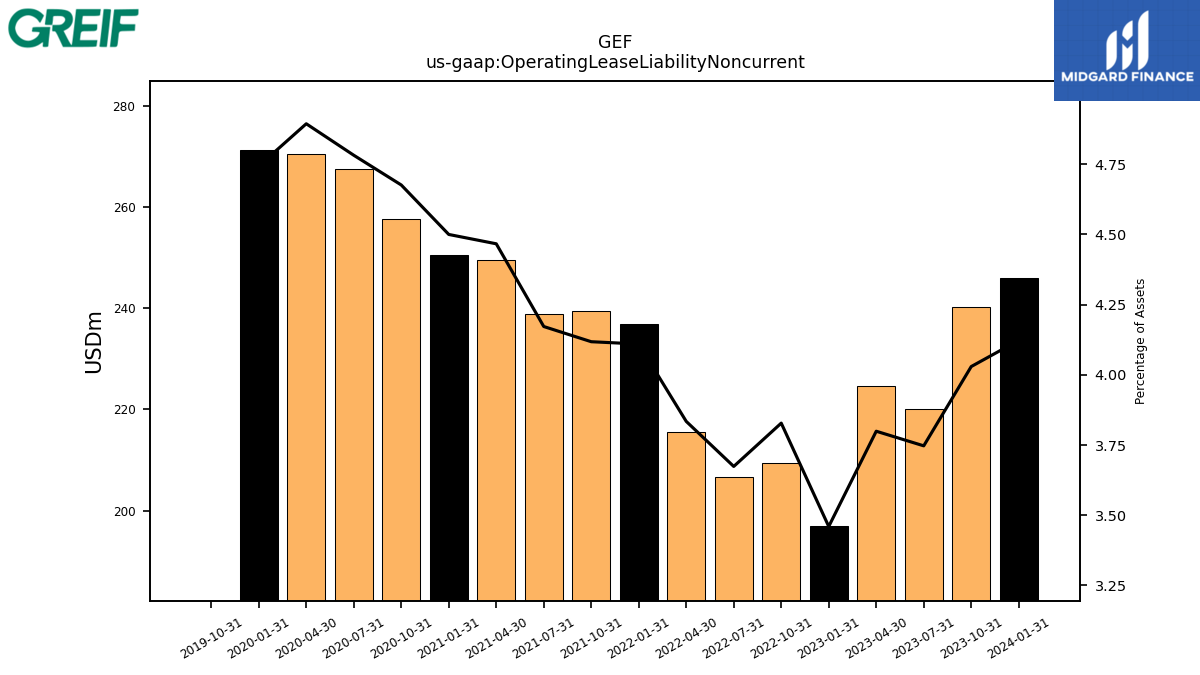
| Operating Lease Liability Noncurrent | 246.10 | 240.20 | 220.10 | 224.60 | 196.90 | 209.40 | 206.70 | 215.60 | 237.00 | 239.50 | 238.80 | 249.60 | 250.50 | 257.70 | 267.50 | 270.60 | 271.40 | 0.00 | NA | NA | NA | NA | NA | NA | NA | NA | NA | NA | NA | NA | NA | NA | NA | NA | NA | NA | NA | NA | NA | NA | NA | NA | NA | NA | NA | NA | NA | NA | NA | NA | NA | NA | NA | NA | NA | NA | NA |
| 2024-01-31 | 2023-10-31 | 2023-07-31 | 2023-04-30 | 2023-01-31 | 2022-10-31 | 2022-07-31 | 2022-04-30 | 2022-01-31 | 2021-10-31 | 2021-07-31 | 2021-04-30 | 2021-01-31 | 2020-10-31 | 2020-07-31 | 2020-04-30 | 2020-01-31 | 2019-10-31 | 2019-07-31 | 2019-04-30 | 2019-01-31 | 2018-10-31 | 2018-07-31 | 2018-04-30 | 2018-01-31 | 2017-10-31 | 2017-07-31 | 2017-04-30 | 2017-01-31 | 2016-10-31 | 2016-07-31 | 2016-04-30 | 2016-01-31 | 2015-10-31 | 2015-07-31 | 2015-04-30 | 2015-01-31 | 2014-10-31 | 2014-07-31 | 2014-04-30 | 2014-01-31 | 2013-10-31 | 2013-07-31 | 2013-04-30 | 2013-01-31 | 2012-10-31 | 2012-07-31 | 2012-04-30 | 2012-01-31 | 2011-10-31 | 2011-07-31 | 2011-04-30 | 2011-01-31 | 2010-10-31 | 2010-07-31 | 2010-04-30 | 2010-01-31 | ||
|---|---|---|---|---|---|---|---|---|---|---|---|---|---|---|---|---|---|---|---|---|---|---|---|---|---|---|---|---|---|---|---|---|---|---|---|---|---|---|---|---|---|---|---|---|---|---|---|---|---|---|---|---|---|---|---|---|---|---|
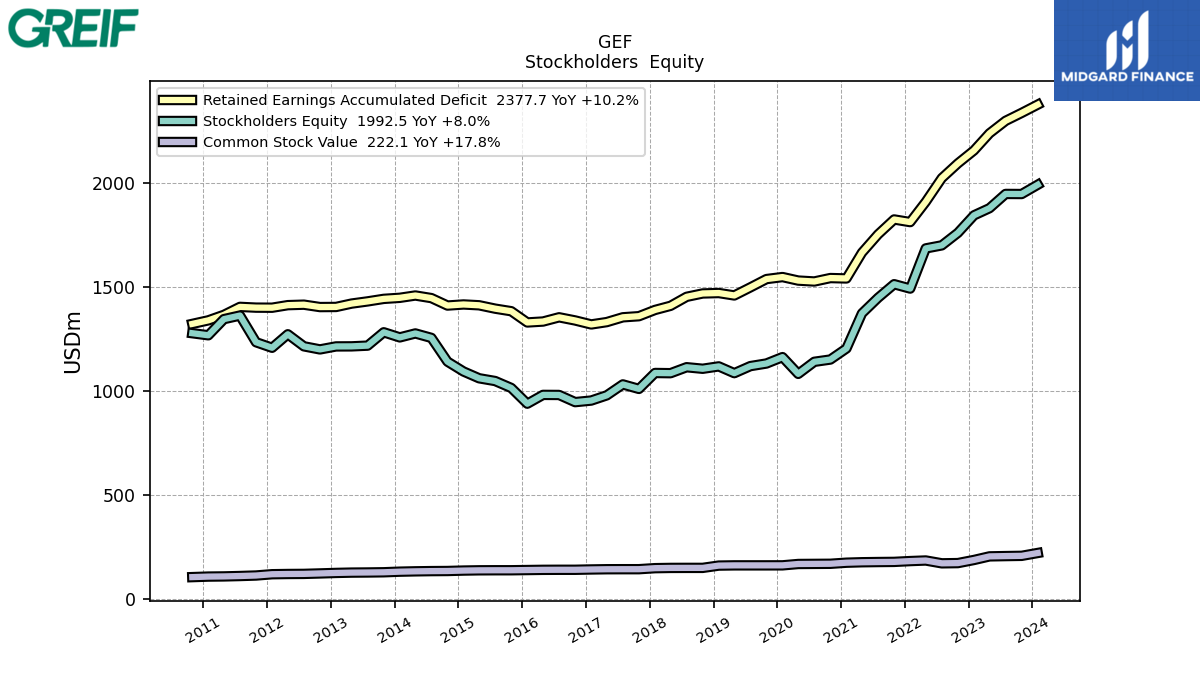
| Stockholders Equity | 1992.50 | 1947.90 | 1948.30 | 1879.80 | 1845.40 | 1761.30 | 1701.10 | 1686.40 | 1493.30 | 1514.30 | 1448.90 | 1374.20 | 1205.30 | 1152.20 | 1141.30 | 1083.20 | 1163.80 | 1133.10 | 1120.60 | 1086.60 | 1119.20 | 1107.80 | 1115.20 | 1086.50 | 1087.50 | 1010.90 | 1032.60 | 980.00 | 955.00 | 947.40 | 981.80 | 982.20 | 939.80 | 1015.60 | 1048.80 | 1062.10 | 1094.60 | 1142.10 | 1256.20 | 1277.60 | 1258.60 | 1283.20 | 1219.00 | 1215.50 | 1215.20 | 1200.80 | 1215.70 | 1273.60 | 1208.70 | 1235.35 | 1363.69 | 1346.35 | 1268.72 | 1278.72 | NA | NA | NA | |
| Stockholders Equity Including Portion Attributable To Noncontrolling Interest | 2036.40 | 1986.30 | 1988.80 | 1914.90 | 1882.20 | 1794.30 | 1736.60 | 1718.40 | 1557.30 | 1575.60 | 1507.50 | 1429.70 | 1262.60 | 1200.70 | 1190.90 | 1135.20 | 1222.70 | 1191.10 | 1175.60 | 1136.40 | 1171.50 | 1154.20 | 1157.40 | 1129.30 | 1126.50 | 1047.50 | 1042.70 | 986.80 | 965.20 | 957.90 | 994.20 | 1000.50 | 958.10 | 1059.90 | 1092.50 | 1103.70 | 1148.30 | 1223.20 | 1384.10 | 1409.80 | 1374.60 | 1398.00 | 1335.10 | 1337.60 | 1338.20 | 1320.40 | 1349.70 | 1411.90 | 1391.90 | 1392.17 | 1473.03 | 1427.64 | 1346.78 | 1355.43 | NA | NA | NA | |
| Common Stock Value | 222.10 | 208.40 | 207.20 | 205.80 | 188.50 | 173.50 | 172.40 | 186.00 | 183.20 | 179.30 | 178.60 | 177.60 | 175.40 | 170.20 | 169.70 | 169.20 | 162.70 | 162.60 | 162.60 | 162.60 | 161.50 | 150.50 | 150.50 | 150.30 | 149.10 | 144.20 | 144.20 | 144.00 | 142.90 | 141.40 | 141.40 | 141.10 | 140.10 | 139.10 | 139.10 | 138.80 | 137.60 | 135.50 | 135.00 | 133.90 | 132.30 | 129.40 | 128.40 | 127.80 | 126.20 | 123.80 | 121.60 | 121.10 | 120.00 | 113.80 | 111.35 | 109.47 | 108.66 | 106.06 | NA | NA | NA | |
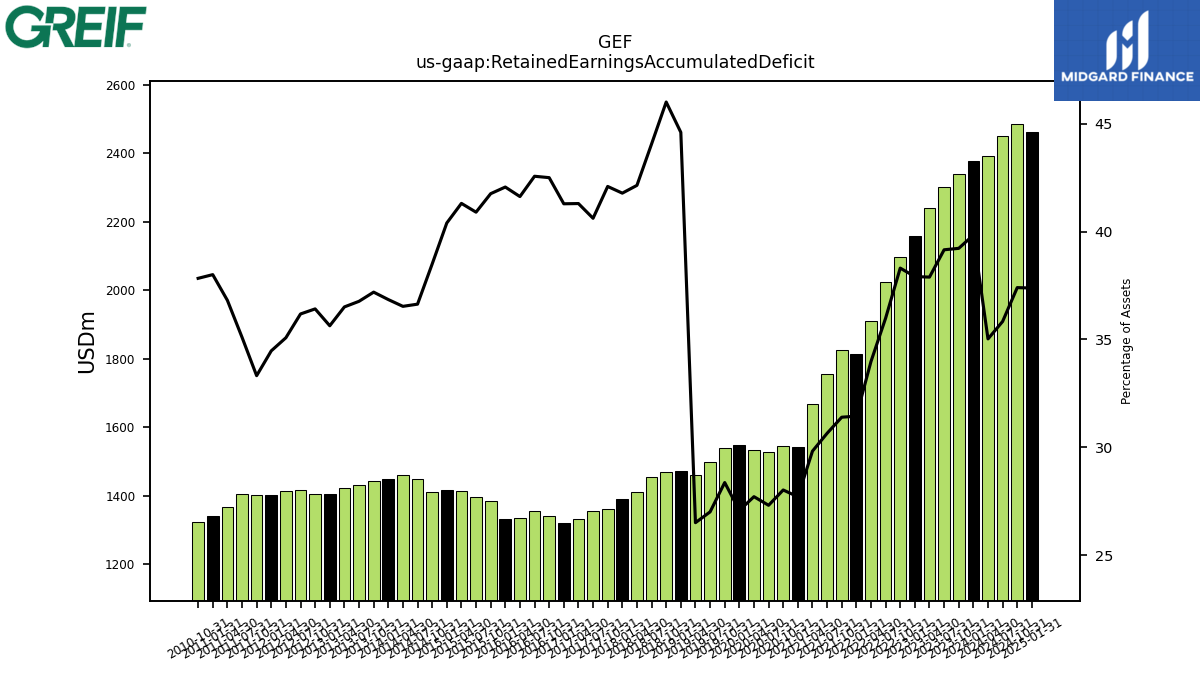
| Retained Earnings Accumulated Deficit | 2377.70 | 2337.90 | 2299.70 | 2239.70 | 2157.40 | 2095.20 | 2024.30 | 1910.30 | 1812.90 | 1825.60 | 1753.90 | 1666.10 | 1542.00 | 1543.90 | 1527.40 | 1531.80 | 1548.70 | 1539.00 | 1499.10 | 1460.20 | 1471.90 | 1469.80 | 1453.70 | 1410.40 | 1390.50 | 1360.50 | 1355.20 | 1332.20 | 1320.90 | 1340.00 | 1355.20 | 1334.90 | 1330.40 | 1384.50 | 1396.80 | 1413.00 | 1416.90 | 1411.70 | 1447.50 | 1460.00 | 1448.90 | 1443.80 | 1431.70 | 1421.20 | 1404.90 | 1404.40 | 1415.90 | 1413.60 | 1401.30 | 1401.70 | 1405.35 | 1366.97 | 1340.60 | 1323.48 | NA | NA | NA | |
| Minority Interest | 43.90 | 38.40 | 40.50 | 35.10 | 36.80 | 33.00 | 35.50 | 32.00 | 64.00 | 61.30 | 58.60 | 55.50 | 57.30 | 48.50 | 49.60 | 52.00 | 58.90 | 58.00 | 55.00 | 49.80 | 52.30 | 46.40 | 42.20 | 42.80 | 39.00 | 36.60 | 10.10 | 6.80 | 10.20 | 10.50 | 12.40 | 18.30 | 18.30 | 44.30 | 43.70 | 41.60 | 53.70 | 81.10 | 127.90 | 132.20 | 116.00 | 114.80 | 116.10 | 122.10 | 123.00 | 119.60 | 134.00 | 138.30 | 183.20 | 156.82 | 109.34 | 81.30 | 78.06 | 76.71 | NA | NA | NA |
| 2024-01-31 | 2023-10-31 | 2023-07-31 | 2023-04-30 | 2023-01-31 | 2022-10-31 | 2022-07-31 | 2022-04-30 | 2022-01-31 | 2021-10-31 | 2021-07-31 | 2021-04-30 | 2021-01-31 | 2020-10-31 | 2020-07-31 | 2020-04-30 | 2020-01-31 | 2019-10-31 | 2019-07-31 | 2019-04-30 | 2019-01-31 | 2018-10-31 | 2018-07-31 | 2018-04-30 | 2018-01-31 | 2017-10-31 | 2017-07-31 | 2017-04-30 | 2017-01-31 | 2016-10-31 | 2016-07-31 | 2016-04-30 | 2016-01-31 | 2015-10-31 | 2015-07-31 | 2015-04-30 | 2015-01-31 | 2014-10-31 | 2014-07-31 | 2014-04-30 | 2014-01-31 | 2013-10-31 | 2013-07-31 | 2013-04-30 | 2013-01-31 | 2012-10-31 | 2012-07-31 | 2012-04-30 | 2012-01-31 | 2011-10-31 | 2011-07-31 | 2011-04-30 | 2011-01-31 | 2010-10-31 | 2010-07-31 | 2010-04-30 | 2010-01-31 | ||
|---|---|---|---|---|---|---|---|---|---|---|---|---|---|---|---|---|---|---|---|---|---|---|---|---|---|---|---|---|---|---|---|---|---|---|---|---|---|---|---|---|---|---|---|---|---|---|---|---|---|---|---|---|---|---|---|---|---|---|
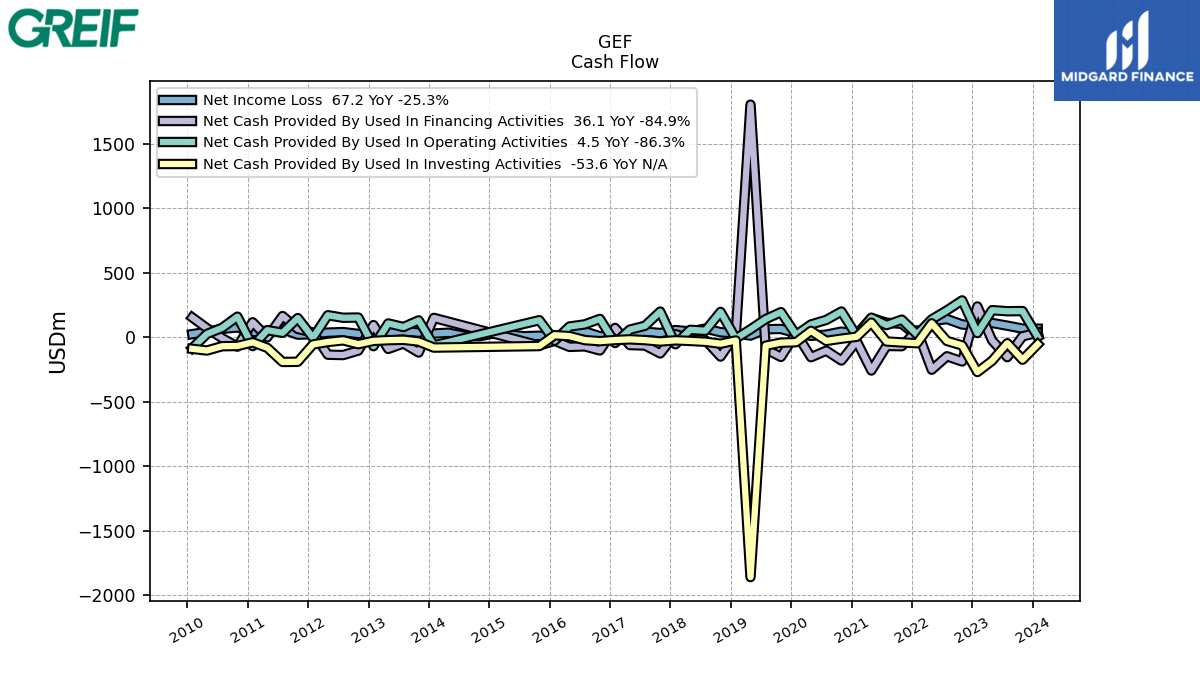
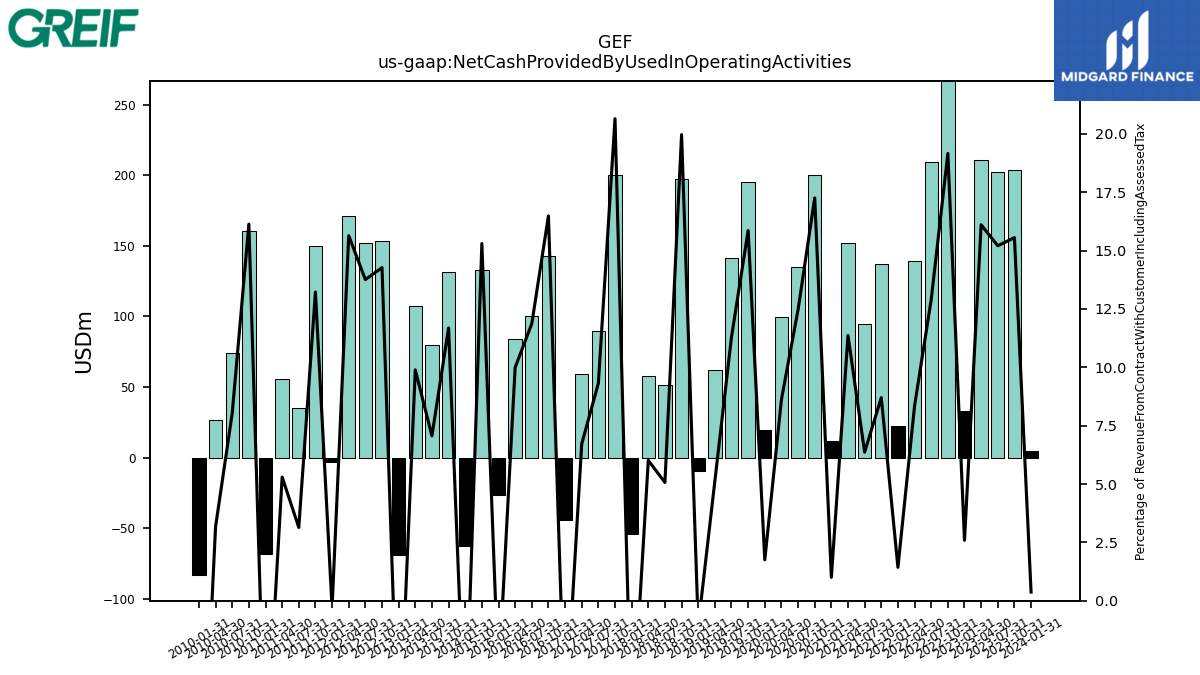
| Net Cash Provided By Used In Operating Activities | 4.50 | 203.50 | 202.30 | 210.80 | 32.90 | 286.60 | 209.30 | 139.20 | 22.40 | 137.30 | 94.90 | 152.30 | 11.50 | 200.40 | 135.00 | 99.80 | 19.50 | 195.40 | 141.50 | 62.20 | -9.60 | 197.20 | 51.30 | 58.20 | -53.70 | 199.90 | 89.60 | 59.60 | -44.10 | 143.00 | 100.30 | 83.90 | -26.20 | 132.90 | NA | NA | NA | NA | NA | NA | -62.80 | 131.60 | 79.80 | 107.70 | -68.80 | 153.50 | 151.70 | 171.30 | -3.10 | 149.62 | 35.23 | 55.65 | -68.16 | 160.34 | 74.00 | 26.56 | -82.78 | |
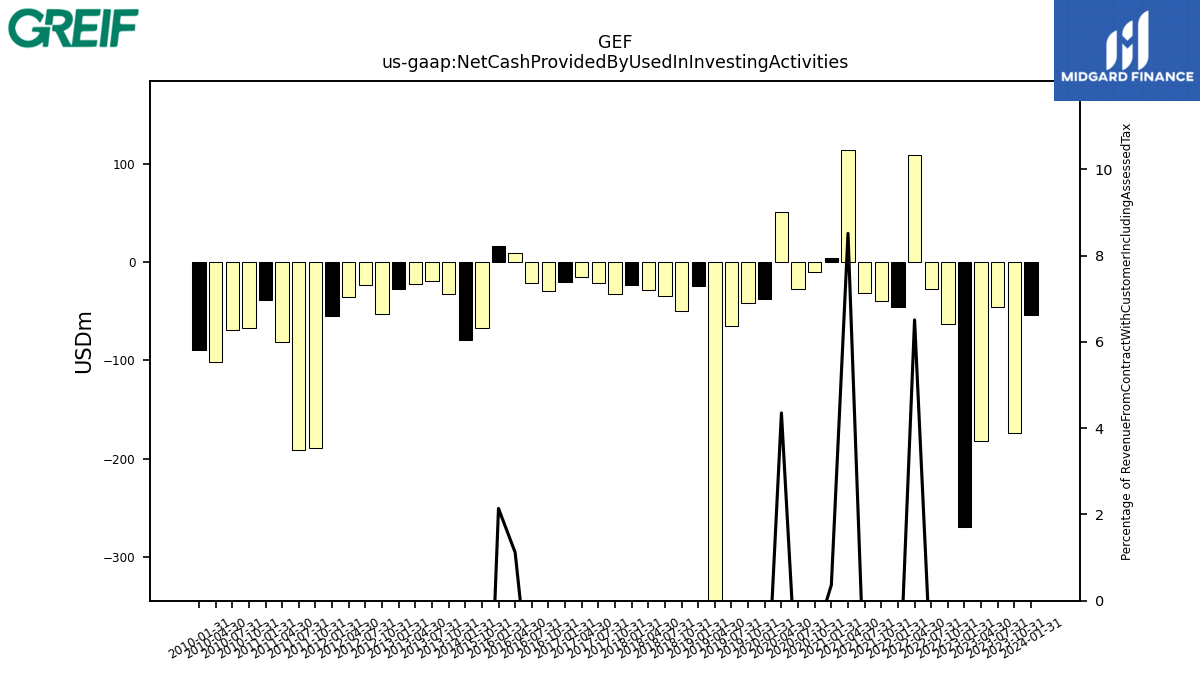
| Net Cash Provided By Used In Investing Activities | -53.60 | -173.50 | -45.70 | -181.90 | -269.10 | -62.90 | -28.00 | 108.50 | -45.80 | -39.40 | -32.10 | 114.10 | 4.20 | -10.40 | -27.60 | 50.40 | -37.60 | -41.40 | -64.80 | -1858.70 | -24.40 | -49.50 | -34.40 | -28.10 | -23.20 | -32.20 | -21.60 | -15.70 | -20.90 | -29.70 | -21.30 | 9.40 | 16.50 | -67.70 | NA | NA | NA | NA | NA | NA | -79.60 | -32.20 | -19.10 | -22.00 | -27.40 | -53.20 | -23.60 | -36.00 | -55.30 | -189.53 | -190.90 | -81.19 | -38.82 | -67.02 | -68.87 | -102.15 | -89.23 | |
| Net Cash Provided By Used In Financing Activities | 36.10 | 7.70 | -153.60 | -23.90 | 239.50 | -187.20 | -146.70 | -251.10 | 54.00 | -68.80 | -66.70 | -257.40 | -30.00 | -179.70 | -103.20 | -154.20 | 31.80 | -151.90 | -91.40 | 1803.80 | 23.00 | -149.30 | -21.20 | -12.30 | 24.50 | -124.90 | -63.50 | -59.90 | 72.70 | -101.60 | -70.00 | -74.10 | -27.10 | -63.50 | NA | NA | NA | NA | NA | NA | 150.70 | -117.70 | -47.30 | -90.00 | 95.10 | -102.80 | -137.50 | -134.60 | 37.00 | 65.22 | 165.40 | 0.58 | 116.94 | -72.12 | -6.43 | 70.48 | 153.95 |
| 2024-01-31 | 2023-10-31 | 2023-07-31 | 2023-04-30 | 2023-01-31 | 2022-10-31 | 2022-07-31 | 2022-04-30 | 2022-01-31 | 2021-10-31 | 2021-07-31 | 2021-04-30 | 2021-01-31 | 2020-10-31 | 2020-07-31 | 2020-04-30 | 2020-01-31 | 2019-10-31 | 2019-07-31 | 2019-04-30 | 2019-01-31 | 2018-10-31 | 2018-07-31 | 2018-04-30 | 2018-01-31 | 2017-10-31 | 2017-07-31 | 2017-04-30 | 2017-01-31 | 2016-10-31 | 2016-07-31 | 2016-04-30 | 2016-01-31 | 2015-10-31 | 2015-07-31 | 2015-04-30 | 2015-01-31 | 2014-10-31 | 2014-07-31 | 2014-04-30 | 2014-01-31 | 2013-10-31 | 2013-07-31 | 2013-04-30 | 2013-01-31 | 2012-10-31 | 2012-07-31 | 2012-04-30 | 2012-01-31 | 2011-10-31 | 2011-07-31 | 2011-04-30 | 2011-01-31 | 2010-10-31 | 2010-07-31 | 2010-04-30 | 2010-01-31 | ||
|---|---|---|---|---|---|---|---|---|---|---|---|---|---|---|---|---|---|---|---|---|---|---|---|---|---|---|---|---|---|---|---|---|---|---|---|---|---|---|---|---|---|---|---|---|---|---|---|---|---|---|---|---|---|---|---|---|---|---|
| Net Cash Provided By Used In Operating Activities | 4.50 | 203.50 | 202.30 | 210.80 | 32.90 | 286.60 | 209.30 | 139.20 | 22.40 | 137.30 | 94.90 | 152.30 | 11.50 | 200.40 | 135.00 | 99.80 | 19.50 | 195.40 | 141.50 | 62.20 | -9.60 | 197.20 | 51.30 | 58.20 | -53.70 | 199.90 | 89.60 | 59.60 | -44.10 | 143.00 | 100.30 | 83.90 | -26.20 | 132.90 | NA | NA | NA | NA | NA | NA | -62.80 | 131.60 | 79.80 | 107.70 | -68.80 | 153.50 | 151.70 | 171.30 | -3.10 | 149.62 | 35.23 | 55.65 | -68.16 | 160.34 | 74.00 | 26.56 | -82.78 | |
| Net Income Loss | 67.20 | 67.80 | 90.30 | 111.20 | 89.90 | 99.50 | 141.80 | 125.10 | 10.30 | 104.50 | 113.00 | 149.80 | 23.40 | 44.40 | 20.70 | 11.40 | 32.30 | 65.00 | 62.70 | 13.60 | 29.70 | 40.10 | 67.70 | 45.10 | 56.50 | 33.30 | 43.90 | 36.00 | 5.40 | 8.50 | 46.10 | 31.40 | -11.10 | 12.40 | 8.60 | 20.80 | 30.10 | 8.70 | 12.20 | 35.80 | 29.50 | 36.80 | 46.70 | 40.90 | 24.90 | 26.50 | 40.70 | 36.80 | 23.90 | 20.77 | 62.94 | 50.88 | 41.44 | 76.56 | 65.97 | 42.63 | 24.82 | |
| Profit Loss | 74.30 | 73.30 | 96.70 | 116.00 | 93.10 | 102.60 | 146.10 | 126.70 | 18.60 | 109.90 | 118.40 | 154.00 | 30.90 | 48.00 | 24.40 | 15.80 | 36.10 | 69.80 | 67.50 | 21.10 | 35.80 | 45.50 | 72.00 | 51.90 | 60.10 | 39.70 | 47.50 | 39.90 | 8.00 | 6.50 | 46.40 | 32.50 | -9.90 | 9.20 | 9.30 | 20.50 | 28.20 | -35.50 | 10.00 | 34.50 | 30.60 | 33.00 | 48.80 | 43.00 | 26.20 | 29.60 | 41.70 | 36.20 | 24.60 | 20.51 | 64.97 | 50.59 | 41.10 | 76.64 | 67.76 | 44.83 | 26.23 | |
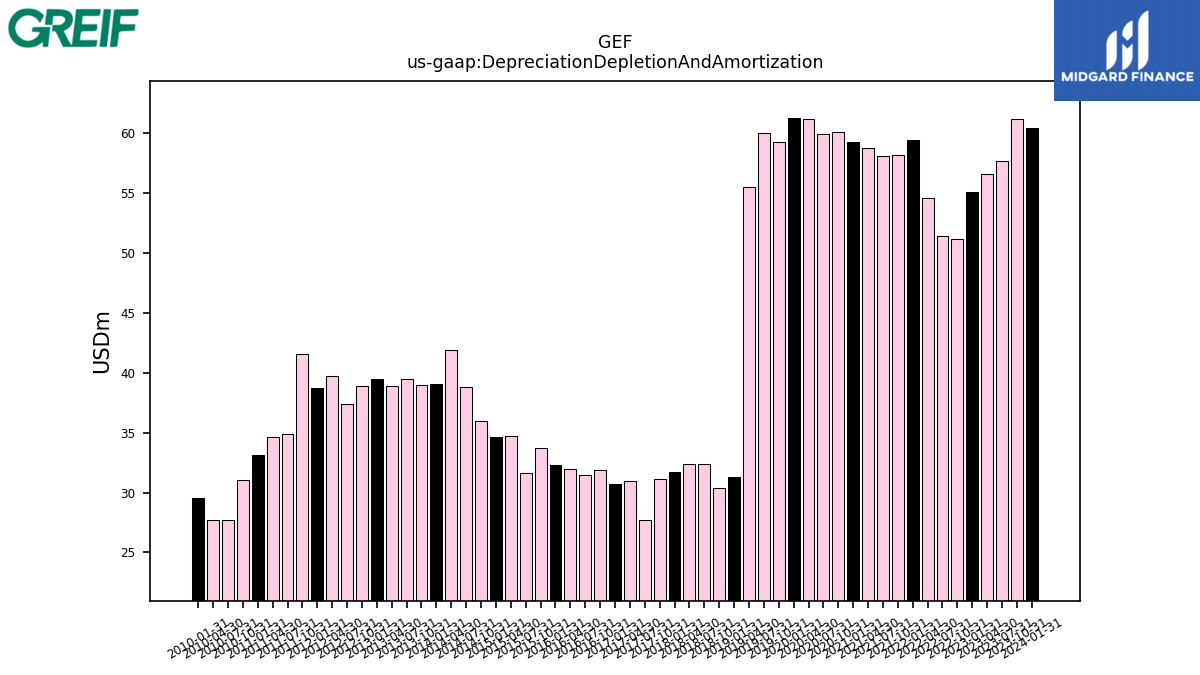
| Depreciation Depletion And Amortization | 60.40 | 61.20 | 57.70 | 56.60 | 55.10 | 51.20 | 51.40 | 54.60 | 59.40 | 58.20 | 58.10 | 58.80 | 59.30 | 60.10 | 59.90 | 61.20 | 61.30 | 59.30 | 60.00 | 55.50 | 31.30 | 30.40 | 32.40 | 32.40 | 31.70 | 31.10 | 27.70 | 31.00 | 30.70 | 31.90 | 31.50 | 32.00 | 32.30 | 33.70 | 31.60 | 34.70 | 34.60 | 36.00 | 38.80 | 41.90 | 39.10 | 39.00 | 39.50 | 38.90 | 39.50 | 38.90 | 37.40 | 39.70 | 38.70 | 41.57 | 34.91 | 34.60 | 33.11 | 31.05 | 27.75 | 27.67 | 29.51 | |
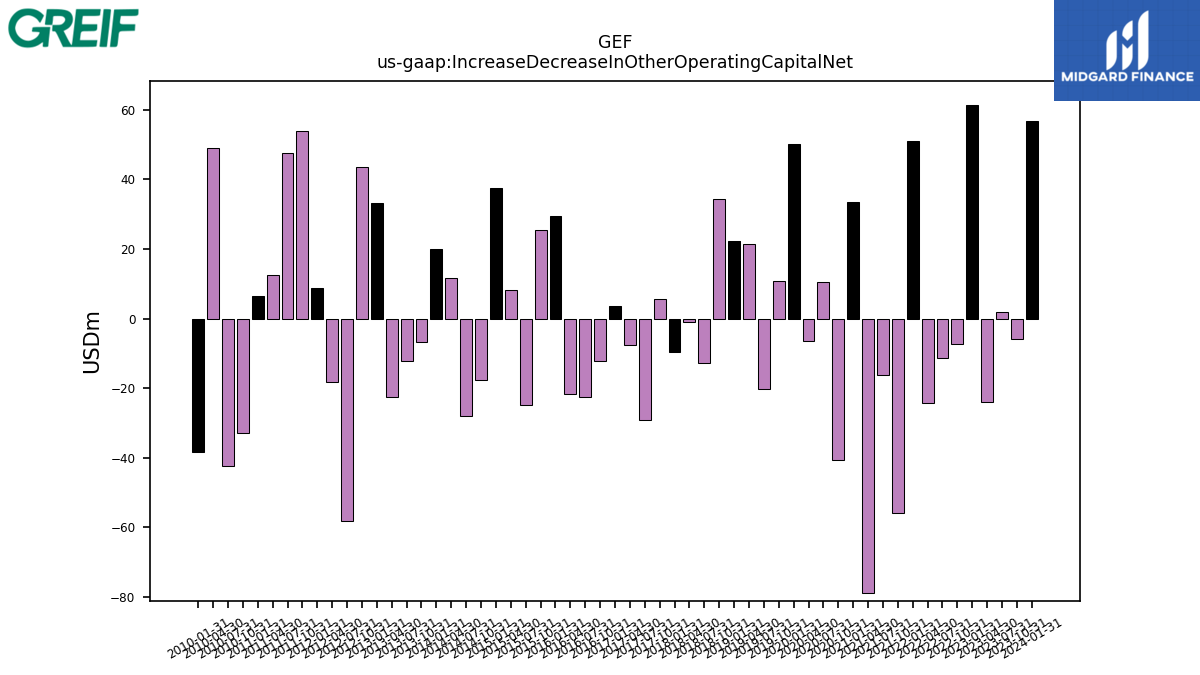
| Increase Decrease In Other Operating Capital Net | 56.70 | -5.70 | 1.80 | -24.00 | 61.30 | -7.30 | -11.40 | -24.30 | 51.00 | -55.80 | -16.20 | -78.70 | 33.40 | -40.70 | 10.50 | -6.40 | 50.20 | 10.80 | -20.30 | 21.60 | 22.40 | 34.40 | -12.60 | -1.00 | -9.70 | 5.60 | -29.20 | -7.70 | 3.50 | -12.20 | -22.50 | -21.70 | 29.60 | 25.50 | -24.70 | 8.10 | 37.60 | -17.60 | -28.10 | 11.80 | 19.90 | -6.60 | -12.20 | -22.50 | 33.20 | 43.70 | -58.10 | -18.20 | 8.80 | 53.89 | 47.53 | 12.42 | 6.56 | -32.78 | -42.45 | 49.07 | -38.40 | |
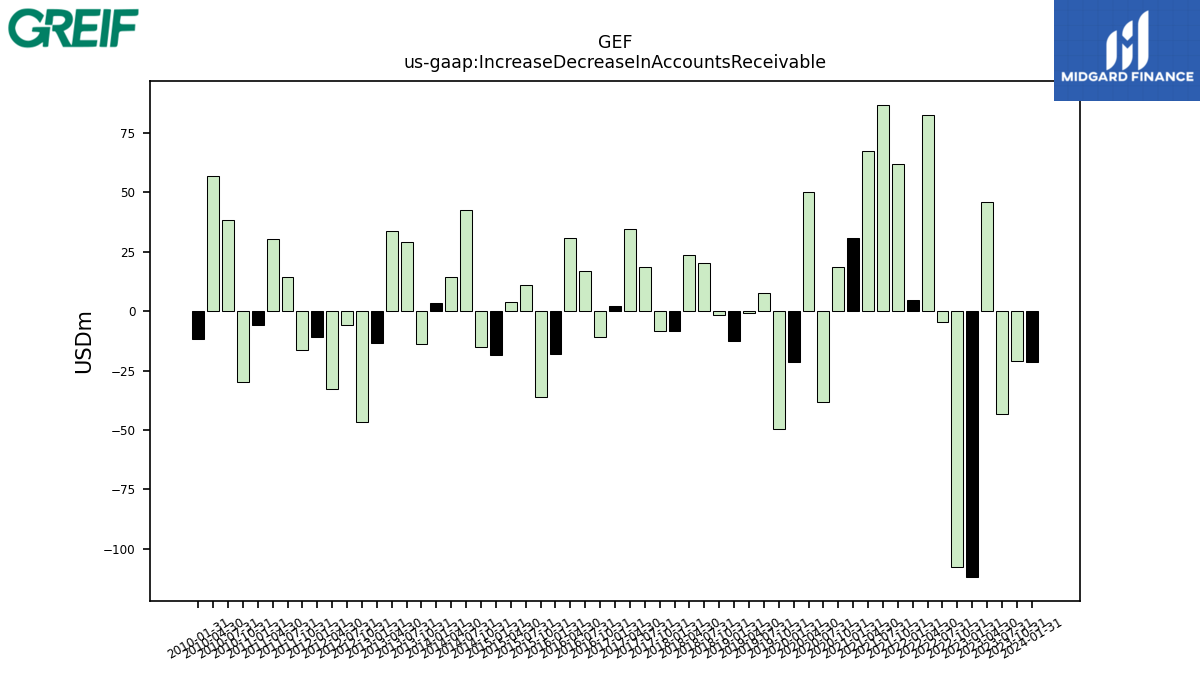
| Increase Decrease In Accounts Receivable | -21.50 | -20.80 | -43.50 | 46.00 | -112.00 | -107.80 | -4.70 | 82.60 | 4.80 | 62.10 | 87.00 | 67.60 | 30.80 | 18.50 | -38.10 | 50.20 | -21.50 | -49.60 | 7.80 | -0.70 | -12.60 | -1.60 | 20.40 | 23.60 | -8.40 | -8.30 | 18.70 | 34.60 | 2.30 | -10.90 | 16.90 | 30.80 | -18.20 | -36.20 | 11.20 | 3.90 | -18.40 | -15.10 | 42.50 | 14.60 | 3.30 | -13.70 | 29.00 | 33.60 | -13.50 | -46.50 | -5.80 | -32.70 | -10.80 | -16.20 | 14.37 | 30.36 | -5.94 | -29.67 | 38.37 | 57.14 | -11.79 | |
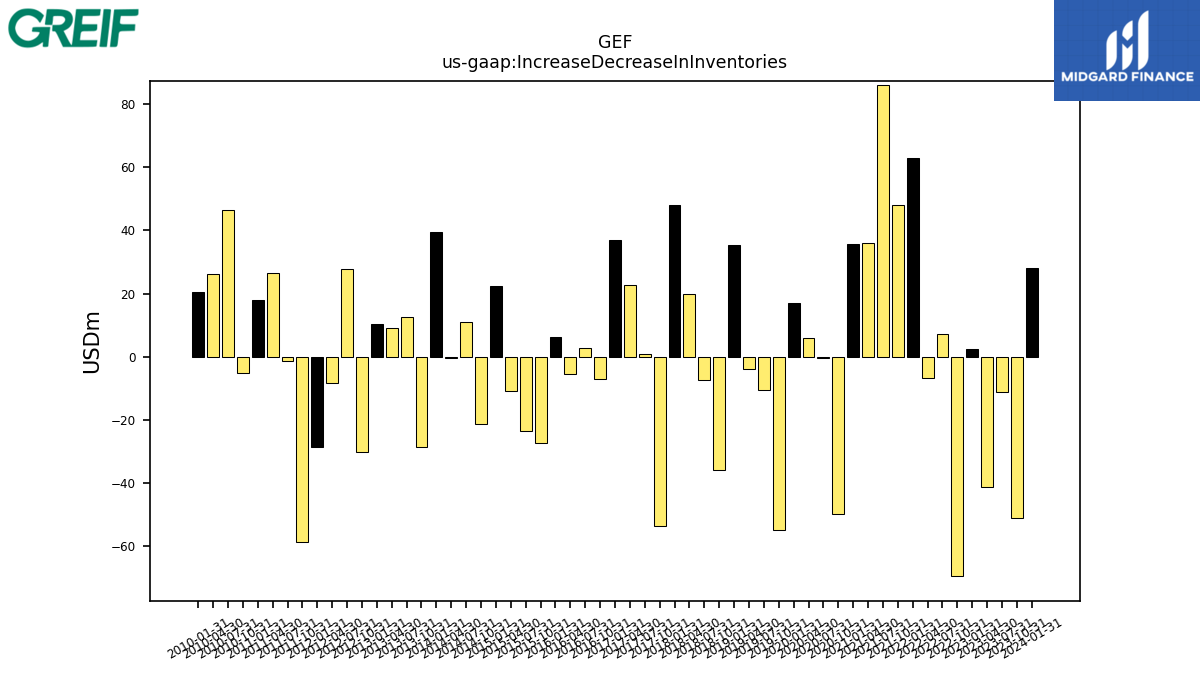
| Increase Decrease In Inventories | 28.00 | -51.10 | -11.30 | -41.20 | 2.60 | -69.40 | 7.10 | -6.70 | 62.90 | 48.10 | 86.10 | 35.90 | 35.50 | -49.60 | -0.50 | 6.00 | 17.00 | -54.70 | -10.40 | -4.00 | 35.20 | -35.90 | -7.30 | 20.00 | 48.00 | -53.50 | 0.90 | 22.80 | 36.80 | -7.00 | 2.80 | -5.60 | 6.40 | -27.20 | -23.40 | -10.70 | 22.40 | -21.40 | 11.10 | -0.30 | 39.30 | -28.50 | 12.70 | 9.00 | 10.30 | -30.20 | 27.80 | -8.40 | -28.70 | -58.65 | -1.31 | 26.57 | 17.99 | -5.01 | 46.39 | 26.10 | 20.35 | |
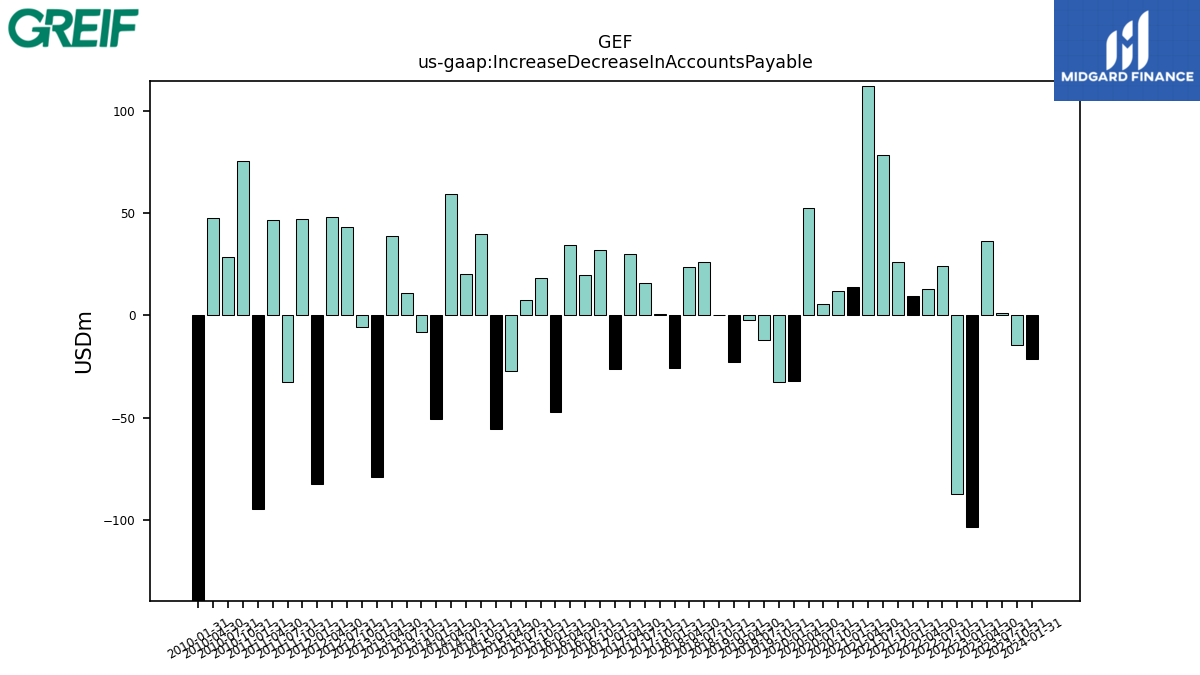
| Increase Decrease In Accounts Payable | -21.10 | -14.20 | 1.30 | 36.20 | -103.10 | -87.10 | 24.20 | 12.80 | 9.60 | 26.30 | 78.30 | 112.10 | 13.70 | 12.20 | 5.70 | 52.40 | -32.20 | -32.70 | -12.10 | -2.20 | -22.90 | 0.30 | 26.00 | 23.70 | -25.70 | 0.50 | 15.80 | 30.20 | -26.00 | 32.10 | 20.00 | 34.30 | -47.00 | 18.20 | 7.40 | -26.90 | -55.30 | 39.80 | 20.40 | 59.40 | -50.70 | -8.20 | 11.20 | 38.80 | -78.90 | -5.40 | 43.20 | 48.10 | -82.40 | 47.28 | -32.69 | 46.50 | -94.45 | 75.46 | 28.48 | 47.77 | -147.58 | |
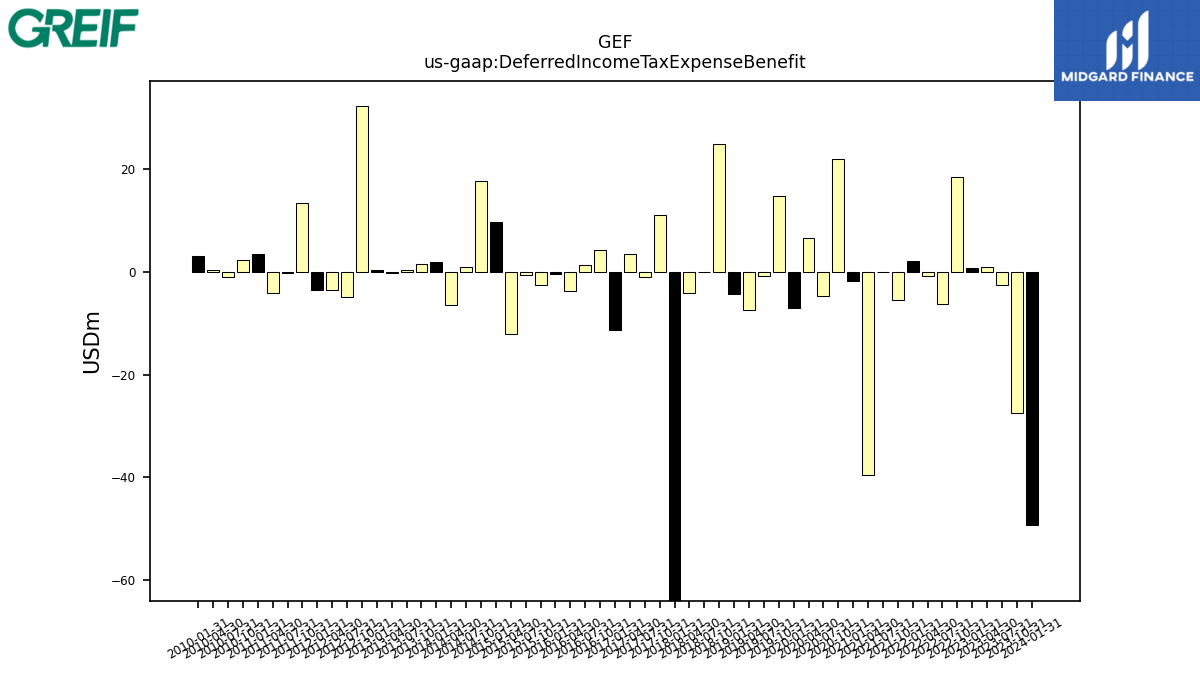
| Deferred Income Tax Expense Benefit | -49.20 | -27.40 | -2.50 | 0.90 | 0.70 | 18.50 | -6.20 | -0.90 | 2.00 | -5.60 | -0.10 | -39.60 | -1.90 | 22.00 | -4.80 | 6.50 | -7.00 | 14.80 | -0.90 | -7.50 | -4.30 | 24.80 | 0.00 | -4.10 | -65.50 | 11.10 | -1.00 | 3.50 | -11.30 | 4.30 | 1.30 | -3.70 | -0.40 | -2.60 | -0.70 | -12.20 | 9.60 | 17.70 | 0.90 | -6.40 | 1.90 | 1.50 | 0.40 | -0.20 | 0.30 | 32.20 | -4.90 | -3.60 | -3.50 | 13.32 | -0.29 | -4.21 | 3.52 | 2.28 | -1.02 | 0.31 | 3.02 |
| 2024-01-31 | 2023-10-31 | 2023-07-31 | 2023-04-30 | 2023-01-31 | 2022-10-31 | 2022-07-31 | 2022-04-30 | 2022-01-31 | 2021-10-31 | 2021-07-31 | 2021-04-30 | 2021-01-31 | 2020-10-31 | 2020-07-31 | 2020-04-30 | 2020-01-31 | 2019-10-31 | 2019-07-31 | 2019-04-30 | 2019-01-31 | 2018-10-31 | 2018-07-31 | 2018-04-30 | 2018-01-31 | 2017-10-31 | 2017-07-31 | 2017-04-30 | 2017-01-31 | 2016-10-31 | 2016-07-31 | 2016-04-30 | 2016-01-31 | 2015-10-31 | 2015-07-31 | 2015-04-30 | 2015-01-31 | 2014-10-31 | 2014-07-31 | 2014-04-30 | 2014-01-31 | 2013-10-31 | 2013-07-31 | 2013-04-30 | 2013-01-31 | 2012-10-31 | 2012-07-31 | 2012-04-30 | 2012-01-31 | 2011-10-31 | 2011-07-31 | 2011-04-30 | 2011-01-31 | 2010-10-31 | 2010-07-31 | 2010-04-30 | 2010-01-31 | ||
|---|---|---|---|---|---|---|---|---|---|---|---|---|---|---|---|---|---|---|---|---|---|---|---|---|---|---|---|---|---|---|---|---|---|---|---|---|---|---|---|---|---|---|---|---|---|---|---|---|---|---|---|---|---|---|---|---|---|---|
| Net Cash Provided By Used In Investing Activities | -53.60 | -173.50 | -45.70 | -181.90 | -269.10 | -62.90 | -28.00 | 108.50 | -45.80 | -39.40 | -32.10 | 114.10 | 4.20 | -10.40 | -27.60 | 50.40 | -37.60 | -41.40 | -64.80 | -1858.70 | -24.40 | -49.50 | -34.40 | -28.10 | -23.20 | -32.20 | -21.60 | -15.70 | -20.90 | -29.70 | -21.30 | 9.40 | 16.50 | -67.70 | NA | NA | NA | NA | NA | NA | -79.60 | -32.20 | -19.10 | -22.00 | -27.40 | -53.20 | -23.60 | -36.00 | -55.30 | -189.53 | -190.90 | -81.19 | -38.82 | -67.02 | -68.87 | -102.15 | -89.23 |
| 2024-01-31 | 2023-10-31 | 2023-07-31 | 2023-04-30 | 2023-01-31 | 2022-10-31 | 2022-07-31 | 2022-04-30 | 2022-01-31 | 2021-10-31 | 2021-07-31 | 2021-04-30 | 2021-01-31 | 2020-10-31 | 2020-07-31 | 2020-04-30 | 2020-01-31 | 2019-10-31 | 2019-07-31 | 2019-04-30 | 2019-01-31 | 2018-10-31 | 2018-07-31 | 2018-04-30 | 2018-01-31 | 2017-10-31 | 2017-07-31 | 2017-04-30 | 2017-01-31 | 2016-10-31 | 2016-07-31 | 2016-04-30 | 2016-01-31 | 2015-10-31 | 2015-07-31 | 2015-04-30 | 2015-01-31 | 2014-10-31 | 2014-07-31 | 2014-04-30 | 2014-01-31 | 2013-10-31 | 2013-07-31 | 2013-04-30 | 2013-01-31 | 2012-10-31 | 2012-07-31 | 2012-04-30 | 2012-01-31 | 2011-10-31 | 2011-07-31 | 2011-04-30 | 2011-01-31 | 2010-10-31 | 2010-07-31 | 2010-04-30 | 2010-01-31 | ||
|---|---|---|---|---|---|---|---|---|---|---|---|---|---|---|---|---|---|---|---|---|---|---|---|---|---|---|---|---|---|---|---|---|---|---|---|---|---|---|---|---|---|---|---|---|---|---|---|---|---|---|---|---|---|---|---|---|---|---|
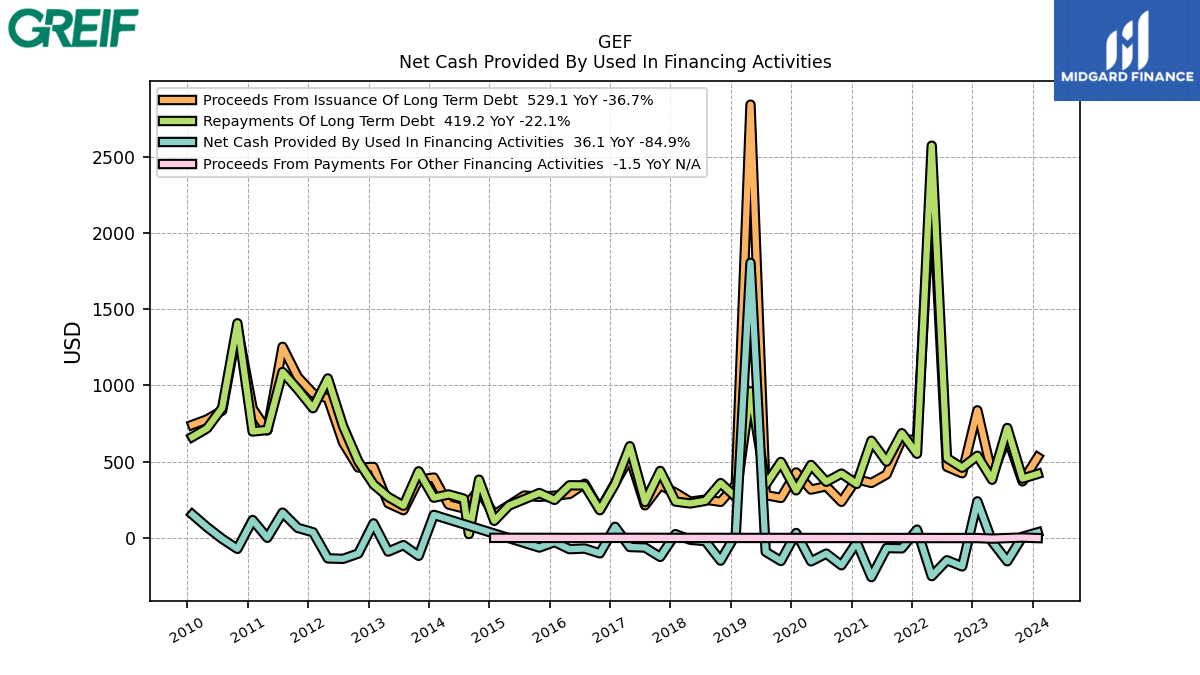
| Net Cash Provided By Used In Financing Activities | 36.10 | 7.70 | -153.60 | -23.90 | 239.50 | -187.20 | -146.70 | -251.10 | 54.00 | -68.80 | -66.70 | -257.40 | -30.00 | -179.70 | -103.20 | -154.20 | 31.80 | -151.90 | -91.40 | 1803.80 | 23.00 | -149.30 | -21.20 | -12.30 | 24.50 | -124.90 | -63.50 | -59.90 | 72.70 | -101.60 | -70.00 | -74.10 | -27.10 | -63.50 | NA | NA | NA | NA | NA | NA | 150.70 | -117.70 | -47.30 | -90.00 | 95.10 | -102.80 | -137.50 | -134.60 | 37.00 | 65.22 | 165.40 | 0.58 | 116.94 | -72.12 | -6.43 | 70.48 | 153.95 | |
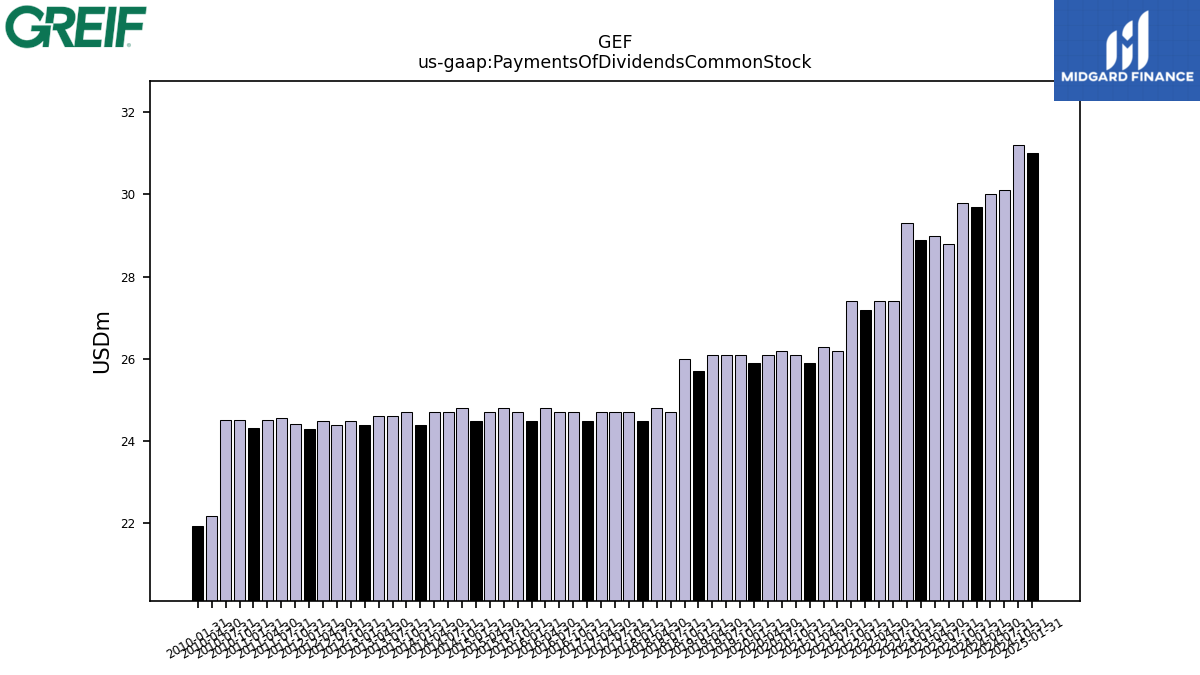
| Payments Of Dividends Common Stock | 29.70 | 29.80 | 28.80 | 29.00 | 28.90 | 29.30 | 27.40 | 27.40 | 27.20 | 27.40 | 26.20 | 26.30 | 25.90 | 26.10 | 26.20 | 26.10 | 25.90 | 26.10 | 26.10 | 26.10 | 25.70 | 26.00 | 24.70 | 24.80 | 24.50 | 24.70 | 24.70 | 24.70 | 24.50 | 24.70 | 24.70 | 24.80 | 24.50 | 24.70 | 24.80 | 24.70 | 24.50 | 24.80 | 24.70 | 24.70 | 24.40 | 24.70 | 24.60 | 24.60 | 24.40 | 24.50 | 24.40 | 24.50 | 24.30 | 24.42 | 24.57 | 24.52 | 24.31 | 24.52 | 24.51 | 22.17 | 21.93 |
| 2024-01-31 | 2023-10-31 | 2023-07-31 | 2023-04-30 | 2023-01-31 | 2022-10-31 | 2022-07-31 | 2022-04-30 | 2022-01-31 | 2021-10-31 | 2021-07-31 | 2021-04-30 | 2021-01-31 | 2020-10-31 | 2020-07-31 | 2020-04-30 | 2020-01-31 | 2019-10-31 | 2019-07-31 | 2019-04-30 | 2019-01-31 | 2018-10-31 | 2018-07-31 | 2018-04-30 | 2018-01-31 | 2017-10-31 | 2017-07-31 | 2017-04-30 | 2017-01-31 | 2016-10-31 | 2016-07-31 | 2016-04-30 | 2016-01-31 | 2015-10-31 | 2015-07-31 | 2015-04-30 | 2015-01-31 | 2014-10-31 | 2014-07-31 | 2014-04-30 | 2014-01-31 | 2013-10-31 | 2013-07-31 | 2013-04-30 | 2013-01-31 | 2012-10-31 | 2012-07-31 | 2012-04-30 | 2012-01-31 | 2011-10-31 | 2011-07-31 | 2011-04-30 | 2011-01-31 | 2010-10-31 | 2010-07-31 | 2010-04-30 | 2010-01-31 | ||
|---|---|---|---|---|---|---|---|---|---|---|---|---|---|---|---|---|---|---|---|---|---|---|---|---|---|---|---|---|---|---|---|---|---|---|---|---|---|---|---|---|---|---|---|---|---|---|---|---|---|---|---|---|---|---|---|---|---|---|
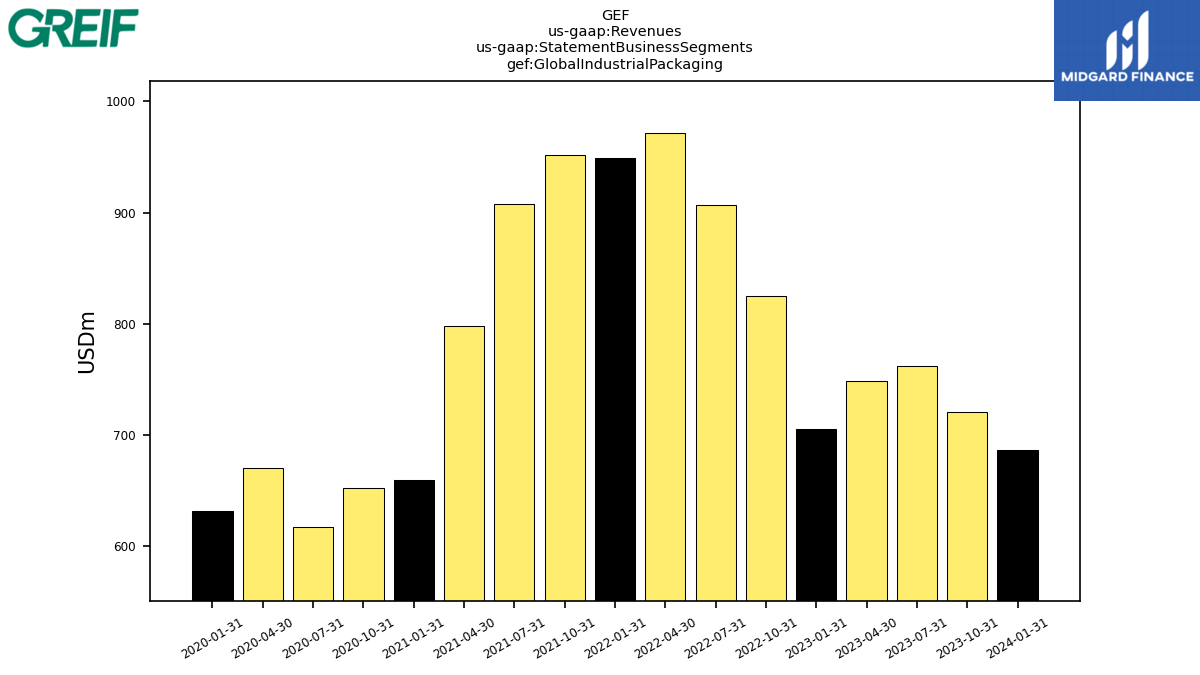
| Revenues | 1205.80 | 1308.40 | 1330.30 | 1308.90 | 1271.00 | 1495.80 | 1622.10 | 1667.30 | 1564.30 | 1578.20 | 1490.80 | 1340.60 | 1146.50 | 1161.30 | 1083.00 | 1158.30 | 1112.40 | 1232.10 | 1252.60 | 1213.30 | 897.00 | 987.70 | 1012.10 | 968.30 | 905.70 | 968.10 | 961.80 | 887.40 | 820.90 | 867.60 | 845.00 | 839.60 | 771.40 | 868.50 | 930.00 | 915.90 | 902.30 | 1048.10 | 1161.10 | 1100.70 | 1034.40 | 1126.20 | 1129.70 | 1088.90 | 1008.60 | 1075.60 | 1102.80 | 1095.30 | 992.70 | 1131.49 | 1121.90 | 1050.77 | 943.79 | 993.94 | 921.33 | 836.58 | 709.68 | |
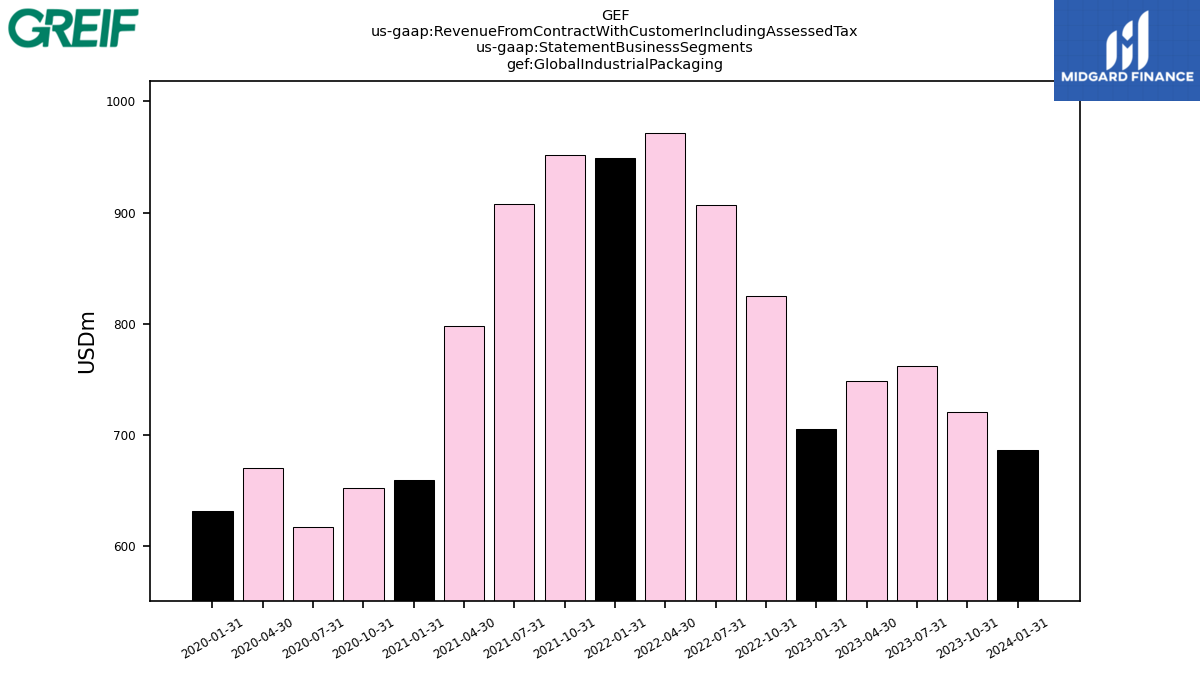
| Global Industrial Packaging | 686.60 | 721.00 | 761.80 | 748.20 | 705.80 | 824.90 | 906.70 | 971.70 | 949.10 | 951.60 | 907.80 | 798.00 | 659.30 | 652.30 | 617.80 | 670.00 | 631.70 | NA | NA | NA | NA | NA | NA | NA | NA | NA | NA | NA | NA | NA | NA | NA | NA | NA | NA | NA | NA | NA | NA | NA | NA | NA | NA | NA | NA | NA | NA | NA | NA | NA | NA | NA | NA | NA | NA | NA | NA | |
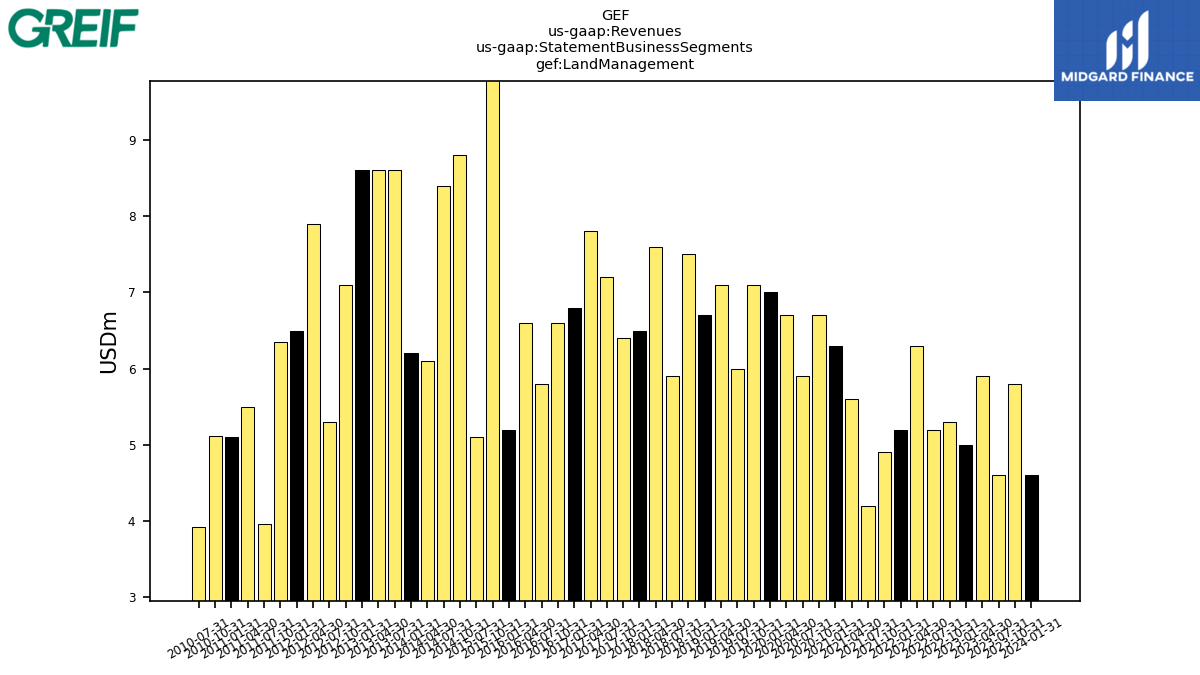
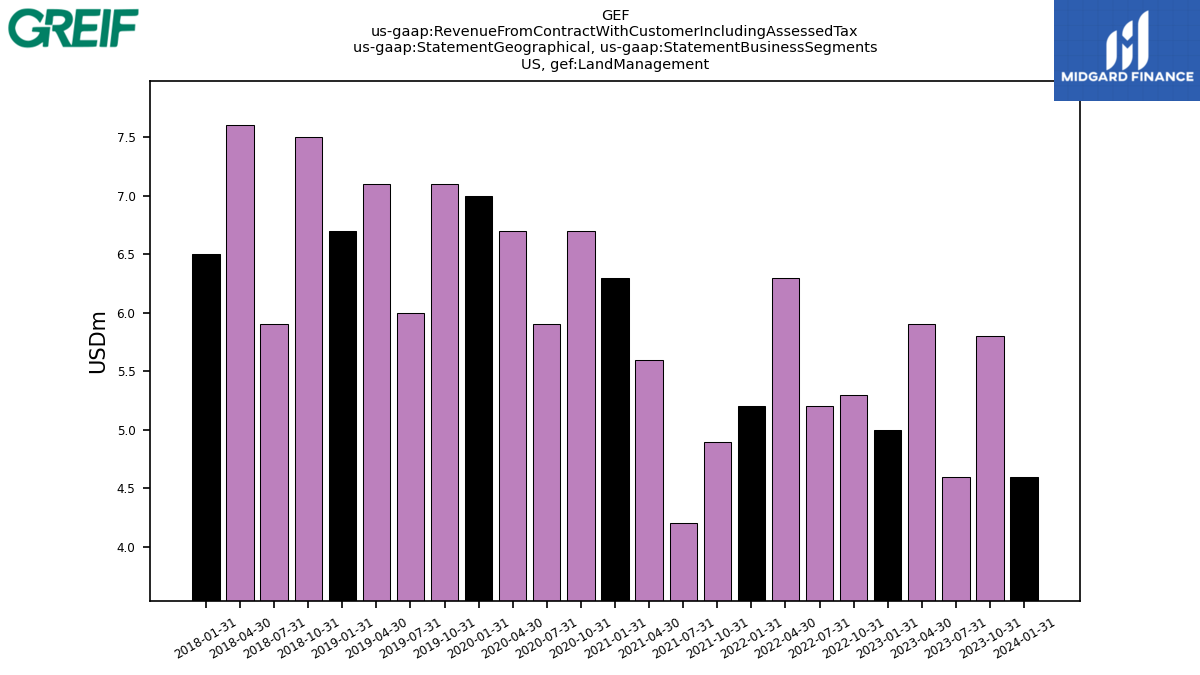
| Land Management | 4.60 | 5.80 | 4.60 | 5.90 | 5.00 | 5.30 | 5.20 | 6.30 | 5.20 | 4.90 | 4.20 | 5.60 | 6.30 | 6.70 | 5.90 | 6.70 | 7.00 | 7.10 | 6.00 | 7.10 | 6.70 | 7.50 | 5.90 | 7.60 | 6.50 | 6.40 | 7.20 | 7.80 | 6.80 | 6.60 | 5.80 | 6.60 | 5.20 | 14.30 | 5.10 | NA | NA | 8.80 | 8.40 | 6.10 | 6.20 | NA | 8.60 | 8.60 | 8.60 | 7.10 | 5.30 | 7.90 | 6.50 | 6.36 | 3.96 | 5.50 | 5.10 | 5.12 | 3.93 | NA | NA | |
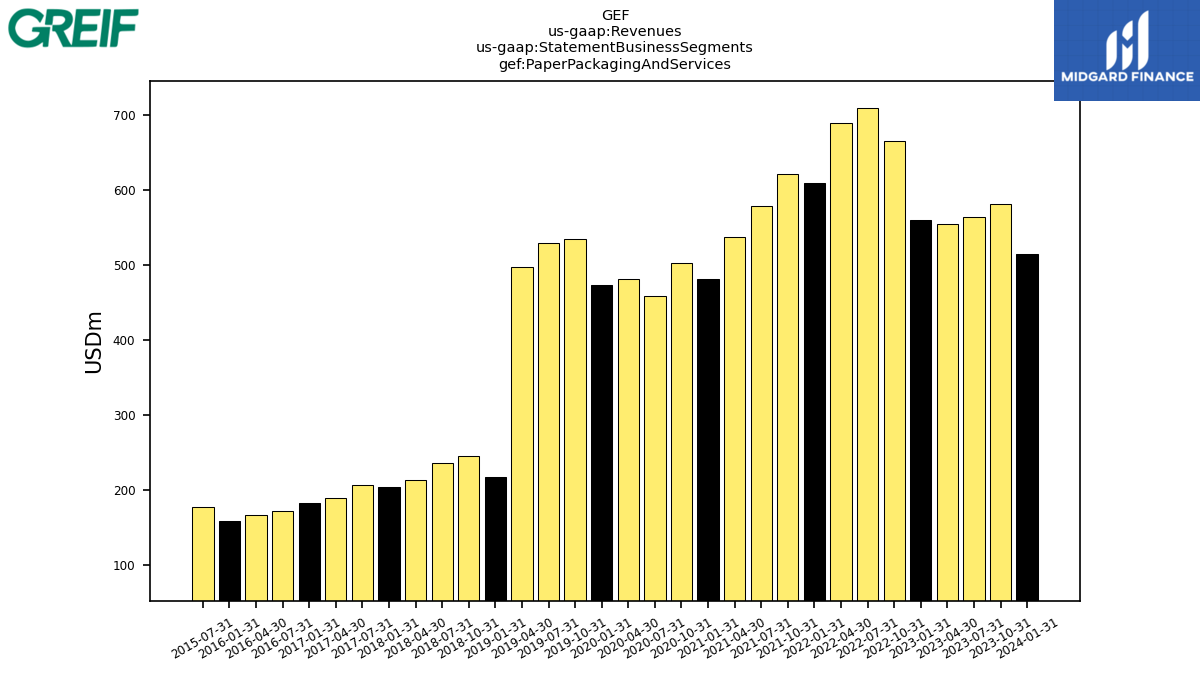
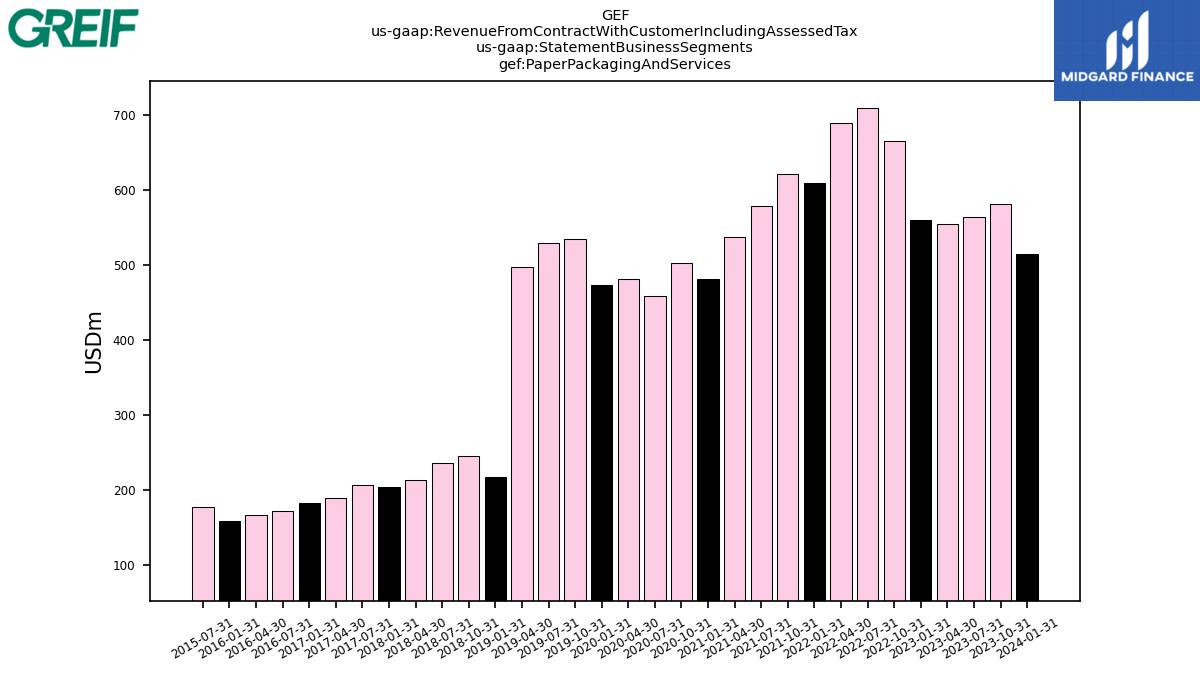
| Paper Packaging And Services | 514.60 | 581.60 | 563.90 | 554.80 | 560.20 | 665.60 | 710.20 | 689.30 | 610.00 | 621.70 | 578.80 | 537.00 | 480.90 | 502.30 | 459.30 | 481.60 | 473.70 | 535.10 | 530.00 | 497.60 | 217.30 | 244.80 | 236.00 | 213.90 | 203.80 | NA | 206.30 | 188.70 | 182.90 | NA | 172.50 | 167.20 | 158.40 | NA | 176.70 | NA | NA | NA | NA | NA | NA | NA | NA | NA | NA | NA | NA | NA | NA | NA | NA | NA | NA | NA | NA | NA | NA | |
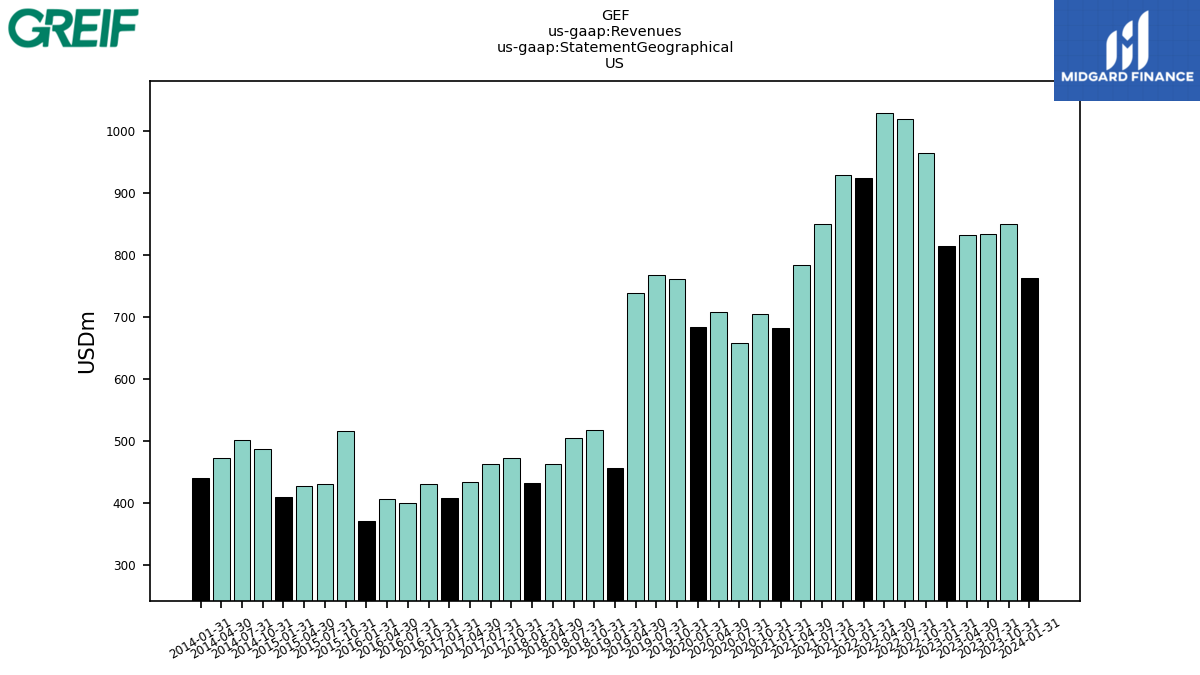
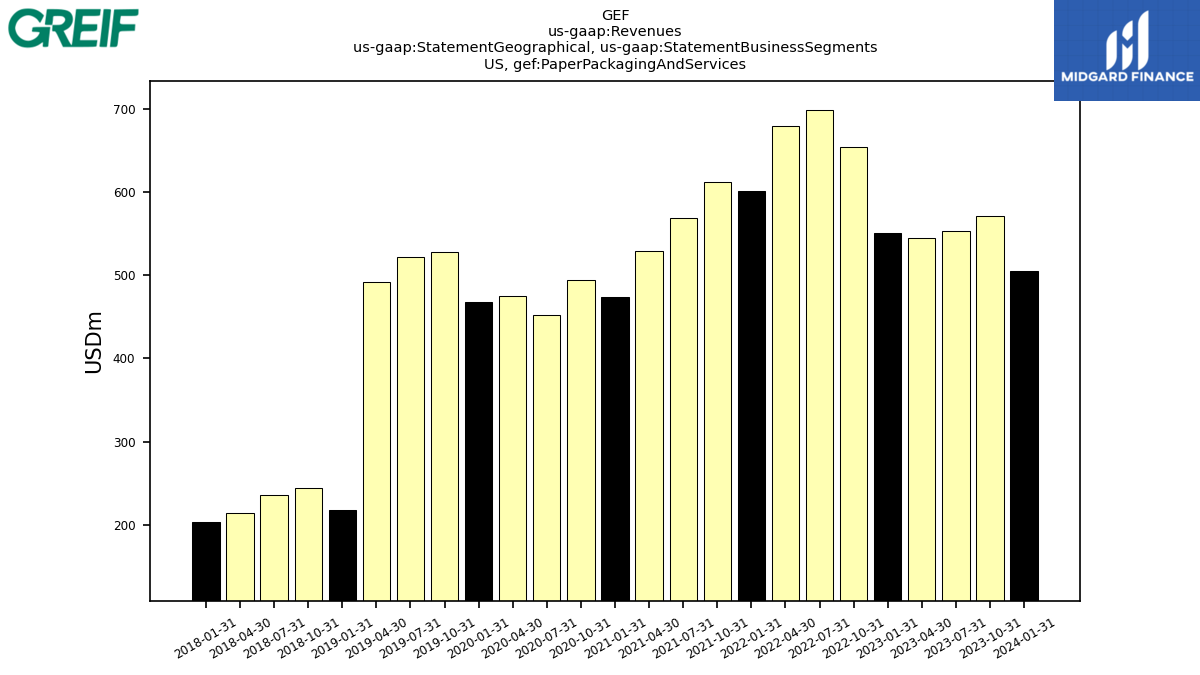
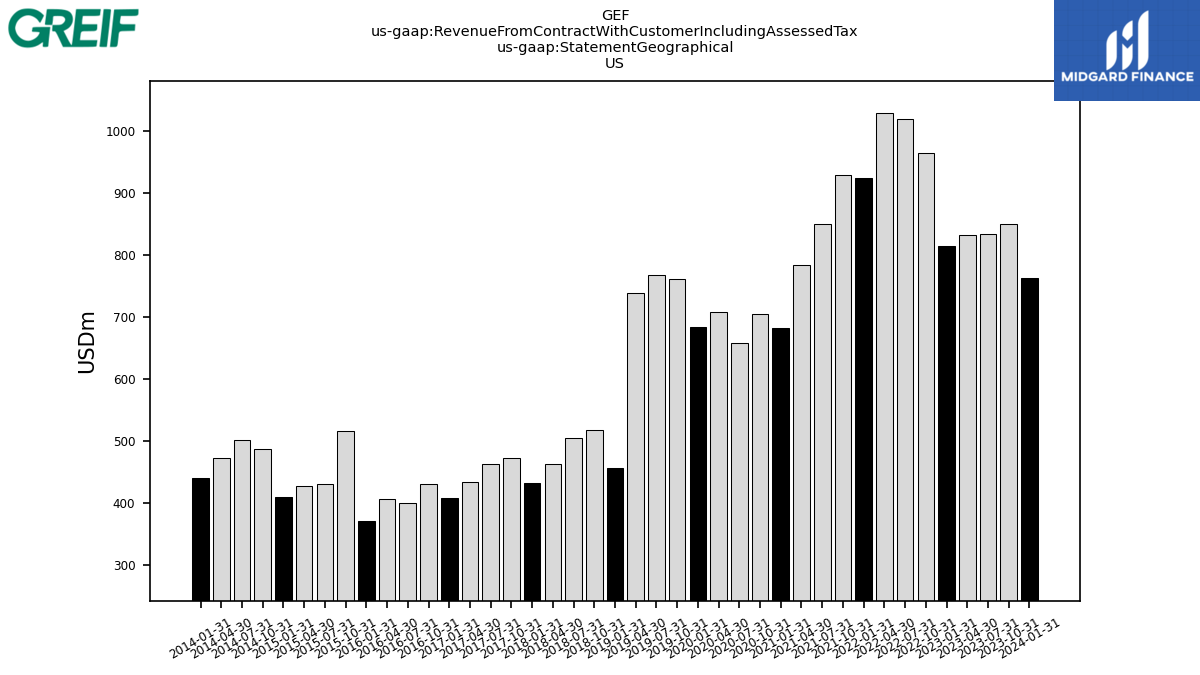
| US | 763.80 | 850.50 | 834.50 | 832.60 | 814.80 | 965.50 | 1019.60 | 1029.90 | 924.80 | 929.80 | 850.70 | 784.30 | 682.60 | 705.60 | 659.20 | 708.30 | 683.90 | 762.20 | 767.80 | 740.20 | 457.60 | 518.30 | 506.00 | 463.50 | 432.90 | 473.10 | 463.70 | 434.50 | 408.00 | 431.80 | 400.30 | 406.30 | 372.40 | 517.40 | 431.50 | 428.20 | 410.00 | 488.50 | 502.40 | 473.30 | 441.60 | NA | NA | NA | NA | NA | NA | NA | NA | NA | NA | NA | NA | NA | NA | NA | NA | |
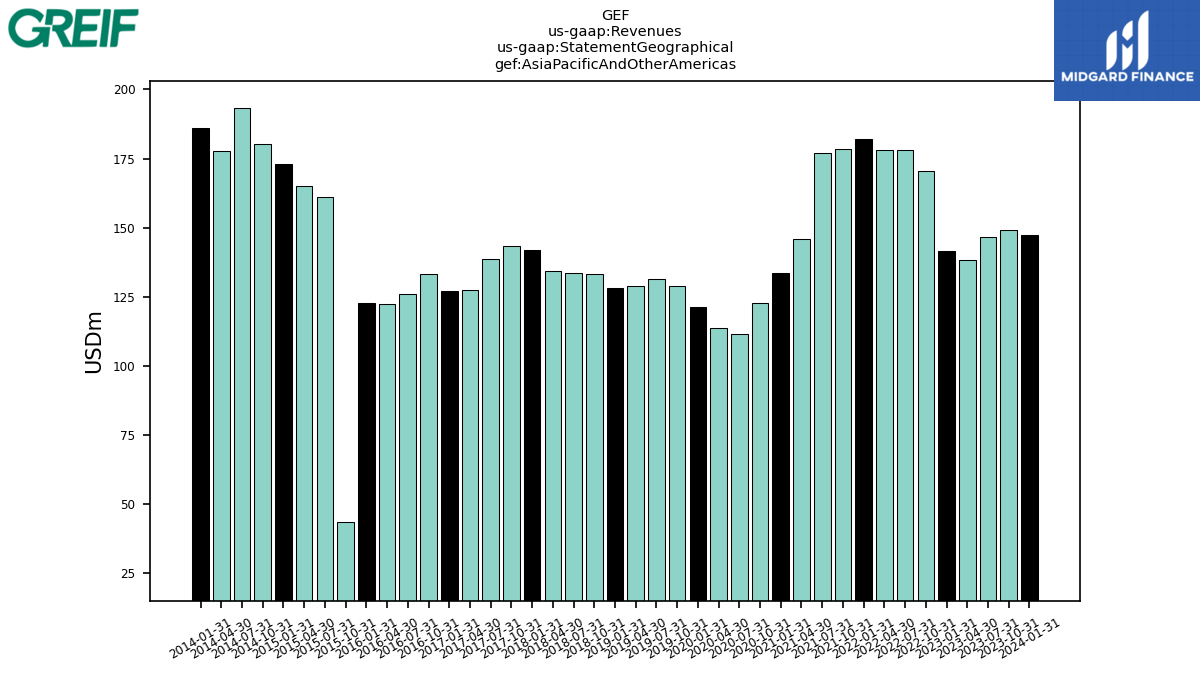
| Asia Pacific And Other Americas | 147.30 | 149.10 | 146.60 | 138.10 | 141.40 | 170.50 | 178.00 | 178.20 | 182.20 | 178.50 | 177.10 | 145.80 | 133.40 | 122.80 | 111.50 | 113.80 | 121.20 | 128.70 | 131.20 | 128.70 | 128.30 | 133.10 | 133.50 | 134.10 | 141.70 | 143.40 | 138.70 | 127.40 | 127.00 | 133.30 | 125.80 | 122.50 | 122.80 | 43.40 | 161.20 | 164.90 | 172.90 | 180.10 | 193.40 | 177.60 | 186.00 | NA | NA | NA | NA | NA | NA | NA | NA | NA | NA | NA | NA | NA | NA | NA | NA | |
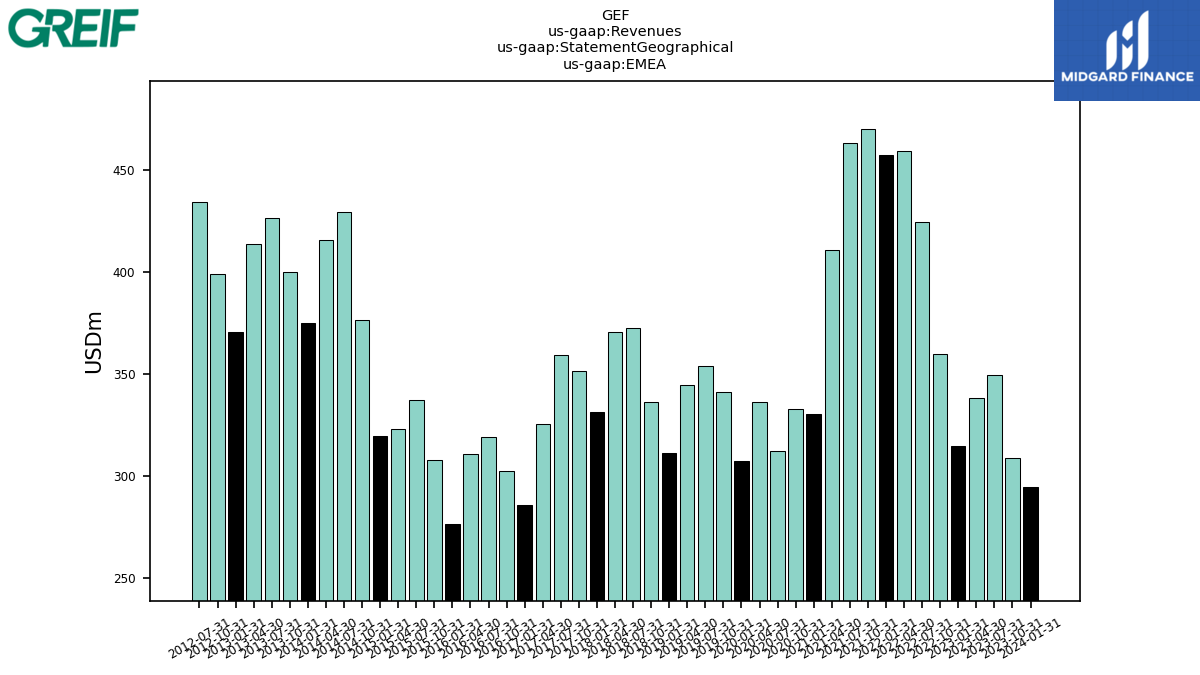
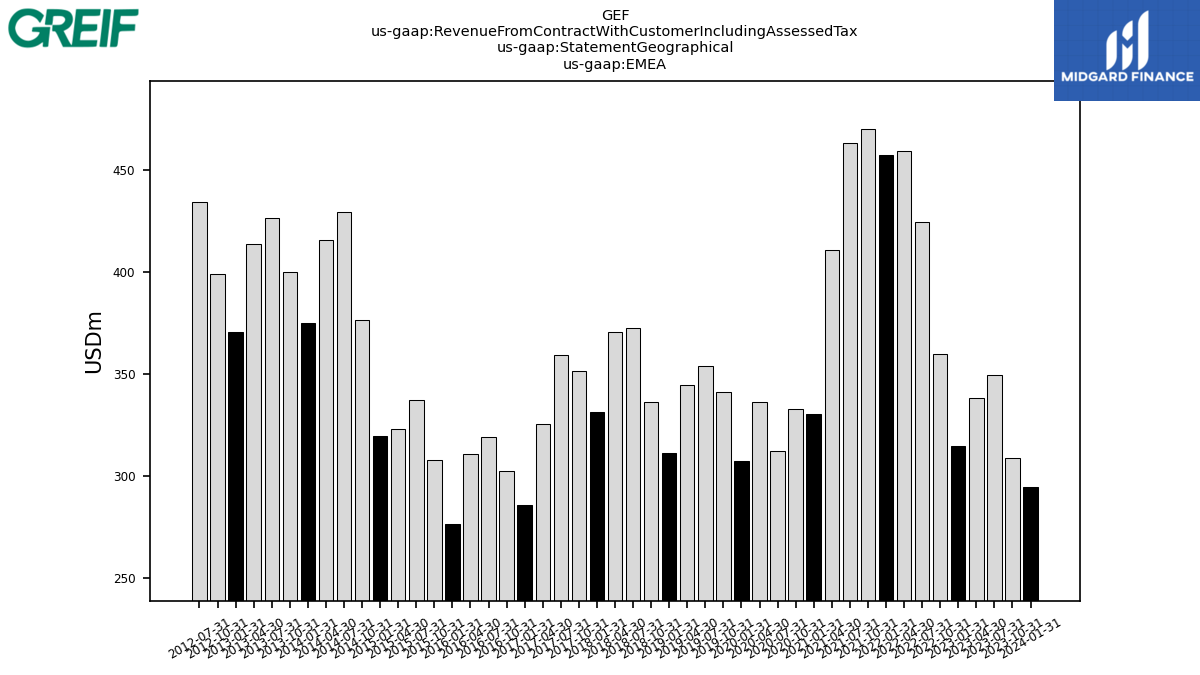
| EMEA | 294.70 | 308.80 | 349.20 | 338.20 | 314.80 | 359.80 | 424.50 | 459.20 | 457.30 | 469.90 | 463.00 | 410.50 | 330.50 | 332.90 | 312.30 | 336.20 | 307.30 | 341.20 | 353.60 | 344.40 | 311.10 | 336.30 | 372.60 | 370.70 | 331.10 | 351.60 | 359.40 | 325.50 | 285.90 | 302.50 | 318.90 | 310.80 | 276.20 | 307.70 | 337.30 | 322.80 | 319.40 | 376.40 | 429.10 | 415.70 | 375.00 | 400.00 | 426.50 | 413.50 | 370.60 | 398.80 | 433.90 | NA | NA | NA | NA | NA | NA | NA | NA | NA | NA | |
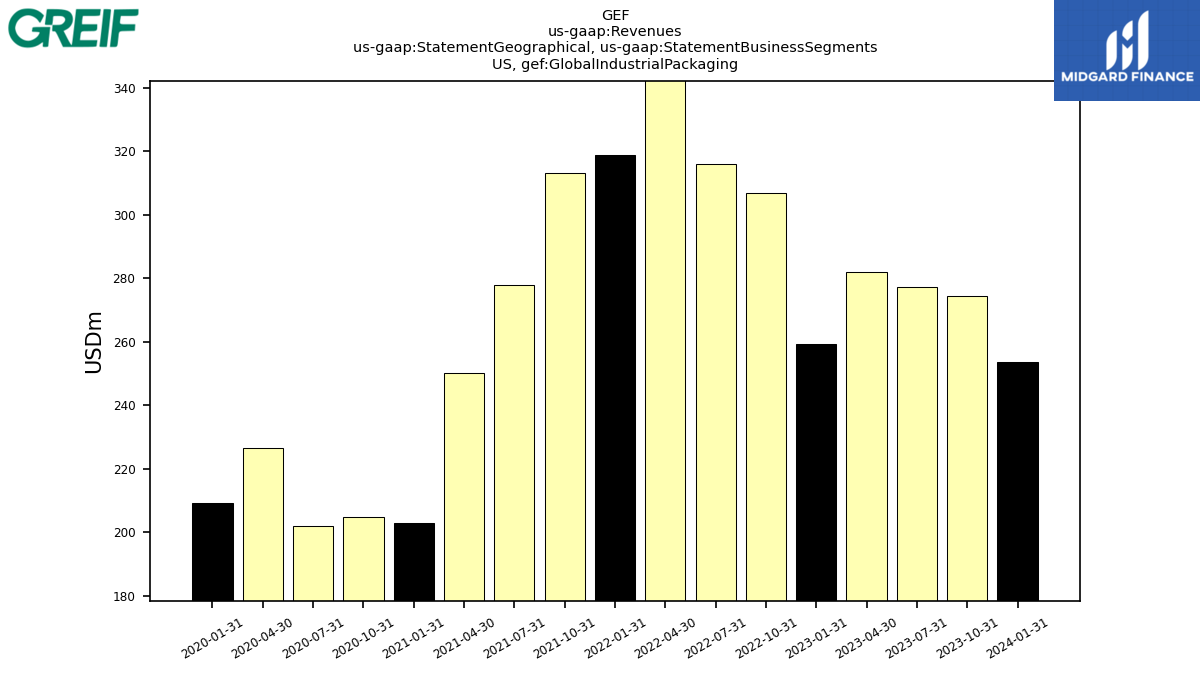
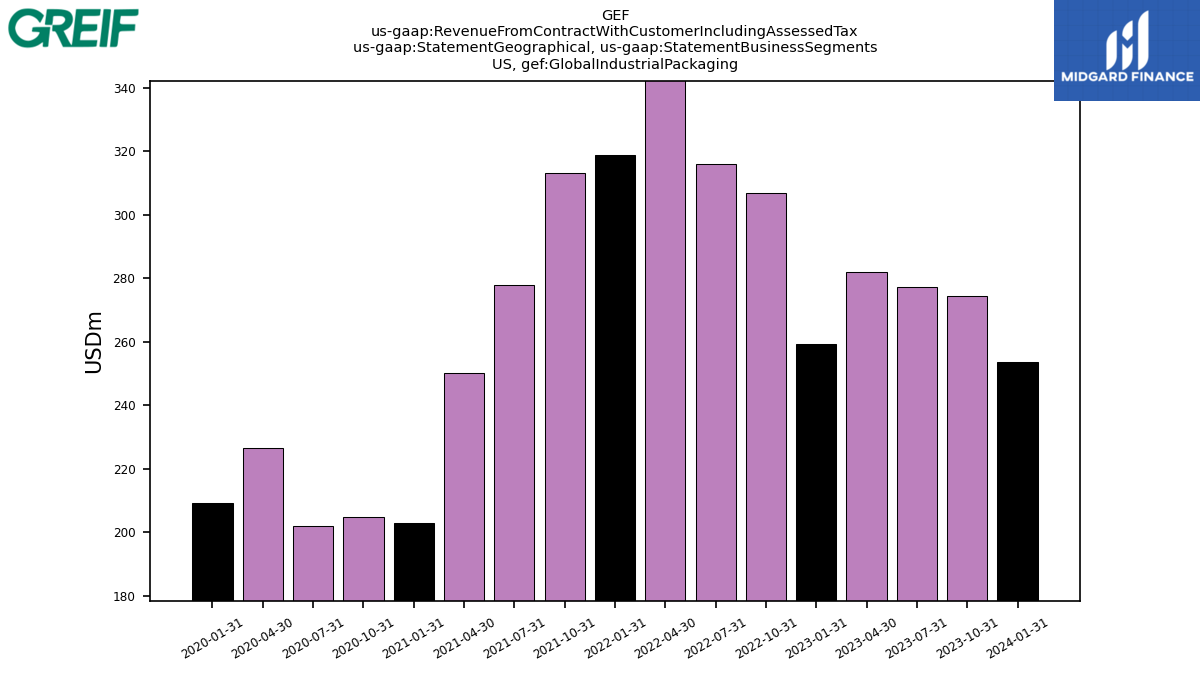
| US, Global Industrial Packaging | 253.70 | 274.30 | 277.30 | 282.10 | 259.30 | 306.90 | 316.20 | 345.10 | 318.80 | 313.30 | 278.00 | 250.30 | 202.80 | 204.80 | 201.80 | 226.50 | 209.10 | NA | NA | NA | NA | NA | NA | NA | NA | NA | NA | NA | NA | NA | NA | NA | NA | NA | NA | NA | NA | NA | NA | NA | NA | NA | NA | NA | NA | NA | NA | NA | NA | NA | NA | NA | NA | NA | NA | NA | NA | |
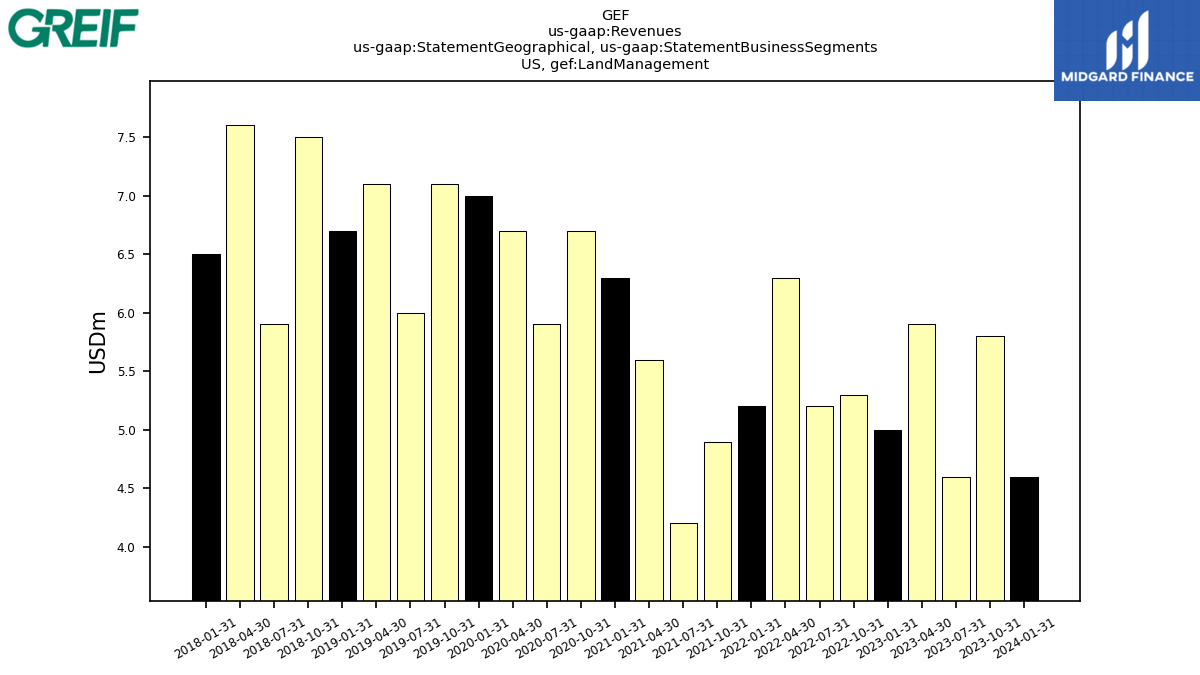
| US, Land Management | 4.60 | 5.80 | 4.60 | 5.90 | 5.00 | 5.30 | 5.20 | 6.30 | 5.20 | 4.90 | 4.20 | 5.60 | 6.30 | 6.70 | 5.90 | 6.70 | 7.00 | 7.10 | 6.00 | 7.10 | 6.70 | 7.50 | 5.90 | 7.60 | 6.50 | NA | NA | NA | NA | NA | NA | NA | NA | NA | NA | NA | NA | NA | NA | NA | NA | NA | NA | NA | NA | NA | NA | NA | NA | NA | NA | NA | NA | NA | NA | NA | NA | |
| US, Paper Packaging And Services | 505.50 | 570.40 | 552.60 | 544.60 | 550.50 | 653.30 | 698.20 | 678.50 | 600.80 | 611.60 | 568.50 | 528.40 | 473.50 | 494.10 | 451.50 | 475.10 | 467.80 | 527.60 | 522.30 | 491.60 | 217.30 | 244.80 | 236.00 | 213.90 | 203.80 | NA | NA | NA | NA | NA | NA | NA | NA | NA | NA | NA | NA | NA | NA | NA | NA | NA | NA | NA | NA | NA | NA | NA | NA | NA | NA | NA | NA | NA | NA | NA | NA | |
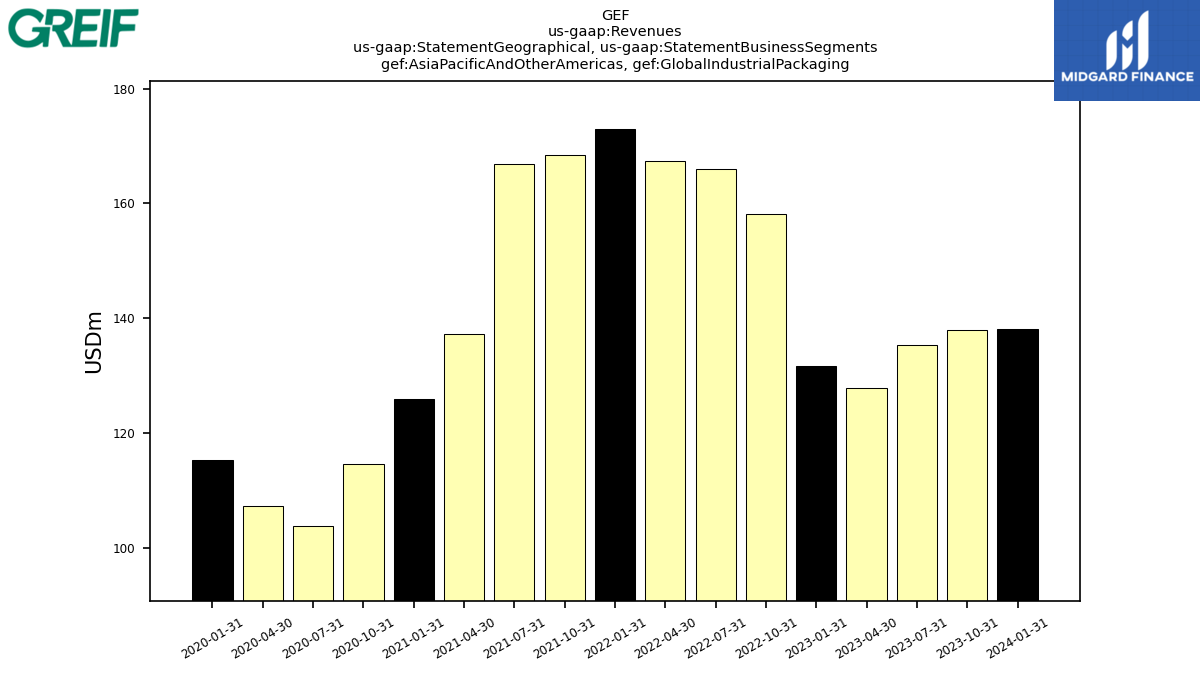
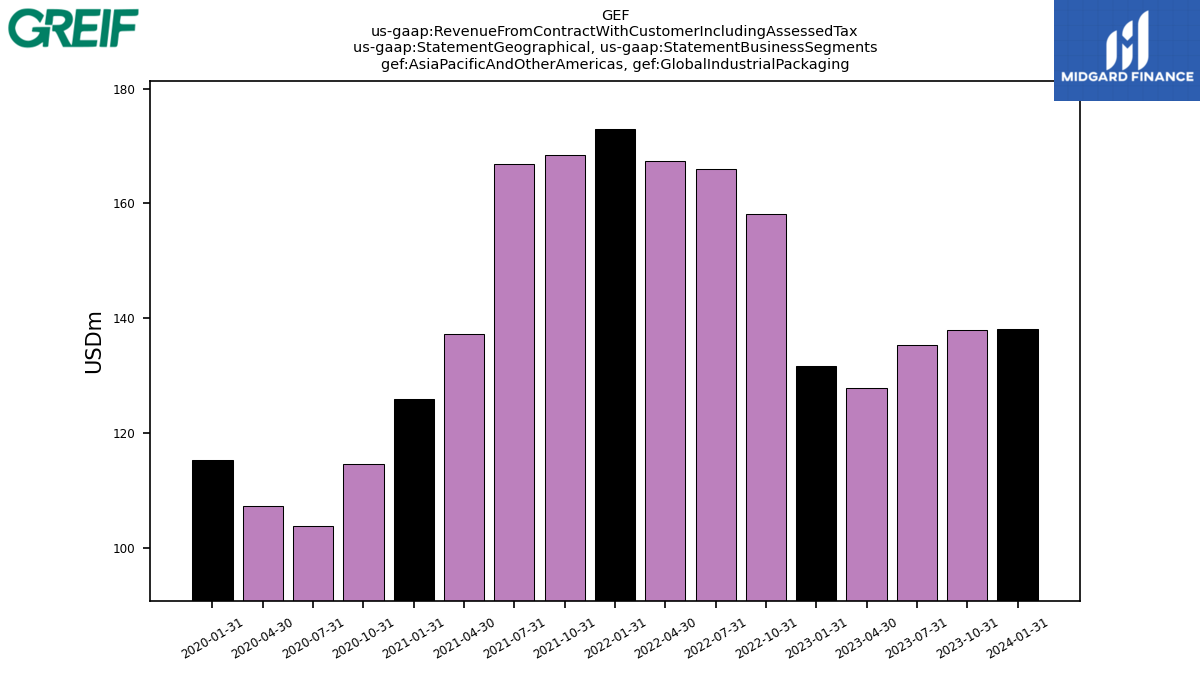
| Asia Pacific And Other Americas, Global Industrial Packaging | 138.20 | 137.90 | 135.30 | 127.90 | 131.70 | 158.20 | 166.00 | 167.40 | 173.00 | 168.40 | 166.80 | 137.20 | 126.00 | 114.60 | 103.70 | 107.30 | 115.30 | NA | NA | NA | NA | NA | NA | NA | NA | NA | NA | NA | NA | NA | NA | NA | NA | NA | NA | NA | NA | NA | NA | NA | NA | NA | NA | NA | NA | NA | NA | NA | NA | NA | NA | NA | NA | NA | NA | NA | NA | |
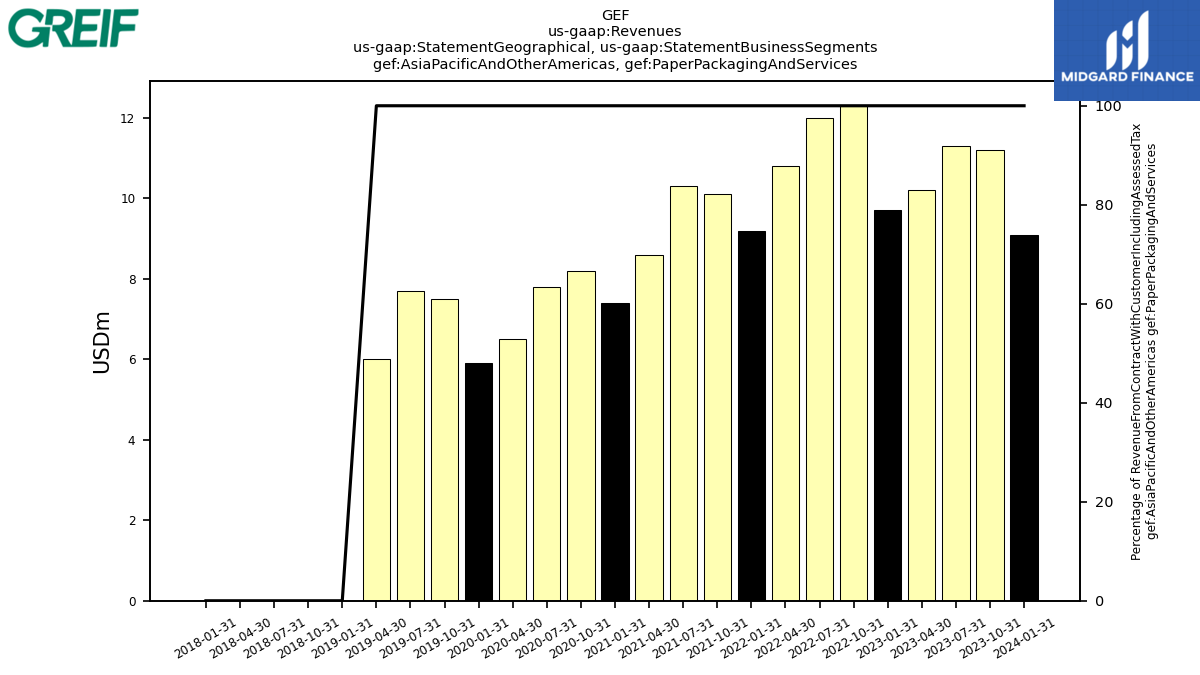
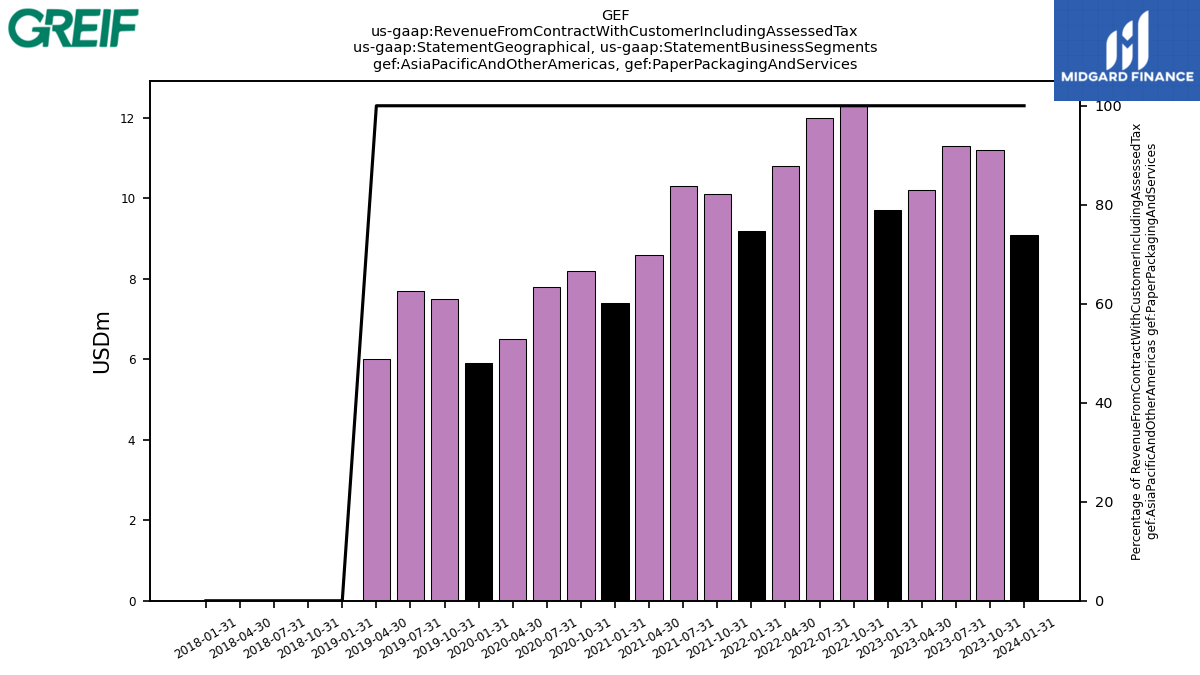
| Asia Pacific And Other Americas, Paper Packaging And Services | 9.10 | 11.20 | 11.30 | 10.20 | 9.70 | 12.30 | 12.00 | 10.80 | 9.20 | 10.10 | 10.30 | 8.60 | 7.40 | 8.20 | 7.80 | 6.50 | 5.90 | 7.50 | 7.70 | 6.00 | 0.00 | 0.00 | 0.00 | 0.00 | 0.00 | NA | NA | NA | NA | NA | NA | NA | NA | NA | NA | NA | NA | NA | NA | NA | NA | NA | NA | NA | NA | NA | NA | NA | NA | NA | NA | NA | NA | NA | NA | NA | NA | |
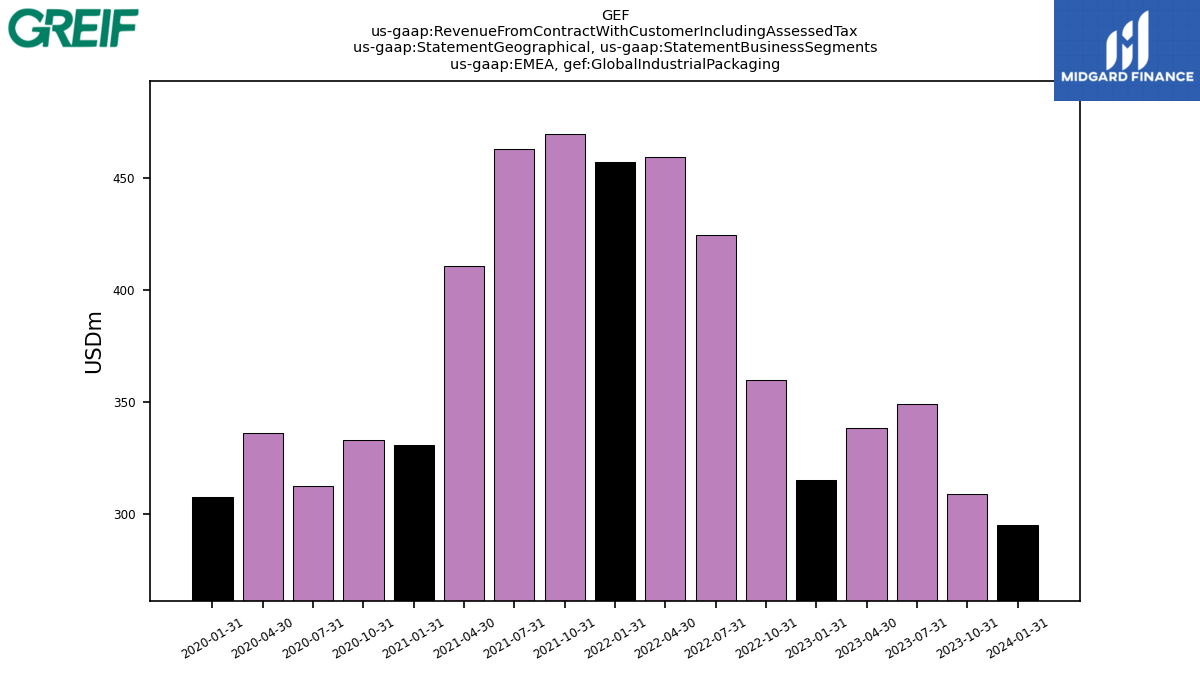
| EMEA, Global Industrial Packaging | 294.70 | 308.80 | 349.20 | 338.20 | 314.80 | 359.80 | 424.50 | 459.20 | 457.30 | 469.90 | 463.00 | 410.50 | 330.50 | 332.90 | 312.30 | 336.20 | 307.30 | NA | NA | NA | NA | NA | NA | NA | NA | NA | NA | NA | NA | NA | NA | NA | NA | NA | NA | NA | NA | NA | NA | NA | NA | NA | NA | NA | NA | NA | NA | NA | NA | NA | NA | NA | NA | NA | NA | NA | NA | |
| Revenue From Contract With Customer Including Assessed Tax | 1205.80 | 1308.40 | 1330.30 | 1308.90 | 1271.00 | 1495.80 | 1622.10 | 1667.30 | 1564.30 | 1578.20 | 1490.80 | 1340.60 | 1146.50 | 1161.30 | 1083.00 | 1158.30 | 1112.40 | 1232.10 | 1252.60 | 1213.30 | 897.00 | 987.70 | 1012.10 | 968.30 | 905.70 | 968.10 | 961.80 | 887.40 | 820.90 | 867.60 | 845.00 | 839.60 | 771.40 | 868.50 | 930.00 | 915.90 | 902.30 | 1048.10 | 1161.10 | 1100.70 | 1034.40 | 1126.20 | 1129.70 | 1088.90 | 1008.60 | 1075.60 | 1102.80 | 1095.30 | 992.70 | 1131.49 | 1121.90 | 1050.77 | 943.79 | 993.94 | 921.33 | 836.58 | 709.68 | |
| Global Industrial Packaging | 686.60 | 721.00 | 761.80 | 748.20 | 705.80 | 824.90 | 906.70 | 971.70 | 949.10 | 951.60 | 907.80 | 798.00 | 659.30 | 652.30 | 617.80 | 670.00 | 631.70 | NA | NA | NA | NA | NA | NA | NA | NA | NA | NA | NA | NA | NA | NA | NA | NA | NA | NA | NA | NA | NA | NA | NA | NA | NA | NA | NA | NA | NA | NA | NA | NA | NA | NA | NA | NA | NA | NA | NA | NA | |
| Land Management | 4.60 | 5.80 | 4.60 | 5.90 | 5.00 | 5.30 | 5.20 | 6.30 | 5.20 | 4.90 | 4.20 | 5.60 | 6.30 | 6.70 | 5.90 | 6.70 | 7.00 | 7.10 | 6.00 | 7.10 | 6.70 | 7.50 | 5.90 | 7.60 | 6.50 | 6.40 | 7.20 | 7.80 | 6.80 | 6.60 | 5.80 | 6.60 | 5.20 | 14.30 | 5.10 | NA | NA | 8.80 | 8.40 | 6.10 | 6.20 | NA | 8.60 | 8.60 | 8.60 | 7.10 | 5.30 | 7.90 | 6.50 | 6.36 | 3.96 | 5.50 | 5.10 | 5.12 | 3.93 | NA | NA | |
| Paper Packaging And Services | 514.60 | 581.60 | 563.90 | 554.80 | 560.20 | 665.60 | 710.20 | 689.30 | 610.00 | 621.70 | 578.80 | 537.00 | 480.90 | 502.30 | 459.30 | 481.60 | 473.70 | 535.10 | 530.00 | 497.60 | 217.30 | 244.80 | 236.00 | 213.90 | 203.80 | NA | 206.30 | 188.70 | 182.90 | NA | 172.50 | 167.20 | 158.40 | NA | 176.70 | NA | NA | NA | NA | NA | NA | NA | NA | NA | NA | NA | NA | NA | NA | NA | NA | NA | NA | NA | NA | NA | NA | |
| US | 763.80 | 850.50 | 834.50 | 832.60 | 814.80 | 965.50 | 1019.60 | 1029.90 | 924.80 | 929.80 | 850.70 | 784.30 | 682.60 | 705.60 | 659.20 | 708.30 | 683.90 | 762.20 | 767.80 | 740.20 | 457.60 | 518.30 | 506.00 | 463.50 | 432.90 | 473.10 | 463.70 | 434.50 | 408.00 | 431.80 | 400.30 | 406.30 | 372.40 | 517.40 | 431.50 | 428.20 | 410.00 | 488.50 | 502.40 | 473.30 | 441.60 | NA | NA | NA | NA | NA | NA | NA | NA | NA | NA | NA | NA | NA | NA | NA | NA | |
| Asia Pacific And Other Americas | 147.30 | 149.10 | 146.60 | 138.10 | 141.40 | 170.50 | 178.00 | 178.20 | 182.20 | 178.50 | 177.10 | 145.80 | 133.40 | 122.80 | 111.50 | 113.80 | 121.20 | 128.70 | 131.20 | 128.70 | 128.30 | 133.10 | 133.50 | 134.10 | 141.70 | 143.40 | 138.70 | 127.40 | 127.00 | 133.30 | 125.80 | 122.50 | 122.80 | 43.40 | 161.20 | 164.90 | 172.90 | 180.10 | 193.40 | 177.60 | 186.00 | NA | NA | NA | NA | NA | NA | NA | NA | NA | NA | NA | NA | NA | NA | NA | NA | |
| EMEA | 294.70 | 308.80 | 349.20 | 338.20 | 314.80 | 359.80 | 424.50 | 459.20 | 457.30 | 469.90 | 463.00 | 410.50 | 330.50 | 332.90 | 312.30 | 336.20 | 307.30 | 341.20 | 353.60 | 344.40 | 311.10 | 336.30 | 372.60 | 370.70 | 331.10 | 351.60 | 359.40 | 325.50 | 285.90 | 302.50 | 318.90 | 310.80 | 276.20 | 307.70 | 337.30 | 322.80 | 319.40 | 376.40 | 429.10 | 415.70 | 375.00 | 400.00 | 426.50 | 413.50 | 370.60 | 398.80 | 433.90 | NA | NA | NA | NA | NA | NA | NA | NA | NA | NA | |
| US, Global Industrial Packaging | 253.70 | 274.30 | 277.30 | 282.10 | 259.30 | 306.90 | 316.20 | 345.10 | 318.80 | 313.30 | 278.00 | 250.30 | 202.80 | 204.80 | 201.80 | 226.50 | 209.10 | NA | NA | NA | NA | NA | NA | NA | NA | NA | NA | NA | NA | NA | NA | NA | NA | NA | NA | NA | NA | NA | NA | NA | NA | NA | NA | NA | NA | NA | NA | NA | NA | NA | NA | NA | NA | NA | NA | NA | NA | |
| US, Land Management | 4.60 | 5.80 | 4.60 | 5.90 | 5.00 | 5.30 | 5.20 | 6.30 | 5.20 | 4.90 | 4.20 | 5.60 | 6.30 | 6.70 | 5.90 | 6.70 | 7.00 | 7.10 | 6.00 | 7.10 | 6.70 | 7.50 | 5.90 | 7.60 | 6.50 | NA | NA | NA | NA | NA | NA | NA | NA | NA | NA | NA | NA | NA | NA | NA | NA | NA | NA | NA | NA | NA | NA | NA | NA | NA | NA | NA | NA | NA | NA | NA | NA | |
| US, Paper Packaging And Services | 505.50 | 570.40 | 552.60 | 544.60 | 550.50 | 653.30 | 698.20 | 678.50 | 600.80 | 611.60 | 568.50 | 528.40 | 473.50 | 494.10 | 451.50 | 475.10 | 467.80 | 527.60 | 522.30 | 491.60 | 217.30 | 244.80 | 236.00 | 213.90 | 203.80 | NA | NA | NA | NA | NA | NA | NA | NA | NA | NA | NA | NA | NA | NA | NA | NA | NA | NA | NA | NA | NA | NA | NA | NA | NA | NA | NA | NA | NA | NA | NA | NA | |
| Asia Pacific And Other Americas, Global Industrial Packaging | 138.20 | 137.90 | 135.30 | 127.90 | 131.70 | 158.20 | 166.00 | 167.40 | 173.00 | 168.40 | 166.80 | 137.20 | 126.00 | 114.60 | 103.70 | 107.30 | 115.30 | NA | NA | NA | NA | NA | NA | NA | NA | NA | NA | NA | NA | NA | NA | NA | NA | NA | NA | NA | NA | NA | NA | NA | NA | NA | NA | NA | NA | NA | NA | NA | NA | NA | NA | NA | NA | NA | NA | NA | NA | |
| Asia Pacific And Other Americas, Paper Packaging And Services | 9.10 | 11.20 | 11.30 | 10.20 | 9.70 | 12.30 | 12.00 | 10.80 | 9.20 | 10.10 | 10.30 | 8.60 | 7.40 | 8.20 | 7.80 | 6.50 | 5.90 | 7.50 | 7.70 | 6.00 | 0.00 | 0.00 | 0.00 | 0.00 | 0.00 | NA | NA | NA | NA | NA | NA | NA | NA | NA | NA | NA | NA | NA | NA | NA | NA | NA | NA | NA | NA | NA | NA | NA | NA | NA | NA | NA | NA | NA | NA | NA | NA | |
| EMEA, Global Industrial Packaging | 294.70 | 308.80 | 349.20 | 338.20 | 314.80 | 359.80 | 424.50 | 459.20 | 457.30 | 469.90 | 463.00 | 410.50 | 330.50 | 332.90 | 312.30 | 336.20 | 307.30 | NA | NA | NA | NA | NA | NA | NA | NA | NA | NA | NA | NA | NA | NA | NA | NA | NA | NA | NA | NA | NA | NA | NA | NA | NA | NA | NA | NA | NA | NA | NA | NA | NA | NA | NA | NA | NA | NA | NA | NA |

