
| 2023-09-30 | 2023-06-30 | 2023-03-31 | 2022-12-31 | 2022-09-30 | 2022-06-30 | 2022-03-31 | 2021-12-31 | 2021-09-30 | 2021-06-30 | 2021-03-31 | 2020-12-31 | 2020-09-30 | 2020-06-30 | 2020-03-31 | 2019-12-31 | 2019-09-30 | 2019-06-30 | 2019-03-31 | 2018-12-31 | 2018-09-30 | 2018-06-30 | 2018-03-31 | 2017-12-31 | 2017-09-30 | 2017-06-30 | 2017-03-31 | 2016-12-31 | 2016-09-30 | 2016-06-30 | 2016-03-31 | 2015-12-31 | 2015-09-30 | 2015-06-30 | 2015-03-31 | 2014-12-31 | 2014-09-30 | 2014-06-30 | 2014-03-31 | 2013-12-31 | 2013-09-30 | 2013-06-30 | 2013-03-31 | 2012-12-31 | 2012-09-30 | 2012-06-30 | 2012-03-31 | 2011-12-31 | 2011-09-30 | 2011-06-30 | 2011-03-31 | 2010-12-31 | 2010-09-30 | 2010-06-30 | 2010-03-31 | ||
|---|---|---|---|---|---|---|---|---|---|---|---|---|---|---|---|---|---|---|---|---|---|---|---|---|---|---|---|---|---|---|---|---|---|---|---|---|---|---|---|---|---|---|---|---|---|---|---|---|---|---|---|---|---|---|---|---|
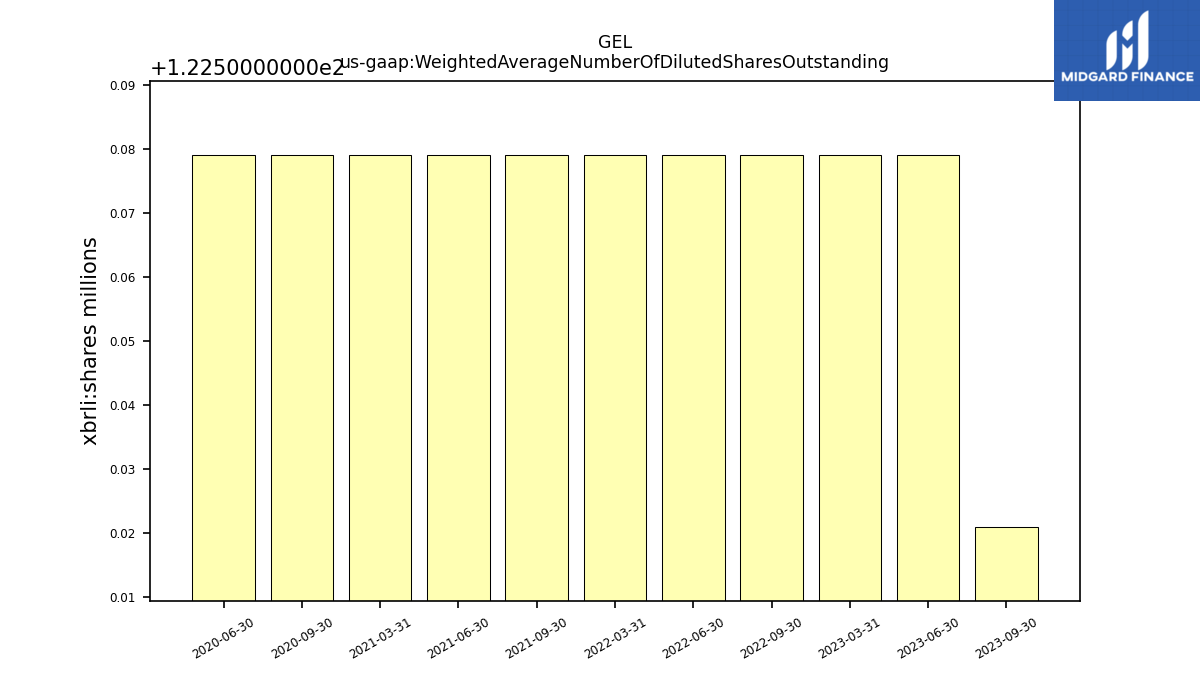
| Weighted Average Number Of Diluted Shares Outstanding | 122.52 | 122.58 | 122.58 | NA | 122.58 | 122.58 | 122.58 | NA | 122.58 | 122.58 | 122.58 | NA | 122.58 | 122.58 | NA | NA | NA | NA | NA | NA | NA | NA | NA | NA | NA | NA | NA | NA | NA | NA | NA | NA | NA | NA | NA | NA | NA | NA | NA | NA | NA | NA | NA | NA | NA | NA | NA | NA | NA | NA | NA | NA | NA | NA | NA | |
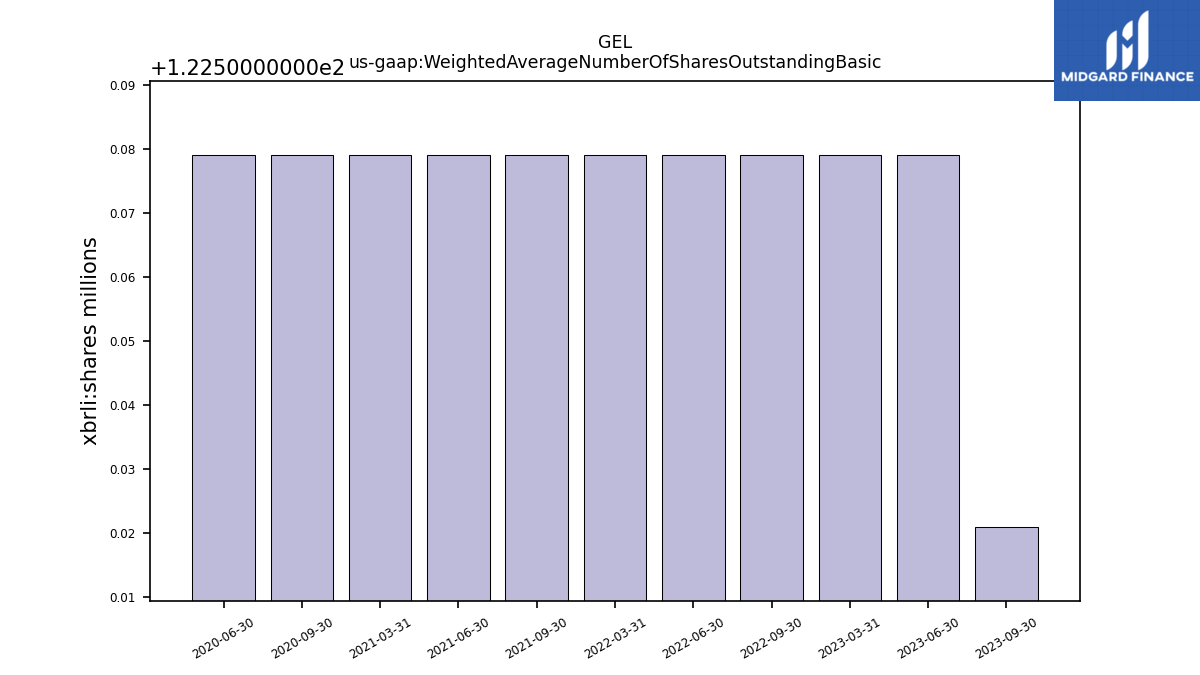
| Weighted Average Number Of Shares Outstanding Basic | 122.52 | 122.58 | 122.58 | NA | 122.58 | 122.58 | 122.58 | NA | 122.58 | 122.58 | 122.58 | NA | 122.58 | 122.58 | NA | NA | NA | NA | NA | NA | NA | NA | NA | NA | NA | NA | NA | NA | NA | NA | NA | NA | NA | NA | NA | NA | NA | NA | NA | NA | NA | NA | NA | NA | NA | NA | NA | NA | NA | NA | NA | NA | NA | NA | NA | |
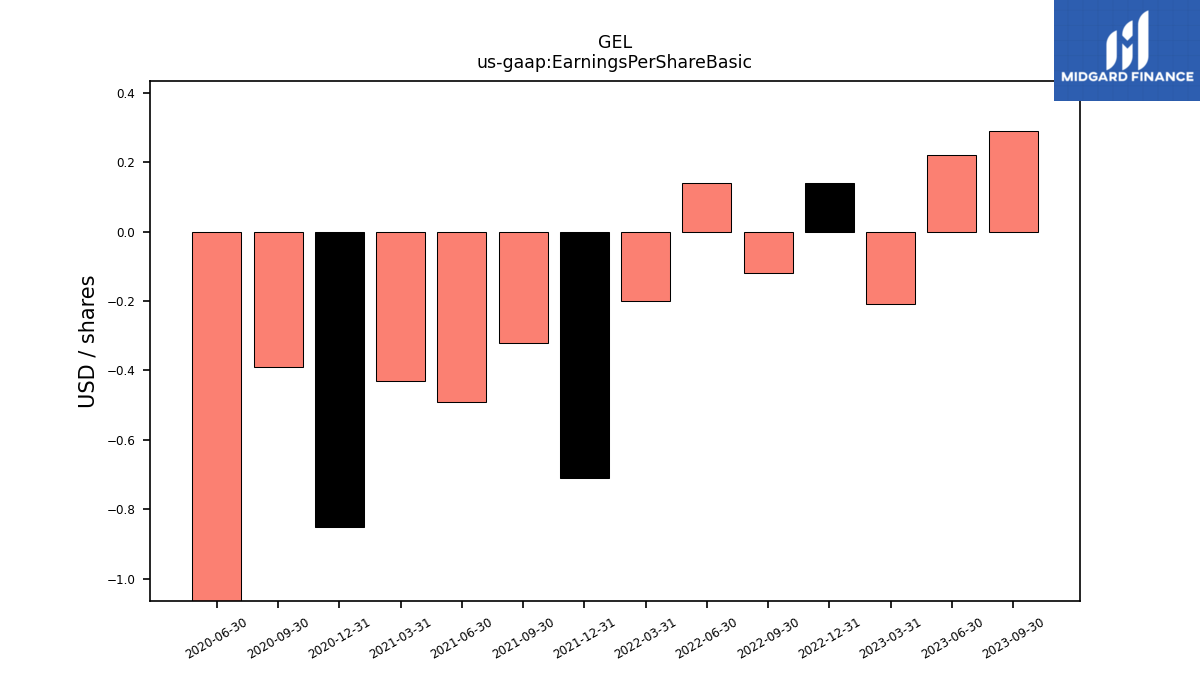
| Earnings Per Share Basic | 0.29 | 0.22 | -0.21 | 0.14 | -0.12 | 0.14 | -0.20 | -0.71 | -0.32 | -0.49 | -0.43 | -0.85 | -0.39 | -2.82 | NA | NA | NA | NA | NA | NA | NA | NA | NA | NA | NA | NA | NA | NA | NA | NA | NA | NA | NA | NA | NA | NA | NA | NA | NA | NA | NA | NA | NA | NA | NA | NA | NA | NA | NA | NA | NA | NA | NA | NA | NA | |
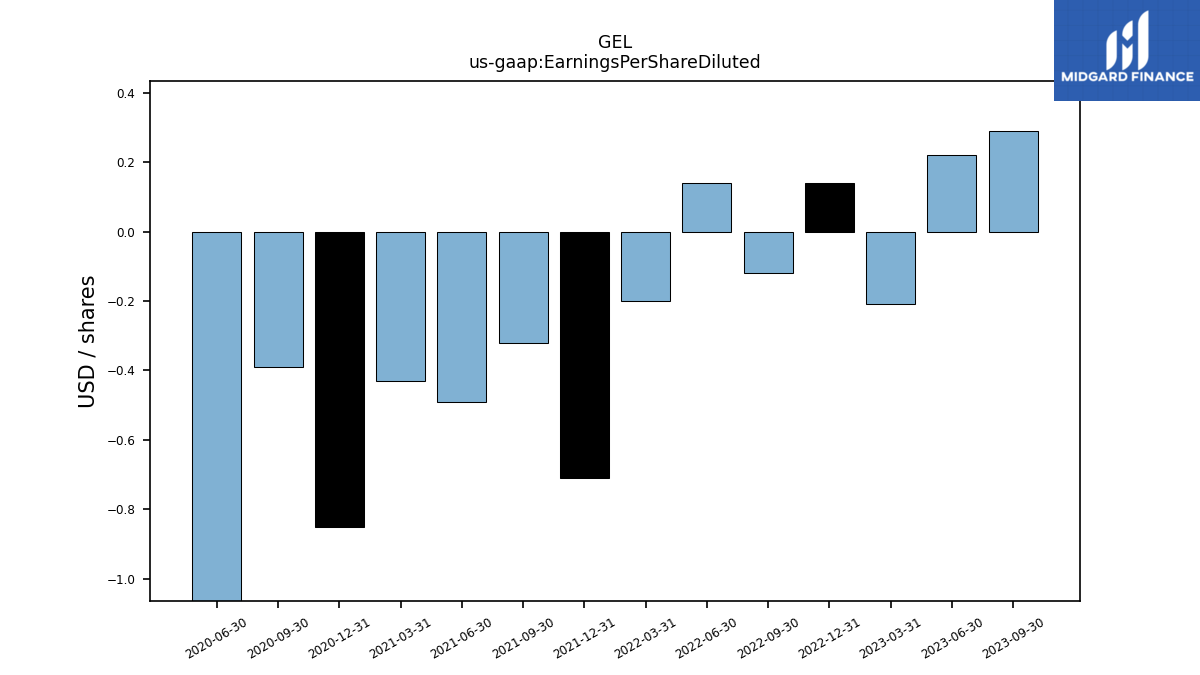
| Earnings Per Share Diluted | 0.29 | 0.22 | -0.21 | 0.14 | -0.12 | 0.14 | -0.20 | -0.71 | -0.32 | -0.49 | -0.43 | -0.85 | -0.39 | -2.82 | NA | NA | NA | NA | NA | NA | NA | NA | NA | NA | NA | NA | NA | NA | NA | NA | NA | NA | NA | NA | NA | NA | NA | NA | NA | NA | NA | NA | NA | NA | NA | NA | NA | NA | NA | NA | NA | NA | NA | NA | NA |
| 2023-09-30 | 2023-06-30 | 2023-03-31 | 2022-12-31 | 2022-09-30 | 2022-06-30 | 2022-03-31 | 2021-12-31 | 2021-09-30 | 2021-06-30 | 2021-03-31 | 2020-12-31 | 2020-09-30 | 2020-06-30 | 2020-03-31 | 2019-12-31 | 2019-09-30 | 2019-06-30 | 2019-03-31 | 2018-12-31 | 2018-09-30 | 2018-06-30 | 2018-03-31 | 2017-12-31 | 2017-09-30 | 2017-06-30 | 2017-03-31 | 2016-12-31 | 2016-09-30 | 2016-06-30 | 2016-03-31 | 2015-12-31 | 2015-09-30 | 2015-06-30 | 2015-03-31 | 2014-12-31 | 2014-09-30 | 2014-06-30 | 2014-03-31 | 2013-12-31 | 2013-09-30 | 2013-06-30 | 2013-03-31 | 2012-12-31 | 2012-09-30 | 2012-06-30 | 2012-03-31 | 2011-12-31 | 2011-09-30 | 2011-06-30 | 2011-03-31 | 2010-12-31 | 2010-09-30 | 2010-06-30 | 2010-03-31 | ||
|---|---|---|---|---|---|---|---|---|---|---|---|---|---|---|---|---|---|---|---|---|---|---|---|---|---|---|---|---|---|---|---|---|---|---|---|---|---|---|---|---|---|---|---|---|---|---|---|---|---|---|---|---|---|---|---|---|
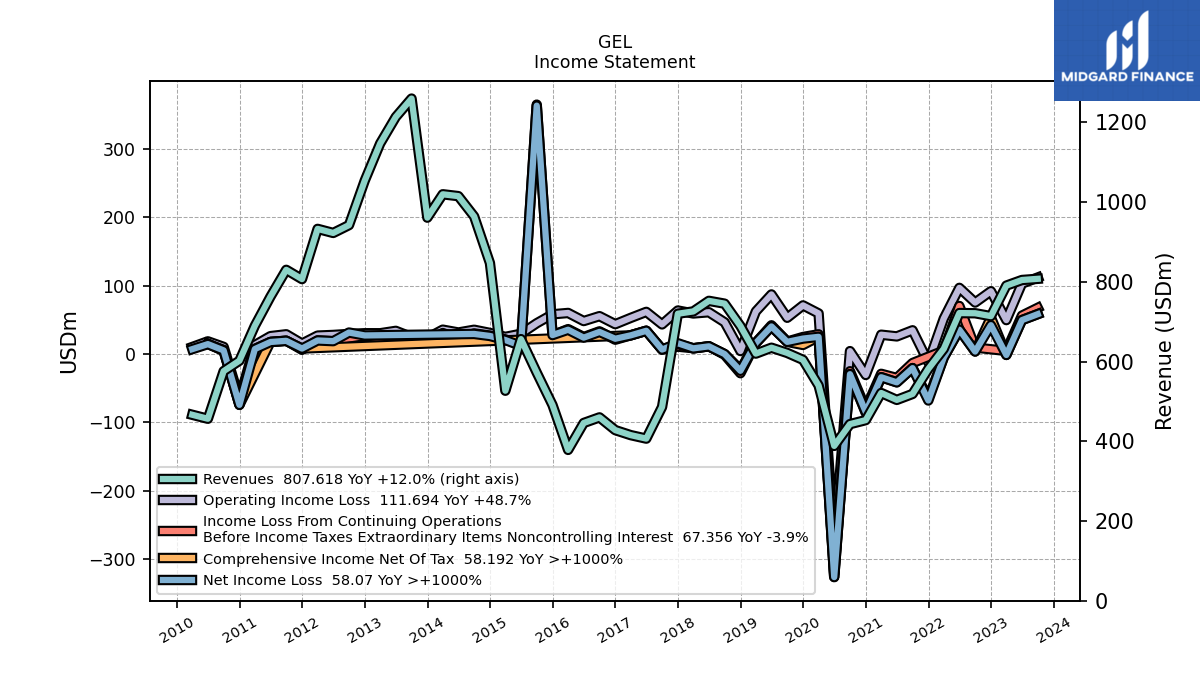
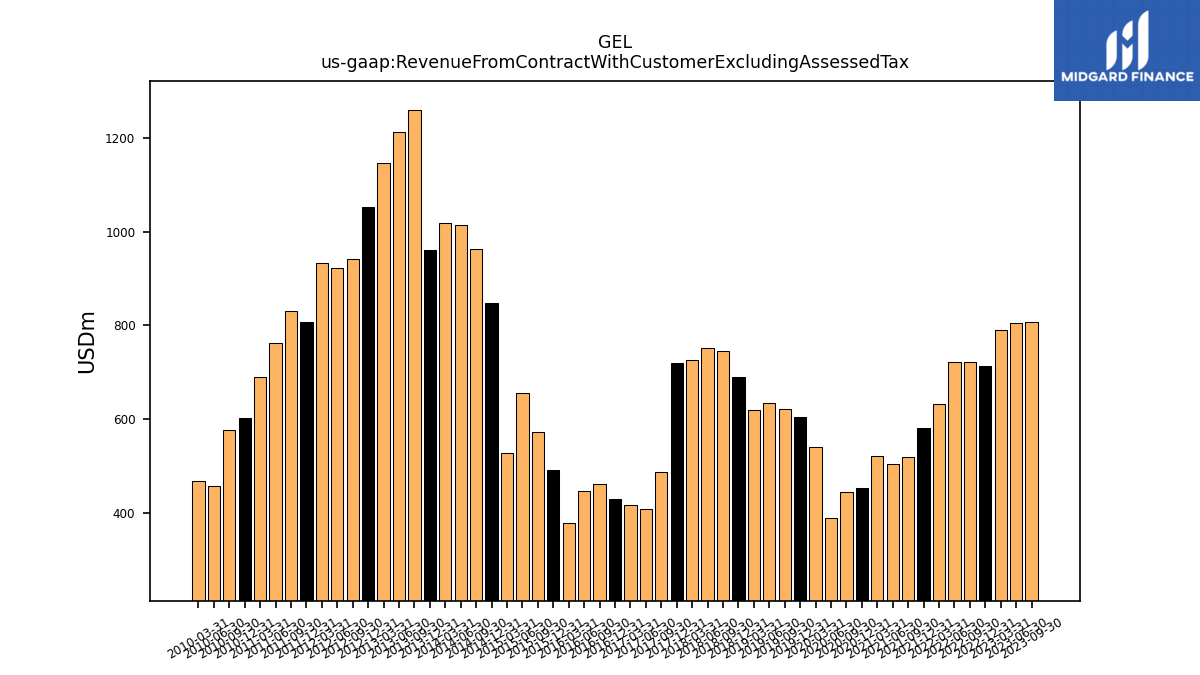
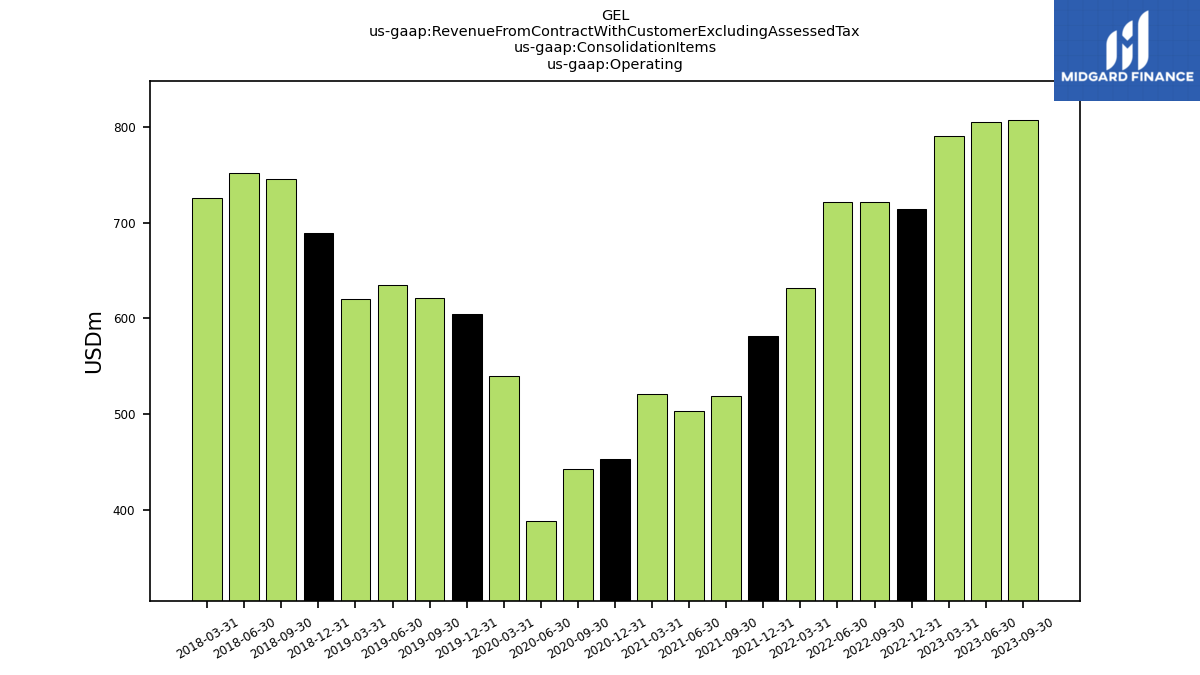
| Revenue From Contract With Customer Excluding Assessed Tax | 807.62 | 804.66 | 790.61 | 714.04 | 721.25 | 721.73 | 631.95 | 581.58 | 518.82 | 503.86 | 521.22 | 453.14 | 443.12 | 388.47 | 539.92 | 604.33 | 621.70 | 634.78 | 620.01 | 689.30 | 745.28 | 752.39 | 725.81 | 720.05 | 486.11 | 406.72 | 415.49 | 428.05 | 460.05 | 445.98 | 378.41 | 491.01 | 572.33 | 656.33 | 526.86 | 847.28 | 964.11 | 1015.05 | 1019.72 | 961.03 | 1259.82 | 1213.66 | 1147.21 | 1054.07 | 942.33 | 922.67 | 932.94 | 806.88 | 830.20 | 762.79 | 689.80 | 602.24 | 576.01 | 456.54 | 466.53 | |
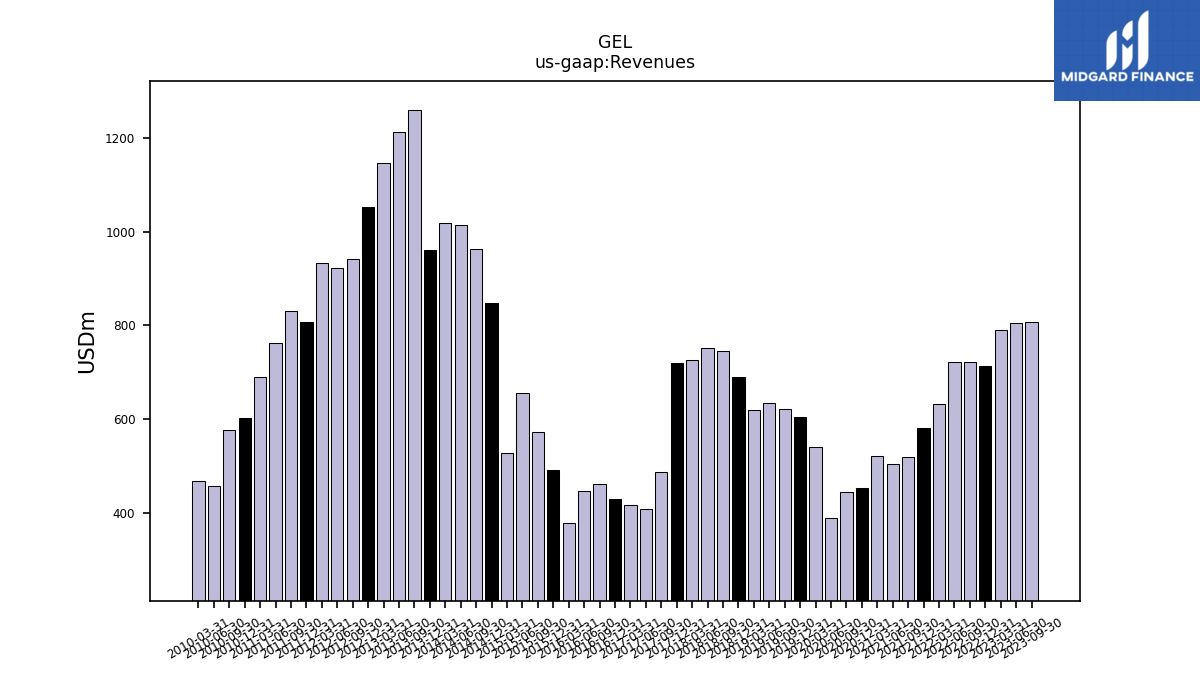
| Revenues | 807.62 | 804.66 | 790.61 | 714.04 | 721.25 | 721.73 | 631.95 | 581.58 | 518.82 | 503.86 | 521.22 | 453.14 | 443.12 | 388.47 | 539.92 | 604.33 | 621.70 | 634.78 | 620.01 | 689.30 | 745.28 | 752.39 | 725.81 | 720.05 | 486.11 | 406.72 | 415.49 | 428.05 | 460.05 | 445.98 | 378.41 | 491.01 | 572.33 | 656.33 | 526.86 | 847.28 | 964.11 | 1015.05 | 1019.72 | 961.03 | 1259.82 | 1213.66 | 1147.21 | 1054.07 | 942.33 | 922.67 | 932.94 | 806.88 | 830.20 | 762.79 | 689.80 | 602.24 | 576.01 | 456.54 | 466.53 | |
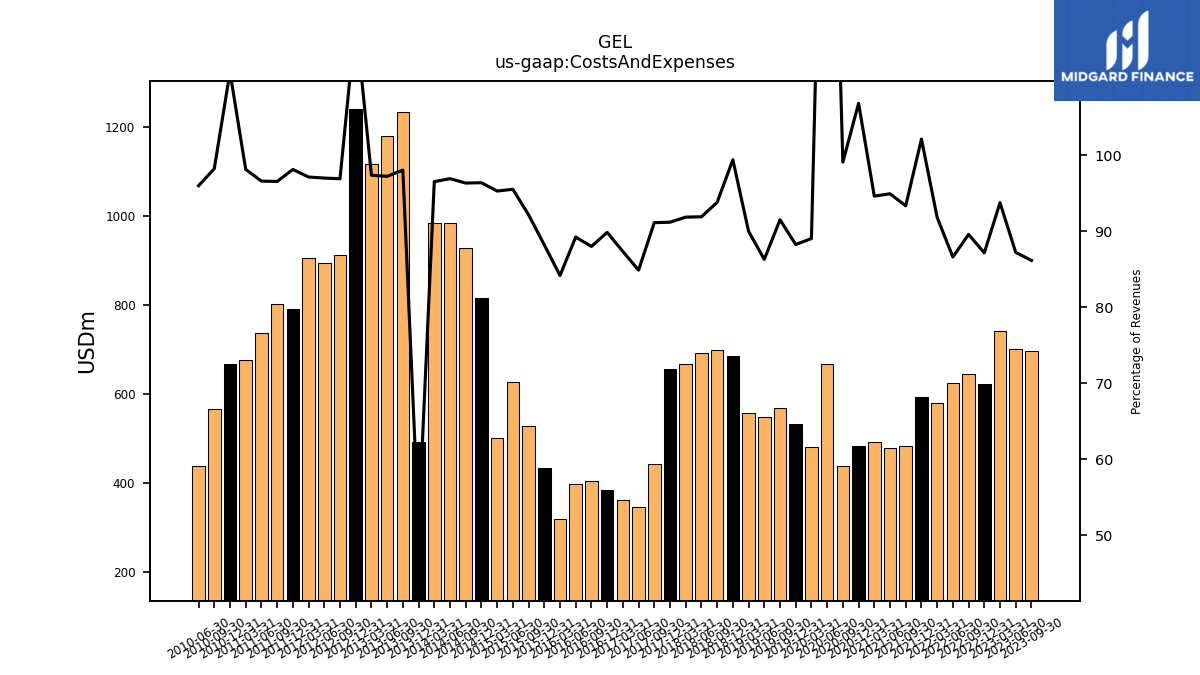
| Costs And Expenses | 695.92 | 701.88 | 741.23 | 622.38 | 646.15 | 625.14 | 580.28 | 593.94 | 484.33 | 478.32 | 493.20 | 484.07 | 439.09 | 666.69 | 480.76 | 533.39 | 568.91 | 547.84 | 557.98 | 685.18 | 699.13 | 691.49 | 666.73 | 656.64 | 443.01 | 345.28 | 362.89 | 384.64 | 404.87 | 397.99 | 318.57 | 433.14 | 527.54 | 626.95 | 502.04 | 816.66 | 928.85 | 983.79 | 984.32 | 491.78 | 1235.22 | 1180.01 | 1117.07 | 1241.94 | 913.22 | 895.00 | 906.21 | 791.82 | 801.57 | 736.86 | 676.97 | 668.15 | 565.83 | 438.24 | NA | |
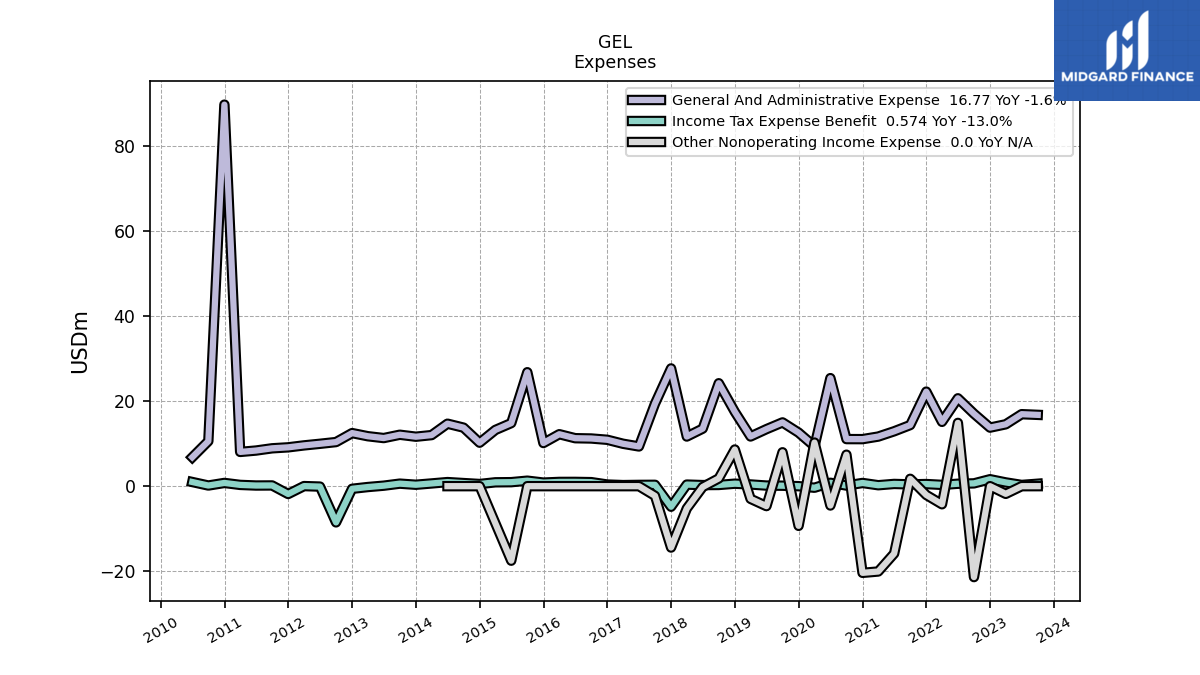
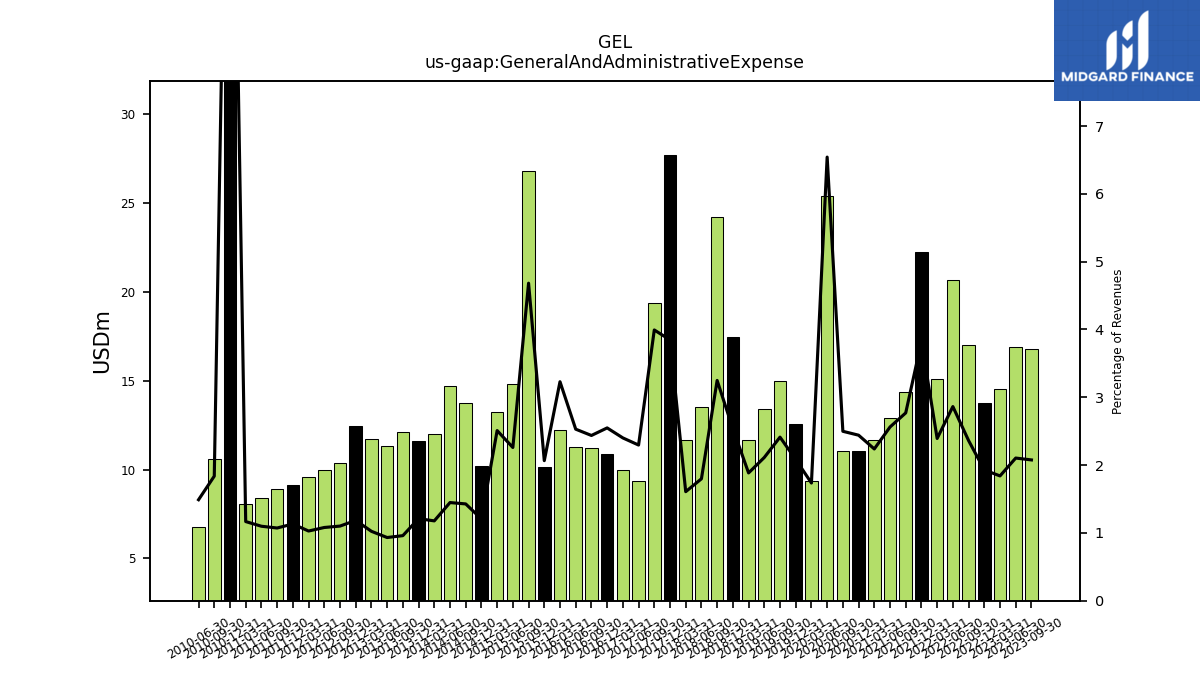
| General And Administrative Expense | 16.77 | 16.93 | 14.55 | 13.77 | 17.04 | 20.66 | 15.12 | 22.24 | 14.37 | 12.91 | 11.67 | 11.06 | 11.07 | 25.41 | 9.37 | 12.59 | 15.00 | 13.41 | 11.69 | 17.49 | 24.21 | 13.53 | 11.67 | 27.70 | 19.41 | 9.34 | 9.98 | 10.91 | 11.21 | 11.28 | 12.22 | 10.14 | 26.80 | 14.83 | 13.22 | 10.22 | 13.77 | 14.70 | 12.01 | 11.63 | 12.10 | 11.31 | 11.75 | 12.48 | 10.38 | 9.97 | 9.59 | 9.13 | 8.90 | 8.38 | 8.05 | 89.73 | 10.58 | 6.80 | NA | |
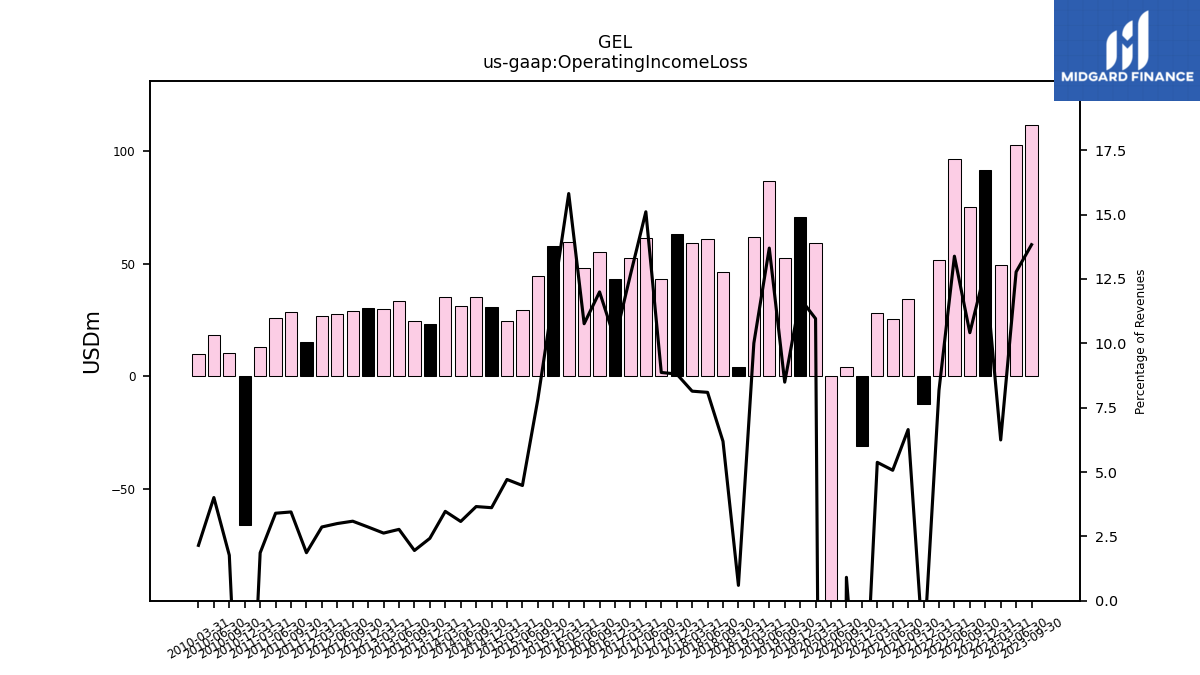
| Operating Income Loss | 111.69 | 102.78 | 49.38 | 91.66 | 75.09 | 96.58 | 51.67 | -12.36 | 34.49 | 25.54 | 28.02 | -30.93 | 4.03 | -278.22 | 59.16 | 70.94 | 52.79 | 86.95 | 62.03 | 4.12 | 46.15 | 60.90 | 59.08 | 63.41 | 43.10 | 61.45 | 52.60 | 43.41 | 55.18 | 47.99 | 59.85 | 57.87 | 44.80 | 29.38 | 24.82 | 30.62 | 35.27 | 31.26 | 35.40 | 23.30 | 24.60 | 33.65 | 30.15 | 30.17 | 29.12 | 27.67 | 26.73 | 15.06 | 28.63 | 25.93 | 12.83 | -65.90 | 10.18 | 18.30 | 10.04 | |
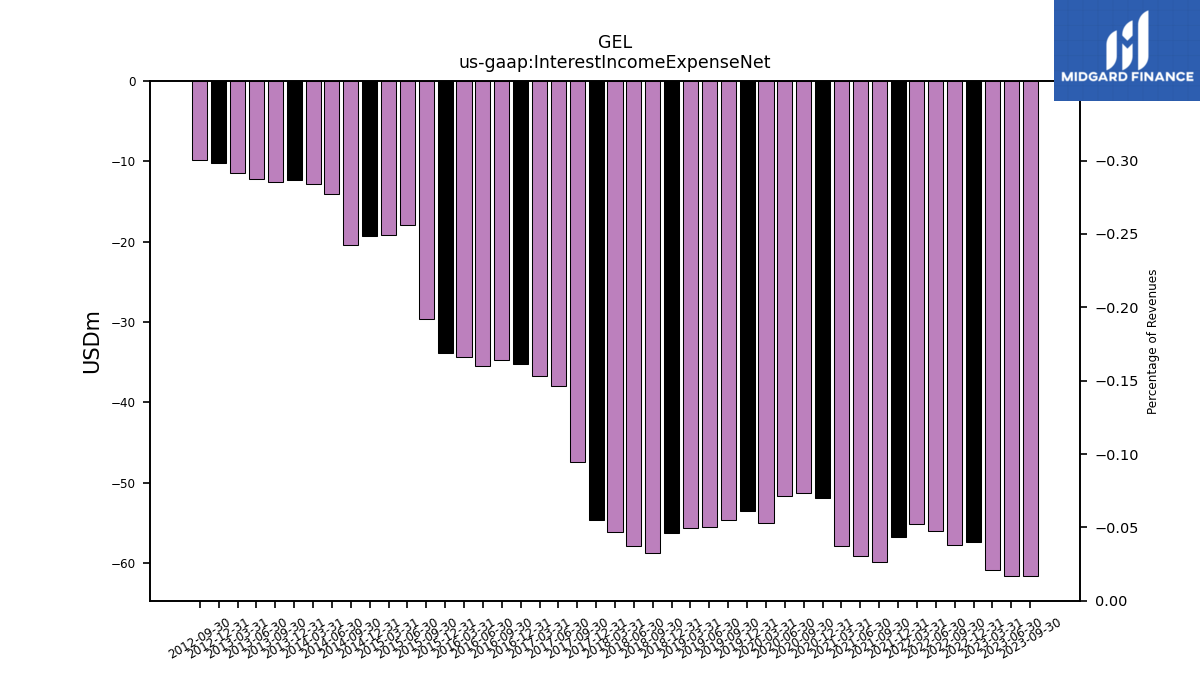
| Interest Income Expense Net | -61.58 | -61.62 | -60.85 | -57.38 | -57.71 | -55.96 | -55.10 | -56.79 | -59.94 | -59.17 | -57.83 | -51.88 | -51.31 | -51.62 | -54.97 | -53.56 | -54.67 | -55.51 | -55.70 | -56.33 | -58.82 | -57.91 | -56.14 | -54.65 | -47.39 | -37.99 | -36.74 | -35.29 | -34.73 | -35.53 | -34.39 | -33.86 | -29.62 | -17.91 | -19.21 | -19.32 | -20.44 | -14.07 | -12.80 | -12.30 | -12.59 | -12.26 | -11.44 | -10.23 | -9.87 | NA | NA | NA | NA | NA | NA | NA | NA | NA | NA | |
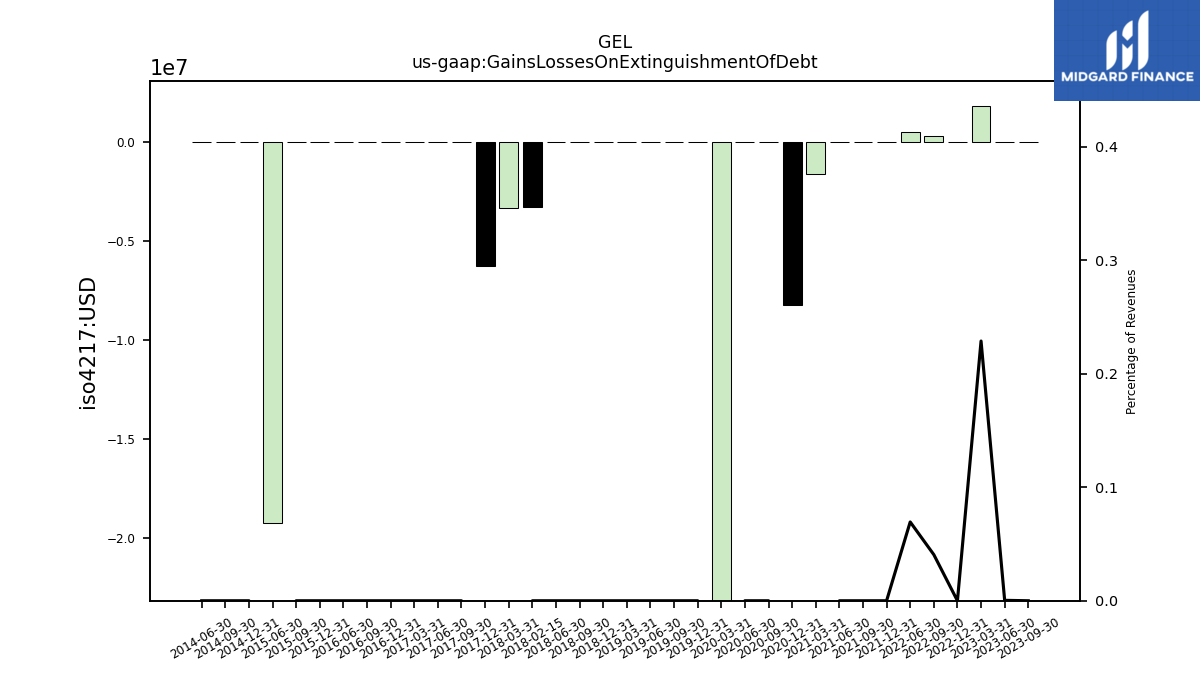
| Gains Losses On Extinguishment Of Debt | 0.00 | 0.00 | 1.81 | 0.00 | 0.29 | 0.50 | NA | 0.00 | 0.00 | 0.00 | -1.63 | -8.23 | 0.00 | 0.00 | -23.50 | 0.00 | 0.00 | 0.00 | 0.00 | 0.00 | 0.00 | 0.00 | -3.34 | -6.24 | 0.00 | 0.00 | 0.00 | 0.00 | 0.00 | 0.00 | NA | 0.00 | 0.00 | -19.23 | NA | 0.00 | 0.00 | 0.00 | NA | NA | NA | NA | NA | NA | NA | NA | NA | NA | NA | NA | NA | NA | NA | NA | NA | |
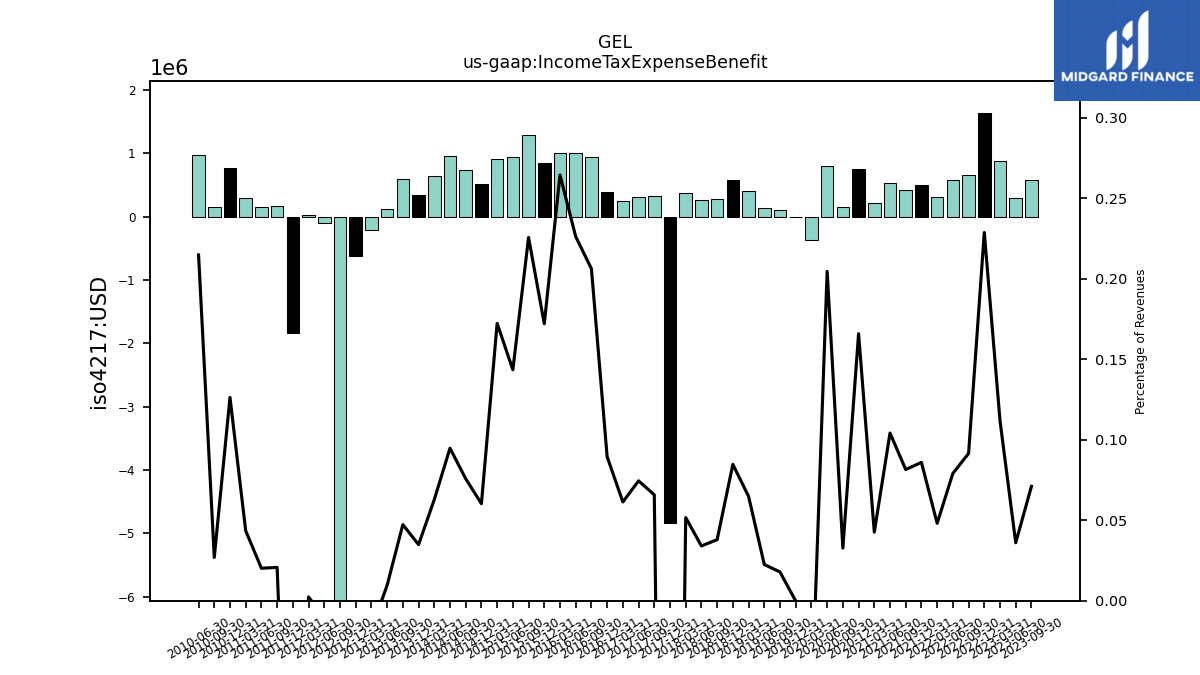
| Income Tax Expense Benefit | 0.57 | 0.29 | 0.88 | 1.63 | 0.66 | 0.57 | 0.30 | 0.50 | 0.42 | 0.53 | 0.22 | 0.75 | 0.14 | 0.80 | -0.36 | -0.00 | 0.11 | 0.14 | 0.40 | 0.58 | 0.28 | 0.26 | 0.38 | -4.84 | 0.32 | 0.30 | 0.26 | 0.38 | 0.95 | 1.01 | 1.00 | 0.84 | 1.29 | 0.94 | 0.91 | 0.51 | 0.73 | 0.96 | 0.64 | 0.34 | 0.60 | 0.12 | -0.20 | -0.61 | -8.52 | -0.10 | 0.02 | -1.84 | 0.17 | 0.15 | 0.30 | 0.76 | 0.15 | 0.98 | NA | |
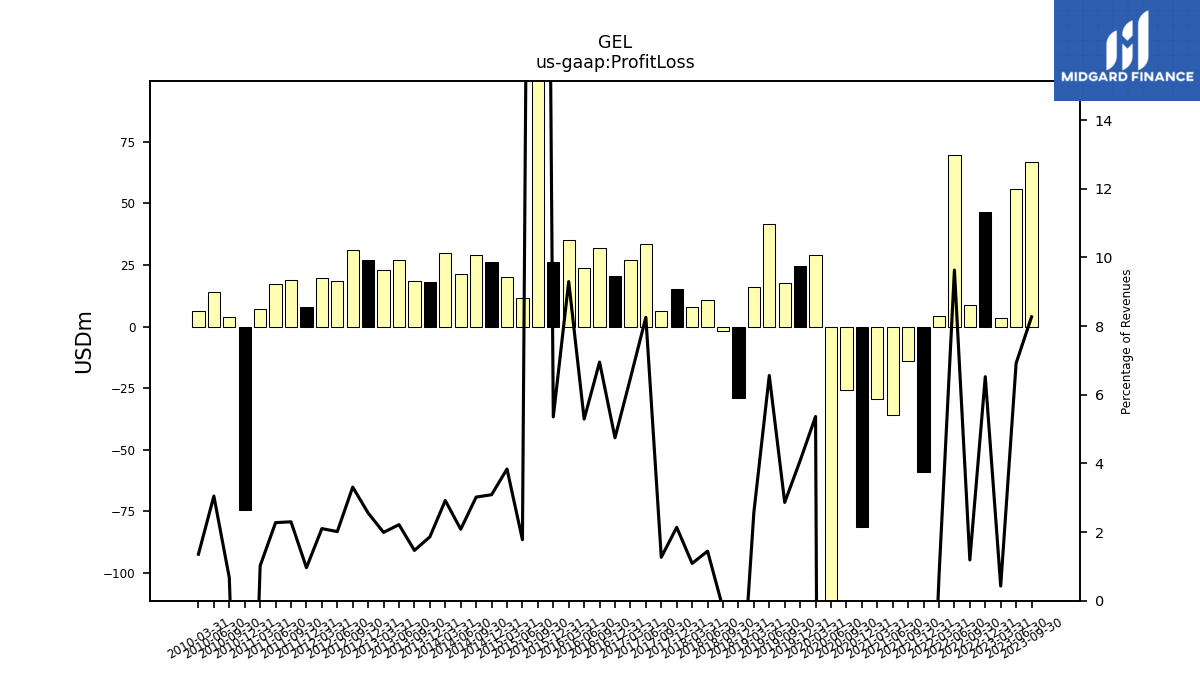
| Profit Loss | 66.78 | 55.68 | 3.39 | 46.60 | 8.57 | 69.52 | 4.45 | -58.99 | -13.83 | -35.78 | -29.43 | -81.15 | -25.58 | -322.56 | 28.98 | 24.66 | 17.81 | 41.65 | 15.95 | -28.93 | -1.63 | 10.87 | 7.90 | 15.40 | 6.16 | 33.58 | 26.94 | 20.32 | 31.98 | 23.60 | 35.18 | 26.30 | 363.41 | 11.66 | 20.21 | 26.17 | 29.11 | 21.15 | 29.77 | 17.89 | 18.47 | 26.90 | 22.85 | 26.94 | 31.19 | 18.58 | 19.60 | 7.77 | 19.09 | 17.36 | 7.03 | -74.65 | 3.86 | 13.92 | 6.33 | |
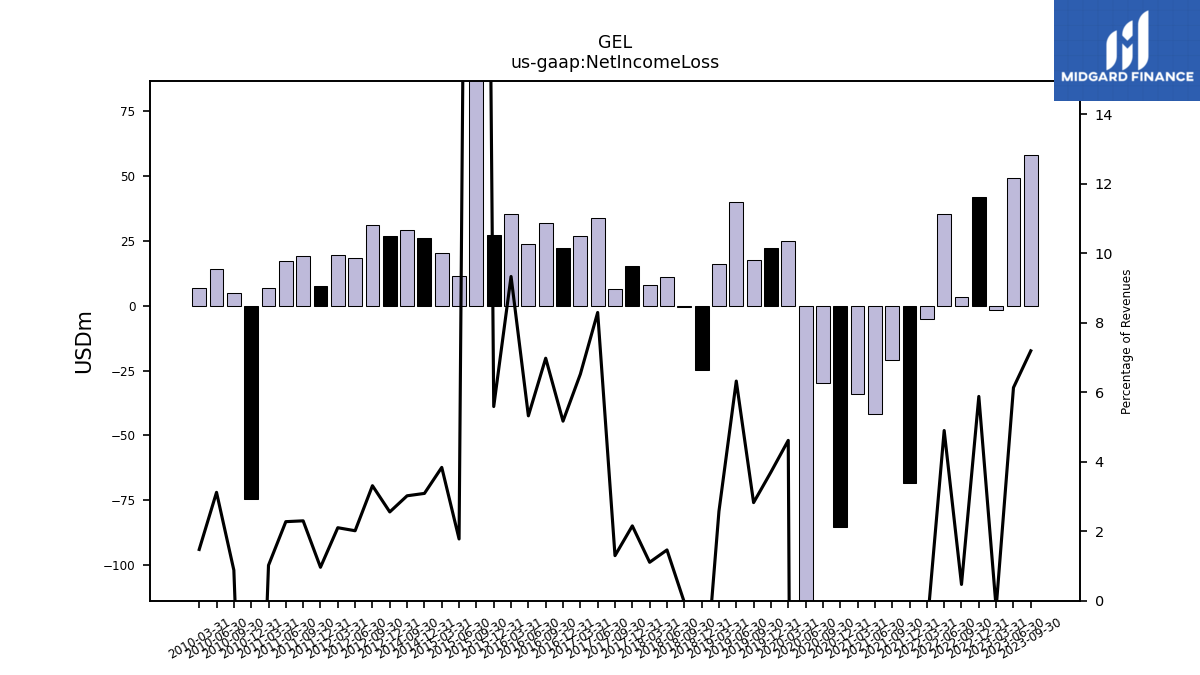
| Net Income Loss | 58.07 | 49.34 | -1.64 | 41.98 | 3.38 | 35.35 | -5.25 | -68.26 | -20.90 | -41.68 | -34.22 | -85.16 | -29.72 | -326.71 | 24.91 | 22.37 | 17.56 | 40.12 | 15.95 | -24.78 | -0.32 | 11.00 | 8.03 | 15.51 | 6.31 | 33.73 | 27.09 | 22.12 | 32.10 | 23.73 | 35.30 | 27.43 | 363.21 | 11.66 | 20.21 | 26.17 | 29.11 | NA | NA | NA | NA | NA | NA | 26.94 | 31.19 | 18.58 | 19.60 | 7.77 | 19.09 | 17.36 | 7.03 | -74.65 | 5.07 | 14.24 | 6.88 | |
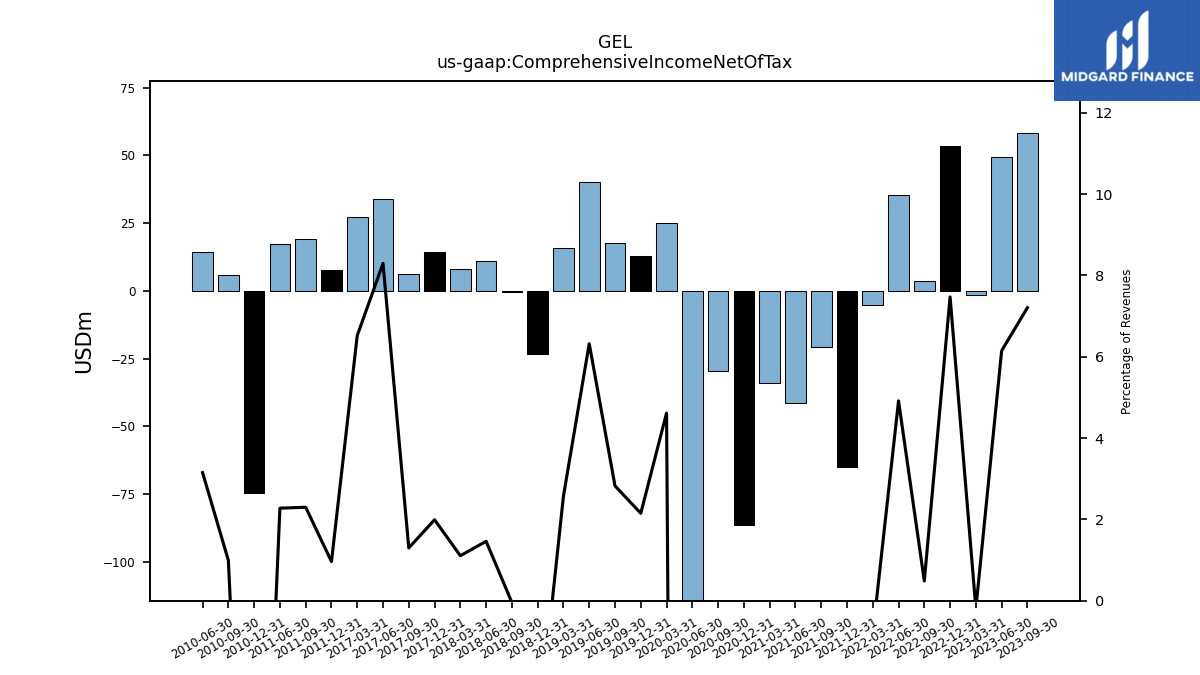
| Comprehensive Income Net Of Tax | 58.19 | 49.47 | -1.52 | 53.33 | 3.51 | 35.47 | -5.13 | -64.87 | -20.78 | -41.56 | -34.10 | -86.45 | -29.59 | -326.47 | 24.91 | 13.00 | 17.56 | 40.12 | 15.95 | -23.24 | -0.32 | 11.00 | 8.03 | 14.34 | 6.31 | 33.73 | 27.09 | NA | NA | NA | NA | NA | NA | NA | NA | NA | NA | NA | NA | NA | NA | NA | NA | NA | NA | NA | NA | 7.77 | 19.09 | 17.36 | NA | -74.65 | 5.72 | 14.38 | NA | |
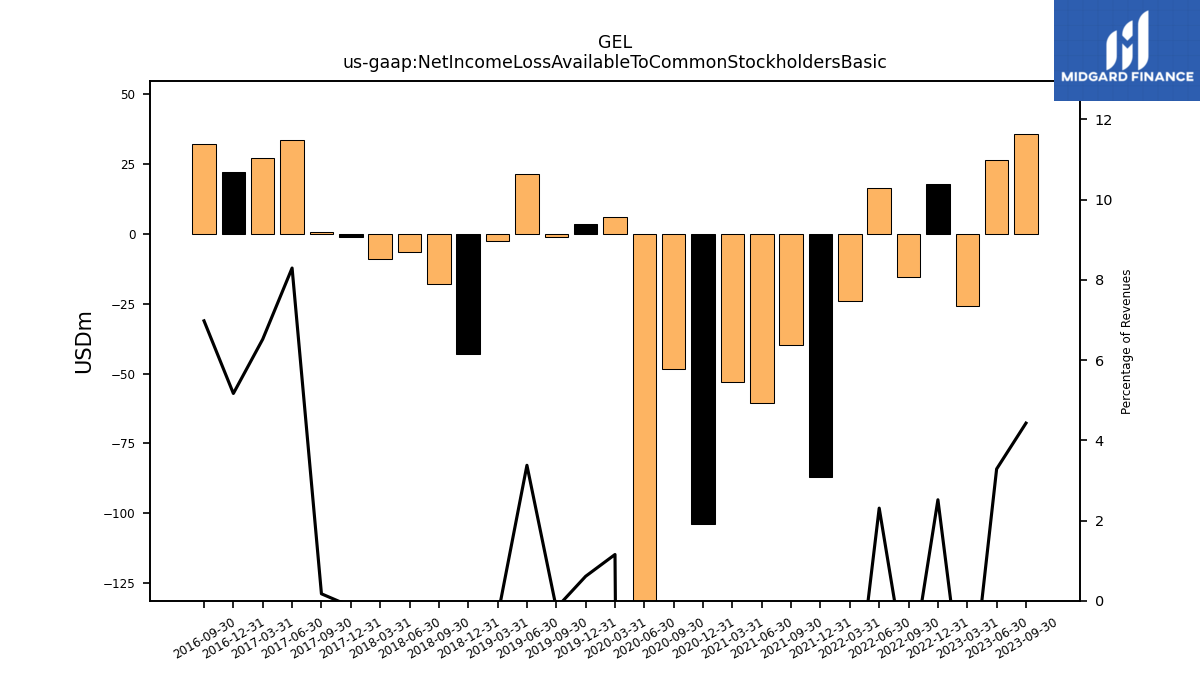
| Net Income Loss Available To Common Stockholders Basic | 35.76 | 26.43 | -25.65 | 17.98 | -15.30 | 16.66 | -23.93 | -86.95 | -39.58 | -60.37 | -52.91 | -103.84 | -48.40 | -345.40 | 6.22 | 3.68 | -1.13 | 21.44 | -2.46 | -42.80 | -17.96 | -6.26 | -8.85 | -1.01 | 0.84 | 33.73 | 27.09 | 22.12 | 32.10 | NA | NA | NA | NA | NA | NA | NA | NA | NA | NA | NA | NA | NA | NA | NA | NA | NA | NA | NA | NA | NA | NA | NA | NA | NA | NA | |
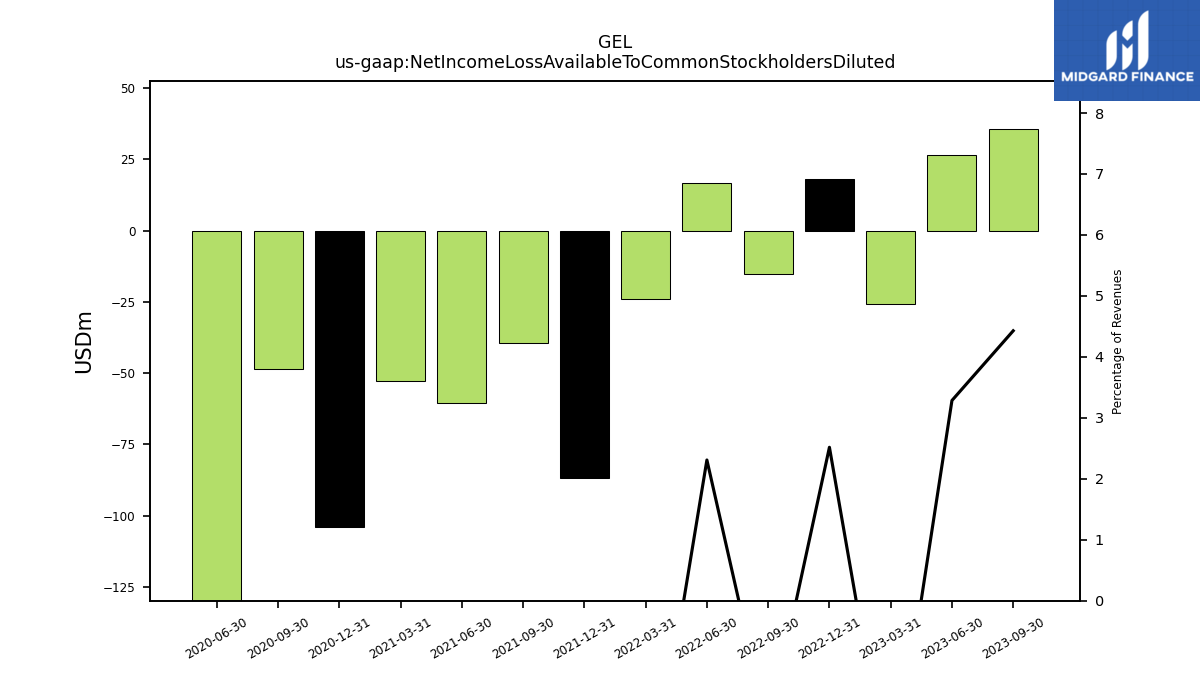
| Net Income Loss Available To Common Stockholders Diluted | 35.76 | 26.43 | -25.65 | 17.98 | -15.30 | 16.66 | -23.93 | -86.95 | -39.58 | -60.37 | -52.91 | -103.84 | -48.40 | -345.40 | NA | NA | NA | NA | NA | NA | NA | NA | NA | NA | NA | NA | NA | NA | NA | NA | NA | NA | NA | NA | NA | NA | NA | NA | NA | NA | NA | NA | NA | NA | NA | NA | NA | NA | NA | NA | NA | NA | NA | NA | NA |
| 2023-09-30 | 2023-06-30 | 2023-03-31 | 2022-12-31 | 2022-09-30 | 2022-06-30 | 2022-03-31 | 2021-12-31 | 2021-09-30 | 2021-06-30 | 2021-03-31 | 2020-12-31 | 2020-09-30 | 2020-06-30 | 2020-03-31 | 2019-12-31 | 2019-09-30 | 2019-06-30 | 2019-03-31 | 2018-12-31 | 2018-09-30 | 2018-06-30 | 2018-03-31 | 2017-12-31 | 2017-09-30 | 2017-06-30 | 2017-03-31 | 2016-12-31 | 2016-09-30 | 2016-06-30 | 2016-03-31 | 2015-12-31 | 2015-09-30 | 2015-06-30 | 2015-03-31 | 2014-12-31 | 2014-09-30 | 2014-06-30 | 2014-03-31 | 2013-12-31 | 2013-09-30 | 2013-06-30 | 2013-03-31 | 2012-12-31 | 2012-09-30 | 2012-06-30 | 2012-03-31 | 2011-12-31 | 2011-09-30 | 2011-06-30 | 2011-03-31 | 2010-12-31 | 2010-09-30 | 2010-06-30 | 2010-03-31 | ||
|---|---|---|---|---|---|---|---|---|---|---|---|---|---|---|---|---|---|---|---|---|---|---|---|---|---|---|---|---|---|---|---|---|---|---|---|---|---|---|---|---|---|---|---|---|---|---|---|---|---|---|---|---|---|---|---|---|
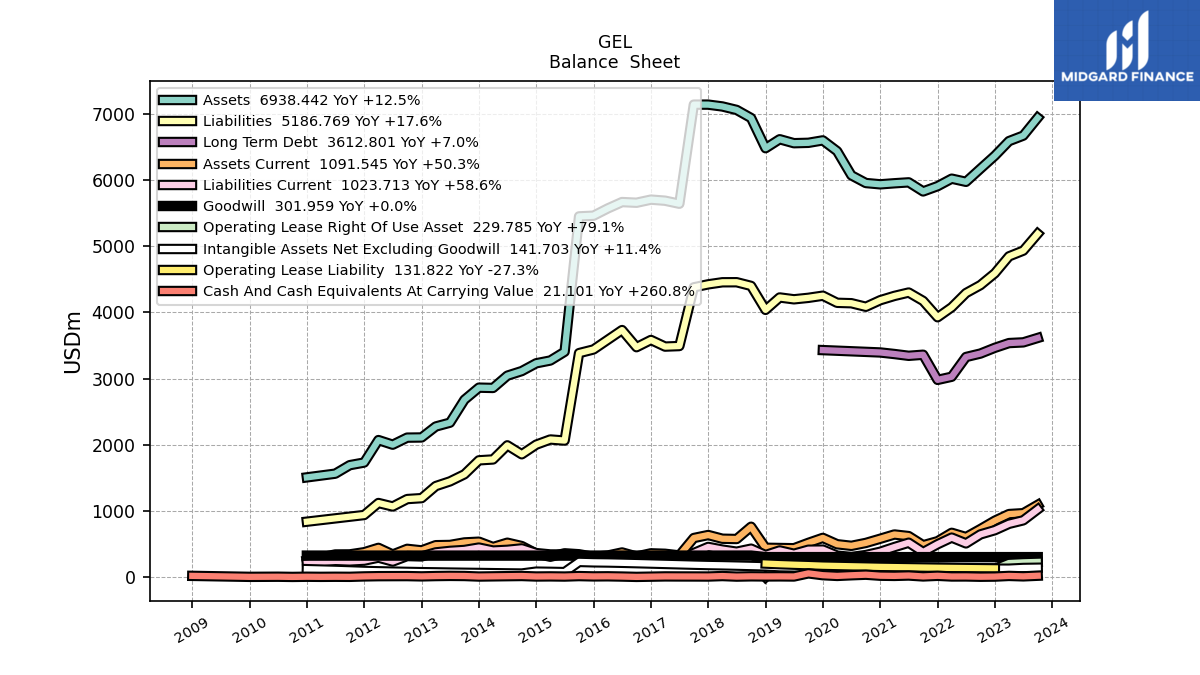
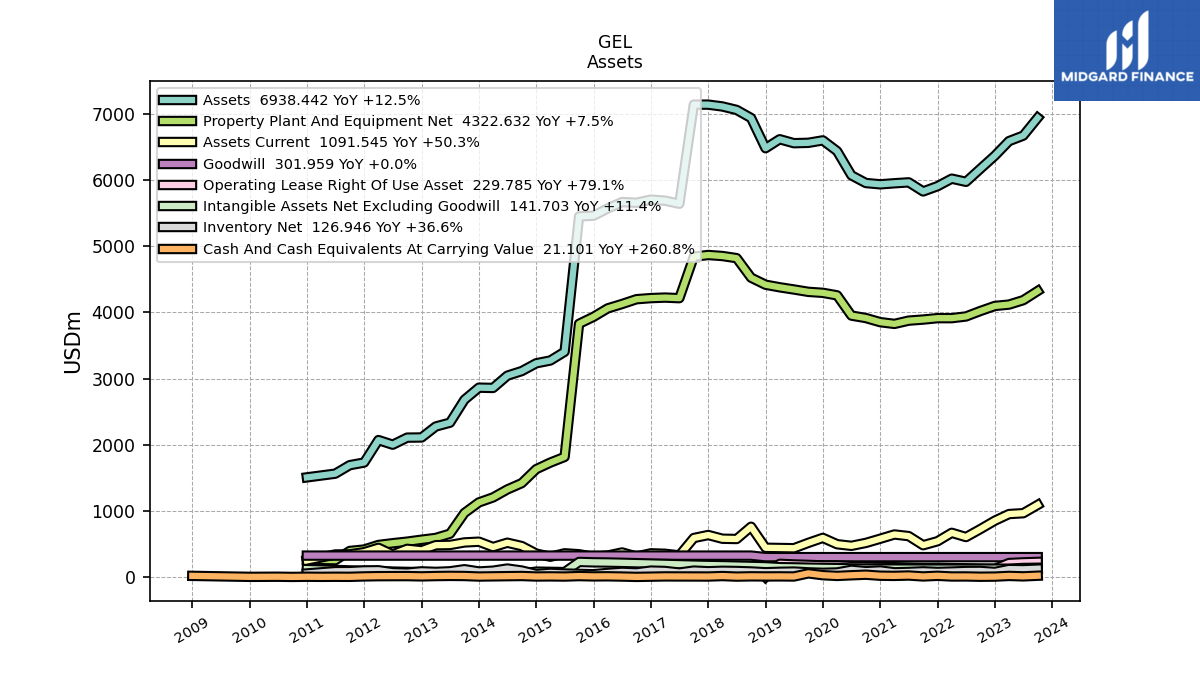
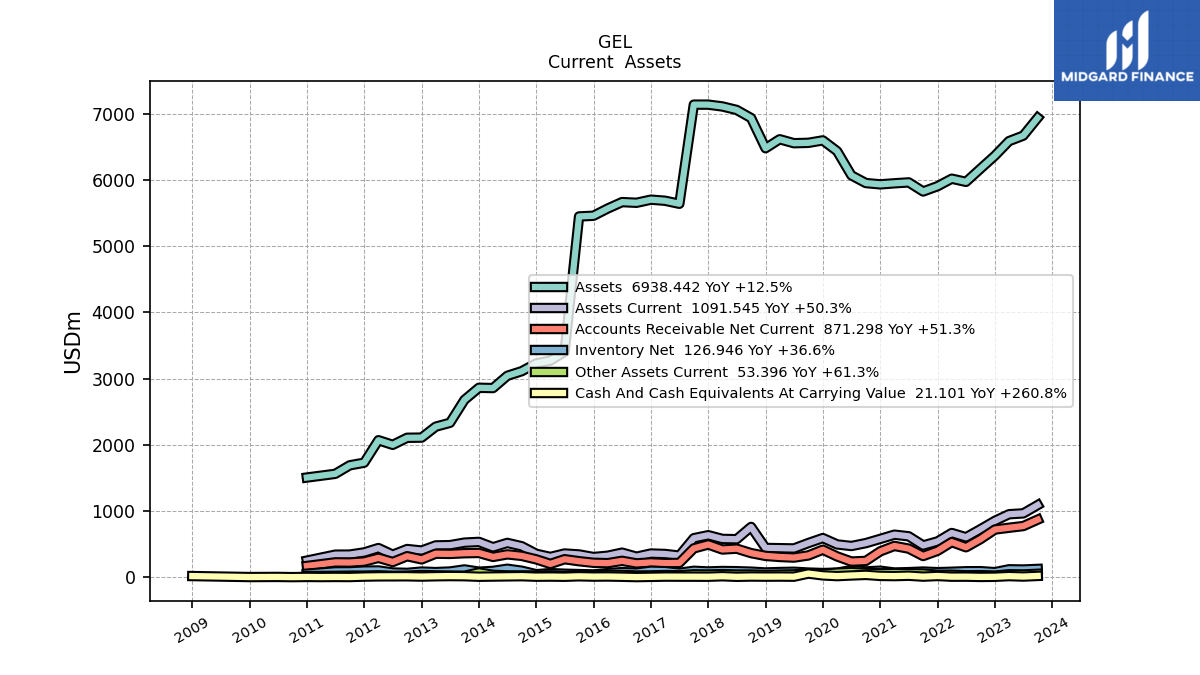
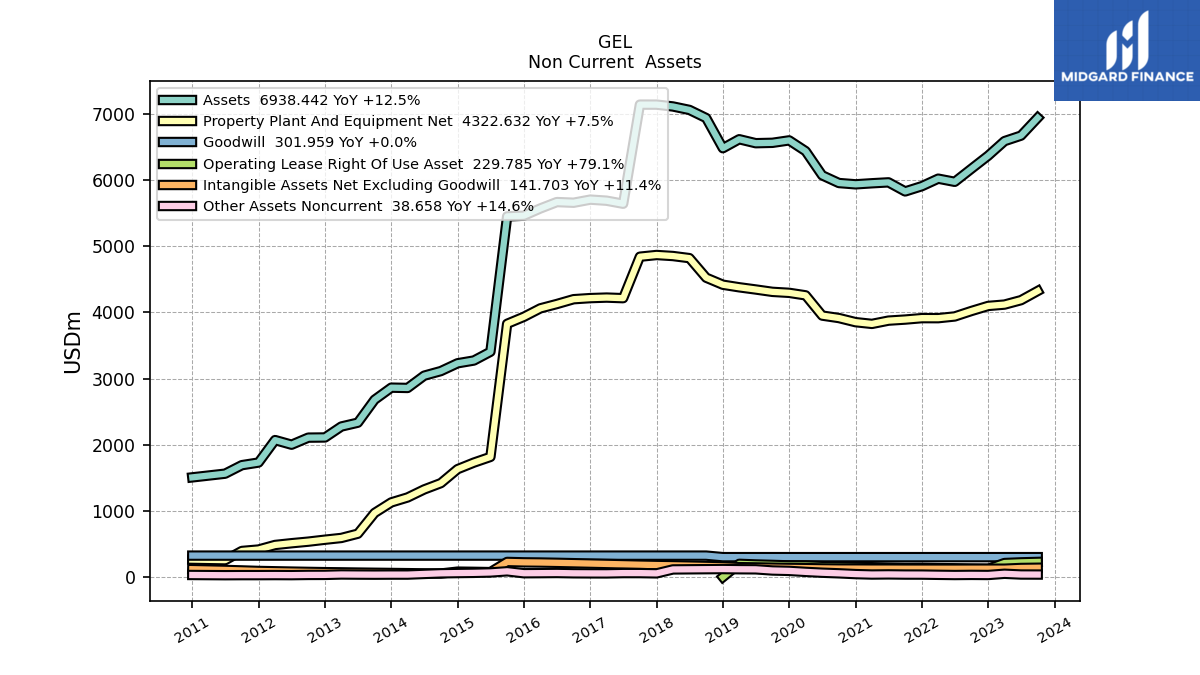
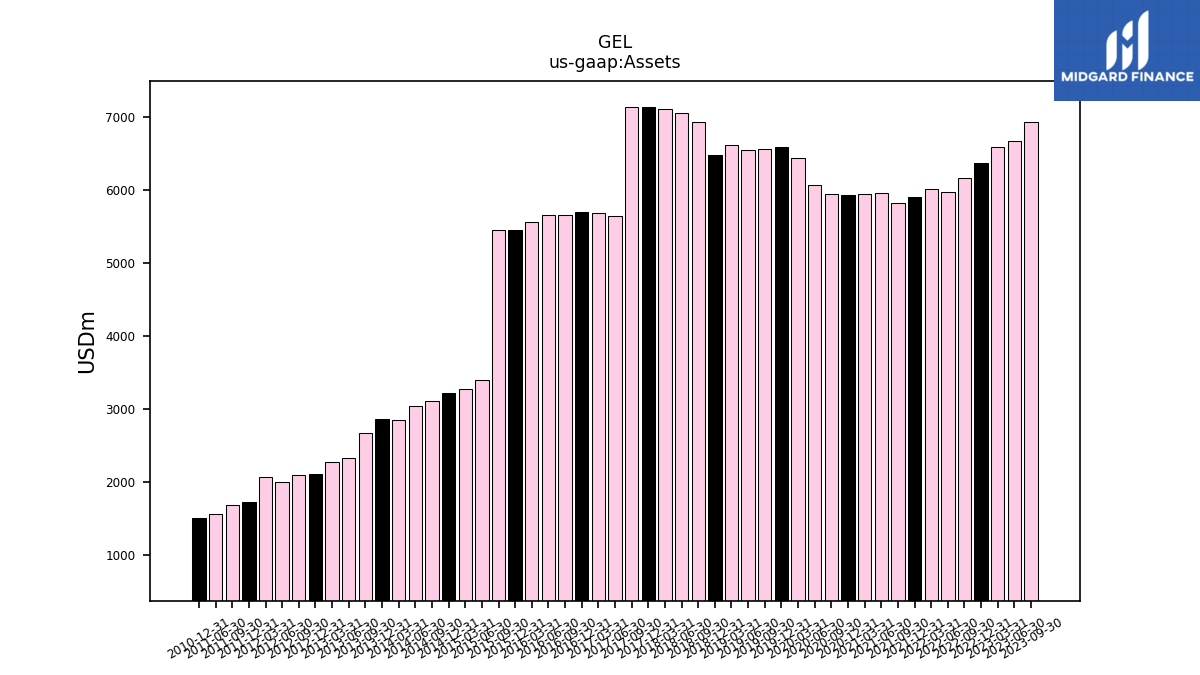
| Assets | 6938.44 | 6669.46 | 6586.46 | 6365.99 | 6169.54 | 5971.46 | 6019.20 | 5905.80 | 5826.33 | 5963.49 | 5949.61 | 5933.62 | 5953.35 | 6069.44 | 6434.46 | 6597.64 | 6560.68 | 6554.94 | 6614.81 | 6479.07 | 6935.17 | 7057.63 | 7109.84 | 7137.48 | 7137.63 | 5640.38 | 5686.19 | 5702.59 | 5655.48 | 5665.81 | 5569.37 | 5459.60 | 5449.24 | 3404.28 | 3272.14 | 3230.37 | 3112.61 | 3043.13 | 2857.55 | 2862.20 | 2679.57 | 2333.05 | 2275.28 | 2109.66 | 2107.16 | 2000.35 | 2070.28 | 1730.84 | 1691.20 | 1562.76 | NA | 1506.73 | NA | NA | NA | |
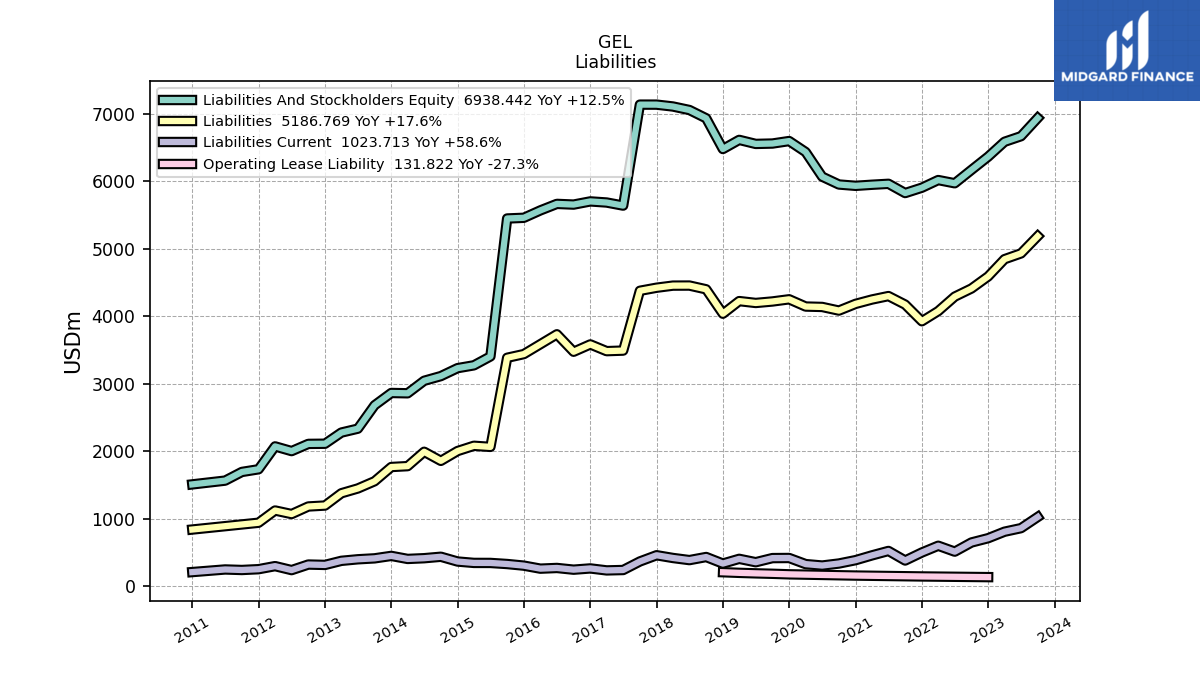
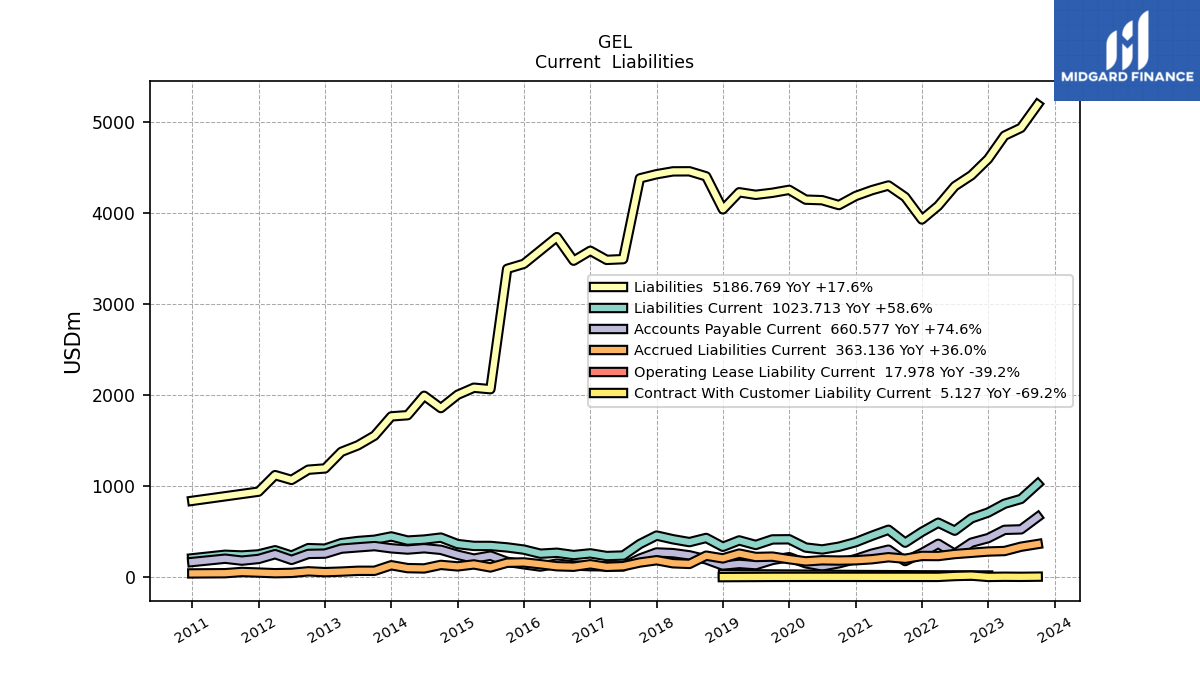
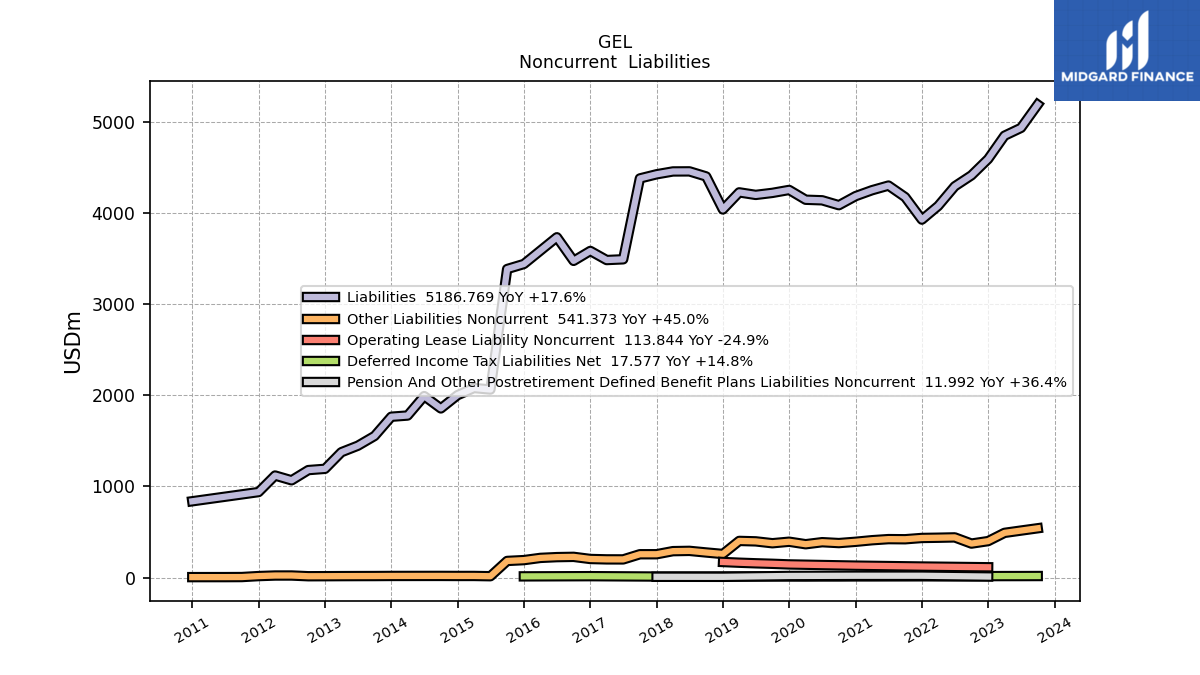
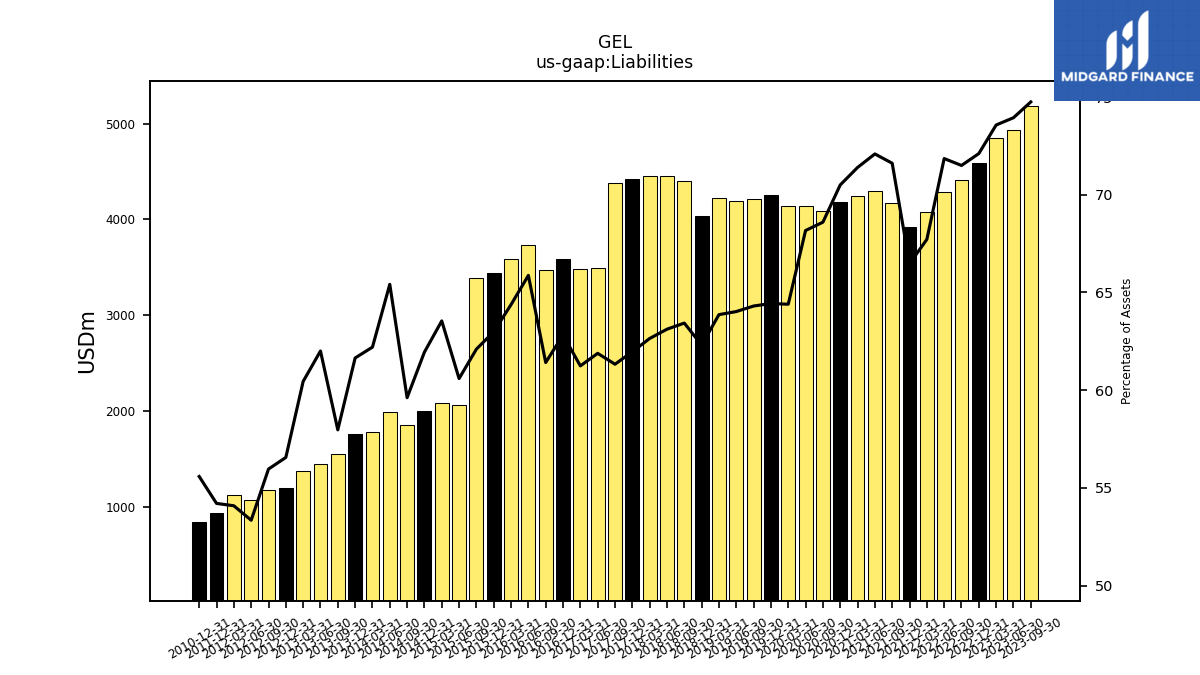
| Liabilities | 5186.77 | 4931.78 | 4845.80 | 4590.53 | 4411.35 | 4290.80 | 4076.09 | 3925.67 | 4172.52 | 4299.16 | 4247.93 | 4183.46 | 4083.86 | 4137.69 | 4143.79 | 4251.22 | 4219.00 | 4196.74 | 4224.65 | 4037.07 | 4399.31 | 4454.84 | 4453.98 | 4422.87 | 4377.42 | 3490.54 | 3482.43 | 3582.54 | 3473.38 | 3732.33 | 3585.53 | 3438.85 | 3384.05 | 2062.79 | 2079.26 | 2001.17 | 1855.58 | 1990.70 | 1777.49 | 1764.46 | 1553.35 | 1446.60 | 1375.33 | 1193.17 | 1179.22 | 1067.05 | 1119.69 | 938.21 | NA | NA | NA | 837.47 | NA | NA | NA | |
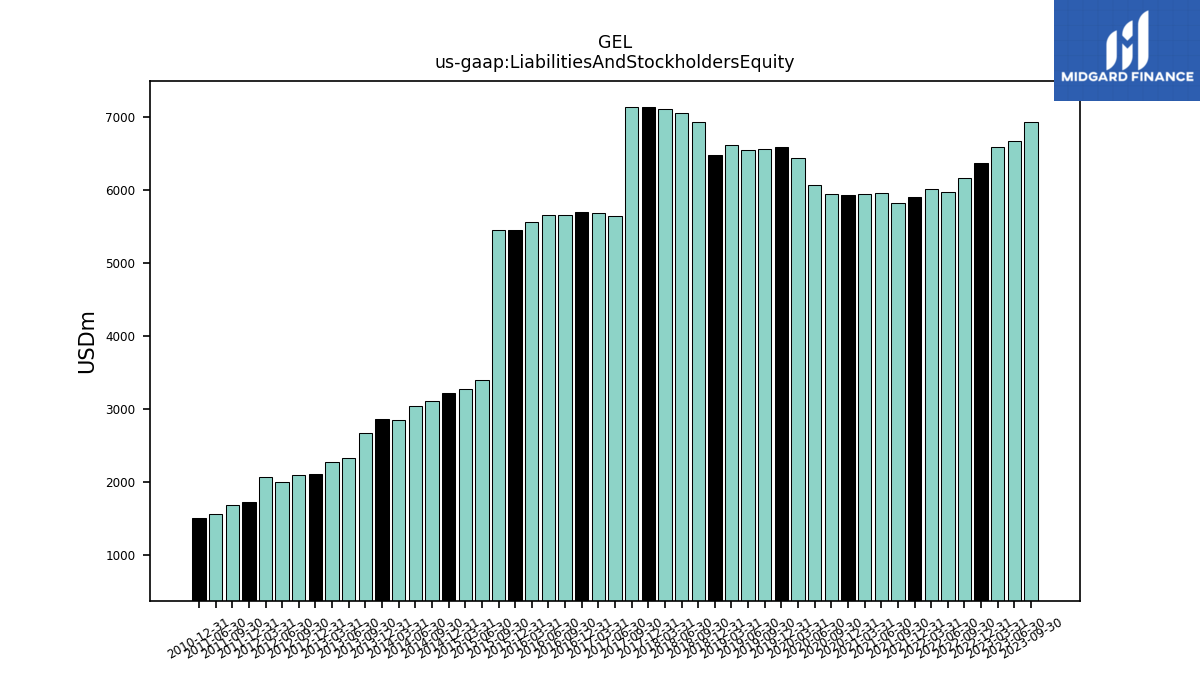
| Liabilities And Stockholders Equity | 6938.44 | 6669.46 | 6586.46 | 6365.99 | 6169.54 | 5971.46 | 6019.20 | 5905.80 | 5826.33 | 5963.49 | 5949.61 | 5933.62 | 5953.35 | 6069.44 | 6434.46 | 6597.64 | 6560.68 | 6554.94 | 6614.81 | 6479.07 | 6935.17 | 7057.63 | 7109.84 | 7137.48 | 7137.63 | 5640.38 | 5686.19 | 5702.59 | 5655.48 | 5665.81 | 5569.37 | 5459.60 | 5449.24 | 3404.28 | 3272.14 | 3230.37 | 3112.61 | 3043.13 | 2857.55 | 2862.20 | 2679.57 | 2333.05 | 2275.28 | 2109.66 | 2107.16 | 2000.35 | 2070.28 | 1730.84 | 1691.20 | 1562.76 | NA | 1506.73 | NA | NA | NA |
| 2023-09-30 | 2023-06-30 | 2023-03-31 | 2022-12-31 | 2022-09-30 | 2022-06-30 | 2022-03-31 | 2021-12-31 | 2021-09-30 | 2021-06-30 | 2021-03-31 | 2020-12-31 | 2020-09-30 | 2020-06-30 | 2020-03-31 | 2019-12-31 | 2019-09-30 | 2019-06-30 | 2019-03-31 | 2018-12-31 | 2018-09-30 | 2018-06-30 | 2018-03-31 | 2017-12-31 | 2017-09-30 | 2017-06-30 | 2017-03-31 | 2016-12-31 | 2016-09-30 | 2016-06-30 | 2016-03-31 | 2015-12-31 | 2015-09-30 | 2015-06-30 | 2015-03-31 | 2014-12-31 | 2014-09-30 | 2014-06-30 | 2014-03-31 | 2013-12-31 | 2013-09-30 | 2013-06-30 | 2013-03-31 | 2012-12-31 | 2012-09-30 | 2012-06-30 | 2012-03-31 | 2011-12-31 | 2011-09-30 | 2011-06-30 | 2011-03-31 | 2010-12-31 | 2010-09-30 | 2010-06-30 | 2010-03-31 | ||
|---|---|---|---|---|---|---|---|---|---|---|---|---|---|---|---|---|---|---|---|---|---|---|---|---|---|---|---|---|---|---|---|---|---|---|---|---|---|---|---|---|---|---|---|---|---|---|---|---|---|---|---|---|---|---|---|---|
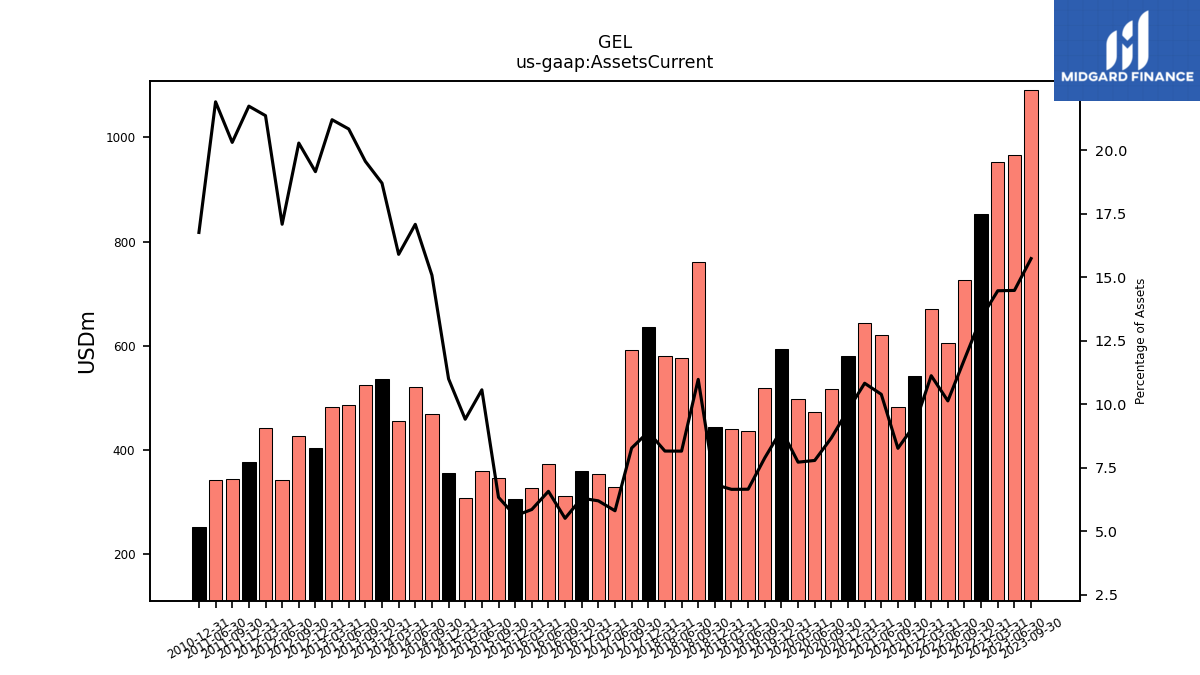
| Assets Current | 1091.55 | 965.69 | 952.79 | 853.05 | 726.43 | 605.09 | 669.60 | 542.48 | 481.68 | 619.72 | 644.14 | 580.17 | 516.59 | 472.79 | 496.88 | 593.07 | 517.75 | 436.40 | 440.07 | 443.28 | 761.42 | 575.67 | 580.09 | 636.03 | 590.82 | 327.71 | 352.57 | 359.57 | 311.78 | 372.53 | 326.37 | 306.32 | 345.40 | 359.77 | 307.94 | 355.37 | 469.31 | 519.77 | 454.34 | 535.22 | 524.07 | 486.00 | 482.26 | 404.03 | 427.27 | 341.72 | 442.13 | 376.10 | 343.36 | 342.24 | NA | 252.54 | NA | NA | NA | |
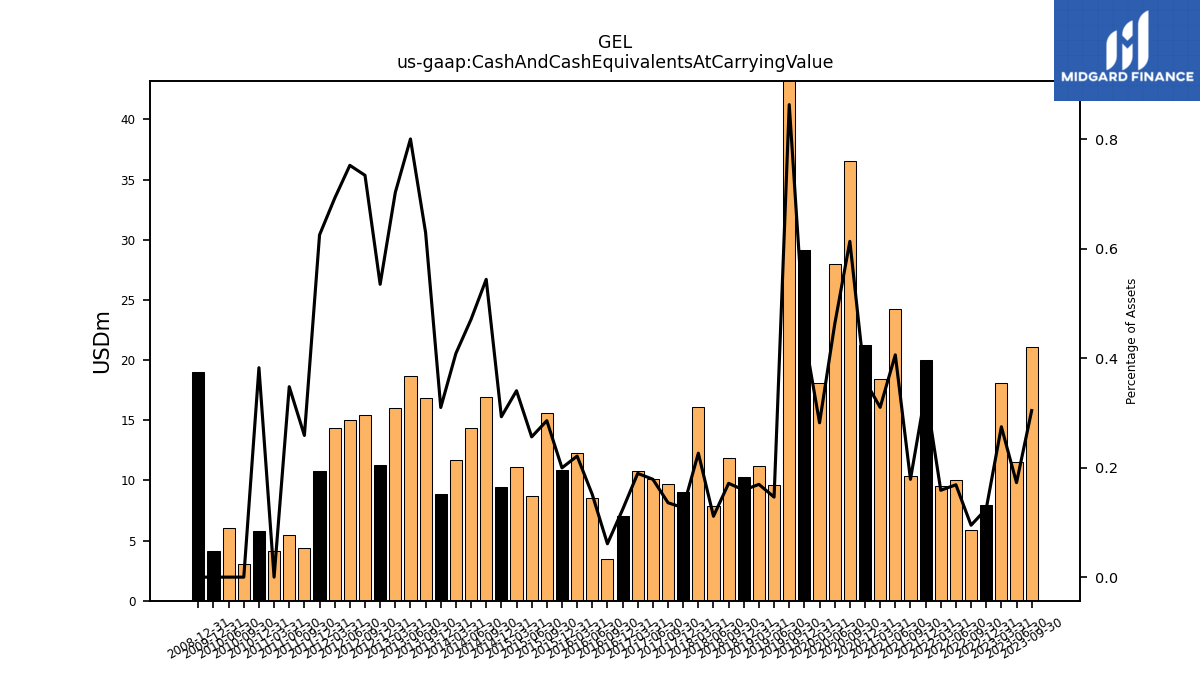
| Cash And Cash Equivalents At Carrying Value | 21.10 | 11.51 | 18.09 | 7.93 | 5.85 | 10.07 | 9.55 | 19.99 | 10.41 | 24.20 | 18.45 | 21.28 | 36.50 | 28.02 | 18.14 | 29.13 | 56.61 | 9.58 | 11.20 | 10.30 | 11.88 | 7.85 | 16.09 | 9.04 | 9.69 | 10.08 | 10.77 | 7.03 | 3.45 | 8.55 | 12.31 | 10.89 | 15.57 | 8.72 | 11.14 | 9.46 | 16.93 | 14.33 | 11.68 | 8.87 | 16.86 | 18.67 | 15.98 | 11.28 | 15.46 | 15.04 | 14.32 | 10.82 | 4.38 | 5.43 | 4.16 | 5.76 | 3.06 | 6.03 | NA | |
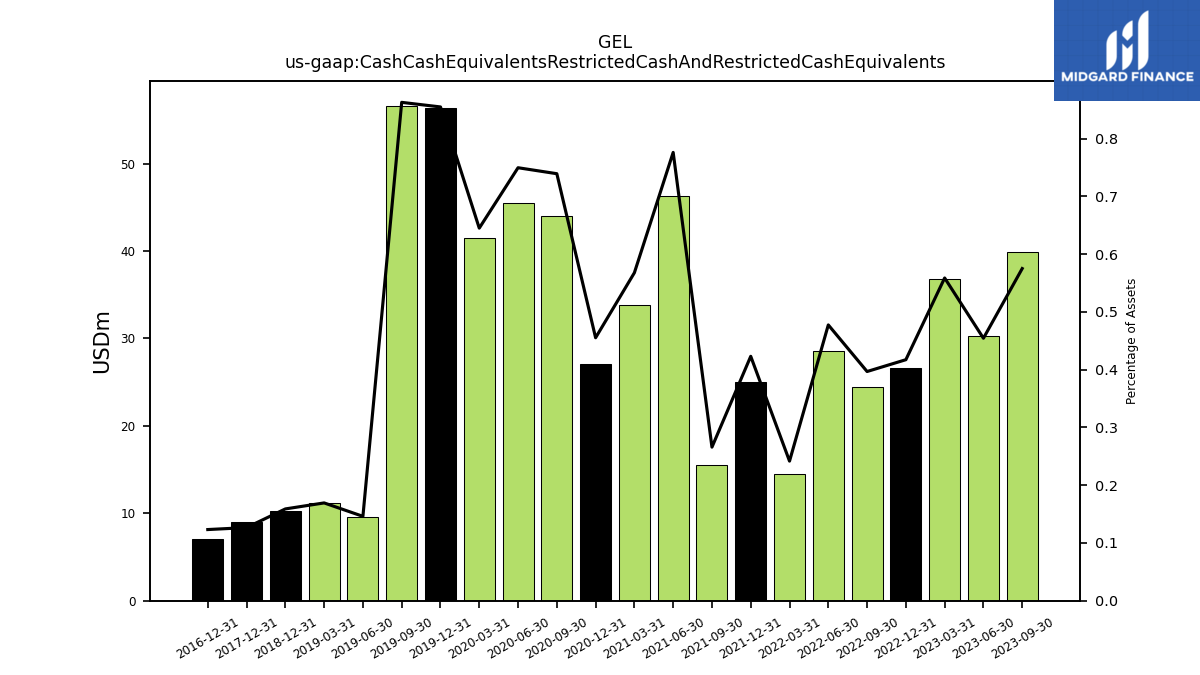
| Cash Cash Equivalents Restricted Cash And Restricted Cash Equivalents | 39.91 | 30.31 | 36.81 | 26.57 | 24.48 | 28.52 | 14.55 | 24.99 | 15.50 | 46.29 | 33.79 | 27.02 | 44.02 | 45.50 | 41.51 | 56.41 | 56.61 | 9.58 | 11.20 | 10.30 | NA | NA | NA | 9.04 | NA | NA | NA | 7.03 | NA | NA | NA | NA | NA | NA | NA | NA | NA | NA | NA | NA | NA | NA | NA | NA | NA | NA | NA | NA | NA | NA | NA | NA | NA | NA | NA | |
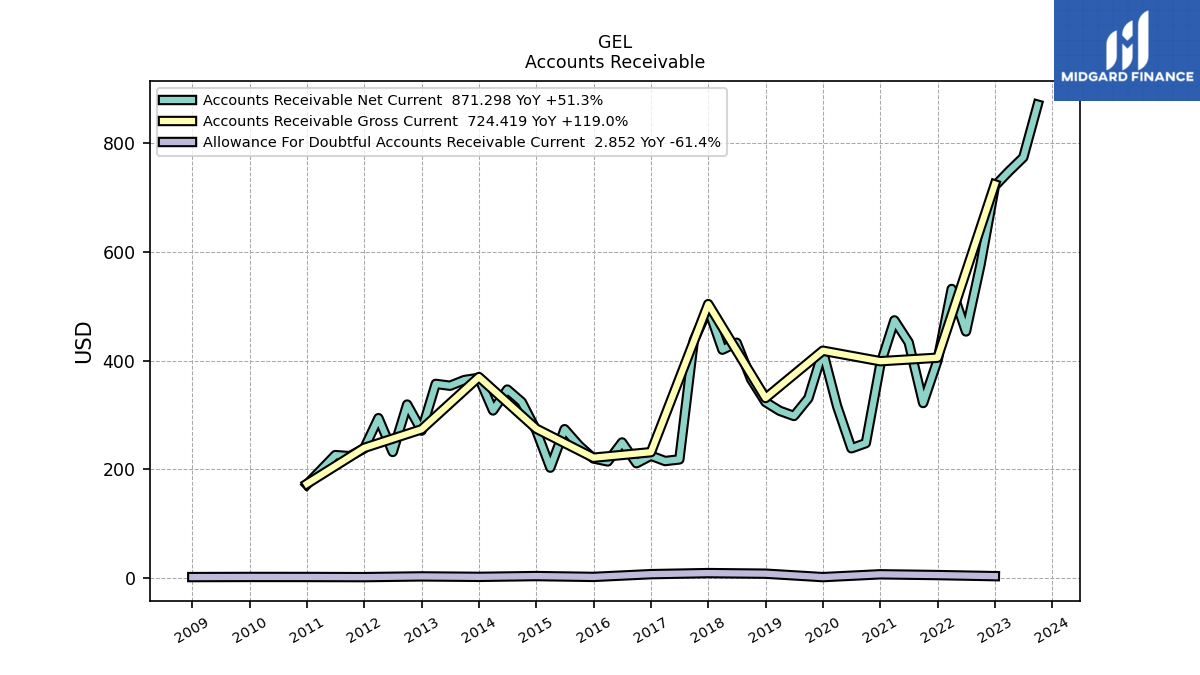
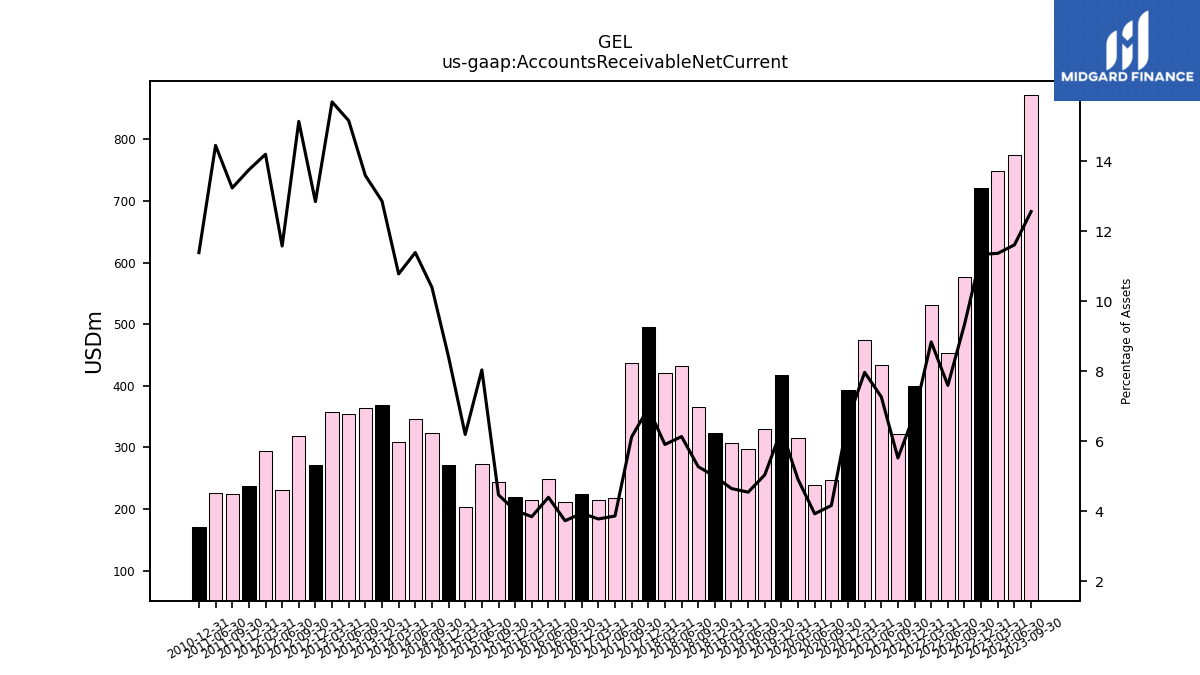
| Accounts Receivable Net Current | 871.30 | 774.09 | 748.54 | 721.57 | 575.93 | 453.50 | 531.79 | 400.33 | 321.64 | 433.31 | 473.93 | 392.46 | 247.82 | 238.30 | 315.64 | 417.00 | 330.58 | 297.85 | 307.39 | 323.46 | 365.65 | 432.78 | 419.90 | 495.45 | 437.04 | 217.83 | 214.87 | 224.68 | 210.81 | 249.13 | 214.11 | 219.53 | 243.37 | 273.57 | 202.63 | 271.53 | 323.54 | 346.55 | 307.98 | 368.03 | 364.08 | 353.55 | 356.97 | 270.93 | 318.89 | 231.53 | 293.87 | 237.99 | 223.80 | 225.78 | NA | 171.55 | NA | NA | NA | |
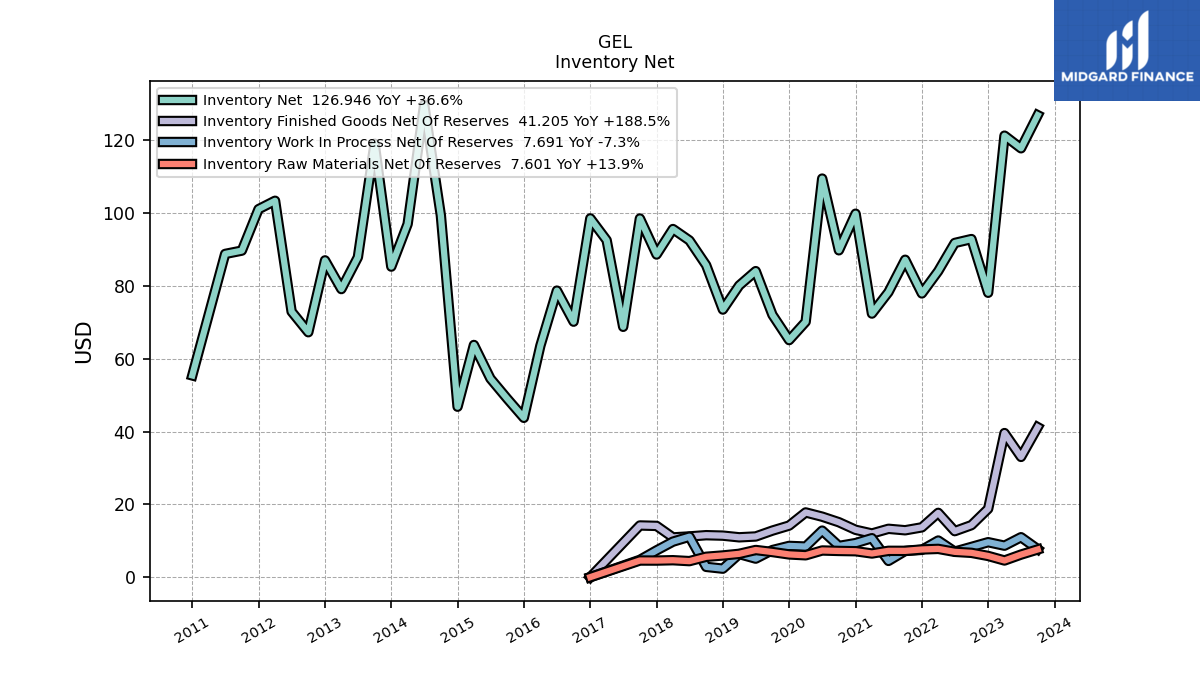
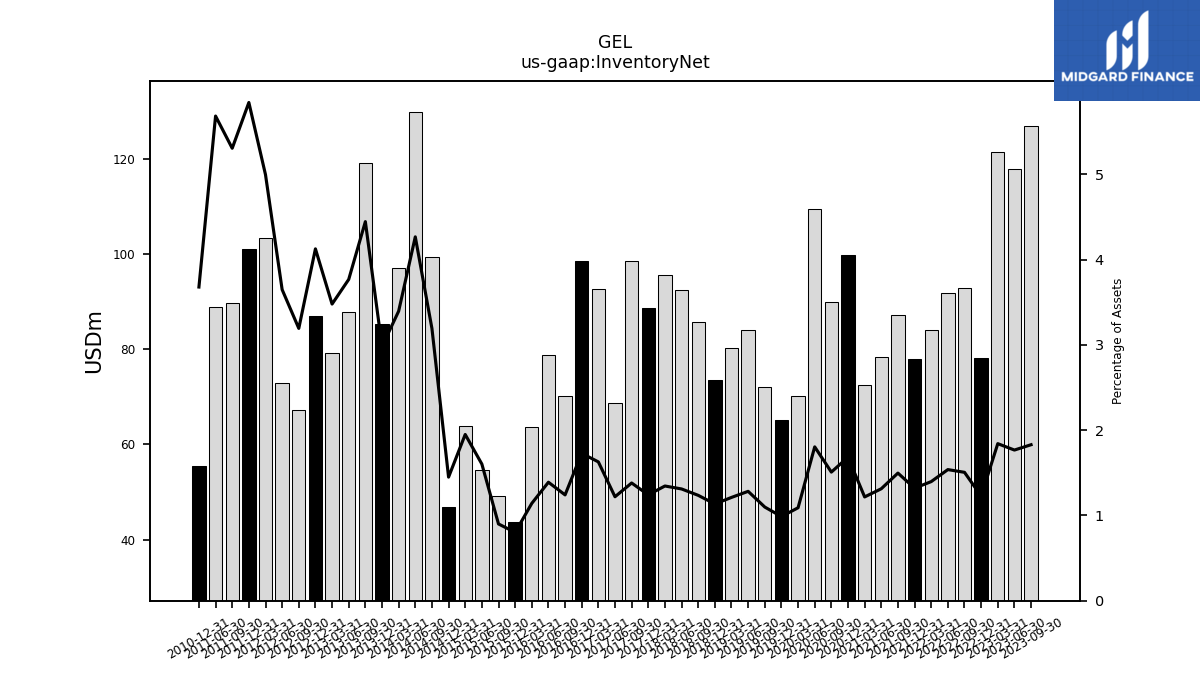
| Inventory Net | 126.95 | 117.85 | 121.33 | 78.14 | 92.91 | 91.83 | 84.09 | 77.96 | 87.22 | 78.33 | 72.43 | 99.88 | 89.81 | 109.53 | 70.16 | 65.14 | 72.09 | 84.09 | 80.15 | 73.53 | 85.72 | 92.52 | 95.67 | 88.65 | 98.56 | 68.79 | 92.58 | 98.59 | 70.20 | 78.74 | 63.59 | 43.77 | 49.07 | 54.57 | 63.80 | 46.83 | 99.39 | 129.85 | 97.03 | 85.33 | 119.12 | 87.91 | 79.16 | 87.05 | 67.30 | 72.98 | 103.43 | 101.12 | 89.73 | 88.82 | NA | 55.43 | NA | NA | NA | |
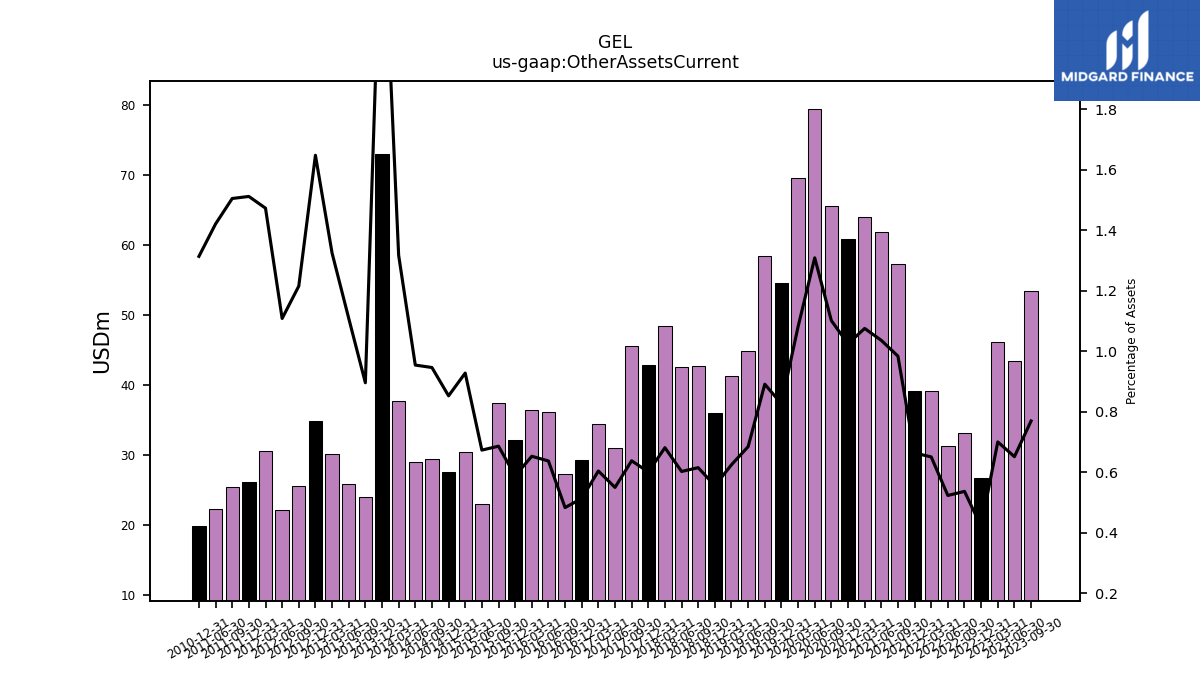
| Other Assets Current | 53.40 | 43.45 | 46.12 | 26.77 | 33.11 | 31.24 | 39.16 | 39.20 | 57.33 | 61.80 | 64.00 | 60.81 | 65.58 | 79.46 | 69.56 | 54.53 | 58.47 | 44.88 | 41.33 | 35.99 | 42.66 | 42.53 | 48.43 | 42.89 | 45.53 | 31.01 | 34.35 | 29.27 | 27.32 | 36.10 | 36.36 | 32.11 | 37.39 | 22.92 | 30.37 | 27.55 | 29.46 | 29.05 | 37.65 | 72.99 | 24.01 | 25.88 | 30.15 | 34.78 | 25.62 | 22.18 | 30.50 | 26.17 | 25.46 | 22.21 | NA | 19.80 | NA | NA | NA |
| 2023-09-30 | 2023-06-30 | 2023-03-31 | 2022-12-31 | 2022-09-30 | 2022-06-30 | 2022-03-31 | 2021-12-31 | 2021-09-30 | 2021-06-30 | 2021-03-31 | 2020-12-31 | 2020-09-30 | 2020-06-30 | 2020-03-31 | 2019-12-31 | 2019-09-30 | 2019-06-30 | 2019-03-31 | 2018-12-31 | 2018-09-30 | 2018-06-30 | 2018-03-31 | 2017-12-31 | 2017-09-30 | 2017-06-30 | 2017-03-31 | 2016-12-31 | 2016-09-30 | 2016-06-30 | 2016-03-31 | 2015-12-31 | 2015-09-30 | 2015-06-30 | 2015-03-31 | 2014-12-31 | 2014-09-30 | 2014-06-30 | 2014-03-31 | 2013-12-31 | 2013-09-30 | 2013-06-30 | 2013-03-31 | 2012-12-31 | 2012-09-30 | 2012-06-30 | 2012-03-31 | 2011-12-31 | 2011-09-30 | 2011-06-30 | 2011-03-31 | 2010-12-31 | 2010-09-30 | 2010-06-30 | 2010-03-31 | ||
|---|---|---|---|---|---|---|---|---|---|---|---|---|---|---|---|---|---|---|---|---|---|---|---|---|---|---|---|---|---|---|---|---|---|---|---|---|---|---|---|---|---|---|---|---|---|---|---|---|---|---|---|---|---|---|---|---|
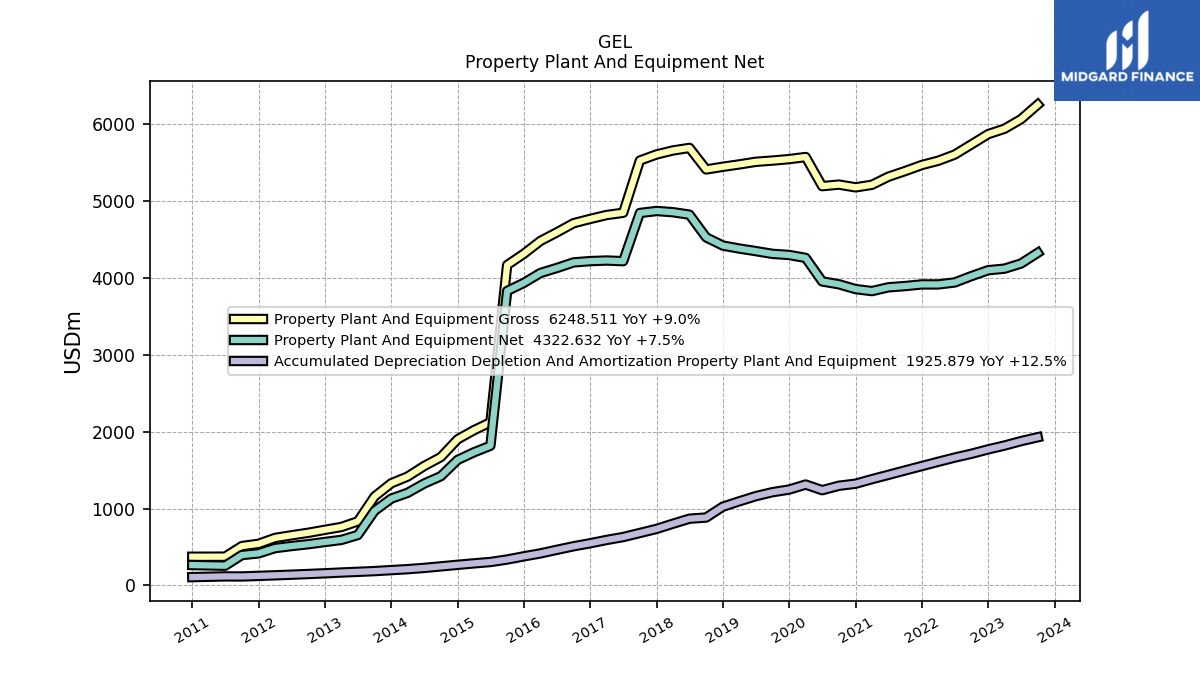
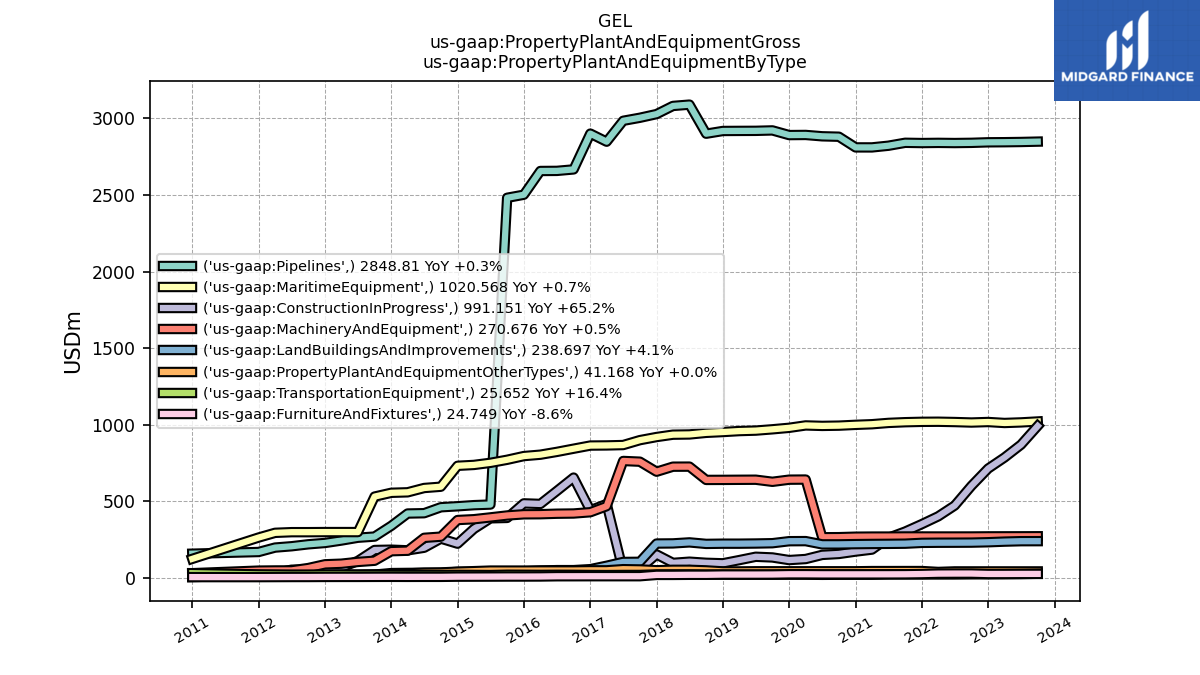
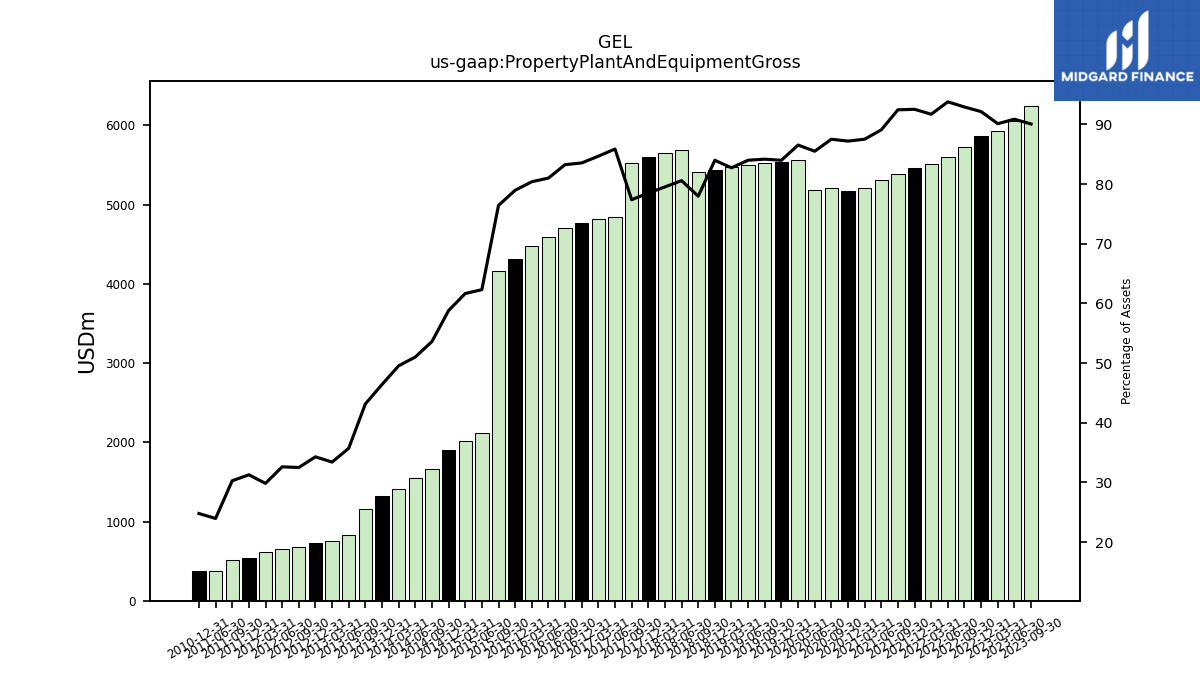
| Property Plant And Equipment Gross | 6248.51 | 6059.54 | 5934.96 | 5865.04 | 5731.63 | 5599.51 | 5519.06 | 5464.04 | 5385.52 | 5312.16 | 5206.51 | 5173.48 | 5209.40 | 5188.91 | 5567.71 | 5540.60 | 5521.43 | 5505.36 | 5471.48 | 5440.86 | 5405.98 | 5686.15 | 5652.88 | 5601.02 | 5522.29 | 4843.01 | 4814.04 | 4763.40 | 4707.69 | 4589.04 | 4476.65 | 4310.23 | 4163.91 | 2120.65 | 2017.24 | 1899.06 | 1668.13 | 1552.11 | 1415.44 | 1327.97 | 1155.98 | 833.15 | 759.89 | 723.23 | 684.66 | 652.18 | 617.61 | 541.14 | 511.90 | 374.28 | NA | 373.34 | NA | NA | NA | |
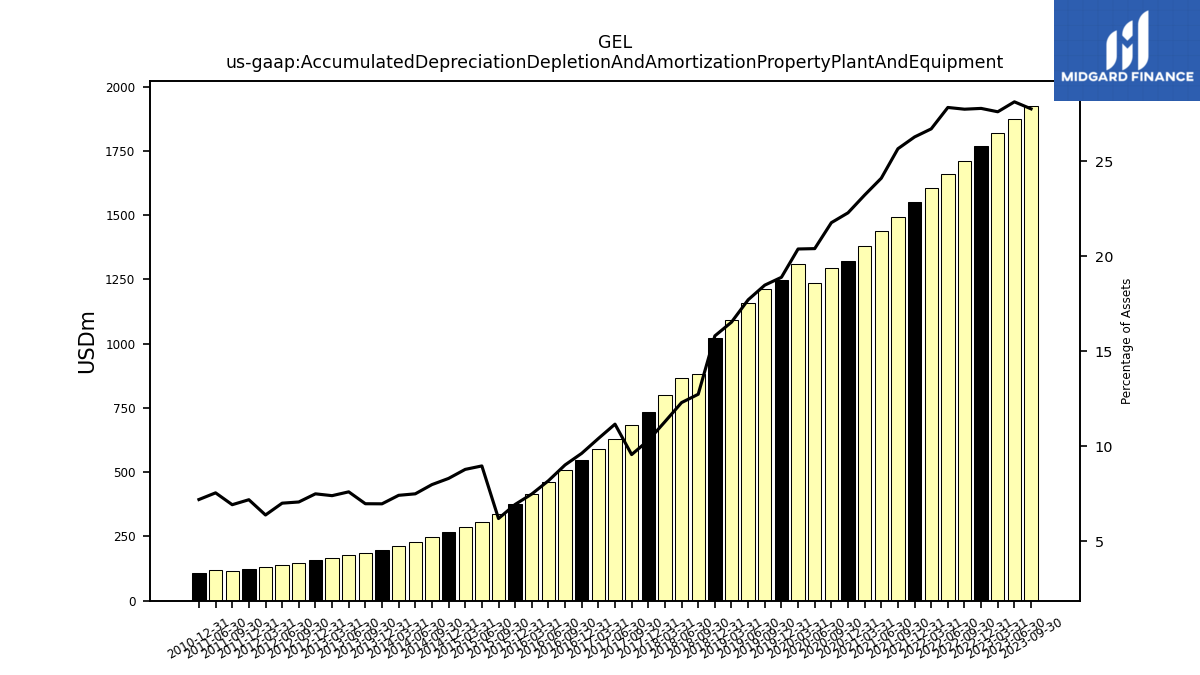
| Accumulated Depreciation Depletion And Amortization Property Plant And Equipment | 1925.88 | 1875.84 | 1818.02 | 1768.46 | 1711.31 | 1661.84 | 1607.29 | 1551.86 | 1494.83 | 1437.51 | 1381.38 | 1322.14 | 1295.65 | 1238.01 | 1311.22 | 1246.12 | 1212.06 | 1160.35 | 1093.20 | 1023.83 | 882.83 | 867.47 | 802.26 | 734.99 | 681.90 | 629.19 | 591.27 | 548.53 | 509.42 | 463.24 | 416.43 | 378.25 | 337.09 | 304.88 | 287.08 | 268.06 | 248.15 | 227.84 | 211.69 | 199.23 | 186.64 | 177.11 | 168.15 | 157.94 | 148.71 | 139.93 | 131.93 | 124.21 | 116.93 | 117.81 | NA | 108.28 | NA | NA | NA | |
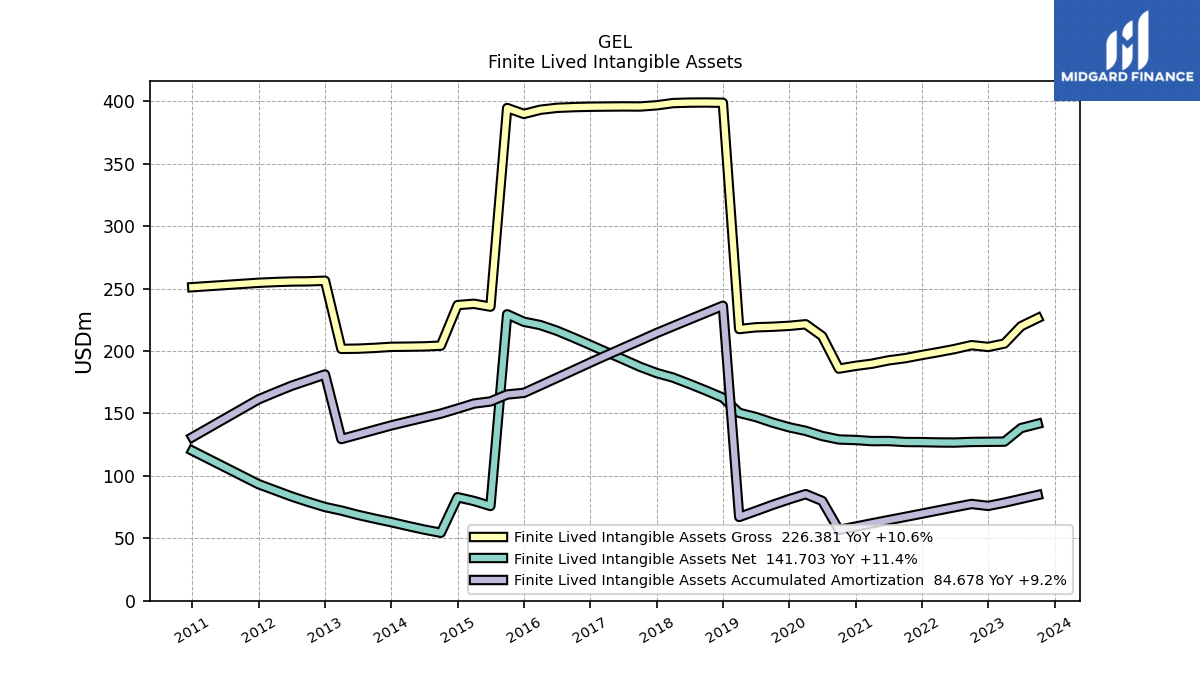
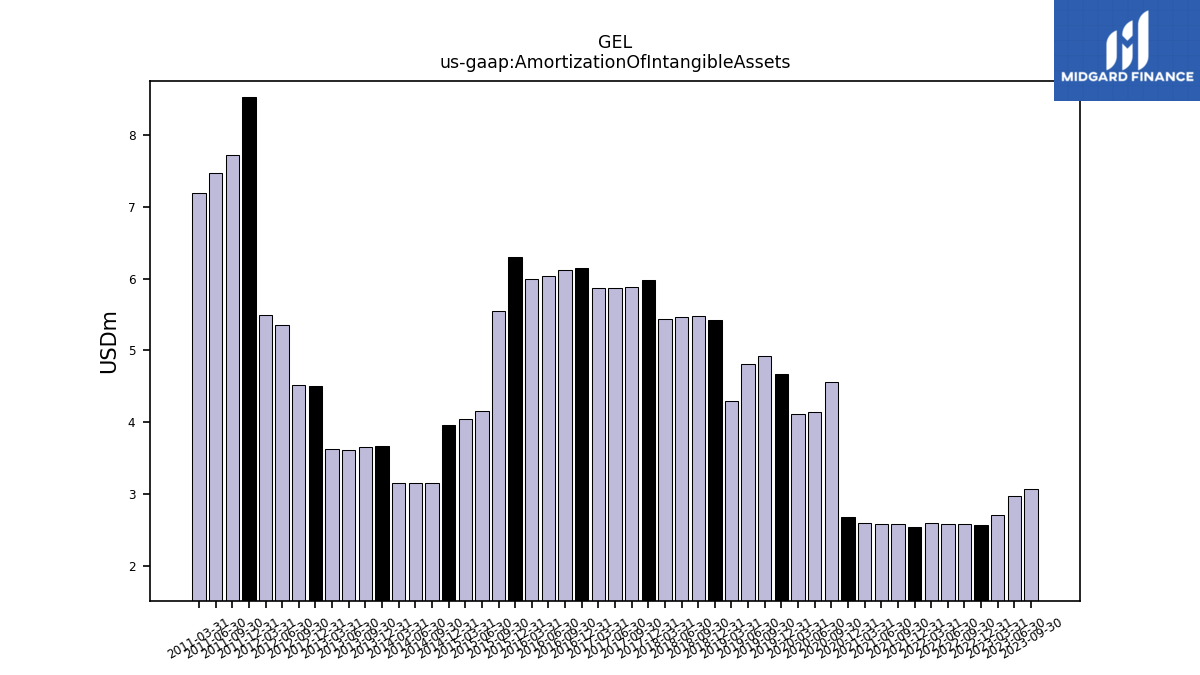
| Amortization Of Intangible Assets | 3.07 | 2.97 | 2.71 | 2.56 | 2.58 | 2.58 | 2.59 | 2.54 | 2.58 | 2.58 | 2.60 | 2.68 | 4.55 | 4.15 | 4.12 | 4.67 | 4.93 | 4.81 | 4.29 | 5.43 | 5.47 | 5.46 | 5.43 | 5.98 | 5.88 | 5.87 | 5.87 | 6.15 | 6.12 | 6.04 | 5.99 | 6.30 | 5.55 | 4.15 | 4.04 | 3.96 | 3.15 | 3.15 | 3.15 | 3.67 | 3.66 | 3.61 | 3.63 | 4.51 | 4.52 | 5.36 | 5.50 | 8.53 | 7.72 | 7.47 | 7.20 | NA | NA | NA | NA | |
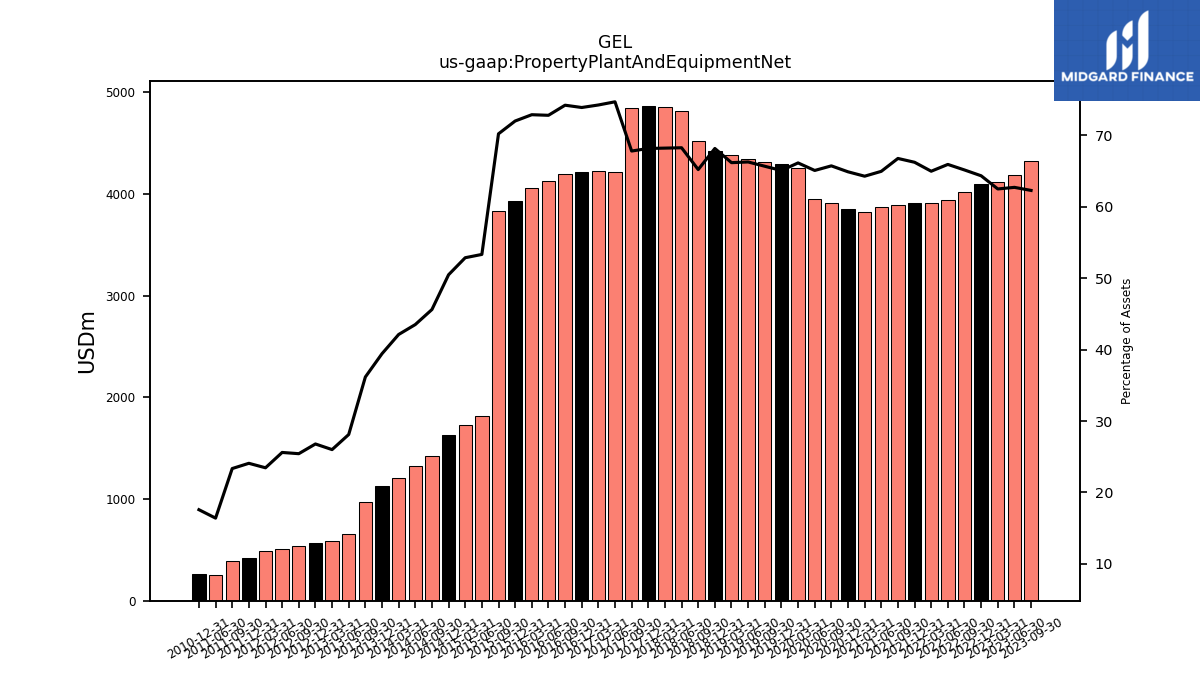
| Property Plant And Equipment Net | 4322.63 | 4183.70 | 4116.94 | 4096.57 | 4020.32 | 3937.68 | 3911.77 | 3912.18 | 3890.68 | 3874.65 | 3825.12 | 3851.33 | 3913.75 | 3950.91 | 4256.49 | 4294.48 | 4309.37 | 4345.01 | 4378.28 | 4417.03 | 4523.15 | 4818.69 | 4850.62 | 4866.03 | 4840.39 | 4213.81 | 4222.77 | 4214.86 | 4198.27 | 4125.79 | 4060.22 | 3931.98 | 3826.82 | 1815.77 | 1730.16 | 1631.00 | 1419.99 | 1324.27 | 1203.75 | 1128.74 | 969.34 | 656.04 | 591.75 | 565.28 | 535.95 | 512.25 | 485.68 | 416.93 | 394.96 | 256.48 | NA | 265.06 | NA | NA | NA | |
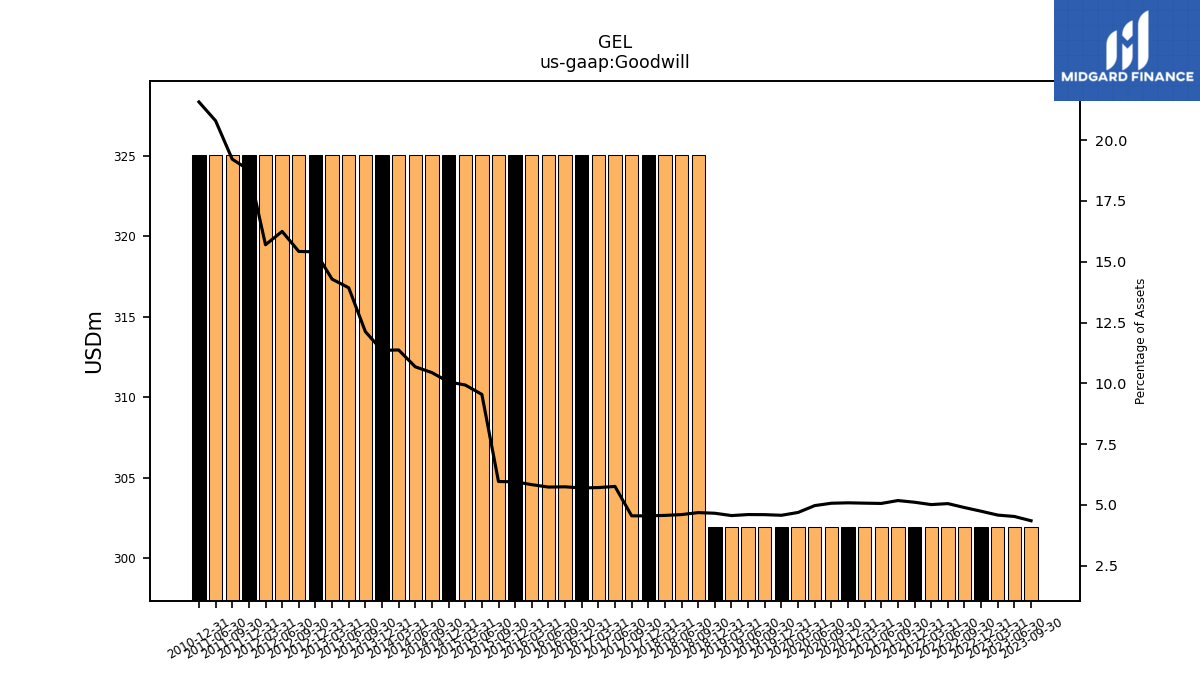
| Goodwill | 301.96 | 301.96 | 301.96 | 301.96 | 301.96 | 301.96 | 301.96 | 301.96 | 301.96 | 301.96 | 301.96 | 301.96 | 301.96 | 301.96 | 301.96 | 301.96 | 301.96 | 301.96 | 301.96 | 301.96 | 325.05 | 325.05 | 325.05 | 325.05 | 325.05 | 325.05 | 325.05 | 325.05 | 325.05 | 325.05 | 325.05 | 325.05 | 325.05 | 325.05 | 325.05 | 325.05 | 325.05 | 325.05 | 325.05 | 325.05 | 325.05 | 325.05 | 325.05 | 325.05 | 325.05 | 325.05 | 325.05 | 325.05 | 325.05 | 325.05 | NA | 325.05 | NA | NA | NA | |
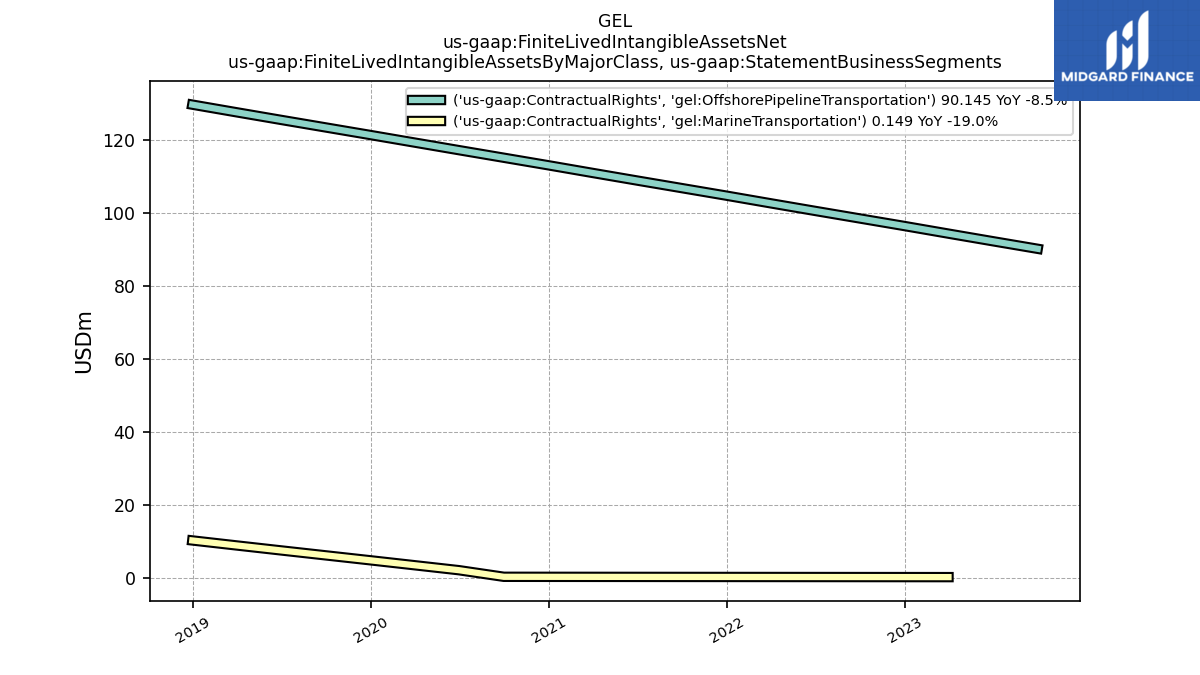
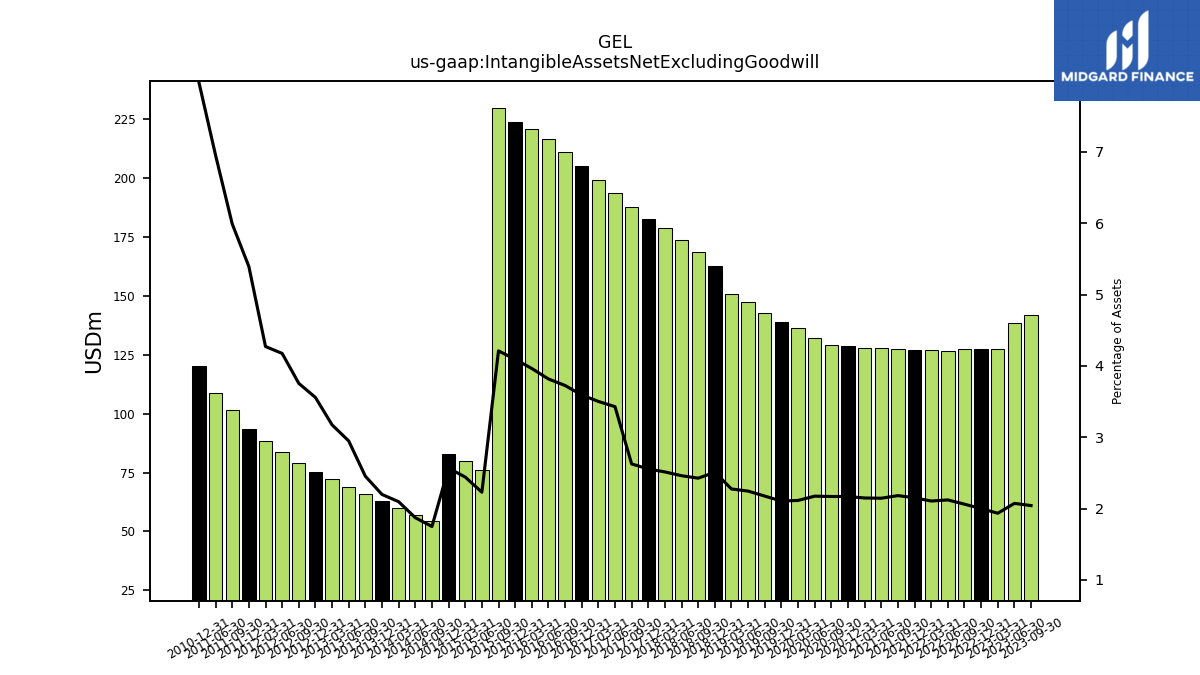
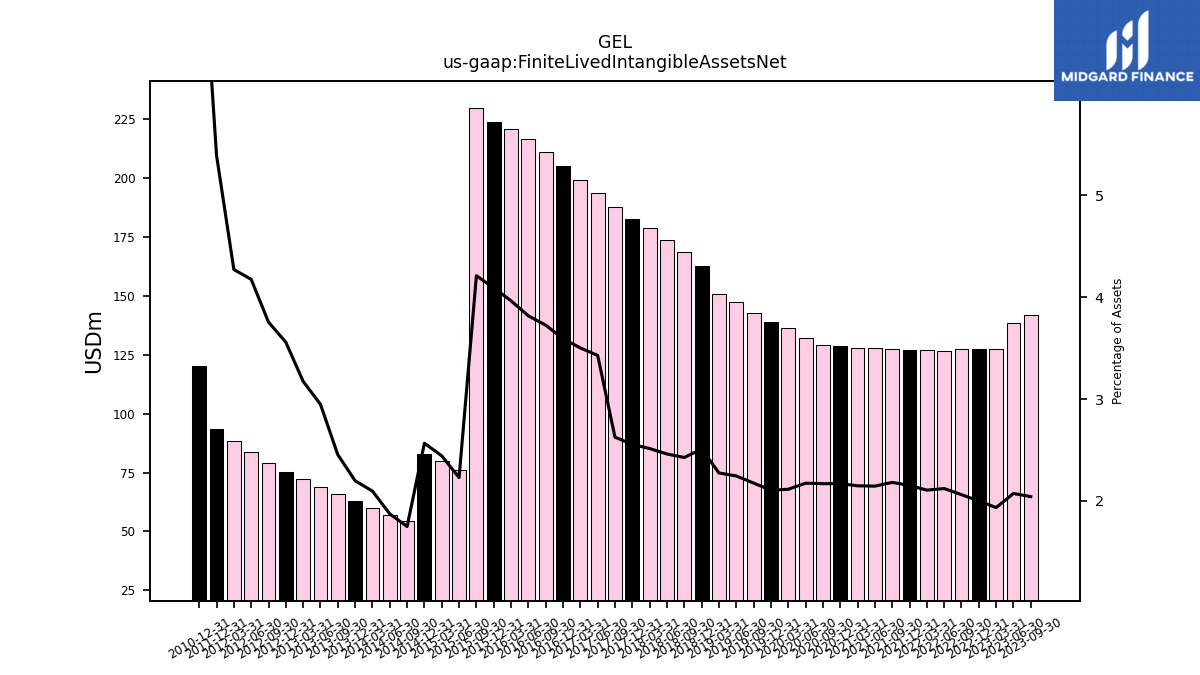
| Intangible Assets Net Excluding Goodwill | 141.70 | 138.28 | 127.46 | 127.32 | 127.20 | 126.70 | 126.78 | 127.06 | 127.15 | 127.95 | 127.85 | 128.74 | 129.18 | 131.97 | 136.07 | 138.93 | 142.72 | 147.18 | 150.49 | 162.60 | 168.29 | 173.69 | 178.75 | 182.41 | 187.44 | 193.39 | 199.15 | 204.89 | 210.71 | 216.27 | 220.79 | 223.45 | 229.46 | 75.91 | 79.92 | 82.93 | 54.45 | 56.99 | 59.91 | 62.93 | 65.75 | 68.79 | 72.22 | 75.06 | 79.14 | 83.53 | 88.44 | 93.36 | 101.32 | 108.66 | NA | 120.17 | NA | NA | NA | |
| Finite Lived Intangible Assets Net | 141.70 | 138.28 | 127.46 | 127.32 | 127.20 | 126.70 | 126.78 | 127.06 | 127.15 | 127.95 | 127.85 | 128.74 | 129.18 | 131.97 | 136.07 | 138.93 | 142.72 | 147.18 | 150.49 | 162.60 | 168.29 | 173.69 | 178.75 | 182.41 | 187.44 | 193.39 | 199.15 | 204.89 | 210.71 | 216.27 | 220.79 | 223.45 | 229.46 | 75.91 | 79.92 | 82.93 | 54.45 | 56.99 | 59.91 | 62.93 | 65.75 | 68.79 | 72.22 | 75.06 | 79.14 | 83.53 | 88.44 | 93.36 | NA | NA | NA | 120.17 | NA | NA | NA | |
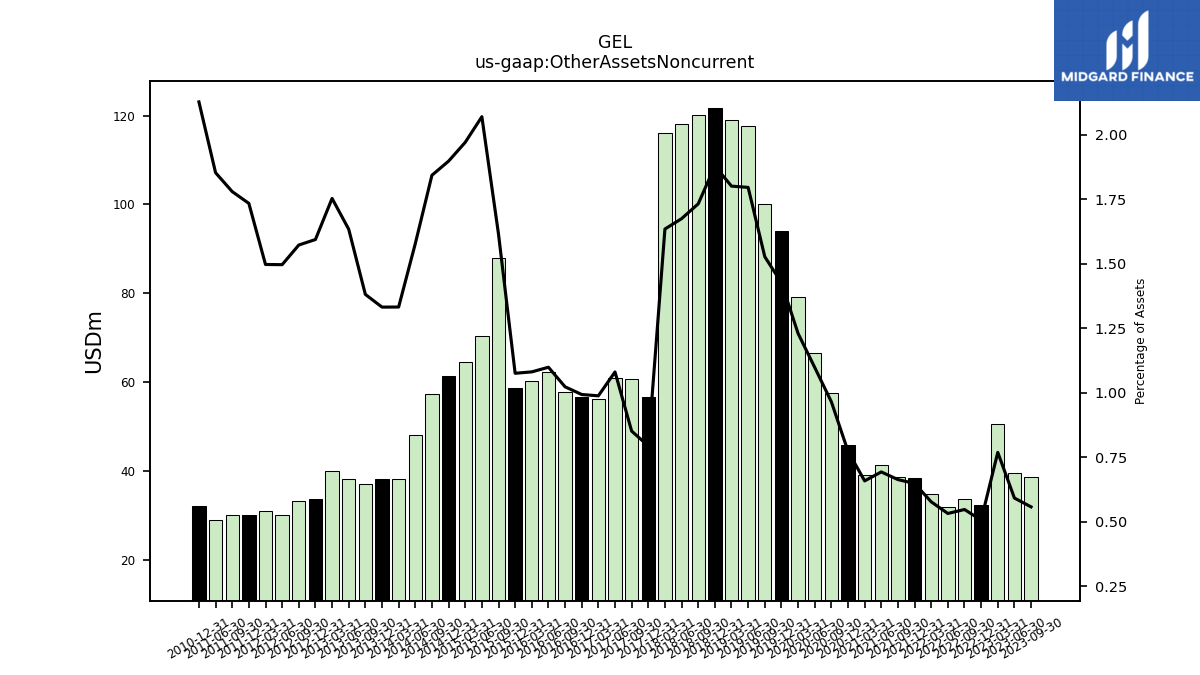
| Other Assets Noncurrent | 38.66 | 39.44 | 50.60 | 32.21 | 33.74 | 31.74 | 34.71 | 38.26 | 38.62 | 41.30 | 39.14 | 45.85 | 57.43 | 66.62 | 79.11 | 94.08 | 100.18 | 117.70 | 119.10 | 121.71 | 120.10 | 118.17 | 116.19 | 56.63 | 60.74 | 60.93 | 56.16 | 56.61 | 57.83 | 62.23 | 60.17 | 58.69 | 87.99 | 70.45 | 64.47 | 61.29 | 57.36 | 48.01 | 38.06 | 38.11 | 37.00 | 38.11 | 39.88 | 33.62 | 33.13 | 29.93 | 30.99 | 30.01 | 30.09 | 28.95 | NA | 32.05 | NA | NA | NA |
| 2023-09-30 | 2023-06-30 | 2023-03-31 | 2022-12-31 | 2022-09-30 | 2022-06-30 | 2022-03-31 | 2021-12-31 | 2021-09-30 | 2021-06-30 | 2021-03-31 | 2020-12-31 | 2020-09-30 | 2020-06-30 | 2020-03-31 | 2019-12-31 | 2019-09-30 | 2019-06-30 | 2019-03-31 | 2018-12-31 | 2018-09-30 | 2018-06-30 | 2018-03-31 | 2017-12-31 | 2017-09-30 | 2017-06-30 | 2017-03-31 | 2016-12-31 | 2016-09-30 | 2016-06-30 | 2016-03-31 | 2015-12-31 | 2015-09-30 | 2015-06-30 | 2015-03-31 | 2014-12-31 | 2014-09-30 | 2014-06-30 | 2014-03-31 | 2013-12-31 | 2013-09-30 | 2013-06-30 | 2013-03-31 | 2012-12-31 | 2012-09-30 | 2012-06-30 | 2012-03-31 | 2011-12-31 | 2011-09-30 | 2011-06-30 | 2011-03-31 | 2010-12-31 | 2010-09-30 | 2010-06-30 | 2010-03-31 | ||
|---|---|---|---|---|---|---|---|---|---|---|---|---|---|---|---|---|---|---|---|---|---|---|---|---|---|---|---|---|---|---|---|---|---|---|---|---|---|---|---|---|---|---|---|---|---|---|---|---|---|---|---|---|---|---|---|---|
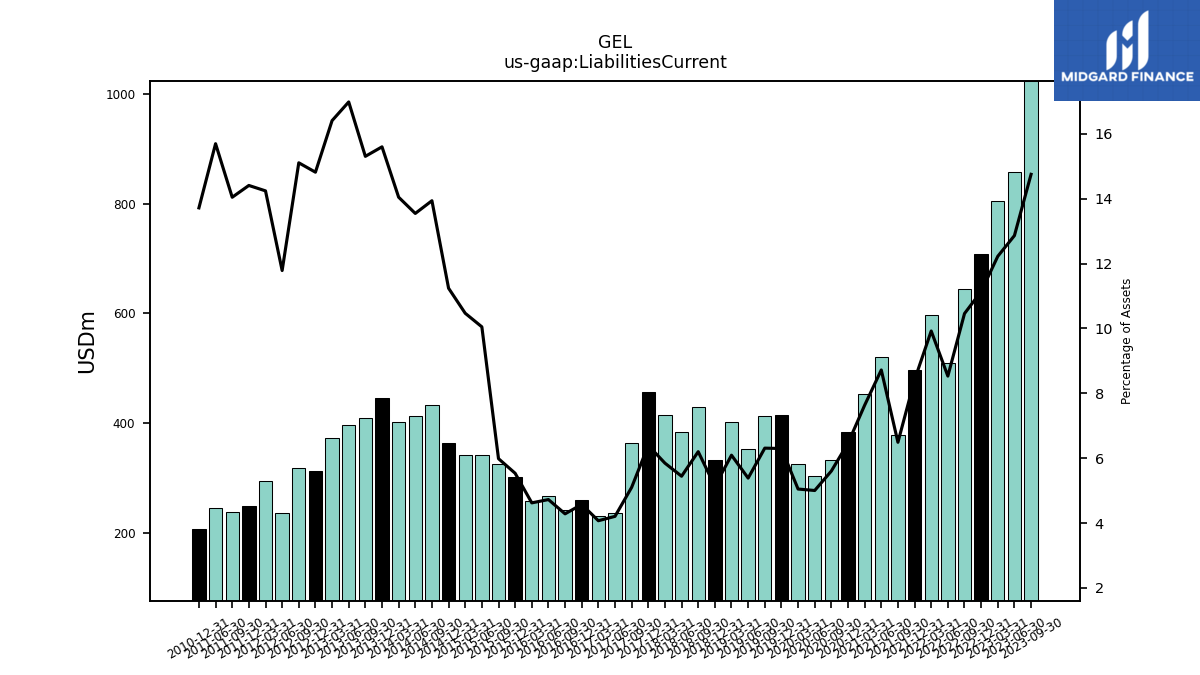
| Liabilities Current | 1023.71 | 857.98 | 805.25 | 709.11 | 645.32 | 509.45 | 597.21 | 496.94 | 378.12 | 520.00 | 454.09 | 383.41 | 333.60 | 303.66 | 324.81 | 415.50 | 413.93 | 353.00 | 402.97 | 332.83 | 430.01 | 384.16 | 415.69 | 456.26 | 364.01 | 237.20 | 231.45 | 260.80 | 242.22 | 267.61 | 257.37 | 302.14 | 326.11 | 342.12 | 342.57 | 363.14 | 433.90 | 412.28 | 401.43 | 446.55 | 410.20 | 396.30 | 373.38 | 312.65 | 318.38 | 235.78 | 294.88 | 249.43 | 237.56 | 245.33 | NA | 206.71 | NA | NA | NA | |
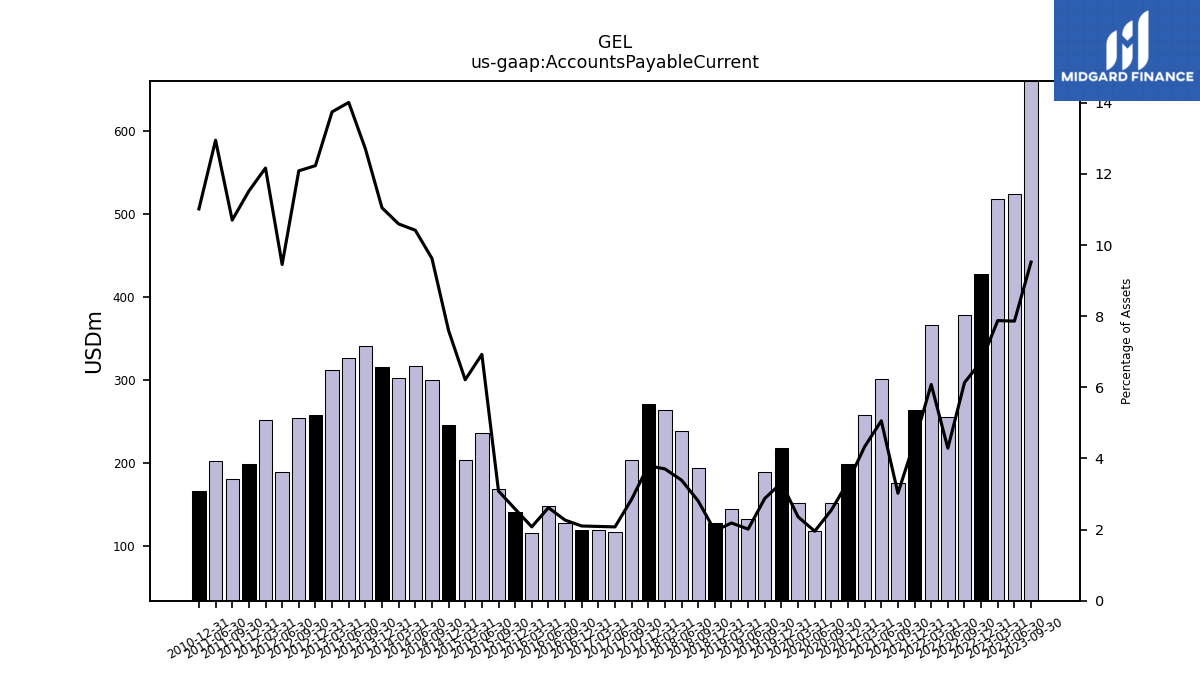
| Accounts Payable Current | 660.58 | 524.27 | 518.82 | 427.96 | 378.37 | 256.09 | 365.94 | 264.32 | 176.09 | 301.68 | 257.73 | 198.43 | 151.76 | 118.61 | 151.87 | 218.74 | 188.70 | 132.03 | 144.63 | 127.33 | 194.49 | 239.21 | 263.53 | 270.86 | 203.72 | 117.10 | 118.79 | 119.84 | 128.19 | 148.25 | 115.70 | 140.73 | 168.12 | 235.76 | 203.30 | 245.41 | 299.62 | 317.00 | 302.69 | 316.20 | 340.53 | 326.84 | 312.72 | 258.05 | 254.69 | 189.10 | 251.85 | 199.36 | 180.99 | 202.33 | NA | 165.98 | NA | NA | NA | |
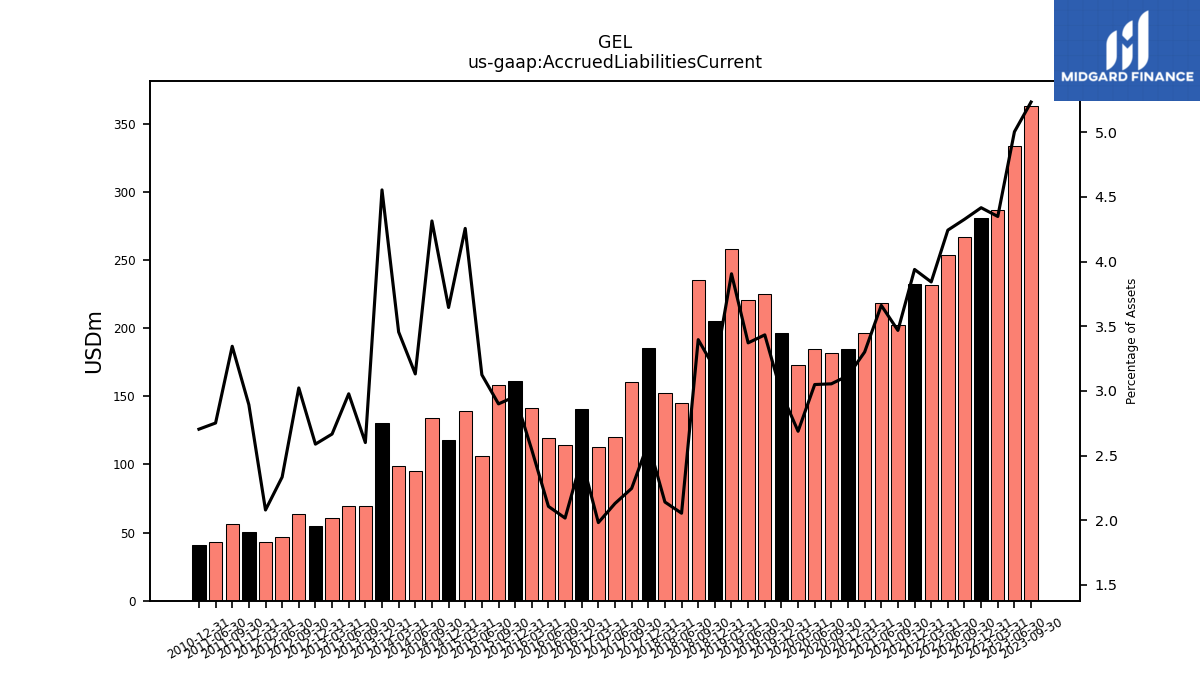
| Accrued Liabilities Current | 363.14 | 333.71 | 286.42 | 281.15 | 266.95 | 253.37 | 231.27 | 232.62 | 202.03 | 218.33 | 196.37 | 184.98 | 181.84 | 185.05 | 172.94 | 196.76 | 225.22 | 220.97 | 258.34 | 205.51 | 235.52 | 144.95 | 152.16 | 185.41 | 160.29 | 120.10 | 112.66 | 140.96 | 114.03 | 119.36 | 141.67 | 161.41 | 157.99 | 106.36 | 139.27 | 117.74 | 134.28 | 95.28 | 98.74 | 130.35 | 69.67 | 69.46 | 60.66 | 54.60 | 63.69 | 46.68 | 43.04 | 50.07 | 56.57 | 43.00 | NA | 40.74 | NA | NA | NA | |
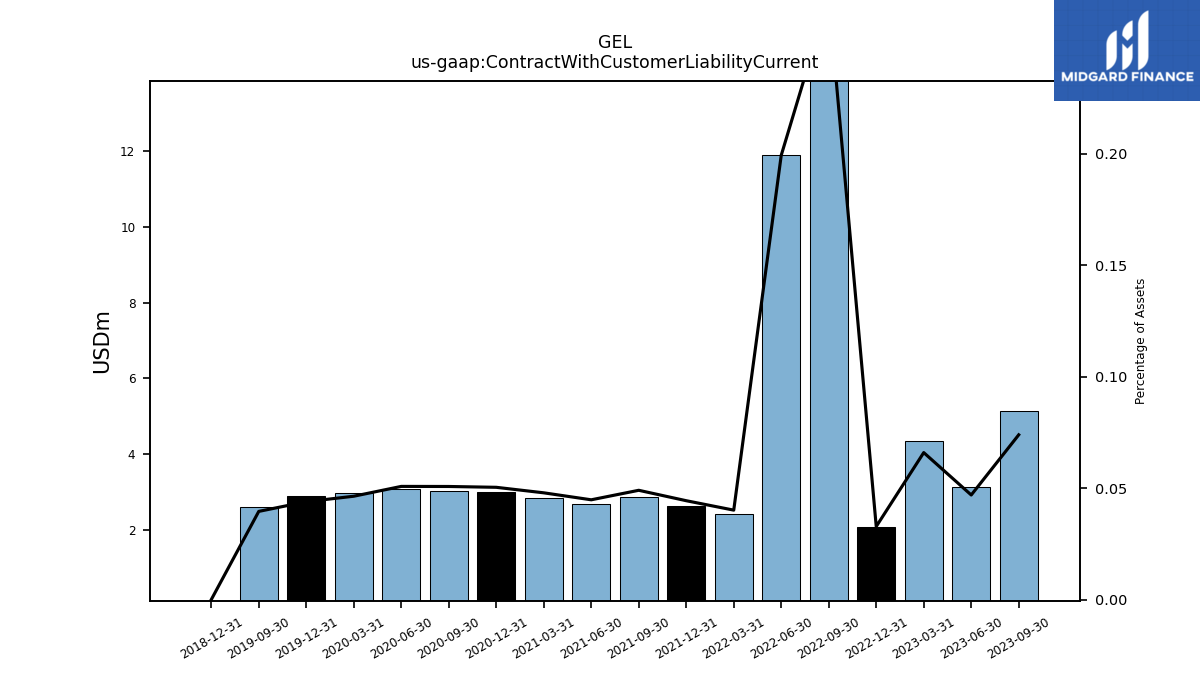
| Contract With Customer Liability Current | 5.13 | 3.13 | 4.34 | 2.09 | 16.66 | 11.90 | 2.42 | 2.62 | 2.86 | 2.67 | 2.85 | 2.99 | 3.02 | 3.08 | 2.98 | 2.90 | 2.60 | NA | NA | 0.00 | NA | NA | NA | NA | NA | NA | NA | NA | NA | NA | NA | NA | NA | NA | NA | NA | NA | NA | NA | NA | NA | NA | NA | NA | NA | NA | NA | NA | NA | NA | NA | NA | NA | NA | NA |
| 2023-09-30 | 2023-06-30 | 2023-03-31 | 2022-12-31 | 2022-09-30 | 2022-06-30 | 2022-03-31 | 2021-12-31 | 2021-09-30 | 2021-06-30 | 2021-03-31 | 2020-12-31 | 2020-09-30 | 2020-06-30 | 2020-03-31 | 2019-12-31 | 2019-09-30 | 2019-06-30 | 2019-03-31 | 2018-12-31 | 2018-09-30 | 2018-06-30 | 2018-03-31 | 2017-12-31 | 2017-09-30 | 2017-06-30 | 2017-03-31 | 2016-12-31 | 2016-09-30 | 2016-06-30 | 2016-03-31 | 2015-12-31 | 2015-09-30 | 2015-06-30 | 2015-03-31 | 2014-12-31 | 2014-09-30 | 2014-06-30 | 2014-03-31 | 2013-12-31 | 2013-09-30 | 2013-06-30 | 2013-03-31 | 2012-12-31 | 2012-09-30 | 2012-06-30 | 2012-03-31 | 2011-12-31 | 2011-09-30 | 2011-06-30 | 2011-03-31 | 2010-12-31 | 2010-09-30 | 2010-06-30 | 2010-03-31 | ||
|---|---|---|---|---|---|---|---|---|---|---|---|---|---|---|---|---|---|---|---|---|---|---|---|---|---|---|---|---|---|---|---|---|---|---|---|---|---|---|---|---|---|---|---|---|---|---|---|---|---|---|---|---|---|---|---|---|
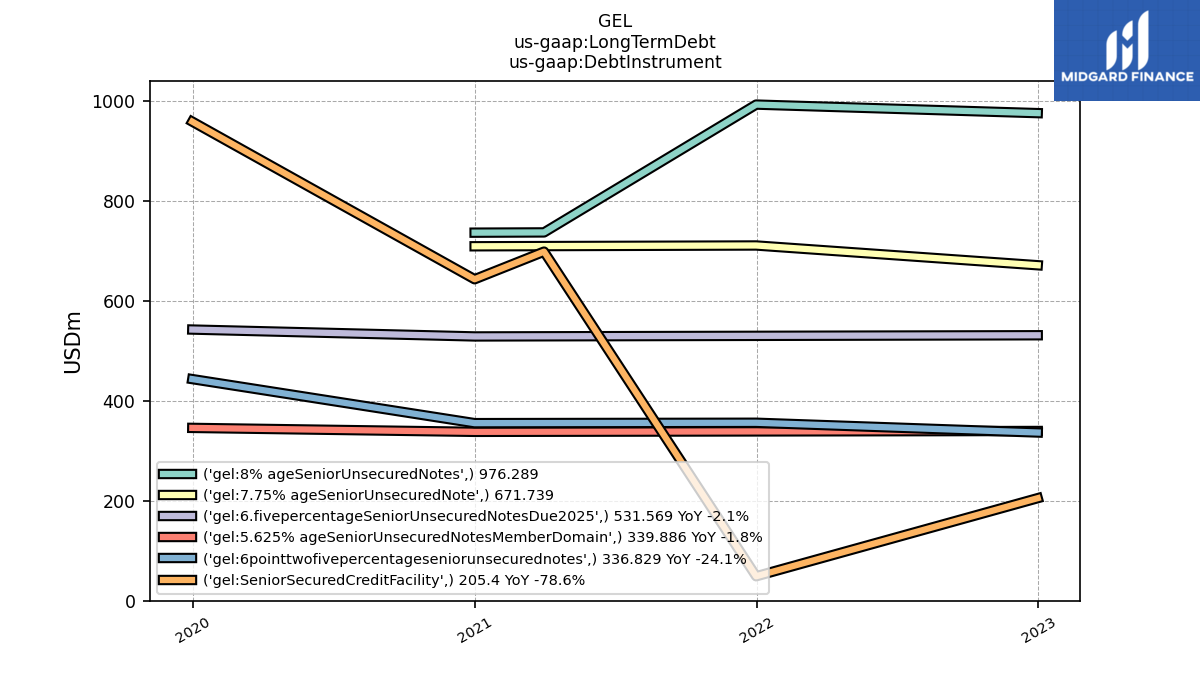
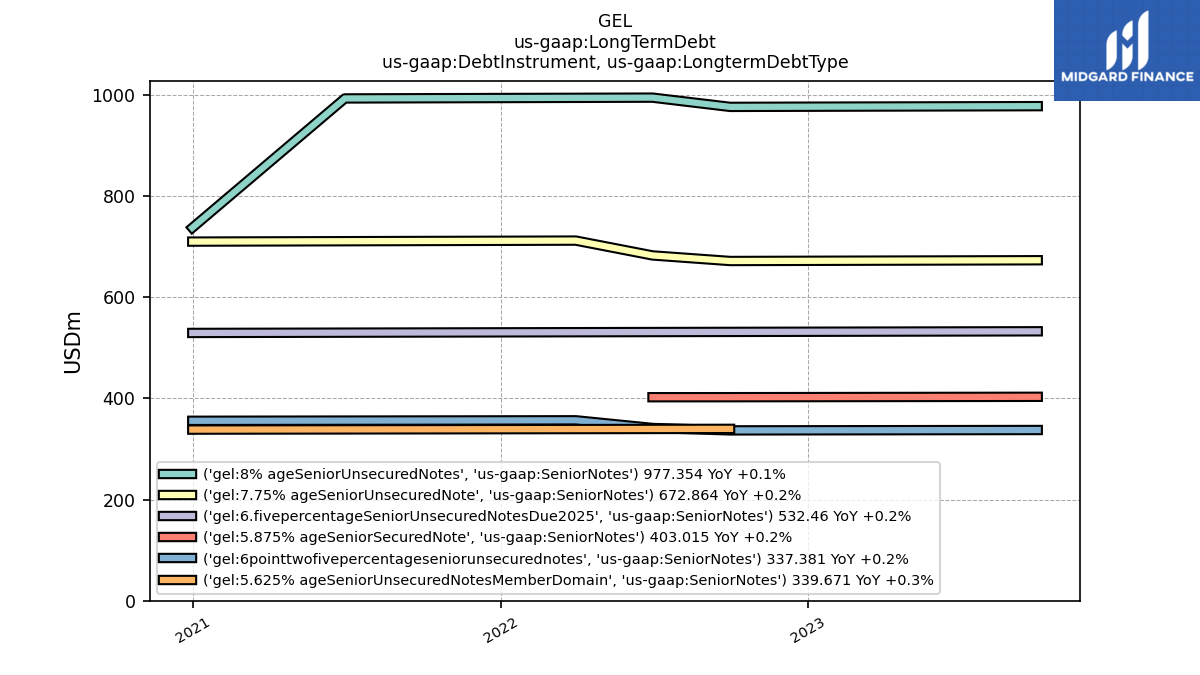
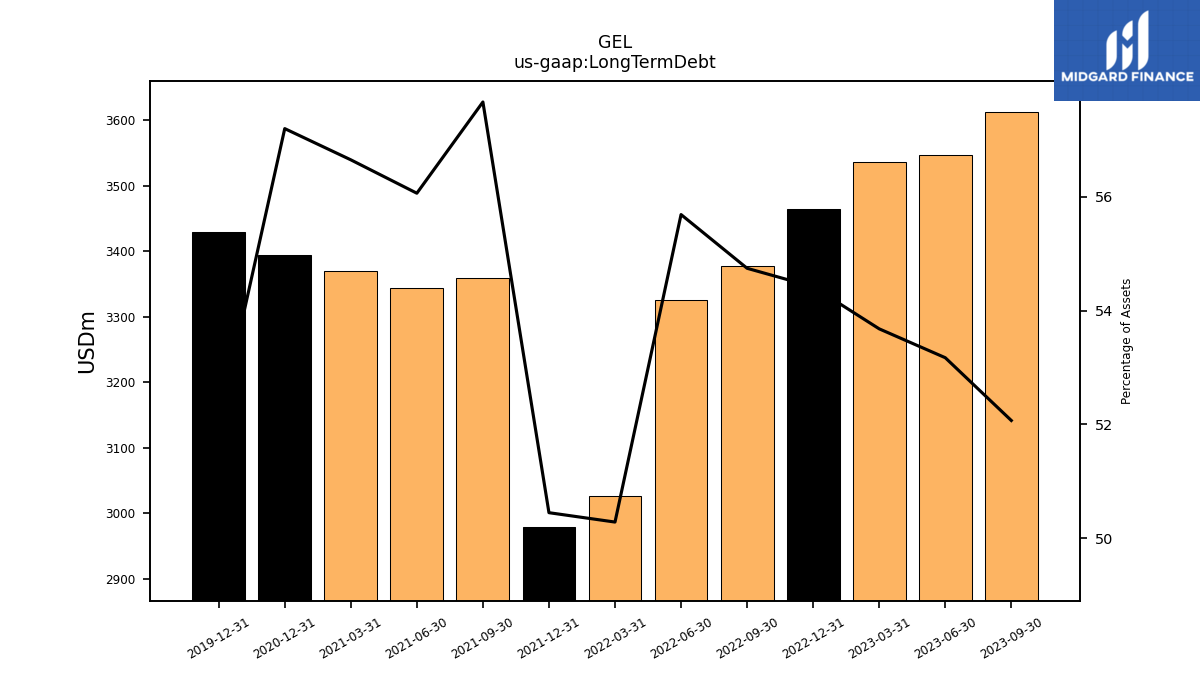
| Long Term Debt | 3612.80 | 3546.27 | 3535.53 | 3464.15 | 3377.33 | 3325.23 | 3026.80 | 2979.51 | 3359.58 | 3343.14 | 3370.26 | 3393.72 | NA | NA | NA | 3429.24 | NA | NA | NA | NA | NA | NA | NA | NA | NA | NA | NA | NA | NA | NA | NA | NA | NA | NA | NA | NA | NA | NA | NA | NA | NA | NA | NA | NA | NA | NA | NA | NA | NA | NA | NA | NA | NA | NA | NA | |
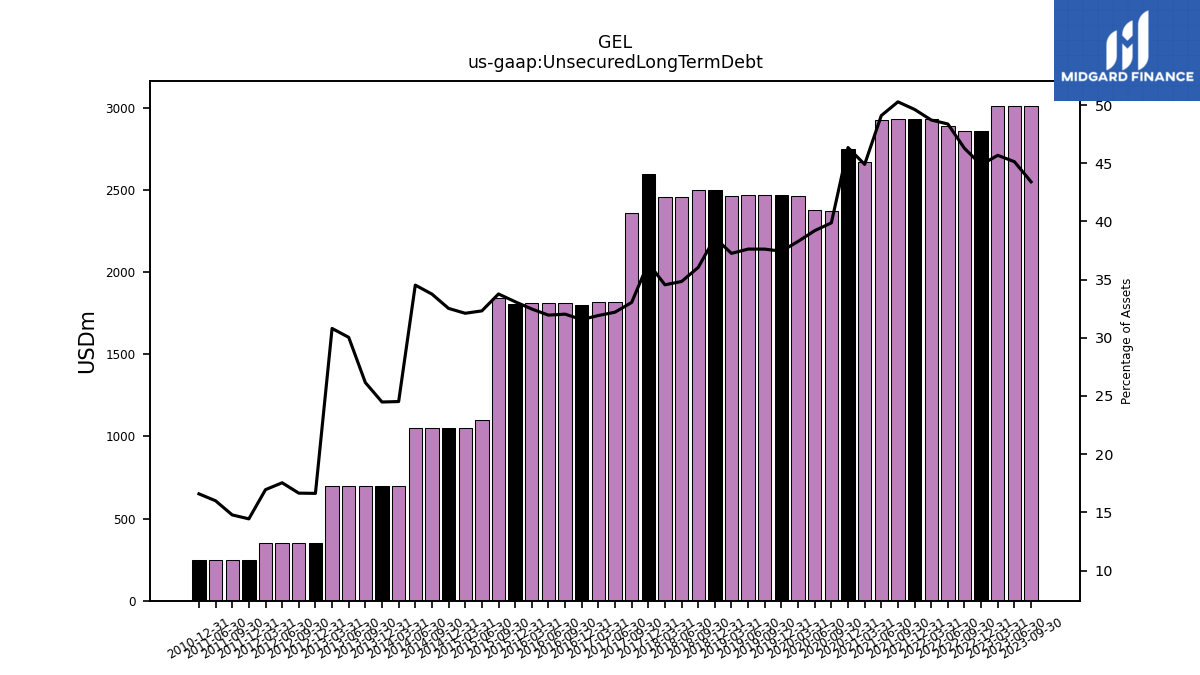
| Unsecured Long Term Debt | 3011.39 | 3009.85 | 3008.57 | 2856.31 | 2854.87 | 2888.42 | 2932.00 | 2930.51 | 2929.00 | 2927.49 | 2671.26 | 2750.02 | 2373.93 | 2379.58 | 2463.17 | 2469.94 | 2468.03 | 2466.14 | 2464.25 | 2500.00 | 2500.00 | 2458.61 | 2456.75 | 2598.92 | 2358.05 | 1816.26 | 1814.71 | 1800.00 | 1811.63 | 1810.10 | 1808.58 | 1807.05 | 1839.93 | 1100.00 | 1050.60 | 1050.64 | 1050.67 | 1050.71 | 700.74 | 700.77 | 700.80 | 700.84 | 700.87 | 350.89 | 350.92 | 350.95 | 350.98 | 250.00 | 250.00 | 250.00 | NA | 250.00 | NA | NA | NA | |
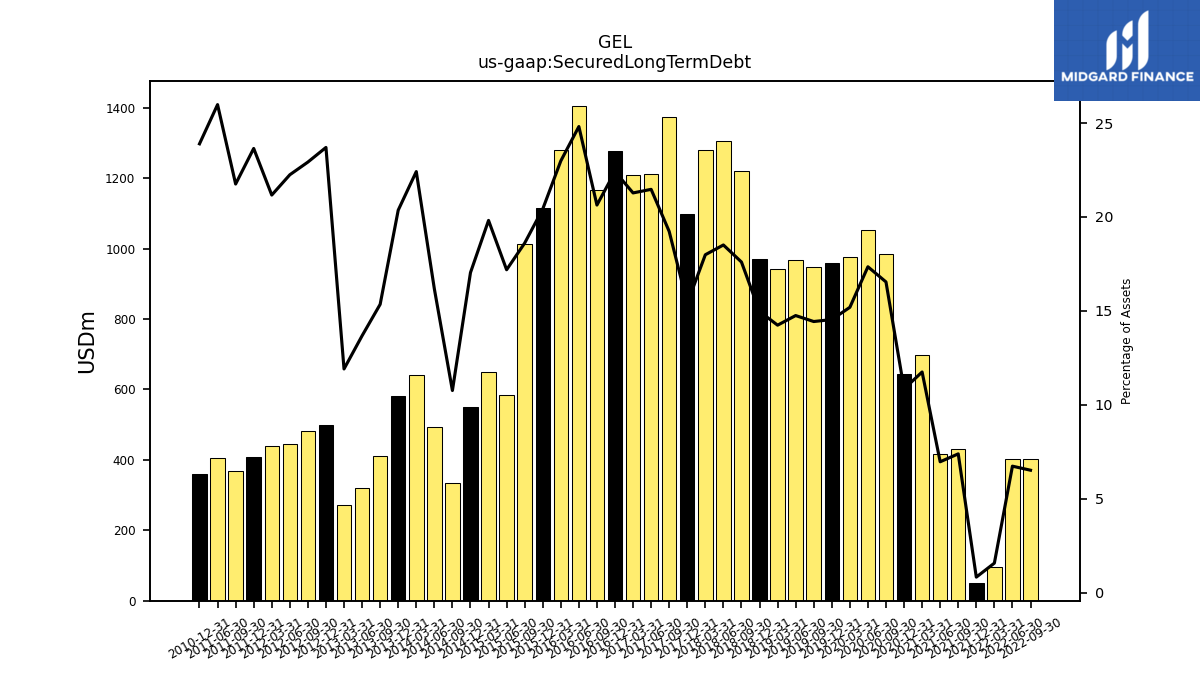
| Secured Long Term Debt | NA | NA | NA | NA | 402.25 | 402.20 | 94.80 | 49.00 | 430.58 | 415.65 | 699.00 | 643.70 | 984.80 | 1053.00 | 977.40 | 959.30 | 947.00 | 967.00 | 942.00 | 970.10 | 1220.70 | 1306.30 | 1279.00 | 1099.20 | 1372.50 | 1211.00 | 1210.00 | 1278.20 | 1167.00 | 1405.80 | 1280.00 | 1115.00 | 1014.10 | 585.20 | 648.40 | 550.40 | 335.00 | 492.20 | 640.50 | 582.80 | 411.30 | 319.10 | 271.00 | 500.00 | 483.00 | 445.00 | 438.20 | 409.30 | 367.90 | 406.00 | NA | 360.00 | NA | NA | NA | |
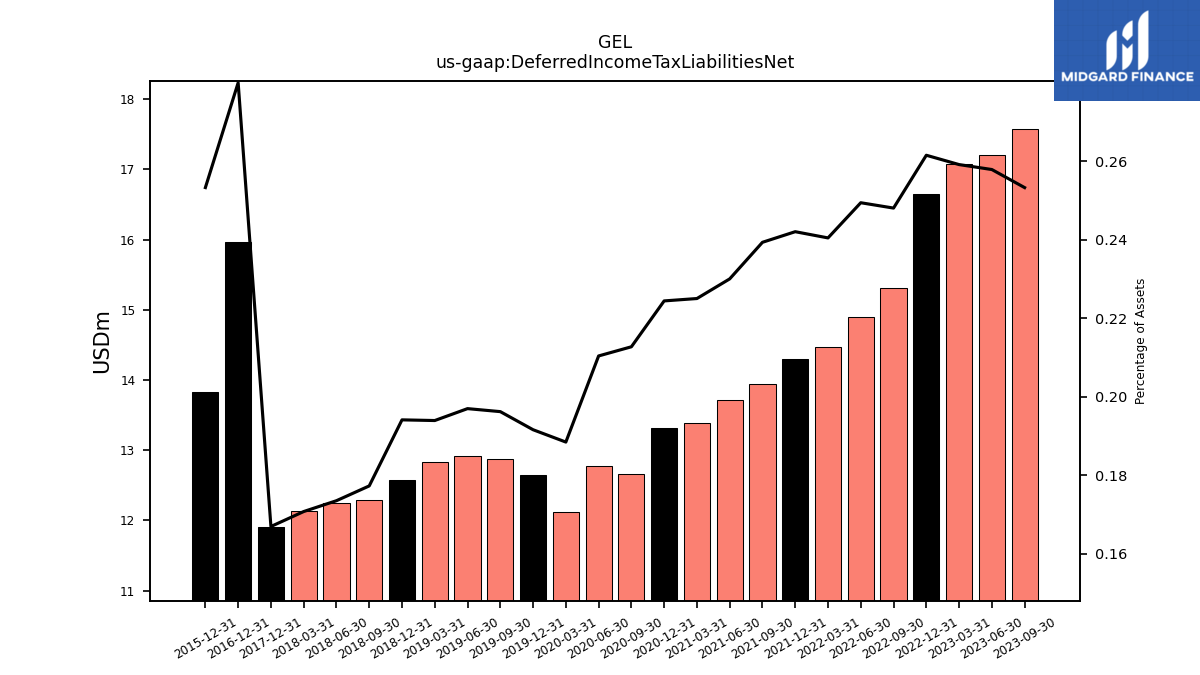
| Deferred Income Tax Liabilities Net | 17.58 | 17.20 | 17.07 | 16.65 | 15.31 | 14.90 | 14.48 | 14.30 | 13.95 | 13.72 | 13.39 | 13.32 | 12.66 | 12.77 | 12.12 | 12.64 | 12.87 | 12.91 | 12.83 | 12.58 | 12.29 | 12.24 | 12.14 | 11.91 | NA | NA | NA | 15.97 | NA | NA | NA | 13.83 | NA | NA | NA | NA | NA | NA | NA | NA | NA | NA | NA | NA | NA | NA | NA | NA | NA | NA | NA | NA | NA | NA | NA | |
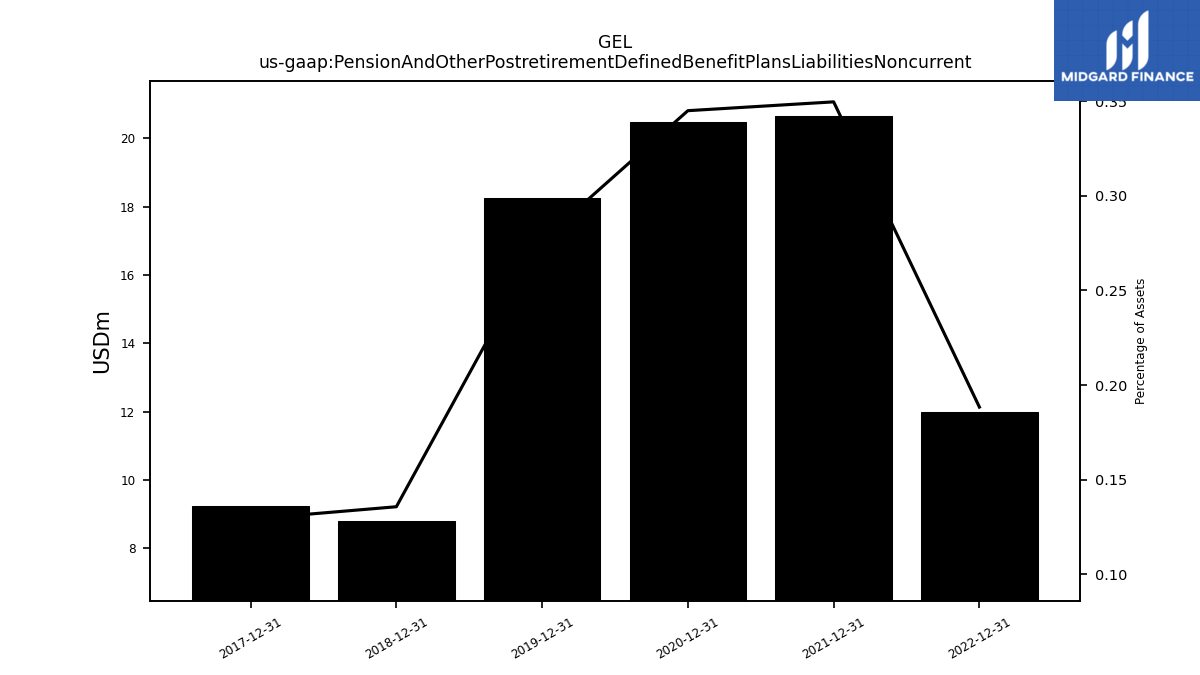
| Pension And Other Postretirement Defined Benefit Plans Liabilities Noncurrent | NA | NA | NA | 11.99 | NA | NA | NA | 20.65 | NA | NA | NA | 20.47 | NA | NA | NA | 18.24 | NA | NA | NA | 8.79 | NA | NA | NA | 9.22 | NA | NA | NA | NA | NA | NA | NA | NA | NA | NA | NA | NA | NA | NA | NA | NA | NA | NA | NA | NA | NA | NA | NA | NA | NA | NA | NA | NA | NA | NA | NA | |
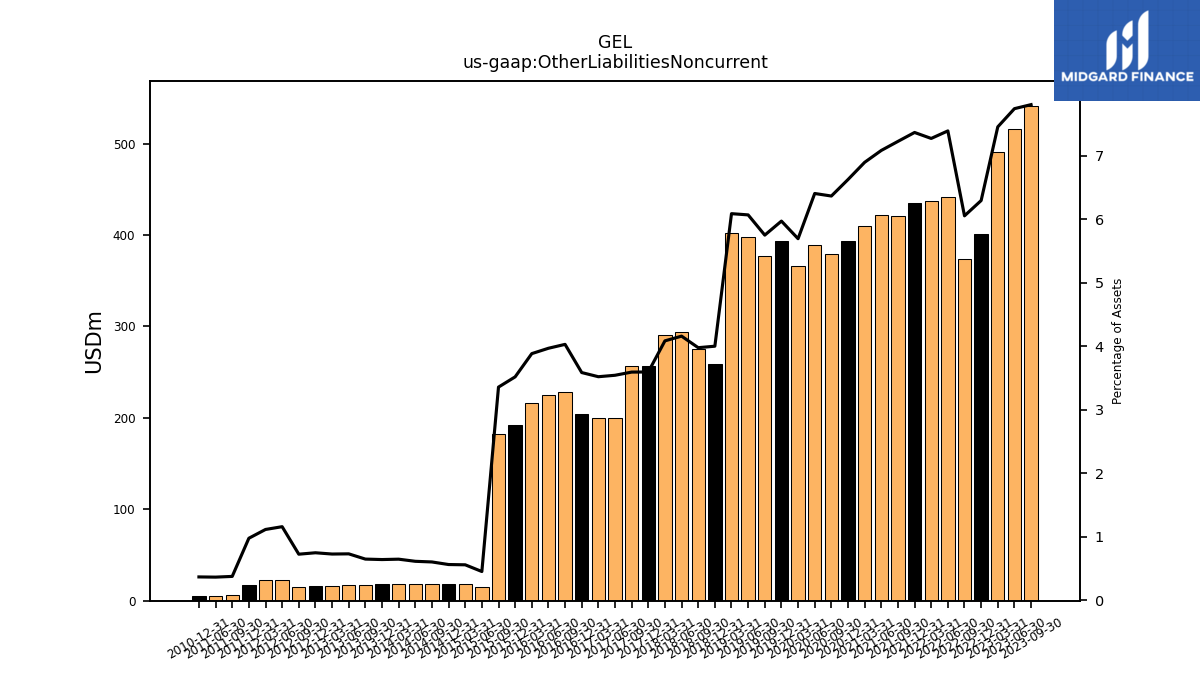
| Other Liabilities Noncurrent | 541.37 | 516.14 | 490.86 | 400.62 | 373.40 | 441.23 | 437.61 | 434.93 | 420.88 | 422.30 | 410.19 | 393.02 | 378.87 | 388.69 | 366.28 | 393.85 | 377.17 | 397.69 | 402.61 | 259.20 | 275.82 | 293.52 | 290.40 | 256.57 | 256.46 | 199.84 | 200.17 | 204.48 | 227.88 | 224.82 | 216.30 | 192.07 | 182.91 | 15.47 | 18.33 | 18.23 | 18.83 | 18.72 | 18.54 | 18.40 | 17.42 | 17.09 | 16.60 | 15.81 | 15.32 | 23.20 | 23.11 | 16.93 | 6.38 | 5.72 | NA | 5.56 | NA | NA | NA | |
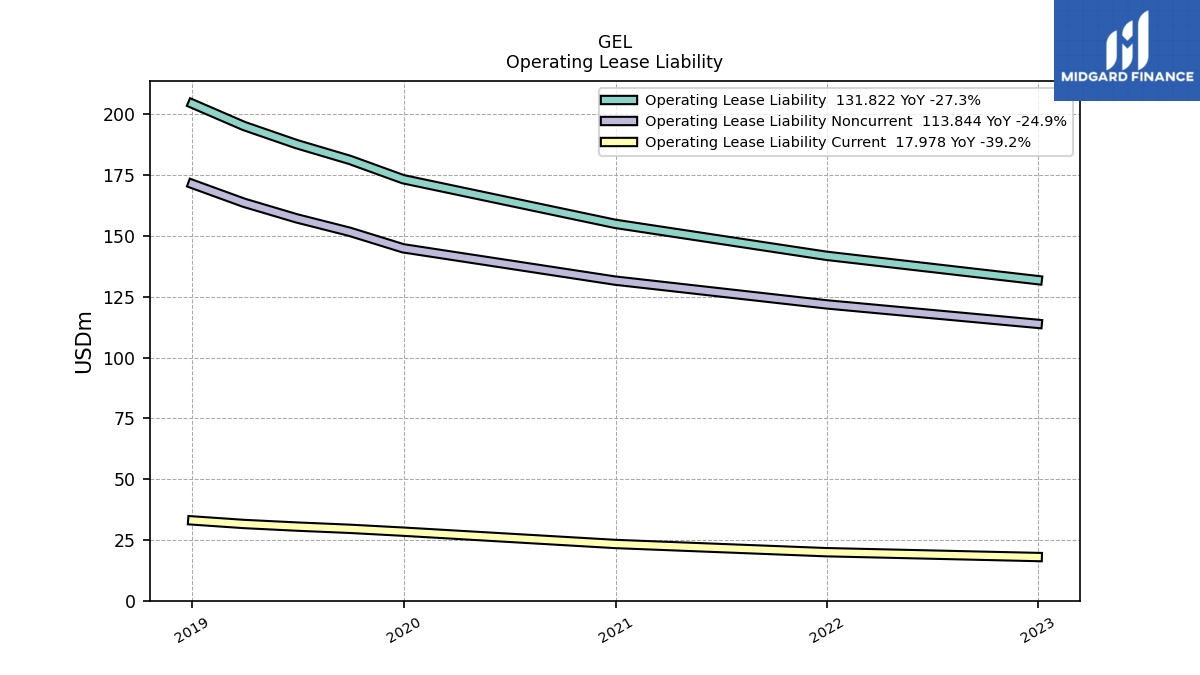
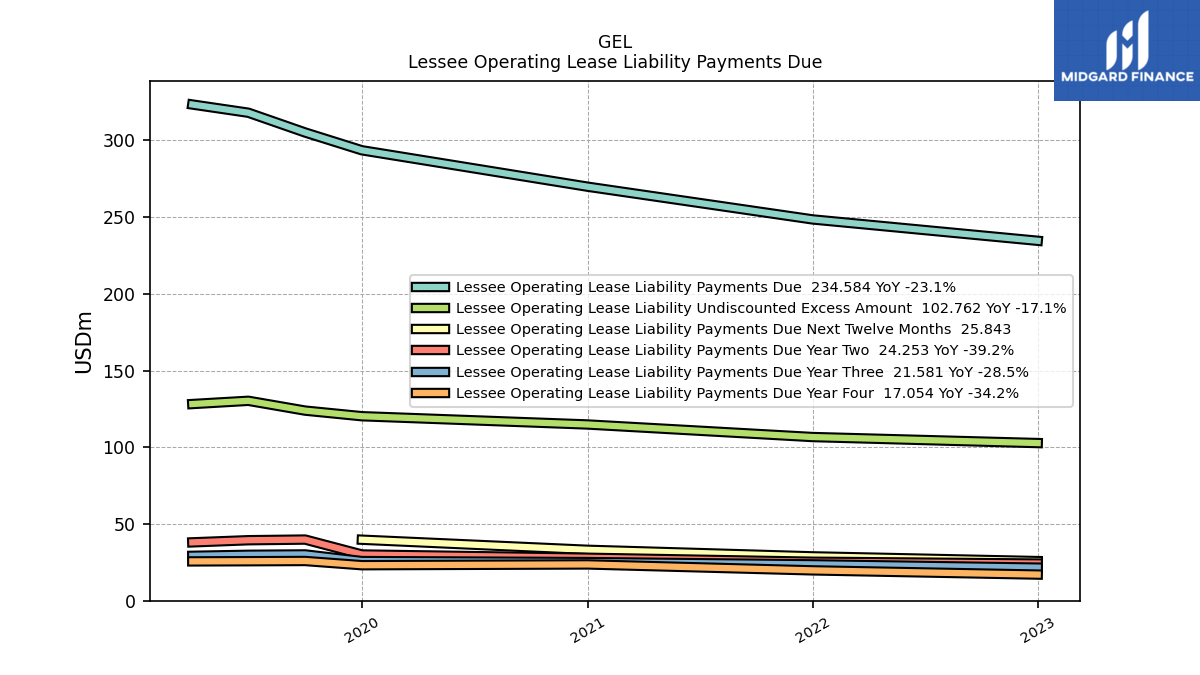
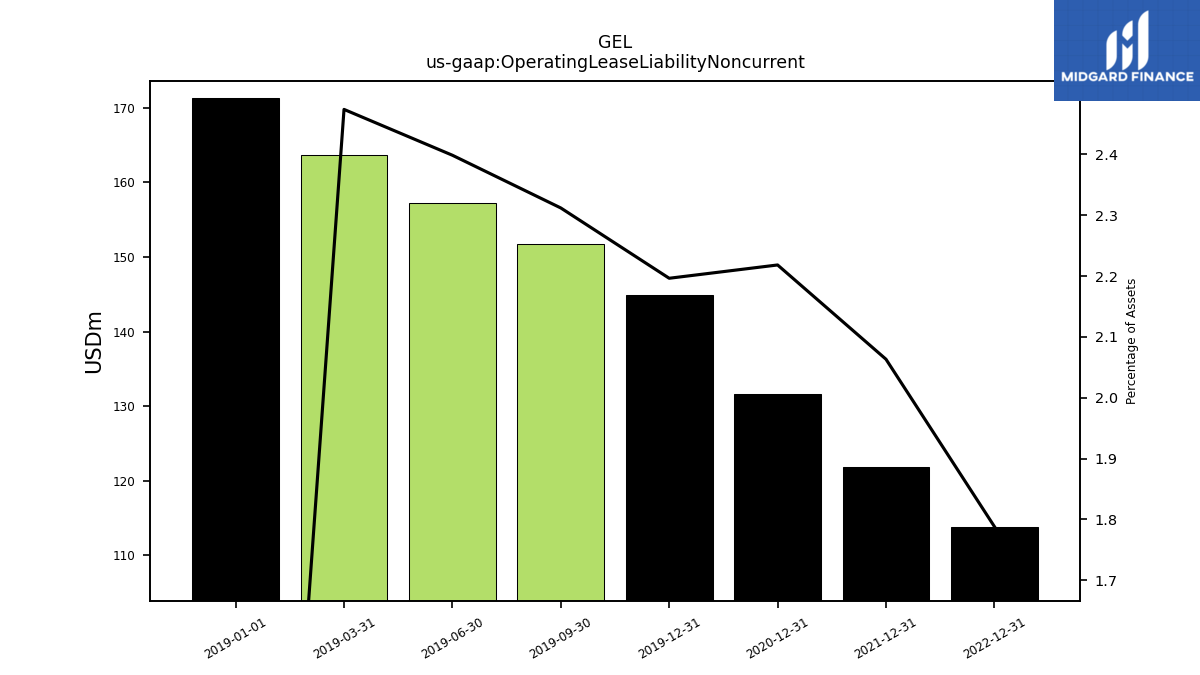
| Operating Lease Liability Noncurrent | NA | NA | NA | 113.84 | NA | NA | NA | 121.85 | NA | NA | NA | 131.62 | NA | NA | NA | 144.91 | 151.68 | 157.23 | 163.65 | NA | NA | NA | NA | NA | NA | NA | NA | NA | NA | NA | NA | NA | NA | NA | NA | NA | NA | NA | NA | NA | NA | NA | NA | NA | NA | NA | NA | NA | NA | NA | NA | NA | NA | NA | NA |
| 2023-09-30 | 2023-06-30 | 2023-03-31 | 2022-12-31 | 2022-09-30 | 2022-06-30 | 2022-03-31 | 2021-12-31 | 2021-09-30 | 2021-06-30 | 2021-03-31 | 2020-12-31 | 2020-09-30 | 2020-06-30 | 2020-03-31 | 2019-12-31 | 2019-09-30 | 2019-06-30 | 2019-03-31 | 2018-12-31 | 2018-09-30 | 2018-06-30 | 2018-03-31 | 2017-12-31 | 2017-09-30 | 2017-06-30 | 2017-03-31 | 2016-12-31 | 2016-09-30 | 2016-06-30 | 2016-03-31 | 2015-12-31 | 2015-09-30 | 2015-06-30 | 2015-03-31 | 2014-12-31 | 2014-09-30 | 2014-06-30 | 2014-03-31 | 2013-12-31 | 2013-09-30 | 2013-06-30 | 2013-03-31 | 2012-12-31 | 2012-09-30 | 2012-06-30 | 2012-03-31 | 2011-12-31 | 2011-09-30 | 2011-06-30 | 2011-03-31 | 2010-12-31 | 2010-09-30 | 2010-06-30 | 2010-03-31 | ||
|---|---|---|---|---|---|---|---|---|---|---|---|---|---|---|---|---|---|---|---|---|---|---|---|---|---|---|---|---|---|---|---|---|---|---|---|---|---|---|---|---|---|---|---|---|---|---|---|---|---|---|---|---|---|---|---|---|
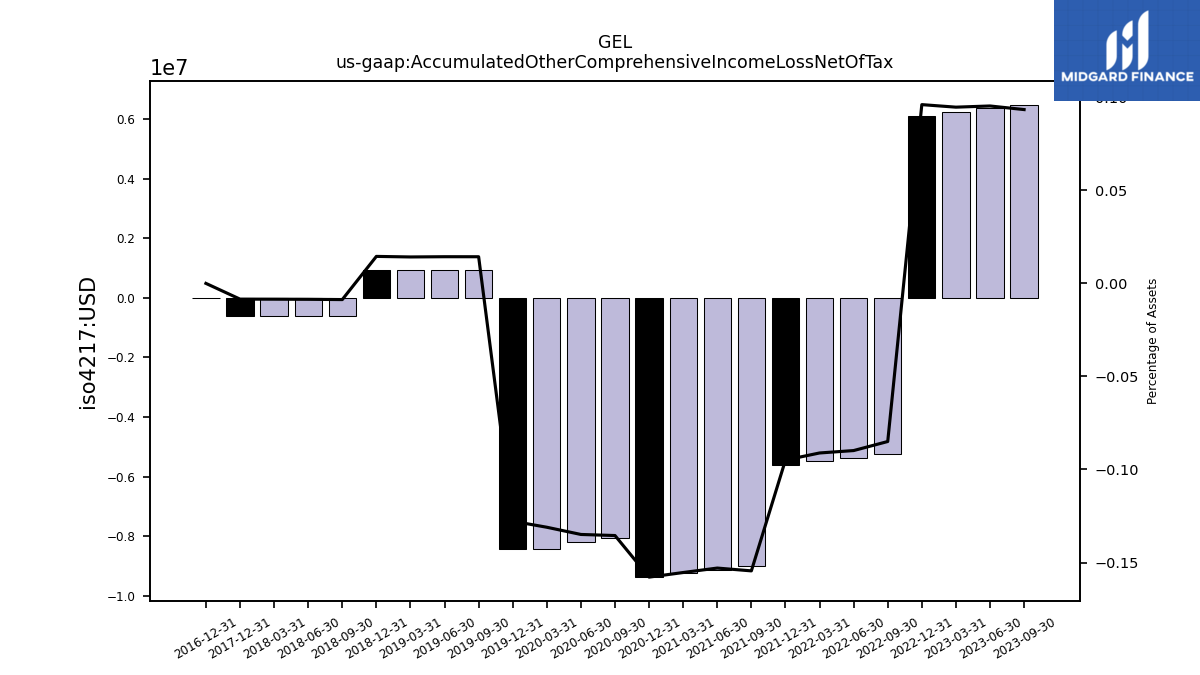
| Accumulated Other Comprehensive Income Loss Net Of Tax | 6.48 | 6.36 | 6.24 | 6.11 | -5.24 | -5.36 | -5.49 | -5.61 | -9.00 | -9.12 | -9.24 | -9.37 | -8.07 | -8.19 | -8.43 | -8.43 | 0.94 | 0.94 | 0.94 | 0.94 | -0.60 | -0.60 | -0.60 | -0.60 | NA | NA | NA | 0.00 | NA | NA | NA | NA | NA | NA | NA | NA | NA | NA | NA | NA | NA | NA | NA | NA | NA | NA | NA | NA | NA | NA | NA | NA | NA | NA | NA | |
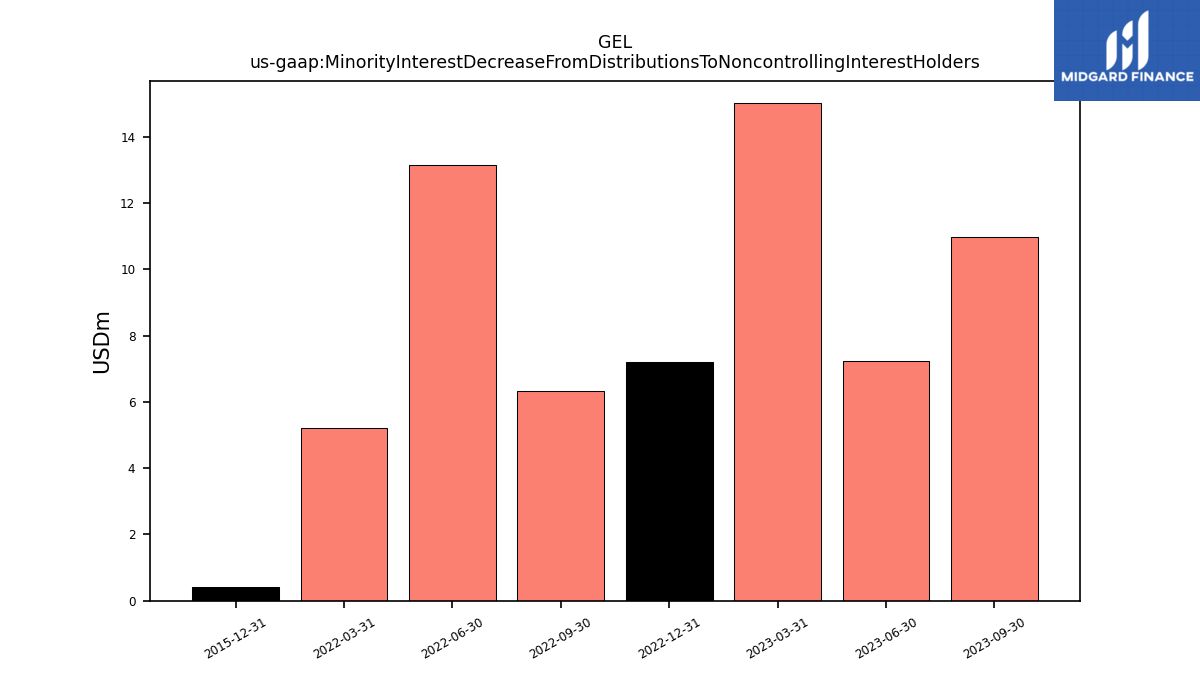
| Minority Interest Decrease From Distributions To Noncontrolling Interest Holders | 10.98 | 7.22 | 15.01 | 7.21 | 6.32 | 13.13 | 5.20 | NA | NA | NA | NA | NA | NA | NA | NA | NA | NA | NA | NA | NA | NA | NA | NA | NA | NA | NA | NA | NA | NA | NA | NA | 0.40 | NA | NA | NA | NA | NA | NA | NA | NA | NA | NA | NA | NA | NA | NA | NA | NA | NA | NA | NA | NA | NA | NA | NA |
| 2023-09-30 | 2023-06-30 | 2023-03-31 | 2022-12-31 | 2022-09-30 | 2022-06-30 | 2022-03-31 | 2021-12-31 | 2021-09-30 | 2021-06-30 | 2021-03-31 | 2020-12-31 | 2020-09-30 | 2020-06-30 | 2020-03-31 | 2019-12-31 | 2019-09-30 | 2019-06-30 | 2019-03-31 | 2018-12-31 | 2018-09-30 | 2018-06-30 | 2018-03-31 | 2017-12-31 | 2017-09-30 | 2017-06-30 | 2017-03-31 | 2016-12-31 | 2016-09-30 | 2016-06-30 | 2016-03-31 | 2015-12-31 | 2015-09-30 | 2015-06-30 | 2015-03-31 | 2014-12-31 | 2014-09-30 | 2014-06-30 | 2014-03-31 | 2013-12-31 | 2013-09-30 | 2013-06-30 | 2013-03-31 | 2012-12-31 | 2012-09-30 | 2012-06-30 | 2012-03-31 | 2011-12-31 | 2011-09-30 | 2011-06-30 | 2011-03-31 | 2010-12-31 | 2010-09-30 | 2010-06-30 | 2010-03-31 | ||
|---|---|---|---|---|---|---|---|---|---|---|---|---|---|---|---|---|---|---|---|---|---|---|---|---|---|---|---|---|---|---|---|---|---|---|---|---|---|---|---|---|---|---|---|---|---|---|---|---|---|---|---|---|---|---|---|---|
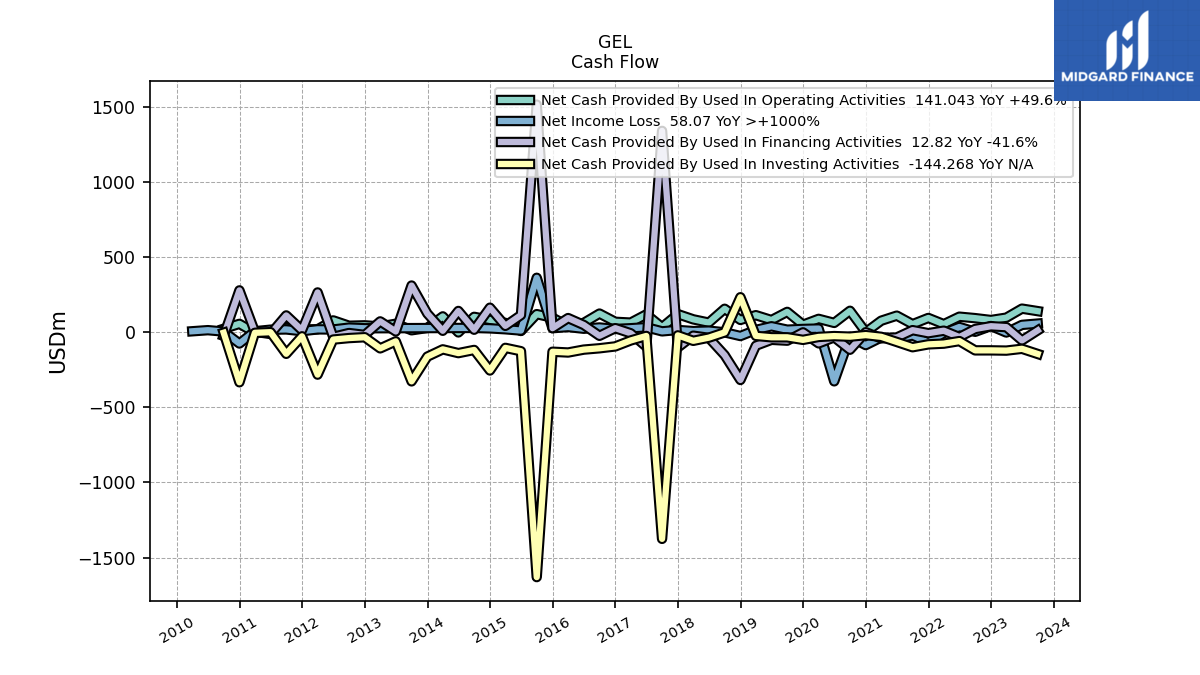
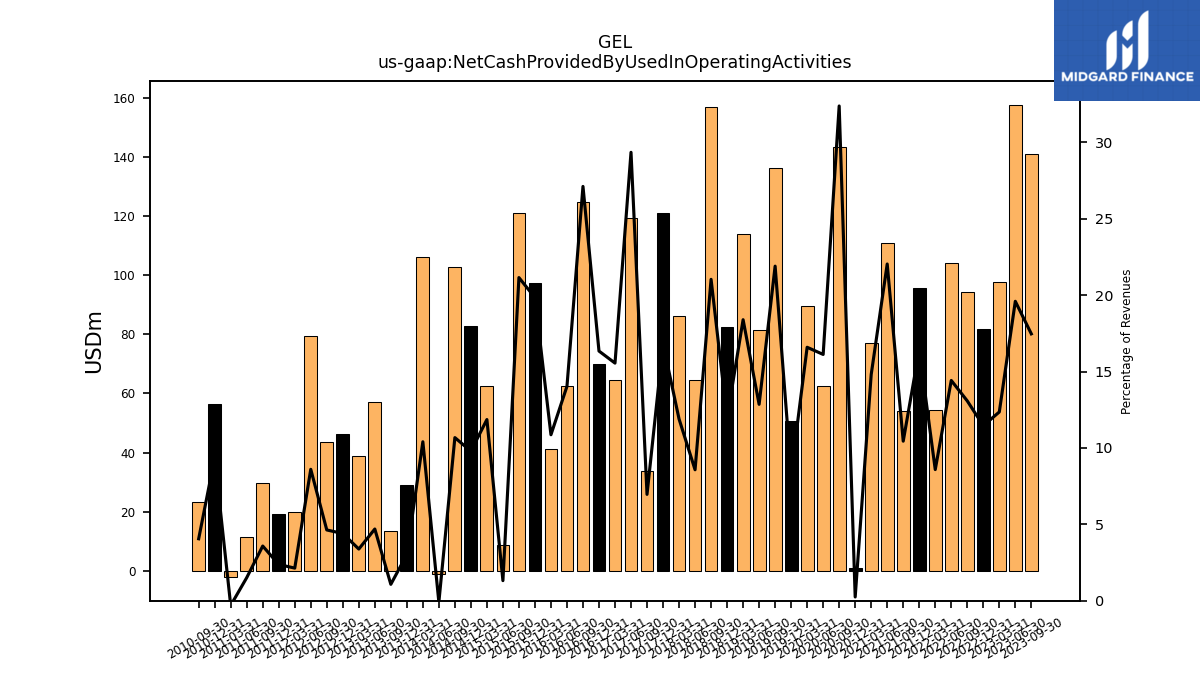
| Net Cash Provided By Used In Operating Activities | 141.04 | 157.66 | 97.66 | 81.80 | 94.31 | 104.04 | 54.24 | 95.59 | 54.17 | 111.03 | 77.16 | 1.12 | 143.47 | 62.61 | 89.55 | 50.56 | 136.12 | 81.59 | 114.02 | 82.47 | 156.75 | 64.49 | 86.33 | 121.07 | 33.84 | 119.35 | 64.61 | 69.94 | 124.72 | 62.57 | 41.11 | 97.41 | 121.03 | 8.64 | 62.47 | 82.94 | 102.92 | -0.89 | 106.09 | 29.05 | 13.55 | 56.97 | 38.82 | 46.37 | 43.66 | 79.36 | 19.92 | 19.16 | 29.72 | 11.53 | -2.10 | 56.39 | 23.36 | NA | NA | |
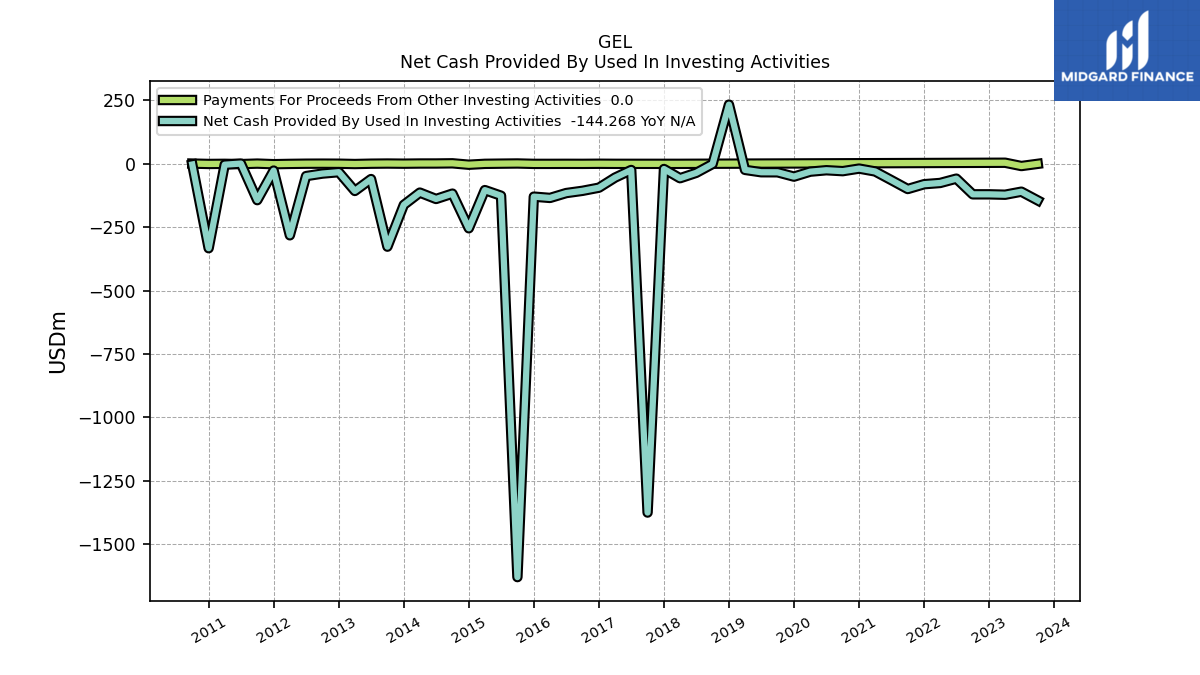
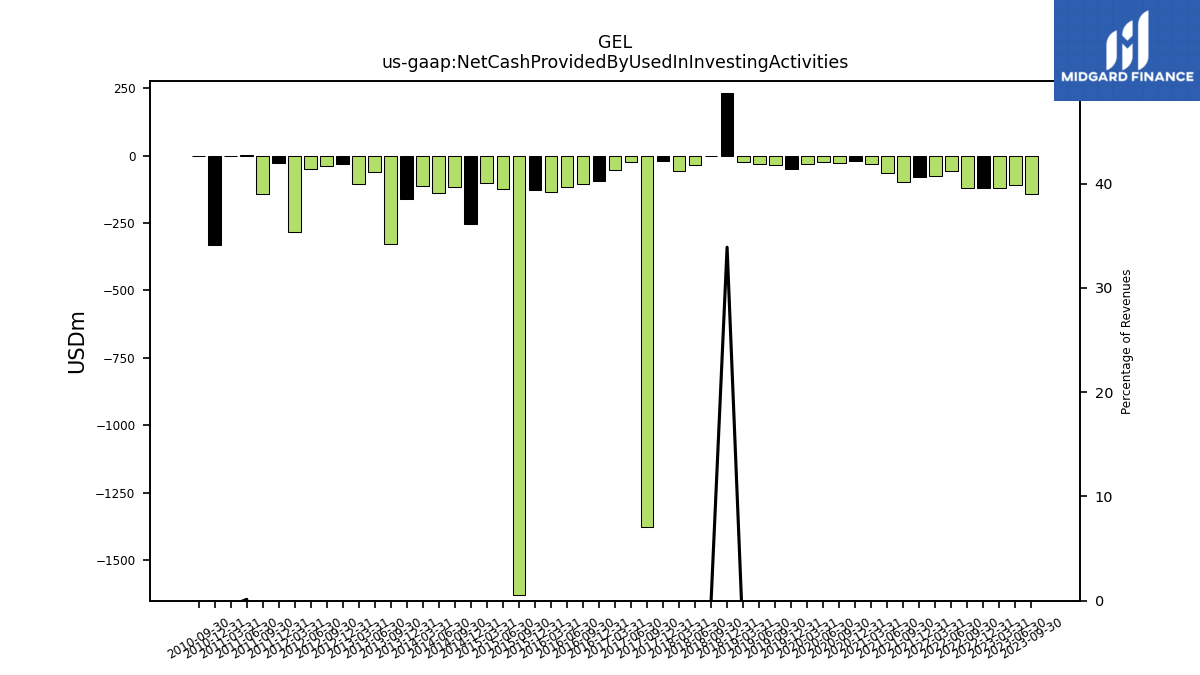
| Net Cash Provided By Used In Investing Activities | -144.27 | -109.86 | -121.86 | -120.31 | -120.30 | -58.40 | -75.51 | -80.36 | -99.39 | -64.31 | -30.05 | -18.77 | -28.89 | -25.22 | -30.88 | -50.44 | -33.38 | -33.16 | -23.83 | 233.62 | -0.58 | -35.58 | -56.77 | -20.31 | -1375.91 | -24.24 | -54.42 | -94.05 | -106.40 | -115.31 | -134.55 | -129.42 | -1630.63 | -125.78 | -103.63 | -254.32 | -117.51 | -138.62 | -113.53 | -161.91 | -326.88 | -60.02 | -107.02 | -32.83 | -38.44 | -48.32 | -282.01 | -26.61 | -143.31 | 1.03 | -3.42 | -333.00 | -2.58 | NA | NA | |
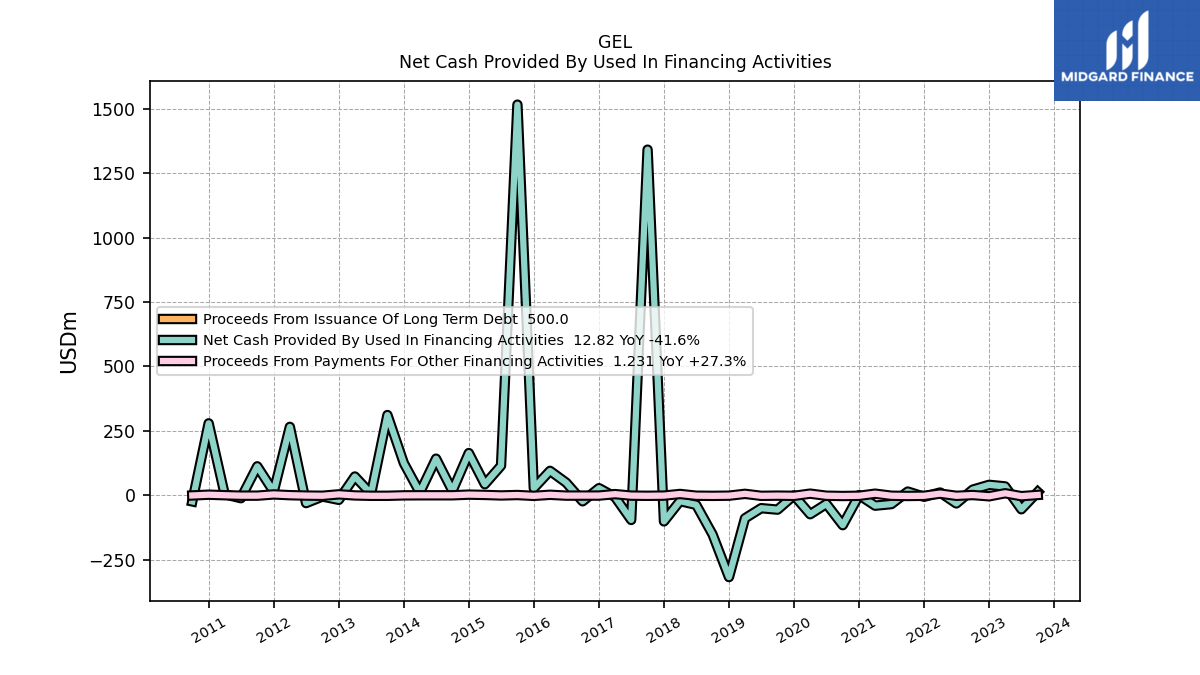
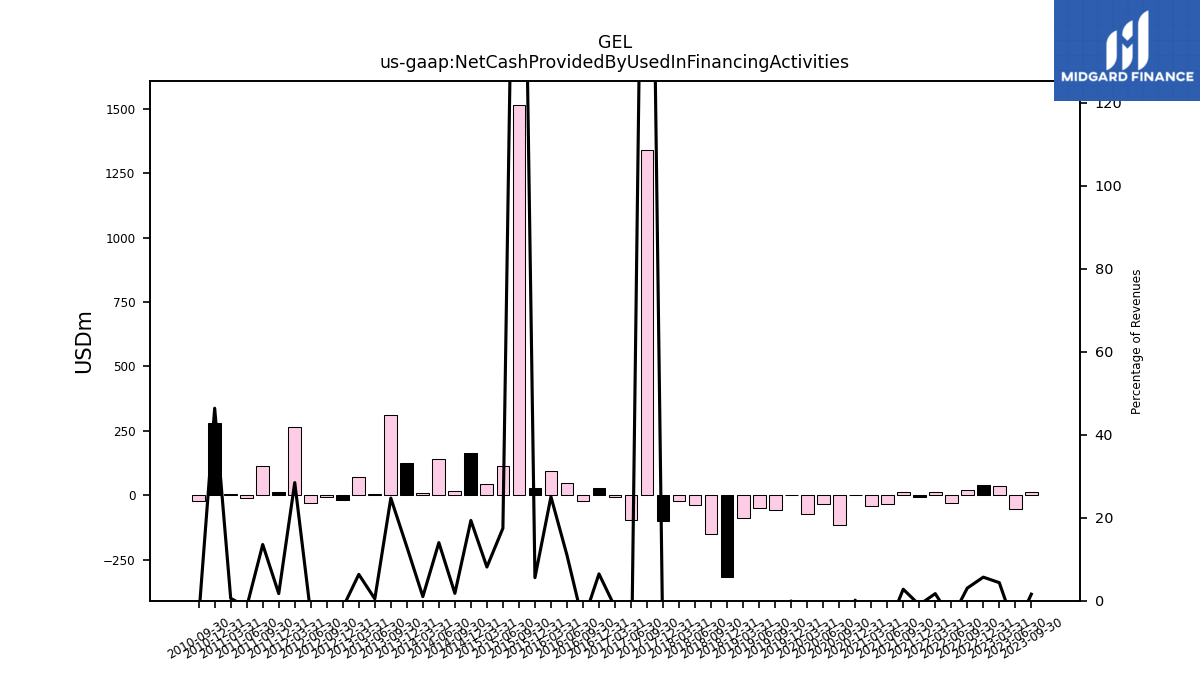
| Net Cash Provided By Used In Financing Activities | 12.82 | -54.30 | 34.44 | 40.59 | 21.96 | -31.68 | 10.83 | -5.73 | 14.42 | -34.21 | -40.34 | 0.65 | -116.06 | -33.40 | -73.57 | -0.33 | -55.71 | -50.05 | -89.29 | -317.67 | -152.13 | -37.16 | -22.51 | -101.42 | 1341.69 | -95.81 | -6.45 | 27.69 | -23.43 | 48.99 | 94.86 | 27.34 | 1516.45 | 114.72 | 42.84 | 163.93 | 17.19 | 142.16 | 10.25 | 124.87 | 311.52 | 5.74 | 72.90 | -17.71 | -4.80 | -30.32 | 265.60 | 13.89 | 112.52 | -11.28 | 3.92 | 279.32 | -23.76 | NA | NA |
| 2023-09-30 | 2023-06-30 | 2023-03-31 | 2022-12-31 | 2022-09-30 | 2022-06-30 | 2022-03-31 | 2021-12-31 | 2021-09-30 | 2021-06-30 | 2021-03-31 | 2020-12-31 | 2020-09-30 | 2020-06-30 | 2020-03-31 | 2019-12-31 | 2019-09-30 | 2019-06-30 | 2019-03-31 | 2018-12-31 | 2018-09-30 | 2018-06-30 | 2018-03-31 | 2017-12-31 | 2017-09-30 | 2017-06-30 | 2017-03-31 | 2016-12-31 | 2016-09-30 | 2016-06-30 | 2016-03-31 | 2015-12-31 | 2015-09-30 | 2015-06-30 | 2015-03-31 | 2014-12-31 | 2014-09-30 | 2014-06-30 | 2014-03-31 | 2013-12-31 | 2013-09-30 | 2013-06-30 | 2013-03-31 | 2012-12-31 | 2012-09-30 | 2012-06-30 | 2012-03-31 | 2011-12-31 | 2011-09-30 | 2011-06-30 | 2011-03-31 | 2010-12-31 | 2010-09-30 | 2010-06-30 | 2010-03-31 | ||
|---|---|---|---|---|---|---|---|---|---|---|---|---|---|---|---|---|---|---|---|---|---|---|---|---|---|---|---|---|---|---|---|---|---|---|---|---|---|---|---|---|---|---|---|---|---|---|---|---|---|---|---|---|---|---|---|---|
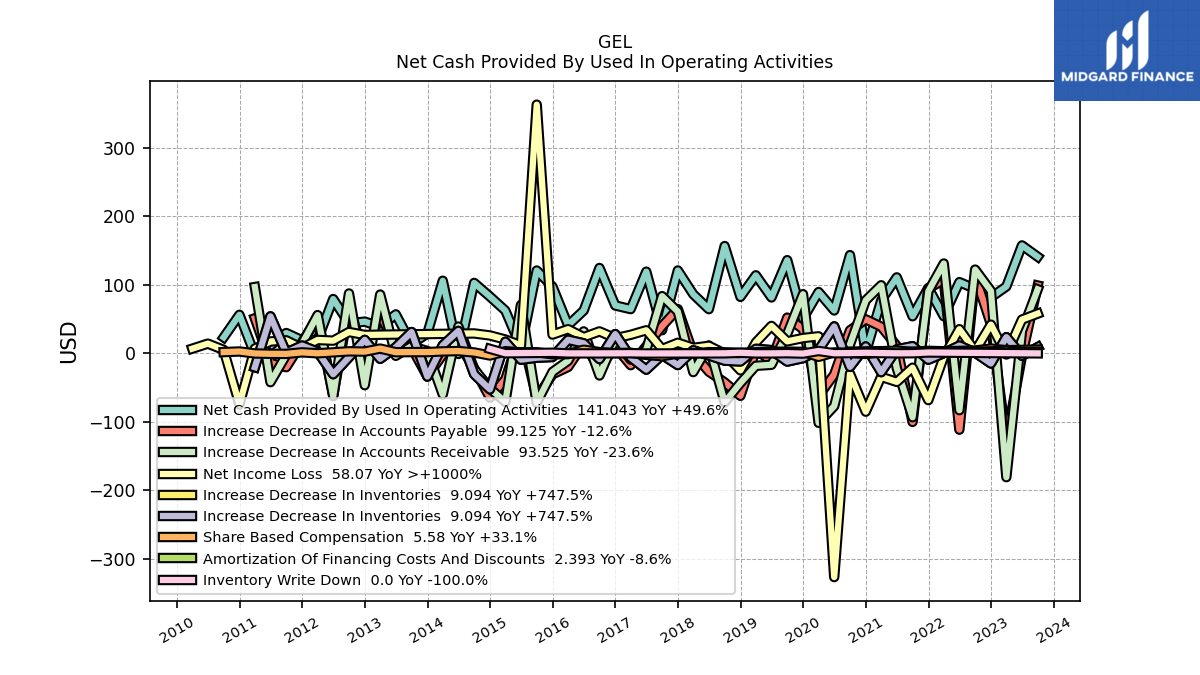
| Net Cash Provided By Used In Operating Activities | 141.04 | 157.66 | 97.66 | 81.80 | 94.31 | 104.04 | 54.24 | 95.59 | 54.17 | 111.03 | 77.16 | 1.12 | 143.47 | 62.61 | 89.55 | 50.56 | 136.12 | 81.59 | 114.02 | 82.47 | 156.75 | 64.49 | 86.33 | 121.07 | 33.84 | 119.35 | 64.61 | 69.94 | 124.72 | 62.57 | 41.11 | 97.41 | 121.03 | 8.64 | 62.47 | 82.94 | 102.92 | -0.89 | 106.09 | 29.05 | 13.55 | 56.97 | 38.82 | 46.37 | 43.66 | 79.36 | 19.92 | 19.16 | 29.72 | 11.53 | -2.10 | 56.39 | 23.36 | NA | NA | |
| Net Income Loss | 58.07 | 49.34 | -1.64 | 41.98 | 3.38 | 35.35 | -5.25 | -68.26 | -20.90 | -41.68 | -34.22 | -85.16 | -29.72 | -326.71 | 24.91 | 22.37 | 17.56 | 40.12 | 15.95 | -24.78 | -0.32 | 11.00 | 8.03 | 15.51 | 6.31 | 33.73 | 27.09 | 22.12 | 32.10 | 23.73 | 35.30 | 27.43 | 363.21 | 11.66 | 20.21 | 26.17 | 29.11 | NA | NA | NA | NA | NA | NA | 26.94 | 31.19 | 18.58 | 19.60 | 7.77 | 19.09 | 17.36 | 7.03 | -74.65 | 5.07 | 14.24 | 6.88 | |
| Profit Loss | 66.78 | 55.68 | 3.39 | 46.60 | 8.57 | 69.52 | 4.45 | -58.99 | -13.83 | -35.78 | -29.43 | -81.15 | -25.58 | -322.56 | 28.98 | 24.66 | 17.81 | 41.65 | 15.95 | -28.93 | -1.63 | 10.87 | 7.90 | 15.40 | 6.16 | 33.58 | 26.94 | 20.32 | 31.98 | 23.60 | 35.18 | 26.30 | 363.41 | 11.66 | 20.21 | 26.17 | 29.11 | 21.15 | 29.77 | 17.89 | 18.47 | 26.90 | 22.85 | 26.94 | 31.19 | 18.58 | 19.60 | 7.77 | 19.09 | 17.36 | 7.03 | -74.65 | 3.86 | 13.92 | 6.33 | |
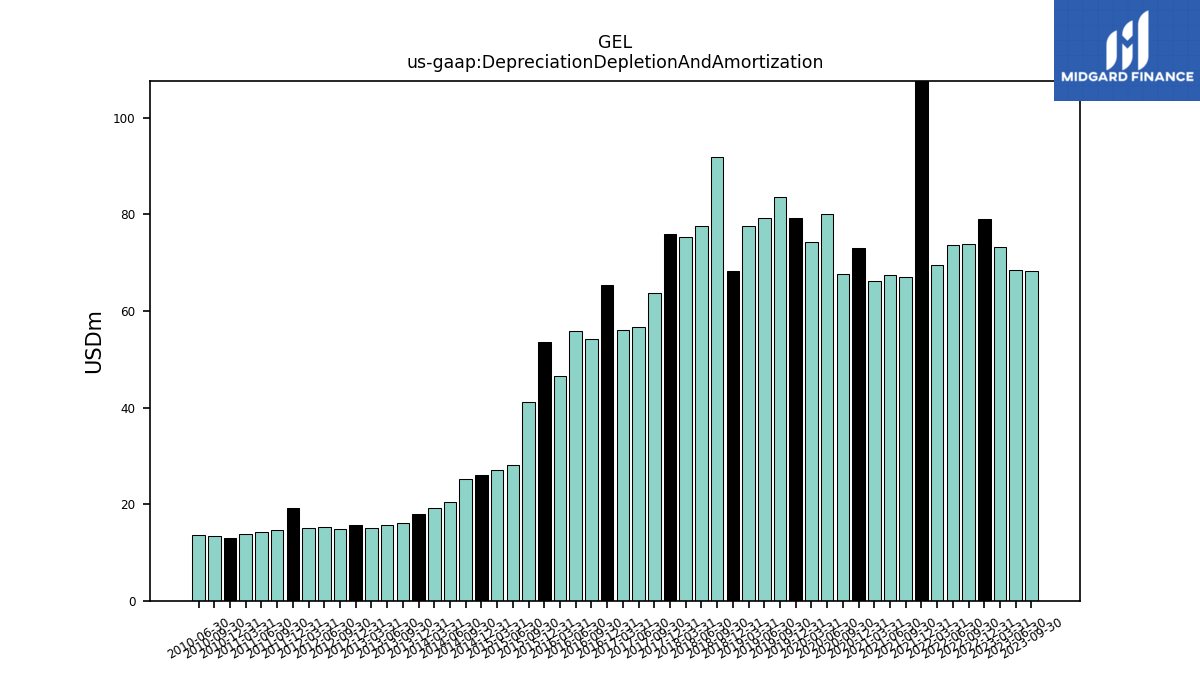
| Depreciation Depletion And Amortization | 68.38 | 68.43 | 73.16 | 79.08 | 73.95 | 73.67 | 69.51 | 108.77 | 67.15 | 67.54 | 66.29 | 73.11 | 67.73 | 80.12 | 74.36 | 79.29 | 83.52 | 79.35 | 77.64 | 68.38 | 91.88 | 77.68 | 75.25 | 76.03 | 63.73 | 56.61 | 56.11 | 65.40 | 54.27 | 55.90 | 46.63 | 53.64 | 41.17 | 28.20 | 27.12 | 25.99 | 25.15 | 20.49 | 19.28 | 18.00 | 16.07 | 15.67 | 15.05 | 15.72 | 14.84 | 15.36 | 15.04 | 19.18 | 14.59 | 14.25 | 13.90 | 13.07 | 13.48 | 13.61 | NA | |
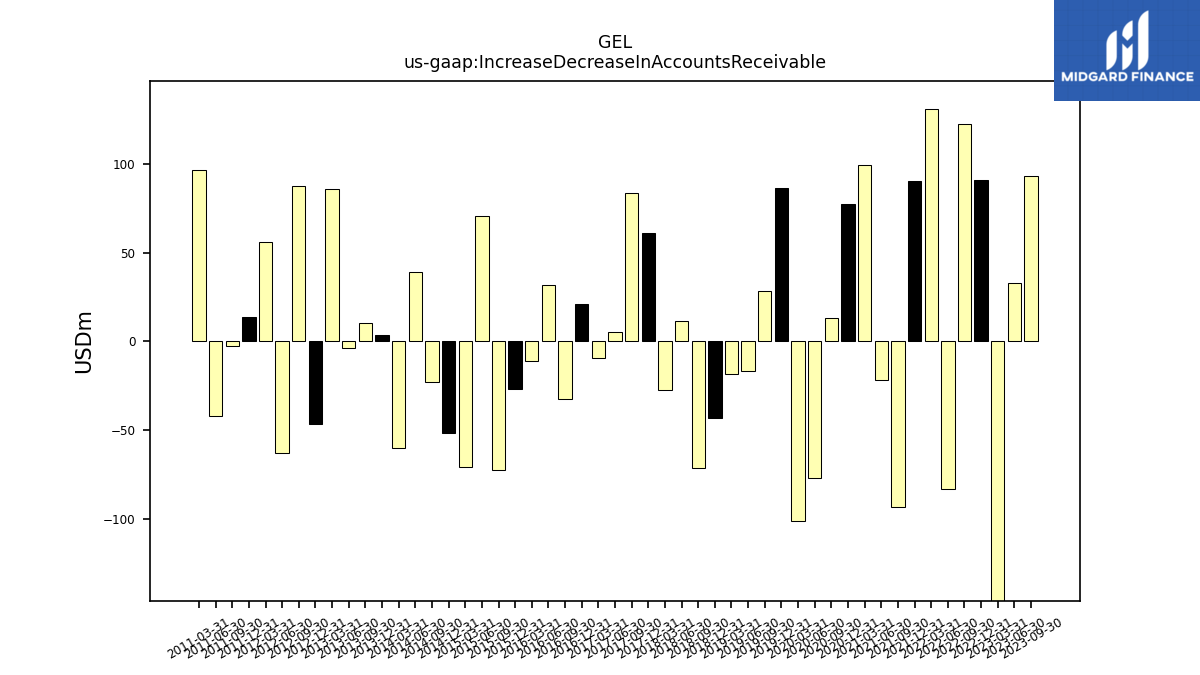
| Increase Decrease In Accounts Receivable | 93.53 | 32.81 | -180.81 | 91.21 | 122.37 | -82.98 | 131.25 | 90.65 | -93.27 | -21.72 | 99.50 | 77.39 | 13.00 | -77.10 | -101.41 | 86.42 | 28.55 | -16.67 | -18.17 | -43.26 | -71.48 | 11.53 | -27.37 | 61.01 | 83.60 | 5.50 | -9.17 | 20.89 | -32.30 | 32.08 | -10.81 | -27.01 | -72.17 | 70.70 | -70.90 | -51.42 | -22.76 | 39.22 | -60.05 | 3.39 | 10.56 | -3.57 | 85.92 | -46.49 | 87.49 | -62.60 | 55.90 | 13.85 | -2.46 | -42.09 | 96.90 | NA | NA | NA | NA | |
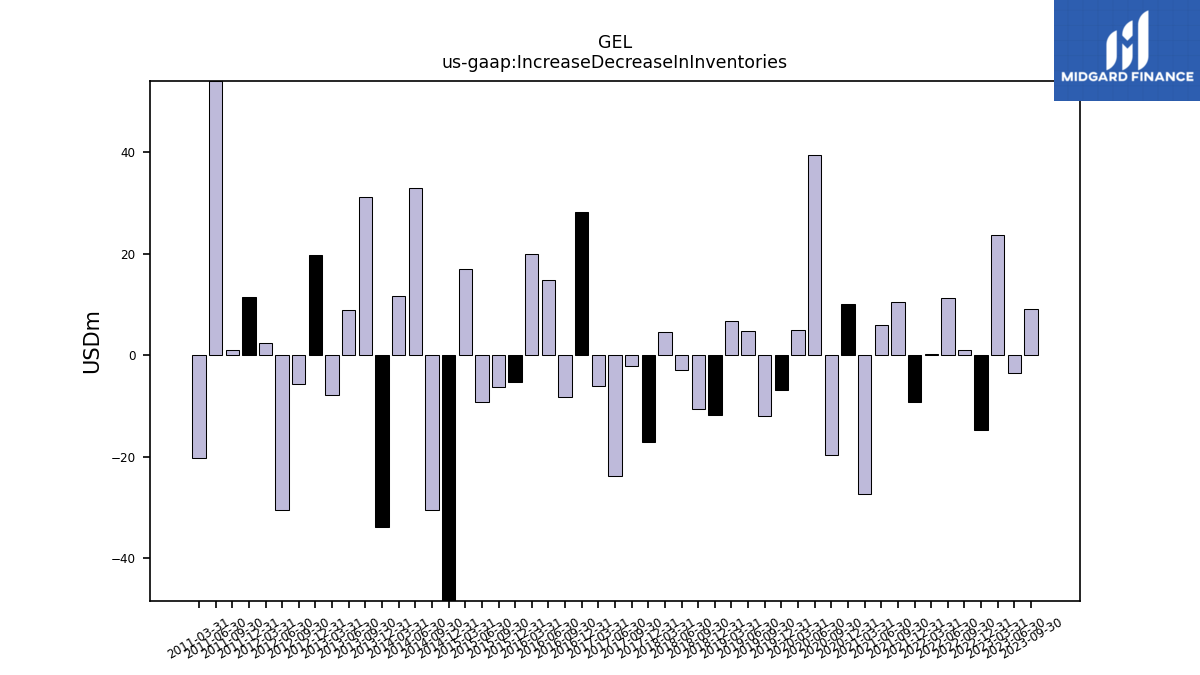
| Increase Decrease In Inventories | 9.09 | -3.48 | 23.66 | -14.76 | 1.07 | 11.32 | 0.28 | -9.26 | 10.44 | 5.90 | -27.45 | 10.07 | -19.72 | 39.37 | 5.02 | -6.95 | -12.01 | 4.68 | 6.62 | -11.80 | -10.60 | -3.03 | 4.47 | -17.08 | -2.17 | -23.79 | -6.01 | 28.15 | -8.30 | 14.70 | 19.82 | -5.29 | -6.26 | -9.24 | 16.97 | -52.56 | -30.46 | 32.82 | 11.70 | -33.79 | 31.21 | 8.80 | -7.95 | 19.75 | -5.68 | -30.45 | 2.31 | 11.39 | 0.91 | 54.06 | -20.21 | NA | NA | NA | NA | |
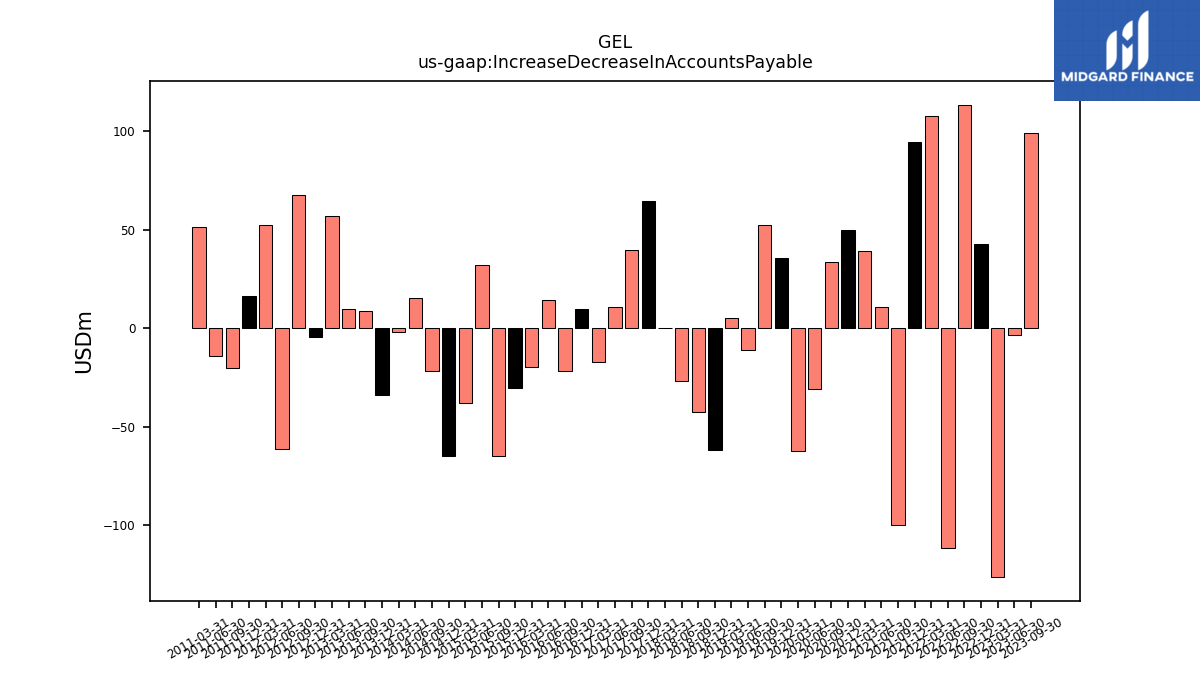
| Increase Decrease In Accounts Payable | 99.12 | -3.69 | -126.44 | 42.45 | 113.41 | -111.47 | 107.75 | 94.48 | -100.17 | 10.81 | 38.99 | 49.73 | 33.60 | -30.71 | -62.37 | 35.38 | 52.23 | -10.93 | 5.23 | -62.02 | -42.38 | -26.69 | 0.09 | 64.67 | 39.74 | 10.46 | -17.30 | 9.79 | -21.57 | 14.21 | -19.85 | -30.60 | -64.98 | 31.83 | -37.83 | -64.73 | -22.01 | 15.30 | -1.87 | -33.79 | 8.65 | 9.81 | 57.05 | -4.71 | 67.40 | -61.60 | 52.05 | 16.10 | -20.21 | -14.08 | 51.25 | NA | NA | NA | NA | |
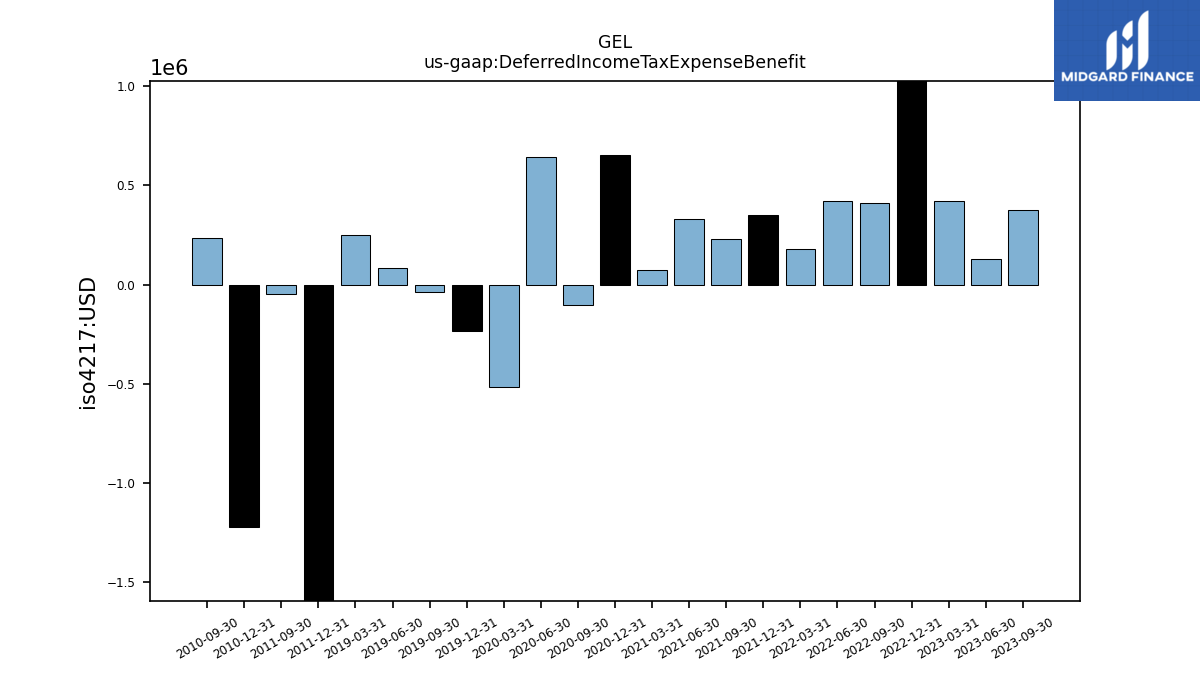
| Deferred Income Tax Expense Benefit | 0.37 | 0.13 | 0.42 | 1.34 | 0.41 | 0.42 | 0.18 | 0.35 | 0.23 | 0.33 | 0.07 | 0.65 | -0.10 | 0.65 | -0.52 | -0.23 | -0.04 | 0.08 | 0.25 | NA | NA | NA | NA | NA | NA | NA | NA | NA | NA | NA | NA | NA | NA | NA | NA | NA | NA | NA | NA | NA | NA | NA | NA | NA | NA | NA | NA | -4.01 | -0.05 | NA | NA | -1.22 | 0.23 | NA | NA | |
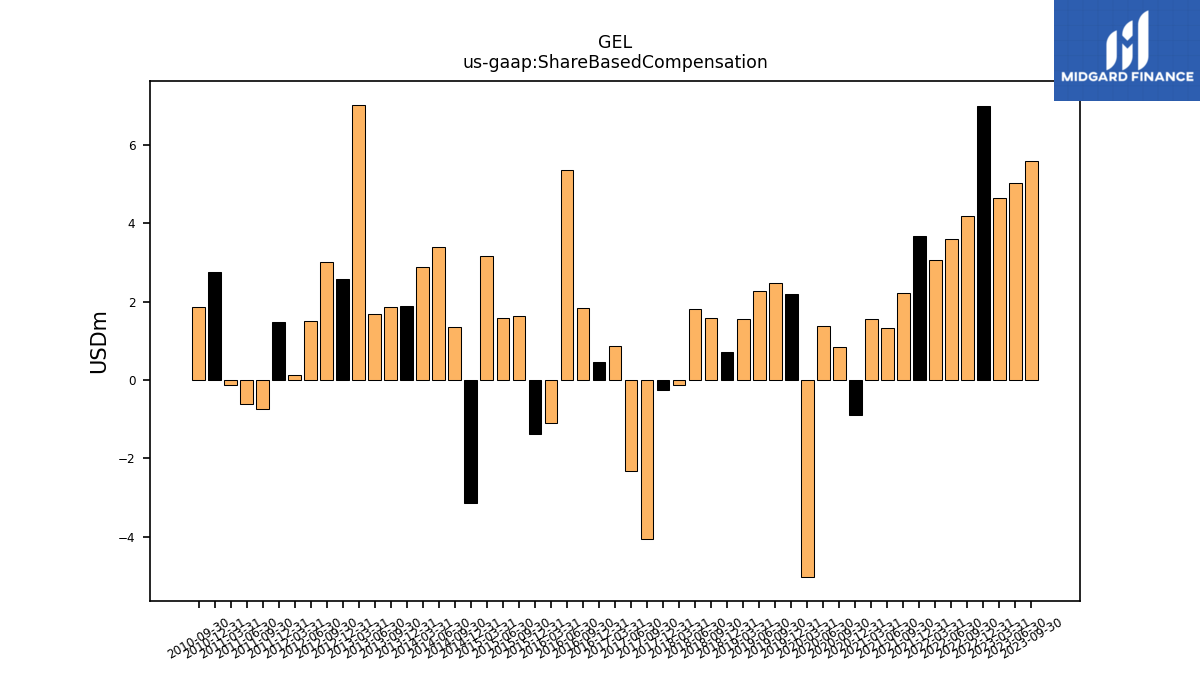
| Share Based Compensation | 5.58 | 5.03 | 4.63 | 6.97 | 4.19 | 3.58 | 3.06 | 3.67 | 2.23 | 1.32 | 1.56 | -0.89 | 0.84 | 1.38 | -5.03 | 2.20 | 2.48 | 2.26 | 1.56 | 0.70 | 1.58 | 1.80 | -0.14 | -0.25 | -4.07 | -2.32 | 0.86 | 0.46 | 1.85 | 5.36 | -1.10 | -1.37 | 1.64 | 1.58 | 3.16 | -3.13 | 1.36 | 3.38 | 2.89 | 1.89 | 1.87 | 1.69 | 7.02 | 2.58 | 3.00 | 1.49 | 0.12 | 1.49 | -0.75 | -0.62 | -0.14 | 2.77 | 1.87 | NA | NA |
| 2023-09-30 | 2023-06-30 | 2023-03-31 | 2022-12-31 | 2022-09-30 | 2022-06-30 | 2022-03-31 | 2021-12-31 | 2021-09-30 | 2021-06-30 | 2021-03-31 | 2020-12-31 | 2020-09-30 | 2020-06-30 | 2020-03-31 | 2019-12-31 | 2019-09-30 | 2019-06-30 | 2019-03-31 | 2018-12-31 | 2018-09-30 | 2018-06-30 | 2018-03-31 | 2017-12-31 | 2017-09-30 | 2017-06-30 | 2017-03-31 | 2016-12-31 | 2016-09-30 | 2016-06-30 | 2016-03-31 | 2015-12-31 | 2015-09-30 | 2015-06-30 | 2015-03-31 | 2014-12-31 | 2014-09-30 | 2014-06-30 | 2014-03-31 | 2013-12-31 | 2013-09-30 | 2013-06-30 | 2013-03-31 | 2012-12-31 | 2012-09-30 | 2012-06-30 | 2012-03-31 | 2011-12-31 | 2011-09-30 | 2011-06-30 | 2011-03-31 | 2010-12-31 | 2010-09-30 | 2010-06-30 | 2010-03-31 | ||
|---|---|---|---|---|---|---|---|---|---|---|---|---|---|---|---|---|---|---|---|---|---|---|---|---|---|---|---|---|---|---|---|---|---|---|---|---|---|---|---|---|---|---|---|---|---|---|---|---|---|---|---|---|---|---|---|---|
| Net Cash Provided By Used In Investing Activities | -144.27 | -109.86 | -121.86 | -120.31 | -120.30 | -58.40 | -75.51 | -80.36 | -99.39 | -64.31 | -30.05 | -18.77 | -28.89 | -25.22 | -30.88 | -50.44 | -33.38 | -33.16 | -23.83 | 233.62 | -0.58 | -35.58 | -56.77 | -20.31 | -1375.91 | -24.24 | -54.42 | -94.05 | -106.40 | -115.31 | -134.55 | -129.42 | -1630.63 | -125.78 | -103.63 | -254.32 | -117.51 | -138.62 | -113.53 | -161.91 | -326.88 | -60.02 | -107.02 | -32.83 | -38.44 | -48.32 | -282.01 | -26.61 | -143.31 | 1.03 | -3.42 | -333.00 | -2.58 | NA | NA | |
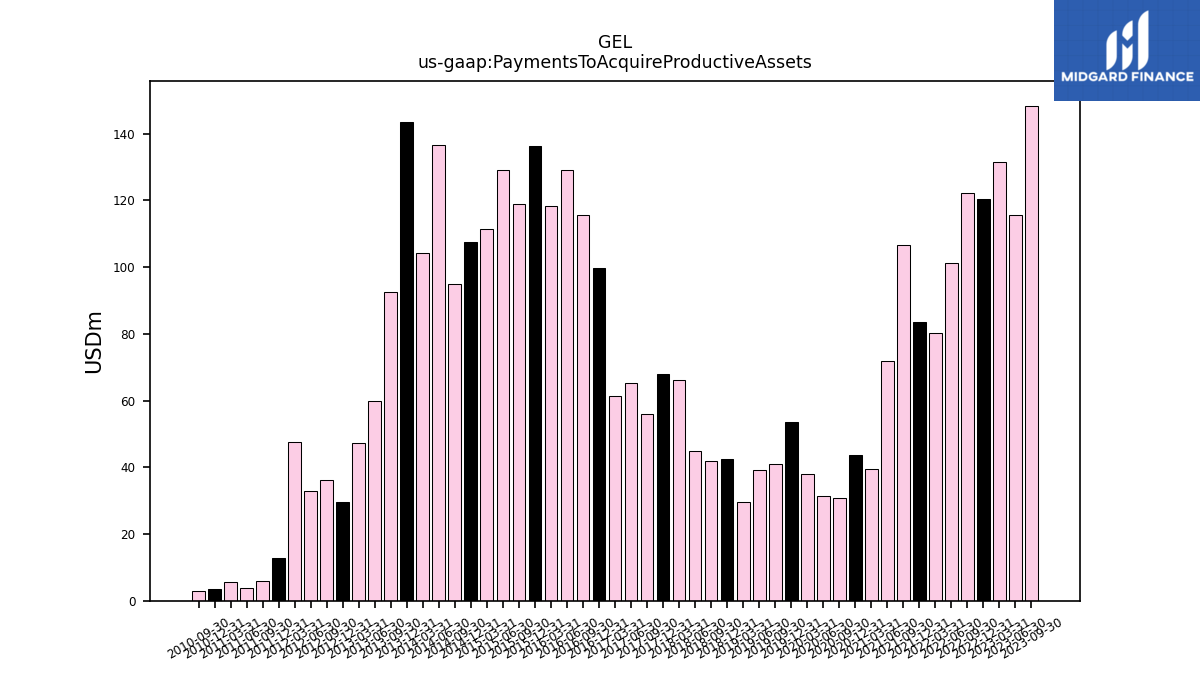
| Payments To Acquire Productive Assets | 148.41 | 115.74 | 131.62 | 120.41 | 122.35 | 101.24 | 80.20 | 83.42 | 106.56 | 72.02 | 39.39 | 43.75 | 30.94 | 31.44 | 38.00 | 53.65 | 40.93 | 39.05 | 29.61 | 42.50 | 41.90 | 44.92 | 66.05 | 67.94 | 56.07 | 65.29 | 61.29 | 99.88 | 115.80 | 129.16 | 118.25 | 136.27 | 118.86 | 129.14 | 111.50 | 107.42 | 95.07 | 136.74 | 104.25 | 143.49 | 92.47 | 60.02 | 47.15 | 29.75 | 36.32 | 32.91 | 47.47 | 12.84 | 5.83 | 3.84 | 5.49 | 3.60 | 2.82 | NA | NA |
| 2023-09-30 | 2023-06-30 | 2023-03-31 | 2022-12-31 | 2022-09-30 | 2022-06-30 | 2022-03-31 | 2021-12-31 | 2021-09-30 | 2021-06-30 | 2021-03-31 | 2020-12-31 | 2020-09-30 | 2020-06-30 | 2020-03-31 | 2019-12-31 | 2019-09-30 | 2019-06-30 | 2019-03-31 | 2018-12-31 | 2018-09-30 | 2018-06-30 | 2018-03-31 | 2017-12-31 | 2017-09-30 | 2017-06-30 | 2017-03-31 | 2016-12-31 | 2016-09-30 | 2016-06-30 | 2016-03-31 | 2015-12-31 | 2015-09-30 | 2015-06-30 | 2015-03-31 | 2014-12-31 | 2014-09-30 | 2014-06-30 | 2014-03-31 | 2013-12-31 | 2013-09-30 | 2013-06-30 | 2013-03-31 | 2012-12-31 | 2012-09-30 | 2012-06-30 | 2012-03-31 | 2011-12-31 | 2011-09-30 | 2011-06-30 | 2011-03-31 | 2010-12-31 | 2010-09-30 | 2010-06-30 | 2010-03-31 | ||
|---|---|---|---|---|---|---|---|---|---|---|---|---|---|---|---|---|---|---|---|---|---|---|---|---|---|---|---|---|---|---|---|---|---|---|---|---|---|---|---|---|---|---|---|---|---|---|---|---|---|---|---|---|---|---|---|---|
| Net Cash Provided By Used In Financing Activities | 12.82 | -54.30 | 34.44 | 40.59 | 21.96 | -31.68 | 10.83 | -5.73 | 14.42 | -34.21 | -40.34 | 0.65 | -116.06 | -33.40 | -73.57 | -0.33 | -55.71 | -50.05 | -89.29 | -317.67 | -152.13 | -37.16 | -22.51 | -101.42 | 1341.69 | -95.81 | -6.45 | 27.69 | -23.43 | 48.99 | 94.86 | 27.34 | 1516.45 | 114.72 | 42.84 | 163.93 | 17.19 | 142.16 | 10.25 | 124.87 | 311.52 | 5.74 | 72.90 | -17.71 | -4.80 | -30.32 | 265.60 | 13.89 | 112.52 | -11.28 | 3.92 | 279.32 | -23.76 | NA | NA |
| 2023-09-30 | 2023-06-30 | 2023-03-31 | 2022-12-31 | 2022-09-30 | 2022-06-30 | 2022-03-31 | 2021-12-31 | 2021-09-30 | 2021-06-30 | 2021-03-31 | 2020-12-31 | 2020-09-30 | 2020-06-30 | 2020-03-31 | 2019-12-31 | 2019-09-30 | 2019-06-30 | 2019-03-31 | 2018-12-31 | 2018-09-30 | 2018-06-30 | 2018-03-31 | 2017-12-31 | 2017-09-30 | 2017-06-30 | 2017-03-31 | 2016-12-31 | 2016-09-30 | 2016-06-30 | 2016-03-31 | 2015-12-31 | 2015-09-30 | 2015-06-30 | 2015-03-31 | 2014-12-31 | 2014-09-30 | 2014-06-30 | 2014-03-31 | 2013-12-31 | 2013-09-30 | 2013-06-30 | 2013-03-31 | 2012-12-31 | 2012-09-30 | 2012-06-30 | 2012-03-31 | 2011-12-31 | 2011-09-30 | 2011-06-30 | 2011-03-31 | 2010-12-31 | 2010-09-30 | 2010-06-30 | 2010-03-31 | ||
|---|---|---|---|---|---|---|---|---|---|---|---|---|---|---|---|---|---|---|---|---|---|---|---|---|---|---|---|---|---|---|---|---|---|---|---|---|---|---|---|---|---|---|---|---|---|---|---|---|---|---|---|---|---|---|---|---|
| Revenues | 807.62 | 804.66 | 790.61 | 714.04 | 721.25 | 721.73 | 631.95 | 581.58 | 518.82 | 503.86 | 521.22 | 453.14 | 443.12 | 388.47 | 539.92 | 604.33 | 621.70 | 634.78 | 620.01 | 689.30 | 745.28 | 752.39 | 725.81 | 720.05 | 486.11 | 406.72 | 415.49 | 428.05 | 460.05 | 445.98 | 378.41 | 491.01 | 572.33 | 656.33 | 526.86 | 847.28 | 964.11 | 1015.05 | 1019.72 | 961.03 | 1259.82 | 1213.66 | 1147.21 | 1054.07 | 942.33 | 922.67 | 932.94 | 806.88 | 830.20 | 762.79 | 689.80 | 602.24 | 576.01 | 456.54 | 466.53 | |
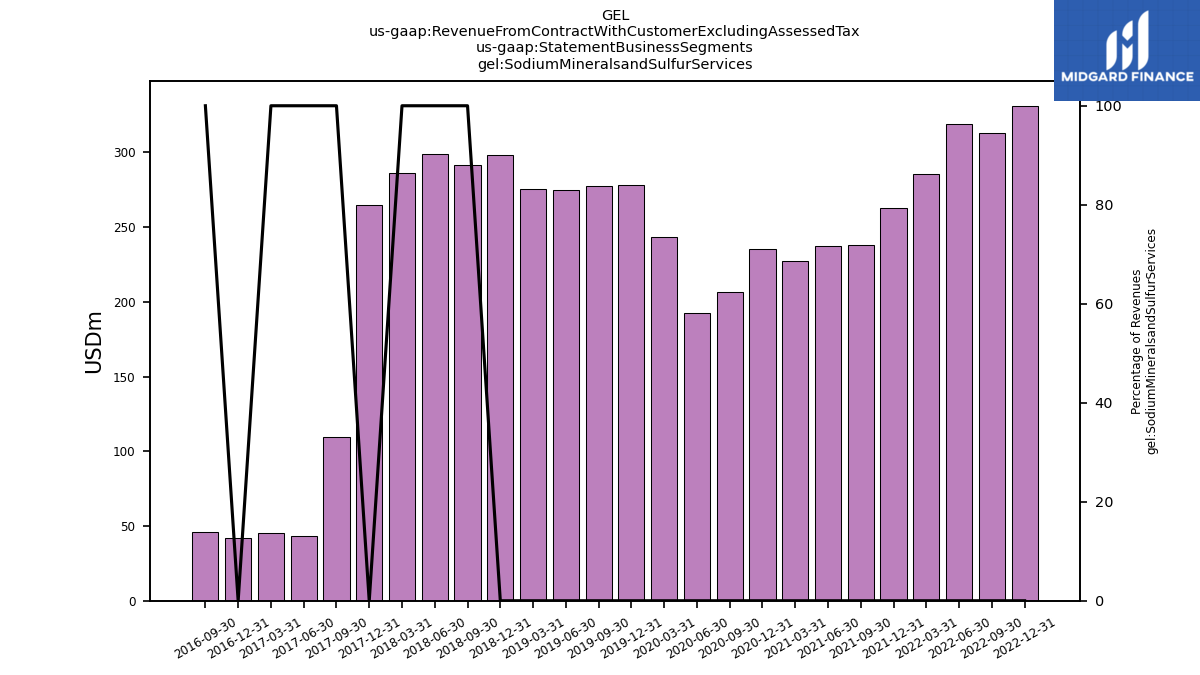
| Revenue From Contract With Customer Excluding Assessed Tax | 807.62 | 804.66 | 790.61 | 714.04 | 721.25 | 721.73 | 631.95 | 581.58 | 518.82 | 503.86 | 521.22 | 453.14 | 443.12 | 388.47 | 539.92 | 604.33 | 621.70 | 634.78 | 620.01 | 689.30 | 745.28 | 752.39 | 725.81 | 720.05 | 486.11 | 406.72 | 415.49 | 428.05 | 460.05 | 445.98 | 378.41 | 491.01 | 572.33 | 656.33 | 526.86 | 847.28 | 964.11 | 1015.05 | 1019.72 | 961.03 | 1259.82 | 1213.66 | 1147.21 | 1054.07 | 942.33 | 922.67 | 932.94 | 806.88 | 830.20 | 762.79 | 689.80 | 602.24 | 576.01 | 456.54 | 466.53 | |
| Operating | 807.62 | 804.66 | 790.61 | 714.04 | 721.25 | 721.73 | 631.95 | 581.58 | 518.82 | 503.86 | 521.22 | 453.14 | 443.12 | 388.47 | 539.92 | 604.33 | 621.70 | 634.78 | 620.01 | 689.30 | 745.28 | 752.39 | 725.81 | NA | NA | NA | NA | NA | NA | NA | NA | NA | NA | NA | NA | NA | NA | NA | NA | NA | NA | NA | NA | NA | NA | NA | NA | NA | NA | NA | NA | NA | NA | NA | NA | |
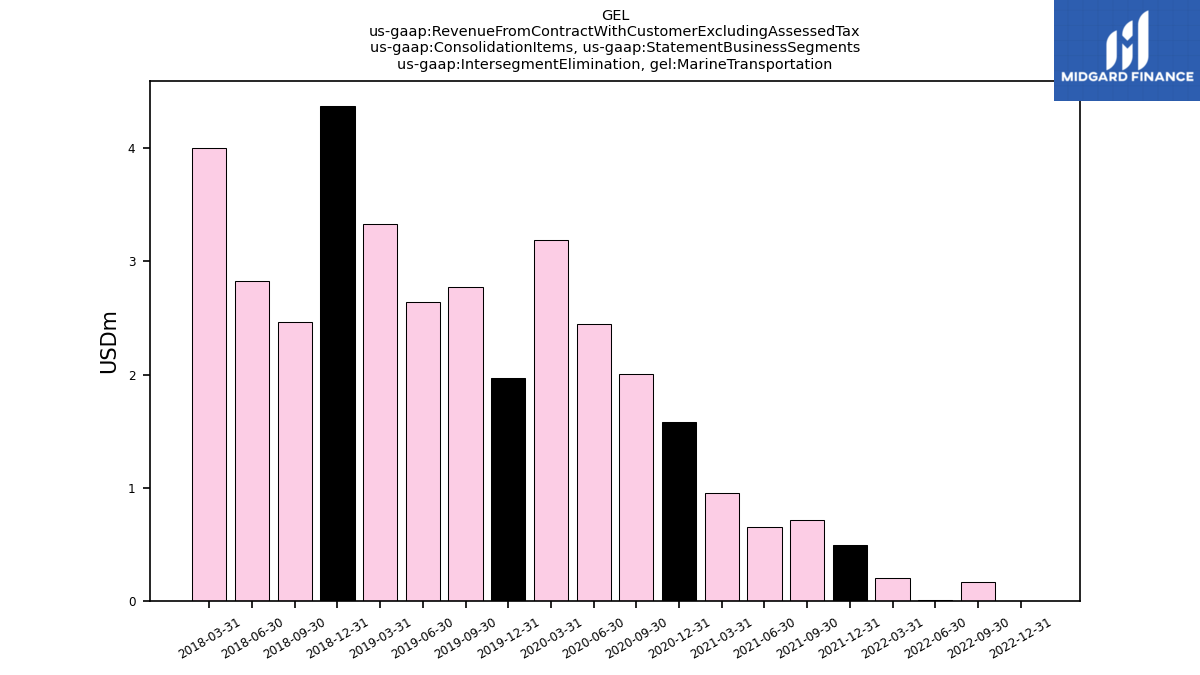
| Intersegment Elimination, Marine Transportation | NA | NA | NA | 0.00 | 0.17 | 0.00 | 0.20 | 0.49 | 0.72 | 0.66 | 0.95 | 1.58 | 2.01 | 2.45 | 3.19 | 1.97 | 2.77 | 2.64 | 3.33 | 4.38 | 2.47 | 2.83 | 4.00 | NA | NA | NA | NA | NA | NA | NA | NA | NA | NA | NA | NA | NA | NA | NA | NA | NA | NA | NA | NA | NA | NA | NA | NA | NA | NA | NA | NA | NA | NA | NA | NA | |
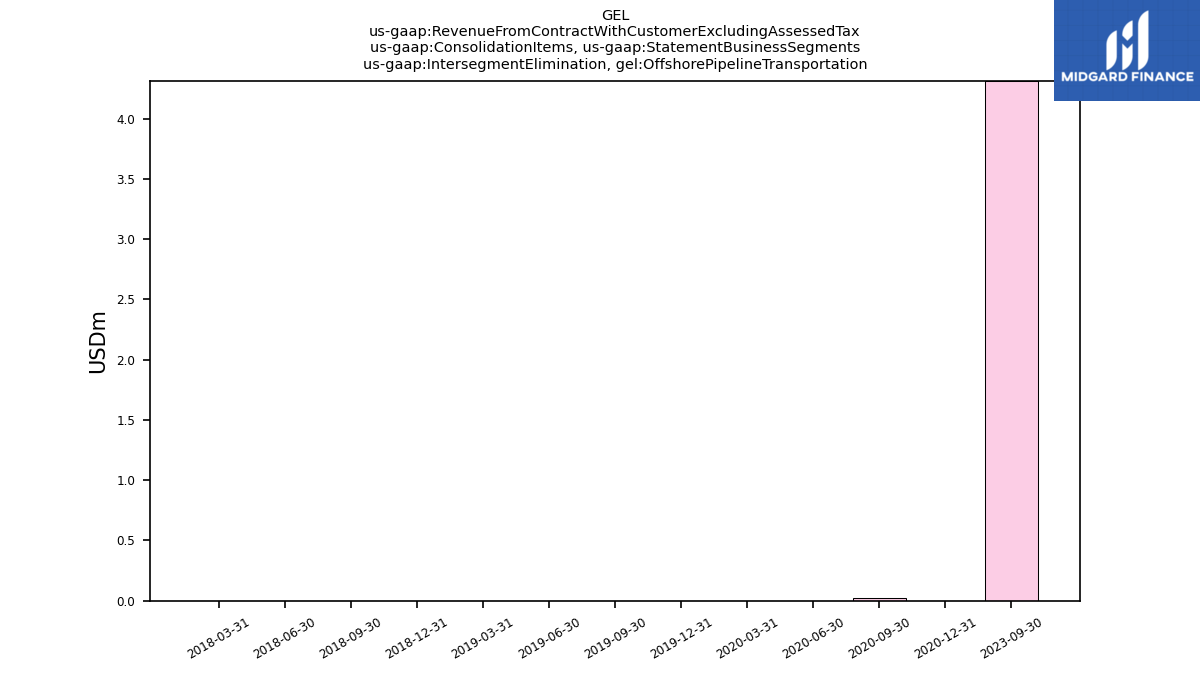
| Intersegment Elimination, Offshore Pipeline Transportation | 4.31 | NA | NA | NA | NA | NA | NA | NA | NA | NA | NA | 0.00 | 0.02 | 0.00 | 0.00 | 0.00 | 0.00 | 0.00 | 0.00 | 0.00 | 0.00 | 0.00 | 0.00 | NA | NA | NA | NA | NA | NA | NA | NA | NA | NA | NA | NA | NA | NA | NA | NA | NA | NA | NA | NA | NA | NA | NA | NA | NA | NA | NA | NA | NA | NA | NA | NA | |
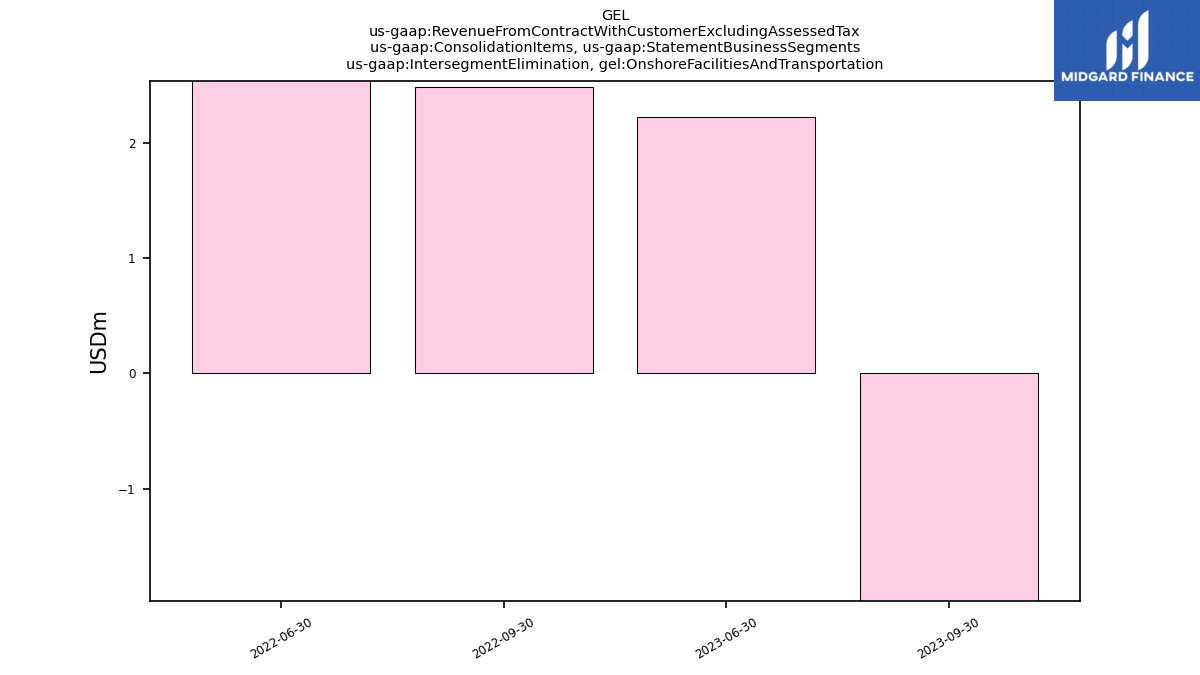
| Intersegment Elimination, Onshore Facilities And Transportation | -1.97 | 2.22 | NA | NA | 2.48 | 2.58 | NA | NA | NA | NA | NA | NA | NA | NA | NA | NA | NA | NA | NA | NA | NA | NA | NA | NA | NA | NA | NA | NA | NA | NA | NA | NA | NA | NA | NA | NA | NA | NA | NA | NA | NA | NA | NA | NA | NA | NA | NA | NA | NA | NA | NA | NA | NA | NA | NA | |
| Intersegment Elimination, Onshore Facilitiesand Transportation | NA | NA | 2.26 | 2.58 | 2.48 | 2.58 | 2.14 | 1.65 | 1.68 | 1.51 | 1.07 | 0.48 | 0.15 | -0.53 | -1.04 | 0.01 | -0.89 | -0.73 | -1.47 | -2.54 | -0.70 | -0.78 | -2.51 | NA | NA | NA | NA | NA | NA | NA | NA | NA | NA | NA | NA | NA | NA | NA | NA | NA | NA | NA | NA | NA | NA | NA | NA | NA | NA | NA | NA | NA | NA | NA | NA | |
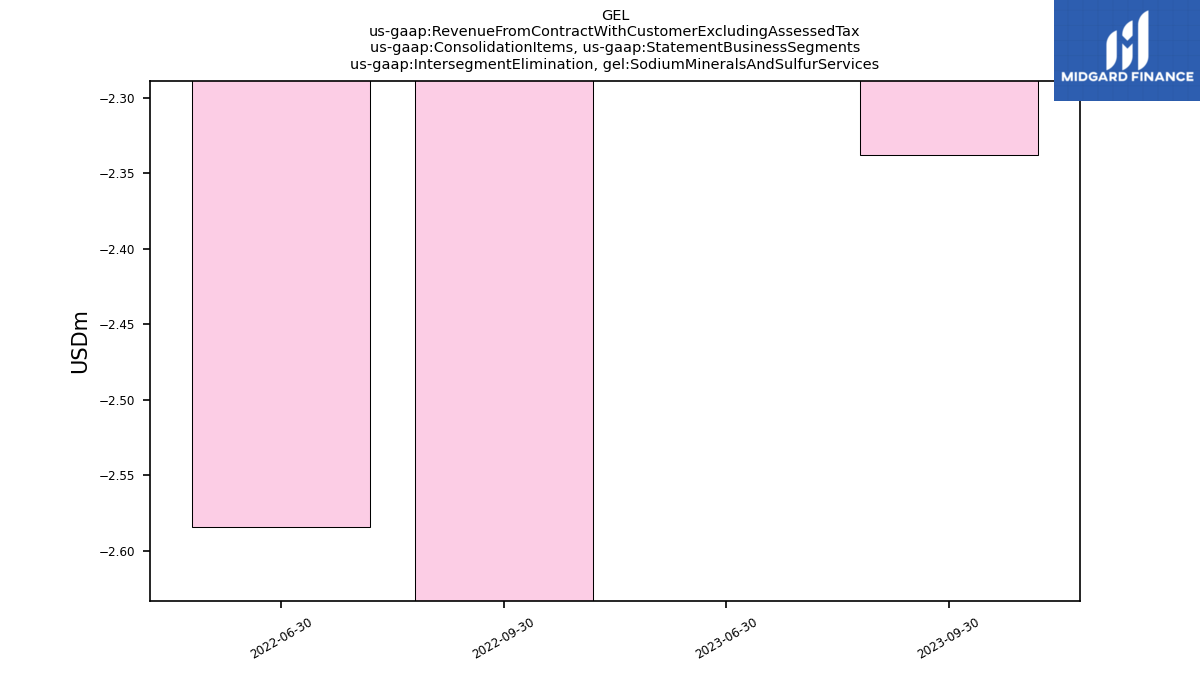
| Intersegment Elimination, Sodium Minerals And Sulfur Services | -2.34 | -2.22 | NA | NA | -2.65 | -2.58 | NA | NA | NA | NA | NA | NA | NA | NA | NA | NA | NA | NA | NA | NA | NA | NA | NA | NA | NA | NA | NA | NA | NA | NA | NA | NA | NA | NA | NA | NA | NA | NA | NA | NA | NA | NA | NA | NA | NA | NA | NA | NA | NA | NA | NA | NA | NA | NA | NA | |
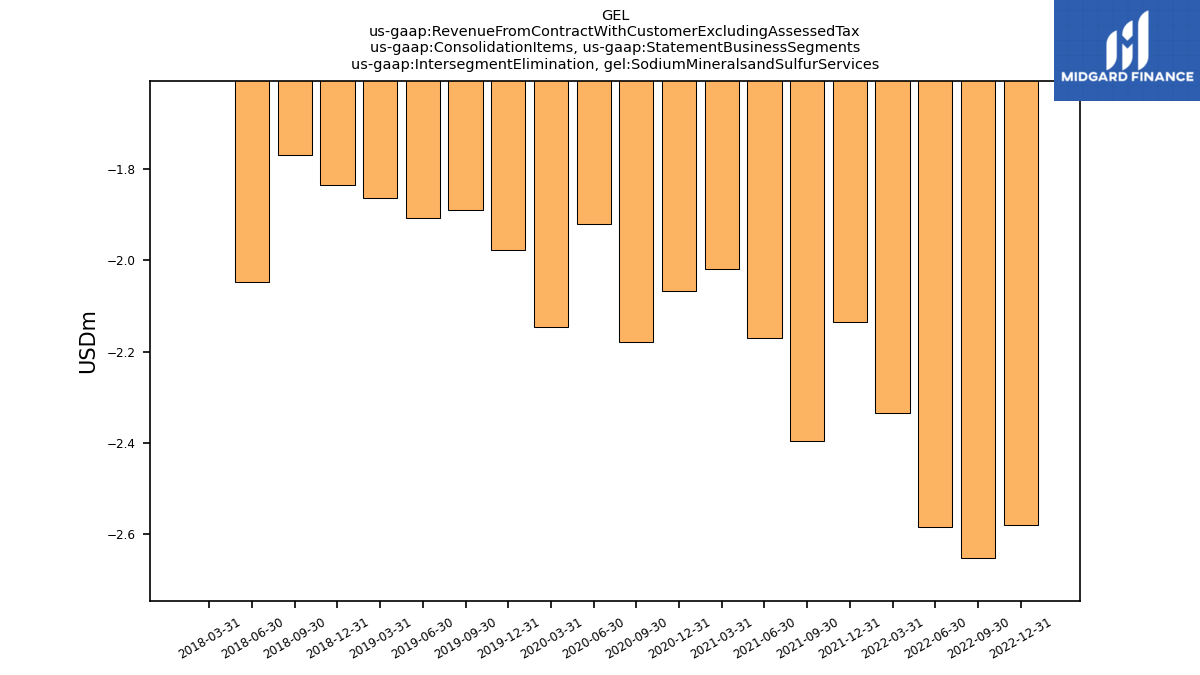
| Intersegment Elimination, Sodium Mineralsand Sulfur Services | NA | NA | -2.26 | -2.58 | -2.65 | -2.58 | -2.33 | -2.13 | -2.40 | -2.17 | -2.02 | -2.07 | -2.18 | -1.92 | -2.15 | -1.98 | -1.89 | -1.91 | -1.86 | -1.83 | -1.77 | -2.05 | -1.49 | NA | NA | NA | NA | NA | NA | NA | NA | NA | NA | NA | NA | NA | NA | NA | NA | NA | NA | NA | NA | NA | NA | NA | NA | NA | NA | NA | NA | NA | NA | NA | NA | |
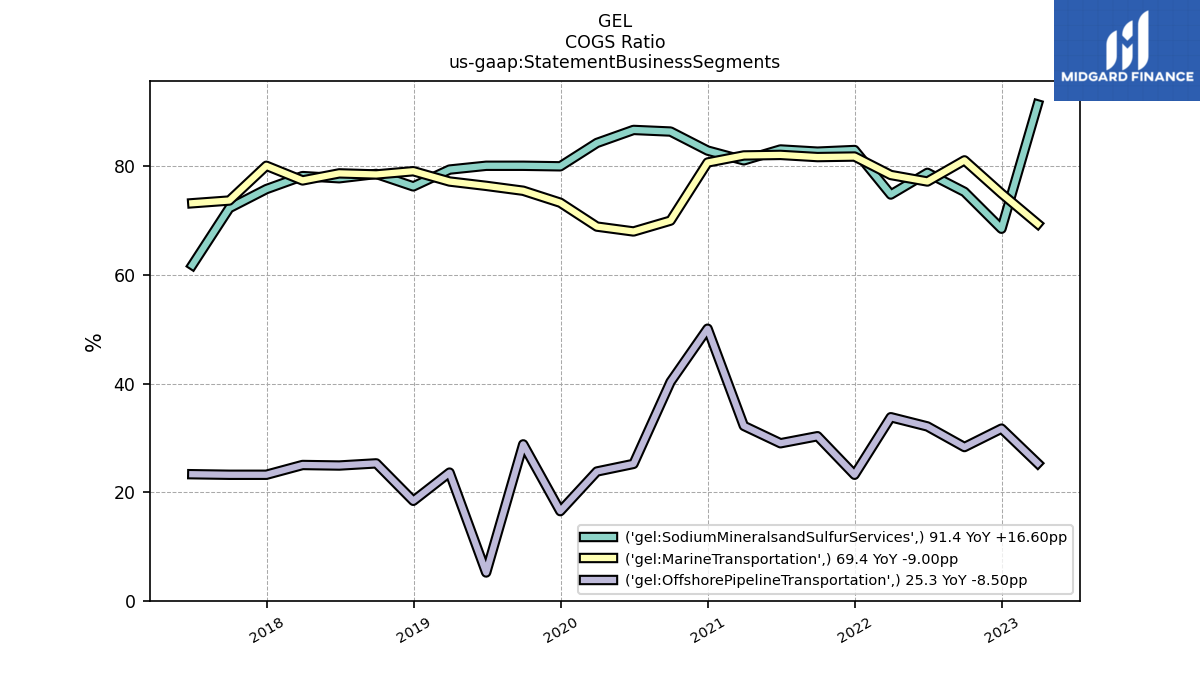
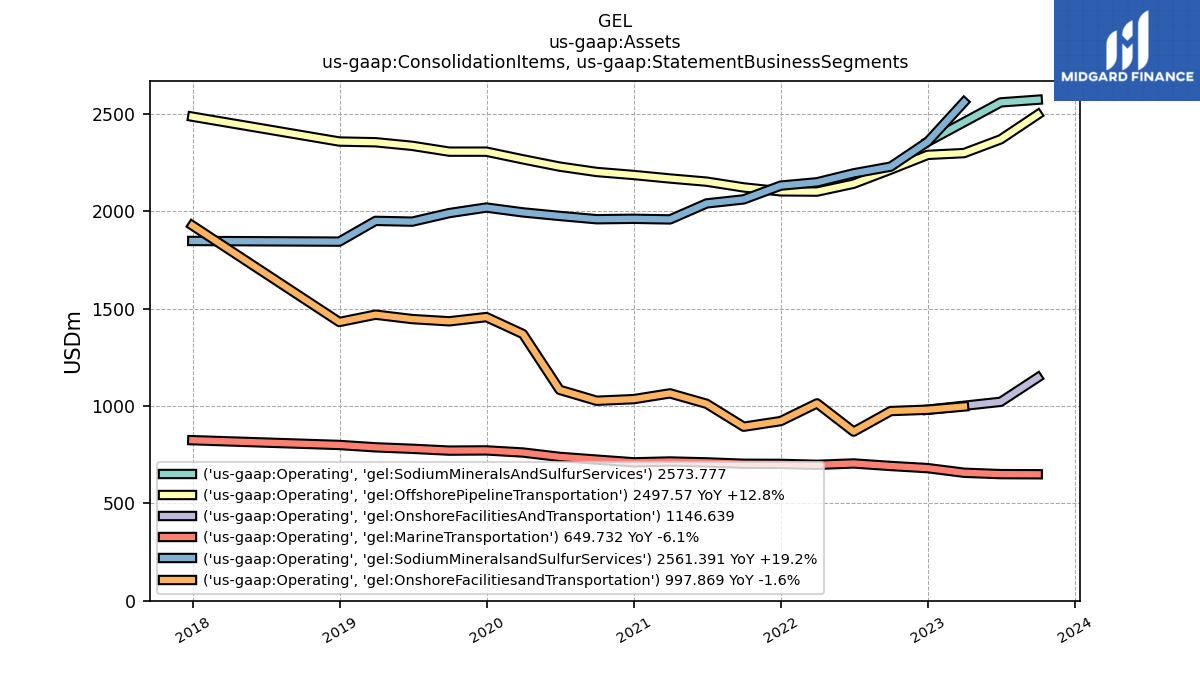
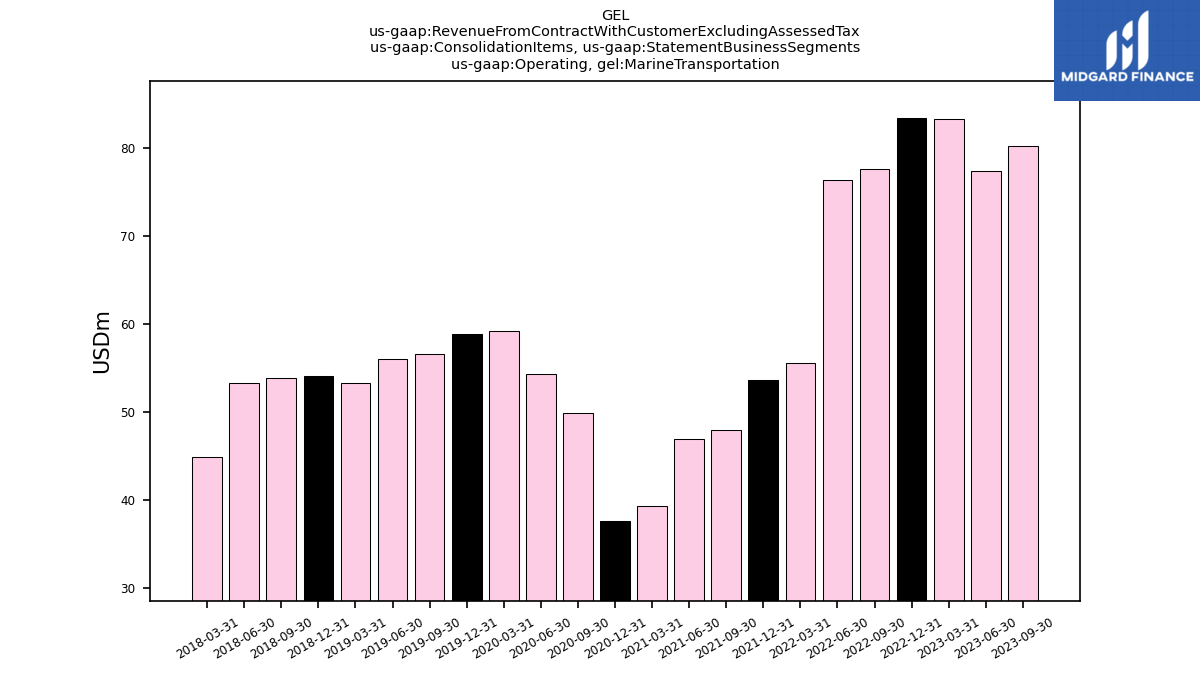
| Operating, Marine Transportation | 80.22 | 77.34 | 83.23 | 83.41 | 77.63 | 76.32 | 55.58 | 53.66 | 48.00 | 46.97 | 39.38 | 37.70 | 49.91 | 54.27 | 59.16 | 58.92 | 56.63 | 56.07 | 53.32 | 54.15 | 53.83 | 53.36 | 44.93 | NA | NA | NA | NA | NA | NA | NA | NA | NA | NA | NA | NA | NA | NA | NA | NA | NA | NA | NA | NA | NA | NA | NA | NA | NA | NA | NA | NA | NA | NA | NA | NA | |
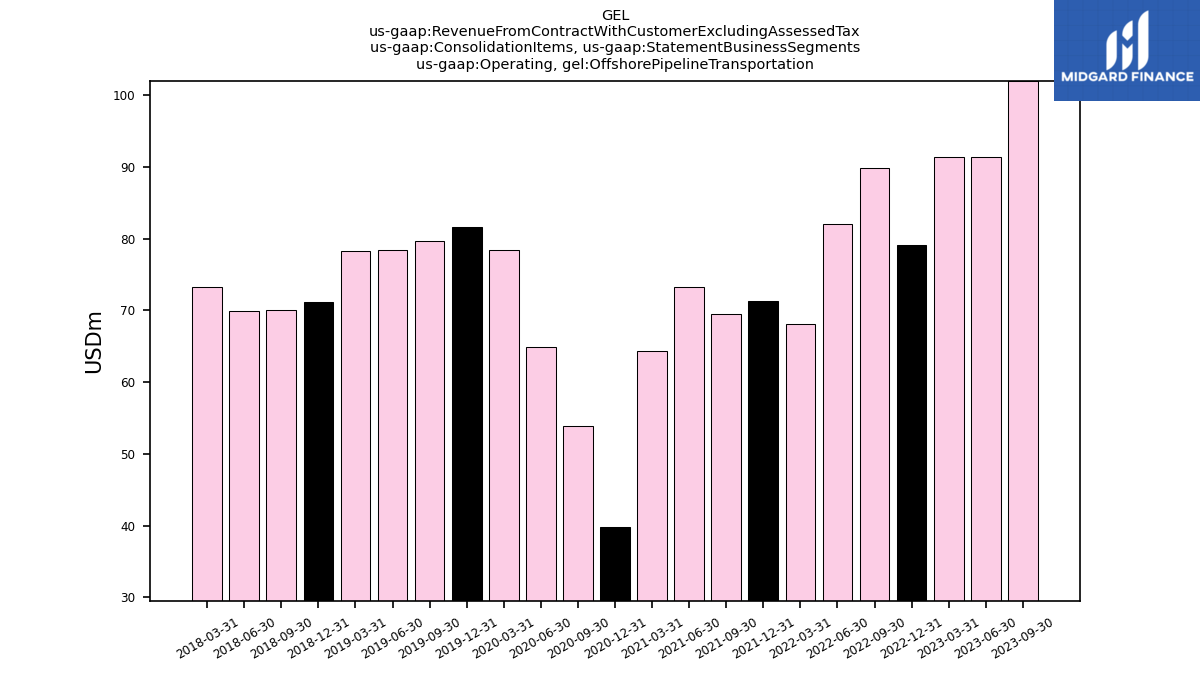
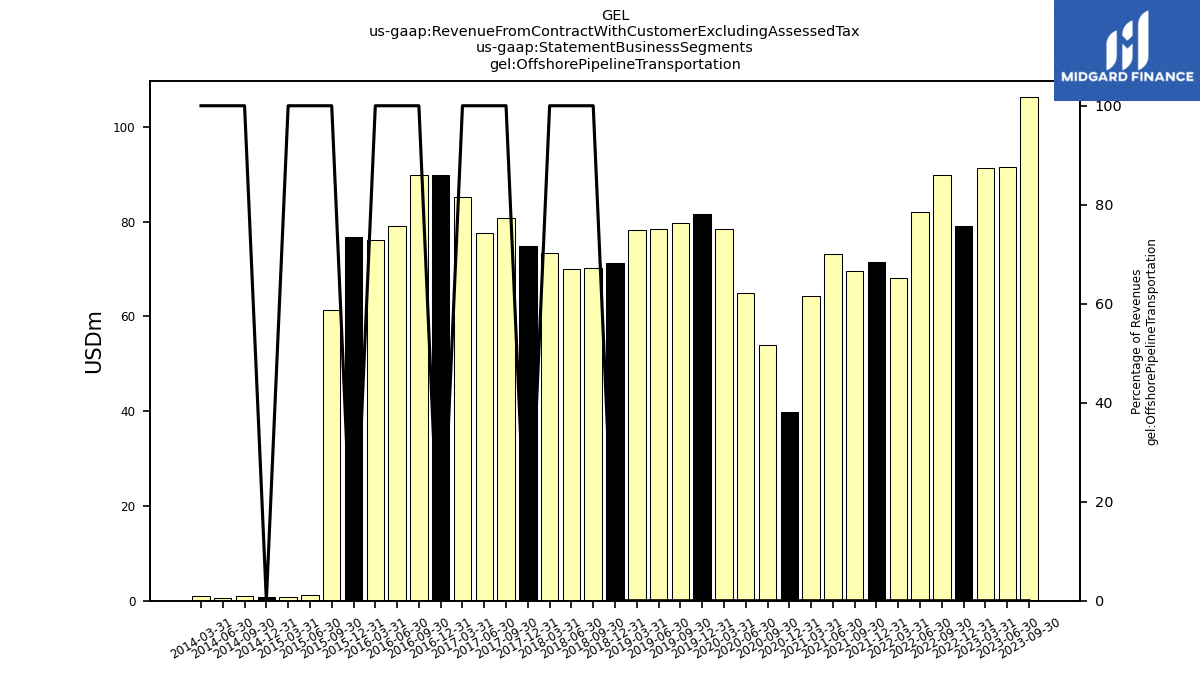
| Operating, Offshore Pipeline Transportation | 101.98 | 91.46 | 91.39 | 79.09 | 89.81 | 82.08 | 68.07 | 71.38 | 69.48 | 73.22 | 64.38 | 39.86 | 53.87 | 64.96 | 78.43 | 81.63 | 79.74 | 78.43 | 78.32 | 71.20 | 70.11 | 69.97 | 73.26 | NA | NA | NA | NA | NA | NA | NA | NA | NA | NA | NA | NA | NA | NA | NA | NA | NA | NA | NA | NA | NA | NA | NA | NA | NA | NA | NA | NA | NA | NA | NA | NA | |
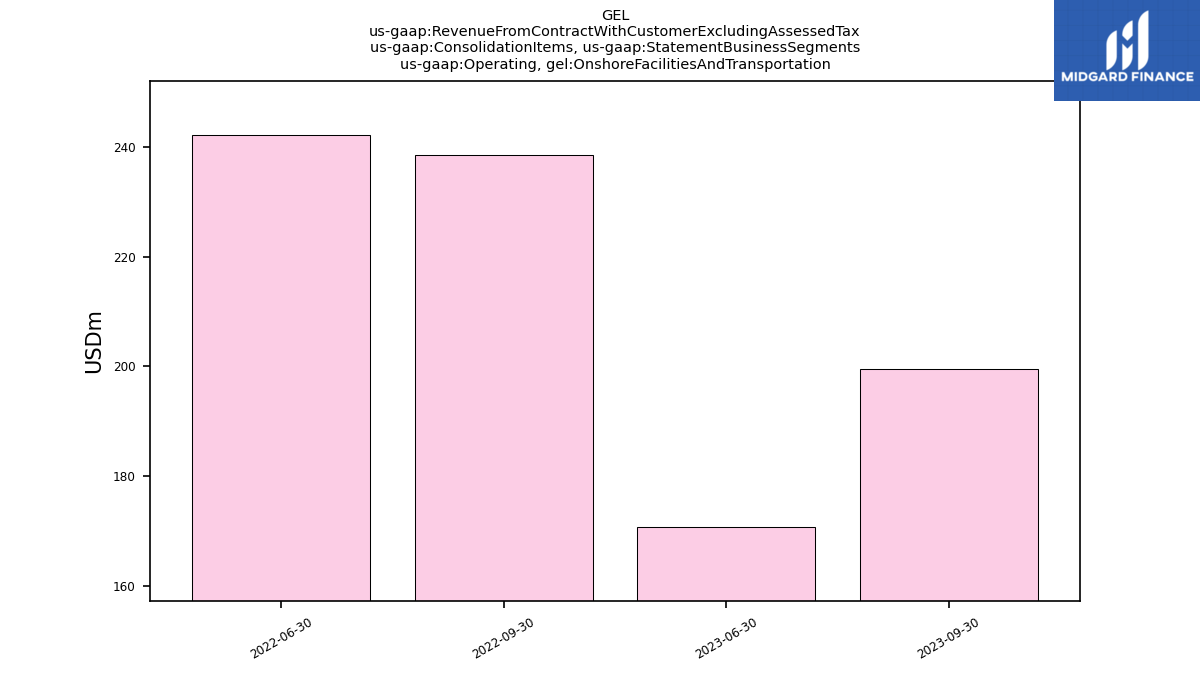
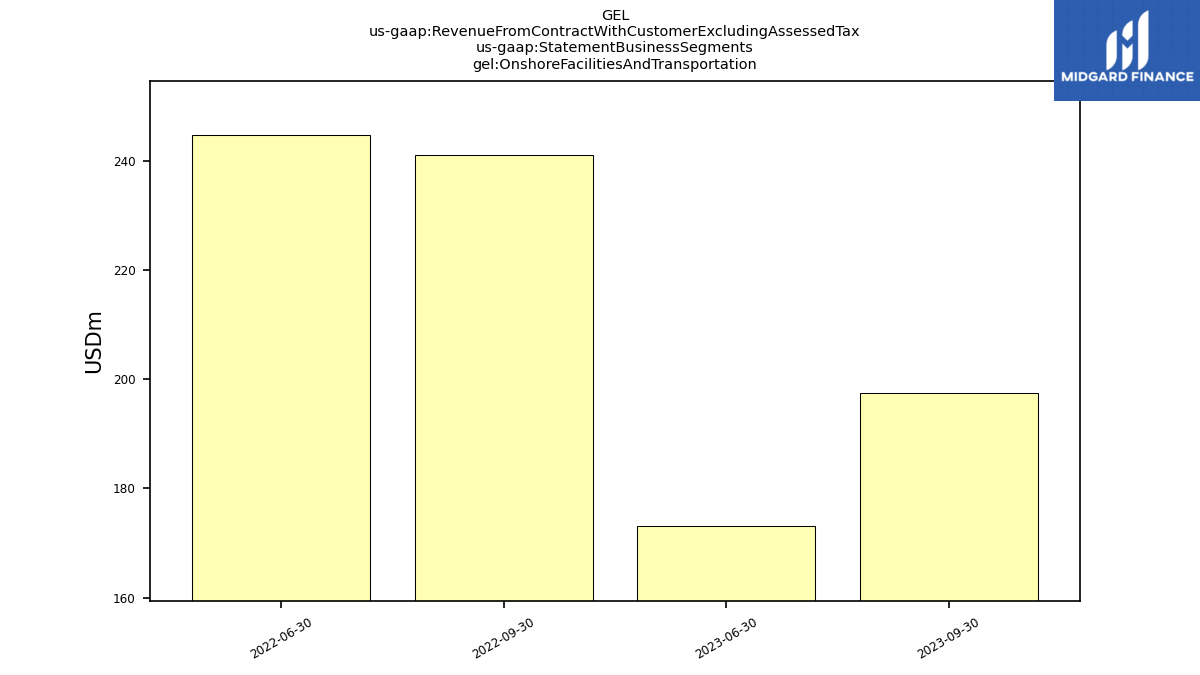
| Operating, Onshore Facilities And Transportation | 199.50 | 170.78 | NA | NA | 238.48 | 242.13 | NA | NA | NA | NA | NA | NA | NA | NA | NA | NA | NA | NA | NA | NA | NA | NA | NA | NA | NA | NA | NA | NA | NA | NA | NA | NA | NA | NA | NA | NA | NA | NA | NA | NA | NA | NA | NA | NA | NA | NA | NA | NA | NA | NA | NA | NA | NA | NA | NA | |
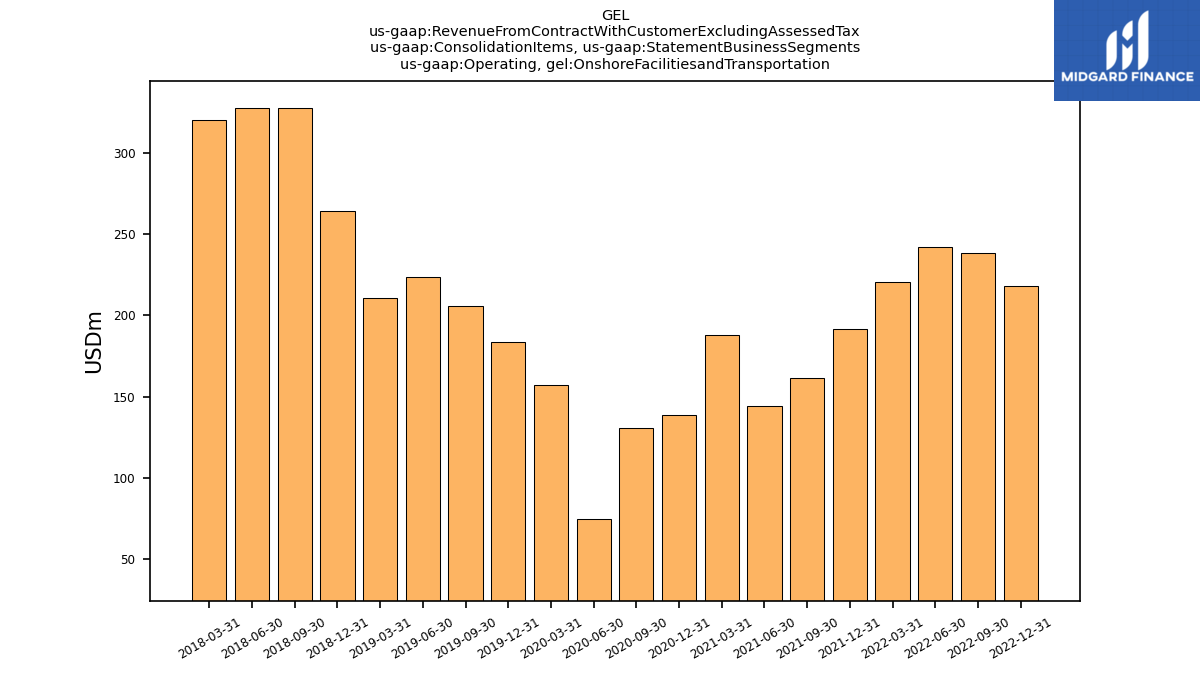
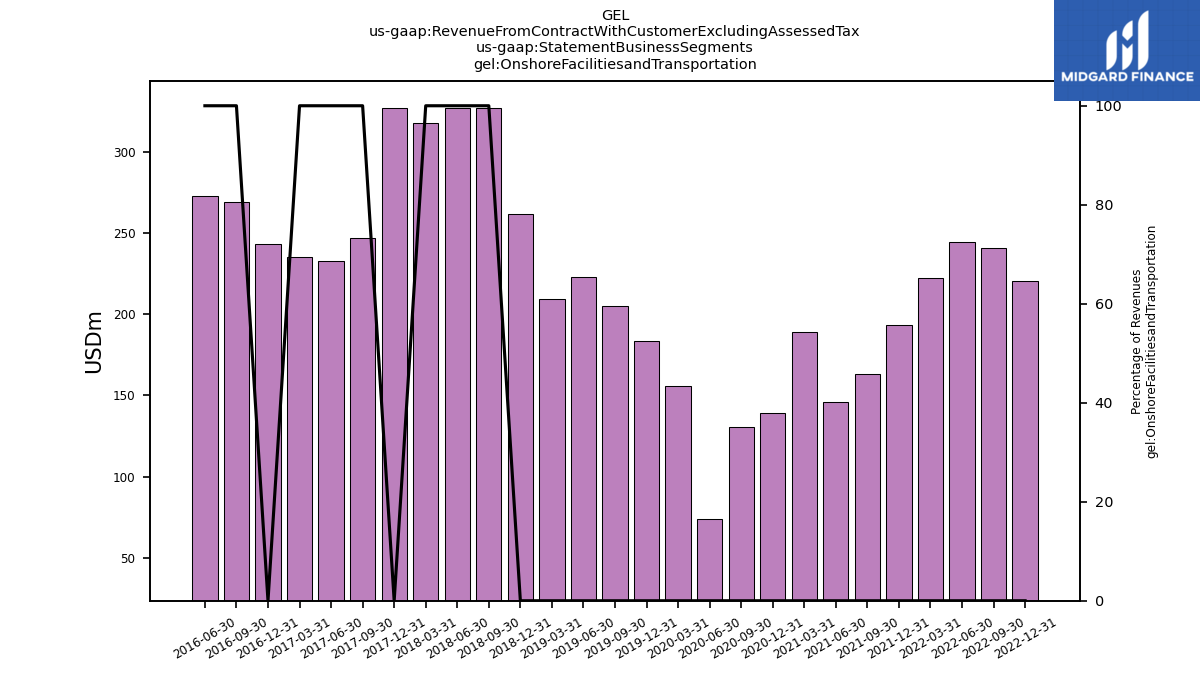
| Operating, Onshore Facilitiesand Transportation | NA | NA | 169.09 | 217.84 | 238.48 | 242.13 | 220.29 | 191.80 | 161.30 | 144.41 | 188.15 | 138.49 | 130.44 | 74.69 | 156.80 | 183.43 | 205.91 | 223.78 | 211.03 | 264.19 | 327.84 | 328.13 | 320.21 | NA | NA | NA | NA | NA | NA | NA | NA | NA | NA | NA | NA | NA | NA | NA | NA | NA | NA | NA | NA | NA | NA | NA | NA | NA | NA | NA | NA | NA | NA | NA | NA | |
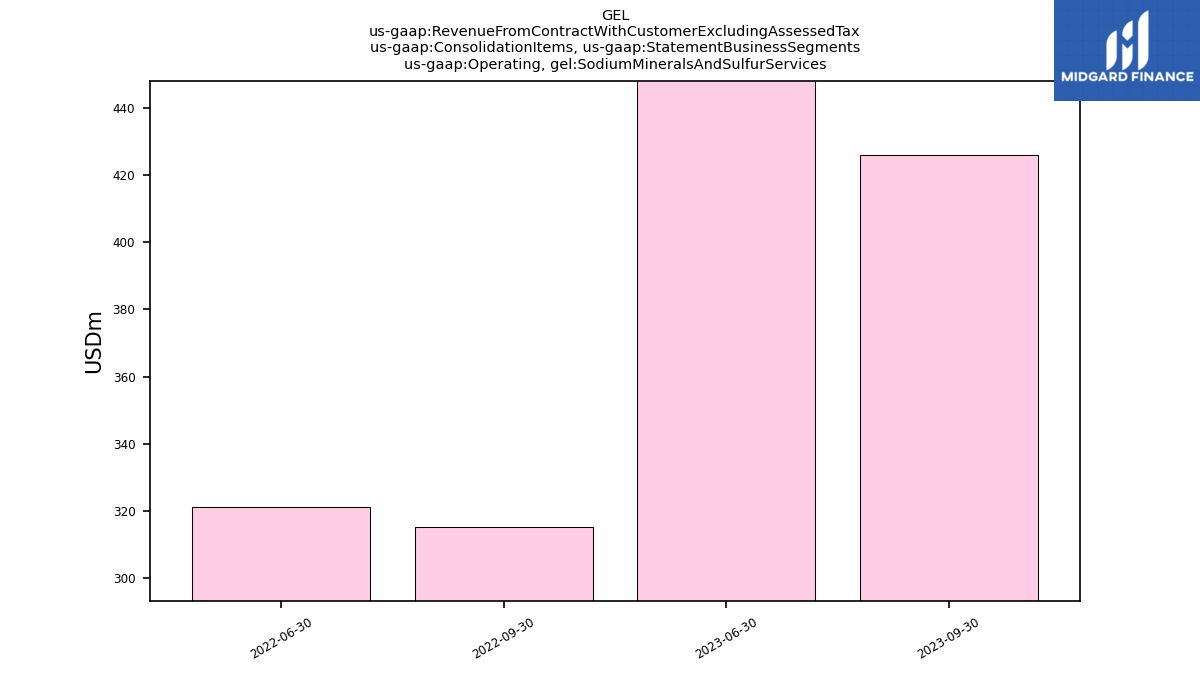
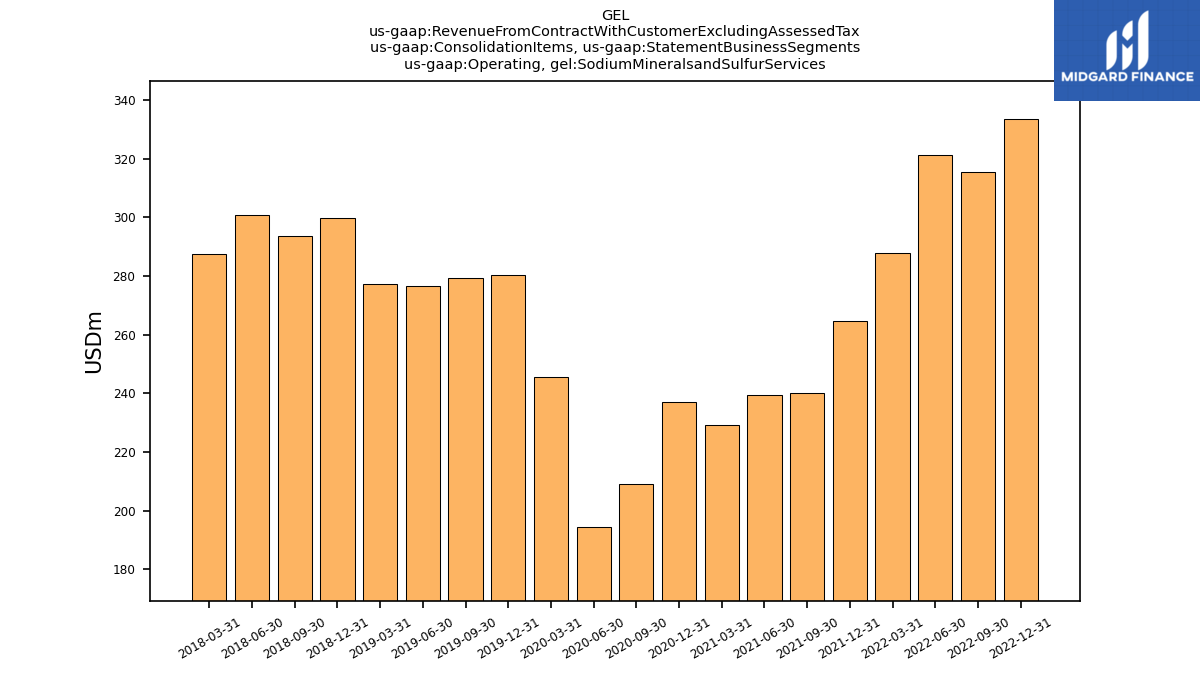
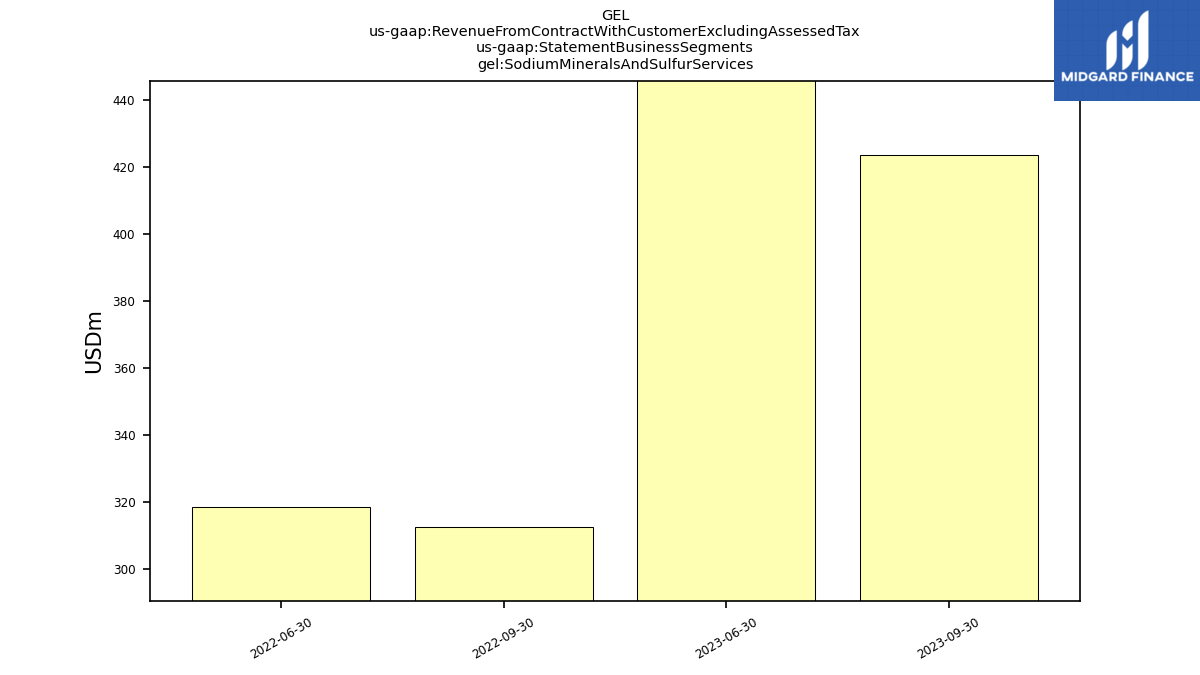
| Operating, Sodium Minerals And Sulfur Services | 425.91 | 465.08 | NA | NA | 315.33 | 321.19 | NA | NA | NA | NA | NA | NA | NA | NA | NA | NA | NA | NA | NA | NA | NA | NA | NA | NA | NA | NA | NA | NA | NA | NA | NA | NA | NA | NA | NA | NA | NA | NA | NA | NA | NA | NA | NA | NA | NA | NA | NA | NA | NA | NA | NA | NA | NA | NA | NA | |
| Operating, Sodium Mineralsand Sulfur Services | NA | NA | 446.91 | 333.70 | 315.33 | 321.19 | 288.01 | 264.74 | 240.05 | 239.26 | 229.31 | 237.09 | 208.91 | 194.54 | 245.53 | 280.35 | 279.42 | 276.51 | 277.35 | 299.76 | 293.49 | 300.93 | 287.40 | NA | NA | NA | NA | NA | NA | NA | NA | NA | NA | NA | NA | NA | NA | NA | NA | NA | NA | NA | NA | NA | NA | NA | NA | NA | NA | NA | NA | NA | NA | NA | NA | |
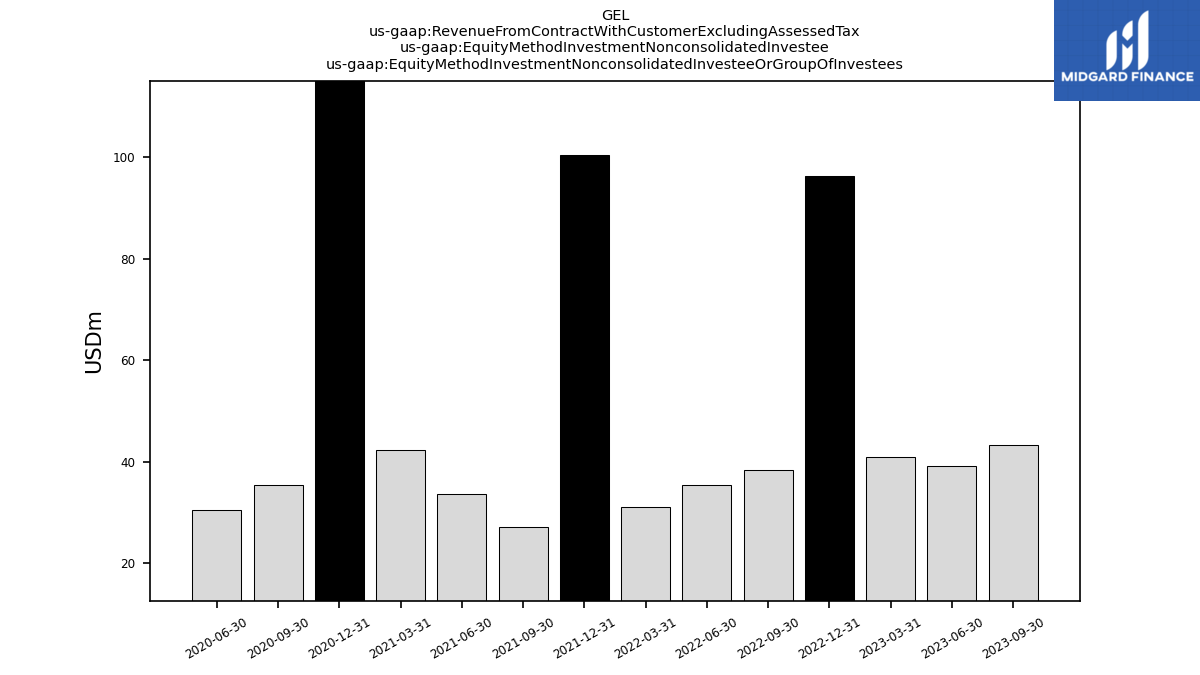
| Equity Method Investment Nonconsolidated Investee Or Group Of Investees | 43.32 | 39.25 | 40.90 | 96.23 | 38.32 | 35.38 | 31.19 | 100.40 | 27.26 | 33.76 | 42.41 | 116.03 | 35.35 | 30.42 | NA | NA | NA | NA | NA | NA | NA | NA | NA | NA | NA | NA | NA | NA | NA | NA | NA | NA | NA | NA | NA | NA | NA | NA | NA | NA | NA | NA | NA | NA | NA | NA | NA | NA | NA | NA | NA | NA | NA | NA | NA | |
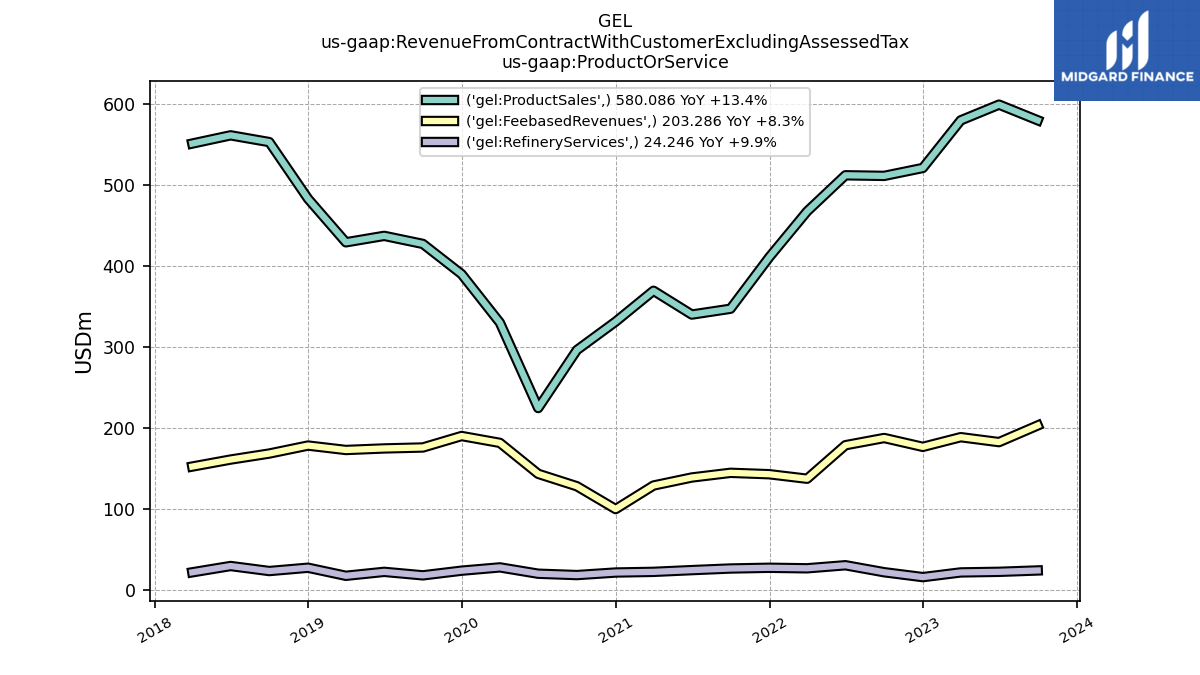
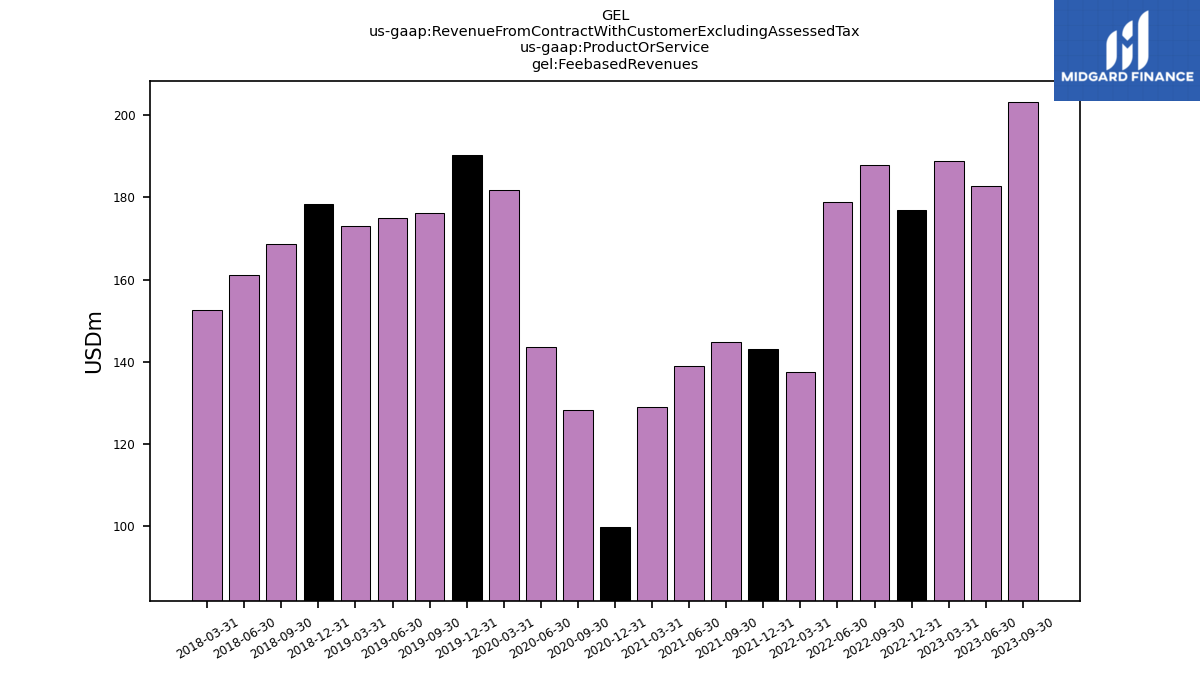
| Feebased Revenues | 203.29 | 182.70 | 188.81 | 176.84 | 187.78 | 178.88 | 137.47 | 143.07 | 144.80 | 139.02 | 129.11 | 99.99 | 128.21 | 143.53 | 181.76 | 190.24 | 176.08 | 174.90 | 172.98 | 178.46 | 168.60 | 161.16 | 152.53 | NA | NA | NA | NA | NA | NA | NA | NA | NA | NA | NA | NA | NA | NA | NA | NA | NA | NA | NA | NA | NA | NA | NA | NA | NA | NA | NA | NA | NA | NA | NA | NA | |
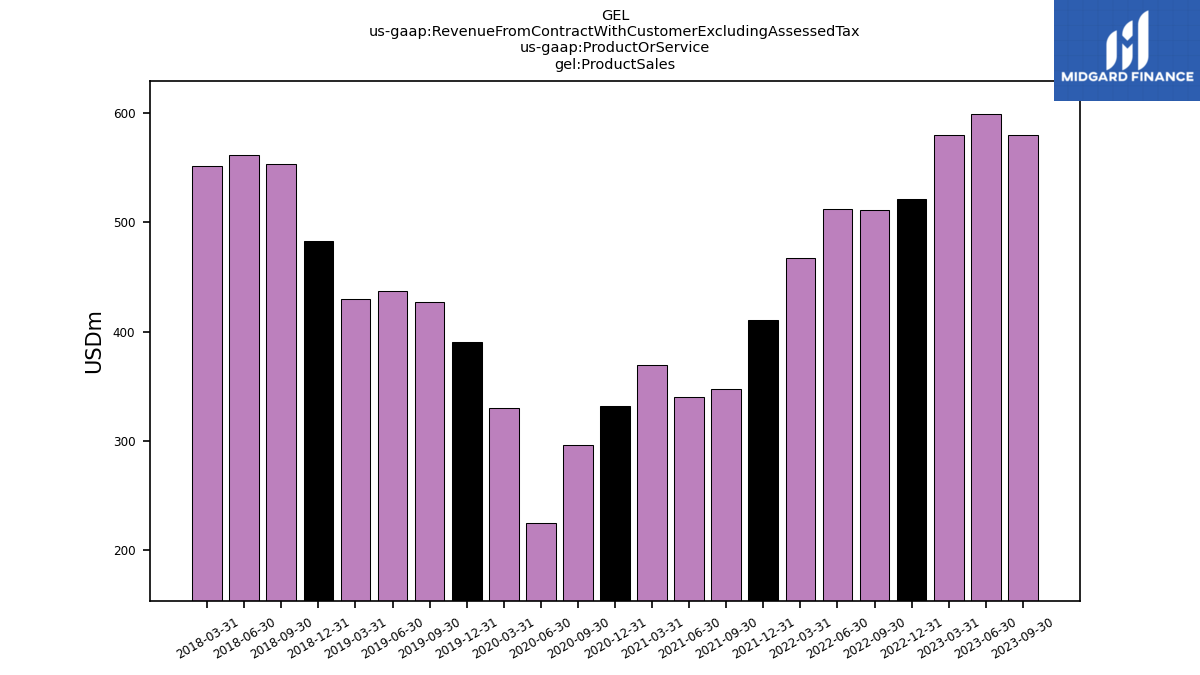
| Product Sales | 580.09 | 599.41 | 579.98 | 521.19 | 511.41 | 512.18 | 467.57 | 410.96 | 347.37 | 340.18 | 369.60 | 331.45 | 296.38 | 224.72 | 330.13 | 390.13 | 427.42 | 437.37 | 429.39 | 483.23 | 553.16 | 561.49 | 551.34 | NA | NA | NA | NA | NA | NA | NA | NA | NA | NA | NA | NA | NA | NA | NA | NA | NA | NA | NA | NA | NA | NA | NA | NA | NA | NA | NA | NA | NA | NA | NA | NA | |
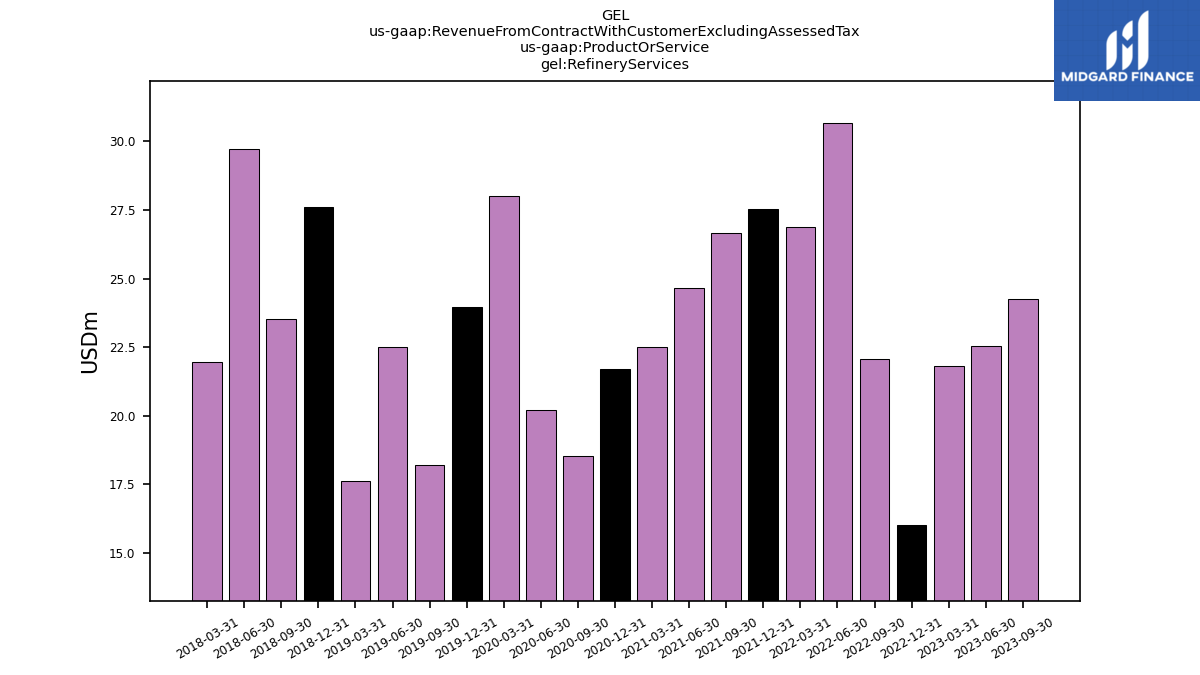
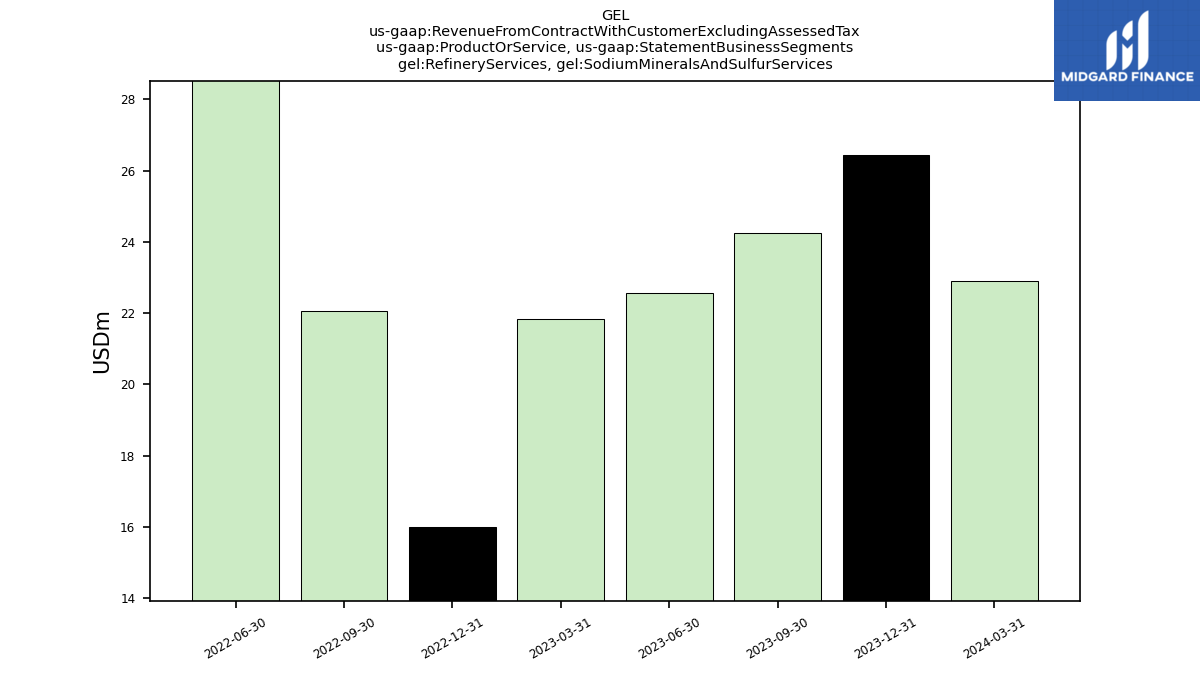
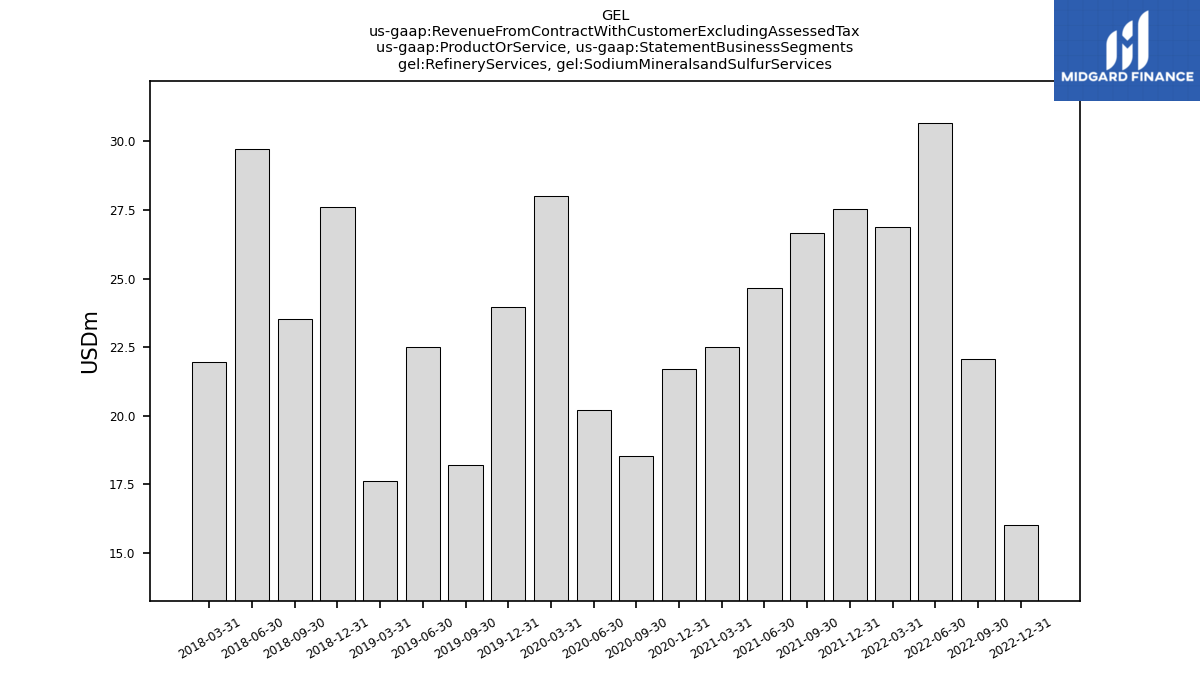
| Refinery Services | 24.25 | 22.55 | 21.82 | 16.01 | 22.06 | 30.67 | 26.90 | 27.55 | 26.65 | 24.65 | 22.51 | 21.69 | 18.53 | 20.21 | 28.02 | 23.96 | 18.20 | 22.52 | 17.64 | 27.61 | 23.52 | 29.73 | 21.95 | NA | NA | NA | NA | NA | NA | NA | NA | NA | NA | NA | NA | NA | NA | NA | NA | NA | NA | NA | NA | NA | NA | NA | NA | NA | NA | NA | NA | NA | NA | NA | NA | |
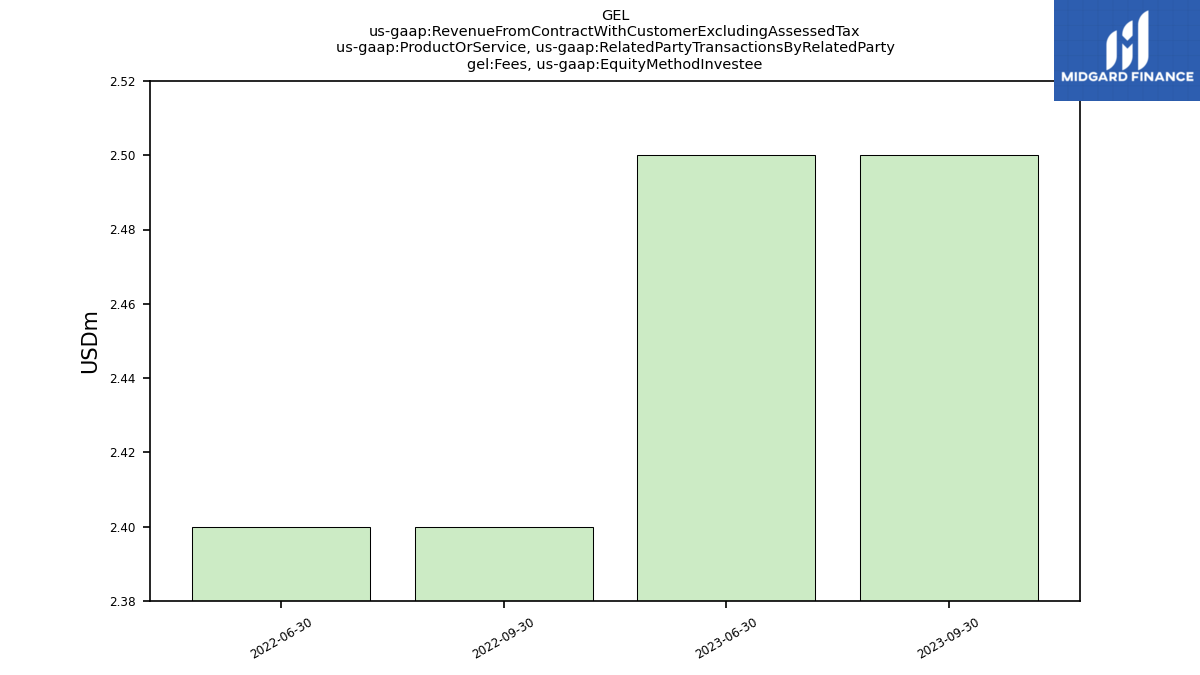
| Fees, Equity Method Investee | 2.50 | 2.50 | NA | NA | 2.40 | 2.40 | NA | NA | NA | NA | NA | NA | NA | NA | NA | NA | NA | NA | NA | NA | NA | NA | NA | NA | NA | NA | NA | NA | NA | NA | NA | NA | NA | NA | NA | NA | NA | NA | NA | NA | NA | NA | NA | NA | NA | NA | NA | NA | NA | NA | NA | NA | NA | NA | NA | |
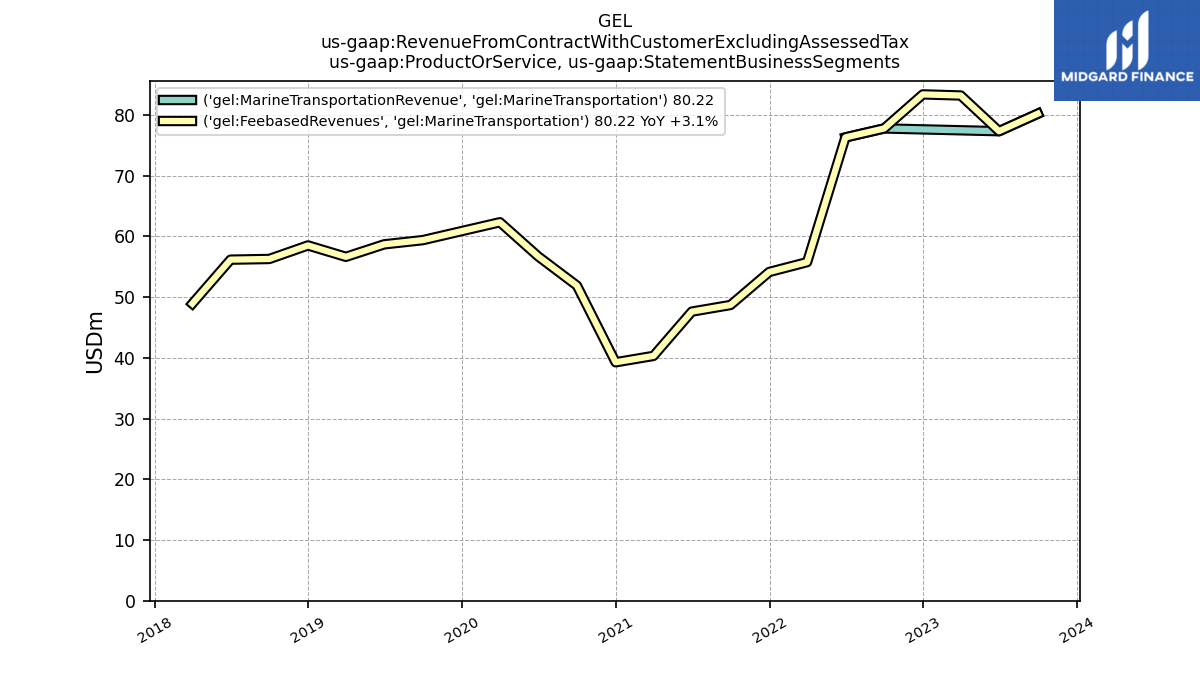
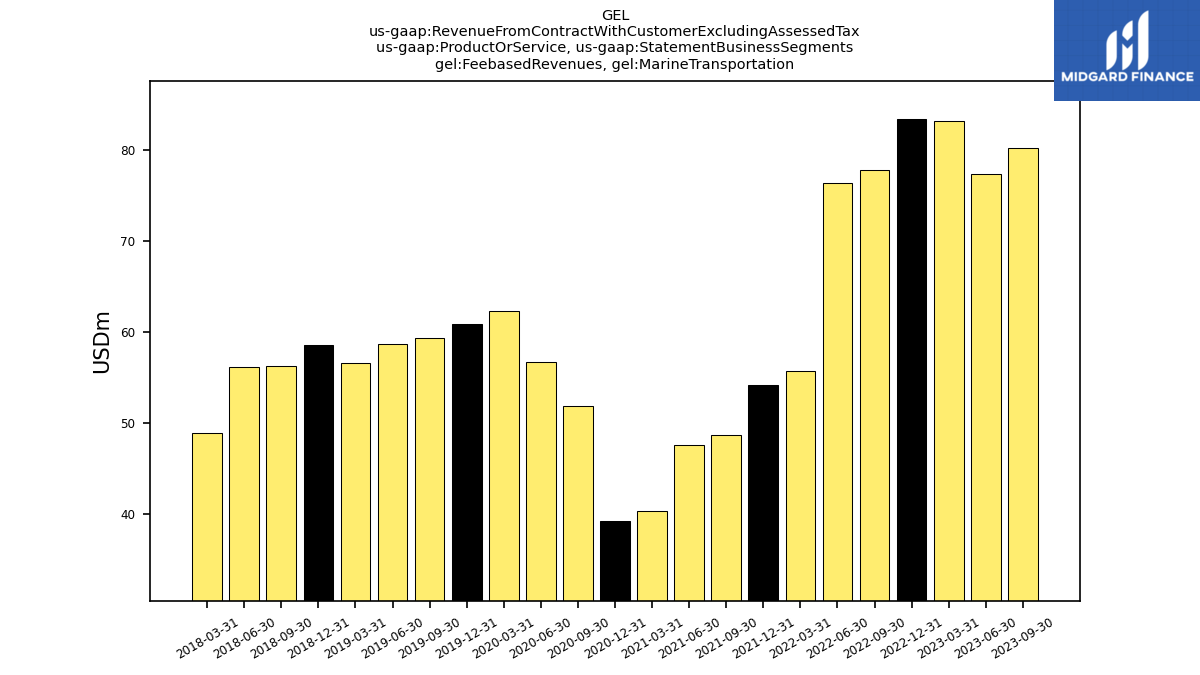
| Feebased Revenues, Marine Transportation | 80.22 | 77.34 | 83.23 | 83.41 | 77.80 | 76.32 | 55.77 | 54.15 | 48.72 | 47.63 | 40.33 | 39.28 | 51.91 | 56.72 | 62.35 | 60.88 | 59.40 | 58.71 | 56.65 | 58.53 | 56.30 | 56.19 | 48.93 | NA | NA | NA | NA | NA | NA | NA | NA | NA | NA | NA | NA | NA | NA | NA | NA | NA | NA | NA | NA | NA | NA | NA | NA | NA | NA | NA | NA | NA | NA | NA | NA | |
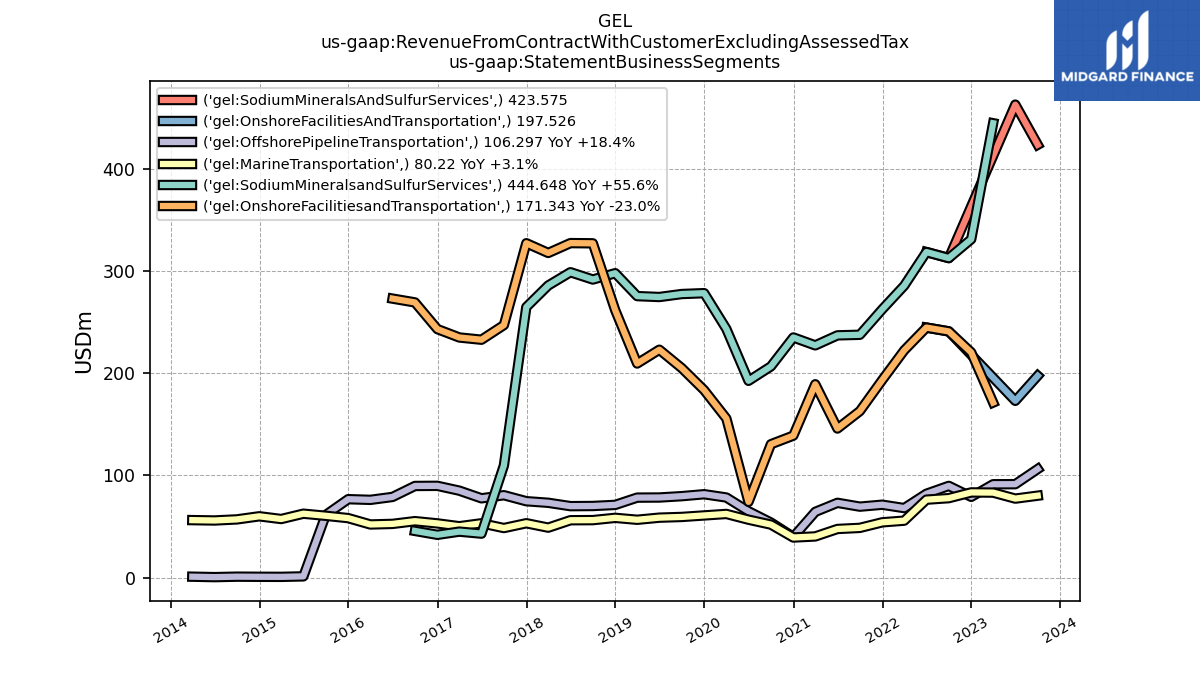
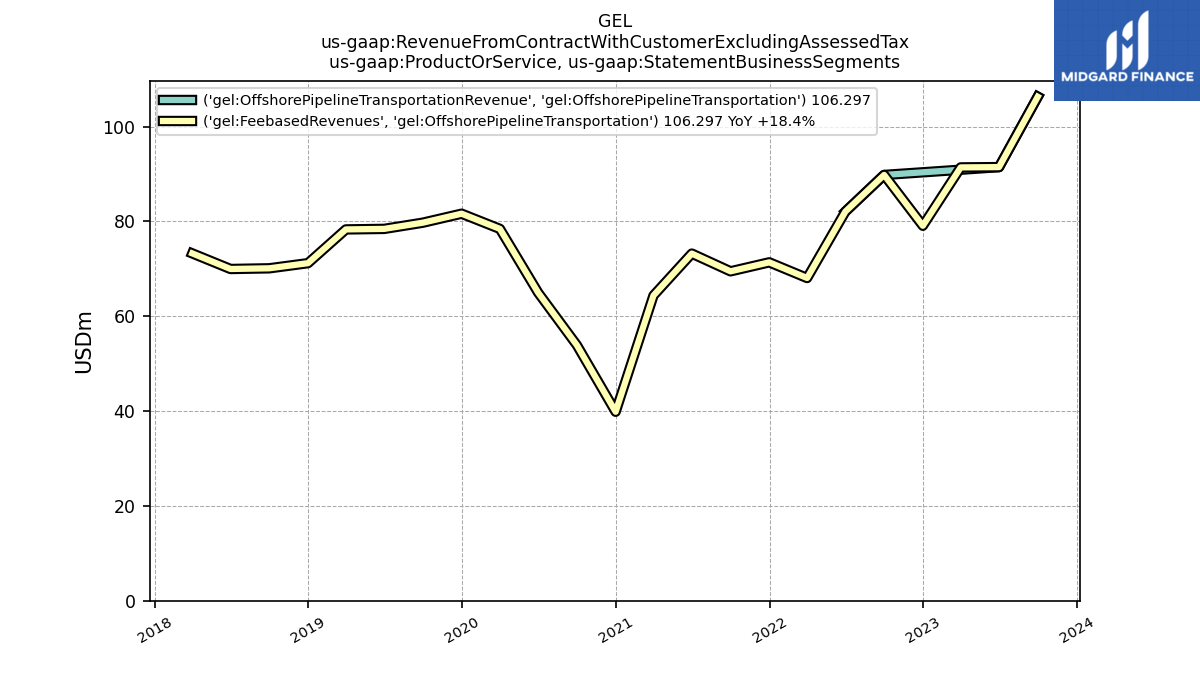
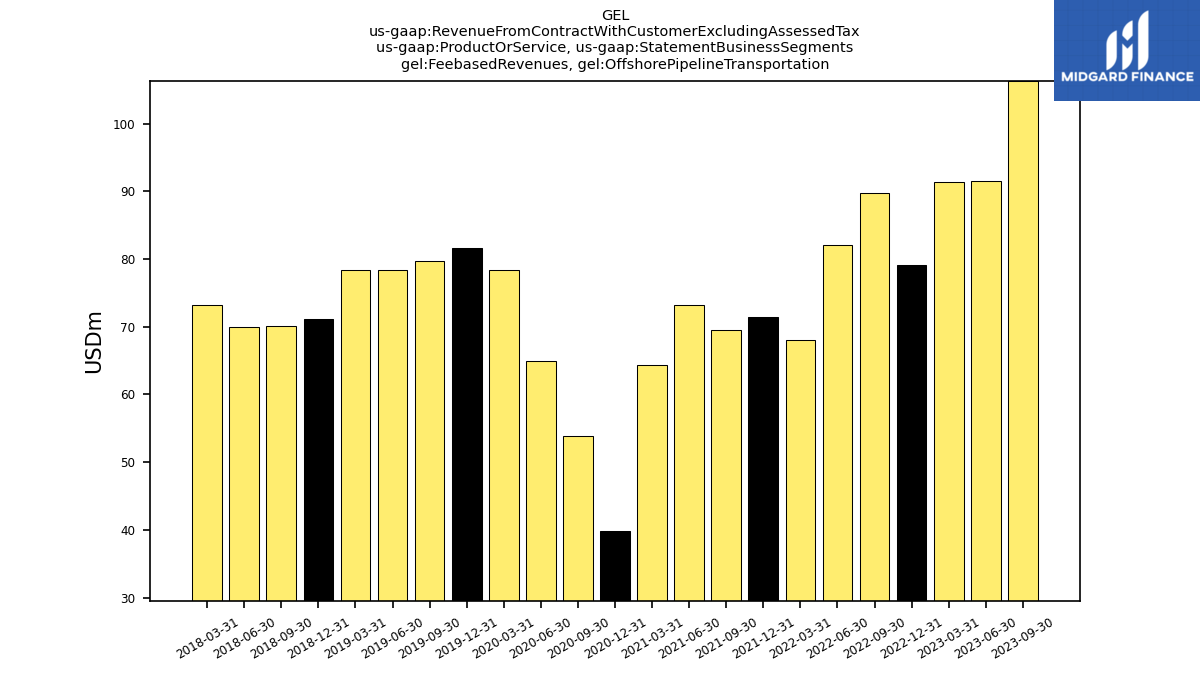
| Feebased Revenues, Offshore Pipeline Transportation | 106.30 | 91.46 | 91.39 | 79.09 | 89.81 | 82.08 | 68.07 | 71.38 | 69.48 | 73.22 | 64.38 | 39.86 | 53.89 | 64.96 | 78.43 | 81.63 | 79.74 | 78.43 | 78.32 | 71.20 | 70.11 | 69.97 | 73.26 | NA | NA | NA | NA | NA | NA | NA | NA | NA | NA | NA | NA | NA | NA | NA | NA | NA | NA | NA | NA | NA | NA | NA | NA | NA | NA | NA | NA | NA | NA | NA | NA | |
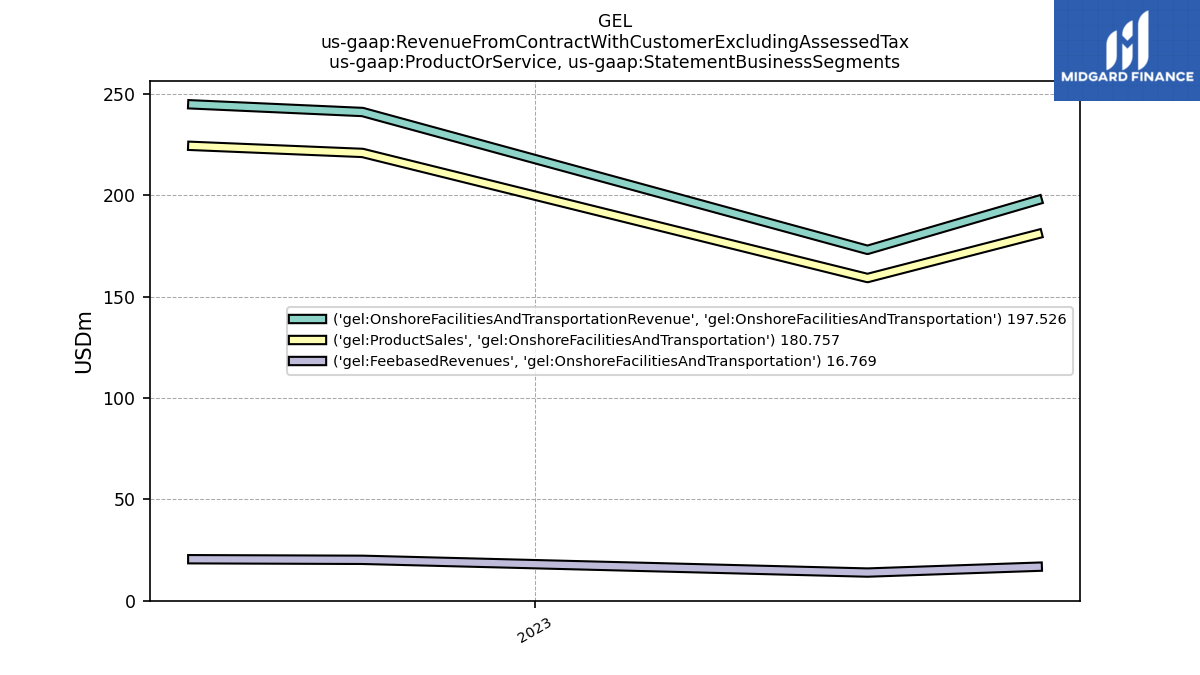
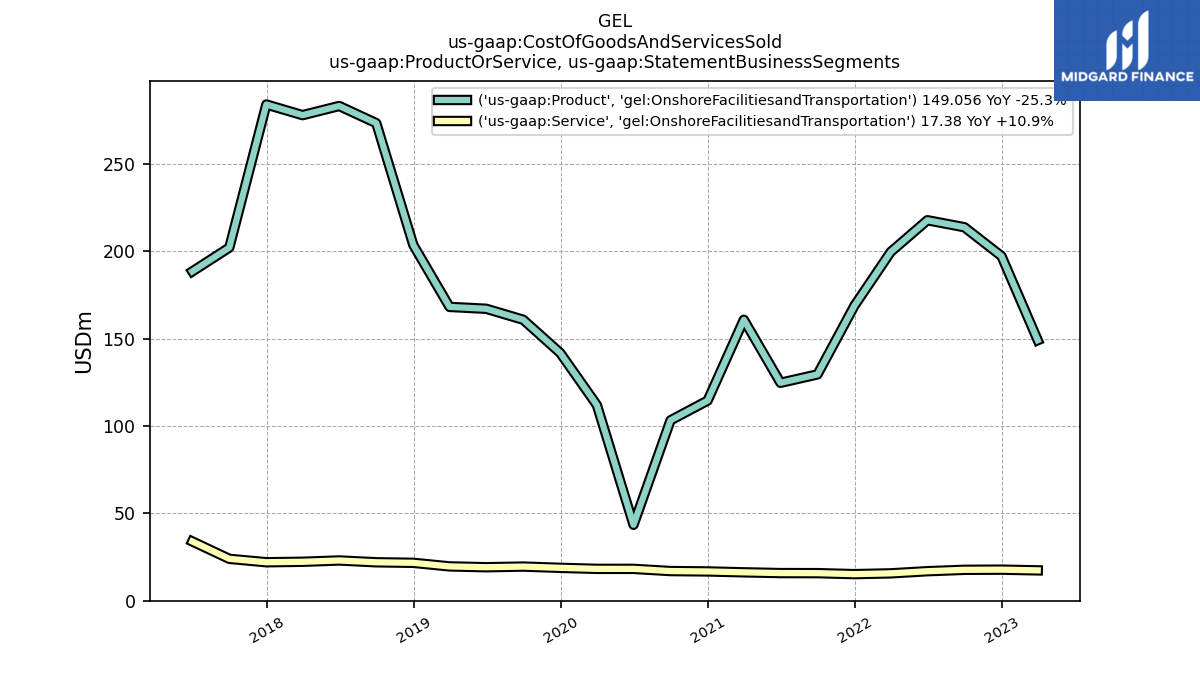
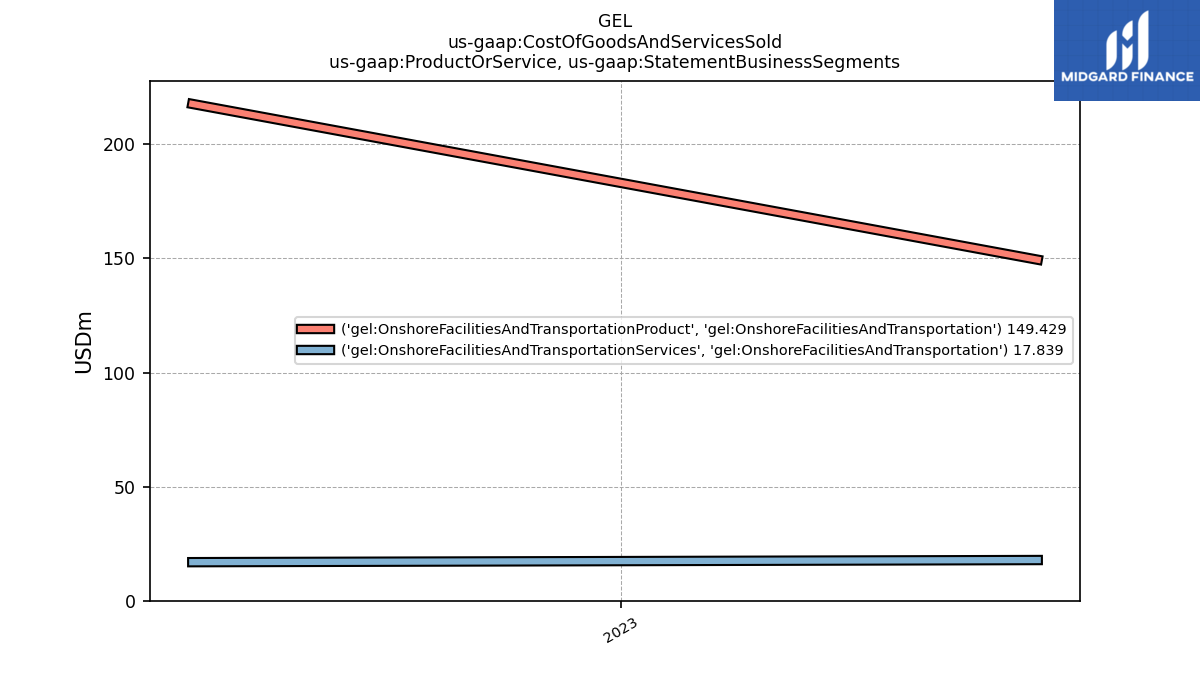
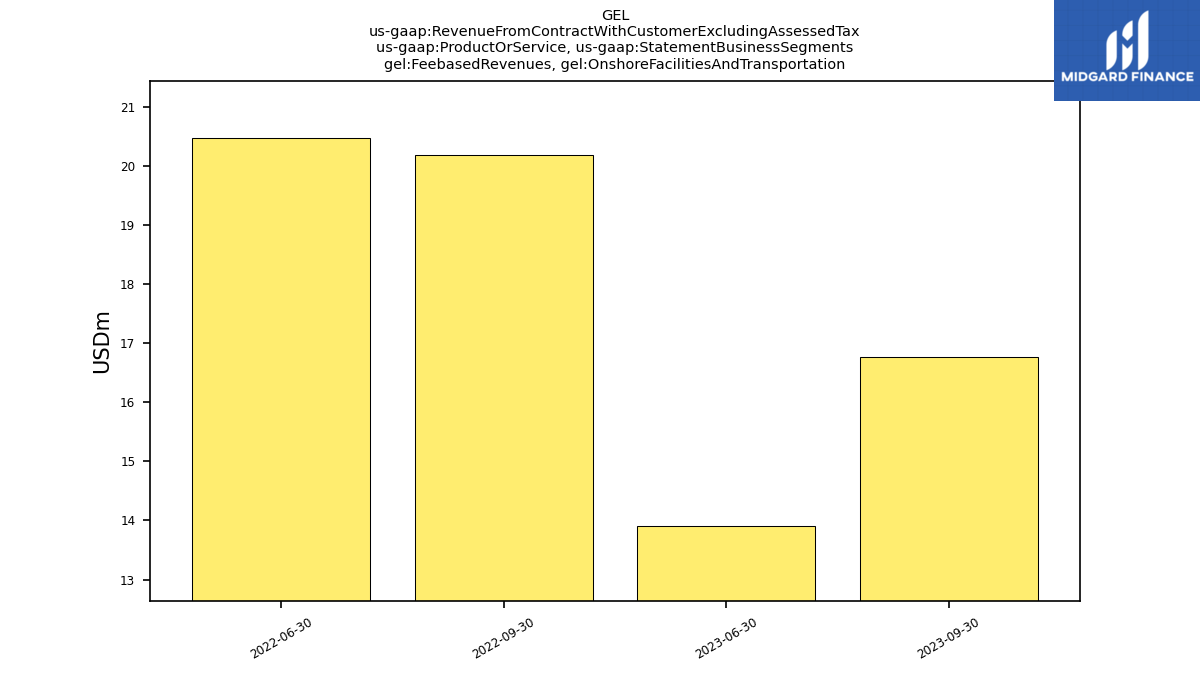
| Feebased Revenues, Onshore Facilities And Transportation | 16.77 | 13.90 | NA | NA | 20.18 | 20.47 | NA | NA | NA | NA | NA | NA | NA | NA | NA | NA | NA | NA | NA | NA | NA | NA | NA | NA | NA | NA | NA | NA | NA | NA | NA | NA | NA | NA | NA | NA | NA | NA | NA | NA | NA | NA | NA | NA | NA | NA | NA | NA | NA | NA | NA | NA | NA | NA | NA | |
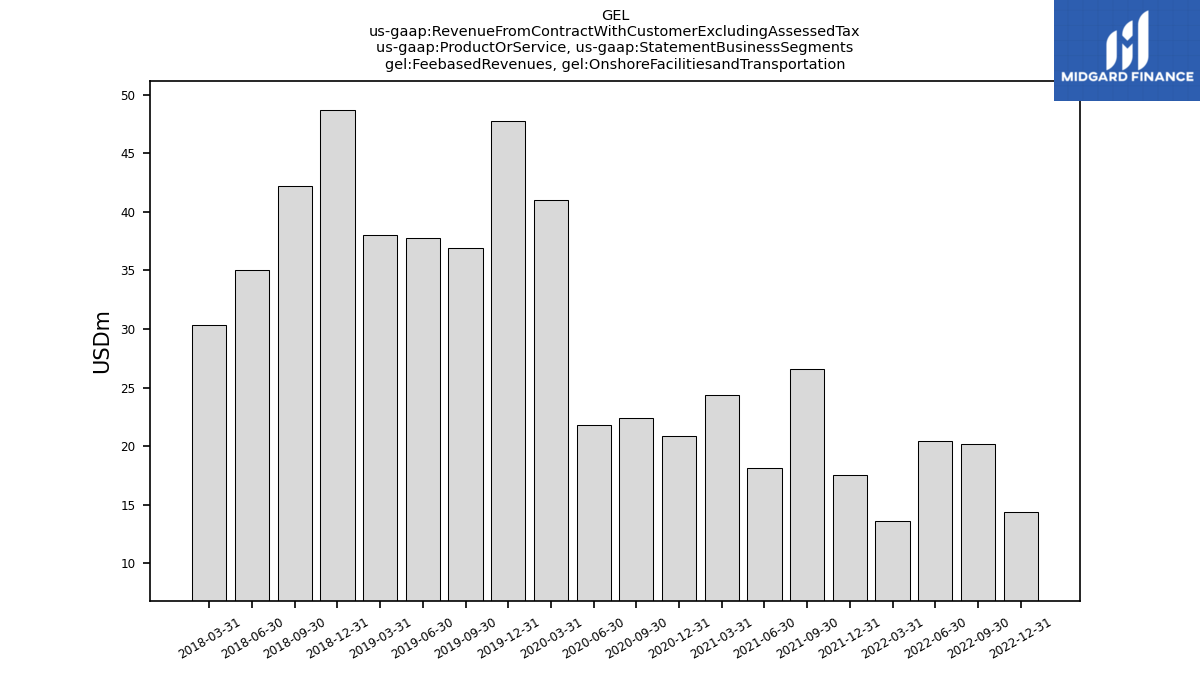
| Feebased Revenues, Onshore Facilitiesand Transportation | NA | NA | 14.18 | 14.35 | 20.18 | 20.47 | 13.63 | 17.54 | 26.60 | 18.18 | 24.39 | 20.85 | 22.41 | 21.84 | 40.99 | 47.72 | 36.94 | 37.76 | 38.01 | 48.73 | 42.19 | 35.01 | 30.34 | NA | NA | NA | NA | NA | NA | NA | NA | NA | NA | NA | NA | NA | NA | NA | NA | NA | NA | NA | NA | NA | NA | NA | NA | NA | NA | NA | NA | NA | NA | NA | NA | |
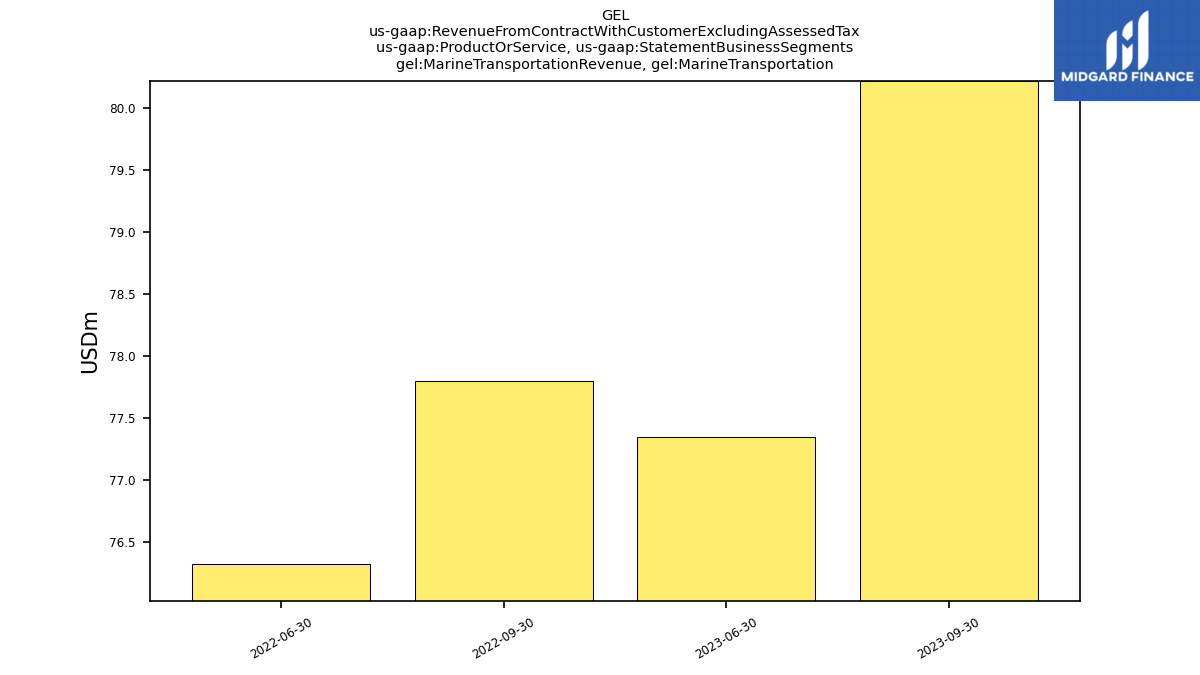
| Marine Transportation Revenue, Marine Transportation | 80.22 | 77.34 | NA | NA | 77.80 | 76.32 | NA | NA | NA | NA | NA | NA | NA | NA | NA | NA | NA | NA | NA | NA | NA | NA | NA | NA | NA | NA | NA | NA | NA | NA | NA | NA | NA | NA | NA | NA | NA | NA | NA | NA | NA | NA | NA | NA | NA | NA | NA | NA | NA | NA | NA | NA | NA | NA | NA | |
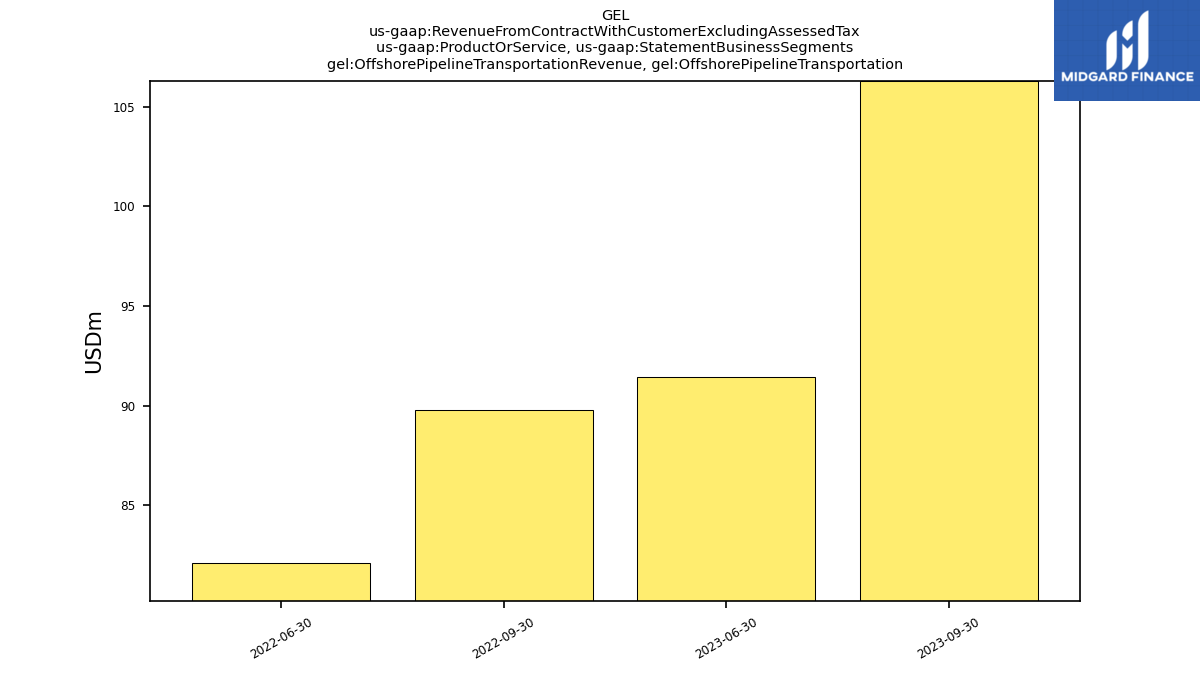
| Offshore Pipeline Transportation Revenue, Offshore Pipeline Transportation | 106.30 | 91.46 | NA | NA | 89.81 | 82.08 | NA | NA | NA | NA | NA | NA | NA | NA | NA | NA | NA | NA | NA | NA | NA | NA | NA | NA | NA | NA | NA | NA | NA | NA | NA | NA | NA | NA | NA | NA | NA | NA | NA | NA | NA | NA | NA | NA | NA | NA | NA | NA | NA | NA | NA | NA | NA | NA | NA | |
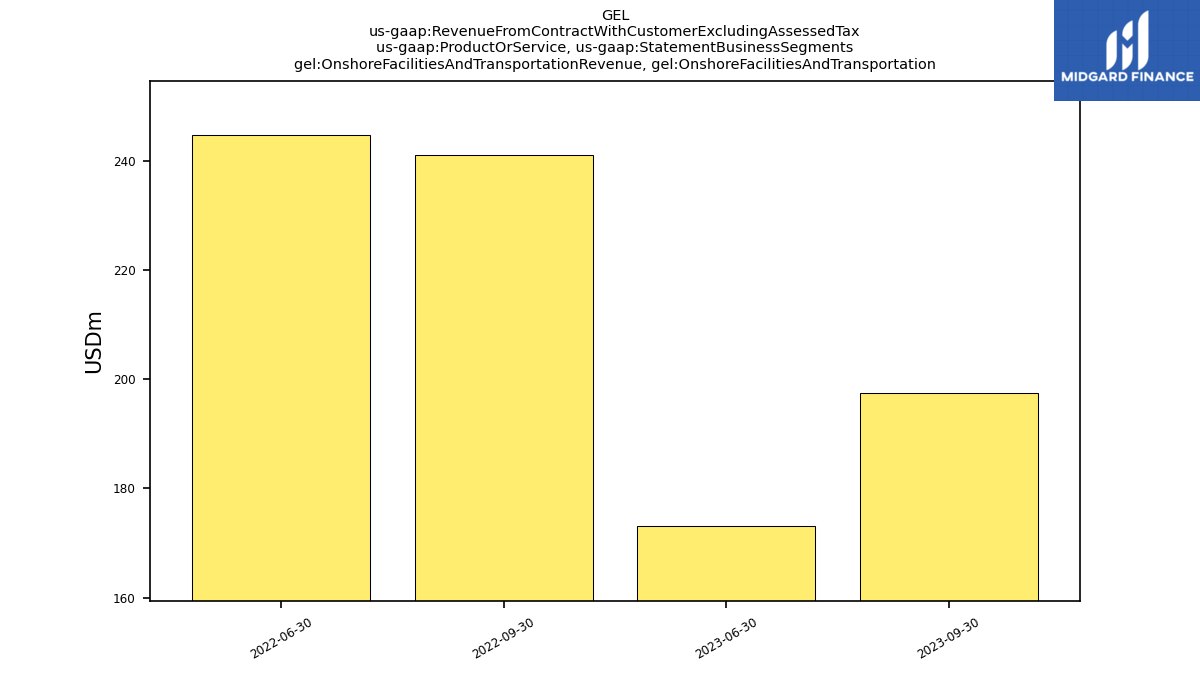
| Onshore Facilities And Transportation Revenue, Onshore Facilities And Transportation | 197.53 | 173.00 | NA | NA | 240.97 | 244.71 | NA | NA | NA | NA | NA | NA | NA | NA | NA | NA | NA | NA | NA | NA | NA | NA | NA | NA | NA | NA | NA | NA | NA | NA | NA | NA | NA | NA | NA | NA | NA | NA | NA | NA | NA | NA | NA | NA | NA | NA | NA | NA | NA | NA | NA | NA | NA | NA | NA | |
| Product Sales, Onshore Facilities And Transportation | 180.76 | 159.11 | NA | NA | 220.79 | 224.24 | NA | NA | NA | NA | NA | NA | NA | NA | NA | NA | NA | NA | NA | NA | NA | NA | NA | NA | NA | NA | NA | NA | NA | NA | NA | NA | NA | NA | NA | NA | NA | NA | NA | NA | NA | NA | NA | NA | NA | NA | NA | NA | NA | NA | NA | NA | NA | NA | NA | |
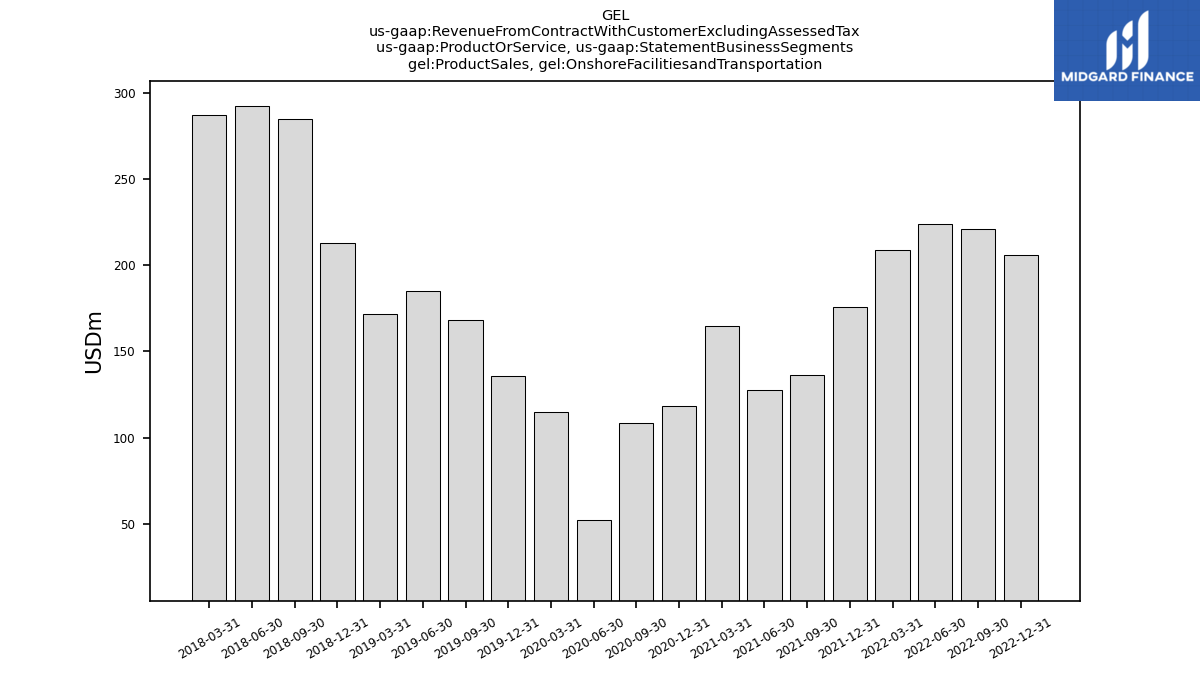
| Product Sales, Onshore Facilitiesand Transportation | NA | NA | 157.16 | 206.08 | 220.79 | 224.24 | 208.80 | 175.91 | 136.37 | 127.75 | 164.82 | 118.12 | 108.18 | 52.31 | 114.77 | 135.72 | 168.09 | 185.28 | 171.54 | 212.92 | 284.96 | 292.34 | 287.37 | NA | NA | NA | NA | NA | NA | NA | NA | NA | NA | NA | NA | NA | NA | NA | NA | NA | NA | NA | NA | NA | NA | NA | NA | NA | NA | NA | NA | NA | NA | NA | NA | |
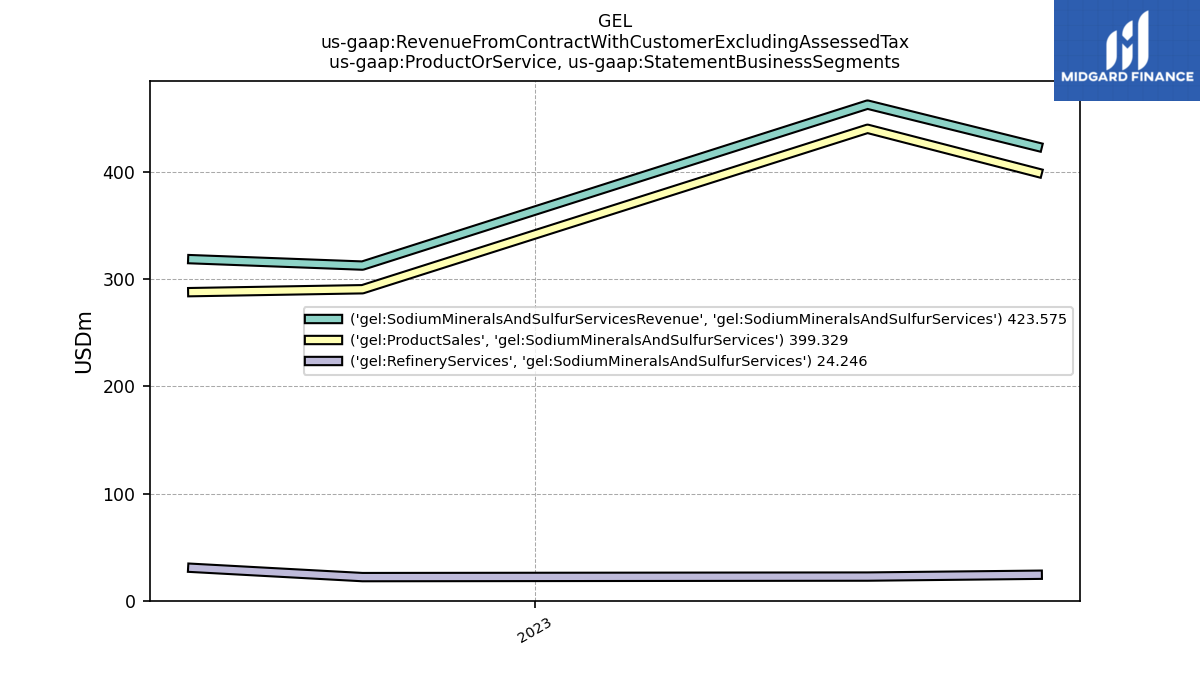
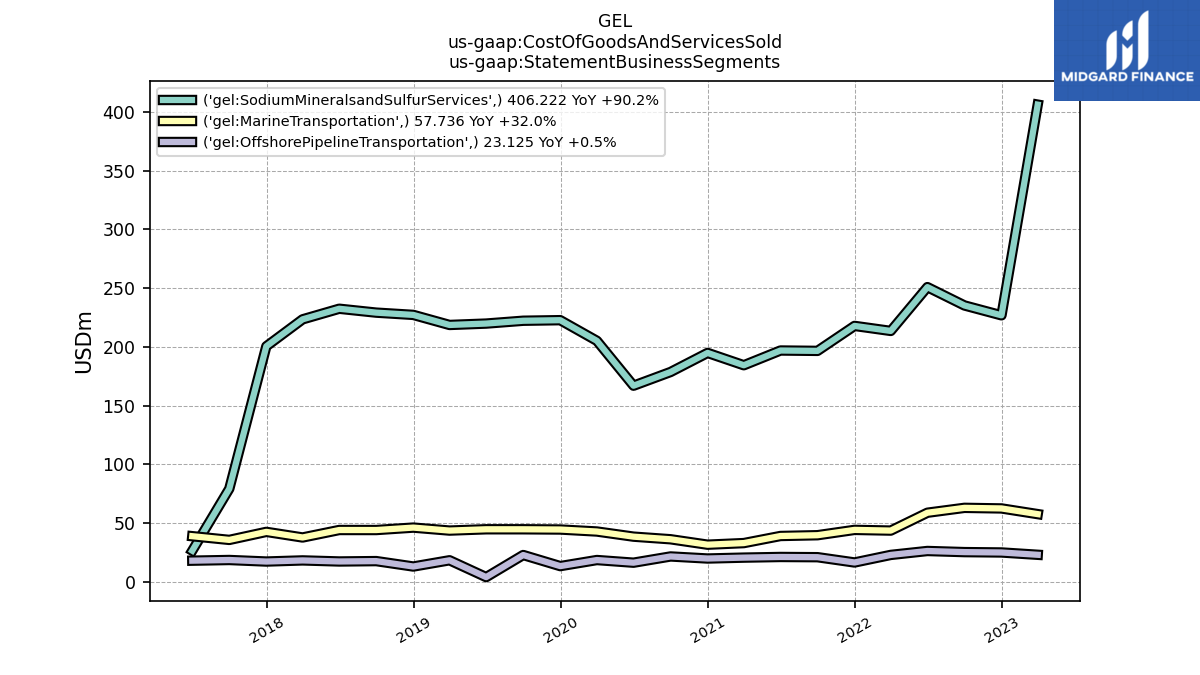
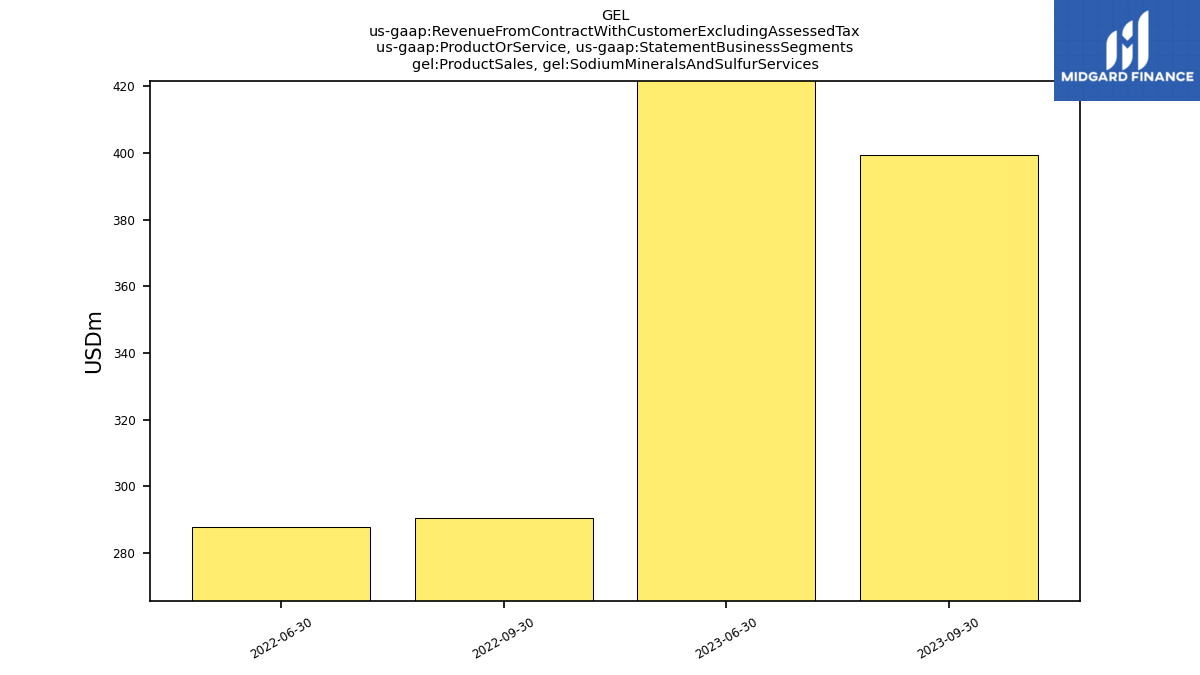
| Product Sales, Sodium Minerals And Sulfur Services | 399.33 | 440.30 | NA | NA | 290.62 | 287.94 | NA | NA | NA | NA | NA | NA | NA | NA | NA | NA | NA | NA | NA | NA | NA | NA | NA | NA | NA | NA | NA | NA | NA | NA | NA | NA | NA | NA | NA | NA | NA | NA | NA | NA | NA | NA | NA | NA | NA | NA | NA | NA | NA | NA | NA | NA | NA | NA | NA | |
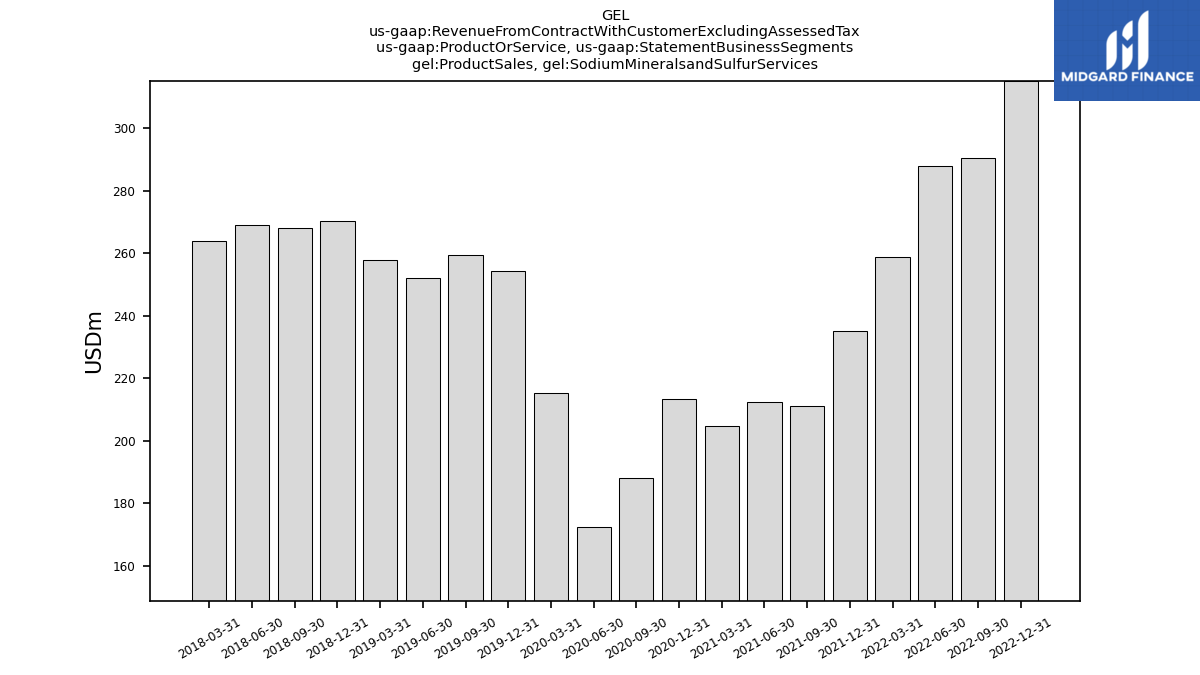
| Product Sales, Sodium Mineralsand Sulfur Services | NA | NA | 422.82 | 315.12 | 290.62 | 287.94 | 258.77 | 235.06 | 211.00 | 212.43 | 204.78 | 213.33 | 188.20 | 172.41 | 215.37 | 254.40 | 259.33 | 252.09 | 257.84 | 270.31 | 268.21 | 269.15 | 263.96 | NA | NA | NA | NA | NA | NA | NA | NA | NA | NA | NA | NA | NA | NA | NA | NA | NA | NA | NA | NA | NA | NA | NA | NA | NA | NA | NA | NA | NA | NA | NA | NA | |
| Refinery Services, Sodium Minerals And Sulfur Services | 24.25 | 22.55 | NA | NA | 22.06 | 30.67 | NA | NA | NA | NA | NA | NA | NA | NA | NA | NA | NA | NA | NA | NA | NA | NA | NA | NA | NA | NA | NA | NA | NA | NA | NA | NA | NA | NA | NA | NA | NA | NA | NA | NA | NA | NA | NA | NA | NA | NA | NA | NA | NA | NA | NA | NA | NA | NA | NA | |
| Refinery Services, Sodium Mineralsand Sulfur Services | NA | NA | 21.82 | 16.01 | 22.06 | 30.67 | 26.90 | 27.55 | 26.65 | 24.65 | 22.51 | 21.69 | 18.53 | 20.21 | 28.02 | 23.96 | 18.20 | 22.52 | 17.64 | 27.61 | 23.52 | 29.73 | 21.95 | NA | NA | NA | NA | NA | NA | NA | NA | NA | NA | NA | NA | NA | NA | NA | NA | NA | NA | NA | NA | NA | NA | NA | NA | NA | NA | NA | NA | NA | NA | NA | NA | |
| Sodium Minerals And Sulfur Services Revenue, Sodium Minerals And Sulfur Services | 423.57 | 462.86 | NA | NA | 312.68 | 318.61 | NA | NA | NA | NA | NA | NA | NA | NA | NA | NA | NA | NA | NA | NA | NA | NA | NA | NA | NA | NA | NA | NA | NA | NA | NA | NA | NA | NA | NA | NA | NA | NA | NA | NA | NA | NA | NA | NA | NA | NA | NA | NA | NA | NA | NA | NA | NA | NA | NA | |
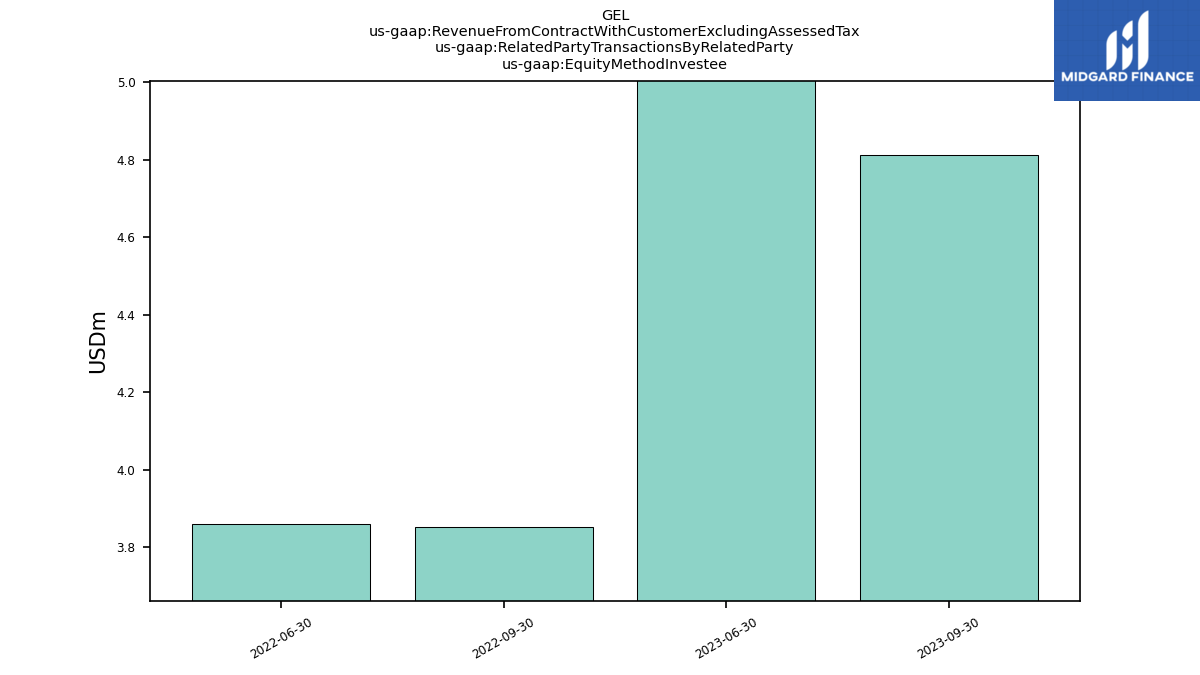
| Equity Method Investee | 4.81 | 5.45 | NA | NA | 3.85 | 3.86 | NA | NA | NA | NA | NA | NA | NA | NA | NA | NA | NA | NA | NA | NA | NA | NA | NA | NA | NA | NA | NA | NA | NA | NA | NA | NA | NA | NA | NA | NA | NA | NA | NA | NA | NA | NA | NA | NA | NA | NA | NA | NA | NA | NA | NA | NA | NA | NA | NA | |
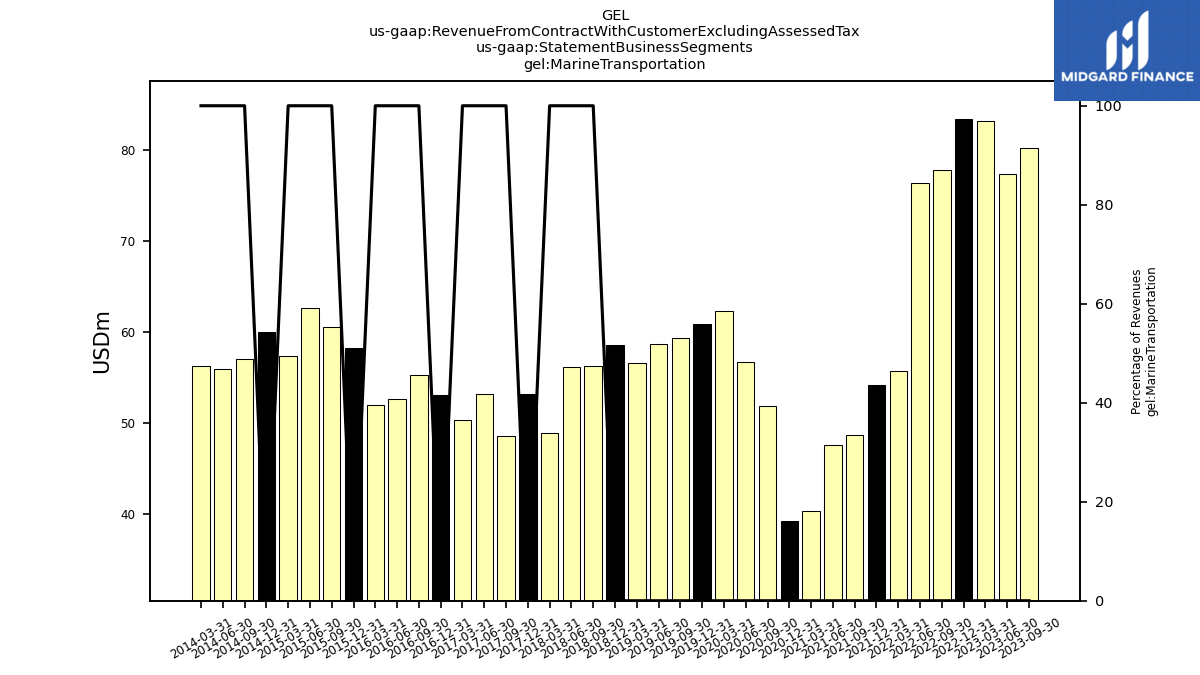
| Marine Transportation | 80.22 | 77.34 | 83.23 | 83.41 | 77.80 | 76.32 | 55.77 | 54.15 | 48.72 | 47.63 | 40.33 | 39.28 | 51.91 | 56.72 | 62.35 | 60.88 | 59.40 | 58.71 | 56.65 | 58.53 | 56.30 | 56.19 | 48.93 | 53.25 | 48.53 | 53.20 | 50.30 | 53.09 | 55.28 | 52.61 | 52.04 | 58.26 | 60.54 | 62.59 | 57.37 | 60.04 | 57.00 | 55.95 | 56.29 | NA | NA | NA | NA | NA | NA | NA | NA | NA | NA | NA | NA | NA | NA | NA | NA | |
| Offshore Pipeline Transportation | 106.30 | 91.46 | 91.39 | 79.09 | 89.81 | 82.08 | 68.07 | 71.38 | 69.48 | 73.22 | 64.38 | 39.86 | 53.89 | 64.96 | 78.43 | 81.63 | 79.74 | 78.43 | 78.32 | 71.20 | 70.11 | 69.97 | 73.26 | 74.80 | 80.67 | 77.64 | 85.13 | 89.84 | 89.72 | 78.99 | 76.13 | 76.79 | 61.39 | 1.26 | 0.79 | 0.85 | 0.97 | 0.52 | 0.95 | NA | NA | NA | NA | NA | NA | NA | NA | NA | NA | NA | NA | NA | NA | NA | NA | |
| Onshore Facilities And Transportation | 197.53 | 173.00 | NA | NA | 240.97 | 244.71 | NA | NA | NA | NA | NA | NA | NA | NA | NA | NA | NA | NA | NA | NA | NA | NA | NA | NA | NA | NA | NA | NA | NA | NA | NA | NA | NA | NA | NA | NA | NA | NA | NA | NA | NA | NA | NA | NA | NA | NA | NA | NA | NA | NA | NA | NA | NA | NA | NA | |
| Onshore Facilitiesand Transportation | NA | NA | 171.34 | 220.42 | 240.97 | 244.71 | 222.43 | 193.44 | 162.97 | 145.92 | 189.22 | 138.98 | 130.59 | 74.16 | 155.76 | 183.44 | 205.03 | 223.05 | 209.56 | 261.65 | 327.14 | 327.35 | 317.71 | 327.25 | 247.14 | 232.81 | 235.01 | 243.20 | 269.32 | 273.05 | NA | NA | NA | NA | NA | NA | NA | NA | NA | NA | NA | NA | NA | NA | NA | NA | NA | NA | NA | NA | NA | NA | NA | NA | NA | |
| Sodium Minerals And Sulfur Services | 423.57 | 462.86 | NA | NA | 312.68 | 318.61 | NA | NA | NA | NA | NA | NA | NA | NA | NA | NA | NA | NA | NA | NA | NA | NA | NA | NA | NA | NA | NA | NA | NA | NA | NA | NA | NA | NA | NA | NA | NA | NA | NA | NA | NA | NA | NA | NA | NA | NA | NA | NA | NA | NA | NA | NA | NA | NA | NA | |
| Sodium Mineralsand Sulfur Services | NA | NA | 444.65 | 331.12 | 312.68 | 318.61 | 285.67 | 262.61 | 237.65 | 237.09 | 227.29 | 235.02 | 206.73 | 192.62 | 243.39 | 278.37 | 277.53 | 274.61 | 275.49 | 297.92 | 291.72 | 298.88 | 285.91 | 264.74 | 109.77 | 43.07 | 45.05 | 41.92 | 45.73 | NA | NA | NA | NA | NA | NA | NA | NA | NA | NA | NA | NA | NA | NA | NA | NA | NA | NA | NA | NA | NA | NA | NA | NA | NA | NA |