
| 2023-12-31 | 2023-09-30 | 2023-06-30 | 2023-03-31 | 2022-12-31 | 2022-09-30 | 2022-06-30 | 2022-03-31 | 2021-12-31 | 2021-09-30 | 2021-06-30 | 2021-03-31 | 2020-12-31 | 2020-09-30 | 2020-06-30 | 2020-03-31 | 2019-12-31 | 2019-09-30 | 2019-06-30 | 2019-03-31 | 2018-12-31 | 2018-09-30 | 2018-06-30 | 2018-03-31 | 2017-12-31 | 2017-09-30 | 2017-06-30 | 2017-03-31 | 2016-12-31 | 2016-09-30 | 2016-06-30 | 2016-03-31 | 2015-12-31 | 2015-09-30 | 2015-06-30 | 2015-03-31 | 2014-12-31 | 2014-09-30 | 2014-06-30 | 2014-03-31 | ||
|---|---|---|---|---|---|---|---|---|---|---|---|---|---|---|---|---|---|---|---|---|---|---|---|---|---|---|---|---|---|---|---|---|---|---|---|---|---|---|---|---|---|
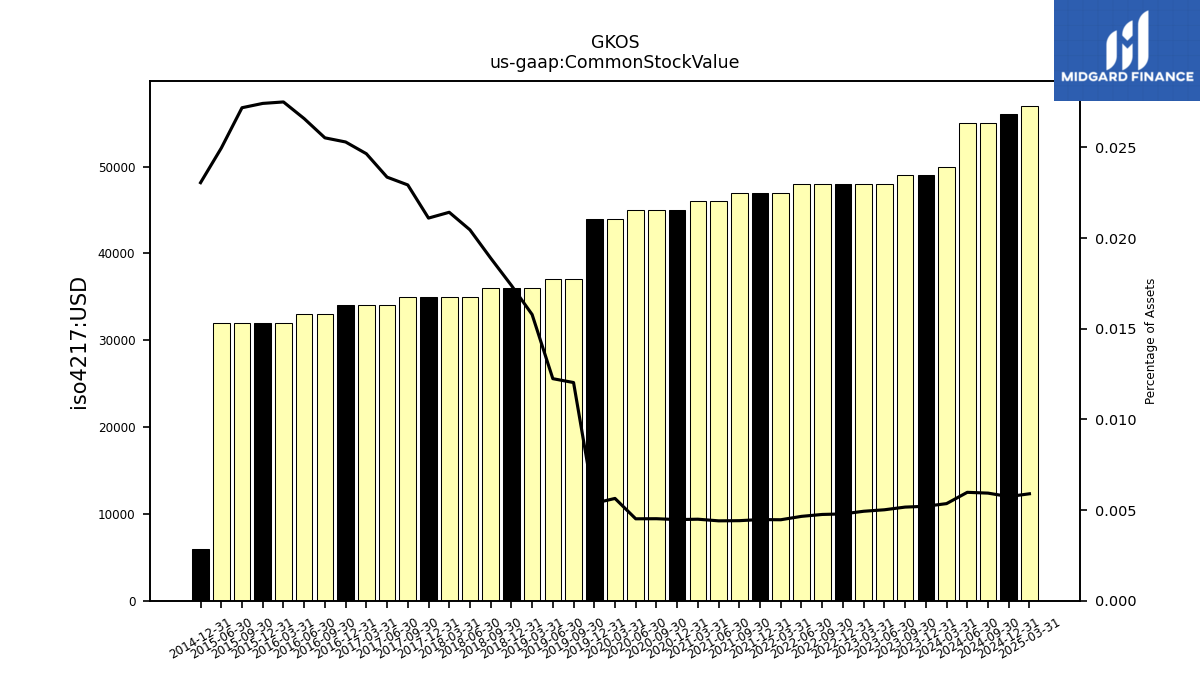
| Common Stock Value | 0.05 | 0.05 | 0.05 | 0.05 | 0.05 | 0.05 | 0.05 | 0.05 | 0.05 | 0.05 | 0.05 | 0.05 | 0.04 | 0.04 | 0.04 | 0.04 | 0.04 | 0.04 | 0.04 | 0.04 | 0.04 | 0.04 | 0.04 | 0.04 | 0.04 | 0.04 | 0.03 | 0.03 | 0.03 | 0.03 | 0.03 | 0.03 | 0.03 | 0.03 | 0.03 | NA | 0.01 | NA | NA | NA | |
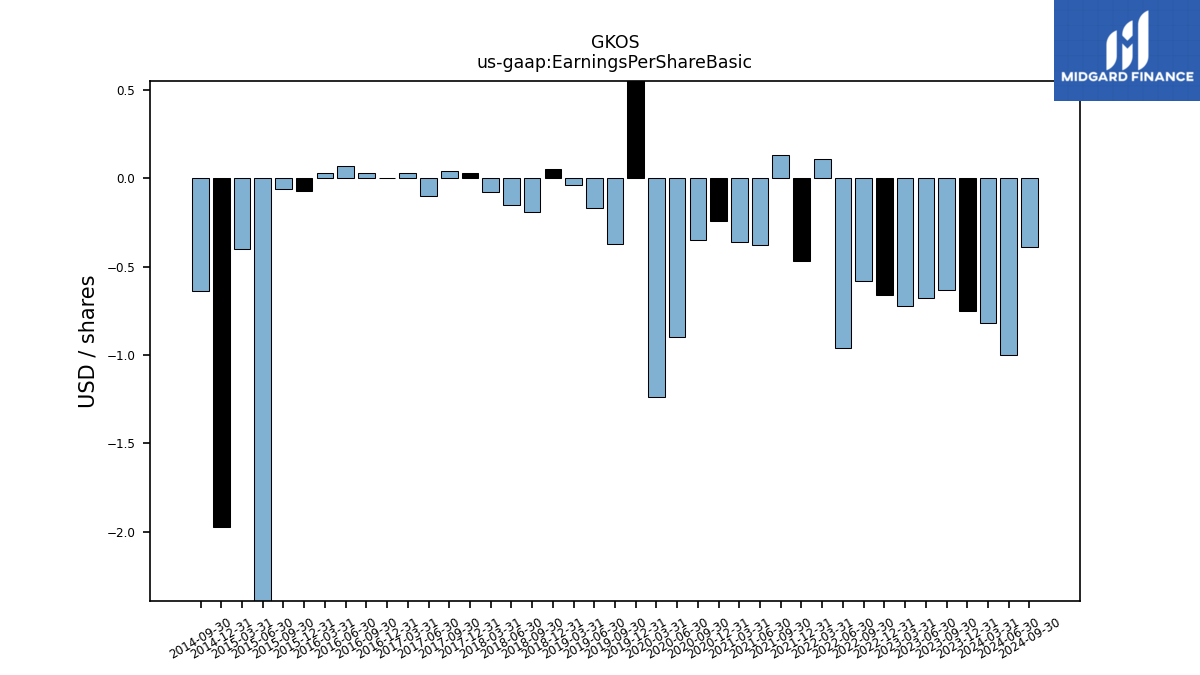
| Earnings Per Share Basic | -0.75 | -0.63 | -0.68 | -0.72 | -0.66 | -0.58 | -0.96 | 0.11 | -0.47 | 0.13 | -0.38 | -0.36 | -0.24 | -0.35 | -0.90 | -1.24 | 0.92 | -0.37 | -0.17 | -0.04 | 0.05 | -0.19 | -0.15 | -0.08 | 0.03 | 0.04 | -0.10 | 0.03 | 0.00 | 0.03 | 0.07 | 0.03 | -0.07 | -0.06 | -10.96 | -0.40 | -1.97 | -0.64 | NA | NA | |
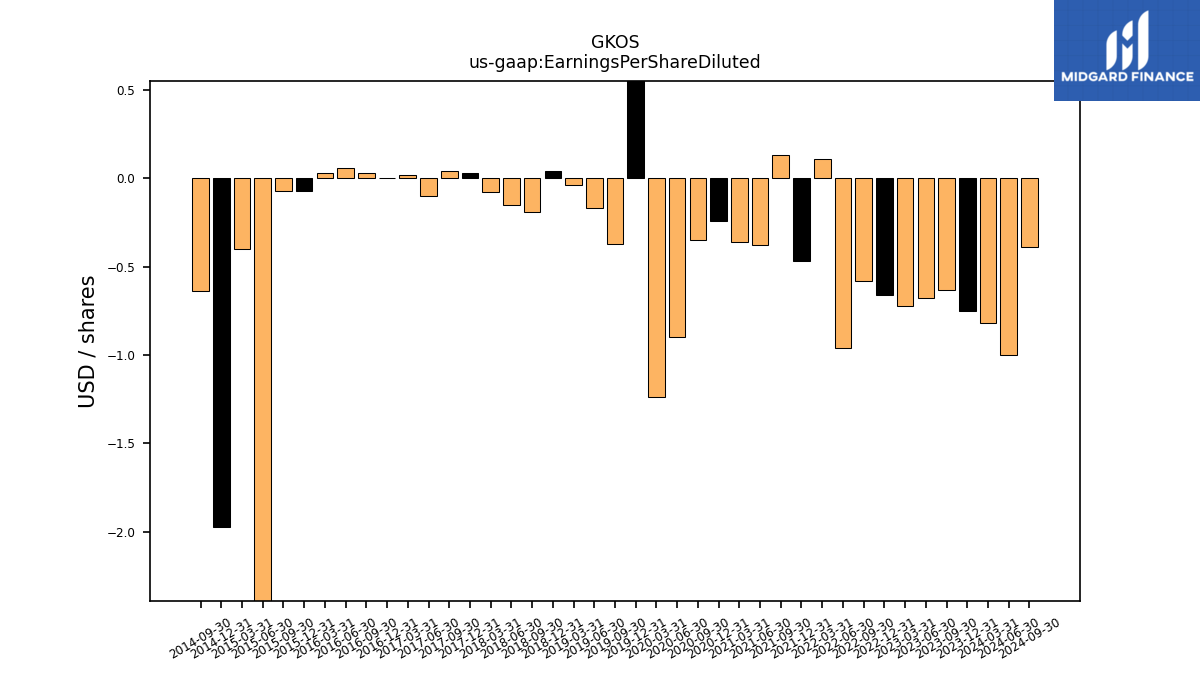
| Earnings Per Share Diluted | -0.75 | -0.63 | -0.68 | -0.72 | -0.66 | -0.58 | -0.96 | 0.11 | -0.47 | 0.13 | -0.38 | -0.36 | -0.24 | -0.35 | -0.90 | -1.24 | 0.84 | -0.37 | -0.17 | -0.04 | 0.04 | -0.19 | -0.15 | -0.08 | 0.03 | 0.04 | -0.10 | 0.02 | 0.00 | 0.03 | 0.06 | 0.03 | -0.07 | -0.07 | -10.96 | -0.40 | -1.97 | -0.64 | NA | NA |
| 2023-12-31 | 2023-09-30 | 2023-06-30 | 2023-03-31 | 2022-12-31 | 2022-09-30 | 2022-06-30 | 2022-03-31 | 2021-12-31 | 2021-09-30 | 2021-06-30 | 2021-03-31 | 2020-12-31 | 2020-09-30 | 2020-06-30 | 2020-03-31 | 2019-12-31 | 2019-09-30 | 2019-06-30 | 2019-03-31 | 2018-12-31 | 2018-09-30 | 2018-06-30 | 2018-03-31 | 2017-12-31 | 2017-09-30 | 2017-06-30 | 2017-03-31 | 2016-12-31 | 2016-09-30 | 2016-06-30 | 2016-03-31 | 2015-12-31 | 2015-09-30 | 2015-06-30 | 2015-03-31 | 2014-12-31 | 2014-09-30 | 2014-06-30 | 2014-03-31 | ||
|---|---|---|---|---|---|---|---|---|---|---|---|---|---|---|---|---|---|---|---|---|---|---|---|---|---|---|---|---|---|---|---|---|---|---|---|---|---|---|---|---|---|
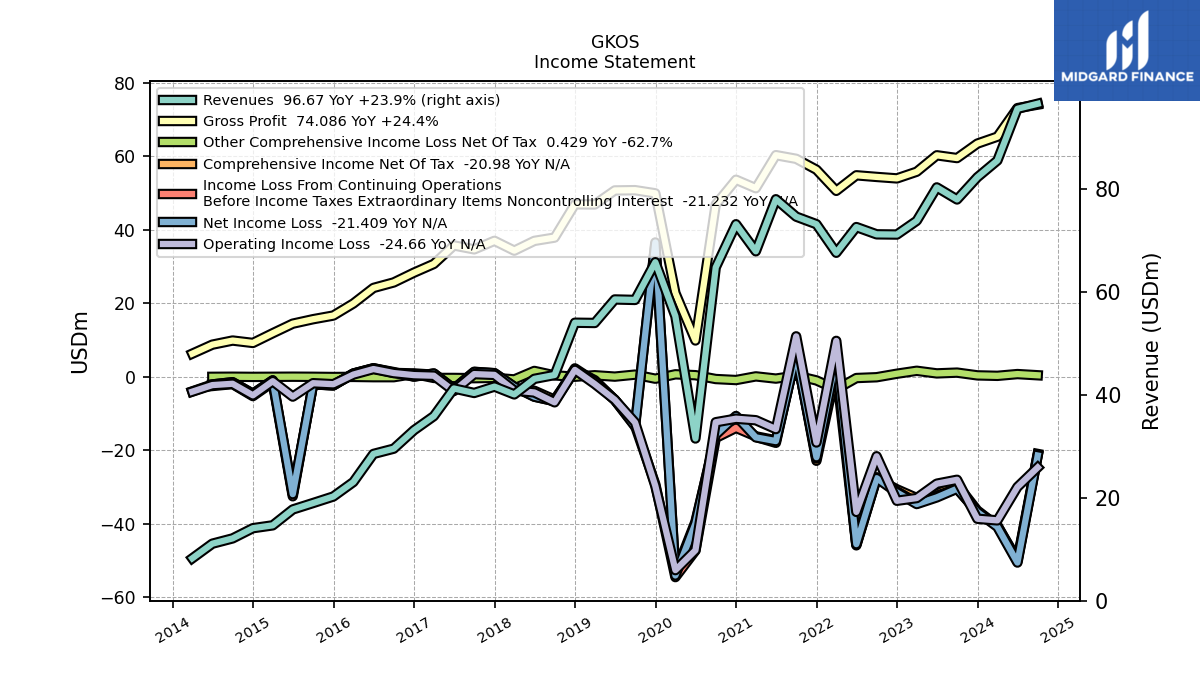
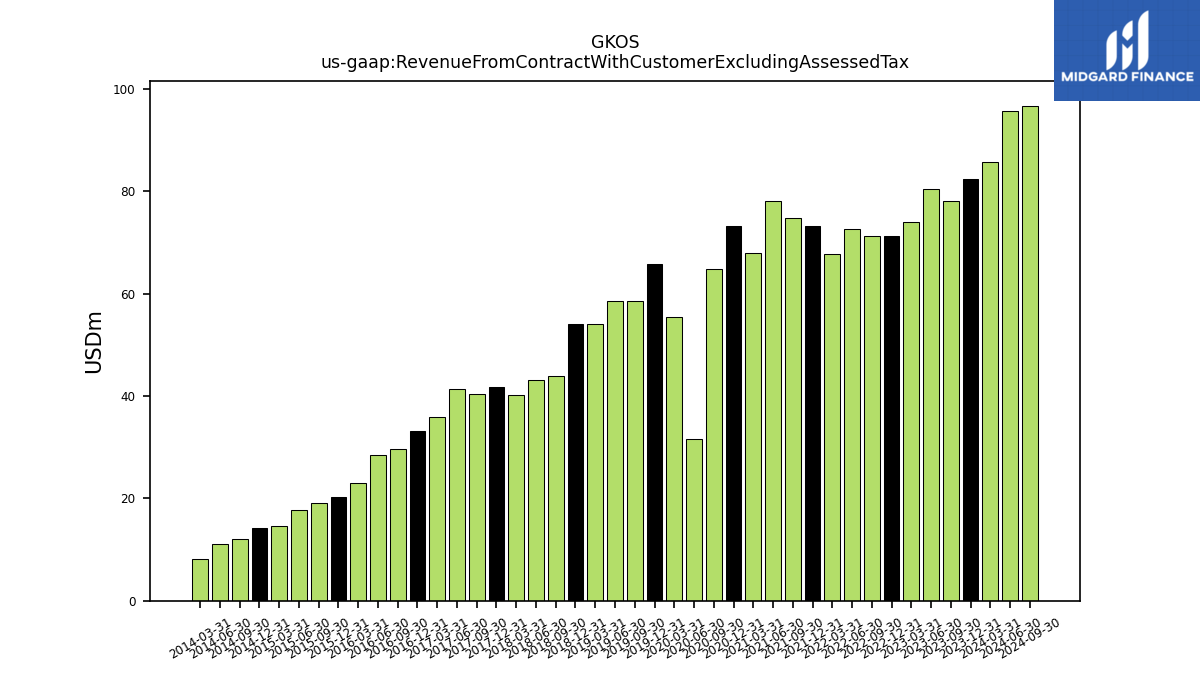
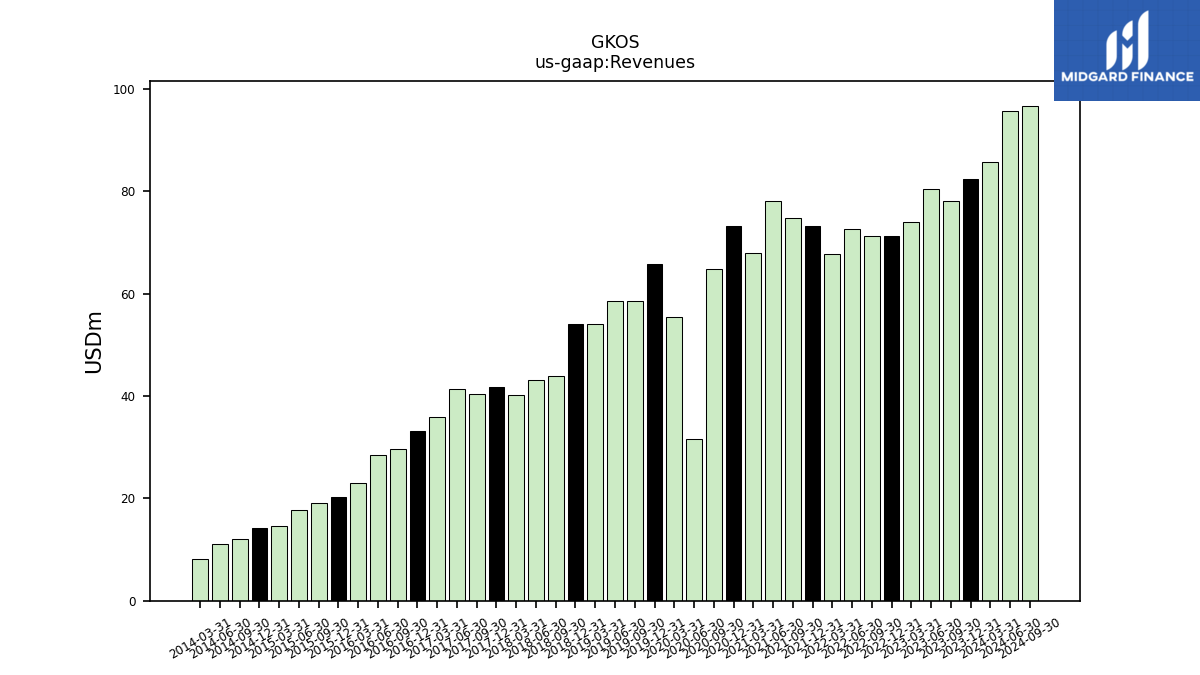
| Revenue From Contract With Customer Excluding Assessed Tax | 82.36 | 78.05 | 80.40 | 73.90 | 71.23 | 71.27 | 72.69 | 67.68 | 73.24 | 74.71 | 78.09 | 67.97 | 73.23 | 64.83 | 31.56 | 55.34 | 65.85 | 58.51 | 58.60 | 54.03 | 54.08 | 43.91 | 43.16 | 40.13 | 41.65 | 40.41 | 41.28 | 35.91 | 33.17 | 29.58 | 28.56 | 23.09 | 20.28 | 19.00 | 17.75 | 14.67 | 14.11 | 12.13 | 11.10 | 8.25 | |
| Revenues | 82.36 | 78.05 | 80.40 | 73.90 | 71.23 | 71.27 | 72.69 | 67.68 | 73.24 | 74.71 | 78.09 | 67.97 | 73.23 | 64.83 | 31.56 | 55.34 | 65.85 | 58.51 | 58.60 | 54.03 | 54.08 | 43.91 | 43.16 | 40.13 | 41.65 | 40.41 | 41.28 | 35.91 | 33.17 | 29.58 | 28.56 | 23.09 | 20.28 | 19.00 | 17.75 | 14.67 | 14.11 | 12.13 | 11.10 | 8.25 | |
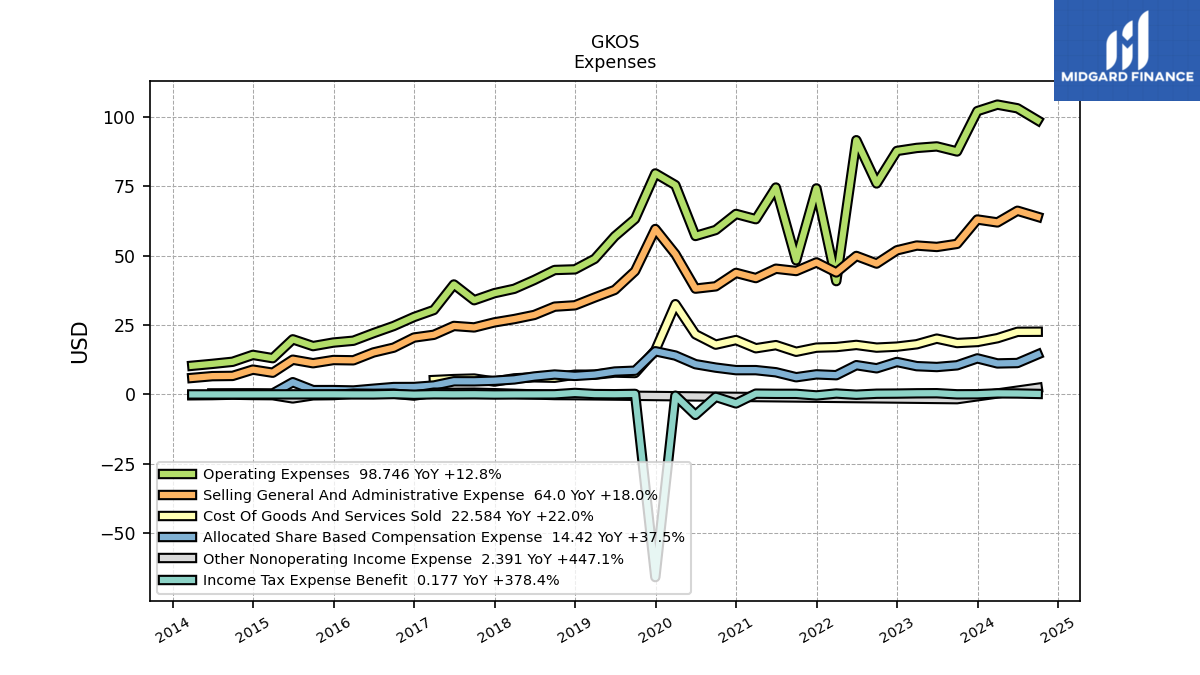
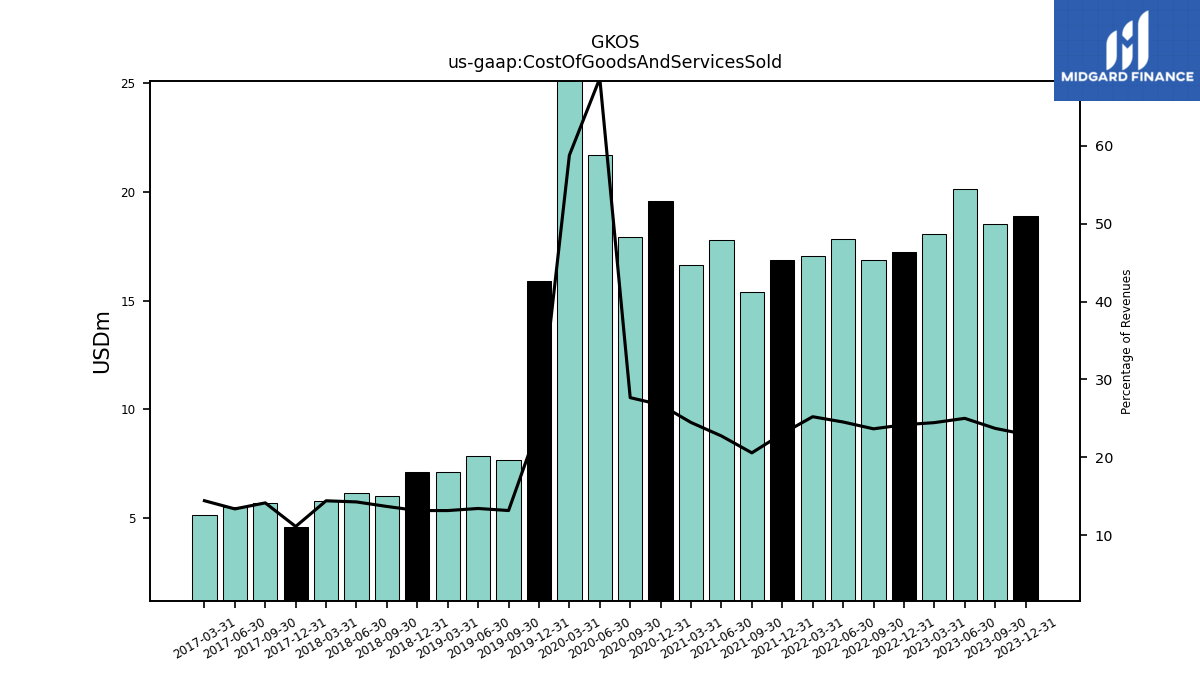
| Cost Of Goods And Services Sold | 18.89 | 18.51 | 20.10 | 18.07 | 17.22 | 16.86 | 17.83 | 17.06 | 16.86 | 15.37 | 17.76 | 16.63 | 19.59 | 17.93 | 21.67 | 32.53 | 15.90 | 7.70 | 7.87 | 7.11 | 7.12 | 6.01 | 6.16 | 5.79 | 4.63 | 5.72 | 5.52 | 5.18 | NA | NA | NA | NA | NA | NA | NA | NA | NA | NA | NA | NA | |
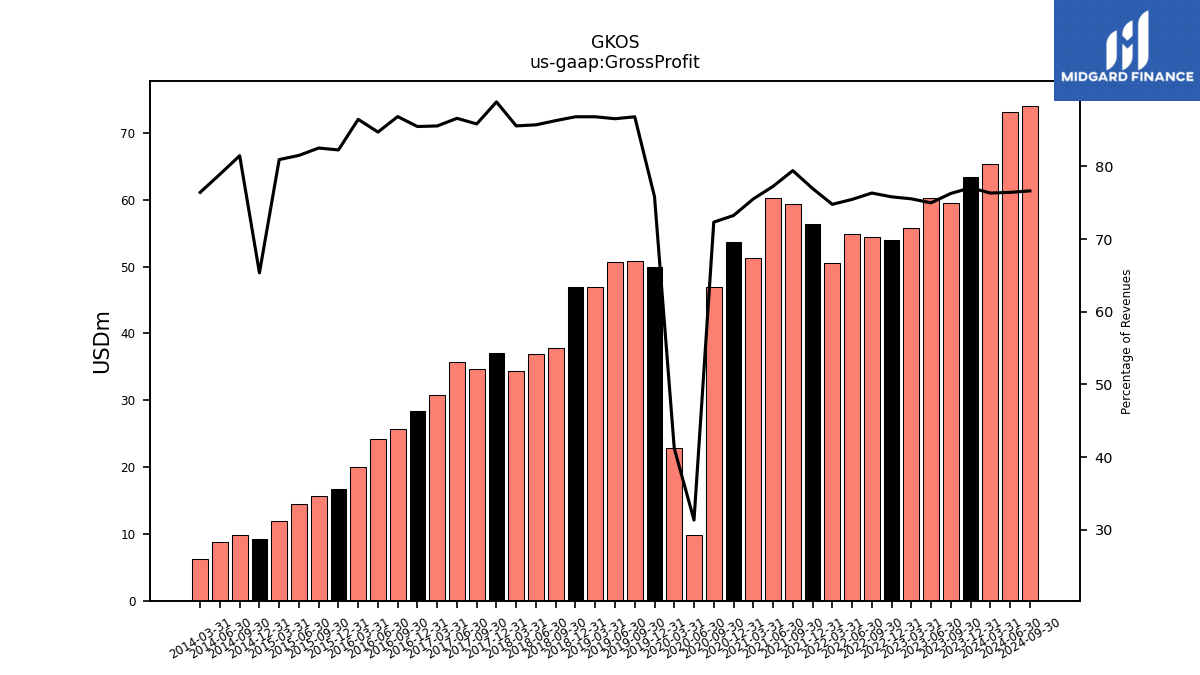
| Gross Profit | 63.47 | 59.54 | 60.30 | 55.83 | 54.01 | 54.41 | 54.85 | 50.62 | 56.38 | 59.34 | 60.33 | 51.34 | 53.64 | 46.90 | 9.89 | 22.81 | 49.95 | 50.81 | 50.73 | 46.91 | 46.96 | 37.90 | 37.00 | 34.35 | 37.02 | 34.69 | 35.76 | 30.73 | 28.36 | 25.69 | 24.20 | 19.97 | 16.68 | 15.69 | 14.47 | 11.87 | 9.22 | 9.88 | 8.76 | 6.30 | |
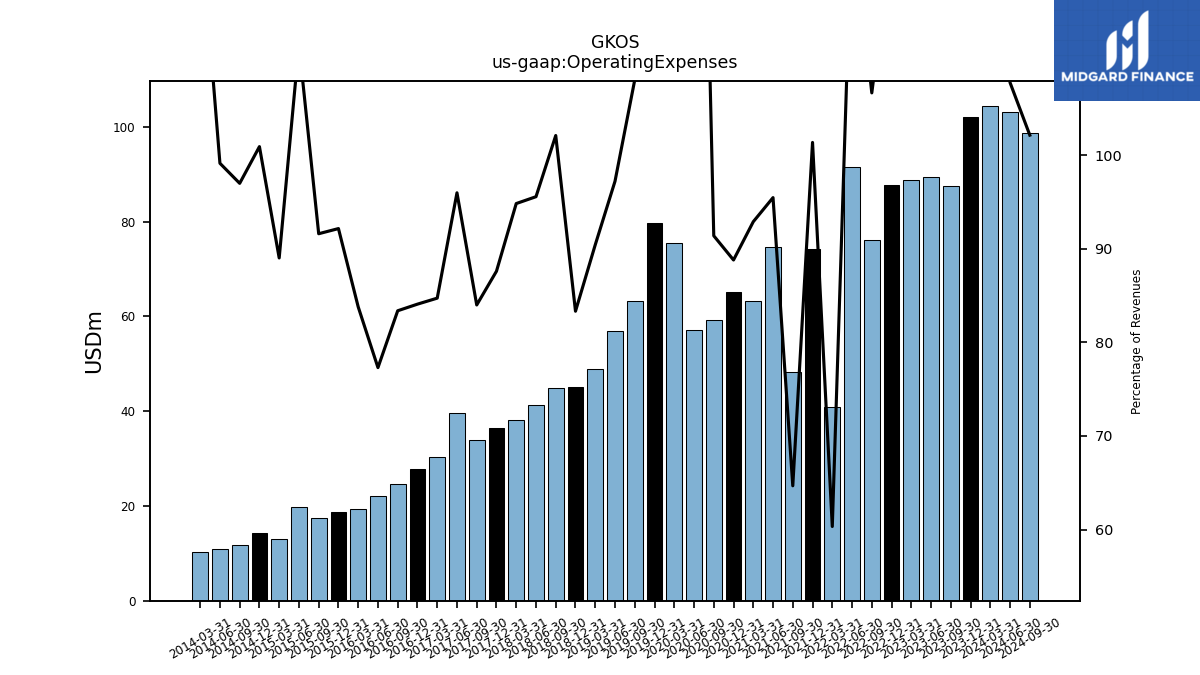
| Operating Expenses | 102.10 | 87.55 | 89.37 | 88.82 | 87.74 | 76.02 | 91.61 | 40.83 | 74.24 | 48.32 | 74.56 | 63.14 | 65.04 | 59.25 | 57.09 | 75.42 | 79.64 | 63.22 | 56.97 | 48.85 | 45.06 | 44.83 | 41.25 | 38.06 | 36.49 | 33.95 | 39.63 | 30.42 | 27.89 | 24.66 | 22.07 | 19.35 | 18.69 | 17.41 | 19.86 | 13.06 | 14.24 | 11.76 | 11.00 | 10.33 | |
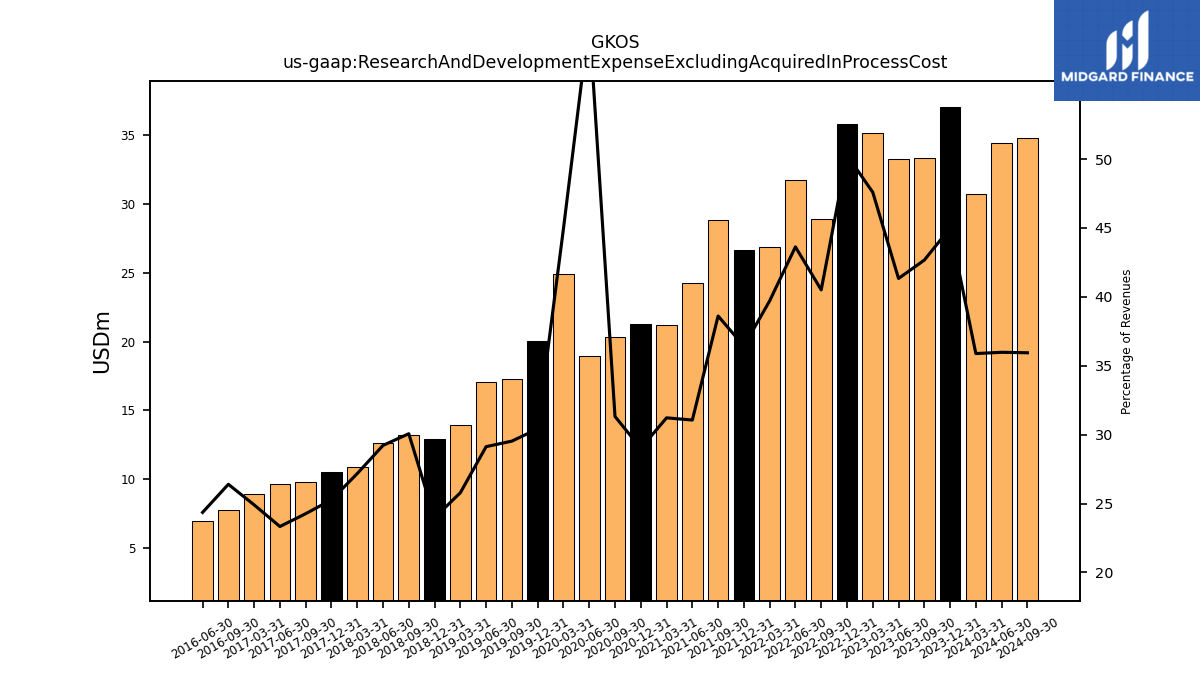
| Research And Development Expense Excluding Acquired In Process Cost | 37.06 | 33.30 | 33.23 | 35.17 | 35.81 | 28.87 | 31.71 | 26.88 | 26.68 | 28.85 | 24.26 | 21.22 | 21.24 | 20.30 | 18.97 | 24.87 | 20.03 | 17.28 | 17.07 | 13.93 | 12.96 | 13.20 | 12.61 | 10.91 | 10.53 | 9.80 | 9.63 | 8.94 | NA | 7.81 | 6.96 | NA | NA | NA | NA | NA | NA | NA | NA | NA | |
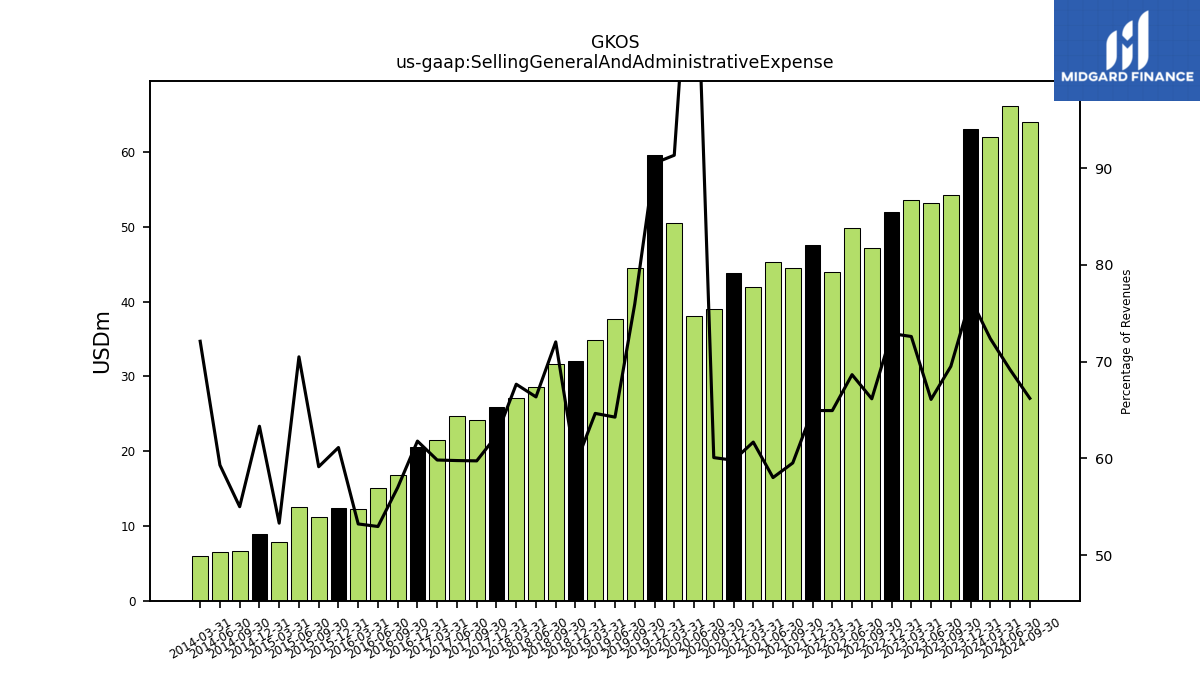
| Selling General And Administrative Expense | 63.03 | 54.25 | 53.14 | 53.65 | 51.93 | 47.15 | 49.90 | 43.95 | 47.57 | 44.47 | 45.30 | 41.92 | 43.79 | 38.95 | 38.12 | 50.55 | 59.61 | 44.44 | 37.66 | 34.92 | 32.10 | 31.63 | 28.64 | 27.16 | 25.96 | 24.14 | 24.68 | 21.48 | 20.49 | 16.85 | 15.12 | 12.29 | 12.39 | 11.24 | 12.52 | 7.82 | 8.94 | 6.67 | 6.58 | 5.95 | |
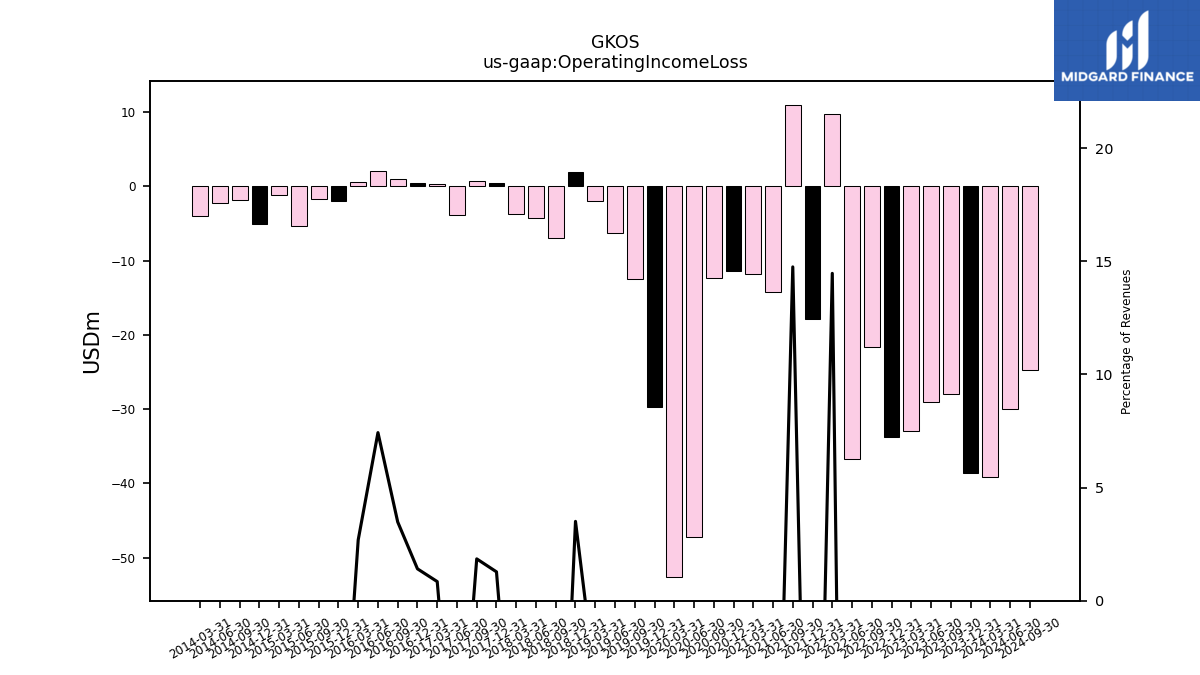
| Operating Income Loss | -38.62 | -28.01 | -29.07 | -32.99 | -33.73 | -21.61 | -36.76 | 9.79 | -17.87 | 11.02 | -14.22 | -11.80 | -11.39 | -12.35 | -47.20 | -52.61 | -29.70 | -12.41 | -6.24 | -1.94 | 1.90 | -6.94 | -4.25 | -3.71 | 0.53 | 0.75 | -3.87 | 0.30 | 0.47 | 1.03 | 2.12 | 0.62 | -2.00 | -1.73 | -5.38 | -1.18 | -5.02 | -1.88 | -2.24 | -4.03 | |
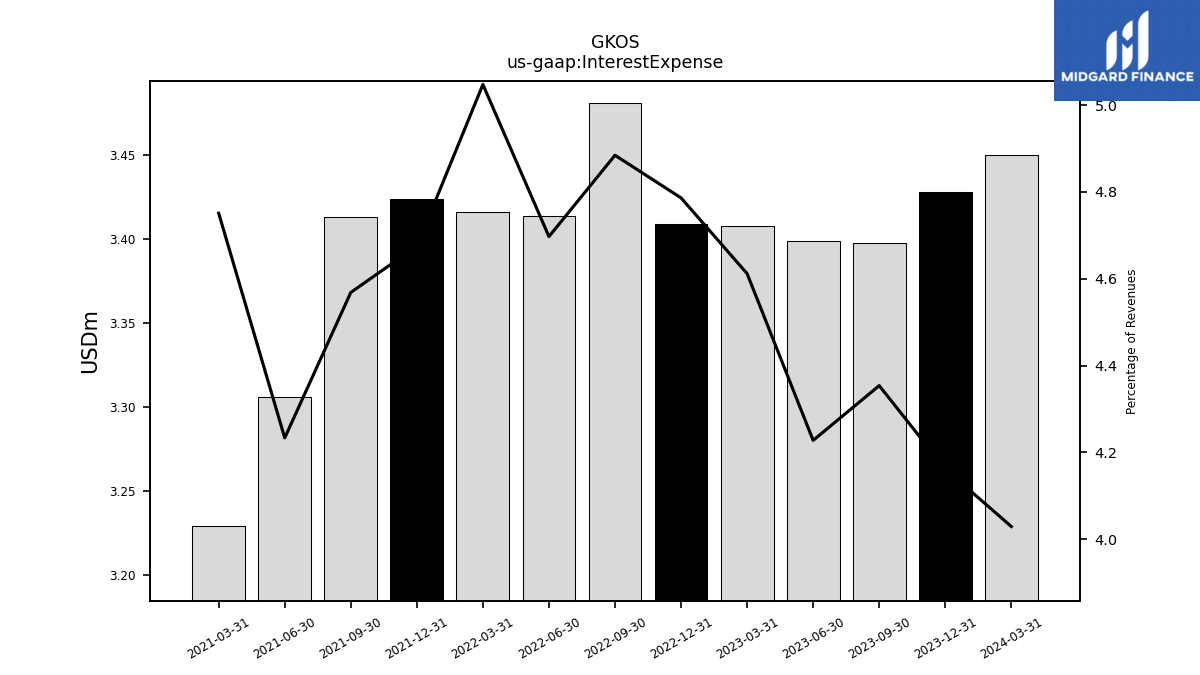
| Interest Expense | 3.43 | 3.40 | 3.40 | 3.41 | 3.41 | 3.48 | 3.41 | 3.42 | 3.42 | 3.41 | 3.31 | 3.23 | NA | NA | NA | NA | NA | NA | NA | NA | NA | NA | NA | NA | NA | NA | NA | NA | NA | NA | NA | NA | NA | NA | NA | NA | NA | NA | NA | NA | |
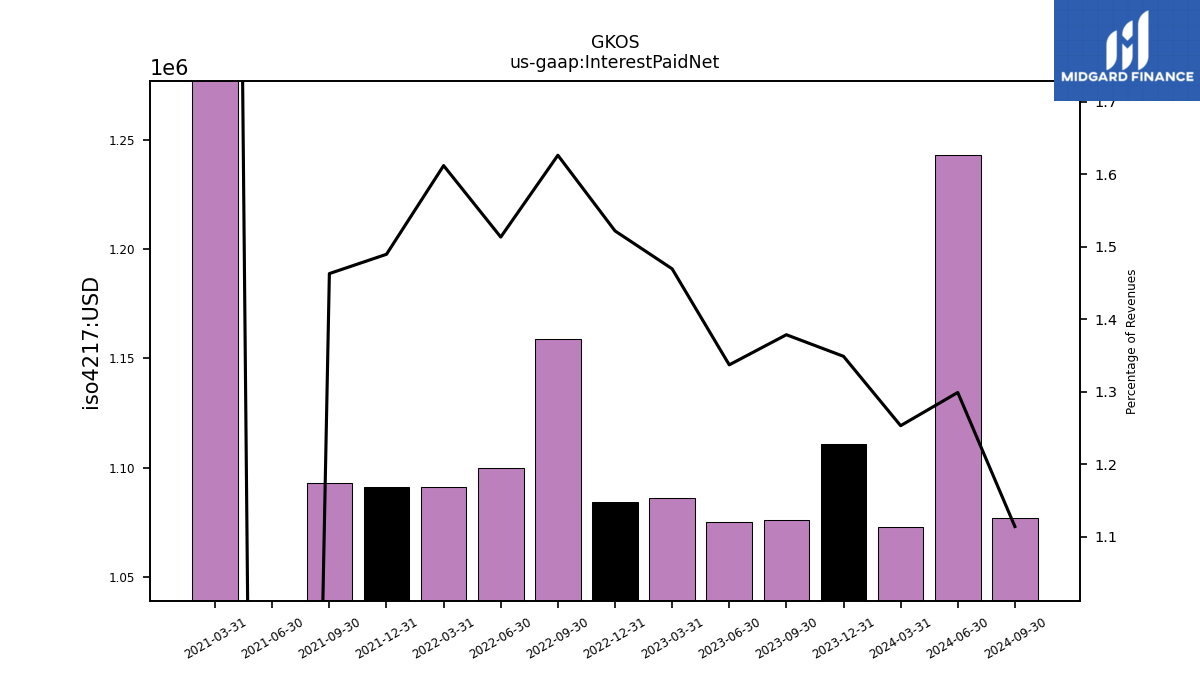
| Interest Paid Net | 1.11 | 1.08 | 1.07 | 1.09 | 1.08 | 1.16 | 1.10 | 1.09 | 1.09 | 1.09 | -1.96 | 3.85 | NA | NA | NA | NA | NA | NA | NA | NA | NA | NA | NA | NA | NA | NA | NA | NA | NA | NA | NA | NA | NA | NA | NA | NA | NA | NA | NA | NA | |
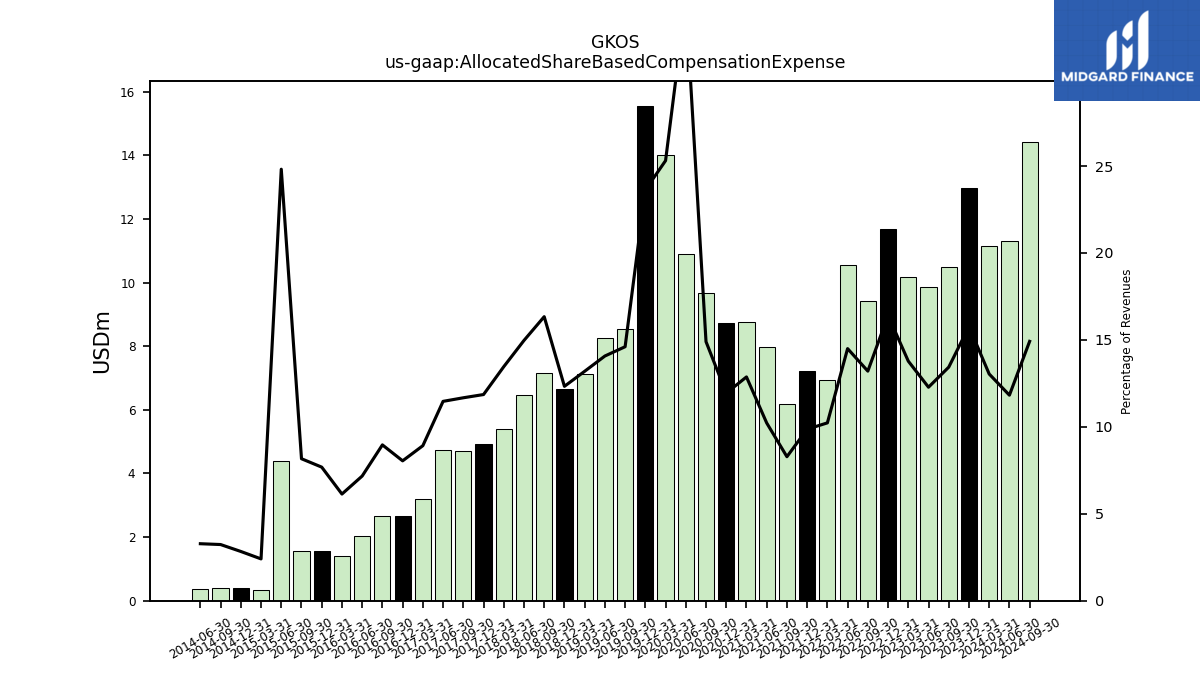
| Allocated Share Based Compensation Expense | 12.99 | 10.48 | 9.87 | 10.18 | 11.69 | 9.41 | 10.54 | 6.92 | 7.22 | 6.19 | 7.98 | 8.75 | 8.74 | 9.66 | 10.90 | 14.01 | 15.56 | 8.55 | 8.25 | 7.13 | 6.67 | 7.17 | 6.46 | 5.40 | 4.94 | 4.72 | 4.73 | 3.20 | 2.67 | 2.65 | 2.05 | 1.42 | 1.56 | 1.55 | 4.41 | 0.35 | 0.40 | 0.39 | 0.36 | NA | |
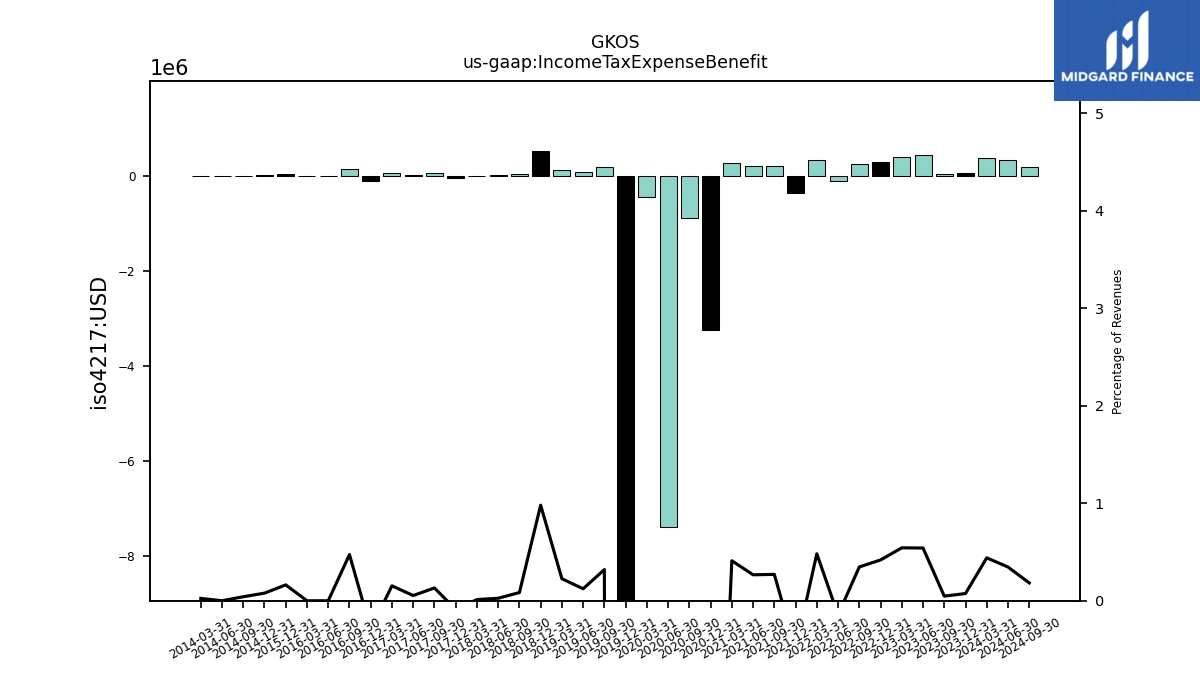
| Income Tax Expense Benefit | 0.06 | 0.04 | 0.43 | 0.40 | 0.30 | 0.25 | -0.10 | 0.33 | -0.36 | 0.20 | 0.21 | 0.28 | -3.24 | -0.89 | -7.38 | -0.45 | -65.84 | 0.19 | 0.07 | 0.12 | 0.53 | 0.04 | 0.01 | 0.01 | -0.04 | 0.05 | 0.02 | 0.06 | -0.10 | 0.14 | 0.00 | 0.00 | 0.03 | NA | NA | NA | 0.01 | 0.01 | 0.00 | 0.00 | |
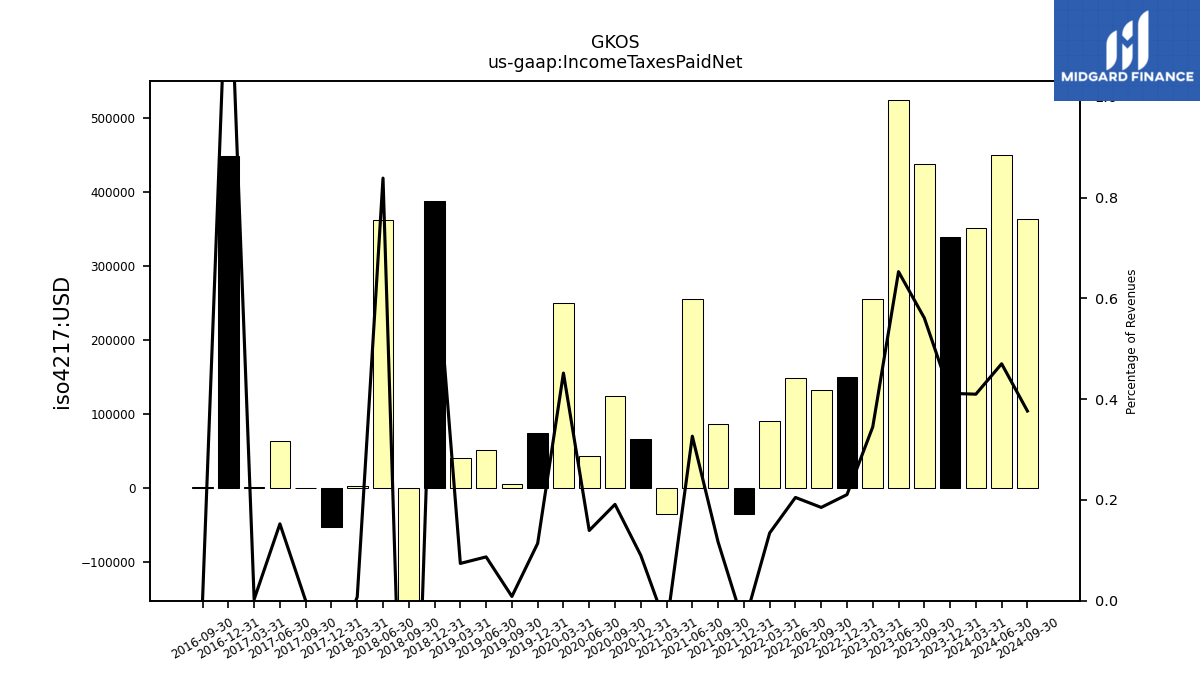
| Income Taxes Paid Net | 0.34 | 0.44 | 0.53 | 0.26 | 0.15 | 0.13 | 0.15 | 0.09 | -0.04 | 0.09 | 0.26 | -0.04 | 0.07 | 0.12 | 0.04 | 0.25 | 0.07 | 0.01 | 0.05 | 0.04 | 0.39 | -0.35 | 0.36 | 0.00 | -0.05 | 0.00 | 0.06 | 0.00 | 0.45 | 0.00 | NA | NA | NA | NA | NA | NA | NA | NA | NA | NA | |
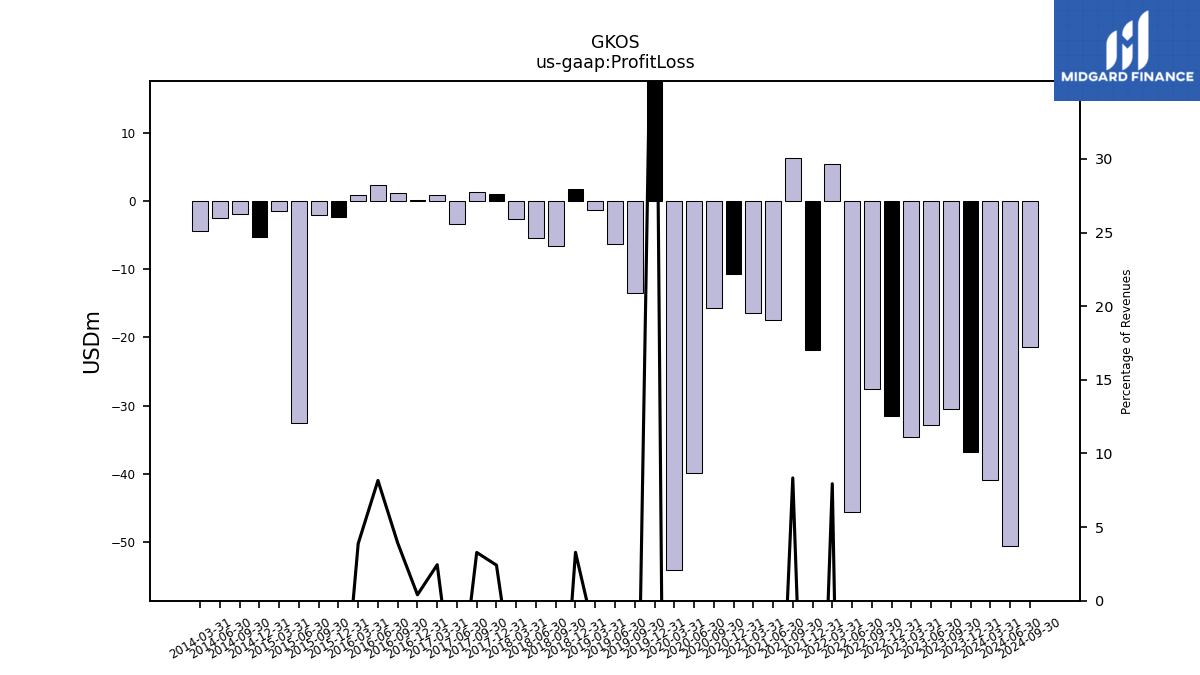
| Profit Loss | -36.78 | -30.44 | -32.81 | -34.63 | -31.46 | -27.58 | -45.54 | 5.38 | -21.87 | 6.23 | -17.48 | -16.47 | -10.65 | -15.75 | -39.89 | -54.06 | 36.58 | -13.51 | -6.31 | -1.34 | 1.78 | -6.62 | -5.40 | -2.71 | 1.01 | 1.32 | -3.30 | 0.88 | 0.13 | 1.16 | 2.33 | 0.90 | -2.29 | -2.06 | -32.51 | -1.46 | -5.25 | -1.97 | -2.49 | -4.34 | |
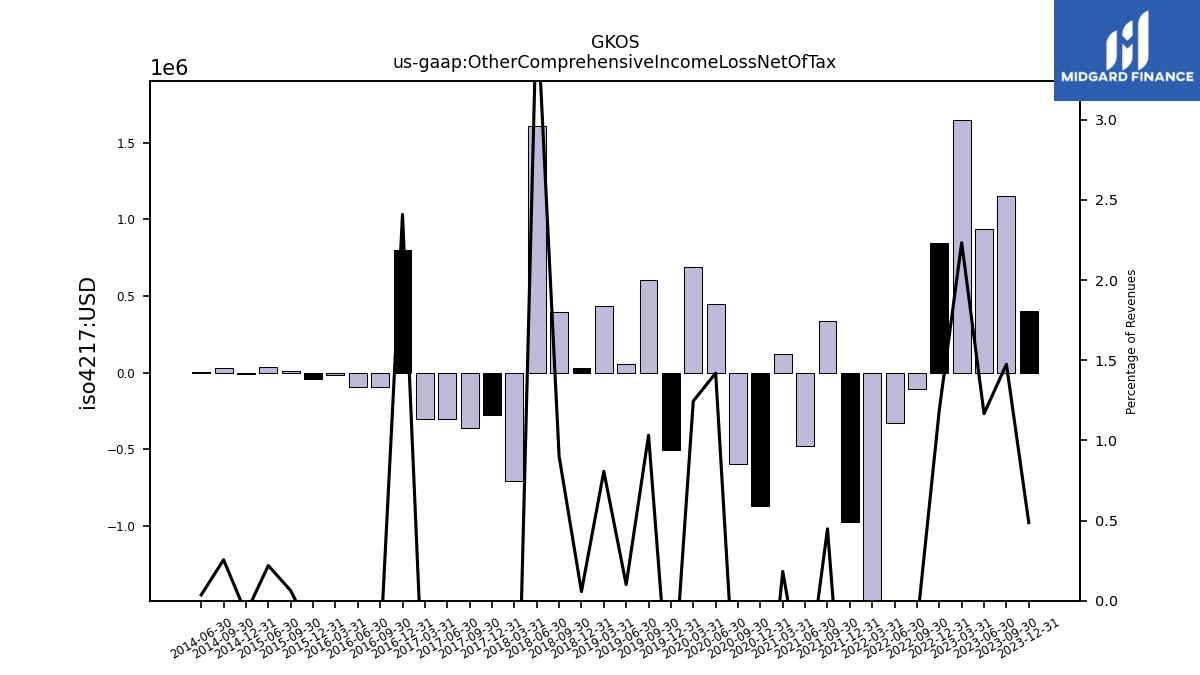
| Other Comprehensive Income Loss Net Of Tax | 0.40 | 1.15 | 0.94 | 1.65 | 0.85 | -0.11 | -0.33 | -3.40 | -0.97 | 0.34 | -0.48 | 0.12 | -0.87 | -0.59 | 0.45 | 0.69 | -0.51 | 0.60 | 0.06 | 0.44 | 0.03 | 0.40 | 1.61 | -0.70 | -0.28 | -0.36 | -0.30 | -0.30 | 0.80 | -0.09 | -0.09 | -0.02 | -0.04 | 0.01 | 0.04 | NA | -0.01 | 0.03 | 0.00 | NA | |
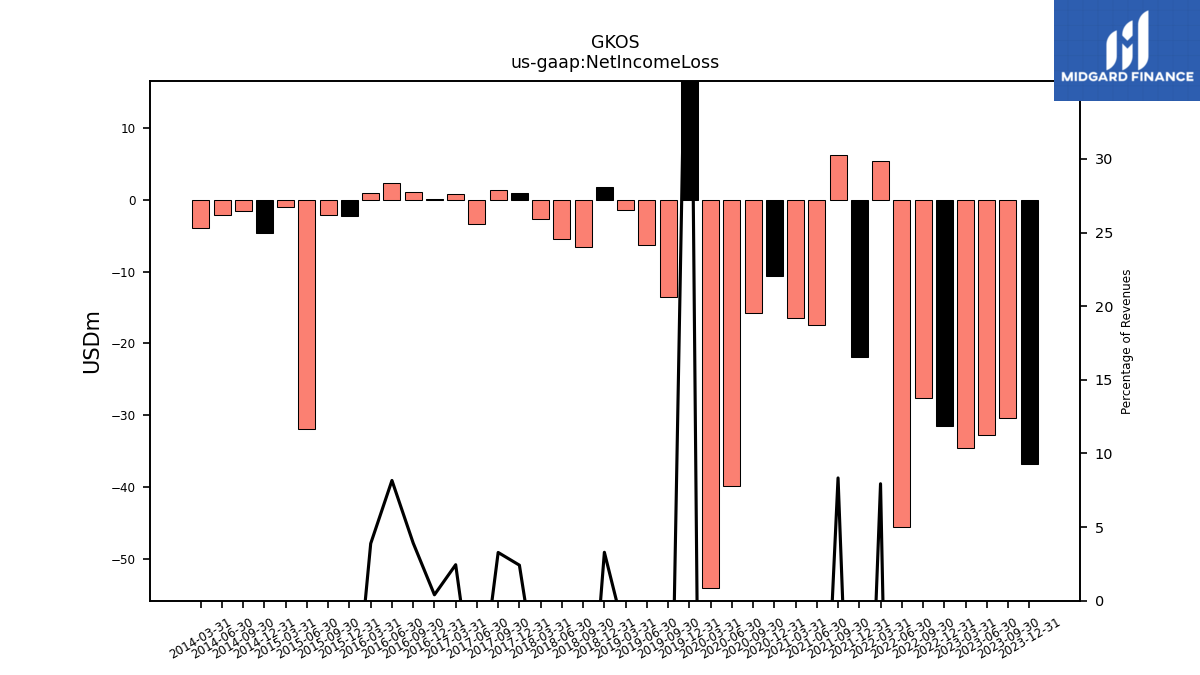
| Net Income Loss | -36.78 | -30.44 | -32.81 | -34.63 | -31.46 | -27.58 | -45.54 | 5.38 | -21.87 | 6.23 | -17.48 | -16.47 | -10.65 | -15.75 | -39.89 | -54.06 | 36.58 | -13.51 | -6.31 | -1.34 | 1.78 | -6.62 | -5.40 | -2.71 | 1.01 | 1.32 | -3.30 | 0.88 | 0.13 | 1.16 | 2.33 | 0.90 | -2.29 | -2.06 | -31.93 | -0.97 | -4.61 | -1.49 | -2.07 | -3.96 | |
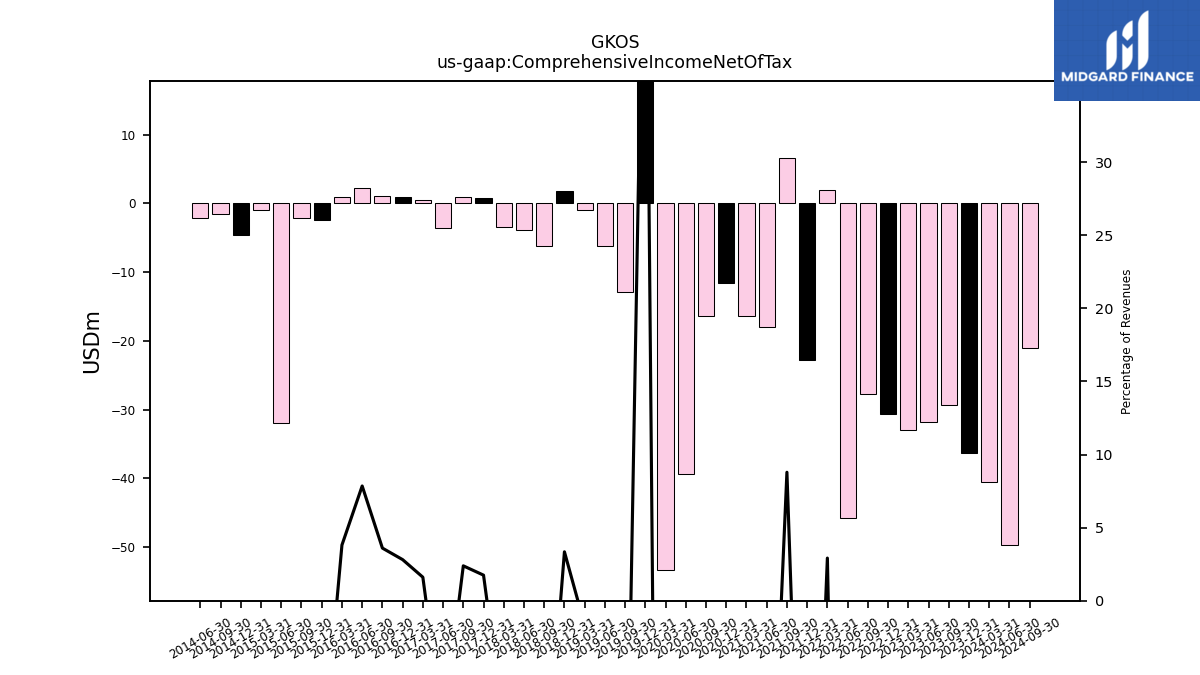
| Comprehensive Income Net Of Tax | -36.38 | -29.29 | -31.87 | -32.98 | -30.61 | -27.68 | -45.86 | 1.98 | -22.84 | 6.57 | -17.96 | -16.34 | -11.52 | -16.34 | -39.45 | -53.37 | 36.07 | -12.90 | -6.25 | -0.91 | 1.81 | -6.22 | -3.79 | -3.42 | 0.73 | 0.96 | -3.60 | 0.58 | 0.93 | 1.06 | 2.24 | 0.88 | -2.33 | -2.04 | -31.89 | -0.97 | -4.62 | -1.46 | -2.07 | NA |
| 2023-12-31 | 2023-09-30 | 2023-06-30 | 2023-03-31 | 2022-12-31 | 2022-09-30 | 2022-06-30 | 2022-03-31 | 2021-12-31 | 2021-09-30 | 2021-06-30 | 2021-03-31 | 2020-12-31 | 2020-09-30 | 2020-06-30 | 2020-03-31 | 2019-12-31 | 2019-09-30 | 2019-06-30 | 2019-03-31 | 2018-12-31 | 2018-09-30 | 2018-06-30 | 2018-03-31 | 2017-12-31 | 2017-09-30 | 2017-06-30 | 2017-03-31 | 2016-12-31 | 2016-09-30 | 2016-06-30 | 2016-03-31 | 2015-12-31 | 2015-09-30 | 2015-06-30 | 2015-03-31 | 2014-12-31 | 2014-09-30 | 2014-06-30 | 2014-03-31 | ||
|---|---|---|---|---|---|---|---|---|---|---|---|---|---|---|---|---|---|---|---|---|---|---|---|---|---|---|---|---|---|---|---|---|---|---|---|---|---|---|---|---|---|
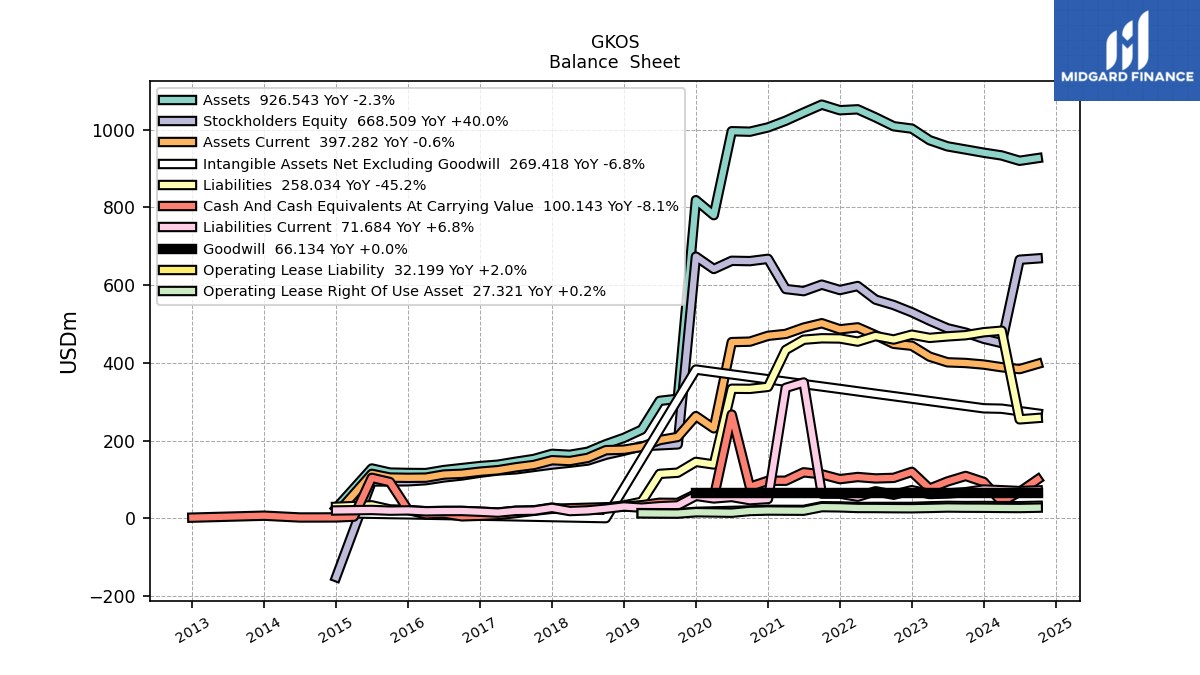
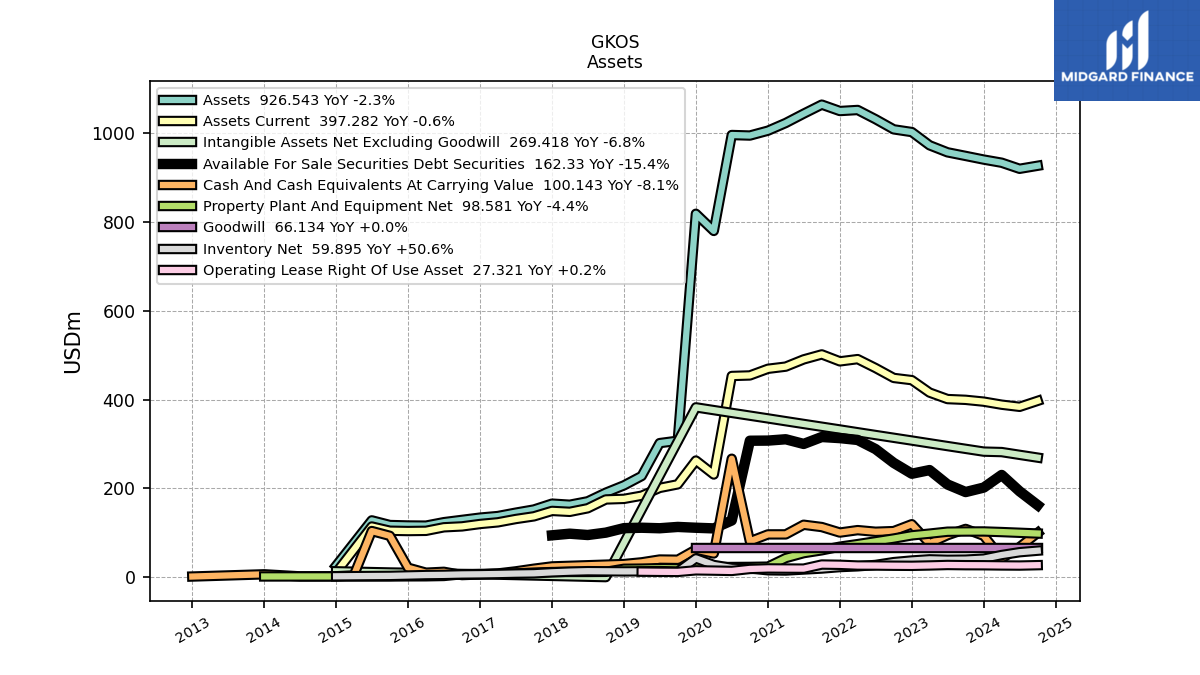
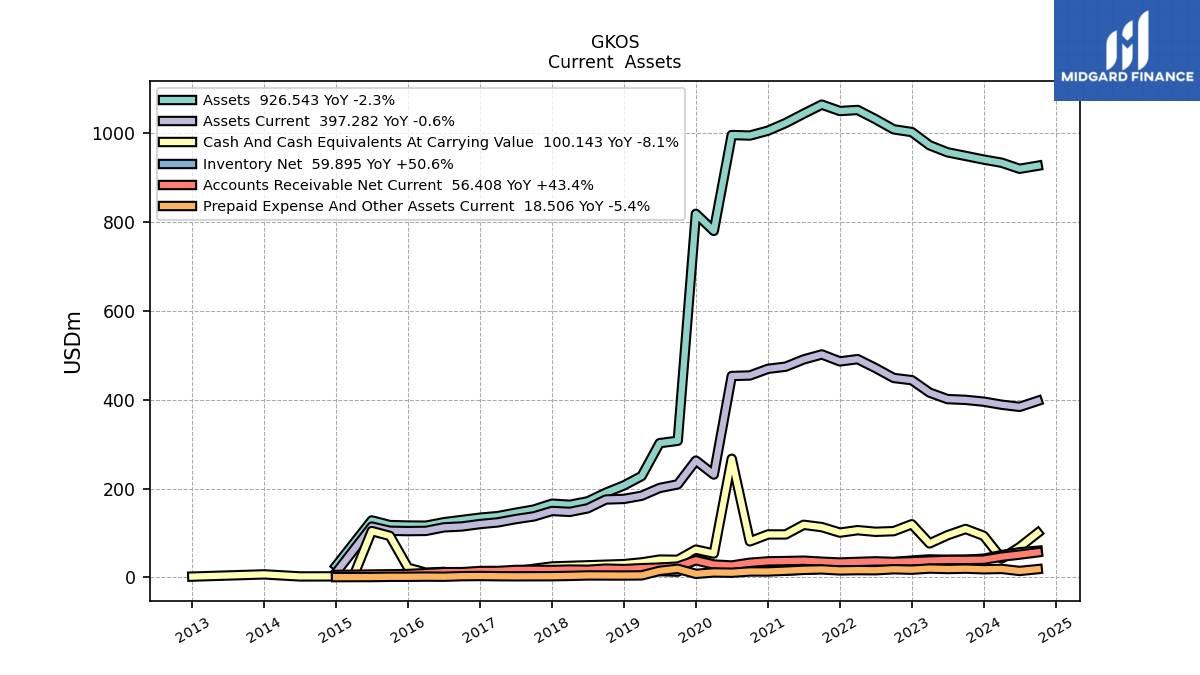
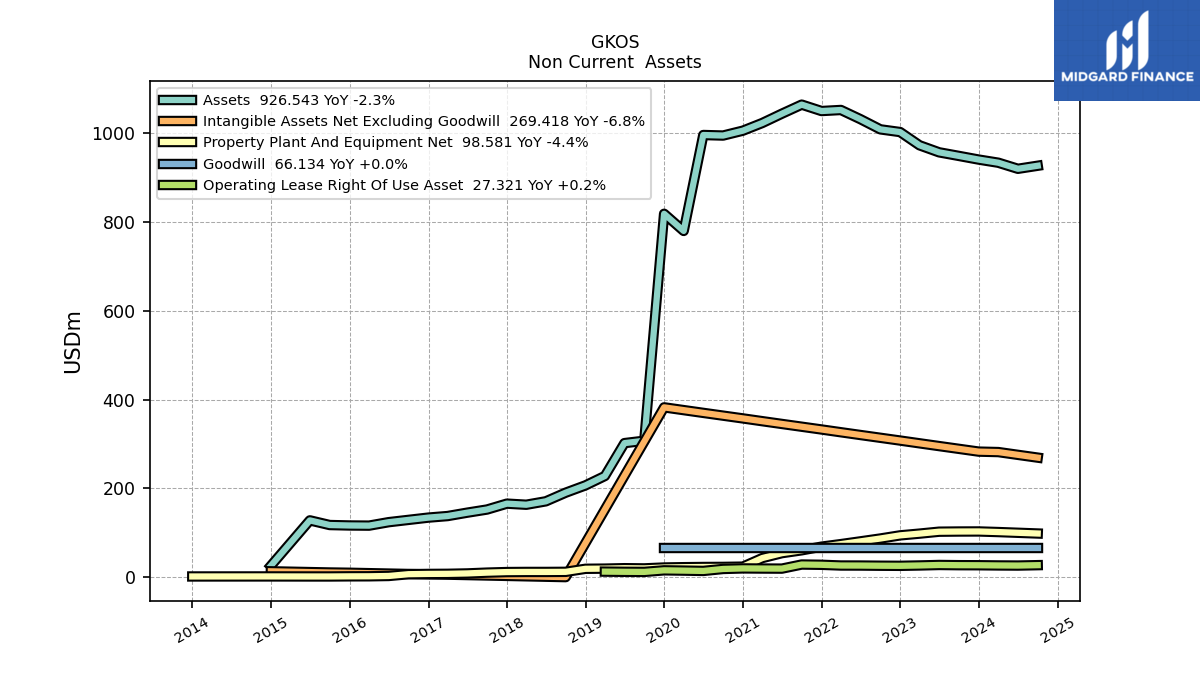
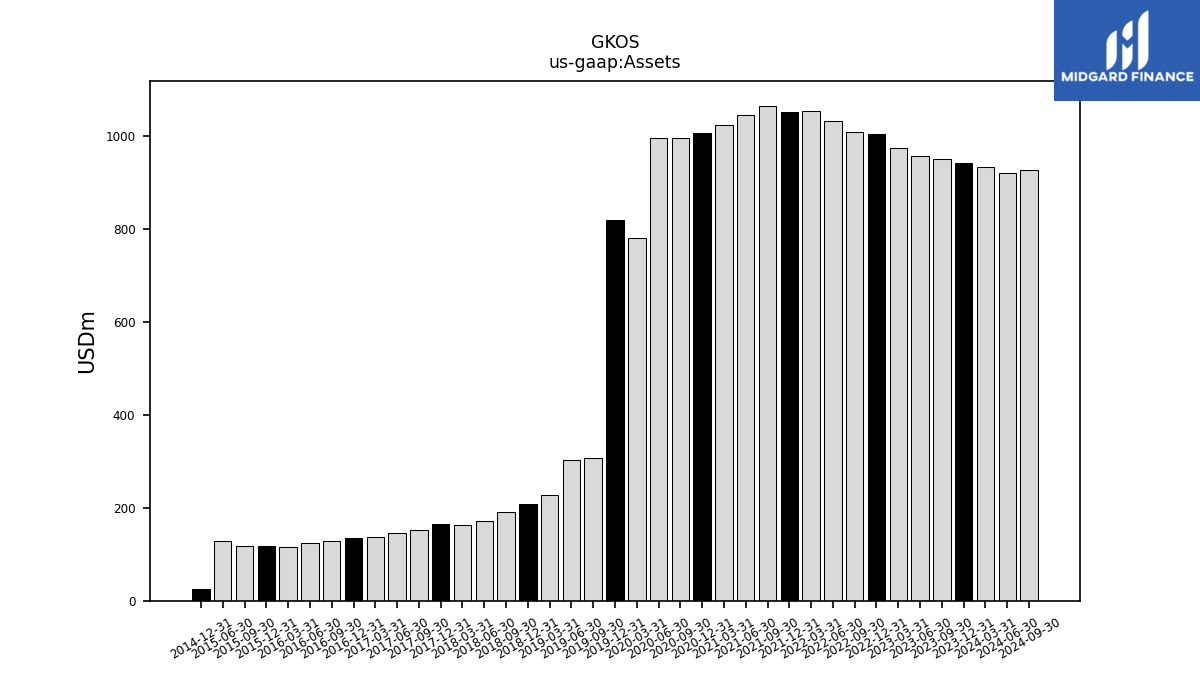
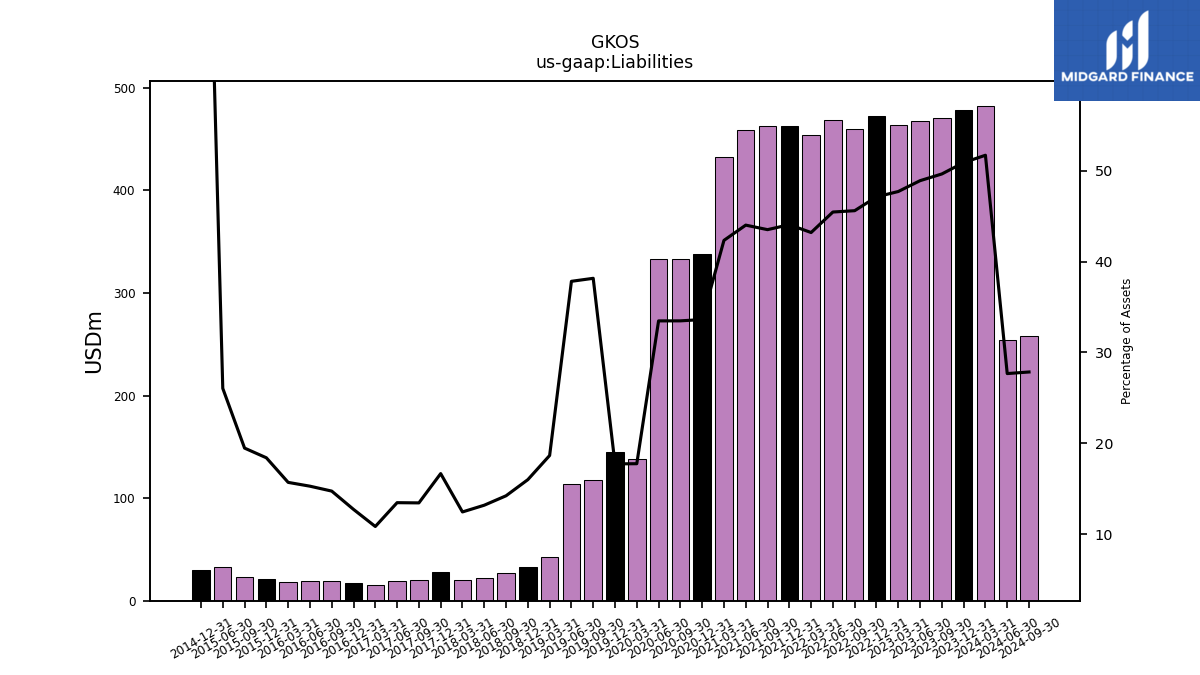
| Assets | 940.41 | 948.63 | 956.74 | 972.59 | 1002.38 | 1008.47 | 1031.28 | 1052.07 | 1049.70 | 1064.13 | 1043.72 | 1022.78 | 1005.50 | 994.51 | 995.73 | 779.72 | 818.40 | 307.44 | 302.08 | 228.03 | 206.97 | 190.50 | 171.09 | 163.35 | 165.84 | 152.61 | 145.53 | 137.90 | 134.37 | 129.25 | 124.10 | 116.32 | 116.66 | 117.68 | 128.17 | NA | 26.02 | NA | NA | NA | |
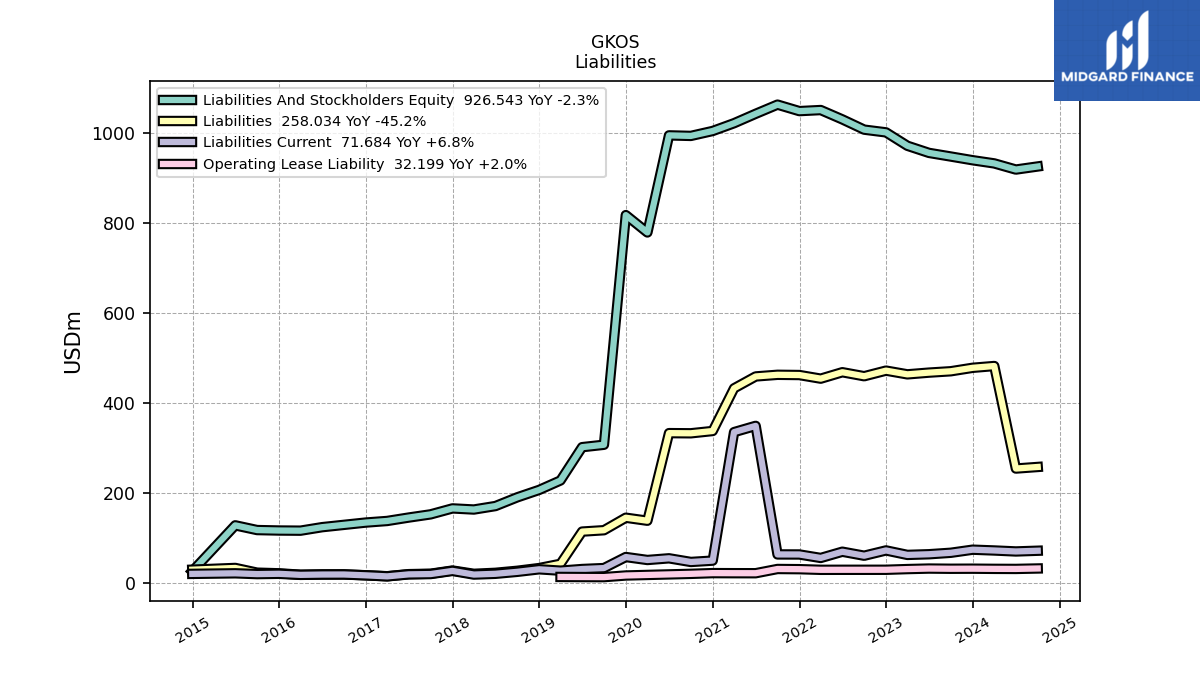
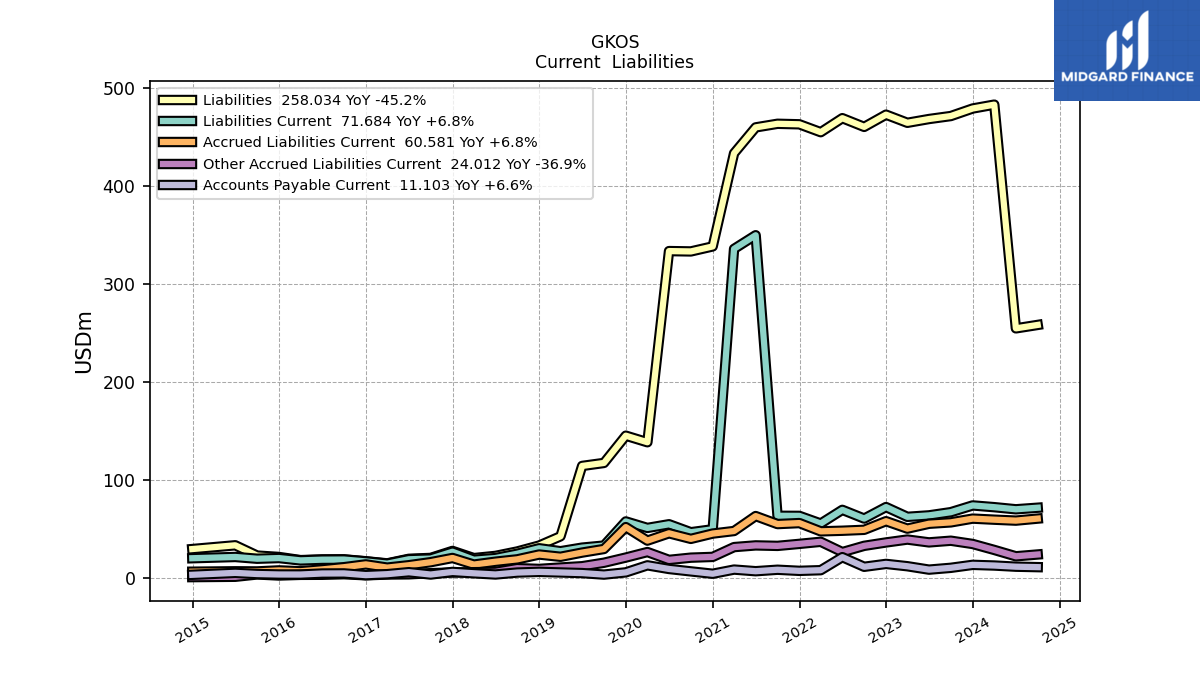
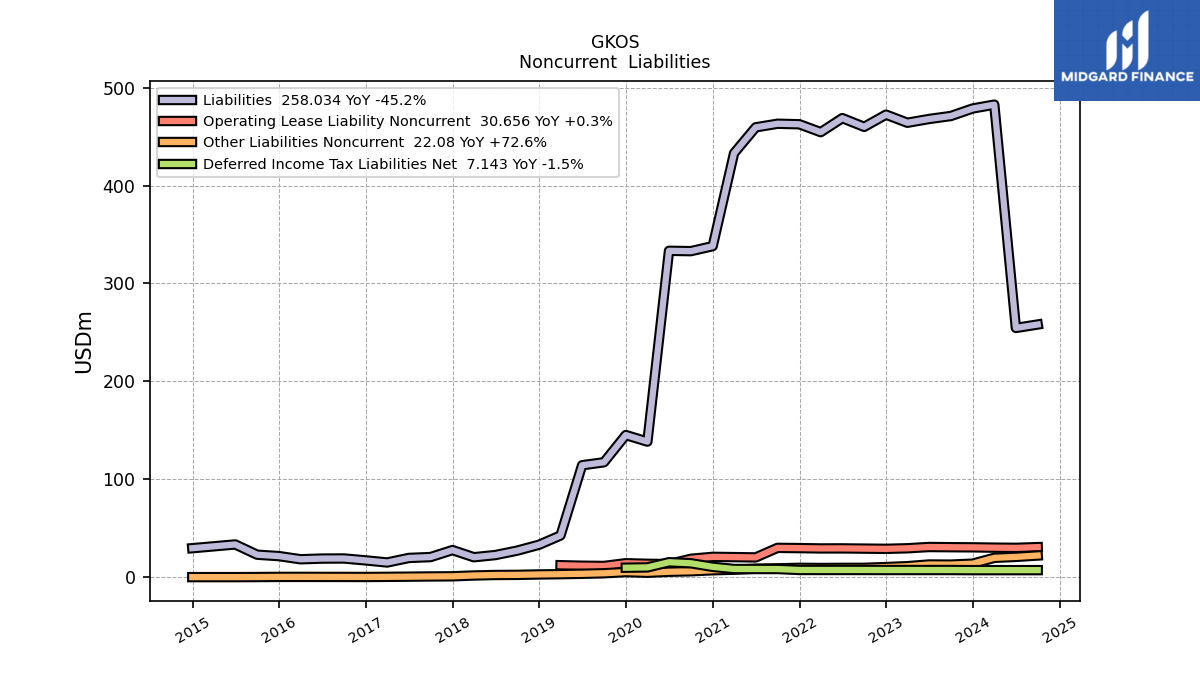
| Liabilities | 478.65 | 470.98 | 467.93 | 464.08 | 472.38 | 459.91 | 468.80 | 454.51 | 462.55 | 463.08 | 459.40 | 433.00 | 338.05 | 332.95 | 333.31 | 138.42 | 145.13 | 117.32 | 114.28 | 42.55 | 33.11 | 27.09 | 22.56 | 20.33 | 27.63 | 20.51 | 19.59 | 14.95 | 17.10 | 19.05 | 18.96 | 18.26 | 21.47 | 22.91 | 33.38 | NA | 29.55 | NA | NA | NA | |
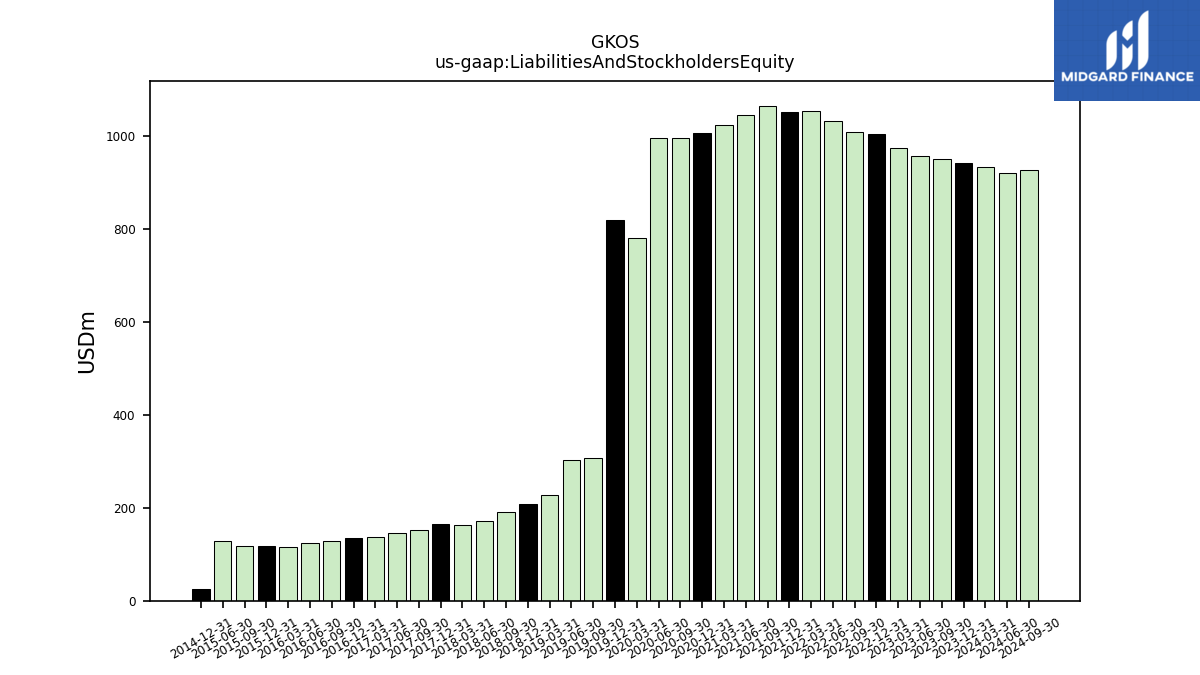
| Liabilities And Stockholders Equity | 940.41 | 948.63 | 956.74 | 972.59 | 1002.38 | 1008.47 | 1031.28 | 1052.07 | 1049.70 | 1064.13 | 1043.72 | 1022.78 | 1005.50 | 994.51 | 995.73 | 779.72 | 818.40 | 307.44 | 302.08 | 228.03 | 206.97 | 190.50 | 171.09 | 163.35 | 165.84 | 152.61 | 145.53 | 137.90 | 134.37 | 129.25 | 124.10 | 116.32 | 116.66 | 117.68 | 128.17 | NA | 26.02 | NA | NA | NA | |
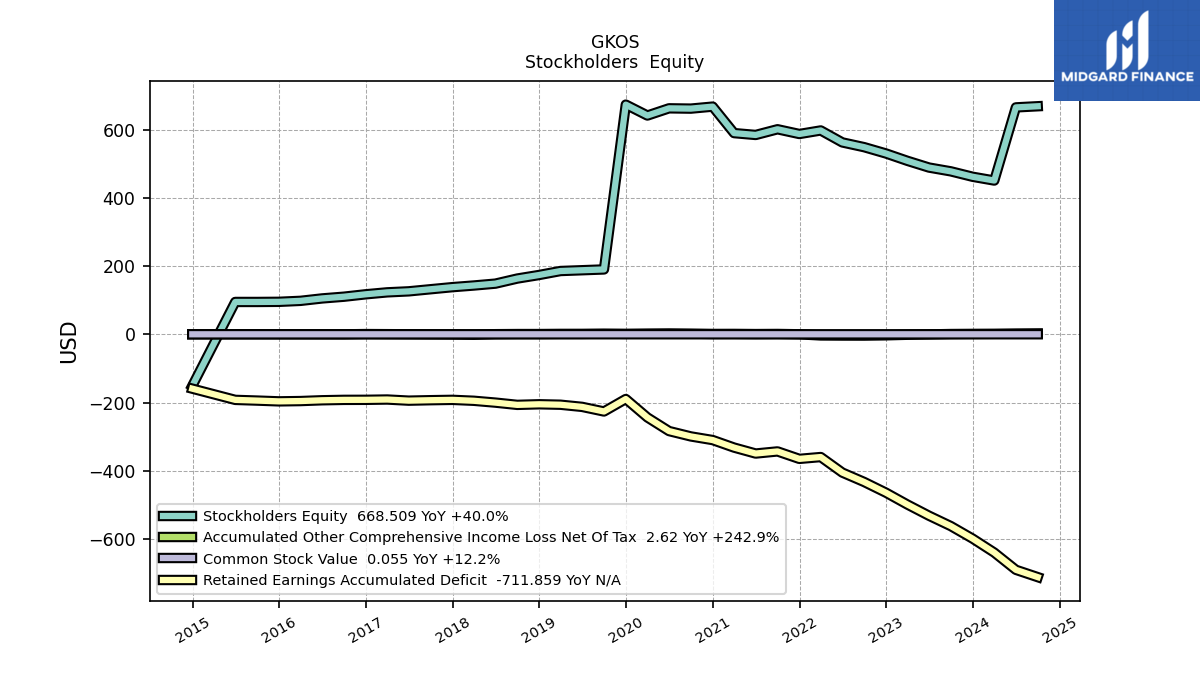
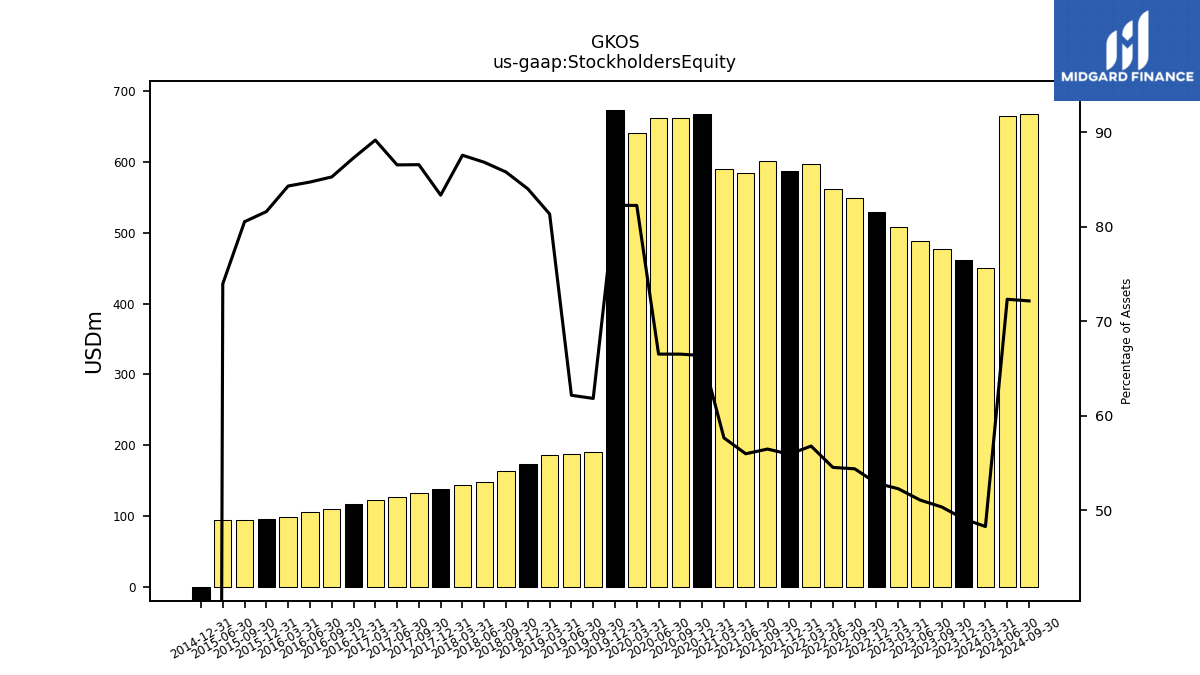
| Stockholders Equity | 461.77 | 477.66 | 488.81 | 508.51 | 530.00 | 548.55 | 562.48 | 597.56 | 587.15 | 601.05 | 584.33 | 589.77 | 667.45 | 661.56 | 662.42 | 641.30 | 673.27 | 190.12 | 187.81 | 185.49 | 173.86 | 163.41 | 148.53 | 143.03 | 138.20 | 132.10 | 125.93 | 122.95 | 117.27 | 110.20 | 105.14 | 98.06 | 95.19 | 94.77 | 94.79 | NA | -151.30 | NA | NA | NA |
| 2023-12-31 | 2023-09-30 | 2023-06-30 | 2023-03-31 | 2022-12-31 | 2022-09-30 | 2022-06-30 | 2022-03-31 | 2021-12-31 | 2021-09-30 | 2021-06-30 | 2021-03-31 | 2020-12-31 | 2020-09-30 | 2020-06-30 | 2020-03-31 | 2019-12-31 | 2019-09-30 | 2019-06-30 | 2019-03-31 | 2018-12-31 | 2018-09-30 | 2018-06-30 | 2018-03-31 | 2017-12-31 | 2017-09-30 | 2017-06-30 | 2017-03-31 | 2016-12-31 | 2016-09-30 | 2016-06-30 | 2016-03-31 | 2015-12-31 | 2015-09-30 | 2015-06-30 | 2015-03-31 | 2014-12-31 | 2014-09-30 | 2014-06-30 | 2014-03-31 | ||
|---|---|---|---|---|---|---|---|---|---|---|---|---|---|---|---|---|---|---|---|---|---|---|---|---|---|---|---|---|---|---|---|---|---|---|---|---|---|---|---|---|---|
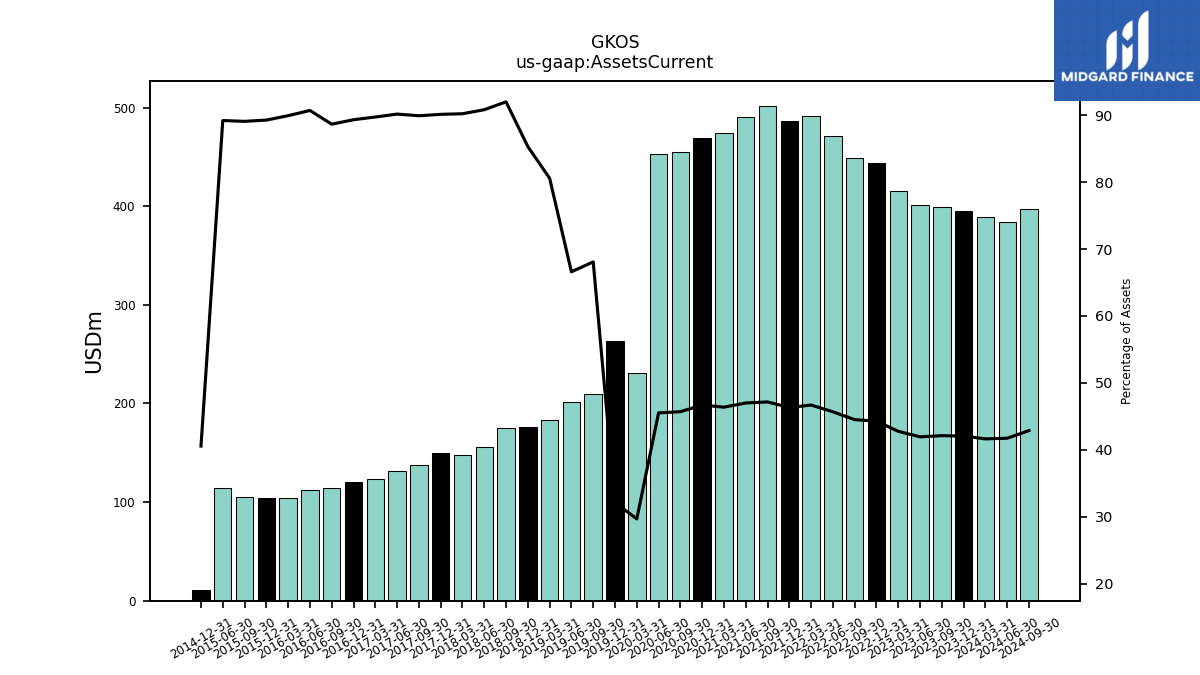
| Assets Current | 395.46 | 399.53 | 401.26 | 415.88 | 443.86 | 448.84 | 471.10 | 491.20 | 486.13 | 501.81 | 490.54 | 474.30 | 469.44 | 454.44 | 453.22 | 231.39 | 262.88 | 209.29 | 201.20 | 183.74 | 176.57 | 175.25 | 155.38 | 147.37 | 149.46 | 137.22 | 131.21 | 123.74 | 120.02 | 114.59 | 112.56 | 104.60 | 104.14 | 104.83 | 114.33 | NA | 10.55 | NA | NA | NA | |
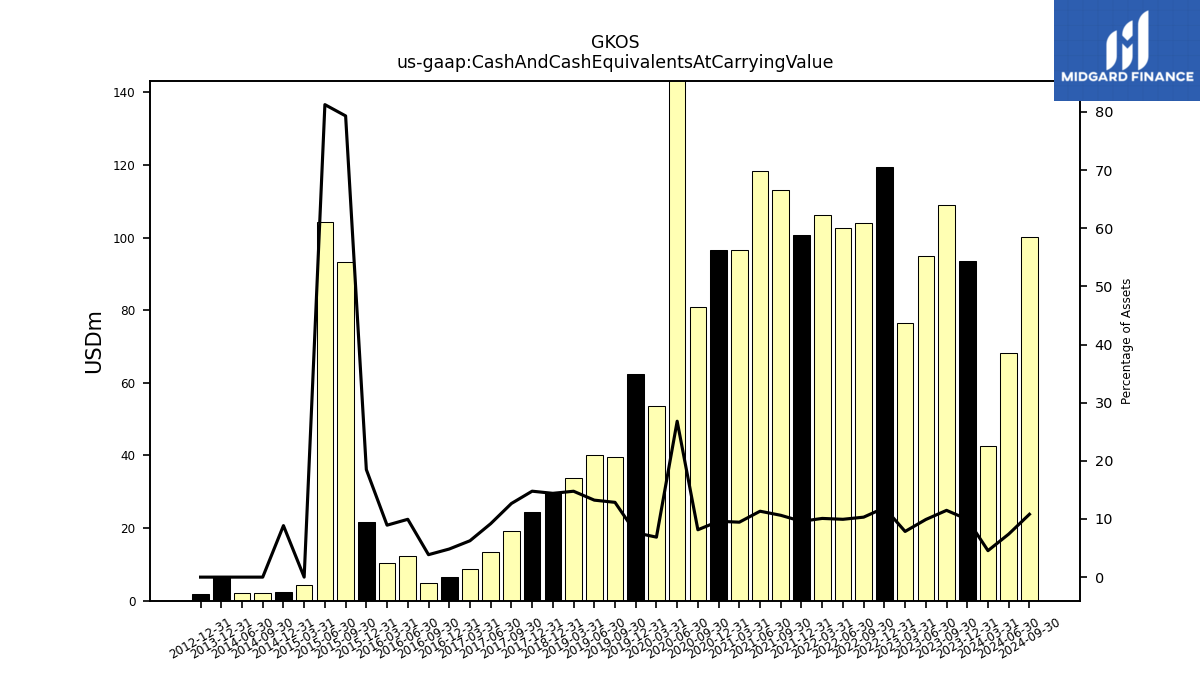
| Cash And Cash Equivalents At Carrying Value | 93.47 | 108.93 | 94.81 | 76.40 | 119.53 | 104.02 | 102.55 | 106.20 | 100.71 | 113.13 | 118.30 | 96.62 | 96.60 | 80.99 | 266.97 | 53.61 | 62.43 | 39.53 | 39.99 | 33.68 | 29.82 | NA | NA | NA | 24.51 | 19.32 | 13.37 | 8.62 | 6.49 | 4.99 | 12.34 | 10.39 | 21.57 | 93.34 | 104.14 | 4.24 | 2.30 | 2.16 | 2.12 | NA | |
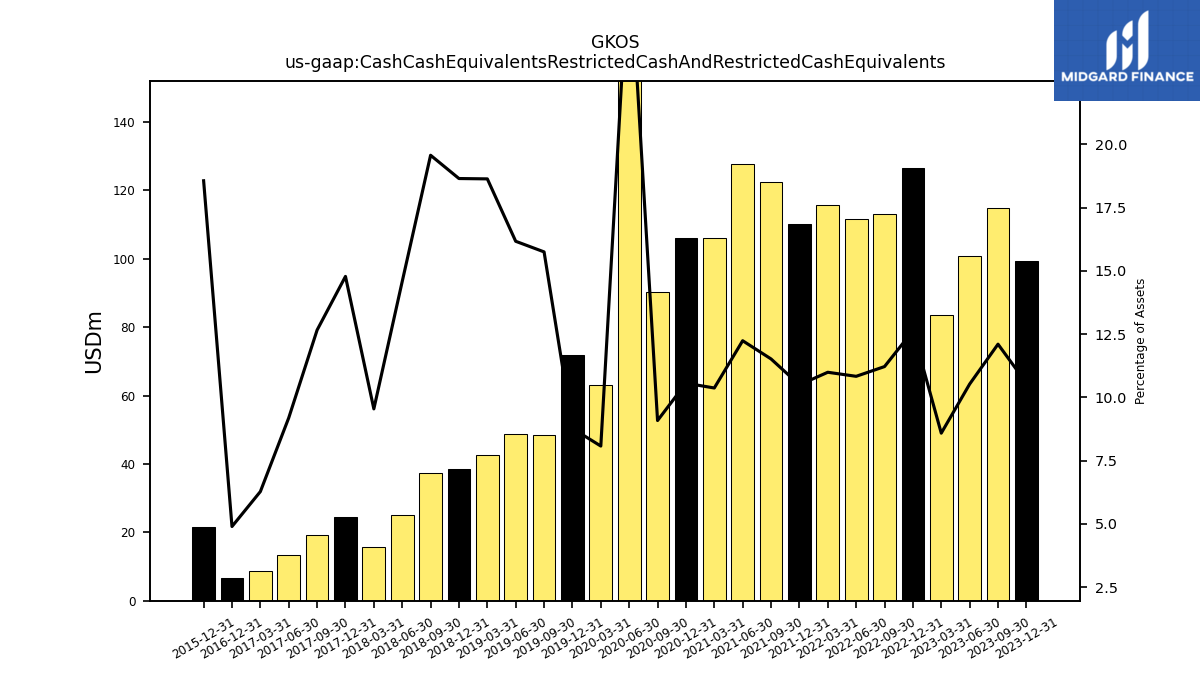
| Cash Cash Equivalents Restricted Cash And Restricted Cash Equivalents | 99.32 | 114.78 | 100.67 | 83.48 | 126.60 | 113.10 | 111.68 | 115.62 | 110.12 | 122.55 | 127.71 | 106.04 | 106.16 | 90.32 | 276.30 | 62.94 | 71.76 | 48.41 | 48.84 | 42.49 | 38.60 | 37.28 | 24.94 | 15.59 | 24.51 | 19.32 | 13.37 | 8.65 | 6.57 | NA | NA | NA | 21.65 | NA | NA | NA | NA | NA | NA | NA | |
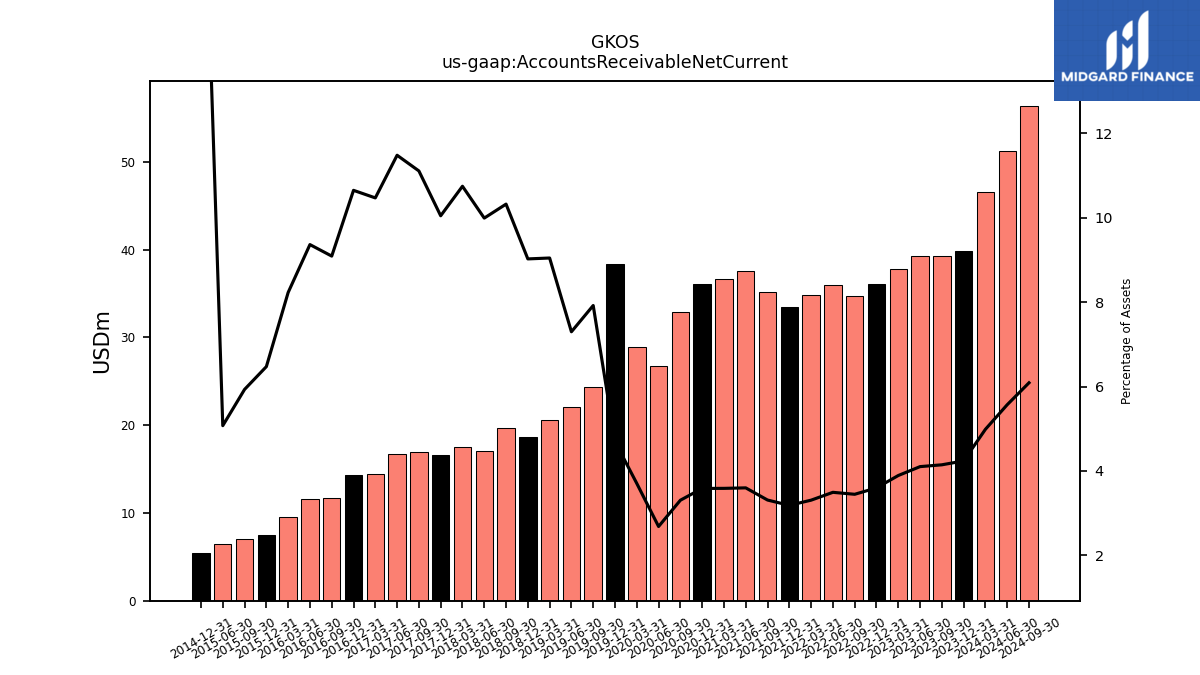
| Accounts Receivable Net Current | 39.85 | 39.33 | 39.25 | 37.85 | 36.07 | 34.77 | 36.03 | 34.80 | 33.44 | 35.24 | 37.57 | 36.69 | 36.06 | 32.88 | 26.73 | 28.89 | 38.42 | 24.34 | 22.04 | 20.62 | 18.67 | 19.66 | 17.09 | 17.55 | 16.66 | 16.95 | 16.70 | 14.43 | 14.30 | 11.75 | 11.62 | 9.57 | 7.55 | 6.98 | 6.50 | NA | 5.40 | NA | NA | NA | |
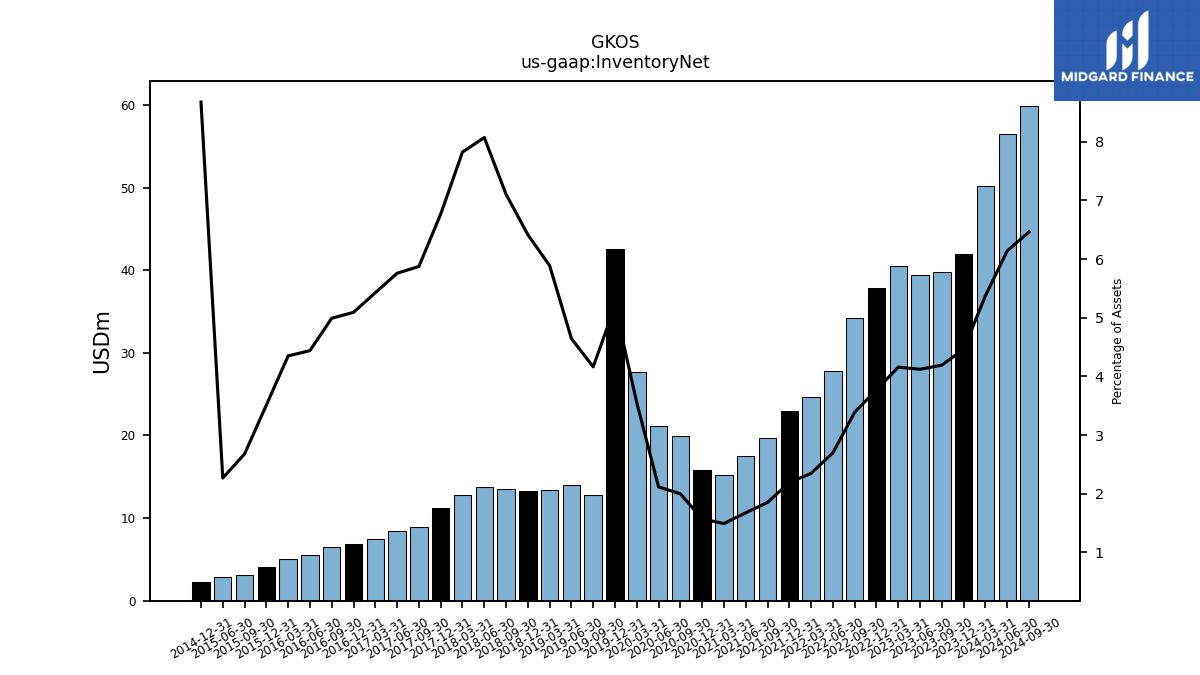
| Inventory Net | 41.99 | 39.78 | 39.45 | 40.45 | 37.84 | 34.18 | 27.84 | 24.71 | 23.01 | 19.72 | 17.50 | 15.27 | 15.81 | 19.89 | 21.09 | 27.70 | 42.58 | 12.80 | 14.04 | 13.43 | 13.28 | 13.54 | 13.81 | 12.78 | 11.22 | 8.97 | 8.38 | 7.49 | 6.84 | 6.45 | 5.51 | 5.06 | 4.10 | 3.15 | 2.91 | NA | 2.26 | NA | NA | NA | |
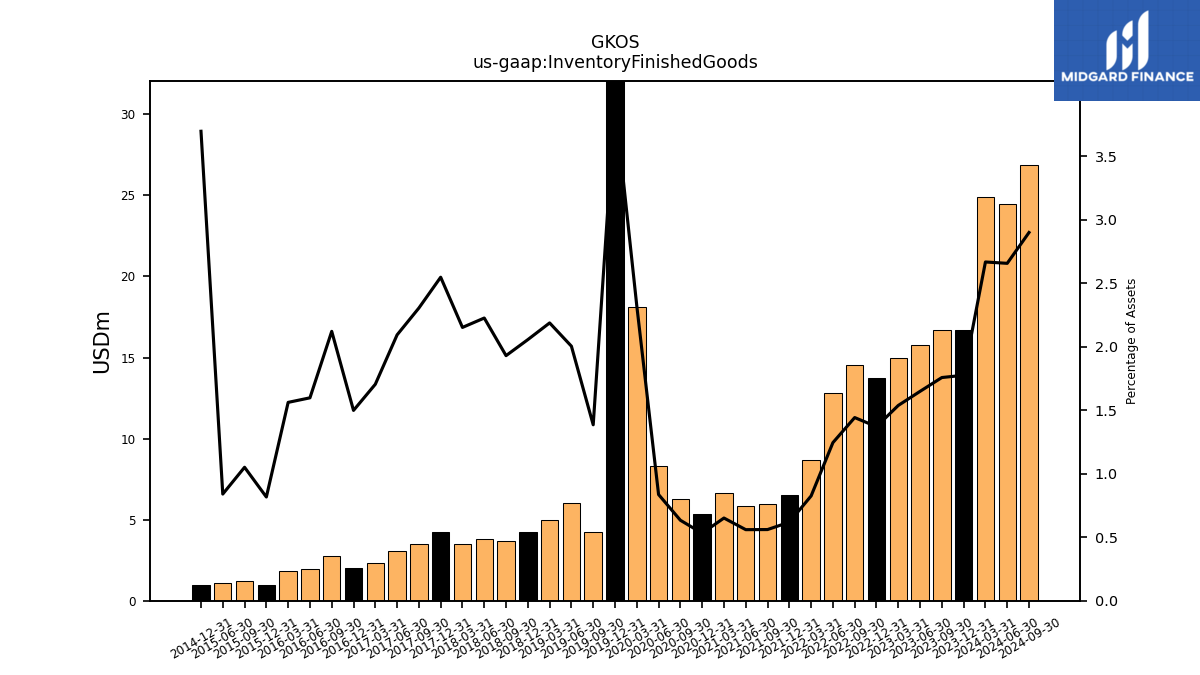
| Inventory Finished Goods | 16.70 | 16.67 | 15.78 | 14.96 | 13.74 | 14.55 | 12.84 | 8.68 | 6.50 | 5.97 | 5.84 | 6.66 | 5.35 | 6.30 | 8.33 | 18.11 | 32.11 | 4.26 | 6.05 | 4.99 | 4.26 | 3.68 | 3.81 | 3.52 | 4.22 | 3.52 | 3.05 | 2.35 | 2.01 | 2.74 | 1.98 | 1.82 | 0.95 | 1.24 | 1.08 | NA | 0.96 | NA | NA | NA | |
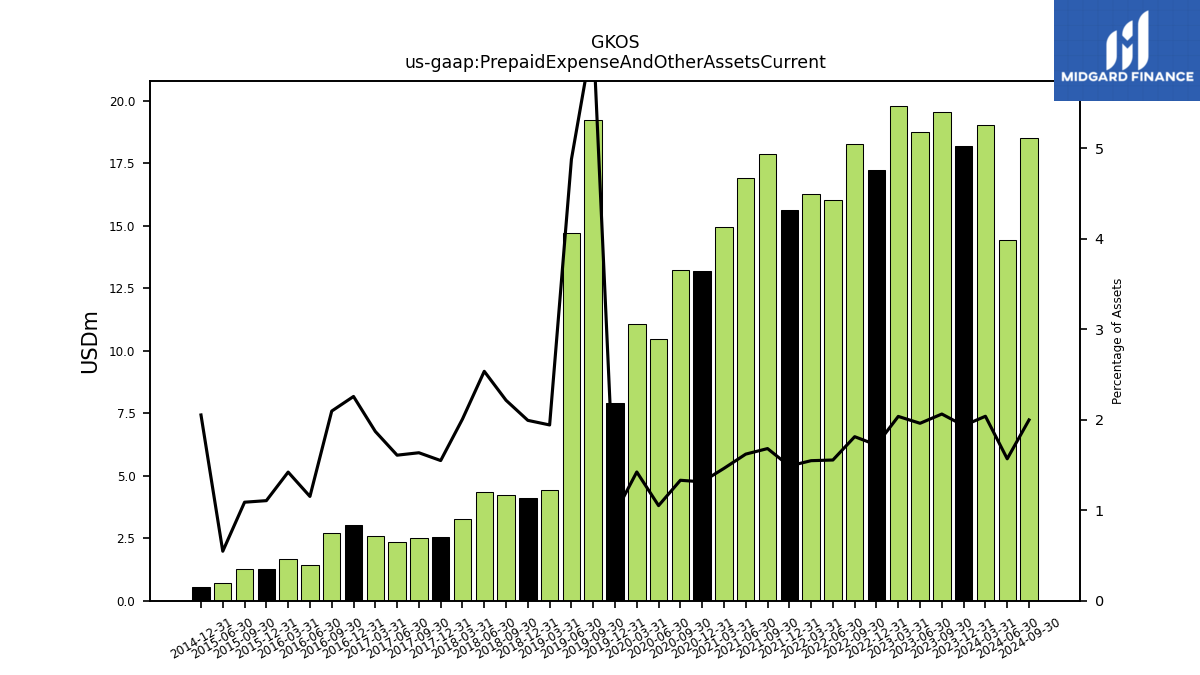
| Prepaid Expense And Other Assets Current | 18.19 | 19.57 | 18.75 | 19.80 | 17.25 | 18.27 | 16.03 | 16.28 | 15.63 | 17.89 | 16.91 | 14.95 | 13.21 | 13.23 | 10.46 | 11.09 | 7.90 | 19.22 | 14.73 | 4.43 | 4.12 | 4.22 | 4.34 | 3.28 | 2.57 | 2.50 | 2.34 | 2.58 | 3.03 | 2.71 | 1.43 | 1.65 | 1.29 | 1.28 | 0.70 | NA | 0.53 | NA | NA | NA | |
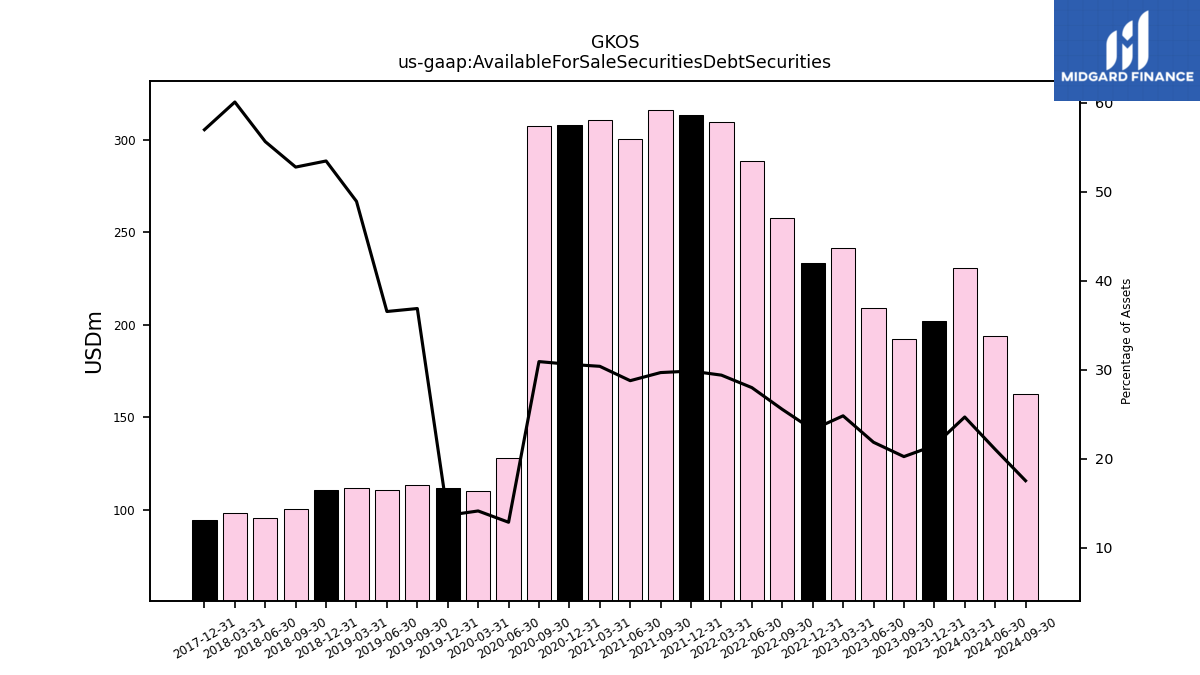
| Available For Sale Securities Debt Securities | 201.96 | 191.93 | 209.00 | 241.37 | 233.17 | 257.60 | 288.64 | 309.21 | 313.34 | 315.83 | 300.26 | 310.75 | 307.77 | 307.44 | 127.97 | 110.10 | 111.55 | 113.39 | 110.40 | 111.58 | 110.67 | 100.56 | 95.21 | 98.18 | 94.51 | NA | NA | NA | NA | NA | NA | NA | NA | NA | NA | NA | NA | NA | NA | NA |
| 2023-12-31 | 2023-09-30 | 2023-06-30 | 2023-03-31 | 2022-12-31 | 2022-09-30 | 2022-06-30 | 2022-03-31 | 2021-12-31 | 2021-09-30 | 2021-06-30 | 2021-03-31 | 2020-12-31 | 2020-09-30 | 2020-06-30 | 2020-03-31 | 2019-12-31 | 2019-09-30 | 2019-06-30 | 2019-03-31 | 2018-12-31 | 2018-09-30 | 2018-06-30 | 2018-03-31 | 2017-12-31 | 2017-09-30 | 2017-06-30 | 2017-03-31 | 2016-12-31 | 2016-09-30 | 2016-06-30 | 2016-03-31 | 2015-12-31 | 2015-09-30 | 2015-06-30 | 2015-03-31 | 2014-12-31 | 2014-09-30 | 2014-06-30 | 2014-03-31 | ||
|---|---|---|---|---|---|---|---|---|---|---|---|---|---|---|---|---|---|---|---|---|---|---|---|---|---|---|---|---|---|---|---|---|---|---|---|---|---|---|---|---|---|
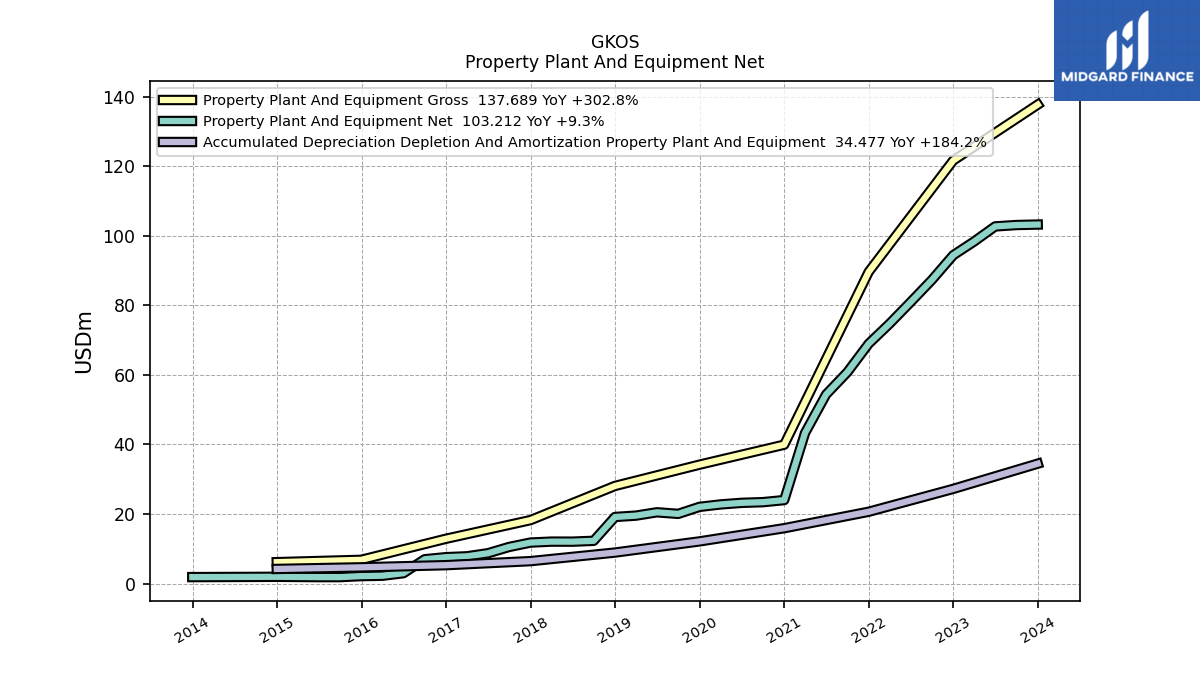
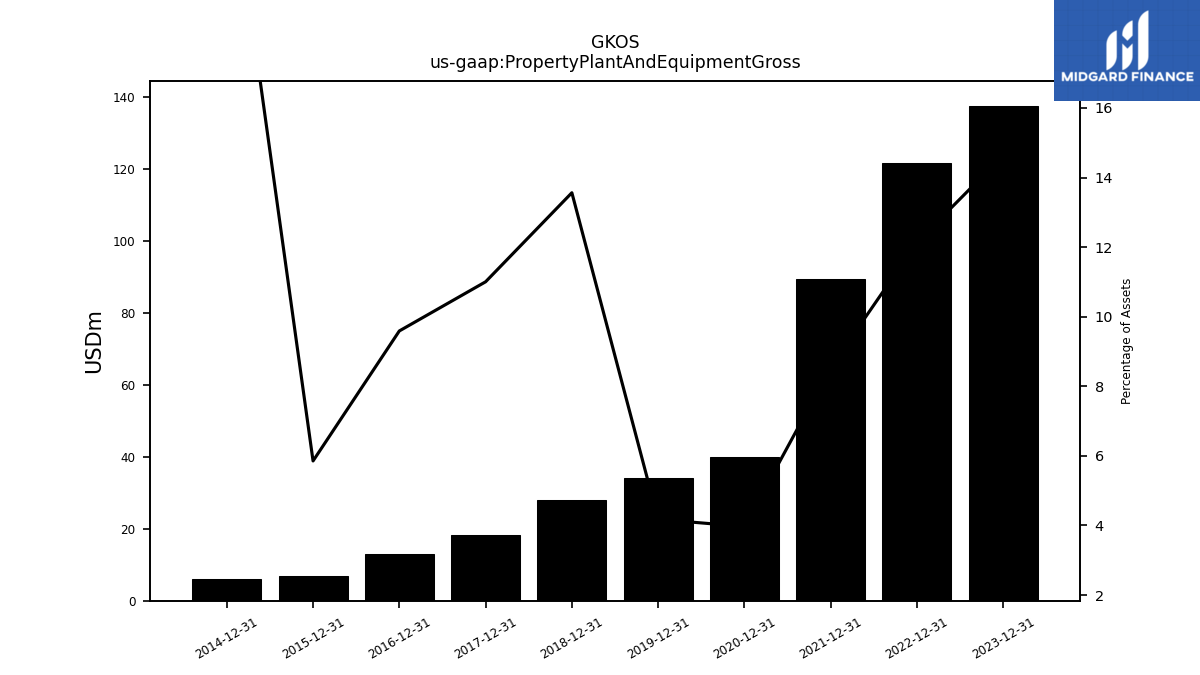
| Property Plant And Equipment Gross | 137.69 | NA | NA | NA | 121.63 | NA | NA | NA | 89.62 | NA | NA | NA | 39.93 | NA | NA | NA | 34.19 | NA | NA | NA | 28.07 | NA | NA | NA | 18.25 | NA | NA | NA | 12.89 | NA | NA | NA | 6.83 | NA | NA | NA | 6.16 | NA | NA | NA | |
| Accumulated Depreciation Depletion And Amortization Property Plant And Equipment | 34.48 | NA | NA | NA | 27.22 | NA | NA | NA | 20.65 | NA | NA | NA | 15.92 | NA | NA | NA | 12.13 | NA | NA | NA | 8.92 | NA | NA | NA | 6.46 | NA | NA | NA | 5.29 | NA | NA | NA | 4.68 | NA | NA | NA | 4.21 | NA | NA | NA | |
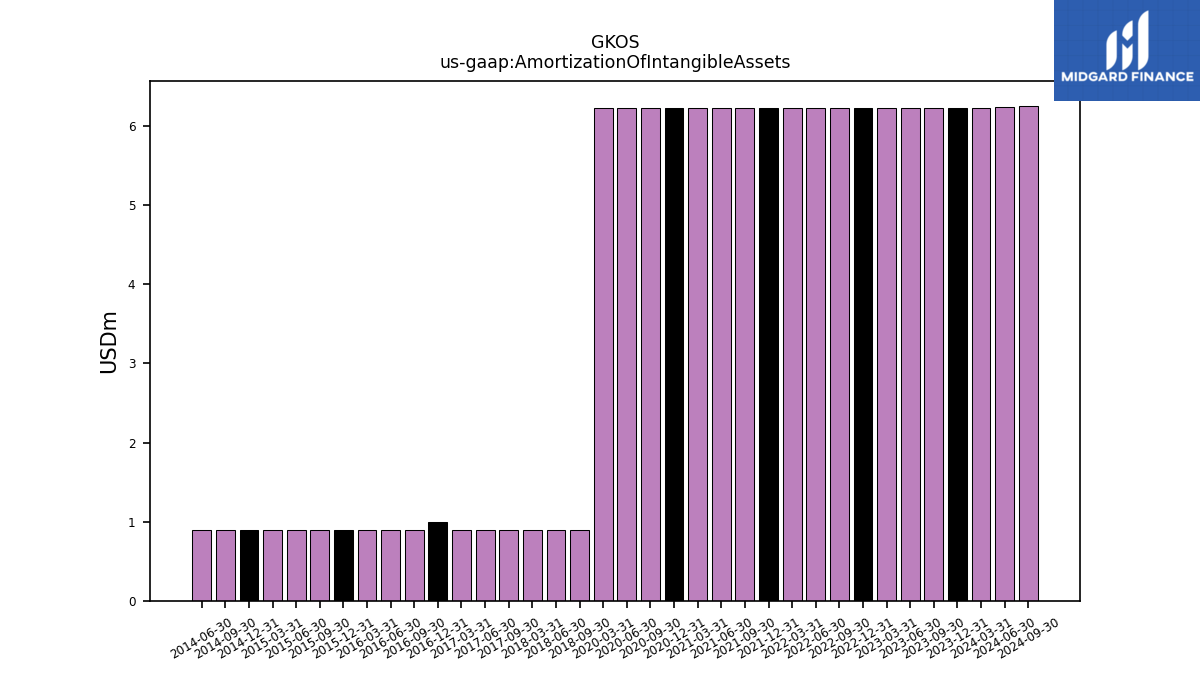
| Amortization Of Intangible Assets | 6.23 | 6.23 | 6.23 | 6.23 | 6.23 | 6.23 | 6.23 | 6.23 | 6.23 | 6.23 | 6.23 | 6.23 | 6.23 | 6.23 | 6.23 | 6.23 | NA | NA | NA | NA | NA | 0.90 | 0.90 | 0.90 | NA | 0.90 | 0.90 | 0.90 | 1.00 | 0.90 | 0.90 | 0.90 | 0.90 | 0.90 | 0.90 | 0.90 | 0.90 | 0.90 | 0.90 | NA | |
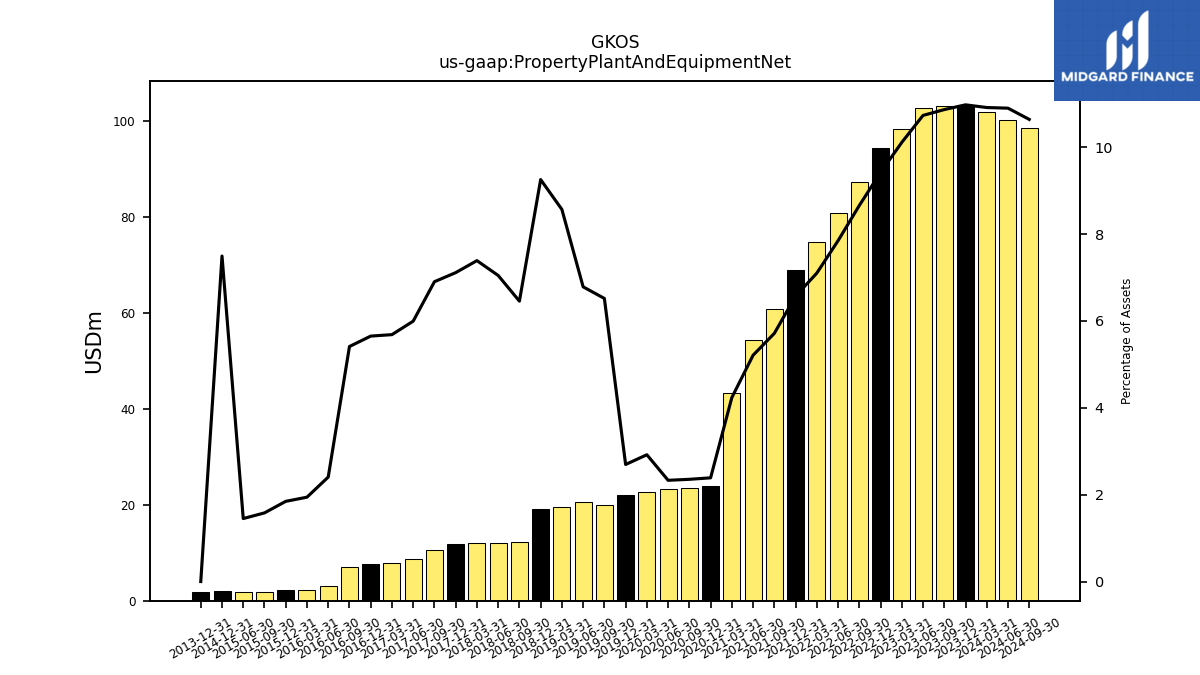
| Property Plant And Equipment Net | 103.21 | 103.08 | 102.67 | 98.33 | 94.40 | 87.31 | 80.92 | 74.71 | 68.97 | 60.80 | 54.38 | 43.31 | 24.01 | 23.41 | 23.21 | 22.76 | 22.06 | 20.04 | 20.50 | 19.54 | 19.15 | 12.30 | 12.06 | 12.07 | 11.79 | 10.54 | 8.72 | 7.84 | 7.59 | 6.99 | 2.98 | 2.26 | 2.15 | 1.86 | 1.86 | NA | 1.95 | NA | NA | NA | |
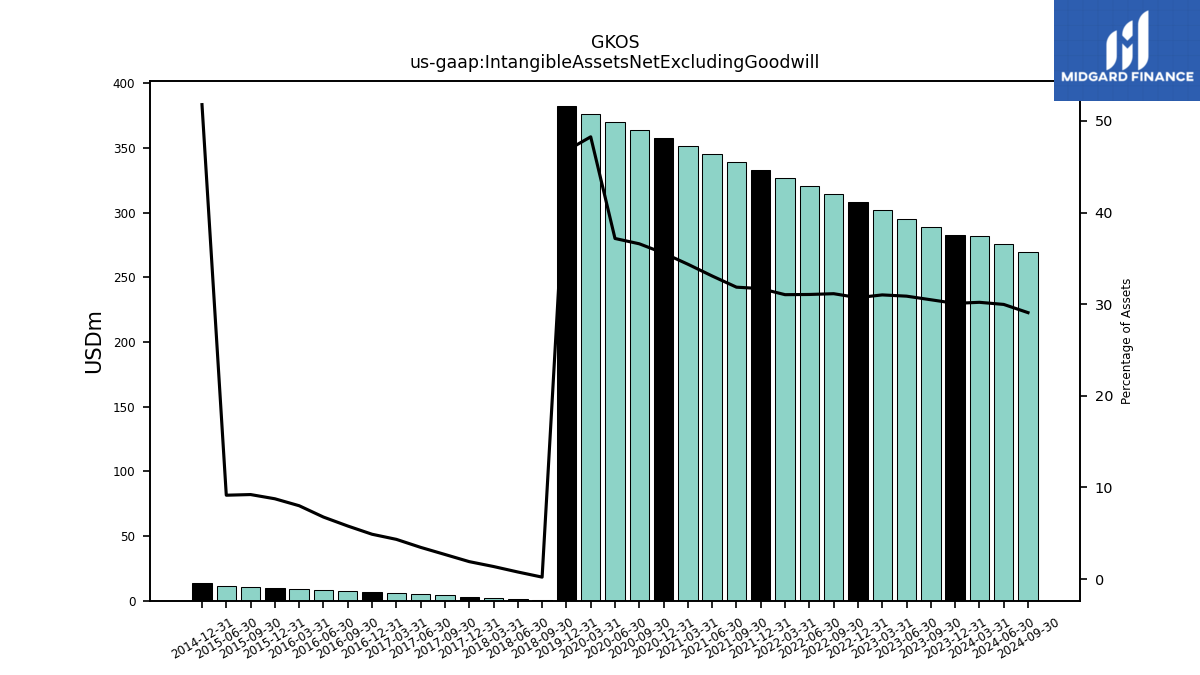
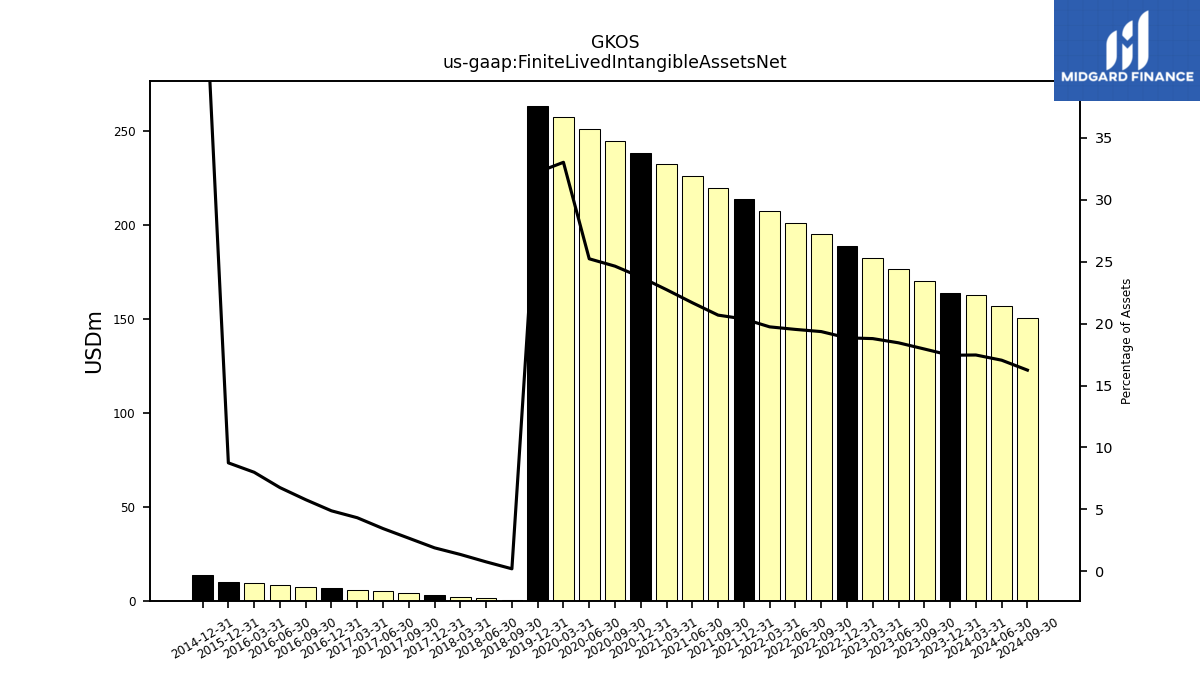
| Intangible Assets Net Excluding Goodwill | 282.96 | 289.18 | 295.41 | 301.64 | 307.87 | 314.10 | 320.32 | 326.55 | 332.78 | 339.01 | 345.24 | 351.46 | 357.69 | 363.92 | 370.15 | 376.38 | 382.61 | NA | NA | NA | NA | 0.39 | 1.31 | 2.23 | 3.15 | 4.09 | 5.03 | 5.97 | 6.57 | 7.48 | 8.39 | 9.30 | 10.22 | 10.85 | 11.72 | NA | 13.47 | NA | NA | NA | |
| Finite Lived Intangible Assets Net | 164.06 | 170.28 | 176.51 | 182.74 | 188.97 | 195.20 | 201.43 | 207.65 | 213.88 | 220.11 | 226.34 | 232.56 | 238.79 | 245.02 | 251.25 | 257.48 | 263.70 | NA | NA | NA | NA | 0.39 | 1.31 | 2.23 | 3.15 | 4.09 | 5.03 | 5.97 | 6.57 | 7.48 | 8.39 | 9.30 | 10.22 | NA | NA | NA | 13.47 | NA | NA | NA |
| 2023-12-31 | 2023-09-30 | 2023-06-30 | 2023-03-31 | 2022-12-31 | 2022-09-30 | 2022-06-30 | 2022-03-31 | 2021-12-31 | 2021-09-30 | 2021-06-30 | 2021-03-31 | 2020-12-31 | 2020-09-30 | 2020-06-30 | 2020-03-31 | 2019-12-31 | 2019-09-30 | 2019-06-30 | 2019-03-31 | 2018-12-31 | 2018-09-30 | 2018-06-30 | 2018-03-31 | 2017-12-31 | 2017-09-30 | 2017-06-30 | 2017-03-31 | 2016-12-31 | 2016-09-30 | 2016-06-30 | 2016-03-31 | 2015-12-31 | 2015-09-30 | 2015-06-30 | 2015-03-31 | 2014-12-31 | 2014-09-30 | 2014-06-30 | 2014-03-31 | ||
|---|---|---|---|---|---|---|---|---|---|---|---|---|---|---|---|---|---|---|---|---|---|---|---|---|---|---|---|---|---|---|---|---|---|---|---|---|---|---|---|---|---|
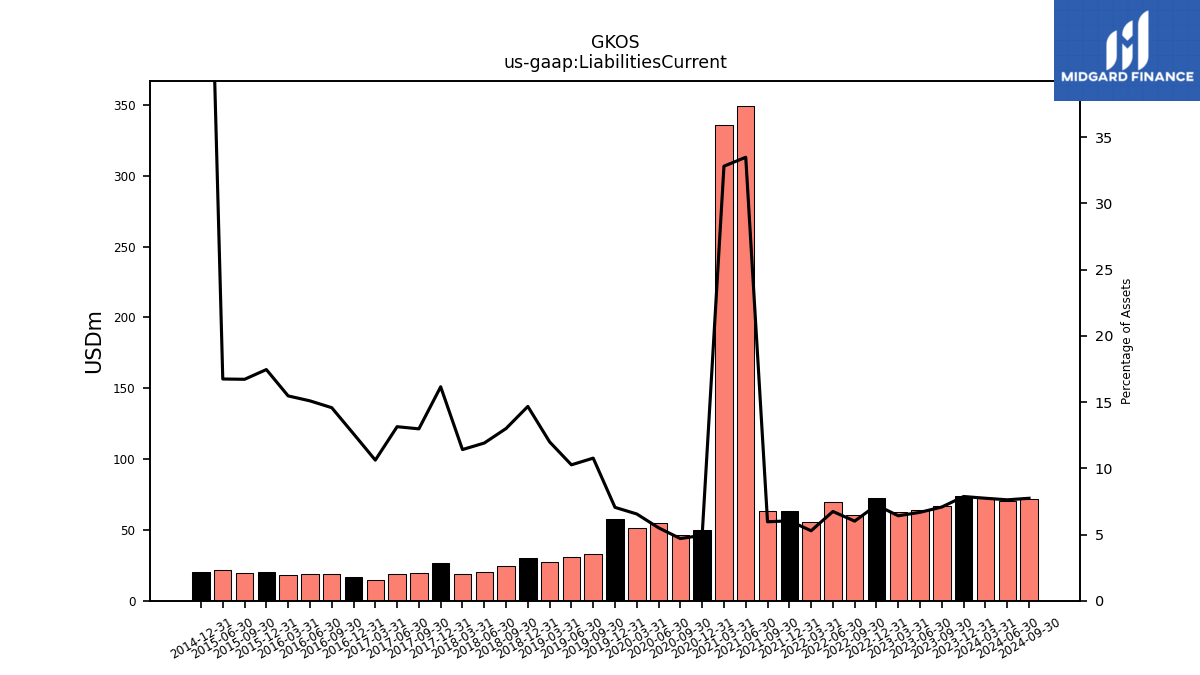
| Liabilities Current | 74.01 | 67.15 | 63.89 | 62.39 | 72.36 | 60.62 | 69.51 | 55.60 | 63.36 | 63.45 | 349.48 | 335.56 | 49.70 | 46.69 | 54.83 | 51.08 | 57.70 | 33.10 | 31.00 | 27.35 | 30.36 | 24.77 | 20.37 | 18.65 | 26.79 | 19.81 | 19.12 | 14.64 | 16.94 | 18.84 | 18.73 | 17.99 | 20.36 | 19.68 | 21.46 | NA | 20.19 | NA | NA | NA | |
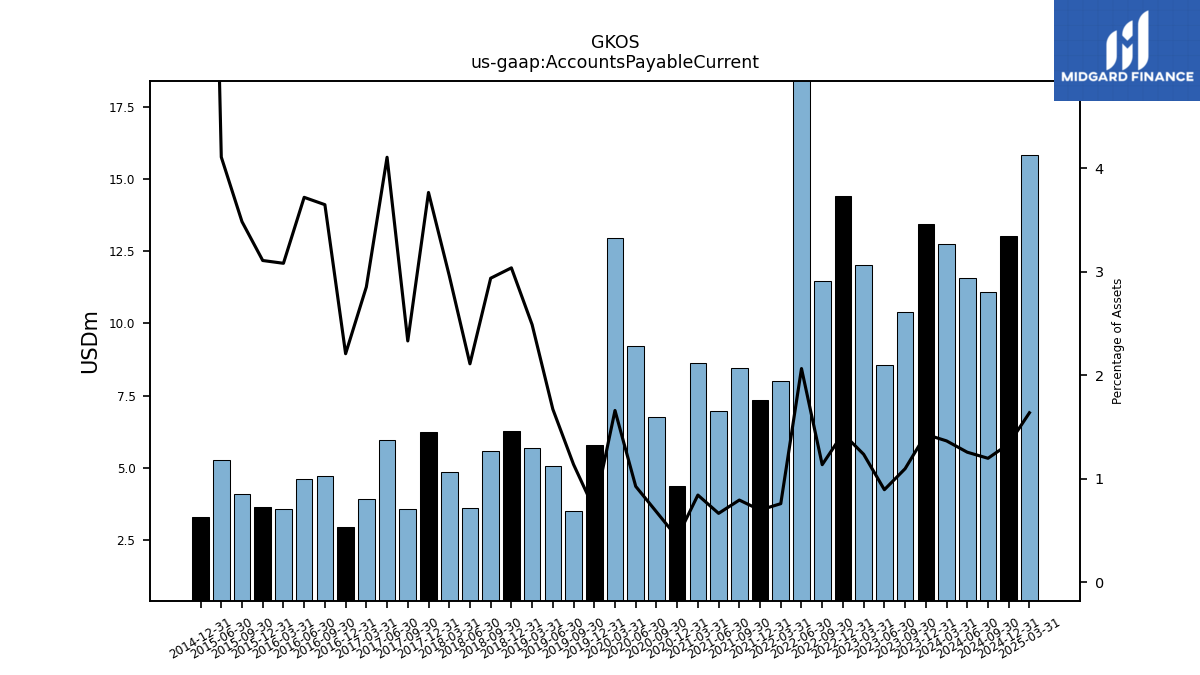
| Accounts Payable Current | 13.44 | 10.41 | 8.56 | 12.03 | 14.40 | 11.46 | 21.29 | 8.00 | 7.33 | 8.46 | 6.96 | 8.62 | 4.37 | 6.77 | 9.23 | 12.94 | 5.78 | 3.50 | 5.05 | 5.67 | 6.29 | 5.59 | 3.61 | 4.84 | 6.24 | 3.56 | 5.97 | 3.93 | 2.97 | 4.71 | 4.61 | 3.58 | 3.63 | 4.10 | 5.26 | NA | 3.30 | NA | NA | NA | |
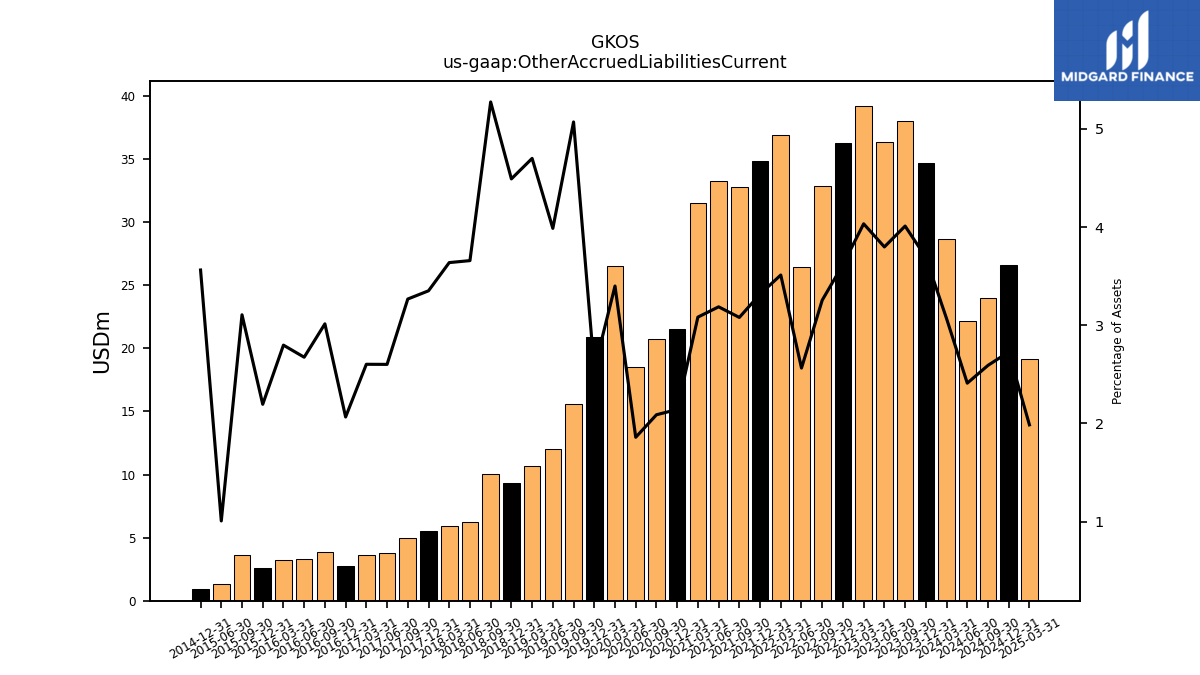
| Other Accrued Liabilities Current | 34.72 | 38.04 | 36.34 | 39.23 | 36.26 | 32.83 | 26.45 | 36.95 | 34.82 | 32.77 | 33.27 | 31.53 | 21.54 | 20.77 | 18.51 | 26.51 | 20.87 | 15.59 | 12.04 | 10.72 | 9.29 | 10.05 | 6.26 | 5.94 | 5.56 | 4.99 | 3.79 | 3.59 | 2.78 | 3.90 | 3.32 | 3.25 | 2.56 | 3.66 | 1.29 | NA | 0.93 | NA | NA | NA | |
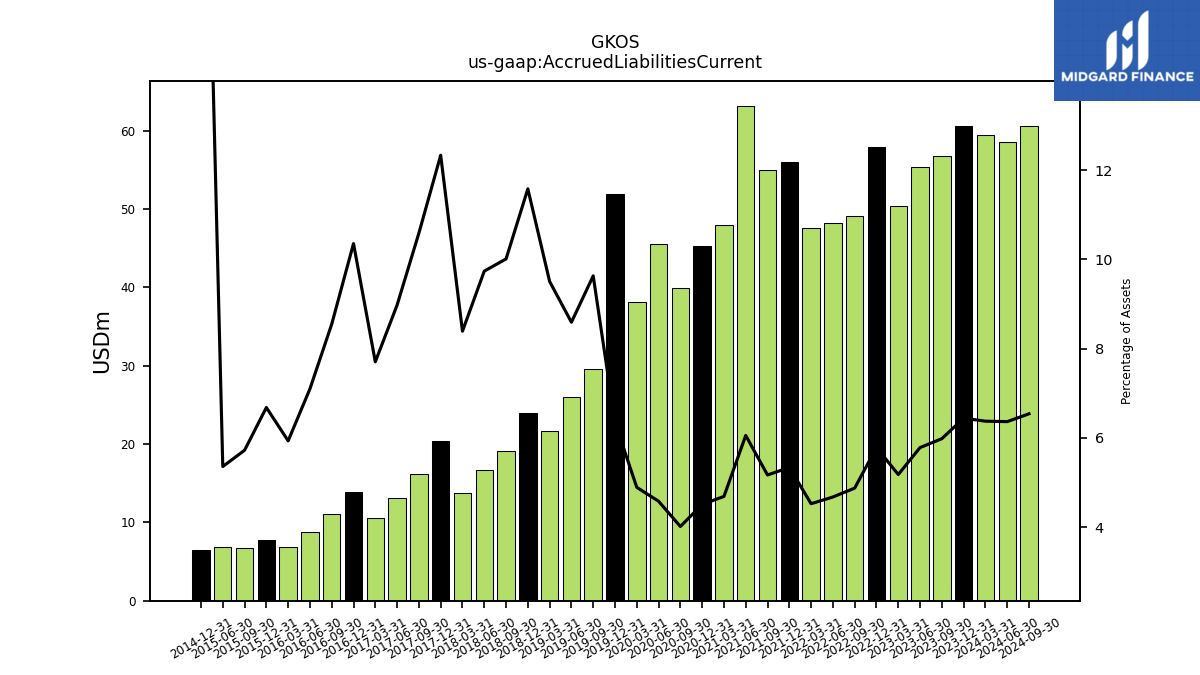
| Accrued Liabilities Current | 60.57 | 56.73 | 55.32 | 50.36 | 57.96 | 49.15 | 48.21 | 47.60 | 56.03 | 54.99 | 63.18 | 47.94 | 45.33 | 39.92 | 45.60 | 38.13 | 51.92 | 29.60 | 25.95 | 21.67 | 23.96 | 19.07 | 16.66 | 13.71 | 20.45 | 16.16 | 13.06 | 10.62 | 13.91 | 11.05 | 8.81 | 6.90 | 7.79 | 6.73 | 6.87 | NA | 6.46 | NA | NA | NA |
| 2023-12-31 | 2023-09-30 | 2023-06-30 | 2023-03-31 | 2022-12-31 | 2022-09-30 | 2022-06-30 | 2022-03-31 | 2021-12-31 | 2021-09-30 | 2021-06-30 | 2021-03-31 | 2020-12-31 | 2020-09-30 | 2020-06-30 | 2020-03-31 | 2019-12-31 | 2019-09-30 | 2019-06-30 | 2019-03-31 | 2018-12-31 | 2018-09-30 | 2018-06-30 | 2018-03-31 | 2017-12-31 | 2017-09-30 | 2017-06-30 | 2017-03-31 | 2016-12-31 | 2016-09-30 | 2016-06-30 | 2016-03-31 | 2015-12-31 | 2015-09-30 | 2015-06-30 | 2015-03-31 | 2014-12-31 | 2014-09-30 | 2014-06-30 | 2014-03-31 | ||
|---|---|---|---|---|---|---|---|---|---|---|---|---|---|---|---|---|---|---|---|---|---|---|---|---|---|---|---|---|---|---|---|---|---|---|---|---|---|---|---|---|---|
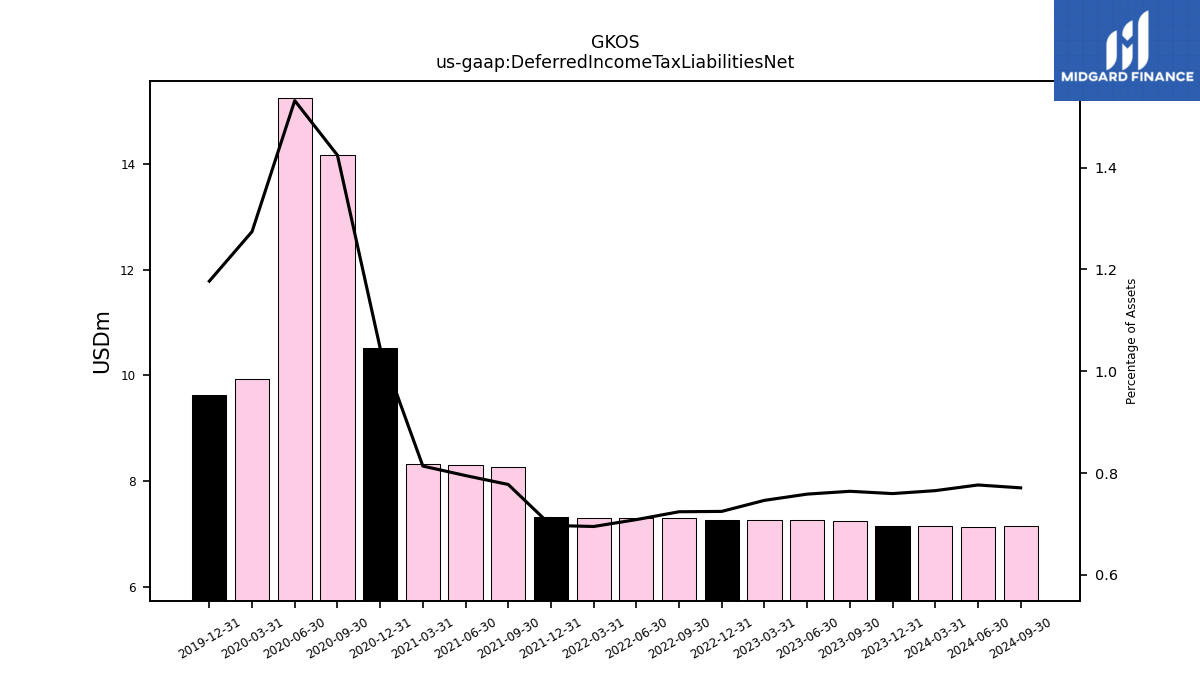
| Deferred Income Tax Liabilities Net | 7.14 | 7.25 | 7.26 | 7.26 | 7.26 | 7.30 | 7.31 | 7.31 | 7.32 | 8.27 | 8.30 | 8.32 | 10.51 | 14.16 | 15.25 | 9.94 | 9.63 | NA | NA | NA | NA | NA | NA | NA | NA | NA | NA | NA | NA | NA | NA | NA | NA | NA | NA | NA | NA | NA | NA | NA | |
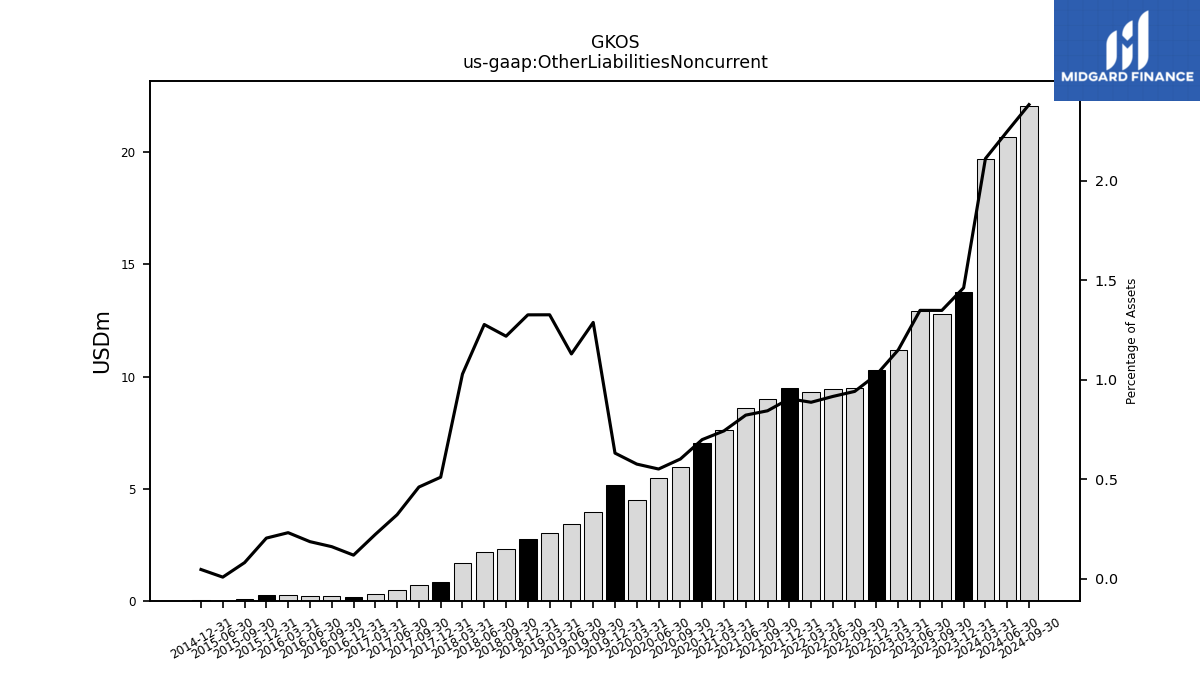
| Other Liabilities Noncurrent | 13.75 | 12.79 | 12.90 | 11.19 | 10.28 | 9.49 | 9.45 | 9.33 | 9.49 | 8.98 | 8.58 | 7.60 | 7.03 | 5.98 | 5.49 | 4.49 | 5.17 | 3.96 | 3.41 | 3.02 | 2.75 | 2.32 | 2.19 | 1.68 | 0.85 | 0.70 | 0.47 | 0.31 | 0.16 | 0.21 | 0.23 | 0.27 | 0.24 | 0.10 | 0.01 | NA | 0.01 | NA | NA | NA | |
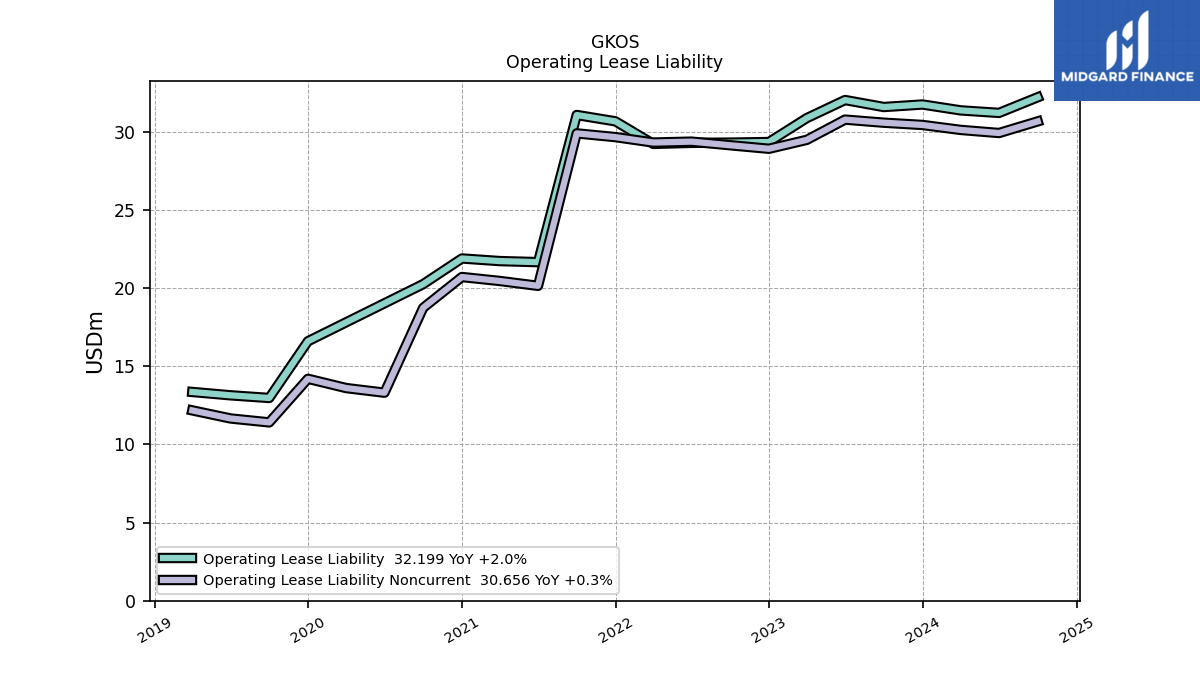
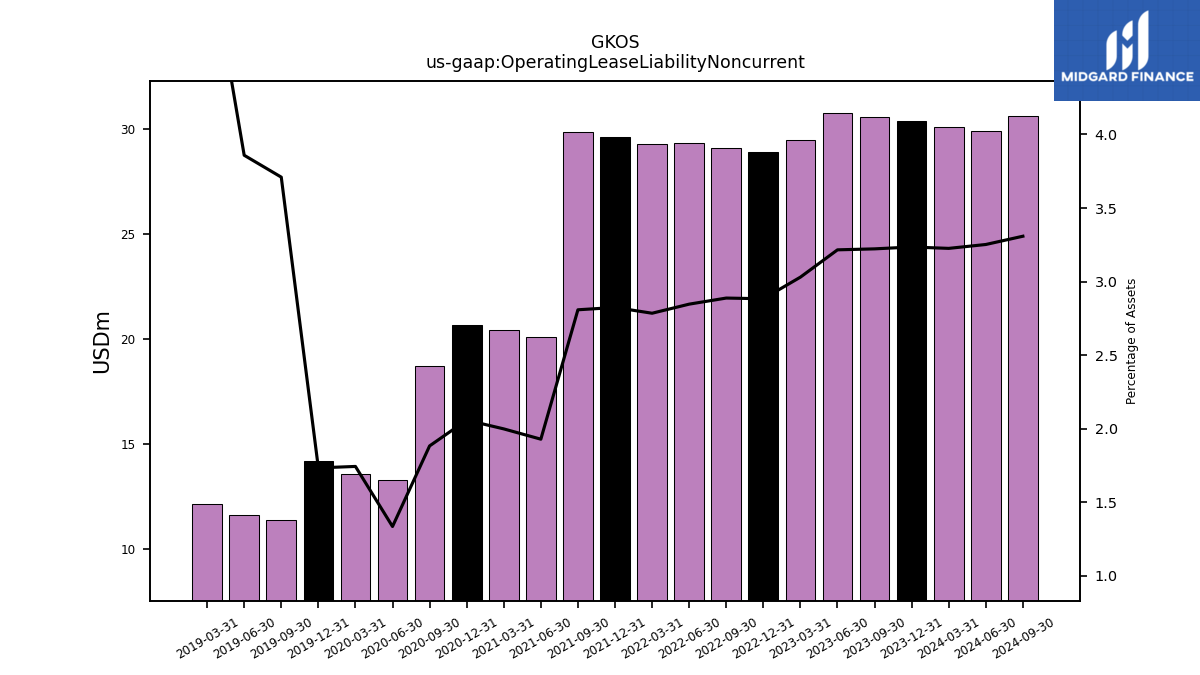
| Operating Lease Liability Noncurrent | 30.43 | 30.57 | 30.77 | 29.48 | 28.91 | 29.13 | 29.36 | 29.30 | 29.65 | 29.89 | 20.14 | 20.45 | 20.70 | 18.73 | 13.30 | 13.60 | 14.20 | 11.41 | 11.66 | 12.17 | NA | NA | NA | NA | NA | NA | NA | NA | NA | NA | NA | NA | NA | NA | NA | NA | NA | NA | NA | NA |
| 2023-12-31 | 2023-09-30 | 2023-06-30 | 2023-03-31 | 2022-12-31 | 2022-09-30 | 2022-06-30 | 2022-03-31 | 2021-12-31 | 2021-09-30 | 2021-06-30 | 2021-03-31 | 2020-12-31 | 2020-09-30 | 2020-06-30 | 2020-03-31 | 2019-12-31 | 2019-09-30 | 2019-06-30 | 2019-03-31 | 2018-12-31 | 2018-09-30 | 2018-06-30 | 2018-03-31 | 2017-12-31 | 2017-09-30 | 2017-06-30 | 2017-03-31 | 2016-12-31 | 2016-09-30 | 2016-06-30 | 2016-03-31 | 2015-12-31 | 2015-09-30 | 2015-06-30 | 2015-03-31 | 2014-12-31 | 2014-09-30 | 2014-06-30 | 2014-03-31 | ||
|---|---|---|---|---|---|---|---|---|---|---|---|---|---|---|---|---|---|---|---|---|---|---|---|---|---|---|---|---|---|---|---|---|---|---|---|---|---|---|---|---|---|
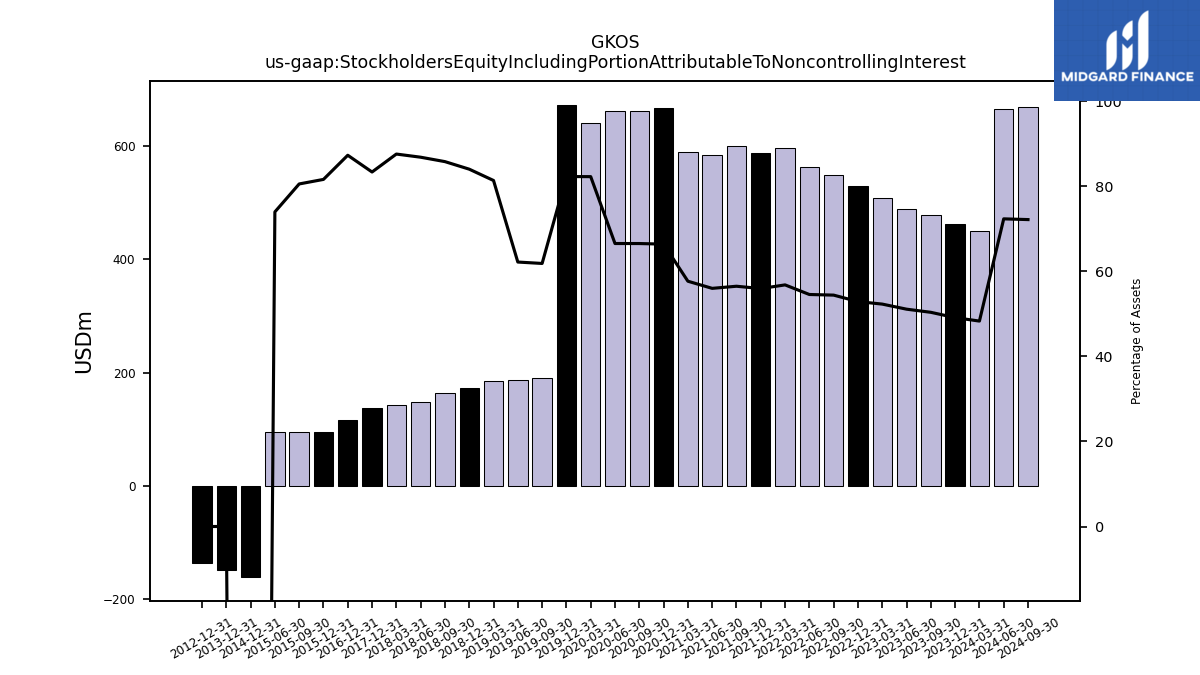
| Stockholders Equity | 461.77 | 477.66 | 488.81 | 508.51 | 530.00 | 548.55 | 562.48 | 597.56 | 587.15 | 601.05 | 584.33 | 589.77 | 667.45 | 661.56 | 662.42 | 641.30 | 673.27 | 190.12 | 187.81 | 185.49 | 173.86 | 163.41 | 148.53 | 143.03 | 138.20 | 132.10 | 125.93 | 122.95 | 117.27 | 110.20 | 105.14 | 98.06 | 95.19 | 94.77 | 94.79 | NA | -151.30 | NA | NA | NA | |
| Stockholders Equity Including Portion Attributable To Noncontrolling Interest | 461.77 | 477.66 | 488.81 | 508.51 | 530.00 | 548.55 | 562.48 | 597.56 | 587.15 | 601.05 | 584.33 | 589.77 | 667.45 | 661.56 | 662.42 | 641.30 | 673.27 | 190.12 | 187.81 | 185.49 | 173.86 | 163.41 | 148.53 | 143.03 | 138.20 | NA | NA | NA | 117.27 | NA | NA | NA | 95.19 | 94.77 | 94.79 | NA | -160.90 | NA | NA | NA | |
| Common Stock Value | 0.05 | 0.05 | 0.05 | 0.05 | 0.05 | 0.05 | 0.05 | 0.05 | 0.05 | 0.05 | 0.05 | 0.05 | 0.04 | 0.04 | 0.04 | 0.04 | 0.04 | 0.04 | 0.04 | 0.04 | 0.04 | 0.04 | 0.04 | 0.04 | 0.04 | 0.04 | 0.03 | 0.03 | 0.03 | 0.03 | 0.03 | 0.03 | 0.03 | 0.03 | 0.03 | NA | 0.01 | NA | NA | NA | |
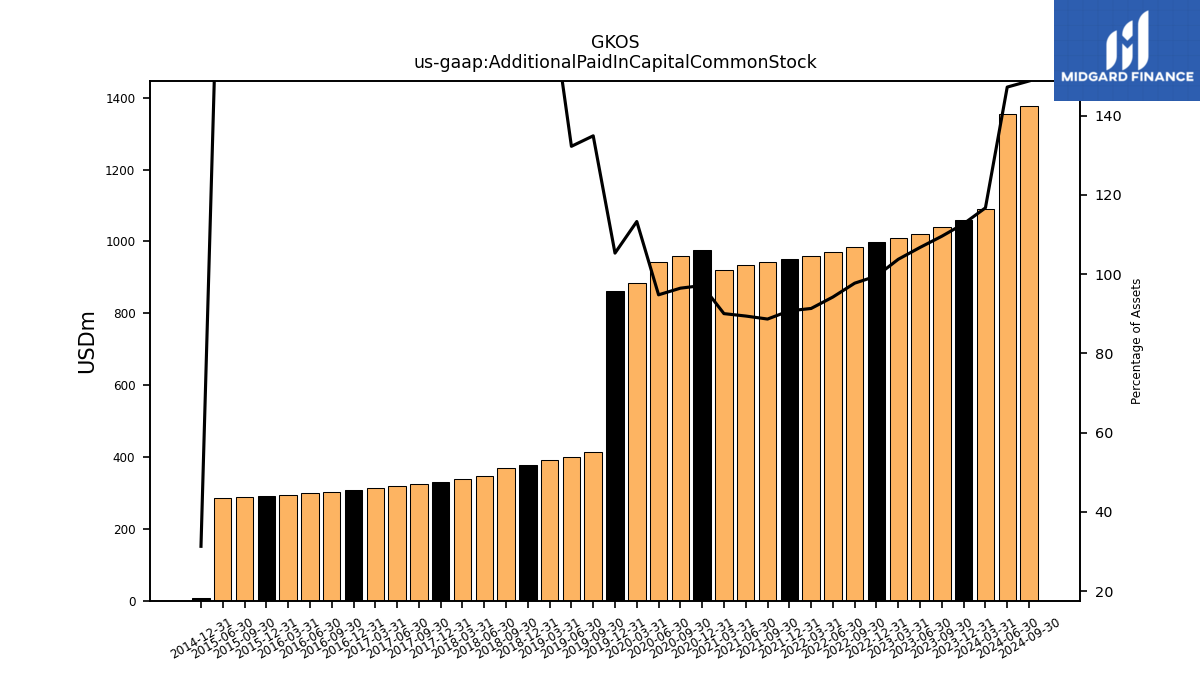
| Additional Paid In Capital Common Stock | 1059.75 | 1039.27 | 1021.13 | 1008.96 | 997.47 | 985.41 | 971.65 | 960.87 | 952.43 | 943.49 | 933.33 | 920.82 | 976.59 | 959.19 | 943.71 | 883.14 | 861.74 | 414.67 | 399.45 | 390.89 | 378.35 | 369.71 | 348.61 | 339.31 | 331.07 | 325.70 | 320.50 | 313.92 | 308.81 | 302.68 | 298.68 | 293.84 | 291.85 | 289.10 | 287.07 | NA | 8.15 | NA | NA | NA | |
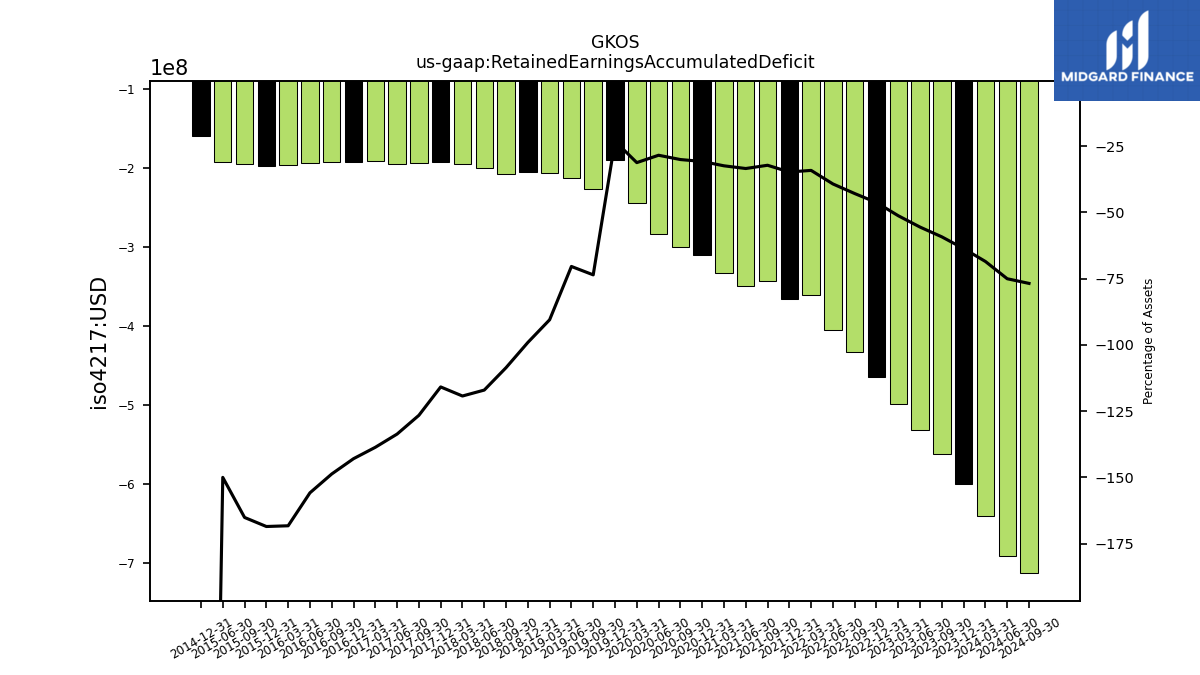
| Retained Earnings Accumulated Deficit | -599.07 | -562.29 | -531.84 | -499.03 | -464.40 | -432.95 | -405.37 | -359.83 | -365.21 | -343.34 | -349.57 | -332.09 | -310.06 | -299.41 | -283.66 | -243.77 | -189.71 | -226.29 | -212.78 | -206.48 | -205.13 | -206.91 | -200.29 | -194.89 | -192.18 | -193.19 | -194.51 | -191.21 | -192.09 | -192.22 | -193.38 | -195.72 | -196.61 | -194.32 | -192.27 | NA | -159.37 | NA | NA | NA | |
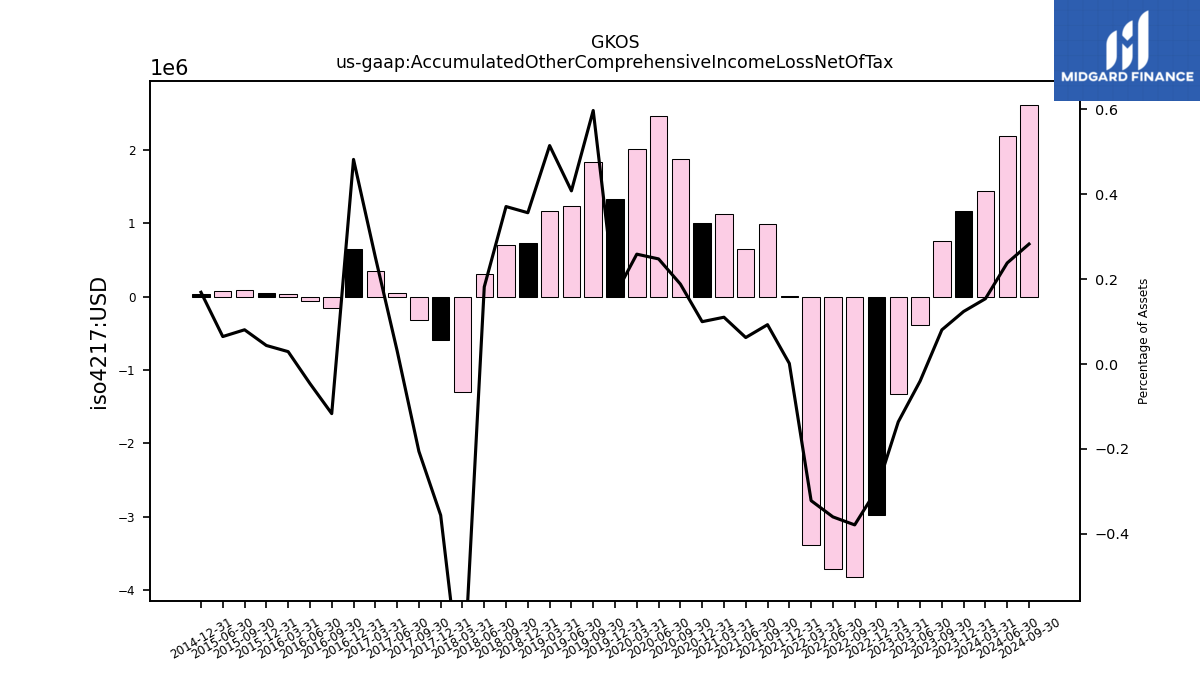
| Accumulated Other Comprehensive Income Loss Net Of Tax | 1.17 | 0.76 | -0.39 | -1.32 | -2.98 | -3.82 | -3.71 | -3.39 | 0.01 | 0.99 | 0.65 | 1.13 | 1.00 | 1.87 | 2.47 | 2.02 | 1.33 | 1.84 | 1.23 | 1.17 | 0.74 | 0.71 | 0.31 | -1.29 | -0.59 | -0.31 | 0.05 | 0.35 | 0.65 | -0.15 | -0.06 | 0.03 | 0.05 | 0.10 | 0.08 | NA | 0.04 | NA | NA | NA |
| 2023-12-31 | 2023-09-30 | 2023-06-30 | 2023-03-31 | 2022-12-31 | 2022-09-30 | 2022-06-30 | 2022-03-31 | 2021-12-31 | 2021-09-30 | 2021-06-30 | 2021-03-31 | 2020-12-31 | 2020-09-30 | 2020-06-30 | 2020-03-31 | 2019-12-31 | 2019-09-30 | 2019-06-30 | 2019-03-31 | 2018-12-31 | 2018-09-30 | 2018-06-30 | 2018-03-31 | 2017-12-31 | 2017-09-30 | 2017-06-30 | 2017-03-31 | 2016-12-31 | 2016-09-30 | 2016-06-30 | 2016-03-31 | 2015-12-31 | 2015-09-30 | 2015-06-30 | 2015-03-31 | 2014-12-31 | 2014-09-30 | 2014-06-30 | 2014-03-31 | ||
|---|---|---|---|---|---|---|---|---|---|---|---|---|---|---|---|---|---|---|---|---|---|---|---|---|---|---|---|---|---|---|---|---|---|---|---|---|---|---|---|---|---|
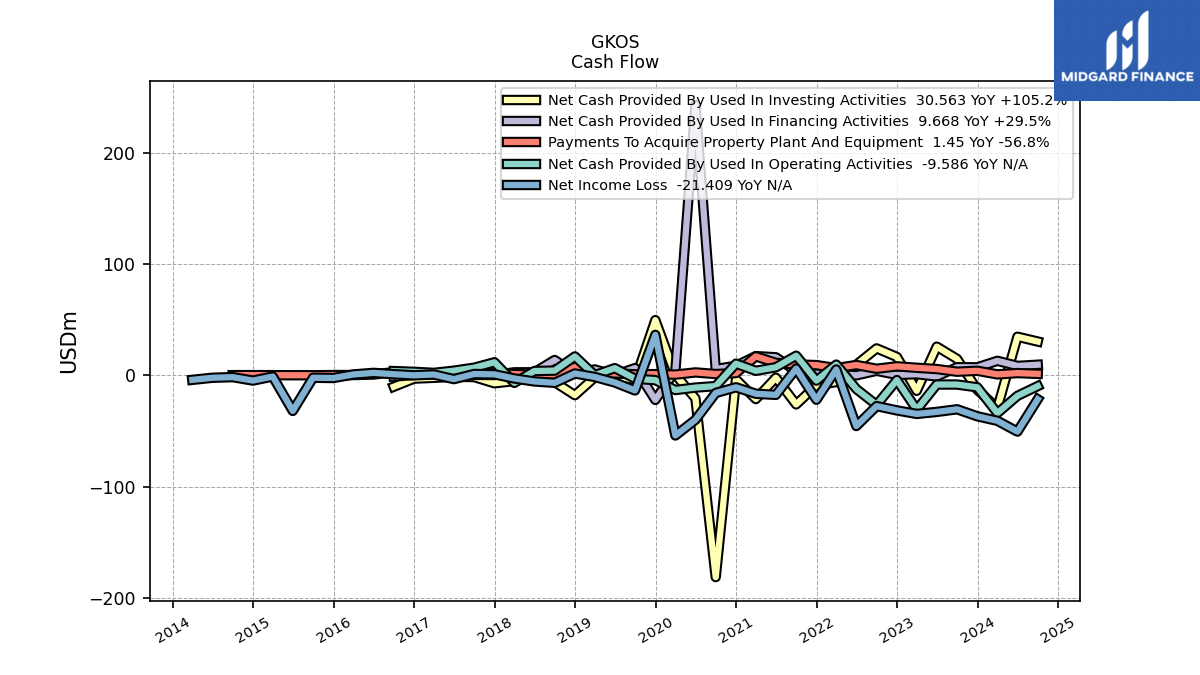
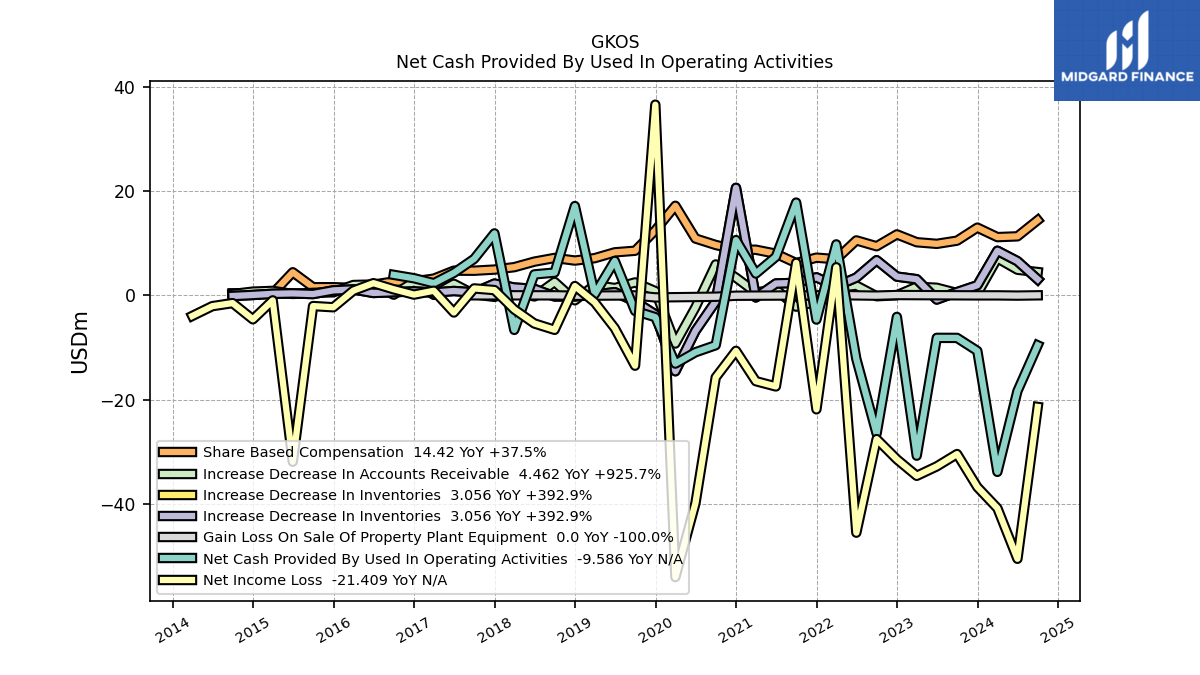
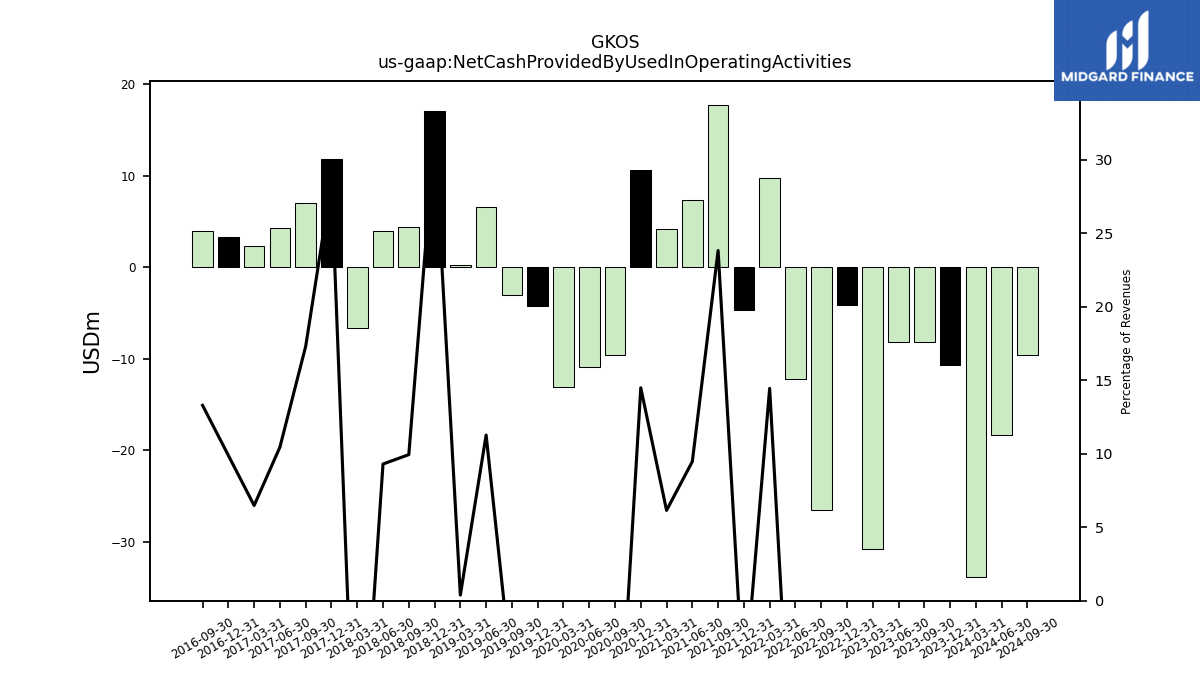
| Net Cash Provided By Used In Operating Activities | -10.66 | -8.17 | -8.16 | -30.76 | -4.14 | -26.52 | -12.21 | 9.77 | -4.65 | 17.79 | 7.39 | 4.18 | 10.60 | -9.57 | -10.92 | -13.10 | -4.19 | -2.99 | 6.60 | 0.21 | 17.13 | 4.36 | 4.01 | -6.64 | 11.88 | 6.99 | 4.31 | 2.33 | 3.28 | 3.93 | NA | NA | NA | NA | NA | NA | NA | NA | NA | NA | |
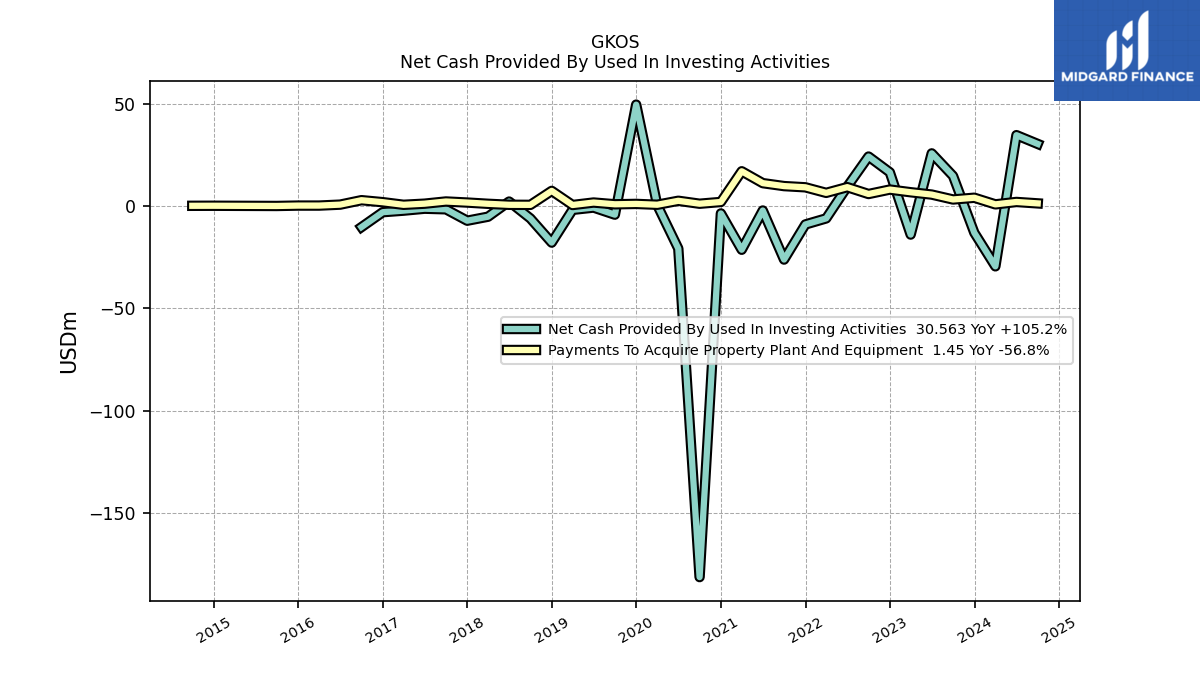
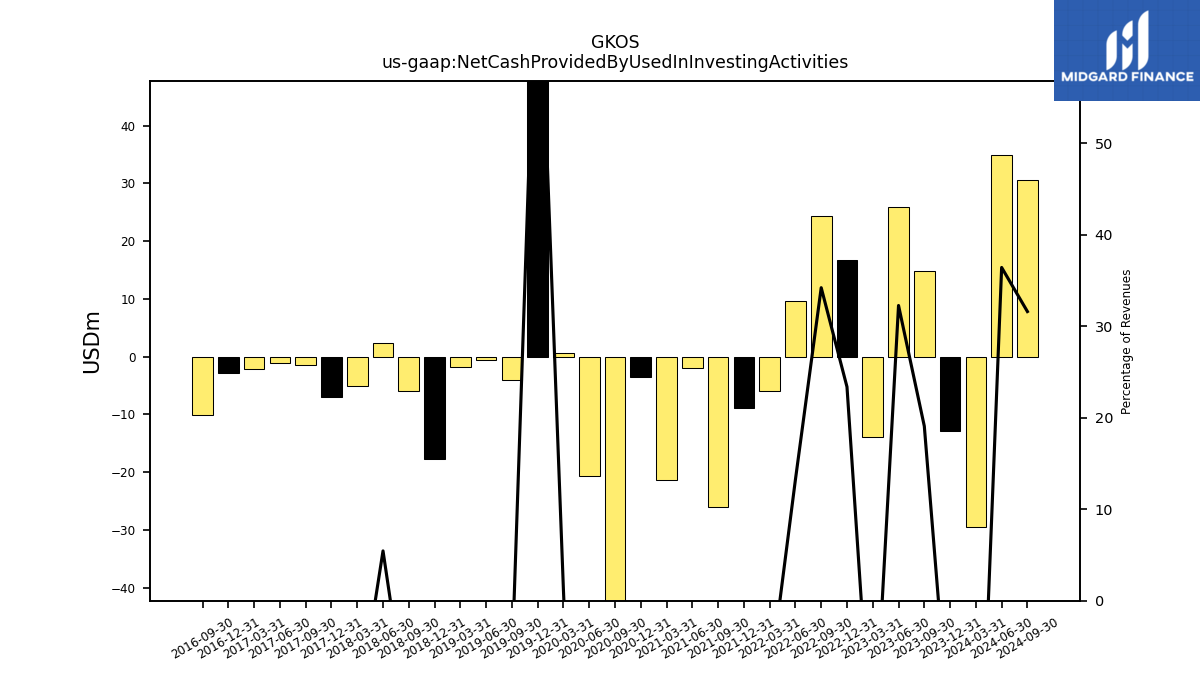
| Net Cash Provided By Used In Investing Activities | -12.92 | 14.90 | 25.95 | -13.83 | 16.66 | 24.39 | 9.63 | -5.90 | -8.87 | -26.06 | -2.03 | -21.26 | -3.46 | -181.56 | -20.67 | 0.63 | 49.81 | -4.07 | -0.60 | -1.71 | -17.75 | -5.93 | 2.35 | -5.07 | -7.03 | -1.44 | -1.16 | -2.10 | -2.86 | -10.17 | NA | NA | NA | NA | NA | NA | NA | NA | NA | NA | |
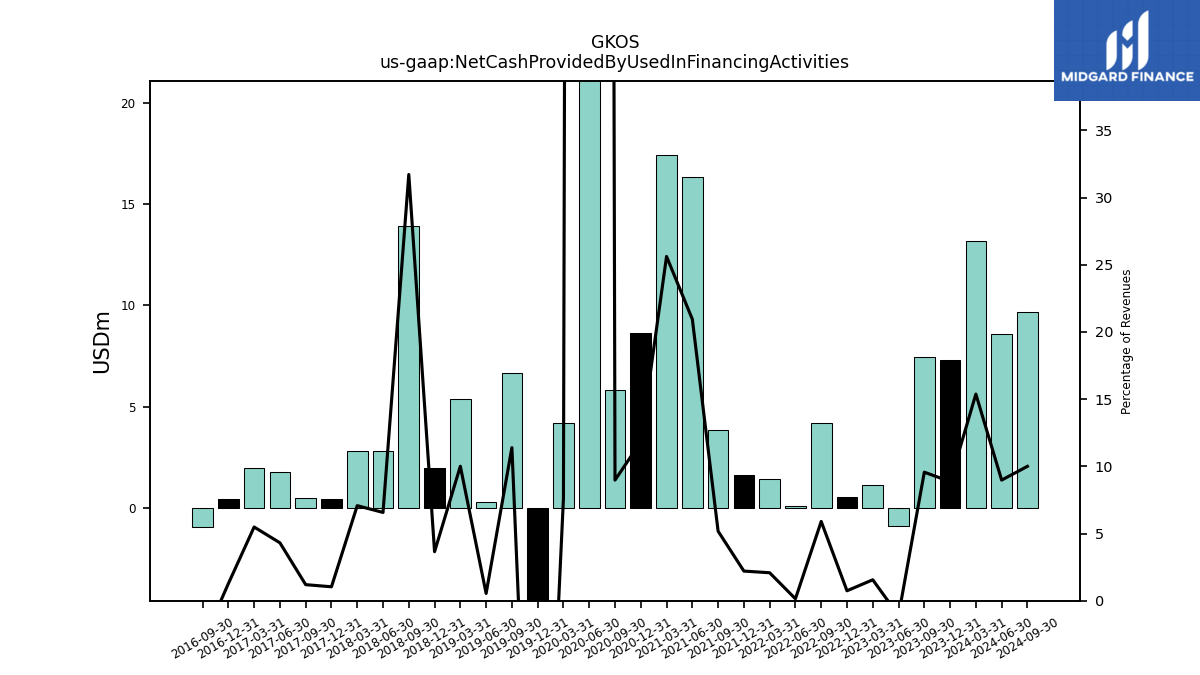
| Net Cash Provided By Used In Financing Activities | 7.30 | 7.47 | -0.88 | 1.15 | 0.53 | 4.21 | 0.11 | 1.41 | 1.62 | 3.87 | 16.36 | 17.41 | 8.66 | 5.82 | 243.84 | 4.22 | -22.04 | 6.67 | 0.32 | 5.41 | 1.97 | 13.93 | 2.84 | 2.84 | 0.43 | 0.48 | 1.78 | 1.97 | 0.42 | -0.91 | NA | NA | NA | NA | NA | NA | NA | NA | NA | NA |
| 2023-12-31 | 2023-09-30 | 2023-06-30 | 2023-03-31 | 2022-12-31 | 2022-09-30 | 2022-06-30 | 2022-03-31 | 2021-12-31 | 2021-09-30 | 2021-06-30 | 2021-03-31 | 2020-12-31 | 2020-09-30 | 2020-06-30 | 2020-03-31 | 2019-12-31 | 2019-09-30 | 2019-06-30 | 2019-03-31 | 2018-12-31 | 2018-09-30 | 2018-06-30 | 2018-03-31 | 2017-12-31 | 2017-09-30 | 2017-06-30 | 2017-03-31 | 2016-12-31 | 2016-09-30 | 2016-06-30 | 2016-03-31 | 2015-12-31 | 2015-09-30 | 2015-06-30 | 2015-03-31 | 2014-12-31 | 2014-09-30 | 2014-06-30 | 2014-03-31 | ||
|---|---|---|---|---|---|---|---|---|---|---|---|---|---|---|---|---|---|---|---|---|---|---|---|---|---|---|---|---|---|---|---|---|---|---|---|---|---|---|---|---|---|
| Net Cash Provided By Used In Operating Activities | -10.66 | -8.17 | -8.16 | -30.76 | -4.14 | -26.52 | -12.21 | 9.77 | -4.65 | 17.79 | 7.39 | 4.18 | 10.60 | -9.57 | -10.92 | -13.10 | -4.19 | -2.99 | 6.60 | 0.21 | 17.13 | 4.36 | 4.01 | -6.64 | 11.88 | 6.99 | 4.31 | 2.33 | 3.28 | 3.93 | NA | NA | NA | NA | NA | NA | NA | NA | NA | NA | |
| Net Income Loss | -36.78 | -30.44 | -32.81 | -34.63 | -31.46 | -27.58 | -45.54 | 5.38 | -21.87 | 6.23 | -17.48 | -16.47 | -10.65 | -15.75 | -39.89 | -54.06 | 36.58 | -13.51 | -6.31 | -1.34 | 1.78 | -6.62 | -5.40 | -2.71 | 1.01 | 1.32 | -3.30 | 0.88 | 0.13 | 1.16 | 2.33 | 0.90 | -2.29 | -2.06 | -31.93 | -0.97 | -4.61 | -1.49 | -2.07 | -3.96 | |
| Profit Loss | -36.78 | -30.44 | -32.81 | -34.63 | -31.46 | -27.58 | -45.54 | 5.38 | -21.87 | 6.23 | -17.48 | -16.47 | -10.65 | -15.75 | -39.89 | -54.06 | 36.58 | -13.51 | -6.31 | -1.34 | 1.78 | -6.62 | -5.40 | -2.71 | 1.01 | 1.32 | -3.30 | 0.88 | 0.13 | 1.16 | 2.33 | 0.90 | -2.29 | -2.06 | -32.51 | -1.46 | -5.25 | -1.97 | -2.49 | -4.34 | |
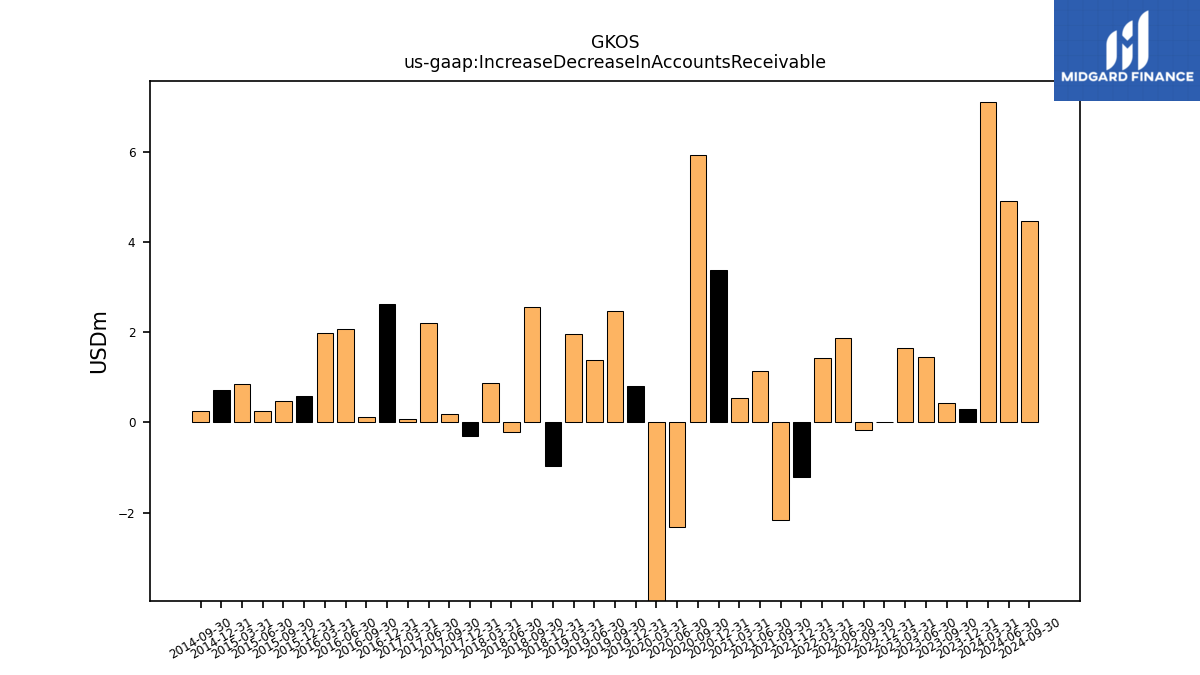
| Increase Decrease In Accounts Receivable | 0.31 | 0.43 | 1.45 | 1.65 | 0.02 | -0.17 | 1.87 | 1.42 | -1.21 | -2.17 | 1.13 | 0.55 | 3.39 | 5.93 | -2.31 | -9.25 | 0.80 | 2.48 | 1.39 | 1.96 | -0.96 | 2.56 | -0.22 | 0.86 | -0.30 | 0.19 | 2.21 | 0.08 | 2.62 | 0.12 | 2.07 | 1.98 | 0.57 | 0.48 | 0.26 | 0.85 | 0.71 | 0.25 | NA | NA | |
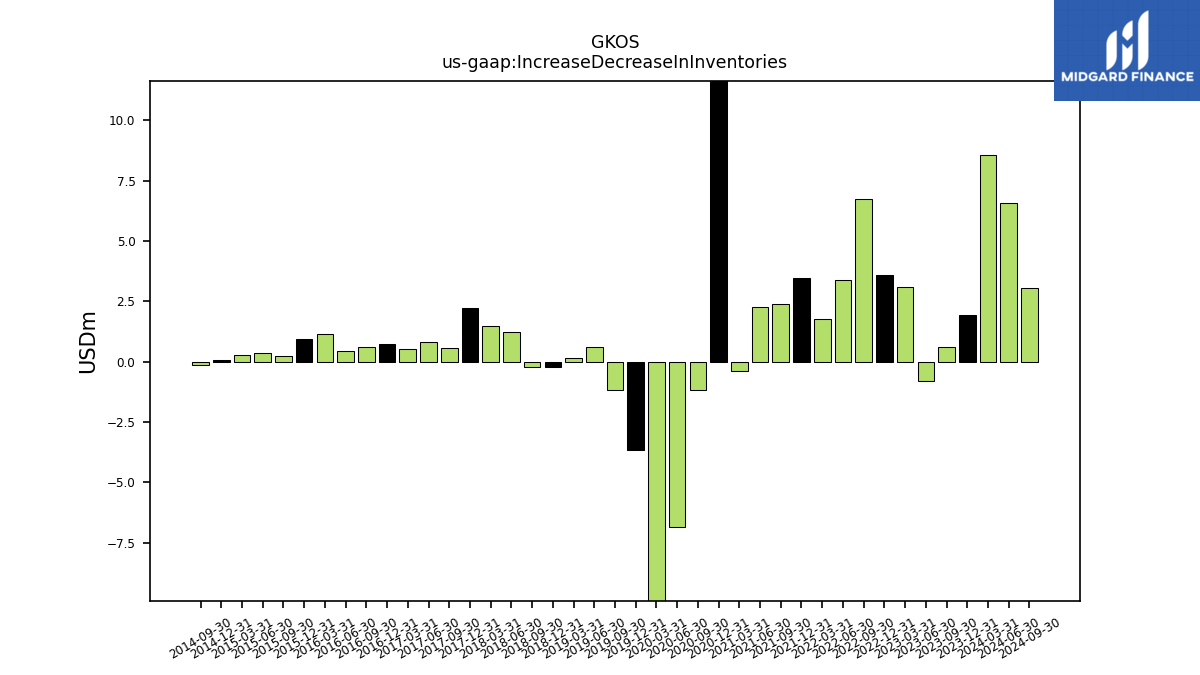
| Increase Decrease In Inventories | 1.93 | 0.62 | -0.81 | 3.09 | 3.59 | 6.73 | 3.40 | 1.75 | 3.45 | 2.39 | 2.27 | -0.40 | 20.62 | -1.18 | -6.83 | -14.57 | -3.66 | -1.17 | 0.59 | 0.16 | -0.21 | -0.21 | 1.24 | 1.49 | 2.24 | 0.55 | 0.83 | 0.54 | 0.74 | 0.61 | 0.45 | 1.13 | 0.95 | 0.24 | 0.37 | 0.29 | 0.07 | -0.13 | NA | NA | |
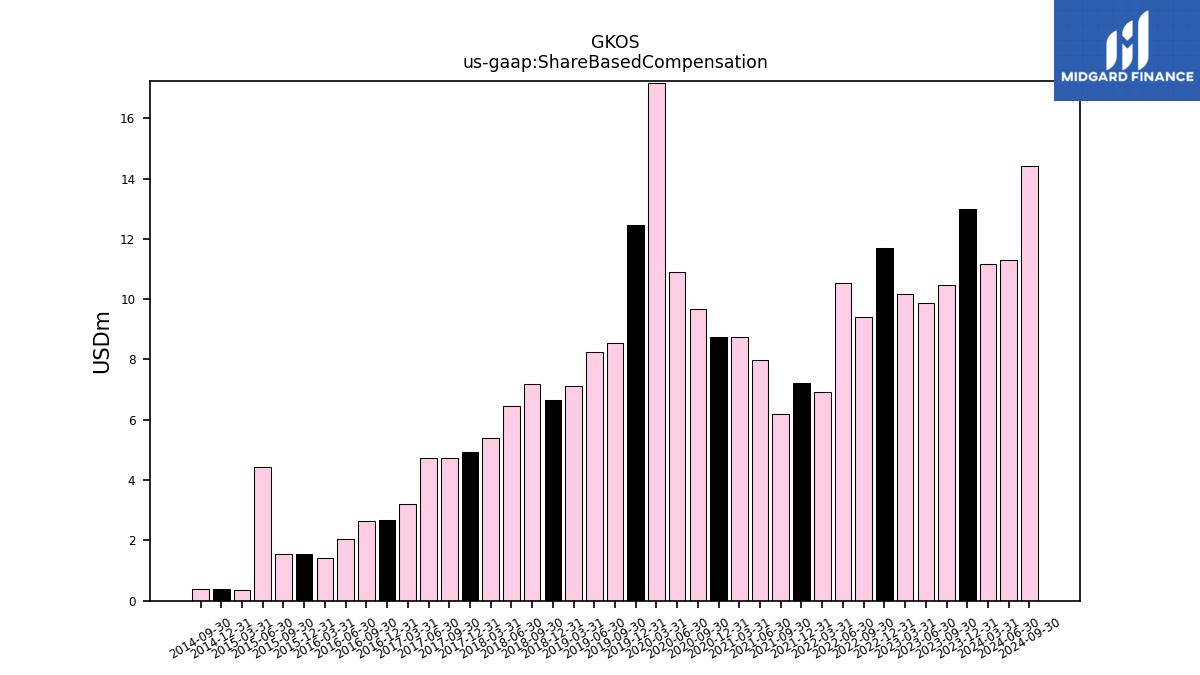
| Share Based Compensation | 12.99 | 10.48 | 9.87 | 10.18 | 11.69 | 9.41 | 10.54 | 6.92 | 7.22 | 6.19 | 7.98 | 8.75 | 8.74 | 9.66 | 10.90 | 17.18 | 12.47 | 8.55 | 8.25 | 7.13 | 6.67 | 7.17 | 6.46 | 5.40 | 4.94 | 4.72 | 4.73 | 3.20 | 2.67 | 2.65 | 2.05 | 1.42 | 1.56 | 1.55 | 4.43 | 0.35 | 0.40 | 0.39 | NA | NA |
| 2023-12-31 | 2023-09-30 | 2023-06-30 | 2023-03-31 | 2022-12-31 | 2022-09-30 | 2022-06-30 | 2022-03-31 | 2021-12-31 | 2021-09-30 | 2021-06-30 | 2021-03-31 | 2020-12-31 | 2020-09-30 | 2020-06-30 | 2020-03-31 | 2019-12-31 | 2019-09-30 | 2019-06-30 | 2019-03-31 | 2018-12-31 | 2018-09-30 | 2018-06-30 | 2018-03-31 | 2017-12-31 | 2017-09-30 | 2017-06-30 | 2017-03-31 | 2016-12-31 | 2016-09-30 | 2016-06-30 | 2016-03-31 | 2015-12-31 | 2015-09-30 | 2015-06-30 | 2015-03-31 | 2014-12-31 | 2014-09-30 | 2014-06-30 | 2014-03-31 | ||
|---|---|---|---|---|---|---|---|---|---|---|---|---|---|---|---|---|---|---|---|---|---|---|---|---|---|---|---|---|---|---|---|---|---|---|---|---|---|---|---|---|---|
| Net Cash Provided By Used In Investing Activities | -12.92 | 14.90 | 25.95 | -13.83 | 16.66 | 24.39 | 9.63 | -5.90 | -8.87 | -26.06 | -2.03 | -21.26 | -3.46 | -181.56 | -20.67 | 0.63 | 49.81 | -4.07 | -0.60 | -1.71 | -17.75 | -5.93 | 2.35 | -5.07 | -7.03 | -1.44 | -1.16 | -2.10 | -2.86 | -10.17 | NA | NA | NA | NA | NA | NA | NA | NA | NA | NA | |
| Payments To Acquire Property Plant And Equipment | 4.21 | 3.36 | 5.77 | 6.91 | 8.22 | 6.04 | 9.40 | 6.60 | 9.33 | 9.92 | 11.36 | 17.18 | 2.15 | 1.28 | 2.73 | 0.78 | 1.19 | 1.01 | 1.87 | 0.65 | 7.58 | 0.73 | 0.76 | 1.25 | 1.86 | 2.38 | 1.31 | 0.76 | 2.04 | 3.02 | 0.84 | 0.38 | 0.38 | 0.18 | NA | NA | 0.29 | 0.27 | NA | NA |
| 2023-12-31 | 2023-09-30 | 2023-06-30 | 2023-03-31 | 2022-12-31 | 2022-09-30 | 2022-06-30 | 2022-03-31 | 2021-12-31 | 2021-09-30 | 2021-06-30 | 2021-03-31 | 2020-12-31 | 2020-09-30 | 2020-06-30 | 2020-03-31 | 2019-12-31 | 2019-09-30 | 2019-06-30 | 2019-03-31 | 2018-12-31 | 2018-09-30 | 2018-06-30 | 2018-03-31 | 2017-12-31 | 2017-09-30 | 2017-06-30 | 2017-03-31 | 2016-12-31 | 2016-09-30 | 2016-06-30 | 2016-03-31 | 2015-12-31 | 2015-09-30 | 2015-06-30 | 2015-03-31 | 2014-12-31 | 2014-09-30 | 2014-06-30 | 2014-03-31 | ||
|---|---|---|---|---|---|---|---|---|---|---|---|---|---|---|---|---|---|---|---|---|---|---|---|---|---|---|---|---|---|---|---|---|---|---|---|---|---|---|---|---|---|
| Net Cash Provided By Used In Financing Activities | 7.30 | 7.47 | -0.88 | 1.15 | 0.53 | 4.21 | 0.11 | 1.41 | 1.62 | 3.87 | 16.36 | 17.41 | 8.66 | 5.82 | 243.84 | 4.22 | -22.04 | 6.67 | 0.32 | 5.41 | 1.97 | 13.93 | 2.84 | 2.84 | 0.43 | 0.48 | 1.78 | 1.97 | 0.42 | -0.91 | NA | NA | NA | NA | NA | NA | NA | NA | NA | NA |
| 2023-12-31 | 2023-09-30 | 2023-06-30 | 2023-03-31 | 2022-12-31 | 2022-09-30 | 2022-06-30 | 2022-03-31 | 2021-12-31 | 2021-09-30 | 2021-06-30 | 2021-03-31 | 2020-12-31 | 2020-09-30 | 2020-06-30 | 2020-03-31 | 2019-12-31 | 2019-09-30 | 2019-06-30 | 2019-03-31 | 2018-12-31 | 2018-09-30 | 2018-06-30 | 2018-03-31 | 2017-12-31 | 2017-09-30 | 2017-06-30 | 2017-03-31 | 2016-12-31 | 2016-09-30 | 2016-06-30 | 2016-03-31 | 2015-12-31 | 2015-09-30 | 2015-06-30 | 2015-03-31 | 2014-12-31 | 2014-09-30 | 2014-06-30 | 2014-03-31 | ||
|---|---|---|---|---|---|---|---|---|---|---|---|---|---|---|---|---|---|---|---|---|---|---|---|---|---|---|---|---|---|---|---|---|---|---|---|---|---|---|---|---|---|
| Revenues | 82.36 | 78.05 | 80.40 | 73.90 | 71.23 | 71.27 | 72.69 | 67.68 | 73.24 | 74.71 | 78.09 | 67.97 | 73.23 | 64.83 | 31.56 | 55.34 | 65.85 | 58.51 | 58.60 | 54.03 | 54.08 | 43.91 | 43.16 | 40.13 | 41.65 | 40.41 | 41.28 | 35.91 | 33.17 | 29.58 | 28.56 | 23.09 | 20.28 | 19.00 | 17.75 | 14.67 | 14.11 | 12.13 | 11.10 | 8.25 | |
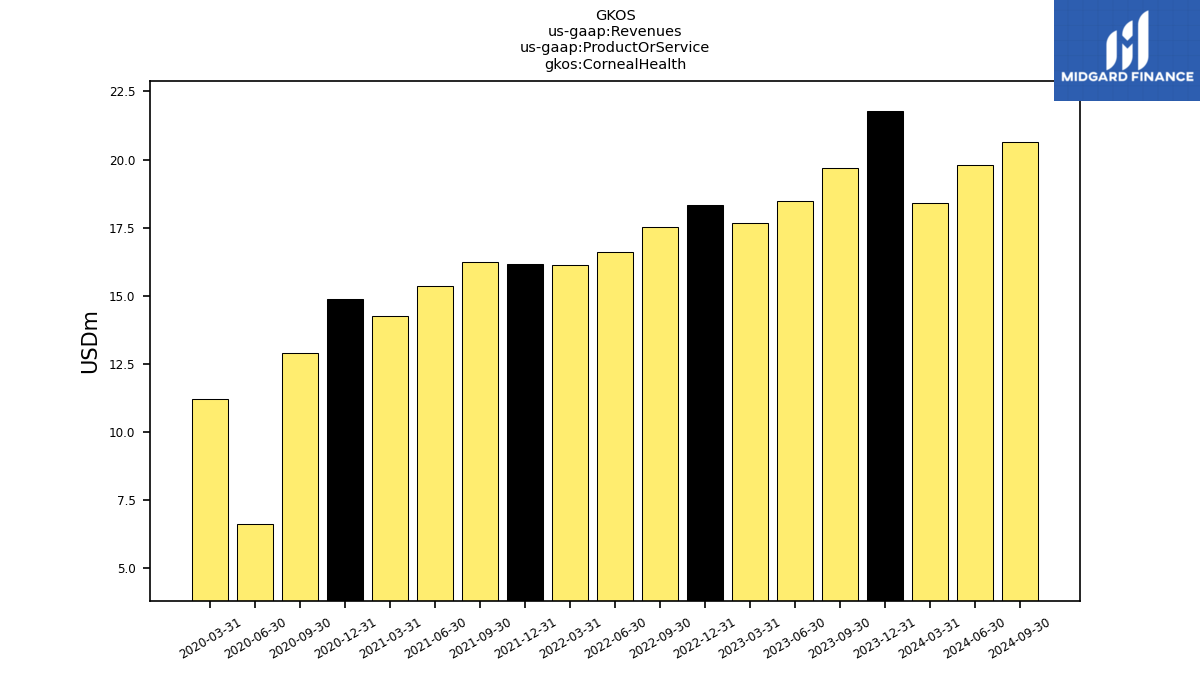
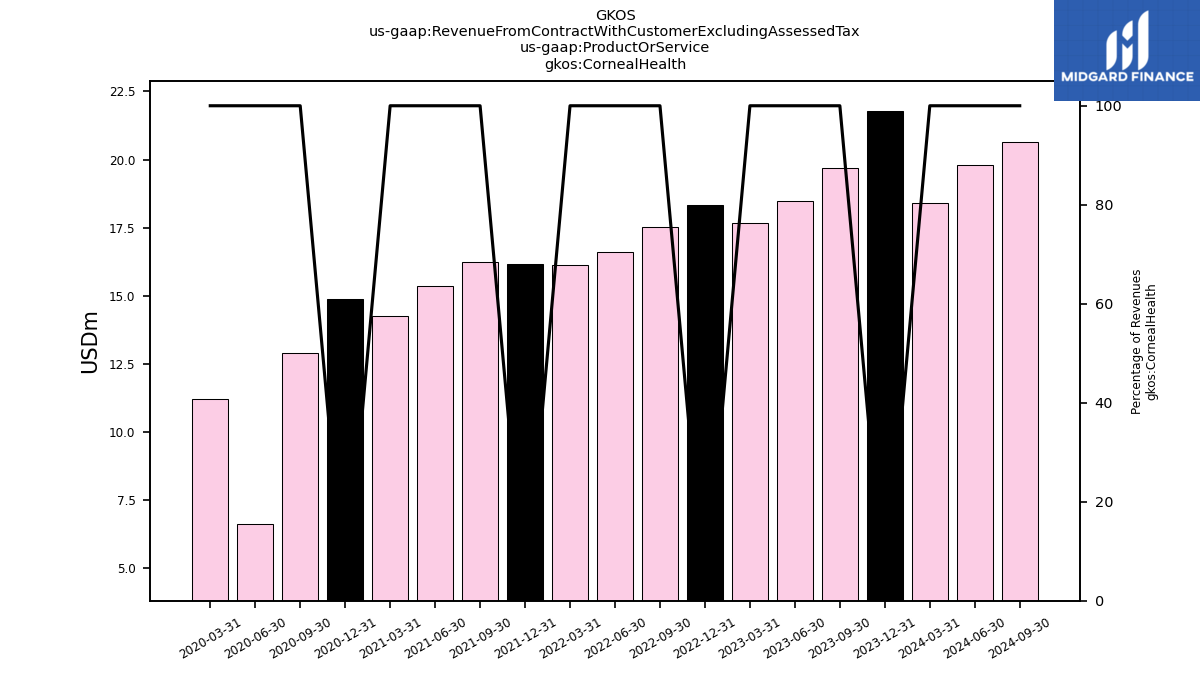
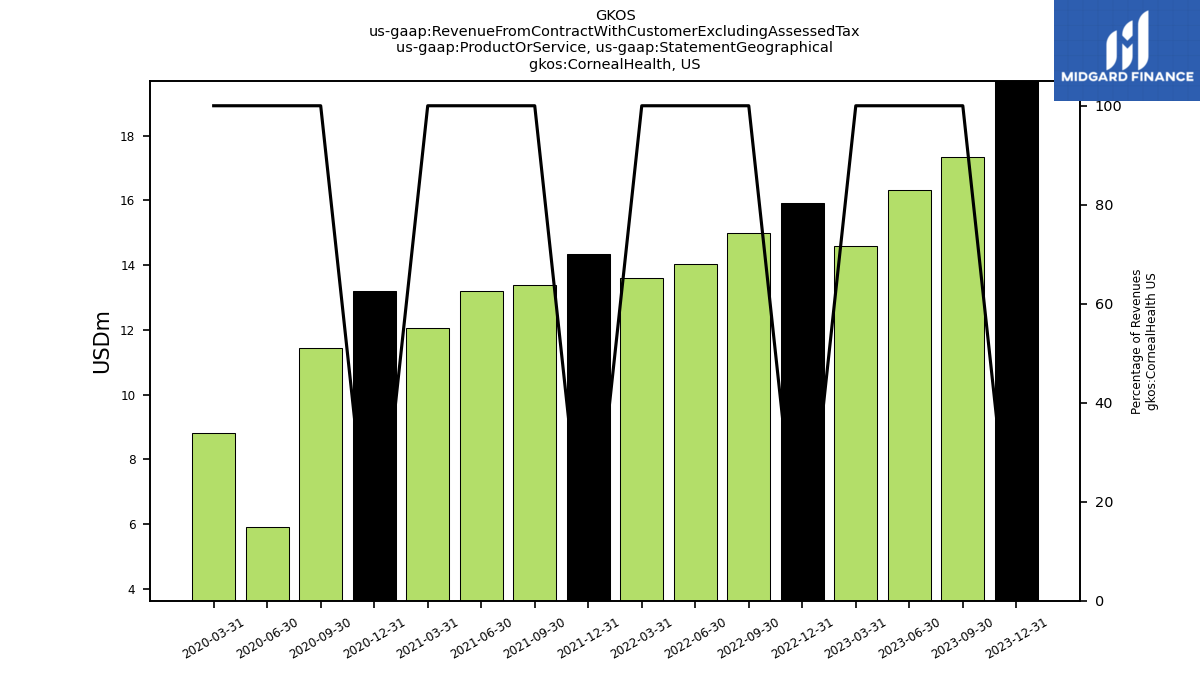
| Corneal Health | 21.79 | 19.71 | 18.50 | 17.68 | 18.35 | 17.52 | 16.62 | 16.13 | 16.17 | 16.23 | 15.37 | 14.27 | 14.88 | 12.90 | 6.61 | 11.20 | NA | NA | NA | NA | NA | NA | NA | NA | NA | NA | NA | NA | NA | NA | NA | NA | NA | NA | NA | NA | NA | NA | NA | NA | |
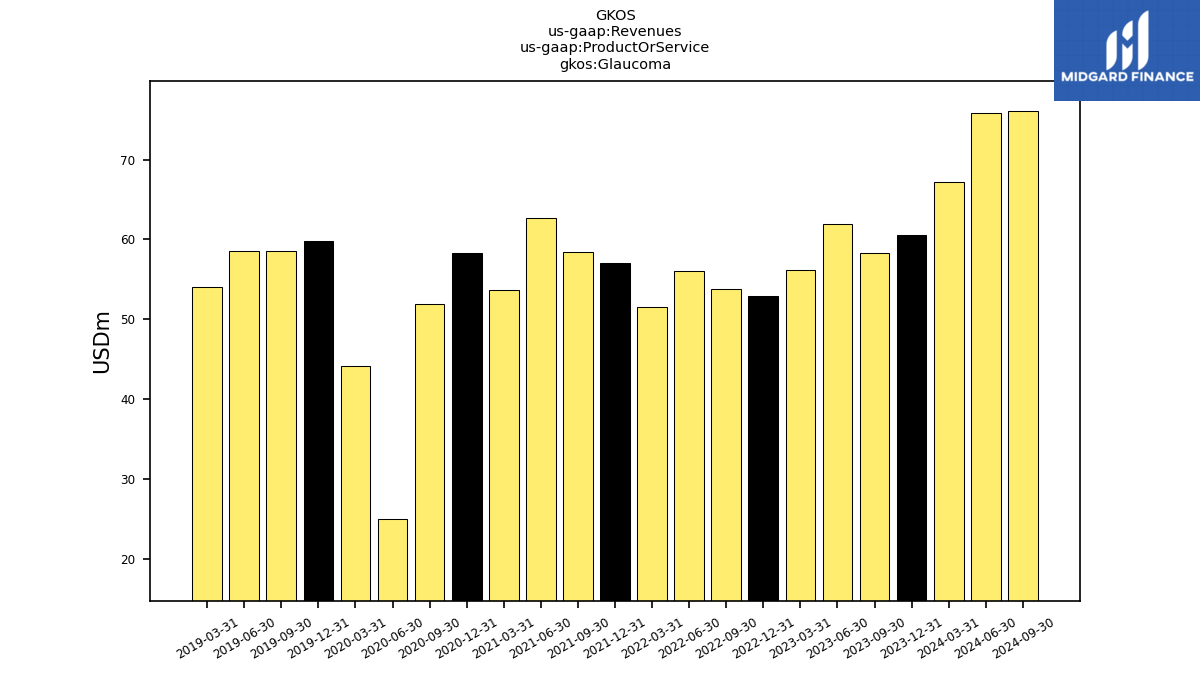
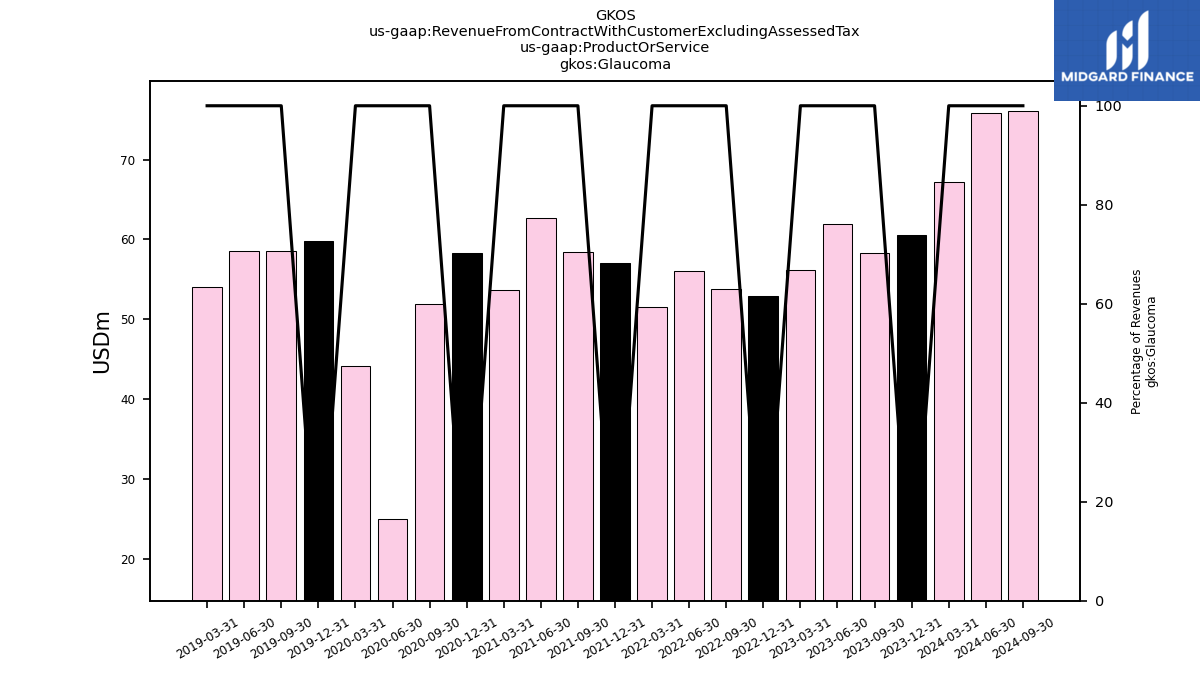
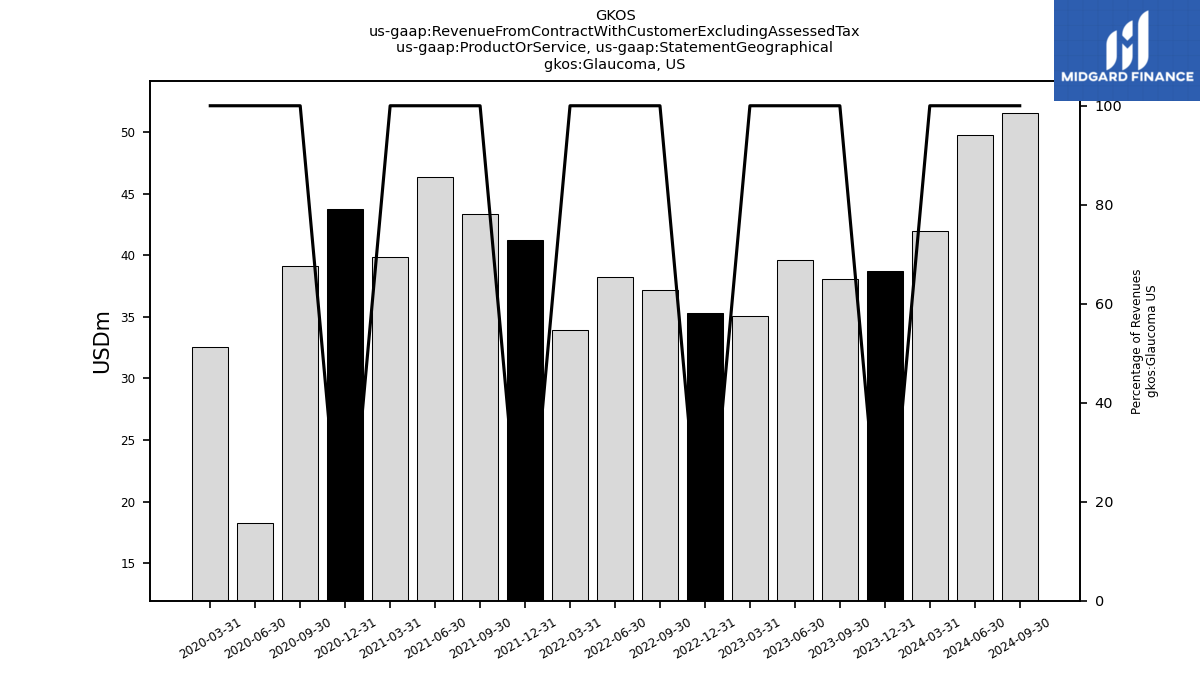
| Glaucoma | 60.57 | 58.34 | 61.90 | 56.22 | 52.88 | 53.75 | 56.07 | 51.55 | 57.07 | 58.48 | 62.72 | 53.70 | 58.36 | 51.93 | 24.95 | 44.13 | 59.83 | 58.51 | 58.60 | 54.03 | NA | NA | NA | NA | NA | NA | NA | NA | NA | NA | NA | NA | NA | NA | NA | NA | NA | NA | NA | NA | |
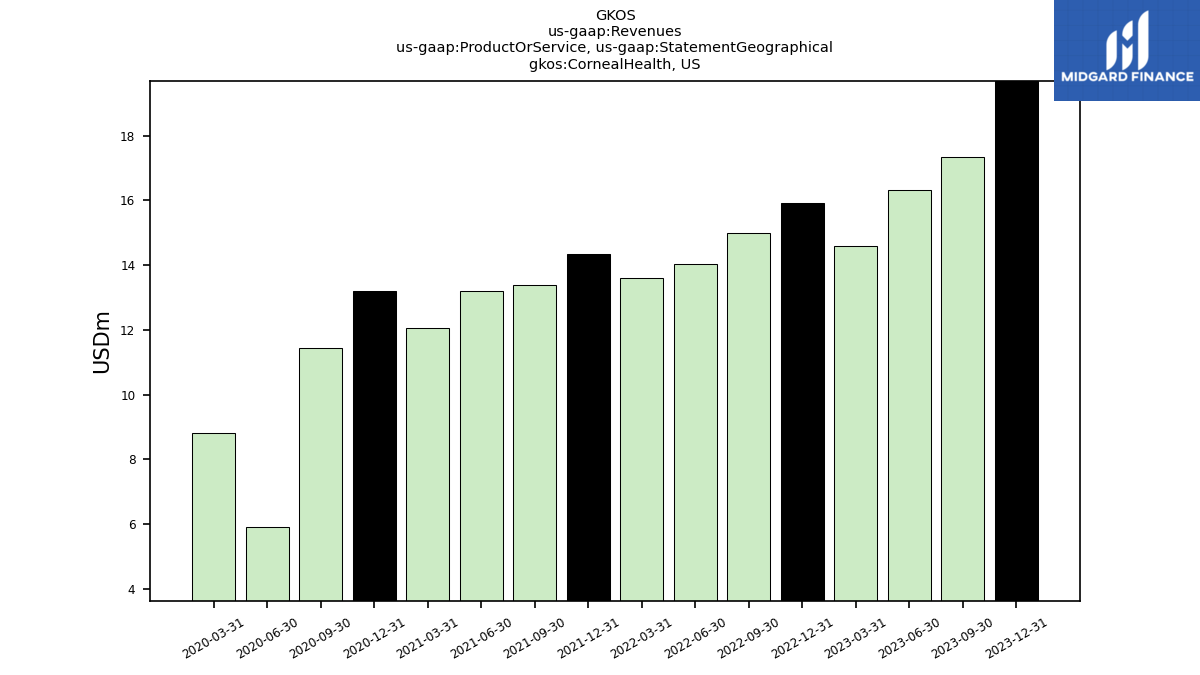
| Corneal Health,US | 19.69 | 17.34 | 16.31 | 14.58 | 15.93 | 14.99 | 14.03 | 13.62 | 14.34 | 13.38 | 13.22 | 12.05 | 13.21 | 11.44 | 5.92 | 8.81 | NA | NA | NA | NA | NA | NA | NA | NA | NA | NA | NA | NA | NA | NA | NA | NA | NA | NA | NA | NA | NA | NA | NA | NA | |
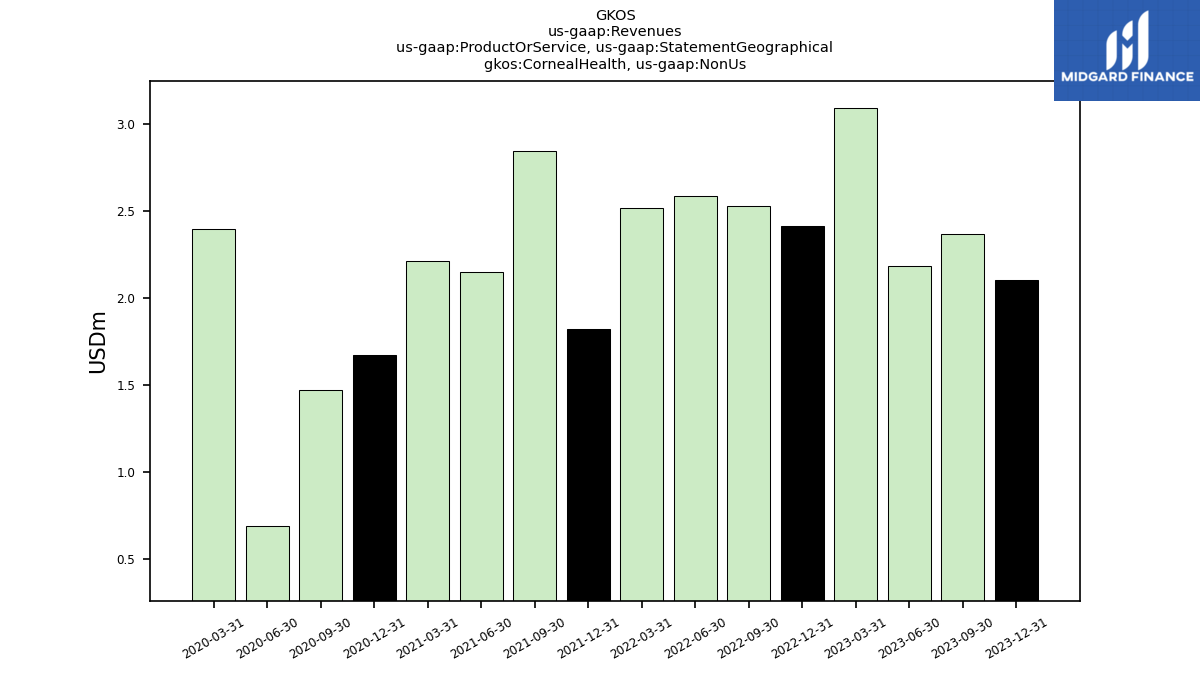
| Corneal Health, Non Us | 2.10 | 2.37 | 2.19 | 3.09 | 2.41 | 2.53 | 2.58 | 2.52 | 1.82 | 2.85 | 2.15 | 2.21 | 1.67 | 1.47 | 0.69 | 2.40 | NA | NA | NA | NA | NA | NA | NA | NA | NA | NA | NA | NA | NA | NA | NA | NA | NA | NA | NA | NA | NA | NA | NA | NA | |
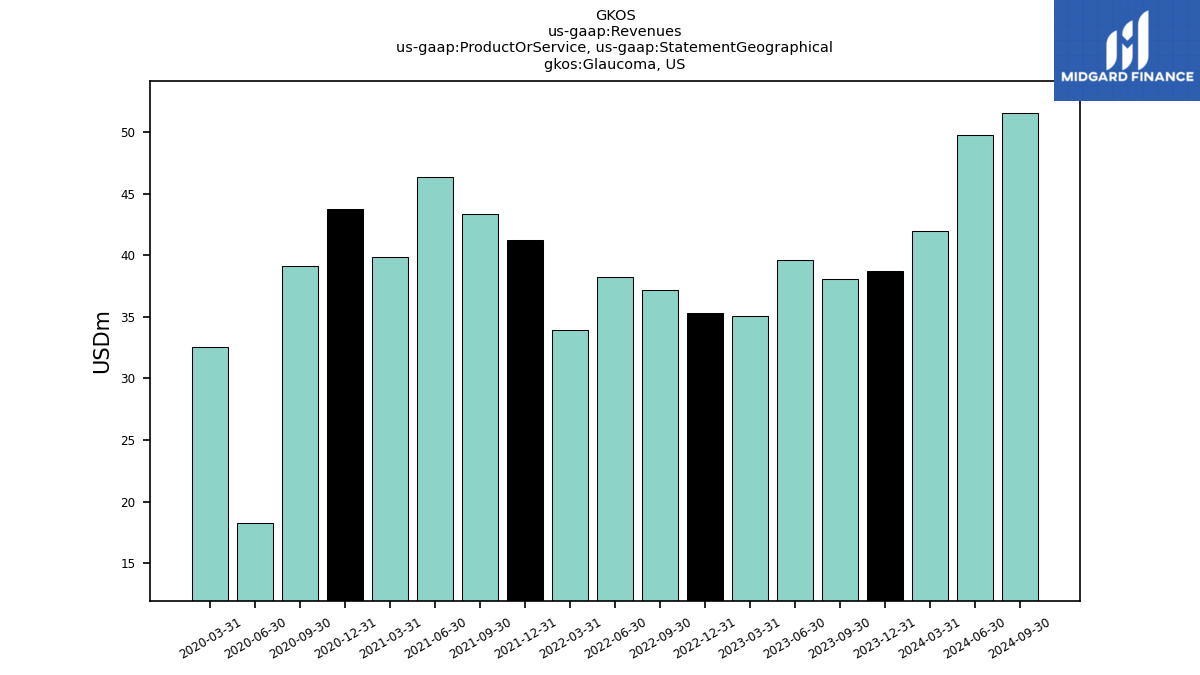
| Glaucoma,US | 38.71 | 38.06 | 39.60 | 35.11 | 35.35 | 37.21 | 38.20 | 33.90 | 41.21 | 43.38 | 46.31 | 39.89 | 43.73 | 39.16 | 18.25 | 32.58 | NA | NA | NA | NA | NA | NA | NA | NA | NA | NA | NA | NA | NA | NA | NA | NA | NA | NA | NA | NA | NA | NA | NA | NA | |
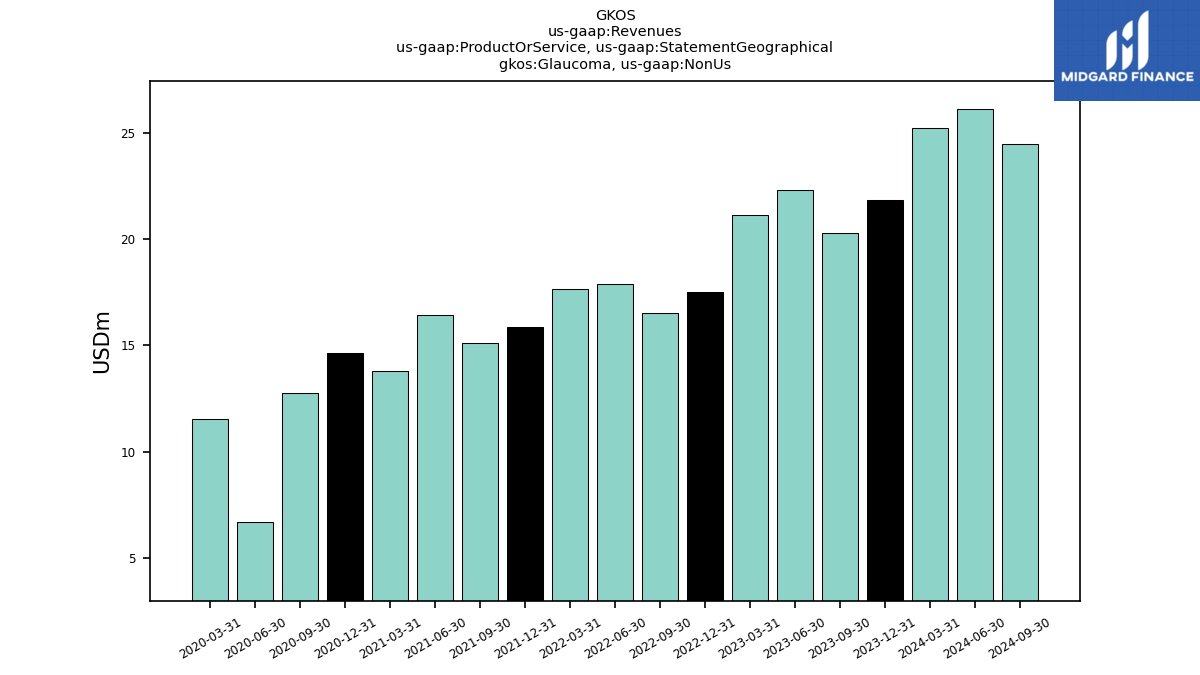
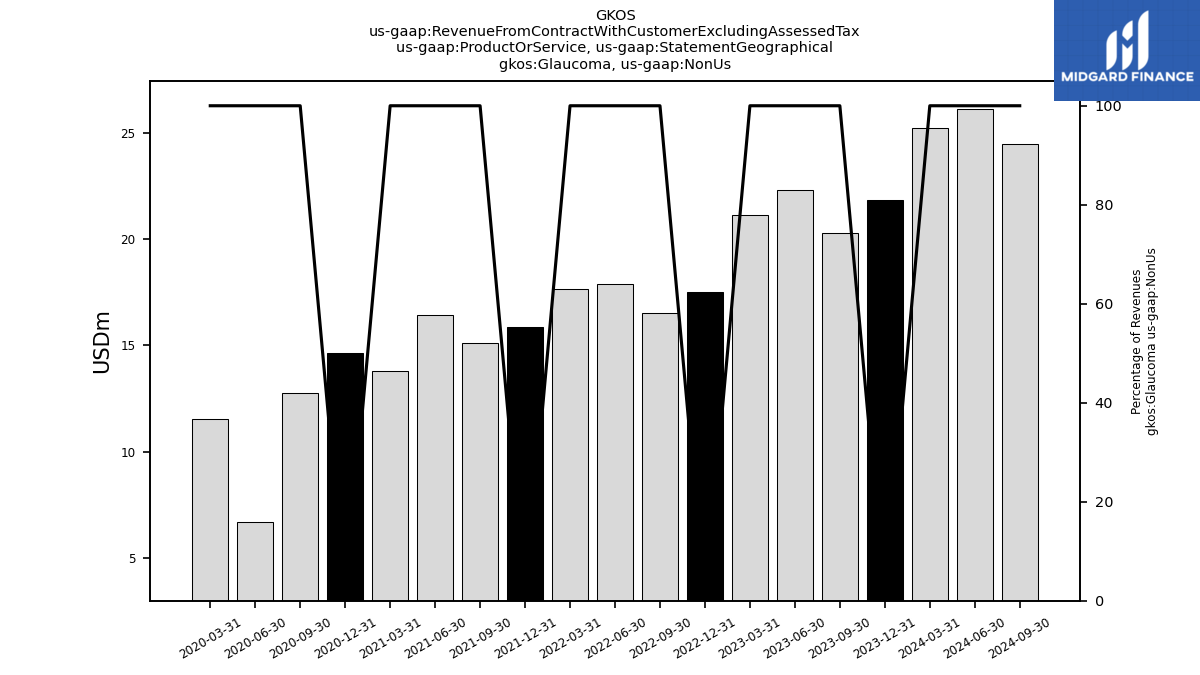
| Glaucoma, Non Us | 21.86 | 20.28 | 22.30 | 21.12 | 17.53 | 16.53 | 17.87 | 17.65 | 15.86 | 15.10 | 16.41 | 13.81 | 14.63 | 12.76 | 6.70 | 11.56 | NA | NA | NA | NA | NA | NA | NA | NA | NA | NA | NA | NA | NA | NA | NA | NA | NA | NA | NA | NA | NA | NA | NA | NA | |
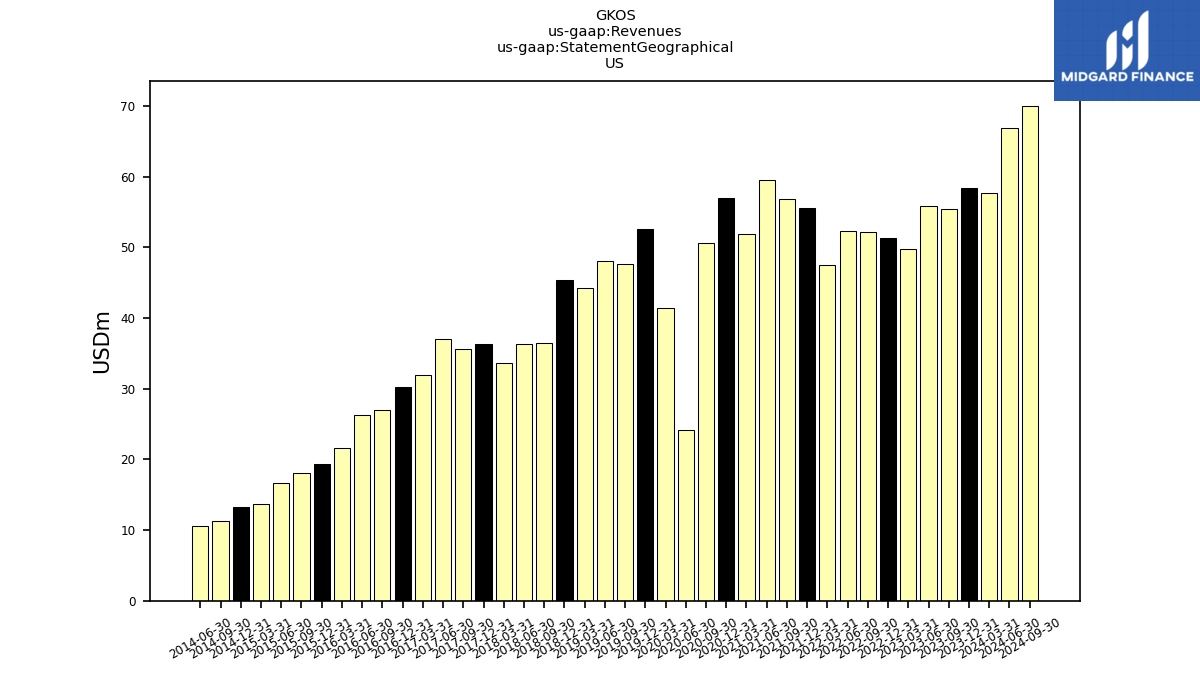
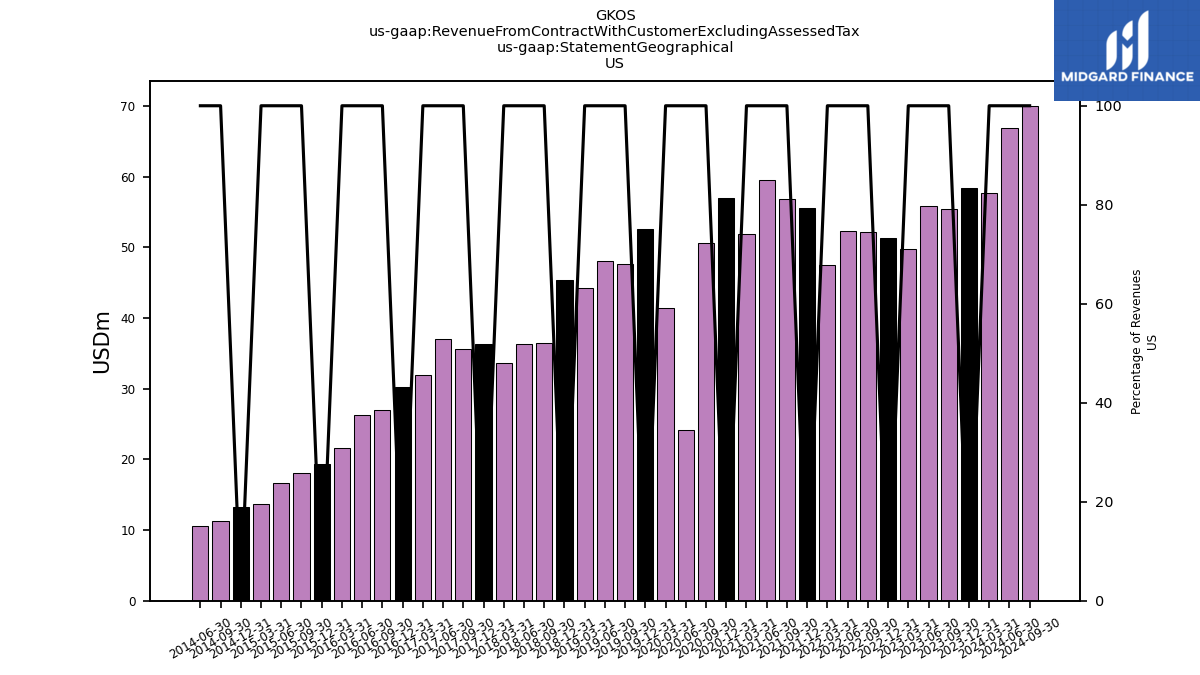
| US | 58.40 | 55.40 | 55.91 | 49.69 | 51.28 | 52.21 | 52.23 | 47.52 | 55.55 | 56.76 | 59.53 | 51.94 | 56.93 | 50.60 | 24.17 | 41.38 | 52.56 | 47.59 | 48.09 | 44.22 | 45.34 | 36.41 | 36.31 | 33.61 | 36.30 | 35.65 | 37.08 | 31.88 | 30.22 | 26.93 | 26.30 | 21.54 | 19.34 | 18.09 | 16.66 | 13.62 | 13.22 | 11.33 | 10.50 | NA | |
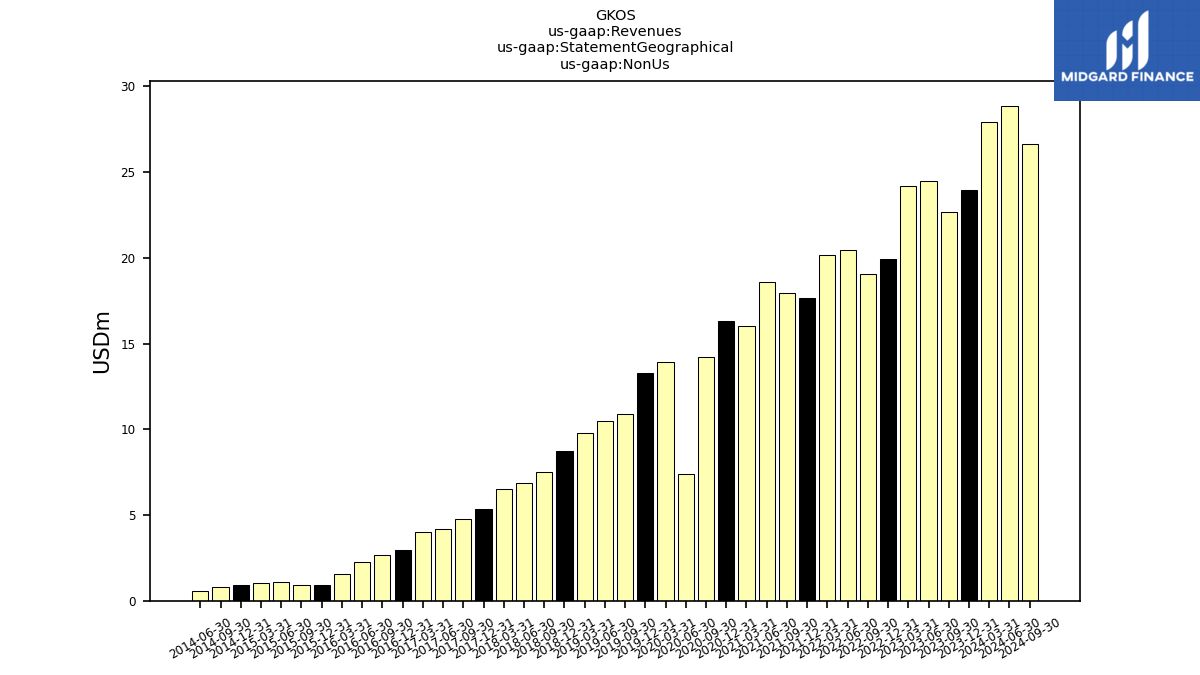
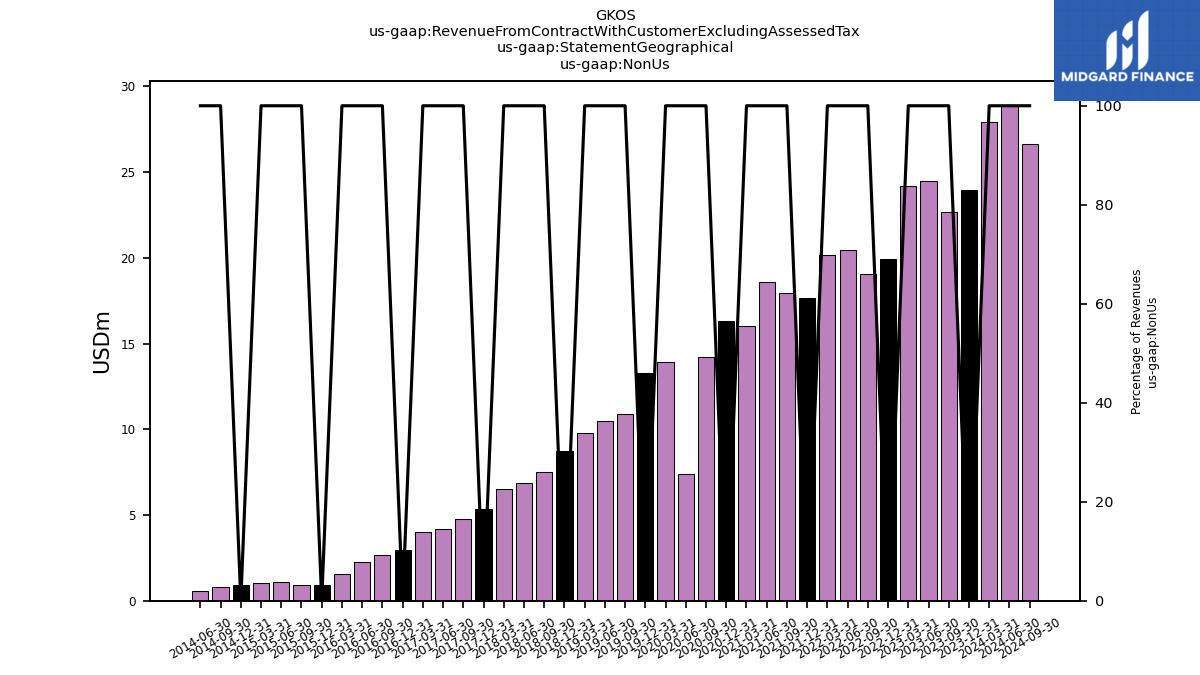
| Non Us | 23.96 | 22.65 | 24.49 | 24.21 | 19.94 | 19.06 | 20.45 | 20.16 | 17.69 | 17.95 | 18.56 | 16.02 | 16.30 | 14.23 | 7.39 | 13.95 | 13.29 | 10.92 | 10.51 | 9.81 | 8.74 | 7.50 | 6.85 | 6.52 | 5.35 | 4.76 | 4.21 | 4.03 | 2.95 | 2.64 | 2.26 | 1.55 | 0.94 | 0.91 | 1.10 | 1.05 | 0.90 | 0.80 | 0.59 | NA | |
| Revenue From Contract With Customer Excluding Assessed Tax | 82.36 | 78.05 | 80.40 | 73.90 | 71.23 | 71.27 | 72.69 | 67.68 | 73.24 | 74.71 | 78.09 | 67.97 | 73.23 | 64.83 | 31.56 | 55.34 | 65.85 | 58.51 | 58.60 | 54.03 | 54.08 | 43.91 | 43.16 | 40.13 | 41.65 | 40.41 | 41.28 | 35.91 | 33.17 | 29.58 | 28.56 | 23.09 | 20.28 | 19.00 | 17.75 | 14.67 | 14.11 | 12.13 | 11.10 | 8.25 | |
| Corneal Health | 21.79 | 19.71 | 18.50 | 17.68 | 18.35 | 17.52 | 16.62 | 16.13 | 16.17 | 16.23 | 15.37 | 14.27 | 14.88 | 12.90 | 6.61 | 11.20 | NA | NA | NA | NA | NA | NA | NA | NA | NA | NA | NA | NA | NA | NA | NA | NA | NA | NA | NA | NA | NA | NA | NA | NA | |
| Glaucoma | 60.57 | 58.34 | 61.90 | 56.22 | 52.88 | 53.75 | 56.07 | 51.55 | 57.07 | 58.48 | 62.72 | 53.70 | 58.36 | 51.93 | 24.95 | 44.13 | 59.83 | 58.51 | 58.60 | 54.03 | NA | NA | NA | NA | NA | NA | NA | NA | NA | NA | NA | NA | NA | NA | NA | NA | NA | NA | NA | NA | |
| Corneal Health,US | 19.69 | 17.34 | 16.31 | 14.58 | 15.93 | 14.99 | 14.03 | 13.62 | 14.34 | 13.38 | 13.22 | 12.05 | 13.21 | 11.44 | 5.92 | 8.81 | NA | NA | NA | NA | NA | NA | NA | NA | NA | NA | NA | NA | NA | NA | NA | NA | NA | NA | NA | NA | NA | NA | NA | NA | |
| Corneal Health, Non Us | 2.10 | 2.37 | 2.19 | 3.09 | 2.41 | 2.53 | 2.58 | 2.52 | 1.82 | 2.85 | 2.15 | 2.21 | 1.67 | 1.47 | 0.69 | 2.40 | NA | NA | NA | NA | NA | NA | NA | NA | NA | NA | NA | NA | NA | NA | NA | NA | NA | NA | NA | NA | NA | NA | NA | NA | |
| Glaucoma,US | 38.71 | 38.06 | 39.60 | 35.11 | 35.35 | 37.21 | 38.20 | 33.90 | 41.21 | 43.38 | 46.31 | 39.89 | 43.73 | 39.16 | 18.25 | 32.58 | NA | NA | NA | NA | NA | NA | NA | NA | NA | NA | NA | NA | NA | NA | NA | NA | NA | NA | NA | NA | NA | NA | NA | NA | |
| Glaucoma, Non Us | 21.86 | 20.28 | 22.30 | 21.12 | 17.53 | 16.53 | 17.87 | 17.65 | 15.86 | 15.10 | 16.41 | 13.81 | 14.63 | 12.76 | 6.70 | 11.56 | NA | NA | NA | NA | NA | NA | NA | NA | NA | NA | NA | NA | NA | NA | NA | NA | NA | NA | NA | NA | NA | NA | NA | NA | |
| US | 58.40 | 55.40 | 55.91 | 49.69 | 51.28 | 52.21 | 52.23 | 47.52 | 55.55 | 56.76 | 59.53 | 51.94 | 56.93 | 50.60 | 24.17 | 41.38 | 52.56 | 47.59 | 48.09 | 44.22 | 45.34 | 36.41 | 36.31 | 33.61 | 36.30 | 35.65 | 37.08 | 31.88 | 30.22 | 26.93 | 26.30 | 21.54 | 19.34 | 18.09 | 16.66 | 13.62 | 13.22 | 11.33 | 10.50 | NA | |
| Non Us | 23.96 | 22.65 | 24.49 | 24.21 | 19.94 | 19.06 | 20.45 | 20.16 | 17.69 | 17.95 | 18.56 | 16.02 | 16.30 | 14.23 | 7.39 | 13.95 | 13.29 | 10.92 | 10.51 | 9.81 | 8.74 | 7.50 | 6.85 | 6.52 | 5.35 | 4.76 | 4.21 | 4.03 | 2.95 | 2.64 | 2.26 | 1.55 | 0.94 | 0.91 | 1.10 | 1.05 | 0.90 | 0.80 | 0.59 | NA |