
| 2024-01-31 | 2023-10-31 | 2023-07-31 | 2023-04-30 | 2023-01-31 | 2022-10-31 | 2022-07-31 | 2022-04-30 | 2022-01-31 | 2021-10-31 | 2021-07-31 | 2021-04-30 | 2021-01-31 | 2020-10-31 | 2020-07-31 | 2020-04-30 | 2020-01-31 | 2019-10-31 | 2019-07-31 | 2019-04-30 | 2019-01-31 | 2018-10-31 | 2018-07-31 | 2018-04-30 | 2018-01-31 | 2017-10-31 | 2017-07-31 | 2017-04-30 | 2017-01-31 | 2016-10-31 | 2016-07-31 | 2016-04-30 | 2016-01-31 | 2015-10-31 | 2015-07-31 | ||
|---|---|---|---|---|---|---|---|---|---|---|---|---|---|---|---|---|---|---|---|---|---|---|---|---|---|---|---|---|---|---|---|---|---|---|---|---|
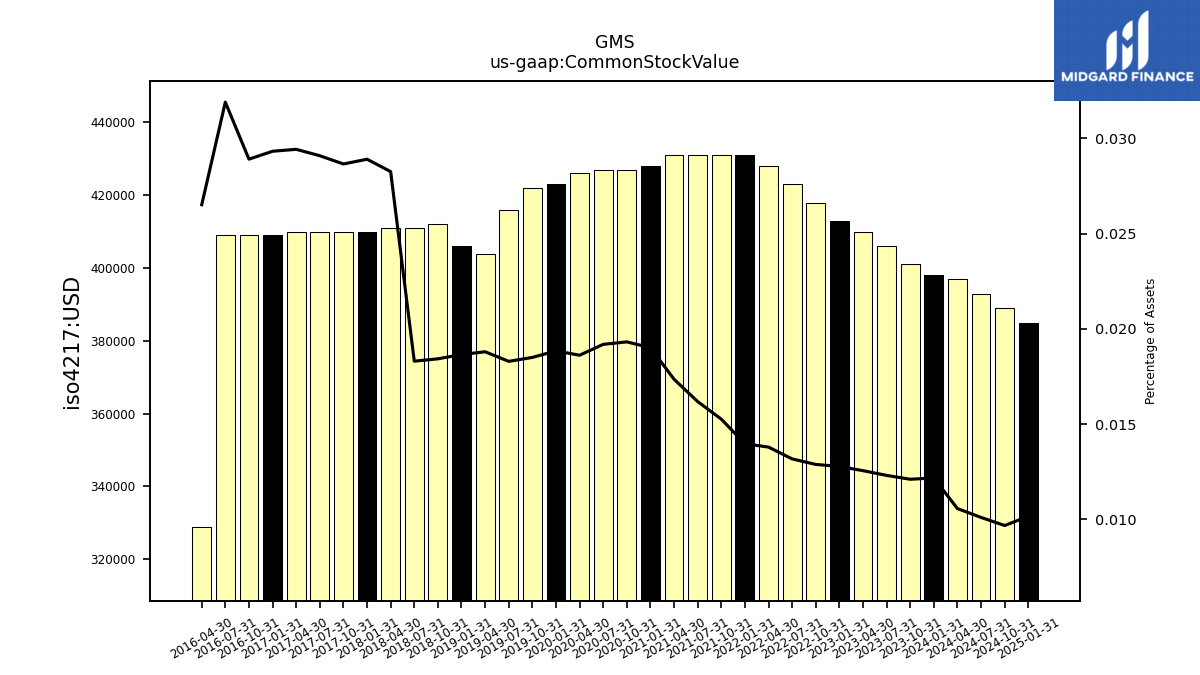
| Common Stock Value | 0.40 | 0.40 | 0.41 | 0.41 | 0.41 | 0.42 | 0.42 | 0.43 | 0.43 | 0.43 | 0.43 | 0.43 | 0.43 | 0.43 | 0.43 | 0.43 | 0.42 | 0.42 | 0.42 | 0.40 | 0.41 | 0.41 | 0.41 | 0.41 | 0.41 | 0.41 | 0.41 | 0.41 | 0.41 | 0.41 | 0.41 | 0.33 | NA | NA | NA | |
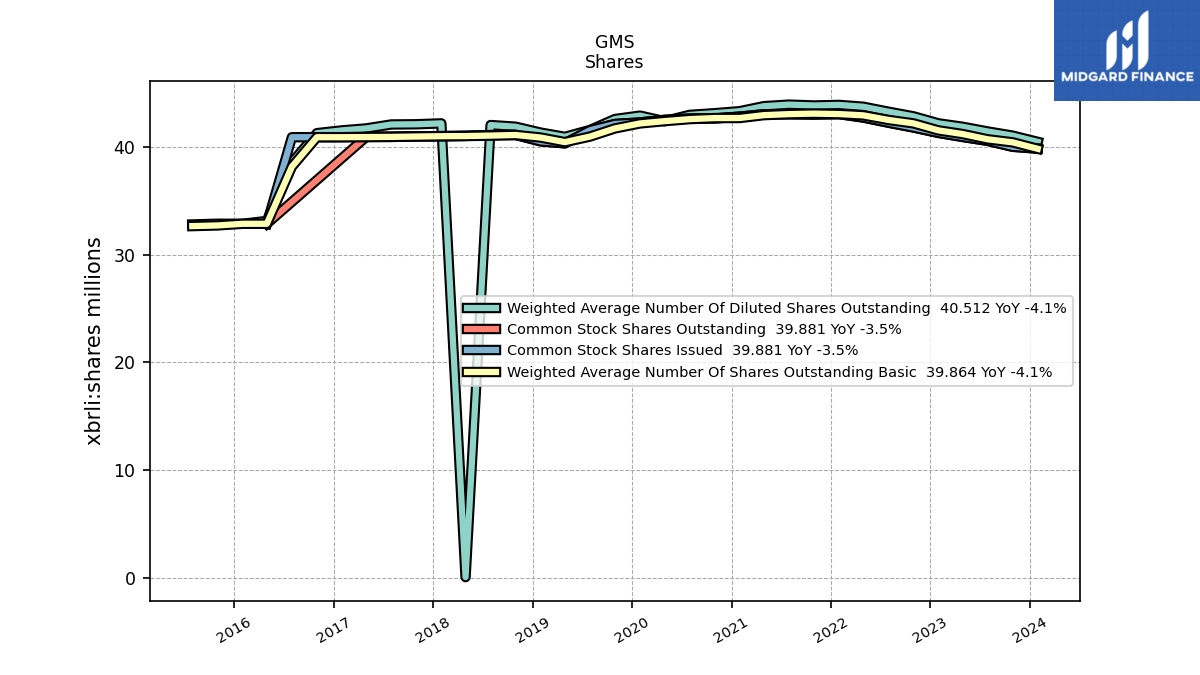
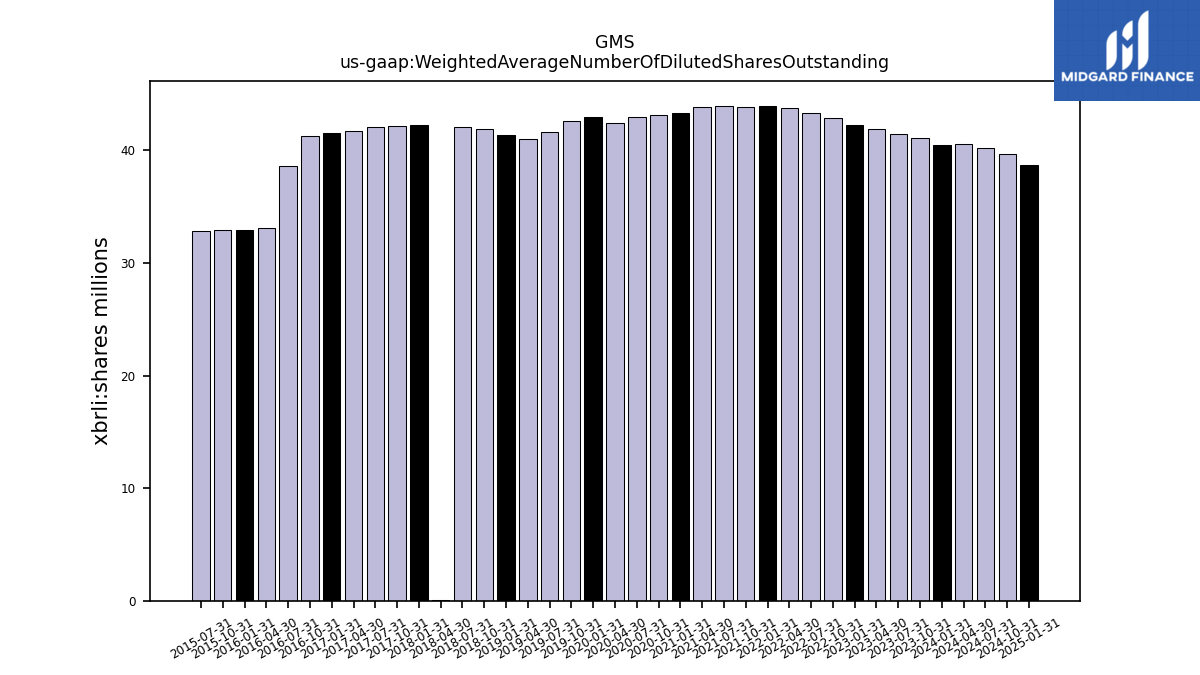
| Weighted Average Number Of Diluted Shares Outstanding | 40.51 | 41.09 | 41.48 | 41.91 | 42.23 | 42.89 | 43.32 | 43.78 | 43.95 | 43.89 | 43.97 | 43.83 | 43.36 | 43.17 | 43.02 | 42.44 | 42.95 | 42.63 | 41.62 | 40.98 | 41.37 | 41.92 | 42.07 | 0.04 | 42.23 | 42.15 | 42.13 | 41.76 | 41.58 | 41.32 | 38.60 | 33.16 | 32.89 | 32.90 | 32.83 | |
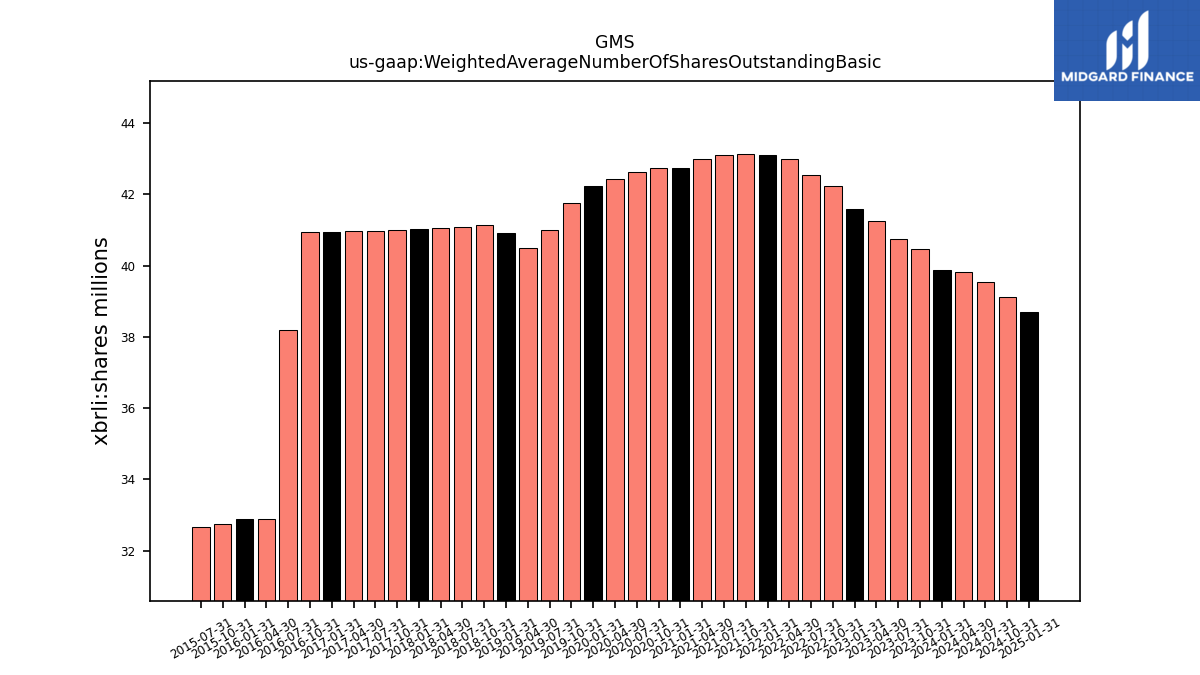
| Weighted Average Number Of Shares Outstanding Basic | 39.86 | 40.47 | 40.75 | 41.24 | 41.58 | 42.23 | 42.55 | 42.98 | 43.09 | 43.13 | 43.09 | 42.99 | 42.73 | 42.72 | 42.62 | 42.44 | 42.22 | 41.76 | 41.00 | 40.49 | 40.91 | 41.15 | 41.09 | 41.05 | 41.04 | 41.01 | 40.97 | 40.96 | 40.94 | 40.94 | 38.20 | 32.89 | 32.89 | 32.74 | 32.68 | |
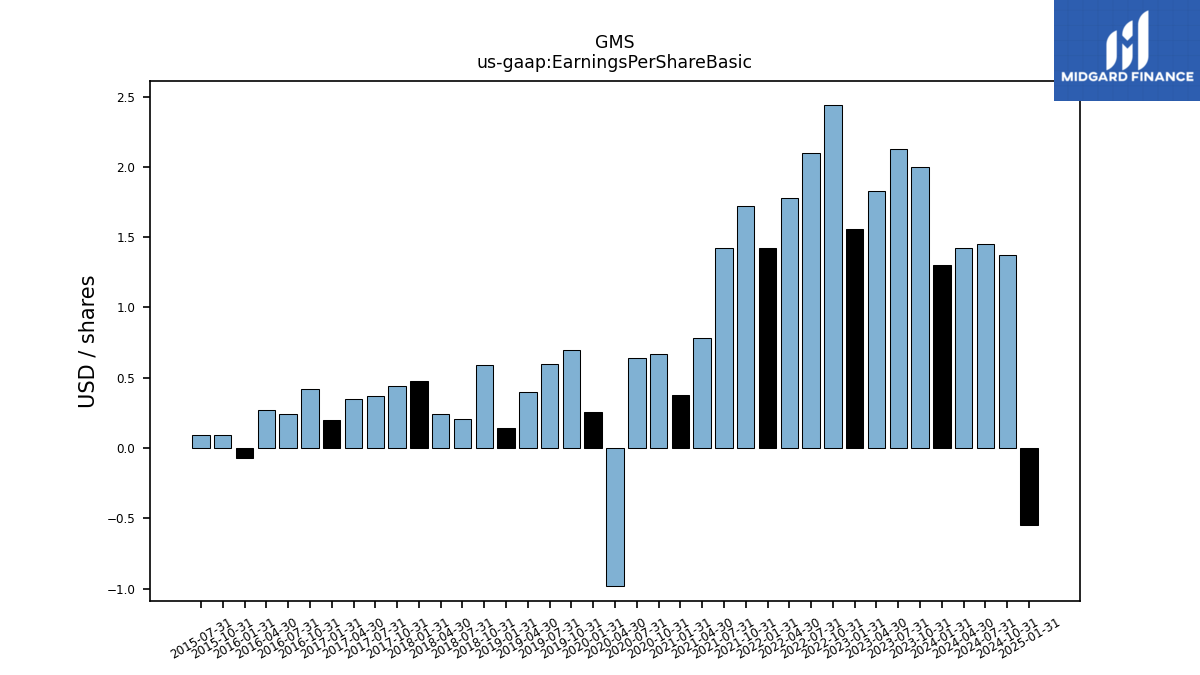
| Earnings Per Share Basic | 1.30 | 2.00 | 2.13 | 1.83 | 1.56 | 2.44 | 2.10 | 1.78 | 1.42 | 1.72 | 1.42 | 0.78 | 0.38 | 0.67 | 0.64 | -0.98 | 0.26 | 0.70 | 0.60 | 0.40 | 0.14 | 0.59 | 0.21 | 0.24 | 0.48 | 0.44 | 0.37 | 0.35 | 0.20 | 0.42 | 0.24 | 0.27 | -0.07 | 0.09 | 0.09 | |
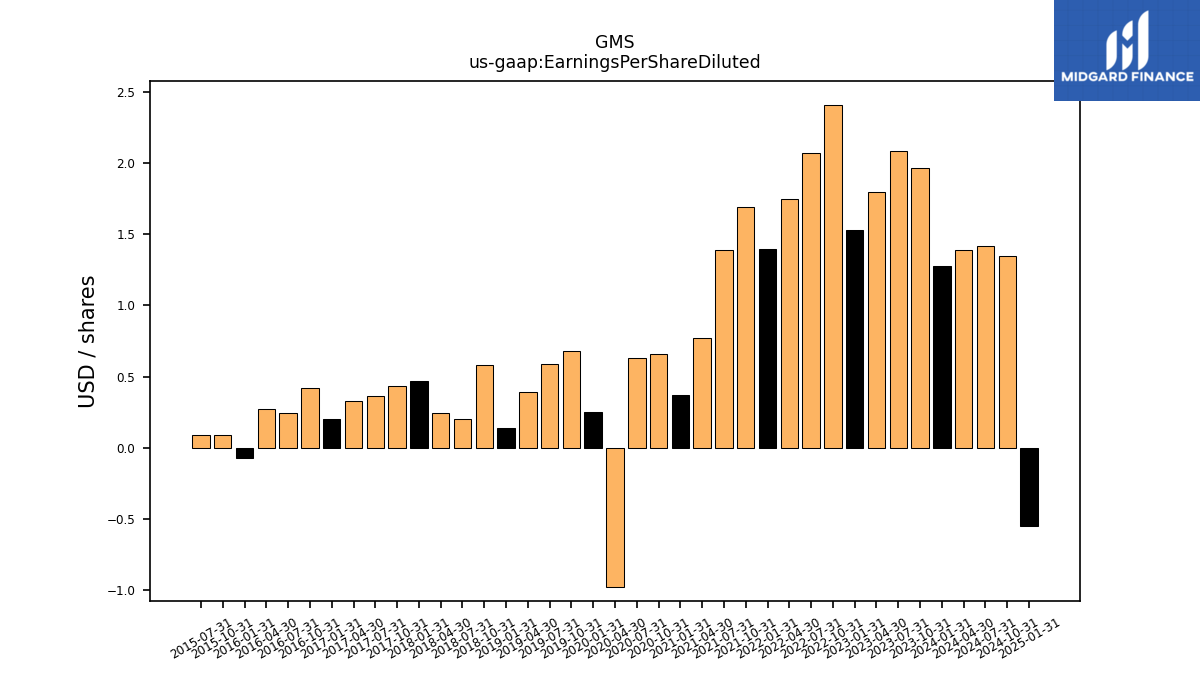
| Earnings Per Share Diluted | 1.28 | 1.97 | 2.09 | 1.80 | 1.53 | 2.41 | 2.07 | 1.75 | 1.40 | 1.69 | 1.39 | 0.77 | 0.37 | 0.66 | 0.63 | -0.98 | 0.25 | 0.68 | 0.59 | 0.39 | 0.14 | 0.58 | 0.20 | 0.24 | 0.47 | 0.43 | 0.36 | 0.33 | 0.20 | 0.42 | 0.24 | 0.27 | -0.07 | 0.09 | 0.09 |
| 2024-01-31 | 2023-10-31 | 2023-07-31 | 2023-04-30 | 2023-01-31 | 2022-10-31 | 2022-07-31 | 2022-04-30 | 2022-01-31 | 2021-10-31 | 2021-07-31 | 2021-04-30 | 2021-01-31 | 2020-10-31 | 2020-07-31 | 2020-04-30 | 2020-01-31 | 2019-10-31 | 2019-07-31 | 2019-04-30 | 2019-01-31 | 2018-10-31 | 2018-07-31 | 2018-04-30 | 2018-01-31 | 2017-10-31 | 2017-07-31 | 2017-04-30 | 2017-01-31 | 2016-10-31 | 2016-07-31 | 2016-04-30 | 2016-01-31 | 2015-10-31 | 2015-07-31 | ||
|---|---|---|---|---|---|---|---|---|---|---|---|---|---|---|---|---|---|---|---|---|---|---|---|---|---|---|---|---|---|---|---|---|---|---|---|---|
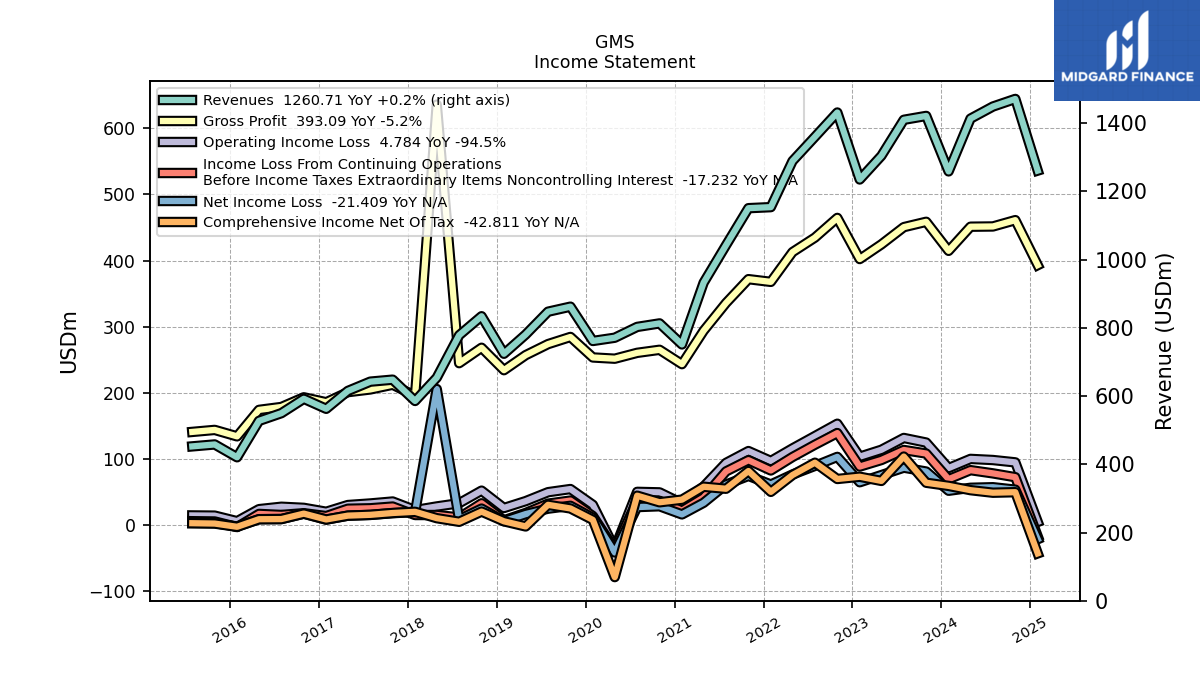
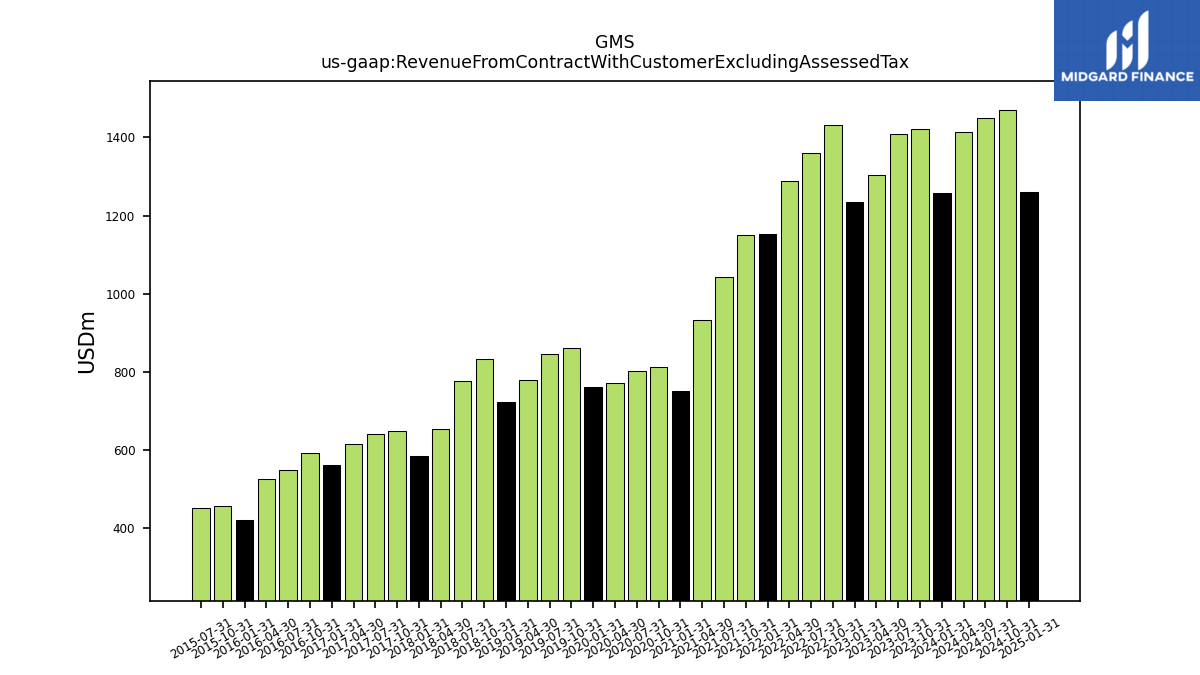
| Revenue From Contract With Customer Excluding Assessed Tax | 1258.35 | 1420.93 | 1409.60 | 1304.10 | 1234.62 | 1430.98 | 1359.55 | 1288.65 | 1153.60 | 1150.55 | 1042.08 | 932.20 | 751.19 | 812.86 | 802.57 | 770.85 | 761.35 | 861.93 | 847.18 | 780.15 | 723.90 | 833.84 | 778.14 | 653.80 | 585.51 | 648.00 | 642.16 | 614.98 | 562.52 | 591.85 | 549.80 | 527.18 | 420.48 | 458.08 | 452.44 | |
| Revenues | 1258.35 | 1420.93 | 1409.60 | 1304.10 | 1234.62 | 1430.98 | 1359.55 | 1288.65 | 1153.60 | 1150.55 | 1042.08 | 932.20 | 751.19 | 812.86 | 802.57 | 770.85 | 761.35 | 861.93 | 847.18 | 780.15 | 723.90 | 833.84 | 778.14 | 653.80 | 585.51 | 648.00 | 642.16 | 614.98 | 562.52 | 591.85 | 549.80 | 527.18 | 420.48 | 458.08 | 452.44 | |
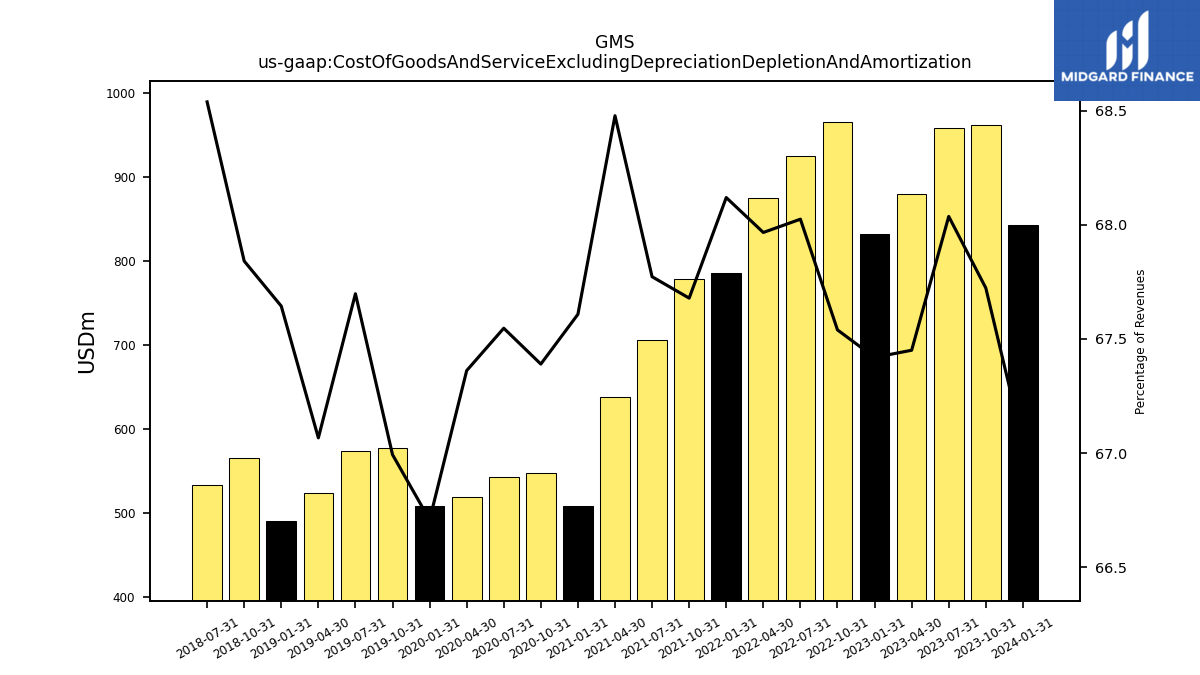
| Cost Of Goods And Service Excluding Depreciation Depletion And Amortization | 843.63 | 962.30 | 959.05 | 879.63 | 832.37 | 966.48 | 924.83 | 875.85 | 785.82 | 778.68 | 706.24 | 638.35 | 507.87 | 547.78 | 542.12 | 519.26 | 507.88 | 577.44 | 573.52 | 523.22 | 489.68 | 565.69 | 533.33 | NA | NA | NA | NA | NA | NA | NA | NA | NA | NA | NA | NA | |
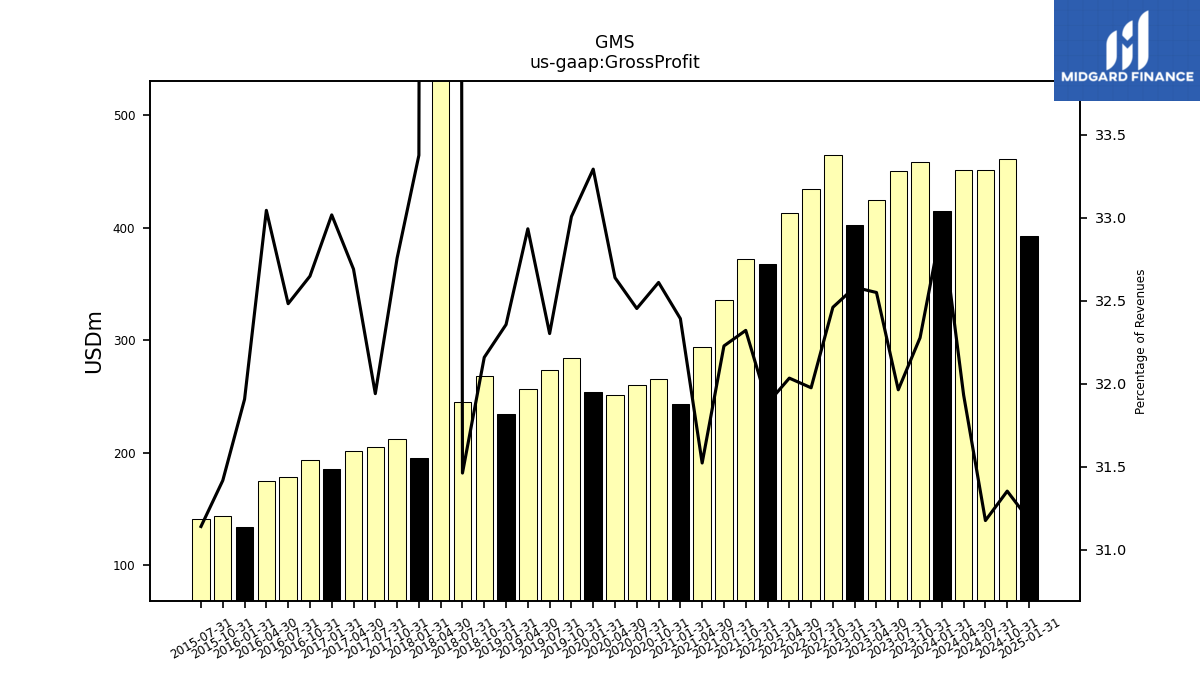
| Gross Profit | 414.72 | 458.63 | 450.55 | 424.48 | 402.25 | 464.50 | 434.72 | 412.80 | 367.77 | 371.87 | 335.83 | 293.85 | 243.32 | 265.07 | 260.46 | 251.59 | 253.47 | 284.49 | 273.65 | 256.93 | 234.23 | 268.15 | 244.82 | 635.80 | 195.42 | 212.26 | 205.10 | 201.03 | 185.73 | 193.22 | 178.59 | 174.20 | 134.16 | 143.91 | 140.89 | |
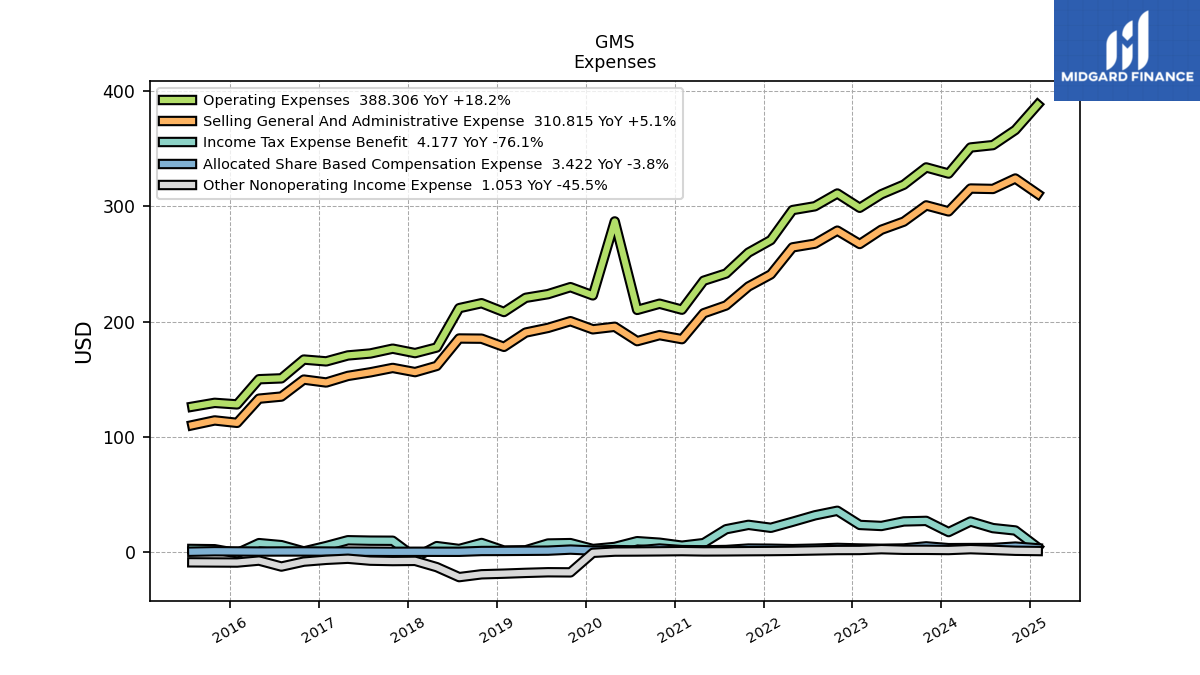
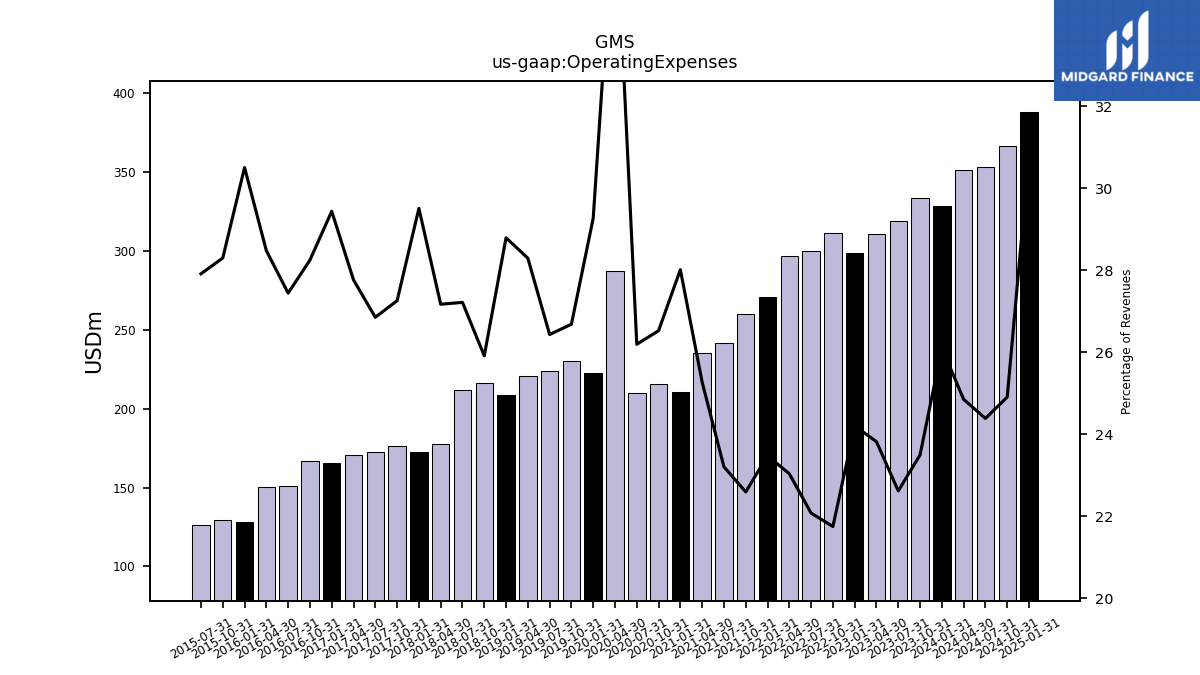
| Operating Expenses | 328.50 | 333.83 | 318.81 | 310.59 | 298.80 | 311.22 | 300.13 | 296.84 | 270.79 | 259.93 | 241.79 | 235.54 | 210.41 | 215.60 | 210.21 | 287.00 | 222.81 | 229.97 | 223.91 | 220.71 | 208.40 | 216.06 | 211.76 | 177.63 | 172.75 | 176.61 | 172.42 | 170.72 | 165.58 | 167.17 | 150.85 | 150.11 | 128.25 | 129.61 | 126.28 | |
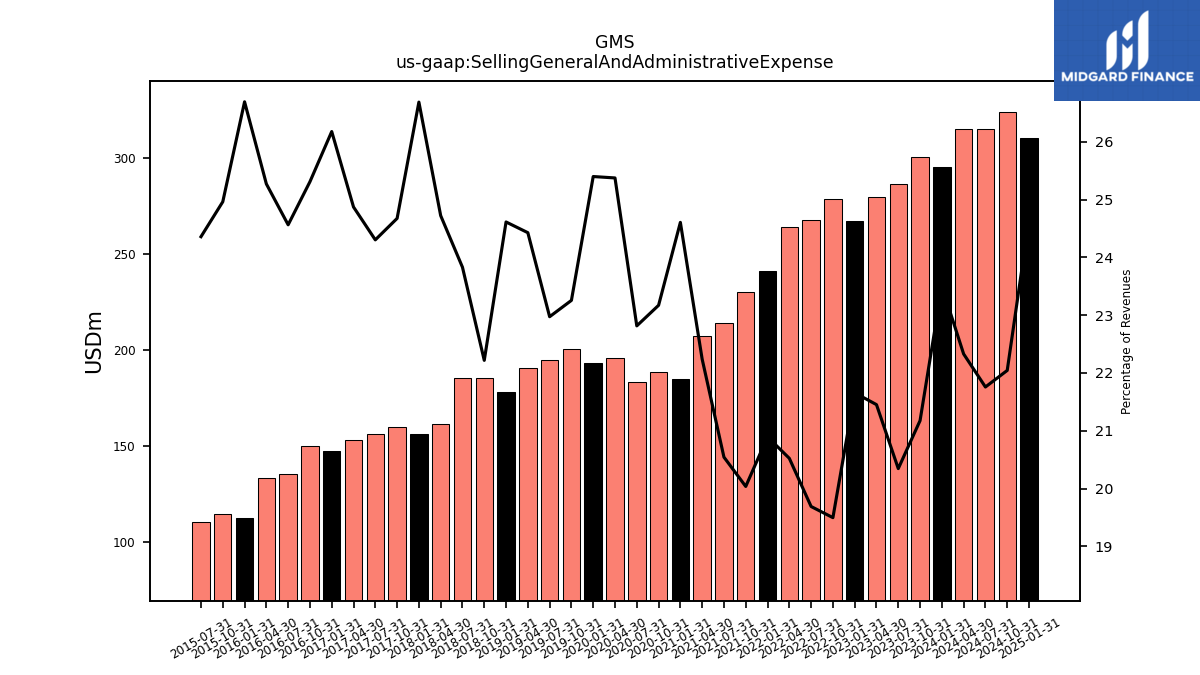
| Selling General And Administrative Expense | 295.69 | 300.89 | 286.80 | 279.76 | 267.38 | 278.99 | 267.69 | 264.47 | 241.04 | 230.53 | 214.08 | 207.32 | 184.84 | 188.35 | 183.11 | 195.61 | 193.38 | 200.46 | 194.63 | 190.58 | 178.18 | 185.27 | 185.44 | 161.65 | 156.26 | 159.90 | 156.07 | 152.96 | 147.26 | 149.80 | 135.06 | 133.23 | 112.24 | 114.35 | 110.21 | |
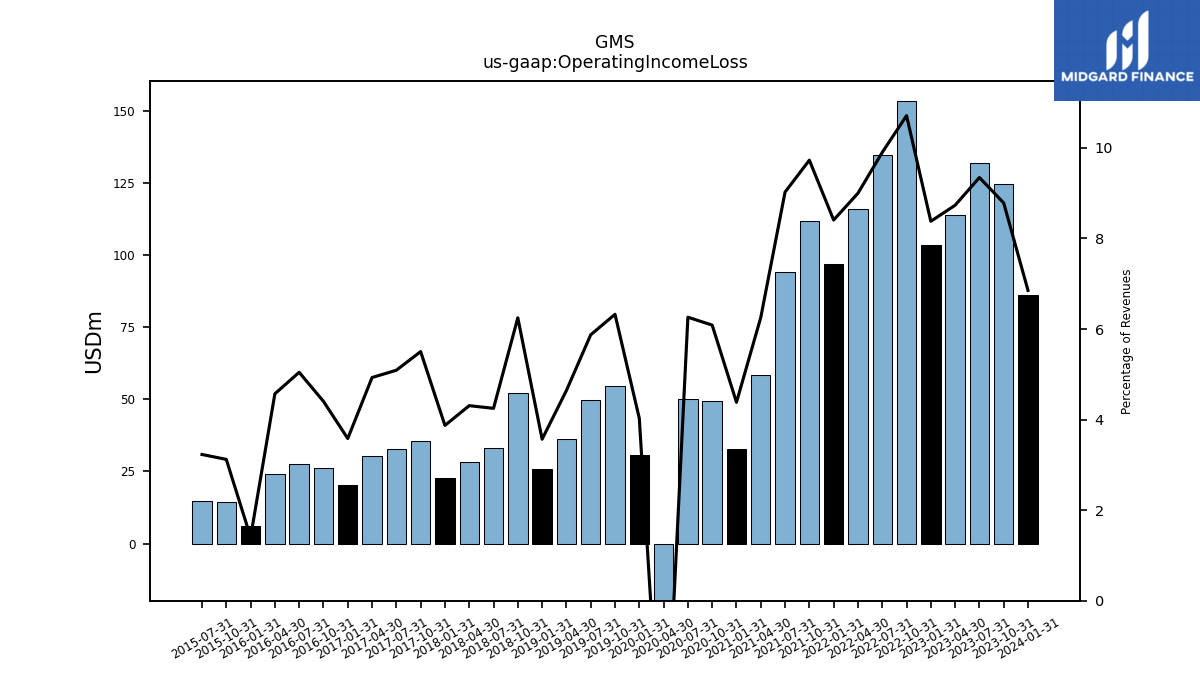
| Operating Income Loss | 86.22 | 124.80 | 131.74 | 113.89 | 103.45 | 153.28 | 134.59 | 115.96 | 96.98 | 111.94 | 94.04 | 58.31 | 32.92 | 49.47 | 50.25 | -35.41 | 30.67 | 54.52 | 49.75 | 36.22 | 25.83 | 52.09 | 33.06 | 28.16 | 22.67 | 35.65 | 32.69 | 30.31 | 20.15 | 26.06 | 27.73 | 24.09 | 5.91 | 14.30 | 14.61 | |
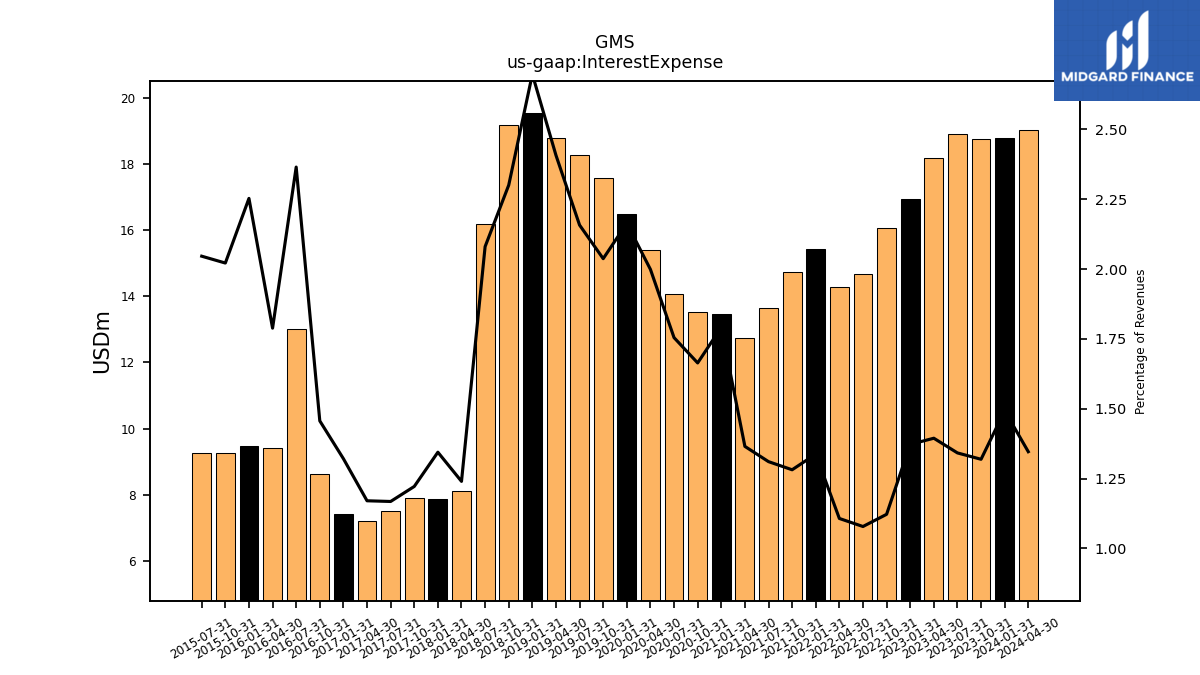
| Interest Expense | 18.78 | 18.74 | 18.91 | 18.18 | 16.94 | 16.05 | 14.66 | 14.27 | 15.43 | 14.74 | 13.66 | 12.73 | 13.45 | 13.53 | 14.08 | 15.41 | 16.47 | 17.56 | 18.28 | 18.78 | 19.53 | 19.18 | 16.19 | 8.11 | 7.87 | 7.92 | 7.50 | 7.20 | 7.43 | 8.62 | 13.00 | 9.43 | 9.47 | 9.26 | 9.26 | |
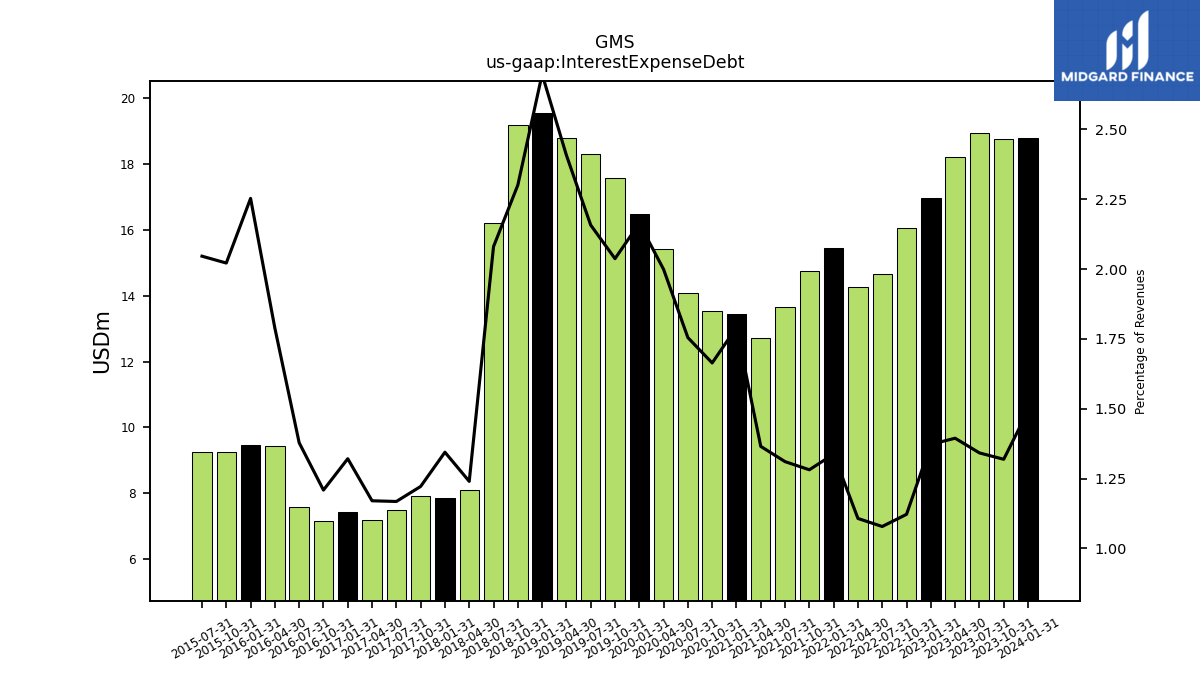
| Interest Expense Debt | 18.78 | 18.74 | 18.91 | 18.18 | 16.94 | 16.05 | 14.66 | 14.27 | 15.43 | 14.74 | 13.66 | 12.73 | 13.45 | 13.53 | 14.08 | 15.41 | 16.47 | 17.56 | 18.28 | 18.78 | 19.53 | 19.18 | 16.19 | 8.11 | 7.87 | 7.92 | 7.50 | 7.20 | 7.43 | 7.15 | 7.58 | 9.43 | 9.47 | 9.26 | 9.26 | |
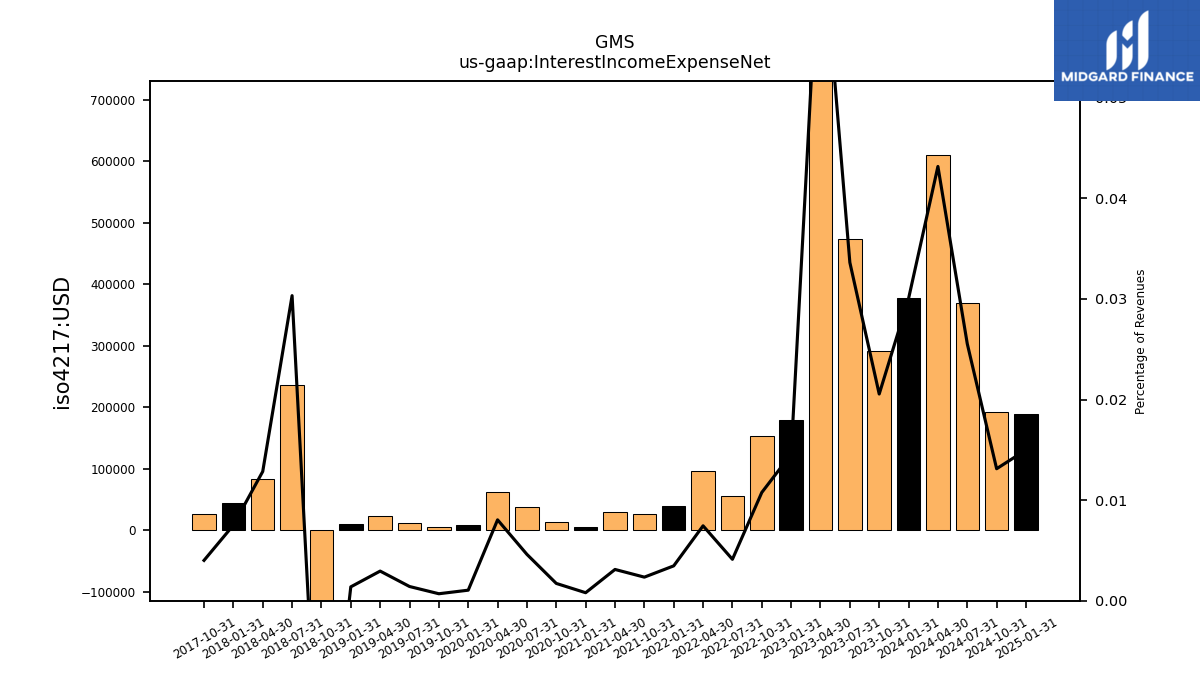
| Interest Income Expense Net | 0.38 | 0.29 | 0.47 | 0.90 | 0.18 | 0.15 | 0.06 | 0.10 | 0.04 | 0.03 | NA | 0.03 | 0.01 | 0.01 | 0.04 | 0.06 | 0.01 | 0.01 | 0.01 | 0.02 | 0.01 | -0.20 | 0.24 | 0.08 | 0.04 | 0.03 | NA | NA | NA | NA | NA | NA | NA | NA | NA | |
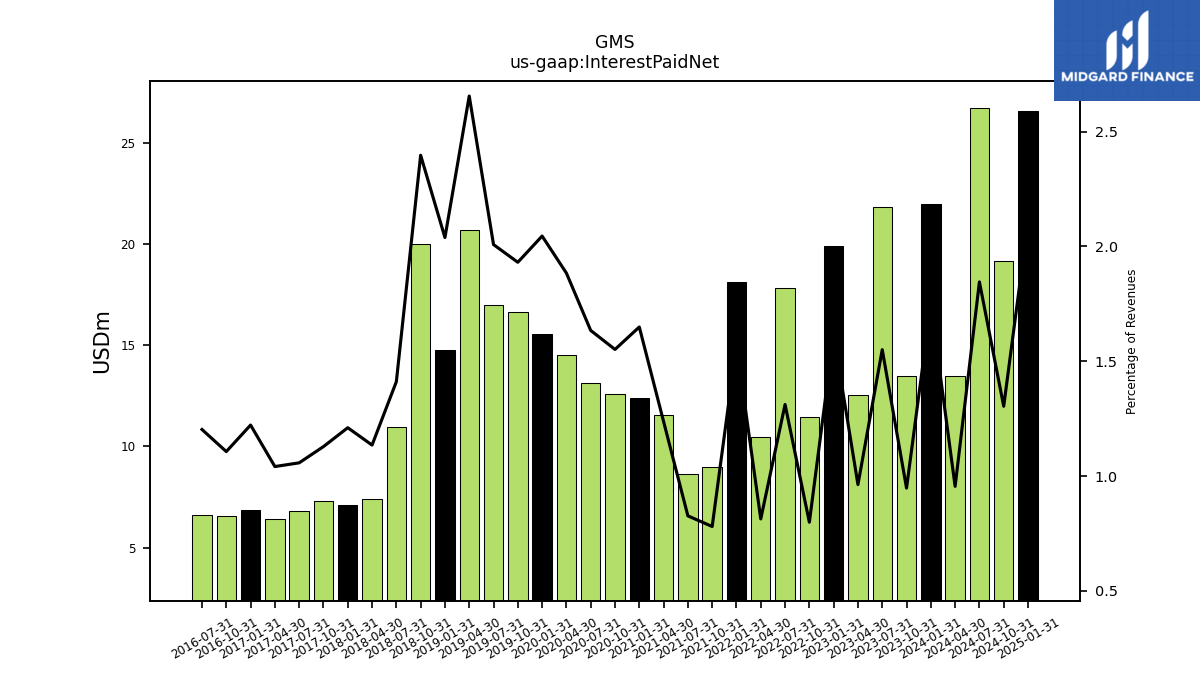
| Interest Paid Net | 21.98 | 13.47 | 21.85 | 12.56 | 19.93 | 11.43 | 17.83 | 10.48 | 18.12 | 8.98 | 8.62 | 11.54 | 12.39 | 12.61 | 13.12 | 14.52 | 15.57 | 16.64 | 17.01 | 20.71 | 14.76 | 19.99 | 10.98 | 7.42 | 7.09 | 7.31 | 6.79 | 6.41 | 6.88 | 6.55 | 6.61 | NA | NA | NA | NA | |
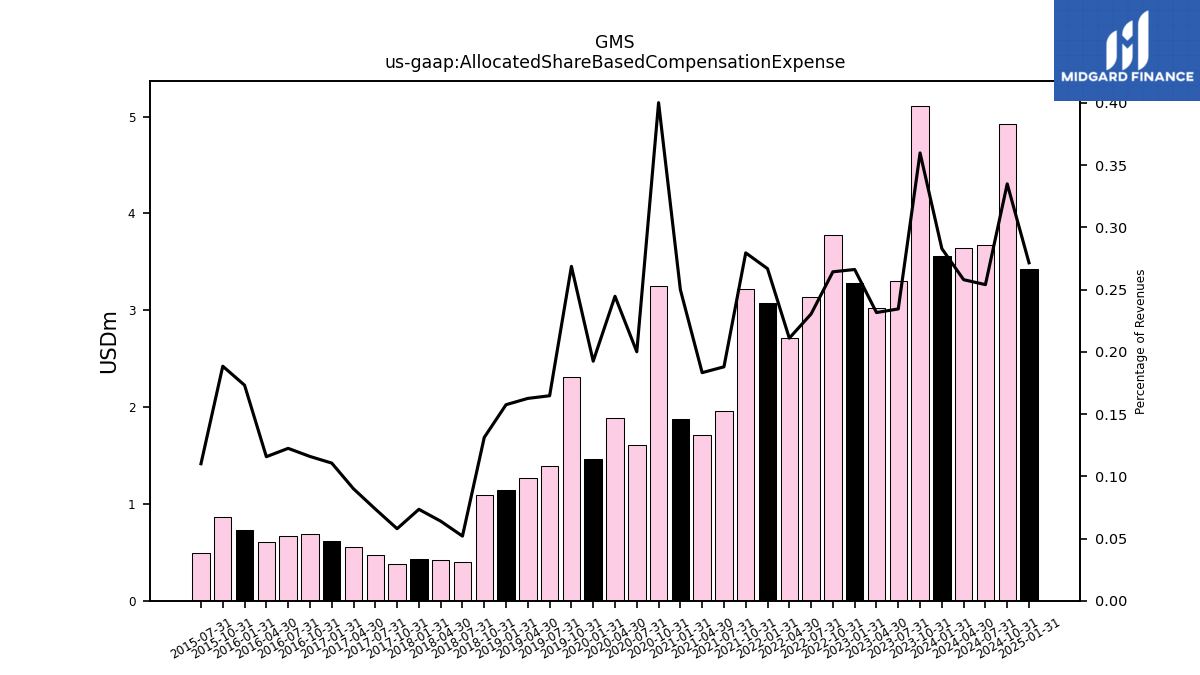
| Allocated Share Based Compensation Expense | 3.56 | 5.11 | 3.30 | 3.02 | 3.29 | 3.78 | 3.13 | 2.72 | 3.08 | 3.21 | 1.96 | 1.71 | 1.88 | 3.25 | 1.60 | 1.89 | 1.47 | 2.31 | 1.40 | 1.27 | 1.14 | 1.09 | 0.40 | 0.42 | 0.43 | 0.38 | 0.47 | 0.55 | 0.62 | 0.69 | 0.67 | 0.61 | 0.73 | 0.86 | 0.50 | |
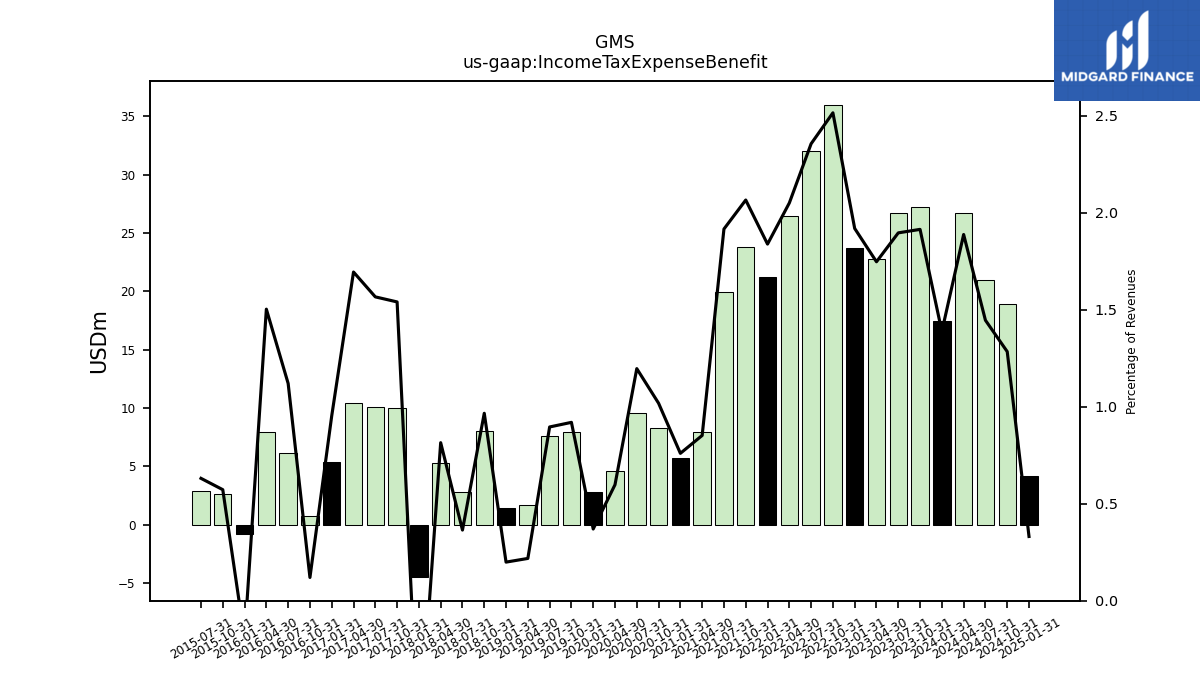
| Income Tax Expense Benefit | 17.47 | 27.20 | 26.73 | 22.79 | 23.70 | 35.99 | 32.03 | 26.43 | 21.21 | 23.77 | 19.97 | 7.94 | 5.71 | 8.28 | 9.60 | 4.61 | 2.82 | 7.93 | 7.59 | 1.70 | 1.44 | 8.06 | 2.84 | 5.33 | -4.49 | 9.98 | 10.06 | 10.42 | 5.36 | 0.71 | 6.16 | 7.92 | -0.82 | 2.62 | 2.85 | |
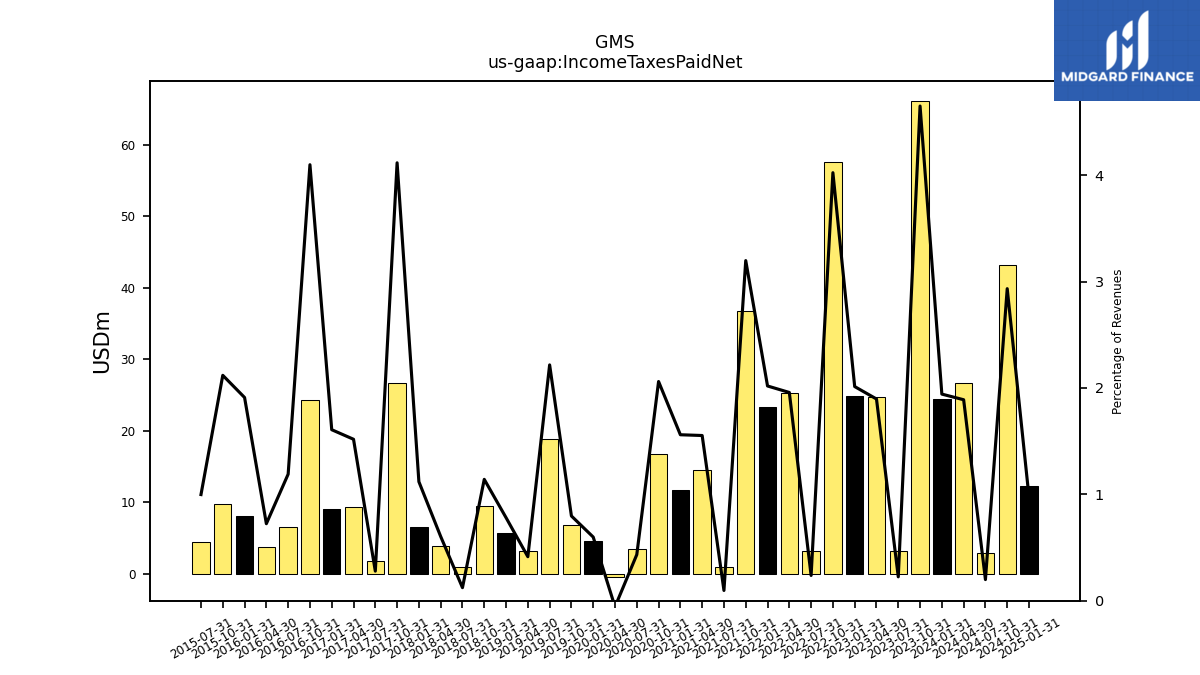
| Income Taxes Paid Net | 24.44 | 66.06 | 3.17 | 24.72 | 24.85 | 57.56 | 3.23 | 25.22 | 23.28 | 36.78 | 1.01 | 14.47 | 11.72 | 16.75 | 3.48 | -0.44 | 4.56 | 6.87 | 18.78 | 3.23 | 5.65 | 9.51 | 0.96 | 3.95 | 6.55 | 26.67 | 1.79 | 9.33 | 9.04 | 24.25 | 6.54 | 3.82 | 8.03 | 9.70 | 4.51 | |
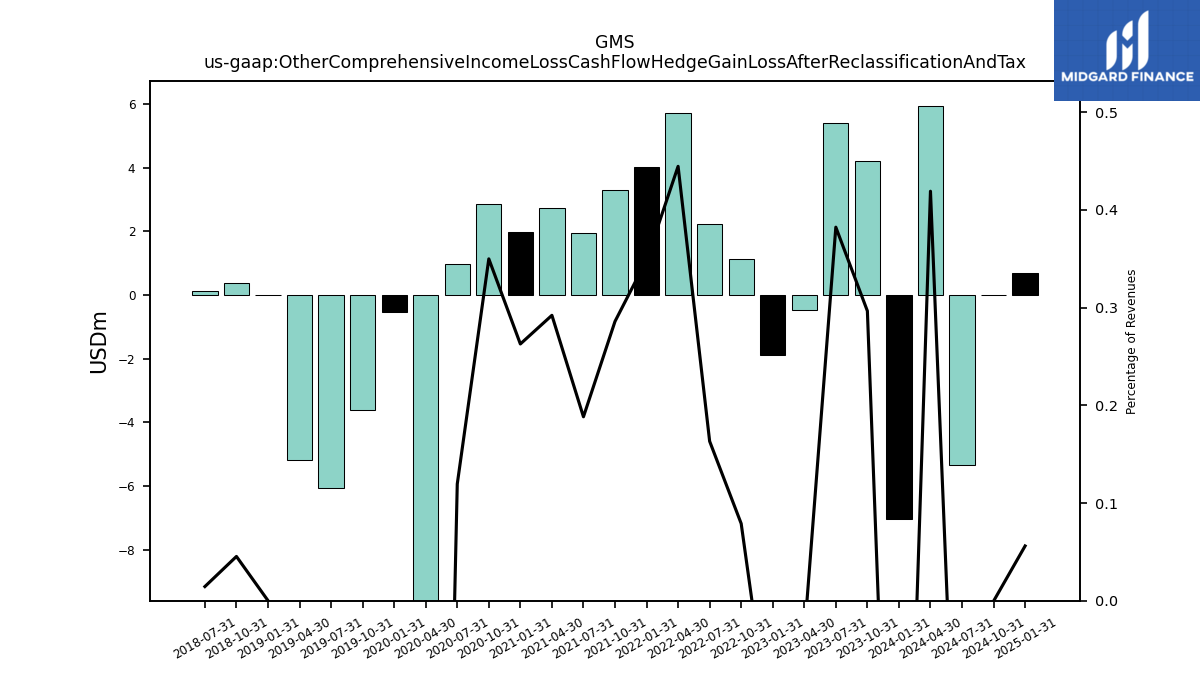
| Other Comprehensive Income Loss Cash Flow Hedge Gain Loss After Reclassification And Tax | -7.04 | 4.21 | 5.39 | -0.47 | -1.88 | 1.13 | 2.22 | 5.73 | 4.02 | 3.29 | 1.96 | 2.72 | 1.97 | 2.84 | 0.96 | -10.04 | -0.55 | -3.60 | -6.07 | -5.19 | 0.00 | 0.38 | 0.11 | NA | NA | NA | NA | NA | NA | NA | NA | NA | NA | NA | NA | |
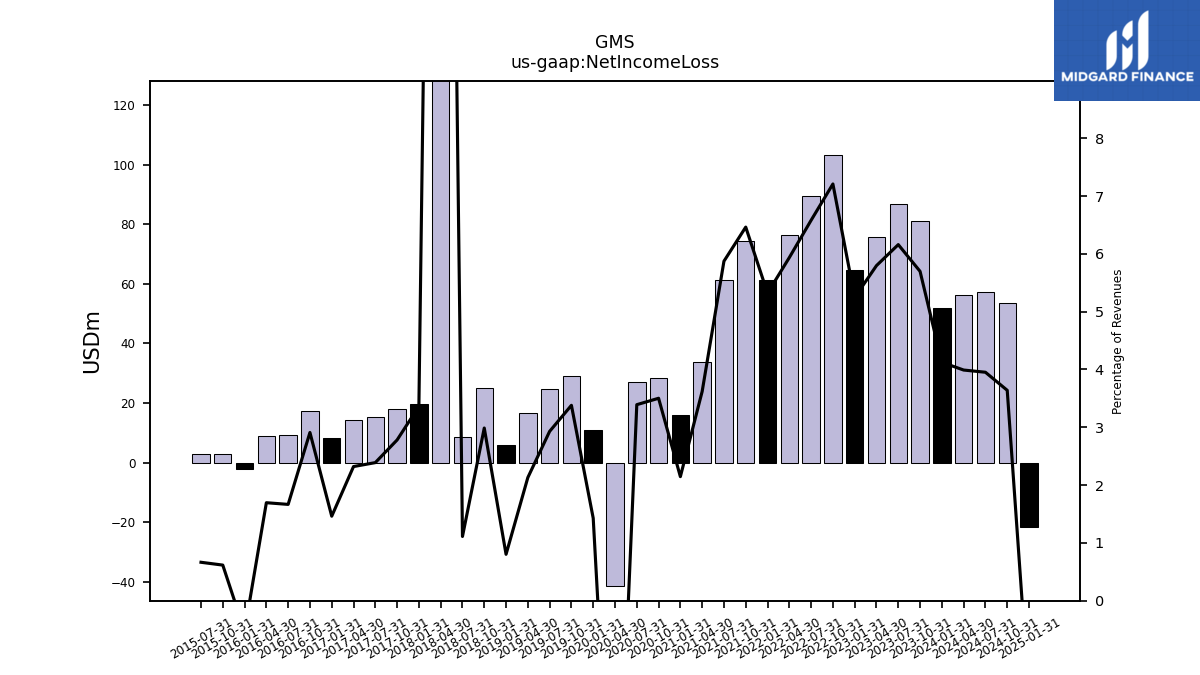
| Net Income Loss | 51.91 | 80.96 | 86.83 | 75.59 | 64.78 | 103.15 | 89.47 | 76.50 | 61.38 | 74.36 | 61.20 | 33.75 | 16.13 | 28.47 | 27.22 | -41.46 | 10.88 | 29.14 | 24.82 | 16.62 | 5.82 | 24.91 | 8.65 | 205.79 | 19.69 | 18.02 | 15.34 | 14.27 | 8.23 | 17.22 | 9.16 | 8.94 | -2.21 | 2.83 | 3.01 | |
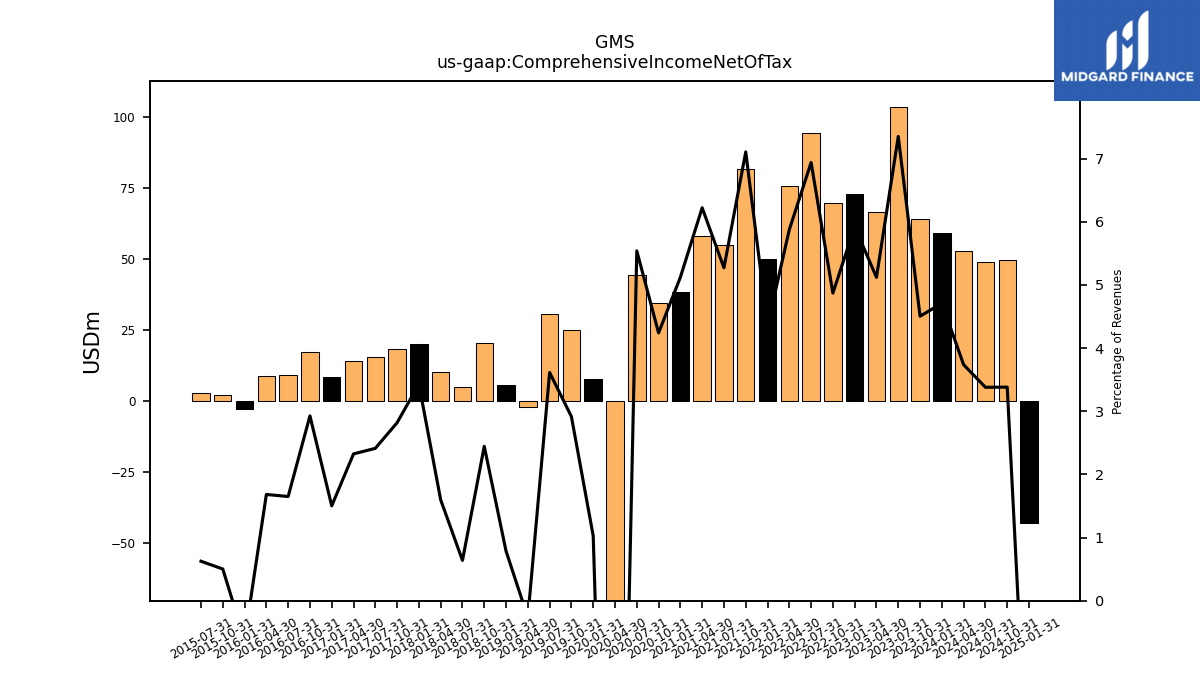
| Comprehensive Income Net Of Tax | 59.27 | 64.01 | 103.62 | 66.77 | 73.11 | 69.70 | 94.33 | 75.72 | 50.22 | 81.76 | 54.93 | 58.00 | 38.47 | 34.47 | 44.46 | -78.70 | 7.83 | 25.13 | 30.61 | -2.06 | 5.69 | 20.39 | 4.97 | 10.45 | 20.09 | 18.27 | 15.50 | 14.30 | 8.45 | 17.32 | 9.07 | 8.87 | -2.60 | 2.30 | 2.83 |
| 2024-01-31 | 2023-10-31 | 2023-07-31 | 2023-04-30 | 2023-01-31 | 2022-10-31 | 2022-07-31 | 2022-04-30 | 2022-01-31 | 2021-10-31 | 2021-07-31 | 2021-04-30 | 2021-01-31 | 2020-10-31 | 2020-07-31 | 2020-04-30 | 2020-01-31 | 2019-10-31 | 2019-07-31 | 2019-04-30 | 2019-01-31 | 2018-10-31 | 2018-07-31 | 2018-04-30 | 2018-01-31 | 2017-10-31 | 2017-07-31 | 2017-04-30 | 2017-01-31 | 2016-10-31 | 2016-07-31 | 2016-04-30 | 2016-01-31 | 2015-10-31 | 2015-07-31 | ||
|---|---|---|---|---|---|---|---|---|---|---|---|---|---|---|---|---|---|---|---|---|---|---|---|---|---|---|---|---|---|---|---|---|---|---|---|---|
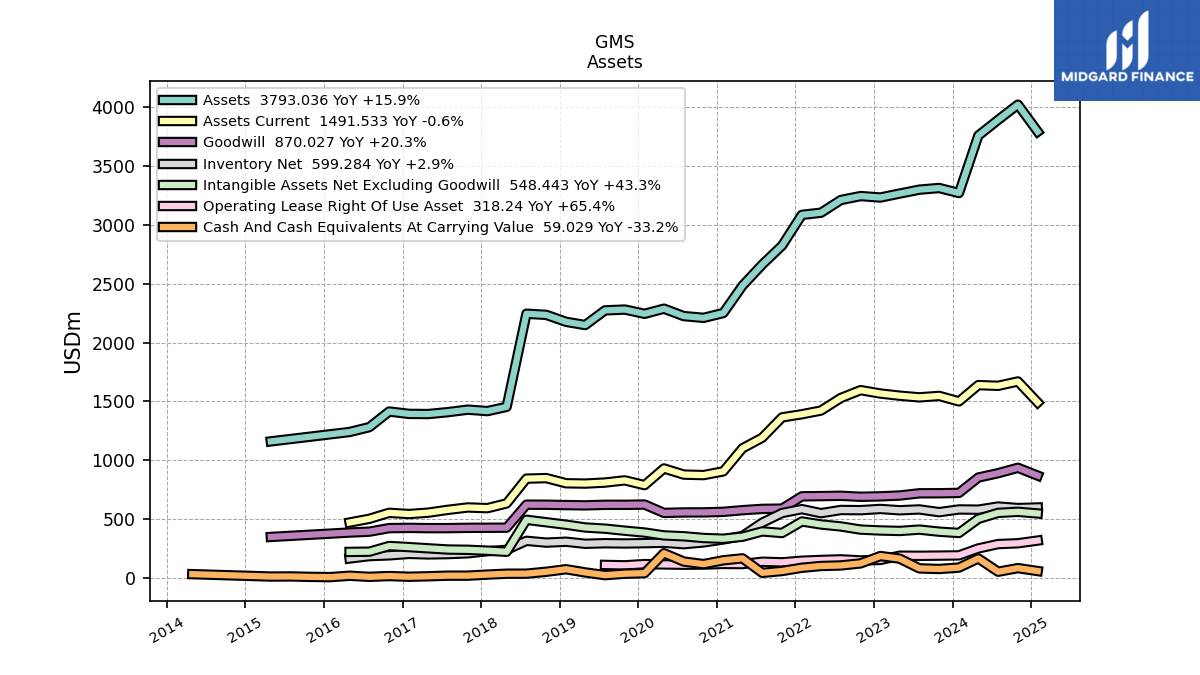
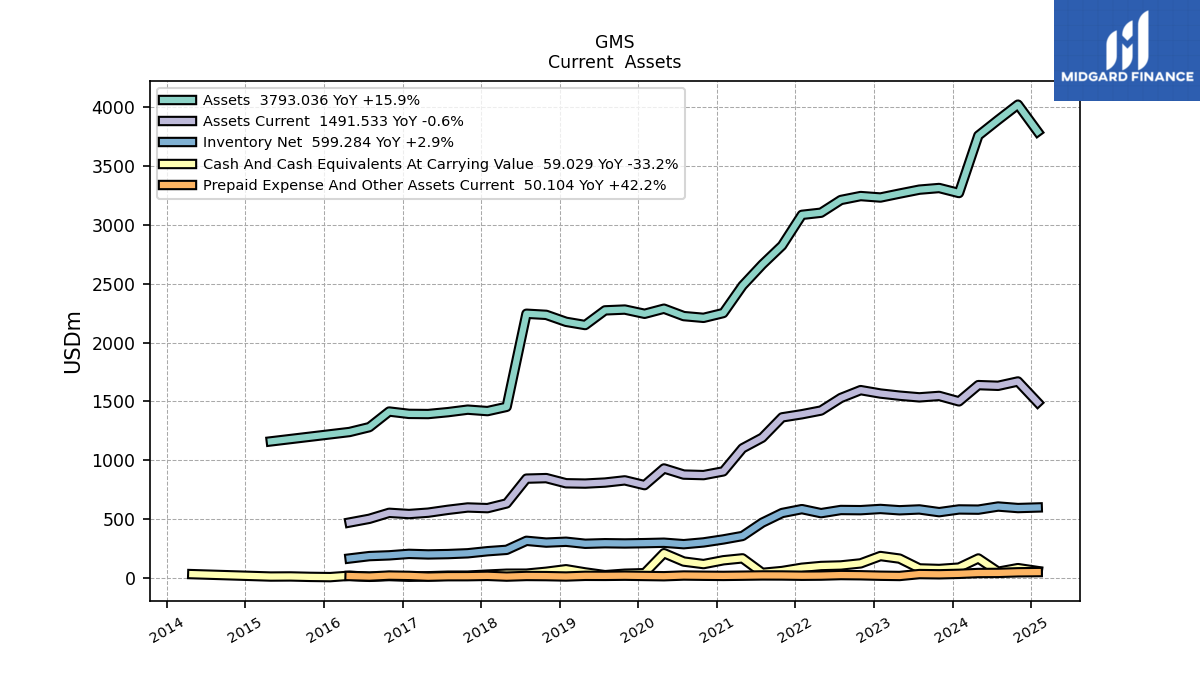
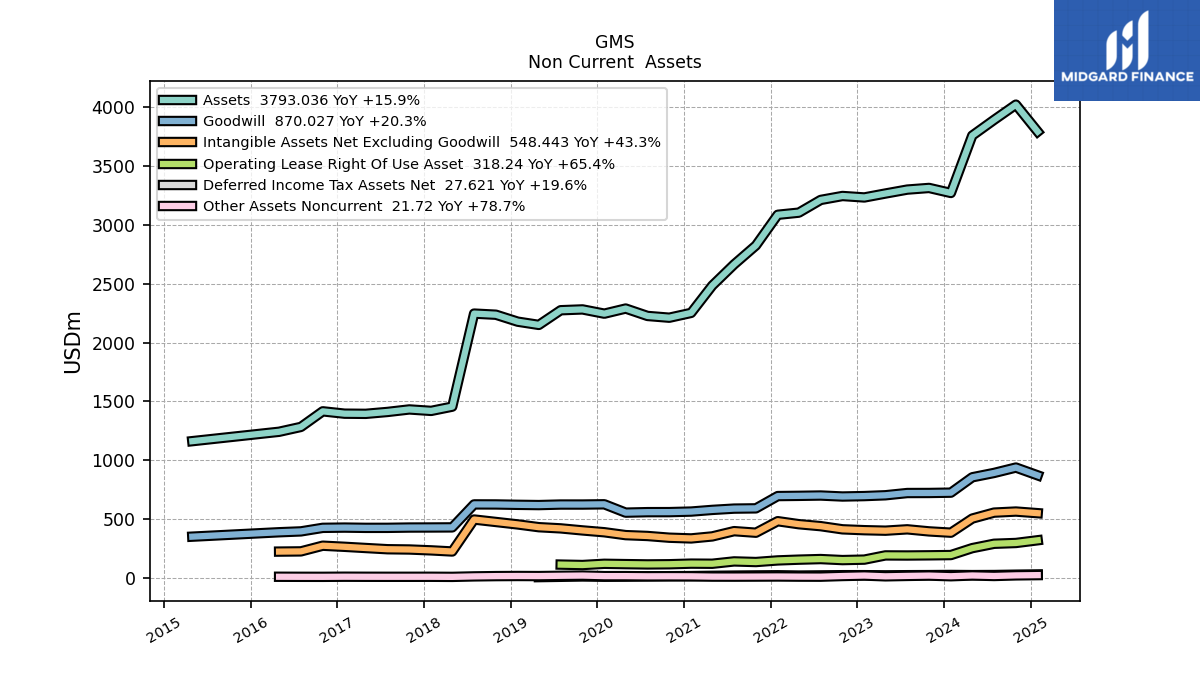
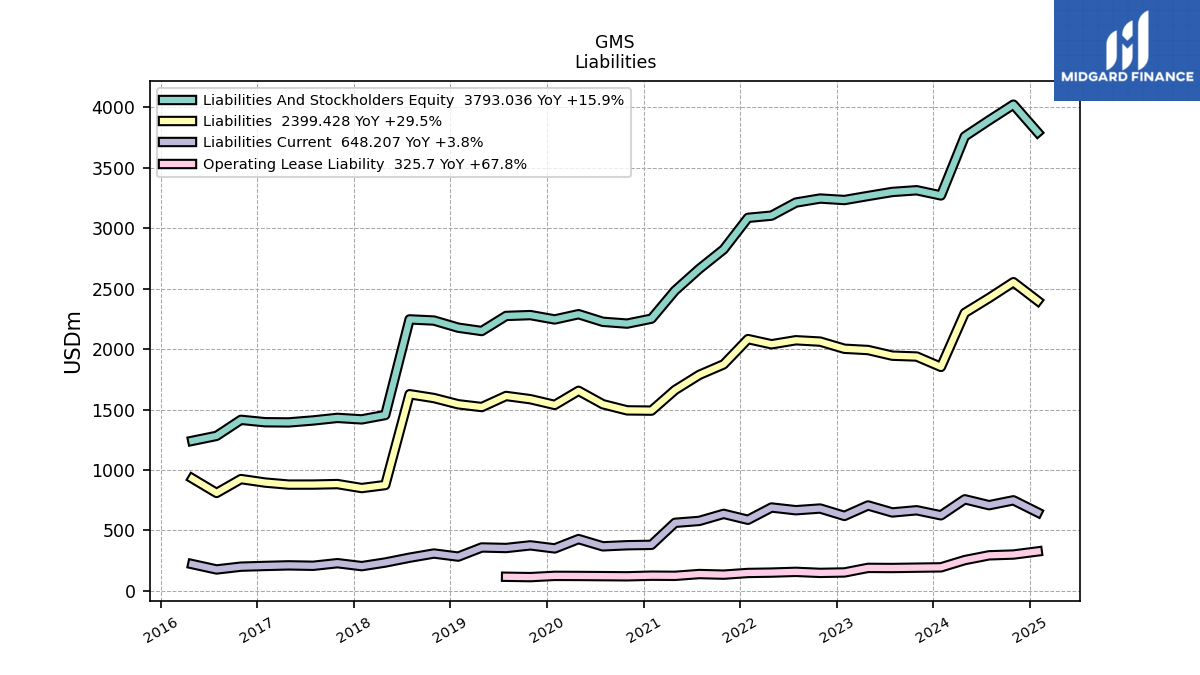
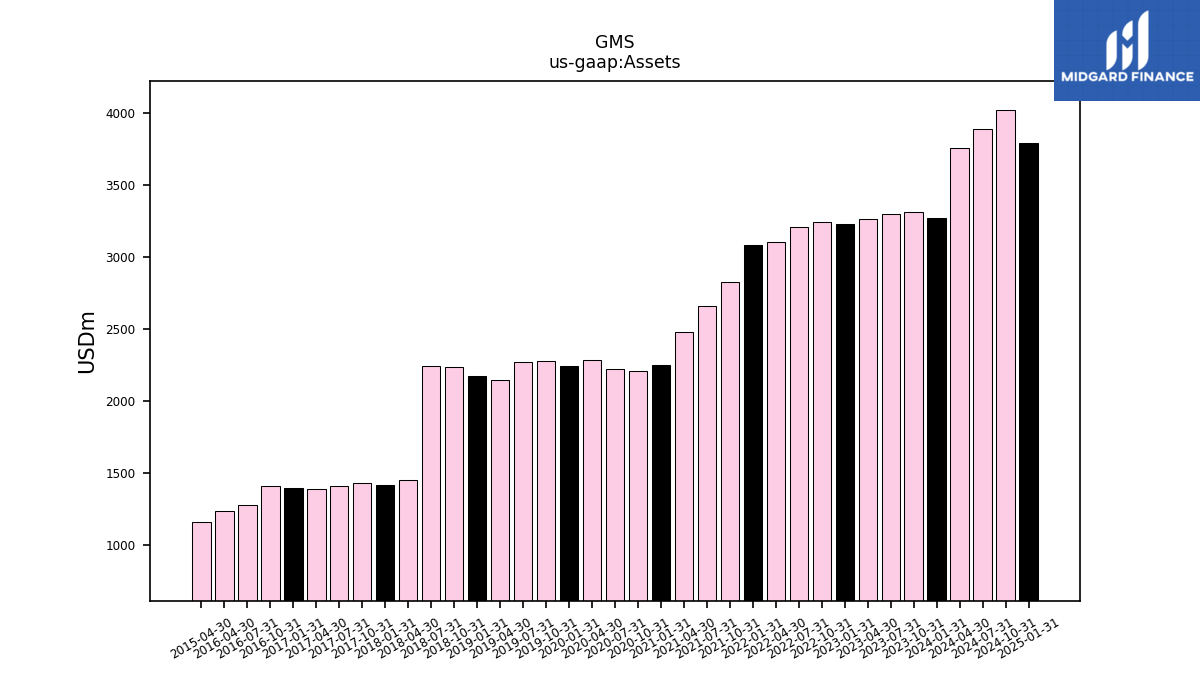
| Assets | 3271.55 | 3314.40 | 3300.40 | 3267.01 | 3233.46 | 3245.95 | 3212.43 | 3104.40 | 3086.18 | 2824.98 | 2664.08 | 2483.90 | 2251.76 | 2210.87 | 2225.83 | 2288.78 | 2245.28 | 2281.35 | 2274.39 | 2149.55 | 2177.15 | 2236.25 | 2245.87 | 1454.51 | 1418.35 | 1430.73 | 1409.39 | 1393.27 | 1394.73 | 1414.71 | 1282.00 | 1240.81 | NA | NA | NA | |
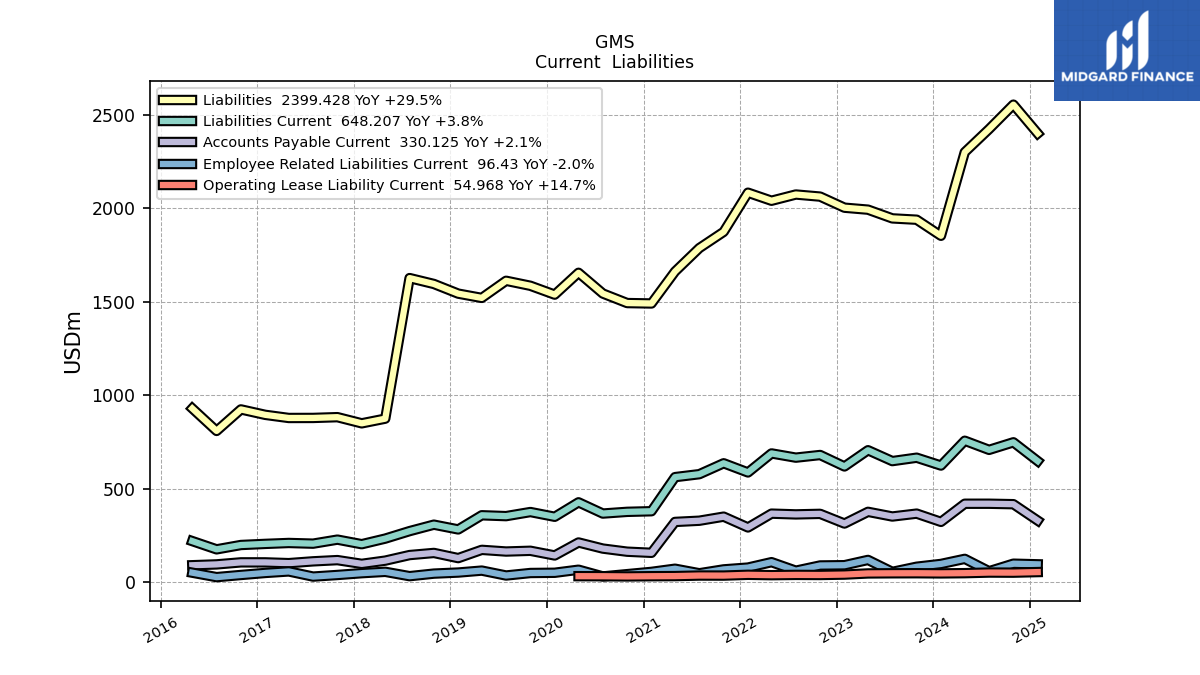
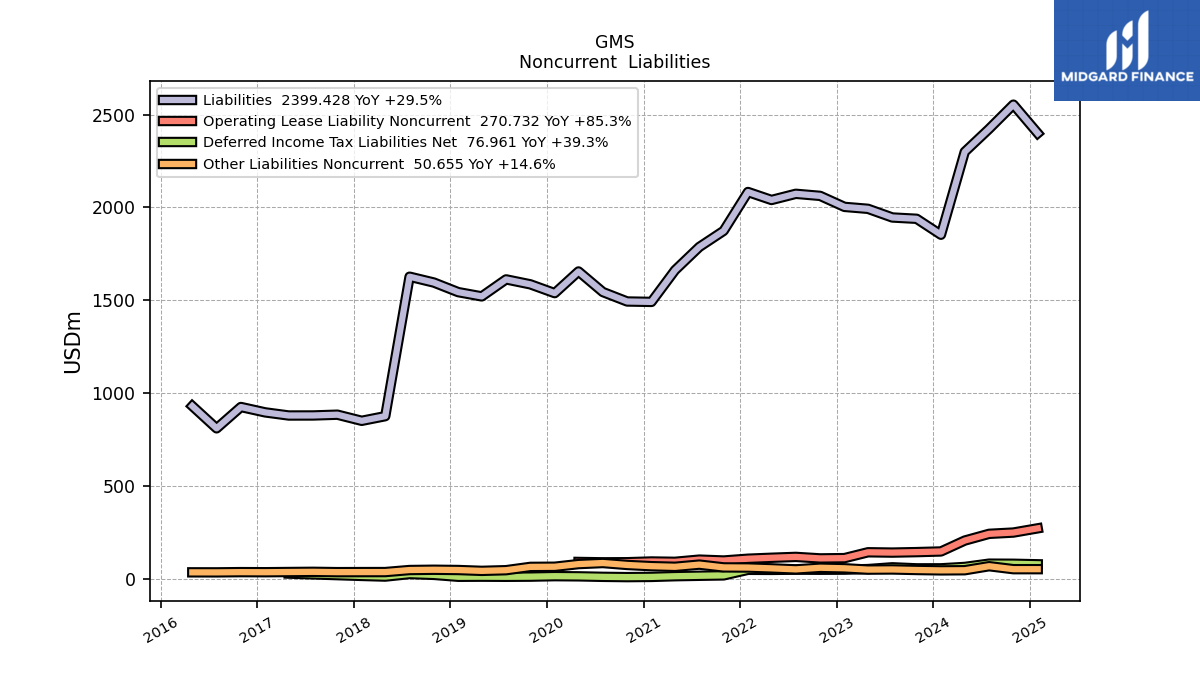
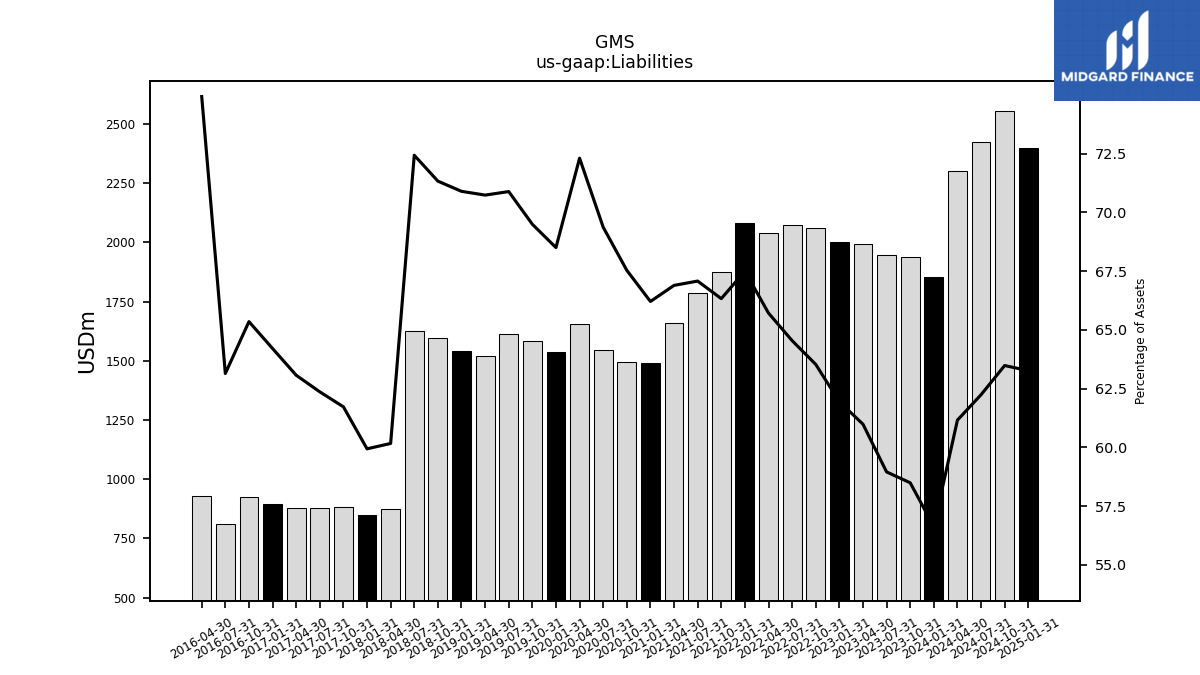
| Liabilities | 1852.61 | 1938.51 | 1945.60 | 1992.25 | 2002.76 | 2062.01 | 2073.20 | 2039.90 | 2082.90 | 1873.63 | 1786.84 | 1661.44 | 1490.74 | 1492.98 | 1543.96 | 1654.80 | 1537.95 | 1585.31 | 1612.10 | 1520.38 | 1543.39 | 1594.99 | 1626.59 | 875.06 | 850.07 | 883.04 | 878.87 | 878.66 | 895.44 | 924.46 | 809.43 | 929.65 | NA | NA | NA | |
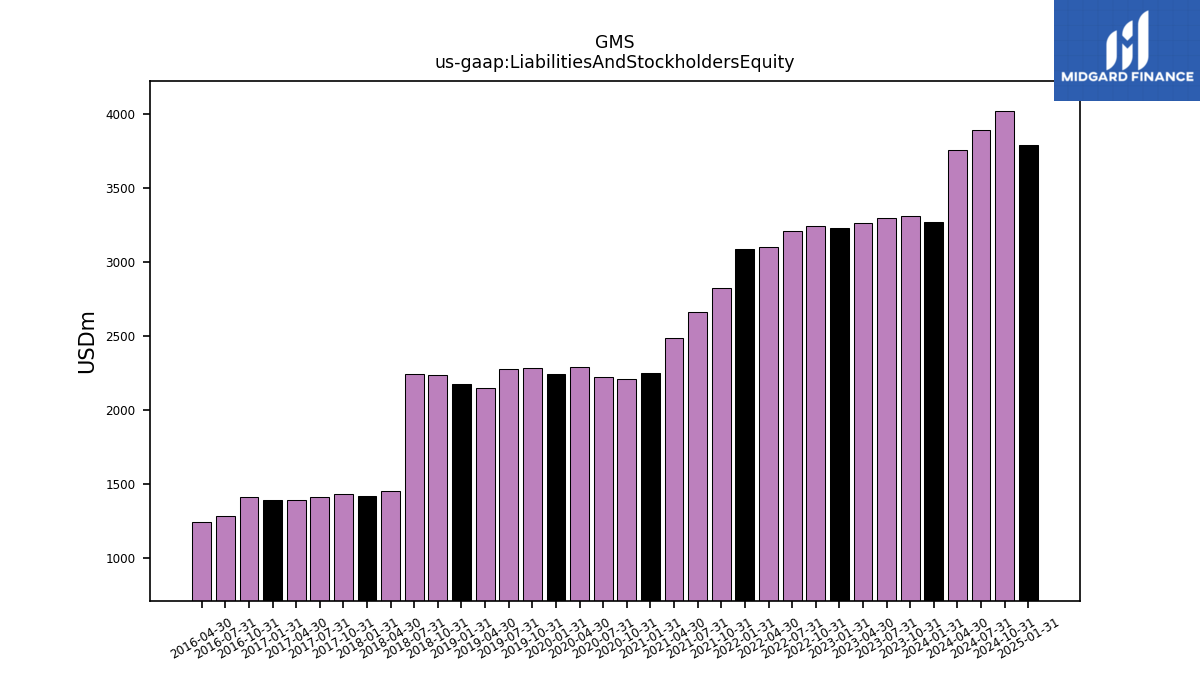
| Liabilities And Stockholders Equity | 3271.55 | 3314.40 | 3300.40 | 3267.01 | 3233.46 | 3245.95 | 3212.43 | 3104.40 | 3086.18 | 2824.98 | 2664.08 | 2483.90 | 2251.76 | 2210.87 | 2225.83 | 2288.78 | 2245.28 | 2281.35 | 2274.39 | 2149.55 | 2177.15 | 2236.25 | 2245.87 | 1454.51 | 1418.35 | 1430.73 | 1409.39 | 1393.27 | 1394.73 | 1414.71 | 1282.00 | 1240.81 | NA | NA | NA | |
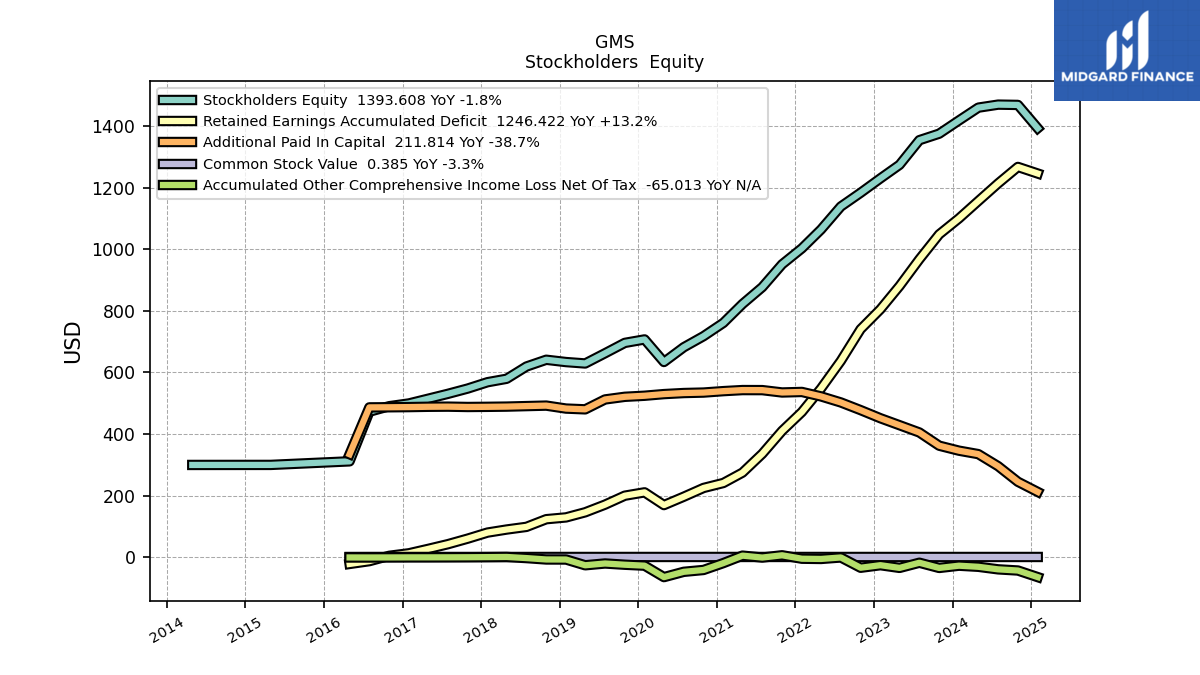
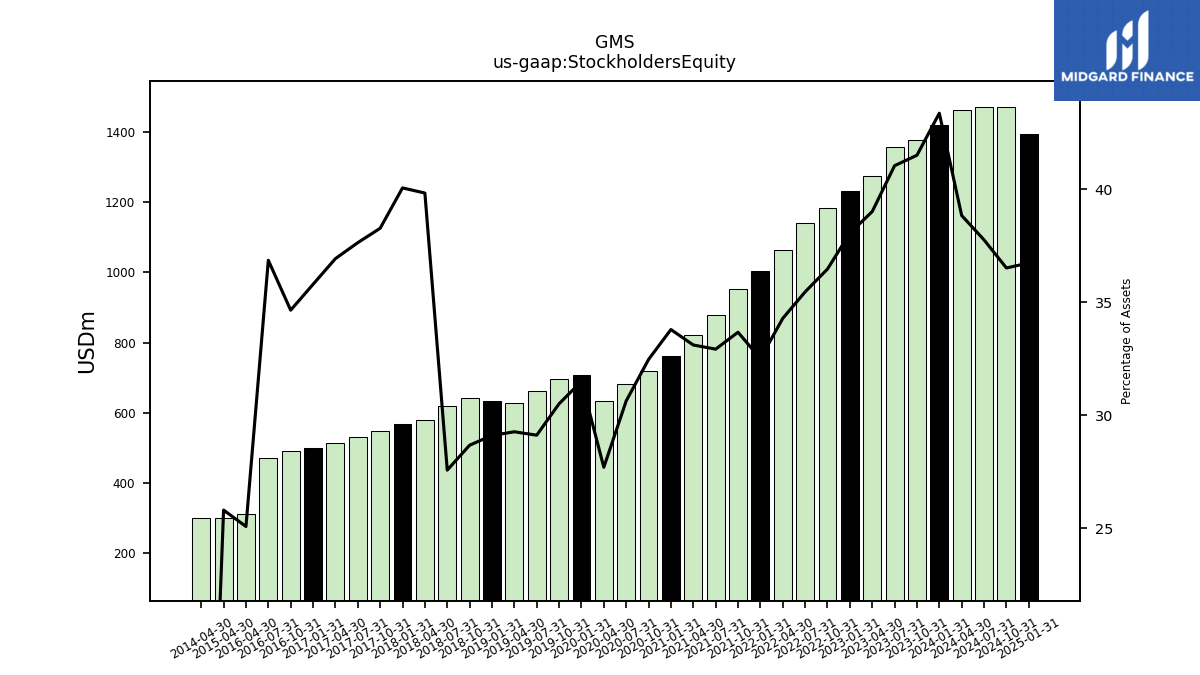
| Stockholders Equity | 1418.94 | 1375.88 | 1354.81 | 1274.76 | 1230.70 | 1183.94 | 1139.22 | 1064.50 | 1003.28 | 951.35 | 877.24 | 822.46 | 761.01 | 717.90 | 681.87 | 633.98 | 707.33 | 696.04 | 662.29 | 629.18 | 633.76 | 641.26 | 619.28 | 579.45 | 568.28 | 547.68 | 530.53 | 514.61 | 499.28 | 490.25 | 472.56 | 311.16 | NA | NA | NA |
| 2024-01-31 | 2023-10-31 | 2023-07-31 | 2023-04-30 | 2023-01-31 | 2022-10-31 | 2022-07-31 | 2022-04-30 | 2022-01-31 | 2021-10-31 | 2021-07-31 | 2021-04-30 | 2021-01-31 | 2020-10-31 | 2020-07-31 | 2020-04-30 | 2020-01-31 | 2019-10-31 | 2019-07-31 | 2019-04-30 | 2019-01-31 | 2018-10-31 | 2018-07-31 | 2018-04-30 | 2018-01-31 | 2017-10-31 | 2017-07-31 | 2017-04-30 | 2017-01-31 | 2016-10-31 | 2016-07-31 | 2016-04-30 | 2016-01-31 | 2015-10-31 | 2015-07-31 | ||
|---|---|---|---|---|---|---|---|---|---|---|---|---|---|---|---|---|---|---|---|---|---|---|---|---|---|---|---|---|---|---|---|---|---|---|---|---|
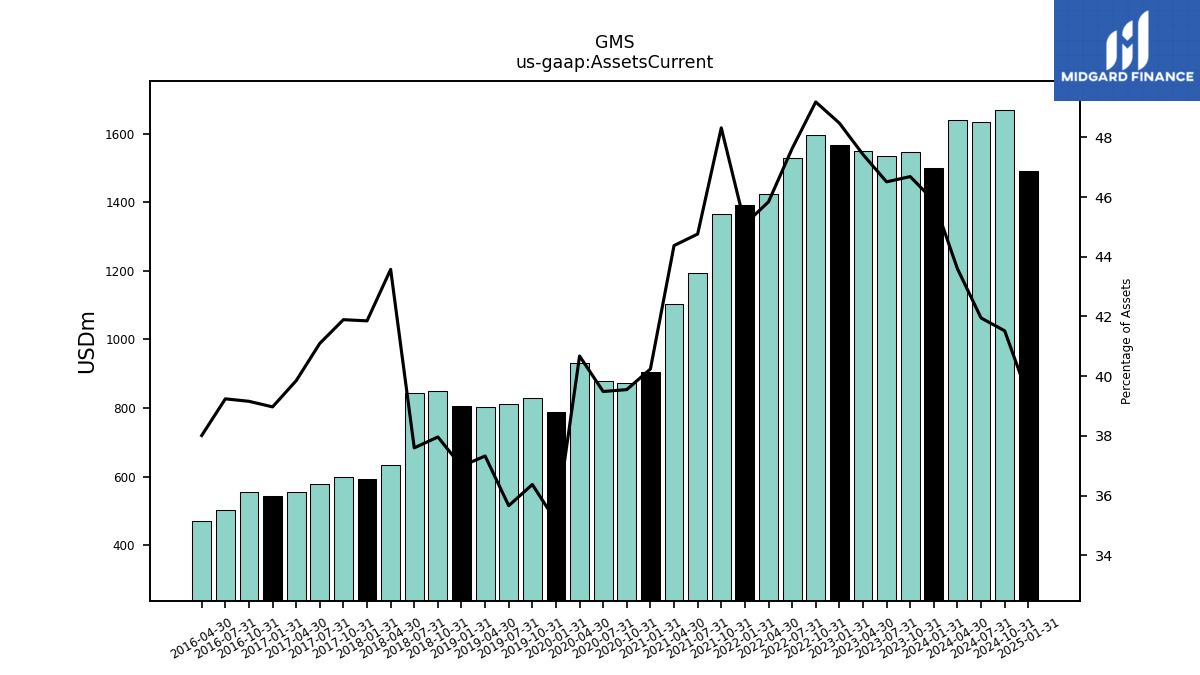
| Assets Current | 1500.91 | 1547.43 | 1535.10 | 1549.52 | 1567.65 | 1596.66 | 1530.00 | 1423.13 | 1391.64 | 1365.09 | 1192.53 | 1102.25 | 906.11 | 874.40 | 878.86 | 930.95 | 789.01 | 829.68 | 811.01 | 802.31 | 805.09 | 848.91 | 844.36 | 633.84 | 593.63 | 599.37 | 579.23 | 555.19 | 543.53 | 553.95 | 503.05 | 471.64 | NA | NA | NA | |
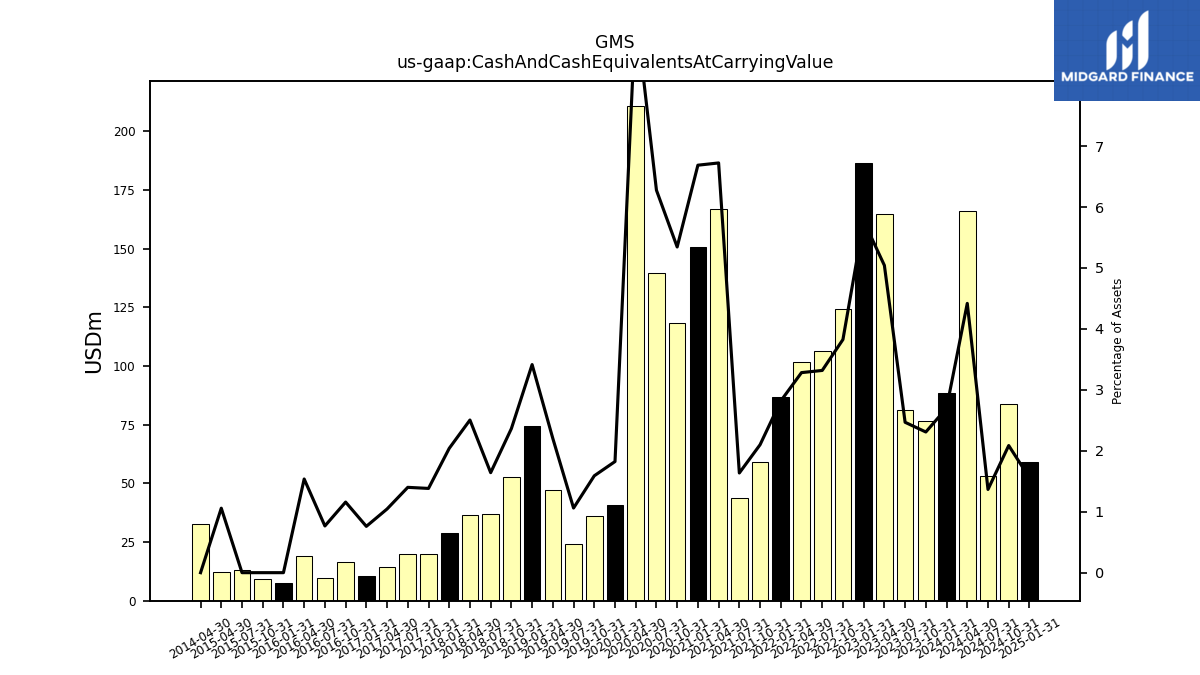
| Cash And Cash Equivalents At Carrying Value | 88.34 | 76.52 | 81.45 | 164.75 | 186.66 | 124.20 | 106.61 | 101.92 | 86.97 | 59.31 | 43.59 | 167.01 | 150.57 | 118.17 | 139.71 | 210.91 | 40.95 | 36.27 | 24.12 | 47.34 | 74.35 | 52.88 | 36.87 | 36.44 | 28.94 | 19.78 | 19.74 | 14.56 | 10.60 | 16.39 | 9.83 | 19.07 | 7.38 | 9.42 | 13.17 | |
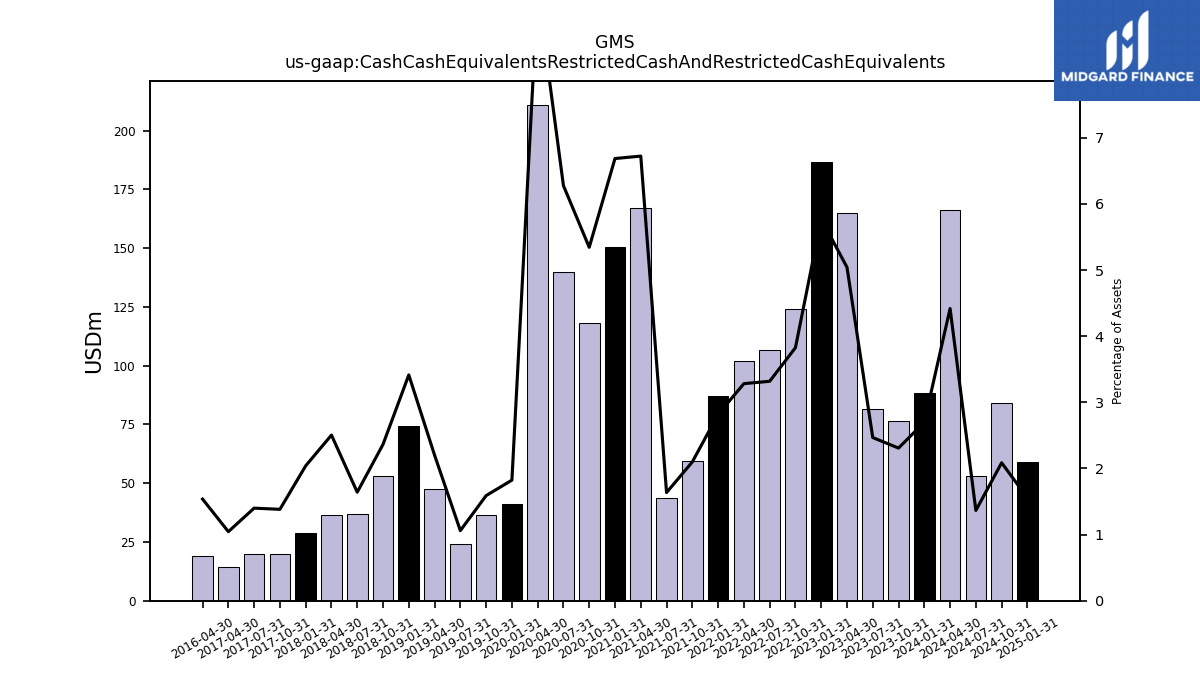
| Cash Cash Equivalents Restricted Cash And Restricted Cash Equivalents | 88.34 | 76.52 | 81.45 | 164.75 | 186.66 | 124.20 | 106.61 | 101.92 | 86.97 | 59.31 | 43.59 | 167.01 | 150.57 | 118.17 | 139.71 | 210.91 | 40.95 | 36.27 | 24.12 | 47.34 | 74.35 | 52.88 | 36.87 | 36.44 | 28.94 | 19.78 | 19.74 | 14.56 | NA | NA | NA | 19.07 | NA | NA | NA | |
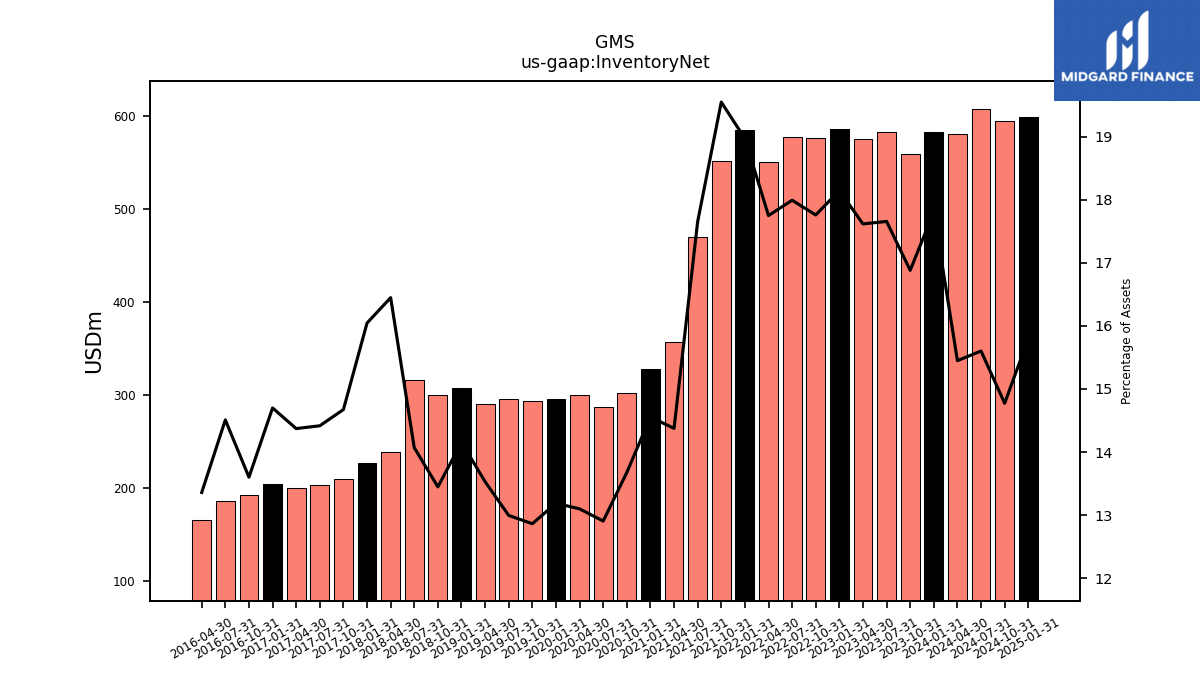
| Inventory Net | 582.61 | 559.45 | 582.68 | 575.50 | 586.65 | 576.39 | 577.94 | 550.95 | 585.35 | 552.18 | 470.25 | 357.05 | 327.73 | 302.36 | 287.27 | 299.81 | 296.12 | 293.46 | 295.55 | 290.83 | 308.12 | 300.74 | 315.97 | 239.22 | 227.56 | 209.93 | 203.18 | 200.23 | 205.01 | 192.42 | 186.01 | 165.77 | NA | NA | NA | |
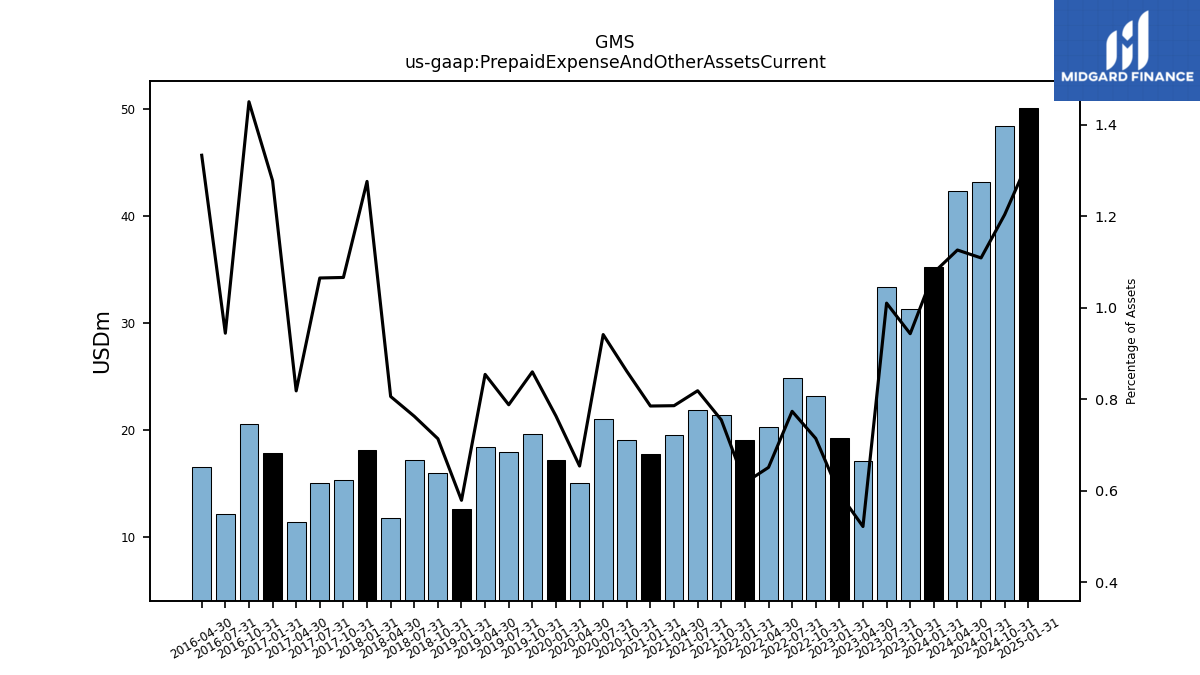
| Prepaid Expense And Other Assets Current | 35.24 | 31.27 | 33.34 | 17.05 | 19.21 | 23.19 | 24.86 | 20.21 | 19.05 | 21.33 | 21.81 | 19.52 | 17.68 | 19.04 | 20.96 | 14.97 | 17.14 | 19.62 | 17.93 | 18.37 | 12.61 | 15.96 | 17.14 | 11.73 | 18.10 | 15.26 | 15.01 | 11.40 | 17.83 | 20.52 | 12.11 | 16.55 | NA | NA | NA |
| 2024-01-31 | 2023-10-31 | 2023-07-31 | 2023-04-30 | 2023-01-31 | 2022-10-31 | 2022-07-31 | 2022-04-30 | 2022-01-31 | 2021-10-31 | 2021-07-31 | 2021-04-30 | 2021-01-31 | 2020-10-31 | 2020-07-31 | 2020-04-30 | 2020-01-31 | 2019-10-31 | 2019-07-31 | 2019-04-30 | 2019-01-31 | 2018-10-31 | 2018-07-31 | 2018-04-30 | 2018-01-31 | 2017-10-31 | 2017-07-31 | 2017-04-30 | 2017-01-31 | 2016-10-31 | 2016-07-31 | 2016-04-30 | 2016-01-31 | 2015-10-31 | 2015-07-31 | ||
|---|---|---|---|---|---|---|---|---|---|---|---|---|---|---|---|---|---|---|---|---|---|---|---|---|---|---|---|---|---|---|---|---|---|---|---|---|
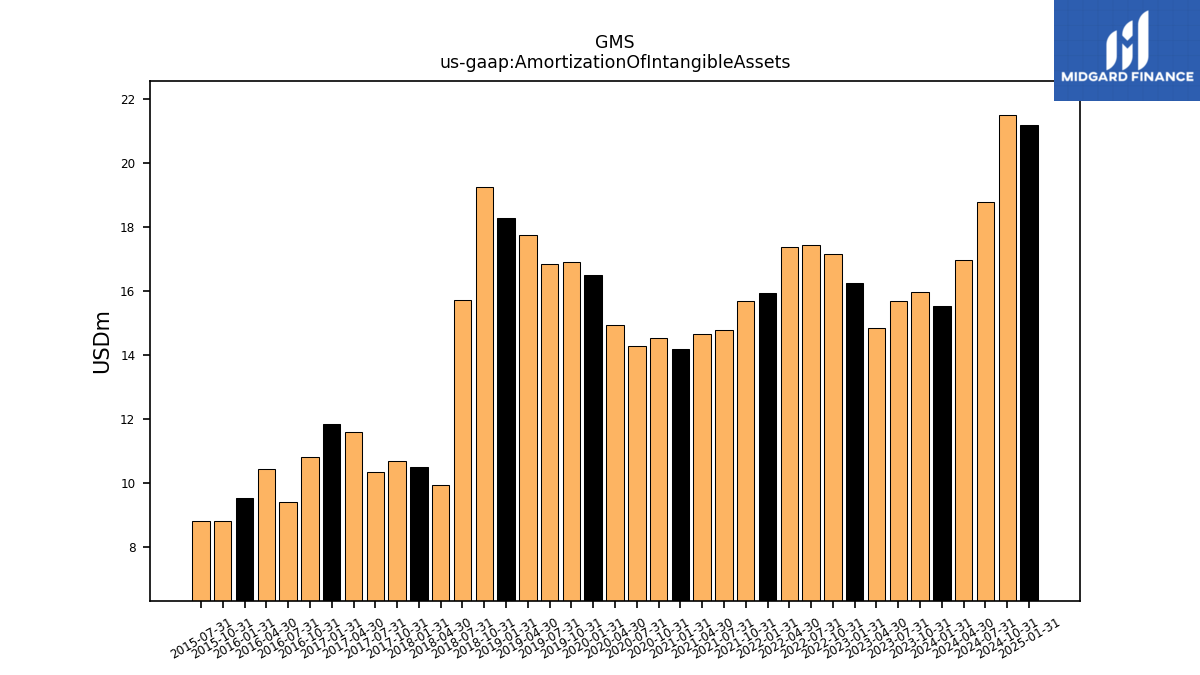
| Amortization Of Intangible Assets | 15.53 | 15.97 | 15.69 | 14.86 | 16.26 | 17.17 | 17.45 | 17.37 | 15.93 | 15.70 | 14.79 | 14.65 | 14.19 | 14.54 | 14.27 | 14.93 | 16.49 | 16.93 | 16.85 | 17.74 | 18.30 | 19.25 | 15.71 | 9.93 | 10.48 | 10.69 | 10.36 | 11.59 | 11.85 | 10.82 | 9.41 | 10.42 | 9.54 | 8.80 | 8.79 | |
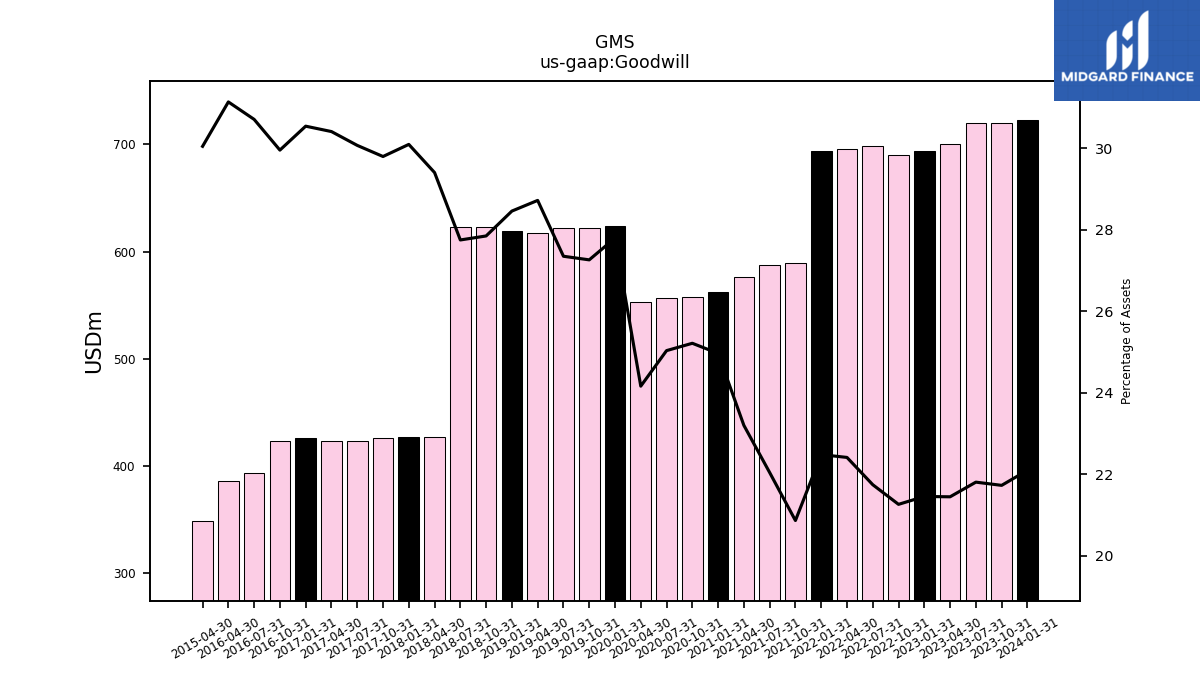
| Goodwill | 723.02 | 720.27 | 719.84 | 700.81 | 693.87 | 690.29 | 698.63 | 695.90 | 693.94 | 589.56 | 587.33 | 576.33 | 562.20 | 557.49 | 557.25 | 553.07 | 624.07 | 621.92 | 622.03 | 617.33 | 619.55 | 622.73 | 623.20 | 427.64 | 426.81 | 426.29 | 423.77 | 423.64 | 425.93 | 423.74 | 393.64 | 386.31 | NA | NA | NA | |
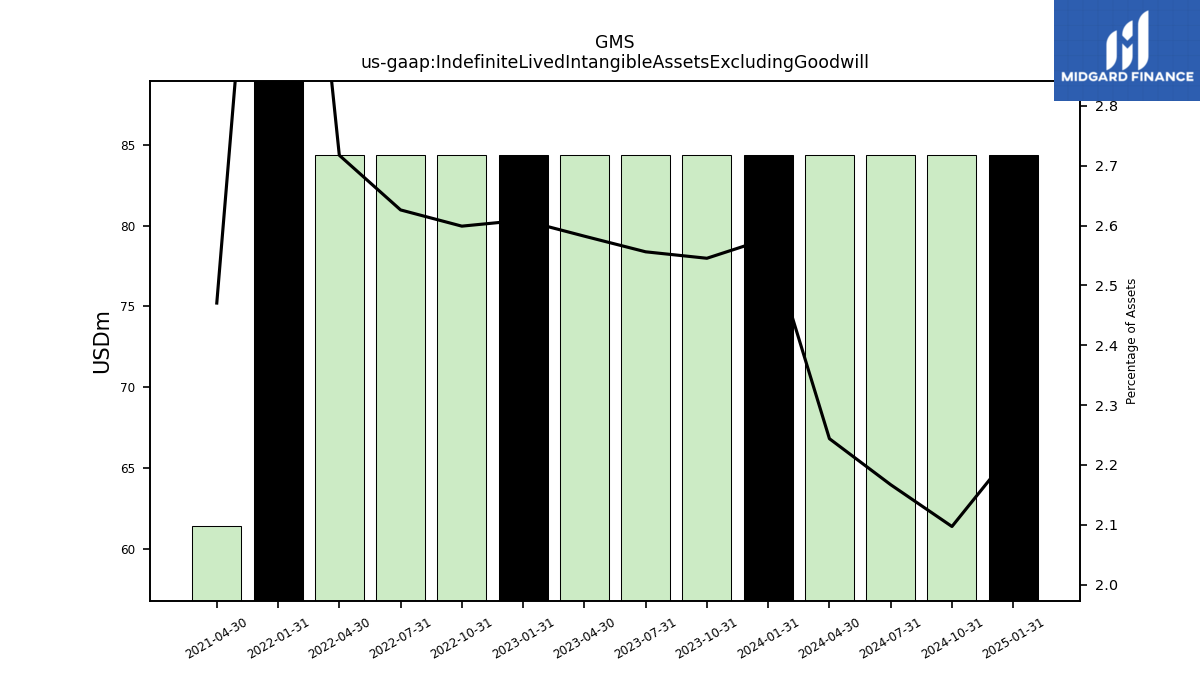
| Indefinite Lived Intangible Assets Excluding Goodwill | 84.37 | 84.37 | 84.37 | 84.37 | 84.37 | 84.37 | 84.37 | 84.37 | 114.37 | NA | NA | 61.37 | NA | NA | NA | NA | NA | NA | NA | NA | NA | NA | NA | NA | NA | NA | NA | NA | NA | NA | NA | NA | NA | NA | NA | |
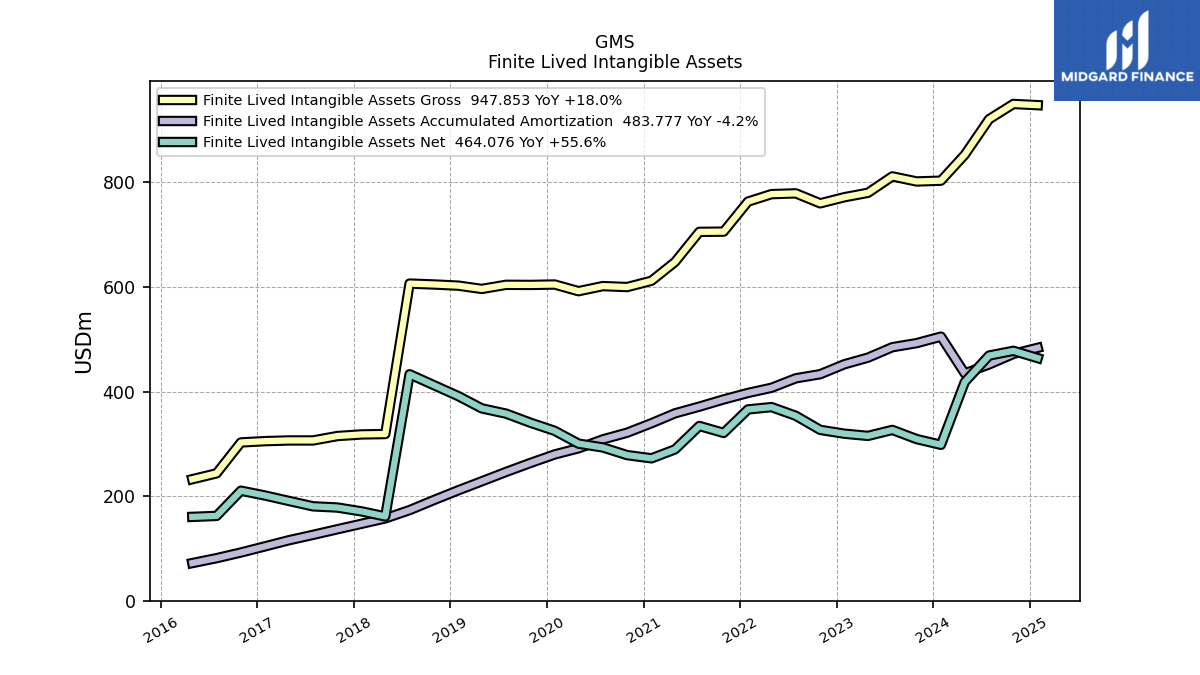
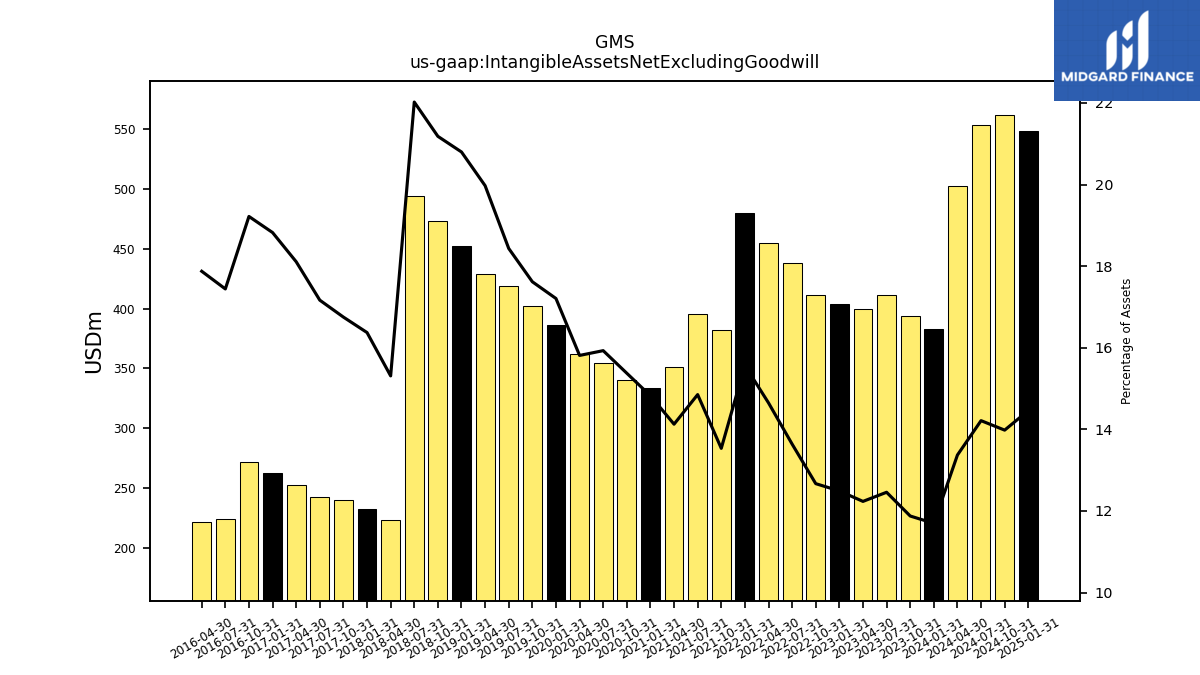
| Intangible Assets Net Excluding Goodwill | 382.61 | 393.59 | 411.13 | 399.66 | 403.85 | 411.20 | 438.10 | 454.75 | 480.31 | 382.33 | 395.65 | 350.87 | 333.77 | 339.92 | 354.54 | 361.88 | 386.35 | 401.91 | 419.25 | 429.31 | 452.81 | 473.69 | 494.59 | 222.68 | 232.21 | 239.66 | 241.94 | 252.29 | 262.53 | 271.88 | 223.59 | 221.79 | NA | NA | NA | |
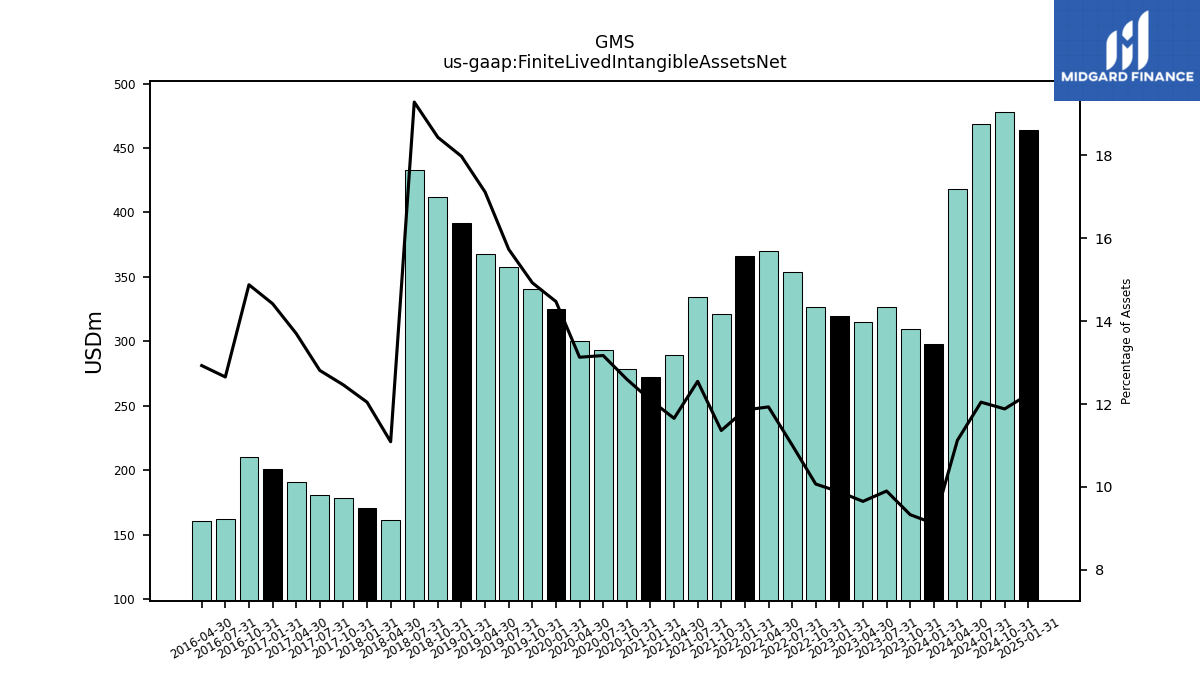
| Finite Lived Intangible Assets Net | 298.25 | 309.22 | 326.76 | 315.29 | 319.48 | 326.83 | 353.74 | 370.38 | 365.94 | 320.96 | 334.28 | 289.50 | 272.40 | 278.55 | 293.18 | 300.52 | 324.98 | 340.54 | 357.88 | 367.95 | 391.44 | 412.32 | 433.22 | 161.31 | 170.85 | 178.29 | 180.57 | 190.93 | 201.16 | 210.51 | 162.23 | 160.42 | NA | NA | NA | |
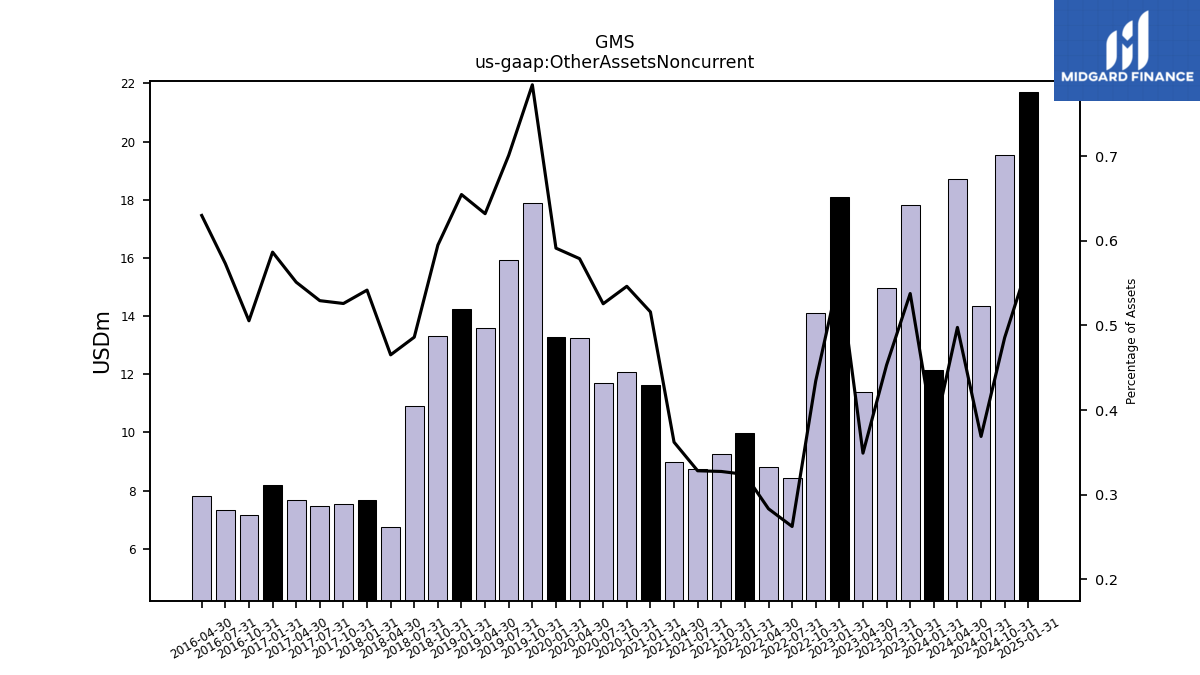
| Other Assets Noncurrent | 12.15 | 17.82 | 14.96 | 11.40 | 18.11 | 14.10 | 8.43 | 8.79 | 10.00 | 9.25 | 8.74 | 8.99 | 11.62 | 12.07 | 11.70 | 13.25 | 13.27 | 17.89 | 15.94 | 13.58 | 14.25 | 13.30 | 10.92 | 6.77 | 7.68 | 7.52 | 7.46 | 7.68 | 8.18 | 7.15 | 7.35 | 7.82 | NA | NA | NA |
| 2024-01-31 | 2023-10-31 | 2023-07-31 | 2023-04-30 | 2023-01-31 | 2022-10-31 | 2022-07-31 | 2022-04-30 | 2022-01-31 | 2021-10-31 | 2021-07-31 | 2021-04-30 | 2021-01-31 | 2020-10-31 | 2020-07-31 | 2020-04-30 | 2020-01-31 | 2019-10-31 | 2019-07-31 | 2019-04-30 | 2019-01-31 | 2018-10-31 | 2018-07-31 | 2018-04-30 | 2018-01-31 | 2017-10-31 | 2017-07-31 | 2017-04-30 | 2017-01-31 | 2016-10-31 | 2016-07-31 | 2016-04-30 | 2016-01-31 | 2015-10-31 | 2015-07-31 | ||
|---|---|---|---|---|---|---|---|---|---|---|---|---|---|---|---|---|---|---|---|---|---|---|---|---|---|---|---|---|---|---|---|---|---|---|---|---|
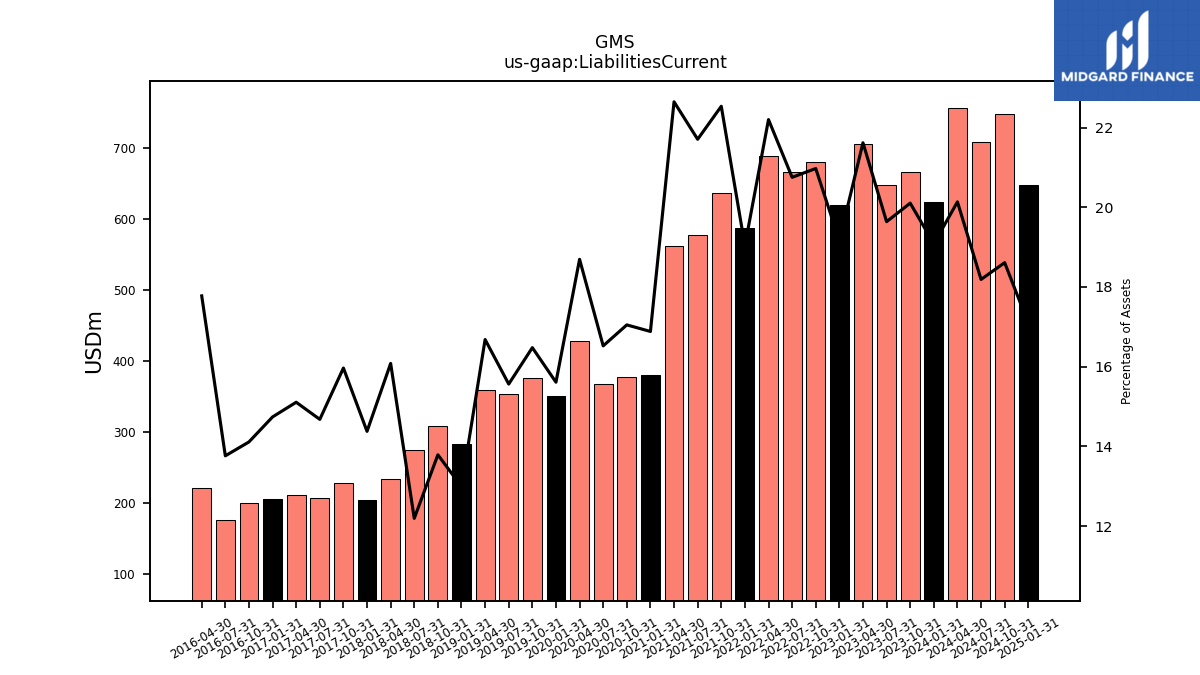
| Liabilities Current | 624.36 | 666.31 | 648.17 | 706.28 | 619.55 | 680.77 | 666.63 | 689.20 | 587.48 | 636.58 | 578.27 | 562.50 | 380.20 | 376.94 | 367.77 | 427.87 | 350.52 | 375.92 | 354.00 | 358.57 | 282.85 | 308.38 | 273.90 | 233.92 | 203.94 | 228.44 | 206.88 | 210.50 | 205.59 | 199.65 | 176.46 | 220.57 | NA | NA | NA | |
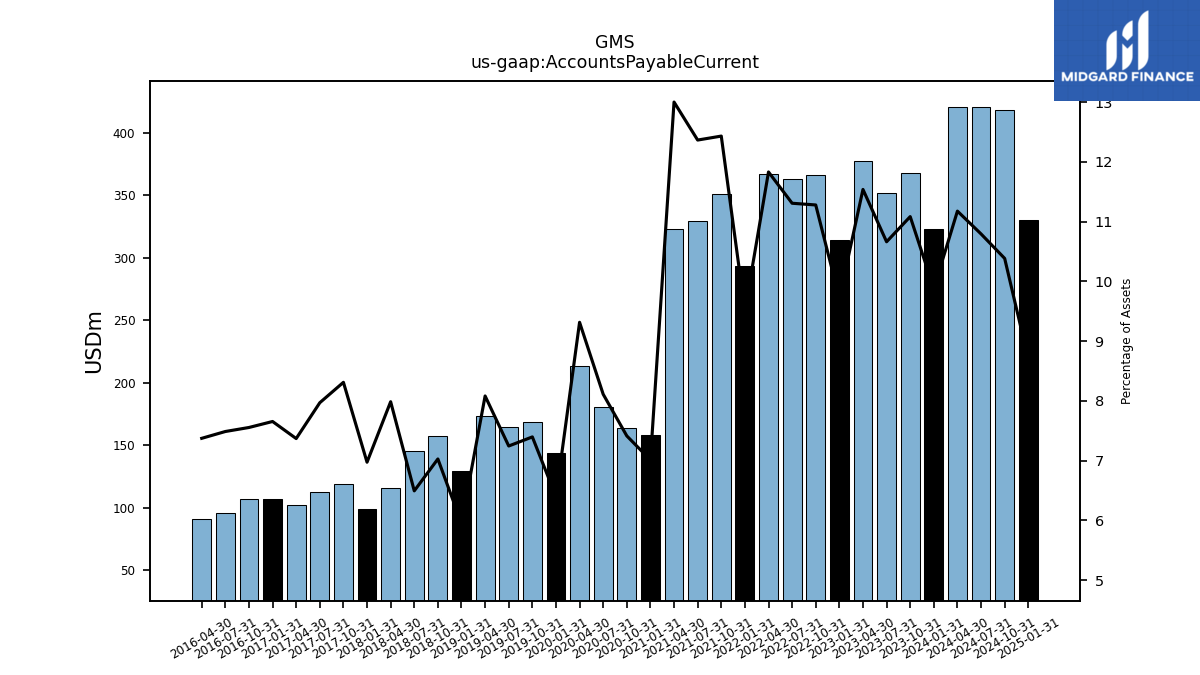
| Accounts Payable Current | 323.26 | 367.40 | 351.95 | 377.00 | 314.35 | 366.14 | 363.29 | 367.31 | 293.49 | 351.23 | 329.45 | 322.96 | 157.89 | 163.93 | 180.56 | 213.23 | 143.69 | 168.77 | 164.79 | 173.75 | 129.58 | 157.18 | 145.87 | 116.17 | 98.92 | 118.92 | 112.33 | 102.69 | 106.78 | 106.89 | 96.00 | 91.50 | NA | NA | NA |
| 2024-01-31 | 2023-10-31 | 2023-07-31 | 2023-04-30 | 2023-01-31 | 2022-10-31 | 2022-07-31 | 2022-04-30 | 2022-01-31 | 2021-10-31 | 2021-07-31 | 2021-04-30 | 2021-01-31 | 2020-10-31 | 2020-07-31 | 2020-04-30 | 2020-01-31 | 2019-10-31 | 2019-07-31 | 2019-04-30 | 2019-01-31 | 2018-10-31 | 2018-07-31 | 2018-04-30 | 2018-01-31 | 2017-10-31 | 2017-07-31 | 2017-04-30 | 2017-01-31 | 2016-10-31 | 2016-07-31 | 2016-04-30 | 2016-01-31 | 2015-10-31 | 2015-07-31 | ||
|---|---|---|---|---|---|---|---|---|---|---|---|---|---|---|---|---|---|---|---|---|---|---|---|---|---|---|---|---|---|---|---|---|---|---|---|---|
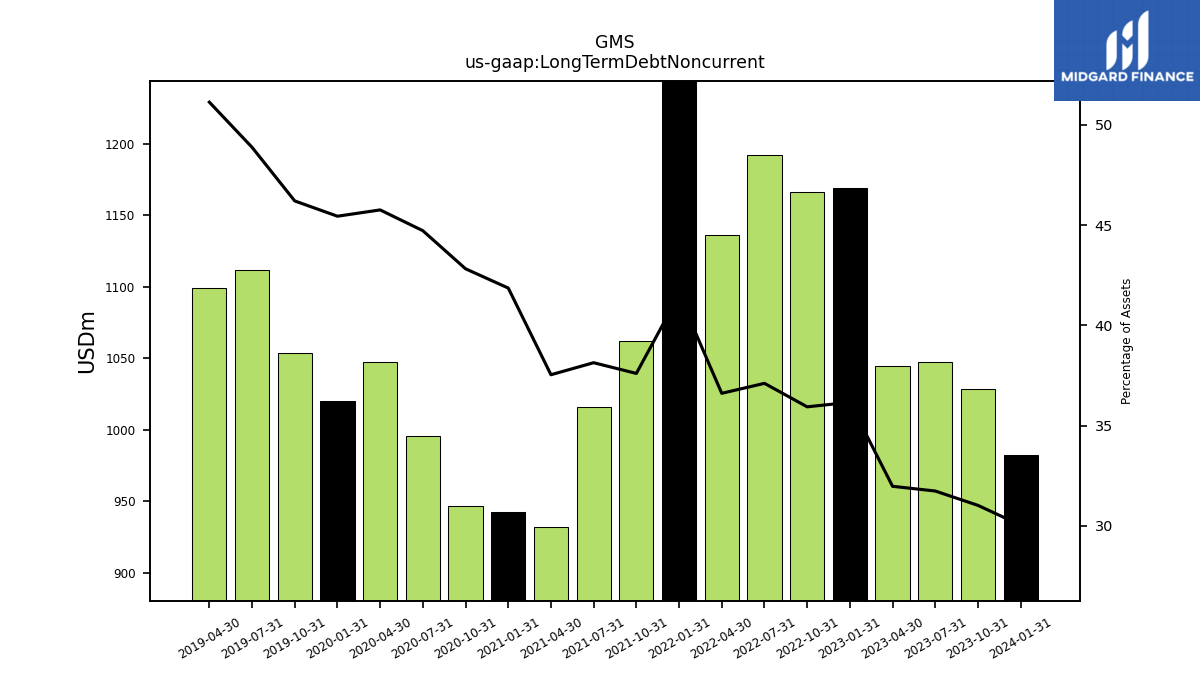
| Long Term Debt Noncurrent | 982.67 | 1028.28 | 1047.54 | 1044.64 | 1169.26 | 1166.54 | 1192.10 | 1136.59 | 1281.74 | 1062.29 | 1016.04 | 932.41 | 942.60 | 946.72 | 995.39 | 1047.28 | 1020.31 | 1054.09 | 1111.70 | 1099.08 | NA | NA | NA | NA | NA | NA | NA | NA | NA | NA | NA | NA | NA | NA | NA | |
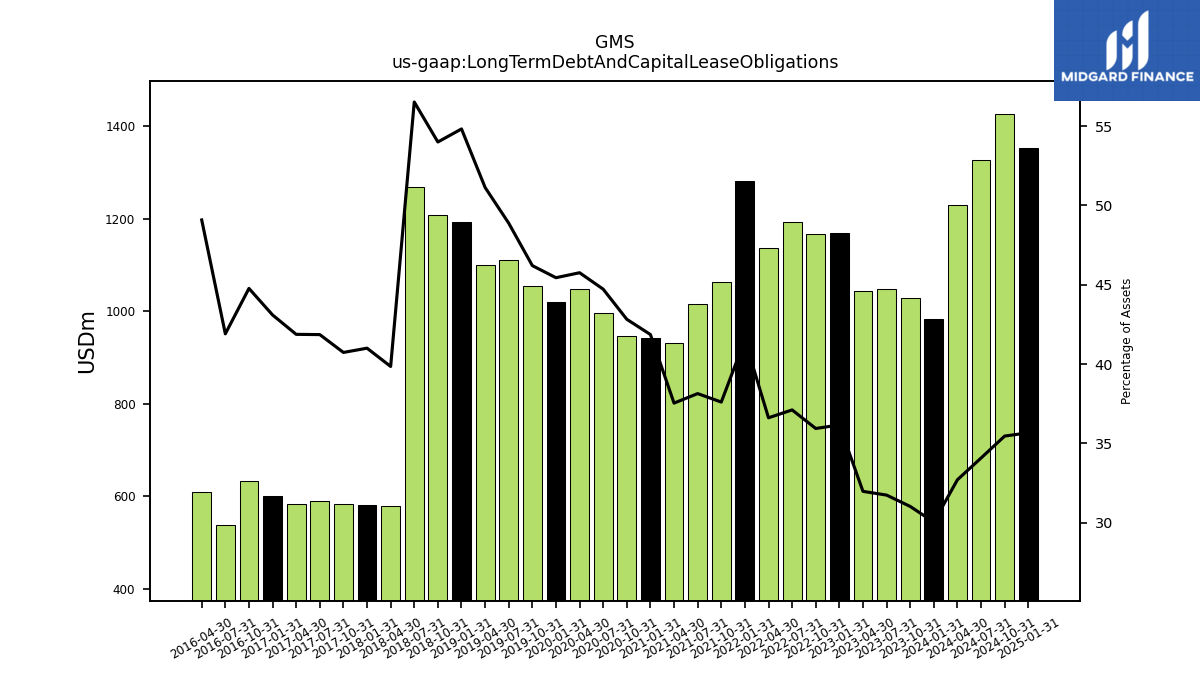
| Long Term Debt And Capital Lease Obligations | 982.67 | 1028.28 | 1047.54 | 1044.64 | 1169.26 | 1166.54 | 1192.10 | 1136.59 | 1281.74 | 1062.29 | 1016.04 | 932.41 | 942.60 | 946.72 | 995.39 | 1047.28 | 1020.31 | 1054.09 | 1111.70 | 1099.08 | 1193.52 | 1207.50 | 1269.32 | 579.60 | 581.53 | 582.75 | 589.92 | 583.39 | 601.04 | 633.33 | 537.22 | 609.03 | NA | NA | NA | |
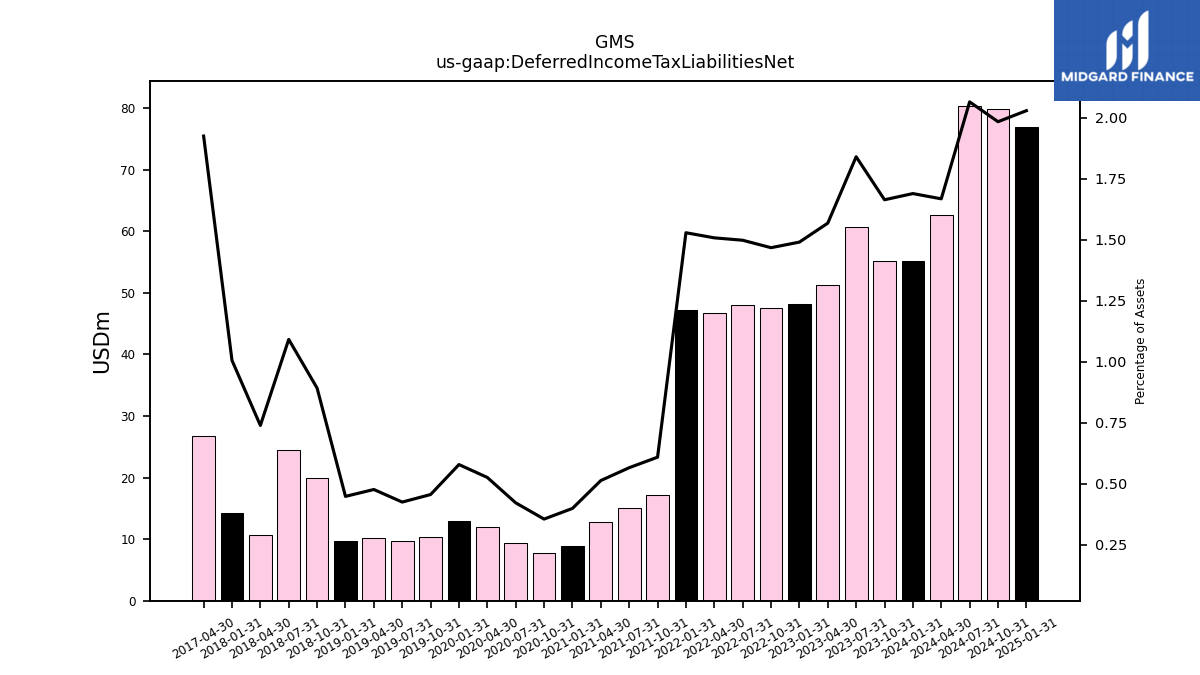
| Deferred Income Tax Liabilities Net | 55.26 | 55.14 | 60.73 | 51.22 | 48.18 | 47.62 | 48.11 | 46.80 | 47.17 | 17.18 | 15.05 | 12.73 | 8.96 | 7.84 | 9.37 | 12.02 | 12.98 | 10.38 | 9.65 | 10.23 | 9.74 | 19.93 | 24.51 | 10.74 | 14.26 | NA | NA | 26.82 | NA | NA | NA | NA | NA | NA | NA | |
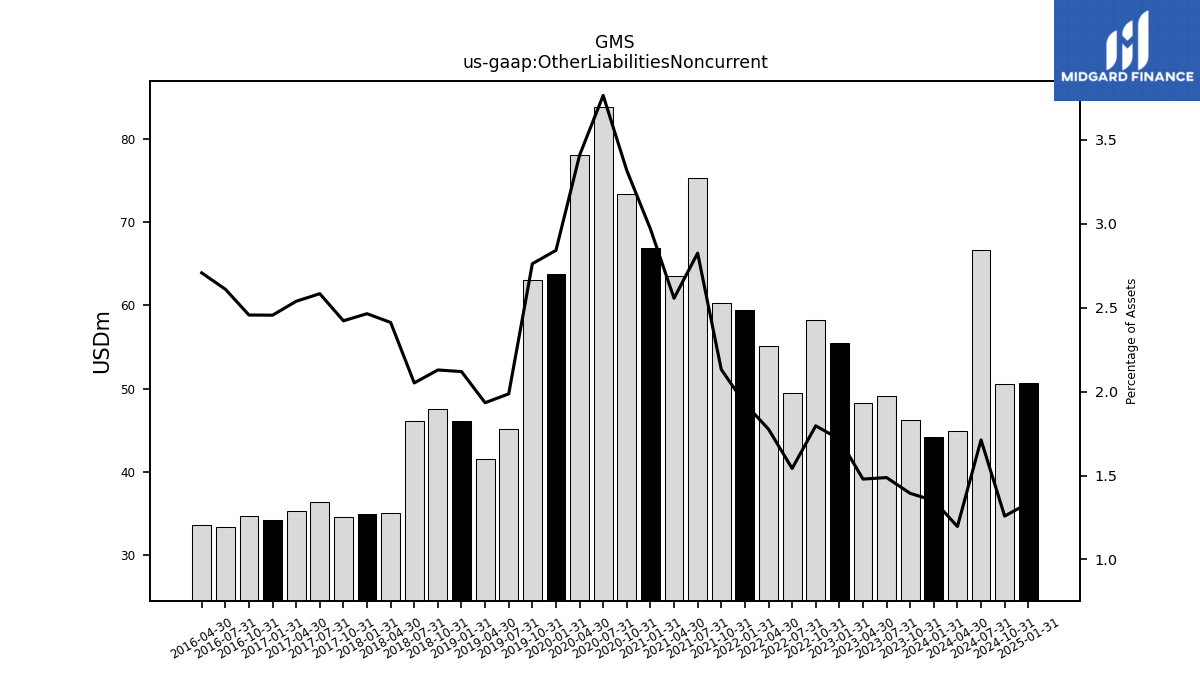
| Other Liabilities Noncurrent | 44.19 | 46.20 | 49.11 | 48.32 | 55.53 | 58.31 | 49.54 | 55.16 | 59.51 | 60.24 | 75.28 | 63.51 | 66.87 | 73.36 | 83.81 | 78.03 | 63.81 | 63.02 | 45.19 | 41.57 | 46.15 | 47.62 | 46.09 | 35.09 | 34.96 | 34.66 | 36.42 | 35.37 | 34.25 | 34.76 | 33.47 | 33.60 | NA | NA | NA | |
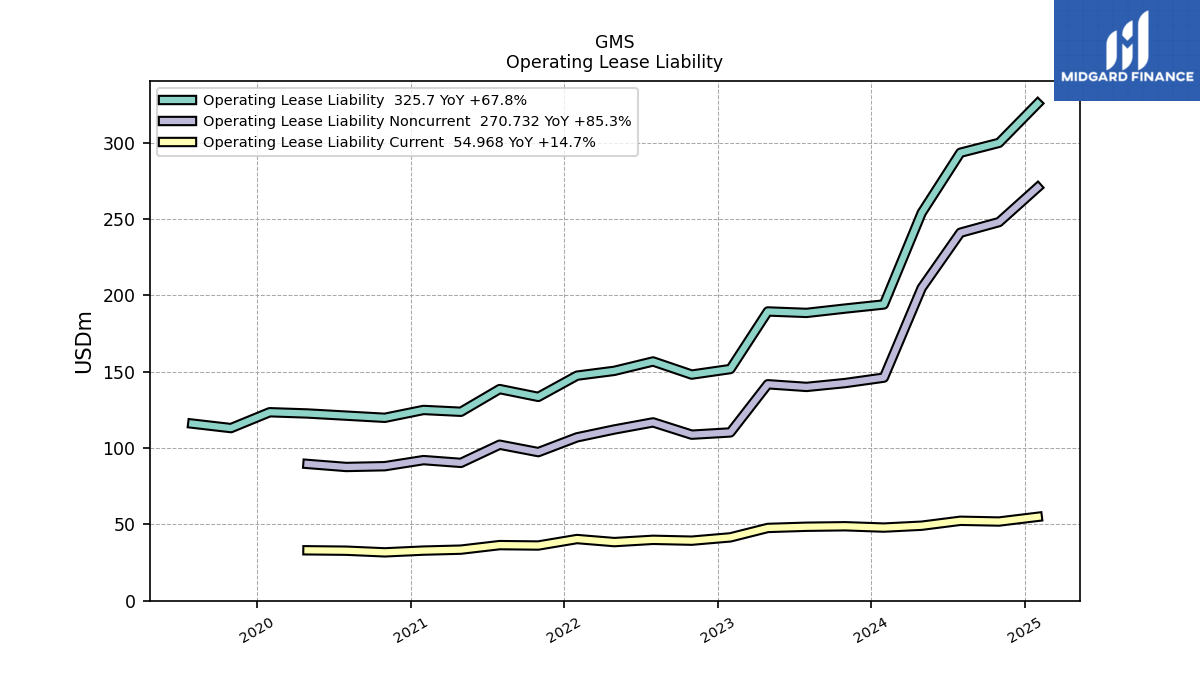
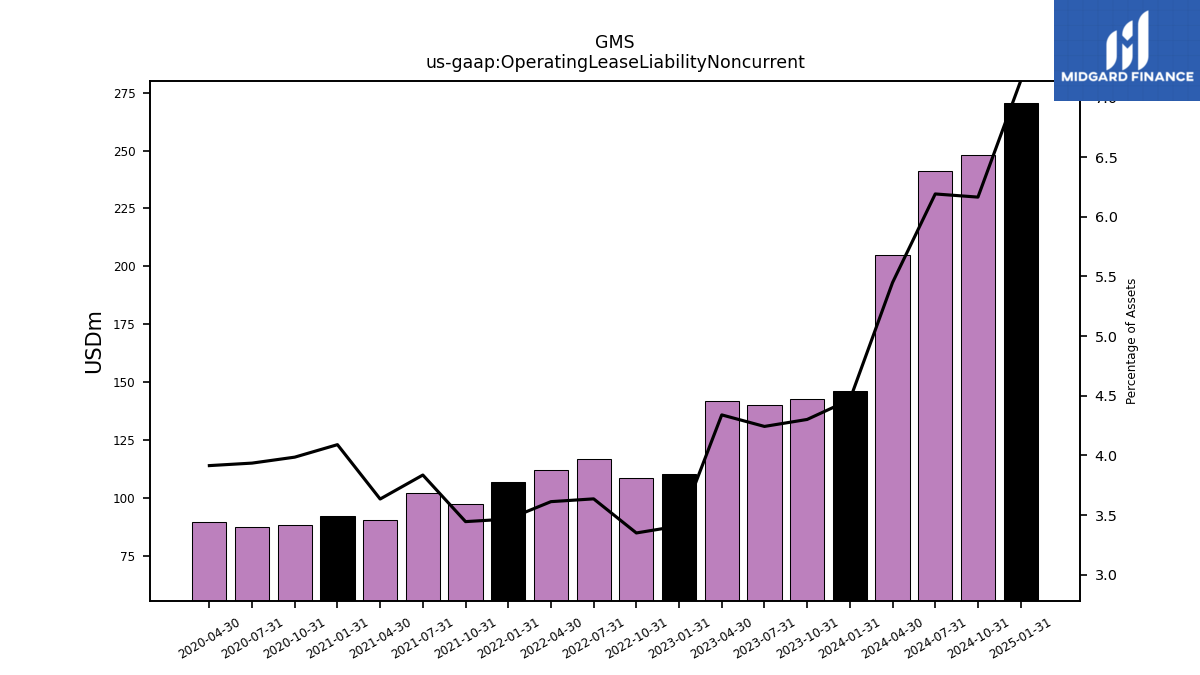
| Operating Lease Liability Noncurrent | 146.13 | 142.58 | 140.04 | 141.79 | 110.24 | 108.76 | 116.81 | 112.16 | 107.00 | 97.34 | 102.20 | 90.29 | 92.11 | 88.12 | 87.61 | 89.61 | NA | NA | NA | NA | NA | NA | NA | NA | NA | NA | NA | NA | NA | NA | NA | NA | NA | NA | NA |
| 2024-01-31 | 2023-10-31 | 2023-07-31 | 2023-04-30 | 2023-01-31 | 2022-10-31 | 2022-07-31 | 2022-04-30 | 2022-01-31 | 2021-10-31 | 2021-07-31 | 2021-04-30 | 2021-01-31 | 2020-10-31 | 2020-07-31 | 2020-04-30 | 2020-01-31 | 2019-10-31 | 2019-07-31 | 2019-04-30 | 2019-01-31 | 2018-10-31 | 2018-07-31 | 2018-04-30 | 2018-01-31 | 2017-10-31 | 2017-07-31 | 2017-04-30 | 2017-01-31 | 2016-10-31 | 2016-07-31 | 2016-04-30 | 2016-01-31 | 2015-10-31 | 2015-07-31 | ||
|---|---|---|---|---|---|---|---|---|---|---|---|---|---|---|---|---|---|---|---|---|---|---|---|---|---|---|---|---|---|---|---|---|---|---|---|---|
| Stockholders Equity | 1418.94 | 1375.88 | 1354.81 | 1274.76 | 1230.70 | 1183.94 | 1139.22 | 1064.50 | 1003.28 | 951.35 | 877.24 | 822.46 | 761.01 | 717.90 | 681.87 | 633.98 | 707.33 | 696.04 | 662.29 | 629.18 | 633.76 | 641.26 | 619.28 | 579.45 | 568.28 | 547.68 | 530.53 | 514.61 | 499.28 | 490.25 | 472.56 | 311.16 | NA | NA | NA | |
| Common Stock Value | 0.40 | 0.40 | 0.41 | 0.41 | 0.41 | 0.42 | 0.42 | 0.43 | 0.43 | 0.43 | 0.43 | 0.43 | 0.43 | 0.43 | 0.43 | 0.43 | 0.42 | 0.42 | 0.42 | 0.40 | 0.41 | 0.41 | 0.41 | 0.41 | 0.41 | 0.41 | 0.41 | 0.41 | 0.41 | 0.41 | 0.41 | 0.33 | NA | NA | NA | |
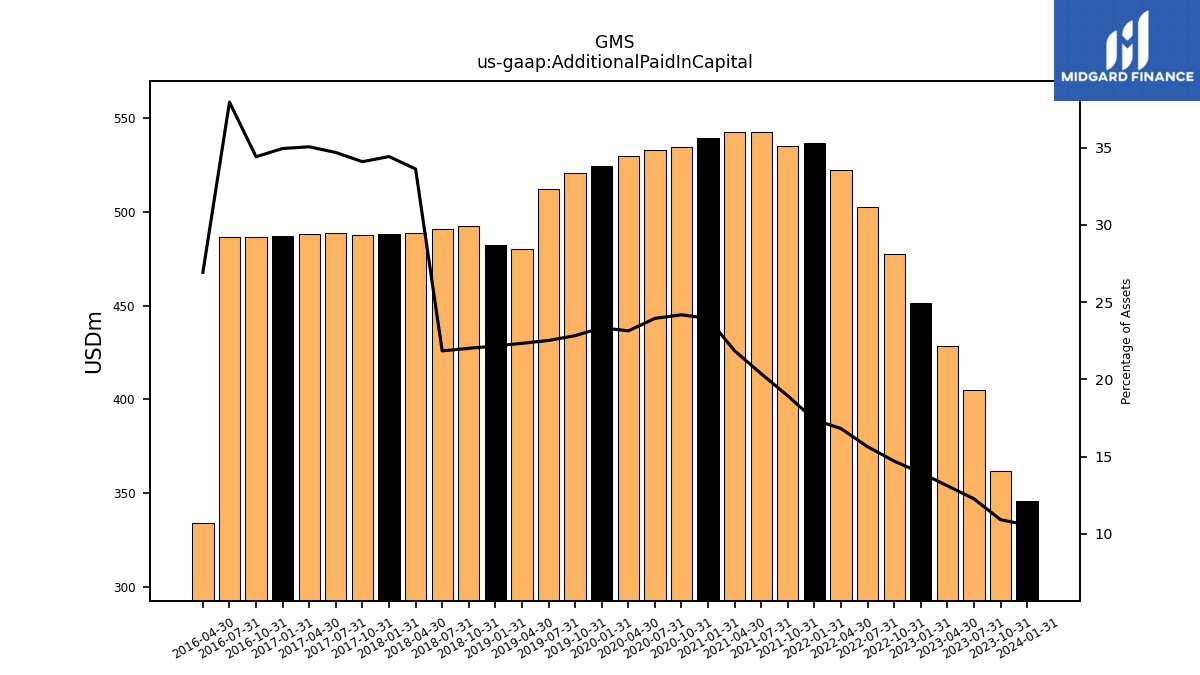
| Additional Paid In Capital | 345.82 | 362.02 | 404.94 | 428.51 | 451.21 | 477.56 | 502.54 | 522.14 | 536.63 | 534.93 | 542.59 | 542.74 | 539.29 | 534.65 | 533.09 | 529.66 | 524.31 | 520.86 | 512.24 | 480.11 | 482.63 | 492.26 | 490.67 | 489.01 | 488.29 | 487.77 | 488.88 | 488.46 | 487.44 | 486.86 | 486.49 | 334.24 | NA | NA | NA | |
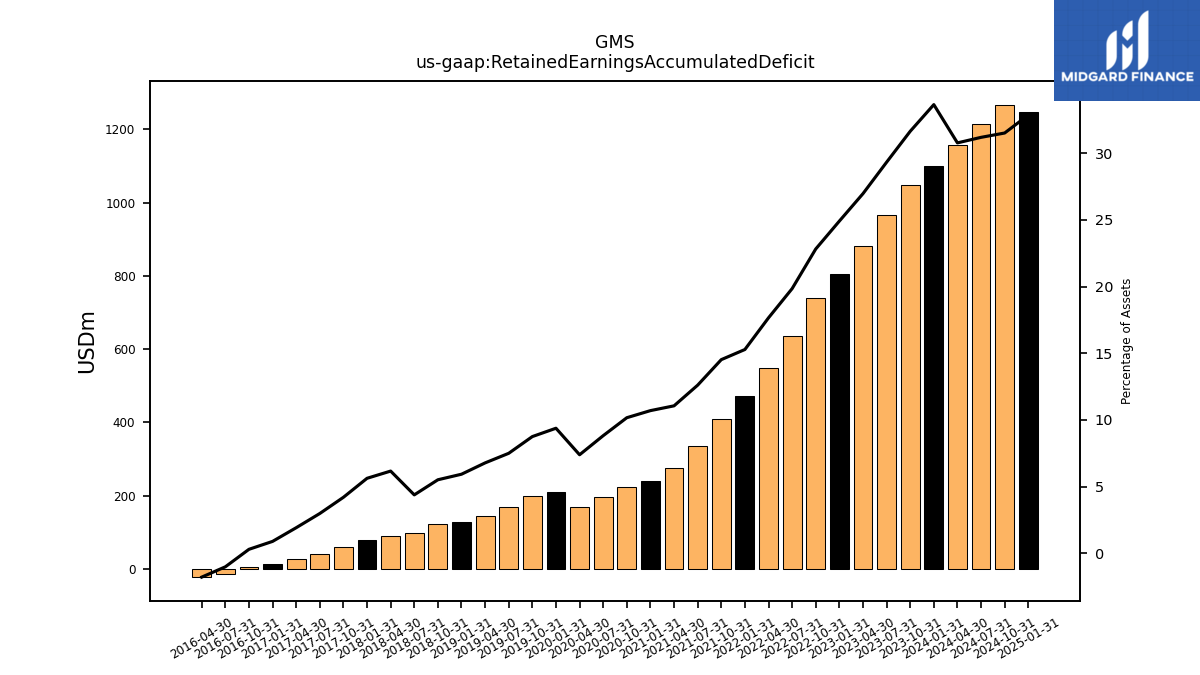
| Retained Earnings Accumulated Deficit | 1100.66 | 1048.76 | 967.80 | 880.97 | 805.38 | 740.60 | 637.45 | 547.98 | 471.48 | 410.10 | 335.74 | 274.54 | 240.79 | 224.66 | 196.19 | 168.97 | 210.43 | 199.55 | 170.41 | 145.59 | 128.97 | 123.15 | 98.24 | 89.59 | 79.67 | 59.99 | 41.97 | 26.62 | 12.35 | 4.12 | -13.10 | -22.27 | NA | NA | NA | |
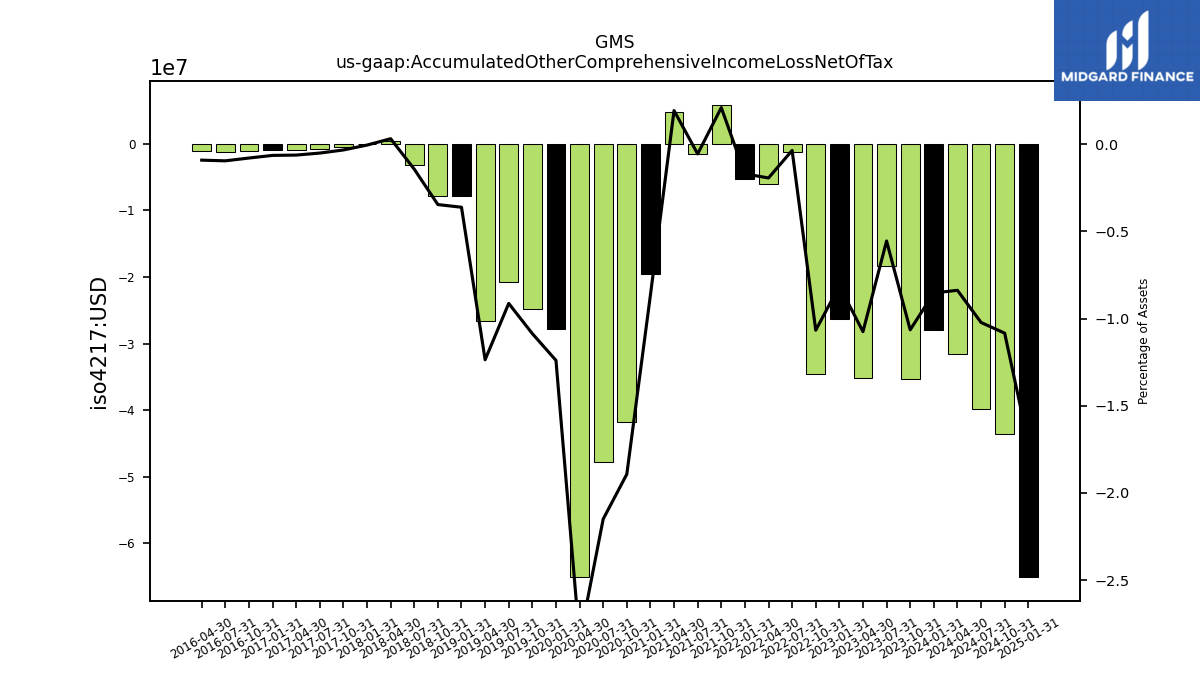
| Accumulated Other Comprehensive Income Loss Net Of Tax | -27.93 | -35.29 | -18.34 | -35.13 | -26.30 | -34.64 | -1.18 | -6.04 | -5.27 | 5.89 | -1.51 | 4.76 | -19.49 | -41.84 | -47.84 | -65.08 | -27.84 | -24.79 | -20.78 | -26.57 | -7.89 | -7.76 | -3.24 | 0.44 | -0.09 | -0.49 | -0.73 | -0.88 | -0.91 | -1.14 | -1.24 | -1.15 | NA | NA | NA |
| 2024-01-31 | 2023-10-31 | 2023-07-31 | 2023-04-30 | 2023-01-31 | 2022-10-31 | 2022-07-31 | 2022-04-30 | 2022-01-31 | 2021-10-31 | 2021-07-31 | 2021-04-30 | 2021-01-31 | 2020-10-31 | 2020-07-31 | 2020-04-30 | 2020-01-31 | 2019-10-31 | 2019-07-31 | 2019-04-30 | 2019-01-31 | 2018-10-31 | 2018-07-31 | 2018-04-30 | 2018-01-31 | 2017-10-31 | 2017-07-31 | 2017-04-30 | 2017-01-31 | 2016-10-31 | 2016-07-31 | 2016-04-30 | 2016-01-31 | 2015-10-31 | 2015-07-31 | ||
|---|---|---|---|---|---|---|---|---|---|---|---|---|---|---|---|---|---|---|---|---|---|---|---|---|---|---|---|---|---|---|---|---|---|---|---|---|
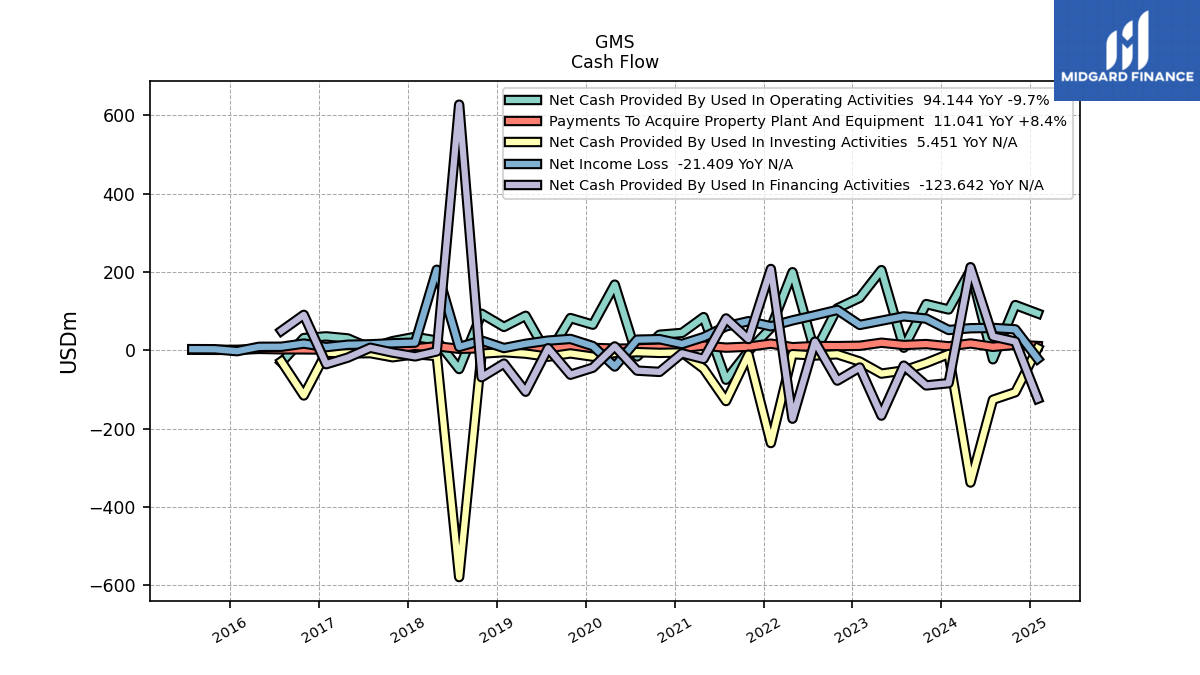
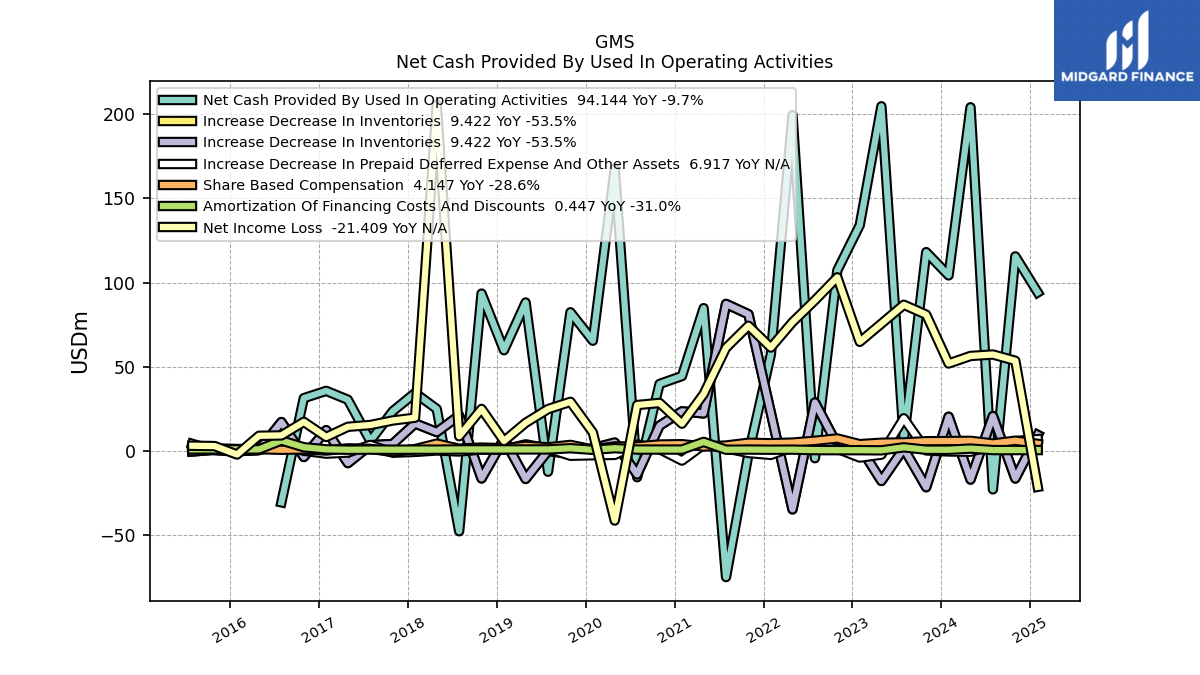
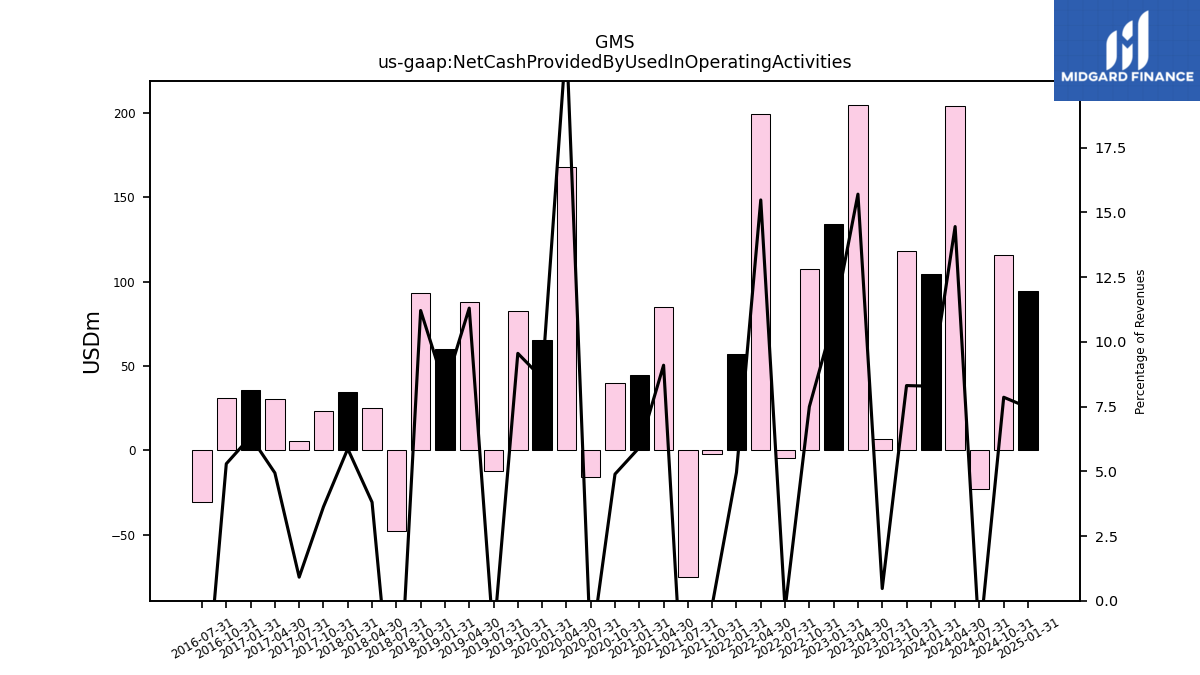
| Net Cash Provided By Used In Operating Activities | 104.28 | 118.10 | 6.65 | 204.81 | 134.07 | 107.26 | -4.40 | 199.50 | 57.21 | -2.02 | -75.08 | 84.81 | 44.45 | 39.76 | -15.71 | 167.71 | 65.44 | 82.37 | -12.44 | 88.18 | 59.78 | 93.48 | -47.82 | 24.88 | 34.37 | 23.51 | 5.85 | 30.37 | 35.65 | 31.31 | -30.62 | NA | NA | NA | NA | |
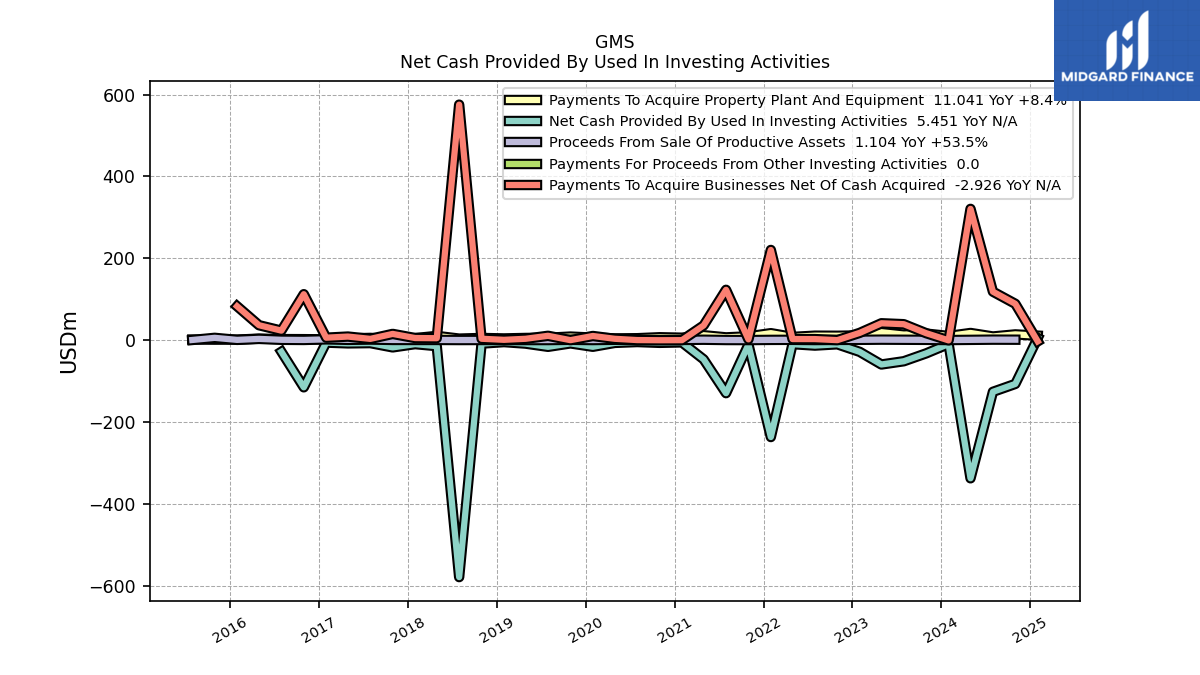
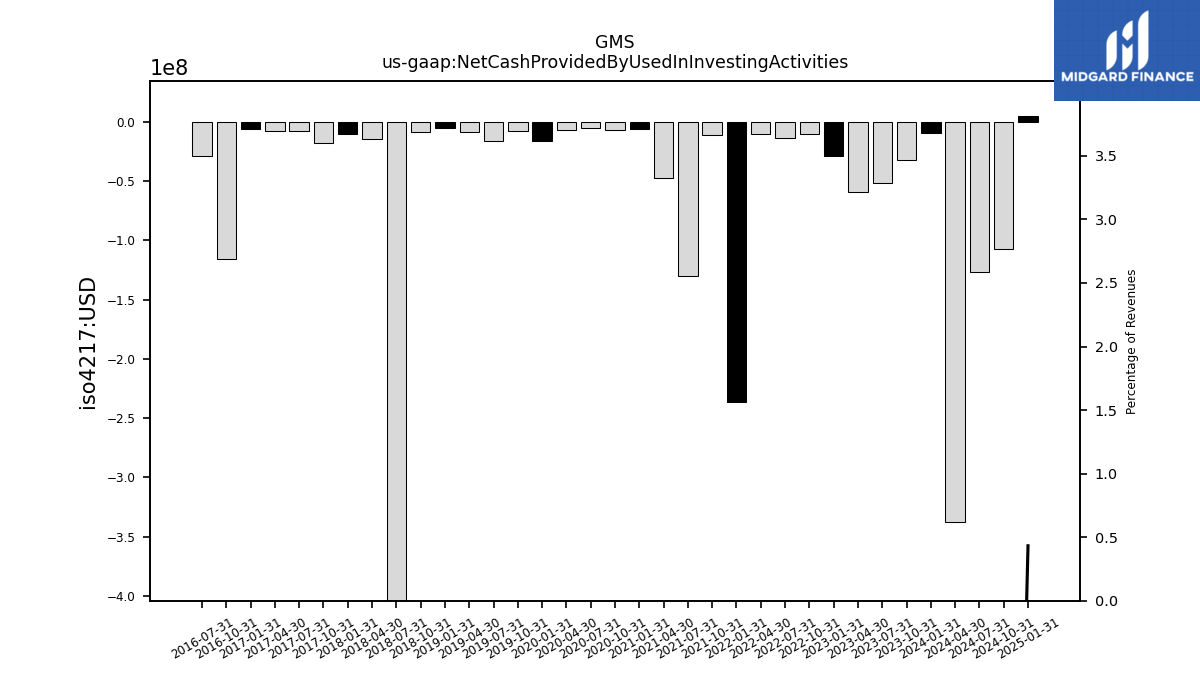
| Net Cash Provided By Used In Investing Activities | -9.37 | -32.28 | -51.53 | -59.47 | -28.61 | -10.12 | -13.28 | -9.80 | -236.78 | -11.05 | -129.58 | -46.91 | -5.50 | -6.56 | -4.61 | -6.71 | -16.17 | -7.92 | -16.29 | -8.49 | -4.77 | -8.41 | -579.03 | -14.61 | -9.71 | -17.68 | -7.21 | -7.88 | -5.99 | -115.30 | -28.35 | NA | NA | NA | NA | |
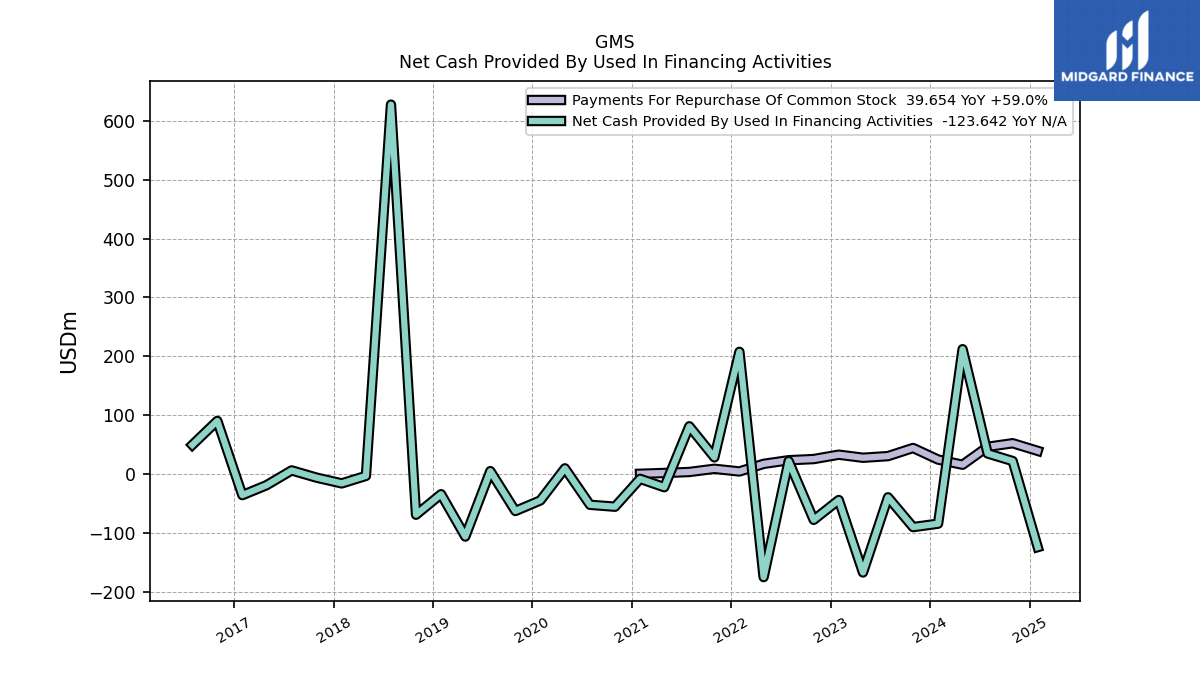
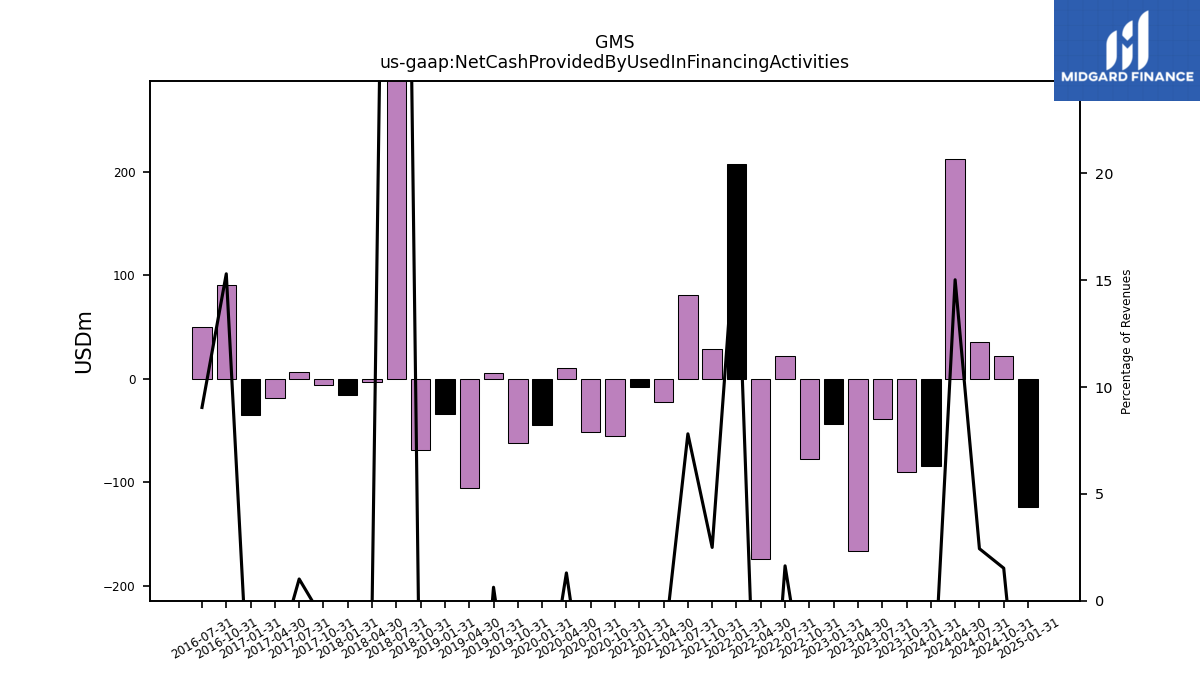
| Net Cash Provided By Used In Financing Activities | -83.89 | -89.67 | -39.10 | -166.68 | -43.79 | -77.35 | 22.21 | -174.57 | 207.75 | 28.71 | 81.39 | -21.97 | -7.76 | -55.08 | -51.82 | 10.04 | -44.37 | -62.35 | 5.34 | -105.72 | -33.89 | -68.70 | 627.28 | -2.78 | -15.50 | -5.79 | 6.53 | -18.52 | -35.45 | 90.54 | 49.72 | NA | NA | NA | NA |
| 2024-01-31 | 2023-10-31 | 2023-07-31 | 2023-04-30 | 2023-01-31 | 2022-10-31 | 2022-07-31 | 2022-04-30 | 2022-01-31 | 2021-10-31 | 2021-07-31 | 2021-04-30 | 2021-01-31 | 2020-10-31 | 2020-07-31 | 2020-04-30 | 2020-01-31 | 2019-10-31 | 2019-07-31 | 2019-04-30 | 2019-01-31 | 2018-10-31 | 2018-07-31 | 2018-04-30 | 2018-01-31 | 2017-10-31 | 2017-07-31 | 2017-04-30 | 2017-01-31 | 2016-10-31 | 2016-07-31 | 2016-04-30 | 2016-01-31 | 2015-10-31 | 2015-07-31 | ||
|---|---|---|---|---|---|---|---|---|---|---|---|---|---|---|---|---|---|---|---|---|---|---|---|---|---|---|---|---|---|---|---|---|---|---|---|---|
| Net Cash Provided By Used In Operating Activities | 104.28 | 118.10 | 6.65 | 204.81 | 134.07 | 107.26 | -4.40 | 199.50 | 57.21 | -2.02 | -75.08 | 84.81 | 44.45 | 39.76 | -15.71 | 167.71 | 65.44 | 82.37 | -12.44 | 88.18 | 59.78 | 93.48 | -47.82 | 24.88 | 34.37 | 23.51 | 5.85 | 30.37 | 35.65 | 31.31 | -30.62 | NA | NA | NA | NA | |
| Net Income Loss | 51.91 | 80.96 | 86.83 | 75.59 | 64.78 | 103.15 | 89.47 | 76.50 | 61.38 | 74.36 | 61.20 | 33.75 | 16.13 | 28.47 | 27.22 | -41.46 | 10.88 | 29.14 | 24.82 | 16.62 | 5.82 | 24.91 | 8.65 | 205.79 | 19.69 | 18.02 | 15.34 | 14.27 | 8.23 | 17.22 | 9.16 | 8.94 | -2.21 | 2.83 | 3.01 | |
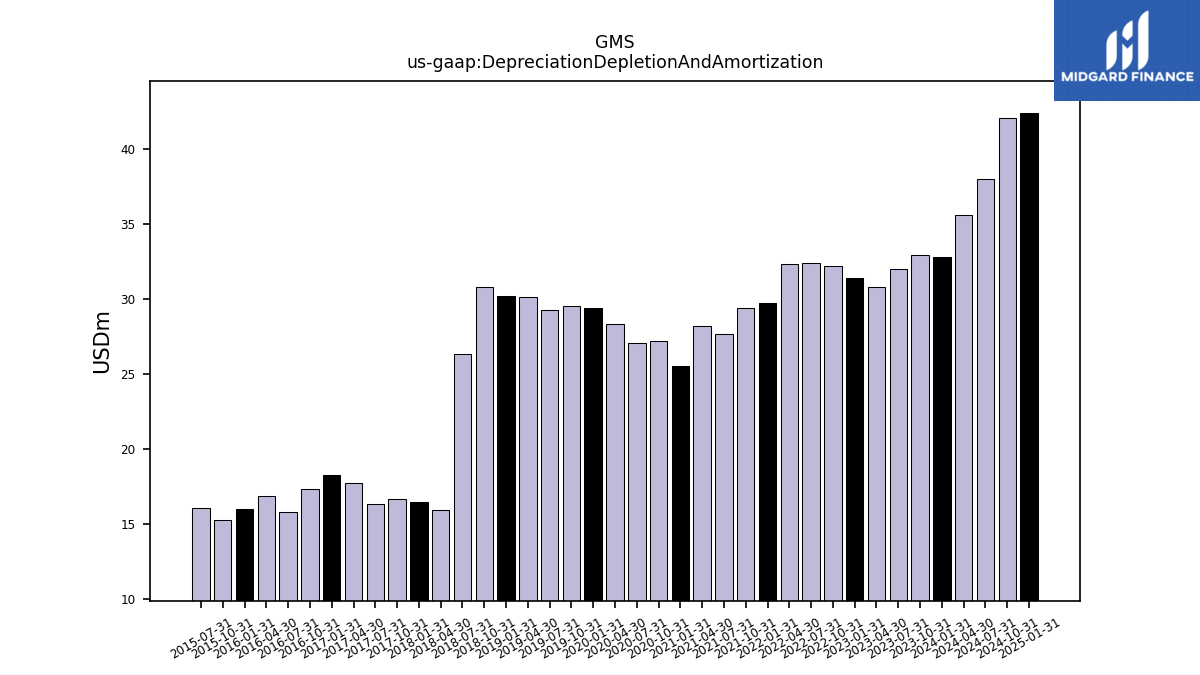
| Depreciation Depletion And Amortization | 32.80 | 32.94 | 32.02 | 30.82 | 31.42 | 32.23 | 32.44 | 32.37 | 29.75 | 29.40 | 27.71 | 28.22 | 25.56 | 27.25 | 27.10 | 28.32 | 29.42 | 29.52 | 29.27 | 30.13 | 30.22 | 30.79 | 26.32 | 15.98 | 16.49 | 16.71 | 16.34 | 17.76 | 18.32 | 17.37 | 15.79 | 16.88 | 16.01 | 15.26 | 16.07 | |
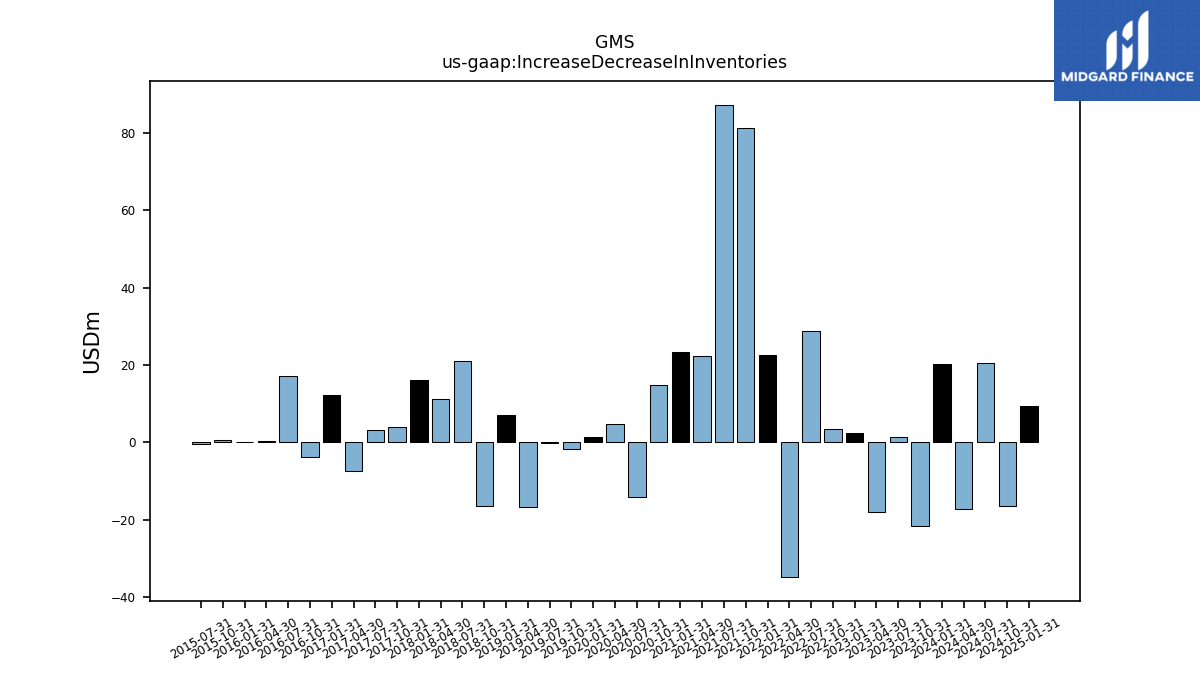
| Increase Decrease In Inventories | 20.26 | -21.63 | 1.36 | -17.91 | 2.45 | 3.56 | 28.71 | -34.79 | 22.58 | 81.21 | 87.31 | 22.27 | 23.44 | 14.96 | -14.01 | 4.90 | 1.48 | -1.78 | -0.02 | -16.71 | 7.02 | -16.39 | 20.94 | 11.16 | 16.25 | 4.05 | 3.32 | -7.32 | 12.26 | -3.66 | 17.10 | 0.43 | 0.02 | 0.62 | -0.38 | |
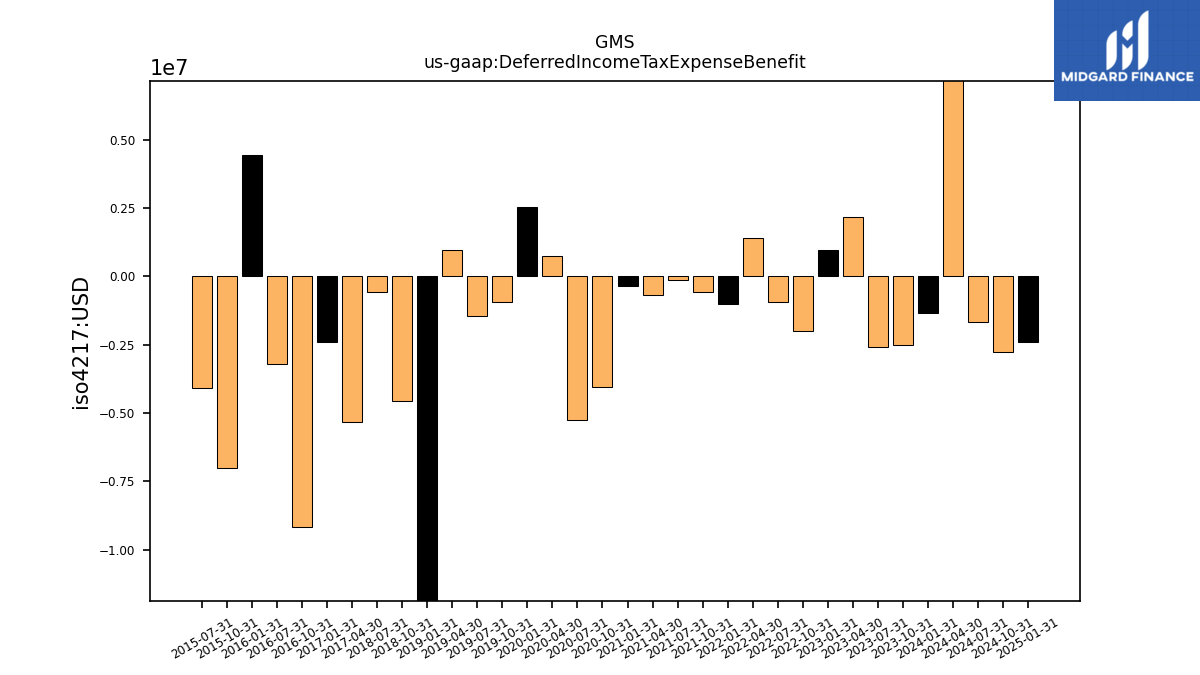
| Deferred Income Tax Expense Benefit | -1.32 | -2.50 | -2.59 | 2.17 | 0.97 | -1.98 | -0.94 | 1.39 | -1.02 | -0.58 | -0.14 | -0.68 | -0.35 | -4.05 | -5.24 | 0.75 | 2.55 | -0.94 | -1.44 | 0.98 | -13.32 | -4.57 | -0.57 | NA | NA | NA | NA | -5.34 | -2.40 | -9.15 | -3.22 | NA | 4.43 | -7.00 | -4.09 | |
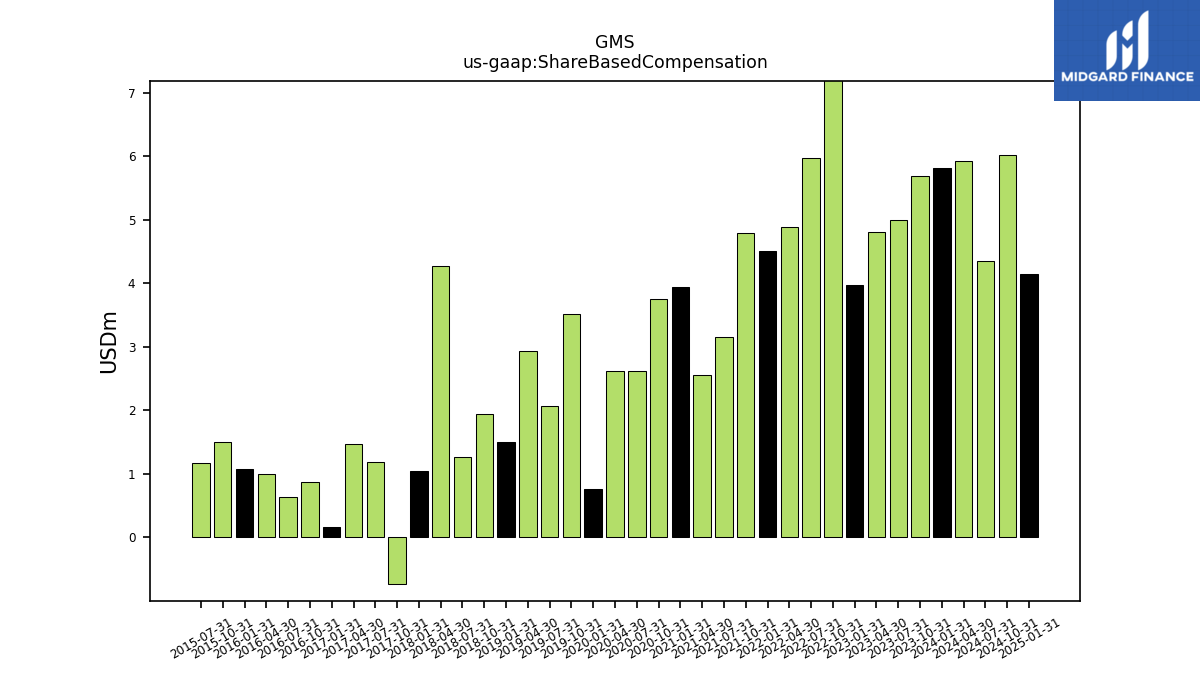
| Share Based Compensation | 5.81 | 5.70 | 5.00 | 4.81 | 3.97 | 7.35 | 5.97 | 4.89 | 4.51 | 4.79 | 3.16 | 2.55 | 3.95 | 3.75 | 2.62 | 2.62 | 0.75 | 3.52 | 2.07 | 2.94 | 1.50 | 1.94 | 1.27 | 4.27 | 1.04 | -0.74 | 1.18 | 1.47 | 0.17 | 0.87 | 0.63 | 0.99 | 1.07 | 1.50 | 1.17 |
| 2024-01-31 | 2023-10-31 | 2023-07-31 | 2023-04-30 | 2023-01-31 | 2022-10-31 | 2022-07-31 | 2022-04-30 | 2022-01-31 | 2021-10-31 | 2021-07-31 | 2021-04-30 | 2021-01-31 | 2020-10-31 | 2020-07-31 | 2020-04-30 | 2020-01-31 | 2019-10-31 | 2019-07-31 | 2019-04-30 | 2019-01-31 | 2018-10-31 | 2018-07-31 | 2018-04-30 | 2018-01-31 | 2017-10-31 | 2017-07-31 | 2017-04-30 | 2017-01-31 | 2016-10-31 | 2016-07-31 | 2016-04-30 | 2016-01-31 | 2015-10-31 | 2015-07-31 | ||
|---|---|---|---|---|---|---|---|---|---|---|---|---|---|---|---|---|---|---|---|---|---|---|---|---|---|---|---|---|---|---|---|---|---|---|---|---|
| Net Cash Provided By Used In Investing Activities | -9.37 | -32.28 | -51.53 | -59.47 | -28.61 | -10.12 | -13.28 | -9.80 | -236.78 | -11.05 | -129.58 | -46.91 | -5.50 | -6.56 | -4.61 | -6.71 | -16.17 | -7.92 | -16.29 | -8.49 | -4.77 | -8.41 | -579.03 | -14.61 | -9.71 | -17.68 | -7.21 | -7.88 | -5.99 | -115.30 | -28.35 | NA | NA | NA | NA | |
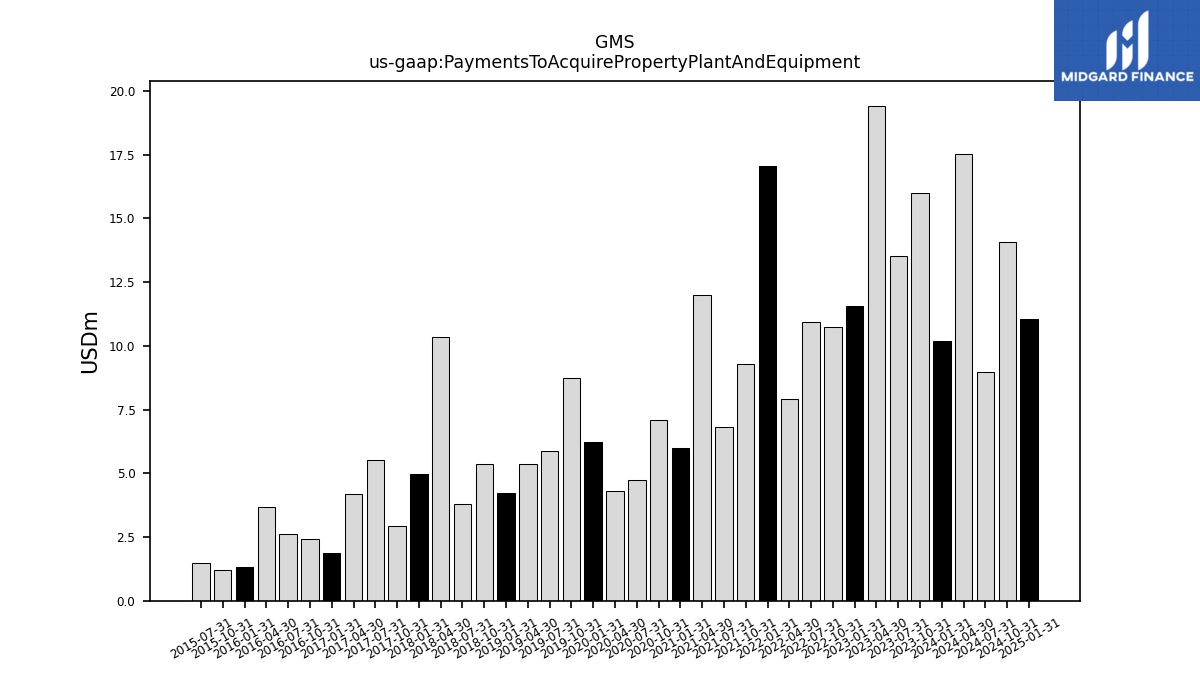
| Payments To Acquire Property Plant And Equipment | 10.18 | 16.01 | 13.54 | 19.42 | 11.58 | 10.73 | 10.94 | 7.92 | 17.04 | 9.30 | 6.81 | 12.02 | 6.01 | 7.10 | 4.75 | 4.31 | 6.25 | 8.75 | 5.89 | 5.38 | 4.23 | 5.36 | 3.79 | 10.33 | 4.97 | 2.93 | 5.51 | 4.18 | 1.88 | 2.42 | 2.61 | 3.70 | 1.32 | 1.21 | 1.47 |
| 2024-01-31 | 2023-10-31 | 2023-07-31 | 2023-04-30 | 2023-01-31 | 2022-10-31 | 2022-07-31 | 2022-04-30 | 2022-01-31 | 2021-10-31 | 2021-07-31 | 2021-04-30 | 2021-01-31 | 2020-10-31 | 2020-07-31 | 2020-04-30 | 2020-01-31 | 2019-10-31 | 2019-07-31 | 2019-04-30 | 2019-01-31 | 2018-10-31 | 2018-07-31 | 2018-04-30 | 2018-01-31 | 2017-10-31 | 2017-07-31 | 2017-04-30 | 2017-01-31 | 2016-10-31 | 2016-07-31 | 2016-04-30 | 2016-01-31 | 2015-10-31 | 2015-07-31 | ||
|---|---|---|---|---|---|---|---|---|---|---|---|---|---|---|---|---|---|---|---|---|---|---|---|---|---|---|---|---|---|---|---|---|---|---|---|---|
| Net Cash Provided By Used In Financing Activities | -83.89 | -89.67 | -39.10 | -166.68 | -43.79 | -77.35 | 22.21 | -174.57 | 207.75 | 28.71 | 81.39 | -21.97 | -7.76 | -55.08 | -51.82 | 10.04 | -44.37 | -62.35 | 5.34 | -105.72 | -33.89 | -68.70 | 627.28 | -2.78 | -15.50 | -5.79 | 6.53 | -18.52 | -35.45 | 90.54 | 49.72 | NA | NA | NA | NA | |
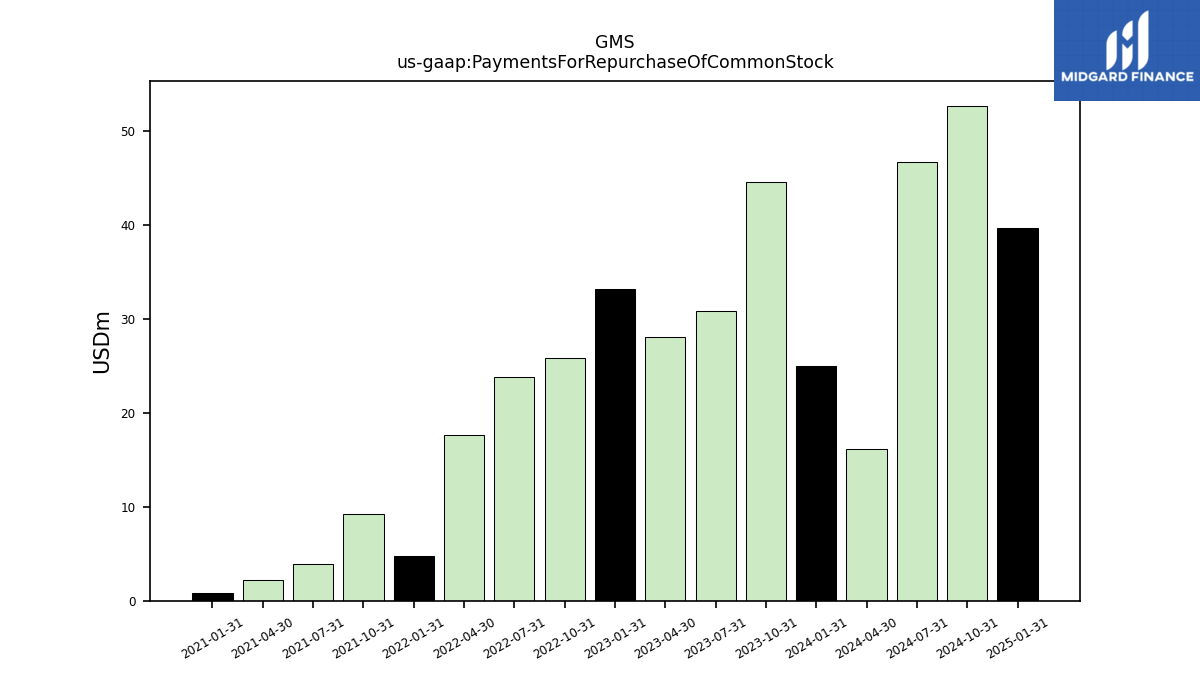
| Payments For Repurchase Of Common Stock | 24.94 | 44.57 | 30.78 | 28.01 | 33.20 | 25.78 | 23.80 | 17.63 | 4.73 | 9.27 | 3.85 | 2.16 | 0.78 | NA | NA | NA | NA | NA | NA | NA | NA | NA | NA | NA | NA | NA | NA | NA | NA | NA | NA | NA | NA | NA | NA |
| 2024-01-31 | 2023-10-31 | 2023-07-31 | 2023-04-30 | 2023-01-31 | 2022-10-31 | 2022-07-31 | 2022-04-30 | 2022-01-31 | 2021-10-31 | 2021-07-31 | 2021-04-30 | 2021-01-31 | 2020-10-31 | 2020-07-31 | 2020-04-30 | 2020-01-31 | 2019-10-31 | 2019-07-31 | 2019-04-30 | 2019-01-31 | 2018-10-31 | 2018-07-31 | 2018-04-30 | 2018-01-31 | 2017-10-31 | 2017-07-31 | 2017-04-30 | 2017-01-31 | 2016-10-31 | 2016-07-31 | 2016-04-30 | 2016-01-31 | 2015-10-31 | 2015-07-31 | ||
|---|---|---|---|---|---|---|---|---|---|---|---|---|---|---|---|---|---|---|---|---|---|---|---|---|---|---|---|---|---|---|---|---|---|---|---|---|
| Revenues | 1258.35 | 1420.93 | 1409.60 | 1304.10 | 1234.62 | 1430.98 | 1359.55 | 1288.65 | 1153.60 | 1150.55 | 1042.08 | 932.20 | 751.19 | 812.86 | 802.57 | 770.85 | 761.35 | 861.93 | 847.18 | 780.15 | 723.90 | 833.84 | 778.14 | 653.80 | 585.51 | 648.00 | 642.16 | 614.98 | 562.52 | 591.85 | 549.80 | 527.18 | 420.48 | 458.08 | 452.44 | |
| Revenue From Contract With Customer Excluding Assessed Tax | 1258.35 | 1420.93 | 1409.60 | 1304.10 | 1234.62 | 1430.98 | 1359.55 | 1288.65 | 1153.60 | 1150.55 | 1042.08 | 932.20 | 751.19 | 812.86 | 802.57 | 770.85 | 761.35 | 861.93 | 847.18 | 780.15 | 723.90 | 833.84 | 778.14 | 653.80 | 585.51 | 648.00 | 642.16 | 614.98 | 562.52 | 591.85 | 549.80 | 527.18 | 420.48 | 458.08 | 452.44 | |
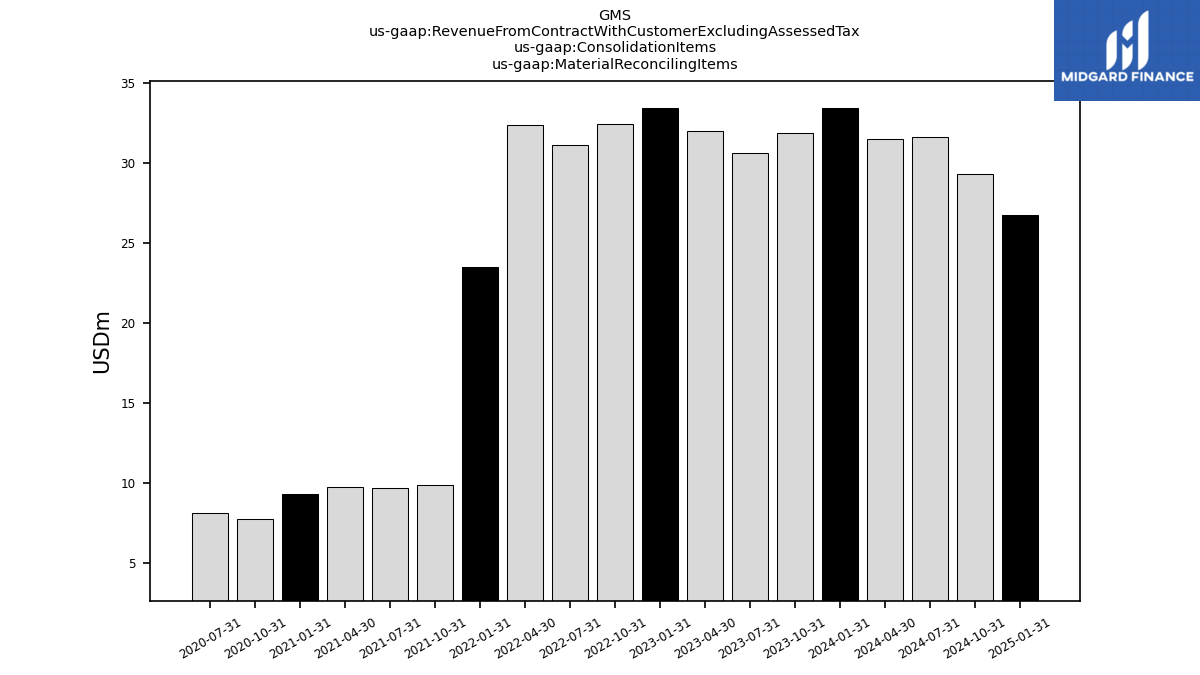
| Material Reconciling Items | 33.44 | 31.86 | 30.64 | 32.00 | 33.44 | 32.44 | 31.11 | 32.35 | 23.46 | 9.90 | 9.69 | 9.74 | 9.31 | 7.78 | 8.10 | NA | NA | NA | NA | NA | NA | NA | NA | NA | NA | NA | NA | NA | NA | NA | NA | NA | NA | NA | NA | |
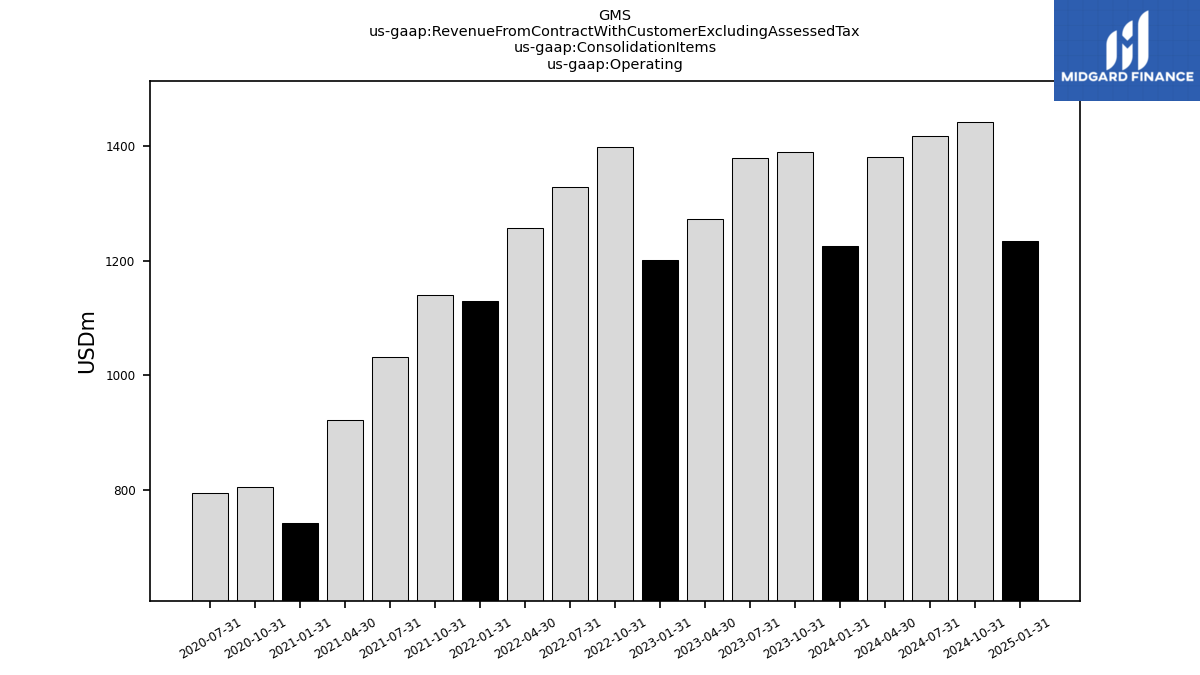
| Operating | 1224.91 | 1389.07 | 1378.96 | 1272.10 | 1201.18 | 1398.54 | 1328.45 | 1256.31 | 1130.13 | 1140.65 | 1032.39 | 922.46 | 741.88 | 805.07 | 794.47 | NA | NA | NA | NA | NA | NA | NA | NA | NA | NA | NA | NA | NA | NA | NA | NA | NA | NA | NA | NA | |
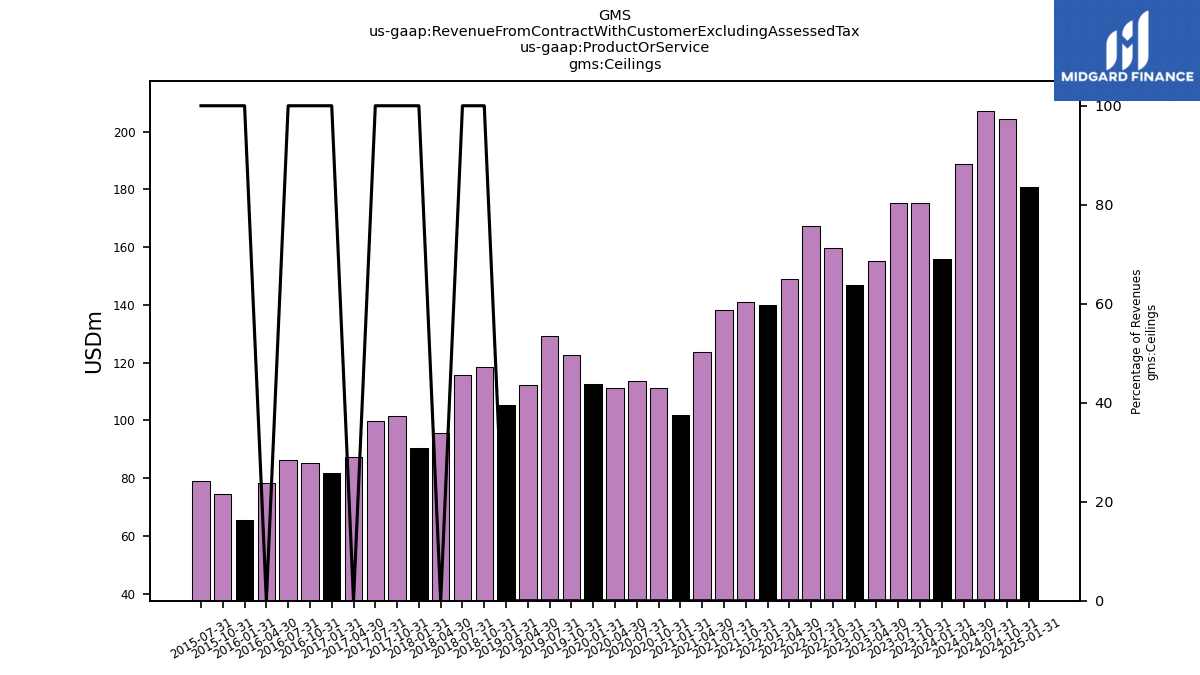
| Ceilings | 155.74 | 175.33 | 175.21 | 155.13 | 146.81 | 159.60 | 167.28 | 148.87 | 139.89 | 140.87 | 138.07 | 123.62 | 101.91 | 111.29 | 113.70 | 111.14 | 112.77 | 122.81 | 129.11 | 112.25 | 105.22 | 118.38 | 115.86 | 95.64 | 90.36 | 101.65 | 99.71 | 87.49 | 81.77 | 85.40 | 86.35 | 78.16 | 65.37 | 74.61 | 78.97 | |
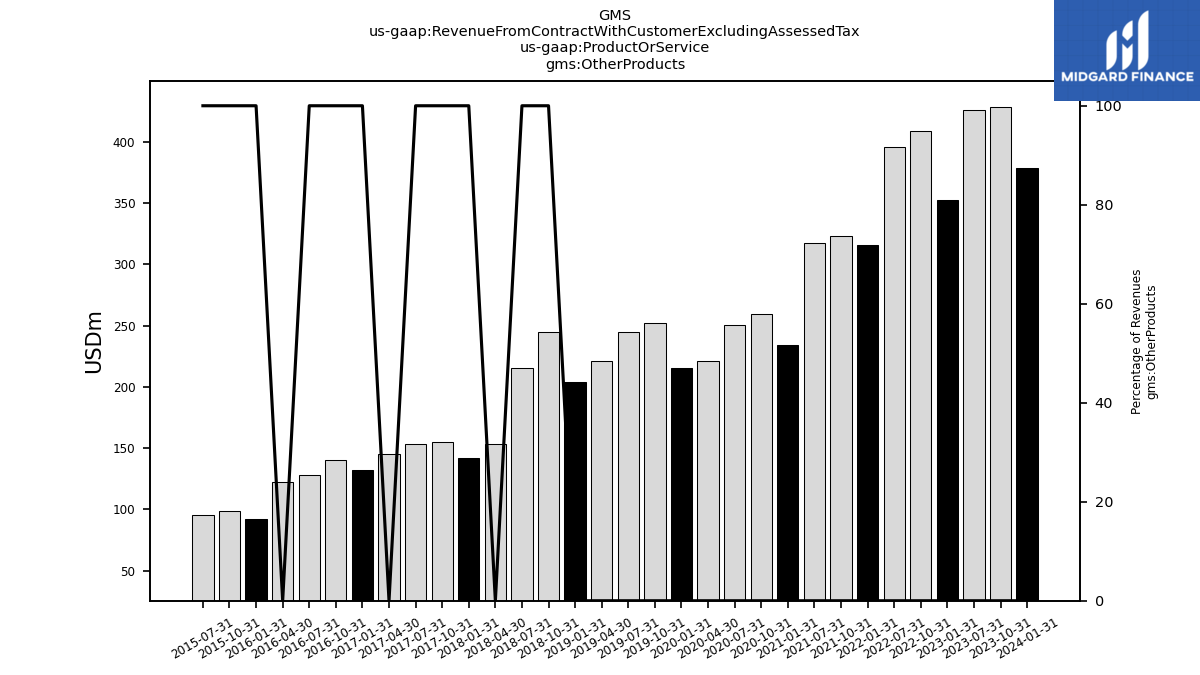
| Other Products | 378.56 | 428.32 | 426.21 | NA | 352.65 | 408.67 | 395.83 | NA | 315.81 | 323.16 | 317.59 | NA | 234.20 | 259.75 | 250.39 | 221.23 | 215.37 | 252.34 | 244.64 | 221.12 | 203.89 | 245.01 | 215.44 | 153.14 | 141.99 | 154.66 | 153.14 | 145.12 | 132.26 | 140.40 | 127.81 | 122.42 | 92.23 | 98.90 | 95.22 | |
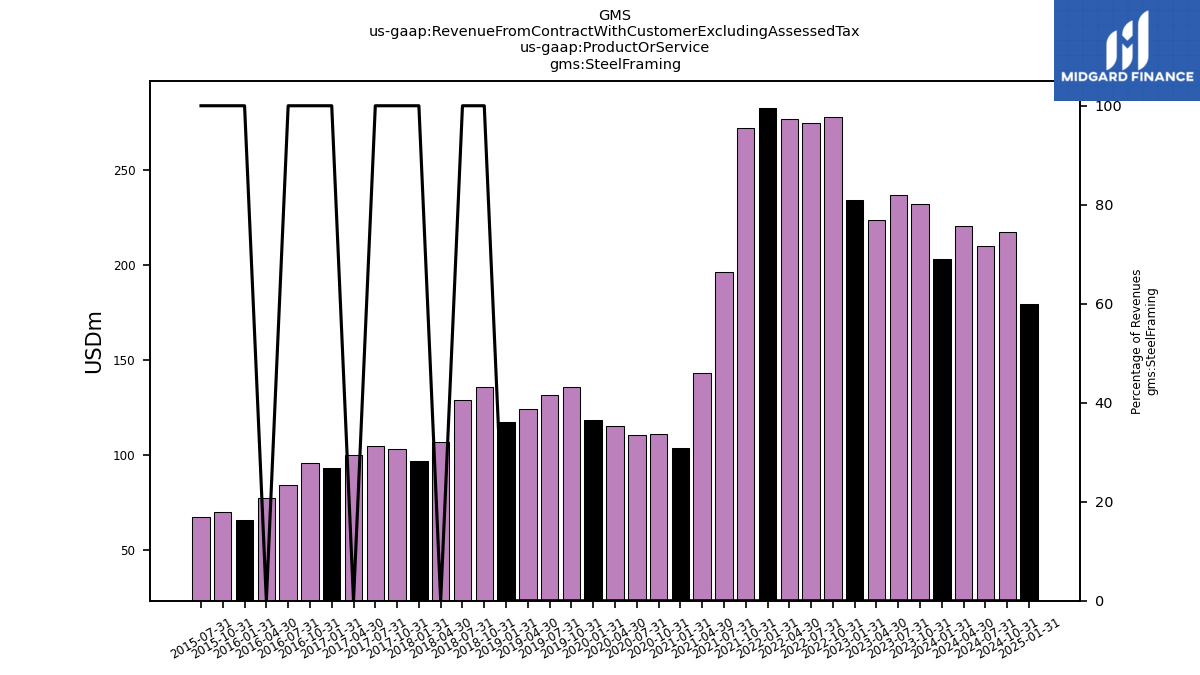
| Steel Framing | 203.36 | 232.11 | 236.76 | 223.81 | 234.45 | 278.15 | 274.90 | 276.90 | 282.76 | 272.00 | 196.28 | 143.27 | 103.96 | 111.29 | 110.49 | 115.31 | 118.82 | 136.16 | 131.83 | 124.50 | 117.43 | 135.76 | 129.11 | 107.03 | 96.74 | 103.20 | 104.65 | 100.22 | 93.51 | 96.08 | 84.34 | 77.77 | 65.93 | 70.31 | 67.33 | |
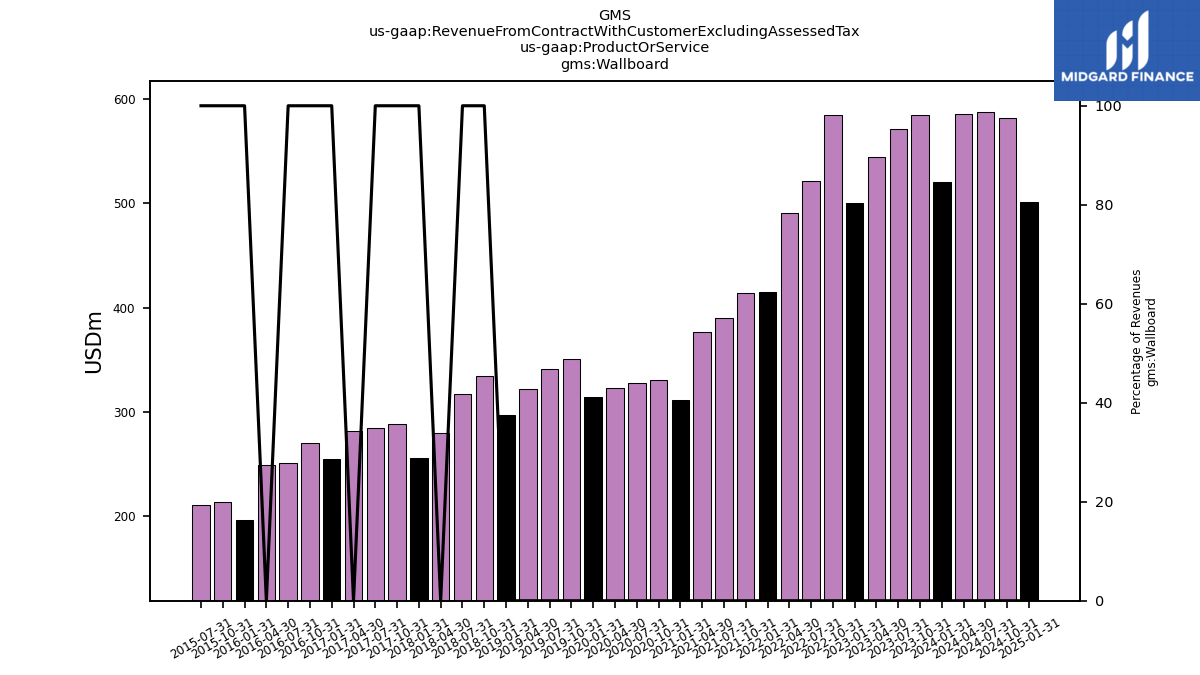
| Wallboard | 520.69 | 585.17 | 571.42 | 544.68 | 500.71 | 584.56 | 521.55 | 491.06 | 415.13 | 414.52 | 390.13 | 376.93 | 311.12 | 330.51 | 328.00 | 323.17 | 314.39 | 350.62 | 341.60 | 322.29 | 297.36 | 334.69 | 317.74 | 279.98 | 256.41 | 288.50 | 284.66 | 282.15 | 254.98 | 269.98 | 251.30 | 248.83 | 196.95 | 214.25 | 210.92 | |
| 151.10 | 182.07 | 191.17 | 157.63 | 144.73 | 178.66 | 171.68 | 162.25 | 137.17 | 162.45 | 179.29 | 162.77 | 113.62 | 128.72 | 123.25 | 101.90 | 99.86 | 117.80 | 115.83 | 100.22 | 99.23 | 127.49 | 87.41 | NA | NA | NA | NA | NA | NA | NA | NA | NA | NA | NA | NA | ||
| US | 1107.24 | 1238.86 | 1218.43 | 1146.47 | 1089.89 | 1252.32 | 1187.87 | 1126.40 | 1016.42 | 988.10 | 862.79 | 769.43 | 637.57 | 684.13 | 679.32 | 668.95 | 661.49 | 744.13 | 731.34 | 679.93 | 624.67 | 706.35 | 690.73 | 635.80 | 585.51 | 648.00 | 642.16 | NA | NA | NA | NA | NA | NA | NA | NA |