
| 2023-12-31 | 2023-09-30 | 2023-06-30 | 2023-03-31 | 2022-12-31 | 2022-09-30 | 2022-06-30 | 2022-03-31 | 2021-12-31 | 2021-09-30 | 2021-06-30 | 2021-03-31 | 2020-12-31 | 2020-09-30 | 2020-06-30 | 2020-03-31 | 2019-12-31 | 2019-09-30 | 2019-06-30 | 2019-03-31 | 2018-12-31 | 2018-09-30 | 2018-06-30 | 2018-03-31 | 2017-12-31 | 2017-09-30 | 2017-06-30 | 2017-03-31 | 2016-12-31 | 2016-09-30 | 2016-06-30 | 2016-03-31 | 2015-12-31 | 2015-09-30 | 2015-06-30 | 2015-03-31 | ||
|---|---|---|---|---|---|---|---|---|---|---|---|---|---|---|---|---|---|---|---|---|---|---|---|---|---|---|---|---|---|---|---|---|---|---|---|---|---|
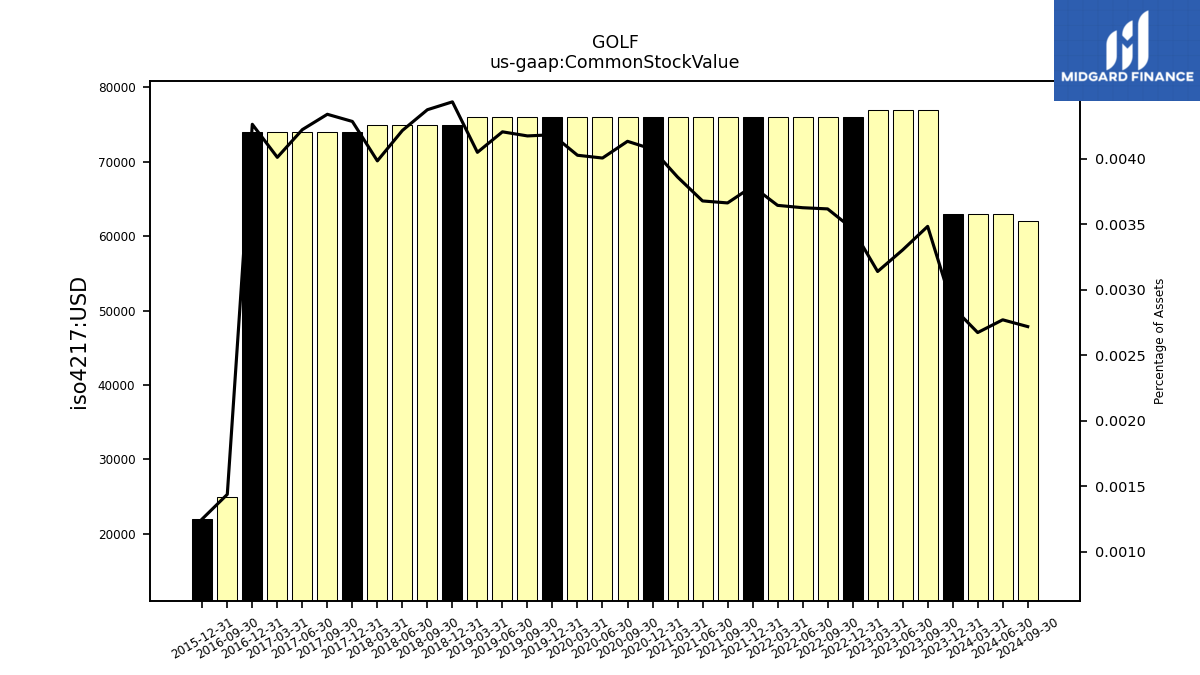
| Common Stock Value | 0.06 | 0.08 | 0.08 | 0.08 | 0.08 | 0.08 | 0.08 | 0.08 | 0.08 | 0.08 | 0.08 | 0.08 | 0.08 | 0.08 | 0.08 | 0.08 | 0.08 | 0.08 | 0.08 | 0.08 | 0.07 | 0.07 | 0.07 | 0.07 | 0.07 | 0.07 | 0.07 | 0.07 | 0.07 | 0.03 | NA | NA | 0.02 | NA | NA | NA | |
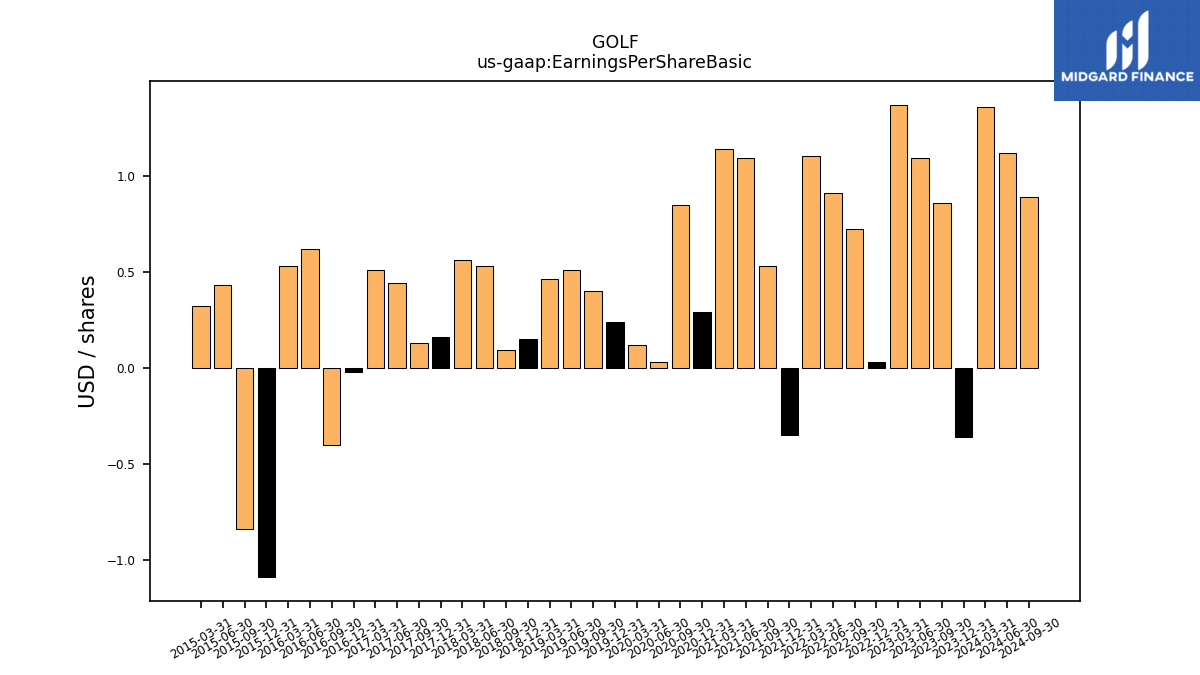
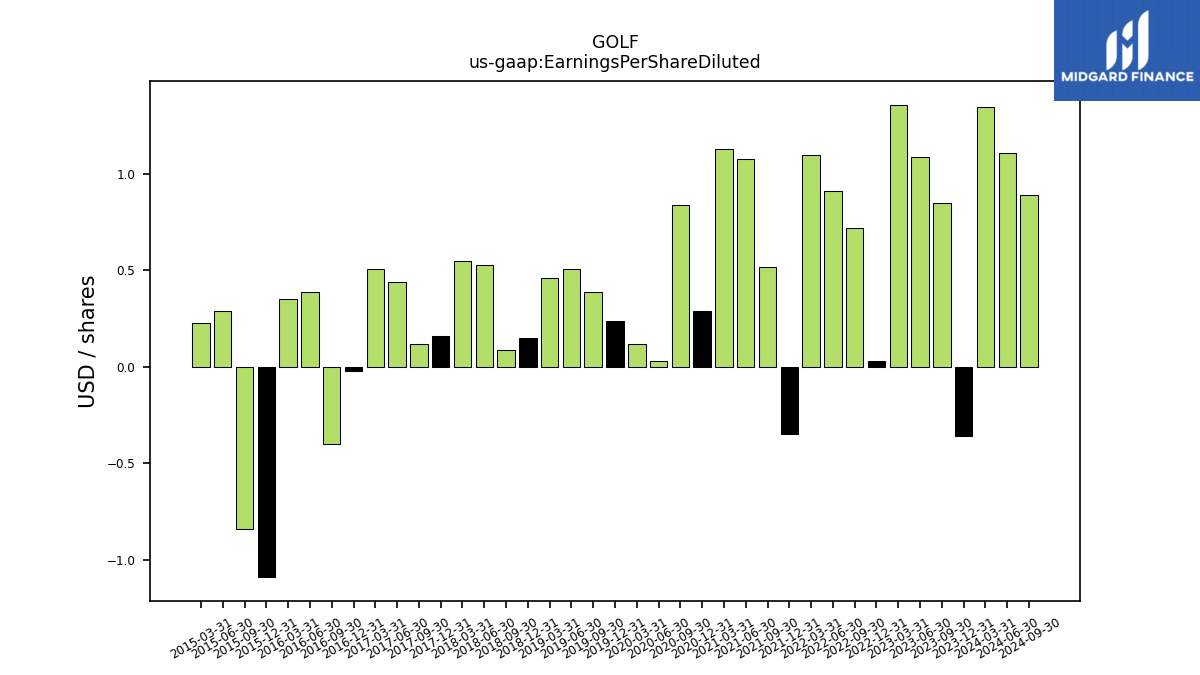
| Earnings Per Share Basic | -0.36 | 0.86 | 1.09 | 1.37 | 0.03 | 0.72 | 0.91 | 1.10 | -0.35 | 0.53 | 1.09 | 1.14 | 0.29 | 0.85 | 0.03 | 0.12 | 0.24 | 0.40 | 0.51 | 0.46 | 0.15 | 0.09 | 0.53 | 0.56 | 0.16 | 0.13 | 0.44 | 0.51 | -0.02 | -0.40 | 0.62 | 0.53 | -1.09 | -0.84 | 0.43 | 0.32 | |
| Earnings Per Share Diluted | -0.36 | 0.85 | 1.09 | 1.36 | 0.03 | 0.72 | 0.91 | 1.10 | -0.35 | 0.52 | 1.08 | 1.13 | 0.29 | 0.84 | 0.03 | 0.12 | 0.24 | 0.39 | 0.51 | 0.46 | 0.15 | 0.09 | 0.53 | 0.55 | 0.16 | 0.12 | 0.44 | 0.51 | -0.02 | -0.40 | 0.39 | 0.35 | -1.09 | -0.84 | 0.29 | 0.23 |
| 2023-12-31 | 2023-09-30 | 2023-06-30 | 2023-03-31 | 2022-12-31 | 2022-09-30 | 2022-06-30 | 2022-03-31 | 2021-12-31 | 2021-09-30 | 2021-06-30 | 2021-03-31 | 2020-12-31 | 2020-09-30 | 2020-06-30 | 2020-03-31 | 2019-12-31 | 2019-09-30 | 2019-06-30 | 2019-03-31 | 2018-12-31 | 2018-09-30 | 2018-06-30 | 2018-03-31 | 2017-12-31 | 2017-09-30 | 2017-06-30 | 2017-03-31 | 2016-12-31 | 2016-09-30 | 2016-06-30 | 2016-03-31 | 2015-12-31 | 2015-09-30 | 2015-06-30 | 2015-03-31 | ||
|---|---|---|---|---|---|---|---|---|---|---|---|---|---|---|---|---|---|---|---|---|---|---|---|---|---|---|---|---|---|---|---|---|---|---|---|---|---|
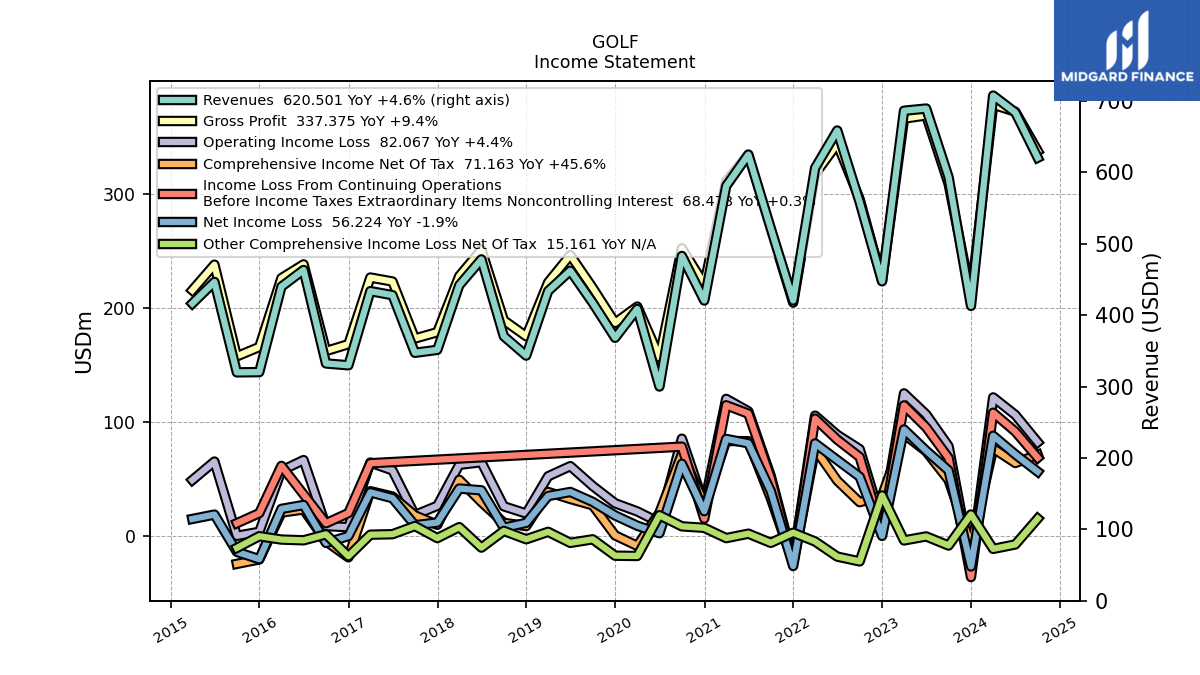
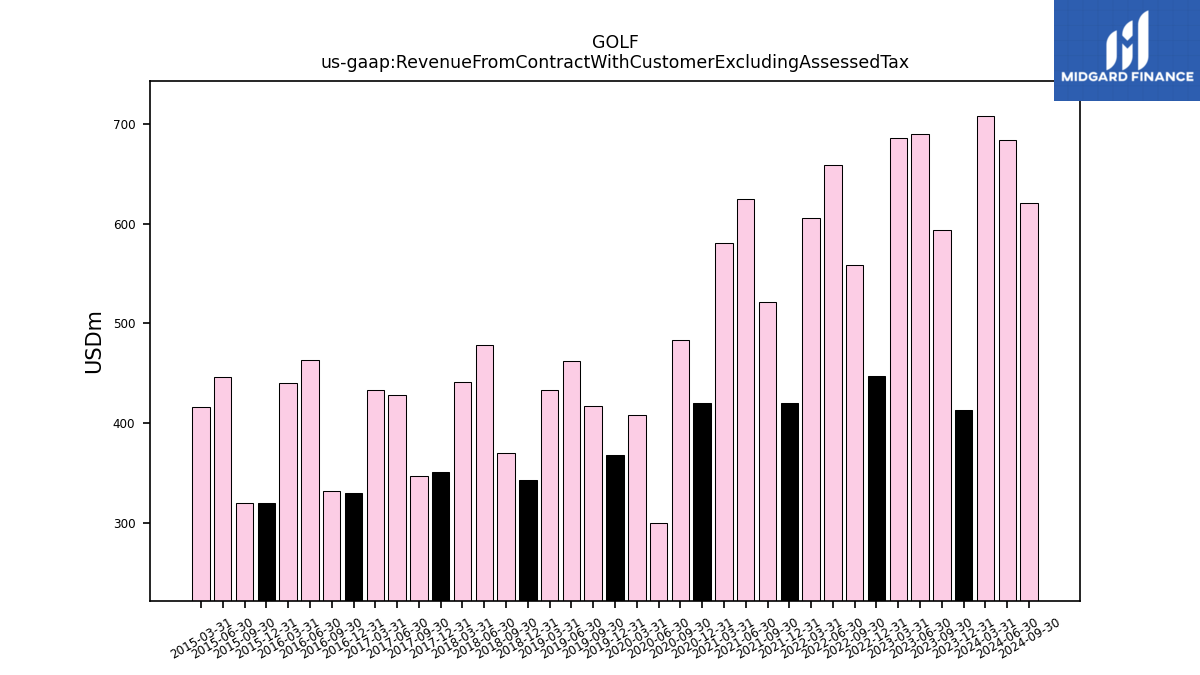
| Revenue From Contract With Customer Excluding Assessed Tax | 412.96 | 593.38 | 689.36 | 686.29 | 447.40 | 558.25 | 658.60 | 606.09 | 420.57 | 521.63 | 624.85 | 580.88 | 420.49 | 482.93 | 300.00 | 408.74 | 368.27 | 417.17 | 462.22 | 433.70 | 343.36 | 370.43 | 478.14 | 441.80 | 351.39 | 347.26 | 427.99 | 433.62 | 329.76 | 332.35 | 463.26 | 439.94 | 320.22 | 319.87 | 446.58 | 416.30 | |
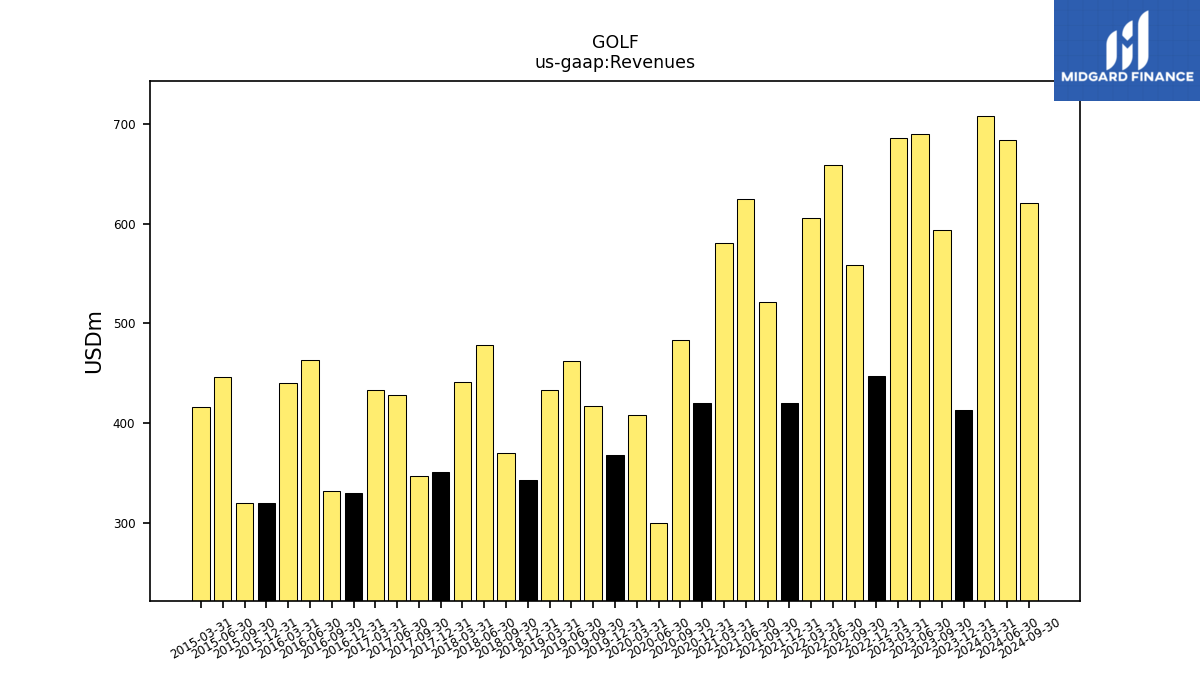
| Revenues | 412.96 | 593.38 | 689.36 | 686.29 | 447.40 | 558.25 | 658.60 | 606.09 | 420.57 | 521.63 | 624.85 | 580.88 | 420.49 | 482.93 | 300.00 | 408.74 | 368.27 | 417.17 | 462.22 | 433.70 | 343.36 | 370.43 | 478.14 | 441.80 | 351.39 | 347.26 | 427.99 | 433.62 | 329.76 | 332.35 | 463.26 | 439.94 | 320.22 | 319.87 | 446.58 | 416.30 | |
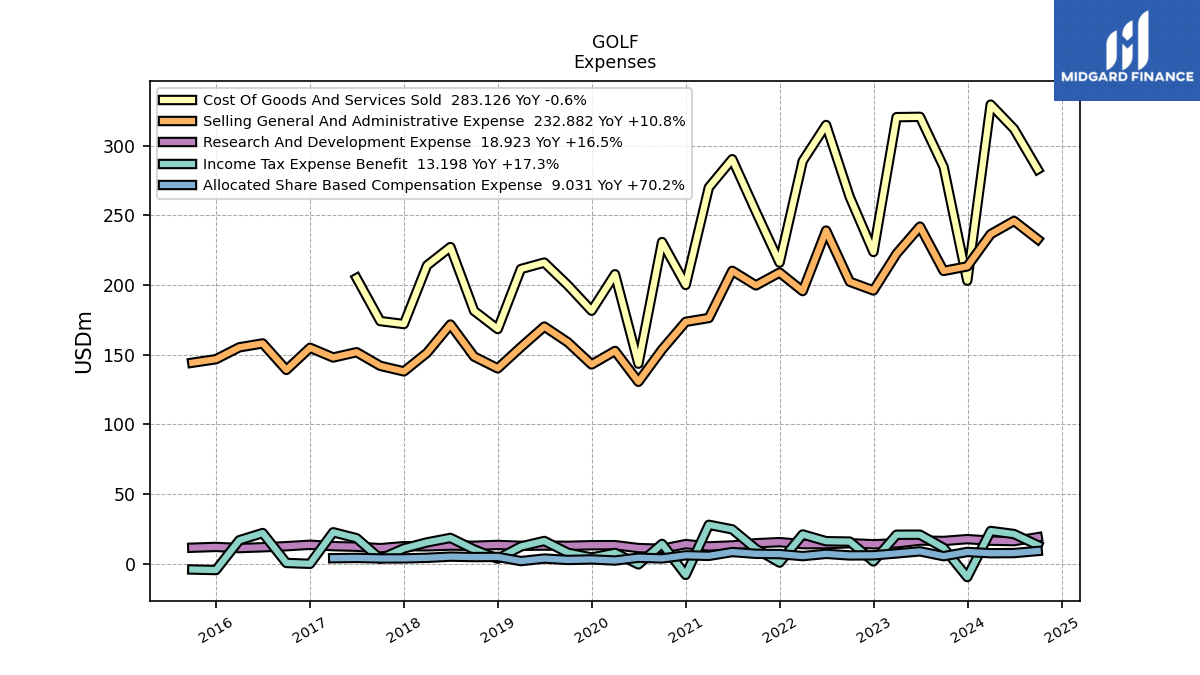
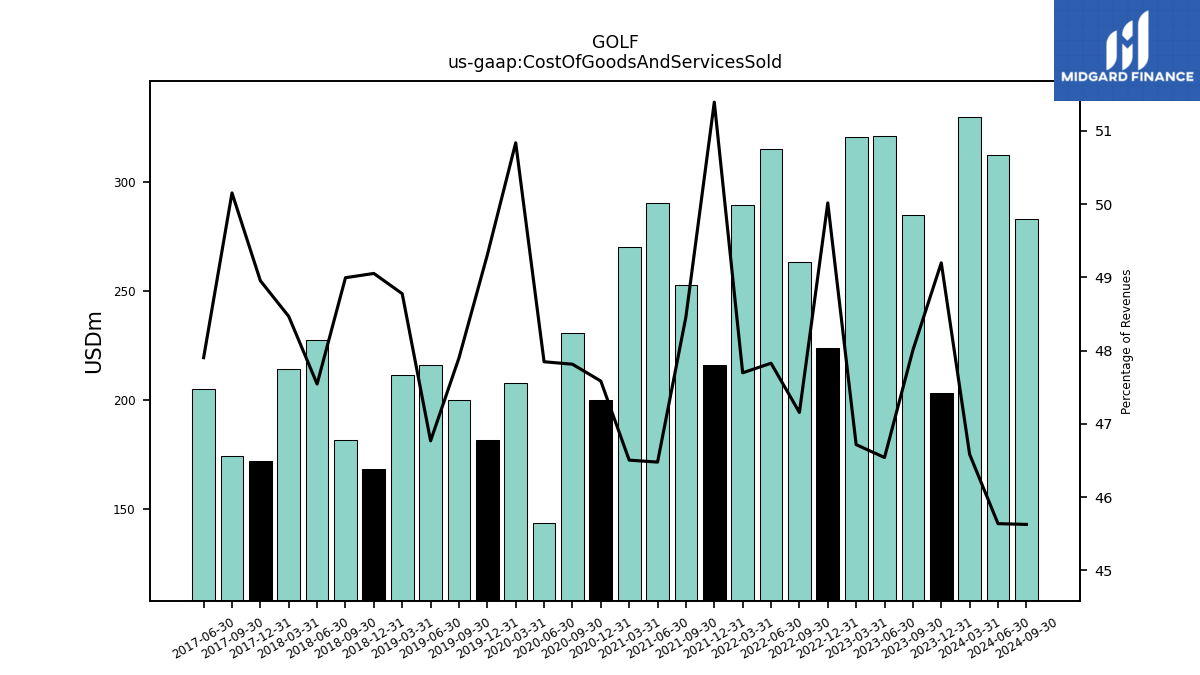
| Cost Of Goods And Services Sold | 203.17 | 284.86 | 320.84 | 320.62 | 223.77 | 263.25 | 314.99 | 289.09 | 216.13 | 252.79 | 290.42 | 270.15 | 200.09 | 230.91 | 143.54 | 207.79 | 181.58 | 199.82 | 216.18 | 211.54 | 168.43 | 181.49 | 227.33 | 214.13 | 172.02 | 174.16 | 205.02 | NA | NA | NA | NA | NA | NA | NA | NA | NA | |
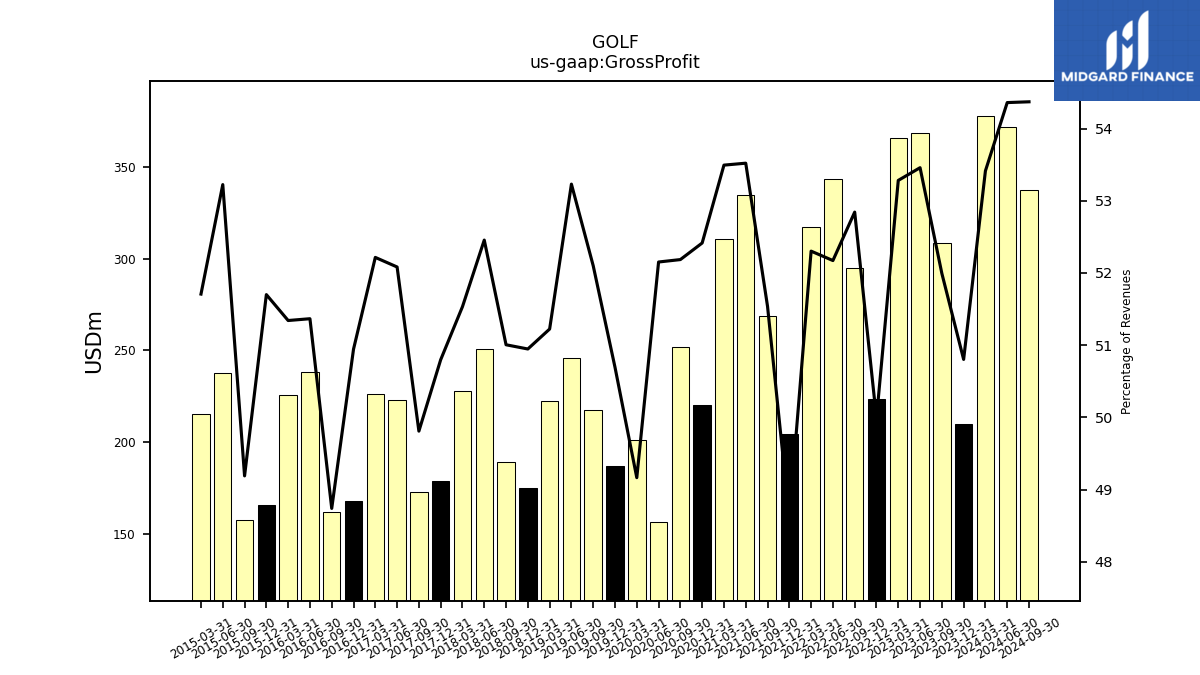
| Gross Profit | 209.79 | 308.52 | 368.52 | 365.67 | 223.63 | 295.00 | 343.61 | 317.00 | 204.44 | 268.84 | 334.43 | 310.74 | 220.40 | 252.02 | 156.46 | 200.96 | 186.69 | 217.34 | 246.04 | 222.16 | 174.93 | 188.94 | 250.81 | 227.67 | 178.50 | 172.97 | 222.91 | 226.41 | 167.99 | 161.98 | 237.96 | 225.87 | 165.55 | 157.34 | 237.69 | 215.26 | |
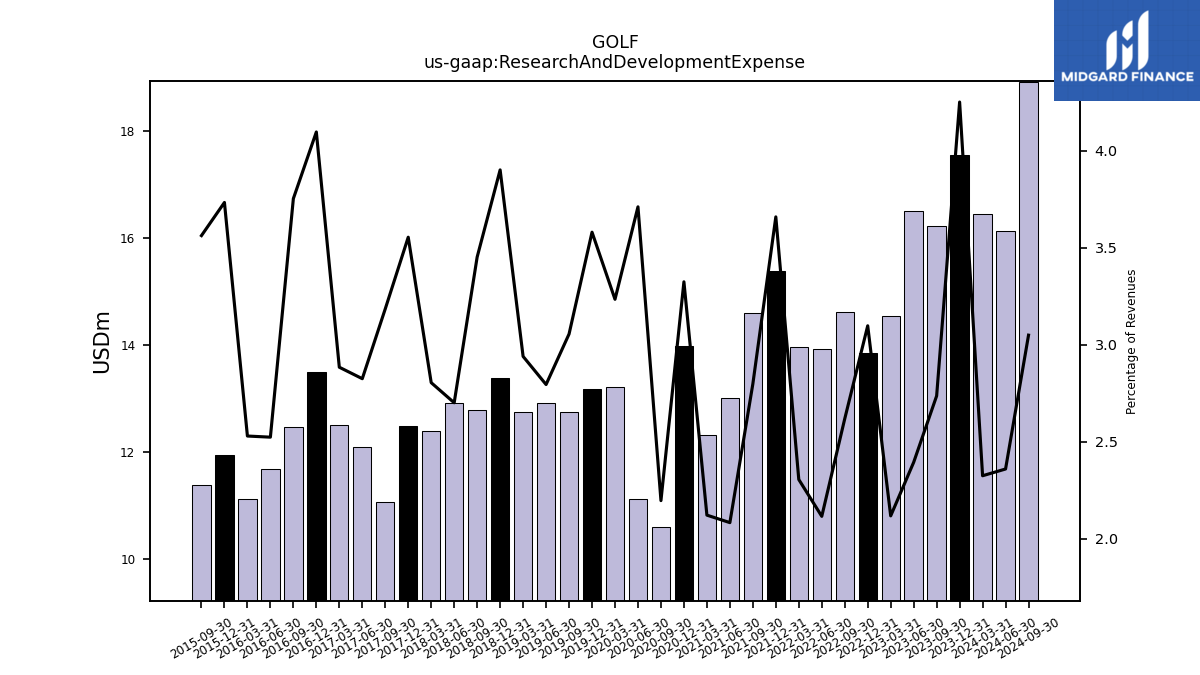
| Research And Development Expense | 17.55 | 16.24 | 16.51 | 14.54 | 13.86 | 14.62 | 13.94 | 13.98 | 15.39 | 14.60 | 13.02 | 12.33 | 13.98 | 10.61 | 11.13 | 13.22 | 13.18 | 12.75 | 12.92 | 12.75 | 13.39 | 12.79 | 12.92 | 12.39 | 12.49 | 11.06 | 12.09 | 12.51 | 13.51 | 12.47 | 11.69 | 11.13 | 11.95 | 11.39 | NA | NA | |
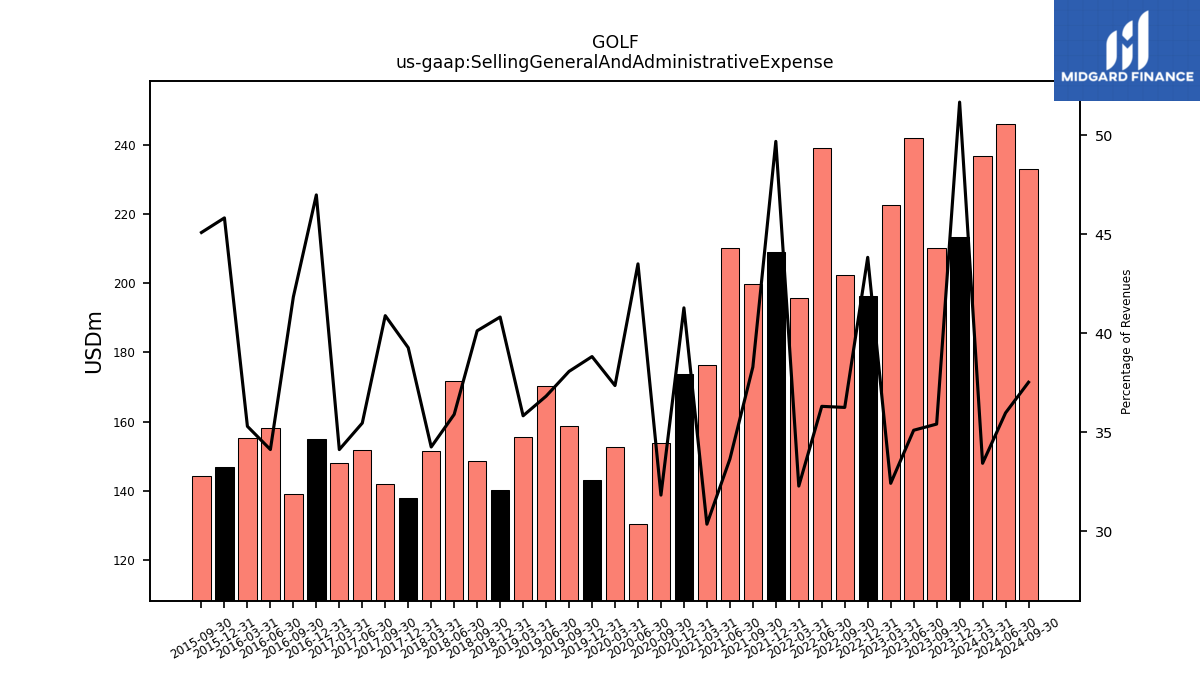
| Selling General And Administrative Expense | 213.43 | 210.17 | 242.01 | 222.54 | 196.15 | 202.42 | 239.17 | 195.69 | 209.01 | 199.79 | 210.25 | 176.37 | 173.62 | 153.72 | 130.53 | 152.72 | 143.00 | 158.86 | 170.22 | 155.43 | 140.18 | 148.65 | 171.69 | 151.37 | 138.01 | 142.02 | 151.81 | 148.00 | 154.97 | 139.06 | 158.12 | 155.32 | 146.76 | 144.25 | NA | NA | |
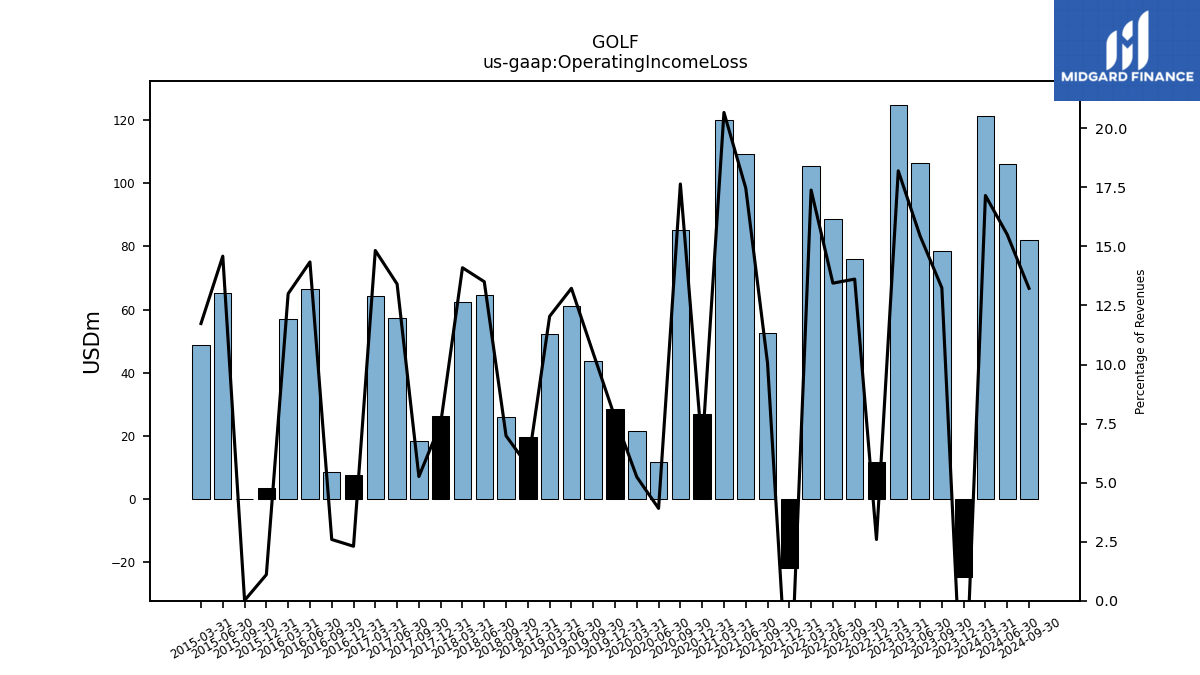
| Operating Income Loss | -24.69 | 78.61 | 106.49 | 124.90 | 11.61 | 76.01 | 88.55 | 105.37 | -21.92 | 52.49 | 109.18 | 120.07 | 27.09 | 85.20 | 11.73 | 21.43 | 28.57 | 43.73 | 61.13 | 52.23 | 19.60 | 25.87 | 64.58 | 62.28 | 26.37 | 18.27 | 57.38 | 64.29 | 7.61 | 8.62 | 66.44 | 57.19 | 3.54 | 0.05 | 65.14 | 48.86 | |
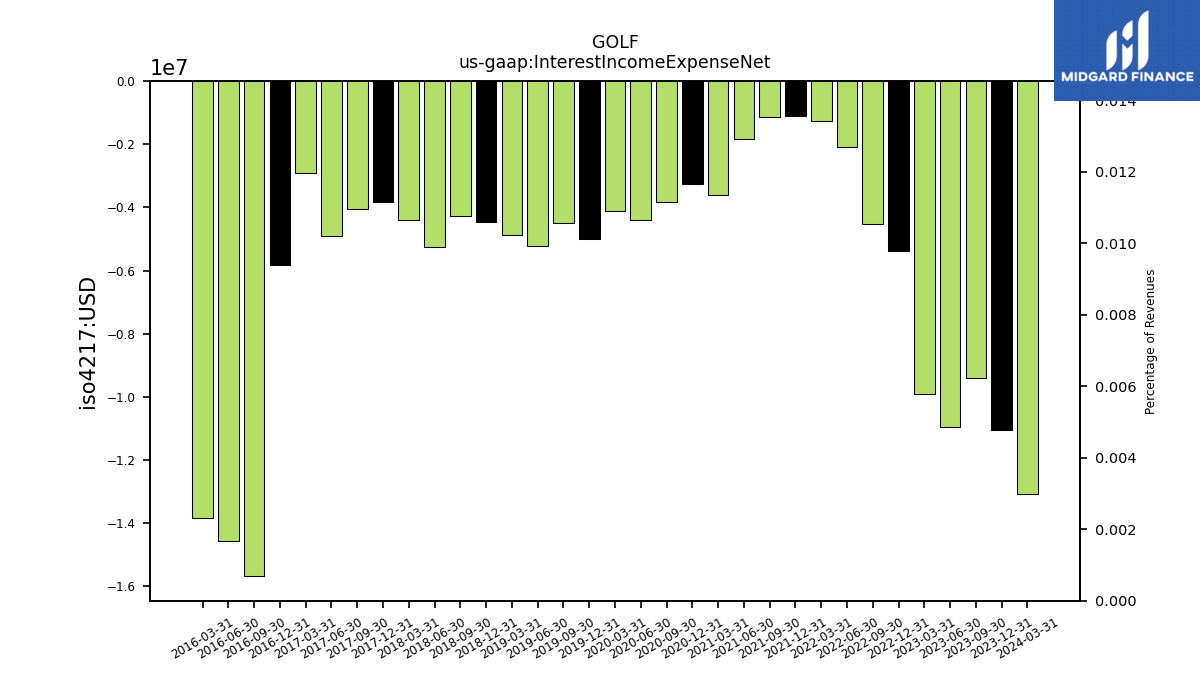
| Interest Income Expense Net | -11.05 | -9.39 | -10.95 | -9.90 | -5.37 | -4.53 | -2.09 | -1.28 | -1.10 | -1.15 | -1.85 | -3.62 | -3.27 | -3.83 | -4.40 | -4.12 | -5.01 | -4.50 | -5.21 | -4.88 | -4.46 | -4.28 | -5.25 | -4.41 | -3.85 | -4.04 | -4.90 | -2.92 | -5.83 | -15.67 | -14.56 | -13.84 | NA | NA | NA | NA | |
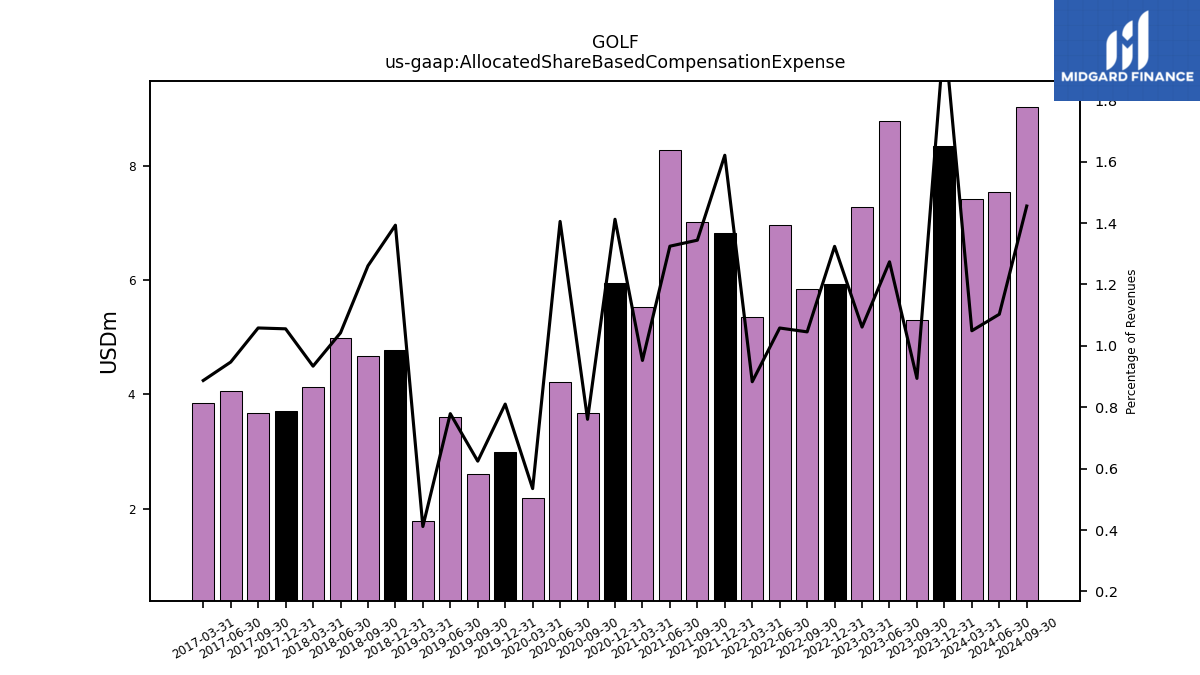
| Allocated Share Based Compensation Expense | 8.34 | 5.30 | 8.78 | 7.28 | 5.92 | 5.84 | 6.97 | 5.35 | 6.82 | 7.01 | 8.28 | 5.53 | 5.94 | 3.67 | 4.22 | 2.19 | 2.98 | 2.60 | 3.60 | 1.78 | 4.78 | 4.67 | 4.98 | 4.13 | 3.71 | 3.67 | 4.05 | 3.85 | NA | NA | NA | NA | NA | NA | NA | NA | |
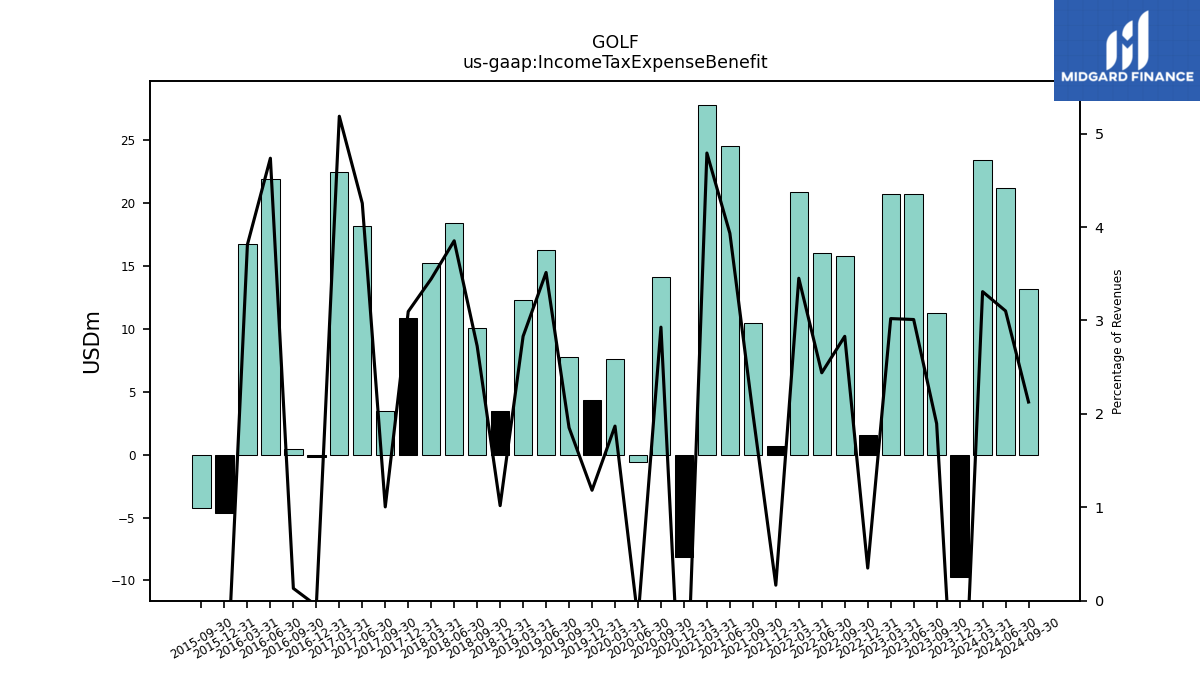
| Income Tax Expense Benefit | -9.73 | 11.25 | 20.75 | 20.73 | 1.56 | 15.80 | 16.07 | 20.92 | 0.70 | 10.47 | 24.57 | 27.83 | -8.14 | 14.14 | -0.60 | 7.64 | 4.36 | 7.73 | 16.24 | 12.28 | 3.50 | 10.10 | 18.42 | 15.22 | 10.88 | 3.49 | 18.21 | 22.48 | -0.17 | 0.44 | 21.94 | 16.77 | -4.65 | -4.27 | NA | NA | |
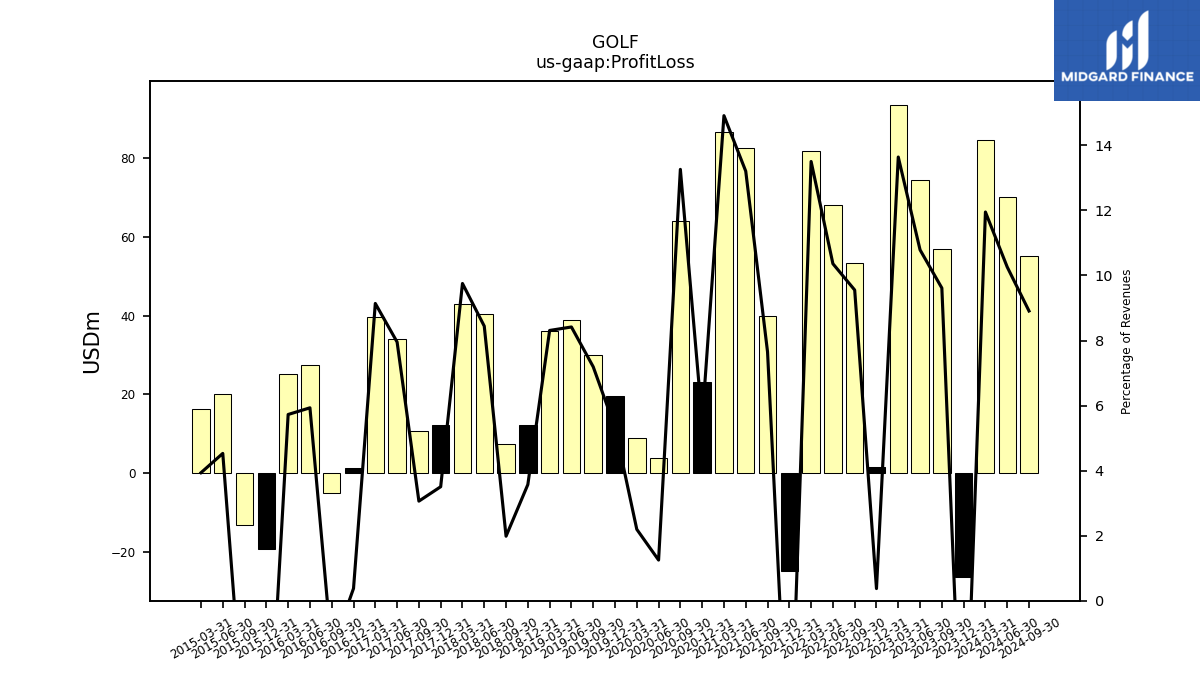
| Profit Loss | -26.42 | 57.05 | 74.36 | 93.62 | 1.67 | 53.32 | 68.24 | 81.85 | -24.83 | 39.92 | 82.52 | 86.63 | 23.24 | 64.05 | 3.75 | 8.97 | 19.62 | 30.01 | 38.90 | 36.04 | 12.26 | 7.35 | 40.37 | 43.09 | 12.32 | 10.63 | 34.04 | 39.63 | 1.25 | -5.04 | 27.48 | 25.19 | -19.16 | -13.30 | 20.23 | 16.39 | |
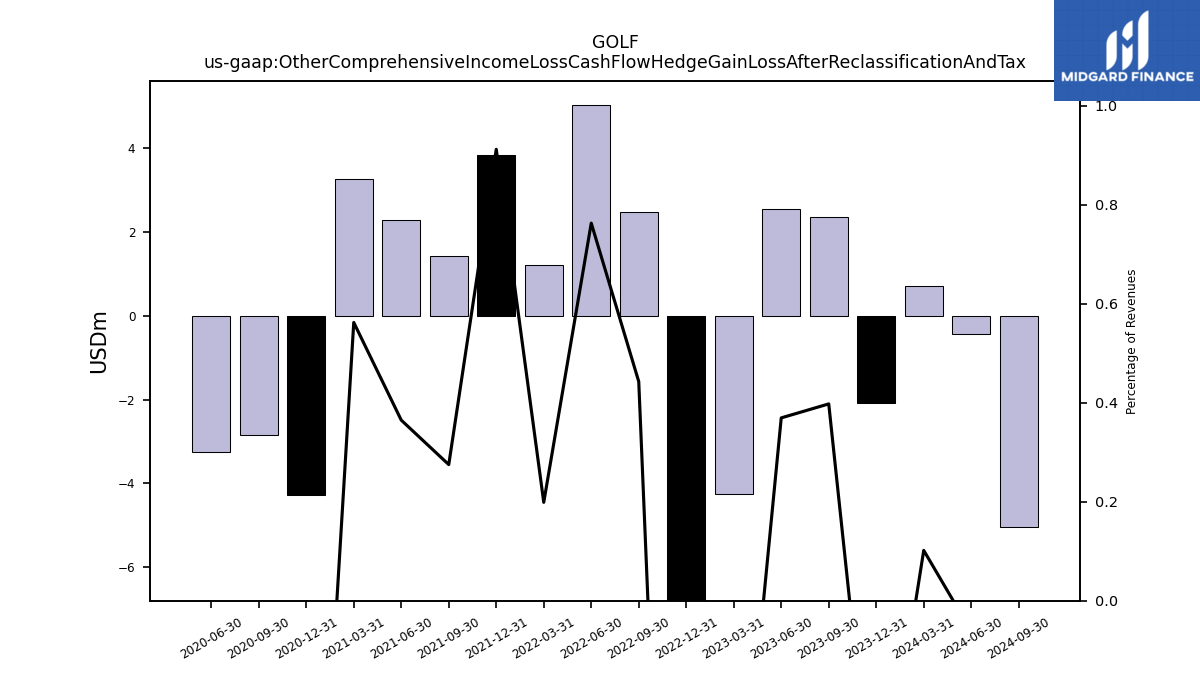
| Other Comprehensive Income Loss Cash Flow Hedge Gain Loss After Reclassification And Tax | -2.09 | 2.36 | 2.55 | -4.26 | -8.27 | 2.47 | 5.03 | 1.21 | 3.84 | 1.44 | 2.28 | 3.27 | -4.28 | -2.85 | -3.25 | NA | NA | NA | NA | NA | NA | NA | NA | NA | NA | NA | NA | NA | NA | NA | NA | NA | NA | NA | NA | NA | |
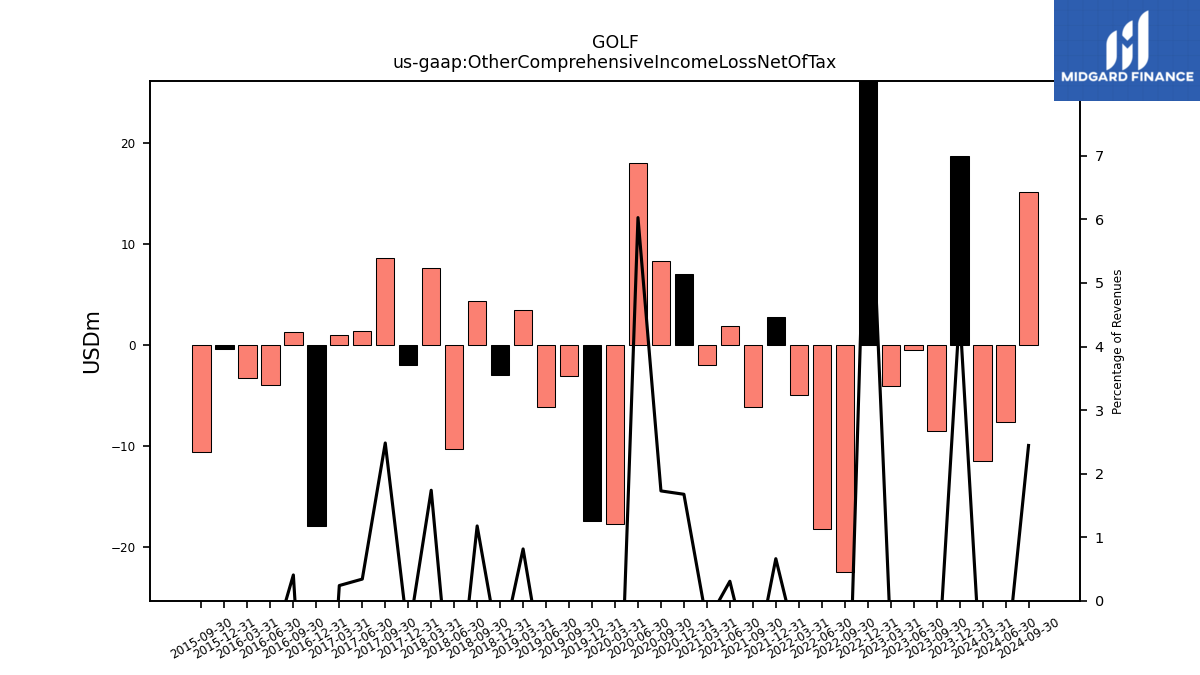
| Other Comprehensive Income Loss Net Of Tax | 18.77 | -8.47 | -0.49 | -4.01 | 35.41 | -22.38 | -18.17 | -4.95 | 2.78 | -6.12 | 1.92 | -1.98 | 7.04 | 8.35 | 18.09 | -17.63 | -17.38 | -3.00 | -6.14 | 3.54 | -2.96 | 4.36 | -10.29 | 7.68 | -1.97 | 8.62 | 1.46 | 1.04 | -17.83 | 1.35 | -3.88 | -3.23 | -0.32 | -10.57 | NA | NA | |
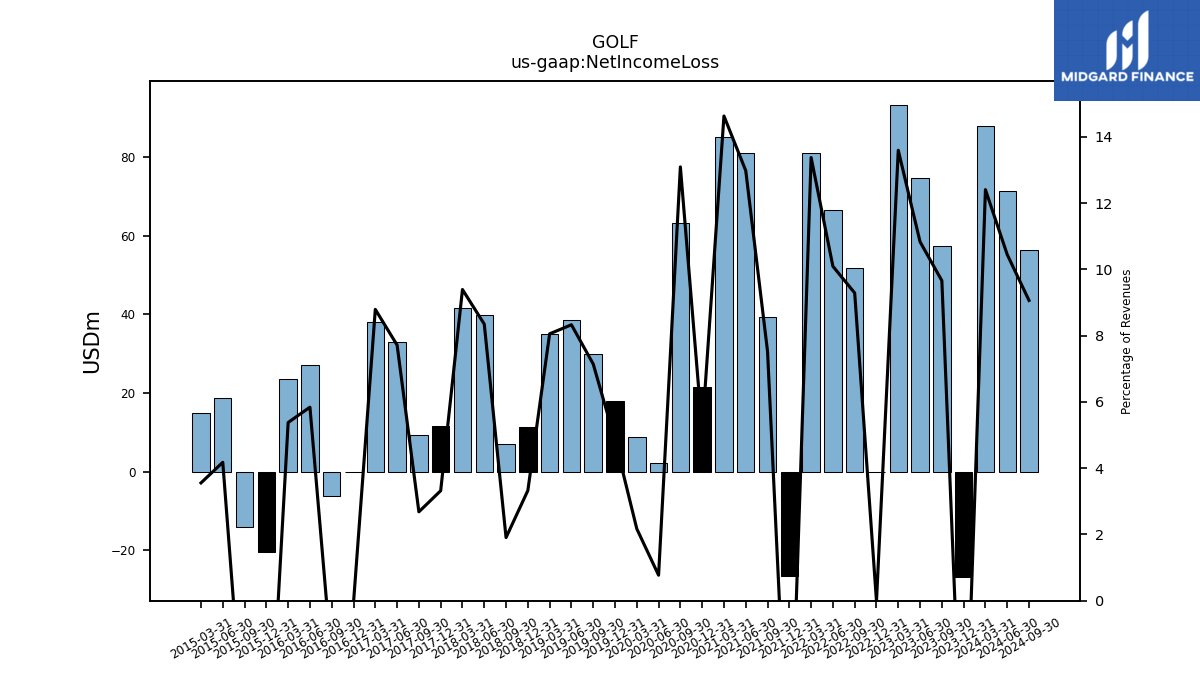
| Net Income Loss | -26.81 | 57.31 | 74.66 | 93.28 | -0.06 | 51.84 | 66.45 | 81.05 | -26.43 | 39.26 | 81.08 | 84.96 | 21.60 | 63.22 | 2.31 | 8.88 | 17.86 | 29.80 | 38.49 | 34.93 | 11.42 | 7.06 | 39.91 | 41.48 | 11.67 | 9.32 | 33.02 | 38.11 | -0.18 | -6.17 | 27.05 | 23.66 | -20.44 | -13.99 | 18.65 | 14.80 | |
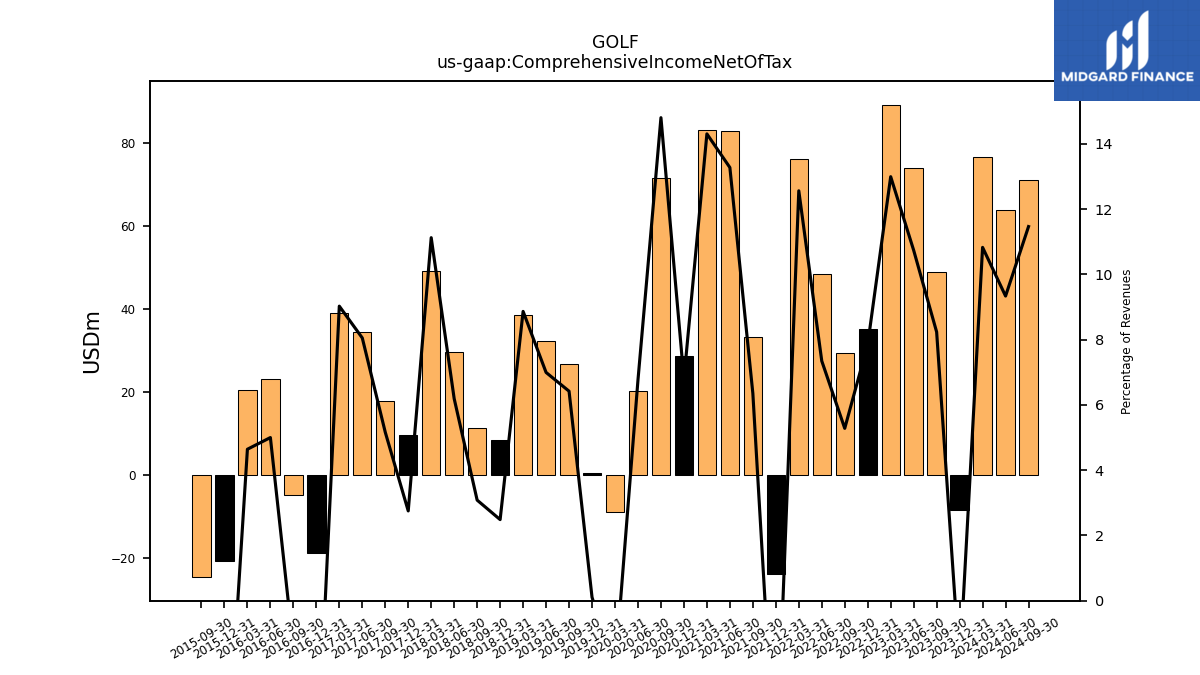
| Comprehensive Income Net Of Tax | -8.39 | 48.88 | 74.05 | 89.20 | 35.17 | 29.50 | 48.40 | 76.16 | -23.72 | 33.16 | 82.97 | 83.12 | 28.58 | 71.50 | 20.30 | -8.77 | 0.40 | 26.79 | 32.34 | 38.46 | 8.54 | 11.42 | 29.61 | 49.16 | 9.67 | 17.94 | 34.48 | 39.15 | -18.78 | -4.82 | 23.17 | 20.43 | -20.65 | -24.55 | NA | NA |
| 2023-12-31 | 2023-09-30 | 2023-06-30 | 2023-03-31 | 2022-12-31 | 2022-09-30 | 2022-06-30 | 2022-03-31 | 2021-12-31 | 2021-09-30 | 2021-06-30 | 2021-03-31 | 2020-12-31 | 2020-09-30 | 2020-06-30 | 2020-03-31 | 2019-12-31 | 2019-09-30 | 2019-06-30 | 2019-03-31 | 2018-12-31 | 2018-09-30 | 2018-06-30 | 2018-03-31 | 2017-12-31 | 2017-09-30 | 2017-06-30 | 2017-03-31 | 2016-12-31 | 2016-09-30 | 2016-06-30 | 2016-03-31 | 2015-12-31 | 2015-09-30 | 2015-06-30 | 2015-03-31 | ||
|---|---|---|---|---|---|---|---|---|---|---|---|---|---|---|---|---|---|---|---|---|---|---|---|---|---|---|---|---|---|---|---|---|---|---|---|---|---|
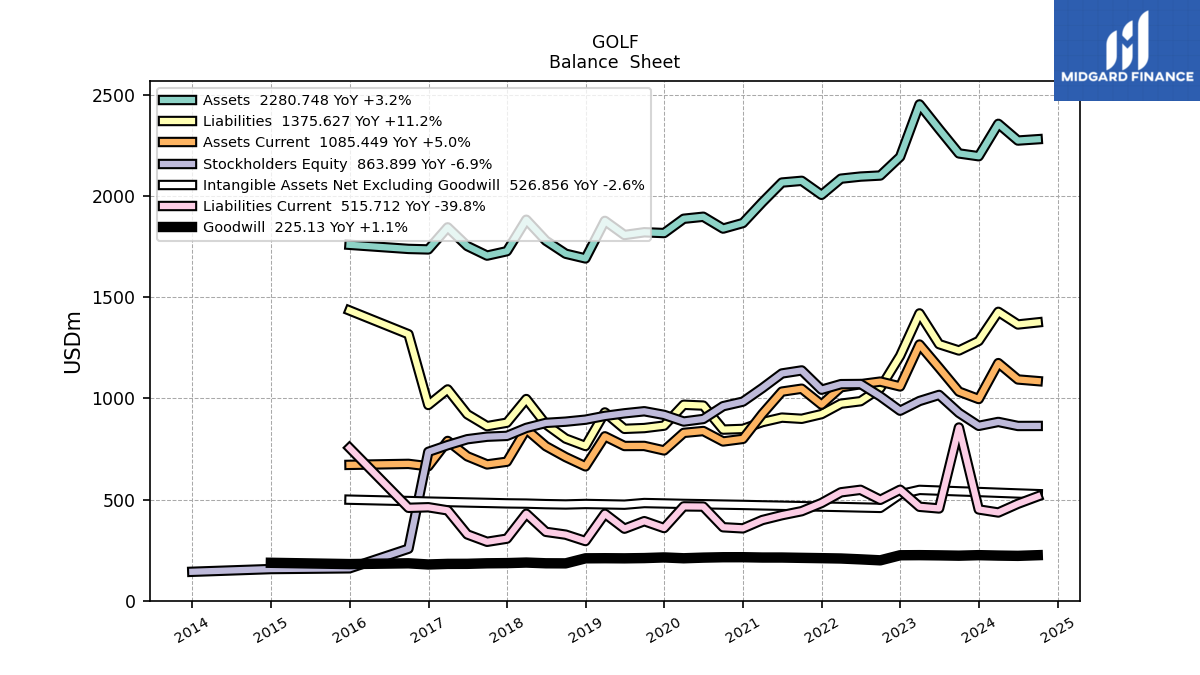
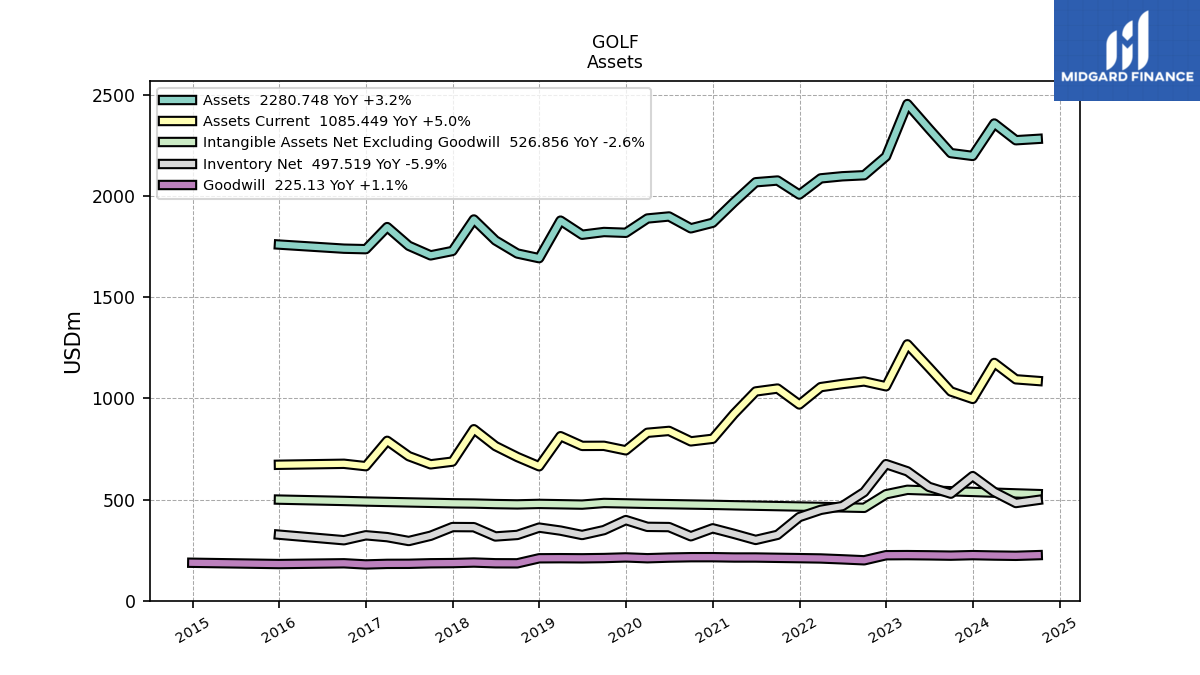
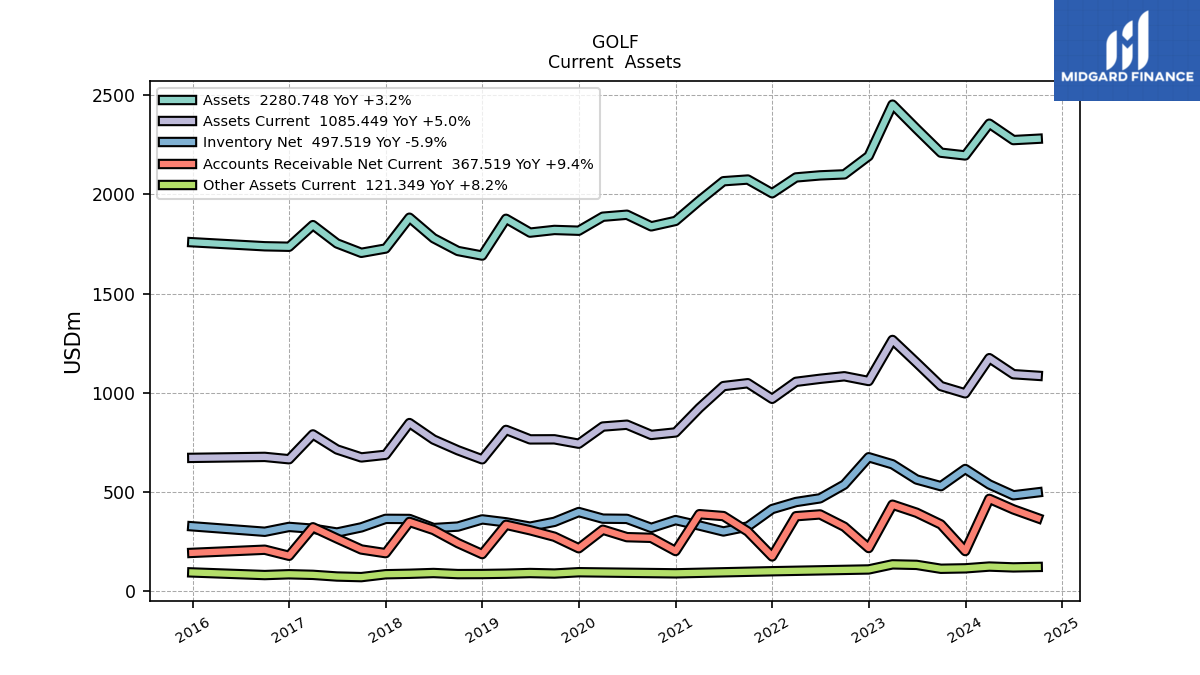
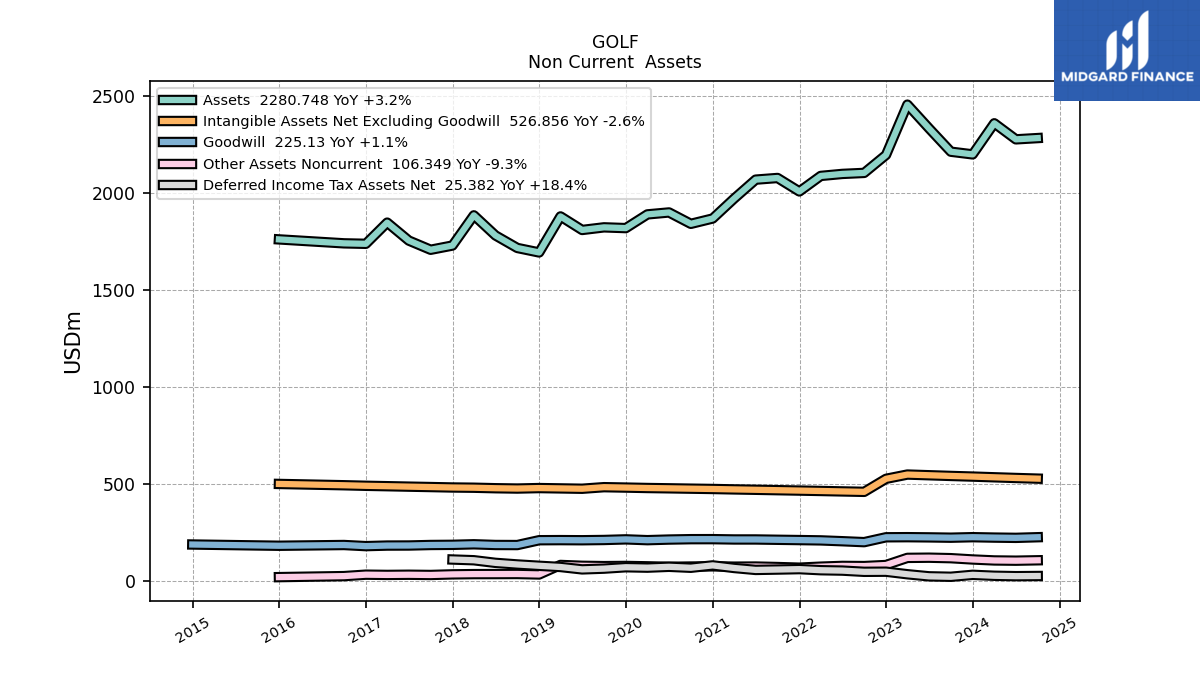
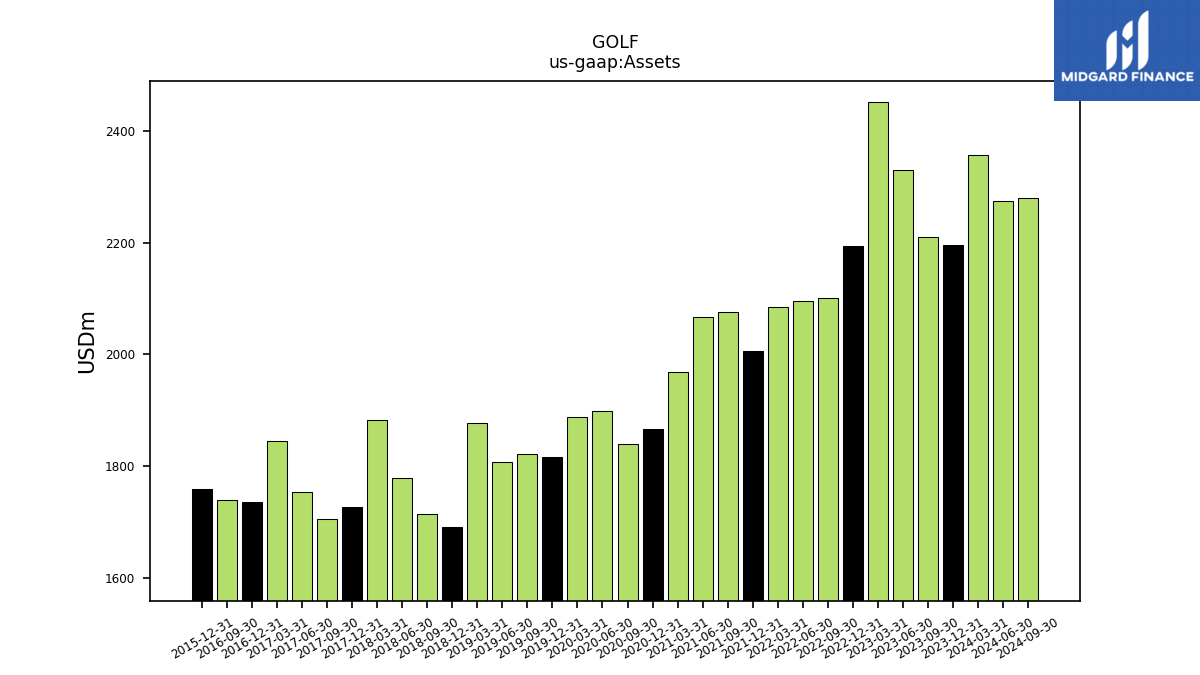
| Assets | 2196.68 | 2210.57 | 2330.93 | 2453.01 | 2193.81 | 2101.36 | 2096.15 | 2085.80 | 2005.84 | 2075.22 | 2066.69 | 1968.88 | 1866.56 | 1839.09 | 1897.72 | 1887.70 | 1817.05 | 1820.97 | 1807.44 | 1877.29 | 1691.62 | 1714.84 | 1779.30 | 1882.89 | 1727.32 | 1705.56 | 1752.85 | 1845.33 | 1736.17 | 1738.64 | NA | NA | 1758.97 | NA | NA | NA | |
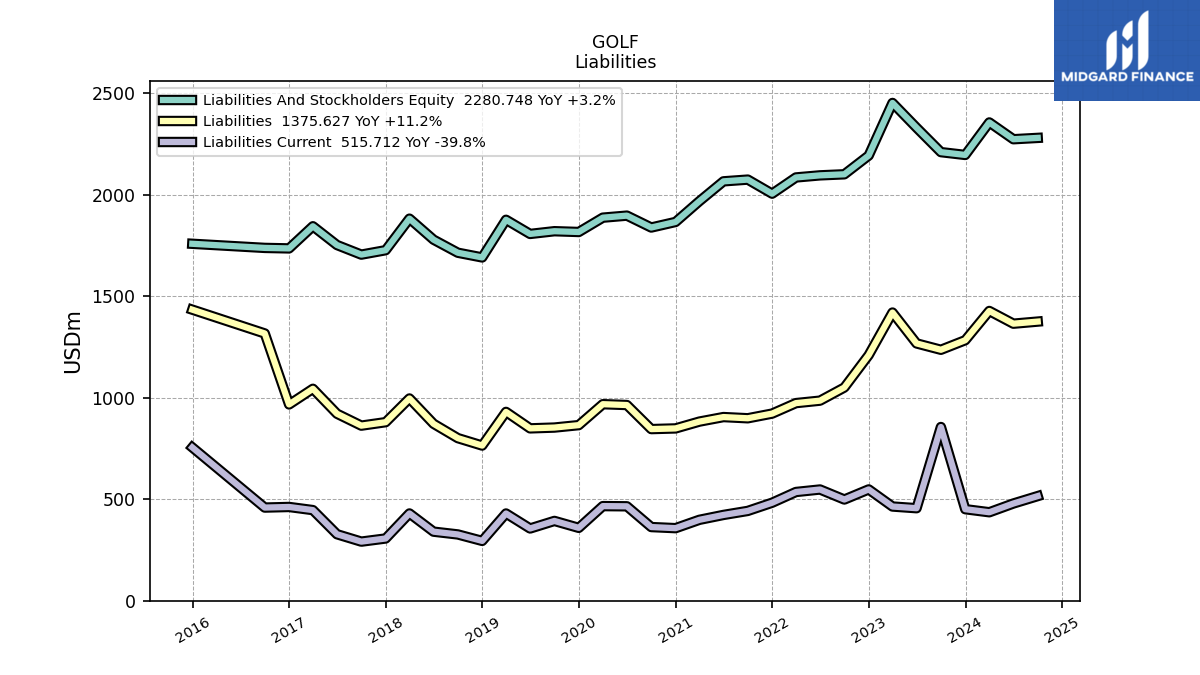
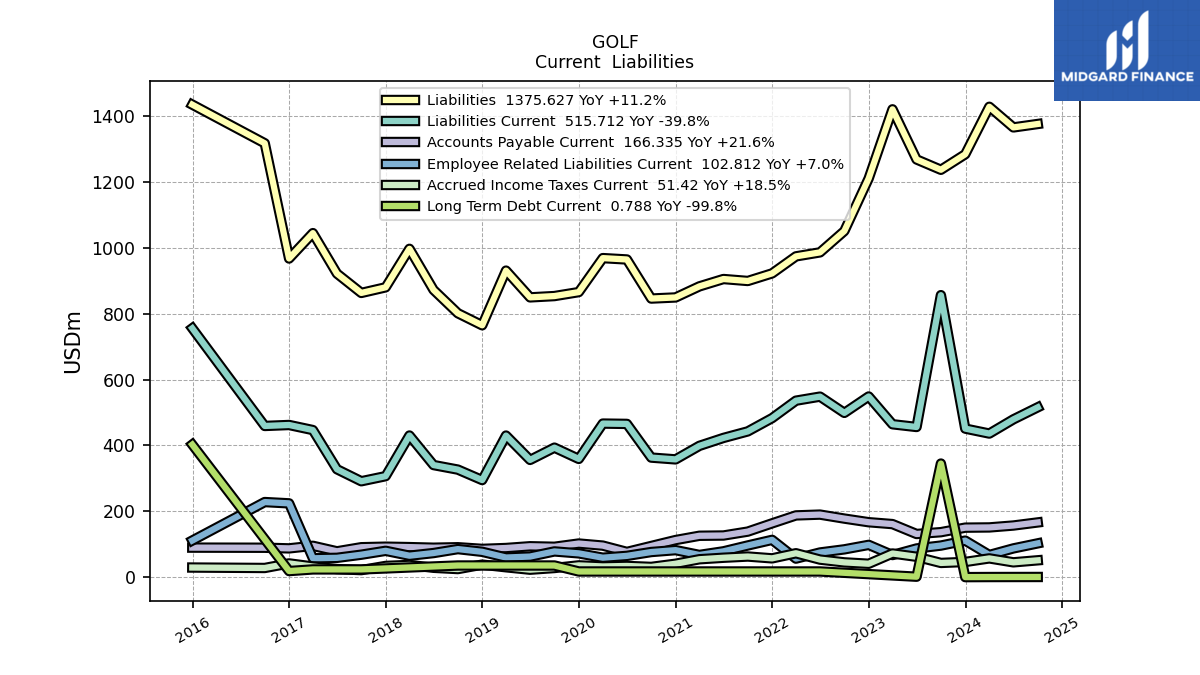
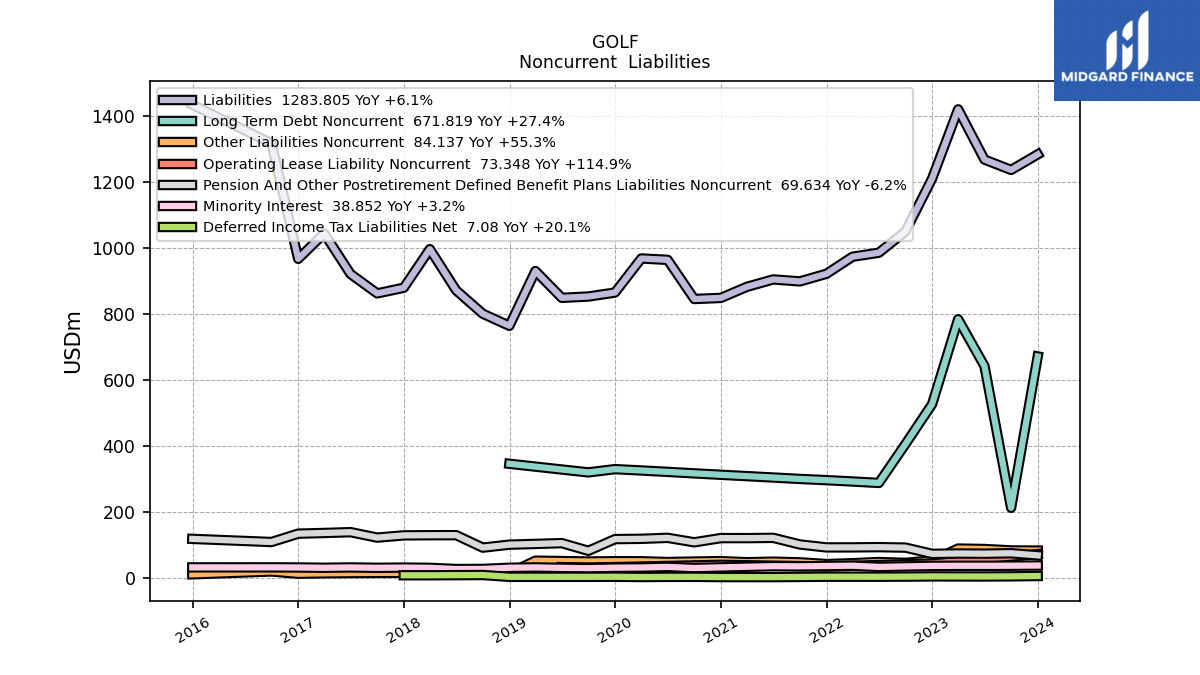
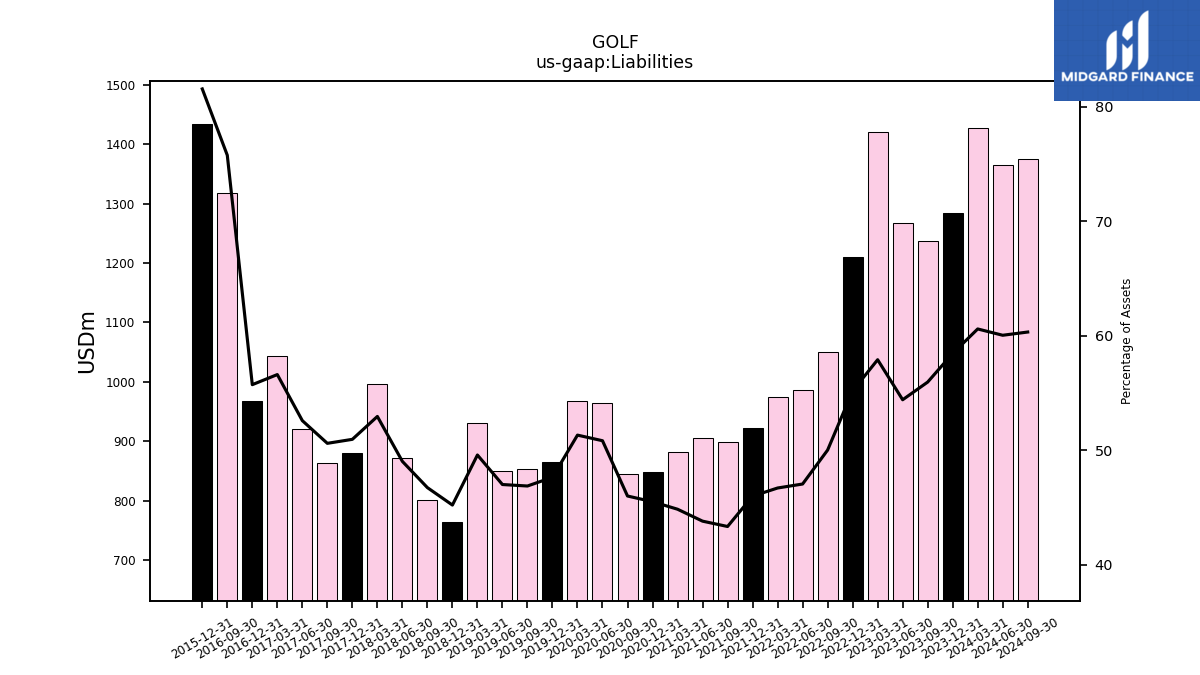
| Liabilities | 1283.81 | 1236.66 | 1268.02 | 1420.19 | 1210.44 | 1050.79 | 986.01 | 973.88 | 922.27 | 899.16 | 905.12 | 882.80 | 849.18 | 845.83 | 964.43 | 968.59 | 865.42 | 853.40 | 849.40 | 930.65 | 764.64 | 801.25 | 872.13 | 996.82 | 879.93 | 862.89 | 921.56 | 1044.44 | 967.35 | 1317.12 | NA | NA | 1434.43 | NA | NA | NA | |
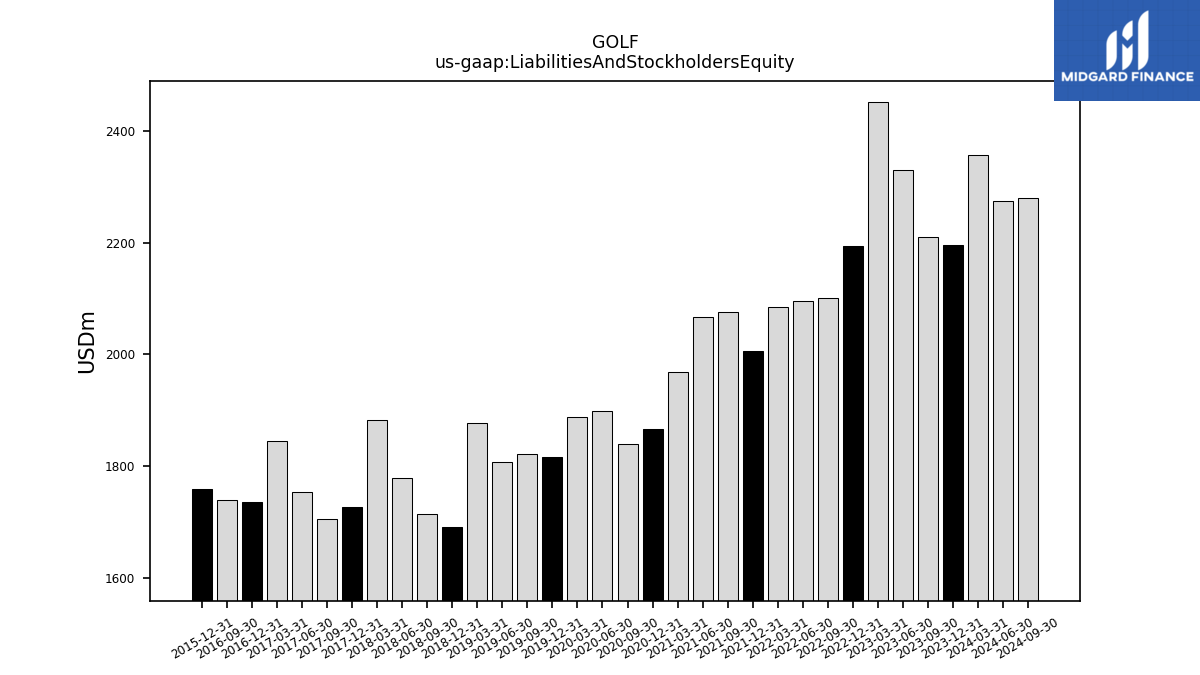
| Liabilities And Stockholders Equity | 2196.68 | 2210.57 | 2330.93 | 2453.01 | 2193.81 | 2101.36 | 2096.15 | 2085.80 | 2005.84 | 2075.22 | 2066.69 | 1968.88 | 1866.56 | 1839.09 | 1897.72 | 1887.70 | 1817.05 | 1820.97 | 1807.44 | 1877.29 | 1691.62 | 1714.84 | 1779.30 | 1882.89 | 1727.32 | 1705.56 | 1752.85 | 1845.33 | 1736.17 | 1738.64 | NA | NA | 1758.97 | NA | NA | NA | |
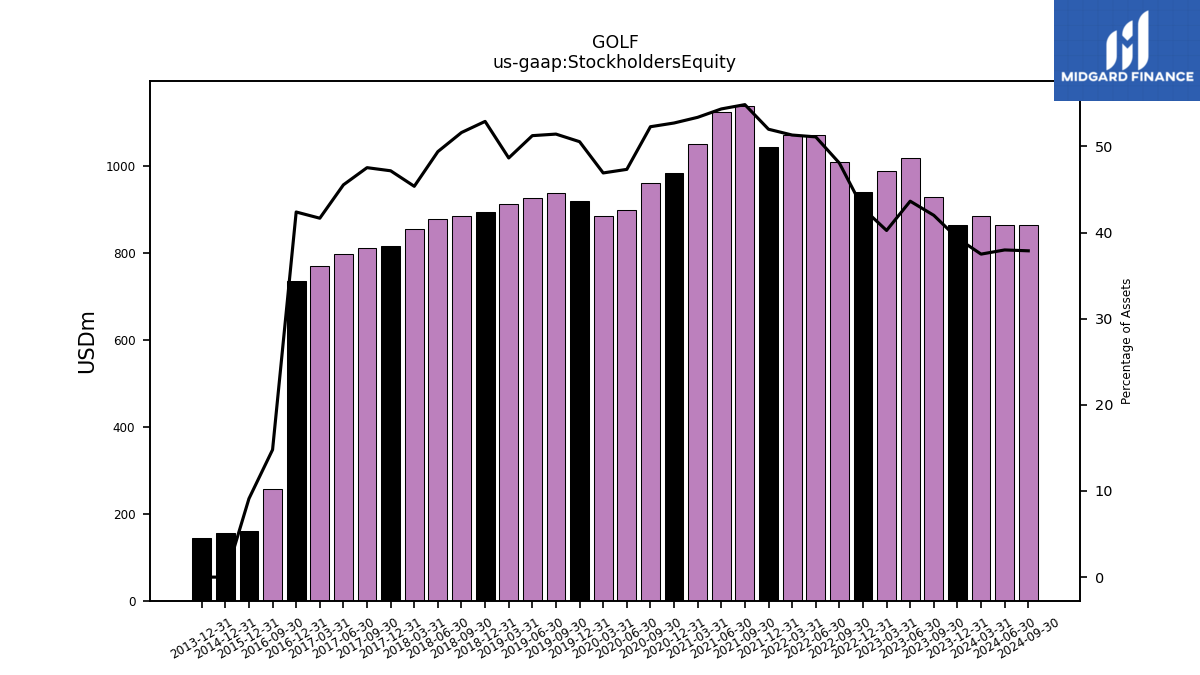
| Stockholders Equity | 864.24 | 928.37 | 1017.22 | 987.12 | 939.06 | 1010.00 | 1071.17 | 1070.39 | 1042.84 | 1138.21 | 1123.17 | 1050.86 | 983.95 | 961.51 | 898.23 | 885.65 | 918.44 | 936.46 | 926.25 | 913.41 | 894.87 | 885.02 | 878.88 | 854.20 | 814.73 | 810.66 | 798.19 | 768.81 | 735.87 | 257.15 | NA | NA | 160.25 | NA | NA | NA |
| 2023-12-31 | 2023-09-30 | 2023-06-30 | 2023-03-31 | 2022-12-31 | 2022-09-30 | 2022-06-30 | 2022-03-31 | 2021-12-31 | 2021-09-30 | 2021-06-30 | 2021-03-31 | 2020-12-31 | 2020-09-30 | 2020-06-30 | 2020-03-31 | 2019-12-31 | 2019-09-30 | 2019-06-30 | 2019-03-31 | 2018-12-31 | 2018-09-30 | 2018-06-30 | 2018-03-31 | 2017-12-31 | 2017-09-30 | 2017-06-30 | 2017-03-31 | 2016-12-31 | 2016-09-30 | 2016-06-30 | 2016-03-31 | 2015-12-31 | 2015-09-30 | 2015-06-30 | 2015-03-31 | ||
|---|---|---|---|---|---|---|---|---|---|---|---|---|---|---|---|---|---|---|---|---|---|---|---|---|---|---|---|---|---|---|---|---|---|---|---|---|---|
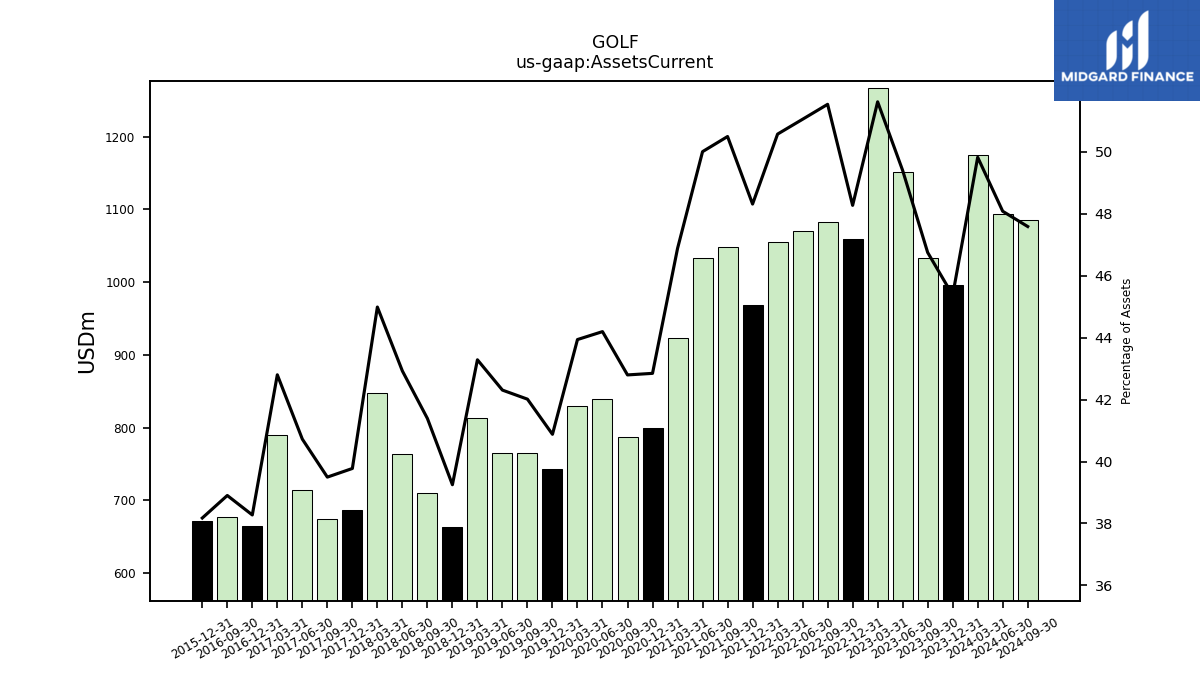
| Assets Current | 996.69 | 1033.52 | 1151.55 | 1266.25 | 1059.08 | 1083.02 | 1070.22 | 1054.94 | 969.18 | 1047.96 | 1033.56 | 923.06 | 799.81 | 787.10 | 838.74 | 829.48 | 742.82 | 765.09 | 764.69 | 812.63 | 664.00 | 709.81 | 763.78 | 847.14 | 687.08 | 673.67 | 713.84 | 789.85 | 664.53 | 676.41 | NA | NA | 671.52 | NA | NA | NA | |
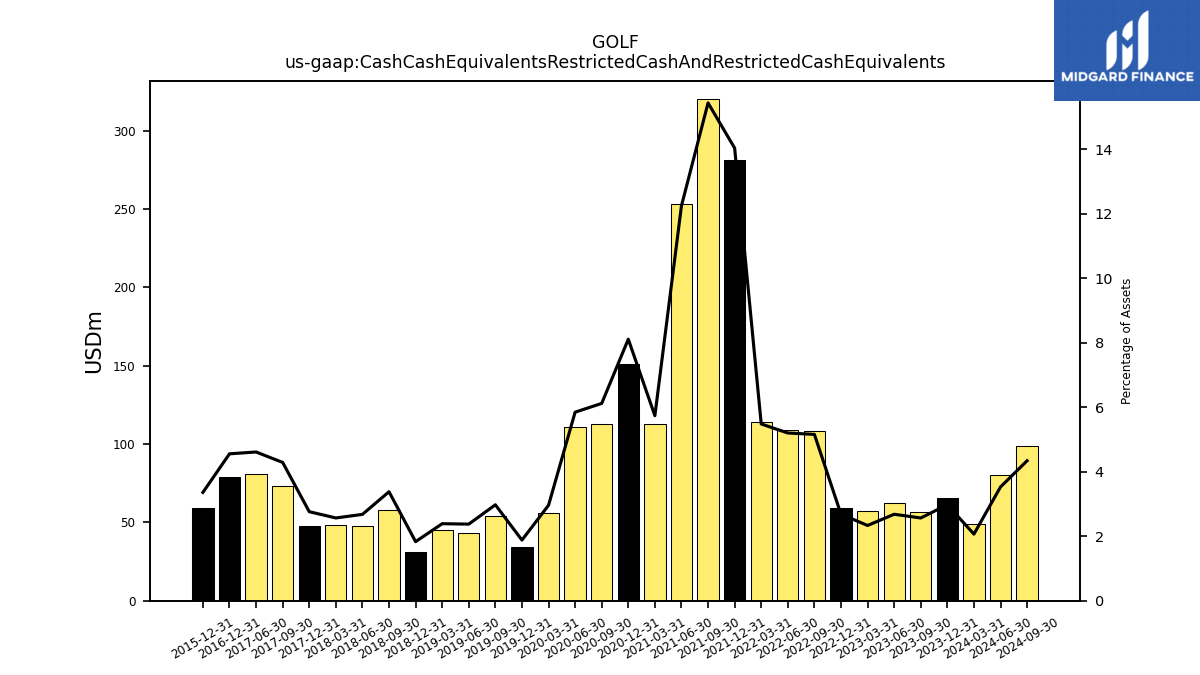
| Cash Cash Equivalents Restricted Cash And Restricted Cash Equivalents | 65.44 | 56.77 | 62.54 | 57.28 | 58.90 | 108.46 | 109.09 | 114.40 | 281.68 | 320.51 | 253.25 | 113.05 | 151.45 | 112.60 | 111.03 | 55.92 | 34.18 | 54.21 | 42.97 | 44.88 | 31.01 | 57.99 | 47.68 | 48.37 | 47.72 | 73.19 | 80.90 | NA | 79.14 | NA | NA | NA | 59.13 | NA | NA | NA | |
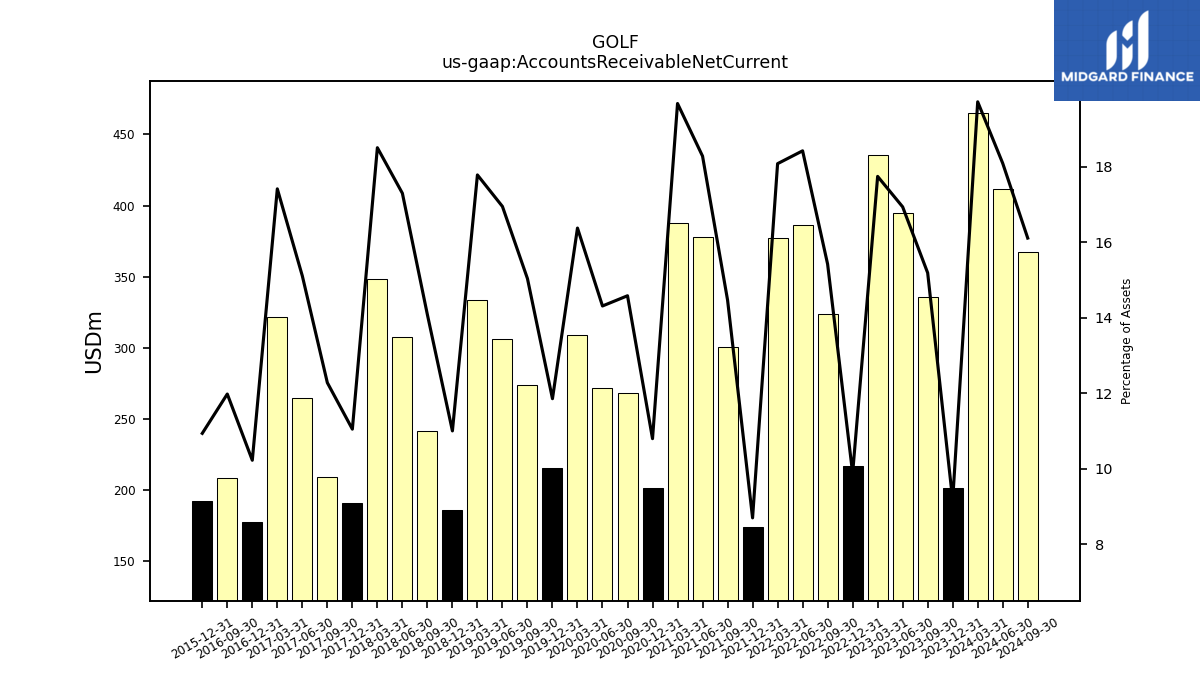
| Accounts Receivable Net Current | 201.35 | 335.82 | 394.89 | 435.38 | 216.69 | 324.10 | 386.26 | 377.25 | 174.44 | 300.33 | 377.92 | 387.51 | 201.52 | 268.23 | 271.64 | 309.20 | 215.43 | 273.88 | 306.40 | 333.93 | 186.11 | 241.49 | 307.85 | 348.52 | 190.85 | 209.44 | 264.87 | 321.44 | 177.51 | 208.28 | NA | NA | 192.38 | NA | NA | NA | |
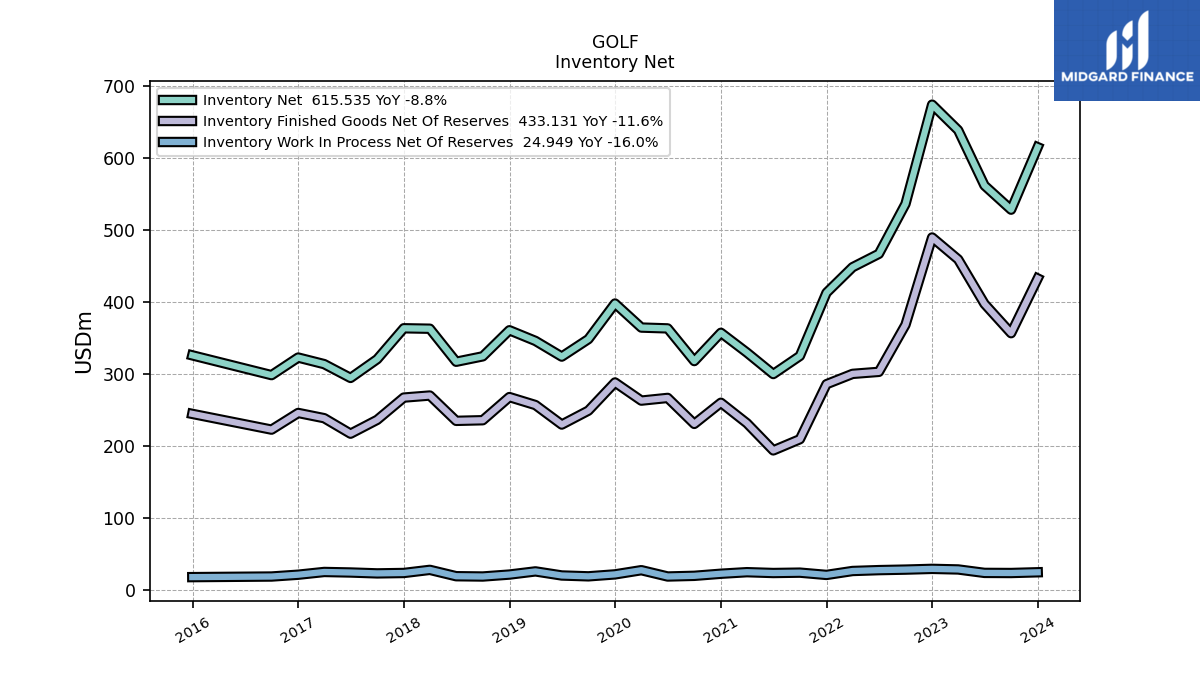
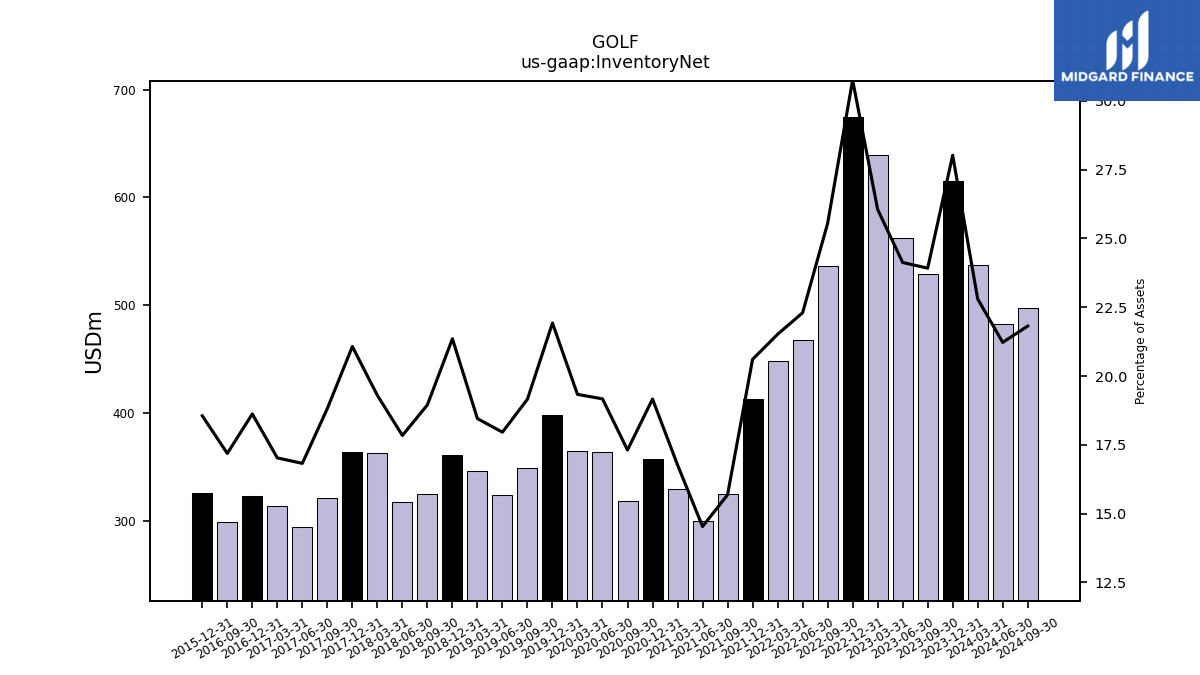
| Inventory Net | 615.53 | 528.73 | 562.33 | 639.12 | 674.68 | 536.74 | 467.39 | 448.78 | 413.31 | 325.49 | 300.32 | 330.17 | 357.68 | 318.36 | 363.79 | 364.94 | 398.37 | 348.87 | 324.59 | 346.40 | 361.21 | 324.97 | 317.42 | 363.33 | 363.96 | 320.97 | 294.94 | 314.15 | 323.29 | 298.82 | NA | NA | 326.36 | NA | NA | NA | |
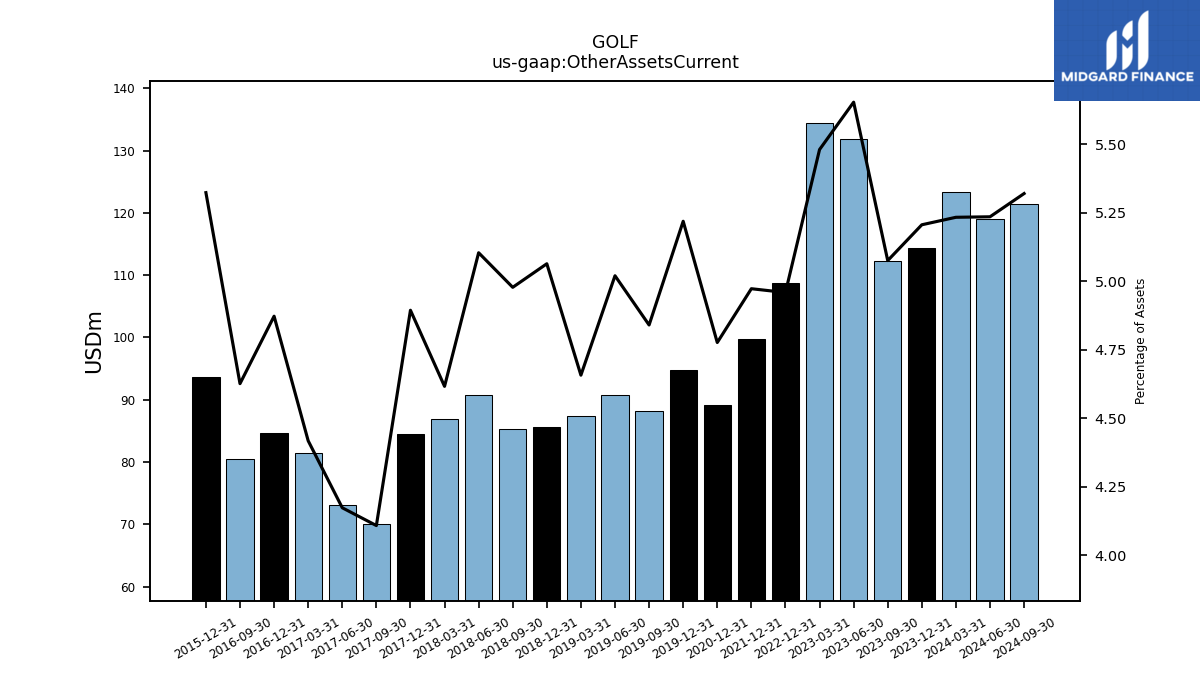
| Other Assets Current | 114.37 | 112.20 | 131.80 | 134.46 | 108.79 | NA | NA | NA | 99.75 | NA | NA | NA | 89.16 | NA | NA | NA | 94.84 | 88.14 | 90.74 | 87.43 | 85.67 | 85.37 | 90.82 | 86.92 | 84.54 | 70.06 | 73.14 | 81.52 | 84.60 | 80.44 | NA | NA | 93.65 | NA | NA | NA |
| 2023-12-31 | 2023-09-30 | 2023-06-30 | 2023-03-31 | 2022-12-31 | 2022-09-30 | 2022-06-30 | 2022-03-31 | 2021-12-31 | 2021-09-30 | 2021-06-30 | 2021-03-31 | 2020-12-31 | 2020-09-30 | 2020-06-30 | 2020-03-31 | 2019-12-31 | 2019-09-30 | 2019-06-30 | 2019-03-31 | 2018-12-31 | 2018-09-30 | 2018-06-30 | 2018-03-31 | 2017-12-31 | 2017-09-30 | 2017-06-30 | 2017-03-31 | 2016-12-31 | 2016-09-30 | 2016-06-30 | 2016-03-31 | 2015-12-31 | 2015-09-30 | 2015-06-30 | 2015-03-31 | ||
|---|---|---|---|---|---|---|---|---|---|---|---|---|---|---|---|---|---|---|---|---|---|---|---|---|---|---|---|---|---|---|---|---|---|---|---|---|---|
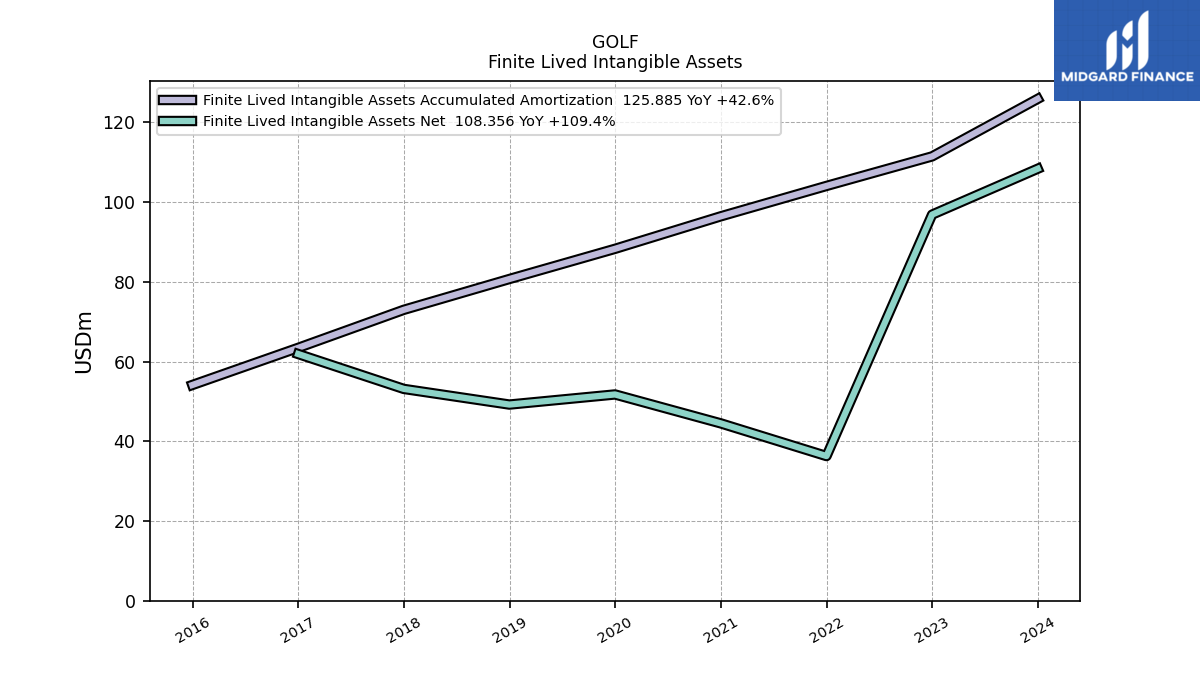
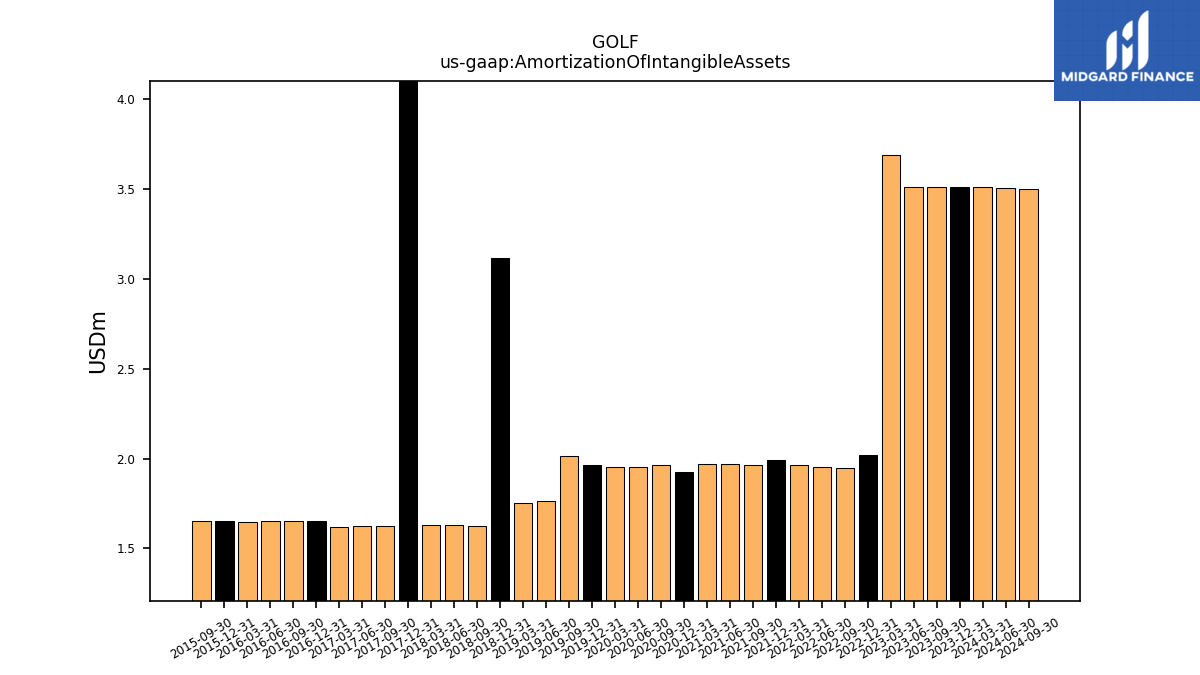
| Amortization Of Intangible Assets | 3.51 | 3.51 | 3.51 | 3.69 | 2.02 | 1.95 | 1.95 | 1.96 | 1.99 | 1.97 | 1.97 | 1.97 | 1.93 | 1.96 | 1.96 | 1.96 | 1.97 | 2.02 | 1.76 | 1.75 | 3.12 | 1.62 | 1.63 | 1.63 | 4.43 | 1.63 | 1.62 | 1.62 | 1.65 | 1.65 | 1.65 | 1.65 | 1.65 | 1.65 | NA | NA | |
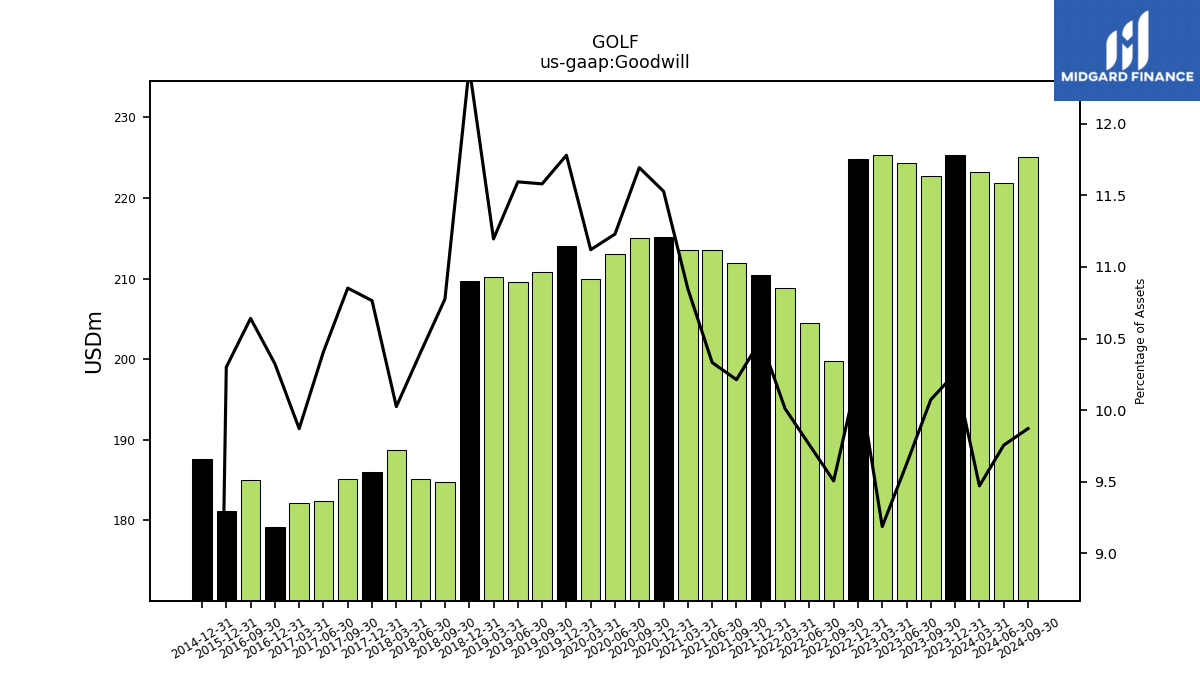
| Goodwill | 225.30 | 222.68 | 224.30 | 225.35 | 224.81 | 199.74 | 204.54 | 208.80 | 210.43 | 211.94 | 213.54 | 213.56 | 215.19 | 215.06 | 213.11 | 209.92 | 214.06 | 210.88 | 209.56 | 210.18 | 209.67 | 184.78 | 185.12 | 188.75 | 185.94 | 185.09 | 182.43 | 182.14 | 179.24 | 185.00 | NA | NA | 181.18 | NA | NA | NA | |
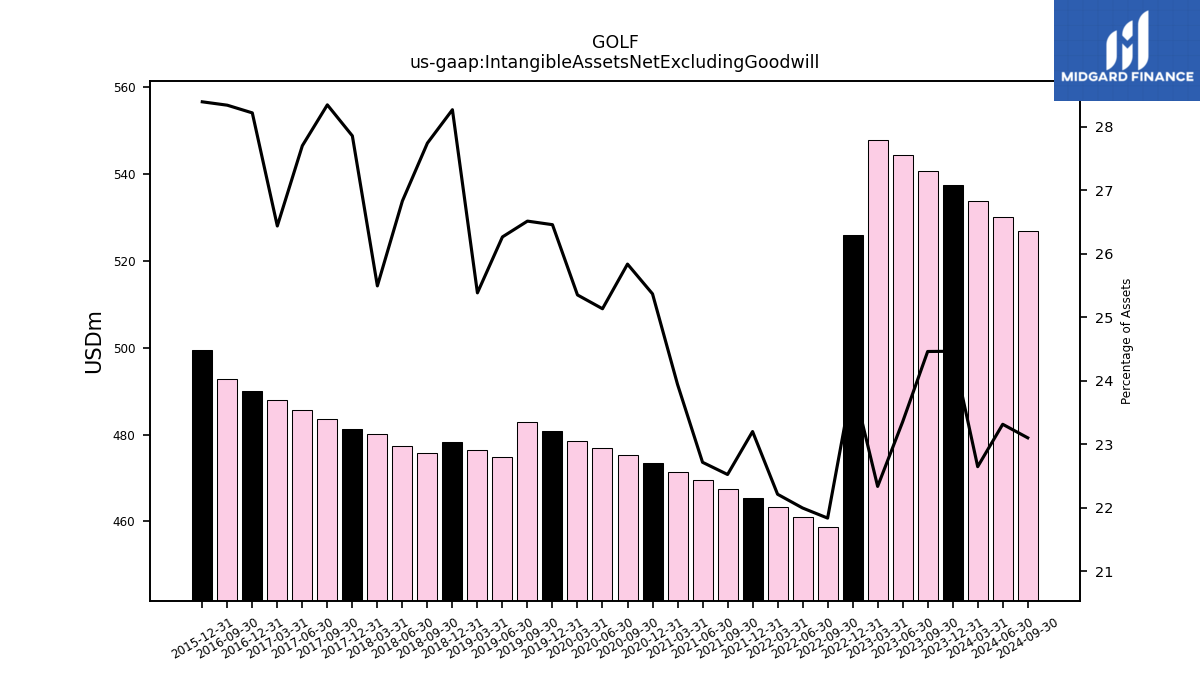
| Intangible Assets Net Excluding Goodwill | 537.41 | 540.73 | 544.33 | 547.86 | 525.90 | 458.82 | 461.02 | 463.27 | 465.34 | 467.38 | 469.44 | 471.39 | 473.53 | 475.19 | 476.99 | 478.58 | 480.79 | 482.85 | 474.76 | 476.56 | 478.26 | 475.80 | 477.45 | 480.04 | 481.23 | 483.51 | 485.62 | 487.89 | 489.99 | 492.79 | NA | NA | 499.49 | NA | NA | NA | |
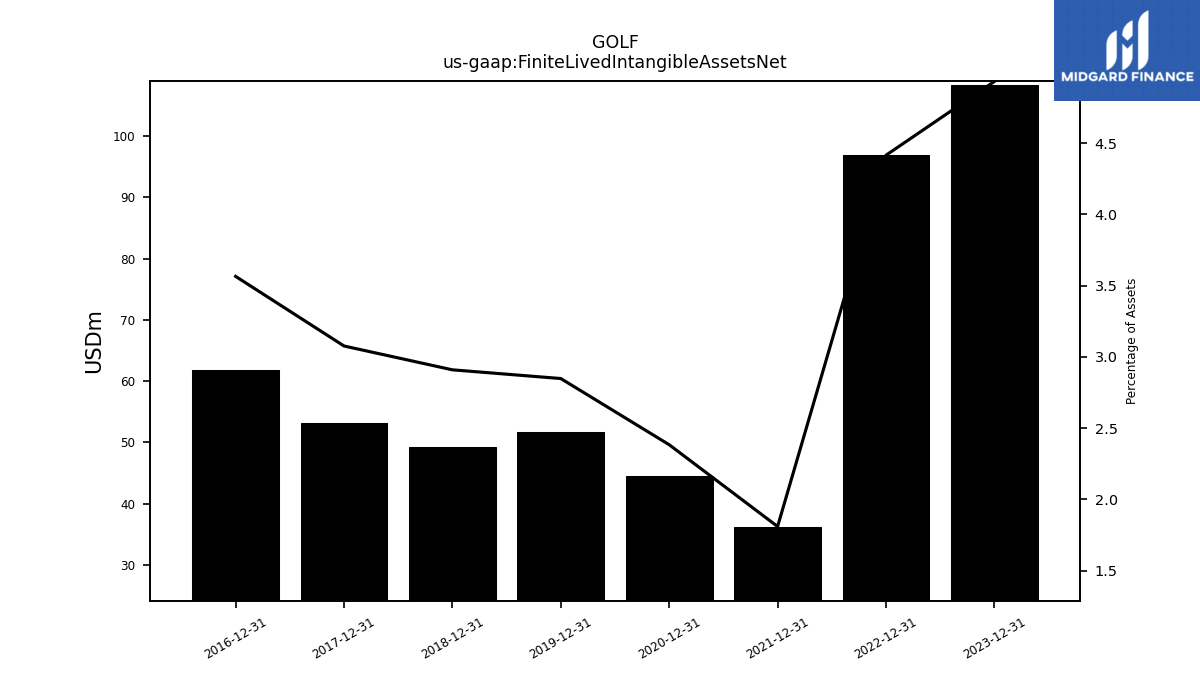
| Finite Lived Intangible Assets Net | 108.36 | NA | NA | NA | 96.85 | NA | NA | NA | 36.29 | NA | NA | NA | 44.48 | NA | NA | NA | 51.74 | NA | NA | NA | 49.21 | NA | NA | NA | 53.13 | NA | NA | NA | 61.89 | NA | NA | NA | NA | NA | NA | NA | |
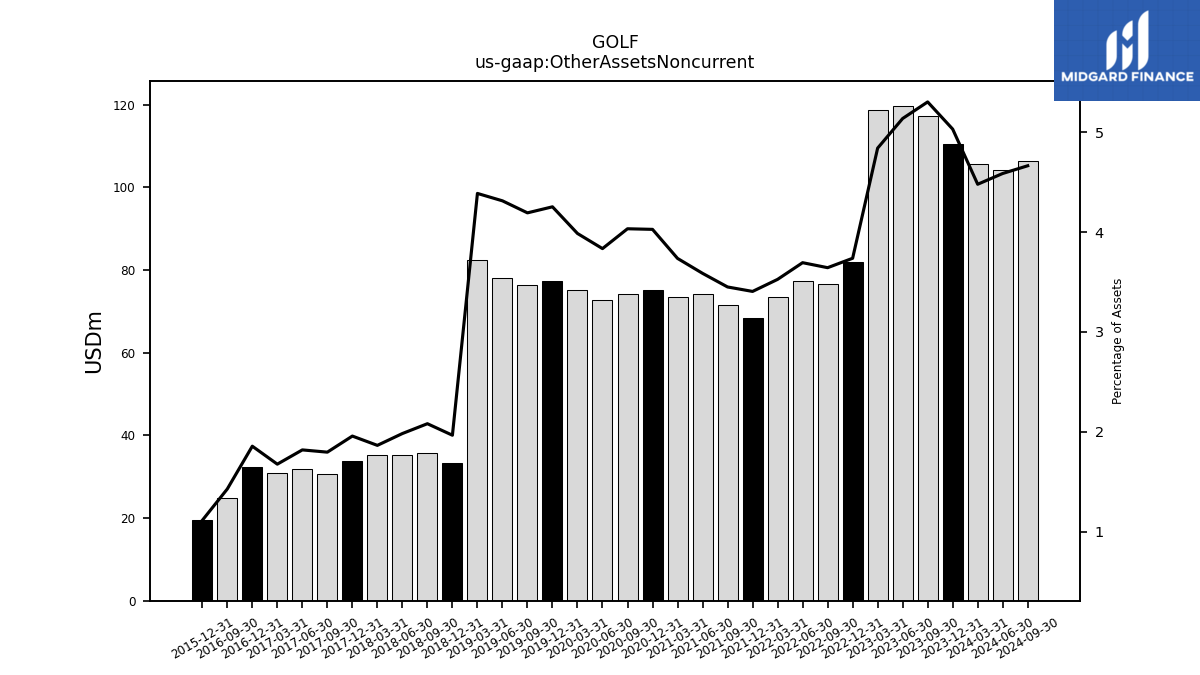
| Other Assets Noncurrent | 110.48 | 117.19 | 119.71 | 118.71 | 81.99 | 76.56 | 77.42 | 73.55 | 68.31 | 71.60 | 74.12 | 73.56 | 75.16 | 74.16 | 72.76 | 75.23 | 77.27 | 76.33 | 77.94 | 82.34 | 33.28 | 35.71 | 35.30 | 35.13 | 33.83 | 30.66 | 31.91 | 30.96 | 32.25 | 24.85 | NA | NA | 19.62 | NA | NA | NA |
| 2023-12-31 | 2023-09-30 | 2023-06-30 | 2023-03-31 | 2022-12-31 | 2022-09-30 | 2022-06-30 | 2022-03-31 | 2021-12-31 | 2021-09-30 | 2021-06-30 | 2021-03-31 | 2020-12-31 | 2020-09-30 | 2020-06-30 | 2020-03-31 | 2019-12-31 | 2019-09-30 | 2019-06-30 | 2019-03-31 | 2018-12-31 | 2018-09-30 | 2018-06-30 | 2018-03-31 | 2017-12-31 | 2017-09-30 | 2017-06-30 | 2017-03-31 | 2016-12-31 | 2016-09-30 | 2016-06-30 | 2016-03-31 | 2015-12-31 | 2015-09-30 | 2015-06-30 | 2015-03-31 | ||
|---|---|---|---|---|---|---|---|---|---|---|---|---|---|---|---|---|---|---|---|---|---|---|---|---|---|---|---|---|---|---|---|---|---|---|---|---|---|
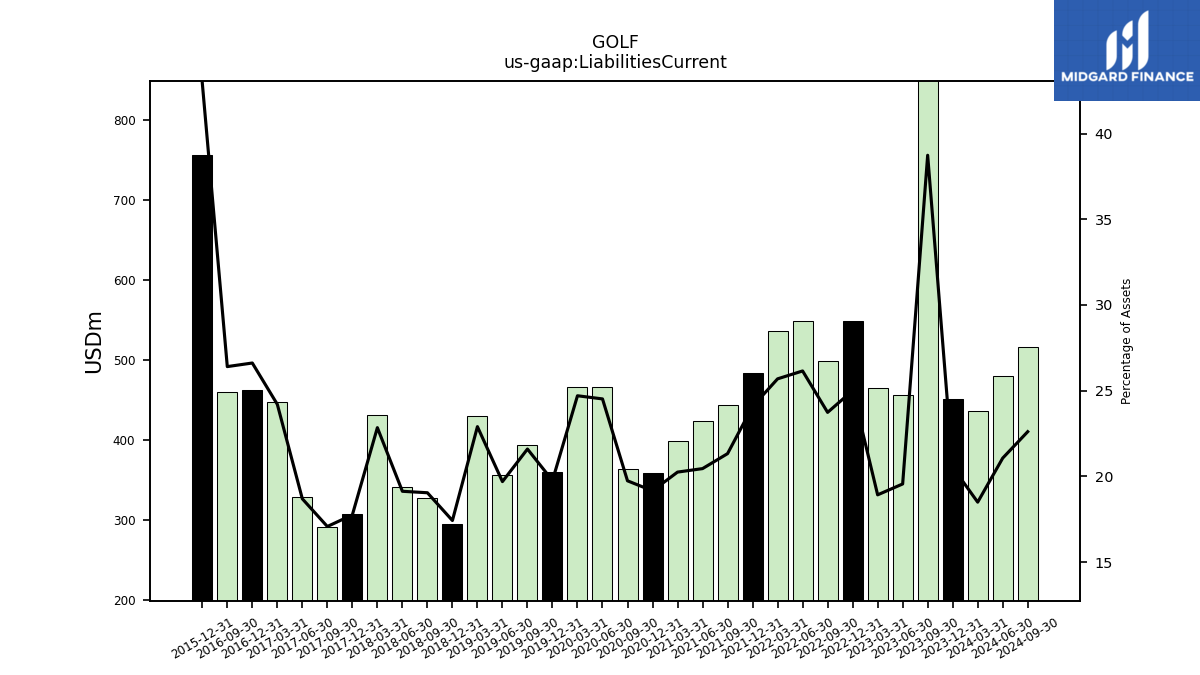
| Liabilities Current | 451.13 | 856.20 | 456.00 | 464.33 | 548.62 | 498.81 | 548.20 | 535.90 | 483.02 | 442.68 | 422.81 | 398.80 | 357.68 | 363.15 | 465.38 | 466.39 | 359.12 | 393.32 | 356.07 | 430.00 | 294.87 | 326.68 | 340.48 | 430.17 | 306.78 | 291.35 | 327.74 | 446.68 | 462.11 | 459.13 | NA | NA | 755.59 | NA | NA | NA | |
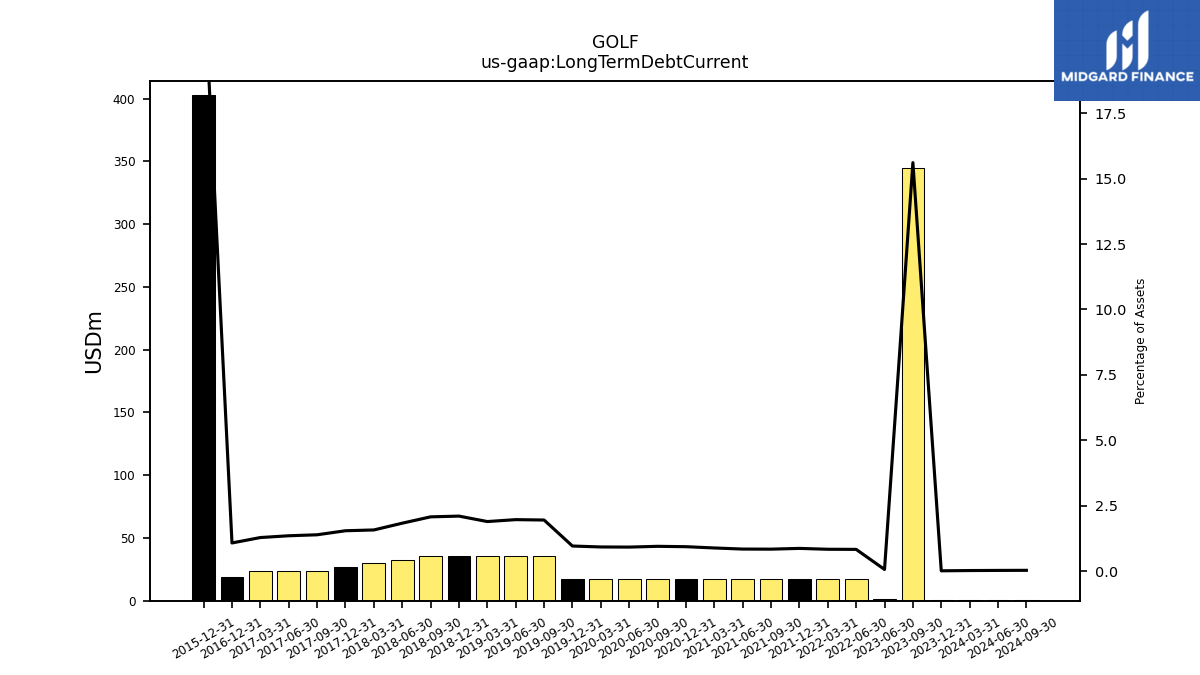
| Long Term Debt Current | 0.35 | 345.06 | 1.58 | NA | NA | NA | 17.50 | 17.50 | 17.50 | 17.50 | 17.50 | 17.50 | 17.50 | 17.50 | 17.50 | 17.50 | 17.50 | 35.62 | 35.62 | 35.62 | 35.62 | 35.62 | 32.66 | 29.69 | 26.72 | 23.75 | 23.75 | 23.75 | 18.75 | NA | NA | NA | 402.64 | NA | NA | NA | |
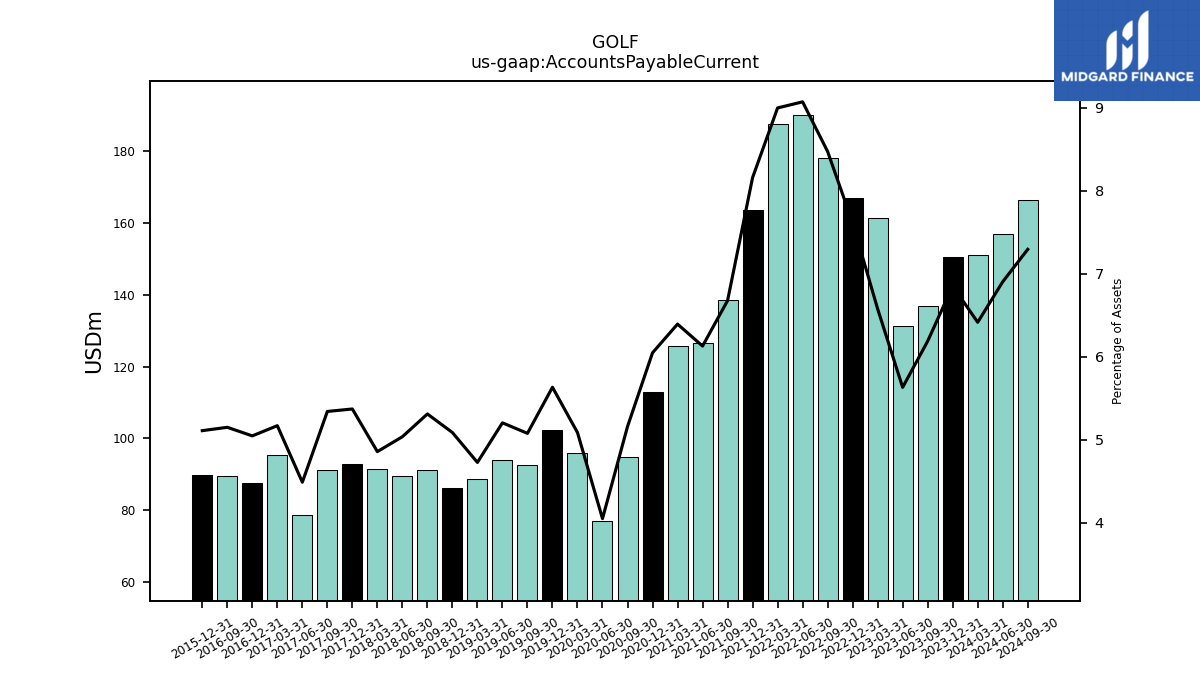
| Accounts Payable Current | 150.51 | 136.78 | 131.26 | 161.30 | 167.00 | 178.01 | 190.12 | 187.64 | 163.61 | 138.53 | 126.64 | 125.86 | 112.87 | 94.87 | 76.85 | 96.01 | 102.33 | 92.44 | 94.05 | 88.73 | 86.05 | 91.06 | 89.61 | 91.45 | 92.76 | 91.08 | 78.67 | 95.39 | 87.61 | 89.53 | NA | NA | 89.87 | NA | NA | NA | |
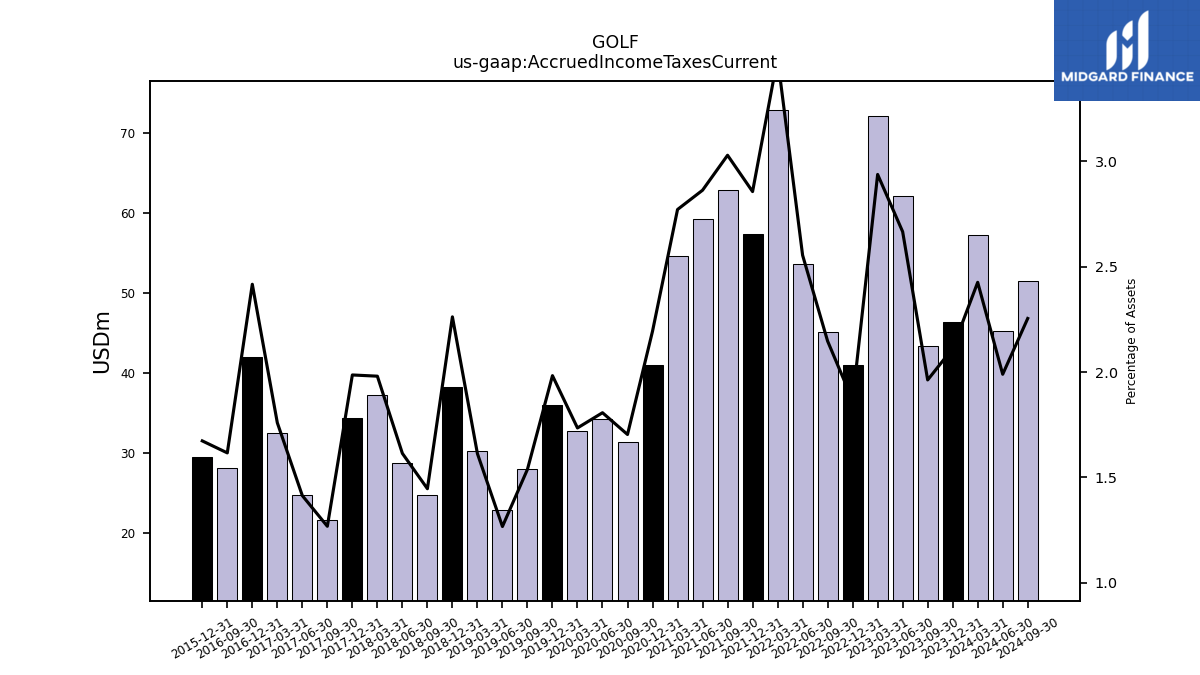
| Accrued Income Taxes Current | 46.40 | 43.39 | 62.15 | 72.08 | 40.92 | 45.12 | 53.55 | 72.82 | 57.31 | 62.87 | 59.18 | 54.58 | 40.95 | 31.33 | 34.29 | 32.75 | 36.03 | 28.01 | 22.90 | 30.27 | 38.27 | 24.80 | 28.72 | 37.29 | 34.31 | 21.62 | 24.77 | 32.47 | 41.96 | 28.10 | NA | NA | 29.43 | NA | NA | NA |
| 2023-12-31 | 2023-09-30 | 2023-06-30 | 2023-03-31 | 2022-12-31 | 2022-09-30 | 2022-06-30 | 2022-03-31 | 2021-12-31 | 2021-09-30 | 2021-06-30 | 2021-03-31 | 2020-12-31 | 2020-09-30 | 2020-06-30 | 2020-03-31 | 2019-12-31 | 2019-09-30 | 2019-06-30 | 2019-03-31 | 2018-12-31 | 2018-09-30 | 2018-06-30 | 2018-03-31 | 2017-12-31 | 2017-09-30 | 2017-06-30 | 2017-03-31 | 2016-12-31 | 2016-09-30 | 2016-06-30 | 2016-03-31 | 2015-12-31 | 2015-09-30 | 2015-06-30 | 2015-03-31 | ||
|---|---|---|---|---|---|---|---|---|---|---|---|---|---|---|---|---|---|---|---|---|---|---|---|---|---|---|---|---|---|---|---|---|---|---|---|---|---|
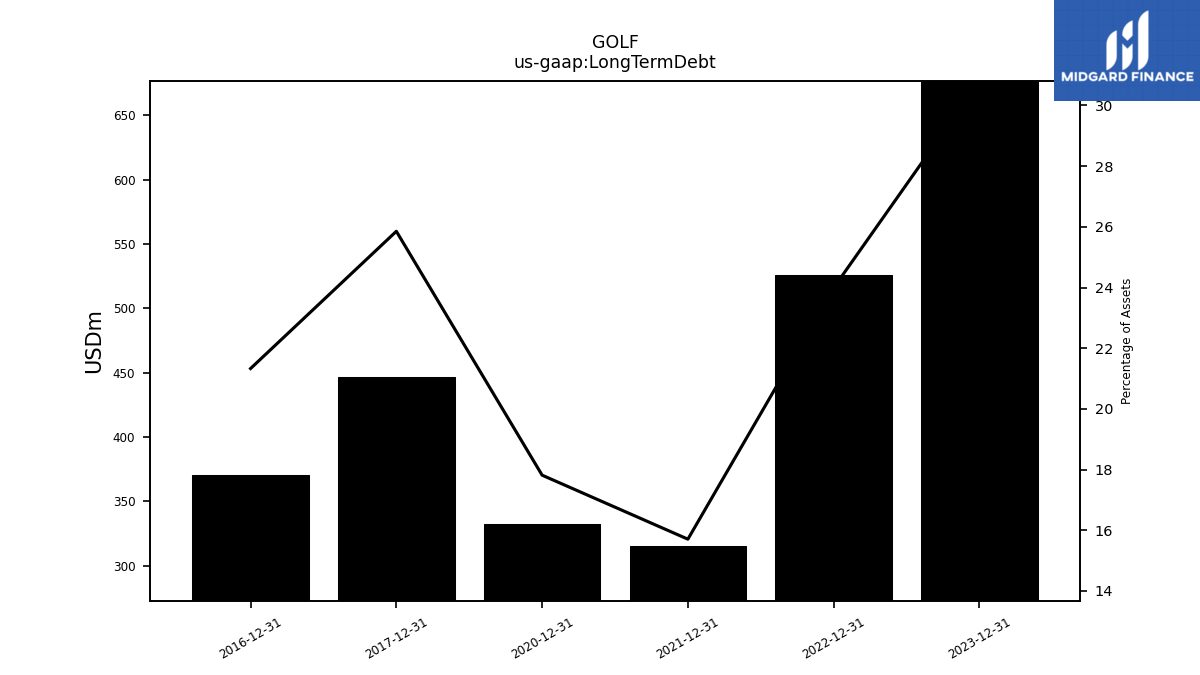
| Long Term Debt | 676.73 | NA | NA | NA | 526.31 | NA | NA | NA | 315.00 | NA | NA | NA | 332.50 | NA | NA | NA | NA | NA | NA | NA | NA | NA | NA | NA | 446.56 | NA | NA | NA | 370.31 | NA | NA | NA | NA | NA | NA | NA | |
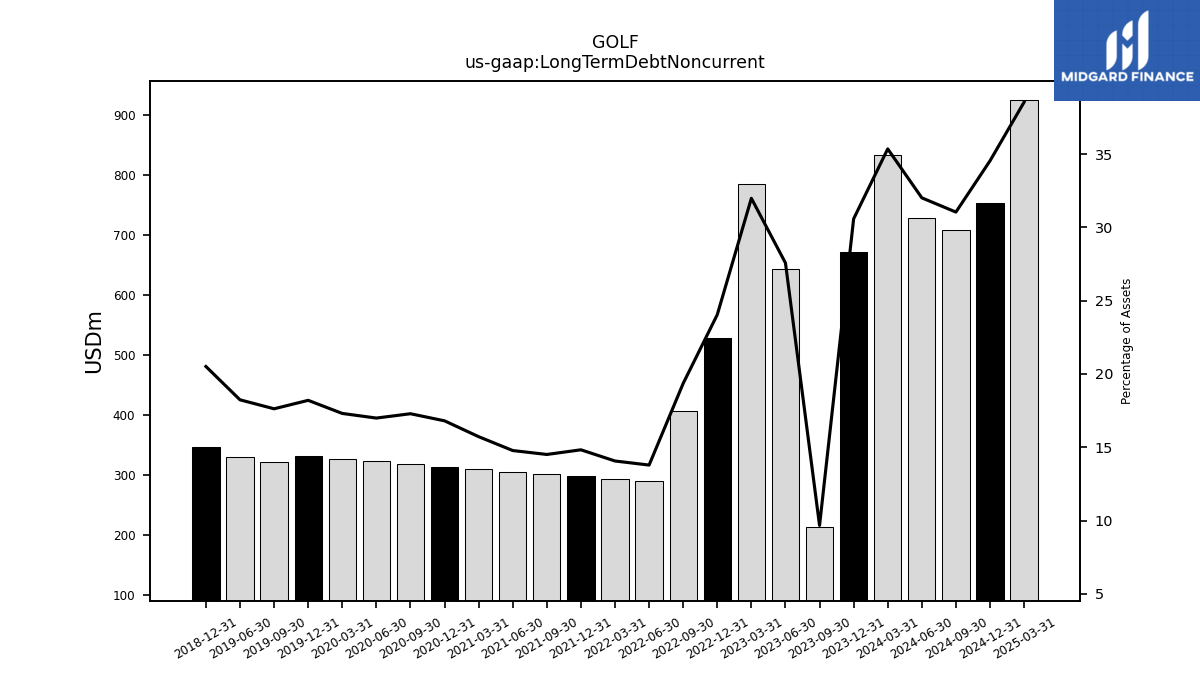
| Long Term Debt Noncurrent | 671.82 | 213.62 | 642.72 | 784.57 | 527.51 | 406.73 | 288.93 | 293.28 | 297.35 | 301.04 | 305.35 | 309.52 | 313.62 | 317.91 | 322.43 | 326.67 | 330.70 | 320.91 | 329.59 | NA | 346.95 | NA | NA | NA | NA | NA | NA | NA | NA | NA | NA | NA | NA | NA | NA | NA | |
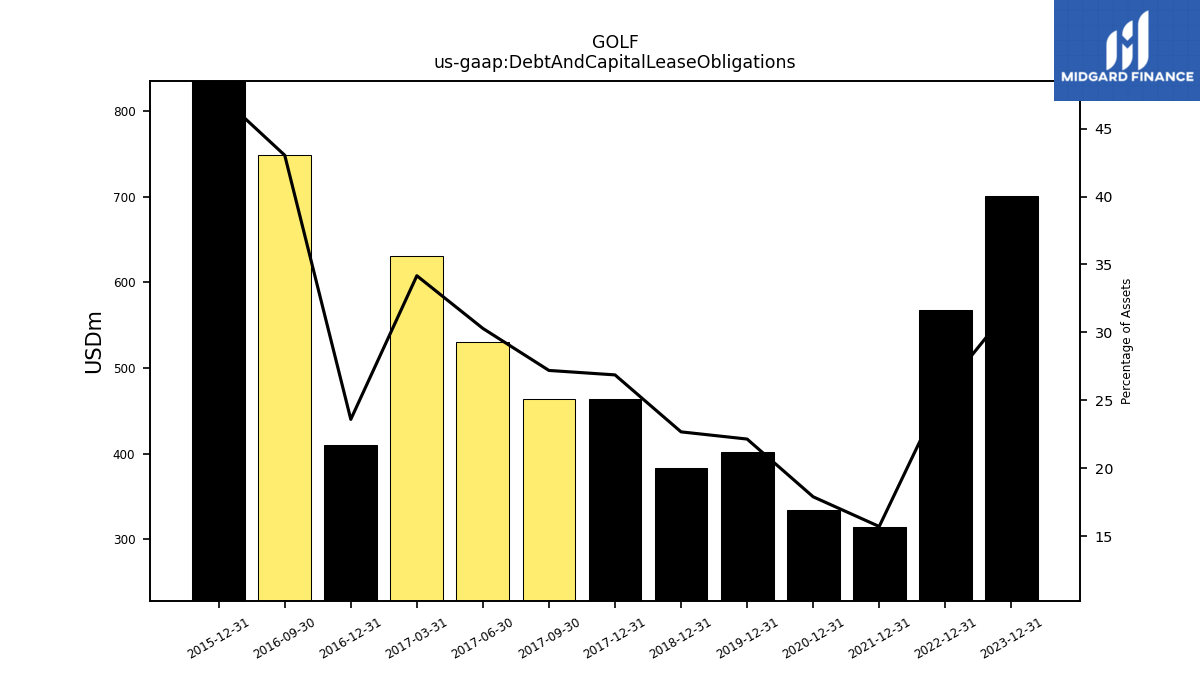
| Debt And Capital Lease Obligations | 701.17 | NA | NA | NA | 567.85 | NA | NA | NA | 314.97 | NA | NA | NA | 333.93 | NA | NA | NA | 402.32 | NA | NA | NA | 383.50 | NA | NA | NA | 464.05 | 463.80 | 530.87 | 630.49 | 409.59 | 748.28 | NA | NA | 836.22 | NA | NA | NA | |
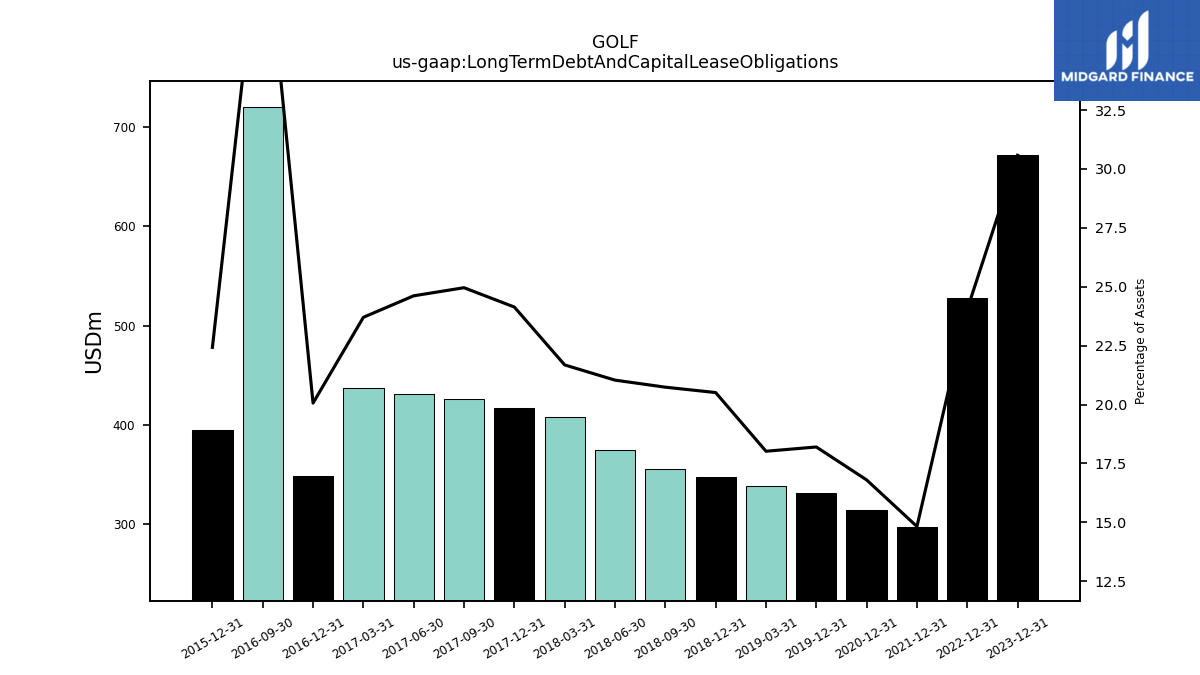
| Long Term Debt And Capital Lease Obligations | 671.82 | NA | NA | NA | 527.51 | NA | NA | NA | 297.35 | NA | NA | NA | 313.62 | NA | NA | NA | 330.70 | NA | NA | 338.27 | 346.95 | 355.63 | 374.32 | 408.26 | 416.97 | 425.72 | 431.50 | 437.43 | 348.35 | 720.70 | NA | NA | 394.51 | NA | NA | NA | |
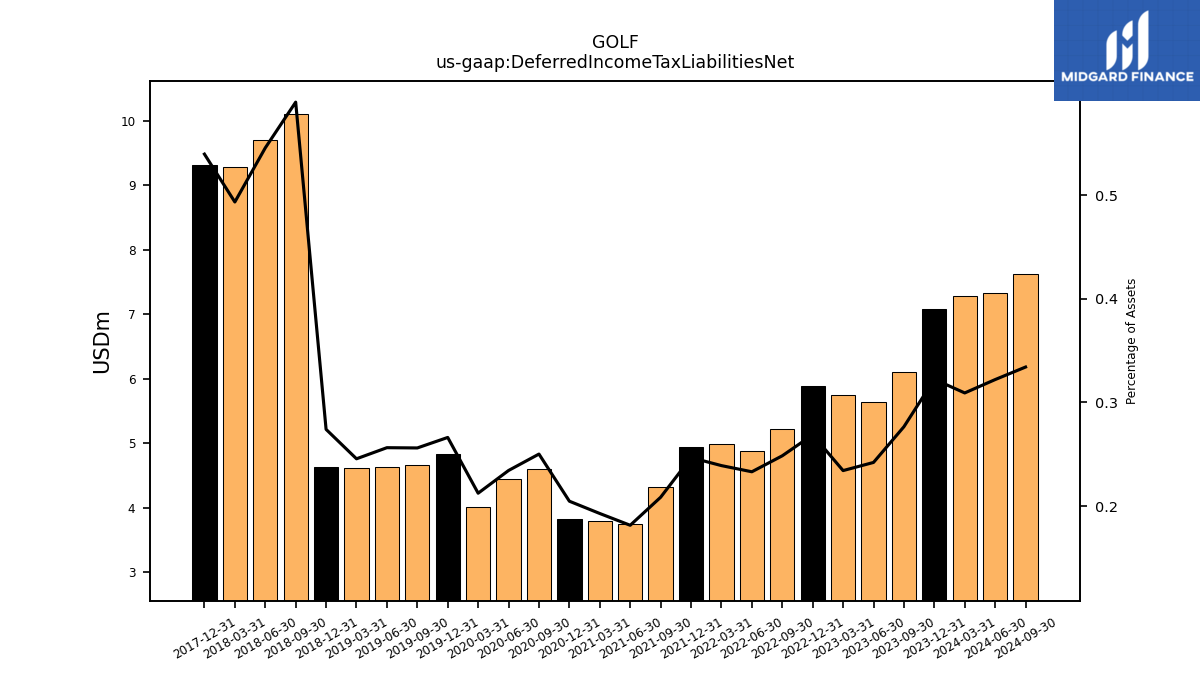
| Deferred Income Tax Liabilities Net | 7.08 | 6.11 | 5.64 | 5.75 | 5.90 | 5.22 | 4.89 | 4.99 | 4.95 | 4.33 | 3.75 | 3.80 | 3.82 | 4.60 | 4.45 | 4.01 | 4.84 | 4.66 | 4.63 | 4.61 | 4.63 | 10.11 | 9.71 | 9.29 | 9.32 | NA | NA | NA | NA | NA | NA | NA | NA | NA | NA | NA | |
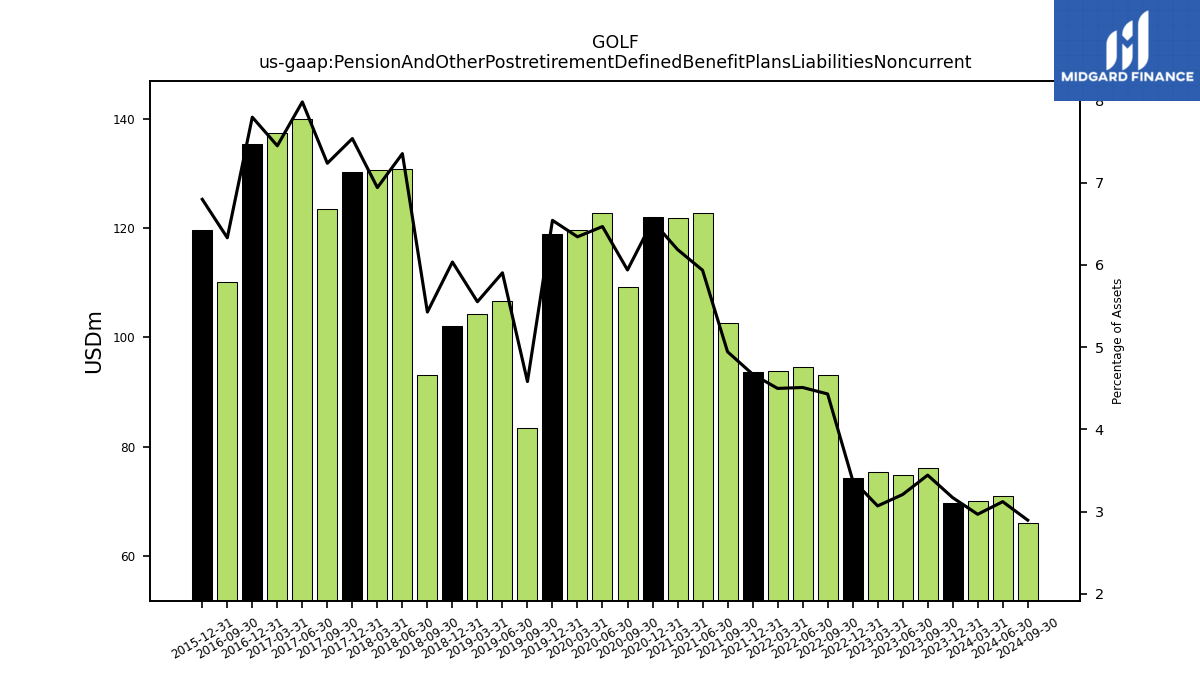
| Pension And Other Postretirement Defined Benefit Plans Liabilities Noncurrent | 69.63 | 76.13 | 74.78 | 75.30 | 74.23 | 93.11 | 94.52 | 93.82 | 93.70 | 102.59 | 122.65 | 121.81 | 121.93 | 109.21 | 122.70 | 119.70 | 118.85 | 83.43 | 106.70 | 104.23 | 102.08 | 93.06 | 130.81 | 130.66 | 130.16 | 123.40 | 139.89 | 137.43 | 135.34 | 110.05 | NA | NA | 119.55 | NA | NA | NA | |
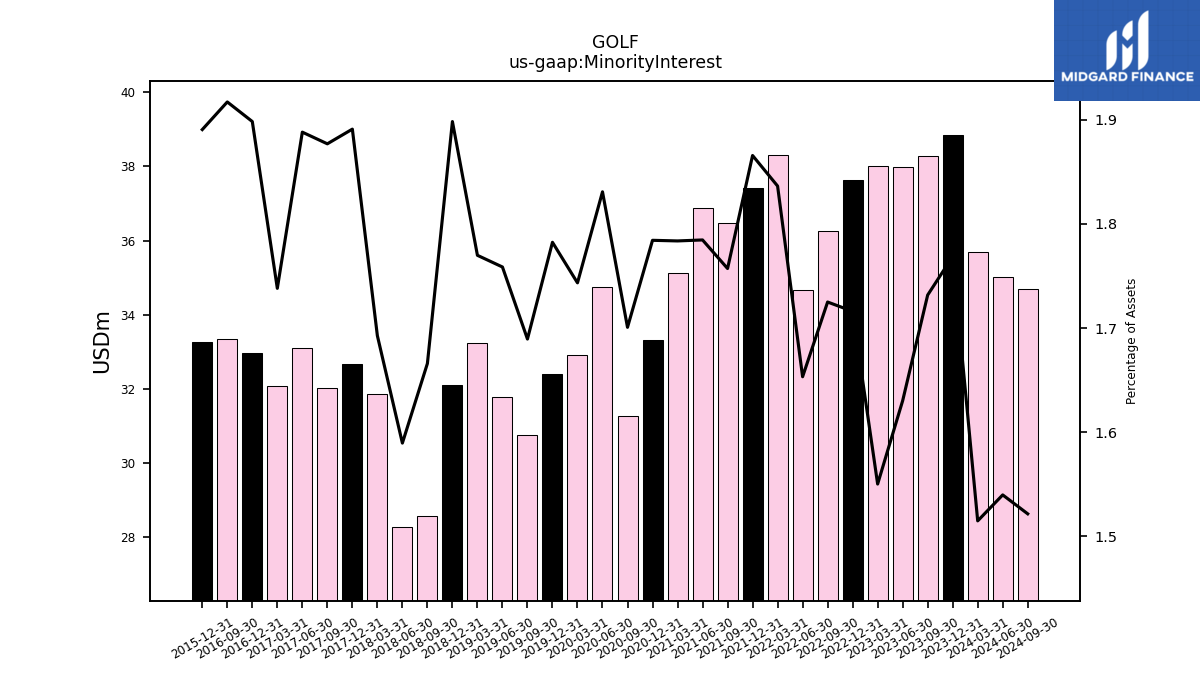
| Minority Interest | 38.85 | 38.28 | 38.00 | 38.03 | 37.65 | 36.25 | 34.65 | 38.30 | 37.42 | 36.47 | 36.88 | 35.12 | 33.30 | 31.28 | 34.74 | 32.91 | 32.39 | 30.76 | 31.79 | 33.23 | 32.11 | 28.57 | 28.28 | 31.87 | 32.66 | 32.01 | 33.10 | 32.07 | 32.96 | 33.33 | NA | NA | 33.26 | NA | NA | NA | |
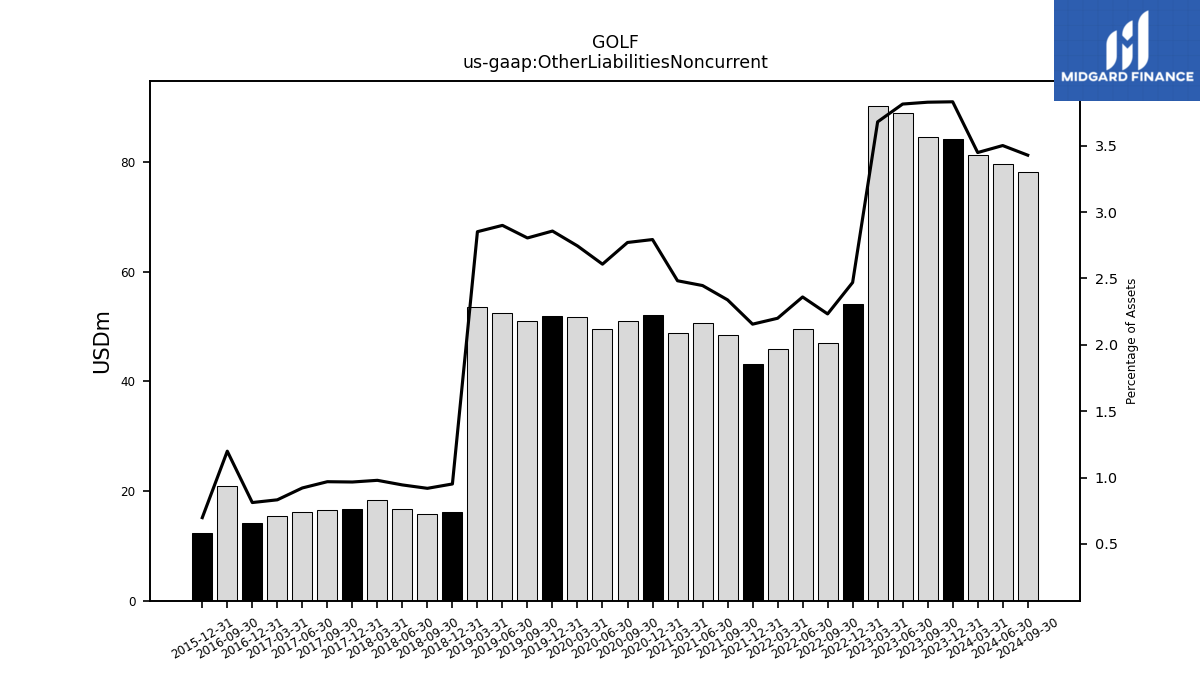
| Other Liabilities Noncurrent | 84.14 | 84.60 | 88.88 | 90.25 | 54.18 | 46.92 | 49.48 | 45.89 | 43.24 | 48.53 | 50.56 | 48.88 | 52.13 | 50.96 | 49.48 | 51.81 | 51.91 | 51.07 | 52.41 | 53.54 | 16.11 | 15.76 | 16.81 | 18.44 | 16.70 | 16.53 | 16.16 | 15.37 | 14.10 | 20.84 | NA | NA | 12.28 | NA | NA | NA | |
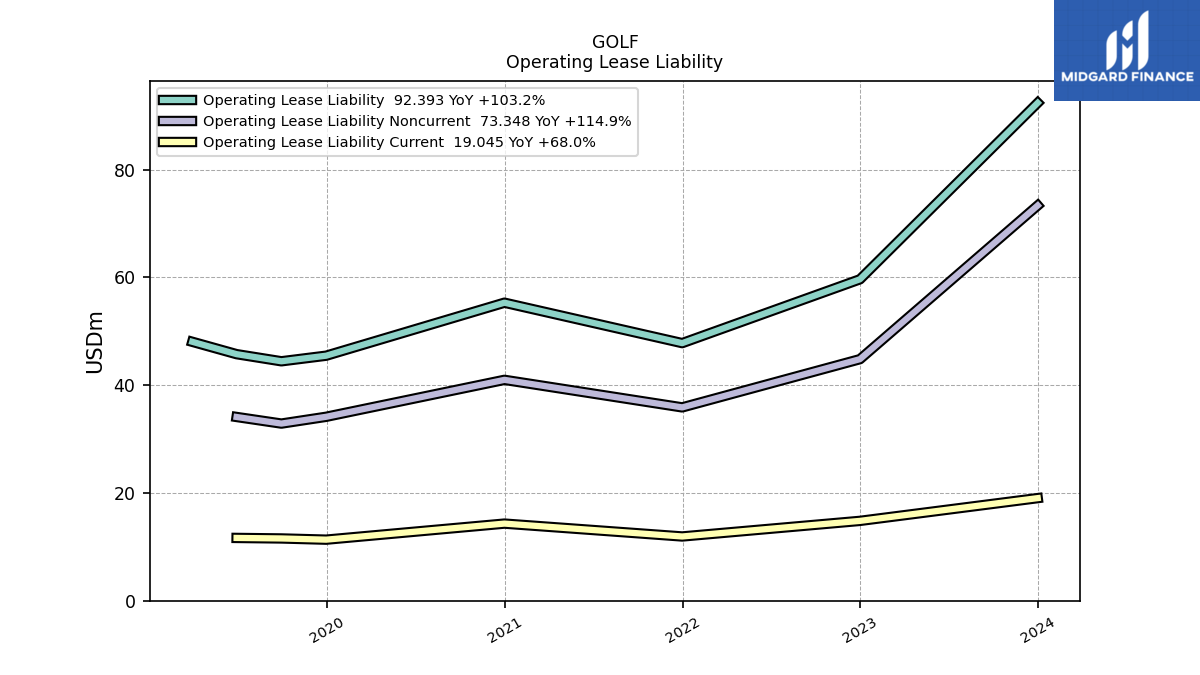
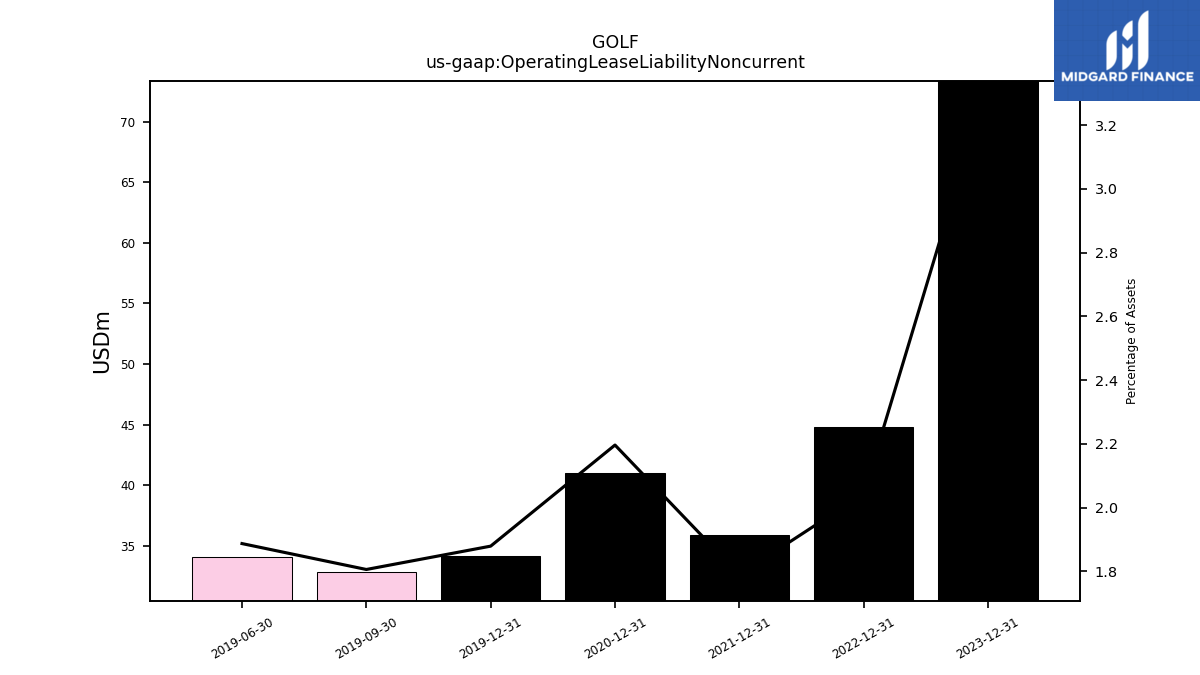
| Operating Lease Liability Noncurrent | 73.35 | NA | NA | NA | 44.83 | NA | NA | NA | 35.88 | NA | NA | NA | 40.99 | NA | NA | NA | 34.14 | 32.88 | 34.10 | NA | NA | NA | NA | NA | NA | NA | NA | NA | NA | NA | NA | NA | NA | NA | NA | NA |
| 2023-12-31 | 2023-09-30 | 2023-06-30 | 2023-03-31 | 2022-12-31 | 2022-09-30 | 2022-06-30 | 2022-03-31 | 2021-12-31 | 2021-09-30 | 2021-06-30 | 2021-03-31 | 2020-12-31 | 2020-09-30 | 2020-06-30 | 2020-03-31 | 2019-12-31 | 2019-09-30 | 2019-06-30 | 2019-03-31 | 2018-12-31 | 2018-09-30 | 2018-06-30 | 2018-03-31 | 2017-12-31 | 2017-09-30 | 2017-06-30 | 2017-03-31 | 2016-12-31 | 2016-09-30 | 2016-06-30 | 2016-03-31 | 2015-12-31 | 2015-09-30 | 2015-06-30 | 2015-03-31 | ||
|---|---|---|---|---|---|---|---|---|---|---|---|---|---|---|---|---|---|---|---|---|---|---|---|---|---|---|---|---|---|---|---|---|---|---|---|---|---|
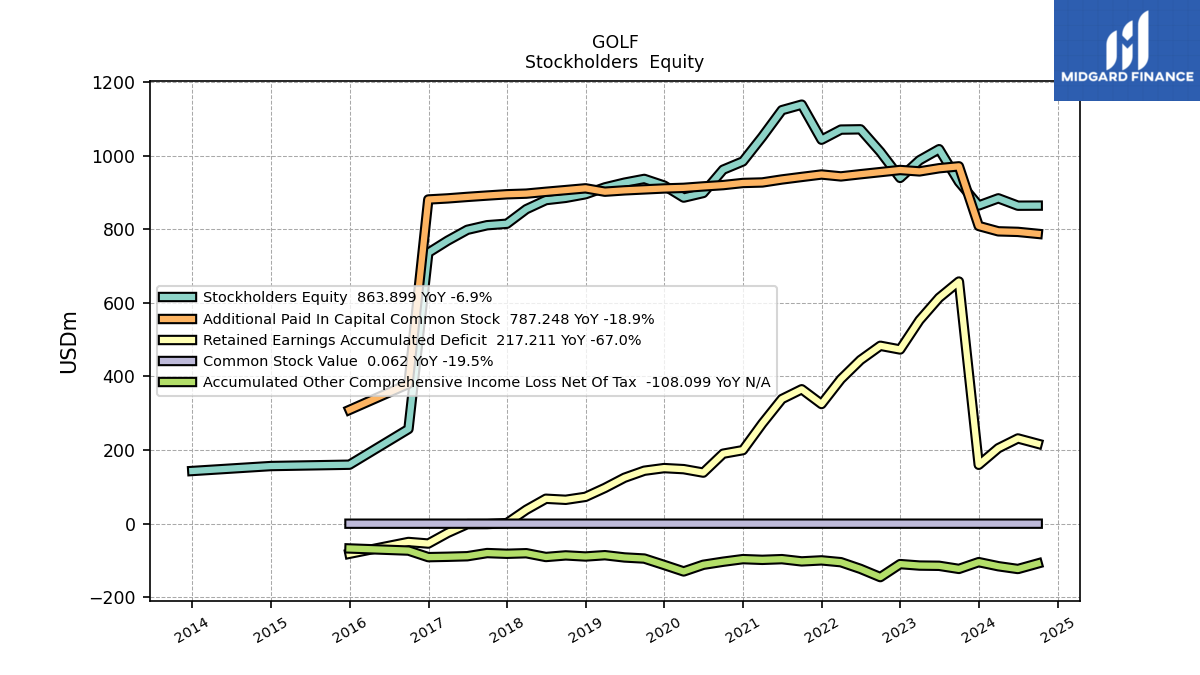
| Stockholders Equity | 864.24 | 928.37 | 1017.22 | 987.12 | 939.06 | 1010.00 | 1071.17 | 1070.39 | 1042.84 | 1138.21 | 1123.17 | 1050.86 | 983.95 | 961.51 | 898.23 | 885.65 | 918.44 | 936.46 | 926.25 | 913.41 | 894.87 | 885.02 | 878.88 | 854.20 | 814.73 | 810.66 | 798.19 | 768.81 | 735.87 | 257.15 | NA | NA | 160.25 | NA | NA | NA | |
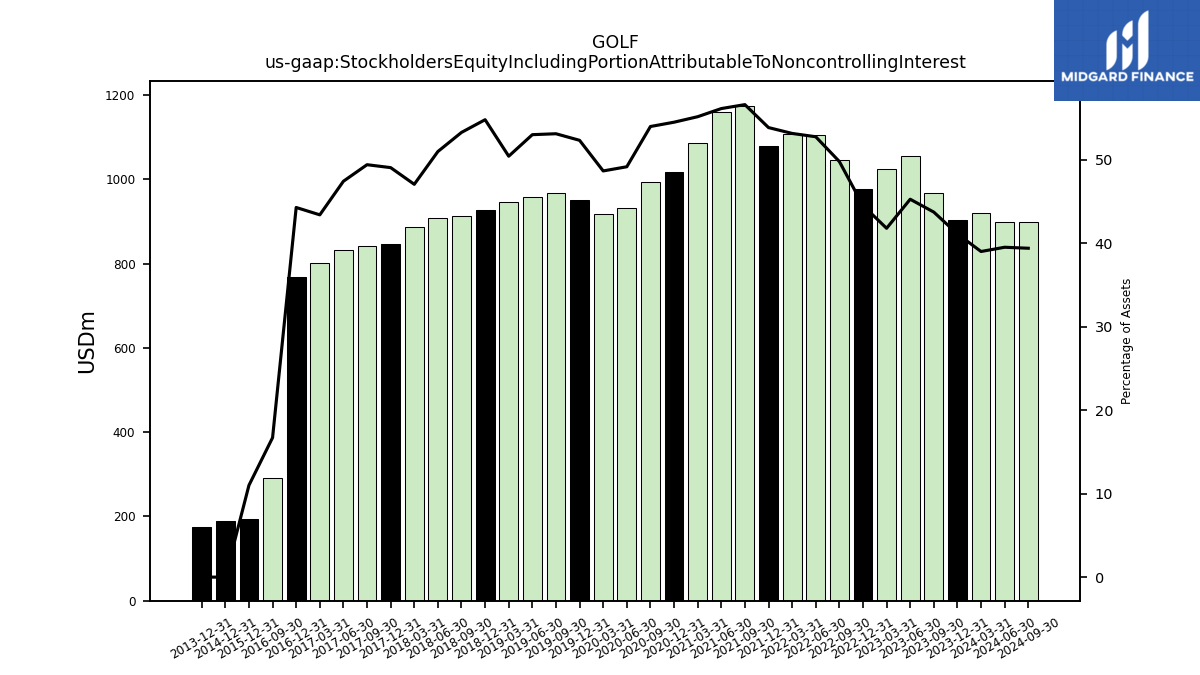
| Stockholders Equity Including Portion Attributable To Noncontrolling Interest | 903.09 | 966.65 | 1055.22 | 1025.15 | 976.70 | 1046.25 | 1105.83 | 1108.70 | 1080.27 | 1174.68 | 1160.05 | 1085.98 | 1017.25 | 992.79 | 932.97 | 918.56 | 950.83 | 967.23 | 958.04 | 946.64 | 926.98 | 913.59 | 907.17 | 886.07 | 847.39 | 842.67 | 831.28 | 800.88 | 768.82 | 290.48 | NA | NA | 193.51 | NA | NA | NA | |
| Common Stock Value | 0.06 | 0.08 | 0.08 | 0.08 | 0.08 | 0.08 | 0.08 | 0.08 | 0.08 | 0.08 | 0.08 | 0.08 | 0.08 | 0.08 | 0.08 | 0.08 | 0.08 | 0.08 | 0.08 | 0.08 | 0.07 | 0.07 | 0.07 | 0.07 | 0.07 | 0.07 | 0.07 | 0.07 | 0.07 | 0.03 | NA | NA | 0.02 | NA | NA | NA | |
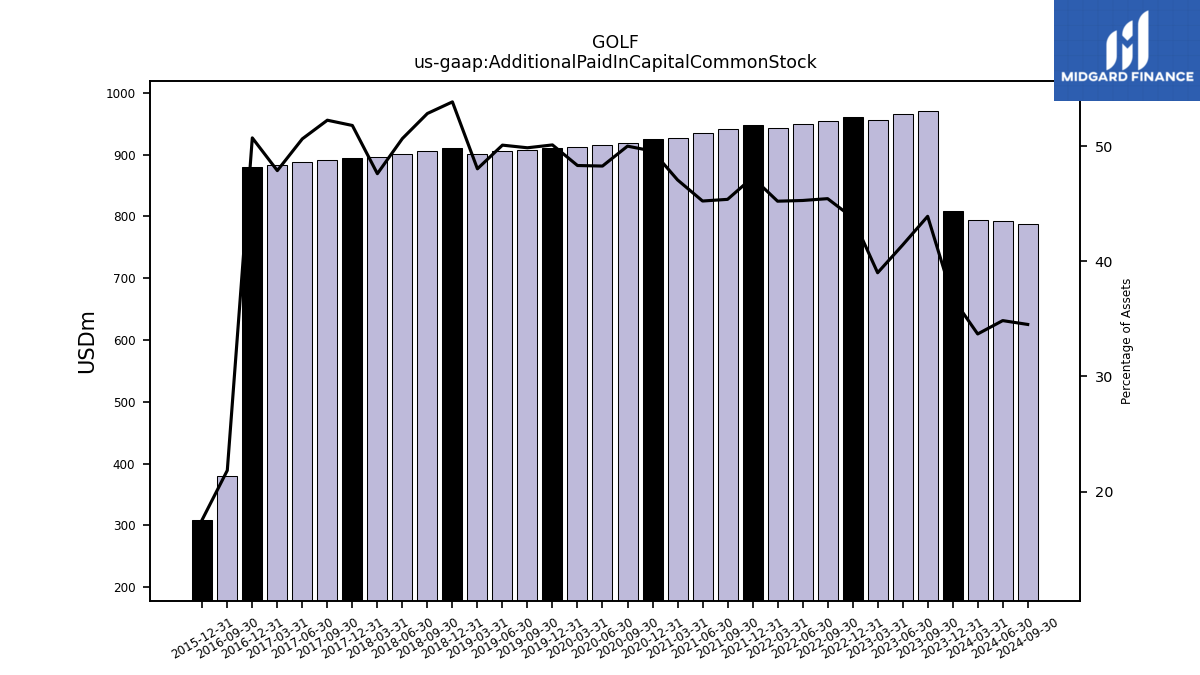
| Additional Paid In Capital Common Stock | 808.62 | 970.65 | 965.45 | 956.83 | 960.68 | 954.93 | 949.21 | 943.24 | 948.42 | 941.77 | 934.92 | 926.81 | 925.38 | 919.61 | 916.10 | 912.16 | 910.51 | 907.96 | 905.35 | 901.75 | 910.89 | 906.11 | 901.44 | 896.45 | 894.73 | 891.25 | 887.57 | 883.52 | 880.58 | 379.73 | NA | NA | 309.11 | NA | NA | NA | |
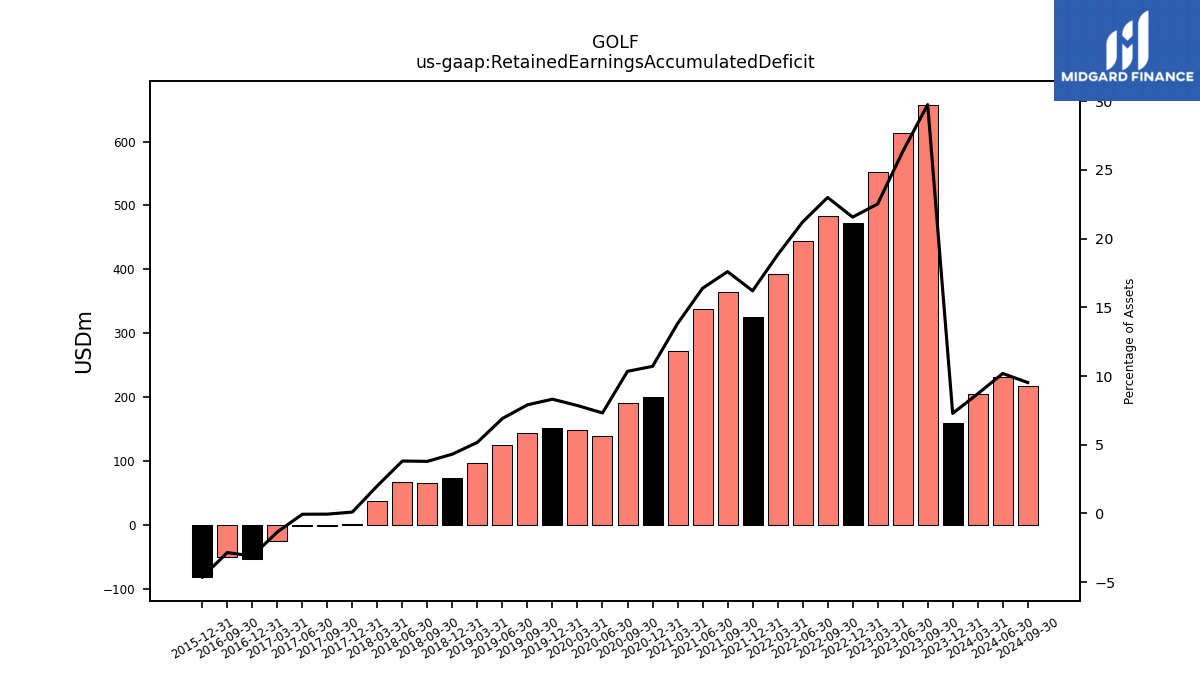
| Retained Earnings Accumulated Deficit | 159.91 | 657.79 | 613.58 | 552.60 | 473.13 | 483.24 | 444.59 | 392.54 | 324.97 | 365.20 | 338.63 | 271.97 | 199.78 | 190.16 | 138.73 | 148.18 | 151.04 | 143.90 | 124.83 | 97.09 | 72.95 | 64.92 | 67.81 | 37.82 | 1.62 | -0.95 | -1.12 | -24.99 | -53.95 | -49.61 | NA | NA | -81.65 | NA | NA | NA | |
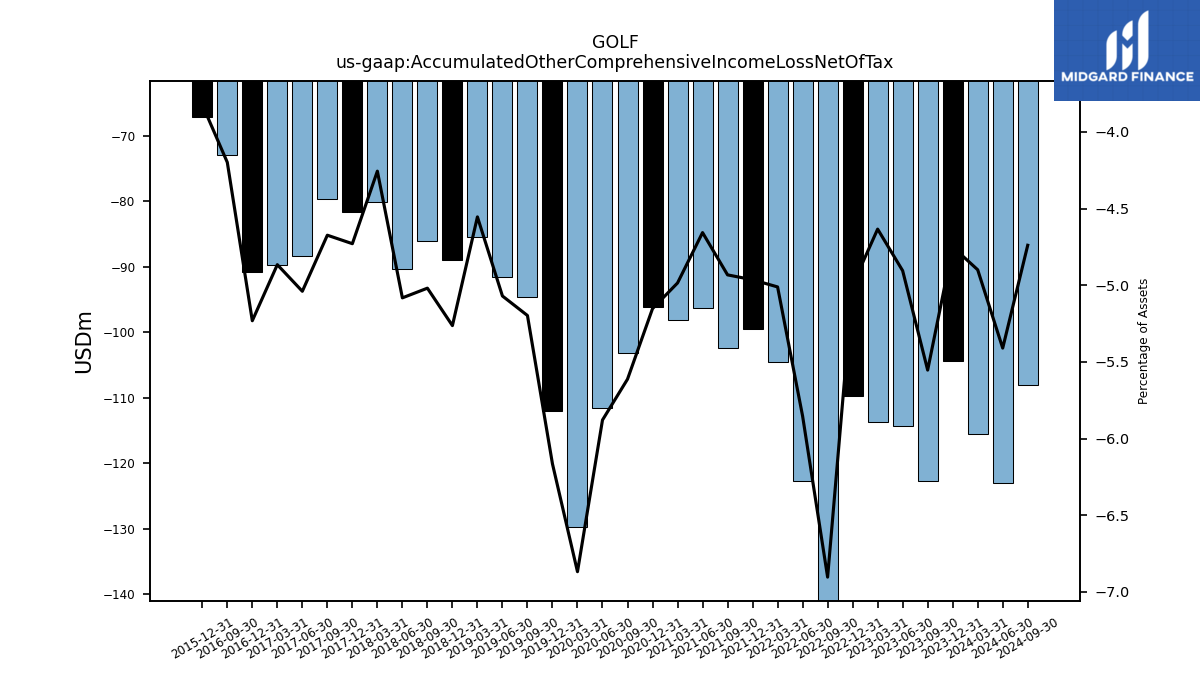
| Accumulated Other Comprehensive Income Loss Net Of Tax | -104.35 | -122.77 | -114.34 | -113.68 | -109.67 | -145.08 | -122.70 | -104.53 | -99.58 | -102.36 | -96.25 | -98.16 | -96.18 | -103.23 | -111.57 | -129.66 | -112.03 | -94.65 | -91.65 | -85.50 | -89.04 | -86.08 | -90.44 | -80.14 | -81.69 | -79.72 | -88.34 | -89.80 | -90.83 | -73.00 | NA | NA | -67.23 | NA | NA | NA | |
| Minority Interest | 38.85 | 38.28 | 38.00 | 38.03 | 37.65 | 36.25 | 34.65 | 38.30 | 37.42 | 36.47 | 36.88 | 35.12 | 33.30 | 31.28 | 34.74 | 32.91 | 32.39 | 30.76 | 31.79 | 33.23 | 32.11 | 28.57 | 28.28 | 31.87 | 32.66 | 32.01 | 33.10 | 32.07 | 32.96 | 33.33 | NA | NA | 33.26 | NA | NA | NA | |
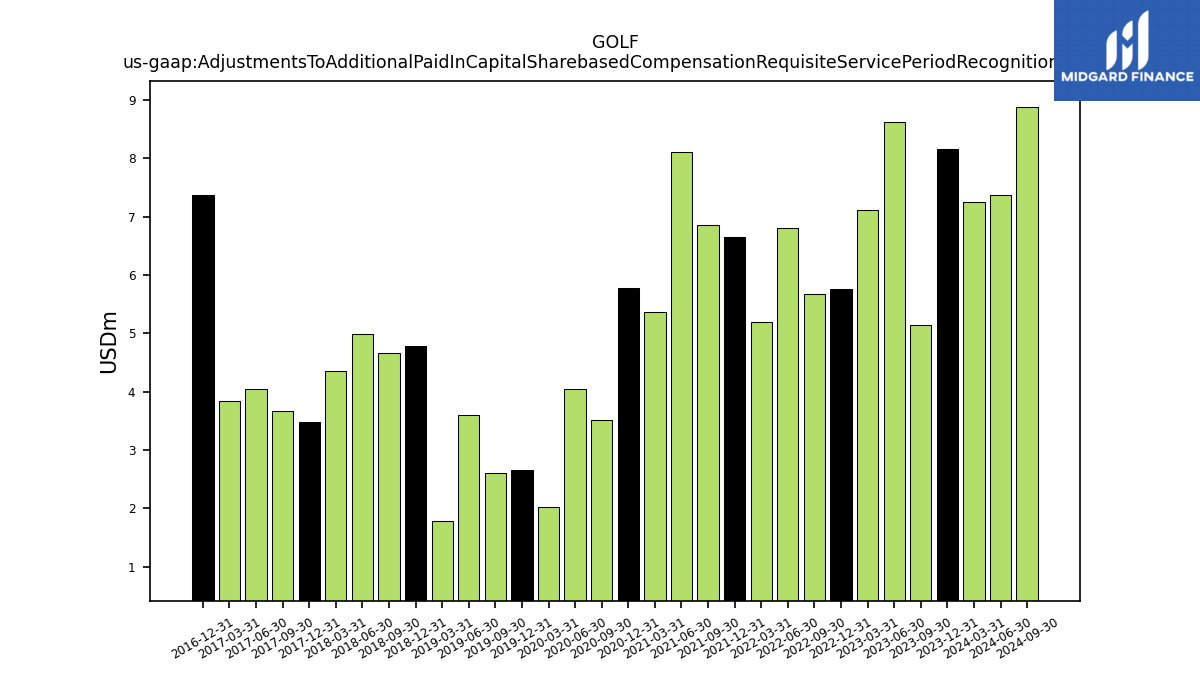
| Adjustments To Additional Paid In Capital Sharebased Compensation Requisite Service Period Recognition Value | 8.17 | 5.14 | 8.62 | 7.12 | 5.76 | 5.67 | 6.80 | 5.19 | 6.65 | 6.85 | 8.11 | 5.37 | 5.78 | 3.51 | 4.05 | 2.02 | 2.66 | 2.60 | 3.60 | 1.78 | 4.78 | 4.67 | 4.98 | 4.36 | 3.48 | 3.67 | 4.05 | 3.85 | 7.37 | NA | NA | NA | NA | NA | NA | NA |
| 2023-12-31 | 2023-09-30 | 2023-06-30 | 2023-03-31 | 2022-12-31 | 2022-09-30 | 2022-06-30 | 2022-03-31 | 2021-12-31 | 2021-09-30 | 2021-06-30 | 2021-03-31 | 2020-12-31 | 2020-09-30 | 2020-06-30 | 2020-03-31 | 2019-12-31 | 2019-09-30 | 2019-06-30 | 2019-03-31 | 2018-12-31 | 2018-09-30 | 2018-06-30 | 2018-03-31 | 2017-12-31 | 2017-09-30 | 2017-06-30 | 2017-03-31 | 2016-12-31 | 2016-09-30 | 2016-06-30 | 2016-03-31 | 2015-12-31 | 2015-09-30 | 2015-06-30 | 2015-03-31 | ||
|---|---|---|---|---|---|---|---|---|---|---|---|---|---|---|---|---|---|---|---|---|---|---|---|---|---|---|---|---|---|---|---|---|---|---|---|---|---|
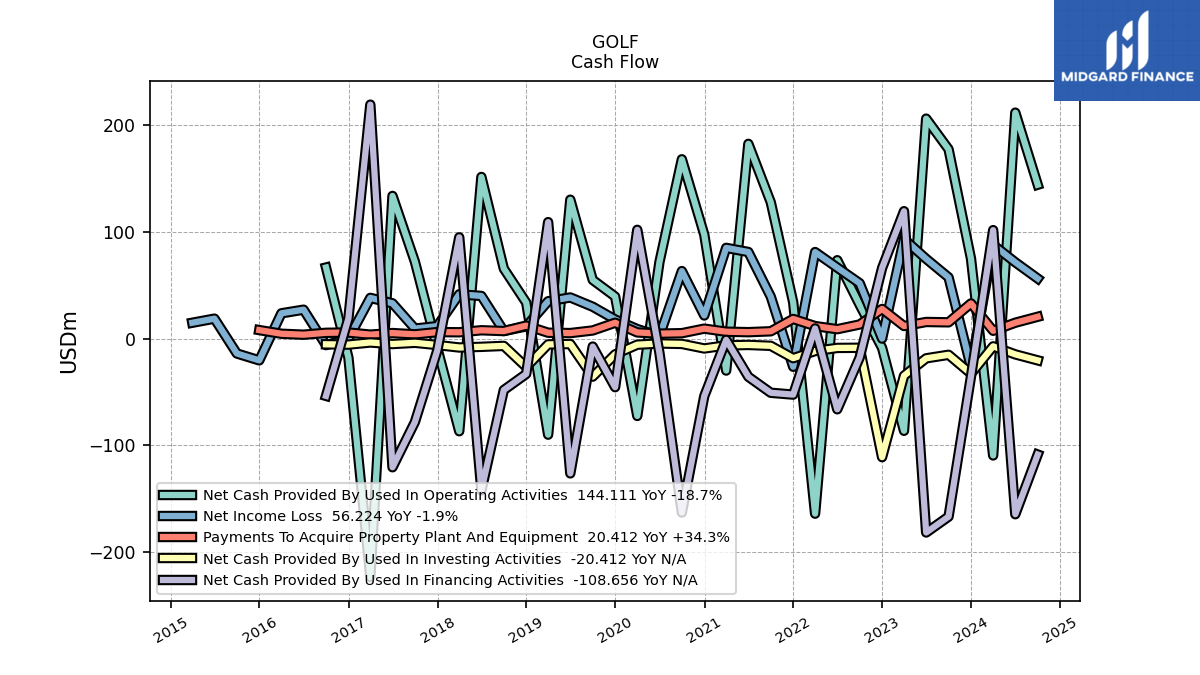
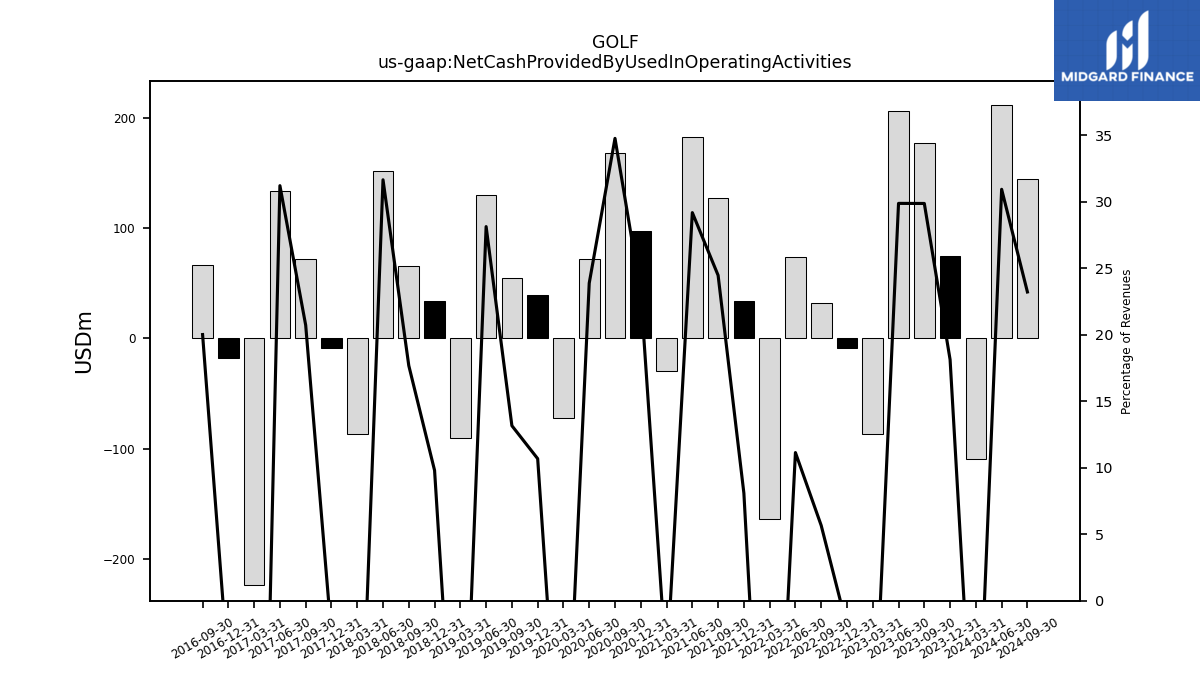
| Net Cash Provided By Used In Operating Activities | 74.90 | 177.31 | 206.03 | -86.42 | -8.74 | 31.60 | 73.40 | -164.05 | 34.03 | 127.68 | 182.41 | -30.00 | 97.31 | 167.95 | 71.67 | -72.51 | 39.35 | 54.92 | 130.08 | -90.06 | 33.67 | 65.51 | 151.39 | -86.83 | -9.15 | 71.98 | 133.62 | -223.49 | -17.76 | 66.54 | NA | NA | NA | NA | NA | NA | |
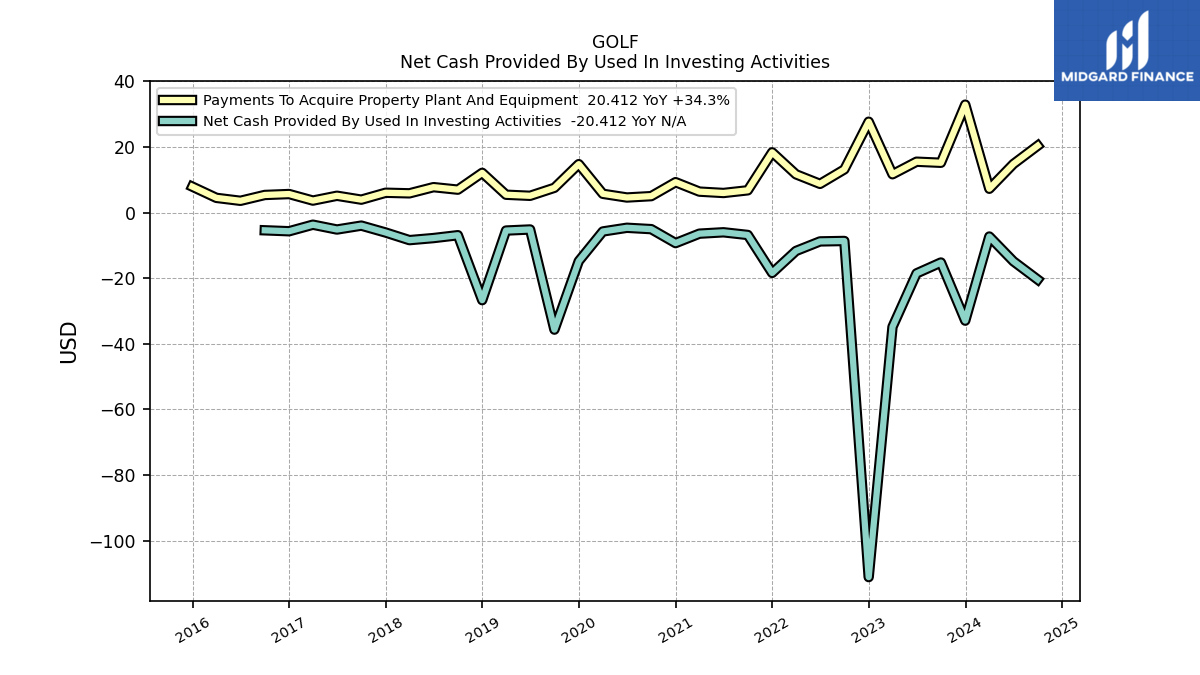
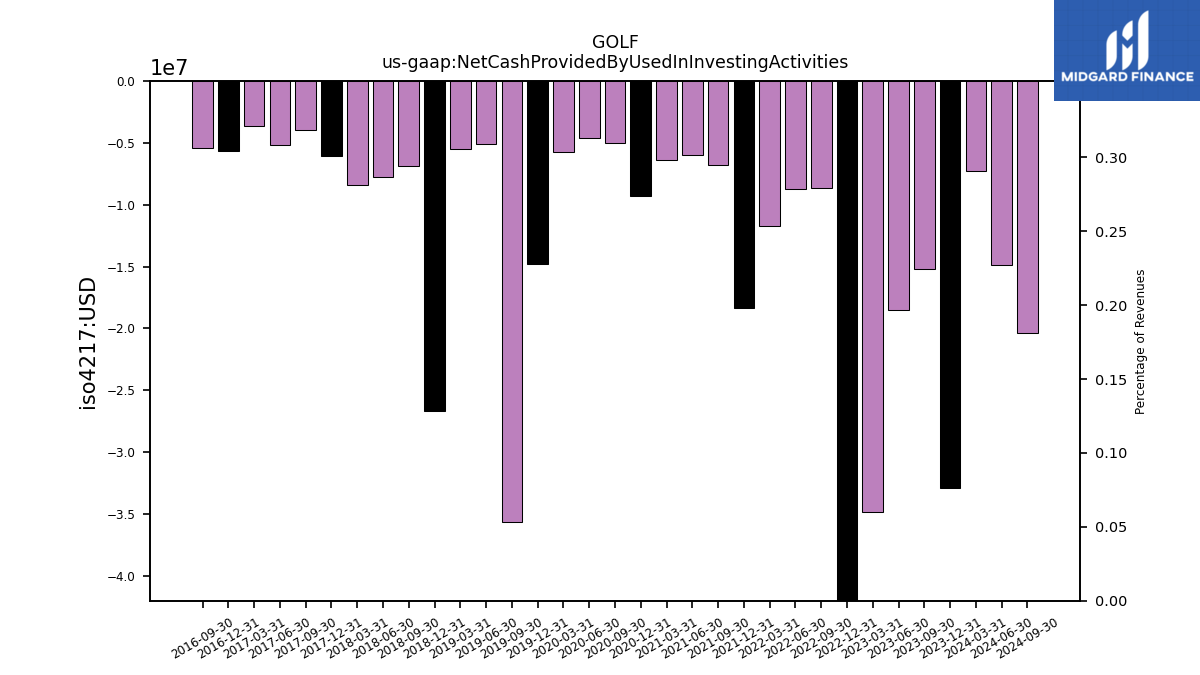
| Net Cash Provided By Used In Investing Activities | -32.93 | -15.20 | -18.52 | -34.83 | -111.13 | -8.64 | -8.77 | -11.69 | -18.39 | -6.81 | -5.99 | -6.41 | -9.29 | -5.03 | -4.61 | -5.74 | -14.79 | -35.67 | -5.13 | -5.46 | -26.69 | -6.88 | -7.75 | -8.38 | -6.06 | -3.96 | -5.15 | -3.68 | -5.67 | -5.39 | NA | NA | NA | NA | NA | NA | |
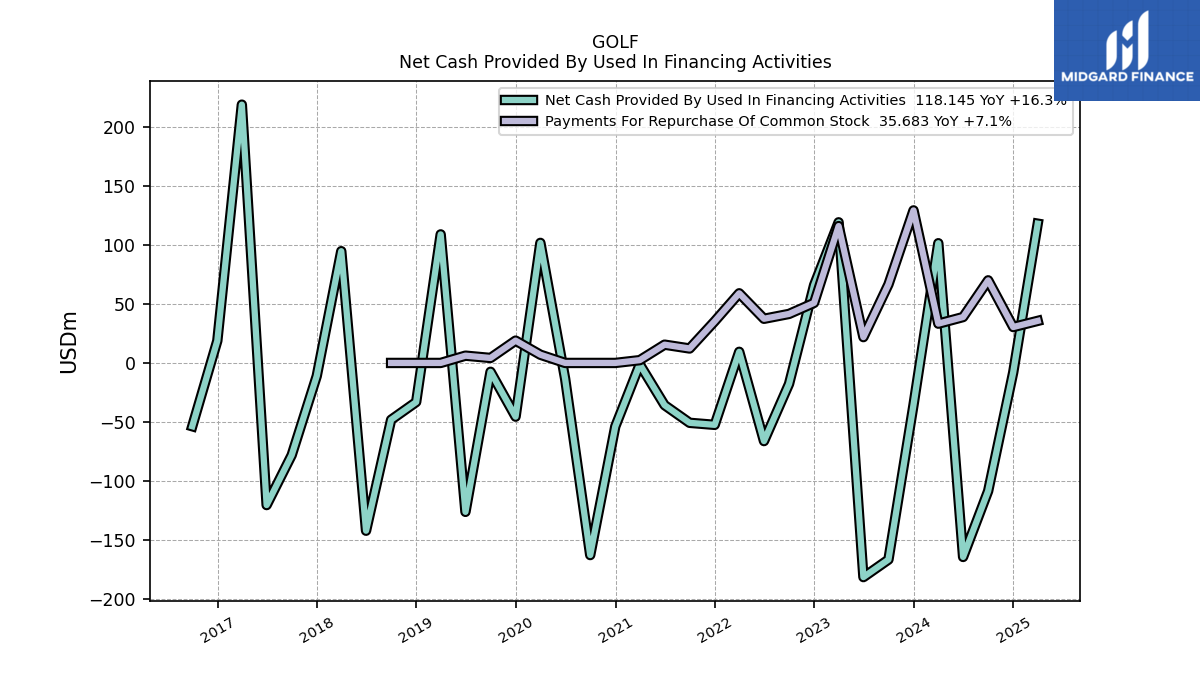
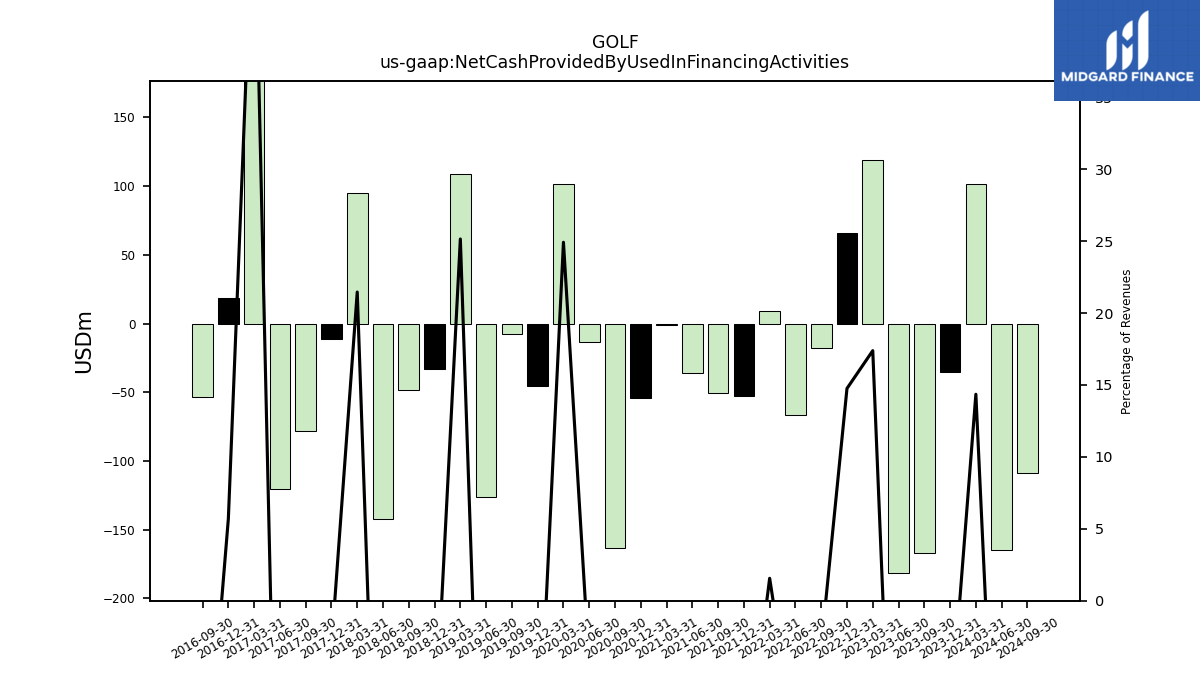
| Net Cash Provided By Used In Financing Activities | -35.52 | -166.82 | -181.69 | 119.31 | 66.03 | -17.79 | -66.30 | 9.47 | -52.51 | -50.79 | -35.80 | -1.23 | -53.94 | -162.99 | -13.52 | 101.87 | -45.57 | -7.50 | -126.34 | 109.08 | -33.16 | -48.21 | -142.33 | 94.82 | -11.11 | -78.21 | -120.57 | 219.14 | 18.83 | -53.70 | NA | NA | NA | NA | NA | NA |
| 2023-12-31 | 2023-09-30 | 2023-06-30 | 2023-03-31 | 2022-12-31 | 2022-09-30 | 2022-06-30 | 2022-03-31 | 2021-12-31 | 2021-09-30 | 2021-06-30 | 2021-03-31 | 2020-12-31 | 2020-09-30 | 2020-06-30 | 2020-03-31 | 2019-12-31 | 2019-09-30 | 2019-06-30 | 2019-03-31 | 2018-12-31 | 2018-09-30 | 2018-06-30 | 2018-03-31 | 2017-12-31 | 2017-09-30 | 2017-06-30 | 2017-03-31 | 2016-12-31 | 2016-09-30 | 2016-06-30 | 2016-03-31 | 2015-12-31 | 2015-09-30 | 2015-06-30 | 2015-03-31 | ||
|---|---|---|---|---|---|---|---|---|---|---|---|---|---|---|---|---|---|---|---|---|---|---|---|---|---|---|---|---|---|---|---|---|---|---|---|---|---|
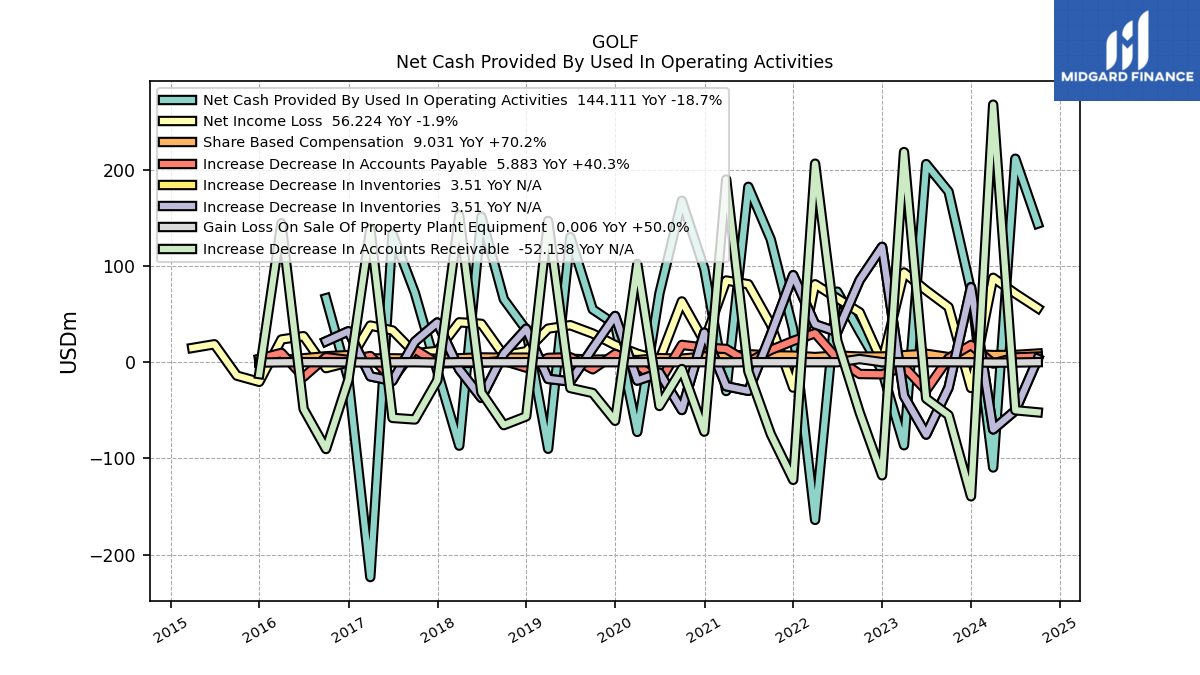
| Net Cash Provided By Used In Operating Activities | 74.90 | 177.31 | 206.03 | -86.42 | -8.74 | 31.60 | 73.40 | -164.05 | 34.03 | 127.68 | 182.41 | -30.00 | 97.31 | 167.95 | 71.67 | -72.51 | 39.35 | 54.92 | 130.08 | -90.06 | 33.67 | 65.51 | 151.39 | -86.83 | -9.15 | 71.98 | 133.62 | -223.49 | -17.76 | 66.54 | NA | NA | NA | NA | NA | NA | |
| Net Income Loss | -26.81 | 57.31 | 74.66 | 93.28 | -0.06 | 51.84 | 66.45 | 81.05 | -26.43 | 39.26 | 81.08 | 84.96 | 21.60 | 63.22 | 2.31 | 8.88 | 17.86 | 29.80 | 38.49 | 34.93 | 11.42 | 7.06 | 39.91 | 41.48 | 11.67 | 9.32 | 33.02 | 38.11 | -0.18 | -6.17 | 27.05 | 23.66 | -20.44 | -13.99 | 18.65 | 14.80 | |
| Profit Loss | -26.42 | 57.05 | 74.36 | 93.62 | 1.67 | 53.32 | 68.24 | 81.85 | -24.83 | 39.92 | 82.52 | 86.63 | 23.24 | 64.05 | 3.75 | 8.97 | 19.62 | 30.01 | 38.90 | 36.04 | 12.26 | 7.35 | 40.37 | 43.09 | 12.32 | 10.63 | 34.04 | 39.63 | 1.25 | -5.04 | 27.48 | 25.19 | -19.16 | -13.30 | 20.23 | 16.39 | |
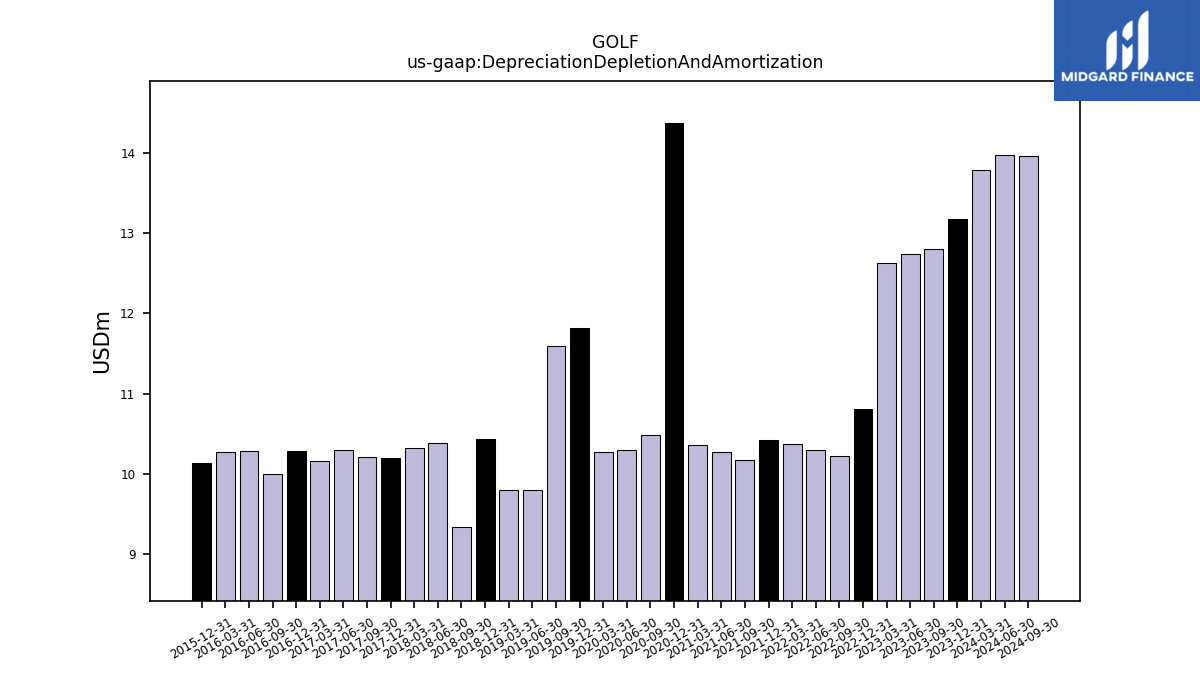
| Depreciation Depletion And Amortization | 13.18 | 12.81 | 12.74 | 12.63 | 10.81 | 10.23 | 10.30 | 10.37 | 10.43 | 10.18 | 10.28 | 10.36 | 14.37 | 10.49 | 10.30 | 10.27 | 11.81 | 11.59 | 9.80 | 9.80 | 10.44 | 9.35 | 10.39 | 10.32 | 10.20 | 10.21 | 10.29 | 10.16 | 10.28 | 10.00 | 10.28 | 10.27 | 10.14 | NA | NA | NA | |
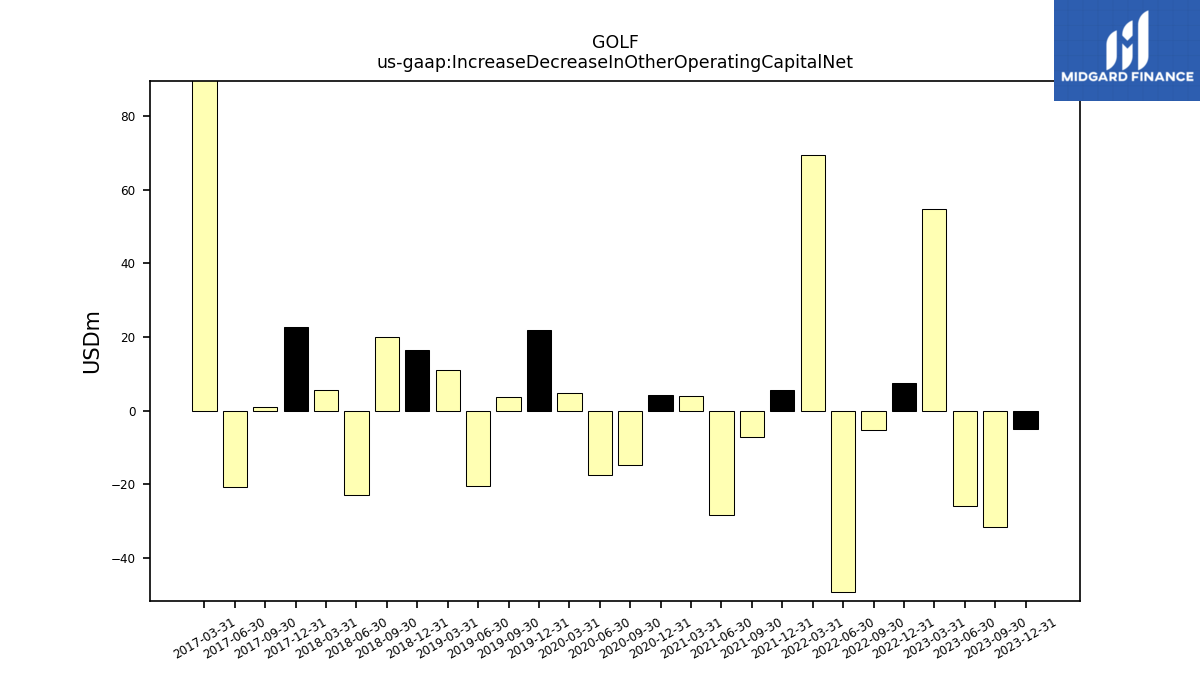
| Increase Decrease In Other Operating Capital Net | -4.99 | -31.47 | -25.78 | 54.84 | 7.58 | -5.18 | -49.18 | 69.33 | 5.57 | -7.17 | -28.35 | 4.06 | 4.16 | -14.88 | -17.43 | 4.89 | 21.88 | 3.66 | -20.37 | 10.91 | 16.57 | 20.01 | -22.79 | 5.54 | 22.70 | 1.07 | -20.74 | 162.57 | NA | NA | NA | NA | NA | NA | NA | NA | |
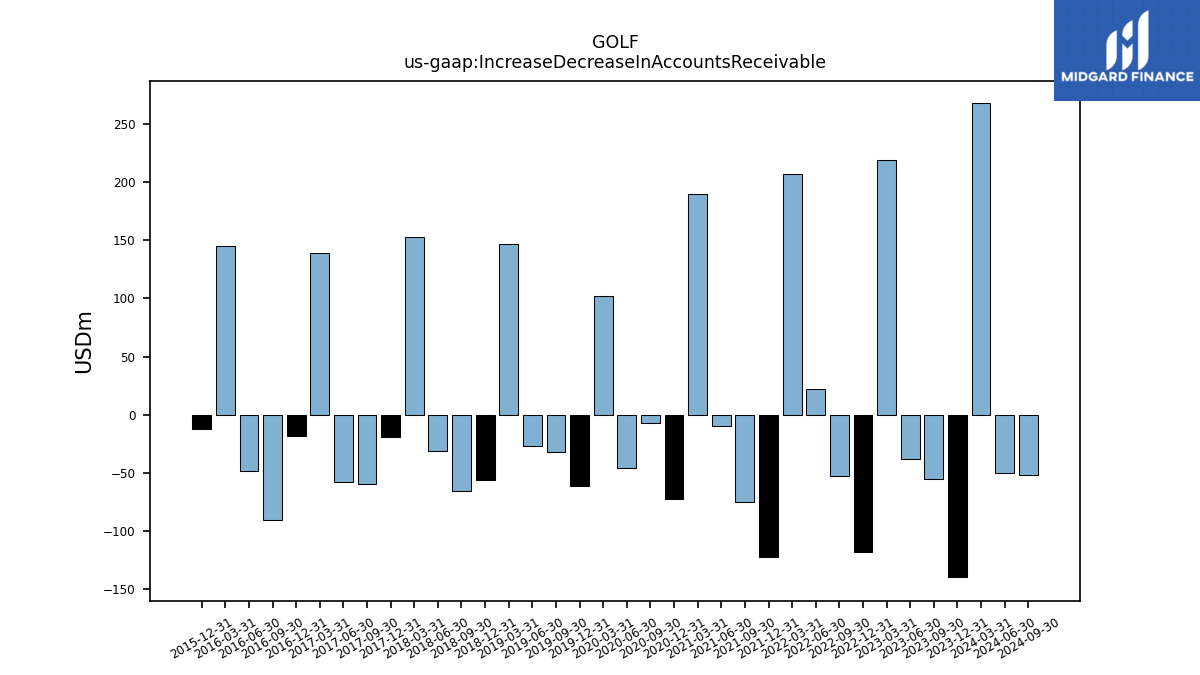
| Increase Decrease In Accounts Receivable | -139.45 | -55.10 | -37.77 | 218.54 | -117.64 | -52.31 | 22.37 | 206.47 | -122.39 | -74.77 | -9.54 | 190.02 | -72.24 | -7.15 | -45.54 | 102.18 | -60.94 | -32.02 | -26.84 | 146.89 | -56.37 | -65.44 | -31.39 | 152.63 | -18.84 | -59.57 | -57.93 | 138.93 | -18.33 | -90.30 | -48.60 | 144.60 | -12.35 | NA | NA | NA | |
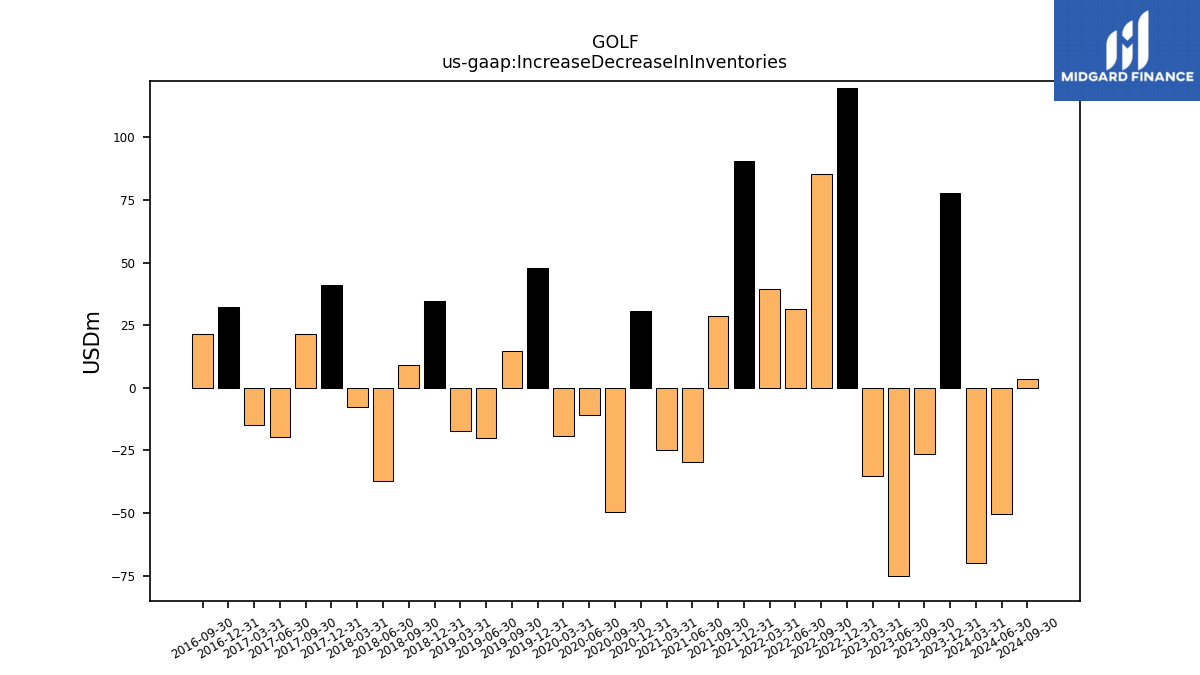
| Increase Decrease In Inventories | 77.93 | -26.44 | -75.26 | -35.13 | 119.91 | 85.31 | 31.41 | 39.34 | 90.48 | 28.50 | -29.76 | -24.99 | 30.75 | -49.69 | -10.97 | -19.09 | 48.05 | 14.53 | -20.05 | -17.37 | 34.80 | 8.96 | -37.10 | -7.46 | 41.22 | 21.37 | -19.50 | -14.72 | 32.16 | 21.70 | NA | NA | NA | NA | NA | NA | |
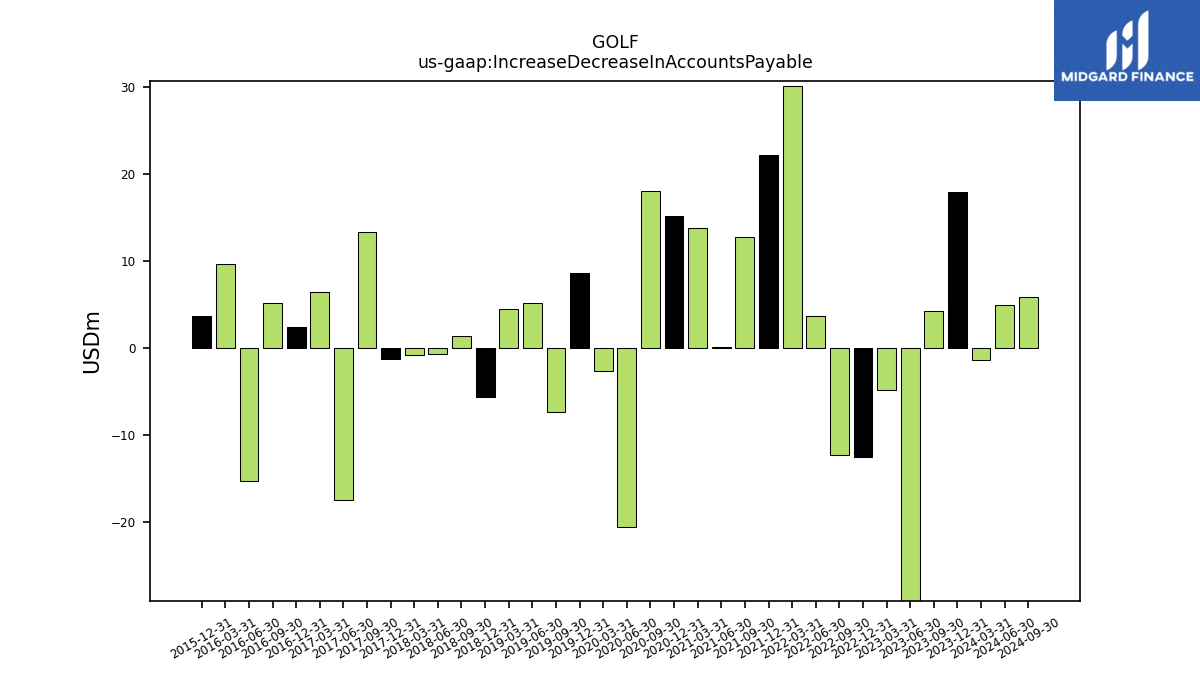
| Increase Decrease In Accounts Payable | 17.93 | 4.19 | -29.39 | -4.83 | -12.60 | -12.27 | 3.63 | 30.08 | 22.16 | 12.70 | 0.14 | 13.79 | 15.15 | 17.99 | -20.54 | -2.65 | 8.57 | -7.40 | 5.18 | 4.49 | -5.70 | 1.38 | -0.70 | -0.77 | -1.26 | 13.31 | -17.51 | 6.43 | 2.35 | 5.21 | -15.30 | 9.71 | 3.62 | NA | NA | NA | |
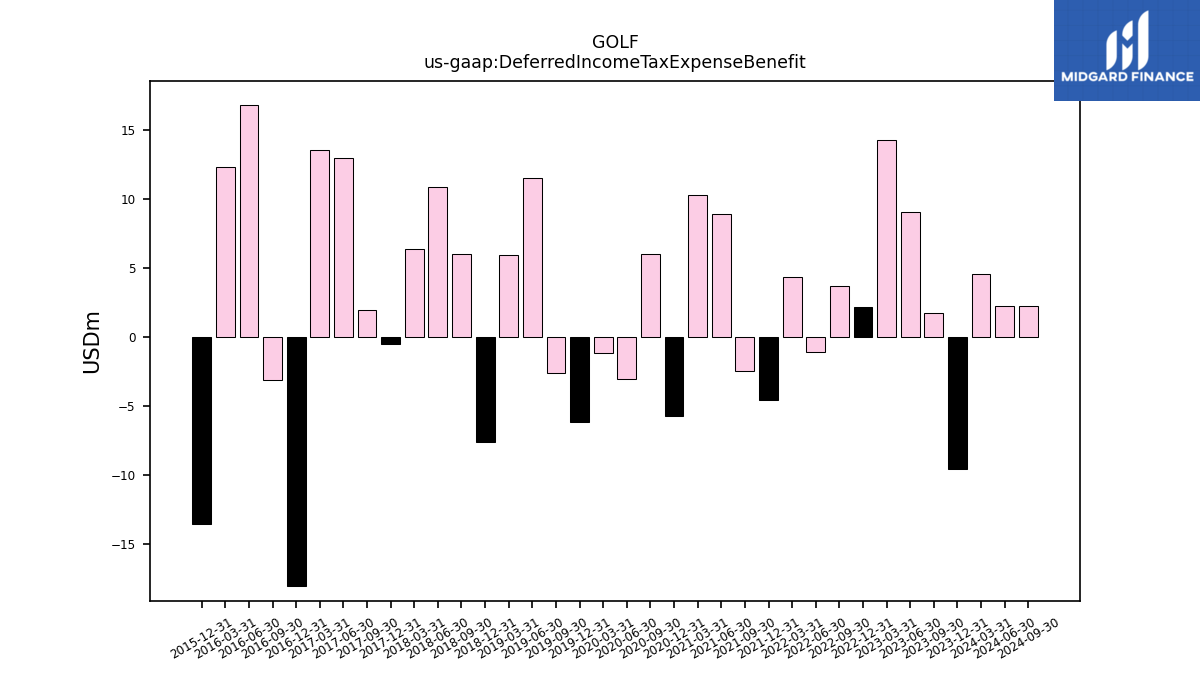
| Deferred Income Tax Expense Benefit | -9.60 | 1.71 | 9.02 | 14.28 | 2.13 | 3.69 | -1.10 | 4.34 | -4.61 | -2.49 | 8.86 | 10.27 | -5.72 | 5.98 | -3.05 | -1.19 | -6.22 | -2.66 | 11.47 | 5.89 | -7.66 | 6.01 | 10.82 | 6.37 | -0.56 | 1.95 | 12.97 | 13.50 | -18.11 | -3.13 | 16.78 | 12.30 | -13.58 | NA | NA | NA | |
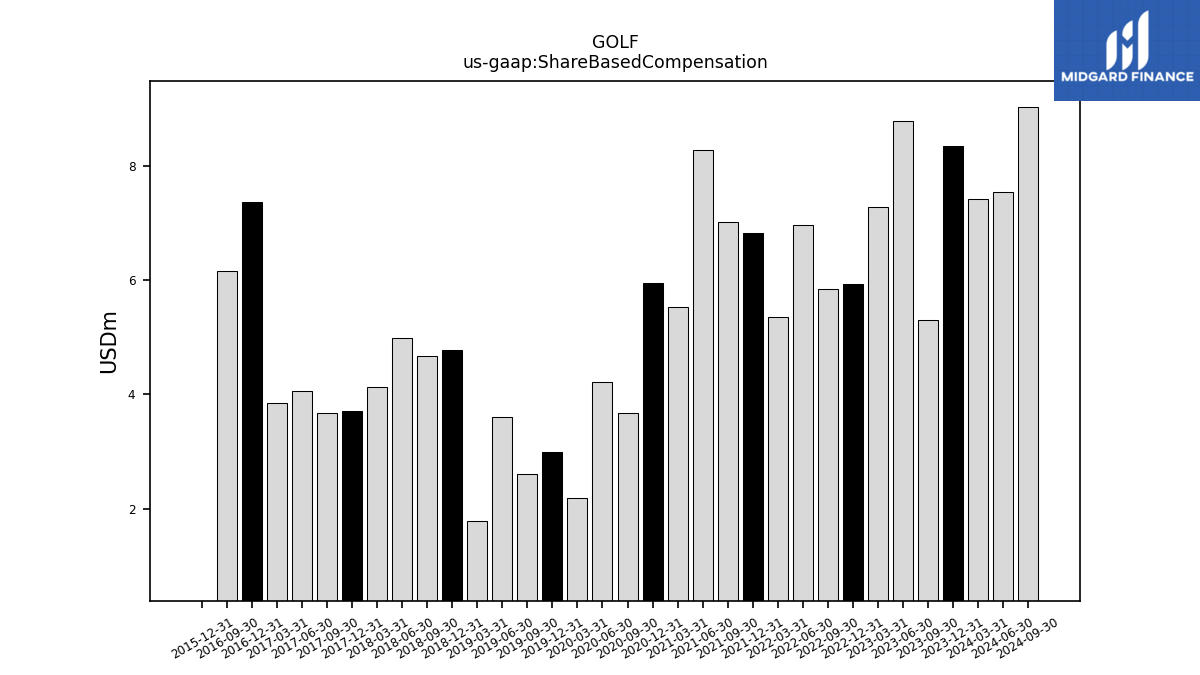
| Share Based Compensation | 8.34 | 5.30 | 8.78 | 7.28 | 5.92 | 5.84 | 6.97 | 5.35 | 6.82 | 7.01 | 8.28 | 5.53 | 5.94 | 3.67 | 4.22 | 2.19 | 2.98 | 2.60 | 3.60 | 1.78 | 4.78 | 4.67 | 4.98 | 4.13 | 3.71 | 3.67 | 4.05 | 3.85 | 7.37 | 6.16 | NA | NA | 0.00 | NA | NA | NA | |
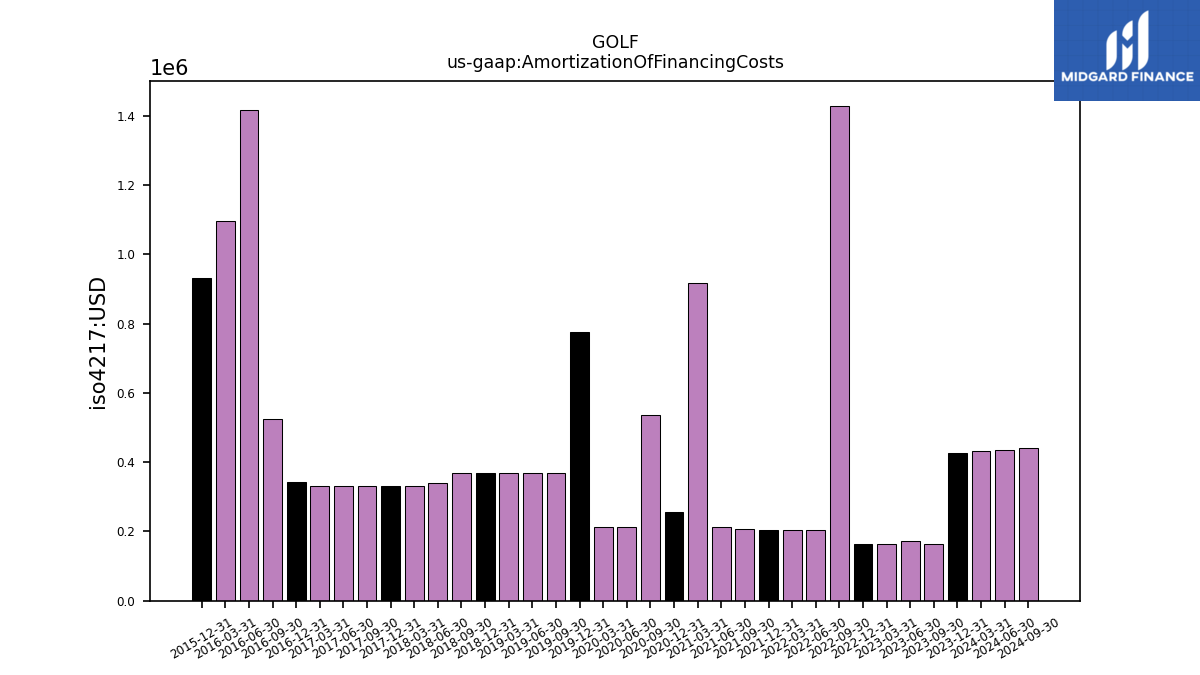
| Amortization Of Financing Costs | 0.43 | 0.16 | 0.17 | 0.17 | 0.17 | 1.43 | 0.20 | 0.20 | 0.20 | 0.21 | 0.21 | 0.92 | 0.26 | 0.54 | 0.21 | 0.21 | 0.78 | 0.37 | 0.37 | 0.37 | 0.37 | 0.37 | 0.34 | 0.33 | 0.33 | 0.33 | 0.33 | 0.33 | 0.34 | 0.52 | 1.42 | 1.09 | 0.93 | NA | NA | NA |
| 2023-12-31 | 2023-09-30 | 2023-06-30 | 2023-03-31 | 2022-12-31 | 2022-09-30 | 2022-06-30 | 2022-03-31 | 2021-12-31 | 2021-09-30 | 2021-06-30 | 2021-03-31 | 2020-12-31 | 2020-09-30 | 2020-06-30 | 2020-03-31 | 2019-12-31 | 2019-09-30 | 2019-06-30 | 2019-03-31 | 2018-12-31 | 2018-09-30 | 2018-06-30 | 2018-03-31 | 2017-12-31 | 2017-09-30 | 2017-06-30 | 2017-03-31 | 2016-12-31 | 2016-09-30 | 2016-06-30 | 2016-03-31 | 2015-12-31 | 2015-09-30 | 2015-06-30 | 2015-03-31 | ||
|---|---|---|---|---|---|---|---|---|---|---|---|---|---|---|---|---|---|---|---|---|---|---|---|---|---|---|---|---|---|---|---|---|---|---|---|---|---|
| Net Cash Provided By Used In Investing Activities | -32.93 | -15.20 | -18.52 | -34.83 | -111.13 | -8.64 | -8.77 | -11.69 | -18.39 | -6.81 | -5.99 | -6.41 | -9.29 | -5.03 | -4.61 | -5.74 | -14.79 | -35.67 | -5.13 | -5.46 | -26.69 | -6.88 | -7.75 | -8.38 | -6.06 | -3.96 | -5.15 | -3.68 | -5.67 | -5.39 | NA | NA | NA | NA | NA | NA | |
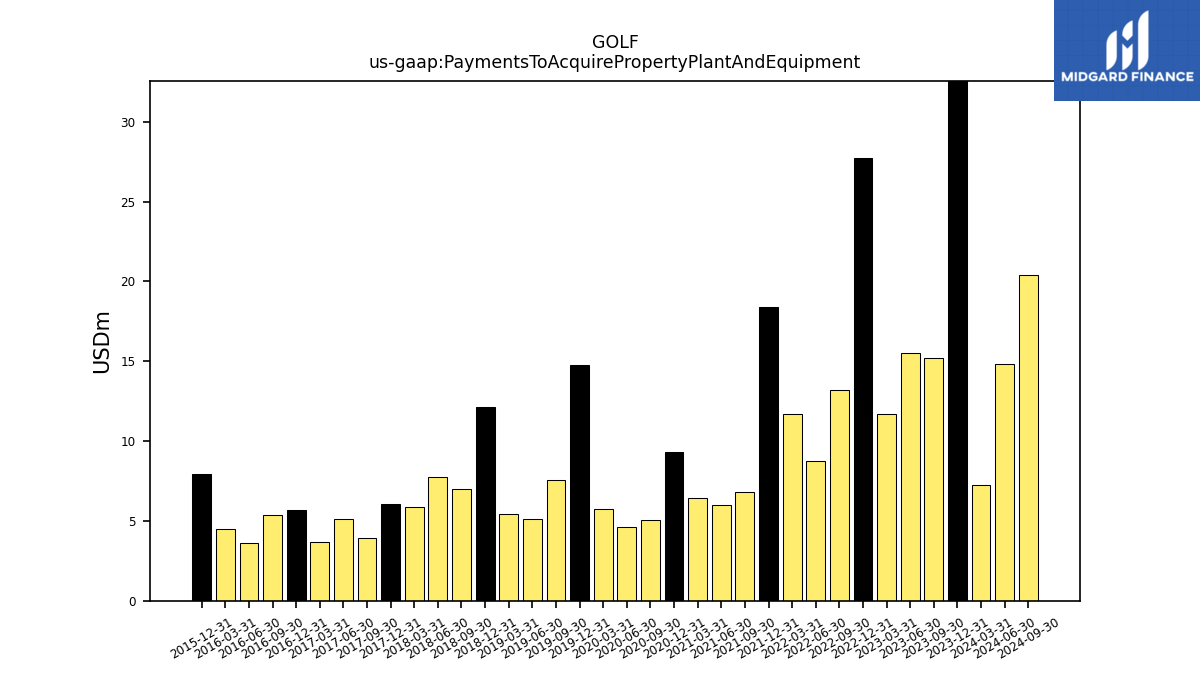
| Payments To Acquire Property Plant And Equipment | 32.93 | 15.20 | 15.53 | 11.70 | 27.73 | 13.18 | 8.77 | 11.69 | 18.39 | 6.81 | 5.99 | 6.41 | 9.29 | 5.03 | 4.61 | 5.74 | 14.79 | 7.57 | 5.13 | 5.46 | 12.14 | 7.00 | 7.77 | 5.89 | 6.06 | 3.96 | 5.15 | 3.68 | 5.67 | 5.39 | 3.61 | 4.51 | 7.93 | NA | NA | NA |
| 2023-12-31 | 2023-09-30 | 2023-06-30 | 2023-03-31 | 2022-12-31 | 2022-09-30 | 2022-06-30 | 2022-03-31 | 2021-12-31 | 2021-09-30 | 2021-06-30 | 2021-03-31 | 2020-12-31 | 2020-09-30 | 2020-06-30 | 2020-03-31 | 2019-12-31 | 2019-09-30 | 2019-06-30 | 2019-03-31 | 2018-12-31 | 2018-09-30 | 2018-06-30 | 2018-03-31 | 2017-12-31 | 2017-09-30 | 2017-06-30 | 2017-03-31 | 2016-12-31 | 2016-09-30 | 2016-06-30 | 2016-03-31 | 2015-12-31 | 2015-09-30 | 2015-06-30 | 2015-03-31 | ||
|---|---|---|---|---|---|---|---|---|---|---|---|---|---|---|---|---|---|---|---|---|---|---|---|---|---|---|---|---|---|---|---|---|---|---|---|---|---|
| Net Cash Provided By Used In Financing Activities | -35.52 | -166.82 | -181.69 | 119.31 | 66.03 | -17.79 | -66.30 | 9.47 | -52.51 | -50.79 | -35.80 | -1.23 | -53.94 | -162.99 | -13.52 | 101.87 | -45.57 | -7.50 | -126.34 | 109.08 | -33.16 | -48.21 | -142.33 | 94.82 | -11.11 | -78.21 | -120.57 | 219.14 | 18.83 | -53.70 | NA | NA | NA | NA | NA | NA | |
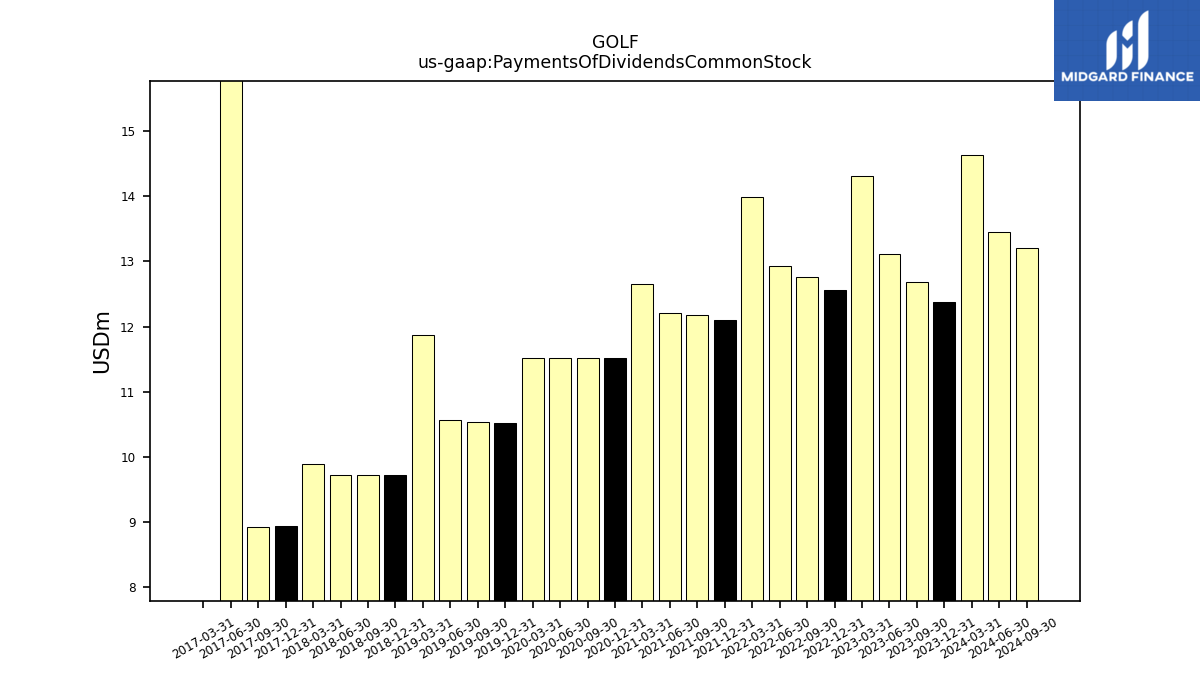
| Payments Of Dividends Common Stock | 12.38 | 12.69 | 13.11 | 14.30 | 12.57 | 12.76 | 12.93 | 13.98 | 12.11 | 12.19 | 12.21 | 12.66 | 11.52 | 11.52 | 11.51 | 11.52 | 10.52 | 10.53 | 10.56 | 11.87 | 9.72 | 9.72 | 9.72 | 9.90 | 8.94 | 8.93 | 17.87 | 0.00 | NA | NA | NA | NA | NA | NA | NA | NA | |
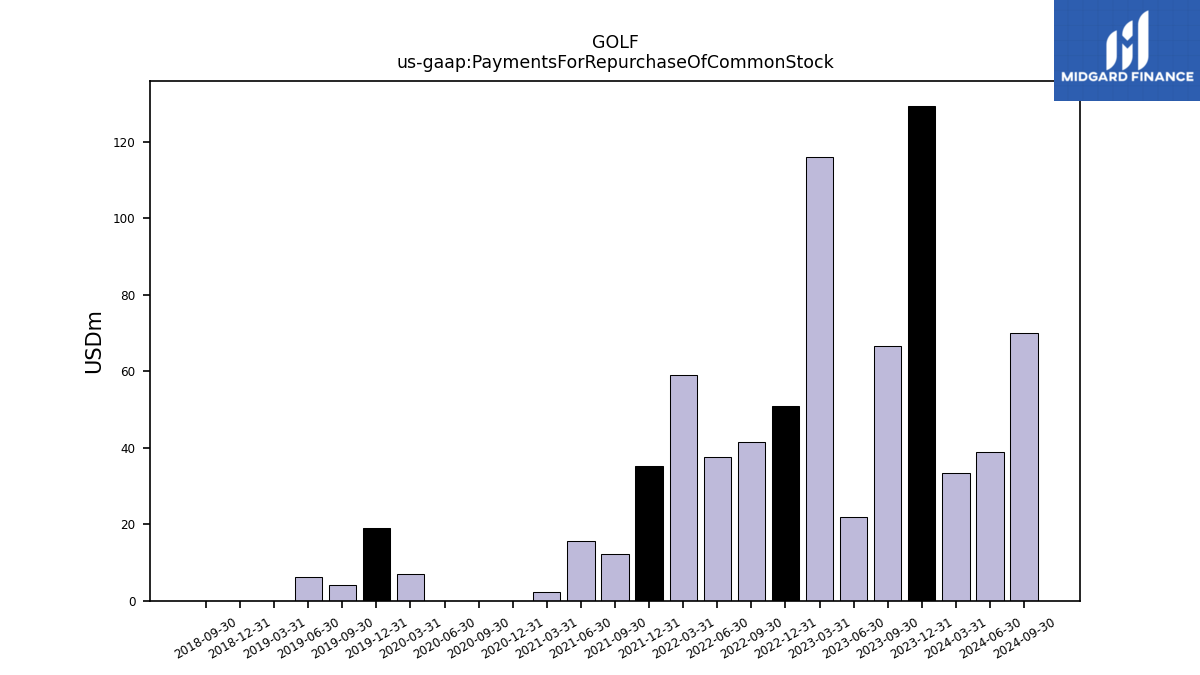
| Payments For Repurchase Of Common Stock | 129.43 | 66.64 | 21.90 | 116.12 | 50.95 | 41.59 | 37.46 | 59.11 | 35.35 | 12.26 | 15.51 | 2.38 | 0.00 | 0.00 | 0.00 | 6.98 | 18.94 | 4.23 | 6.18 | 0.00 | 0.00 | 0.00 | NA | NA | NA | NA | NA | NA | NA | NA | NA | NA | NA | NA | NA | NA |
| 2023-12-31 | 2023-09-30 | 2023-06-30 | 2023-03-31 | 2022-12-31 | 2022-09-30 | 2022-06-30 | 2022-03-31 | 2021-12-31 | 2021-09-30 | 2021-06-30 | 2021-03-31 | 2020-12-31 | 2020-09-30 | 2020-06-30 | 2020-03-31 | 2019-12-31 | 2019-09-30 | 2019-06-30 | 2019-03-31 | 2018-12-31 | 2018-09-30 | 2018-06-30 | 2018-03-31 | 2017-12-31 | 2017-09-30 | 2017-06-30 | 2017-03-31 | 2016-12-31 | 2016-09-30 | 2016-06-30 | 2016-03-31 | 2015-12-31 | 2015-09-30 | 2015-06-30 | 2015-03-31 | ||
|---|---|---|---|---|---|---|---|---|---|---|---|---|---|---|---|---|---|---|---|---|---|---|---|---|---|---|---|---|---|---|---|---|---|---|---|---|---|
| Revenues | 412.96 | 593.38 | 689.36 | 686.29 | 447.40 | 558.25 | 658.60 | 606.09 | 420.57 | 521.63 | 624.85 | 580.88 | 420.49 | 482.93 | 300.00 | 408.74 | 368.27 | 417.17 | 462.22 | 433.70 | 343.36 | 370.43 | 478.14 | 441.80 | 351.39 | 347.26 | 427.99 | 433.62 | 329.76 | 332.35 | 463.26 | 439.94 | 320.22 | 319.87 | 446.58 | 416.30 | |
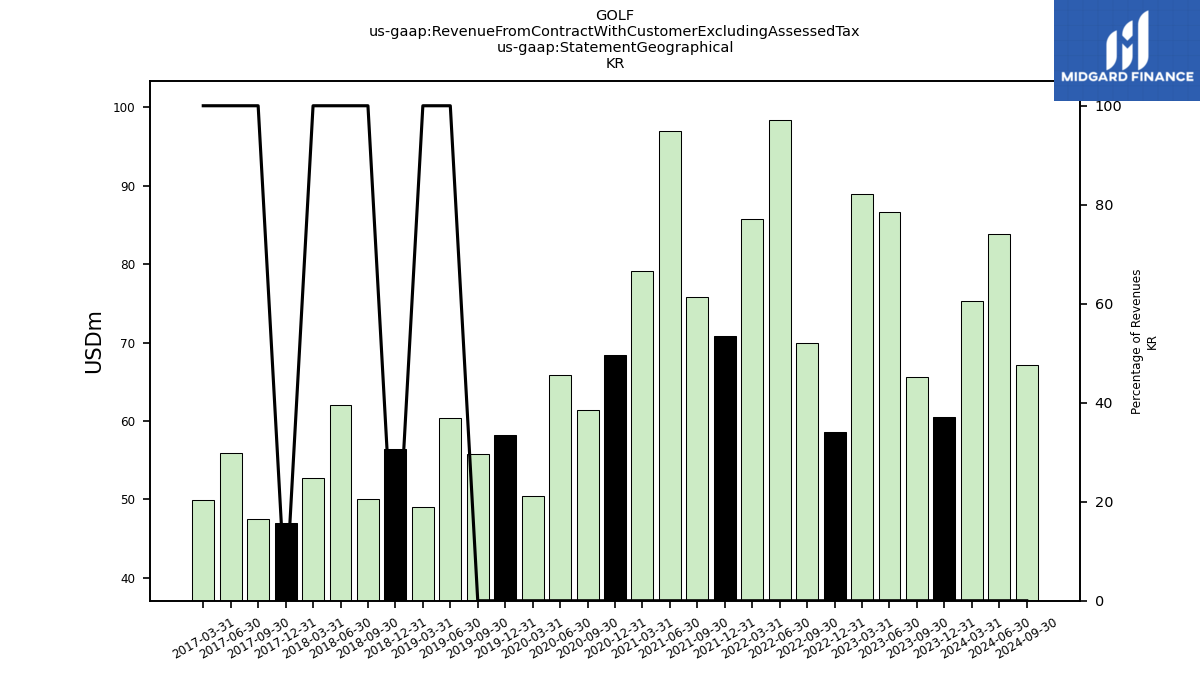
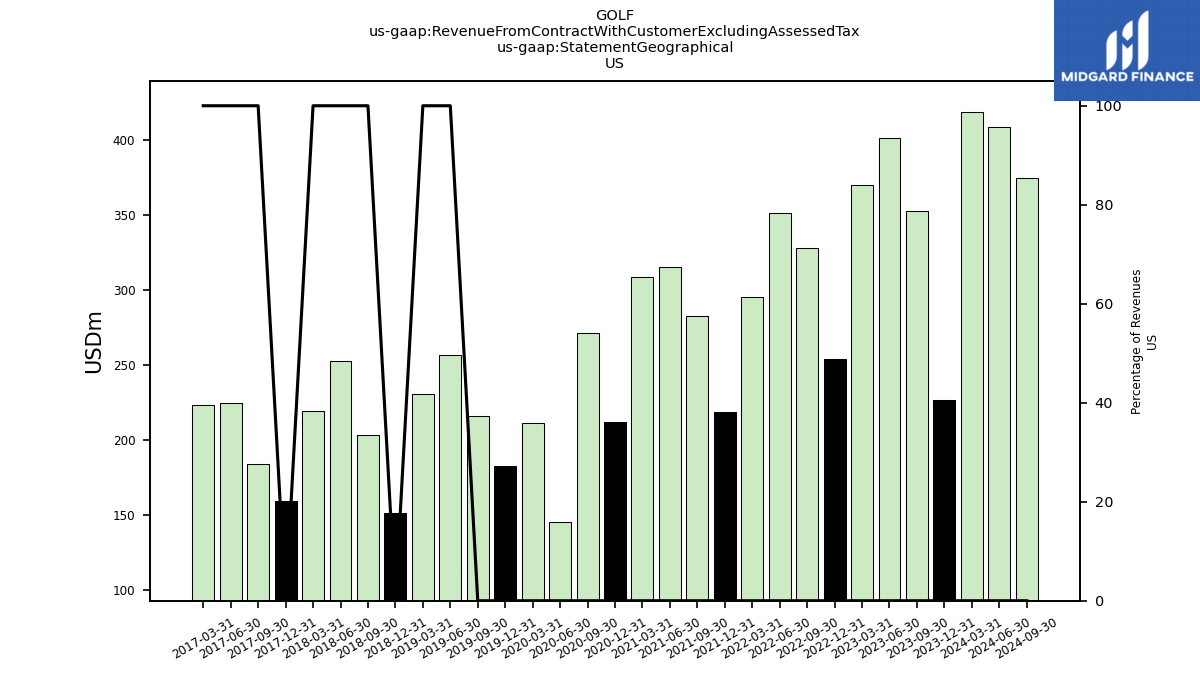
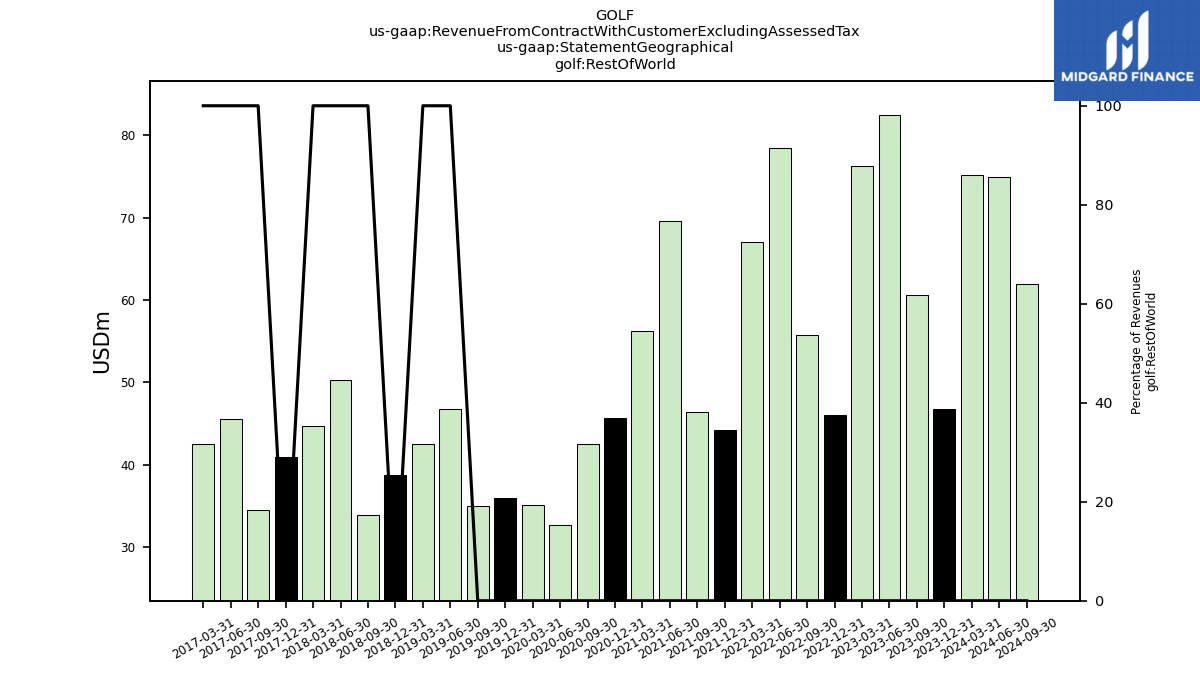
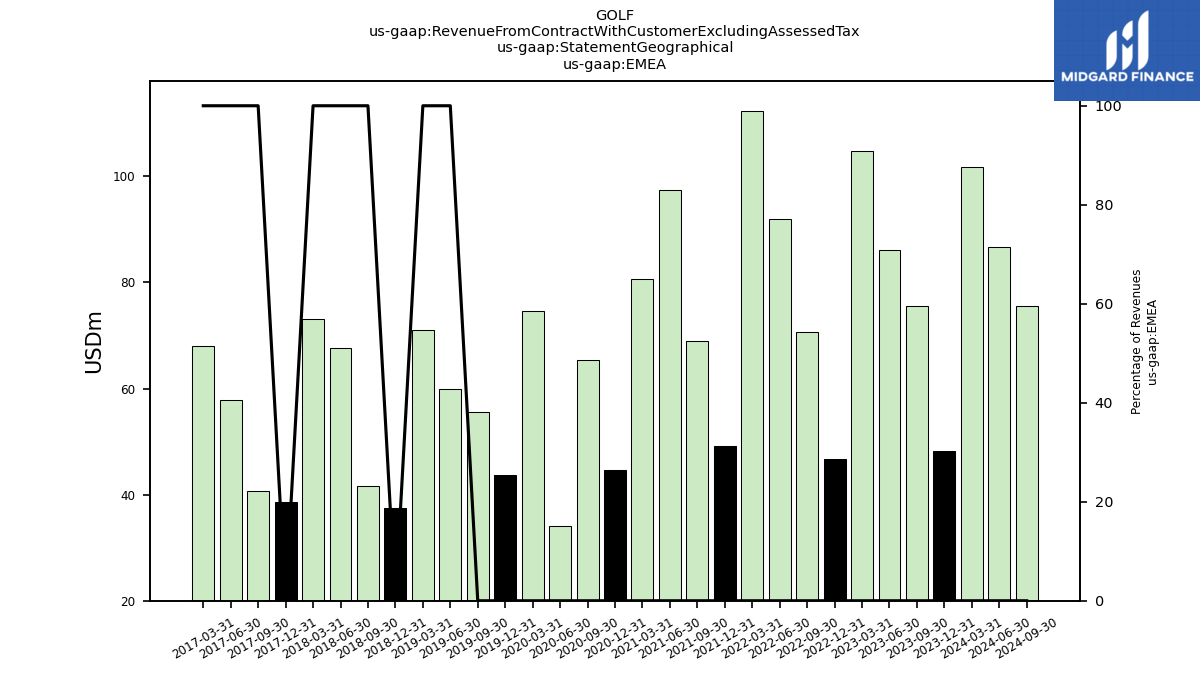
| Revenue From Contract With Customer Excluding Assessed Tax | 412.96 | 593.38 | 689.36 | 686.29 | 447.40 | 558.25 | 658.60 | 606.09 | 420.57 | 521.63 | 624.85 | 580.88 | 420.49 | 482.93 | 300.00 | 408.74 | 368.27 | 417.17 | 462.22 | 433.70 | 343.36 | 370.43 | 478.14 | 441.80 | 351.39 | 347.26 | 427.99 | 433.62 | 329.76 | 332.35 | 463.26 | 439.94 | 320.22 | 319.87 | 446.58 | 416.30 | |
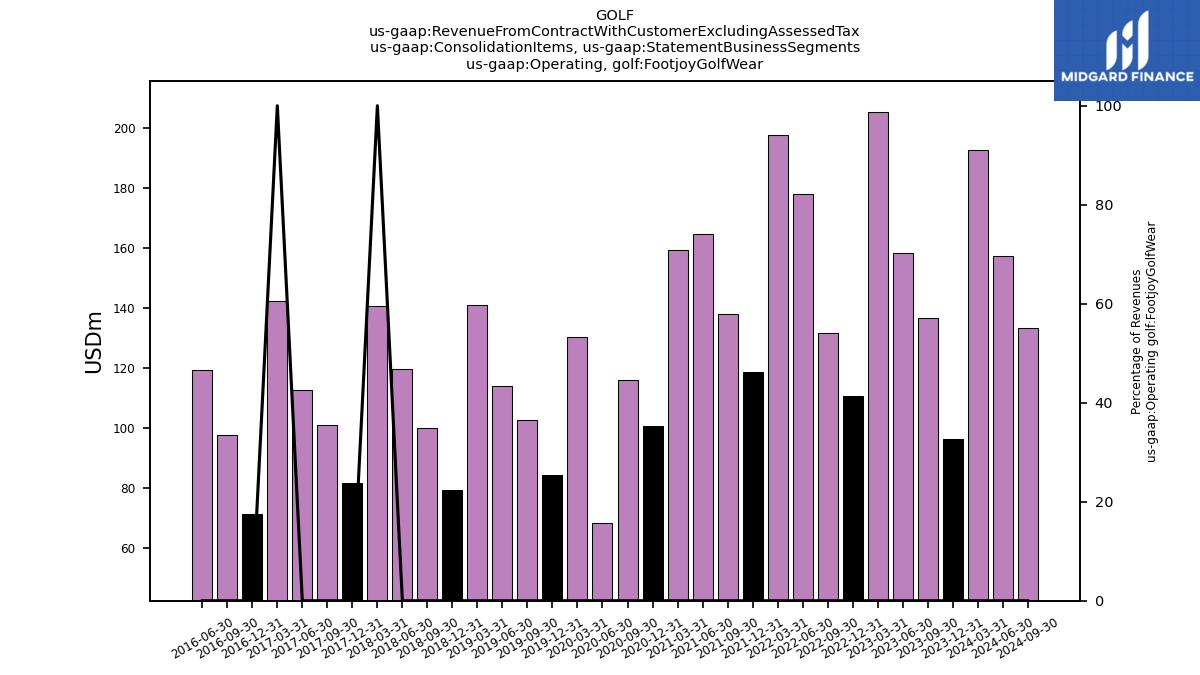
| Operating, Footjoy Golf Wear | 96.27 | 136.67 | 158.23 | 205.27 | 110.82 | 131.69 | 177.89 | 197.55 | 118.57 | 137.91 | 164.64 | 159.43 | 100.53 | 116.01 | 68.34 | 130.39 | 84.22 | 102.57 | 114.09 | 140.98 | 79.31 | 100.17 | 119.50 | 140.71 | 81.70 | 101.01 | 112.50 | 142.24 | 71.27 | 97.76 | 119.40 | NA | NA | NA | NA | NA | |
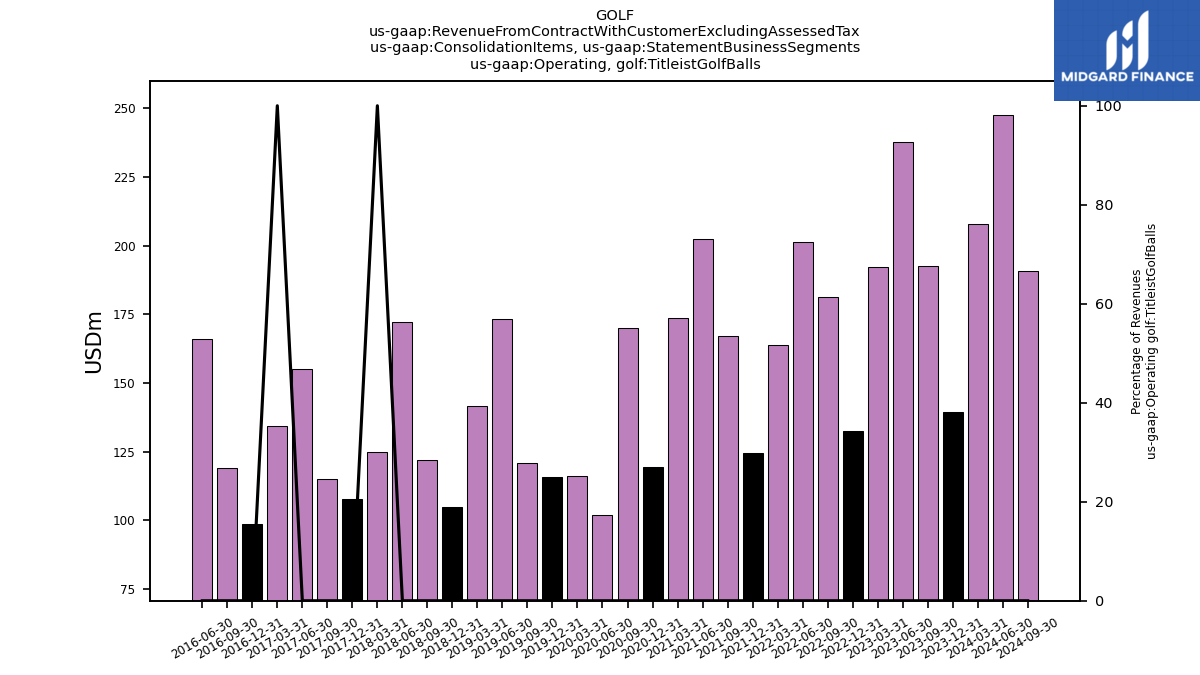
| Operating, Titleist Golf Balls | 139.60 | 192.56 | 237.57 | 192.00 | 132.47 | 181.24 | 201.29 | 163.84 | 124.45 | 167.20 | 202.26 | 173.64 | 119.34 | 170.12 | 102.14 | 116.24 | 115.74 | 120.89 | 173.31 | 141.67 | 105.06 | 121.79 | 172.21 | 124.91 | 107.94 | 114.95 | 154.96 | 134.19 | 98.57 | 119.08 | 165.88 | NA | NA | NA | NA | NA | |
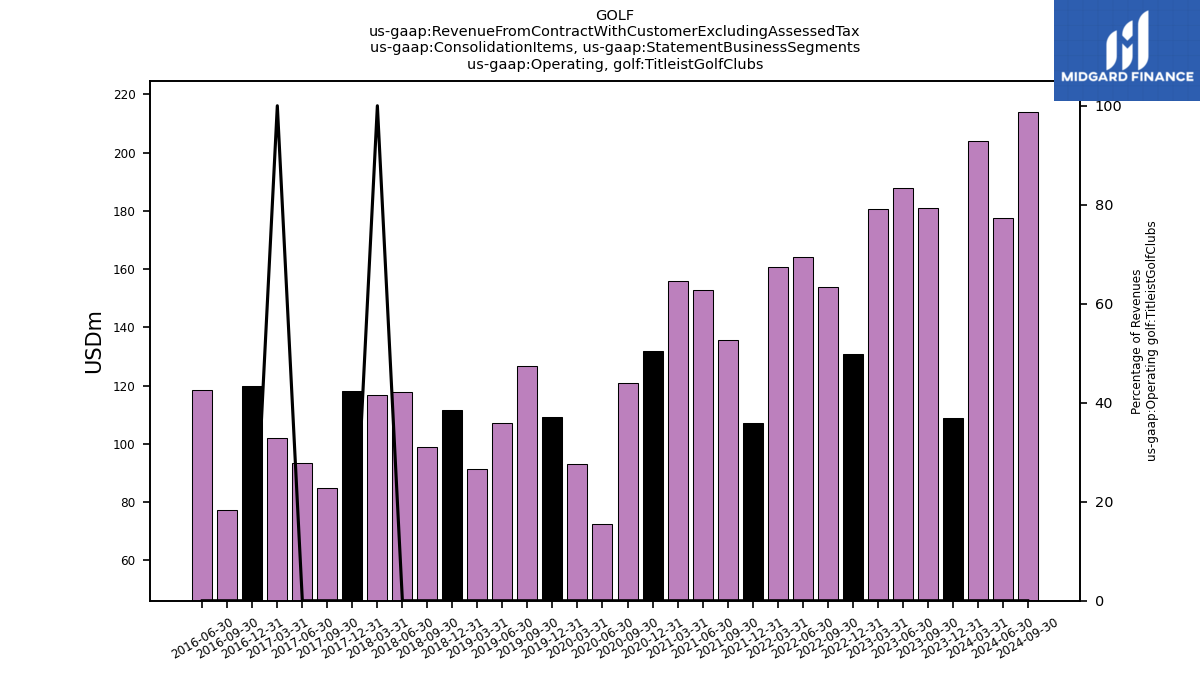
| Operating, Titleist Golf Clubs | 108.80 | 181.04 | 188.02 | 180.78 | 130.69 | 153.88 | 164.19 | 160.81 | 107.28 | 135.60 | 152.82 | 155.83 | 131.99 | 120.82 | 72.40 | 93.21 | 109.25 | 126.78 | 107.01 | 91.32 | 111.59 | 99.02 | 117.84 | 116.89 | 118.03 | 84.68 | 93.34 | 101.94 | 119.82 | 77.32 | 118.34 | NA | NA | NA | NA | NA | |
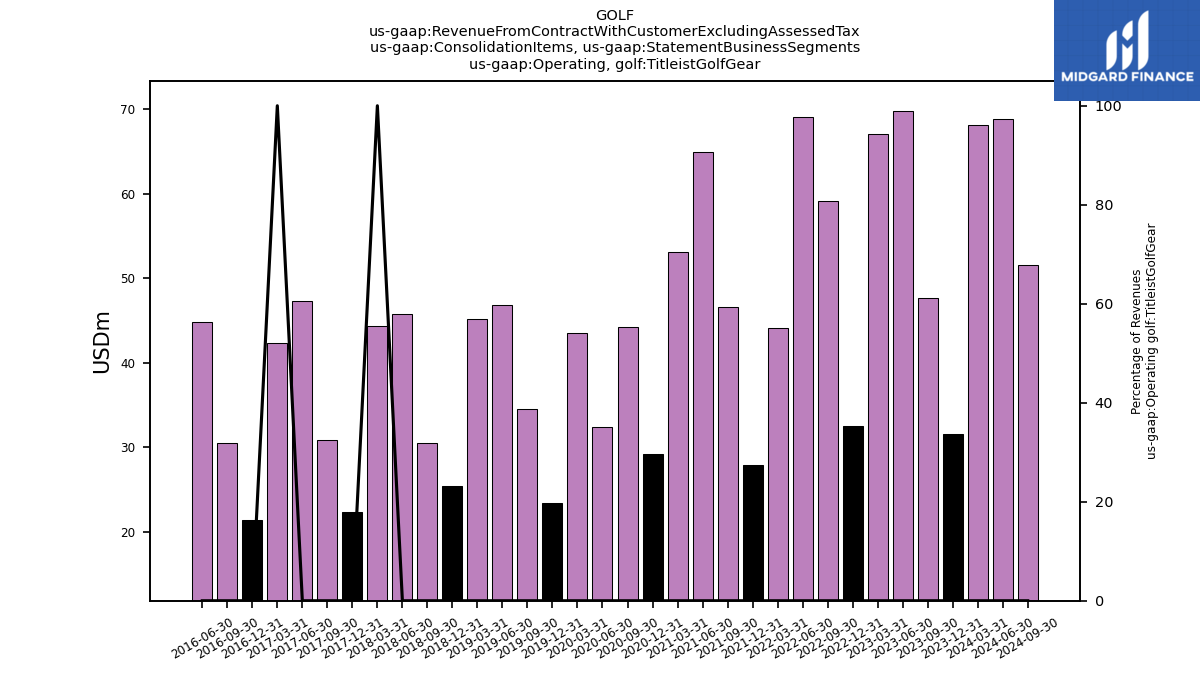
| Operating, Titleist Golf Gear | 31.59 | 47.66 | 69.87 | 67.04 | 32.47 | 59.19 | 69.13 | 44.15 | 27.90 | 46.62 | 64.97 | 53.12 | 29.25 | 44.27 | 32.37 | 43.52 | 23.39 | 34.58 | 46.84 | 45.18 | 25.40 | 30.50 | 45.82 | 44.34 | 22.33 | 30.89 | 47.30 | 42.39 | 21.38 | 30.50 | 44.78 | NA | NA | NA | NA | NA | |
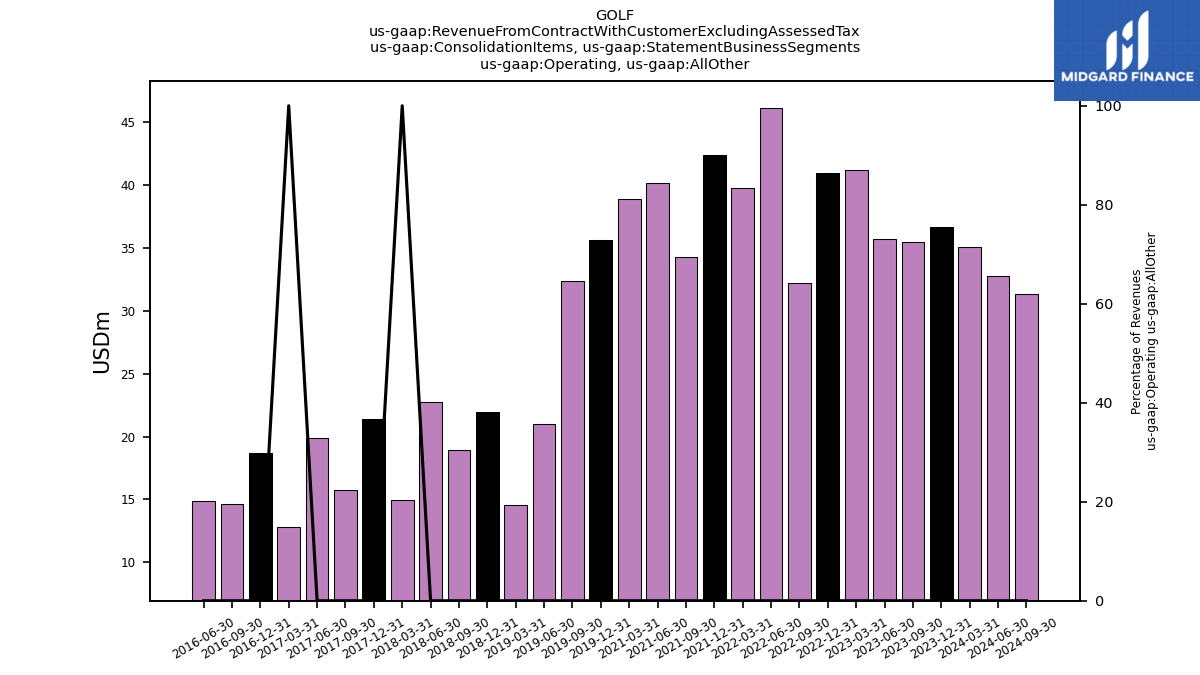
| Operating, All Other | 36.70 | 35.45 | 35.67 | 41.19 | 40.95 | 32.24 | 46.10 | 39.73 | 42.37 | 34.29 | 40.15 | 38.87 | NA | NA | NA | NA | 35.67 | 32.35 | 20.97 | 14.55 | 21.99 | 18.95 | 22.77 | 14.95 | 21.39 | 15.73 | 19.89 | 12.85 | 18.72 | 14.67 | 14.87 | NA | NA | NA | NA | NA | |
| 31.24 | 39.03 | 32.77 | 46.38 | 42.47 | 34.36 | 38.40 | 45.80 | 38.10 | 47.92 | 45.59 | 56.38 | 49.85 | 42.28 | 22.14 | 37.56 | 47.94 | 55.20 | 38.81 | 40.73 | 59.81 | 41.68 | 45.49 | 52.13 | 65.66 | 41.13 | 44.42 | 50.05 | NA | NA | NA | NA | NA | NA | NA | NA | ||
| 60.55 | 65.65 | 86.63 | 88.98 | 58.57 | 69.92 | 98.45 | 85.72 | 70.78 | 75.78 | 96.95 | 79.10 | 68.39 | 61.45 | 65.89 | 50.45 | 58.19 | 55.73 | 60.41 | 49.04 | 56.47 | 50.03 | 61.97 | 52.67 | 47.04 | 47.50 | 55.97 | 49.88 | NA | NA | NA | NA | NA | NA | NA | NA | ||
| US | 226.24 | 352.46 | 401.37 | 369.93 | 253.61 | 327.64 | 351.42 | 295.13 | 218.40 | 282.65 | 315.32 | 308.64 | 211.86 | 271.28 | 145.23 | 211.01 | 182.47 | 215.68 | 256.27 | 230.38 | 150.89 | 203.19 | 252.74 | 219.29 | 159.09 | 183.50 | 224.18 | 223.12 | NA | NA | NA | NA | NA | NA | NA | NA | |
| Rest Of World | 46.78 | 60.59 | 82.49 | 76.24 | 46.05 | 55.71 | 78.46 | 67.09 | 44.17 | 46.35 | 69.61 | 56.20 | 45.65 | 42.48 | 32.62 | 35.06 | 35.96 | 34.90 | 46.73 | 42.46 | 38.76 | 33.86 | 50.26 | 44.67 | 40.93 | 34.49 | 45.54 | 42.56 | NA | NA | NA | NA | NA | NA | NA | NA | |
| EMEA | 48.15 | 75.64 | 86.10 | 104.76 | 46.70 | 70.61 | 91.87 | 112.36 | 49.12 | 68.93 | 97.37 | 80.58 | 44.73 | 65.44 | 34.13 | 74.67 | 43.72 | 55.67 | 60.00 | 71.08 | 37.43 | 41.66 | 67.67 | 73.04 | 38.67 | 40.65 | 57.88 | 68.01 | NA | NA | NA | NA | NA | NA | NA | NA |