
| 2023-12-31 | 2023-09-30 | 2023-06-30 | 2023-03-31 | 2022-12-31 | 2022-09-30 | 2022-06-30 | 2022-03-31 | 2021-12-31 | 2021-09-30 | 2021-06-30 | 2021-03-31 | 2020-12-31 | 2020-09-30 | 2020-06-30 | 2020-03-31 | 2019-12-31 | 2019-09-30 | 2019-06-30 | 2019-03-31 | 2018-12-31 | 2018-09-30 | 2018-06-30 | 2018-03-31 | 2017-12-31 | 2017-09-30 | 2017-06-30 | 2017-03-31 | ||
|---|---|---|---|---|---|---|---|---|---|---|---|---|---|---|---|---|---|---|---|---|---|---|---|---|---|---|---|---|---|
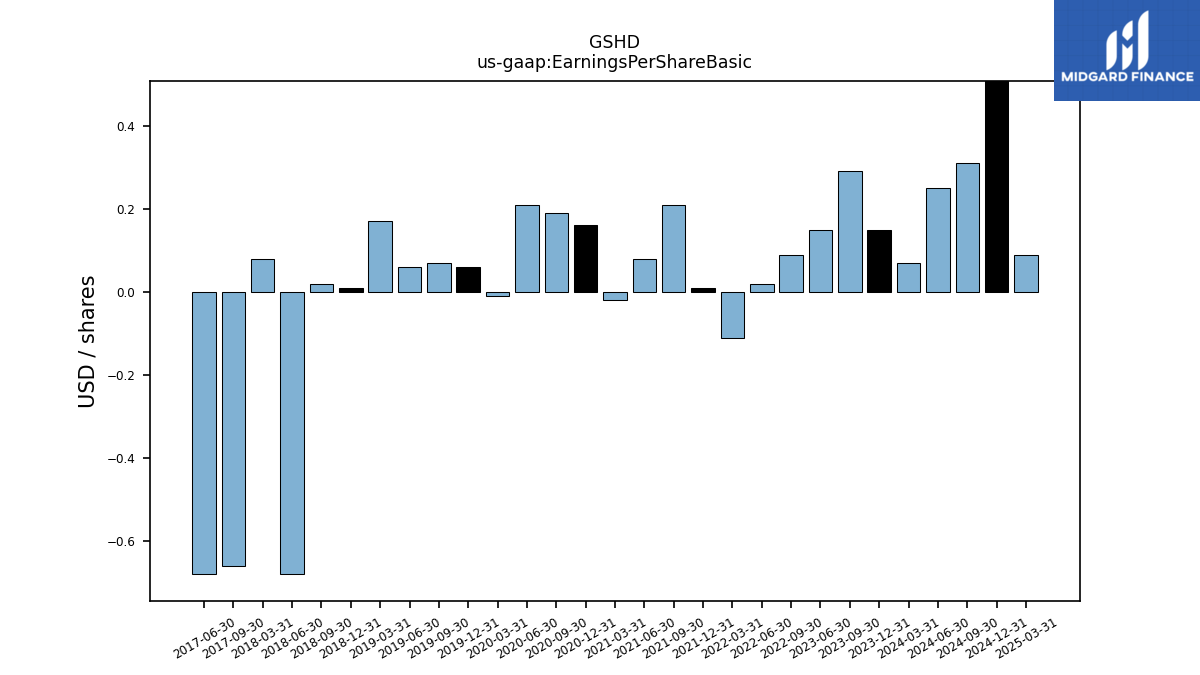
| Earnings Per Share Basic | 0.15 | 0.29 | 0.15 | NA | NA | 0.09 | 0.02 | -0.11 | 0.01 | 0.21 | 0.08 | -0.02 | 0.16 | 0.19 | 0.21 | -0.01 | 0.06 | 0.07 | 0.06 | 0.17 | 0.01 | 0.02 | -0.68 | 0.08 | NA | -0.66 | -0.68 | NA | |
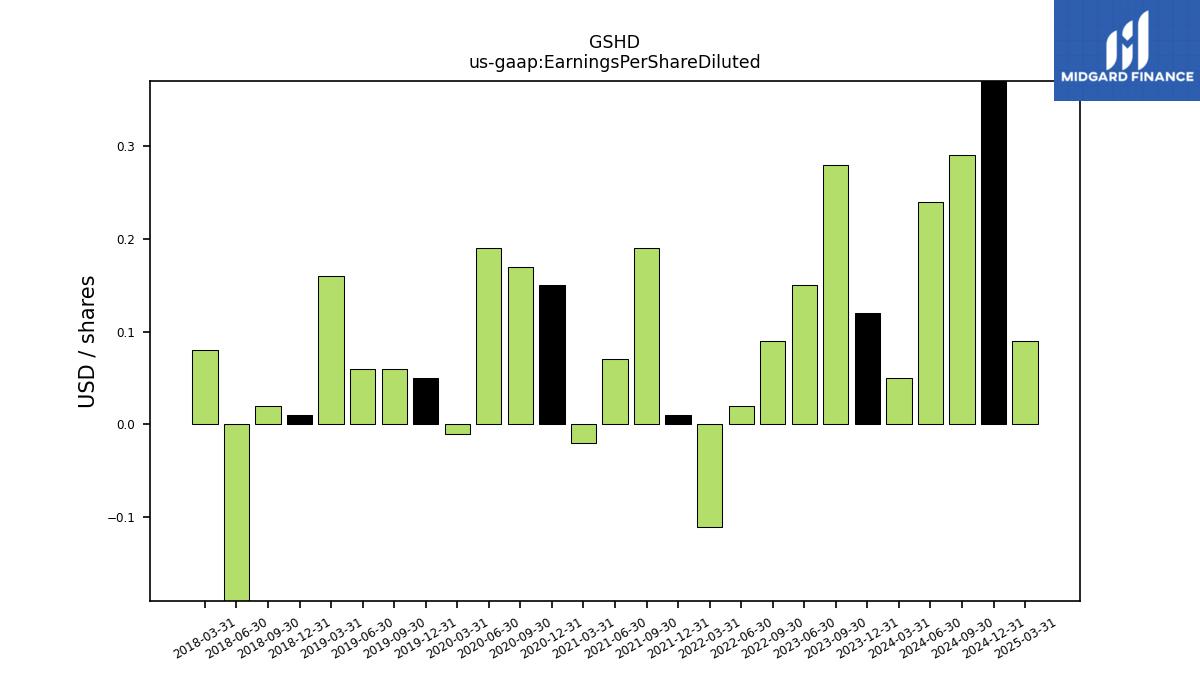
| Earnings Per Share Diluted | 0.12 | 0.28 | 0.15 | NA | NA | 0.09 | 0.02 | -0.11 | 0.01 | 0.19 | 0.07 | -0.02 | 0.15 | 0.17 | 0.19 | -0.01 | 0.05 | 0.06 | 0.06 | 0.16 | 0.01 | 0.02 | -0.68 | 0.08 | NA | NA | NA | NA |
| 2023-12-31 | 2023-09-30 | 2023-06-30 | 2023-03-31 | 2022-12-31 | 2022-09-30 | 2022-06-30 | 2022-03-31 | 2021-12-31 | 2021-09-30 | 2021-06-30 | 2021-03-31 | 2020-12-31 | 2020-09-30 | 2020-06-30 | 2020-03-31 | 2019-12-31 | 2019-09-30 | 2019-06-30 | 2019-03-31 | 2018-12-31 | 2018-09-30 | 2018-06-30 | 2018-03-31 | 2017-12-31 | 2017-09-30 | 2017-06-30 | 2017-03-31 | ||
|---|---|---|---|---|---|---|---|---|---|---|---|---|---|---|---|---|---|---|---|---|---|---|---|---|---|---|---|---|---|
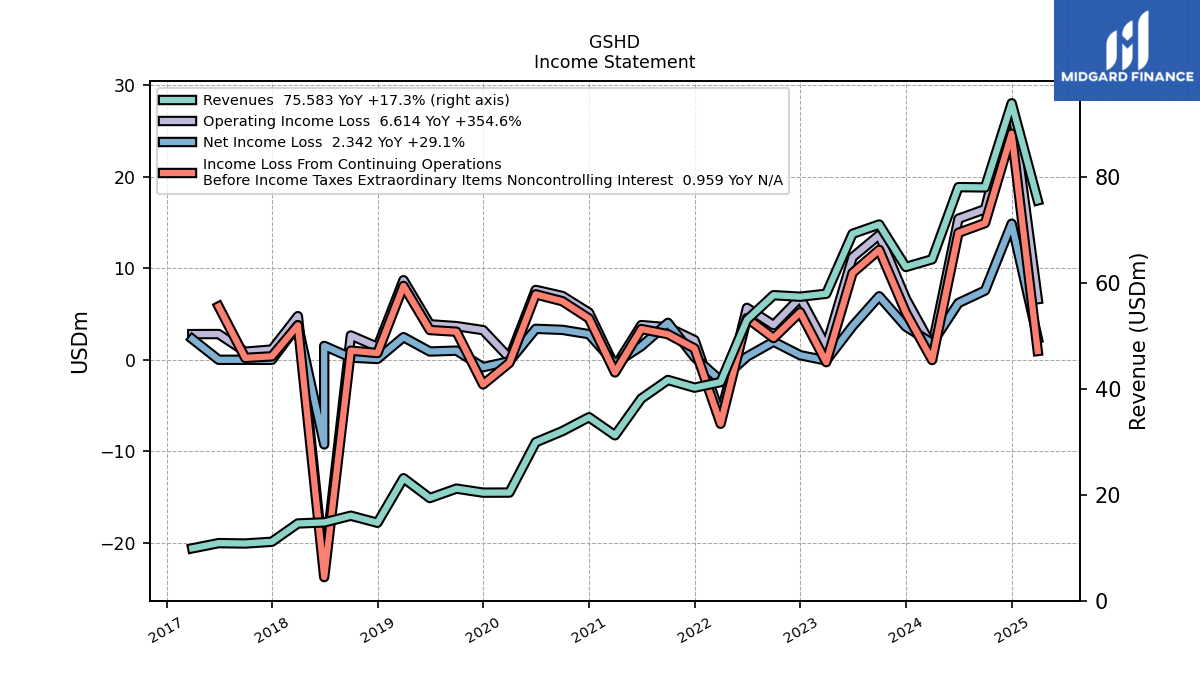
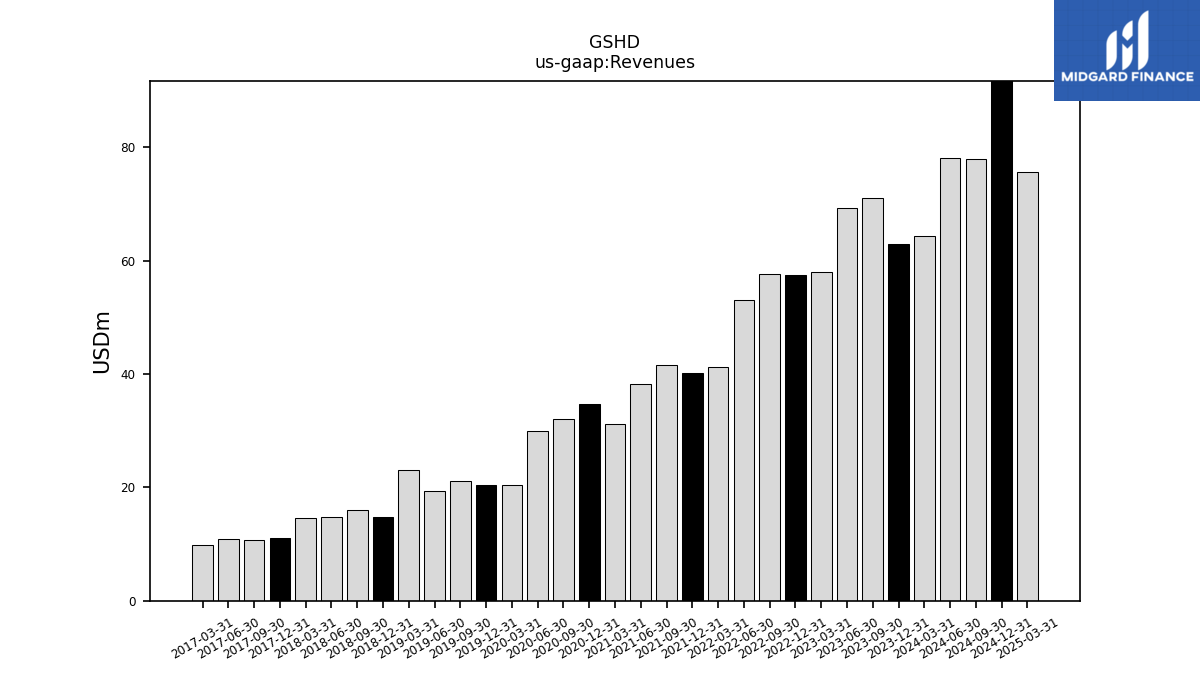
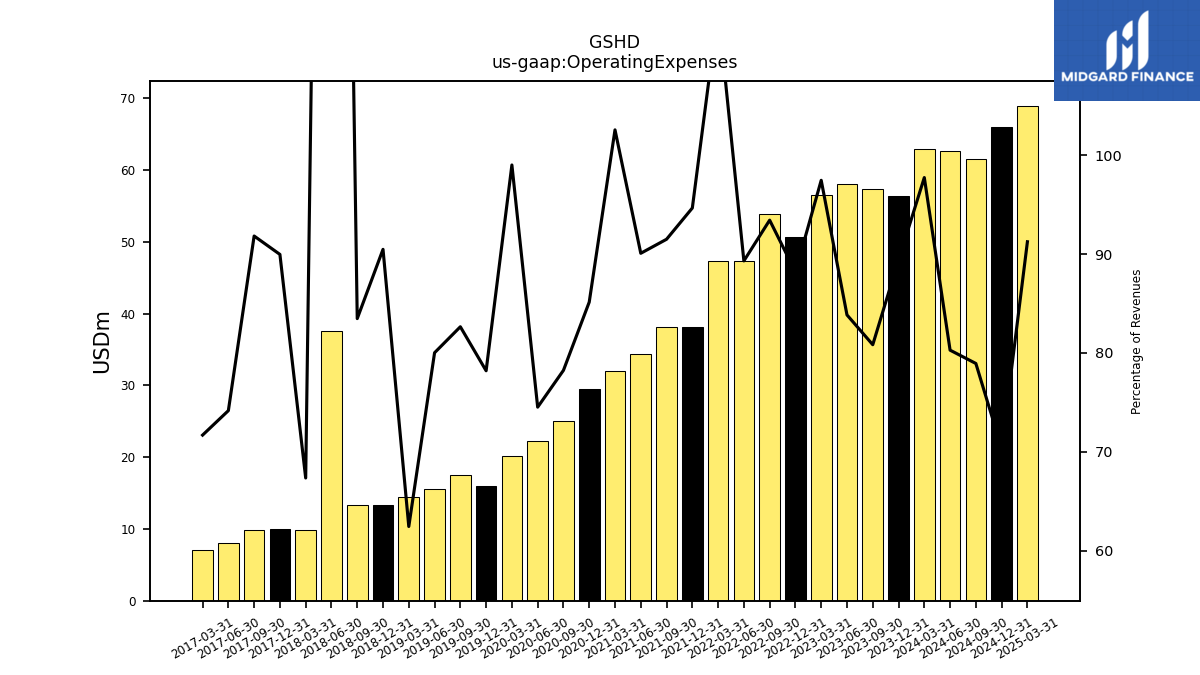
| Revenues | 63.01 | 71.03 | 69.28 | 57.95 | 57.40 | 57.69 | 53.02 | 41.28 | 40.23 | 41.68 | 38.17 | 31.23 | 34.65 | 32.02 | 29.92 | 20.43 | 20.41 | 21.17 | 19.39 | 23.13 | 14.72 | 16.05 | 14.79 | 14.59 | 11.13 | 10.81 | 10.88 | 9.89 | |
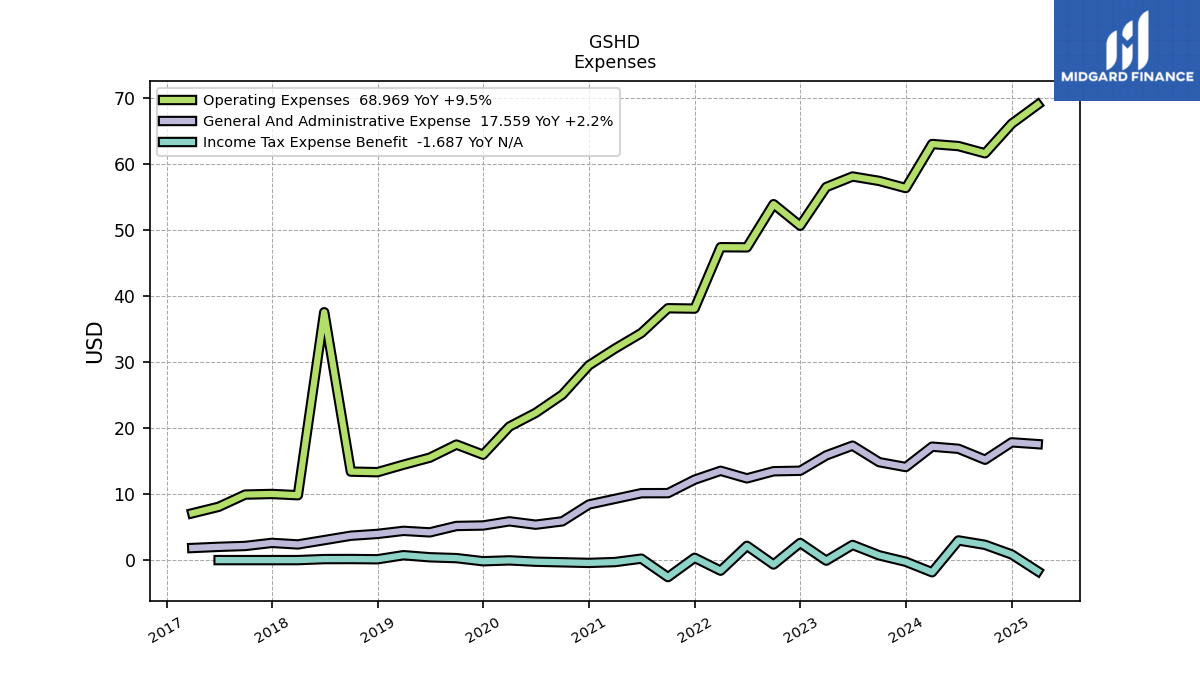
| Operating Expenses | 56.33 | 57.42 | 58.09 | 56.49 | 50.63 | 53.90 | 47.35 | 47.38 | 38.08 | 38.14 | 34.39 | 32.03 | 29.50 | 25.05 | 22.30 | 20.22 | 15.96 | 17.50 | 15.51 | 14.45 | 13.32 | 13.40 | 37.54 | 9.83 | 10.02 | 9.92 | 8.07 | 7.09 | |
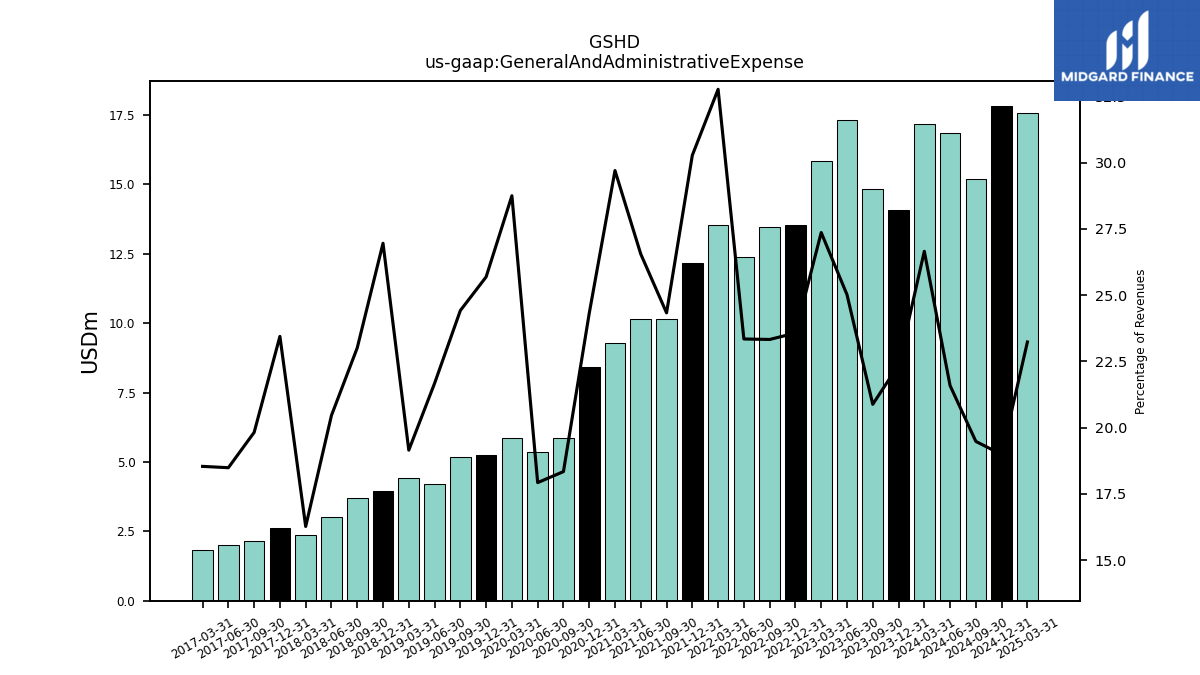
| General And Administrative Expense | 14.09 | 14.83 | 17.33 | 15.86 | 13.53 | 13.46 | 12.38 | 13.52 | 12.18 | 10.14 | 10.13 | 9.27 | 8.42 | 5.87 | 5.36 | 5.87 | 5.24 | 5.17 | 4.20 | 4.43 | 3.97 | 3.69 | 3.03 | 2.37 | 2.61 | 2.14 | 2.01 | 1.83 | |
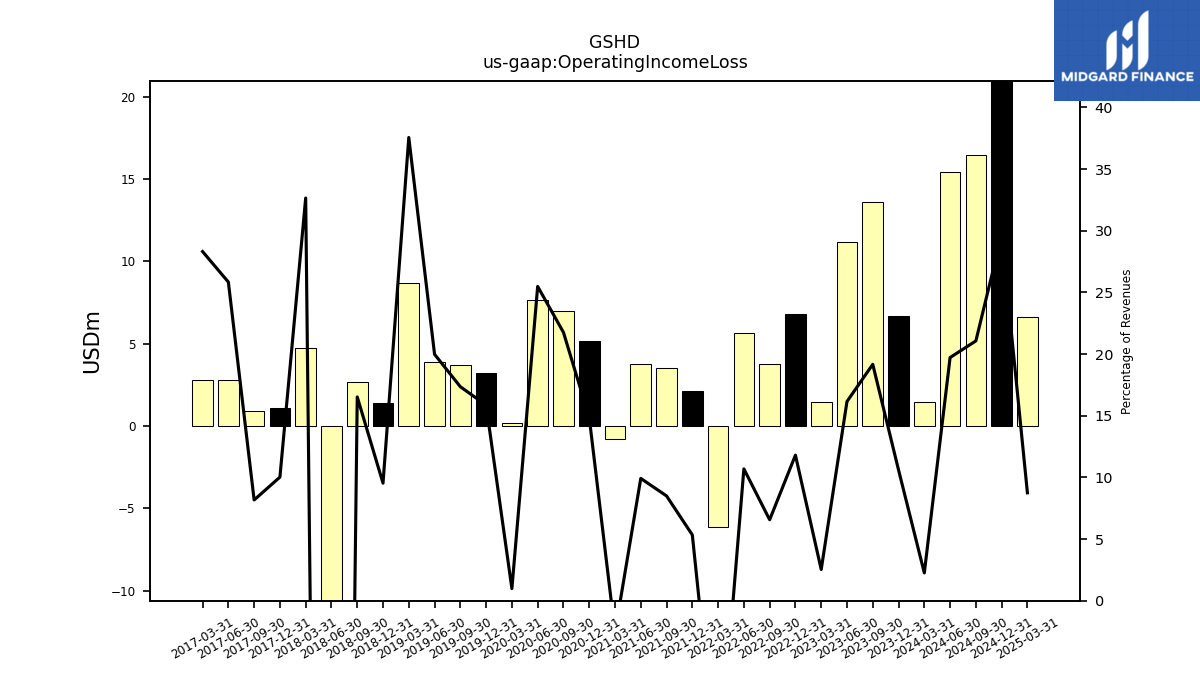
| Operating Income Loss | 6.68 | 13.61 | 11.19 | 1.47 | 6.78 | 3.79 | 5.67 | -6.10 | 2.15 | 3.54 | 3.79 | -0.80 | 5.15 | 6.97 | 7.62 | 0.20 | 3.24 | 3.67 | 3.87 | 8.69 | 1.40 | 2.65 | -22.75 | 4.76 | 1.12 | 0.88 | 2.81 | 2.80 | |
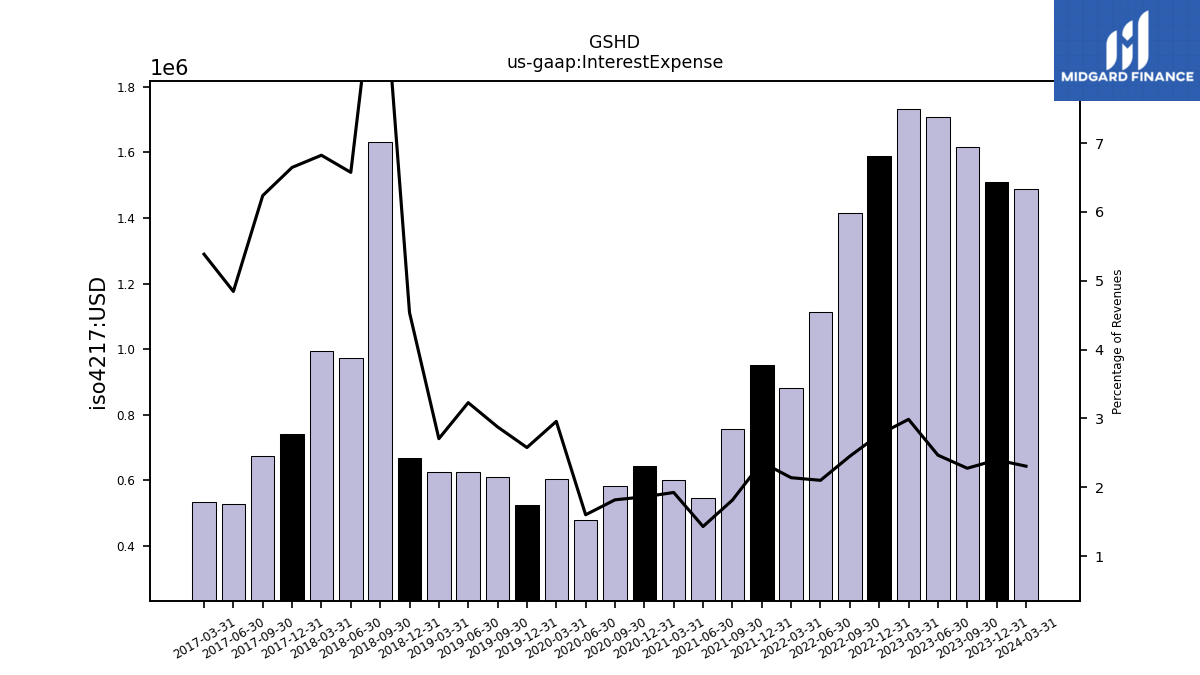
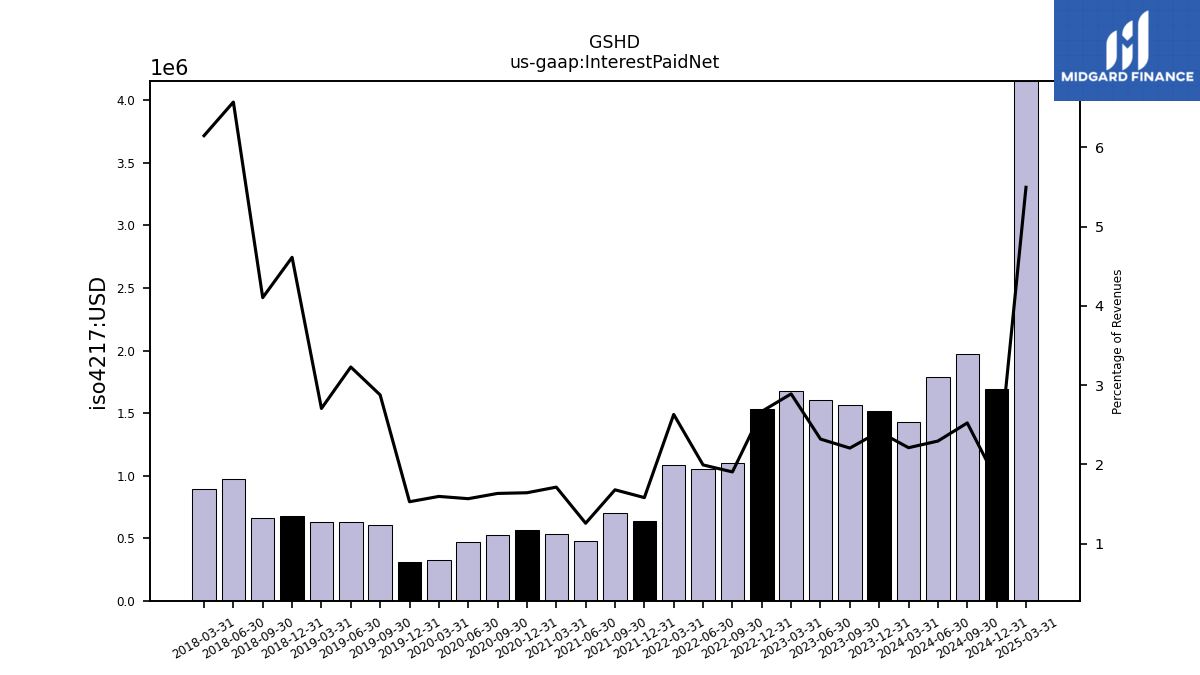
| Interest Expense | 1.51 | 1.62 | 1.71 | 1.73 | 1.59 | 1.41 | 1.11 | 0.88 | 0.95 | 0.76 | 0.55 | 0.60 | 0.65 | 0.58 | 0.48 | 0.60 | 0.53 | 0.61 | 0.63 | 0.63 | 0.67 | 1.63 | 0.97 | 1.00 | 0.74 | 0.67 | 0.53 | 0.53 | |
| Interest Paid Net | 1.52 | 1.57 | 1.61 | 1.68 | 1.53 | 1.10 | 1.06 | 1.09 | 0.64 | 0.70 | 0.48 | 0.54 | 0.57 | 0.52 | 0.47 | 0.33 | 0.31 | 0.61 | 0.63 | 0.63 | 0.68 | 0.66 | 0.97 | 0.90 | NA | NA | NA | NA | |
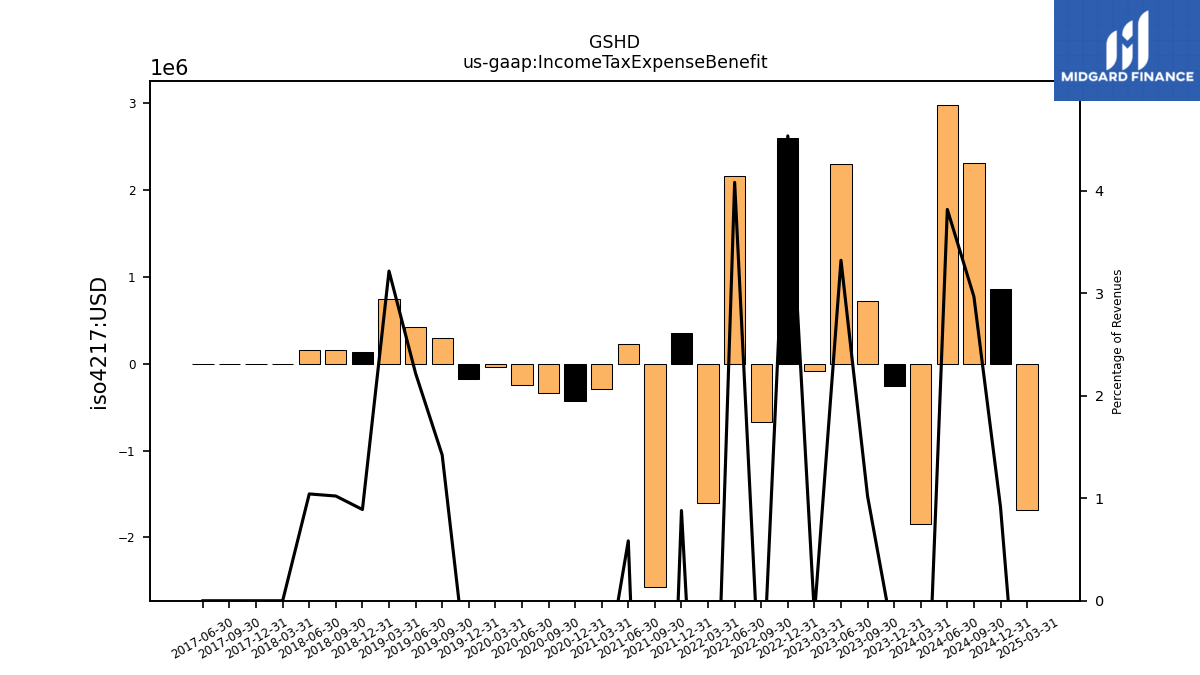
| Income Tax Expense Benefit | -0.25 | 0.72 | 2.30 | -0.08 | 2.60 | -0.67 | 2.16 | -1.60 | 0.35 | -2.58 | 0.22 | -0.29 | -0.42 | -0.33 | -0.24 | -0.04 | -0.17 | 0.30 | 0.43 | 0.74 | 0.13 | 0.16 | 0.15 | 0.00 | 0.00 | 0.00 | 0.00 | NA | |
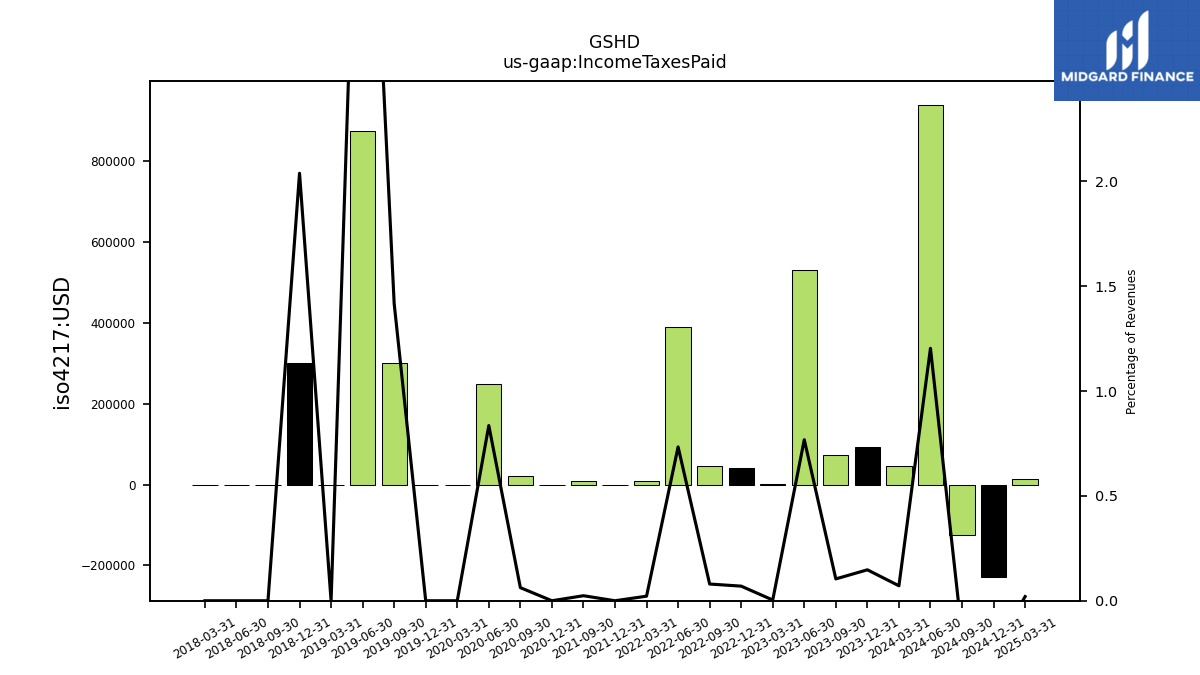
| Income Taxes Paid | 0.09 | 0.07 | 0.53 | 0.00 | 0.04 | 0.05 | 0.39 | 0.01 | 0.00 | 0.01 | NA | NA | 0.00 | 0.02 | 0.25 | 0.00 | 0.00 | 0.30 | 0.88 | 0.00 | 0.30 | 0.00 | 0.00 | 0.00 | NA | NA | NA | NA | |
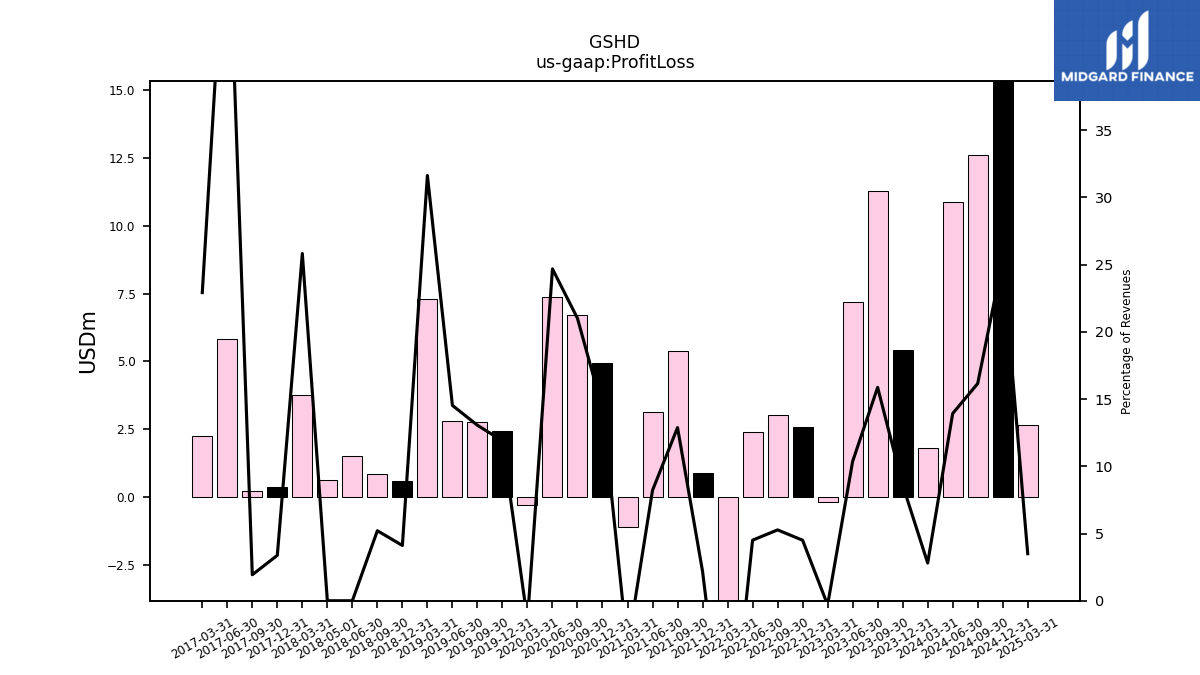
| Profit Loss | 5.42 | 11.27 | 7.18 | -0.18 | 2.58 | 3.04 | 2.39 | -5.38 | 0.88 | 5.37 | 3.14 | -1.09 | 4.94 | 6.72 | 7.39 | -0.30 | 2.43 | 2.76 | 2.82 | 7.32 | 0.60 | 0.84 | 1.52 | 3.77 | 0.38 | 0.21 | 5.82 | 2.27 | |
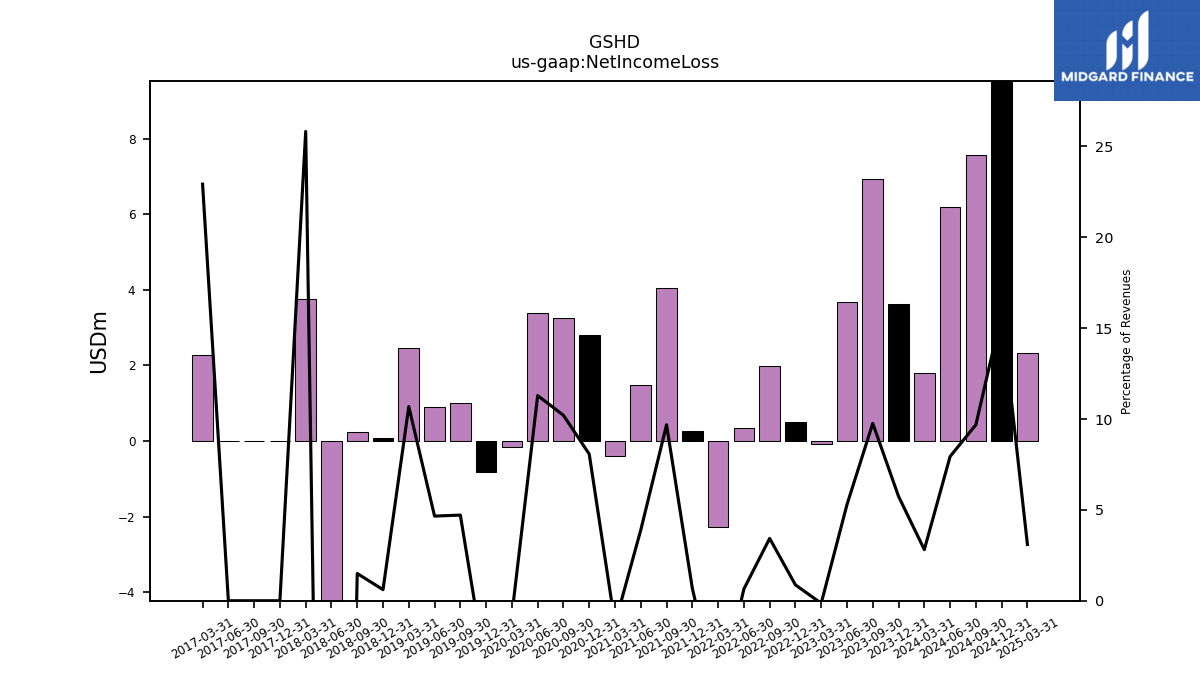
| Net Income Loss | 3.62 | 6.93 | 3.67 | -0.08 | 0.50 | 1.98 | 0.34 | -2.26 | 0.28 | 4.04 | 1.49 | -0.40 | 2.80 | 3.27 | 3.38 | -0.16 | -0.81 | 1.00 | 0.90 | 2.47 | 0.09 | 0.24 | -9.23 | 3.77 | 0.00 | 0.00 | 0.00 | 2.27 | |
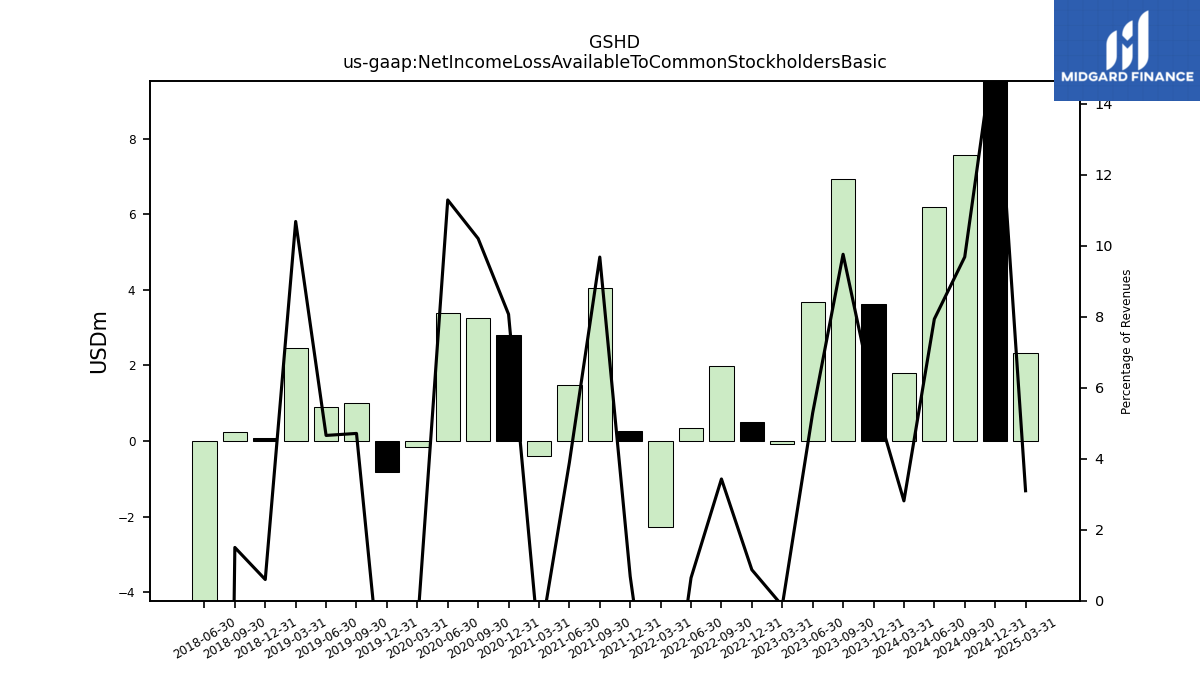
| Net Income Loss Available To Common Stockholders Basic | 3.62 | 6.93 | 3.67 | -0.08 | 0.50 | 1.98 | 0.34 | -2.26 | 0.28 | 4.04 | 1.49 | -0.40 | 2.80 | 3.27 | 3.38 | -0.16 | -0.81 | 1.00 | 0.90 | 2.47 | 0.09 | 0.24 | -9.23 | NA | NA | NA | NA | NA |
| 2023-12-31 | 2023-09-30 | 2023-06-30 | 2023-03-31 | 2022-12-31 | 2022-09-30 | 2022-06-30 | 2022-03-31 | 2021-12-31 | 2021-09-30 | 2021-06-30 | 2021-03-31 | 2020-12-31 | 2020-09-30 | 2020-06-30 | 2020-03-31 | 2019-12-31 | 2019-09-30 | 2019-06-30 | 2019-03-31 | 2018-12-31 | 2018-09-30 | 2018-06-30 | 2018-03-31 | 2017-12-31 | 2017-09-30 | 2017-06-30 | 2017-03-31 | ||
|---|---|---|---|---|---|---|---|---|---|---|---|---|---|---|---|---|---|---|---|---|---|---|---|---|---|---|---|---|---|
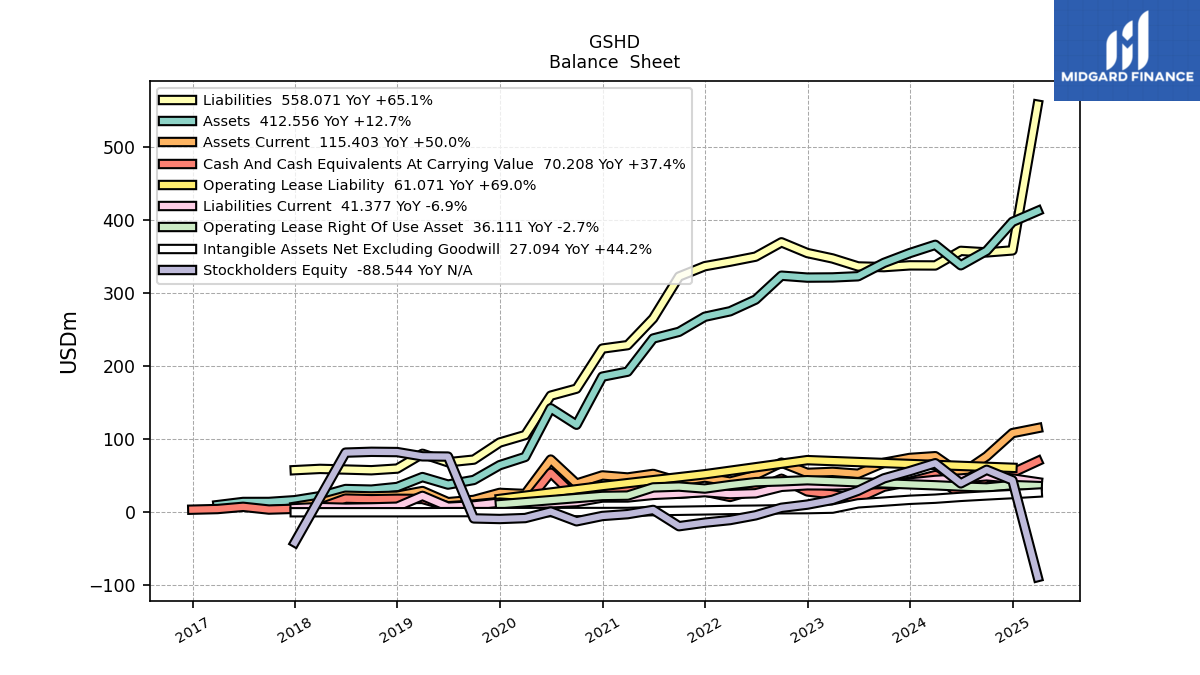
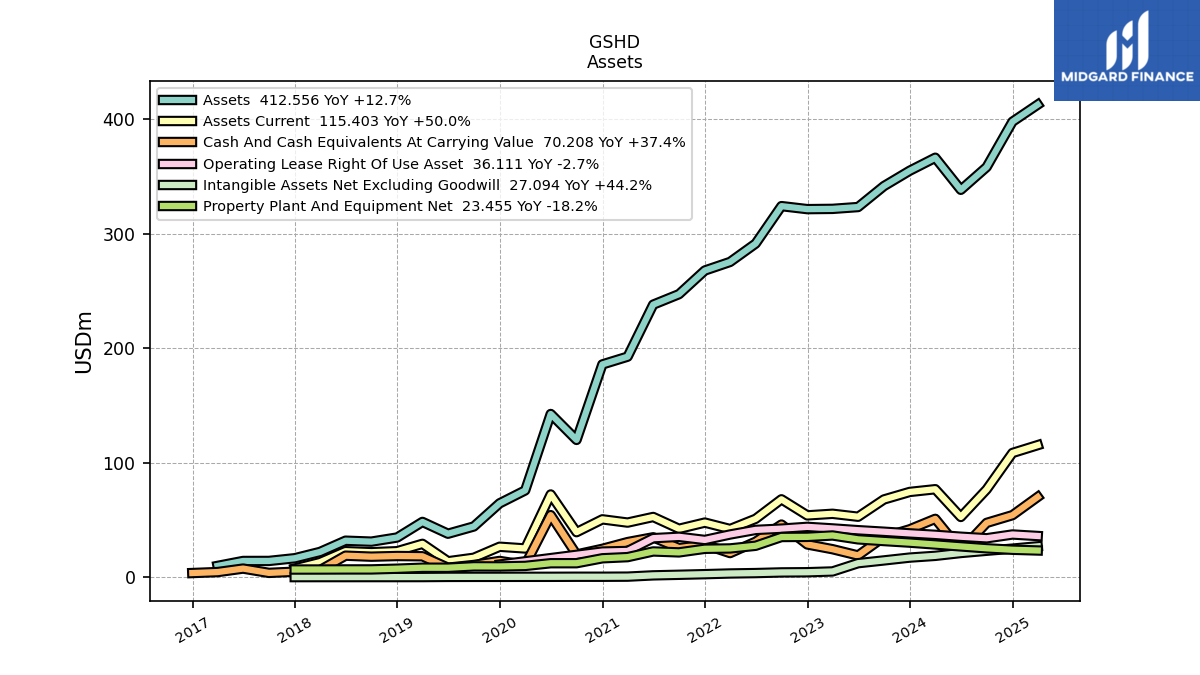
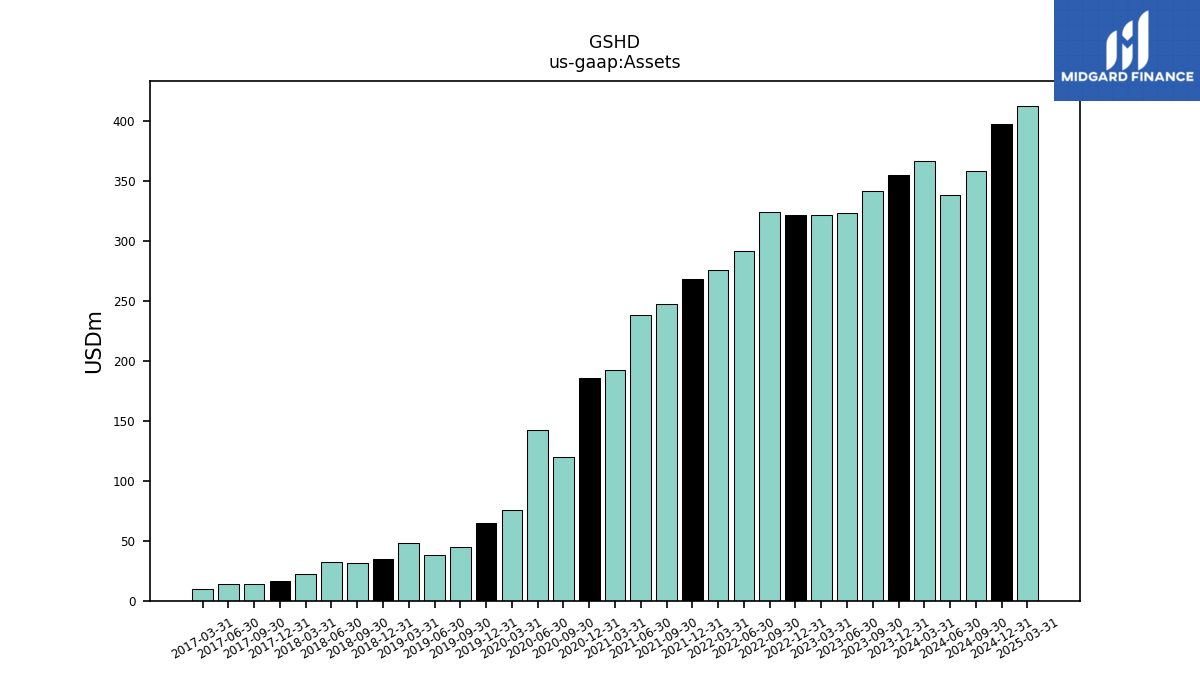
| Assets | 354.89 | 341.46 | 323.18 | 321.58 | 321.35 | 323.99 | 291.29 | 275.27 | 267.80 | 247.14 | 238.00 | 192.61 | 185.84 | 119.95 | 142.59 | 75.89 | 64.63 | 44.42 | 38.09 | 48.40 | 34.80 | 31.20 | 32.02 | 22.20 | 16.71 | 14.34 | 14.31 | 10.00 | |
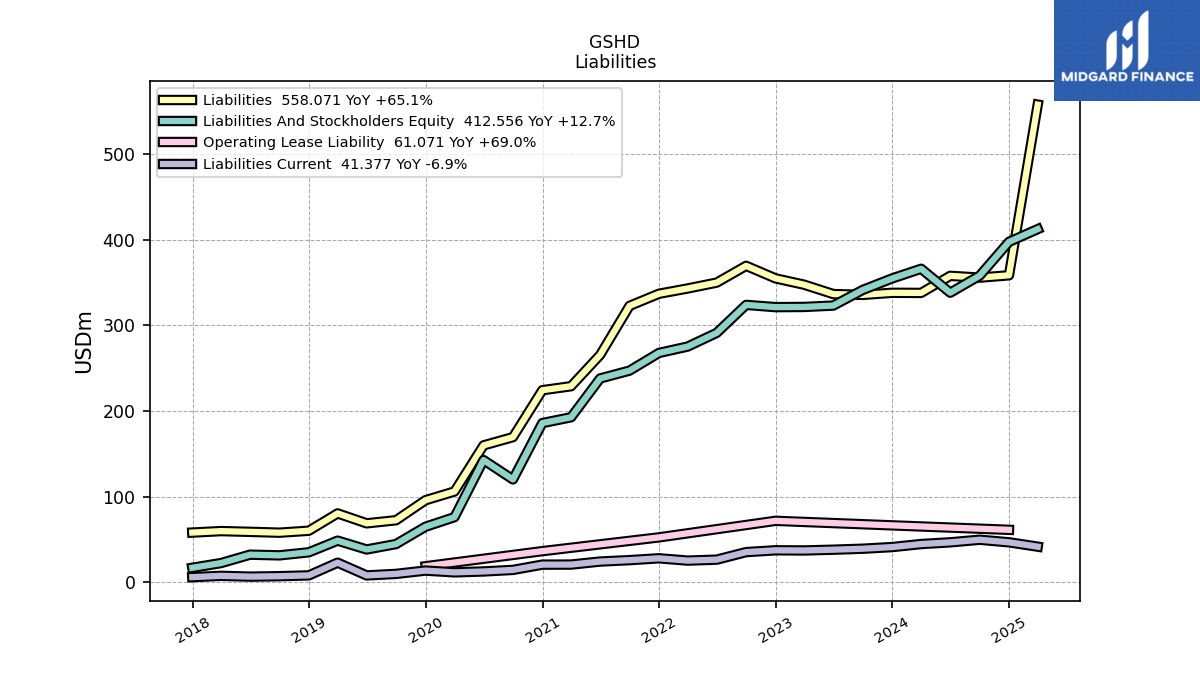
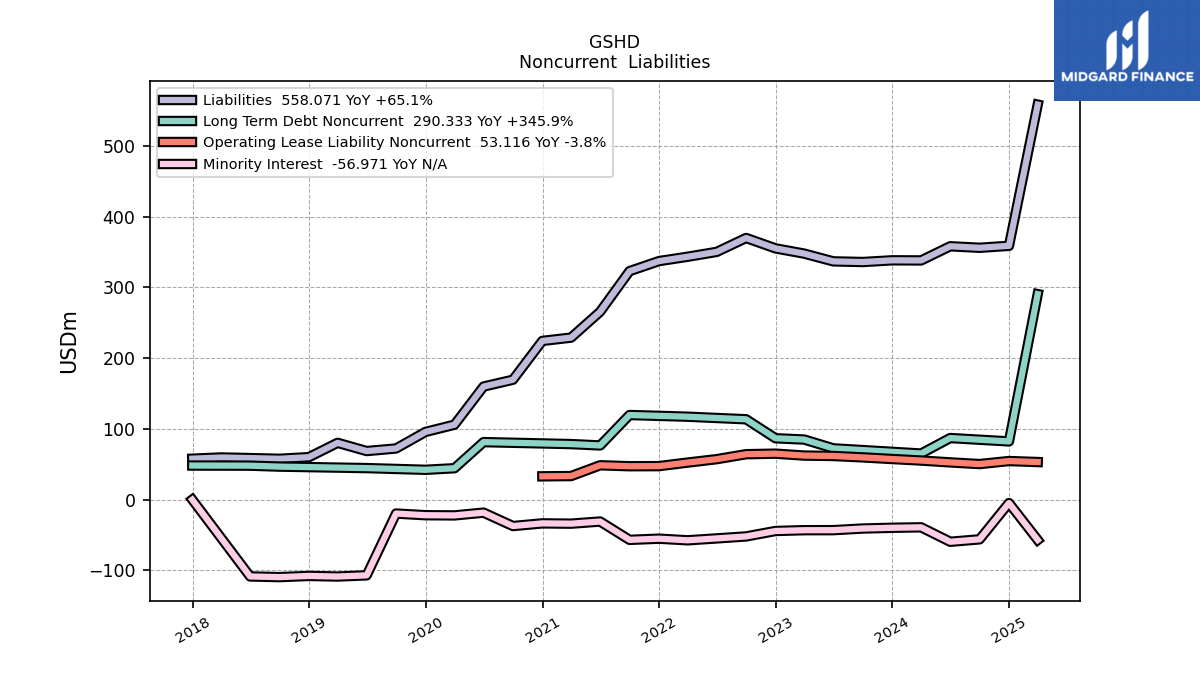
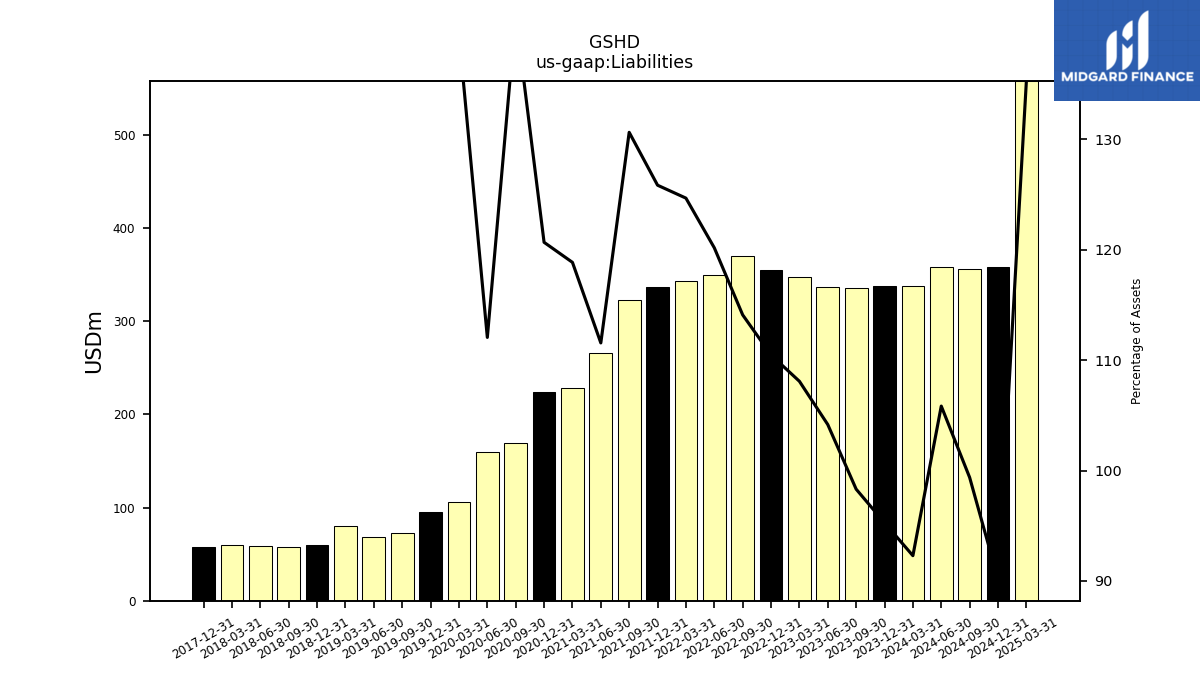
| Liabilities | 338.11 | 335.70 | 336.63 | 347.57 | 354.98 | 369.65 | 350.03 | 343.17 | 336.99 | 322.82 | 265.50 | 228.91 | 224.24 | 169.39 | 159.78 | 105.88 | 95.64 | 72.27 | 68.64 | 80.25 | 60.00 | 57.72 | 58.70 | 59.57 | 57.84 | NA | NA | NA | |
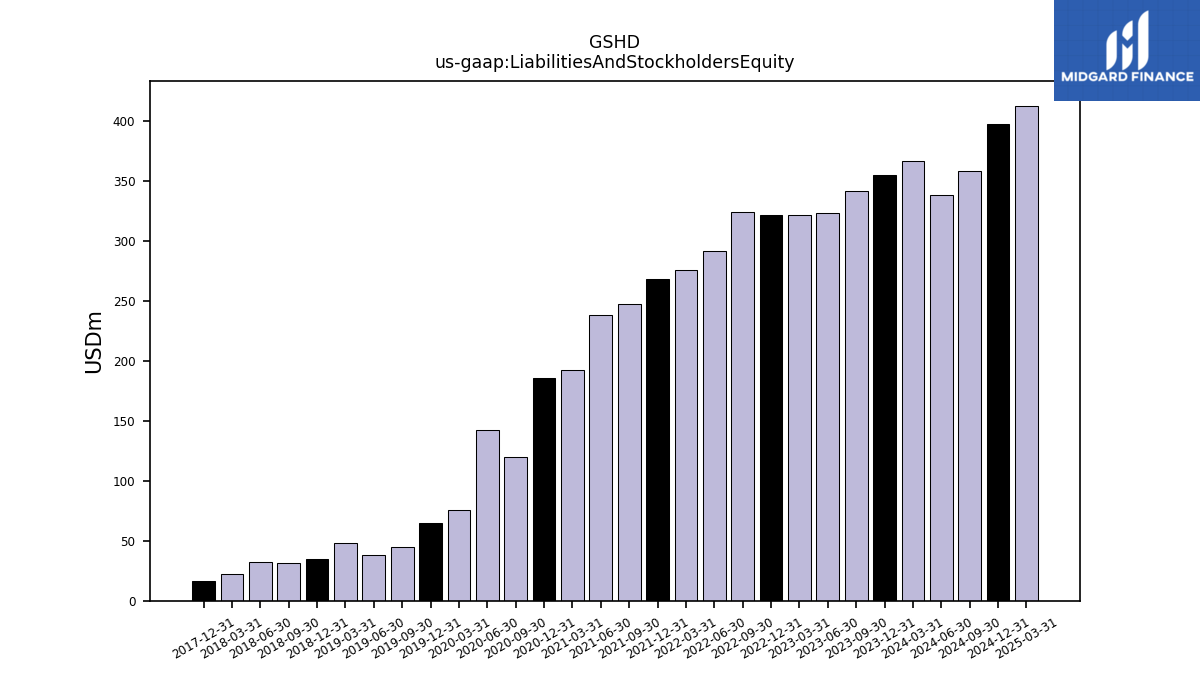
| Liabilities And Stockholders Equity | 354.89 | 341.46 | 323.18 | 321.58 | 321.35 | 323.99 | 291.29 | 275.27 | 267.80 | 247.14 | 238.00 | 192.61 | 185.84 | 119.95 | 142.59 | 75.89 | 64.63 | 44.42 | 38.09 | 48.40 | 34.80 | 31.20 | 32.02 | 22.20 | 16.71 | NA | NA | NA | |
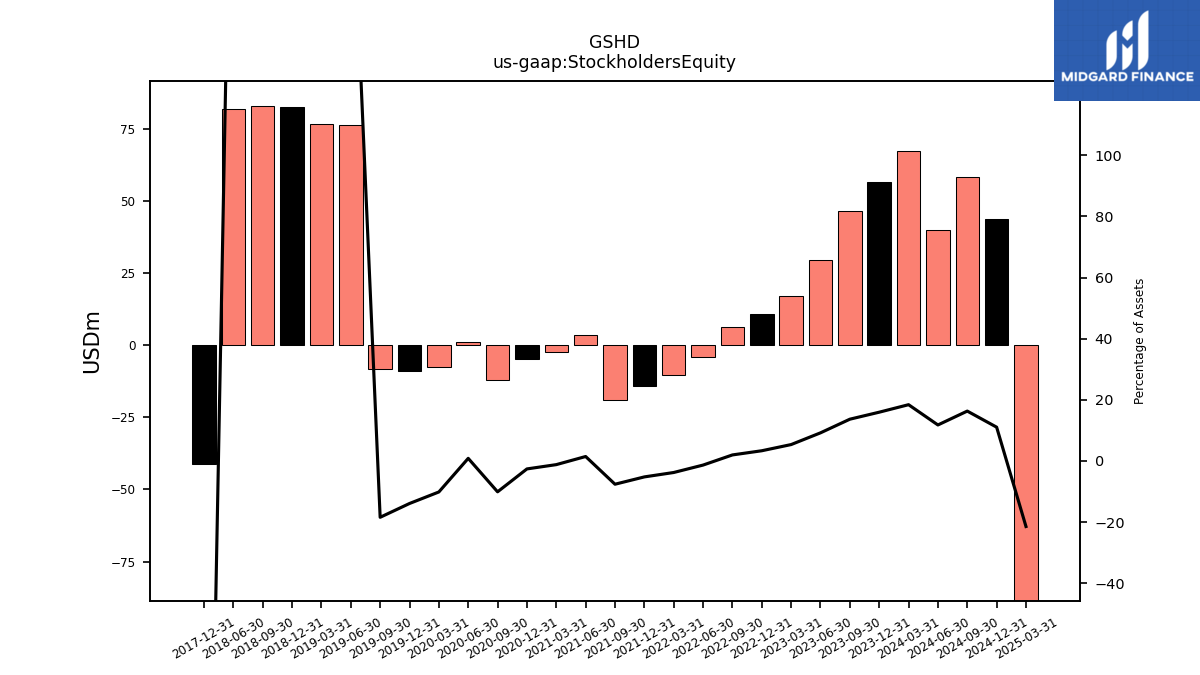
| Stockholders Equity | 56.55 | 46.58 | 29.67 | 17.19 | 10.67 | 6.33 | -3.98 | -10.45 | -14.02 | -18.86 | 3.42 | -2.35 | -4.88 | -12.13 | 1.19 | -7.71 | -9.01 | -8.20 | 76.42 | 76.78 | 82.59 | 82.95 | 81.84 | NA | -41.13 | NA | NA | NA |
| 2023-12-31 | 2023-09-30 | 2023-06-30 | 2023-03-31 | 2022-12-31 | 2022-09-30 | 2022-06-30 | 2022-03-31 | 2021-12-31 | 2021-09-30 | 2021-06-30 | 2021-03-31 | 2020-12-31 | 2020-09-30 | 2020-06-30 | 2020-03-31 | 2019-12-31 | 2019-09-30 | 2019-06-30 | 2019-03-31 | 2018-12-31 | 2018-09-30 | 2018-06-30 | 2018-03-31 | 2017-12-31 | 2017-09-30 | 2017-06-30 | 2017-03-31 | ||
|---|---|---|---|---|---|---|---|---|---|---|---|---|---|---|---|---|---|---|---|---|---|---|---|---|---|---|---|---|---|
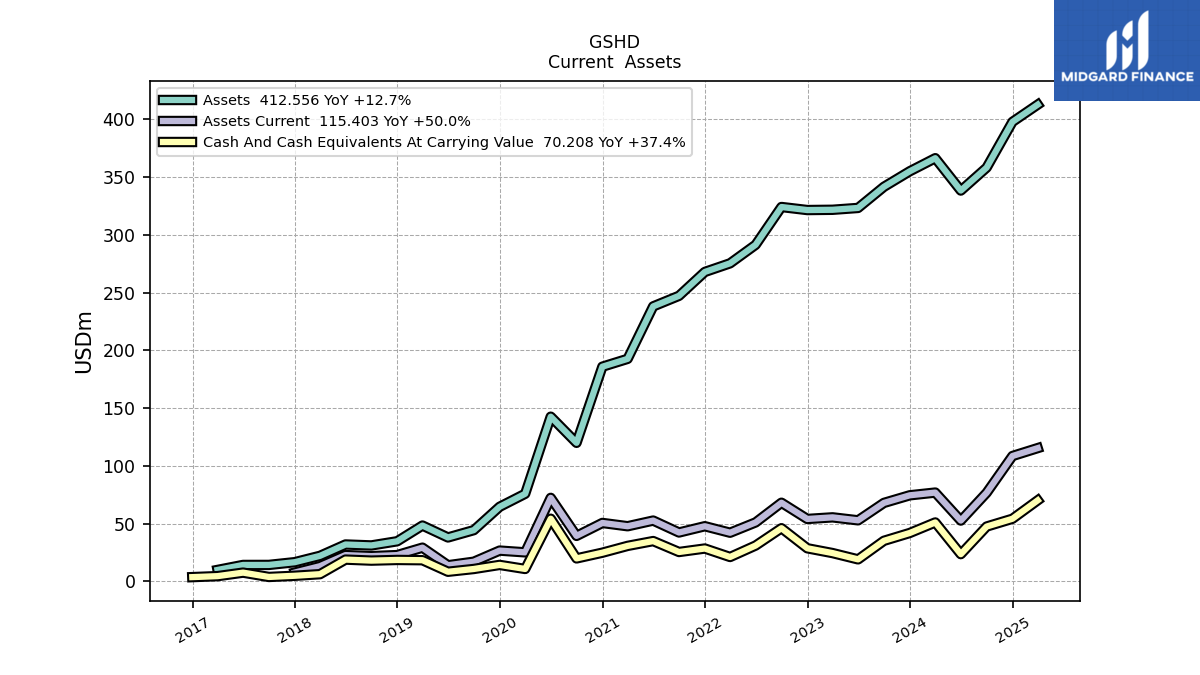
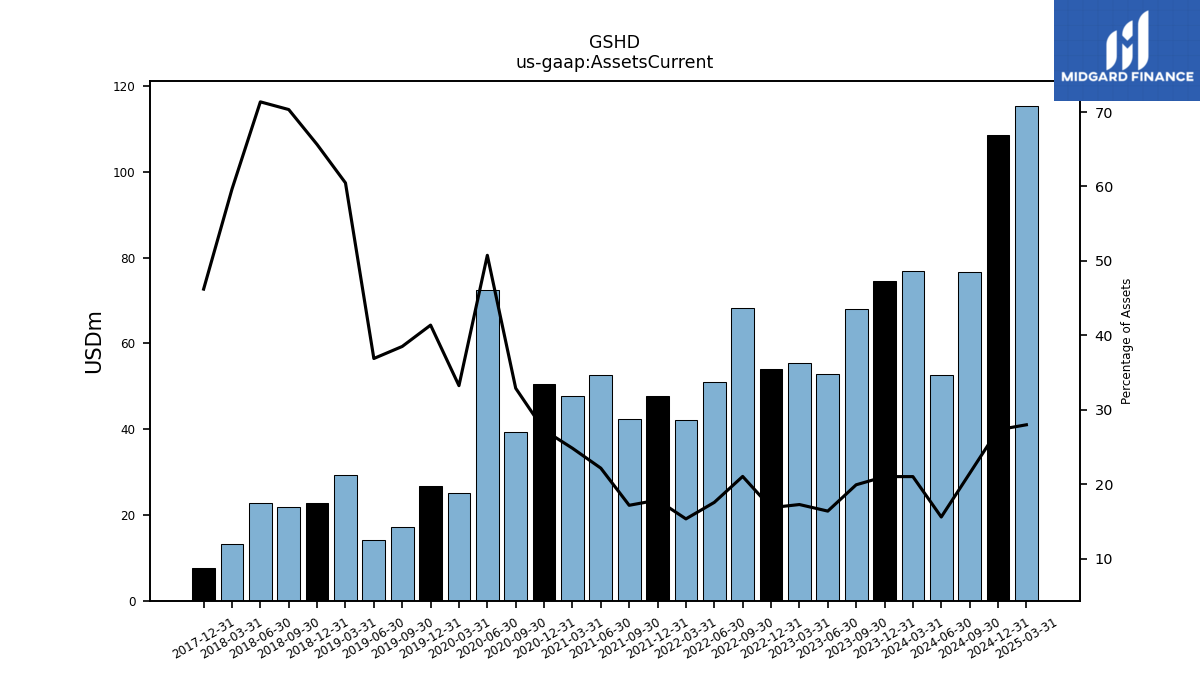
| Assets Current | 74.56 | 67.98 | 52.91 | 55.49 | 54.09 | 68.14 | 51.11 | 42.19 | 47.81 | 42.39 | 52.71 | 47.80 | 50.65 | 39.45 | 72.36 | 25.22 | 26.73 | 17.10 | 14.05 | 29.27 | 22.84 | 21.94 | 22.85 | 13.24 | 7.72 | NA | NA | NA | |
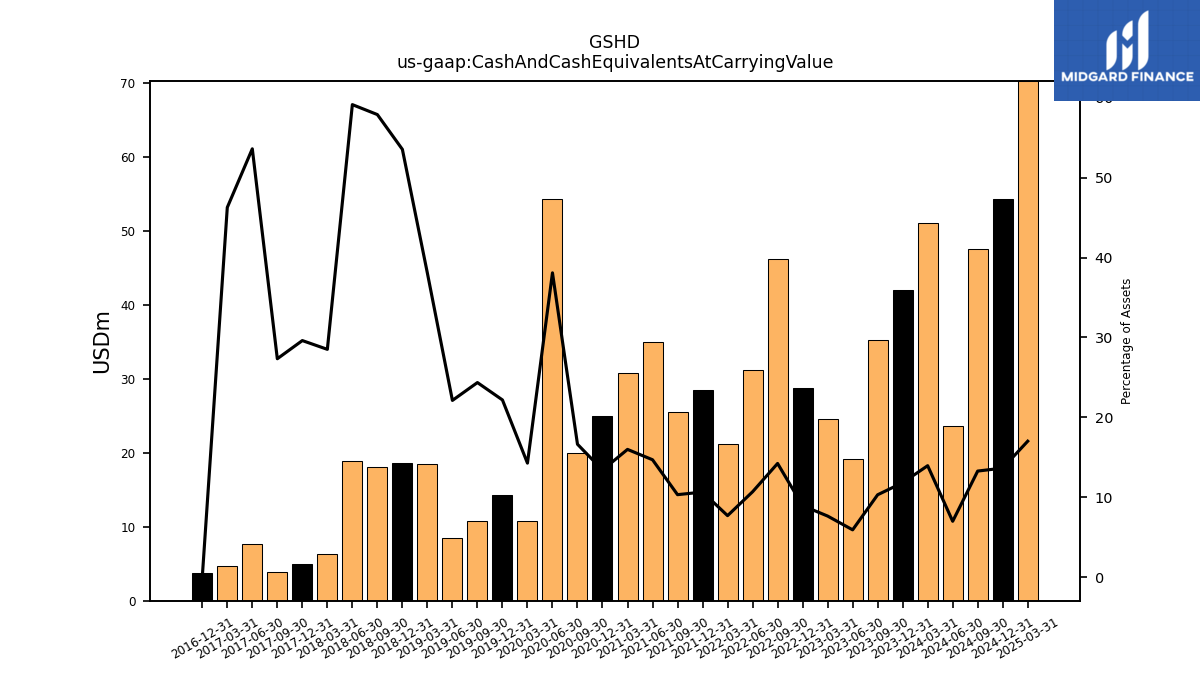
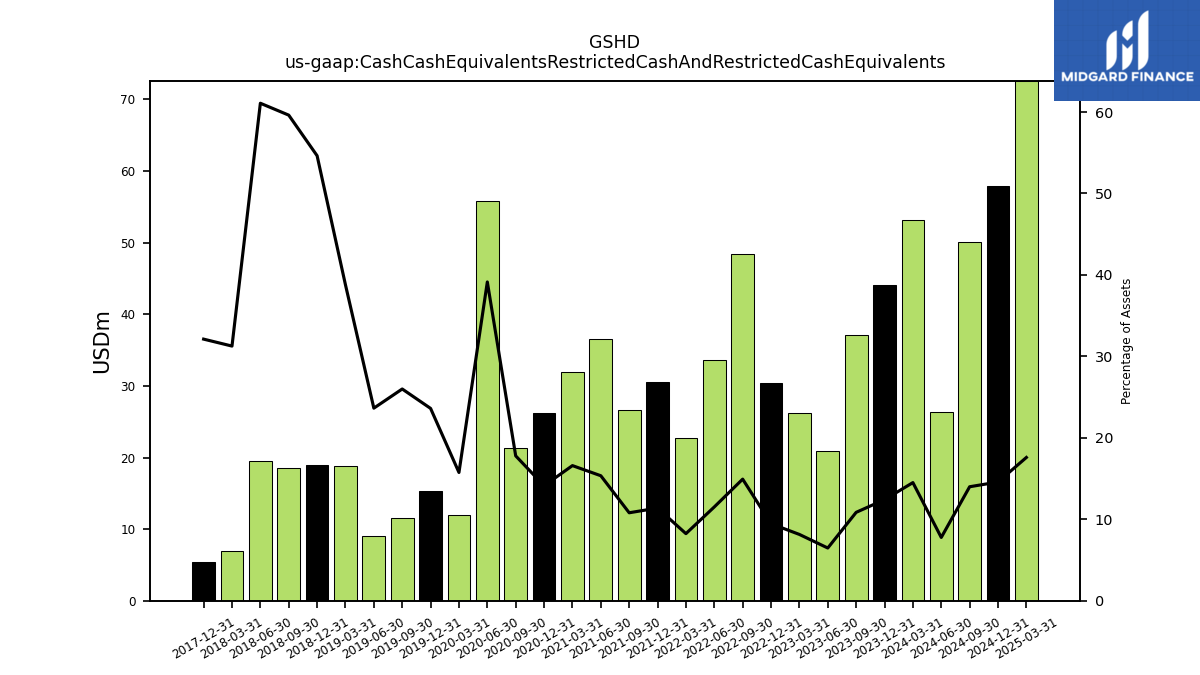
| Cash And Cash Equivalents At Carrying Value | 41.96 | 35.20 | 19.13 | 24.59 | 28.74 | 46.11 | 31.12 | 21.19 | 28.53 | 25.51 | 34.98 | 30.80 | 24.91 | 19.96 | 54.32 | 10.83 | 14.34 | 10.82 | 8.43 | 18.42 | 18.64 | 18.07 | 18.94 | 6.33 | 4.95 | 3.92 | 7.67 | 4.63 | |
| Cash Cash Equivalents Restricted Cash And Restricted Cash Equivalents | 44.05 | 37.06 | 20.92 | 26.18 | 30.39 | 48.37 | 33.55 | 22.68 | 30.48 | 26.69 | 36.53 | 31.95 | 26.24 | 21.34 | 55.81 | 11.95 | 15.26 | 11.55 | 9.01 | 18.77 | 19.01 | 18.60 | 19.55 | 6.94 | 5.37 | NA | NA | NA |
| 2023-12-31 | 2023-09-30 | 2023-06-30 | 2023-03-31 | 2022-12-31 | 2022-09-30 | 2022-06-30 | 2022-03-31 | 2021-12-31 | 2021-09-30 | 2021-06-30 | 2021-03-31 | 2020-12-31 | 2020-09-30 | 2020-06-30 | 2020-03-31 | 2019-12-31 | 2019-09-30 | 2019-06-30 | 2019-03-31 | 2018-12-31 | 2018-09-30 | 2018-06-30 | 2018-03-31 | 2017-12-31 | 2017-09-30 | 2017-06-30 | 2017-03-31 | ||
|---|---|---|---|---|---|---|---|---|---|---|---|---|---|---|---|---|---|---|---|---|---|---|---|---|---|---|---|---|---|
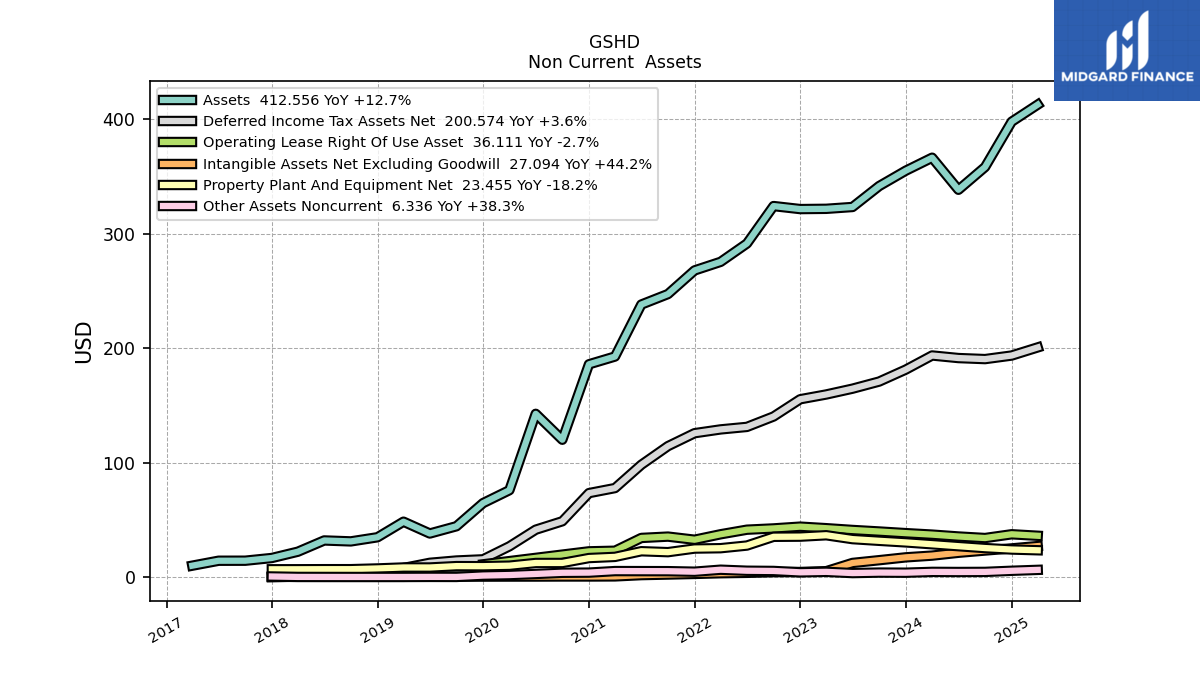
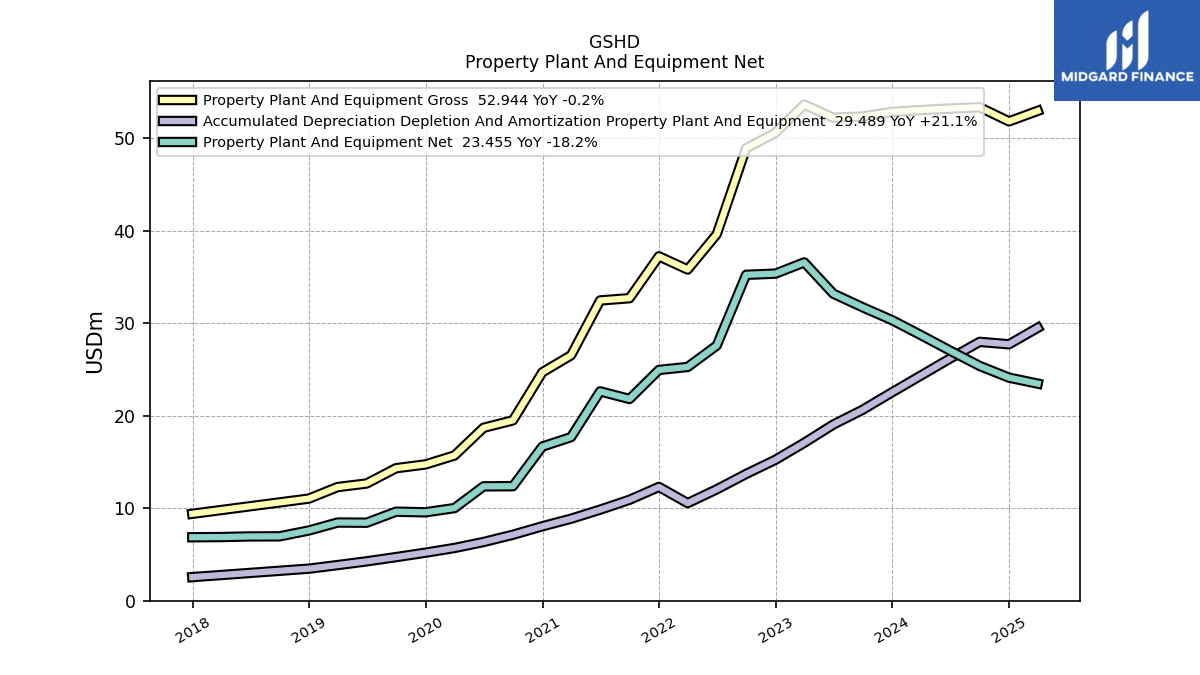
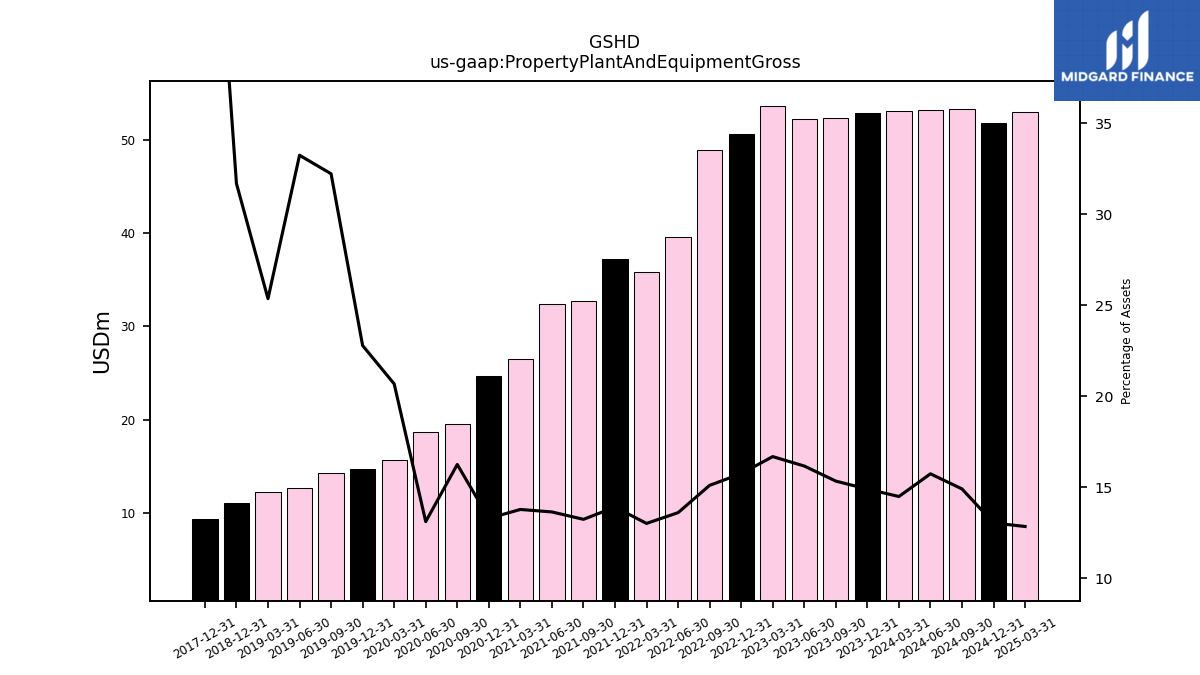
| Property Plant And Equipment Gross | 52.83 | 52.34 | 52.21 | 53.62 | 50.57 | 48.91 | 39.60 | 35.79 | 37.22 | 32.69 | 32.45 | 26.52 | 24.68 | 19.48 | 18.68 | 15.69 | 14.72 | 14.31 | 12.66 | 12.27 | 11.02 | NA | NA | NA | 9.38 | NA | NA | NA | |
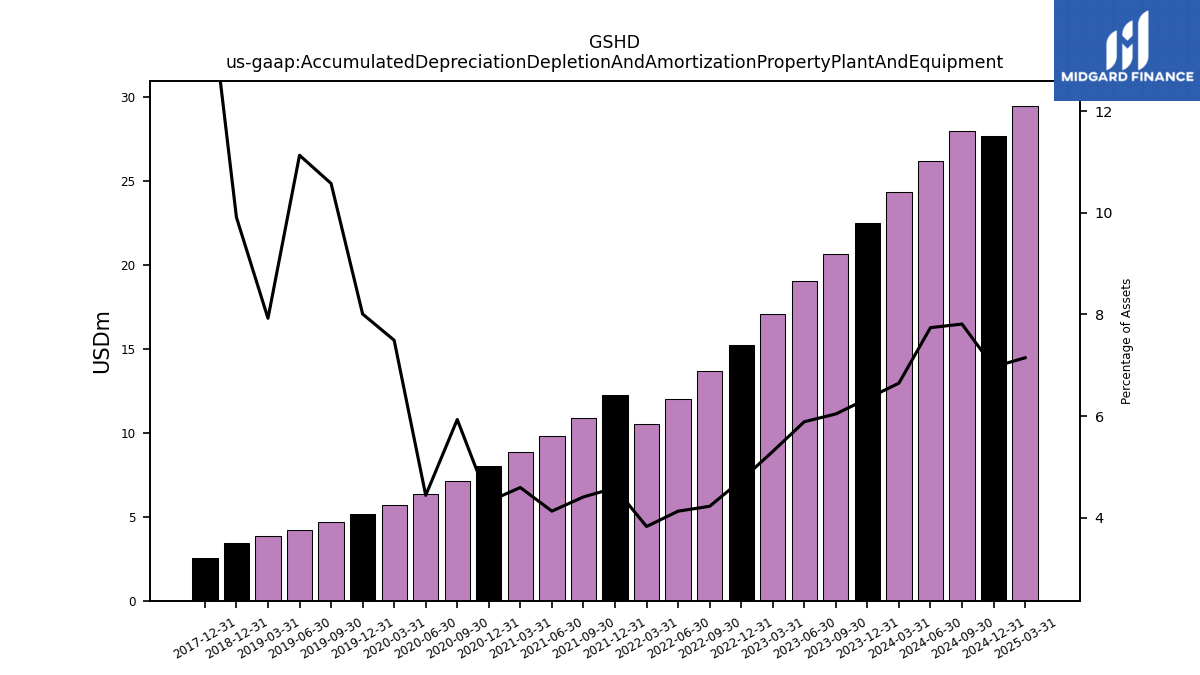
| Accumulated Depreciation Depletion And Amortization Property Plant And Equipment | 22.52 | 20.63 | 19.03 | 17.05 | 15.22 | 13.69 | 12.03 | 10.54 | 12.29 | 10.90 | 9.83 | 8.85 | 8.03 | 7.12 | 6.33 | 5.69 | 5.18 | 4.70 | 4.24 | 3.84 | 3.45 | NA | NA | NA | 2.53 | NA | NA | NA | |
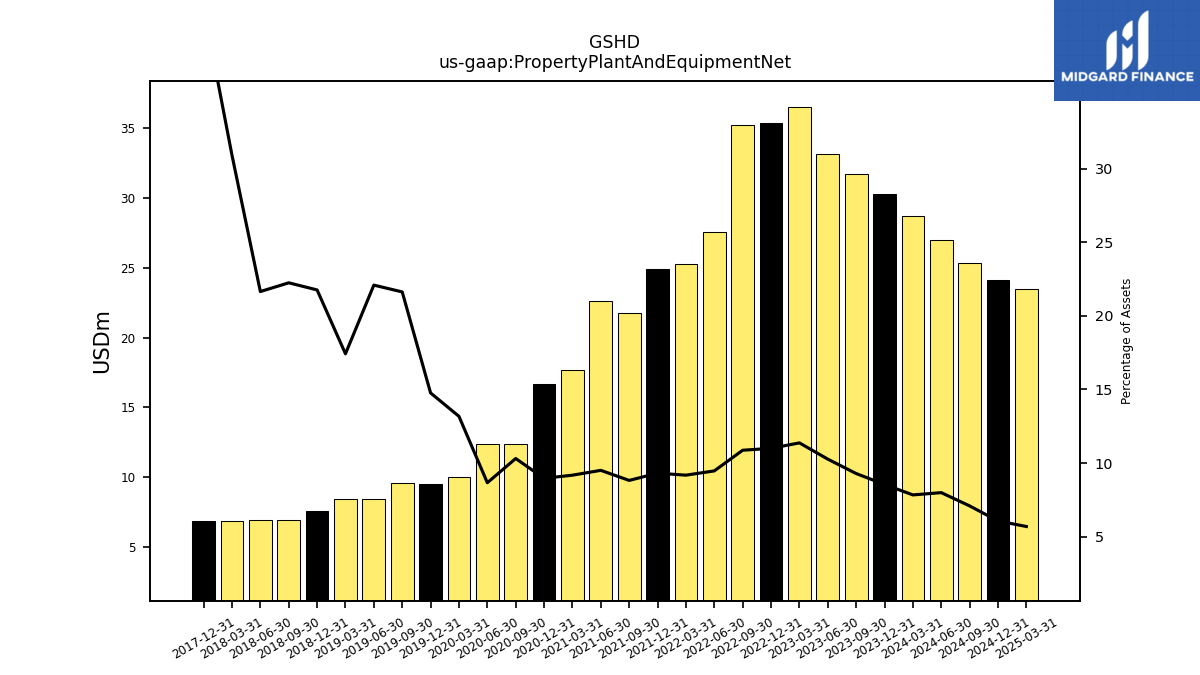
| Property Plant And Equipment Net | 30.32 | 31.71 | 33.18 | 36.56 | 35.35 | 35.22 | 27.57 | 25.26 | 24.93 | 21.79 | 22.62 | 17.67 | 16.65 | 12.37 | 12.35 | 10.00 | 9.54 | 9.61 | 8.42 | 8.44 | 7.58 | 6.94 | 6.93 | 6.87 | 6.85 | NA | NA | NA | |
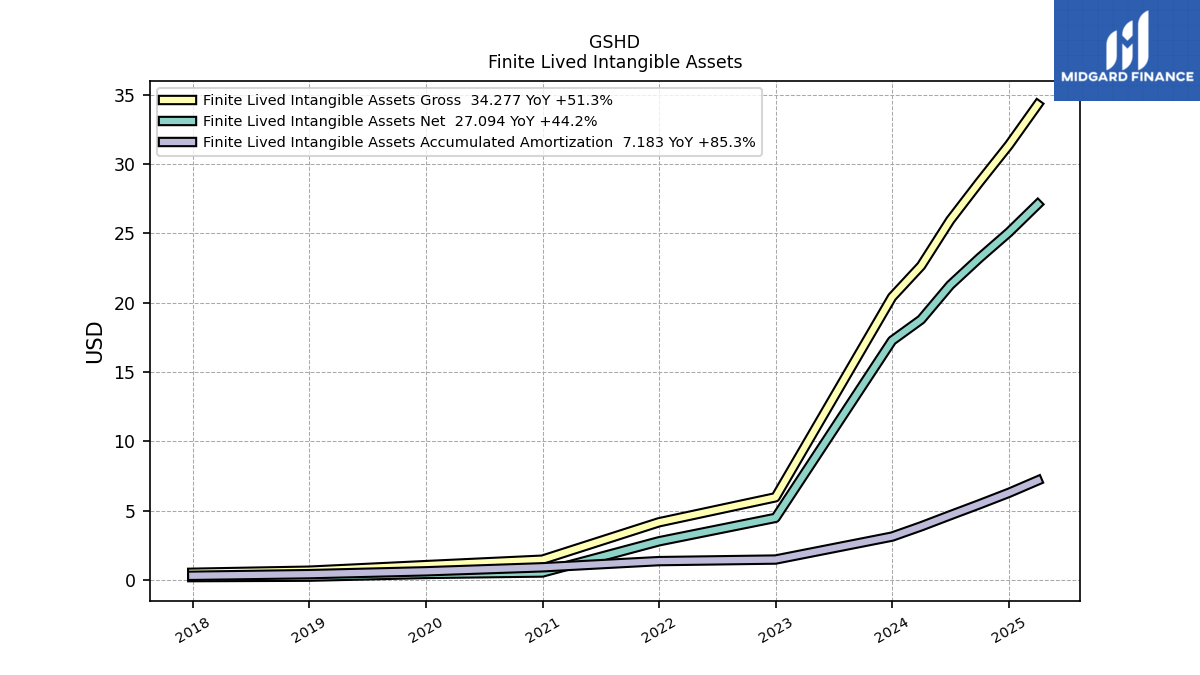
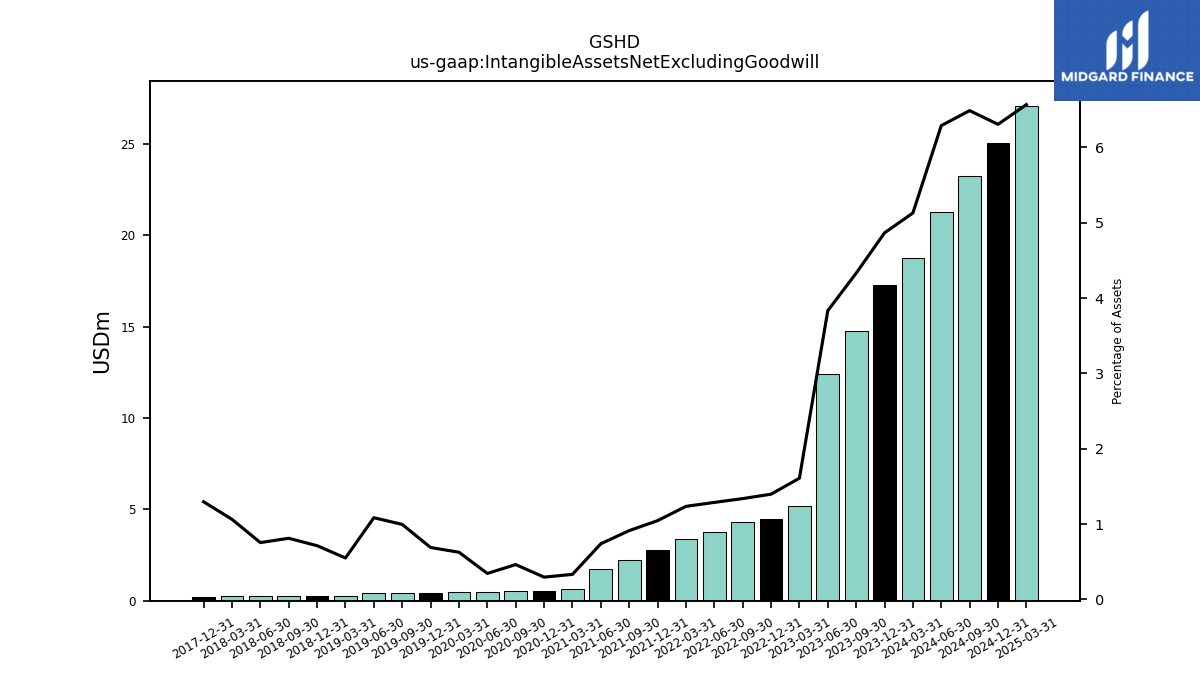
| Intangible Assets Net Excluding Goodwill | 17.27 | 14.79 | 12.38 | 5.17 | 4.49 | 4.33 | 3.75 | 3.40 | 2.80 | 2.26 | 1.76 | 0.64 | 0.55 | 0.55 | 0.49 | 0.47 | 0.45 | 0.44 | 0.41 | 0.27 | 0.25 | 0.25 | 0.24 | 0.24 | 0.22 | NA | NA | NA | |
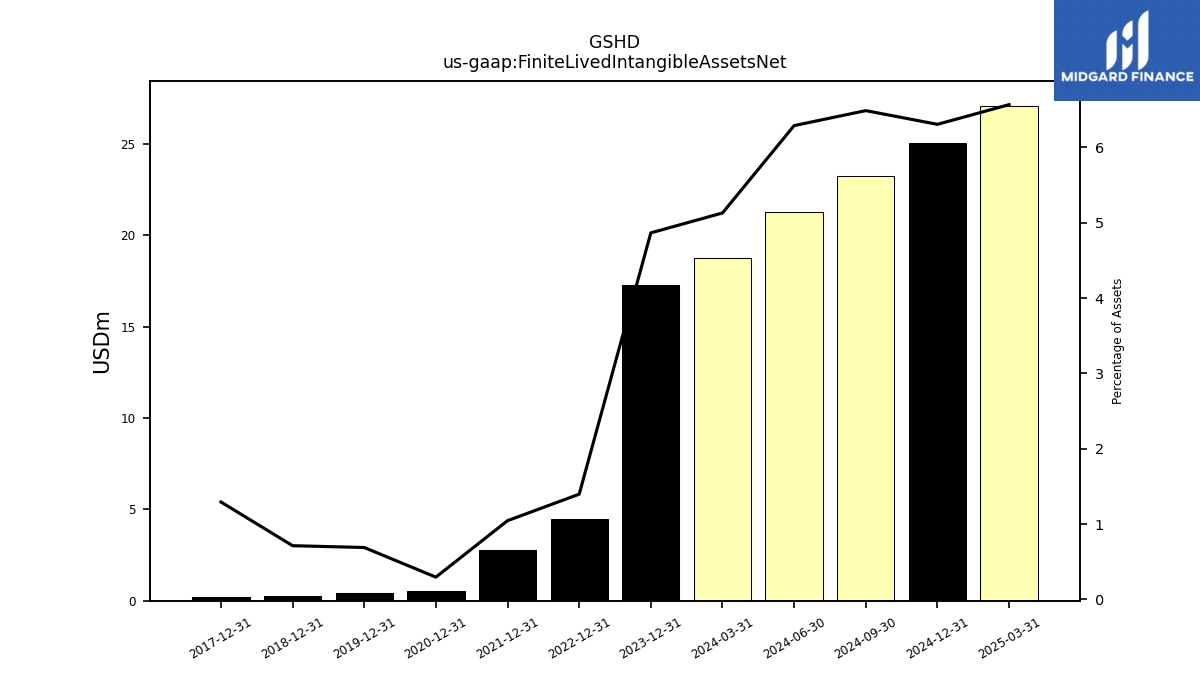
| Finite Lived Intangible Assets Net | 17.27 | NA | NA | NA | 4.49 | NA | NA | NA | 2.80 | NA | NA | NA | 0.55 | NA | NA | NA | 0.45 | NA | NA | NA | 0.25 | NA | NA | NA | 0.22 | NA | NA | NA | |
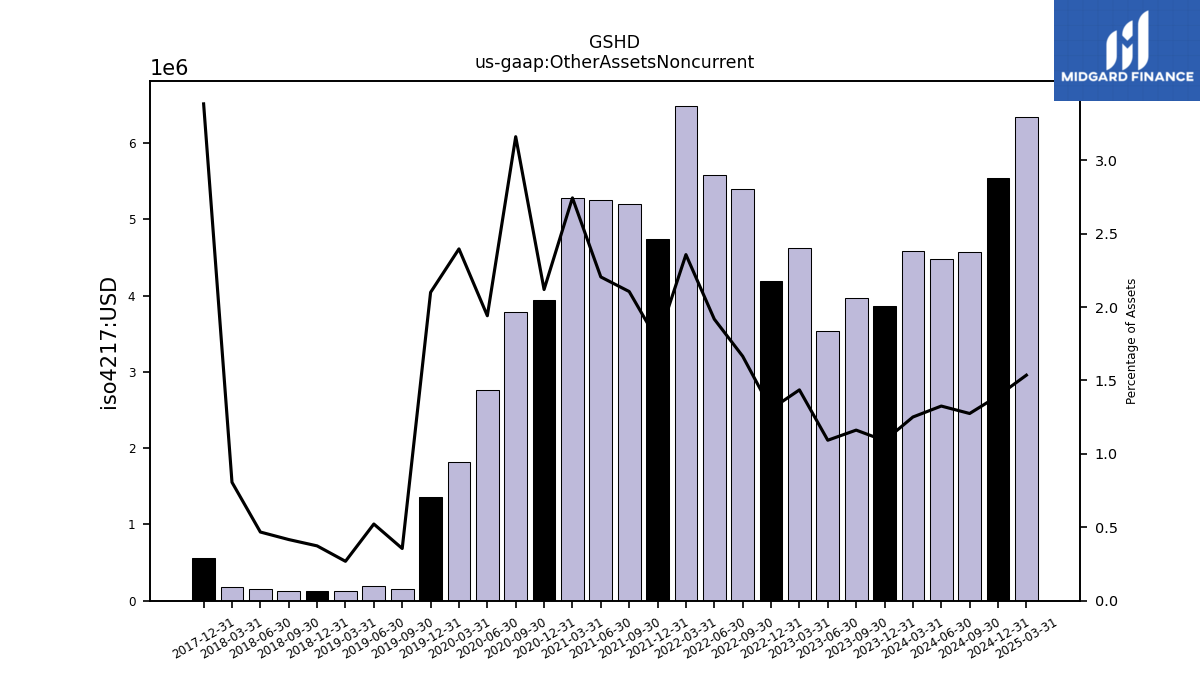
| Other Assets Noncurrent | 3.87 | 3.97 | 3.53 | 4.62 | 4.19 | 5.39 | 5.58 | 6.49 | 4.74 | 5.20 | 5.25 | 5.28 | 3.94 | 3.79 | 2.77 | 1.82 | 1.36 | 0.16 | 0.20 | 0.13 | 0.13 | 0.13 | 0.15 | 0.18 | 0.57 | NA | NA | NA |
| 2023-12-31 | 2023-09-30 | 2023-06-30 | 2023-03-31 | 2022-12-31 | 2022-09-30 | 2022-06-30 | 2022-03-31 | 2021-12-31 | 2021-09-30 | 2021-06-30 | 2021-03-31 | 2020-12-31 | 2020-09-30 | 2020-06-30 | 2020-03-31 | 2019-12-31 | 2019-09-30 | 2019-06-30 | 2019-03-31 | 2018-12-31 | 2018-09-30 | 2018-06-30 | 2018-03-31 | 2017-12-31 | 2017-09-30 | 2017-06-30 | 2017-03-31 | ||
|---|---|---|---|---|---|---|---|---|---|---|---|---|---|---|---|---|---|---|---|---|---|---|---|---|---|---|---|---|---|
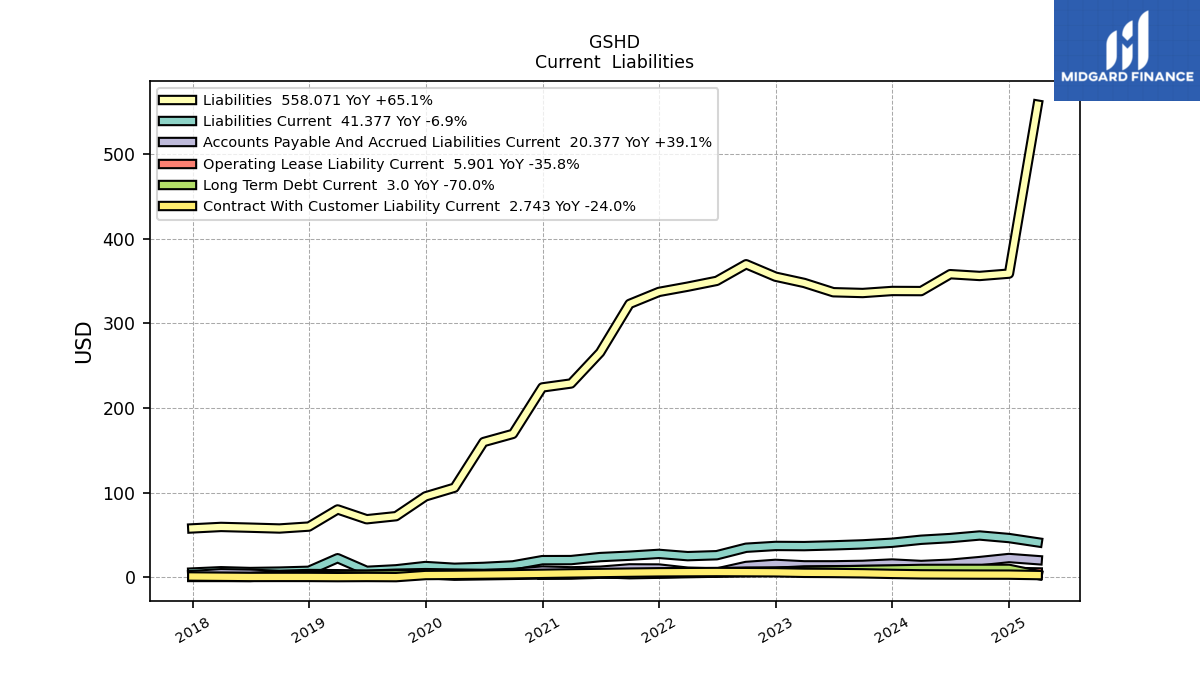
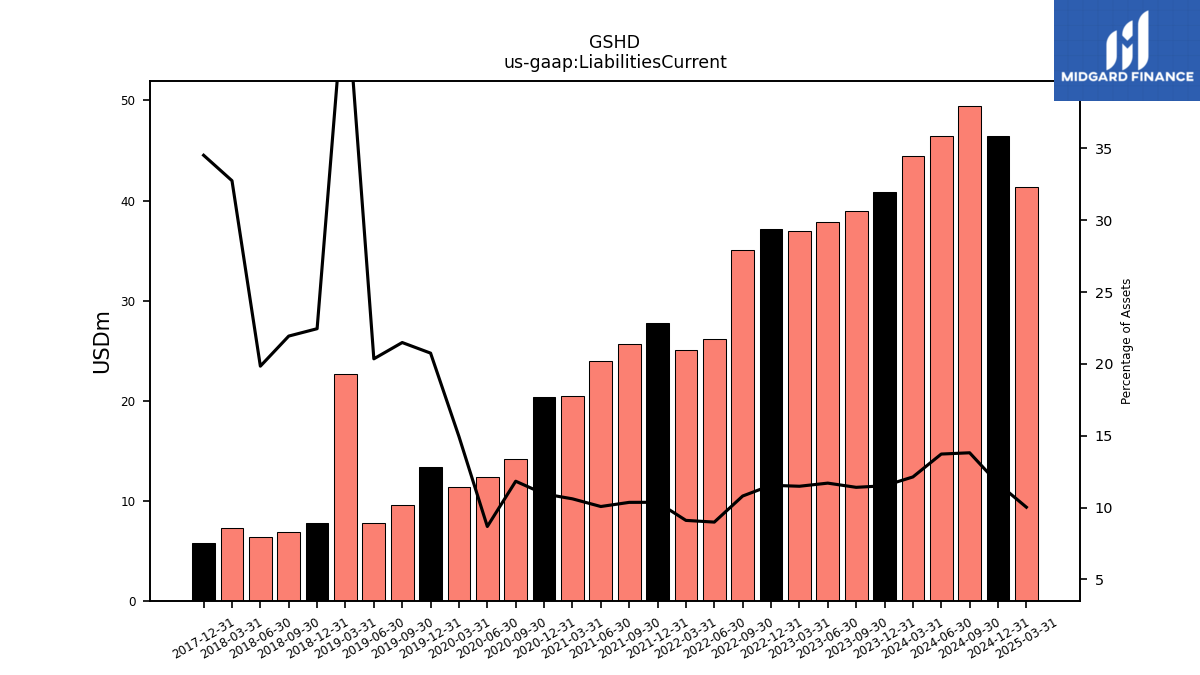
| Liabilities Current | 40.89 | 38.97 | 37.83 | 36.94 | 37.13 | 35.01 | 26.19 | 25.08 | 27.78 | 25.62 | 23.98 | 20.44 | 20.36 | 14.20 | 12.39 | 11.34 | 13.41 | 9.54 | 7.75 | 22.67 | 7.81 | 6.84 | 6.35 | 7.27 | 5.77 | NA | NA | NA | |
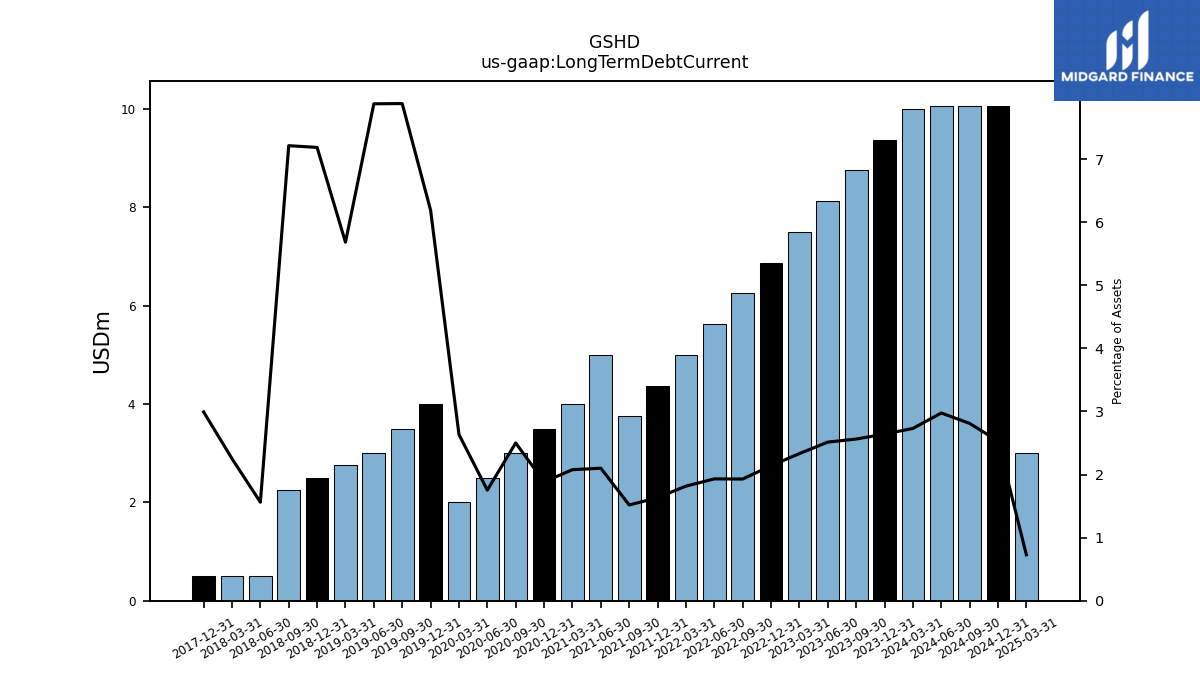
| Long Term Debt Current | 9.38 | 8.75 | 8.12 | 7.50 | 6.88 | 6.25 | 5.62 | 5.00 | 4.38 | 3.75 | 5.00 | 4.00 | 3.50 | 3.00 | 2.50 | 2.00 | 4.00 | 3.50 | 3.00 | 2.75 | 2.50 | 2.25 | 0.50 | 0.50 | 0.50 | NA | NA | NA | |
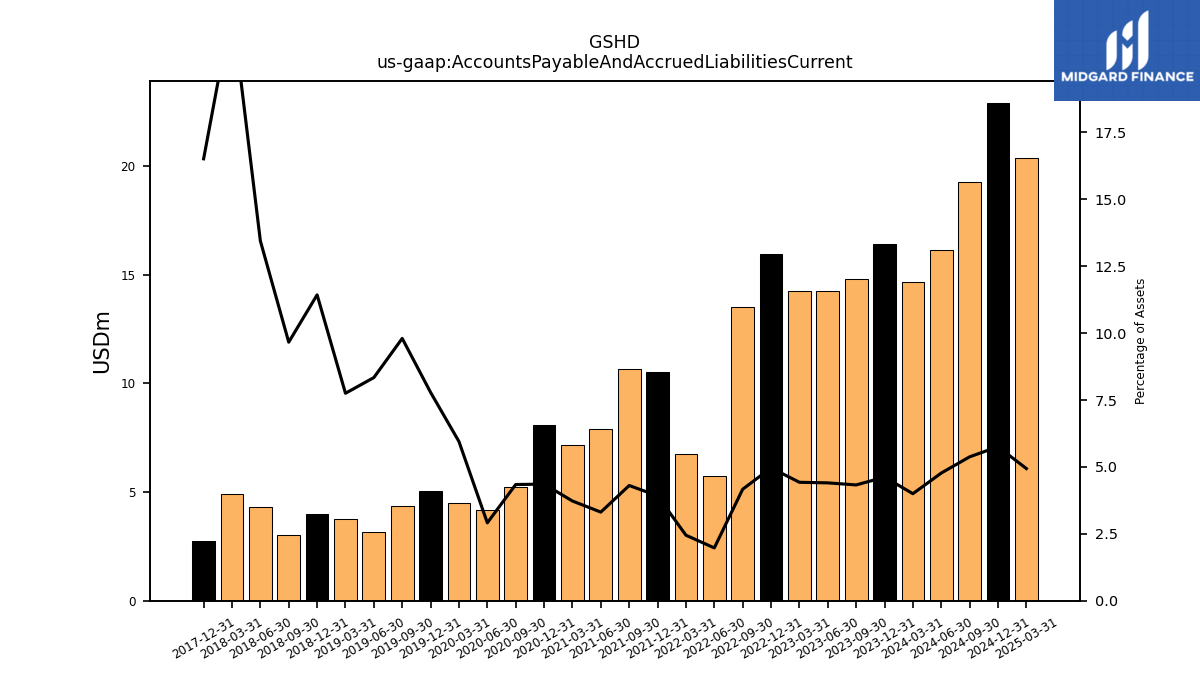
| Accounts Payable And Accrued Liabilities Current | 16.40 | 14.78 | 14.24 | 14.24 | 15.96 | 13.50 | 5.75 | 6.74 | 10.50 | 10.64 | 7.88 | 7.18 | 8.10 | 5.21 | 4.15 | 4.51 | 5.03 | 4.36 | 3.18 | 3.75 | 3.98 | 3.02 | 4.31 | 4.93 | 2.76 | NA | NA | NA | |
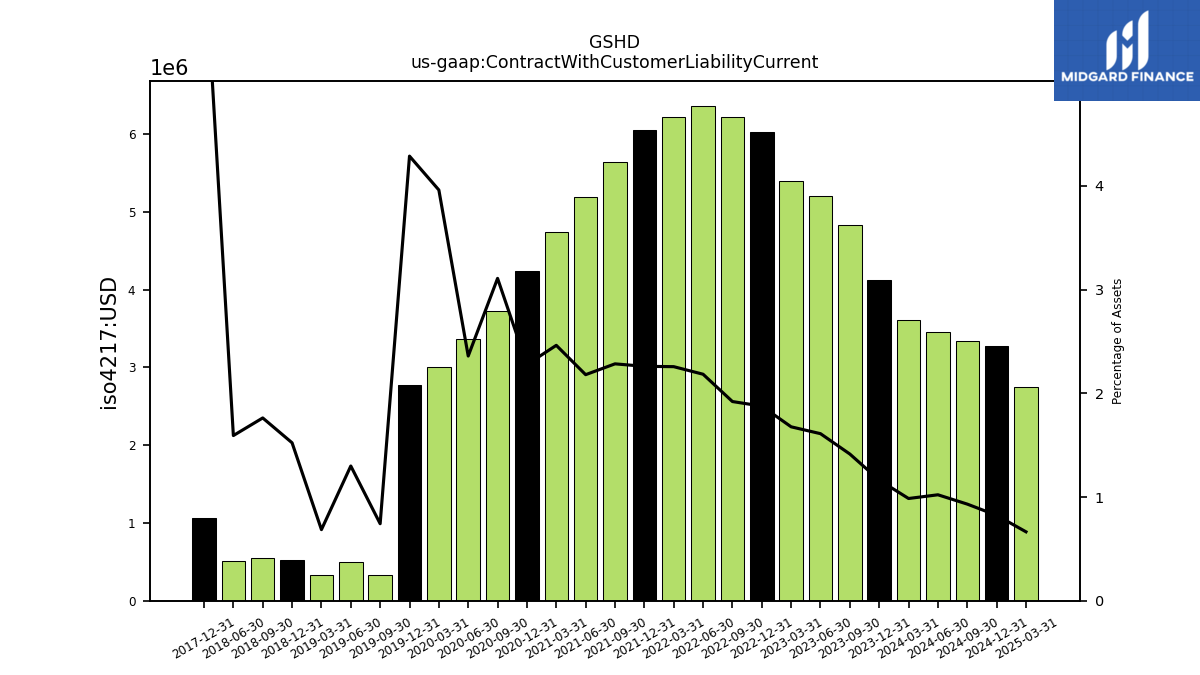
| Contract With Customer Liability Current | 4.13 | 4.83 | 5.21 | 5.39 | 6.03 | 6.22 | 6.36 | 6.21 | 6.05 | 5.65 | 5.19 | 4.74 | 4.23 | 3.73 | 3.37 | 3.01 | 2.77 | 0.33 | 0.49 | 0.33 | 0.53 | 0.55 | 0.51 | NA | 1.06 | NA | NA | NA |
| 2023-12-31 | 2023-09-30 | 2023-06-30 | 2023-03-31 | 2022-12-31 | 2022-09-30 | 2022-06-30 | 2022-03-31 | 2021-12-31 | 2021-09-30 | 2021-06-30 | 2021-03-31 | 2020-12-31 | 2020-09-30 | 2020-06-30 | 2020-03-31 | 2019-12-31 | 2019-09-30 | 2019-06-30 | 2019-03-31 | 2018-12-31 | 2018-09-30 | 2018-06-30 | 2018-03-31 | 2017-12-31 | 2017-09-30 | 2017-06-30 | 2017-03-31 | ||
|---|---|---|---|---|---|---|---|---|---|---|---|---|---|---|---|---|---|---|---|---|---|---|---|---|---|---|---|---|---|
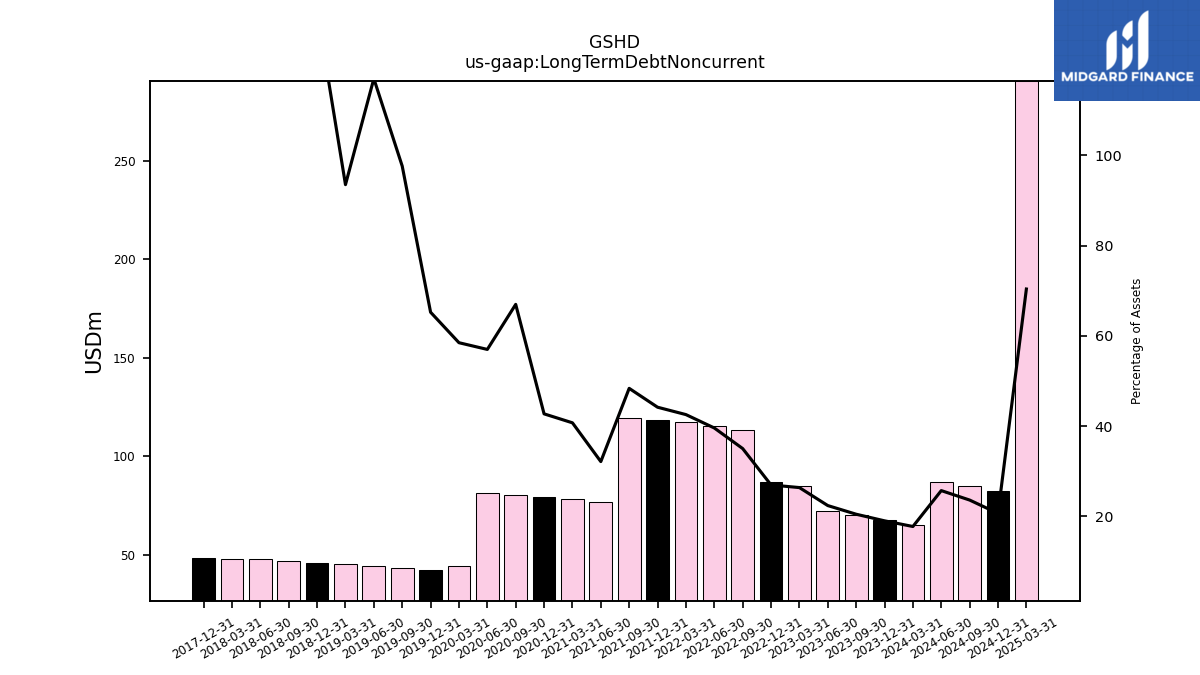
| Long Term Debt Noncurrent | 67.56 | 70.00 | 72.45 | 84.89 | 86.71 | 113.53 | 115.35 | 117.17 | 118.36 | 119.56 | 76.54 | 78.47 | 79.41 | 80.33 | 81.27 | 44.38 | 42.16 | 43.35 | 44.55 | 45.25 | 45.95 | 46.64 | 48.00 | 48.08 | 48.16 | NA | NA | NA | |
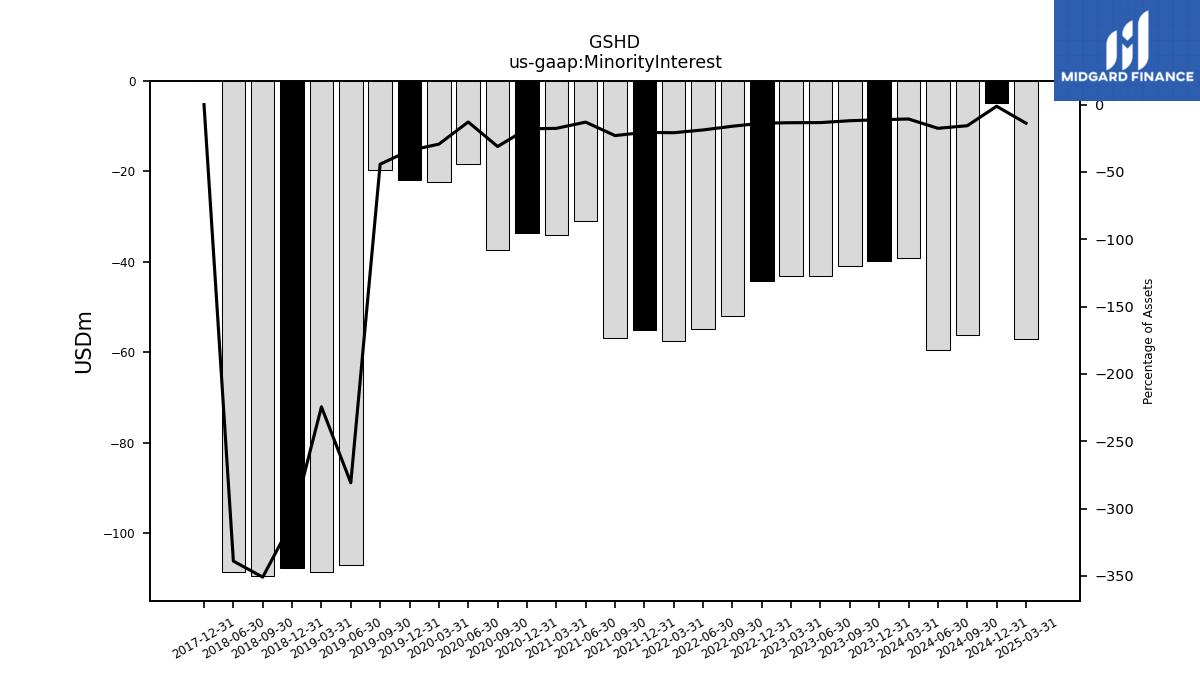
| Minority Interest | -39.77 | -40.82 | -43.12 | -43.17 | -44.29 | -51.99 | -54.77 | -57.45 | -55.17 | -56.82 | -30.92 | -33.96 | -33.53 | -37.30 | -18.37 | -22.27 | -22.00 | -19.65 | -106.97 | -108.63 | -107.80 | -109.47 | -108.52 | NA | 0.00 | NA | NA | NA | |
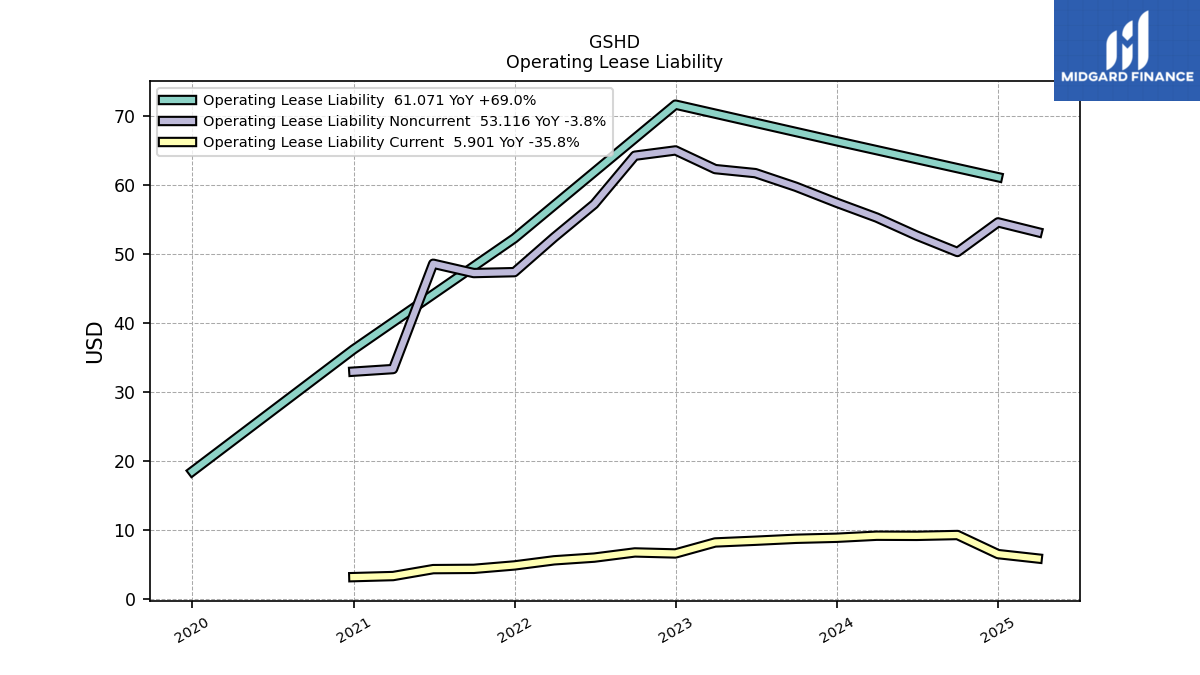
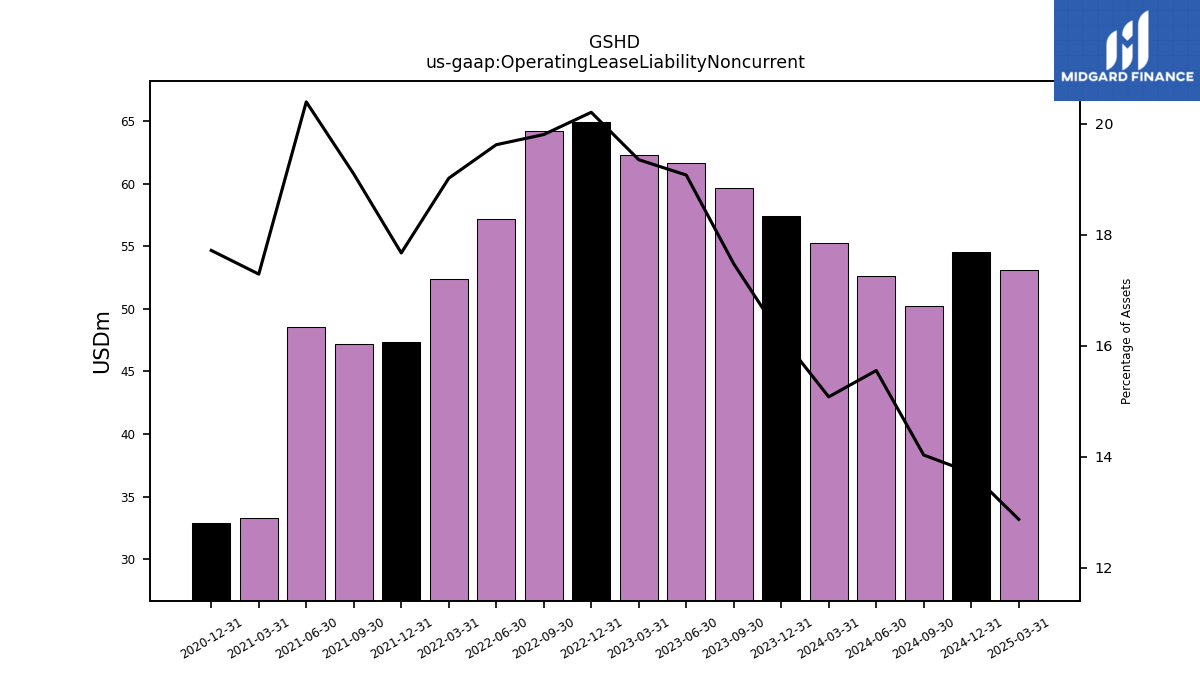
| Operating Lease Liability Noncurrent | 57.38 | 59.69 | 61.66 | 62.25 | 64.95 | 64.18 | 57.17 | 52.36 | 47.34 | 47.20 | 48.55 | 33.31 | 32.93 | NA | NA | NA | NA | NA | NA | NA | NA | NA | NA | NA | NA | NA | NA | NA |
| 2023-12-31 | 2023-09-30 | 2023-06-30 | 2023-03-31 | 2022-12-31 | 2022-09-30 | 2022-06-30 | 2022-03-31 | 2021-12-31 | 2021-09-30 | 2021-06-30 | 2021-03-31 | 2020-12-31 | 2020-09-30 | 2020-06-30 | 2020-03-31 | 2019-12-31 | 2019-09-30 | 2019-06-30 | 2019-03-31 | 2018-12-31 | 2018-09-30 | 2018-06-30 | 2018-03-31 | 2017-12-31 | 2017-09-30 | 2017-06-30 | 2017-03-31 | ||
|---|---|---|---|---|---|---|---|---|---|---|---|---|---|---|---|---|---|---|---|---|---|---|---|---|---|---|---|---|---|
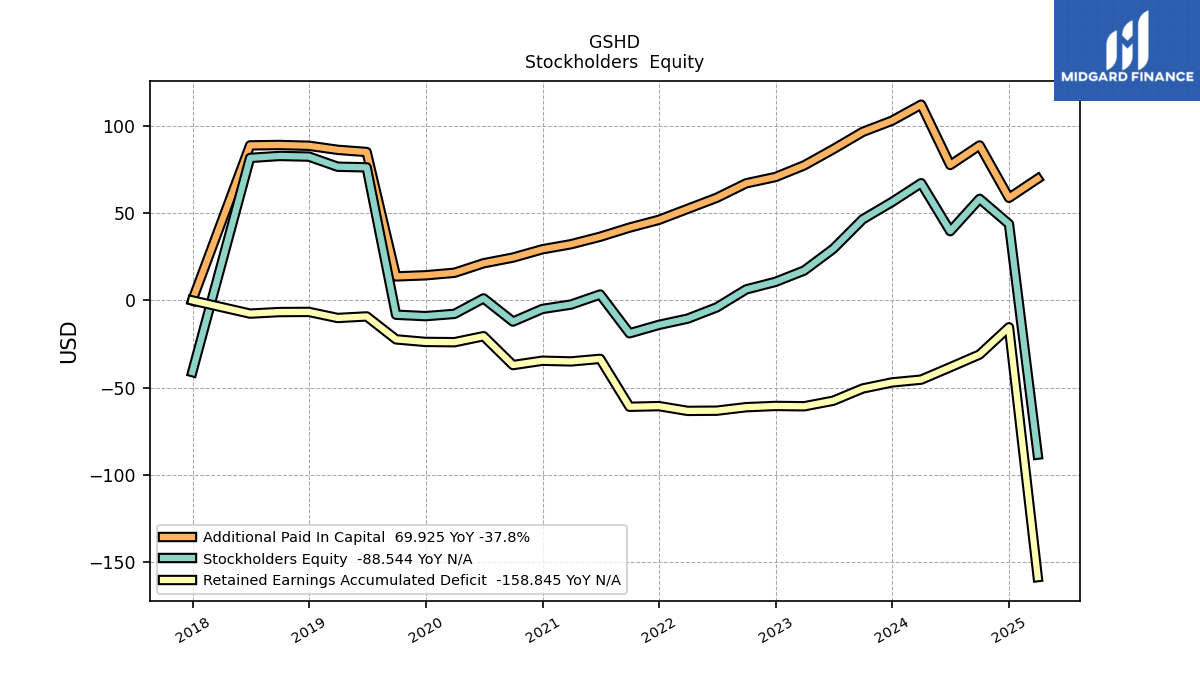
| Stockholders Equity | 56.55 | 46.58 | 29.67 | 17.19 | 10.67 | 6.33 | -3.98 | -10.45 | -14.02 | -18.86 | 3.42 | -2.35 | -4.88 | -12.13 | 1.19 | -7.71 | -9.01 | -8.20 | 76.42 | 76.78 | 82.59 | 82.95 | 81.84 | NA | -41.13 | NA | NA | NA | |
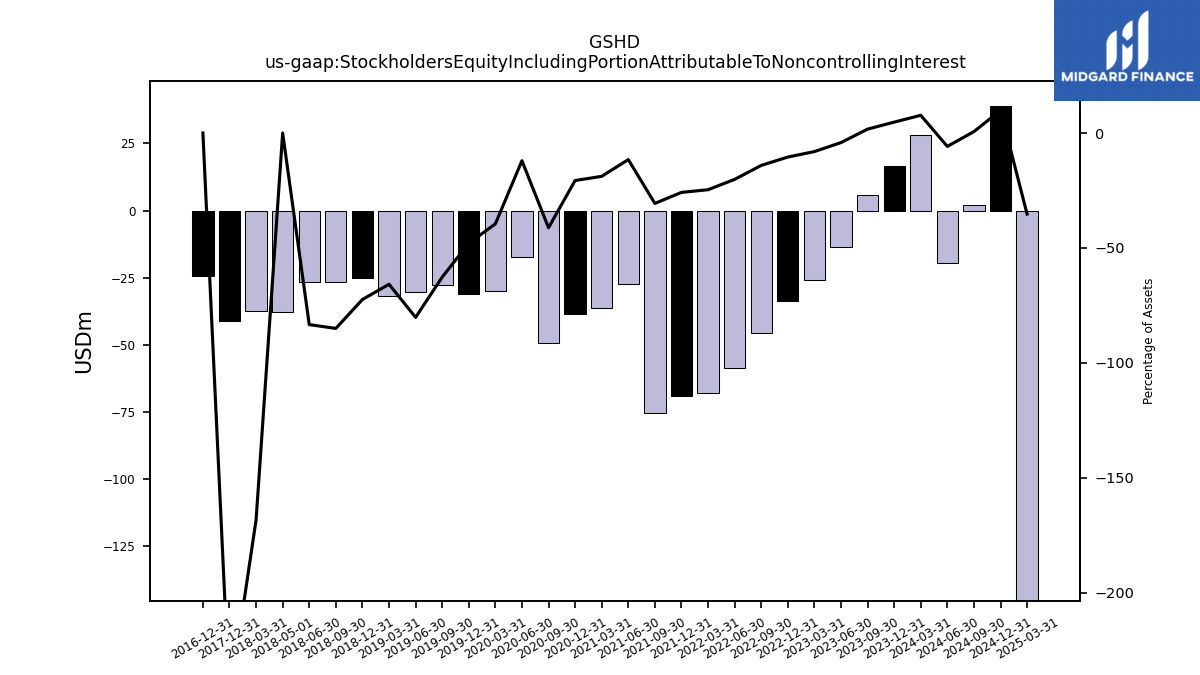
| Stockholders Equity Including Portion Attributable To Noncontrolling Interest | 16.79 | 5.76 | -13.45 | -25.98 | -33.62 | -45.66 | -58.75 | -67.90 | -69.19 | -75.68 | -27.50 | -36.30 | -38.40 | -49.43 | -17.19 | -29.99 | -31.01 | -27.85 | -30.55 | -31.85 | -25.20 | -26.52 | -26.68 | -37.37 | -41.13 | NA | NA | NA | |
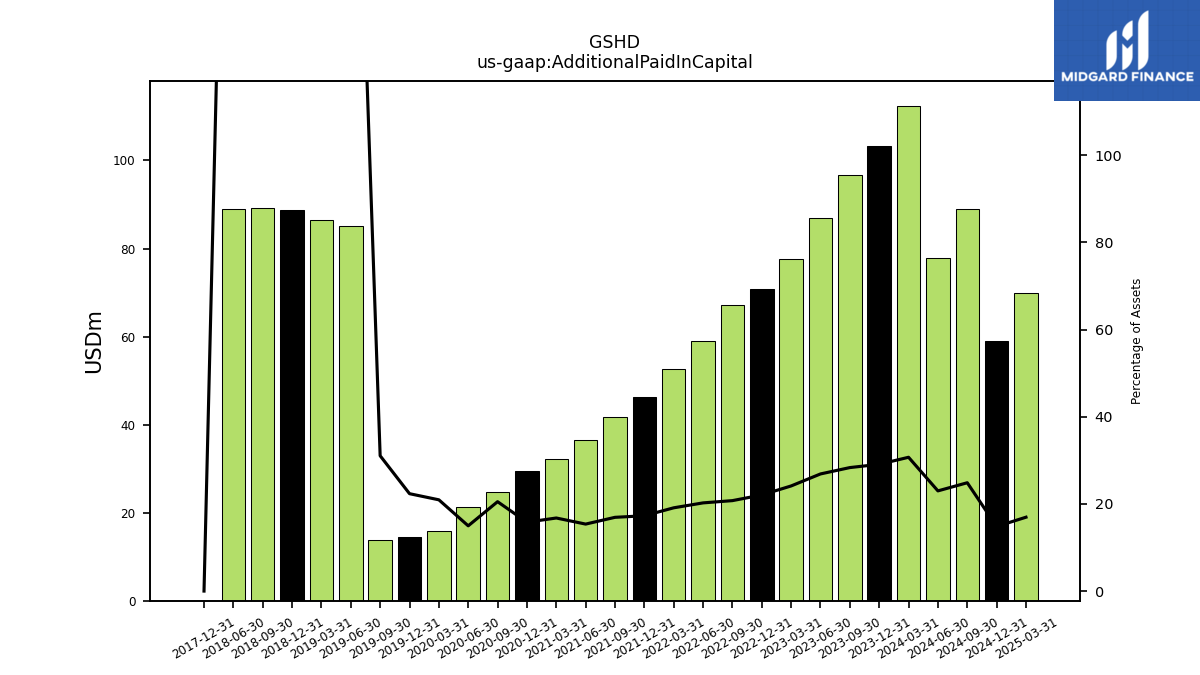
| Additional Paid In Capital | 103.23 | 96.75 | 86.86 | 77.57 | 70.87 | 67.24 | 58.94 | 52.59 | 46.28 | 41.82 | 36.58 | 32.29 | 29.37 | 24.60 | 21.35 | 15.89 | 14.44 | 13.79 | 85.22 | 86.48 | 88.81 | 89.26 | 89.03 | NA | 0.00 | NA | NA | NA | |
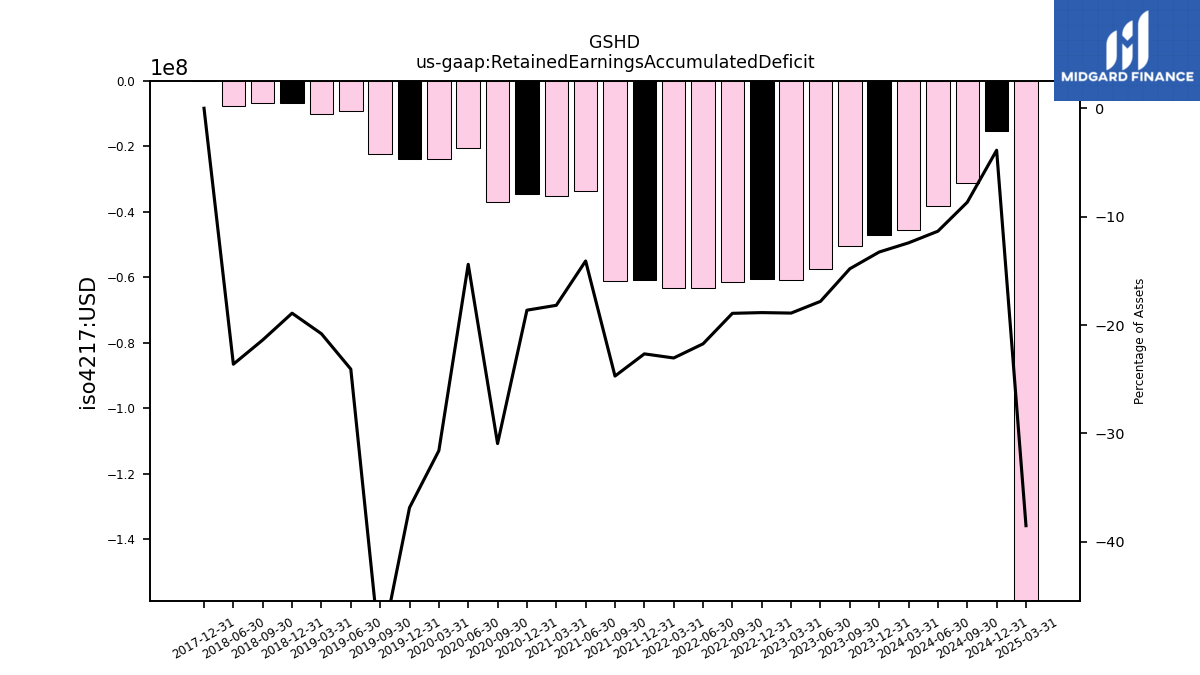
| Retained Earnings Accumulated Deficit | -47.06 | -50.55 | -57.56 | -60.75 | -60.57 | -61.28 | -63.29 | -63.41 | -60.67 | -61.05 | -33.53 | -35.01 | -34.61 | -37.10 | -20.52 | -23.97 | -23.81 | -22.35 | -9.16 | -10.07 | -6.58 | -6.67 | -7.56 | NA | 0.00 | NA | NA | NA | |
| Minority Interest | -39.77 | -40.82 | -43.12 | -43.17 | -44.29 | -51.99 | -54.77 | -57.45 | -55.17 | -56.82 | -30.92 | -33.96 | -33.53 | -37.30 | -18.37 | -22.27 | -22.00 | -19.65 | -106.97 | -108.63 | -107.80 | -109.47 | -108.52 | NA | 0.00 | NA | NA | NA |
| 2023-12-31 | 2023-09-30 | 2023-06-30 | 2023-03-31 | 2022-12-31 | 2022-09-30 | 2022-06-30 | 2022-03-31 | 2021-12-31 | 2021-09-30 | 2021-06-30 | 2021-03-31 | 2020-12-31 | 2020-09-30 | 2020-06-30 | 2020-03-31 | 2019-12-31 | 2019-09-30 | 2019-06-30 | 2019-03-31 | 2018-12-31 | 2018-09-30 | 2018-06-30 | 2018-03-31 | 2017-12-31 | 2017-09-30 | 2017-06-30 | 2017-03-31 | ||
|---|---|---|---|---|---|---|---|---|---|---|---|---|---|---|---|---|---|---|---|---|---|---|---|---|---|---|---|---|---|
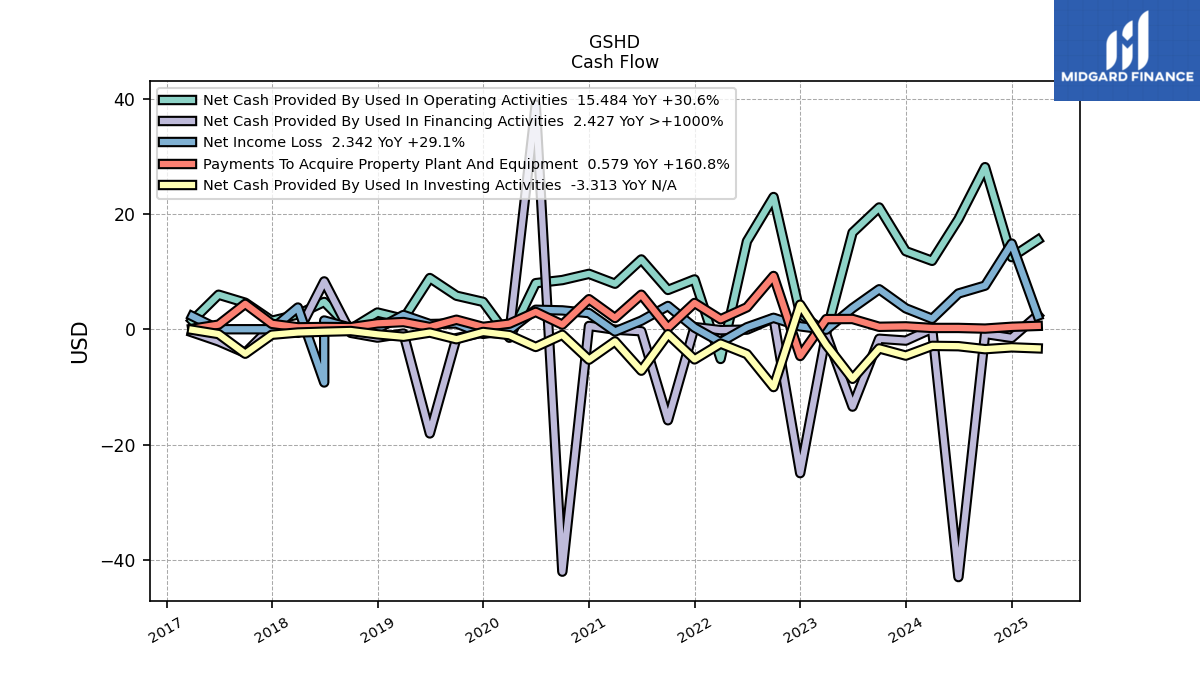
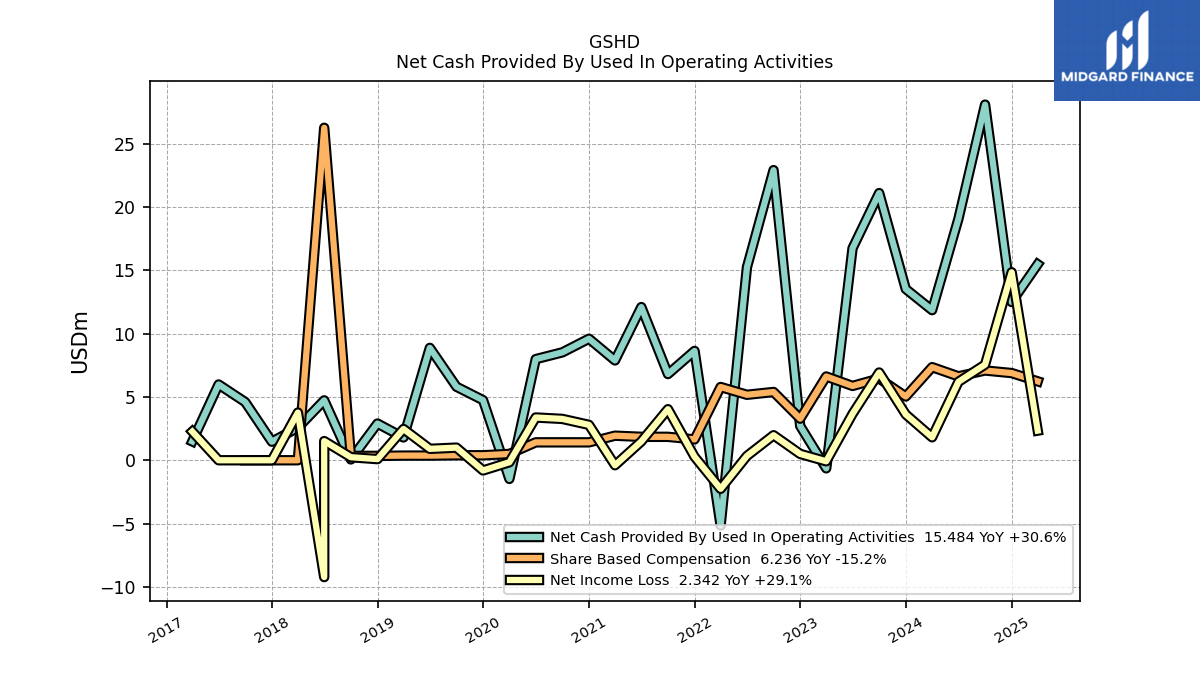
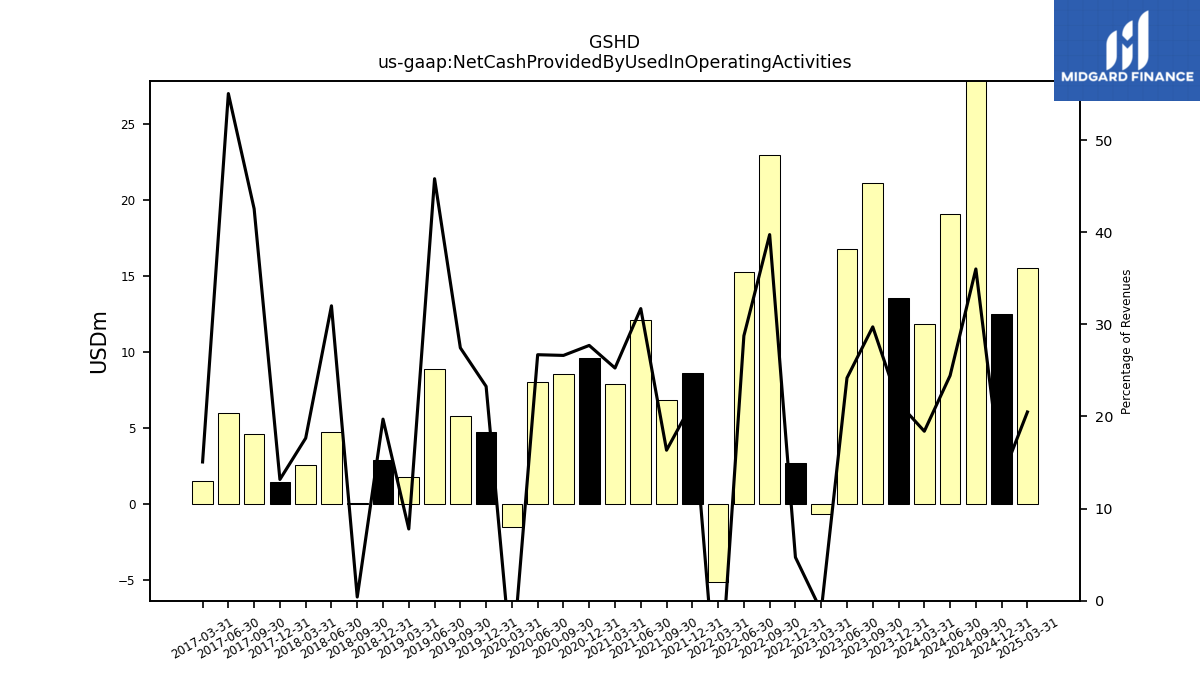
| Net Cash Provided By Used In Operating Activities | 13.53 | 21.11 | 16.75 | -0.64 | 2.71 | 22.93 | 15.25 | -5.15 | 8.64 | 6.81 | 12.10 | 7.89 | 9.60 | 8.53 | 7.99 | -1.48 | 4.75 | 5.81 | 8.88 | 1.80 | 2.90 | 0.07 | 4.73 | 2.57 | 1.47 | 4.60 | 5.99 | 1.49 | |
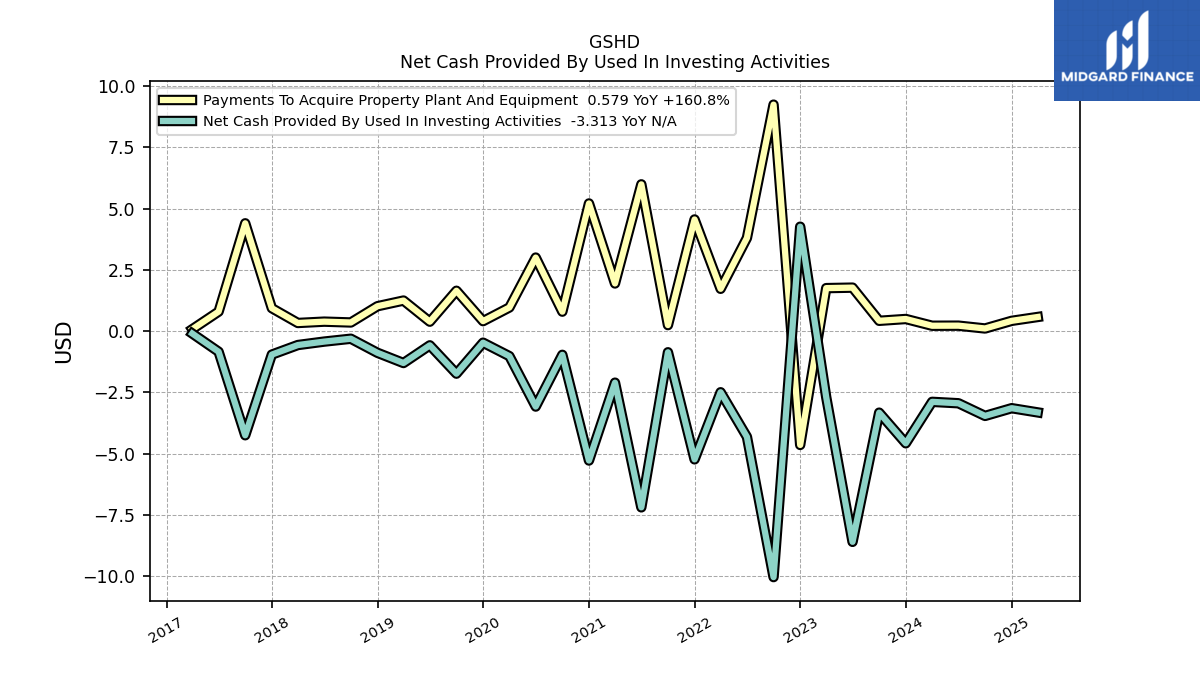
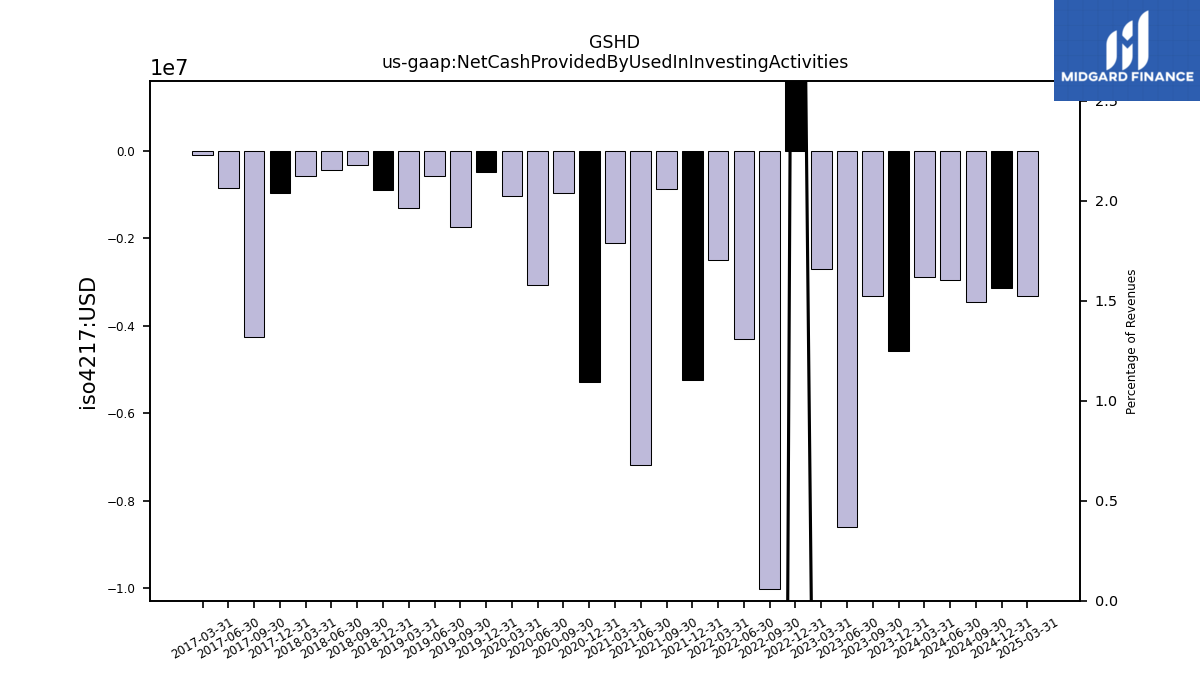
| Net Cash Provided By Used In Investing Activities | -4.57 | -3.32 | -8.59 | -2.69 | 4.26 | -10.03 | -4.31 | -2.49 | -5.23 | -0.86 | -7.19 | -2.10 | -5.28 | -0.96 | -3.08 | -1.02 | -0.47 | -1.73 | -0.58 | -1.30 | -0.88 | -0.31 | -0.42 | -0.57 | -0.95 | -4.25 | -0.84 | -0.10 | |
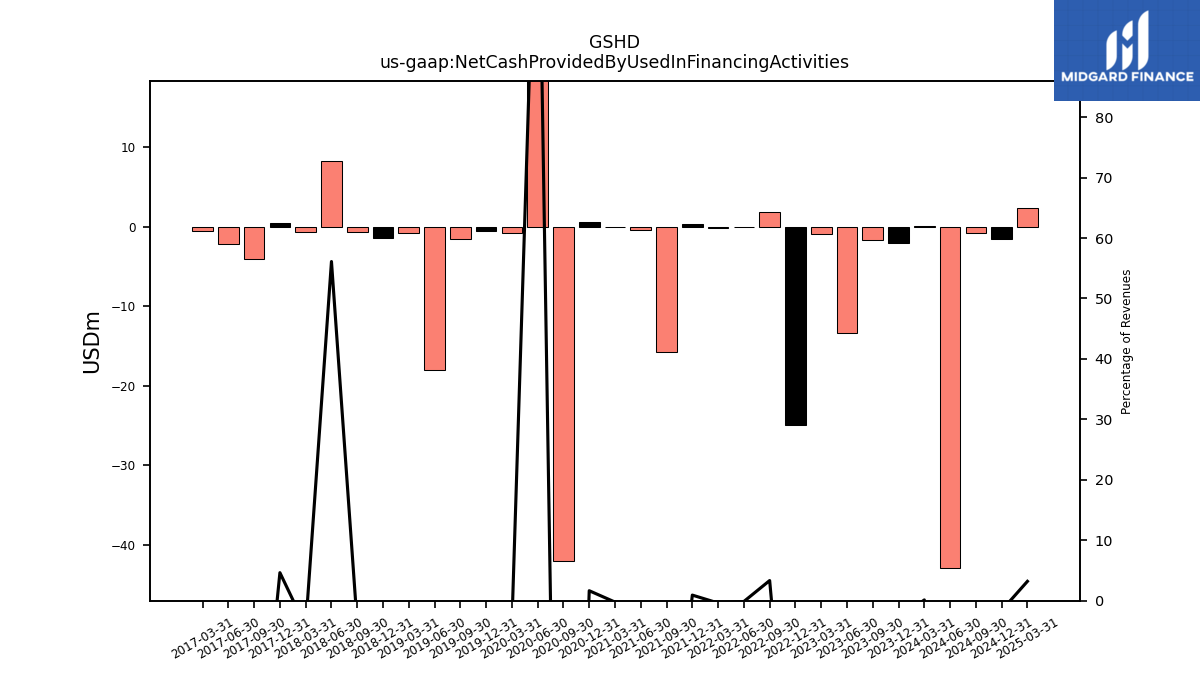
| Net Cash Provided By Used In Financing Activities | -1.97 | -1.65 | -13.42 | -0.88 | -24.95 | 1.93 | -0.07 | -0.15 | 0.38 | -15.79 | -0.35 | -0.07 | 0.57 | -42.03 | 38.94 | -0.82 | -0.57 | -1.54 | -18.07 | -0.74 | -1.45 | -0.63 | 8.30 | -0.63 | 0.52 | -4.10 | -2.11 | -0.54 |
| 2023-12-31 | 2023-09-30 | 2023-06-30 | 2023-03-31 | 2022-12-31 | 2022-09-30 | 2022-06-30 | 2022-03-31 | 2021-12-31 | 2021-09-30 | 2021-06-30 | 2021-03-31 | 2020-12-31 | 2020-09-30 | 2020-06-30 | 2020-03-31 | 2019-12-31 | 2019-09-30 | 2019-06-30 | 2019-03-31 | 2018-12-31 | 2018-09-30 | 2018-06-30 | 2018-03-31 | 2017-12-31 | 2017-09-30 | 2017-06-30 | 2017-03-31 | ||
|---|---|---|---|---|---|---|---|---|---|---|---|---|---|---|---|---|---|---|---|---|---|---|---|---|---|---|---|---|---|
| Net Cash Provided By Used In Operating Activities | 13.53 | 21.11 | 16.75 | -0.64 | 2.71 | 22.93 | 15.25 | -5.15 | 8.64 | 6.81 | 12.10 | 7.89 | 9.60 | 8.53 | 7.99 | -1.48 | 4.75 | 5.81 | 8.88 | 1.80 | 2.90 | 0.07 | 4.73 | 2.57 | 1.47 | 4.60 | 5.99 | 1.49 | |
| Net Income Loss | 3.62 | 6.93 | 3.67 | -0.08 | 0.50 | 1.98 | 0.34 | -2.26 | 0.28 | 4.04 | 1.49 | -0.40 | 2.80 | 3.27 | 3.38 | -0.16 | -0.81 | 1.00 | 0.90 | 2.47 | 0.09 | 0.24 | -9.23 | 3.77 | 0.00 | 0.00 | 0.00 | 2.27 | |
| Profit Loss | 5.42 | 11.27 | 7.18 | -0.18 | 2.58 | 3.04 | 2.39 | -5.38 | 0.88 | 5.37 | 3.14 | -1.09 | 4.94 | 6.72 | 7.39 | -0.30 | 2.43 | 2.76 | 2.82 | 7.32 | 0.60 | 0.84 | 1.52 | 3.77 | 0.38 | 0.21 | 5.82 | 2.27 | |
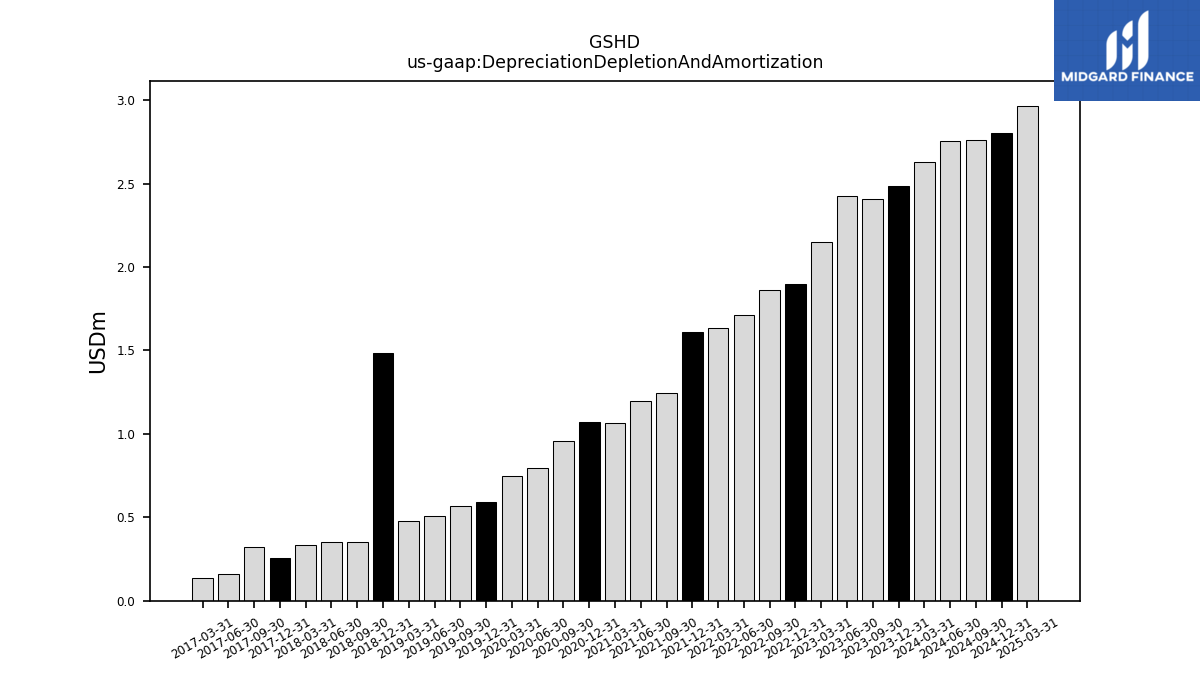
| Depreciation Depletion And Amortization | 2.48 | 2.41 | 2.43 | 2.15 | 1.90 | 1.86 | 1.72 | 1.63 | 1.61 | 1.24 | 1.20 | 1.07 | 1.07 | 0.96 | 0.79 | 0.75 | 0.59 | 0.57 | 0.51 | 0.48 | 1.48 | 0.35 | 0.35 | 0.34 | 0.26 | 0.32 | 0.16 | 0.14 | |
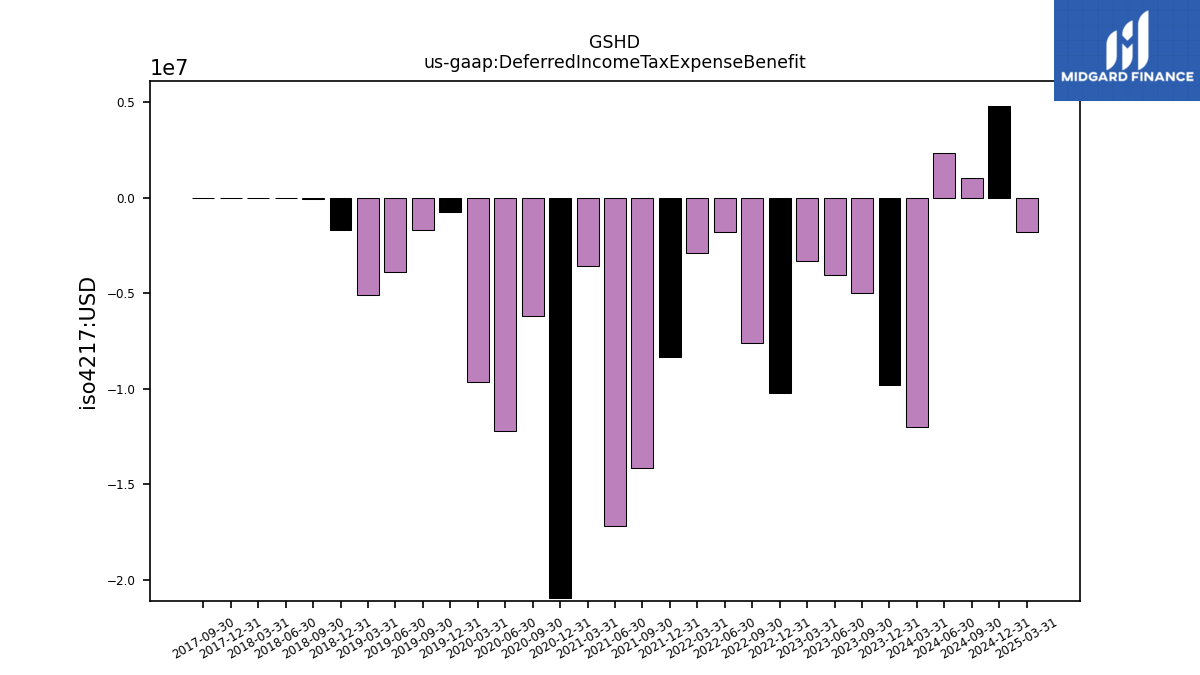
| Deferred Income Tax Expense Benefit | -9.79 | -4.96 | -4.05 | -3.32 | -10.20 | -7.60 | -1.78 | -2.88 | -8.34 | -14.17 | -17.20 | -3.57 | -20.99 | -6.21 | -12.21 | -9.66 | -0.76 | -1.68 | -3.86 | -5.08 | -1.68 | -0.05 | 0.00 | 0.00 | 0.00 | 0.00 | NA | NA | |
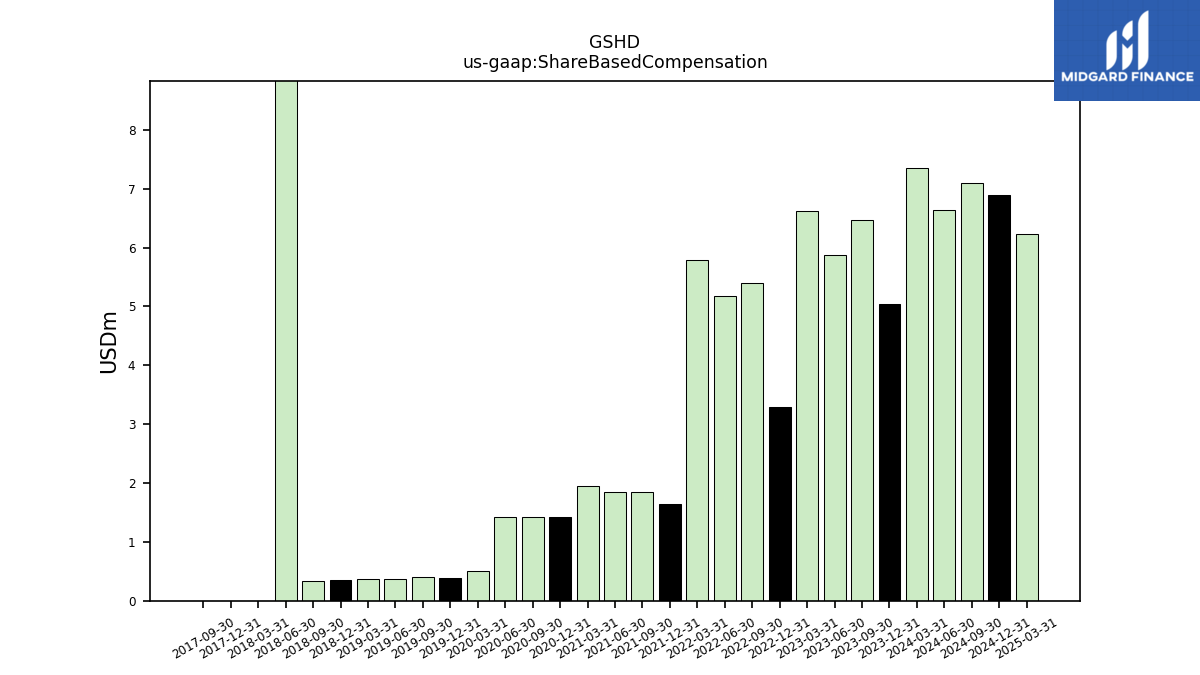
| Share Based Compensation | 5.04 | 6.46 | 5.87 | 6.62 | 3.29 | 5.39 | 5.17 | 5.79 | 1.65 | 1.85 | 1.85 | 1.94 | 1.42 | 1.42 | 1.42 | 0.50 | 0.39 | 0.40 | 0.37 | 0.37 | 0.34 | 0.34 | 26.27 | 0.00 | 0.00 | 0.00 | NA | NA |
| 2023-12-31 | 2023-09-30 | 2023-06-30 | 2023-03-31 | 2022-12-31 | 2022-09-30 | 2022-06-30 | 2022-03-31 | 2021-12-31 | 2021-09-30 | 2021-06-30 | 2021-03-31 | 2020-12-31 | 2020-09-30 | 2020-06-30 | 2020-03-31 | 2019-12-31 | 2019-09-30 | 2019-06-30 | 2019-03-31 | 2018-12-31 | 2018-09-30 | 2018-06-30 | 2018-03-31 | 2017-12-31 | 2017-09-30 | 2017-06-30 | 2017-03-31 | ||
|---|---|---|---|---|---|---|---|---|---|---|---|---|---|---|---|---|---|---|---|---|---|---|---|---|---|---|---|---|---|
| Net Cash Provided By Used In Investing Activities | -4.57 | -3.32 | -8.59 | -2.69 | 4.26 | -10.03 | -4.31 | -2.49 | -5.23 | -0.86 | -7.19 | -2.10 | -5.28 | -0.96 | -3.08 | -1.02 | -0.47 | -1.73 | -0.58 | -1.30 | -0.88 | -0.31 | -0.42 | -0.57 | -0.95 | -4.25 | -0.84 | -0.10 | |
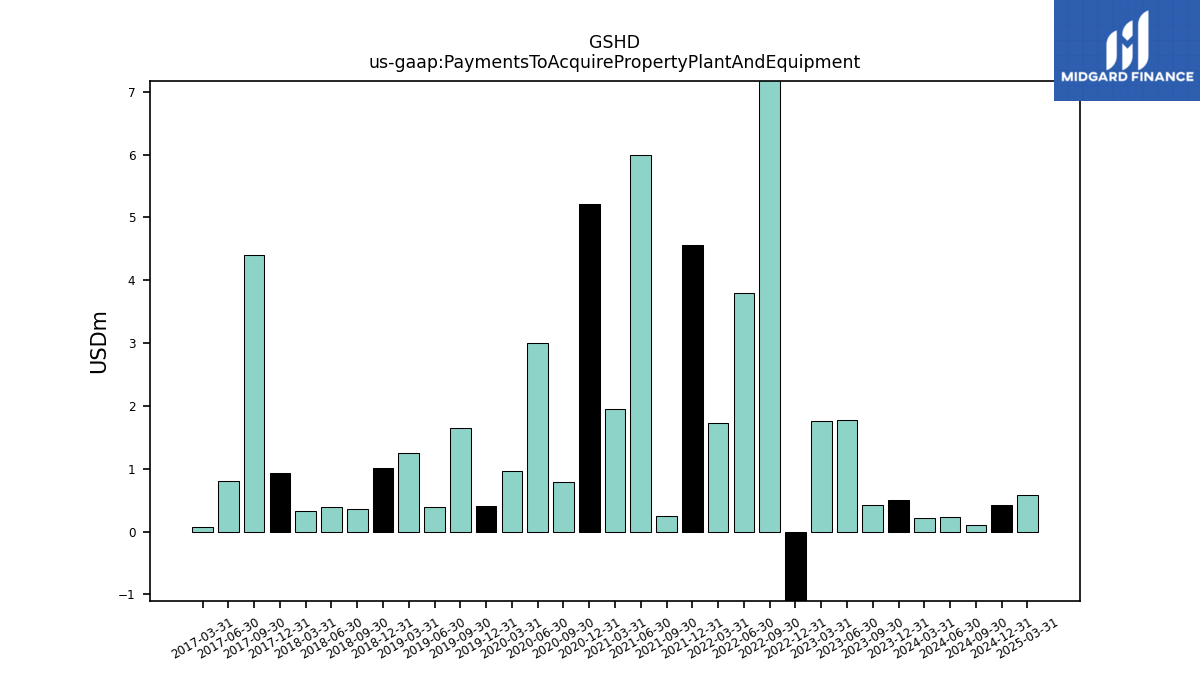
| Payments To Acquire Property Plant And Equipment | 0.50 | 0.42 | 1.78 | 1.76 | -4.64 | 9.24 | 3.80 | 1.73 | 4.56 | 0.25 | 5.99 | 1.95 | 5.21 | 0.80 | 3.00 | 0.97 | 0.41 | 1.65 | 0.39 | 1.25 | 1.02 | 0.36 | 0.39 | 0.33 | 0.94 | 4.40 | 0.80 | 0.08 |
| 2023-12-31 | 2023-09-30 | 2023-06-30 | 2023-03-31 | 2022-12-31 | 2022-09-30 | 2022-06-30 | 2022-03-31 | 2021-12-31 | 2021-09-30 | 2021-06-30 | 2021-03-31 | 2020-12-31 | 2020-09-30 | 2020-06-30 | 2020-03-31 | 2019-12-31 | 2019-09-30 | 2019-06-30 | 2019-03-31 | 2018-12-31 | 2018-09-30 | 2018-06-30 | 2018-03-31 | 2017-12-31 | 2017-09-30 | 2017-06-30 | 2017-03-31 | ||
|---|---|---|---|---|---|---|---|---|---|---|---|---|---|---|---|---|---|---|---|---|---|---|---|---|---|---|---|---|---|
| Net Cash Provided By Used In Financing Activities | -1.97 | -1.65 | -13.42 | -0.88 | -24.95 | 1.93 | -0.07 | -0.15 | 0.38 | -15.79 | -0.35 | -0.07 | 0.57 | -42.03 | 38.94 | -0.82 | -0.57 | -1.54 | -18.07 | -0.74 | -1.45 | -0.63 | 8.30 | -0.63 | 0.52 | -4.10 | -2.11 | -0.54 |
| 2023-12-31 | 2023-09-30 | 2023-06-30 | 2023-03-31 | 2022-12-31 | 2022-09-30 | 2022-06-30 | 2022-03-31 | 2021-12-31 | 2021-09-30 | 2021-06-30 | 2021-03-31 | 2020-12-31 | 2020-09-30 | 2020-06-30 | 2020-03-31 | 2019-12-31 | 2019-09-30 | 2019-06-30 | 2019-03-31 | 2018-12-31 | 2018-09-30 | 2018-06-30 | 2018-03-31 | 2017-12-31 | 2017-09-30 | 2017-06-30 | 2017-03-31 | ||
|---|---|---|---|---|---|---|---|---|---|---|---|---|---|---|---|---|---|---|---|---|---|---|---|---|---|---|---|---|---|
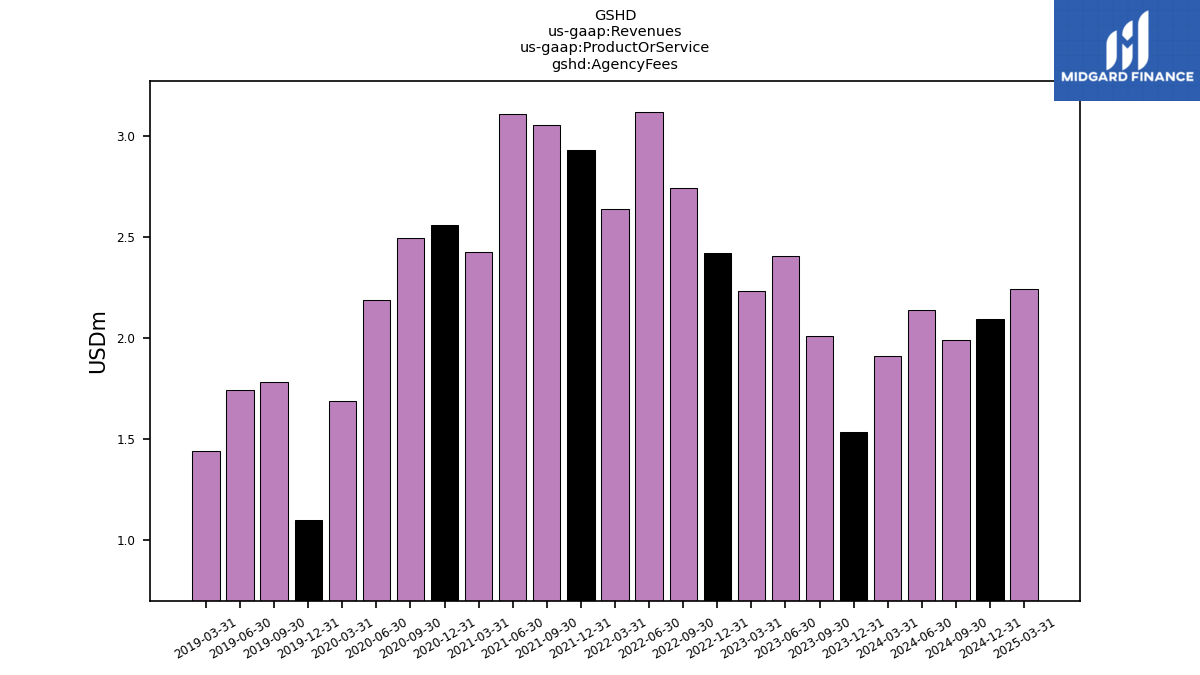
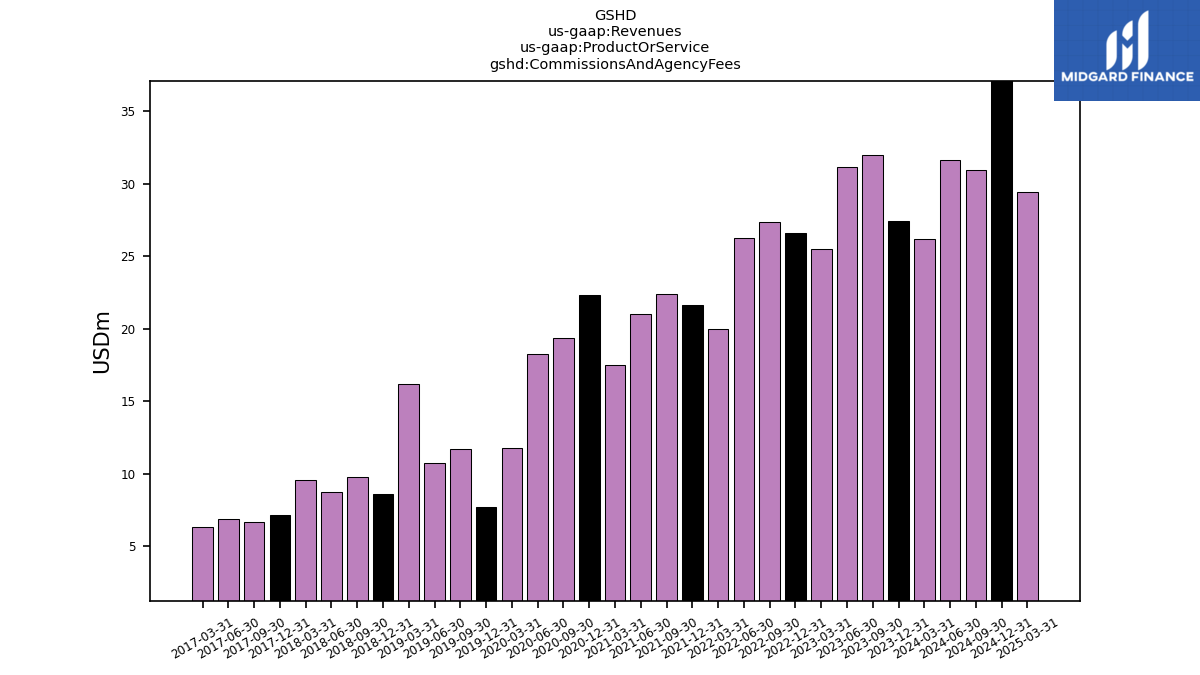
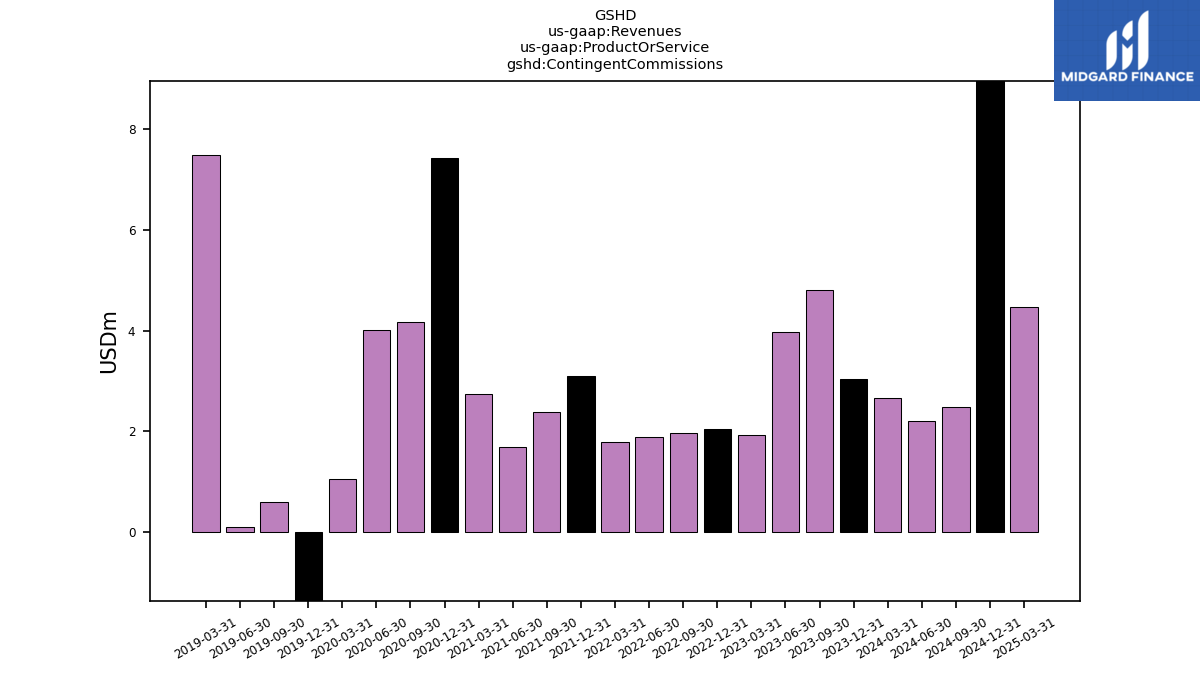
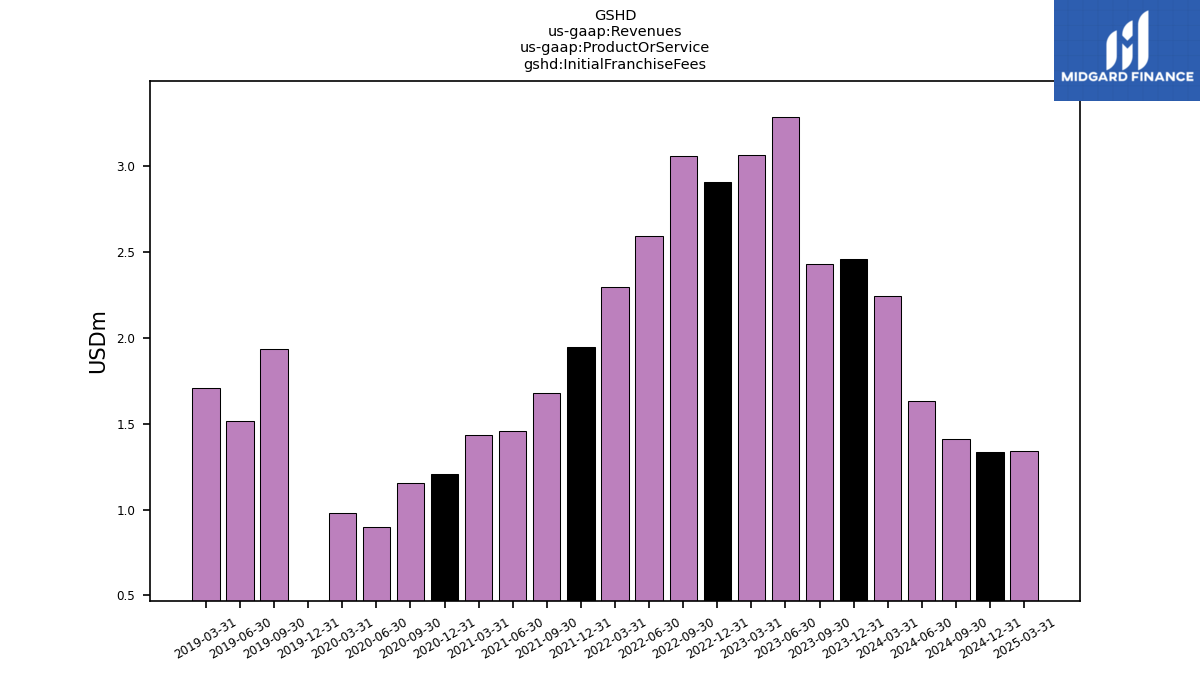
| Revenues | 63.01 | 71.03 | 69.28 | 57.95 | 57.40 | 57.69 | 53.02 | 41.28 | 40.23 | 41.68 | 38.17 | 31.23 | 34.65 | 32.02 | 29.92 | 20.43 | 20.41 | 21.17 | 19.39 | 23.13 | 14.72 | 16.05 | 14.79 | 14.59 | 11.13 | 10.81 | 10.88 | 9.89 | |
| Agency Fees | 1.53 | 2.01 | 2.40 | 2.23 | 2.42 | 2.74 | 3.11 | 2.64 | 2.93 | 3.05 | 3.10 | 2.42 | 2.56 | 2.49 | 2.19 | 1.69 | 1.10 | 1.78 | 1.74 | 1.44 | NA | NA | NA | NA | NA | NA | NA | NA | |
| Commissions And Agency Fees | 27.42 | 31.98 | 31.17 | 25.48 | 26.59 | 27.40 | 26.27 | 20.01 | 21.64 | 22.42 | 21.05 | 17.53 | 22.37 | 19.39 | 18.25 | 11.81 | 7.69 | 11.74 | 10.76 | 16.17 | 8.63 | 9.76 | 8.72 | 9.60 | 7.12 | 6.69 | 6.85 | 6.36 | |
| Contingent Commissions | 3.04 | 4.81 | 3.97 | 1.92 | 2.04 | 1.96 | 1.88 | 1.80 | 3.11 | 2.39 | 1.69 | 2.74 | 7.43 | 4.17 | 4.02 | 1.06 | -2.78 | 0.61 | 0.11 | 7.49 | NA | NA | NA | NA | NA | NA | NA | NA | |
| Initial Franchise Fees | 2.46 | 2.43 | 3.29 | 3.06 | 2.91 | 3.06 | 2.59 | 2.30 | 1.95 | 1.68 | 1.46 | 1.43 | 1.21 | 1.15 | 0.90 | 0.98 | -1.38 | 1.94 | 1.51 | 1.71 | NA | NA | NA | NA | NA | NA | NA | NA | |
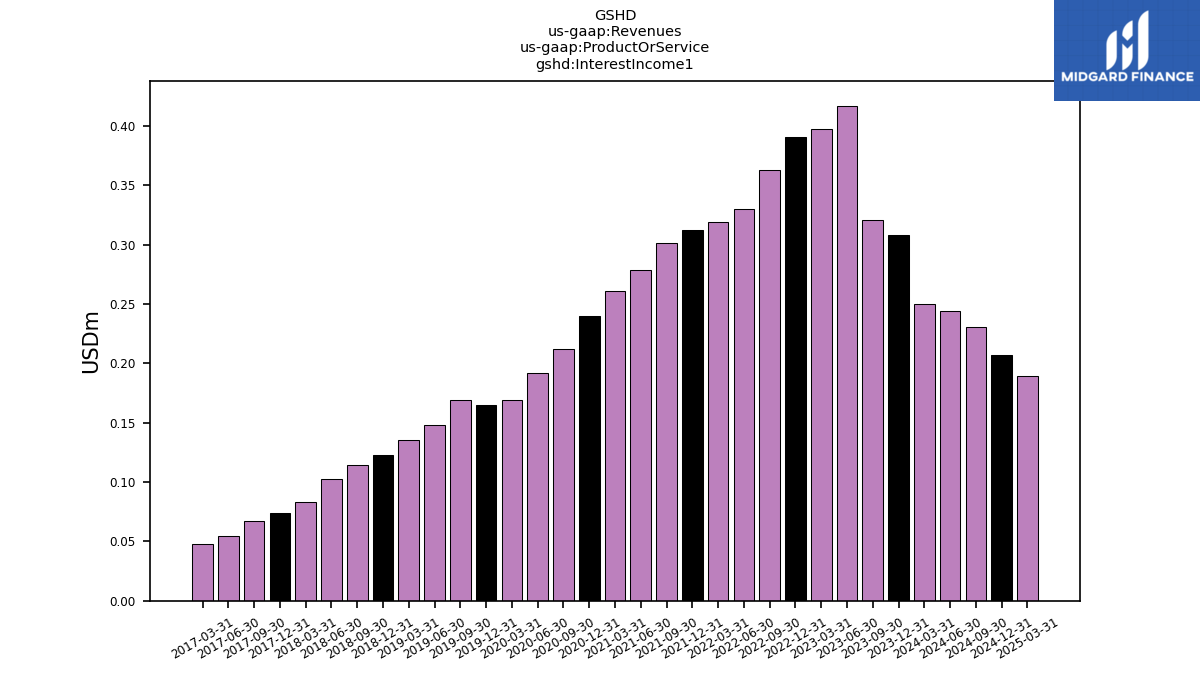
| Interest Income1 | 0.31 | 0.32 | 0.42 | 0.40 | 0.39 | 0.36 | 0.33 | 0.32 | 0.31 | 0.30 | 0.28 | 0.26 | 0.24 | 0.21 | 0.19 | 0.17 | 0.17 | 0.17 | 0.15 | 0.14 | 0.12 | 0.11 | 0.10 | 0.08 | 0.07 | 0.07 | 0.05 | 0.05 | |
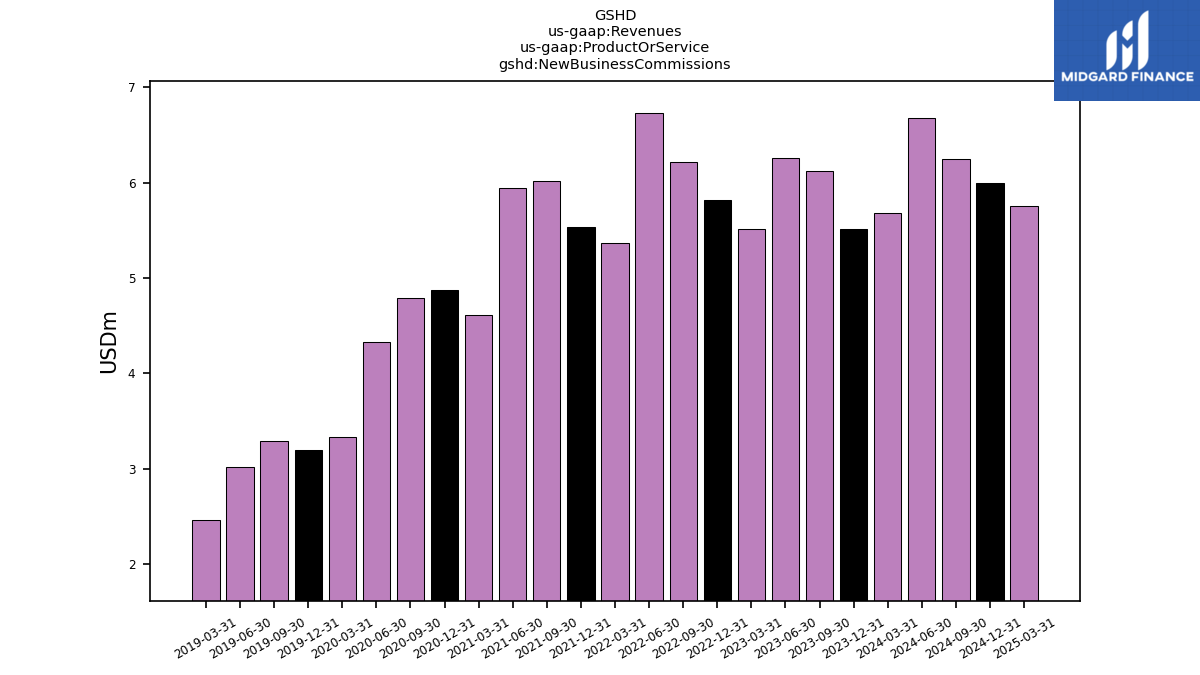
| New Business Commissions | 5.51 | 6.12 | 6.26 | 5.52 | 5.81 | 6.21 | 6.73 | 5.37 | 5.54 | 6.01 | 5.94 | 4.62 | 4.87 | 4.79 | 4.33 | 3.33 | 3.19 | 3.29 | 3.01 | 2.46 | NA | NA | NA | NA | NA | NA | NA | NA | |
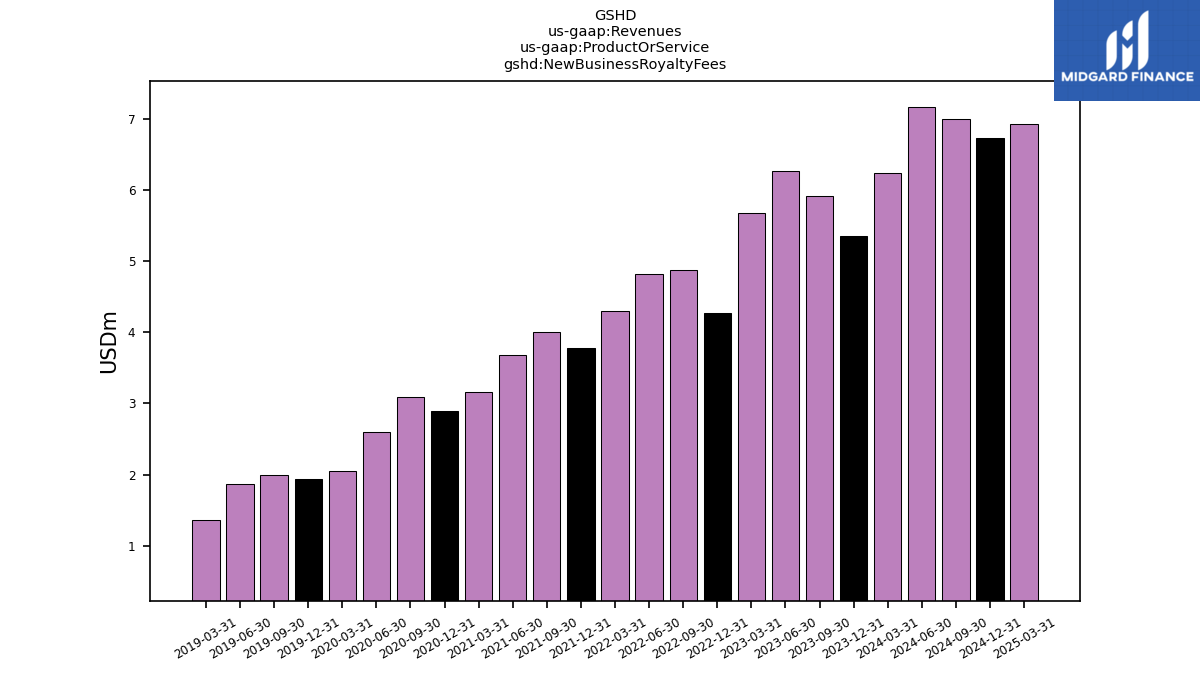
| New Business Royalty Fees | 5.35 | 5.91 | 6.27 | 5.67 | 4.26 | 4.87 | 4.82 | 4.29 | 3.78 | 4.00 | 3.68 | 3.16 | 2.89 | 3.09 | 2.60 | 2.05 | 1.94 | 1.99 | 1.86 | 1.35 | NA | NA | NA | NA | NA | NA | NA | NA | |
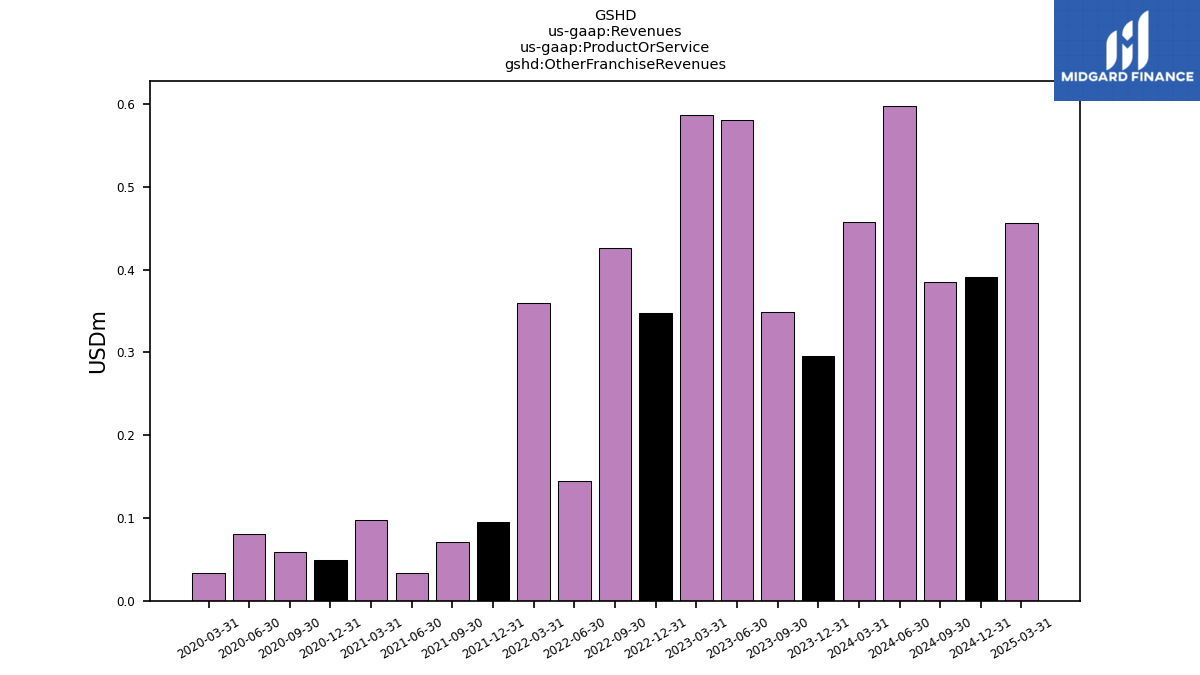
| Other Franchise Revenues | 0.30 | 0.35 | 0.58 | 0.59 | 0.35 | 0.43 | 0.14 | 0.36 | 0.10 | 0.07 | 0.03 | 0.10 | 0.05 | 0.06 | 0.08 | 0.03 | NA | NA | NA | NA | NA | NA | NA | NA | NA | NA | NA | NA | |
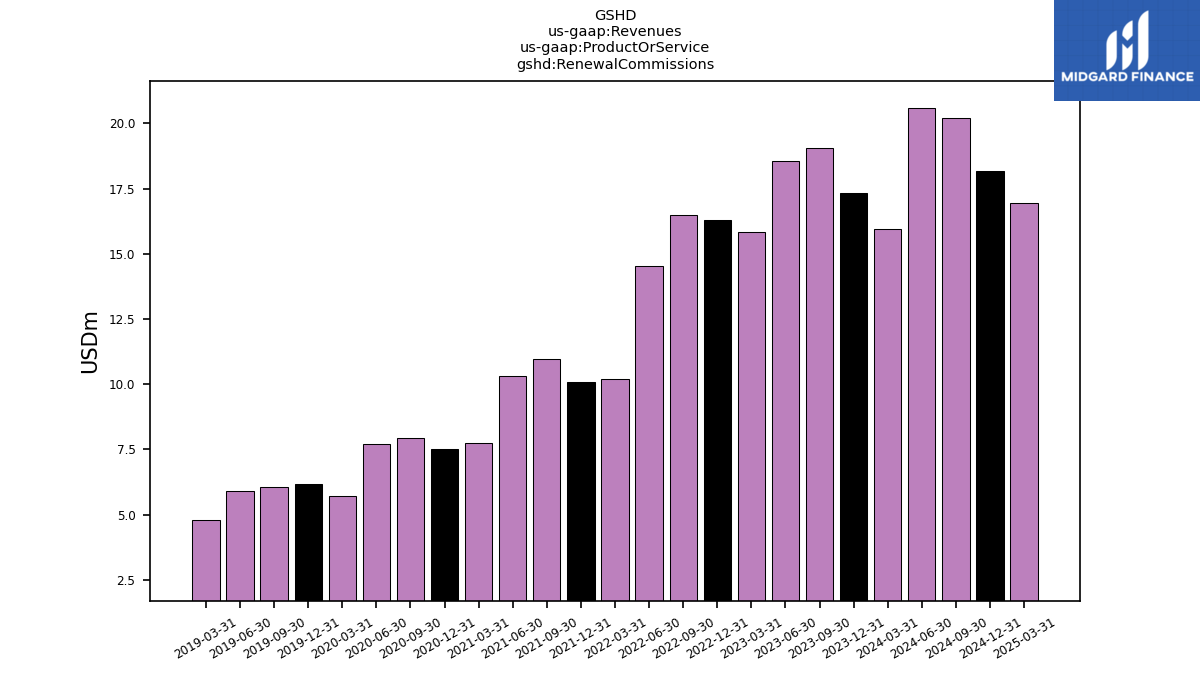
| Renewal Commissions | 17.34 | 19.04 | 18.54 | 15.82 | 16.31 | 16.48 | 14.54 | 10.21 | 10.07 | 10.97 | 10.31 | 7.76 | 7.51 | 7.93 | 7.72 | 5.73 | 6.18 | 6.06 | 5.90 | 4.79 | NA | NA | NA | NA | NA | NA | NA | NA | |
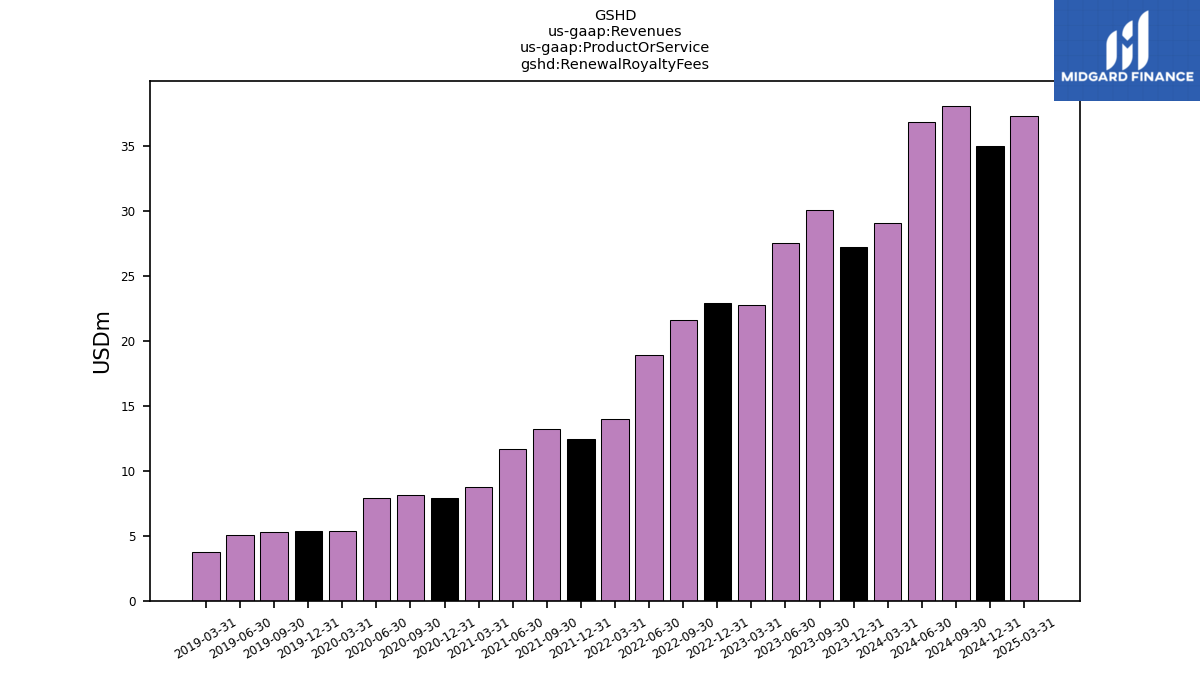
| Renewal Royalty Fees | 27.18 | 30.04 | 27.55 | 22.75 | 22.90 | 21.57 | 18.87 | 14.00 | 12.46 | 13.21 | 11.67 | 8.75 | 7.90 | 8.12 | 7.90 | 5.39 | 5.34 | 5.29 | 5.06 | 3.76 | NA | NA | NA | NA | NA | NA | NA | NA | |
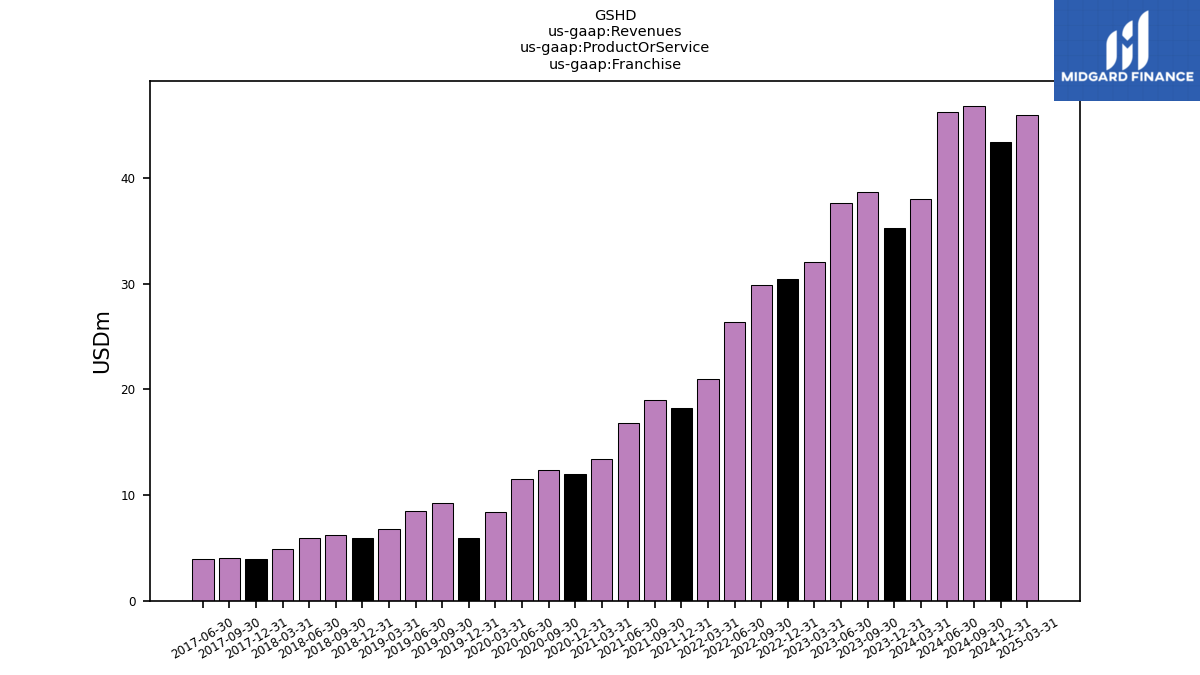
| Franchise | 35.28 | 38.73 | 37.69 | 32.07 | 30.42 | 29.92 | 26.43 | 20.95 | 18.27 | 18.96 | 16.84 | 13.43 | 12.04 | 12.42 | 11.48 | 8.45 | 5.94 | 9.26 | 8.47 | 6.83 | 5.96 | 6.18 | 5.97 | 4.91 | 3.94 | 4.05 | 3.97 | NA | |
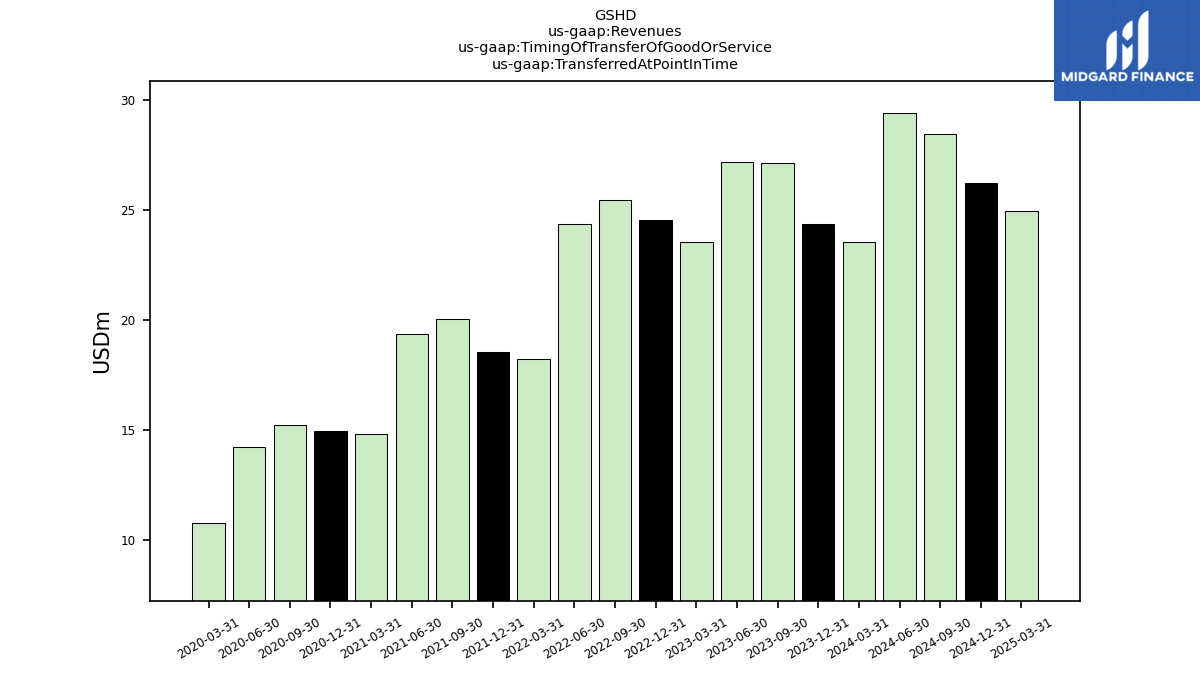
| Transferred At Point In Time | 24.38 | 27.17 | 27.20 | 23.57 | 24.55 | 25.44 | 24.39 | 18.21 | 18.54 | 20.03 | 19.36 | 14.80 | 14.94 | 15.21 | 14.23 | 10.75 | NA | NA | NA | NA | NA | NA | NA | NA | NA | NA | NA | NA | |
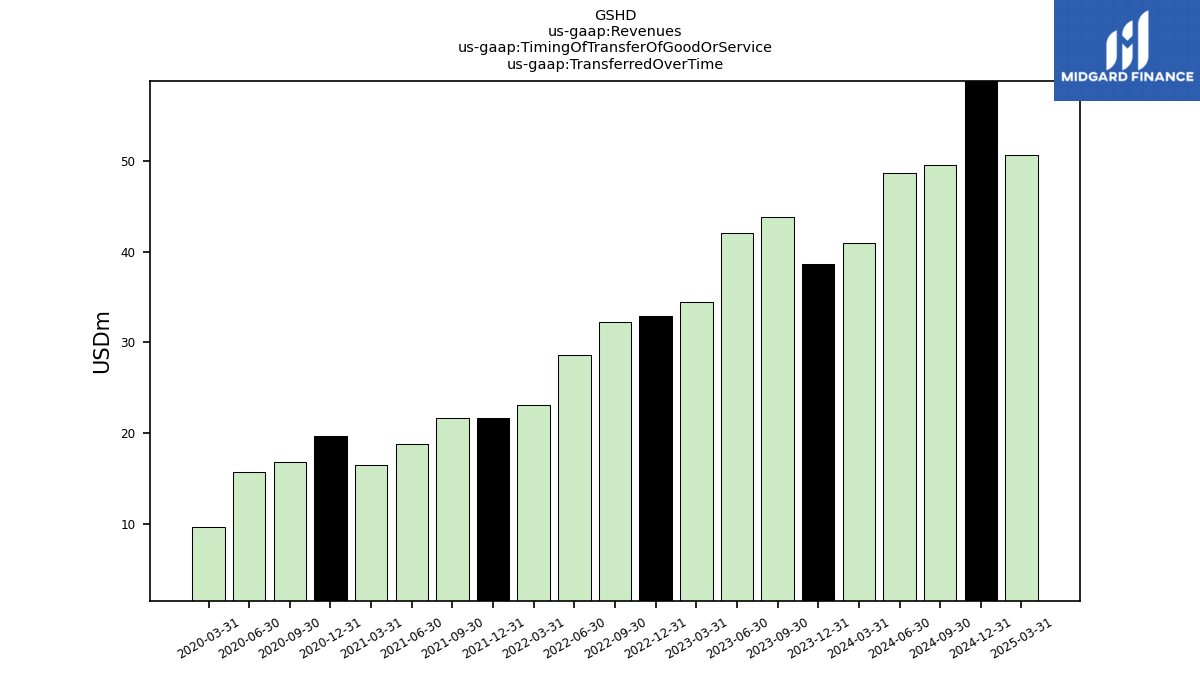
| Transferred Over Time | 38.63 | 43.86 | 42.08 | 34.39 | 32.86 | 32.25 | 28.64 | 23.07 | 21.69 | 21.65 | 18.81 | 16.43 | 19.71 | 16.80 | 15.69 | 9.67 | NA | NA | NA | NA | NA | NA | NA | NA | NA | NA | NA | NA |