
| 2023-12-31 | 2023-09-30 | 2023-06-30 | 2023-03-31 | 2022-12-31 | 2022-09-30 | 2022-06-30 | 2022-03-31 | 2021-12-31 | 2021-09-30 | 2021-06-30 | 2021-03-31 | 2020-12-31 | 2020-09-30 | 2020-06-30 | 2020-03-31 | 2019-12-31 | 2019-09-30 | 2019-06-30 | 2019-03-31 | 2018-12-31 | 2018-09-30 | 2018-06-30 | 2018-03-31 | 2017-12-31 | 2017-09-30 | 2017-06-30 | 2017-03-31 | 2016-12-31 | 2016-09-30 | 2016-06-30 | 2016-03-31 | 2015-12-31 | 2015-09-30 | 2015-06-30 | 2015-03-31 | 2014-12-31 | 2014-09-30 | 2014-06-30 | 2014-03-31 | 2013-12-31 | 2013-09-30 | 2013-06-30 | 2013-03-31 | 2012-12-31 | 2012-09-30 | 2012-06-30 | 2012-03-31 | 2011-12-31 | 2011-09-30 | 2011-06-30 | 2011-03-31 | 2010-12-31 | 2010-09-30 | 2010-06-30 | 2010-03-31 | 2009-12-31 | ||
|---|---|---|---|---|---|---|---|---|---|---|---|---|---|---|---|---|---|---|---|---|---|---|---|---|---|---|---|---|---|---|---|---|---|---|---|---|---|---|---|---|---|---|---|---|---|---|---|---|---|---|---|---|---|---|---|---|---|---|
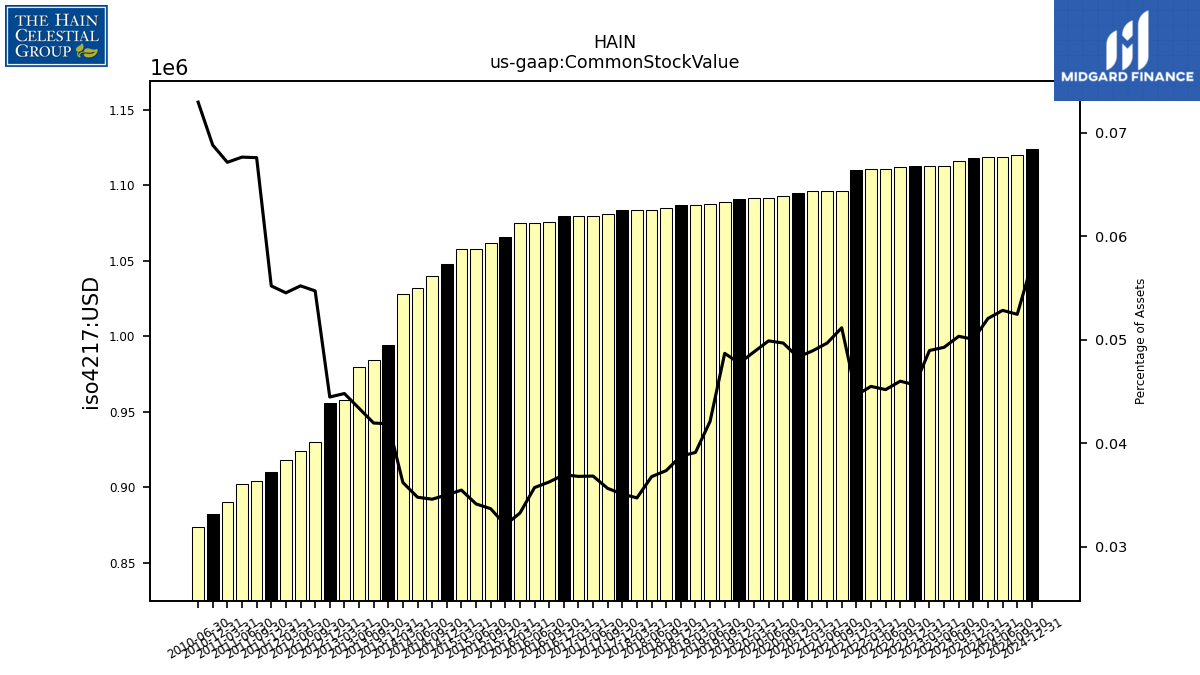
| Common Stock Value | 1.12 | 1.12 | 1.11 | 1.11 | 1.11 | 1.11 | 1.11 | 1.11 | 1.11 | 1.10 | 1.10 | 1.10 | 1.09 | 1.09 | 1.09 | 1.09 | 1.09 | 1.09 | 1.09 | 1.09 | 1.09 | 1.08 | 1.08 | 1.08 | 1.08 | 1.08 | 1.08 | 1.08 | 1.08 | 1.08 | 1.07 | 1.07 | 1.07 | 1.06 | 1.06 | 1.06 | 1.05 | 1.04 | 1.03 | 1.03 | 0.99 | 0.98 | 0.98 | 0.96 | 0.96 | 0.93 | 0.92 | 0.92 | 0.91 | 0.90 | 0.90 | 0.89 | 0.88 | NA | 0.87 | NA | NA | |
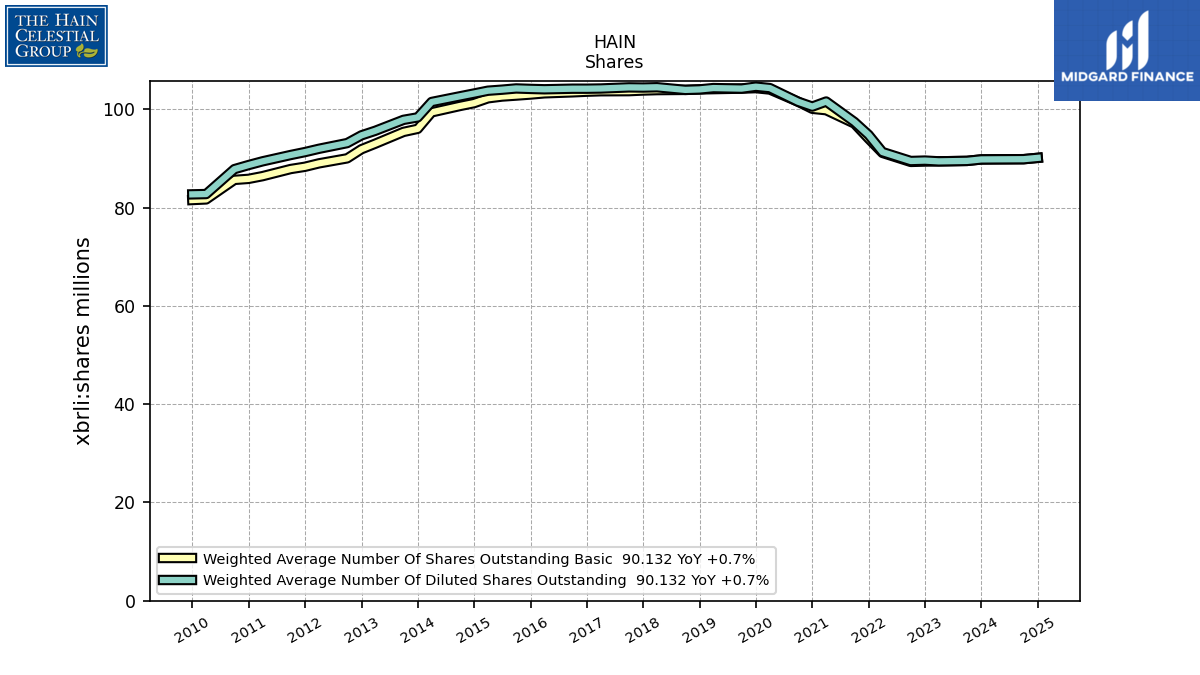
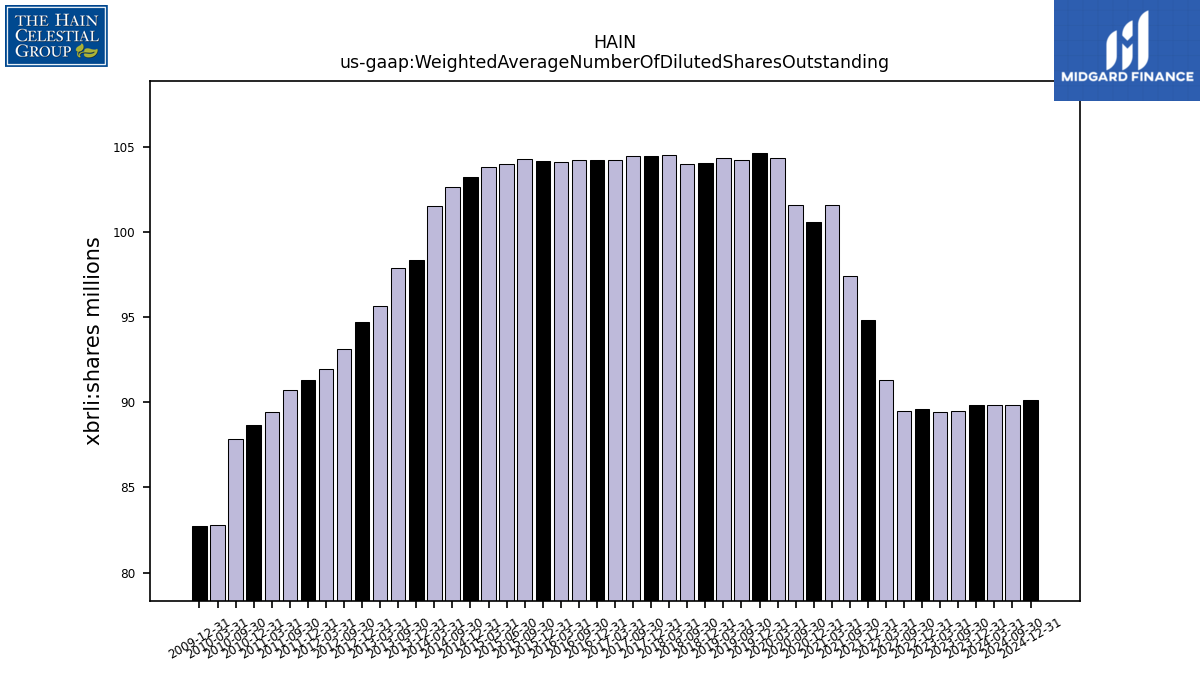
| Weighted Average Number Of Diluted Shares Outstanding | 89.81 | 89.51 | NA | 89.42 | 89.58 | 89.49 | NA | 91.31 | 94.81 | 97.44 | NA | 101.60 | 100.56 | 101.56 | NA | 104.34 | 104.62 | 104.22 | NA | 104.33 | 104.06 | 103.96 | NA | 104.50 | 104.44 | 104.48 | NA | 104.25 | 104.20 | 104.21 | NA | 104.09 | 104.16 | 104.26 | 104.00 | 103.80 | 103.23 | 102.66 | NA | 101.50 | 98.37 | 97.87 | NA | 95.64 | 94.71 | 93.14 | NA | 91.98 | 91.30 | 90.71 | NA | 89.42 | 88.67 | 87.84 | NA | 82.77 | 82.70 | |
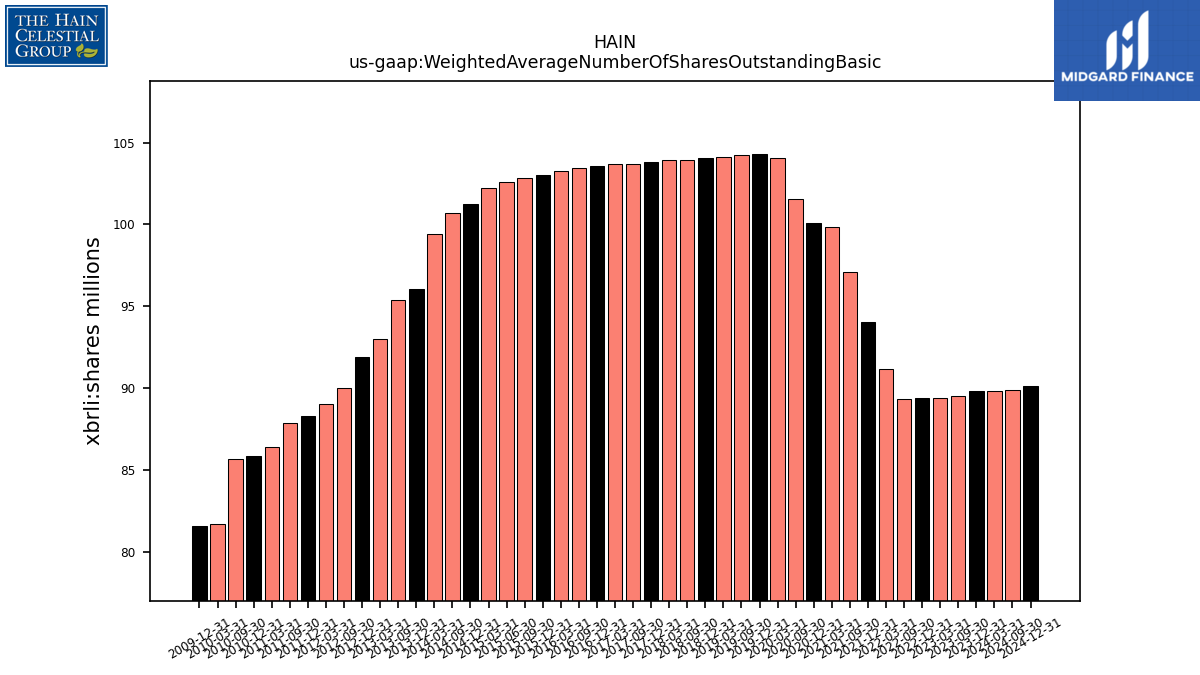
| Weighted Average Number Of Shares Outstanding Basic | 89.81 | 89.51 | NA | 89.42 | 89.38 | 89.31 | NA | 91.14 | 94.04 | 97.12 | NA | 99.83 | 100.12 | 101.56 | NA | 104.03 | 104.32 | 104.22 | NA | 104.12 | 104.06 | 103.96 | NA | 103.92 | 103.84 | 103.71 | NA | 103.69 | 103.60 | 103.47 | NA | 103.27 | 103.02 | 102.81 | 102.61 | 102.25 | 101.27 | 100.68 | NA | 99.39 | 96.04 | 95.41 | NA | 93.02 | 91.88 | 90.03 | NA | 89.01 | 88.32 | 87.86 | NA | 86.40 | 85.86 | 85.65 | NA | 81.68 | 81.55 | |
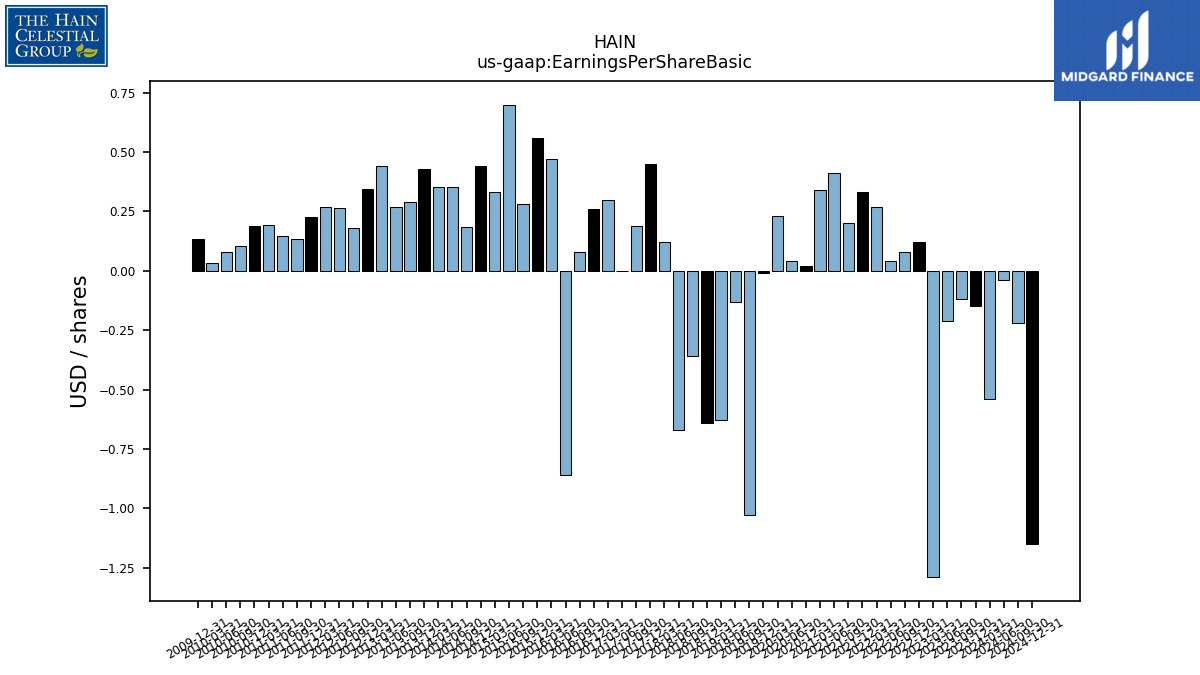
| Earnings Per Share Basic | -0.15 | -0.12 | -0.21 | -1.29 | 0.12 | 0.08 | 0.04 | 0.27 | 0.33 | 0.20 | 0.41 | 0.34 | 0.02 | NA | 0.04 | 0.23 | -0.01 | -1.03 | -0.13 | -0.63 | -0.64 | -0.36 | -0.67 | 0.12 | 0.45 | 0.19 | 0.00 | 0.30 | 0.26 | 0.08 | -0.86 | 0.47 | 0.56 | 0.28 | 0.70 | 0.33 | 0.44 | 0.18 | 0.35 | 0.35 | 0.43 | 0.29 | 0.27 | 0.44 | 0.34 | 0.18 | 0.27 | 0.27 | 0.23 | 0.14 | 0.15 | 0.20 | 0.19 | 0.10 | 0.08 | 0.04 | 0.14 | |
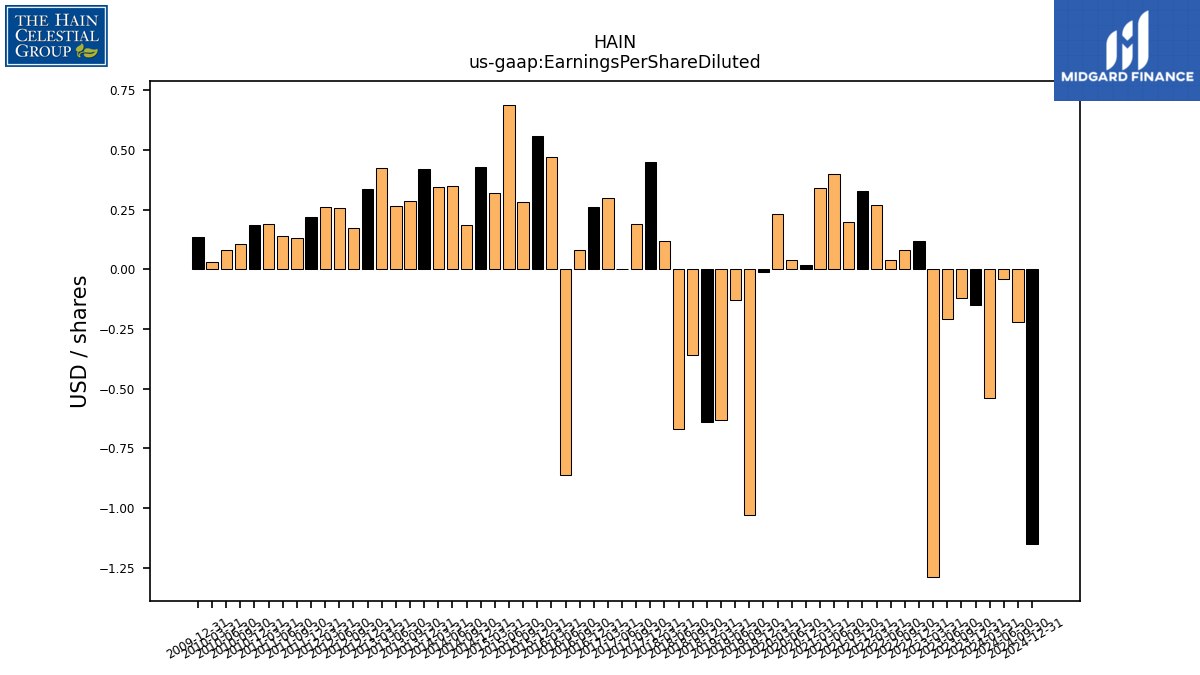
| Earnings Per Share Diluted | -0.15 | -0.12 | -0.21 | -1.29 | 0.12 | 0.08 | 0.04 | 0.27 | 0.33 | 0.20 | 0.40 | 0.34 | 0.02 | NA | 0.04 | 0.23 | -0.01 | -1.03 | -0.13 | -0.63 | -0.64 | -0.36 | -0.67 | 0.12 | 0.45 | 0.19 | 0.00 | 0.30 | 0.26 | 0.08 | -0.86 | 0.47 | 0.56 | 0.28 | 0.69 | 0.32 | 0.43 | 0.18 | 0.35 | 0.34 | 0.42 | 0.28 | 0.27 | 0.42 | 0.34 | 0.17 | 0.26 | 0.26 | 0.22 | 0.13 | 0.14 | 0.19 | 0.18 | 0.10 | 0.08 | 0.03 | 0.14 | |
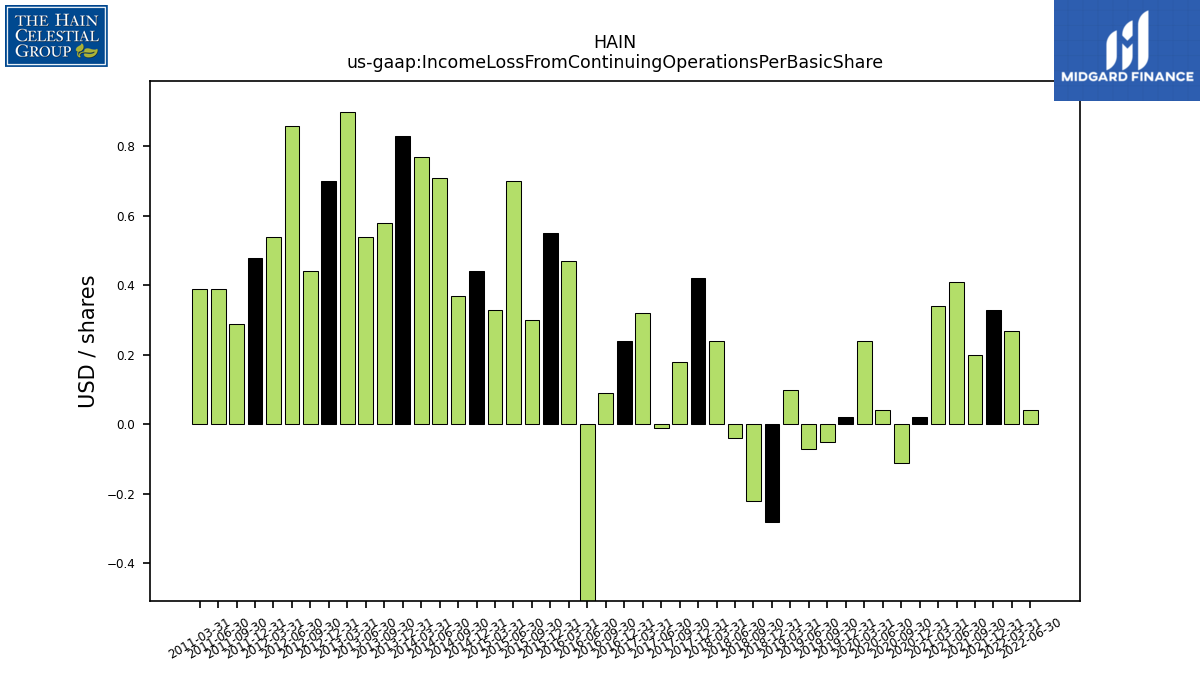
| Income Loss From Continuing Operations Per Basic Share | NA | NA | NA | NA | NA | NA | 0.00 | 0.00 | 0.00 | 0.00 | 0.00 | 0.00 | 0.00 | -0.00 | 0.00 | 0.00 | 0.00 | -0.00 | -0.00 | 0.00 | -0.00 | -0.00 | -0.00 | 0.00 | 0.00 | 0.00 | -0.00 | 0.00 | 0.00 | 0.00 | -0.00 | 0.00 | 0.00 | 0.00 | 0.00 | 0.00 | 0.00 | 0.00 | 0.00 | 0.00 | 0.00 | 0.00 | 0.00 | 0.00 | 0.00 | 0.00 | 0.00 | 0.00 | 0.00 | 0.00 | 0.00 | 0.00 | NA | NA | NA | NA | NA | |
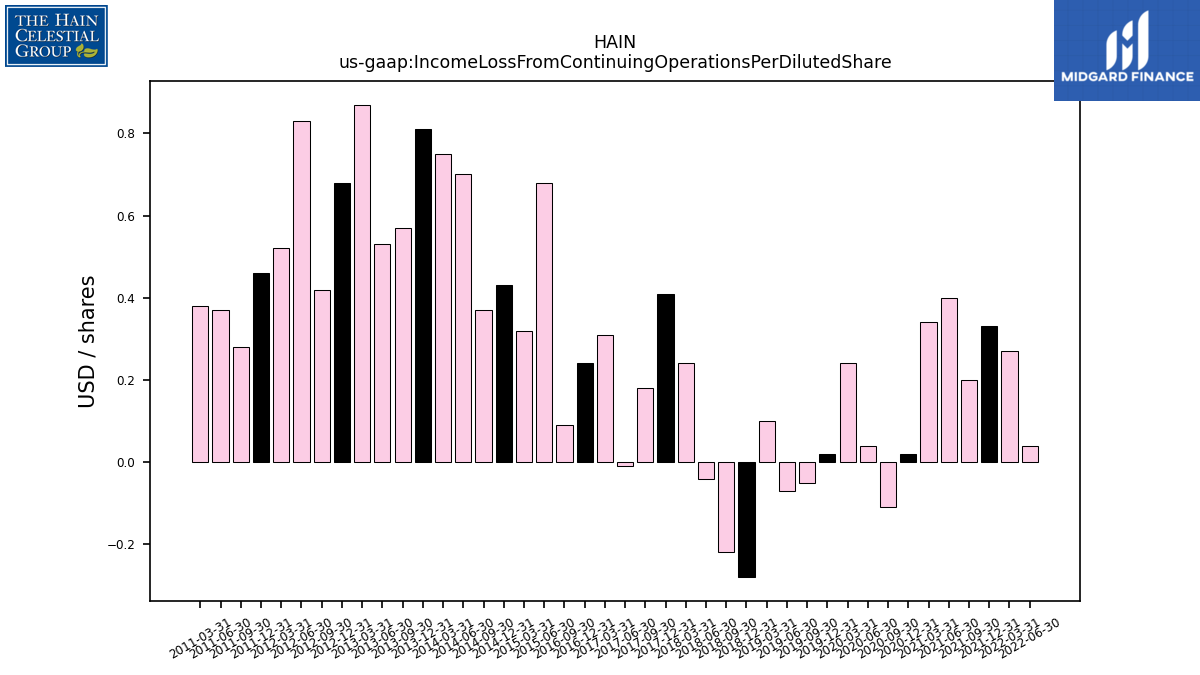
| Income Loss From Continuing Operations Per Diluted Share | NA | NA | NA | NA | NA | NA | 0.00 | 0.00 | 0.00 | 0.00 | 0.00 | 0.00 | 0.00 | -0.00 | 0.00 | 0.00 | 0.00 | -0.00 | -0.00 | 0.00 | -0.00 | -0.00 | -0.00 | 0.00 | 0.00 | 0.00 | -0.00 | 0.00 | 0.00 | 0.00 | NA | NA | NA | NA | 0.00 | 0.00 | 0.00 | 0.00 | 0.00 | 0.00 | 0.00 | 0.00 | 0.00 | 0.00 | 0.00 | 0.00 | 0.00 | 0.00 | 0.00 | 0.00 | 0.00 | 0.00 | NA | NA | NA | NA | NA |
| 2023-12-31 | 2023-09-30 | 2023-06-30 | 2023-03-31 | 2022-12-31 | 2022-09-30 | 2022-06-30 | 2022-03-31 | 2021-12-31 | 2021-09-30 | 2021-06-30 | 2021-03-31 | 2020-12-31 | 2020-09-30 | 2020-06-30 | 2020-03-31 | 2019-12-31 | 2019-09-30 | 2019-06-30 | 2019-03-31 | 2018-12-31 | 2018-09-30 | 2018-06-30 | 2018-03-31 | 2017-12-31 | 2017-09-30 | 2017-06-30 | 2017-03-31 | 2016-12-31 | 2016-09-30 | 2016-06-30 | 2016-03-31 | 2015-12-31 | 2015-09-30 | 2015-06-30 | 2015-03-31 | 2014-12-31 | 2014-09-30 | 2014-06-30 | 2014-03-31 | 2013-12-31 | 2013-09-30 | 2013-06-30 | 2013-03-31 | 2012-12-31 | 2012-09-30 | 2012-06-30 | 2012-03-31 | 2011-12-31 | 2011-09-30 | 2011-06-30 | 2011-03-31 | 2010-12-31 | 2010-09-30 | 2010-06-30 | 2010-03-31 | 2009-12-31 | ||
|---|---|---|---|---|---|---|---|---|---|---|---|---|---|---|---|---|---|---|---|---|---|---|---|---|---|---|---|---|---|---|---|---|---|---|---|---|---|---|---|---|---|---|---|---|---|---|---|---|---|---|---|---|---|---|---|---|---|---|
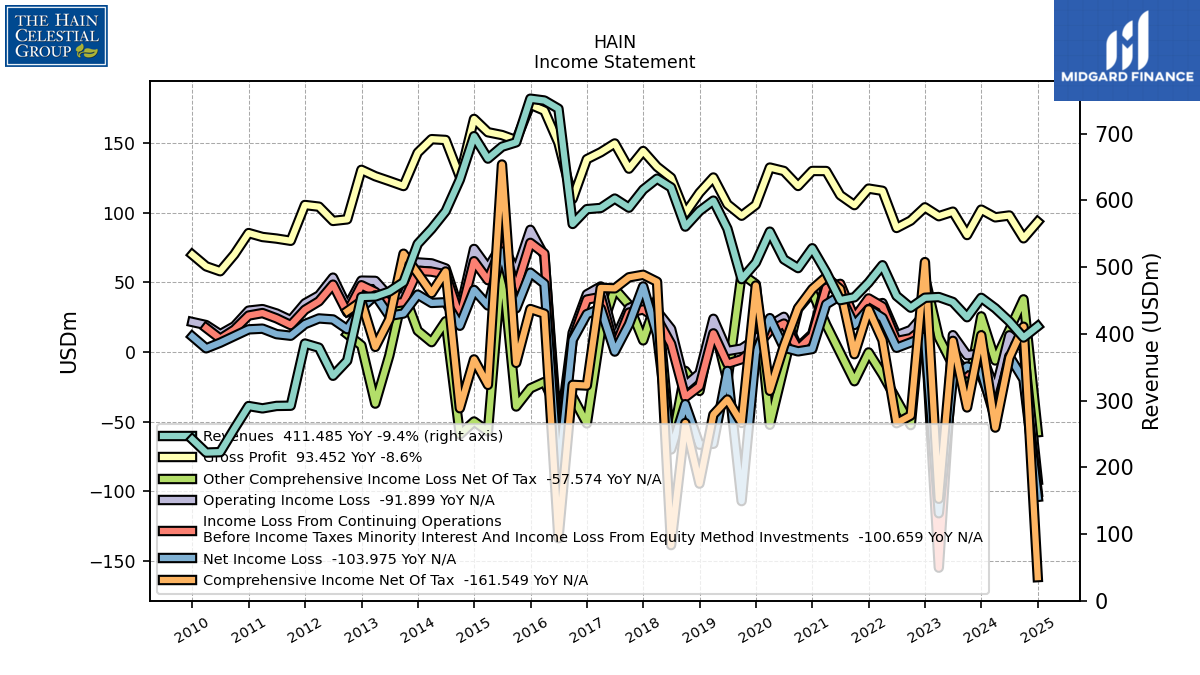
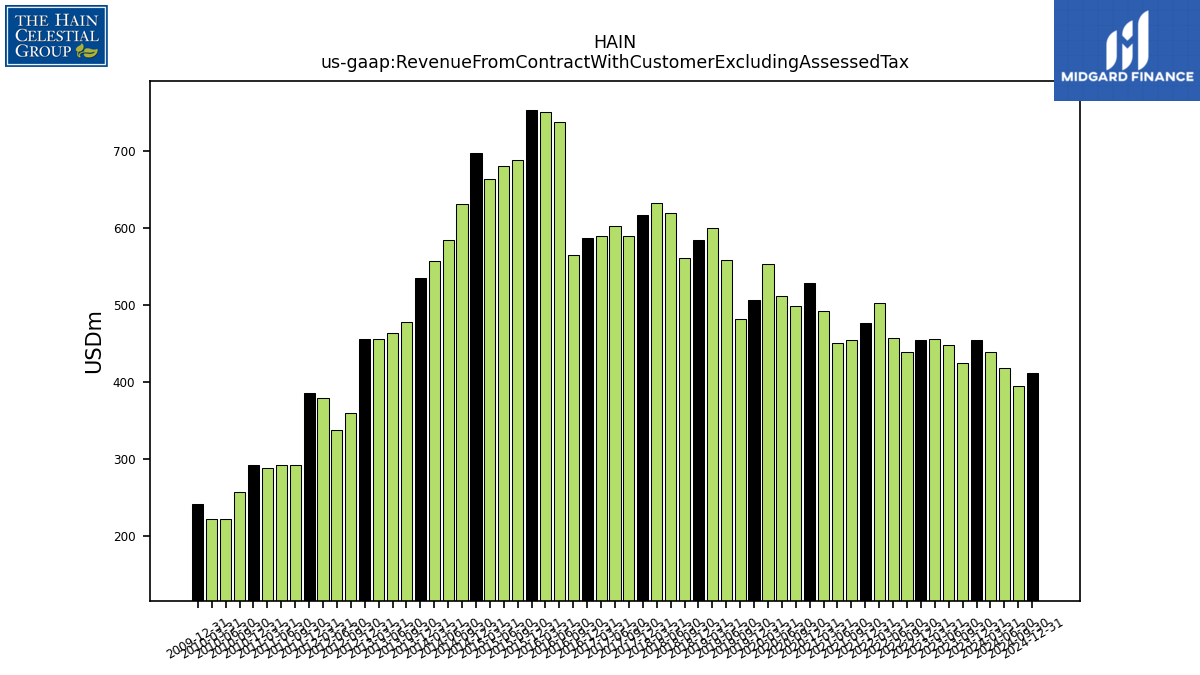
| Revenue From Contract With Customer Excluding Assessed Tax | 454.10 | 425.03 | 447.84 | 455.24 | 454.21 | 439.35 | 457.01 | 502.94 | 476.94 | 454.90 | 450.65 | 492.60 | 528.42 | 498.63 | 511.75 | 553.30 | 506.78 | 482.08 | 557.68 | 599.80 | 584.16 | 560.83 | 619.60 | 632.72 | 616.23 | 589.22 | 602.89 | 588.80 | 587.02 | 564.79 | 737.55 | 749.86 | 752.59 | 687.19 | 680.57 | 662.74 | 696.38 | 631.26 | 583.83 | 557.42 | 534.88 | 477.48 | 463.47 | 456.09 | 455.32 | 359.81 | 337.23 | 379.36 | 385.55 | 292.36 | 292.03 | 288.39 | 291.88 | 257.96 | 222.79 | 222.10 | 241.97 | |
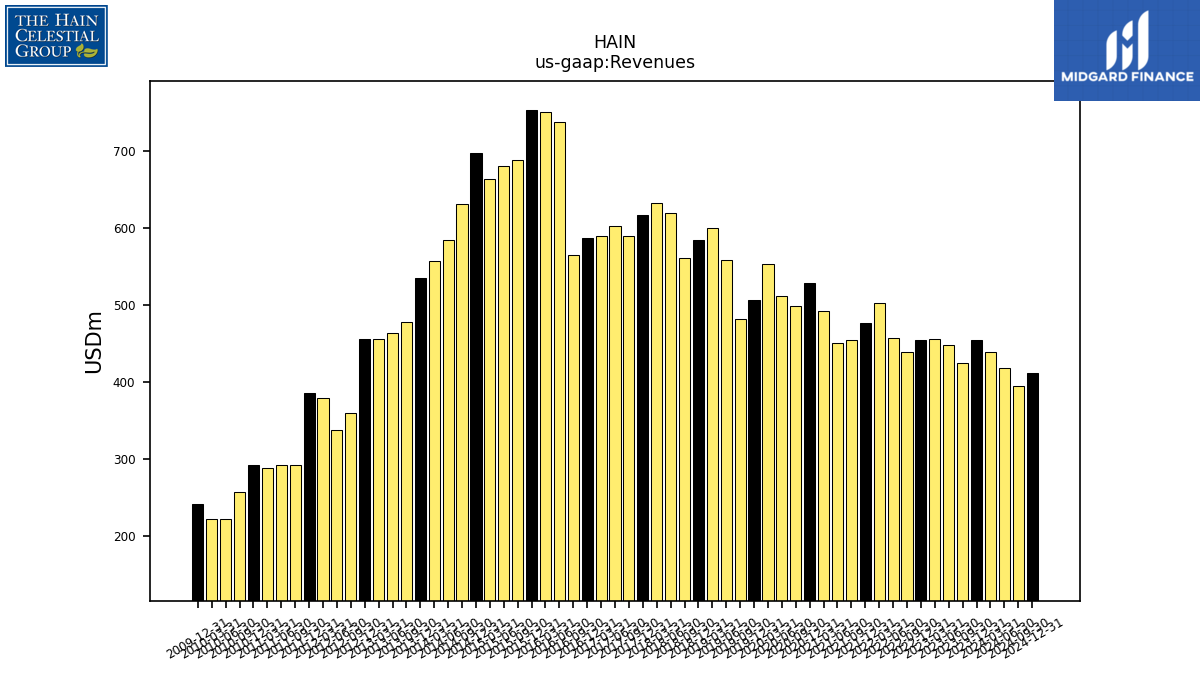
| Revenues | 454.10 | 425.03 | 447.84 | 455.24 | 454.21 | 439.35 | 457.01 | 502.94 | 476.94 | 454.90 | 450.65 | 492.60 | 528.42 | 498.63 | 511.75 | 553.30 | 506.78 | 482.08 | 557.68 | 599.80 | 584.16 | 560.83 | 619.60 | 632.72 | 616.23 | 589.22 | 602.89 | 588.80 | 587.02 | 564.79 | 737.55 | 749.86 | 752.59 | 687.19 | 680.57 | 662.74 | 696.38 | 631.26 | 583.83 | 557.42 | 534.88 | 477.48 | 463.47 | 456.09 | 455.32 | 359.81 | 337.23 | 379.36 | 385.55 | 292.36 | 292.03 | 288.39 | 291.88 | 257.96 | 222.79 | 222.10 | 241.97 | |
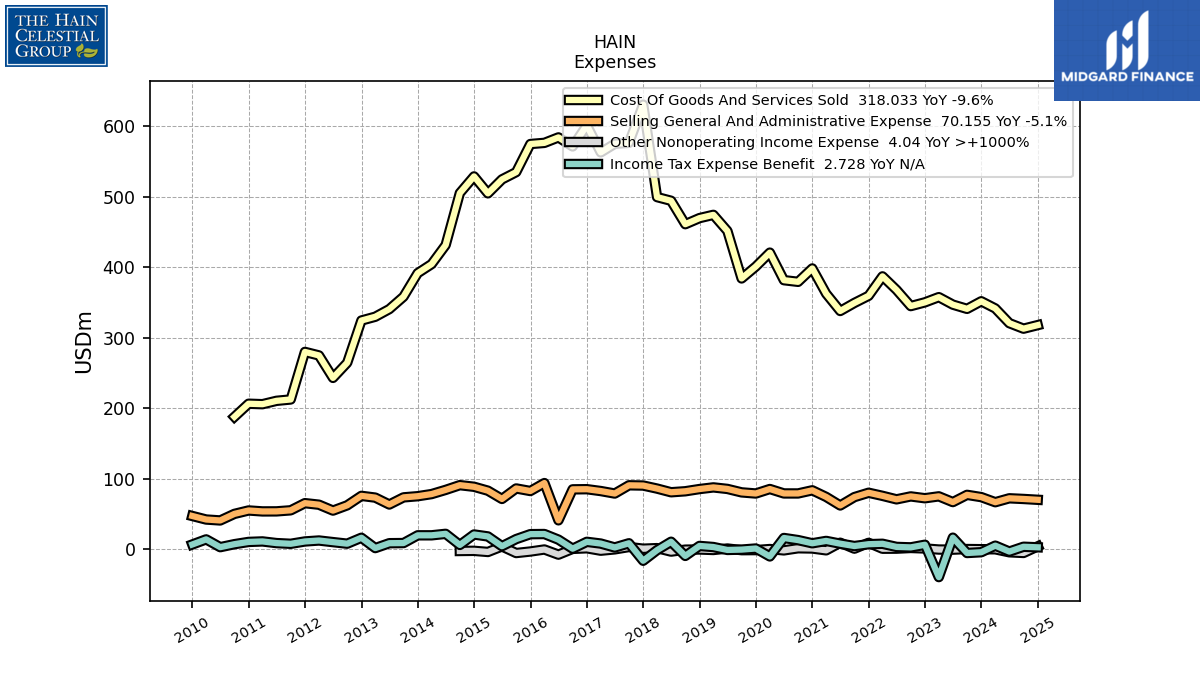
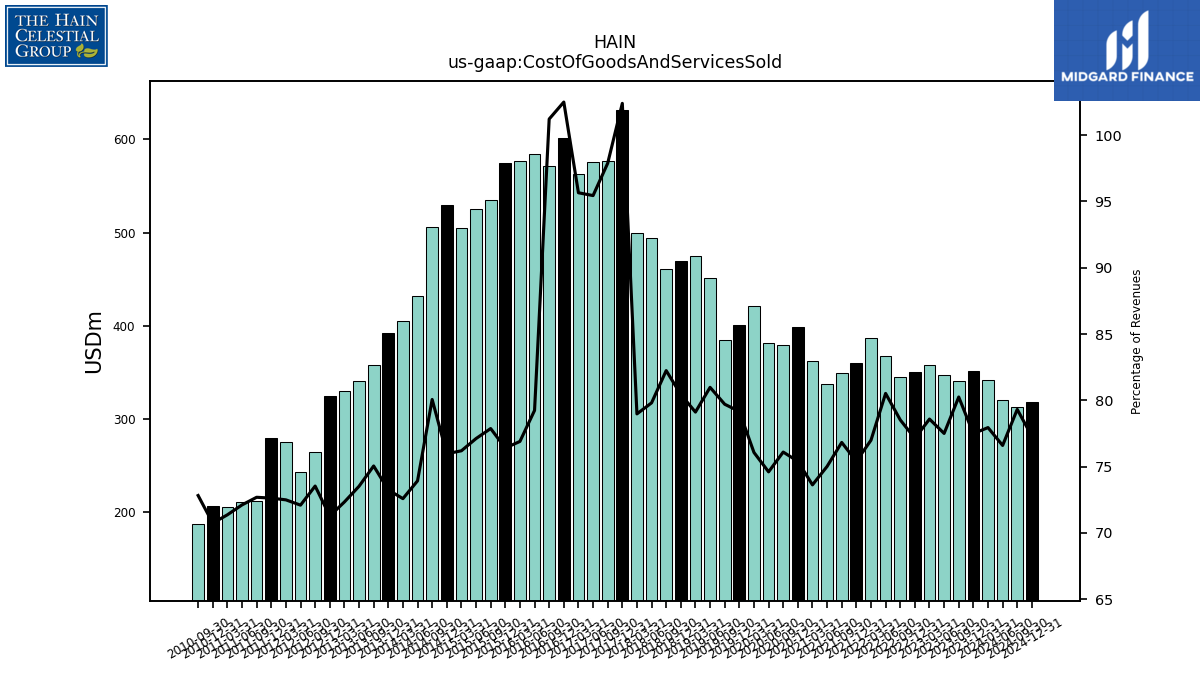
| Cost Of Goods And Services Sold | 351.88 | 341.09 | 347.10 | 357.76 | 350.35 | 345.02 | 367.99 | 387.24 | 359.65 | 349.49 | 338.07 | 362.70 | 398.45 | 379.46 | 381.81 | 420.90 | 401.18 | 384.25 | 451.61 | 474.53 | 469.88 | 461.24 | 494.50 | 499.71 | 630.93 | 576.67 | 575.37 | 563.17 | 601.61 | 571.60 | 584.42 | 576.65 | 575.03 | 535.14 | 524.84 | 504.99 | 529.06 | 505.41 | 431.63 | 404.63 | 391.80 | 358.36 | 340.75 | 329.92 | 324.56 | 264.60 | 243.14 | 275.03 | 280.02 | 212.52 | 210.61 | 205.82 | 206.49 | 187.86 | NA | NA | NA | |
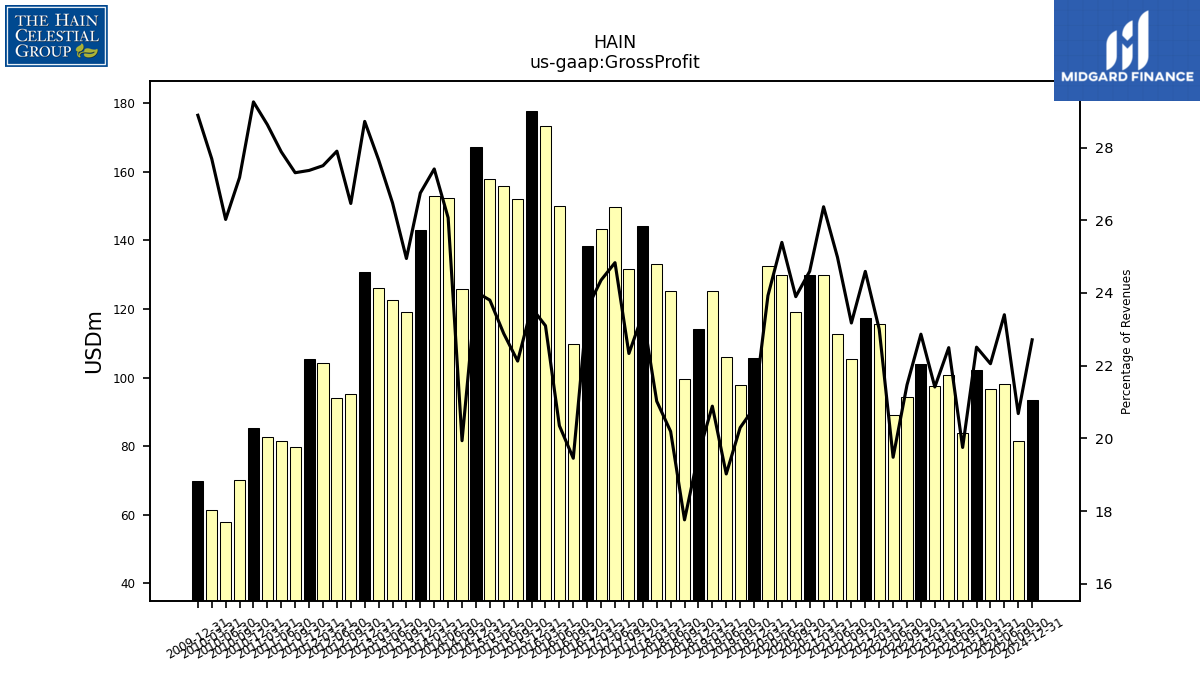
| Gross Profit | 102.22 | 83.94 | 100.74 | 97.48 | 103.86 | 94.33 | 89.03 | 115.70 | 117.30 | 105.42 | 112.58 | 129.91 | 129.97 | 119.16 | 129.94 | 132.40 | 105.61 | 97.83 | 106.08 | 125.27 | 114.27 | 99.59 | 125.10 | 133.01 | 144.27 | 131.60 | 149.72 | 143.39 | 138.39 | 109.87 | 150.08 | 173.21 | 177.56 | 152.05 | 155.72 | 157.75 | 167.33 | 125.84 | 152.20 | 152.79 | 143.08 | 119.12 | 122.72 | 126.16 | 130.76 | 95.21 | 94.09 | 104.33 | 105.53 | 79.84 | 81.43 | 82.56 | 85.39 | 70.10 | 57.98 | 61.50 | 69.90 | |
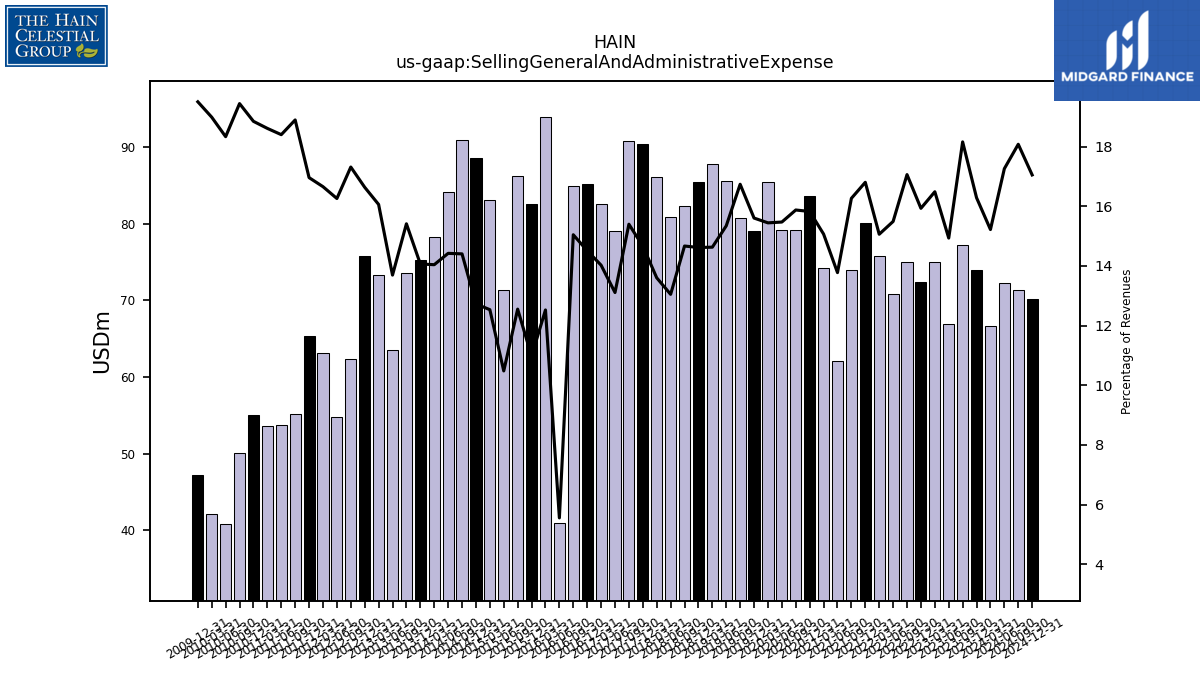
| Selling General And Administrative Expense | 73.95 | 77.17 | 66.88 | 75.05 | 72.36 | 74.95 | 70.79 | 75.75 | 80.14 | 73.99 | 62.08 | 74.22 | 83.62 | 79.15 | 79.17 | 85.45 | 79.08 | 80.68 | 85.57 | 87.74 | 85.39 | 82.26 | 80.84 | 86.06 | 90.37 | 90.72 | 79.03 | 82.58 | 85.19 | 84.97 | 40.99 | 93.92 | 82.61 | 86.25 | 71.34 | 83.07 | 88.62 | 90.92 | 84.20 | 78.27 | 75.24 | 73.59 | 63.46 | 73.25 | 75.74 | 62.30 | 54.83 | 63.18 | 65.38 | 55.23 | 53.73 | 53.66 | 55.00 | 50.15 | 40.84 | 42.16 | 47.18 | |
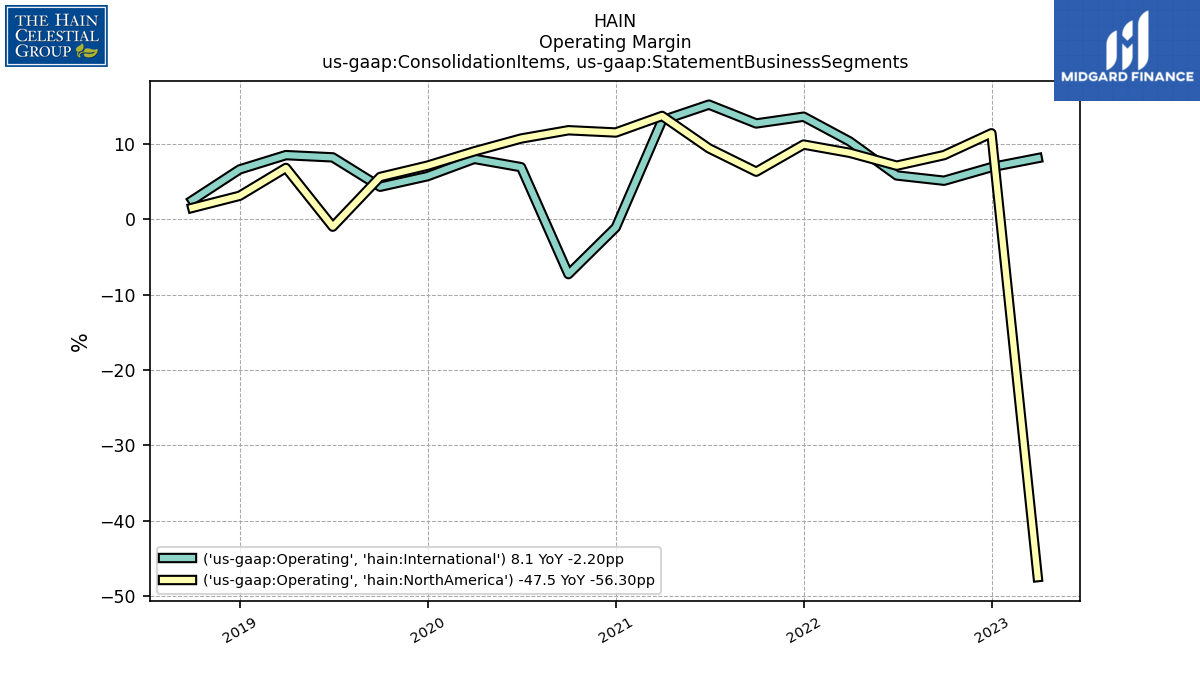
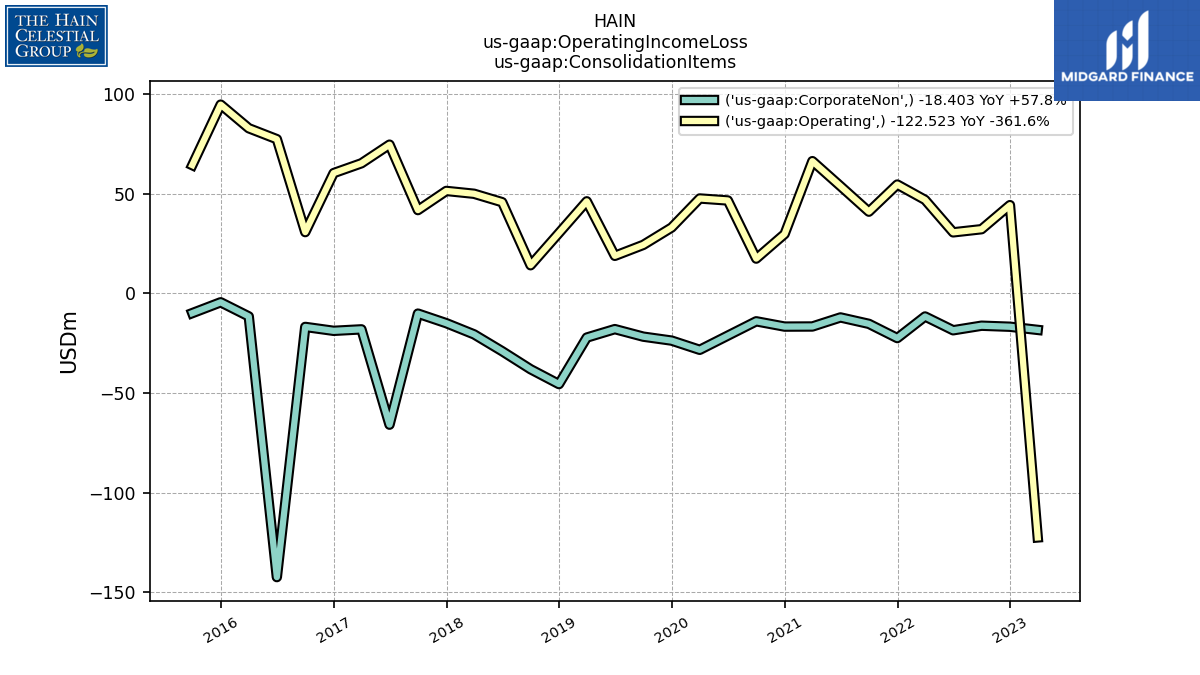
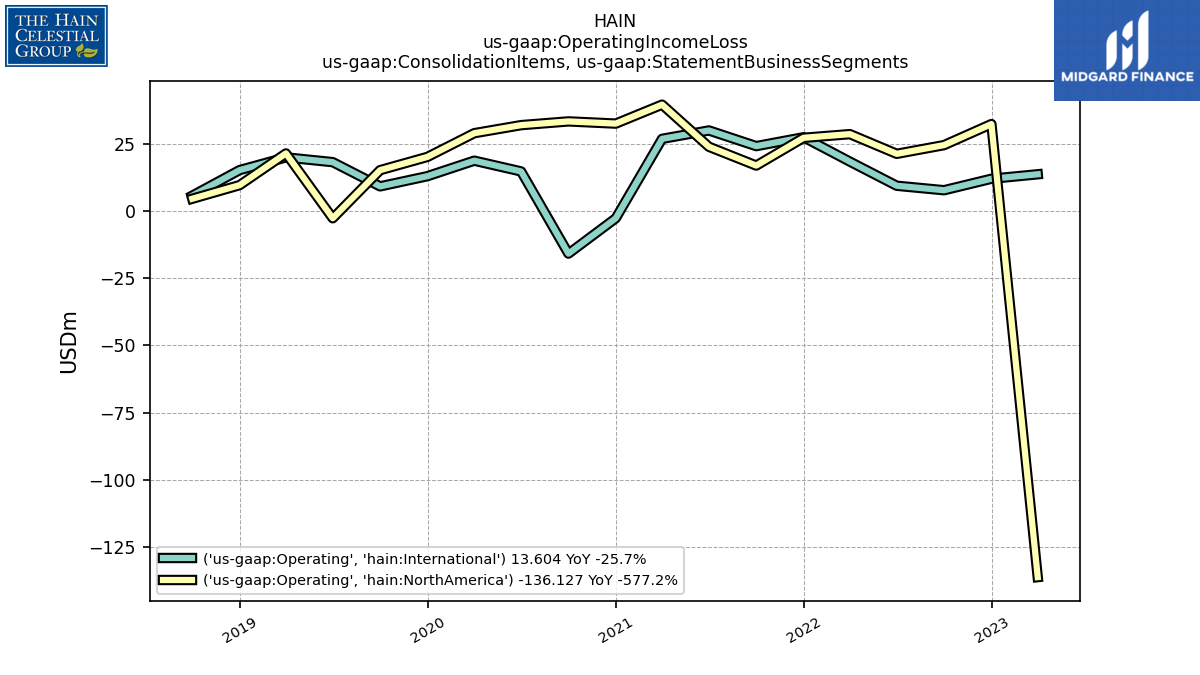
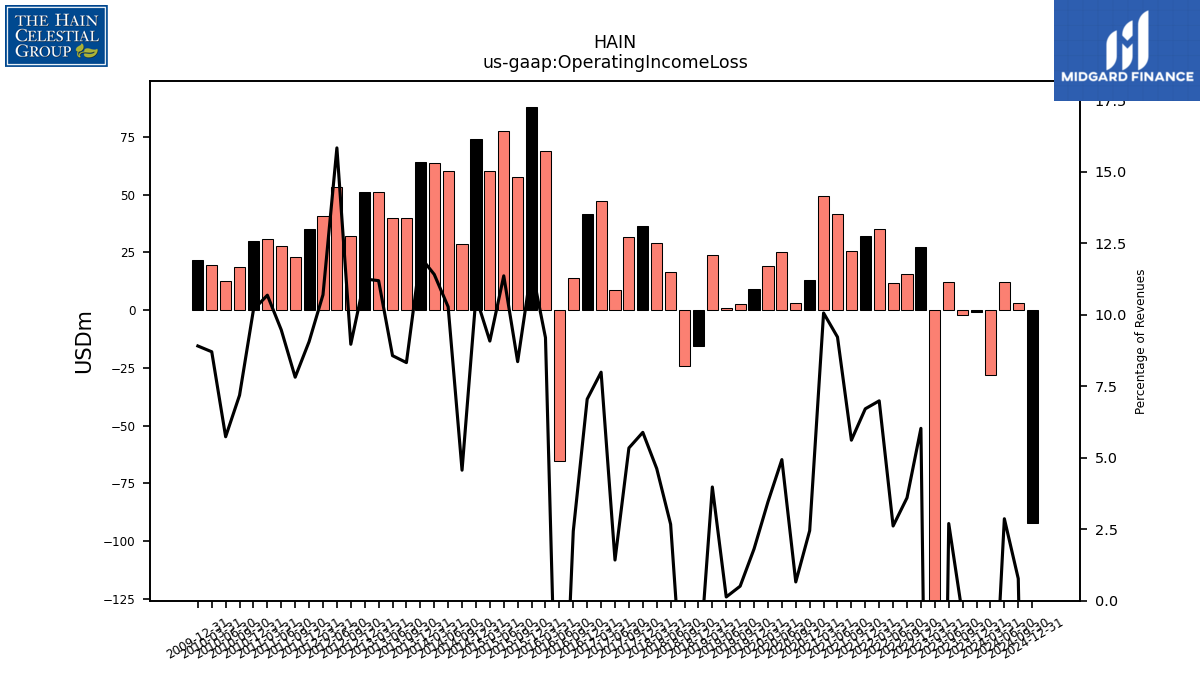
| Operating Income Loss | -0.78 | -2.28 | 12.09 | -140.93 | 27.39 | 15.82 | 11.95 | 35.16 | 32.02 | 25.55 | 41.57 | 49.58 | 12.96 | 3.28 | 25.26 | 19.14 | 9.19 | 2.46 | 0.74 | 23.86 | -15.39 | -24.10 | 16.58 | 29.25 | 36.29 | 31.48 | 8.59 | 47.07 | 41.40 | 13.75 | -65.14 | 69.01 | 87.72 | 57.47 | 77.34 | 60.19 | 74.01 | 28.83 | 60.02 | 63.63 | 64.31 | 39.77 | 39.73 | 51.06 | 51.24 | 32.28 | 53.41 | 40.60 | 34.94 | 22.86 | 27.66 | 30.82 | 29.71 | 18.54 | 12.78 | 19.34 | 21.56 | |
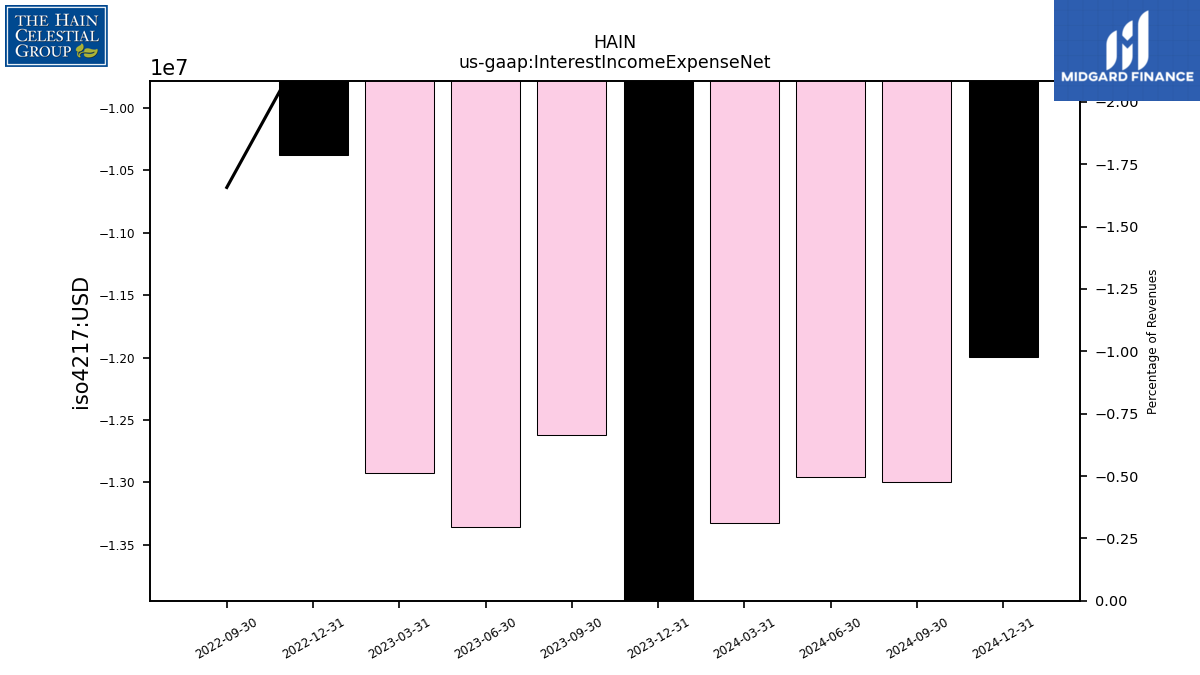
| Interest Income Expense Net | -15.33 | -12.62 | NA | NA | -10.38 | -7.28 | NA | NA | NA | NA | NA | NA | NA | NA | NA | NA | NA | NA | NA | NA | NA | NA | NA | NA | NA | NA | NA | NA | NA | NA | NA | NA | NA | NA | NA | NA | NA | NA | NA | NA | NA | NA | NA | NA | NA | NA | NA | NA | NA | NA | NA | NA | NA | NA | NA | NA | NA | |
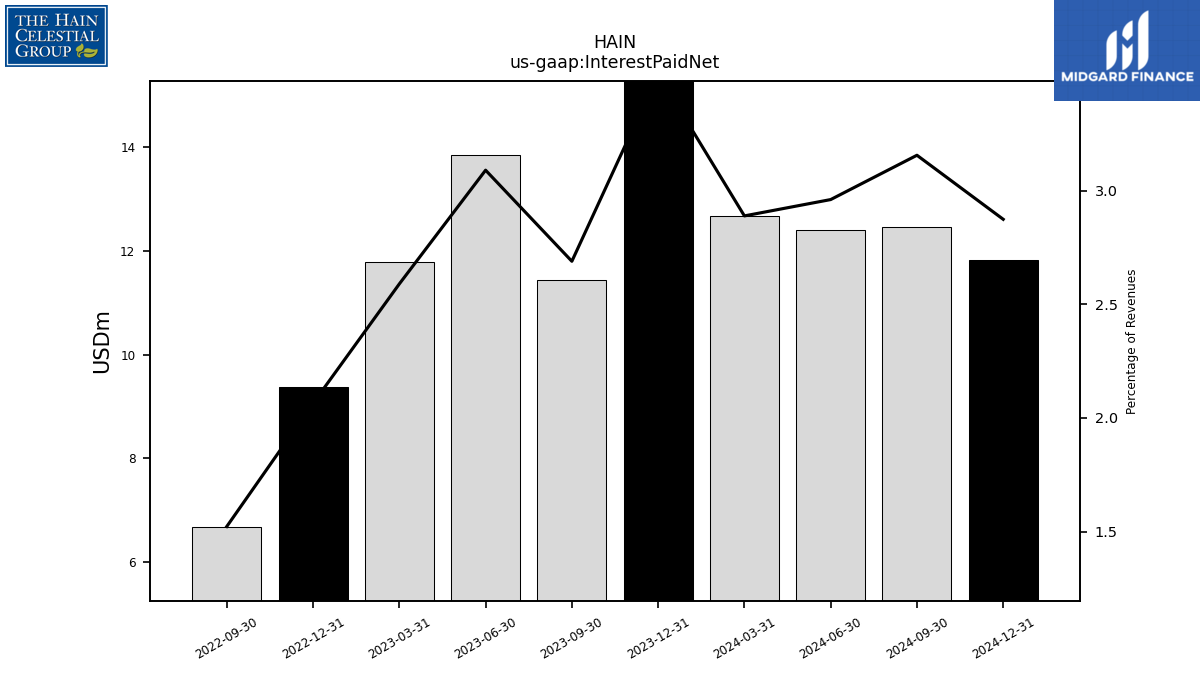
| Interest Paid Net | 15.96 | 11.43 | NA | NA | 9.38 | 6.69 | NA | NA | NA | NA | NA | NA | NA | NA | NA | NA | NA | NA | NA | NA | NA | NA | NA | NA | NA | NA | NA | NA | NA | NA | NA | NA | NA | NA | NA | NA | NA | NA | NA | NA | NA | NA | NA | NA | NA | NA | NA | NA | NA | NA | NA | NA | NA | NA | NA | NA | NA | |
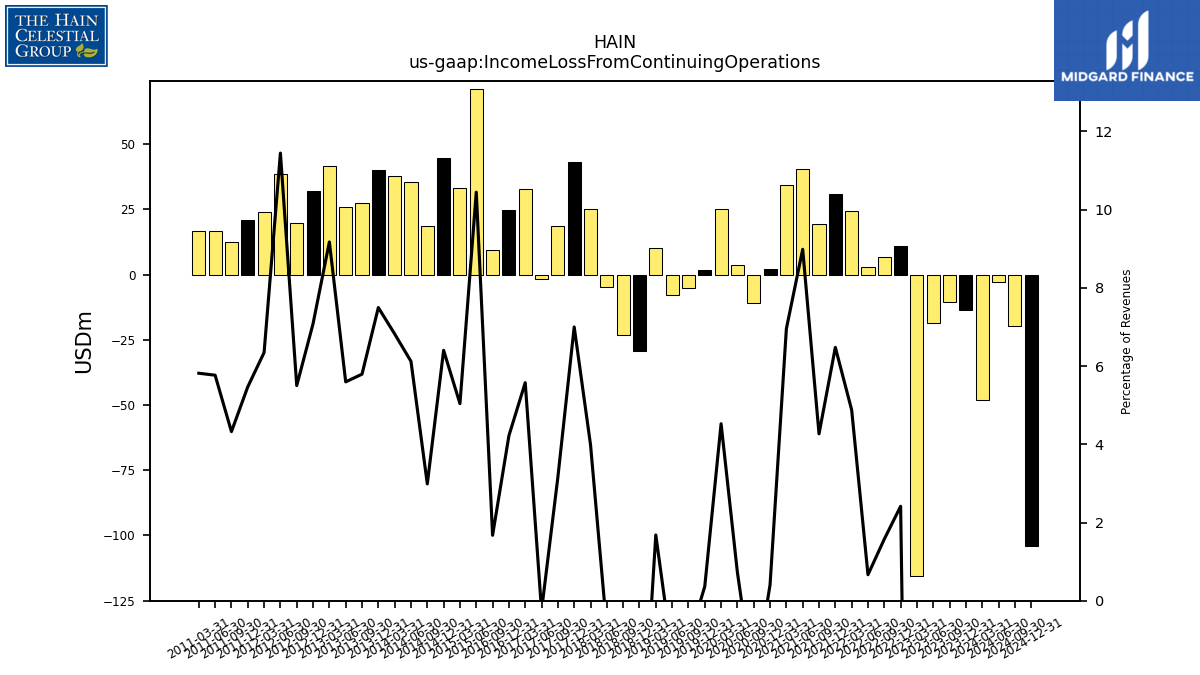
| Income Loss From Continuing Operations | -13.54 | -10.38 | NA | NA | 10.97 | 6.92 | 3.04 | 24.53 | 30.89 | 19.41 | 40.48 | 34.25 | 2.15 | -10.78 | 3.70 | 25.04 | 1.85 | -4.95 | -7.65 | 10.09 | -29.28 | -23.10 | -4.56 | 25.24 | 43.13 | 18.61 | -1.50 | 32.82 | 24.77 | 9.45 | NA | NA | NA | NA | 71.07 | 33.39 | 44.58 | 18.86 | 35.72 | 38.02 | 40.08 | 27.66 | 25.93 | 41.83 | 32.24 | 19.79 | 38.59 | 24.07 | 21.08 | 12.64 | 16.84 | 16.77 | NA | NA | NA | NA | NA | |
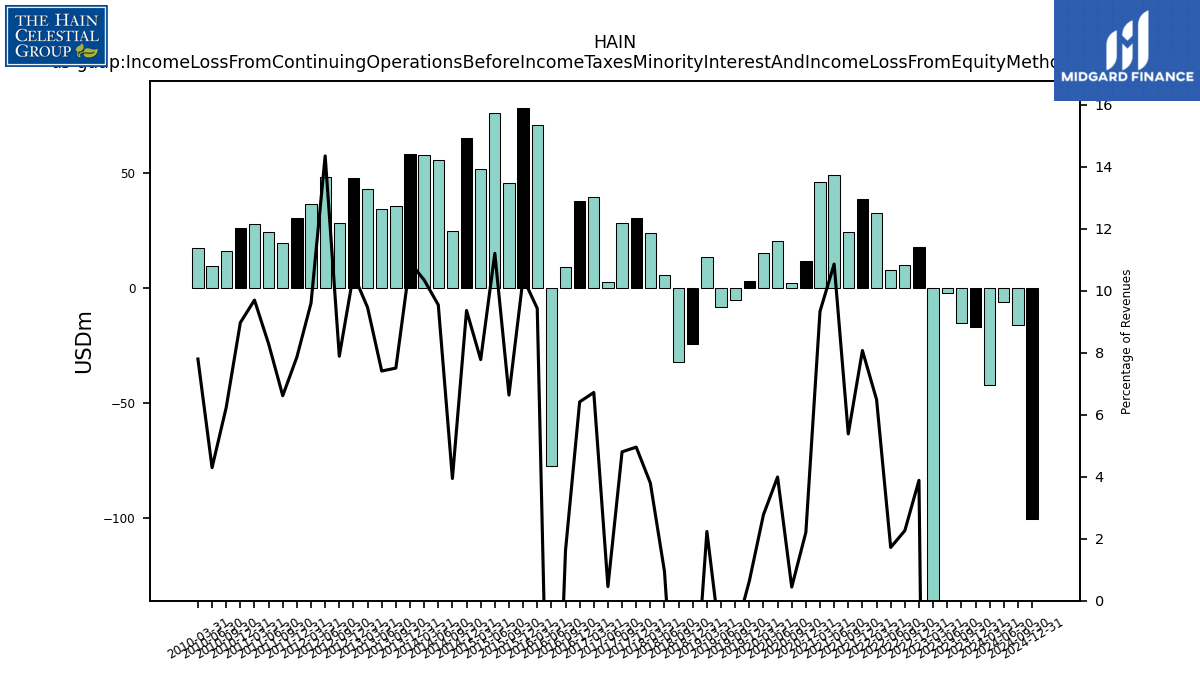
| Income Loss From Continuing Operations Before Income Taxes Minority Interest And Income Loss From Equity Method Investments | -16.88 | -15.26 | -2.37 | -154.79 | 17.64 | 9.94 | 7.86 | 32.65 | 38.50 | 24.48 | 48.95 | 45.98 | 11.66 | 2.20 | 20.43 | 15.36 | 3.21 | -5.17 | -8.41 | 13.41 | -24.58 | -32.41 | 5.84 | 24.03 | 30.54 | 28.30 | 2.75 | 39.56 | 37.66 | 9.18 | -77.57 | 70.72 | 78.36 | 45.60 | 76.27 | 51.55 | 65.20 | 24.90 | 55.72 | 57.68 | 58.36 | 35.83 | 34.34 | 43.15 | 47.95 | 28.38 | 48.38 | 36.42 | 30.32 | 19.34 | 24.20 | 27.97 | 26.18 | 16.09 | 9.57 | 17.32 | NA | |
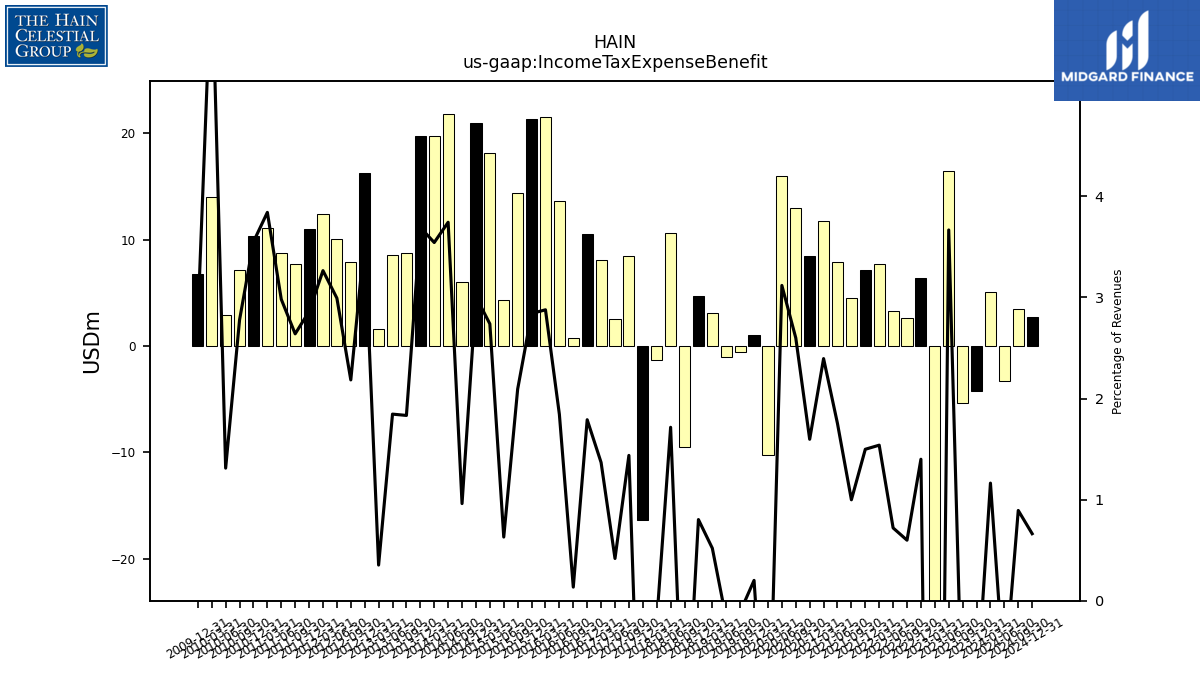
| Income Tax Expense Benefit | -4.25 | -5.38 | 16.42 | -39.59 | 6.36 | 2.63 | 3.29 | 7.74 | 7.14 | 4.54 | 7.90 | 11.80 | 8.44 | 12.96 | 15.96 | -10.24 | 1.02 | -0.53 | -1.02 | 3.11 | 4.69 | -9.48 | 10.63 | -1.31 | -16.37 | 8.47 | 2.52 | 8.05 | 10.51 | 0.76 | 13.60 | 21.58 | 21.38 | 14.38 | 4.29 | 18.15 | 20.93 | 6.07 | 21.85 | 19.75 | 19.75 | 8.75 | 8.55 | 1.61 | 16.30 | 7.86 | 10.09 | 12.38 | 11.03 | 7.72 | 8.71 | 11.08 | 10.36 | 7.16 | 2.92 | 14.01 | 6.73 | |
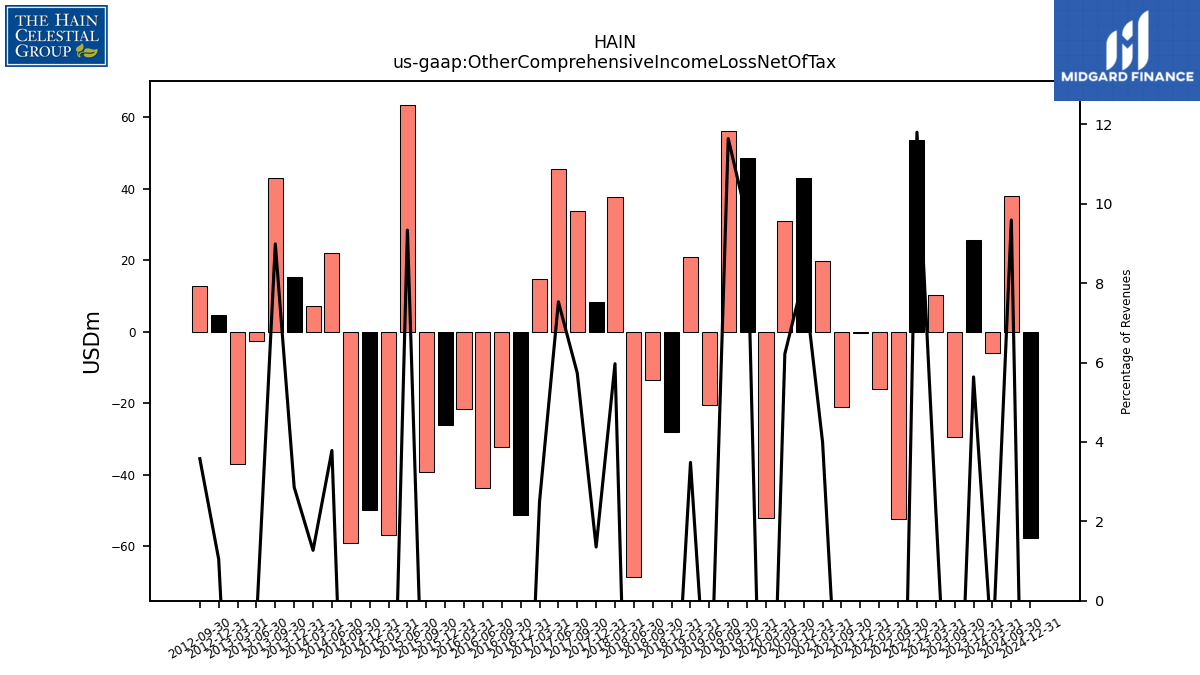
| Other Comprehensive Income Loss Net Of Tax | 25.60 | -29.41 | NA | 10.40 | 53.60 | -52.46 | NA | -16.12 | -0.26 | -20.96 | NA | 19.66 | 43.04 | 31.00 | NA | -52.21 | 48.70 | 56.11 | -20.54 | 20.89 | -27.95 | -13.52 | -68.66 | 37.77 | 8.34 | 33.79 | 45.39 | 14.66 | -51.25 | -32.17 | -43.82 | -21.48 | -26.06 | -39.11 | 63.53 | -56.99 | -49.85 | -59.22 | 22.09 | 7.08 | 15.29 | 42.91 | -2.48 | -37.03 | 4.77 | 12.88 | NA | NA | NA | NA | NA | NA | NA | NA | NA | NA | NA | |
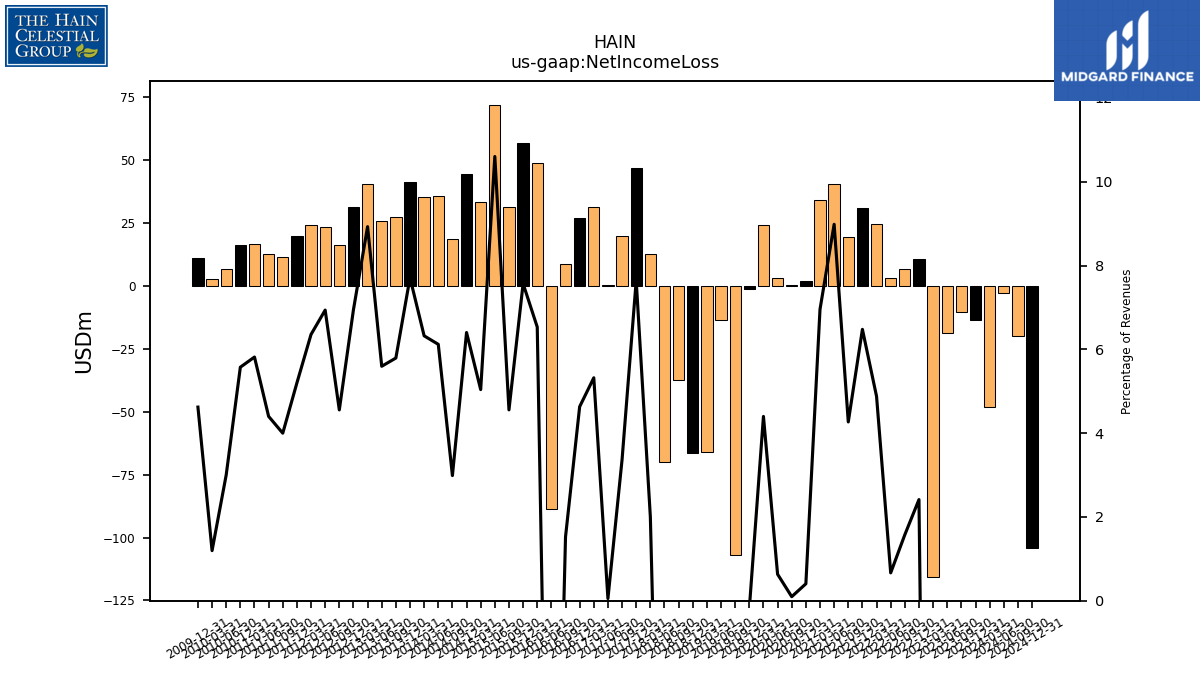
| Net Income Loss | -13.54 | -10.38 | -18.70 | -115.73 | 10.97 | 6.92 | 3.04 | 24.53 | 30.89 | 19.41 | 40.48 | 34.25 | 2.14 | 0.48 | 3.24 | 24.34 | -0.96 | -107.02 | -13.55 | -65.84 | -66.50 | -37.42 | -69.94 | 12.69 | 47.10 | 19.85 | 0.31 | 31.33 | 27.18 | 8.60 | -88.60 | 48.98 | 56.95 | 31.30 | 72.15 | 33.39 | 44.58 | 18.86 | 35.72 | 35.24 | 41.23 | 27.66 | 25.93 | 40.72 | 31.62 | 16.39 | 23.39 | 24.11 | 20.04 | 11.69 | 12.85 | 16.77 | 16.27 | NA | 6.69 | 2.66 | 11.18 | |
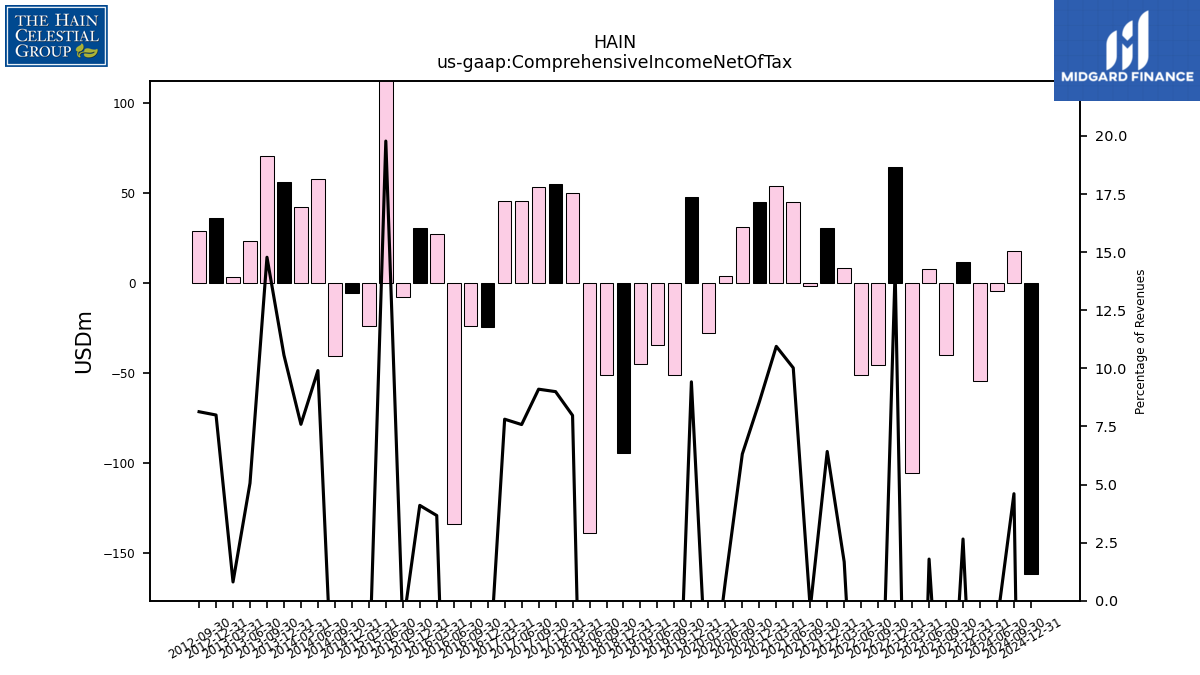
| Comprehensive Income Net Of Tax | 12.06 | -39.78 | 8.03 | -105.33 | 64.56 | -45.54 | -51.09 | 8.41 | 30.63 | -1.55 | 45.16 | 53.91 | 45.18 | 31.49 | 4.25 | -27.87 | 47.73 | -50.91 | -34.09 | -44.95 | -94.45 | -50.94 | -138.60 | 50.45 | 55.44 | 53.63 | 45.70 | 45.99 | -24.07 | -23.57 | -133.63 | 27.50 | 30.88 | -7.81 | 134.60 | -23.59 | -5.28 | -40.37 | 57.82 | 42.32 | 56.52 | 70.57 | 23.45 | 3.69 | 36.39 | 29.26 | NA | NA | NA | NA | NA | NA | NA | NA | NA | NA | NA |
| 2023-12-31 | 2023-09-30 | 2023-06-30 | 2023-03-31 | 2022-12-31 | 2022-09-30 | 2022-06-30 | 2022-03-31 | 2021-12-31 | 2021-09-30 | 2021-06-30 | 2021-03-31 | 2020-12-31 | 2020-09-30 | 2020-06-30 | 2020-03-31 | 2019-12-31 | 2019-09-30 | 2019-06-30 | 2019-03-31 | 2018-12-31 | 2018-09-30 | 2018-06-30 | 2018-03-31 | 2017-12-31 | 2017-09-30 | 2017-06-30 | 2017-03-31 | 2016-12-31 | 2016-09-30 | 2016-06-30 | 2016-03-31 | 2015-12-31 | 2015-09-30 | 2015-06-30 | 2015-03-31 | 2014-12-31 | 2014-09-30 | 2014-06-30 | 2014-03-31 | 2013-12-31 | 2013-09-30 | 2013-06-30 | 2013-03-31 | 2012-12-31 | 2012-09-30 | 2012-06-30 | 2012-03-31 | 2011-12-31 | 2011-09-30 | 2011-06-30 | 2011-03-31 | 2010-12-31 | 2010-09-30 | 2010-06-30 | 2010-03-31 | 2009-12-31 | ||
|---|---|---|---|---|---|---|---|---|---|---|---|---|---|---|---|---|---|---|---|---|---|---|---|---|---|---|---|---|---|---|---|---|---|---|---|---|---|---|---|---|---|---|---|---|---|---|---|---|---|---|---|---|---|---|---|---|---|---|
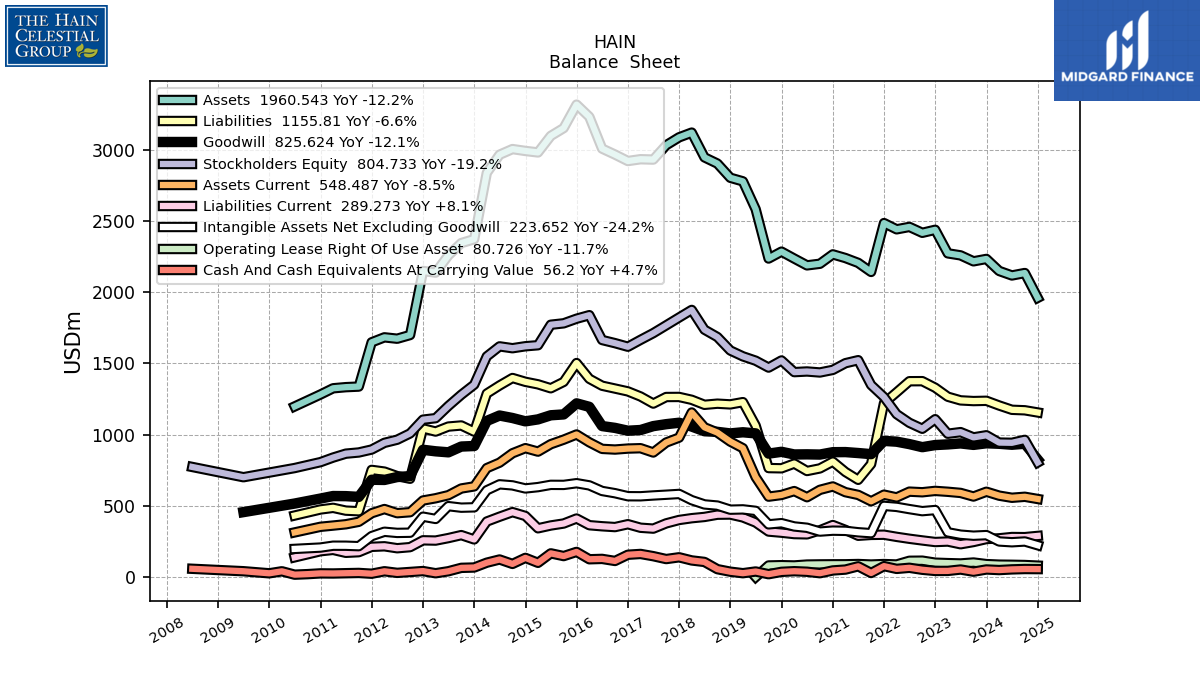
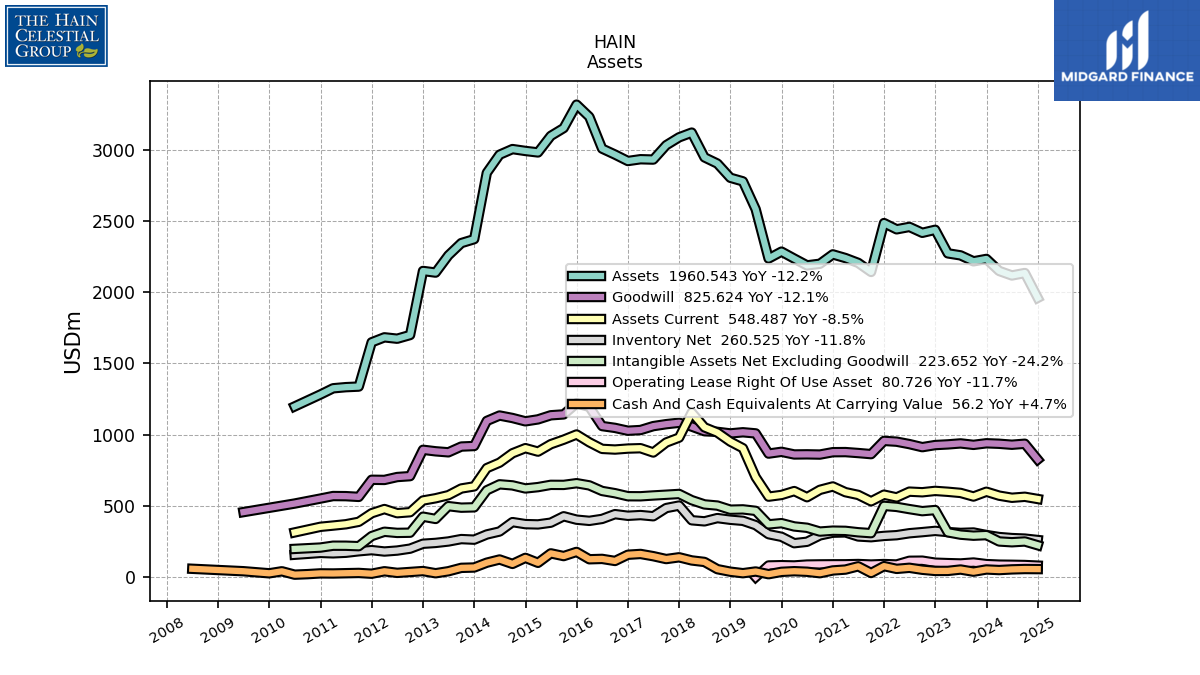
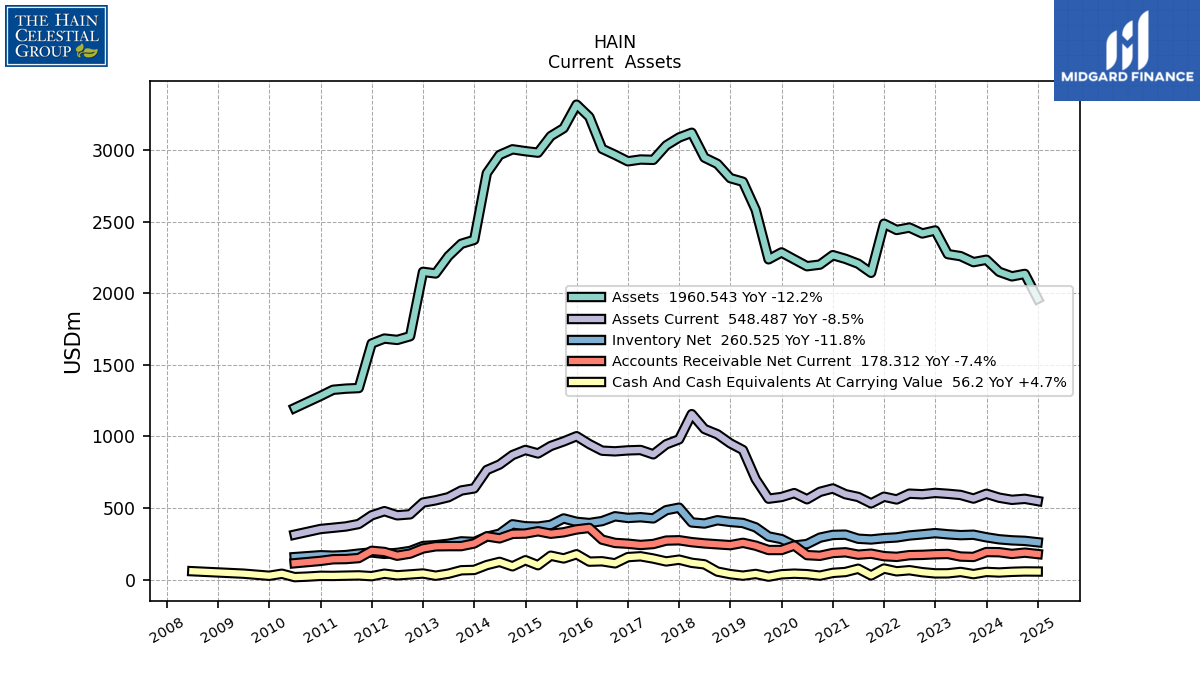
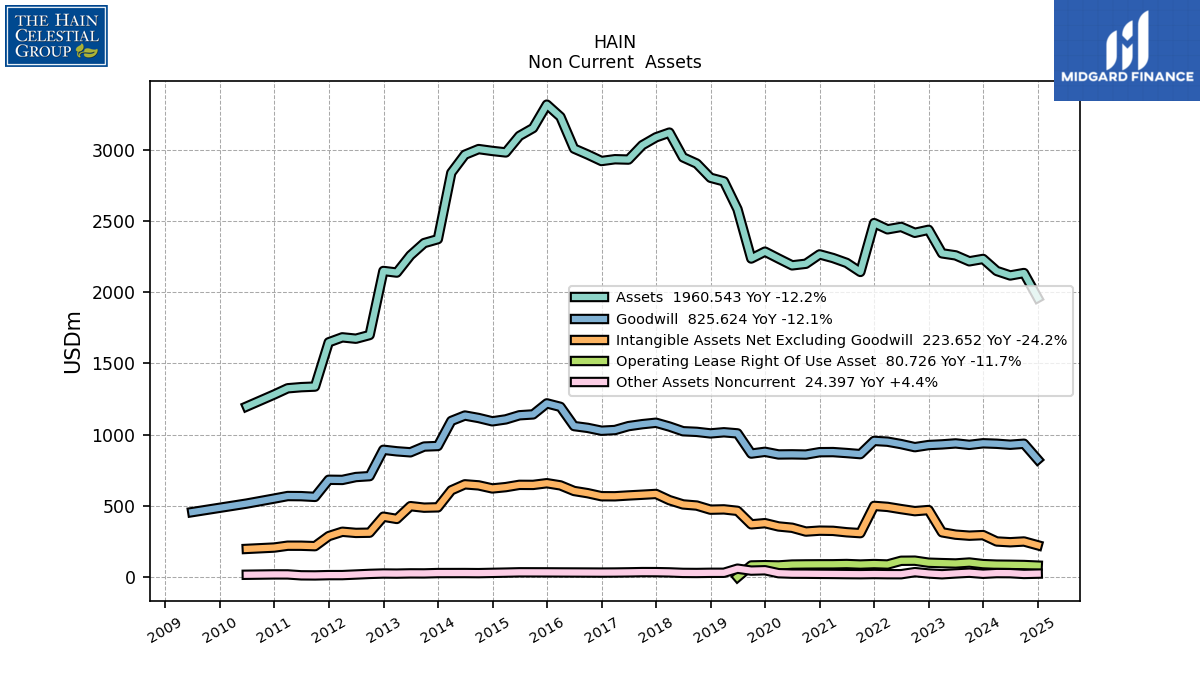
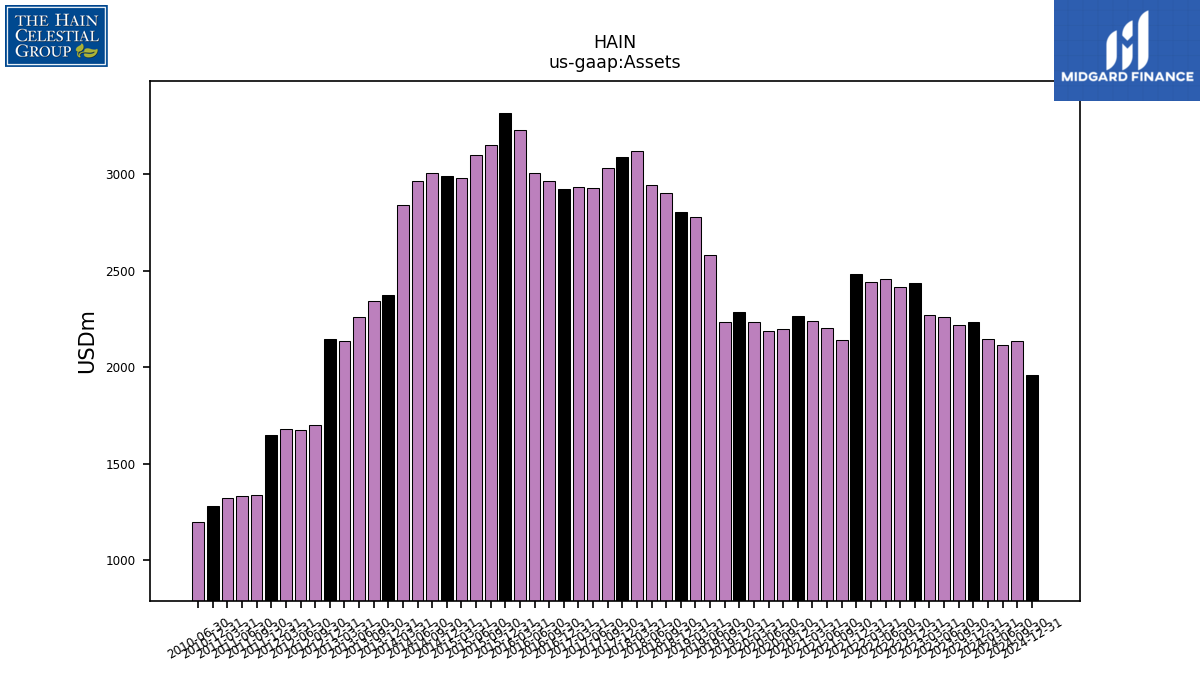
| Assets | 2233.63 | 2216.90 | 2258.64 | 2272.82 | 2438.16 | 2416.99 | 2458.38 | 2441.48 | 2485.37 | 2142.26 | 2205.91 | 2239.89 | 2265.60 | 2199.73 | 2188.45 | 2236.14 | 2284.95 | 2236.43 | 2582.62 | 2778.27 | 2803.49 | 2903.03 | 2946.67 | 3120.52 | 3087.34 | 3031.85 | 2931.10 | 2933.58 | 2920.94 | 2966.17 | 3008.08 | 3231.17 | 3316.86 | 3152.18 | 3097.27 | 2981.20 | 2991.70 | 3004.83 | 2965.32 | 2838.05 | 2372.32 | 2344.82 | 2258.49 | 2137.77 | 2149.27 | 1699.41 | 1673.59 | 1683.25 | 1648.43 | 1337.51 | 1333.50 | 1325.59 | 1282.04 | NA | 1198.09 | NA | NA | |
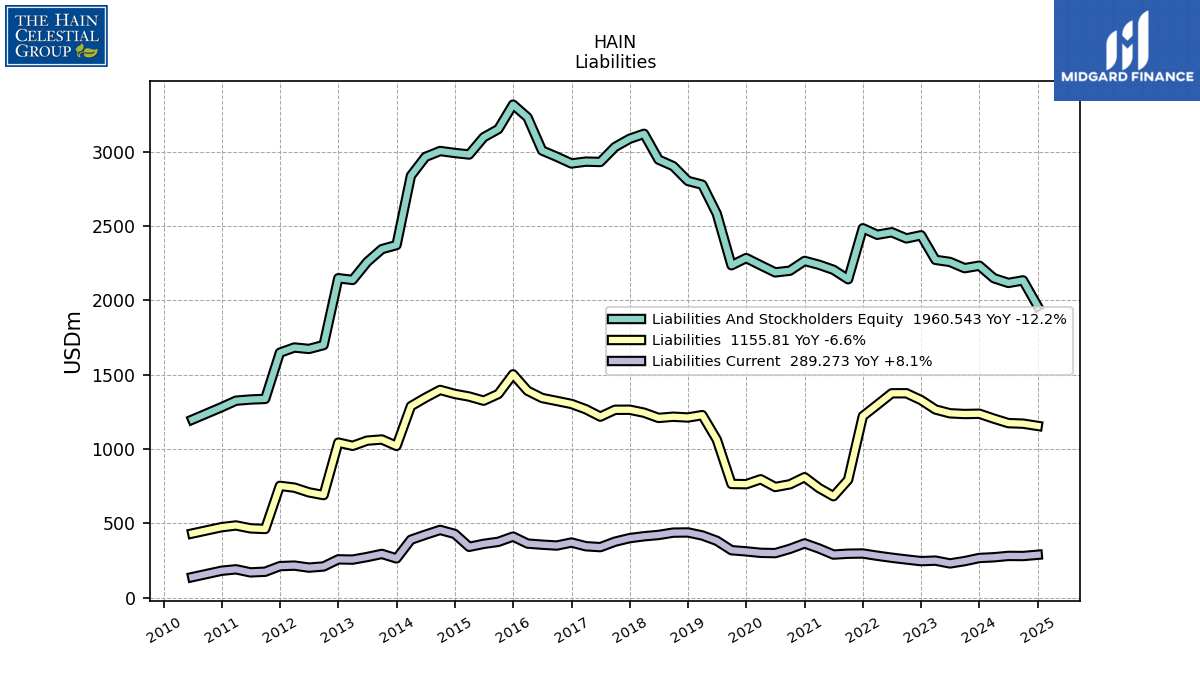
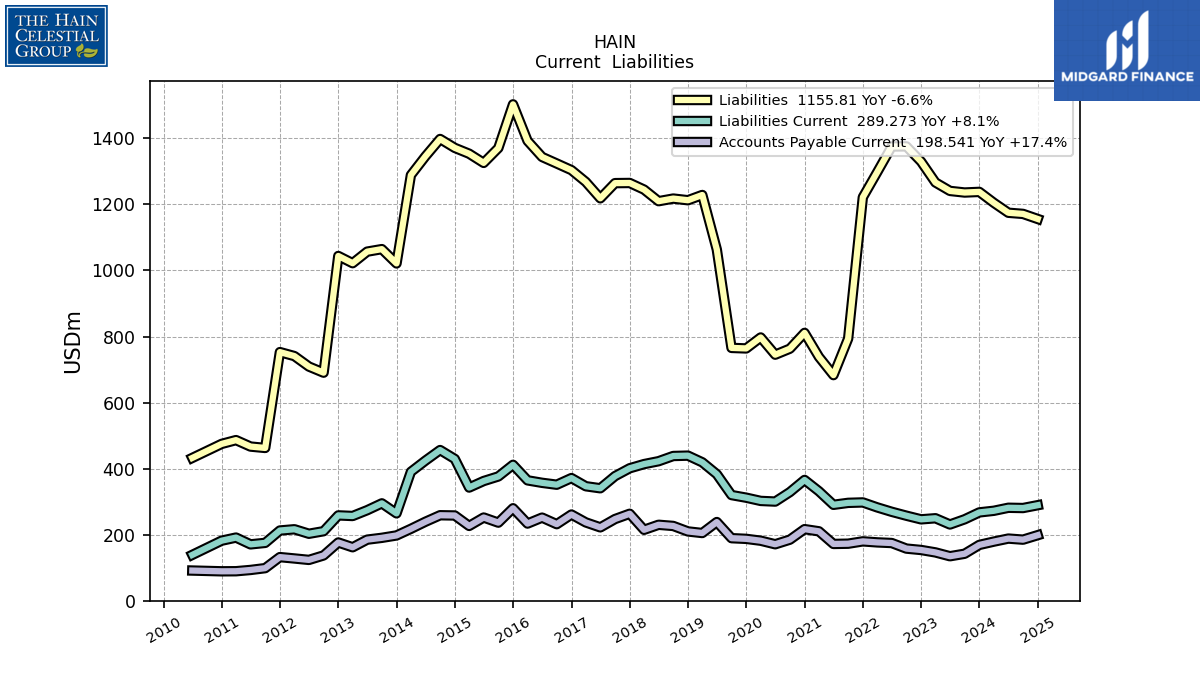
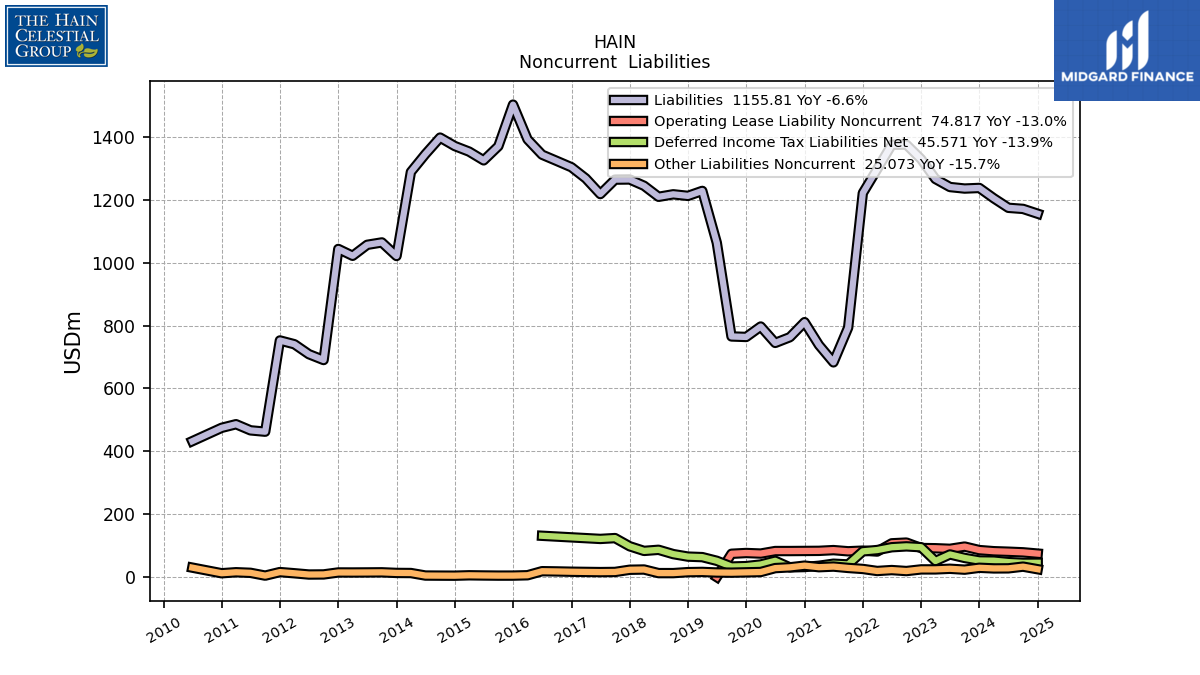
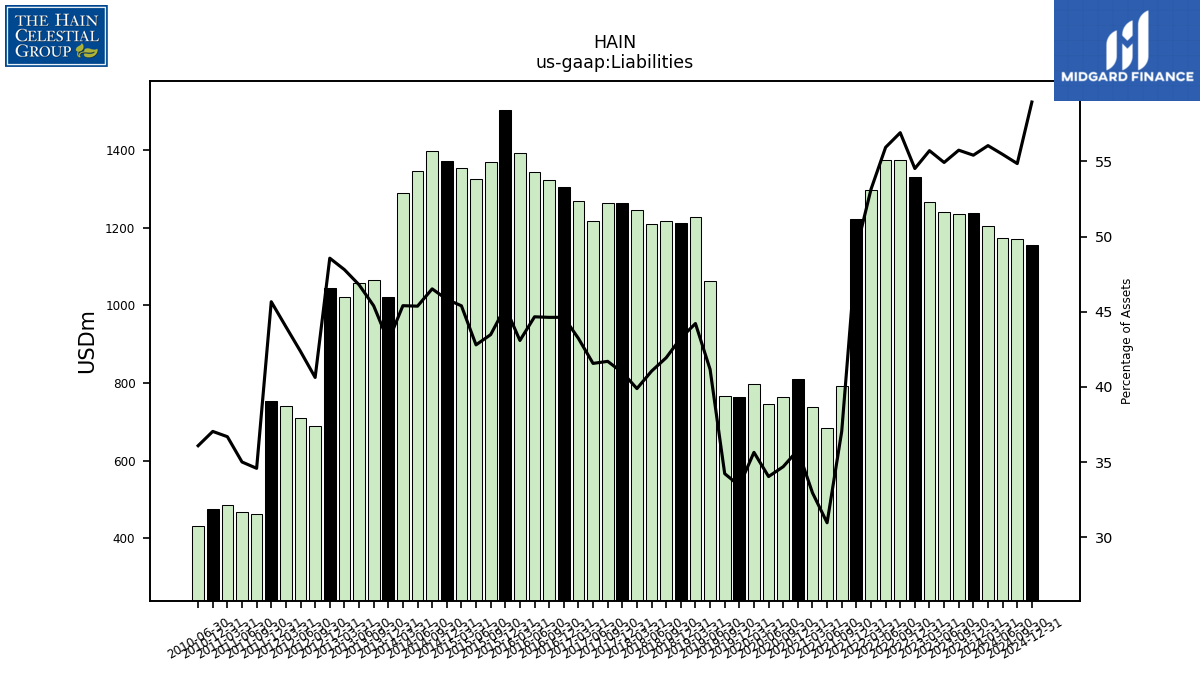
| Liabilities | 1237.81 | 1235.90 | 1240.73 | 1266.35 | 1329.52 | 1375.60 | 1375.22 | 1297.44 | 1221.51 | 793.51 | 683.02 | 738.21 | 810.95 | 763.15 | 744.90 | 797.09 | 763.86 | 765.50 | 1063.30 | 1228.48 | 1212.55 | 1217.61 | 1209.62 | 1244.76 | 1264.79 | 1264.32 | 1218.27 | 1268.06 | 1303.71 | 1323.73 | 1343.57 | 1392.30 | 1502.84 | 1370.55 | 1325.58 | 1353.37 | 1371.05 | 1397.95 | 1345.45 | 1288.63 | 1021.20 | 1064.55 | 1056.94 | 1021.93 | 1043.80 | 690.48 | 708.99 | 740.72 | 752.79 | 462.57 | 466.80 | 486.34 | 474.86 | NA | 432.36 | NA | NA | |
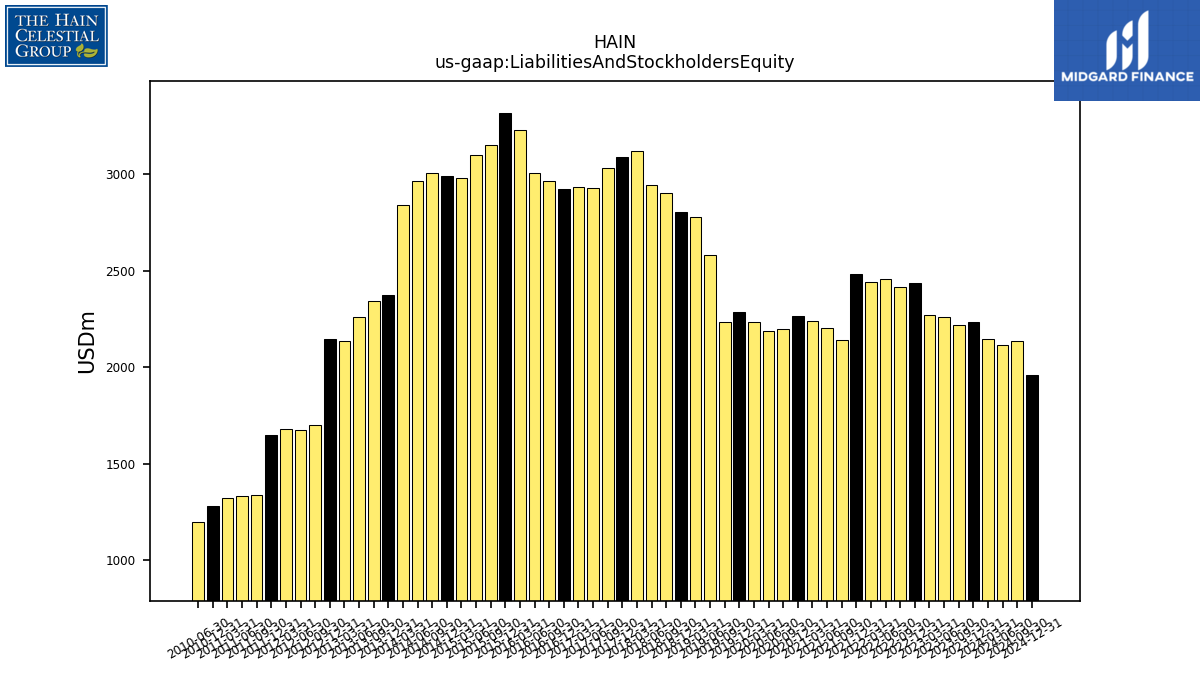
| Liabilities And Stockholders Equity | 2233.63 | 2216.90 | 2258.64 | 2272.82 | 2438.16 | 2416.99 | 2458.38 | 2441.48 | 2485.37 | 2142.26 | 2205.91 | 2239.89 | 2265.60 | 2199.73 | 2188.45 | 2236.14 | 2284.95 | 2236.43 | 2582.62 | 2778.27 | 2803.49 | 2903.03 | 2946.67 | 3120.52 | 3087.34 | 3031.85 | 2931.10 | 2933.58 | 2920.94 | 2966.17 | 3008.08 | 3231.17 | 3316.86 | 3152.18 | 3097.27 | 2981.20 | 2991.70 | 3004.83 | 2965.32 | 2838.05 | 2372.32 | 2344.82 | 2258.49 | 2137.77 | 2149.27 | 1699.41 | 1673.59 | 1683.25 | 1648.43 | 1337.51 | 1333.50 | 1325.59 | 1282.04 | NA | 1198.09 | NA | NA | |
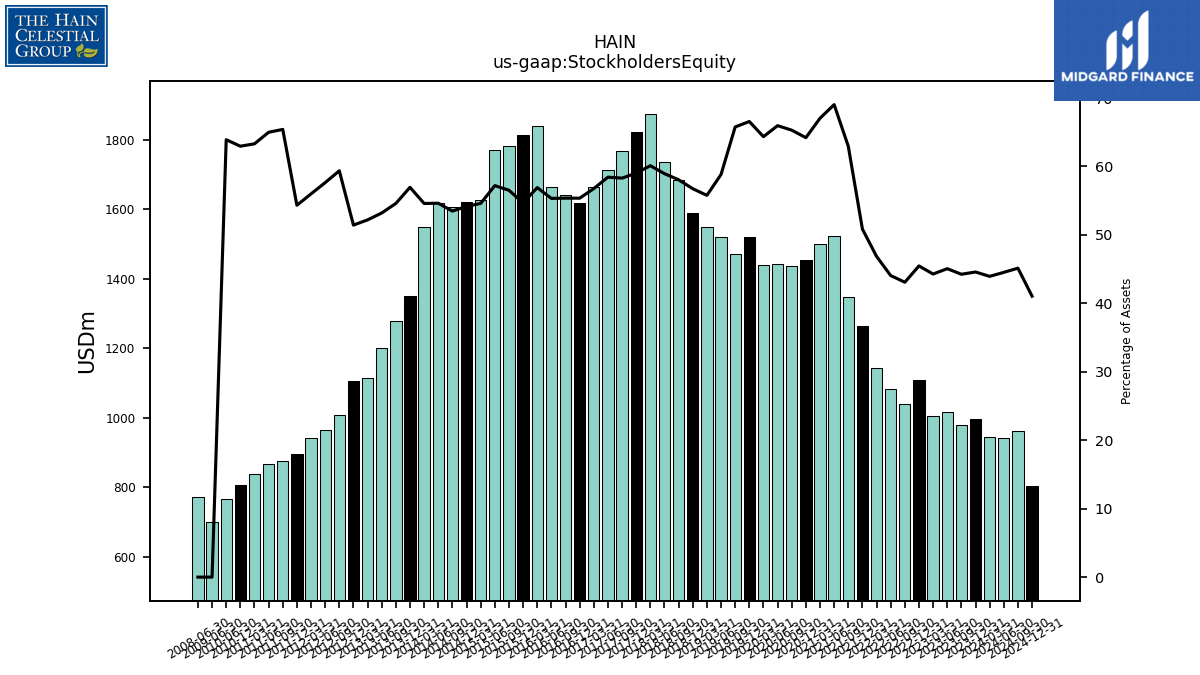
| Stockholders Equity | 995.82 | 980.99 | 1017.91 | 1006.48 | 1108.64 | 1041.39 | 1083.17 | 1144.04 | 1263.86 | 1348.76 | 1522.88 | 1501.68 | 1454.65 | 1436.58 | 1443.55 | 1439.05 | 1521.08 | 1470.94 | 1519.32 | 1549.79 | 1590.94 | 1685.42 | 1737.05 | 1875.77 | 1822.55 | 1767.53 | 1712.83 | 1665.52 | 1617.23 | 1642.43 | 1664.51 | 1838.87 | 1814.03 | 1781.62 | 1771.69 | 1627.83 | 1620.65 | 1606.88 | 1619.87 | 1549.42 | 1351.12 | 1280.28 | 1201.56 | 1115.84 | 1105.46 | 1008.93 | 964.60 | 942.53 | 895.65 | 874.94 | 866.70 | 839.25 | 807.18 | NA | 765.72 | NA | NA |
| 2023-12-31 | 2023-09-30 | 2023-06-30 | 2023-03-31 | 2022-12-31 | 2022-09-30 | 2022-06-30 | 2022-03-31 | 2021-12-31 | 2021-09-30 | 2021-06-30 | 2021-03-31 | 2020-12-31 | 2020-09-30 | 2020-06-30 | 2020-03-31 | 2019-12-31 | 2019-09-30 | 2019-06-30 | 2019-03-31 | 2018-12-31 | 2018-09-30 | 2018-06-30 | 2018-03-31 | 2017-12-31 | 2017-09-30 | 2017-06-30 | 2017-03-31 | 2016-12-31 | 2016-09-30 | 2016-06-30 | 2016-03-31 | 2015-12-31 | 2015-09-30 | 2015-06-30 | 2015-03-31 | 2014-12-31 | 2014-09-30 | 2014-06-30 | 2014-03-31 | 2013-12-31 | 2013-09-30 | 2013-06-30 | 2013-03-31 | 2012-12-31 | 2012-09-30 | 2012-06-30 | 2012-03-31 | 2011-12-31 | 2011-09-30 | 2011-06-30 | 2011-03-31 | 2010-12-31 | 2010-09-30 | 2010-06-30 | 2010-03-31 | 2009-12-31 | ||
|---|---|---|---|---|---|---|---|---|---|---|---|---|---|---|---|---|---|---|---|---|---|---|---|---|---|---|---|---|---|---|---|---|---|---|---|---|---|---|---|---|---|---|---|---|---|---|---|---|---|---|---|---|---|---|---|---|---|---|
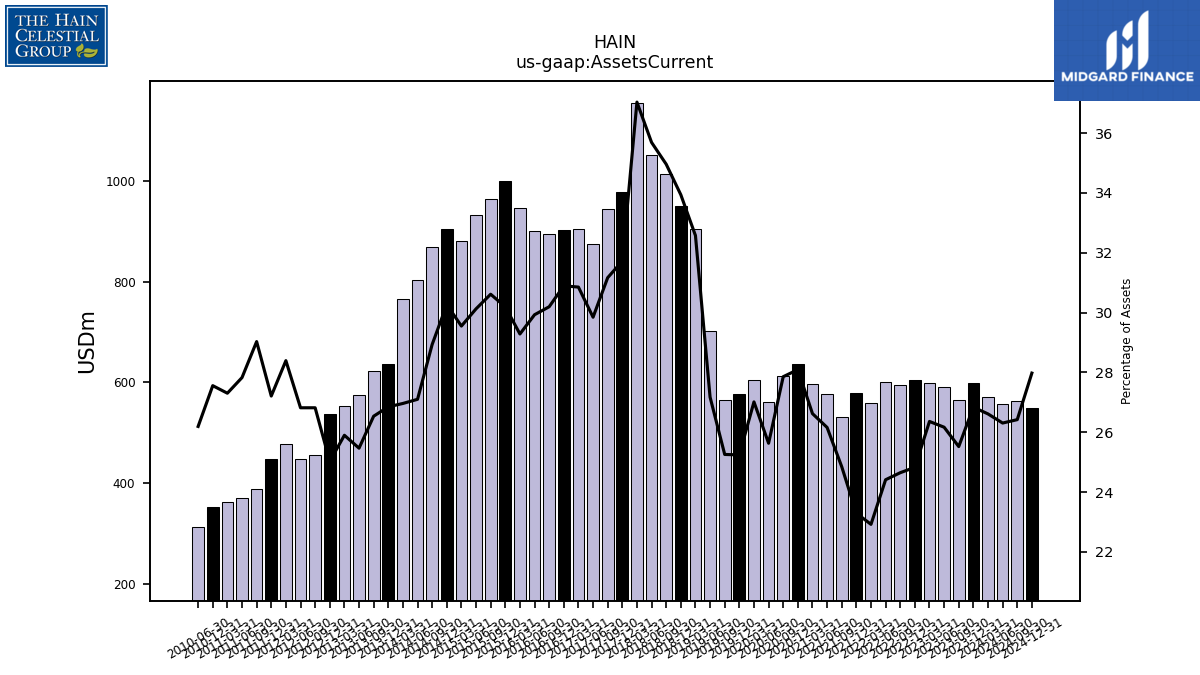
| Assets Current | 599.44 | 565.75 | 591.03 | 599.11 | 605.30 | 595.71 | 600.13 | 559.59 | 578.97 | 532.32 | 577.05 | 596.30 | 636.46 | 612.75 | 560.93 | 604.05 | 576.75 | 564.86 | 701.79 | 905.03 | 951.43 | 1014.86 | 1051.59 | 1155.66 | 979.31 | 944.90 | 874.78 | 905.05 | 902.39 | 895.61 | 900.23 | 946.20 | 1001.37 | 964.96 | 933.02 | 880.90 | 905.37 | 869.41 | 803.60 | 765.18 | 636.92 | 622.21 | 575.17 | 553.64 | 537.87 | 455.74 | 448.81 | 477.91 | 448.54 | 388.27 | 371.07 | 361.94 | 353.28 | NA | 313.82 | NA | NA | |
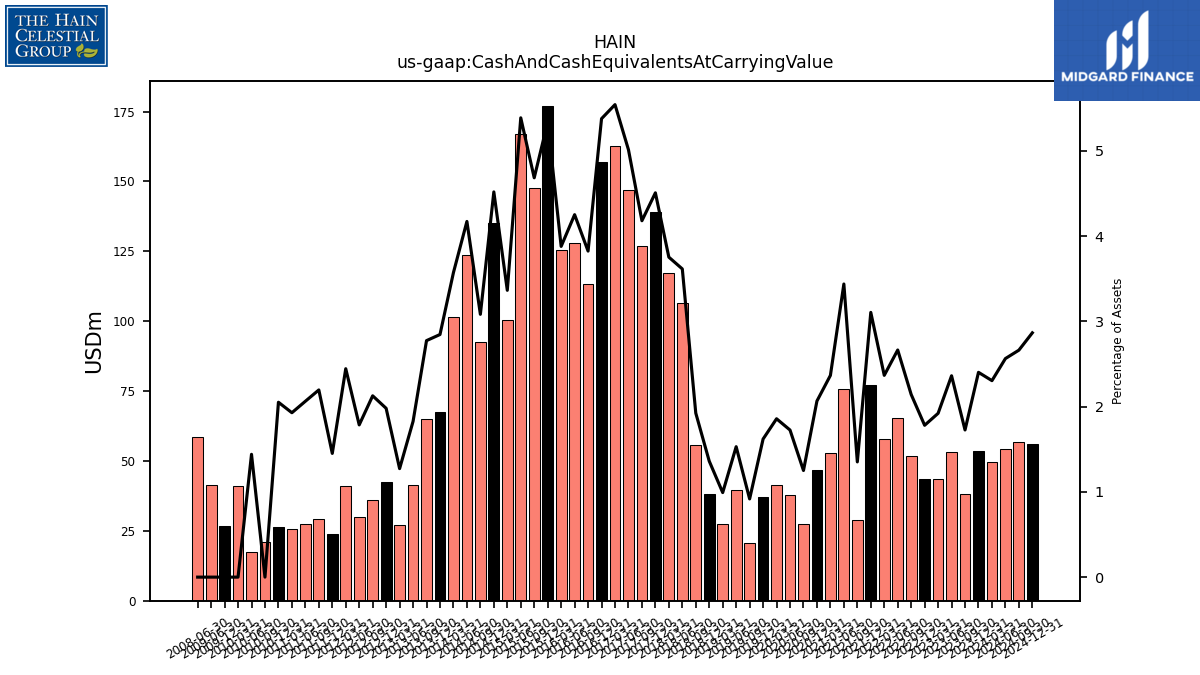
| Cash And Cash Equivalents At Carrying Value | 53.67 | 38.28 | 53.36 | 43.68 | 43.44 | 51.79 | 65.51 | 57.81 | 77.20 | 28.96 | 75.87 | 53.01 | 46.81 | 27.52 | 37.77 | 41.55 | 37.02 | 20.52 | 39.53 | 27.56 | 38.16 | 55.87 | 106.56 | 117.15 | 139.22 | 126.79 | 146.99 | 162.64 | 157.12 | 113.47 | 127.93 | 125.39 | 177.10 | 147.70 | 166.92 | 100.33 | 135.23 | 92.66 | 123.75 | 101.42 | 67.53 | 65.07 | 41.26 | 27.22 | 42.57 | 36.15 | 29.89 | 41.16 | 23.93 | 29.38 | 27.52 | 25.57 | 26.31 | 20.95 | 17.27 | 40.98 | 26.81 | |
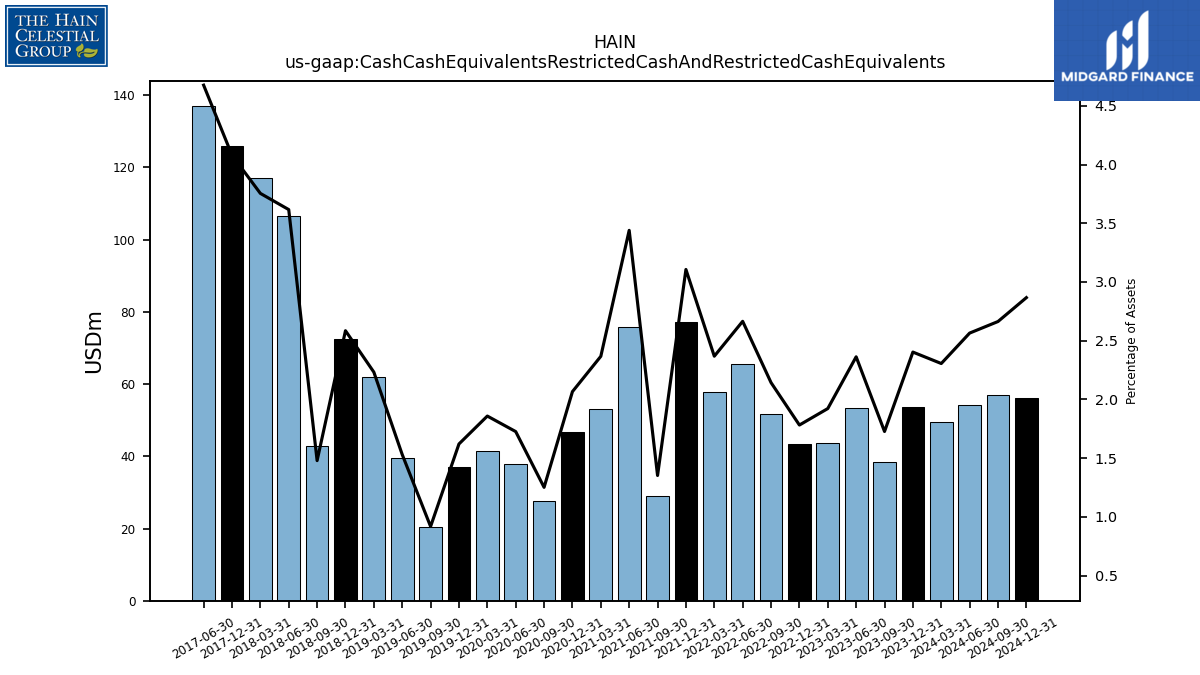
| Cash Cash Equivalents Restricted Cash And Restricted Cash Equivalents | 53.67 | 38.28 | 53.36 | NA | 43.44 | 51.79 | 65.51 | 57.81 | 77.20 | 28.96 | 75.87 | 53.01 | 46.81 | 27.52 | 37.77 | 41.55 | 37.02 | 20.52 | 39.53 | 62.01 | 72.46 | 42.92 | 106.56 | 117.15 | 125.93 | NA | 137.06 | NA | NA | NA | NA | NA | NA | NA | NA | NA | NA | NA | NA | NA | NA | NA | NA | NA | NA | NA | NA | NA | NA | NA | NA | NA | NA | NA | NA | NA | NA | |
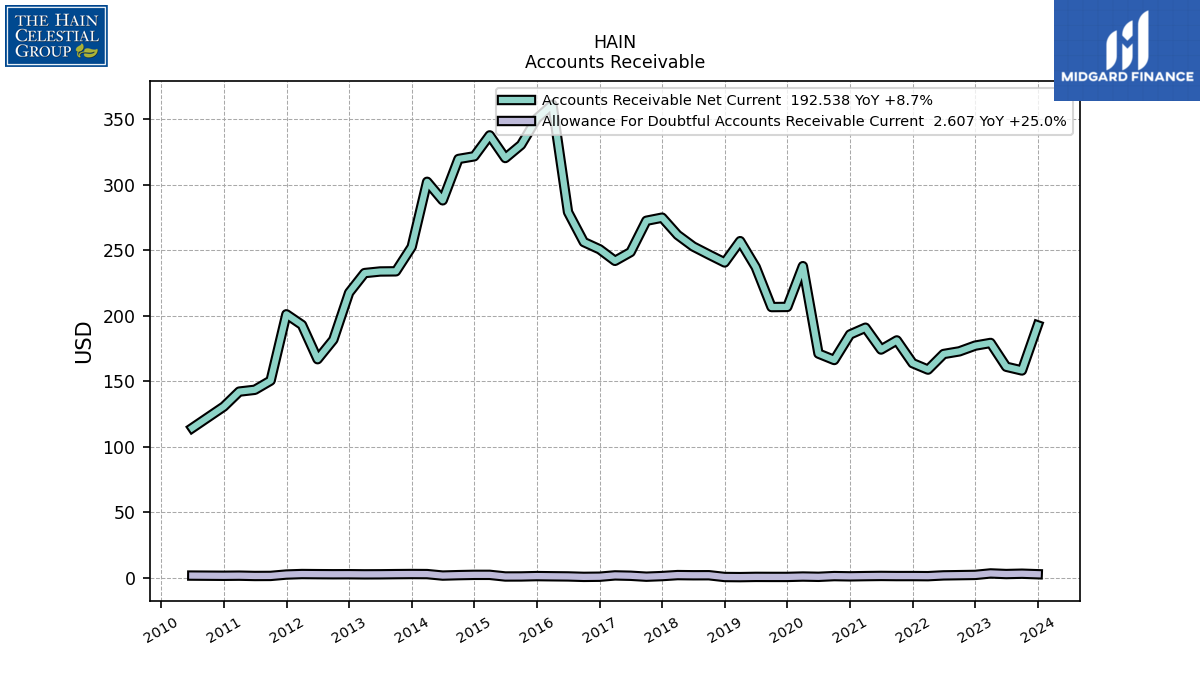
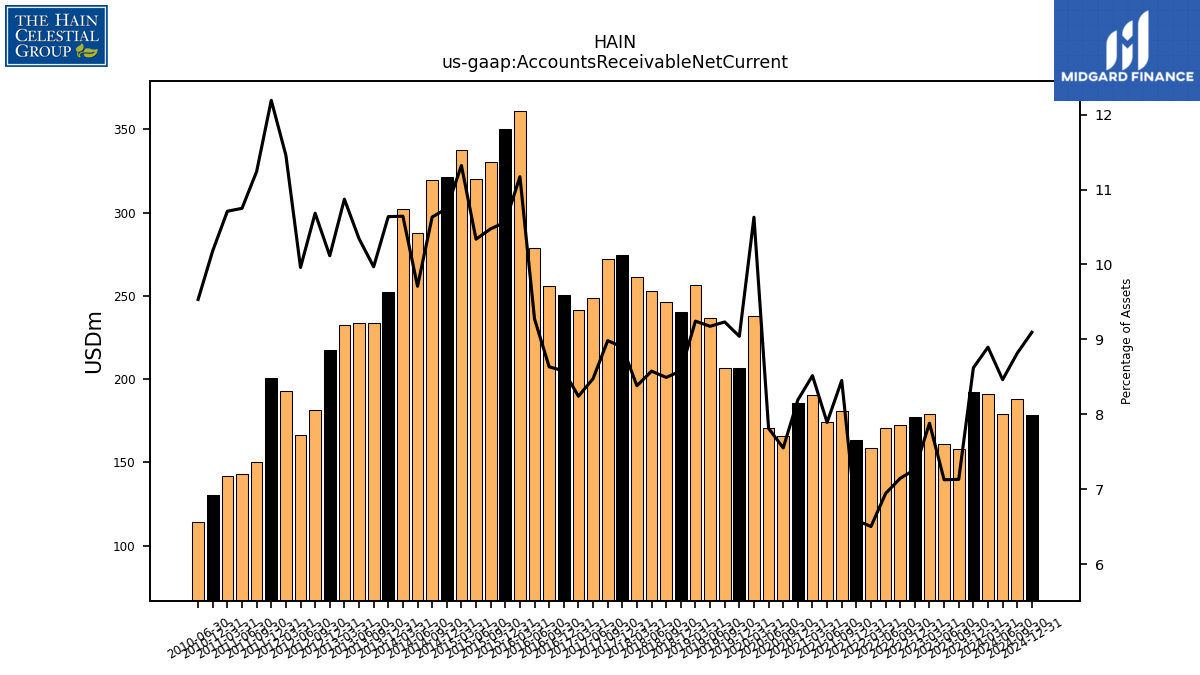
| Accounts Receivable Net Current | 192.54 | 158.09 | 160.95 | 179.11 | 177.06 | 172.69 | 170.66 | 158.73 | 163.67 | 181.05 | 174.07 | 190.74 | 185.58 | 166.09 | 170.97 | 237.72 | 206.58 | 206.48 | 236.94 | 256.80 | 240.52 | 246.52 | 252.71 | 261.52 | 274.73 | 272.34 | 248.44 | 241.74 | 250.58 | 256.08 | 278.93 | 360.96 | 350.41 | 330.22 | 320.20 | 337.52 | 321.52 | 319.50 | 287.92 | 302.08 | 252.39 | 233.76 | 233.64 | 232.42 | 217.43 | 181.57 | 166.68 | 192.87 | 200.97 | 150.35 | 143.35 | 141.98 | 130.56 | NA | 114.22 | NA | NA | |
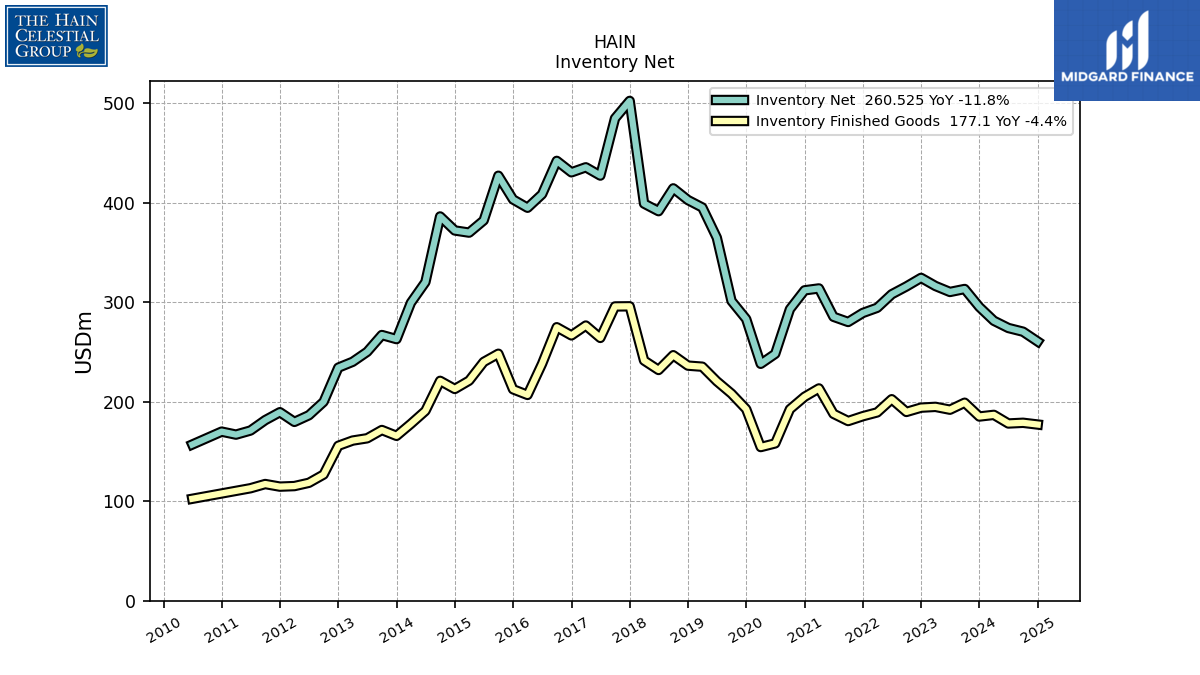
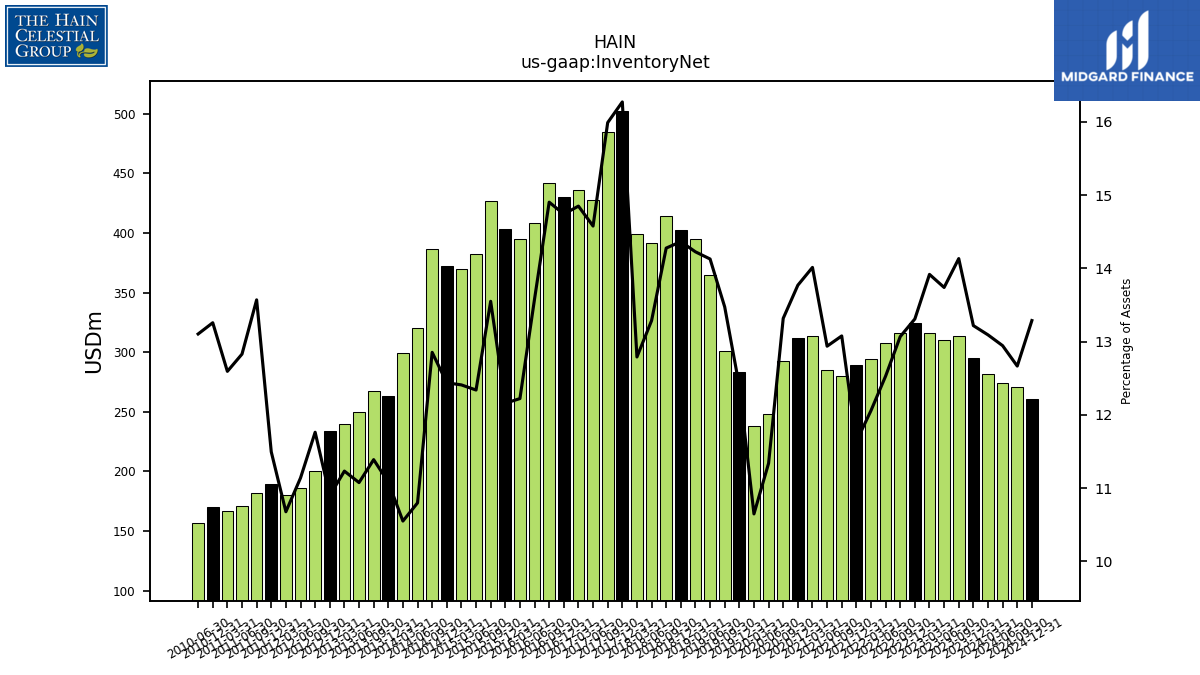
| Inventory Net | 295.28 | 313.33 | 310.34 | 316.35 | 324.52 | 315.88 | 308.03 | 294.43 | 289.24 | 280.18 | 285.41 | 313.90 | 311.99 | 292.97 | 248.17 | 238.13 | 283.13 | 301.35 | 364.89 | 395.25 | 402.72 | 414.48 | 391.52 | 399.16 | 502.37 | 484.79 | 427.31 | 435.65 | 430.58 | 442.08 | 408.56 | 394.96 | 403.32 | 427.15 | 382.21 | 369.97 | 372.15 | 386.25 | 320.25 | 299.46 | 262.95 | 267.07 | 250.18 | 240.15 | 234.28 | 199.92 | 186.44 | 179.75 | 189.51 | 181.51 | 171.10 | 166.96 | 169.98 | NA | 157.01 | NA | NA | |
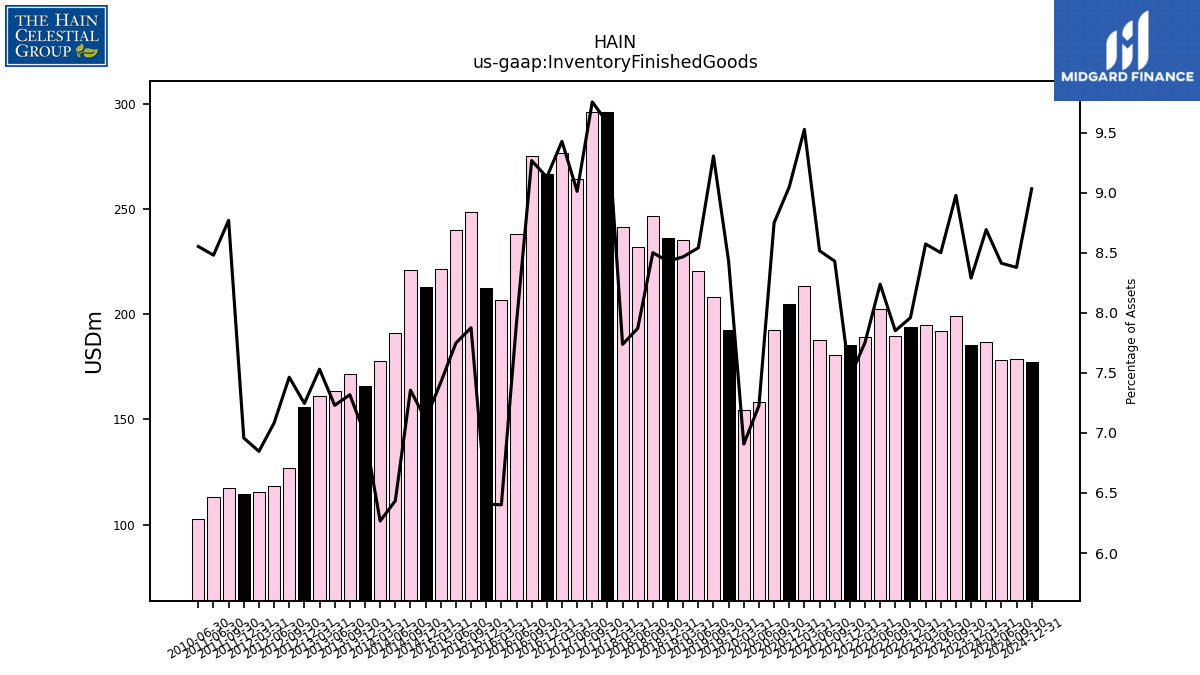
| Inventory Finished Goods | 185.16 | 199.04 | 192.01 | 194.86 | 194.07 | 189.76 | 202.54 | 189.29 | 185.47 | 180.60 | 187.88 | 213.41 | 205.00 | 192.47 | 158.16 | 154.45 | 192.59 | 208.13 | 220.60 | 235.23 | 236.31 | 246.78 | 231.93 | 241.45 | 295.93 | 295.79 | 264.15 | 276.58 | 266.68 | 274.91 | 238.18 | 206.85 | 212.53 | 248.26 | 240.00 | 221.23 | 212.84 | 221.04 | 190.82 | 177.84 | 165.71 | 171.60 | 163.29 | 160.99 | 155.74 | 126.85 | 118.54 | 115.25 | 114.69 | 117.31 | 113.09 | NA | NA | NA | 102.47 | NA | NA | |
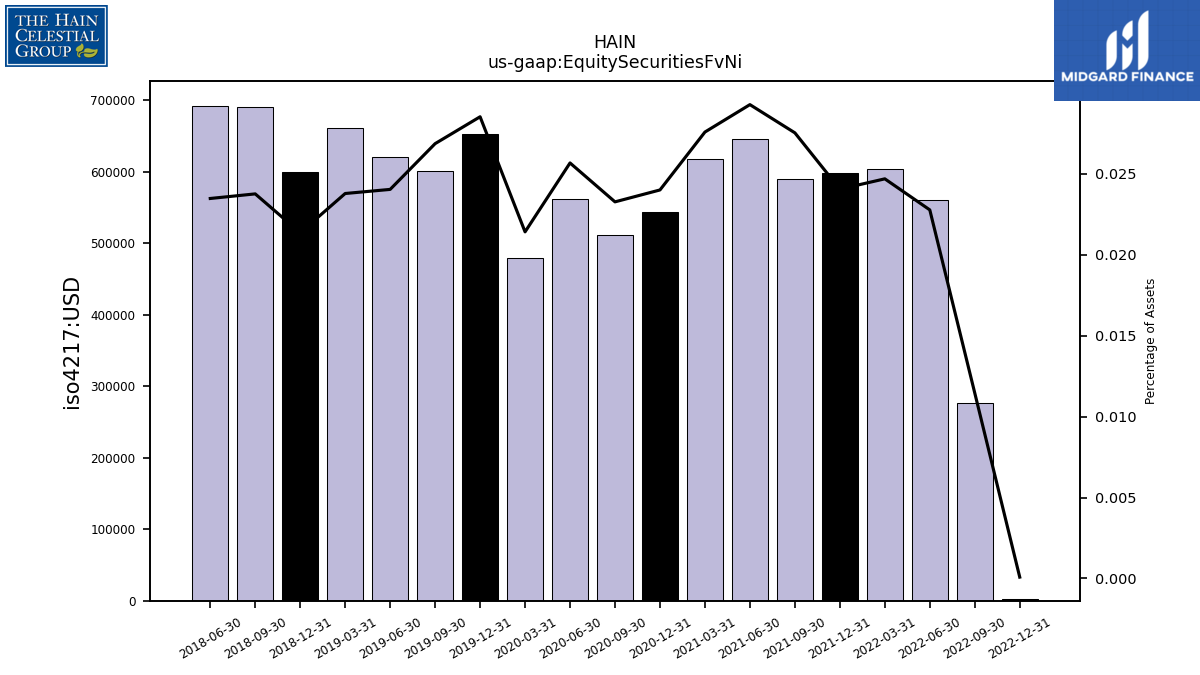
| Equity Securities Fv Ni | NA | NA | NA | NA | 0.00 | 0.28 | 0.56 | 0.60 | 0.60 | 0.59 | 0.65 | 0.62 | 0.54 | 0.51 | 0.56 | 0.48 | 0.65 | 0.60 | 0.62 | 0.66 | 0.60 | 0.69 | 0.69 | NA | NA | NA | NA | NA | NA | NA | NA | NA | NA | NA | NA | NA | NA | NA | NA | NA | NA | NA | NA | NA | NA | NA | NA | NA | NA | NA | NA | NA | NA | NA | NA | NA | NA |
| 2023-12-31 | 2023-09-30 | 2023-06-30 | 2023-03-31 | 2022-12-31 | 2022-09-30 | 2022-06-30 | 2022-03-31 | 2021-12-31 | 2021-09-30 | 2021-06-30 | 2021-03-31 | 2020-12-31 | 2020-09-30 | 2020-06-30 | 2020-03-31 | 2019-12-31 | 2019-09-30 | 2019-06-30 | 2019-03-31 | 2018-12-31 | 2018-09-30 | 2018-06-30 | 2018-03-31 | 2017-12-31 | 2017-09-30 | 2017-06-30 | 2017-03-31 | 2016-12-31 | 2016-09-30 | 2016-06-30 | 2016-03-31 | 2015-12-31 | 2015-09-30 | 2015-06-30 | 2015-03-31 | 2014-12-31 | 2014-09-30 | 2014-06-30 | 2014-03-31 | 2013-12-31 | 2013-09-30 | 2013-06-30 | 2013-03-31 | 2012-12-31 | 2012-09-30 | 2012-06-30 | 2012-03-31 | 2011-12-31 | 2011-09-30 | 2011-06-30 | 2011-03-31 | 2010-12-31 | 2010-09-30 | 2010-06-30 | 2010-03-31 | 2009-12-31 | ||
|---|---|---|---|---|---|---|---|---|---|---|---|---|---|---|---|---|---|---|---|---|---|---|---|---|---|---|---|---|---|---|---|---|---|---|---|---|---|---|---|---|---|---|---|---|---|---|---|---|---|---|---|---|---|---|---|---|---|---|
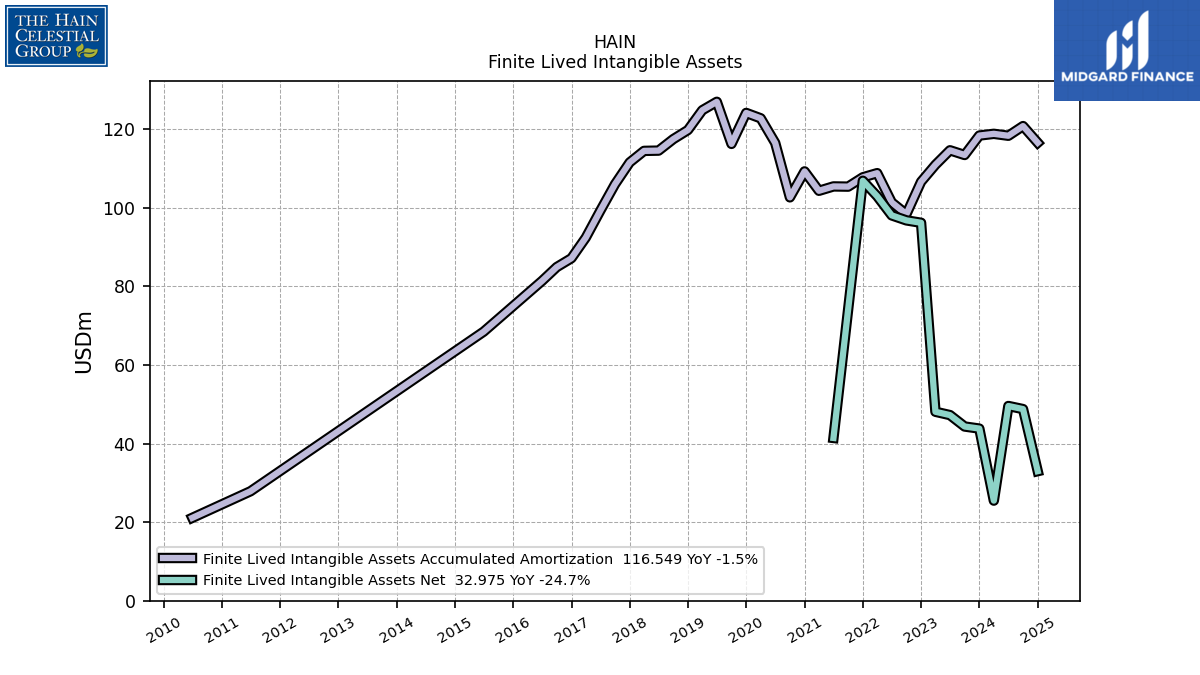
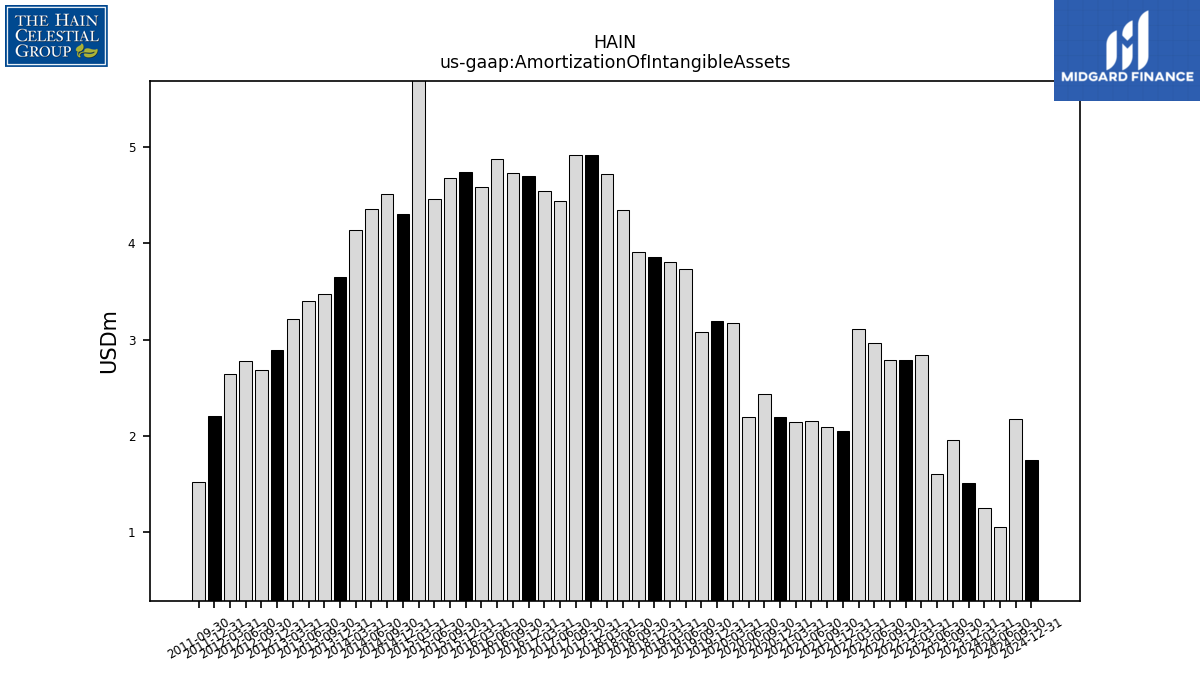
| Amortization Of Intangible Assets | 1.51 | 1.96 | 1.60 | 2.84 | 2.79 | 2.79 | 2.96 | 3.11 | 2.05 | 2.10 | 2.16 | 2.15 | 2.19 | 2.43 | 2.19 | 3.17 | 3.19 | 3.08 | 3.73 | 3.80 | 3.86 | 3.90 | 4.34 | 4.71 | 4.91 | 4.91 | 4.44 | 4.54 | 4.69 | 4.73 | 4.88 | 4.59 | 4.74 | 4.67 | 4.46 | 10.19 | 4.30 | 4.51 | 4.35 | 4.13 | 3.65 | 3.47 | 3.40 | 3.21 | 2.89 | 2.69 | 2.77 | 2.64 | 2.21 | 1.52 | NA | NA | NA | NA | NA | NA | NA | |
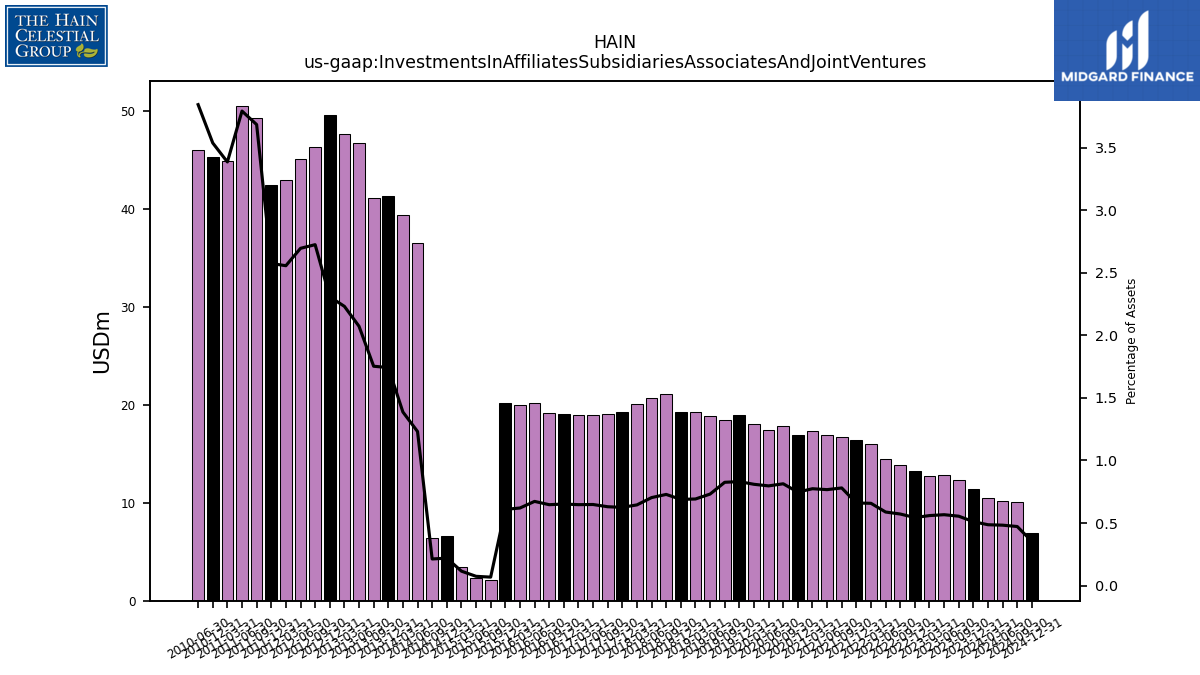
| Investments In Affiliates Subsidiaries Associates And Joint Ventures | 11.41 | 12.30 | 12.80 | 12.72 | 13.26 | 13.83 | 14.46 | 16.06 | 16.41 | 16.72 | 16.92 | 17.34 | 16.93 | 17.90 | 17.44 | 18.10 | 18.99 | 18.46 | 18.89 | 19.23 | 19.32 | 21.15 | 20.73 | 20.13 | 19.30 | 19.11 | 19.00 | 18.98 | 19.05 | 19.18 | 20.24 | 20.03 | 20.21 | 2.14 | 2.31 | 3.45 | 6.57 | 6.40 | 36.51 | 39.37 | 41.33 | 41.10 | 46.80 | 47.70 | 49.59 | 46.29 | 45.10 | 43.02 | 42.43 | 49.27 | 50.56 | 44.87 | 45.34 | NA | 46.04 | NA | NA | |
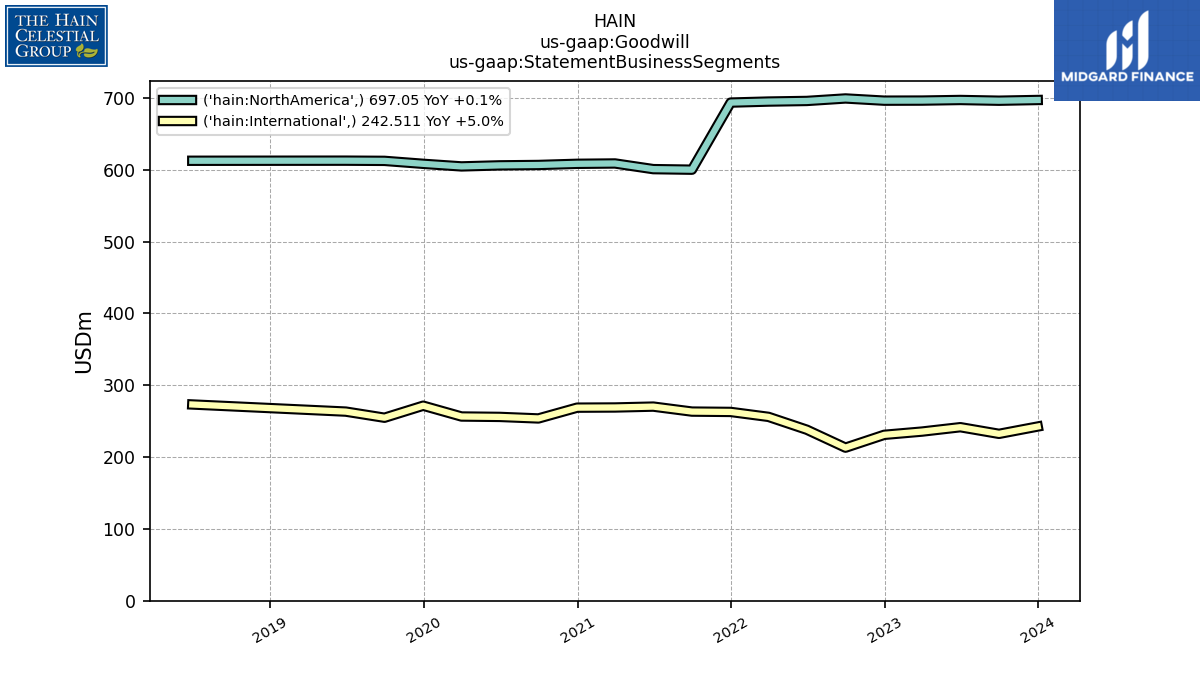
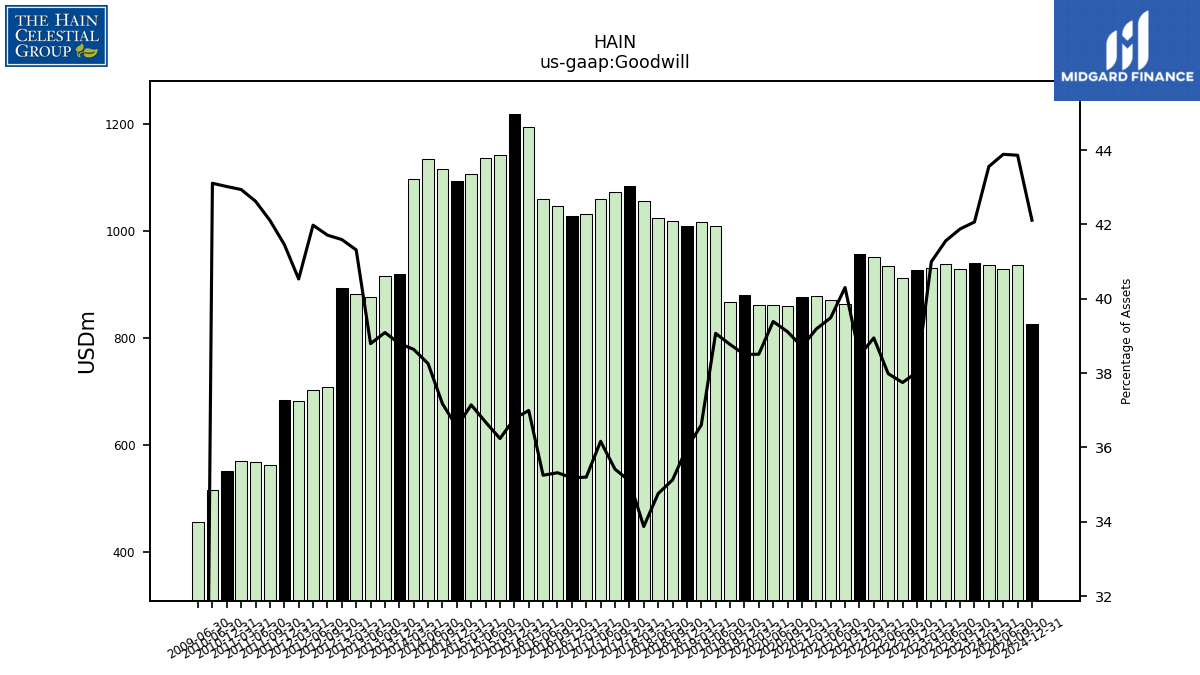
| Goodwill | 939.56 | 928.38 | 938.64 | 931.73 | 927.08 | 912.28 | 933.80 | 950.82 | 956.28 | 863.35 | 871.07 | 877.72 | 876.99 | 860.35 | 861.96 | 861.07 | 879.71 | 867.07 | 1008.98 | 1016.86 | 1008.79 | 1019.69 | 1024.14 | 1056.95 | 1083.70 | 1073.68 | 1059.98 | 1032.58 | 1027.66 | 1047.58 | 1060.34 | 1195.31 | 1219.72 | 1142.26 | 1136.08 | 1107.33 | 1093.59 | 1116.97 | 1134.37 | 1096.53 | 920.37 | 916.59 | 876.11 | 883.20 | 893.92 | 708.85 | 702.56 | 682.26 | 683.45 | 563.21 | 568.37 | 569.18 | 551.52 | NA | 516.46 | NA | NA | |
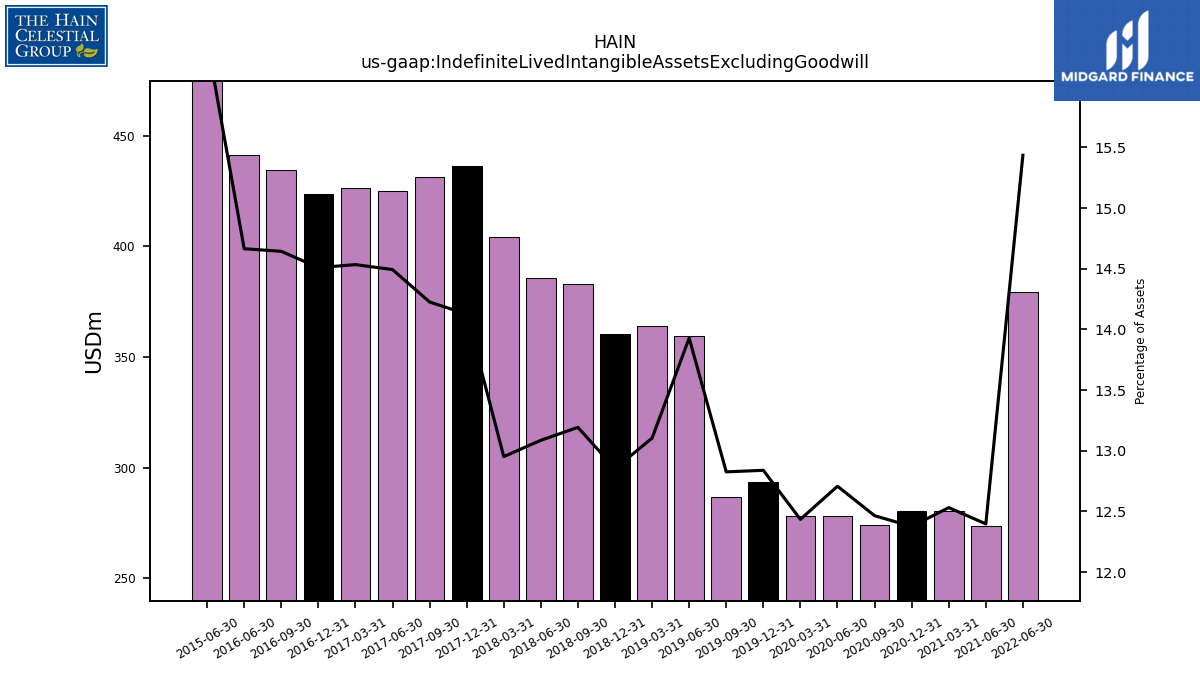
| Indefinite Lived Intangible Assets Excluding Goodwill | NA | NA | NA | NA | NA | NA | 379.47 | NA | NA | NA | 273.47 | 280.69 | 280.38 | 274.20 | 278.10 | 278.06 | 293.36 | 286.85 | 359.73 | 364.07 | 360.32 | 383.00 | 385.61 | 404.16 | 436.11 | 431.32 | 424.82 | 426.37 | 423.81 | 434.36 | 441.14 | NA | NA | NA | 507.26 | NA | NA | NA | NA | NA | NA | NA | NA | NA | NA | NA | NA | NA | NA | NA | NA | NA | NA | NA | NA | NA | NA | |
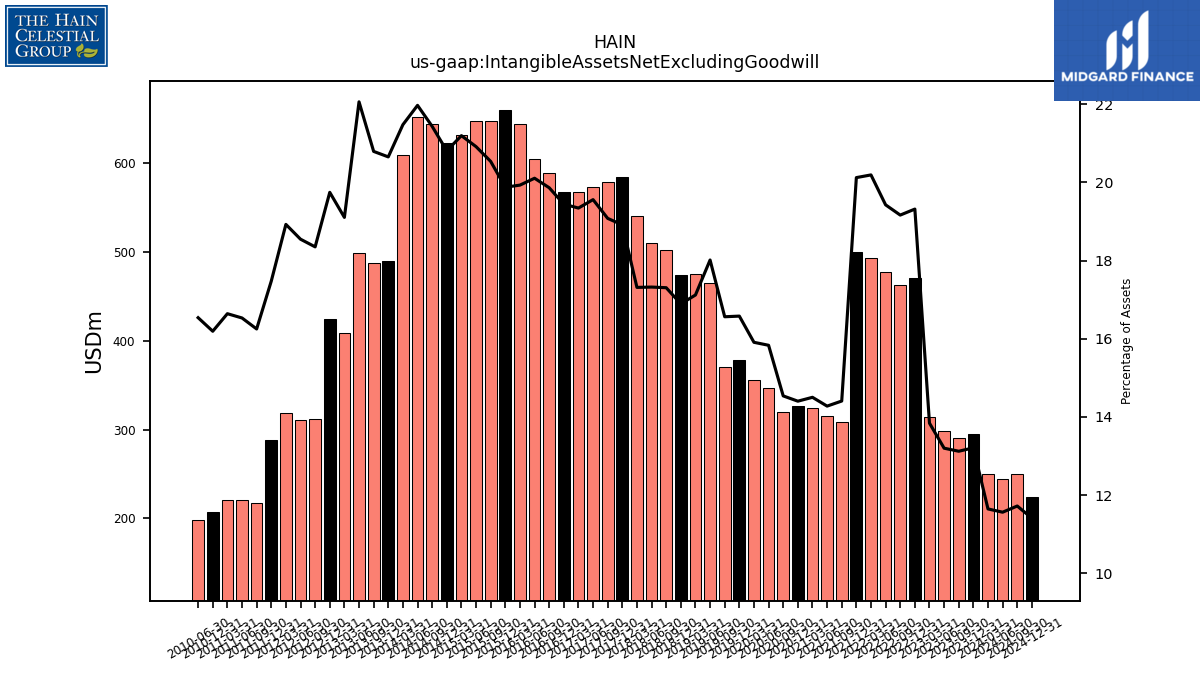
| Intangible Assets Net Excluding Goodwill | 295.01 | 290.87 | 298.11 | 314.54 | 470.96 | 463.16 | 477.53 | 492.94 | 500.09 | 308.59 | 314.89 | 324.79 | 326.27 | 319.76 | 346.46 | 355.71 | 378.80 | 370.38 | 465.21 | 475.58 | 473.53 | 502.36 | 510.39 | 540.23 | 583.91 | 578.42 | 573.27 | 567.42 | 567.91 | 589.15 | 604.79 | 643.94 | 659.27 | 647.34 | 647.75 | 631.87 | 622.47 | 644.02 | 651.48 | 609.49 | 489.92 | 487.53 | 498.24 | 408.39 | 424.36 | 311.83 | 310.38 | 318.54 | 288.01 | 217.33 | 220.43 | 220.57 | 207.57 | NA | 198.13 | NA | NA | |
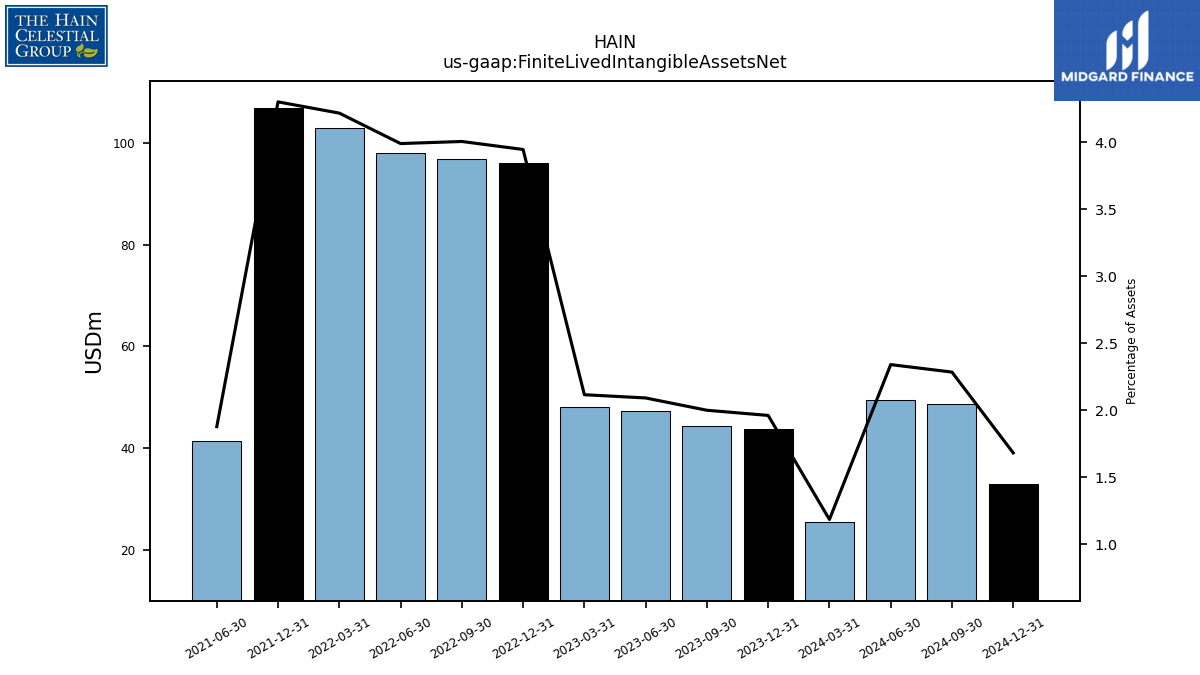
| Finite Lived Intangible Assets Net | 43.81 | 44.34 | 47.24 | 48.09 | 96.18 | 96.79 | 98.07 | 102.94 | 106.87 | NA | 41.42 | NA | NA | NA | NA | NA | NA | NA | NA | NA | NA | NA | NA | NA | NA | NA | NA | NA | NA | NA | NA | NA | NA | NA | NA | NA | NA | NA | NA | NA | NA | NA | NA | NA | NA | NA | NA | NA | NA | NA | NA | NA | NA | NA | NA | NA | NA | |
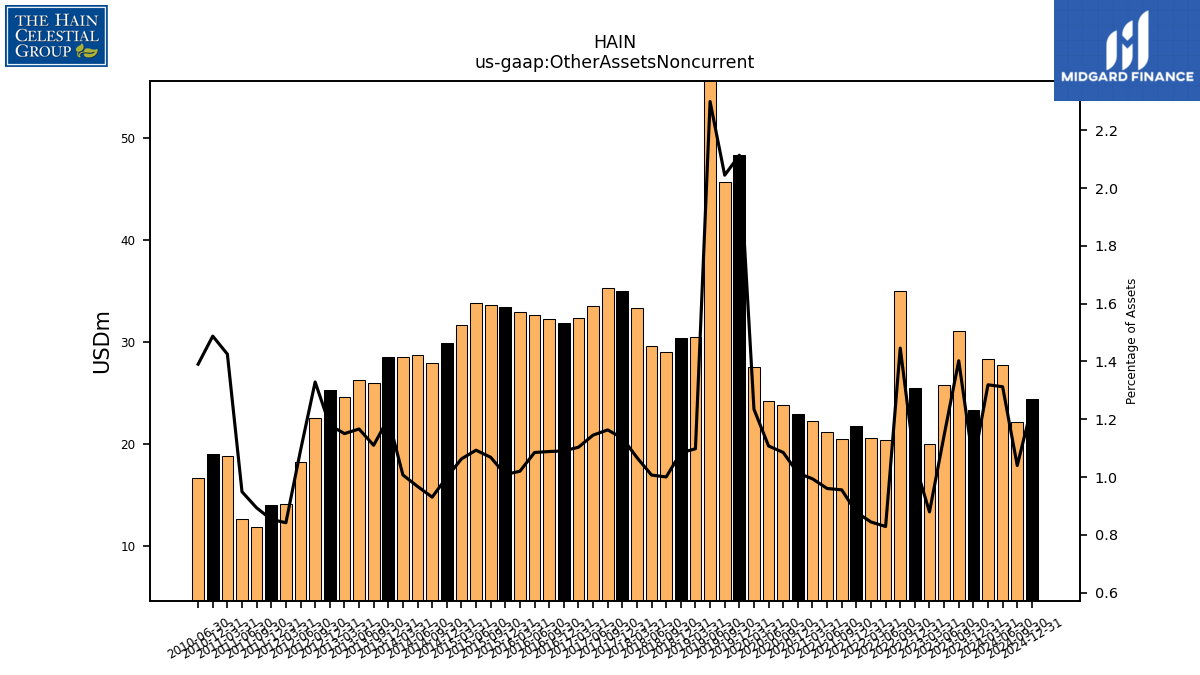
| Other Assets Noncurrent | 23.37 | 31.09 | 25.85 | 19.99 | 25.55 | 34.96 | 20.38 | 20.62 | 21.83 | 20.47 | 21.19 | 22.26 | 22.97 | 23.87 | 24.24 | 27.61 | 48.30 | 45.73 | 59.39 | 30.50 | 30.39 | 29.04 | 29.67 | 33.31 | 35.04 | 35.26 | 33.56 | 32.36 | 31.86 | 32.28 | 32.64 | 32.97 | 33.46 | 33.68 | 33.85 | 31.69 | 29.89 | 27.96 | 28.69 | 28.59 | 28.53 | 26.03 | 26.34 | 24.59 | 25.36 | 22.59 | 18.28 | 14.17 | 14.07 | 11.95 | 12.65 | 18.90 | 19.07 | NA | 16.66 | NA | NA | |
| Equity Securities Fv Ni | NA | NA | NA | NA | 0.00 | 0.28 | 0.56 | 0.60 | 0.60 | 0.59 | 0.65 | 0.62 | 0.54 | 0.51 | 0.56 | 0.48 | 0.65 | 0.60 | 0.62 | 0.66 | 0.60 | 0.69 | 0.69 | NA | NA | NA | NA | NA | NA | NA | NA | NA | NA | NA | NA | NA | NA | NA | NA | NA | NA | NA | NA | NA | NA | NA | NA | NA | NA | NA | NA | NA | NA | NA | NA | NA | NA |
| 2023-12-31 | 2023-09-30 | 2023-06-30 | 2023-03-31 | 2022-12-31 | 2022-09-30 | 2022-06-30 | 2022-03-31 | 2021-12-31 | 2021-09-30 | 2021-06-30 | 2021-03-31 | 2020-12-31 | 2020-09-30 | 2020-06-30 | 2020-03-31 | 2019-12-31 | 2019-09-30 | 2019-06-30 | 2019-03-31 | 2018-12-31 | 2018-09-30 | 2018-06-30 | 2018-03-31 | 2017-12-31 | 2017-09-30 | 2017-06-30 | 2017-03-31 | 2016-12-31 | 2016-09-30 | 2016-06-30 | 2016-03-31 | 2015-12-31 | 2015-09-30 | 2015-06-30 | 2015-03-31 | 2014-12-31 | 2014-09-30 | 2014-06-30 | 2014-03-31 | 2013-12-31 | 2013-09-30 | 2013-06-30 | 2013-03-31 | 2012-12-31 | 2012-09-30 | 2012-06-30 | 2012-03-31 | 2011-12-31 | 2011-09-30 | 2011-06-30 | 2011-03-31 | 2010-12-31 | 2010-09-30 | 2010-06-30 | 2010-03-31 | 2009-12-31 | ||
|---|---|---|---|---|---|---|---|---|---|---|---|---|---|---|---|---|---|---|---|---|---|---|---|---|---|---|---|---|---|---|---|---|---|---|---|---|---|---|---|---|---|---|---|---|---|---|---|---|---|---|---|---|---|---|---|---|---|---|
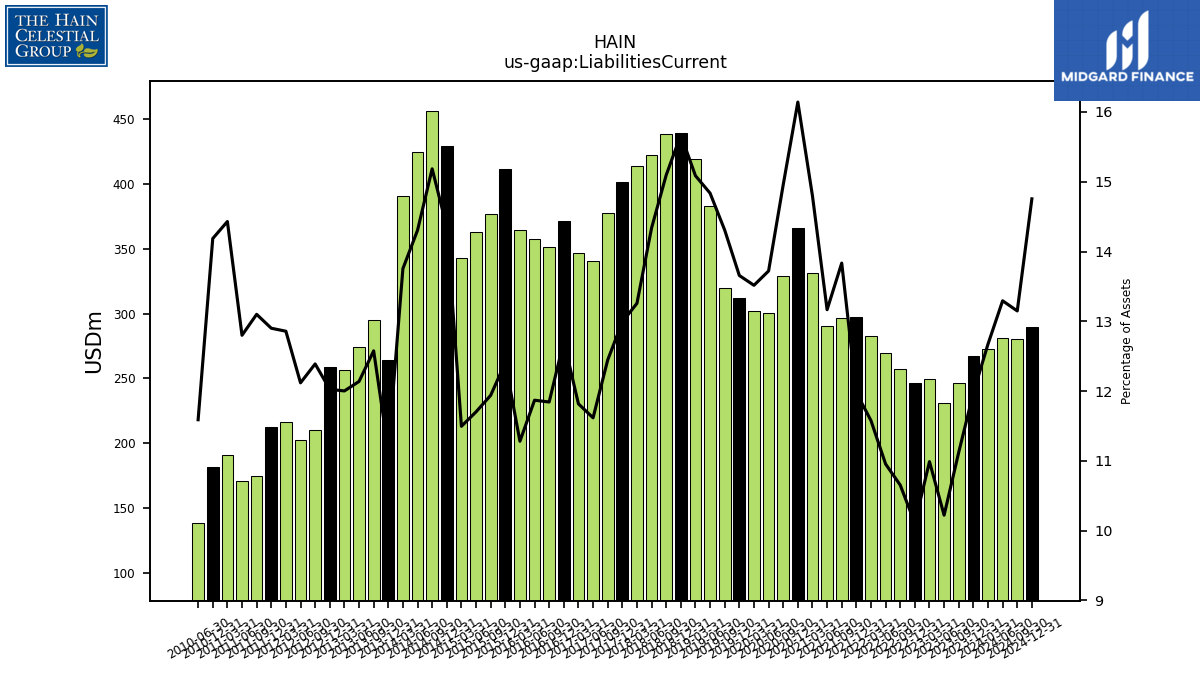
| Liabilities Current | 267.48 | 246.59 | 230.87 | 249.76 | 246.45 | 257.48 | 269.30 | 282.65 | 297.67 | 296.36 | 290.43 | 331.42 | 365.70 | 329.00 | 300.28 | 302.23 | 312.04 | 319.96 | 383.16 | 419.13 | 439.33 | 438.21 | 422.44 | 413.69 | 401.09 | 377.30 | 340.49 | 346.67 | 371.43 | 351.30 | 357.03 | 364.50 | 411.56 | 376.34 | 362.44 | 342.69 | 429.34 | 456.27 | 424.16 | 390.36 | 264.55 | 294.89 | 274.13 | 256.57 | 258.46 | 210.54 | 202.81 | 216.43 | 212.66 | 175.21 | 170.69 | 191.28 | 181.87 | NA | 138.85 | NA | NA | |
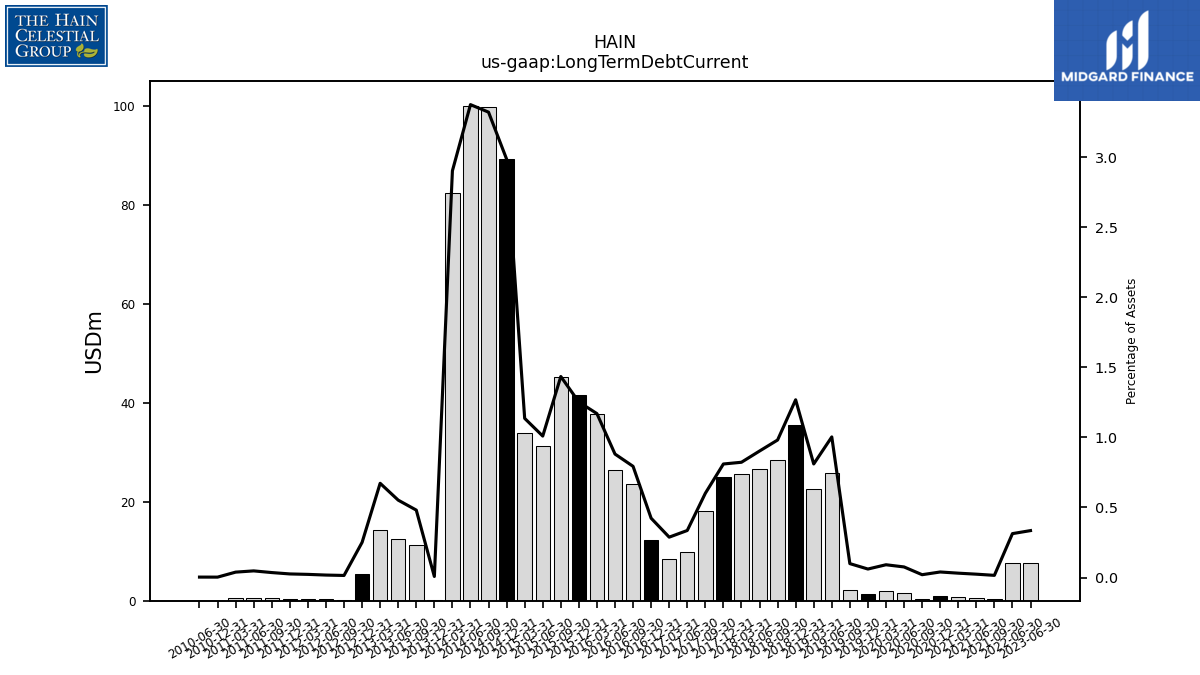
| Long Term Debt Current | NA | NA | 7.57 | NA | NA | NA | 7.71 | NA | NA | 0.34 | 0.53 | 0.70 | 0.90 | 0.45 | 1.66 | 2.04 | 1.39 | 2.22 | 25.92 | 22.52 | 35.57 | 28.50 | 26.61 | 25.68 | 25.02 | 18.23 | 9.84 | 8.46 | 12.37 | 23.55 | 26.51 | 37.81 | 41.55 | 45.23 | 31.27 | 33.87 | 89.35 | 99.81 | 100.10 | 82.39 | 0.18 | 11.29 | 12.48 | 14.38 | 5.39 | 0.25 | 0.30 | 0.38 | 0.42 | 0.47 | 0.63 | 0.51 | 0.04 | NA | 0.04 | NA | NA | |
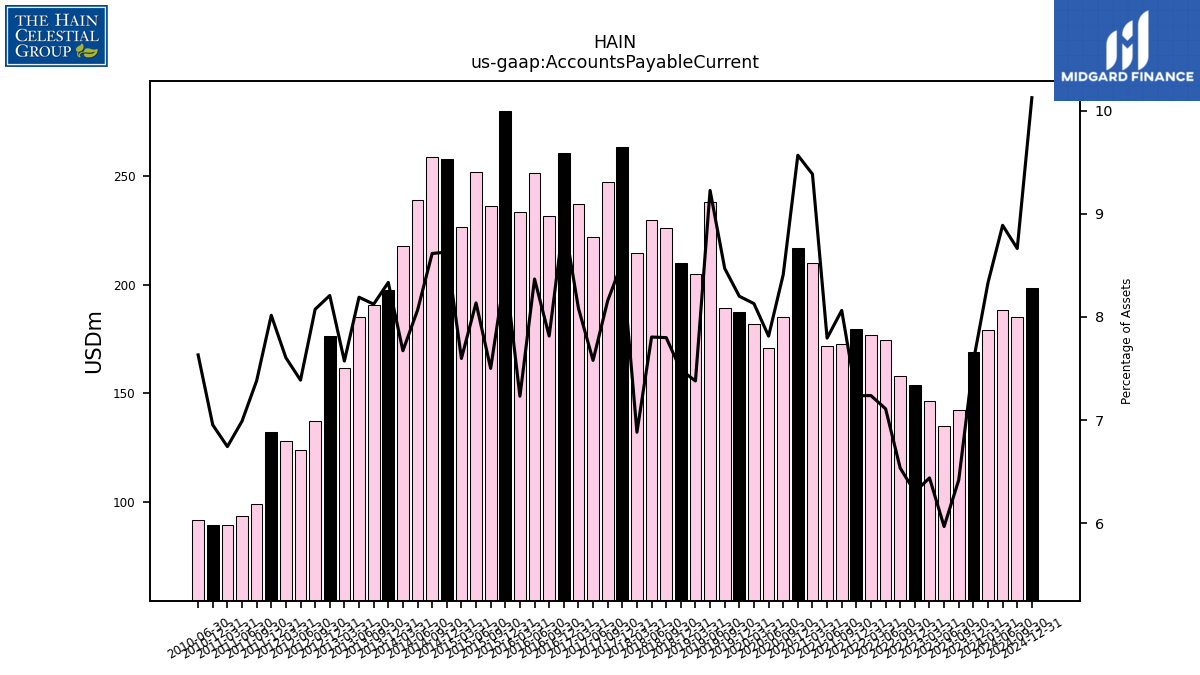
| Accounts Payable Current | 169.05 | 142.29 | 134.78 | 146.34 | 153.68 | 157.92 | 174.76 | 176.70 | 179.81 | 172.73 | 171.95 | 210.22 | 216.78 | 185.00 | 171.01 | 181.78 | 187.38 | 189.44 | 238.30 | 205.01 | 209.87 | 226.42 | 229.99 | 214.74 | 263.39 | 247.32 | 222.14 | 237.19 | 261.04 | 231.79 | 251.71 | 233.64 | 280.04 | 236.43 | 252.00 | 226.50 | 258.14 | 258.89 | 239.16 | 217.75 | 197.72 | 190.49 | 185.00 | 161.88 | 176.41 | 137.22 | 123.63 | 128.00 | 132.14 | 98.72 | 93.19 | 89.38 | 89.14 | NA | 91.44 | NA | NA | |
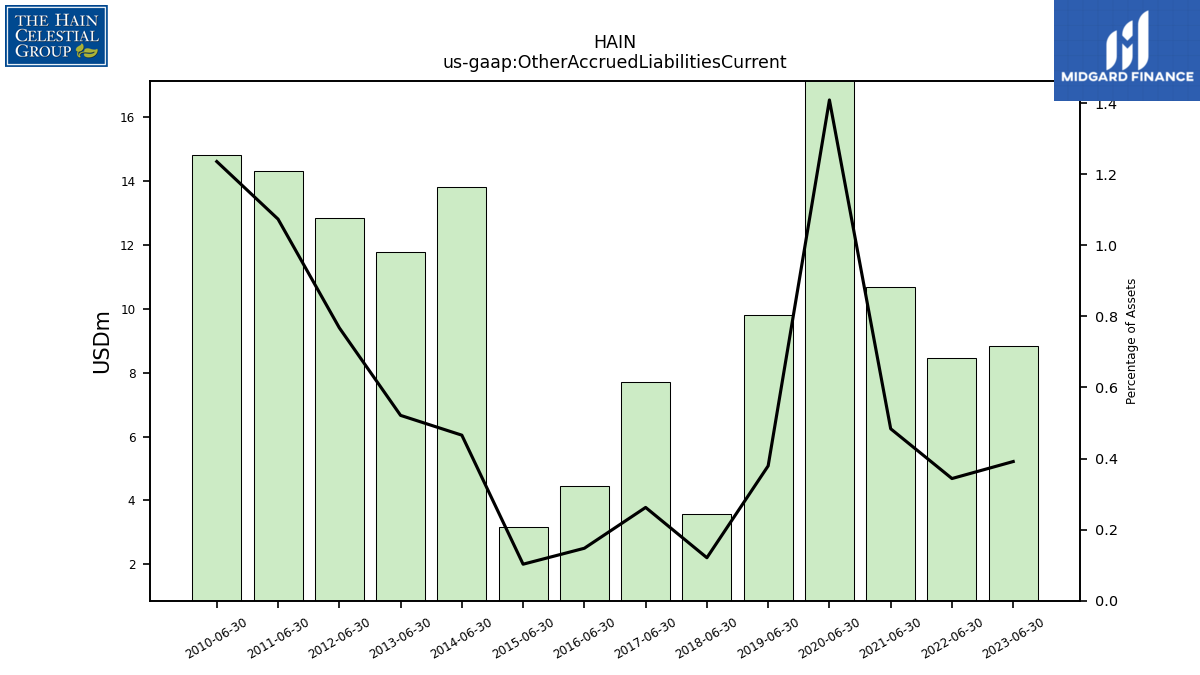
| Other Accrued Liabilities Current | NA | NA | 8.85 | NA | NA | NA | 8.45 | NA | NA | NA | 10.67 | NA | NA | NA | 30.83 | NA | NA | NA | 9.80 | NA | NA | NA | 3.57 | NA | NA | NA | 7.70 | NA | NA | NA | 4.44 | NA | NA | NA | 3.19 | NA | NA | NA | 13.81 | NA | NA | NA | 11.78 | NA | NA | NA | 12.85 | NA | NA | NA | 14.32 | NA | NA | NA | 14.80 | NA | NA | |
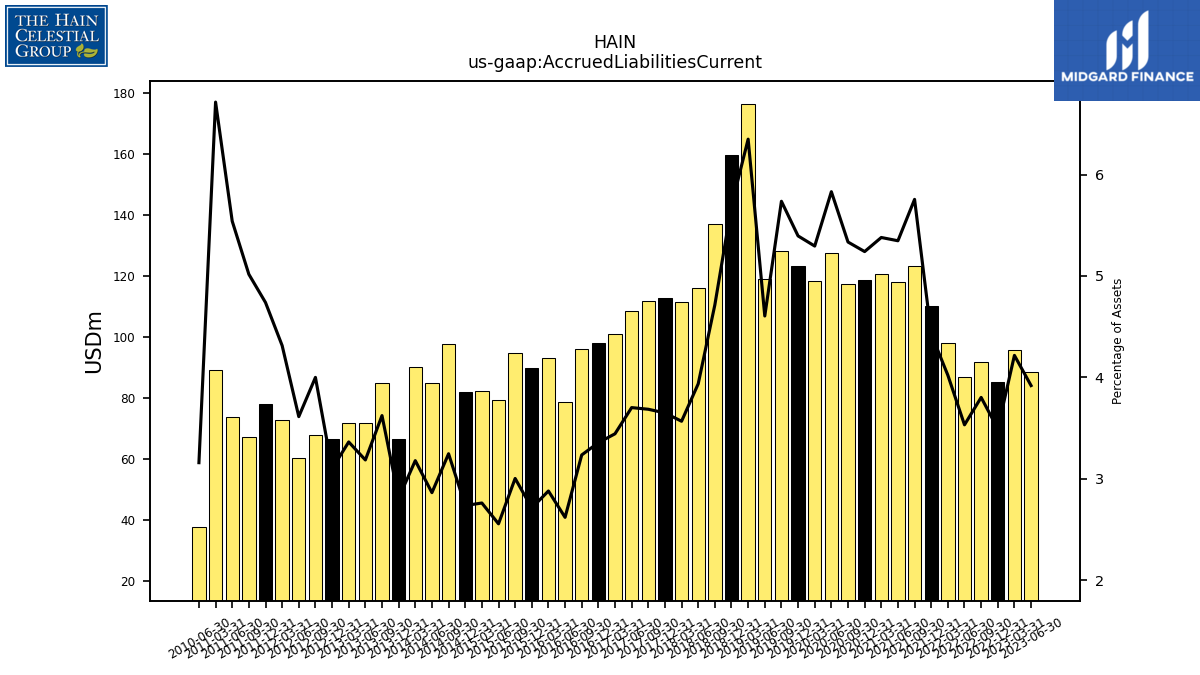
| Accrued Liabilities Current | NA | NA | 88.52 | 95.84 | 85.17 | 91.91 | 86.83 | 98.18 | 110.03 | 123.30 | 117.96 | 120.50 | 118.73 | 117.35 | 127.61 | 118.41 | 123.27 | 128.30 | 118.94 | 176.40 | 159.59 | 136.89 | 116.00 | 111.33 | 112.68 | 111.75 | 108.51 | 101.03 | 98.03 | 95.95 | 78.80 | 93.05 | 89.97 | 94.67 | 79.17 | 82.32 | 81.86 | 97.57 | 84.91 | 90.22 | 66.66 | 84.96 | 71.95 | 71.90 | 66.61 | 67.98 | 60.47 | 72.61 | 78.11 | 67.10 | 73.88 | 89.01 | NA | NA | 37.85 | NA | NA |
| 2023-12-31 | 2023-09-30 | 2023-06-30 | 2023-03-31 | 2022-12-31 | 2022-09-30 | 2022-06-30 | 2022-03-31 | 2021-12-31 | 2021-09-30 | 2021-06-30 | 2021-03-31 | 2020-12-31 | 2020-09-30 | 2020-06-30 | 2020-03-31 | 2019-12-31 | 2019-09-30 | 2019-06-30 | 2019-03-31 | 2018-12-31 | 2018-09-30 | 2018-06-30 | 2018-03-31 | 2017-12-31 | 2017-09-30 | 2017-06-30 | 2017-03-31 | 2016-12-31 | 2016-09-30 | 2016-06-30 | 2016-03-31 | 2015-12-31 | 2015-09-30 | 2015-06-30 | 2015-03-31 | 2014-12-31 | 2014-09-30 | 2014-06-30 | 2014-03-31 | 2013-12-31 | 2013-09-30 | 2013-06-30 | 2013-03-31 | 2012-12-31 | 2012-09-30 | 2012-06-30 | 2012-03-31 | 2011-12-31 | 2011-09-30 | 2011-06-30 | 2011-03-31 | 2010-12-31 | 2010-09-30 | 2010-06-30 | 2010-03-31 | 2009-12-31 | ||
|---|---|---|---|---|---|---|---|---|---|---|---|---|---|---|---|---|---|---|---|---|---|---|---|---|---|---|---|---|---|---|---|---|---|---|---|---|---|---|---|---|---|---|---|---|---|---|---|---|---|---|---|---|---|---|---|---|---|---|
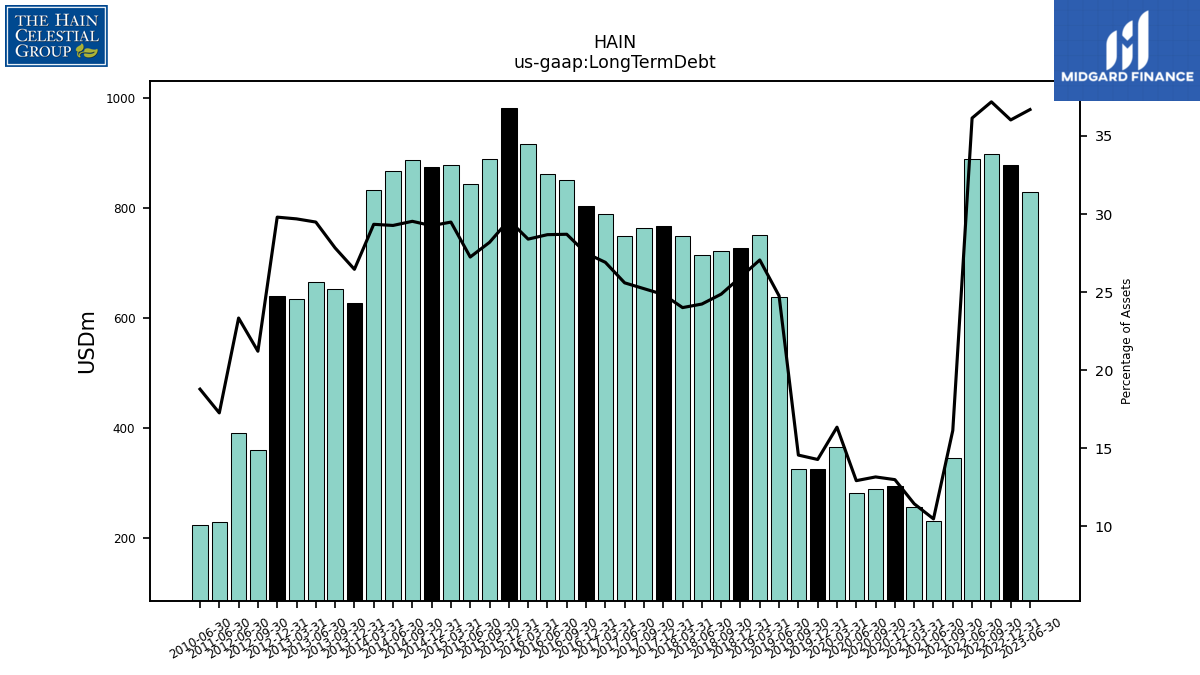
| Long Term Debt | NA | NA | 828.75 | NA | 878.40 | 898.78 | 888.64 | NA | NA | 345.75 | 231.02 | 256.24 | 294.23 | 289.49 | 282.77 | 365.57 | 326.25 | 325.61 | 639.46 | 751.72 | 727.69 | 721.93 | 714.11 | 749.13 | 767.15 | 764.62 | 750.15 | 789.33 | 803.06 | 851.42 | 862.68 | 917.43 | 982.01 | 888.52 | 843.88 | 878.97 | 875.19 | 887.44 | 867.92 | 832.73 | 627.70 | 652.53 | 665.94 | 634.71 | 640.50 | 360.50 | 390.58 | NA | NA | NA | 230.17 | NA | NA | NA | 225.04 | NA | NA | |
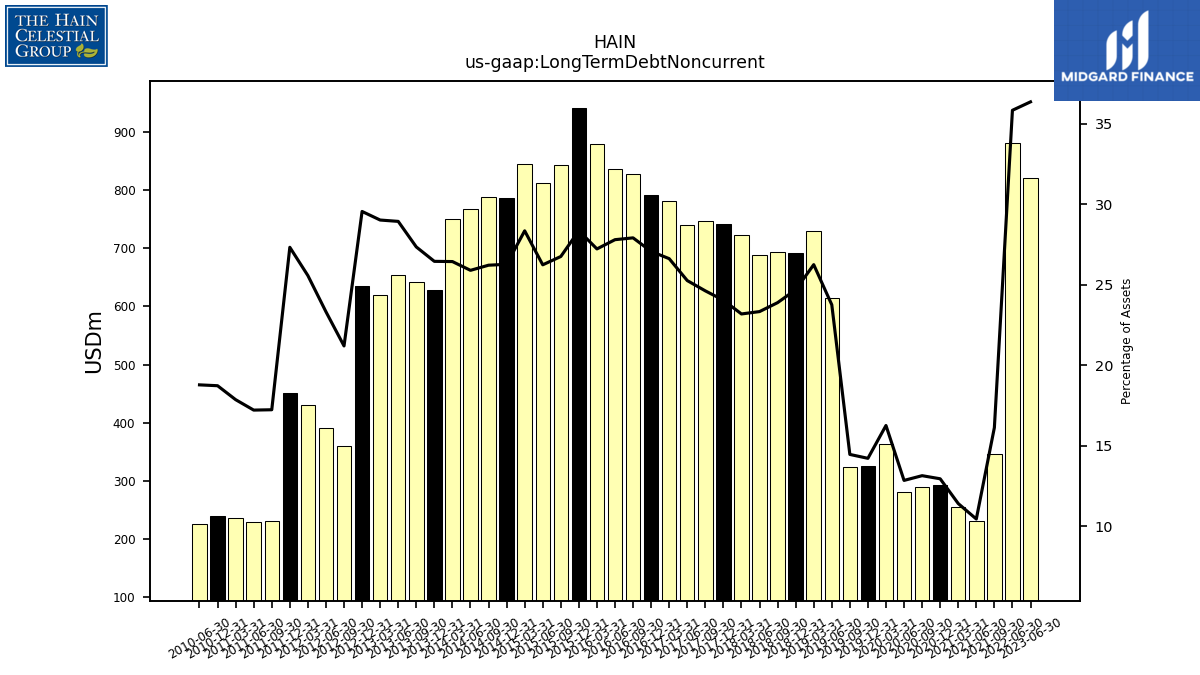
| Long Term Debt Noncurrent | NA | NA | 821.18 | NA | NA | NA | 880.94 | NA | NA | 345.41 | 230.49 | 255.54 | 293.33 | 289.04 | 281.12 | 363.53 | 324.86 | 323.39 | 613.54 | 729.20 | 692.13 | 693.43 | 687.50 | 723.46 | 742.12 | 746.39 | 740.30 | 780.87 | 790.69 | 827.88 | 836.17 | 879.63 | 940.46 | 843.29 | 812.61 | 845.10 | 785.85 | 787.63 | 767.83 | 750.33 | 627.52 | 641.24 | 653.46 | 620.33 | 635.11 | 360.25 | 390.29 | 430.36 | 450.41 | 230.51 | 229.54 | 236.76 | 240.09 | NA | 225.00 | NA | NA | |
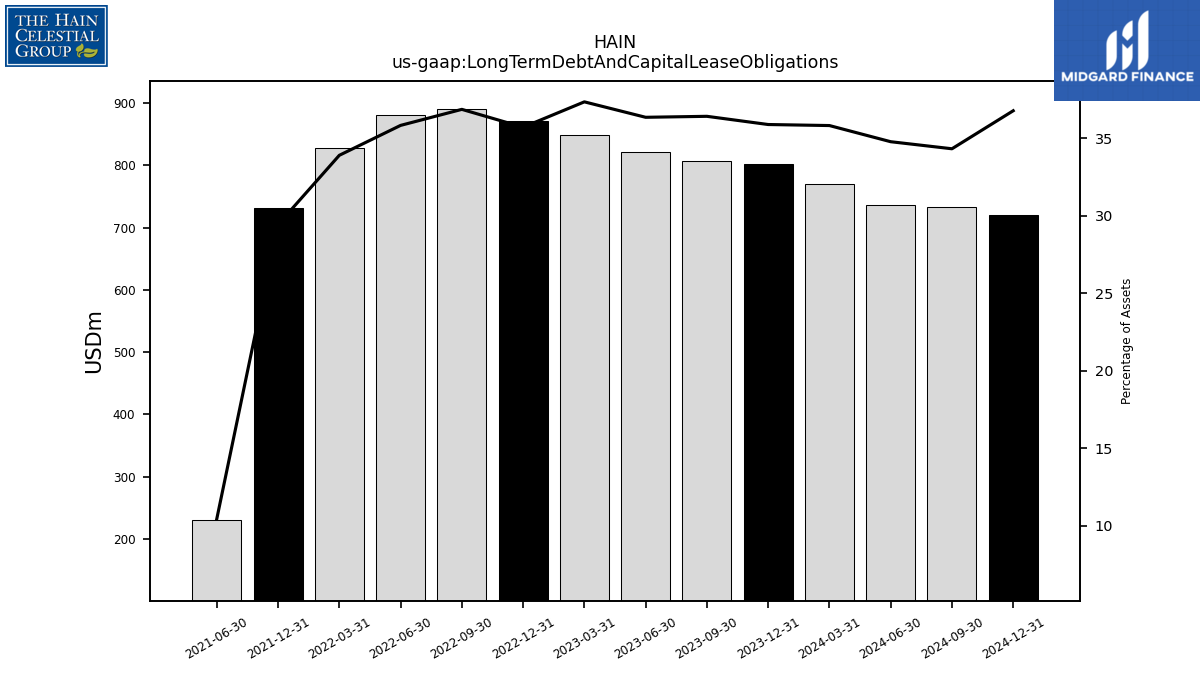
| Long Term Debt And Capital Lease Obligations | 801.67 | 807.40 | 821.18 | 848.98 | 870.80 | 891.12 | 880.94 | 827.77 | 731.61 | NA | 230.49 | NA | NA | NA | NA | NA | NA | NA | NA | NA | NA | NA | NA | NA | NA | NA | NA | NA | NA | NA | NA | NA | NA | NA | NA | NA | NA | NA | NA | NA | NA | NA | NA | NA | NA | NA | NA | NA | NA | NA | NA | NA | NA | NA | NA | NA | NA | |
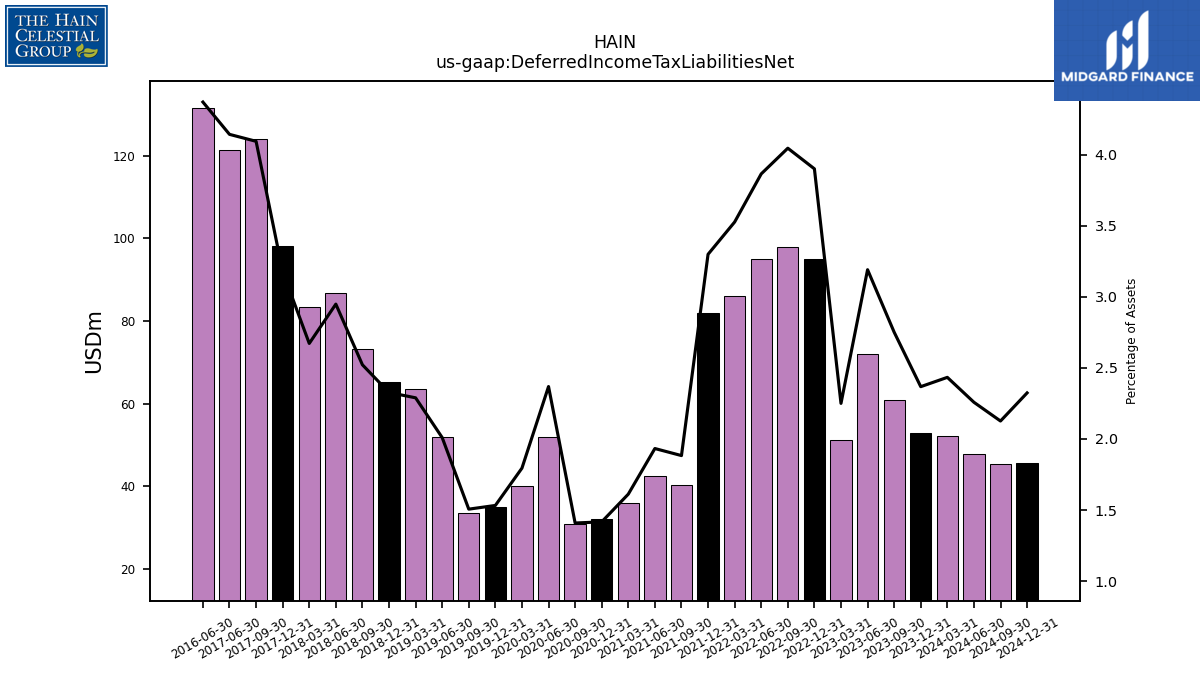
| Deferred Income Tax Liabilities Net | 52.90 | 61.01 | 72.09 | 51.16 | 95.13 | 97.81 | 95.04 | 86.12 | 82.02 | 40.34 | 42.64 | 36.10 | 32.10 | 30.98 | 51.85 | 40.14 | 35.01 | 33.69 | 51.91 | 63.62 | 65.25 | 73.22 | 86.91 | 83.40 | 98.13 | 124.17 | 121.47 | NA | NA | NA | 131.51 | NA | NA | NA | NA | NA | NA | NA | NA | NA | NA | NA | NA | NA | NA | NA | NA | NA | NA | NA | NA | NA | NA | NA | NA | NA | NA | |
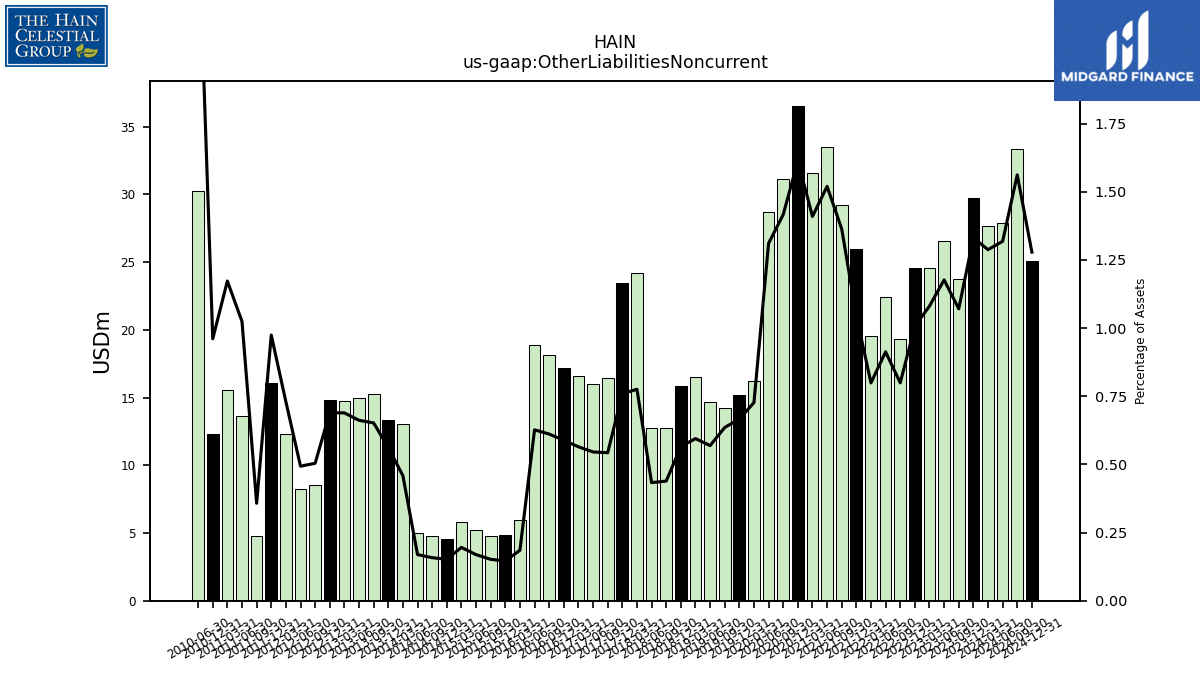
| Other Liabilities Noncurrent | 29.74 | 23.74 | 26.58 | 24.57 | 24.55 | 19.32 | 22.45 | 19.51 | 25.99 | 29.21 | 33.53 | 31.58 | 36.55 | 31.16 | 28.69 | 16.26 | 15.22 | 14.21 | 14.70 | 16.53 | 15.85 | 12.74 | 12.77 | 24.21 | 23.45 | 16.46 | 16.00 | 16.57 | 17.19 | 18.14 | 18.86 | 5.99 | 4.83 | 4.79 | 5.24 | 5.83 | 4.55 | 4.75 | 5.02 | 13.01 | 13.33 | 15.29 | 14.95 | 14.73 | 14.84 | 8.57 | 8.26 | 12.29 | 16.07 | 4.78 | 13.66 | 15.55 | 12.32 | NA | 30.23 | NA | NA | |
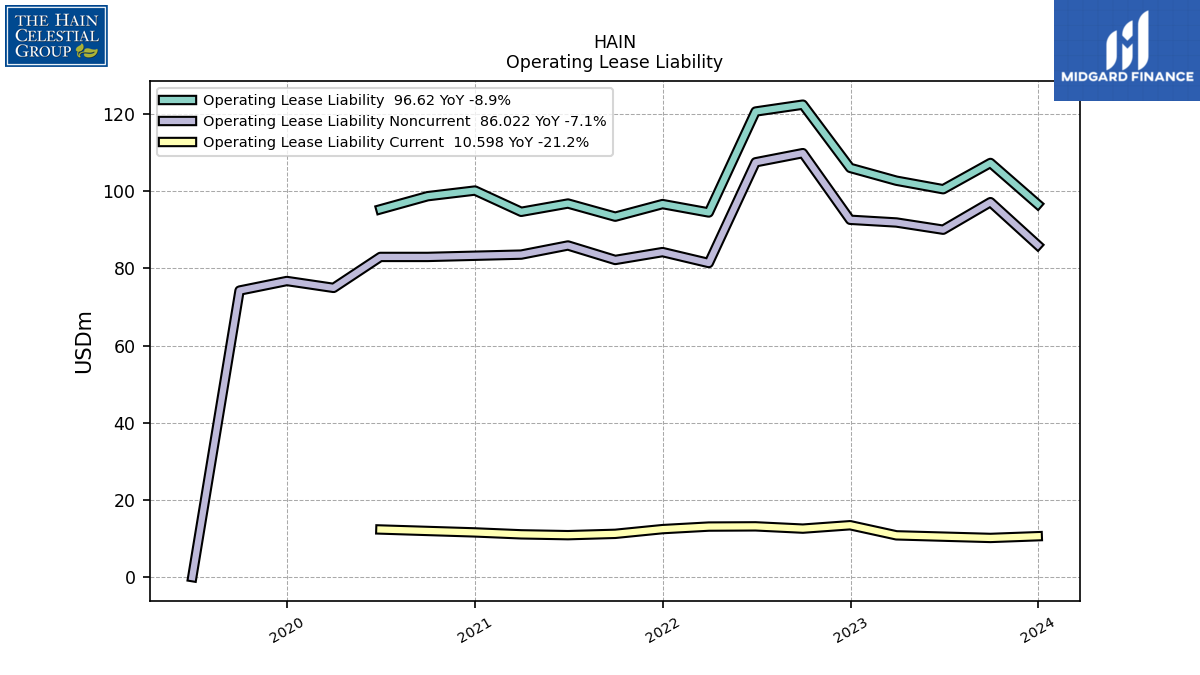
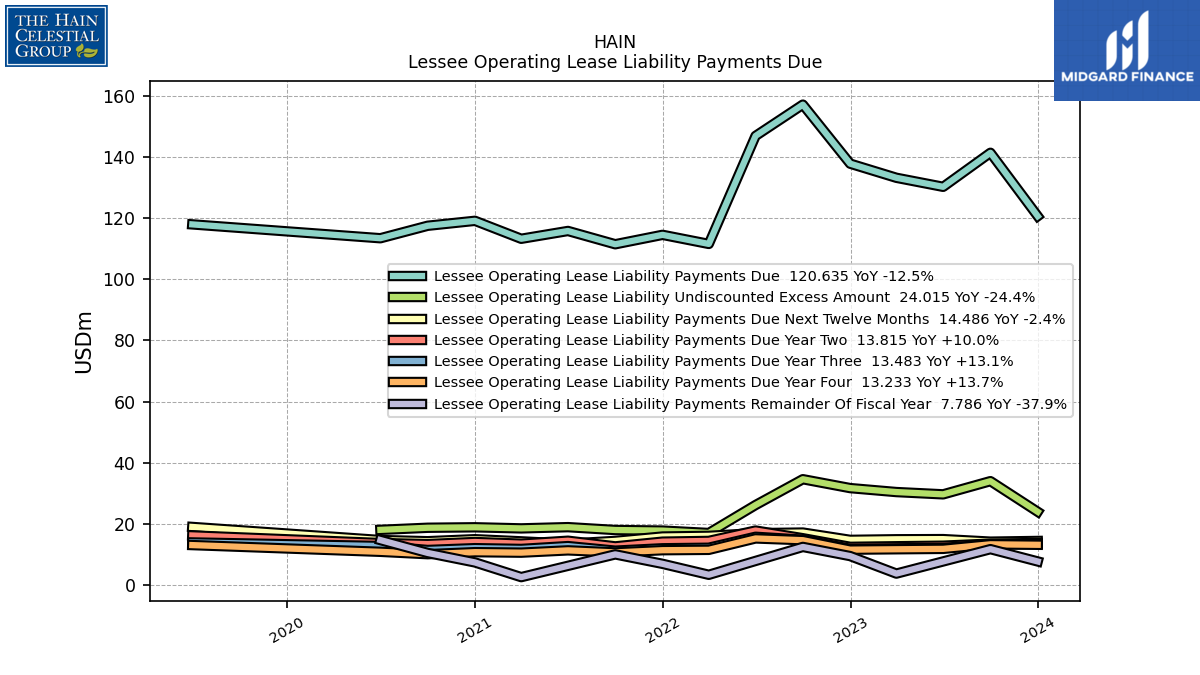
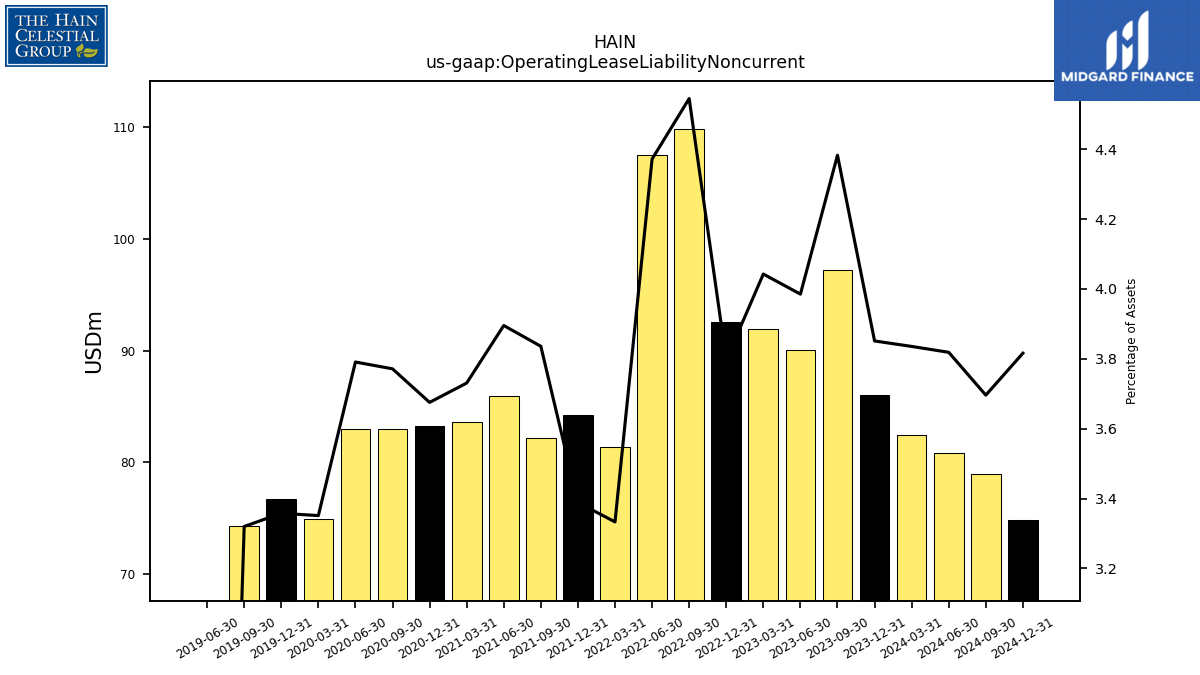
| Operating Lease Liability Noncurrent | 86.02 | 97.17 | 90.01 | 91.89 | 92.59 | 109.86 | 107.48 | 81.38 | 84.22 | 82.18 | 85.93 | 83.56 | 83.27 | 82.96 | 82.96 | 74.94 | 76.73 | 74.25 | 0.00 | NA | NA | NA | NA | NA | NA | NA | NA | NA | NA | NA | NA | NA | NA | NA | NA | NA | NA | NA | NA | NA | NA | NA | NA | NA | NA | NA | NA | NA | NA | NA | NA | NA | NA | NA | NA | NA | NA |
| 2023-12-31 | 2023-09-30 | 2023-06-30 | 2023-03-31 | 2022-12-31 | 2022-09-30 | 2022-06-30 | 2022-03-31 | 2021-12-31 | 2021-09-30 | 2021-06-30 | 2021-03-31 | 2020-12-31 | 2020-09-30 | 2020-06-30 | 2020-03-31 | 2019-12-31 | 2019-09-30 | 2019-06-30 | 2019-03-31 | 2018-12-31 | 2018-09-30 | 2018-06-30 | 2018-03-31 | 2017-12-31 | 2017-09-30 | 2017-06-30 | 2017-03-31 | 2016-12-31 | 2016-09-30 | 2016-06-30 | 2016-03-31 | 2015-12-31 | 2015-09-30 | 2015-06-30 | 2015-03-31 | 2014-12-31 | 2014-09-30 | 2014-06-30 | 2014-03-31 | 2013-12-31 | 2013-09-30 | 2013-06-30 | 2013-03-31 | 2012-12-31 | 2012-09-30 | 2012-06-30 | 2012-03-31 | 2011-12-31 | 2011-09-30 | 2011-06-30 | 2011-03-31 | 2010-12-31 | 2010-09-30 | 2010-06-30 | 2010-03-31 | 2009-12-31 | ||
|---|---|---|---|---|---|---|---|---|---|---|---|---|---|---|---|---|---|---|---|---|---|---|---|---|---|---|---|---|---|---|---|---|---|---|---|---|---|---|---|---|---|---|---|---|---|---|---|---|---|---|---|---|---|---|---|---|---|---|
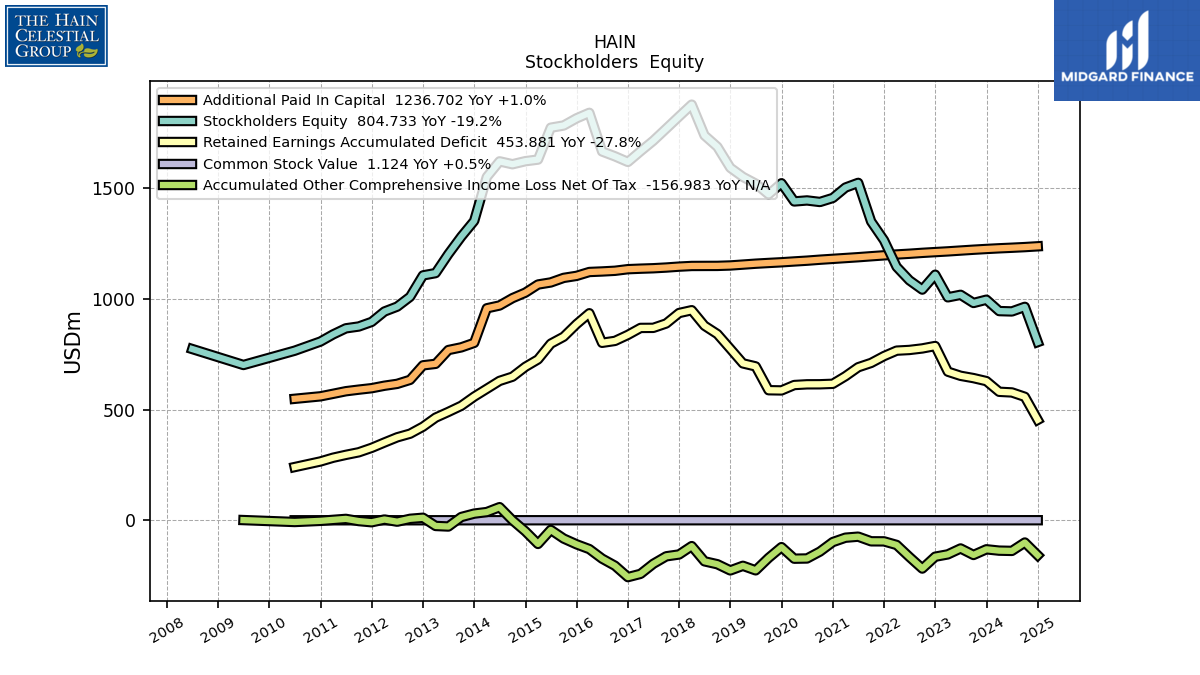
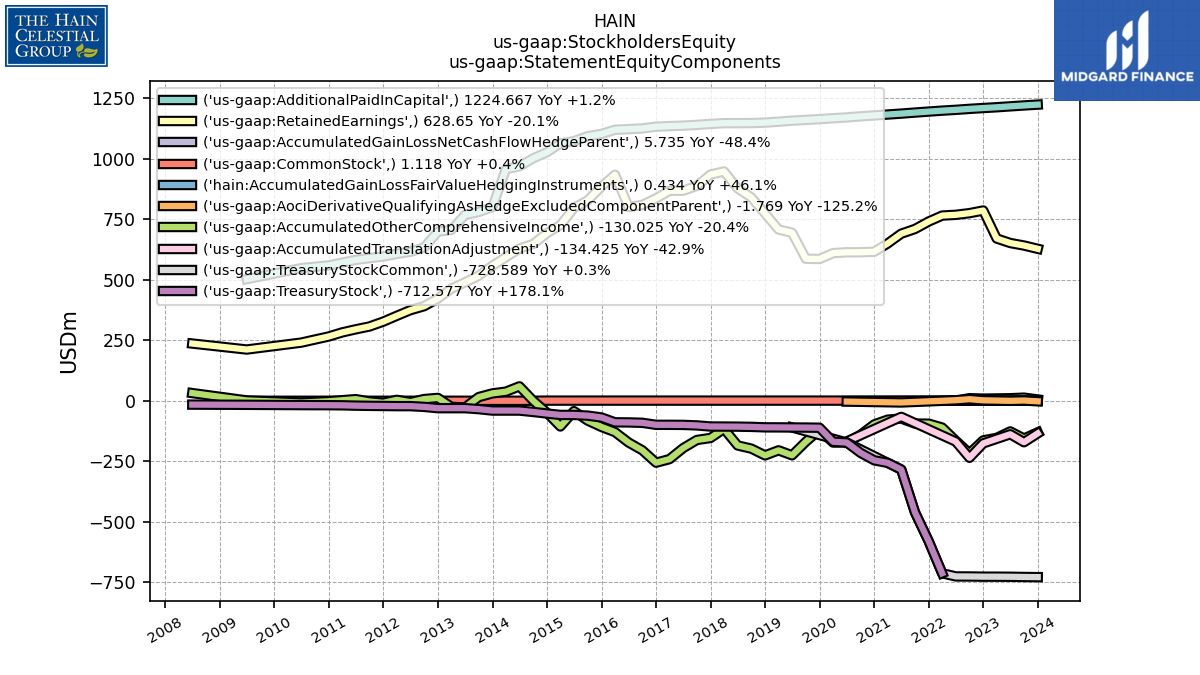
| Stockholders Equity | 995.82 | 980.99 | 1017.91 | 1006.48 | 1108.64 | 1041.39 | 1083.17 | 1144.04 | 1263.86 | 1348.76 | 1522.88 | 1501.68 | 1454.65 | 1436.58 | 1443.55 | 1439.05 | 1521.08 | 1470.94 | 1519.32 | 1549.79 | 1590.94 | 1685.42 | 1737.05 | 1875.77 | 1822.55 | 1767.53 | 1712.83 | 1665.52 | 1617.23 | 1642.43 | 1664.51 | 1838.87 | 1814.03 | 1781.62 | 1771.69 | 1627.83 | 1620.65 | 1606.88 | 1619.87 | 1549.42 | 1351.12 | 1280.28 | 1201.56 | 1115.84 | 1105.46 | 1008.93 | 964.60 | 942.53 | 895.65 | 874.94 | 866.70 | 839.25 | 807.18 | NA | 765.72 | NA | NA | |
| Common Stock Value | 1.12 | 1.12 | 1.11 | 1.11 | 1.11 | 1.11 | 1.11 | 1.11 | 1.11 | 1.10 | 1.10 | 1.10 | 1.09 | 1.09 | 1.09 | 1.09 | 1.09 | 1.09 | 1.09 | 1.09 | 1.09 | 1.08 | 1.08 | 1.08 | 1.08 | 1.08 | 1.08 | 1.08 | 1.08 | 1.08 | 1.07 | 1.07 | 1.07 | 1.06 | 1.06 | 1.06 | 1.05 | 1.04 | 1.03 | 1.03 | 0.99 | 0.98 | 0.98 | 0.96 | 0.96 | 0.93 | 0.92 | 0.92 | 0.91 | 0.90 | 0.90 | 0.89 | 0.88 | NA | 0.87 | NA | NA | |
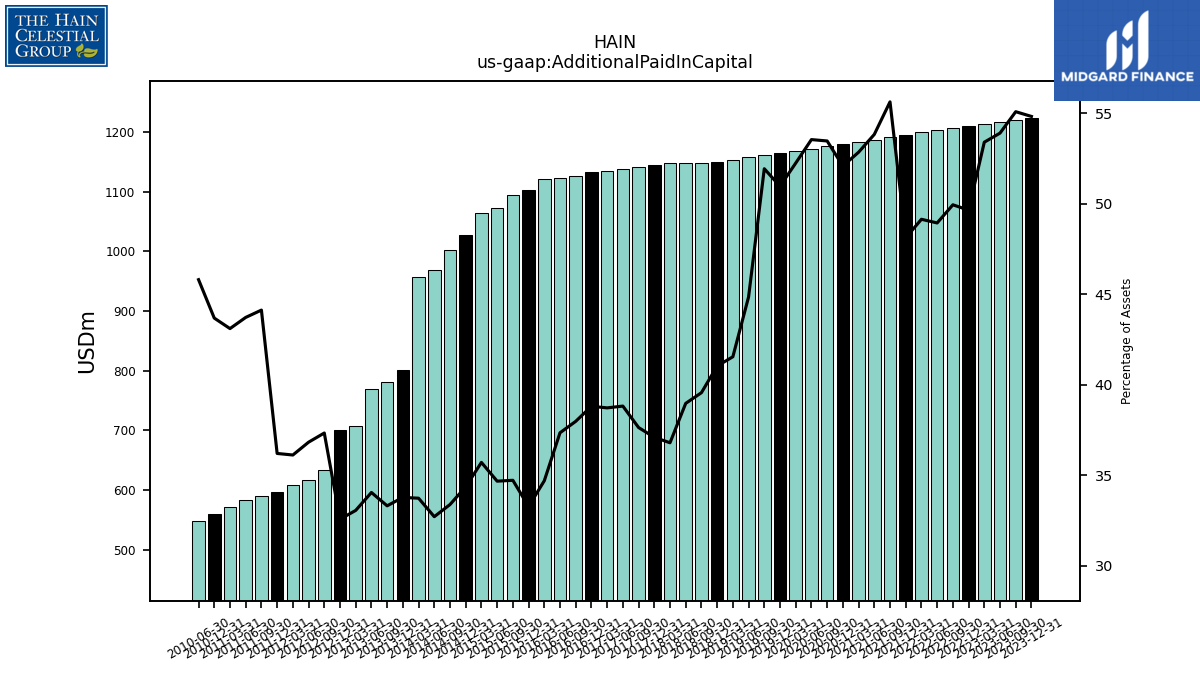
| Additional Paid In Capital | 1224.67 | 1221.29 | 1217.55 | 1213.78 | 1210.56 | 1207.12 | 1203.13 | 1199.80 | 1195.96 | 1191.82 | 1187.53 | 1183.76 | 1180.06 | 1176.24 | 1171.88 | 1168.38 | 1164.62 | 1161.54 | 1158.26 | 1154.18 | 1150.24 | 1148.33 | 1148.20 | 1147.98 | 1145.04 | 1140.89 | 1137.72 | 1135.79 | 1133.48 | 1126.31 | 1123.21 | 1120.78 | 1103.36 | 1094.22 | 1073.67 | 1064.34 | 1027.77 | 1002.81 | 969.70 | 957.07 | 801.09 | 780.87 | 768.77 | 706.50 | 699.80 | 634.34 | 616.20 | 607.83 | 596.69 | 590.14 | 582.97 | 571.33 | 560.00 | NA | 548.78 | NA | NA | |
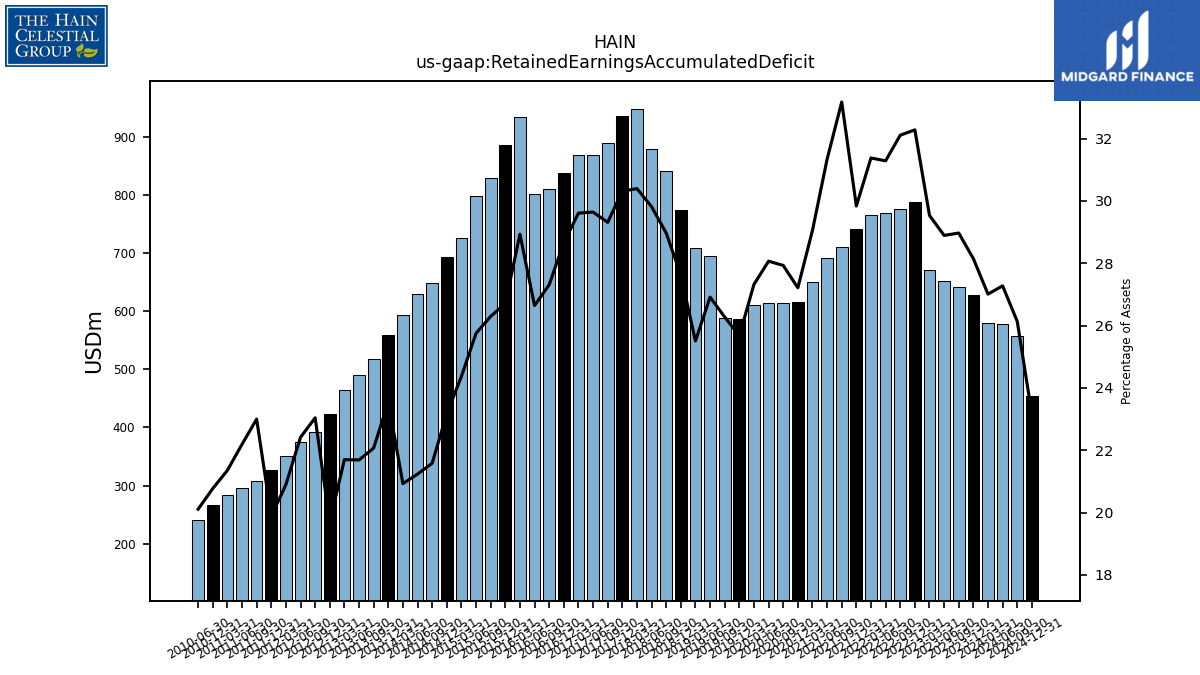
| Retained Earnings Accumulated Deficit | 628.65 | 642.18 | 652.56 | 671.26 | 786.99 | 776.02 | 769.10 | 766.06 | 741.52 | 710.64 | 691.23 | 650.74 | 616.49 | 614.35 | 614.17 | 610.93 | 586.59 | 587.56 | 695.02 | 708.57 | 774.40 | 840.91 | 878.52 | 948.46 | 935.77 | 888.67 | 868.82 | 868.51 | 837.18 | 810.00 | 801.39 | 934.75 | 885.76 | 828.82 | 797.51 | 726.44 | 693.05 | 648.47 | 629.62 | 593.89 | 558.65 | 517.42 | 489.77 | 463.83 | 423.12 | 391.50 | 375.11 | 351.72 | 327.61 | 307.58 | 295.89 | 283.04 | 266.27 | NA | 240.90 | NA | NA | |
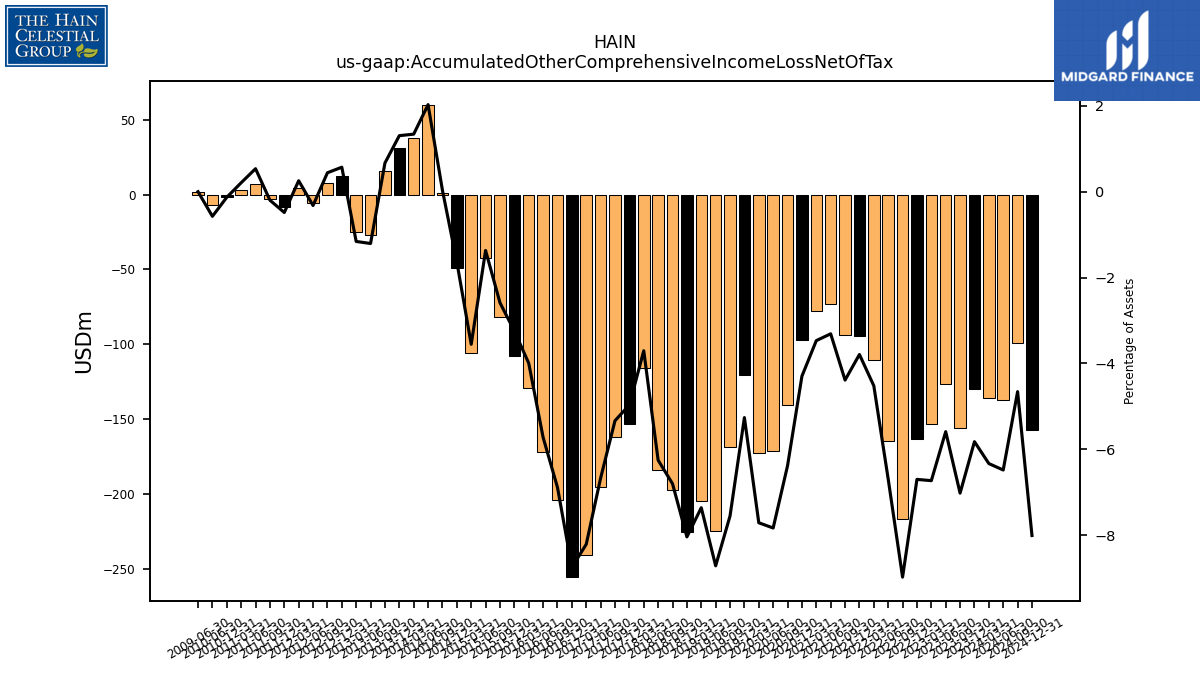
| Accumulated Other Comprehensive Income Loss Net Of Tax | -130.03 | -155.62 | -126.22 | -152.94 | -163.35 | -216.94 | -164.48 | -110.35 | -94.23 | -93.97 | -73.01 | -77.68 | -97.34 | -140.39 | -171.39 | -172.40 | -120.20 | -168.89 | -225.00 | -204.47 | -225.36 | -197.41 | -184.24 | -115.58 | -153.35 | -161.69 | -195.48 | -240.87 | -255.53 | -204.28 | -172.11 | -129.06 | -107.58 | -81.51 | -42.41 | -105.94 | -48.95 | 0.90 | 60.13 | 38.03 | 30.96 | 15.66 | -27.25 | -24.77 | 12.26 | 7.49 | -5.38 | 4.29 | -7.99 | -2.65 | 7.14 | 2.76 | -1.67 | NA | -6.87 | NA | NA | |
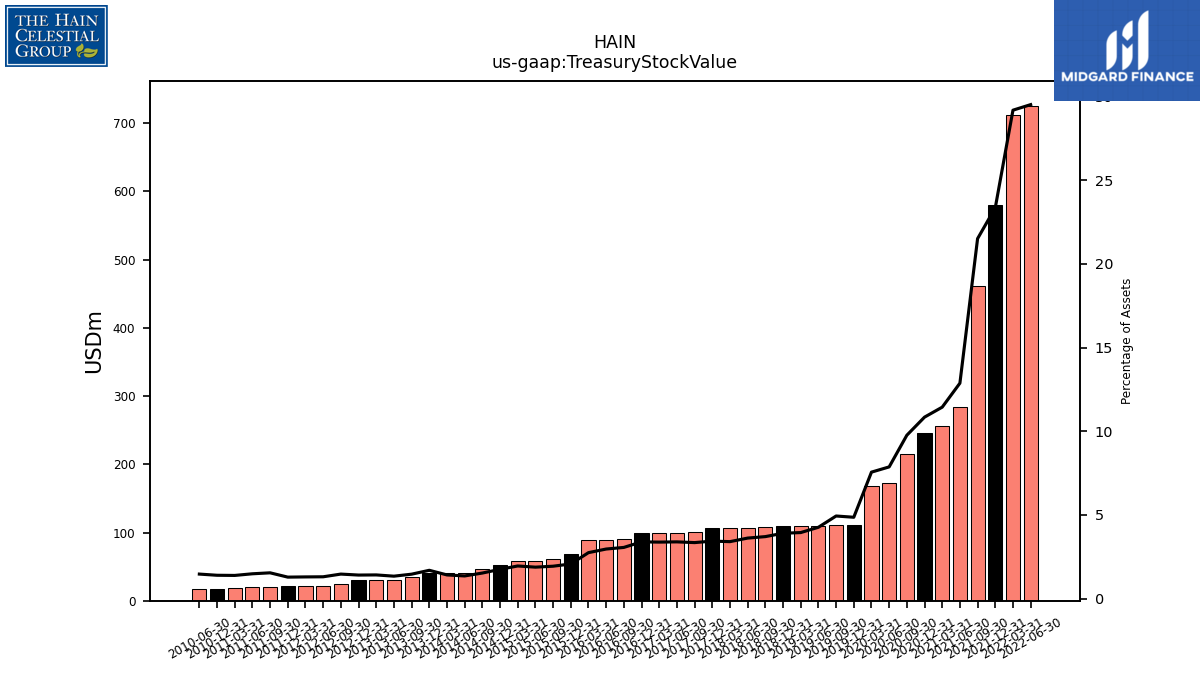
| Treasury Stock Value | NA | NA | NA | NA | NA | NA | 725.68 | 712.58 | 580.51 | 460.82 | 283.96 | 256.23 | 245.65 | 214.71 | 172.19 | 168.95 | 111.02 | 110.35 | 110.04 | 109.58 | 109.43 | 107.49 | 106.51 | 106.17 | 106.00 | 101.41 | 99.31 | 98.98 | 98.98 | 90.66 | 89.05 | 88.67 | 68.58 | 60.96 | 58.15 | 58.07 | 52.27 | 45.84 | 40.09 | 40.09 | 40.08 | 34.17 | 30.23 | 30.21 | 30.19 | 24.86 | 21.79 | 21.78 | 21.12 | 20.58 | 19.75 | 18.33 | 17.85 | NA | 17.53 | NA | NA | |
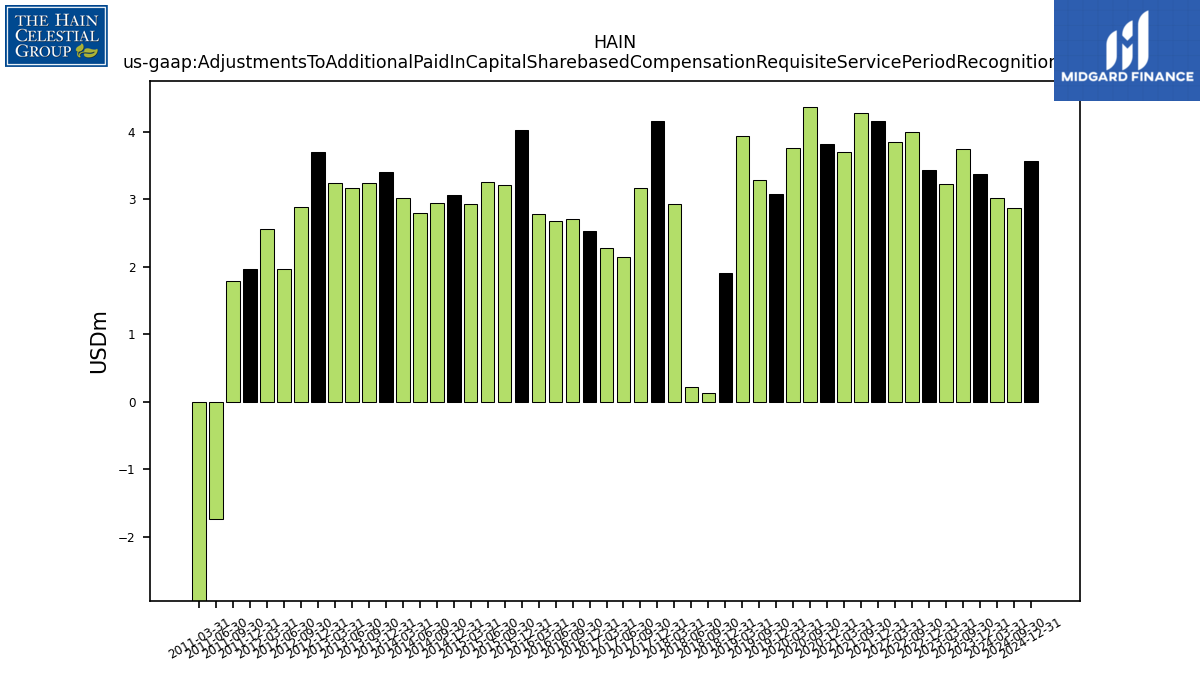
| Adjustments To Additional Paid In Capital Sharebased Compensation Requisite Service Period Recognition Value | 3.38 | 3.74 | NA | 3.23 | 3.44 | 3.99 | NA | 3.85 | 4.16 | 4.29 | NA | 3.70 | 3.82 | 4.37 | NA | 3.76 | 3.08 | 3.28 | NA | 3.94 | 1.91 | 0.14 | 0.22 | 2.94 | 4.16 | 3.16 | 2.14 | 2.28 | 2.53 | 2.70 | 2.68 | 2.78 | 4.02 | 3.21 | 3.26 | 2.94 | 3.06 | 2.94 | 2.79 | 3.02 | 3.40 | 3.24 | 3.17 | 3.24 | 3.71 | 2.89 | 1.97 | 2.56 | 1.97 | 1.79 | -1.74 | -3.38 | NA | NA | NA | NA | NA |
| 2023-12-31 | 2023-09-30 | 2023-06-30 | 2023-03-31 | 2022-12-31 | 2022-09-30 | 2022-06-30 | 2022-03-31 | 2021-12-31 | 2021-09-30 | 2021-06-30 | 2021-03-31 | 2020-12-31 | 2020-09-30 | 2020-06-30 | 2020-03-31 | 2019-12-31 | 2019-09-30 | 2019-06-30 | 2019-03-31 | 2018-12-31 | 2018-09-30 | 2018-06-30 | 2018-03-31 | 2017-12-31 | 2017-09-30 | 2017-06-30 | 2017-03-31 | 2016-12-31 | 2016-09-30 | 2016-06-30 | 2016-03-31 | 2015-12-31 | 2015-09-30 | 2015-06-30 | 2015-03-31 | 2014-12-31 | 2014-09-30 | 2014-06-30 | 2014-03-31 | 2013-12-31 | 2013-09-30 | 2013-06-30 | 2013-03-31 | 2012-12-31 | 2012-09-30 | 2012-06-30 | 2012-03-31 | 2011-12-31 | 2011-09-30 | 2011-06-30 | 2011-03-31 | 2010-12-31 | 2010-09-30 | 2010-06-30 | 2010-03-31 | 2009-12-31 | ||
|---|---|---|---|---|---|---|---|---|---|---|---|---|---|---|---|---|---|---|---|---|---|---|---|---|---|---|---|---|---|---|---|---|---|---|---|---|---|---|---|---|---|---|---|---|---|---|---|---|---|---|---|---|---|---|---|---|---|---|
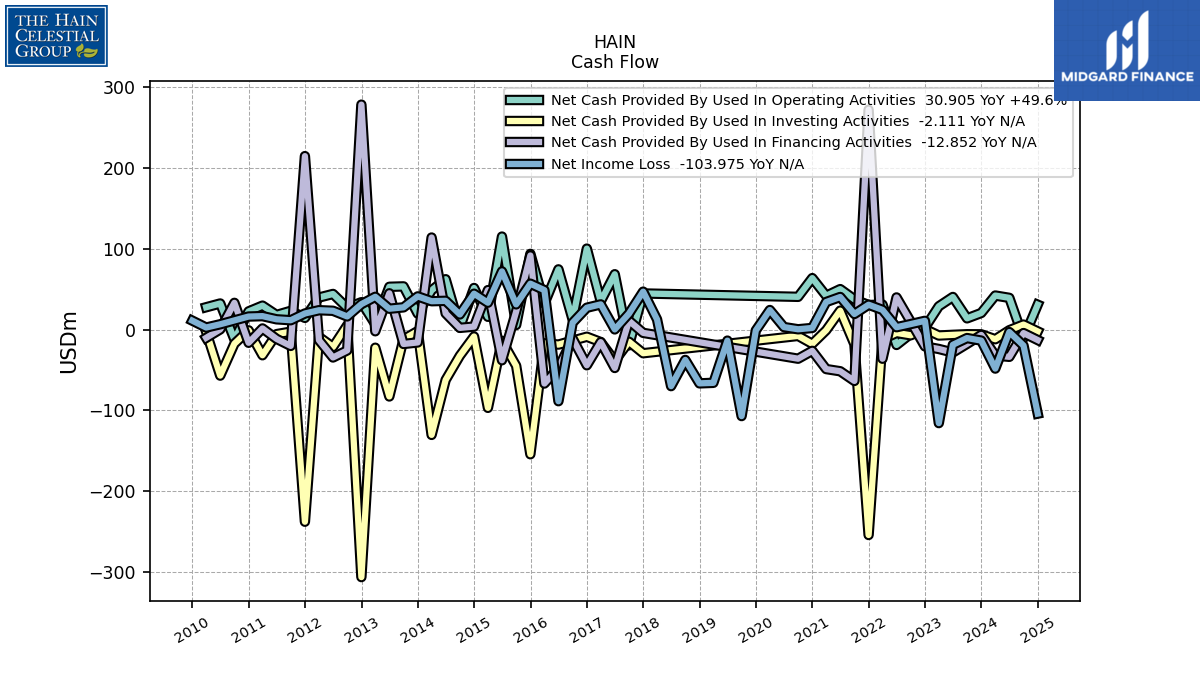
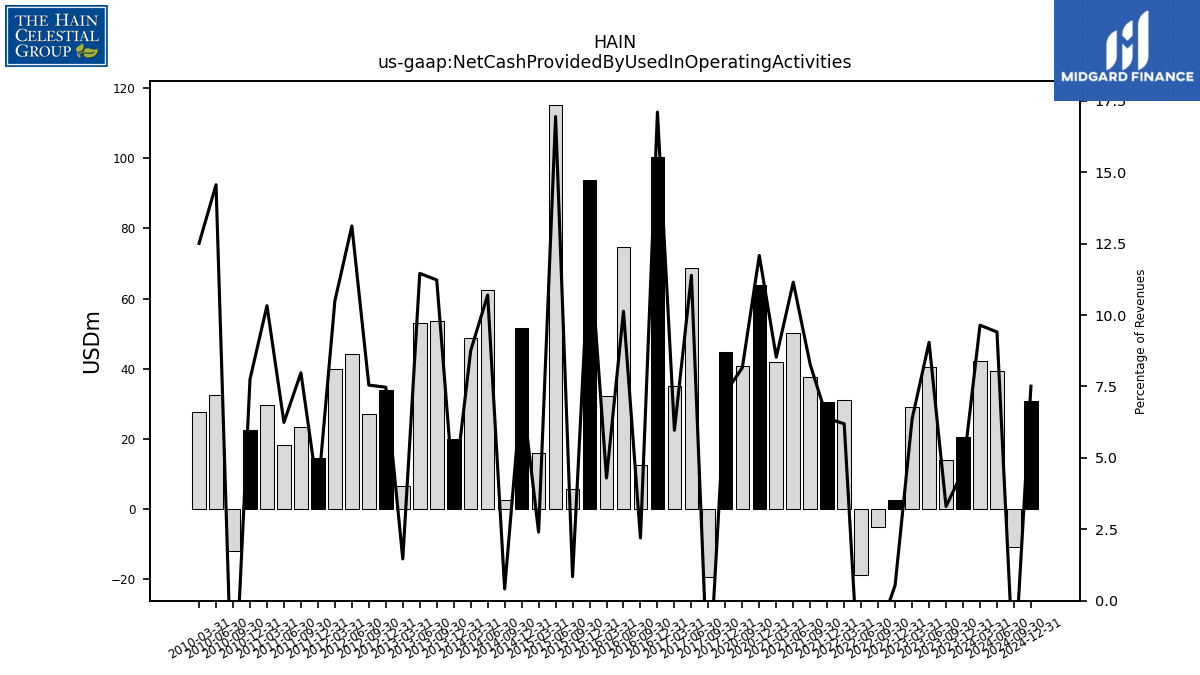
| Net Cash Provided By Used In Operating Activities | 20.66 | 14.03 | 40.51 | 28.96 | 2.46 | -5.12 | -18.95 | 31.16 | 30.45 | 37.59 | 50.24 | 41.99 | 63.86 | 40.67 | NA | NA | NA | NA | NA | NA | NA | NA | NA | NA | 44.86 | -19.44 | 68.67 | 35.14 | 100.40 | 12.41 | 74.72 | 32.21 | 93.86 | 5.79 | 115.31 | 15.92 | 51.64 | 2.61 | 62.49 | 48.79 | 19.88 | 53.61 | 53.10 | 6.68 | 34.03 | 27.16 | 44.24 | 39.81 | 14.59 | 23.32 | 18.23 | 29.78 | 22.63 | -11.98 | 32.44 | 27.78 | NA | |
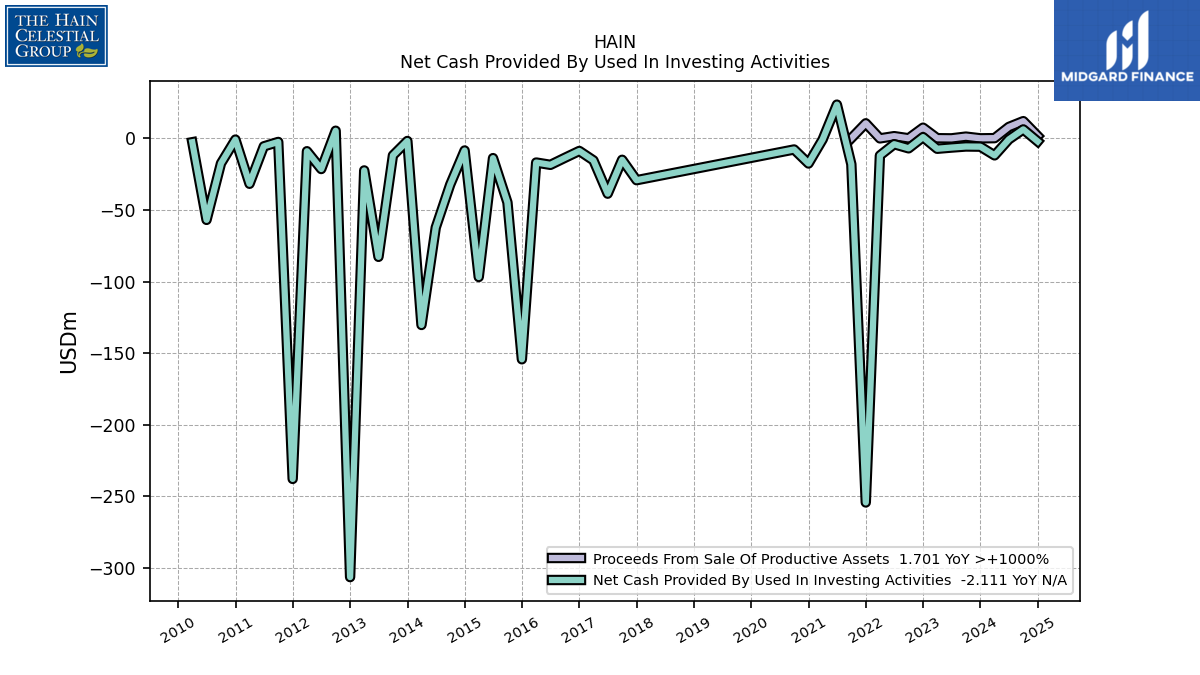
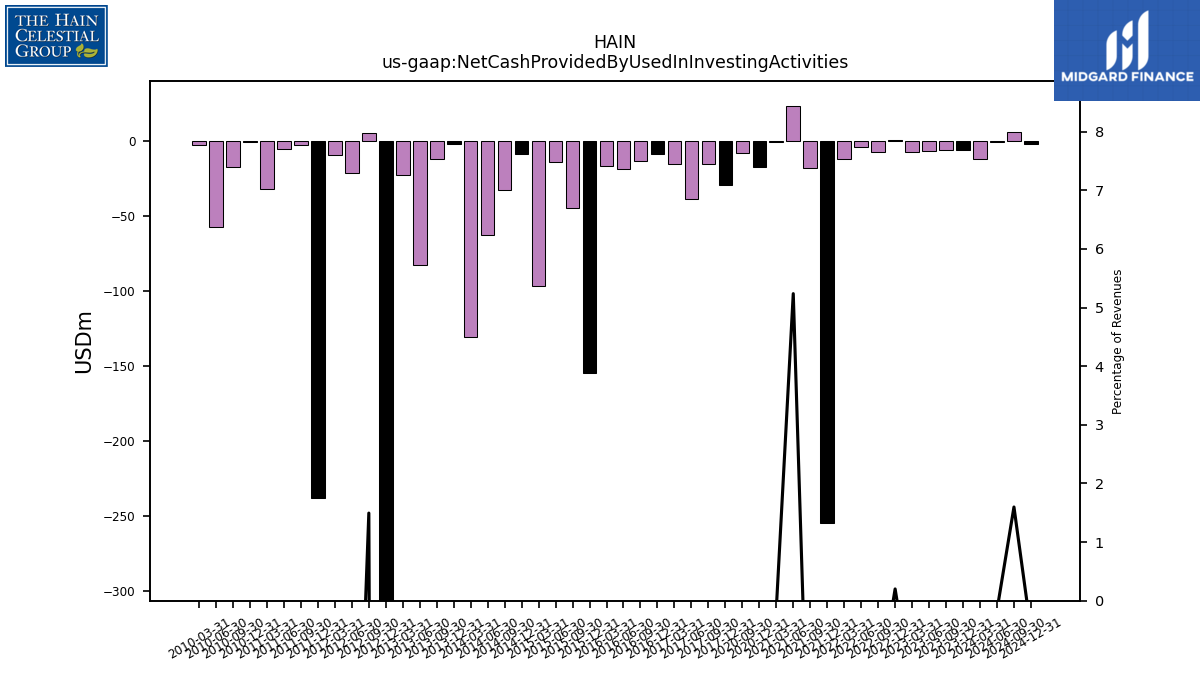
| Net Cash Provided By Used In Investing Activities | -5.75 | -5.65 | -6.40 | -7.23 | 0.91 | -6.93 | -4.04 | -11.93 | -254.29 | -18.05 | 23.60 | -0.72 | -17.52 | -7.73 | NA | NA | NA | NA | NA | NA | NA | NA | NA | NA | -29.18 | -14.91 | -38.60 | -15.34 | -8.75 | -13.55 | -18.46 | -16.84 | -154.29 | -44.75 | -13.76 | -96.82 | -8.43 | -32.28 | -62.25 | -130.32 | -1.79 | -11.87 | -82.73 | -22.35 | -306.44 | 5.38 | -21.40 | -8.94 | -237.86 | -2.46 | -5.54 | -31.70 | -0.82 | -17.43 | -56.91 | -2.66 | NA | |
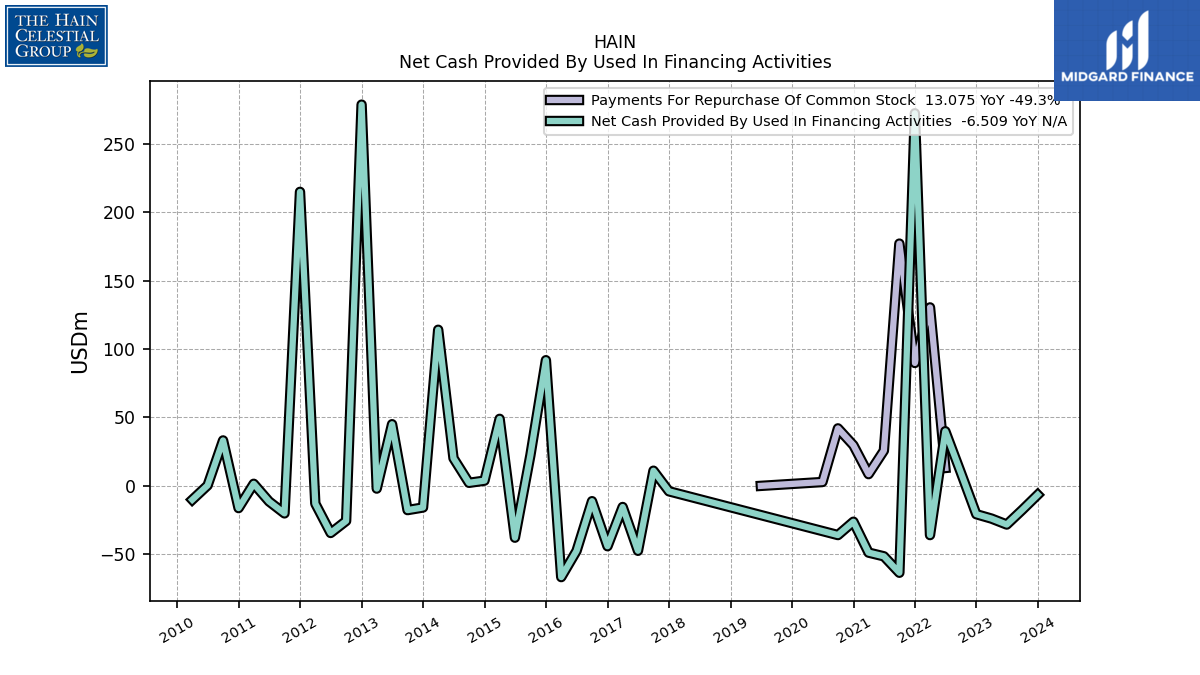
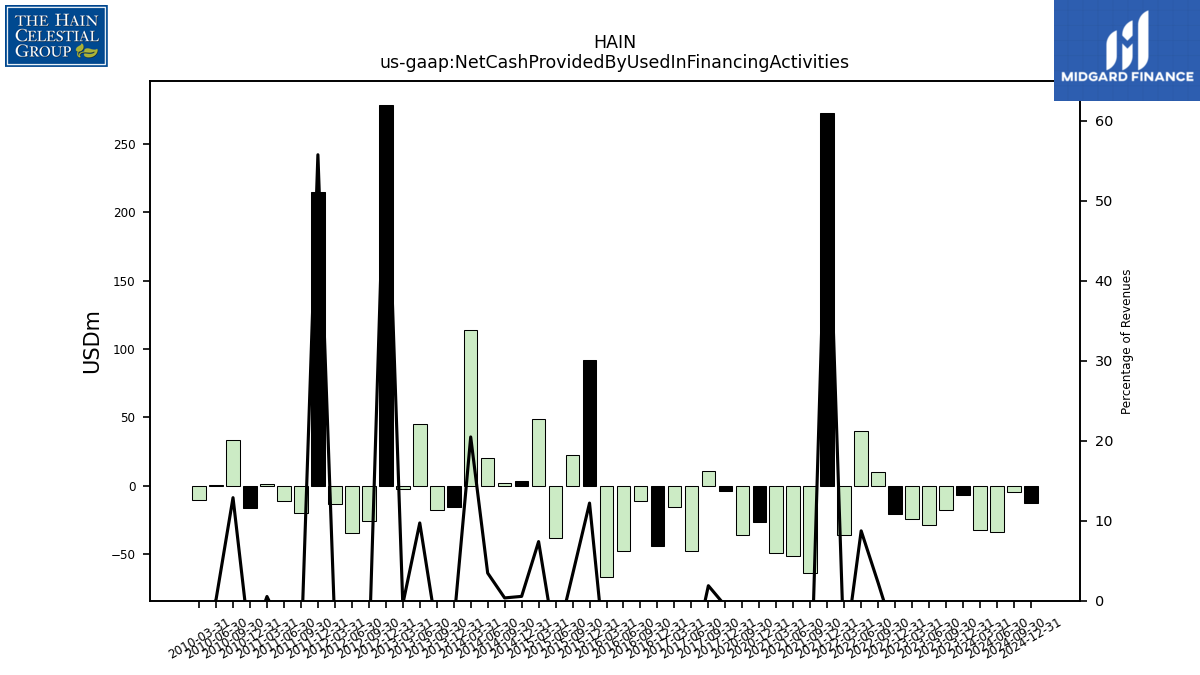
| Net Cash Provided By Used In Financing Activities | -6.51 | -17.58 | -28.27 | -23.90 | -20.72 | 9.82 | 39.93 | -35.99 | 272.36 | -63.52 | -51.49 | -48.79 | -26.21 | -35.96 | NA | NA | NA | NA | NA | NA | NA | NA | NA | NA | -3.96 | 11.09 | -47.46 | -15.43 | -44.12 | -11.18 | -47.55 | -66.71 | 91.87 | 22.46 | -37.88 | 49.01 | 3.81 | 2.23 | 20.21 | 114.13 | -15.81 | -17.71 | 45.07 | -1.99 | 278.70 | -25.65 | -34.44 | -12.97 | 214.94 | -20.12 | -11.38 | 1.52 | -16.25 | 33.23 | 0.34 | -10.14 | NA |
| 2023-12-31 | 2023-09-30 | 2023-06-30 | 2023-03-31 | 2022-12-31 | 2022-09-30 | 2022-06-30 | 2022-03-31 | 2021-12-31 | 2021-09-30 | 2021-06-30 | 2021-03-31 | 2020-12-31 | 2020-09-30 | 2020-06-30 | 2020-03-31 | 2019-12-31 | 2019-09-30 | 2019-06-30 | 2019-03-31 | 2018-12-31 | 2018-09-30 | 2018-06-30 | 2018-03-31 | 2017-12-31 | 2017-09-30 | 2017-06-30 | 2017-03-31 | 2016-12-31 | 2016-09-30 | 2016-06-30 | 2016-03-31 | 2015-12-31 | 2015-09-30 | 2015-06-30 | 2015-03-31 | 2014-12-31 | 2014-09-30 | 2014-06-30 | 2014-03-31 | 2013-12-31 | 2013-09-30 | 2013-06-30 | 2013-03-31 | 2012-12-31 | 2012-09-30 | 2012-06-30 | 2012-03-31 | 2011-12-31 | 2011-09-30 | 2011-06-30 | 2011-03-31 | 2010-12-31 | 2010-09-30 | 2010-06-30 | 2010-03-31 | 2009-12-31 | ||
|---|---|---|---|---|---|---|---|---|---|---|---|---|---|---|---|---|---|---|---|---|---|---|---|---|---|---|---|---|---|---|---|---|---|---|---|---|---|---|---|---|---|---|---|---|---|---|---|---|---|---|---|---|---|---|---|---|---|---|
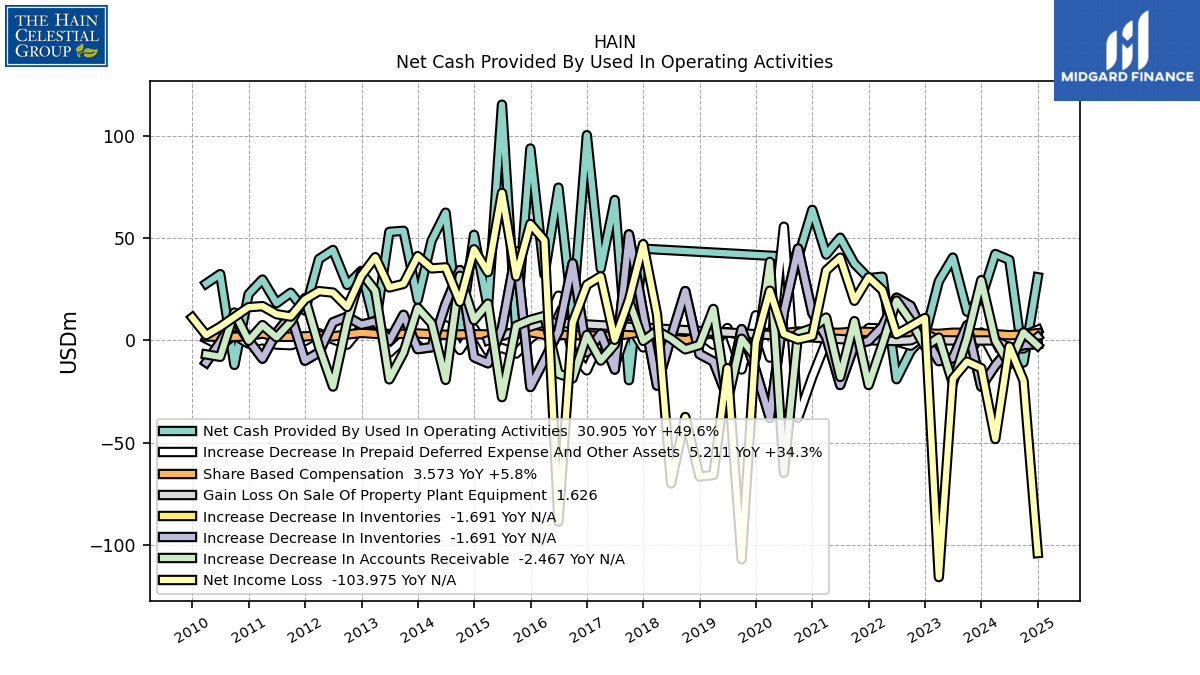
| Net Cash Provided By Used In Operating Activities | 20.66 | 14.03 | 40.51 | 28.96 | 2.46 | -5.12 | -18.95 | 31.16 | 30.45 | 37.59 | 50.24 | 41.99 | 63.86 | 40.67 | NA | NA | NA | NA | NA | NA | NA | NA | NA | NA | 44.86 | -19.44 | 68.67 | 35.14 | 100.40 | 12.41 | 74.72 | 32.21 | 93.86 | 5.79 | 115.31 | 15.92 | 51.64 | 2.61 | 62.49 | 48.79 | 19.88 | 53.61 | 53.10 | 6.68 | 34.03 | 27.16 | 44.24 | 39.81 | 14.59 | 23.32 | 18.23 | 29.78 | 22.63 | -11.98 | 32.44 | 27.78 | NA | |
| Net Income Loss | -13.54 | -10.38 | -18.70 | -115.73 | 10.97 | 6.92 | 3.04 | 24.53 | 30.89 | 19.41 | 40.48 | 34.25 | 2.14 | 0.48 | 3.24 | 24.34 | -0.96 | -107.02 | -13.55 | -65.84 | -66.50 | -37.42 | -69.94 | 12.69 | 47.10 | 19.85 | 0.31 | 31.33 | 27.18 | 8.60 | -88.60 | 48.98 | 56.95 | 31.30 | 72.15 | 33.39 | 44.58 | 18.86 | 35.72 | 35.24 | 41.23 | 27.66 | 25.93 | 40.72 | 31.62 | 16.39 | 23.39 | 24.11 | 20.04 | 11.69 | 12.85 | 16.77 | 16.27 | NA | 6.69 | 2.66 | 11.18 | |
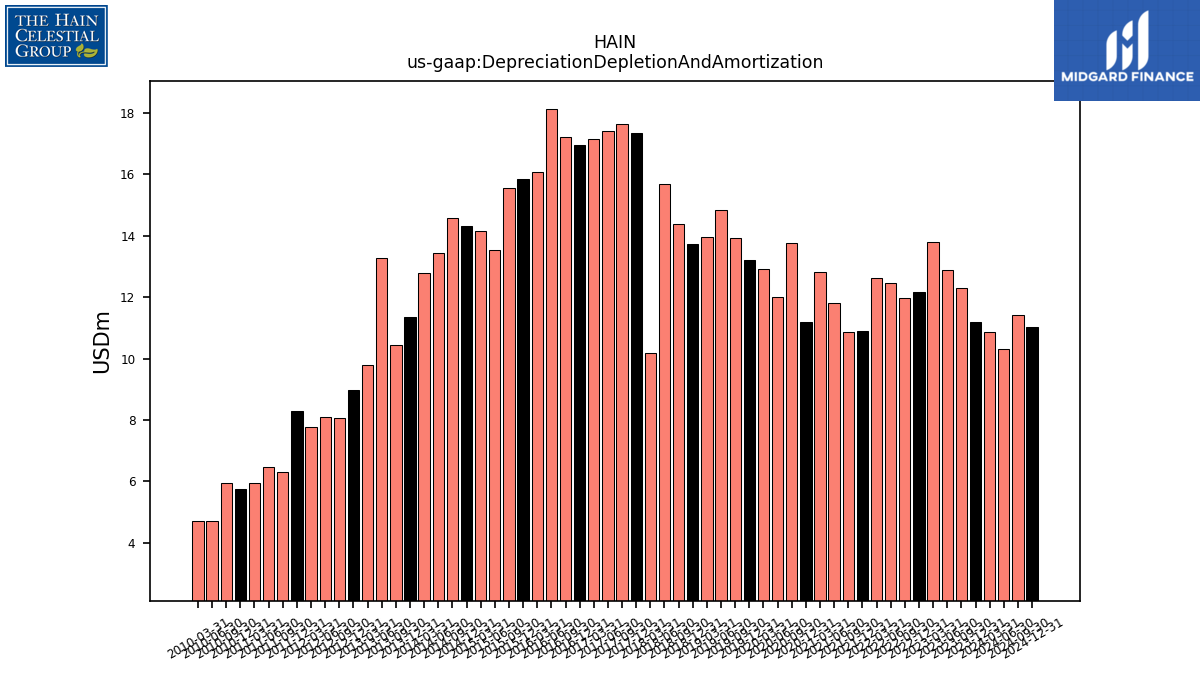
| Depreciation Depletion And Amortization | 11.20 | 12.30 | 12.87 | 13.78 | 12.15 | 11.97 | 12.45 | 12.64 | 10.90 | 10.86 | 11.80 | 12.81 | 11.19 | 13.76 | 12.02 | 12.93 | 13.22 | 13.92 | 14.84 | 13.97 | 13.72 | 14.38 | 15.67 | 10.17 | 17.35 | 17.63 | 17.40 | 17.13 | 16.95 | 17.22 | 18.13 | 16.09 | 15.85 | 15.56 | 13.52 | 14.16 | 14.32 | 14.58 | 13.44 | 12.79 | 11.36 | 10.45 | 13.28 | 9.79 | 8.97 | 8.05 | 8.09 | 7.78 | 8.28 | 6.31 | 6.46 | 5.95 | 5.77 | 5.94 | 4.71 | 4.70 | NA | |
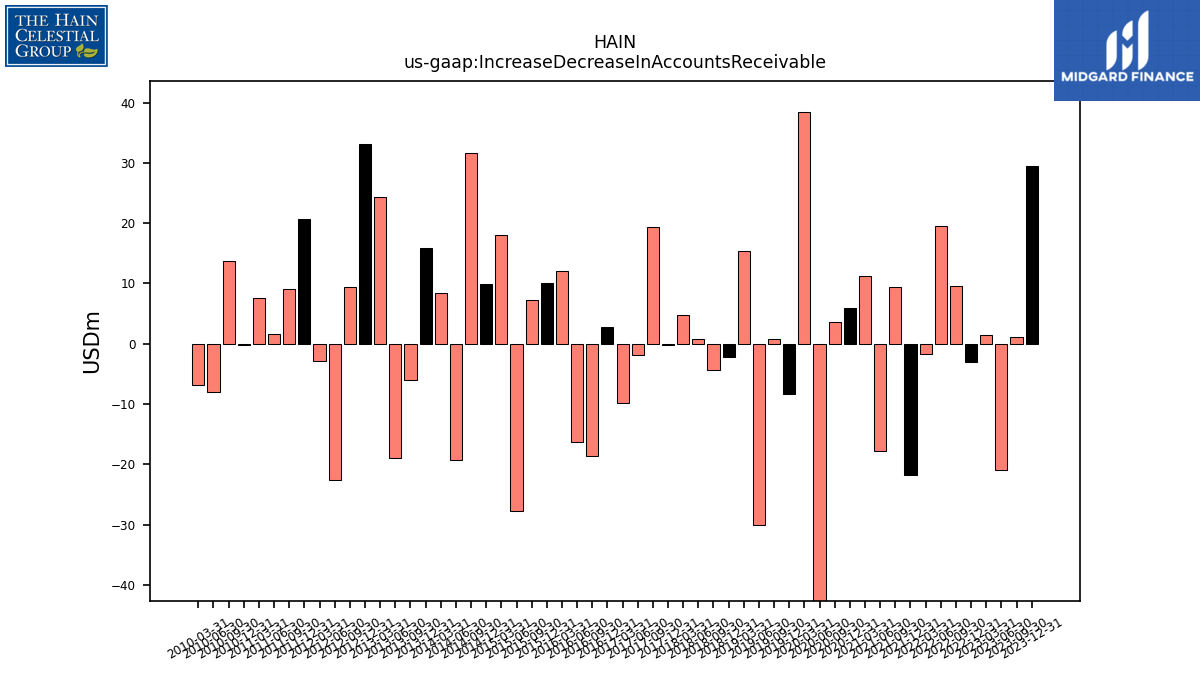
| Increase Decrease In Accounts Receivable | 29.50 | 1.15 | -20.99 | 1.39 | -3.05 | 9.59 | 19.50 | -1.78 | -21.81 | 9.44 | -17.83 | 11.20 | 5.95 | 3.58 | -64.73 | 38.41 | -8.39 | 0.85 | -30.02 | 15.41 | -2.23 | -4.36 | 0.84 | 4.80 | -0.21 | 19.41 | -1.95 | -9.84 | 2.68 | -18.57 | -16.32 | 11.97 | 10.06 | 7.17 | -27.74 | 18.02 | 9.93 | 31.63 | -19.29 | 8.37 | 15.92 | -5.97 | -19.04 | 24.35 | 33.10 | 9.34 | -22.56 | -2.90 | 20.73 | 9.05 | 1.54 | 7.50 | -0.15 | 13.66 | -8.00 | -6.82 | NA | |
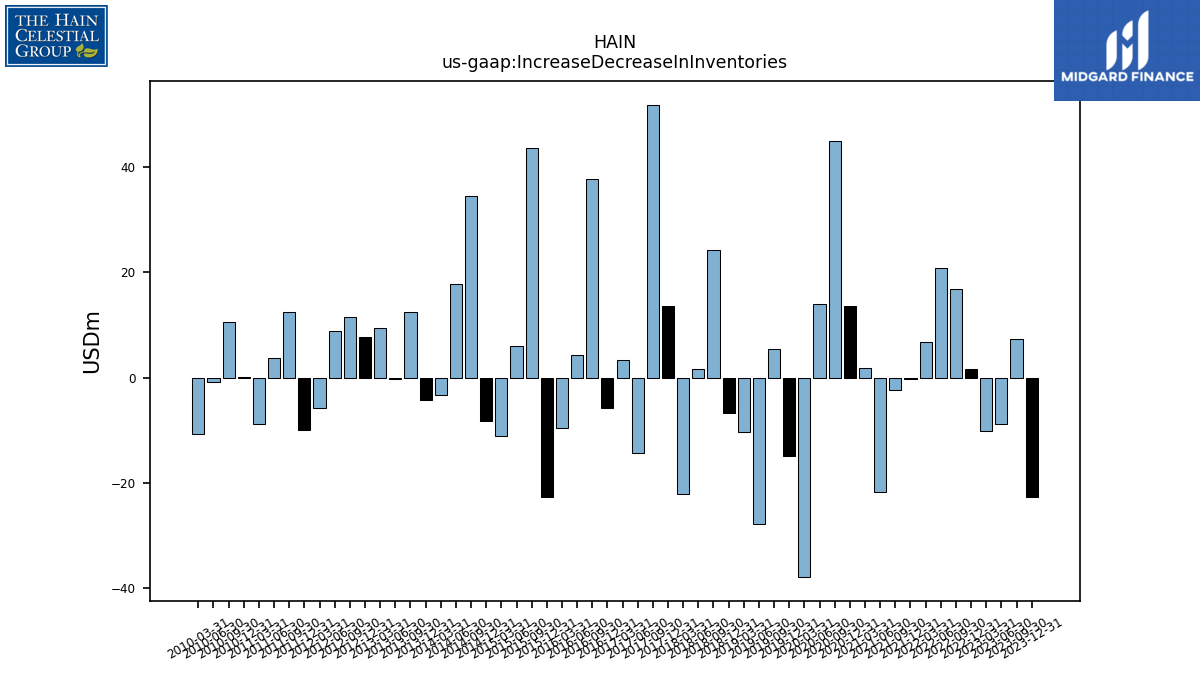
| Increase Decrease In Inventories | -22.59 | 7.42 | -8.72 | -10.10 | 1.72 | 16.91 | 20.90 | 6.84 | -0.20 | -2.28 | -21.78 | 1.79 | 13.55 | 44.96 | 14.04 | -37.89 | -14.90 | 5.51 | -27.82 | -10.30 | -6.67 | 24.15 | 1.68 | -22.08 | 13.59 | 51.84 | -14.23 | 3.27 | -5.79 | 37.71 | 4.34 | -9.49 | -22.77 | 43.66 | 5.99 | -11.14 | -8.18 | 34.43 | 17.79 | -3.29 | -4.23 | 12.51 | -0.30 | 9.33 | 7.71 | 11.60 | 8.87 | -5.87 | -9.87 | 12.47 | 3.76 | -8.89 | 0.17 | 10.64 | -0.79 | -10.75 | NA | |
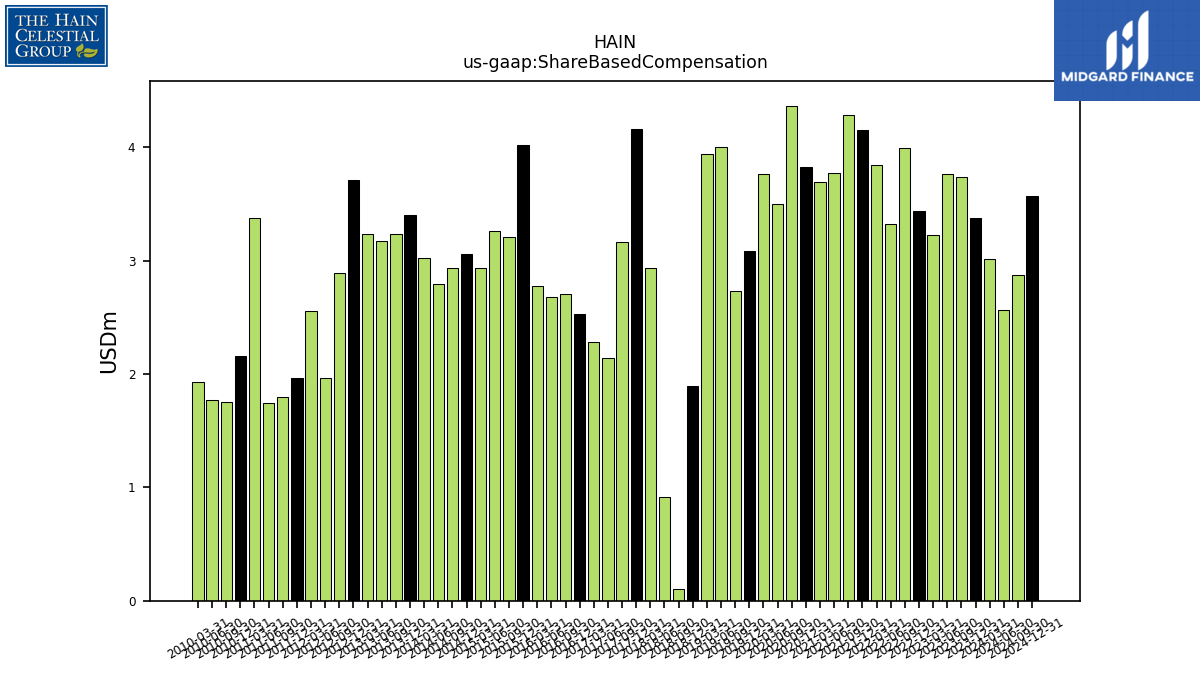
| Share Based Compensation | 3.38 | 3.74 | 3.77 | 3.23 | 3.44 | 3.99 | 3.32 | 3.85 | 4.16 | 4.29 | 3.77 | 3.70 | 3.82 | 4.37 | 3.50 | 3.76 | 3.08 | 2.74 | 4.00 | 3.94 | 1.89 | 0.10 | 0.92 | 2.94 | 4.16 | 3.16 | 2.14 | 2.28 | 2.53 | 2.70 | 2.68 | 2.78 | 4.02 | 3.21 | 3.26 | 2.94 | 3.06 | 2.94 | 2.79 | 3.02 | 3.40 | 3.24 | 3.17 | 3.24 | 3.71 | 2.89 | 1.97 | 2.56 | 1.97 | 1.79 | 1.74 | 3.38 | 2.16 | 1.75 | 1.77 | 1.93 | NA |
| 2023-12-31 | 2023-09-30 | 2023-06-30 | 2023-03-31 | 2022-12-31 | 2022-09-30 | 2022-06-30 | 2022-03-31 | 2021-12-31 | 2021-09-30 | 2021-06-30 | 2021-03-31 | 2020-12-31 | 2020-09-30 | 2020-06-30 | 2020-03-31 | 2019-12-31 | 2019-09-30 | 2019-06-30 | 2019-03-31 | 2018-12-31 | 2018-09-30 | 2018-06-30 | 2018-03-31 | 2017-12-31 | 2017-09-30 | 2017-06-30 | 2017-03-31 | 2016-12-31 | 2016-09-30 | 2016-06-30 | 2016-03-31 | 2015-12-31 | 2015-09-30 | 2015-06-30 | 2015-03-31 | 2014-12-31 | 2014-09-30 | 2014-06-30 | 2014-03-31 | 2013-12-31 | 2013-09-30 | 2013-06-30 | 2013-03-31 | 2012-12-31 | 2012-09-30 | 2012-06-30 | 2012-03-31 | 2011-12-31 | 2011-09-30 | 2011-06-30 | 2011-03-31 | 2010-12-31 | 2010-09-30 | 2010-06-30 | 2010-03-31 | 2009-12-31 | ||
|---|---|---|---|---|---|---|---|---|---|---|---|---|---|---|---|---|---|---|---|---|---|---|---|---|---|---|---|---|---|---|---|---|---|---|---|---|---|---|---|---|---|---|---|---|---|---|---|---|---|---|---|---|---|---|---|---|---|---|
| Net Cash Provided By Used In Investing Activities | -5.75 | -5.65 | -6.40 | -7.23 | 0.91 | -6.93 | -4.04 | -11.93 | -254.29 | -18.05 | 23.60 | -0.72 | -17.52 | -7.73 | NA | NA | NA | NA | NA | NA | NA | NA | NA | NA | -29.18 | -14.91 | -38.60 | -15.34 | -8.75 | -13.55 | -18.46 | -16.84 | -154.29 | -44.75 | -13.76 | -96.82 | -8.43 | -32.28 | -62.25 | -130.32 | -1.79 | -11.87 | -82.73 | -22.35 | -306.44 | 5.38 | -21.40 | -8.94 | -237.86 | -2.46 | -5.54 | -31.70 | -0.82 | -17.43 | -56.91 | -2.66 | NA |
| 2023-12-31 | 2023-09-30 | 2023-06-30 | 2023-03-31 | 2022-12-31 | 2022-09-30 | 2022-06-30 | 2022-03-31 | 2021-12-31 | 2021-09-30 | 2021-06-30 | 2021-03-31 | 2020-12-31 | 2020-09-30 | 2020-06-30 | 2020-03-31 | 2019-12-31 | 2019-09-30 | 2019-06-30 | 2019-03-31 | 2018-12-31 | 2018-09-30 | 2018-06-30 | 2018-03-31 | 2017-12-31 | 2017-09-30 | 2017-06-30 | 2017-03-31 | 2016-12-31 | 2016-09-30 | 2016-06-30 | 2016-03-31 | 2015-12-31 | 2015-09-30 | 2015-06-30 | 2015-03-31 | 2014-12-31 | 2014-09-30 | 2014-06-30 | 2014-03-31 | 2013-12-31 | 2013-09-30 | 2013-06-30 | 2013-03-31 | 2012-12-31 | 2012-09-30 | 2012-06-30 | 2012-03-31 | 2011-12-31 | 2011-09-30 | 2011-06-30 | 2011-03-31 | 2010-12-31 | 2010-09-30 | 2010-06-30 | 2010-03-31 | 2009-12-31 | ||
|---|---|---|---|---|---|---|---|---|---|---|---|---|---|---|---|---|---|---|---|---|---|---|---|---|---|---|---|---|---|---|---|---|---|---|---|---|---|---|---|---|---|---|---|---|---|---|---|---|---|---|---|---|---|---|---|---|---|---|
| Net Cash Provided By Used In Financing Activities | -6.51 | -17.58 | -28.27 | -23.90 | -20.72 | 9.82 | 39.93 | -35.99 | 272.36 | -63.52 | -51.49 | -48.79 | -26.21 | -35.96 | NA | NA | NA | NA | NA | NA | NA | NA | NA | NA | -3.96 | 11.09 | -47.46 | -15.43 | -44.12 | -11.18 | -47.55 | -66.71 | 91.87 | 22.46 | -37.88 | 49.01 | 3.81 | 2.23 | 20.21 | 114.13 | -15.81 | -17.71 | 45.07 | -1.99 | 278.70 | -25.65 | -34.44 | -12.97 | 214.94 | -20.12 | -11.38 | 1.52 | -16.25 | 33.23 | 0.34 | -10.14 | NA | |
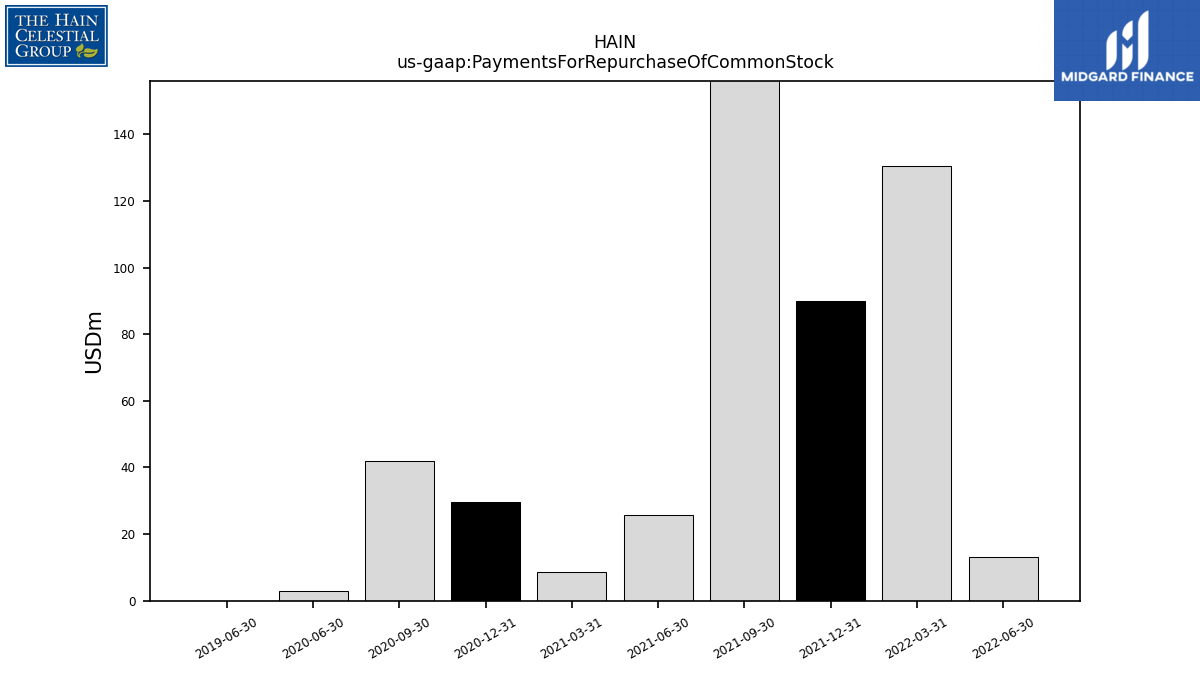
| Payments For Repurchase Of Common Stock | NA | NA | NA | NA | NA | NA | 13.07 | 130.47 | 89.83 | 177.10 | 25.77 | 8.56 | 29.68 | 42.05 | 2.81 | NA | NA | NA | 0.00 | NA | NA | NA | NA | NA | NA | NA | NA | NA | NA | NA | NA | NA | NA | NA | NA | NA | NA | NA | NA | NA | NA | NA | NA | NA | NA | NA | NA | NA | NA | NA | NA | NA | NA | NA | NA | NA | NA |
| 2023-12-31 | 2023-09-30 | 2023-06-30 | 2023-03-31 | 2022-12-31 | 2022-09-30 | 2022-06-30 | 2022-03-31 | 2021-12-31 | 2021-09-30 | 2021-06-30 | 2021-03-31 | 2020-12-31 | 2020-09-30 | 2020-06-30 | 2020-03-31 | 2019-12-31 | 2019-09-30 | 2019-06-30 | 2019-03-31 | 2018-12-31 | 2018-09-30 | 2018-06-30 | 2018-03-31 | 2017-12-31 | 2017-09-30 | 2017-06-30 | 2017-03-31 | 2016-12-31 | 2016-09-30 | 2016-06-30 | 2016-03-31 | 2015-12-31 | 2015-09-30 | 2015-06-30 | 2015-03-31 | 2014-12-31 | 2014-09-30 | 2014-06-30 | 2014-03-31 | 2013-12-31 | 2013-09-30 | 2013-06-30 | 2013-03-31 | 2012-12-31 | 2012-09-30 | 2012-06-30 | 2012-03-31 | 2011-12-31 | 2011-09-30 | 2011-06-30 | 2011-03-31 | 2010-12-31 | 2010-09-30 | 2010-06-30 | 2010-03-31 | 2009-12-31 | ||
|---|---|---|---|---|---|---|---|---|---|---|---|---|---|---|---|---|---|---|---|---|---|---|---|---|---|---|---|---|---|---|---|---|---|---|---|---|---|---|---|---|---|---|---|---|---|---|---|---|---|---|---|---|---|---|---|---|---|---|
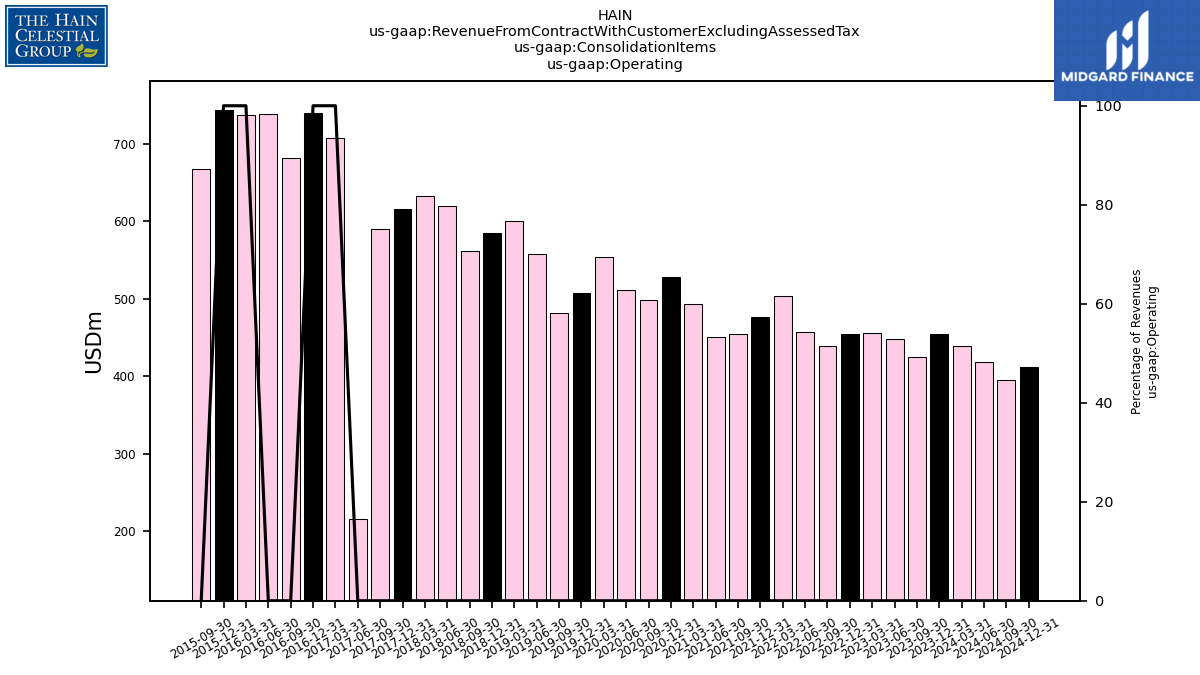
| Revenues | 454.10 | 425.03 | 447.84 | 455.24 | 454.21 | 439.35 | 457.01 | 502.94 | 476.94 | 454.90 | 450.65 | 492.60 | 528.42 | 498.63 | 511.75 | 553.30 | 506.78 | 482.08 | 557.68 | 599.80 | 584.16 | 560.83 | 619.60 | 632.72 | 616.23 | 589.22 | 602.89 | 588.80 | 587.02 | 564.79 | 737.55 | 749.86 | 752.59 | 687.19 | 680.57 | 662.74 | 696.38 | 631.26 | 583.83 | 557.42 | 534.88 | 477.48 | 463.47 | 456.09 | 455.32 | 359.81 | 337.23 | 379.36 | 385.55 | 292.36 | 292.03 | 288.39 | 291.88 | 257.96 | 222.79 | 222.10 | 241.97 | |
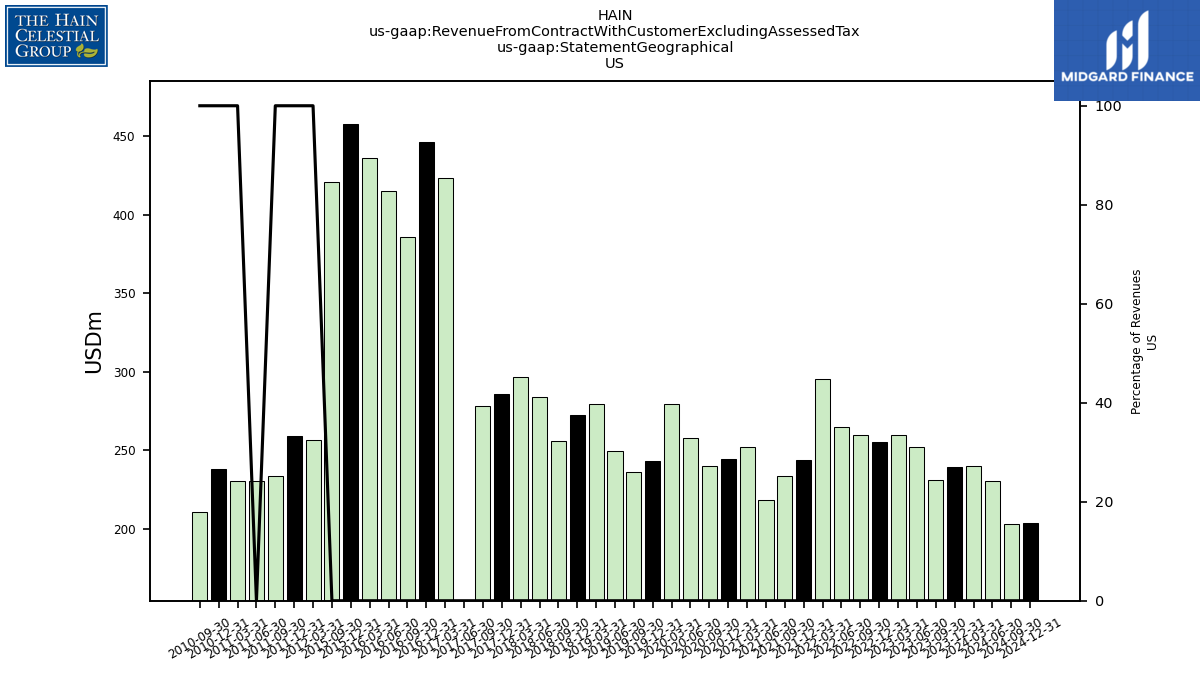
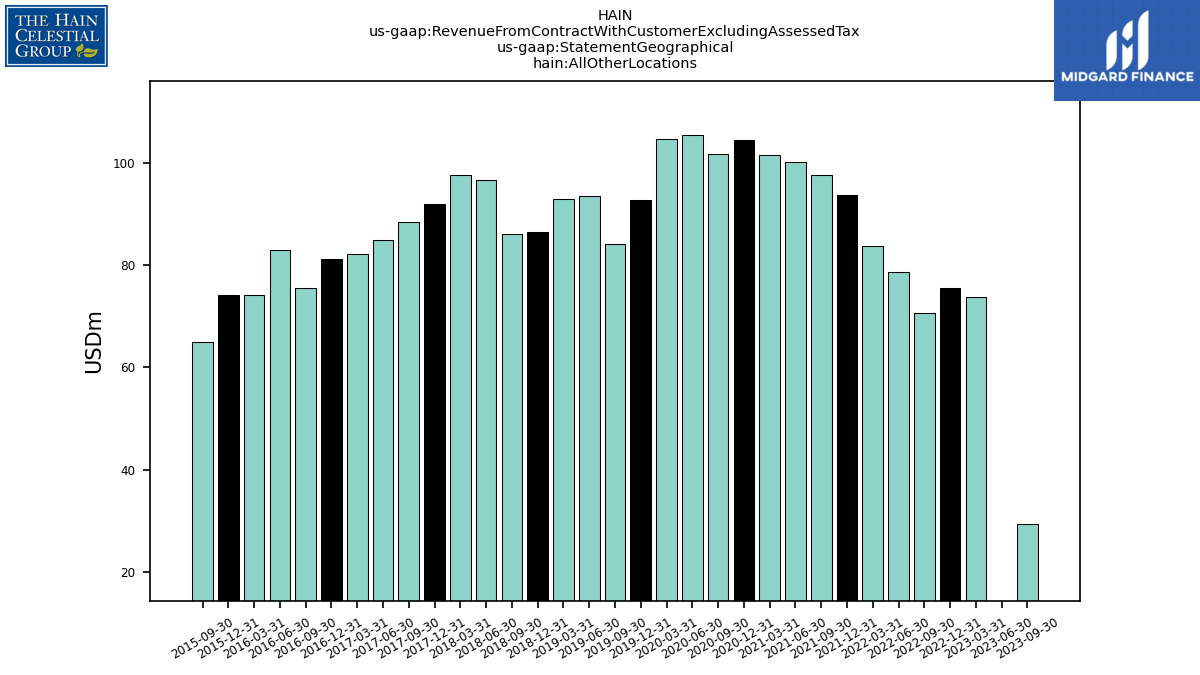
| Revenue From Contract With Customer Excluding Assessed Tax | 454.10 | 425.03 | 447.84 | 455.24 | 454.21 | 439.35 | 457.01 | 502.94 | 476.94 | 454.90 | 450.65 | 492.60 | 528.42 | 498.63 | 511.75 | 553.30 | 506.78 | 482.08 | 557.68 | 599.80 | 584.16 | 560.83 | 619.60 | 632.72 | 616.23 | 589.22 | 602.89 | 588.80 | 587.02 | 564.79 | 737.55 | 749.86 | 752.59 | 687.19 | 680.57 | 662.74 | 696.38 | 631.26 | 583.83 | 557.42 | 534.88 | 477.48 | 463.47 | 456.09 | 455.32 | 359.81 | 337.23 | 379.36 | 385.55 | 292.36 | 292.03 | 288.39 | 291.88 | 257.96 | 222.79 | 222.10 | 241.97 | |
| Operating | 454.10 | 425.03 | 447.84 | 455.24 | 454.21 | 439.35 | 457.01 | 502.94 | 476.94 | 454.90 | 450.65 | 492.60 | 528.42 | 498.63 | 511.75 | 553.30 | 506.78 | 482.08 | 557.68 | 599.80 | 584.16 | 560.83 | 619.60 | 632.72 | 616.23 | 589.22 | 215.48 | 706.56 | 740.00 | 681.46 | 737.55 | 736.66 | 743.44 | 667.73 | NA | NA | NA | NA | NA | NA | NA | NA | NA | NA | NA | NA | NA | NA | NA | NA | NA | NA | NA | NA | NA | NA | NA | |
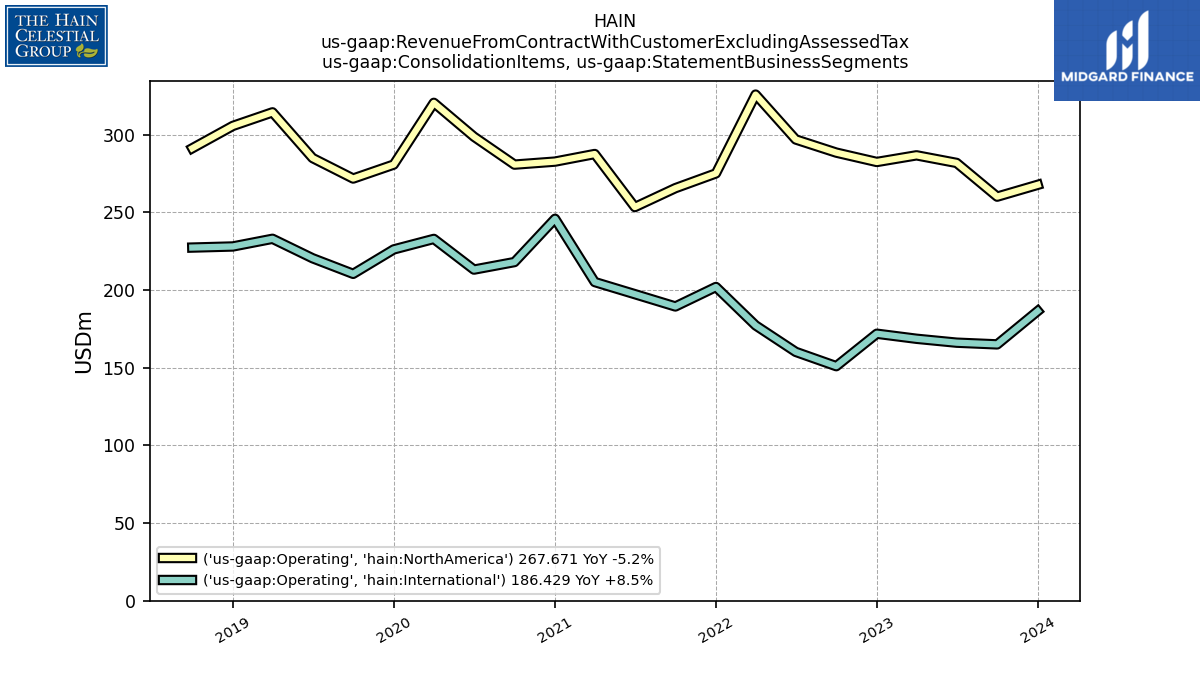
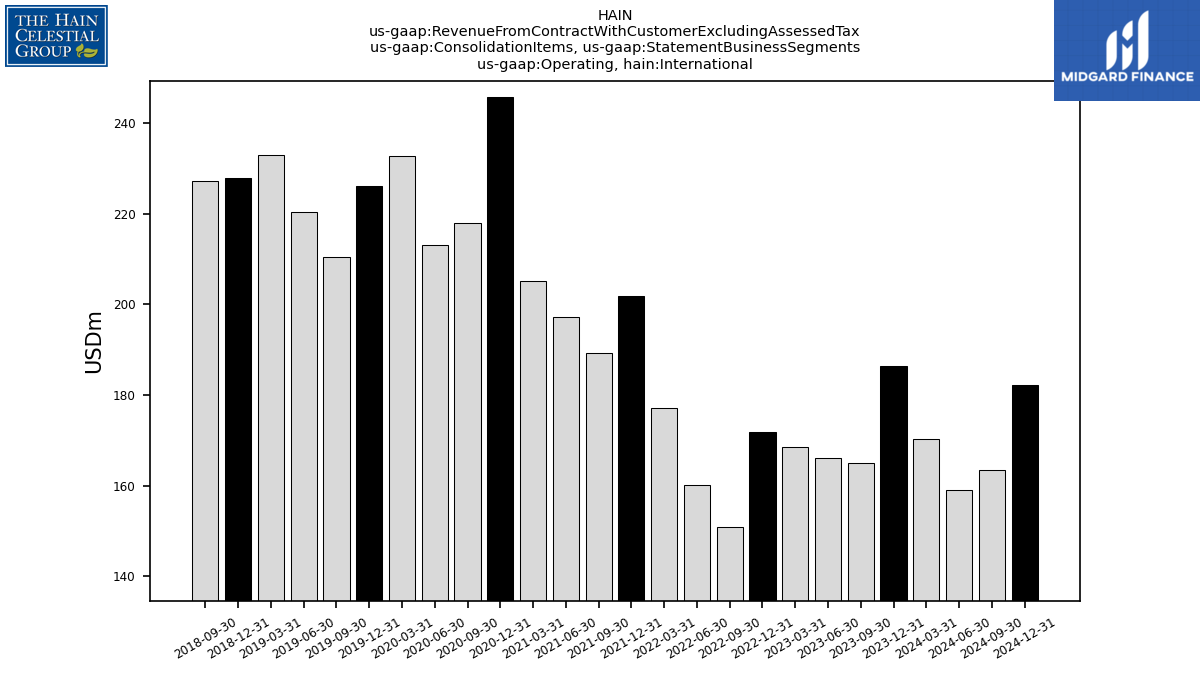
| Operating, International | 186.43 | 164.97 | 166.09 | 168.59 | 171.85 | 150.96 | 160.16 | 177.20 | 201.93 | 189.38 | 197.31 | 205.10 | 245.81 | 217.96 | 213.10 | 232.86 | 226.09 | 210.38 | 220.41 | 232.94 | 227.99 | 227.29 | NA | NA | NA | NA | NA | NA | NA | NA | NA | NA | NA | NA | NA | NA | NA | NA | NA | NA | NA | NA | NA | NA | NA | NA | NA | NA | NA | NA | NA | NA | NA | NA | NA | NA | NA | |
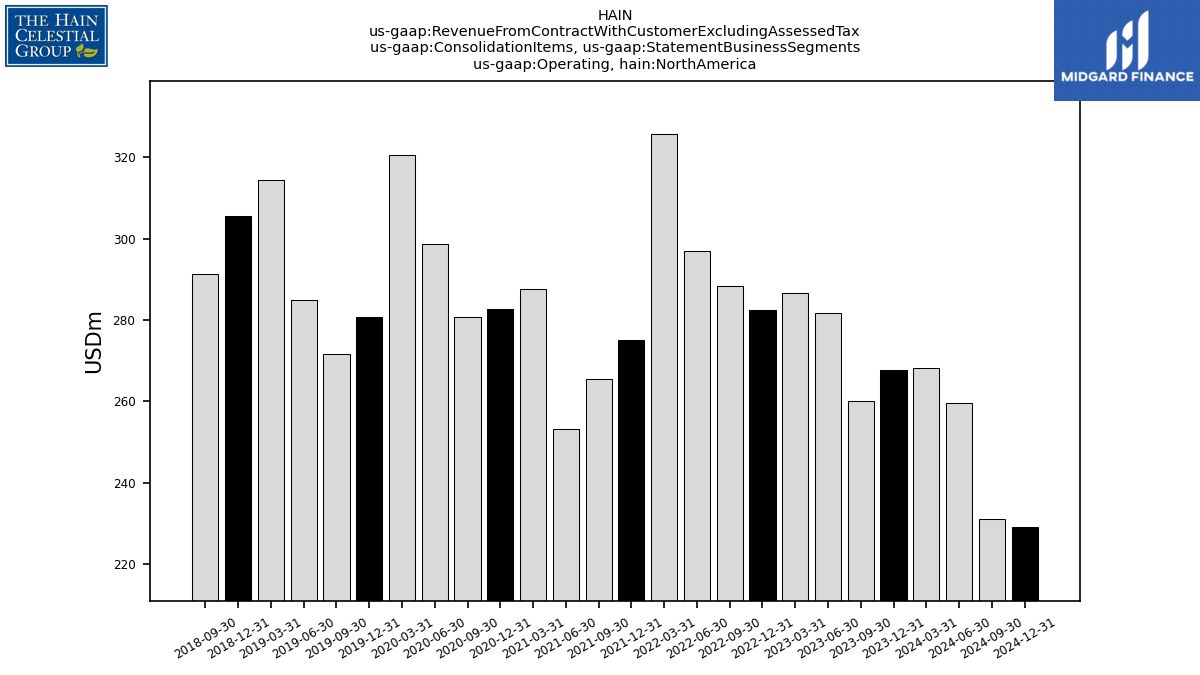
| Operating, North America | 267.67 | 260.05 | 281.76 | 286.65 | 282.36 | 288.40 | 296.85 | 325.74 | 275.01 | 265.52 | 253.35 | 287.50 | 282.61 | 280.67 | 298.64 | 320.44 | 280.69 | 271.70 | 284.89 | 314.32 | 305.57 | 291.19 | NA | NA | NA | NA | NA | NA | NA | NA | NA | NA | NA | NA | NA | NA | NA | NA | NA | NA | NA | NA | NA | NA | NA | NA | NA | NA | NA | NA | NA | NA | NA | NA | NA | NA | NA | |
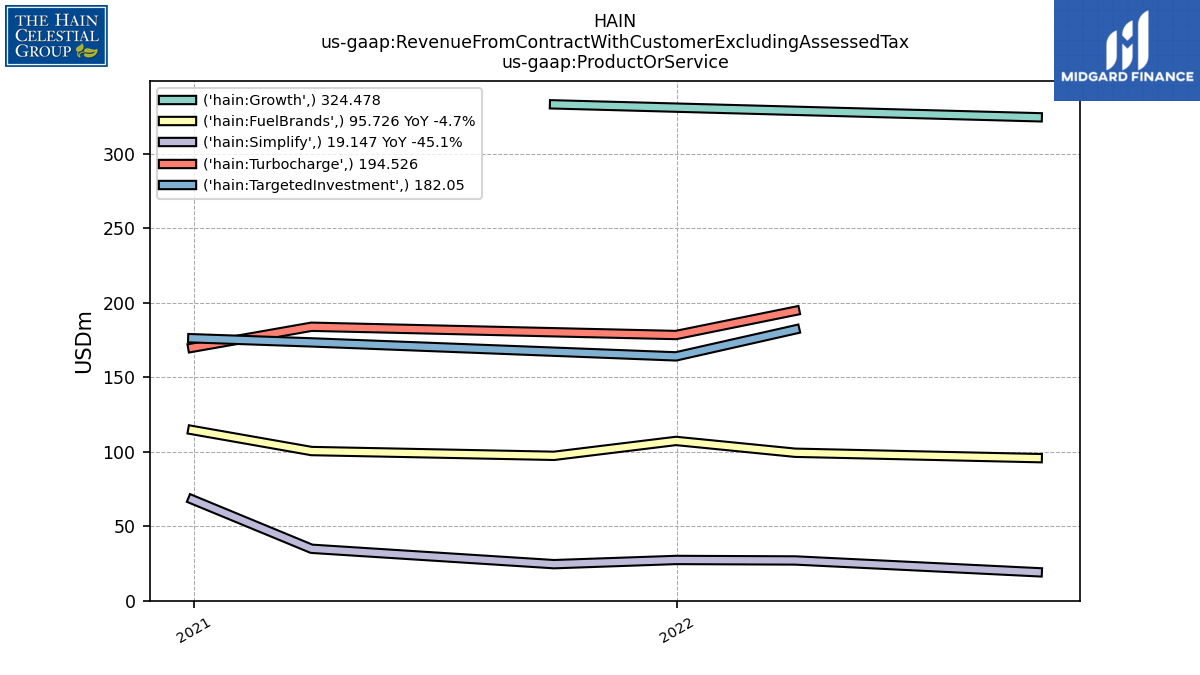
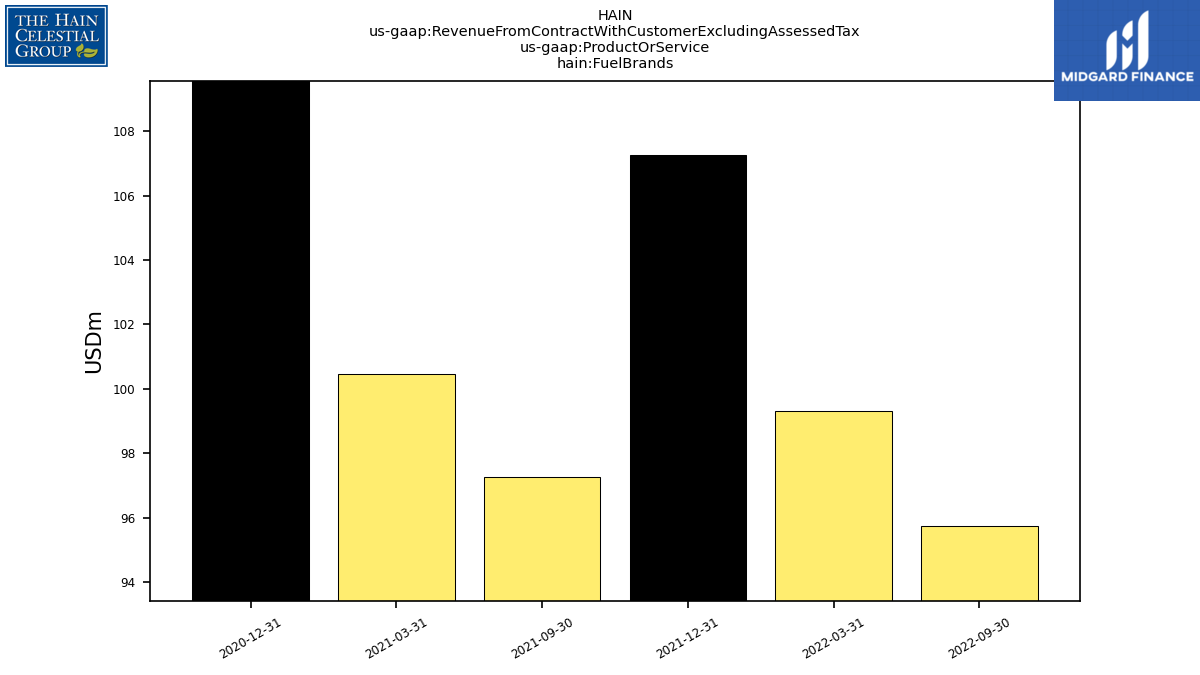
| Fuel Brands | NA | NA | NA | NA | NA | 95.73 | NA | 99.32 | 107.25 | 97.25 | NA | 100.47 | 114.53 | NA | NA | NA | NA | NA | NA | NA | NA | NA | NA | NA | NA | NA | NA | NA | NA | NA | NA | NA | NA | NA | NA | NA | NA | NA | NA | NA | NA | NA | NA | NA | NA | NA | NA | NA | NA | NA | NA | NA | NA | NA | NA | NA | NA | |
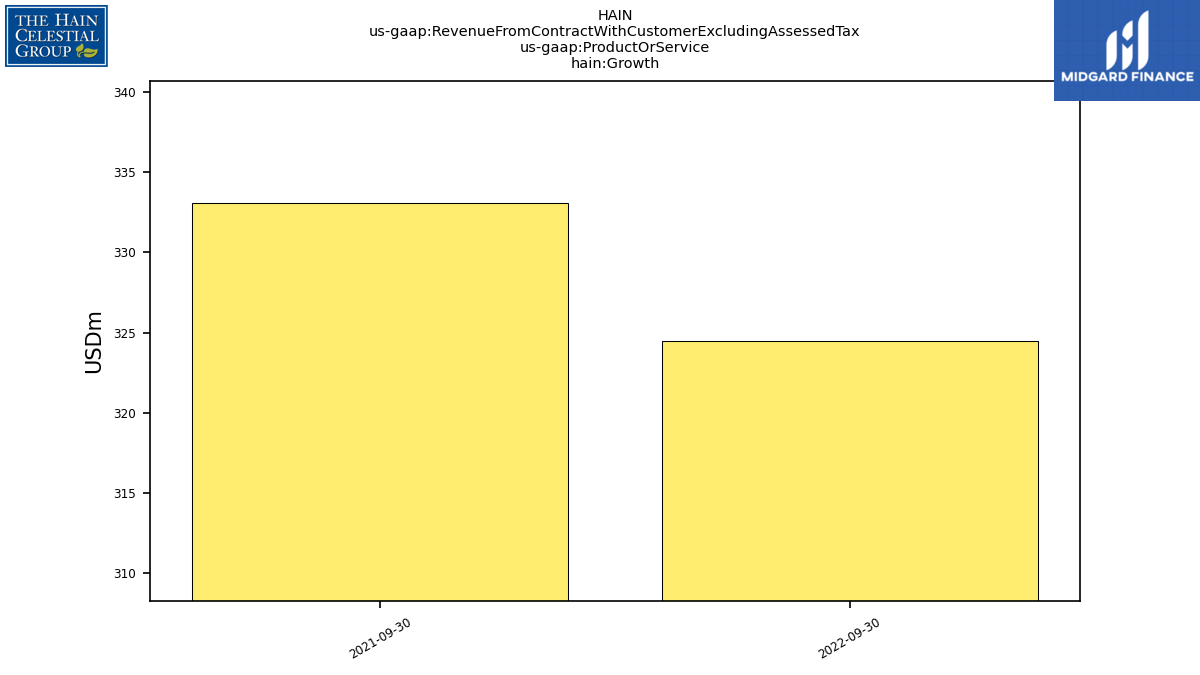
| Growth | NA | NA | NA | NA | NA | 324.48 | NA | NA | NA | 333.10 | NA | NA | NA | NA | NA | NA | NA | NA | NA | NA | NA | NA | NA | NA | NA | NA | NA | NA | NA | NA | NA | NA | NA | NA | NA | NA | NA | NA | NA | NA | NA | NA | NA | NA | NA | NA | NA | NA | NA | NA | NA | NA | NA | NA | NA | NA | NA | |
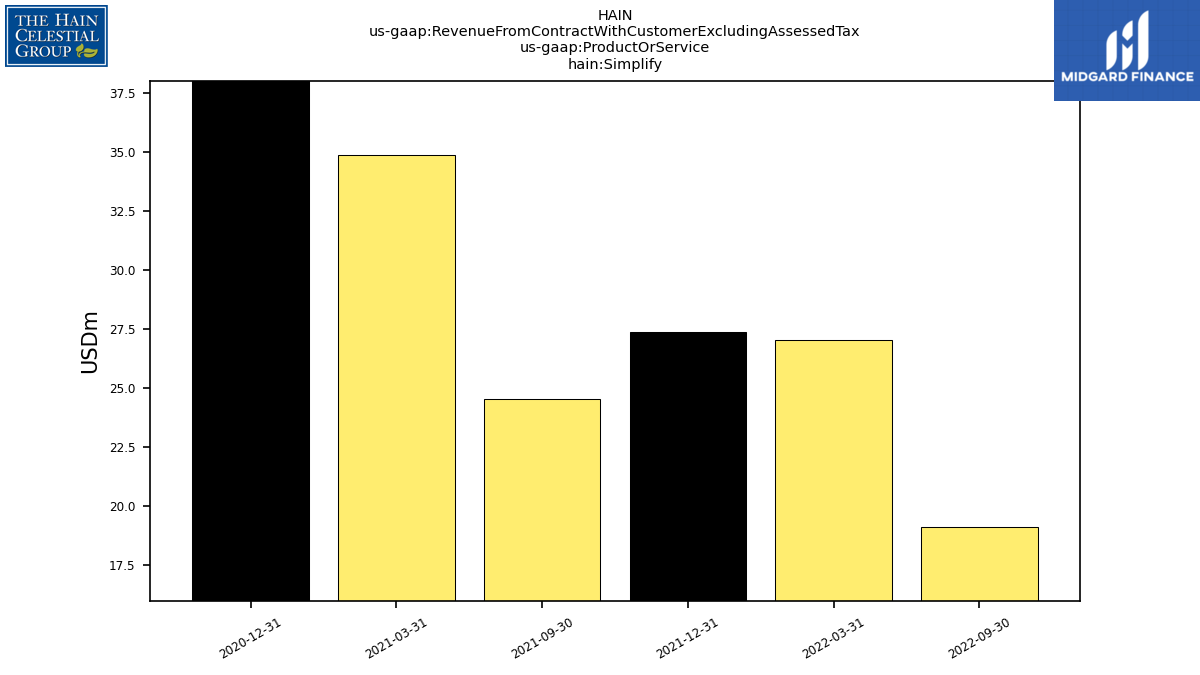
| Simplify | NA | NA | NA | NA | NA | 19.15 | NA | 27.04 | 27.37 | 24.55 | NA | 34.88 | 67.92 | NA | NA | NA | NA | NA | NA | NA | NA | NA | NA | NA | NA | NA | NA | NA | NA | NA | NA | NA | NA | NA | NA | NA | NA | NA | NA | NA | NA | NA | NA | NA | NA | NA | NA | NA | NA | NA | NA | NA | NA | NA | NA | NA | NA | |
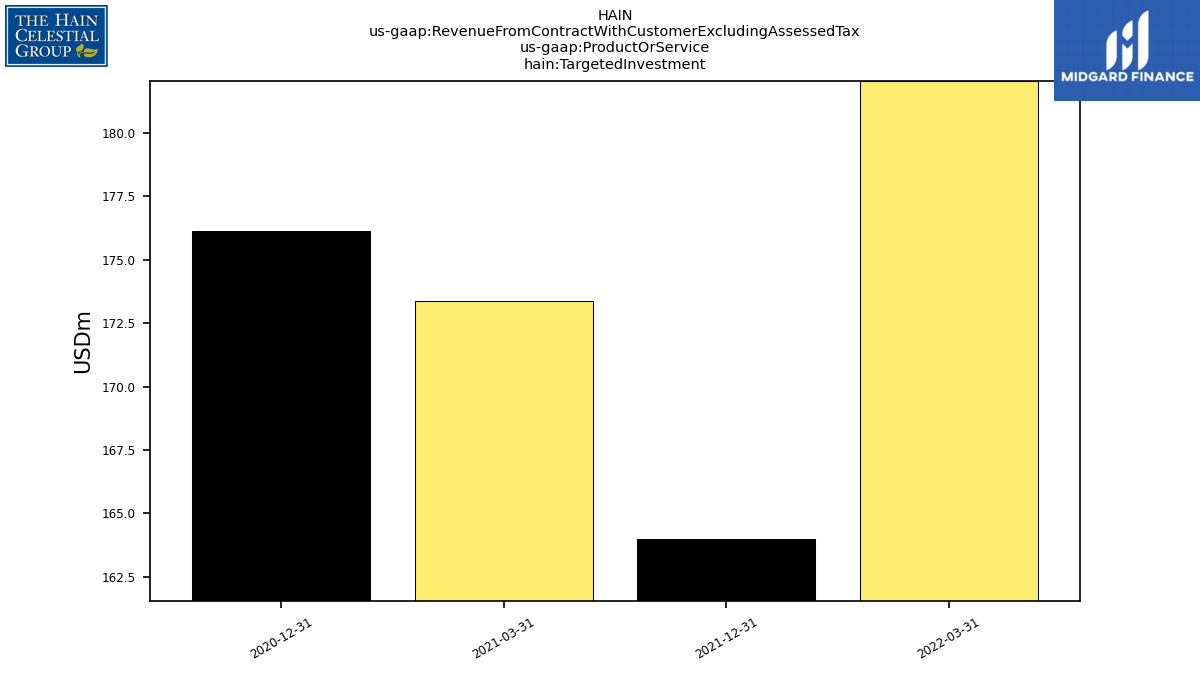
| Targeted Investment | NA | NA | NA | NA | NA | NA | NA | 182.05 | 163.99 | NA | NA | 173.38 | 176.15 | NA | NA | NA | NA | NA | NA | NA | NA | NA | NA | NA | NA | NA | NA | NA | NA | NA | NA | NA | NA | NA | NA | NA | NA | NA | NA | NA | NA | NA | NA | NA | NA | NA | NA | NA | NA | NA | NA | NA | NA | NA | NA | NA | NA | |
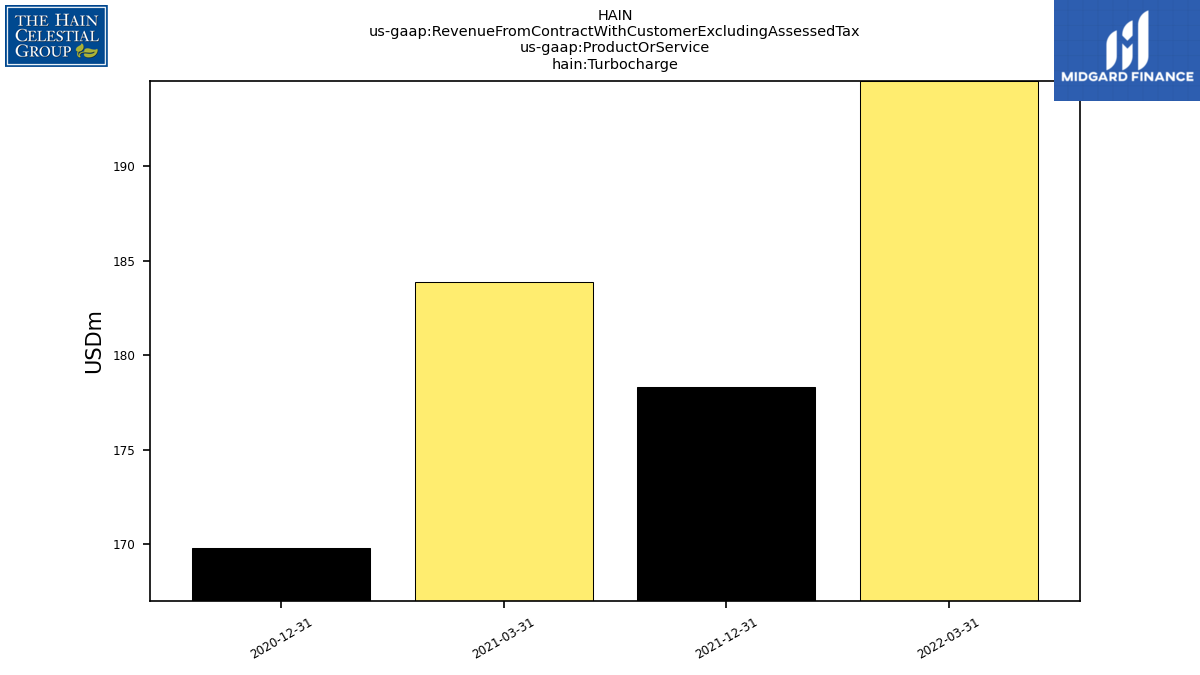
| Turbocharge | NA | NA | NA | NA | NA | NA | NA | 194.53 | 178.33 | NA | NA | 183.88 | 169.82 | NA | NA | NA | NA | NA | NA | NA | NA | NA | NA | NA | NA | NA | NA | NA | NA | NA | NA | NA | NA | NA | NA | NA | NA | NA | NA | NA | NA | NA | NA | NA | NA | NA | NA | NA | NA | NA | NA | NA | NA | NA | NA | NA | NA | |
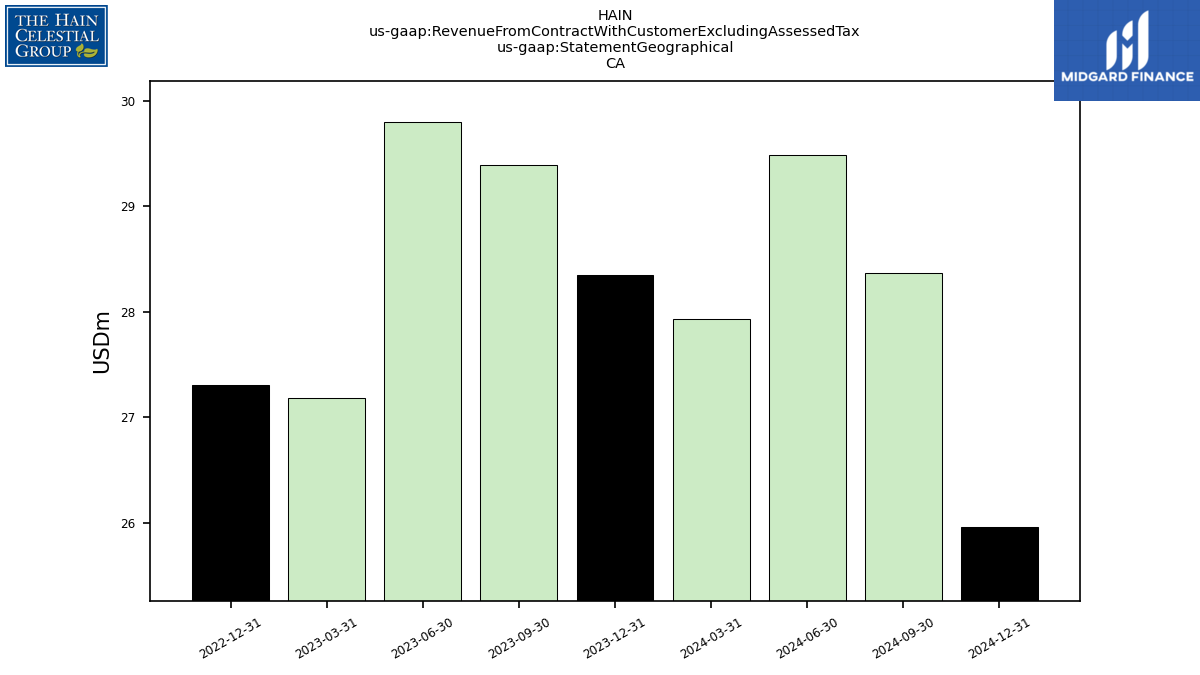
| 28.35 | NA | NA | NA | 27.31 | NA | NA | NA | NA | NA | NA | NA | NA | NA | NA | NA | NA | NA | NA | NA | NA | NA | NA | NA | NA | NA | NA | NA | NA | NA | NA | NA | NA | NA | NA | NA | NA | NA | NA | NA | NA | NA | NA | NA | NA | NA | NA | NA | NA | NA | NA | NA | NA | NA | NA | NA | NA | ||
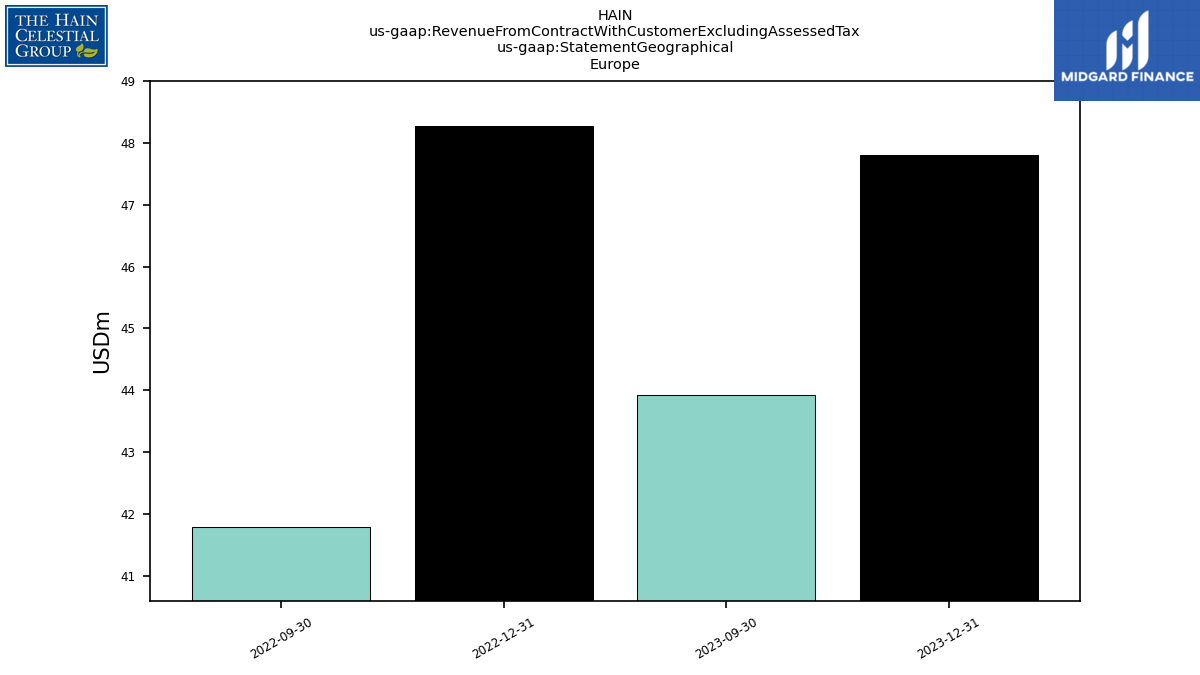
| 47.80 | 43.92 | NA | NA | 48.27 | 41.80 | NA | NA | NA | NA | NA | NA | NA | NA | NA | NA | NA | NA | NA | NA | NA | NA | NA | NA | NA | NA | NA | NA | NA | NA | NA | NA | NA | NA | NA | NA | NA | NA | NA | NA | NA | NA | NA | NA | NA | NA | NA | NA | NA | NA | NA | NA | NA | NA | NA | NA | NA | ||
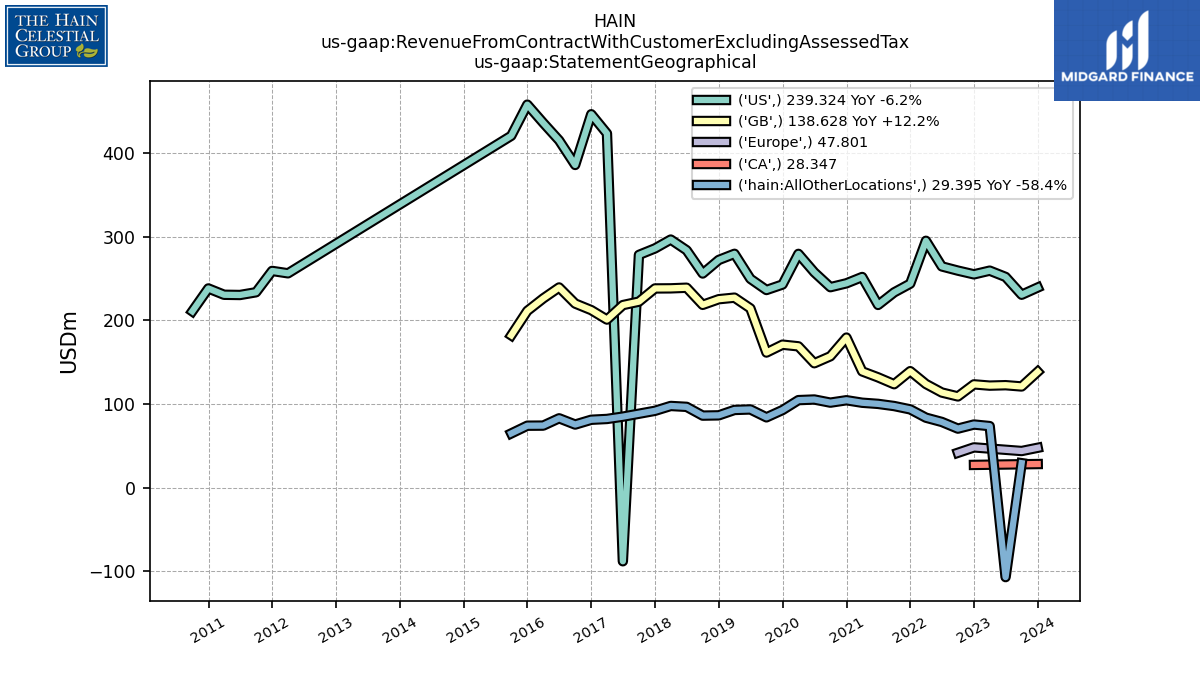
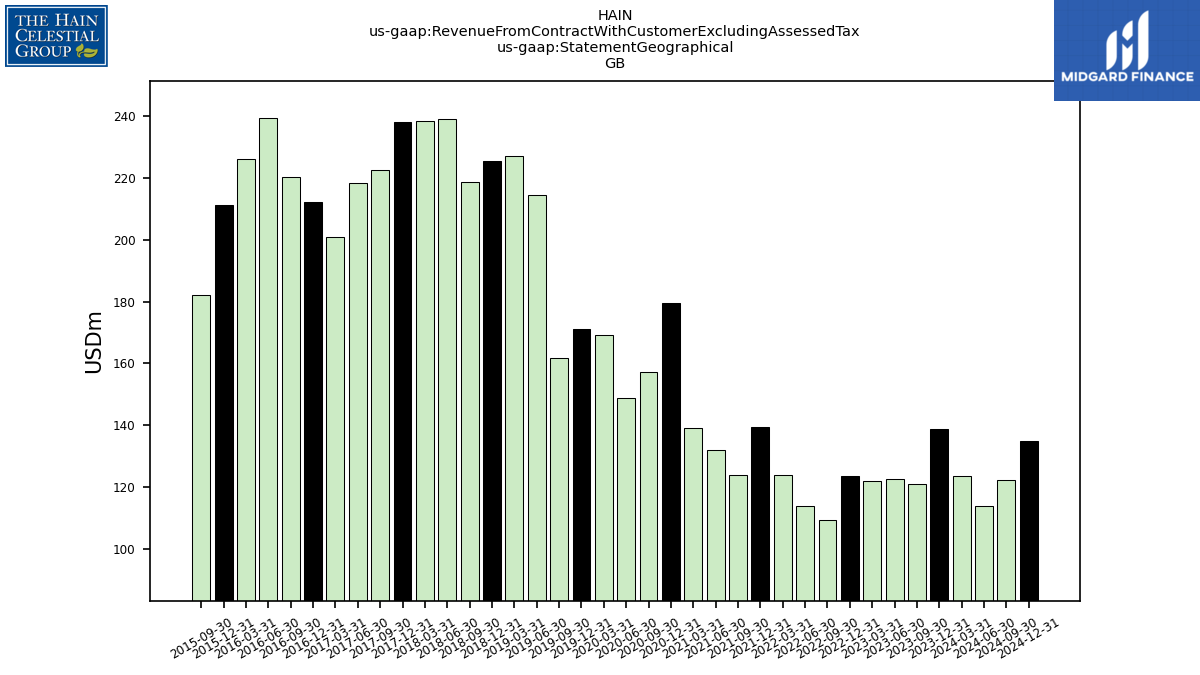
| 138.63 | 121.05 | 122.59 | 122.07 | 123.58 | 109.16 | 113.82 | 124.03 | 139.35 | 123.75 | 131.94 | 139.09 | 179.47 | 157.17 | 148.80 | 169.02 | 171.01 | 161.58 | 214.37 | 227.21 | 225.34 | 218.58 | 239.06 | 238.32 | 238.20 | 222.44 | 218.32 | 200.98 | 212.31 | 220.15 | 239.38 | 226.27 | 211.38 | 182.15 | NA | NA | NA | NA | NA | NA | NA | NA | NA | NA | NA | NA | NA | NA | NA | NA | NA | NA | NA | NA | NA | NA | NA | ||
| US | 239.32 | 230.66 | 251.96 | 259.47 | 255.06 | 259.51 | 264.53 | 295.15 | 243.91 | 233.49 | 218.47 | 251.89 | 244.34 | 239.72 | 257.47 | 279.53 | 242.89 | 236.33 | 249.73 | 279.61 | 272.26 | 256.03 | 283.85 | 296.63 | 286.06 | 278.29 | -87.85 | 423.36 | 446.41 | 385.77 | 415.13 | 436.11 | 457.88 | 420.63 | NA | NA | NA | NA | NA | NA | NA | NA | NA | NA | NA | NA | NA | 256.28 | 259.15 | 233.64 | 230.38 | 230.65 | 238.20 | 210.87 | NA | NA | NA | |
| All Other Locations | NA | 29.39 | -106.79 | 73.71 | 75.57 | 70.68 | 78.66 | 83.76 | 93.68 | 97.67 | 100.25 | 101.62 | 104.60 | 101.74 | 105.48 | 104.74 | 92.88 | 84.16 | 93.59 | 92.98 | 86.56 | 86.23 | 96.69 | 97.76 | 91.97 | 88.48 | 85.01 | 82.23 | 81.28 | 75.55 | 83.03 | 74.29 | 74.17 | 64.95 | NA | NA | NA | NA | NA | NA | NA | NA | NA | NA | NA | NA | NA | NA | NA | NA | NA | NA | NA | NA | NA | NA | NA |