
| 2023-12-31 | 2023-09-30 | 2023-06-30 | 2023-03-31 | 2022-12-31 | 2022-09-30 | 2022-06-30 | 2022-03-31 | 2021-12-31 | 2021-09-30 | 2021-06-30 | 2021-03-31 | 2020-12-31 | 2020-09-30 | 2020-06-30 | 2020-03-31 | 2019-12-31 | 2019-09-30 | 2019-06-30 | 2019-03-31 | 2018-12-31 | 2018-09-30 | 2018-06-30 | 2018-03-31 | 2017-12-31 | 2017-09-30 | 2017-06-30 | 2017-03-31 | 2016-12-31 | 2016-09-30 | 2016-06-30 | 2016-03-31 | 2015-12-31 | 2015-09-30 | 2015-06-30 | 2015-03-31 | 2014-12-31 | 2014-09-30 | 2014-06-30 | 2014-03-31 | 2013-12-31 | 2013-09-30 | 2013-06-30 | 2013-03-31 | 2012-12-31 | 2012-09-30 | 2012-06-30 | 2012-03-31 | 2011-12-31 | 2011-09-30 | 2011-06-30 | 2011-03-31 | 2010-12-31 | 2010-09-30 | 2010-06-30 | ||
|---|---|---|---|---|---|---|---|---|---|---|---|---|---|---|---|---|---|---|---|---|---|---|---|---|---|---|---|---|---|---|---|---|---|---|---|---|---|---|---|---|---|---|---|---|---|---|---|---|---|---|---|---|---|---|---|---|
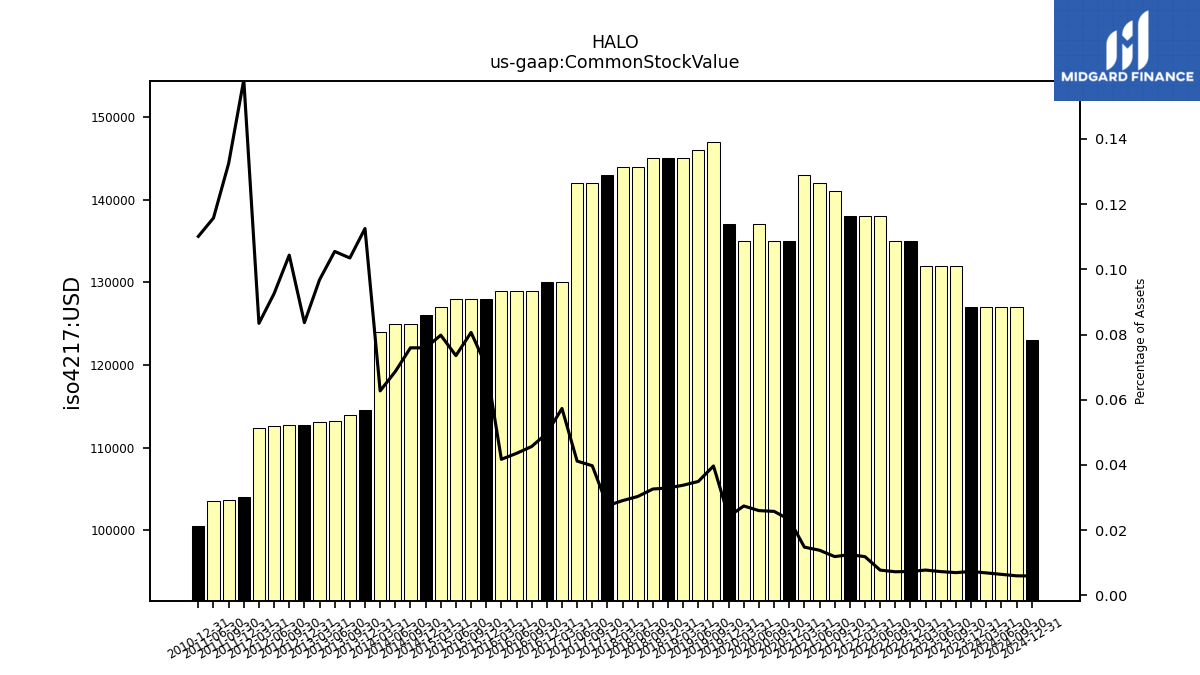
| Common Stock Value | 0.13 | 0.13 | 0.13 | 0.13 | 0.14 | 0.14 | 0.14 | 0.14 | 0.14 | 0.14 | 0.14 | 0.14 | 0.14 | 0.14 | 0.14 | 0.14 | 0.14 | 0.15 | 0.15 | 0.14 | 0.14 | 0.14 | 0.14 | 0.14 | 0.14 | 0.14 | 0.14 | 0.13 | 0.13 | 0.13 | 0.13 | 0.13 | 0.13 | 0.13 | 0.13 | 0.13 | 0.13 | 0.12 | 0.12 | 0.12 | 0.11 | 0.11 | 0.11 | 0.11 | 0.11 | 0.11 | 0.11 | 0.11 | 0.10 | 0.10 | 0.10 | NA | 0.10 | NA | NA | |
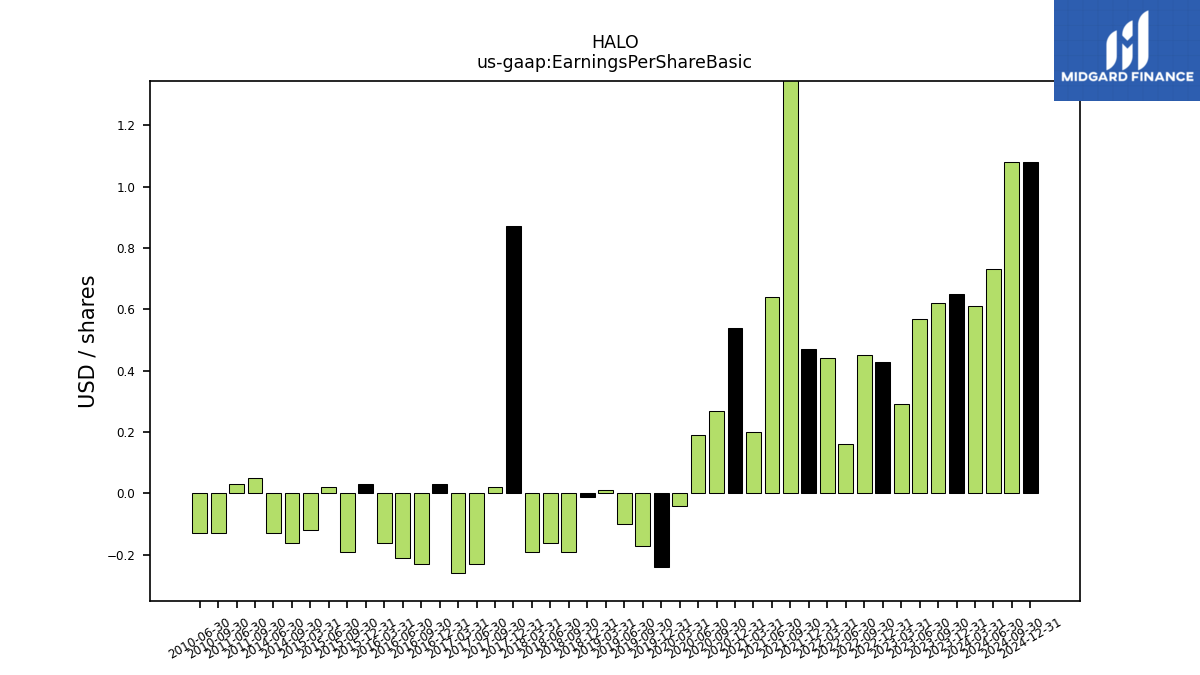
| Earnings Per Share Basic | 0.65 | 0.62 | 0.57 | 0.29 | 0.43 | 0.45 | 0.16 | 0.44 | 0.47 | 1.53 | 0.64 | 0.20 | 0.54 | 0.27 | 0.19 | -0.04 | -0.24 | -0.17 | -0.10 | 0.01 | -0.01 | -0.19 | -0.16 | -0.19 | 0.87 | 0.02 | -0.23 | -0.26 | 0.03 | -0.23 | -0.21 | -0.16 | 0.03 | -0.19 | 0.02 | -0.12 | NA | -0.16 | -0.13 | NA | NA | NA | NA | NA | NA | NA | NA | NA | NA | 0.05 | 0.03 | NA | NA | -0.13 | -0.13 | |
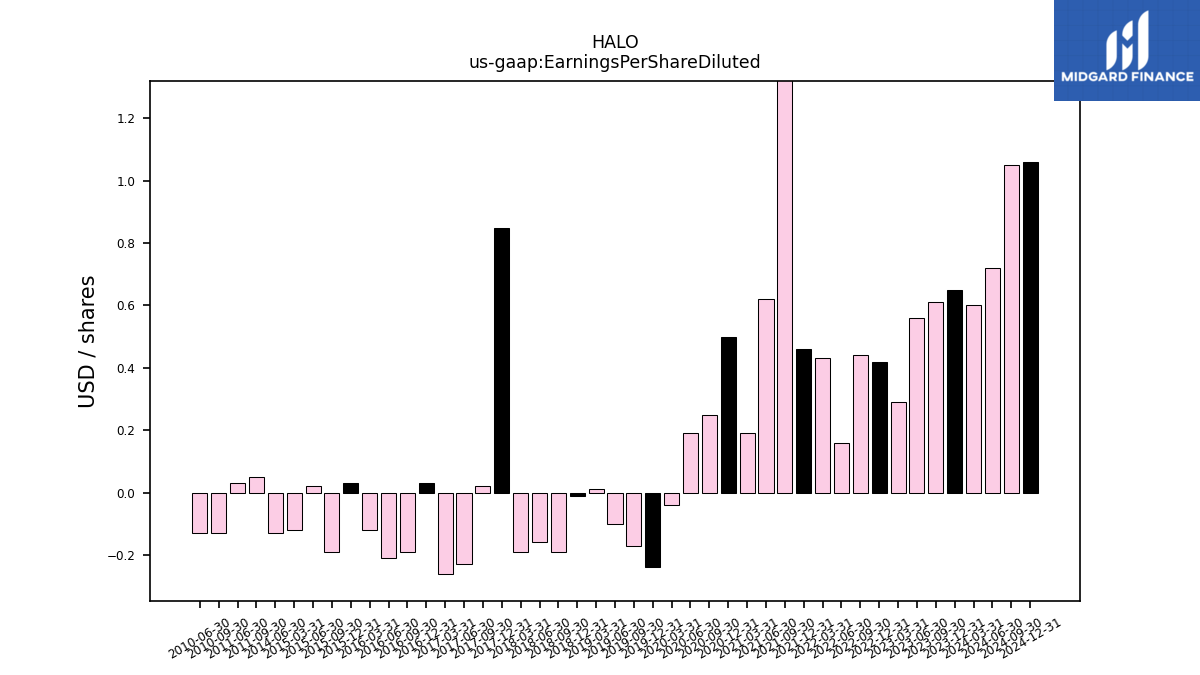
| Earnings Per Share Diluted | 0.65 | 0.61 | 0.56 | 0.29 | 0.42 | 0.44 | 0.16 | 0.43 | 0.46 | 1.48 | 0.62 | 0.19 | 0.50 | 0.25 | 0.19 | -0.04 | -0.24 | -0.17 | -0.10 | 0.01 | -0.01 | -0.19 | -0.16 | -0.19 | 0.85 | 0.02 | -0.23 | -0.26 | 0.03 | -0.19 | -0.21 | -0.12 | 0.03 | -0.19 | 0.02 | -0.12 | NA | NA | -0.13 | NA | NA | NA | NA | NA | NA | NA | NA | NA | NA | 0.05 | 0.03 | NA | NA | -0.13 | -0.13 |
| 2023-12-31 | 2023-09-30 | 2023-06-30 | 2023-03-31 | 2022-12-31 | 2022-09-30 | 2022-06-30 | 2022-03-31 | 2021-12-31 | 2021-09-30 | 2021-06-30 | 2021-03-31 | 2020-12-31 | 2020-09-30 | 2020-06-30 | 2020-03-31 | 2019-12-31 | 2019-09-30 | 2019-06-30 | 2019-03-31 | 2018-12-31 | 2018-09-30 | 2018-06-30 | 2018-03-31 | 2017-12-31 | 2017-09-30 | 2017-06-30 | 2017-03-31 | 2016-12-31 | 2016-09-30 | 2016-06-30 | 2016-03-31 | 2015-12-31 | 2015-09-30 | 2015-06-30 | 2015-03-31 | 2014-12-31 | 2014-09-30 | 2014-06-30 | 2014-03-31 | 2013-12-31 | 2013-09-30 | 2013-06-30 | 2013-03-31 | 2012-12-31 | 2012-09-30 | 2012-06-30 | 2012-03-31 | 2011-12-31 | 2011-09-30 | 2011-06-30 | 2011-03-31 | 2010-12-31 | 2010-09-30 | 2010-06-30 | ||
|---|---|---|---|---|---|---|---|---|---|---|---|---|---|---|---|---|---|---|---|---|---|---|---|---|---|---|---|---|---|---|---|---|---|---|---|---|---|---|---|---|---|---|---|---|---|---|---|---|---|---|---|---|---|---|---|---|
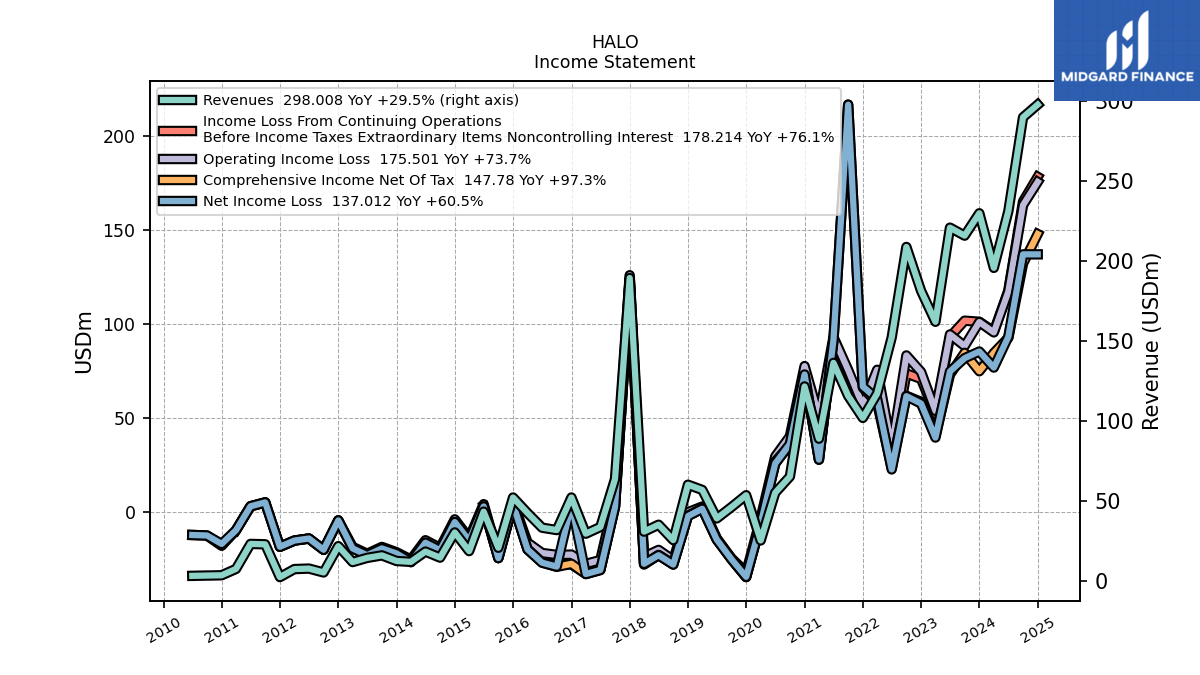
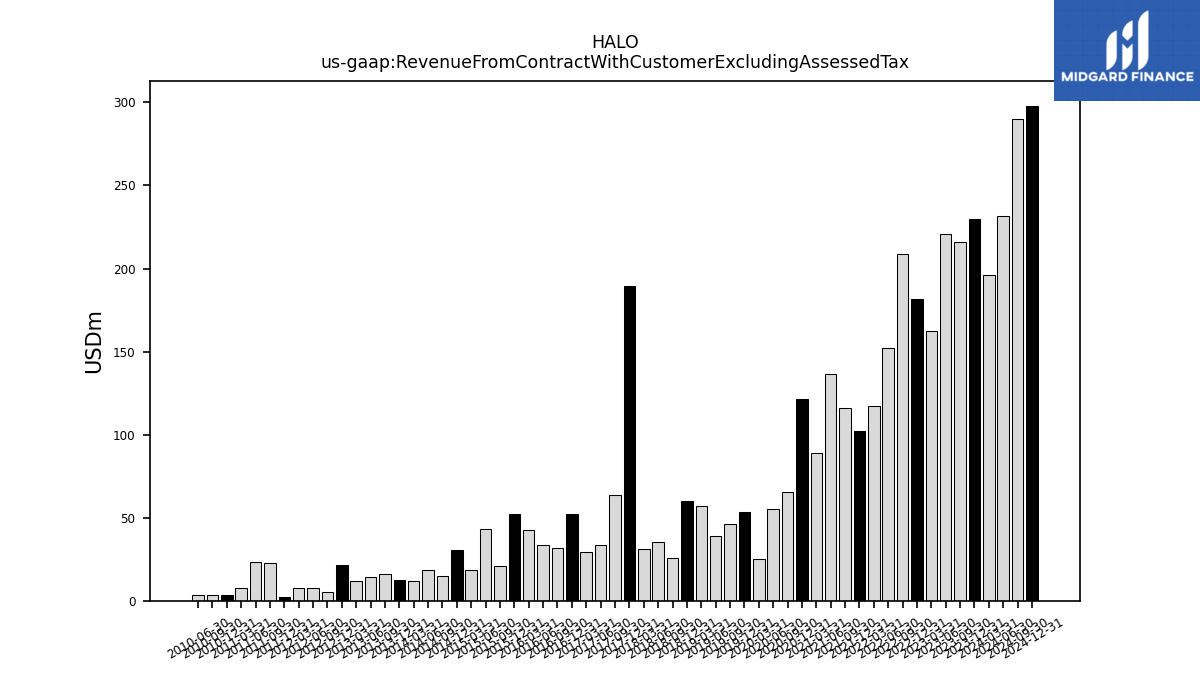
| Revenue From Contract With Customer Excluding Assessed Tax | 230.04 | 216.03 | 221.04 | 162.14 | 181.50 | 208.98 | 152.37 | 117.28 | 102.00 | 115.83 | 136.46 | 89.02 | 121.70 | 65.32 | 55.22 | 25.35 | 53.66 | 46.23 | 39.15 | 56.95 | 60.23 | 25.56 | 35.20 | 30.87 | 189.56 | 63.73 | 33.75 | 29.57 | 52.23 | 31.85 | 33.34 | 42.50 | 52.23 | 20.78 | 43.38 | 18.67 | 30.38 | 14.61 | 18.39 | 11.97 | 12.50 | 16.01 | 14.45 | 11.83 | 21.79 | 5.33 | 7.76 | 7.44 | 2.41 | 22.94 | 23.19 | 7.54 | 3.57 | 3.40 | 3.21 | |
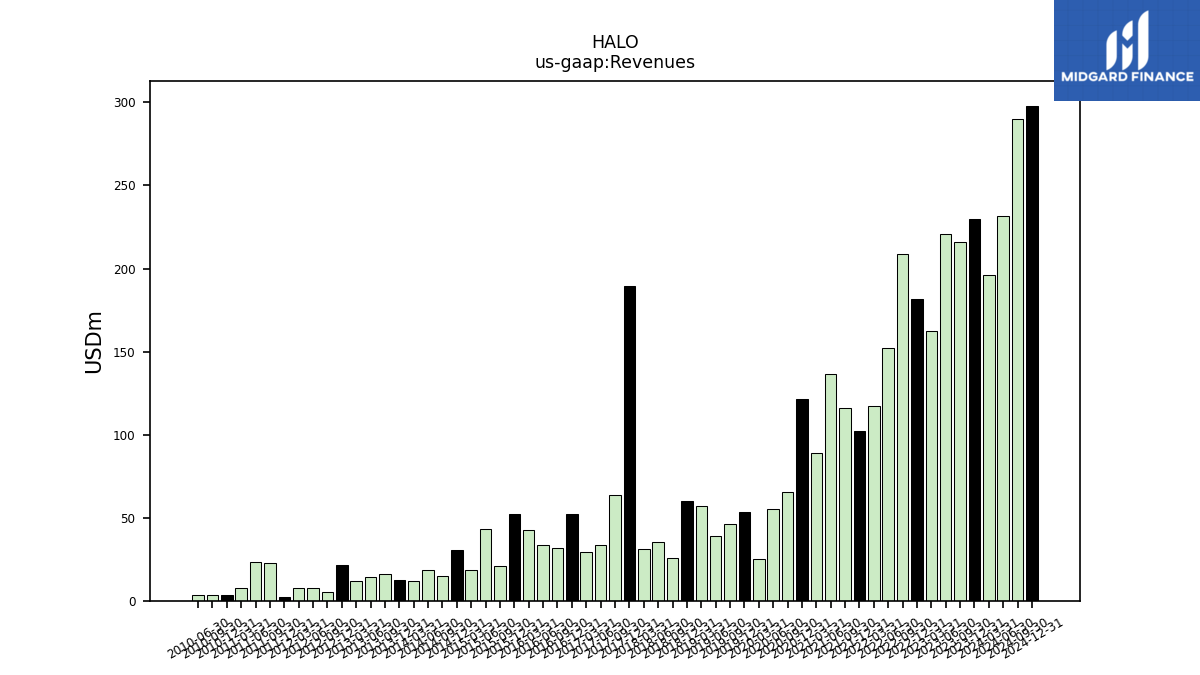
| Revenues | 230.04 | 216.03 | 221.04 | 162.14 | 181.50 | 208.98 | 152.37 | 117.28 | 102.00 | 115.83 | 136.46 | 89.02 | 121.70 | 65.32 | 55.22 | 25.35 | 53.66 | 46.23 | 39.15 | 56.95 | 60.23 | 25.56 | 35.20 | 30.87 | 189.56 | 63.73 | 33.75 | 29.57 | 52.23 | 31.85 | 33.34 | 42.50 | 52.23 | 20.78 | 43.38 | 18.67 | 30.38 | 14.61 | 18.39 | 11.97 | 12.50 | 16.01 | 14.45 | 11.83 | 21.79 | 5.33 | 7.76 | 7.44 | 2.41 | 22.94 | 23.19 | 7.54 | 3.57 | 3.40 | 3.21 | |
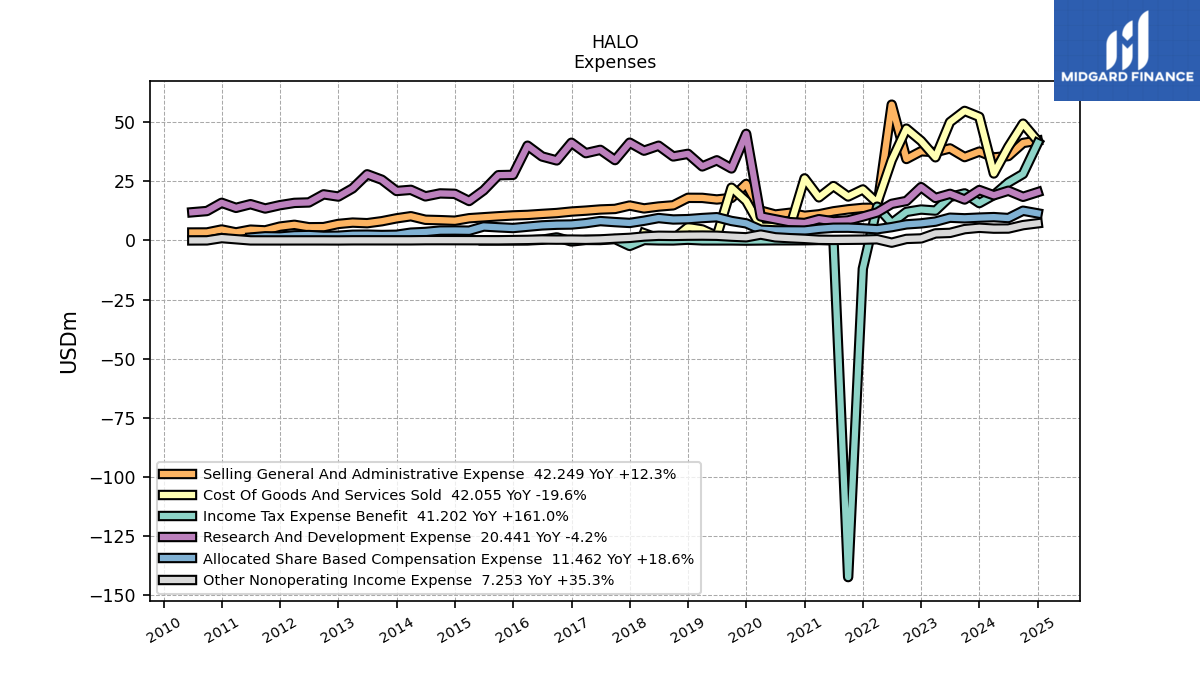
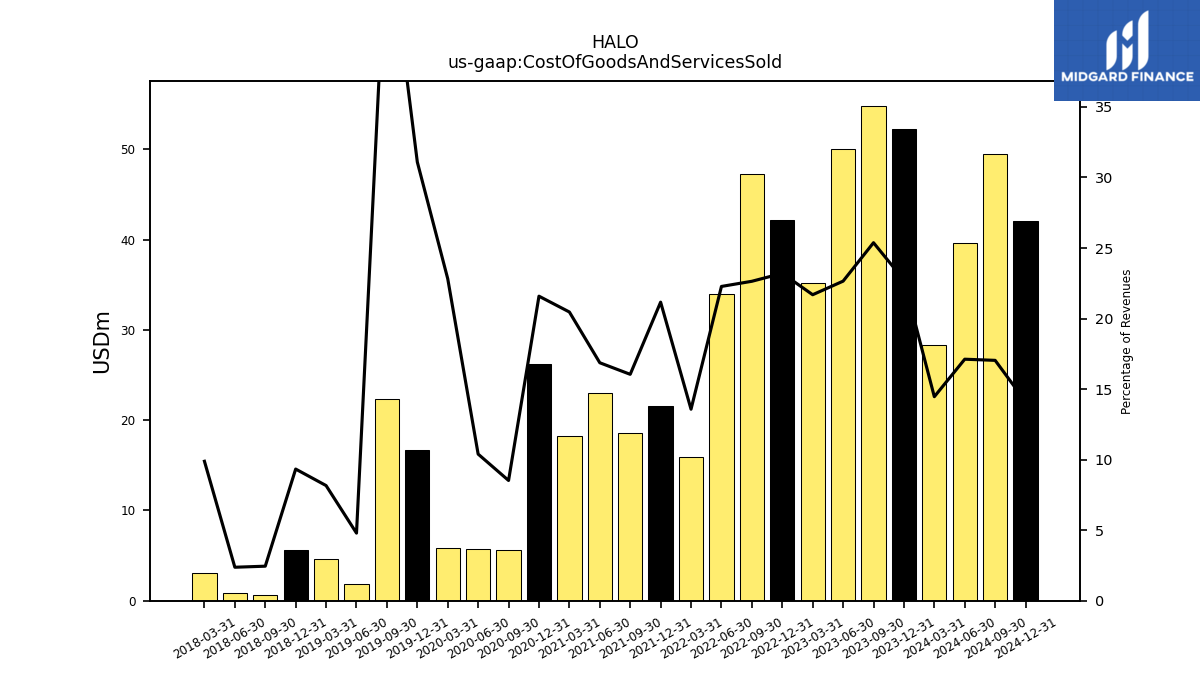
| Cost Of Goods And Services Sold | 52.30 | 54.82 | 50.07 | 35.17 | 42.12 | 47.32 | 33.94 | 15.92 | 21.59 | 18.59 | 23.02 | 18.22 | 26.27 | 5.57 | 5.74 | 5.79 | 16.69 | 22.33 | 1.88 | 4.65 | 5.62 | 0.63 | 0.84 | 3.05 | NA | NA | NA | NA | NA | NA | NA | NA | NA | NA | NA | NA | NA | NA | NA | NA | NA | NA | NA | NA | NA | NA | NA | NA | NA | NA | NA | NA | NA | NA | NA | |
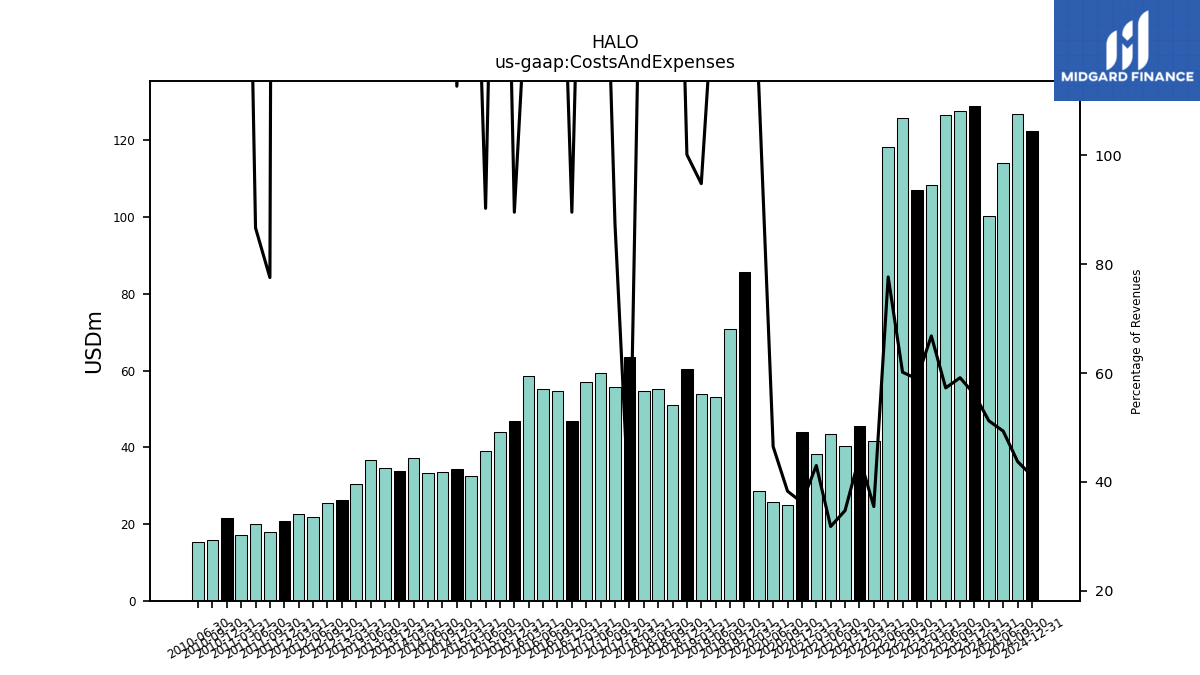
| Costs And Expenses | 129.00 | 127.75 | 126.58 | 108.34 | 106.99 | 125.68 | 118.31 | 41.61 | 45.47 | 40.24 | 43.41 | 38.29 | 44.08 | 25.02 | 25.67 | 28.58 | 85.73 | 70.77 | 53.12 | 53.98 | 60.30 | 51.03 | 55.27 | 54.58 | 63.63 | 55.65 | 59.23 | 57.09 | 46.76 | 54.60 | 55.06 | 58.67 | 46.76 | 44.02 | 39.15 | 32.58 | 34.23 | 33.63 | 33.33 | 37.19 | 33.82 | 34.51 | 36.57 | 30.33 | 26.20 | 25.36 | 21.81 | 22.58 | 20.84 | 17.79 | 20.09 | 17.20 | 21.46 | 15.83 | 15.37 | |
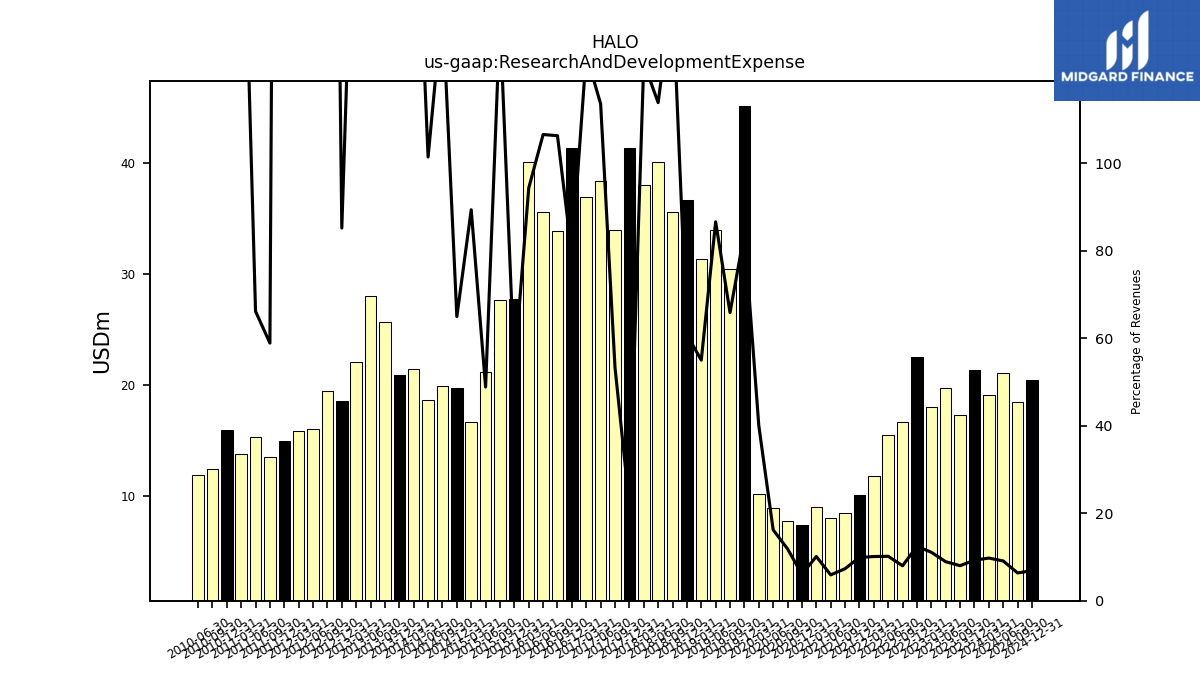
| Research And Development Expense | 21.34 | 17.32 | 19.73 | 17.98 | 22.57 | 16.70 | 15.48 | 11.85 | 10.11 | 8.49 | 8.07 | 9.01 | 7.38 | 7.75 | 8.95 | 10.16 | 45.11 | 30.45 | 33.91 | 31.33 | 36.65 | 35.54 | 40.09 | 37.98 | 41.38 | 33.99 | 38.34 | 36.94 | 41.35 | 33.86 | 35.53 | 40.10 | 27.75 | 27.61 | 21.20 | 16.68 | 19.73 | 19.90 | 18.65 | 21.41 | 20.93 | 25.69 | 27.99 | 22.03 | 18.57 | 19.50 | 16.08 | 15.89 | 14.92 | 13.51 | 15.35 | 13.79 | 15.93 | 12.45 | 11.92 | |
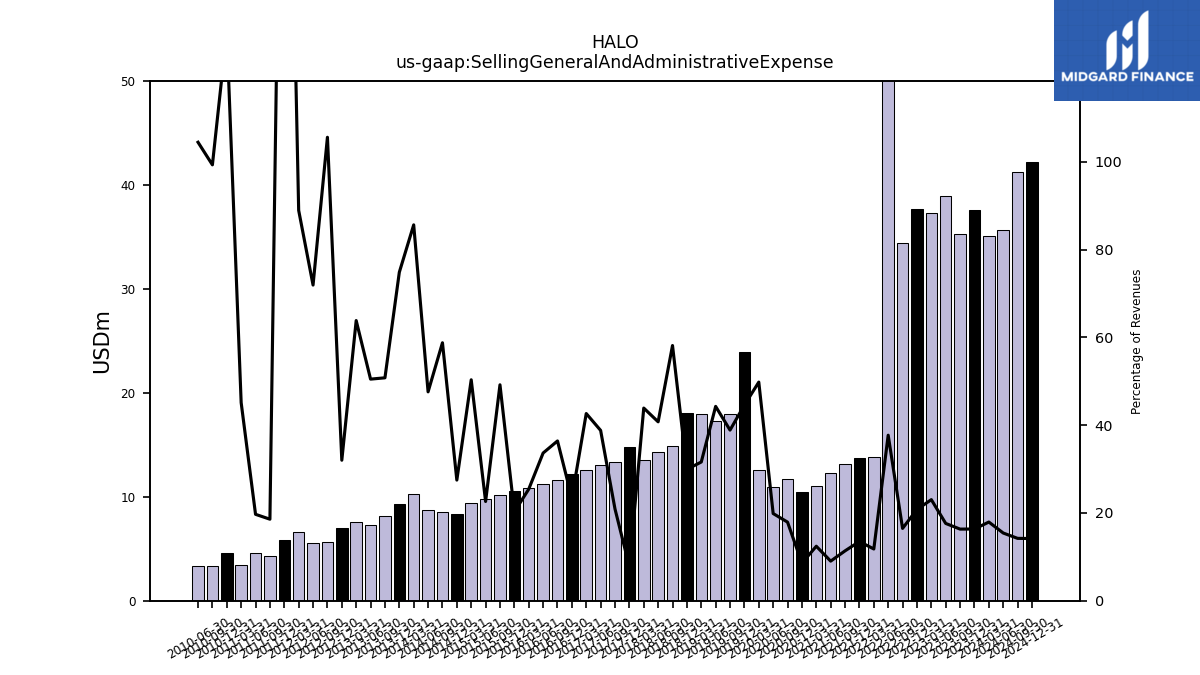
| Selling General And Administrative Expense | 37.61 | 35.27 | 38.95 | 37.36 | 37.75 | 34.47 | 57.48 | 13.83 | 13.77 | 13.17 | 12.32 | 11.06 | 10.43 | 11.70 | 10.97 | 12.63 | 23.93 | 17.98 | 17.34 | 18.01 | 18.03 | 14.86 | 14.35 | 13.56 | 14.77 | 13.33 | 13.10 | 12.62 | 12.23 | 11.60 | 11.22 | 10.81 | 10.59 | 10.23 | 9.81 | 9.40 | 8.35 | 8.59 | 8.75 | 10.25 | 9.36 | 8.14 | 7.30 | 7.56 | 6.98 | 5.63 | 5.58 | 6.62 | 5.87 | 4.26 | 4.57 | 3.41 | 4.63 | 3.37 | 3.36 | |
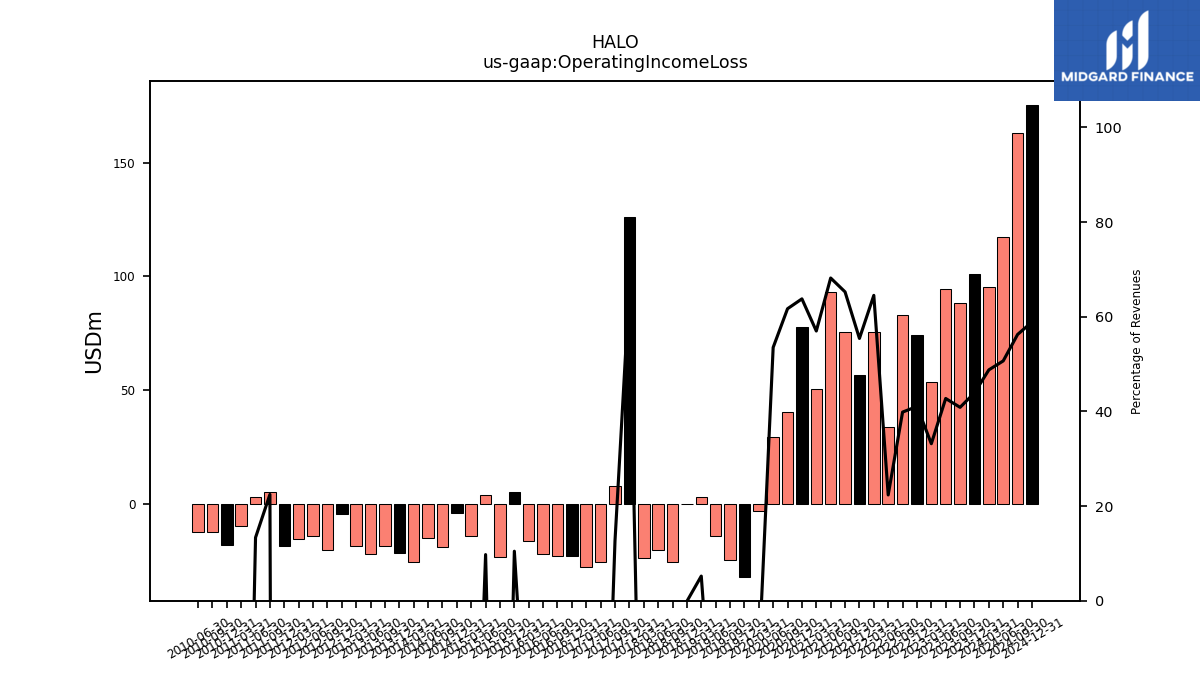
| Operating Income Loss | 101.03 | 88.28 | 94.46 | 53.80 | 74.51 | 83.29 | 34.06 | 75.67 | 56.53 | 75.59 | 93.05 | 50.73 | 77.62 | 40.30 | 29.55 | -3.22 | -32.06 | -24.54 | -13.98 | 2.97 | -0.07 | -25.47 | -20.07 | -23.71 | 125.93 | 8.08 | -25.48 | -27.53 | -22.57 | -22.74 | -21.72 | -16.17 | 5.46 | -23.24 | 4.23 | -13.91 | -3.85 | -19.03 | -14.94 | -25.22 | -21.32 | -18.49 | -22.12 | -18.50 | -4.41 | -20.03 | -14.05 | -15.14 | -18.43 | 5.15 | 3.10 | -9.66 | -17.88 | -12.43 | -12.15 | |
| Interest Expense | 5.22 | 4.50 | 4.49 | 4.54 | 4.57 | 7.51 | 3.10 | 1.76 | 2.06 | 1.75 | 1.75 | 1.97 | 5.04 | 4.99 | 5.00 | 5.35 | 3.73 | 2.08 | 2.61 | 3.21 | 3.75 | 4.29 | 4.77 | 5.23 | 5.46 | 5.54 | 5.54 | 5.45 | 5.60 | 5.25 | 5.25 | 3.88 | 1.30 | 1.30 | 1.30 | 1.30 | 1.38 | 1.38 | 1.45 | 1.38 | 0.73 | 0.85 | 0.85 | 0.85 | 0.00 | 0.00 | 0.00 | 0.00 | NA | NA | NA | NA | NA | NA | NA | |
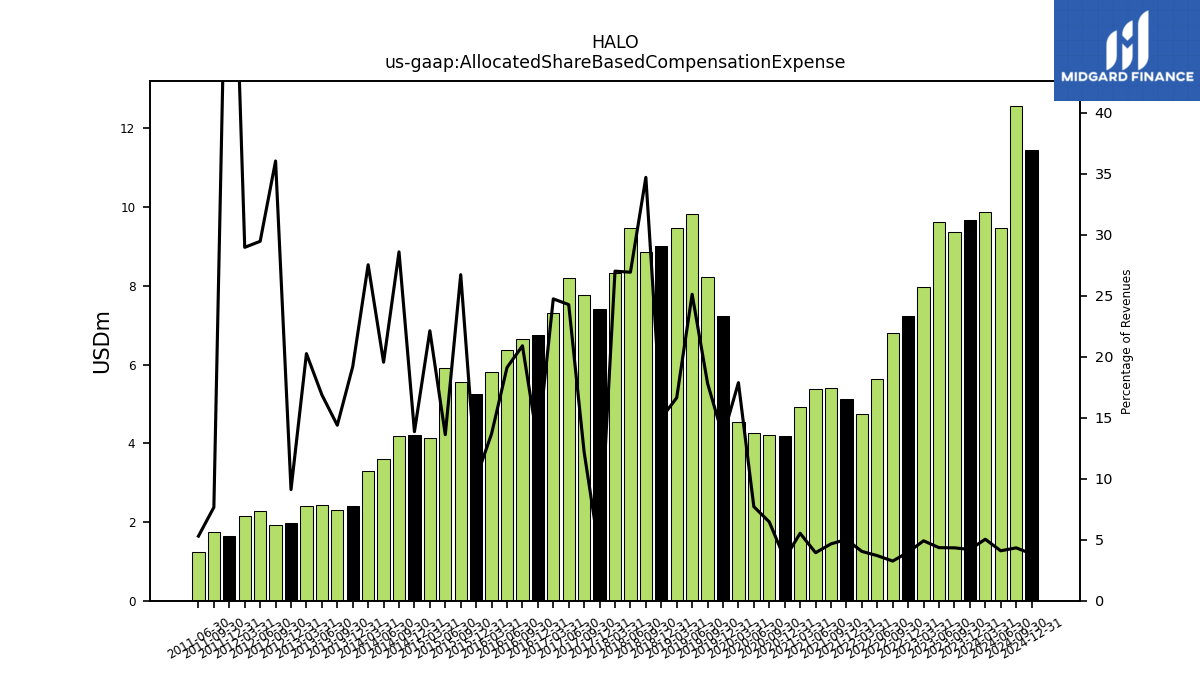
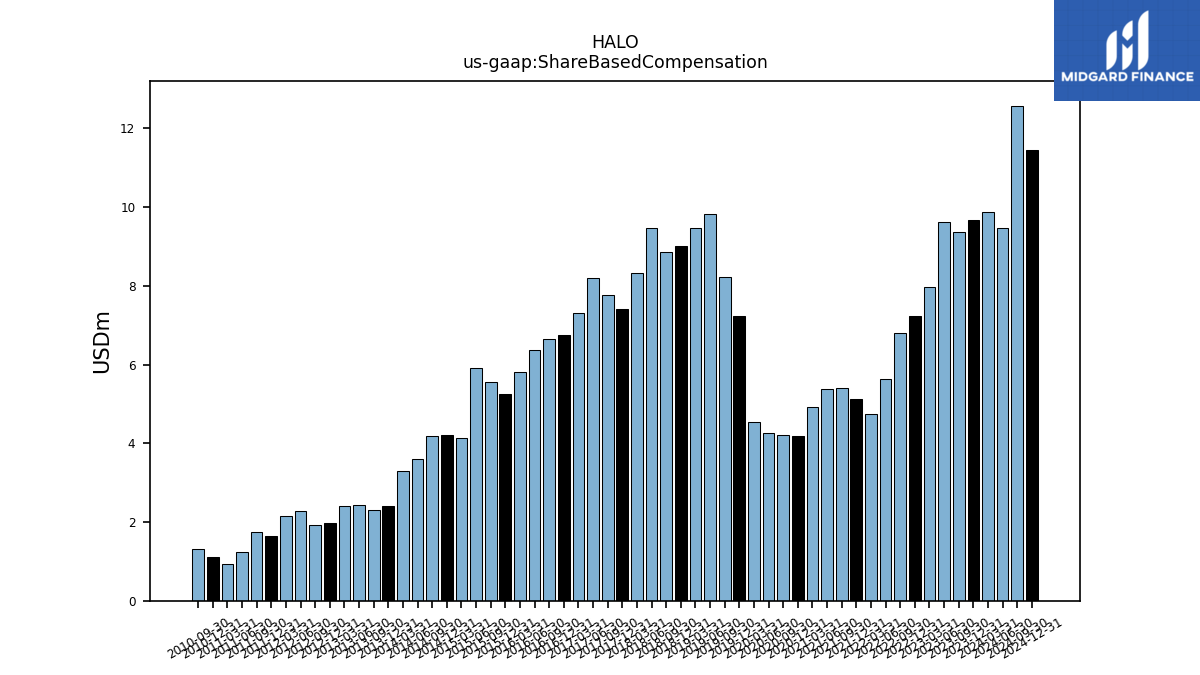
| Allocated Share Based Compensation Expense | 9.66 | 9.37 | 9.62 | 7.97 | 7.22 | 6.80 | 5.63 | 4.74 | 5.13 | 5.40 | 5.37 | 4.92 | 4.20 | 4.22 | 4.26 | 4.53 | 7.23 | 8.24 | 9.83 | 9.47 | 9.01 | 8.87 | 9.48 | 8.34 | 7.40 | 7.76 | 8.19 | 7.32 | 6.74 | 6.66 | 6.37 | 5.82 | 5.25 | 5.55 | 5.91 | 4.13 | 4.21 | 4.18 | 3.59 | 3.29 | 2.40 | 2.30 | 2.44 | 2.40 | 1.99 | 1.92 | 2.29 | 2.15 | 1.65 | 1.76 | 1.23 | NA | NA | NA | NA | |
| Income Tax Expense Benefit | 15.79 | 19.92 | 18.40 | 12.62 | 13.09 | 12.07 | 7.33 | 14.30 | -11.96 | -142.48 | 0.06 | 0.19 | 0.09 | 0.06 | 0.06 | 0.01 | -0.06 | 0.01 | 0.02 | 0.02 | 0.32 | 0.00 | 0.03 | 0.19 | -2.33 | 0.58 | 0.18 | 0.21 | -0.42 | 1.28 | 0.30 | 0.00 | 0.00 | 0.00 | 0.00 | NA | NA | NA | NA | NA | NA | NA | NA | NA | NA | NA | NA | NA | NA | NA | NA | NA | NA | NA | NA | |
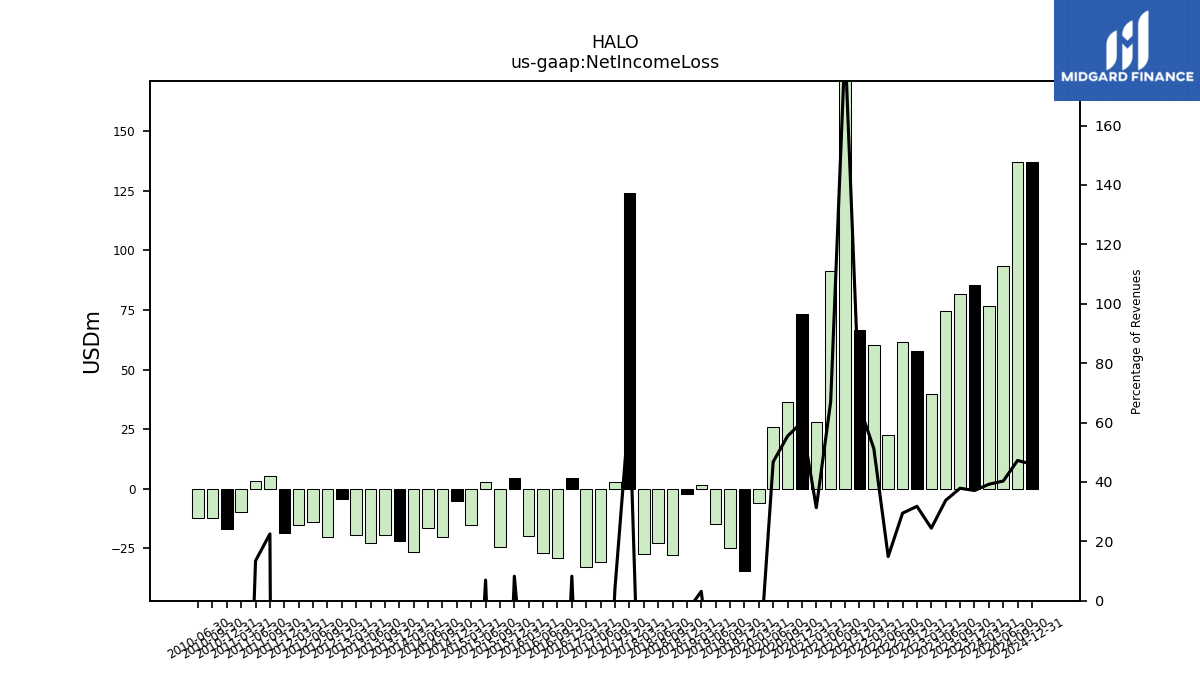
| Net Income Loss | 85.39 | 81.84 | 74.75 | 39.62 | 57.70 | 61.63 | 22.68 | 60.11 | 66.77 | 216.59 | 91.46 | 27.89 | 73.16 | 36.21 | 25.82 | -6.10 | -34.40 | -25.02 | -14.62 | 1.80 | -2.13 | -27.85 | -22.89 | -27.46 | 123.88 | 2.75 | -30.76 | -32.90 | 4.32 | -28.95 | -26.88 | -19.82 | 4.32 | -24.46 | 3.02 | -15.11 | -5.27 | -20.28 | -16.27 | -26.55 | -21.99 | -19.29 | -22.91 | -19.29 | -4.41 | -20.01 | -14.02 | -15.12 | -18.42 | 5.17 | 3.12 | -9.64 | -16.89 | -12.41 | -12.15 | |
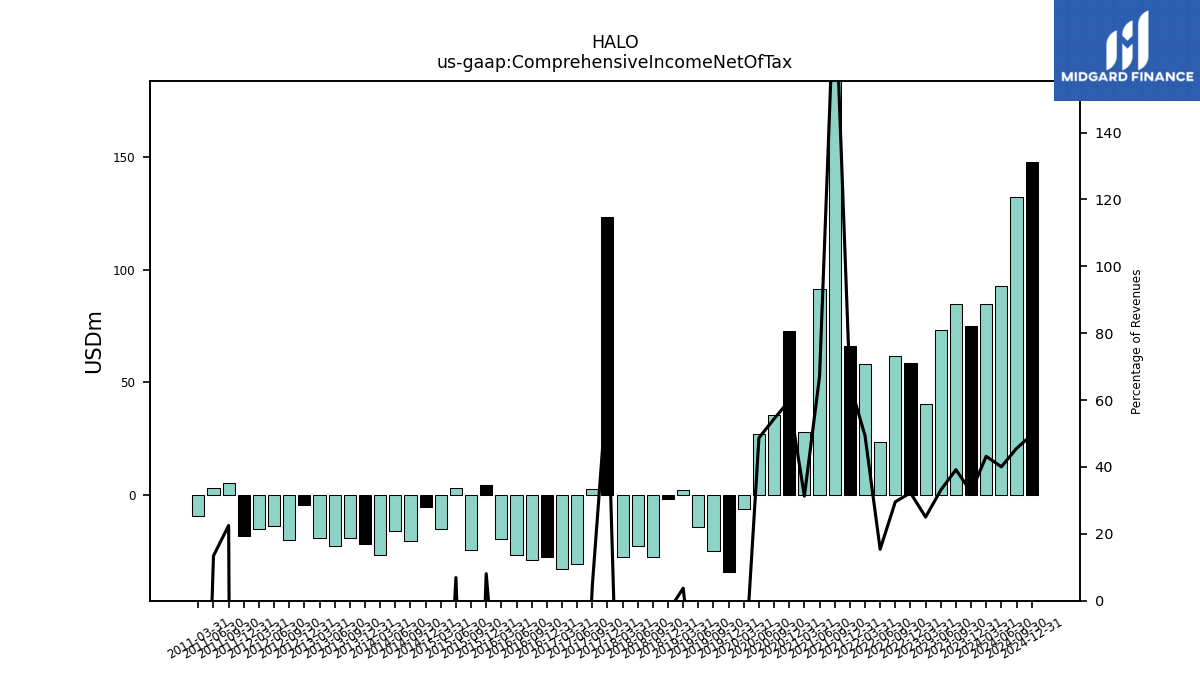
| Comprehensive Income Net Of Tax | 74.88 | 84.68 | 73.11 | 40.56 | 58.62 | 61.81 | 23.46 | 57.94 | 66.16 | 216.60 | 91.44 | 27.86 | 72.76 | 35.55 | 26.89 | -6.33 | -34.55 | -25.01 | -14.29 | 2.13 | -1.93 | -27.59 | -22.76 | -27.88 | 123.48 | 2.76 | -30.77 | -32.94 | -27.48 | -29.08 | -26.75 | -19.63 | 4.22 | -24.42 | 3.01 | -15.09 | -5.27 | -20.33 | -16.25 | -26.59 | -21.99 | -19.24 | -22.92 | -19.32 | -4.41 | -20.01 | -14.02 | -15.12 | -18.42 | 5.17 | 3.12 | -9.64 | NA | NA | NA |
| 2023-12-31 | 2023-09-30 | 2023-06-30 | 2023-03-31 | 2022-12-31 | 2022-09-30 | 2022-06-30 | 2022-03-31 | 2021-12-31 | 2021-09-30 | 2021-06-30 | 2021-03-31 | 2020-12-31 | 2020-09-30 | 2020-06-30 | 2020-03-31 | 2019-12-31 | 2019-09-30 | 2019-06-30 | 2019-03-31 | 2018-12-31 | 2018-09-30 | 2018-06-30 | 2018-03-31 | 2017-12-31 | 2017-09-30 | 2017-06-30 | 2017-03-31 | 2016-12-31 | 2016-09-30 | 2016-06-30 | 2016-03-31 | 2015-12-31 | 2015-09-30 | 2015-06-30 | 2015-03-31 | 2014-12-31 | 2014-09-30 | 2014-06-30 | 2014-03-31 | 2013-12-31 | 2013-09-30 | 2013-06-30 | 2013-03-31 | 2012-12-31 | 2012-09-30 | 2012-06-30 | 2012-03-31 | 2011-12-31 | 2011-09-30 | 2011-06-30 | 2011-03-31 | 2010-12-31 | 2010-09-30 | 2010-06-30 | ||
|---|---|---|---|---|---|---|---|---|---|---|---|---|---|---|---|---|---|---|---|---|---|---|---|---|---|---|---|---|---|---|---|---|---|---|---|---|---|---|---|---|---|---|---|---|---|---|---|---|---|---|---|---|---|---|---|---|
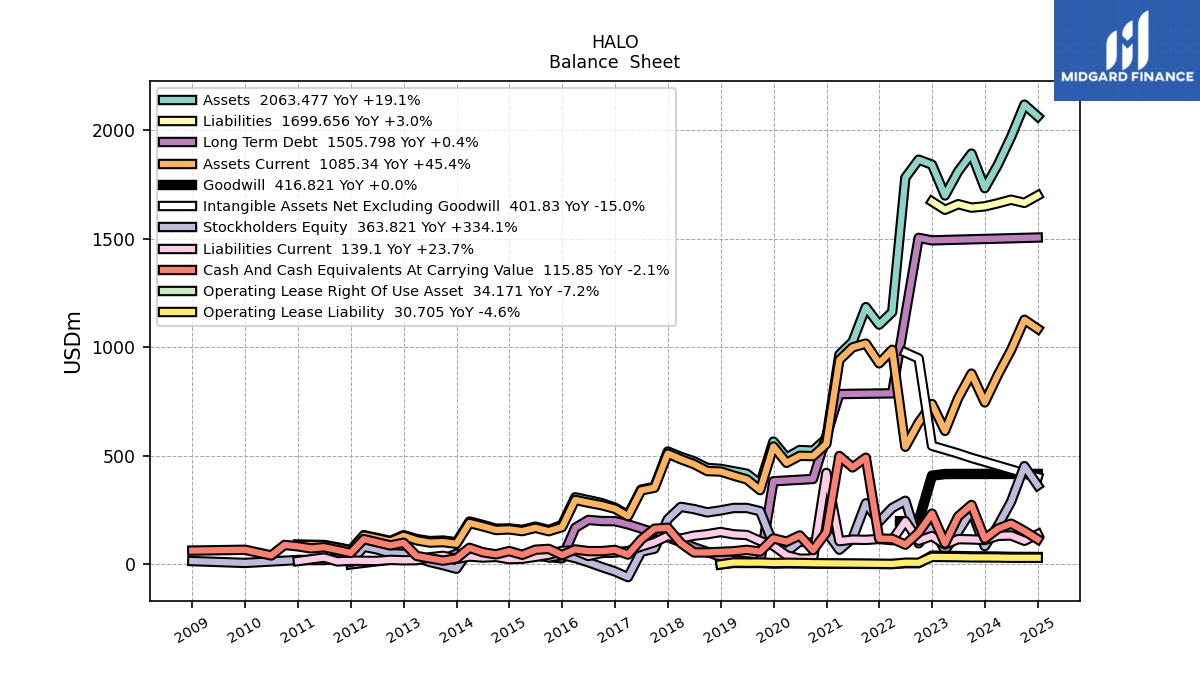
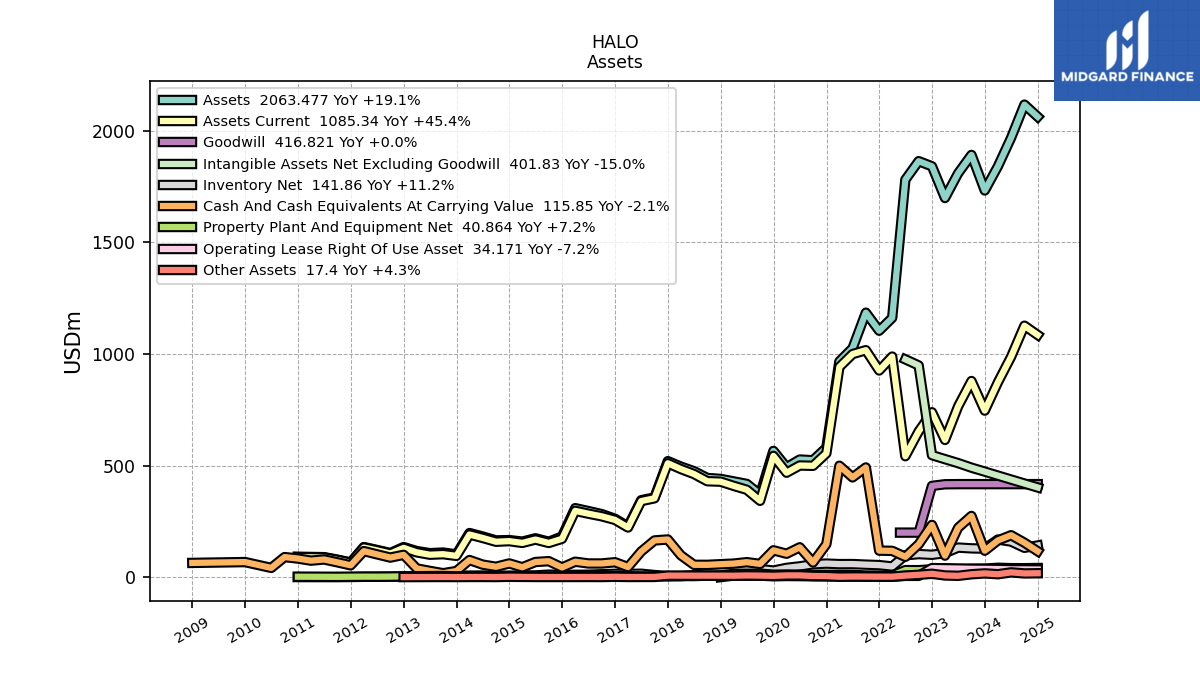
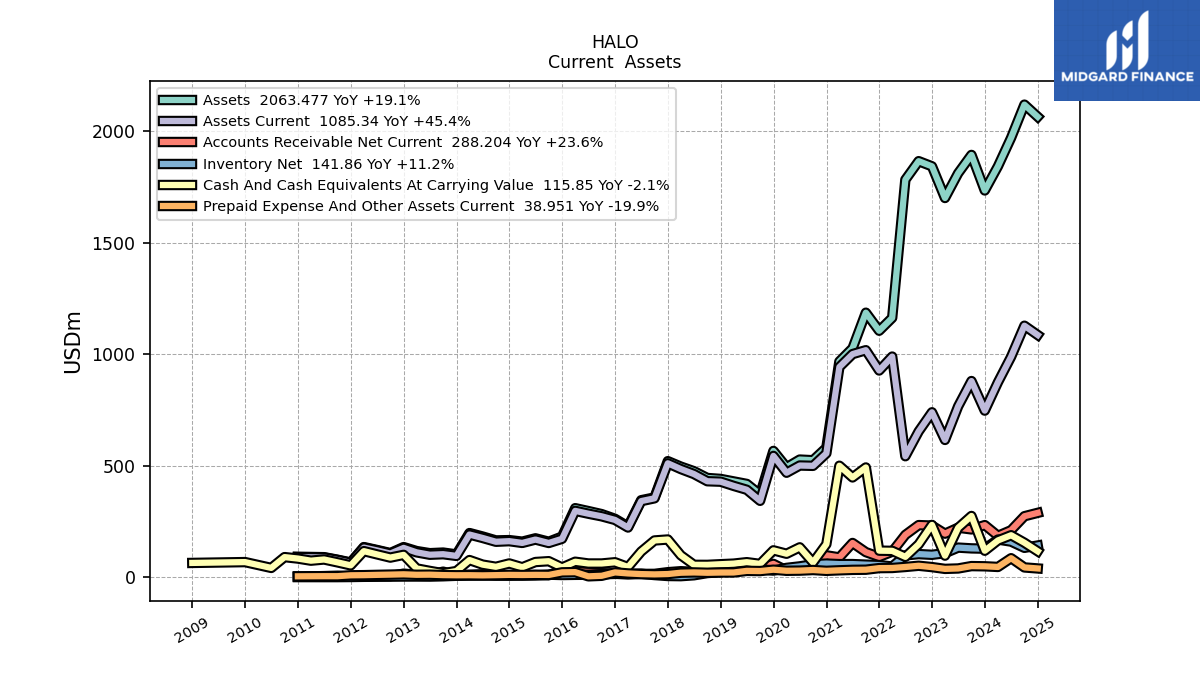
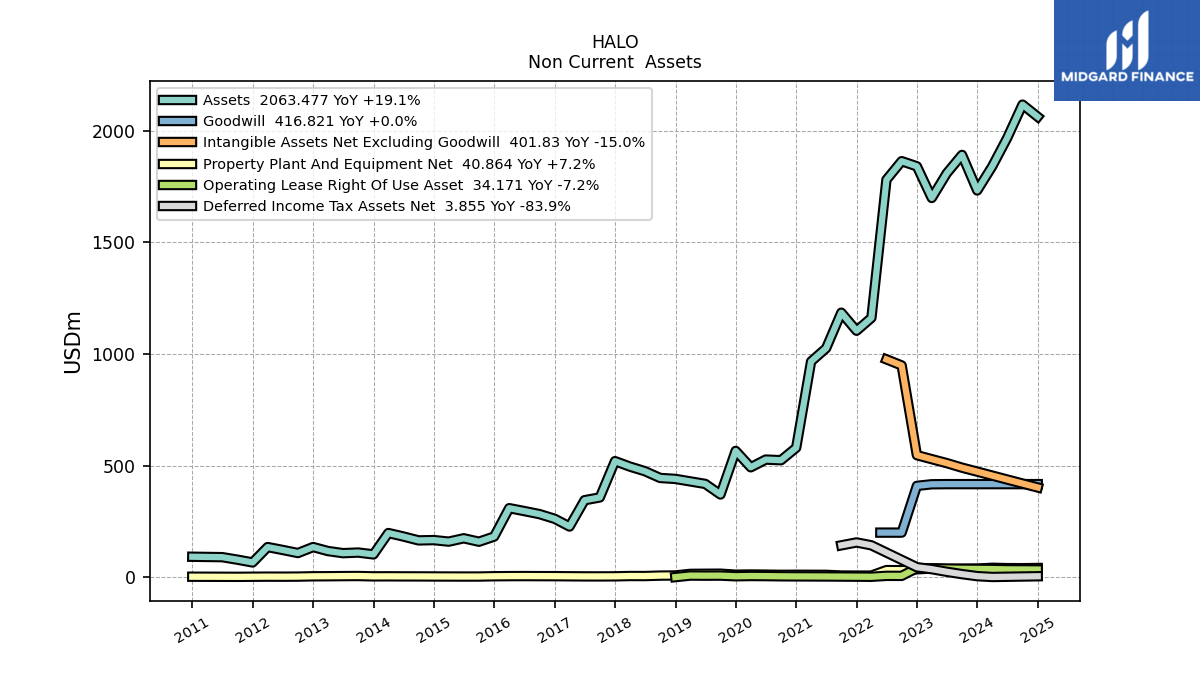
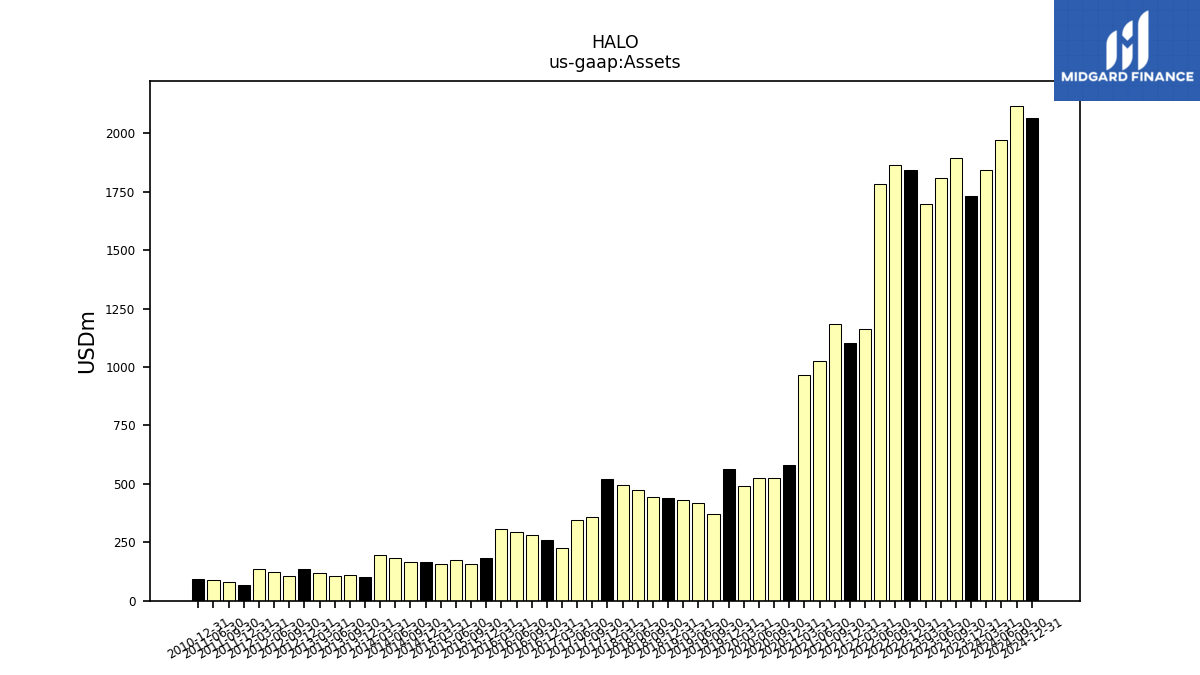
| Assets | 1733.27 | 1892.66 | 1810.44 | 1699.45 | 1841.51 | 1864.54 | 1781.39 | 1162.25 | 1104.43 | 1185.42 | 1025.86 | 966.58 | 579.92 | 524.03 | 527.00 | 492.35 | 565.87 | 370.36 | 417.83 | 429.11 | 440.25 | 444.51 | 474.75 | 495.47 | 519.95 | 357.15 | 344.79 | 226.77 | 261.51 | 282.50 | 296.13 | 309.10 | 181.79 | 158.73 | 174.05 | 159.12 | 165.98 | 164.63 | 182.05 | 197.69 | 101.79 | 110.15 | 107.39 | 116.87 | 134.73 | 107.98 | 121.75 | 134.72 | 65.76 | 78.24 | 89.51 | NA | 91.35 | NA | NA | |
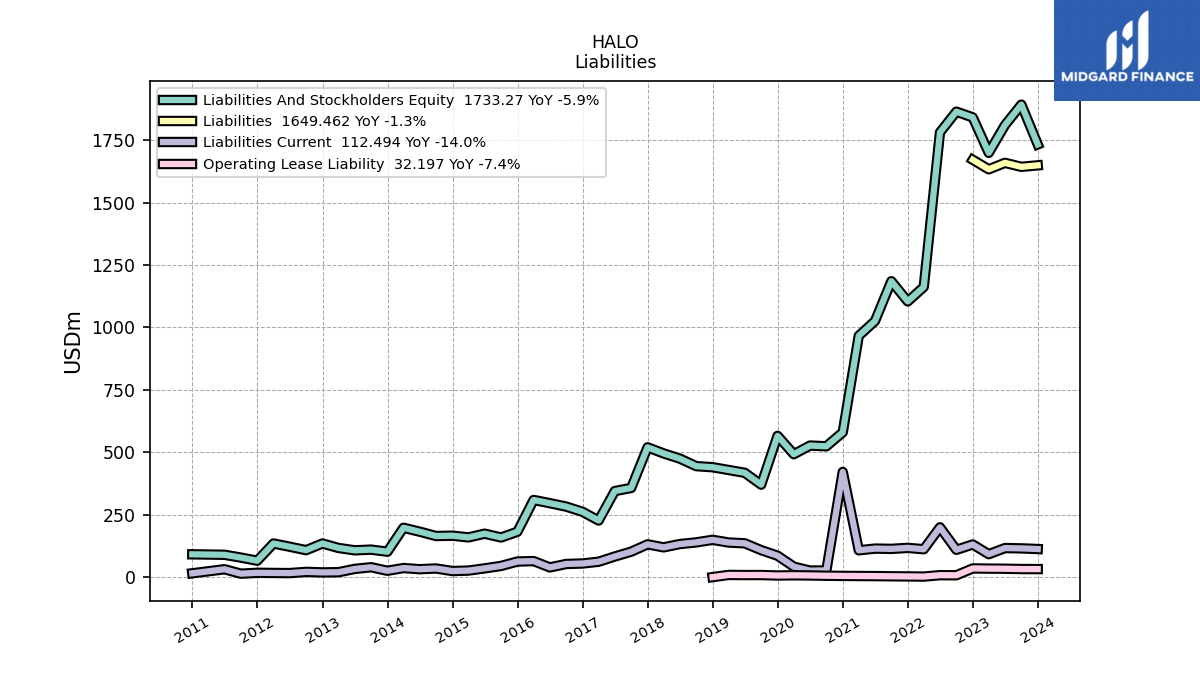
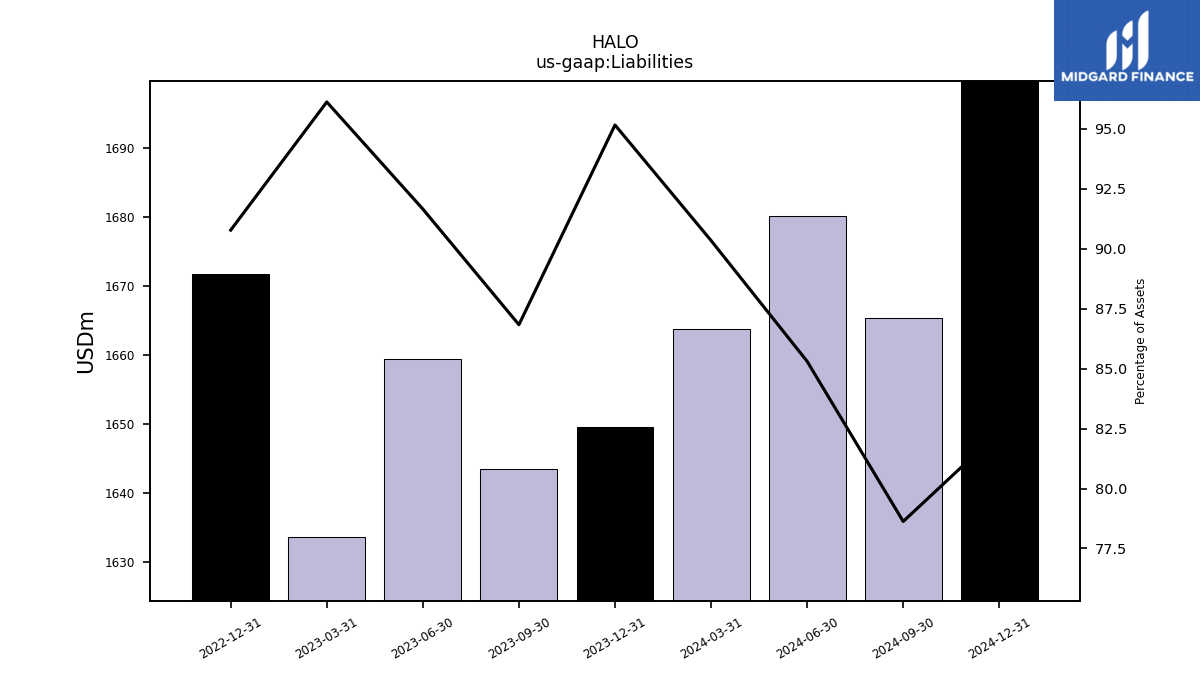
| Liabilities | 1649.46 | 1643.48 | 1659.41 | 1633.60 | 1671.71 | NA | NA | NA | NA | NA | NA | NA | NA | NA | NA | NA | NA | NA | NA | NA | NA | NA | NA | NA | NA | NA | NA | NA | NA | NA | NA | NA | NA | NA | NA | NA | NA | NA | NA | NA | NA | NA | NA | NA | NA | NA | NA | NA | NA | NA | NA | NA | NA | NA | NA | |
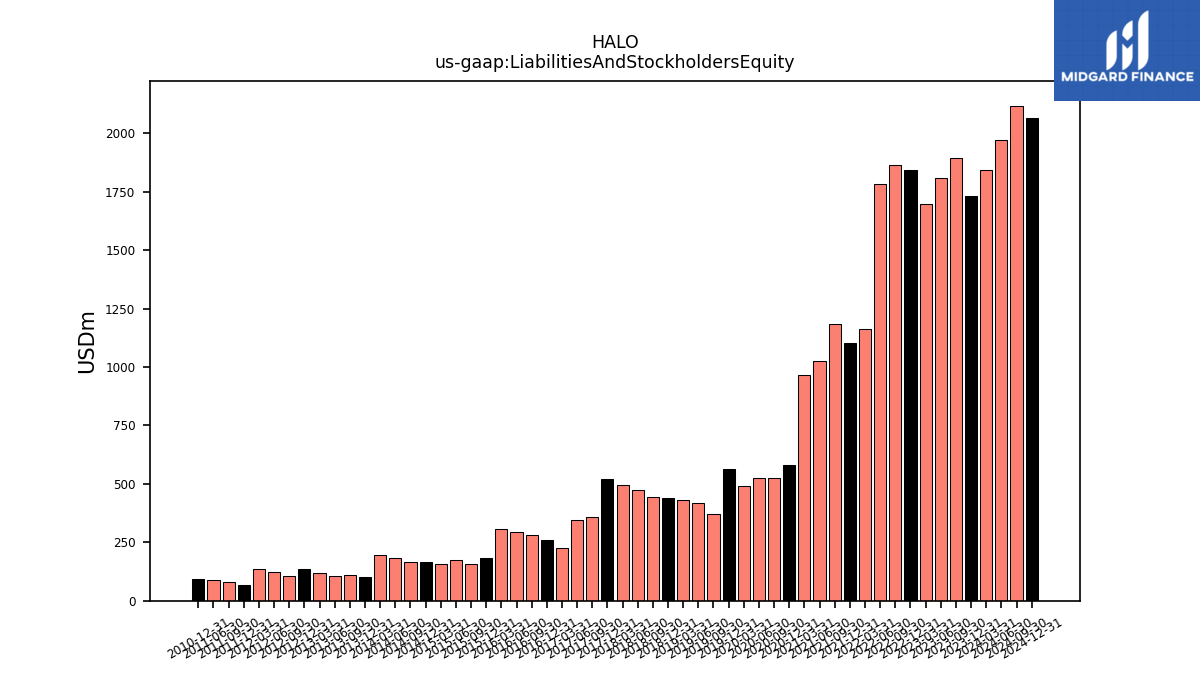
| Liabilities And Stockholders Equity | 1733.27 | 1892.66 | 1810.44 | 1699.45 | 1841.51 | 1864.54 | 1781.39 | 1162.25 | 1104.43 | 1185.42 | 1025.86 | 966.58 | 579.92 | 524.03 | 527.00 | 492.35 | 565.87 | 370.36 | 417.83 | 429.11 | 440.25 | 444.51 | 474.75 | 495.47 | 519.95 | 357.15 | 344.79 | 226.77 | 261.51 | 282.50 | 296.13 | 309.10 | 181.79 | 158.73 | 174.05 | 159.12 | 165.98 | 164.63 | 182.05 | 197.69 | 101.79 | 110.15 | 107.39 | 116.87 | 134.73 | 107.98 | 121.75 | 134.72 | 65.76 | 78.24 | 89.51 | NA | 91.35 | NA | NA | |
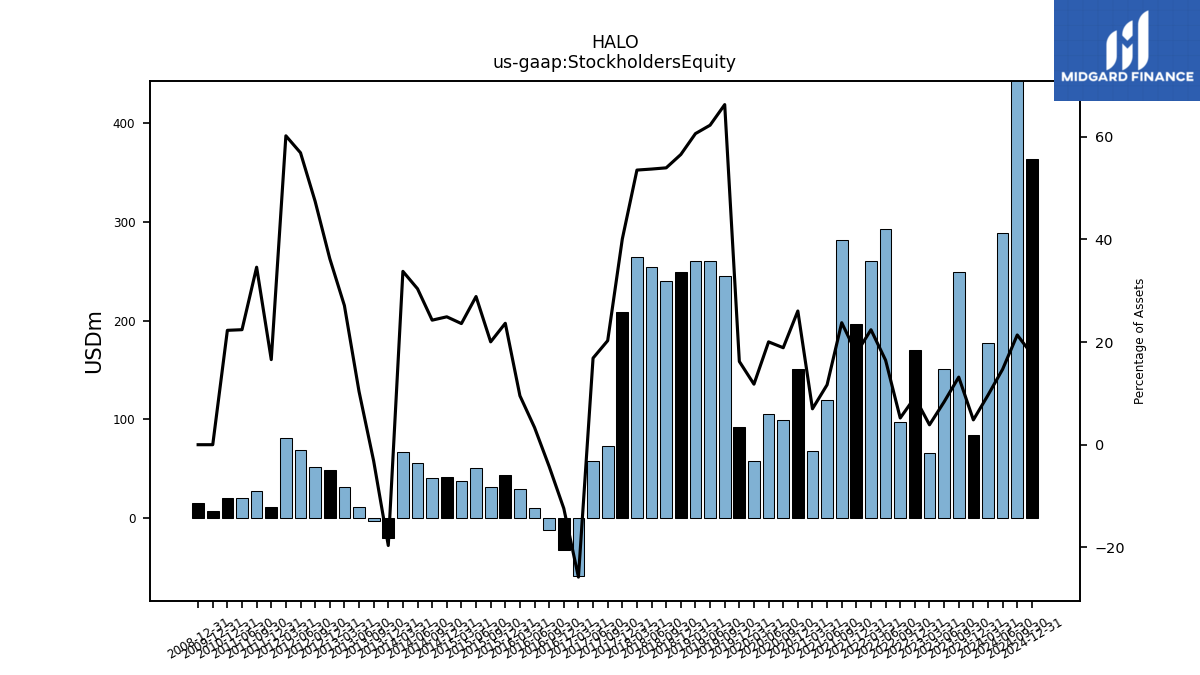
| Stockholders Equity | 83.81 | 249.18 | 151.03 | 65.85 | 169.80 | 96.99 | 293.17 | 260.26 | 196.95 | 281.67 | 119.75 | 67.59 | 151.05 | 98.99 | 105.58 | 58.04 | 91.77 | 245.35 | 260.05 | 260.05 | 248.89 | 239.74 | 254.93 | 265.06 | 208.37 | 72.39 | 58.16 | -58.50 | -32.48 | -11.99 | 9.92 | 29.47 | 43.00 | 31.80 | 50.23 | 37.55 | 41.35 | 39.94 | 55.30 | 66.75 | -19.99 | -3.49 | 11.14 | 31.68 | 48.85 | 51.19 | 69.23 | 81.06 | 10.90 | 27.06 | 20.05 | NA | 20.35 | NA | NA |
| 2023-12-31 | 2023-09-30 | 2023-06-30 | 2023-03-31 | 2022-12-31 | 2022-09-30 | 2022-06-30 | 2022-03-31 | 2021-12-31 | 2021-09-30 | 2021-06-30 | 2021-03-31 | 2020-12-31 | 2020-09-30 | 2020-06-30 | 2020-03-31 | 2019-12-31 | 2019-09-30 | 2019-06-30 | 2019-03-31 | 2018-12-31 | 2018-09-30 | 2018-06-30 | 2018-03-31 | 2017-12-31 | 2017-09-30 | 2017-06-30 | 2017-03-31 | 2016-12-31 | 2016-09-30 | 2016-06-30 | 2016-03-31 | 2015-12-31 | 2015-09-30 | 2015-06-30 | 2015-03-31 | 2014-12-31 | 2014-09-30 | 2014-06-30 | 2014-03-31 | 2013-12-31 | 2013-09-30 | 2013-06-30 | 2013-03-31 | 2012-12-31 | 2012-09-30 | 2012-06-30 | 2012-03-31 | 2011-12-31 | 2011-09-30 | 2011-06-30 | 2011-03-31 | 2010-12-31 | 2010-09-30 | 2010-06-30 | ||
|---|---|---|---|---|---|---|---|---|---|---|---|---|---|---|---|---|---|---|---|---|---|---|---|---|---|---|---|---|---|---|---|---|---|---|---|---|---|---|---|---|---|---|---|---|---|---|---|---|---|---|---|---|---|---|---|---|
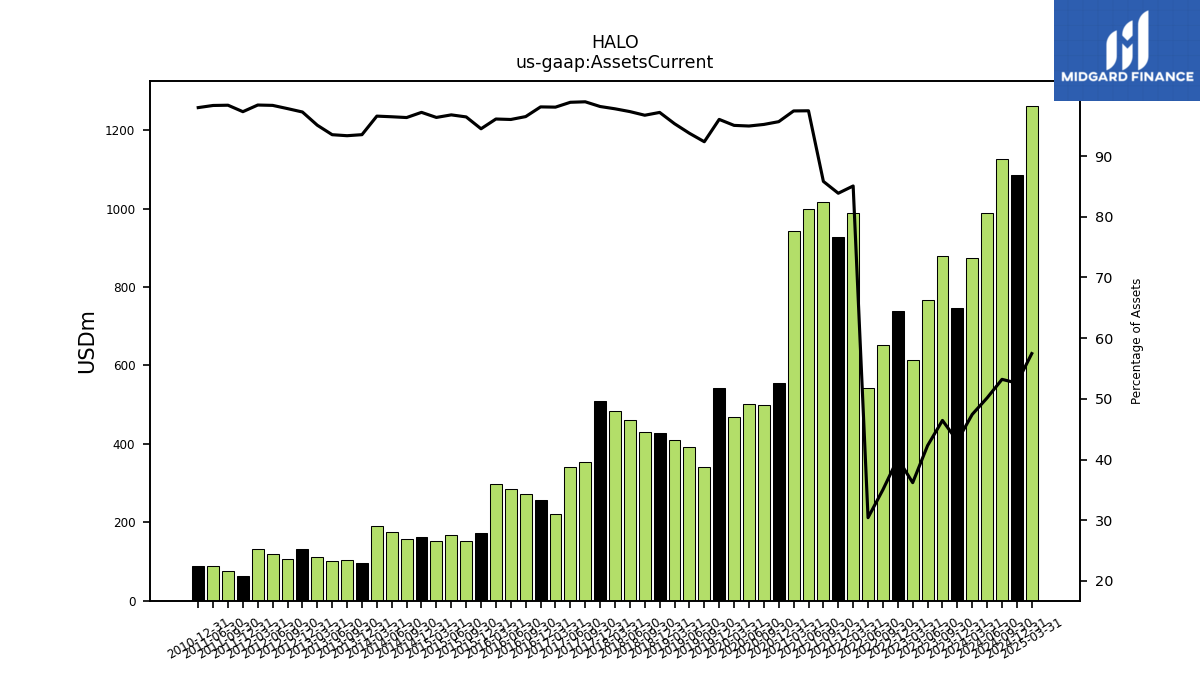
| Assets Current | 746.42 | 879.01 | 765.75 | 615.02 | 739.01 | 653.20 | 541.94 | 988.69 | 926.29 | 1017.30 | 999.75 | 941.72 | 554.76 | 498.89 | 500.36 | 467.97 | 543.44 | 342.04 | 391.71 | 409.04 | 427.85 | 429.93 | 462.03 | 484.47 | 510.37 | 353.35 | 340.83 | 222.35 | 256.53 | 272.61 | 284.34 | 297.04 | 171.77 | 153.09 | 168.44 | 153.33 | 161.32 | 158.60 | 175.62 | 190.91 | 95.20 | 102.82 | 100.42 | 111.11 | 131.03 | 105.62 | 119.73 | 132.57 | 63.99 | 76.97 | 88.01 | NA | 89.50 | NA | NA | |
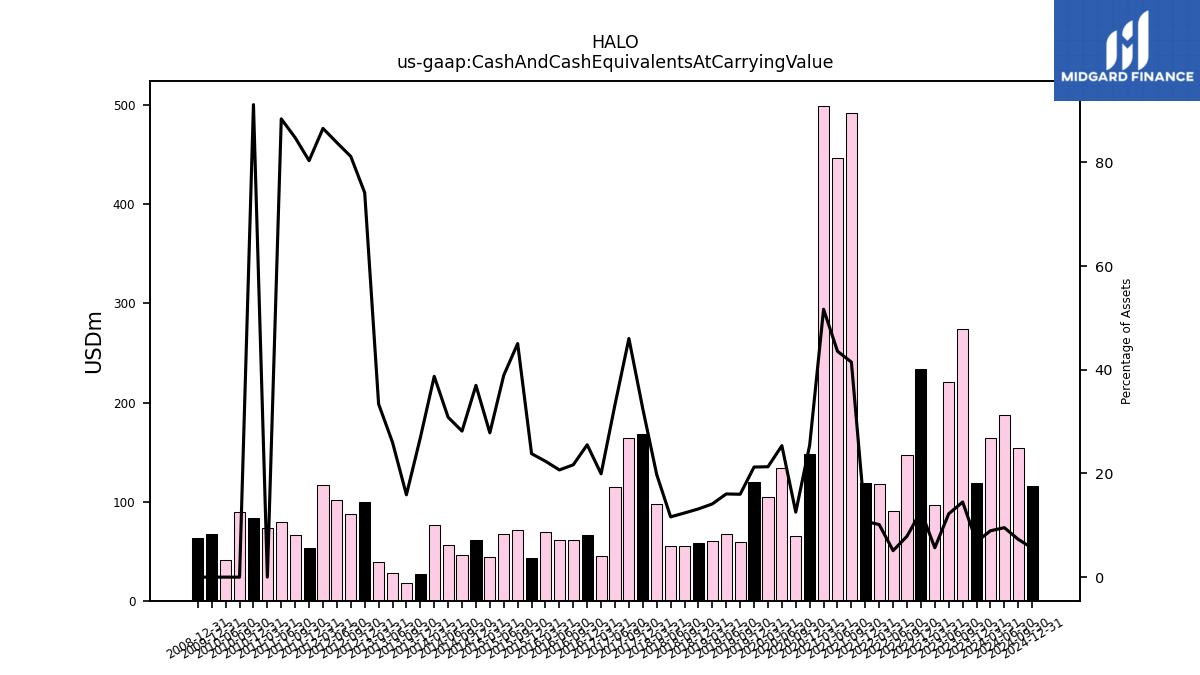
| Cash And Cash Equivalents At Carrying Value | 118.37 | 274.23 | 221.16 | 96.38 | 234.19 | 147.16 | 90.93 | 117.83 | 118.72 | 491.68 | 446.97 | 499.45 | 147.70 | 65.74 | 133.61 | 104.82 | 120.18 | 59.20 | 67.04 | 60.59 | 57.94 | 55.02 | 55.17 | 98.01 | 168.74 | 164.40 | 114.75 | 45.19 | 66.76 | 61.21 | 61.23 | 69.09 | 43.29 | 71.51 | 67.77 | 44.29 | 61.39 | 46.38 | 56.13 | 76.57 | 27.36 | 17.49 | 27.93 | 39.02 | 99.90 | 87.61 | 102.04 | 116.61 | 52.83 | 66.33 | 79.12 | 73.83 | 83.26 | 89.84 | 41.31 | |
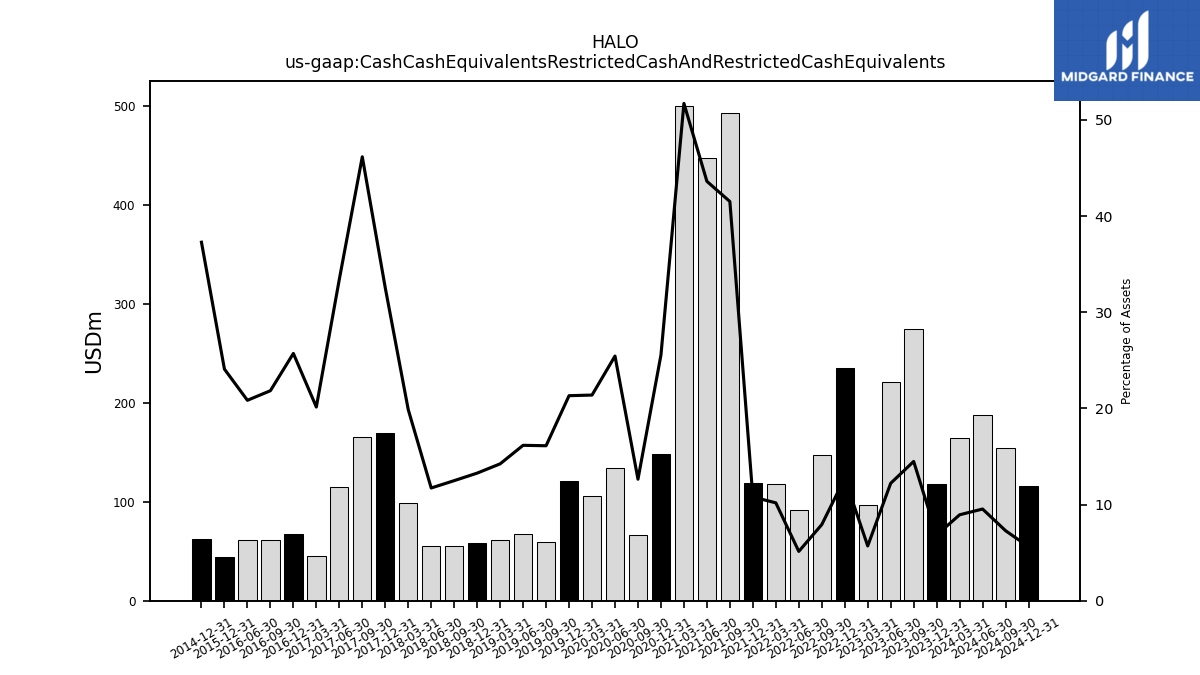
| Cash Cash Equivalents Restricted Cash And Restricted Cash Equivalents | 118.37 | 274.23 | 221.16 | 96.88 | 234.69 | 147.66 | 91.43 | 118.33 | 119.22 | 492.18 | 447.47 | 499.95 | 148.20 | 66.24 | 134.11 | 105.32 | 120.68 | 59.70 | 67.54 | 61.09 | 58.44 | 55.52 | 55.67 | 98.51 | 169.24 | 164.90 | 115.25 | 45.69 | 67.26 | 61.71 | 61.73 | NA | 43.79 | NA | NA | NA | 61.89 | NA | NA | NA | NA | NA | NA | NA | NA | NA | NA | NA | NA | NA | NA | NA | NA | NA | NA | |
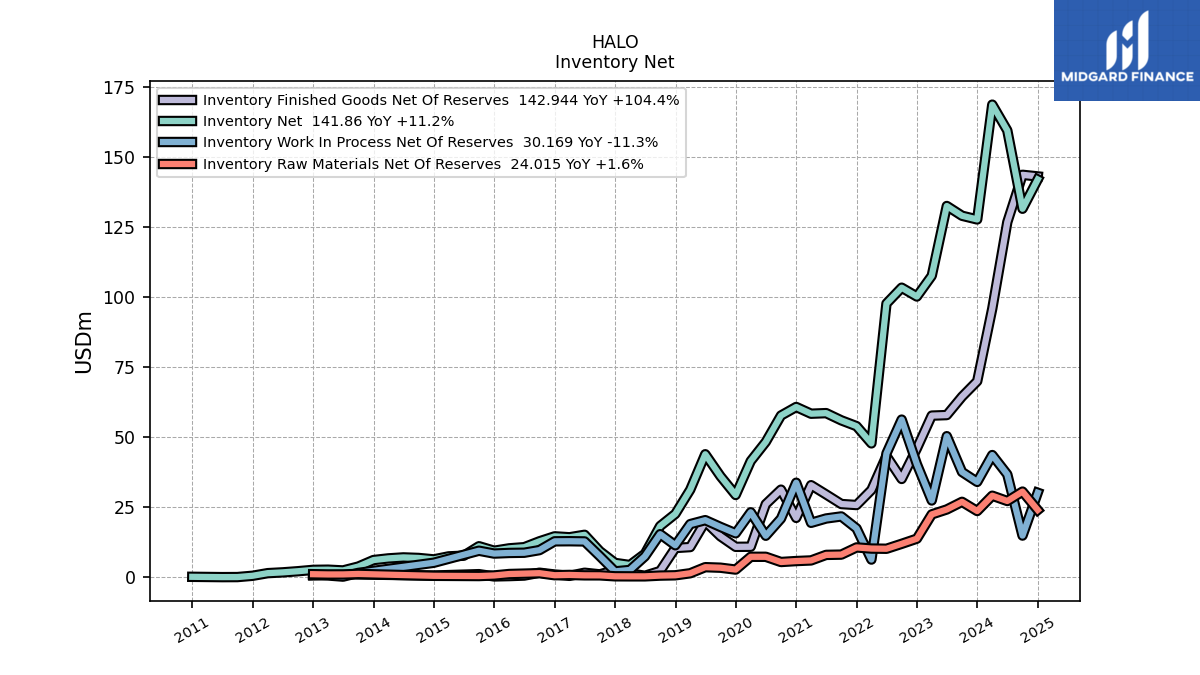
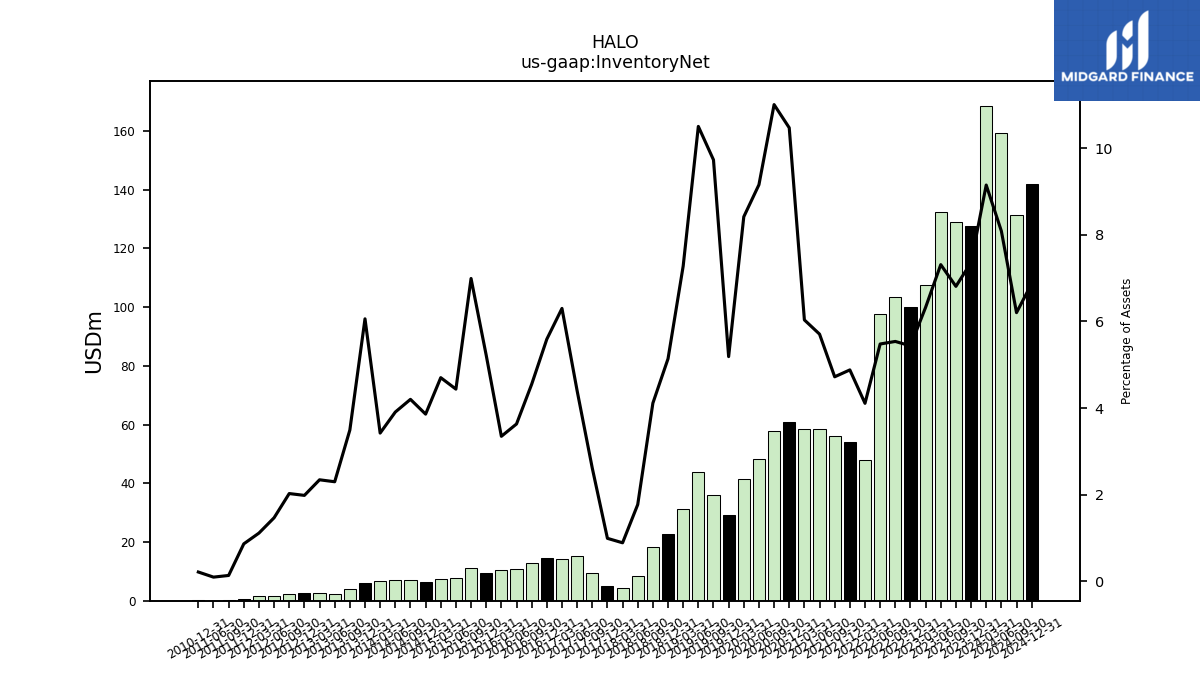
| Inventory Net | 127.60 | 128.92 | 132.41 | 107.52 | 100.12 | 103.28 | 97.61 | 47.76 | 53.91 | 55.98 | 58.55 | 58.34 | 60.75 | 57.70 | 48.27 | 41.45 | 29.36 | 36.05 | 43.90 | 31.24 | 22.62 | 18.29 | 8.40 | 4.39 | 5.15 | 9.33 | 15.17 | 14.29 | 14.62 | 12.85 | 10.76 | 10.35 | 9.49 | 11.10 | 7.72 | 7.48 | 6.41 | 6.92 | 7.11 | 6.76 | 6.17 | 3.85 | 2.47 | 2.74 | 2.67 | 2.19 | 1.78 | 1.50 | 0.57 | 0.10 | 0.08 | NA | 0.19 | NA | NA | |
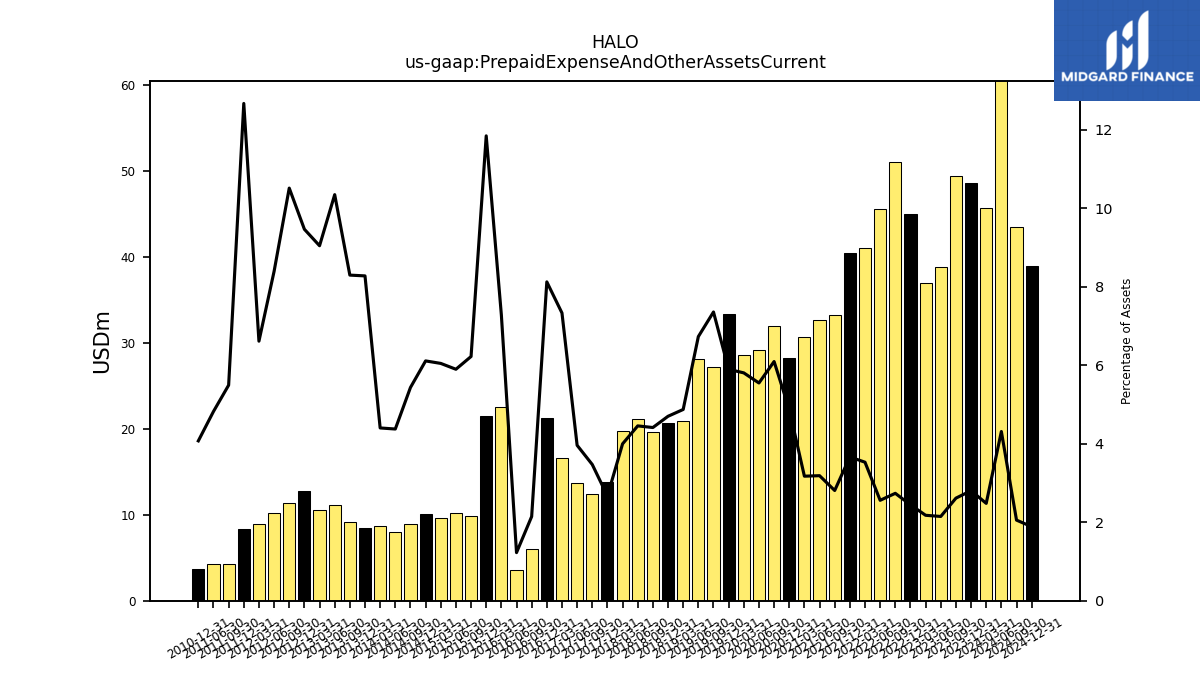
| Prepaid Expense And Other Assets Current | 48.61 | 49.48 | 38.88 | 37.01 | 45.02 | 51.04 | 45.59 | 41.03 | 40.48 | 33.30 | 32.69 | 30.68 | 28.27 | 31.94 | 29.24 | 28.59 | 33.37 | 27.25 | 28.12 | 20.91 | 20.69 | 19.62 | 21.15 | 19.81 | 13.88 | 12.40 | 13.66 | 16.63 | 21.25 | 6.06 | 3.63 | 22.51 | 21.53 | 9.88 | 10.27 | 9.62 | 10.14 | 8.95 | 7.97 | 8.70 | 8.43 | 9.14 | 11.11 | 10.57 | 12.75 | 11.35 | 10.22 | 8.91 | 8.33 | 4.30 | 4.32 | NA | 3.72 | NA | NA |
| 2023-12-31 | 2023-09-30 | 2023-06-30 | 2023-03-31 | 2022-12-31 | 2022-09-30 | 2022-06-30 | 2022-03-31 | 2021-12-31 | 2021-09-30 | 2021-06-30 | 2021-03-31 | 2020-12-31 | 2020-09-30 | 2020-06-30 | 2020-03-31 | 2019-12-31 | 2019-09-30 | 2019-06-30 | 2019-03-31 | 2018-12-31 | 2018-09-30 | 2018-06-30 | 2018-03-31 | 2017-12-31 | 2017-09-30 | 2017-06-30 | 2017-03-31 | 2016-12-31 | 2016-09-30 | 2016-06-30 | 2016-03-31 | 2015-12-31 | 2015-09-30 | 2015-06-30 | 2015-03-31 | 2014-12-31 | 2014-09-30 | 2014-06-30 | 2014-03-31 | 2013-12-31 | 2013-09-30 | 2013-06-30 | 2013-03-31 | 2012-12-31 | 2012-09-30 | 2012-06-30 | 2012-03-31 | 2011-12-31 | 2011-09-30 | 2011-06-30 | 2011-03-31 | 2010-12-31 | 2010-09-30 | 2010-06-30 | ||
|---|---|---|---|---|---|---|---|---|---|---|---|---|---|---|---|---|---|---|---|---|---|---|---|---|---|---|---|---|---|---|---|---|---|---|---|---|---|---|---|---|---|---|---|---|---|---|---|---|---|---|---|---|---|---|---|---|
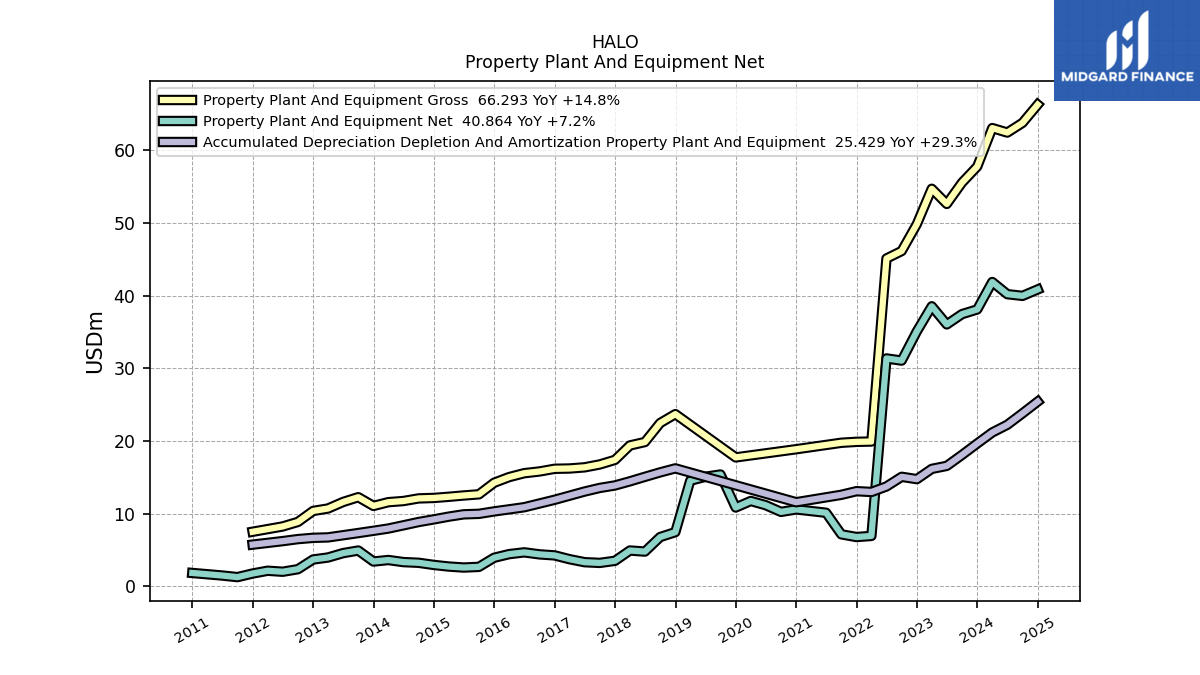
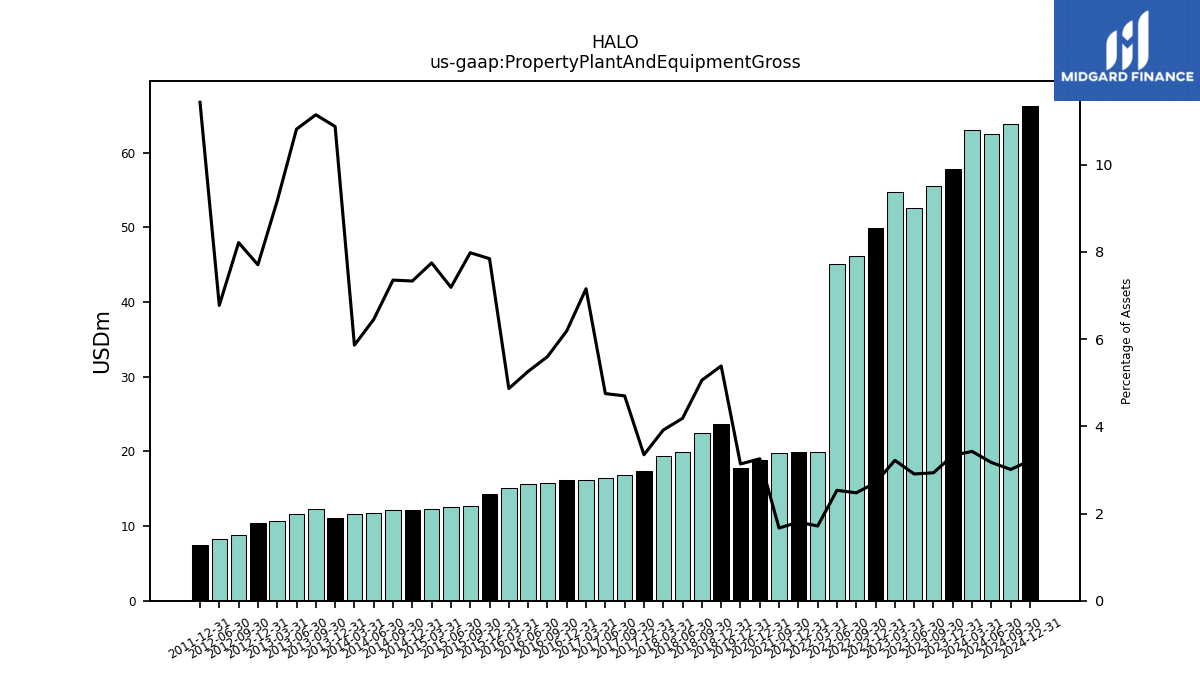
| Property Plant And Equipment Gross | 57.77 | 55.56 | 52.63 | 54.72 | 49.86 | 46.15 | 45.12 | 19.93 | 19.89 | 19.76 | NA | NA | 18.88 | NA | NA | NA | 17.75 | NA | NA | NA | 23.70 | 22.48 | 19.86 | 19.39 | 17.41 | 16.78 | 16.38 | 16.22 | 16.18 | 15.81 | 15.58 | 15.04 | 14.26 | 12.67 | 12.51 | 12.33 | 12.17 | 12.11 | 11.75 | 11.59 | 11.07 | 12.28 | 11.61 | 10.72 | 10.38 | 8.87 | 8.25 | NA | 7.52 | NA | NA | NA | NA | NA | NA | |
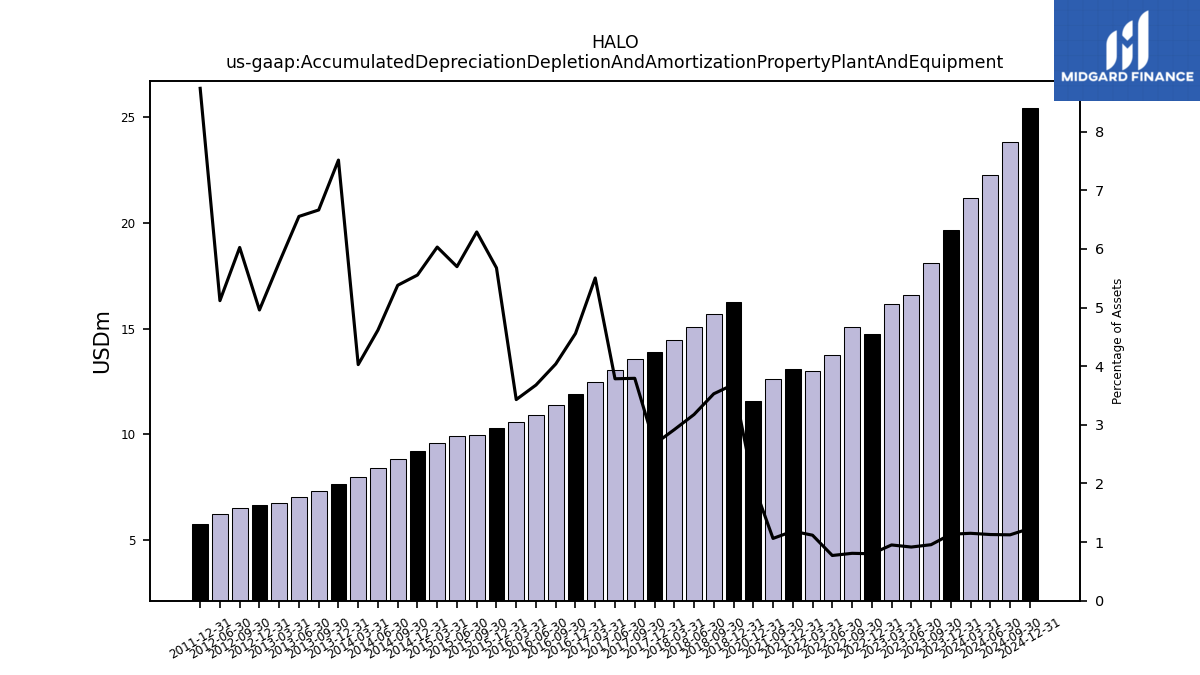
| Accumulated Depreciation Depletion And Amortization Property Plant And Equipment | 19.66 | 18.09 | 16.58 | 16.17 | 14.76 | 15.08 | 13.75 | 12.99 | 13.10 | 12.60 | NA | NA | 11.58 | NA | NA | NA | NA | NA | NA | NA | 16.24 | 15.69 | 15.08 | 14.46 | 13.89 | 13.55 | 13.05 | 12.48 | 11.92 | 11.41 | 10.89 | 10.60 | 10.32 | 9.98 | 9.92 | 9.60 | 9.22 | 8.86 | 8.40 | 7.96 | 7.65 | 7.34 | 7.04 | 6.74 | 6.68 | 6.51 | 6.23 | NA | 5.75 | NA | NA | NA | NA | NA | NA | |
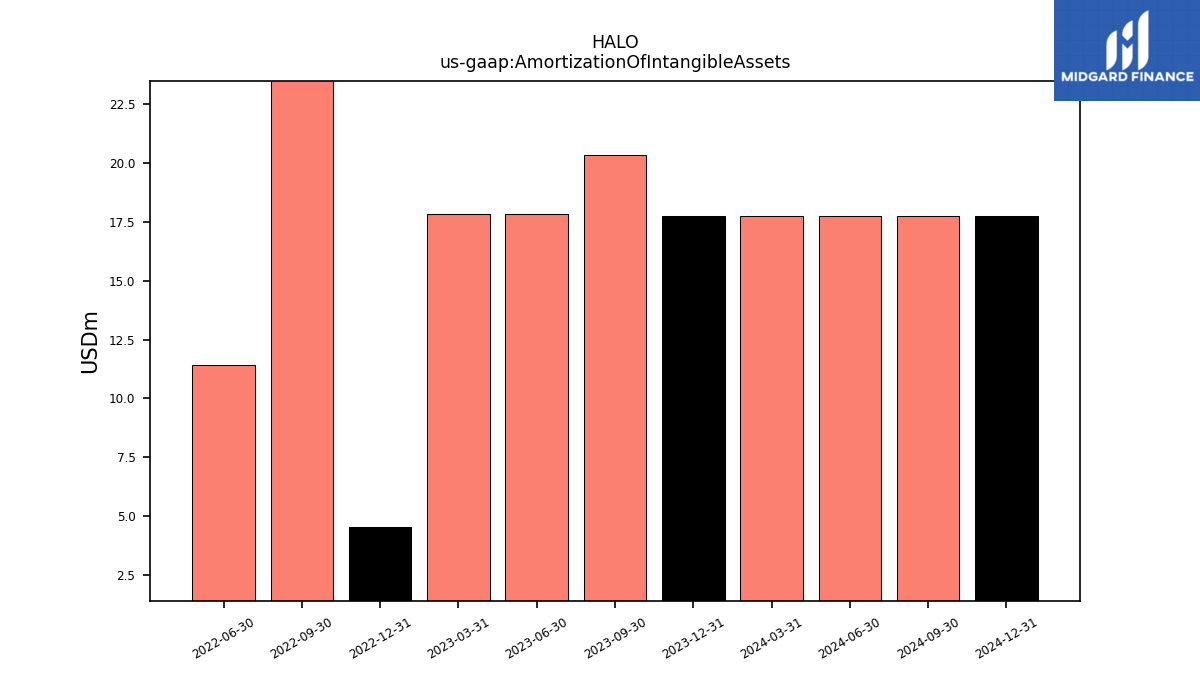
| Amortization Of Intangible Assets | 17.76 | 20.34 | 17.84 | 17.84 | 4.55 | 27.19 | 11.40 | NA | NA | NA | NA | NA | NA | NA | NA | NA | NA | NA | NA | NA | NA | NA | NA | NA | NA | NA | NA | NA | NA | NA | NA | NA | NA | NA | NA | NA | NA | NA | NA | NA | NA | NA | NA | NA | NA | NA | NA | NA | NA | NA | NA | NA | NA | NA | NA | |
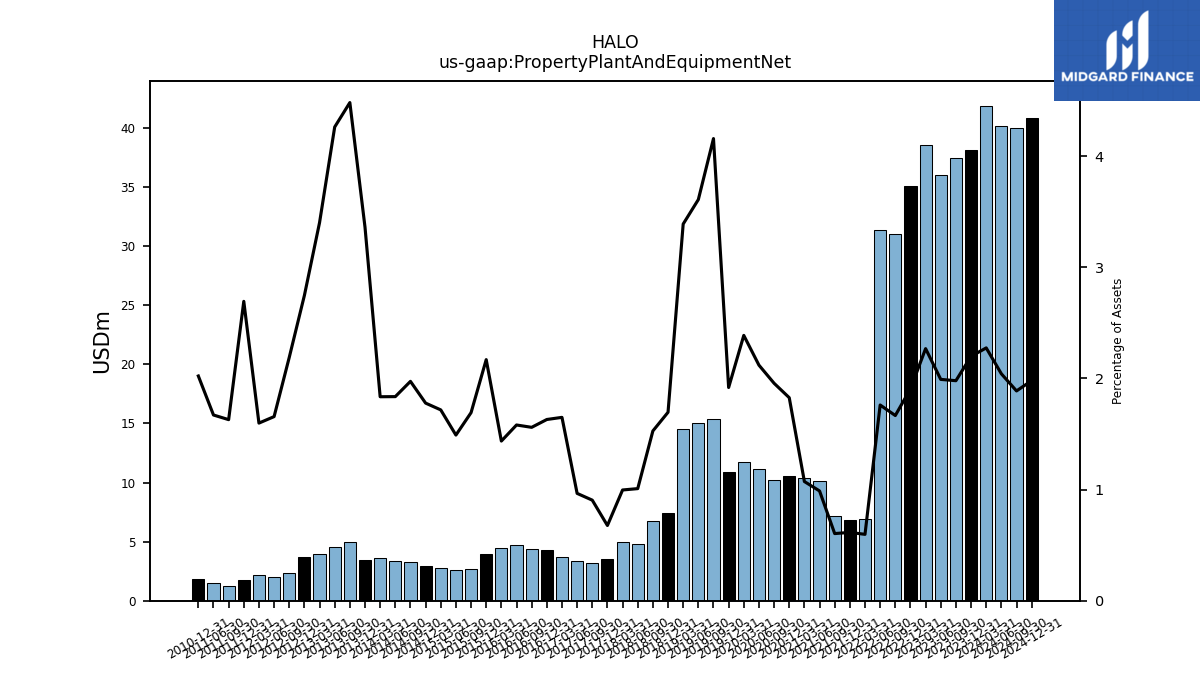
| Property Plant And Equipment Net | 38.11 | 37.47 | 36.05 | 38.54 | 35.10 | 31.07 | 31.37 | 6.94 | 6.79 | 7.16 | 10.13 | 10.37 | 10.59 | 10.25 | 11.17 | 11.75 | 10.86 | 15.40 | 15.08 | 14.54 | 7.46 | 6.79 | 4.79 | 4.94 | 3.52 | 3.23 | 3.33 | 3.74 | 4.26 | 4.41 | 4.68 | 4.44 | 3.94 | 2.69 | 2.59 | 2.73 | 2.95 | 3.25 | 3.34 | 3.63 | 3.42 | 4.94 | 4.58 | 3.98 | 3.70 | 2.36 | 2.02 | 2.15 | 1.77 | 1.27 | 1.50 | NA | 1.85 | NA | NA | |
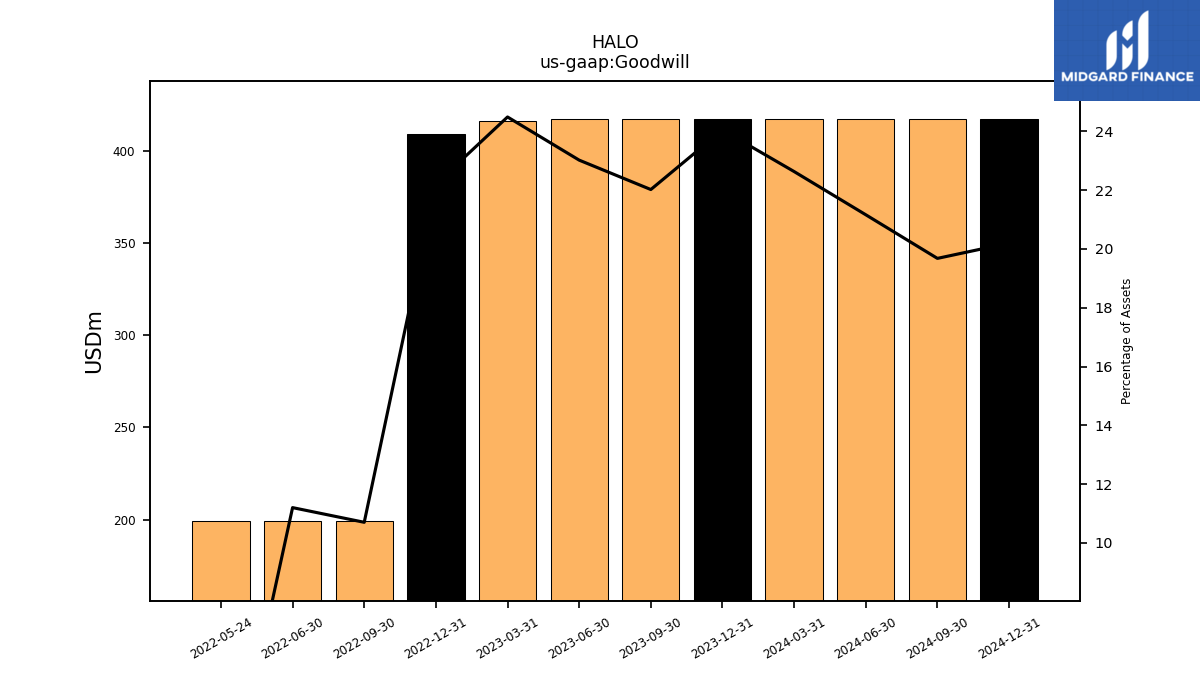
| Goodwill | 416.82 | 416.82 | 416.82 | 416.22 | 409.05 | 199.48 | 199.48 | NA | NA | NA | NA | NA | NA | NA | NA | NA | NA | NA | NA | NA | NA | NA | NA | NA | NA | NA | NA | NA | NA | NA | NA | NA | NA | NA | NA | NA | NA | NA | NA | NA | NA | NA | NA | NA | NA | NA | NA | NA | NA | NA | NA | NA | NA | NA | NA | |
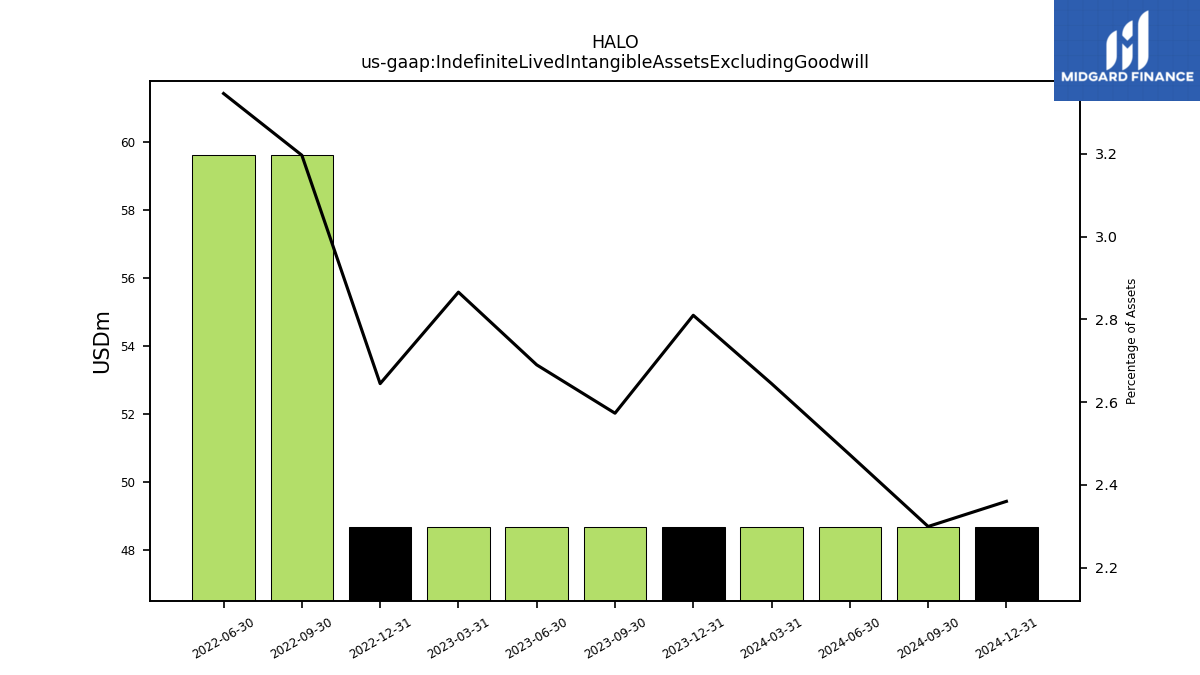
| Indefinite Lived Intangible Assets Excluding Goodwill | 48.70 | 48.70 | 48.70 | 48.70 | 48.70 | 59.60 | 59.60 | NA | NA | NA | NA | NA | NA | NA | NA | NA | NA | NA | NA | NA | NA | NA | NA | NA | NA | NA | NA | NA | NA | NA | NA | NA | NA | NA | NA | NA | NA | NA | NA | NA | NA | NA | NA | NA | NA | NA | NA | NA | NA | NA | NA | NA | NA | NA | NA | |
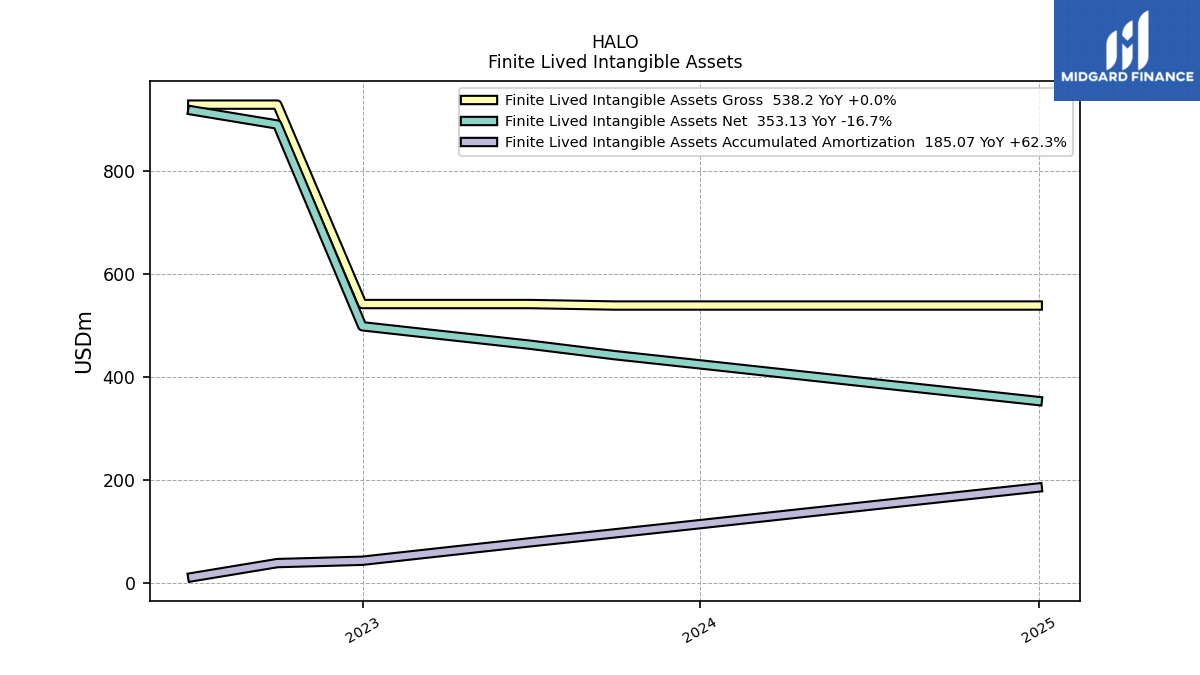
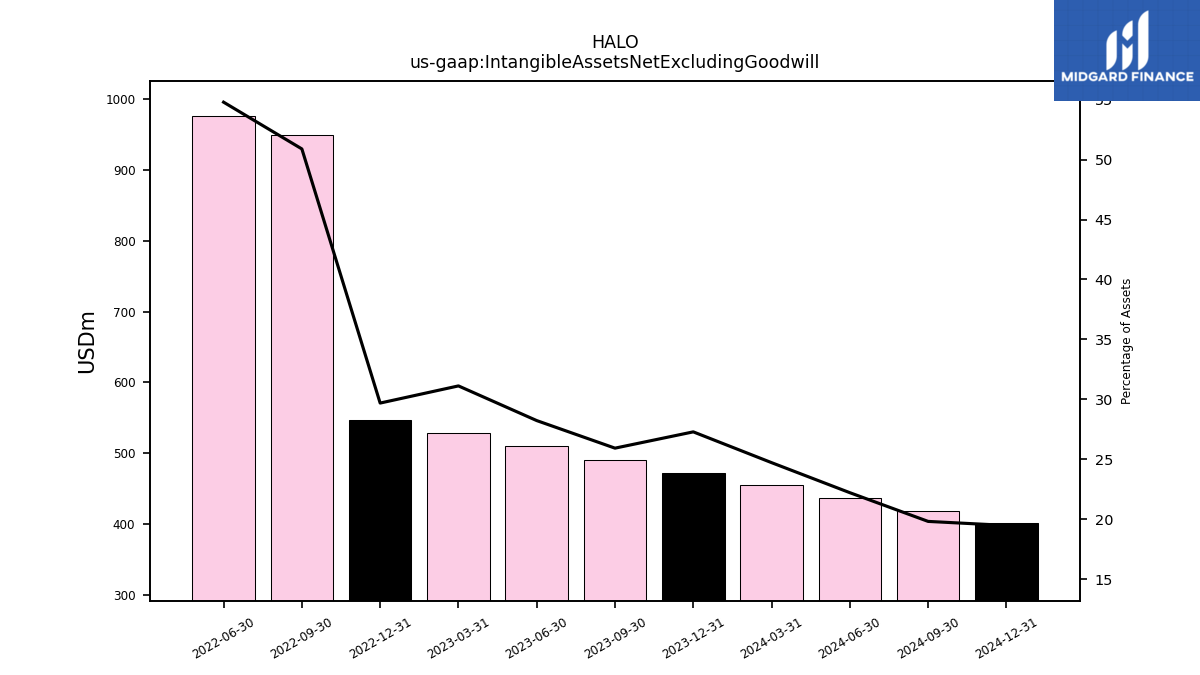
| Intangible Assets Net Excluding Goodwill | 472.88 | 490.64 | 510.98 | 528.82 | 546.65 | 948.90 | 976.10 | NA | NA | NA | NA | NA | NA | NA | NA | NA | NA | NA | NA | NA | NA | NA | NA | NA | NA | NA | NA | NA | NA | NA | NA | NA | NA | NA | NA | NA | NA | NA | NA | NA | NA | NA | NA | NA | NA | NA | NA | NA | NA | NA | NA | NA | NA | NA | NA | |
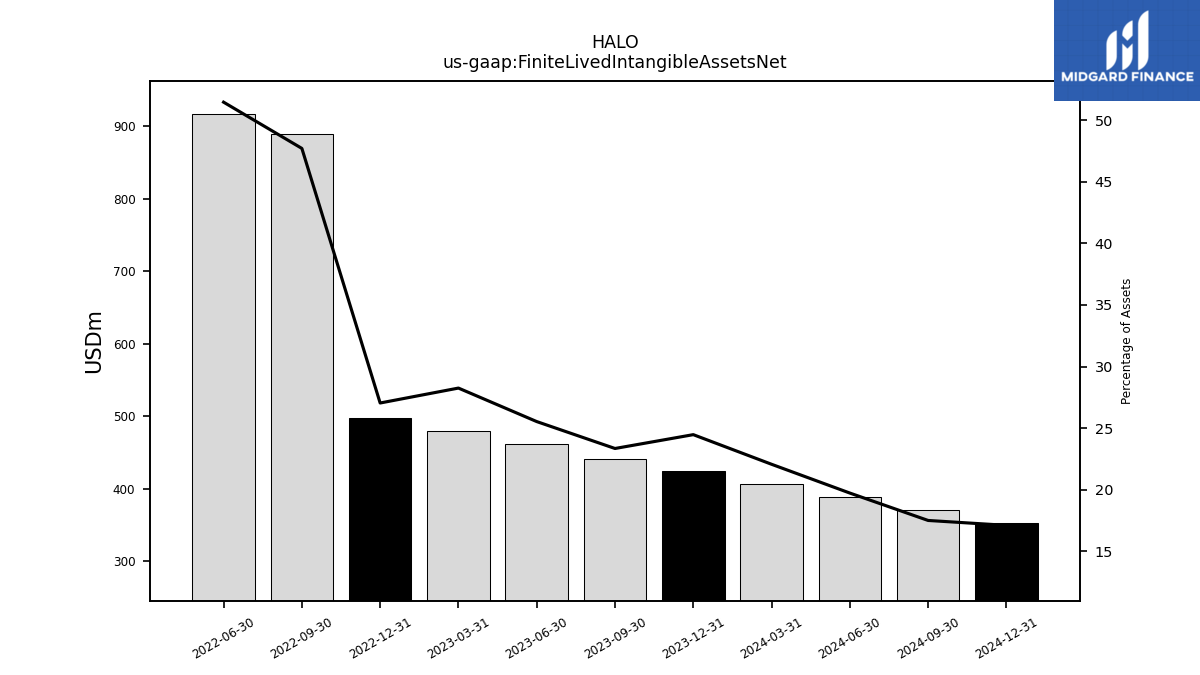
| Finite Lived Intangible Assets Net | 424.18 | 441.94 | 462.28 | 480.12 | 497.95 | 889.30 | 916.50 | NA | NA | NA | NA | NA | NA | NA | NA | NA | NA | NA | NA | NA | NA | NA | NA | NA | NA | NA | NA | NA | NA | NA | NA | NA | NA | NA | NA | NA | NA | NA | NA | NA | NA | NA | NA | NA | NA | NA | NA | NA | NA | NA | NA | NA | NA | NA | NA |
| 2023-12-31 | 2023-09-30 | 2023-06-30 | 2023-03-31 | 2022-12-31 | 2022-09-30 | 2022-06-30 | 2022-03-31 | 2021-12-31 | 2021-09-30 | 2021-06-30 | 2021-03-31 | 2020-12-31 | 2020-09-30 | 2020-06-30 | 2020-03-31 | 2019-12-31 | 2019-09-30 | 2019-06-30 | 2019-03-31 | 2018-12-31 | 2018-09-30 | 2018-06-30 | 2018-03-31 | 2017-12-31 | 2017-09-30 | 2017-06-30 | 2017-03-31 | 2016-12-31 | 2016-09-30 | 2016-06-30 | 2016-03-31 | 2015-12-31 | 2015-09-30 | 2015-06-30 | 2015-03-31 | 2014-12-31 | 2014-09-30 | 2014-06-30 | 2014-03-31 | 2013-12-31 | 2013-09-30 | 2013-06-30 | 2013-03-31 | 2012-12-31 | 2012-09-30 | 2012-06-30 | 2012-03-31 | 2011-12-31 | 2011-09-30 | 2011-06-30 | 2011-03-31 | 2010-12-31 | 2010-09-30 | 2010-06-30 | ||
|---|---|---|---|---|---|---|---|---|---|---|---|---|---|---|---|---|---|---|---|---|---|---|---|---|---|---|---|---|---|---|---|---|---|---|---|---|---|---|---|---|---|---|---|---|---|---|---|---|---|---|---|---|---|---|---|---|
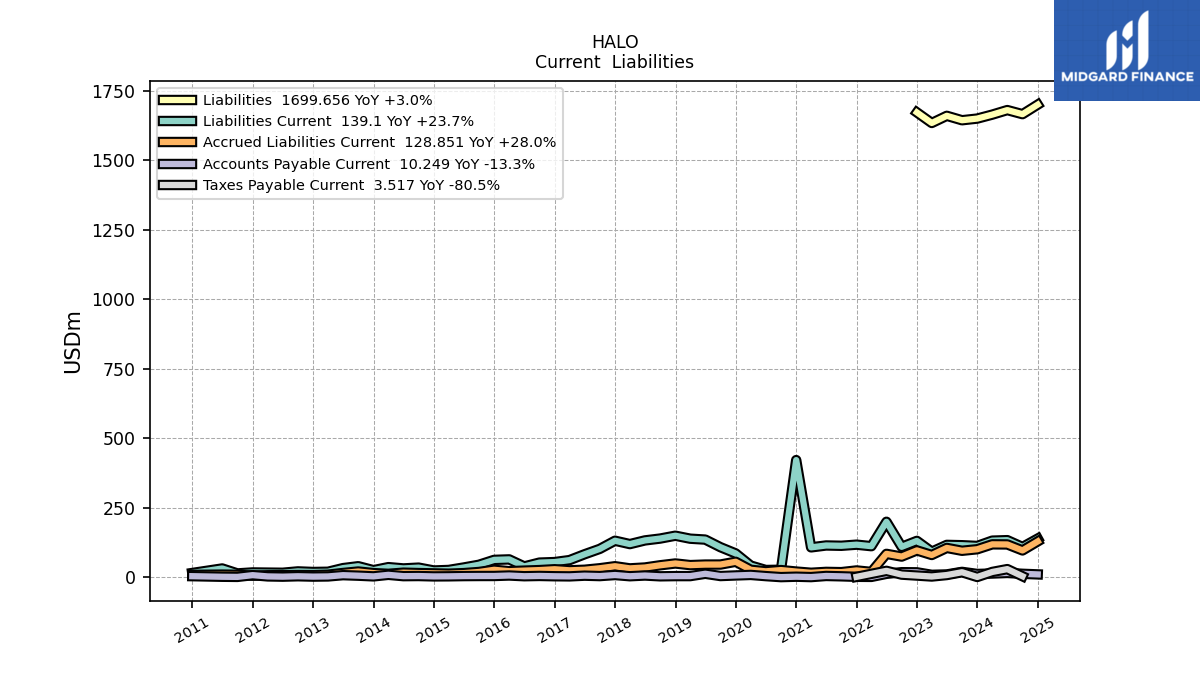
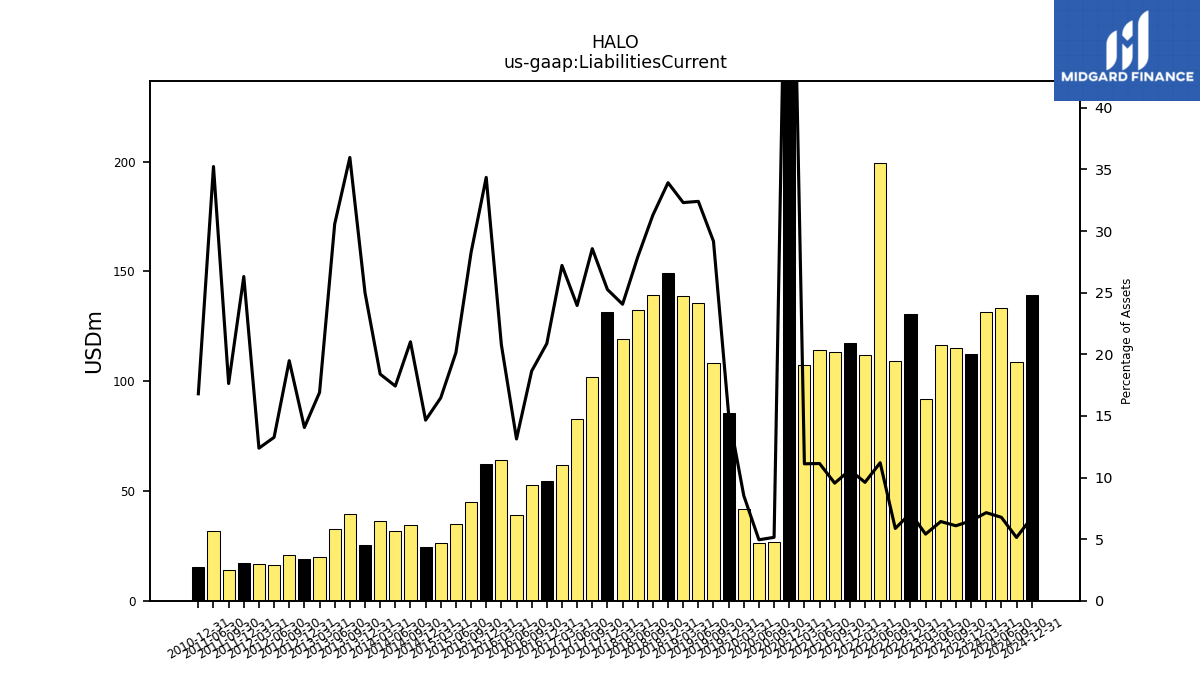
| Liabilities Current | 112.49 | 115.19 | 116.39 | 91.92 | 130.79 | 109.38 | 199.51 | 111.69 | 117.15 | 113.15 | 114.25 | 107.42 | 421.38 | 26.98 | 26.07 | 42.00 | 85.64 | 108.04 | 135.42 | 138.66 | 149.36 | 139.12 | 132.43 | 119.22 | 131.33 | 102.05 | 82.61 | 61.71 | 54.59 | 52.66 | 38.88 | 64.22 | 62.46 | 44.85 | 35.04 | 26.21 | 24.33 | 34.59 | 31.72 | 36.36 | 25.45 | 39.62 | 32.83 | 19.75 | 18.95 | 21.04 | 16.15 | 16.68 | 17.30 | 13.79 | 31.54 | NA | 15.34 | NA | NA | |
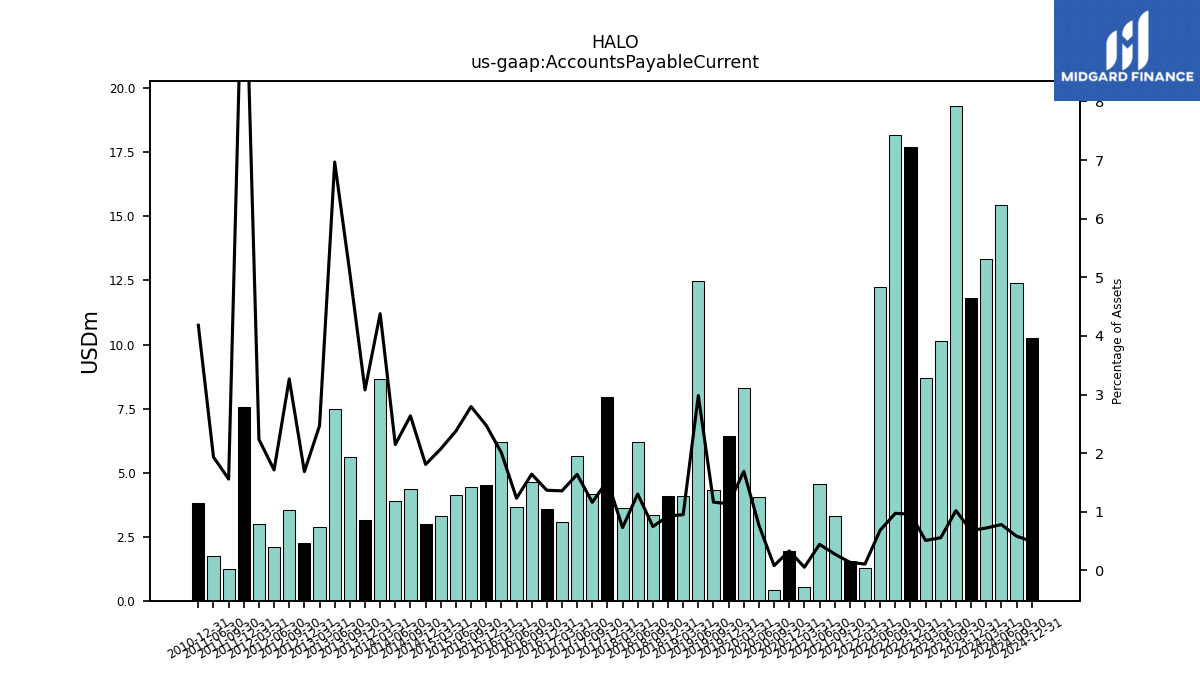
| Accounts Payable Current | 11.82 | 19.32 | 10.12 | 8.70 | 17.69 | 18.17 | 12.23 | 1.27 | 1.54 | 3.32 | 4.56 | 0.54 | 1.93 | 0.43 | 4.07 | 8.32 | 6.43 | 4.31 | 12.47 | 4.09 | 4.08 | 3.33 | 6.19 | 3.63 | 7.95 | 4.15 | 5.65 | 3.08 | 3.58 | 4.64 | 3.65 | 6.21 | 4.50 | 4.44 | 4.14 | 3.30 | 3.00 | 4.34 | 3.91 | 8.66 | 3.13 | 5.59 | 7.48 | 2.88 | 2.27 | 3.53 | 2.09 | 3.01 | 7.56 | 1.22 | 1.73 | NA | 3.82 | NA | NA | |
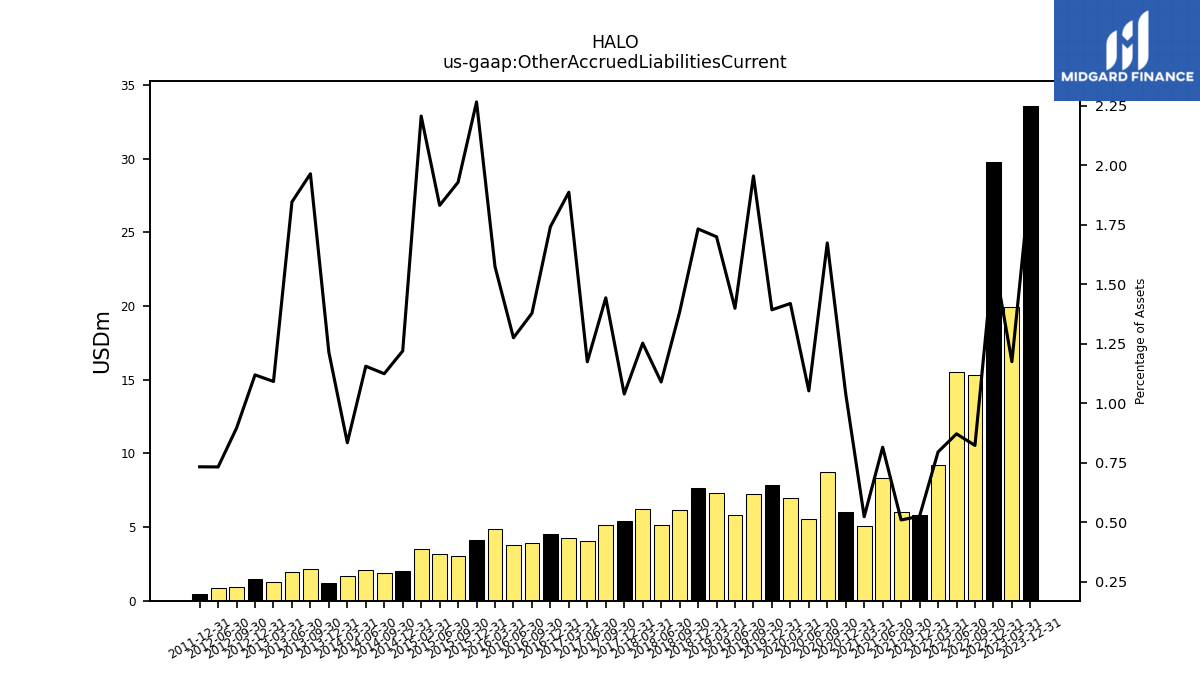
| Other Accrued Liabilities Current | 33.58 | NA | NA | 19.95 | 29.77 | 15.32 | 15.51 | 9.23 | 5.79 | 6.03 | 8.35 | 5.05 | 6.02 | 8.77 | 5.54 | 6.98 | 7.88 | 7.24 | 5.84 | 7.29 | 7.62 | 6.14 | 5.17 | 6.20 | 5.40 | 5.15 | 4.04 | 4.28 | 4.55 | 3.89 | 3.77 | 4.86 | 4.12 | 3.06 | 3.19 | 3.51 | 2.02 | 1.85 | 2.10 | 1.65 | 1.23 | 2.16 | 1.98 | 1.27 | 1.51 | 0.97 | 0.89 | NA | 0.48 | NA | NA | NA | NA | NA | NA | |
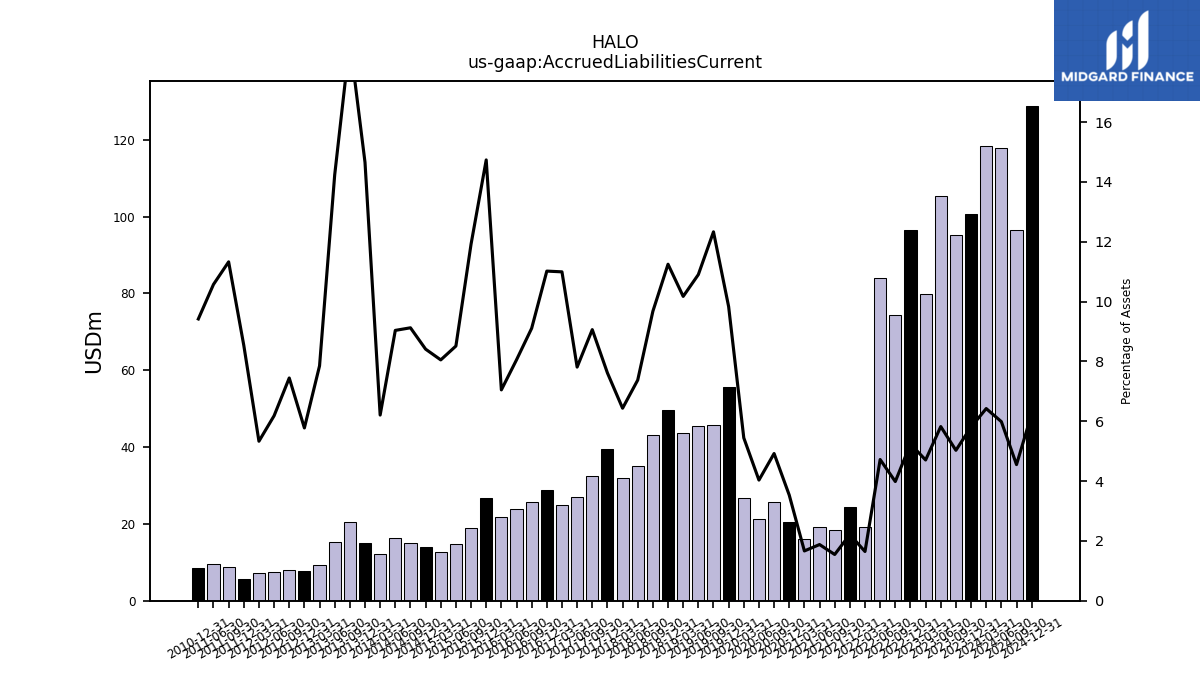
| Accrued Liabilities Current | 100.68 | 95.20 | 105.43 | 79.98 | 96.52 | 74.32 | 84.10 | 19.13 | 24.44 | 18.34 | 19.27 | 16.10 | 20.48 | 25.80 | 21.26 | 26.81 | 55.65 | 45.68 | 45.56 | 43.66 | 49.53 | 43.02 | 35.03 | 31.89 | 39.60 | 32.37 | 26.93 | 24.93 | 28.82 | 25.73 | 23.85 | 21.79 | 26.79 | 18.93 | 14.82 | 12.81 | 13.96 | 15.02 | 16.45 | 12.27 | 14.92 | 20.62 | 15.29 | 9.18 | 7.78 | 8.04 | 7.53 | 7.18 | 5.62 | 8.86 | 9.47 | NA | 8.61 | NA | NA |
| 2023-12-31 | 2023-09-30 | 2023-06-30 | 2023-03-31 | 2022-12-31 | 2022-09-30 | 2022-06-30 | 2022-03-31 | 2021-12-31 | 2021-09-30 | 2021-06-30 | 2021-03-31 | 2020-12-31 | 2020-09-30 | 2020-06-30 | 2020-03-31 | 2019-12-31 | 2019-09-30 | 2019-06-30 | 2019-03-31 | 2018-12-31 | 2018-09-30 | 2018-06-30 | 2018-03-31 | 2017-12-31 | 2017-09-30 | 2017-06-30 | 2017-03-31 | 2016-12-31 | 2016-09-30 | 2016-06-30 | 2016-03-31 | 2015-12-31 | 2015-09-30 | 2015-06-30 | 2015-03-31 | 2014-12-31 | 2014-09-30 | 2014-06-30 | 2014-03-31 | 2013-12-31 | 2013-09-30 | 2013-06-30 | 2013-03-31 | 2012-12-31 | 2012-09-30 | 2012-06-30 | 2012-03-31 | 2011-12-31 | 2011-09-30 | 2011-06-30 | 2011-03-31 | 2010-12-31 | 2010-09-30 | 2010-06-30 | ||
|---|---|---|---|---|---|---|---|---|---|---|---|---|---|---|---|---|---|---|---|---|---|---|---|---|---|---|---|---|---|---|---|---|---|---|---|---|---|---|---|---|---|---|---|---|---|---|---|---|---|---|---|---|---|---|---|---|
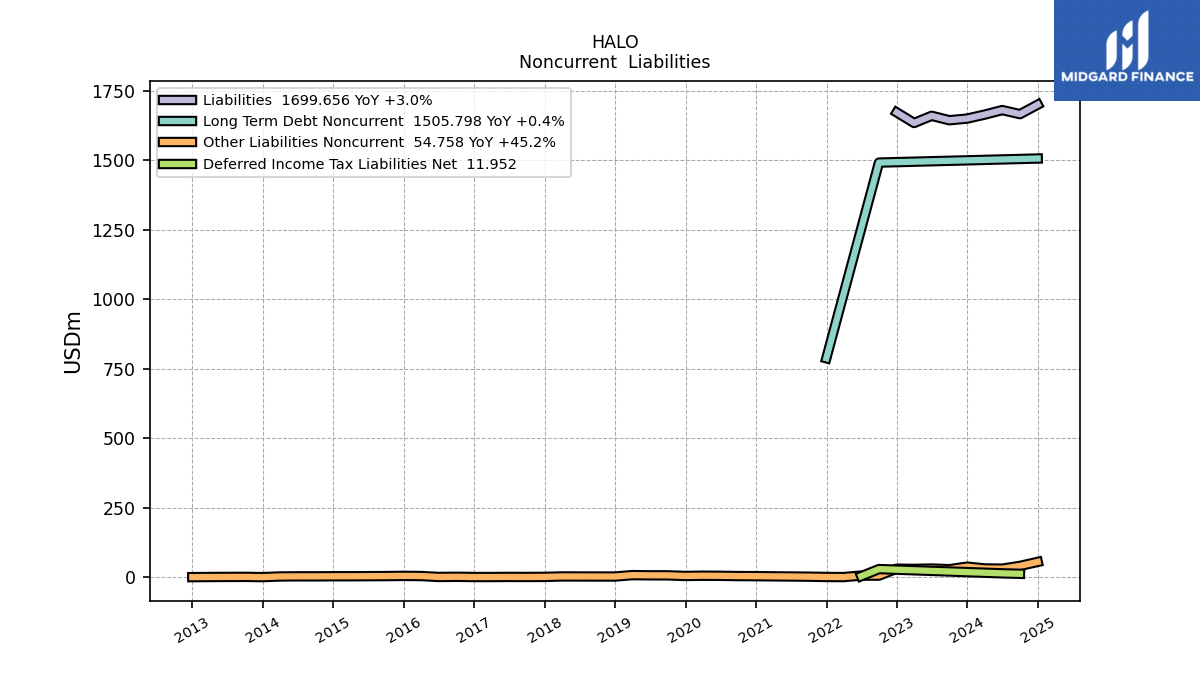
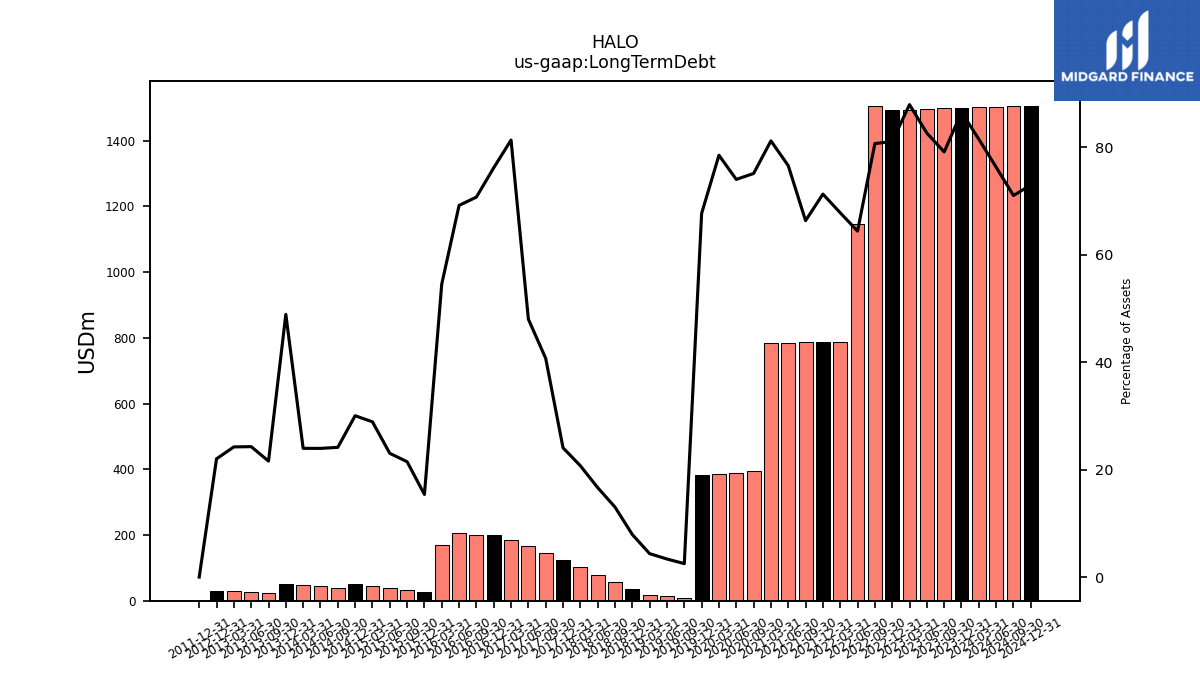
| Long Term Debt | 1499.25 | 1497.62 | 1496.00 | 1494.38 | 1492.77 | 1504.47 | 1147.13 | 788.10 | 787.25 | 786.45 | 785.57 | 784.73 | NA | 393.63 | 390.08 | 386.57 | 383.05 | 9.31 | 14.08 | 18.74 | 34.87 | 57.94 | 79.08 | 102.70 | 125.14 | 145.42 | 165.52 | 184.43 | 199.23 | 199.80 | 204.85 | 168.60 | 27.97 | 34.09 | 40.10 | 45.98 | 49.86 | 39.76 | 43.61 | 47.39 | 49.77 | 23.78 | 26.08 | 28.32 | 29.66 | NA | NA | NA | 0.00 | NA | NA | NA | NA | NA | NA | |
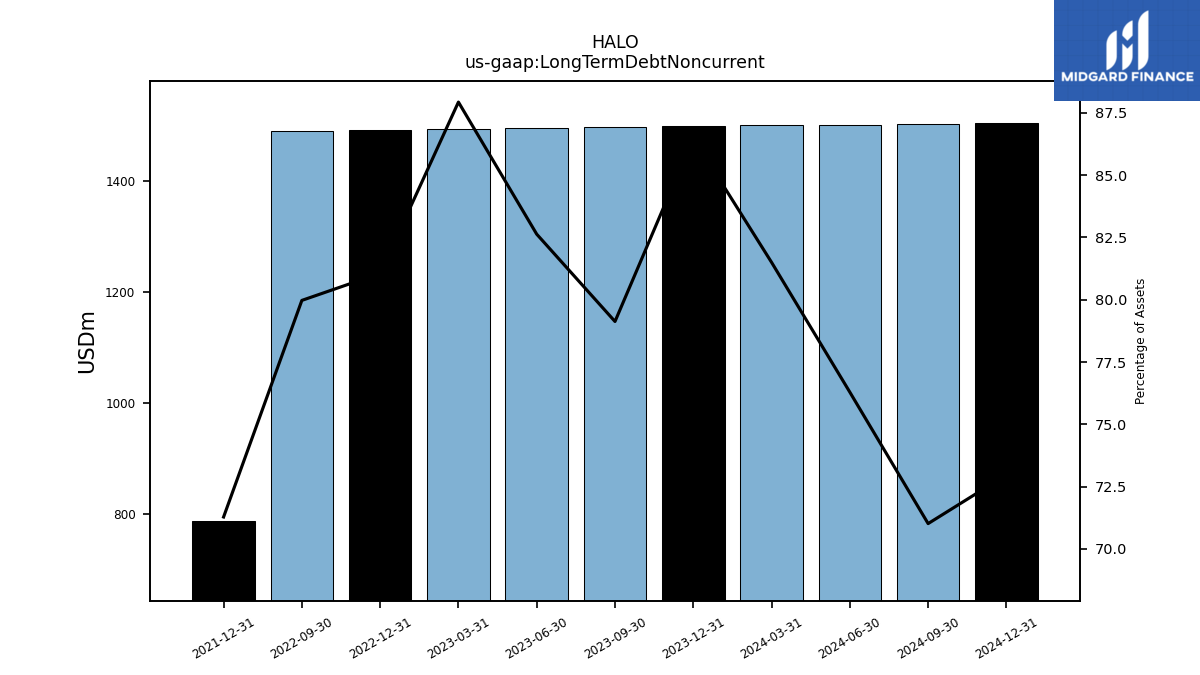
| Long Term Debt Noncurrent | 1499.25 | 1497.62 | 1496.00 | 1494.38 | 1492.77 | 1491.16 | NA | NA | 787.25 | NA | NA | NA | NA | NA | NA | NA | NA | NA | NA | NA | NA | NA | NA | NA | NA | NA | NA | NA | NA | NA | NA | NA | NA | NA | NA | NA | NA | NA | NA | NA | NA | NA | NA | NA | NA | NA | NA | NA | NA | NA | NA | NA | NA | NA | NA | |
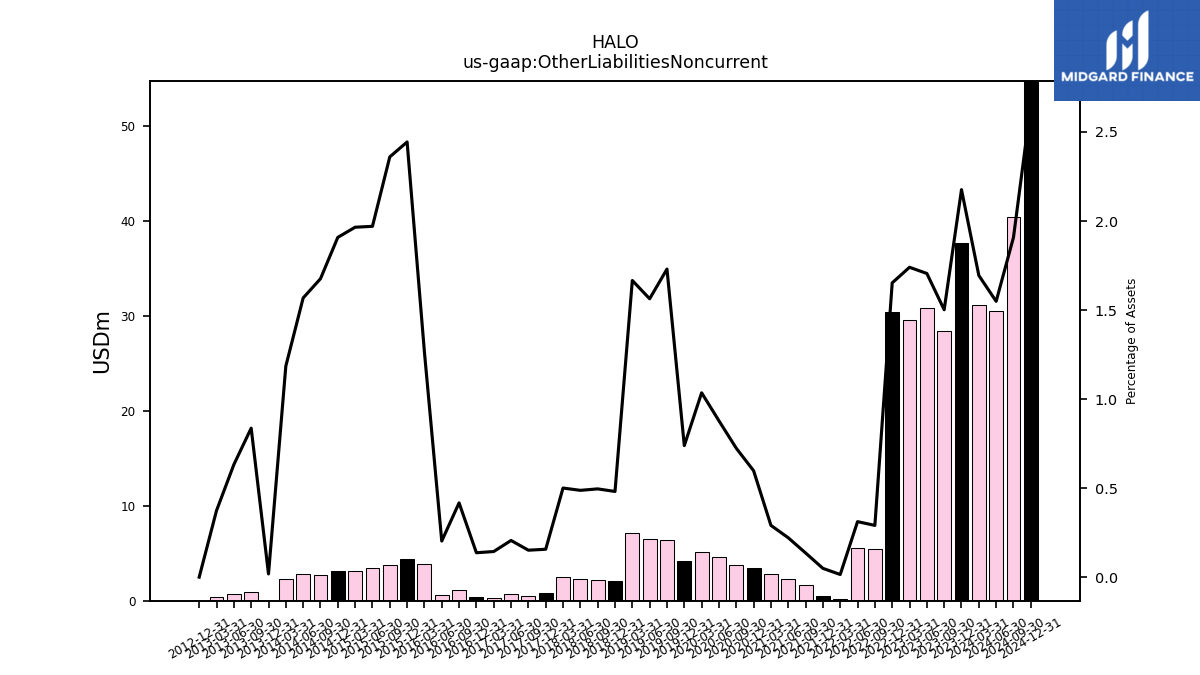
| Other Liabilities Noncurrent | 37.72 | 28.42 | 30.88 | 29.57 | 30.43 | 5.42 | 5.55 | 0.17 | 0.54 | 1.61 | 2.27 | 2.81 | 3.47 | 3.79 | 4.63 | 5.10 | 4.18 | 6.41 | 6.53 | 7.15 | 2.12 | 2.20 | 2.31 | 2.48 | 0.81 | 0.54 | 0.71 | 0.33 | 0.36 | 1.18 | 0.60 | 3.91 | 4.44 | 3.75 | 3.43 | 3.13 | 3.17 | 2.76 | 2.85 | 2.34 | 0.02 | 0.92 | 0.68 | 0.44 | 0.00 | NA | NA | NA | NA | NA | NA | NA | NA | NA | NA |
| 2023-12-31 | 2023-09-30 | 2023-06-30 | 2023-03-31 | 2022-12-31 | 2022-09-30 | 2022-06-30 | 2022-03-31 | 2021-12-31 | 2021-09-30 | 2021-06-30 | 2021-03-31 | 2020-12-31 | 2020-09-30 | 2020-06-30 | 2020-03-31 | 2019-12-31 | 2019-09-30 | 2019-06-30 | 2019-03-31 | 2018-12-31 | 2018-09-30 | 2018-06-30 | 2018-03-31 | 2017-12-31 | 2017-09-30 | 2017-06-30 | 2017-03-31 | 2016-12-31 | 2016-09-30 | 2016-06-30 | 2016-03-31 | 2015-12-31 | 2015-09-30 | 2015-06-30 | 2015-03-31 | 2014-12-31 | 2014-09-30 | 2014-06-30 | 2014-03-31 | 2013-12-31 | 2013-09-30 | 2013-06-30 | 2013-03-31 | 2012-12-31 | 2012-09-30 | 2012-06-30 | 2012-03-31 | 2011-12-31 | 2011-09-30 | 2011-06-30 | 2011-03-31 | 2010-12-31 | 2010-09-30 | 2010-06-30 | ||
|---|---|---|---|---|---|---|---|---|---|---|---|---|---|---|---|---|---|---|---|---|---|---|---|---|---|---|---|---|---|---|---|---|---|---|---|---|---|---|---|---|---|---|---|---|---|---|---|---|---|---|---|---|---|---|---|---|
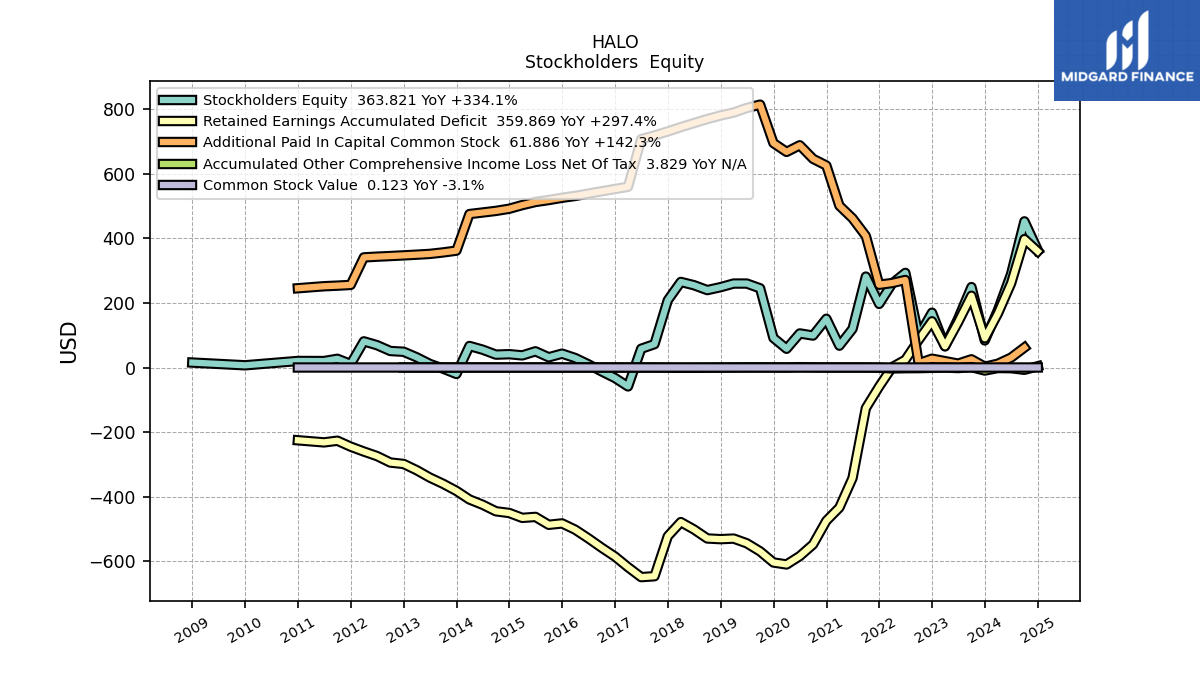
| Stockholders Equity | 83.81 | 249.18 | 151.03 | 65.85 | 169.80 | 96.99 | 293.17 | 260.26 | 196.95 | 281.67 | 119.75 | 67.59 | 151.05 | 98.99 | 105.58 | 58.04 | 91.77 | 245.35 | 260.05 | 260.05 | 248.89 | 239.74 | 254.93 | 265.06 | 208.37 | 72.39 | 58.16 | -58.50 | -32.48 | -11.99 | 9.92 | 29.47 | 43.00 | 31.80 | 50.23 | 37.55 | 41.35 | 39.94 | 55.30 | 66.75 | -19.99 | -3.49 | 11.14 | 31.68 | 48.85 | 51.19 | 69.23 | 81.06 | 10.90 | 27.06 | 20.05 | NA | 20.35 | NA | NA | |
| Common Stock Value | 0.13 | 0.13 | 0.13 | 0.13 | 0.14 | 0.14 | 0.14 | 0.14 | 0.14 | 0.14 | 0.14 | 0.14 | 0.14 | 0.14 | 0.14 | 0.14 | 0.14 | 0.15 | 0.15 | 0.14 | 0.14 | 0.14 | 0.14 | 0.14 | 0.14 | 0.14 | 0.14 | 0.13 | 0.13 | 0.13 | 0.13 | 0.13 | 0.13 | 0.13 | 0.13 | 0.13 | 0.13 | 0.12 | 0.12 | 0.12 | 0.11 | 0.11 | 0.11 | 0.11 | 0.11 | 0.11 | 0.11 | 0.11 | 0.10 | 0.10 | 0.10 | NA | 0.10 | NA | NA | |
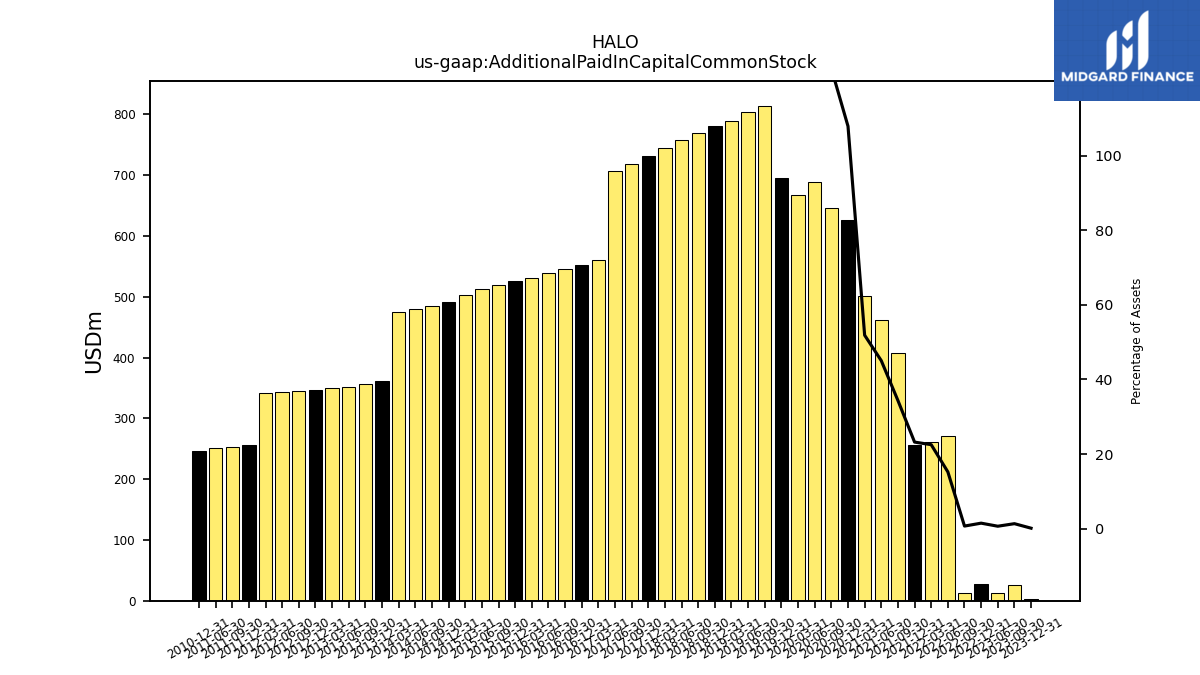
| Additional Paid In Capital Common Stock | 2.41 | 25.54 | 12.07 | NA | 27.37 | 13.18 | 271.17 | 261.71 | 256.35 | 407.23 | 461.90 | 501.19 | 625.48 | 646.18 | 688.32 | 667.68 | 695.07 | 814.10 | 803.78 | 789.48 | 780.46 | 769.38 | 756.98 | 744.36 | 731.04 | 718.55 | 707.09 | 559.66 | 552.74 | 545.75 | 538.59 | 531.39 | 525.63 | 518.65 | 512.66 | 502.98 | 491.69 | 485.01 | 480.04 | 475.25 | 361.93 | 356.45 | 351.84 | 349.46 | 347.31 | 345.24 | 343.28 | 341.09 | 255.82 | 253.56 | 251.72 | NA | 245.50 | NA | NA | |
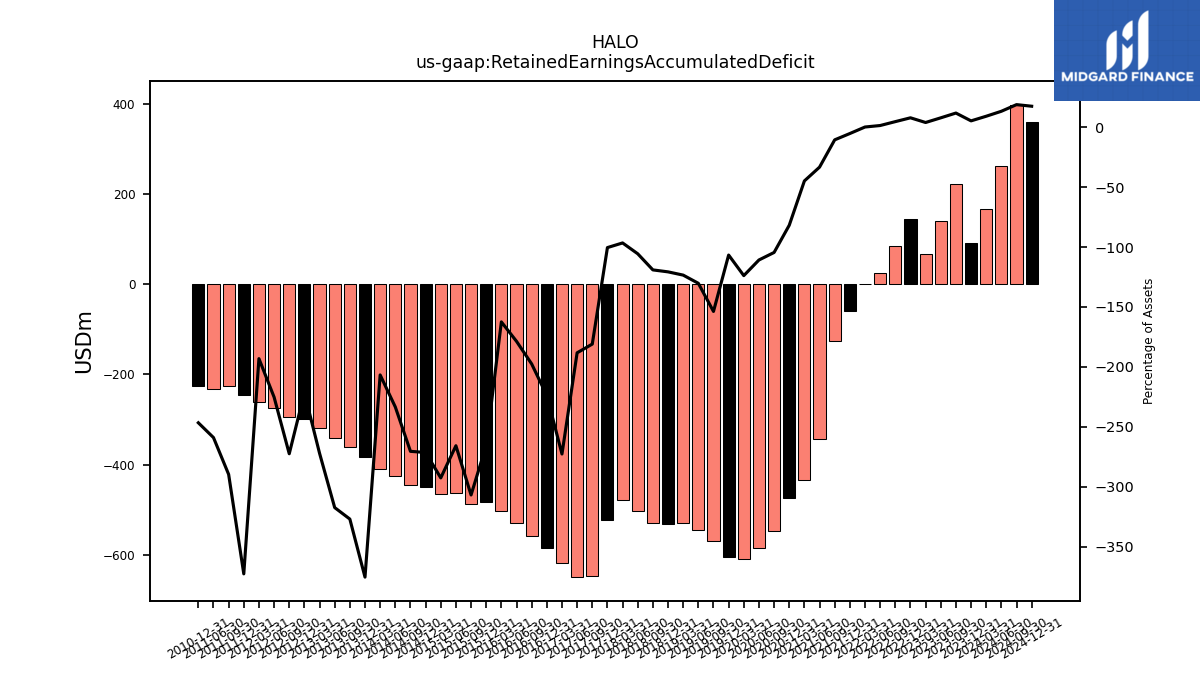
| Retained Earnings Accumulated Deficit | 90.55 | 222.28 | 140.45 | 65.69 | 143.22 | 85.52 | 23.88 | 1.20 | -58.91 | -125.68 | -342.27 | -433.73 | -474.59 | -547.76 | -583.96 | -609.78 | -603.68 | -569.28 | -544.27 | -529.64 | -531.44 | -529.31 | -501.46 | -478.57 | -522.37 | -646.25 | -649.00 | -618.24 | -585.34 | -557.96 | -529.01 | -502.13 | -482.66 | -486.98 | -462.52 | -465.54 | -450.43 | -445.15 | -424.87 | -408.60 | -382.05 | -360.07 | -340.77 | -317.86 | -298.57 | -294.17 | -274.16 | -260.14 | -245.02 | -226.61 | -231.77 | NA | -225.25 | NA | NA | |
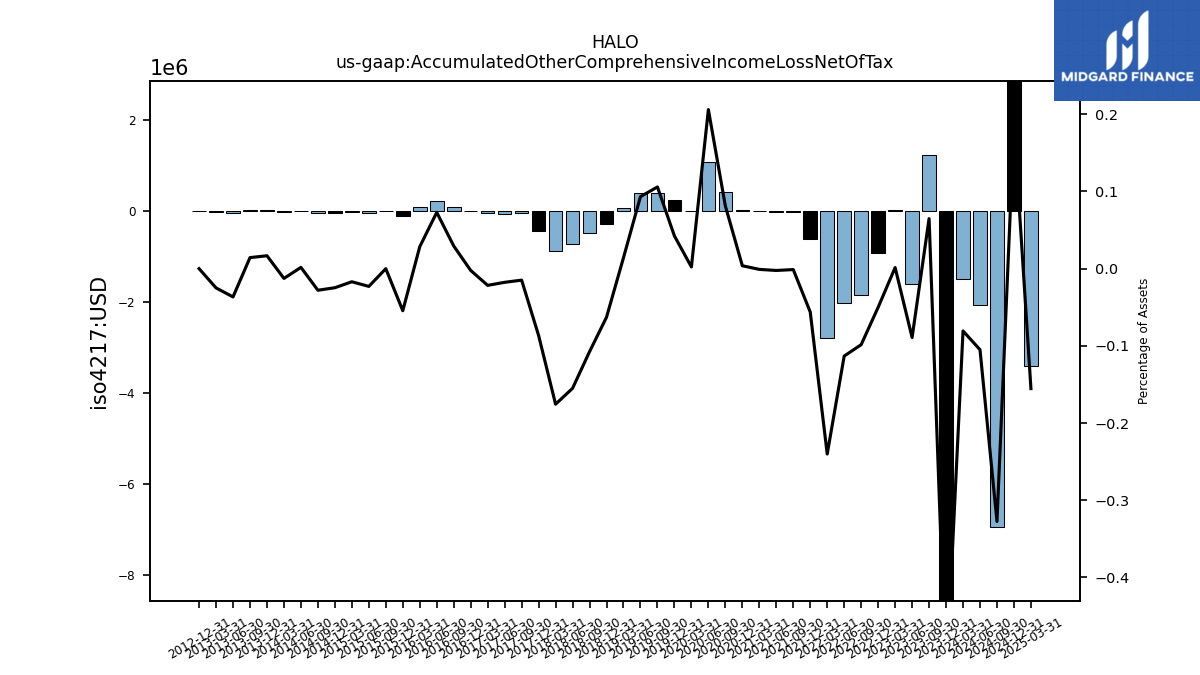
| Accumulated Other Comprehensive Income Loss Net Of Tax | -9.28 | 1.23 | -1.61 | 0.02 | -0.92 | -1.84 | -2.02 | -2.79 | -0.62 | -0.01 | -0.02 | -0.01 | 0.02 | 0.43 | 1.09 | 0.01 | 0.24 | 0.39 | 0.39 | 0.06 | -0.28 | -0.48 | -0.74 | -0.87 | -0.45 | -0.05 | -0.06 | -0.05 | -0.01 | 0.08 | 0.22 | 0.09 | -0.10 | 0.00 | -0.04 | -0.03 | -0.04 | -0.05 | 0.00 | -0.03 | 0.02 | 0.02 | -0.04 | -0.03 | 0.00 | NA | NA | NA | NA | NA | NA | NA | NA | NA | NA | |
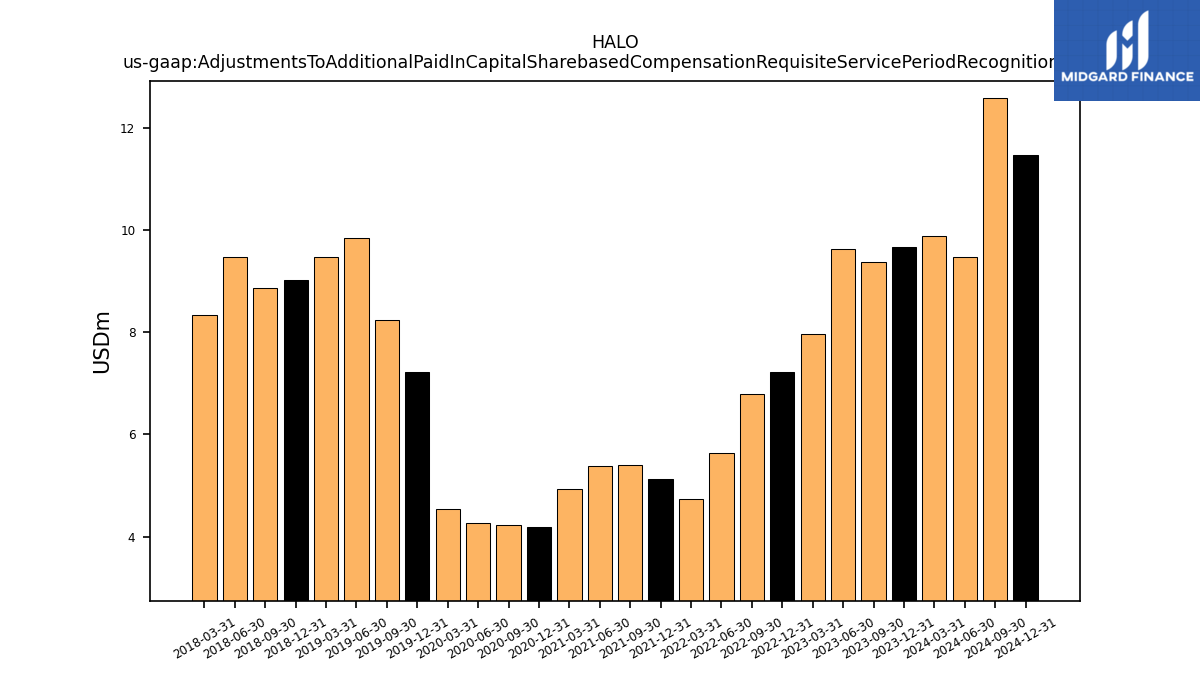
| Adjustments To Additional Paid In Capital Sharebased Compensation Requisite Service Period Recognition Value | 9.66 | 9.37 | 9.62 | 7.97 | 7.22 | 6.80 | 5.63 | 4.74 | 5.13 | 5.40 | 5.37 | 4.92 | 4.20 | 4.22 | 4.26 | 4.53 | 7.23 | 8.24 | 9.83 | 9.47 | 9.01 | 8.87 | 9.48 | 8.34 | NA | NA | NA | NA | NA | NA | NA | NA | NA | NA | NA | NA | NA | NA | NA | NA | NA | NA | NA | NA | NA | NA | NA | NA | NA | NA | NA | NA | NA | NA | NA |
| 2023-12-31 | 2023-09-30 | 2023-06-30 | 2023-03-31 | 2022-12-31 | 2022-09-30 | 2022-06-30 | 2022-03-31 | 2021-12-31 | 2021-09-30 | 2021-06-30 | 2021-03-31 | 2020-12-31 | 2020-09-30 | 2020-06-30 | 2020-03-31 | 2019-12-31 | 2019-09-30 | 2019-06-30 | 2019-03-31 | 2018-12-31 | 2018-09-30 | 2018-06-30 | 2018-03-31 | 2017-12-31 | 2017-09-30 | 2017-06-30 | 2017-03-31 | 2016-12-31 | 2016-09-30 | 2016-06-30 | 2016-03-31 | 2015-12-31 | 2015-09-30 | 2015-06-30 | 2015-03-31 | 2014-12-31 | 2014-09-30 | 2014-06-30 | 2014-03-31 | 2013-12-31 | 2013-09-30 | 2013-06-30 | 2013-03-31 | 2012-12-31 | 2012-09-30 | 2012-06-30 | 2012-03-31 | 2011-12-31 | 2011-09-30 | 2011-06-30 | 2011-03-31 | 2010-12-31 | 2010-09-30 | 2010-06-30 | ||
|---|---|---|---|---|---|---|---|---|---|---|---|---|---|---|---|---|---|---|---|---|---|---|---|---|---|---|---|---|---|---|---|---|---|---|---|---|---|---|---|---|---|---|---|---|---|---|---|---|---|---|---|---|---|---|---|---|
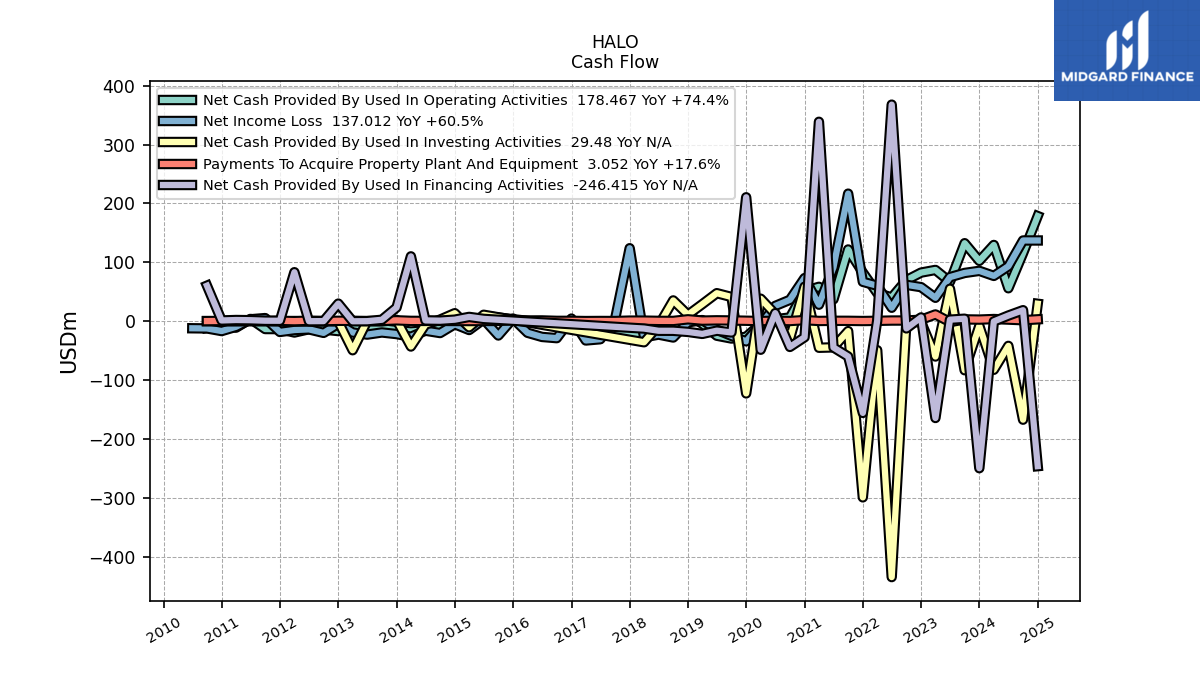
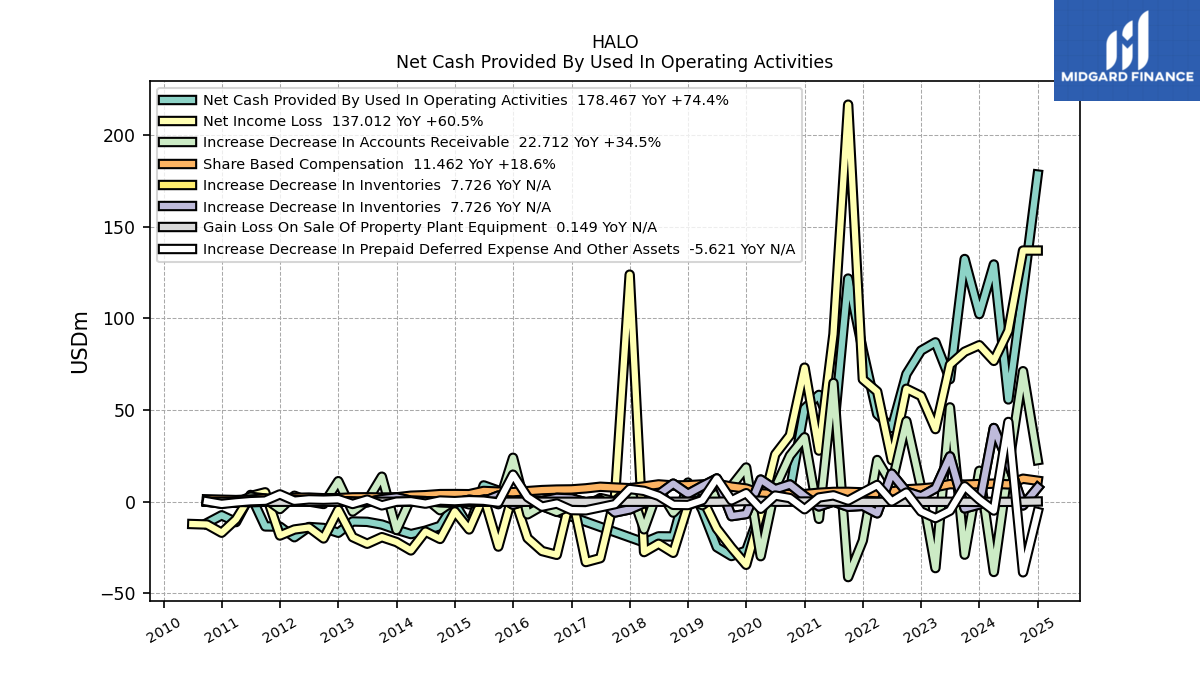
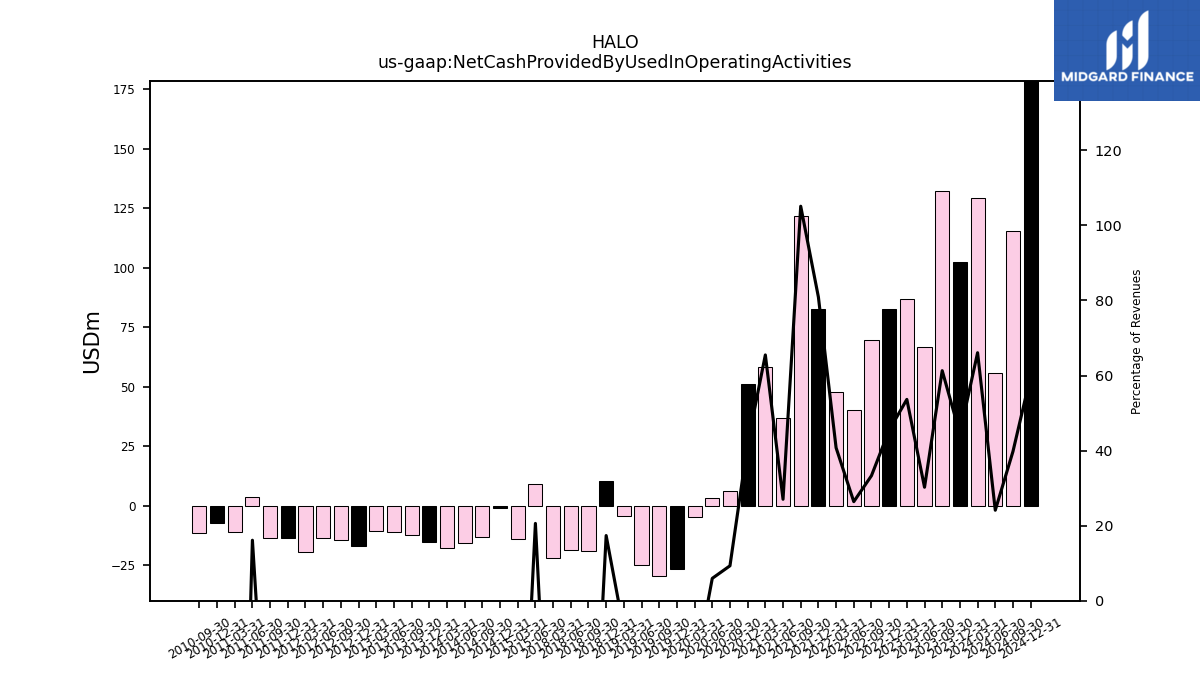
| Net Cash Provided By Used In Operating Activities | 102.35 | 132.41 | 66.84 | 86.96 | 82.45 | 69.64 | 40.23 | 47.80 | 82.52 | 121.74 | 36.89 | 58.30 | 50.92 | 6.08 | 3.29 | -4.84 | -26.62 | -29.59 | -24.79 | -4.42 | 10.46 | -18.93 | -18.86 | -22.18 | NA | NA | NA | NA | NA | NA | NA | NA | NA | NA | 8.94 | -13.84 | -0.94 | -13.18 | -15.77 | -17.63 | -15.22 | -12.41 | -10.95 | -10.75 | -16.92 | -14.30 | -13.76 | -19.36 | -13.55 | -13.44 | 3.74 | -11.09 | -7.38 | -11.62 | NA | |
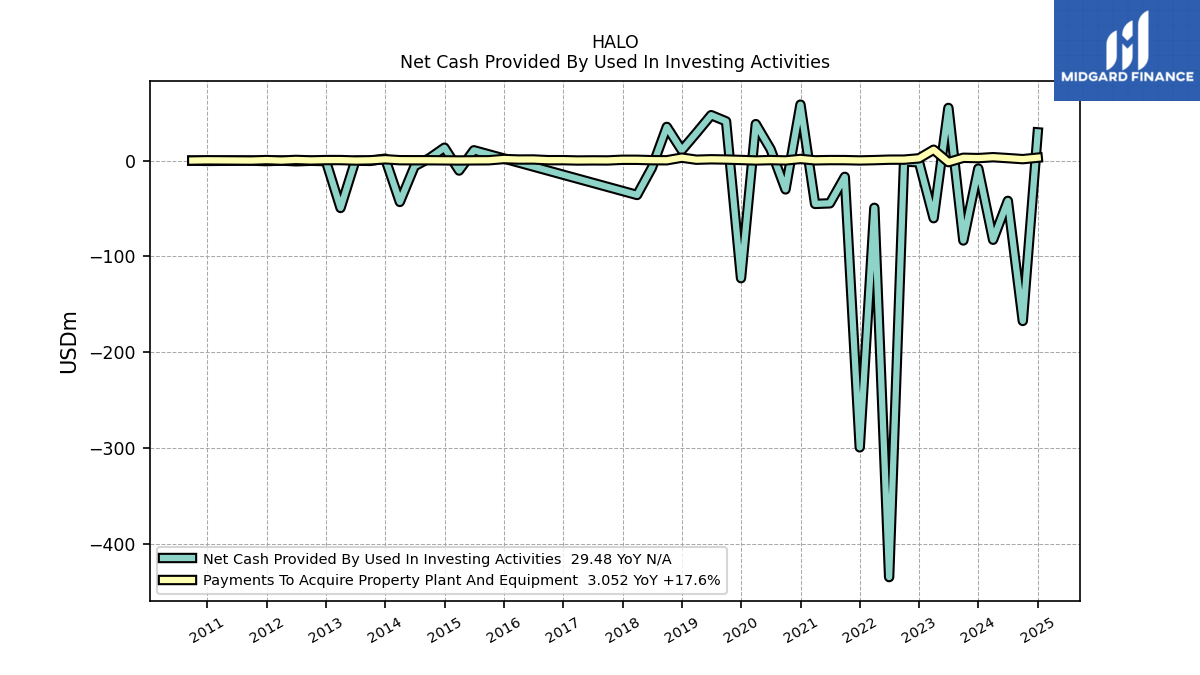
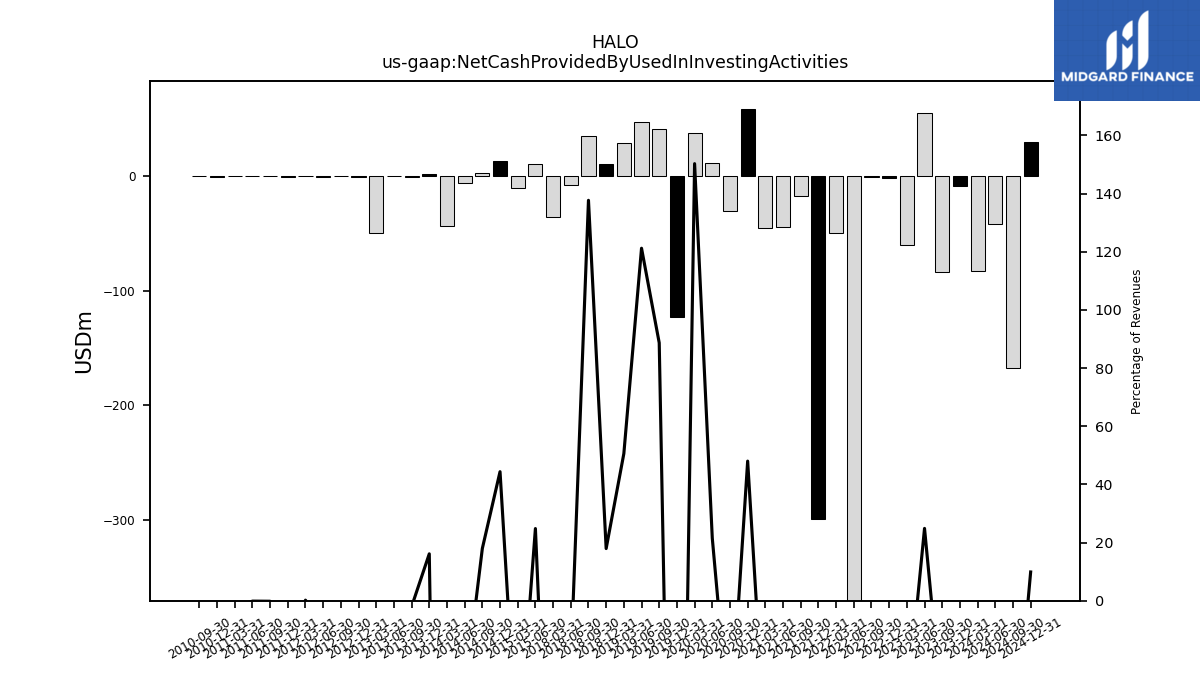
| Net Cash Provided By Used In Investing Activities | -8.29 | -83.45 | 54.99 | -60.16 | -1.75 | -1.01 | -434.95 | -49.30 | -299.47 | -16.95 | -44.62 | -45.25 | 58.44 | -30.09 | 11.90 | 38.11 | -122.82 | 41.00 | 47.46 | 28.81 | 10.81 | 35.19 | -7.61 | -35.90 | NA | NA | NA | NA | NA | NA | NA | NA | NA | NA | 10.77 | -10.42 | 13.48 | 2.63 | -5.87 | -43.19 | 2.02 | -0.33 | -0.08 | -49.48 | -0.54 | -0.17 | -0.72 | 0.02 | -0.56 | -0.04 | -0.03 | -0.20 | -0.33 | -0.06 | NA | |
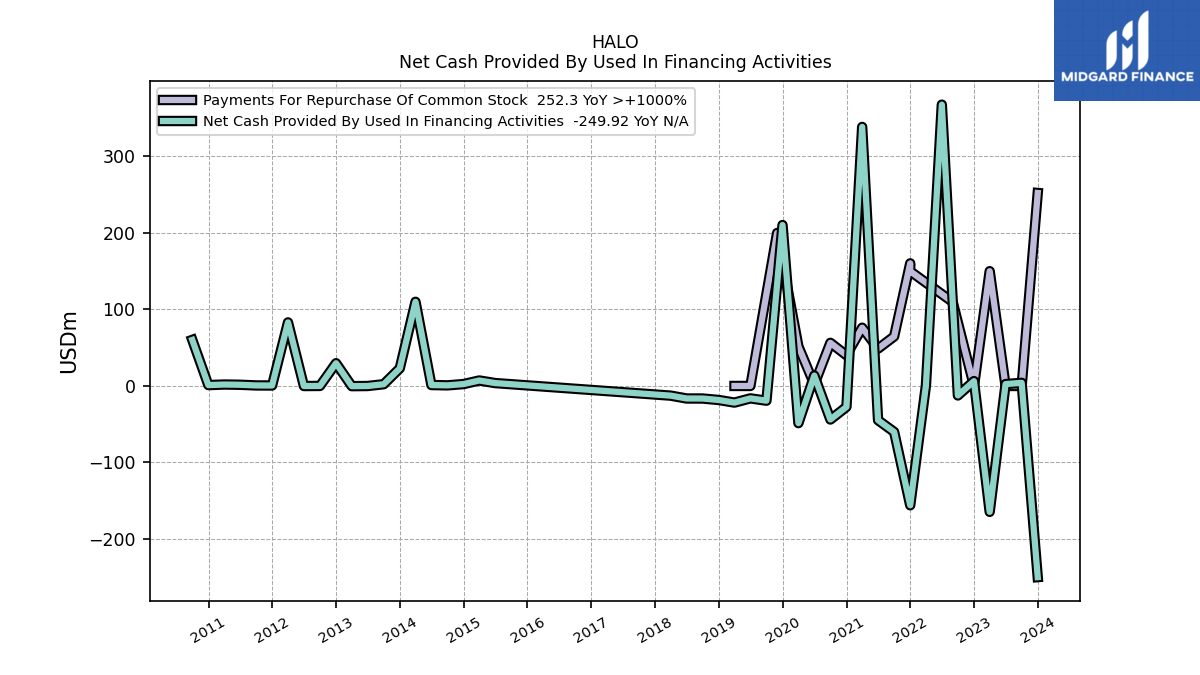
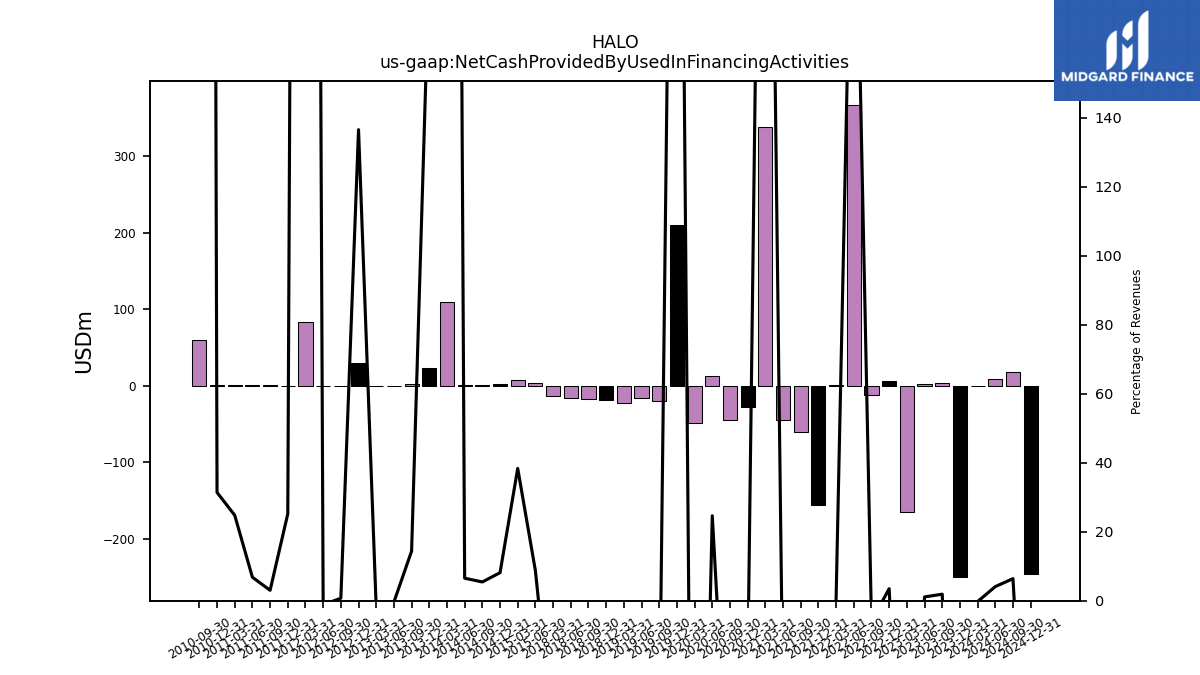
| Net Cash Provided By Used In Financing Activities | -249.92 | 4.10 | 2.45 | -164.61 | 6.33 | -12.40 | 367.82 | 0.62 | -156.01 | -60.07 | -44.76 | 338.70 | -27.40 | -43.85 | 13.59 | -48.62 | 210.42 | -19.25 | -16.23 | -21.73 | -18.35 | -16.42 | -16.37 | -12.65 | NA | NA | NA | NA | NA | NA | NA | NA | NA | NA | 3.77 | 7.16 | 2.47 | 0.80 | 1.20 | 110.03 | 23.07 | 2.30 | -0.06 | -0.25 | 29.74 | 0.04 | -0.09 | 83.12 | 0.61 | 0.70 | 1.58 | 1.87 | 1.12 | 60.20 | NA |
| 2023-12-31 | 2023-09-30 | 2023-06-30 | 2023-03-31 | 2022-12-31 | 2022-09-30 | 2022-06-30 | 2022-03-31 | 2021-12-31 | 2021-09-30 | 2021-06-30 | 2021-03-31 | 2020-12-31 | 2020-09-30 | 2020-06-30 | 2020-03-31 | 2019-12-31 | 2019-09-30 | 2019-06-30 | 2019-03-31 | 2018-12-31 | 2018-09-30 | 2018-06-30 | 2018-03-31 | 2017-12-31 | 2017-09-30 | 2017-06-30 | 2017-03-31 | 2016-12-31 | 2016-09-30 | 2016-06-30 | 2016-03-31 | 2015-12-31 | 2015-09-30 | 2015-06-30 | 2015-03-31 | 2014-12-31 | 2014-09-30 | 2014-06-30 | 2014-03-31 | 2013-12-31 | 2013-09-30 | 2013-06-30 | 2013-03-31 | 2012-12-31 | 2012-09-30 | 2012-06-30 | 2012-03-31 | 2011-12-31 | 2011-09-30 | 2011-06-30 | 2011-03-31 | 2010-12-31 | 2010-09-30 | 2010-06-30 | ||
|---|---|---|---|---|---|---|---|---|---|---|---|---|---|---|---|---|---|---|---|---|---|---|---|---|---|---|---|---|---|---|---|---|---|---|---|---|---|---|---|---|---|---|---|---|---|---|---|---|---|---|---|---|---|---|---|---|
| Net Cash Provided By Used In Operating Activities | 102.35 | 132.41 | 66.84 | 86.96 | 82.45 | 69.64 | 40.23 | 47.80 | 82.52 | 121.74 | 36.89 | 58.30 | 50.92 | 6.08 | 3.29 | -4.84 | -26.62 | -29.59 | -24.79 | -4.42 | 10.46 | -18.93 | -18.86 | -22.18 | NA | NA | NA | NA | NA | NA | NA | NA | NA | NA | 8.94 | -13.84 | -0.94 | -13.18 | -15.77 | -17.63 | -15.22 | -12.41 | -10.95 | -10.75 | -16.92 | -14.30 | -13.76 | -19.36 | -13.55 | -13.44 | 3.74 | -11.09 | -7.38 | -11.62 | NA | |
| Net Income Loss | 85.39 | 81.84 | 74.75 | 39.62 | 57.70 | 61.63 | 22.68 | 60.11 | 66.77 | 216.59 | 91.46 | 27.89 | 73.16 | 36.21 | 25.82 | -6.10 | -34.40 | -25.02 | -14.62 | 1.80 | -2.13 | -27.85 | -22.89 | -27.46 | 123.88 | 2.75 | -30.76 | -32.90 | 4.32 | -28.95 | -26.88 | -19.82 | 4.32 | -24.46 | 3.02 | -15.11 | -5.27 | -20.28 | -16.27 | -26.55 | -21.99 | -19.29 | -22.91 | -19.29 | -4.41 | -20.01 | -14.02 | -15.12 | -18.42 | 5.17 | 3.12 | -9.64 | -16.89 | -12.41 | -12.15 | |
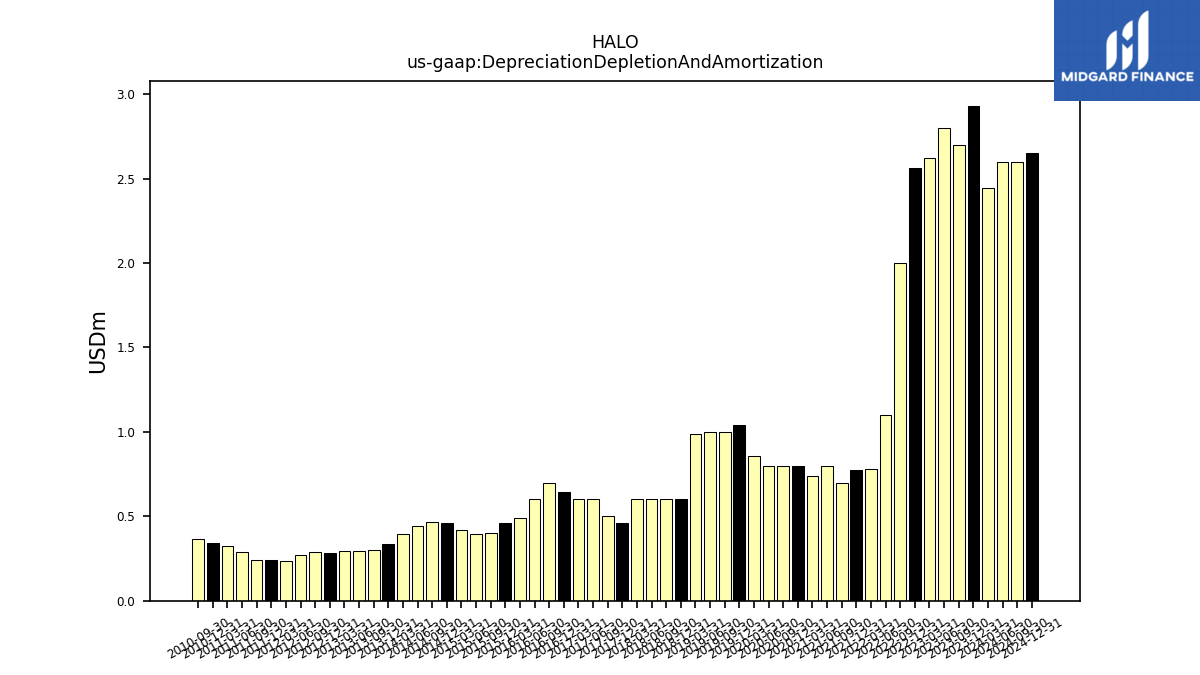
| Depreciation Depletion And Amortization | 2.93 | 2.70 | 2.80 | 2.62 | 2.56 | 2.00 | 1.10 | 0.78 | 0.77 | 0.70 | 0.80 | 0.74 | 0.80 | 0.80 | 0.80 | 0.86 | 1.04 | 1.00 | 1.00 | 0.99 | 0.60 | 0.60 | 0.60 | 0.60 | 0.46 | 0.50 | 0.60 | 0.60 | 0.64 | 0.70 | 0.60 | 0.49 | 0.46 | 0.40 | 0.40 | 0.42 | 0.46 | 0.46 | 0.44 | 0.40 | 0.33 | 0.30 | 0.30 | 0.29 | 0.28 | 0.29 | 0.27 | 0.24 | 0.24 | 0.24 | 0.29 | 0.33 | 0.34 | 0.36 | NA | |
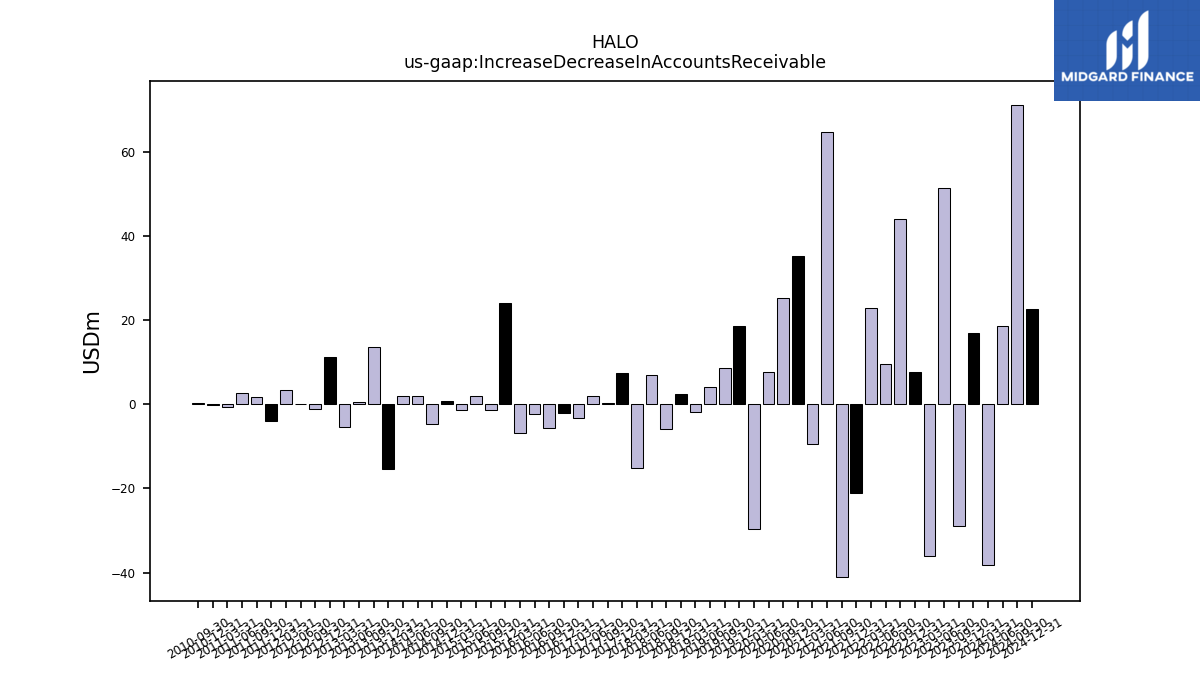
| Increase Decrease In Accounts Receivable | 16.89 | -28.85 | 51.50 | -36.19 | 7.75 | 43.93 | 9.46 | 22.79 | -21.12 | -41.10 | 64.81 | -9.34 | 35.18 | 25.15 | 7.65 | -29.69 | 18.70 | 8.53 | 4.05 | -1.84 | 2.35 | -5.93 | 7.01 | -15.04 | 7.44 | 0.22 | 2.02 | -3.23 | -2.00 | -5.55 | -2.32 | -6.87 | 24.02 | -1.35 | 2.01 | -1.42 | 0.87 | -4.62 | 1.94 | 1.86 | -15.42 | 13.69 | 0.46 | -5.33 | 11.24 | -1.22 | 0.14 | 3.29 | -3.98 | 1.74 | 2.76 | -0.60 | -0.29 | 0.37 | NA | |
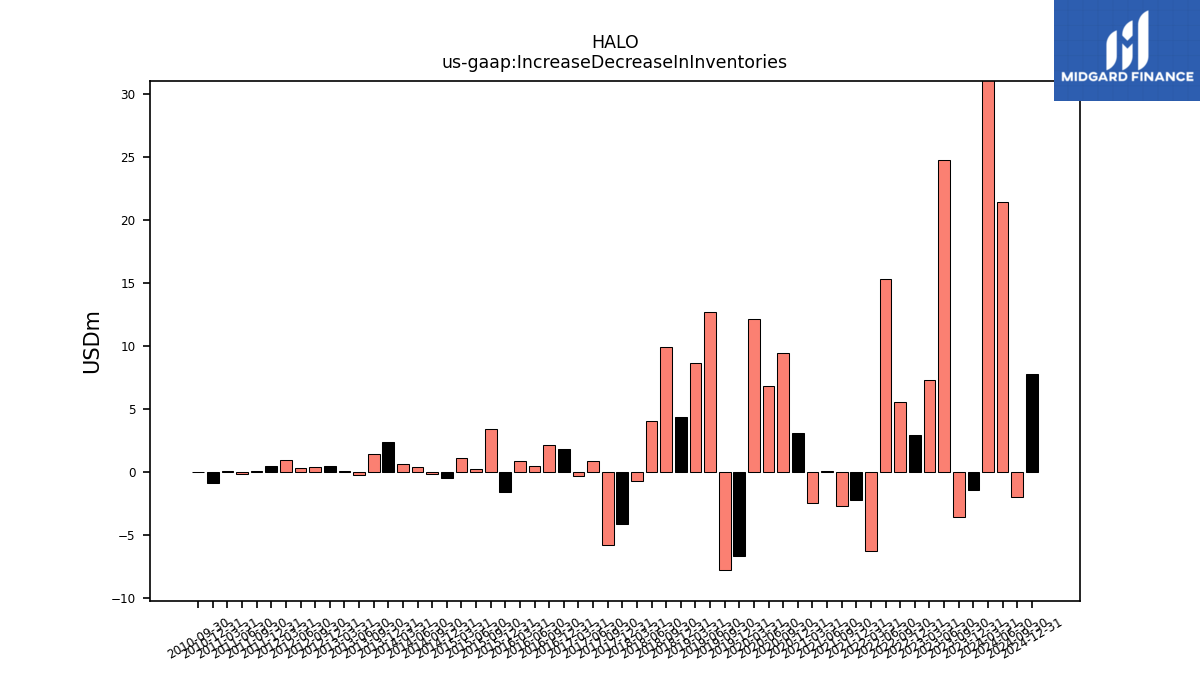
| Increase Decrease In Inventories | -1.47 | -3.63 | 24.74 | 7.25 | 2.94 | 5.51 | 15.32 | -6.30 | -2.22 | -2.73 | 0.09 | -2.51 | 3.05 | 9.43 | 6.82 | 12.09 | -6.69 | -7.85 | 12.66 | 8.62 | 4.34 | 9.88 | 4.01 | -0.75 | -4.18 | -5.84 | 0.88 | -0.33 | 1.77 | 2.10 | 0.41 | 0.86 | -1.61 | 3.38 | 0.24 | 1.08 | -0.51 | -0.20 | 0.35 | 0.59 | 2.32 | 1.38 | -0.27 | 0.07 | 0.48 | 0.40 | 0.29 | 0.93 | 0.46 | 0.02 | -0.16 | 0.06 | -0.88 | -0.01 | NA | |
| Share Based Compensation | 9.66 | 9.37 | 9.62 | 7.97 | 7.22 | 6.80 | 5.63 | 4.74 | 5.13 | 5.40 | 5.37 | 4.92 | 4.20 | 4.22 | 4.26 | 4.53 | 7.23 | 8.24 | 9.83 | 9.47 | 9.01 | 8.87 | 9.48 | 8.34 | 7.40 | 7.76 | 8.19 | 7.32 | 6.74 | 6.66 | 6.37 | 5.82 | 5.25 | 5.55 | 5.91 | 4.13 | 4.21 | 4.18 | 3.59 | 3.29 | 2.40 | 2.30 | 2.44 | 2.40 | 1.99 | 1.92 | 2.29 | 2.15 | 1.65 | 1.76 | 1.23 | 0.93 | 1.12 | 1.33 | NA |
| 2023-12-31 | 2023-09-30 | 2023-06-30 | 2023-03-31 | 2022-12-31 | 2022-09-30 | 2022-06-30 | 2022-03-31 | 2021-12-31 | 2021-09-30 | 2021-06-30 | 2021-03-31 | 2020-12-31 | 2020-09-30 | 2020-06-30 | 2020-03-31 | 2019-12-31 | 2019-09-30 | 2019-06-30 | 2019-03-31 | 2018-12-31 | 2018-09-30 | 2018-06-30 | 2018-03-31 | 2017-12-31 | 2017-09-30 | 2017-06-30 | 2017-03-31 | 2016-12-31 | 2016-09-30 | 2016-06-30 | 2016-03-31 | 2015-12-31 | 2015-09-30 | 2015-06-30 | 2015-03-31 | 2014-12-31 | 2014-09-30 | 2014-06-30 | 2014-03-31 | 2013-12-31 | 2013-09-30 | 2013-06-30 | 2013-03-31 | 2012-12-31 | 2012-09-30 | 2012-06-30 | 2012-03-31 | 2011-12-31 | 2011-09-30 | 2011-06-30 | 2011-03-31 | 2010-12-31 | 2010-09-30 | 2010-06-30 | ||
|---|---|---|---|---|---|---|---|---|---|---|---|---|---|---|---|---|---|---|---|---|---|---|---|---|---|---|---|---|---|---|---|---|---|---|---|---|---|---|---|---|---|---|---|---|---|---|---|---|---|---|---|---|---|---|---|---|
| Net Cash Provided By Used In Investing Activities | -8.29 | -83.45 | 54.99 | -60.16 | -1.75 | -1.01 | -434.95 | -49.30 | -299.47 | -16.95 | -44.62 | -45.25 | 58.44 | -30.09 | 11.90 | 38.11 | -122.82 | 41.00 | 47.46 | 28.81 | 10.81 | 35.19 | -7.61 | -35.90 | NA | NA | NA | NA | NA | NA | NA | NA | NA | NA | 10.77 | -10.42 | 13.48 | 2.63 | -5.87 | -43.19 | 2.02 | -0.33 | -0.08 | -49.48 | -0.54 | -0.17 | -0.72 | 0.02 | -0.56 | -0.04 | -0.03 | -0.20 | -0.33 | -0.06 | NA | |
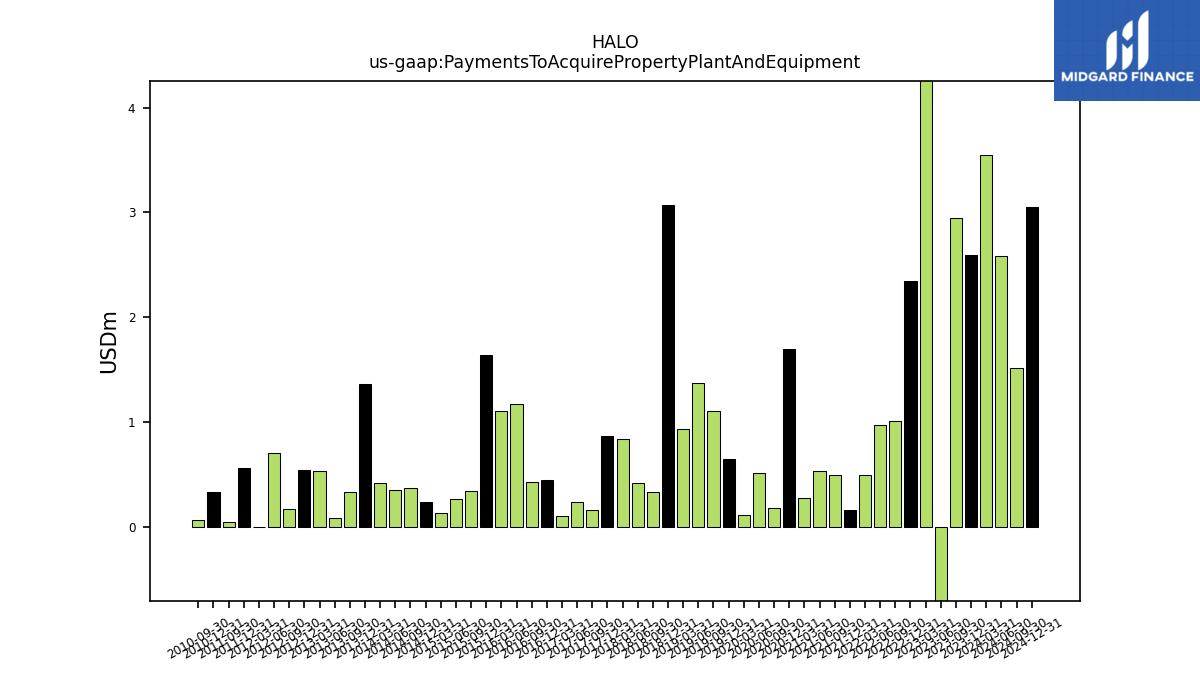
| Payments To Acquire Property Plant And Equipment | 2.60 | 2.94 | -1.62 | 11.38 | 2.34 | 1.01 | 0.97 | 0.49 | 0.16 | 0.50 | 0.53 | 0.27 | 1.70 | 0.18 | 0.52 | 0.11 | 0.64 | 1.10 | 1.37 | 0.93 | 3.07 | 0.33 | 0.42 | 0.84 | 0.86 | 0.16 | 0.23 | 0.10 | 0.45 | 0.42 | 1.17 | 1.10 | 1.63 | 0.34 | 0.26 | 0.13 | 0.24 | 0.37 | 0.35 | 0.41 | 1.36 | 0.33 | 0.08 | 0.53 | 0.54 | 0.17 | 0.71 | 0.00 | 0.56 | 0.04 | NA | NA | 0.33 | 0.06 | NA |
| 2023-12-31 | 2023-09-30 | 2023-06-30 | 2023-03-31 | 2022-12-31 | 2022-09-30 | 2022-06-30 | 2022-03-31 | 2021-12-31 | 2021-09-30 | 2021-06-30 | 2021-03-31 | 2020-12-31 | 2020-09-30 | 2020-06-30 | 2020-03-31 | 2019-12-31 | 2019-09-30 | 2019-06-30 | 2019-03-31 | 2018-12-31 | 2018-09-30 | 2018-06-30 | 2018-03-31 | 2017-12-31 | 2017-09-30 | 2017-06-30 | 2017-03-31 | 2016-12-31 | 2016-09-30 | 2016-06-30 | 2016-03-31 | 2015-12-31 | 2015-09-30 | 2015-06-30 | 2015-03-31 | 2014-12-31 | 2014-09-30 | 2014-06-30 | 2014-03-31 | 2013-12-31 | 2013-09-30 | 2013-06-30 | 2013-03-31 | 2012-12-31 | 2012-09-30 | 2012-06-30 | 2012-03-31 | 2011-12-31 | 2011-09-30 | 2011-06-30 | 2011-03-31 | 2010-12-31 | 2010-09-30 | 2010-06-30 | ||
|---|---|---|---|---|---|---|---|---|---|---|---|---|---|---|---|---|---|---|---|---|---|---|---|---|---|---|---|---|---|---|---|---|---|---|---|---|---|---|---|---|---|---|---|---|---|---|---|---|---|---|---|---|---|---|---|---|
| Net Cash Provided By Used In Financing Activities | -249.92 | 4.10 | 2.45 | -164.61 | 6.33 | -12.40 | 367.82 | 0.62 | -156.01 | -60.07 | -44.76 | 338.70 | -27.40 | -43.85 | 13.59 | -48.62 | 210.42 | -19.25 | -16.23 | -21.73 | -18.35 | -16.42 | -16.37 | -12.65 | NA | NA | NA | NA | NA | NA | NA | NA | NA | NA | 3.77 | 7.16 | 2.47 | 0.80 | 1.20 | 110.03 | 23.07 | 2.30 | -0.06 | -0.25 | 29.74 | 0.04 | -0.09 | 83.12 | 0.61 | 0.70 | 1.58 | 1.87 | 1.12 | 60.20 | NA | |
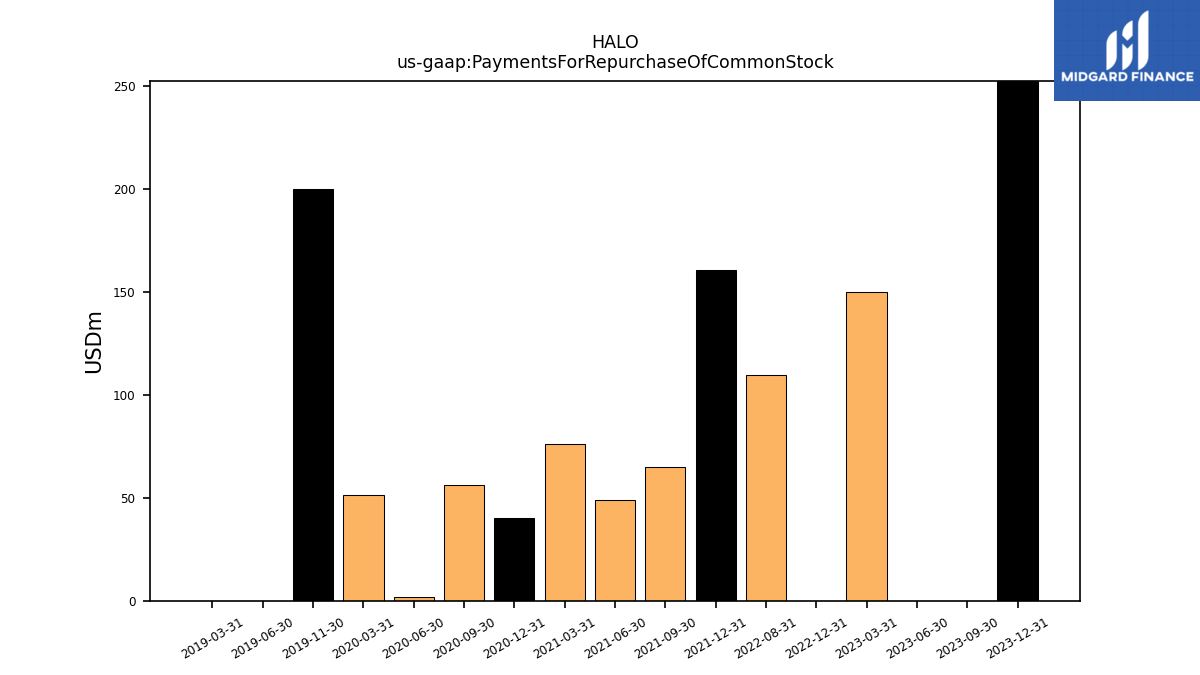
| Payments For Repurchase Of Common Stock | 252.30 | 0.00 | 0.00 | 150.08 | 0.00 | NA | NA | NA | 160.32 | 64.72 | 48.84 | 76.18 | 40.15 | 56.40 | 2.00 | 51.57 | NA | NA | 0.00 | 0.00 | NA | NA | NA | NA | NA | NA | NA | NA | NA | NA | NA | NA | NA | NA | NA | NA | NA | NA | NA | NA | NA | NA | NA | NA | NA | NA | NA | NA | NA | NA | NA | NA | NA | NA | NA |
| 2023-12-31 | 2023-09-30 | 2023-06-30 | 2023-03-31 | 2022-12-31 | 2022-09-30 | 2022-06-30 | 2022-03-31 | 2021-12-31 | 2021-09-30 | 2021-06-30 | 2021-03-31 | 2020-12-31 | 2020-09-30 | 2020-06-30 | 2020-03-31 | 2019-12-31 | 2019-09-30 | 2019-06-30 | 2019-03-31 | 2018-12-31 | 2018-09-30 | 2018-06-30 | 2018-03-31 | 2017-12-31 | 2017-09-30 | 2017-06-30 | 2017-03-31 | 2016-12-31 | 2016-09-30 | 2016-06-30 | 2016-03-31 | 2015-12-31 | 2015-09-30 | 2015-06-30 | 2015-03-31 | 2014-12-31 | 2014-09-30 | 2014-06-30 | 2014-03-31 | 2013-12-31 | 2013-09-30 | 2013-06-30 | 2013-03-31 | 2012-12-31 | 2012-09-30 | 2012-06-30 | 2012-03-31 | 2011-12-31 | 2011-09-30 | 2011-06-30 | 2011-03-31 | 2010-12-31 | 2010-09-30 | 2010-06-30 | ||
|---|---|---|---|---|---|---|---|---|---|---|---|---|---|---|---|---|---|---|---|---|---|---|---|---|---|---|---|---|---|---|---|---|---|---|---|---|---|---|---|---|---|---|---|---|---|---|---|---|---|---|---|---|---|---|---|---|
| Revenues | 230.04 | 216.03 | 221.04 | 162.14 | 181.50 | 208.98 | 152.37 | 117.28 | 102.00 | 115.83 | 136.46 | 89.02 | 121.70 | 65.32 | 55.22 | 25.35 | 53.66 | 46.23 | 39.15 | 56.95 | 60.23 | 25.56 | 35.20 | 30.87 | 189.56 | 63.73 | 33.75 | 29.57 | 52.23 | 31.85 | 33.34 | 42.50 | 52.23 | 20.78 | 43.38 | 18.67 | 30.38 | 14.61 | 18.39 | 11.97 | 12.50 | 16.01 | 14.45 | 11.83 | 21.79 | 5.33 | 7.76 | 7.44 | 2.41 | 22.94 | 23.19 | 7.54 | 3.57 | 3.40 | 3.21 | |
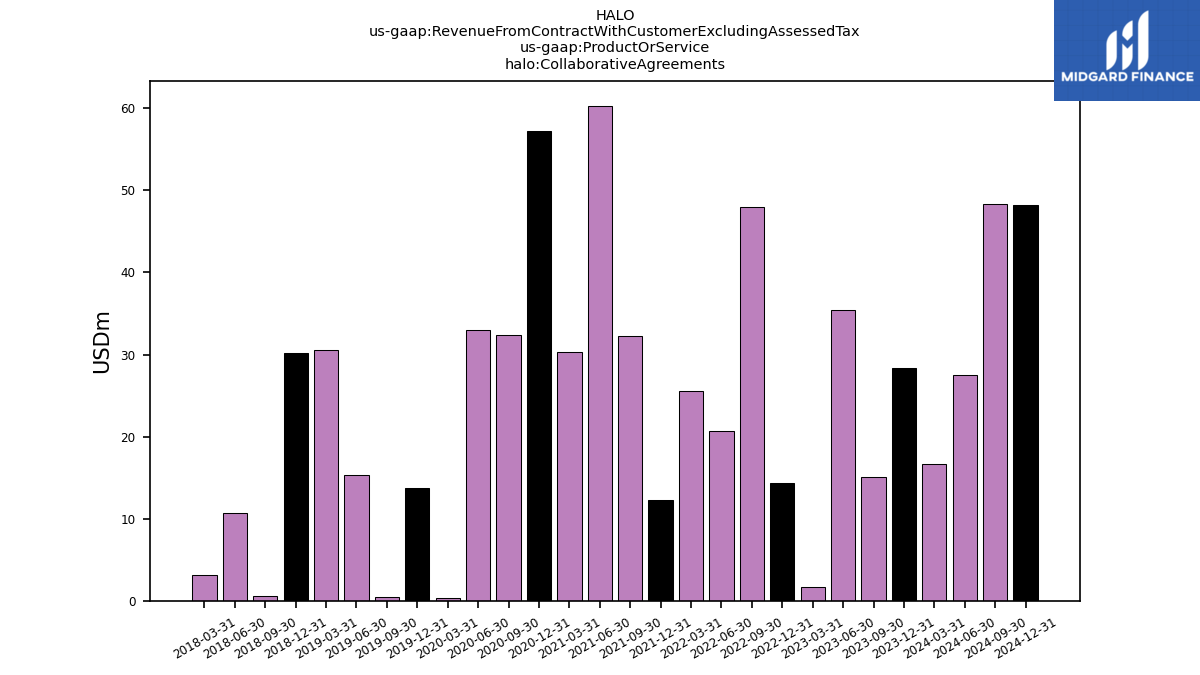
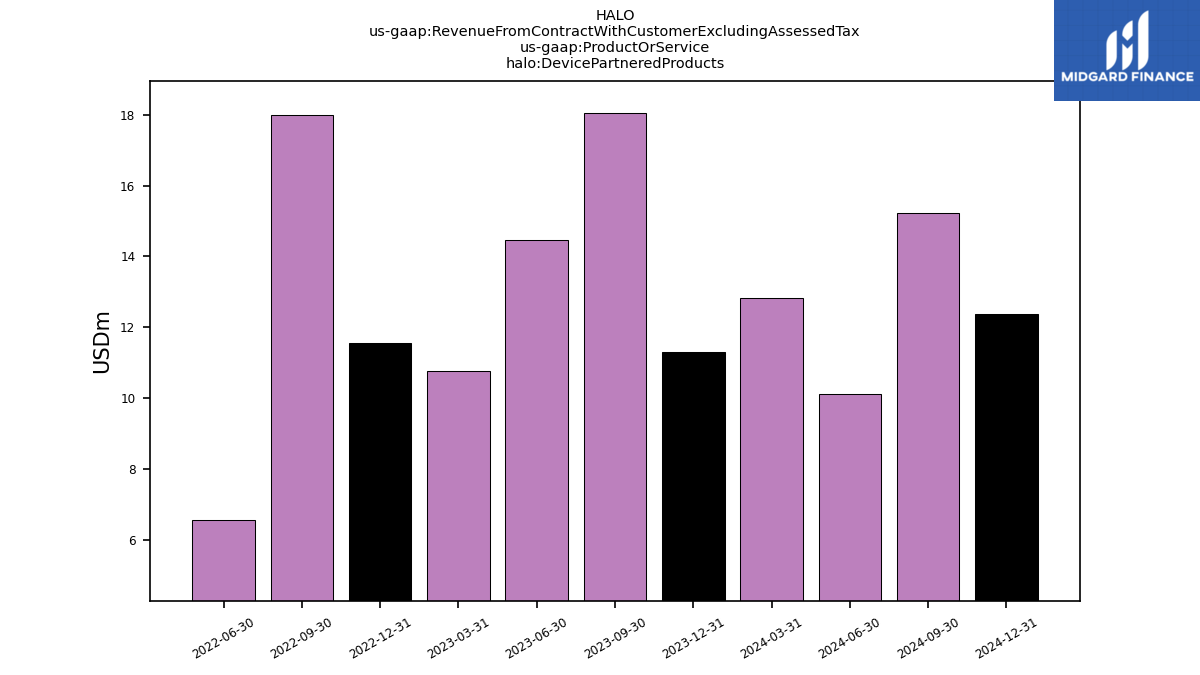
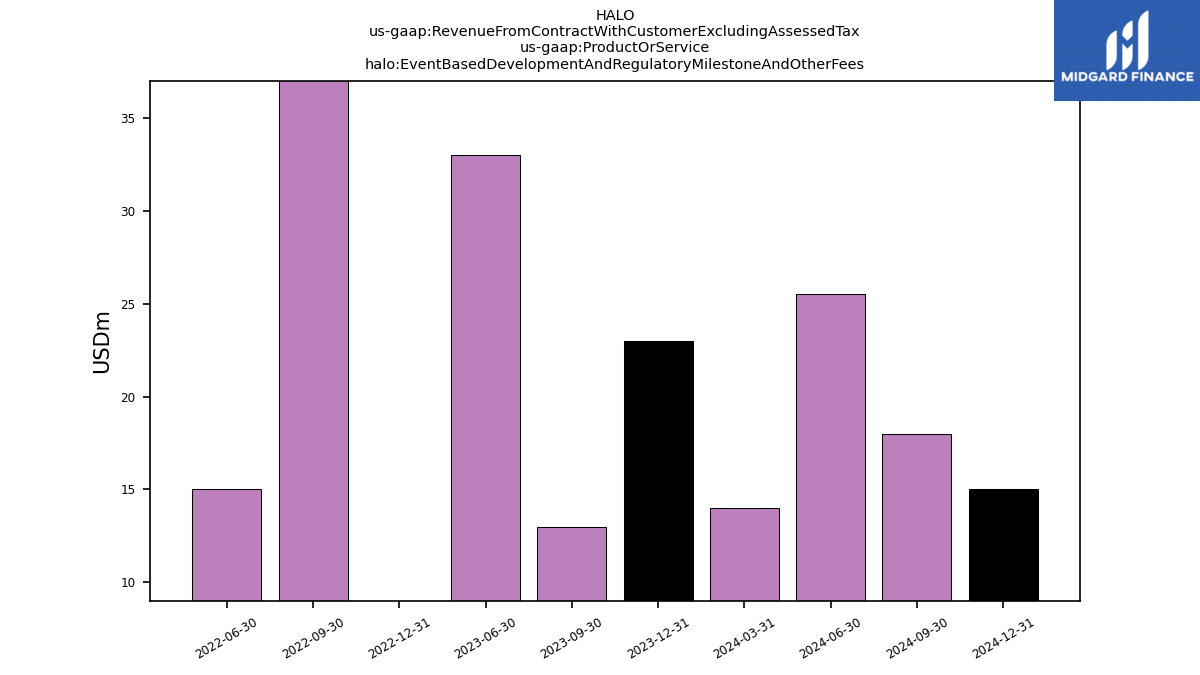
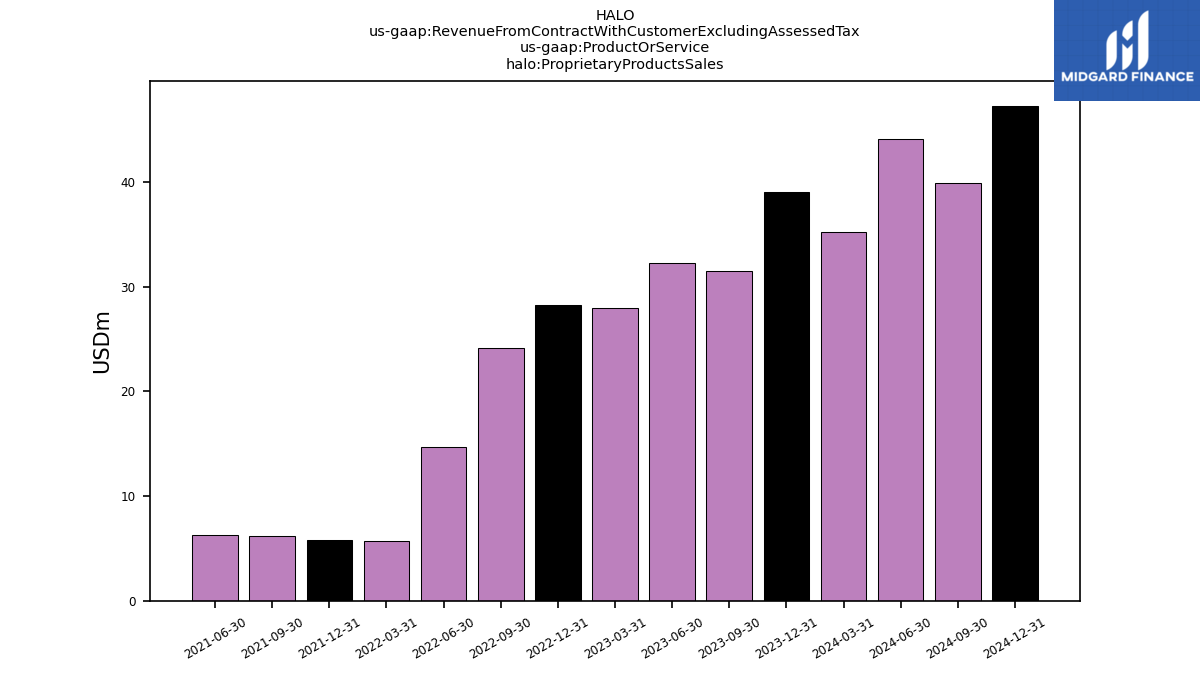
| Revenue From Contract With Customer Excluding Assessed Tax | 230.04 | 216.03 | 221.04 | 162.14 | 181.50 | 208.98 | 152.37 | 117.28 | 102.00 | 115.83 | 136.46 | 89.02 | 121.70 | 65.32 | 55.22 | 25.35 | 53.66 | 46.23 | 39.15 | 56.95 | 60.23 | 25.56 | 35.20 | 30.87 | 189.56 | 63.73 | 33.75 | 29.57 | 52.23 | 31.85 | 33.34 | 42.50 | 52.23 | 20.78 | 43.38 | 18.67 | 30.38 | 14.61 | 18.39 | 11.97 | 12.50 | 16.01 | 14.45 | 11.83 | 21.79 | 5.33 | 7.76 | 7.44 | 2.41 | 22.94 | 23.19 | 7.54 | 3.57 | 3.40 | 3.21 | |
| Collaborative Agreements | 28.39 | 15.03 | 35.41 | 1.71 | 14.35 | 48.00 | 20.73 | 25.53 | 12.32 | 32.22 | 60.32 | 30.33 | 57.25 | 32.34 | 33.04 | 0.39 | 13.74 | 0.42 | 15.28 | 30.61 | 30.21 | 0.58 | 10.73 | 3.13 | NA | NA | NA | NA | NA | NA | NA | NA | NA | NA | NA | NA | NA | NA | NA | NA | NA | NA | NA | NA | NA | NA | NA | NA | NA | NA | NA | NA | NA | NA | NA | |
| Device Partnered Products | 11.29 | 18.06 | 14.46 | 10.76 | 11.55 | 17.99 | 6.56 | NA | NA | NA | NA | NA | NA | NA | NA | NA | NA | NA | NA | NA | NA | NA | NA | NA | NA | NA | NA | NA | NA | NA | NA | NA | NA | NA | NA | NA | NA | NA | NA | NA | NA | NA | NA | NA | NA | NA | NA | NA | NA | NA | NA | NA | NA | NA | NA | |
| Event Based Development And Regulatory Milestone And Other Fees | 23.00 | 13.00 | 33.00 | NA | 0.00 | 44.00 | 15.00 | NA | NA | NA | NA | NA | NA | NA | NA | NA | NA | NA | NA | NA | NA | NA | NA | NA | NA | NA | NA | NA | NA | NA | NA | NA | NA | NA | NA | NA | NA | NA | NA | NA | NA | NA | NA | NA | NA | NA | NA | NA | NA | NA | NA | NA | NA | NA | NA | |
| Proprietary Products Sales | 39.07 | 31.51 | 32.29 | 27.96 | 28.29 | 24.18 | 14.69 | 5.69 | 5.81 | 6.18 | 6.27 | NA | NA | NA | NA | NA | NA | NA | NA | NA | NA | NA | NA | NA | NA | NA | NA | NA | NA | NA | NA | NA | NA | NA | NA | NA | NA | NA | NA | NA | NA | NA | NA | NA | NA | NA | NA | NA | NA | NA | NA | NA | NA | NA | NA | |
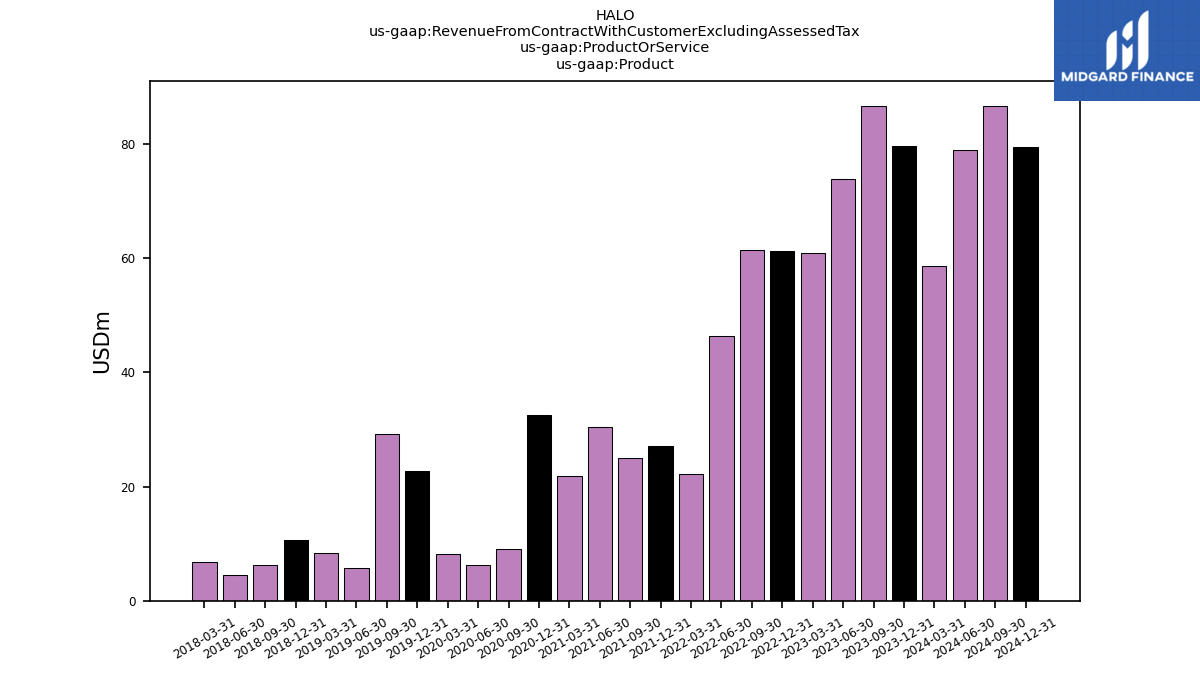
| Product | 79.60 | 86.57 | 73.89 | 60.79 | 61.16 | 61.43 | 46.30 | 22.14 | 27.05 | 25.05 | 30.36 | 21.77 | 32.45 | 9.05 | 6.34 | 8.15 | 22.69 | 29.20 | 5.76 | 8.39 | 10.68 | 6.27 | 4.48 | 6.80 | NA | NA | NA | NA | NA | NA | NA | NA | NA | NA | NA | NA | NA | NA | NA | NA | NA | NA | NA | NA | NA | NA | NA | NA | NA | NA | NA | NA | NA | NA | NA | |
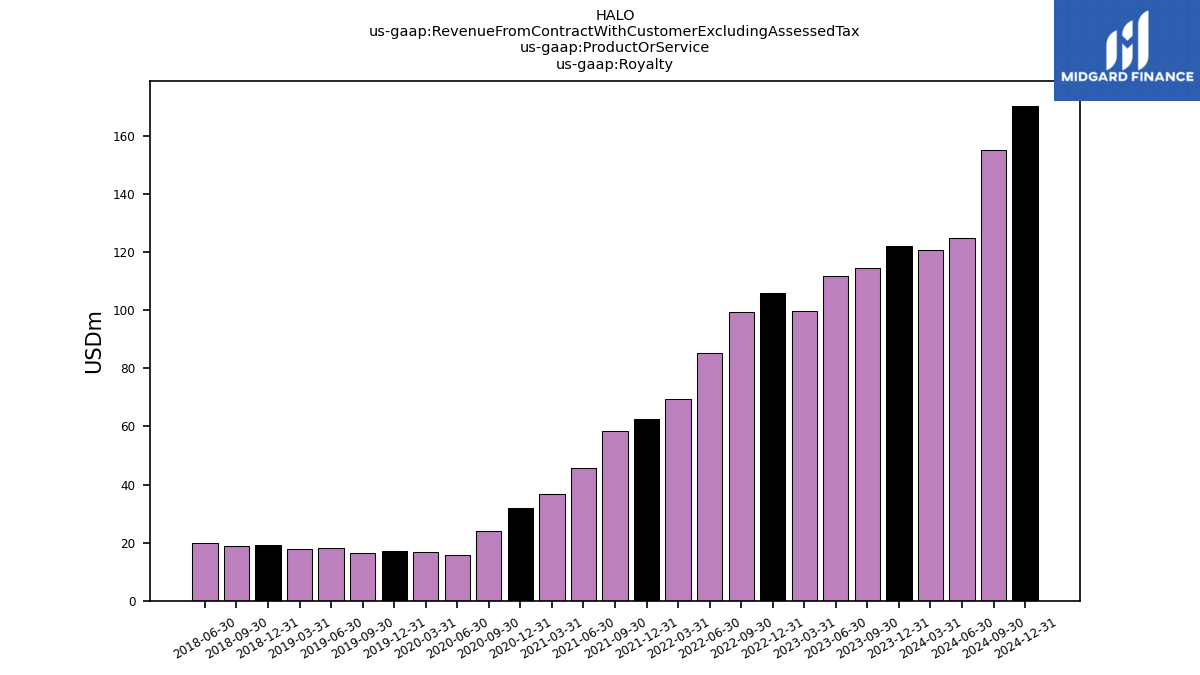
| Royalty | 122.05 | 114.43 | 111.74 | 99.64 | 105.98 | 99.55 | 85.34 | 69.61 | 62.64 | 58.56 | 45.78 | 36.92 | 32.00 | 23.93 | 15.85 | 16.82 | 17.23 | 16.61 | 18.11 | 17.95 | 19.34 | 18.71 | 19.99 | NA | NA | NA | NA | NA | NA | NA | NA | NA | NA | NA | NA | NA | NA | NA | NA | NA | NA | NA | NA | NA | NA | NA | NA | NA | NA | NA | NA | NA | NA | NA | NA |