
| 2023-12-31 | 2023-09-30 | 2023-07-01 | 2023-04-01 | 2022-12-31 | 2022-10-01 | 2022-07-02 | 2022-04-02 | 2021-12-31 | 2021-10-02 | 2021-07-03 | 2021-04-03 | 2020-12-31 | 2020-09-26 | 2020-06-27 | 2020-03-28 | ||
|---|---|---|---|---|---|---|---|---|---|---|---|---|---|---|---|---|---|
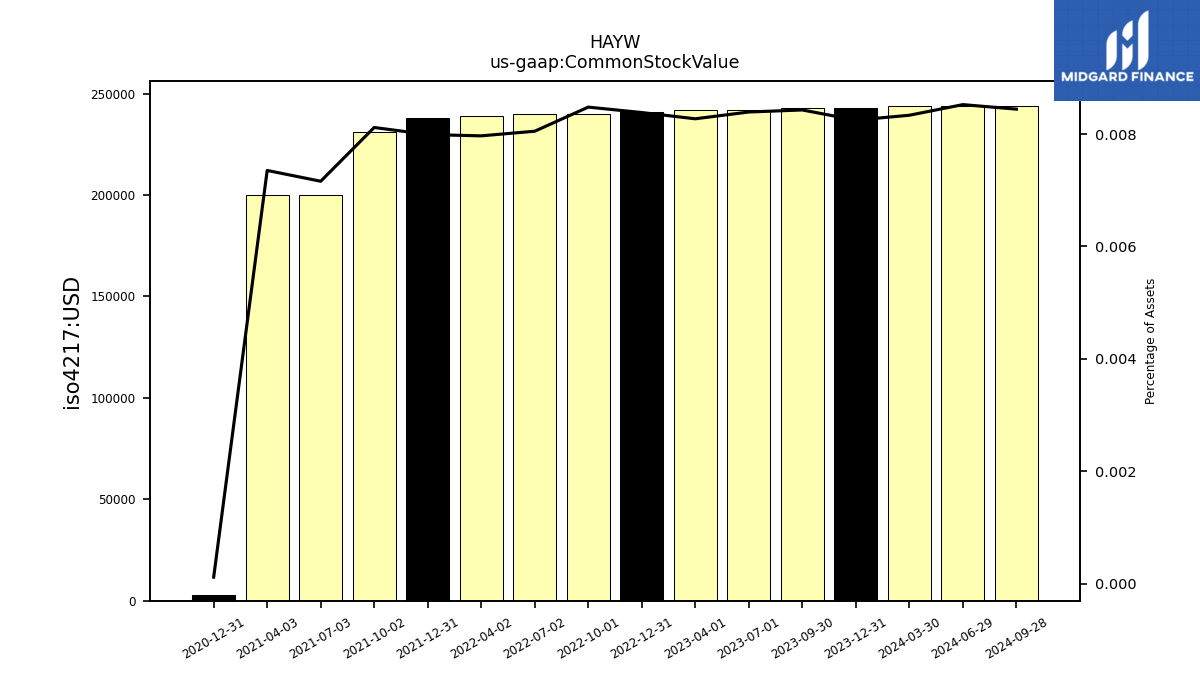
| Common Stock Value | 0.24 | 0.24 | 0.24 | 0.24 | 0.24 | 0.24 | 0.24 | 0.24 | 0.24 | 0.23 | 0.20 | 0.20 | 0.00 | NA | NA | NA | |
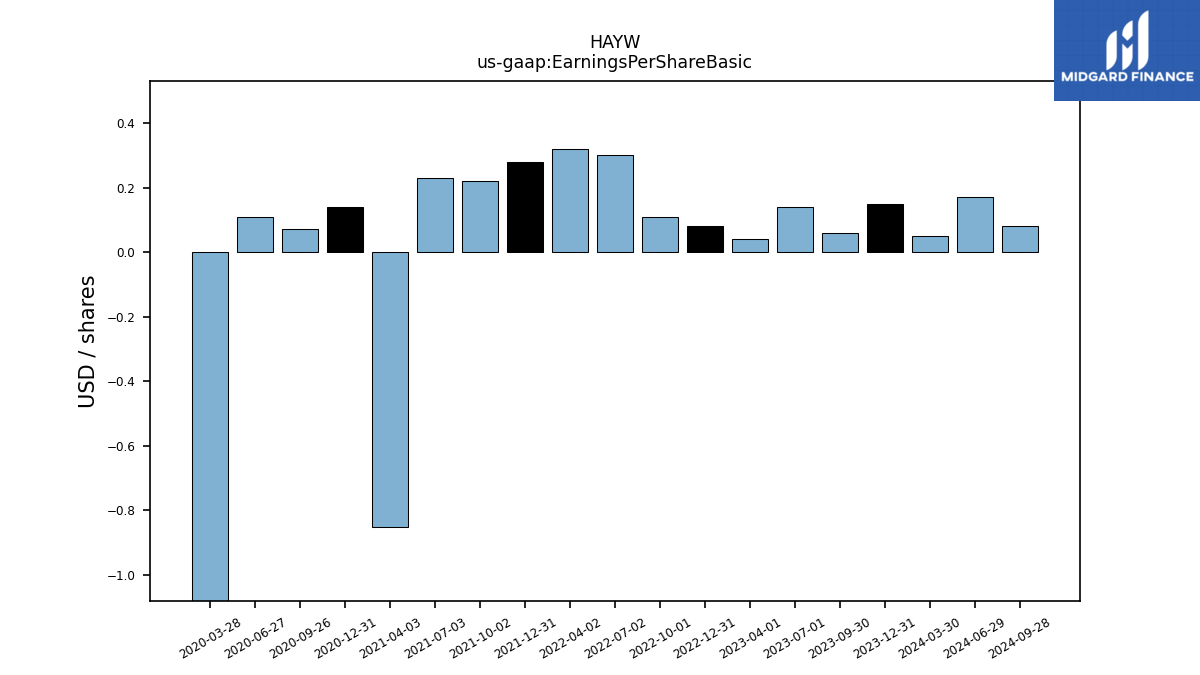
| Earnings Per Share Basic | 0.15 | 0.06 | 0.14 | 0.04 | 0.08 | 0.11 | 0.30 | 0.32 | 0.28 | 0.22 | 0.23 | -0.85 | 0.14 | 0.07 | 0.11 | -8.80 | |
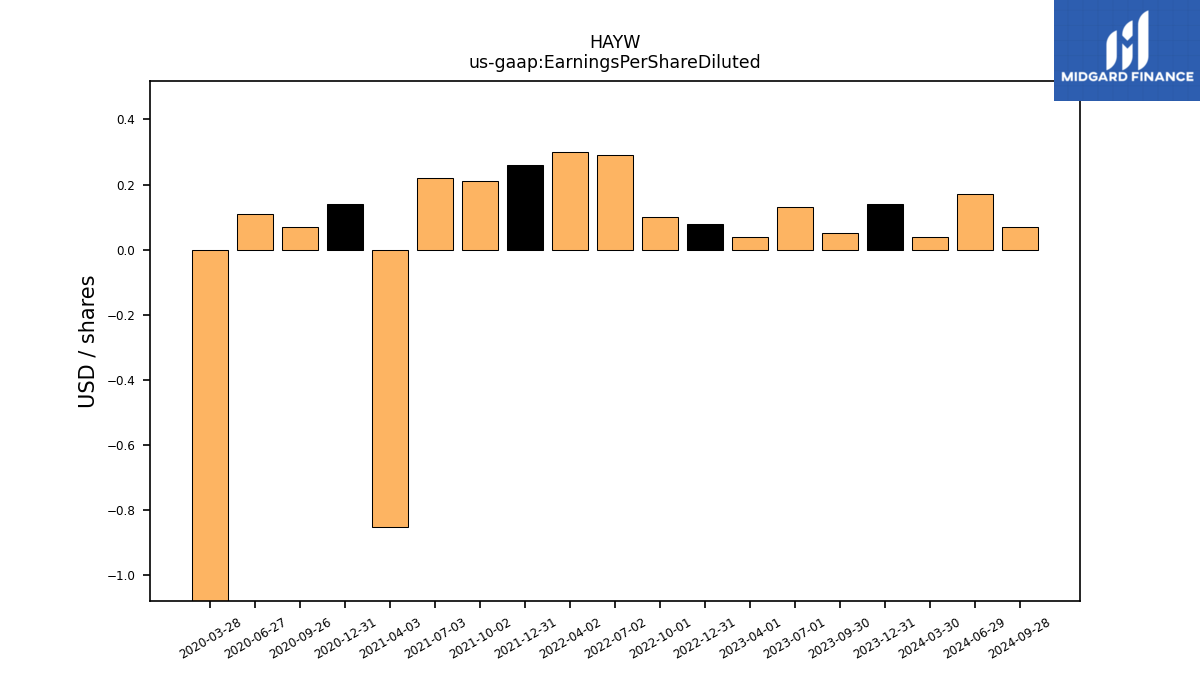
| Earnings Per Share Diluted | 0.14 | 0.05 | 0.13 | 0.04 | 0.08 | 0.10 | 0.29 | 0.30 | 0.26 | 0.21 | 0.22 | -0.85 | 0.14 | 0.07 | 0.11 | -8.80 |
| 2023-12-31 | 2023-09-30 | 2023-07-01 | 2023-04-01 | 2022-12-31 | 2022-10-01 | 2022-07-02 | 2022-04-02 | 2021-12-31 | 2021-10-02 | 2021-07-03 | 2021-04-03 | 2020-12-31 | 2020-09-26 | 2020-06-27 | 2020-03-28 | ||
|---|---|---|---|---|---|---|---|---|---|---|---|---|---|---|---|---|---|
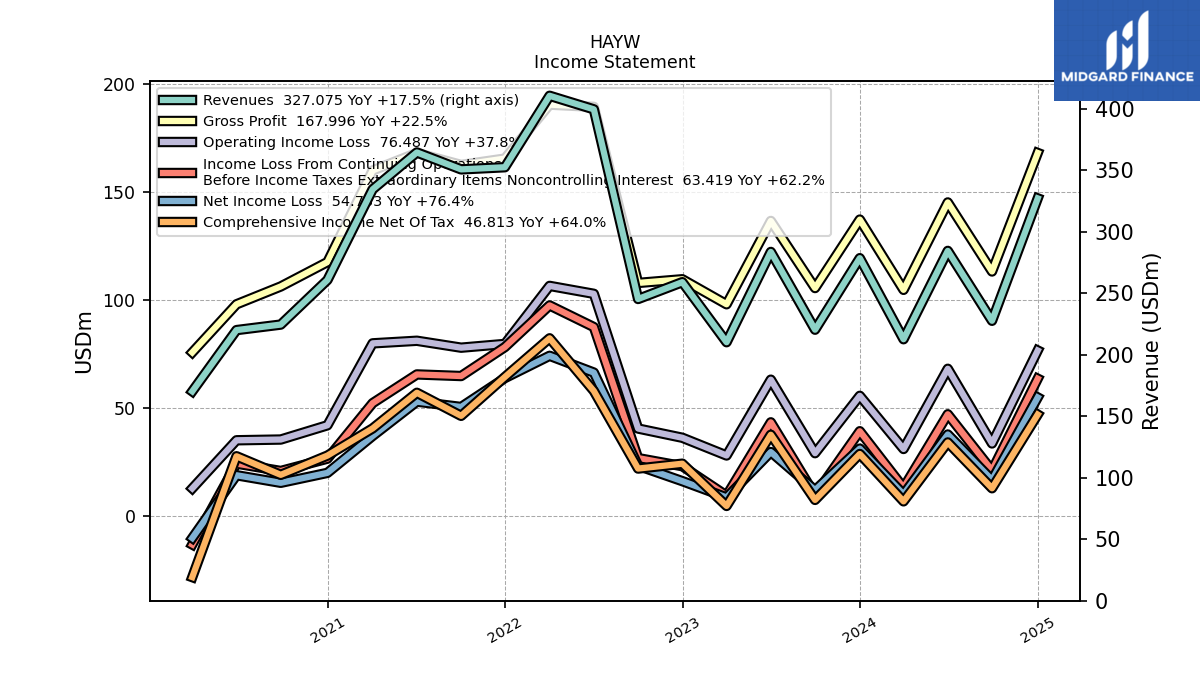
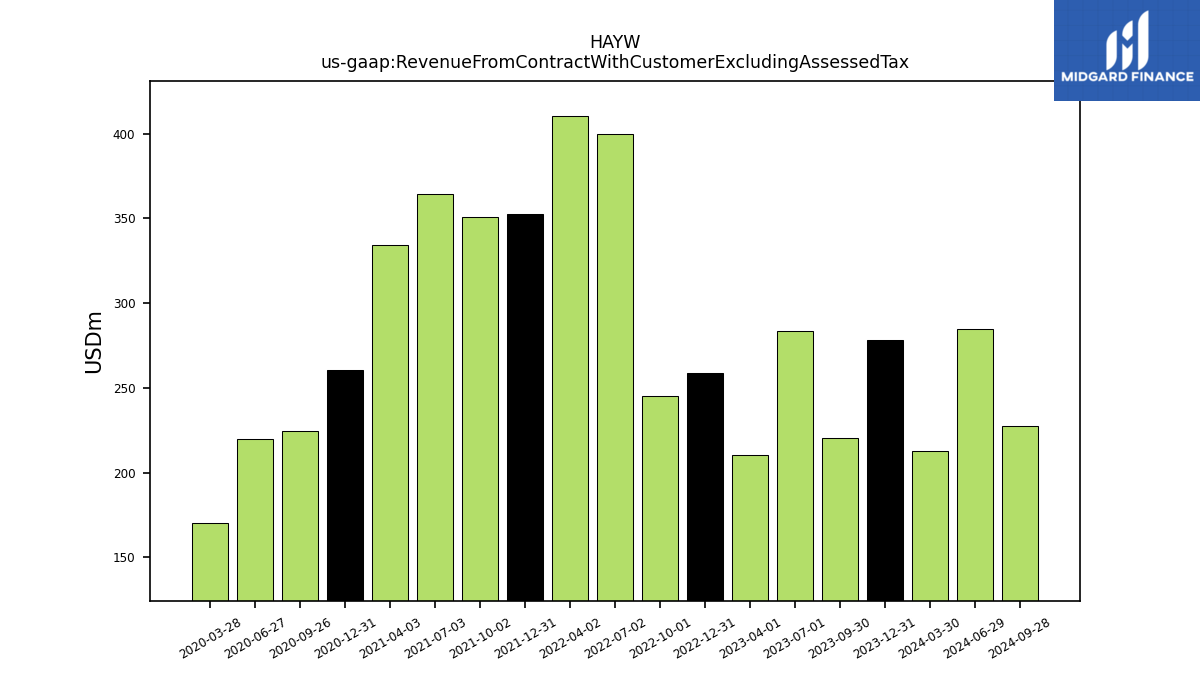
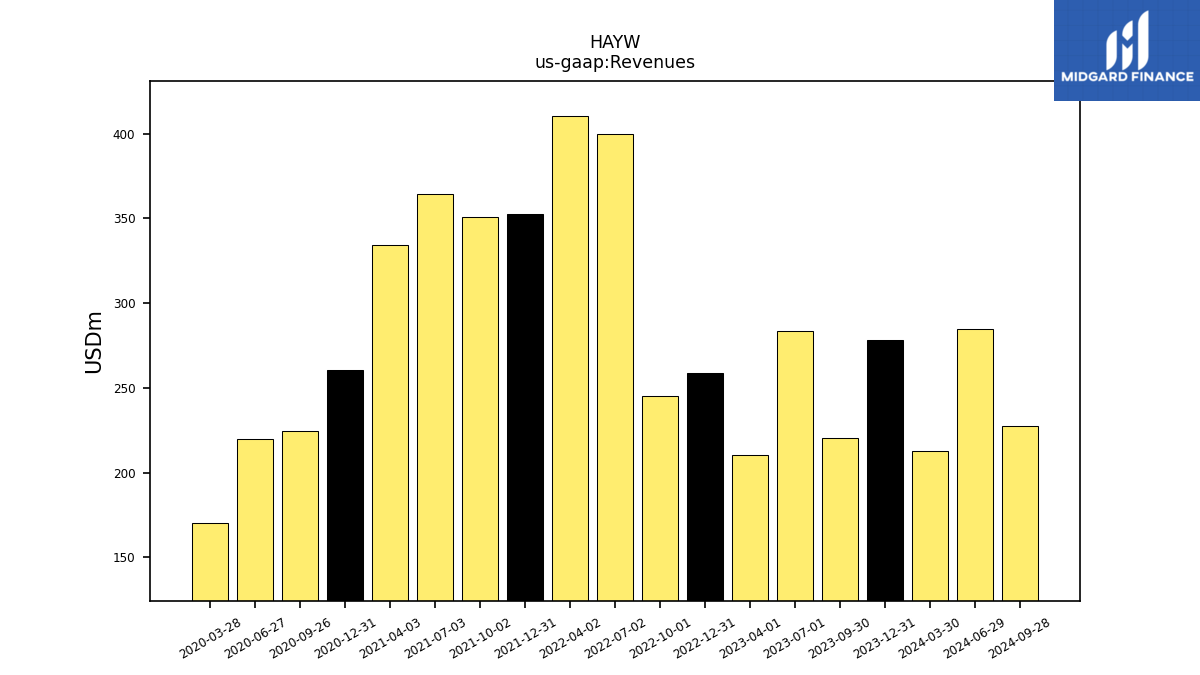
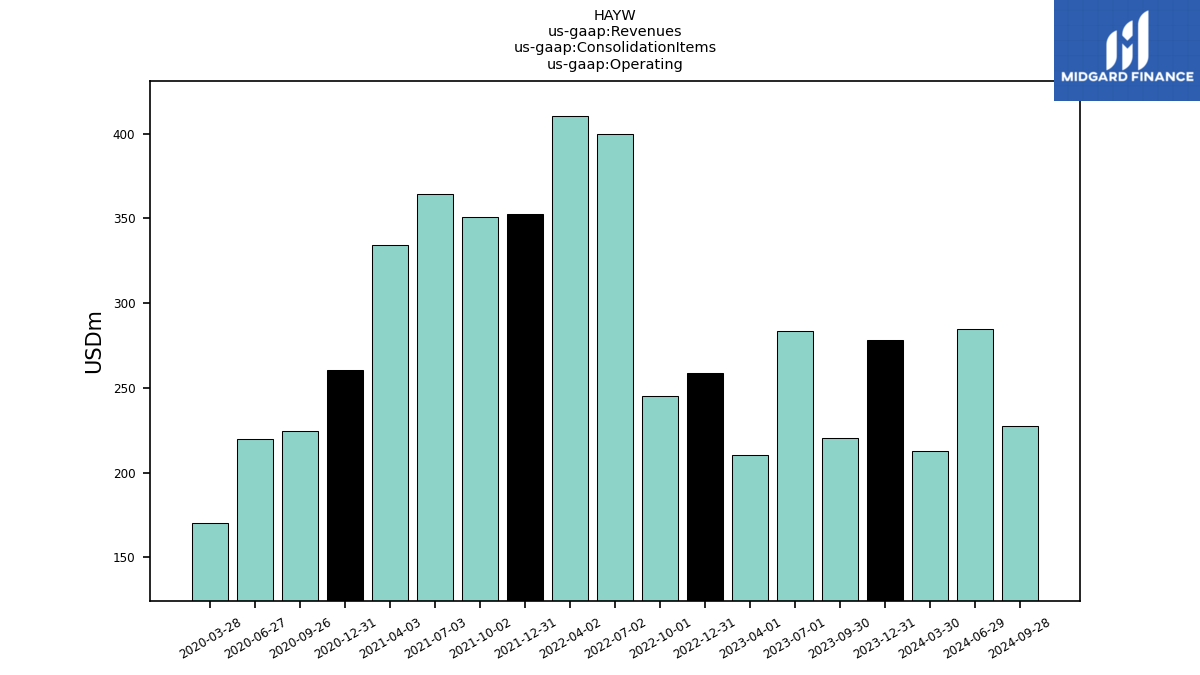
| Revenue From Contract With Customer Excluding Assessed Tax | 278.47 | 220.30 | 283.54 | 210.14 | 258.97 | 245.27 | 399.44 | 410.46 | 352.38 | 350.62 | 364.40 | 334.40 | 260.70 | 224.49 | 220.00 | 170.20 | |
| Revenues | 278.47 | 220.30 | 283.54 | 210.14 | 258.97 | 245.27 | 399.44 | 410.46 | 352.38 | 350.62 | 364.40 | 334.40 | 260.70 | 224.49 | 220.00 | 170.20 | |
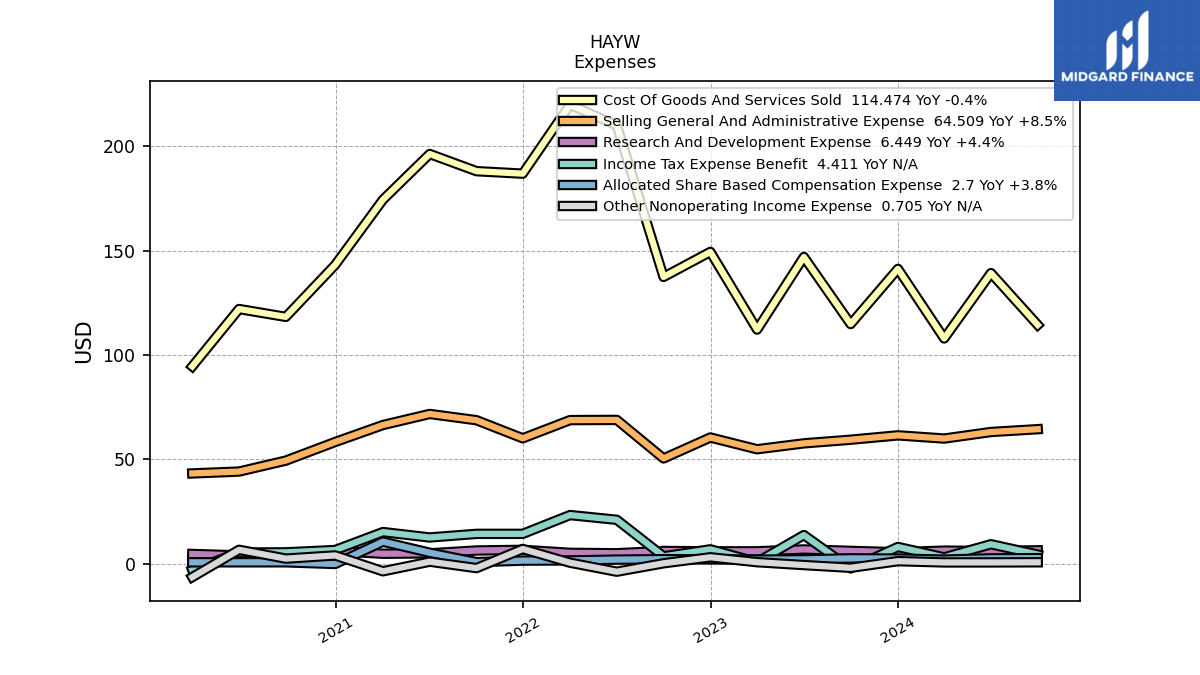
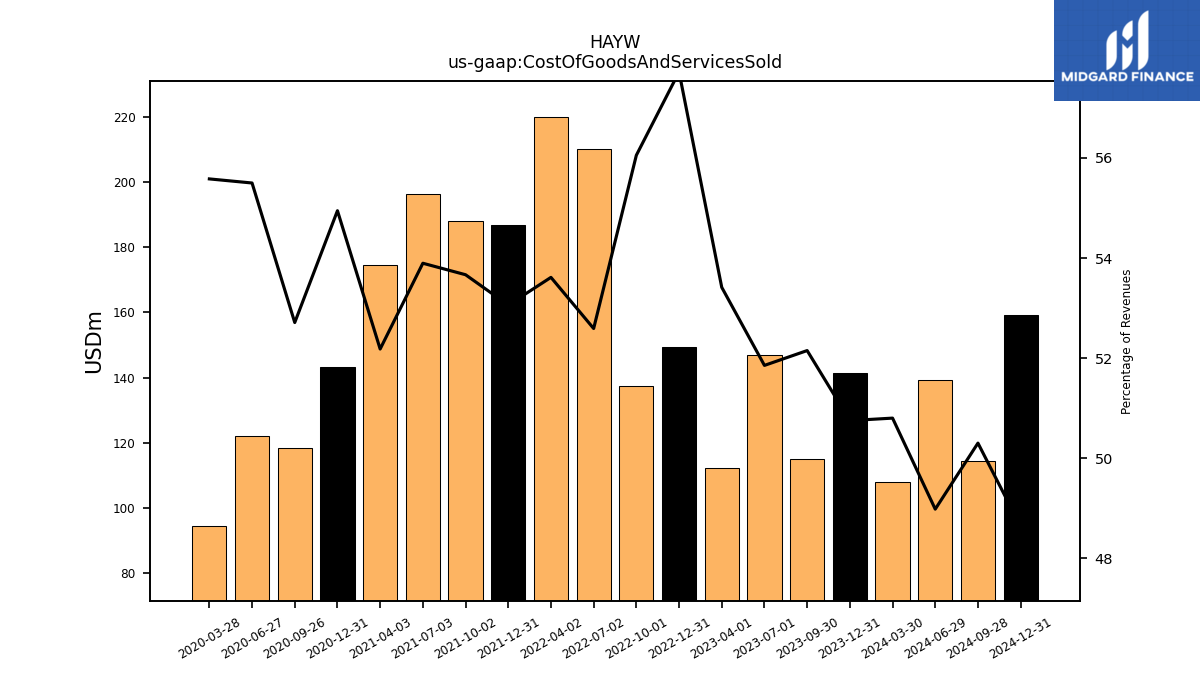
| Cost Of Goods And Services Sold | 141.33 | 114.89 | 147.03 | 112.25 | 149.47 | 137.48 | 210.08 | 220.07 | 186.98 | 188.17 | 196.40 | 174.50 | 143.24 | 118.33 | 122.10 | 94.60 | |
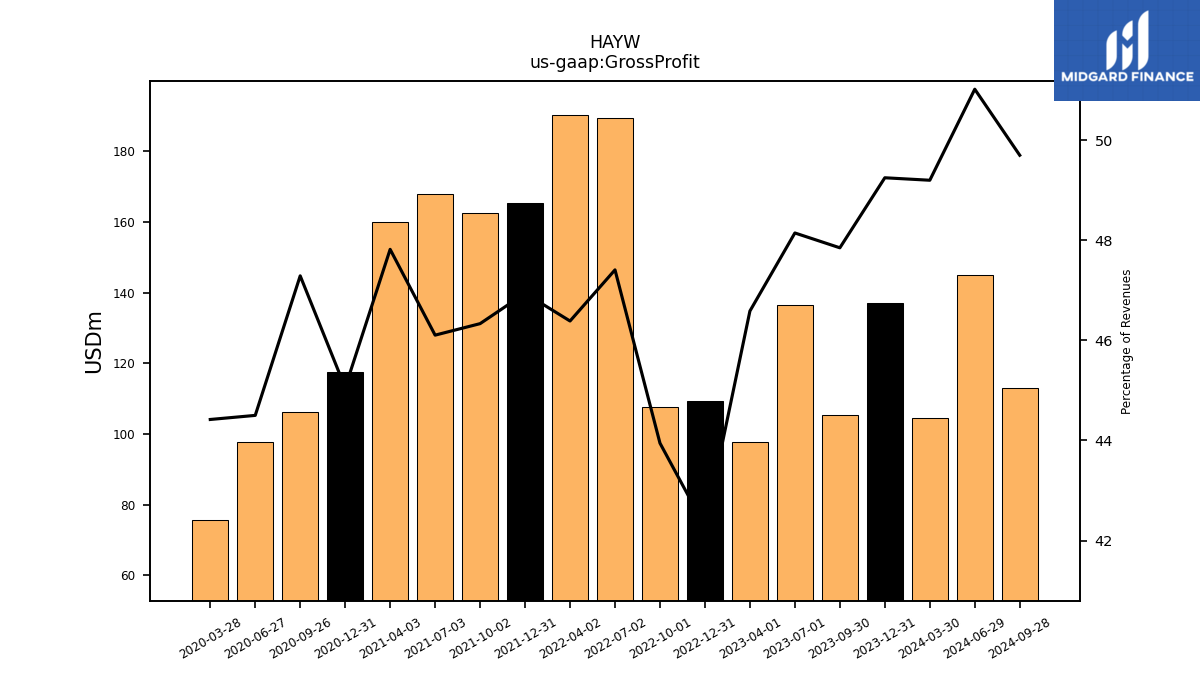
| Gross Profit | 137.14 | 105.41 | 136.51 | 97.89 | 109.49 | 107.78 | 189.37 | 190.39 | 165.41 | 162.45 | 168.00 | 159.90 | 117.45 | 106.15 | 97.90 | 75.60 | |
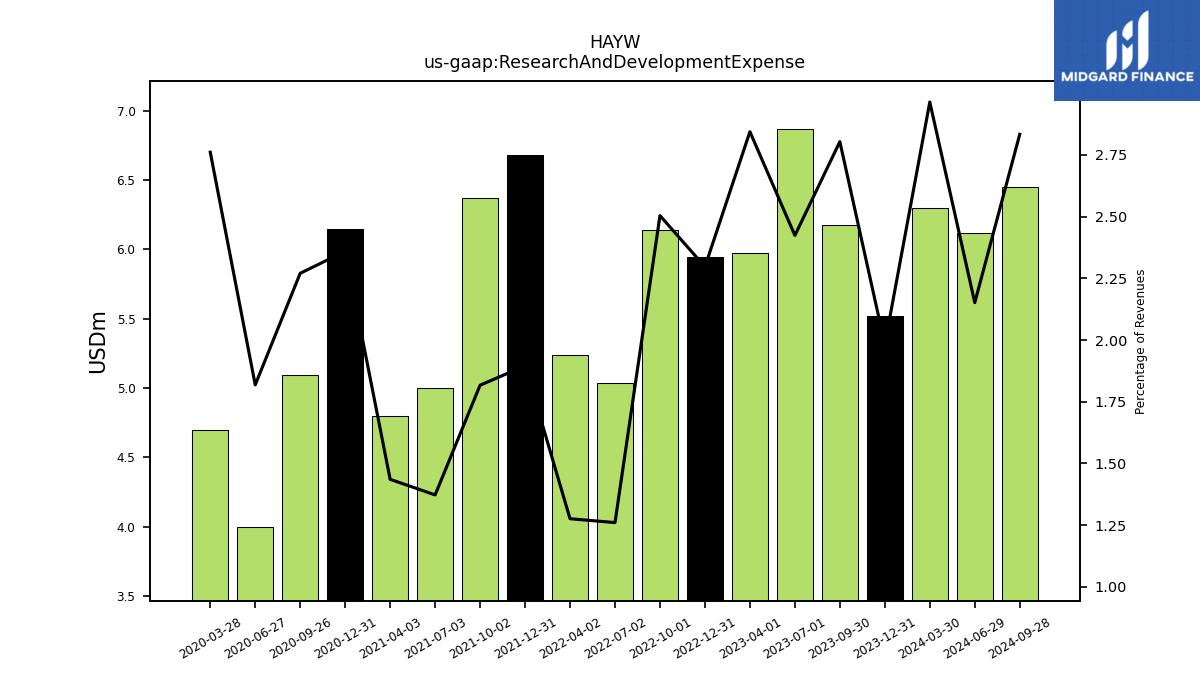
| Research And Development Expense | 5.52 | 6.18 | 6.87 | 5.98 | 5.95 | 6.14 | 5.03 | 5.24 | 6.68 | 6.37 | 5.00 | 4.80 | 6.15 | 5.10 | 4.00 | 4.70 | |
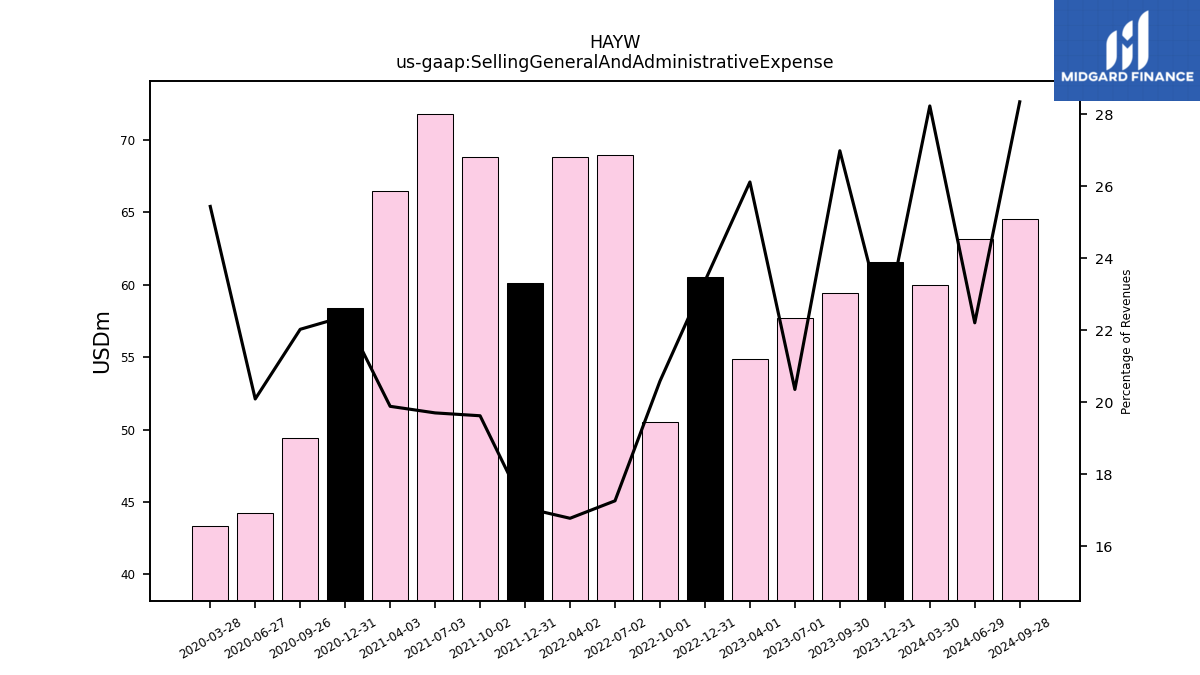
| Selling General And Administrative Expense | 61.55 | 59.45 | 57.72 | 54.89 | 60.52 | 50.49 | 68.95 | 68.86 | 60.13 | 68.81 | 71.80 | 66.50 | 58.37 | 49.45 | 44.20 | 43.30 | |
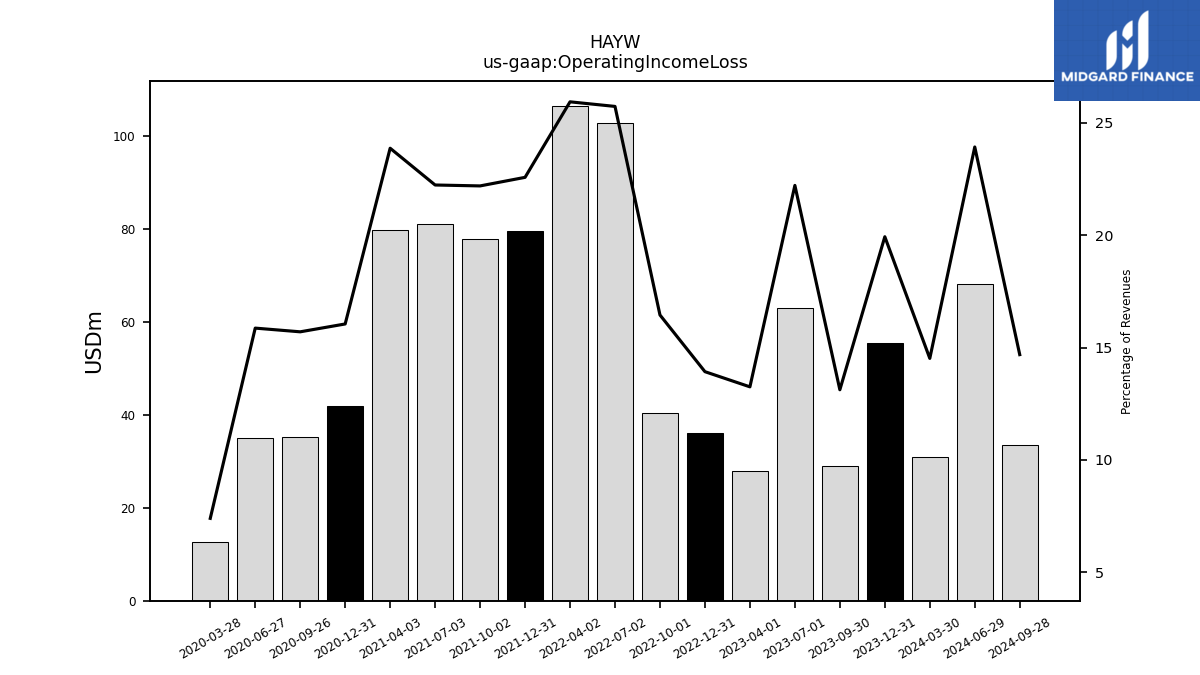
| Operating Income Loss | 55.49 | 28.91 | 62.98 | 27.85 | 36.06 | 40.34 | 102.75 | 106.42 | 79.53 | 77.79 | 81.00 | 79.80 | 41.84 | 35.24 | 34.90 | 12.60 | |
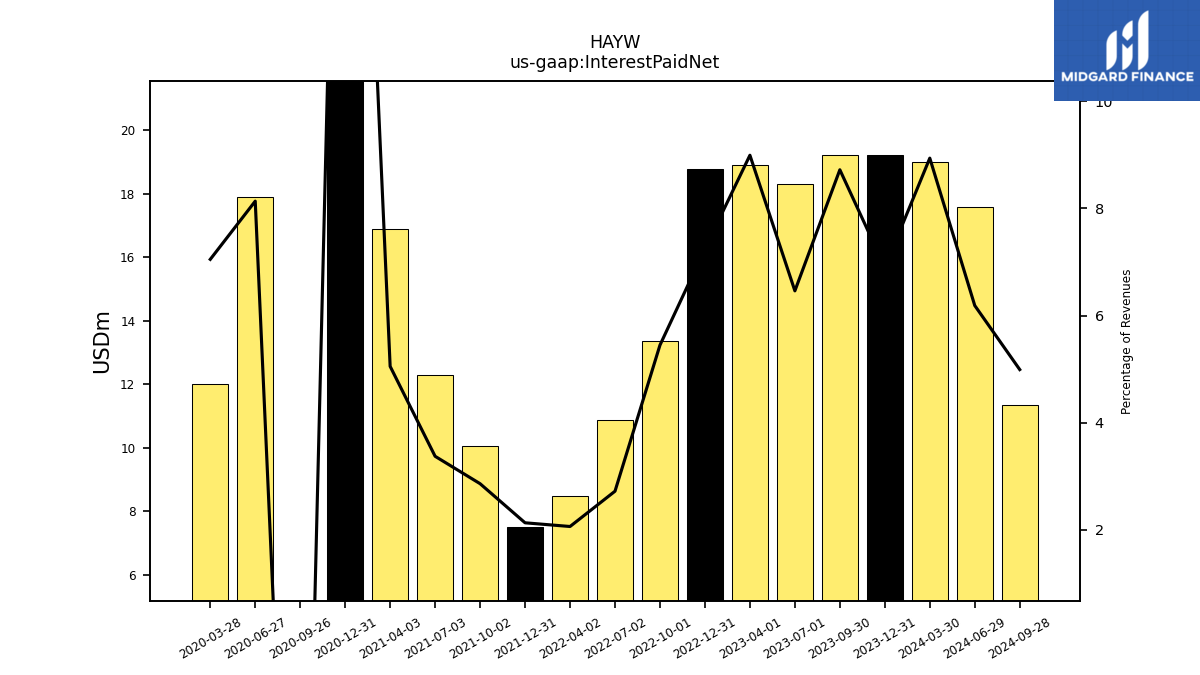
| Interest Paid Net | 19.22 | 19.21 | 18.32 | 18.90 | 18.77 | 13.37 | 10.88 | 8.48 | 7.52 | 10.04 | 12.30 | 16.90 | 62.12 | -23.56 | 17.90 | 12.00 | |
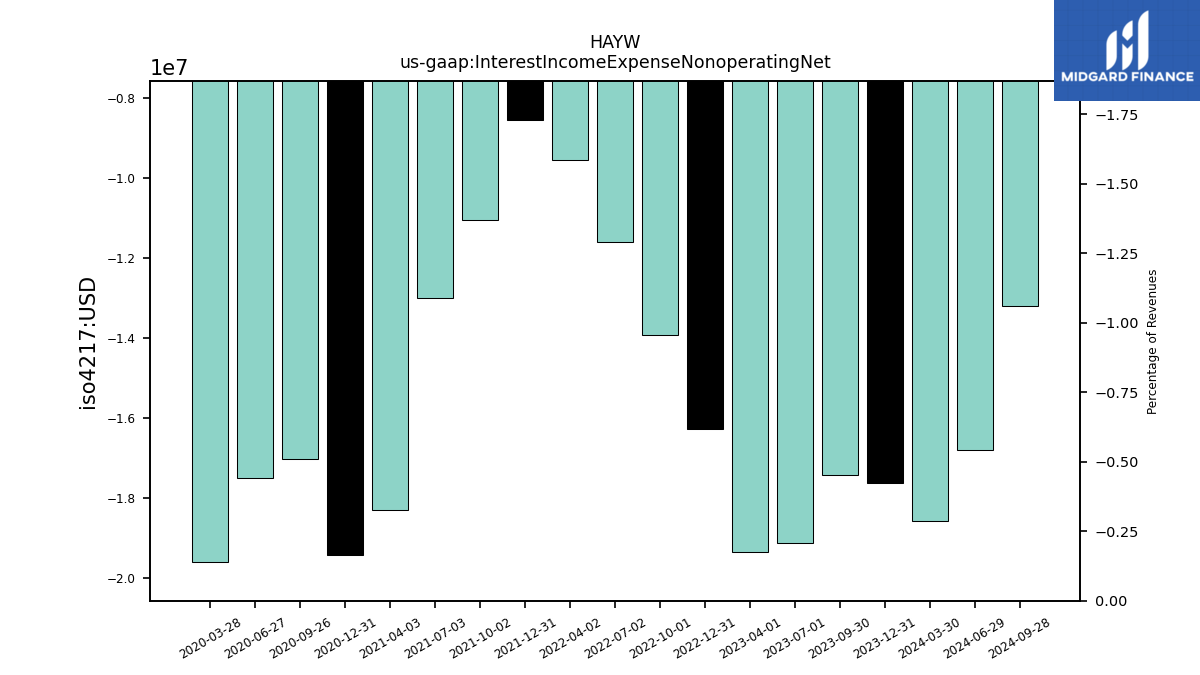
| Interest Income Expense Nonoperating Net | -17.64 | -17.45 | -19.13 | -19.36 | -16.28 | -13.94 | -11.61 | -9.56 | -8.56 | -11.05 | -13.00 | -18.30 | -19.45 | -17.05 | -17.50 | -19.60 | |
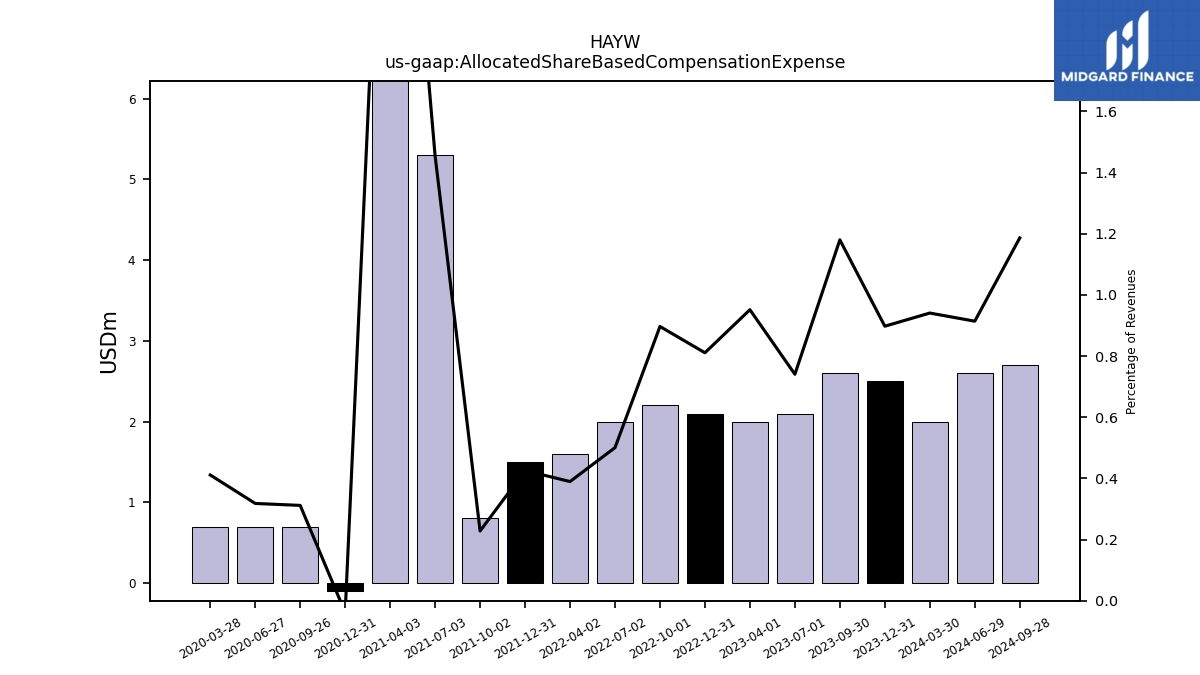
| Allocated Share Based Compensation Expense | 2.50 | 2.60 | 2.10 | 2.00 | 2.10 | 2.20 | 2.00 | 1.60 | 1.50 | 0.80 | 5.30 | 10.60 | -0.10 | 0.70 | 0.70 | 0.70 | |
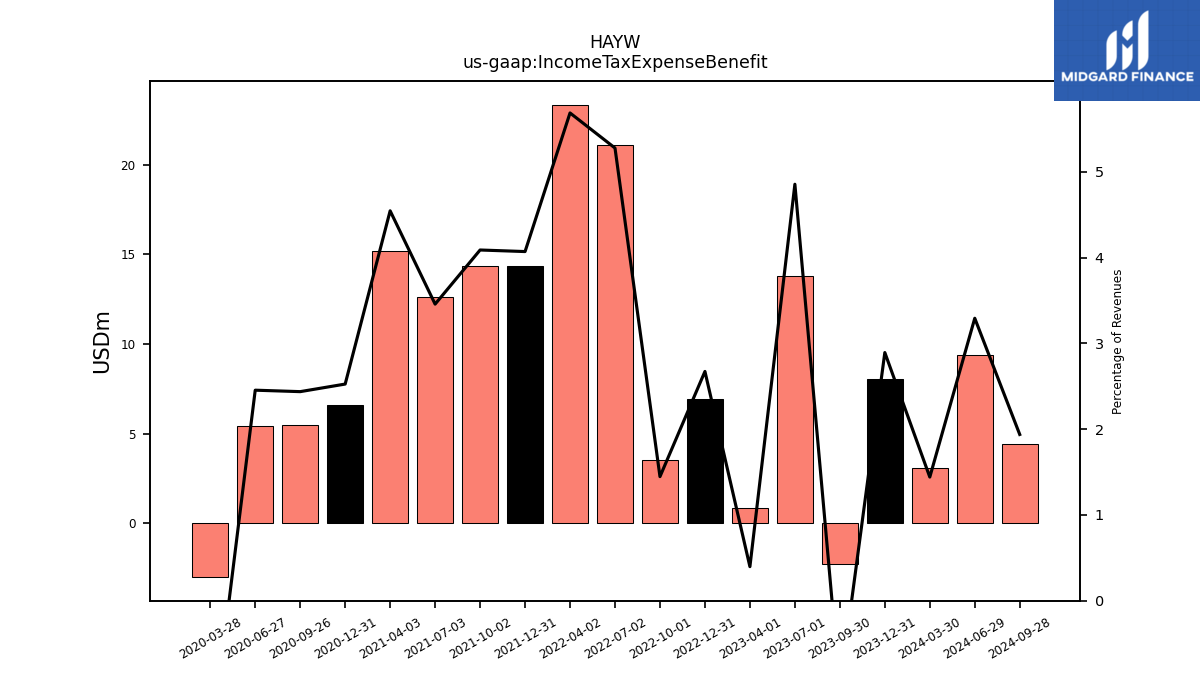
| Income Tax Expense Benefit | 8.06 | -2.26 | 13.77 | 0.83 | 6.92 | 3.55 | 21.08 | 23.34 | 14.34 | 14.34 | 12.60 | 15.20 | 6.58 | 5.47 | 5.40 | -3.00 | |
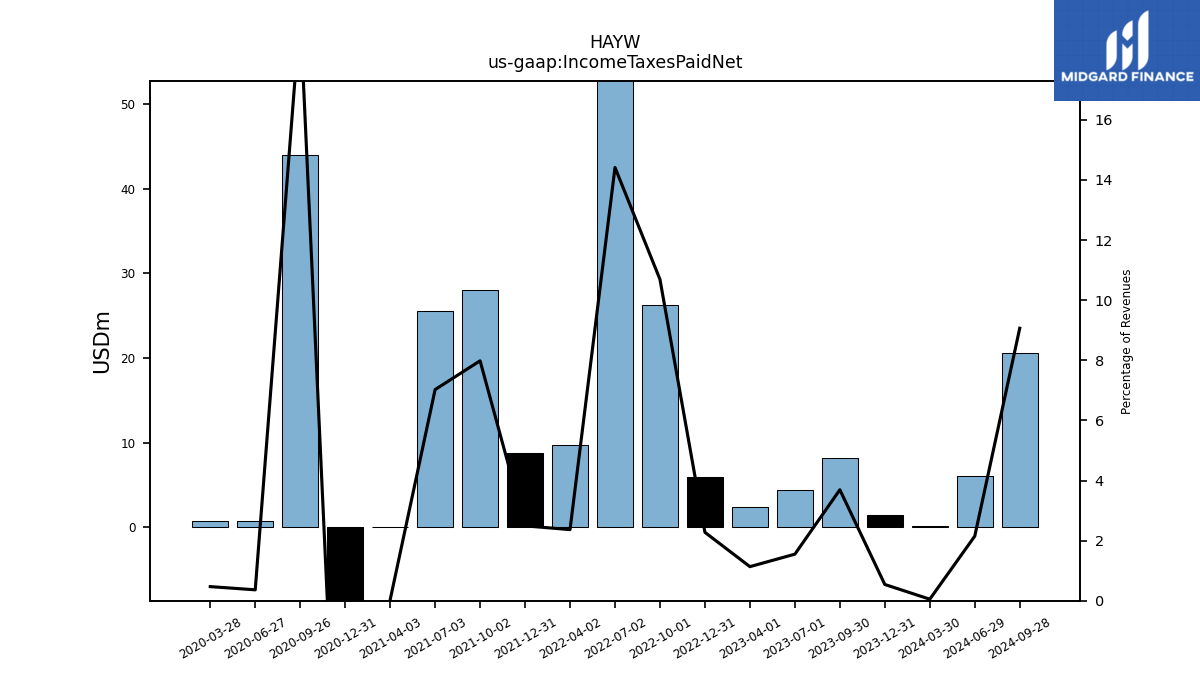
| Income Taxes Paid Net | 1.51 | 8.13 | 4.39 | 2.38 | 5.89 | 26.22 | 57.57 | 9.71 | 8.78 | 27.99 | 25.60 | 0.10 | -33.51 | 43.95 | 0.80 | 0.80 | |
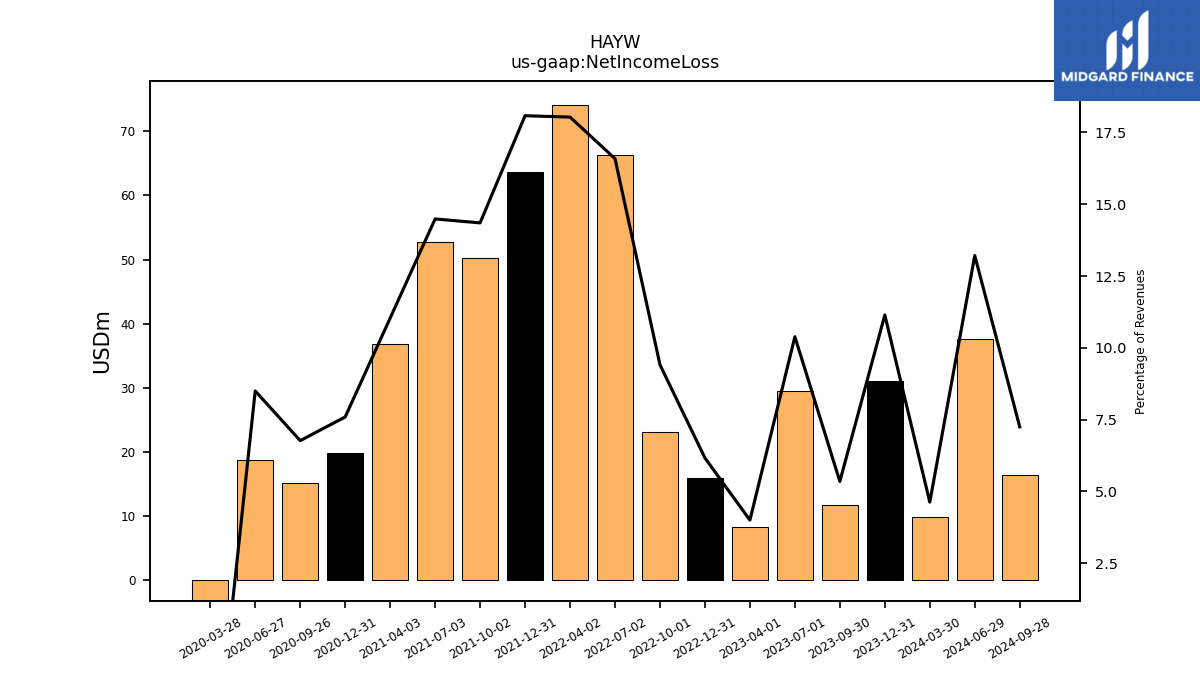
| Net Income Loss | 31.04 | 11.79 | 29.45 | 8.41 | 15.97 | 23.09 | 66.26 | 74.03 | 63.72 | 50.32 | 52.80 | 36.90 | 19.80 | 15.20 | 18.70 | -10.40 | |
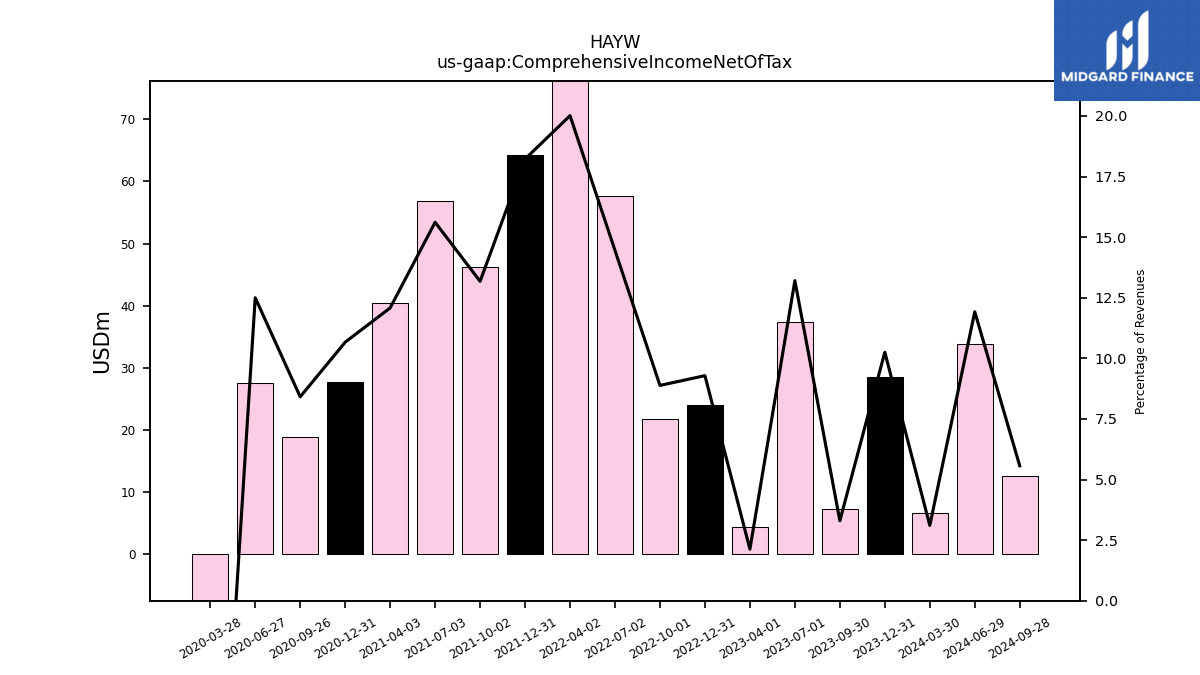
| Comprehensive Income Net Of Tax | 28.55 | 7.27 | 37.45 | 4.48 | 24.05 | 21.79 | 57.73 | 82.14 | 64.22 | 46.21 | 56.90 | 40.40 | 27.81 | 18.89 | 27.50 | -28.50 |
| 2023-12-31 | 2023-09-30 | 2023-07-01 | 2023-04-01 | 2022-12-31 | 2022-10-01 | 2022-07-02 | 2022-04-02 | 2021-12-31 | 2021-10-02 | 2021-07-03 | 2021-04-03 | 2020-12-31 | 2020-09-26 | 2020-06-27 | 2020-03-28 | ||
|---|---|---|---|---|---|---|---|---|---|---|---|---|---|---|---|---|---|
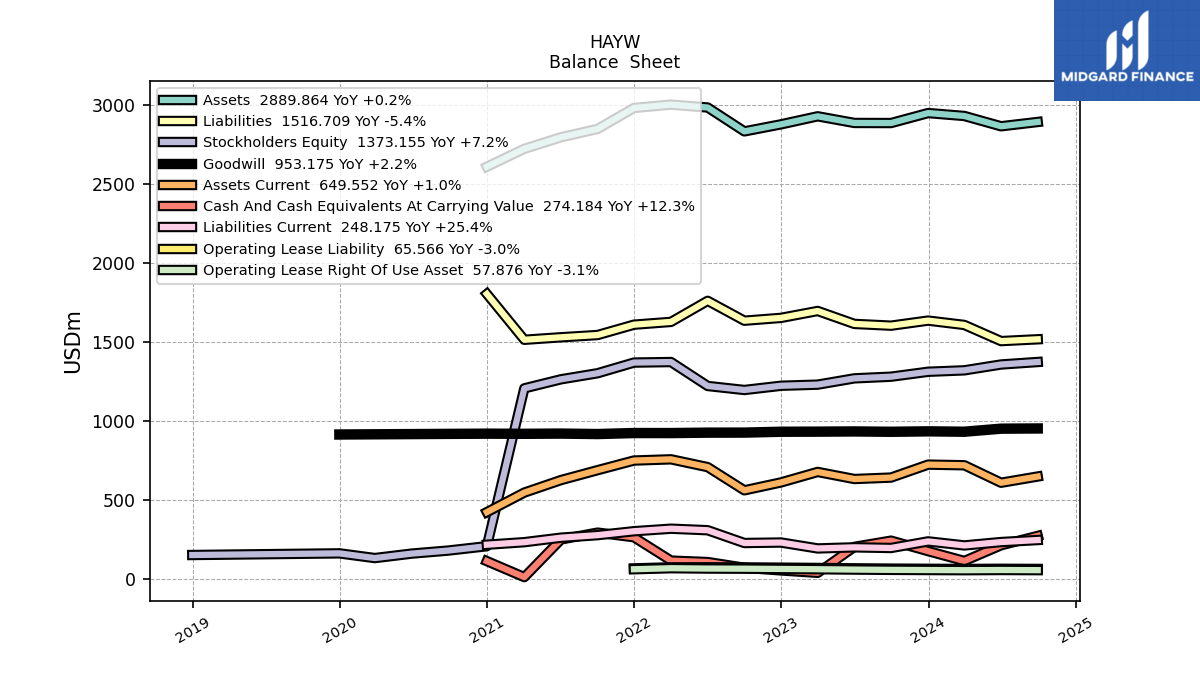
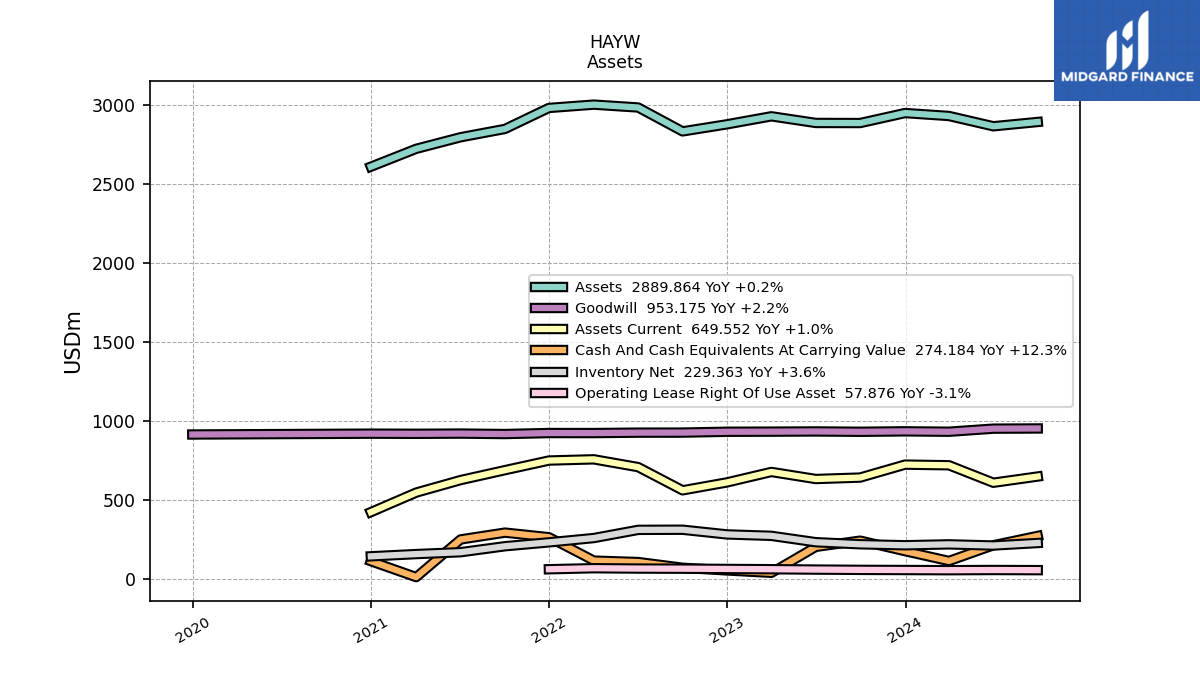
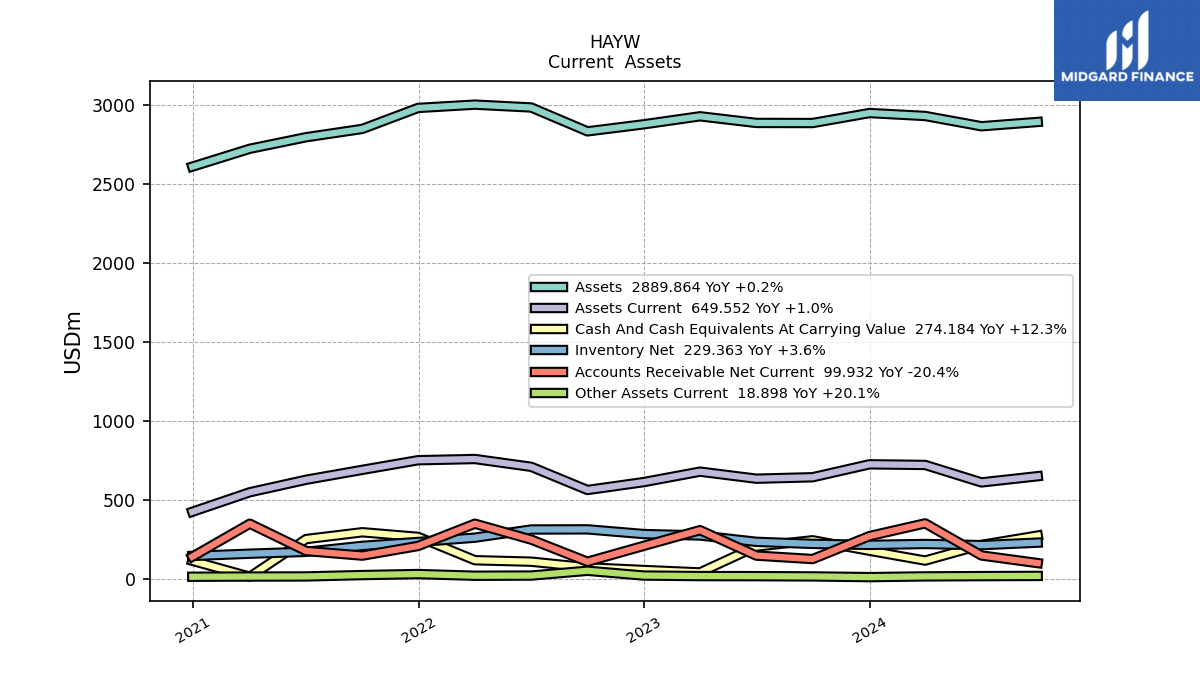
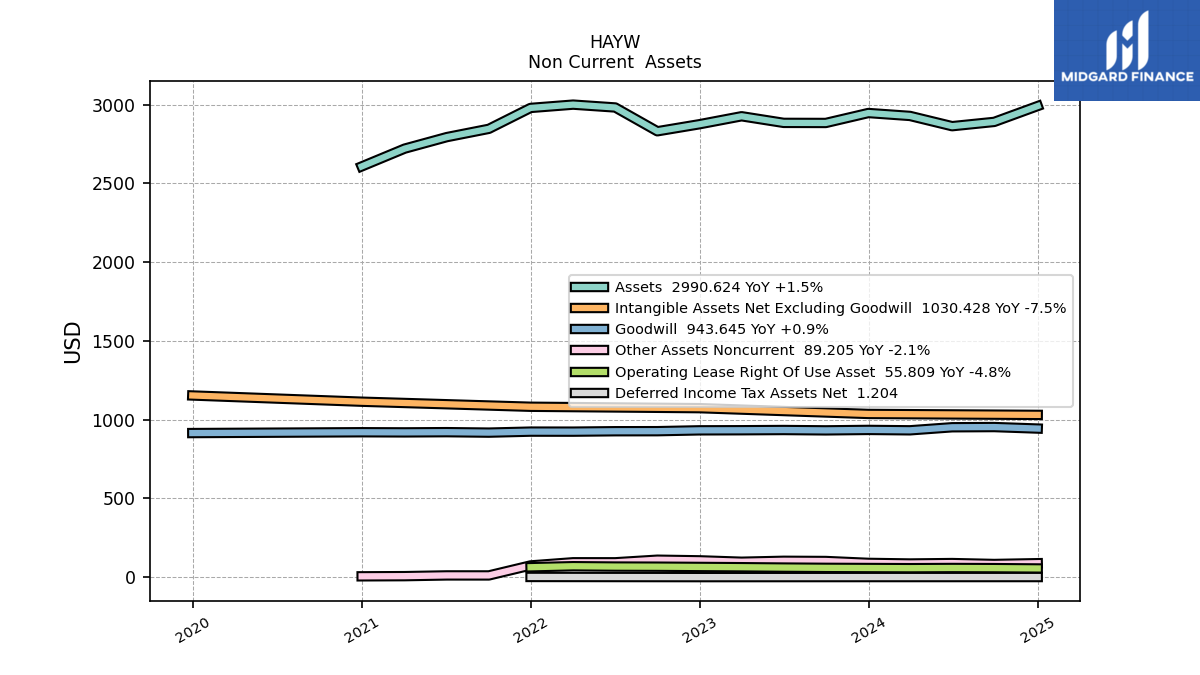
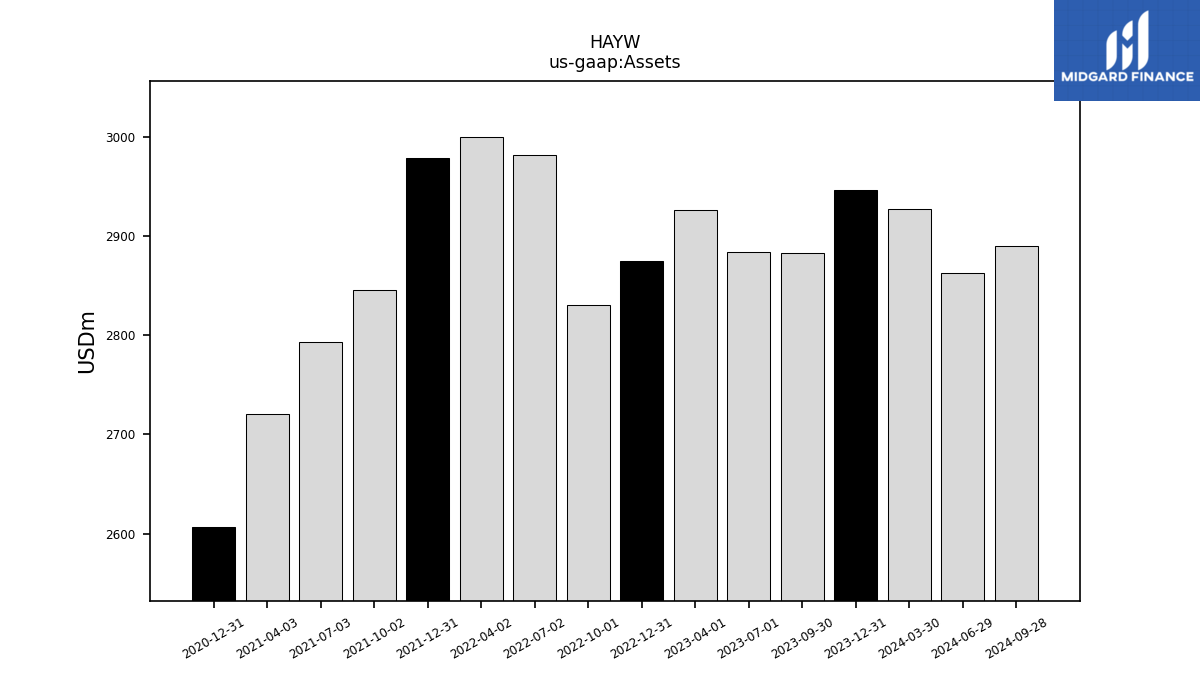
| Assets | 2946.28 | 2883.08 | 2883.65 | 2925.69 | 2875.01 | 2830.40 | 2981.36 | 2999.51 | 2978.47 | 2845.94 | 2793.30 | 2720.30 | 2607.10 | NA | NA | NA | |
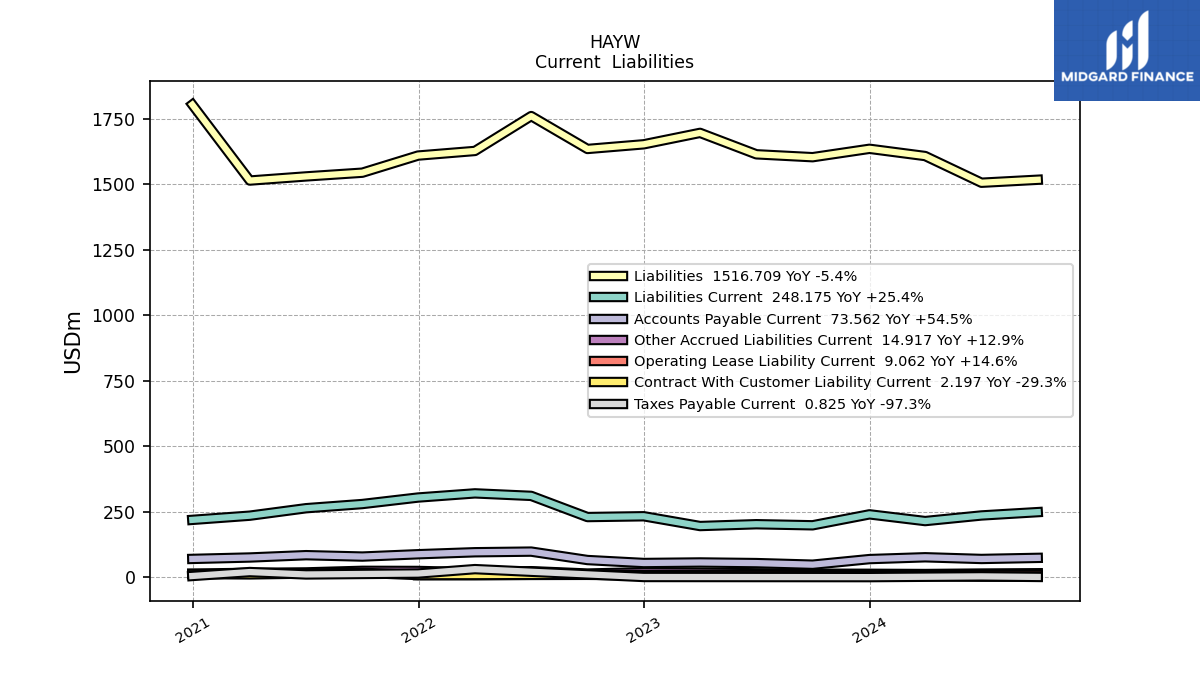
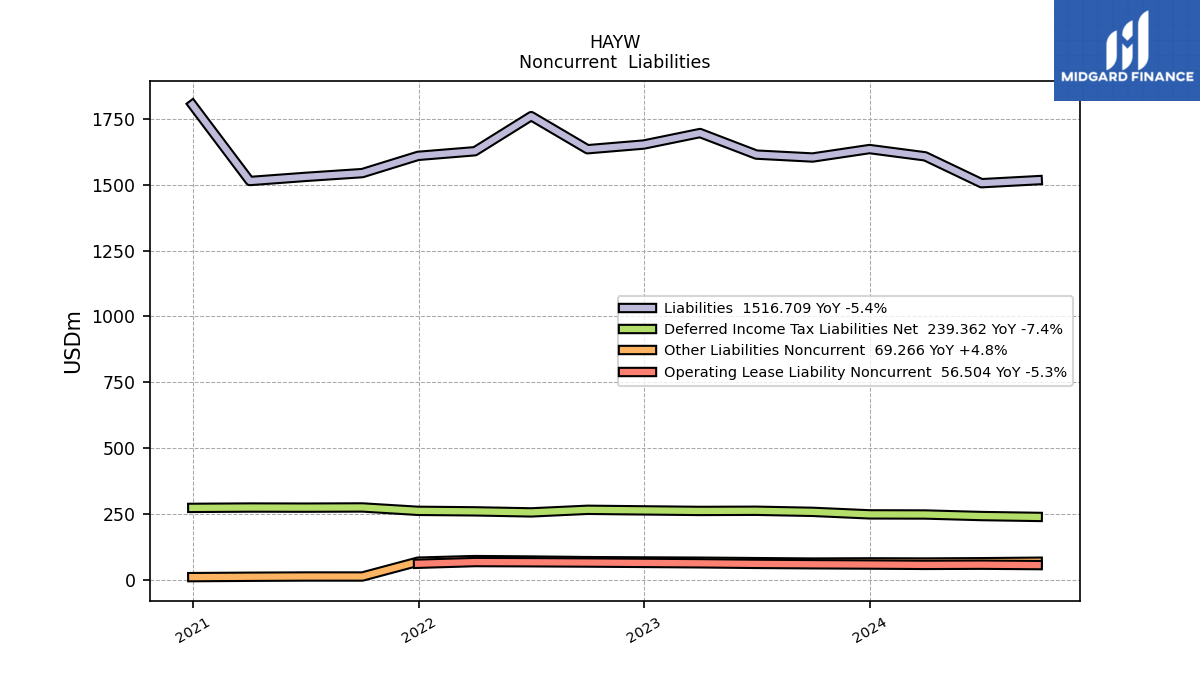
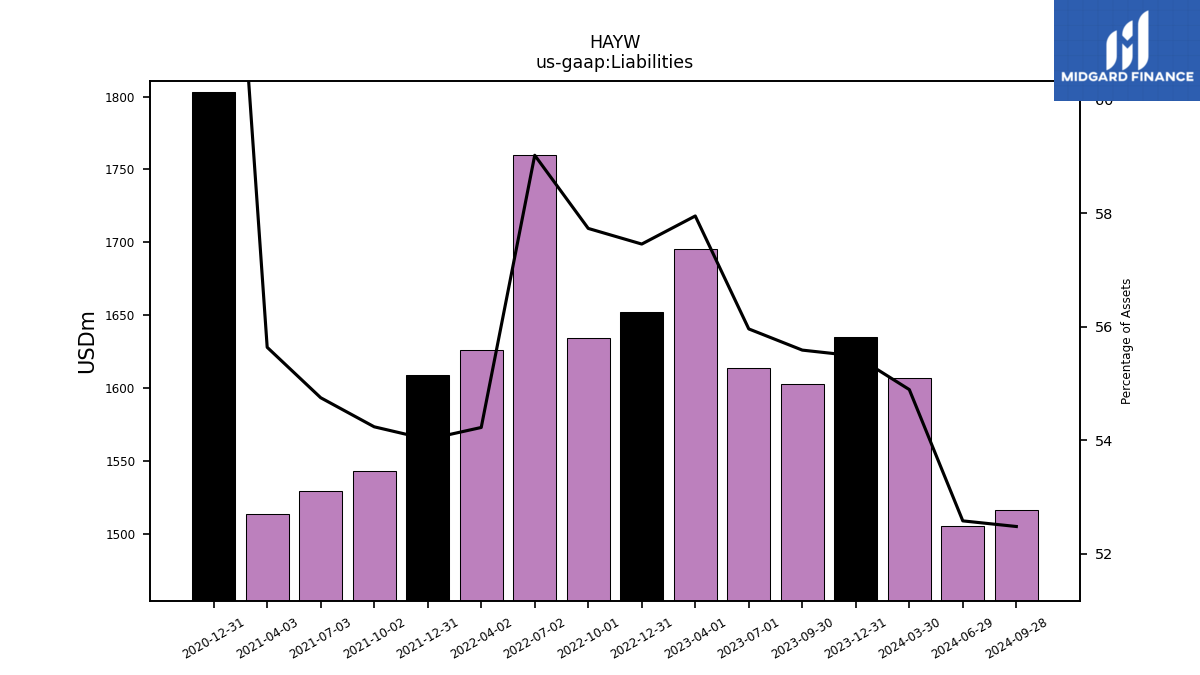
| Liabilities | 1634.83 | 1602.75 | 1613.83 | 1695.57 | 1651.98 | 1634.14 | 1759.73 | 1626.59 | 1608.96 | 1543.65 | 1529.40 | 1513.60 | 1803.40 | NA | NA | NA | |
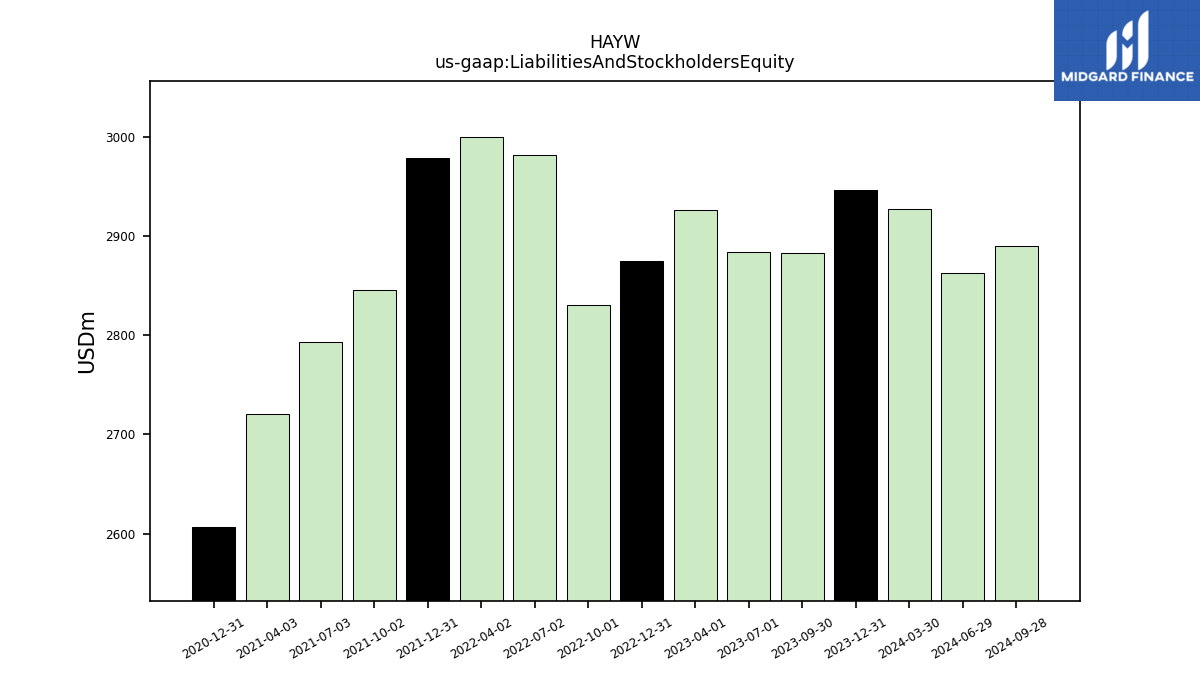
| Liabilities And Stockholders Equity | 2946.28 | 2883.08 | 2883.65 | 2925.69 | 2875.01 | 2830.40 | 2981.36 | 2999.51 | 2978.47 | 2845.94 | 2793.30 | 2720.30 | 2607.10 | NA | NA | NA | |
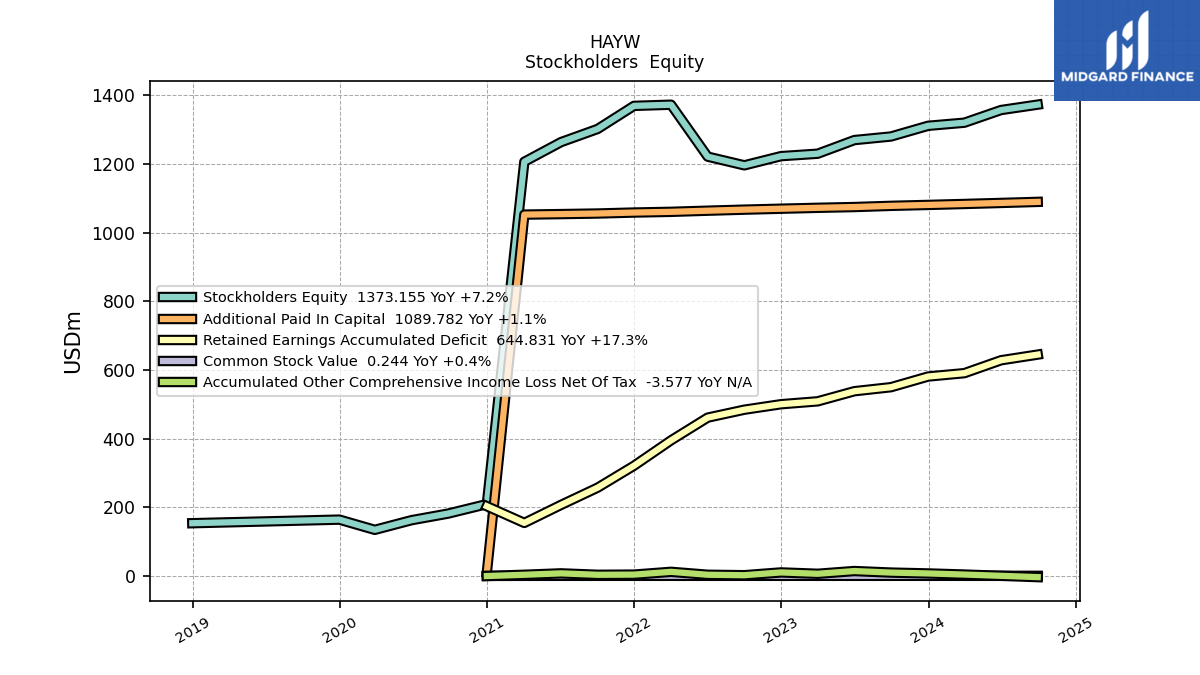
| Stockholders Equity | 1311.46 | 1280.33 | 1269.82 | 1230.12 | 1223.03 | 1196.26 | 1221.62 | 1372.92 | 1369.51 | 1302.30 | 1263.90 | 1206.70 | 209.20 | 181.58 | 162.30 | 134.20 |
| 2023-12-31 | 2023-09-30 | 2023-07-01 | 2023-04-01 | 2022-12-31 | 2022-10-01 | 2022-07-02 | 2022-04-02 | 2021-12-31 | 2021-10-02 | 2021-07-03 | 2021-04-03 | 2020-12-31 | 2020-09-26 | 2020-06-27 | 2020-03-28 | ||
|---|---|---|---|---|---|---|---|---|---|---|---|---|---|---|---|---|---|
| Assets Current | 724.74 | 642.90 | 633.71 | 678.37 | 612.28 | 562.25 | 708.90 | 758.20 | 750.52 | 689.75 | 627.00 | 548.00 | 424.40 | NA | NA | NA | |
| Cash And Cash Equivalents At Carrying Value | 178.10 | 244.25 | 205.00 | 41.03 | 56.18 | 72.91 | 108.97 | 118.16 | 265.80 | 295.08 | 251.90 | 13.80 | 114.90 | NA | NA | NA | |
| Cash Cash Equivalents Restricted Cash And Restricted Cash Equivalents | 178.10 | 244.25 | 205.00 | 41.03 | 56.18 | 72.91 | 108.97 | 118.16 | 265.80 | 296.97 | 253.80 | 13.80 | 114.90 | 255.91 | 161.10 | 92.40 | |
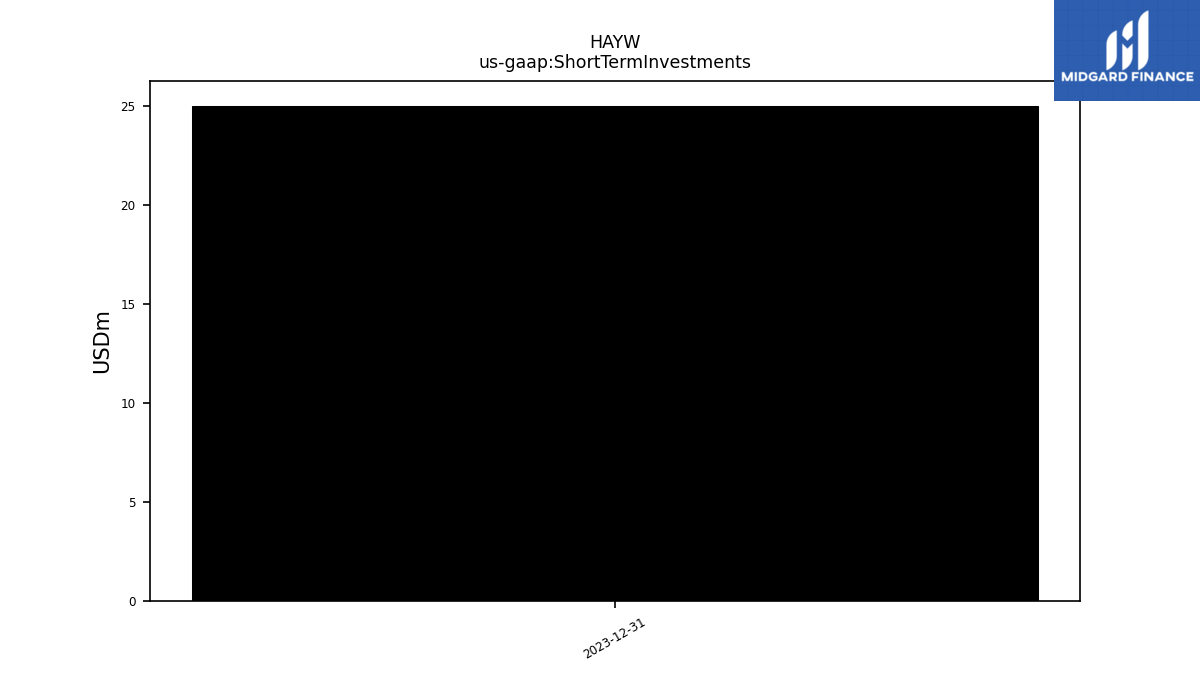
| Short Term Investments | 25.00 | NA | NA | NA | NA | NA | NA | NA | NA | NA | NA | NA | NA | NA | NA | NA | |
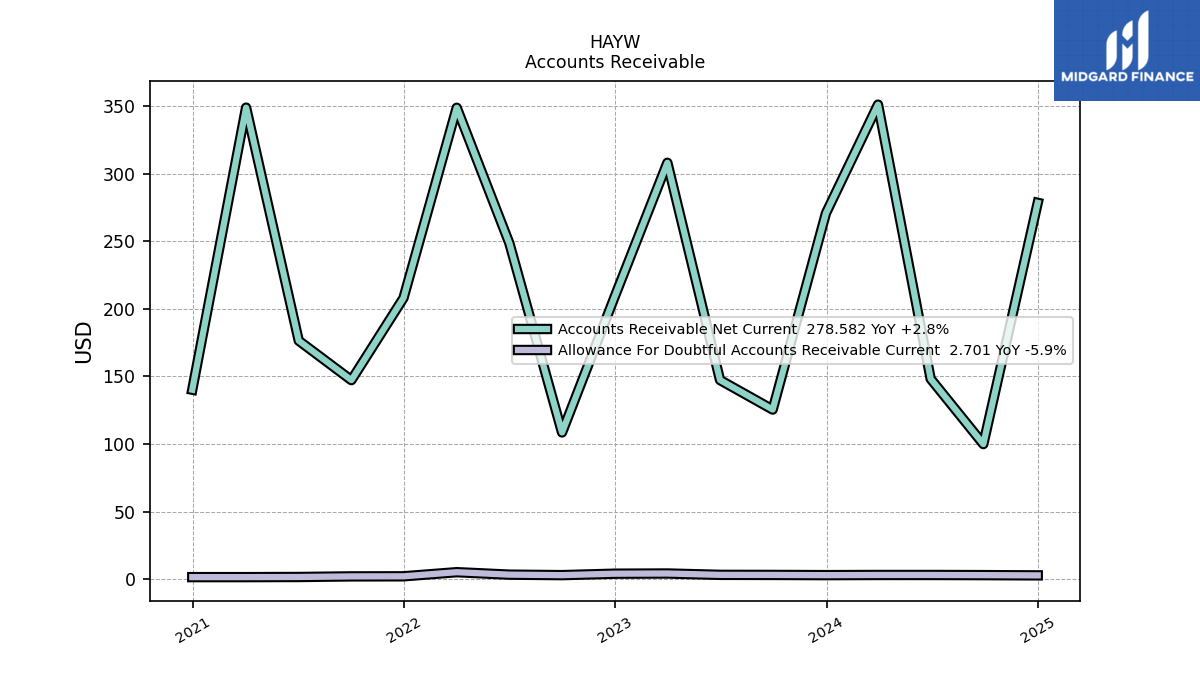
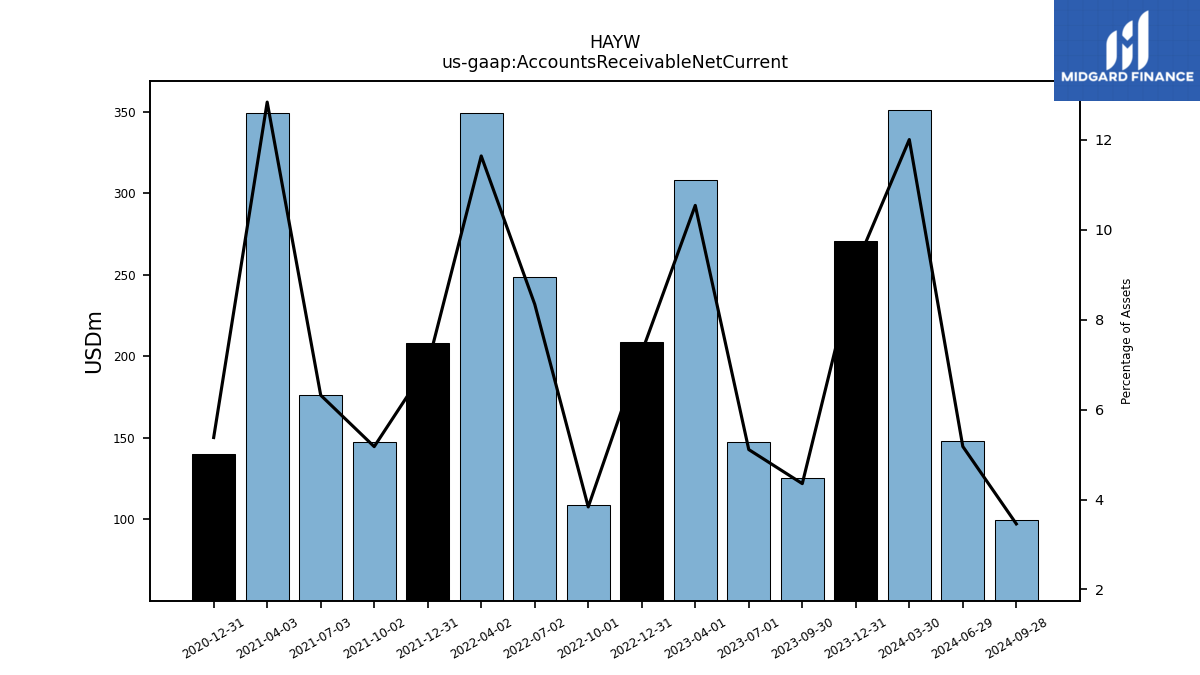
| Accounts Receivable Net Current | 270.88 | 125.49 | 147.35 | 308.27 | 209.11 | 108.54 | 248.64 | 349.02 | 208.11 | 147.28 | 176.50 | 349.10 | 140.20 | NA | NA | NA | |
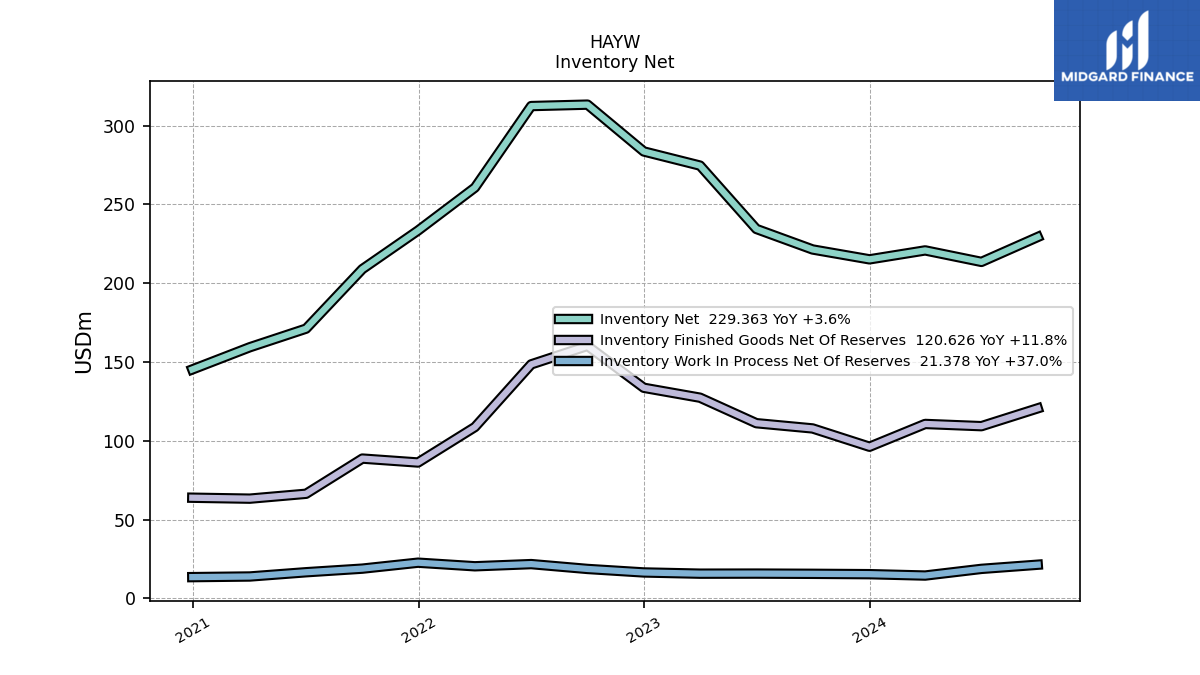
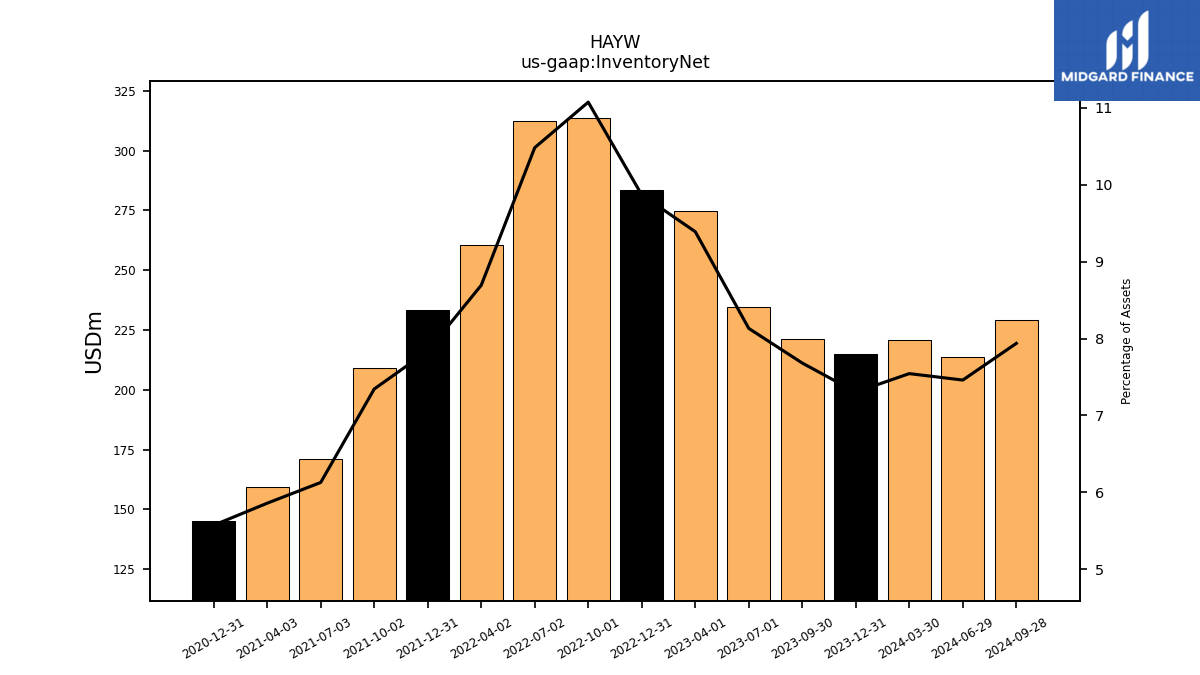
| Inventory Net | 215.18 | 221.45 | 234.48 | 274.68 | 283.66 | 313.38 | 312.46 | 260.71 | 233.45 | 208.99 | 171.20 | 159.40 | 145.30 | NA | NA | NA | |
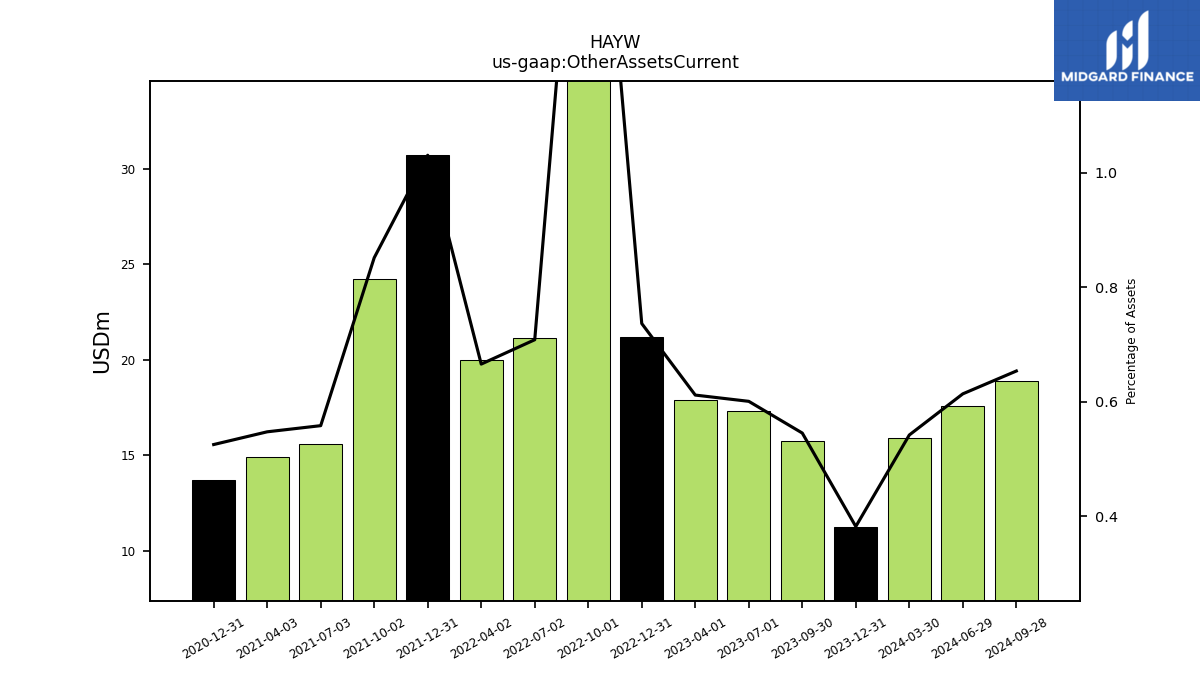
| Other Assets Current | 11.26 | 15.73 | 17.33 | 17.90 | 21.19 | 51.37 | 21.13 | 19.98 | 30.70 | 24.24 | 15.60 | 14.90 | 13.70 | NA | NA | NA |
| 2023-12-31 | 2023-09-30 | 2023-07-01 | 2023-04-01 | 2022-12-31 | 2022-10-01 | 2022-07-02 | 2022-04-02 | 2021-12-31 | 2021-10-02 | 2021-07-03 | 2021-04-03 | 2020-12-31 | 2020-09-26 | 2020-06-27 | 2020-03-28 | ||
|---|---|---|---|---|---|---|---|---|---|---|---|---|---|---|---|---|---|
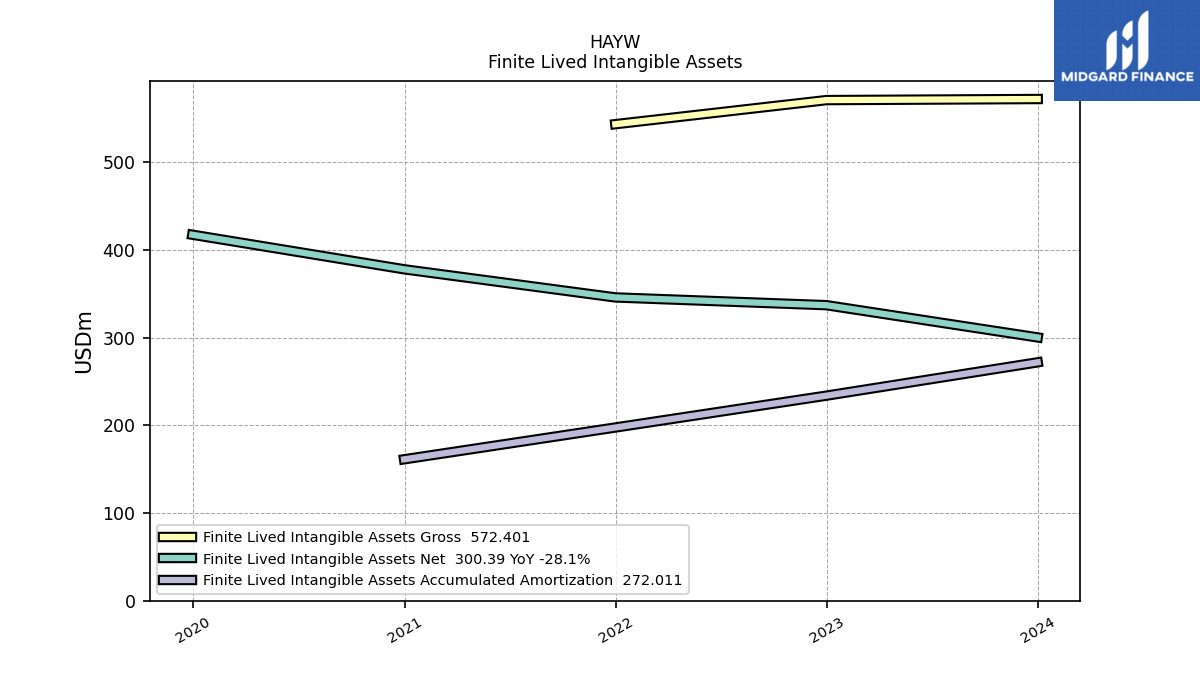
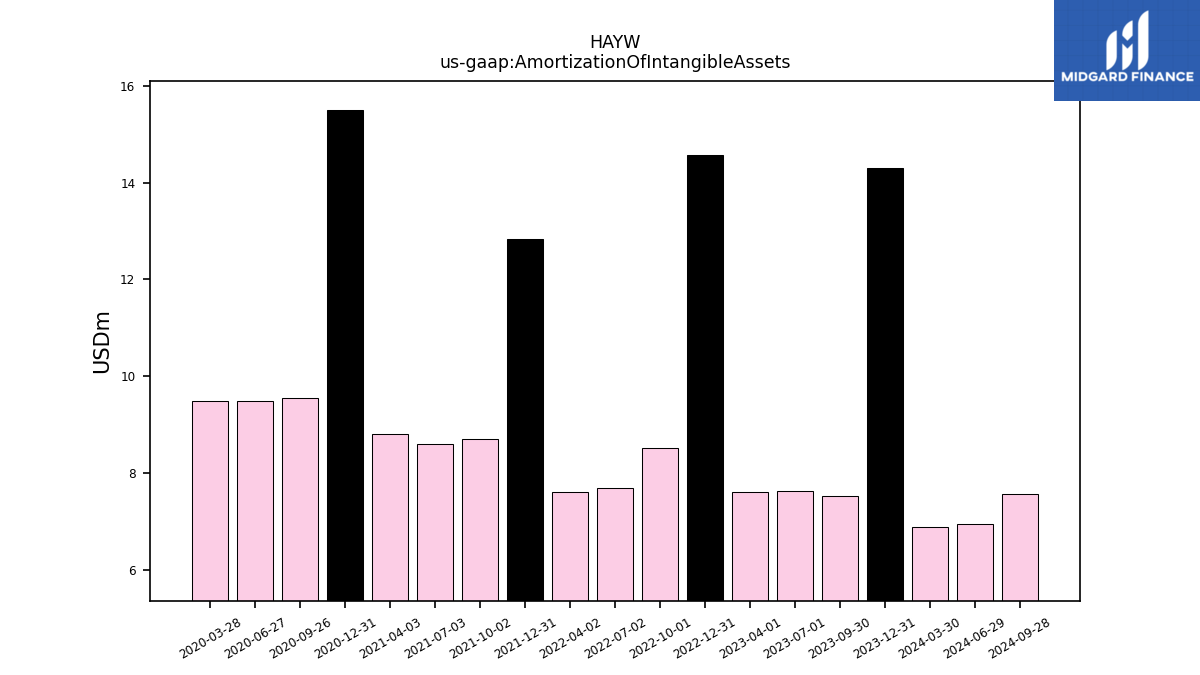
| Amortization Of Intangible Assets | 14.30 | 7.52 | 7.64 | 7.62 | 14.56 | 8.52 | 7.70 | 7.61 | 12.83 | 8.70 | 8.60 | 8.80 | 15.50 | 9.54 | 9.50 | 9.50 | |
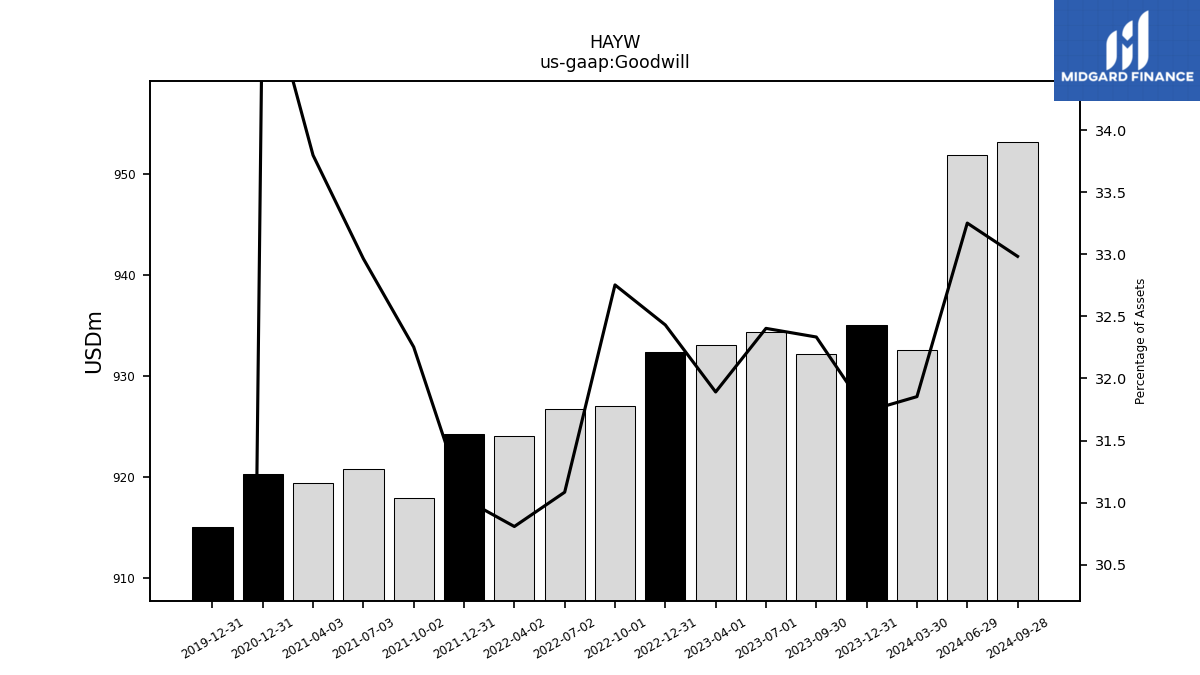
| Goodwill | 935.01 | 932.22 | 934.40 | 933.04 | 932.40 | 927.05 | 926.73 | 924.09 | 924.26 | 917.91 | 920.80 | 919.40 | 920.30 | NA | NA | NA | |
| Intangible Assets Net Excluding Goodwill | 1036.39 | NA | NA | NA | 1073.18 | NA | NA | NA | 1082.05 | NA | NA | NA | 1114.16 | NA | NA | NA | |
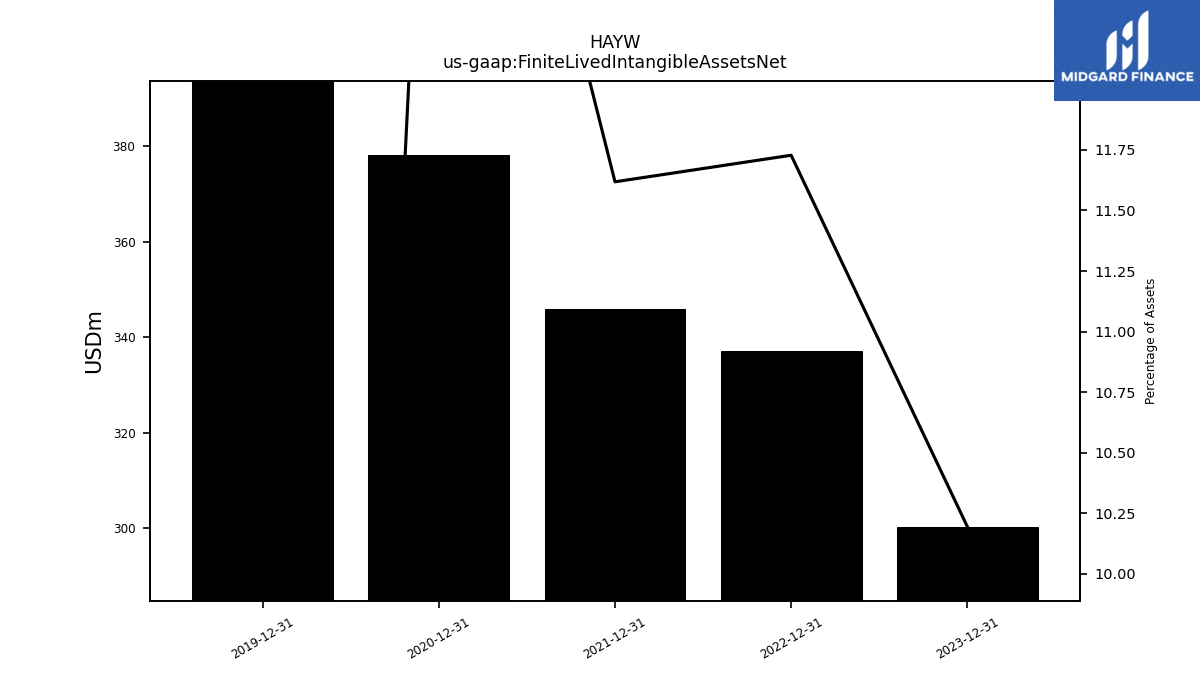
| Finite Lived Intangible Assets Net | 300.39 | NA | NA | NA | 337.18 | NA | NA | NA | 346.05 | NA | NA | NA | 378.16 | NA | NA | NA | |
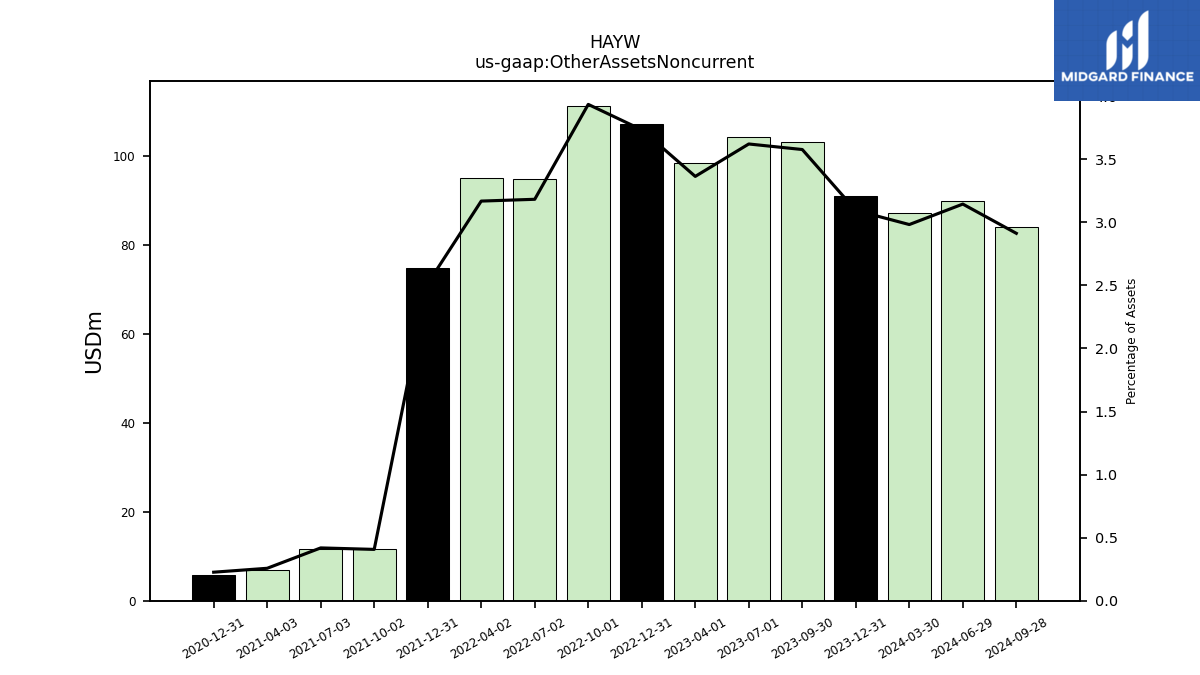
| Other Assets Noncurrent | 91.16 | 103.12 | 104.41 | 98.41 | 107.33 | 111.36 | 94.88 | 95.03 | 74.89 | 11.59 | 11.70 | 7.00 | 5.90 | NA | NA | NA |
| 2023-12-31 | 2023-09-30 | 2023-07-01 | 2023-04-01 | 2022-12-31 | 2022-10-01 | 2022-07-02 | 2022-04-02 | 2021-12-31 | 2021-10-02 | 2021-07-03 | 2021-04-03 | 2020-12-31 | 2020-09-26 | 2020-06-27 | 2020-03-28 | ||
|---|---|---|---|---|---|---|---|---|---|---|---|---|---|---|---|---|---|
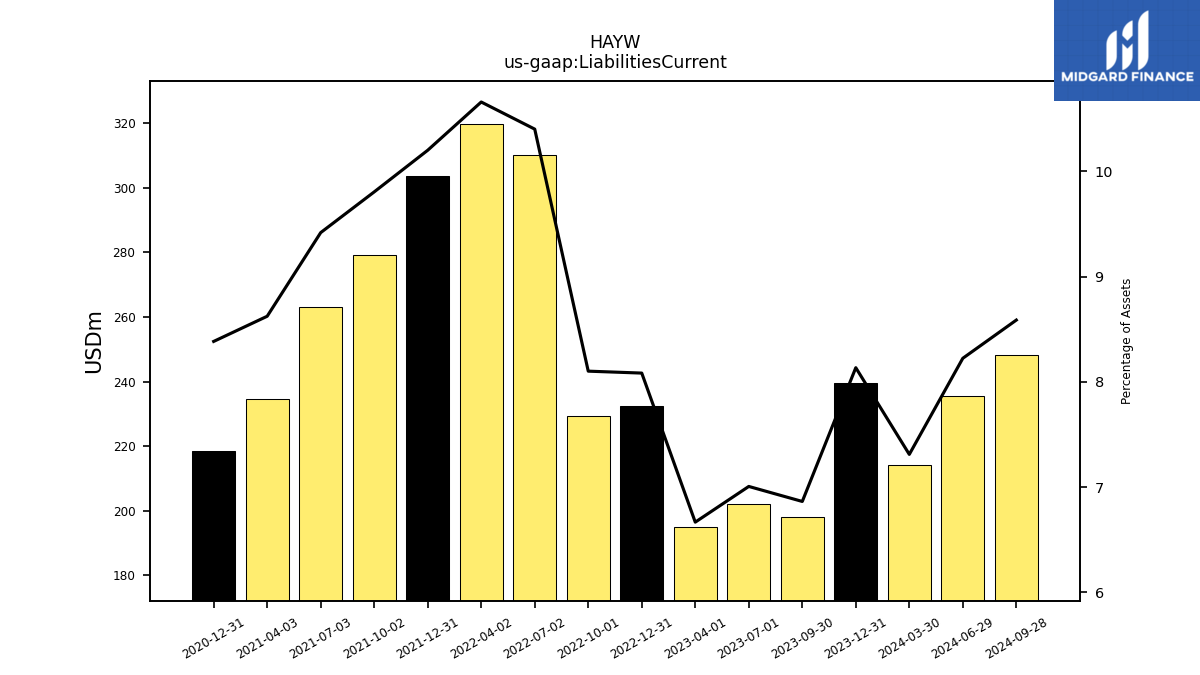
| Liabilities Current | 239.68 | 197.88 | 202.04 | 195.05 | 232.41 | 229.32 | 310.14 | 319.76 | 303.86 | 279.08 | 263.10 | 234.60 | 218.60 | NA | NA | NA | |
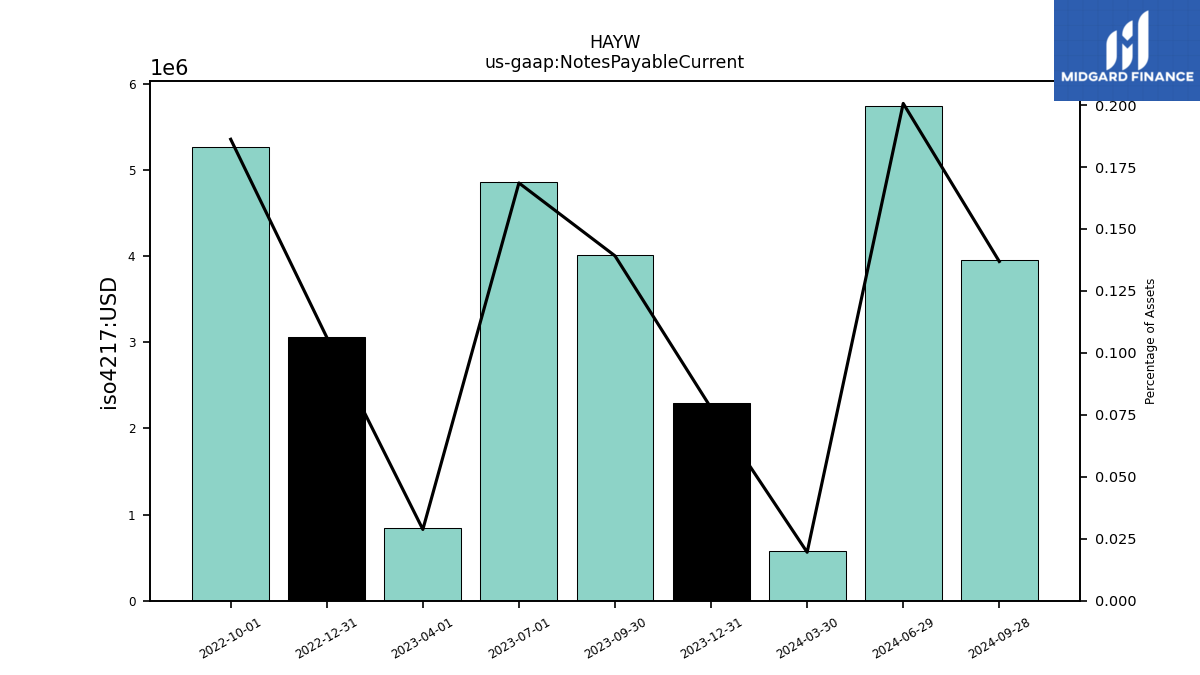
| Notes Payable Current | 2.29 | 4.01 | 4.86 | 0.84 | 3.06 | 5.27 | NA | NA | NA | NA | NA | NA | NA | NA | NA | NA | |
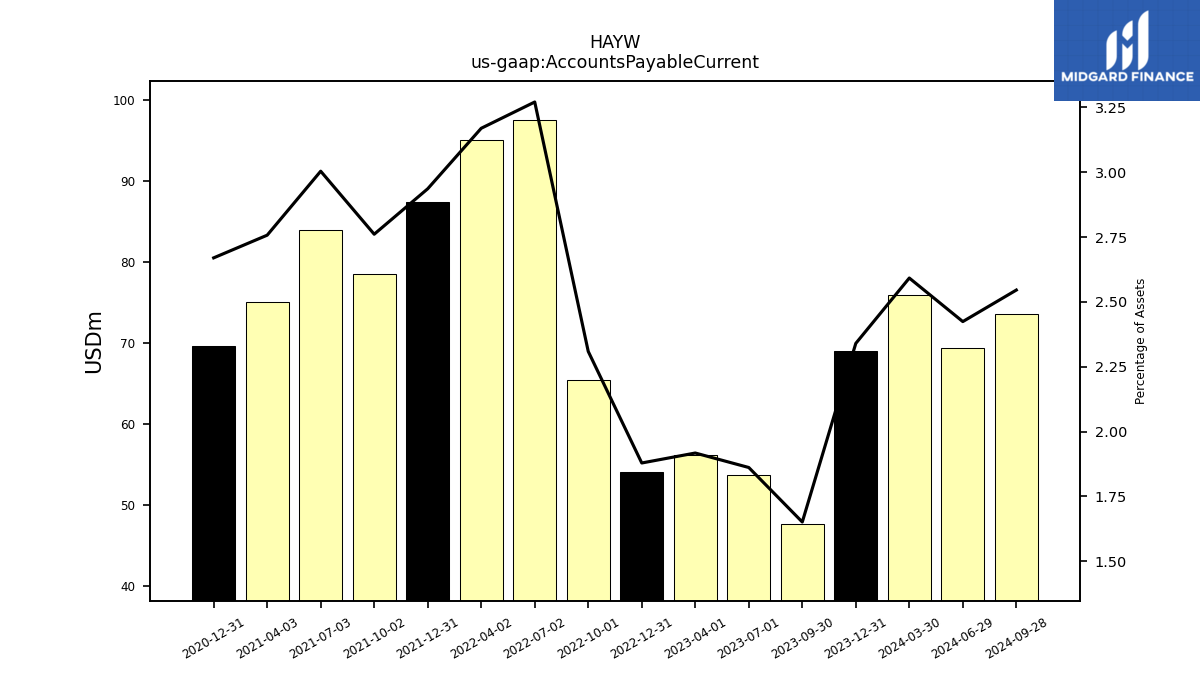
| Accounts Payable Current | 68.94 | 47.62 | 53.68 | 56.10 | 54.02 | 65.35 | 97.50 | 95.06 | 87.44 | 78.57 | 83.90 | 75.00 | 69.60 | NA | NA | NA | |
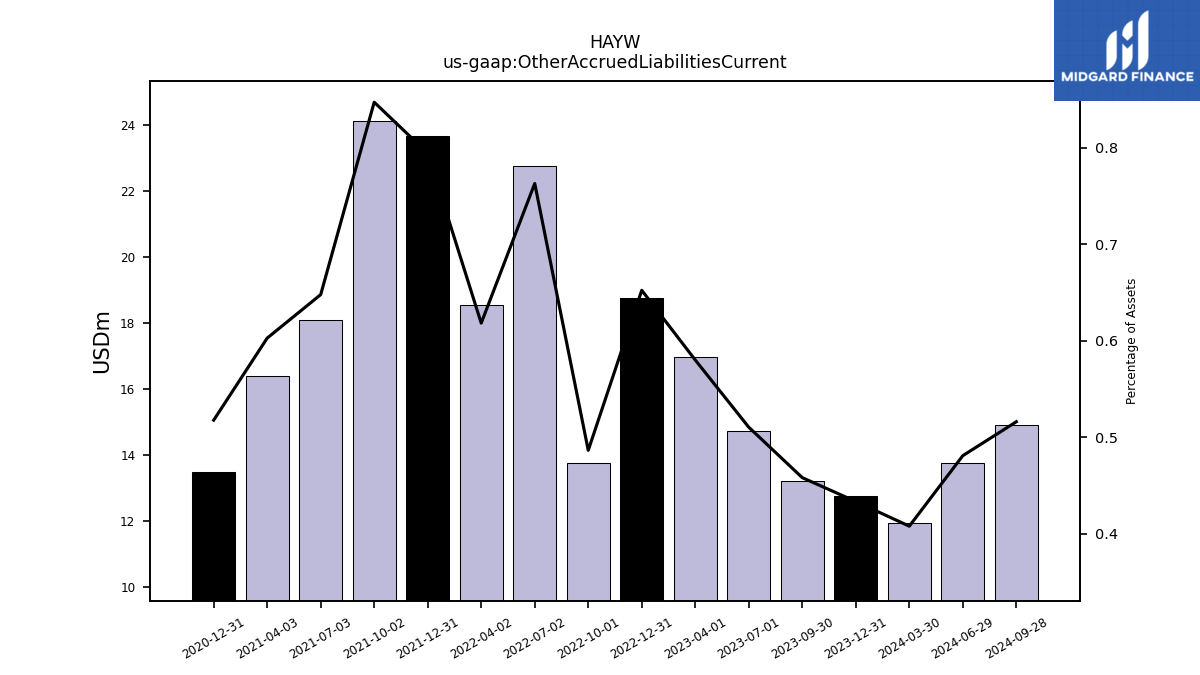
| Other Accrued Liabilities Current | 12.77 | 13.21 | 14.72 | 16.97 | 18.76 | 13.77 | 22.75 | 18.55 | 23.66 | 24.12 | 18.10 | 16.40 | 13.50 | NA | NA | NA | |
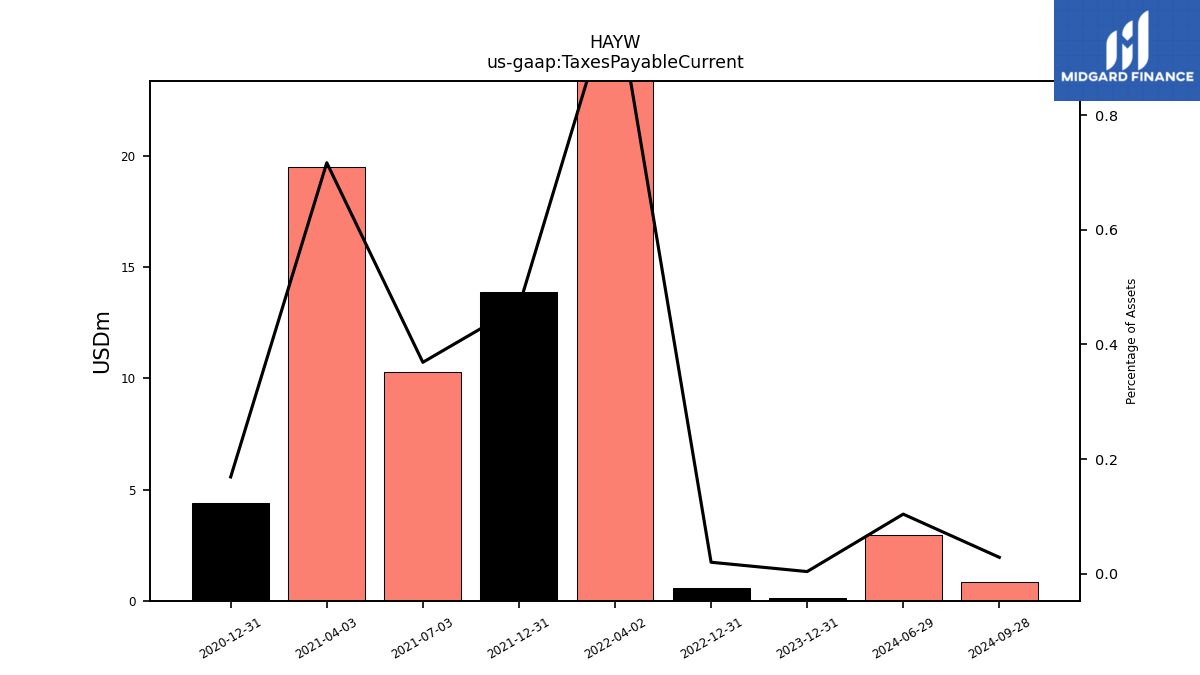
| Taxes Payable Current | 0.11 | NA | NA | NA | 0.57 | NA | NA | 30.65 | 13.89 | NA | 10.30 | 19.50 | 4.40 | NA | NA | NA | |
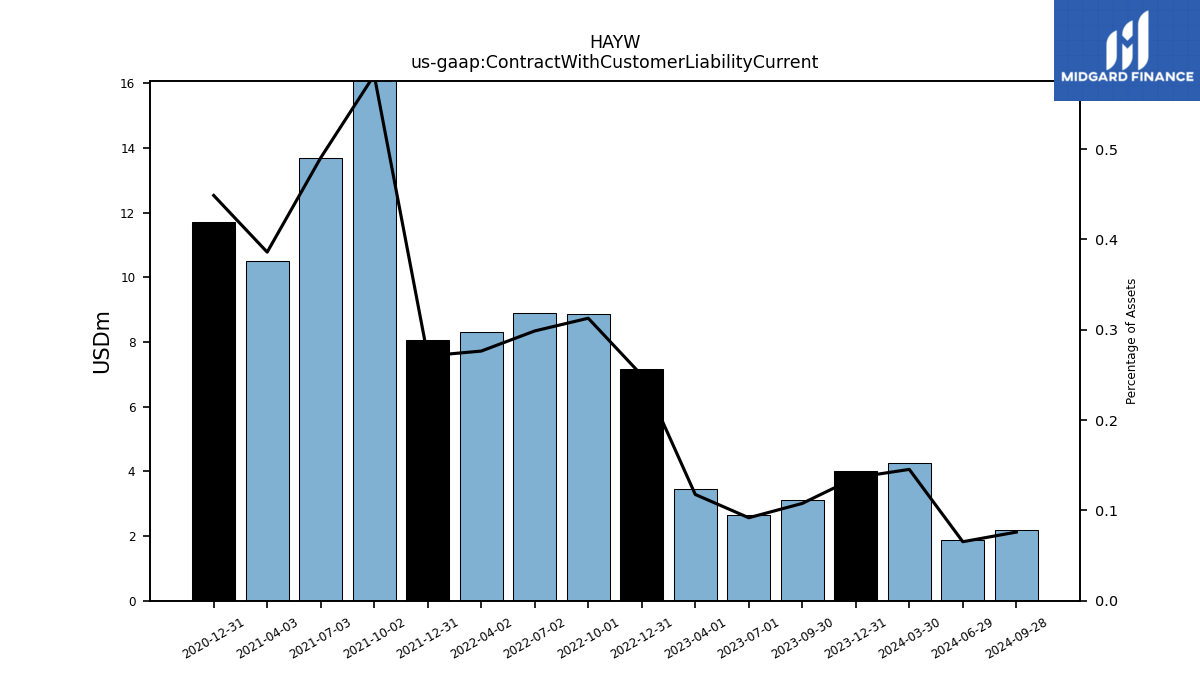
| Contract With Customer Liability Current | 4.02 | 3.11 | 2.65 | 3.44 | 7.18 | 8.85 | 8.91 | 8.29 | 8.07 | 16.56 | 13.70 | 10.50 | 11.70 | NA | NA | NA |
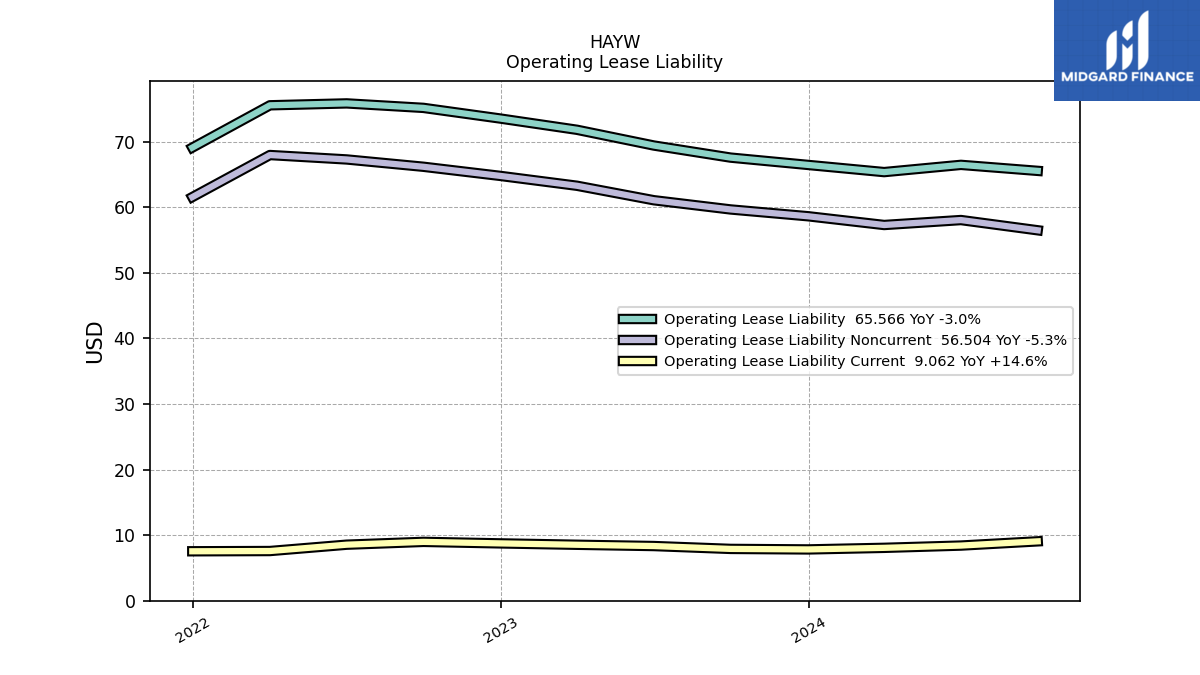
| 2023-12-31 | 2023-09-30 | 2023-07-01 | 2023-04-01 | 2022-12-31 | 2022-10-01 | 2022-07-02 | 2022-04-02 | 2021-12-31 | 2021-10-02 | 2021-07-03 | 2021-04-03 | 2020-12-31 | 2020-09-26 | 2020-06-27 | 2020-03-28 | ||
|---|---|---|---|---|---|---|---|---|---|---|---|---|---|---|---|---|---|
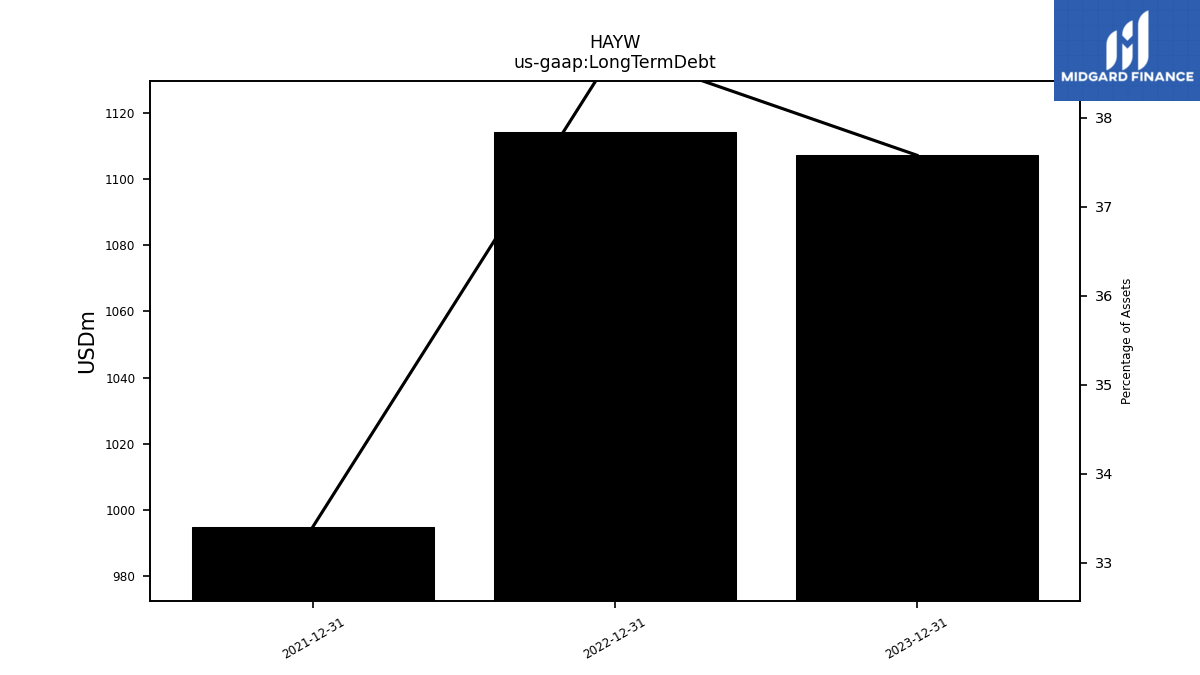
| Long Term Debt | 1107.21 | NA | NA | NA | 1114.28 | NA | NA | NA | 995.00 | NA | NA | NA | NA | NA | NA | NA | |
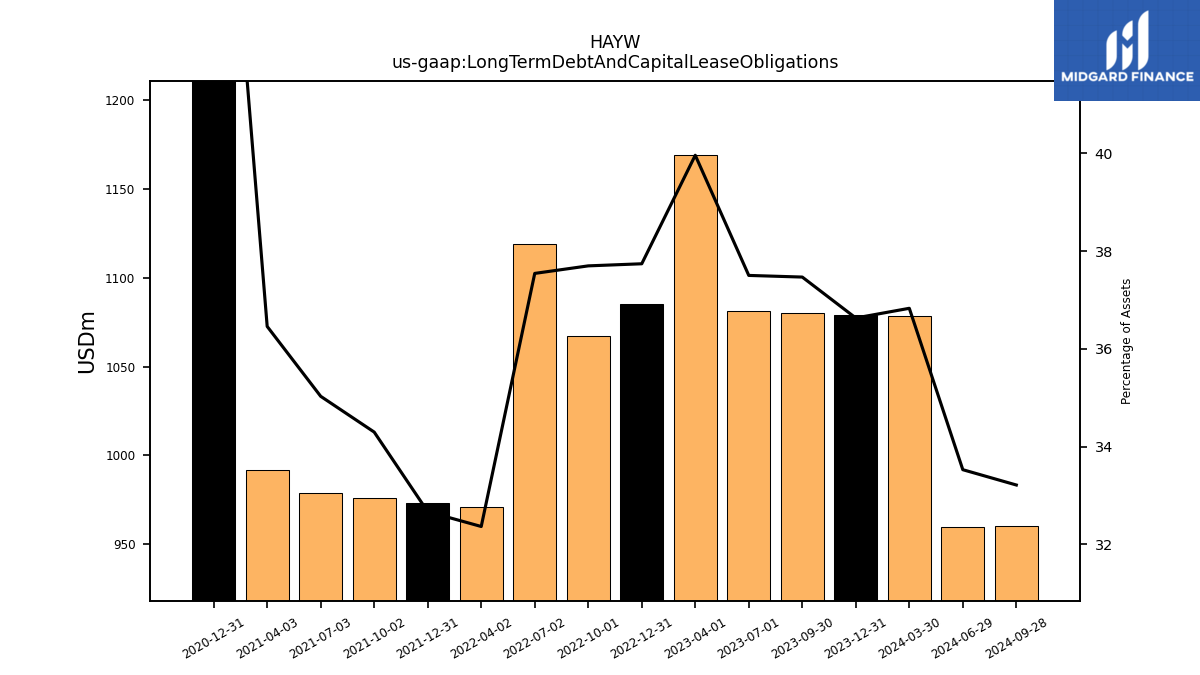
| Long Term Debt And Capital Lease Obligations | 1079.28 | 1080.26 | 1081.44 | 1169.11 | 1085.06 | 1067.00 | 1119.31 | 970.87 | 973.12 | 976.12 | 978.50 | 991.80 | 1300.30 | NA | NA | NA | |
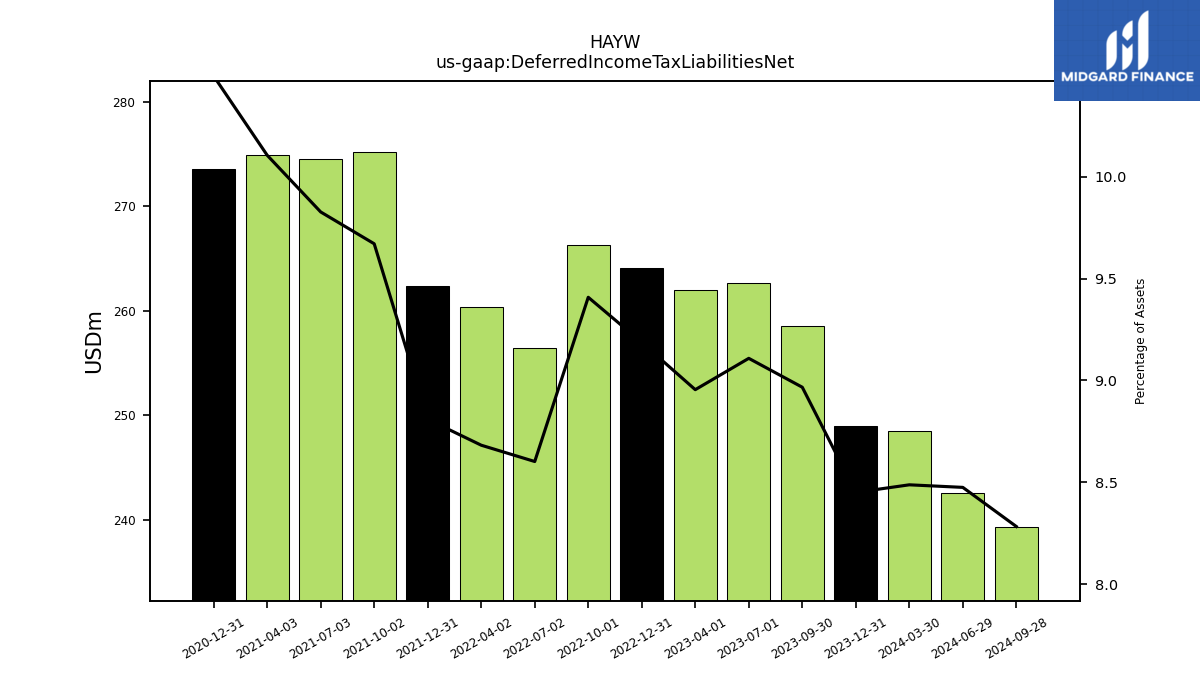
| Deferred Income Tax Liabilities Net | 248.97 | 258.51 | 262.65 | 261.99 | 264.11 | 266.29 | 256.45 | 260.42 | 262.38 | 275.23 | 274.50 | 274.90 | 273.60 | NA | NA | NA | |
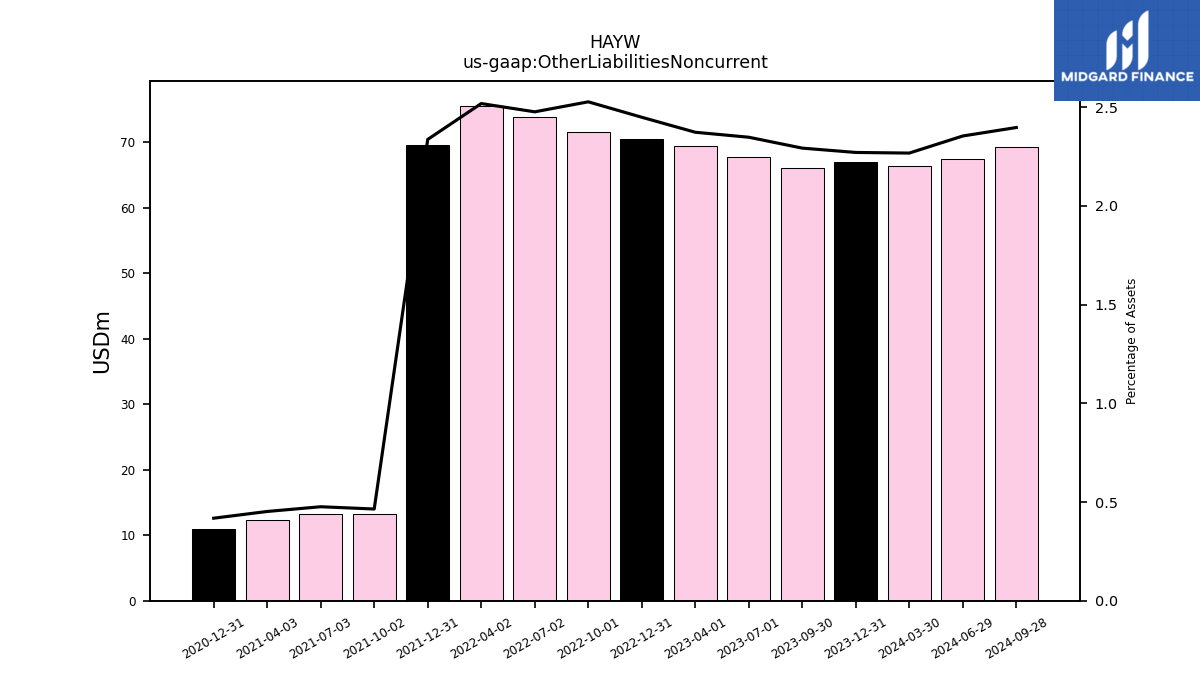
| Other Liabilities Noncurrent | 66.90 | 66.09 | 67.70 | 69.42 | 70.40 | 71.52 | 73.83 | 75.53 | 69.59 | 13.22 | 13.30 | 12.30 | 10.90 | NA | NA | NA | |
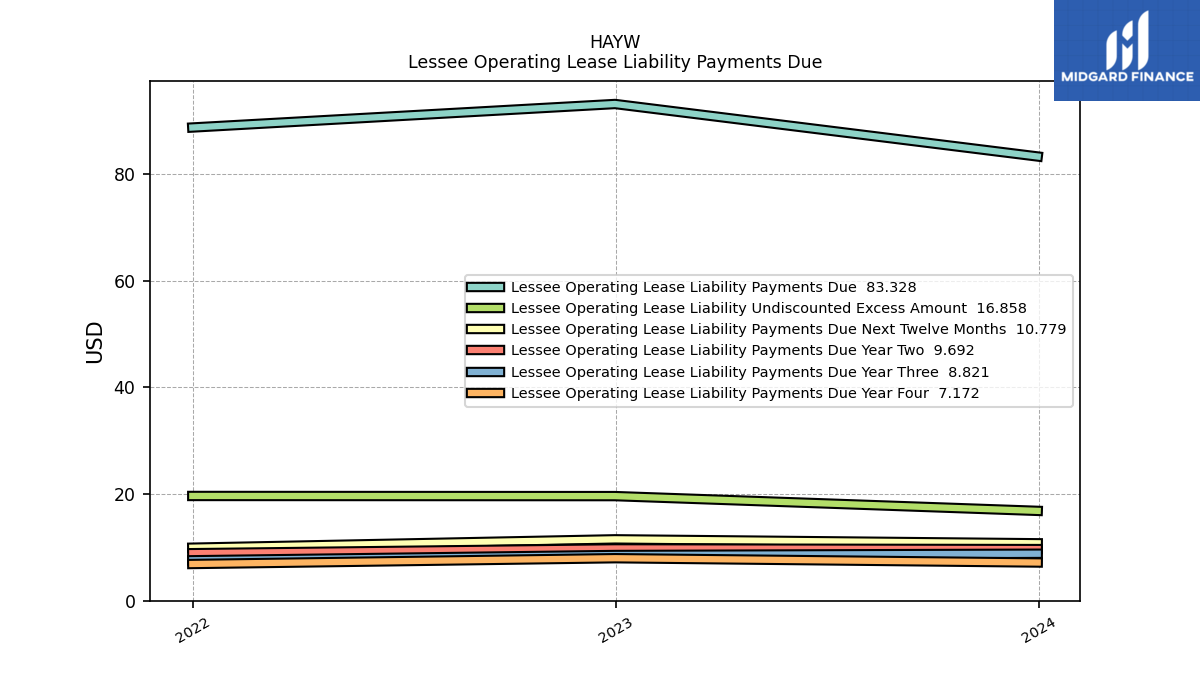
| Operating Lease Liability Noncurrent | 58.64 | 59.68 | 61.09 | 63.29 | 64.80 | 66.19 | 67.31 | 67.98 | 61.56 | NA | NA | NA | NA | NA | NA | NA |
| 2023-12-31 | 2023-09-30 | 2023-07-01 | 2023-04-01 | 2022-12-31 | 2022-10-01 | 2022-07-02 | 2022-04-02 | 2021-12-31 | 2021-10-02 | 2021-07-03 | 2021-04-03 | 2020-12-31 | 2020-09-26 | 2020-06-27 | 2020-03-28 | ||
|---|---|---|---|---|---|---|---|---|---|---|---|---|---|---|---|---|---|
| Stockholders Equity | 1311.46 | 1280.33 | 1269.82 | 1230.12 | 1223.03 | 1196.26 | 1221.62 | 1372.92 | 1369.51 | 1302.30 | 1263.90 | 1206.70 | 209.20 | 181.58 | 162.30 | 134.20 | |
| Common Stock Value | 0.24 | 0.24 | 0.24 | 0.24 | 0.24 | 0.24 | 0.24 | 0.24 | 0.24 | 0.23 | 0.20 | 0.20 | 0.00 | NA | NA | NA | |
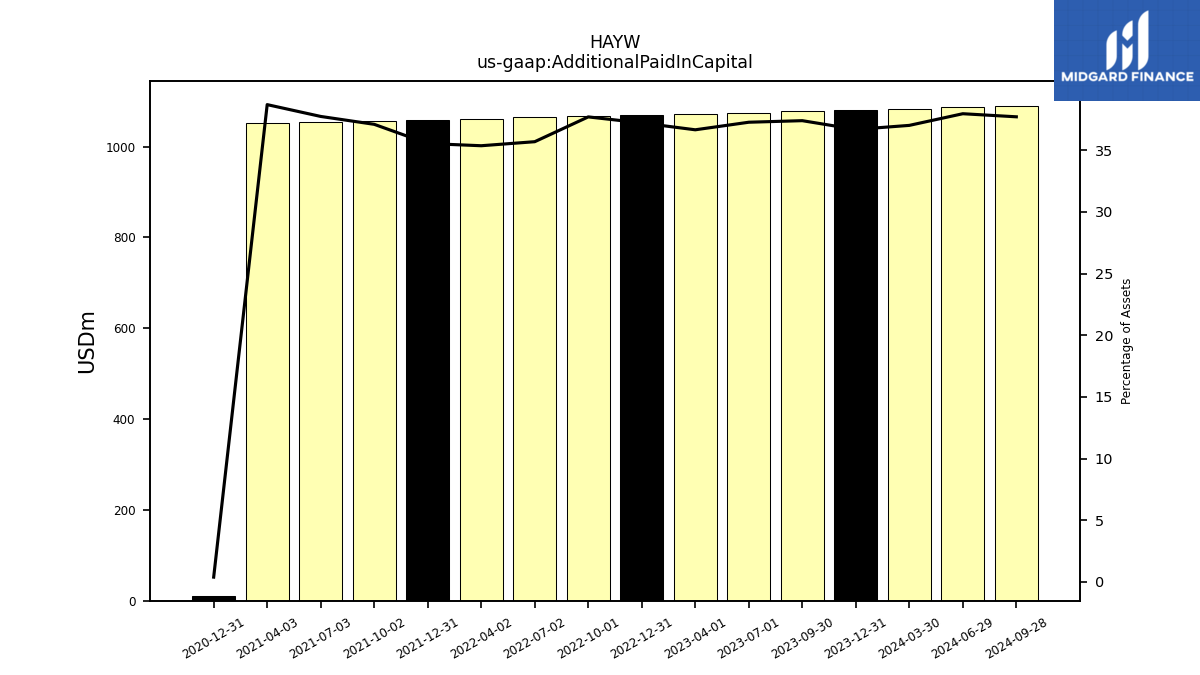
| Additional Paid In Capital | 1080.89 | 1078.20 | 1074.75 | 1072.49 | 1069.88 | 1067.15 | 1064.11 | 1060.79 | 1058.72 | 1055.89 | 1054.20 | 1052.70 | 10.30 | NA | NA | NA | |
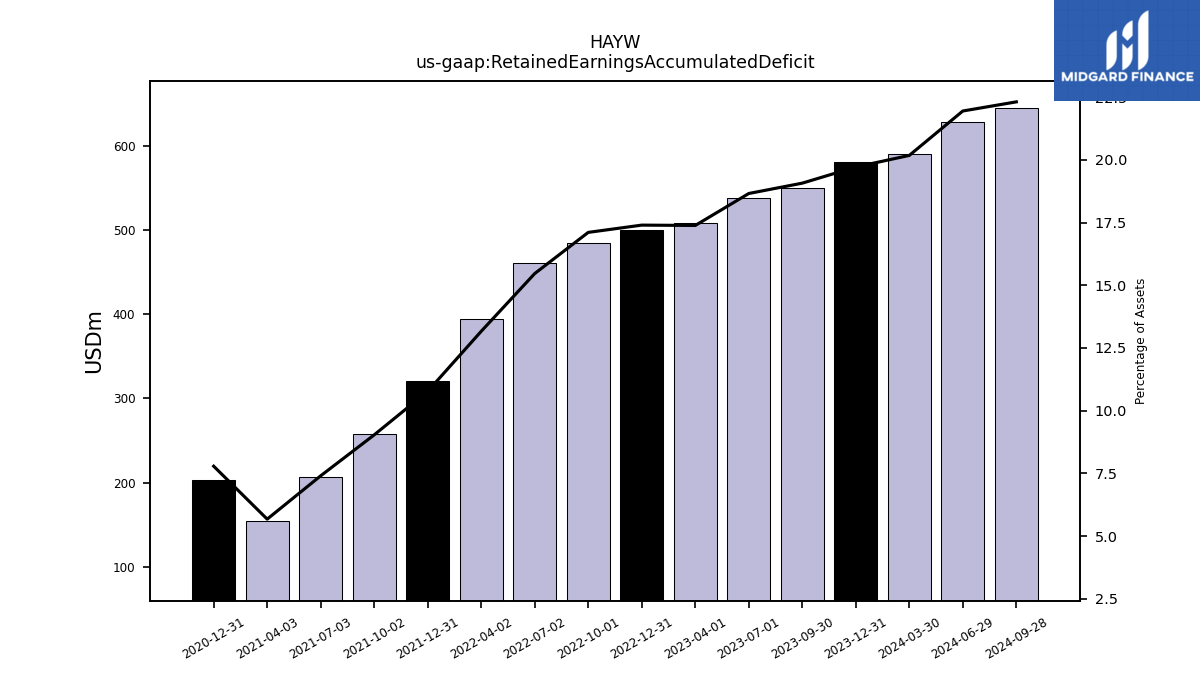
| Retained Earnings Accumulated Deficit | 580.91 | 549.87 | 538.09 | 508.63 | 500.22 | 484.25 | 461.17 | 394.91 | 320.88 | 257.15 | 206.80 | 154.40 | 203.00 | NA | NA | NA | |
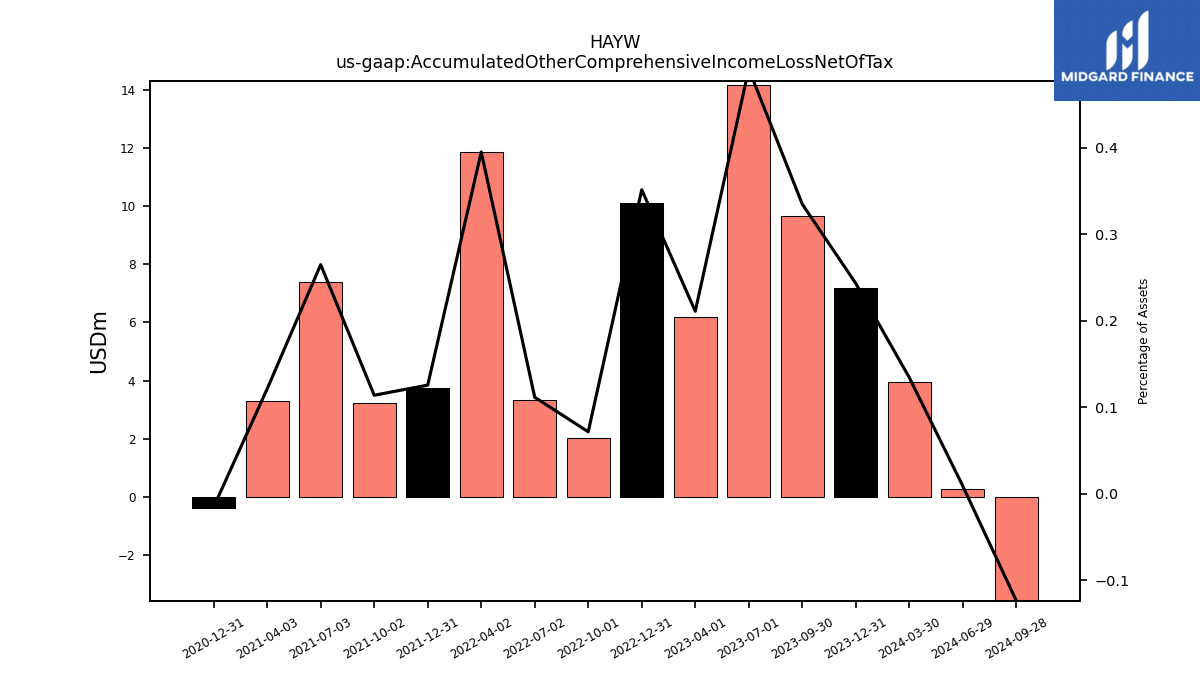
| Accumulated Other Comprehensive Income Loss Net Of Tax | 7.17 | 9.65 | 14.17 | 6.17 | 10.11 | 2.03 | 3.33 | 11.86 | 3.74 | 3.24 | 7.40 | 3.30 | -0.40 | NA | NA | NA |
| 2023-12-31 | 2023-09-30 | 2023-07-01 | 2023-04-01 | 2022-12-31 | 2022-10-01 | 2022-07-02 | 2022-04-02 | 2021-12-31 | 2021-10-02 | 2021-07-03 | 2021-04-03 | 2020-12-31 | 2020-09-26 | 2020-06-27 | 2020-03-28 | ||
|---|---|---|---|---|---|---|---|---|---|---|---|---|---|---|---|---|---|
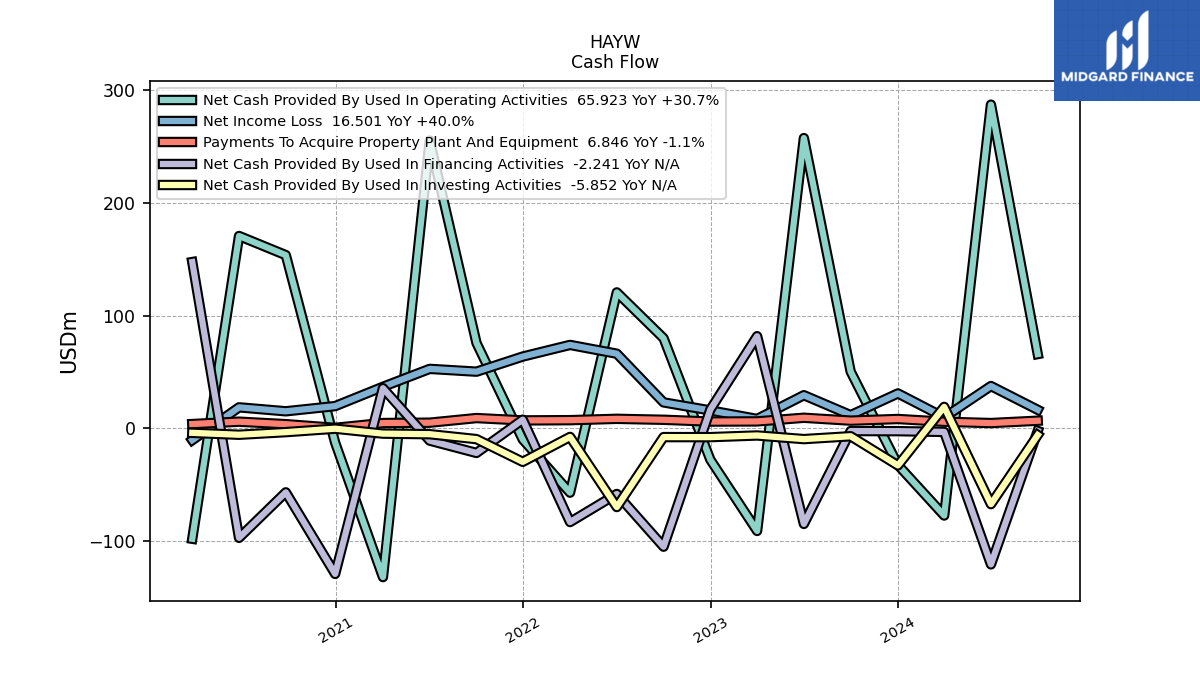
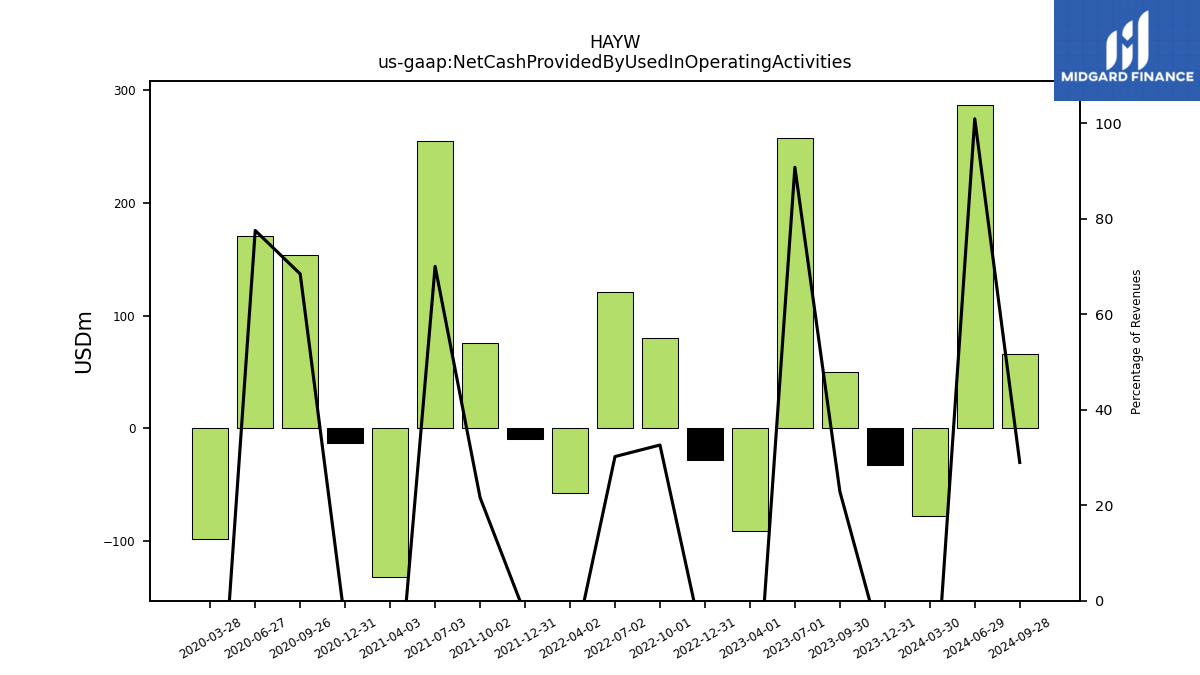
| Net Cash Provided By Used In Operating Activities | -32.40 | 50.42 | 257.40 | -90.88 | -27.72 | 79.99 | 120.62 | -56.94 | -9.78 | 75.76 | 255.20 | -131.80 | -12.59 | 153.63 | 170.60 | -97.80 | |
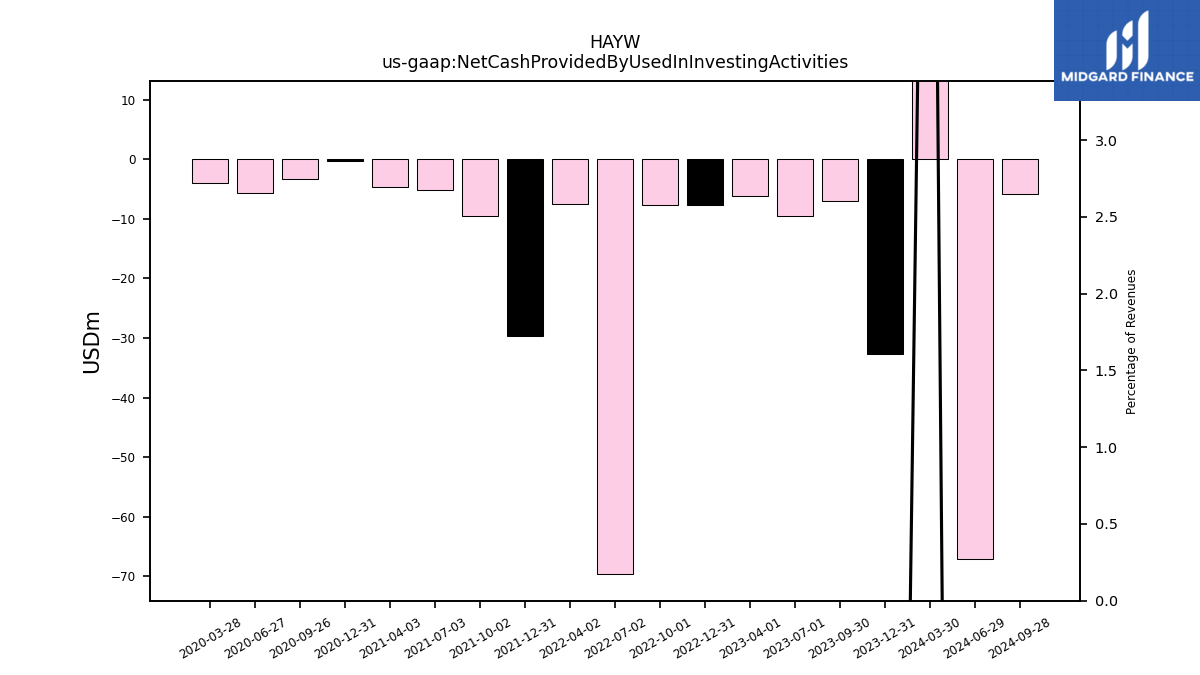
| Net Cash Provided By Used In Investing Activities | -32.77 | -6.91 | -9.46 | -6.24 | -7.71 | -7.68 | -69.68 | -7.51 | -29.61 | -9.47 | -5.10 | -4.60 | -0.23 | -3.27 | -5.60 | -3.90 | |
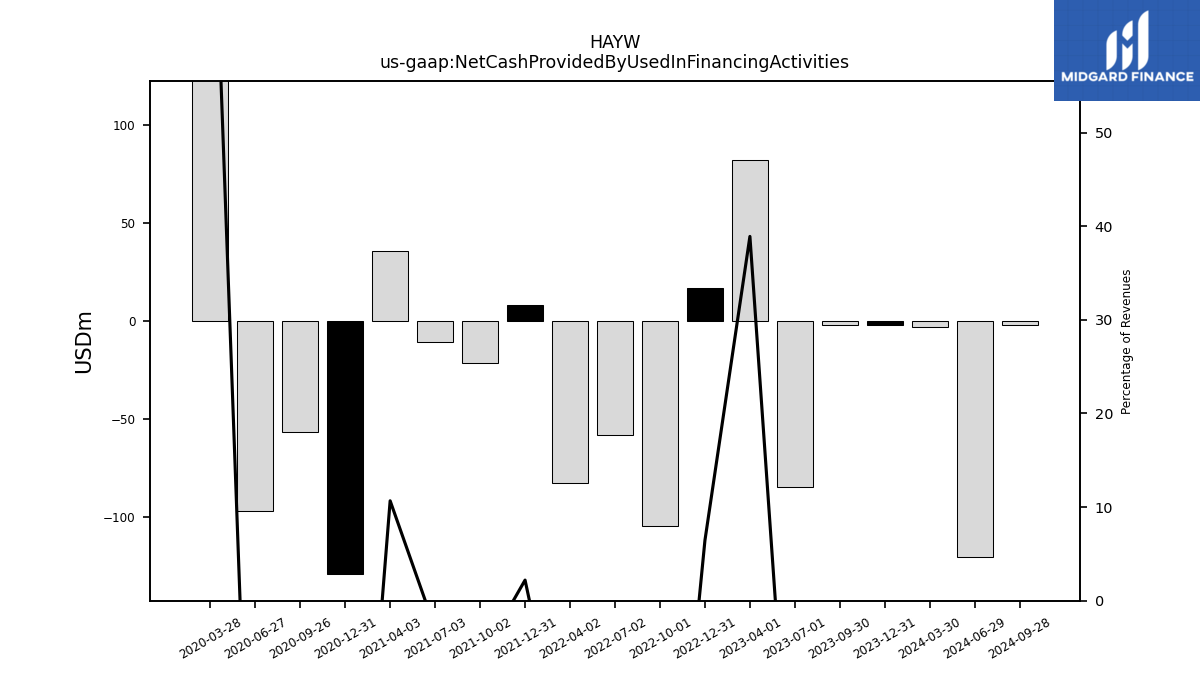
| Net Cash Provided By Used In Financing Activities | -2.41 | -2.32 | -84.65 | 81.77 | 16.71 | -104.85 | -58.09 | -83.01 | 7.77 | -21.71 | -10.80 | 35.70 | -128.98 | -56.64 | -97.00 | 147.50 |
| 2023-12-31 | 2023-09-30 | 2023-07-01 | 2023-04-01 | 2022-12-31 | 2022-10-01 | 2022-07-02 | 2022-04-02 | 2021-12-31 | 2021-10-02 | 2021-07-03 | 2021-04-03 | 2020-12-31 | 2020-09-26 | 2020-06-27 | 2020-03-28 | ||
|---|---|---|---|---|---|---|---|---|---|---|---|---|---|---|---|---|---|
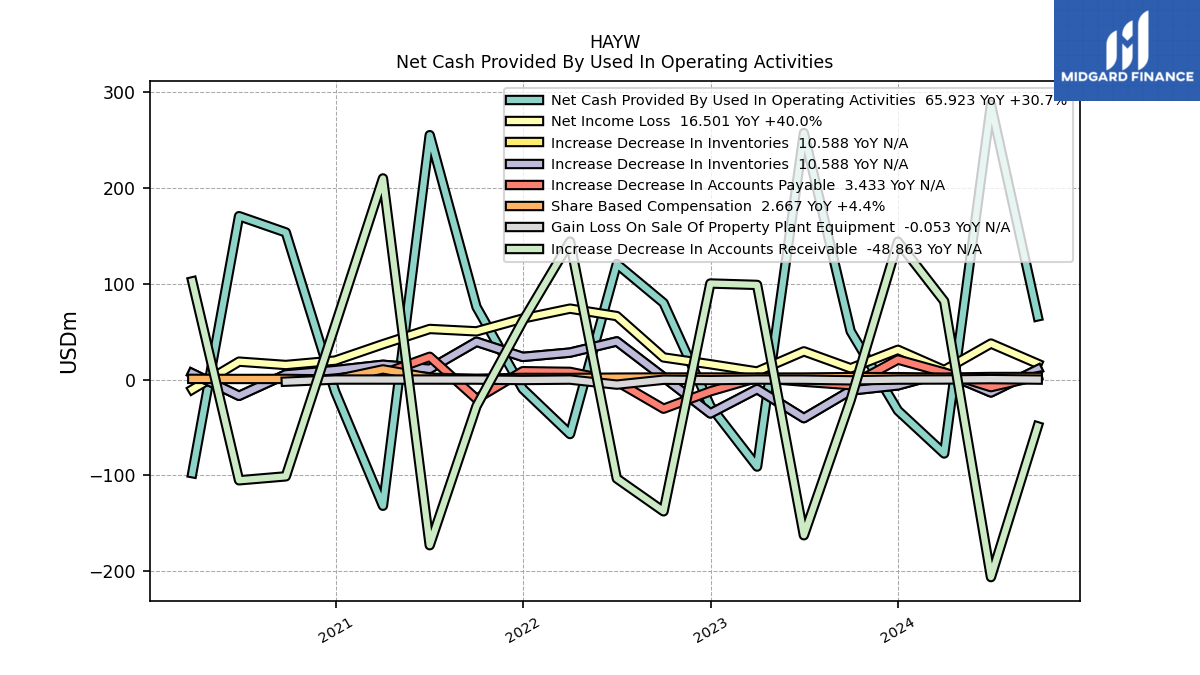
| Net Cash Provided By Used In Operating Activities | -32.40 | 50.42 | 257.40 | -90.88 | -27.72 | 79.99 | 120.62 | -56.94 | -9.78 | 75.76 | 255.20 | -131.80 | -12.59 | 153.63 | 170.60 | -97.80 | |
| Net Income Loss | 31.04 | 11.79 | 29.45 | 8.41 | 15.97 | 23.09 | 66.26 | 74.03 | 63.72 | 50.32 | 52.80 | 36.90 | 19.80 | 15.20 | 18.70 | -10.40 | |
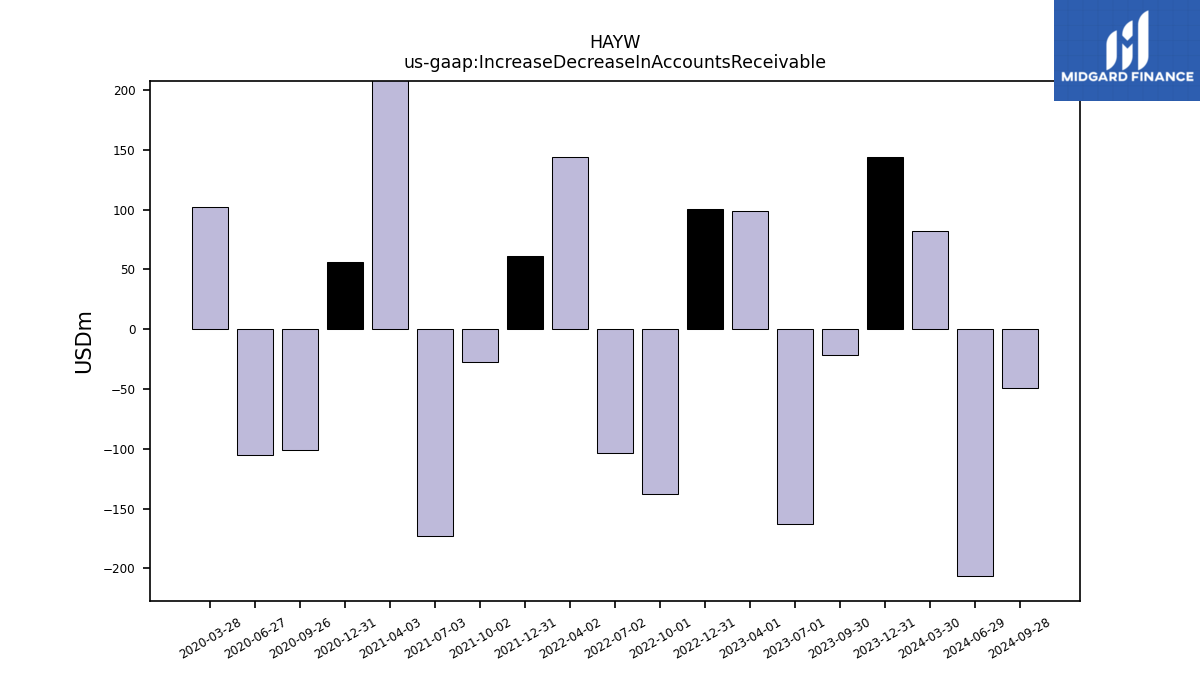
| Increase Decrease In Accounts Receivable | 143.92 | -21.41 | -162.60 | 98.80 | 100.28 | -137.60 | -103.32 | 144.04 | 61.00 | -27.89 | -173.00 | 210.00 | 56.51 | -101.07 | -105.20 | 102.50 | |
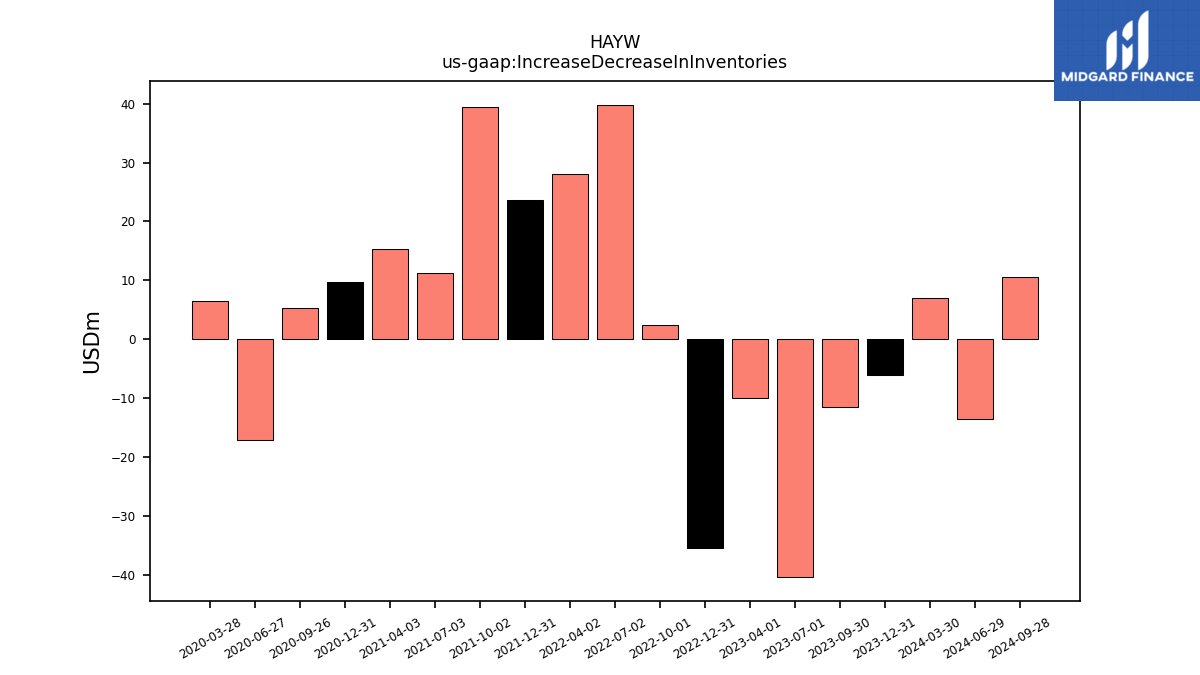
| Increase Decrease In Inventories | -6.11 | -11.48 | -40.30 | -9.93 | -35.35 | 2.52 | 39.81 | 28.13 | 23.63 | 39.43 | 11.20 | 15.40 | 9.80 | 5.35 | -17.00 | 6.50 | |
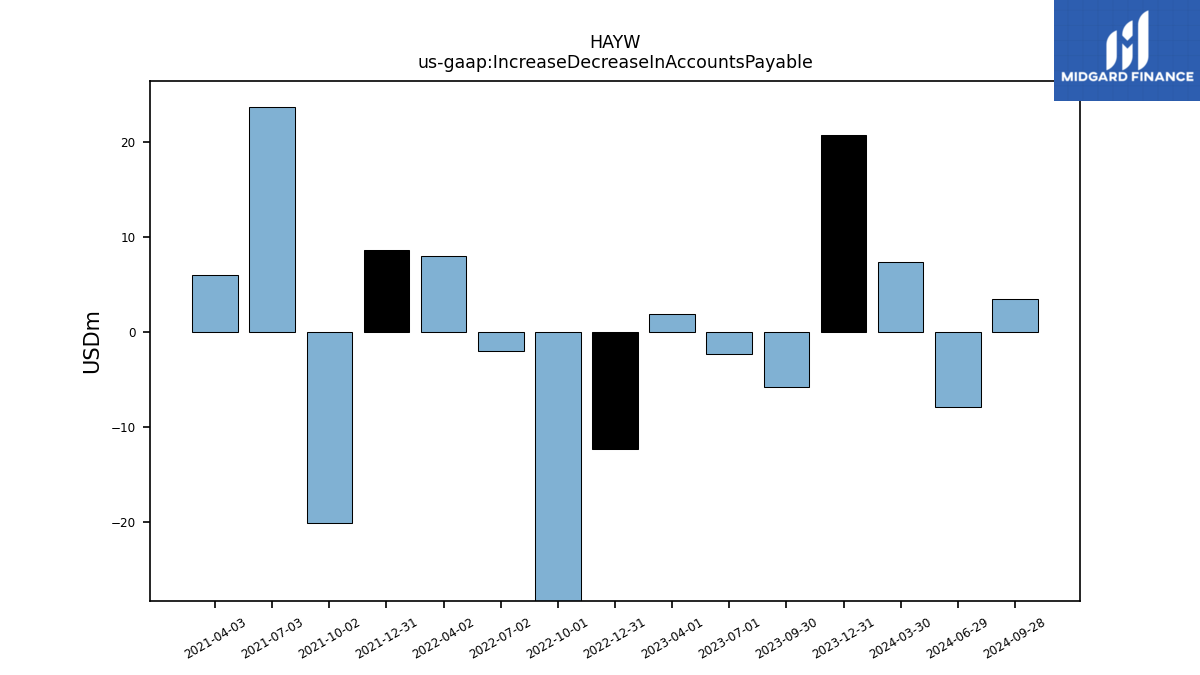
| Increase Decrease In Accounts Payable | 20.82 | -5.84 | -2.28 | 1.85 | -12.30 | -30.45 | -2.03 | 8.02 | 8.69 | -20.15 | 23.76 | 6.05 | NA | NA | NA | NA | |
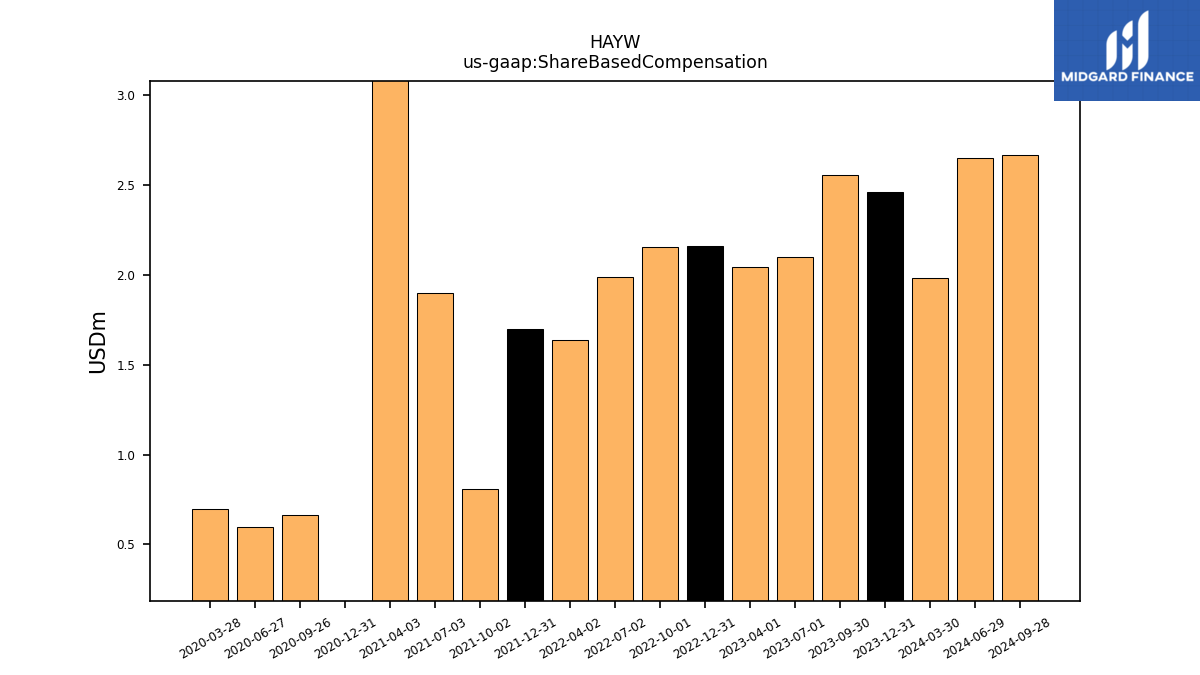
| Share Based Compensation | 2.46 | 2.56 | 2.10 | 2.05 | 2.16 | 2.15 | 1.99 | 1.64 | 1.70 | 0.81 | 1.90 | 10.60 | -0.02 | 0.66 | 0.60 | 0.70 | |
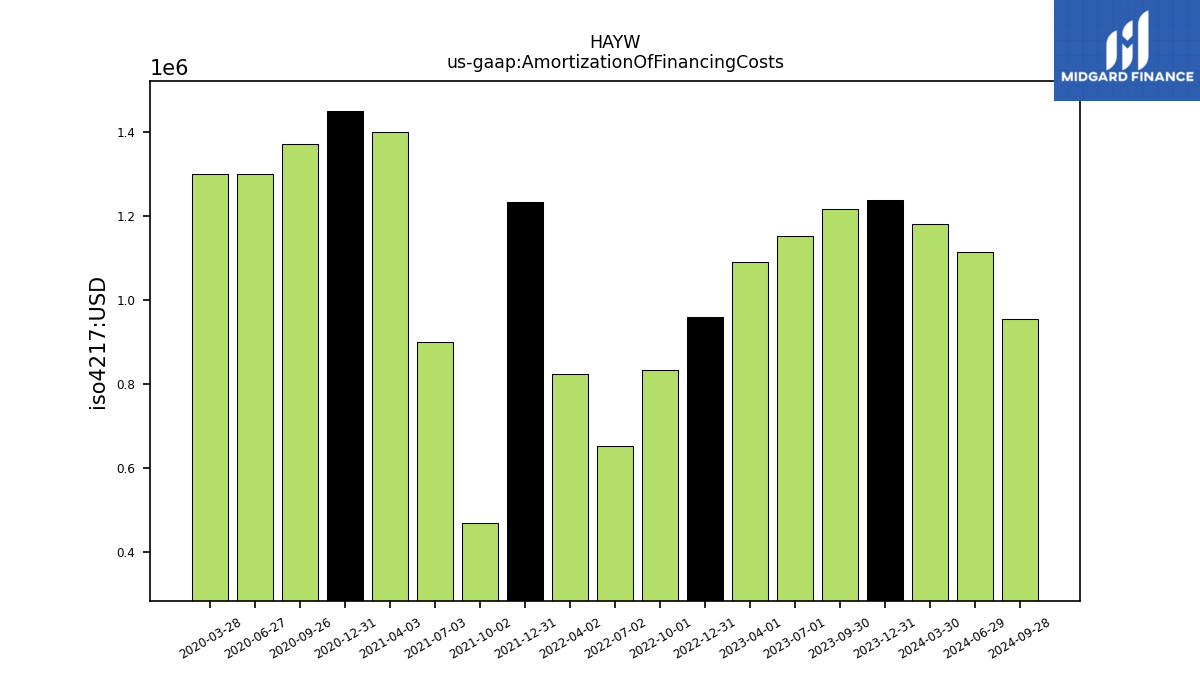
| Amortization Of Financing Costs | 1.24 | 1.22 | 1.15 | 1.09 | 0.96 | 0.83 | 0.65 | 0.82 | 1.23 | 0.47 | 0.90 | 1.40 | 1.45 | 1.37 | 1.30 | 1.30 |
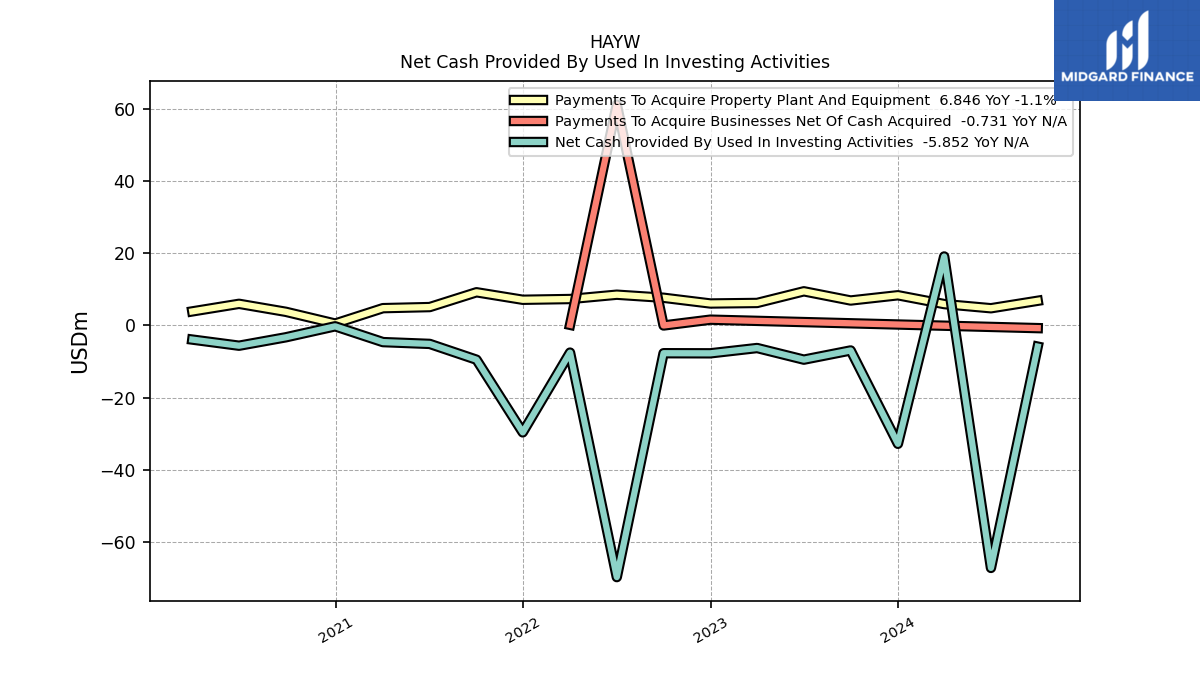
| 2023-12-31 | 2023-09-30 | 2023-07-01 | 2023-04-01 | 2022-12-31 | 2022-10-01 | 2022-07-02 | 2022-04-02 | 2021-12-31 | 2021-10-02 | 2021-07-03 | 2021-04-03 | 2020-12-31 | 2020-09-26 | 2020-06-27 | 2020-03-28 | ||
|---|---|---|---|---|---|---|---|---|---|---|---|---|---|---|---|---|---|
| Net Cash Provided By Used In Investing Activities | -32.77 | -6.91 | -9.46 | -6.24 | -7.71 | -7.68 | -69.68 | -7.51 | -29.61 | -9.47 | -5.10 | -4.60 | -0.23 | -3.27 | -5.60 | -3.90 | |
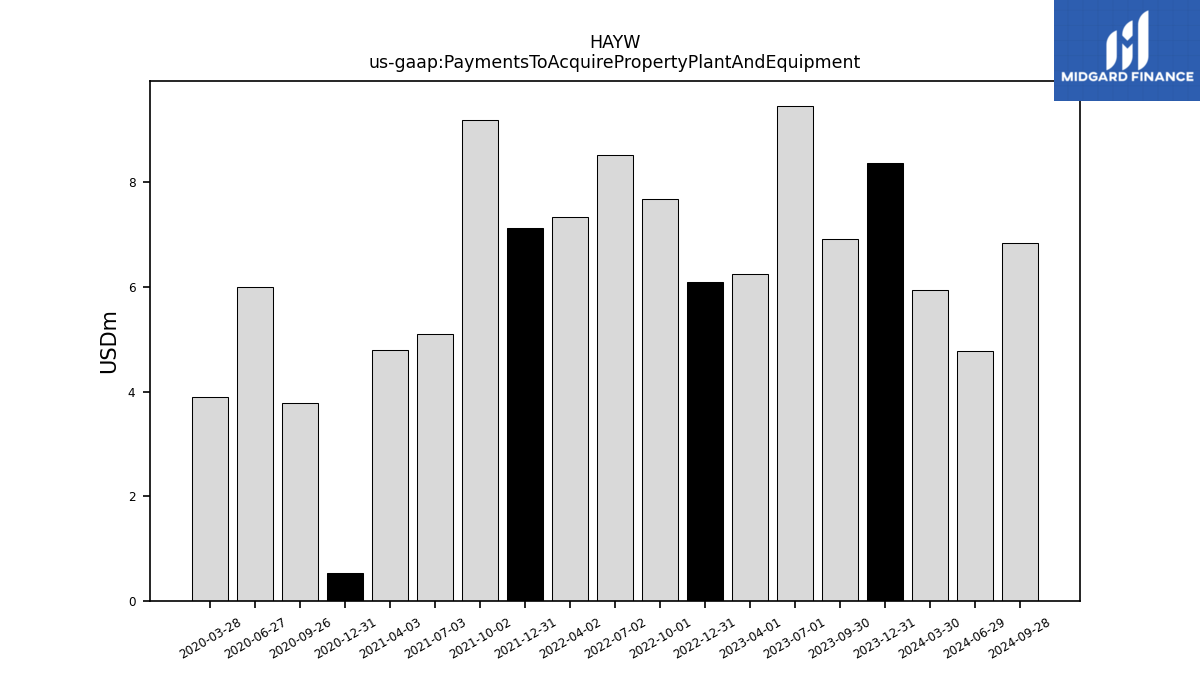
| Payments To Acquire Property Plant And Equipment | 8.37 | 6.92 | 9.46 | 6.24 | 6.09 | 7.68 | 8.53 | 7.33 | 7.12 | 9.20 | 5.10 | 4.80 | 0.53 | 3.79 | 6.00 | 3.90 |
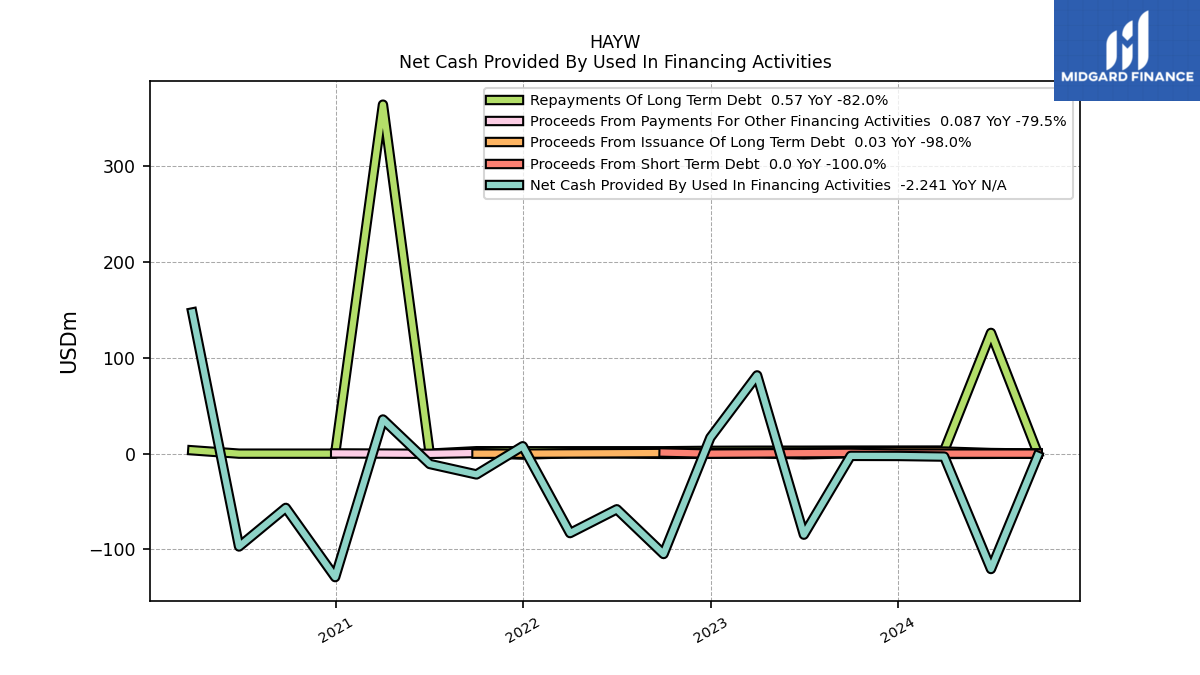
| 2023-12-31 | 2023-09-30 | 2023-07-01 | 2023-04-01 | 2022-12-31 | 2022-10-01 | 2022-07-02 | 2022-04-02 | 2021-12-31 | 2021-10-02 | 2021-07-03 | 2021-04-03 | 2020-12-31 | 2020-09-26 | 2020-06-27 | 2020-03-28 | ||
|---|---|---|---|---|---|---|---|---|---|---|---|---|---|---|---|---|---|
| Net Cash Provided By Used In Financing Activities | -2.41 | -2.32 | -84.65 | 81.77 | 16.71 | -104.85 | -58.09 | -83.01 | 7.77 | -21.71 | -10.80 | 35.70 | -128.98 | -56.64 | -97.00 | 147.50 | |
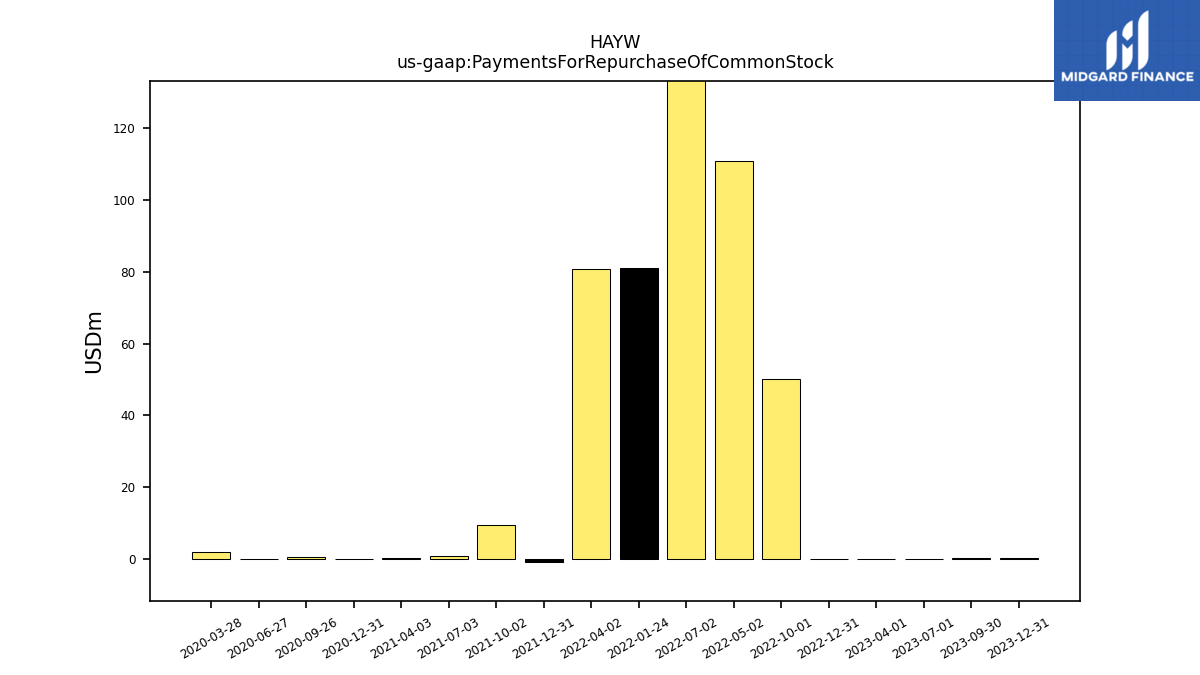
| Payments For Repurchase Of Common Stock | 0.12 | 0.21 | 0.00 | 0.01 | 0.03 | 50.16 | 212.23 | 80.93 | -1.01 | 9.53 | 0.80 | 0.20 | 0.00 | 0.40 | 0.10 | 2.00 |
| 2023-12-31 | 2023-09-30 | 2023-07-01 | 2023-04-01 | 2022-12-31 | 2022-10-01 | 2022-07-02 | 2022-04-02 | 2021-12-31 | 2021-10-02 | 2021-07-03 | 2021-04-03 | 2020-12-31 | 2020-09-26 | 2020-06-27 | 2020-03-28 | ||
|---|---|---|---|---|---|---|---|---|---|---|---|---|---|---|---|---|---|
| Revenues | 278.47 | 220.30 | 283.54 | 210.14 | 258.97 | 245.27 | 399.44 | 410.46 | 352.38 | 350.62 | 364.40 | 334.40 | 260.70 | 224.49 | 220.00 | 170.20 | |
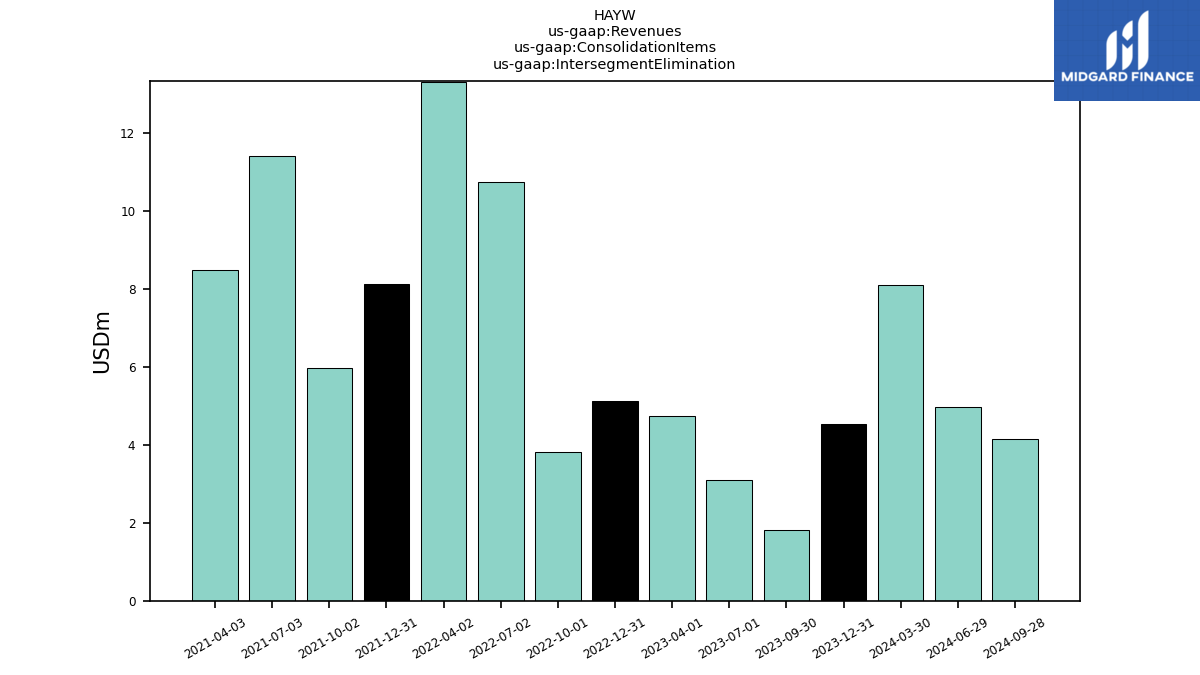
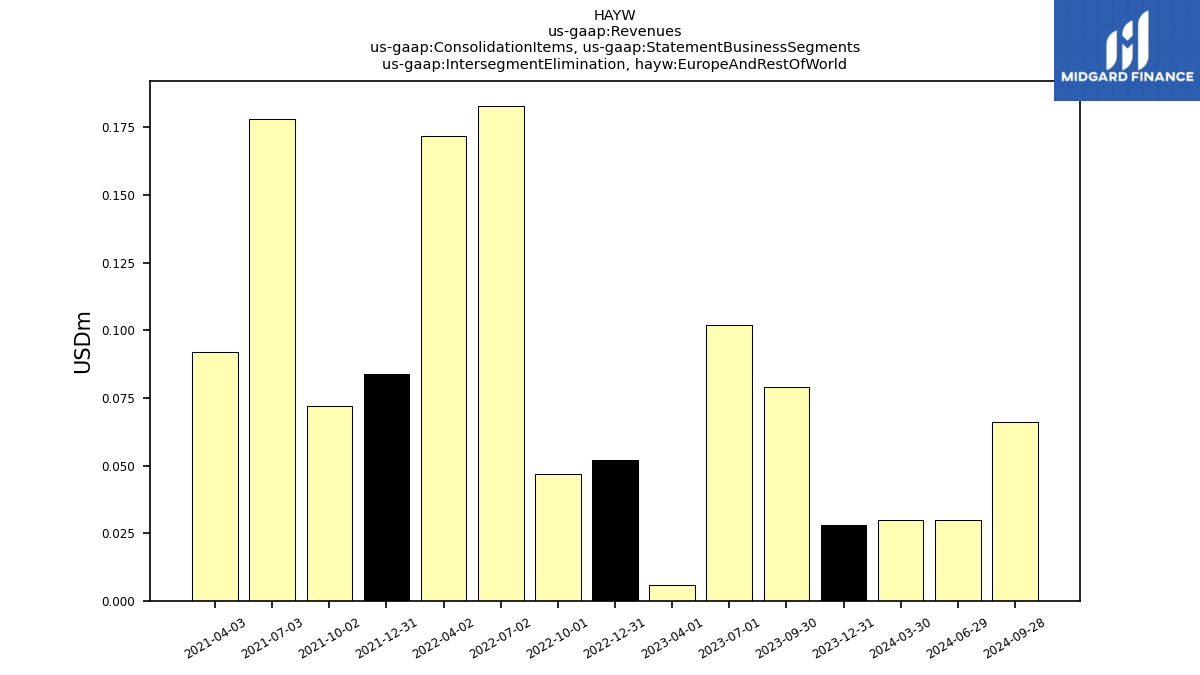
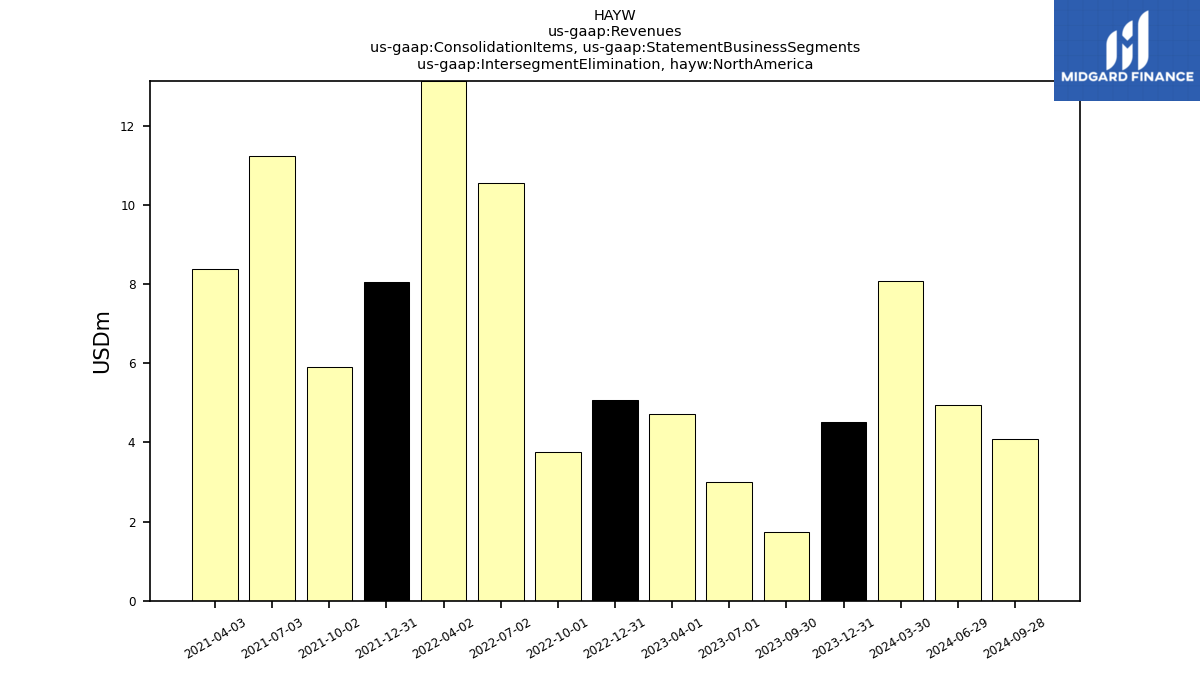
| Intersegment Elimination | 4.54 | 1.81 | 3.10 | 4.73 | 5.13 | 3.81 | 10.74 | 13.30 | 8.12 | 5.97 | 11.41 | 8.47 | NA | NA | NA | NA | |
| Operating | 278.47 | 220.30 | 283.54 | 210.14 | 258.97 | 245.27 | 399.44 | 410.46 | 352.38 | 350.62 | 364.40 | 334.40 | 260.70 | 224.49 | 220.00 | 170.20 | |
| Intersegment Elimination, Europe And Rest Of World | 0.03 | 0.08 | 0.10 | 0.01 | 0.05 | 0.05 | 0.18 | 0.17 | 0.08 | 0.07 | 0.18 | 0.09 | NA | NA | NA | NA | |
| Intersegment Elimination, North America | 4.51 | 1.73 | 3.00 | 4.72 | 5.08 | 3.76 | 10.55 | 13.12 | 8.04 | 5.90 | 11.23 | 8.38 | NA | NA | NA | NA | |
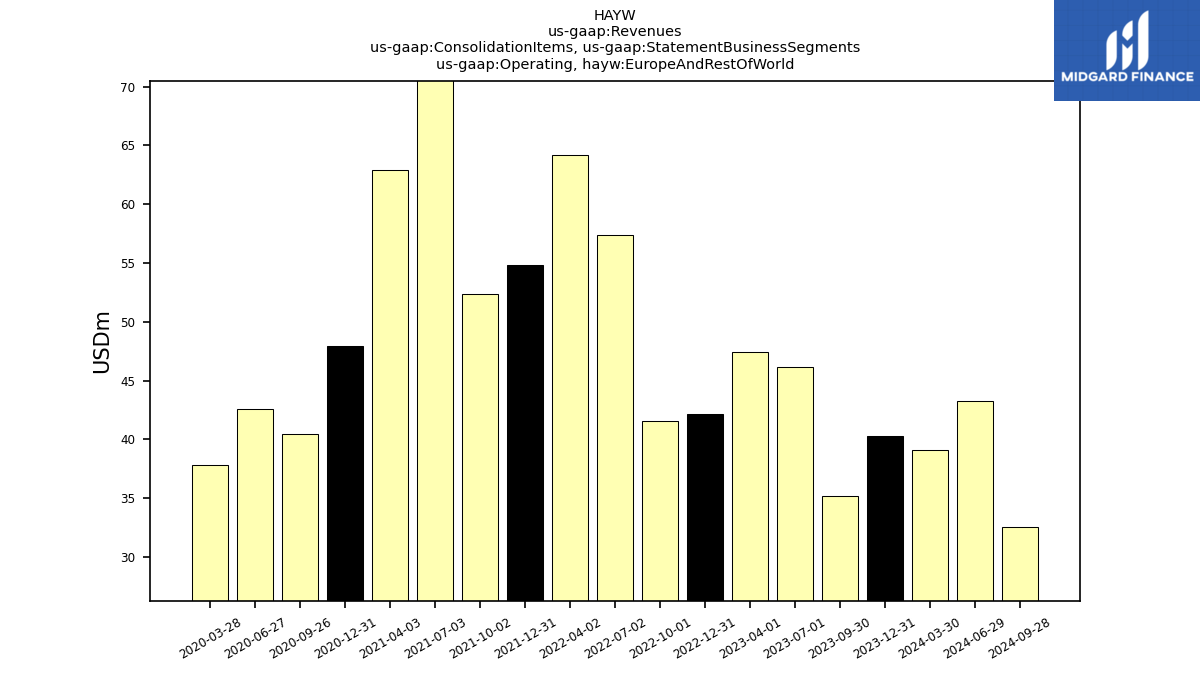
| Operating, Europe And Rest Of World | 40.32 | 35.23 | 46.19 | 47.43 | 42.16 | 41.59 | 57.36 | 64.16 | 54.81 | 52.39 | 70.80 | 62.90 | 47.94 | 40.47 | 42.60 | 37.80 | |
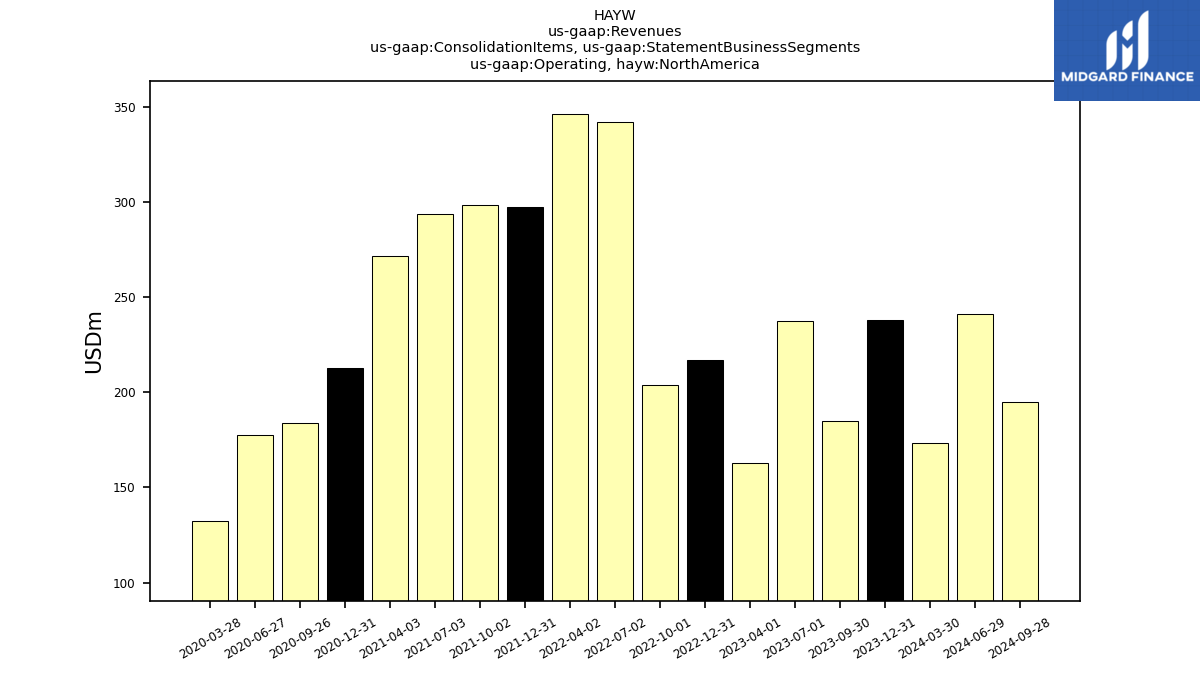
| Operating, North America | 238.15 | 185.07 | 237.35 | 162.70 | 216.81 | 203.67 | 342.08 | 346.30 | 297.57 | 298.24 | 293.60 | 271.50 | 212.76 | 184.01 | 177.40 | 132.40 | |
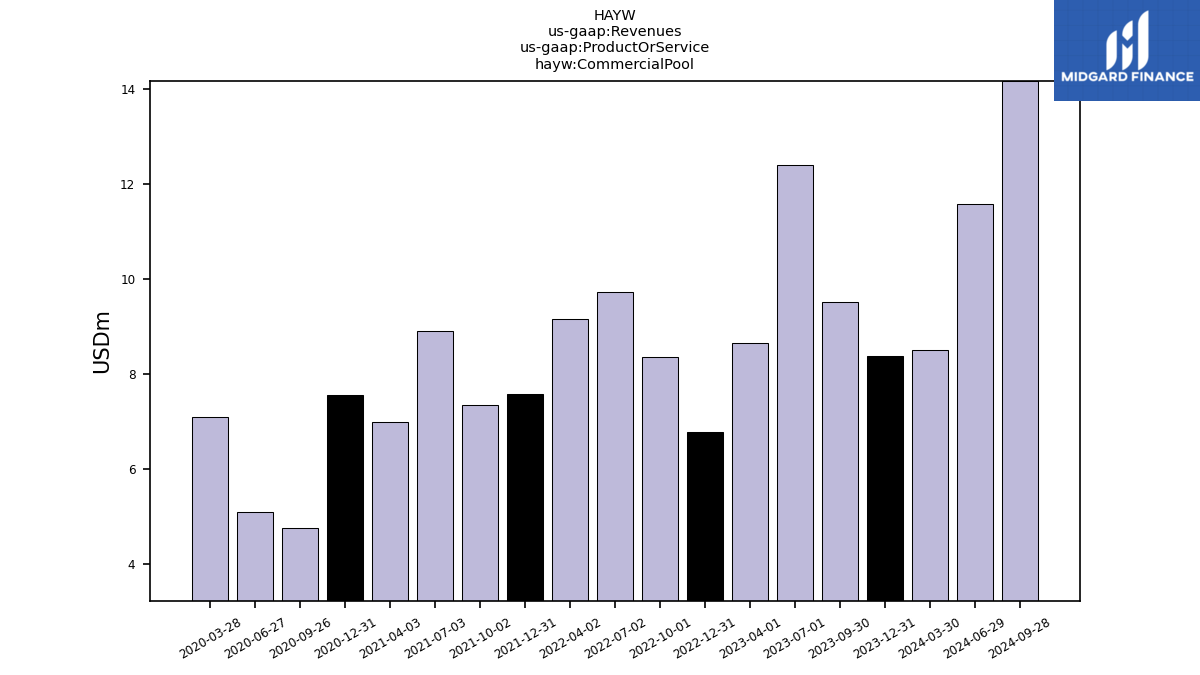
| Commercial Pool | 8.38 | 9.52 | 12.41 | 8.66 | 6.78 | 8.37 | 9.74 | 9.15 | 7.59 | 7.36 | 8.90 | 7.00 | 7.57 | 4.76 | 5.10 | 7.10 | |
| Industrial Flow Control | 12.67 | 12.71 | 12.76 | 11.31 | 12.55 | 13.24 | 12.30 | 11.67 | 10.49 | 12.37 | 11.40 | 11.30 | 4.85 | 10.20 | 8.00 | 9.00 | |
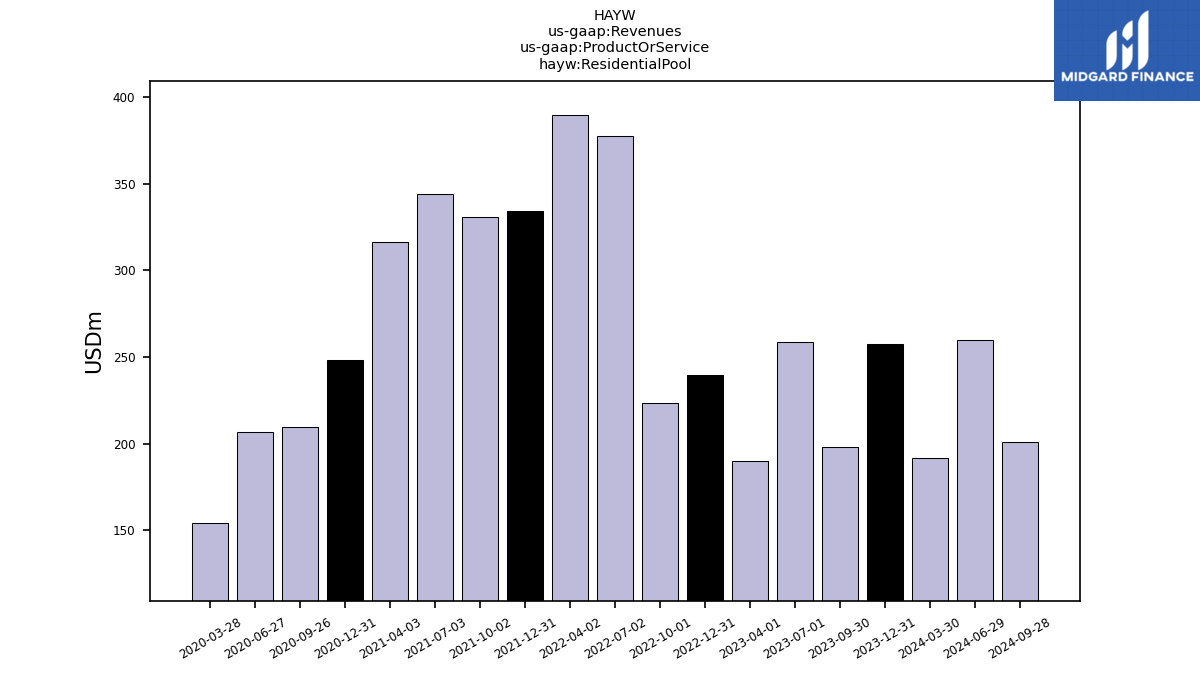
| Residential Pool | 257.42 | 198.07 | 258.37 | 190.17 | 239.65 | 223.66 | 377.40 | 389.63 | 334.31 | 330.90 | 344.10 | 316.10 | 248.28 | 209.52 | 206.90 | 154.10 | |
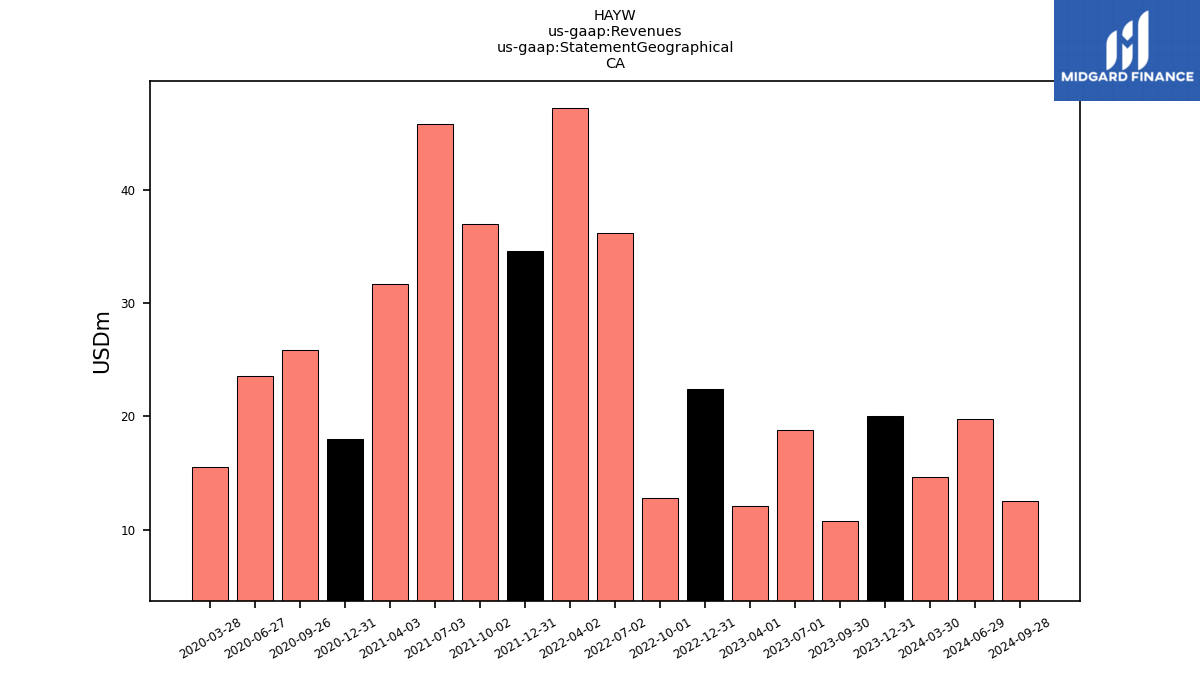
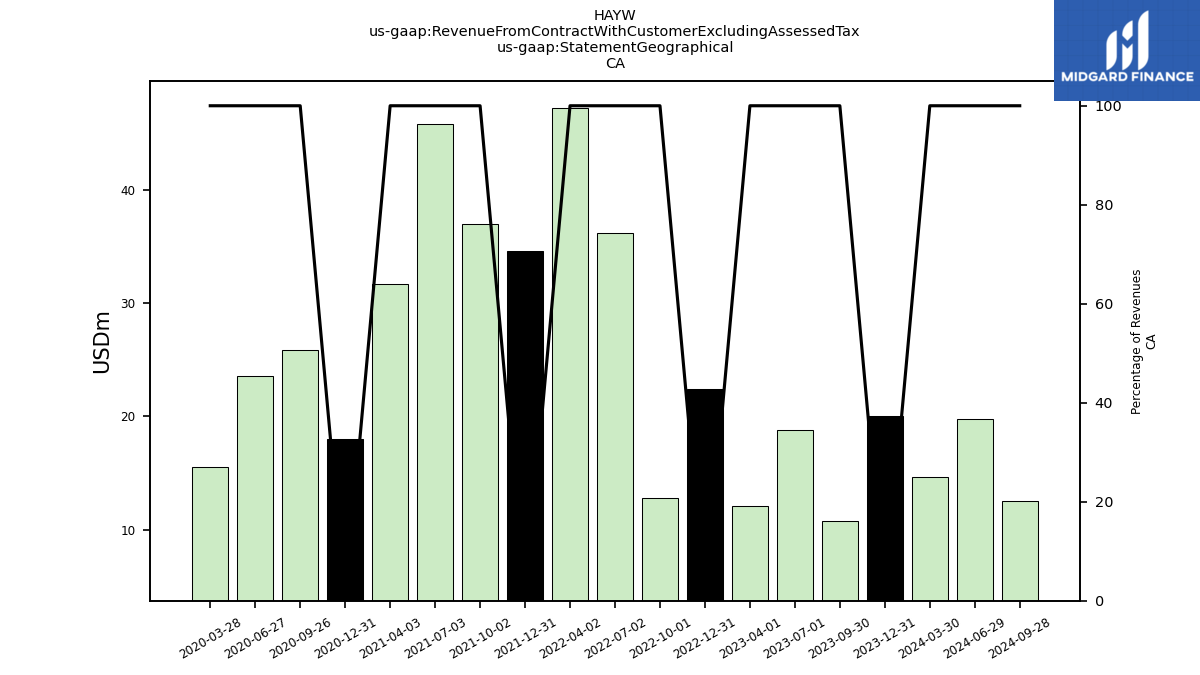
| 20.02 | 10.75 | 18.78 | 12.12 | 22.39 | 12.82 | 36.21 | 47.23 | 34.59 | 37.01 | 45.80 | 31.70 | 18.00 | 25.86 | 23.60 | 15.50 | ||
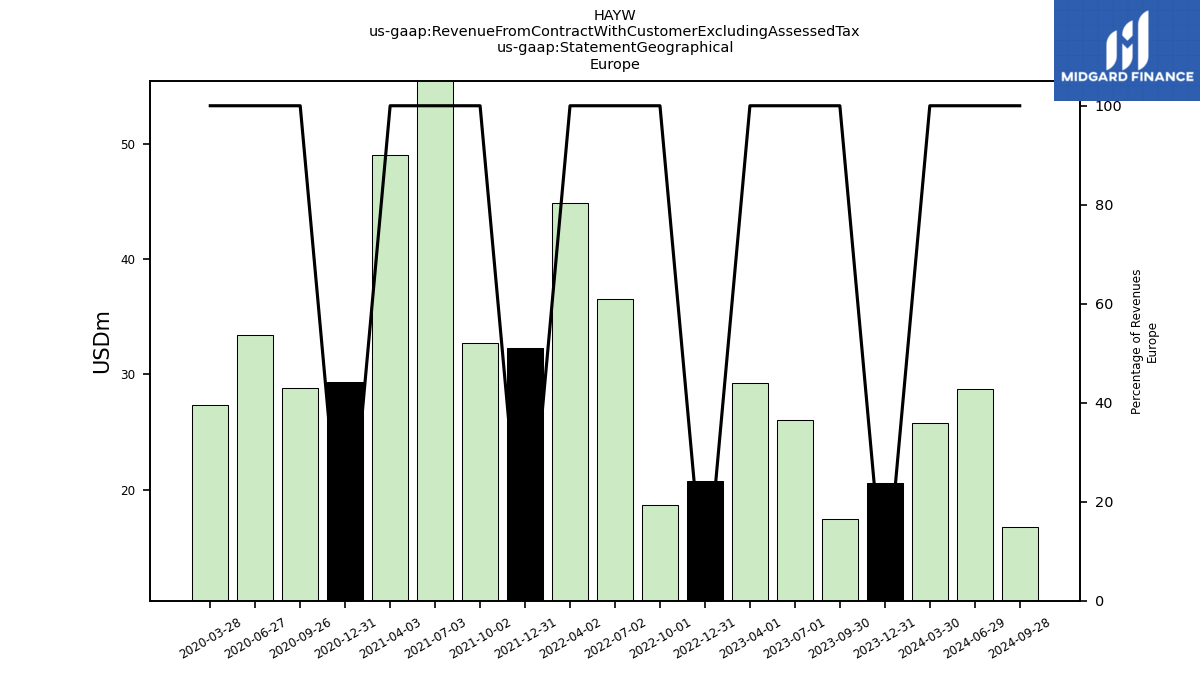
| 20.61 | 17.50 | 26.00 | 29.21 | 20.80 | 18.67 | 36.55 | 44.84 | 32.31 | 32.73 | 55.90 | 49.00 | 29.31 | 28.86 | 33.40 | 27.30 | ||
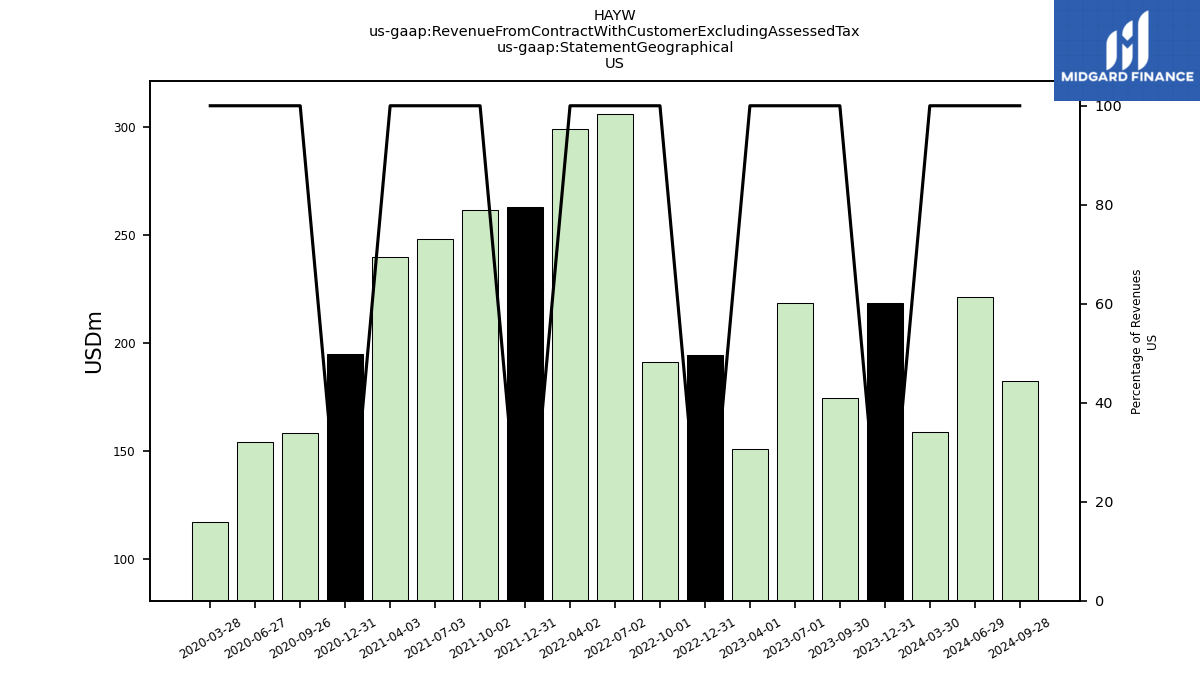
| US | 218.12 | 174.32 | 218.57 | 150.58 | 194.41 | 190.85 | 305.87 | 299.06 | 262.98 | 261.22 | 247.80 | 239.80 | 194.76 | 158.16 | 153.80 | 116.90 | |
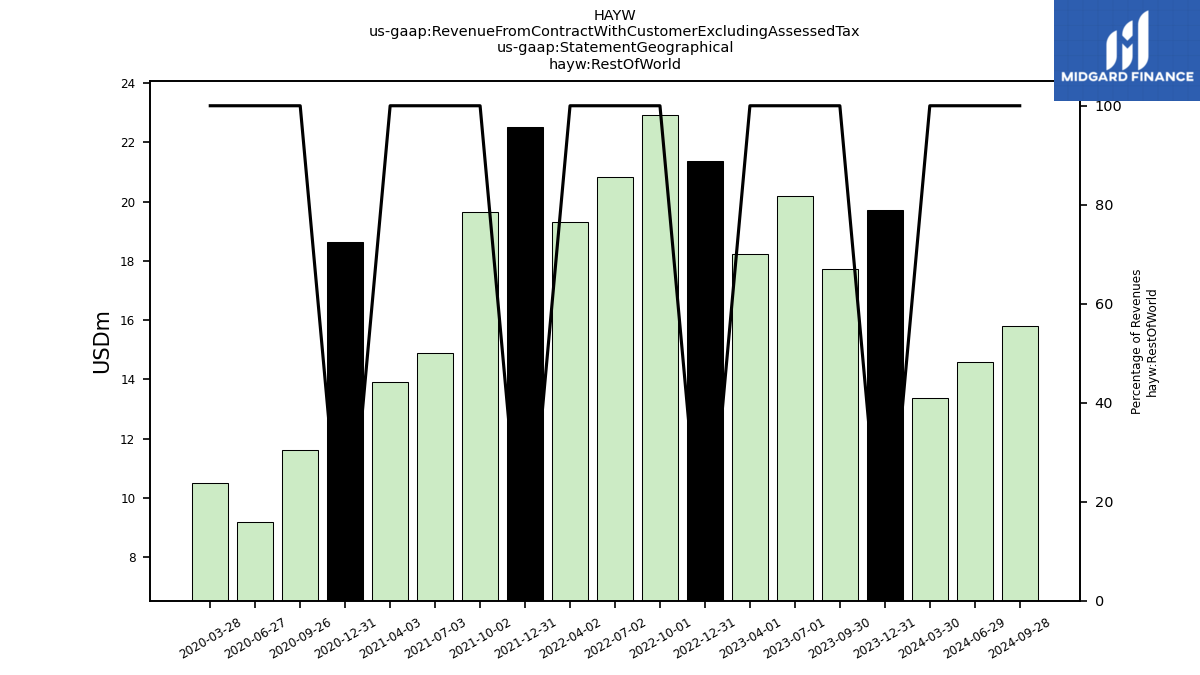
| Rest Of World | 19.71 | 17.74 | 20.19 | 18.22 | 21.36 | 22.92 | 20.82 | 19.32 | 22.50 | 19.66 | 14.90 | 13.90 | 18.63 | 11.61 | 9.20 | 10.50 | |
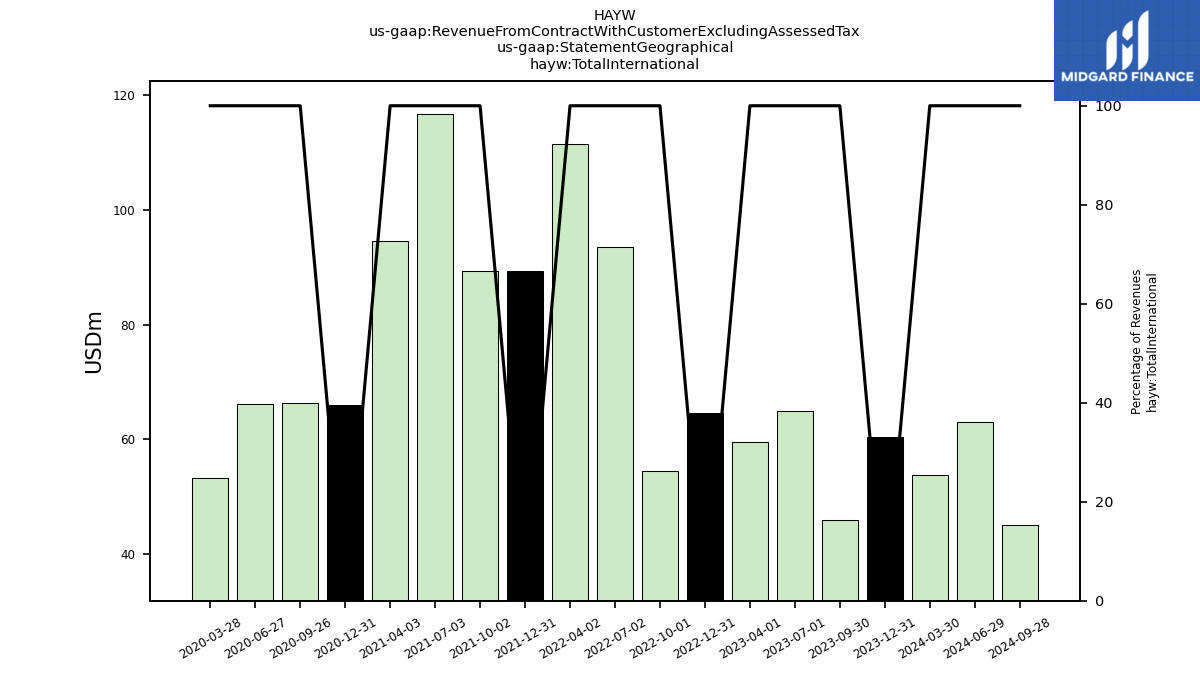
| Total International | 60.34 | 45.99 | 64.97 | 59.55 | 64.55 | 54.42 | 93.57 | 111.40 | 89.40 | 89.40 | 116.60 | 94.60 | 65.94 | 66.33 | 66.20 | 53.30 | |
| Revenue From Contract With Customer Excluding Assessed Tax | 278.47 | 220.30 | 283.54 | 210.14 | 258.97 | 245.27 | 399.44 | 410.46 | 352.38 | 350.62 | 364.40 | 334.40 | 260.70 | 224.49 | 220.00 | 170.20 | |
| Intersegment Elimination | 4.54 | 1.81 | 3.10 | 4.73 | 5.13 | 3.81 | 10.74 | 13.30 | 8.12 | 5.97 | 11.41 | 8.47 | NA | NA | NA | NA | |
| Operating | 278.47 | 220.30 | 283.54 | 210.14 | 258.97 | 245.27 | 399.44 | 410.46 | 352.38 | 350.62 | 364.40 | 334.40 | 260.70 | 224.49 | 220.00 | 170.20 | |
| Intersegment Elimination, Europe And Rest Of World | 0.03 | 0.08 | 0.10 | 0.01 | 0.05 | 0.05 | 0.18 | 0.17 | 0.08 | 0.07 | 0.18 | 0.09 | NA | NA | NA | NA | |
| Intersegment Elimination, North America | 4.51 | 1.73 | 3.00 | 4.72 | 5.08 | 3.76 | 10.55 | 13.12 | 8.04 | 5.90 | 11.23 | 8.38 | NA | NA | NA | NA | |
| Operating, Europe And Rest Of World | 40.32 | 35.23 | 46.19 | 47.43 | 42.16 | 41.59 | 57.36 | 64.16 | 54.81 | 52.39 | 70.80 | 62.90 | 47.94 | 40.47 | 42.60 | 37.80 | |
| Operating, North America | 238.15 | 185.07 | 237.35 | 162.70 | 216.81 | 203.67 | 342.08 | 346.30 | 297.57 | 298.24 | 293.60 | 271.50 | 212.76 | 184.01 | 177.40 | 132.40 | |
| Commercial Pool | 8.38 | 9.52 | 12.41 | 8.66 | 6.78 | 8.37 | 9.74 | 9.15 | 7.59 | 7.36 | 8.90 | 7.00 | 7.57 | 4.76 | 5.10 | 7.10 | |
| Industrial Flow Control | 12.67 | 12.71 | 12.76 | 11.31 | 12.55 | 13.24 | 12.30 | 11.67 | 10.49 | 12.37 | 11.40 | 11.30 | 4.85 | 10.20 | 8.00 | 9.00 | |
| Residential Pool | 257.42 | 198.07 | 258.37 | 190.17 | 239.65 | 223.66 | 377.40 | 389.63 | 334.31 | 330.90 | 344.10 | 316.10 | 248.28 | 209.52 | 206.90 | 154.10 | |
| 20.02 | 10.75 | 18.78 | 12.12 | 22.39 | 12.82 | 36.21 | 47.23 | 34.59 | 37.01 | 45.80 | 31.70 | 18.00 | 25.86 | 23.60 | 15.50 | ||
| 20.61 | 17.50 | 26.00 | 29.21 | 20.80 | 18.67 | 36.55 | 44.84 | 32.31 | 32.73 | 55.90 | 49.00 | 29.31 | 28.86 | 33.40 | 27.30 | ||
| US | 218.12 | 174.32 | 218.57 | 150.58 | 194.41 | 190.85 | 305.87 | 299.06 | 262.98 | 261.22 | 247.80 | 239.80 | 194.76 | 158.16 | 153.80 | 116.90 | |
| Rest Of World | 19.71 | 17.74 | 20.19 | 18.22 | 21.36 | 22.92 | 20.82 | 19.32 | 22.50 | 19.66 | 14.90 | 13.90 | 18.63 | 11.61 | 9.20 | 10.50 | |
| Total International | 60.34 | 45.99 | 64.97 | 59.55 | 64.55 | 54.42 | 93.57 | 111.40 | 89.40 | 89.40 | 116.60 | 94.60 | 65.94 | 66.33 | 66.20 | 53.30 |