
| 2024-01-31 | 2023-10-31 | 2023-07-31 | 2023-04-30 | 2023-01-31 | 2022-10-31 | 2022-07-31 | 2022-04-30 | 2022-01-31 | 2021-10-31 | 2021-07-31 | 2021-04-30 | 2021-01-31 | 2020-10-31 | 2020-07-31 | 2020-04-30 | 2020-01-31 | 2019-10-31 | 2019-07-31 | 2019-04-30 | 2019-01-31 | 2018-10-31 | 2018-07-31 | 2018-04-30 | 2018-01-31 | 2017-10-31 | 2017-07-31 | 2017-04-30 | 2017-01-31 | 2016-10-31 | 2016-07-31 | 2016-04-30 | 2016-01-31 | 2015-10-31 | 2015-07-31 | 2015-04-30 | 2015-01-31 | 2014-10-31 | 2014-07-31 | 2014-04-30 | 2014-01-31 | 2013-10-31 | 2013-07-31 | 2013-04-30 | 2013-01-31 | 2012-10-31 | 2012-07-31 | 2012-04-30 | 2012-01-31 | 2011-10-31 | 2011-07-31 | 2011-04-30 | 2011-01-31 | 2010-10-31 | 2010-07-31 | 2010-04-30 | 2010-01-31 | ||
|---|---|---|---|---|---|---|---|---|---|---|---|---|---|---|---|---|---|---|---|---|---|---|---|---|---|---|---|---|---|---|---|---|---|---|---|---|---|---|---|---|---|---|---|---|---|---|---|---|---|---|---|---|---|---|---|---|---|---|
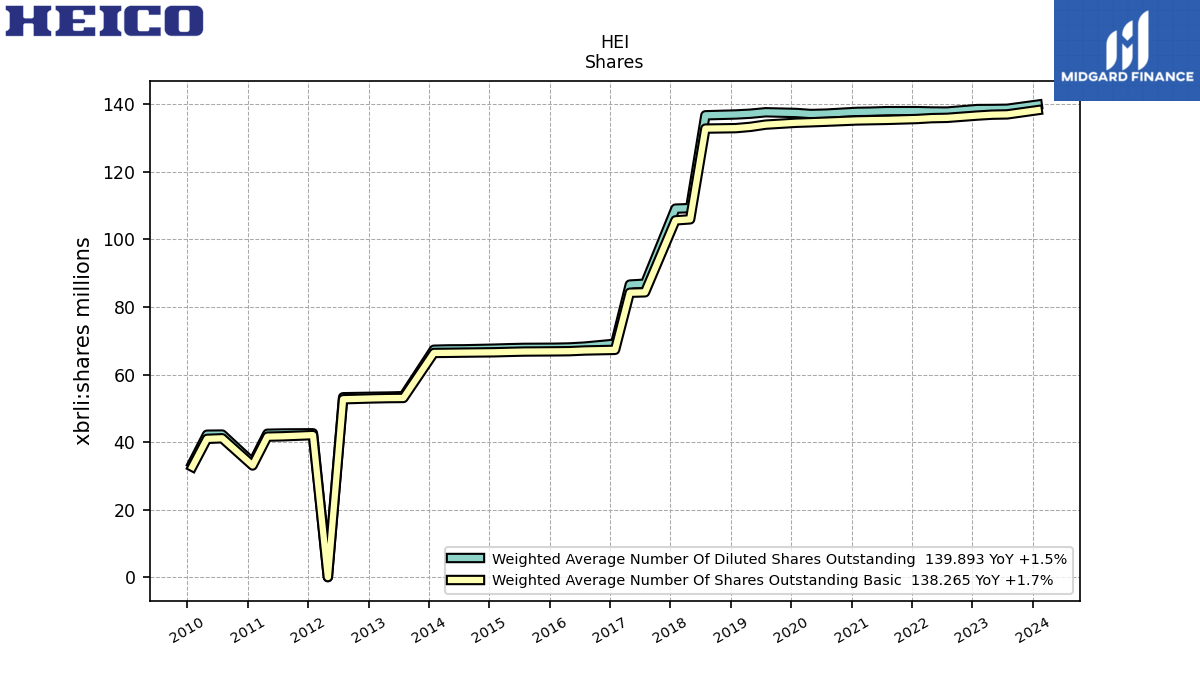
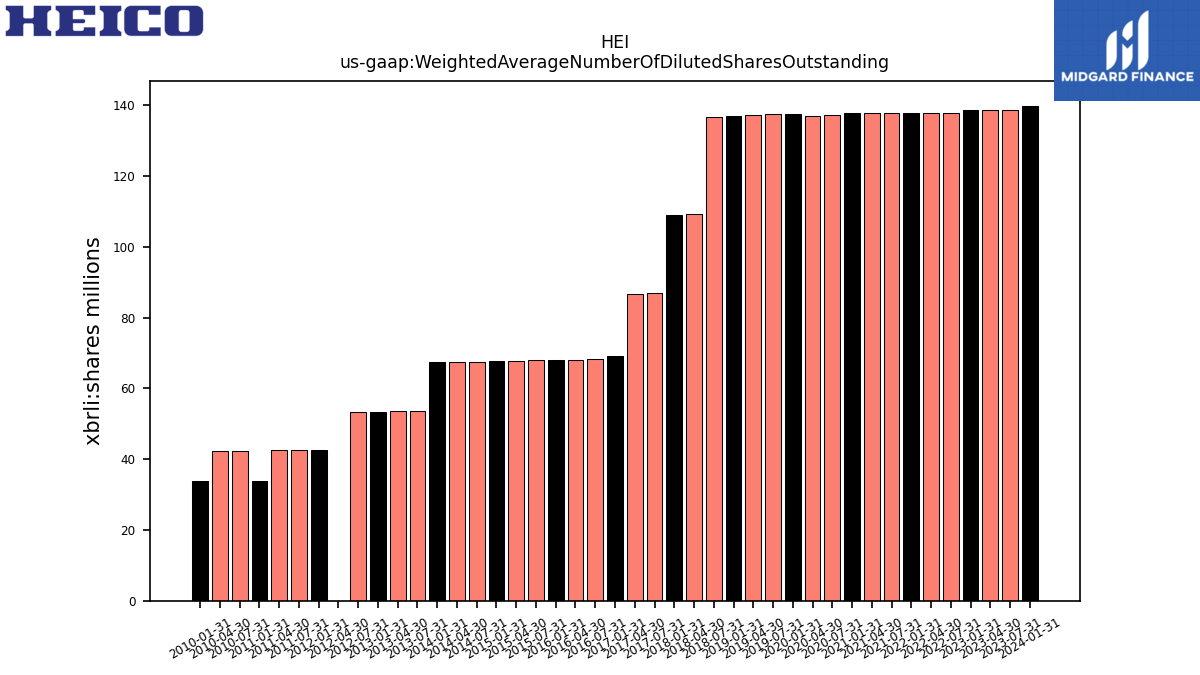
| Weighted Average Number Of Diluted Shares Outstanding | 139.89 | NA | 138.67 | 138.60 | 138.58 | NA | 137.84 | 137.87 | 137.97 | NA | 137.96 | 137.81 | 137.74 | NA | 137.23 | 137.12 | 137.42 | NA | 137.63 | 137.21 | 136.98 | NA | 136.73 | 109.27 | 109.11 | NA | 86.89 | 86.64 | 69.12 | NA | 68.28 | 68.03 | 67.94 | NA | 67.90 | 67.80 | 67.67 | NA | 67.47 | 67.45 | 67.35 | NA | 53.61 | 53.50 | 53.44 | NA | 53.29 | 0.05 | 42.63 | NA | 42.57 | 42.48 | 33.91 | NA | 42.25 | 42.20 | 33.70 | |
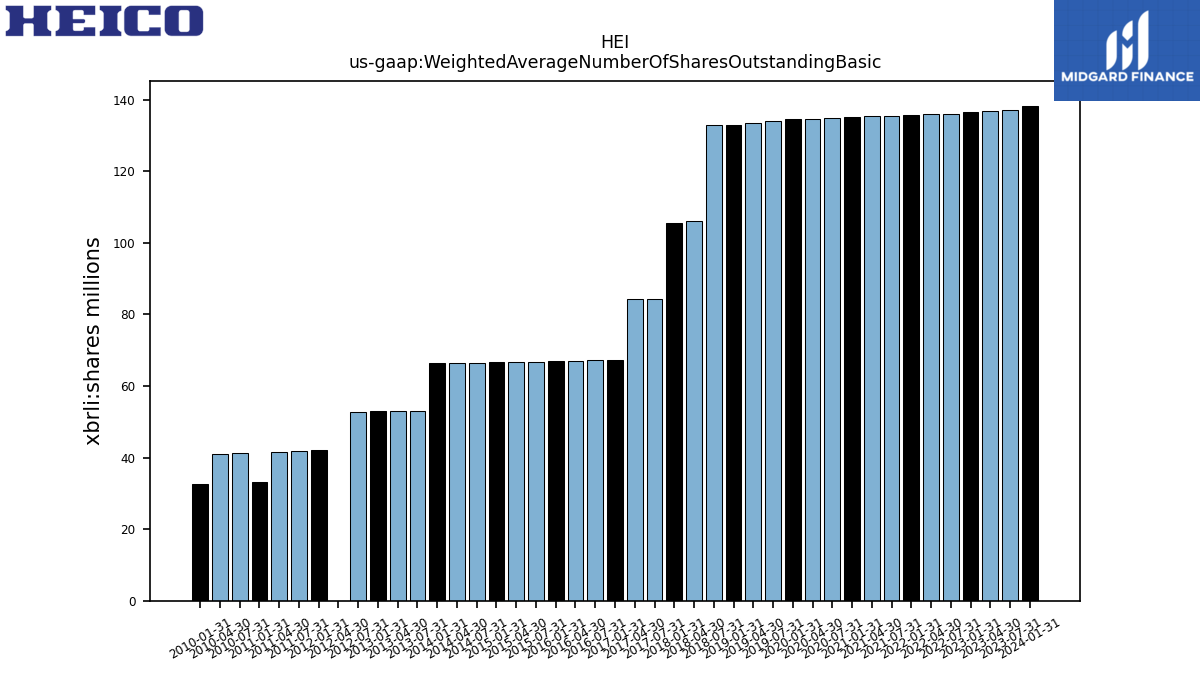
| Weighted Average Number Of Shares Outstanding Basic | 138.26 | NA | 137.01 | 136.92 | 136.66 | NA | 135.98 | 135.89 | 135.63 | NA | 135.37 | 135.29 | 135.21 | NA | 134.84 | 134.67 | 134.52 | NA | 133.97 | 133.31 | 132.93 | NA | 132.79 | 105.94 | 105.64 | NA | 84.34 | 84.22 | 67.31 | NA | 67.13 | 66.92 | 66.88 | NA | 66.81 | 66.71 | 66.59 | NA | 66.50 | 66.44 | 66.39 | NA | 53.07 | 53.03 | 52.95 | NA | 52.70 | 0.05 | 42.09 | NA | 41.73 | 41.63 | 33.09 | NA | 41.15 | 40.97 | 32.68 | |
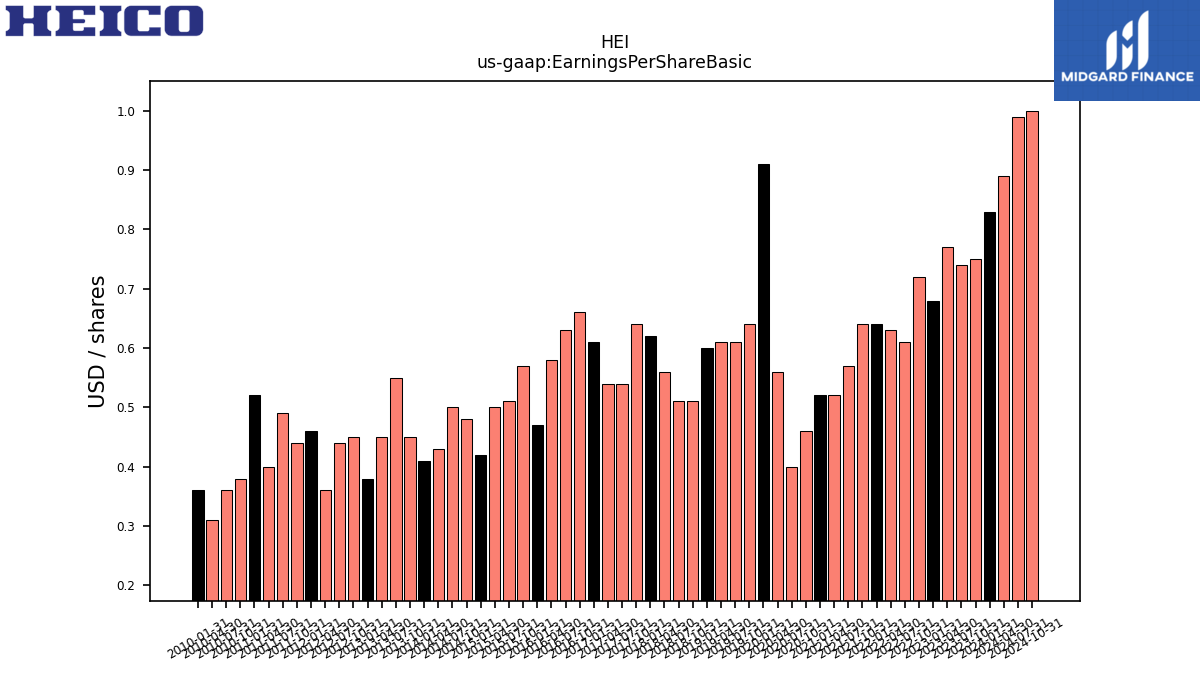
| Earnings Per Share Basic | 0.83 | 0.75 | 0.74 | 0.77 | 0.68 | 0.72 | 0.61 | 0.63 | 0.64 | 0.64 | 0.57 | 0.52 | 0.52 | 0.46 | 0.40 | 0.56 | 0.91 | 0.64 | 0.61 | 0.61 | 0.60 | 0.51 | 0.51 | 0.56 | 0.62 | 0.64 | 0.54 | 0.54 | 0.61 | 0.66 | 0.63 | 0.58 | 0.47 | 0.57 | 0.51 | 0.50 | 0.42 | 0.48 | 0.50 | 0.43 | 0.41 | 0.45 | 0.55 | 0.45 | 0.38 | 0.45 | 0.44 | 0.36 | 0.46 | 0.44 | 0.49 | 0.40 | 0.52 | 0.38 | 0.36 | 0.31 | 0.36 | |
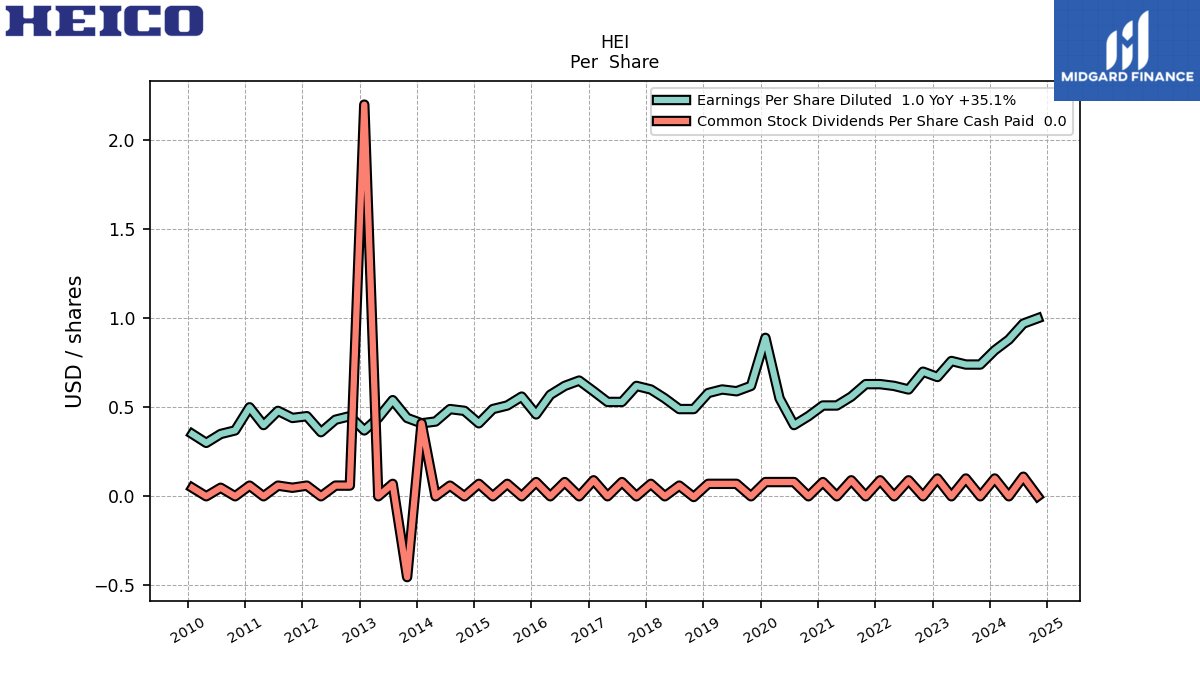
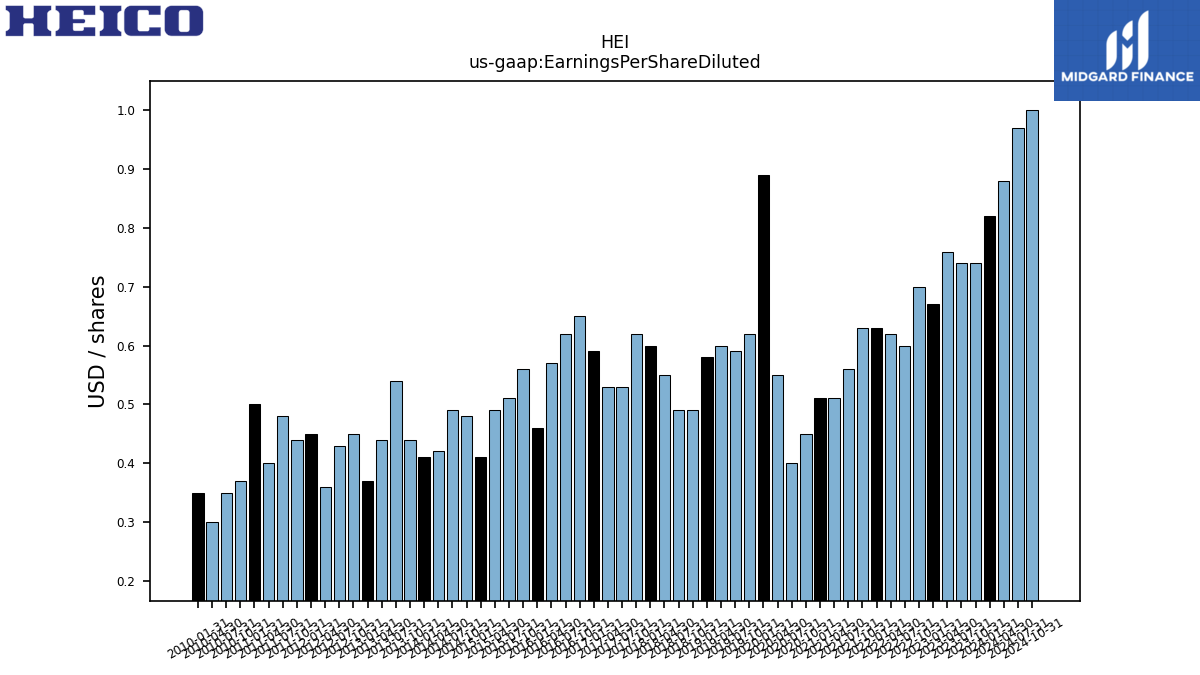
| Earnings Per Share Diluted | 0.82 | 0.74 | 0.74 | 0.76 | 0.67 | 0.70 | 0.60 | 0.62 | 0.63 | 0.63 | 0.56 | 0.51 | 0.51 | 0.45 | 0.40 | 0.55 | 0.89 | 0.62 | 0.59 | 0.60 | 0.58 | 0.49 | 0.49 | 0.55 | 0.60 | 0.62 | 0.53 | 0.53 | 0.59 | 0.65 | 0.62 | 0.57 | 0.46 | 0.56 | 0.51 | 0.49 | 0.41 | 0.48 | 0.49 | 0.42 | 0.41 | 0.44 | 0.54 | 0.44 | 0.37 | 0.45 | 0.43 | 0.36 | 0.45 | 0.44 | 0.48 | 0.40 | 0.50 | 0.37 | 0.35 | 0.30 | 0.35 |
| 2024-01-31 | 2023-10-31 | 2023-07-31 | 2023-04-30 | 2023-01-31 | 2022-10-31 | 2022-07-31 | 2022-04-30 | 2022-01-31 | 2021-10-31 | 2021-07-31 | 2021-04-30 | 2021-01-31 | 2020-10-31 | 2020-07-31 | 2020-04-30 | 2020-01-31 | 2019-10-31 | 2019-07-31 | 2019-04-30 | 2019-01-31 | 2018-10-31 | 2018-07-31 | 2018-04-30 | 2018-01-31 | 2017-10-31 | 2017-07-31 | 2017-04-30 | 2017-01-31 | 2016-10-31 | 2016-07-31 | 2016-04-30 | 2016-01-31 | 2015-10-31 | 2015-07-31 | 2015-04-30 | 2015-01-31 | 2014-10-31 | 2014-07-31 | 2014-04-30 | 2014-01-31 | 2013-10-31 | 2013-07-31 | 2013-04-30 | 2013-01-31 | 2012-10-31 | 2012-07-31 | 2012-04-30 | 2012-01-31 | 2011-10-31 | 2011-07-31 | 2011-04-30 | 2011-01-31 | 2010-10-31 | 2010-07-31 | 2010-04-30 | 2010-01-31 | ||
|---|---|---|---|---|---|---|---|---|---|---|---|---|---|---|---|---|---|---|---|---|---|---|---|---|---|---|---|---|---|---|---|---|---|---|---|---|---|---|---|---|---|---|---|---|---|---|---|---|---|---|---|---|---|---|---|---|---|---|
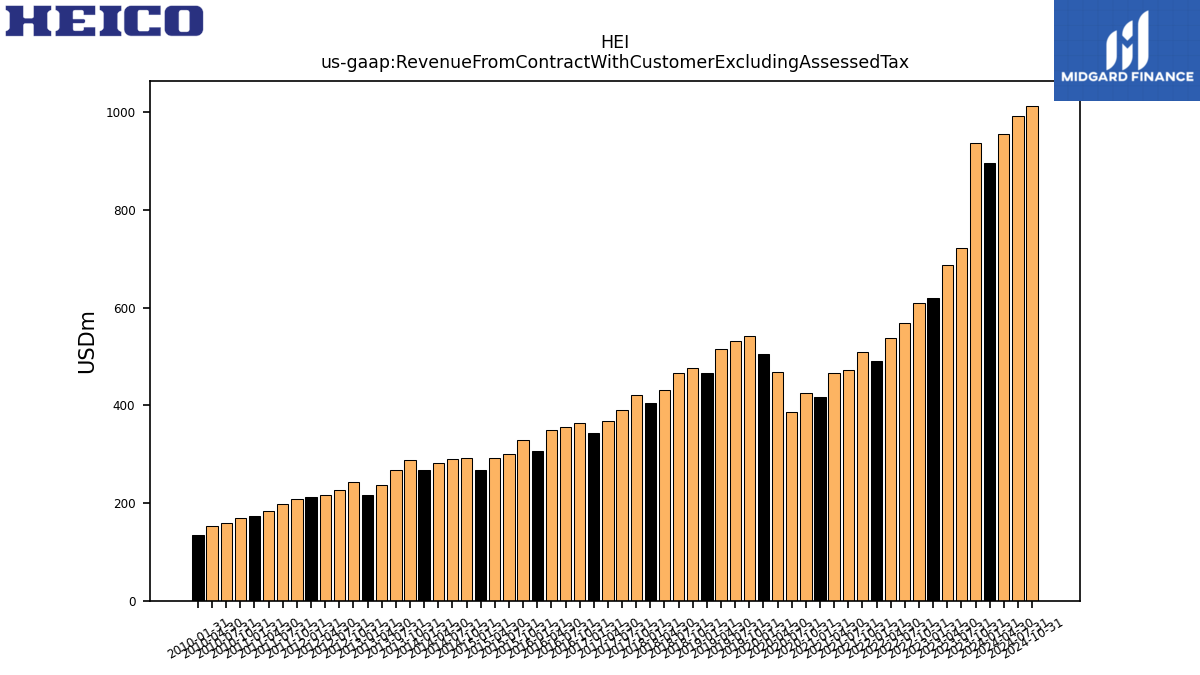
| Revenue From Contract With Customer Excluding Assessed Tax | 896.36 | 936.45 | 722.90 | 687.84 | 620.91 | 609.64 | 569.53 | 538.81 | 490.34 | 509.42 | 471.71 | 466.65 | 417.90 | 426.18 | 386.41 | 468.15 | 506.27 | 541.53 | 532.32 | 515.65 | 466.15 | 476.88 | 465.82 | 430.60 | 404.41 | 421.22 | 391.50 | 368.66 | 343.43 | 363.30 | 356.08 | 350.65 | 306.23 | 328.67 | 300.37 | 291.42 | 268.19 | 292.22 | 291.03 | 282.23 | 266.83 | 287.43 | 267.13 | 237.71 | 216.49 | 242.41 | 225.97 | 216.31 | 212.66 | 208.92 | 197.27 | 184.49 | 174.22 | 169.37 | 158.27 | 153.84 | 135.53 | |
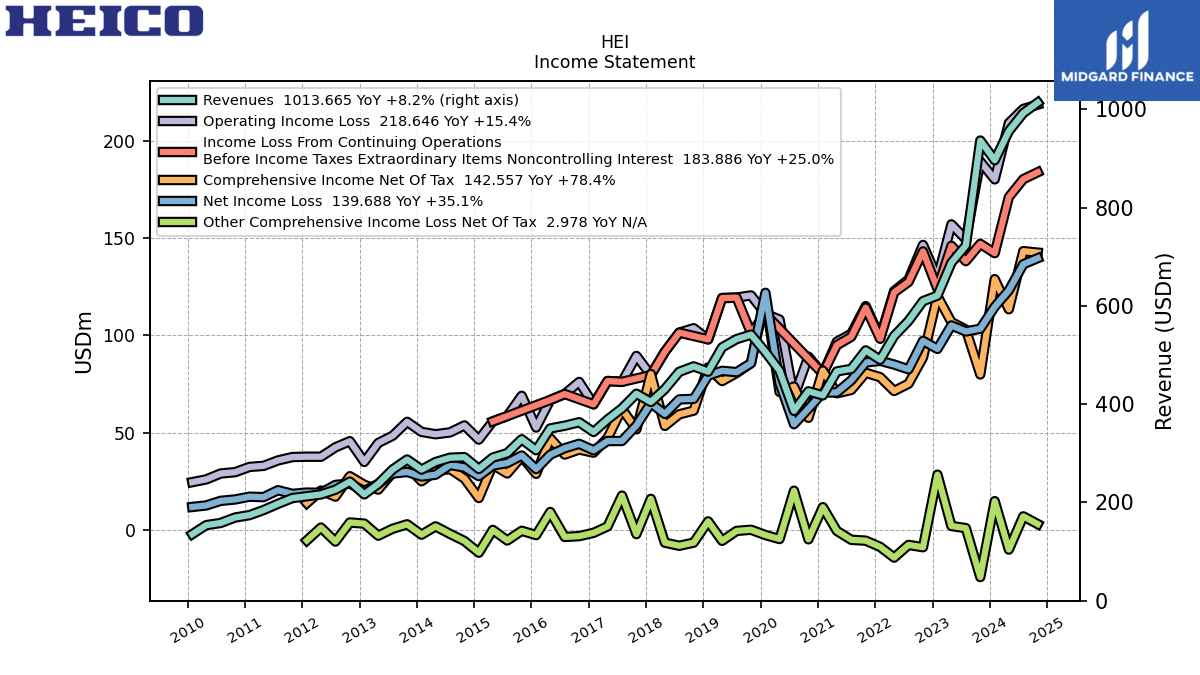
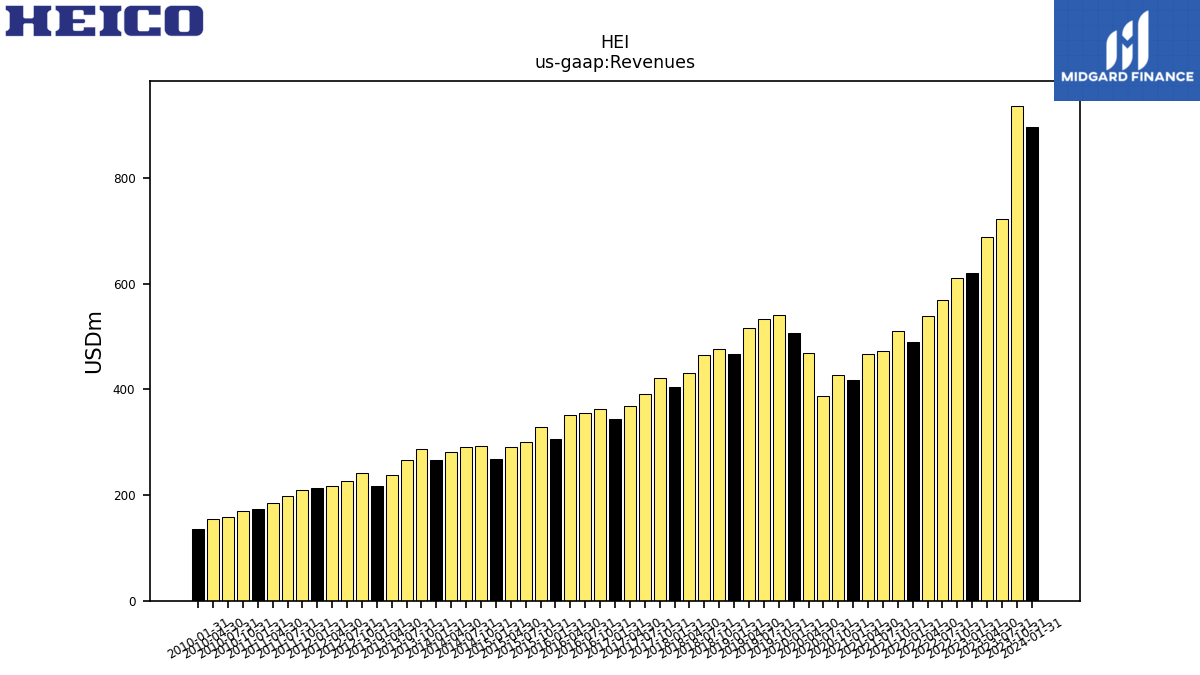
| Revenues | 896.36 | 936.45 | 722.90 | 687.84 | 620.91 | 609.64 | 569.53 | 538.81 | 490.34 | 509.42 | 471.71 | 466.65 | 417.90 | 426.18 | 386.41 | 468.15 | 506.27 | 541.53 | 532.32 | 515.65 | 466.15 | 476.88 | 465.82 | 430.60 | 404.41 | 421.22 | 391.50 | 368.66 | 343.43 | 363.30 | 356.08 | 350.65 | 306.23 | 328.67 | 300.37 | 291.42 | 268.19 | 292.22 | 291.03 | 282.23 | 266.83 | 287.43 | 267.13 | 237.71 | 216.49 | 242.41 | 225.97 | 216.31 | 212.66 | 208.92 | 197.27 | 184.49 | 174.22 | 169.37 | 158.27 | 153.84 | 135.53 | |
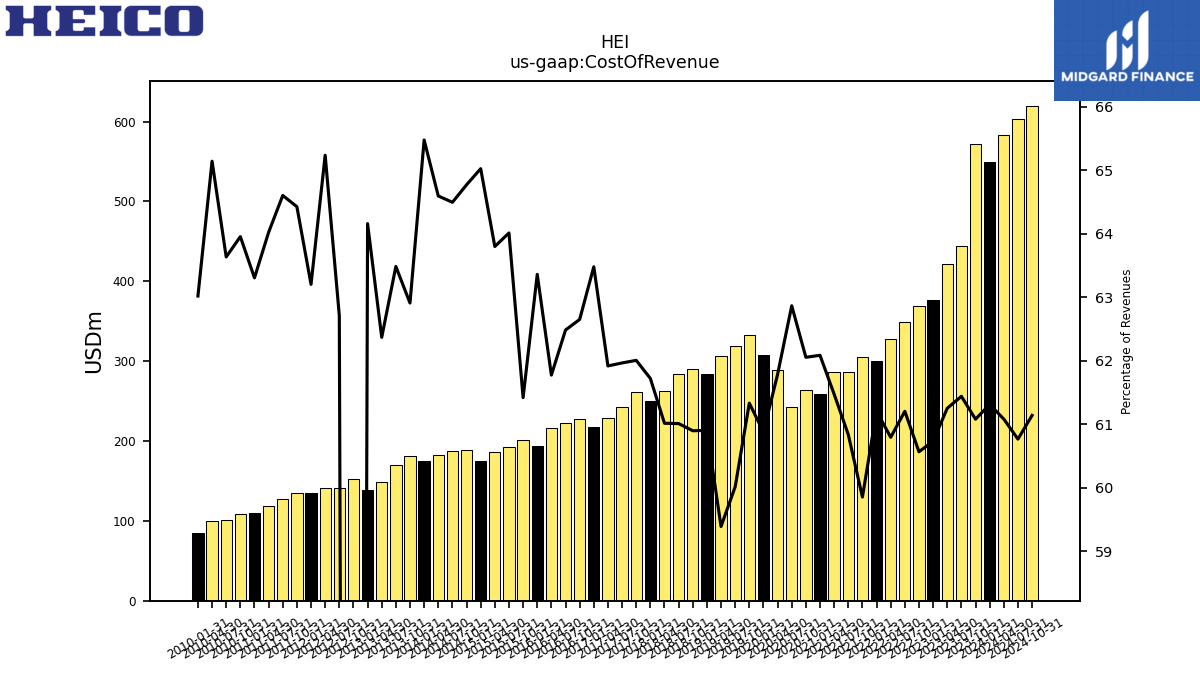
| Cost Of Revenue | 549.59 | 572.00 | 444.17 | 421.33 | 377.12 | 369.25 | 348.59 | 327.58 | 300.13 | 304.92 | 286.99 | 286.88 | 259.47 | 264.47 | 242.93 | 289.26 | 308.23 | 332.14 | 319.49 | 306.26 | 283.91 | 290.43 | 284.22 | 262.75 | 249.62 | 261.19 | 242.60 | 228.28 | 218.01 | 227.62 | 222.50 | 216.62 | 194.03 | 201.88 | 192.28 | 185.93 | 174.39 | 189.28 | 187.70 | 182.31 | 174.71 | 180.82 | 169.59 | 148.26 | 138.90 | 152.67 | 141.72 | 141.12 | 134.41 | 134.60 | 127.44 | 118.11 | 110.29 | 108.32 | 100.72 | 100.22 | 85.42 | |
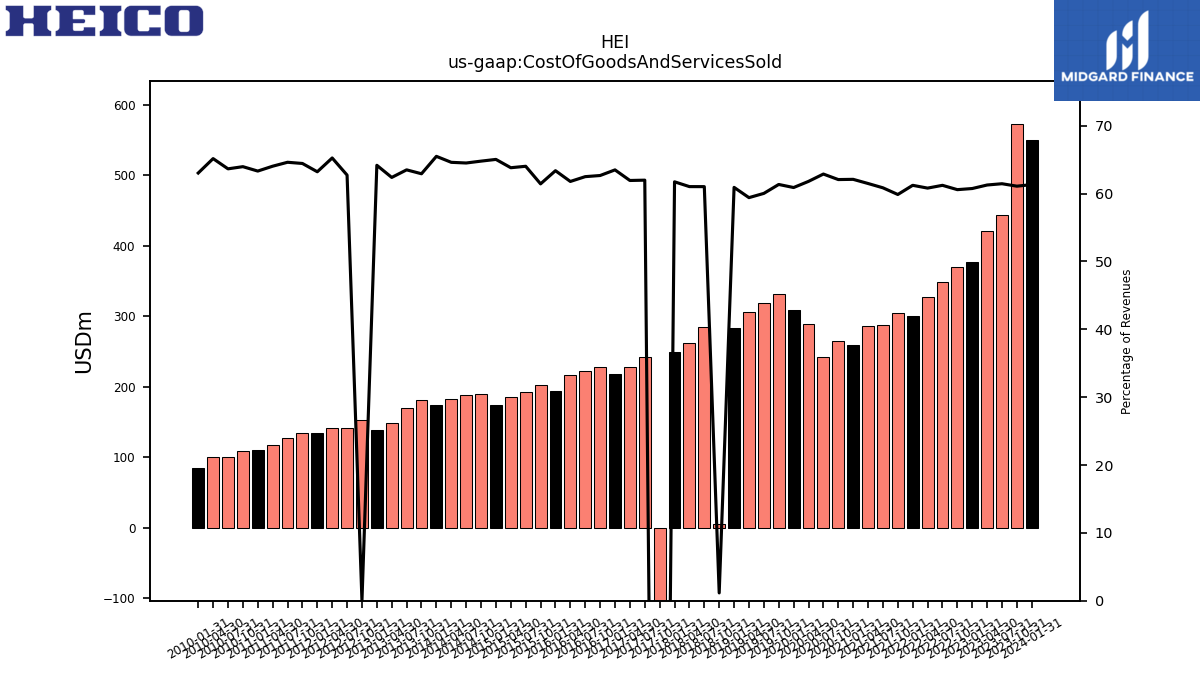
| Cost Of Goods And Services Sold | 549.59 | 572.00 | 444.17 | 421.33 | 377.12 | 369.25 | 348.59 | 327.58 | 300.13 | 304.92 | 286.99 | 286.88 | 259.47 | 264.47 | 242.93 | 289.26 | 308.23 | 332.14 | 319.49 | 306.26 | 283.91 | 5.50 | 284.22 | 262.75 | 249.62 | -659.40 | 242.60 | 228.28 | 218.01 | 227.62 | 222.50 | 216.62 | 194.03 | 201.88 | 192.28 | 185.93 | 174.39 | 189.28 | 187.70 | 182.31 | 174.71 | 180.82 | 169.59 | 148.26 | 138.90 | 152.67 | 141.72 | 141.12 | 134.41 | 134.60 | 127.44 | 118.11 | 110.29 | 108.32 | 100.72 | 100.22 | 85.42 | |
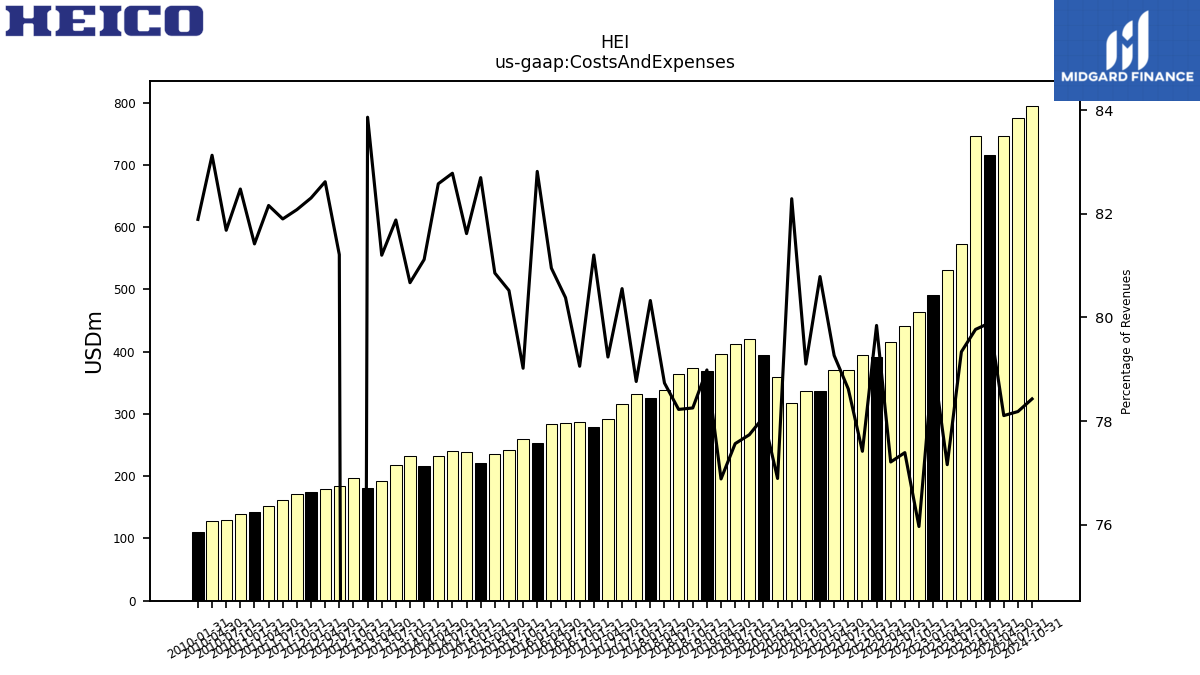
| Costs And Expenses | 716.15 | 747.00 | 573.53 | 530.75 | 491.48 | 463.14 | 440.78 | 416.04 | 391.52 | 394.39 | 370.87 | 369.90 | 337.62 | 337.12 | 317.98 | 359.99 | 395.29 | 420.98 | 412.91 | 396.46 | 368.20 | 373.19 | 364.40 | 339.04 | 324.85 | 331.78 | 315.38 | 292.12 | 278.88 | 287.22 | 286.23 | 283.85 | 253.61 | 259.72 | 241.86 | 235.63 | 221.78 | 238.50 | 240.92 | 233.06 | 216.44 | 231.87 | 218.73 | 193.02 | 181.55 | 196.80 | 183.51 | 178.71 | 175.02 | 171.48 | 161.56 | 151.57 | 141.85 | 139.69 | 129.28 | 127.89 | 110.99 | |
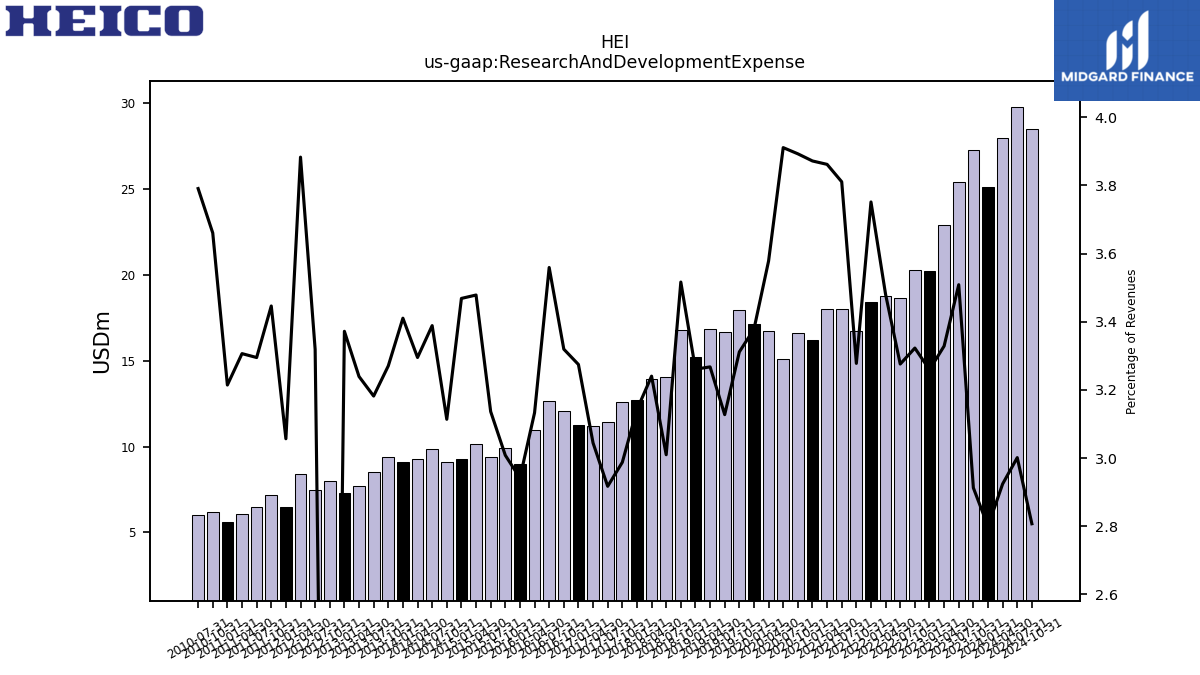
| Research And Development Expense | 25.10 | 27.27 | 25.36 | 22.90 | 20.24 | 20.26 | 18.66 | 18.75 | 18.40 | 16.70 | 17.98 | 18.02 | 16.18 | 16.59 | 15.11 | 16.75 | 17.10 | 17.93 | 16.65 | 16.85 | 15.20 | 16.77 | 14.02 | 13.95 | 12.71 | 12.58 | 11.42 | 11.22 | 11.25 | 12.06 | 12.67 | 10.98 | 9.01 | 9.89 | 9.42 | 10.14 | 9.30 | 9.10 | 9.86 | 9.30 | 9.10 | 9.40 | 8.50 | 7.70 | 7.30 | 8.00 | 7.50 | 8.40 | 6.50 | 7.20 | 6.50 | 6.10 | 5.60 | 6.20 | 6.00 | NA | NA | |
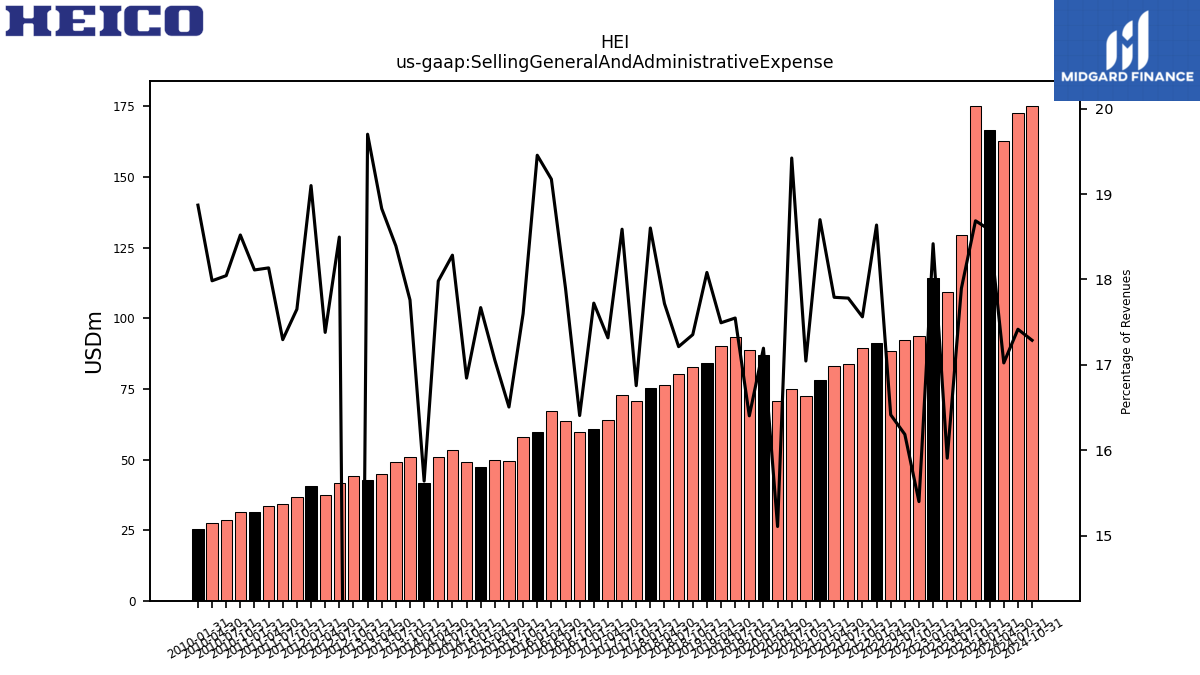
| Selling General And Administrative Expense | 166.56 | 175.00 | 129.37 | 109.42 | 114.36 | 93.89 | 92.19 | 88.45 | 91.39 | 89.47 | 83.88 | 83.03 | 78.15 | 72.64 | 75.05 | 70.73 | 87.06 | 88.83 | 93.42 | 90.20 | 84.29 | 82.76 | 80.19 | 76.29 | 75.23 | 70.58 | 72.78 | 63.84 | 60.87 | 59.61 | 63.73 | 67.23 | 59.58 | 57.84 | 49.58 | 49.71 | 47.39 | 49.23 | 53.21 | 50.75 | 41.73 | 51.05 | 49.13 | 44.76 | 42.65 | 44.13 | 41.80 | 37.60 | 40.62 | 36.88 | 34.12 | 33.46 | 31.55 | 31.37 | 28.56 | 27.67 | 25.58 | |
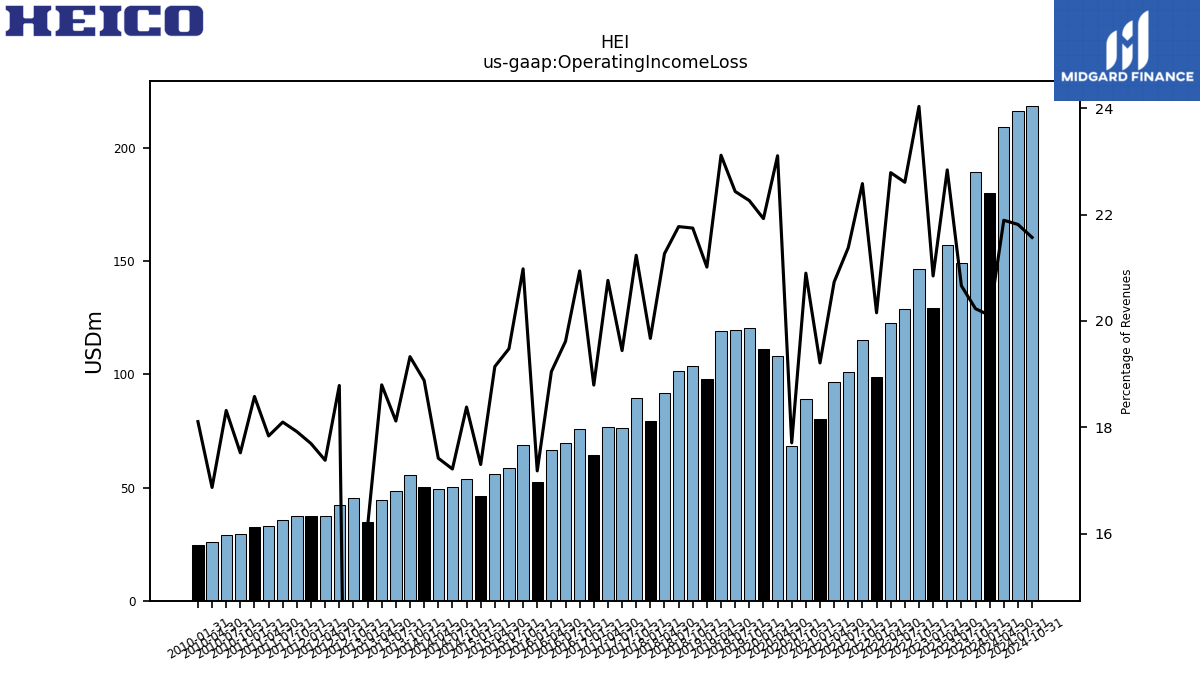
| Operating Income Loss | 180.21 | 189.45 | 149.37 | 157.09 | 129.43 | 146.50 | 128.75 | 122.78 | 98.82 | 115.03 | 100.84 | 96.75 | 80.28 | 89.06 | 68.43 | 108.16 | 110.99 | 120.55 | 119.41 | 119.18 | 97.95 | 103.70 | 101.42 | 91.56 | 79.56 | 89.44 | 76.12 | 76.54 | 64.55 | 76.08 | 69.85 | 66.79 | 52.62 | 68.95 | 58.51 | 55.79 | 46.41 | 53.72 | 50.11 | 49.17 | 50.38 | 55.56 | 48.41 | 44.69 | 34.94 | 45.61 | 42.45 | 37.60 | 37.63 | 37.44 | 35.71 | 32.91 | 32.37 | 29.68 | 28.99 | 25.96 | 24.54 | |
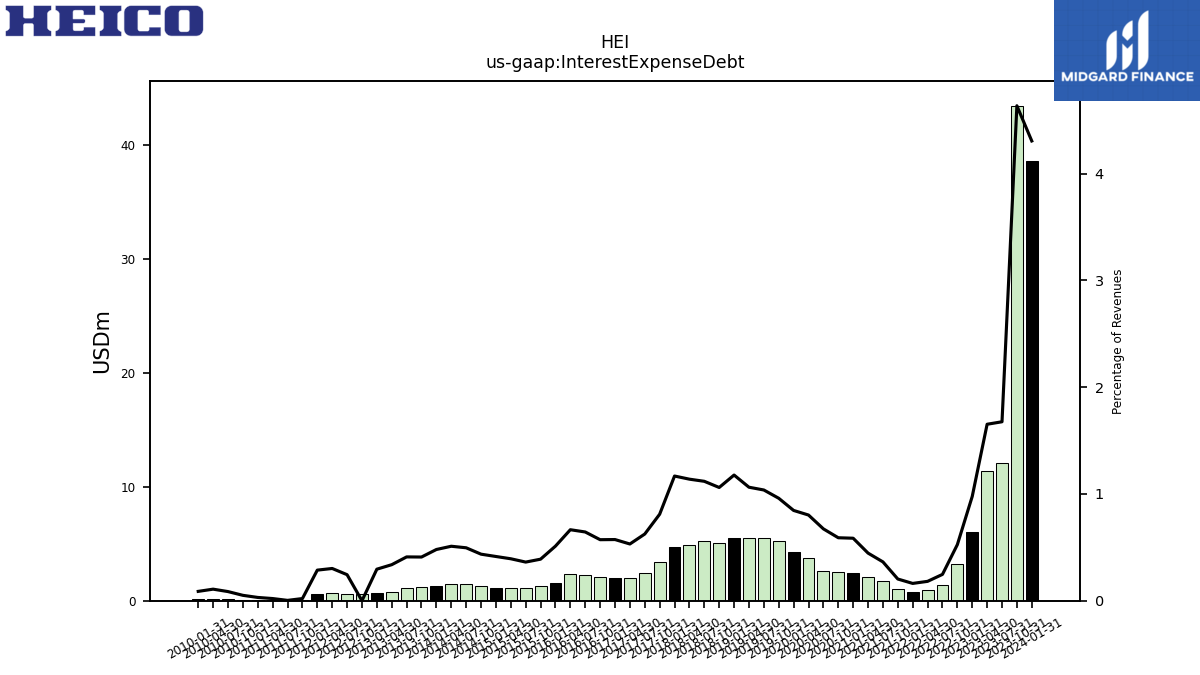
| Interest Expense Debt | 38.61 | 43.42 | 12.12 | 11.37 | 6.07 | 3.21 | 1.41 | 0.98 | 0.80 | 1.04 | 1.72 | 2.08 | 2.45 | 2.52 | 2.60 | 3.76 | 4.28 | 5.20 | 5.52 | 5.48 | 5.49 | 5.06 | 5.21 | 4.90 | 4.72 | 3.41 | 2.45 | 1.96 | 1.97 | 2.08 | 2.29 | 2.33 | 1.57 | 1.28 | 1.09 | 1.15 | 1.11 | 1.27 | 1.44 | 1.44 | 1.28 | 1.18 | 1.10 | 0.80 | 0.64 | 0.62 | 0.55 | 0.65 | 0.61 | 0.04 | 0.01 | 0.04 | 0.05 | 0.09 | 0.14 | 0.17 | 0.12 | |
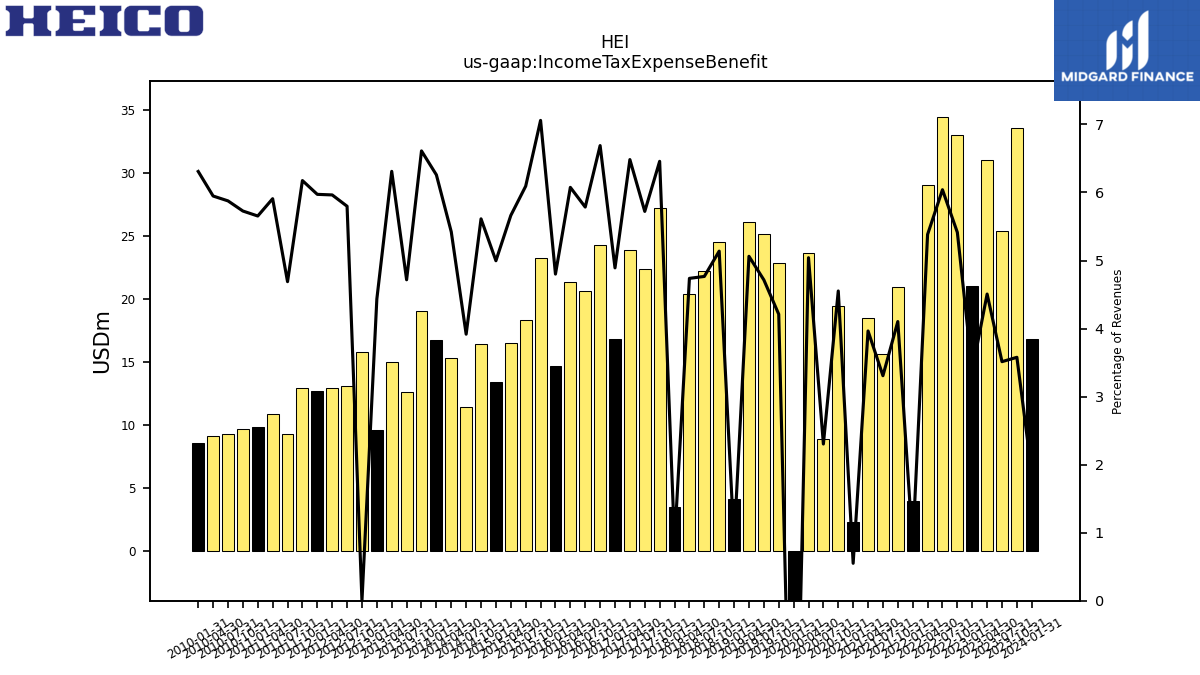
| Income Tax Expense Benefit | 16.80 | 33.50 | 25.40 | 31.00 | 21.00 | 33.00 | 34.40 | 29.00 | 4.00 | 20.90 | 15.60 | 18.50 | 2.30 | 19.40 | 8.90 | 23.60 | -22.90 | 22.80 | 25.10 | 26.10 | 4.10 | 24.50 | 22.20 | 20.40 | 3.50 | 27.20 | 22.40 | 23.90 | 16.80 | 24.30 | 20.60 | 21.30 | 14.70 | 23.20 | 18.30 | 16.50 | 13.40 | 16.40 | 11.40 | 15.30 | 16.70 | 19.00 | 12.60 | 15.00 | 9.60 | 15.80 | 13.10 | 12.90 | 12.70 | 12.90 | 9.25 | 10.90 | 9.85 | 9.70 | 9.30 | 9.15 | 8.55 | |
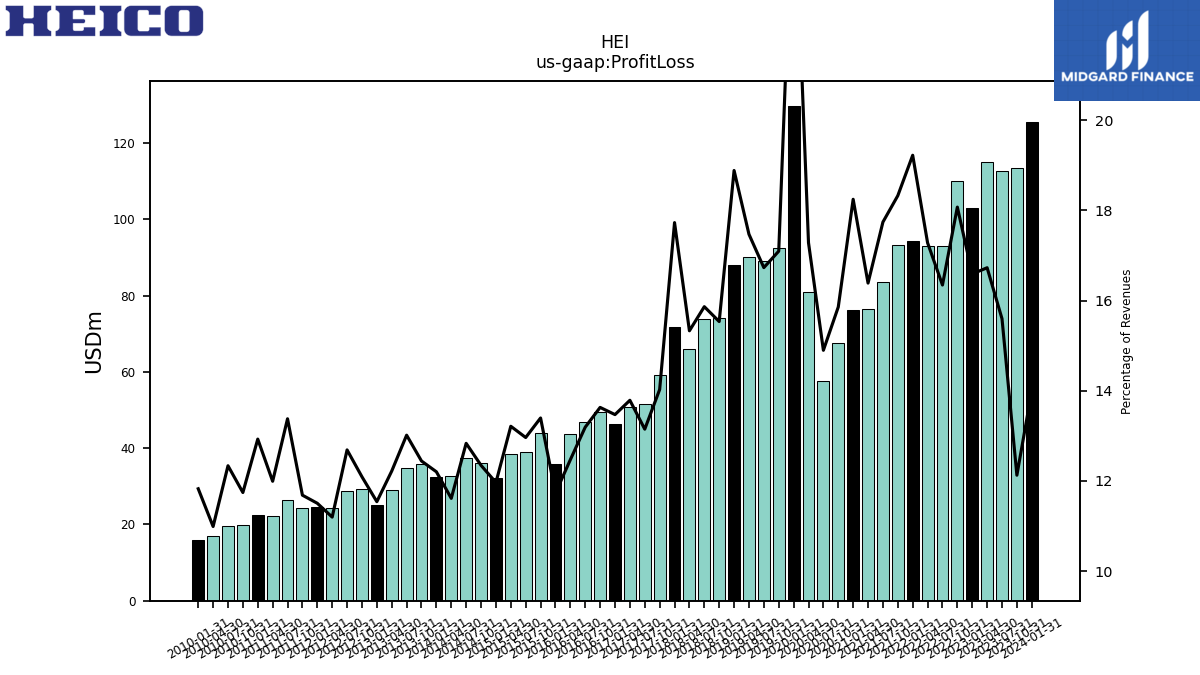
| Profit Loss | 125.48 | 113.56 | 112.75 | 115.06 | 103.00 | 110.17 | 93.09 | 93.11 | 94.25 | 93.36 | 83.68 | 76.47 | 76.25 | 67.58 | 57.56 | 80.91 | 129.80 | 92.57 | 89.06 | 90.08 | 88.03 | 74.08 | 73.90 | 66.01 | 71.69 | 59.09 | 51.48 | 50.83 | 46.27 | 49.52 | 46.98 | 43.73 | 35.92 | 44.03 | 38.94 | 38.50 | 32.09 | 36.08 | 37.35 | 32.78 | 32.56 | 35.76 | 34.77 | 29.05 | 24.98 | 29.31 | 28.67 | 24.22 | 24.47 | 24.41 | 26.39 | 22.13 | 22.52 | 19.89 | 19.53 | 16.91 | 16.03 | |
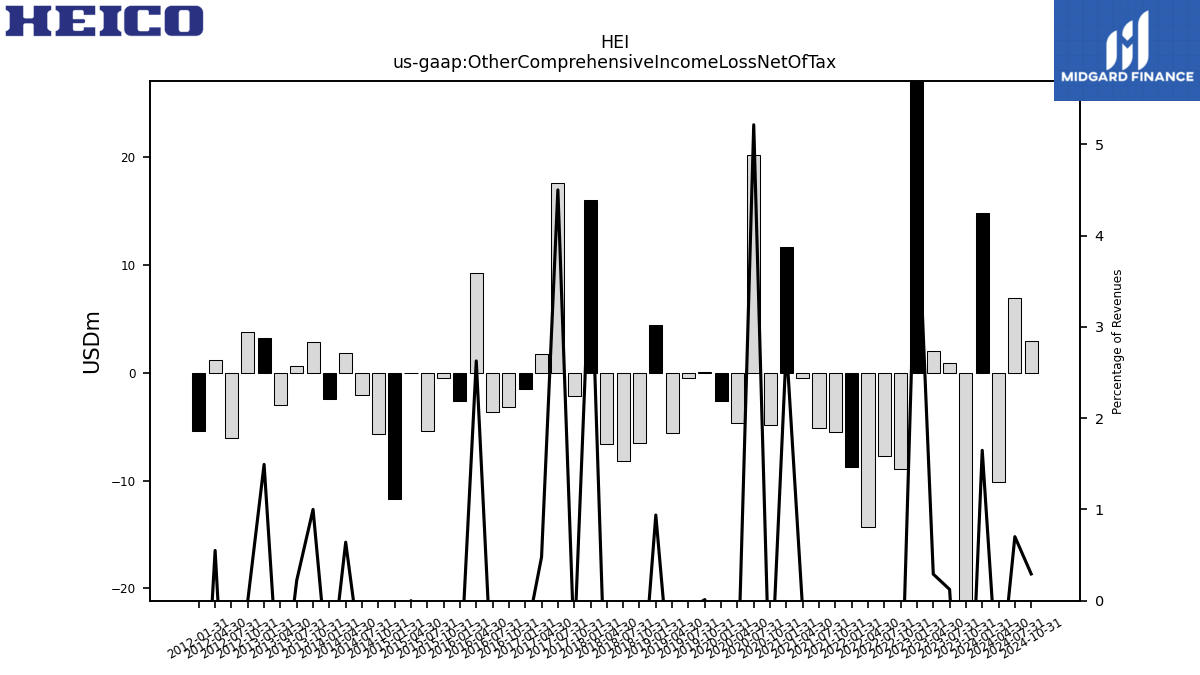
| Other Comprehensive Income Loss Net Of Tax | 14.77 | -24.29 | 0.90 | 2.01 | 28.40 | -8.92 | -7.73 | -14.26 | -8.74 | -5.53 | -5.11 | -0.51 | 11.68 | -4.86 | 20.15 | -4.71 | -2.65 | 0.07 | -0.53 | -5.63 | 4.38 | -6.55 | -8.18 | -6.57 | 15.97 | -2.18 | 17.63 | 1.77 | -1.52 | -3.22 | -3.64 | 9.21 | -2.67 | -0.47 | -5.44 | 0.00 | -11.74 | -5.72 | -2.06 | 1.81 | -2.46 | 2.88 | 0.60 | -2.99 | 3.23 | 3.81 | -6.03 | 1.19 | -5.43 | NA | NA | NA | NA | NA | NA | NA | NA | |
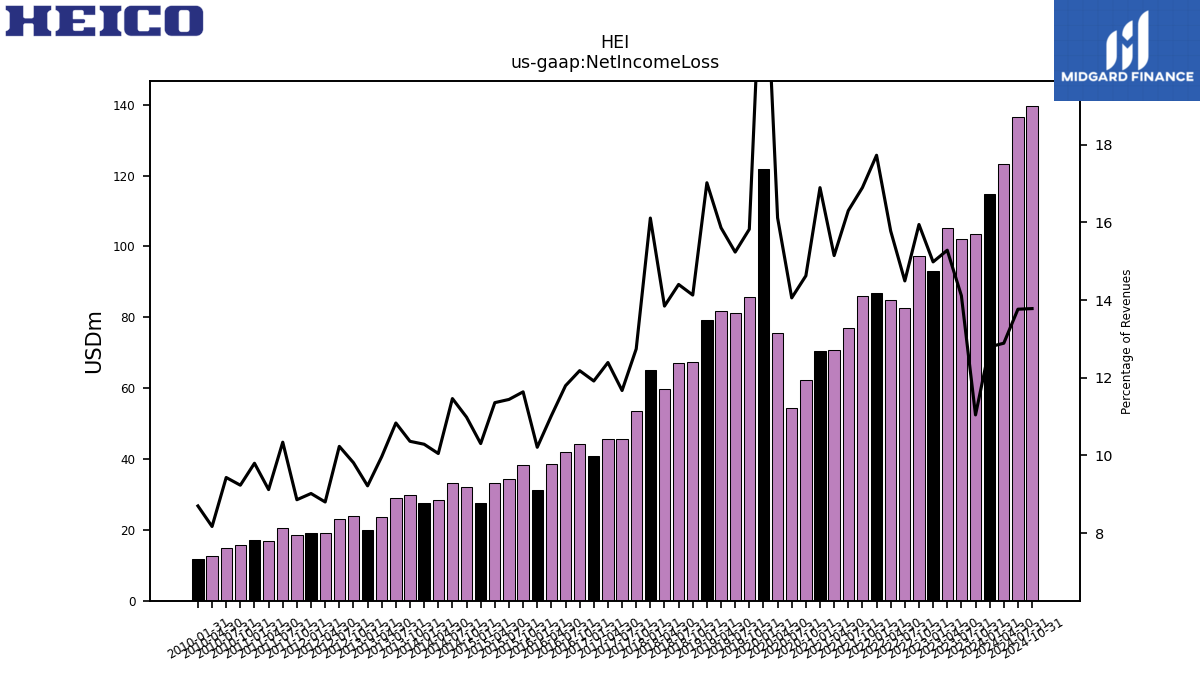
| Net Income Loss | 114.70 | 103.43 | 102.02 | 105.12 | 93.03 | 97.20 | 82.54 | 85.01 | 86.92 | 86.06 | 76.89 | 70.67 | 70.60 | 62.33 | 54.32 | 75.45 | 121.89 | 85.68 | 81.10 | 81.78 | 79.33 | 67.38 | 67.09 | 59.62 | 65.15 | 53.67 | 45.70 | 45.69 | 40.93 | 44.26 | 42.00 | 38.66 | 31.27 | 38.25 | 34.37 | 33.10 | 27.64 | 32.10 | 33.37 | 28.37 | 27.45 | 29.79 | 28.95 | 23.70 | 19.96 | 23.79 | 23.13 | 19.04 | 19.18 | 18.51 | 20.40 | 16.83 | 17.07 | 15.64 | 14.93 | 12.57 | 11.79 | |
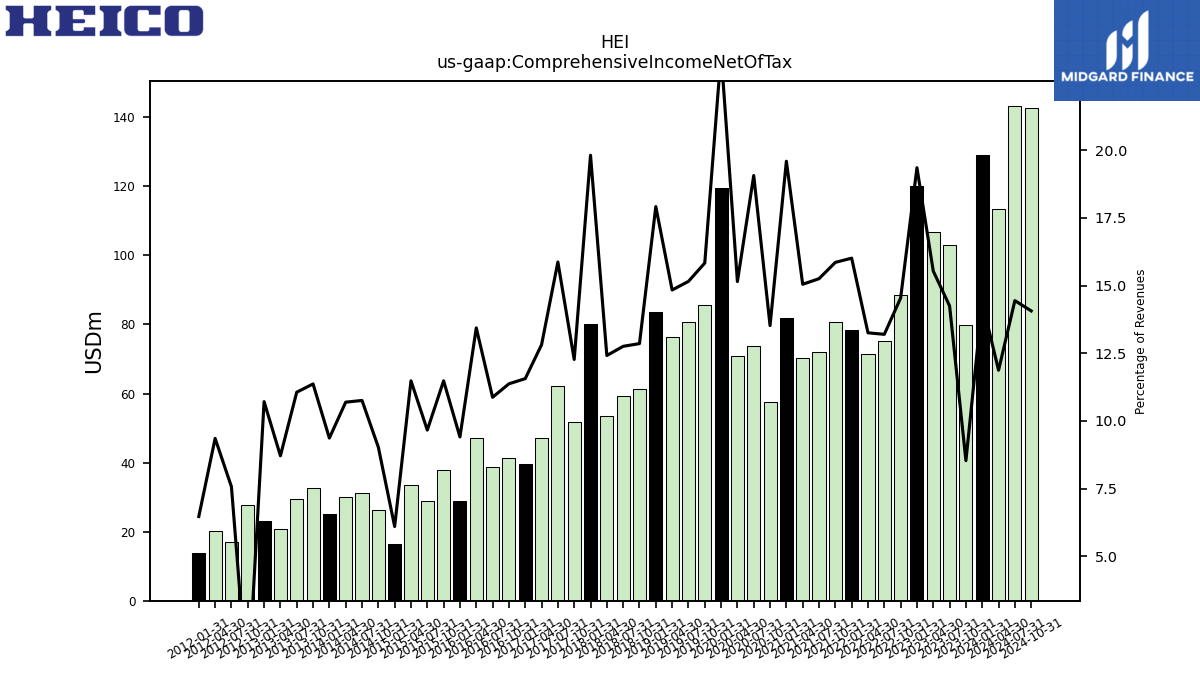
| Comprehensive Income Net Of Tax | 128.92 | 79.90 | 102.99 | 106.85 | 120.17 | 88.63 | 75.17 | 71.42 | 78.51 | 80.78 | 71.95 | 70.22 | 81.87 | 57.63 | 73.67 | 70.91 | 119.36 | 85.73 | 80.67 | 76.50 | 83.52 | 61.31 | 59.41 | 53.46 | 80.12 | 51.69 | 62.13 | 47.23 | 39.71 | 41.31 | 38.72 | 47.11 | 28.81 | 37.73 | 29.02 | 33.46 | 16.36 | 26.39 | 31.30 | 30.18 | 24.99 | 32.67 | 29.55 | 20.71 | 23.19 | 27.60 | 17.10 | 20.23 | 13.76 | NA | NA | NA | NA | NA | NA | NA | NA |
| 2024-01-31 | 2023-10-31 | 2023-07-31 | 2023-04-30 | 2023-01-31 | 2022-10-31 | 2022-07-31 | 2022-04-30 | 2022-01-31 | 2021-10-31 | 2021-07-31 | 2021-04-30 | 2021-01-31 | 2020-10-31 | 2020-07-31 | 2020-04-30 | 2020-01-31 | 2019-10-31 | 2019-07-31 | 2019-04-30 | 2019-01-31 | 2018-10-31 | 2018-07-31 | 2018-04-30 | 2018-01-31 | 2017-10-31 | 2017-07-31 | 2017-04-30 | 2017-01-31 | 2016-10-31 | 2016-07-31 | 2016-04-30 | 2016-01-31 | 2015-10-31 | 2015-07-31 | 2015-04-30 | 2015-01-31 | 2014-10-31 | 2014-07-31 | 2014-04-30 | 2014-01-31 | 2013-10-31 | 2013-07-31 | 2013-04-30 | 2013-01-31 | 2012-10-31 | 2012-07-31 | 2012-04-30 | 2012-01-31 | 2011-10-31 | 2011-07-31 | 2011-04-30 | 2011-01-31 | 2010-10-31 | 2010-07-31 | 2010-04-30 | 2010-01-31 | ||
|---|---|---|---|---|---|---|---|---|---|---|---|---|---|---|---|---|---|---|---|---|---|---|---|---|---|---|---|---|---|---|---|---|---|---|---|---|---|---|---|---|---|---|---|---|---|---|---|---|---|---|---|---|---|---|---|---|---|---|
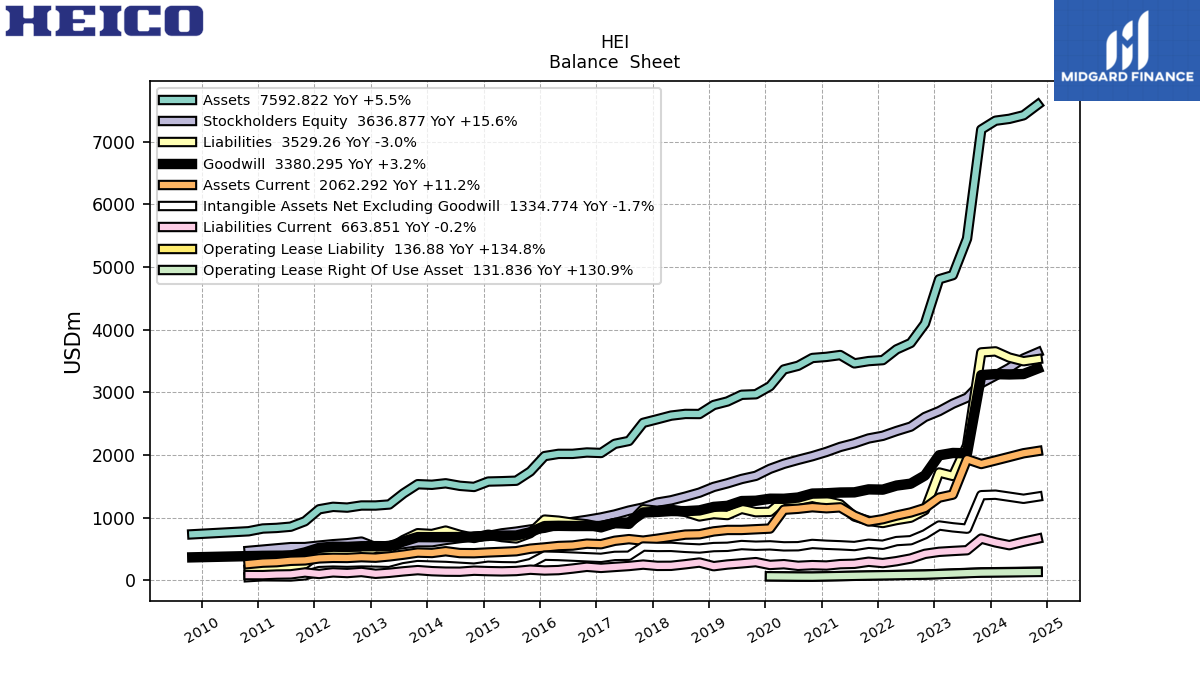
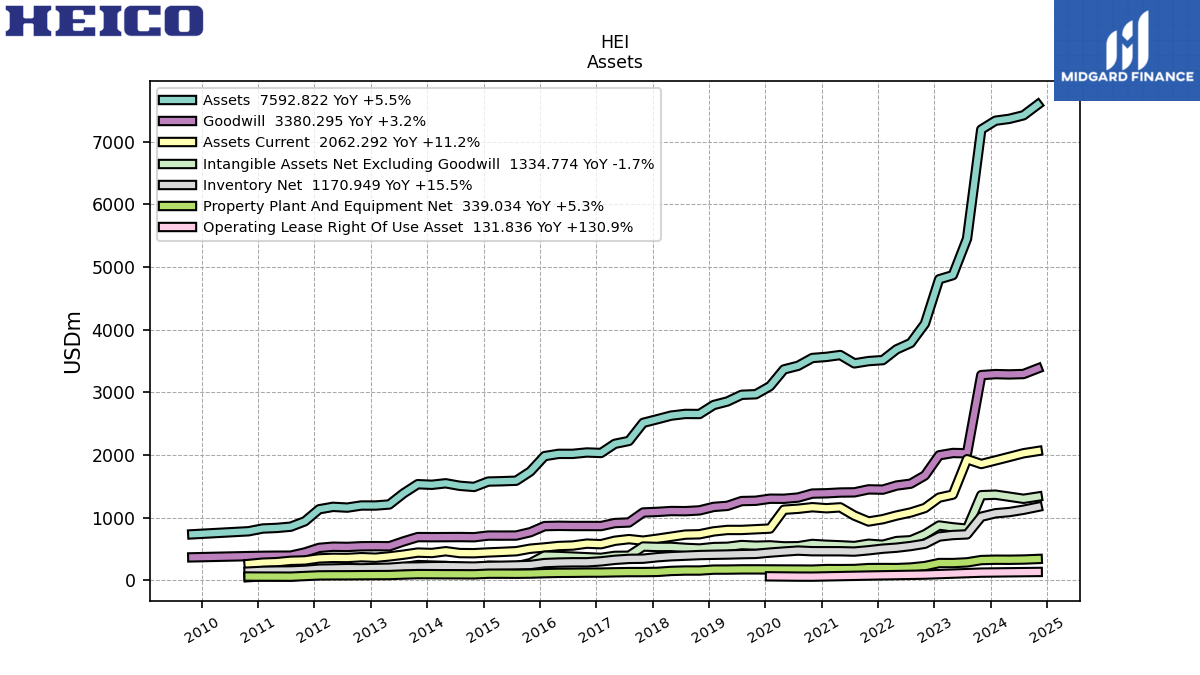
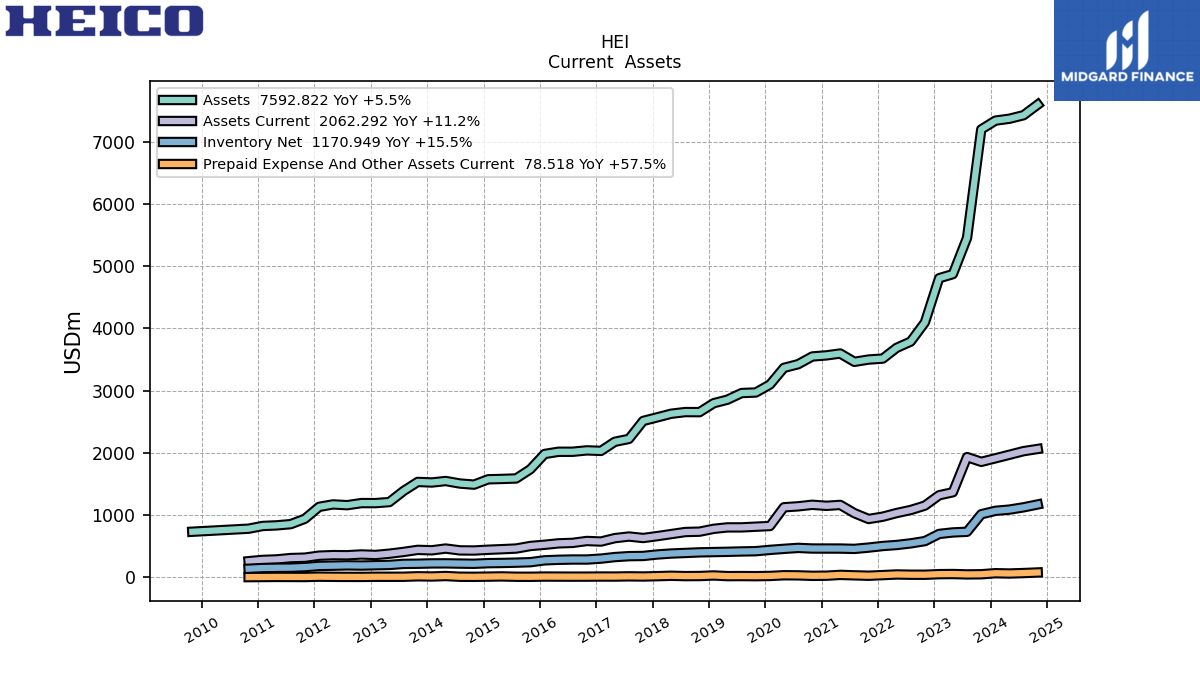
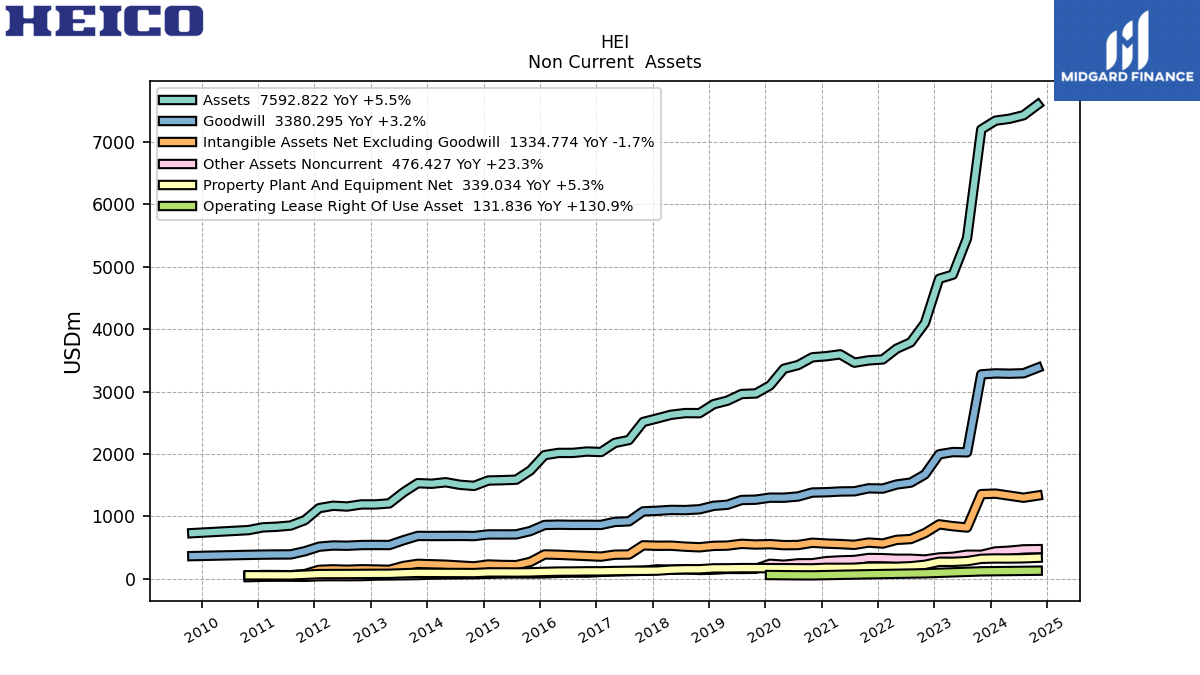
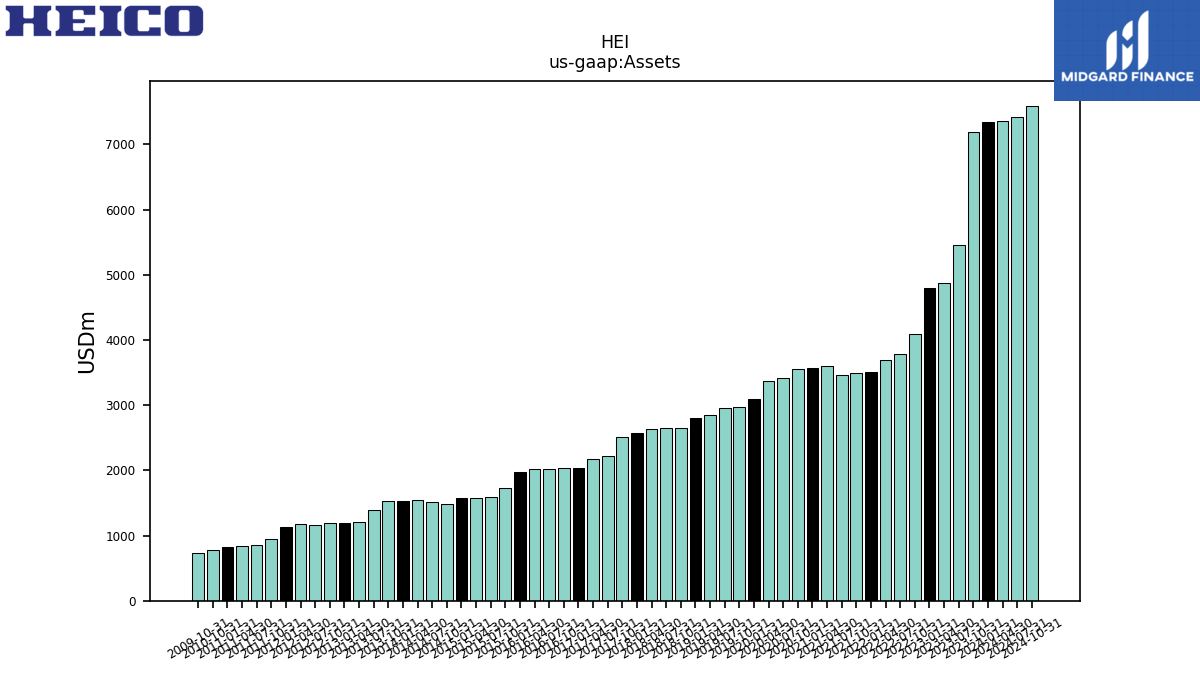
| Assets | 7336.07 | 7195.06 | 5453.30 | 4870.20 | 4804.62 | 4095.50 | 3787.35 | 3685.33 | 3513.89 | 3498.41 | 3461.64 | 3595.17 | 3565.58 | 3547.71 | 3423.25 | 3364.84 | 3097.12 | 2969.21 | 2960.29 | 2853.64 | 2797.01 | 2653.40 | 2654.84 | 2627.88 | 2570.44 | 2512.43 | 2223.72 | 2177.34 | 2031.42 | 2039.47 | 2017.32 | 2017.11 | 1981.50 | 1736.39 | 1588.41 | 1580.59 | 1575.26 | 1489.21 | 1507.12 | 1547.44 | 1523.57 | 1533.02 | 1386.66 | 1209.21 | 1192.52 | 1192.85 | 1159.20 | 1171.52 | 1132.50 | 941.07 | 854.74 | 834.91 | 825.50 | 781.64 | NA | NA | NA | |
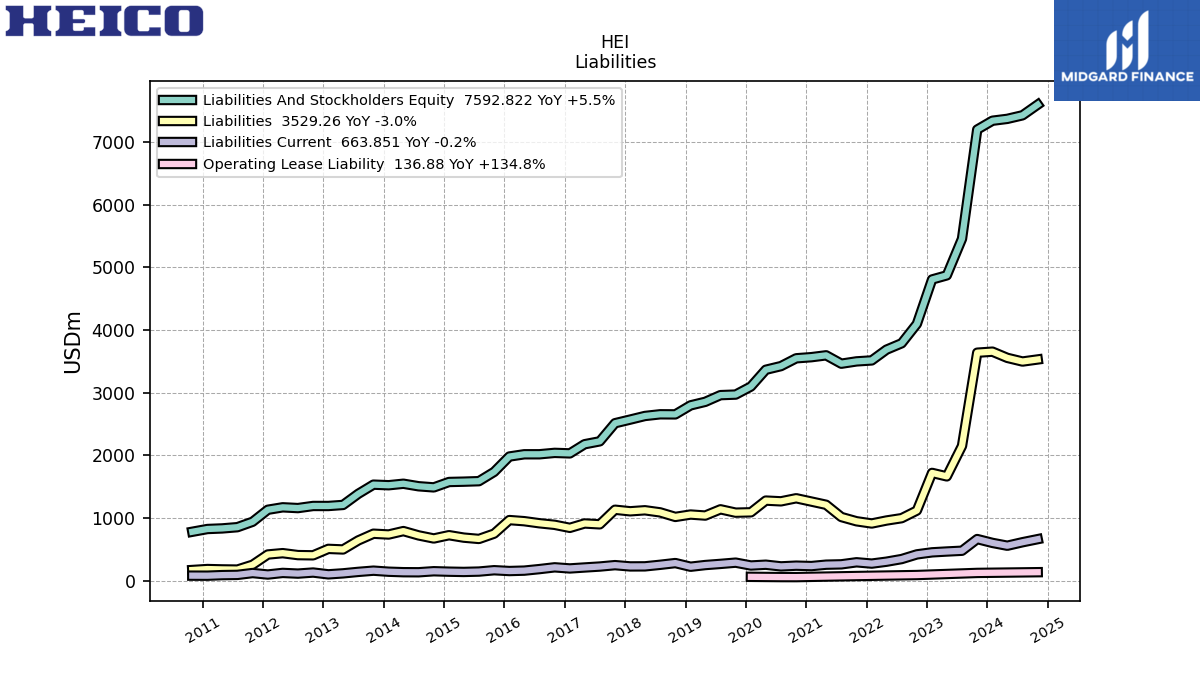
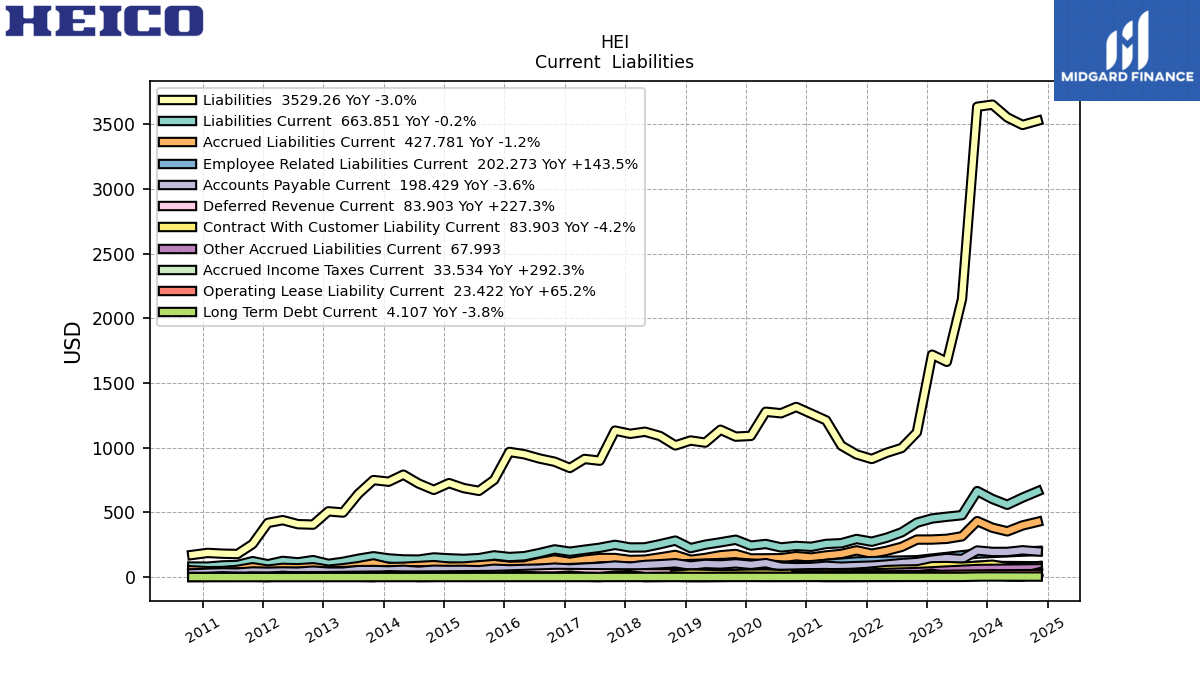
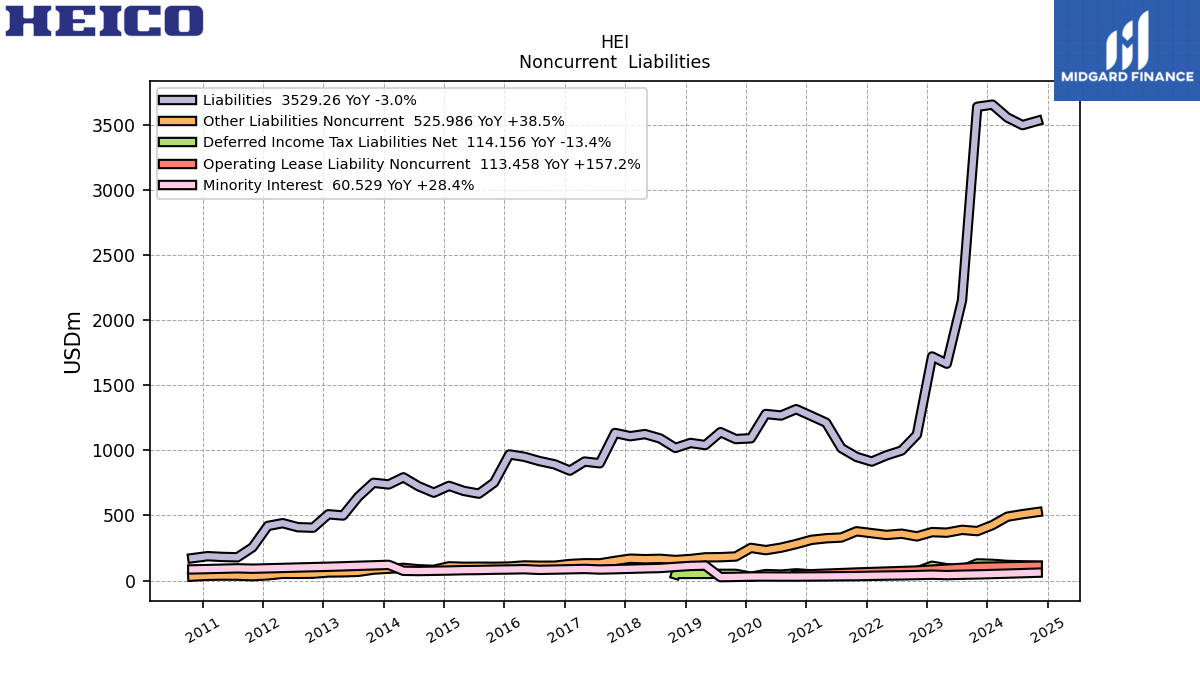
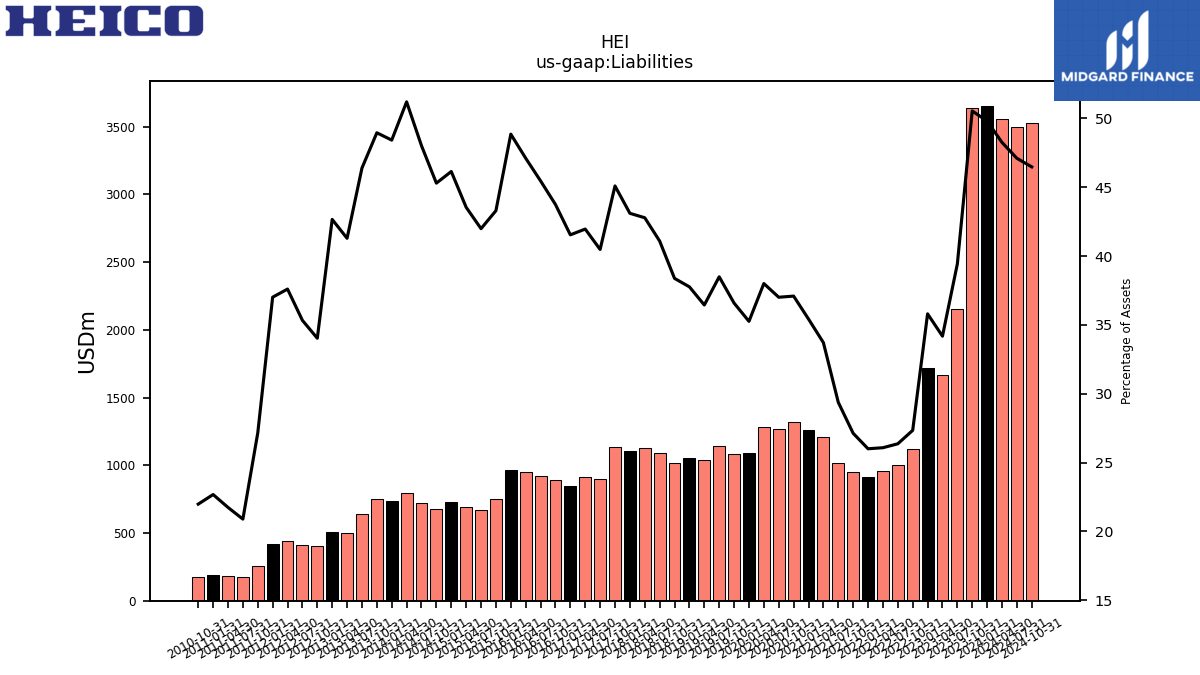
| Liabilities | 3653.57 | 3637.11 | 2150.22 | 1664.70 | 1720.16 | 1119.59 | 998.37 | 960.93 | 913.55 | 948.88 | 1016.87 | 1212.01 | 1263.20 | 1315.90 | 1266.90 | 1278.81 | 1091.98 | 1086.29 | 1139.56 | 1040.03 | 1056.26 | 1018.34 | 1090.92 | 1124.34 | 1108.07 | 1133.02 | 900.17 | 913.68 | 843.93 | 892.26 | 917.14 | 950.29 | 968.15 | 751.83 | 667.01 | 688.28 | 726.91 | 674.63 | 723.72 | 792.39 | 737.82 | 750.56 | 643.37 | 499.31 | 508.76 | 405.92 | 409.52 | 440.51 | 419.17 | 255.49 | 178.53 | 181.47 | 187.15 | 171.77 | NA | NA | NA | |
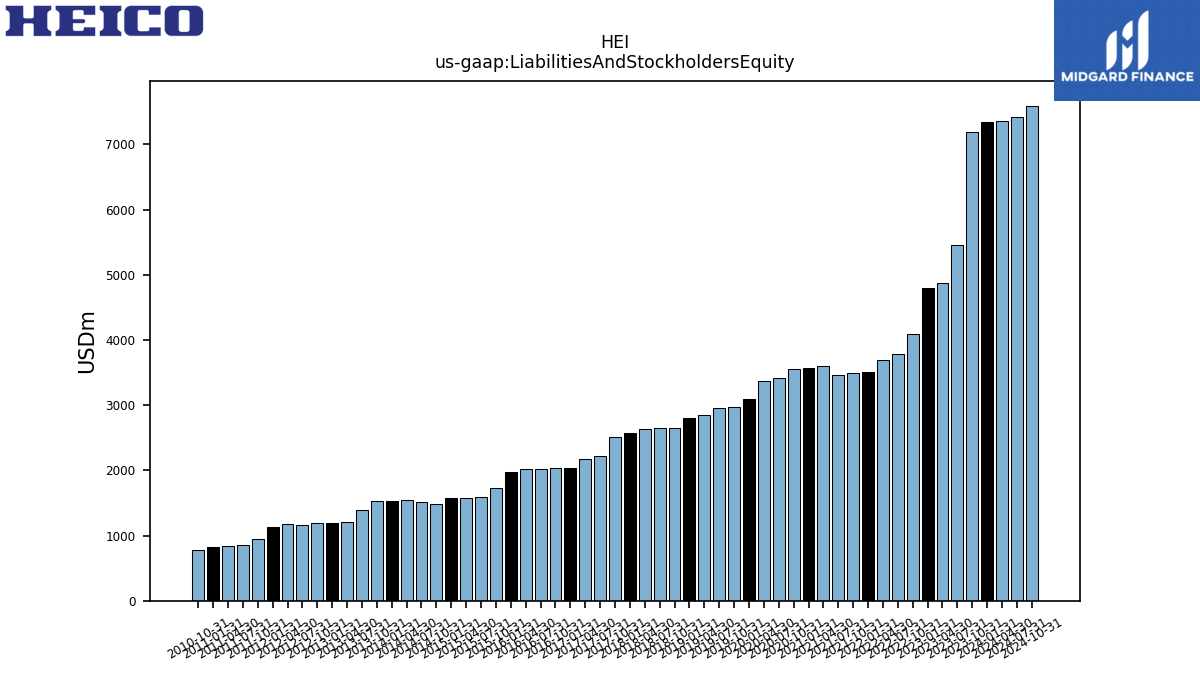
| Liabilities And Stockholders Equity | 7336.07 | 7195.06 | 5453.30 | 4870.20 | 4804.62 | 4095.50 | 3787.35 | 3685.33 | 3513.89 | 3498.41 | 3461.64 | 3595.17 | 3565.58 | 3547.71 | 3423.25 | 3364.84 | 3097.12 | 2969.21 | 2960.29 | 2853.64 | 2797.01 | 2653.40 | 2654.84 | 2627.88 | 2570.44 | 2512.43 | 2223.72 | 2177.34 | 2031.42 | 2039.47 | 2017.32 | 2017.11 | 1981.50 | 1736.39 | 1588.41 | 1580.59 | 1575.26 | 1489.21 | 1507.12 | 1547.44 | 1523.57 | 1533.02 | 1386.66 | 1209.21 | 1192.52 | 1192.85 | 1159.20 | 1171.52 | 1132.50 | 941.07 | 854.74 | 834.91 | 825.50 | 781.64 | NA | NA | NA | |
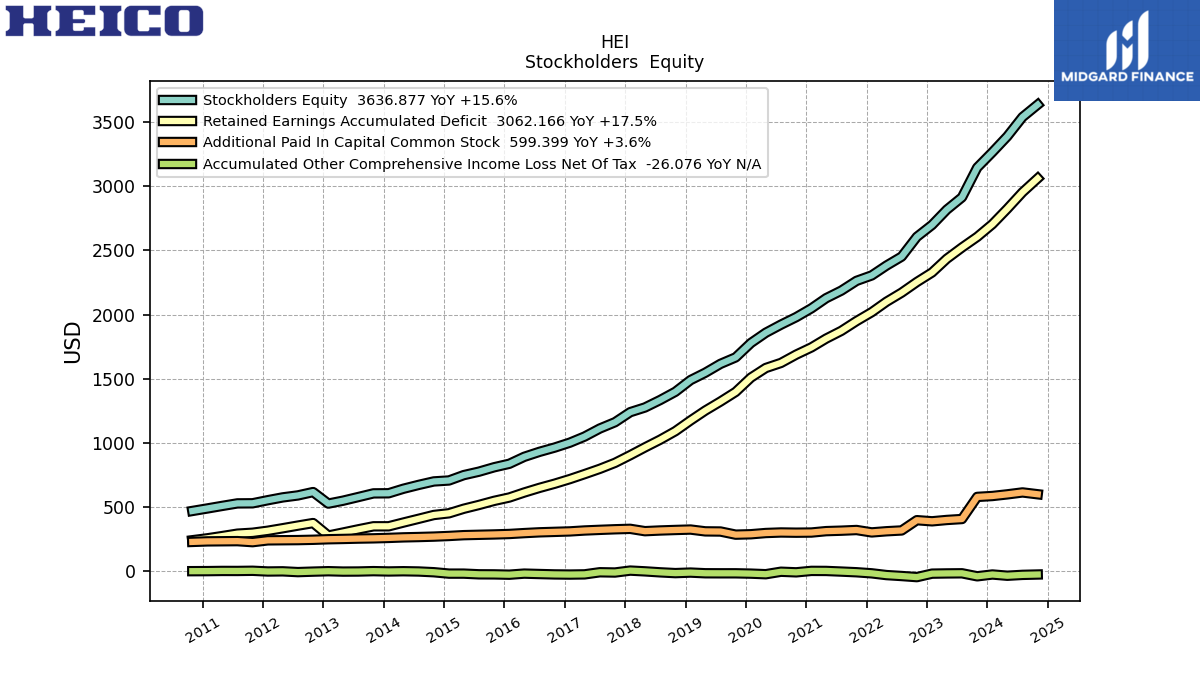
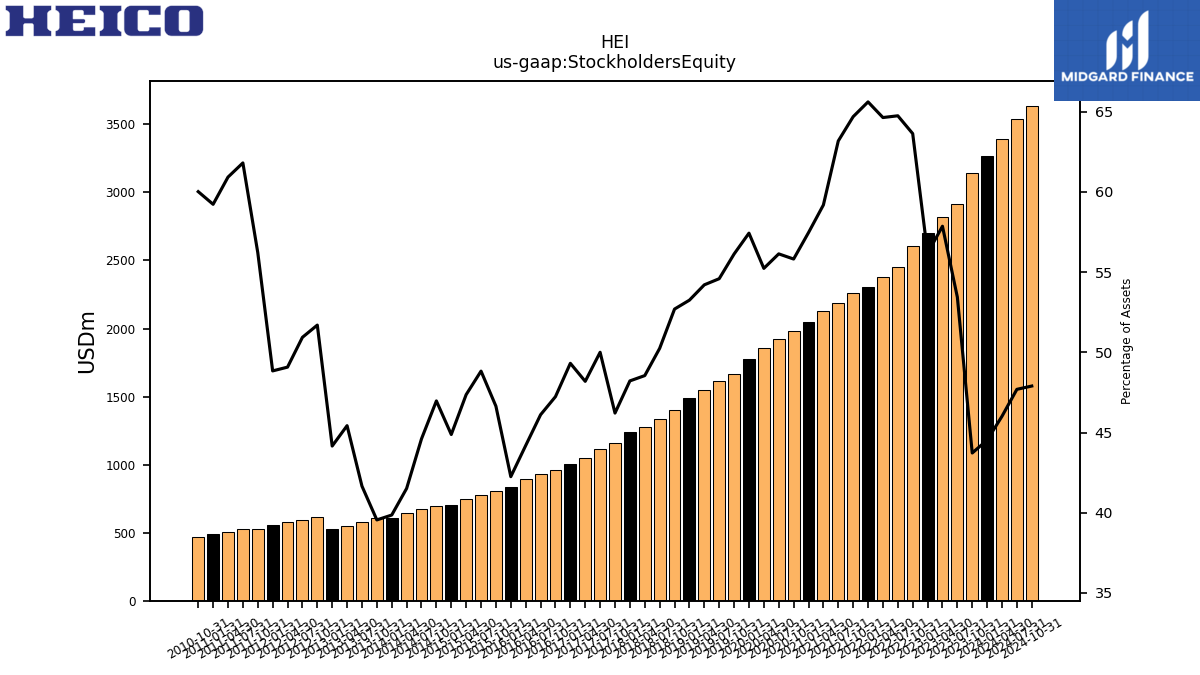
| Stockholders Equity | 3266.44 | 3145.99 | 2914.37 | 2817.89 | 2699.14 | 2606.14 | 2452.13 | 2382.04 | 2305.49 | 2263.07 | 2186.93 | 2127.82 | 2048.84 | 1980.18 | 1921.71 | 1858.51 | 1778.65 | 1666.54 | 1616.00 | 1546.89 | 1489.47 | 1398.25 | 1333.97 | 1275.83 | 1239.41 | 1161.08 | 1111.92 | 1049.30 | 1001.79 | 963.38 | 930.16 | 891.35 | 837.17 | 809.86 | 775.60 | 748.60 | 706.95 | 699.48 | 672.27 | 642.41 | 607.24 | 606.35 | 577.68 | 549.33 | 526.60 | 616.67 | 590.43 | 574.95 | 553.13 | 529.07 | 528.29 | 508.65 | 488.92 | 469.11 | NA | NA | NA |
| 2024-01-31 | 2023-10-31 | 2023-07-31 | 2023-04-30 | 2023-01-31 | 2022-10-31 | 2022-07-31 | 2022-04-30 | 2022-01-31 | 2021-10-31 | 2021-07-31 | 2021-04-30 | 2021-01-31 | 2020-10-31 | 2020-07-31 | 2020-04-30 | 2020-01-31 | 2019-10-31 | 2019-07-31 | 2019-04-30 | 2019-01-31 | 2018-10-31 | 2018-07-31 | 2018-04-30 | 2018-01-31 | 2017-10-31 | 2017-07-31 | 2017-04-30 | 2017-01-31 | 2016-10-31 | 2016-07-31 | 2016-04-30 | 2016-01-31 | 2015-10-31 | 2015-07-31 | 2015-04-30 | 2015-01-31 | 2014-10-31 | 2014-07-31 | 2014-04-30 | 2014-01-31 | 2013-10-31 | 2013-07-31 | 2013-04-30 | 2013-01-31 | 2012-10-31 | 2012-07-31 | 2012-04-30 | 2012-01-31 | 2011-10-31 | 2011-07-31 | 2011-04-30 | 2011-01-31 | 2010-10-31 | 2010-07-31 | 2010-04-30 | 2010-01-31 | ||
|---|---|---|---|---|---|---|---|---|---|---|---|---|---|---|---|---|---|---|---|---|---|---|---|---|---|---|---|---|---|---|---|---|---|---|---|---|---|---|---|---|---|---|---|---|---|---|---|---|---|---|---|---|---|---|---|---|---|---|
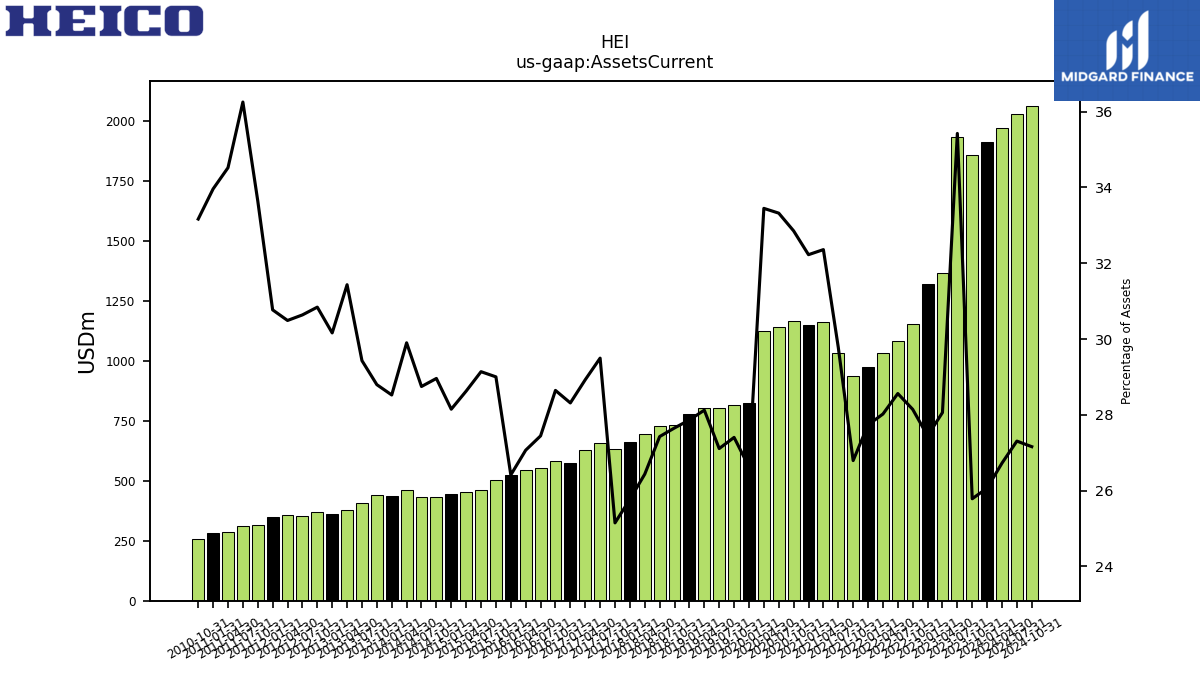
| Assets Current | 1912.36 | 1855.34 | 1931.92 | 1366.64 | 1318.80 | 1152.73 | 1081.77 | 1032.72 | 974.56 | 937.38 | 1031.02 | 1163.42 | 1149.10 | 1165.62 | 1140.74 | 1125.51 | 824.71 | 813.73 | 802.58 | 802.57 | 779.42 | 733.81 | 728.16 | 694.73 | 662.43 | 631.89 | 655.93 | 629.84 | 575.21 | 584.22 | 553.67 | 546.00 | 523.43 | 503.61 | 462.86 | 452.49 | 443.44 | 431.29 | 433.29 | 462.71 | 434.60 | 441.47 | 408.11 | 380.11 | 359.69 | 367.91 | 355.15 | 357.21 | 348.48 | 316.64 | 309.89 | 288.23 | 280.36 | 259.25 | NA | NA | NA | |
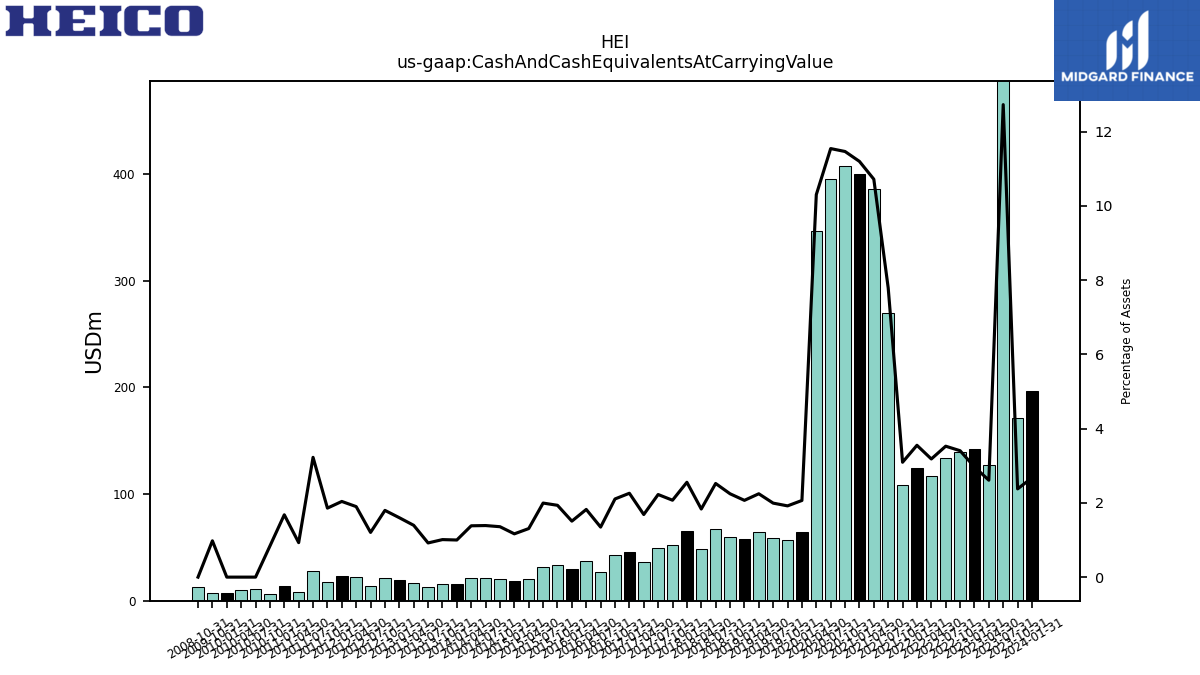
| Cash And Cash Equivalents At Carrying Value | 196.32 | 171.05 | 694.26 | 127.16 | 142.62 | 139.50 | 133.60 | 117.32 | 124.82 | 108.30 | 269.82 | 385.44 | 399.40 | 406.85 | 395.28 | 346.79 | 63.97 | 57.00 | 59.02 | 64.09 | 57.86 | 59.60 | 66.98 | 48.23 | 65.69 | 52.07 | 49.49 | 36.73 | 45.91 | 42.95 | 27.19 | 36.79 | 29.89 | 33.60 | 31.70 | 20.68 | 18.37 | 20.23 | 20.94 | 21.40 | 15.24 | 15.50 | 12.77 | 16.88 | 19.09 | 21.45 | 13.96 | 22.26 | 23.09 | 17.50 | 27.59 | 7.76 | 13.87 | 6.54 | 11.04 | 10.53 | 7.52 | |
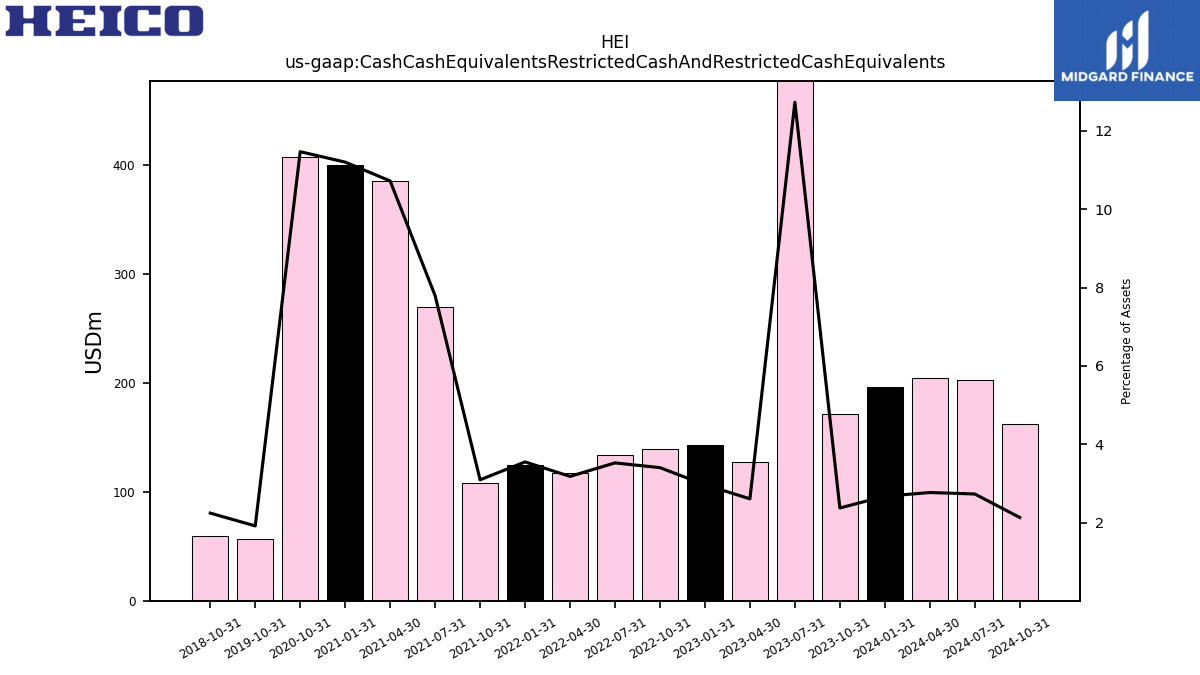
| Cash Cash Equivalents Restricted Cash And Restricted Cash Equivalents | 196.32 | 171.05 | 694.26 | 127.16 | 142.62 | 139.50 | 133.60 | 117.32 | 124.82 | 108.30 | 269.82 | 385.44 | 399.40 | 406.85 | NA | NA | NA | 57.00 | NA | NA | NA | 59.60 | NA | NA | NA | NA | NA | NA | NA | NA | NA | NA | NA | NA | NA | NA | NA | NA | NA | NA | NA | NA | NA | NA | NA | NA | NA | NA | NA | NA | NA | NA | NA | NA | NA | NA | NA | |
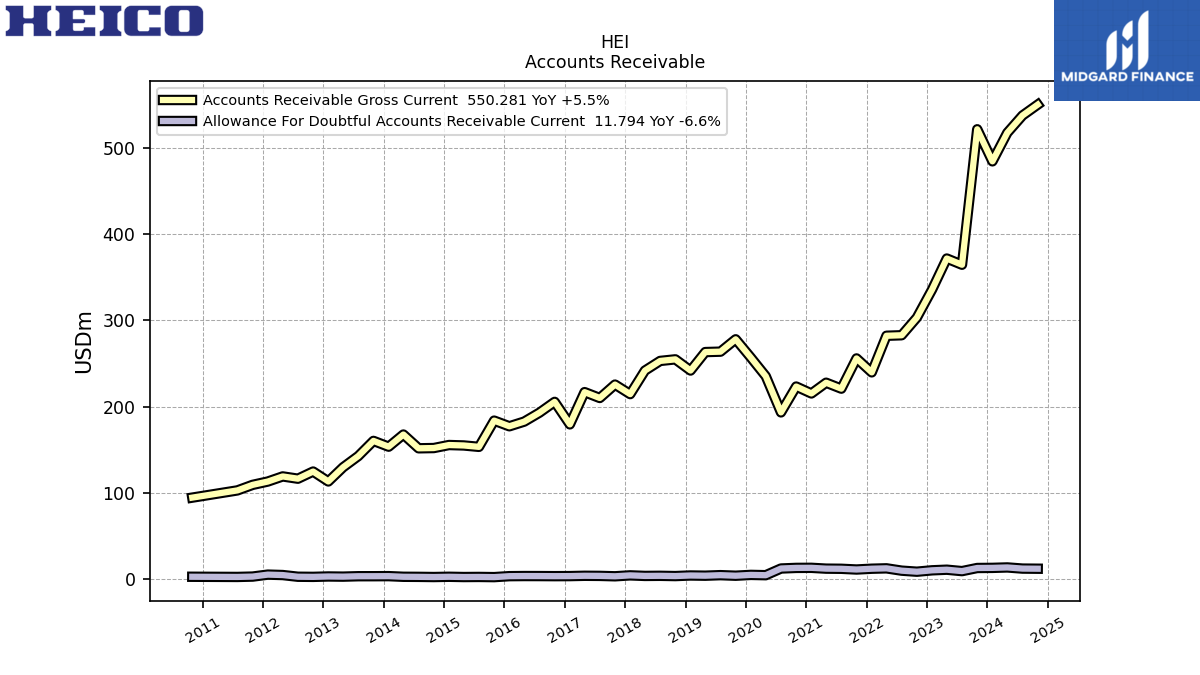
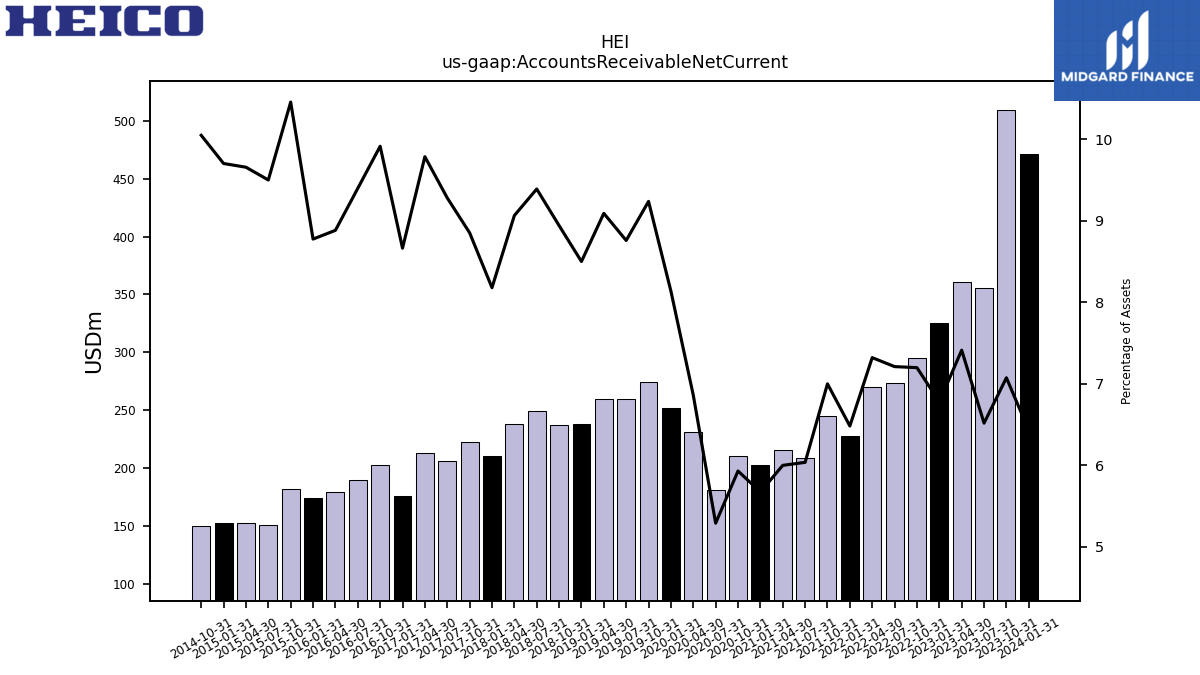
| Accounts Receivable Net Current | 471.70 | 509.07 | 355.49 | 361.06 | 325.76 | 294.85 | 273.15 | 269.85 | 227.83 | 244.92 | 209.00 | 215.74 | 202.32 | 210.43 | 181.13 | 230.88 | 252.05 | 274.33 | 259.32 | 259.47 | 237.80 | 237.29 | 249.33 | 238.23 | 210.28 | 222.46 | 206.41 | 213.11 | 176.03 | 202.23 | 189.62 | 179.21 | 173.91 | 181.59 | 150.93 | 152.66 | 152.87 | 149.67 | NA | NA | NA | NA | NA | NA | NA | NA | NA | NA | NA | NA | NA | NA | NA | NA | NA | NA | NA | |
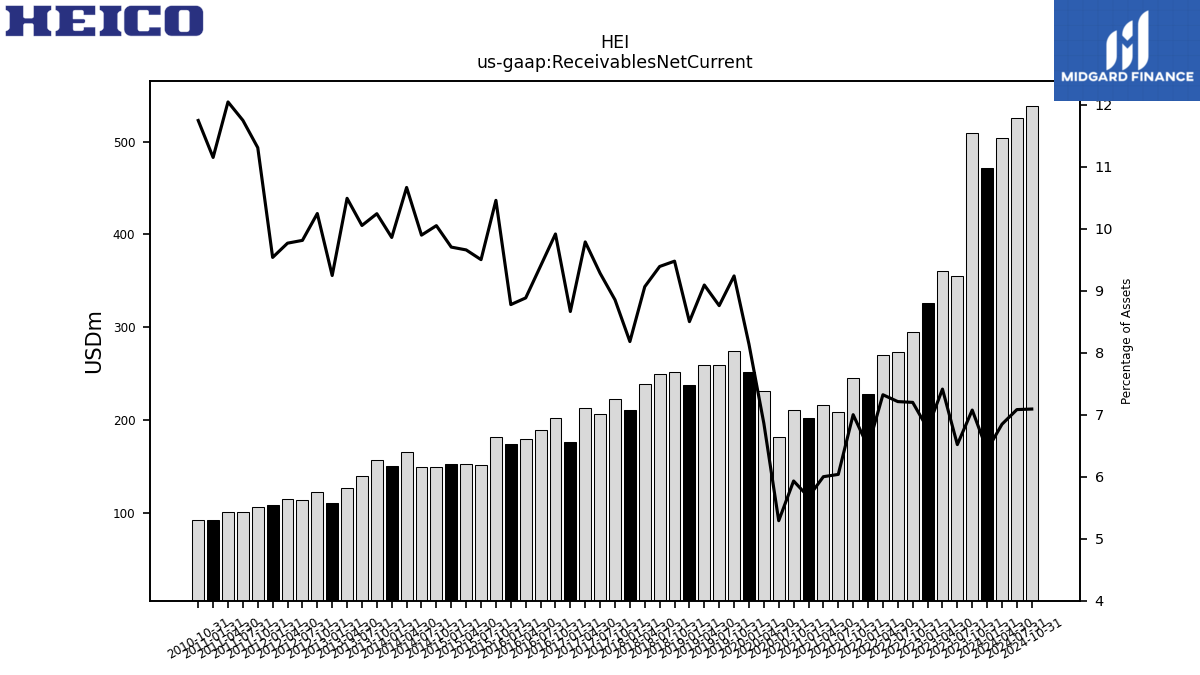
| Receivables Net Current | 471.70 | 509.07 | 355.49 | 361.06 | 325.76 | 294.85 | 273.15 | 269.85 | 227.83 | 244.92 | 209.00 | 215.74 | 202.32 | 210.43 | 181.13 | 230.88 | 252.05 | 274.33 | 259.32 | 259.47 | 237.80 | 251.47 | 249.33 | 238.23 | 210.28 | 222.46 | 206.41 | 213.11 | 176.03 | 202.23 | 189.62 | 179.21 | 173.91 | 181.59 | 150.93 | 152.66 | 152.87 | 149.67 | 149.16 | 165.05 | 150.21 | 157.02 | 139.40 | 126.86 | 110.26 | 122.21 | 113.75 | 114.43 | 108.01 | 106.41 | 100.42 | 100.57 | 92.05 | 91.81 | NA | NA | NA | |
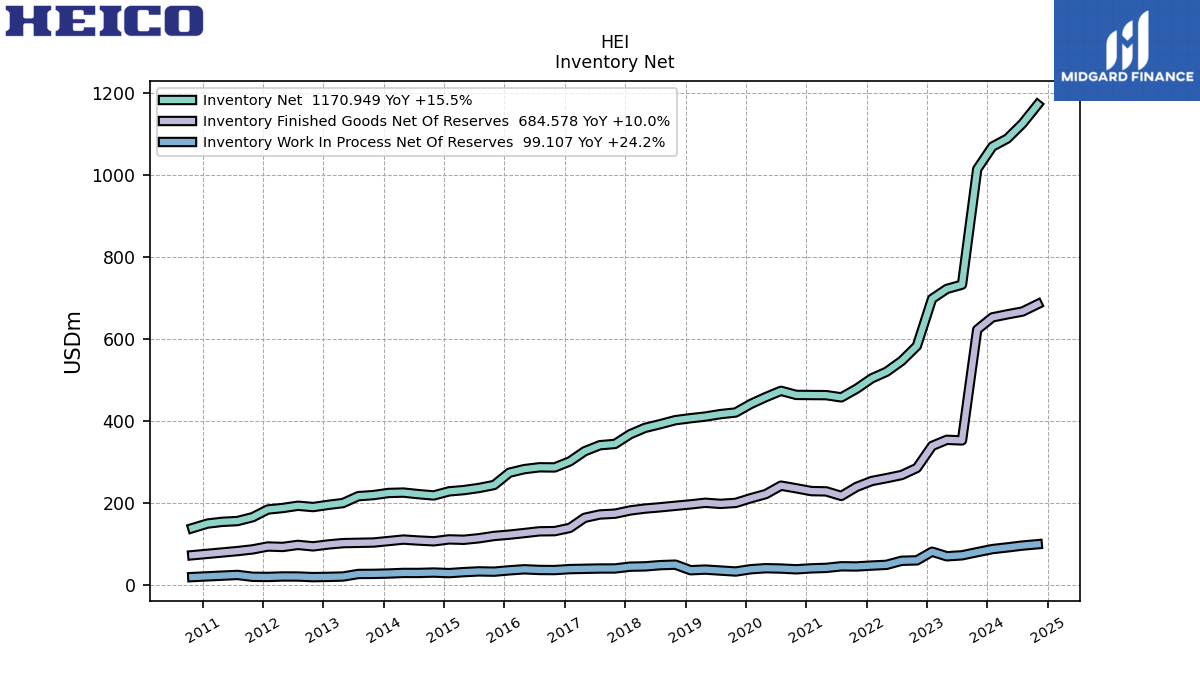
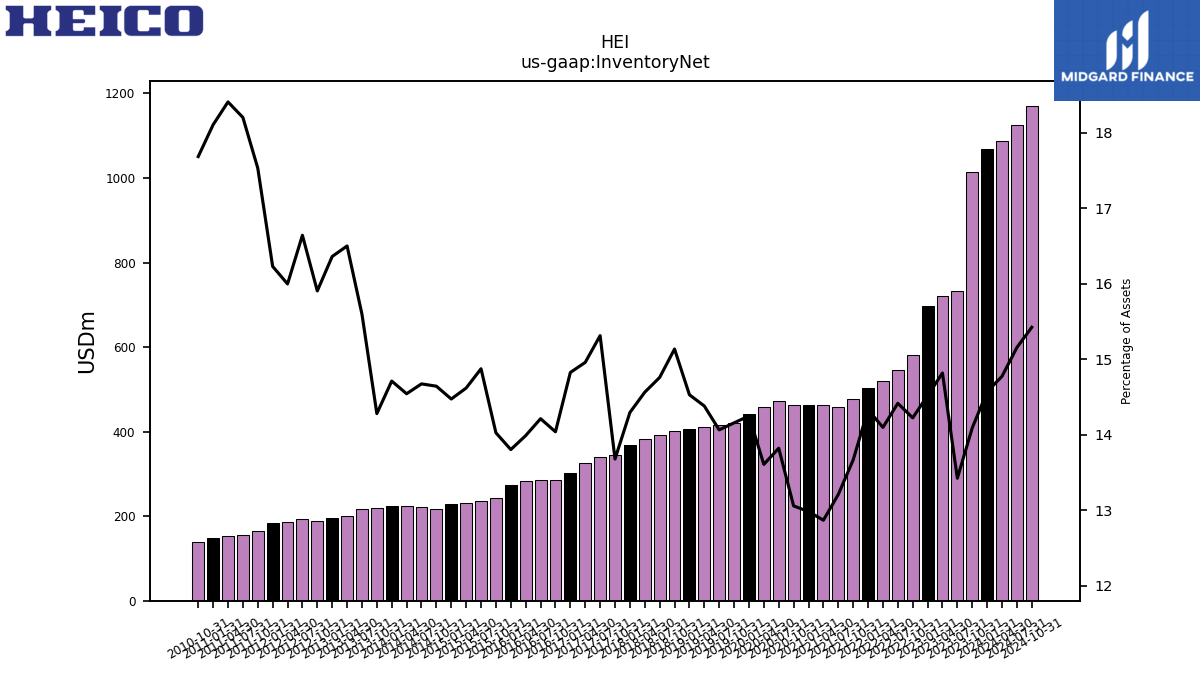
| Inventory Net | 1068.73 | 1013.68 | 731.97 | 721.57 | 697.50 | 582.47 | 545.94 | 519.50 | 503.51 | 478.05 | 457.17 | 462.59 | 462.85 | 463.20 | 473.10 | 457.82 | 441.25 | 420.32 | 416.31 | 410.33 | 406.35 | 401.55 | 391.79 | 382.67 | 367.39 | 343.63 | 340.47 | 325.66 | 301.12 | 286.30 | 286.68 | 282.14 | 273.49 | 243.52 | 236.24 | 231.03 | 227.97 | 218.04 | 221.13 | 225.02 | 224.11 | 218.89 | 216.26 | 199.50 | 195.09 | 189.70 | 192.89 | 187.40 | 183.79 | 164.97 | 155.57 | 153.68 | 149.44 | 138.22 | NA | NA | NA | |
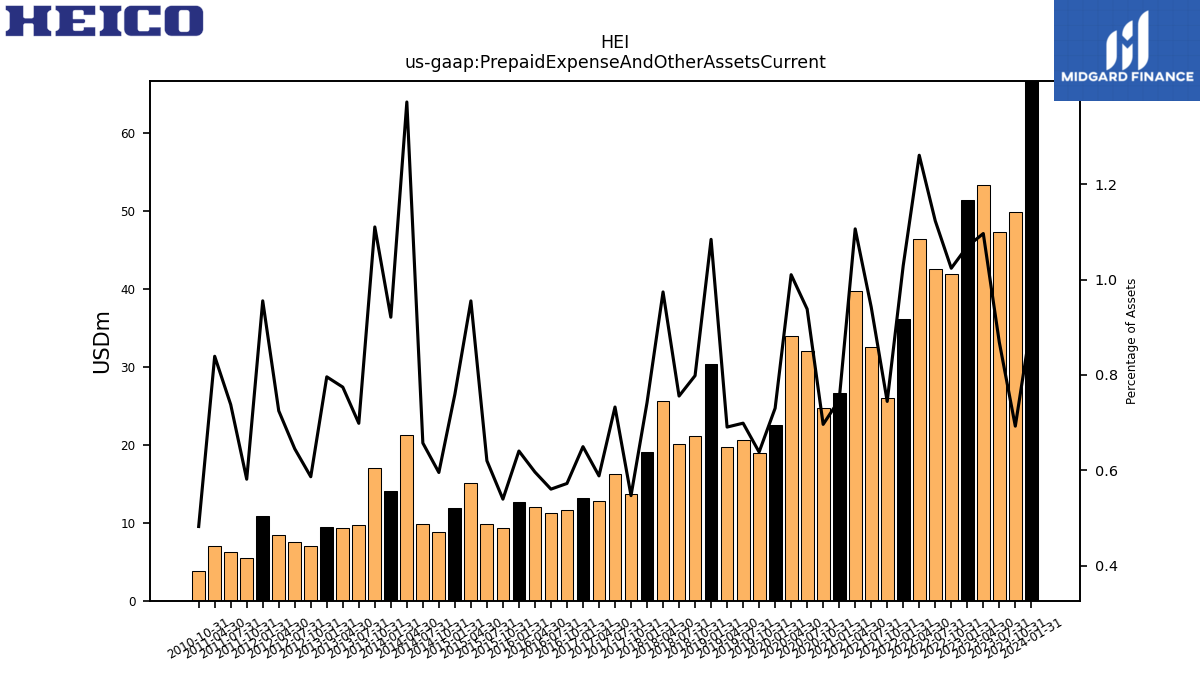
| Prepaid Expense And Other Assets Current | 66.72 | 49.84 | 47.37 | 53.40 | 51.38 | 41.93 | 42.54 | 46.46 | 36.17 | 26.05 | 32.63 | 39.77 | 26.65 | 24.71 | 32.12 | 33.99 | 22.62 | 18.95 | 20.69 | 19.71 | 30.33 | 21.19 | 20.06 | 25.60 | 19.07 | 13.74 | 16.29 | 12.81 | 13.20 | 11.67 | 11.31 | 12.03 | 12.69 | 9.37 | 9.85 | 15.10 | 11.96 | 8.87 | 9.90 | 21.24 | 14.03 | 17.02 | 9.69 | 9.37 | 9.49 | 7.00 | 7.48 | 8.49 | 10.82 | 5.47 | 6.31 | 7.01 | NA | 3.77 | NA | NA | NA | |
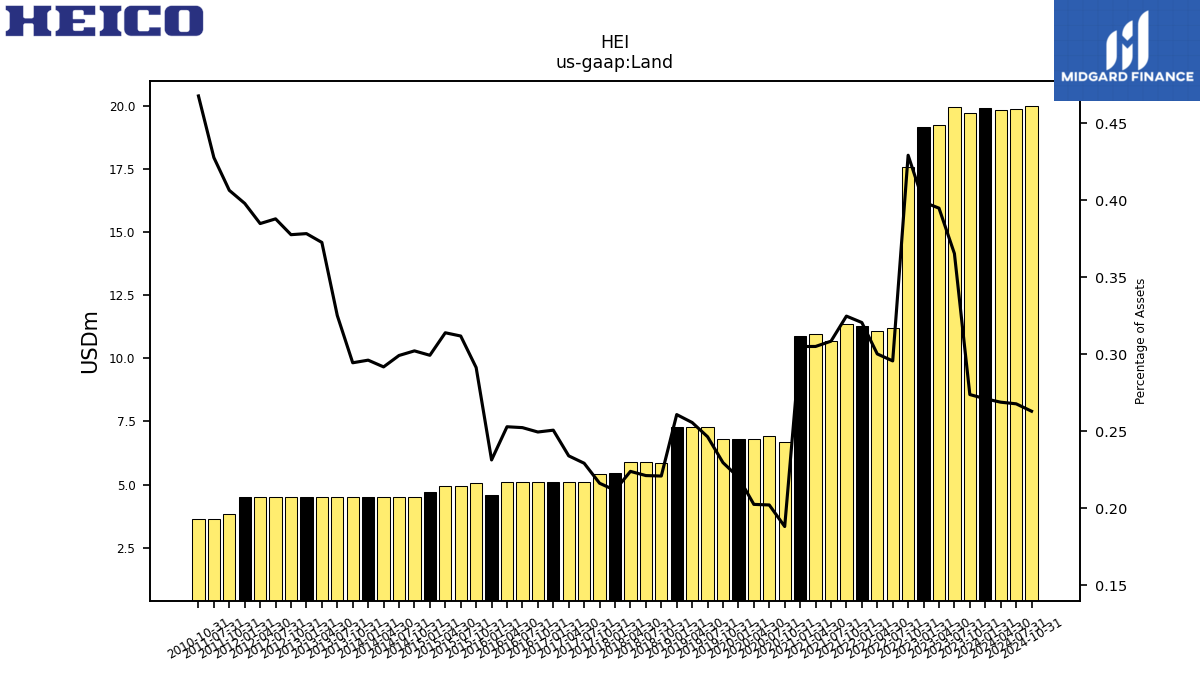
| Land | 19.89 | 19.71 | 19.93 | 19.23 | 19.16 | 17.58 | 11.20 | 11.06 | 11.27 | 11.36 | 10.68 | 10.97 | 10.88 | 6.68 | 6.92 | 6.82 | 6.82 | 6.82 | 7.30 | 7.30 | 7.30 | 5.86 | 5.88 | 5.89 | 5.44 | 5.43 | 5.10 | 5.10 | 5.09 | 5.09 | 5.09 | 5.10 | 4.59 | 5.06 | 4.95 | 4.96 | 4.72 | 4.50 | 4.51 | 4.52 | 4.51 | 4.51 | 4.51 | 4.51 | 4.51 | 4.50 | 4.50 | 4.51 | 4.51 | 3.83 | 3.66 | NA | NA | 3.66 | NA | NA | NA | |
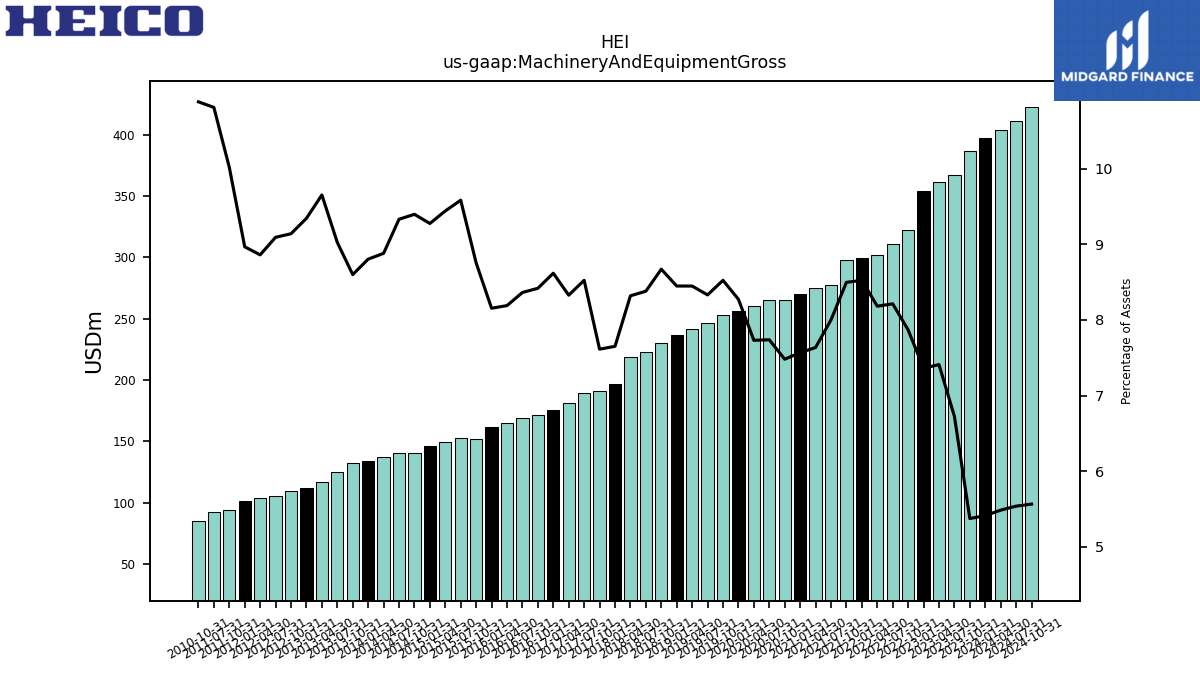
| Machinery And Equipment Gross | 397.01 | 386.60 | 366.74 | 360.89 | 353.71 | 322.25 | 311.10 | 301.56 | 299.57 | 297.30 | 276.98 | 274.52 | 269.84 | 265.41 | 264.90 | 260.15 | 256.26 | 253.13 | 246.65 | 241.11 | 236.34 | 230.11 | 222.50 | 218.64 | 196.69 | 191.30 | 189.58 | 181.34 | 175.09 | 171.72 | 168.74 | 165.21 | 161.60 | 152.02 | 152.25 | 149.25 | 146.14 | 139.96 | 140.66 | 137.45 | 134.15 | 131.85 | 125.17 | 116.75 | 111.44 | 109.04 | 105.42 | 103.82 | 101.57 | 94.30 | 92.42 | NA | NA | 85.09 | NA | NA | NA |
| 2024-01-31 | 2023-10-31 | 2023-07-31 | 2023-04-30 | 2023-01-31 | 2022-10-31 | 2022-07-31 | 2022-04-30 | 2022-01-31 | 2021-10-31 | 2021-07-31 | 2021-04-30 | 2021-01-31 | 2020-10-31 | 2020-07-31 | 2020-04-30 | 2020-01-31 | 2019-10-31 | 2019-07-31 | 2019-04-30 | 2019-01-31 | 2018-10-31 | 2018-07-31 | 2018-04-30 | 2018-01-31 | 2017-10-31 | 2017-07-31 | 2017-04-30 | 2017-01-31 | 2016-10-31 | 2016-07-31 | 2016-04-30 | 2016-01-31 | 2015-10-31 | 2015-07-31 | 2015-04-30 | 2015-01-31 | 2014-10-31 | 2014-07-31 | 2014-04-30 | 2014-01-31 | 2013-10-31 | 2013-07-31 | 2013-04-30 | 2013-01-31 | 2012-10-31 | 2012-07-31 | 2012-04-30 | 2012-01-31 | 2011-10-31 | 2011-07-31 | 2011-04-30 | 2011-01-31 | 2010-10-31 | 2010-07-31 | 2010-04-30 | 2010-01-31 | ||
|---|---|---|---|---|---|---|---|---|---|---|---|---|---|---|---|---|---|---|---|---|---|---|---|---|---|---|---|---|---|---|---|---|---|---|---|---|---|---|---|---|---|---|---|---|---|---|---|---|---|---|---|---|---|---|---|---|---|---|
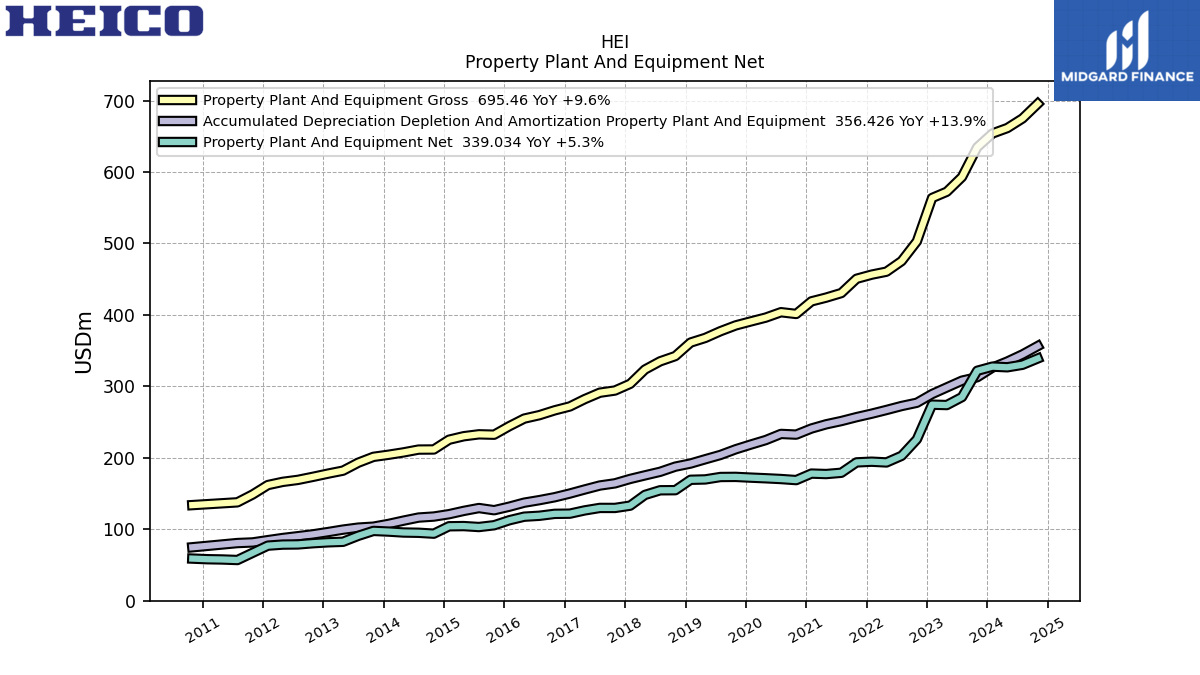
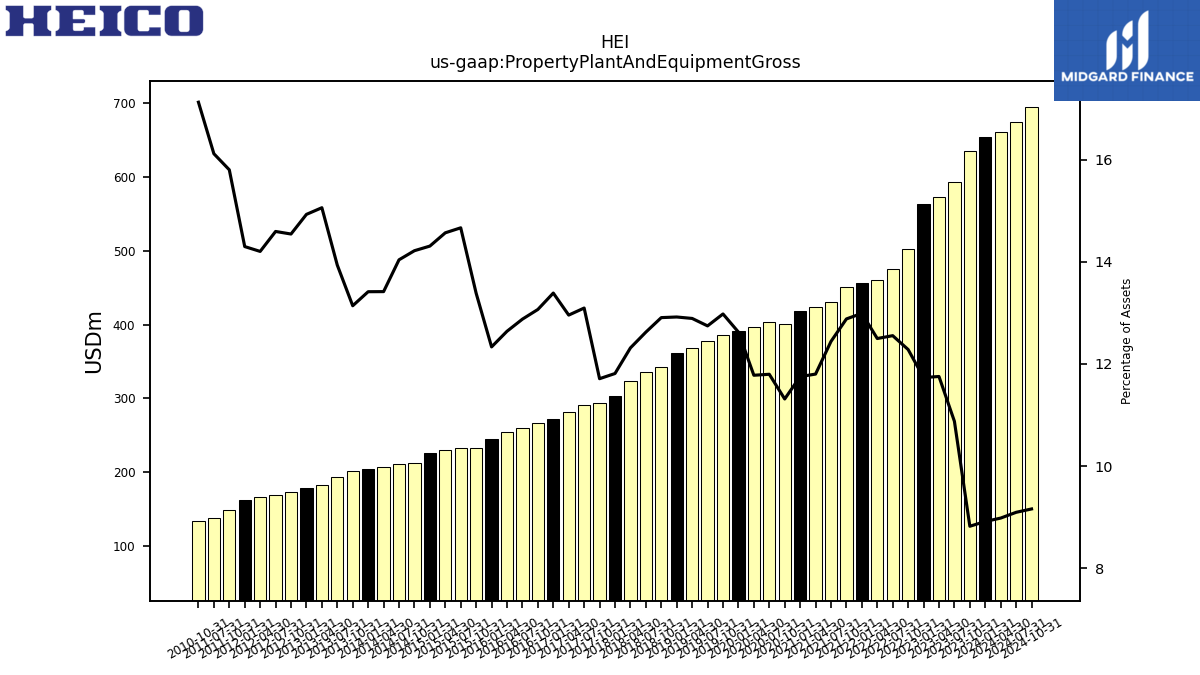
| Property Plant And Equipment Gross | 653.95 | 634.67 | 593.07 | 572.39 | 563.68 | 502.96 | 475.40 | 460.53 | 456.41 | 450.59 | 430.60 | 424.24 | 418.98 | 401.34 | 403.82 | 396.28 | 390.94 | 385.33 | 377.25 | 367.82 | 361.31 | 342.44 | 335.07 | 323.57 | 303.60 | 294.20 | 291.15 | 282.07 | 271.93 | 266.46 | 259.75 | 254.93 | 244.36 | 232.38 | 232.92 | 230.23 | 225.36 | 211.70 | 211.56 | 207.58 | 204.35 | 201.41 | 193.21 | 182.08 | 178.01 | 173.47 | 169.16 | 166.37 | 161.91 | 148.69 | 137.74 | NA | NA | 133.84 | NA | NA | NA | |
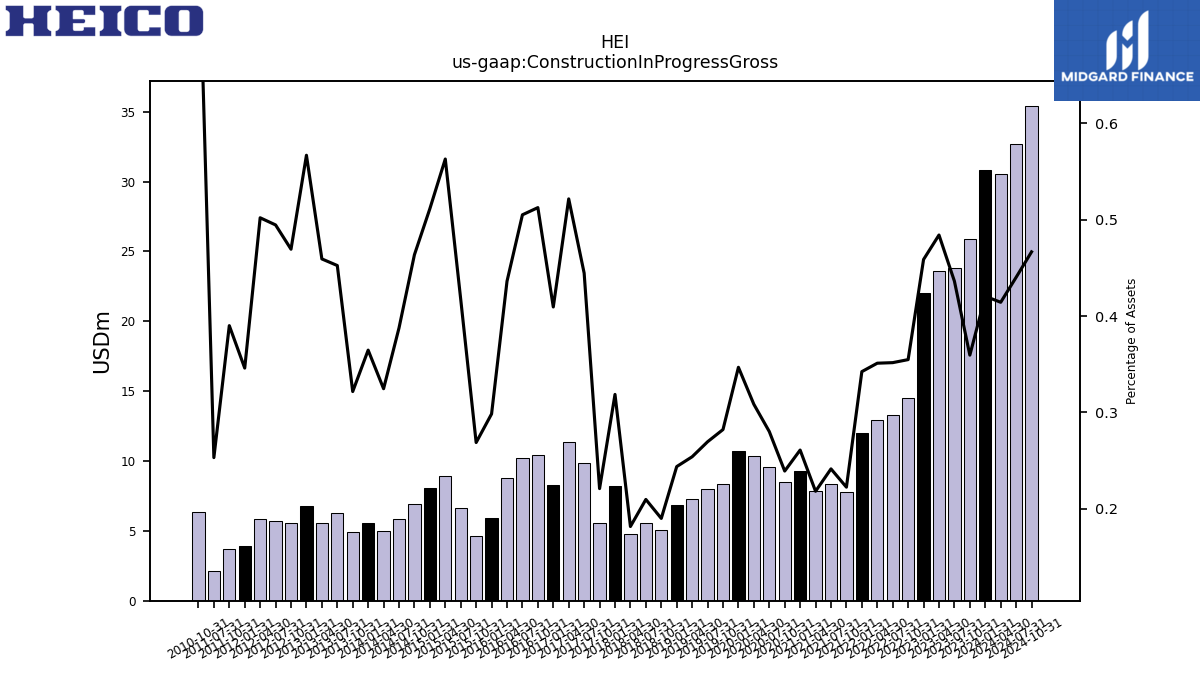
| Construction In Progress Gross | 30.85 | 25.87 | 23.79 | 23.58 | 22.04 | 14.53 | 13.32 | 12.94 | 12.03 | 7.78 | 8.36 | 7.85 | 9.31 | 8.49 | 9.59 | 10.38 | 10.74 | 8.38 | 7.98 | 7.25 | 6.82 | 5.04 | 5.57 | 4.78 | 8.19 | 5.55 | 9.89 | 11.36 | 8.32 | 10.45 | 10.19 | 8.80 | 5.92 | 4.67 | 6.63 | 8.90 | 8.06 | 6.91 | 5.84 | 5.02 | 5.56 | 4.93 | 6.27 | 5.55 | 6.76 | 5.60 | 5.73 | 5.88 | 3.92 | 3.67 | 2.16 | NA | NA | 6.32 | NA | NA | NA | |
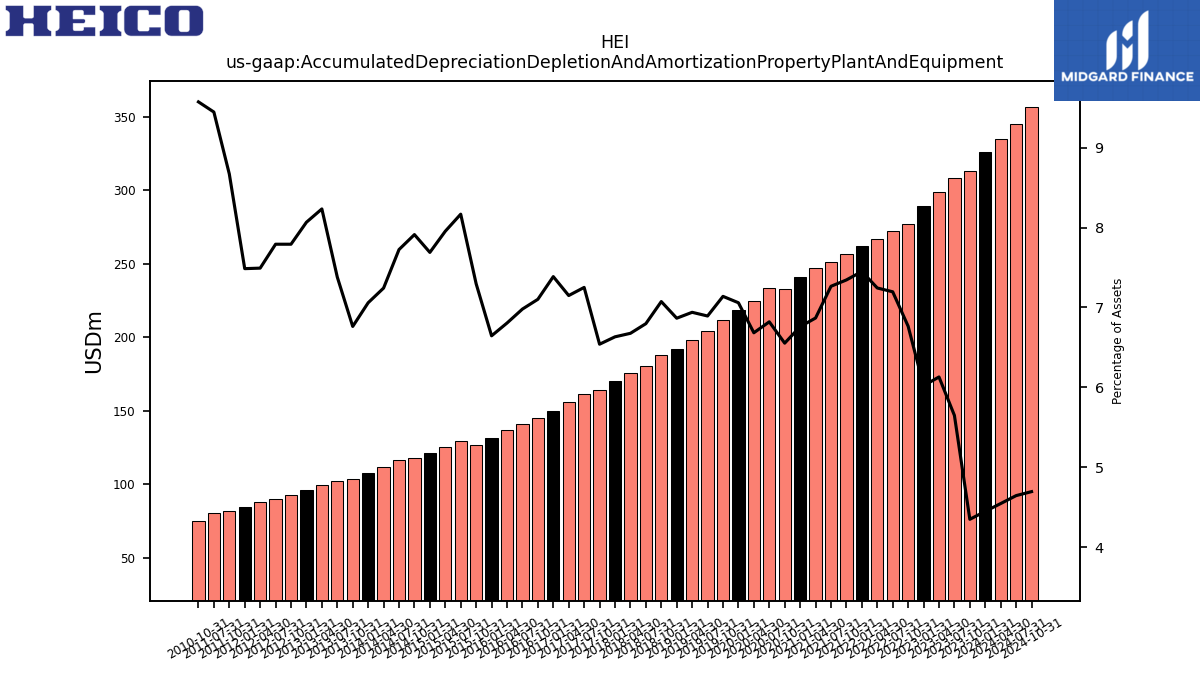
| Accumulated Depreciation Depletion And Amortization Property Plant And Equipment | 326.29 | 312.83 | 308.03 | 298.54 | 289.27 | 277.08 | 272.56 | 266.98 | 261.81 | 256.96 | 251.50 | 246.92 | 241.01 | 232.49 | 233.48 | 224.88 | 218.64 | 211.98 | 204.06 | 198.03 | 192.04 | 187.70 | 180.46 | 175.45 | 170.49 | 164.32 | 161.25 | 155.67 | 150.05 | 144.85 | 140.81 | 137.27 | 131.68 | 126.71 | 129.75 | 125.73 | 121.13 | 117.84 | 116.43 | 112.08 | 107.55 | 103.67 | 102.34 | 99.57 | 96.21 | 92.95 | 90.33 | 87.78 | 84.78 | 81.61 | 80.75 | NA | NA | 74.84 | NA | NA | NA | |
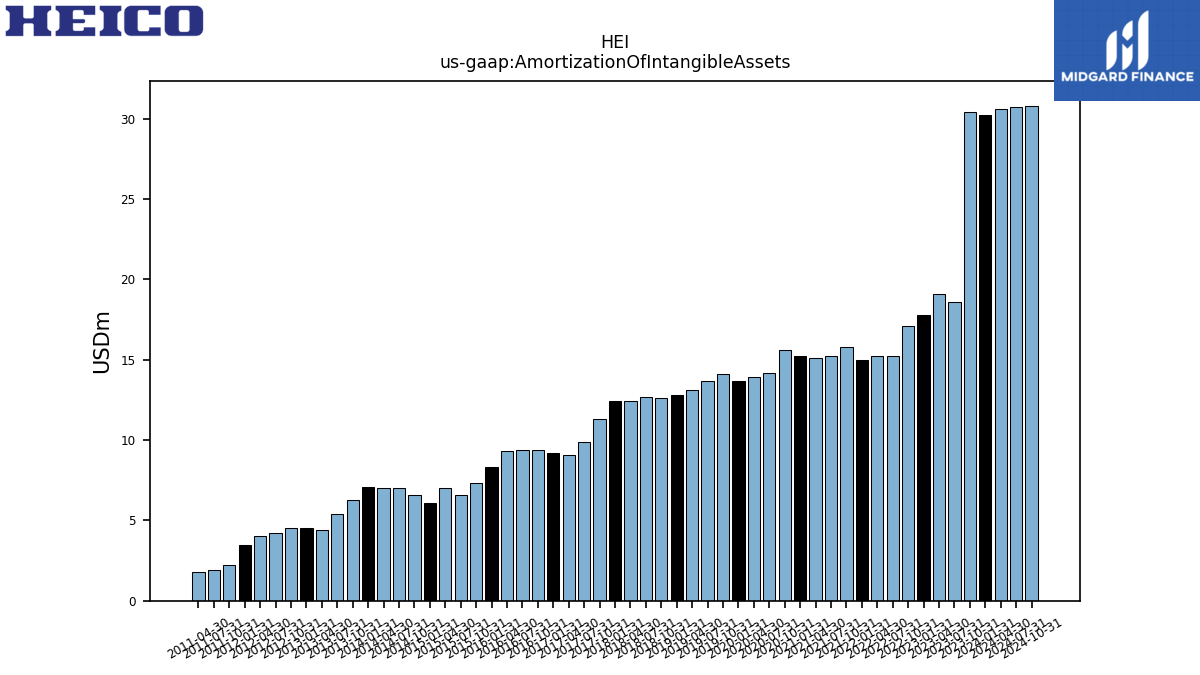
| Amortization Of Intangible Assets | 30.20 | 30.40 | 18.60 | 19.10 | 17.80 | 17.10 | 15.20 | 15.20 | 15.00 | 15.80 | 15.20 | 15.10 | 15.20 | 15.60 | 14.20 | 13.90 | 13.70 | 14.10 | 13.70 | 13.10 | 12.80 | 12.60 | 12.70 | 12.40 | 12.40 | 11.30 | 9.90 | 9.10 | 9.20 | 9.40 | 9.40 | 9.30 | 8.30 | 7.30 | 6.60 | 7.00 | 6.10 | 6.60 | 7.00 | 7.00 | 7.10 | 6.30 | 5.40 | 4.40 | 4.50 | 4.50 | 4.20 | 4.00 | 3.50 | 2.20 | 1.90 | 1.80 | NA | NA | NA | NA | NA | |
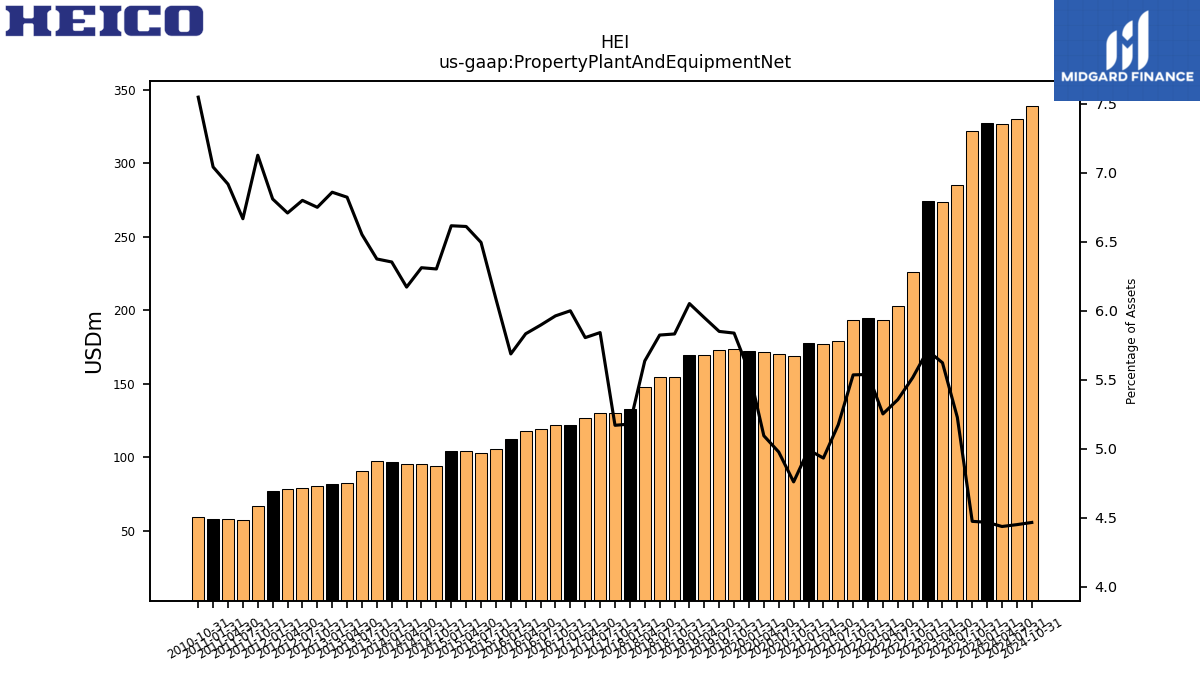
| Property Plant And Equipment Net | 327.66 | 321.85 | 285.03 | 273.86 | 274.40 | 225.88 | 202.84 | 193.56 | 194.60 | 193.64 | 179.10 | 177.31 | 177.97 | 168.85 | 170.34 | 171.40 | 172.30 | 173.34 | 173.18 | 169.79 | 169.28 | 154.74 | 154.61 | 148.11 | 133.12 | 129.88 | 129.91 | 126.40 | 121.88 | 121.61 | 118.94 | 117.66 | 112.69 | 105.67 | 103.17 | 104.49 | 104.22 | 93.86 | 95.13 | 95.50 | 96.80 | 97.74 | 90.86 | 82.51 | 81.80 | 80.52 | 78.83 | 78.59 | 77.13 | 67.07 | 56.99 | 57.76 | 58.13 | 59.00 | NA | NA | NA | |
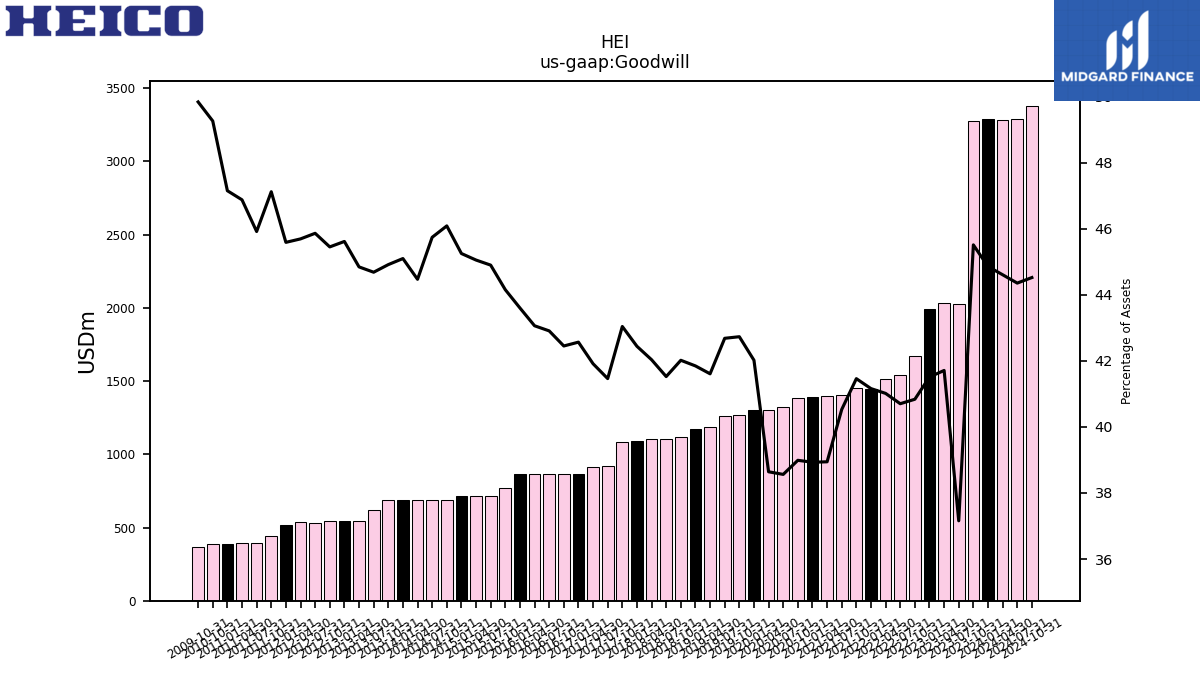
| Goodwill | 3290.49 | 3274.33 | 2026.28 | 2031.23 | 1994.35 | 1672.42 | 1541.48 | 1511.47 | 1446.25 | 1450.39 | 1402.88 | 1400.05 | 1388.05 | 1383.17 | 1320.05 | 1300.19 | 1301.32 | 1268.70 | 1263.47 | 1187.28 | 1170.40 | 1114.83 | 1102.35 | 1104.56 | 1090.86 | 1081.31 | 921.98 | 912.54 | 864.66 | 865.72 | 865.53 | 868.57 | 863.92 | 766.64 | 713.13 | 712.04 | 712.75 | 686.27 | 689.32 | 688.09 | 687.04 | 688.49 | 619.57 | 542.24 | 543.93 | 542.11 | 531.59 | 535.26 | 516.25 | 443.40 | 392.44 | 391.34 | 389.20 | 385.02 | NA | NA | NA | |
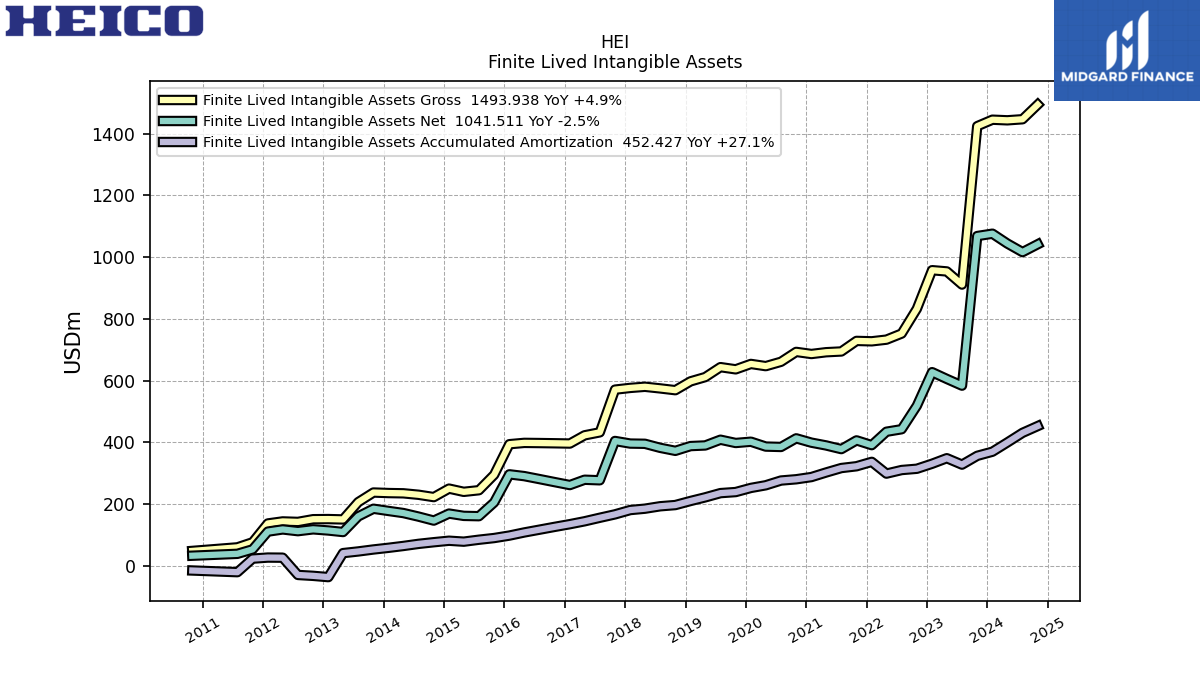
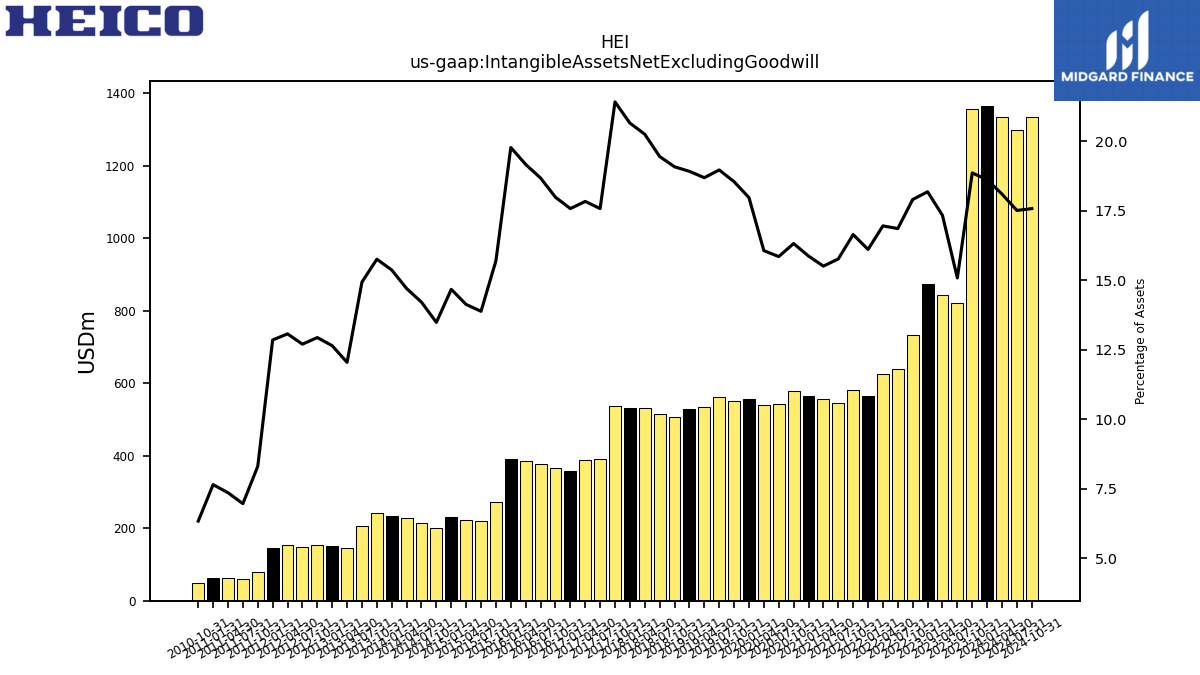
| Intangible Assets Net Excluding Goodwill | 1365.68 | 1357.28 | 822.54 | 844.32 | 873.72 | 733.33 | 638.55 | 624.92 | 566.09 | 582.31 | 545.80 | 557.55 | 565.92 | 579.04 | 542.67 | 540.62 | 556.72 | 550.69 | 561.55 | 533.37 | 529.19 | 506.36 | 516.45 | 532.26 | 530.99 | 538.08 | 390.93 | 388.37 | 357.12 | 366.86 | 376.83 | 386.65 | 391.91 | 272.59 | 220.51 | 223.30 | 231.14 | 200.81 | 214.18 | 227.52 | 234.17 | 241.56 | 207.10 | 145.66 | 150.79 | 154.32 | 147.21 | 153.11 | 145.54 | 78.16 | 59.50 | 61.40 | 63.10 | 49.49 | NA | NA | NA | |
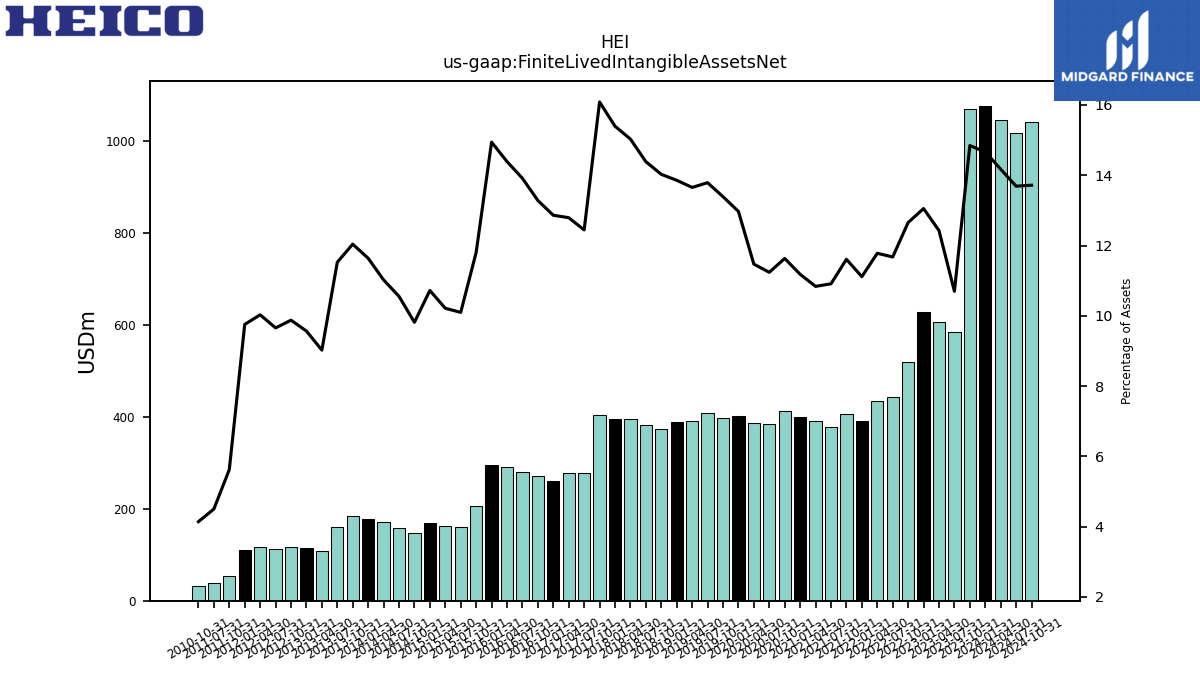
| Finite Lived Intangible Assets Net | 1075.76 | 1068.12 | 583.39 | 605.17 | 627.14 | 518.27 | 442.18 | 434.11 | 390.56 | 406.10 | 377.72 | 389.65 | 398.69 | 412.71 | 384.72 | 385.98 | 401.75 | 397.59 | 408.19 | 389.64 | 387.59 | 372.18 | 381.94 | 394.99 | 395.75 | 404.14 | 276.75 | 278.54 | 261.28 | 270.89 | 280.67 | 290.26 | 296.08 | 204.97 | 160.41 | 161.45 | 168.90 | 146.18 | 159.06 | 170.57 | 177.32 | 184.57 | 159.82 | 109.11 | 114.08 | 117.80 | 111.93 | 117.49 | 110.49 | 52.92 | 38.48 | NA | NA | 32.38 | NA | NA | NA | |
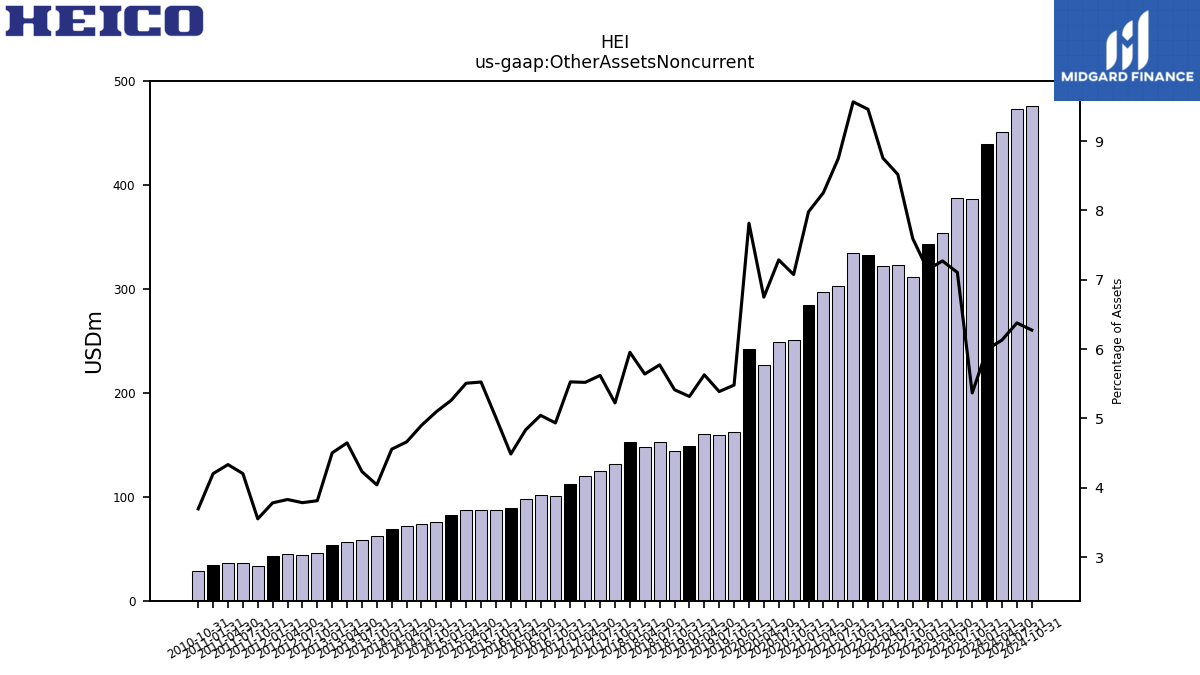
| Other Assets Noncurrent | 439.87 | 386.26 | 387.52 | 354.15 | 343.35 | 311.13 | 322.71 | 322.67 | 332.39 | 334.68 | 302.84 | 296.83 | 284.55 | 251.03 | 249.44 | 227.11 | 242.08 | 162.74 | 159.50 | 160.63 | 148.72 | 143.66 | 153.26 | 148.22 | 153.04 | 131.27 | 124.98 | 120.20 | 112.28 | 100.66 | 101.77 | 97.55 | 88.91 | 87.03 | 87.76 | 87.06 | 82.90 | 75.91 | 73.85 | 72.13 | 69.42 | 61.97 | 58.70 | 56.20 | 53.70 | 45.49 | 43.87 | 44.88 | 42.84 | 33.42 | 35.93 | 36.19 | 34.70 | 28.89 | NA | NA | NA |
| 2024-01-31 | 2023-10-31 | 2023-07-31 | 2023-04-30 | 2023-01-31 | 2022-10-31 | 2022-07-31 | 2022-04-30 | 2022-01-31 | 2021-10-31 | 2021-07-31 | 2021-04-30 | 2021-01-31 | 2020-10-31 | 2020-07-31 | 2020-04-30 | 2020-01-31 | 2019-10-31 | 2019-07-31 | 2019-04-30 | 2019-01-31 | 2018-10-31 | 2018-07-31 | 2018-04-30 | 2018-01-31 | 2017-10-31 | 2017-07-31 | 2017-04-30 | 2017-01-31 | 2016-10-31 | 2016-07-31 | 2016-04-30 | 2016-01-31 | 2015-10-31 | 2015-07-31 | 2015-04-30 | 2015-01-31 | 2014-10-31 | 2014-07-31 | 2014-04-30 | 2014-01-31 | 2013-10-31 | 2013-07-31 | 2013-04-30 | 2013-01-31 | 2012-10-31 | 2012-07-31 | 2012-04-30 | 2012-01-31 | 2011-10-31 | 2011-07-31 | 2011-04-30 | 2011-01-31 | 2010-10-31 | 2010-07-31 | 2010-04-30 | 2010-01-31 | ||
|---|---|---|---|---|---|---|---|---|---|---|---|---|---|---|---|---|---|---|---|---|---|---|---|---|---|---|---|---|---|---|---|---|---|---|---|---|---|---|---|---|---|---|---|---|---|---|---|---|---|---|---|---|---|---|---|---|---|---|
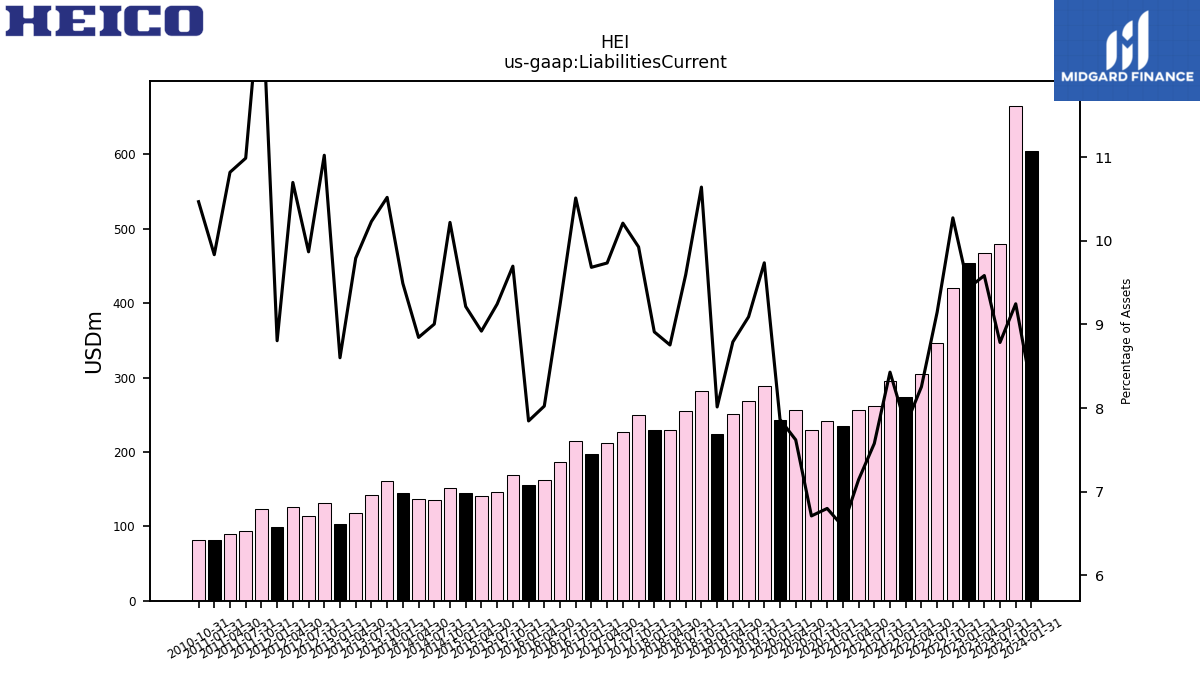
| Liabilities Current | 604.10 | 665.34 | 479.05 | 466.83 | 453.50 | 420.86 | 346.44 | 304.19 | 273.88 | 294.88 | 262.22 | 256.76 | 234.68 | 241.16 | 229.64 | 256.35 | 243.53 | 289.14 | 269.14 | 250.87 | 224.12 | 282.43 | 254.76 | 230.05 | 229.06 | 249.44 | 227.10 | 211.98 | 196.72 | 214.42 | 186.26 | 161.83 | 155.45 | 168.39 | 146.83 | 140.99 | 145.16 | 152.22 | 135.71 | 136.87 | 144.60 | 161.29 | 141.89 | 118.42 | 102.57 | 131.51 | 114.41 | 125.35 | 99.72 | 123.39 | 93.94 | 90.35 | 81.19 | 81.83 | NA | NA | NA | |
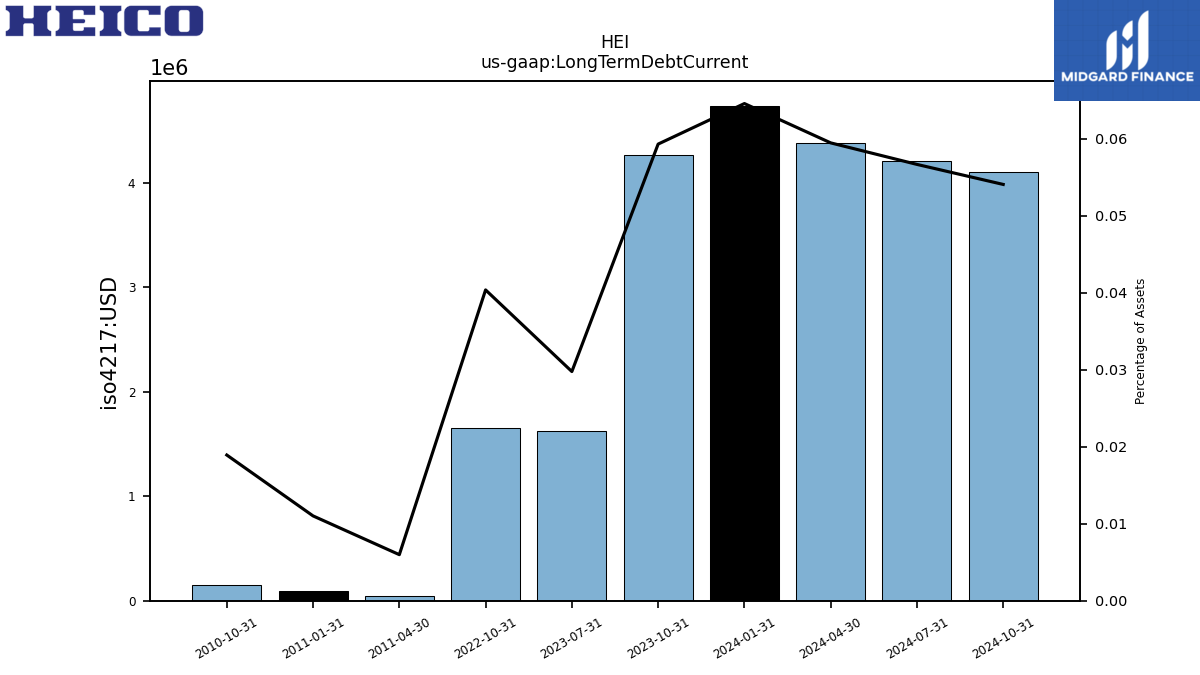
| Long Term Debt Current | 4.74 | 4.27 | 1.62 | NA | NA | 1.65 | NA | NA | NA | NA | NA | NA | NA | NA | NA | NA | NA | NA | NA | NA | NA | NA | NA | NA | NA | NA | NA | NA | NA | NA | NA | NA | NA | NA | NA | NA | NA | NA | NA | NA | NA | NA | NA | NA | NA | NA | NA | NA | NA | NA | NA | 0.05 | 0.09 | 0.15 | NA | NA | NA | |
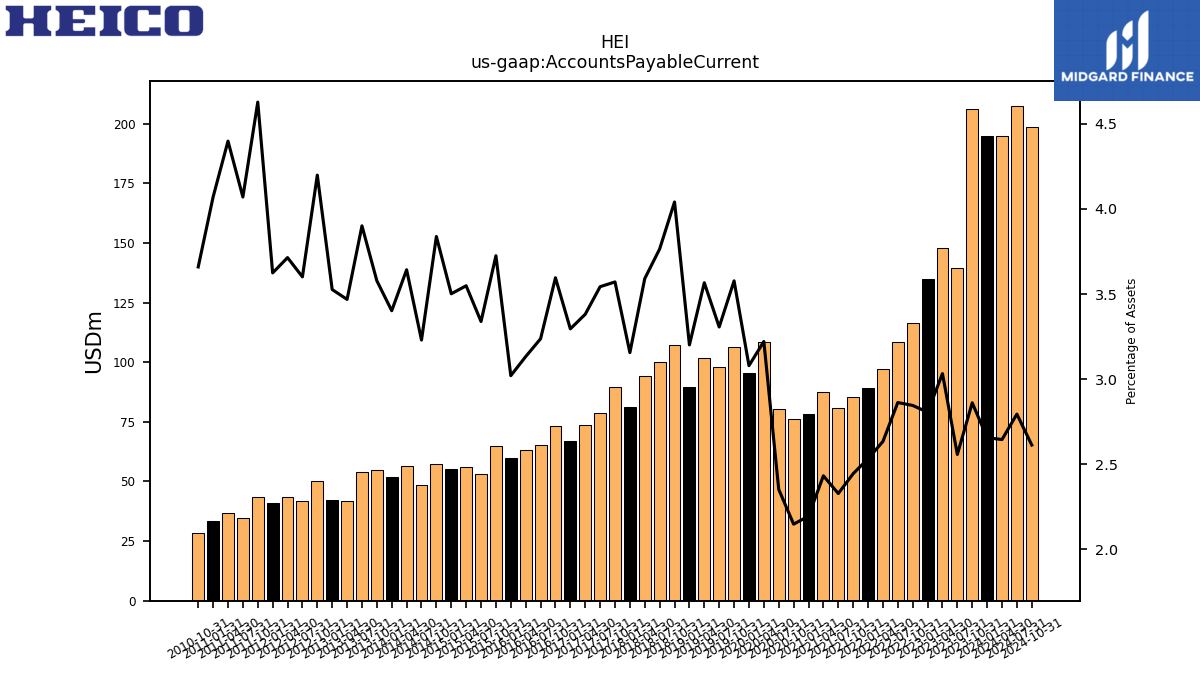
| Accounts Payable Current | 194.89 | 205.89 | 139.51 | 147.71 | 134.84 | 116.55 | 108.44 | 97.09 | 89.00 | 85.54 | 80.61 | 87.47 | 78.29 | 76.24 | 80.55 | 108.40 | 95.39 | 106.22 | 97.89 | 101.78 | 89.55 | 107.22 | 99.95 | 94.37 | 81.13 | 89.72 | 78.80 | 73.62 | 66.95 | 73.33 | 65.31 | 63.19 | 59.86 | 64.68 | 53.03 | 56.09 | 55.16 | 57.16 | 48.68 | 56.37 | 51.84 | 54.85 | 54.09 | 41.94 | 42.05 | 50.08 | 41.75 | 43.51 | 41.05 | 43.55 | 34.79 | 36.72 | 33.60 | 28.60 | NA | NA | NA | |
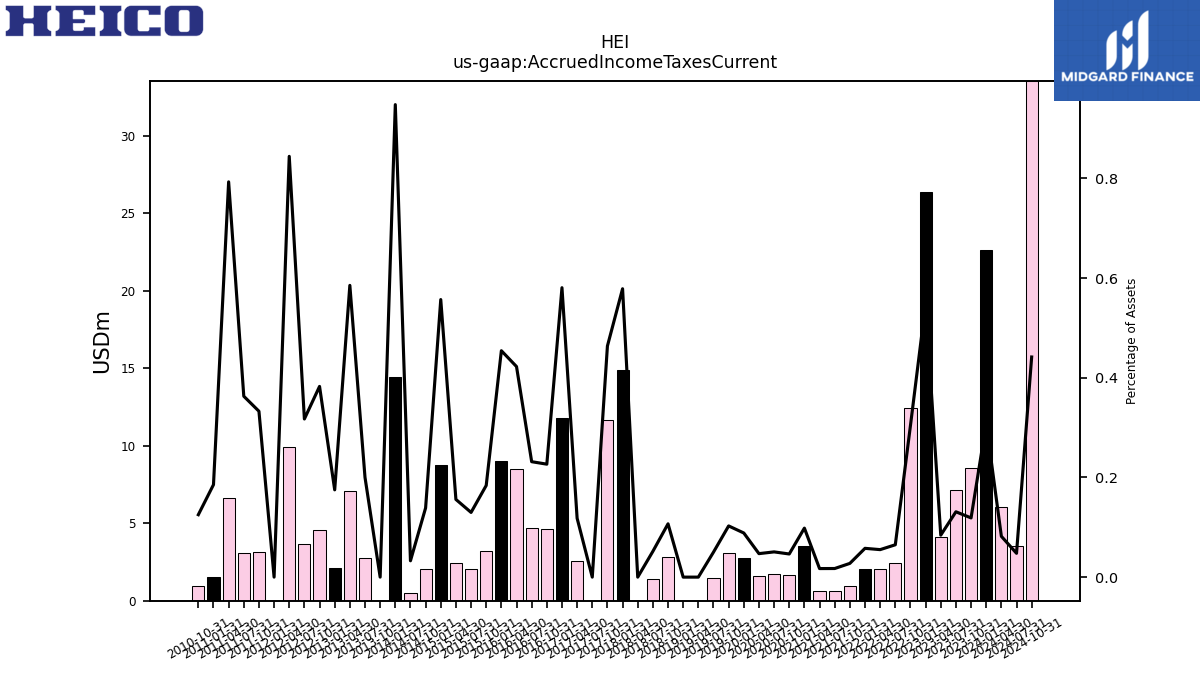
| Accrued Income Taxes Current | 22.62 | 8.55 | 7.15 | 4.10 | 26.35 | 12.46 | 2.46 | 2.03 | 2.03 | 0.96 | 0.60 | 0.62 | 3.51 | 1.65 | 1.73 | 1.59 | 2.74 | 3.05 | 1.48 | 0.00 | 0.00 | 2.84 | 1.37 | 0.00 | 14.87 | 11.65 | 0.00 | 2.57 | 11.80 | 4.62 | 4.67 | 8.52 | 9.00 | 3.19 | 2.06 | 2.46 | 8.77 | 2.07 | 0.49 | NA | 14.44 | 0.00 | 2.78 | 7.08 | 2.09 | 4.56 | 3.68 | 9.89 | 0.00 | 3.13 | 3.10 | 6.62 | 1.53 | 0.98 | NA | NA | NA | |
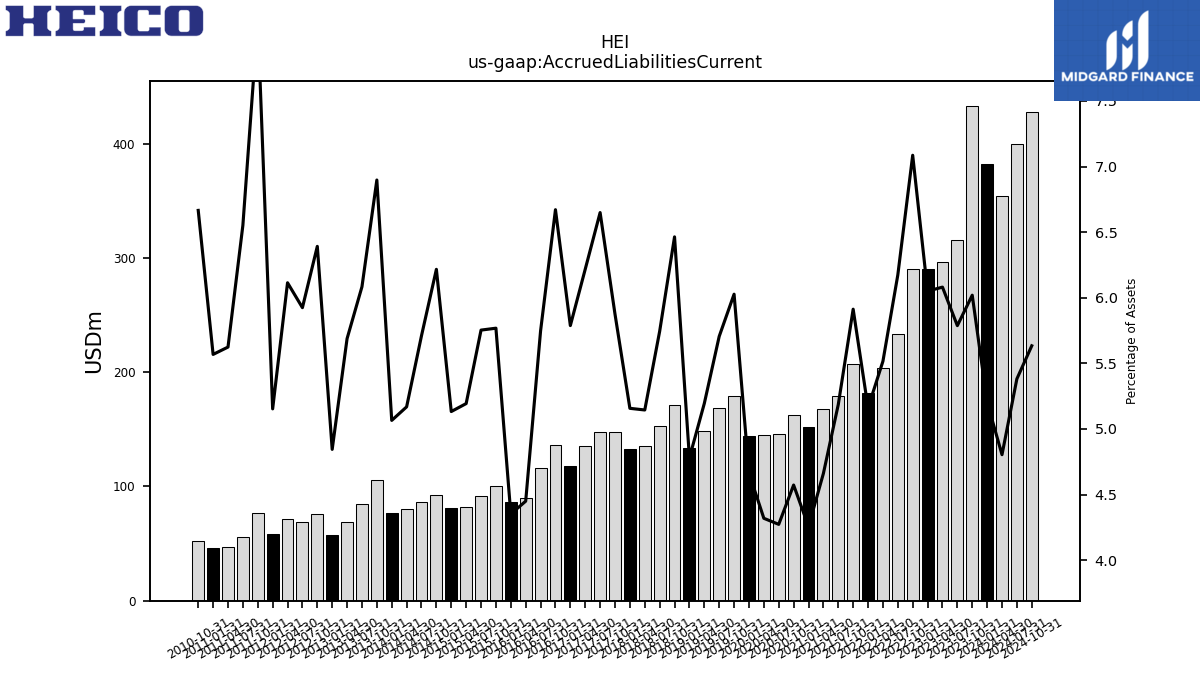
| Accrued Liabilities Current | 381.84 | 433.10 | 315.61 | 296.16 | 290.69 | 290.20 | 233.81 | 203.29 | 181.36 | 206.86 | 179.51 | 167.56 | 151.79 | 162.23 | 146.29 | 145.34 | 144.47 | 178.96 | 168.90 | 148.24 | 133.71 | 171.51 | 152.50 | 135.20 | 132.57 | 147.61 | 147.86 | 135.38 | 117.58 | 136.05 | 115.94 | 89.76 | 86.24 | 100.16 | 91.39 | 82.09 | 80.86 | 92.58 | 86.07 | 79.98 | 77.17 | 105.73 | 84.36 | 68.79 | 57.77 | 76.24 | 68.68 | 71.63 | 58.36 | 76.38 | 56.00 | 46.96 | 45.97 | 52.10 | NA | NA | NA | |
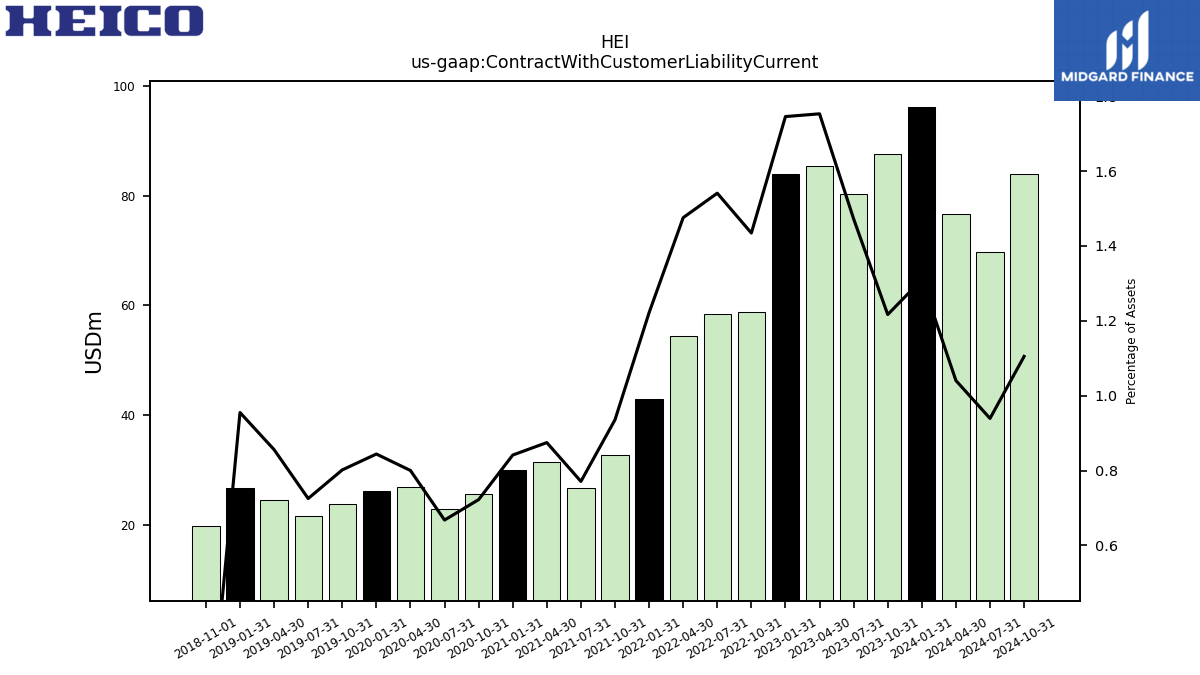
| Contract With Customer Liability Current | 96.12 | 87.56 | 80.30 | 85.38 | 83.88 | 58.76 | 58.37 | 54.38 | 42.94 | 32.74 | 26.69 | 31.45 | 30.00 | 25.63 | 22.86 | 26.93 | 26.15 | 23.81 | 21.47 | 24.43 | 26.71 | NA | NA | NA | NA | NA | NA | NA | NA | NA | NA | NA | NA | NA | NA | NA | NA | NA | NA | NA | NA | NA | NA | NA | NA | NA | NA | NA | NA | NA | NA | NA | NA | NA | NA | NA | NA | |
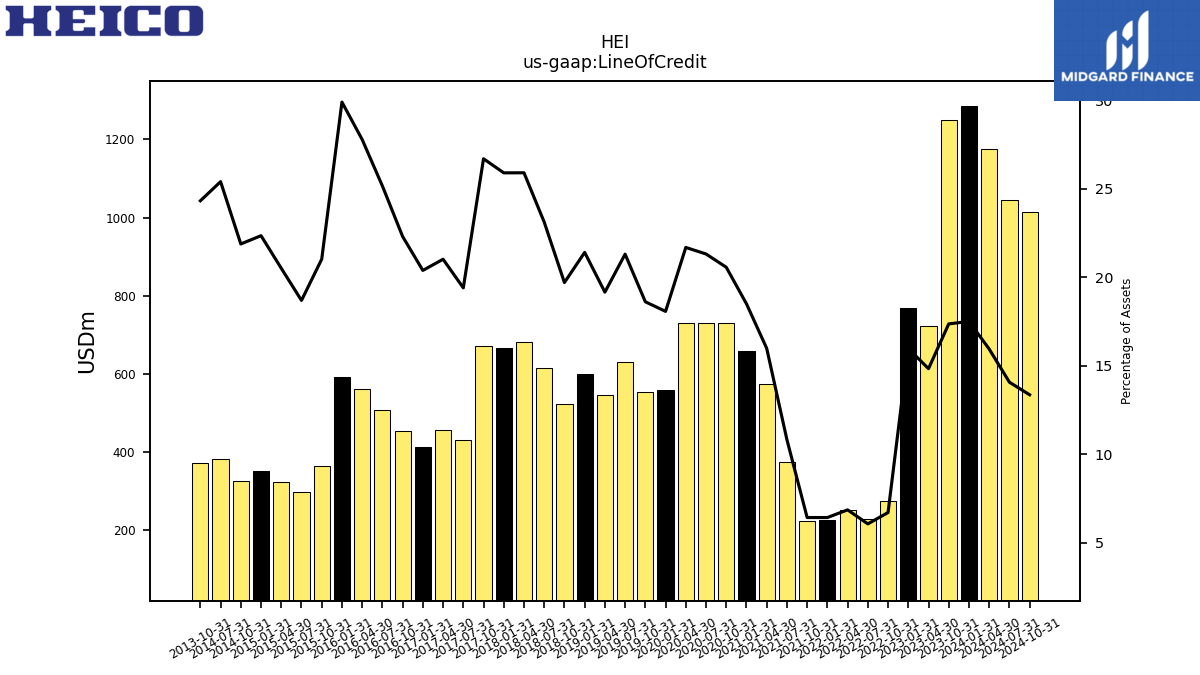
| Line Of Credit | 1285.00 | 1250.00 | NA | 723.00 | 768.00 | 275.00 | 230.00 | 253.00 | 226.00 | 225.00 | 375.00 | 575.00 | 660.00 | 730.00 | 730.00 | 730.00 | 560.00 | 553.00 | 631.00 | 547.00 | 599.00 | 523.00 | 614.00 | 681.00 | 666.00 | 671.00 | 431.66 | 457.85 | 414.34 | 455.08 | 507.74 | 560.62 | 592.65 | 365.20 | 297.05 | 324.29 | 352.22 | 326.00 | 383.00 | NA | NA | 373.00 | NA | NA | NA | NA | NA | NA | NA | NA | NA | NA | NA | NA | NA | NA | NA |
| 2024-01-31 | 2023-10-31 | 2023-07-31 | 2023-04-30 | 2023-01-31 | 2022-10-31 | 2022-07-31 | 2022-04-30 | 2022-01-31 | 2021-10-31 | 2021-07-31 | 2021-04-30 | 2021-01-31 | 2020-10-31 | 2020-07-31 | 2020-04-30 | 2020-01-31 | 2019-10-31 | 2019-07-31 | 2019-04-30 | 2019-01-31 | 2018-10-31 | 2018-07-31 | 2018-04-30 | 2018-01-31 | 2017-10-31 | 2017-07-31 | 2017-04-30 | 2017-01-31 | 2016-10-31 | 2016-07-31 | 2016-04-30 | 2016-01-31 | 2015-10-31 | 2015-07-31 | 2015-04-30 | 2015-01-31 | 2014-10-31 | 2014-07-31 | 2014-04-30 | 2014-01-31 | 2013-10-31 | 2013-07-31 | 2013-04-30 | 2013-01-31 | 2012-10-31 | 2012-07-31 | 2012-04-30 | 2012-01-31 | 2011-10-31 | 2011-07-31 | 2011-04-30 | 2011-01-31 | 2010-10-31 | 2010-07-31 | 2010-04-30 | 2010-01-31 | ||
|---|---|---|---|---|---|---|---|---|---|---|---|---|---|---|---|---|---|---|---|---|---|---|---|---|---|---|---|---|---|---|---|---|---|---|---|---|---|---|---|---|---|---|---|---|---|---|---|---|---|---|---|---|---|---|---|---|---|---|
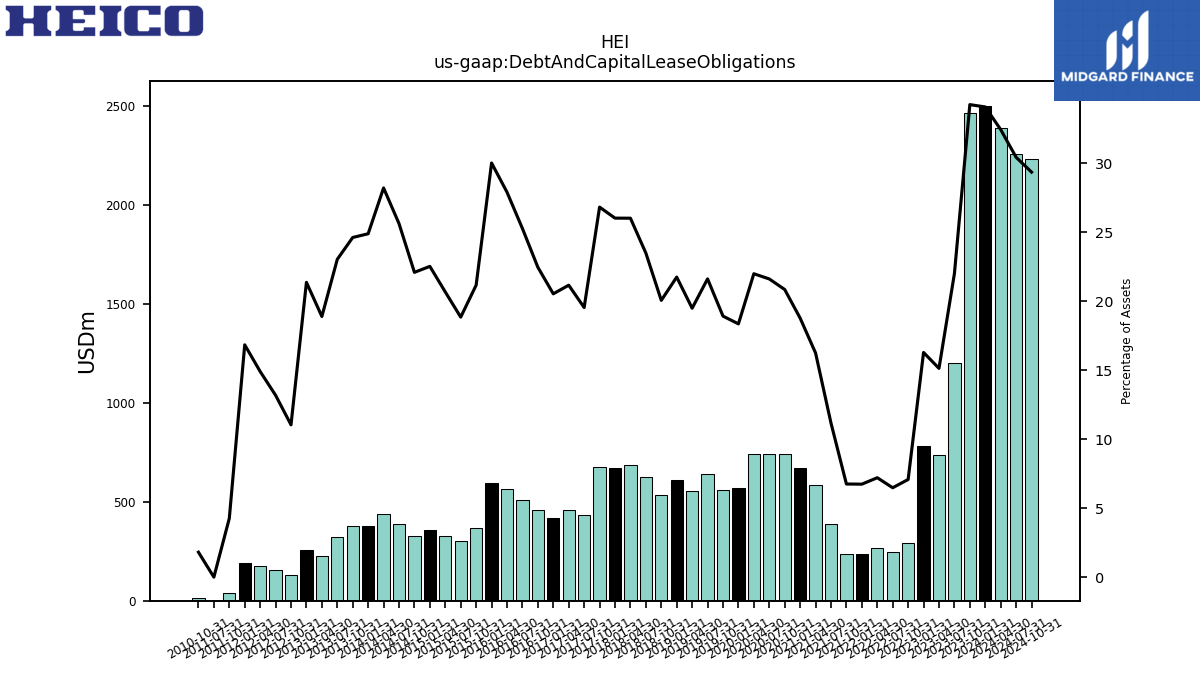
| Debt And Capital Lease Obligations | 2500.47 | 2464.55 | 1200.11 | 737.40 | 782.79 | 290.27 | 245.76 | 265.88 | 237.13 | 236.50 | 386.87 | 584.46 | 669.68 | 739.83 | 740.09 | 740.21 | 568.80 | 561.96 | 640.16 | 556.38 | 608.52 | 532.47 | 623.82 | 683.84 | 669.01 | 673.98 | 434.76 | 460.87 | 417.33 | 458.23 | 509.90 | 562.93 | 594.92 | 367.60 | 299.47 | 326.82 | 354.92 | 329.11 | 386.33 | 436.59 | 379.29 | 377.51 | 319.54 | 228.55 | 254.88 | 131.82 | 152.92 | 174.72 | 190.78 | 40.16 | 0.10 | NA | NA | 14.22 | NA | NA | NA | |
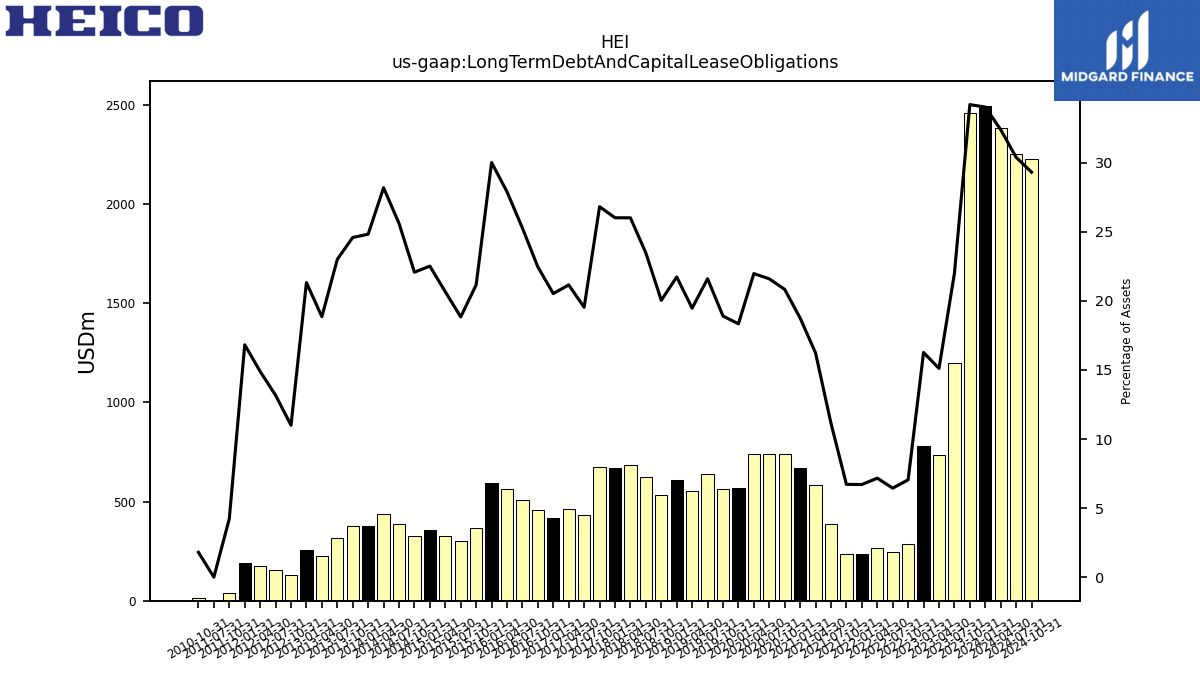
| Long Term Debt And Capital Lease Obligations | 2495.73 | 2460.28 | 1198.48 | 735.78 | 781.17 | 288.62 | 244.02 | 264.10 | 235.65 | 234.98 | 385.38 | 583.35 | 668.60 | 738.79 | 739.02 | 739.19 | 567.86 | 561.05 | 639.30 | 555.52 | 607.66 | 531.61 | 622.89 | 683.36 | 668.53 | 673.53 | 434.31 | 460.46 | 416.93 | 457.81 | 509.57 | 562.58 | 594.58 | 367.24 | 299.13 | 326.47 | 354.55 | 328.69 | 385.87 | 436.07 | 378.14 | 376.82 | 318.88 | 227.93 | 254.22 | 131.19 | 152.62 | 174.40 | 190.47 | 39.82 | 0.06 | NA | NA | 14.07 | NA | NA | NA | |
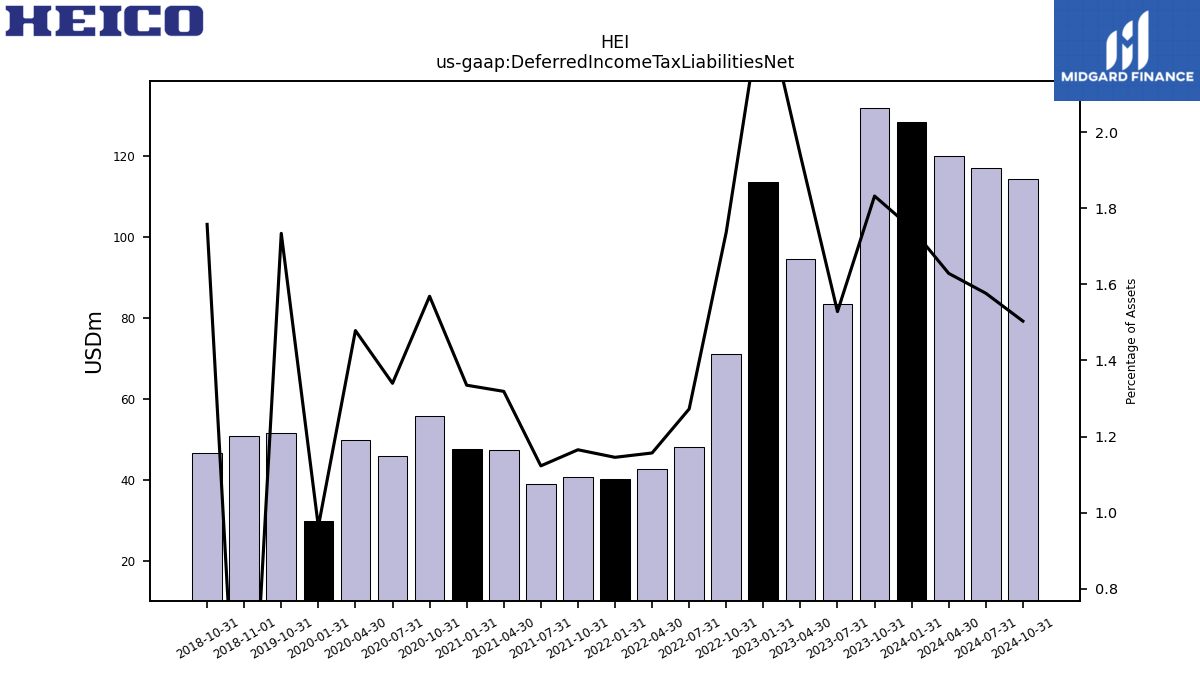
| Deferred Income Tax Liabilities Net | 128.20 | 131.85 | 83.36 | 94.47 | 113.48 | 71.16 | 48.19 | 42.63 | 40.24 | 40.76 | 38.87 | 47.41 | 47.60 | 55.66 | 45.87 | 49.75 | 29.84 | 51.50 | NA | NA | NA | 46.64 | NA | NA | NA | NA | NA | NA | NA | NA | NA | NA | NA | NA | NA | NA | NA | NA | NA | NA | NA | NA | NA | NA | NA | NA | NA | NA | NA | NA | NA | NA | NA | NA | NA | NA | NA | |
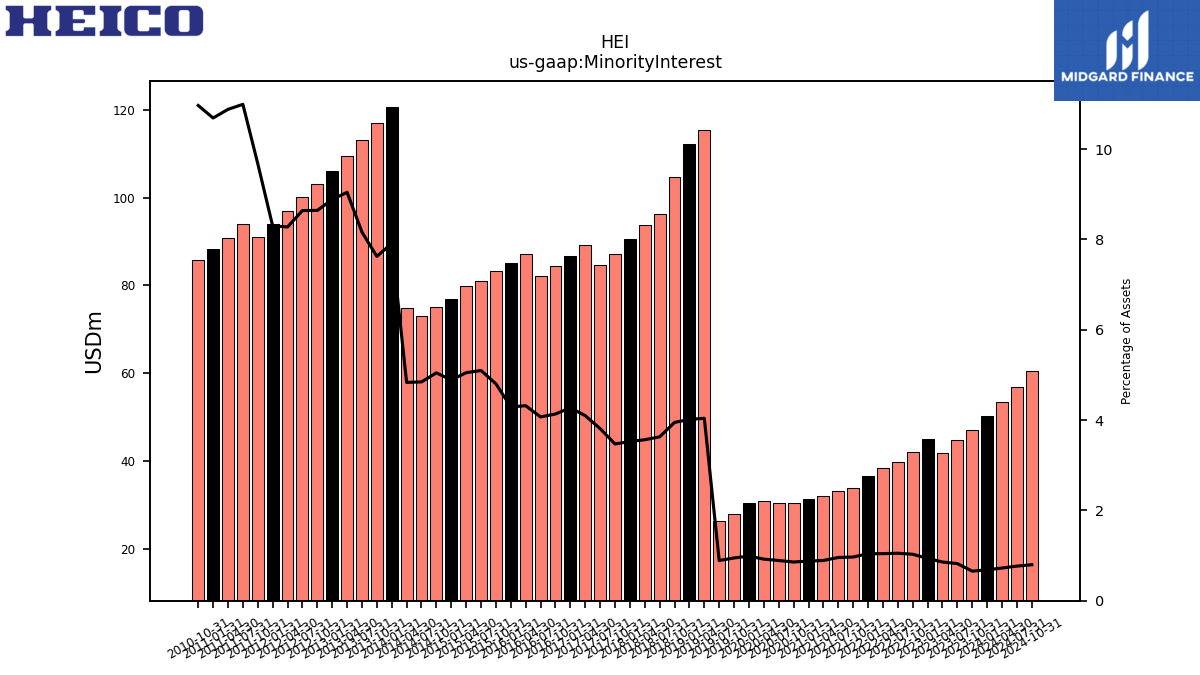
| Minority Interest | 50.20 | 47.16 | 44.83 | 41.78 | 45.04 | 42.17 | 39.85 | 38.44 | 36.56 | 33.87 | 33.16 | 32.07 | 31.32 | 30.43 | 30.50 | 31.01 | 30.60 | 28.12 | 26.38 | 115.28 | 112.29 | 104.76 | 96.35 | 93.68 | 90.60 | 87.21 | 84.75 | 89.23 | 86.80 | 84.33 | 82.11 | 87.09 | 85.05 | 83.41 | 80.98 | 79.81 | 76.99 | 75.14 | 73.02 | 74.81 | 120.50 | 116.89 | 113.18 | 109.35 | 105.94 | 103.09 | 100.14 | 96.96 | 93.98 | 91.08 | 93.94 | 90.83 | 88.23 | 85.71 | NA | NA | NA | |
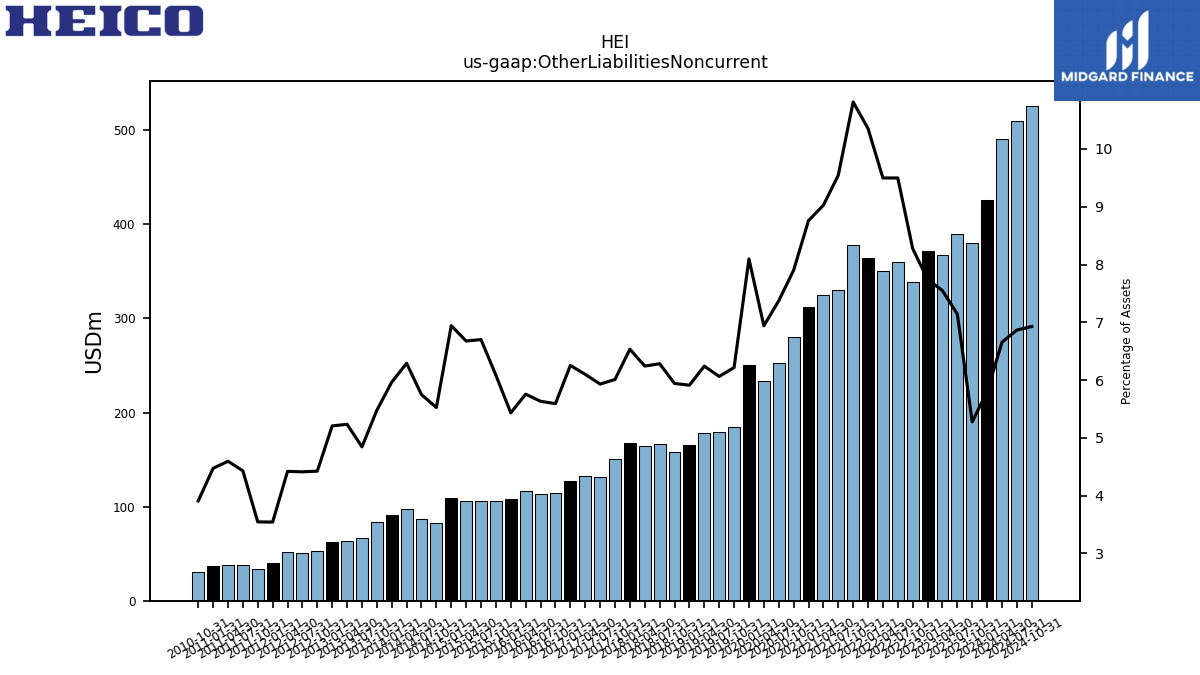
| Other Liabilities Noncurrent | 425.54 | 379.64 | 389.33 | 367.62 | 372.01 | 338.95 | 359.71 | 350.02 | 363.78 | 378.26 | 330.40 | 324.49 | 312.33 | 280.29 | 252.37 | 233.52 | 250.75 | 184.60 | 179.49 | 178.12 | 165.36 | 157.66 | 166.80 | 164.05 | 167.96 | 151.03 | 131.89 | 132.80 | 127.04 | 114.06 | 113.63 | 116.11 | 107.65 | 105.62 | 106.44 | 105.53 | 109.35 | 82.29 | 86.62 | 97.34 | 90.86 | 83.98 | 67.18 | 63.30 | 62.10 | 52.78 | 51.15 | 51.78 | 40.13 | 33.37 | 37.86 | 38.37 | 36.92 | 30.56 | NA | NA | NA |
| 2024-01-31 | 2023-10-31 | 2023-07-31 | 2023-04-30 | 2023-01-31 | 2022-10-31 | 2022-07-31 | 2022-04-30 | 2022-01-31 | 2021-10-31 | 2021-07-31 | 2021-04-30 | 2021-01-31 | 2020-10-31 | 2020-07-31 | 2020-04-30 | 2020-01-31 | 2019-10-31 | 2019-07-31 | 2019-04-30 | 2019-01-31 | 2018-10-31 | 2018-07-31 | 2018-04-30 | 2018-01-31 | 2017-10-31 | 2017-07-31 | 2017-04-30 | 2017-01-31 | 2016-10-31 | 2016-07-31 | 2016-04-30 | 2016-01-31 | 2015-10-31 | 2015-07-31 | 2015-04-30 | 2015-01-31 | 2014-10-31 | 2014-07-31 | 2014-04-30 | 2014-01-31 | 2013-10-31 | 2013-07-31 | 2013-04-30 | 2013-01-31 | 2012-10-31 | 2012-07-31 | 2012-04-30 | 2012-01-31 | 2011-10-31 | 2011-07-31 | 2011-04-30 | 2011-01-31 | 2010-10-31 | 2010-07-31 | 2010-04-30 | 2010-01-31 | ||
|---|---|---|---|---|---|---|---|---|---|---|---|---|---|---|---|---|---|---|---|---|---|---|---|---|---|---|---|---|---|---|---|---|---|---|---|---|---|---|---|---|---|---|---|---|---|---|---|---|---|---|---|---|---|---|---|---|---|---|
| Stockholders Equity | 3266.44 | 3145.99 | 2914.37 | 2817.89 | 2699.14 | 2606.14 | 2452.13 | 2382.04 | 2305.49 | 2263.07 | 2186.93 | 2127.82 | 2048.84 | 1980.18 | 1921.71 | 1858.51 | 1778.65 | 1666.54 | 1616.00 | 1546.89 | 1489.47 | 1398.25 | 1333.97 | 1275.83 | 1239.41 | 1161.08 | 1111.92 | 1049.30 | 1001.79 | 963.38 | 930.16 | 891.35 | 837.17 | 809.86 | 775.60 | 748.60 | 706.95 | 699.48 | 672.27 | 642.41 | 607.24 | 606.35 | 577.68 | 549.33 | 526.60 | 616.67 | 590.43 | 574.95 | 553.13 | 529.07 | 528.29 | 508.65 | 488.92 | 469.11 | NA | NA | NA | |
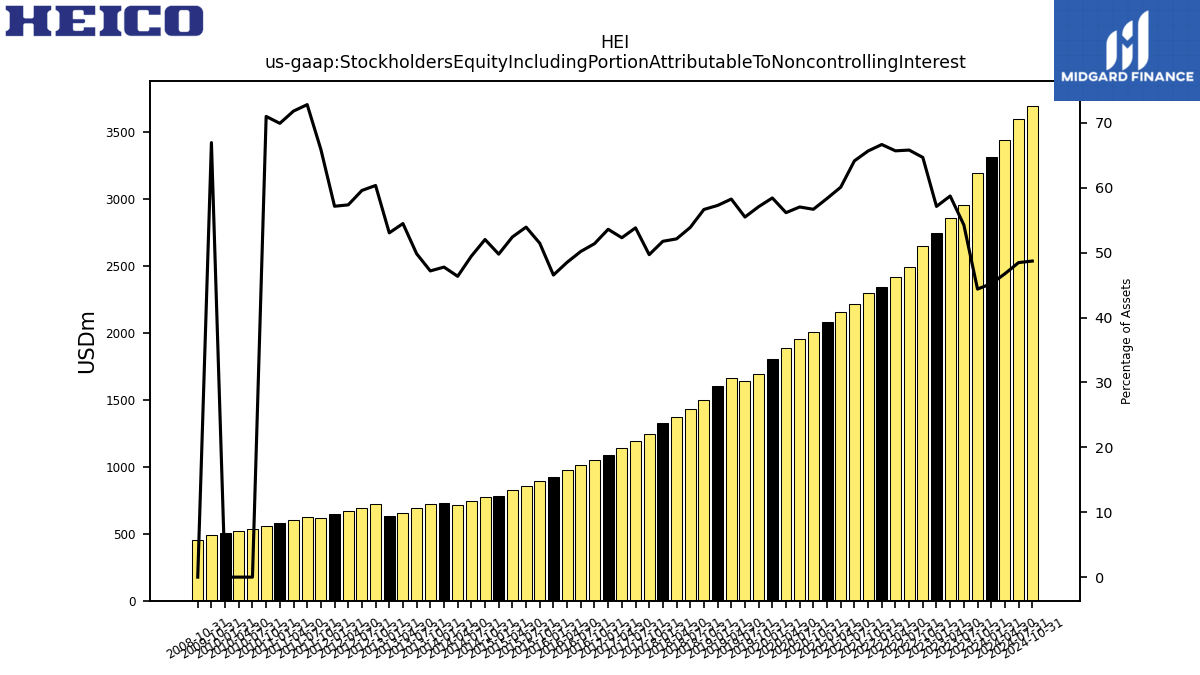
| Stockholders Equity Including Portion Attributable To Noncontrolling Interest | 3316.64 | 3193.15 | 2959.20 | 2859.67 | 2744.17 | 2648.31 | 2491.98 | 2420.47 | 2342.06 | 2296.94 | 2220.09 | 2159.89 | 2080.16 | 2010.61 | 1952.21 | 1889.52 | 1809.25 | 1694.66 | 1642.38 | 1662.16 | 1601.76 | 1503.01 | 1430.32 | 1369.51 | 1330.01 | 1248.29 | 1196.67 | 1138.53 | 1088.59 | 1047.70 | 1012.27 | 978.44 | 922.22 | 893.27 | 856.58 | 828.40 | 783.94 | 774.62 | 745.29 | 717.22 | 727.74 | 723.24 | 690.85 | 658.68 | 632.54 | 719.76 | 690.58 | 671.91 | 647.11 | 620.15 | 622.24 | 599.48 | 577.15 | 554.83 | 535.95 | 521.71 | 503.72 | |
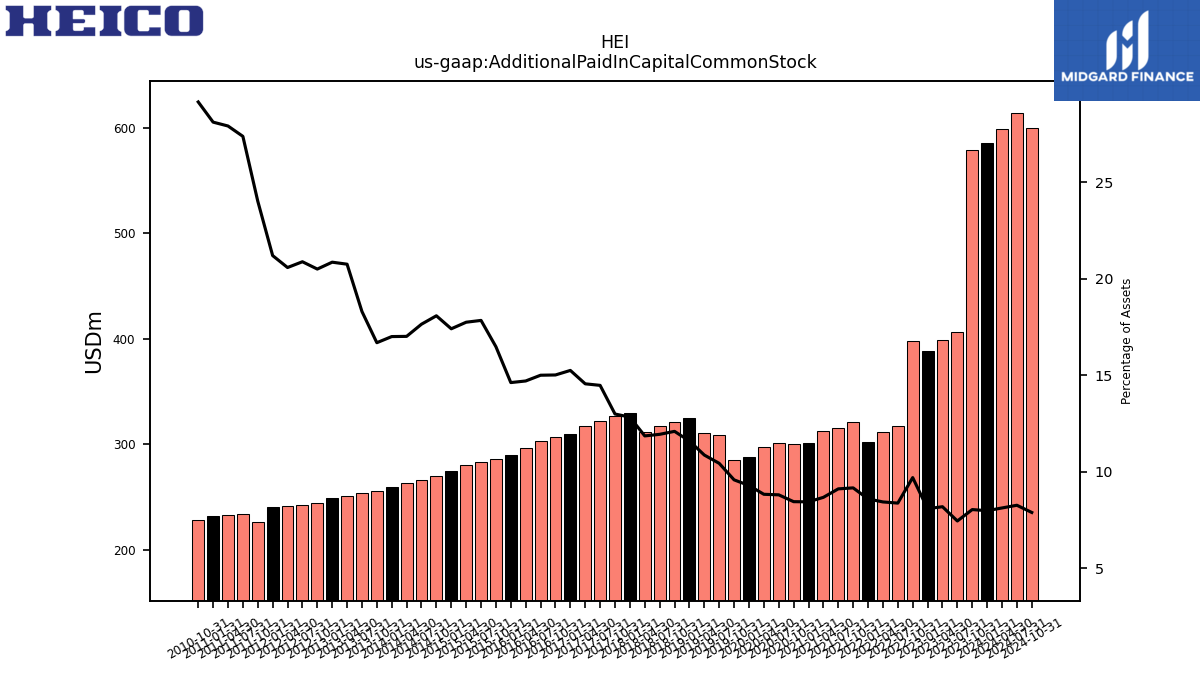
| Additional Paid In Capital Common Stock | 585.89 | 578.81 | 406.44 | 398.99 | 388.60 | 397.34 | 317.37 | 311.05 | 302.10 | 320.75 | 315.60 | 312.00 | 301.11 | 299.93 | 301.53 | 297.32 | 287.78 | 284.61 | 309.06 | 310.20 | 324.39 | 320.99 | 317.09 | 311.71 | 329.91 | 326.54 | 322.02 | 317.05 | 309.90 | 306.33 | 302.73 | 296.69 | 289.81 | 286.22 | 283.49 | 280.61 | 274.31 | 269.35 | 266.03 | 263.37 | 259.15 | 255.89 | 253.87 | 251.04 | 248.82 | 244.63 | 242.12 | 241.19 | 240.17 | 226.12 | 234.08 | 233.12 | 232.15 | 227.99 | NA | NA | NA | |
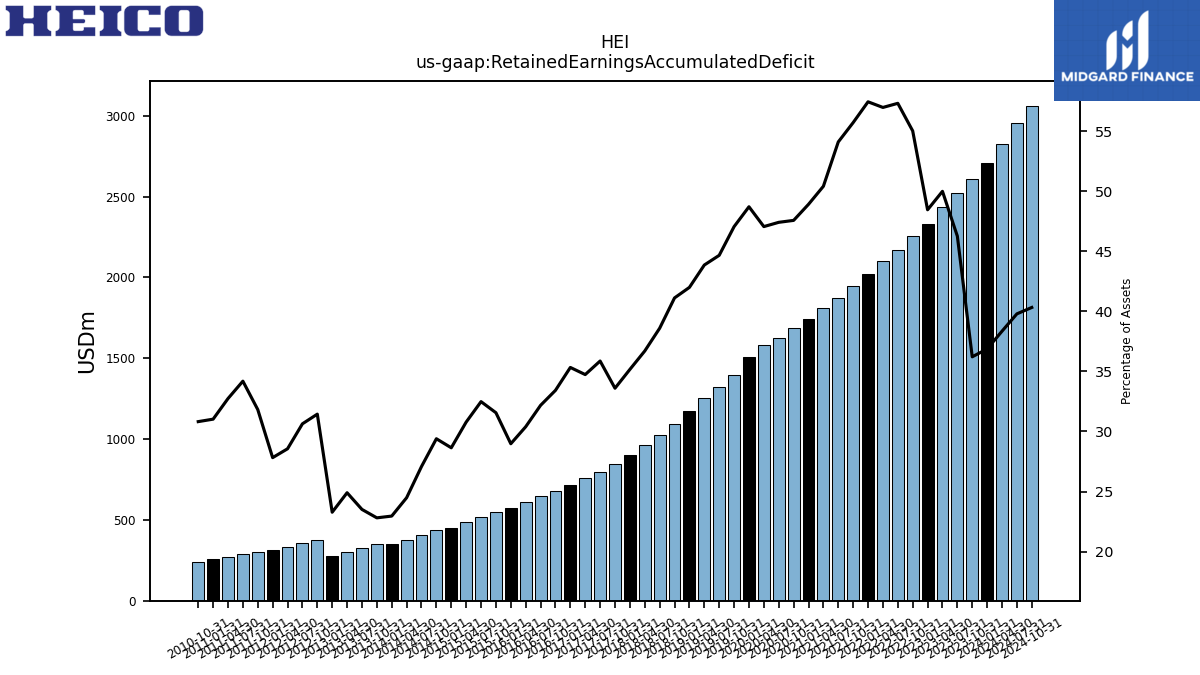
| Retained Earnings Accumulated Deficit | 2705.13 | 2605.98 | 2523.21 | 2435.16 | 2328.52 | 2253.93 | 2171.33 | 2100.18 | 2018.99 | 1949.52 | 1873.24 | 1812.80 | 1744.25 | 1688.05 | 1623.29 | 1583.65 | 1508.78 | 1397.33 | 1322.38 | 1251.70 | 1174.81 | 1091.18 | 1024.74 | 964.57 | 904.03 | 844.25 | 797.62 | 756.41 | 717.76 | 681.70 | 649.13 | 613.07 | 574.23 | 548.05 | 516.01 | 486.53 | 451.20 | 437.76 | 408.15 | 378.88 | 349.74 | 349.65 | 326.00 | 301.09 | 277.59 | 375.08 | 355.16 | 334.58 | 315.08 | 299.50 | 292.24 | 273.36 | 256.12 | 240.91 | NA | NA | NA | |
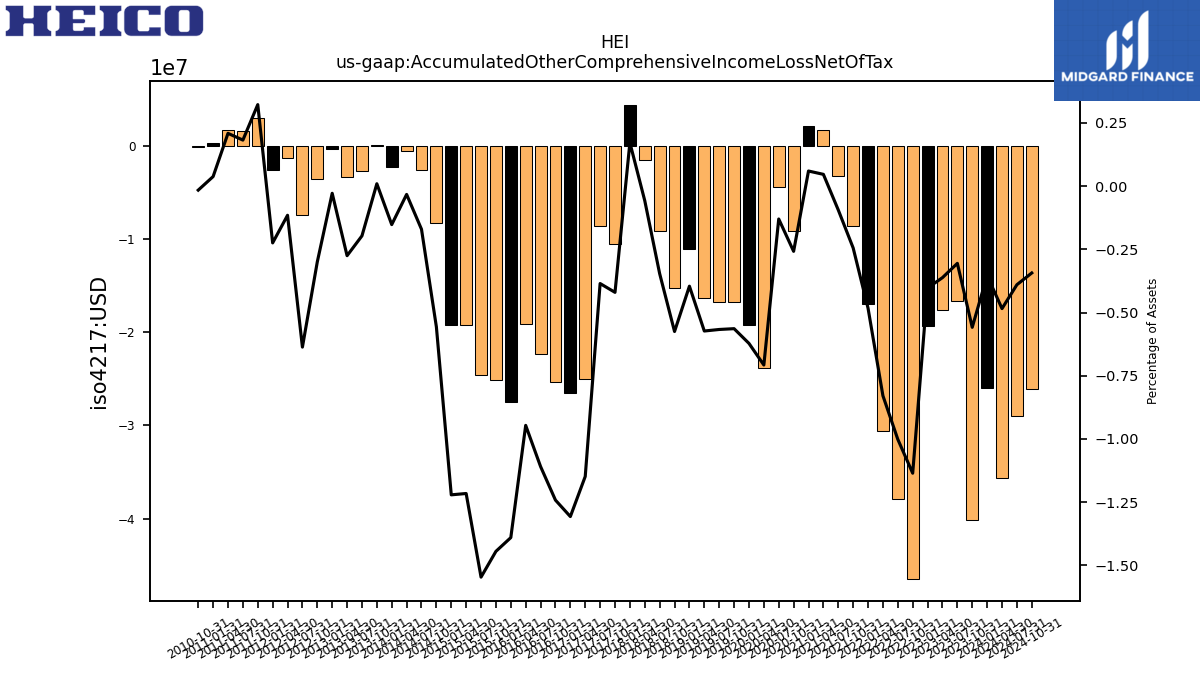
| Accumulated Other Comprehensive Income Loss Net Of Tax | -25.96 | -40.18 | -16.66 | -17.63 | -19.36 | -46.50 | -37.93 | -30.55 | -16.96 | -8.55 | -3.27 | 1.67 | 2.13 | -9.15 | -4.45 | -23.80 | -19.26 | -16.74 | -16.78 | -16.35 | -11.07 | -15.26 | -9.19 | -1.52 | 4.42 | -10.56 | -8.57 | -25.00 | -26.55 | -25.33 | -22.37 | -19.09 | -27.54 | -25.08 | -24.56 | -19.21 | -19.23 | -8.29 | -2.57 | -0.51 | -2.32 | 0.14 | -2.73 | -3.33 | -0.34 | -3.57 | -7.38 | -1.35 | -2.54 | 3.03 | 1.56 | 1.74 | 0.31 | -0.12 | NA | NA | NA | |
| Minority Interest | 50.20 | 47.16 | 44.83 | 41.78 | 45.04 | 42.17 | 39.85 | 38.44 | 36.56 | 33.87 | 33.16 | 32.07 | 31.32 | 30.43 | 30.50 | 31.01 | 30.60 | 28.12 | 26.38 | 115.28 | 112.29 | 104.76 | 96.35 | 93.68 | 90.60 | 87.21 | 84.75 | 89.23 | 86.80 | 84.33 | 82.11 | 87.09 | 85.05 | 83.41 | 80.98 | 79.81 | 76.99 | 75.14 | 73.02 | 74.81 | 120.50 | 116.89 | 113.18 | 109.35 | 105.94 | 103.09 | 100.14 | 96.96 | 93.98 | 91.08 | 93.94 | 90.83 | 88.23 | 85.71 | NA | NA | NA |
| 2024-01-31 | 2023-10-31 | 2023-07-31 | 2023-04-30 | 2023-01-31 | 2022-10-31 | 2022-07-31 | 2022-04-30 | 2022-01-31 | 2021-10-31 | 2021-07-31 | 2021-04-30 | 2021-01-31 | 2020-10-31 | 2020-07-31 | 2020-04-30 | 2020-01-31 | 2019-10-31 | 2019-07-31 | 2019-04-30 | 2019-01-31 | 2018-10-31 | 2018-07-31 | 2018-04-30 | 2018-01-31 | 2017-10-31 | 2017-07-31 | 2017-04-30 | 2017-01-31 | 2016-10-31 | 2016-07-31 | 2016-04-30 | 2016-01-31 | 2015-10-31 | 2015-07-31 | 2015-04-30 | 2015-01-31 | 2014-10-31 | 2014-07-31 | 2014-04-30 | 2014-01-31 | 2013-10-31 | 2013-07-31 | 2013-04-30 | 2013-01-31 | 2012-10-31 | 2012-07-31 | 2012-04-30 | 2012-01-31 | 2011-10-31 | 2011-07-31 | 2011-04-30 | 2011-01-31 | 2010-10-31 | 2010-07-31 | 2010-04-30 | 2010-01-31 | ||
|---|---|---|---|---|---|---|---|---|---|---|---|---|---|---|---|---|---|---|---|---|---|---|---|---|---|---|---|---|---|---|---|---|---|---|---|---|---|---|---|---|---|---|---|---|---|---|---|---|---|---|---|---|---|---|---|---|---|---|
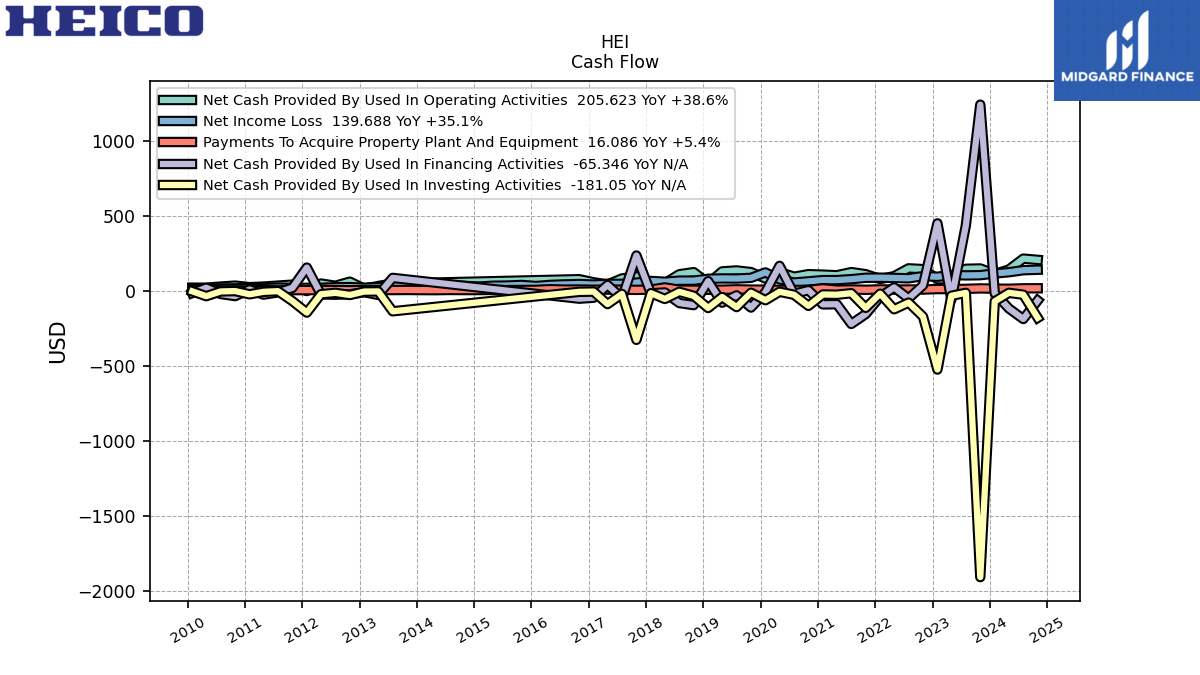
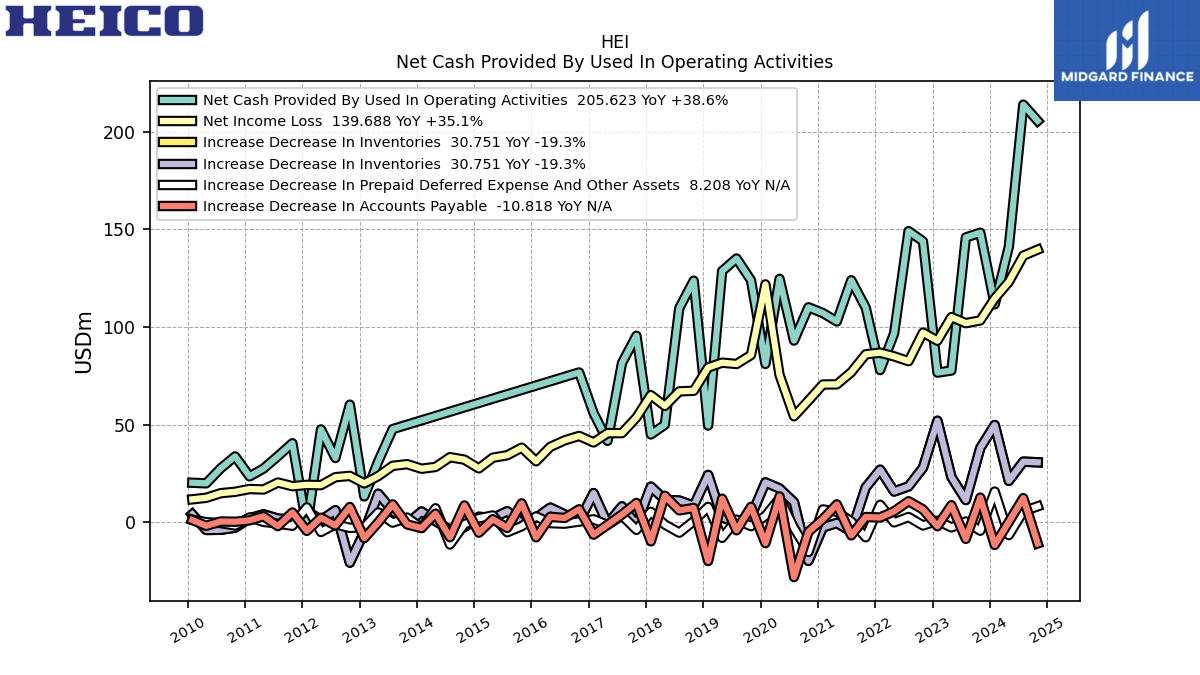
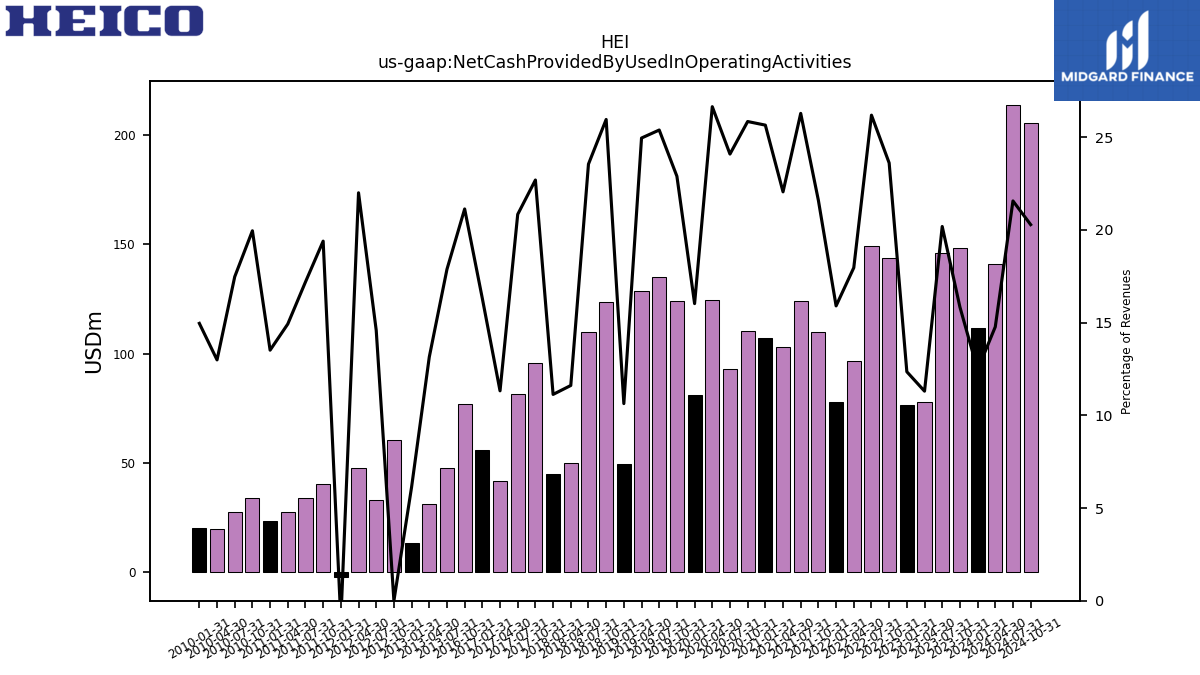
| Net Cash Provided By Used In Operating Activities | 111.65 | 148.38 | 145.92 | 77.75 | 76.69 | 143.95 | 149.16 | 96.77 | 77.98 | 109.98 | 123.99 | 102.91 | 107.20 | 110.15 | 93.09 | 124.75 | 81.14 | 123.98 | 135.15 | 128.69 | 49.57 | 123.78 | 109.70 | 49.99 | 45.01 | 95.58 | 81.59 | 41.74 | 55.98 | 76.77 | NA | NA | NA | NA | NA | NA | NA | NA | NA | NA | NA | NA | 47.76 | 31.25 | 13.28 | 60.28 | 32.96 | 47.60 | -2.25 | 40.52 | 33.92 | 27.53 | 23.55 | 33.80 | 27.66 | 19.99 | 20.28 | |
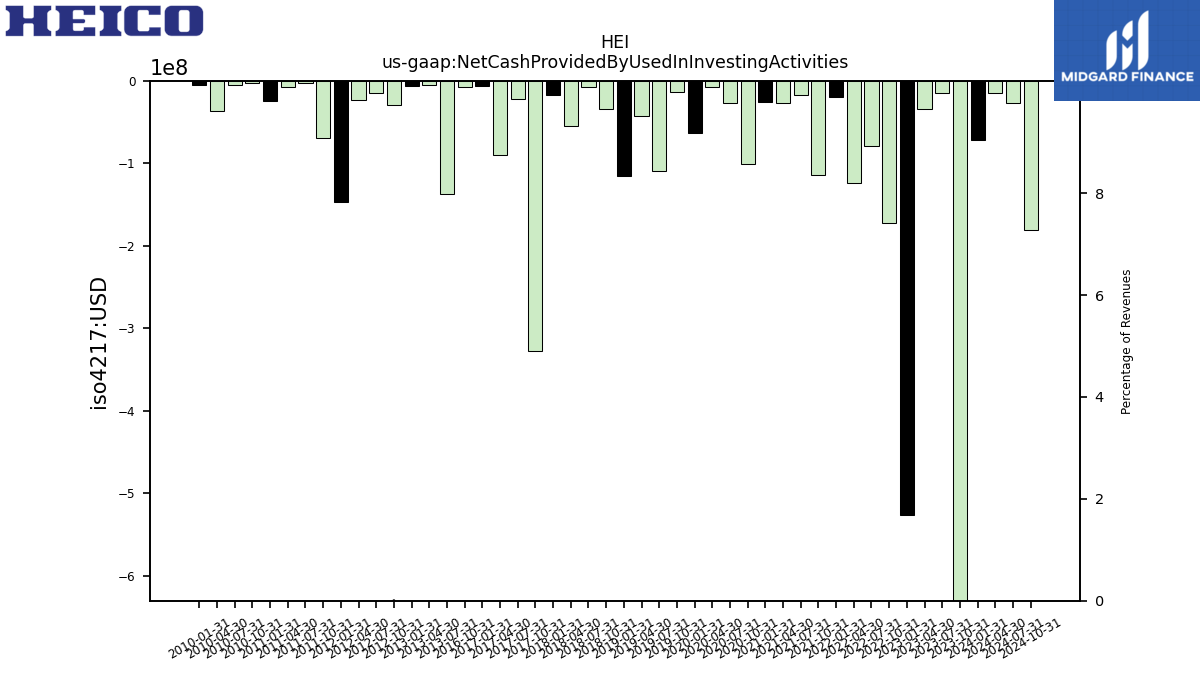
| Net Cash Provided By Used In Investing Activities | -71.14 | -1910.28 | -14.40 | -33.81 | -525.98 | -172.48 | -79.40 | -124.00 | -19.96 | -114.56 | -16.84 | -26.78 | -25.27 | -101.04 | -27.10 | -7.35 | -63.55 | -13.63 | -109.32 | -42.13 | -115.57 | -34.28 | -7.67 | -55.07 | -16.49 | -327.93 | -21.57 | -89.32 | -6.00 | -7.69 | NA | NA | NA | NA | NA | NA | NA | NA | NA | NA | NA | NA | -137.39 | -4.80 | -5.71 | -28.68 | -14.38 | -23.42 | -146.22 | -69.17 | -2.95 | -7.56 | -24.22 | -2.44 | -5.03 | -36.45 | -4.34 | |
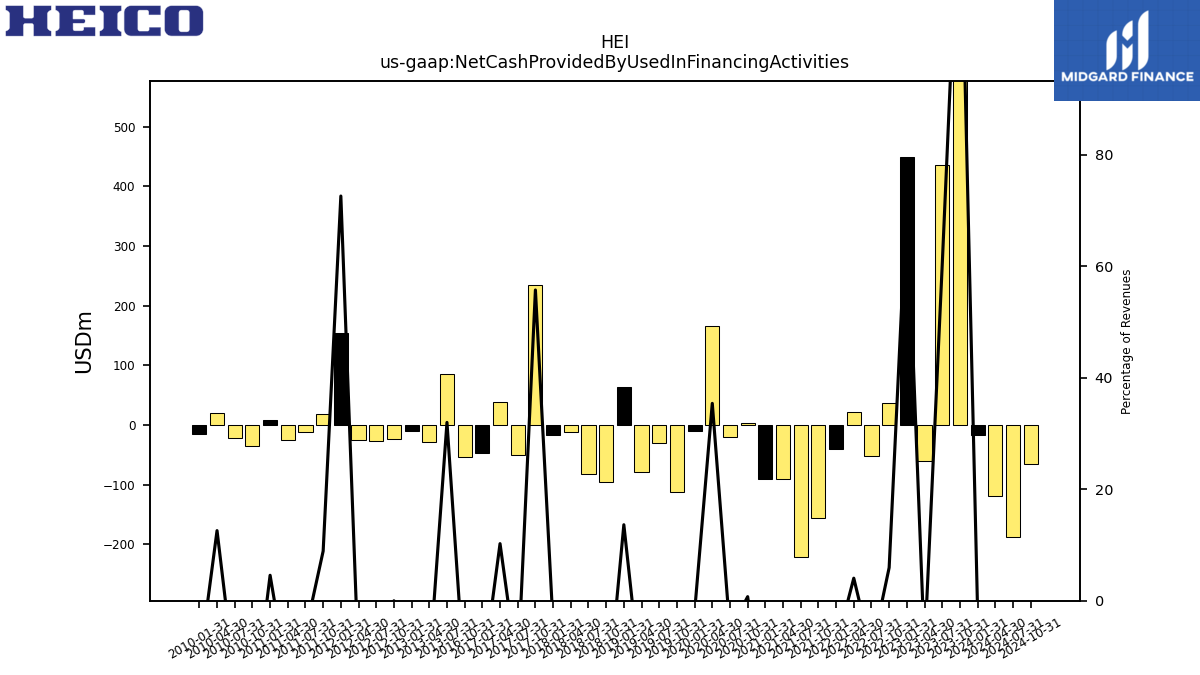
| Net Cash Provided By Used In Financing Activities | -16.73 | 1240.97 | 435.32 | -60.41 | 449.18 | 36.26 | -51.98 | 21.82 | -39.92 | -155.75 | -221.81 | -90.01 | -91.41 | 3.12 | -20.93 | 165.77 | -10.21 | -112.54 | -31.01 | -79.73 | 63.56 | -96.27 | -82.19 | -11.74 | -17.33 | 234.83 | -49.81 | 37.77 | -46.92 | -53.23 | NA | NA | NA | NA | NA | NA | NA | NA | NA | NA | NA | NA | 85.46 | -28.31 | -10.26 | -24.30 | -26.60 | -25.09 | 154.41 | 18.62 | -11.12 | -26.14 | 7.96 | -35.90 | -22.08 | 19.36 | -15.57 |
| 2024-01-31 | 2023-10-31 | 2023-07-31 | 2023-04-30 | 2023-01-31 | 2022-10-31 | 2022-07-31 | 2022-04-30 | 2022-01-31 | 2021-10-31 | 2021-07-31 | 2021-04-30 | 2021-01-31 | 2020-10-31 | 2020-07-31 | 2020-04-30 | 2020-01-31 | 2019-10-31 | 2019-07-31 | 2019-04-30 | 2019-01-31 | 2018-10-31 | 2018-07-31 | 2018-04-30 | 2018-01-31 | 2017-10-31 | 2017-07-31 | 2017-04-30 | 2017-01-31 | 2016-10-31 | 2016-07-31 | 2016-04-30 | 2016-01-31 | 2015-10-31 | 2015-07-31 | 2015-04-30 | 2015-01-31 | 2014-10-31 | 2014-07-31 | 2014-04-30 | 2014-01-31 | 2013-10-31 | 2013-07-31 | 2013-04-30 | 2013-01-31 | 2012-10-31 | 2012-07-31 | 2012-04-30 | 2012-01-31 | 2011-10-31 | 2011-07-31 | 2011-04-30 | 2011-01-31 | 2010-10-31 | 2010-07-31 | 2010-04-30 | 2010-01-31 | ||
|---|---|---|---|---|---|---|---|---|---|---|---|---|---|---|---|---|---|---|---|---|---|---|---|---|---|---|---|---|---|---|---|---|---|---|---|---|---|---|---|---|---|---|---|---|---|---|---|---|---|---|---|---|---|---|---|---|---|---|
| Net Cash Provided By Used In Operating Activities | 111.65 | 148.38 | 145.92 | 77.75 | 76.69 | 143.95 | 149.16 | 96.77 | 77.98 | 109.98 | 123.99 | 102.91 | 107.20 | 110.15 | 93.09 | 124.75 | 81.14 | 123.98 | 135.15 | 128.69 | 49.57 | 123.78 | 109.70 | 49.99 | 45.01 | 95.58 | 81.59 | 41.74 | 55.98 | 76.77 | NA | NA | NA | NA | NA | NA | NA | NA | NA | NA | NA | NA | 47.76 | 31.25 | 13.28 | 60.28 | 32.96 | 47.60 | -2.25 | 40.52 | 33.92 | 27.53 | 23.55 | 33.80 | 27.66 | 19.99 | 20.28 | |
| Net Income Loss | 114.70 | 103.43 | 102.02 | 105.12 | 93.03 | 97.20 | 82.54 | 85.01 | 86.92 | 86.06 | 76.89 | 70.67 | 70.60 | 62.33 | 54.32 | 75.45 | 121.89 | 85.68 | 81.10 | 81.78 | 79.33 | 67.38 | 67.09 | 59.62 | 65.15 | 53.67 | 45.70 | 45.69 | 40.93 | 44.26 | 42.00 | 38.66 | 31.27 | 38.25 | 34.37 | 33.10 | 27.64 | 32.10 | 33.37 | 28.37 | 27.45 | 29.79 | 28.95 | 23.70 | 19.96 | 23.79 | 23.13 | 19.04 | 19.18 | 18.51 | 20.40 | 16.83 | 17.07 | 15.64 | 14.93 | 12.57 | 11.79 | |
| Profit Loss | 125.48 | 113.56 | 112.75 | 115.06 | 103.00 | 110.17 | 93.09 | 93.11 | 94.25 | 93.36 | 83.68 | 76.47 | 76.25 | 67.58 | 57.56 | 80.91 | 129.80 | 92.57 | 89.06 | 90.08 | 88.03 | 74.08 | 73.90 | 66.01 | 71.69 | 59.09 | 51.48 | 50.83 | 46.27 | 49.52 | 46.98 | 43.73 | 35.92 | 44.03 | 38.94 | 38.50 | 32.09 | 36.08 | 37.35 | 32.78 | 32.56 | 35.76 | 34.77 | 29.05 | 24.98 | 29.31 | 28.67 | 24.22 | 24.47 | 24.41 | 26.39 | 22.13 | 22.52 | 19.89 | 19.53 | 16.91 | 16.03 | |
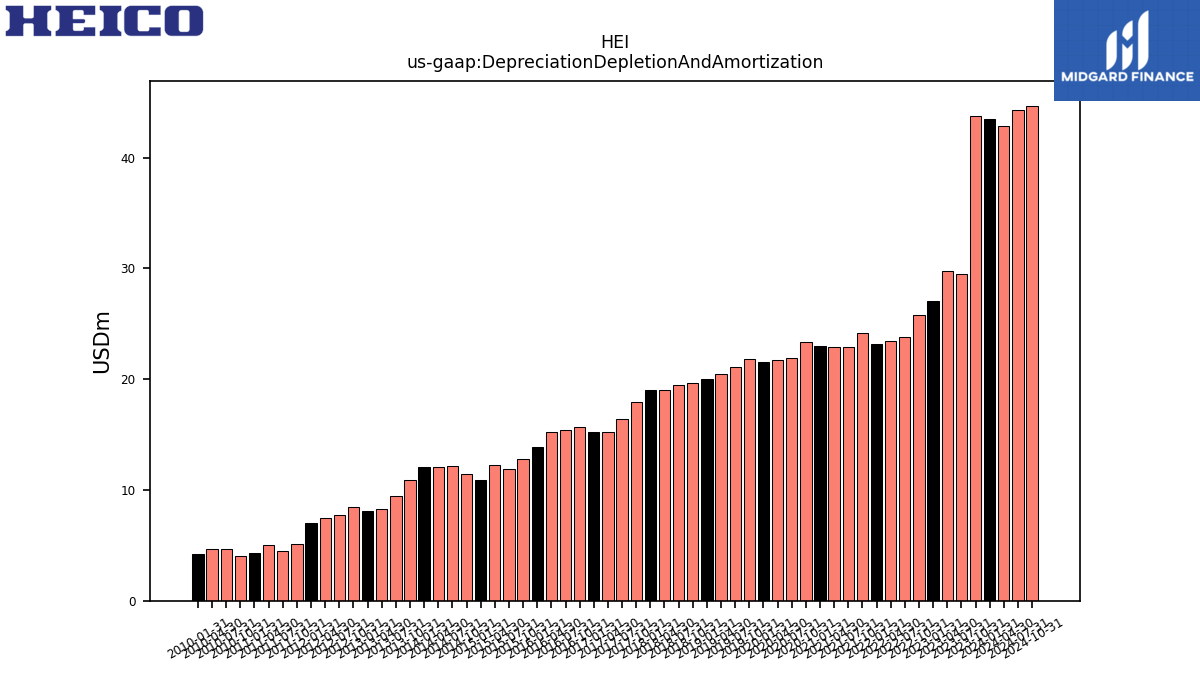
| Depreciation Depletion And Amortization | 43.51 | 43.73 | 29.53 | 29.72 | 27.06 | 25.81 | 23.82 | 23.48 | 23.22 | 24.20 | 22.90 | 22.92 | 23.00 | 23.34 | 21.94 | 21.69 | 21.58 | 21.81 | 21.14 | 20.51 | 20.04 | 19.67 | 19.43 | 19.07 | 19.02 | 17.91 | 16.41 | 15.25 | 15.25 | 15.67 | 15.42 | 15.26 | 13.92 | 12.84 | 11.93 | 12.24 | 10.90 | 11.49 | 12.13 | 12.09 | 12.05 | 10.89 | 9.49 | 8.27 | 8.14 | 8.48 | 7.74 | 7.46 | 6.97 | 5.12 | 4.54 | 5.00 | 4.31 | 4.02 | 4.70 | 4.63 | 4.25 | |
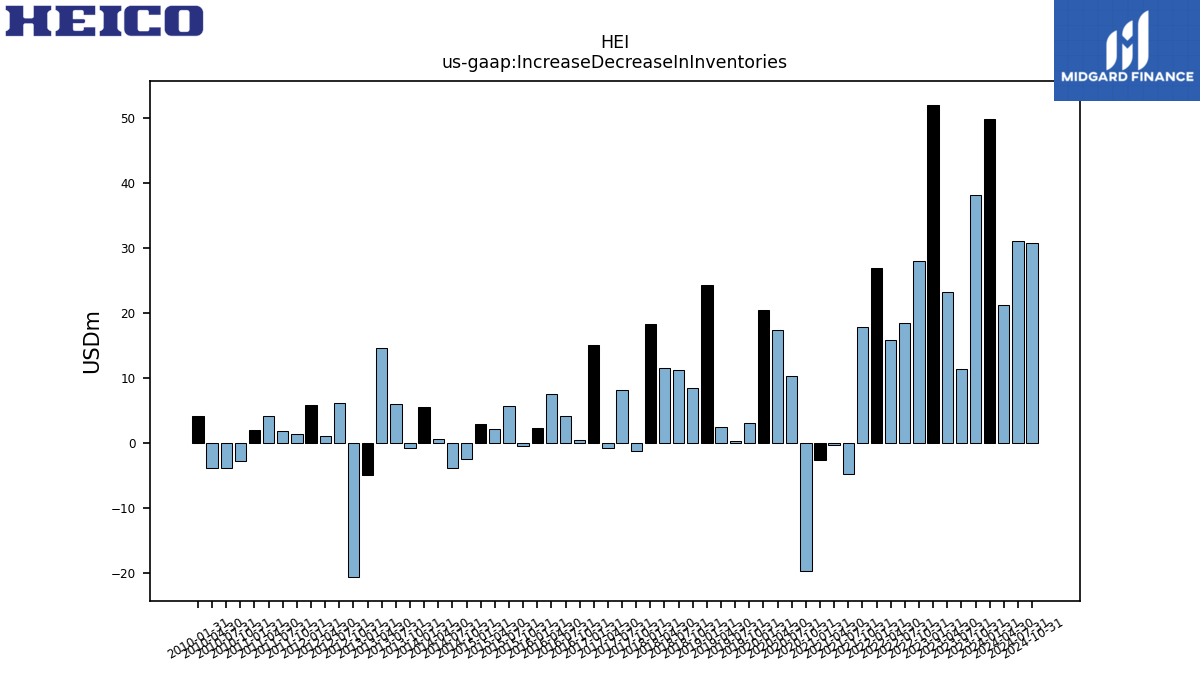
| Increase Decrease In Inventories | 49.85 | 38.10 | 11.43 | 23.21 | 52.04 | 28.00 | 18.42 | 15.80 | 26.97 | 17.85 | -4.80 | -0.33 | -2.60 | -19.76 | 10.29 | 17.34 | 20.45 | 3.06 | 0.29 | 2.44 | 24.28 | 8.49 | 11.15 | 11.51 | 18.30 | -1.21 | 8.16 | -0.74 | 14.99 | 0.51 | 4.06 | 7.53 | 2.33 | -0.47 | 5.69 | 2.11 | 2.85 | -2.42 | -3.91 | 0.66 | 5.54 | -0.75 | 5.93 | 14.66 | -4.96 | -20.66 | 6.19 | 1.10 | 5.88 | 1.35 | 1.90 | 4.11 | 2.04 | -2.73 | -3.81 | -3.90 | 4.08 | |
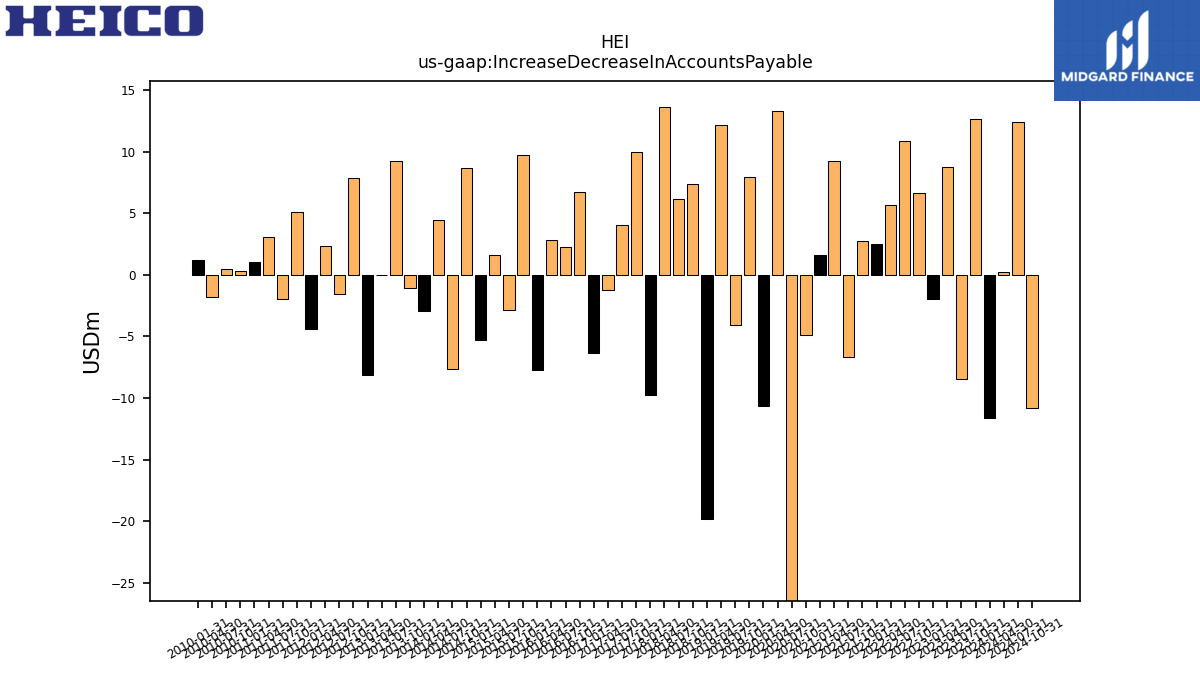
| Increase Decrease In Accounts Payable | -11.61 | 12.66 | -8.48 | 8.79 | -1.99 | 6.61 | 10.82 | 5.67 | 2.47 | 2.74 | -6.68 | 9.20 | 1.64 | -4.89 | -28.06 | 13.30 | -10.68 | 7.93 | -4.08 | 12.13 | -19.83 | 7.36 | 6.14 | 13.65 | -9.73 | 9.95 | 4.01 | -1.25 | -6.32 | 6.70 | 2.23 | 2.84 | -7.70 | 9.74 | -2.87 | 1.60 | -5.30 | 8.64 | -7.64 | 4.46 | -2.95 | -1.07 | 9.20 | -0.04 | -8.12 | 7.87 | -1.60 | 2.37 | -4.38 | 5.07 | -1.94 | 3.09 | 1.03 | 0.30 | 0.44 | -1.79 | 1.18 | |
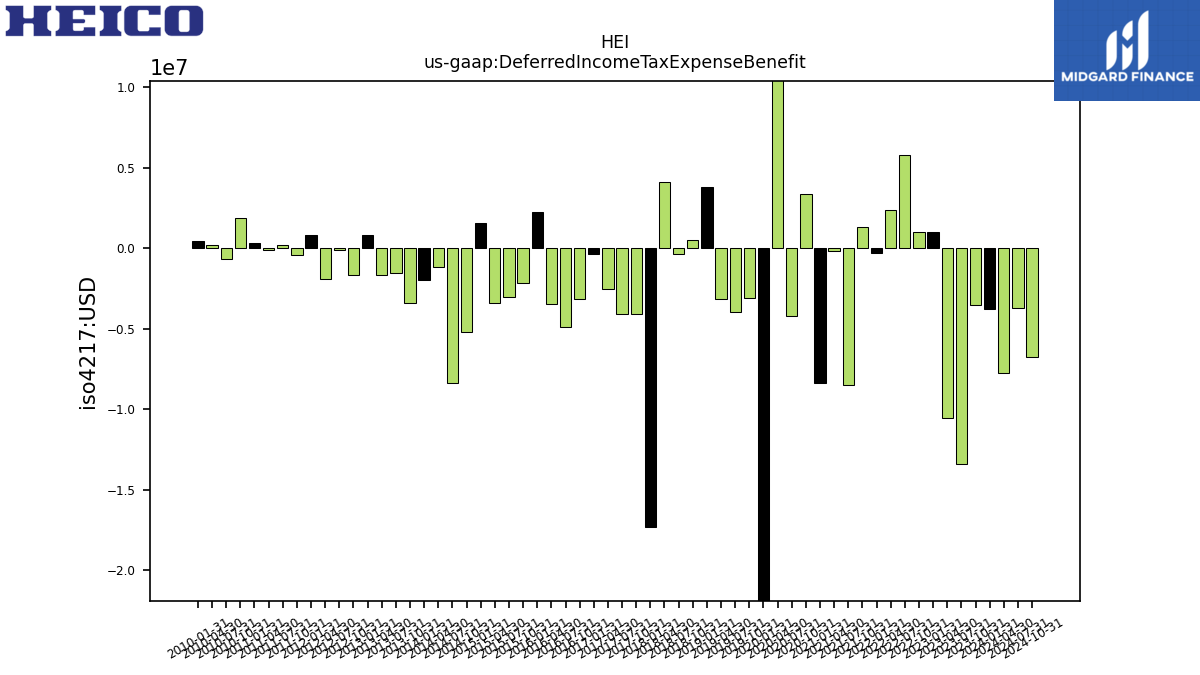
| Deferred Income Tax Expense Benefit | -3.76 | -3.56 | -13.38 | -10.58 | 0.98 | 1.02 | 5.78 | 2.40 | -0.32 | 1.32 | -8.47 | -0.14 | -8.35 | 3.35 | -4.21 | 20.58 | -25.72 | -3.10 | -3.94 | -3.15 | 3.80 | 0.51 | -0.33 | 4.13 | -17.29 | -4.10 | -4.09 | -2.56 | -0.35 | -3.14 | -4.88 | -3.44 | 2.28 | -2.17 | -3.06 | -3.41 | 1.56 | -5.20 | -8.40 | -1.15 | -2.00 | -3.39 | -1.54 | -1.66 | 0.80 | -1.64 | -0.13 | -1.91 | 0.85 | -0.39 | 0.18 | -0.10 | 0.35 | 1.90 | -0.69 | 0.18 | 0.43 |
| 2024-01-31 | 2023-10-31 | 2023-07-31 | 2023-04-30 | 2023-01-31 | 2022-10-31 | 2022-07-31 | 2022-04-30 | 2022-01-31 | 2021-10-31 | 2021-07-31 | 2021-04-30 | 2021-01-31 | 2020-10-31 | 2020-07-31 | 2020-04-30 | 2020-01-31 | 2019-10-31 | 2019-07-31 | 2019-04-30 | 2019-01-31 | 2018-10-31 | 2018-07-31 | 2018-04-30 | 2018-01-31 | 2017-10-31 | 2017-07-31 | 2017-04-30 | 2017-01-31 | 2016-10-31 | 2016-07-31 | 2016-04-30 | 2016-01-31 | 2015-10-31 | 2015-07-31 | 2015-04-30 | 2015-01-31 | 2014-10-31 | 2014-07-31 | 2014-04-30 | 2014-01-31 | 2013-10-31 | 2013-07-31 | 2013-04-30 | 2013-01-31 | 2012-10-31 | 2012-07-31 | 2012-04-30 | 2012-01-31 | 2011-10-31 | 2011-07-31 | 2011-04-30 | 2011-01-31 | 2010-10-31 | 2010-07-31 | 2010-04-30 | 2010-01-31 | ||
|---|---|---|---|---|---|---|---|---|---|---|---|---|---|---|---|---|---|---|---|---|---|---|---|---|---|---|---|---|---|---|---|---|---|---|---|---|---|---|---|---|---|---|---|---|---|---|---|---|---|---|---|---|---|---|---|---|---|---|
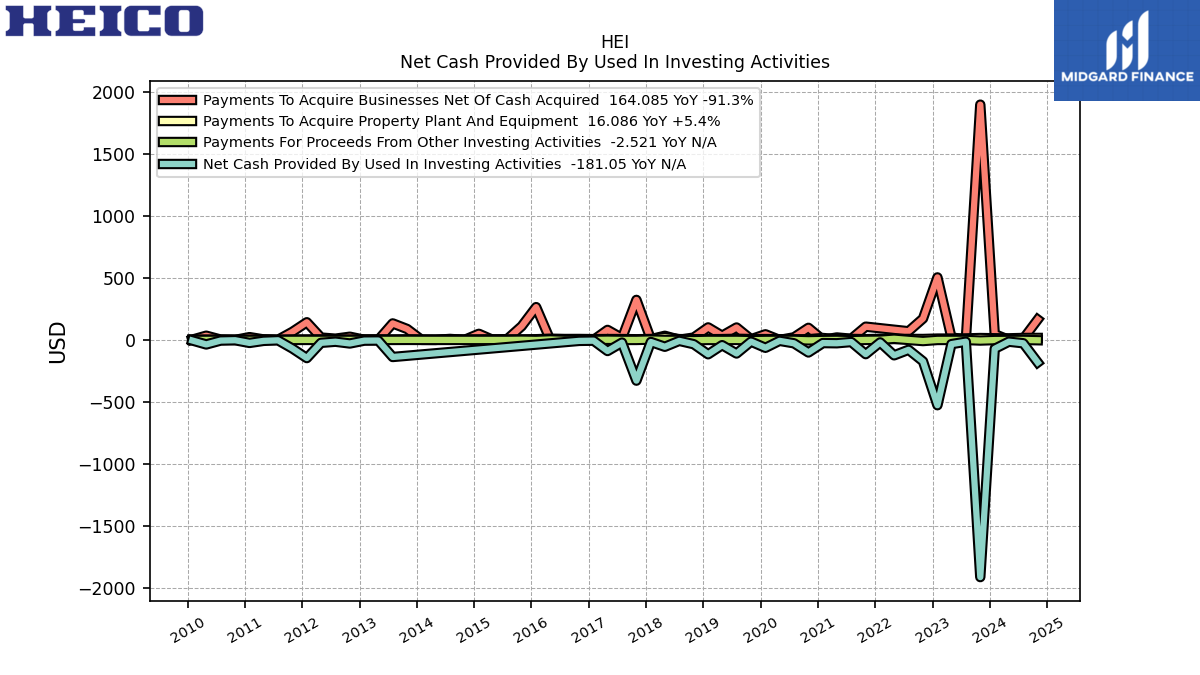
| Net Cash Provided By Used In Investing Activities | -71.14 | -1910.28 | -14.40 | -33.81 | -525.98 | -172.48 | -79.40 | -124.00 | -19.96 | -114.56 | -16.84 | -26.78 | -25.27 | -101.04 | -27.10 | -7.35 | -63.55 | -13.63 | -109.32 | -42.13 | -115.57 | -34.28 | -7.67 | -55.07 | -16.49 | -327.93 | -21.57 | -89.32 | -6.00 | -7.69 | NA | NA | NA | NA | NA | NA | NA | NA | NA | NA | NA | NA | -137.39 | -4.80 | -5.71 | -28.68 | -14.38 | -23.42 | -146.22 | -69.17 | -2.95 | -7.56 | -24.22 | -2.44 | -5.03 | -36.45 | -4.34 | |
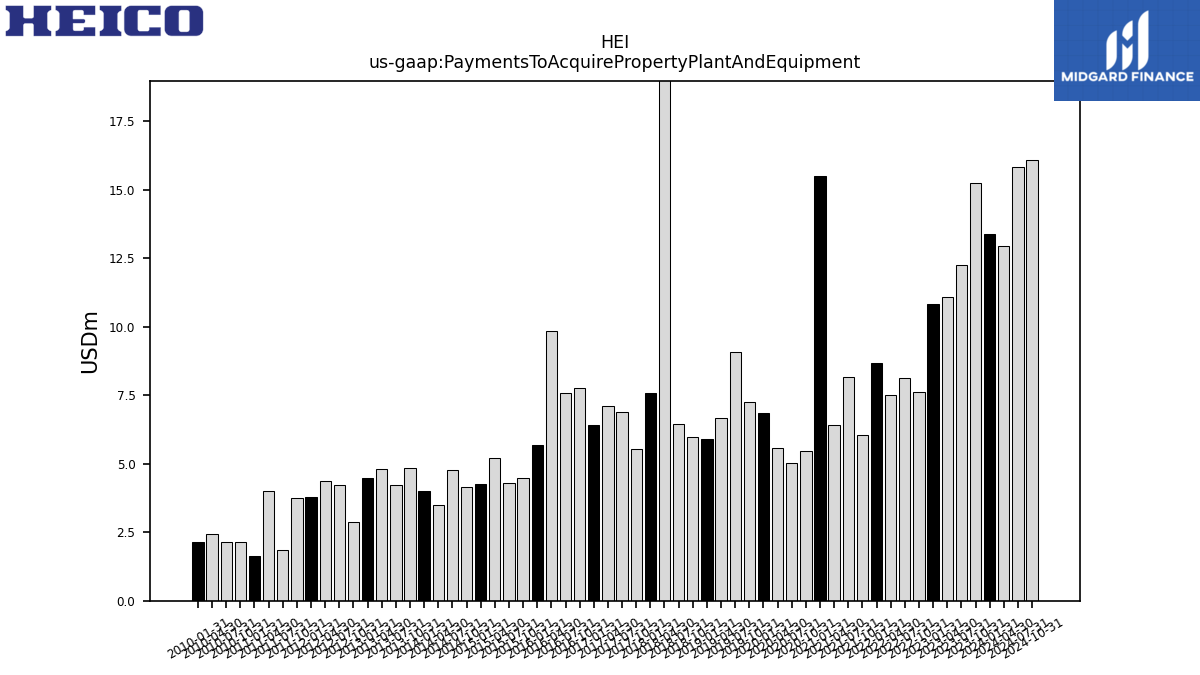
| Payments To Acquire Property Plant And Equipment | 13.38 | 15.26 | 12.26 | 11.07 | 10.85 | 7.62 | 8.15 | 7.52 | 8.69 | 6.06 | 8.19 | 6.43 | 15.51 | 5.47 | 5.04 | 5.58 | 6.85 | 7.27 | 9.07 | 6.69 | 5.91 | 5.97 | 6.44 | 21.88 | 7.58 | 5.55 | 6.91 | 7.12 | 6.42 | 7.75 | 7.57 | 9.86 | 5.69 | 4.48 | 4.31 | 5.21 | 4.25 | 4.15 | 4.78 | 3.50 | 3.99 | 4.83 | 4.23 | 4.80 | 4.47 | 2.88 | 4.23 | 4.36 | 3.79 | 3.74 | 1.86 | 4.00 | 1.64 | 2.13 | 2.14 | 2.44 | 2.16 |
| 2024-01-31 | 2023-10-31 | 2023-07-31 | 2023-04-30 | 2023-01-31 | 2022-10-31 | 2022-07-31 | 2022-04-30 | 2022-01-31 | 2021-10-31 | 2021-07-31 | 2021-04-30 | 2021-01-31 | 2020-10-31 | 2020-07-31 | 2020-04-30 | 2020-01-31 | 2019-10-31 | 2019-07-31 | 2019-04-30 | 2019-01-31 | 2018-10-31 | 2018-07-31 | 2018-04-30 | 2018-01-31 | 2017-10-31 | 2017-07-31 | 2017-04-30 | 2017-01-31 | 2016-10-31 | 2016-07-31 | 2016-04-30 | 2016-01-31 | 2015-10-31 | 2015-07-31 | 2015-04-30 | 2015-01-31 | 2014-10-31 | 2014-07-31 | 2014-04-30 | 2014-01-31 | 2013-10-31 | 2013-07-31 | 2013-04-30 | 2013-01-31 | 2012-10-31 | 2012-07-31 | 2012-04-30 | 2012-01-31 | 2011-10-31 | 2011-07-31 | 2011-04-30 | 2011-01-31 | 2010-10-31 | 2010-07-31 | 2010-04-30 | 2010-01-31 | ||
|---|---|---|---|---|---|---|---|---|---|---|---|---|---|---|---|---|---|---|---|---|---|---|---|---|---|---|---|---|---|---|---|---|---|---|---|---|---|---|---|---|---|---|---|---|---|---|---|---|---|---|---|---|---|---|---|---|---|---|
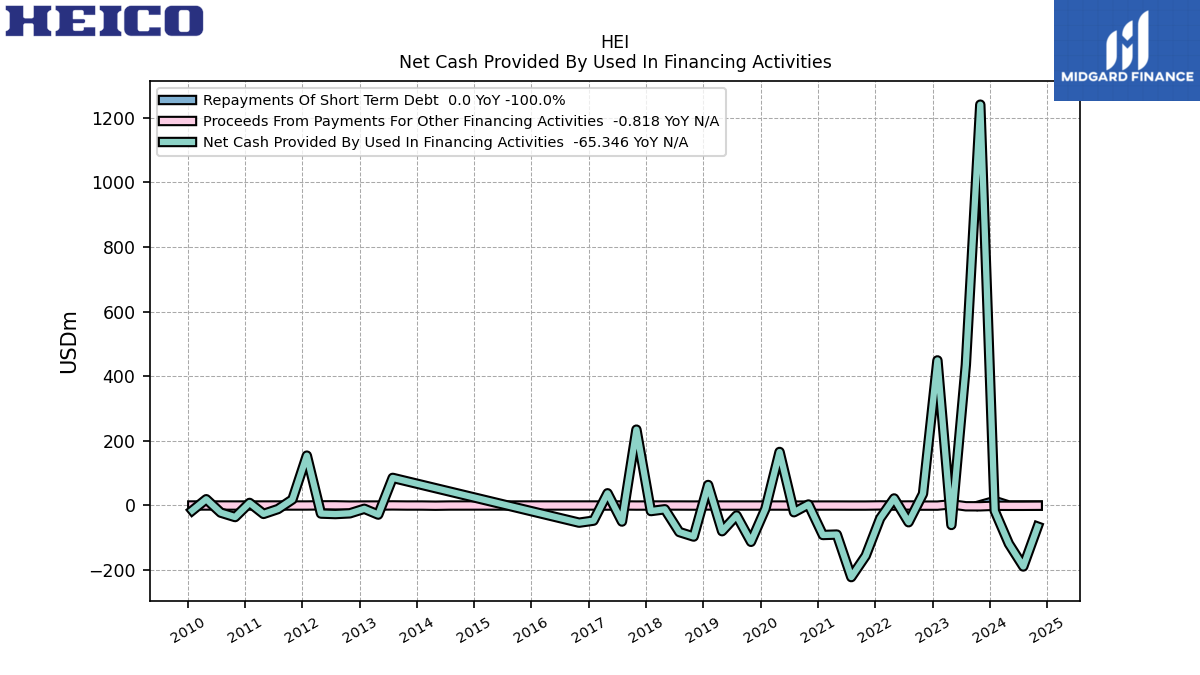
| Net Cash Provided By Used In Financing Activities | -16.73 | 1240.97 | 435.32 | -60.41 | 449.18 | 36.26 | -51.98 | 21.82 | -39.92 | -155.75 | -221.81 | -90.01 | -91.41 | 3.12 | -20.93 | 165.77 | -10.21 | -112.54 | -31.01 | -79.73 | 63.56 | -96.27 | -82.19 | -11.74 | -17.33 | 234.83 | -49.81 | 37.77 | -46.92 | -53.23 | NA | NA | NA | NA | NA | NA | NA | NA | NA | NA | NA | NA | 85.46 | -28.31 | -10.26 | -24.30 | -26.60 | -25.09 | 154.41 | 18.62 | -11.12 | -26.14 | 7.96 | -35.90 | -22.08 | 19.36 | -15.57 | |
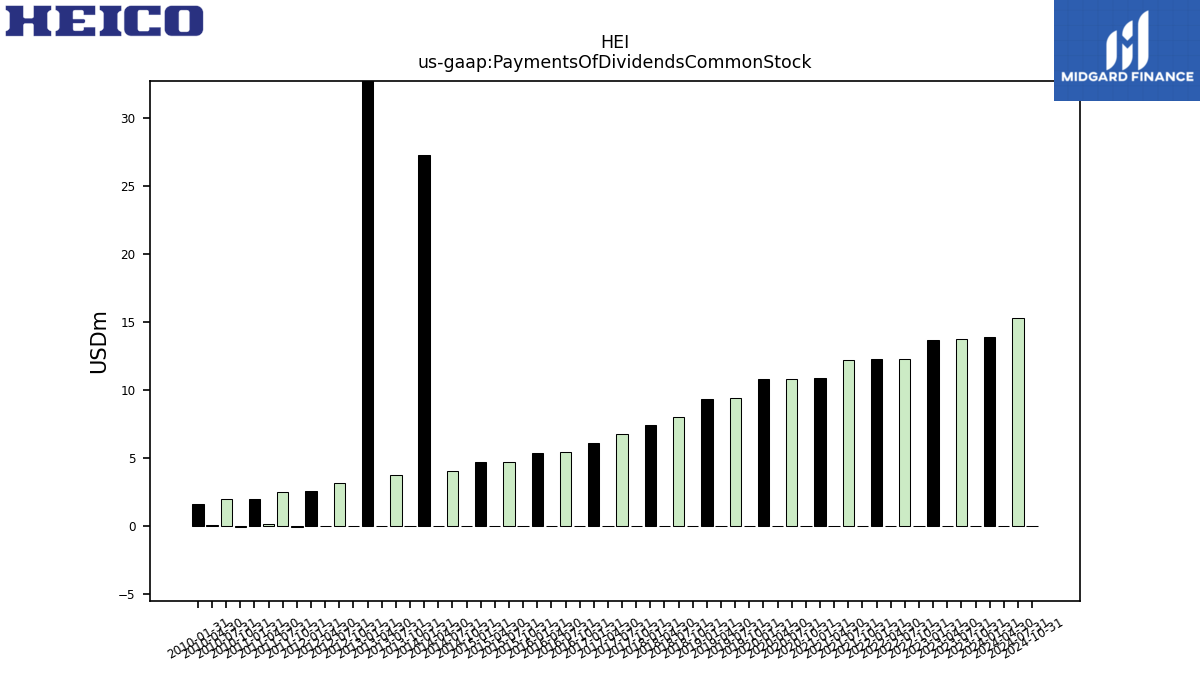
| Payments Of Dividends Common Stock | 13.83 | 0.00 | 13.70 | 0.00 | 13.67 | 0.00 | 12.24 | 0.00 | 12.23 | 0.00 | 12.18 | 0.00 | 10.82 | 0.00 | 10.79 | 0.00 | 10.76 | 0.00 | 9.39 | 0.00 | 9.30 | 0.00 | 7.97 | 0.00 | 7.39 | 0.00 | 6.75 | 0.00 | 6.06 | 0.00 | 5.37 | 0.00 | 5.35 | 0.00 | 4.68 | 0.00 | 4.67 | 0.00 | 3.99 | 0.00 | 27.23 | 0.00 | 3.72 | 0.00 | 116.64 | 0.00 | 3.16 | 0.00 | 2.53 | -0.10 | 2.50 | 0.10 | 1.99 | -0.07 | 1.98 | 0.07 | 1.57 |
| 2024-01-31 | 2023-10-31 | 2023-07-31 | 2023-04-30 | 2023-01-31 | 2022-10-31 | 2022-07-31 | 2022-04-30 | 2022-01-31 | 2021-10-31 | 2021-07-31 | 2021-04-30 | 2021-01-31 | 2020-10-31 | 2020-07-31 | 2020-04-30 | 2020-01-31 | 2019-10-31 | 2019-07-31 | 2019-04-30 | 2019-01-31 | 2018-10-31 | 2018-07-31 | 2018-04-30 | 2018-01-31 | 2017-10-31 | 2017-07-31 | 2017-04-30 | 2017-01-31 | 2016-10-31 | 2016-07-31 | 2016-04-30 | 2016-01-31 | 2015-10-31 | 2015-07-31 | 2015-04-30 | 2015-01-31 | 2014-10-31 | 2014-07-31 | 2014-04-30 | 2014-01-31 | 2013-10-31 | 2013-07-31 | 2013-04-30 | 2013-01-31 | 2012-10-31 | 2012-07-31 | 2012-04-30 | 2012-01-31 | 2011-10-31 | 2011-07-31 | 2011-04-30 | 2011-01-31 | 2010-10-31 | 2010-07-31 | 2010-04-30 | 2010-01-31 | ||
|---|---|---|---|---|---|---|---|---|---|---|---|---|---|---|---|---|---|---|---|---|---|---|---|---|---|---|---|---|---|---|---|---|---|---|---|---|---|---|---|---|---|---|---|---|---|---|---|---|---|---|---|---|---|---|---|---|---|---|
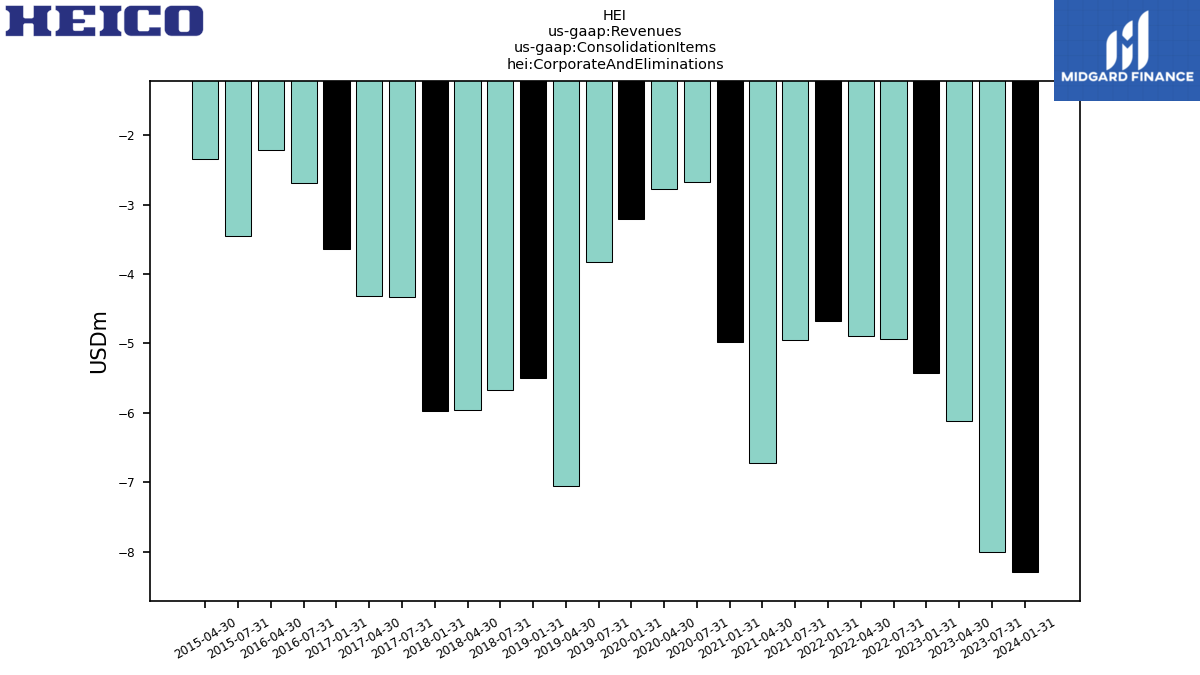
| Revenues | 896.36 | 936.45 | 722.90 | 687.84 | 620.91 | 609.64 | 569.53 | 538.81 | 490.34 | 509.42 | 471.71 | 466.65 | 417.90 | 426.18 | 386.41 | 468.15 | 506.27 | 541.53 | 532.32 | 515.65 | 466.15 | 476.88 | 465.82 | 430.60 | 404.41 | 421.22 | 391.50 | 368.66 | 343.43 | 363.30 | 356.08 | 350.65 | 306.23 | 328.67 | 300.37 | 291.42 | 268.19 | 292.22 | 291.03 | 282.23 | 266.83 | 287.43 | 267.13 | 237.71 | 216.49 | 242.41 | 225.97 | 216.31 | 212.66 | 208.92 | 197.27 | 184.49 | 174.22 | 169.37 | 158.27 | 153.84 | 135.53 | |
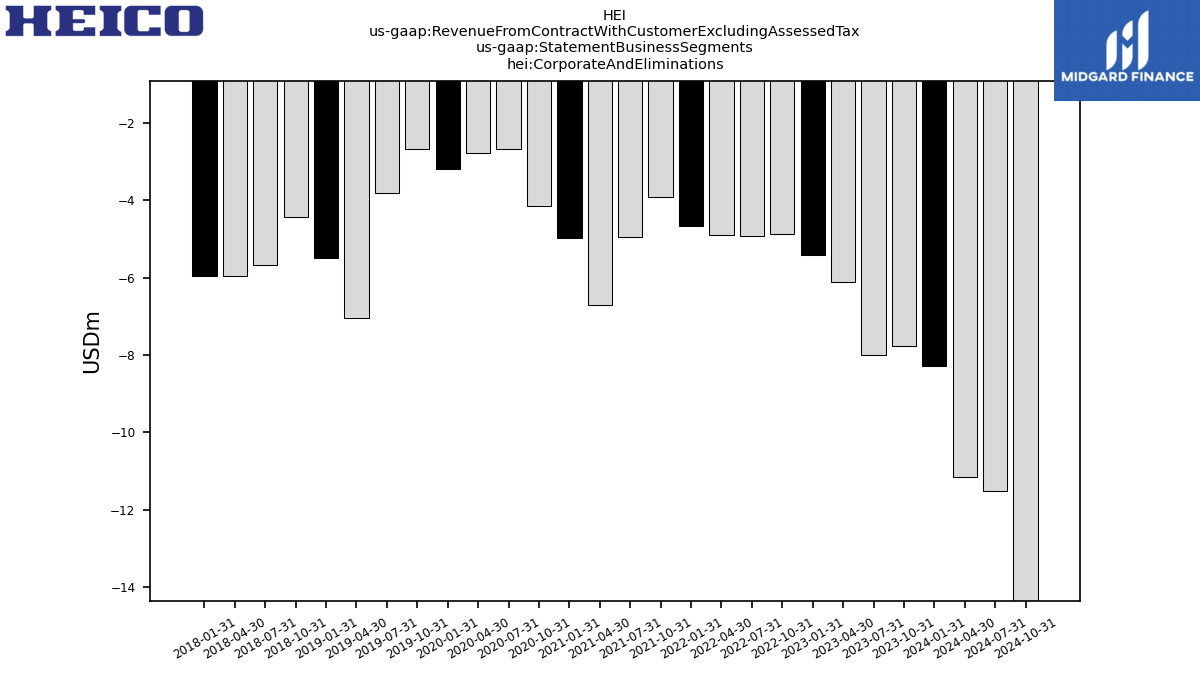
| Corporate And Eliminations | -8.29 | NA | -8.01 | -6.12 | -5.42 | NA | -4.93 | -4.89 | -4.67 | NA | -4.95 | -6.72 | -4.98 | NA | -2.67 | -2.77 | -3.20 | NA | -3.82 | -7.05 | -5.50 | NA | -5.67 | -5.96 | -5.97 | NA | -4.33 | -4.32 | -3.63 | NA | -2.68 | -2.21 | NA | NA | -3.45 | -2.35 | NA | NA | NA | NA | NA | NA | NA | NA | NA | NA | NA | NA | NA | NA | NA | NA | NA | NA | NA | NA | NA | |
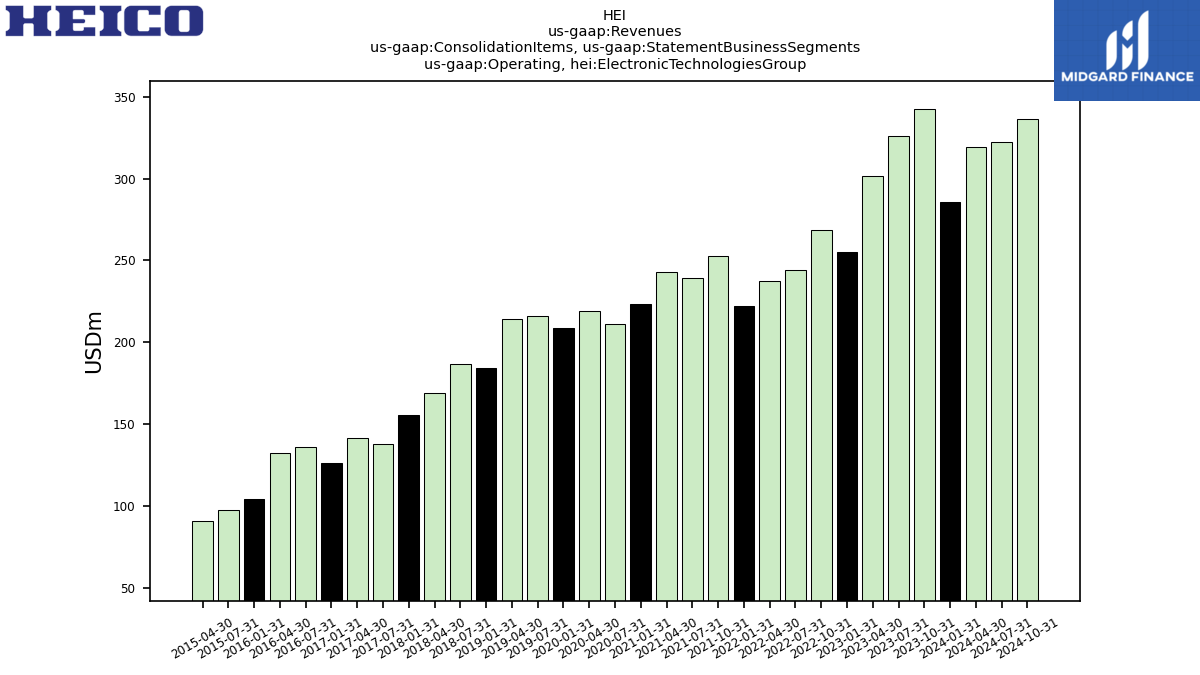
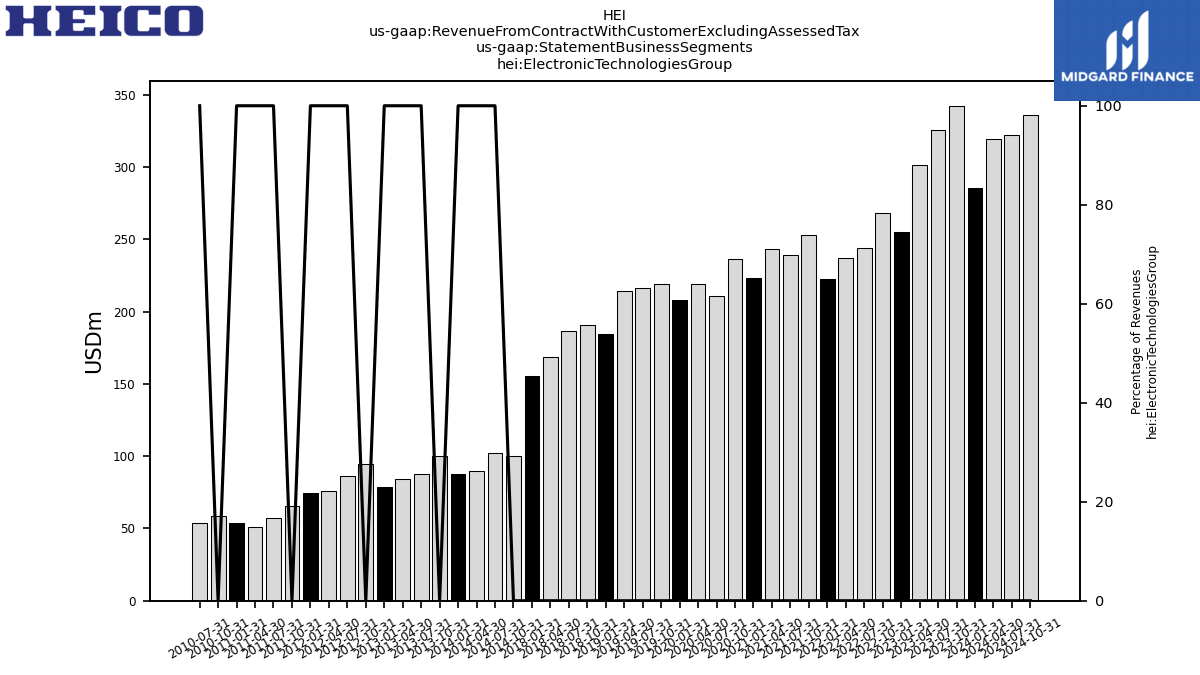
| Operating, Electronic Technologies Group | 285.94 | 342.54 | 325.87 | 301.76 | 255.06 | 268.54 | 244.20 | 237.39 | 222.34 | 252.99 | 239.54 | 243.09 | 223.55 | NA | 210.92 | 218.96 | 208.41 | NA | 216.13 | 214.45 | 184.43 | NA | 186.37 | 168.72 | 155.66 | NA | 137.86 | 141.17 | 126.17 | NA | 136.22 | 132.57 | 104.15 | NA | 97.22 | 91.00 | NA | NA | NA | NA | NA | NA | NA | NA | NA | NA | NA | NA | NA | NA | NA | NA | NA | NA | NA | NA | NA | |
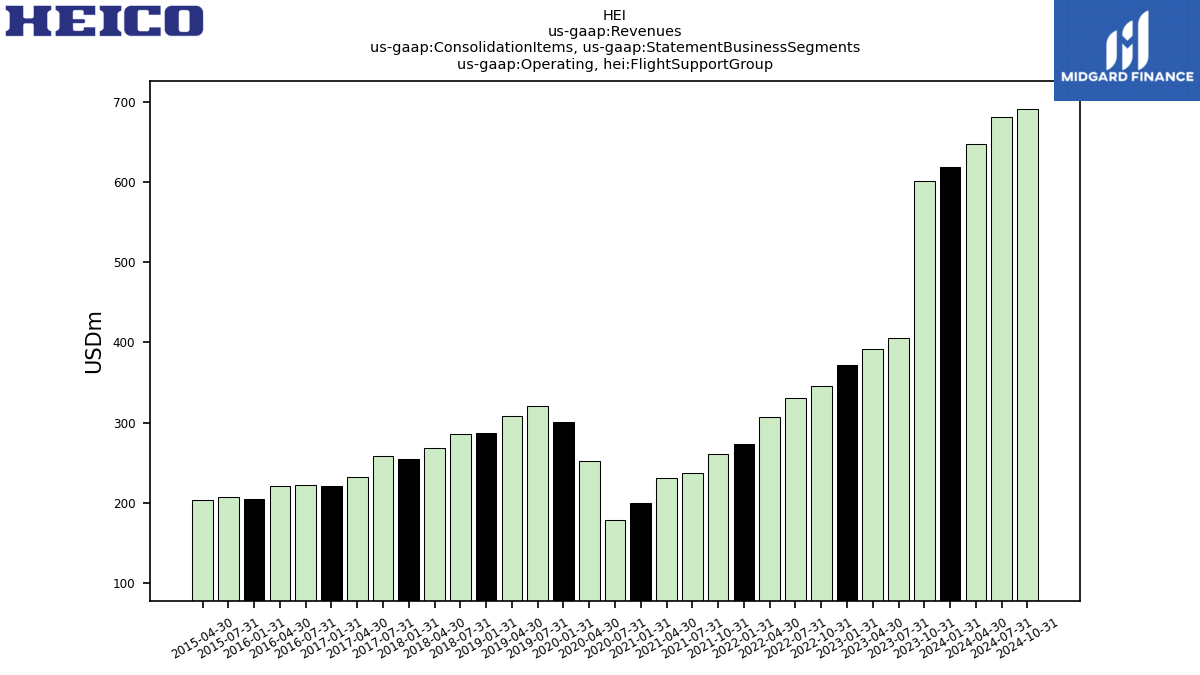
| Operating, Flight Support Group | 618.72 | 601.66 | 405.04 | 392.20 | 371.28 | 345.96 | 330.26 | 306.31 | 272.68 | 260.36 | 237.12 | 230.28 | 199.33 | NA | 178.16 | 251.96 | 301.07 | NA | 320.02 | 308.25 | 287.21 | NA | 285.13 | 267.84 | 254.72 | NA | 257.97 | 231.81 | 220.90 | NA | 222.55 | 220.29 | 204.58 | NA | 206.60 | 202.78 | NA | NA | NA | NA | NA | NA | NA | NA | NA | NA | NA | NA | NA | NA | NA | NA | NA | NA | NA | NA | NA | |
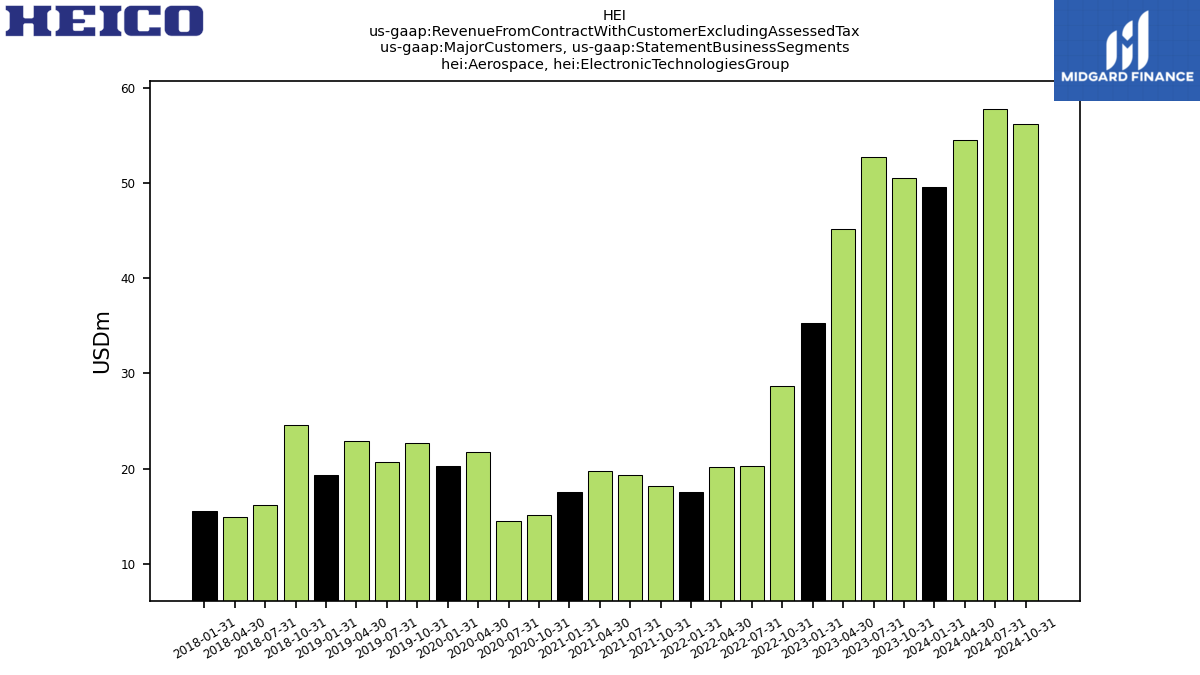
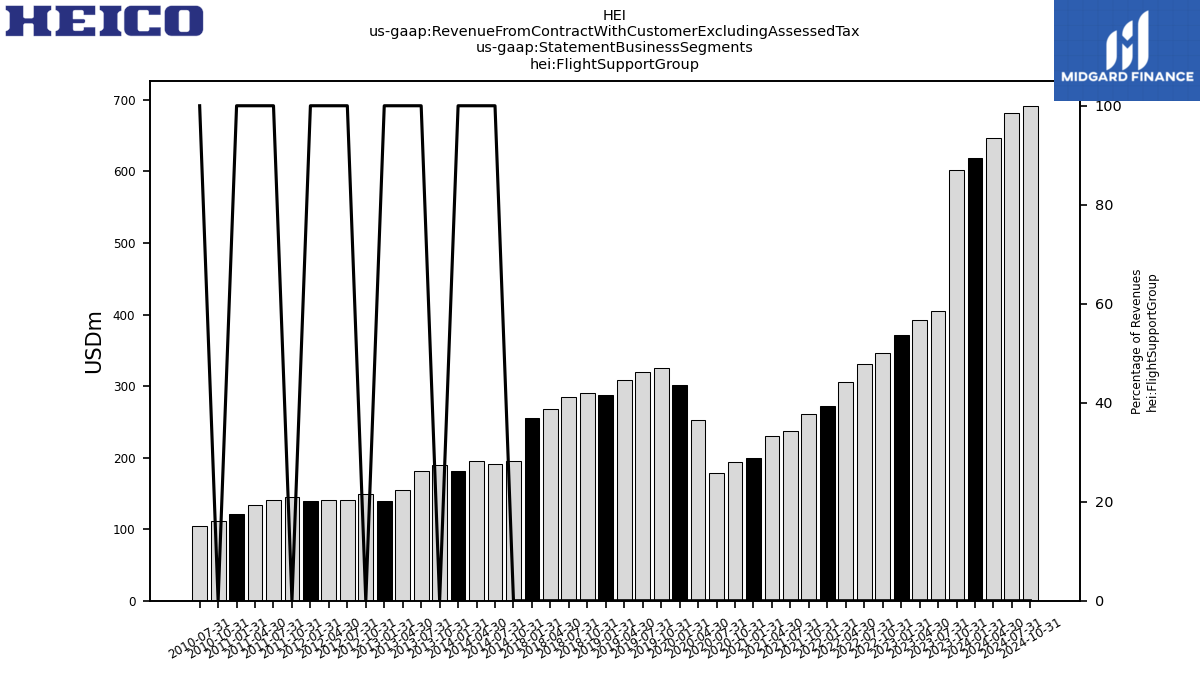
| Revenue From Contract With Customer Excluding Assessed Tax | 896.36 | 936.45 | 722.90 | 687.84 | 620.91 | 609.64 | 569.53 | 538.81 | 490.34 | 509.42 | 471.71 | 466.65 | 417.90 | 426.18 | 386.41 | 468.15 | 506.27 | 541.53 | 532.32 | 515.65 | 466.15 | 476.88 | 465.82 | 430.60 | 404.41 | 421.22 | 391.50 | 368.66 | 343.43 | 363.30 | 356.08 | 350.65 | 306.23 | 328.67 | 300.37 | 291.42 | 268.19 | 292.22 | 291.03 | 282.23 | 266.83 | 287.43 | 267.13 | 237.71 | 216.49 | 242.41 | 225.97 | 216.31 | 212.66 | 208.92 | 197.27 | 184.49 | 174.22 | 169.37 | 158.27 | 153.84 | 135.53 | |
| Aerospace, Electronic Technologies Group | 49.56 | 50.48 | 52.69 | 45.13 | 35.33 | 28.73 | 20.32 | 20.21 | 17.53 | 18.19 | 19.30 | 19.72 | 17.55 | 15.12 | 14.48 | 21.72 | 20.34 | 22.70 | 20.73 | 22.88 | 19.30 | 24.63 | 16.15 | 14.94 | 15.52 | NA | NA | NA | NA | NA | NA | NA | NA | NA | NA | NA | NA | NA | NA | NA | NA | NA | NA | NA | NA | NA | NA | NA | NA | NA | NA | NA | NA | NA | NA | NA | NA | |
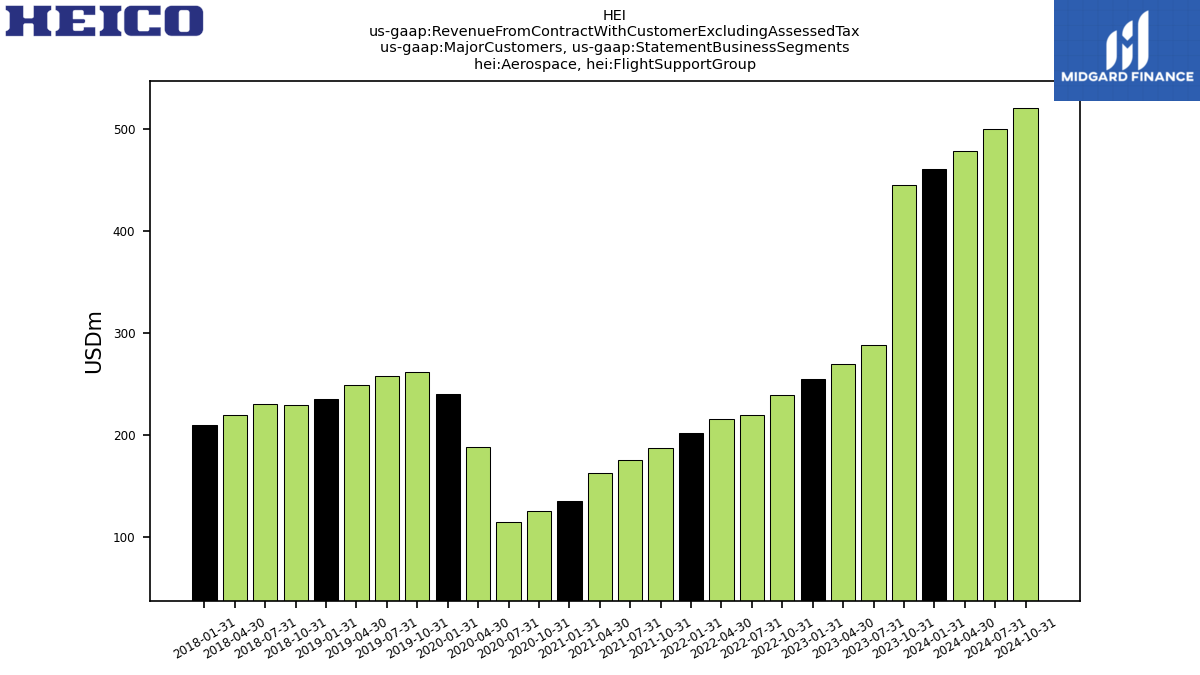
| Aerospace, Flight Support Group | 461.24 | 445.69 | 288.07 | 269.35 | 254.54 | 238.97 | 219.56 | 215.32 | 202.41 | 187.40 | 175.39 | 163.03 | 135.06 | 125.99 | 114.63 | 188.66 | 239.92 | 261.53 | 258.16 | 249.22 | 235.17 | 229.75 | 230.63 | 220.08 | 209.59 | NA | NA | NA | NA | NA | NA | NA | NA | NA | NA | NA | NA | NA | NA | NA | NA | NA | NA | NA | NA | NA | NA | NA | NA | NA | NA | NA | NA | NA | NA | NA | NA | |
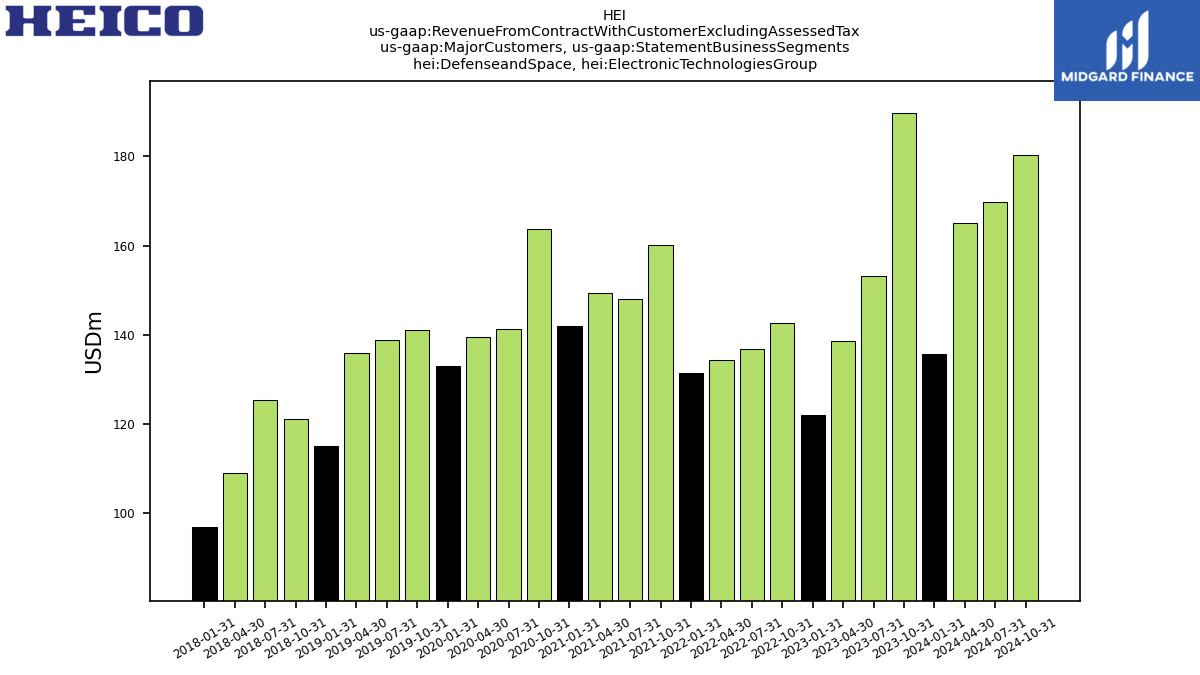
| Defenseand Space, Electronic Technologies Group | 135.78 | 189.65 | 153.19 | 138.61 | 121.96 | 142.75 | 136.78 | 134.41 | 131.45 | 160.08 | 148.03 | 149.36 | 142.09 | 163.70 | 141.28 | 139.49 | 133.11 | 140.98 | 138.88 | 135.95 | 115.22 | 121.13 | 125.38 | 109.13 | 97.08 | NA | NA | NA | NA | NA | NA | NA | NA | NA | NA | NA | NA | NA | NA | NA | NA | NA | NA | NA | NA | NA | NA | NA | NA | NA | NA | NA | NA | NA | NA | NA | NA | |
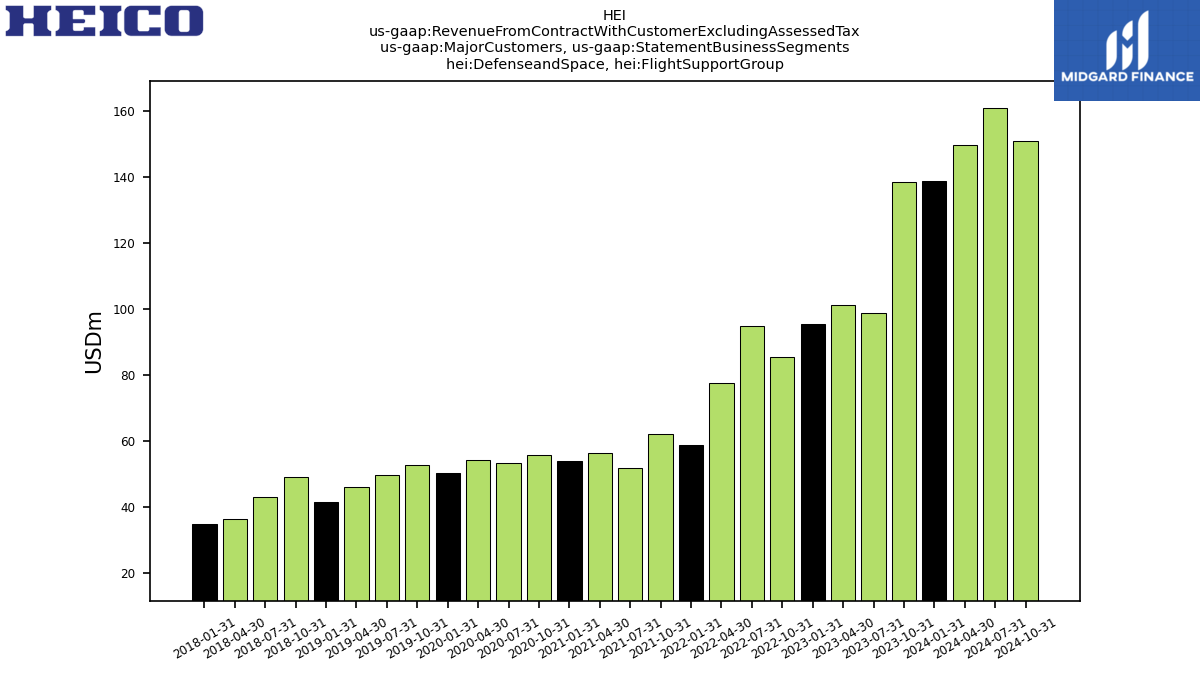
| Defenseand Space, Flight Support Group | 138.77 | 138.54 | 98.78 | 101.27 | 95.64 | 85.45 | 94.76 | 77.60 | 58.66 | 62.04 | 51.90 | 56.25 | 54.04 | 55.61 | 53.27 | 54.14 | 50.25 | 52.80 | 49.77 | 45.97 | 41.53 | 49.23 | 43.01 | 36.31 | 34.78 | NA | NA | NA | NA | NA | NA | NA | NA | NA | NA | NA | NA | NA | NA | NA | NA | NA | NA | NA | NA | NA | NA | NA | NA | NA | NA | NA | NA | NA | NA | NA | NA | |
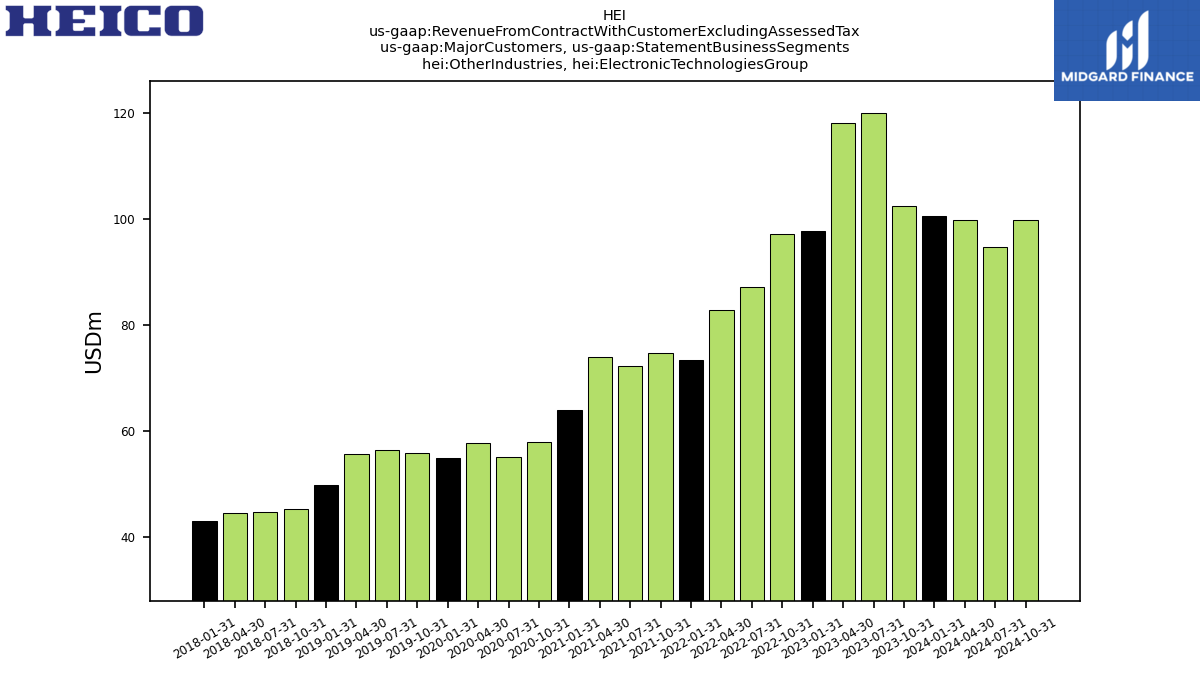
| Other Industries, Electronic Technologies Group | 100.61 | 102.40 | 119.99 | 118.02 | 97.77 | 97.07 | 87.10 | 82.77 | 73.36 | 74.72 | 72.20 | 74.00 | 63.91 | 57.89 | 55.16 | 57.74 | 54.96 | 55.83 | 56.52 | 55.62 | 49.91 | 45.32 | 44.85 | 44.66 | 43.05 | NA | NA | NA | NA | NA | NA | NA | NA | NA | NA | NA | NA | NA | NA | NA | NA | NA | NA | NA | NA | NA | NA | NA | NA | NA | NA | NA | NA | NA | NA | NA | NA | |
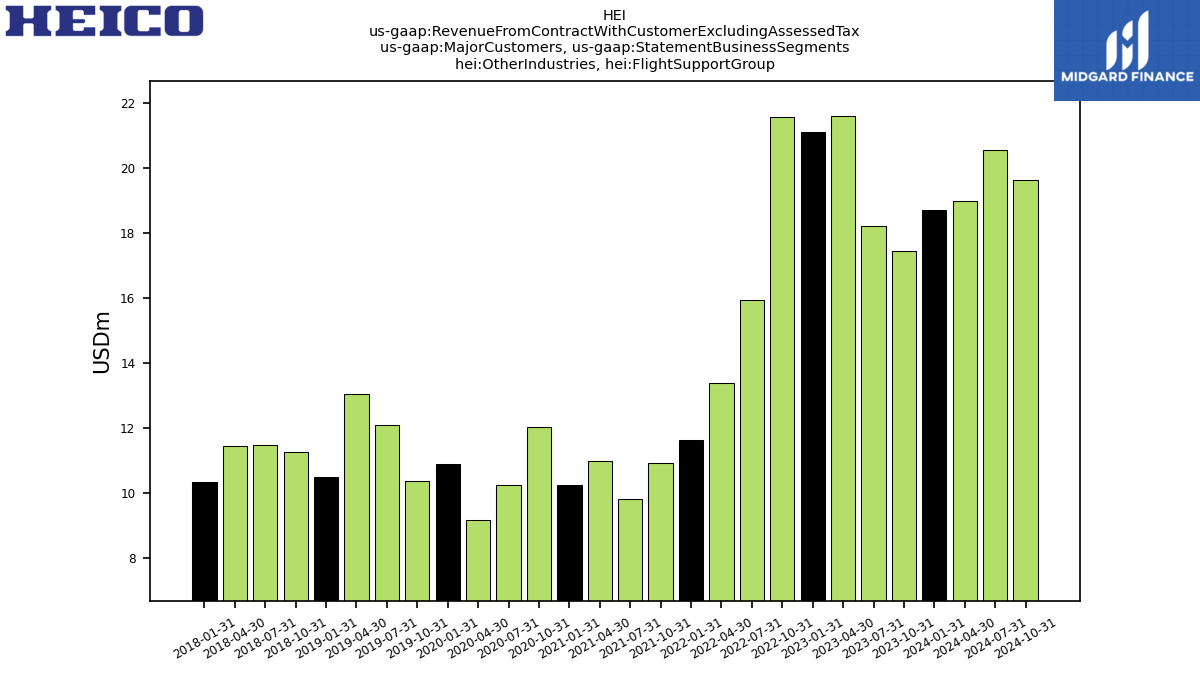
| Other Industries, Flight Support Group | 18.70 | 17.43 | 18.19 | 21.58 | 21.10 | 21.54 | 15.95 | 13.39 | 11.62 | 10.92 | 9.83 | 11.00 | 10.23 | 12.03 | 10.26 | 9.17 | 10.89 | 10.37 | 12.09 | 13.06 | 10.51 | 11.28 | 11.48 | 11.44 | 10.35 | NA | NA | NA | NA | NA | NA | NA | NA | NA | NA | NA | NA | NA | NA | NA | NA | NA | NA | NA | NA | NA | NA | NA | NA | NA | NA | NA | NA | NA | NA | NA | NA | |
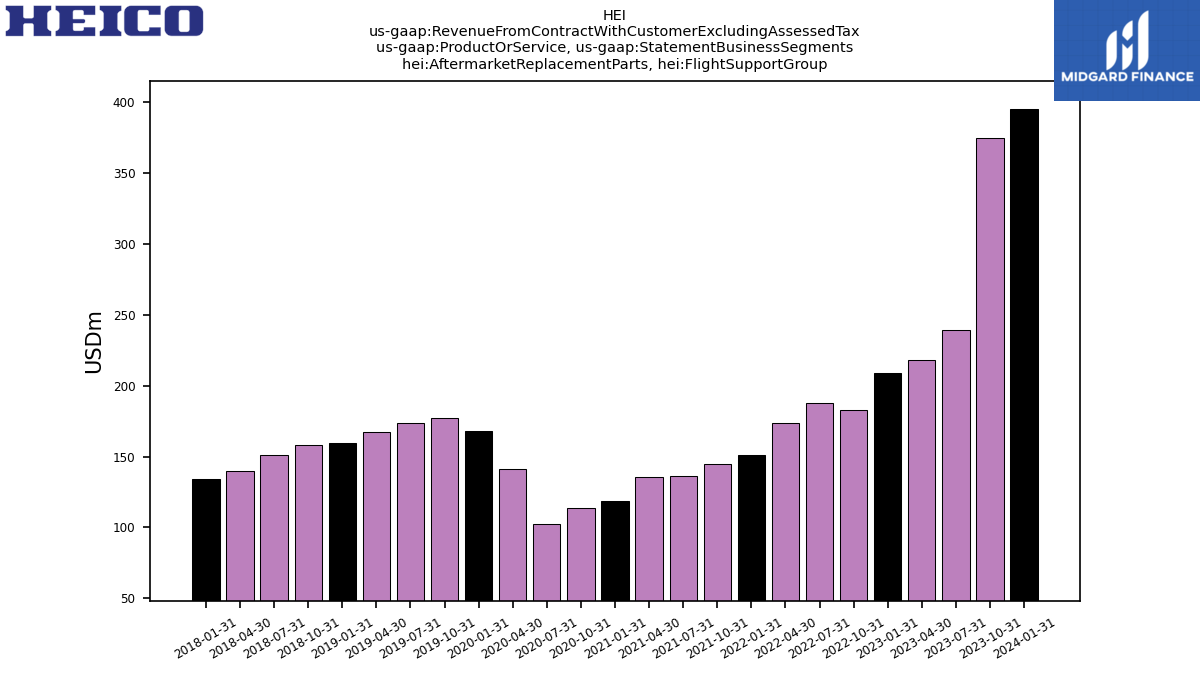
| Aftermarket Replacement Parts, Flight Support Group | 395.15 | 374.57 | 238.95 | 218.34 | 208.64 | 182.56 | 187.45 | 173.98 | 150.90 | 144.53 | 136.36 | 135.89 | 118.43 | 113.55 | 102.63 | 141.19 | 168.27 | 177.29 | 173.99 | 167.22 | 159.50 | 157.98 | 150.73 | 139.57 | 134.29 | NA | NA | NA | NA | NA | NA | NA | NA | NA | NA | NA | NA | NA | NA | NA | NA | NA | NA | NA | NA | NA | NA | NA | NA | NA | NA | NA | NA | NA | NA | NA | NA | |
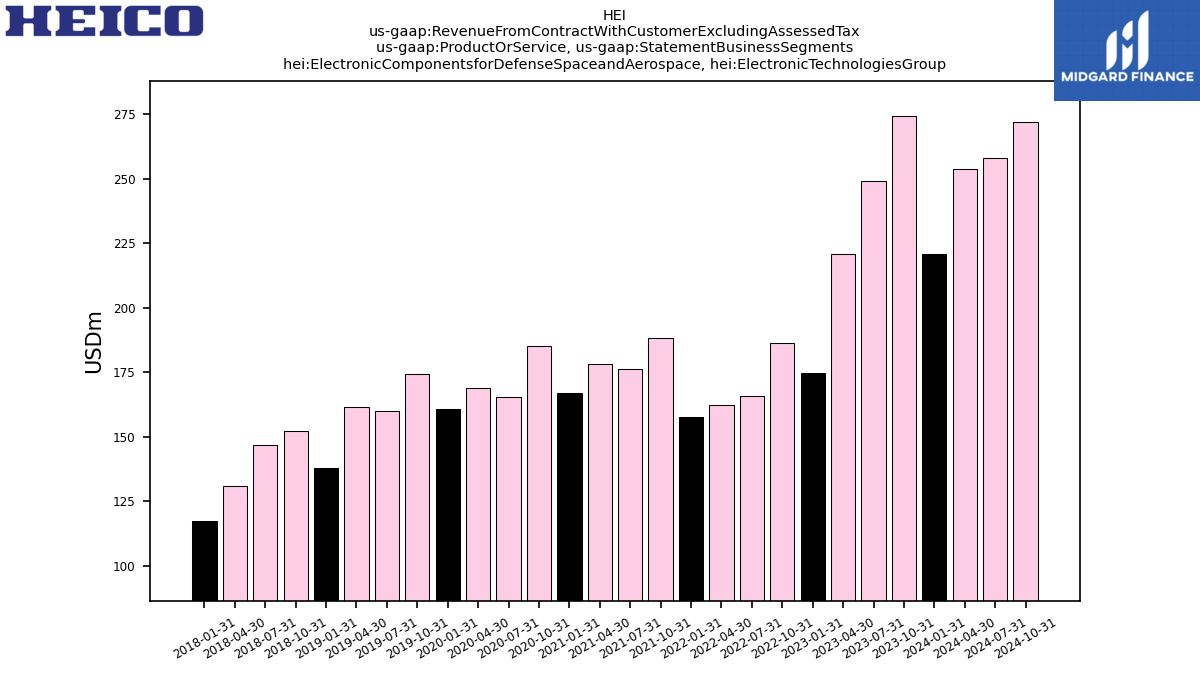
| Electronic Componentsfor Defense Spaceand Aerospace, Electronic Technologies Group | 220.65 | 274.13 | 248.92 | 220.74 | 174.58 | 186.37 | 165.87 | 162.44 | 157.47 | 188.03 | 176.24 | 178.26 | 167.09 | 185.04 | 165.19 | 168.96 | 160.71 | 174.24 | 160.03 | 161.66 | 137.75 | 152.20 | 146.65 | 130.89 | 117.34 | NA | NA | NA | NA | NA | NA | NA | NA | NA | NA | NA | NA | NA | NA | NA | NA | NA | NA | NA | NA | NA | NA | NA | NA | NA | NA | NA | NA | NA | NA | NA | NA | |
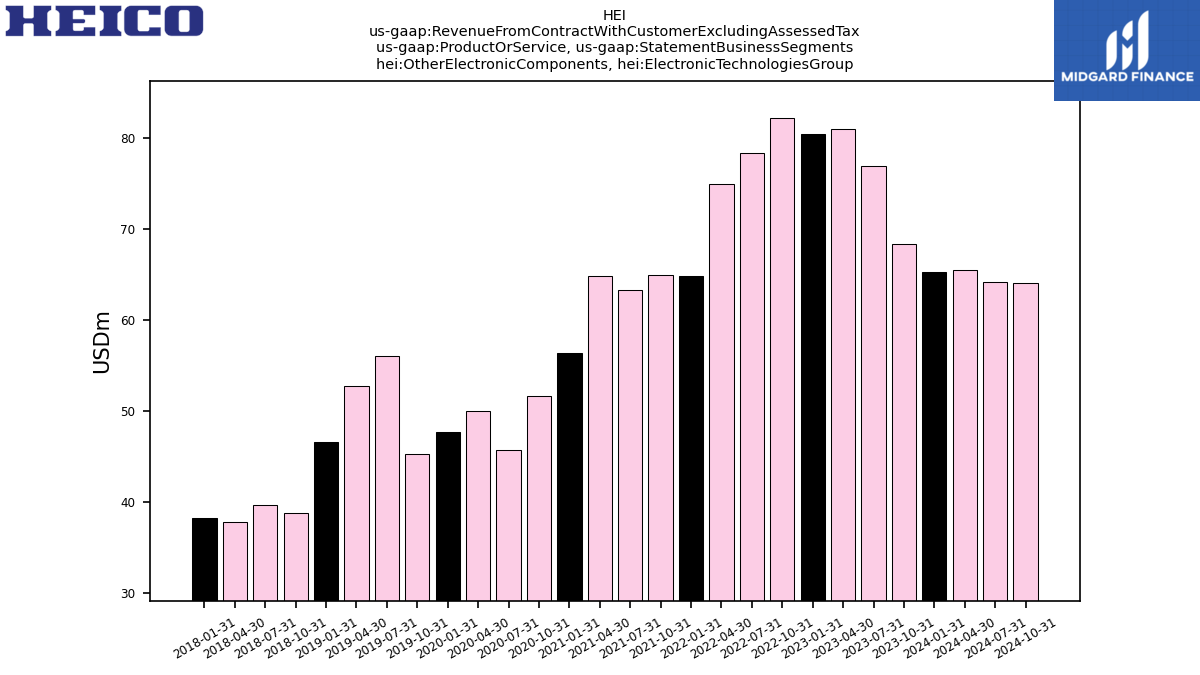
| Other Electronic Components, Electronic Technologies Group | 65.30 | 68.40 | 76.95 | 81.02 | 80.48 | 82.18 | 78.33 | 74.95 | 64.87 | 64.95 | 63.30 | 64.83 | 56.46 | 51.66 | 45.73 | 49.99 | 47.70 | 45.27 | 56.10 | 52.79 | 46.68 | 38.87 | 39.72 | 37.83 | 38.32 | NA | NA | NA | NA | NA | NA | NA | NA | NA | NA | NA | NA | NA | NA | NA | NA | NA | NA | NA | NA | NA | NA | NA | NA | NA | NA | NA | NA | NA | NA | NA | NA | |
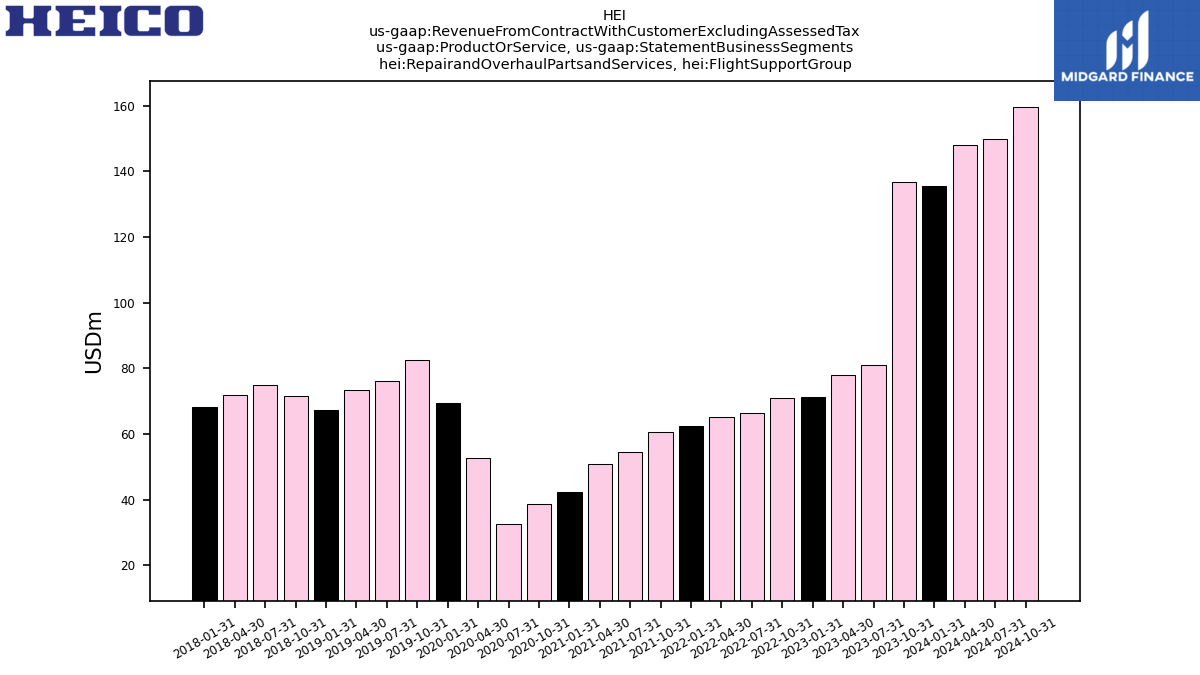
| Repairand Overhaul Partsand Services, Flight Support Group | 135.58 | 136.64 | 80.92 | 77.85 | 71.15 | 71.01 | 66.44 | 65.05 | 62.49 | 60.51 | 54.59 | 50.71 | 42.41 | 38.65 | 32.60 | 52.63 | 69.29 | 82.44 | 76.27 | 73.45 | 67.16 | 71.52 | 74.85 | 71.76 | 68.32 | NA | NA | NA | NA | NA | NA | NA | NA | NA | NA | NA | NA | NA | NA | NA | NA | NA | NA | NA | NA | NA | NA | NA | NA | NA | NA | NA | NA | NA | NA | NA | NA | |
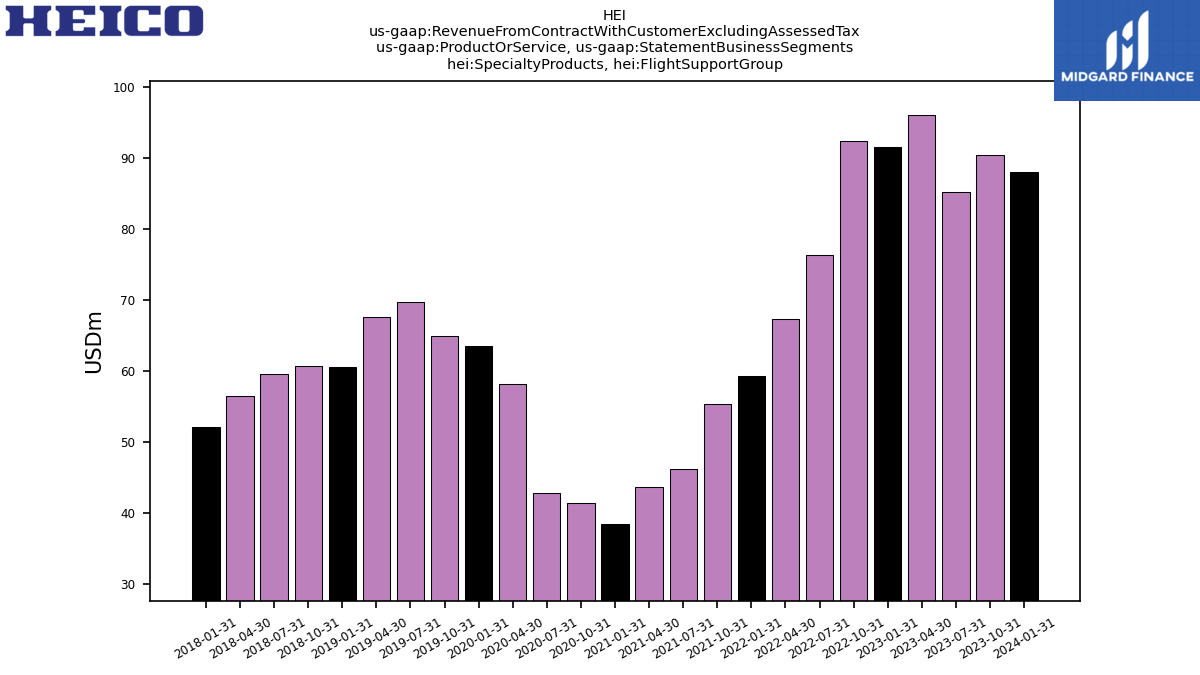
| Specialty Products, Flight Support Group | 87.98 | 90.46 | 85.17 | 96.01 | 91.48 | 92.38 | 76.37 | 67.29 | 59.29 | 55.32 | 46.17 | 43.68 | 38.49 | 41.43 | 42.93 | 58.14 | 63.51 | 64.98 | 69.75 | 67.57 | 60.55 | 60.76 | 59.54 | 56.51 | 52.11 | NA | NA | NA | NA | NA | NA | NA | NA | NA | NA | NA | NA | NA | NA | NA | NA | NA | NA | NA | NA | NA | NA | NA | NA | NA | NA | NA | NA | NA | NA | NA | NA | |
| Corporate And Eliminations | -8.29 | -7.75 | -8.01 | -6.12 | -5.42 | -4.86 | -4.93 | -4.89 | -4.67 | -3.92 | -4.95 | -6.72 | -4.98 | -4.15 | -2.67 | -2.77 | -3.20 | -2.69 | -3.82 | -7.05 | -5.50 | -4.45 | -5.67 | -5.96 | -5.97 | NA | NA | NA | NA | NA | NA | NA | NA | NA | NA | NA | NA | NA | NA | NA | NA | NA | NA | NA | NA | NA | NA | NA | NA | NA | NA | NA | NA | NA | NA | NA | NA | |
| Electronic Technologies Group | 285.94 | 342.54 | 325.87 | 301.76 | 255.06 | 268.54 | 244.20 | 237.39 | 222.34 | 252.99 | 239.54 | 243.09 | 223.55 | 236.70 | 210.92 | 218.96 | 208.41 | 219.51 | 216.13 | 214.45 | 184.43 | 191.08 | 186.37 | 168.72 | 155.66 | NA | NA | NA | NA | NA | NA | NA | NA | NA | NA | NA | NA | 100.11 | 102.06 | 89.74 | 87.49 | 99.85 | 87.40 | 83.94 | 78.84 | 94.37 | 86.48 | 76.27 | 74.47 | 65.29 | 57.17 | 51.37 | 53.94 | 58.42 | 54.11 | NA | NA | |
| Flight Support Group | 618.72 | 601.66 | 405.04 | 392.20 | 371.28 | 345.96 | 330.26 | 306.31 | 272.68 | 260.36 | 237.12 | 230.28 | 199.33 | 193.62 | 178.16 | 251.96 | 301.07 | 324.70 | 320.02 | 308.25 | 287.21 | 290.25 | 285.13 | 267.84 | 254.72 | NA | NA | NA | NA | NA | NA | NA | NA | NA | NA | NA | NA | 194.76 | 191.56 | 194.89 | 181.59 | 189.59 | 181.33 | 155.23 | 139.00 | 149.67 | 140.76 | 141.03 | 138.87 | 144.37 | 140.75 | 133.80 | 120.64 | 111.19 | 104.32 | NA | NA |
