
| 2023-11-30 | 2023-08-31 | 2023-05-31 | 2023-02-28 | 2022-11-30 | 2022-08-31 | 2022-05-31 | 2022-02-28 | 2021-11-30 | 2021-08-31 | 2021-05-31 | 2021-02-28 | 2020-11-30 | 2020-08-31 | 2020-05-31 | 2020-02-29 | 2019-11-30 | 2019-08-31 | 2019-05-31 | 2019-02-28 | 2018-11-30 | 2018-08-31 | 2018-05-31 | 2018-02-28 | 2017-11-30 | 2017-08-31 | 2017-05-31 | ||
|---|---|---|---|---|---|---|---|---|---|---|---|---|---|---|---|---|---|---|---|---|---|---|---|---|---|---|---|---|
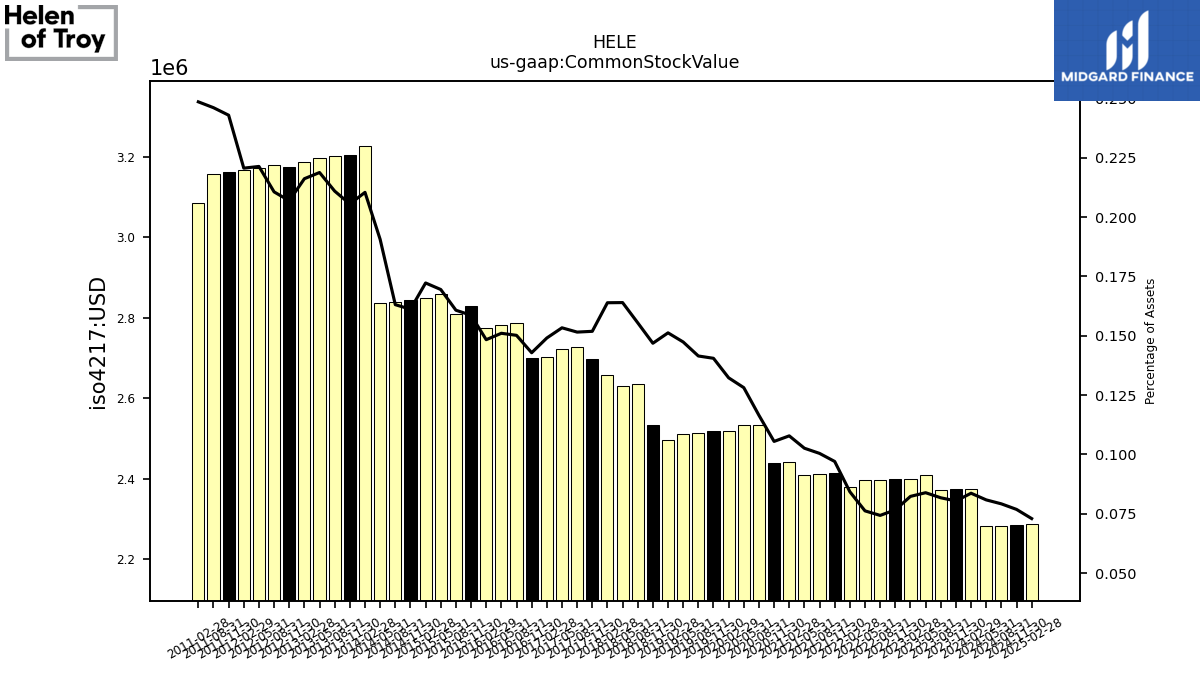
| Common Stock Value | 2.37 | 2.37 | 2.41 | 2.40 | 2.40 | 2.40 | 2.40 | 2.38 | 2.41 | 2.41 | 2.41 | 2.44 | 2.44 | 2.53 | 2.53 | 2.52 | 2.52 | 2.51 | 2.51 | 2.50 | 2.53 | 2.63 | 2.63 | 2.66 | 2.70 | 2.73 | 2.72 | |
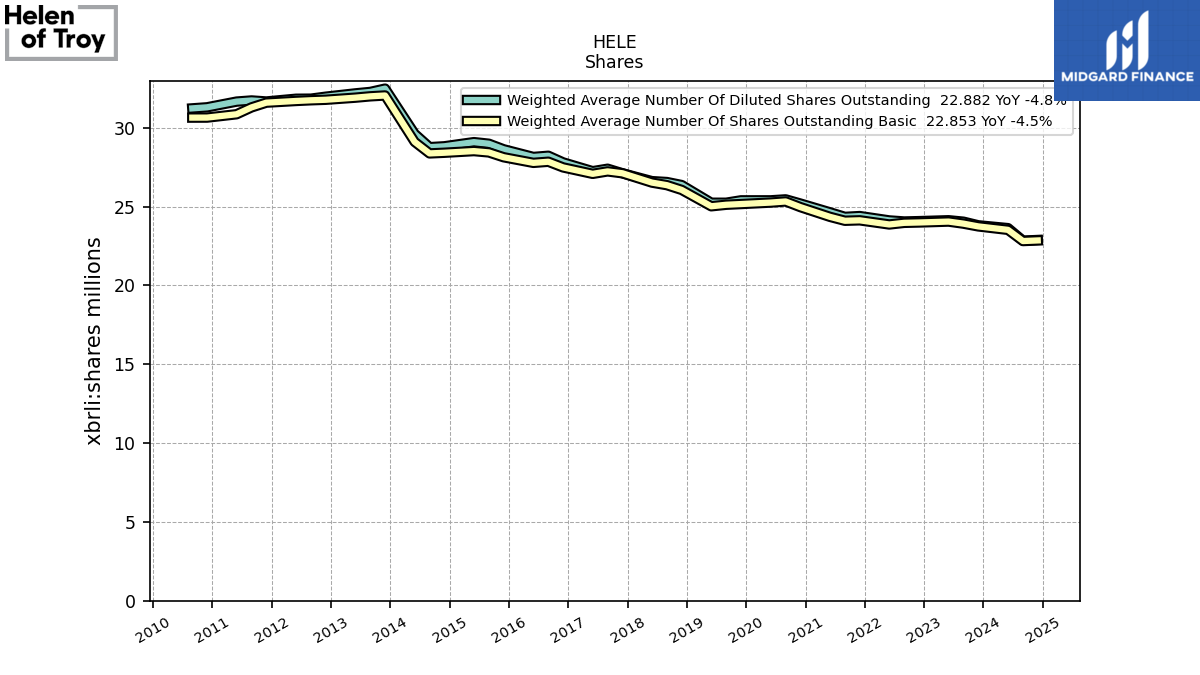
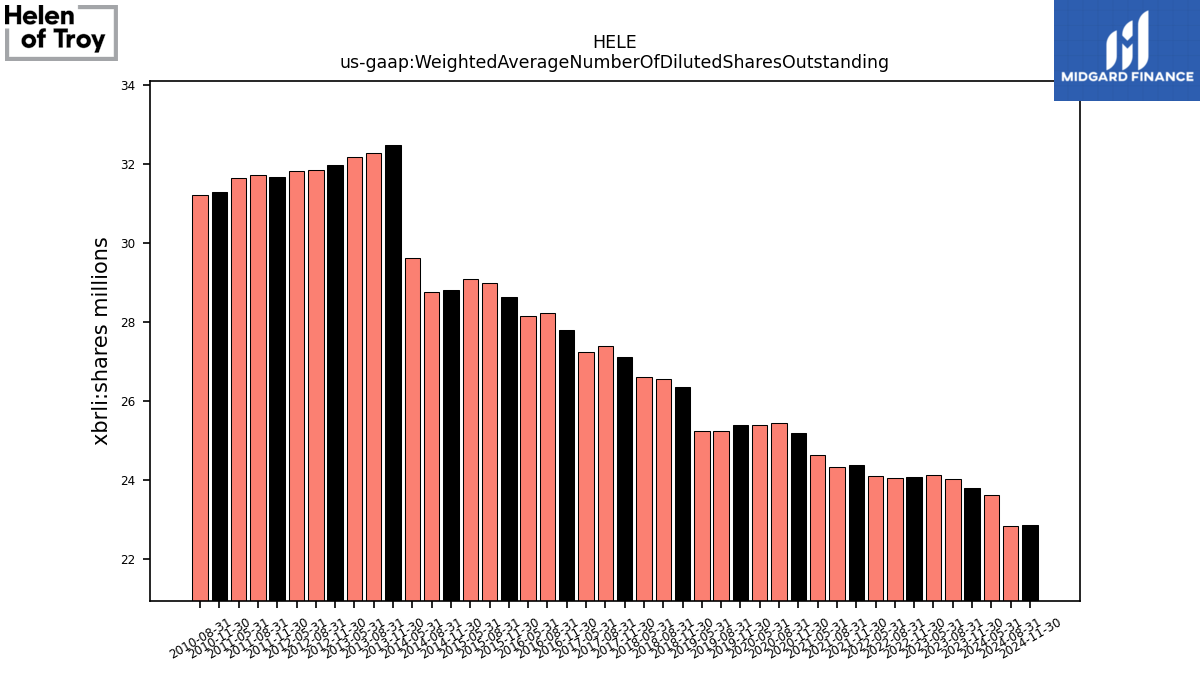
| Weighted Average Number Of Diluted Shares Outstanding | 23.81 | 24.04 | 24.13 | NA | 24.08 | 24.06 | 24.12 | NA | 24.40 | 24.35 | 24.64 | NA | 25.19 | 25.46 | 25.40 | NA | 25.40 | 25.25 | 25.25 | NA | 26.37 | 26.56 | 26.61 | NA | 27.11 | 27.40 | 27.25 | |
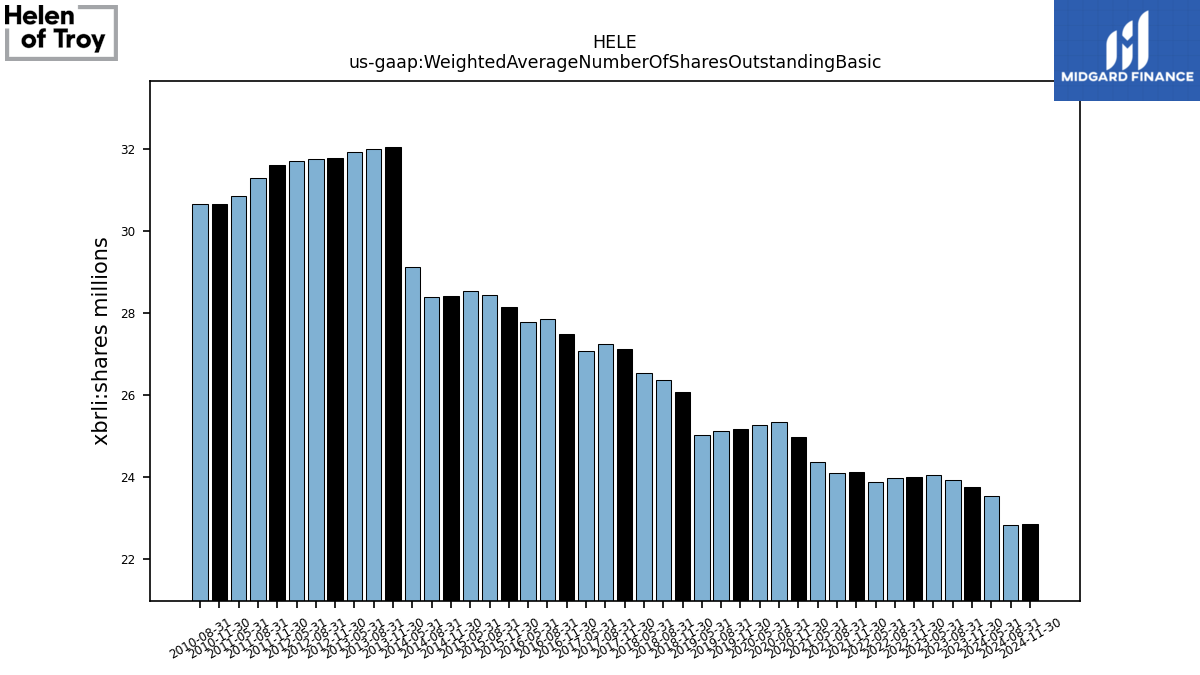
| Weighted Average Number Of Shares Outstanding Basic | 23.74 | 23.92 | 24.05 | NA | 23.99 | 23.97 | 23.86 | NA | 24.13 | 24.10 | 24.35 | NA | 24.96 | 25.32 | 25.25 | NA | 25.16 | 25.12 | 25.02 | NA | 26.06 | 26.36 | 26.52 | NA | 27.11 | 27.23 | 27.08 | |
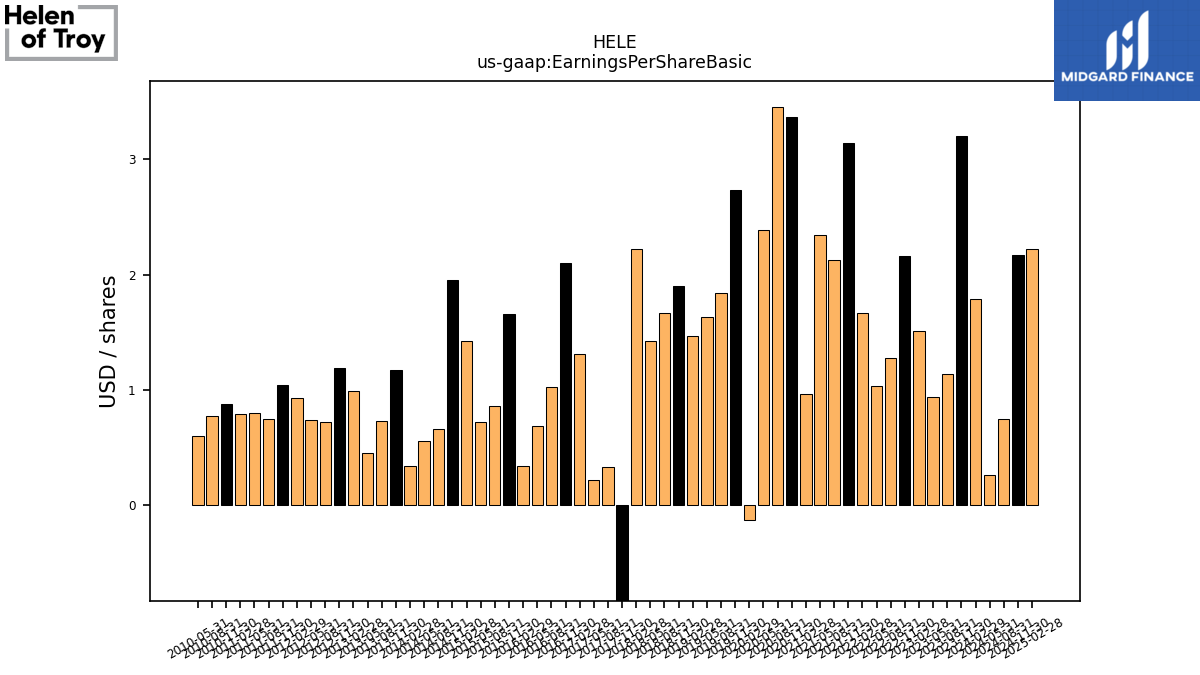
| Earnings Per Share Basic | 3.20 | 1.14 | 0.94 | 1.51 | 2.16 | 1.28 | 1.03 | 1.67 | 3.14 | 2.13 | 2.34 | 0.96 | 3.37 | 3.45 | 2.39 | -0.13 | 2.73 | 1.84 | 1.63 | 1.47 | 1.90 | 1.67 | 1.42 | 2.22 | -1.12 | 0.33 | 0.22 | |
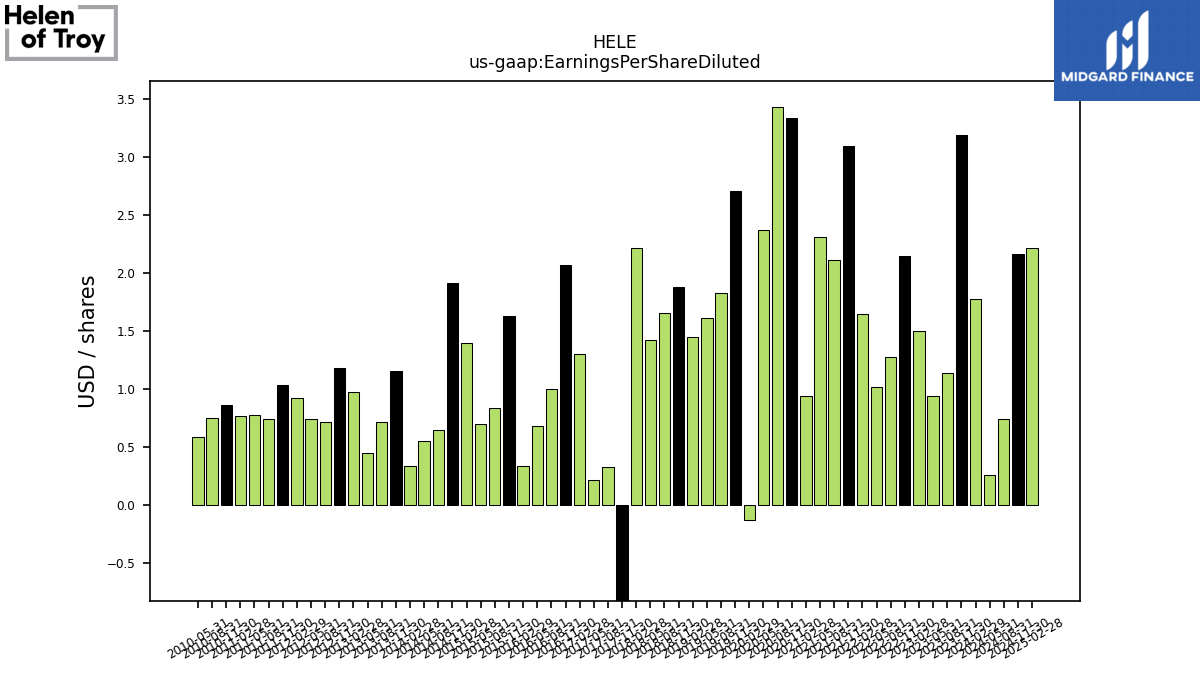
| Earnings Per Share Diluted | 3.19 | 1.14 | 0.94 | 1.50 | 2.15 | 1.28 | 1.02 | 1.65 | 3.10 | 2.11 | 2.31 | 0.94 | 3.34 | 3.43 | 2.37 | -0.13 | 2.71 | 1.83 | 1.61 | 1.45 | 1.88 | 1.66 | 1.42 | 2.22 | -1.12 | 0.33 | 0.22 |
| 2023-11-30 | 2023-08-31 | 2023-05-31 | 2023-02-28 | 2022-11-30 | 2022-08-31 | 2022-05-31 | 2022-02-28 | 2021-11-30 | 2021-08-31 | 2021-05-31 | 2021-02-28 | 2020-11-30 | 2020-08-31 | 2020-05-31 | 2020-02-29 | 2019-11-30 | 2019-08-31 | 2019-05-31 | 2019-02-28 | 2018-11-30 | 2018-08-31 | 2018-05-31 | 2018-02-28 | 2017-11-30 | 2017-08-31 | 2017-05-31 | ||
|---|---|---|---|---|---|---|---|---|---|---|---|---|---|---|---|---|---|---|---|---|---|---|---|---|---|---|---|---|
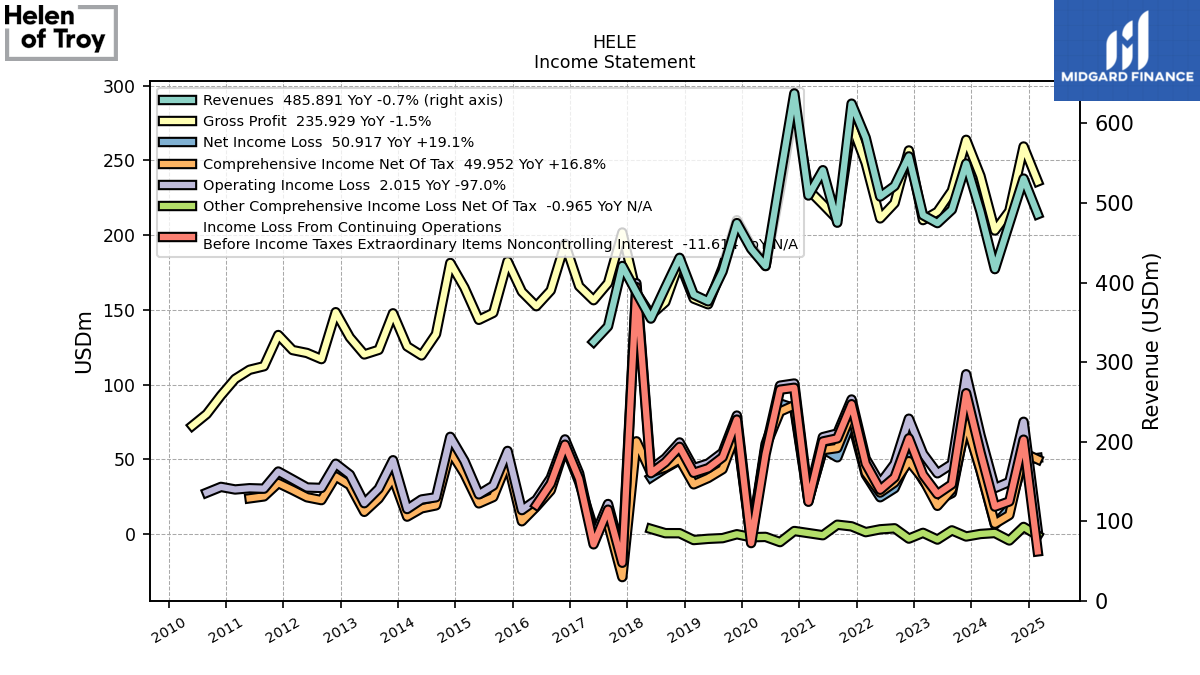
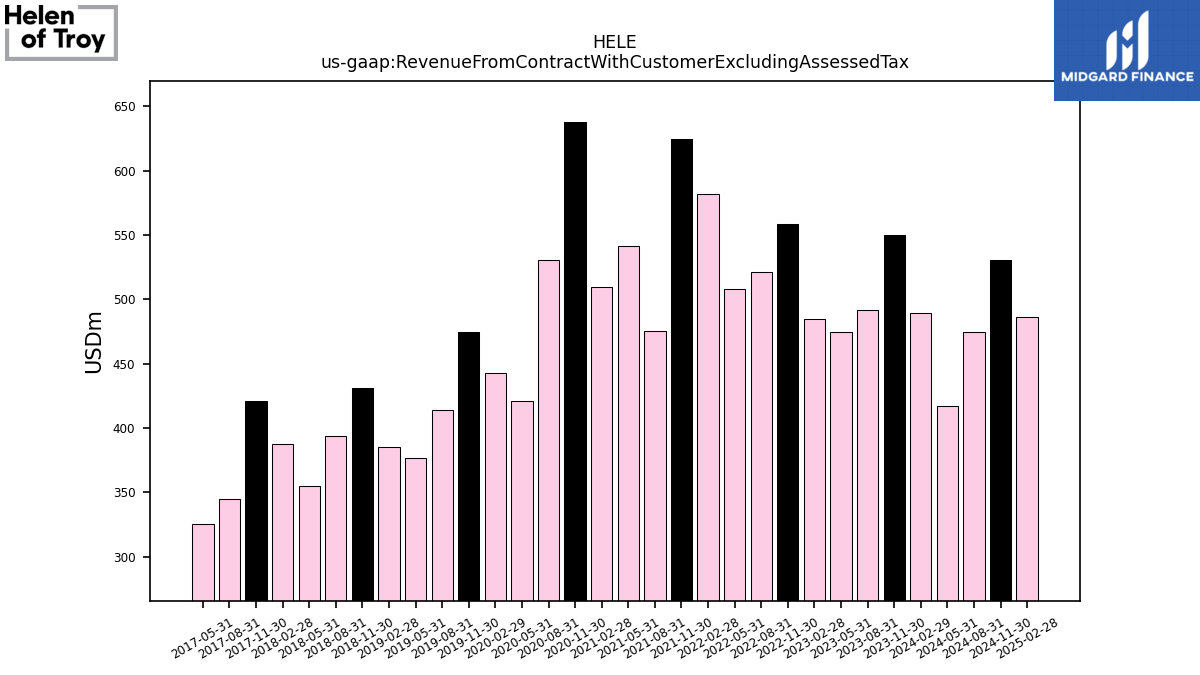
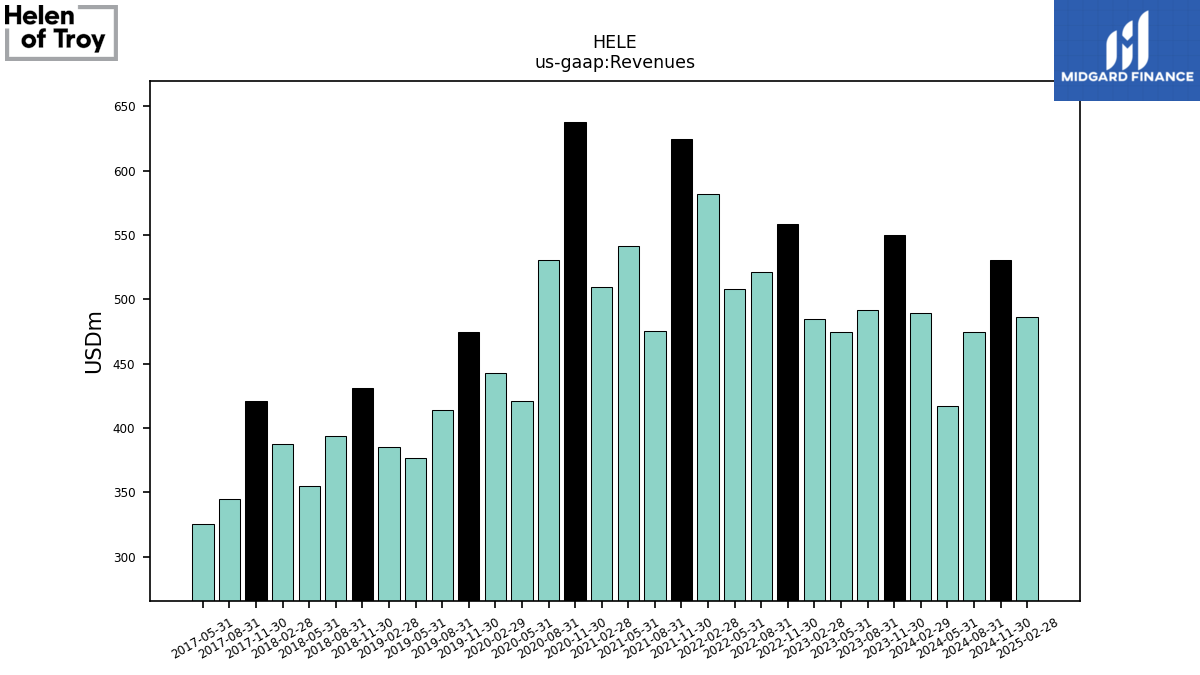
| Revenue From Contract With Customer Excluding Assessed Tax | 549.61 | 491.56 | 474.67 | 484.58 | 558.61 | 521.40 | 508.08 | 582.02 | 624.88 | 475.23 | 541.22 | 509.38 | 637.74 | 530.85 | 420.83 | 442.37 | 474.74 | 414.00 | 376.33 | 384.84 | 431.08 | 393.55 | 354.68 | 387.56 | 420.84 | 344.95 | 325.49 | |
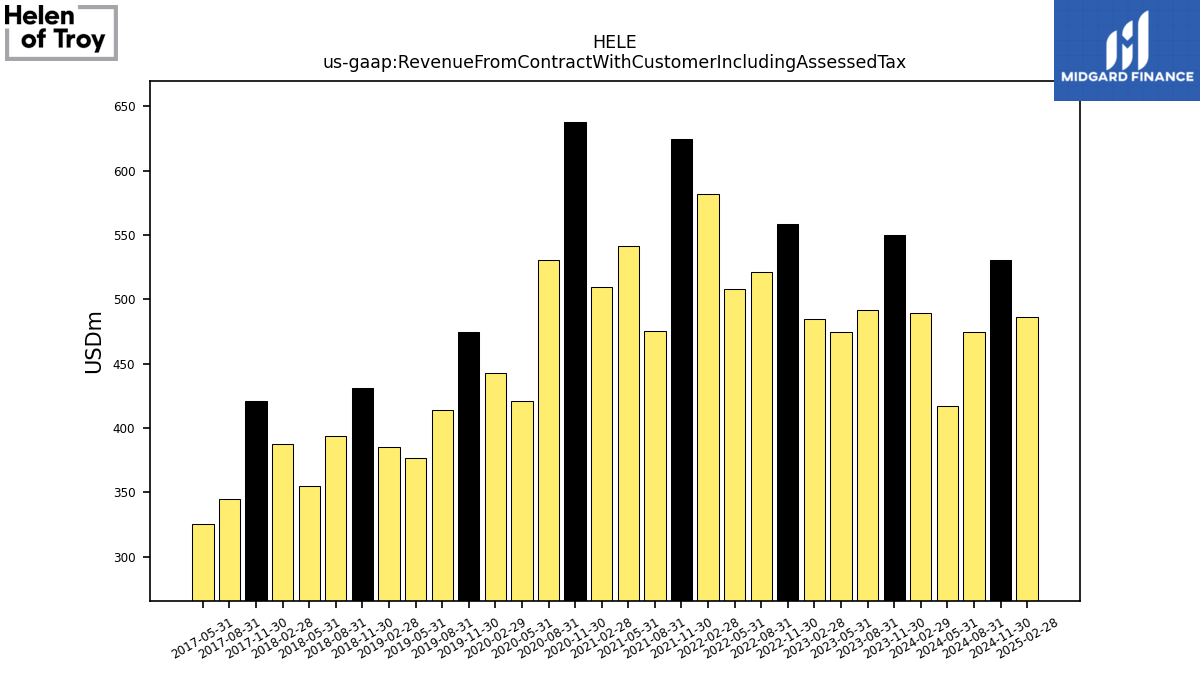
| Revenue From Contract With Customer Including Assessed Tax | 549.61 | 491.56 | 474.67 | 484.58 | 558.61 | 521.40 | 508.08 | 582.02 | 624.88 | 475.23 | 541.22 | 509.38 | 637.74 | 530.85 | 420.83 | 442.37 | 474.74 | 414.00 | 376.33 | 384.84 | 431.08 | 393.55 | 354.68 | 387.56 | 420.84 | 344.95 | 325.49 | |
| Revenues | 549.61 | 491.56 | 474.67 | 484.58 | 558.61 | 521.40 | 508.08 | 582.02 | 624.88 | 475.23 | 541.22 | 509.38 | 637.74 | 530.85 | 420.83 | 442.37 | 474.74 | 414.00 | 376.33 | 384.84 | 431.08 | 393.55 | 354.68 | 387.56 | 420.84 | 344.95 | 325.49 | |
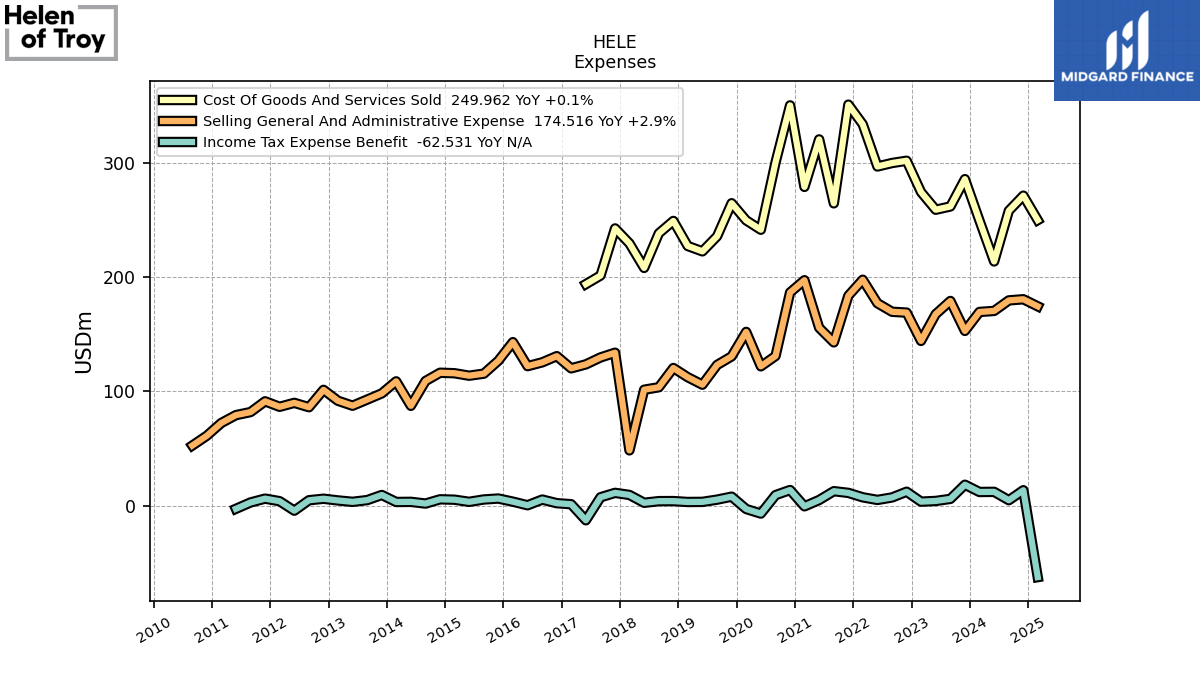
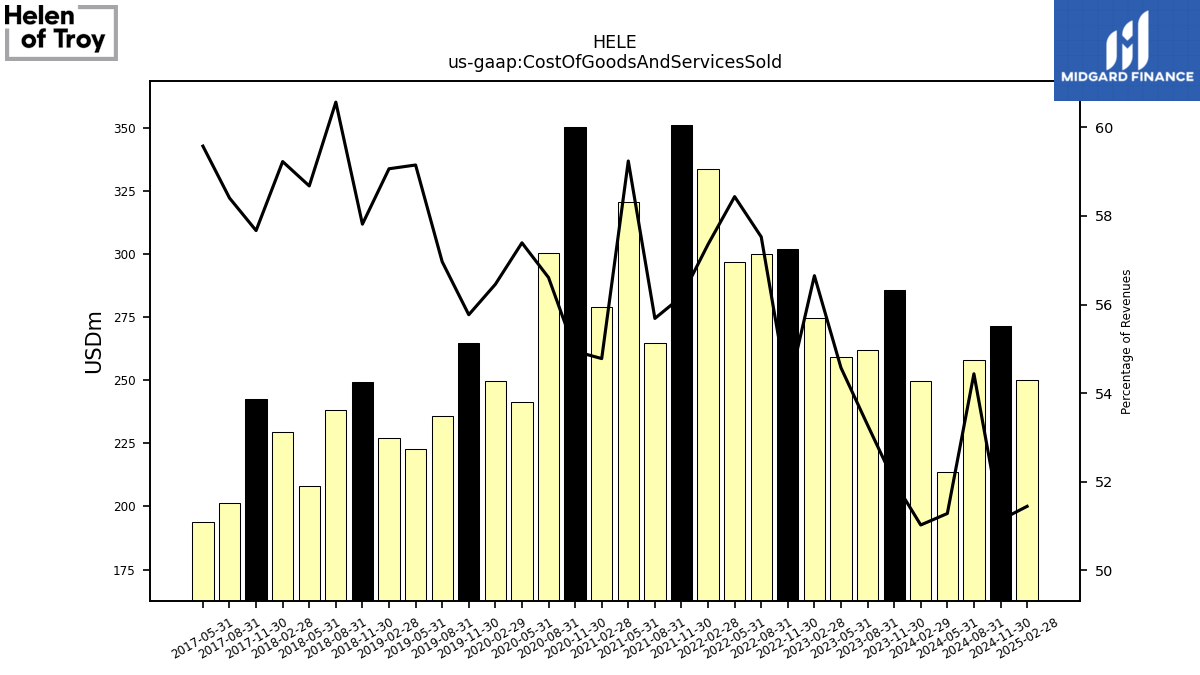
| Cost Of Goods And Services Sold | 285.83 | 261.91 | 259.04 | 274.52 | 301.93 | 299.95 | 296.91 | 333.85 | 351.05 | 264.64 | 320.63 | 279.04 | 350.41 | 300.52 | 241.53 | 249.75 | 264.76 | 235.84 | 222.61 | 227.31 | 249.24 | 238.38 | 208.12 | 229.55 | 242.70 | 201.47 | 193.92 | |
| Gross Profit | 263.78 | 229.65 | 215.63 | 210.06 | 256.68 | 221.45 | 211.17 | 248.17 | 273.83 | 210.59 | 220.59 | 230.34 | 287.33 | 230.34 | 179.30 | 192.62 | 209.97 | 178.15 | 153.73 | 157.53 | 181.84 | 155.17 | 146.56 | 161.30 | 201.77 | 167.93 | 156.45 | |
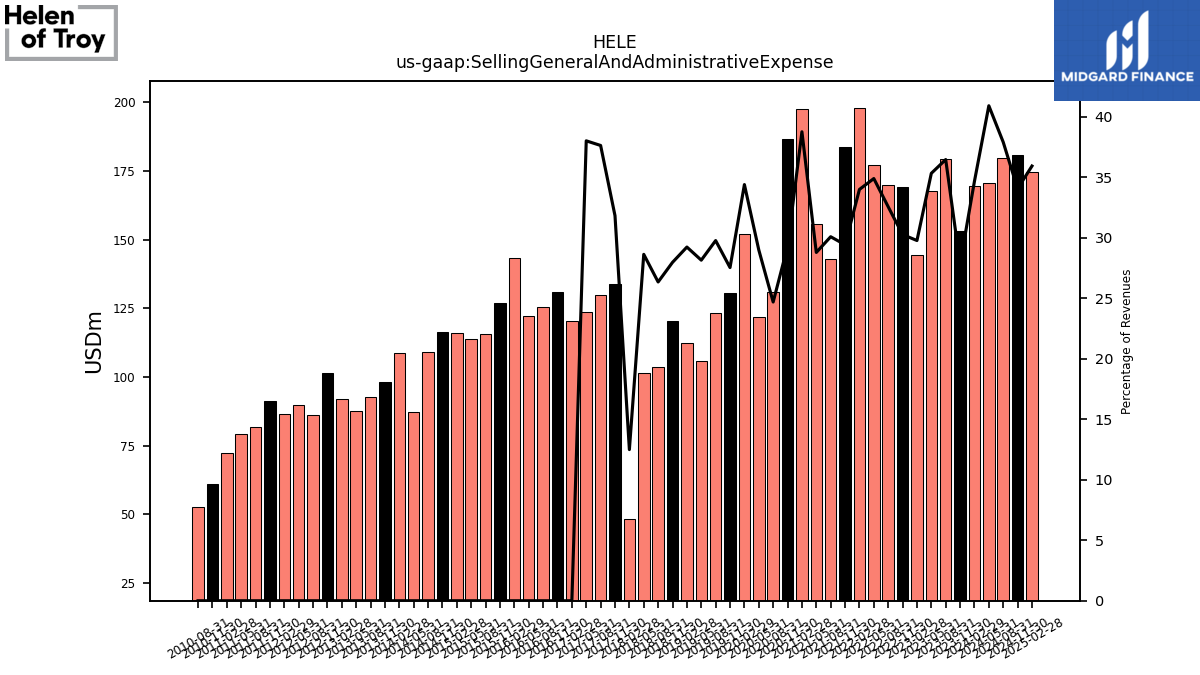
| Selling General And Administrative Expense | 152.96 | 179.19 | 167.63 | 144.22 | 169.02 | 169.72 | 177.23 | 197.79 | 183.79 | 142.93 | 155.75 | 197.37 | 186.63 | 131.03 | 121.99 | 152.11 | 130.69 | 123.20 | 105.90 | 112.46 | 120.52 | 103.65 | 101.51 | 48.40 | 133.89 | 129.75 | 123.68 | |
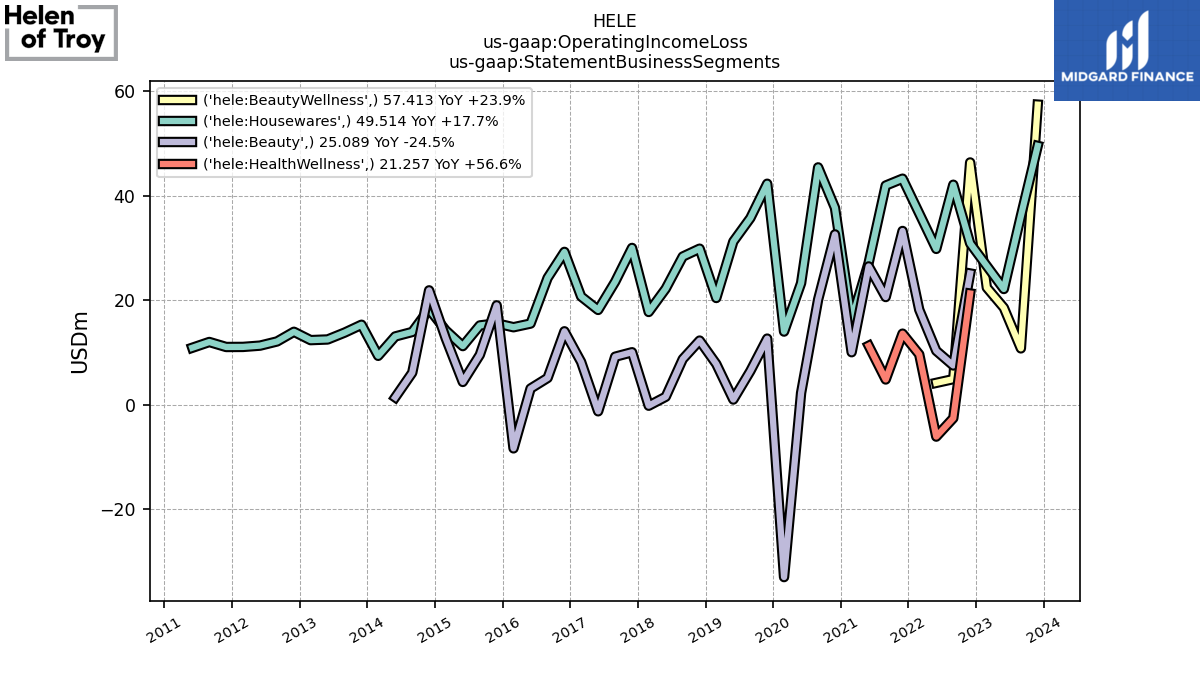
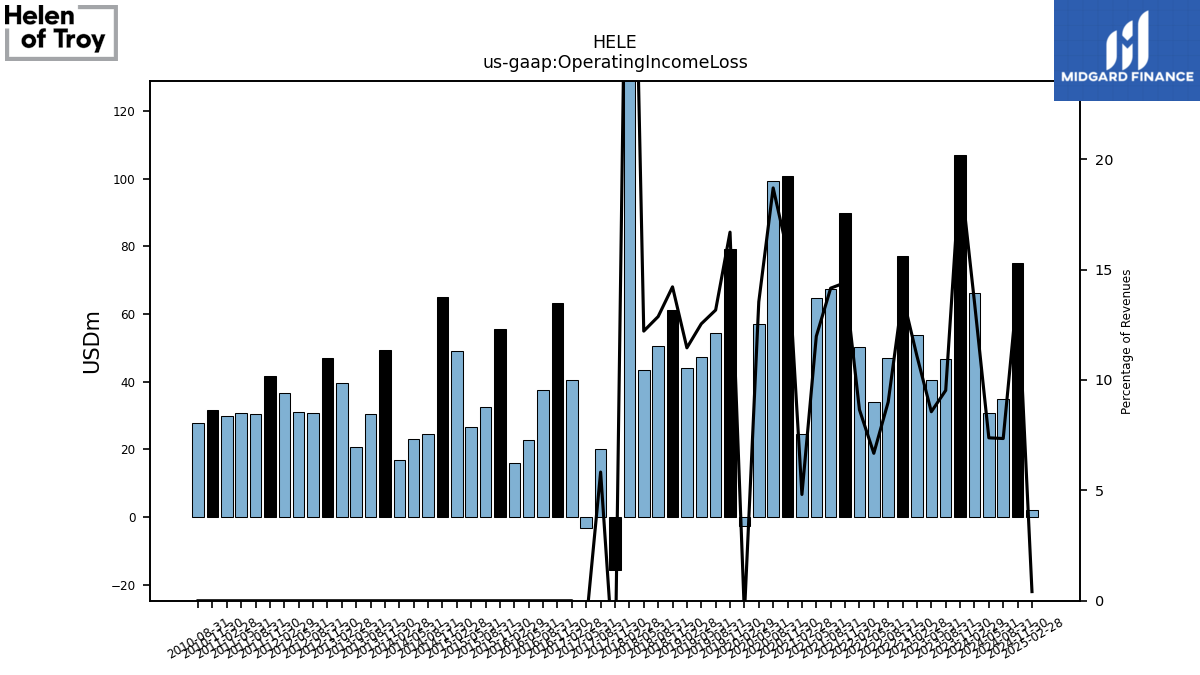
| Operating Income Loss | 106.93 | 46.84 | 40.64 | 53.71 | 77.19 | 46.95 | 33.94 | 50.38 | 90.04 | 67.29 | 64.83 | 24.52 | 100.71 | 99.28 | 56.98 | -2.75 | 79.27 | 54.52 | 47.21 | 44.10 | 61.30 | 50.66 | 43.33 | 167.82 | -15.63 | 20.11 | -3.23 | |
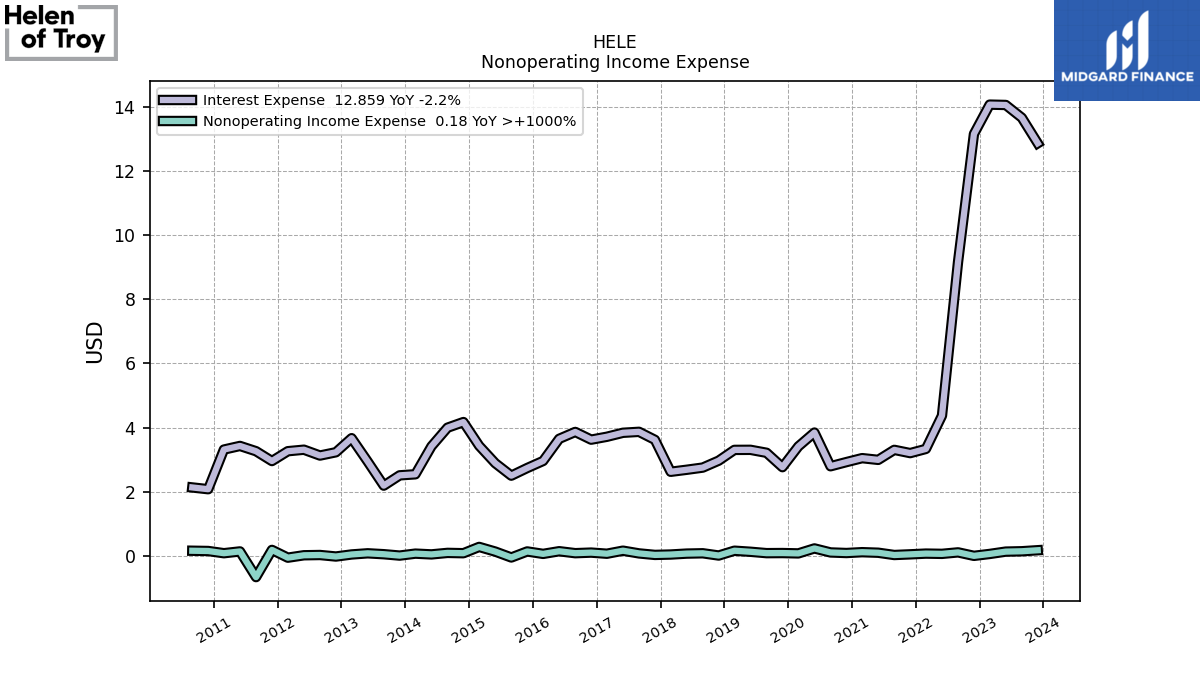
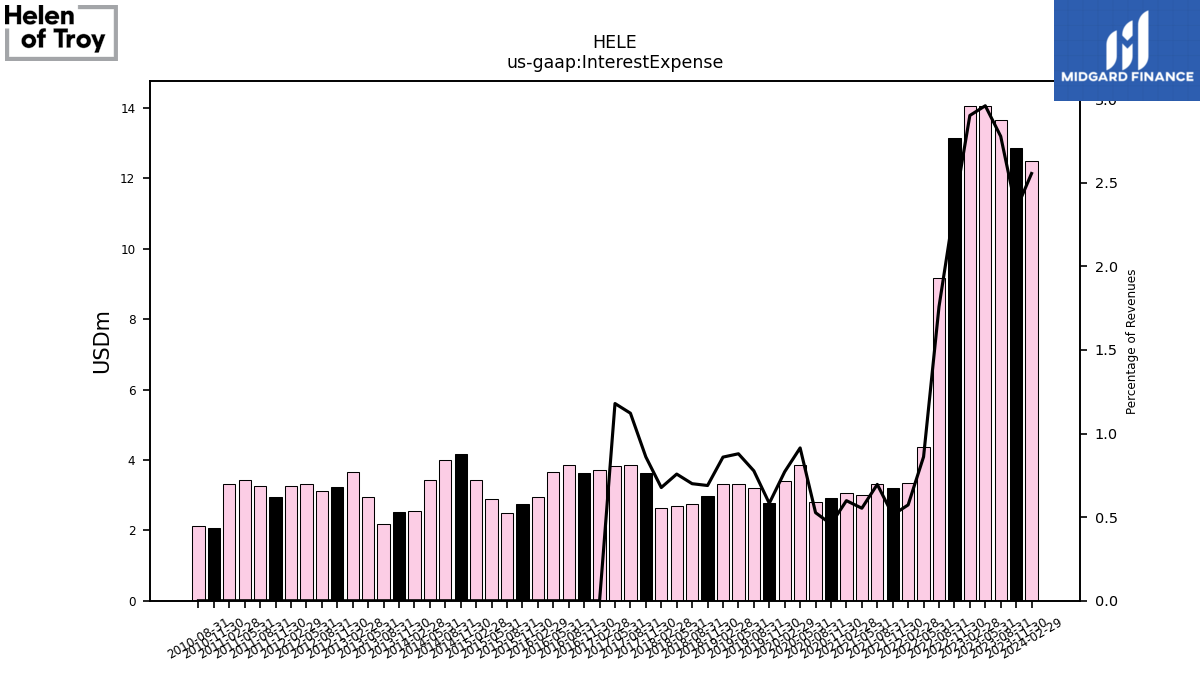
| Interest Expense | 12.86 | 13.65 | 14.05 | 14.06 | 13.15 | 9.17 | 4.37 | 3.34 | 3.21 | 3.31 | 3.00 | 3.05 | 2.93 | 2.80 | 3.85 | 3.41 | 2.77 | 3.22 | 3.31 | 3.31 | 2.97 | 2.75 | 2.69 | 2.62 | 3.62 | 3.87 | 3.84 | |
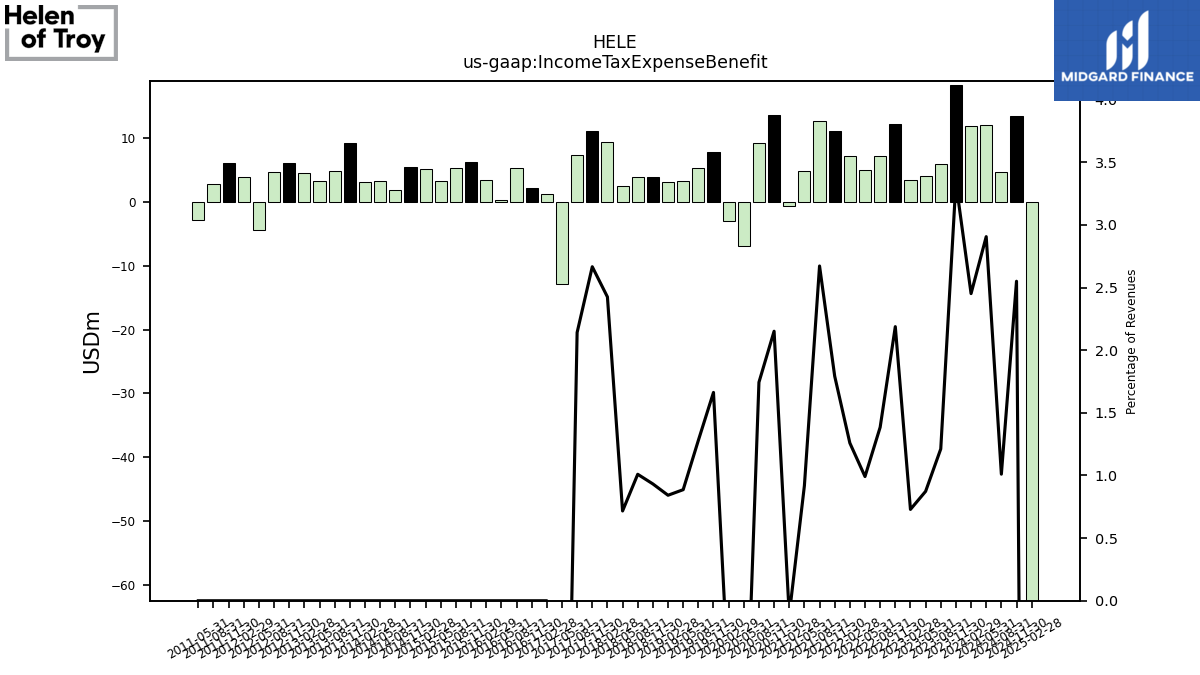
| Income Tax Expense Benefit | 18.35 | 5.96 | 4.14 | 3.53 | 12.22 | 7.22 | 5.04 | 7.33 | 11.20 | 12.70 | 4.97 | -0.58 | 13.72 | 9.26 | -6.92 | -2.92 | 7.89 | 5.30 | 3.34 | 3.24 | 4.02 | 3.97 | 2.54 | 9.40 | 11.22 | 7.39 | -12.78 | |
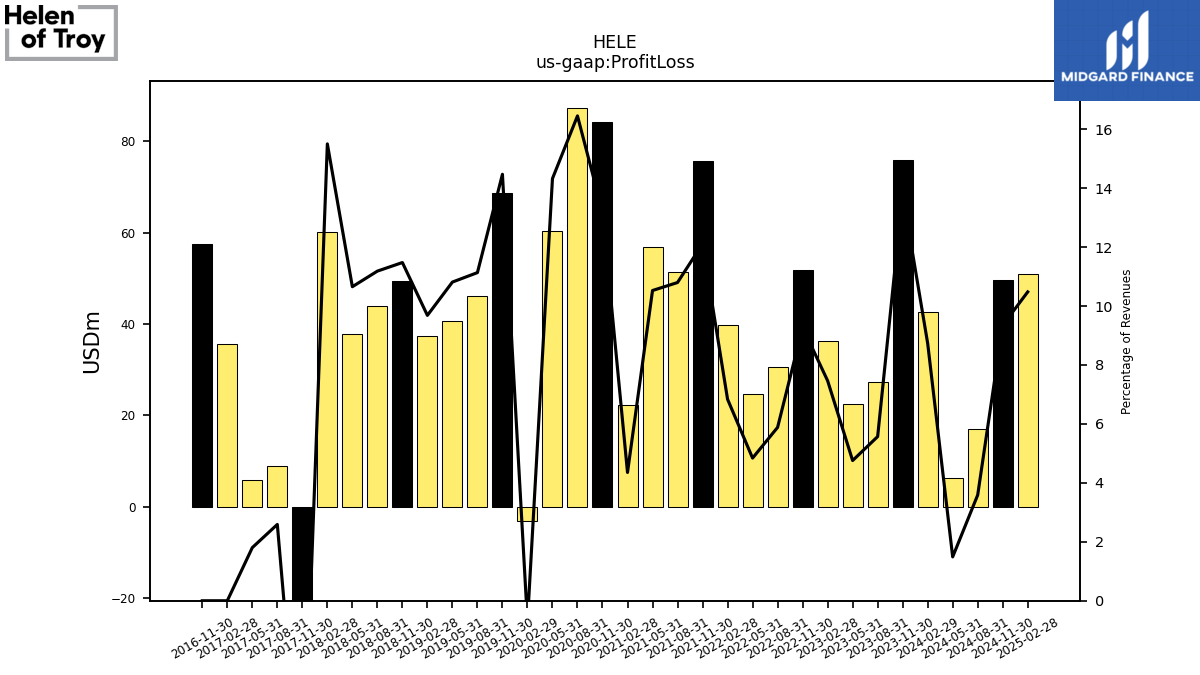
| Profit Loss | 75.90 | 27.38 | 22.58 | 36.18 | 51.83 | 30.67 | 24.59 | 39.79 | 75.68 | 51.31 | 56.97 | 22.17 | 84.16 | 87.33 | 60.29 | -3.15 | 68.70 | 46.09 | 40.69 | 37.27 | 49.47 | 44.02 | 37.79 | 60.08 | -30.44 | 8.93 | 5.87 | |
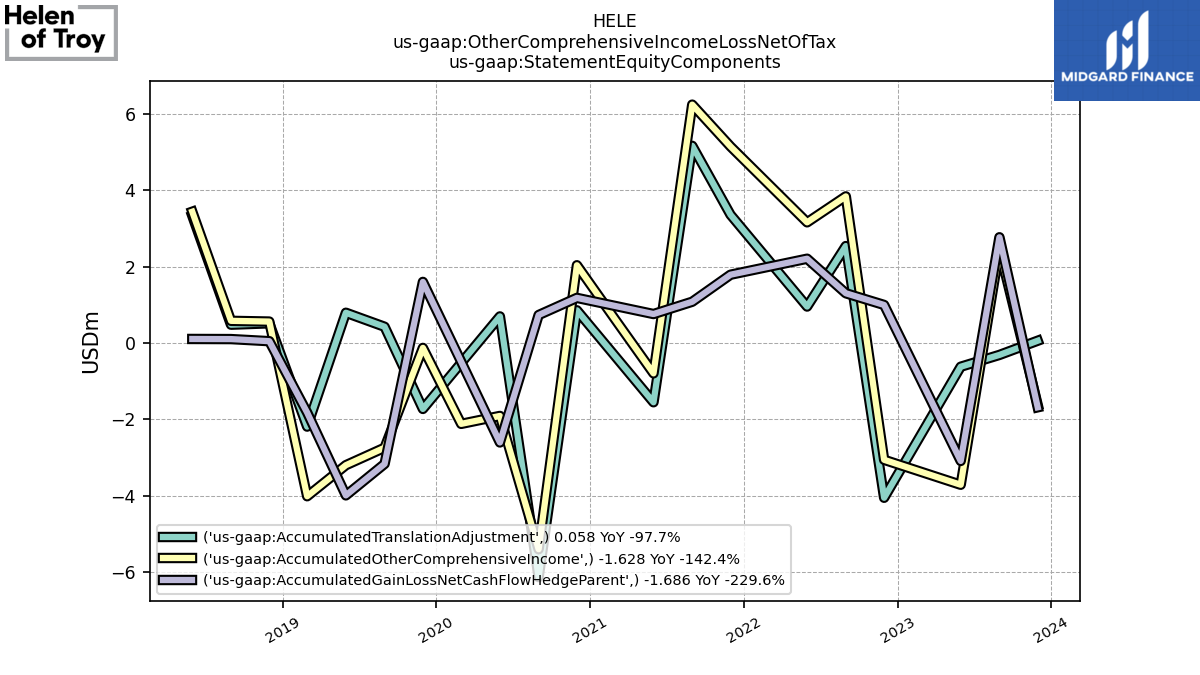
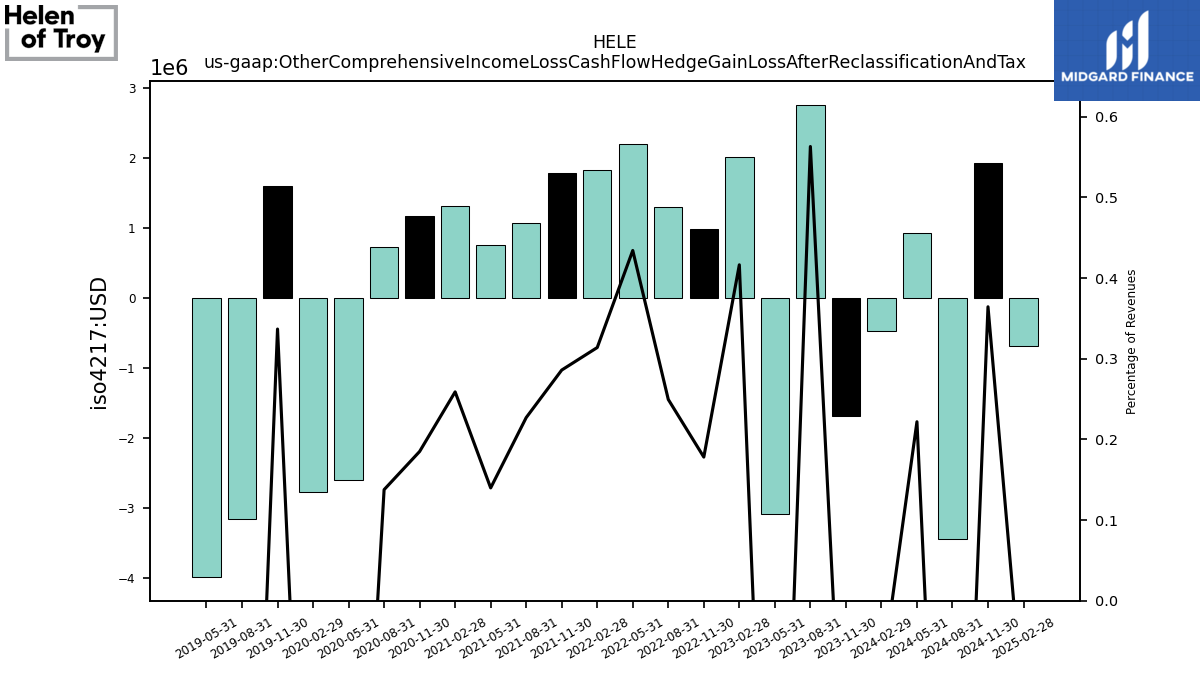
| Other Comprehensive Income Loss Cash Flow Hedge Gain Loss After Reclassification And Tax | -1.69 | 2.77 | -3.09 | 2.02 | 0.99 | 1.30 | 2.21 | 1.83 | 1.79 | 1.08 | 0.76 | 1.32 | 1.18 | 0.73 | -2.61 | -2.77 | 1.60 | -3.17 | -3.99 | NA | NA | NA | NA | NA | NA | NA | NA | |
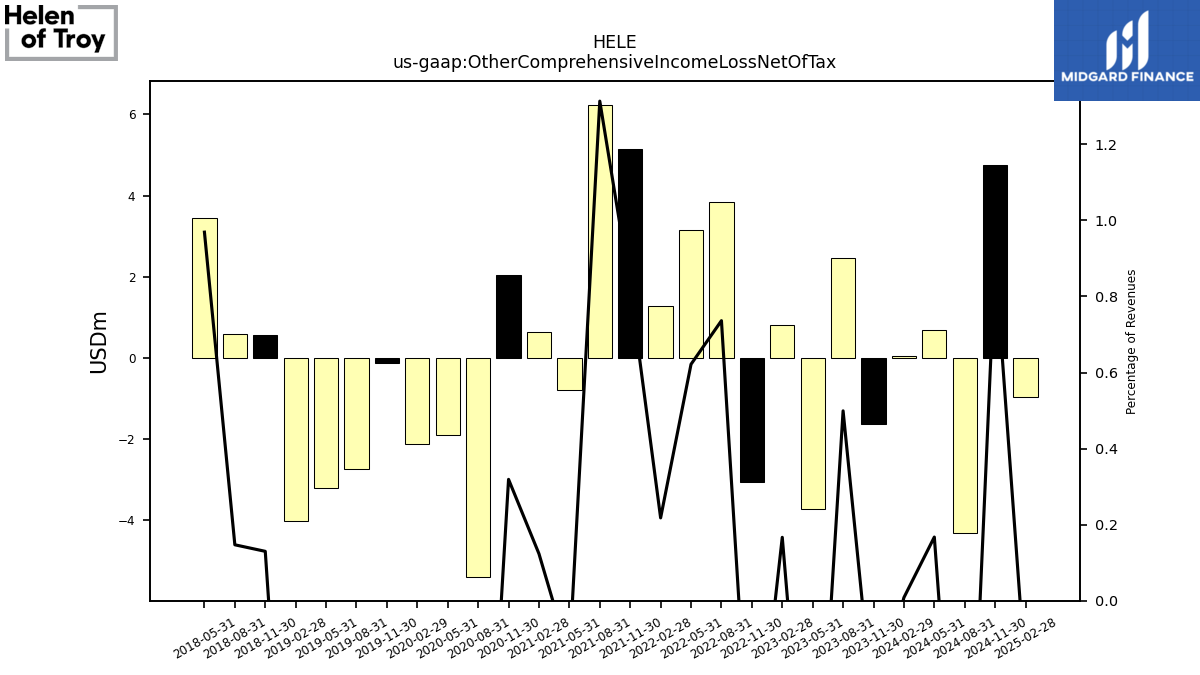
| Other Comprehensive Income Loss Net Of Tax | -1.63 | 2.45 | -3.71 | 0.81 | -3.06 | 3.84 | 3.16 | 1.27 | 5.14 | 6.24 | -0.80 | 0.63 | 2.04 | -5.40 | -1.91 | -2.12 | -0.13 | -2.74 | -3.20 | -4.02 | 0.56 | 0.58 | 3.44 | NA | NA | NA | NA | |
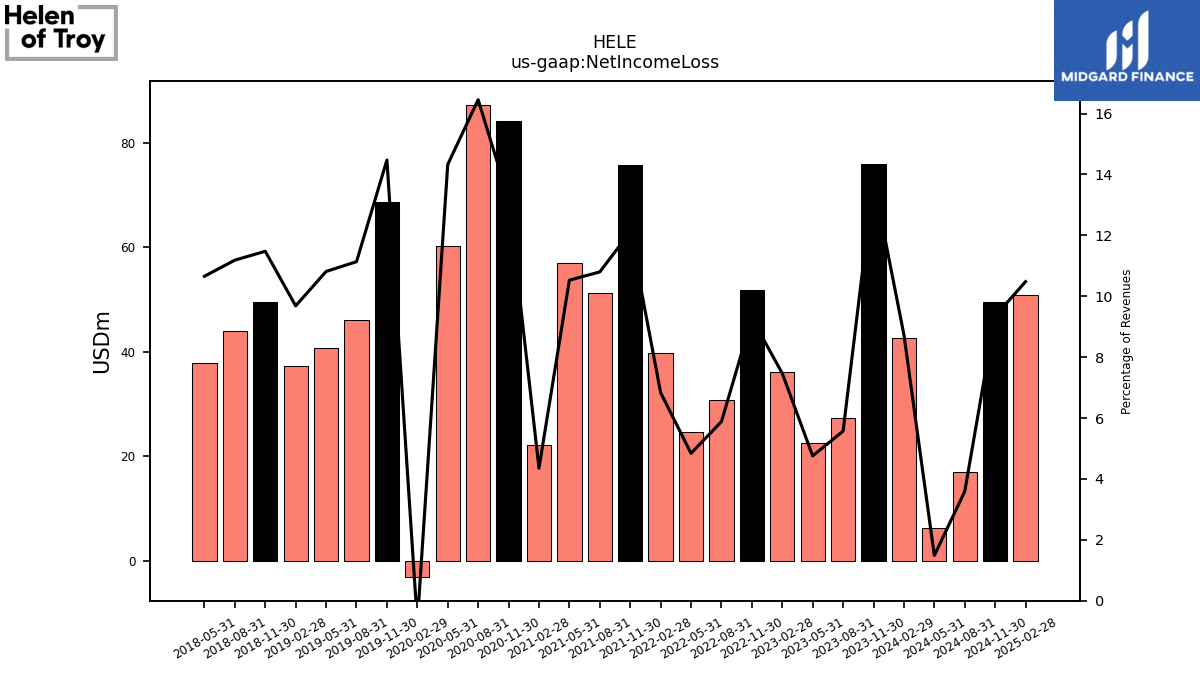
| Net Income Loss | 75.90 | 27.38 | 22.58 | 36.18 | 51.83 | 30.67 | 24.59 | 39.79 | 75.68 | 51.31 | 56.97 | 22.17 | 84.16 | 87.33 | 60.29 | -3.15 | 68.70 | 46.09 | 40.69 | 37.27 | 49.47 | 44.02 | 37.79 | NA | NA | NA | NA | |
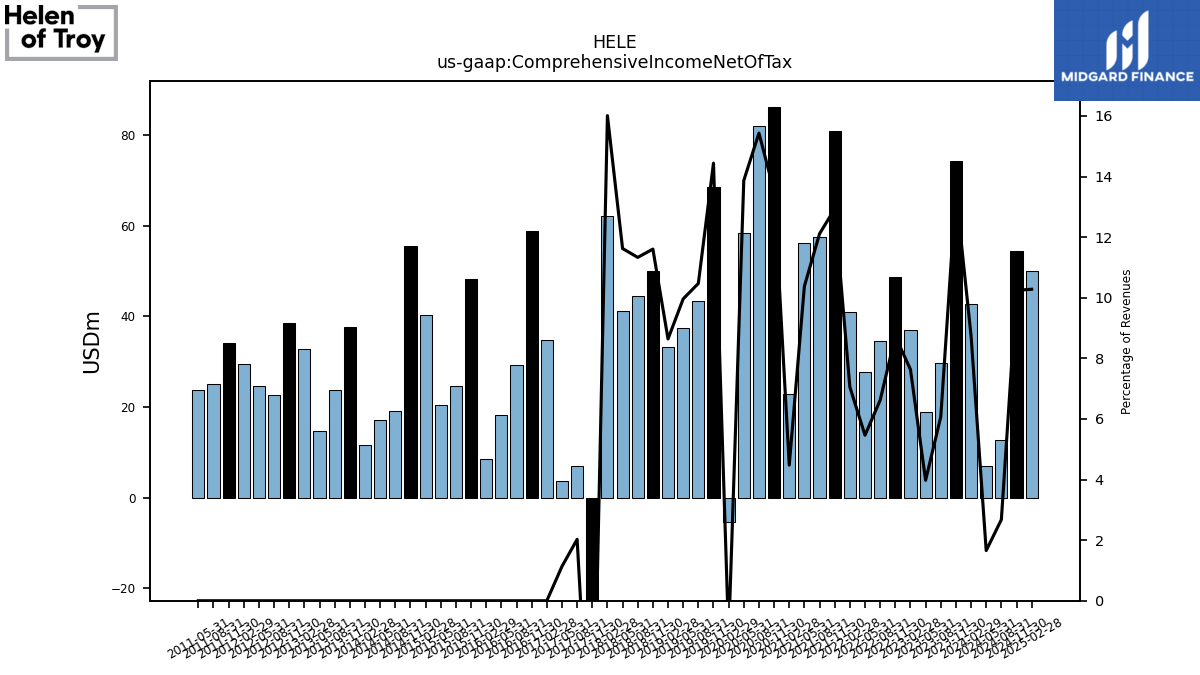
| Comprehensive Income Net Of Tax | 74.27 | 29.84 | 18.87 | 36.99 | 48.77 | 34.51 | 27.75 | 41.06 | 80.83 | 57.56 | 56.17 | 22.80 | 86.19 | 81.93 | 58.37 | -5.28 | 68.57 | 43.35 | 37.49 | 33.25 | 50.03 | 44.60 | 41.23 | 62.05 | -28.83 | 6.99 | 3.69 |
| 2023-11-30 | 2023-08-31 | 2023-05-31 | 2023-02-28 | 2022-11-30 | 2022-08-31 | 2022-05-31 | 2022-02-28 | 2021-11-30 | 2021-08-31 | 2021-05-31 | 2021-02-28 | 2020-11-30 | 2020-08-31 | 2020-05-31 | 2020-02-29 | 2019-11-30 | 2019-08-31 | 2019-05-31 | 2019-02-28 | 2018-11-30 | 2018-08-31 | 2018-05-31 | 2018-02-28 | 2017-11-30 | 2017-08-31 | 2017-05-31 | ||
|---|---|---|---|---|---|---|---|---|---|---|---|---|---|---|---|---|---|---|---|---|---|---|---|---|---|---|---|---|
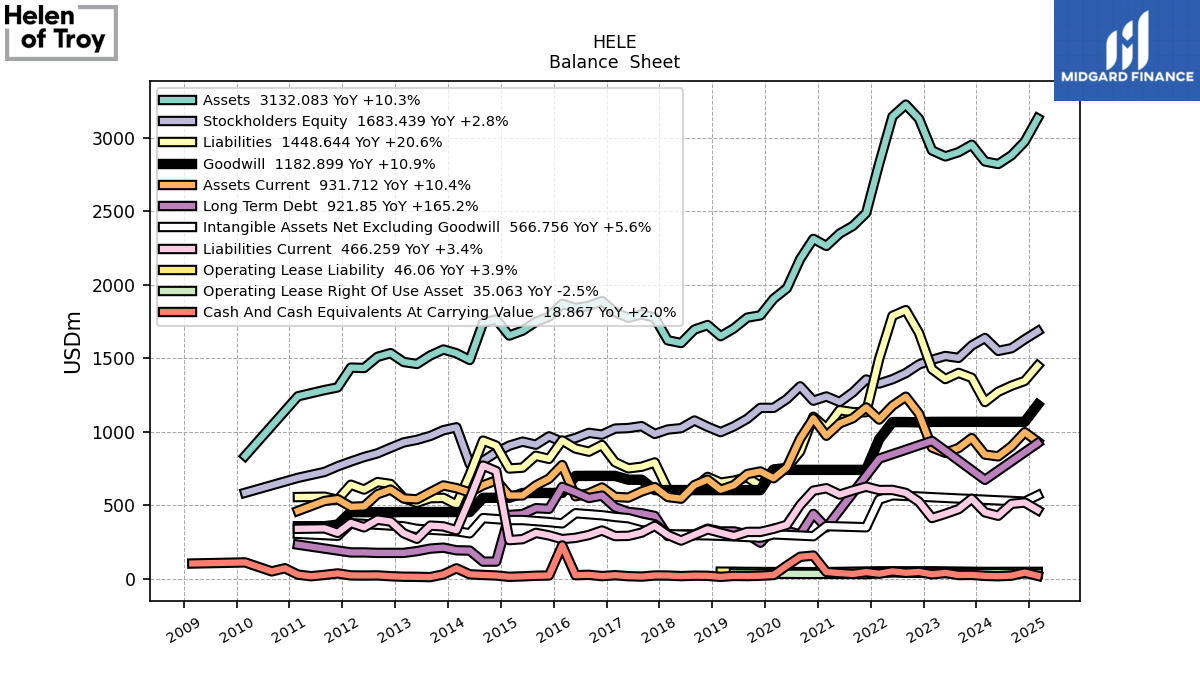
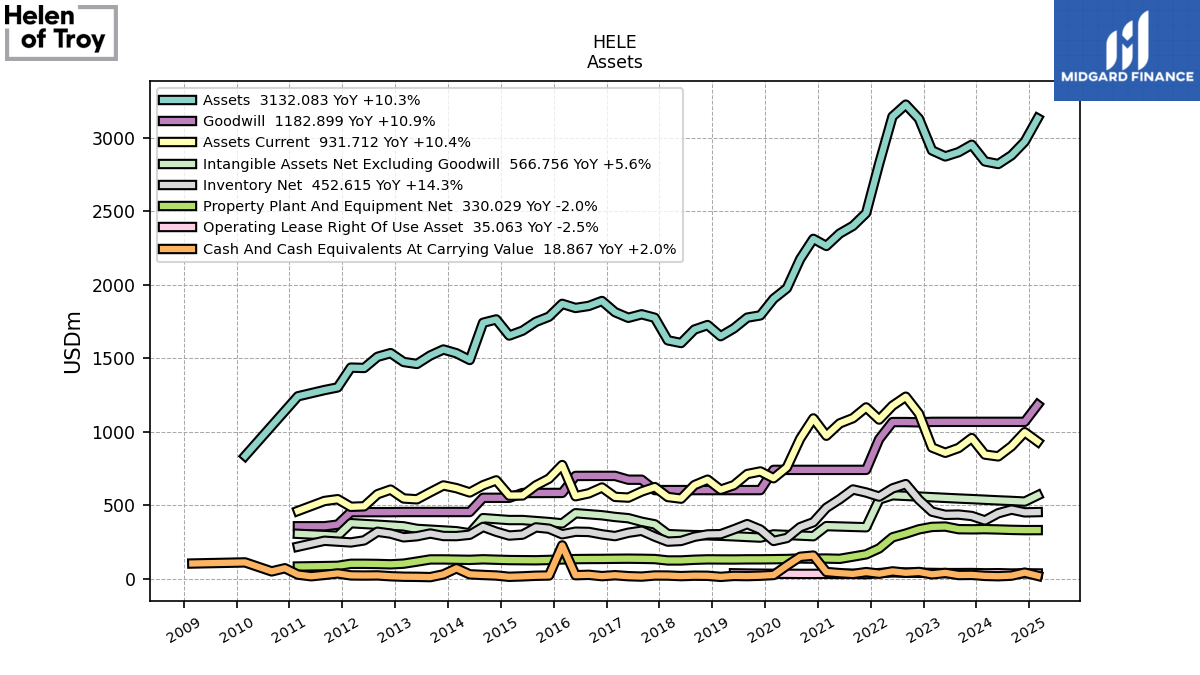
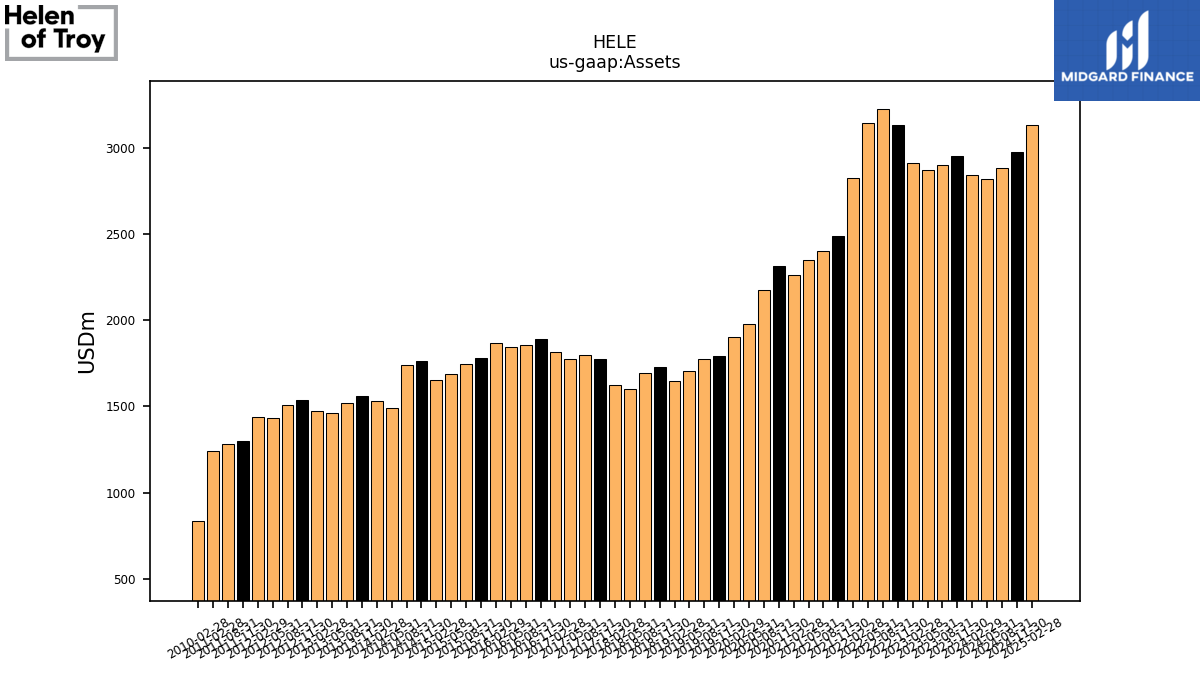
| Assets | 2952.29 | 2901.66 | 2872.83 | 2913.72 | 3129.43 | 3225.21 | 3144.25 | 2823.45 | 2487.41 | 2400.16 | 2348.09 | 2263.49 | 2311.74 | 2174.19 | 1975.69 | 1903.88 | 1791.09 | 1775.95 | 1702.83 | 1649.54 | 1725.37 | 1694.59 | 1602.97 | 1621.32 | 1774.89 | 1798.49 | 1774.68 | |
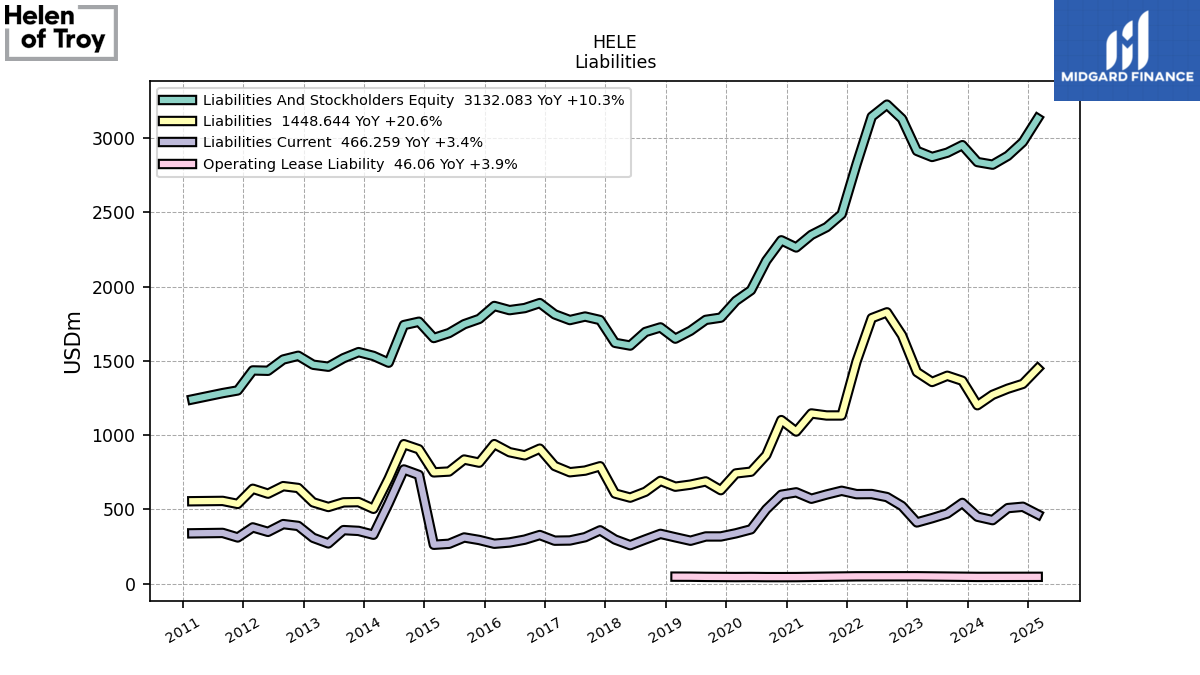
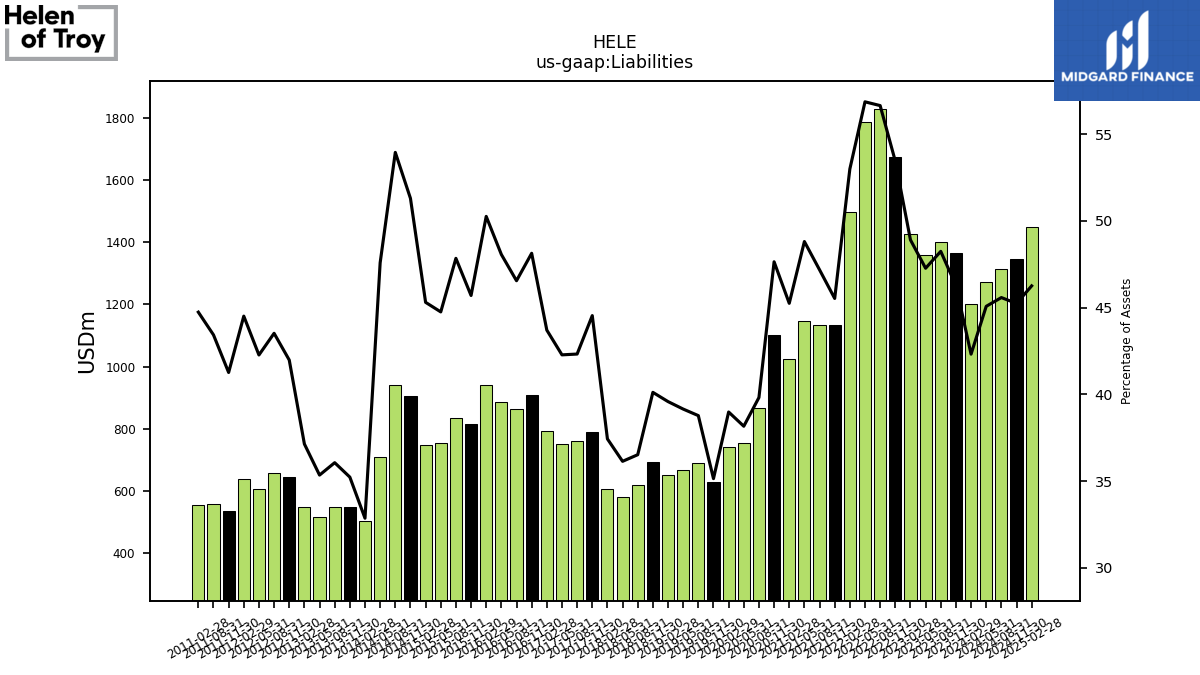
| Liabilities | 1366.01 | 1399.78 | 1357.92 | 1424.90 | 1672.35 | 1826.86 | 1787.83 | 1496.11 | 1132.45 | 1132.34 | 1146.01 | 1024.14 | 1101.31 | 865.66 | 753.94 | 742.16 | 629.40 | 688.58 | 666.65 | 652.90 | 692.11 | 618.85 | 579.28 | 606.86 | 790.49 | 761.15 | 750.24 | |
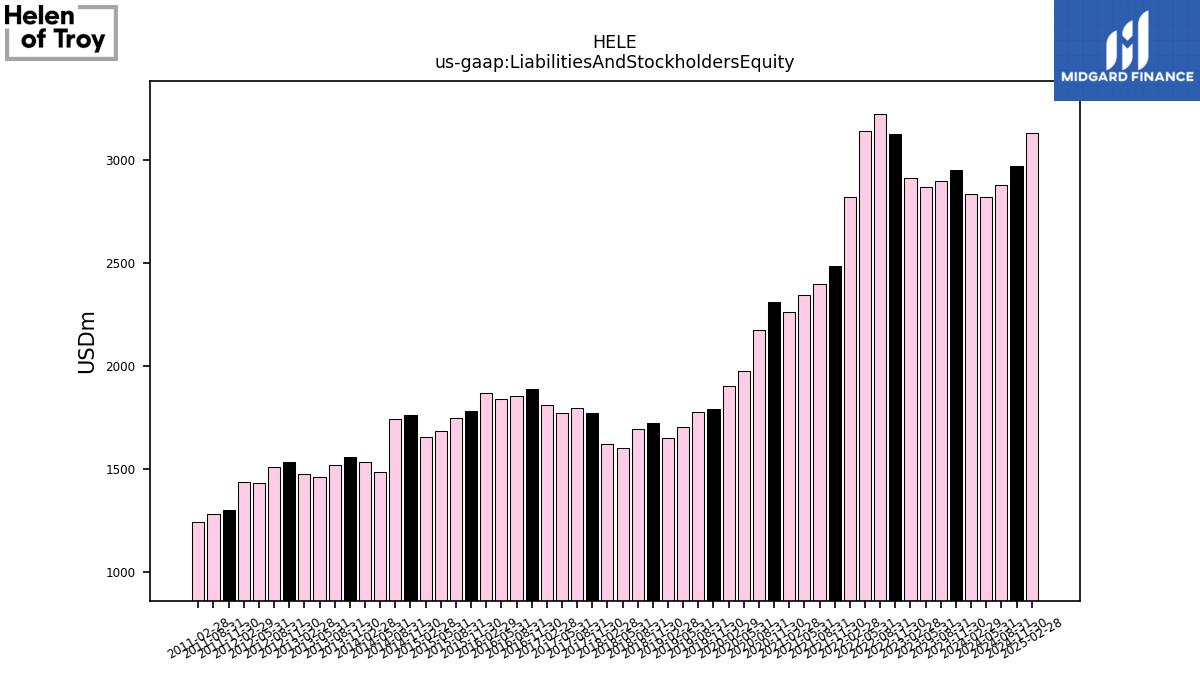
| Liabilities And Stockholders Equity | 2952.29 | 2901.66 | 2872.83 | 2913.72 | 3129.43 | 3225.21 | 3144.25 | 2823.45 | 2487.41 | 2400.16 | 2348.09 | 2263.49 | 2311.74 | 2174.19 | 1975.69 | 1903.88 | 1791.09 | 1775.95 | 1702.83 | 1649.54 | 1725.37 | 1694.59 | 1602.97 | 1621.32 | 1774.89 | 1798.49 | 1774.68 | |
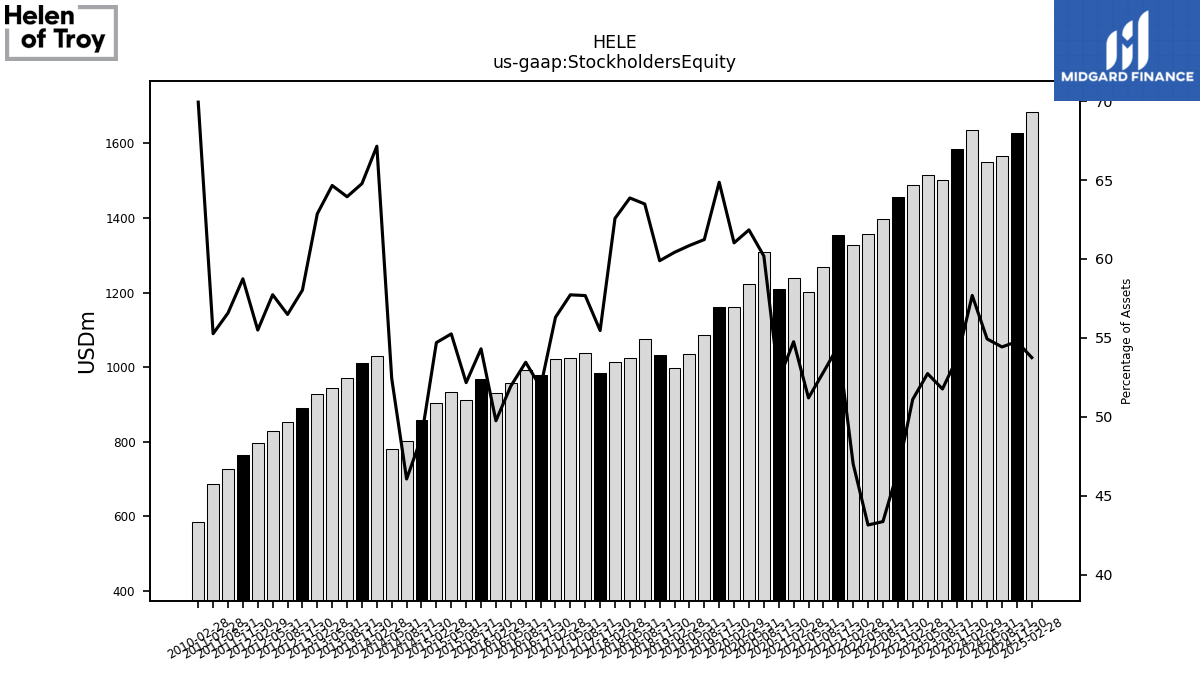
| Stockholders Equity | 1586.28 | 1501.88 | 1514.91 | 1488.81 | 1457.07 | 1398.35 | 1356.42 | 1327.34 | 1354.96 | 1267.82 | 1202.08 | 1239.35 | 1210.44 | 1308.53 | 1221.75 | 1161.72 | 1161.68 | 1087.38 | 1036.18 | 996.64 | 1033.26 | 1075.74 | 1023.70 | 1014.46 | 984.41 | 1037.34 | 1024.44 |
| 2023-11-30 | 2023-08-31 | 2023-05-31 | 2023-02-28 | 2022-11-30 | 2022-08-31 | 2022-05-31 | 2022-02-28 | 2021-11-30 | 2021-08-31 | 2021-05-31 | 2021-02-28 | 2020-11-30 | 2020-08-31 | 2020-05-31 | 2020-02-29 | 2019-11-30 | 2019-08-31 | 2019-05-31 | 2019-02-28 | 2018-11-30 | 2018-08-31 | 2018-05-31 | 2018-02-28 | 2017-11-30 | 2017-08-31 | 2017-05-31 | ||
|---|---|---|---|---|---|---|---|---|---|---|---|---|---|---|---|---|---|---|---|---|---|---|---|---|---|---|---|---|
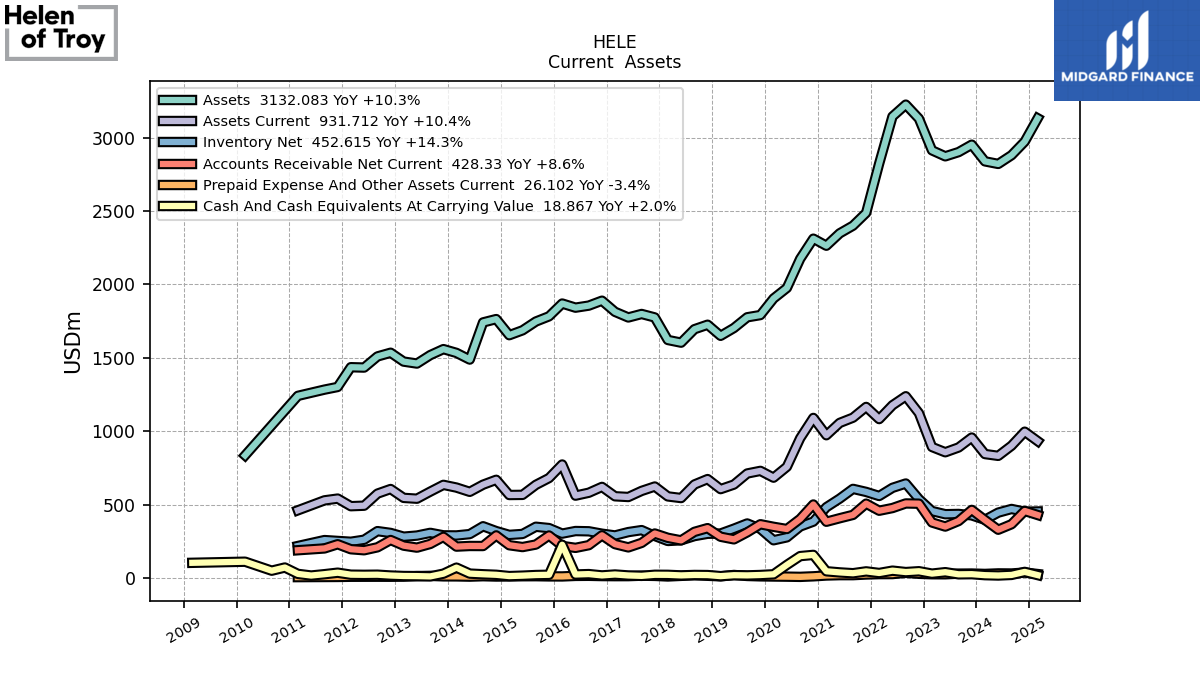
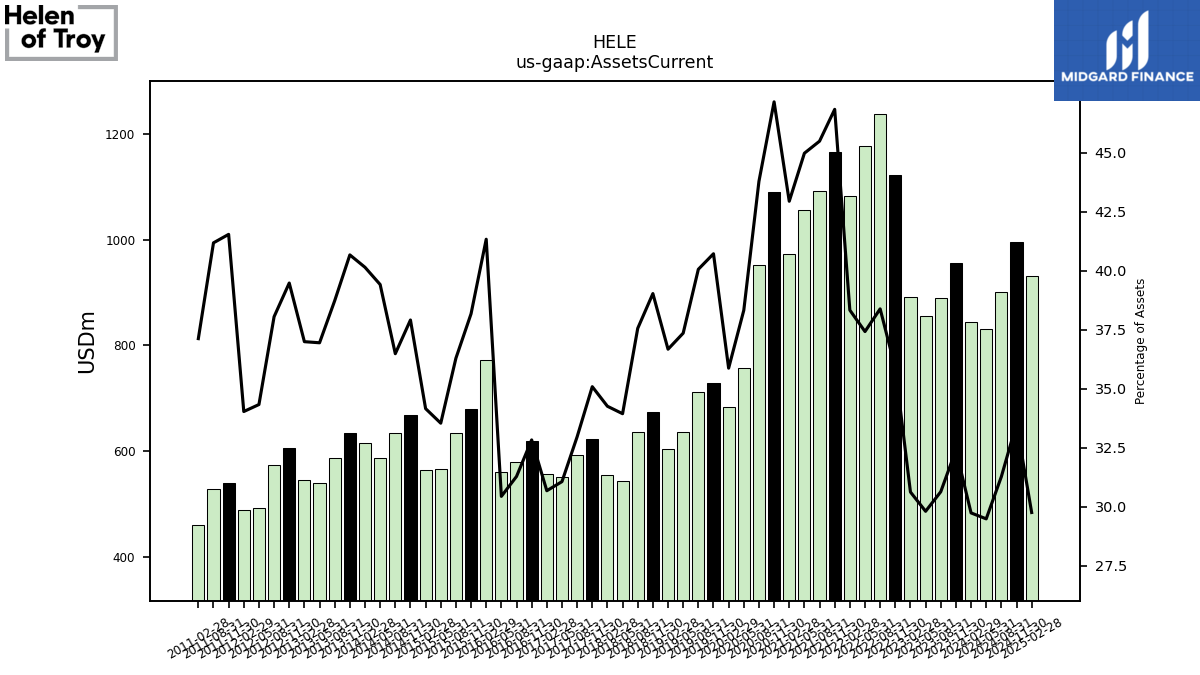
| Assets Current | 956.44 | 888.69 | 856.06 | 892.04 | 1122.40 | 1237.82 | 1176.50 | 1082.08 | 1164.99 | 1091.77 | 1056.07 | 971.94 | 1090.07 | 951.92 | 757.04 | 682.84 | 729.24 | 711.37 | 635.99 | 604.86 | 673.35 | 636.37 | 543.97 | 555.31 | 622.65 | 592.70 | 551.14 | |
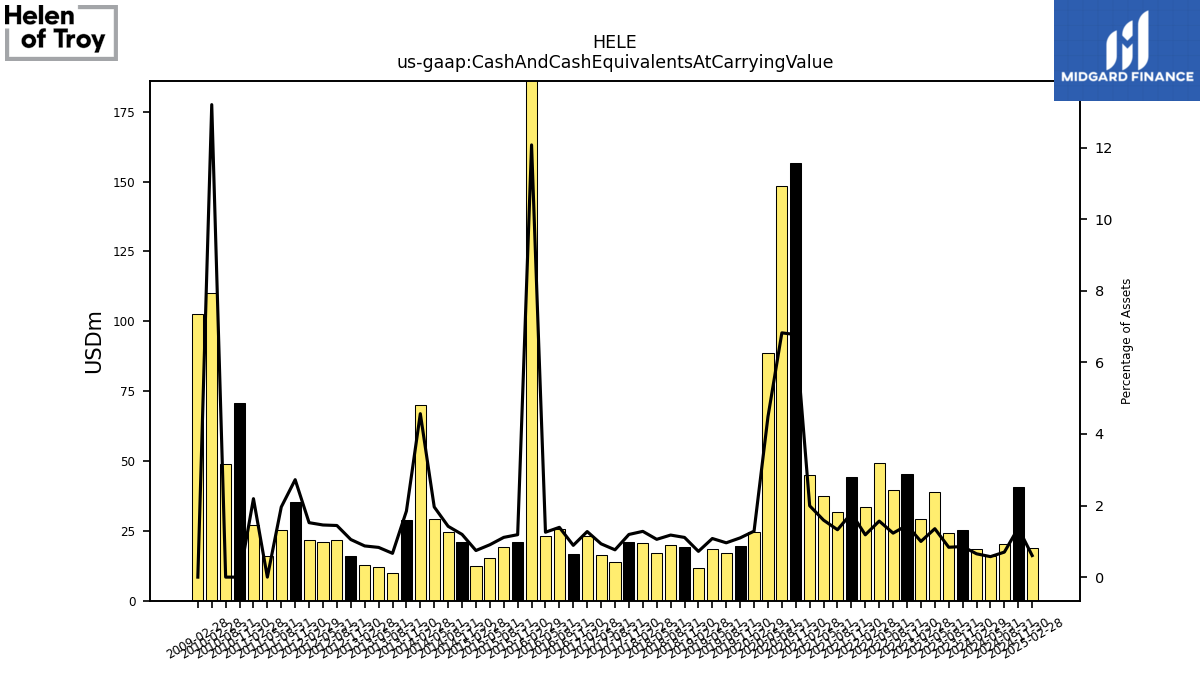
| Cash And Cash Equivalents At Carrying Value | 25.25 | 24.21 | 38.87 | 29.07 | 45.34 | 39.65 | 49.25 | 33.38 | 44.34 | 31.78 | 37.37 | 45.12 | 156.66 | 148.40 | 88.52 | 24.47 | 19.64 | 17.03 | 18.38 | 11.87 | 19.14 | 19.91 | 16.93 | 20.74 | 21.16 | 13.72 | 16.51 | |
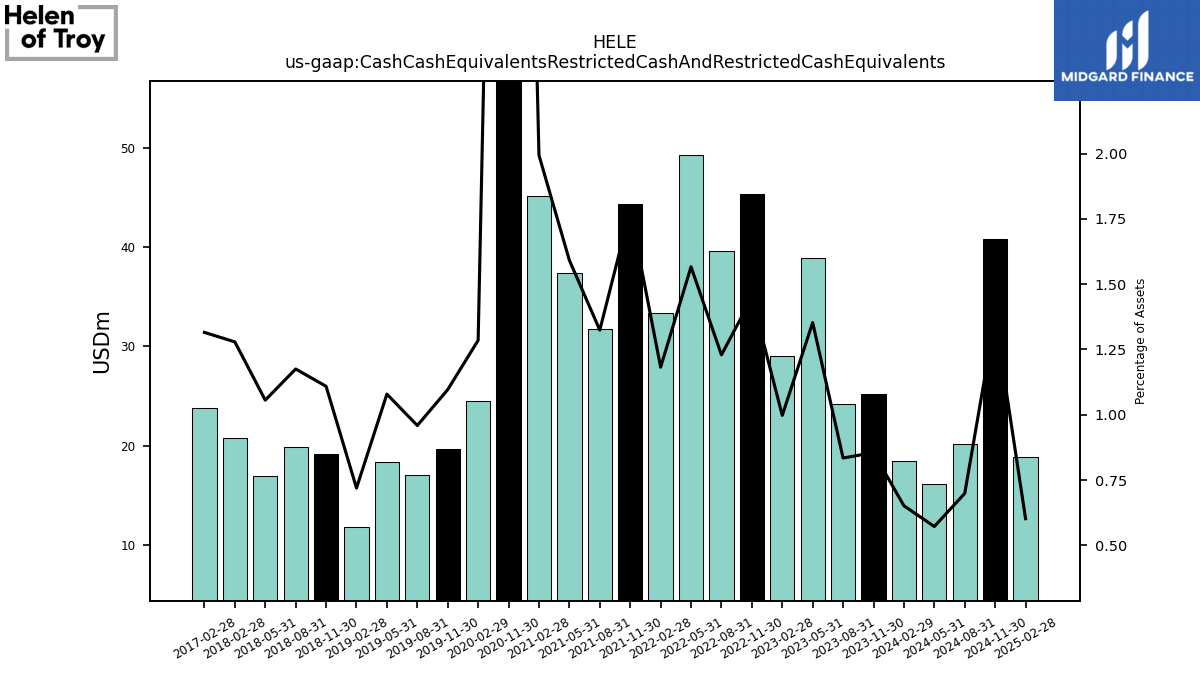
| Cash Cash Equivalents Restricted Cash And Restricted Cash Equivalents | 25.25 | 24.21 | 38.87 | 29.07 | 45.34 | 39.65 | 49.25 | 33.38 | 44.34 | 31.78 | 37.37 | 45.12 | 156.66 | NA | NA | 24.47 | 19.64 | 17.03 | 18.38 | 11.87 | 19.14 | 19.91 | 16.93 | 20.74 | NA | NA | NA | |
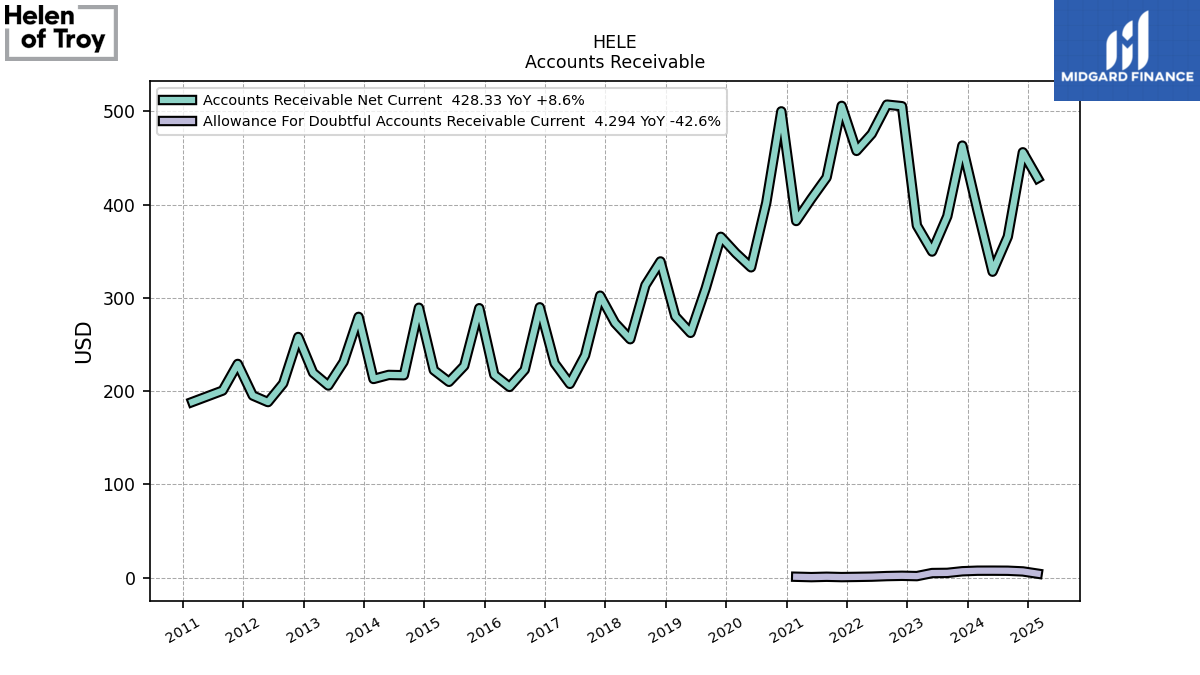
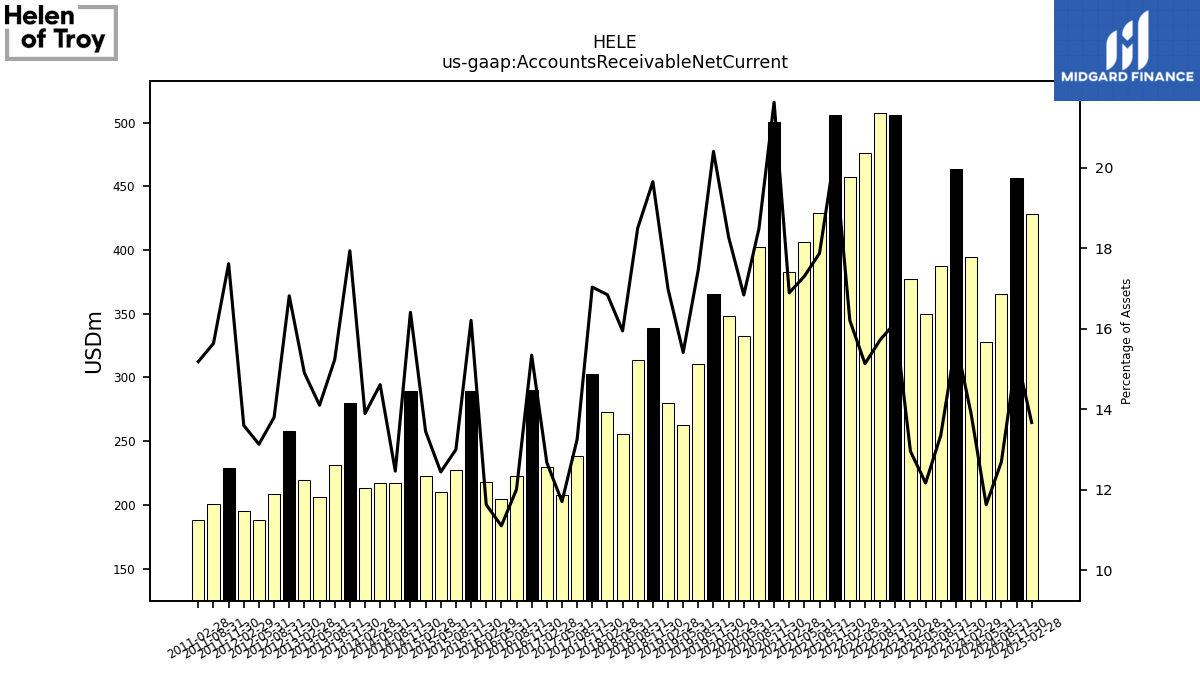
| Accounts Receivable Net Current | 463.32 | 387.50 | 349.70 | 377.60 | 505.56 | 507.26 | 475.90 | 457.62 | 505.93 | 429.18 | 406.41 | 382.45 | 500.07 | 402.03 | 332.77 | 348.02 | 365.54 | 310.38 | 262.51 | 280.28 | 339.12 | 313.62 | 255.67 | 273.17 | 302.39 | 238.42 | 207.79 | |
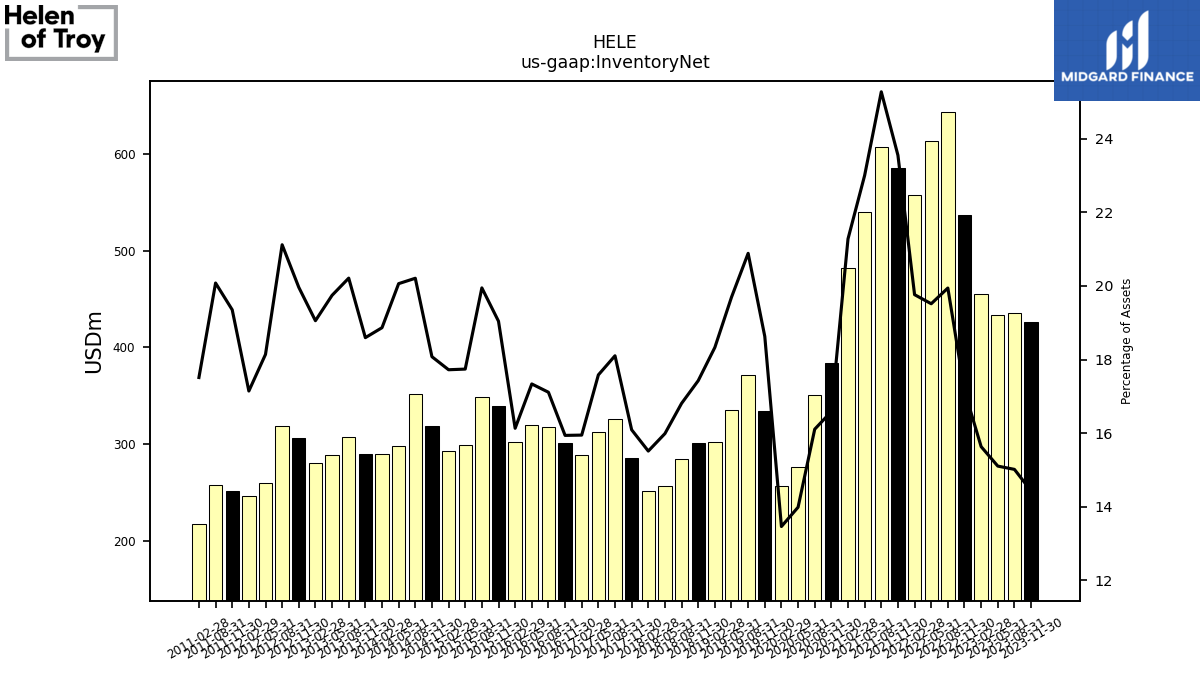
| Inventory Net | 426.03 | 435.68 | 433.91 | 455.49 | 536.79 | 643.19 | 613.62 | 557.99 | 585.81 | 606.65 | 540.13 | 481.61 | 383.44 | 350.18 | 276.33 | 256.31 | 333.66 | 370.92 | 335.34 | 302.34 | 300.65 | 284.83 | 256.27 | 251.51 | 285.59 | 325.56 | 312.02 | |
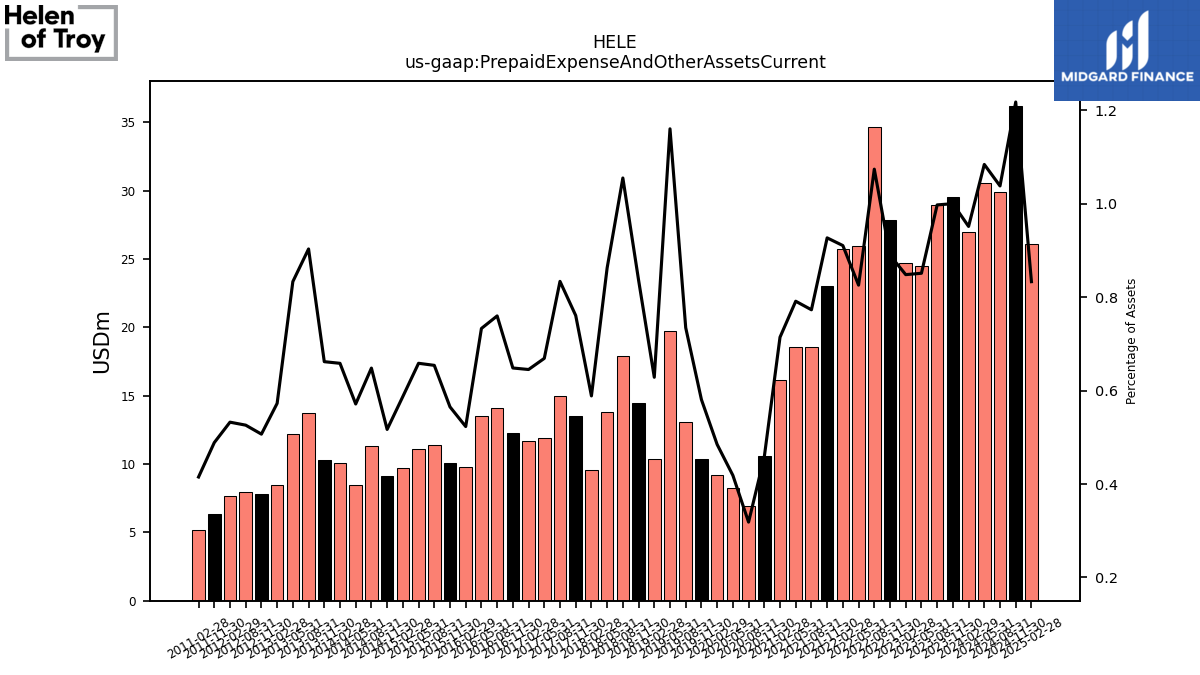
| Prepaid Expense And Other Assets Current | 29.54 | 28.95 | 24.46 | 24.72 | 27.85 | 34.65 | 25.97 | 25.71 | 23.06 | 18.56 | 18.58 | 16.17 | 10.59 | 6.92 | 8.27 | 9.23 | 10.40 | 13.05 | 19.76 | 10.37 | 14.44 | 17.88 | 13.83 | 9.54 | 13.51 | 15.00 | 11.87 |
| 2023-11-30 | 2023-08-31 | 2023-05-31 | 2023-02-28 | 2022-11-30 | 2022-08-31 | 2022-05-31 | 2022-02-28 | 2021-11-30 | 2021-08-31 | 2021-05-31 | 2021-02-28 | 2020-11-30 | 2020-08-31 | 2020-05-31 | 2020-02-29 | 2019-11-30 | 2019-08-31 | 2019-05-31 | 2019-02-28 | 2018-11-30 | 2018-08-31 | 2018-05-31 | 2018-02-28 | 2017-11-30 | 2017-08-31 | 2017-05-31 | ||
|---|---|---|---|---|---|---|---|---|---|---|---|---|---|---|---|---|---|---|---|---|---|---|---|---|---|---|---|---|
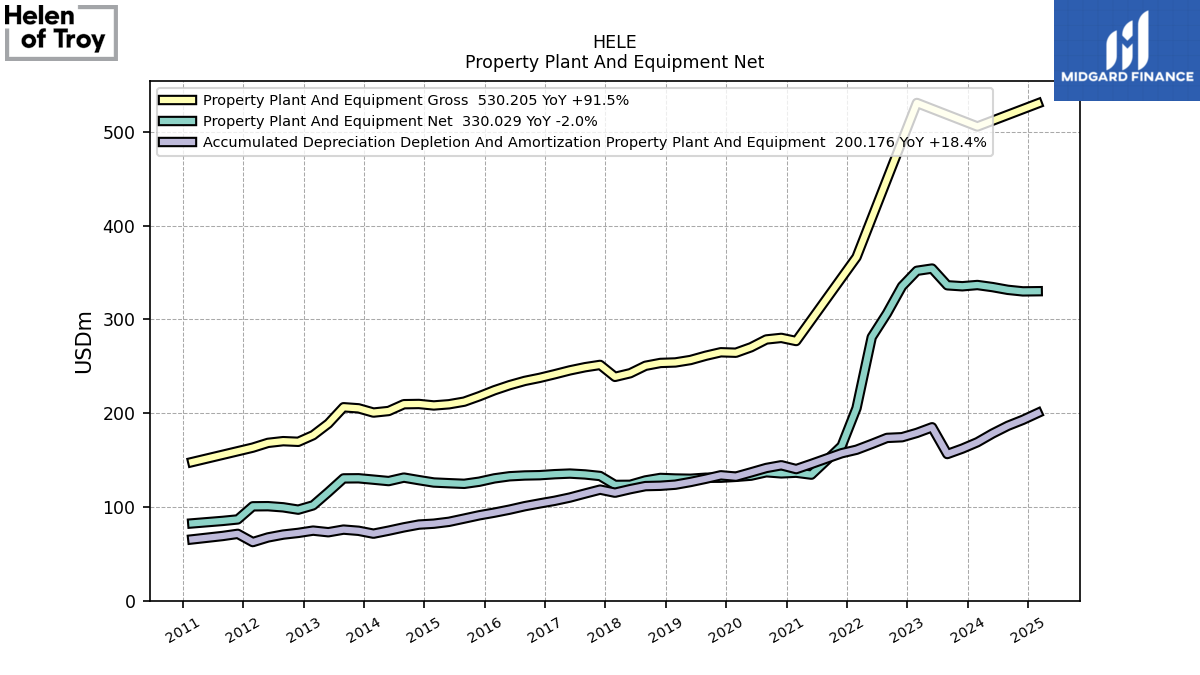
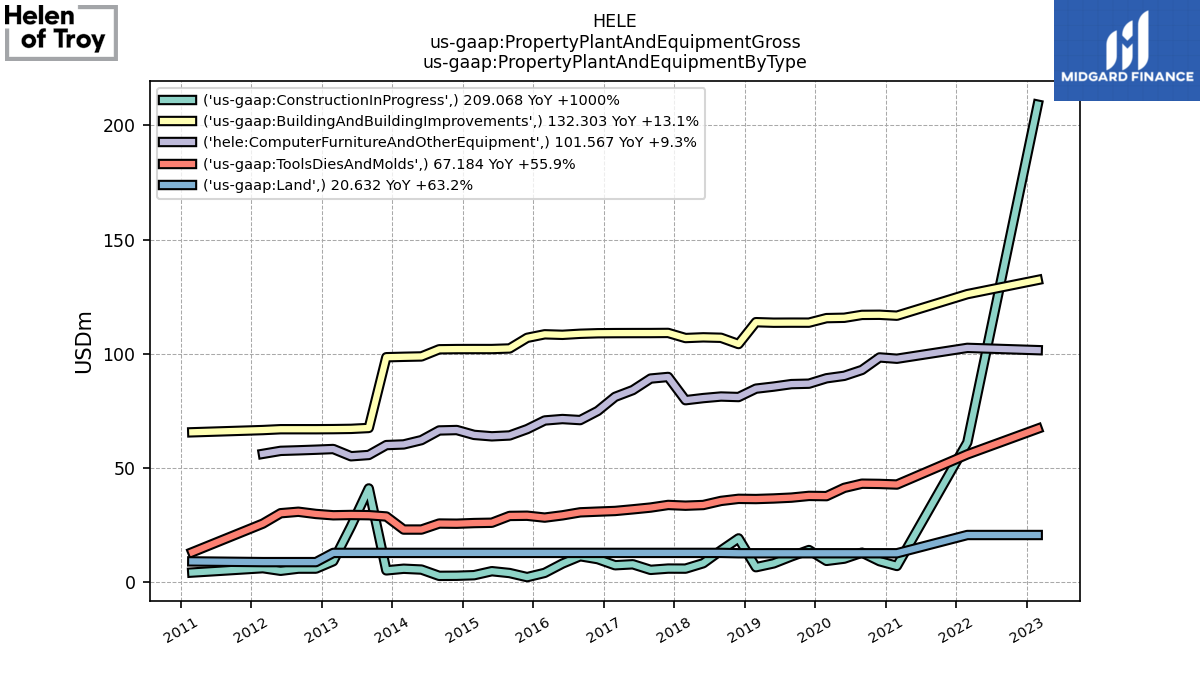
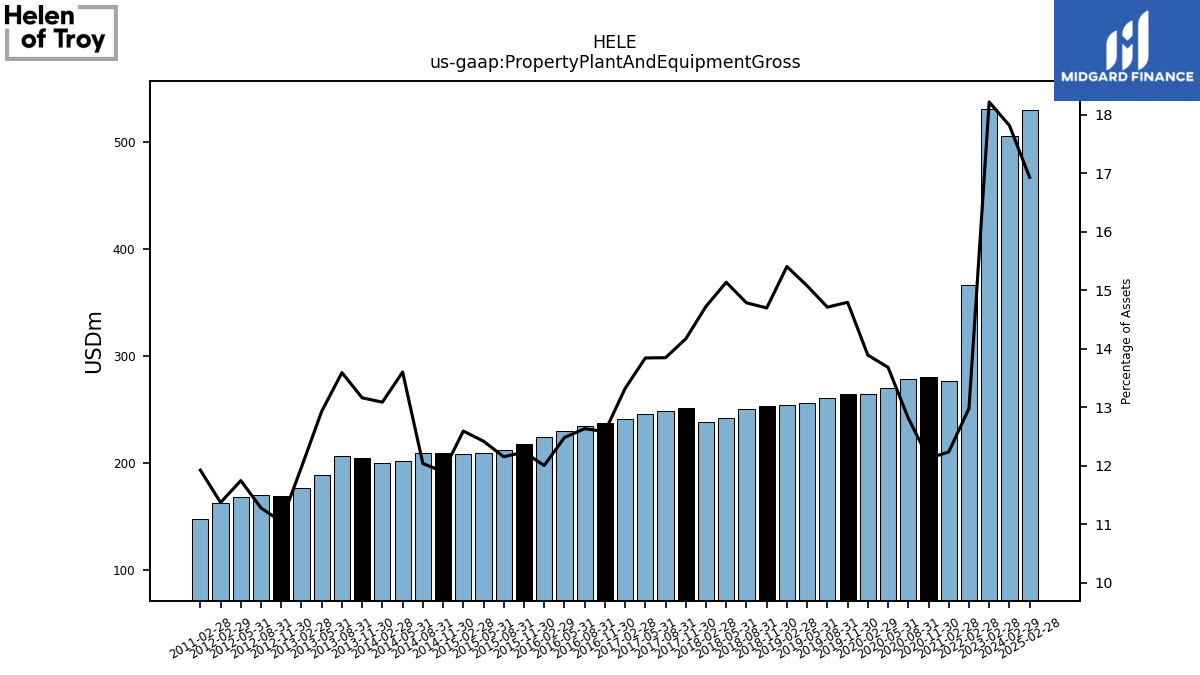
| Property Plant And Equipment Gross | NA | NA | NA | 530.75 | NA | NA | NA | 366.38 | NA | NA | NA | 276.91 | 280.26 | 278.58 | 270.27 | 264.45 | 264.94 | 261.22 | 256.68 | 254.08 | 253.54 | 250.50 | 242.59 | 238.71 | 251.47 | 249.00 | 245.62 | |
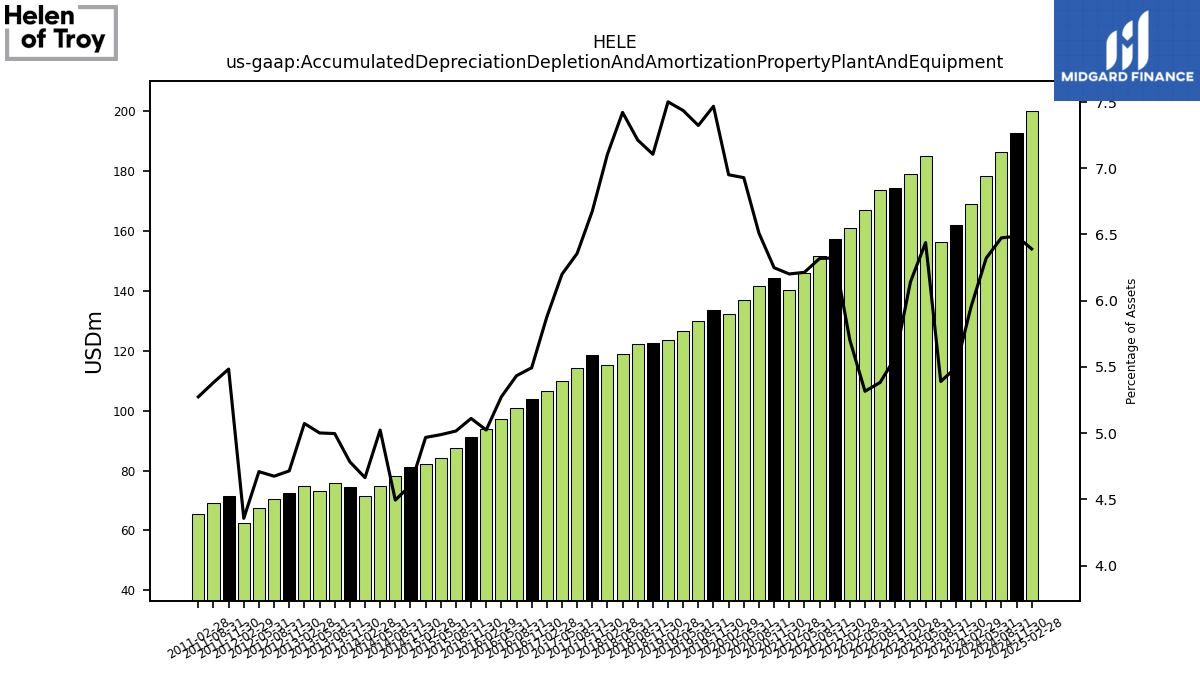
| Accumulated Depreciation Depletion And Amortization Property Plant And Equipment | 162.21 | 156.41 | 184.97 | 178.96 | 174.35 | 173.61 | 167.15 | 161.01 | 157.29 | 151.66 | 145.91 | 140.38 | 144.46 | 141.55 | 136.90 | 132.34 | 133.76 | 130.06 | 126.62 | 123.74 | 122.60 | 122.23 | 118.97 | 115.20 | 118.48 | 114.33 | 110.02 | |
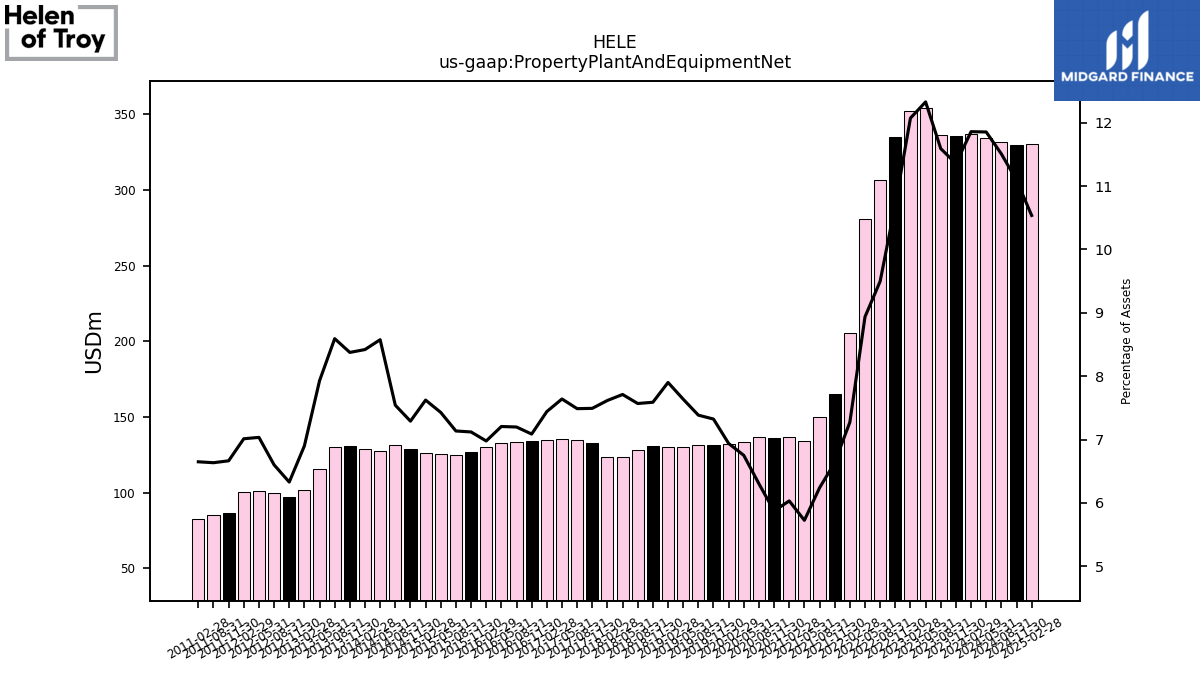
| Property Plant And Equipment Net | 335.30 | 336.35 | 354.19 | 351.79 | 335.23 | 306.34 | 281.01 | 205.38 | 165.06 | 149.74 | 134.45 | 136.53 | 135.79 | 137.02 | 133.38 | 132.11 | 131.18 | 131.16 | 130.06 | 130.34 | 130.94 | 128.27 | 123.62 | 123.50 | 132.99 | 134.67 | 135.60 | |
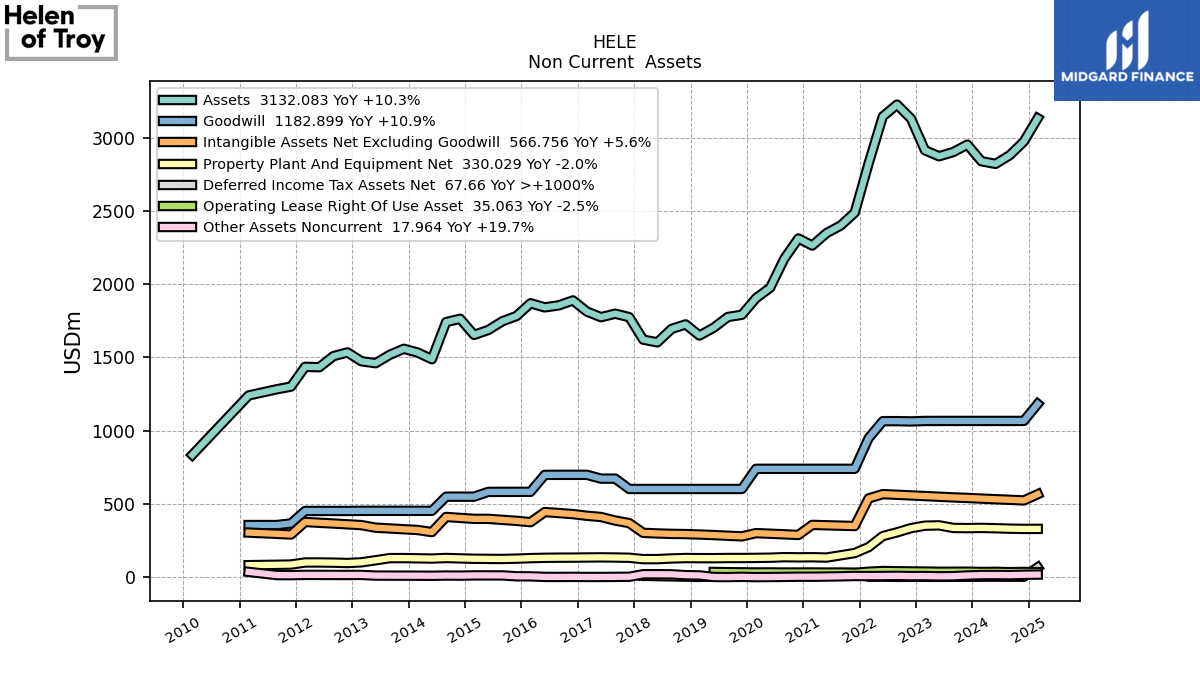
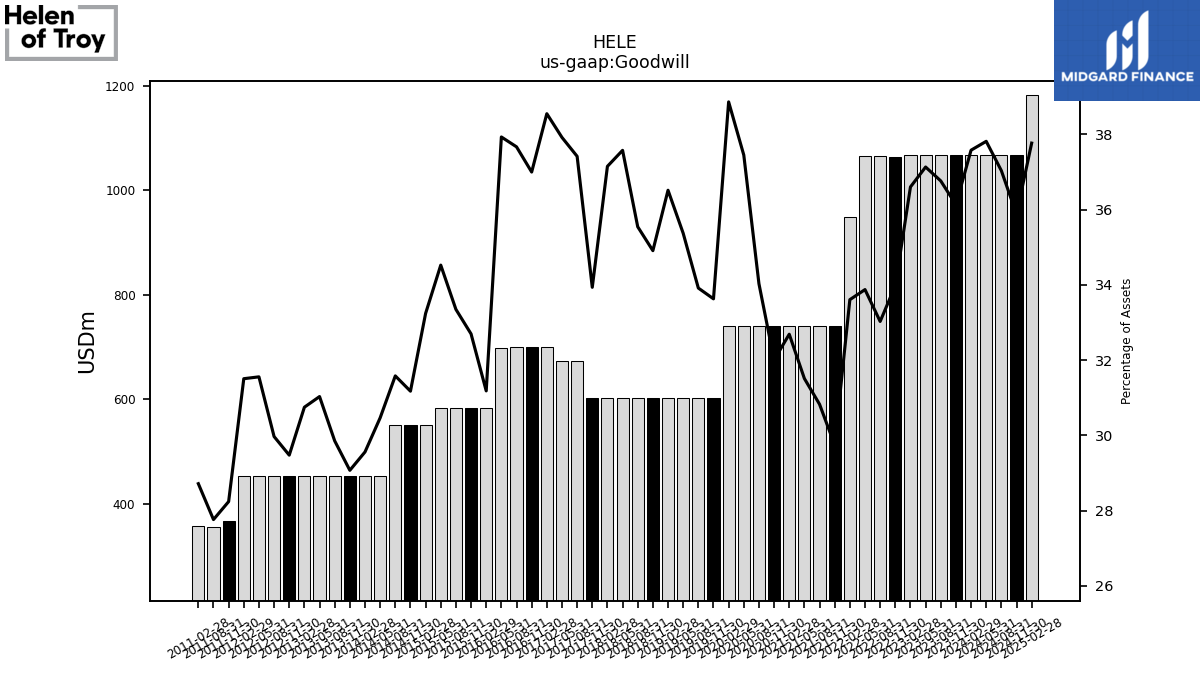
| Goodwill | 1066.73 | 1066.73 | 1066.73 | 1066.48 | 1063.31 | 1065.21 | 1065.11 | 948.87 | 739.90 | 739.90 | 739.90 | 739.90 | 739.90 | 739.90 | 739.90 | 739.90 | 602.32 | 602.32 | 602.32 | 602.32 | 602.32 | 602.32 | 602.32 | 602.32 | 602.32 | 672.93 | 672.93 | |
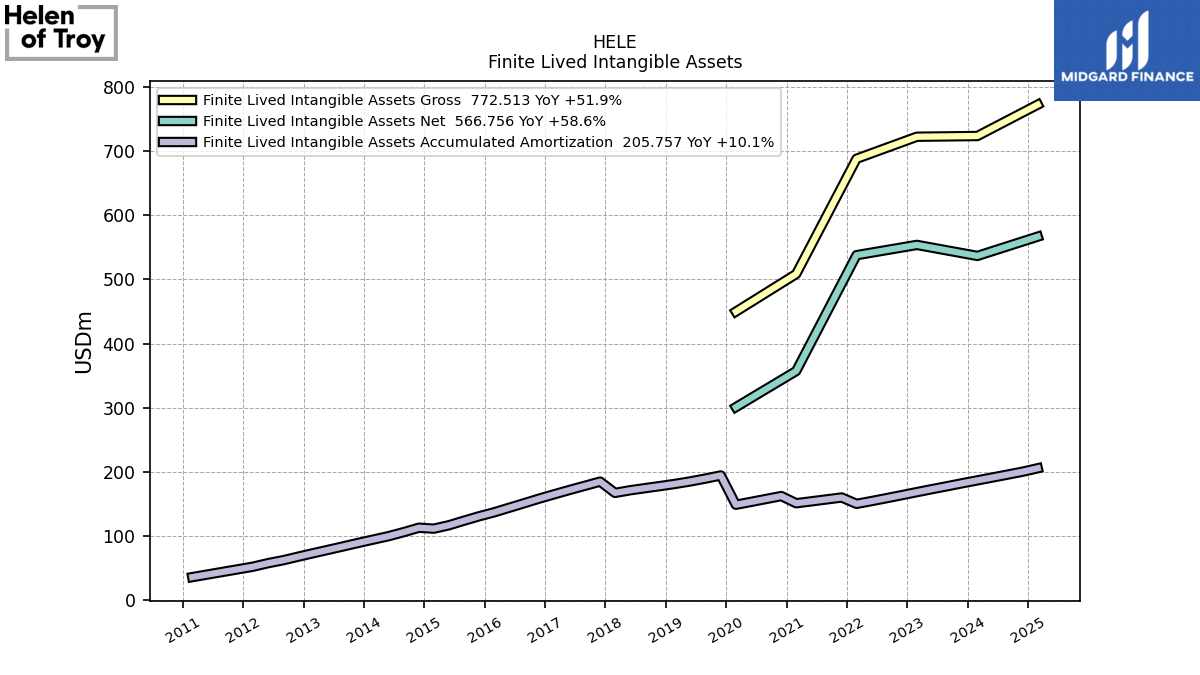
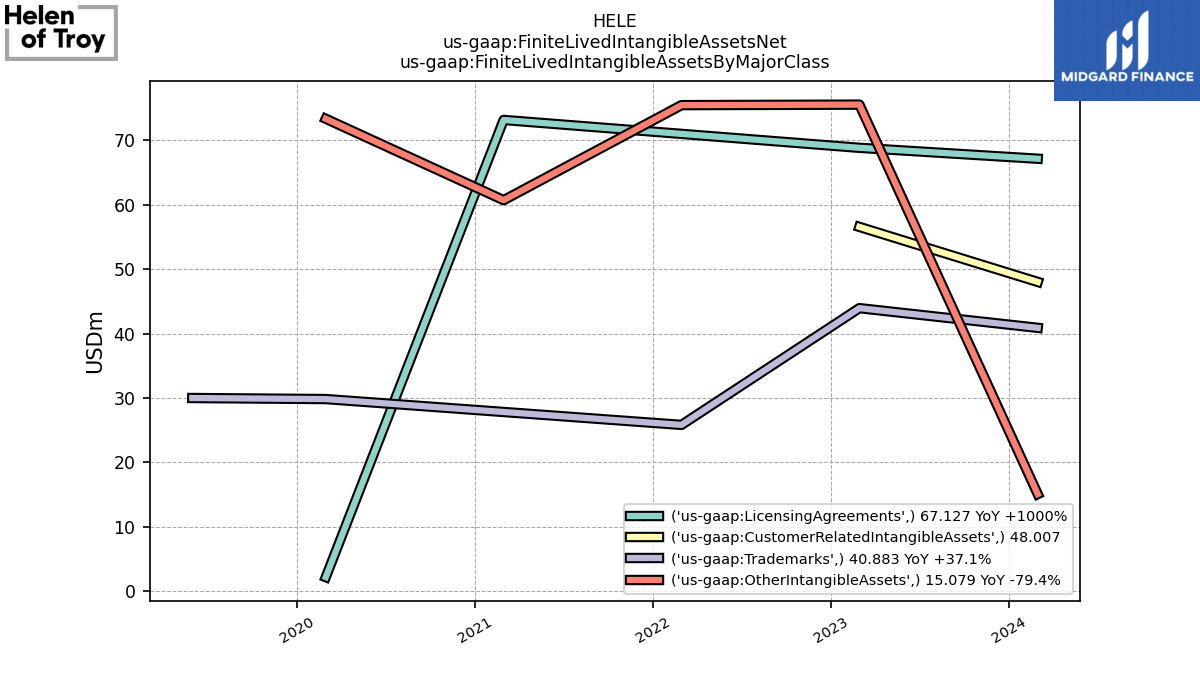
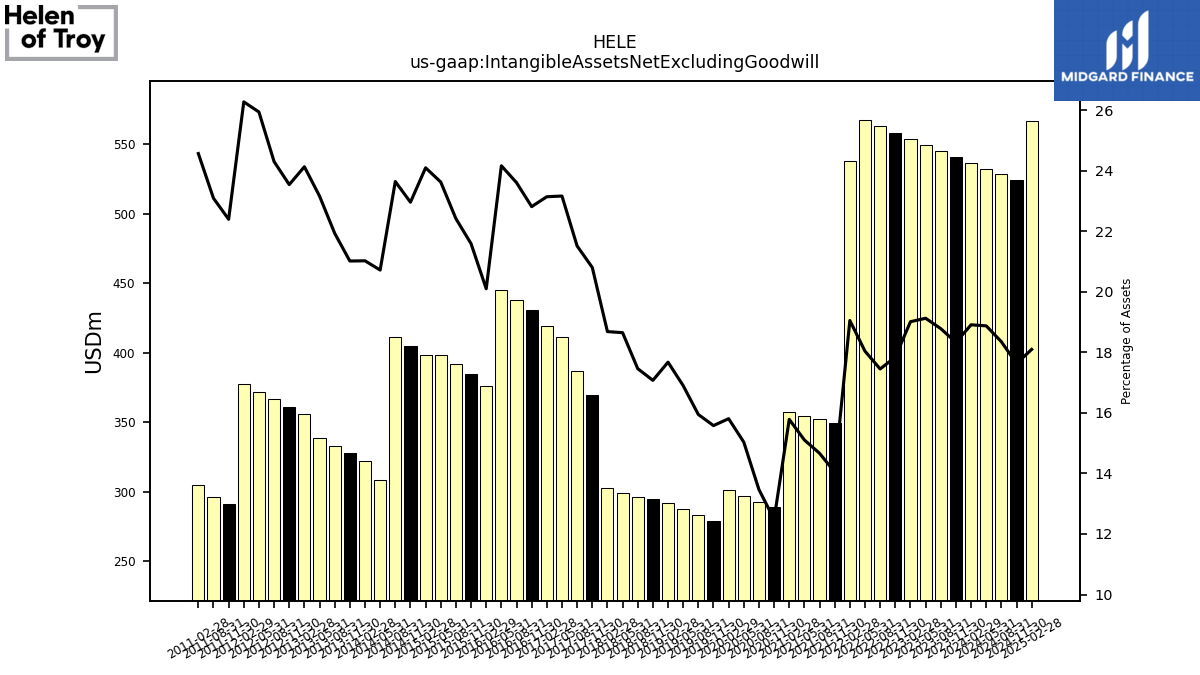
| Intangible Assets Net Excluding Goodwill | 541.06 | 544.96 | 549.38 | 553.88 | 558.38 | 562.75 | 567.10 | 537.85 | 349.33 | 351.97 | 354.64 | 357.26 | 288.62 | 292.79 | 297.00 | 300.95 | 279.03 | 283.19 | 287.76 | 291.53 | 294.56 | 295.87 | 298.92 | 302.92 | 369.20 | 386.86 | 411.00 | |
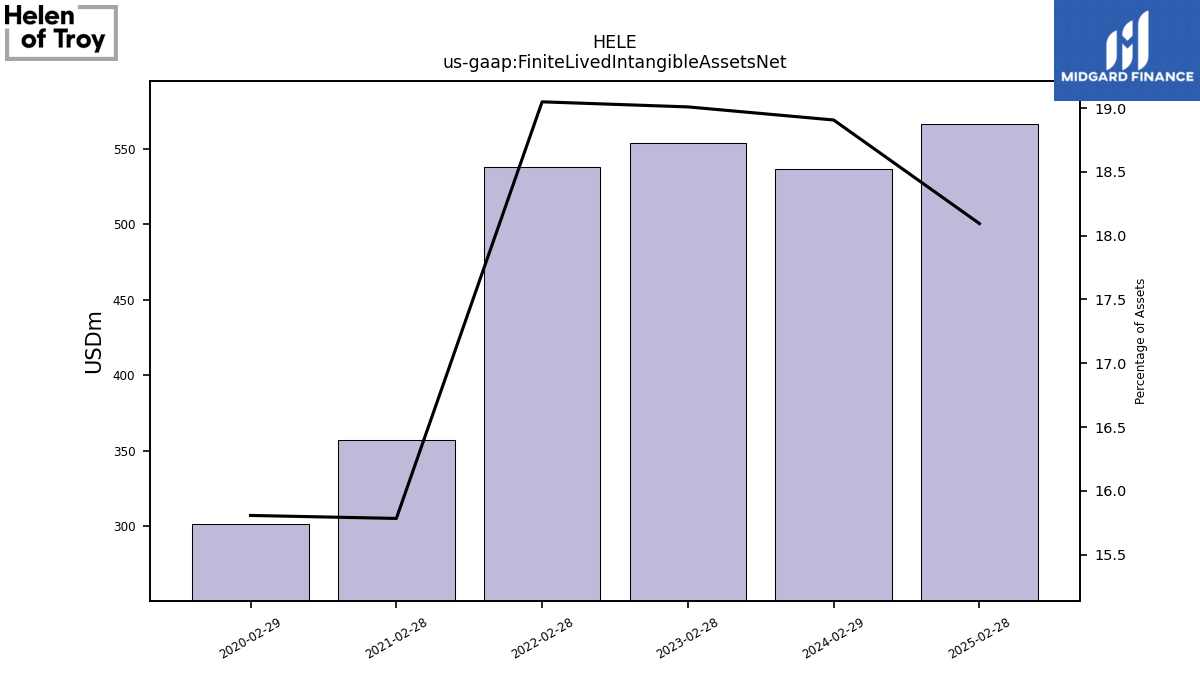
| Finite Lived Intangible Assets Net | NA | NA | NA | 553.88 | NA | NA | NA | 537.85 | NA | NA | NA | 357.26 | NA | NA | NA | 300.95 | NA | NA | NA | NA | NA | NA | NA | NA | NA | NA | NA | |
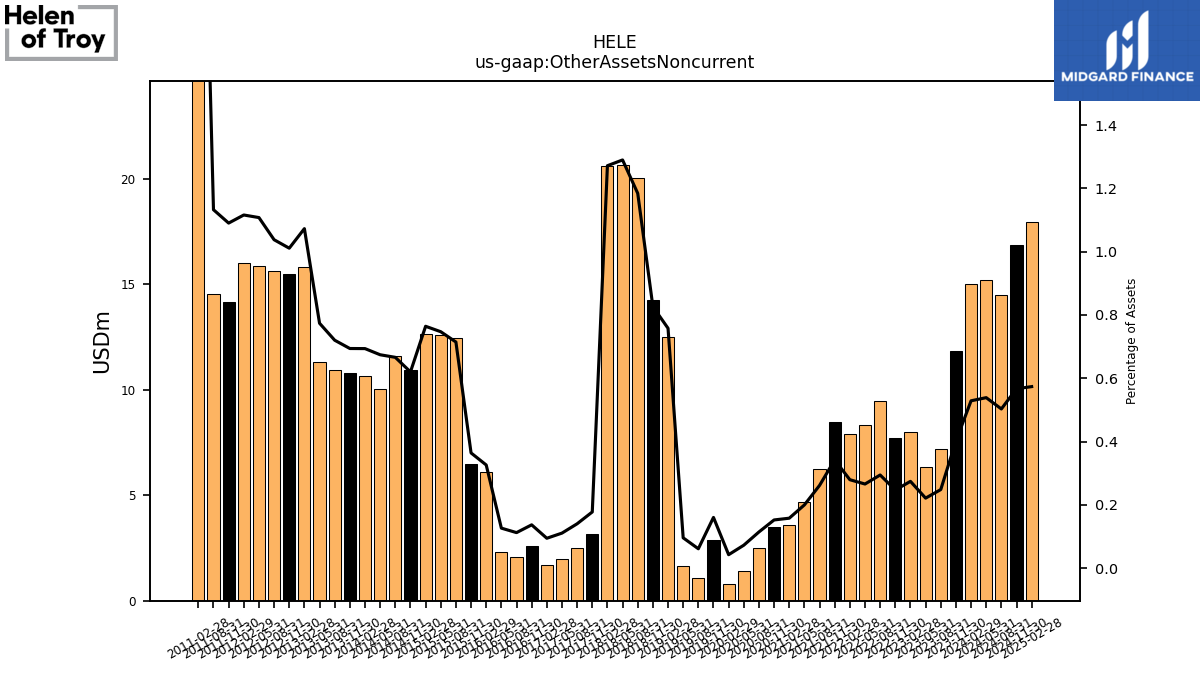
| Other Assets Noncurrent | 11.85 | 7.20 | 6.35 | 7.99 | 7.72 | 9.49 | 8.36 | 7.89 | 8.50 | 6.27 | 4.69 | 3.57 | 3.52 | 2.48 | 1.43 | 0.81 | 2.87 | 1.08 | 1.63 | 12.50 | 14.26 | 20.07 | 20.68 | 20.62 | 3.15 | 2.52 | 1.96 |
| 2023-11-30 | 2023-08-31 | 2023-05-31 | 2023-02-28 | 2022-11-30 | 2022-08-31 | 2022-05-31 | 2022-02-28 | 2021-11-30 | 2021-08-31 | 2021-05-31 | 2021-02-28 | 2020-11-30 | 2020-08-31 | 2020-05-31 | 2020-02-29 | 2019-11-30 | 2019-08-31 | 2019-05-31 | 2019-02-28 | 2018-11-30 | 2018-08-31 | 2018-05-31 | 2018-02-28 | 2017-11-30 | 2017-08-31 | 2017-05-31 | ||
|---|---|---|---|---|---|---|---|---|---|---|---|---|---|---|---|---|---|---|---|---|---|---|---|---|---|---|---|---|
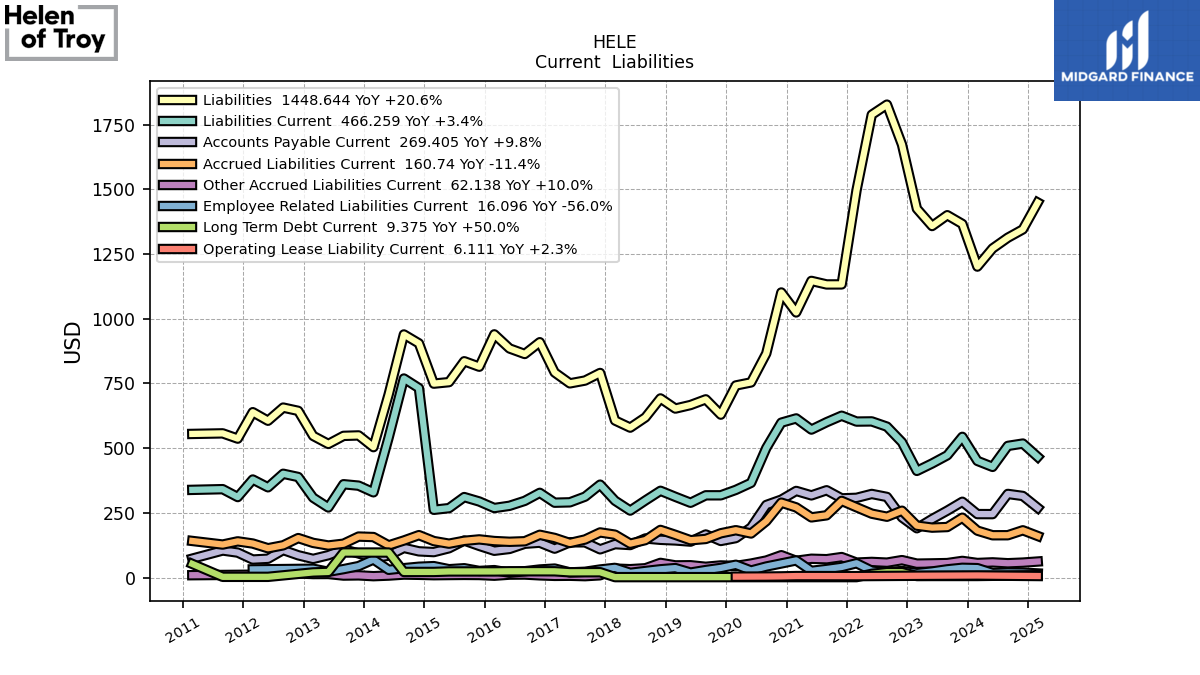
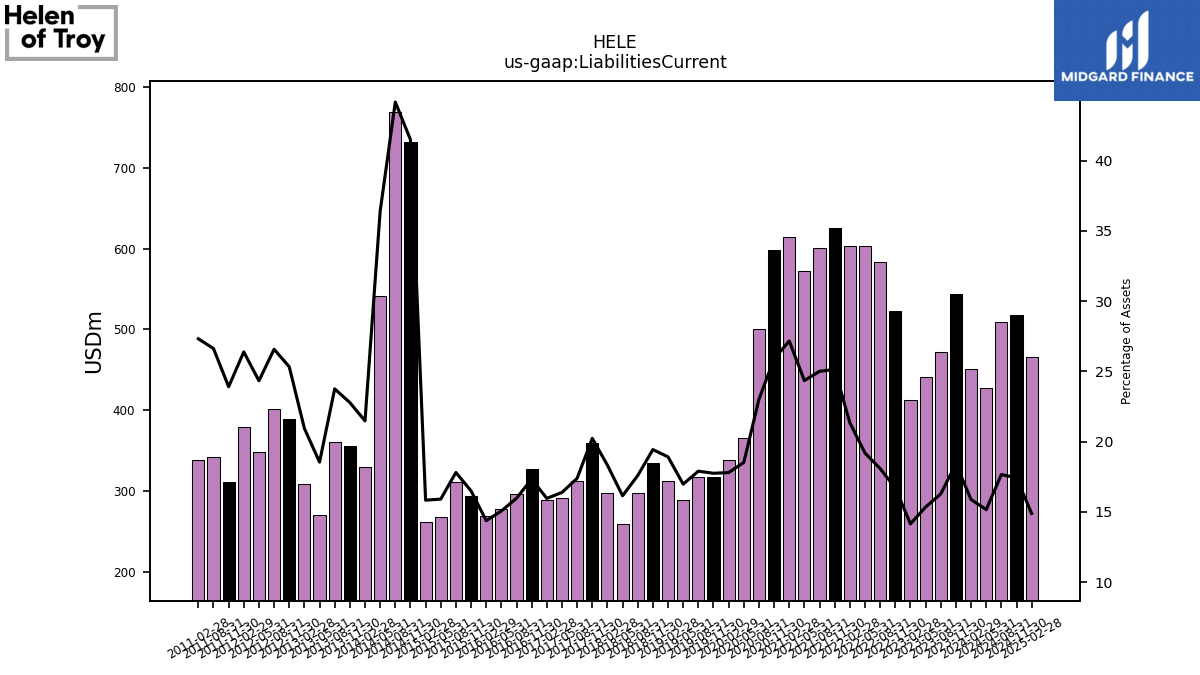
| Liabilities Current | 543.72 | 472.39 | 440.79 | 412.16 | 522.70 | 583.11 | 603.34 | 602.69 | 625.31 | 600.24 | 571.74 | 614.89 | 598.50 | 500.33 | 365.93 | 338.90 | 317.90 | 317.86 | 289.06 | 312.03 | 335.34 | 298.01 | 258.86 | 297.09 | 359.13 | 312.78 | 290.80 | |
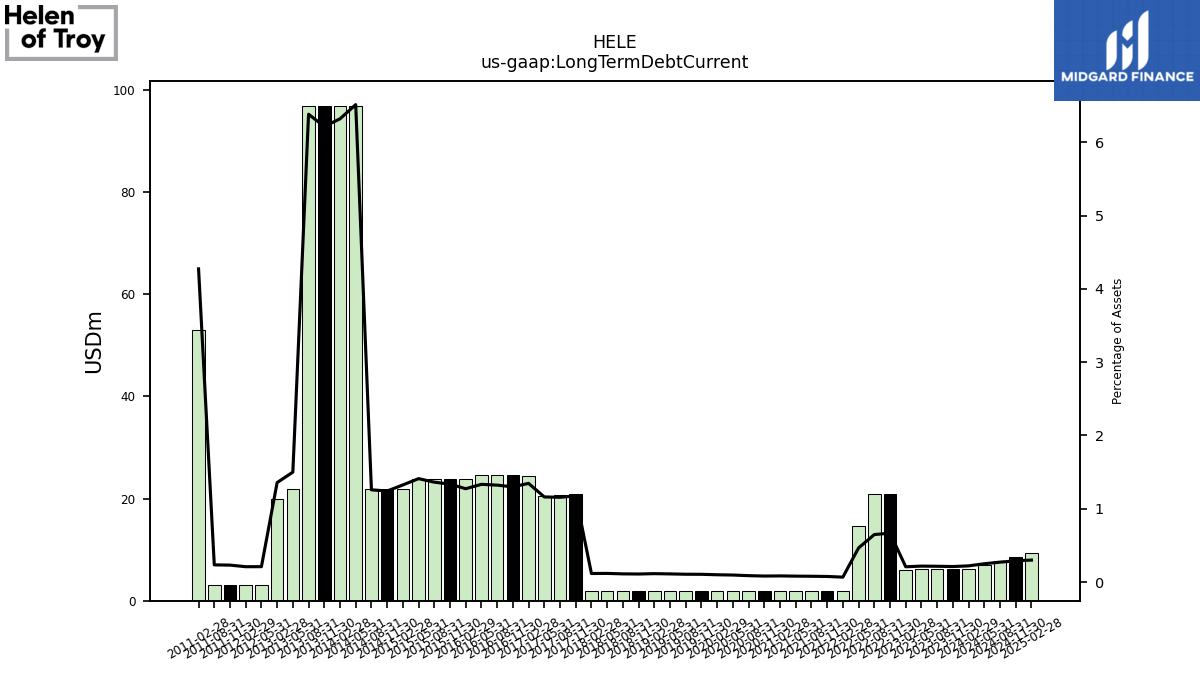
| Long Term Debt Current | 6.24 | 6.24 | 6.24 | 6.06 | 20.87 | 20.87 | 14.62 | 1.88 | 1.88 | 1.88 | 1.88 | 1.88 | 1.88 | 1.88 | 1.88 | 1.88 | 1.88 | 1.88 | 1.88 | 1.88 | 1.88 | 1.88 | 1.88 | 1.88 | 20.86 | 20.79 | 20.60 | |
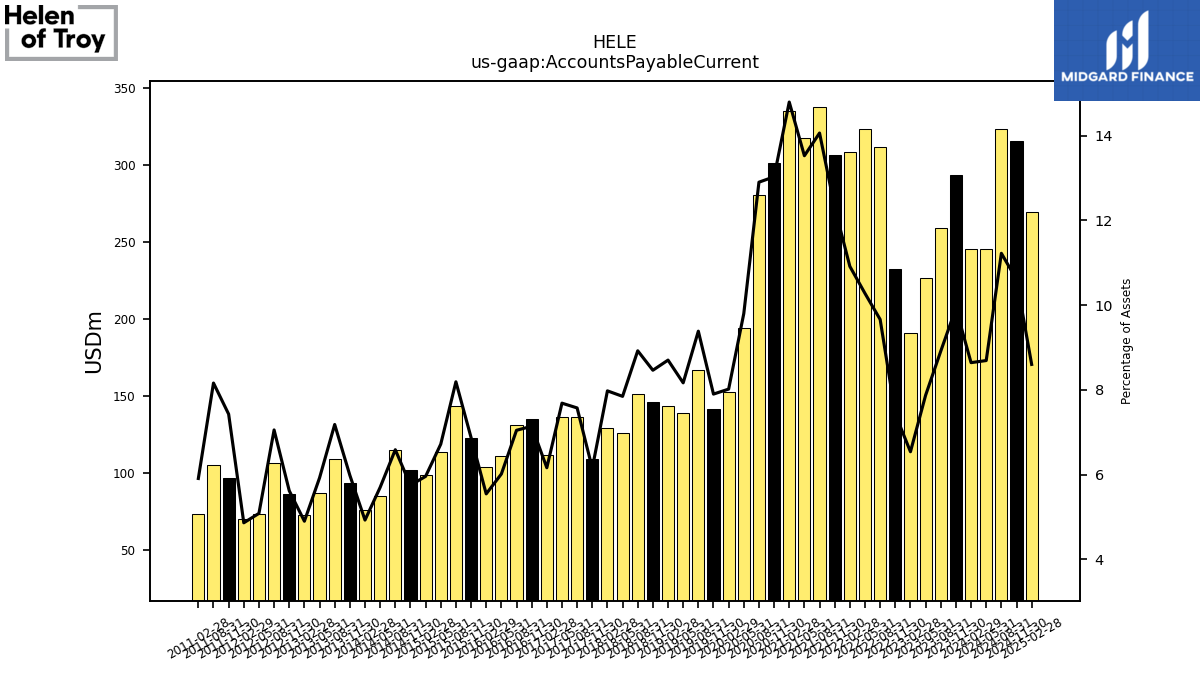
| Accounts Payable Current | 293.05 | 258.67 | 226.19 | 190.60 | 232.46 | 311.62 | 323.12 | 308.18 | 306.05 | 337.46 | 317.57 | 334.81 | 301.18 | 280.49 | 193.64 | 152.67 | 141.52 | 166.68 | 139.06 | 143.56 | 146.03 | 151.21 | 125.81 | 129.34 | 109.20 | 136.22 | 136.43 | |
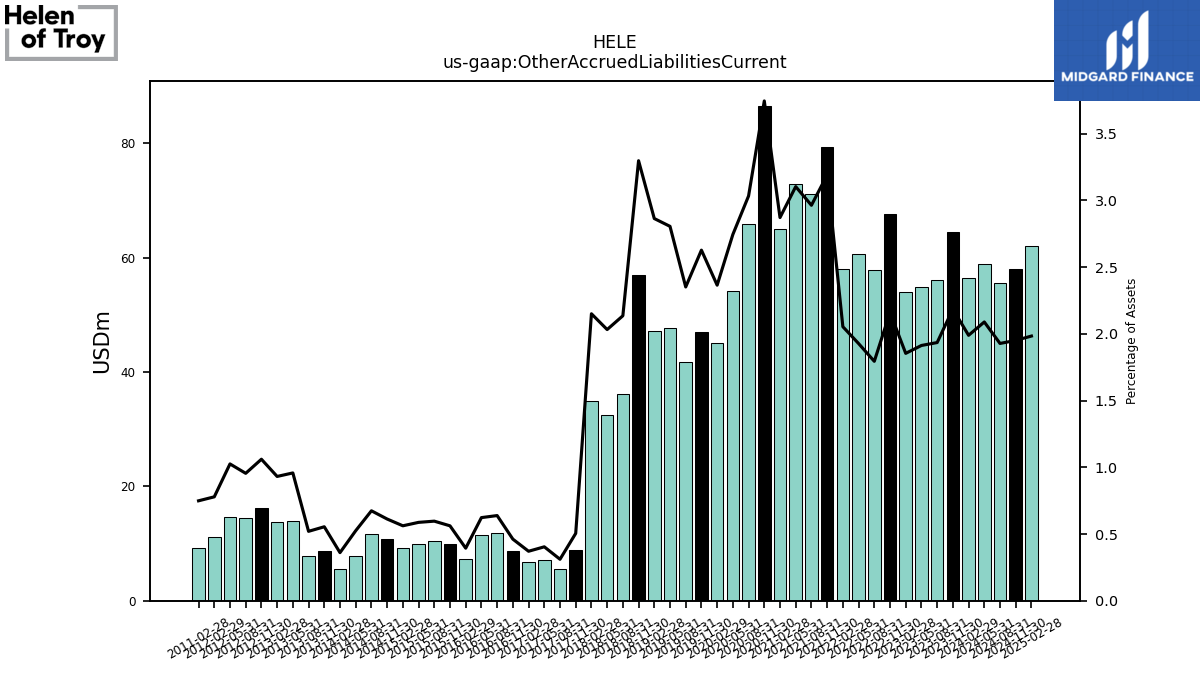
| Other Accrued Liabilities Current | 64.54 | 56.15 | 54.97 | 54.03 | 67.62 | 57.88 | 60.62 | 57.99 | 79.38 | 71.14 | 72.89 | 65.01 | 86.60 | 65.97 | 54.24 | 45.03 | 47.07 | 41.77 | 47.78 | 47.25 | 56.91 | 36.20 | 32.58 | 34.88 | 8.96 | 5.59 | 7.17 | |
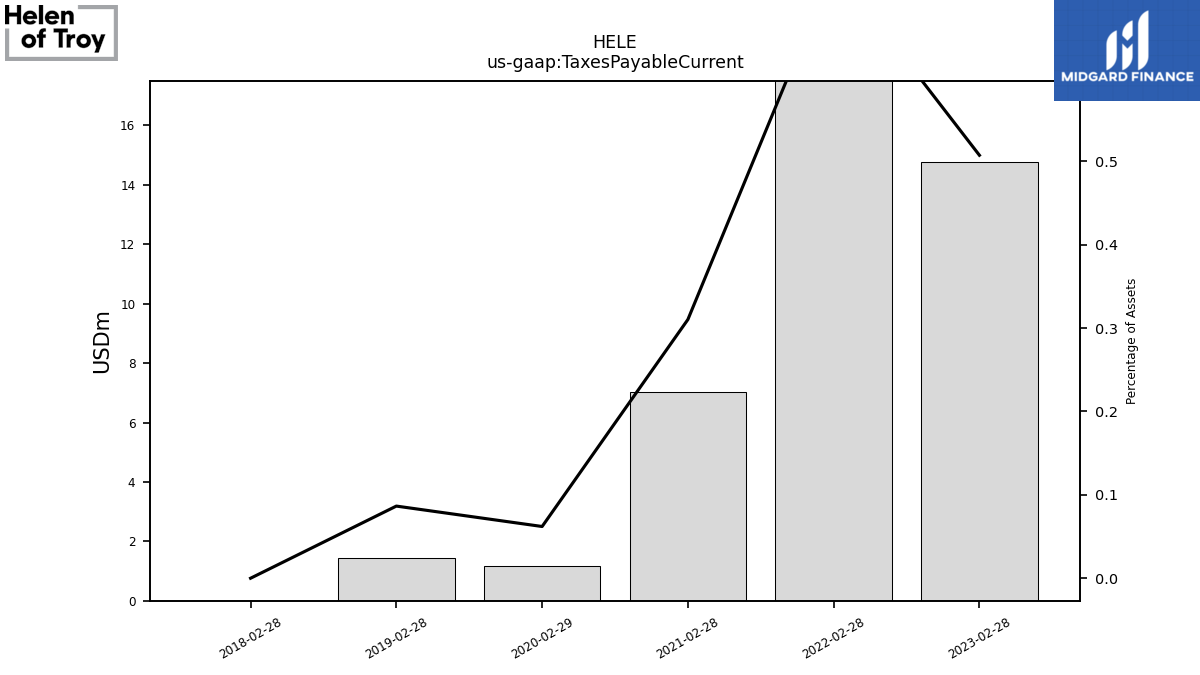
| Taxes Payable Current | NA | NA | NA | 14.78 | NA | NA | NA | 20.72 | NA | NA | NA | 7.02 | NA | NA | NA | 1.18 | NA | NA | NA | 1.43 | NA | NA | NA | 0.00 | NA | NA | NA | |
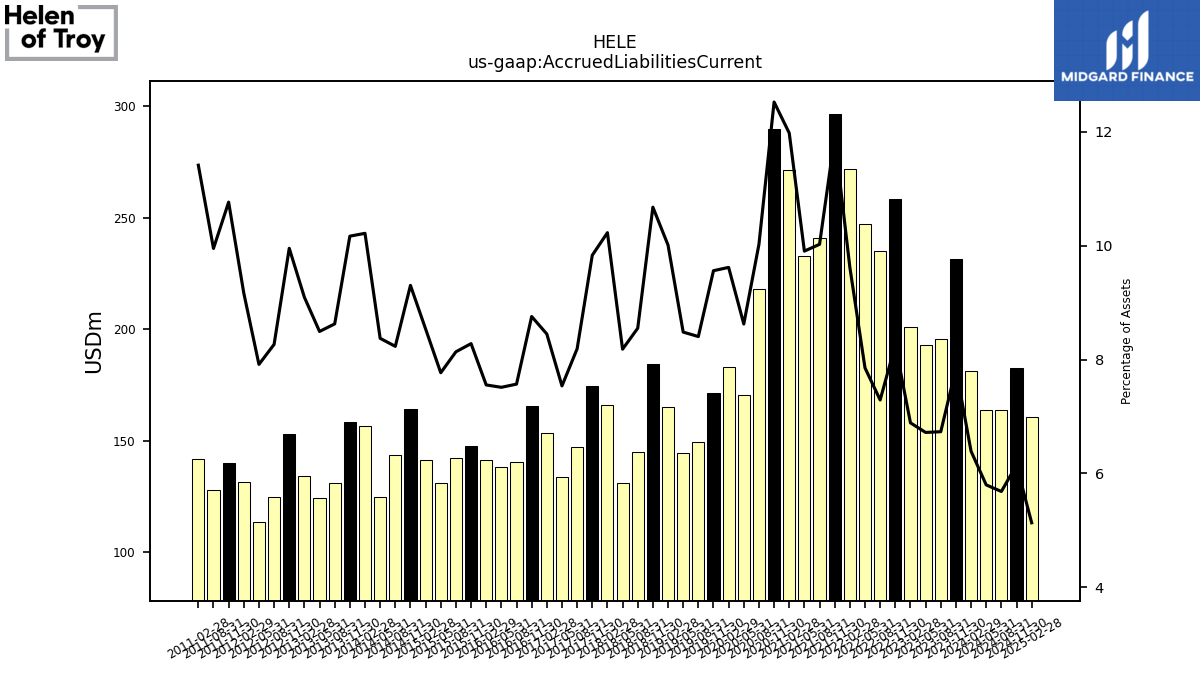
| Accrued Liabilities Current | 231.52 | 195.36 | 193.05 | 200.72 | 258.43 | 235.13 | 246.97 | 271.68 | 296.36 | 240.64 | 232.60 | 271.18 | 289.57 | 217.96 | 170.41 | 183.16 | 171.27 | 149.27 | 144.46 | 165.16 | 184.24 | 144.91 | 131.17 | 165.86 | 174.53 | 147.28 | 133.77 |
| 2023-11-30 | 2023-08-31 | 2023-05-31 | 2023-02-28 | 2022-11-30 | 2022-08-31 | 2022-05-31 | 2022-02-28 | 2021-11-30 | 2021-08-31 | 2021-05-31 | 2021-02-28 | 2020-11-30 | 2020-08-31 | 2020-05-31 | 2020-02-29 | 2019-11-30 | 2019-08-31 | 2019-05-31 | 2019-02-28 | 2018-11-30 | 2018-08-31 | 2018-05-31 | 2018-02-28 | 2017-11-30 | 2017-08-31 | 2017-05-31 | ||
|---|---|---|---|---|---|---|---|---|---|---|---|---|---|---|---|---|---|---|---|---|---|---|---|---|---|---|---|---|
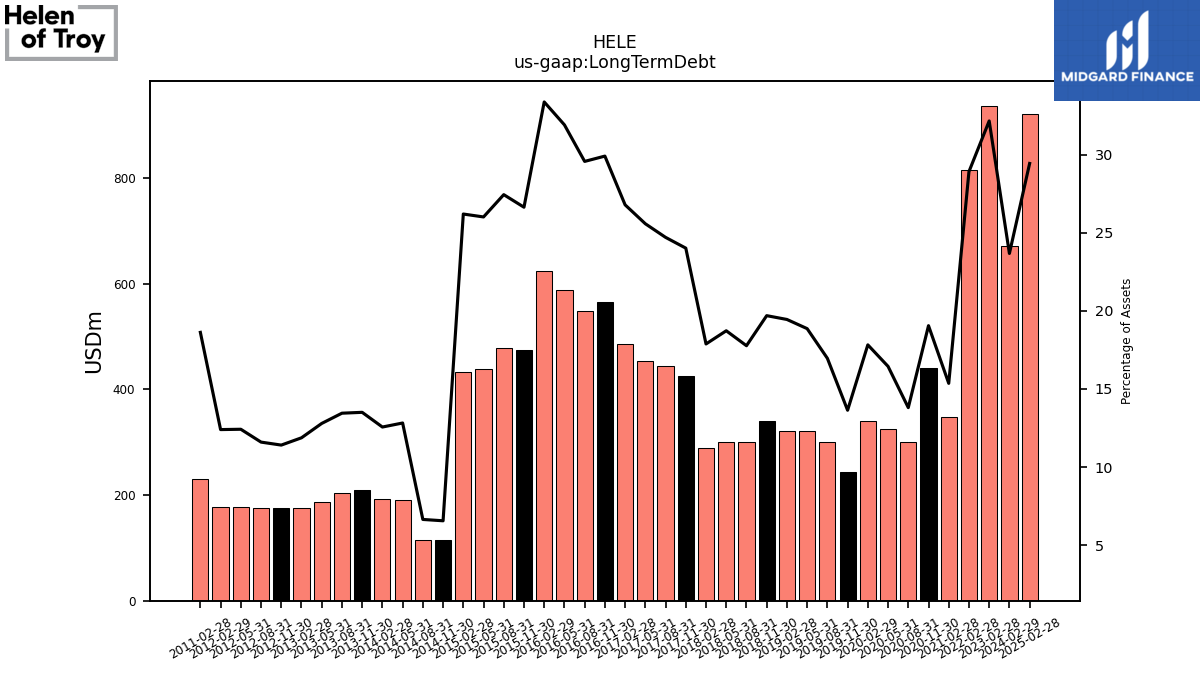
| Long Term Debt | NA | NA | NA | 936.88 | NA | NA | NA | 816.21 | NA | NA | NA | 347.61 | 440.38 | 300.13 | 324.88 | 339.31 | 244.25 | 301.19 | 321.14 | 320.78 | 339.73 | 301.08 | 300.12 | 289.87 | 426.19 | 444.27 | 453.84 | |
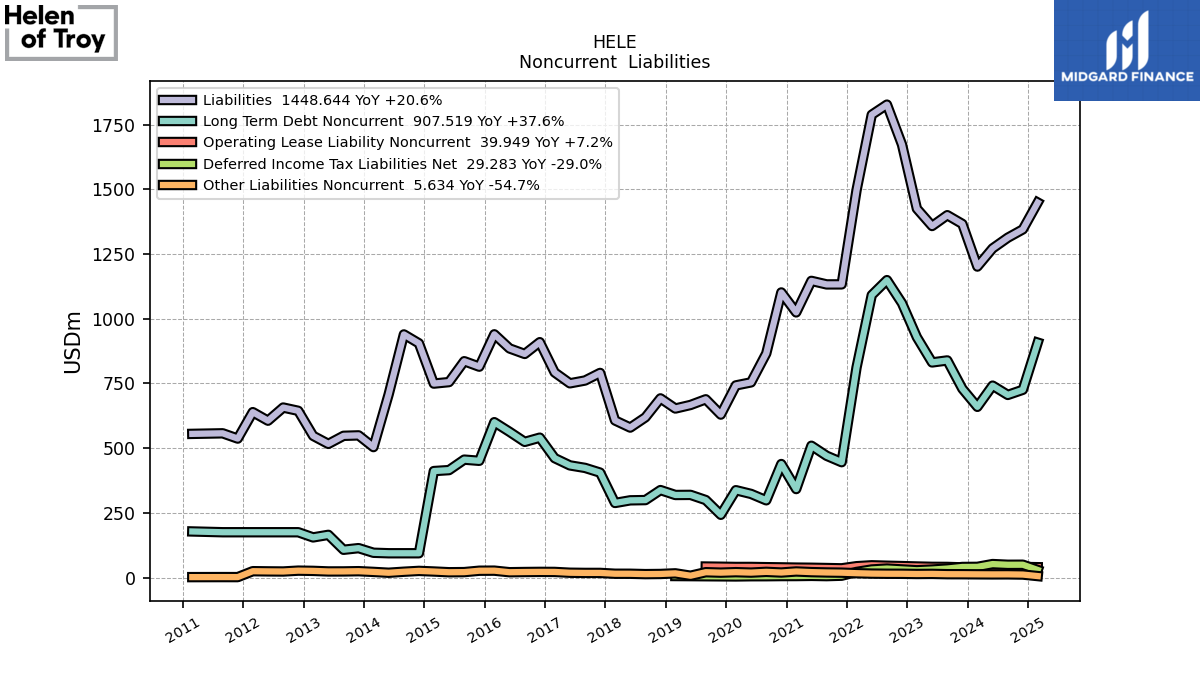
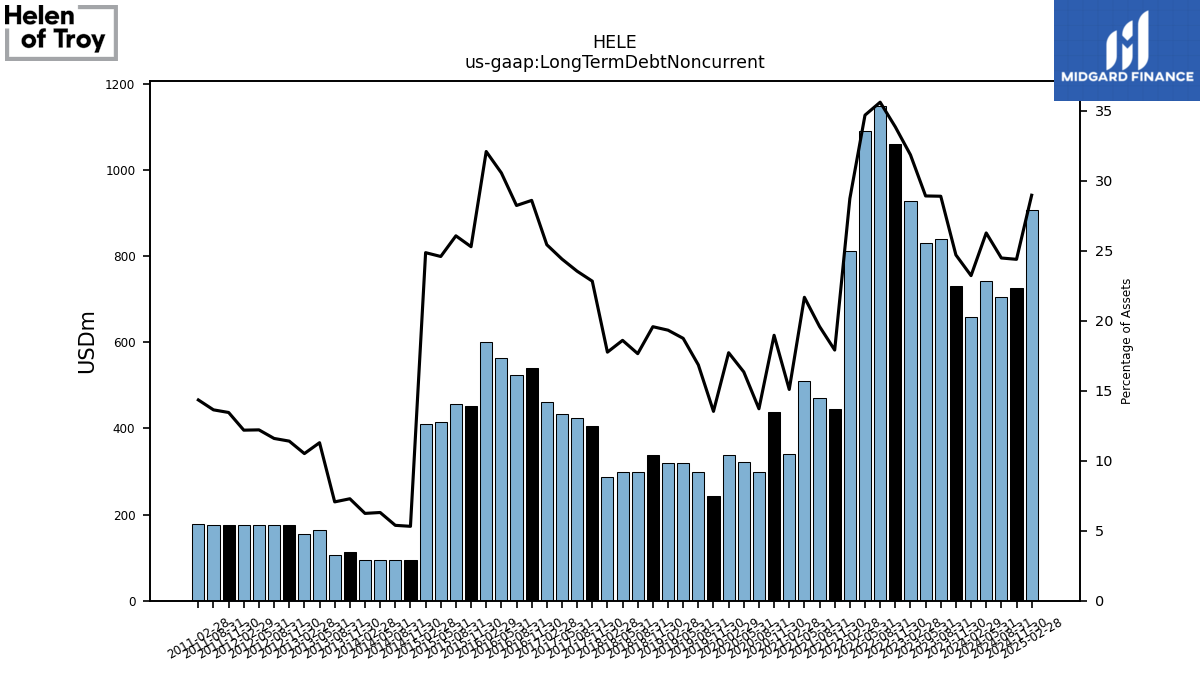
| Long Term Debt Noncurrent | 729.41 | 838.67 | 830.92 | 928.35 | 1059.59 | 1148.87 | 1090.95 | 811.33 | 445.58 | 470.33 | 509.09 | 341.75 | 438.50 | 298.25 | 323.00 | 337.42 | 242.36 | 299.31 | 319.25 | 318.90 | 337.85 | 299.19 | 298.24 | 287.99 | 405.33 | 423.48 | 433.24 | |
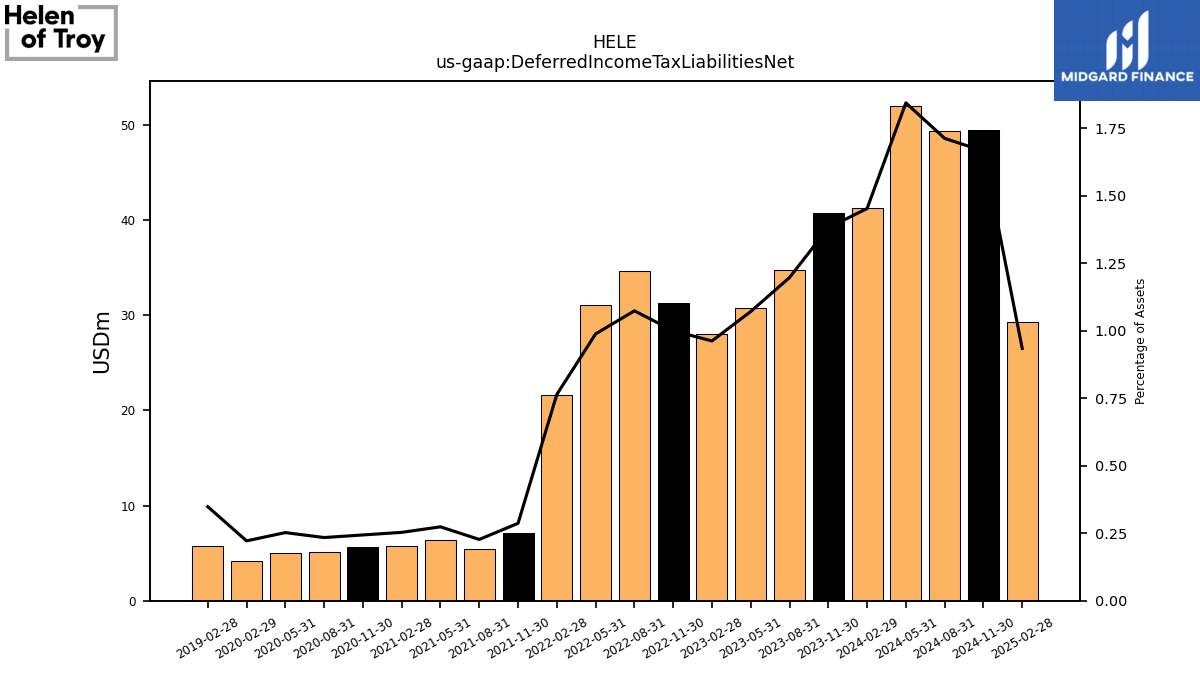
| Deferred Income Tax Liabilities Net | 40.80 | 34.75 | 30.79 | 28.05 | 31.31 | 34.64 | 31.09 | 21.58 | 7.14 | 5.45 | 6.43 | 5.74 | 5.64 | 5.09 | 4.99 | 4.22 | NA | NA | NA | 5.75 | NA | NA | NA | NA | NA | NA | NA | |
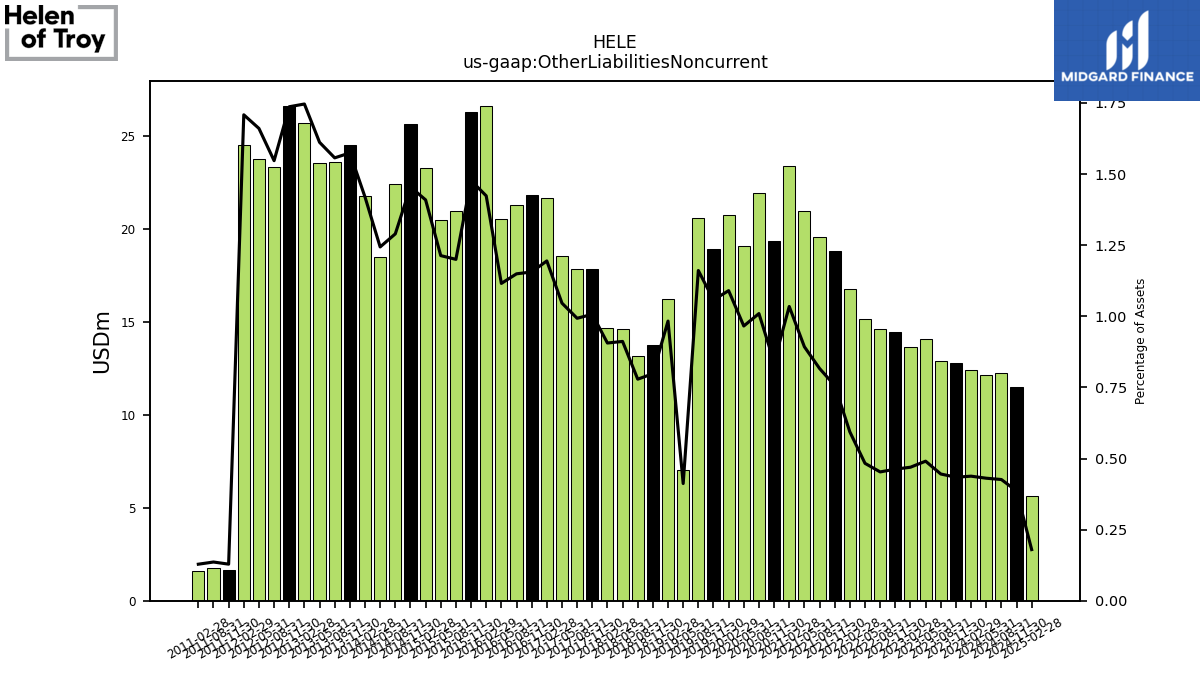
| Other Liabilities Noncurrent | 12.82 | 12.93 | 14.10 | 13.68 | 14.48 | 14.61 | 15.19 | 16.76 | 18.82 | 19.60 | 20.97 | 23.42 | 19.39 | 21.95 | 19.08 | 20.76 | 18.94 | 20.62 | 7.02 | 16.22 | 13.77 | 13.20 | 14.61 | 14.69 | 17.88 | 17.86 | 18.57 | |
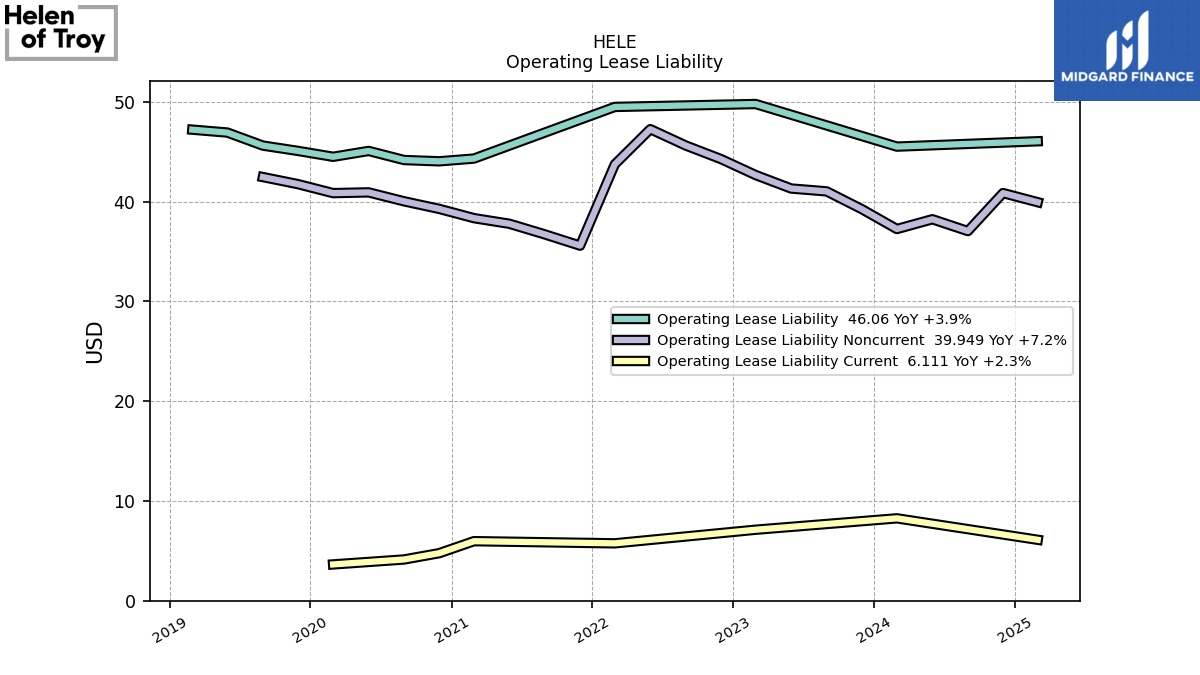
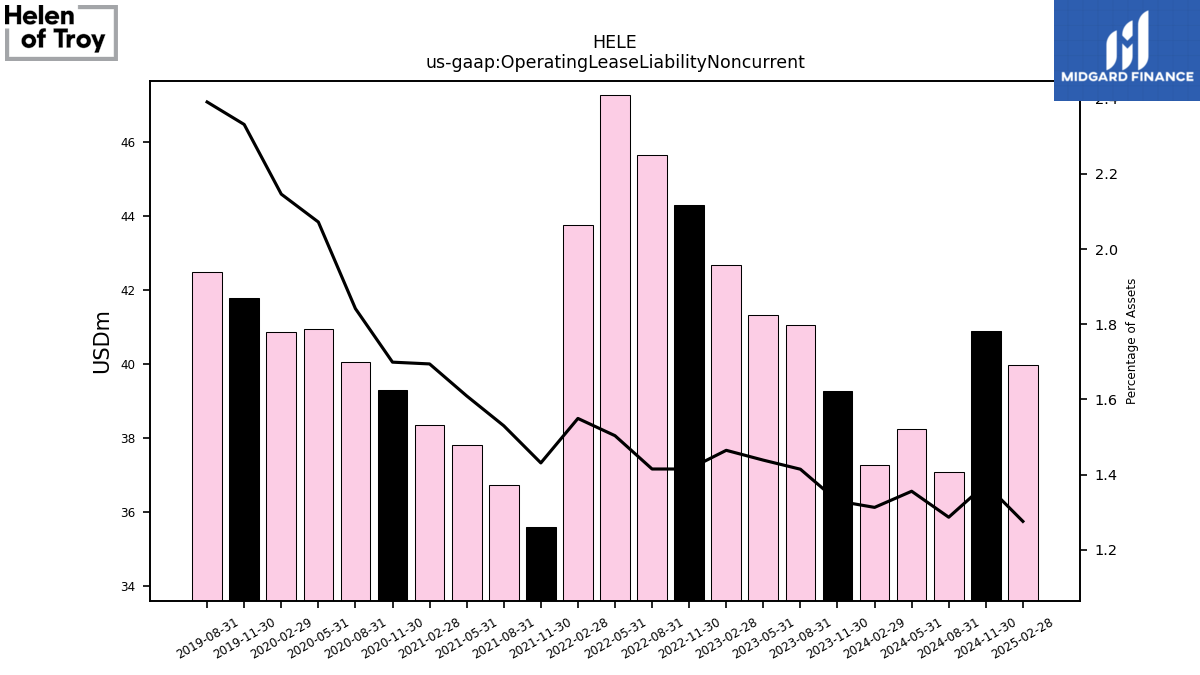
| Operating Lease Liability Noncurrent | 39.26 | 41.04 | 41.32 | 42.67 | 44.28 | 45.63 | 47.27 | 43.74 | 35.59 | 36.72 | 37.79 | 38.35 | 39.28 | 40.04 | 40.94 | 40.86 | 41.76 | 42.47 | NA | NA | NA | NA | NA | NA | NA | NA | NA |
| 2023-11-30 | 2023-08-31 | 2023-05-31 | 2023-02-28 | 2022-11-30 | 2022-08-31 | 2022-05-31 | 2022-02-28 | 2021-11-30 | 2021-08-31 | 2021-05-31 | 2021-02-28 | 2020-11-30 | 2020-08-31 | 2020-05-31 | 2020-02-29 | 2019-11-30 | 2019-08-31 | 2019-05-31 | 2019-02-28 | 2018-11-30 | 2018-08-31 | 2018-05-31 | 2018-02-28 | 2017-11-30 | 2017-08-31 | 2017-05-31 | ||
|---|---|---|---|---|---|---|---|---|---|---|---|---|---|---|---|---|---|---|---|---|---|---|---|---|---|---|---|---|
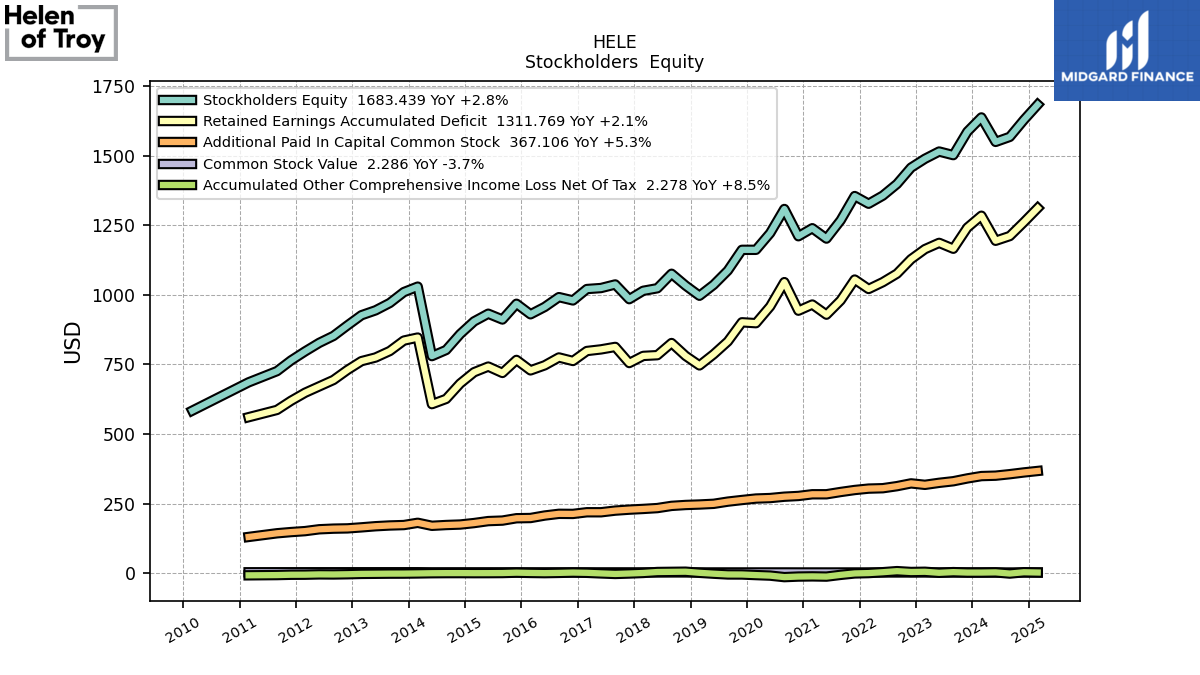
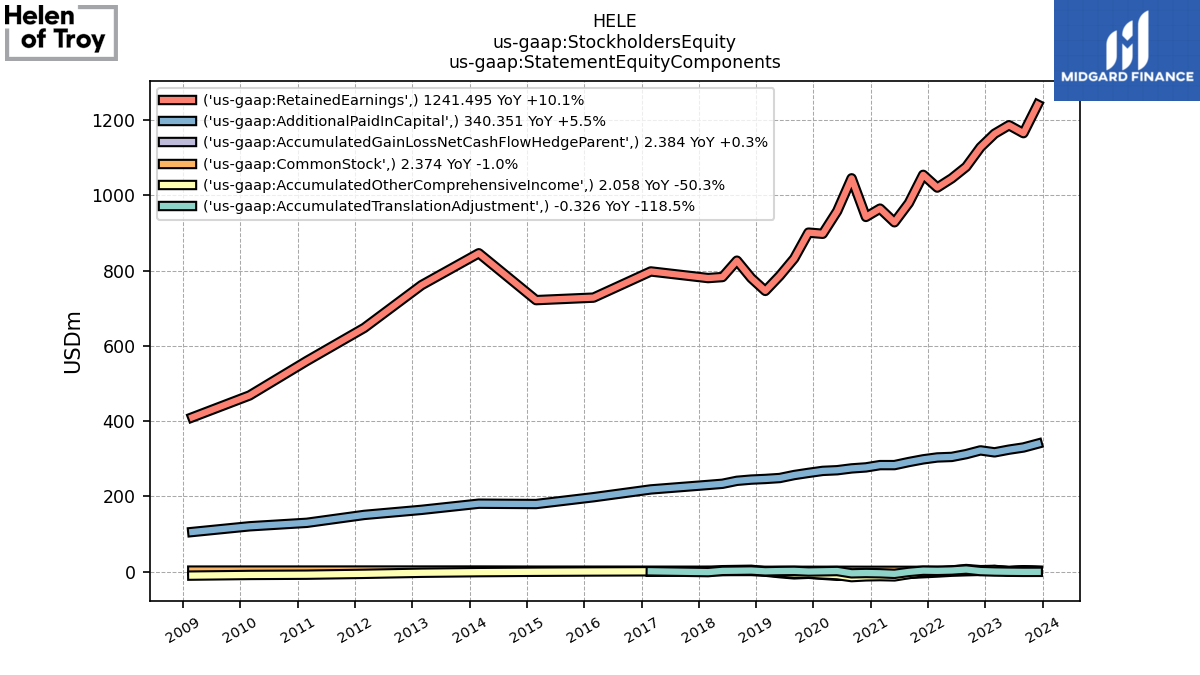
| Stockholders Equity | 1586.28 | 1501.88 | 1514.91 | 1488.81 | 1457.07 | 1398.35 | 1356.42 | 1327.34 | 1354.96 | 1267.82 | 1202.08 | 1239.35 | 1210.44 | 1308.53 | 1221.75 | 1161.72 | 1161.68 | 1087.38 | 1036.18 | 996.64 | 1033.26 | 1075.74 | 1023.70 | 1014.46 | 984.41 | 1037.34 | 1024.44 | |
| Common Stock Value | 2.37 | 2.37 | 2.41 | 2.40 | 2.40 | 2.40 | 2.40 | 2.38 | 2.41 | 2.41 | 2.41 | 2.44 | 2.44 | 2.53 | 2.53 | 2.52 | 2.52 | 2.51 | 2.51 | 2.50 | 2.53 | 2.63 | 2.63 | 2.66 | 2.70 | 2.73 | 2.72 | |
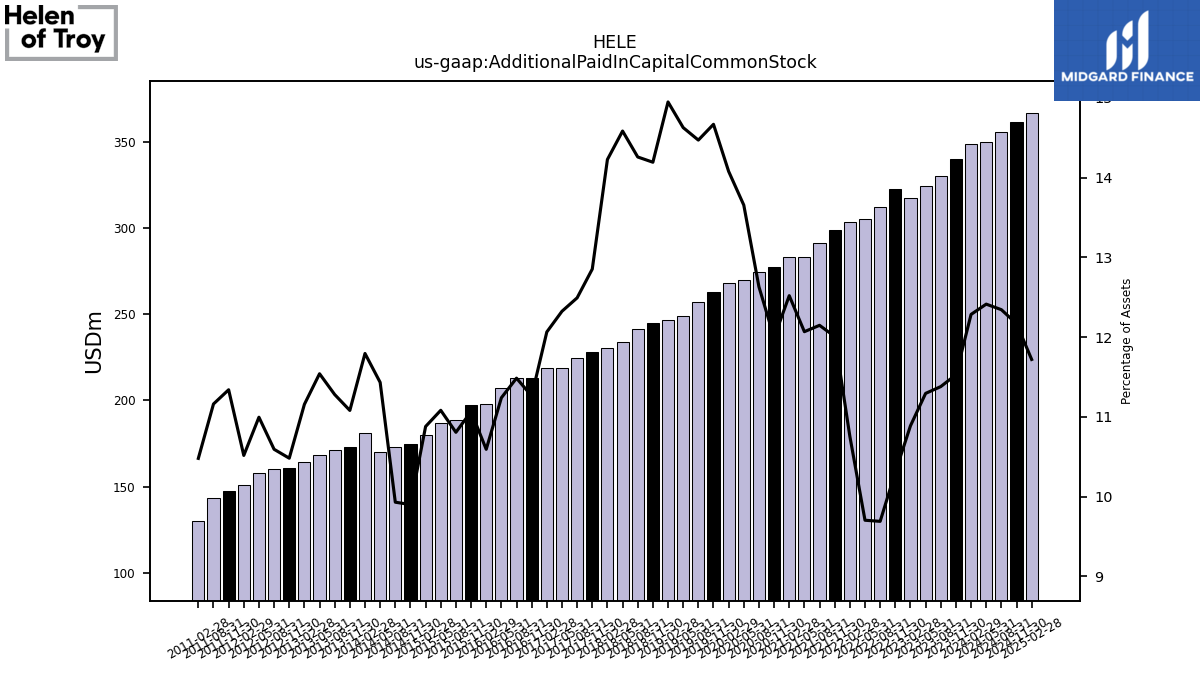
| Additional Paid In Capital Common Stock | 340.35 | 330.23 | 324.50 | 317.28 | 322.53 | 312.57 | 305.15 | 303.74 | 298.71 | 291.59 | 283.39 | 283.40 | 277.29 | 274.64 | 269.80 | 268.04 | 262.73 | 257.00 | 249.08 | 246.59 | 244.89 | 241.63 | 233.78 | 230.68 | 228.14 | 224.69 | 218.72 | |
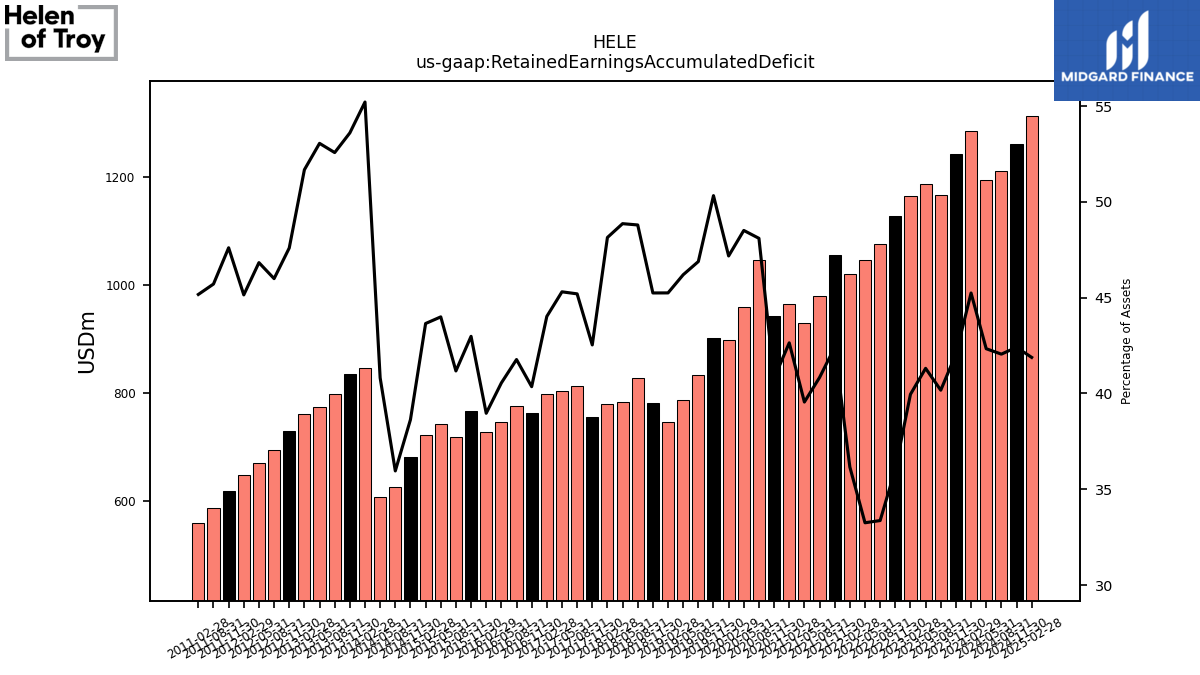
| Retained Earnings Accumulated Deficit | 1241.49 | 1165.60 | 1186.77 | 1164.19 | 1128.01 | 1076.18 | 1045.51 | 1021.02 | 1054.90 | 980.03 | 928.73 | 965.17 | 943.00 | 1045.67 | 958.34 | 898.17 | 901.32 | 832.62 | 786.60 | 746.37 | 780.63 | 826.83 | 783.22 | 780.49 | 754.91 | 812.87 | 804.00 | |
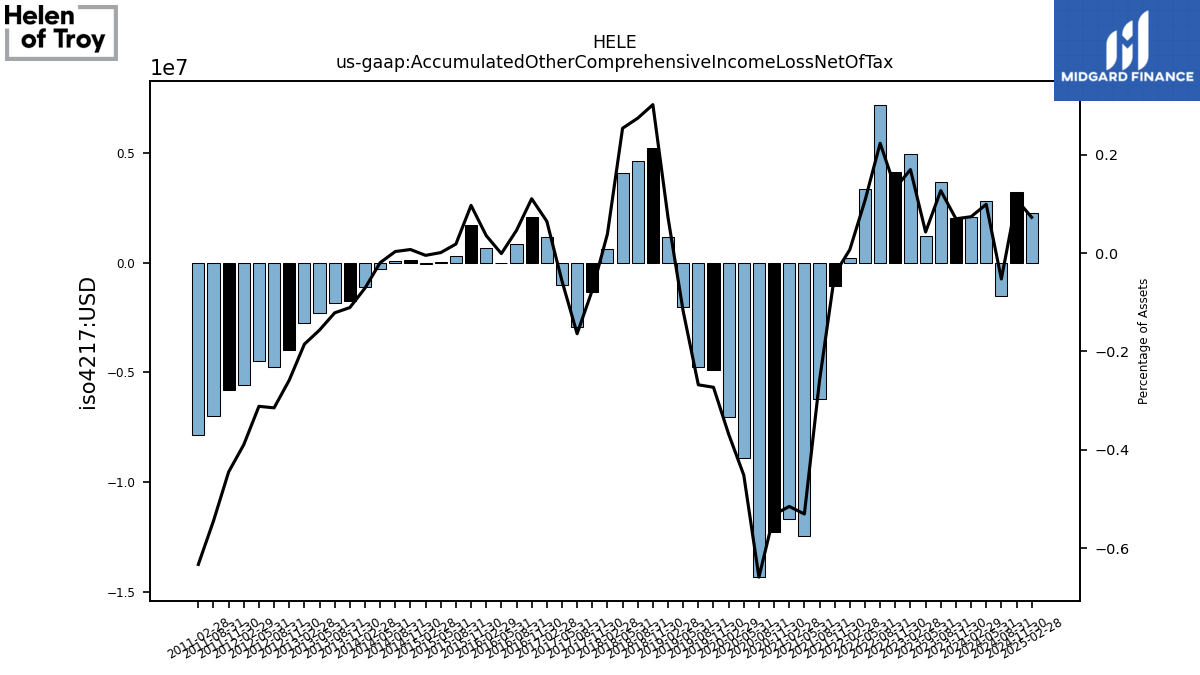
| Accumulated Other Comprehensive Income Loss Net Of Tax | 2.06 | 3.69 | 1.23 | 4.95 | 4.14 | 7.20 | 3.36 | 0.20 | -1.07 | -6.21 | -12.45 | -11.66 | -12.29 | -14.32 | -8.92 | -7.00 | -4.88 | -4.75 | -2.01 | 1.19 | 5.21 | 4.65 | 4.07 | 0.63 | -1.34 | -2.95 | -1.00 |
| 2023-11-30 | 2023-08-31 | 2023-05-31 | 2023-02-28 | 2022-11-30 | 2022-08-31 | 2022-05-31 | 2022-02-28 | 2021-11-30 | 2021-08-31 | 2021-05-31 | 2021-02-28 | 2020-11-30 | 2020-08-31 | 2020-05-31 | 2020-02-29 | 2019-11-30 | 2019-08-31 | 2019-05-31 | 2019-02-28 | 2018-11-30 | 2018-08-31 | 2018-05-31 | 2018-02-28 | 2017-11-30 | 2017-08-31 | 2017-05-31 | ||
|---|---|---|---|---|---|---|---|---|---|---|---|---|---|---|---|---|---|---|---|---|---|---|---|---|---|---|---|---|
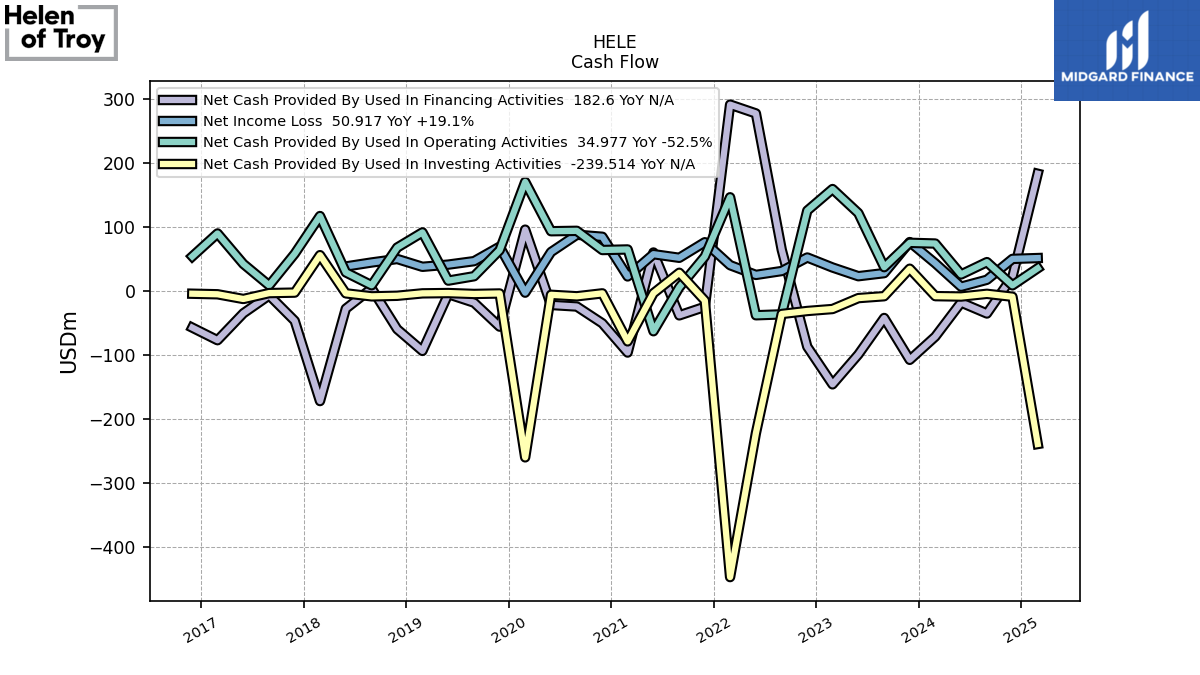
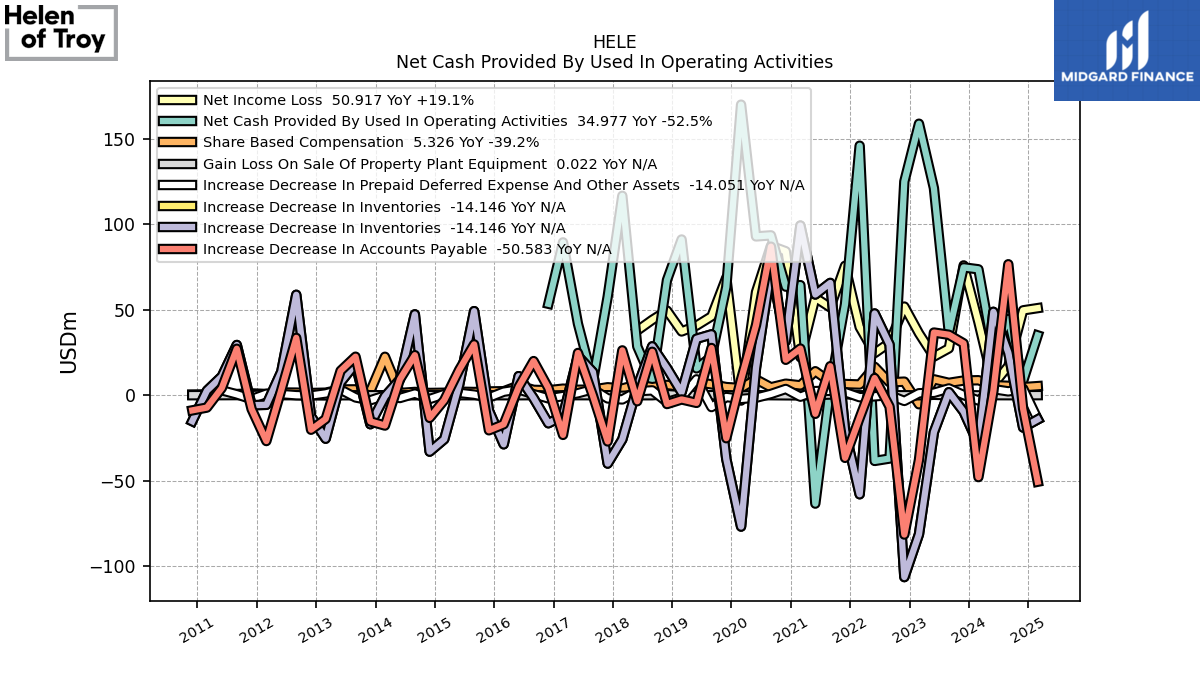
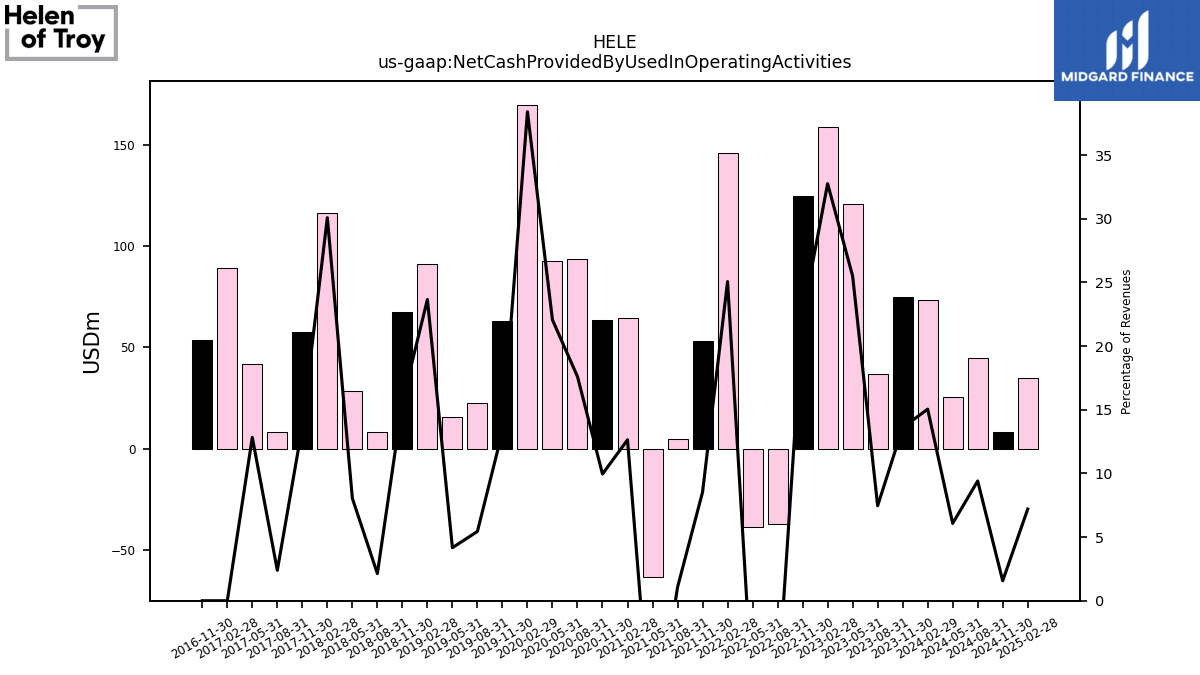
| Net Cash Provided By Used In Operating Activities | 74.73 | 36.68 | 121.06 | 158.72 | 124.97 | -37.02 | -38.43 | 145.88 | 53.28 | 5.05 | -63.38 | 64.36 | 63.47 | 93.45 | 92.83 | 169.88 | 63.21 | 22.54 | 15.68 | 91.04 | 67.33 | 8.40 | 28.53 | 116.58 | 57.63 | 8.26 | 41.74 | |
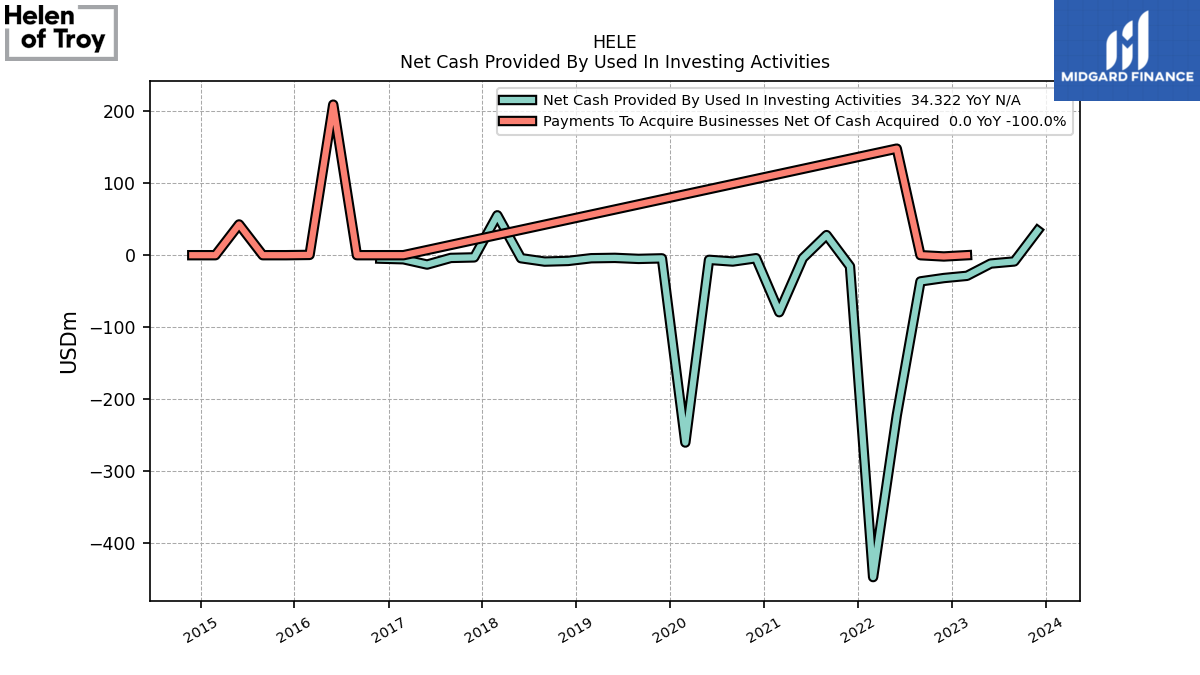
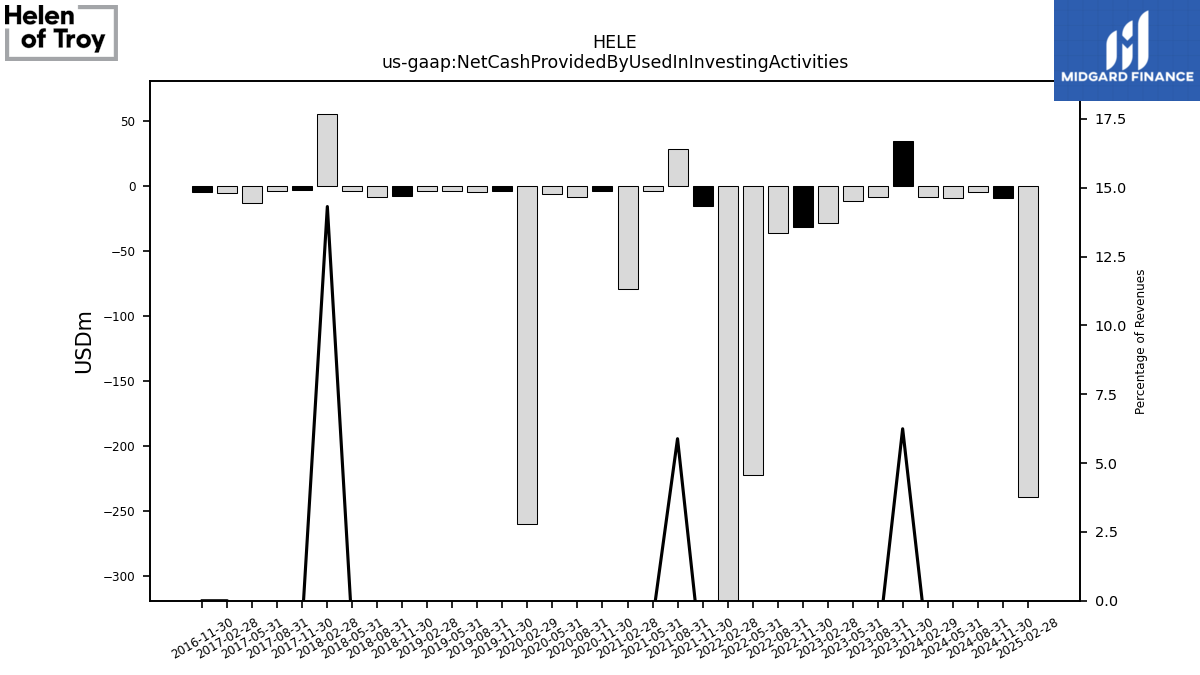
| Net Cash Provided By Used In Investing Activities | 34.32 | -8.68 | -11.63 | -28.66 | -31.75 | -36.41 | -222.51 | -447.39 | -15.48 | 27.96 | -4.01 | -79.25 | -4.19 | -8.79 | -6.45 | -260.37 | -4.38 | -5.14 | -3.72 | -4.21 | -7.98 | -8.88 | -4.18 | 55.48 | -3.04 | -3.79 | -13.01 | |
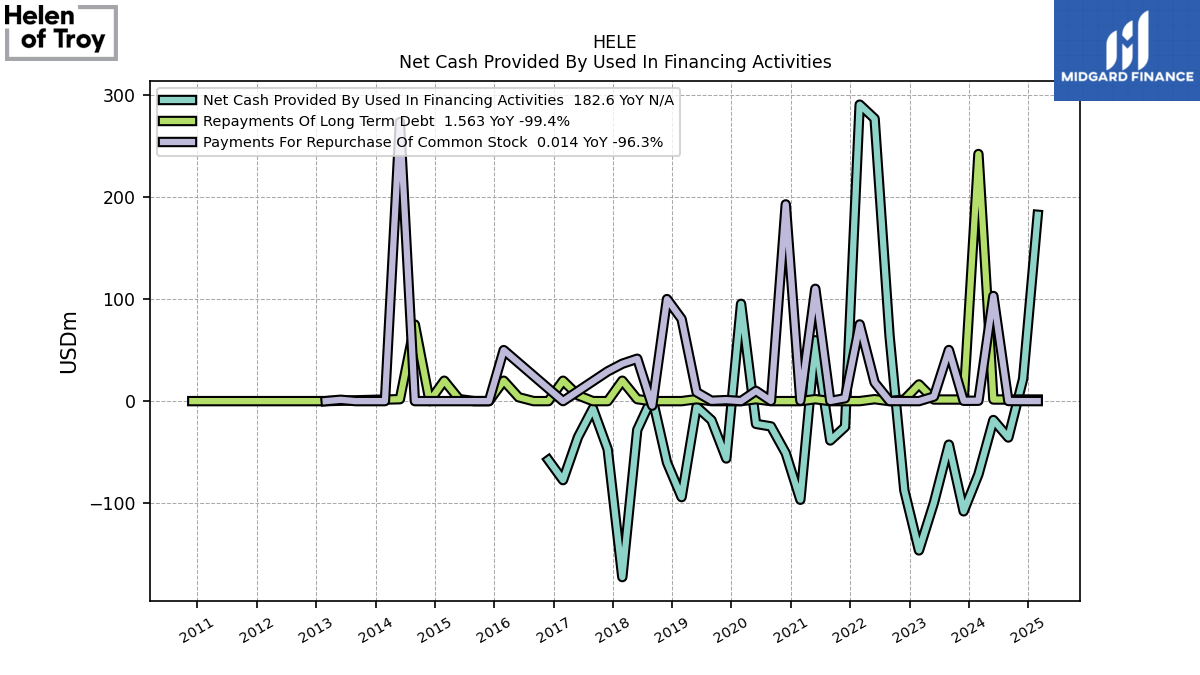
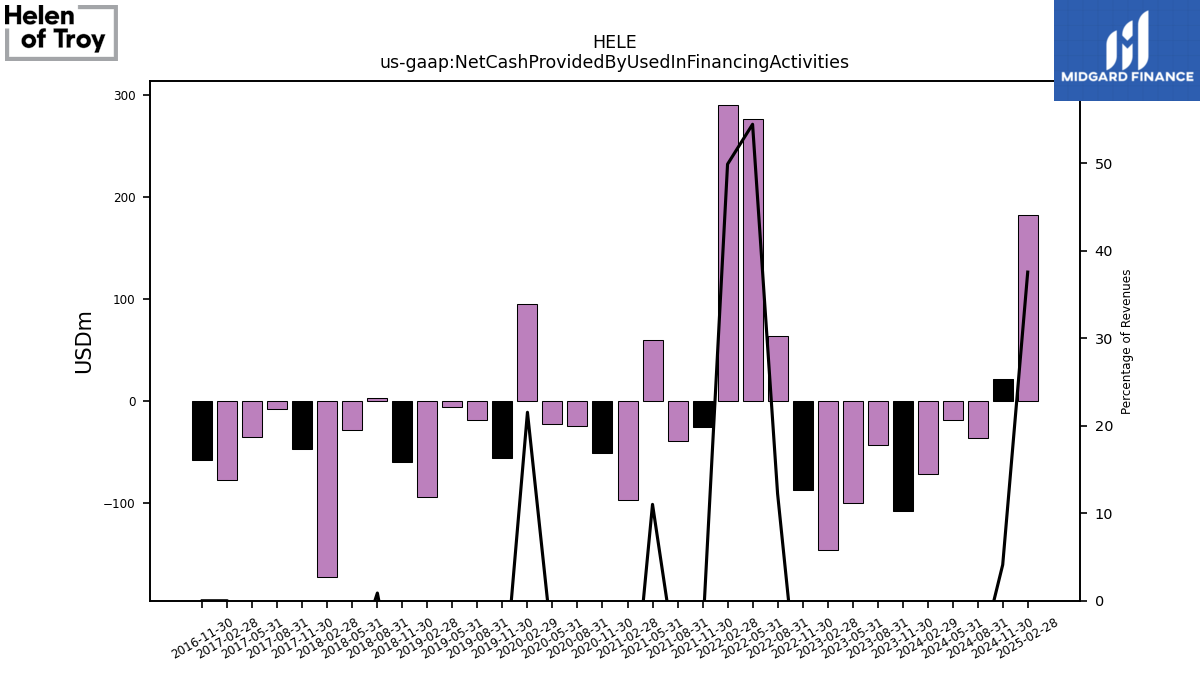
| Net Cash Provided By Used In Financing Activities | -108.02 | -42.65 | -99.63 | -146.32 | -87.54 | 63.83 | 276.81 | 290.55 | -25.24 | -38.60 | 59.64 | -96.66 | -51.02 | -24.78 | -22.32 | 95.33 | -56.22 | -18.74 | -5.45 | -94.10 | -60.13 | 3.46 | -28.16 | -172.47 | -47.15 | -7.26 | -35.31 |
| 2023-11-30 | 2023-08-31 | 2023-05-31 | 2023-02-28 | 2022-11-30 | 2022-08-31 | 2022-05-31 | 2022-02-28 | 2021-11-30 | 2021-08-31 | 2021-05-31 | 2021-02-28 | 2020-11-30 | 2020-08-31 | 2020-05-31 | 2020-02-29 | 2019-11-30 | 2019-08-31 | 2019-05-31 | 2019-02-28 | 2018-11-30 | 2018-08-31 | 2018-05-31 | 2018-02-28 | 2017-11-30 | 2017-08-31 | 2017-05-31 | ||
|---|---|---|---|---|---|---|---|---|---|---|---|---|---|---|---|---|---|---|---|---|---|---|---|---|---|---|---|---|
| Net Cash Provided By Used In Operating Activities | 74.73 | 36.68 | 121.06 | 158.72 | 124.97 | -37.02 | -38.43 | 145.88 | 53.28 | 5.05 | -63.38 | 64.36 | 63.47 | 93.45 | 92.83 | 169.88 | 63.21 | 22.54 | 15.68 | 91.04 | 67.33 | 8.40 | 28.53 | 116.58 | 57.63 | 8.26 | 41.74 | |
| Net Income Loss | 75.90 | 27.38 | 22.58 | 36.18 | 51.83 | 30.67 | 24.59 | 39.79 | 75.68 | 51.31 | 56.97 | 22.17 | 84.16 | 87.33 | 60.29 | -3.15 | 68.70 | 46.09 | 40.69 | 37.27 | 49.47 | 44.02 | 37.79 | NA | NA | NA | NA | |
| Profit Loss | 75.90 | 27.38 | 22.58 | 36.18 | 51.83 | 30.67 | 24.59 | 39.79 | 75.68 | 51.31 | 56.97 | 22.17 | 84.16 | 87.33 | 60.29 | -3.15 | 68.70 | 46.09 | 40.69 | 37.27 | 49.47 | 44.02 | 37.79 | 60.08 | -30.44 | 8.93 | 5.87 | |
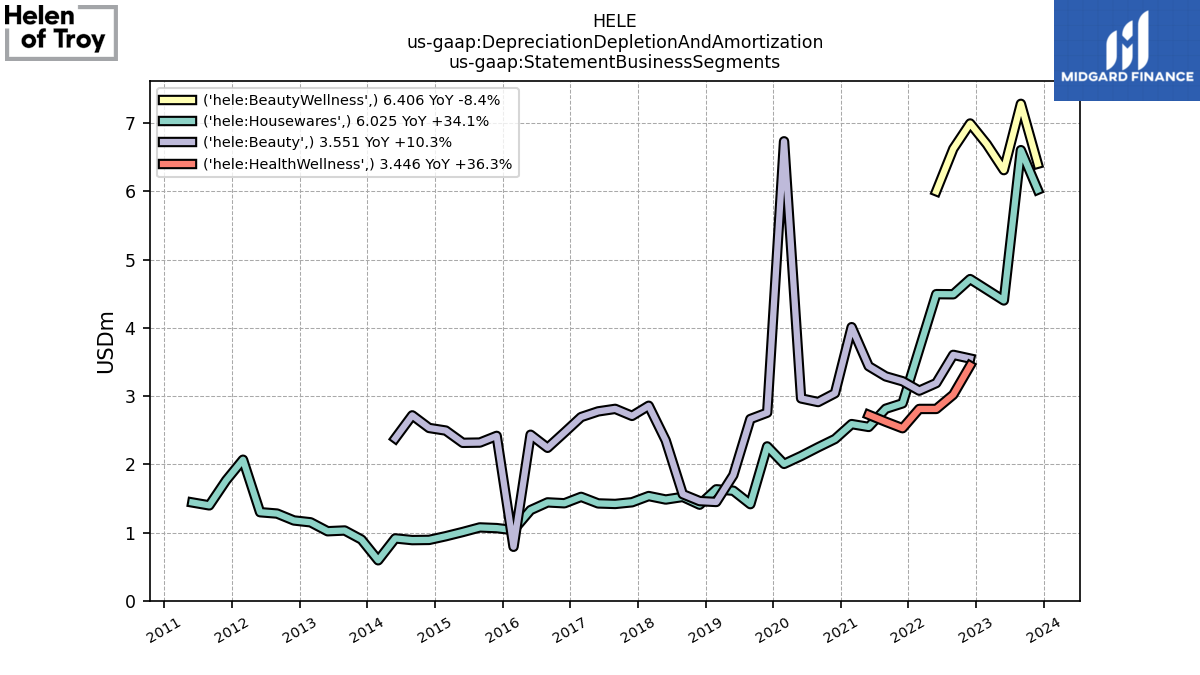
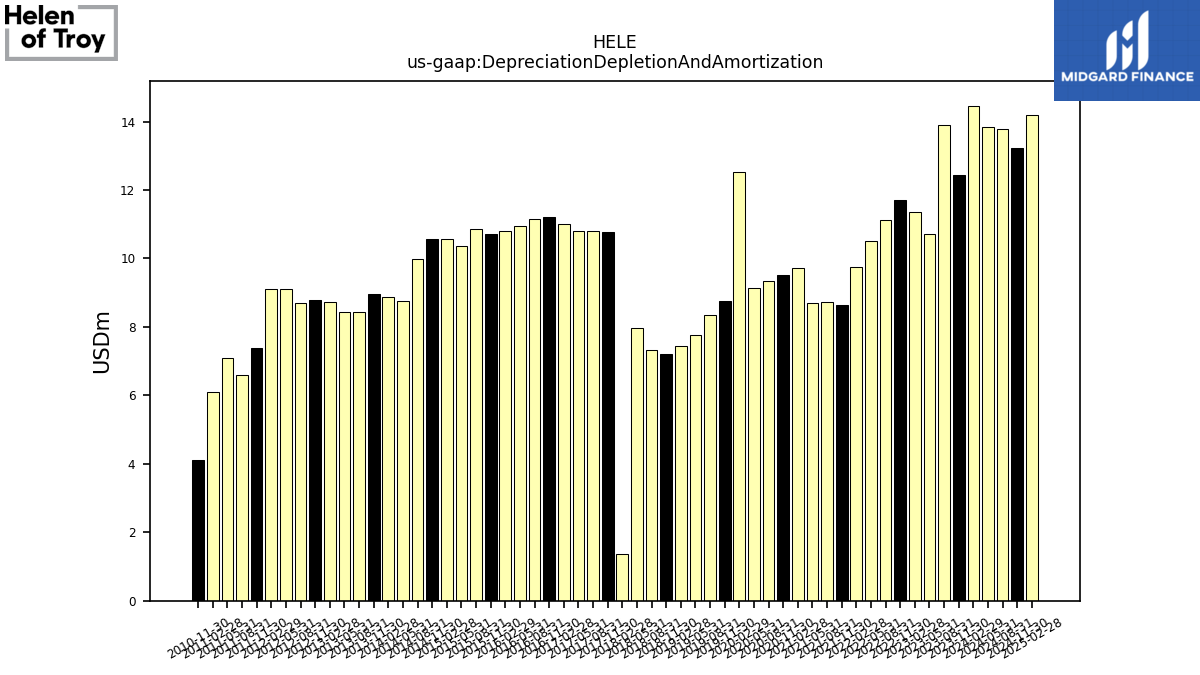
| Depreciation Depletion And Amortization | 12.43 | 13.89 | 10.71 | 11.35 | 11.71 | 11.12 | 10.50 | 9.75 | 8.64 | 8.73 | 8.71 | 9.72 | 9.52 | 9.34 | 9.14 | 12.53 | 8.76 | 8.35 | 7.77 | 7.44 | 7.20 | 7.31 | 7.98 | 1.37 | 10.76 | 10.80 | 10.80 | |
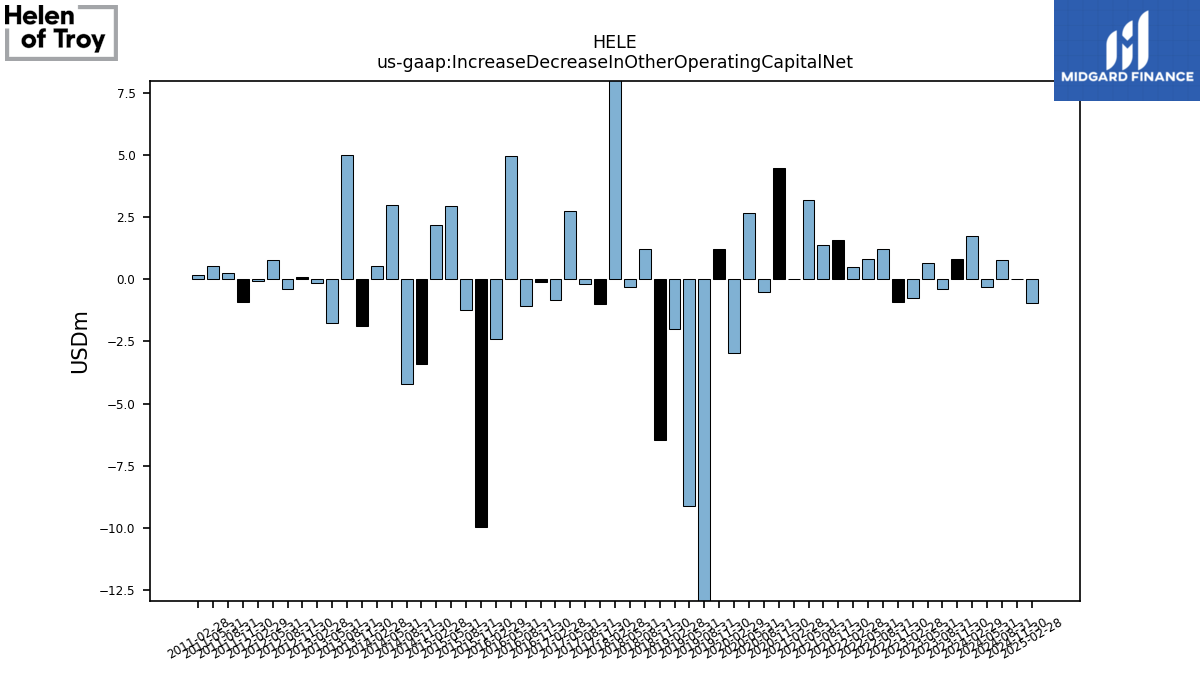
| Increase Decrease In Other Operating Capital Net | 0.83 | -0.40 | 0.66 | -0.76 | -0.93 | 1.22 | 0.82 | 0.48 | 1.56 | 1.36 | 3.19 | -0.00 | 4.47 | -0.50 | 2.65 | -2.98 | 1.19 | -13.15 | -9.14 | -2.00 | -6.46 | 1.21 | -0.30 | 15.20 | -1.02 | -0.17 | 2.73 | |
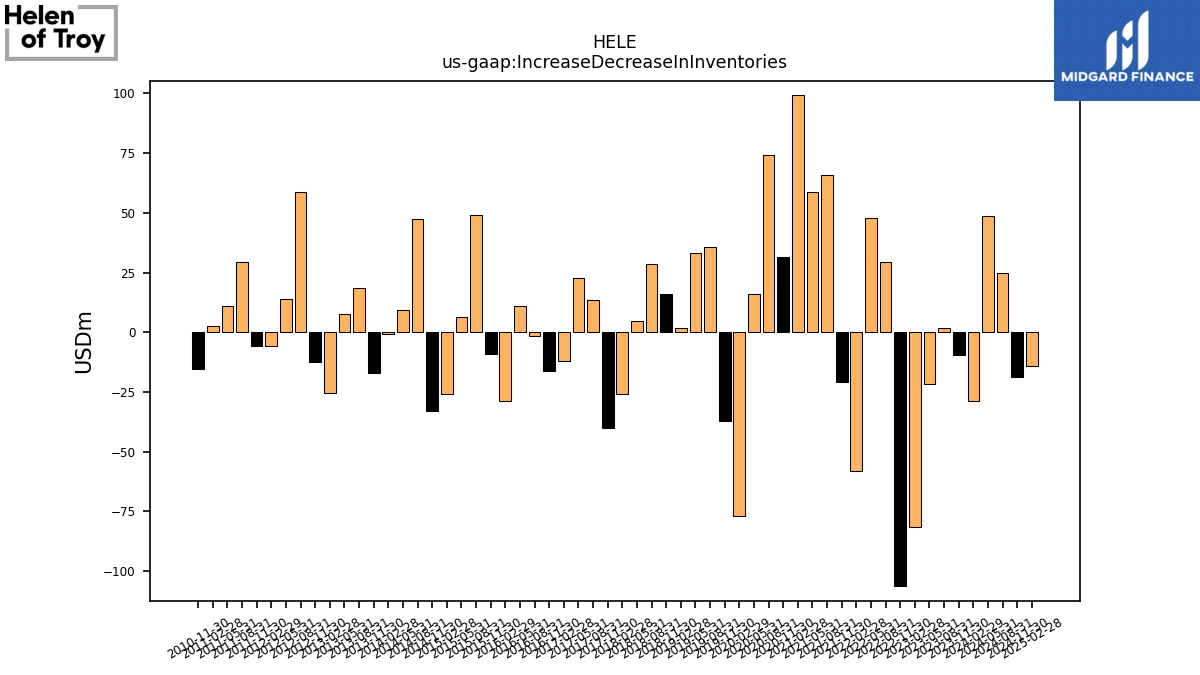
| Increase Decrease In Inventories | -9.65 | 1.77 | -21.57 | -81.31 | -106.34 | 29.57 | 47.78 | -57.91 | -20.68 | 65.65 | 58.86 | 99.19 | 31.54 | 74.08 | 16.02 | -76.80 | -37.26 | 35.57 | 33.01 | 1.69 | 15.82 | 28.56 | 4.76 | -25.84 | -39.97 | 13.54 | 22.90 | |
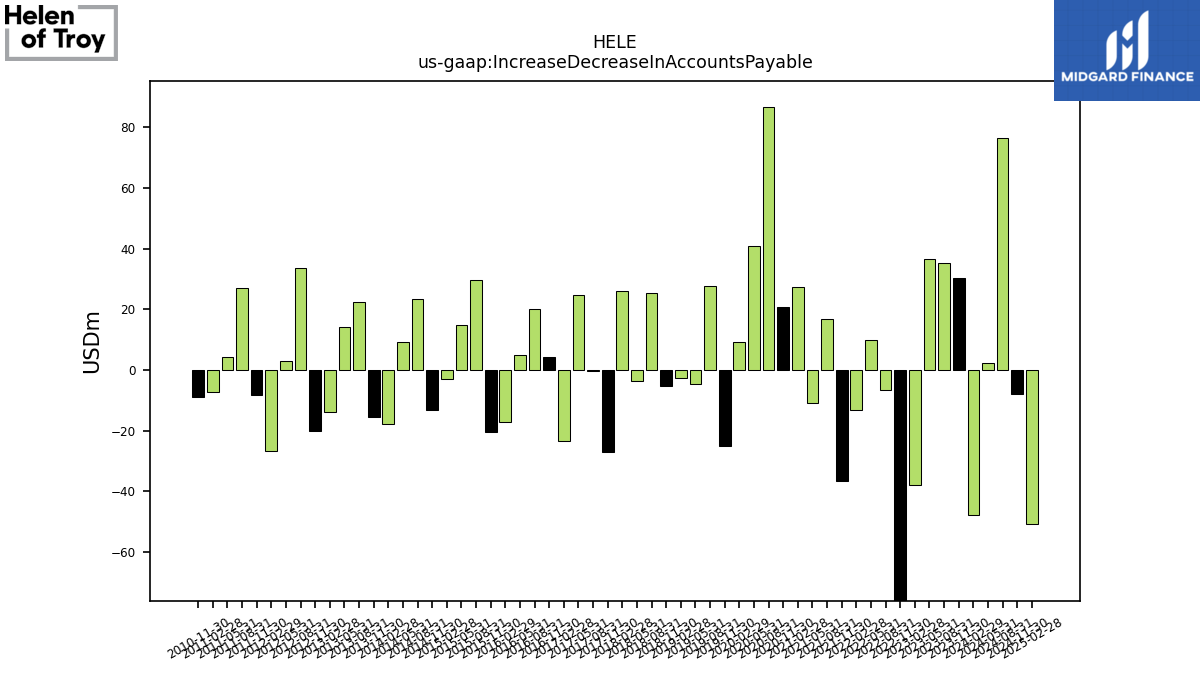
| Increase Decrease In Accounts Payable | 30.30 | 35.35 | 36.64 | -37.80 | -81.46 | -6.69 | 10.03 | -13.20 | -36.63 | 16.96 | -10.88 | 27.28 | 20.69 | 86.85 | 40.96 | 9.20 | -25.16 | 27.62 | -4.50 | -2.48 | -5.17 | 25.40 | -3.54 | 26.22 | -27.03 | -0.22 | 24.71 | |
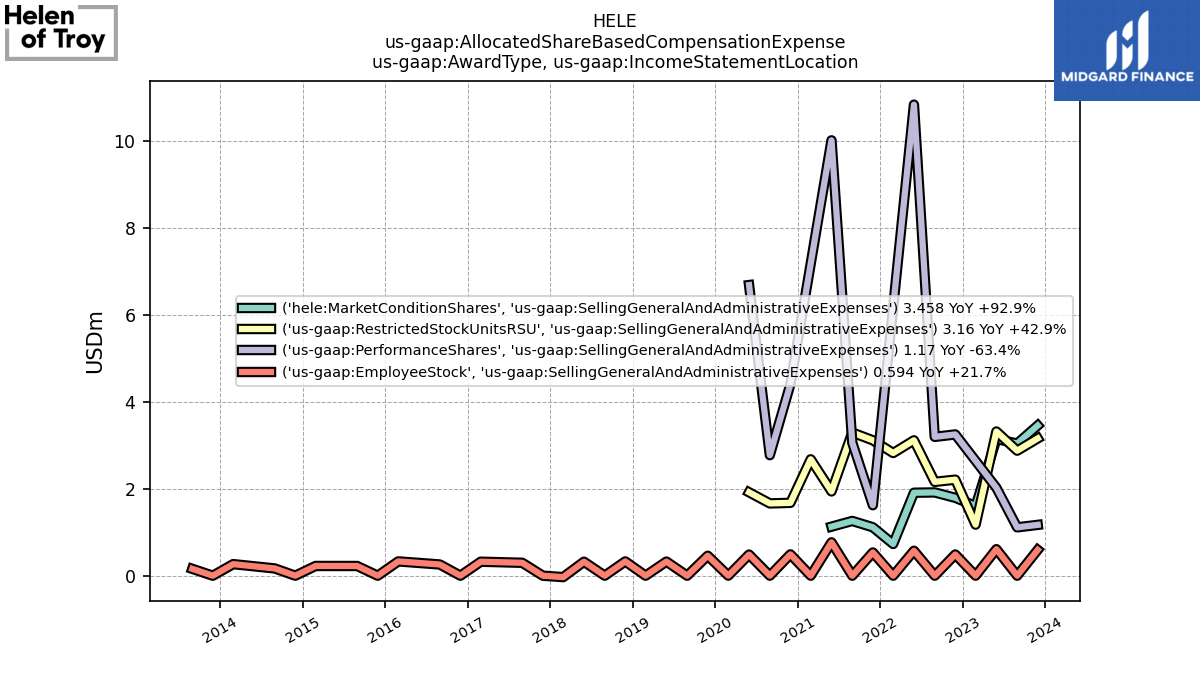
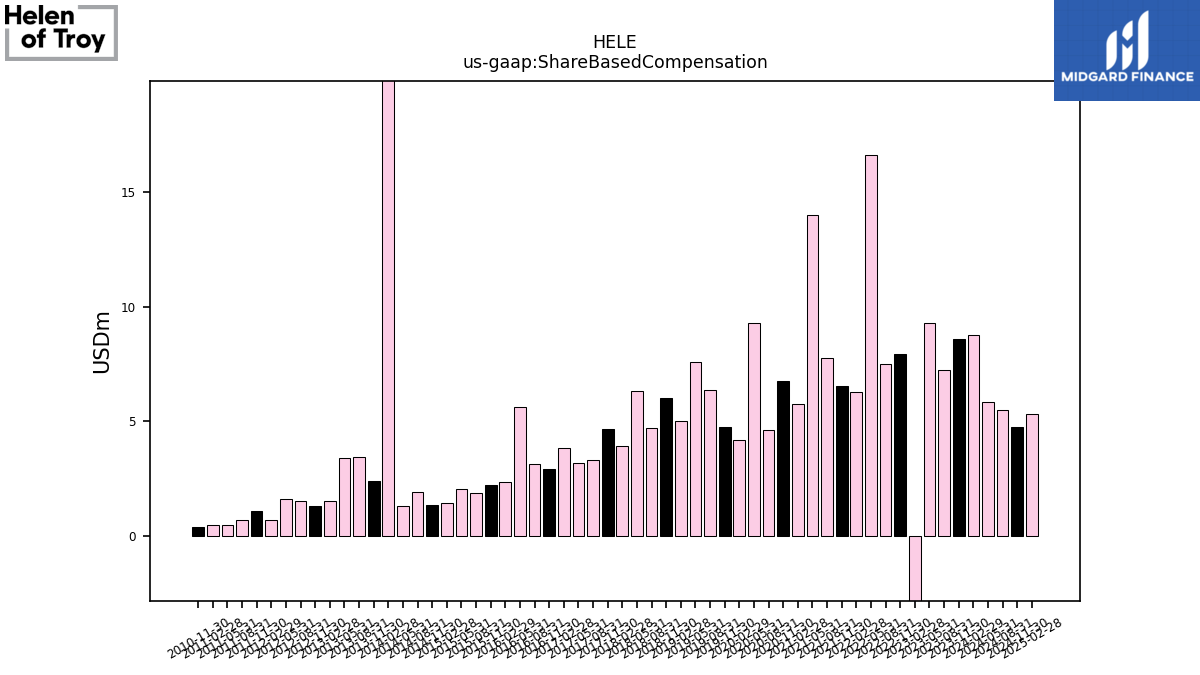
| Share Based Compensation | 8.58 | 7.23 | 9.30 | -5.30 | 7.94 | 7.50 | 16.62 | 6.27 | 6.55 | 7.78 | 14.02 | 5.76 | 6.74 | 4.62 | 9.29 | 4.19 | 4.76 | 6.38 | 7.60 | 5.02 | 6.02 | 4.69 | 6.32 | 3.92 | 4.65 | 3.29 | 3.19 | |
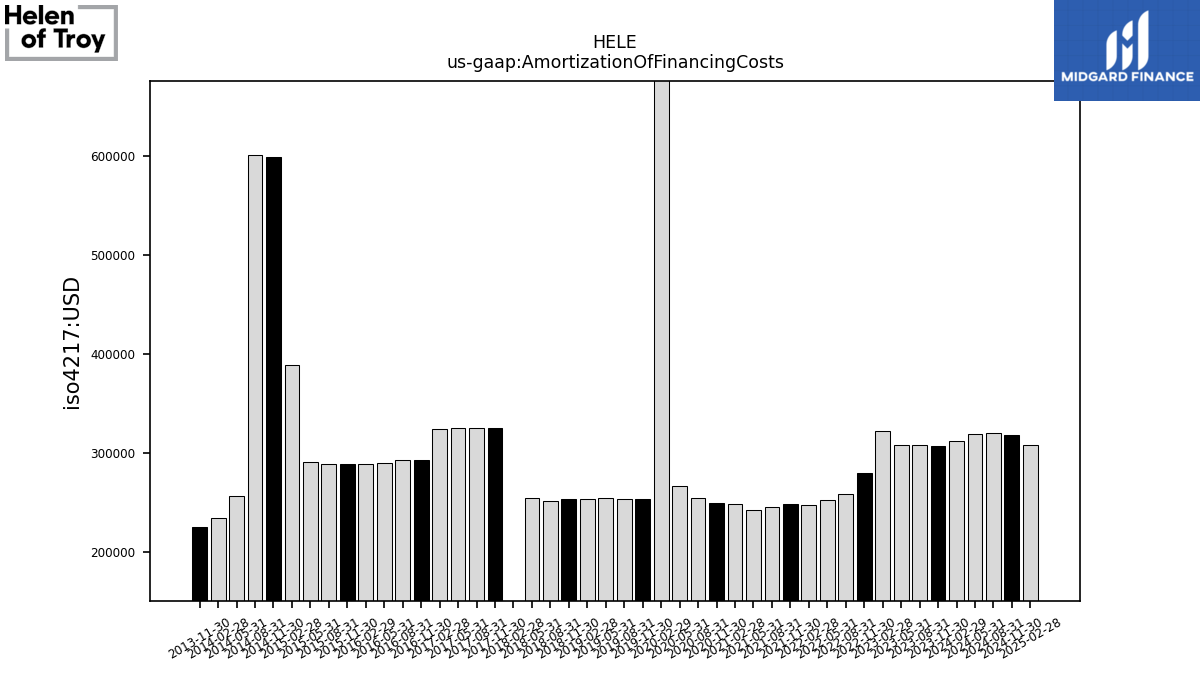
| Amortization Of Financing Costs | 0.31 | 0.31 | 0.31 | 0.32 | 0.28 | 0.26 | 0.25 | 0.25 | 0.25 | 0.25 | 0.24 | 0.25 | 0.25 | 0.26 | 0.27 | 0.86 | 0.25 | 0.25 | 0.26 | 0.25 | 0.25 | 0.25 | 0.26 | -0.09 | 0.33 | 0.33 | 0.33 |
| 2023-11-30 | 2023-08-31 | 2023-05-31 | 2023-02-28 | 2022-11-30 | 2022-08-31 | 2022-05-31 | 2022-02-28 | 2021-11-30 | 2021-08-31 | 2021-05-31 | 2021-02-28 | 2020-11-30 | 2020-08-31 | 2020-05-31 | 2020-02-29 | 2019-11-30 | 2019-08-31 | 2019-05-31 | 2019-02-28 | 2018-11-30 | 2018-08-31 | 2018-05-31 | 2018-02-28 | 2017-11-30 | 2017-08-31 | 2017-05-31 | ||
|---|---|---|---|---|---|---|---|---|---|---|---|---|---|---|---|---|---|---|---|---|---|---|---|---|---|---|---|---|
| Net Cash Provided By Used In Investing Activities | 34.32 | -8.68 | -11.63 | -28.66 | -31.75 | -36.41 | -222.51 | -447.39 | -15.48 | 27.96 | -4.01 | -79.25 | -4.19 | -8.79 | -6.45 | -260.37 | -4.38 | -5.14 | -3.72 | -4.21 | -7.98 | -8.88 | -4.18 | 55.48 | -3.04 | -3.79 | -13.01 | |
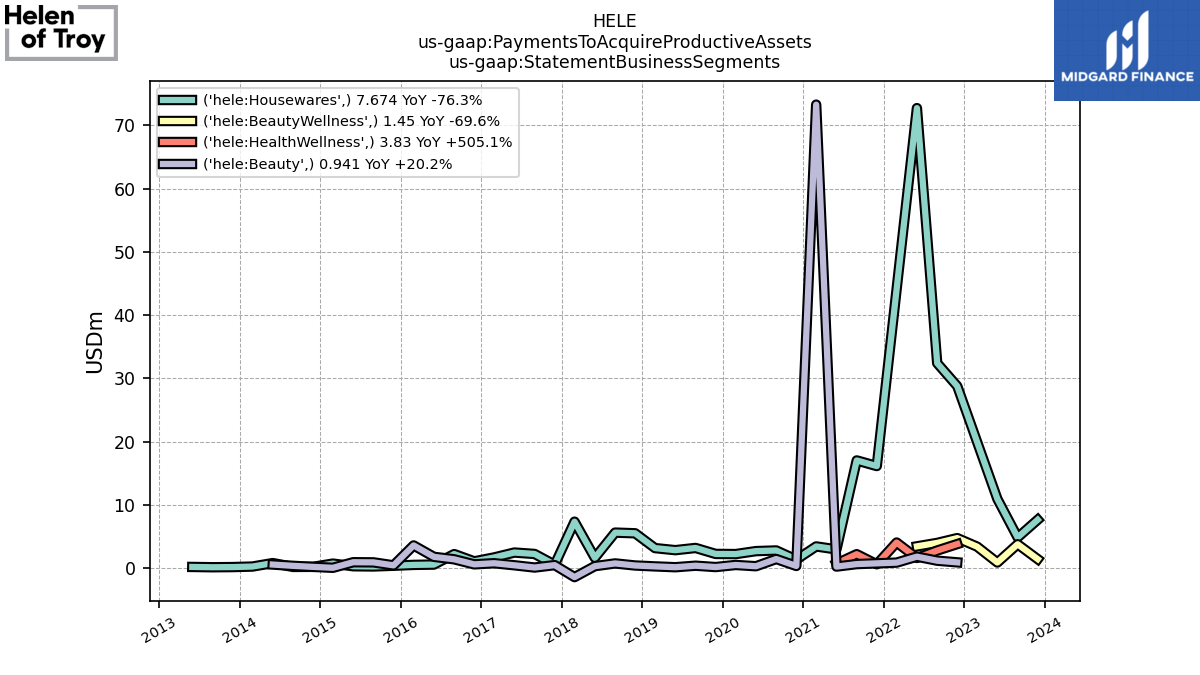
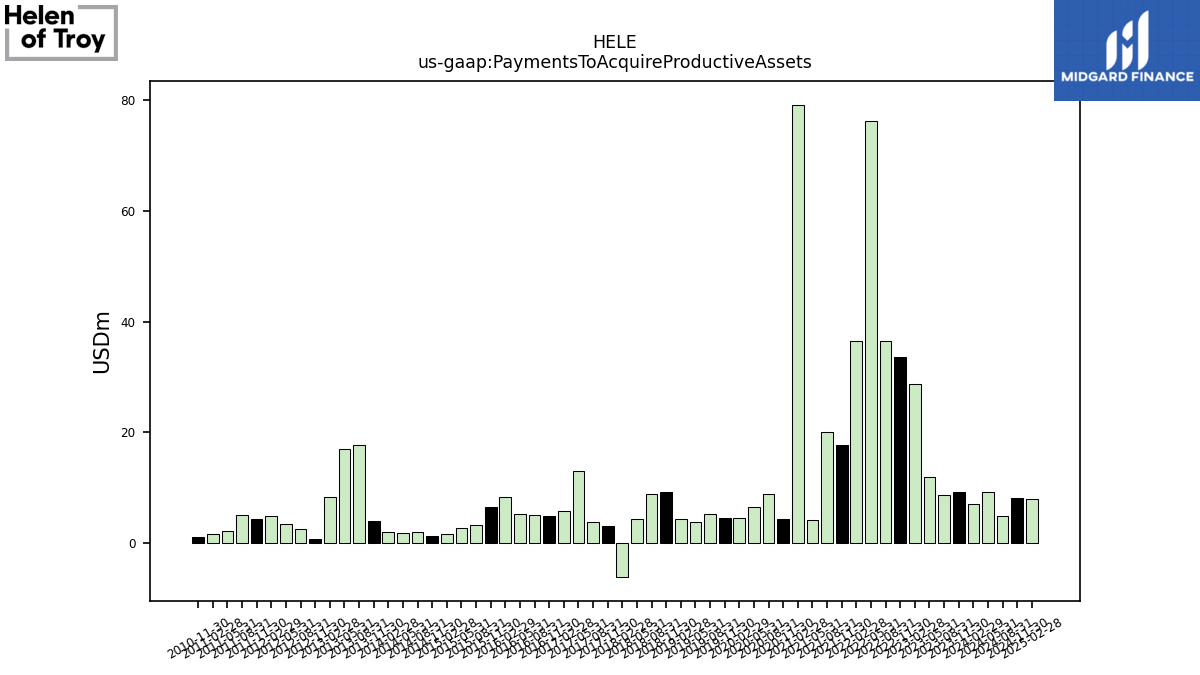
| Payments To Acquire Productive Assets | 9.12 | 8.68 | 11.88 | 28.67 | 33.56 | 36.43 | 76.20 | 36.51 | 17.57 | 19.95 | 4.01 | 79.25 | 4.19 | 8.79 | 6.45 | 4.51 | 4.39 | 5.14 | 3.72 | 4.22 | 9.11 | 8.88 | 4.18 | -6.25 | 3.04 | 3.79 | 13.03 |
| 2023-11-30 | 2023-08-31 | 2023-05-31 | 2023-02-28 | 2022-11-30 | 2022-08-31 | 2022-05-31 | 2022-02-28 | 2021-11-30 | 2021-08-31 | 2021-05-31 | 2021-02-28 | 2020-11-30 | 2020-08-31 | 2020-05-31 | 2020-02-29 | 2019-11-30 | 2019-08-31 | 2019-05-31 | 2019-02-28 | 2018-11-30 | 2018-08-31 | 2018-05-31 | 2018-02-28 | 2017-11-30 | 2017-08-31 | 2017-05-31 | ||
|---|---|---|---|---|---|---|---|---|---|---|---|---|---|---|---|---|---|---|---|---|---|---|---|---|---|---|---|---|
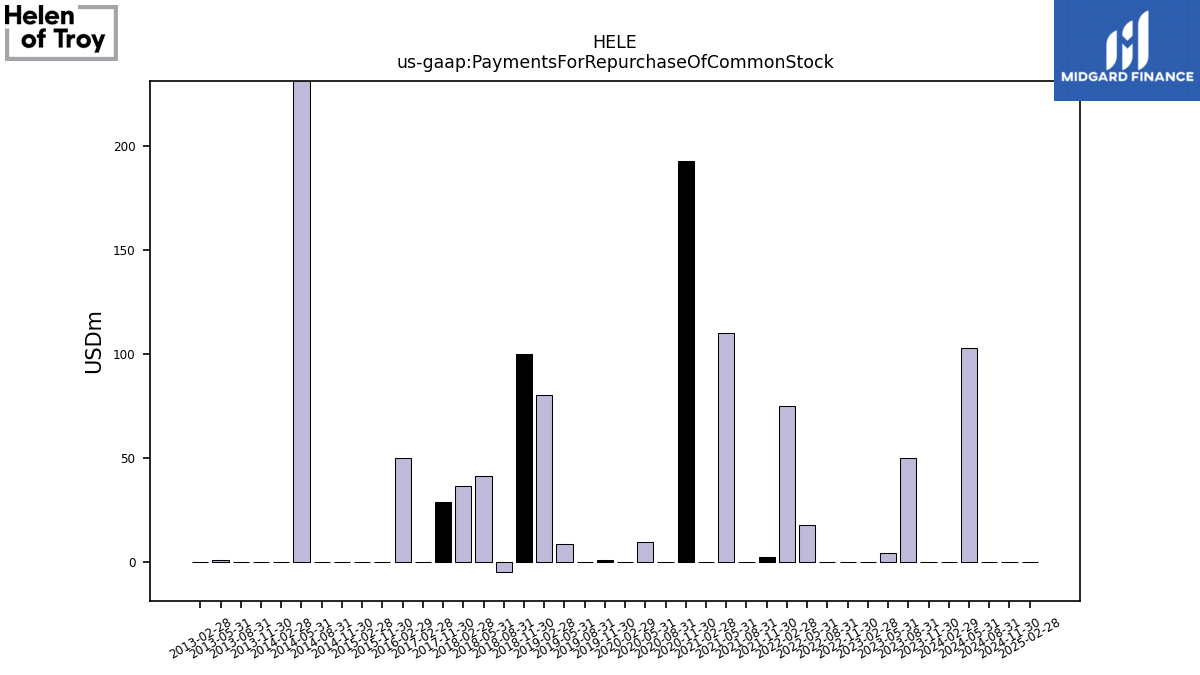
| Net Cash Provided By Used In Financing Activities | -108.02 | -42.65 | -99.63 | -146.32 | -87.54 | 63.83 | 276.81 | 290.55 | -25.24 | -38.60 | 59.64 | -96.66 | -51.02 | -24.78 | -22.32 | 95.33 | -56.22 | -18.74 | -5.45 | -94.10 | -60.13 | 3.46 | -28.16 | -172.47 | -47.15 | -7.26 | -35.31 | |
| Payments For Repurchase Of Common Stock | 0.31 | 50.09 | 4.45 | 0.01 | 0.04 | 0.08 | 18.22 | 75.19 | 2.83 | 0.12 | 110.07 | 0.33 | 192.80 | 0.15 | 10.01 | 0.04 | 1.00 | 0.34 | 8.79 | 80.43 | 100.00 | -4.48 | 41.55 | 36.64 | 29.16 | NA | NA |
| 2023-11-30 | 2023-08-31 | 2023-05-31 | 2023-02-28 | 2022-11-30 | 2022-08-31 | 2022-05-31 | 2022-02-28 | 2021-11-30 | 2021-08-31 | 2021-05-31 | 2021-02-28 | 2020-11-30 | 2020-08-31 | 2020-05-31 | 2020-02-29 | 2019-11-30 | 2019-08-31 | 2019-05-31 | 2019-02-28 | 2018-11-30 | 2018-08-31 | 2018-05-31 | 2018-02-28 | 2017-11-30 | 2017-08-31 | 2017-05-31 | ||
|---|---|---|---|---|---|---|---|---|---|---|---|---|---|---|---|---|---|---|---|---|---|---|---|---|---|---|---|---|
| Revenues | 549.61 | 491.56 | 474.67 | 484.58 | 558.61 | 521.40 | 508.08 | 582.02 | 624.88 | 475.23 | 541.22 | 509.38 | 637.74 | 530.85 | 420.83 | 442.37 | 474.74 | 414.00 | 376.33 | 384.84 | 431.08 | 393.55 | 354.68 | 387.56 | 420.84 | 344.95 | 325.49 | |
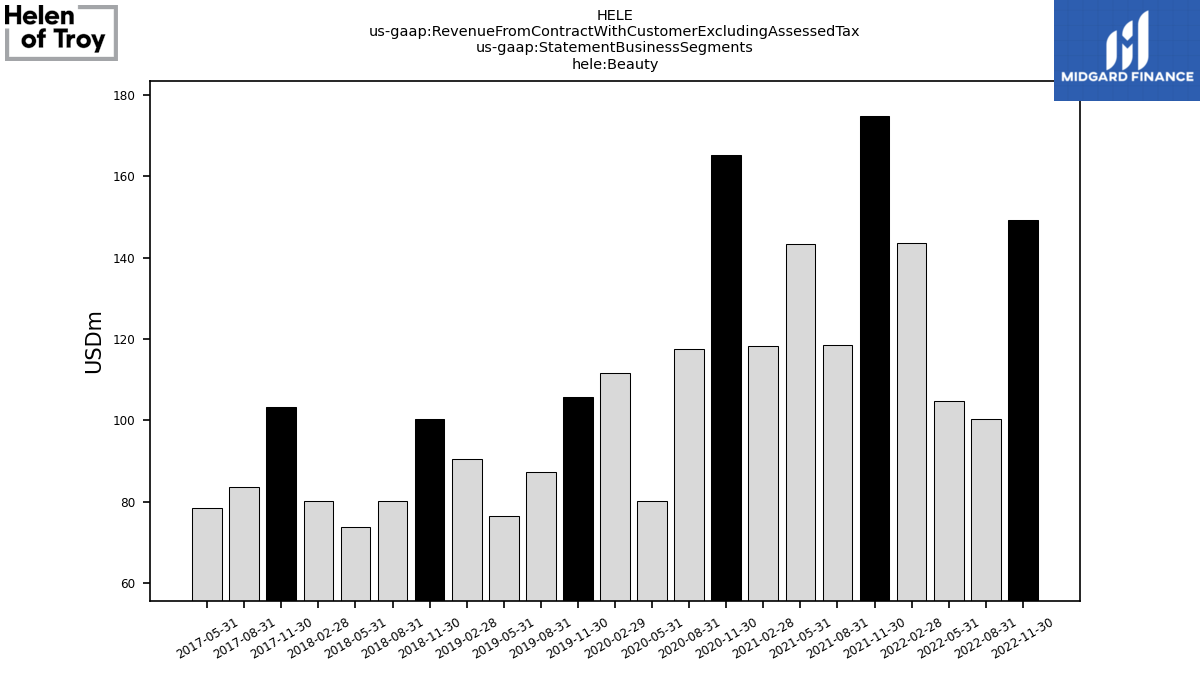
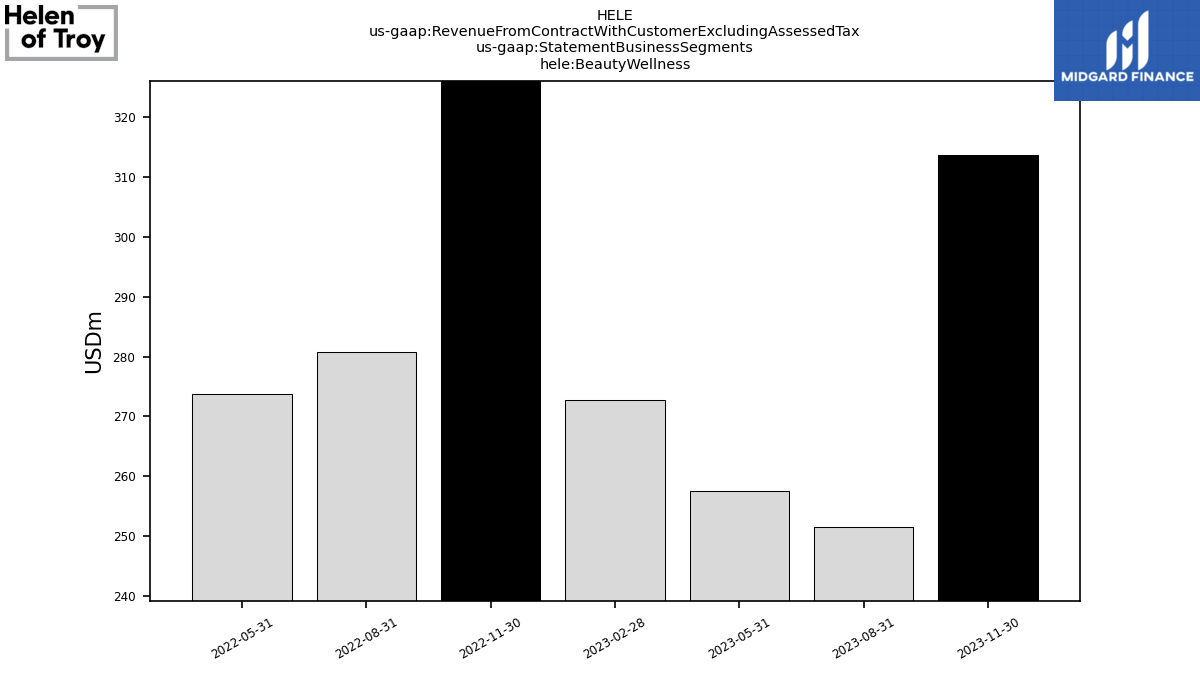
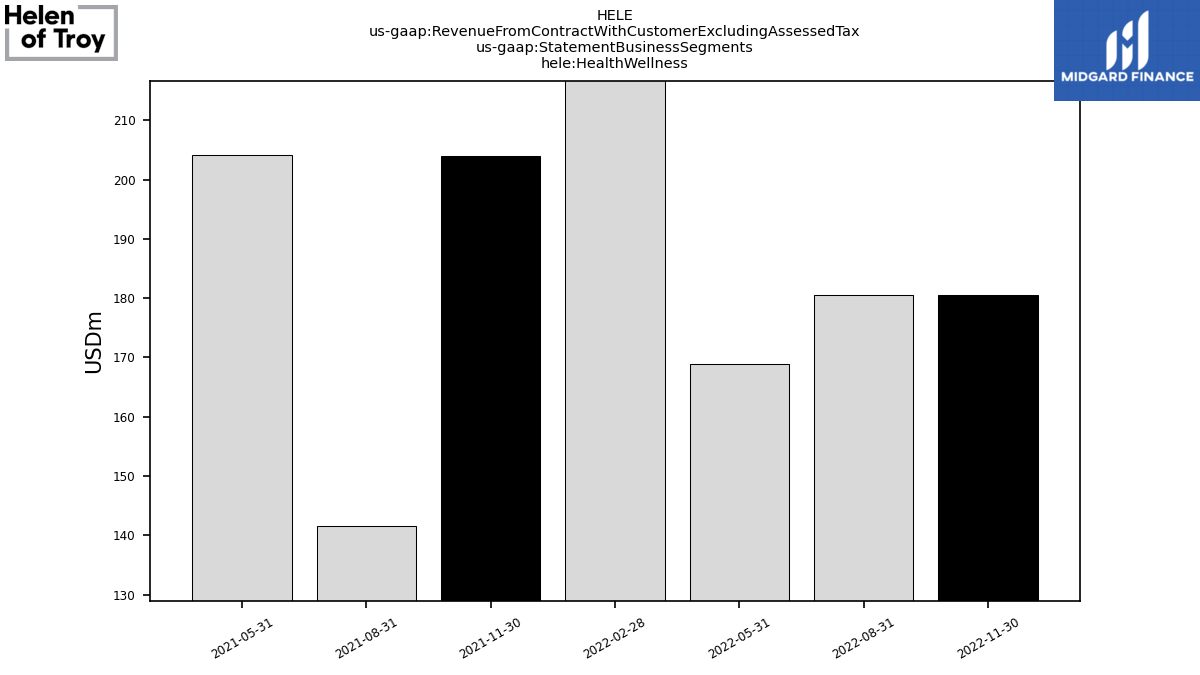
| Revenue From Contract With Customer Excluding Assessed Tax | 549.61 | 491.56 | 474.67 | 484.58 | 558.61 | 521.40 | 508.08 | 582.02 | 624.88 | 475.23 | 541.22 | 509.38 | 637.74 | 530.85 | 420.83 | 442.37 | 474.74 | 414.00 | 376.33 | 384.84 | 431.08 | 393.55 | 354.68 | 387.56 | 420.84 | 344.95 | 325.49 | |
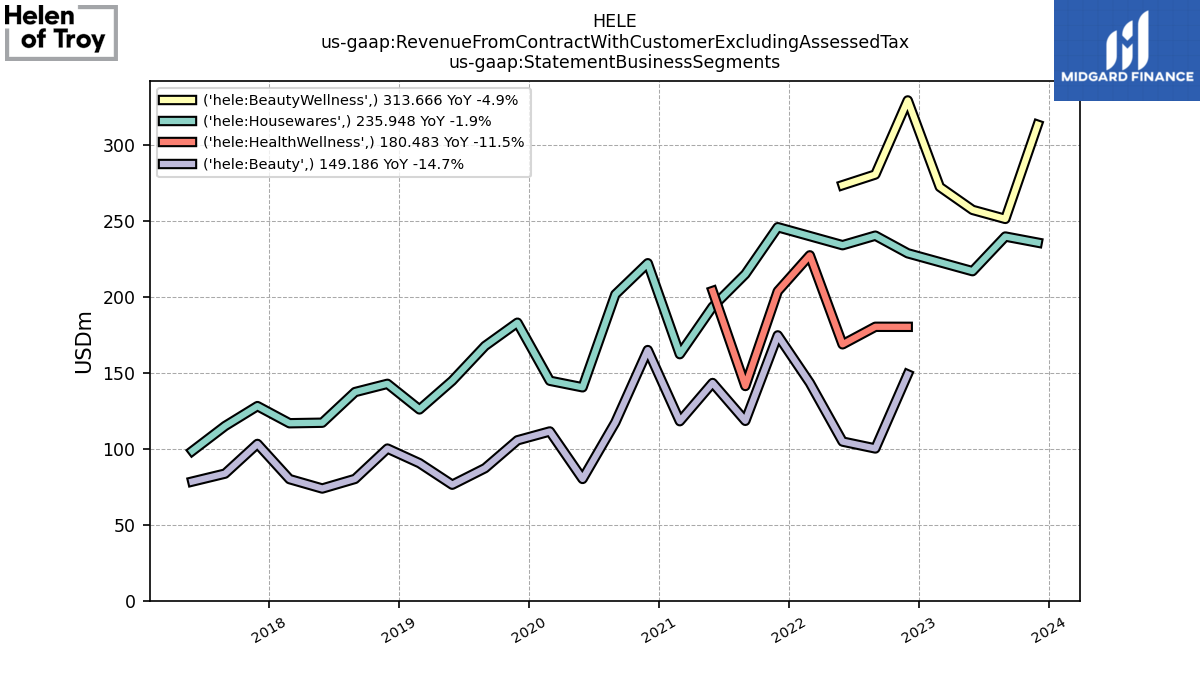
| Beauty | NA | NA | NA | NA | 149.19 | 100.33 | 104.87 | 143.57 | 174.85 | 118.53 | 143.48 | 118.29 | 165.18 | 117.53 | 80.25 | 111.56 | 105.72 | 87.34 | 76.45 | 90.63 | 100.28 | 80.27 | 73.94 | 80.14 | 103.34 | 83.76 | 78.54 | |
| Beauty Wellness | 313.67 | 251.59 | 257.53 | 272.66 | 329.67 | 280.84 | 273.81 | NA | NA | NA | NA | NA | NA | NA | NA | NA | NA | NA | NA | NA | NA | NA | NA | NA | NA | NA | NA | |
| Health Wellness | NA | NA | NA | NA | 180.48 | 180.51 | 168.94 | 227.60 | 203.90 | 141.48 | 204.10 | NA | NA | NA | NA | NA | NA | NA | NA | NA | NA | NA | NA | NA | NA | NA | NA | |
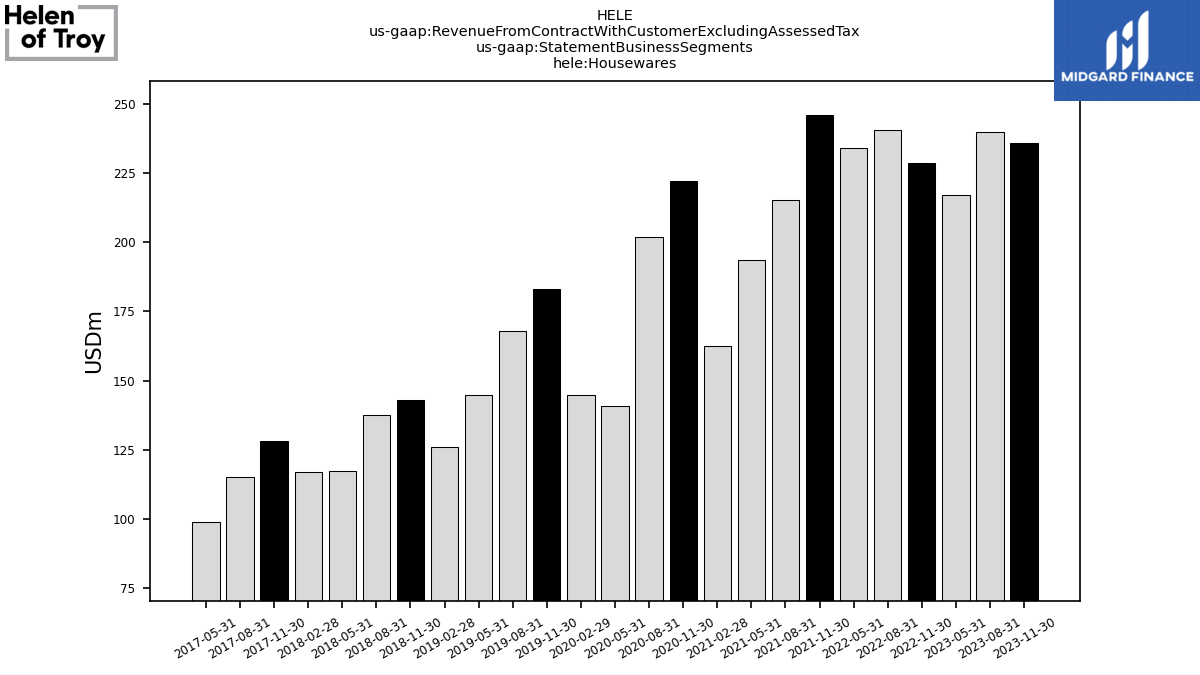
| Housewares | 235.95 | 239.98 | 217.14 | NA | 228.94 | 240.56 | 234.26 | NA | 246.13 | 215.22 | 193.64 | 162.46 | 222.40 | 201.86 | 140.63 | 144.95 | 183.21 | 167.86 | 144.94 | 126.07 | 142.94 | 137.50 | 117.30 | 116.95 | 128.26 | 115.12 | 98.67 | |
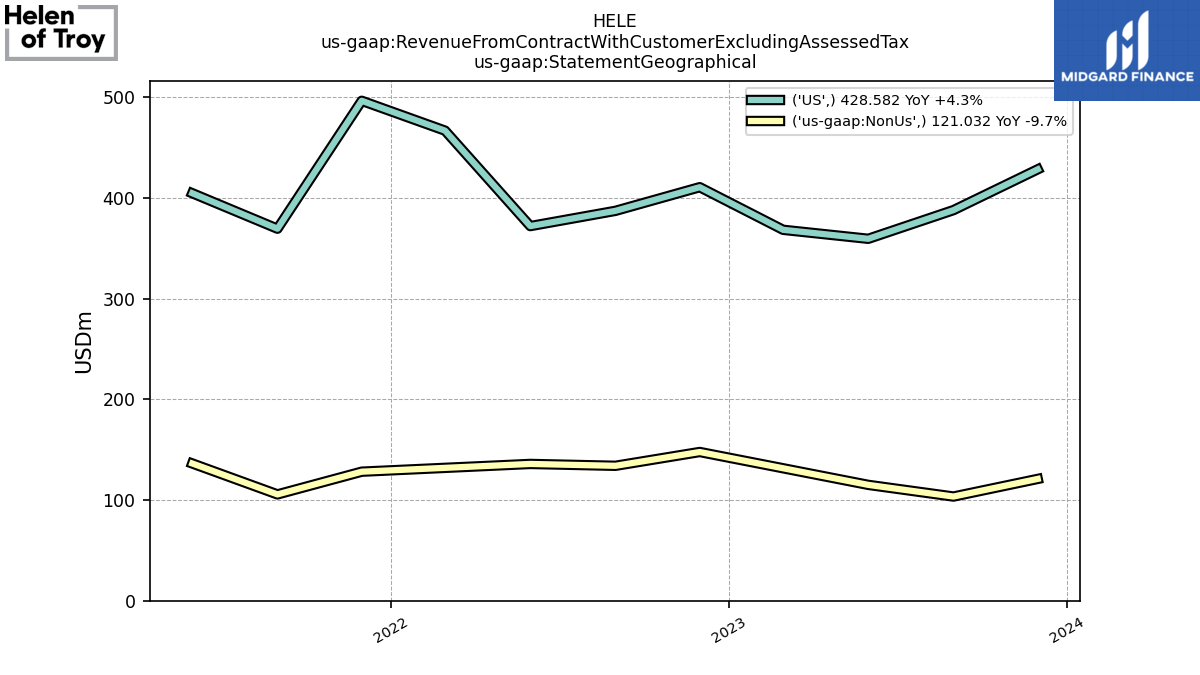
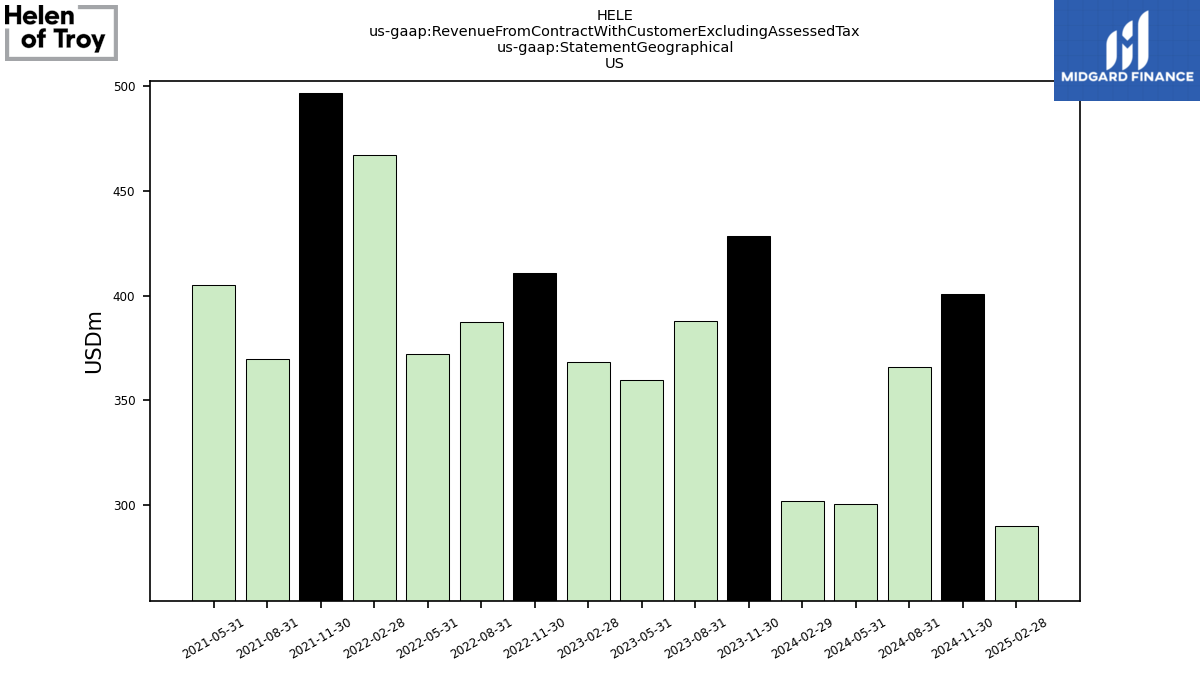
| US | 428.58 | 388.05 | 359.56 | 368.50 | 410.83 | 387.34 | 372.18 | 467.00 | 496.67 | 369.59 | 404.85 | NA | NA | NA | NA | NA | NA | NA | NA | NA | NA | NA | NA | NA | NA | NA | NA | |
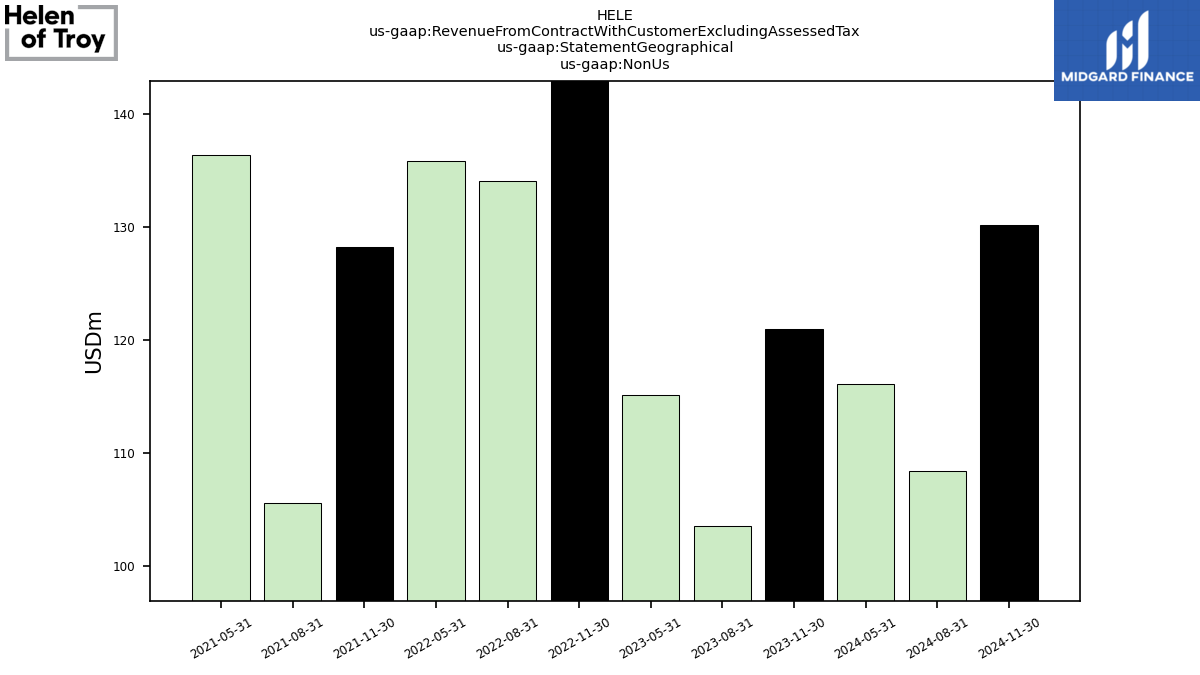
| Non Us | 121.03 | 103.51 | 115.11 | NA | 147.77 | 134.06 | 135.90 | NA | 128.22 | 105.64 | 136.38 | NA | NA | NA | NA | NA | NA | NA | NA | NA | NA | NA | NA | NA | NA | NA | NA | |
| Revenue From Contract With Customer Including Assessed Tax | 549.61 | 491.56 | 474.67 | 484.58 | 558.61 | 521.40 | 508.08 | 582.02 | 624.88 | 475.23 | 541.22 | 509.38 | 637.74 | 530.85 | 420.83 | 442.37 | 474.74 | 414.00 | 376.33 | 384.84 | 431.08 | 393.55 | 354.68 | 387.56 | 420.84 | 344.95 | 325.49 |