
| 2024-02-03 | 2023-10-28 | 2023-07-29 | 2023-04-29 | 2023-01-28 | 2022-10-29 | 2022-07-30 | 2022-04-30 | 2022-01-29 | 2021-10-30 | 2021-07-31 | 2021-05-01 | 2021-01-30 | 2020-10-31 | 2020-08-01 | 2020-05-02 | 2020-02-01 | 2019-11-02 | 2019-08-03 | 2019-05-04 | 2019-02-02 | 2018-11-03 | 2018-08-04 | 2018-05-05 | 2018-02-03 | 2017-10-28 | 2017-07-29 | 2017-04-29 | 2017-01-28 | 2016-10-29 | 2016-07-30 | 2016-04-30 | 2016-01-30 | 2015-10-31 | 2015-08-01 | 2015-05-02 | 2015-01-31 | 2014-11-01 | 2014-08-02 | 2014-05-03 | 2014-02-01 | 2013-11-02 | 2013-08-03 | 2013-05-04 | 2013-02-02 | 2012-10-27 | 2012-07-28 | 2012-04-28 | 2012-01-28 | 2011-10-29 | 2011-07-30 | 2011-04-30 | 2011-01-29 | 2010-01-30 | ||
|---|---|---|---|---|---|---|---|---|---|---|---|---|---|---|---|---|---|---|---|---|---|---|---|---|---|---|---|---|---|---|---|---|---|---|---|---|---|---|---|---|---|---|---|---|---|---|---|---|---|---|---|---|---|---|---|
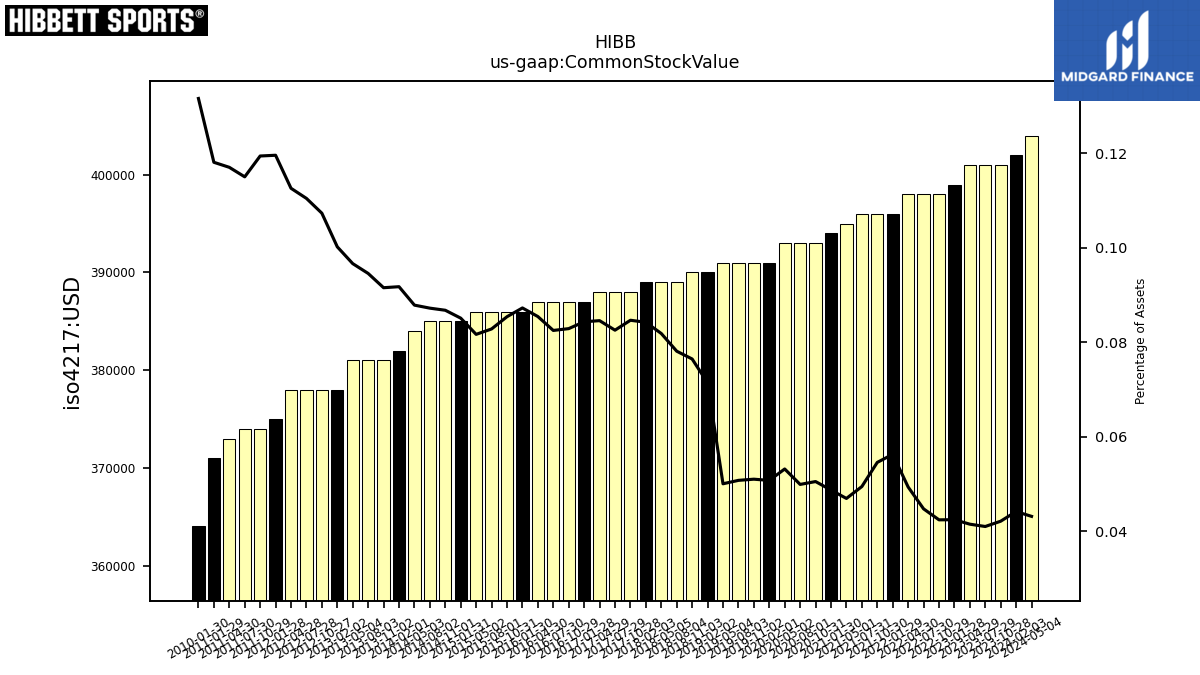
| Common Stock Value | 0.40 | 0.40 | 0.40 | 0.40 | 0.40 | 0.40 | 0.40 | 0.40 | 0.40 | 0.40 | 0.40 | 0.40 | 0.39 | 0.39 | 0.39 | 0.39 | 0.39 | 0.39 | 0.39 | 0.39 | 0.39 | 0.39 | 0.39 | 0.39 | 0.39 | 0.39 | 0.39 | 0.39 | 0.39 | 0.39 | 0.39 | 0.39 | 0.39 | 0.39 | 0.39 | 0.39 | 0.39 | 0.39 | 0.39 | 0.38 | 0.38 | 0.38 | 0.38 | 0.38 | 0.38 | 0.38 | 0.38 | 0.38 | 0.38 | 0.37 | 0.37 | 0.37 | 0.37 | 0.36 | |
| Number Of Stores | 0.00 | NA | NA | NA | 0.00 | NA | NA | NA | 0.00 | NA | NA | NA | NA | NA | NA | NA | NA | NA | NA | NA | NA | NA | NA | NA | NA | NA | NA | NA | NA | NA | NA | NA | NA | NA | NA | NA | NA | NA | NA | NA | NA | NA | NA | NA | NA | NA | NA | NA | NA | NA | NA | NA | NA | NA |
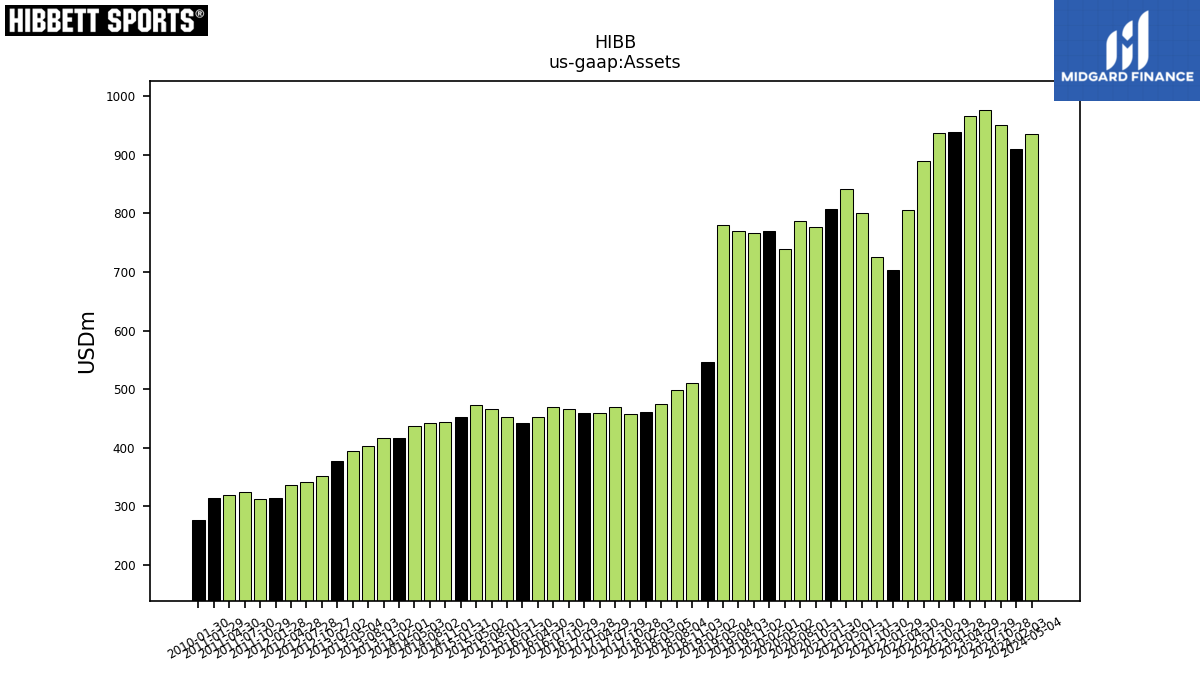
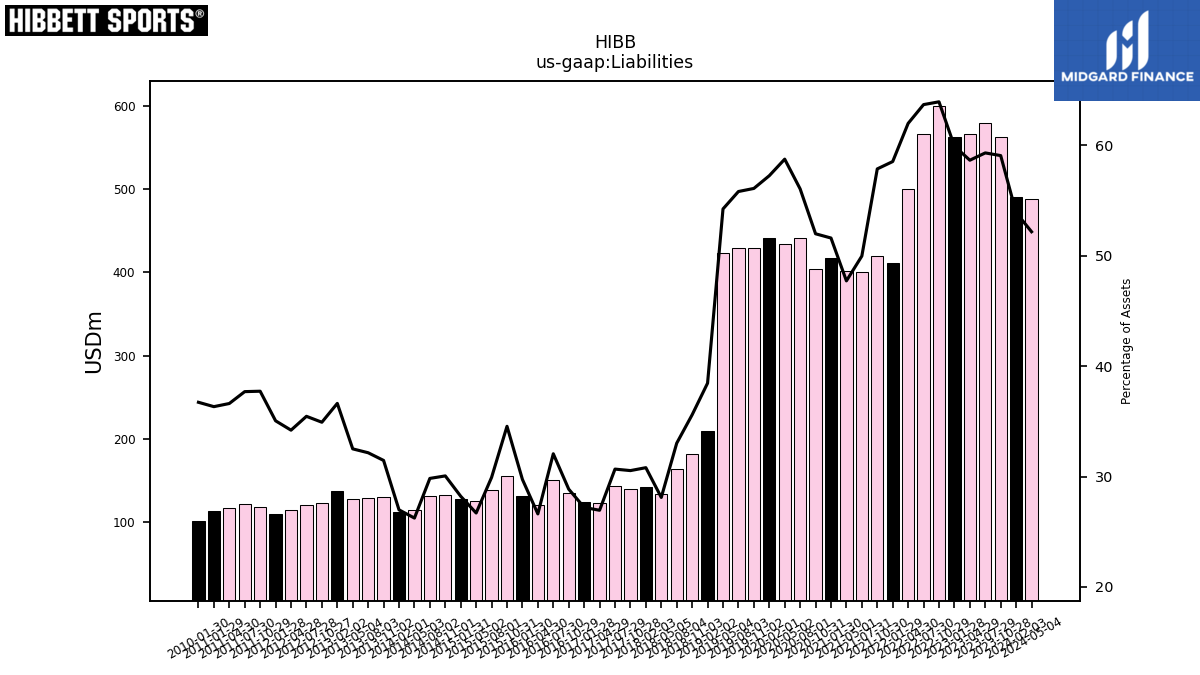
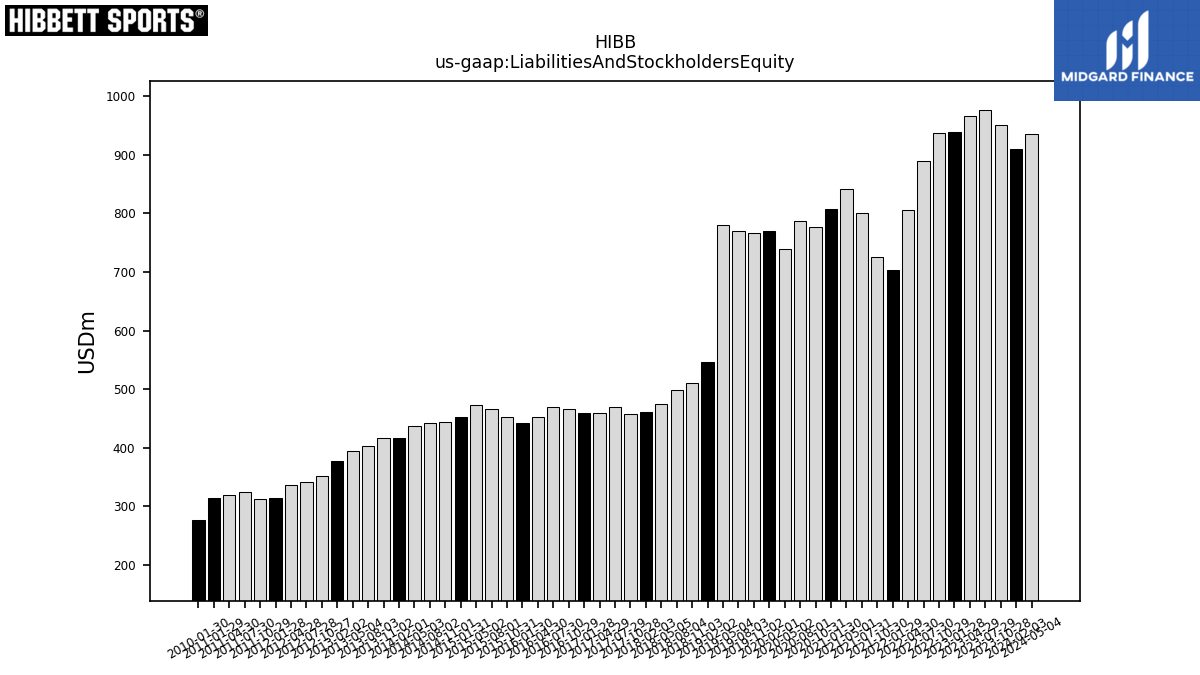
| 2024-02-03 | 2023-10-28 | 2023-07-29 | 2023-04-29 | 2023-01-28 | 2022-10-29 | 2022-07-30 | 2022-04-30 | 2022-01-29 | 2021-10-30 | 2021-07-31 | 2021-05-01 | 2021-01-30 | 2020-10-31 | 2020-08-01 | 2020-05-02 | 2020-02-01 | 2019-11-02 | 2019-08-03 | 2019-05-04 | 2019-02-02 | 2018-11-03 | 2018-08-04 | 2018-05-05 | 2018-02-03 | 2017-10-28 | 2017-07-29 | 2017-04-29 | 2017-01-28 | 2016-10-29 | 2016-07-30 | 2016-04-30 | 2016-01-30 | 2015-10-31 | 2015-08-01 | 2015-05-02 | 2015-01-31 | 2014-11-01 | 2014-08-02 | 2014-05-03 | 2014-02-01 | 2013-11-02 | 2013-08-03 | 2013-05-04 | 2013-02-02 | 2012-10-27 | 2012-07-28 | 2012-04-28 | 2012-01-28 | 2011-10-29 | 2011-07-30 | 2011-04-30 | 2011-01-29 | 2010-01-30 | ||
|---|---|---|---|---|---|---|---|---|---|---|---|---|---|---|---|---|---|---|---|---|---|---|---|---|---|---|---|---|---|---|---|---|---|---|---|---|---|---|---|---|---|---|---|---|---|---|---|---|---|---|---|---|---|---|---|
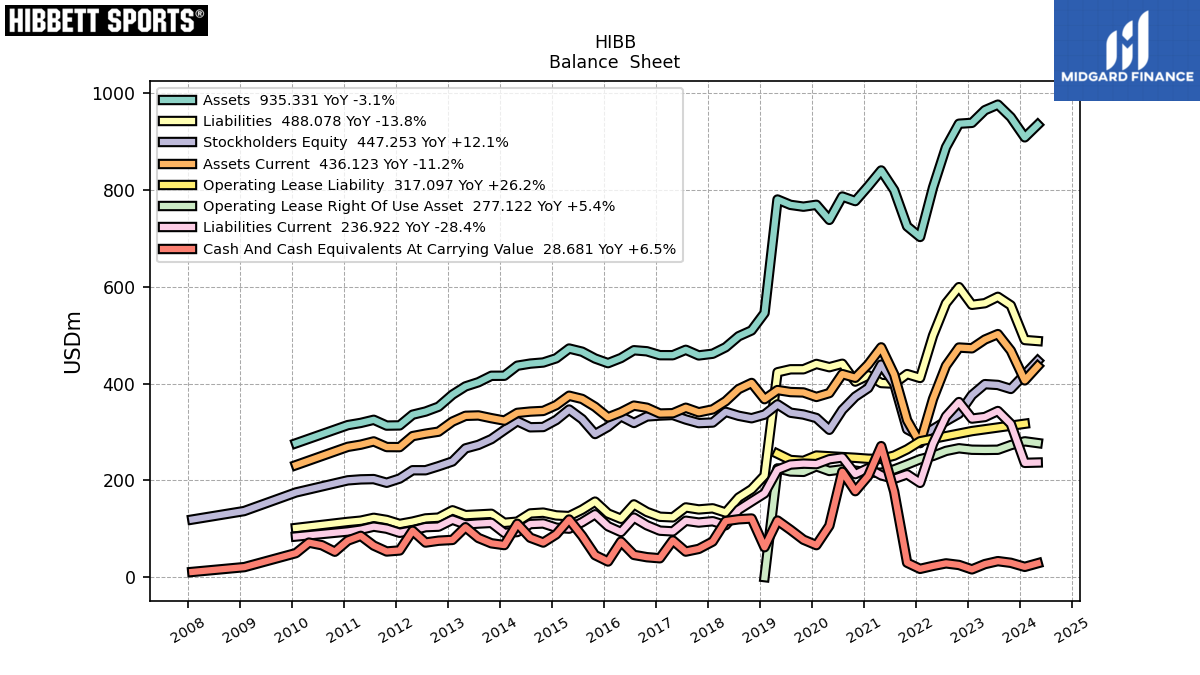
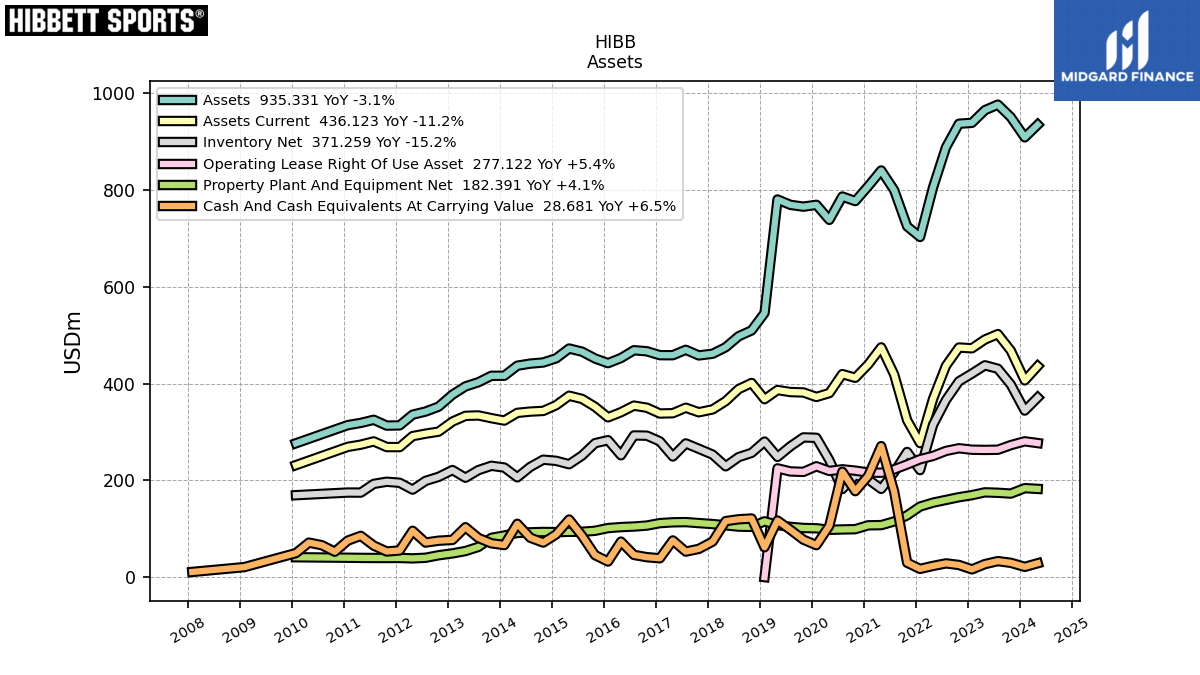
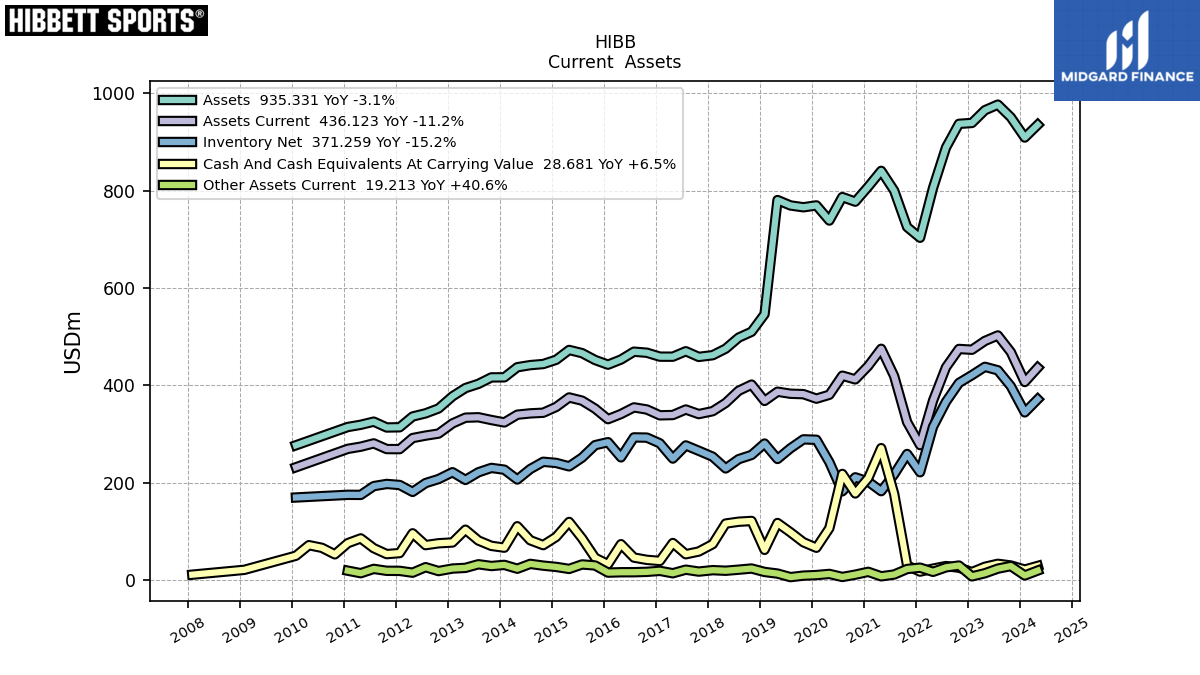
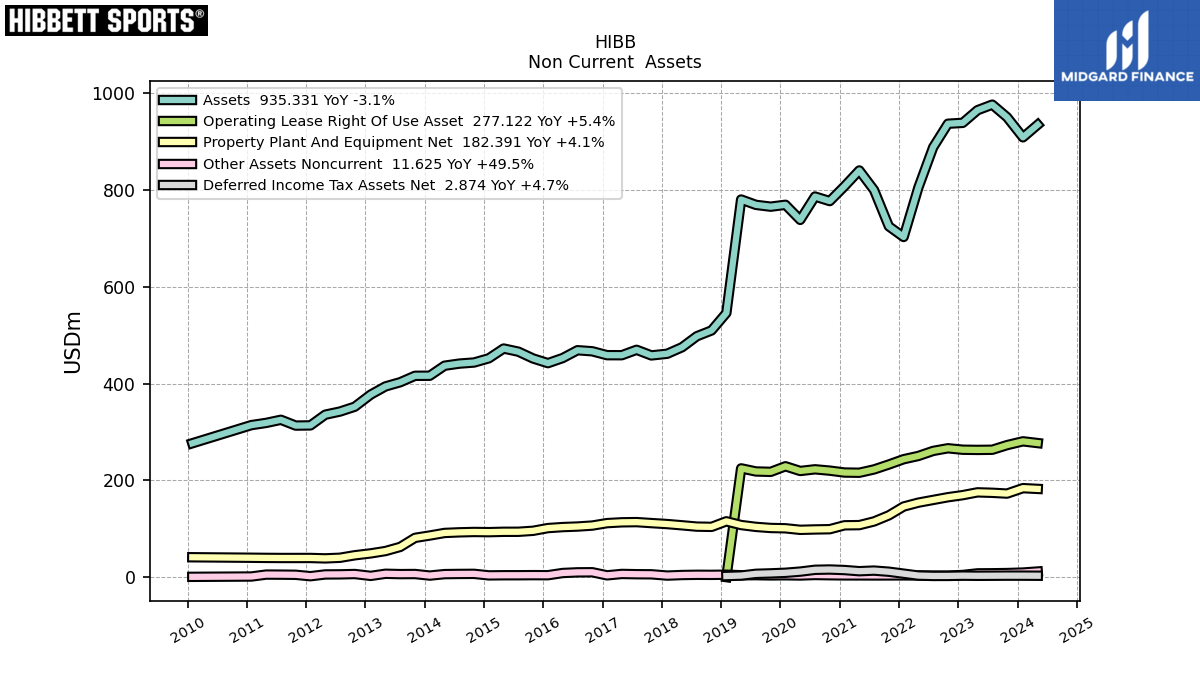
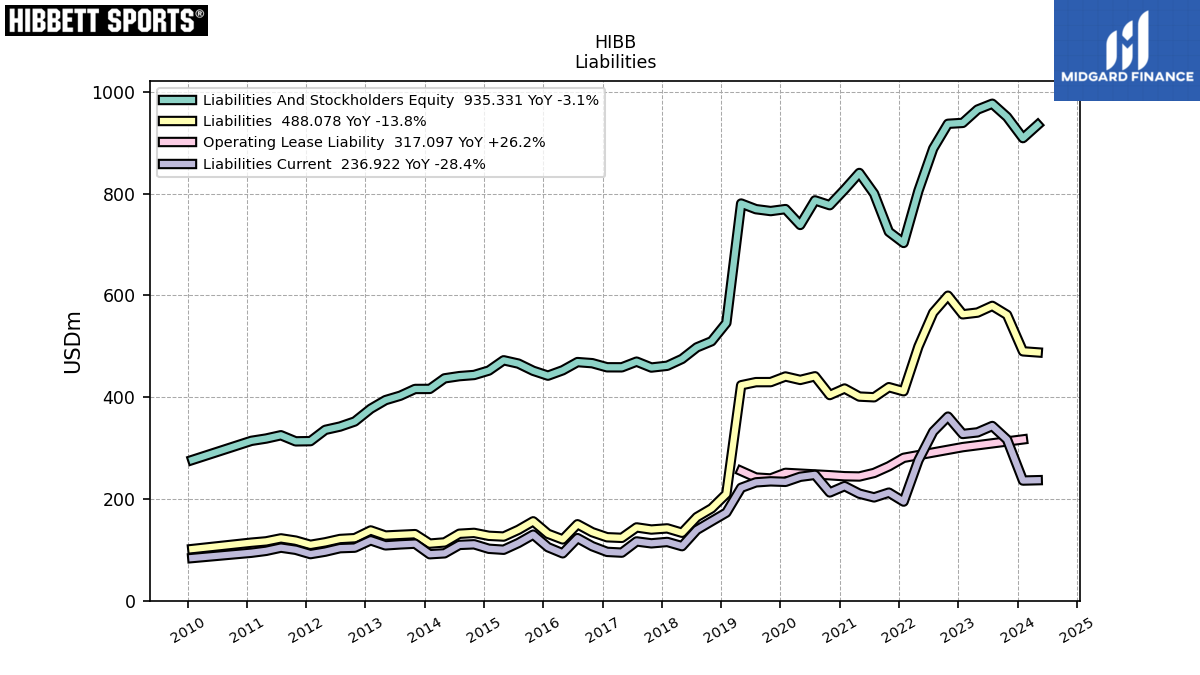
| Assets | 909.22 | 950.89 | 976.87 | 965.35 | 939.16 | 937.37 | 888.70 | 805.61 | 703.22 | 725.24 | 800.07 | 840.76 | 808.17 | 777.40 | 786.84 | 738.57 | 769.76 | 765.88 | 769.61 | 780.71 | 546.07 | 510.01 | 497.98 | 475.25 | 461.85 | 458.33 | 469.99 | 458.78 | 458.85 | 466.90 | 469.08 | 452.95 | 442.37 | 451.97 | 466.09 | 472.62 | 452.40 | 443.70 | 441.44 | 437.09 | 416.35 | 416.23 | 402.95 | 394.28 | 377.33 | 352.32 | 342.33 | 335.83 | 313.70 | 313.28 | 325.28 | 318.83 | 314.26 | 276.70 | |
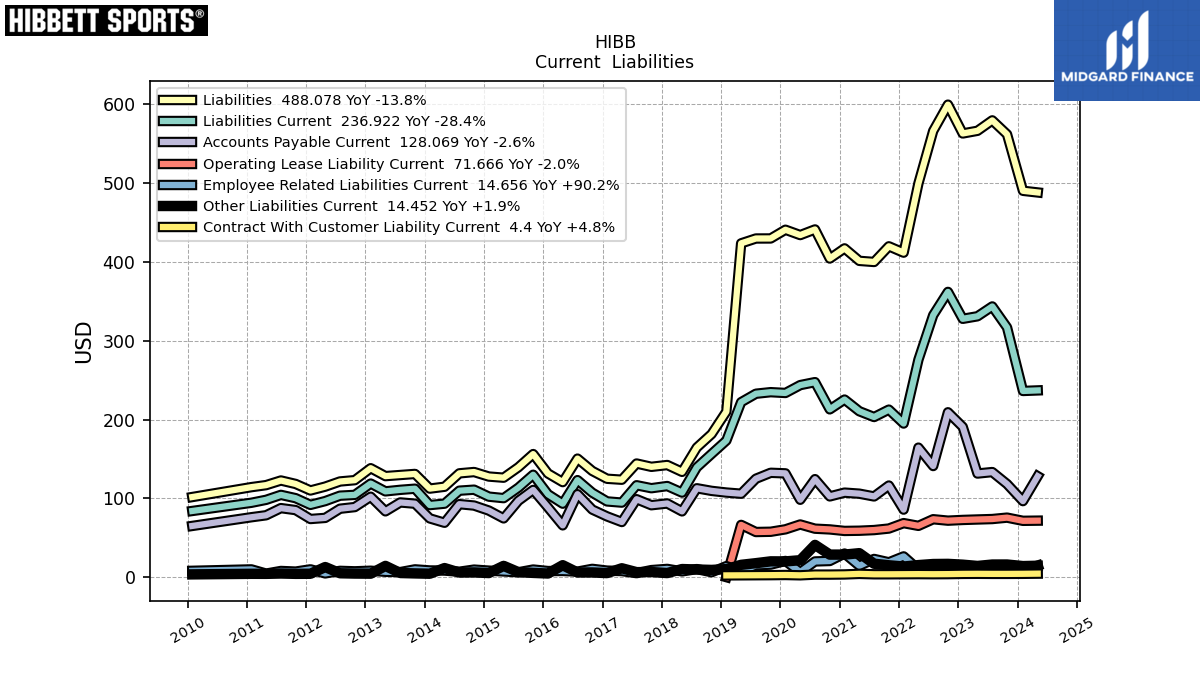
| Liabilities | 490.20 | 561.84 | 579.56 | 566.33 | 562.93 | 599.54 | 566.15 | 499.51 | 411.70 | 419.76 | 399.89 | 401.29 | 417.13 | 404.24 | 441.16 | 434.00 | 440.78 | 429.72 | 429.67 | 423.52 | 210.02 | 181.53 | 164.43 | 133.57 | 142.25 | 139.96 | 144.15 | 123.59 | 124.81 | 134.73 | 150.39 | 120.54 | 131.53 | 156.15 | 139.44 | 126.16 | 127.62 | 133.35 | 131.67 | 114.67 | 112.32 | 130.93 | 129.56 | 128.16 | 138.20 | 123.03 | 121.38 | 114.85 | 109.95 | 118.20 | 122.61 | 116.74 | 114.18 | 101.62 | |
| Liabilities And Stockholders Equity | 909.22 | 950.89 | 976.87 | 965.35 | 939.16 | 937.37 | 888.70 | 805.61 | 703.22 | 725.24 | 800.07 | 840.76 | 808.17 | 777.40 | 786.84 | 738.57 | 769.76 | 765.88 | 769.61 | 780.71 | 546.07 | 510.01 | 497.98 | 475.25 | 461.85 | 458.33 | 469.99 | 458.78 | 458.85 | 466.90 | 469.08 | 452.95 | 442.37 | 451.97 | 466.09 | 472.62 | 452.40 | 443.70 | 441.44 | 437.09 | 416.35 | 416.23 | 402.95 | 394.28 | 377.33 | 352.32 | 342.33 | 335.83 | 313.70 | 313.28 | 325.28 | 318.83 | 314.26 | 276.70 | |
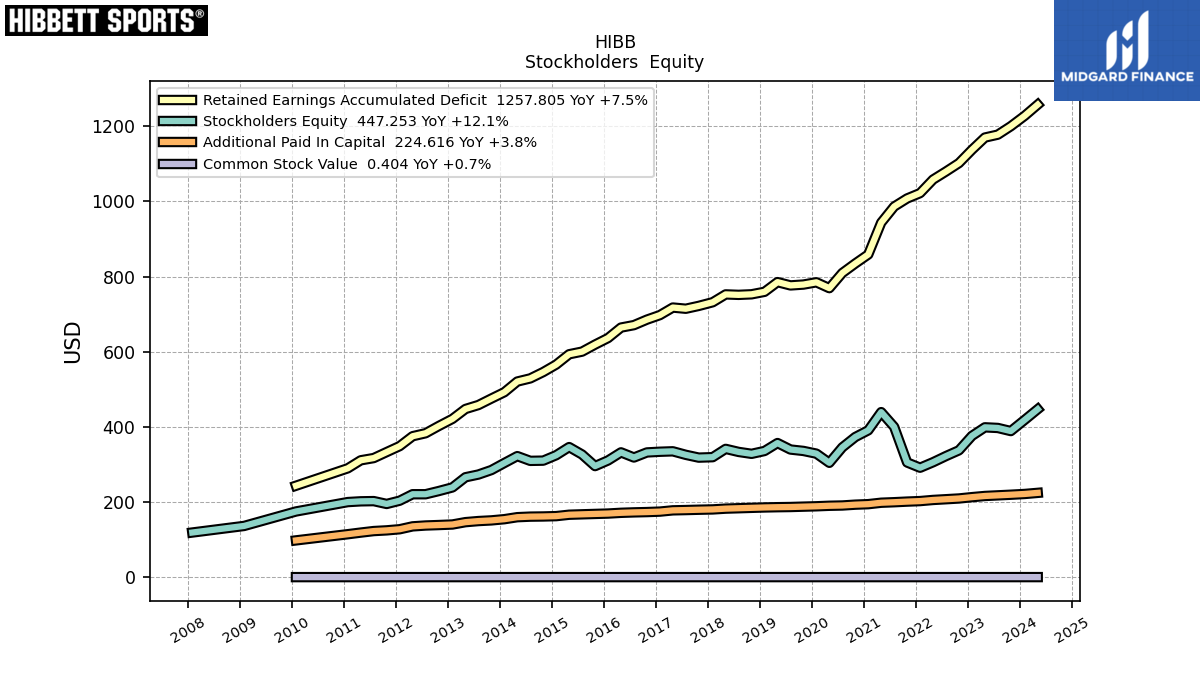
| Stockholders Equity | 419.02 | 389.05 | 397.31 | 399.01 | 376.23 | 337.83 | 322.54 | 306.11 | 291.51 | 305.49 | 400.18 | 439.47 | 391.04 | 373.16 | 345.68 | 304.57 | 328.98 | 336.16 | 339.94 | 357.18 | 336.05 | 328.48 | 333.55 | 341.68 | 319.60 | 318.38 | 325.84 | 335.19 | 334.04 | 332.17 | 318.69 | 332.41 | 310.85 | 295.82 | 326.65 | 346.46 | 324.78 | 310.35 | 309.77 | 322.43 | 304.02 | 285.30 | 273.39 | 266.12 | 239.13 | 229.29 | 220.96 | 220.98 | 203.75 | 195.08 | 202.67 | 202.09 | 200.09 | 175.08 |
| 2024-02-03 | 2023-10-28 | 2023-07-29 | 2023-04-29 | 2023-01-28 | 2022-10-29 | 2022-07-30 | 2022-04-30 | 2022-01-29 | 2021-10-30 | 2021-07-31 | 2021-05-01 | 2021-01-30 | 2020-10-31 | 2020-08-01 | 2020-05-02 | 2020-02-01 | 2019-11-02 | 2019-08-03 | 2019-05-04 | 2019-02-02 | 2018-11-03 | 2018-08-04 | 2018-05-05 | 2018-02-03 | 2017-10-28 | 2017-07-29 | 2017-04-29 | 2017-01-28 | 2016-10-29 | 2016-07-30 | 2016-04-30 | 2016-01-30 | 2015-10-31 | 2015-08-01 | 2015-05-02 | 2015-01-31 | 2014-11-01 | 2014-08-02 | 2014-05-03 | 2014-02-01 | 2013-11-02 | 2013-08-03 | 2013-05-04 | 2013-02-02 | 2012-10-27 | 2012-07-28 | 2012-04-28 | 2012-01-28 | 2011-10-29 | 2011-07-30 | 2011-04-30 | 2011-01-29 | 2010-01-30 | ||
|---|---|---|---|---|---|---|---|---|---|---|---|---|---|---|---|---|---|---|---|---|---|---|---|---|---|---|---|---|---|---|---|---|---|---|---|---|---|---|---|---|---|---|---|---|---|---|---|---|---|---|---|---|---|---|---|
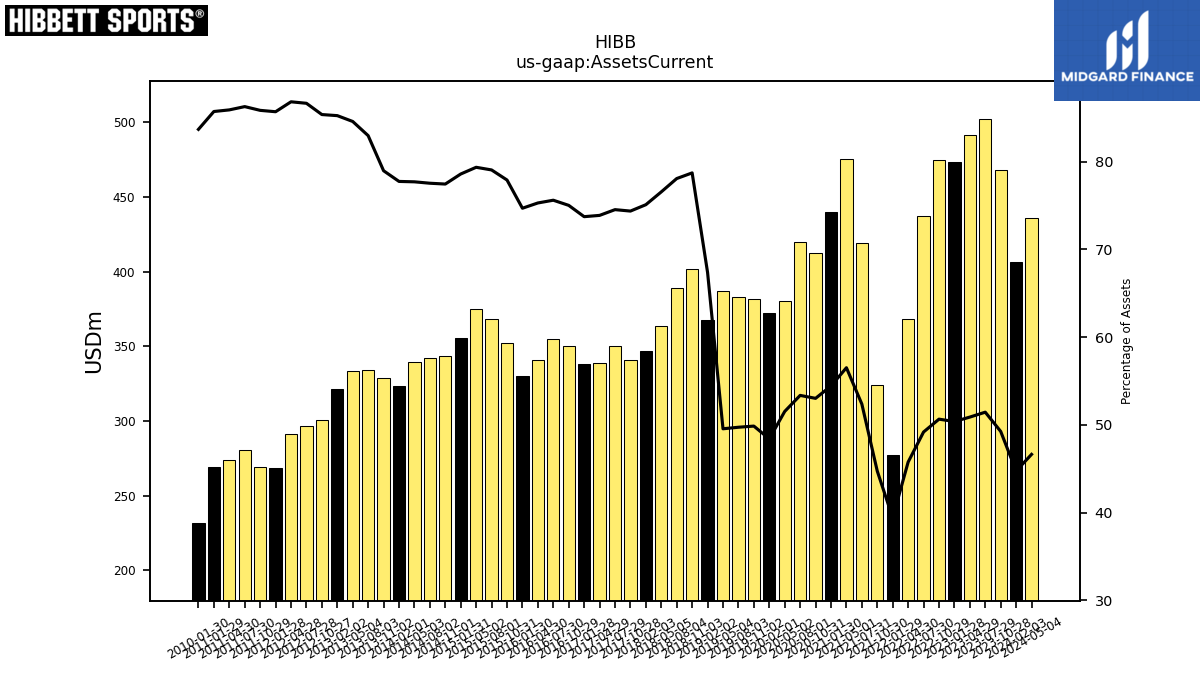
| Assets Current | 406.71 | 468.23 | 502.46 | 491.13 | 473.06 | 474.68 | 437.01 | 368.54 | 277.01 | 324.34 | 418.92 | 475.06 | 439.80 | 412.12 | 419.77 | 380.49 | 372.51 | 381.79 | 382.64 | 386.79 | 367.86 | 401.43 | 388.74 | 363.78 | 346.77 | 340.80 | 350.23 | 338.88 | 338.26 | 350.21 | 354.60 | 340.98 | 330.37 | 352.07 | 368.42 | 375.01 | 355.50 | 343.59 | 342.25 | 339.58 | 323.65 | 328.63 | 334.26 | 333.44 | 321.61 | 300.73 | 296.60 | 291.54 | 268.77 | 268.91 | 280.60 | 273.84 | 269.34 | 231.52 | |
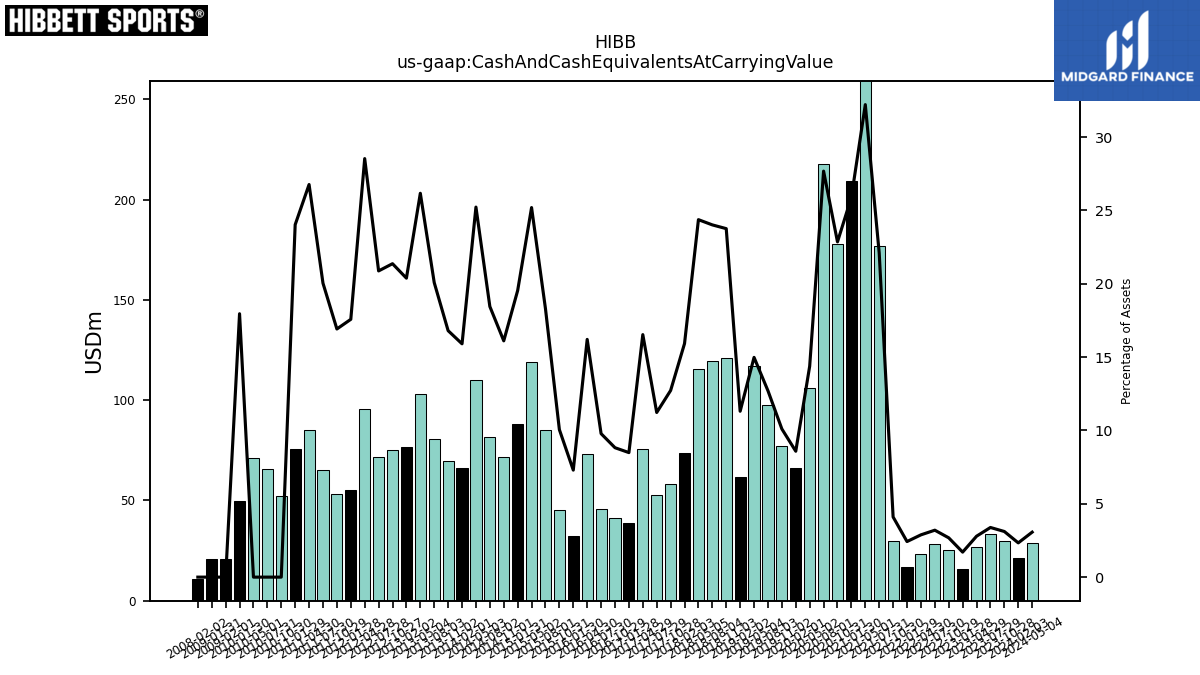
| Cash And Cash Equivalents At Carrying Value | 21.23 | 29.58 | 33.07 | 26.93 | 16.02 | 25.11 | 28.44 | 23.22 | 17.05 | 29.75 | 176.84 | 270.85 | 209.29 | 177.70 | 217.81 | 106.20 | 66.08 | 77.37 | 97.79 | 116.96 | 61.76 | 121.18 | 119.59 | 115.83 | 73.54 | 58.33 | 52.76 | 75.86 | 38.96 | 41.20 | 45.89 | 73.42 | 32.27 | 45.45 | 85.30 | 119.09 | 88.40 | 71.48 | 81.45 | 110.28 | 66.23 | 69.94 | 80.91 | 103.19 | 76.91 | 75.29 | 71.47 | 95.83 | 55.14 | 53.00 | 65.19 | 85.34 | 75.52 | 49.69 | |
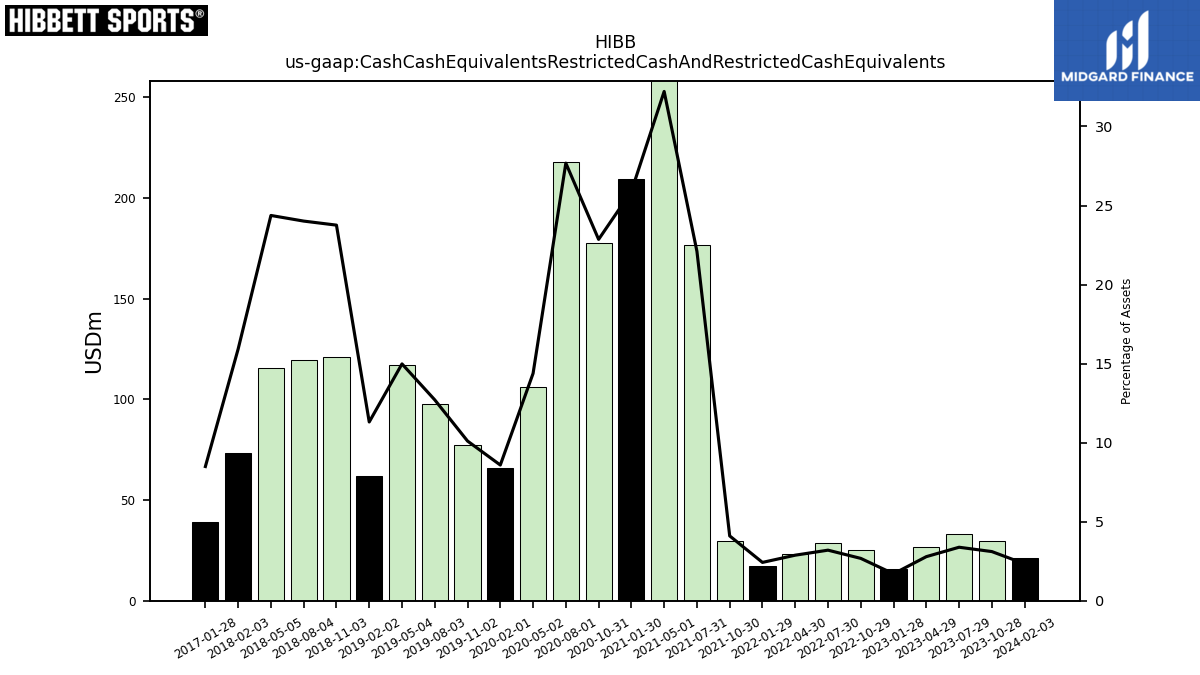
| Cash Cash Equivalents Restricted Cash And Restricted Cash Equivalents | 21.23 | 29.58 | 33.07 | 26.93 | 16.02 | 25.11 | 28.44 | 23.22 | 17.05 | 29.75 | 176.84 | 270.85 | 209.29 | 177.70 | 217.81 | 106.20 | 66.08 | 77.37 | 97.79 | 116.96 | 61.76 | 121.18 | 119.59 | 115.83 | 73.54 | NA | NA | NA | 38.96 | NA | NA | NA | NA | NA | NA | NA | NA | NA | NA | NA | NA | NA | NA | NA | NA | NA | NA | NA | NA | NA | NA | NA | NA | NA | |
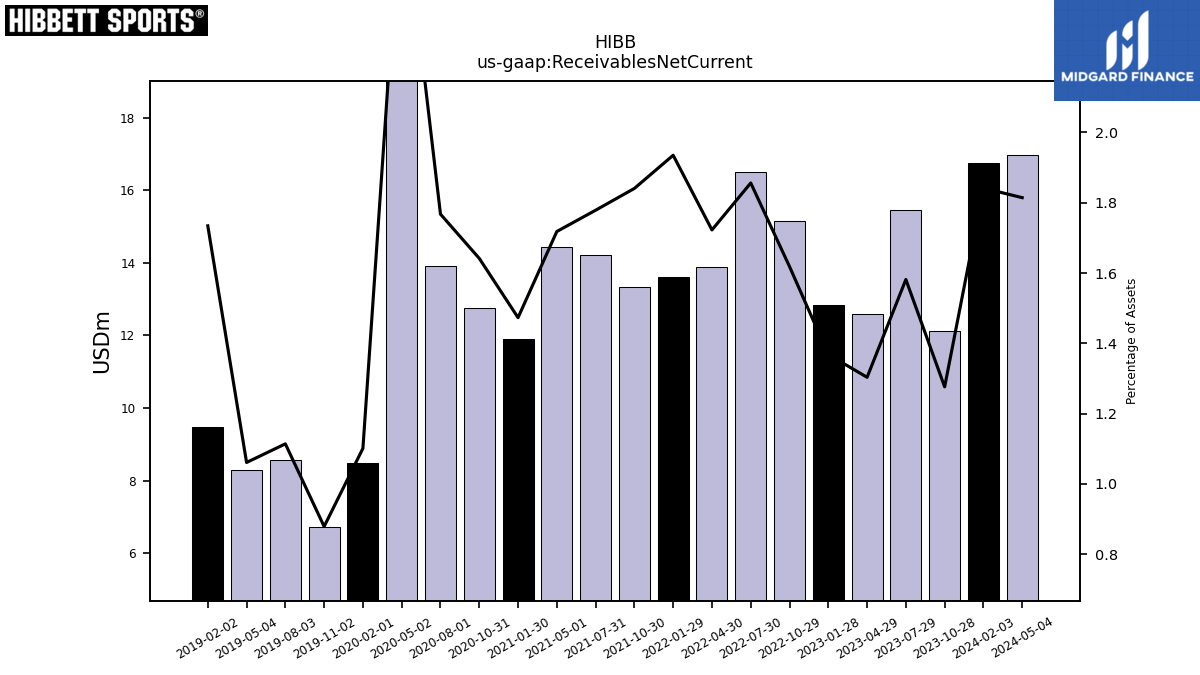
| Receivables Net Current | 16.74 | 12.14 | 15.45 | 12.58 | 12.85 | 15.17 | 16.50 | 13.88 | 13.61 | 13.35 | 14.23 | 14.45 | 11.90 | 12.76 | 13.91 | 20.00 | 8.48 | 6.73 | 8.57 | 8.28 | 9.47 | NA | NA | NA | NA | NA | NA | NA | NA | NA | NA | NA | NA | NA | NA | NA | NA | NA | NA | NA | NA | NA | NA | NA | NA | NA | NA | NA | NA | NA | NA | NA | NA | NA | |
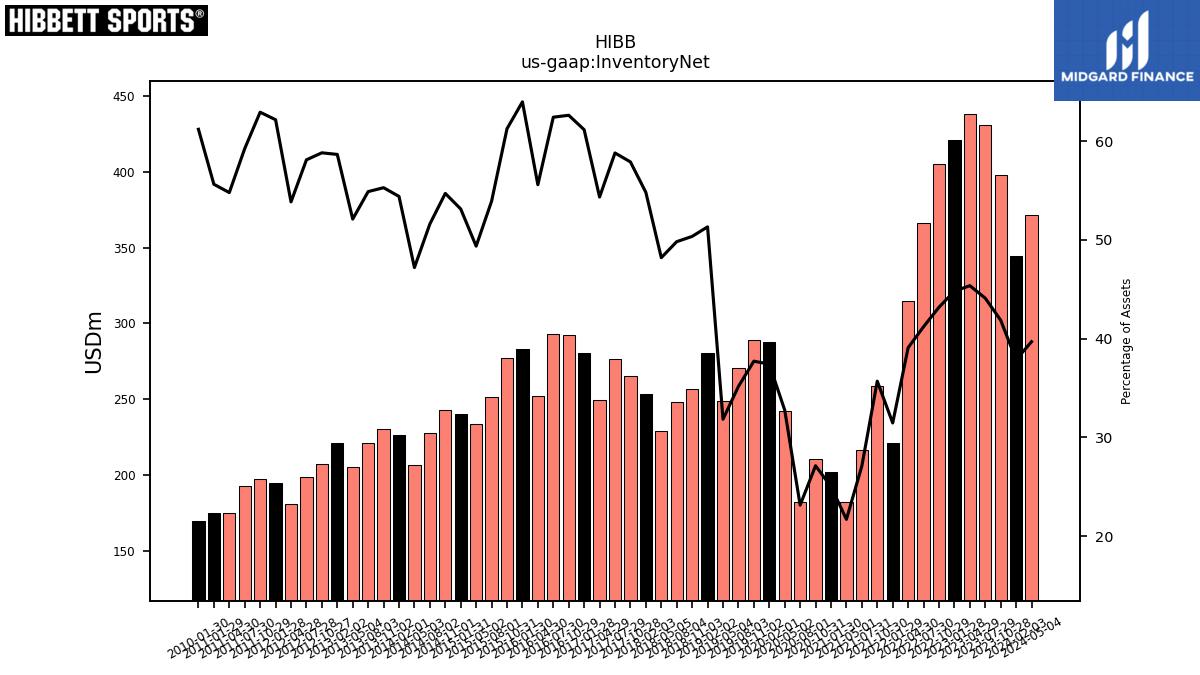
| Inventory Net | 344.29 | 398.11 | 430.82 | 437.96 | 420.84 | 404.82 | 366.22 | 314.86 | 221.22 | 258.84 | 216.79 | 182.37 | 202.04 | 210.86 | 182.03 | 241.98 | 288.01 | 288.88 | 270.56 | 248.55 | 280.29 | 256.85 | 248.13 | 229.11 | 253.20 | 265.42 | 276.43 | 249.36 | 280.70 | 292.46 | 292.91 | 251.84 | 283.10 | 276.94 | 251.34 | 233.36 | 240.41 | 242.79 | 227.87 | 206.34 | 226.54 | 230.17 | 221.22 | 205.50 | 221.38 | 207.28 | 198.97 | 180.88 | 195.07 | 197.20 | 192.77 | 174.73 | 174.88 | 169.39 | |
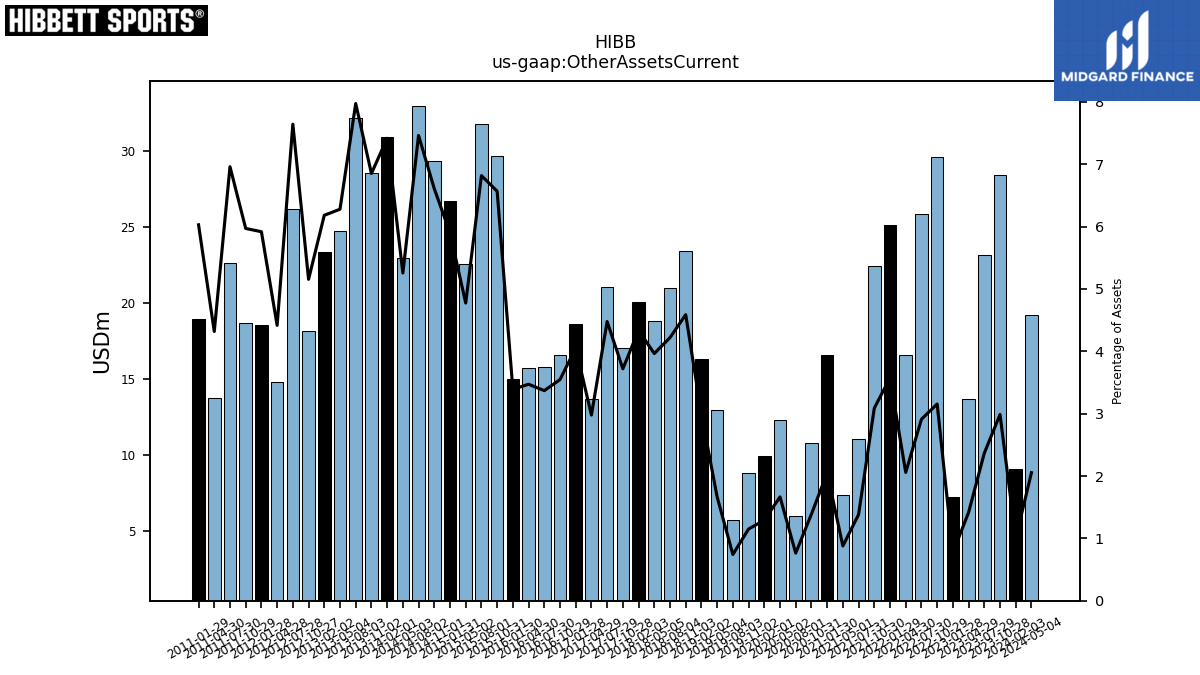
| Other Assets Current | 9.09 | 28.41 | 23.12 | 13.66 | 7.26 | 29.58 | 25.86 | 16.58 | 25.13 | 22.40 | 11.06 | 7.39 | 16.57 | 10.80 | 6.01 | 12.30 | 9.95 | 8.81 | 5.71 | 12.99 | 16.34 | 23.39 | 21.01 | 18.84 | 20.03 | 17.05 | 21.04 | 13.66 | 18.61 | 16.56 | 15.81 | 15.73 | 14.99 | 29.68 | 31.78 | 22.57 | 26.69 | 29.32 | 32.94 | 22.97 | 30.88 | 28.52 | 32.13 | 24.76 | 23.32 | 18.16 | 26.16 | 14.83 | 18.56 | 18.70 | 22.64 | 13.77 | 18.95 | NA |
| 2024-02-03 | 2023-10-28 | 2023-07-29 | 2023-04-29 | 2023-01-28 | 2022-10-29 | 2022-07-30 | 2022-04-30 | 2022-01-29 | 2021-10-30 | 2021-07-31 | 2021-05-01 | 2021-01-30 | 2020-10-31 | 2020-08-01 | 2020-05-02 | 2020-02-01 | 2019-11-02 | 2019-08-03 | 2019-05-04 | 2019-02-02 | 2018-11-03 | 2018-08-04 | 2018-05-05 | 2018-02-03 | 2017-10-28 | 2017-07-29 | 2017-04-29 | 2017-01-28 | 2016-10-29 | 2016-07-30 | 2016-04-30 | 2016-01-30 | 2015-10-31 | 2015-08-01 | 2015-05-02 | 2015-01-31 | 2014-11-01 | 2014-08-02 | 2014-05-03 | 2014-02-01 | 2013-11-02 | 2013-08-03 | 2013-05-04 | 2013-02-02 | 2012-10-27 | 2012-07-28 | 2012-04-28 | 2012-01-28 | 2011-10-29 | 2011-07-30 | 2011-04-30 | 2011-01-29 | 2010-01-30 | ||
|---|---|---|---|---|---|---|---|---|---|---|---|---|---|---|---|---|---|---|---|---|---|---|---|---|---|---|---|---|---|---|---|---|---|---|---|---|---|---|---|---|---|---|---|---|---|---|---|---|---|---|---|---|---|---|---|
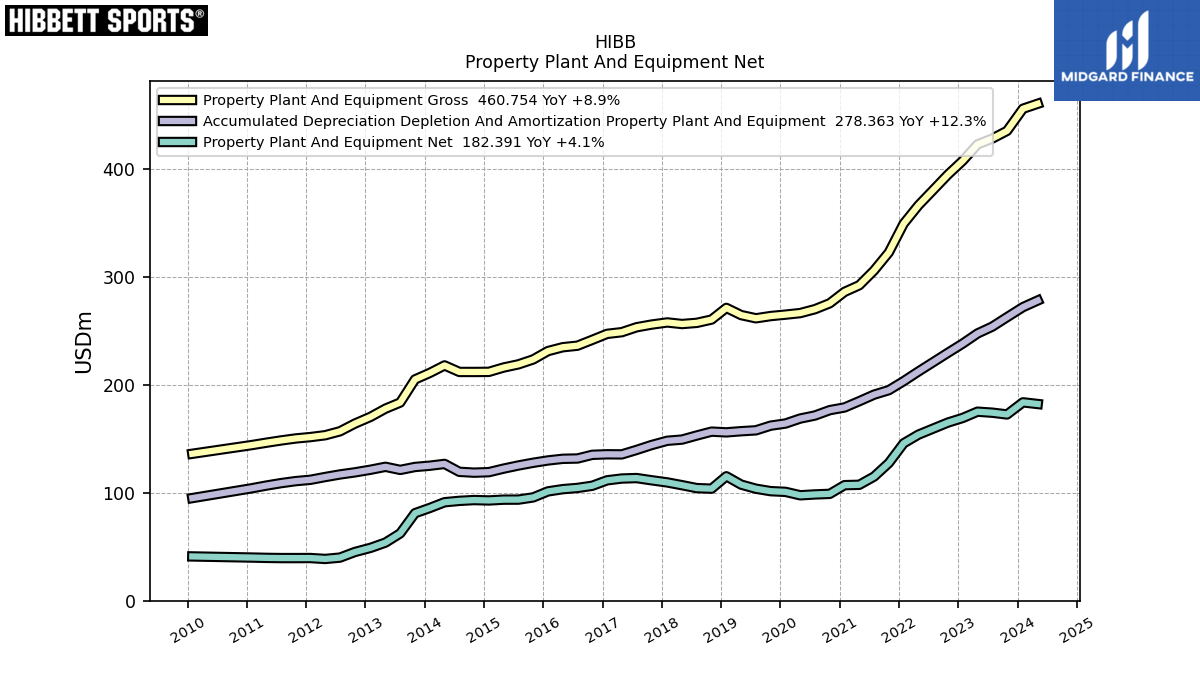
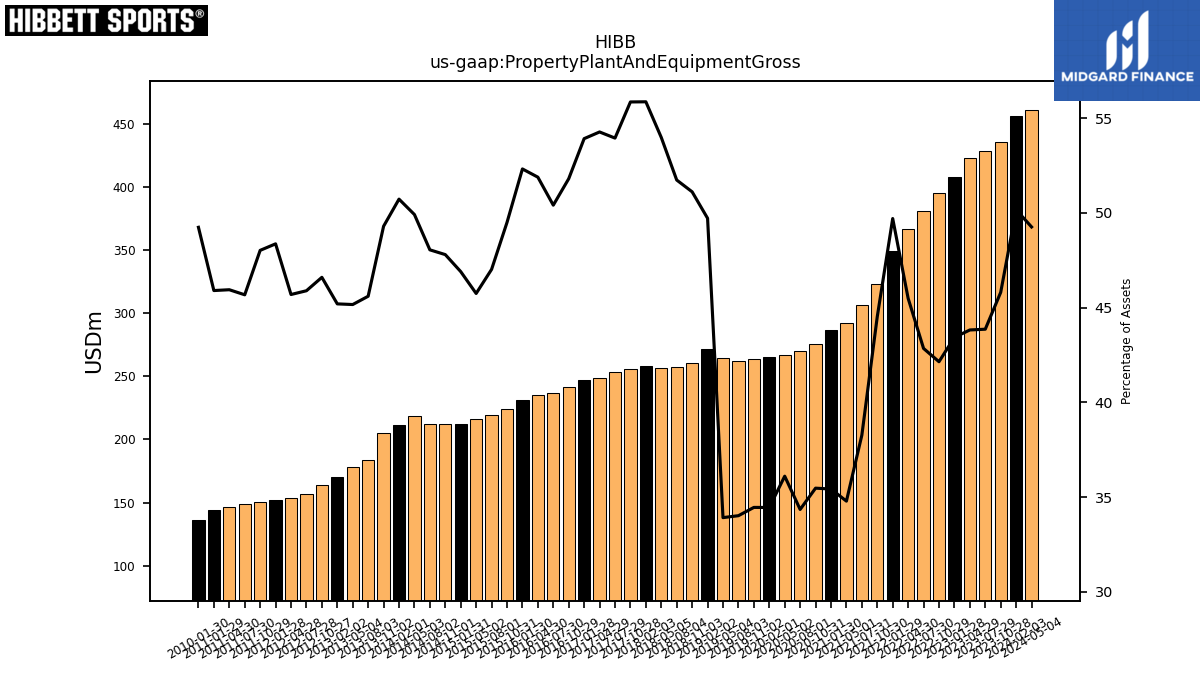
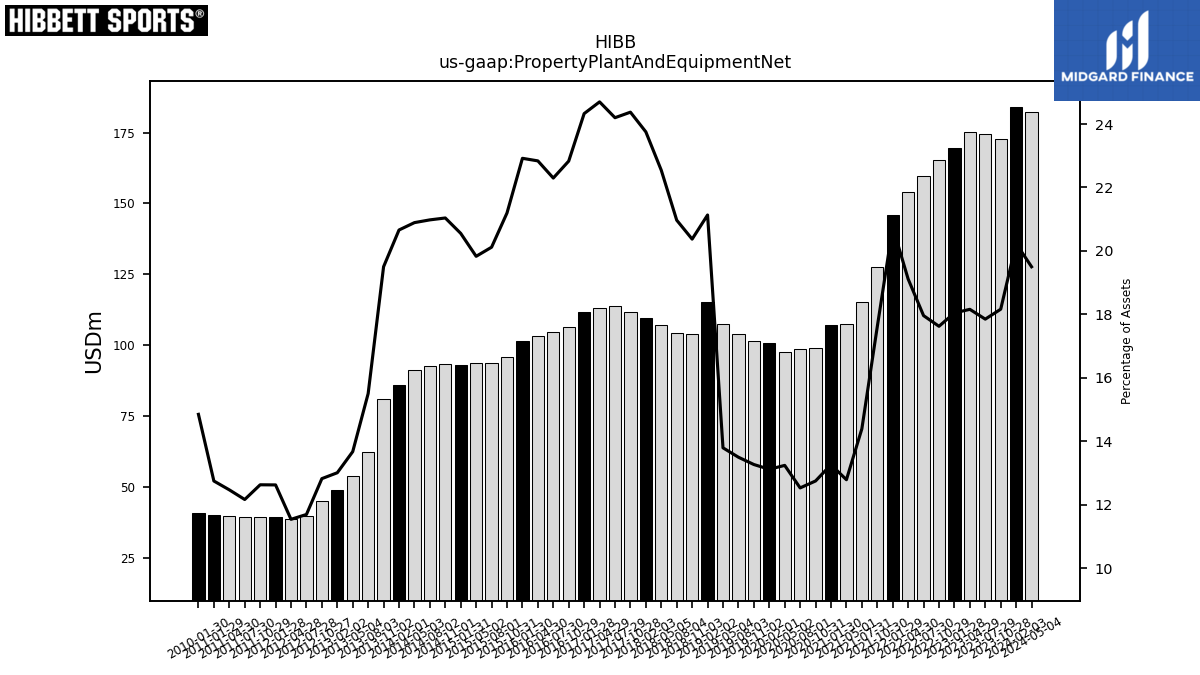
| Property Plant And Equipment Gross | 456.15 | 435.60 | 428.50 | 423.06 | 407.91 | 395.10 | 380.81 | 366.52 | 349.53 | 322.96 | 306.21 | 292.53 | 286.35 | 275.80 | 270.31 | 266.69 | 265.25 | 263.93 | 261.86 | 264.84 | 271.49 | 260.69 | 257.64 | 256.55 | 258.01 | 256.01 | 253.55 | 248.99 | 247.42 | 241.88 | 236.47 | 235.02 | 231.46 | 223.72 | 219.16 | 216.23 | 212.19 | 212.10 | 212.13 | 218.18 | 211.20 | 205.19 | 183.76 | 178.09 | 170.56 | 164.19 | 157.11 | 153.46 | 151.73 | 150.45 | 148.59 | 146.50 | 144.26 | 136.26 | |
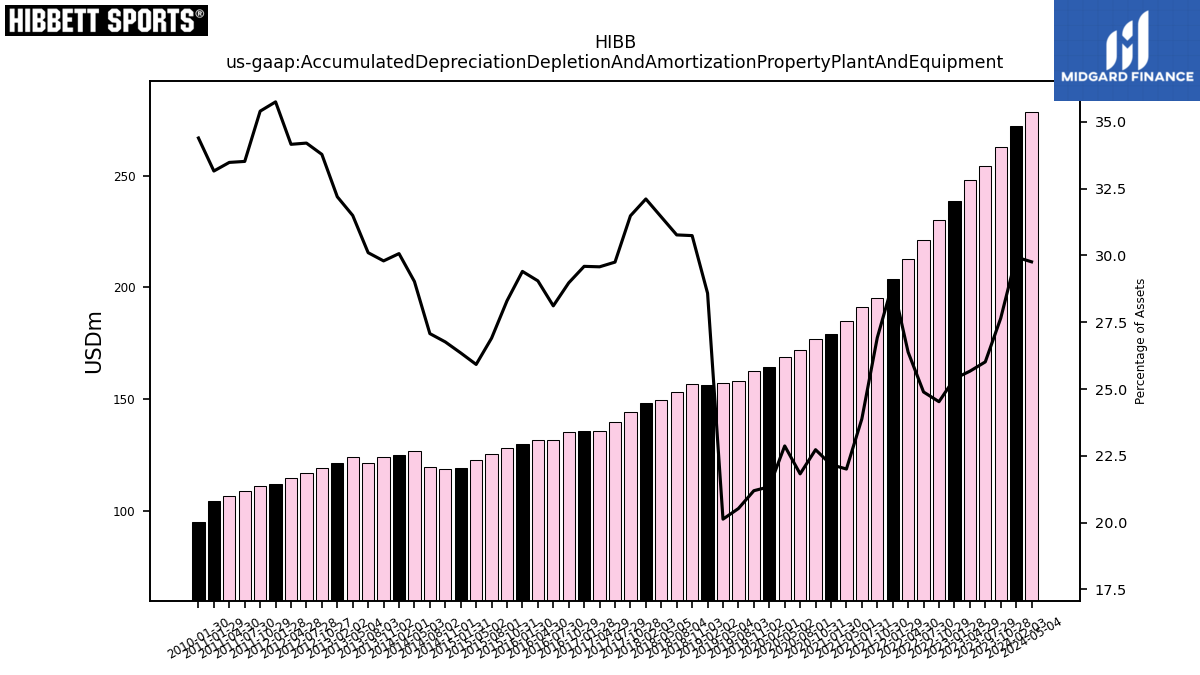
| Accumulated Depreciation Depletion And Amortization Property Plant And Equipment | 272.21 | 262.90 | 254.14 | 247.78 | 238.43 | 229.90 | 221.20 | 212.53 | 203.56 | 195.24 | 191.08 | 185.03 | 179.19 | 176.71 | 171.74 | 168.92 | 164.29 | 162.34 | 158.00 | 157.17 | 156.10 | 156.79 | 153.22 | 149.42 | 148.31 | 144.29 | 139.82 | 135.68 | 135.78 | 135.28 | 131.87 | 131.58 | 130.07 | 127.92 | 125.40 | 122.51 | 119.21 | 118.75 | 119.52 | 126.86 | 125.19 | 124.02 | 121.30 | 124.18 | 121.48 | 119.02 | 117.09 | 114.71 | 112.14 | 110.90 | 109.03 | 106.75 | 104.21 | 95.17 | |
| Property Plant And Equipment Net | 183.95 | 172.70 | 174.36 | 175.28 | 169.48 | 165.20 | 159.61 | 153.99 | 145.97 | 127.72 | 115.13 | 107.50 | 107.16 | 99.09 | 98.57 | 97.77 | 100.96 | 101.60 | 103.86 | 107.67 | 115.39 | 103.90 | 104.42 | 107.13 | 109.70 | 111.71 | 113.73 | 113.31 | 111.63 | 106.60 | 104.59 | 103.45 | 101.39 | 95.80 | 93.76 | 93.72 | 92.98 | 93.35 | 92.61 | 91.32 | 86.01 | 81.17 | 62.46 | 53.91 | 49.08 | 45.17 | 40.02 | 38.75 | 39.60 | 39.56 | 39.56 | 39.75 | 40.06 | 41.08 | |
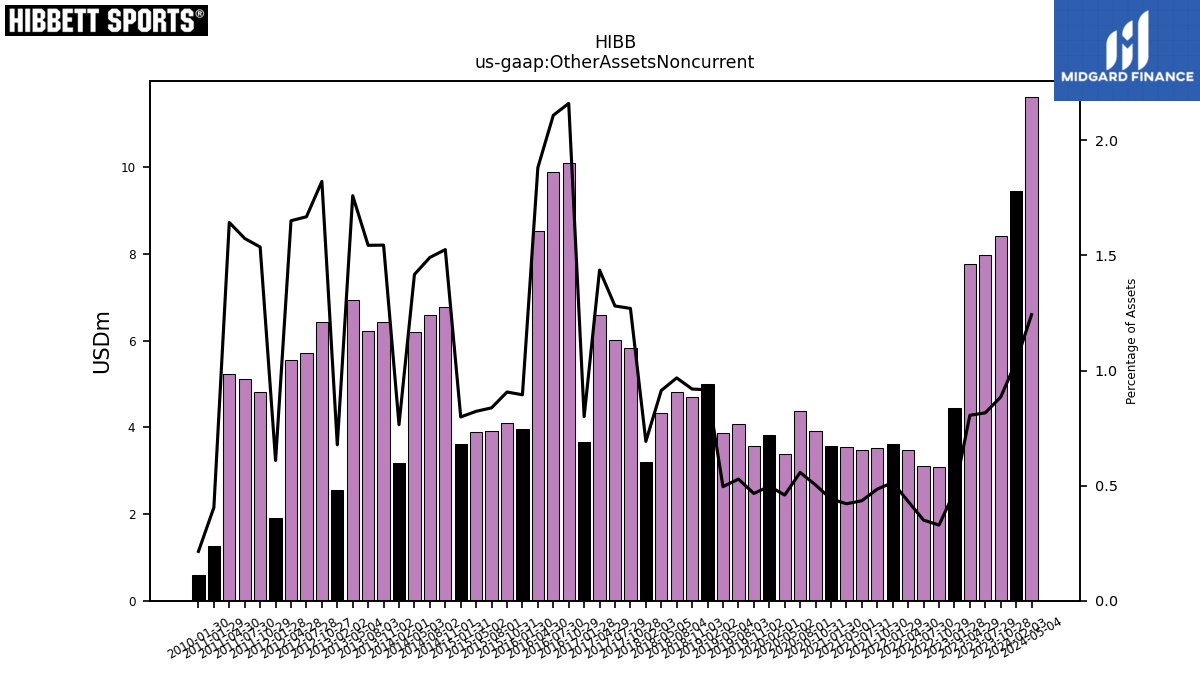
| Other Assets Noncurrent | 9.44 | 8.41 | 7.97 | 7.78 | 4.43 | 3.08 | 3.11 | 3.48 | 3.61 | 3.52 | 3.48 | 3.54 | 3.57 | 3.91 | 4.39 | 3.39 | 3.83 | 3.57 | 4.07 | 3.87 | 5.00 | 4.69 | 4.82 | 4.34 | 3.20 | 5.82 | 6.02 | 6.59 | 3.67 | 10.09 | 9.89 | 8.52 | 3.96 | 4.10 | 3.91 | 3.89 | 3.61 | 6.77 | 6.58 | 6.20 | 3.19 | 6.43 | 6.22 | 6.94 | 2.56 | 6.42 | 5.71 | 5.54 | 1.91 | 4.81 | 5.12 | 5.24 | 1.27 | 0.59 |
| 2024-02-03 | 2023-10-28 | 2023-07-29 | 2023-04-29 | 2023-01-28 | 2022-10-29 | 2022-07-30 | 2022-04-30 | 2022-01-29 | 2021-10-30 | 2021-07-31 | 2021-05-01 | 2021-01-30 | 2020-10-31 | 2020-08-01 | 2020-05-02 | 2020-02-01 | 2019-11-02 | 2019-08-03 | 2019-05-04 | 2019-02-02 | 2018-11-03 | 2018-08-04 | 2018-05-05 | 2018-02-03 | 2017-10-28 | 2017-07-29 | 2017-04-29 | 2017-01-28 | 2016-10-29 | 2016-07-30 | 2016-04-30 | 2016-01-30 | 2015-10-31 | 2015-08-01 | 2015-05-02 | 2015-01-31 | 2014-11-01 | 2014-08-02 | 2014-05-03 | 2014-02-01 | 2013-11-02 | 2013-08-03 | 2013-05-04 | 2013-02-02 | 2012-10-27 | 2012-07-28 | 2012-04-28 | 2012-01-28 | 2011-10-29 | 2011-07-30 | 2011-04-30 | 2011-01-29 | 2010-01-30 | ||
|---|---|---|---|---|---|---|---|---|---|---|---|---|---|---|---|---|---|---|---|---|---|---|---|---|---|---|---|---|---|---|---|---|---|---|---|---|---|---|---|---|---|---|---|---|---|---|---|---|---|---|---|---|---|---|---|
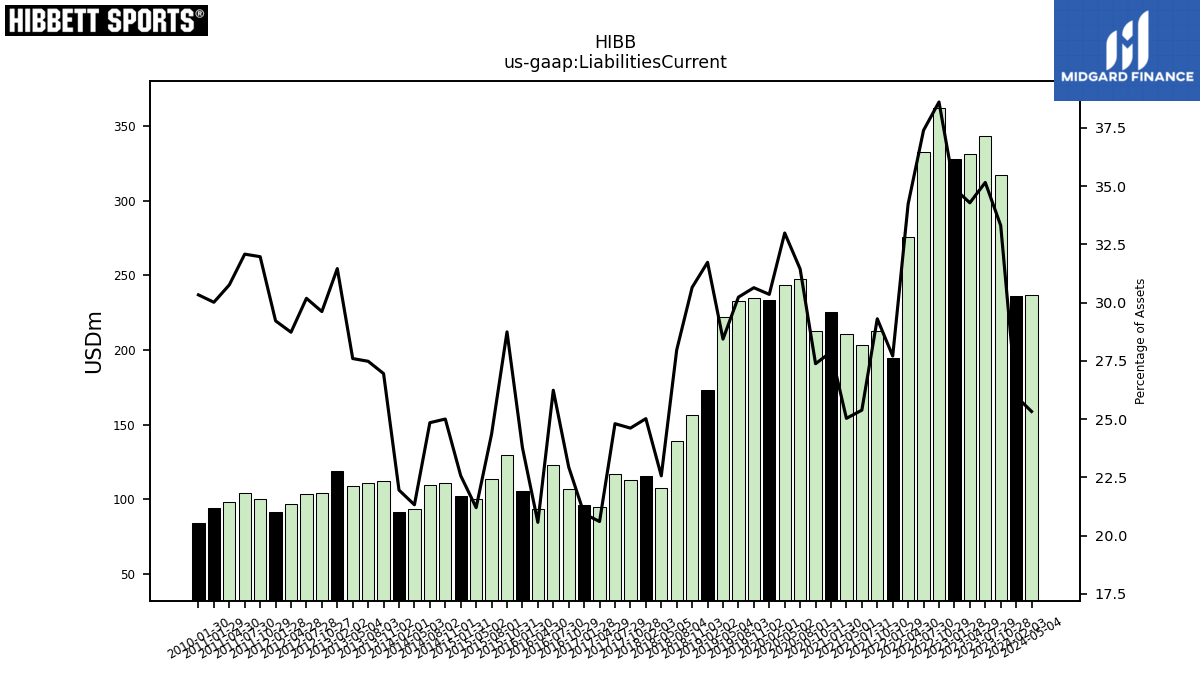
| Liabilities Current | 236.21 | 316.77 | 343.46 | 330.98 | 327.75 | 361.93 | 332.35 | 275.80 | 194.86 | 212.55 | 203.12 | 210.48 | 225.32 | 212.85 | 247.43 | 243.65 | 233.66 | 234.68 | 232.71 | 222.00 | 173.27 | 156.35 | 139.29 | 107.25 | 115.57 | 112.83 | 116.58 | 94.55 | 96.07 | 107.13 | 123.10 | 93.18 | 105.19 | 129.93 | 113.53 | 100.21 | 102.12 | 110.95 | 109.69 | 93.21 | 91.41 | 112.20 | 110.75 | 108.83 | 118.72 | 104.35 | 103.34 | 96.49 | 91.66 | 100.17 | 104.36 | 98.08 | 94.33 | 83.94 | |
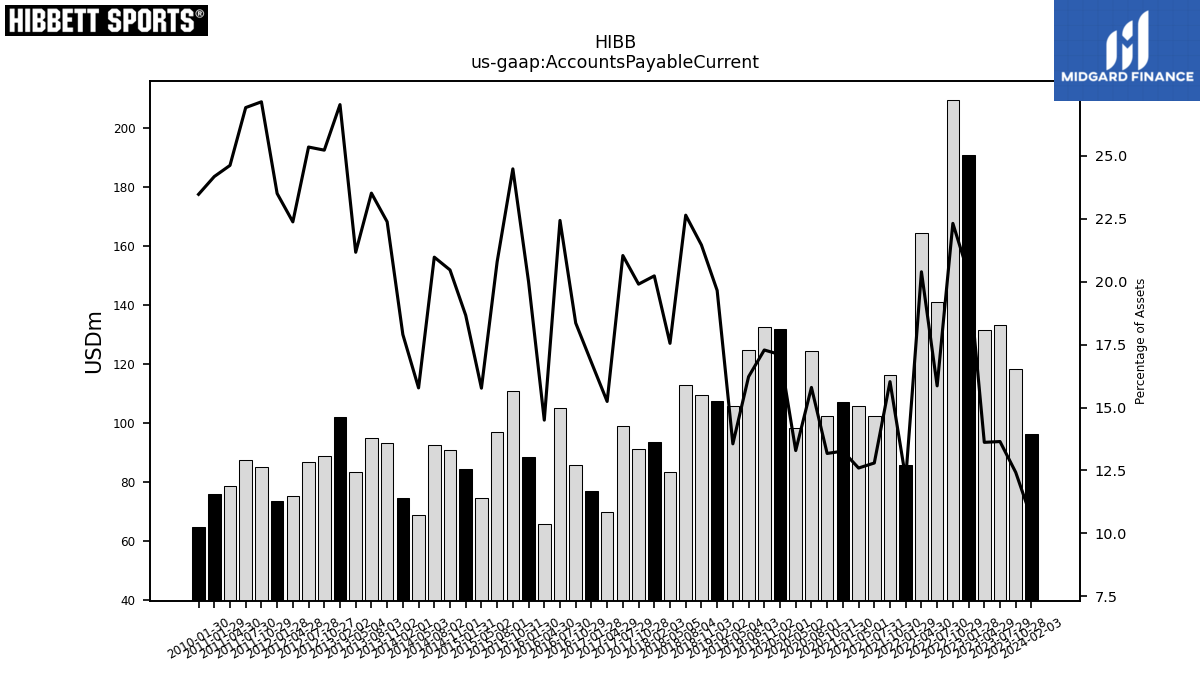
| Accounts Payable Current | 96.43 | 118.13 | 133.31 | 131.44 | 190.65 | 209.19 | 140.95 | 164.29 | 85.65 | 116.23 | 102.36 | 105.89 | 107.22 | 102.41 | 124.30 | 98.15 | 131.66 | 132.39 | 124.86 | 105.83 | 107.31 | 109.44 | 112.76 | 83.41 | 93.44 | 91.22 | 98.88 | 69.92 | 77.05 | 85.71 | 105.24 | 65.67 | 88.46 | 110.66 | 96.90 | 74.53 | 84.44 | 90.82 | 92.59 | 68.97 | 74.53 | 93.16 | 94.77 | 83.47 | 102.02 | 88.88 | 86.79 | 75.15 | 73.73 | 85.05 | 87.57 | 78.50 | 75.99 | 64.95 | |
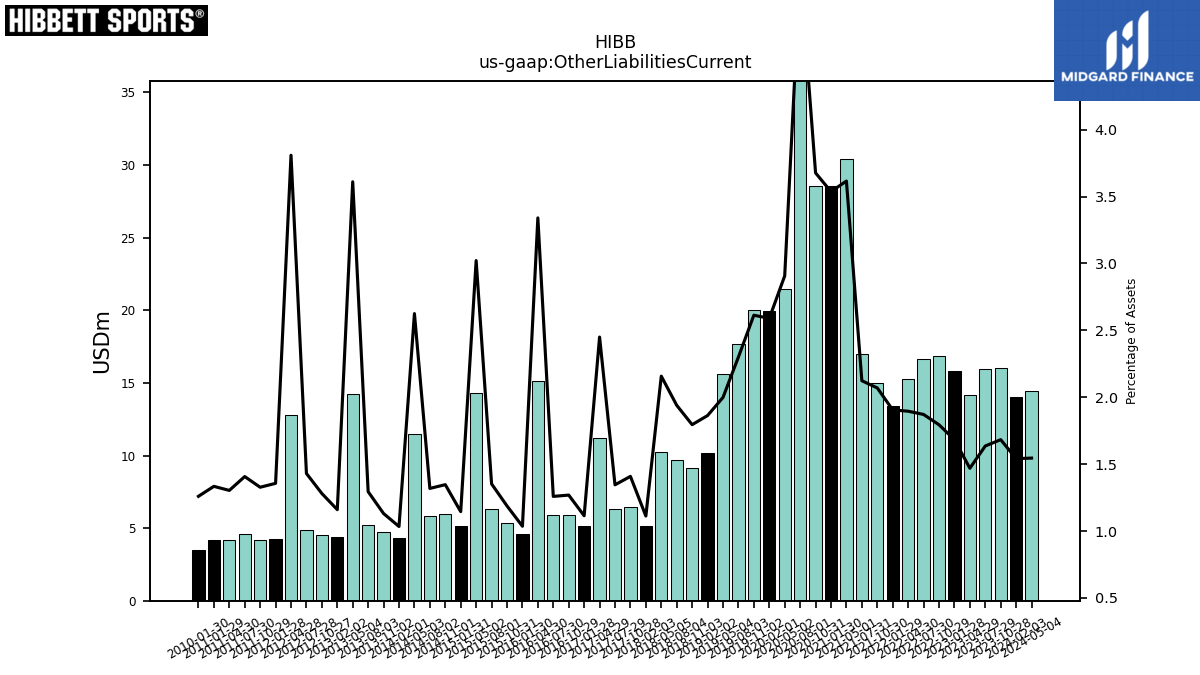
| Other Liabilities Current | 14.01 | 16.00 | 15.98 | 14.18 | 15.80 | 16.82 | 16.63 | 15.27 | 13.40 | 15.01 | 16.99 | 30.40 | 28.59 | 28.59 | 40.89 | 21.47 | 19.93 | 20.02 | 17.71 | 15.60 | 10.17 | 9.15 | 9.66 | 10.25 | 5.14 | 6.46 | 6.32 | 11.24 | 5.11 | 5.92 | 5.91 | 15.13 | 4.58 | 5.37 | 6.30 | 14.28 | 5.18 | 5.97 | 5.82 | 11.47 | 4.30 | 4.71 | 5.21 | 14.24 | 4.38 | 4.51 | 4.90 | 12.79 | 4.25 | 4.16 | 4.58 | 4.16 | 4.19 | 3.48 | |
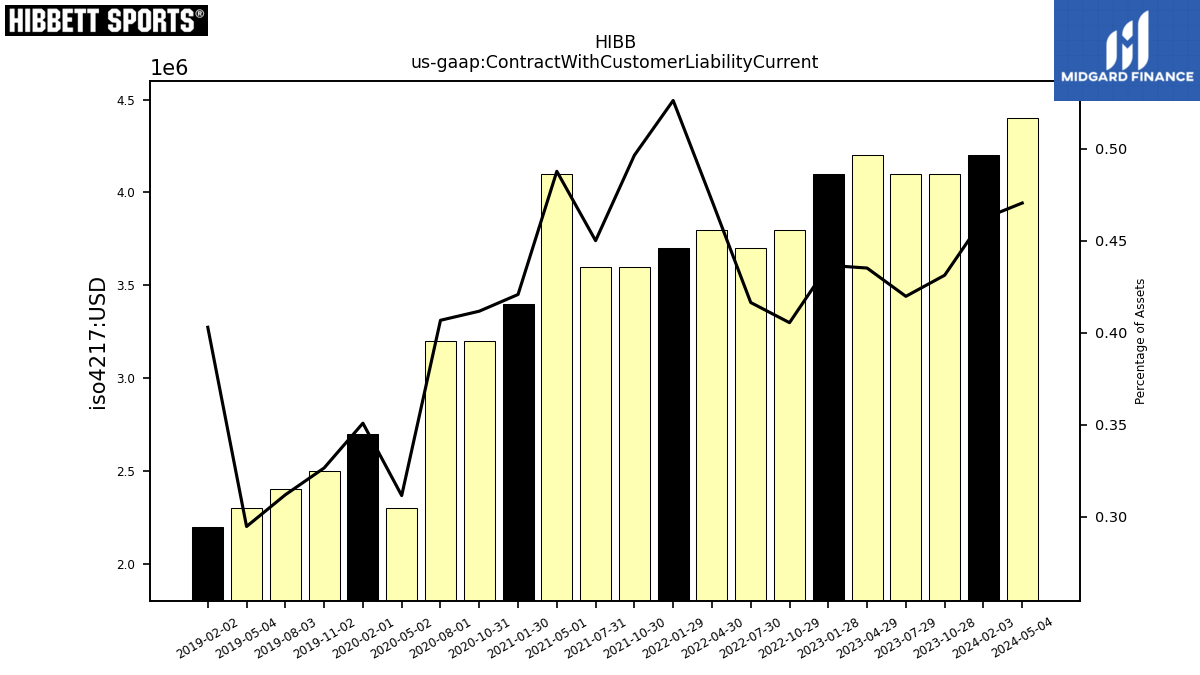
| Contract With Customer Liability Current | 4.20 | 4.10 | 4.10 | 4.20 | 4.10 | 3.80 | 3.70 | 3.80 | 3.70 | 3.60 | 3.60 | 4.10 | 3.40 | 3.20 | 3.20 | 2.30 | 2.70 | 2.50 | 2.40 | 2.30 | 2.20 | NA | NA | NA | NA | NA | NA | NA | NA | NA | NA | NA | NA | NA | NA | NA | NA | NA | NA | NA | NA | NA | NA | NA | NA | NA | NA | NA | NA | NA | NA | NA | NA | NA |
| 2024-02-03 | 2023-10-28 | 2023-07-29 | 2023-04-29 | 2023-01-28 | 2022-10-29 | 2022-07-30 | 2022-04-30 | 2022-01-29 | 2021-10-30 | 2021-07-31 | 2021-05-01 | 2021-01-30 | 2020-10-31 | 2020-08-01 | 2020-05-02 | 2020-02-01 | 2019-11-02 | 2019-08-03 | 2019-05-04 | 2019-02-02 | 2018-11-03 | 2018-08-04 | 2018-05-05 | 2018-02-03 | 2017-10-28 | 2017-07-29 | 2017-04-29 | 2017-01-28 | 2016-10-29 | 2016-07-30 | 2016-04-30 | 2016-01-30 | 2015-10-31 | 2015-08-01 | 2015-05-02 | 2015-01-31 | 2014-11-01 | 2014-08-02 | 2014-05-03 | 2014-02-01 | 2013-11-02 | 2013-08-03 | 2013-05-04 | 2013-02-02 | 2012-10-27 | 2012-07-28 | 2012-04-28 | 2012-01-28 | 2011-10-29 | 2011-07-30 | 2011-04-30 | 2011-01-29 | 2010-01-30 | ||
|---|---|---|---|---|---|---|---|---|---|---|---|---|---|---|---|---|---|---|---|---|---|---|---|---|---|---|---|---|---|---|---|---|---|---|---|---|---|---|---|---|---|---|---|---|---|---|---|---|---|---|---|---|---|---|---|
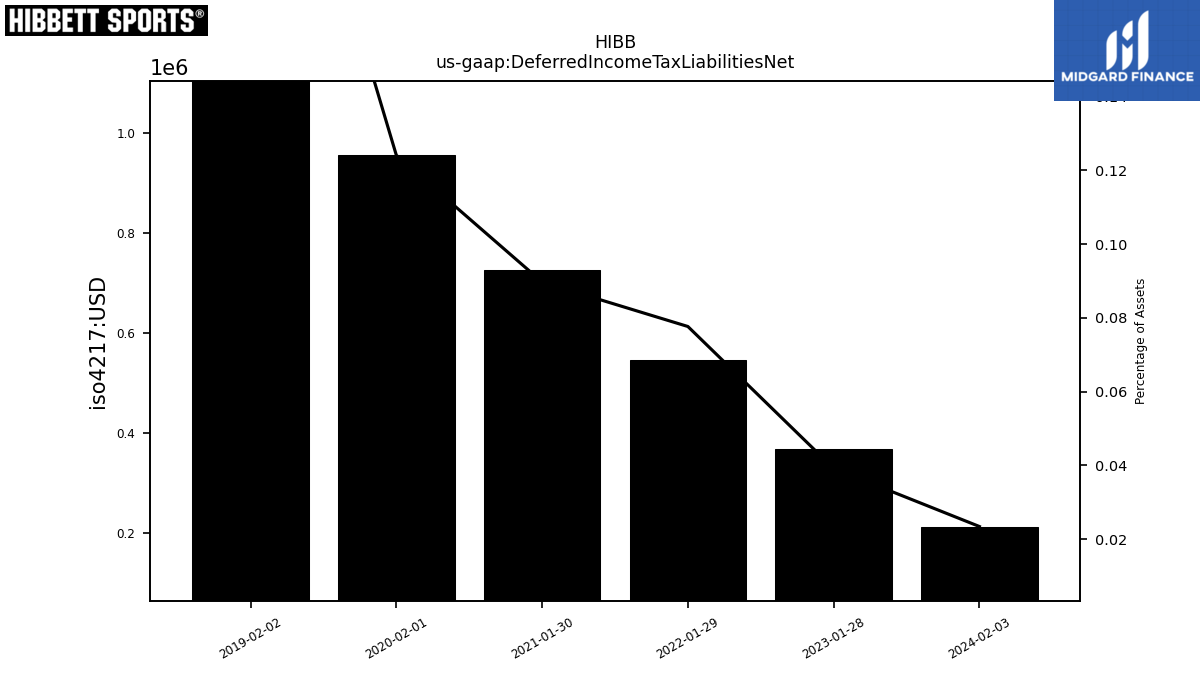
| Deferred Income Tax Liabilities Net | 0.21 | NA | NA | NA | 0.37 | NA | NA | NA | 0.55 | NA | NA | NA | 0.72 | NA | NA | NA | 0.95 | NA | NA | NA | 1.40 | NA | NA | NA | NA | NA | NA | NA | NA | NA | NA | NA | NA | NA | NA | NA | NA | NA | NA | NA | NA | NA | NA | NA | NA | NA | NA | NA | NA | NA | NA | NA | NA | NA | |
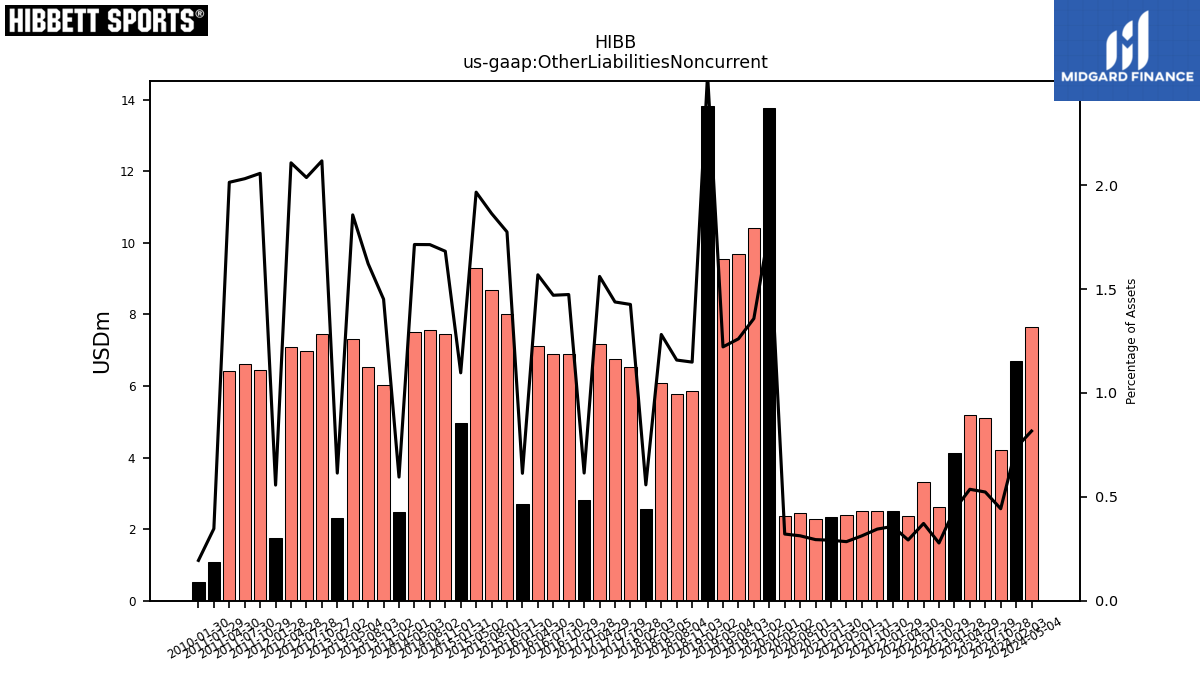
| Other Liabilities Noncurrent | 6.70 | 4.21 | 5.11 | 5.18 | 4.12 | 2.60 | 3.31 | 2.36 | 2.52 | 2.50 | 2.50 | 2.39 | 2.35 | 2.29 | 2.46 | 2.37 | 13.76 | 10.40 | 9.70 | 9.54 | 13.83 | 5.86 | 5.77 | 6.09 | 2.58 | 6.54 | 6.76 | 7.16 | 2.82 | 6.88 | 6.90 | 7.10 | 2.71 | 8.02 | 8.69 | 9.29 | 4.96 | 7.46 | 7.57 | 7.49 | 2.48 | 6.04 | 6.54 | 7.32 | 2.32 | 7.46 | 6.97 | 7.08 | 1.75 | 6.44 | 6.61 | 6.42 | 1.09 | 0.54 | |
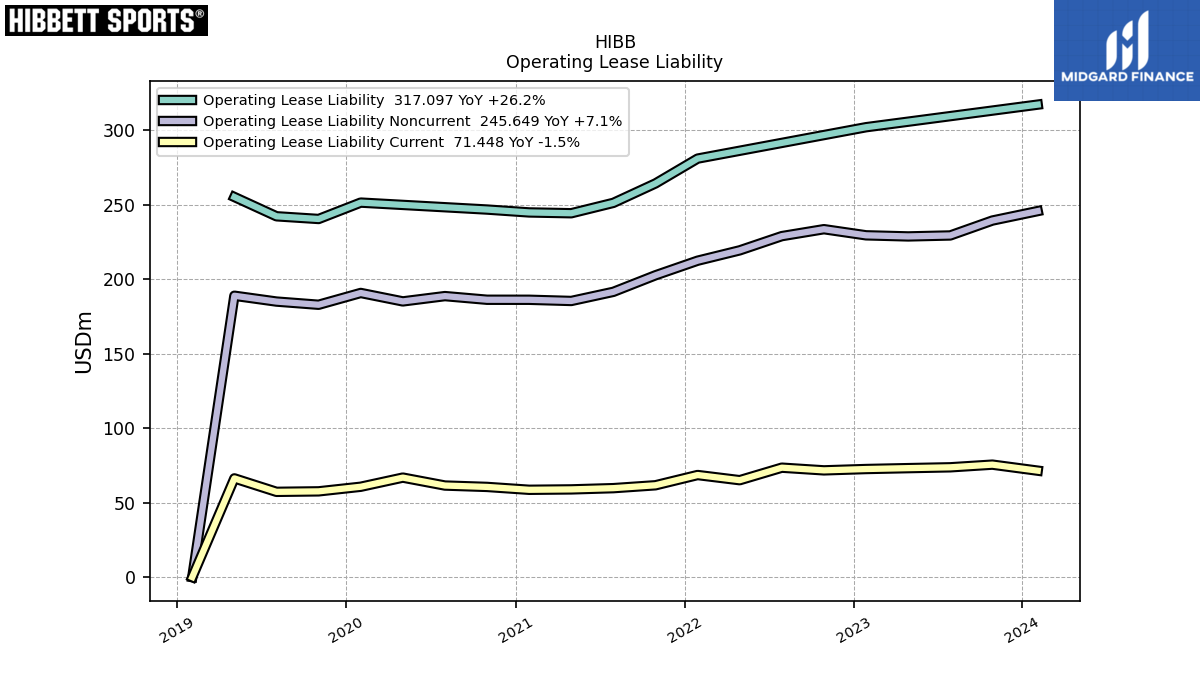
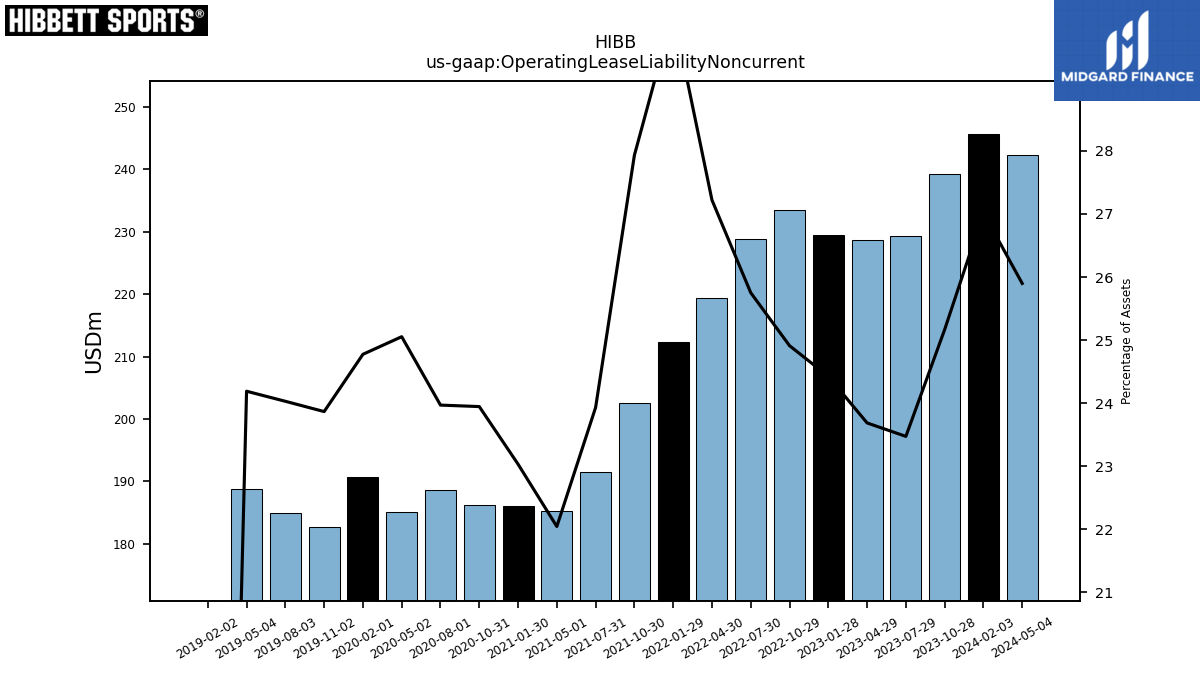
| Operating Lease Liability Noncurrent | 245.65 | 239.30 | 229.29 | 228.65 | 229.39 | 233.50 | 228.85 | 219.30 | 212.35 | 202.57 | 191.46 | 185.33 | 186.13 | 186.15 | 188.59 | 185.03 | 190.70 | 182.78 | 184.93 | 188.84 | 0.00 | NA | NA | NA | NA | NA | NA | NA | NA | NA | NA | NA | NA | NA | NA | NA | NA | NA | NA | NA | NA | NA | NA | NA | NA | NA | NA | NA | NA | NA | NA | NA | NA | NA |
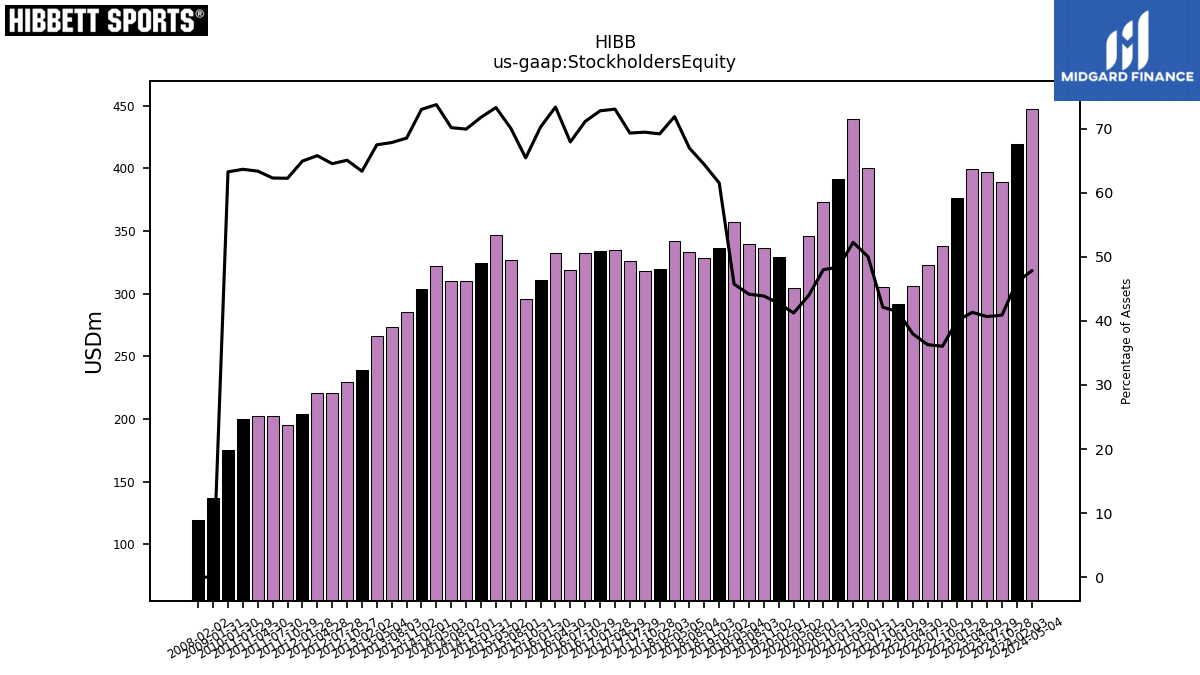
| 2024-02-03 | 2023-10-28 | 2023-07-29 | 2023-04-29 | 2023-01-28 | 2022-10-29 | 2022-07-30 | 2022-04-30 | 2022-01-29 | 2021-10-30 | 2021-07-31 | 2021-05-01 | 2021-01-30 | 2020-10-31 | 2020-08-01 | 2020-05-02 | 2020-02-01 | 2019-11-02 | 2019-08-03 | 2019-05-04 | 2019-02-02 | 2018-11-03 | 2018-08-04 | 2018-05-05 | 2018-02-03 | 2017-10-28 | 2017-07-29 | 2017-04-29 | 2017-01-28 | 2016-10-29 | 2016-07-30 | 2016-04-30 | 2016-01-30 | 2015-10-31 | 2015-08-01 | 2015-05-02 | 2015-01-31 | 2014-11-01 | 2014-08-02 | 2014-05-03 | 2014-02-01 | 2013-11-02 | 2013-08-03 | 2013-05-04 | 2013-02-02 | 2012-10-27 | 2012-07-28 | 2012-04-28 | 2012-01-28 | 2011-10-29 | 2011-07-30 | 2011-04-30 | 2011-01-29 | 2010-01-30 | ||
|---|---|---|---|---|---|---|---|---|---|---|---|---|---|---|---|---|---|---|---|---|---|---|---|---|---|---|---|---|---|---|---|---|---|---|---|---|---|---|---|---|---|---|---|---|---|---|---|---|---|---|---|---|---|---|---|
| Stockholders Equity | 419.02 | 389.05 | 397.31 | 399.01 | 376.23 | 337.83 | 322.54 | 306.11 | 291.51 | 305.49 | 400.18 | 439.47 | 391.04 | 373.16 | 345.68 | 304.57 | 328.98 | 336.16 | 339.94 | 357.18 | 336.05 | 328.48 | 333.55 | 341.68 | 319.60 | 318.38 | 325.84 | 335.19 | 334.04 | 332.17 | 318.69 | 332.41 | 310.85 | 295.82 | 326.65 | 346.46 | 324.78 | 310.35 | 309.77 | 322.43 | 304.02 | 285.30 | 273.39 | 266.12 | 239.13 | 229.29 | 220.96 | 220.98 | 203.75 | 195.08 | 202.67 | 202.09 | 200.09 | 175.08 | |
| Common Stock Value | 0.40 | 0.40 | 0.40 | 0.40 | 0.40 | 0.40 | 0.40 | 0.40 | 0.40 | 0.40 | 0.40 | 0.40 | 0.39 | 0.39 | 0.39 | 0.39 | 0.39 | 0.39 | 0.39 | 0.39 | 0.39 | 0.39 | 0.39 | 0.39 | 0.39 | 0.39 | 0.39 | 0.39 | 0.39 | 0.39 | 0.39 | 0.39 | 0.39 | 0.39 | 0.39 | 0.39 | 0.39 | 0.39 | 0.39 | 0.38 | 0.38 | 0.38 | 0.38 | 0.38 | 0.38 | 0.38 | 0.38 | 0.38 | 0.38 | 0.37 | 0.37 | 0.37 | 0.37 | 0.36 | |
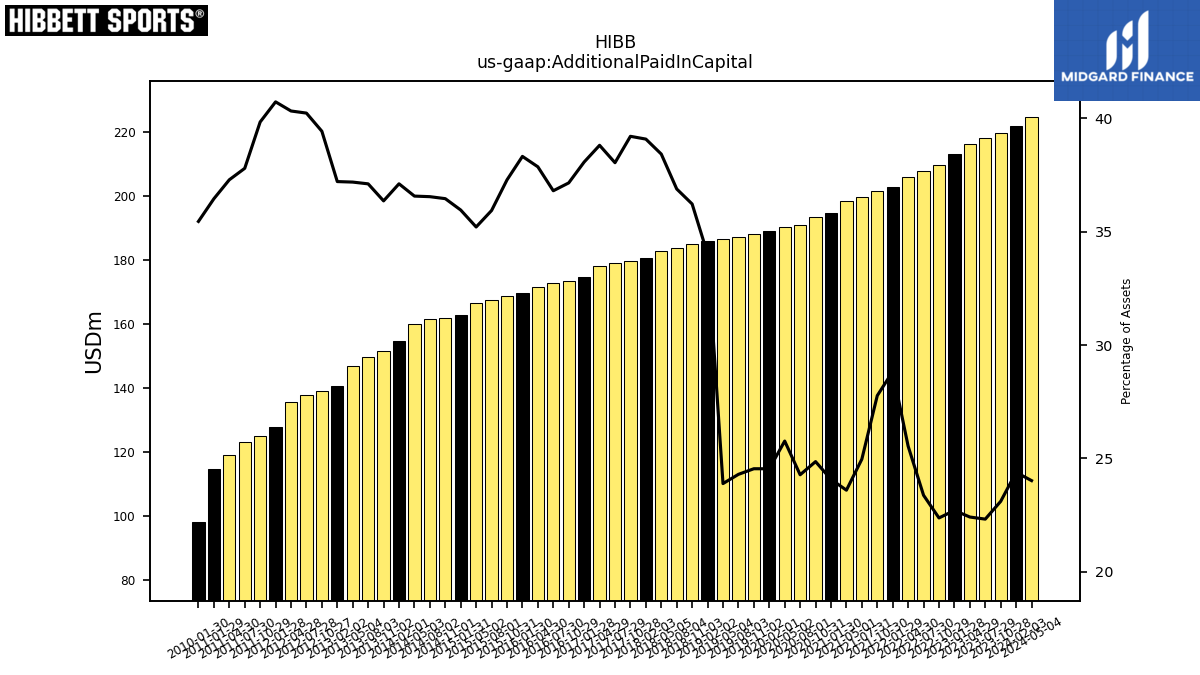
| Additional Paid In Capital | 221.67 | 219.65 | 217.99 | 216.31 | 213.18 | 209.66 | 207.68 | 205.72 | 202.73 | 201.37 | 199.71 | 198.36 | 194.53 | 193.21 | 190.99 | 190.26 | 188.88 | 187.94 | 186.95 | 186.46 | 185.75 | 184.75 | 183.70 | 182.63 | 180.54 | 179.72 | 178.82 | 178.08 | 174.72 | 173.48 | 172.67 | 171.52 | 169.54 | 168.54 | 167.50 | 166.41 | 162.68 | 161.78 | 161.34 | 159.86 | 154.53 | 151.35 | 149.55 | 146.64 | 140.42 | 138.94 | 137.75 | 135.44 | 127.78 | 124.83 | 122.95 | 118.90 | 114.57 | 98.11 | |
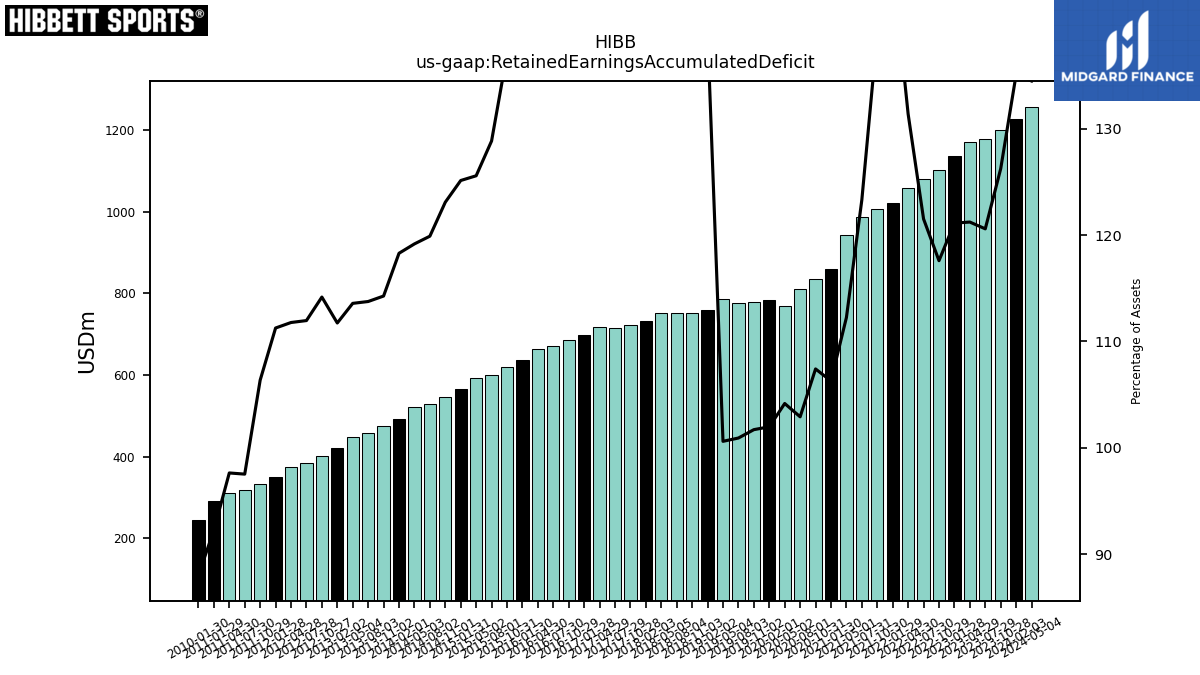
| Retained Earnings Accumulated Deficit | 1228.26 | 1200.32 | 1177.91 | 1170.18 | 1137.48 | 1102.24 | 1079.87 | 1058.38 | 1022.32 | 1008.07 | 986.57 | 943.72 | 858.95 | 835.02 | 809.75 | 769.32 | 784.94 | 778.94 | 776.68 | 785.45 | 759.68 | 753.04 | 751.54 | 752.76 | 731.90 | 722.17 | 714.61 | 717.78 | 697.66 | 685.60 | 671.00 | 664.49 | 636.58 | 619.17 | 600.50 | 593.46 | 566.05 | 546.13 | 529.24 | 520.86 | 492.47 | 475.60 | 458.35 | 447.81 | 421.59 | 402.24 | 383.27 | 375.38 | 349.01 | 333.19 | 317.23 | 311.29 | 289.95 | 243.55 |