
| 2023-09-30 | 2023-06-30 | 2023-03-31 | 2022-12-31 | 2022-09-30 | 2022-06-30 | 2022-03-31 | 2021-12-31 | 2021-09-30 | 2021-06-30 | 2021-03-31 | 2020-12-31 | 2020-09-30 | 2020-06-30 | 2020-03-31 | 2019-12-31 | 2019-09-30 | 2019-06-30 | 2019-03-31 | 2018-12-31 | 2018-09-30 | 2018-06-30 | 2018-03-31 | 2017-12-31 | 2017-09-30 | 2017-06-30 | 2017-03-31 | 2016-12-31 | 2016-09-30 | 2016-06-30 | ||
|---|---|---|---|---|---|---|---|---|---|---|---|---|---|---|---|---|---|---|---|---|---|---|---|---|---|---|---|---|---|---|---|
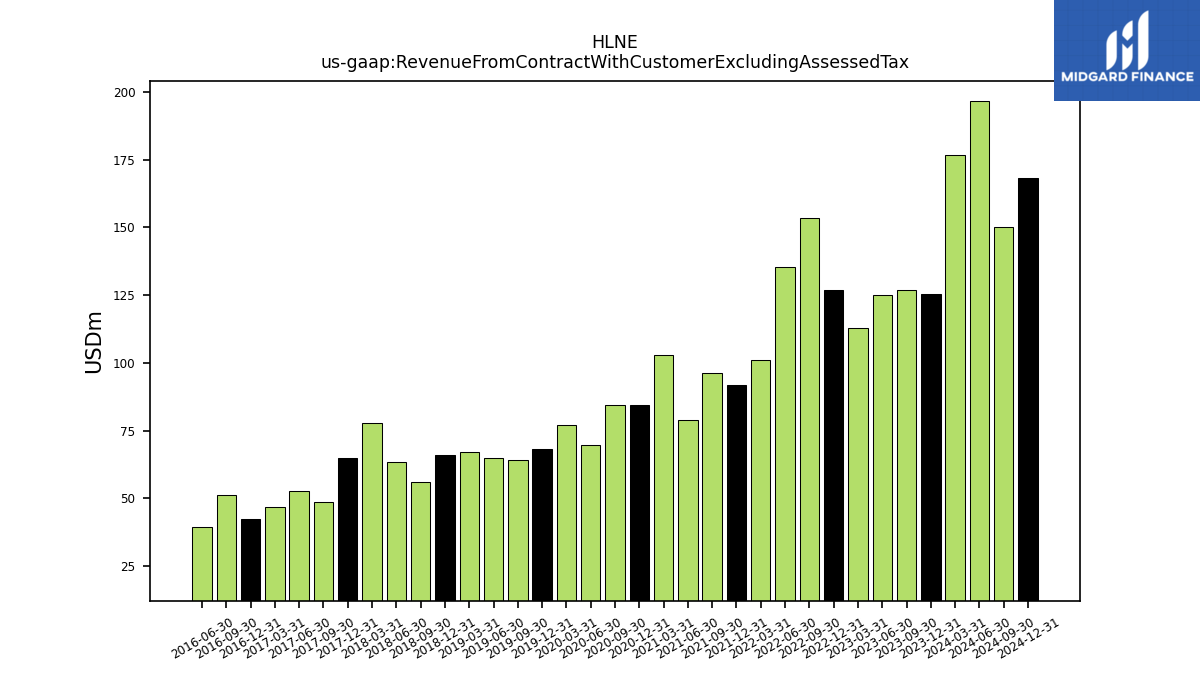
| Revenue From Contract With Customer Excluding Assessed Tax | 126.88 | 125.04 | 112.79 | 127.07 | 153.38 | 135.51 | 100.90 | 91.70 | 96.32 | 79.00 | 102.88 | 84.58 | 84.43 | 69.74 | 76.93 | 68.14 | 64.29 | 64.69 | 66.99 | 66.00 | 55.83 | 63.36 | 77.61 | 65.01 | 48.71 | 52.70 | 46.68 | 42.33 | 51.24 | 39.57 | |
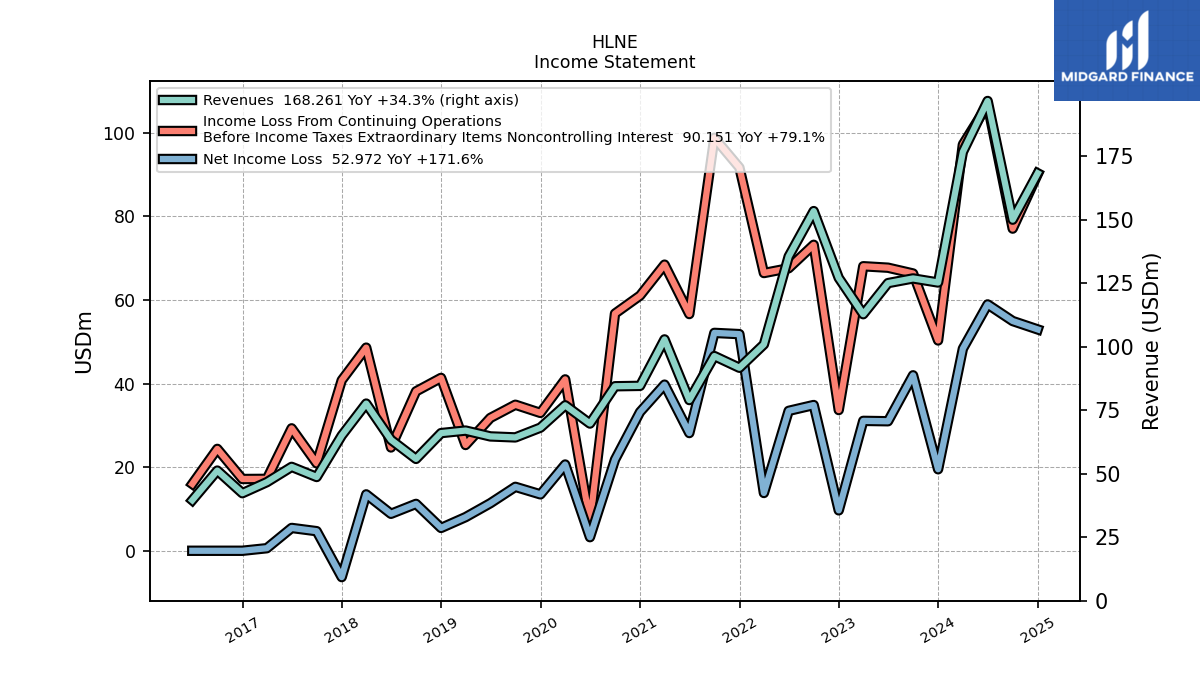
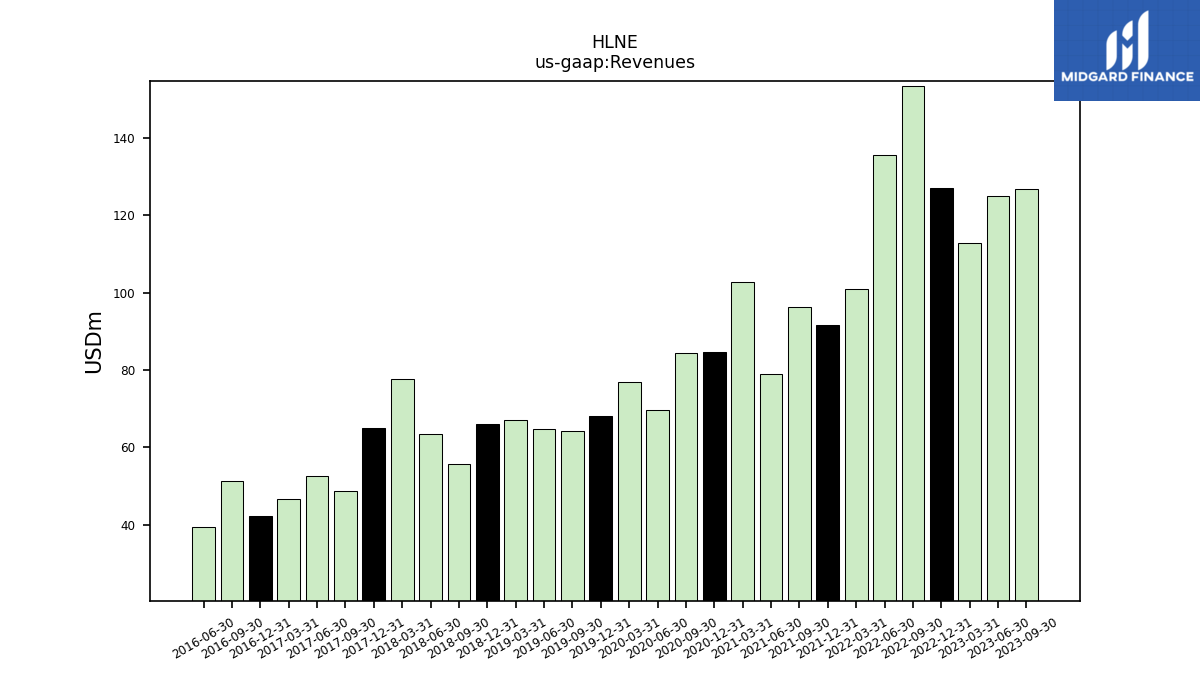
| Revenues | 126.88 | 125.04 | 112.79 | 127.07 | 153.38 | 135.51 | 100.90 | 91.70 | 96.32 | 79.00 | 102.88 | 84.58 | 84.43 | 69.74 | 76.93 | 68.14 | 64.29 | 64.69 | 66.99 | 66.00 | 55.83 | 63.36 | 77.61 | 65.01 | 48.71 | 52.70 | 46.68 | 42.33 | 51.24 | 39.57 | |
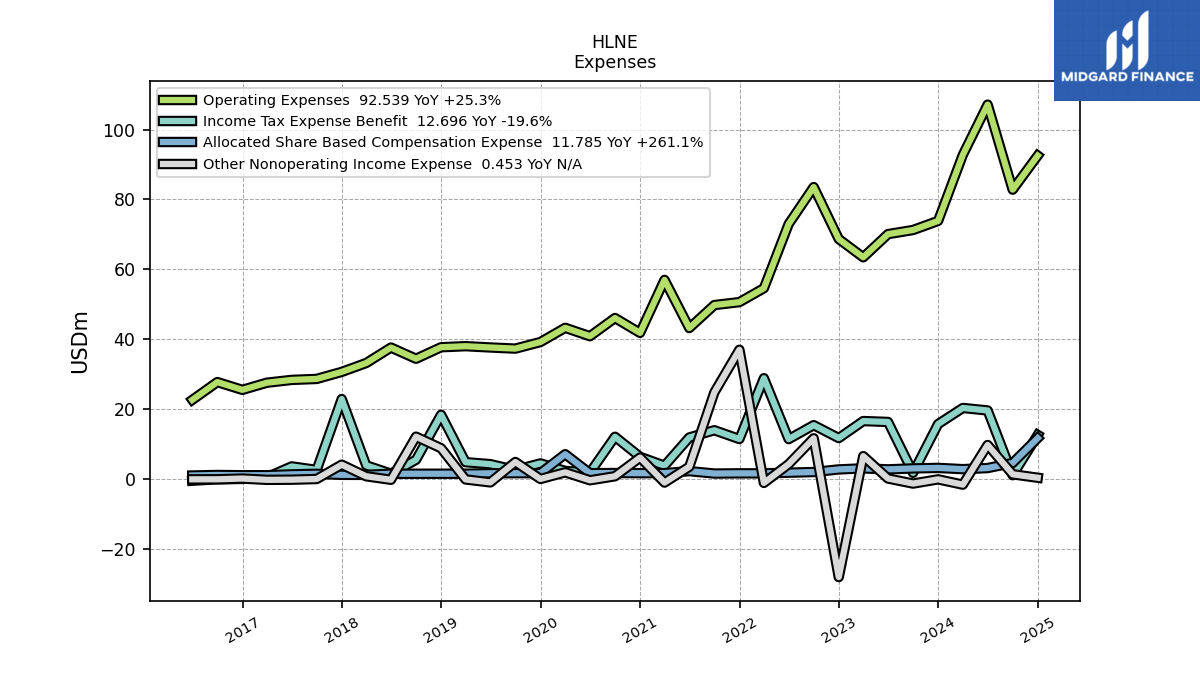
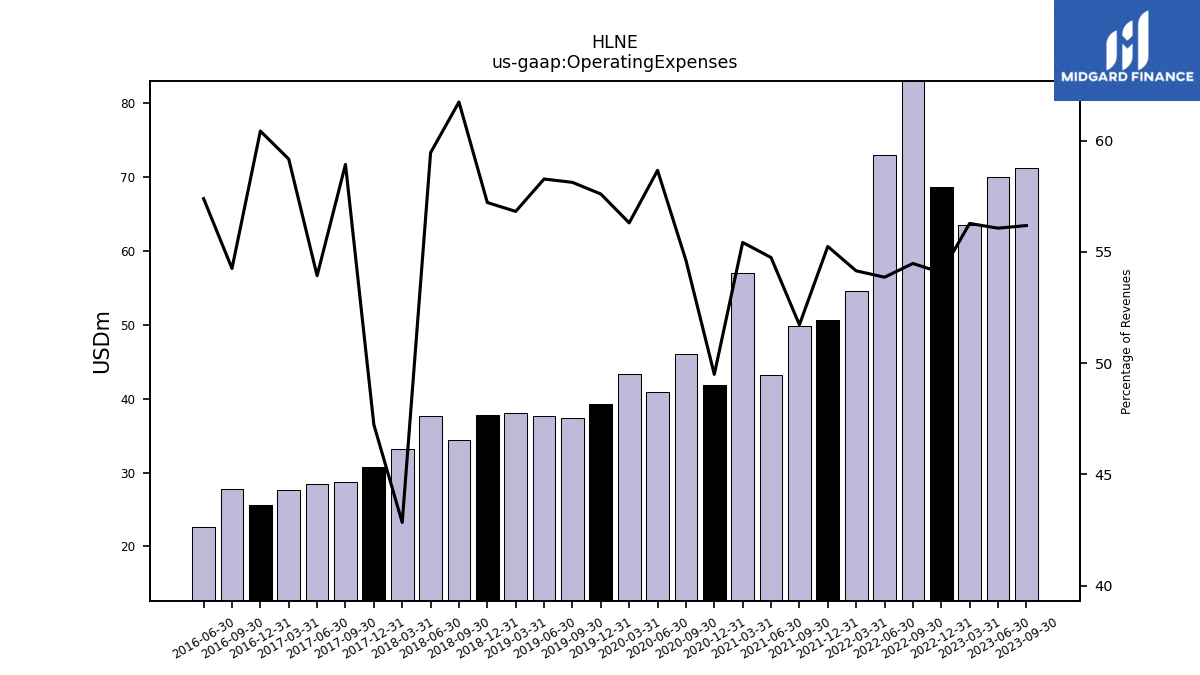
| Operating Expenses | 71.28 | 70.10 | 63.47 | 68.70 | 83.56 | 72.98 | 54.63 | 50.66 | 49.82 | 43.24 | 57.02 | 41.86 | 46.12 | 40.91 | 43.31 | 39.25 | 37.37 | 37.69 | 38.06 | 37.76 | 34.47 | 37.67 | 33.25 | 30.71 | 28.70 | 28.42 | 27.62 | 25.58 | 27.80 | 22.71 | |
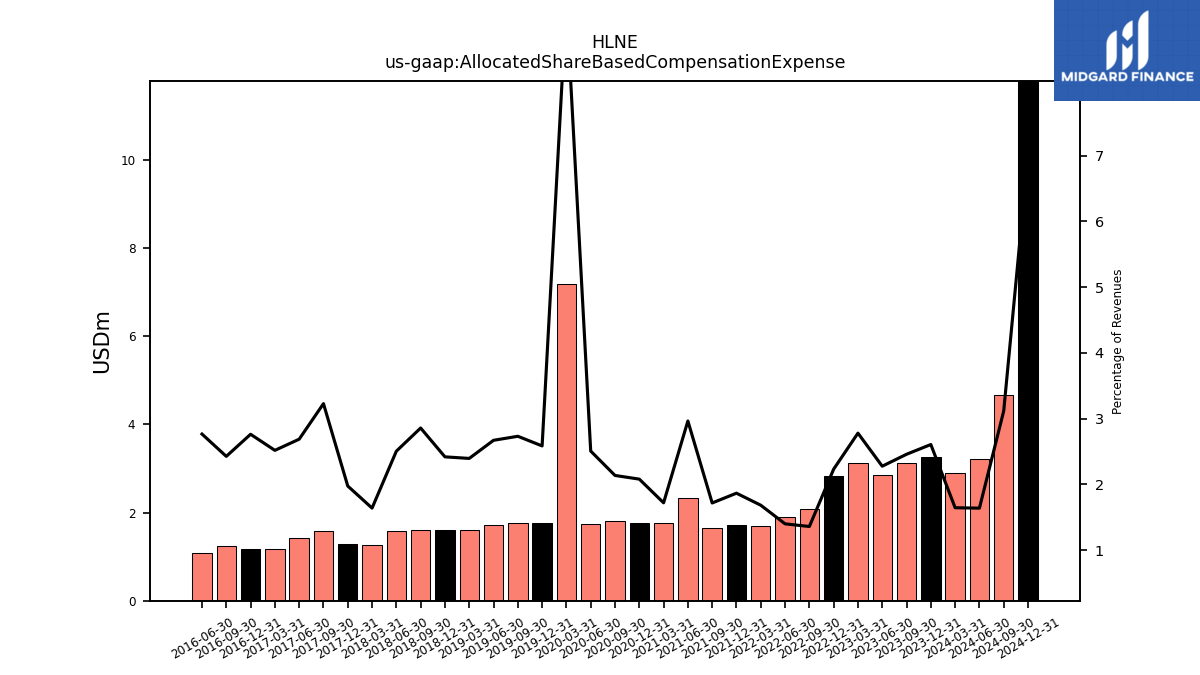
| Allocated Share Based Compensation Expense | 3.12 | 2.85 | 3.13 | 2.83 | 2.08 | 1.90 | 1.70 | 1.71 | 1.65 | 2.34 | 1.77 | 1.76 | 1.80 | 1.75 | 7.18 | 1.76 | 1.76 | 1.73 | 1.60 | 1.60 | 1.59 | 1.59 | 1.27 | 1.28 | 1.57 | 1.42 | 1.18 | 1.17 | 1.24 | 1.09 | |
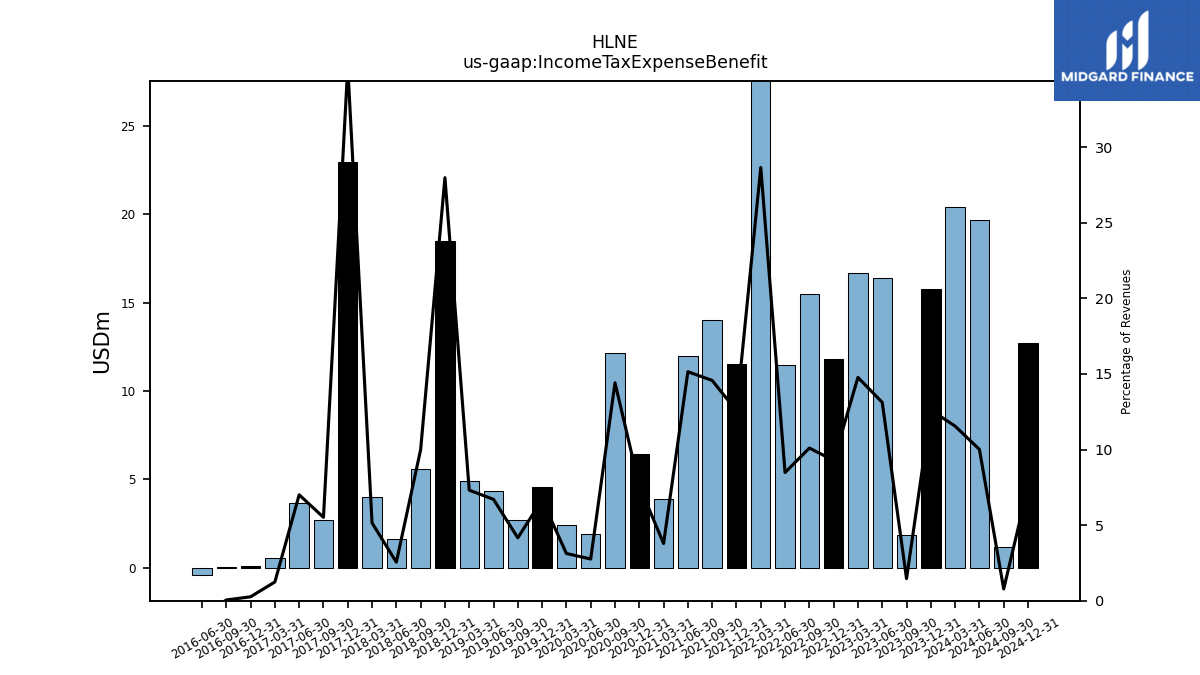
| Income Tax Expense Benefit | 1.86 | 16.40 | 16.66 | 11.79 | 15.49 | 11.49 | 28.91 | 11.52 | 14.03 | 11.96 | 3.90 | 6.43 | 12.17 | 1.92 | 2.40 | 4.55 | 2.68 | 4.34 | 4.90 | 18.46 | 5.58 | 1.62 | 4.00 | 22.96 | 2.69 | 3.69 | 0.58 | 0.11 | 0.03 | -0.40 | |
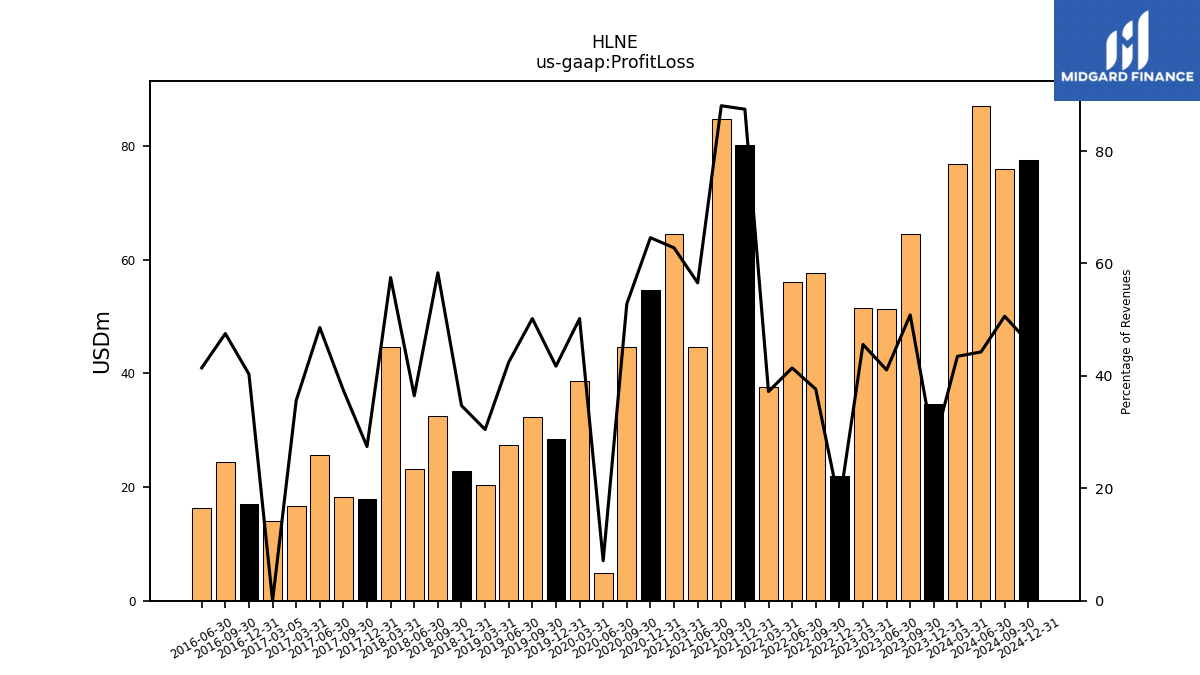
| Profit Loss | 64.50 | 51.34 | 51.44 | 21.88 | 57.74 | 56.13 | 37.56 | 80.20 | 84.82 | 44.68 | 64.59 | 54.63 | 44.60 | 4.97 | 38.61 | 28.44 | 32.27 | 27.45 | 20.41 | 22.91 | 32.57 | 23.10 | 44.62 | 17.83 | 18.23 | 25.61 | 16.63 | 17.06 | 24.36 | 16.39 | |
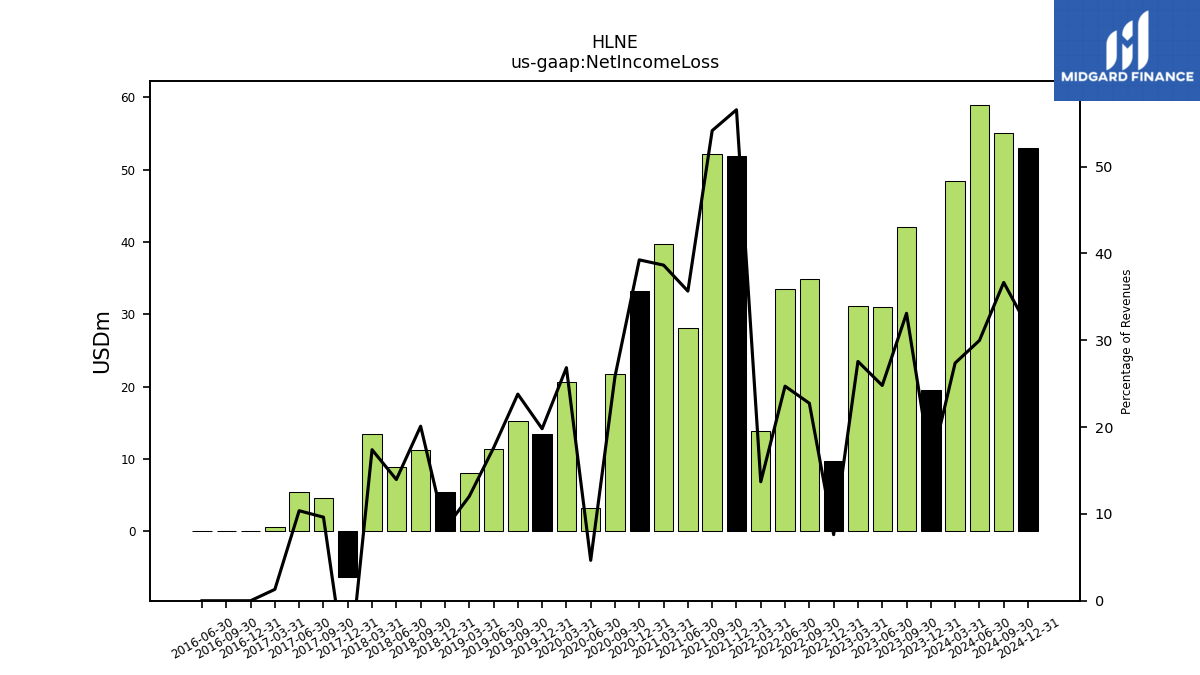
| Net Income Loss | 41.99 | 31.00 | 31.09 | 9.67 | 34.88 | 33.48 | 13.82 | 51.85 | 52.15 | 28.17 | 39.76 | 33.20 | 21.81 | 3.25 | 20.65 | 13.50 | 15.30 | 11.38 | 8.05 | 5.46 | 11.22 | 8.85 | 13.50 | -6.31 | 4.69 | 5.46 | 0.61 | 0.00 | 0.00 | 0.00 | |
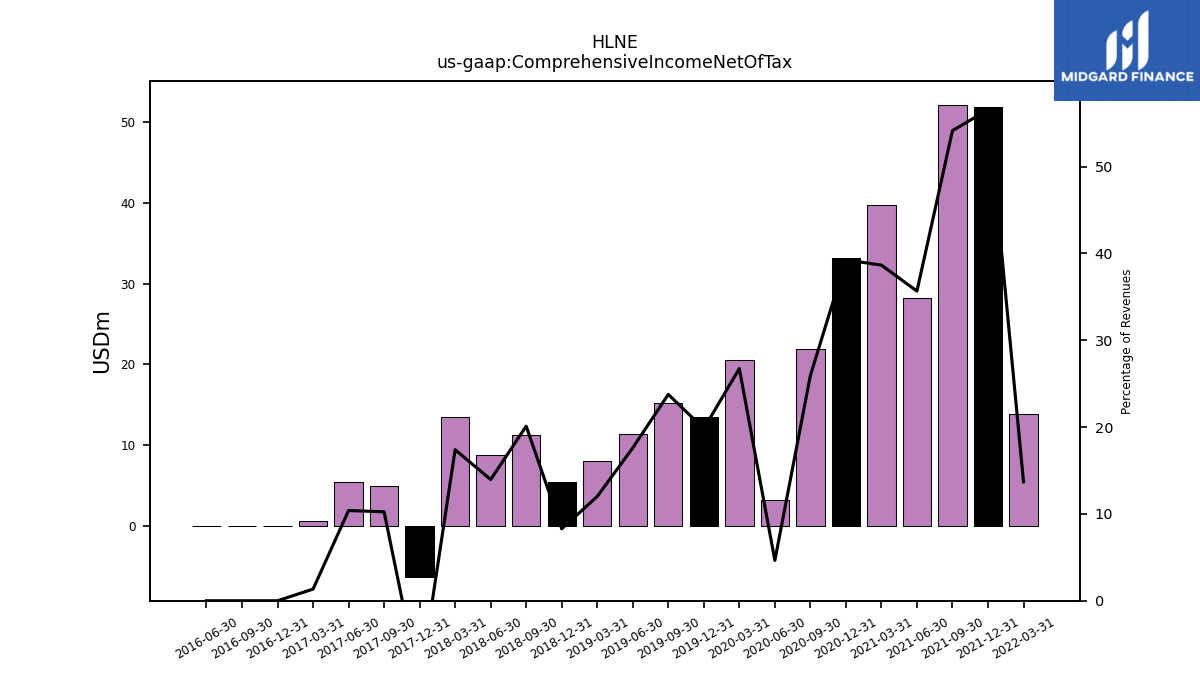
| Comprehensive Income Net Of Tax | NA | NA | NA | NA | NA | NA | 13.82 | 51.85 | 52.15 | 28.17 | 39.76 | 33.20 | 21.90 | 3.24 | 20.57 | 13.51 | 15.28 | 11.39 | 8.04 | 5.47 | 11.22 | 8.85 | 13.50 | -6.31 | 4.99 | 5.48 | 0.63 | 0.00 | 0.00 | 0.00 |
| 2023-09-30 | 2023-06-30 | 2023-03-31 | 2022-12-31 | 2022-09-30 | 2022-06-30 | 2022-03-31 | 2021-12-31 | 2021-09-30 | 2021-06-30 | 2021-03-31 | 2020-12-31 | 2020-09-30 | 2020-06-30 | 2020-03-31 | 2019-12-31 | 2019-09-30 | 2019-06-30 | 2019-03-31 | 2018-12-31 | 2018-09-30 | 2018-06-30 | 2018-03-31 | 2017-12-31 | 2017-09-30 | 2017-06-30 | 2017-03-31 | 2016-12-31 | 2016-09-30 | 2016-06-30 | ||
|---|---|---|---|---|---|---|---|---|---|---|---|---|---|---|---|---|---|---|---|---|---|---|---|---|---|---|---|---|---|---|---|
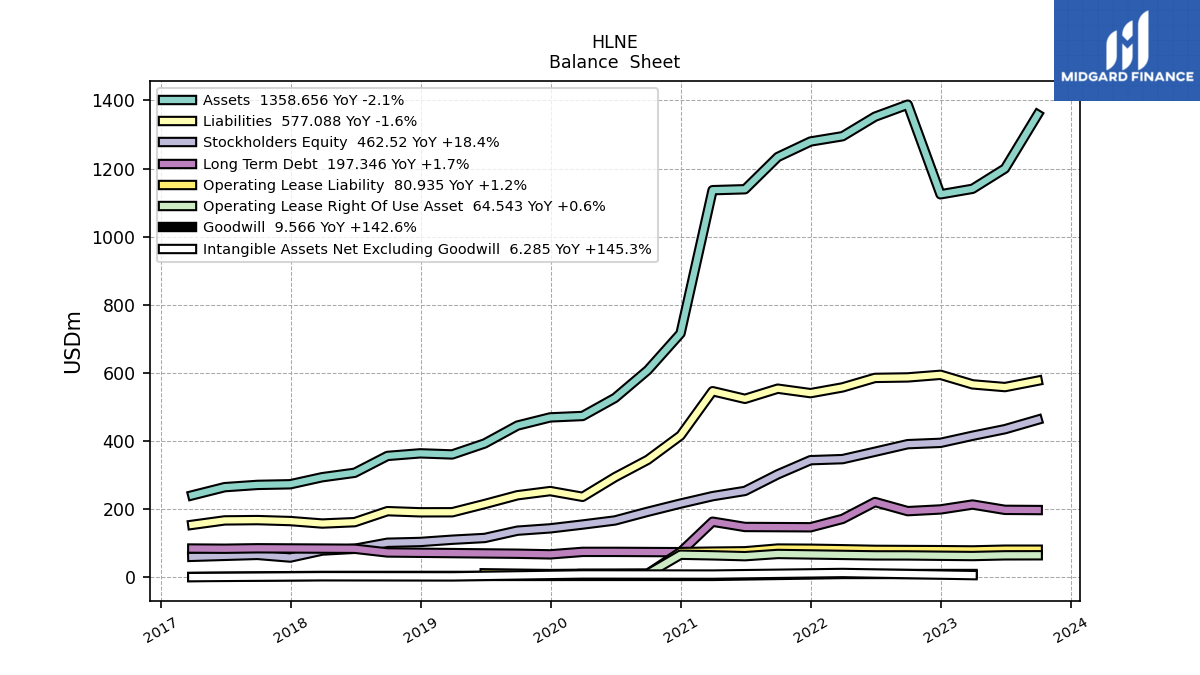
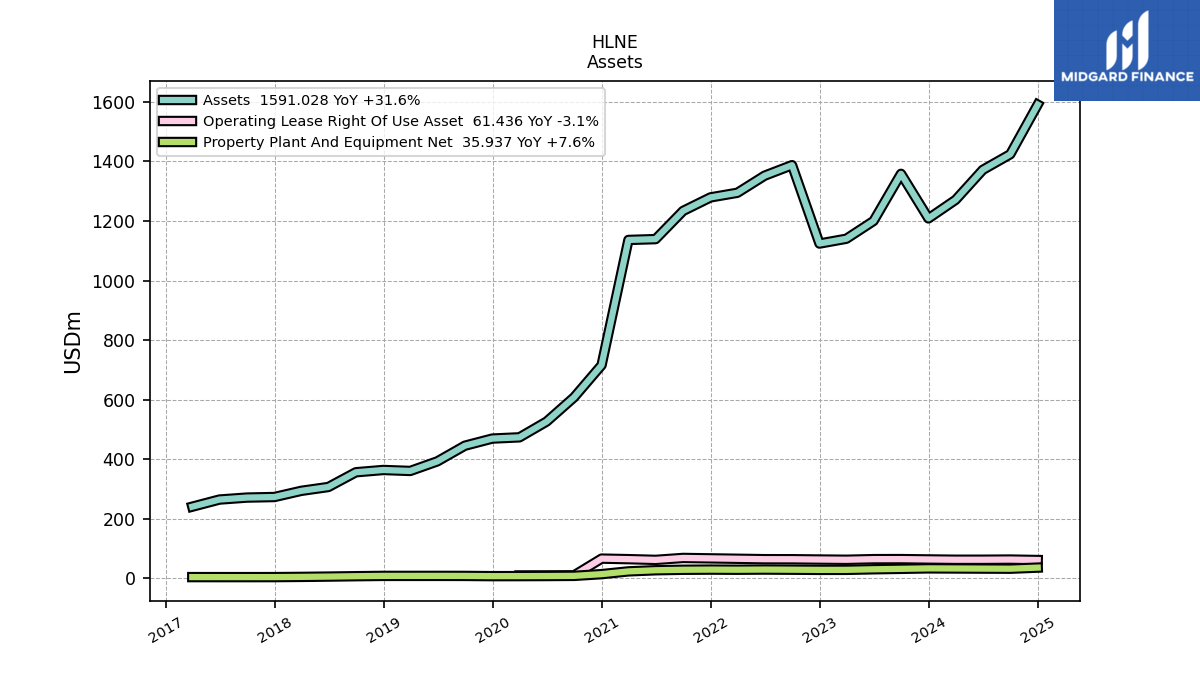
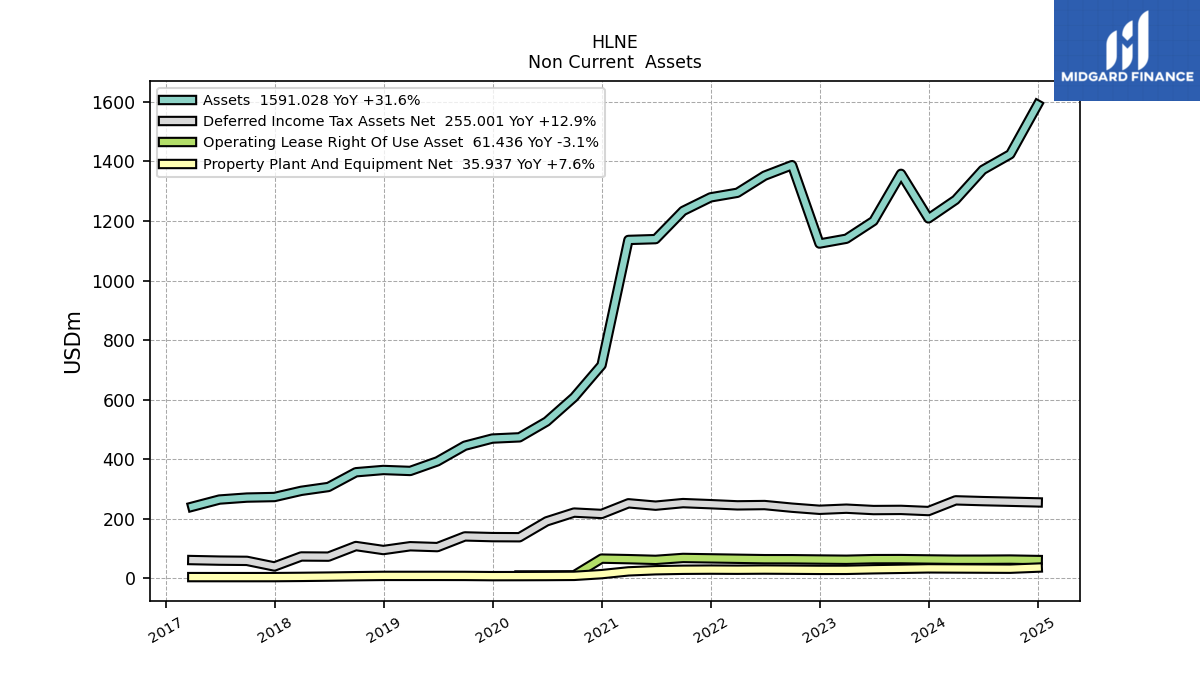
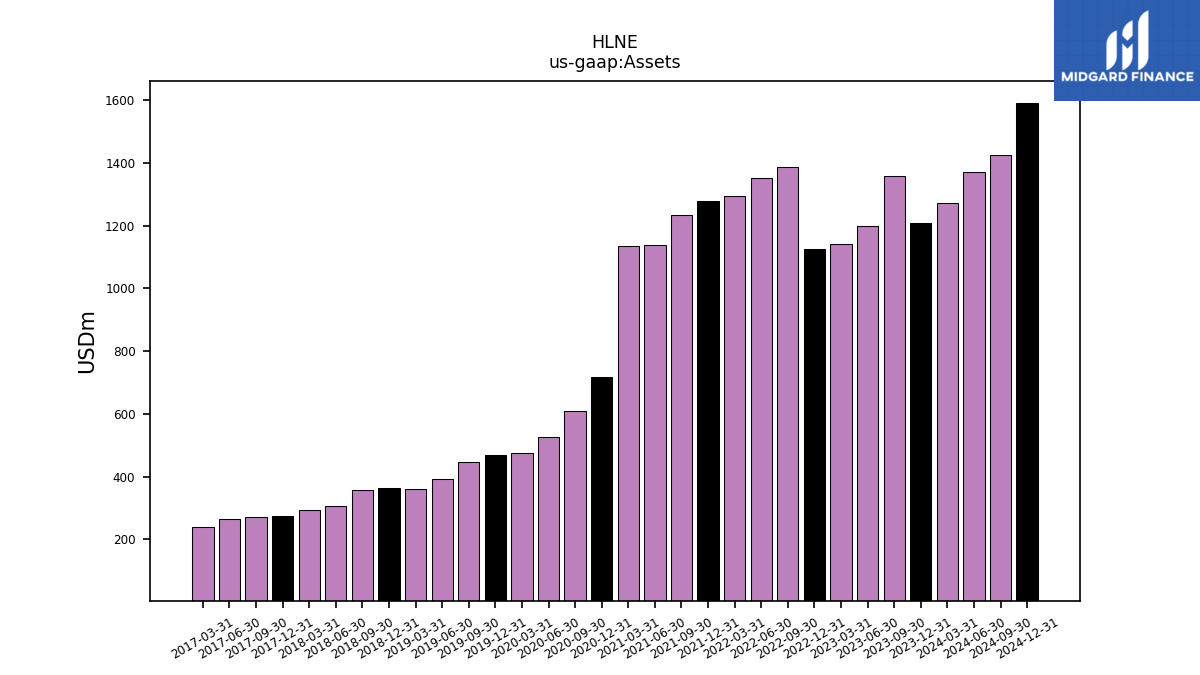
| Assets | 1358.66 | 1200.09 | 1140.54 | 1124.36 | 1387.74 | 1352.30 | 1294.95 | 1279.45 | 1233.97 | 1139.30 | 1136.52 | 715.83 | 608.09 | 526.51 | 473.53 | 469.38 | 445.38 | 392.84 | 360.59 | 363.85 | 356.24 | 306.74 | 293.80 | 273.05 | 271.18 | 264.54 | 240.62 | NA | NA | NA | |
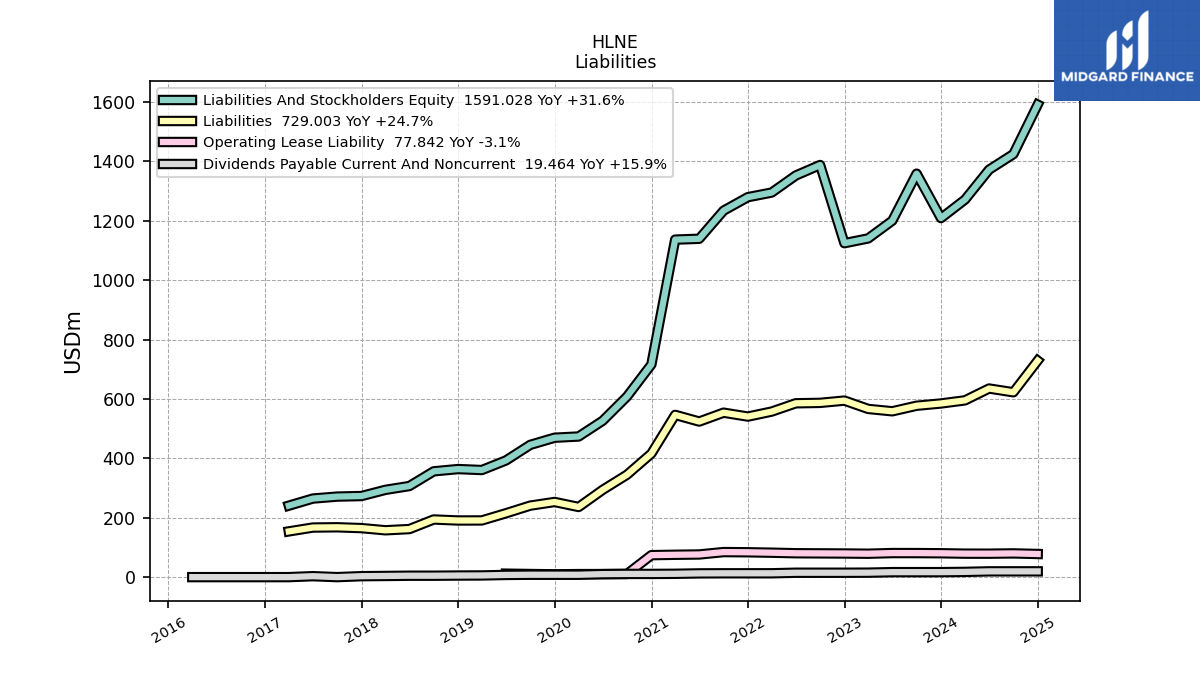
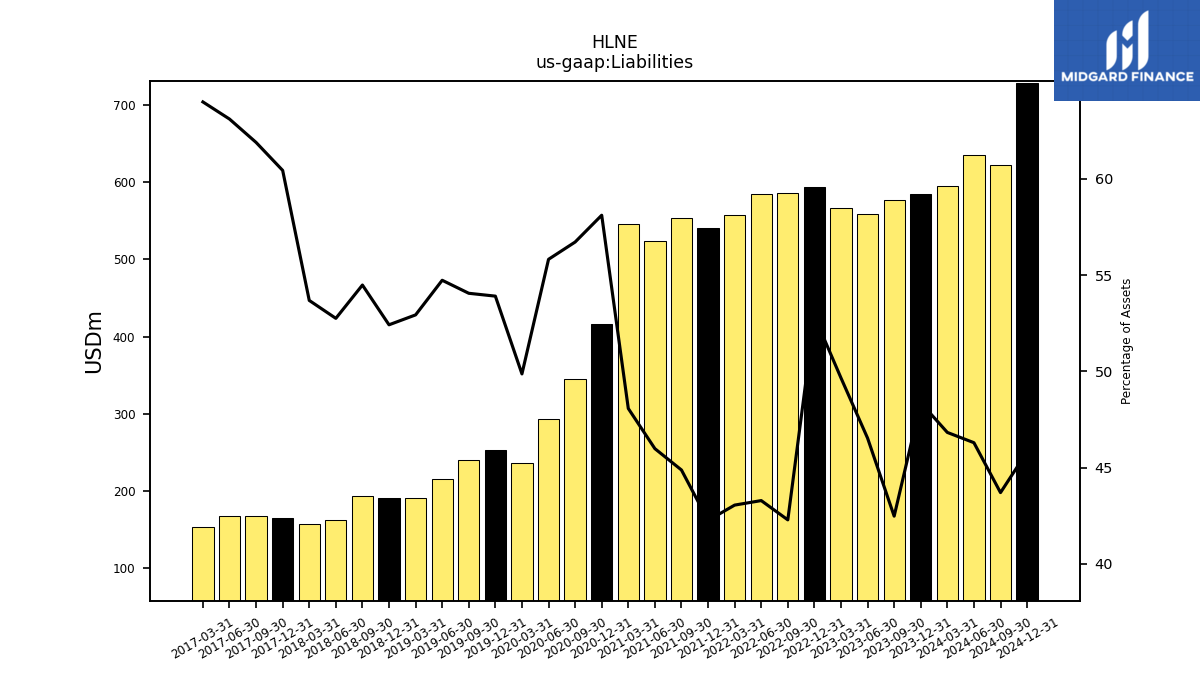
| Liabilities | 577.09 | 558.39 | 566.35 | 594.40 | 586.76 | 585.33 | 557.46 | 540.58 | 553.72 | 523.88 | 546.32 | 415.98 | 344.89 | 293.90 | 236.13 | 253.03 | 240.75 | 215.01 | 190.87 | 190.72 | 194.09 | 161.81 | 157.72 | 165.03 | 167.84 | 166.95 | 153.99 | NA | NA | NA | |
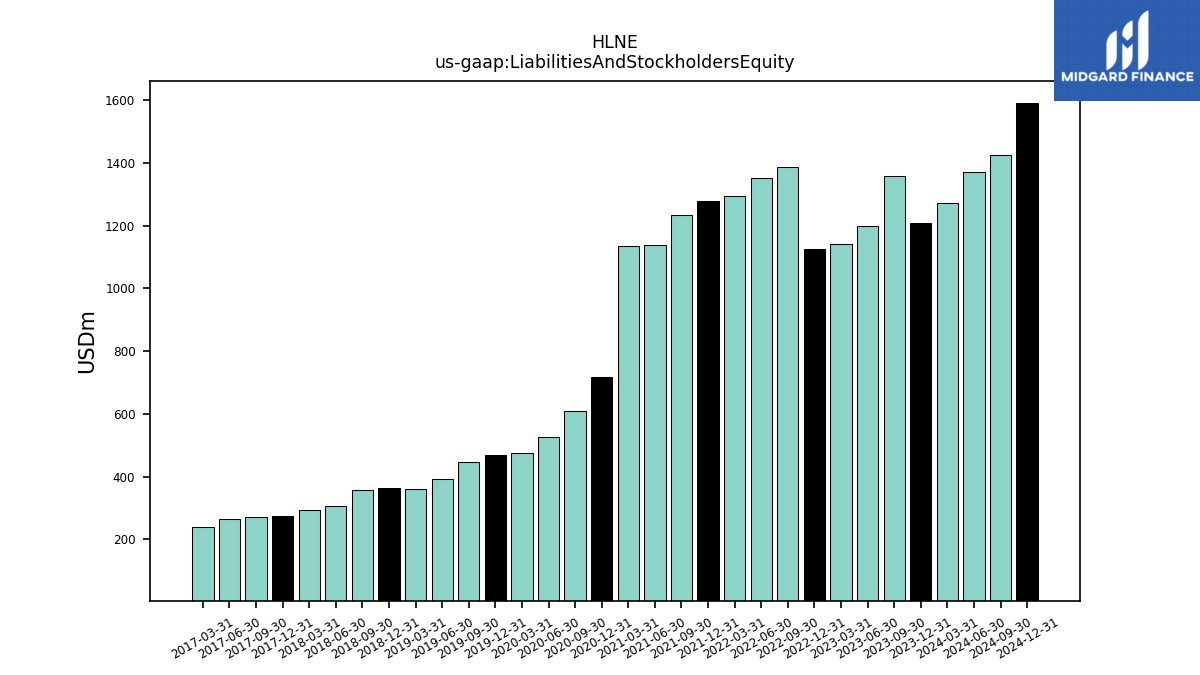
| Liabilities And Stockholders Equity | 1358.66 | 1200.09 | 1140.54 | 1124.36 | 1387.74 | 1352.30 | 1294.95 | 1279.45 | 1233.97 | 1139.30 | 1136.52 | 715.83 | 608.09 | 526.51 | 473.53 | 469.38 | 445.38 | 392.84 | 360.59 | 363.85 | 356.24 | 306.74 | 293.80 | 273.05 | 271.18 | 264.54 | 240.62 | NA | NA | NA | |
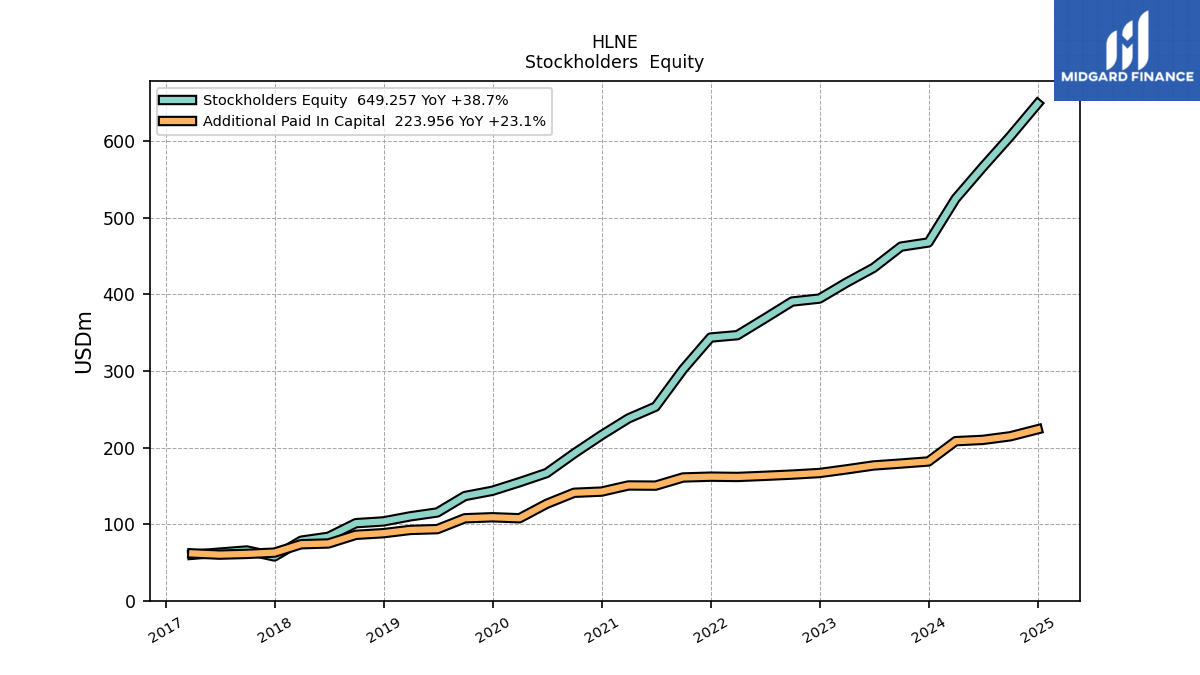
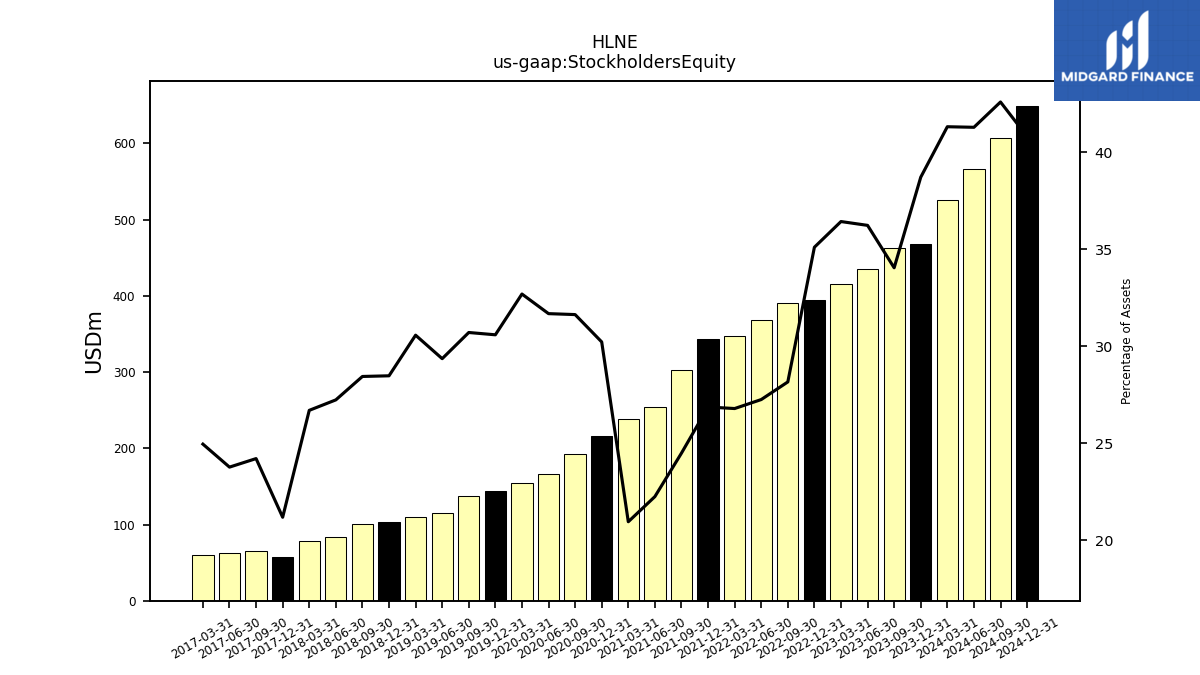
| Stockholders Equity | 462.52 | 434.77 | 415.44 | 394.66 | 390.77 | 368.51 | 346.88 | 343.76 | 302.18 | 253.48 | 238.13 | 216.32 | 192.34 | 166.79 | 154.79 | 143.57 | 136.76 | 115.33 | 110.23 | 103.61 | 101.32 | 83.53 | 78.43 | 57.84 | 65.65 | 62.88 | 60.04 | NA | NA | NA |
| 2023-09-30 | 2023-06-30 | 2023-03-31 | 2022-12-31 | 2022-09-30 | 2022-06-30 | 2022-03-31 | 2021-12-31 | 2021-09-30 | 2021-06-30 | 2021-03-31 | 2020-12-31 | 2020-09-30 | 2020-06-30 | 2020-03-31 | 2019-12-31 | 2019-09-30 | 2019-06-30 | 2019-03-31 | 2018-12-31 | 2018-09-30 | 2018-06-30 | 2018-03-31 | 2017-12-31 | 2017-09-30 | 2017-06-30 | 2017-03-31 | 2016-12-31 | 2016-09-30 | 2016-06-30 | ||
|---|---|---|---|---|---|---|---|---|---|---|---|---|---|---|---|---|---|---|---|---|---|---|---|---|---|---|---|---|---|---|---|
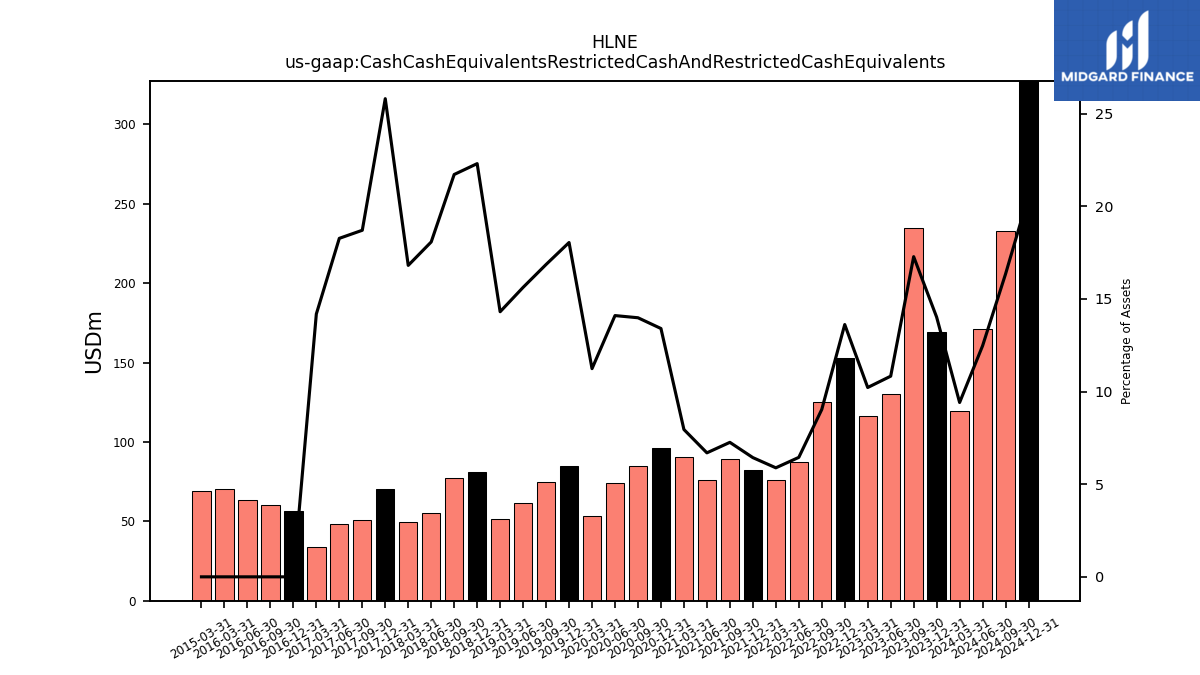
| Cash Cash Equivalents Restricted Cash And Restricted Cash Equivalents | 234.78 | 129.97 | 116.55 | 153.09 | 125.35 | 87.19 | 76.20 | 82.34 | 89.57 | 76.25 | 90.38 | 95.94 | 85.03 | 74.24 | 53.21 | 84.69 | 75.08 | 61.37 | 51.59 | 81.14 | 77.36 | 55.44 | 49.38 | 70.46 | 50.72 | 48.33 | 34.13 | 56.24 | 60.01 | 63.65 |
| 2023-09-30 | 2023-06-30 | 2023-03-31 | 2022-12-31 | 2022-09-30 | 2022-06-30 | 2022-03-31 | 2021-12-31 | 2021-09-30 | 2021-06-30 | 2021-03-31 | 2020-12-31 | 2020-09-30 | 2020-06-30 | 2020-03-31 | 2019-12-31 | 2019-09-30 | 2019-06-30 | 2019-03-31 | 2018-12-31 | 2018-09-30 | 2018-06-30 | 2018-03-31 | 2017-12-31 | 2017-09-30 | 2017-06-30 | 2017-03-31 | 2016-12-31 | 2016-09-30 | 2016-06-30 | ||
|---|---|---|---|---|---|---|---|---|---|---|---|---|---|---|---|---|---|---|---|---|---|---|---|---|---|---|---|---|---|---|---|
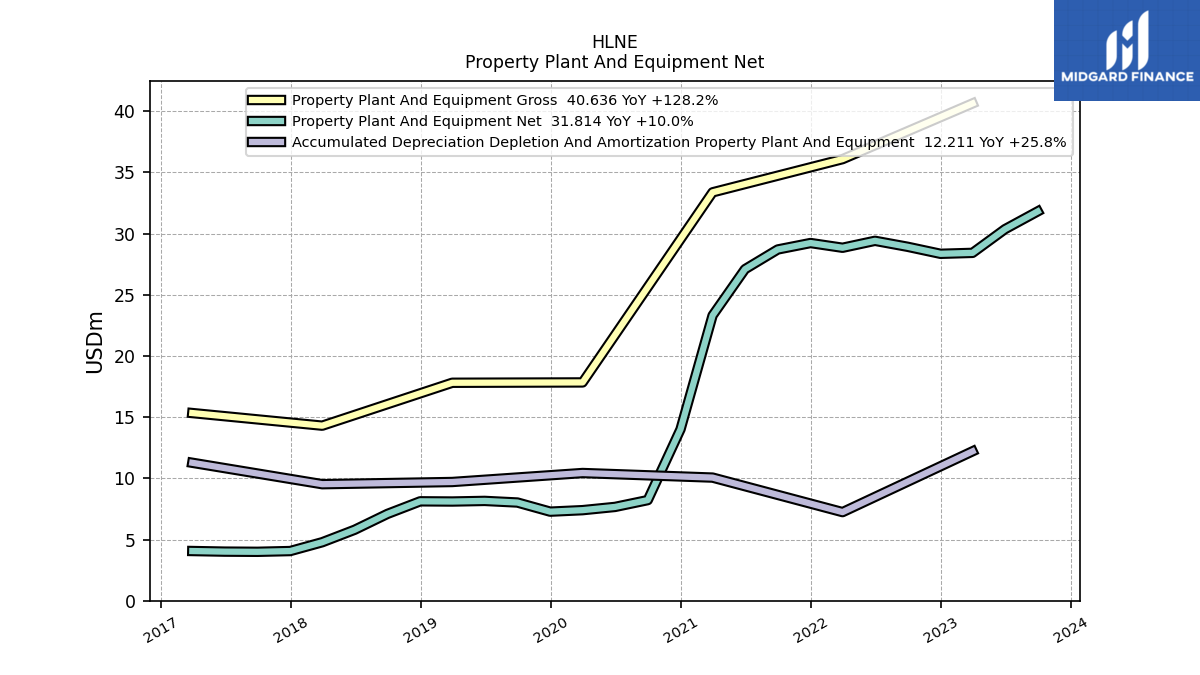
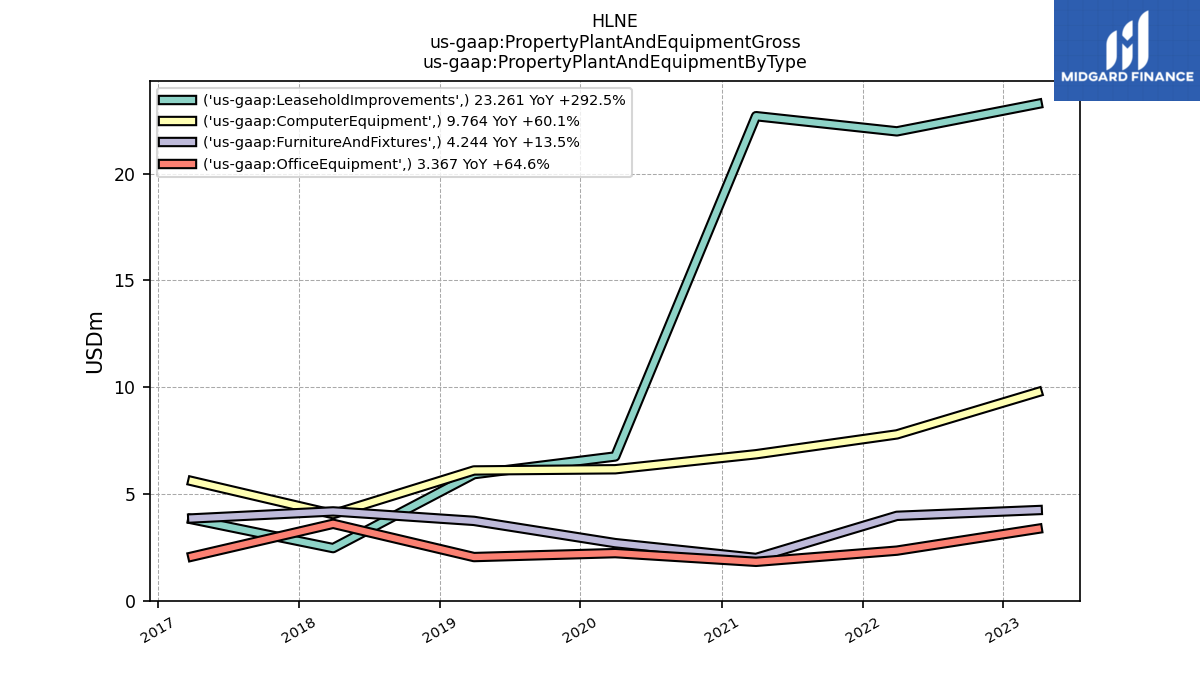
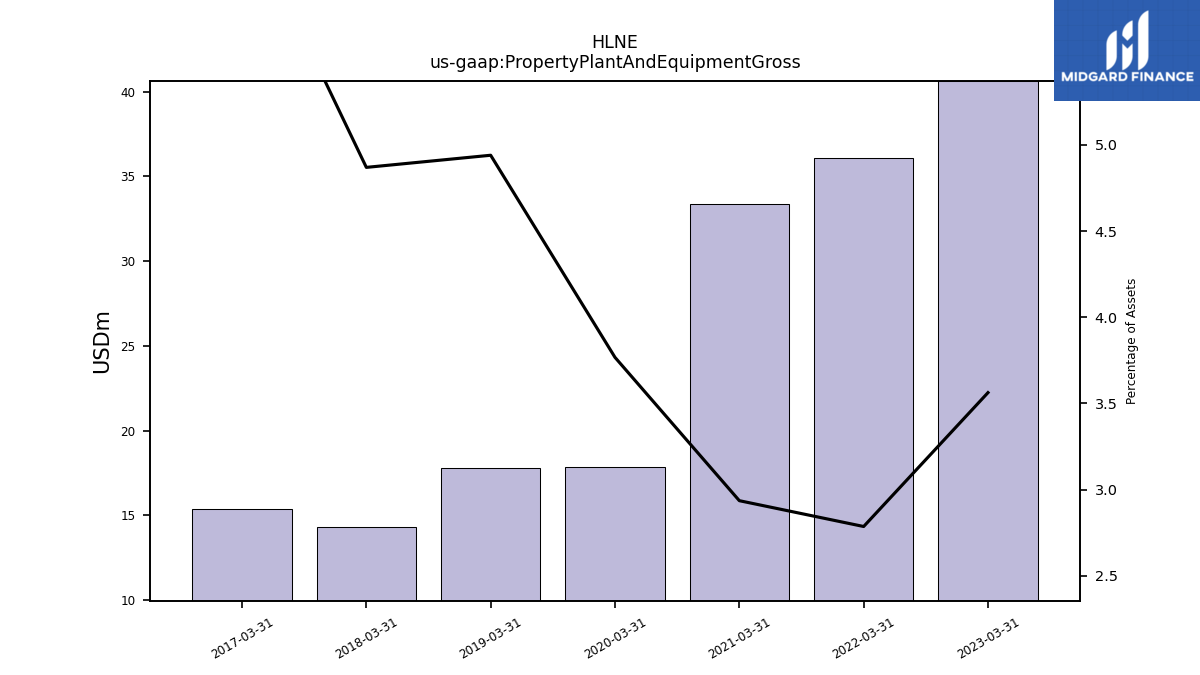
| Property Plant And Equipment Gross | NA | NA | 40.64 | NA | NA | NA | 36.08 | NA | NA | NA | 33.37 | NA | NA | NA | 17.84 | NA | NA | NA | 17.81 | NA | NA | NA | 14.30 | NA | NA | NA | 15.34 | NA | NA | NA | |
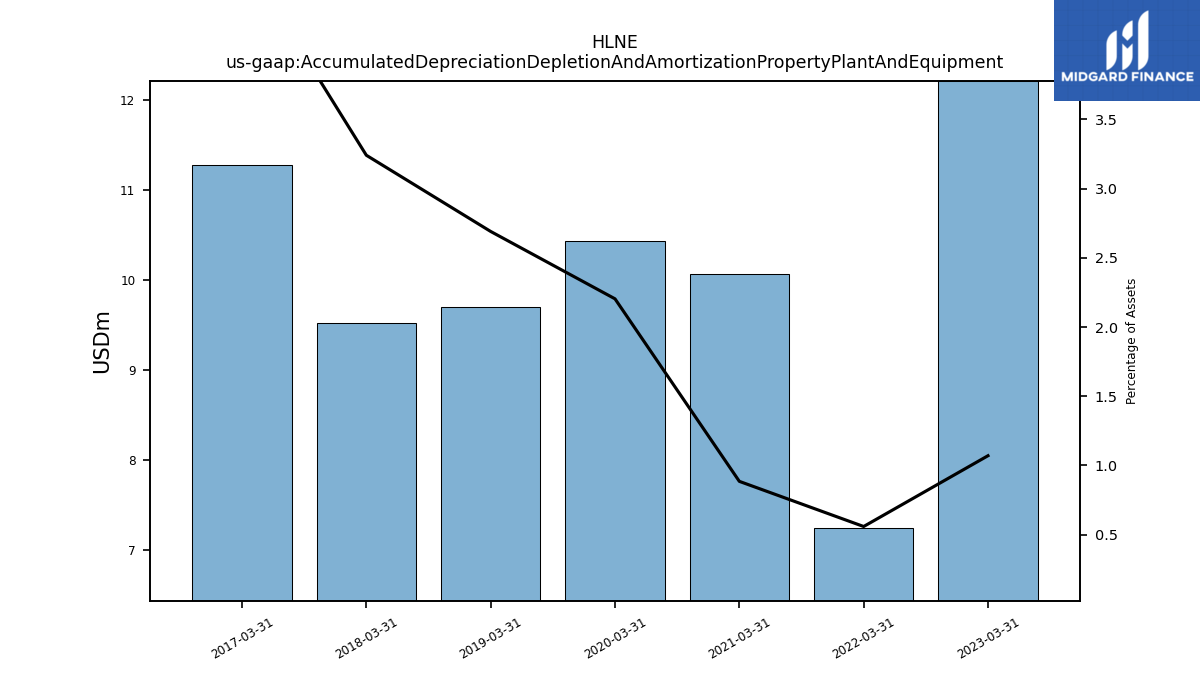
| Accumulated Depreciation Depletion And Amortization Property Plant And Equipment | NA | NA | 12.21 | NA | NA | NA | 7.24 | NA | NA | NA | 10.06 | NA | NA | NA | 10.44 | NA | NA | NA | 9.70 | NA | NA | NA | 9.52 | NA | NA | NA | 11.27 | NA | NA | NA | |
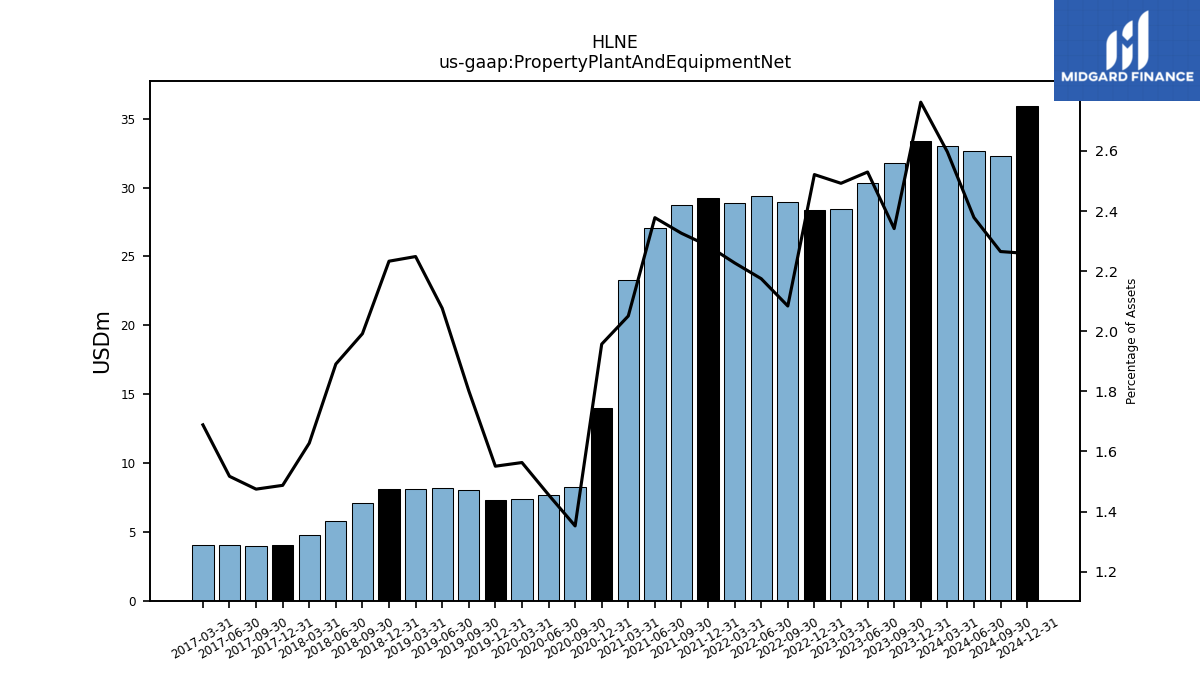
| Property Plant And Equipment Net | 31.81 | 30.36 | 28.43 | 28.35 | 28.92 | 29.41 | 28.84 | 29.23 | 28.70 | 27.09 | 23.31 | 14.01 | 8.22 | 7.67 | 7.40 | 7.28 | 8.03 | 8.16 | 8.11 | 8.12 | 7.10 | 5.80 | 4.78 | 4.06 | 4.00 | 4.01 | 4.06 | NA | NA | NA | |
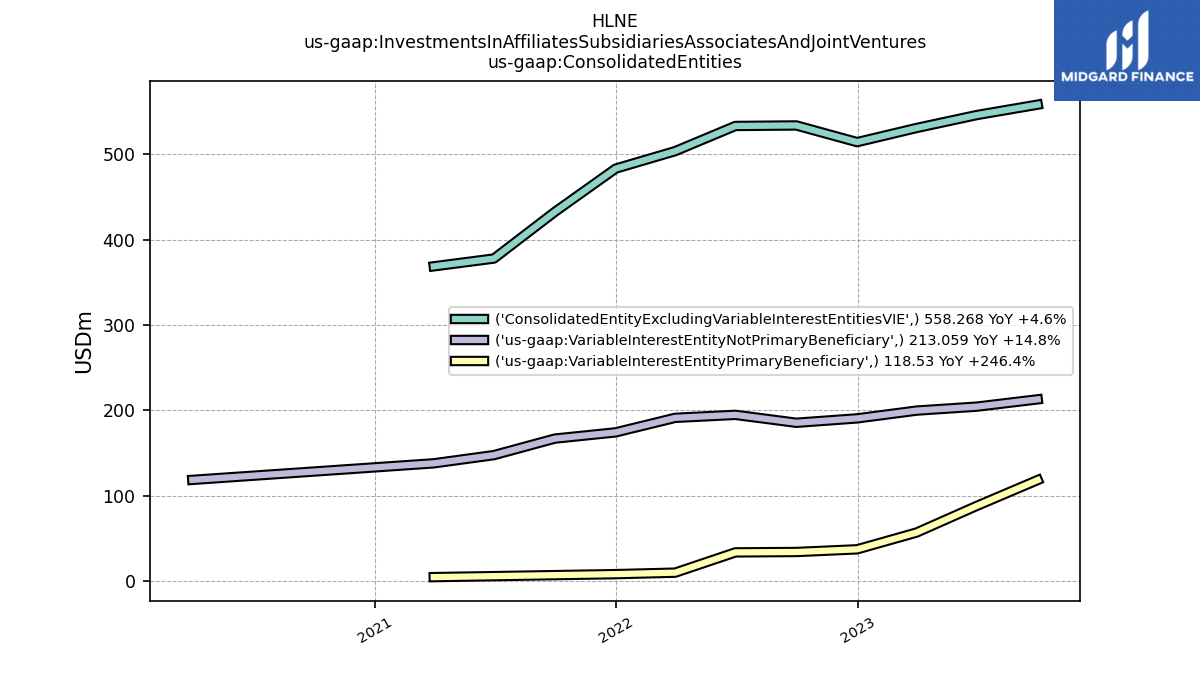
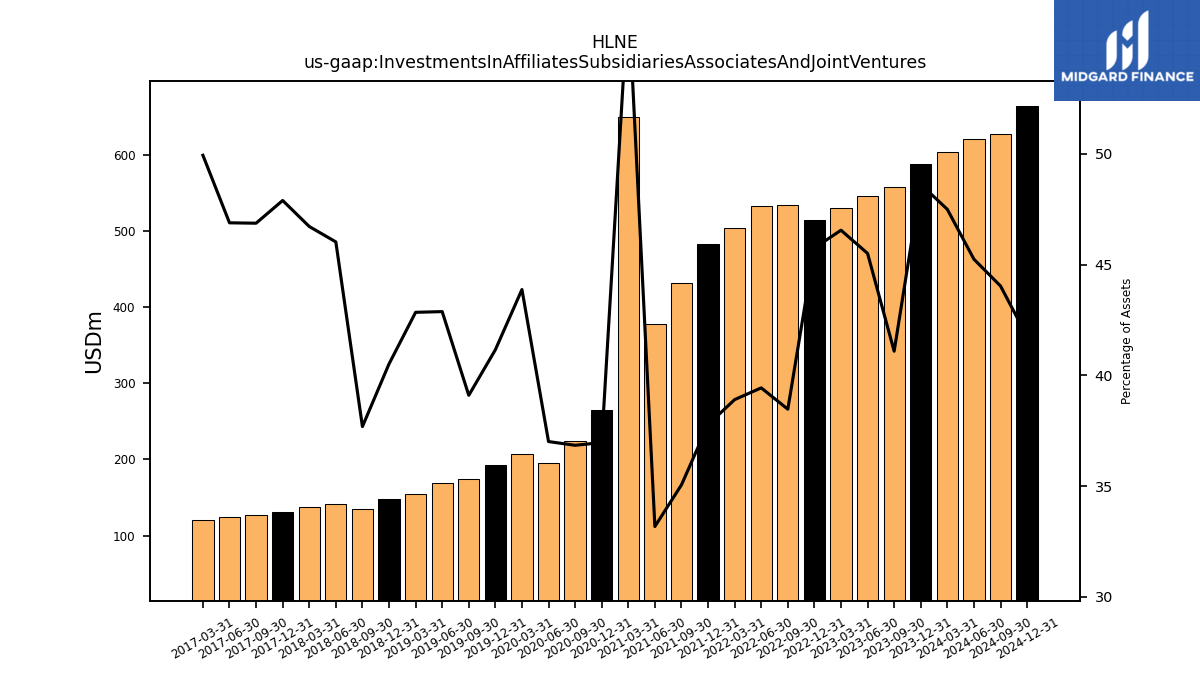
| Investments In Affiliates Subsidiaries Associates And Joint Ventures | 558.27 | 546.08 | 530.92 | 514.33 | 533.89 | 533.26 | 503.79 | 483.32 | 432.59 | 377.99 | 649.63 | 264.61 | 224.03 | 194.86 | 207.75 | 193.17 | 174.13 | 168.44 | 154.49 | 147.41 | 134.26 | 141.16 | 137.25 | 130.76 | 127.09 | 124.03 | 120.15 | NA | NA | NA | |
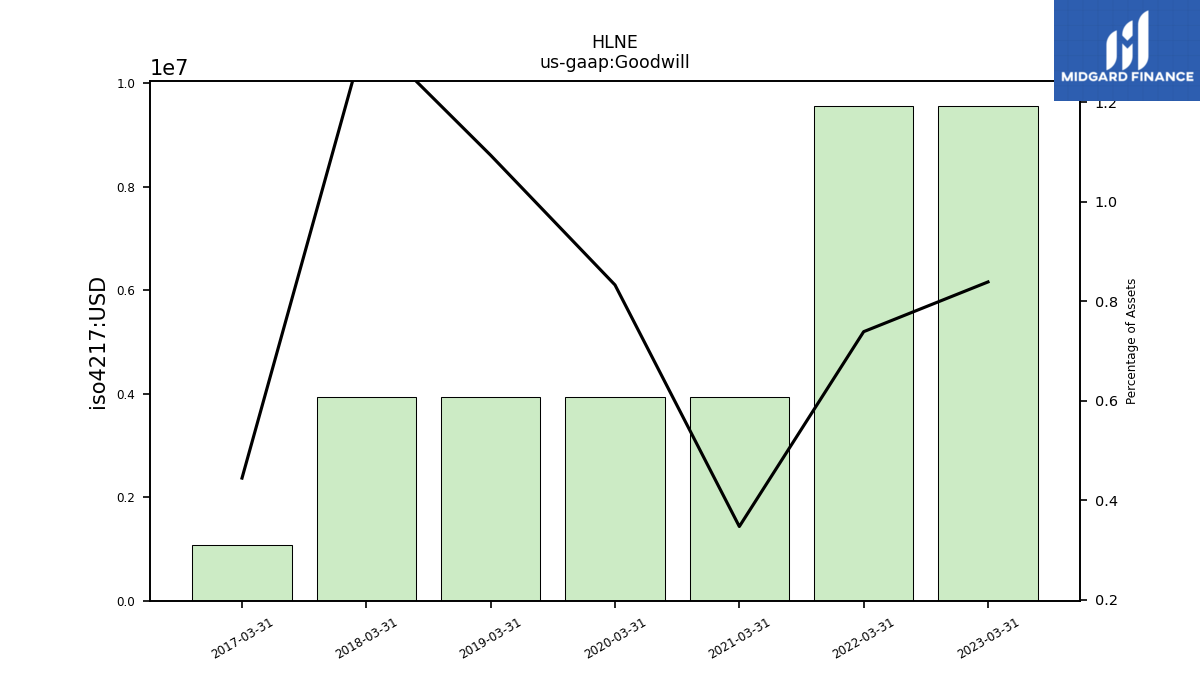
| Goodwill | NA | NA | 9.57 | NA | NA | NA | 9.57 | NA | NA | NA | 3.94 | NA | NA | NA | 3.94 | NA | NA | NA | 3.94 | NA | NA | NA | 3.94 | NA | NA | NA | 1.07 | NA | NA | NA | |
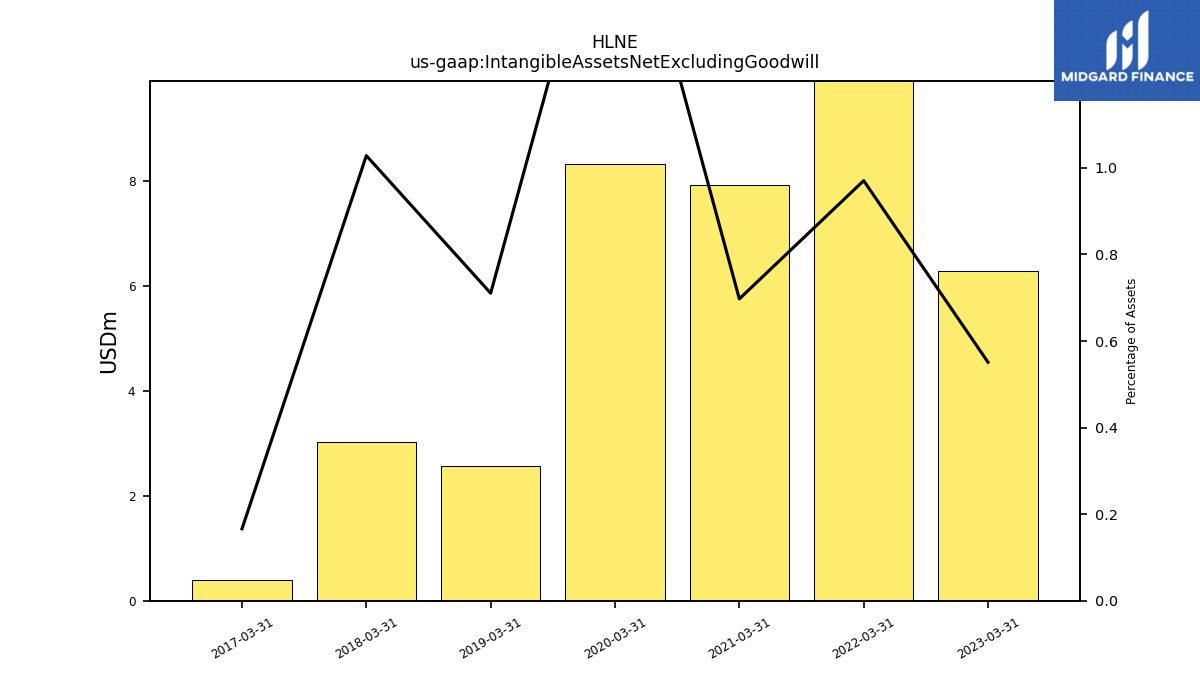
| Intangible Assets Net Excluding Goodwill | NA | NA | 6.29 | NA | NA | NA | 12.57 | NA | NA | NA | 7.92 | NA | NA | NA | 8.33 | NA | NA | NA | 2.56 | NA | NA | NA | 3.02 | NA | NA | NA | 0.40 | NA | NA | NA |
| 2023-09-30 | 2023-06-30 | 2023-03-31 | 2022-12-31 | 2022-09-30 | 2022-06-30 | 2022-03-31 | 2021-12-31 | 2021-09-30 | 2021-06-30 | 2021-03-31 | 2020-12-31 | 2020-09-30 | 2020-06-30 | 2020-03-31 | 2019-12-31 | 2019-09-30 | 2019-06-30 | 2019-03-31 | 2018-12-31 | 2018-09-30 | 2018-06-30 | 2018-03-31 | 2017-12-31 | 2017-09-30 | 2017-06-30 | 2017-03-31 | 2016-12-31 | 2016-09-30 | 2016-06-30 | ||
|---|---|---|---|---|---|---|---|---|---|---|---|---|---|---|---|---|---|---|---|---|---|---|---|---|---|---|---|---|---|---|---|
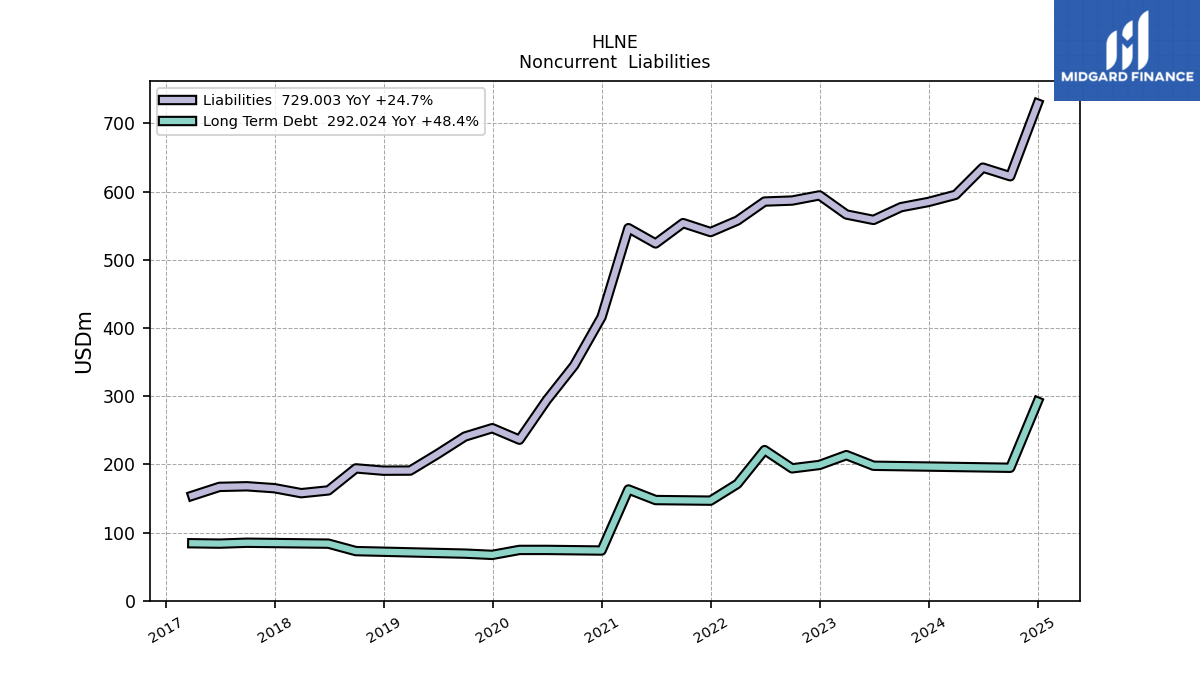
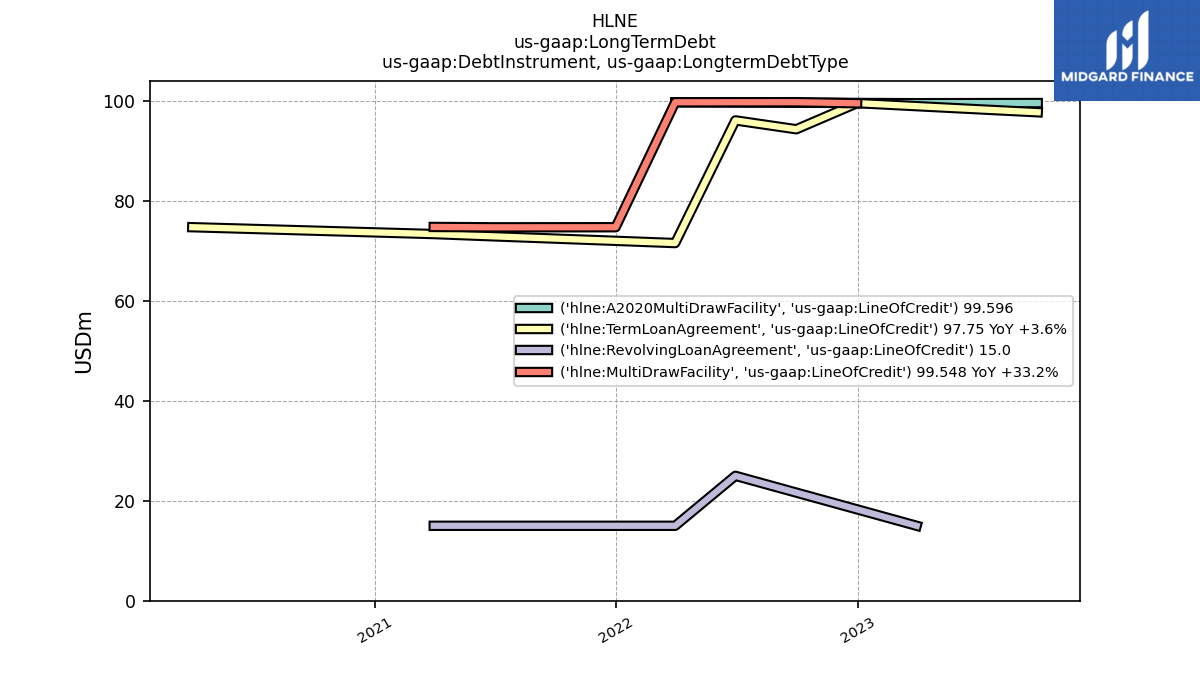
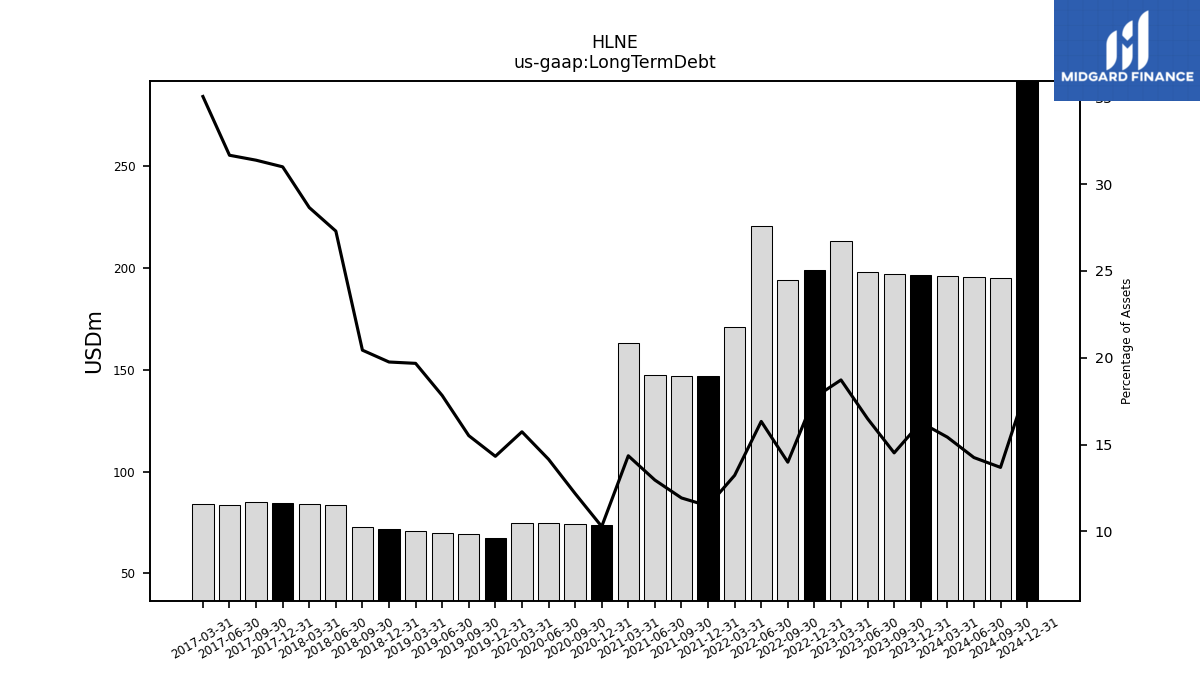
| Long Term Debt | 197.35 | 197.94 | 213.53 | 199.13 | 194.12 | 220.88 | 171.33 | 146.77 | 147.21 | 147.65 | 163.18 | 73.63 | 74.08 | 74.54 | 74.52 | 67.25 | 69.11 | 70.03 | 70.95 | 71.88 | 72.80 | 83.71 | 84.16 | 84.62 | 85.07 | 83.75 | 84.31 | NA | NA | NA |
| 2023-09-30 | 2023-06-30 | 2023-03-31 | 2022-12-31 | 2022-09-30 | 2022-06-30 | 2022-03-31 | 2021-12-31 | 2021-09-30 | 2021-06-30 | 2021-03-31 | 2020-12-31 | 2020-09-30 | 2020-06-30 | 2020-03-31 | 2019-12-31 | 2019-09-30 | 2019-06-30 | 2019-03-31 | 2018-12-31 | 2018-09-30 | 2018-06-30 | 2018-03-31 | 2017-12-31 | 2017-09-30 | 2017-06-30 | 2017-03-31 | 2016-12-31 | 2016-09-30 | 2016-06-30 | ||
|---|---|---|---|---|---|---|---|---|---|---|---|---|---|---|---|---|---|---|---|---|---|---|---|---|---|---|---|---|---|---|---|
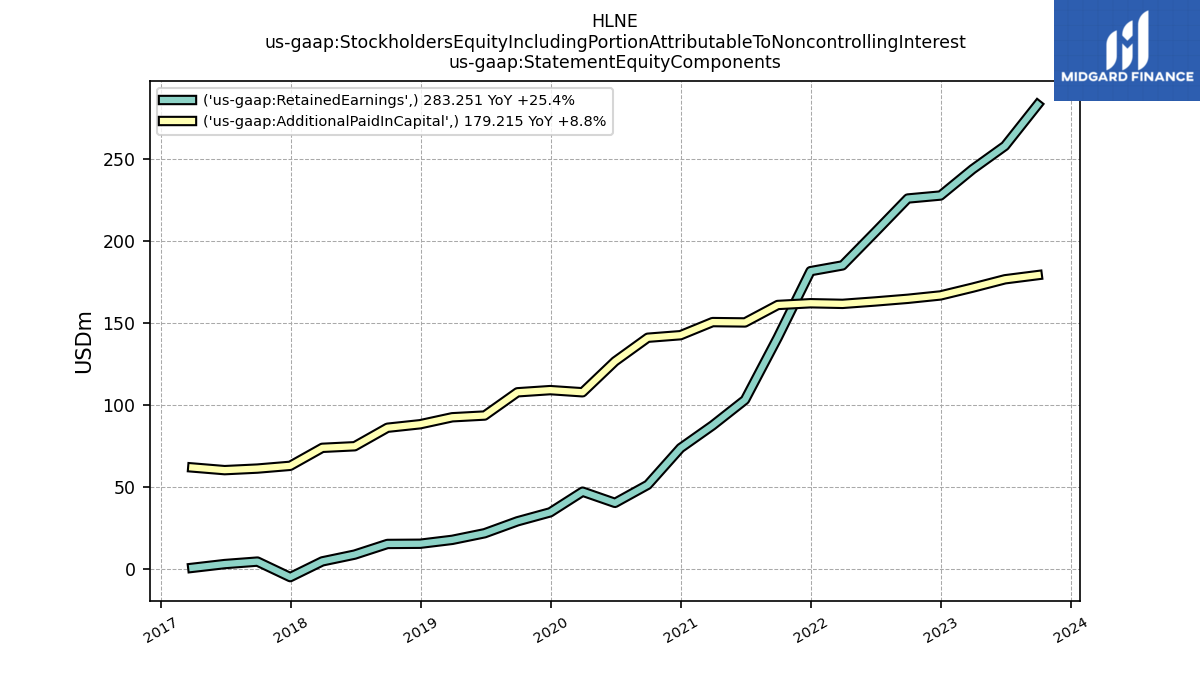
| Stockholders Equity | 462.52 | 434.77 | 415.44 | 394.66 | 390.77 | 368.51 | 346.88 | 343.76 | 302.18 | 253.48 | 238.13 | 216.32 | 192.34 | 166.79 | 154.79 | 143.57 | 136.76 | 115.33 | 110.23 | 103.61 | 101.32 | 83.53 | 78.43 | 57.84 | 65.65 | 62.88 | 60.04 | NA | NA | NA | |
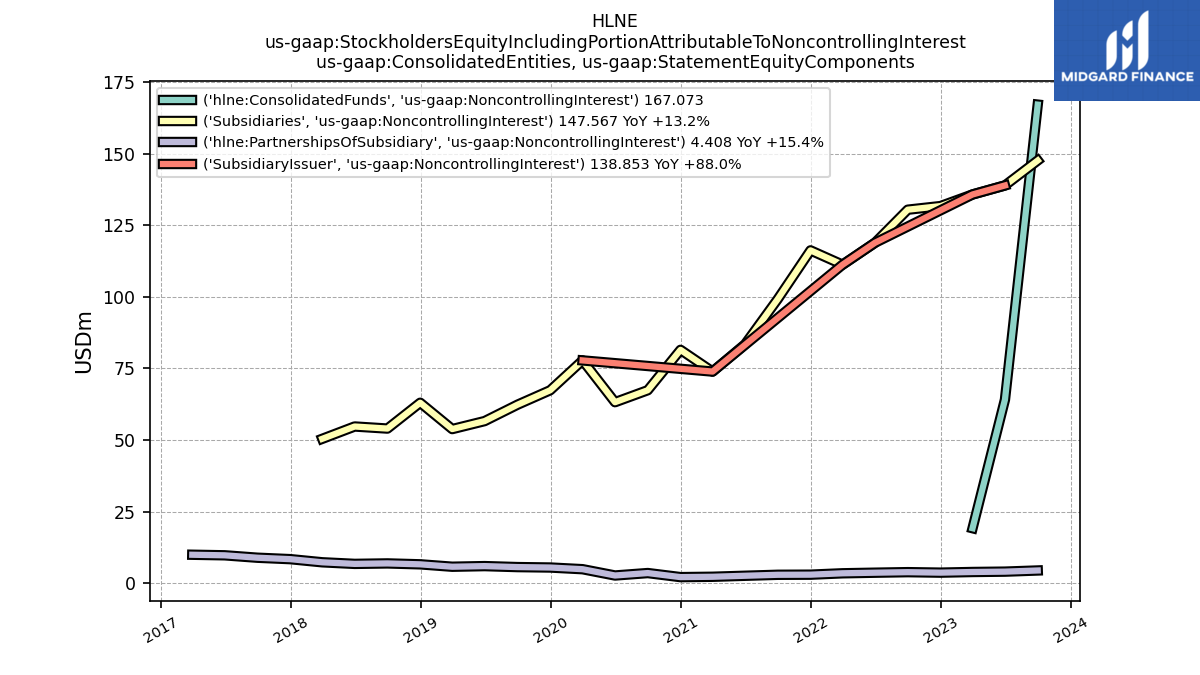
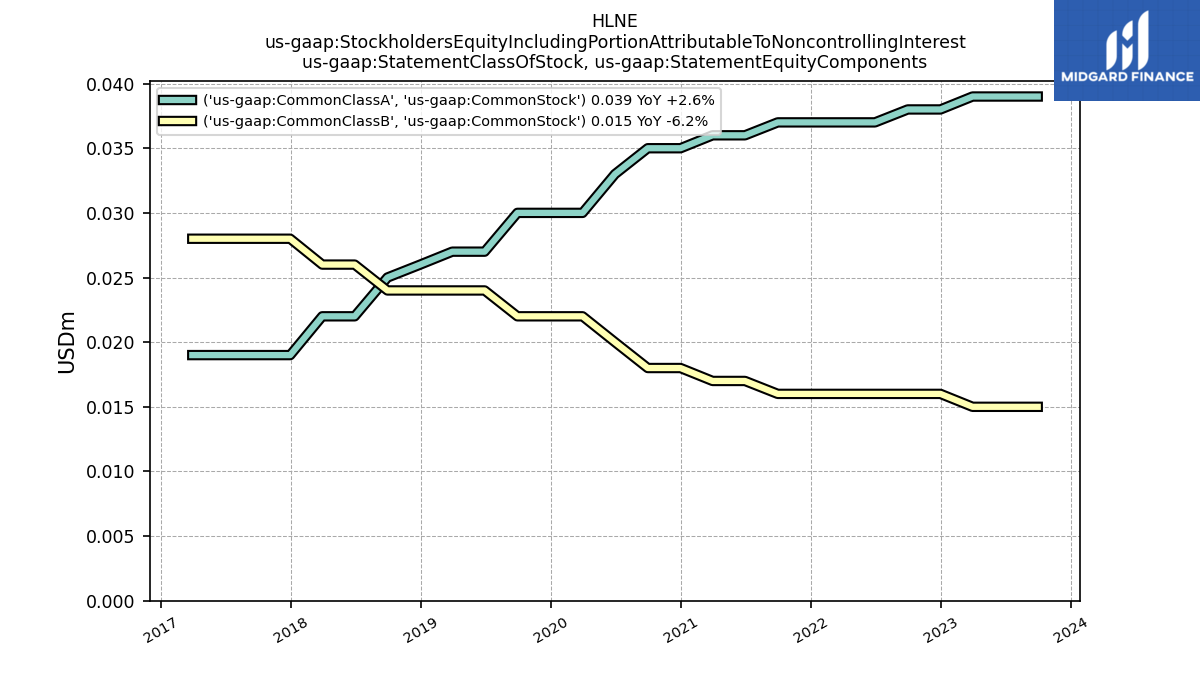
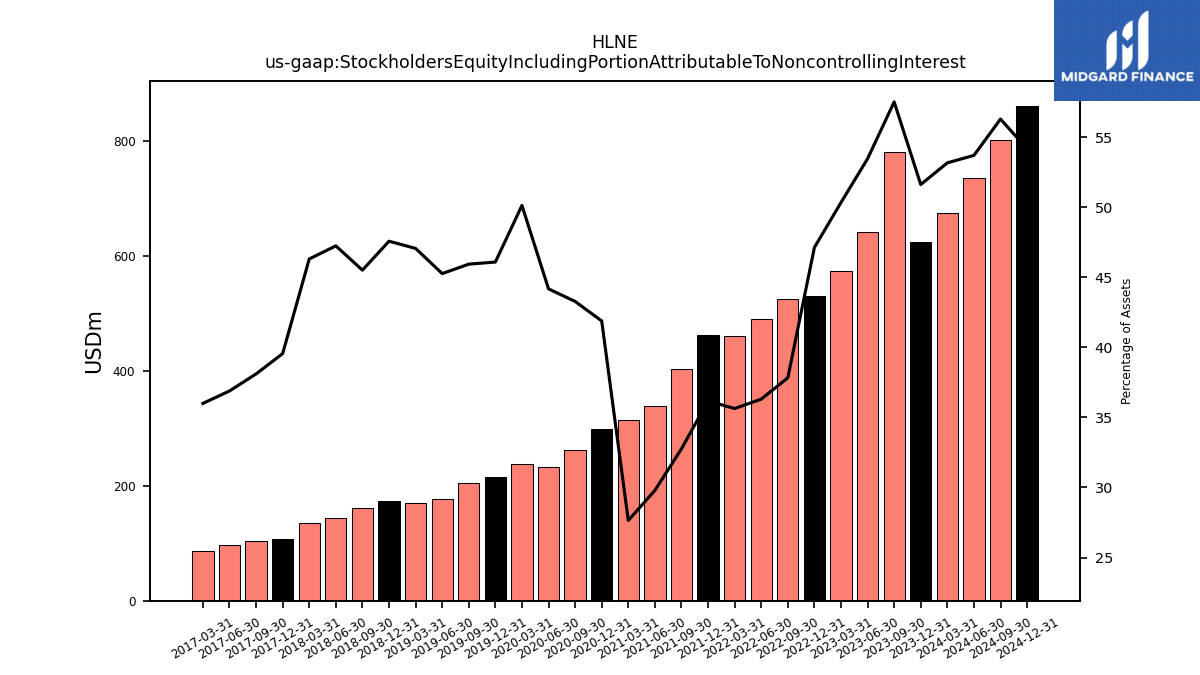
| Stockholders Equity Including Portion Attributable To Noncontrolling Interest | 781.57 | 641.70 | 574.19 | 529.96 | 524.98 | 490.97 | 461.49 | 462.88 | 404.25 | 339.42 | 314.20 | 299.85 | 263.19 | 232.61 | 237.40 | 216.35 | 204.63 | 177.84 | 169.72 | 173.13 | 162.15 | 144.93 | 136.07 | 108.02 | 103.33 | 97.59 | 86.63 | NA | NA | NA | |
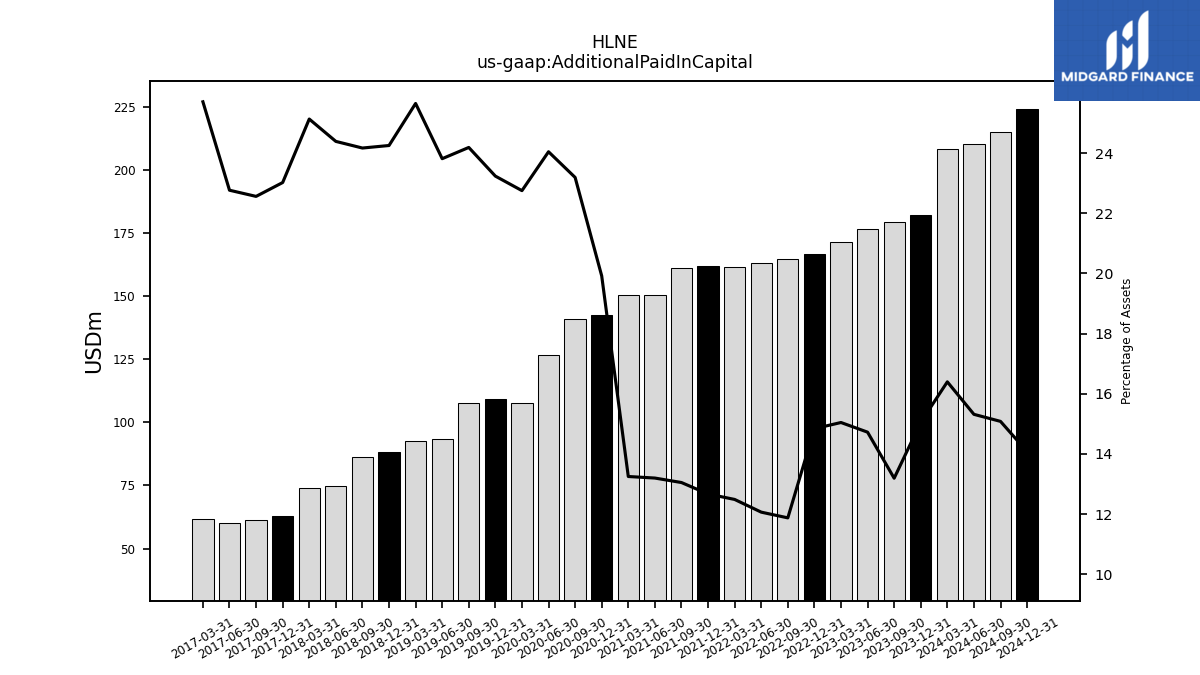
| Additional Paid In Capital | 179.22 | 176.67 | 171.57 | 166.82 | 164.76 | 163.13 | 161.68 | 162.07 | 161.00 | 150.34 | 150.56 | 142.56 | 141.01 | 126.58 | 107.73 | 109.05 | 107.72 | 93.54 | 92.48 | 88.23 | 86.09 | 74.80 | 73.83 | 62.85 | 61.17 | 60.22 | 61.84 | NA | NA | NA | |
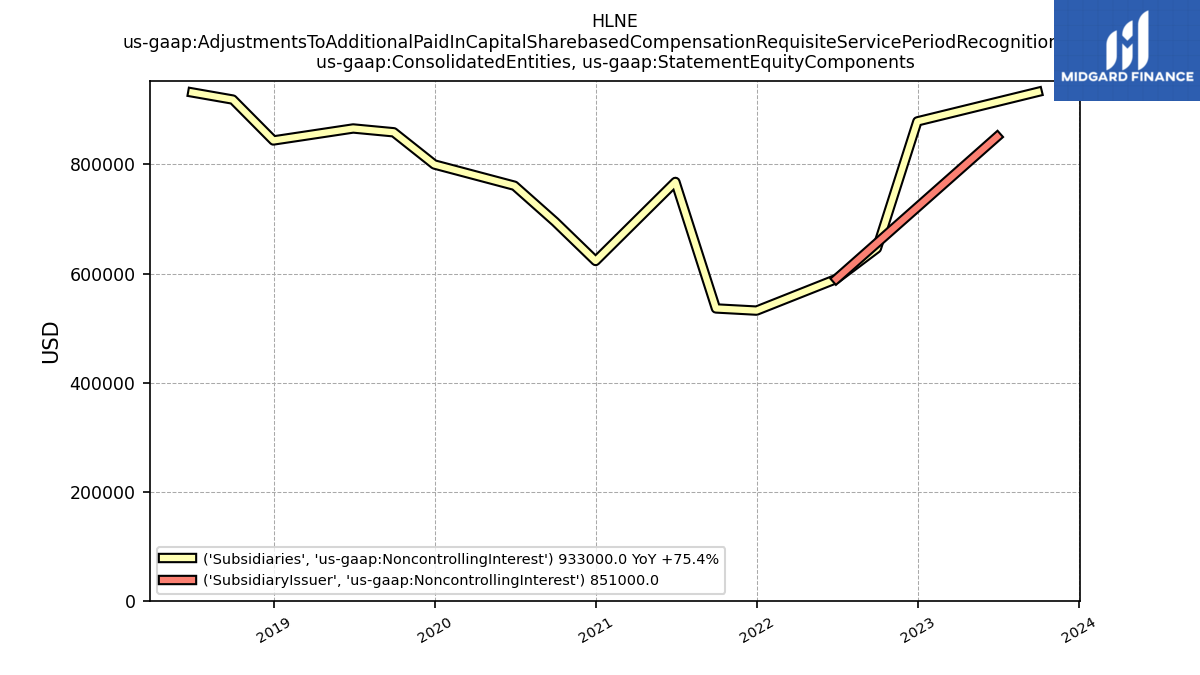
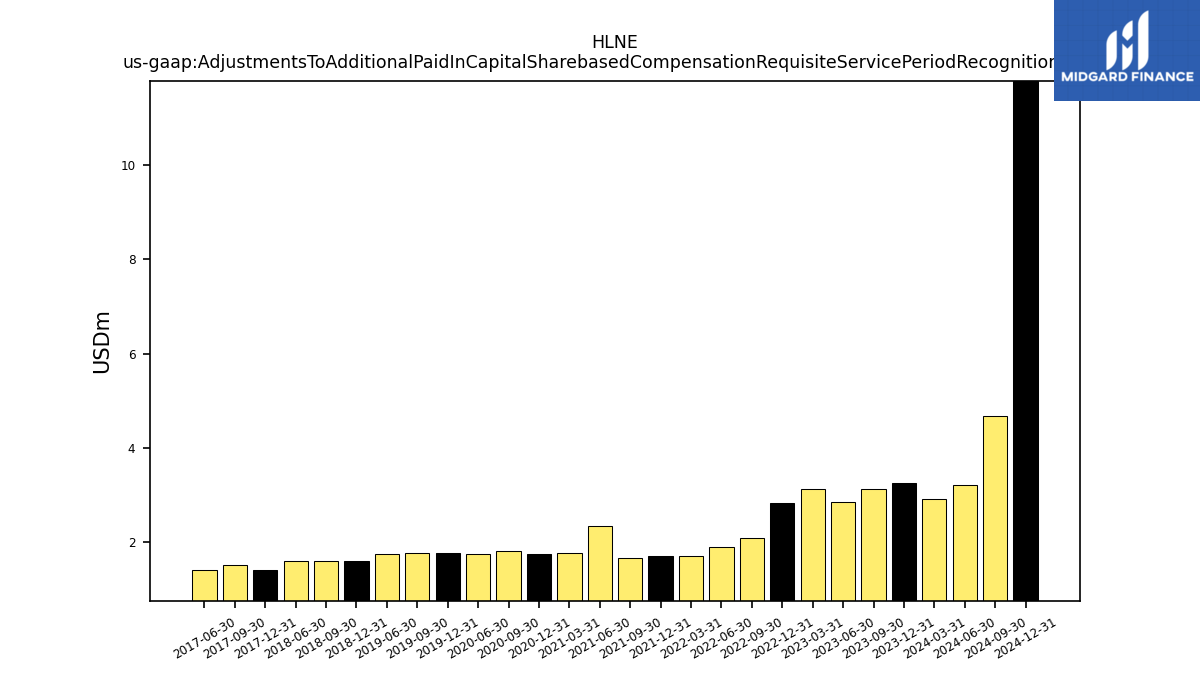
| Adjustments To Additional Paid In Capital Sharebased Compensation Requisite Service Period Recognition Value | 3.12 | 2.85 | 3.13 | 2.83 | 2.08 | 1.90 | 1.70 | 1.71 | 1.65 | 2.34 | 1.78 | 1.76 | 1.81 | 1.76 | NA | 1.78 | 1.76 | 1.74 | NA | 1.60 | 1.61 | 1.61 | NA | 1.41 | 1.52 | 1.42 | NA | NA | NA | NA | |
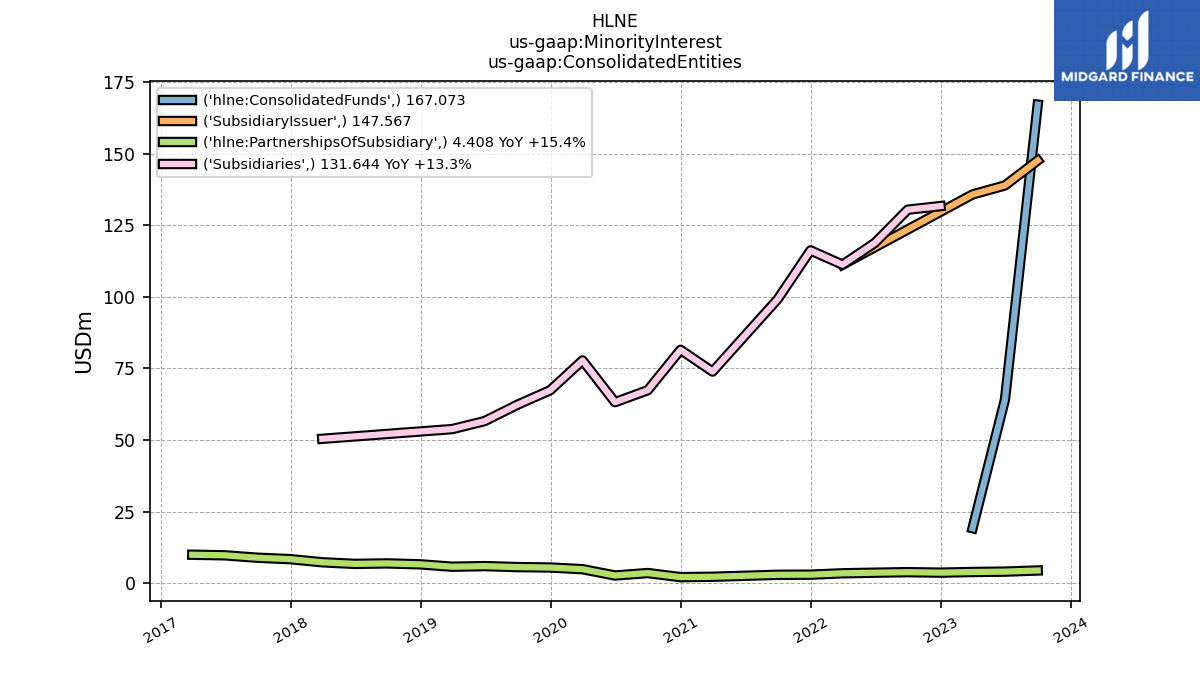
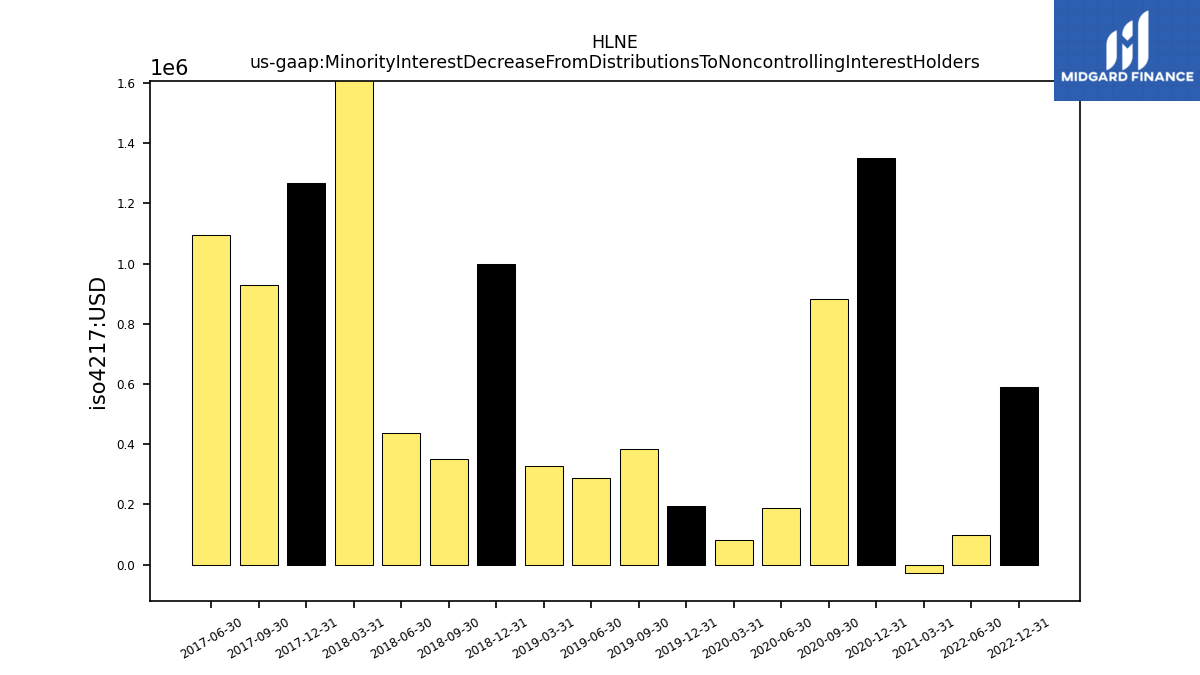
| Minority Interest Decrease From Distributions To Noncontrolling Interest Holders | NA | NA | NA | 0.59 | NA | 0.10 | NA | NA | NA | NA | -0.03 | 1.35 | 0.88 | 0.19 | 0.08 | 0.20 | 0.39 | 0.29 | 0.33 | 1.00 | 0.35 | 0.44 | 1.79 | 1.27 | 0.93 | 1.09 | NA | NA | NA | NA |
| 2023-09-30 | 2023-06-30 | 2023-03-31 | 2022-12-31 | 2022-09-30 | 2022-06-30 | 2022-03-31 | 2021-12-31 | 2021-09-30 | 2021-06-30 | 2021-03-31 | 2020-12-31 | 2020-09-30 | 2020-06-30 | 2020-03-31 | 2019-12-31 | 2019-09-30 | 2019-06-30 | 2019-03-31 | 2018-12-31 | 2018-09-30 | 2018-06-30 | 2018-03-31 | 2017-12-31 | 2017-09-30 | 2017-06-30 | 2017-03-31 | 2016-12-31 | 2016-09-30 | 2016-06-30 | ||
|---|---|---|---|---|---|---|---|---|---|---|---|---|---|---|---|---|---|---|---|---|---|---|---|---|---|---|---|---|---|---|---|
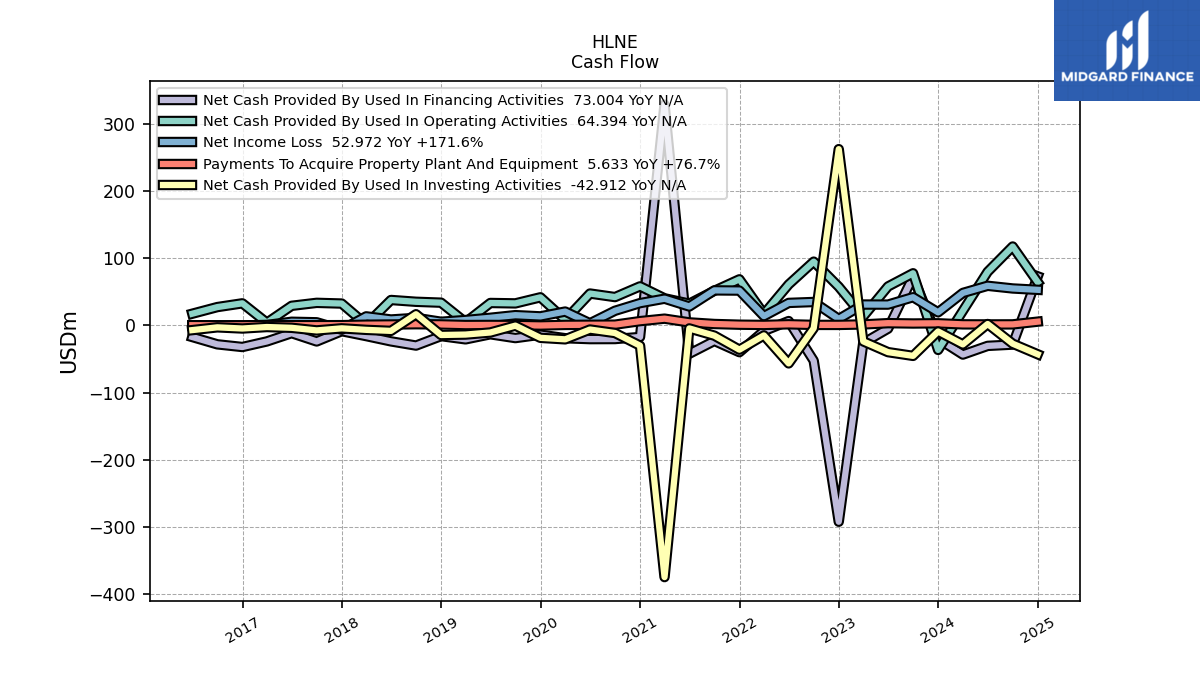
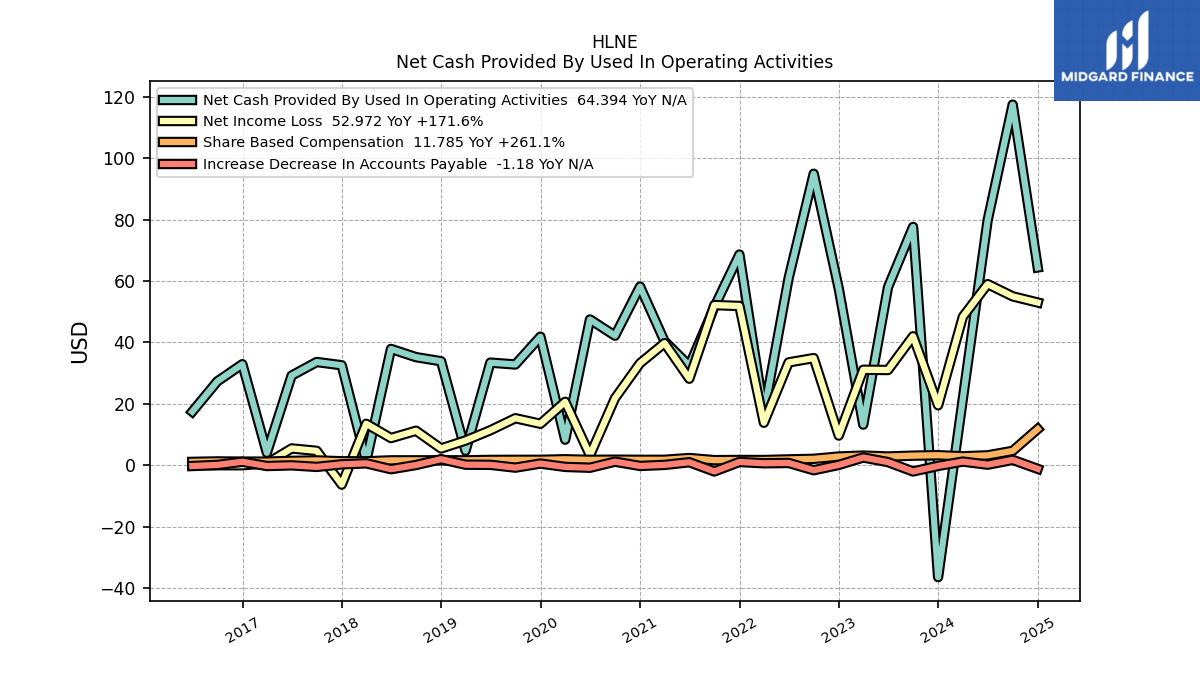
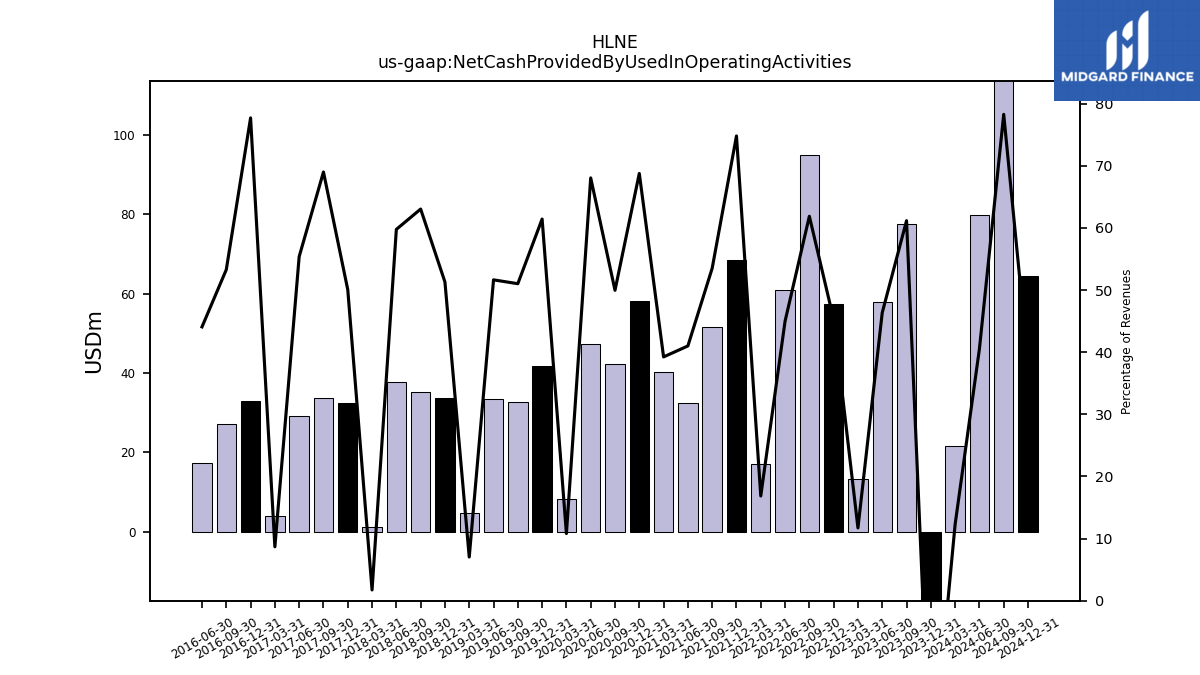
| Net Cash Provided By Used In Operating Activities | 77.60 | 57.97 | 13.22 | 57.52 | 94.90 | 60.95 | 17.01 | 68.59 | 51.53 | 32.39 | 40.37 | 58.16 | 42.18 | 47.45 | 8.32 | 41.85 | 32.80 | 33.40 | 4.71 | 33.85 | 35.19 | 37.86 | 1.35 | 32.55 | 33.60 | 29.19 | 4.05 | 32.89 | 27.30 | 17.44 | |
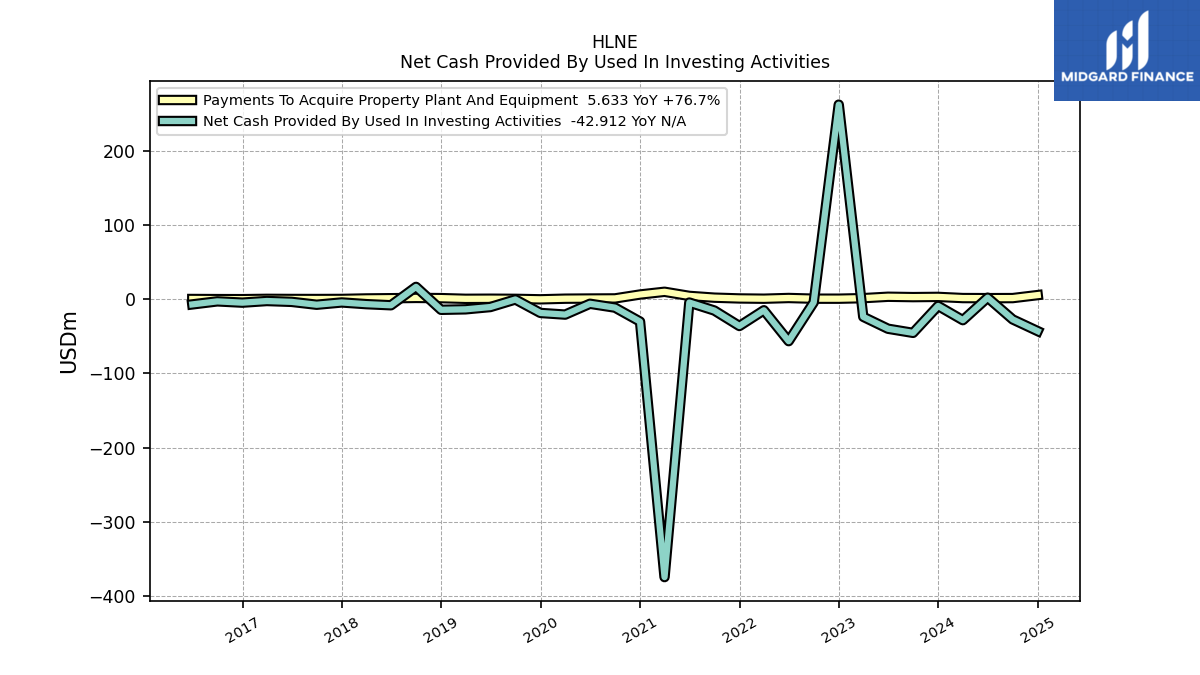
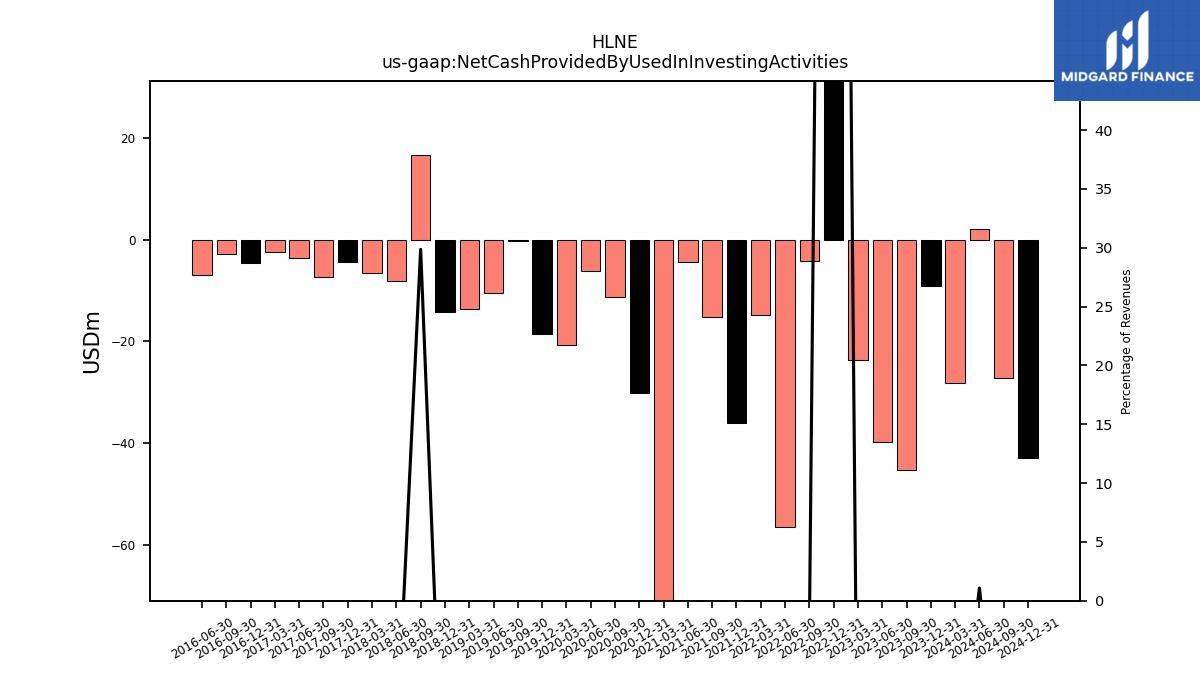
| Net Cash Provided By Used In Investing Activities | -45.29 | -39.72 | -23.65 | 262.23 | -4.21 | -56.45 | -14.82 | -36.05 | -15.18 | -4.43 | -374.37 | -30.06 | -11.28 | -6.07 | -20.67 | -18.45 | -0.29 | -10.49 | -13.57 | -14.23 | 16.67 | -8.09 | -6.58 | -4.30 | -7.38 | -3.51 | -2.37 | -4.57 | -2.84 | -6.95 | |
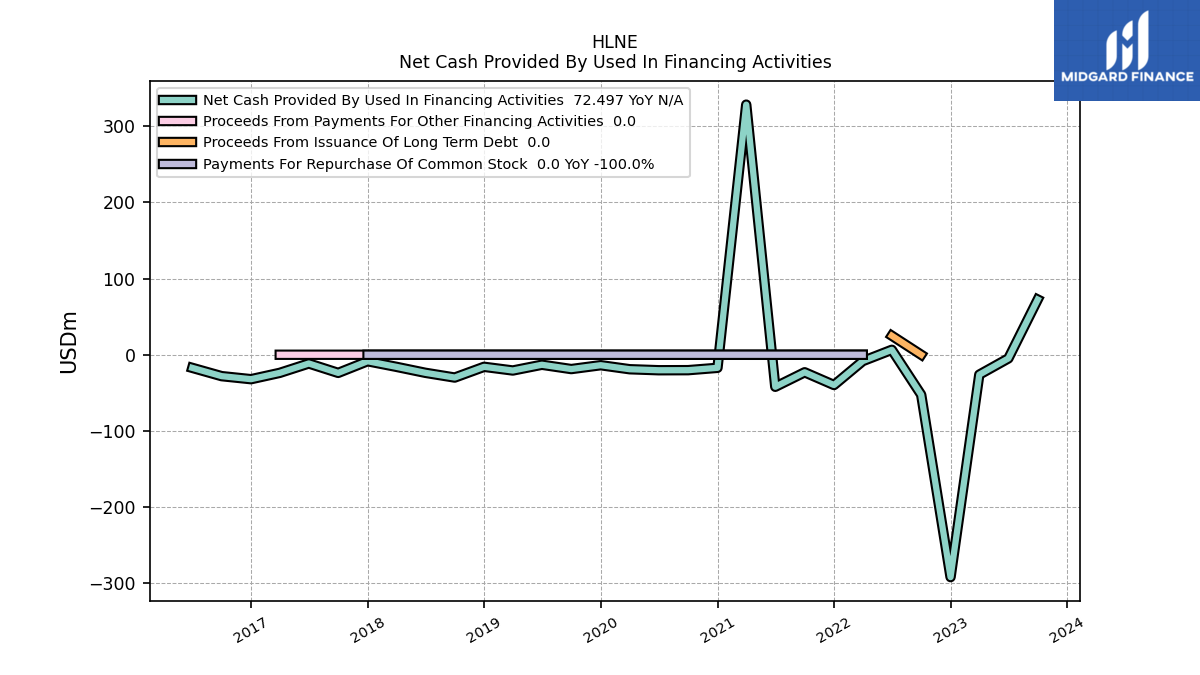
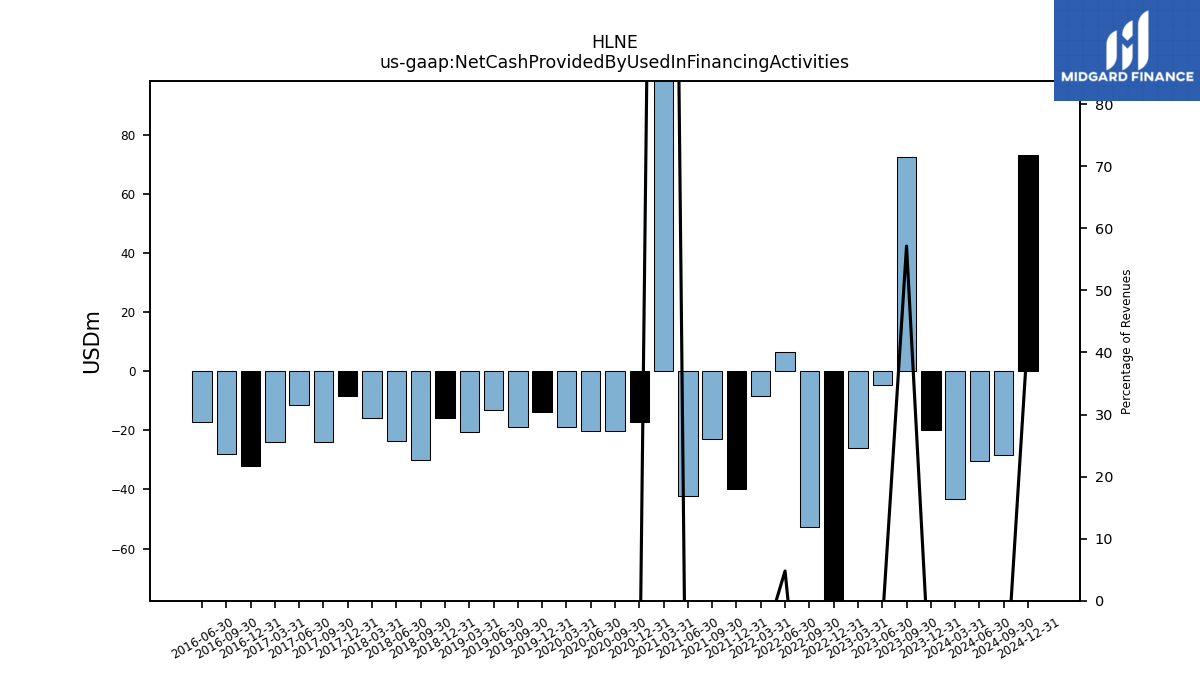
| Net Cash Provided By Used In Financing Activities | 72.50 | -4.83 | -26.11 | -292.01 | -52.52 | 6.50 | -8.33 | -39.77 | -23.03 | -42.09 | 328.44 | -17.19 | -20.25 | -20.34 | -19.02 | -13.74 | -18.81 | -13.13 | -20.69 | -15.86 | -29.95 | -23.71 | -15.85 | -8.51 | -23.83 | -11.48 | -23.79 | -32.09 | -28.10 | -17.22 |
| 2023-09-30 | 2023-06-30 | 2023-03-31 | 2022-12-31 | 2022-09-30 | 2022-06-30 | 2022-03-31 | 2021-12-31 | 2021-09-30 | 2021-06-30 | 2021-03-31 | 2020-12-31 | 2020-09-30 | 2020-06-30 | 2020-03-31 | 2019-12-31 | 2019-09-30 | 2019-06-30 | 2019-03-31 | 2018-12-31 | 2018-09-30 | 2018-06-30 | 2018-03-31 | 2017-12-31 | 2017-09-30 | 2017-06-30 | 2017-03-31 | 2016-12-31 | 2016-09-30 | 2016-06-30 | ||
|---|---|---|---|---|---|---|---|---|---|---|---|---|---|---|---|---|---|---|---|---|---|---|---|---|---|---|---|---|---|---|---|
| Net Cash Provided By Used In Operating Activities | 77.60 | 57.97 | 13.22 | 57.52 | 94.90 | 60.95 | 17.01 | 68.59 | 51.53 | 32.39 | 40.37 | 58.16 | 42.18 | 47.45 | 8.32 | 41.85 | 32.80 | 33.40 | 4.71 | 33.85 | 35.19 | 37.86 | 1.35 | 32.55 | 33.60 | 29.19 | 4.05 | 32.89 | 27.30 | 17.44 | |
| Net Income Loss | 41.99 | 31.00 | 31.09 | 9.67 | 34.88 | 33.48 | 13.82 | 51.85 | 52.15 | 28.17 | 39.76 | 33.20 | 21.81 | 3.25 | 20.65 | 13.50 | 15.30 | 11.38 | 8.05 | 5.46 | 11.22 | 8.85 | 13.50 | -6.31 | 4.69 | 5.46 | 0.61 | 0.00 | 0.00 | 0.00 | |
| Profit Loss | 64.50 | 51.34 | 51.44 | 21.88 | 57.74 | 56.13 | 37.56 | 80.20 | 84.82 | 44.68 | 64.59 | 54.63 | 44.60 | 4.97 | 38.61 | 28.44 | 32.27 | 27.45 | 20.41 | 22.91 | 32.57 | 23.10 | 44.62 | 17.83 | 18.23 | 25.61 | 16.63 | 17.06 | 24.36 | 16.39 | |
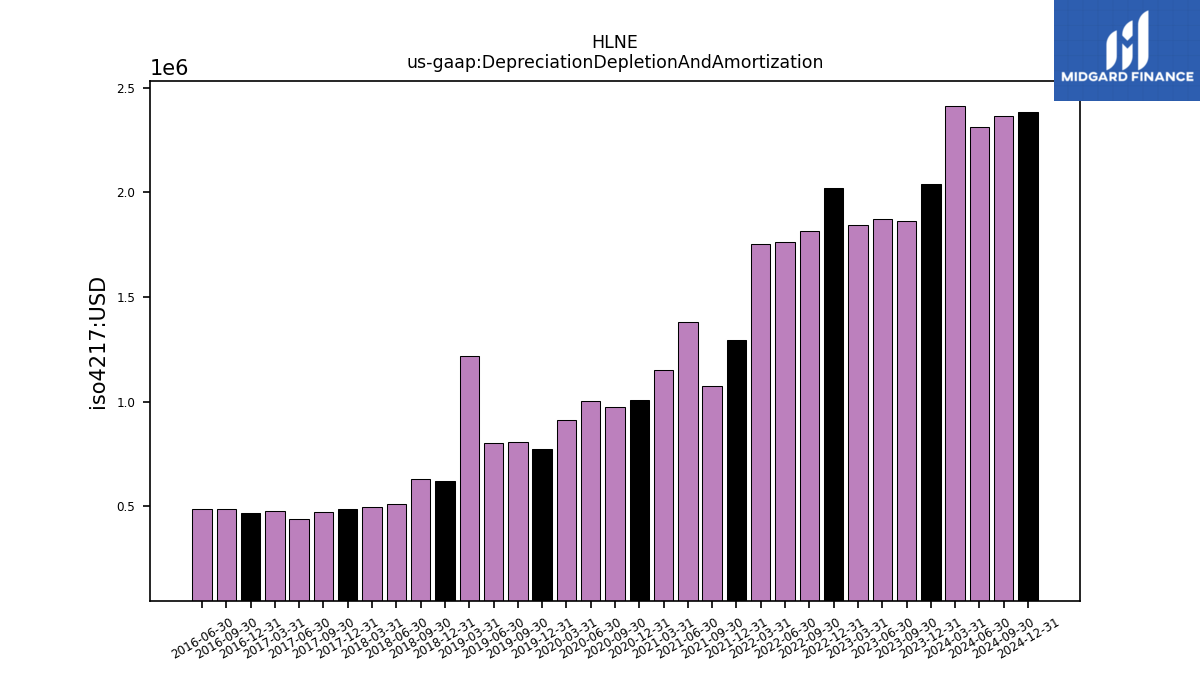
| Depreciation Depletion And Amortization | 1.86 | 1.87 | 1.84 | 2.02 | 1.81 | 1.76 | 1.75 | 1.29 | 1.07 | 1.38 | 1.15 | 1.00 | 0.97 | 1.00 | 0.91 | 0.77 | 0.81 | 0.80 | 1.22 | 0.62 | 0.63 | 0.51 | 0.49 | 0.49 | 0.47 | 0.44 | 0.47 | 0.47 | 0.48 | 0.49 | |
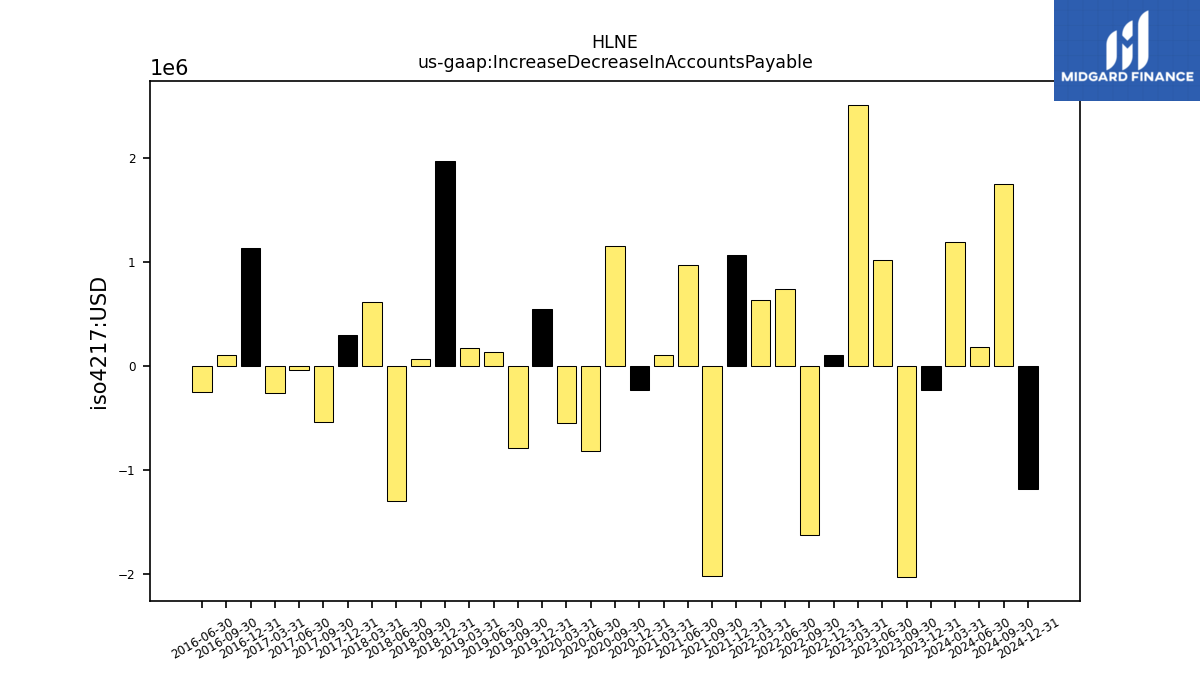
| Increase Decrease In Accounts Payable | -2.03 | 1.01 | 2.52 | 0.10 | -1.63 | 0.74 | 0.64 | 1.07 | -2.02 | 0.98 | 0.10 | -0.23 | 1.16 | -0.82 | -0.55 | 0.55 | -0.79 | 0.13 | 0.17 | 1.97 | 0.07 | -1.29 | 0.62 | 0.30 | -0.54 | -0.04 | -0.26 | 1.13 | 0.10 | -0.25 | |
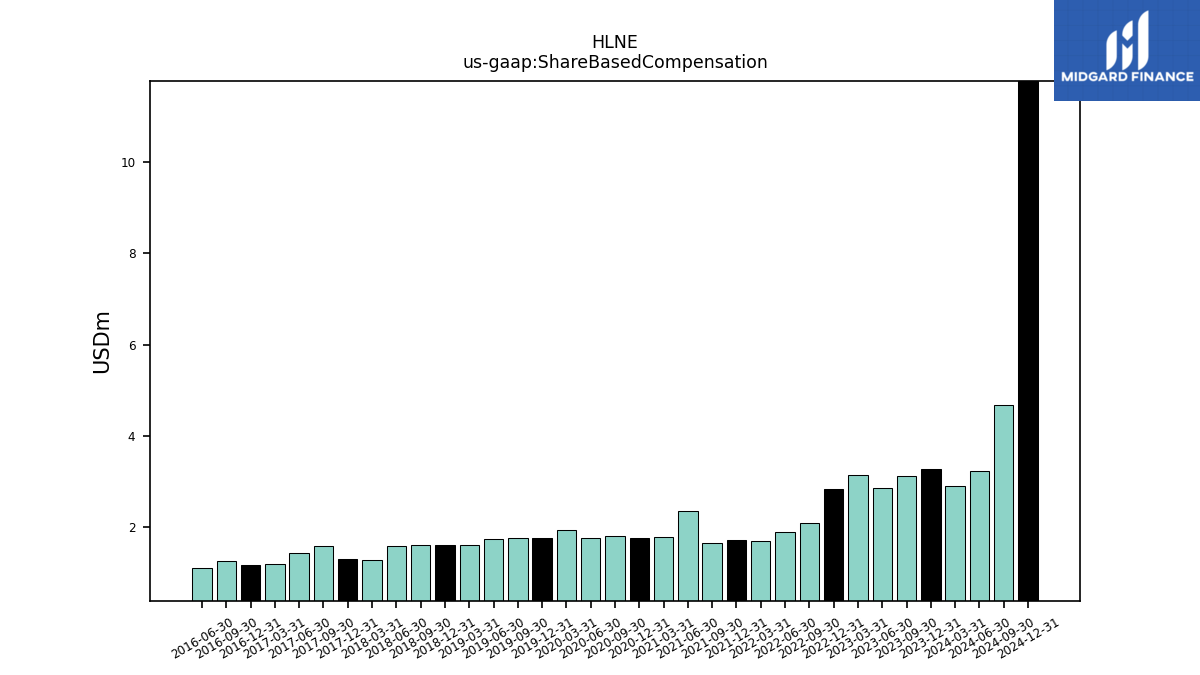
| Share Based Compensation | 3.12 | 2.85 | 3.13 | 2.83 | 2.08 | 1.90 | 1.70 | 1.71 | 1.65 | 2.34 | 1.77 | 1.76 | 1.80 | 1.75 | 1.94 | 1.76 | 1.76 | 1.73 | 1.60 | 1.59 | 1.59 | 1.59 | 1.27 | 1.28 | 1.57 | 1.42 | 1.18 | 1.17 | 1.24 | 1.09 |
| 2023-09-30 | 2023-06-30 | 2023-03-31 | 2022-12-31 | 2022-09-30 | 2022-06-30 | 2022-03-31 | 2021-12-31 | 2021-09-30 | 2021-06-30 | 2021-03-31 | 2020-12-31 | 2020-09-30 | 2020-06-30 | 2020-03-31 | 2019-12-31 | 2019-09-30 | 2019-06-30 | 2019-03-31 | 2018-12-31 | 2018-09-30 | 2018-06-30 | 2018-03-31 | 2017-12-31 | 2017-09-30 | 2017-06-30 | 2017-03-31 | 2016-12-31 | 2016-09-30 | 2016-06-30 | ||
|---|---|---|---|---|---|---|---|---|---|---|---|---|---|---|---|---|---|---|---|---|---|---|---|---|---|---|---|---|---|---|---|
| Net Cash Provided By Used In Investing Activities | -45.29 | -39.72 | -23.65 | 262.23 | -4.21 | -56.45 | -14.82 | -36.05 | -15.18 | -4.43 | -374.37 | -30.06 | -11.28 | -6.07 | -20.67 | -18.45 | -0.29 | -10.49 | -13.57 | -14.23 | 16.67 | -8.09 | -6.58 | -4.30 | -7.38 | -3.51 | -2.37 | -4.57 | -2.84 | -6.95 | |
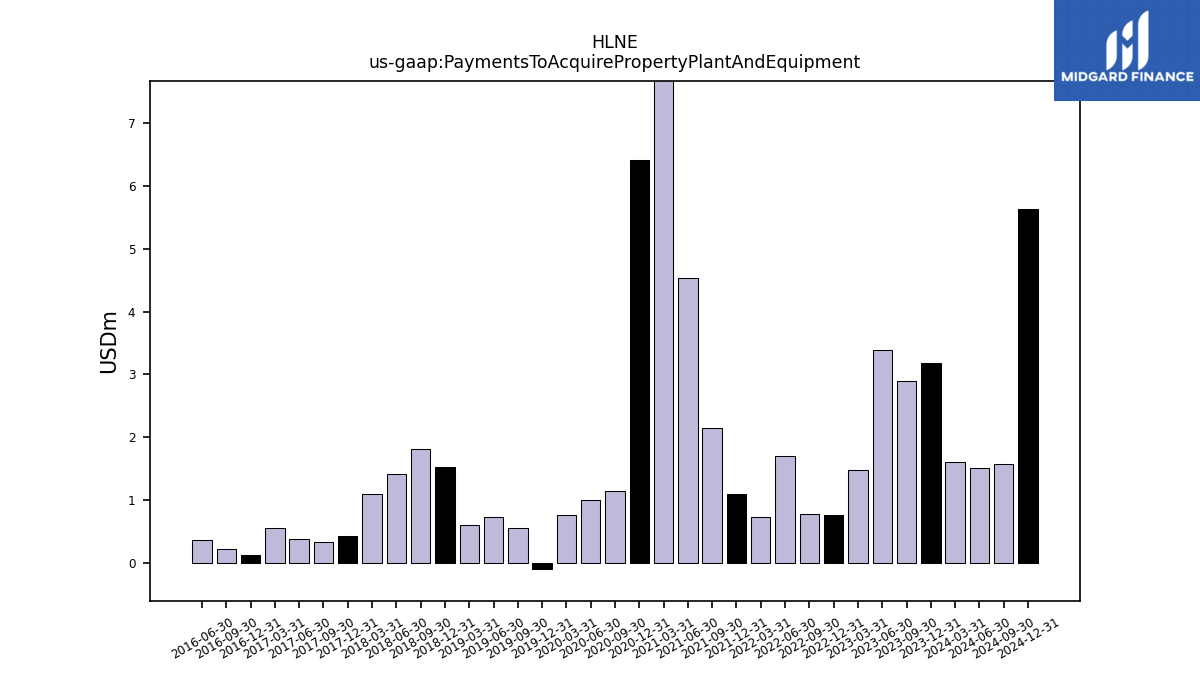
| Payments To Acquire Property Plant And Equipment | 2.89 | 3.38 | 1.49 | 0.77 | 0.78 | 1.71 | 0.74 | 1.10 | 2.15 | 4.54 | 10.08 | 6.41 | 1.15 | 1.00 | 0.77 | -0.09 | 0.56 | 0.74 | 0.61 | 1.53 | 1.81 | 1.41 | 1.10 | 0.43 | 0.33 | 0.39 | 0.56 | 0.14 | 0.22 | 0.36 |
| 2023-09-30 | 2023-06-30 | 2023-03-31 | 2022-12-31 | 2022-09-30 | 2022-06-30 | 2022-03-31 | 2021-12-31 | 2021-09-30 | 2021-06-30 | 2021-03-31 | 2020-12-31 | 2020-09-30 | 2020-06-30 | 2020-03-31 | 2019-12-31 | 2019-09-30 | 2019-06-30 | 2019-03-31 | 2018-12-31 | 2018-09-30 | 2018-06-30 | 2018-03-31 | 2017-12-31 | 2017-09-30 | 2017-06-30 | 2017-03-31 | 2016-12-31 | 2016-09-30 | 2016-06-30 | ||
|---|---|---|---|---|---|---|---|---|---|---|---|---|---|---|---|---|---|---|---|---|---|---|---|---|---|---|---|---|---|---|---|
| Net Cash Provided By Used In Financing Activities | 72.50 | -4.83 | -26.11 | -292.01 | -52.52 | 6.50 | -8.33 | -39.77 | -23.03 | -42.09 | 328.44 | -17.19 | -20.25 | -20.34 | -19.02 | -13.74 | -18.81 | -13.13 | -20.69 | -15.86 | -29.95 | -23.71 | -15.85 | -8.51 | -23.83 | -11.48 | -23.79 | -32.09 | -28.10 | -17.22 | |
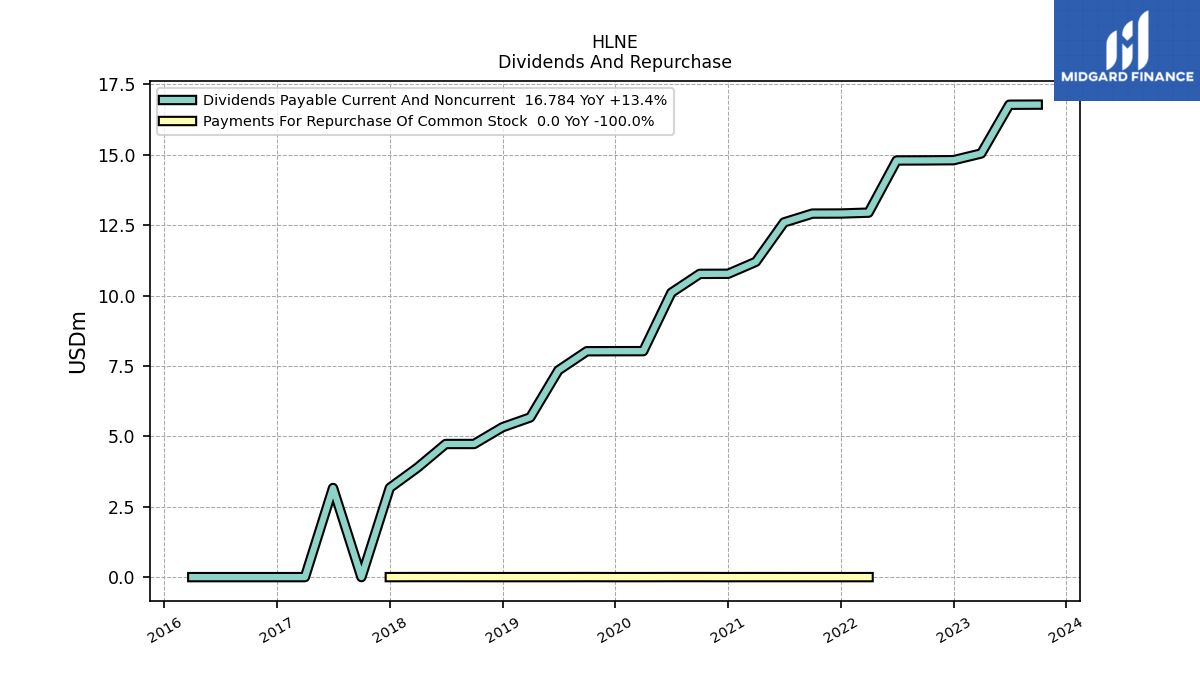
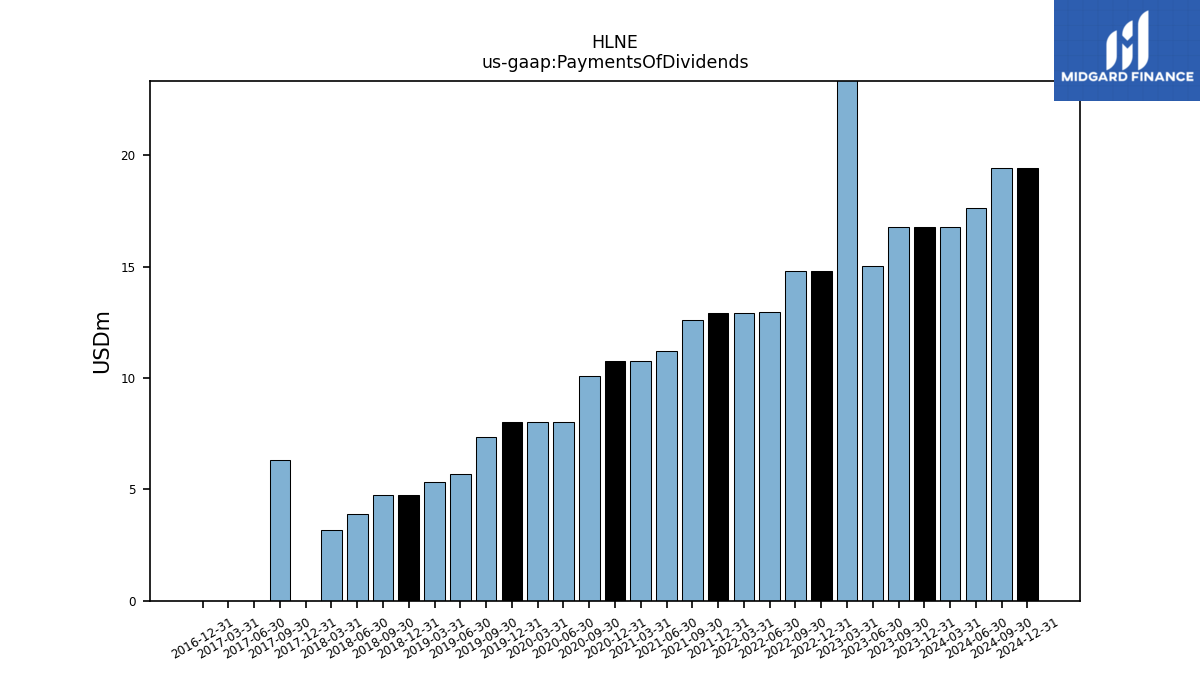
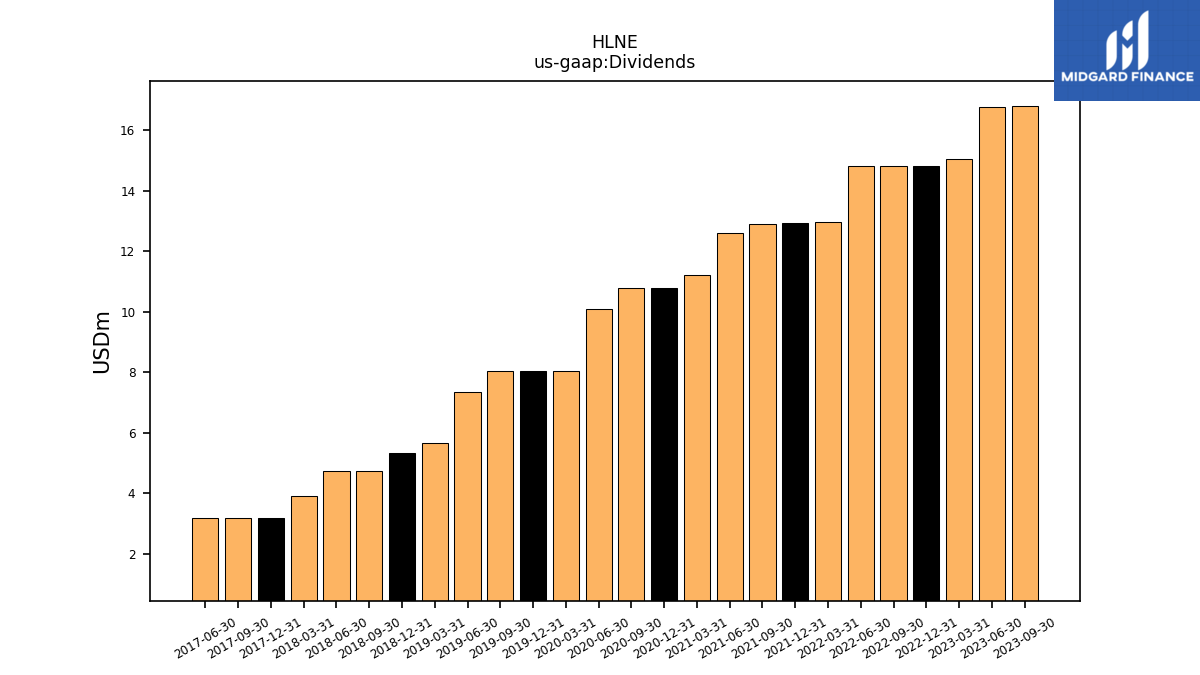
| Payments Of Dividends | 16.78 | 15.05 | 29.86 | 14.80 | 14.80 | 12.95 | 12.92 | 12.91 | 12.60 | 11.20 | 10.77 | 10.77 | 10.10 | 8.03 | 8.03 | 8.02 | 7.34 | 5.67 | 5.33 | 4.73 | 4.73 | 3.89 | 3.17 | 0.00 | 6.34 | 0.00 | 0.00 | 0.00 | NA | NA | |
| Dividends | 16.78 | 16.78 | 15.05 | 14.81 | 14.80 | 14.80 | 12.95 | 12.92 | 12.91 | 12.60 | 11.20 | 10.78 | 10.77 | 10.10 | 8.03 | 8.03 | 8.02 | 7.34 | 5.67 | 5.33 | 4.73 | 4.73 | 3.89 | 3.17 | 3.17 | 3.17 | NA | NA | NA | NA | |
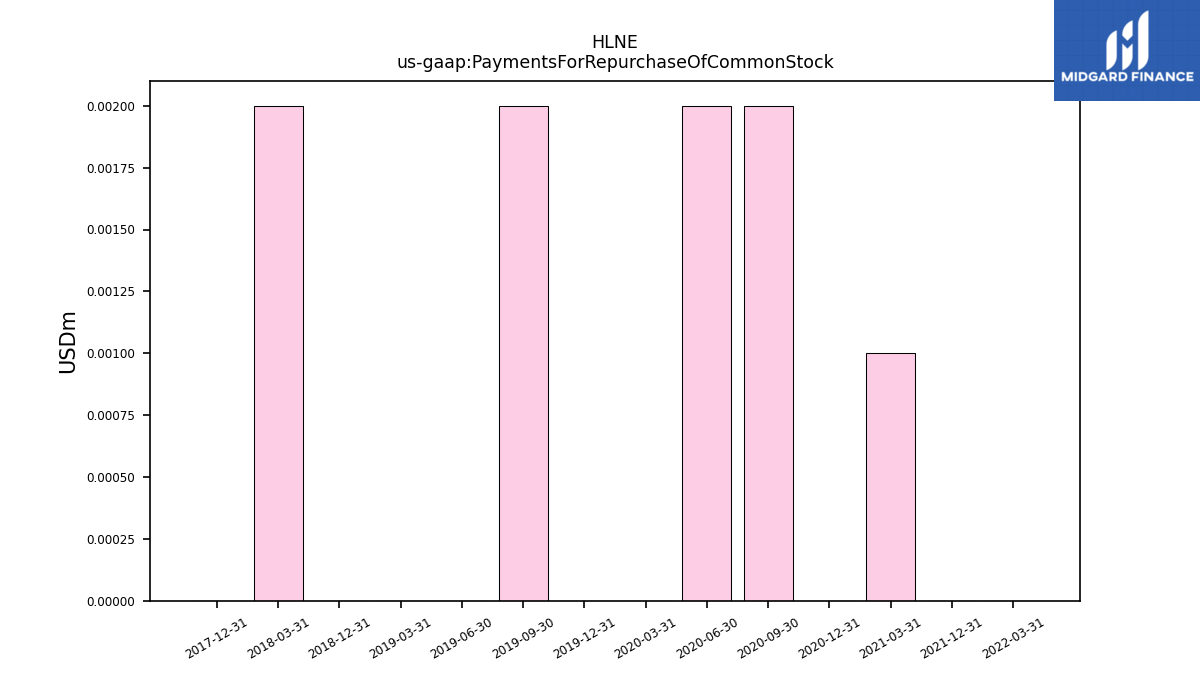
| Payments For Repurchase Of Common Stock | NA | NA | NA | NA | NA | NA | 0.00 | 0.00 | NA | NA | 0.00 | 0.00 | 0.00 | 0.00 | 0.00 | 0.00 | 0.00 | 0.00 | 0.00 | 0.00 | NA | NA | 0.00 | 0.00 | NA | NA | NA | NA | NA | NA |
| 2023-09-30 | 2023-06-30 | 2023-03-31 | 2022-12-31 | 2022-09-30 | 2022-06-30 | 2022-03-31 | 2021-12-31 | 2021-09-30 | 2021-06-30 | 2021-03-31 | 2020-12-31 | 2020-09-30 | 2020-06-30 | 2020-03-31 | 2019-12-31 | 2019-09-30 | 2019-06-30 | 2019-03-31 | 2018-12-31 | 2018-09-30 | 2018-06-30 | 2018-03-31 | 2017-12-31 | 2017-09-30 | 2017-06-30 | 2017-03-31 | 2016-12-31 | 2016-09-30 | 2016-06-30 | ||
|---|---|---|---|---|---|---|---|---|---|---|---|---|---|---|---|---|---|---|---|---|---|---|---|---|---|---|---|---|---|---|---|
| Revenues | 126.88 | 125.04 | 112.79 | 127.07 | 153.38 | 135.51 | 100.90 | 91.70 | 96.32 | 79.00 | 102.88 | 84.58 | 84.43 | 69.74 | 76.93 | 68.14 | 64.29 | 64.69 | 66.99 | 66.00 | 55.83 | 63.36 | 77.61 | 65.01 | 48.71 | 52.70 | 46.68 | 42.33 | 51.24 | 39.57 | |
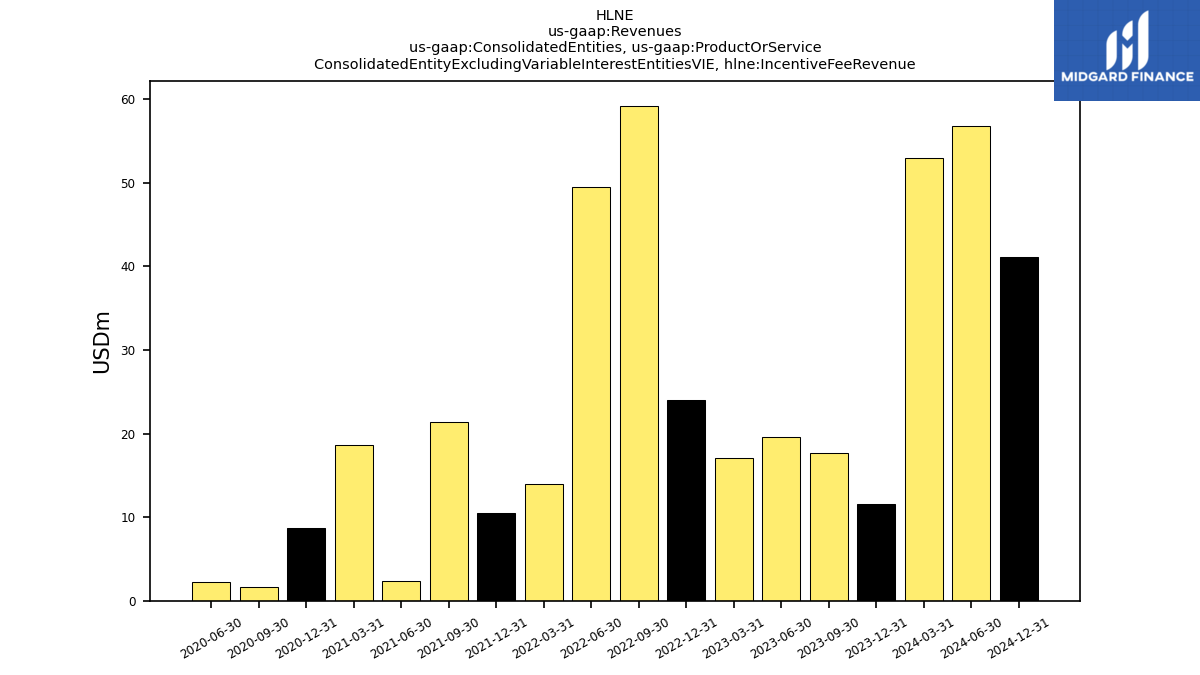
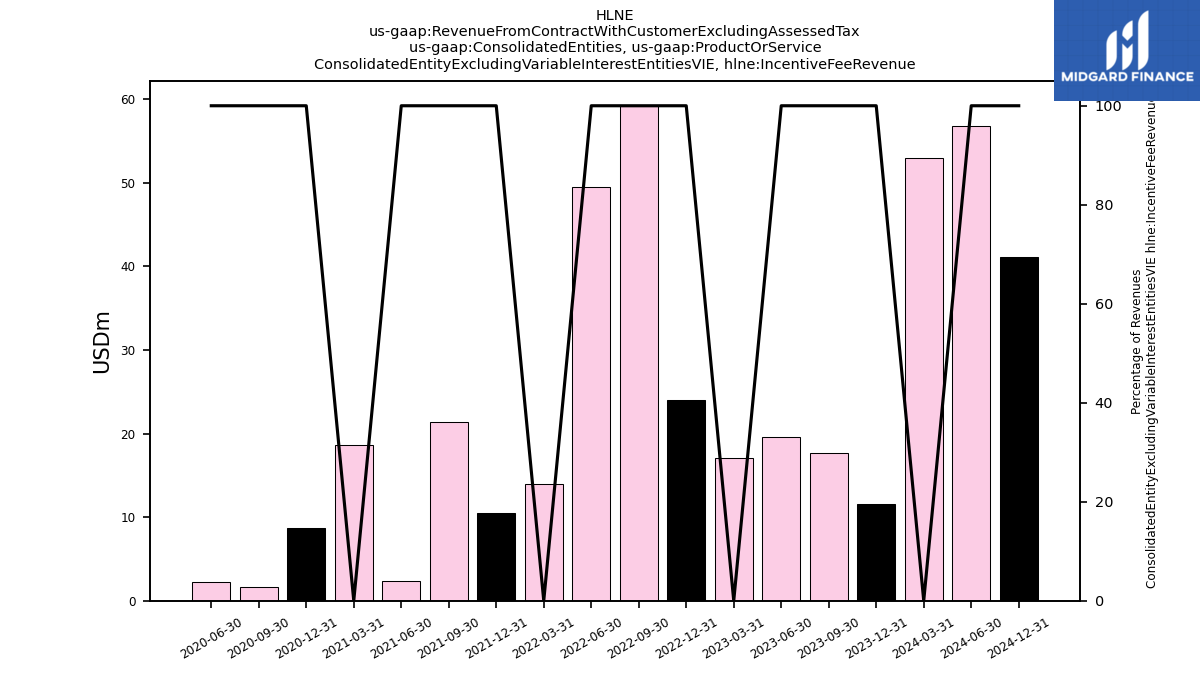
| , Incentive Fee Revenue | 17.69 | 19.63 | 17.10 | 24.07 | 59.24 | 49.52 | 13.92 | 10.49 | 21.36 | 2.36 | 18.62 | 8.68 | 1.59 | 2.24 | NA | NA | NA | NA | NA | NA | NA | NA | NA | NA | NA | NA | NA | NA | NA | NA | |
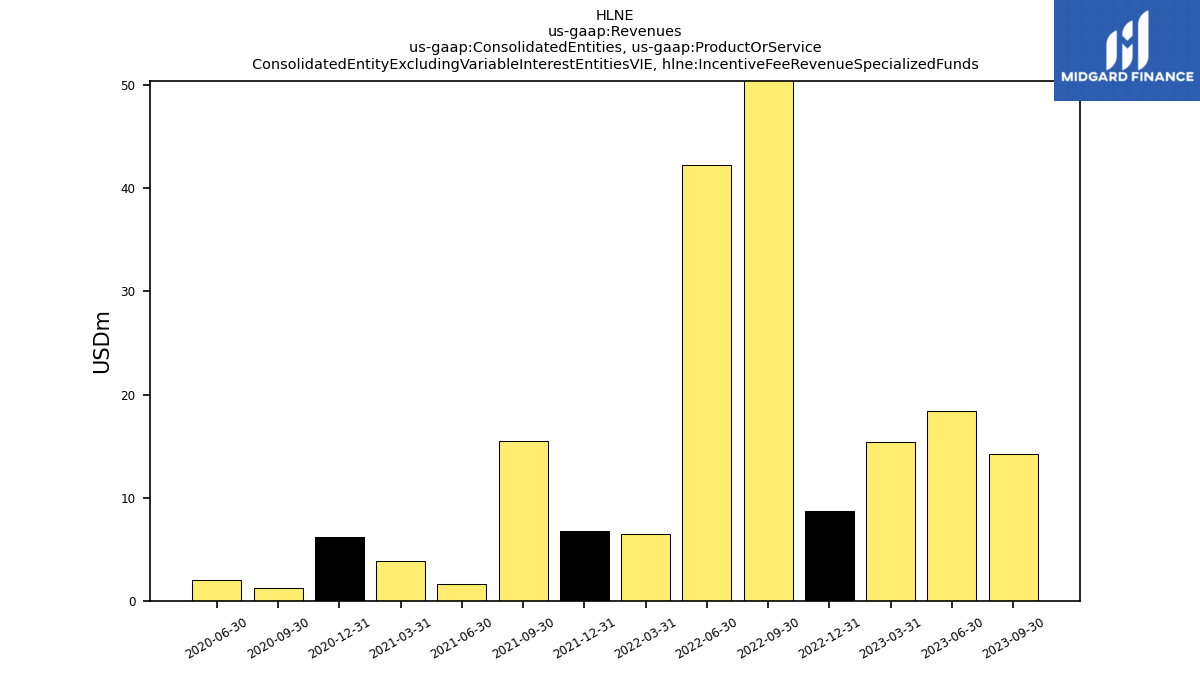
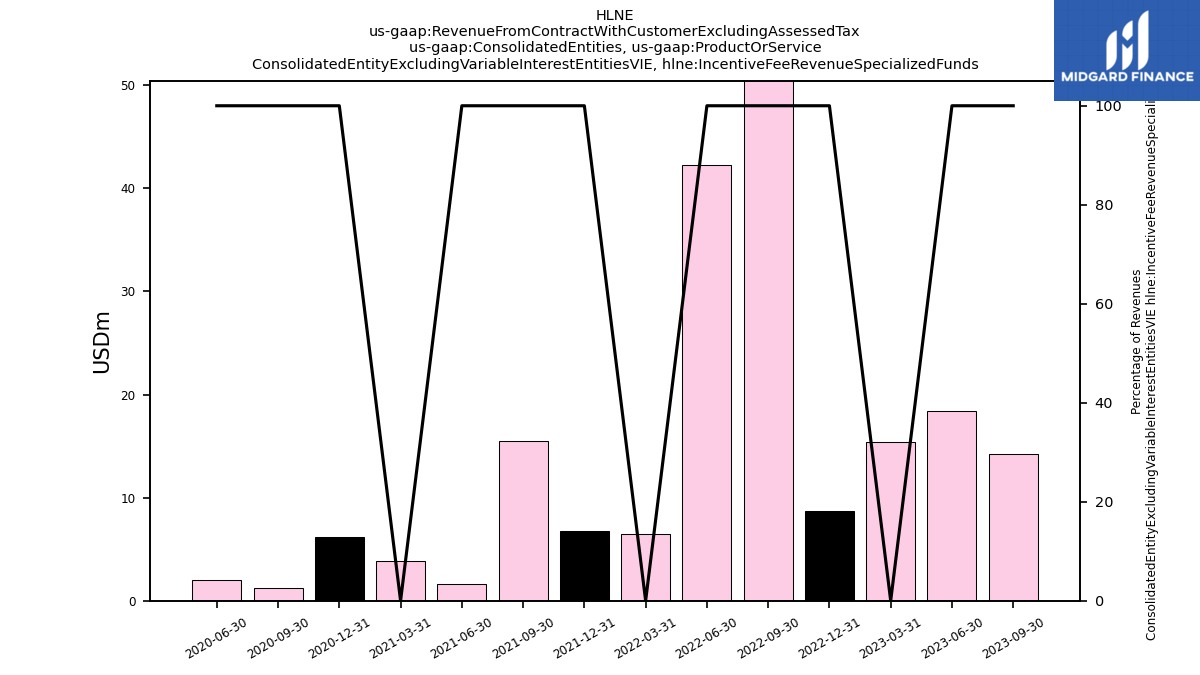
| , Incentive Fee Revenue Specialized Funds | 14.28 | 18.39 | 15.40 | 8.68 | 51.93 | 42.21 | 6.43 | 6.76 | 15.48 | 1.66 | 3.83 | 6.18 | 1.24 | 1.99 | NA | NA | NA | NA | NA | NA | NA | NA | NA | NA | NA | NA | NA | NA | NA | NA | |
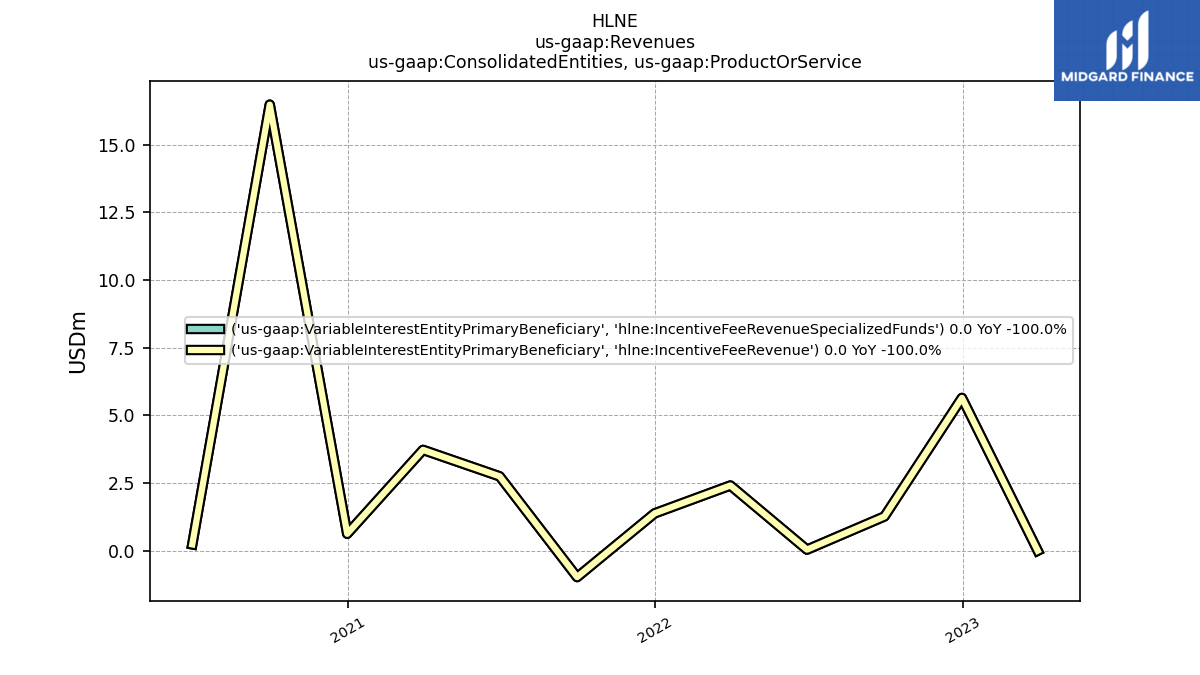
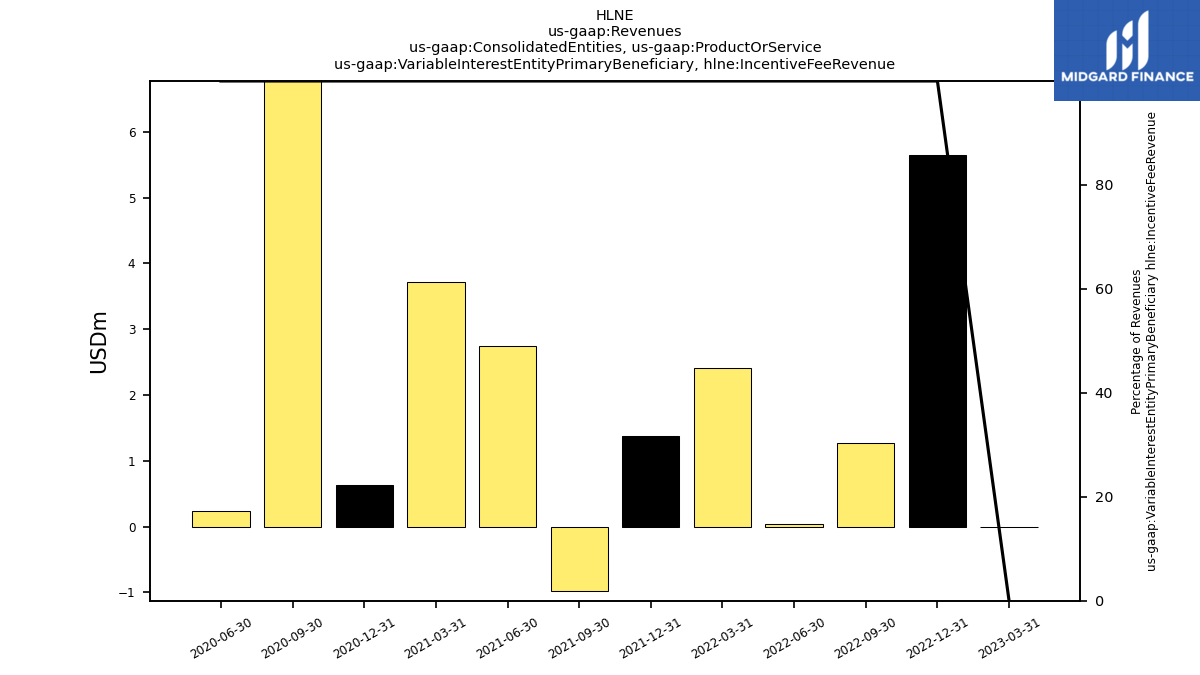
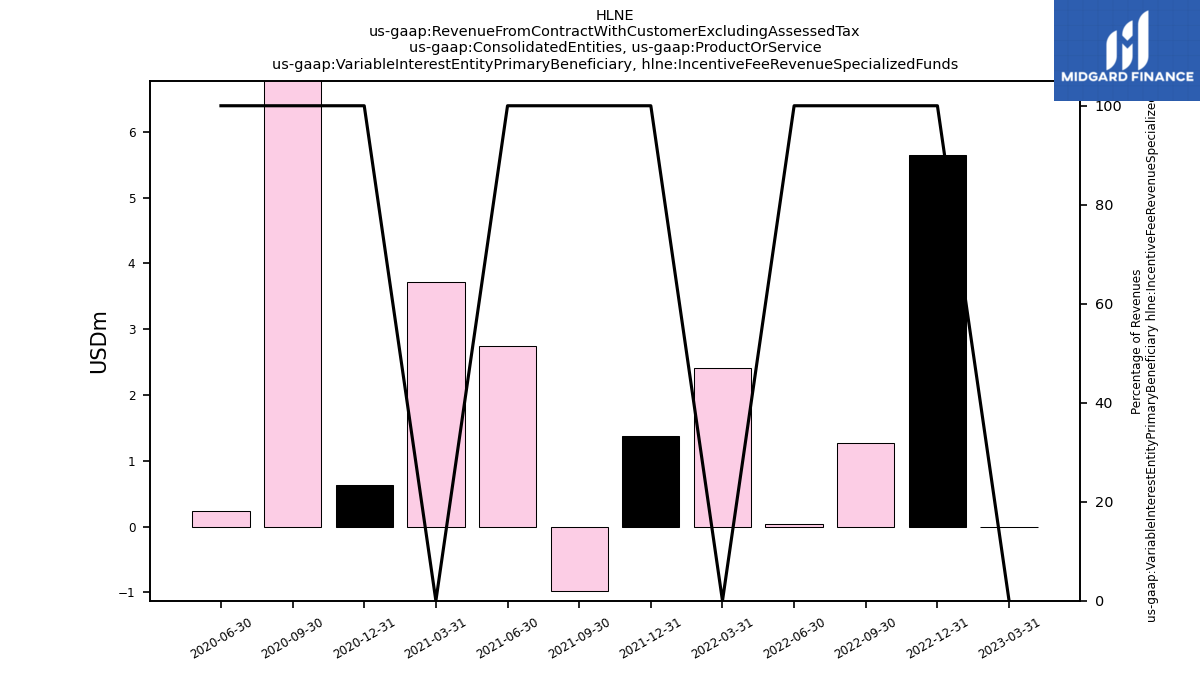
| Variable Interest Entity Primary Beneficiary, Incentive Fee Revenue | NA | NA | 0.00 | 5.64 | 1.26 | 0.04 | 2.41 | 1.38 | -0.98 | 2.75 | 3.72 | 0.62 | 16.48 | 0.23 | NA | NA | NA | NA | NA | NA | NA | NA | NA | NA | NA | NA | NA | NA | NA | NA | |
| Variable Interest Entity Primary Beneficiary, Incentive Fee Revenue Specialized Funds | NA | NA | 0.00 | 5.64 | 1.26 | 0.04 | 2.41 | 1.38 | -0.98 | 2.75 | 3.72 | 0.62 | 16.48 | 0.23 | NA | NA | NA | NA | NA | NA | NA | NA | NA | NA | NA | NA | NA | NA | NA | NA | |
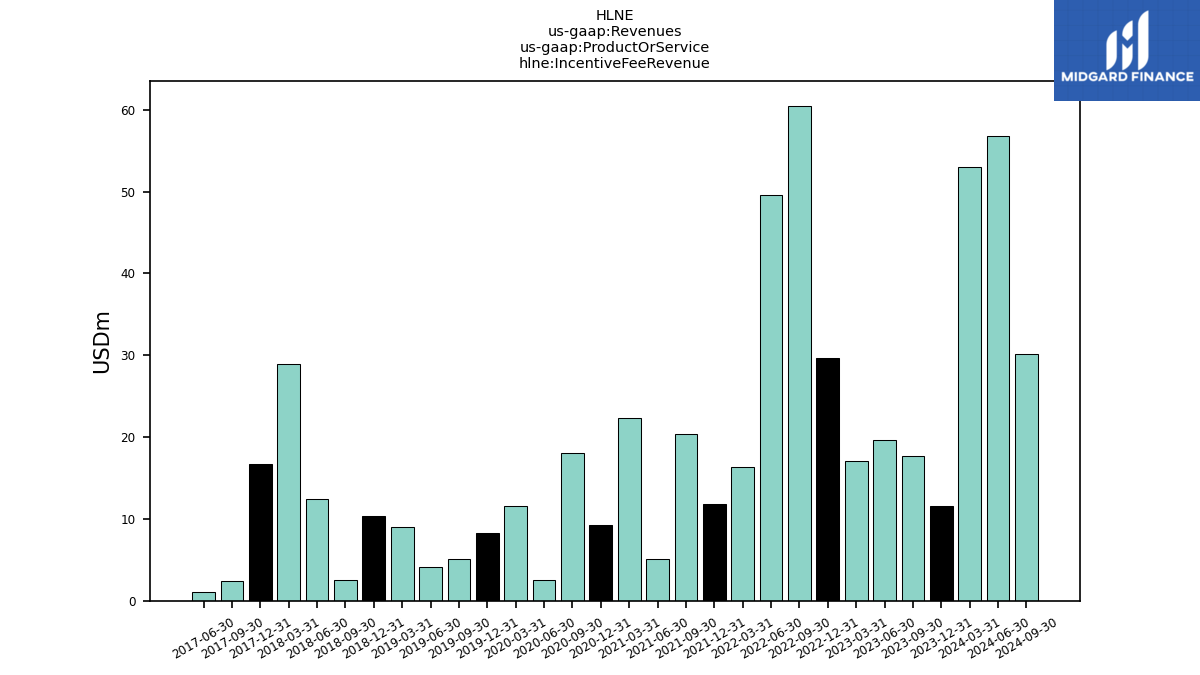
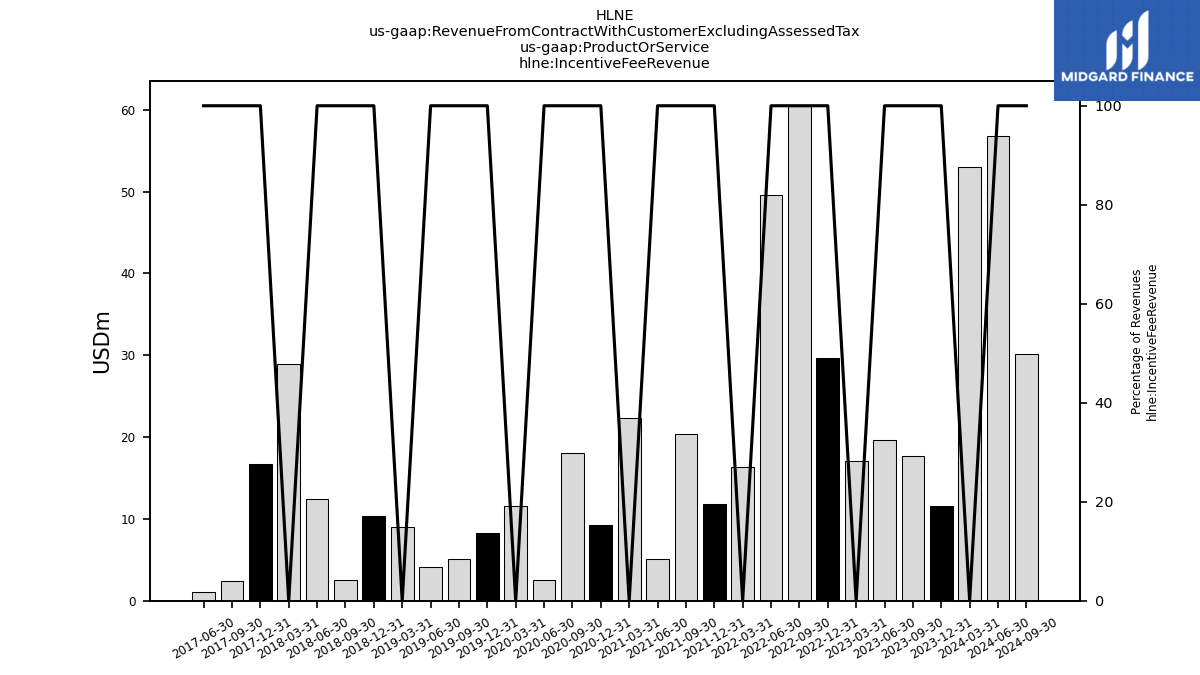
| Incentive Fee Revenue | 17.69 | 19.63 | 17.10 | 29.72 | 60.50 | 49.56 | 16.32 | 11.87 | 20.39 | 5.11 | 22.35 | 9.30 | 18.06 | 2.48 | 11.60 | 8.30 | 5.10 | 4.13 | 9.06 | 10.38 | 2.58 | 12.38 | 28.91 | 16.67 | 2.41 | 1.02 | NA | NA | NA | NA | |
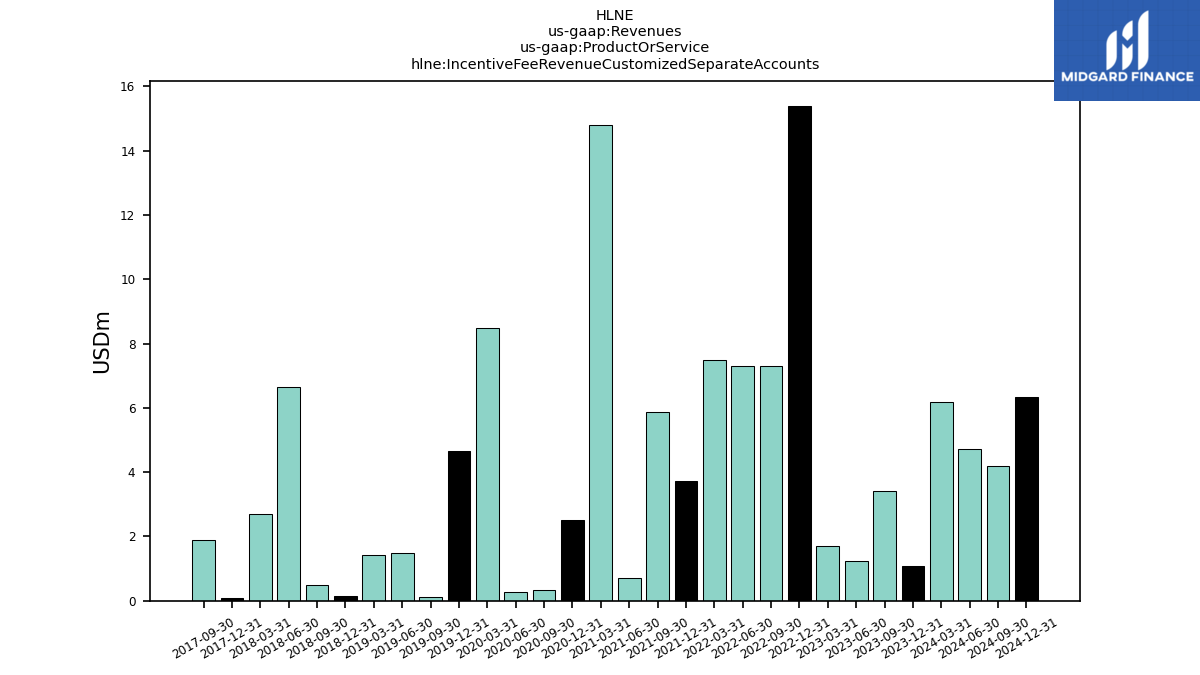
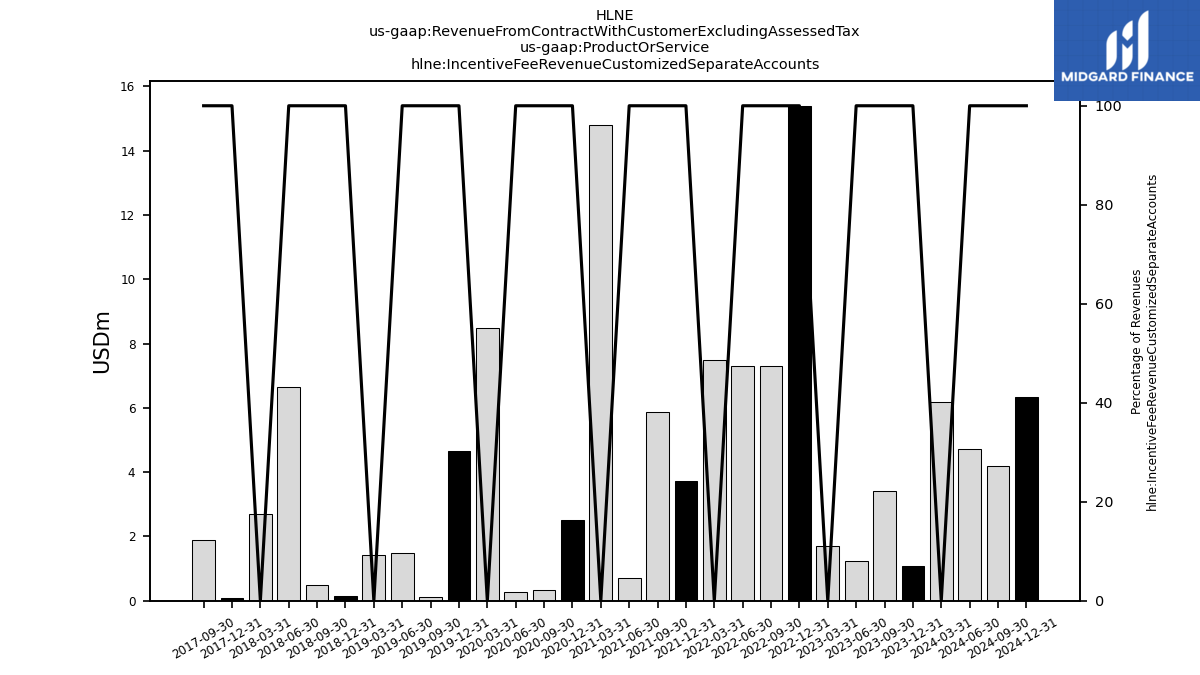
| Incentive Fee Revenue Customized Separate Accounts | 3.42 | 1.24 | 1.70 | 15.40 | 7.31 | 7.32 | 7.49 | 3.73 | 5.88 | 0.70 | 14.79 | 2.50 | 0.34 | 0.26 | 8.48 | 4.66 | 0.12 | 1.50 | 1.41 | 0.15 | 0.50 | 6.66 | 2.68 | 0.10 | 1.90 | NA | NA | NA | NA | NA | |
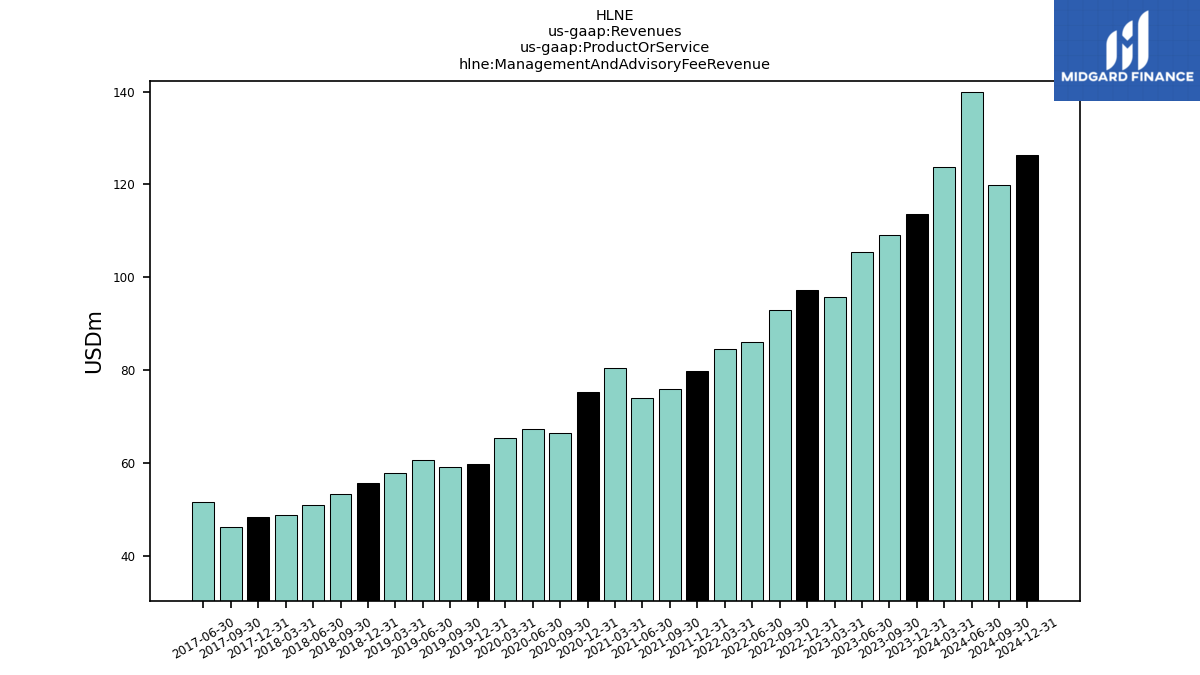
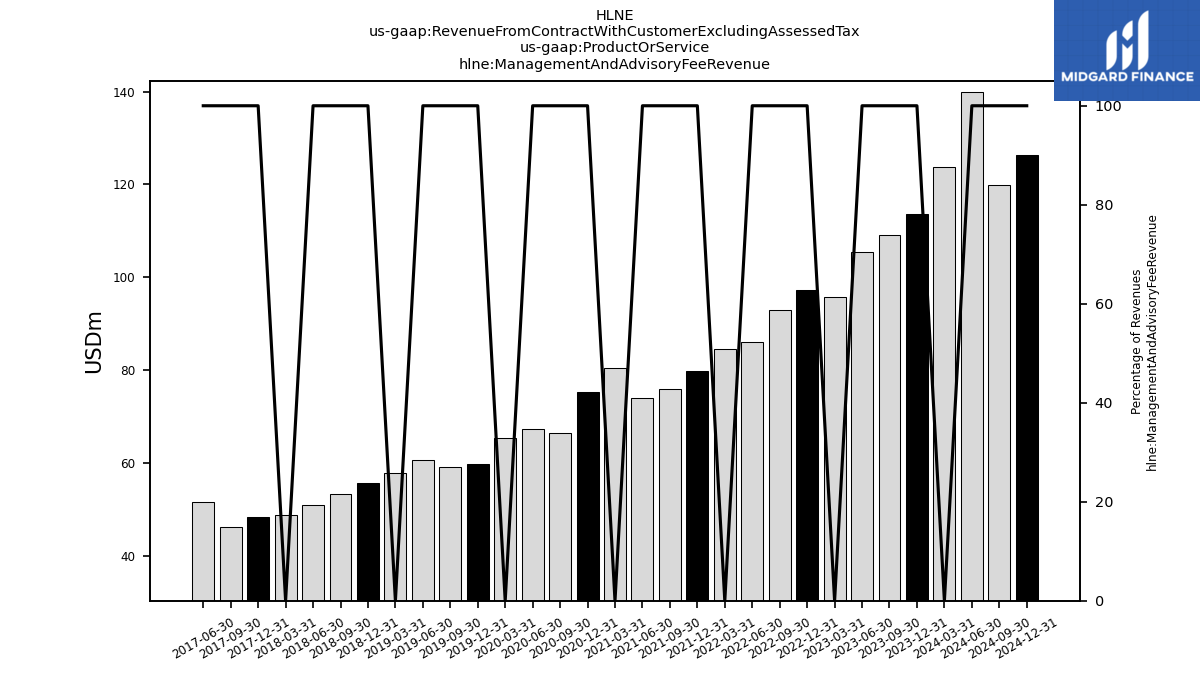
| Management And Advisory Fee Revenue | 109.18 | 105.41 | 95.69 | 97.36 | 92.88 | 85.95 | 84.58 | 79.84 | 75.93 | 73.88 | 80.53 | 75.28 | 66.37 | 67.27 | 65.34 | 59.84 | 59.20 | 60.55 | 57.93 | 55.62 | 53.25 | 50.98 | 48.70 | 48.34 | 46.30 | 51.68 | NA | NA | NA | NA | |
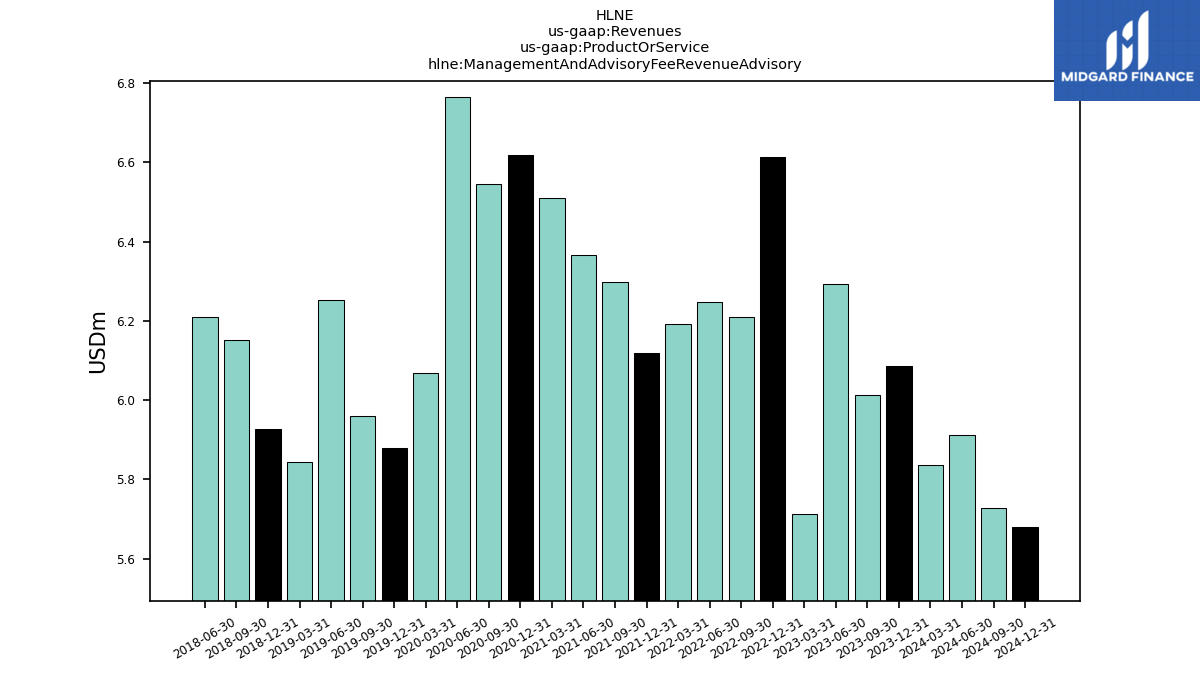
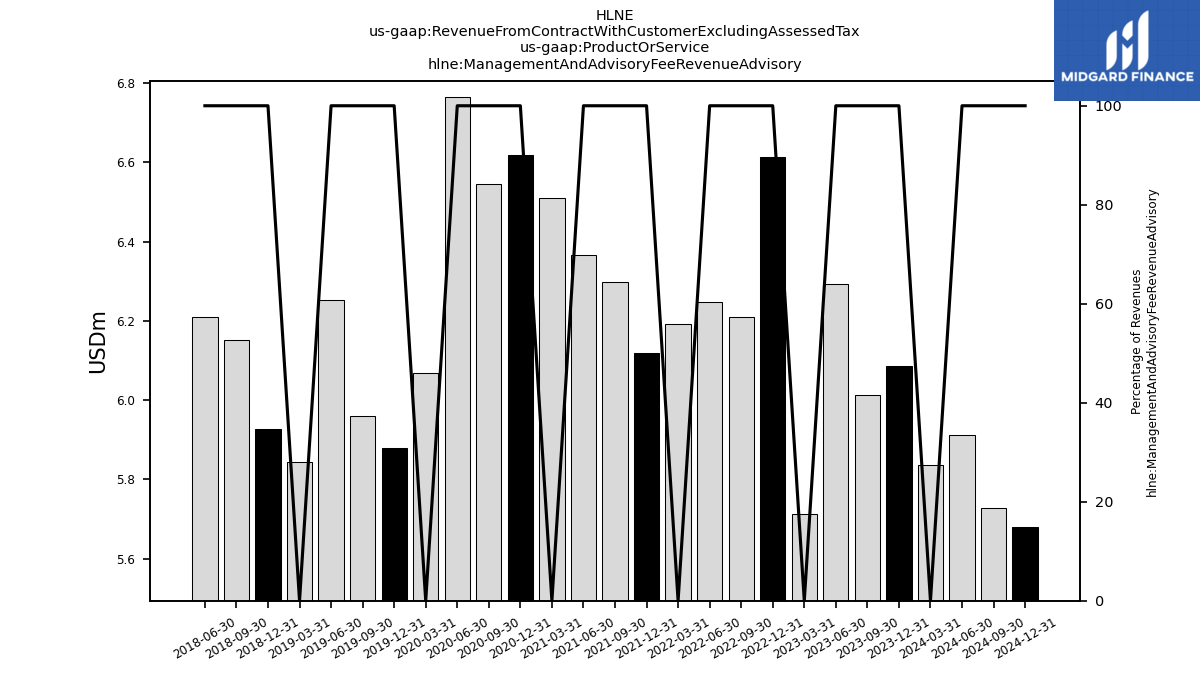
| Management And Advisory Fee Revenue Advisory | 6.01 | 6.29 | 5.71 | 6.61 | 6.21 | 6.25 | 6.19 | 6.12 | 6.30 | 6.37 | 6.51 | 6.62 | 6.54 | 6.76 | 6.07 | 5.88 | 5.96 | 6.25 | 5.84 | 5.93 | 6.15 | 6.21 | NA | NA | NA | NA | NA | NA | NA | NA | |
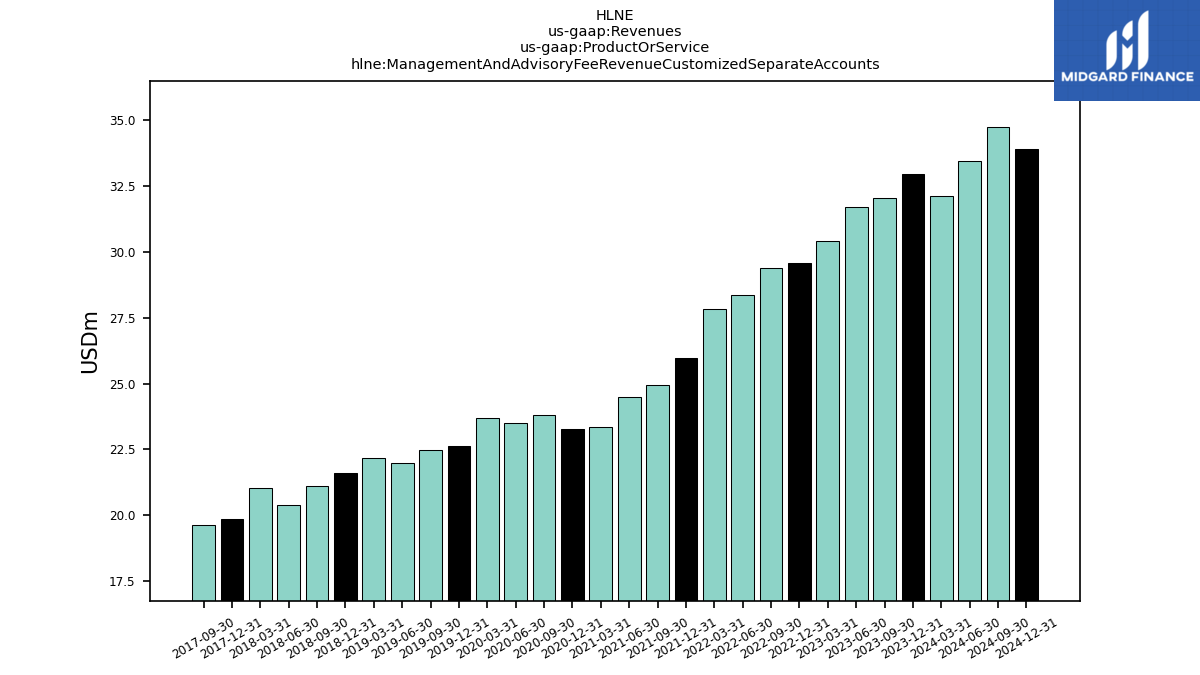
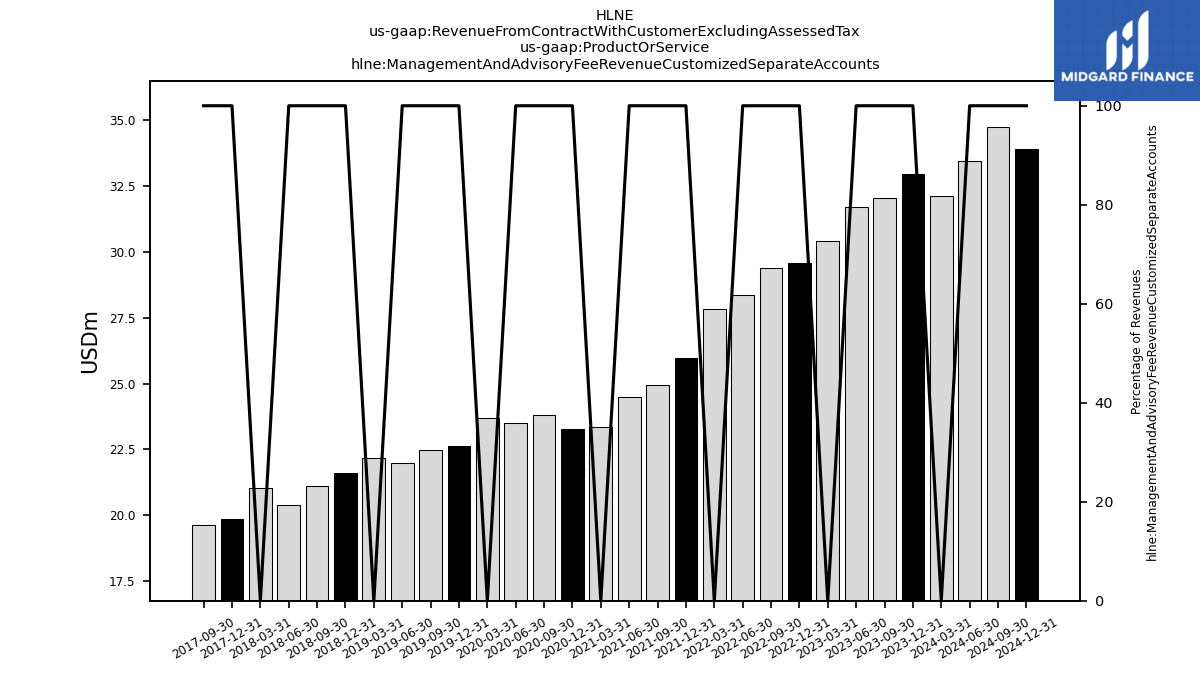
| Management And Advisory Fee Revenue Customized Separate Accounts | 32.04 | 31.72 | 30.43 | 29.57 | 29.38 | 28.38 | 27.81 | 25.98 | 24.93 | 24.50 | 23.36 | 23.29 | 23.80 | 23.52 | 23.70 | 22.62 | 22.47 | 21.96 | 22.16 | 21.59 | 21.11 | 20.39 | 21.02 | 19.86 | 19.61 | NA | NA | NA | NA | NA | |
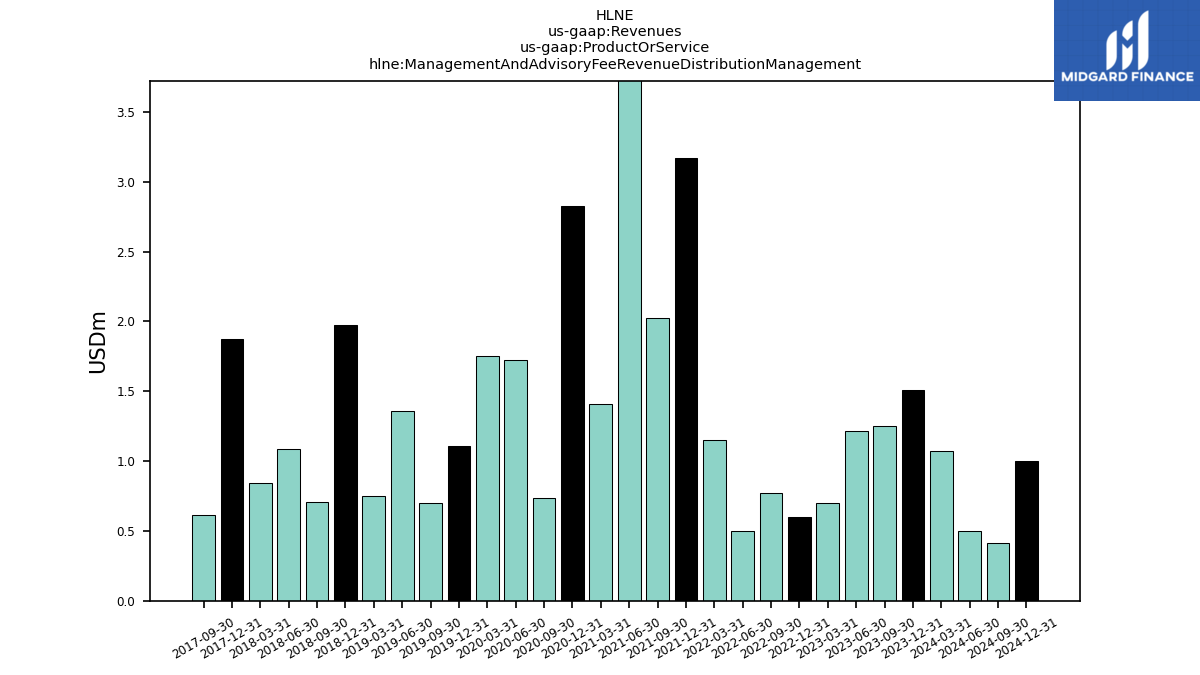
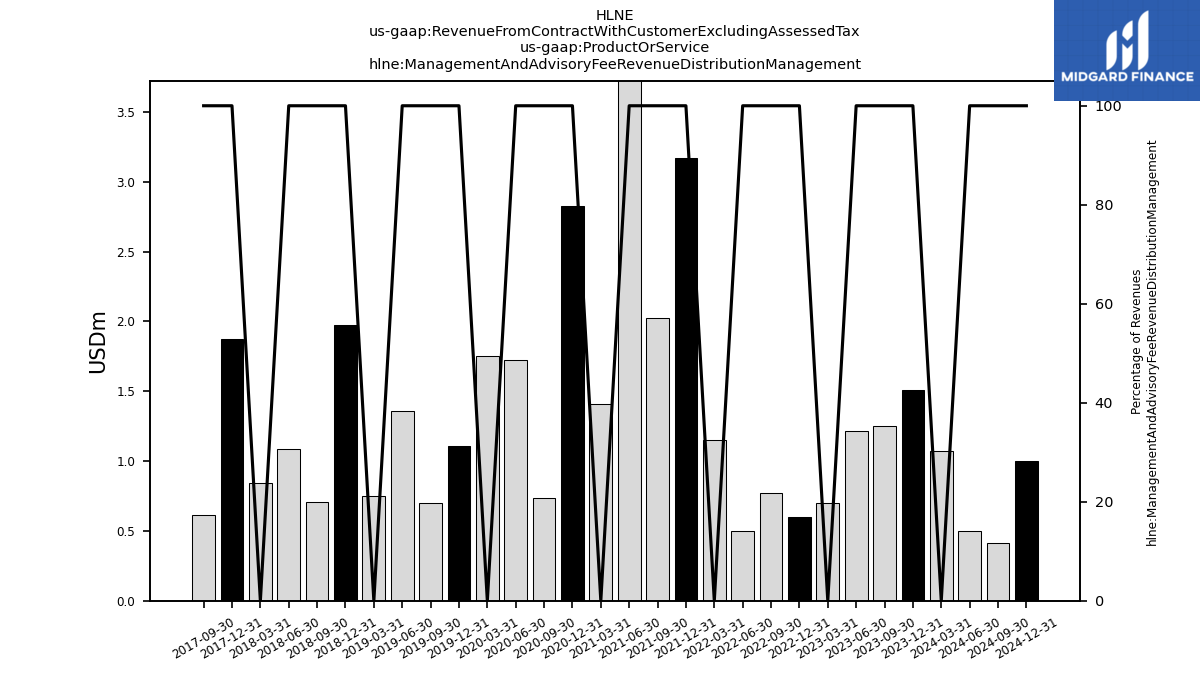
| Management And Advisory Fee Revenue Distribution Management | 1.25 | 1.21 | 0.70 | 0.60 | 0.77 | 0.50 | 1.15 | 3.17 | 2.02 | 4.12 | 1.41 | 2.83 | 0.74 | 1.73 | 1.75 | 1.11 | 0.70 | 1.36 | 0.75 | 1.98 | 0.71 | 1.09 | 0.84 | 1.87 | 0.62 | NA | NA | NA | NA | NA | |
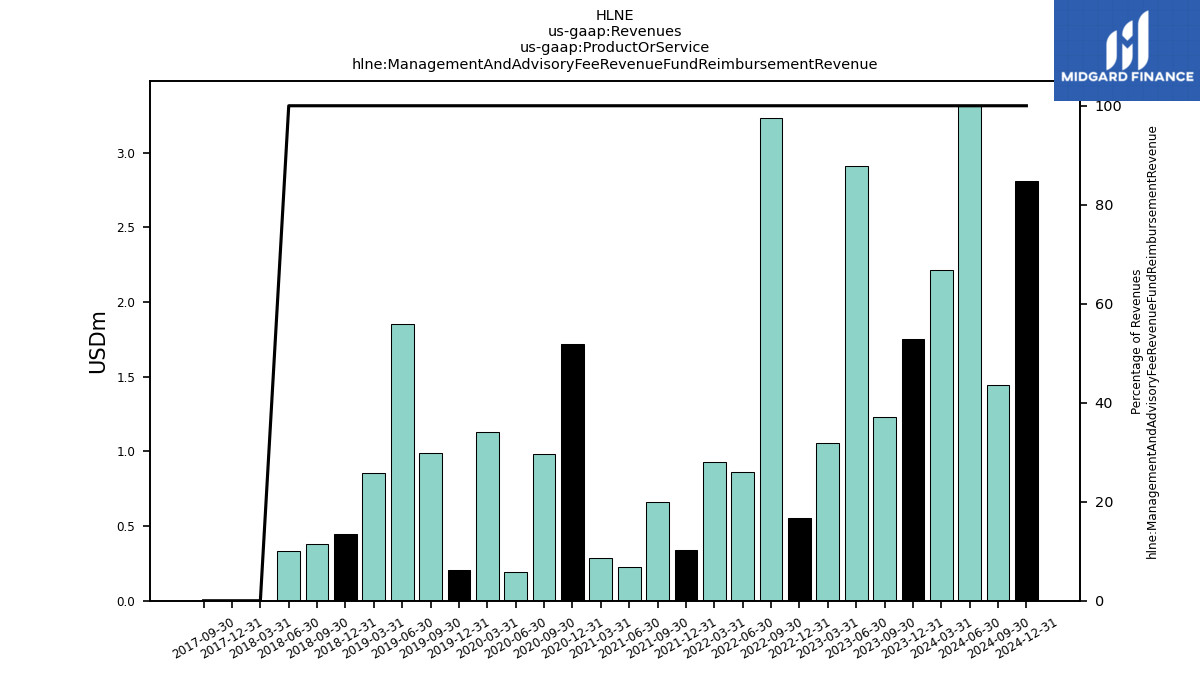
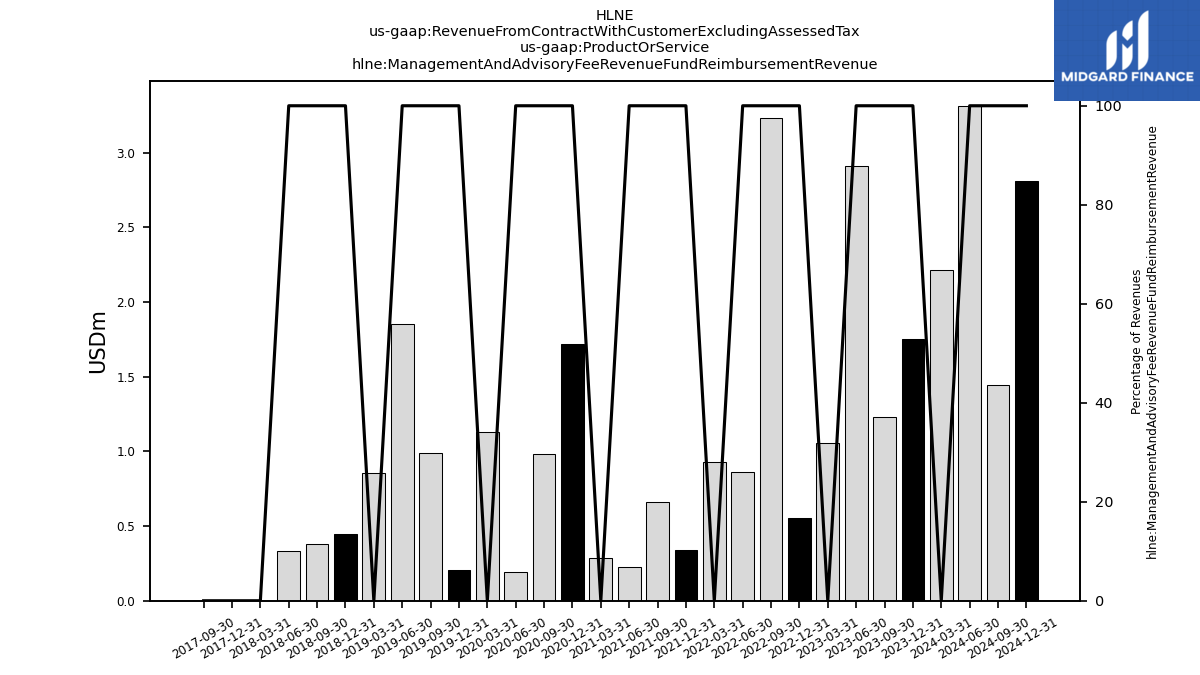
| Management And Advisory Fee Revenue Fund Reimbursement Revenue | 1.23 | 2.91 | 1.06 | 0.56 | 3.23 | 0.86 | 0.93 | 0.34 | 0.66 | 0.23 | 0.29 | 1.72 | 0.98 | 0.19 | 1.13 | 0.21 | 0.99 | 1.85 | 0.85 | 0.45 | 0.38 | 0.33 | 0.00 | 0.00 | 0.00 | NA | NA | NA | NA | NA | |
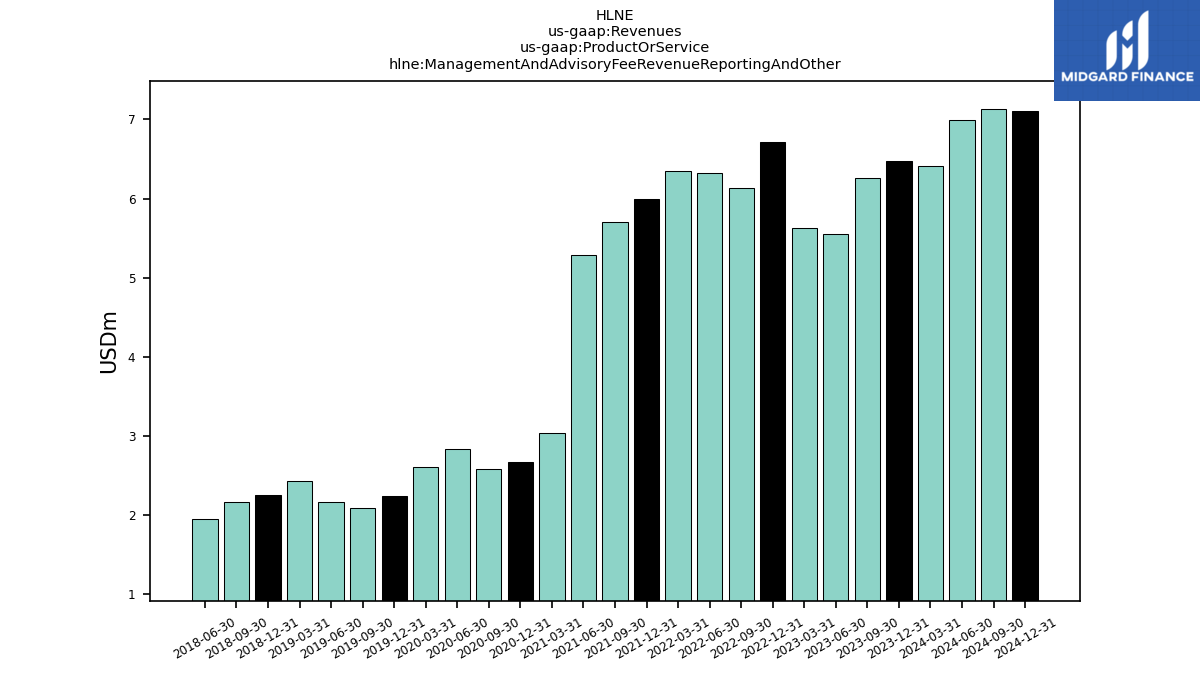
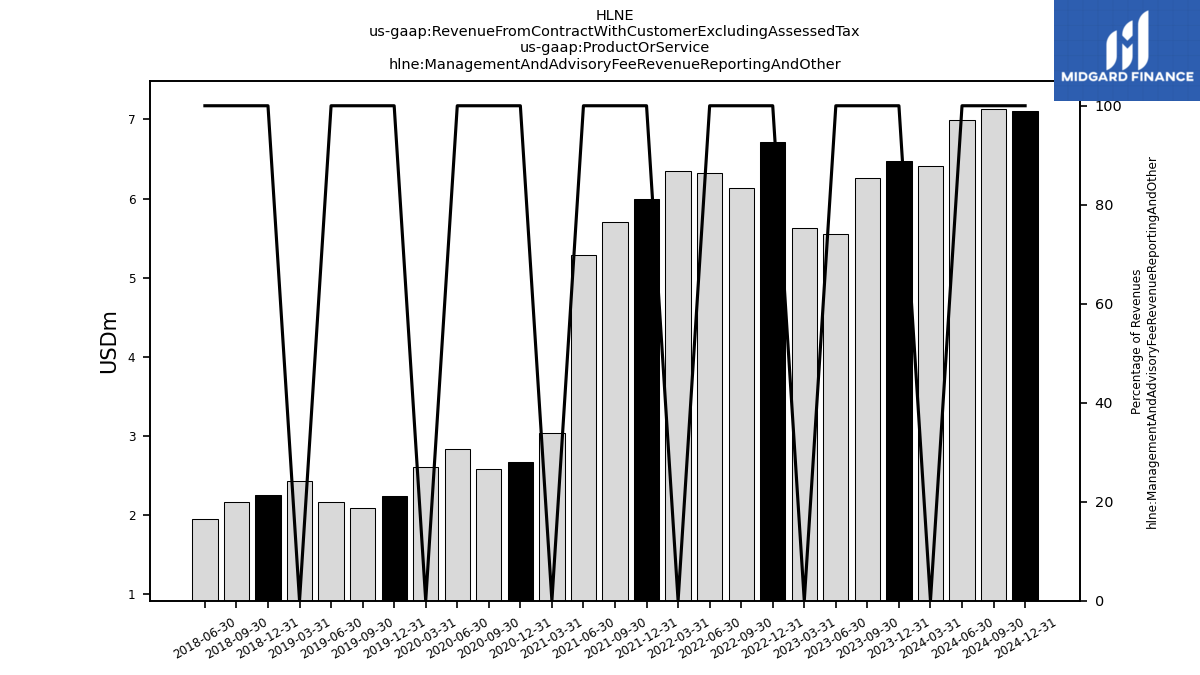
| Management And Advisory Fee Revenue Reporting And Other | 6.26 | 5.56 | 5.62 | 6.72 | 6.13 | 6.32 | 6.34 | 5.99 | 5.71 | 5.28 | 3.04 | 2.67 | 2.58 | 2.84 | 2.61 | 2.24 | 2.09 | 2.16 | 2.43 | 2.26 | 2.16 | 1.95 | NA | NA | NA | NA | NA | NA | NA | NA | |
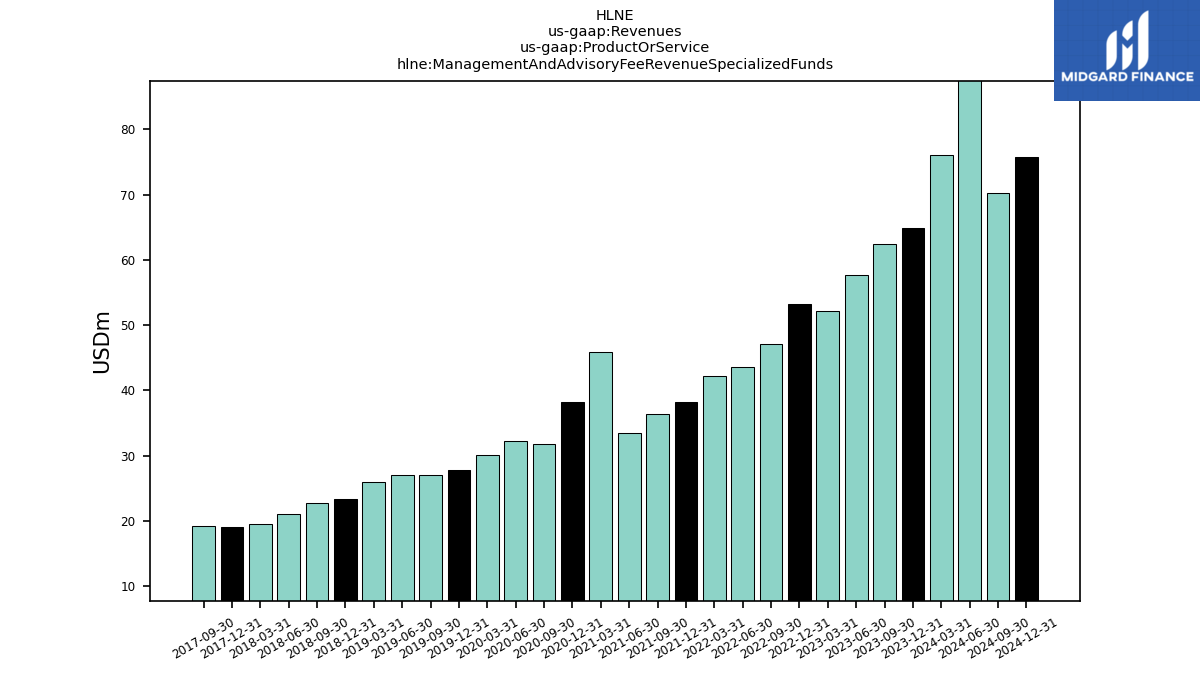
| Management And Advisory Fee Revenue Specialized Funds | 62.39 | 57.72 | 52.17 | 53.30 | 47.15 | 43.65 | 42.14 | 38.23 | 36.31 | 33.39 | 45.92 | 38.16 | 31.72 | 32.23 | 30.07 | 27.79 | 26.98 | 26.96 | 25.89 | 23.41 | 22.74 | 21.02 | 19.57 | 19.13 | 19.24 | NA | NA | NA | NA | NA | |
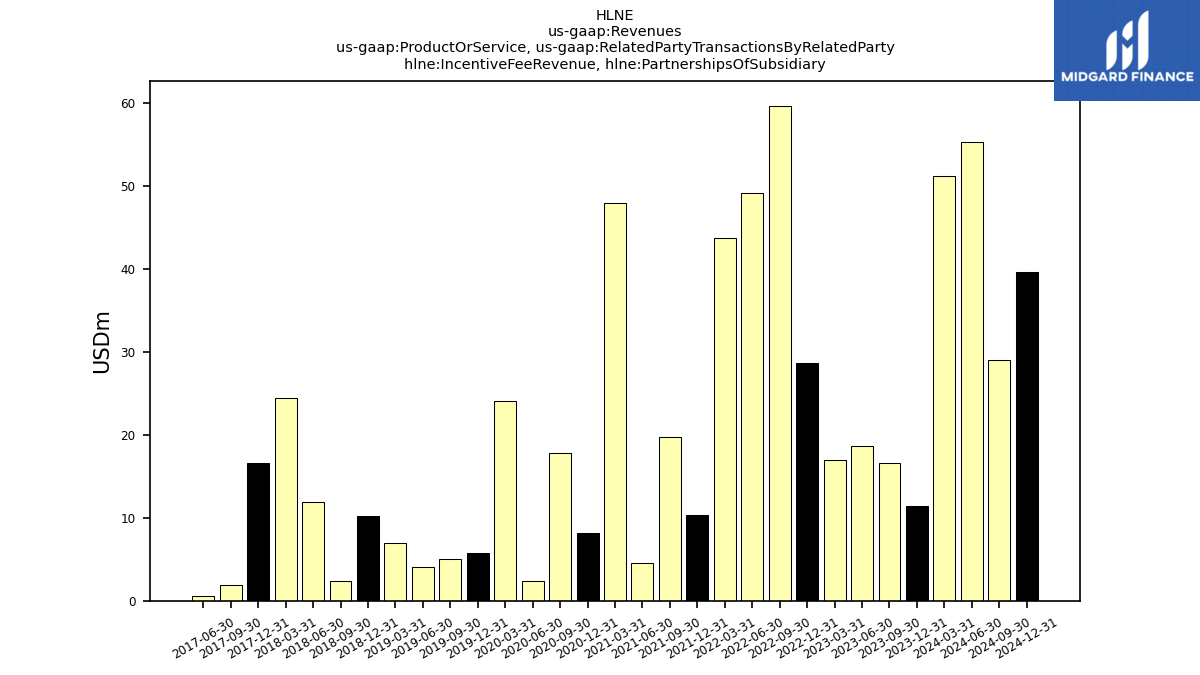
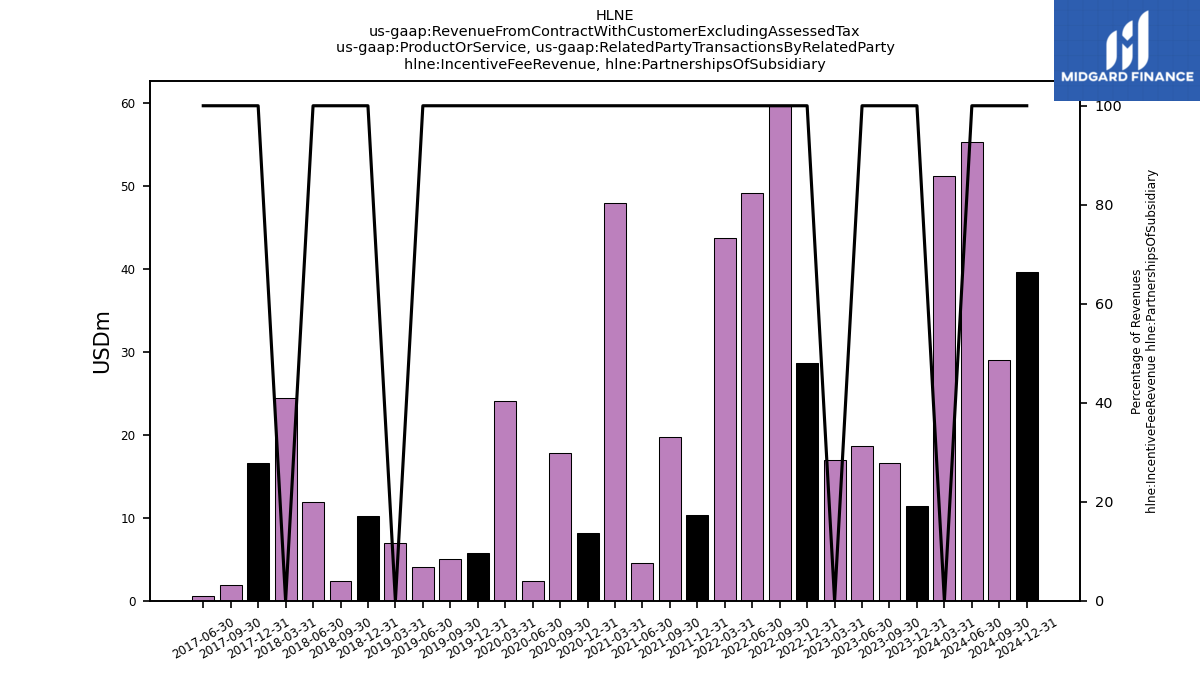
| Incentive Fee Revenue, Partnerships Of Subsidiary | 16.60 | 18.62 | 17.03 | 28.65 | 59.71 | 49.18 | 43.74 | 10.34 | 19.76 | 4.58 | 47.96 | 8.15 | 17.82 | 2.35 | 24.08 | 5.73 | 5.03 | 4.09 | 7.02 | 10.27 | 2.43 | 11.89 | 24.49 | 16.57 | 1.86 | 0.60 | NA | NA | NA | NA | |
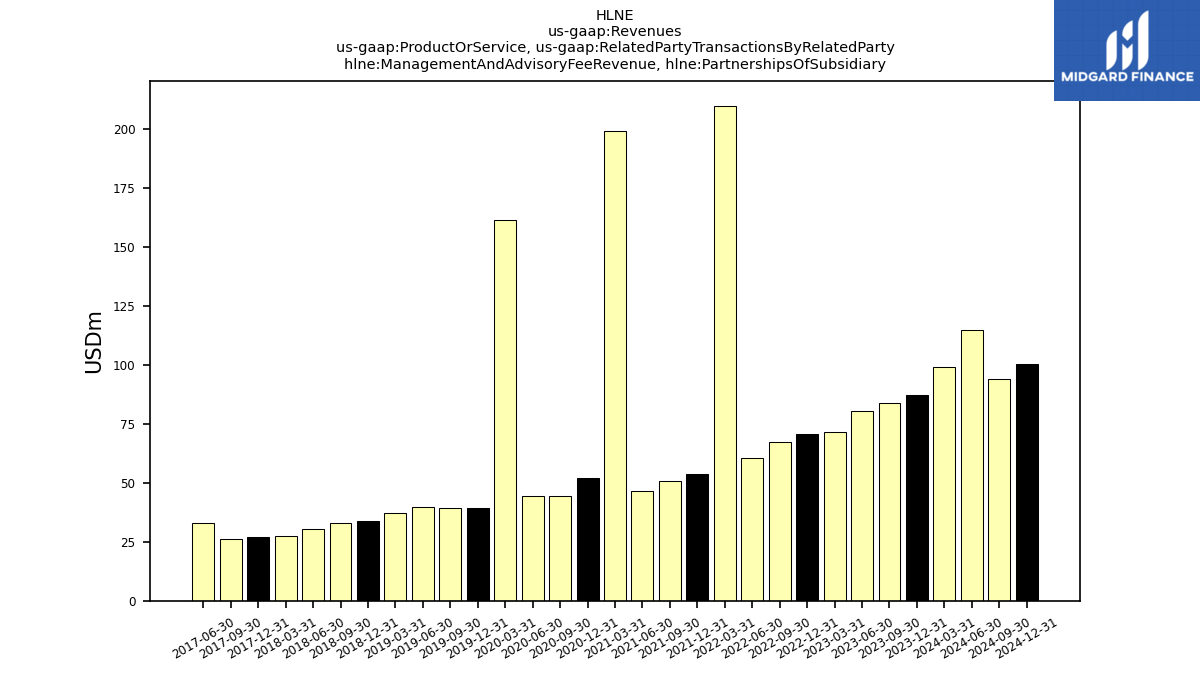
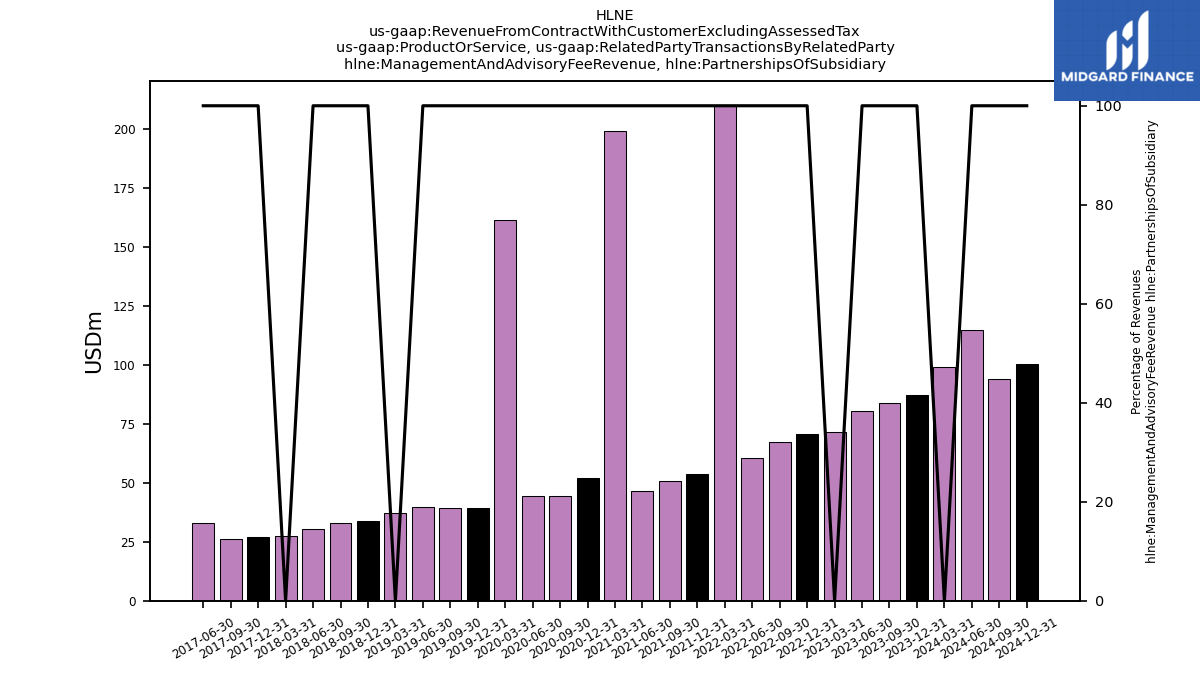
| Management And Advisory Fee Revenue, Partnerships Of Subsidiary | 83.72 | 80.30 | 71.74 | 70.93 | 67.33 | 60.71 | 209.98 | 53.70 | 50.83 | 46.42 | 199.42 | 52.08 | 44.55 | 44.25 | 161.32 | 39.14 | 39.17 | 39.63 | 37.17 | 33.72 | 32.85 | 30.59 | 27.57 | 27.08 | 25.99 | 32.87 | NA | NA | NA | NA | |
| Revenue From Contract With Customer Excluding Assessed Tax | 126.88 | 125.04 | 112.79 | 127.07 | 153.38 | 135.51 | 100.90 | 91.70 | 96.32 | 79.00 | 102.88 | 84.58 | 84.43 | 69.74 | 76.93 | 68.14 | 64.29 | 64.69 | 66.99 | 66.00 | 55.83 | 63.36 | 77.61 | 65.01 | 48.71 | 52.70 | 46.68 | 42.33 | 51.24 | 39.57 | |
| , Incentive Fee Revenue | 17.69 | 19.63 | 17.10 | 24.07 | 59.24 | 49.52 | 13.92 | 10.49 | 21.36 | 2.36 | 18.62 | 8.68 | 1.59 | 2.24 | NA | NA | NA | NA | NA | NA | NA | NA | NA | NA | NA | NA | NA | NA | NA | NA | |
| , Incentive Fee Revenue Specialized Funds | 14.28 | 18.39 | 15.40 | 8.68 | 51.93 | 42.21 | 6.43 | 6.76 | 15.48 | 1.66 | 3.83 | 6.18 | 1.24 | 1.99 | NA | NA | NA | NA | NA | NA | NA | NA | NA | NA | NA | NA | NA | NA | NA | NA | |
| Variable Interest Entity Primary Beneficiary, Incentive Fee Revenue | NA | NA | 0.00 | 5.64 | 1.26 | 0.04 | 2.41 | 1.38 | -0.98 | 2.75 | 3.72 | 0.62 | 16.48 | 0.23 | NA | NA | NA | NA | NA | NA | NA | NA | NA | NA | NA | NA | NA | NA | NA | NA | |
| Variable Interest Entity Primary Beneficiary, Incentive Fee Revenue Specialized Funds | NA | NA | 0.00 | 5.64 | 1.26 | 0.04 | 2.41 | 1.38 | -0.98 | 2.75 | 3.72 | 0.62 | 16.48 | 0.23 | NA | NA | NA | NA | NA | NA | NA | NA | NA | NA | NA | NA | NA | NA | NA | NA | |
| Incentive Fee Revenue | 17.69 | 19.63 | 17.10 | 29.72 | 60.50 | 49.56 | 16.32 | 11.87 | 20.39 | 5.11 | 22.35 | 9.30 | 18.06 | 2.48 | 11.60 | 8.30 | 5.10 | 4.13 | 9.06 | 10.38 | 2.58 | 12.38 | 28.91 | 16.67 | 2.41 | 1.02 | NA | NA | NA | NA | |
| Incentive Fee Revenue Customized Separate Accounts | 3.42 | 1.24 | 1.70 | 15.40 | 7.31 | 7.32 | 7.49 | 3.73 | 5.88 | 0.70 | 14.79 | 2.50 | 0.34 | 0.26 | 8.48 | 4.66 | 0.12 | 1.50 | 1.41 | 0.15 | 0.50 | 6.66 | 2.68 | 0.10 | 1.90 | NA | NA | NA | NA | NA | |
| Management And Advisory Fee Revenue | 109.18 | 105.41 | 95.69 | 97.36 | 92.88 | 85.95 | 84.58 | 79.84 | 75.93 | 73.88 | 80.53 | 75.28 | 66.37 | 67.27 | 65.34 | 59.84 | 59.20 | 60.55 | 57.93 | 55.62 | 53.25 | 50.98 | 48.70 | 48.34 | 46.30 | 51.68 | NA | NA | NA | NA | |
| Management And Advisory Fee Revenue Advisory | 6.01 | 6.29 | 5.71 | 6.61 | 6.21 | 6.25 | 6.19 | 6.12 | 6.30 | 6.37 | 6.51 | 6.62 | 6.54 | 6.76 | 6.07 | 5.88 | 5.96 | 6.25 | 5.84 | 5.93 | 6.15 | 6.21 | NA | NA | NA | NA | NA | NA | NA | NA | |
| Management And Advisory Fee Revenue Customized Separate Accounts | 32.04 | 31.72 | 30.43 | 29.57 | 29.38 | 28.38 | 27.81 | 25.98 | 24.93 | 24.50 | 23.36 | 23.29 | 23.80 | 23.52 | 23.70 | 22.62 | 22.47 | 21.96 | 22.16 | 21.59 | 21.11 | 20.39 | 21.02 | 19.86 | 19.61 | NA | NA | NA | NA | NA | |
| Management And Advisory Fee Revenue Distribution Management | 1.25 | 1.21 | 0.70 | 0.60 | 0.77 | 0.50 | 1.15 | 3.17 | 2.02 | 4.12 | 1.41 | 2.83 | 0.74 | 1.73 | 1.75 | 1.11 | 0.70 | 1.36 | 0.75 | 1.98 | 0.71 | 1.09 | 0.84 | 1.87 | 0.62 | NA | NA | NA | NA | NA | |
| Management And Advisory Fee Revenue Fund Reimbursement Revenue | 1.23 | 2.91 | 1.06 | 0.56 | 3.23 | 0.86 | 0.93 | 0.34 | 0.66 | 0.23 | 0.29 | 1.72 | 0.98 | 0.19 | 1.13 | 0.21 | 0.99 | 1.85 | 0.85 | 0.45 | 0.38 | 0.33 | 0.00 | 0.00 | 0.00 | NA | NA | NA | NA | NA | |
| Management And Advisory Fee Revenue Reporting And Other | 6.26 | 5.56 | 5.62 | 6.72 | 6.13 | 6.32 | 6.34 | 5.99 | 5.71 | 5.28 | 3.04 | 2.67 | 2.58 | 2.84 | 2.61 | 2.24 | 2.09 | 2.16 | 2.43 | 2.26 | 2.16 | 1.95 | NA | NA | NA | NA | NA | NA | NA | NA | |
| Management And Advisory Fee Revenue Specialized Funds | 62.39 | 57.72 | 52.17 | 53.30 | 47.15 | 43.65 | 42.14 | 38.23 | 36.31 | 33.39 | 45.92 | 38.16 | 31.72 | 32.23 | 30.07 | 27.79 | 26.98 | 26.96 | 25.89 | 23.41 | 22.74 | 21.02 | 19.57 | 19.13 | 19.24 | NA | NA | NA | NA | NA | |
| Incentive Fee Revenue, Partnerships Of Subsidiary | 16.60 | 18.62 | 17.03 | 28.65 | 59.71 | 49.18 | 43.74 | 10.34 | 19.76 | 4.58 | 47.96 | 8.15 | 17.82 | 2.35 | 24.08 | 5.73 | 5.03 | 4.09 | 7.02 | 10.27 | 2.43 | 11.89 | 24.49 | 16.57 | 1.86 | 0.60 | NA | NA | NA | NA | |
| Management And Advisory Fee Revenue, Partnerships Of Subsidiary | 83.72 | 80.30 | 71.74 | 70.93 | 67.33 | 60.71 | 209.98 | 53.70 | 50.83 | 46.42 | 199.42 | 52.08 | 44.55 | 44.25 | 161.32 | 39.14 | 39.17 | 39.63 | 37.17 | 33.72 | 32.85 | 30.59 | 27.57 | 27.08 | 25.99 | 32.87 | NA | NA | NA | NA |

