
| 2024-01-31 | 2023-10-31 | 2023-07-31 | 2023-04-30 | 2023-01-31 | 2022-10-31 | 2022-07-31 | 2022-04-30 | 2022-01-31 | 2021-10-31 | 2021-07-31 | 2021-04-30 | 2021-01-31 | 2020-10-31 | 2020-07-31 | 2020-04-30 | 2020-01-31 | 2019-10-31 | 2019-07-31 | 2019-04-30 | 2019-01-31 | 2018-10-31 | 2018-07-31 | 2018-04-30 | 2018-01-31 | 2017-10-31 | 2017-07-31 | 2017-04-30 | 2017-01-31 | 2016-10-31 | 2016-07-31 | 2016-04-30 | 2016-01-31 | 2015-10-31 | 2015-07-31 | 2015-04-30 | 2015-01-31 | 2014-10-31 | 2014-07-31 | 2014-04-30 | 2014-01-31 | 2013-10-31 | 2013-07-31 | 2013-04-30 | ||
|---|---|---|---|---|---|---|---|---|---|---|---|---|---|---|---|---|---|---|---|---|---|---|---|---|---|---|---|---|---|---|---|---|---|---|---|---|---|---|---|---|---|---|---|---|---|
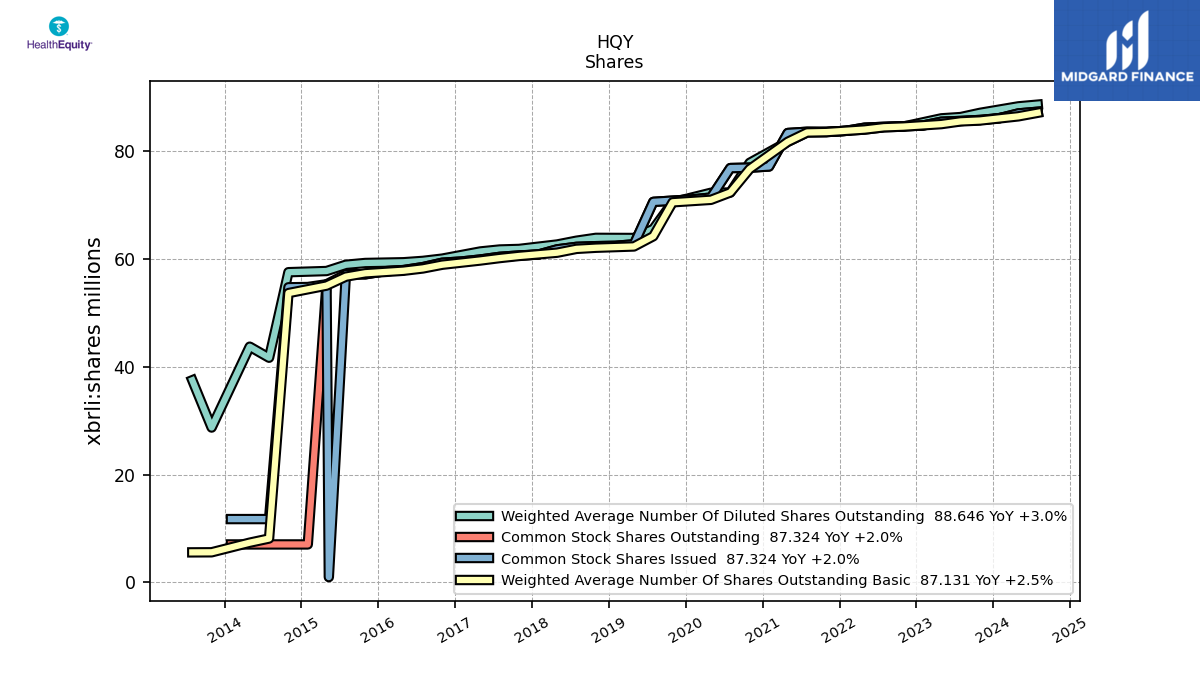
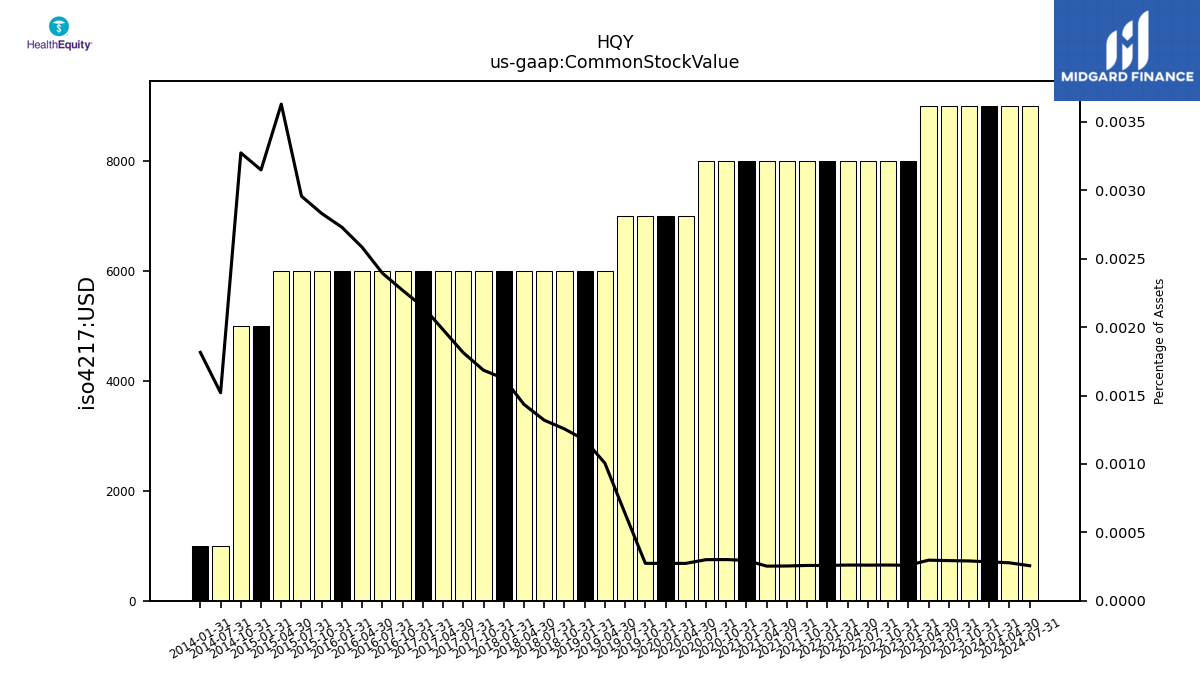
| Common Stock Value | 0.01 | 0.01 | 0.01 | 0.01 | 0.01 | 0.01 | 0.01 | 0.01 | 0.01 | 0.01 | 0.01 | 0.01 | 0.01 | 0.01 | 0.01 | 0.01 | 0.01 | 0.01 | 0.01 | 0.01 | 0.01 | 0.01 | 0.01 | 0.01 | 0.01 | 0.01 | 0.01 | 0.01 | 0.01 | 0.01 | 0.01 | 0.01 | 0.01 | 0.01 | 0.01 | 0.01 | 0.01 | 0.01 | 0.00 | NA | 0.00 | NA | NA | NA | |
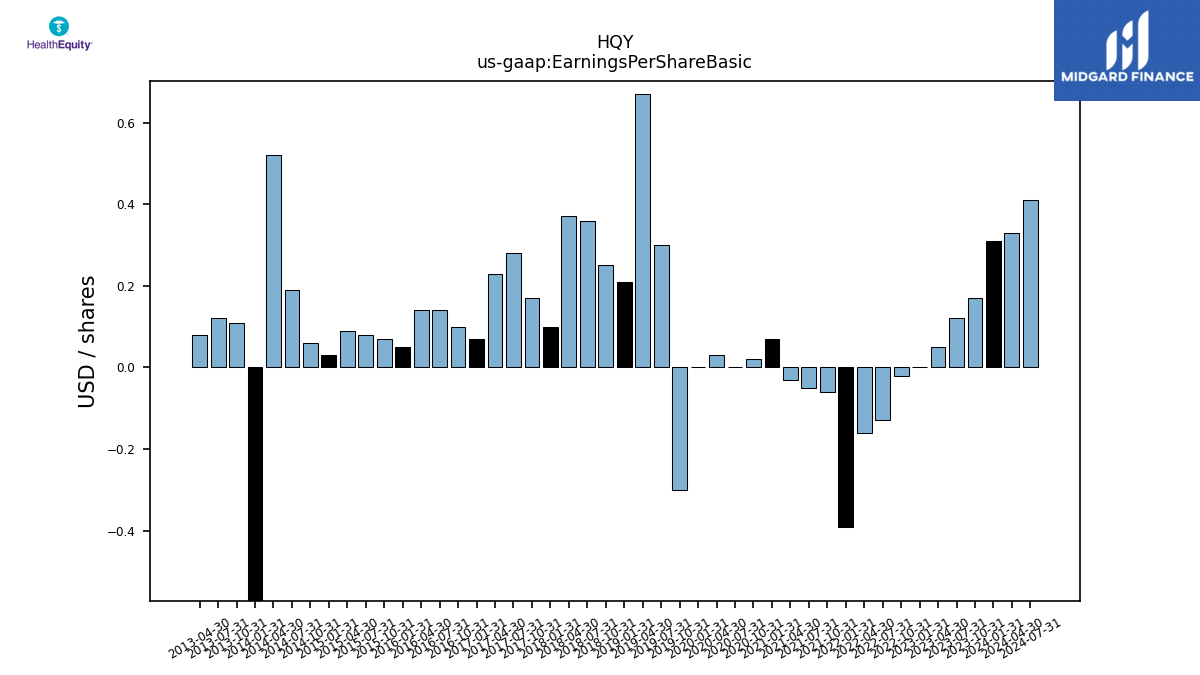
| Earnings Per Share Basic | 0.31 | 0.17 | 0.12 | 0.05 | 0.00 | -0.02 | -0.13 | -0.16 | -0.39 | -0.06 | -0.05 | -0.03 | 0.07 | 0.02 | 0.00 | 0.03 | 0.00 | -0.30 | 0.30 | 0.67 | 0.21 | 0.25 | 0.36 | 0.37 | 0.10 | 0.17 | 0.28 | 0.23 | 0.07 | 0.10 | 0.14 | 0.14 | 0.05 | 0.07 | 0.08 | 0.09 | 0.03 | 0.06 | 0.19 | 0.52 | -1.71 | 0.11 | 0.12 | 0.08 | |
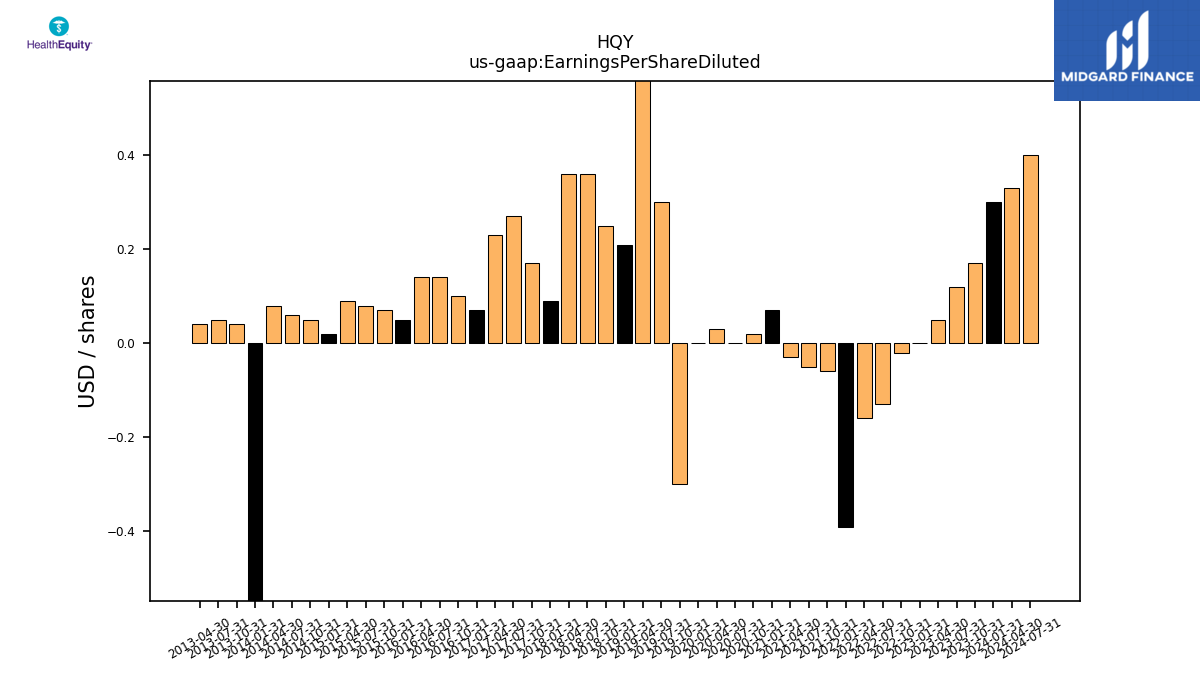
| Earnings Per Share Diluted | 0.30 | 0.17 | 0.12 | 0.05 | 0.00 | -0.02 | -0.13 | -0.16 | -0.39 | -0.06 | -0.05 | -0.03 | 0.07 | 0.02 | 0.00 | 0.03 | 0.00 | -0.30 | 0.30 | 0.65 | 0.21 | 0.25 | 0.36 | 0.36 | 0.09 | 0.17 | 0.27 | 0.23 | 0.07 | 0.10 | 0.14 | 0.14 | 0.05 | 0.07 | 0.08 | 0.09 | 0.02 | 0.05 | 0.06 | 0.08 | -1.71 | 0.04 | 0.05 | 0.04 |
| 2024-01-31 | 2023-10-31 | 2023-07-31 | 2023-04-30 | 2023-01-31 | 2022-10-31 | 2022-07-31 | 2022-04-30 | 2022-01-31 | 2021-10-31 | 2021-07-31 | 2021-04-30 | 2021-01-31 | 2020-10-31 | 2020-07-31 | 2020-04-30 | 2020-01-31 | 2019-10-31 | 2019-07-31 | 2019-04-30 | 2019-01-31 | 2018-10-31 | 2018-07-31 | 2018-04-30 | 2018-01-31 | 2017-10-31 | 2017-07-31 | 2017-04-30 | 2017-01-31 | 2016-10-31 | 2016-07-31 | 2016-04-30 | 2016-01-31 | 2015-10-31 | 2015-07-31 | 2015-04-30 | 2015-01-31 | 2014-10-31 | 2014-07-31 | 2014-04-30 | 2014-01-31 | 2013-10-31 | 2013-07-31 | 2013-04-30 | ||
|---|---|---|---|---|---|---|---|---|---|---|---|---|---|---|---|---|---|---|---|---|---|---|---|---|---|---|---|---|---|---|---|---|---|---|---|---|---|---|---|---|---|---|---|---|---|
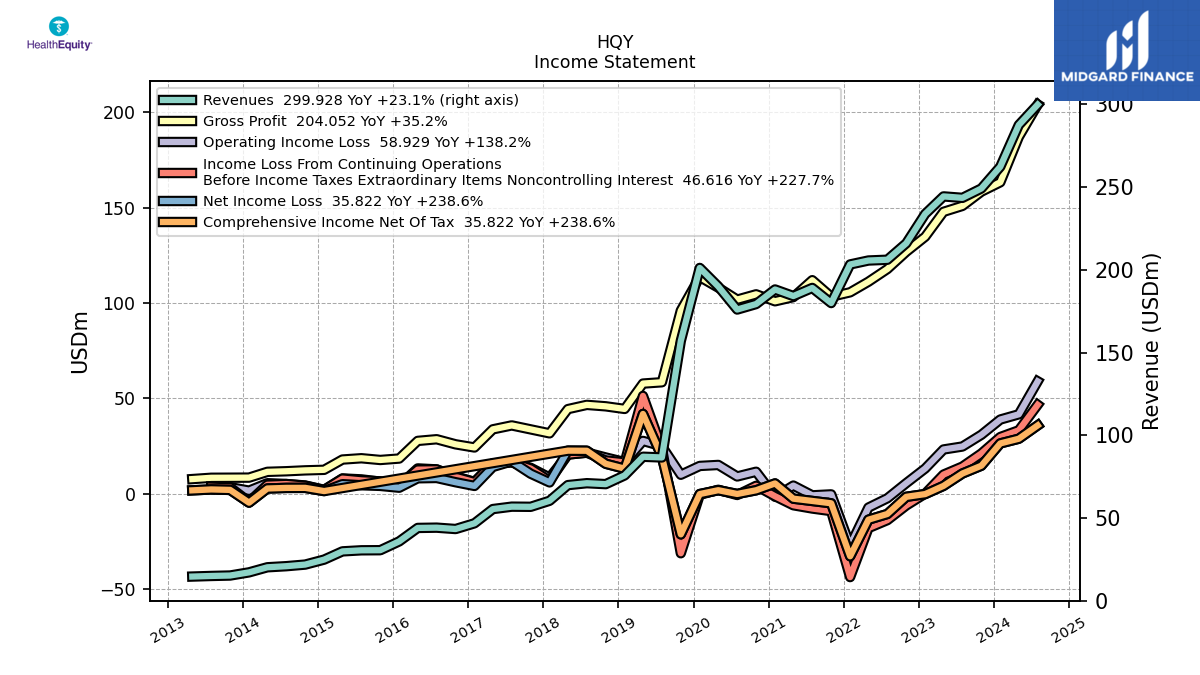
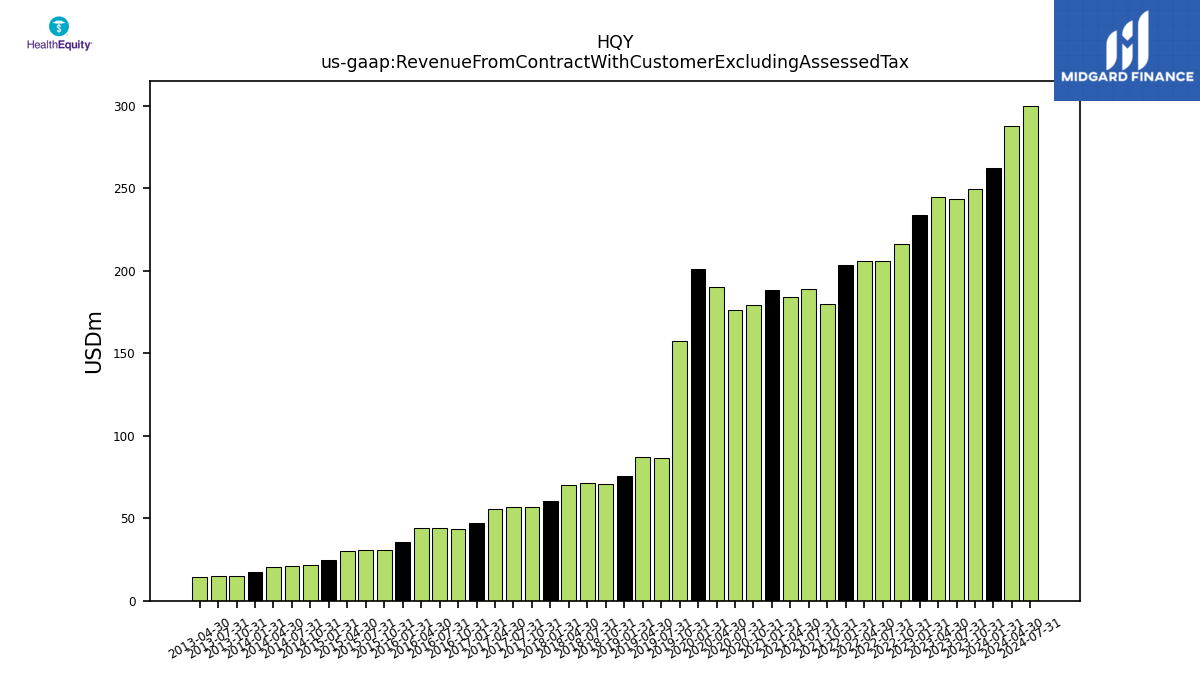
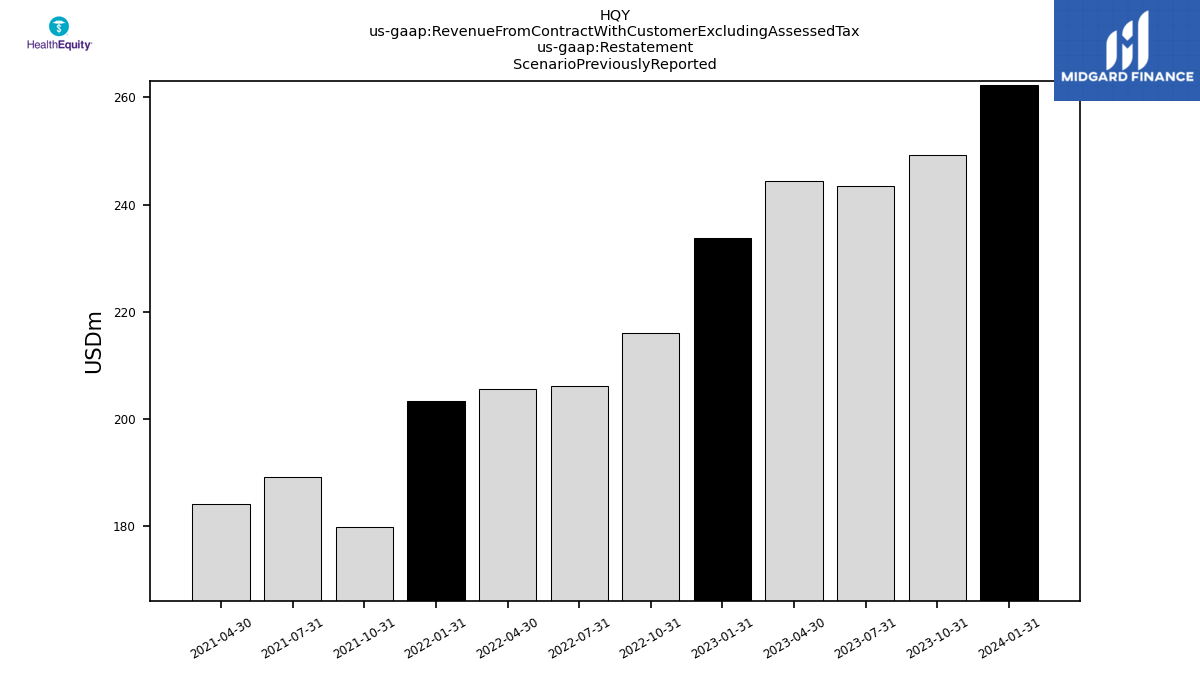
| Revenue From Contract With Customer Excluding Assessed Tax | 262.39 | 249.22 | 243.55 | 244.43 | 233.84 | 216.09 | 206.14 | 205.68 | 203.30 | 179.95 | 189.10 | 184.20 | 188.17 | 179.35 | 176.04 | 190.01 | 201.20 | 157.12 | 86.62 | 87.05 | 75.78 | 70.50 | 71.07 | 69.90 | 60.44 | 56.79 | 56.88 | 55.42 | 46.81 | 43.36 | 44.19 | 44.01 | 35.89 | 30.56 | 30.49 | 29.85 | 24.87 | 21.86 | 20.89 | 20.23 | 17.16 | 15.25 | 14.98 | 14.62 | |
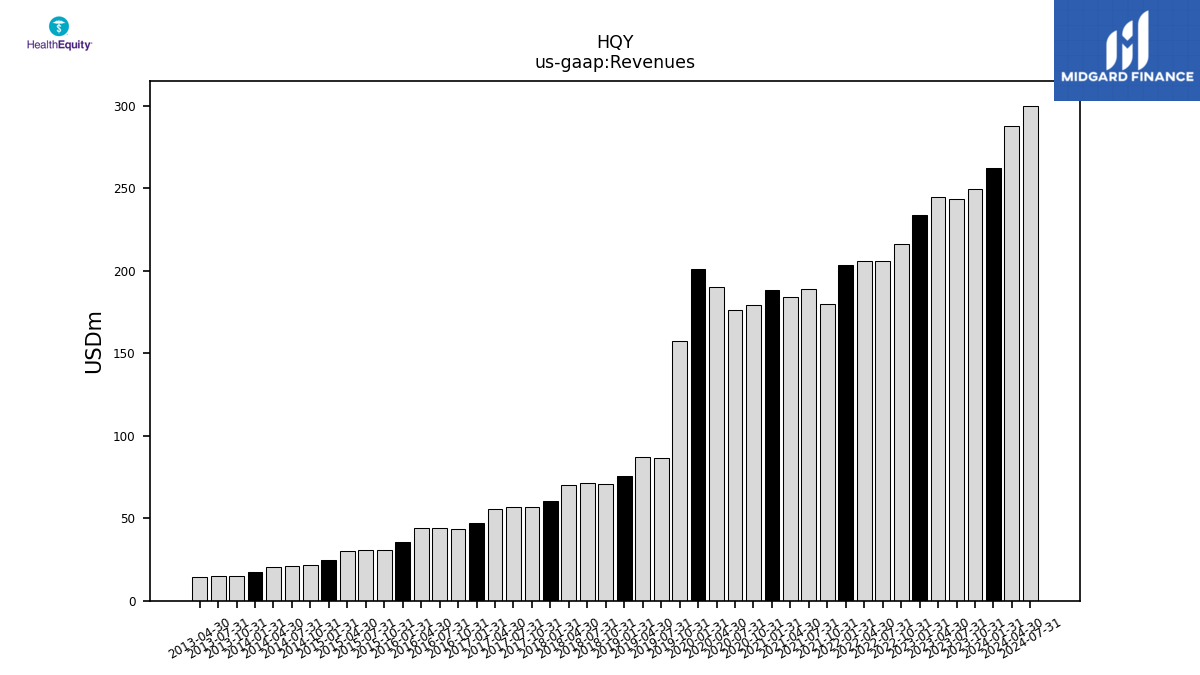
| Revenues | 262.39 | 249.22 | 243.55 | 244.43 | 233.84 | 216.09 | 206.14 | 205.68 | 203.30 | 179.95 | 189.10 | 184.20 | 188.17 | 179.35 | 176.04 | 190.01 | 201.20 | 157.12 | 86.62 | 87.05 | 75.78 | 70.50 | 71.07 | 69.90 | 60.44 | 56.79 | 56.88 | 55.42 | 46.81 | 43.36 | 44.19 | 44.01 | 35.89 | 30.56 | 30.49 | 29.85 | 24.87 | 21.86 | 20.89 | 20.23 | 17.16 | 15.25 | 14.98 | 14.62 | |
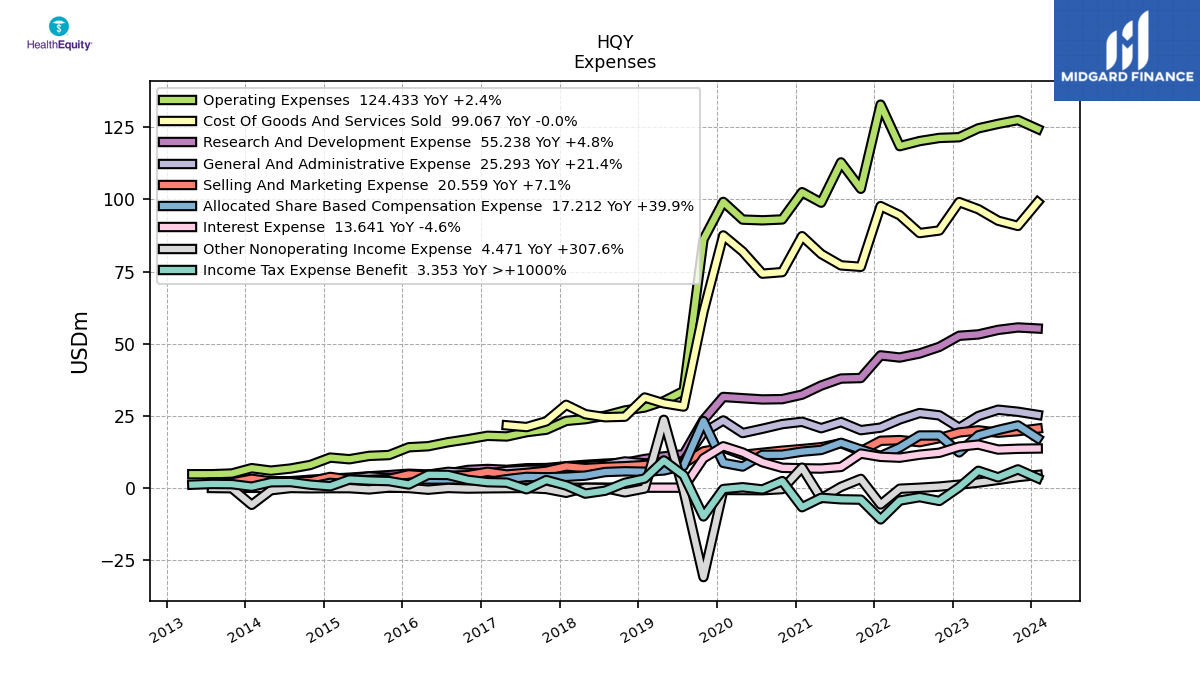
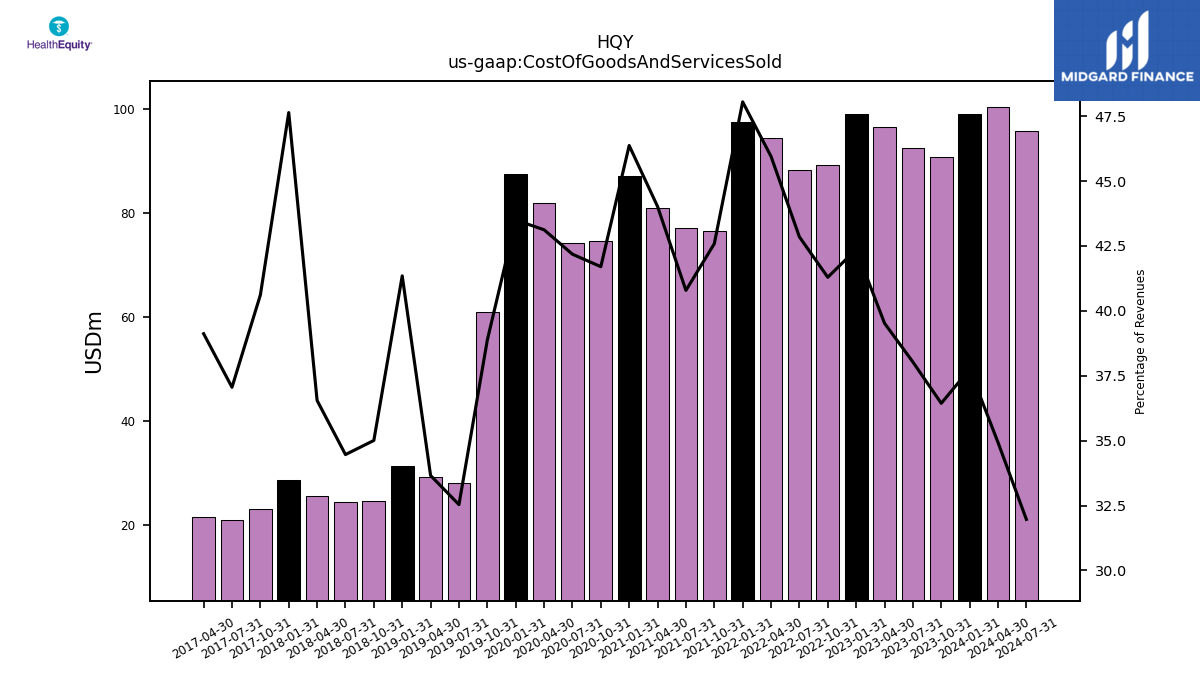
| Cost Of Goods And Services Sold | 99.07 | 90.81 | 92.62 | 96.61 | 99.07 | 89.23 | 88.33 | 94.51 | 97.68 | 76.63 | 77.13 | 81.09 | 87.25 | 74.79 | 74.25 | 81.94 | 87.52 | 61.08 | 28.18 | 29.30 | 31.33 | 24.68 | 24.49 | 25.55 | 28.79 | 23.06 | 21.08 | 21.68 | NA | NA | NA | NA | NA | NA | NA | NA | NA | NA | NA | NA | NA | NA | NA | NA | |
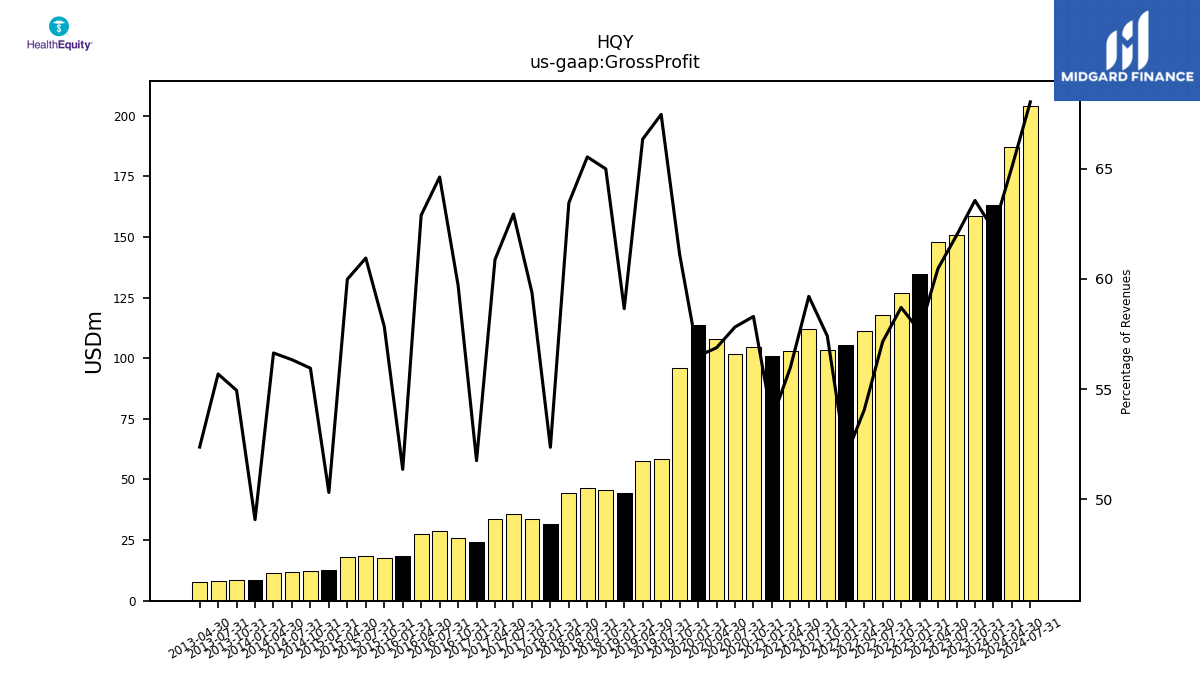
| Gross Profit | 163.32 | 158.41 | 150.93 | 147.83 | 134.77 | 126.86 | 117.81 | 111.17 | 105.61 | 103.32 | 111.97 | 103.12 | 100.92 | 104.56 | 101.78 | 108.07 | 113.68 | 96.03 | 58.44 | 57.75 | 44.45 | 45.82 | 46.58 | 44.36 | 31.65 | 33.73 | 35.80 | 33.74 | 24.23 | 25.89 | 28.55 | 27.68 | 18.43 | 17.68 | 18.59 | 17.91 | 12.51 | 12.23 | 11.77 | 11.46 | 8.42 | 8.38 | 8.34 | 7.66 | |
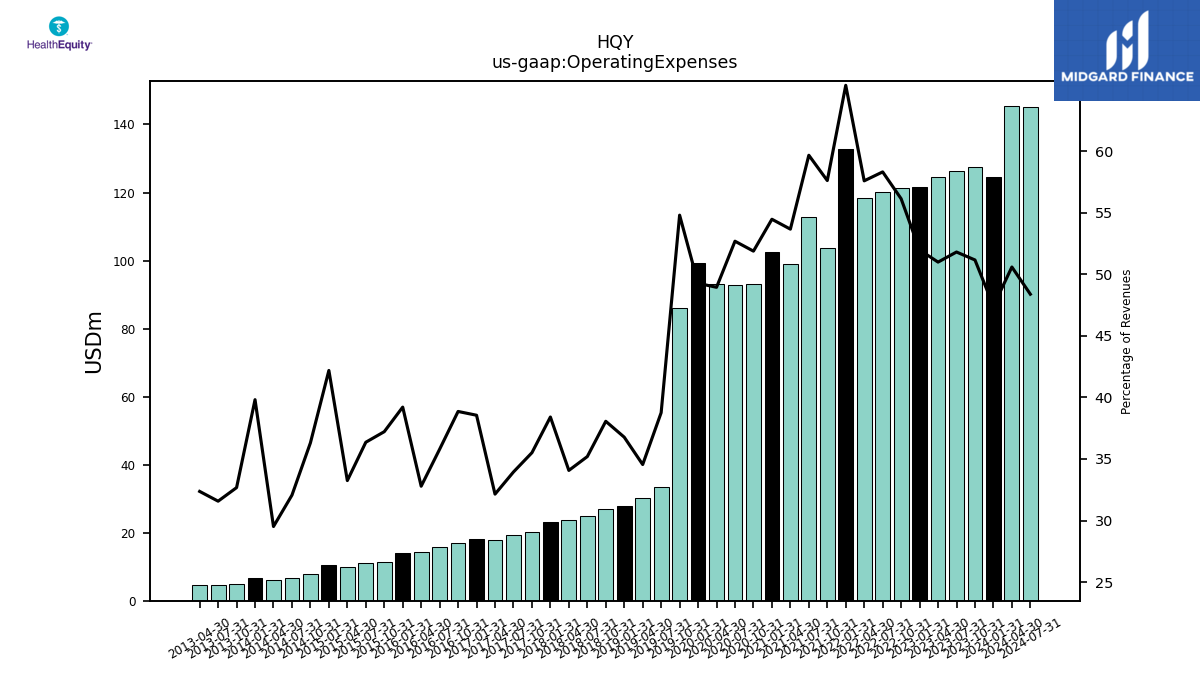
| Operating Expenses | 124.43 | 127.52 | 126.19 | 124.64 | 121.56 | 121.32 | 120.22 | 118.46 | 132.86 | 103.69 | 112.85 | 98.86 | 102.50 | 93.06 | 92.76 | 93.00 | 99.14 | 86.11 | 33.58 | 30.07 | 27.86 | 26.83 | 25.01 | 23.82 | 23.21 | 20.16 | 19.31 | 17.81 | 18.05 | 16.85 | 15.81 | 14.43 | 14.07 | 11.37 | 11.09 | 9.92 | 10.49 | 7.94 | 6.70 | 5.97 | 6.83 | 4.98 | 4.73 | 4.73 | |
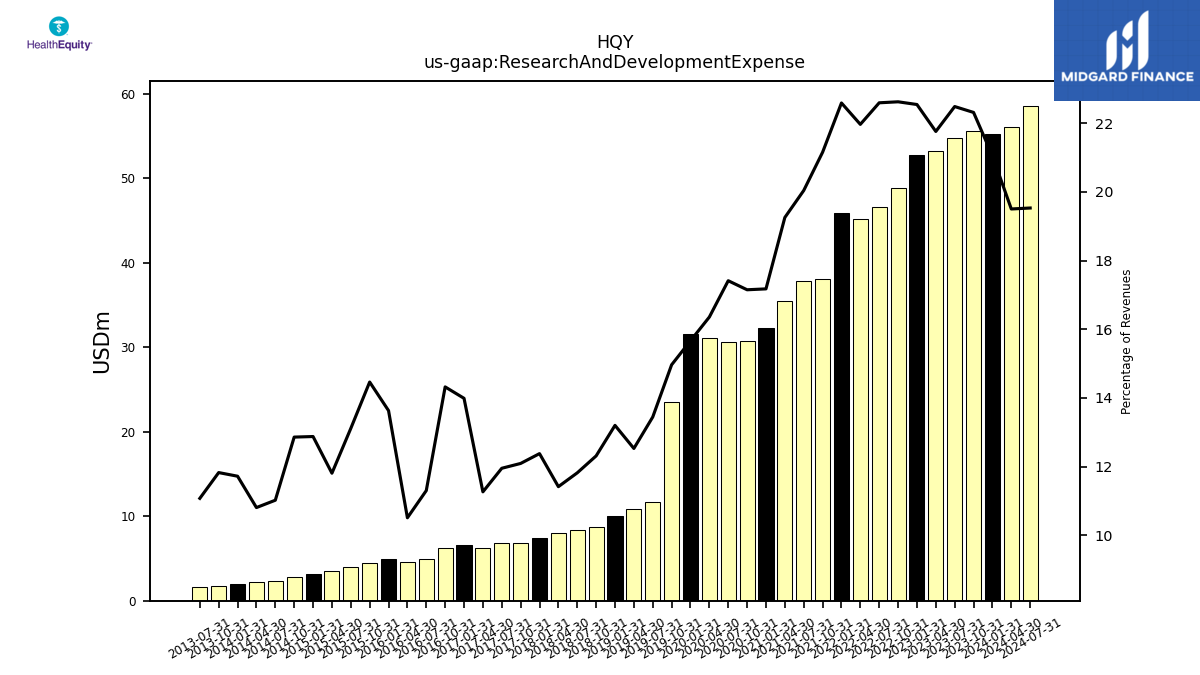
| Research And Development Expense | 55.24 | 55.61 | 54.77 | 53.19 | 52.72 | 48.89 | 46.58 | 45.18 | 45.93 | 38.07 | 37.90 | 35.47 | 32.32 | 30.76 | 30.65 | 31.08 | 31.52 | 23.51 | 11.64 | 10.90 | 10.00 | 8.68 | 8.40 | 7.98 | 7.48 | 6.87 | 6.80 | 6.24 | 6.55 | 6.21 | 4.99 | 4.62 | 4.89 | 4.42 | 4.00 | 3.52 | 3.20 | 2.81 | 2.30 | 2.19 | 2.01 | 1.80 | 1.66 | NA | |
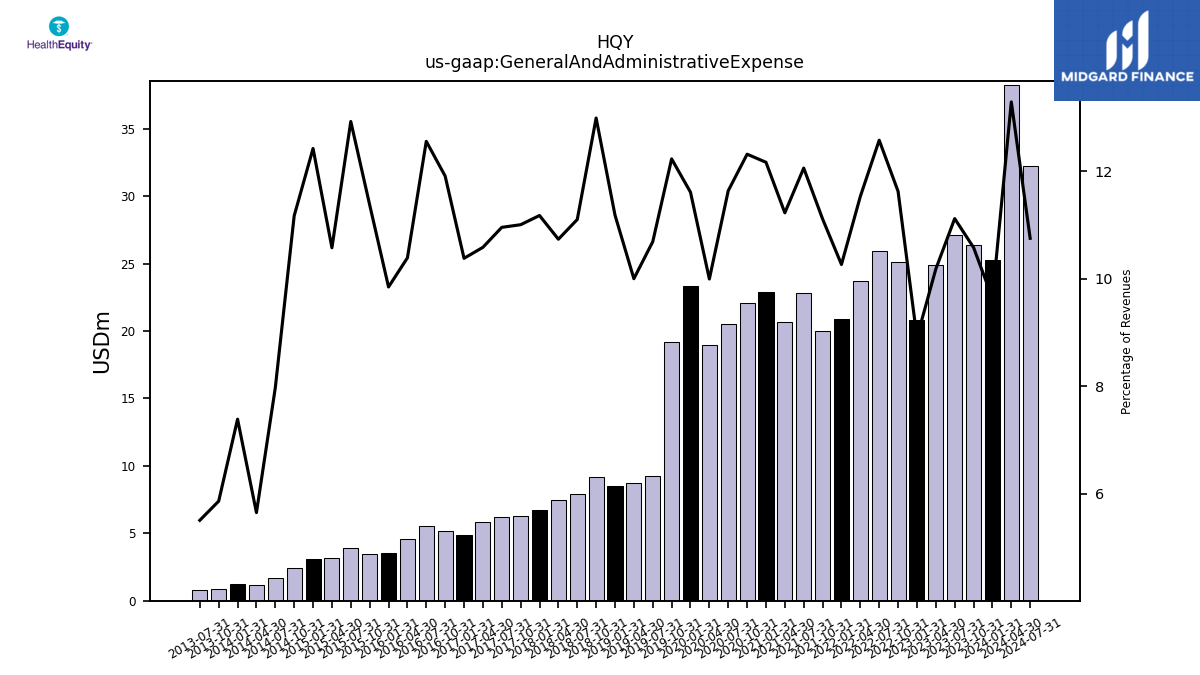
| General And Administrative Expense | 25.29 | 26.38 | 27.09 | 24.89 | 20.83 | 25.13 | 25.94 | 23.73 | 20.88 | 20.00 | 22.81 | 20.69 | 22.90 | 22.10 | 20.49 | 19.00 | 23.37 | 19.22 | 9.26 | 8.71 | 8.48 | 9.16 | 7.89 | 7.51 | 6.76 | 6.25 | 6.23 | 5.87 | 4.86 | 5.17 | 5.55 | 4.57 | 3.54 | 3.48 | 3.94 | 3.16 | 3.09 | 2.44 | 1.67 | 1.14 | 1.27 | 0.89 | 0.82 | NA | |
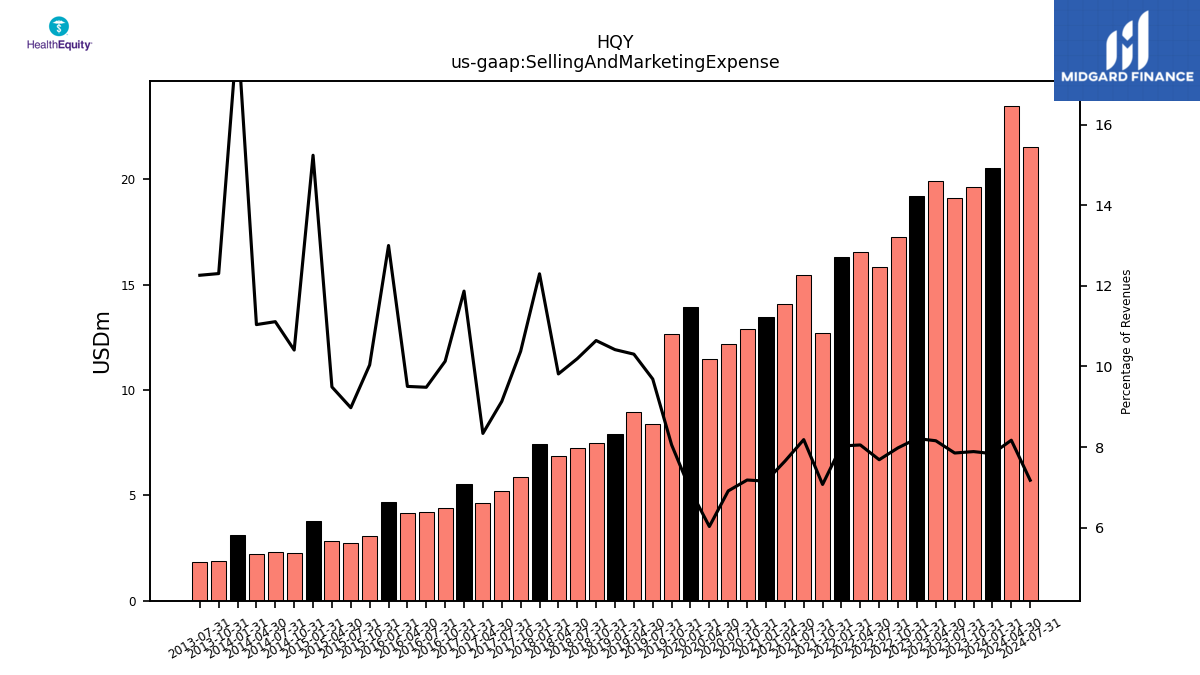
| Selling And Marketing Expense | 20.56 | 19.66 | 19.12 | 19.93 | 19.20 | 17.25 | 15.84 | 16.56 | 16.32 | 12.73 | 15.48 | 14.09 | 13.46 | 12.88 | 12.17 | 11.46 | 13.94 | 12.65 | 8.39 | 8.97 | 7.89 | 7.50 | 7.24 | 6.86 | 7.43 | 5.89 | 5.19 | 4.62 | 5.56 | 4.39 | 4.19 | 4.18 | 4.67 | 3.07 | 2.74 | 2.83 | 3.79 | 2.27 | 2.32 | 2.23 | 3.14 | 1.88 | 1.84 | NA | |
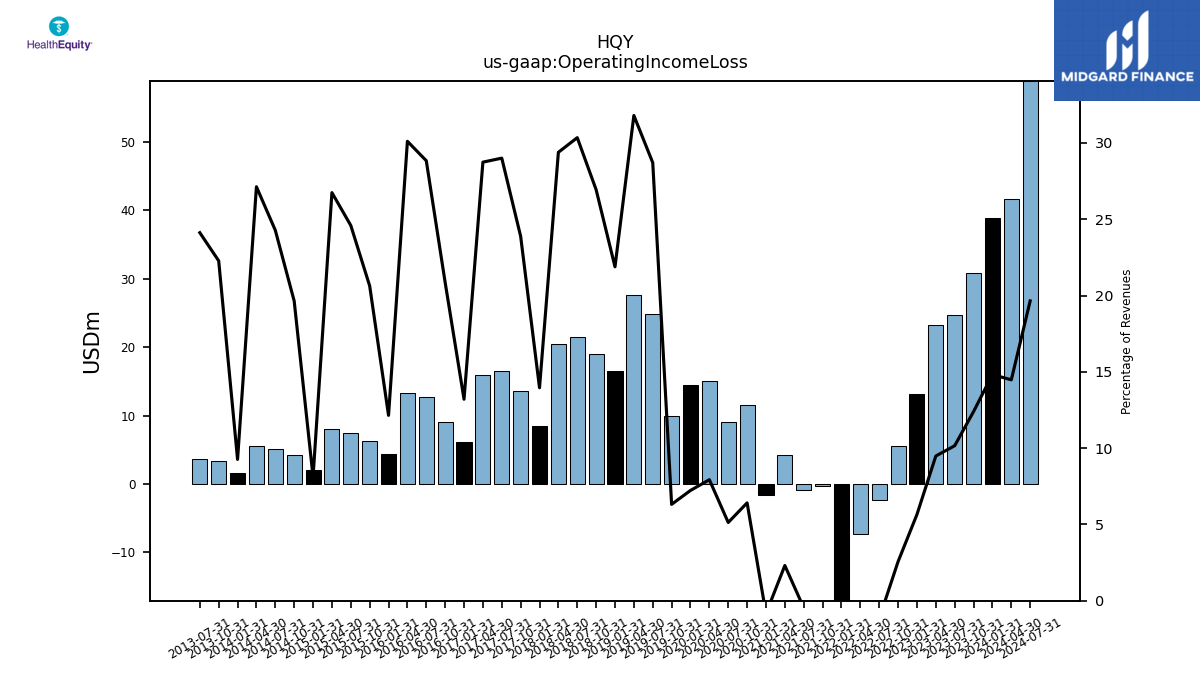
| Operating Income Loss | 38.89 | 30.89 | 24.74 | 23.18 | 13.22 | 5.54 | -2.41 | -7.29 | -27.25 | -0.37 | -0.88 | 4.25 | -1.59 | 11.50 | 9.03 | 15.07 | 14.54 | 9.92 | 24.86 | 27.68 | 16.58 | 18.99 | 21.56 | 20.54 | 8.43 | 13.56 | 16.50 | 15.93 | 6.18 | 9.04 | 12.74 | 13.25 | 4.36 | 6.30 | 7.50 | 7.98 | 2.02 | 4.29 | 5.07 | 5.49 | 1.59 | 3.40 | 3.61 | NA | |
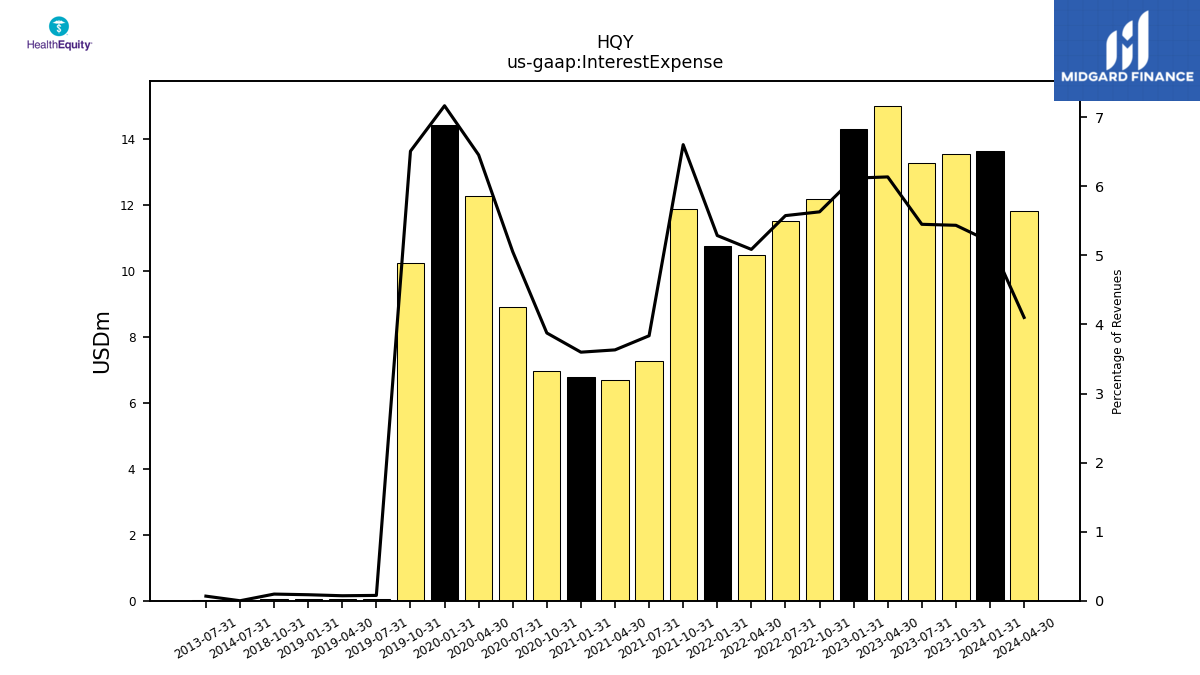
| Interest Expense | 13.64 | 13.54 | 13.27 | 15.00 | 14.30 | 12.16 | 11.49 | 10.46 | 10.75 | 11.88 | 7.25 | 6.69 | 6.77 | 6.95 | 8.89 | 12.26 | 14.42 | 10.22 | 0.07 | 0.06 | 0.07 | 0.07 | NA | NA | NA | NA | NA | NA | NA | NA | NA | NA | NA | NA | NA | NA | NA | NA | 0.00 | NA | NA | NA | 0.01 | NA | |
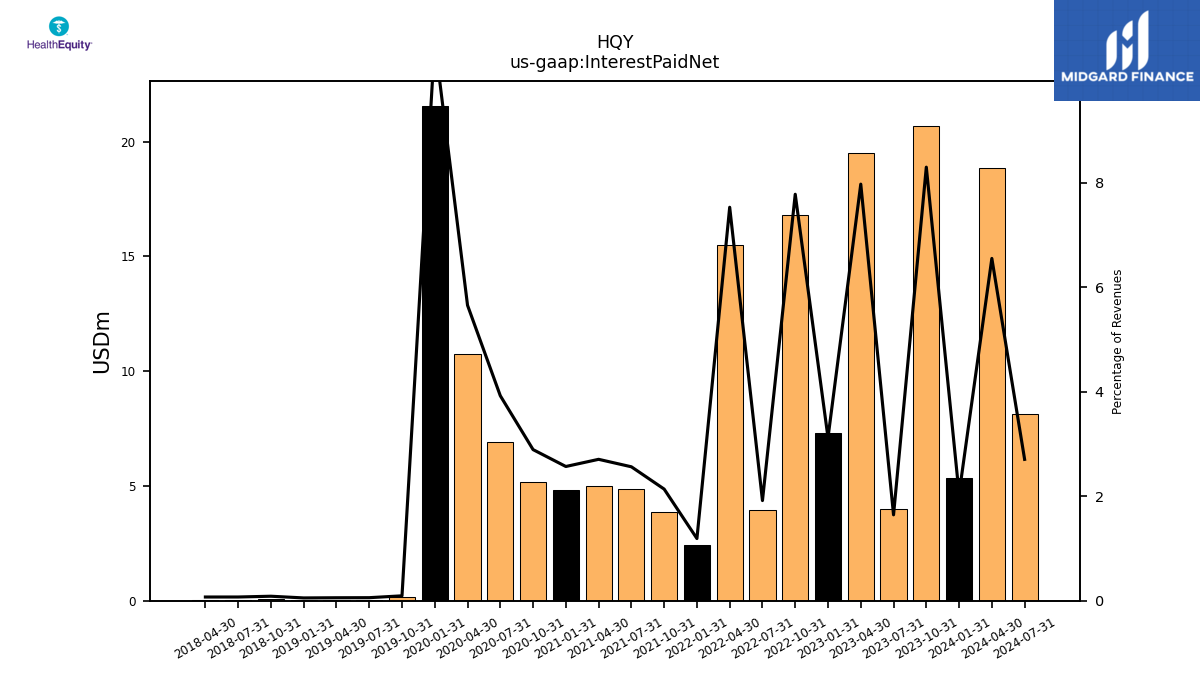
| Interest Paid Net | 5.37 | 20.69 | 4.01 | 19.50 | 7.30 | 16.82 | 3.95 | 15.50 | 2.42 | 3.85 | 4.85 | 4.99 | 4.84 | 5.19 | 6.91 | 10.75 | 21.56 | 0.15 | 0.05 | 0.05 | 0.04 | 0.06 | 0.05 | 0.05 | NA | NA | NA | NA | NA | NA | NA | NA | NA | NA | NA | NA | NA | NA | NA | NA | NA | NA | NA | NA | |
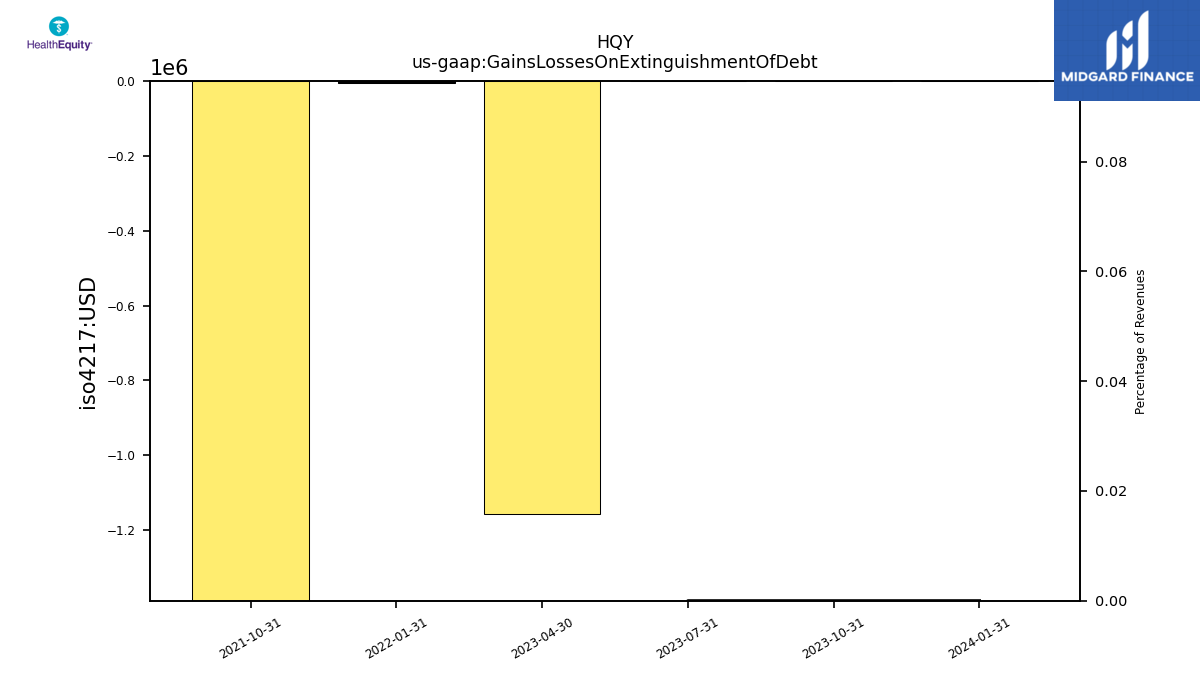
| Gains Losses On Extinguishment Of Debt | 0.00 | 0.00 | 0.00 | -1.16 | NA | NA | NA | NA | -0.01 | -4.00 | NA | NA | NA | NA | NA | NA | NA | NA | NA | NA | NA | NA | NA | NA | NA | NA | NA | NA | NA | NA | NA | NA | NA | NA | NA | NA | NA | NA | NA | NA | NA | NA | NA | NA | |
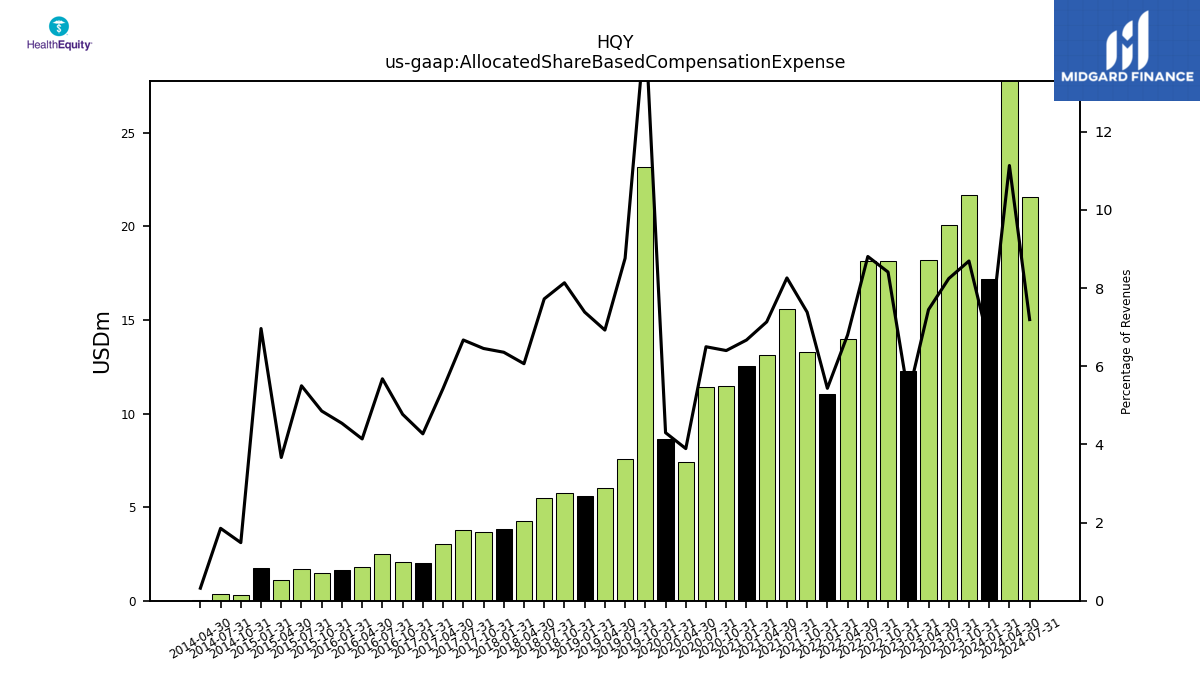
| Allocated Share Based Compensation Expense | 17.21 | 21.66 | 20.07 | 18.20 | 12.30 | 18.17 | 18.15 | 13.99 | 11.05 | 13.28 | 15.62 | 13.14 | 12.55 | 11.48 | 11.44 | 7.40 | 8.65 | 23.16 | 7.59 | 6.03 | 5.60 | 5.73 | 5.49 | 4.24 | 3.84 | 3.67 | 3.79 | 3.01 | 2.00 | 2.07 | 2.51 | 1.82 | 1.63 | 1.48 | 1.68 | 1.09 | 1.73 | 0.33 | 0.39 | 0.07 | NA | NA | NA | NA | |
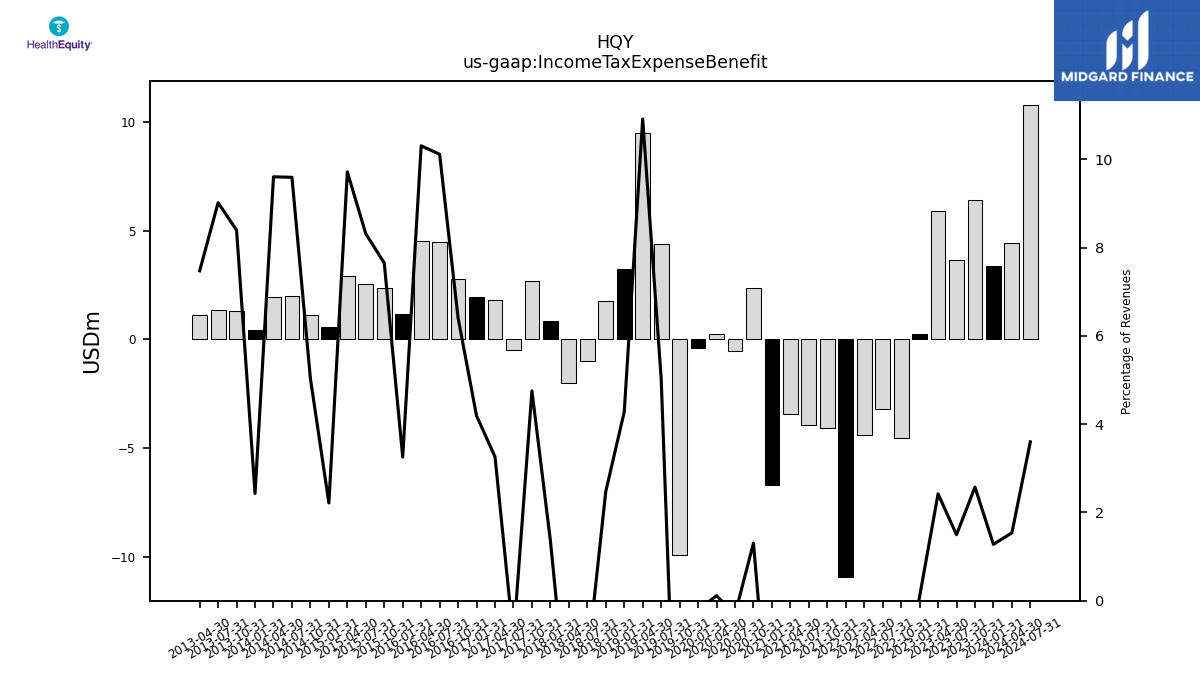
| Income Tax Expense Benefit | 3.35 | 6.41 | 3.64 | 5.92 | 0.22 | -4.54 | -3.22 | -4.41 | -10.95 | -4.09 | -3.97 | -3.45 | -6.71 | 2.34 | -0.54 | 0.22 | -0.42 | -9.92 | 4.37 | 9.50 | 3.24 | 1.75 | -1.00 | -2.00 | 0.82 | 2.70 | -0.49 | 1.81 | 1.96 | 2.78 | 4.47 | 4.54 | 1.17 | 2.34 | 2.54 | 2.90 | 0.55 | 1.10 | 2.00 | 1.94 | 0.42 | 1.28 | 1.35 | 1.09 | |
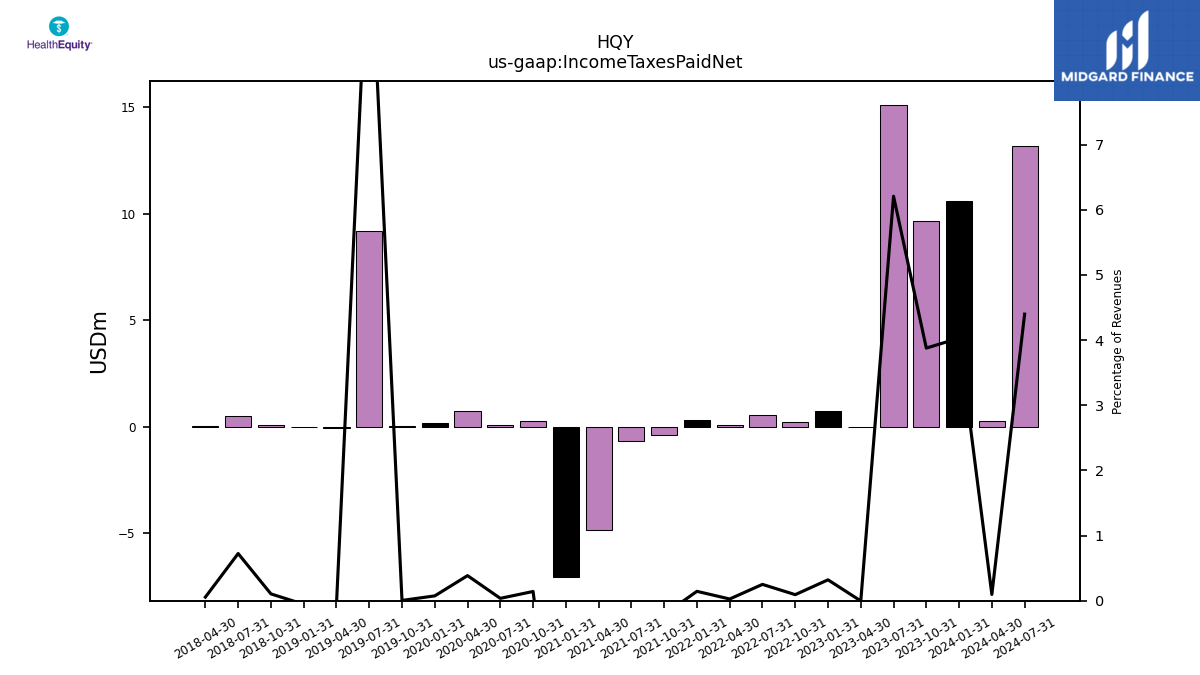
| Income Taxes Paid Net | 10.57 | 9.66 | 15.12 | -0.01 | 0.75 | 0.20 | 0.52 | 0.06 | 0.29 | -0.38 | -0.69 | -4.85 | -7.08 | 0.26 | 0.07 | 0.73 | 0.15 | 0.01 | 9.17 | -0.05 | -0.04 | 0.07 | 0.52 | 0.04 | NA | NA | NA | NA | NA | NA | NA | NA | NA | NA | NA | NA | NA | NA | NA | NA | NA | NA | NA | NA | |
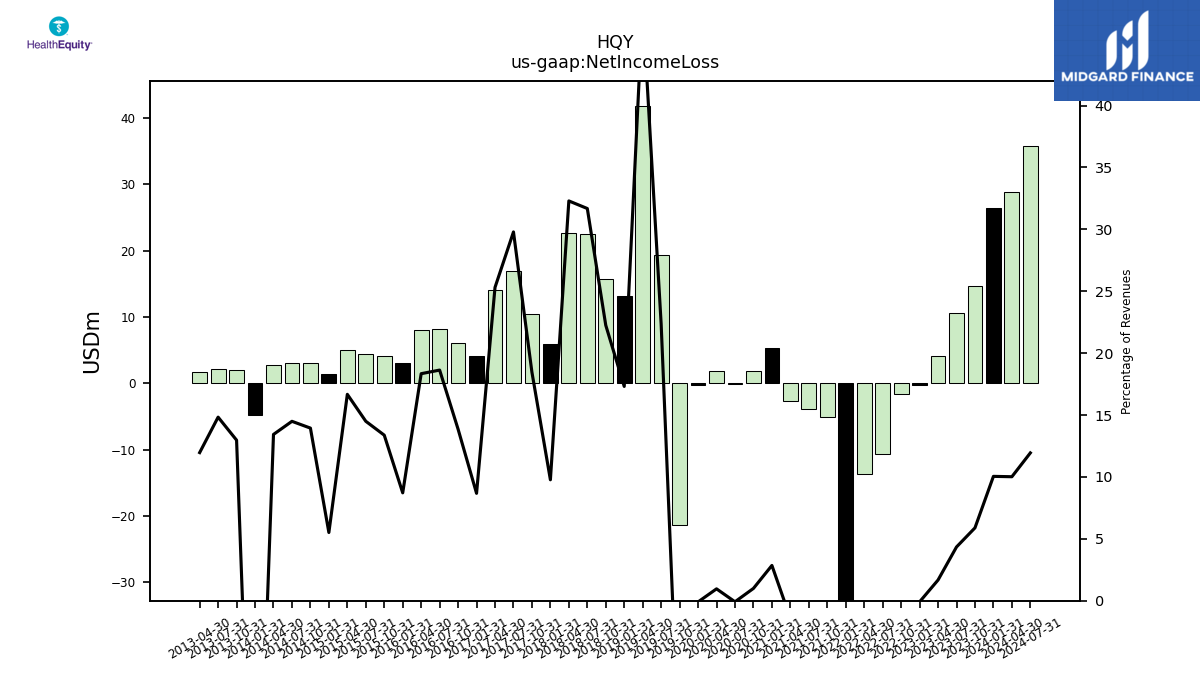
| Net Income Loss | 26.36 | 14.67 | 10.58 | 4.09 | -0.21 | -1.64 | -10.65 | -13.64 | -32.82 | -5.04 | -3.82 | -2.62 | 5.37 | 1.79 | -0.15 | 1.83 | -0.19 | -21.33 | 19.37 | 41.82 | 13.12 | 15.69 | 22.52 | 22.58 | 5.91 | 10.48 | 16.95 | 14.03 | 4.06 | 6.01 | 8.23 | 8.07 | 3.13 | 4.09 | 4.42 | 4.98 | 1.37 | 3.05 | 3.03 | 2.72 | -4.72 | 1.98 | 2.22 | 1.75 | |
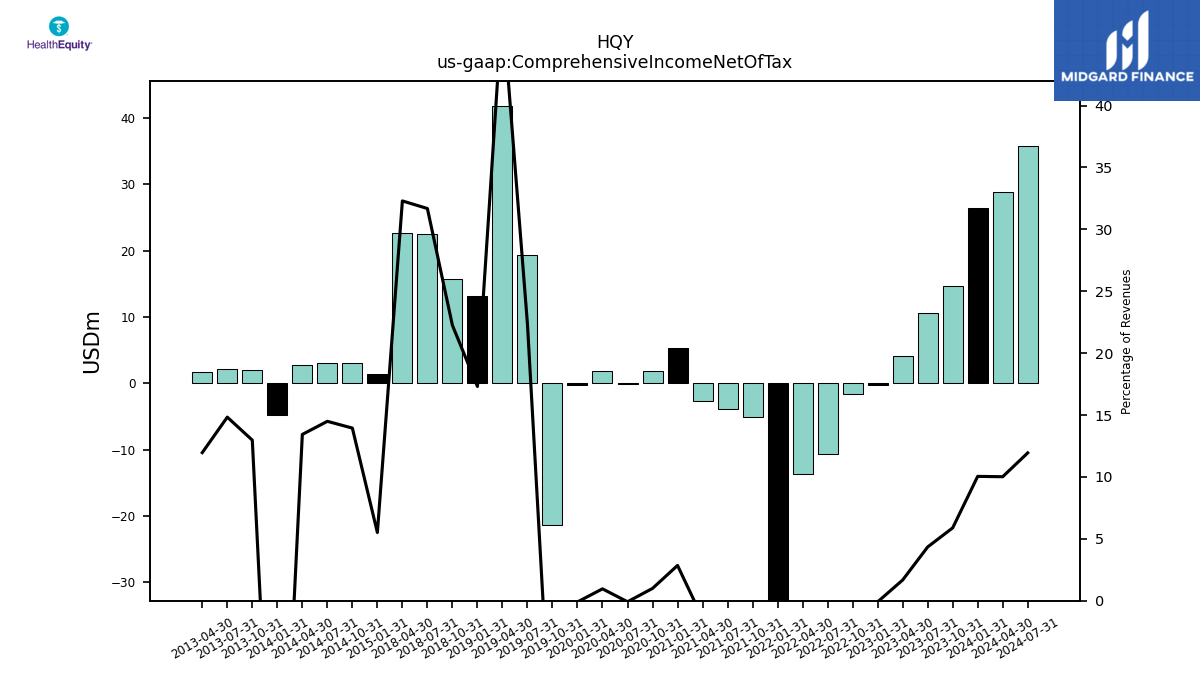
| Comprehensive Income Net Of Tax | 26.36 | 14.67 | 10.58 | 4.09 | -0.21 | -1.64 | -10.65 | -13.64 | -32.82 | -5.04 | -3.82 | -2.62 | 5.37 | 1.79 | -0.15 | 1.83 | -0.19 | -21.33 | 19.37 | 41.82 | 13.12 | 15.69 | 22.52 | 22.58 | NA | NA | NA | NA | NA | NA | NA | NA | NA | NA | NA | NA | 1.37 | 3.05 | 3.03 | 2.72 | -4.72 | 1.98 | 2.22 | 1.75 |
| 2024-01-31 | 2023-10-31 | 2023-07-31 | 2023-04-30 | 2023-01-31 | 2022-10-31 | 2022-07-31 | 2022-04-30 | 2022-01-31 | 2021-10-31 | 2021-07-31 | 2021-04-30 | 2021-01-31 | 2020-10-31 | 2020-07-31 | 2020-04-30 | 2020-01-31 | 2019-10-31 | 2019-07-31 | 2019-04-30 | 2019-01-31 | 2018-10-31 | 2018-07-31 | 2018-04-30 | 2018-01-31 | 2017-10-31 | 2017-07-31 | 2017-04-30 | 2017-01-31 | 2016-10-31 | 2016-07-31 | 2016-04-30 | 2016-01-31 | 2015-10-31 | 2015-07-31 | 2015-04-30 | 2015-01-31 | 2014-10-31 | 2014-07-31 | 2014-04-30 | 2014-01-31 | 2013-10-31 | 2013-07-31 | 2013-04-30 | ||
|---|---|---|---|---|---|---|---|---|---|---|---|---|---|---|---|---|---|---|---|---|---|---|---|---|---|---|---|---|---|---|---|---|---|---|---|---|---|---|---|---|---|---|---|---|---|
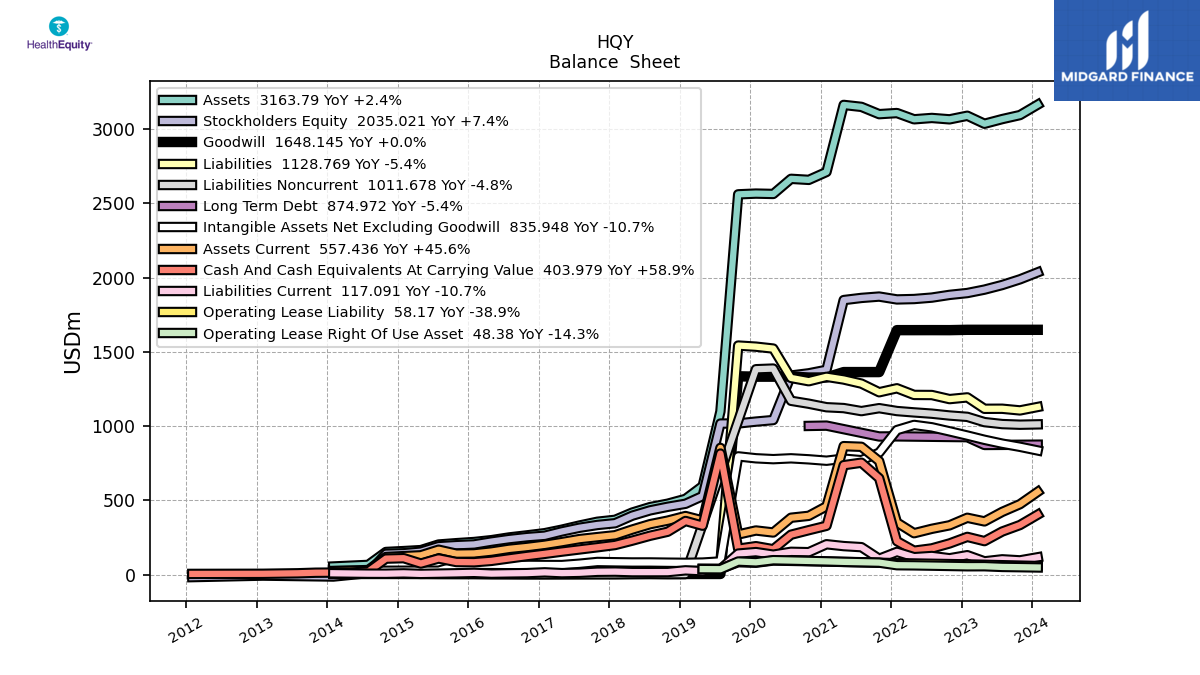
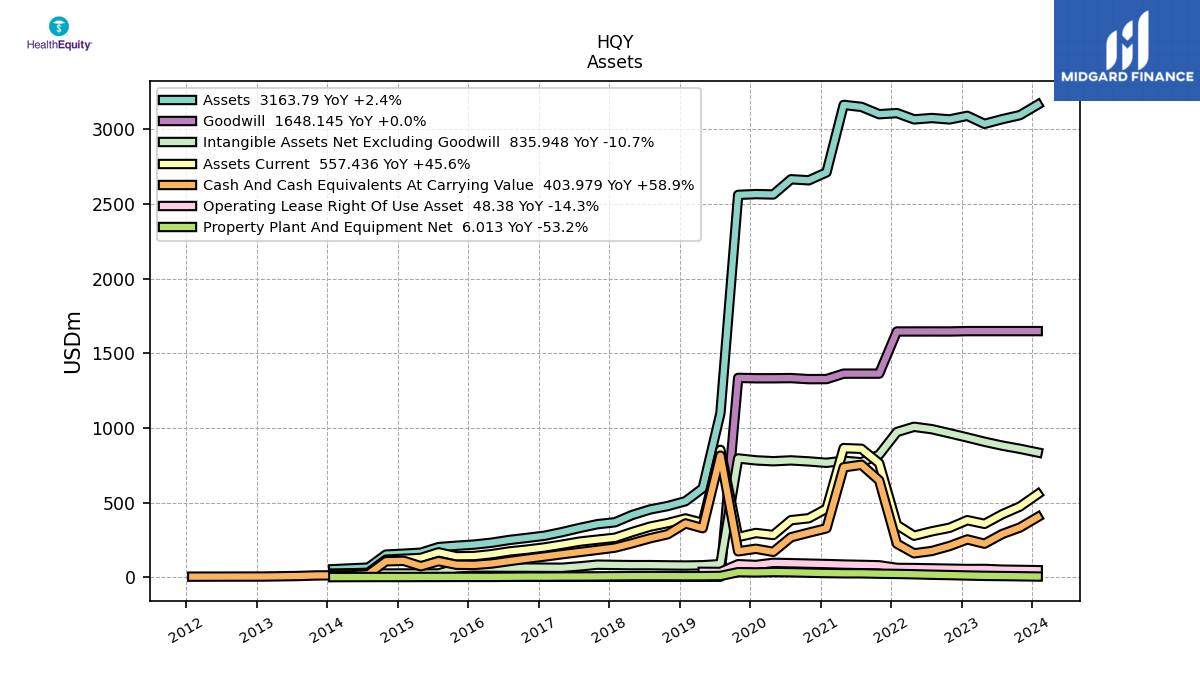
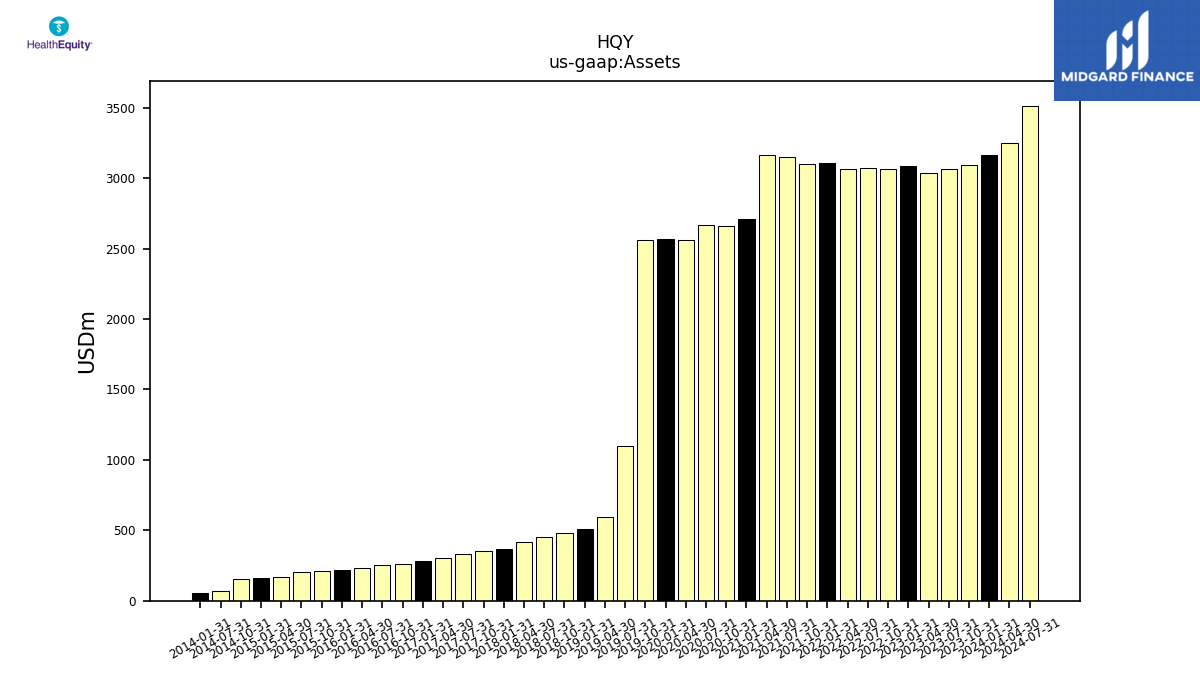
| Assets | 3163.79 | 3093.50 | 3066.46 | 3035.01 | 3088.90 | 3064.76 | 3074.02 | 3065.07 | 3107.10 | 3099.61 | 3148.63 | 3161.87 | 2710.41 | 2657.26 | 2664.38 | 2562.48 | 2564.98 | 2559.92 | 1098.34 | 596.64 | 510.02 | 477.70 | 454.60 | 418.03 | 369.16 | 356.12 | 330.94 | 302.85 | 279.14 | 264.47 | 250.59 | 232.24 | 219.79 | 211.96 | 202.92 | 165.28 | 158.77 | 152.74 | 65.77 | NA | 55.09 | NA | NA | NA | |
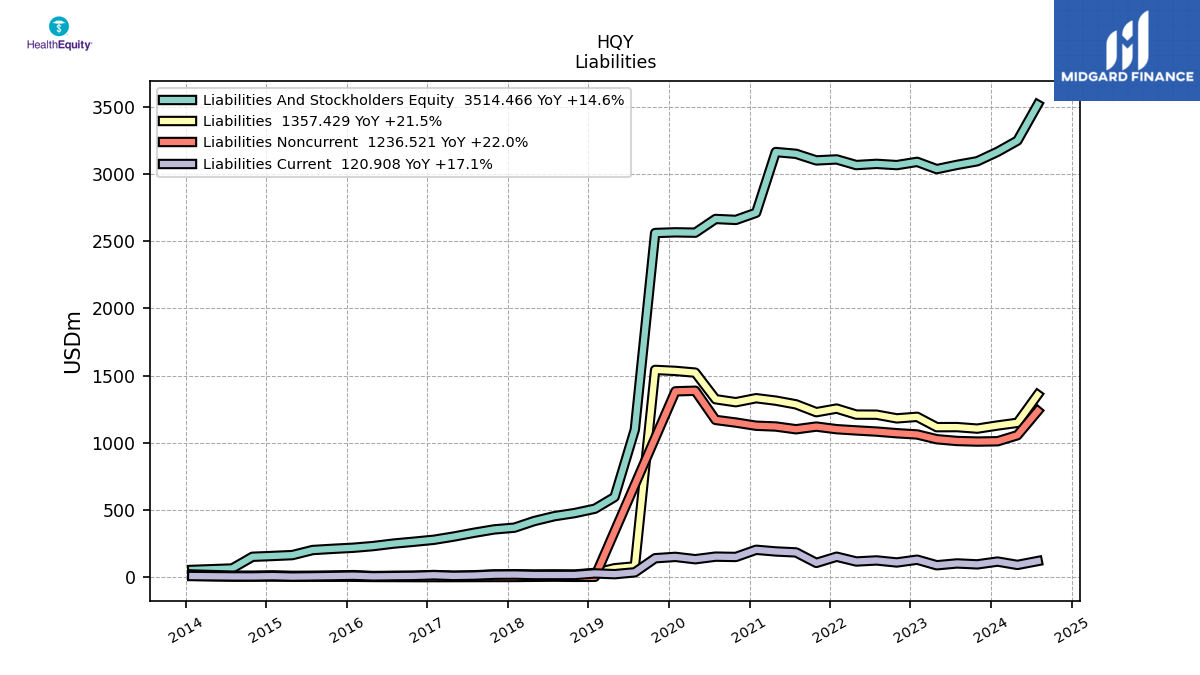
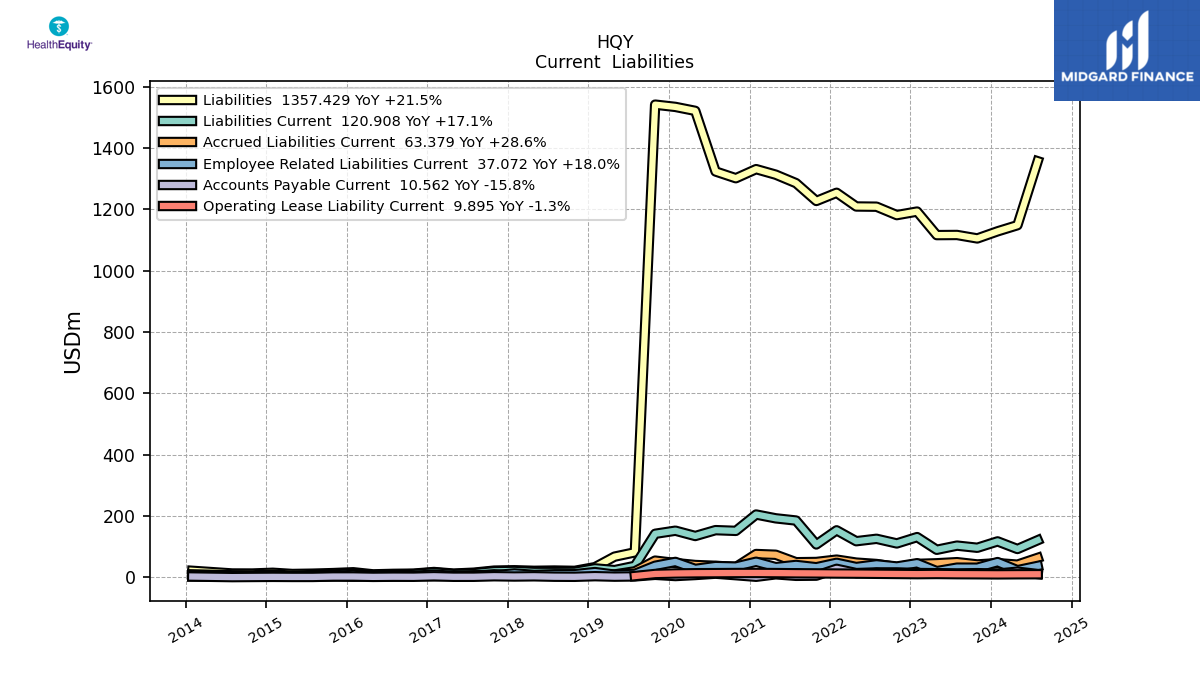
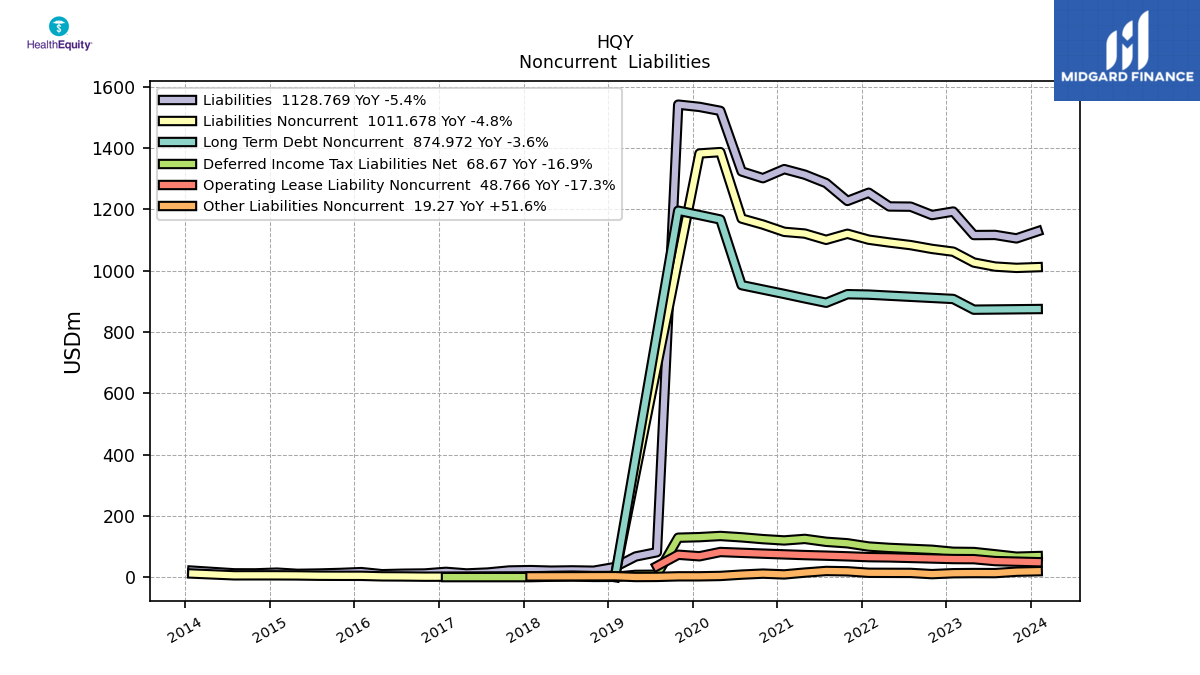
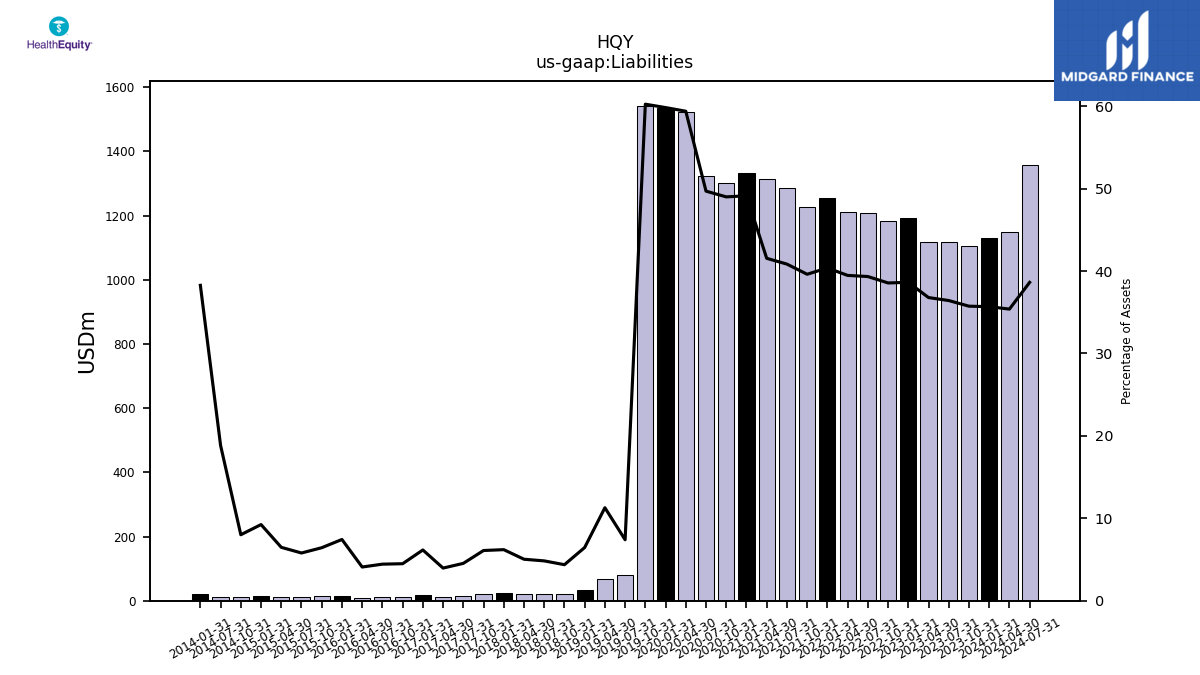
| Liabilities | 1128.77 | 1105.53 | 1116.84 | 1116.42 | 1193.26 | 1181.64 | 1209.13 | 1209.80 | 1254.53 | 1227.76 | 1285.97 | 1313.60 | 1331.68 | 1302.01 | 1324.05 | 1521.83 | 1534.69 | 1542.16 | 81.31 | 67.34 | 32.94 | 20.90 | 21.98 | 21.06 | 22.89 | 21.70 | 15.01 | 12.01 | 17.20 | 11.88 | 11.13 | 9.51 | 16.34 | 13.64 | 11.76 | 10.71 | 14.67 | 12.23 | 12.39 | NA | 21.08 | NA | NA | NA | |
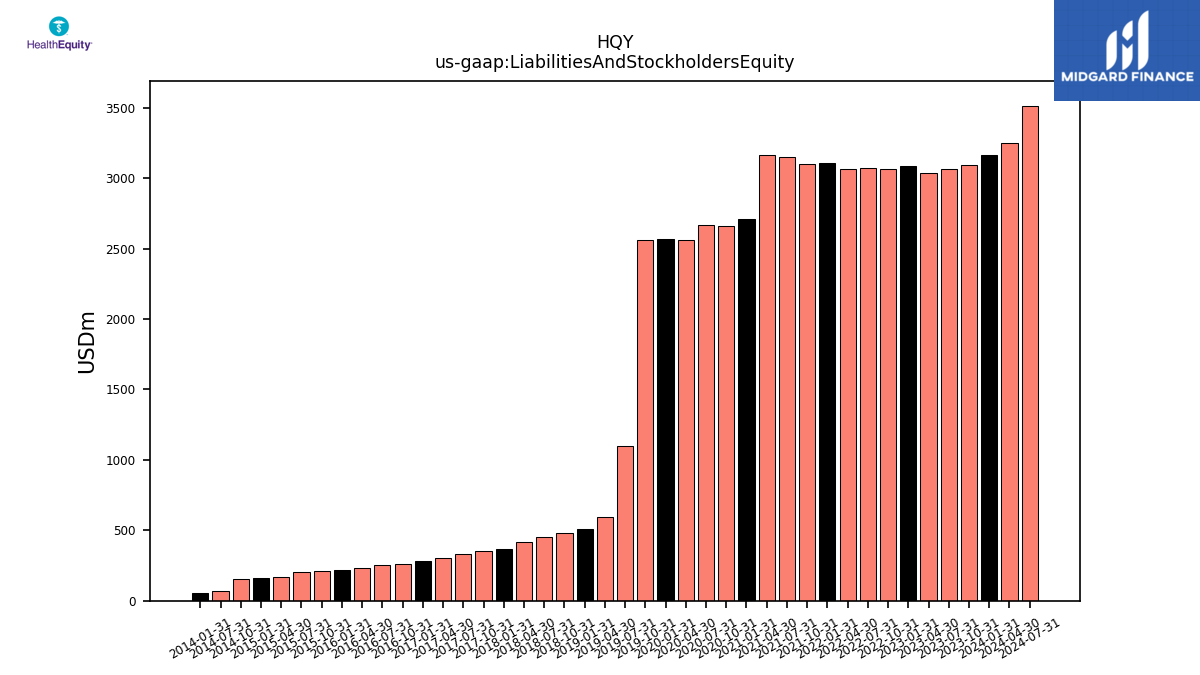
| Liabilities And Stockholders Equity | 3163.79 | 3093.50 | 3066.46 | 3035.01 | 3088.90 | 3064.76 | 3074.02 | 3065.07 | 3107.10 | 3099.61 | 3148.63 | 3161.87 | 2710.41 | 2657.26 | 2664.38 | 2562.48 | 2564.98 | 2559.92 | 1098.34 | 596.64 | 510.02 | 477.70 | 454.60 | 418.03 | 369.16 | 356.12 | 330.94 | 302.85 | 279.14 | 264.47 | 250.59 | 232.24 | 219.79 | 211.96 | 202.92 | 165.28 | 158.77 | 152.74 | 65.77 | NA | 55.09 | NA | NA | NA | |
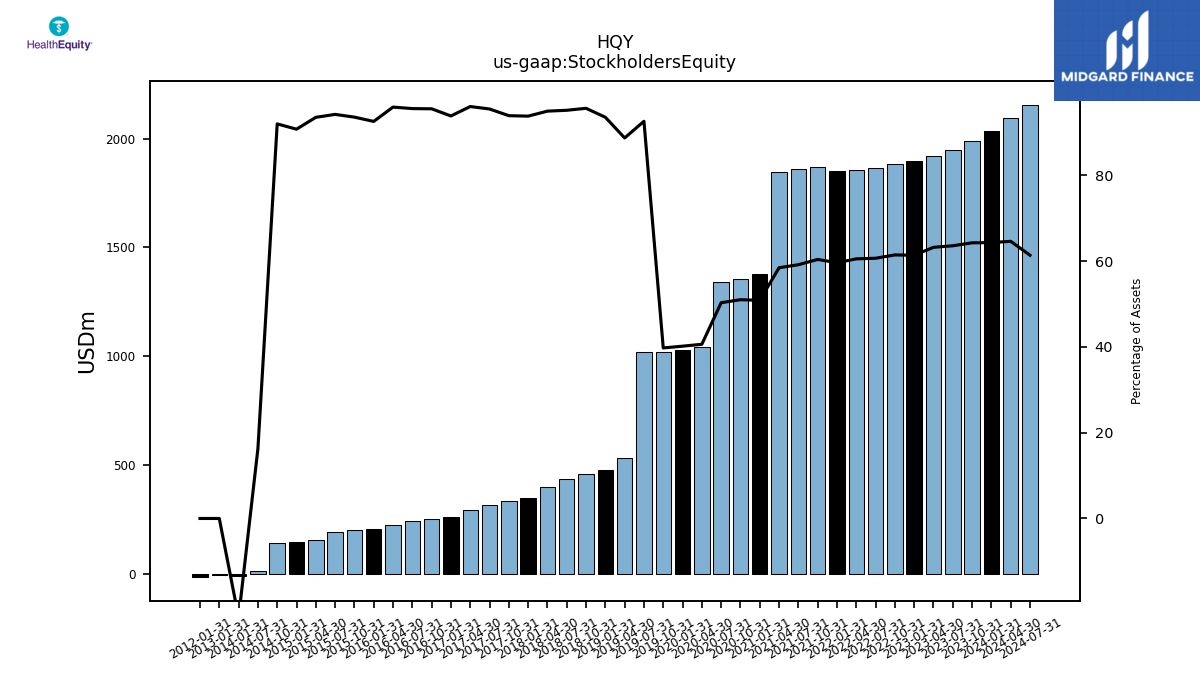
| Stockholders Equity | 2035.02 | 1987.97 | 1949.61 | 1918.59 | 1895.64 | 1883.12 | 1864.90 | 1855.26 | 1852.58 | 1871.85 | 1862.67 | 1848.27 | 1378.73 | 1355.26 | 1340.34 | 1040.65 | 1030.30 | 1017.76 | 1017.03 | 529.30 | 477.08 | 456.80 | 432.62 | 396.97 | 346.27 | 334.41 | 315.93 | 290.84 | 261.94 | 252.59 | 239.46 | 222.74 | 203.46 | 198.32 | 191.16 | 154.57 | 144.09 | 140.50 | 10.68 | NA | -12.71 | NA | NA | NA |
| 2024-01-31 | 2023-10-31 | 2023-07-31 | 2023-04-30 | 2023-01-31 | 2022-10-31 | 2022-07-31 | 2022-04-30 | 2022-01-31 | 2021-10-31 | 2021-07-31 | 2021-04-30 | 2021-01-31 | 2020-10-31 | 2020-07-31 | 2020-04-30 | 2020-01-31 | 2019-10-31 | 2019-07-31 | 2019-04-30 | 2019-01-31 | 2018-10-31 | 2018-07-31 | 2018-04-30 | 2018-01-31 | 2017-10-31 | 2017-07-31 | 2017-04-30 | 2017-01-31 | 2016-10-31 | 2016-07-31 | 2016-04-30 | 2016-01-31 | 2015-10-31 | 2015-07-31 | 2015-04-30 | 2015-01-31 | 2014-10-31 | 2014-07-31 | 2014-04-30 | 2014-01-31 | 2013-10-31 | 2013-07-31 | 2013-04-30 | ||
|---|---|---|---|---|---|---|---|---|---|---|---|---|---|---|---|---|---|---|---|---|---|---|---|---|---|---|---|---|---|---|---|---|---|---|---|---|---|---|---|---|---|---|---|---|---|
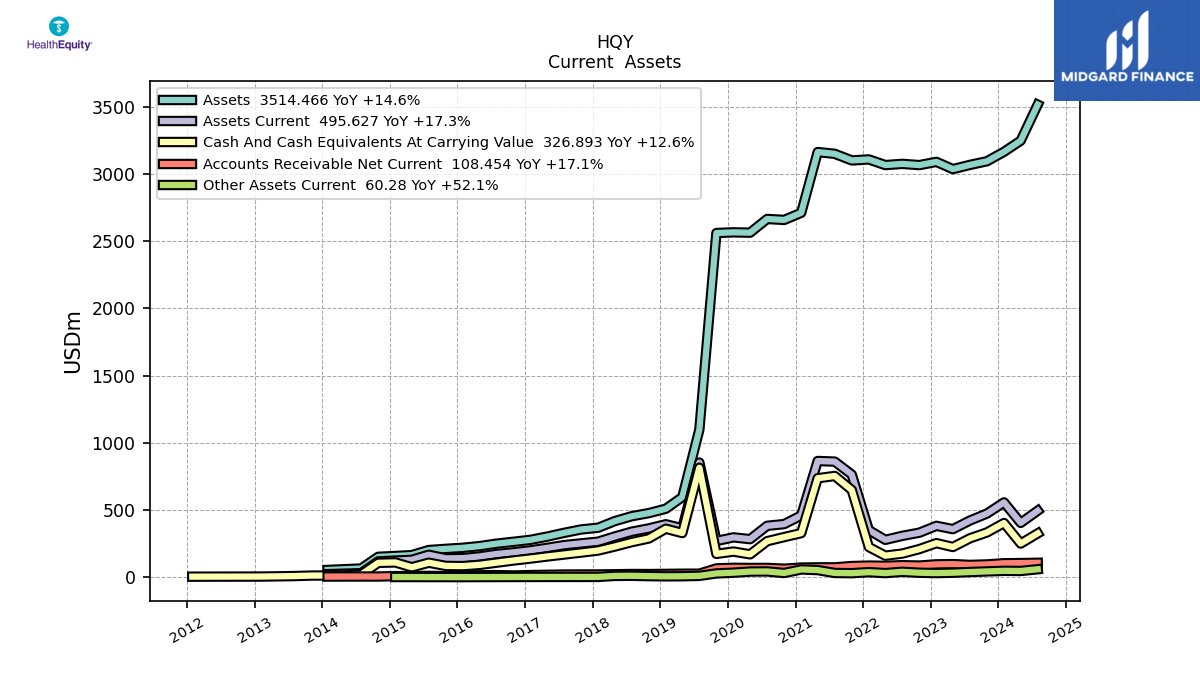
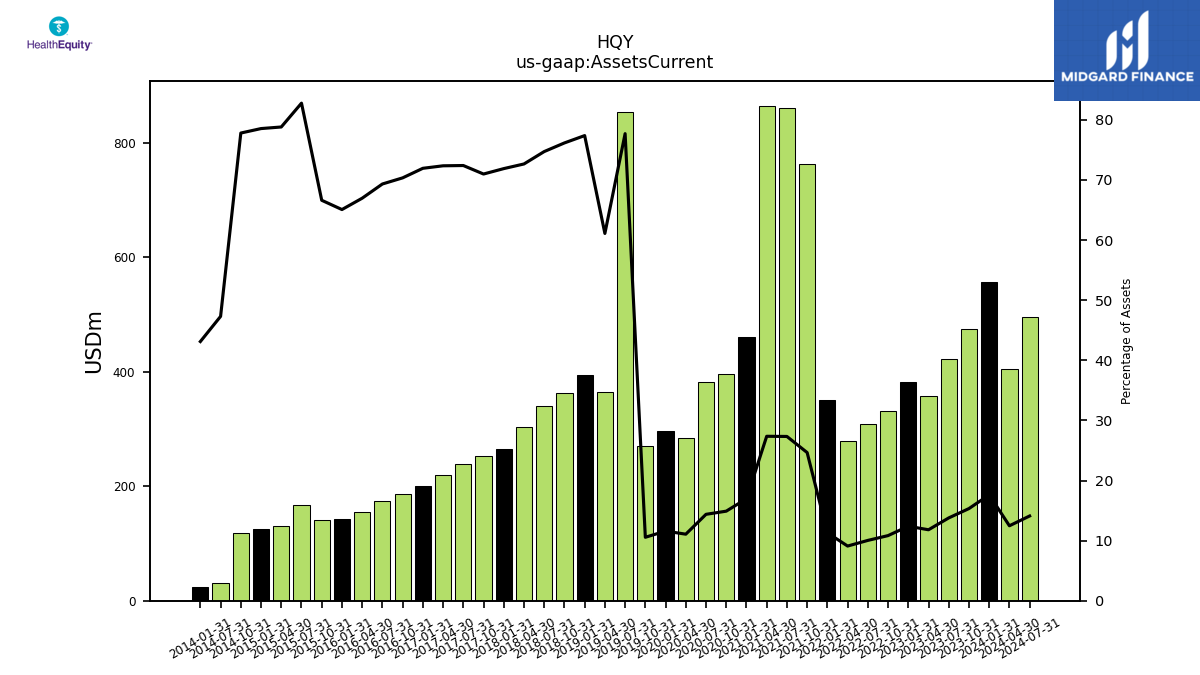
| Assets Current | 557.44 | 474.41 | 422.56 | 358.41 | 382.89 | 332.16 | 308.59 | 278.92 | 351.34 | 764.13 | 860.61 | 865.11 | 460.18 | 396.03 | 383.13 | 283.78 | 297.30 | 270.32 | 853.52 | 364.58 | 394.68 | 363.84 | 339.71 | 303.76 | 265.40 | 252.81 | 239.62 | 219.14 | 200.82 | 186.06 | 173.74 | 155.53 | 143.05 | 141.22 | 167.98 | 130.27 | 124.72 | 118.84 | 31.11 | NA | 23.76 | NA | NA | NA | |
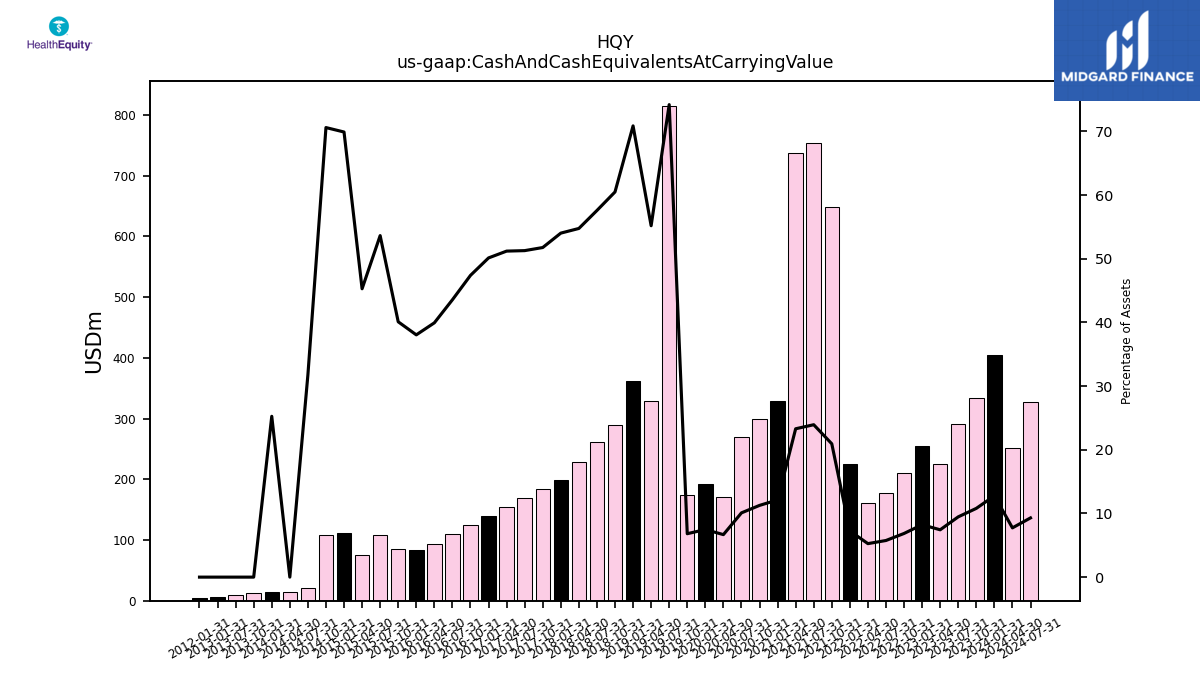
| Cash And Cash Equivalents At Carrying Value | 403.98 | 334.06 | 290.35 | 225.64 | 254.27 | 210.20 | 176.89 | 161.25 | 225.41 | 649.13 | 753.75 | 736.77 | 328.80 | 299.36 | 268.91 | 171.09 | 191.73 | 174.56 | 815.16 | 329.31 | 361.50 | 289.01 | 261.81 | 228.94 | 199.47 | 184.37 | 169.72 | 155.09 | 139.95 | 125.35 | 109.17 | 92.77 | 83.64 | 85.01 | 108.85 | 74.86 | 111.00 | 107.85 | 20.89 | 13.99 | 13.92 | 13.13 | 9.33 | NA | |
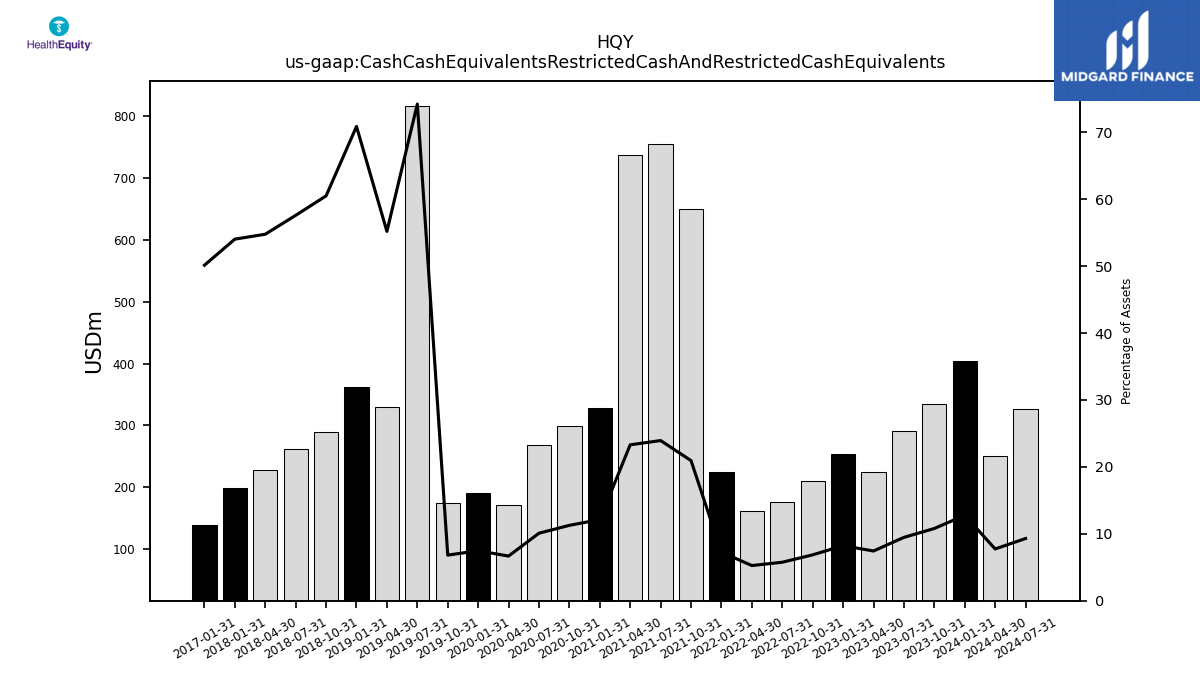
| Cash Cash Equivalents Restricted Cash And Restricted Cash Equivalents | 403.98 | 334.06 | 290.35 | 225.64 | 254.27 | 210.20 | 176.89 | 161.25 | 225.41 | 649.13 | 753.75 | 736.77 | 328.80 | 299.36 | 268.91 | 171.09 | 191.73 | 174.56 | 815.16 | 329.31 | 361.48 | 289.01 | 261.81 | 228.94 | 199.47 | NA | NA | NA | 139.95 | NA | NA | NA | NA | NA | NA | NA | NA | NA | NA | NA | NA | NA | NA | NA | |
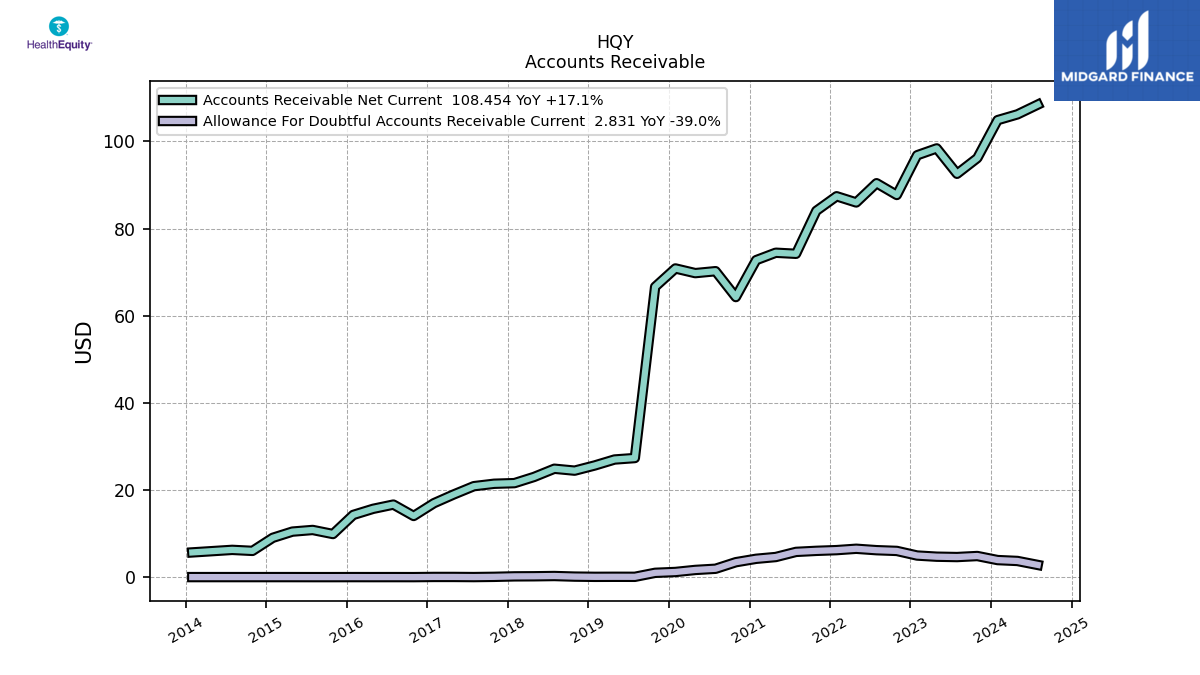
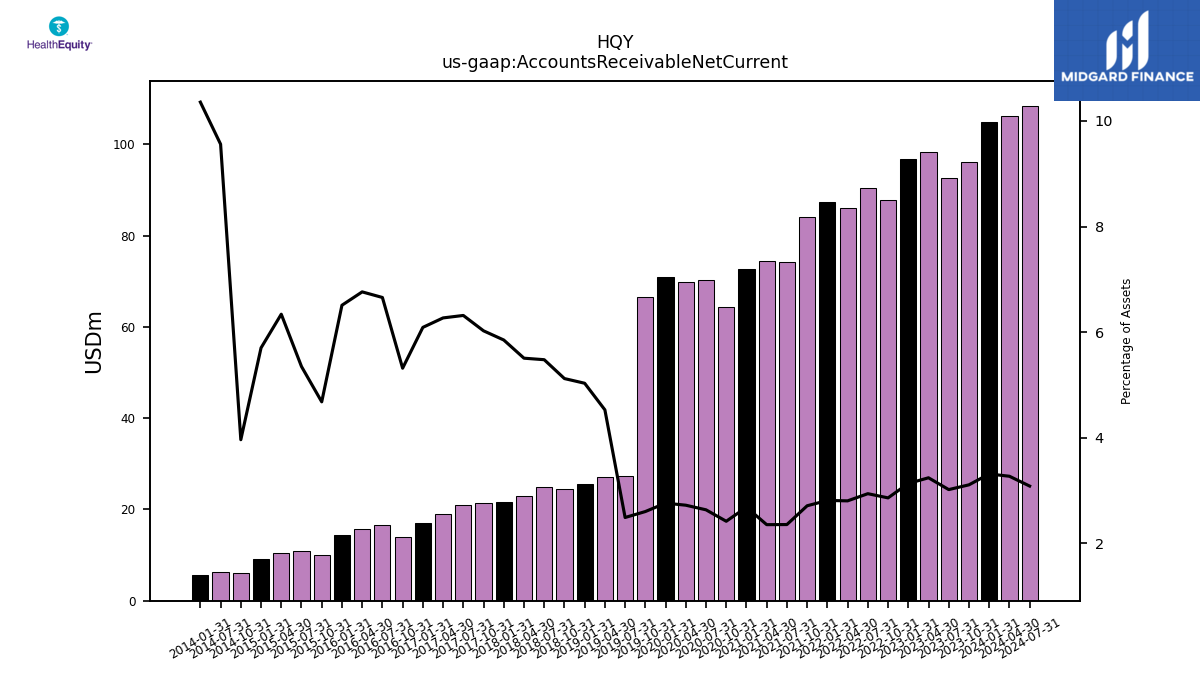
| Accounts Receivable Net Current | 104.89 | 96.18 | 92.58 | 98.41 | 96.83 | 87.72 | 90.43 | 86.00 | 87.43 | 84.08 | 74.22 | 74.47 | 72.77 | 64.29 | 70.23 | 69.79 | 70.86 | 66.65 | 27.36 | 27.02 | 25.67 | 24.46 | 24.91 | 23.02 | 21.60 | 21.46 | 20.90 | 18.99 | 17.00 | 14.06 | 16.68 | 15.71 | 14.31 | 9.92 | 10.86 | 10.48 | 9.05 | 6.05 | 6.29 | NA | 5.71 | NA | NA | NA | |
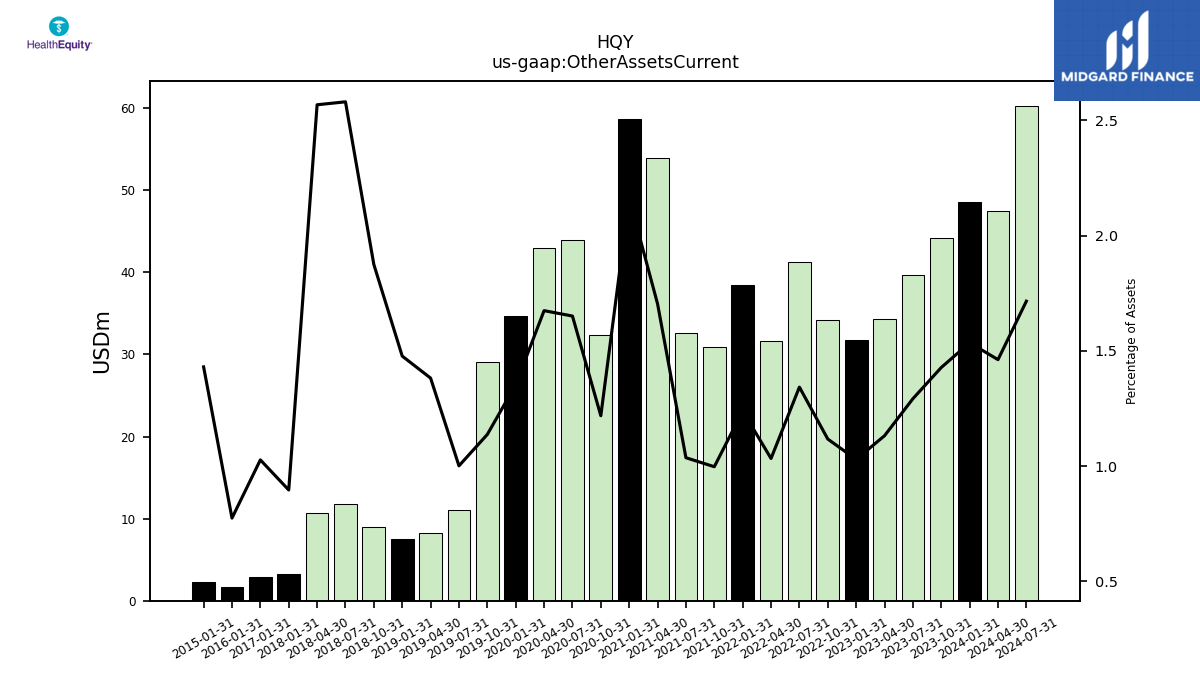
| Other Assets Current | 48.56 | 44.17 | 39.63 | 34.35 | 31.79 | 34.25 | 41.27 | 31.67 | 38.49 | 30.92 | 32.64 | 53.87 | 58.61 | 32.38 | 43.98 | 42.90 | 34.71 | 29.12 | 11.00 | 8.24 | 7.53 | 8.95 | 11.73 | 10.73 | 3.31 | NA | NA | NA | 2.87 | NA | NA | NA | 1.70 | NA | NA | NA | 2.27 | NA | NA | NA | NA | NA | NA | NA |
| 2024-01-31 | 2023-10-31 | 2023-07-31 | 2023-04-30 | 2023-01-31 | 2022-10-31 | 2022-07-31 | 2022-04-30 | 2022-01-31 | 2021-10-31 | 2021-07-31 | 2021-04-30 | 2021-01-31 | 2020-10-31 | 2020-07-31 | 2020-04-30 | 2020-01-31 | 2019-10-31 | 2019-07-31 | 2019-04-30 | 2019-01-31 | 2018-10-31 | 2018-07-31 | 2018-04-30 | 2018-01-31 | 2017-10-31 | 2017-07-31 | 2017-04-30 | 2017-01-31 | 2016-10-31 | 2016-07-31 | 2016-04-30 | 2016-01-31 | 2015-10-31 | 2015-07-31 | 2015-04-30 | 2015-01-31 | 2014-10-31 | 2014-07-31 | 2014-04-30 | 2014-01-31 | 2013-10-31 | 2013-07-31 | 2013-04-30 | ||
|---|---|---|---|---|---|---|---|---|---|---|---|---|---|---|---|---|---|---|---|---|---|---|---|---|---|---|---|---|---|---|---|---|---|---|---|---|---|---|---|---|---|---|---|---|---|
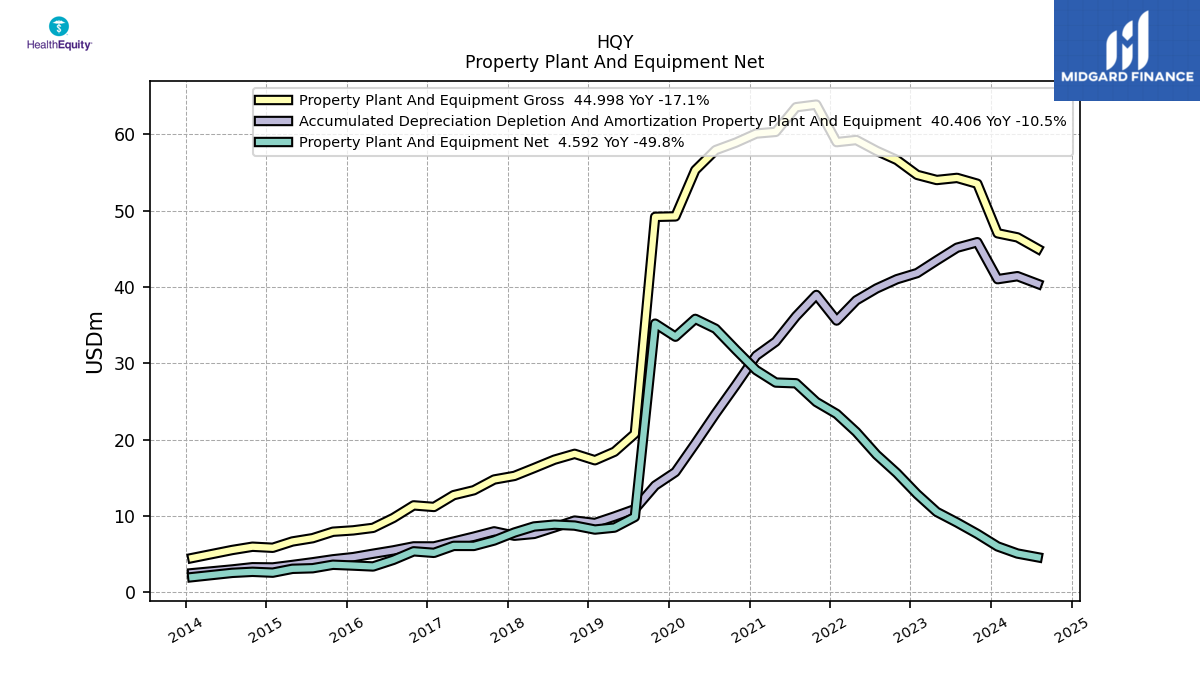
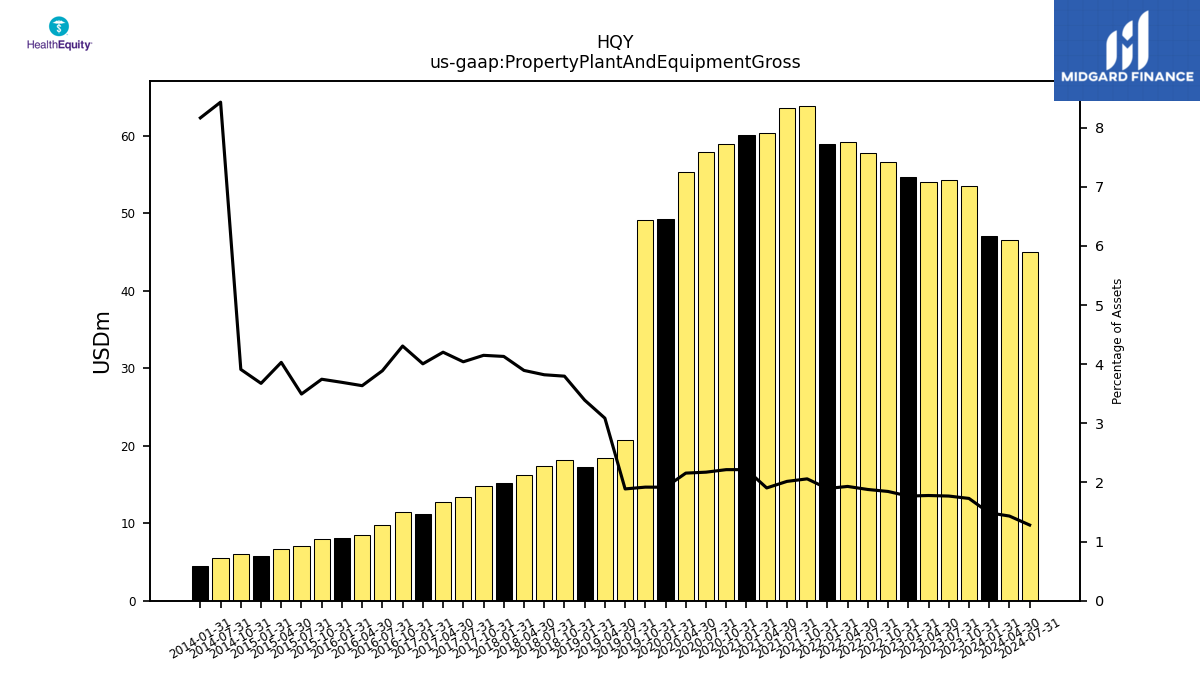
| Property Plant And Equipment Gross | 47.03 | 53.52 | 54.29 | 54.01 | 54.68 | 56.63 | 57.83 | 59.25 | 58.97 | 63.88 | 63.55 | 60.31 | 60.09 | 58.91 | 57.93 | 55.30 | 49.24 | 49.18 | 20.77 | 18.42 | 17.30 | 18.14 | 17.37 | 16.28 | 15.25 | 14.78 | 13.37 | 12.73 | 11.18 | 11.39 | 9.75 | 8.45 | 8.12 | 7.94 | 7.09 | 6.66 | 5.84 | 5.97 | 5.54 | NA | 4.50 | NA | NA | NA | |
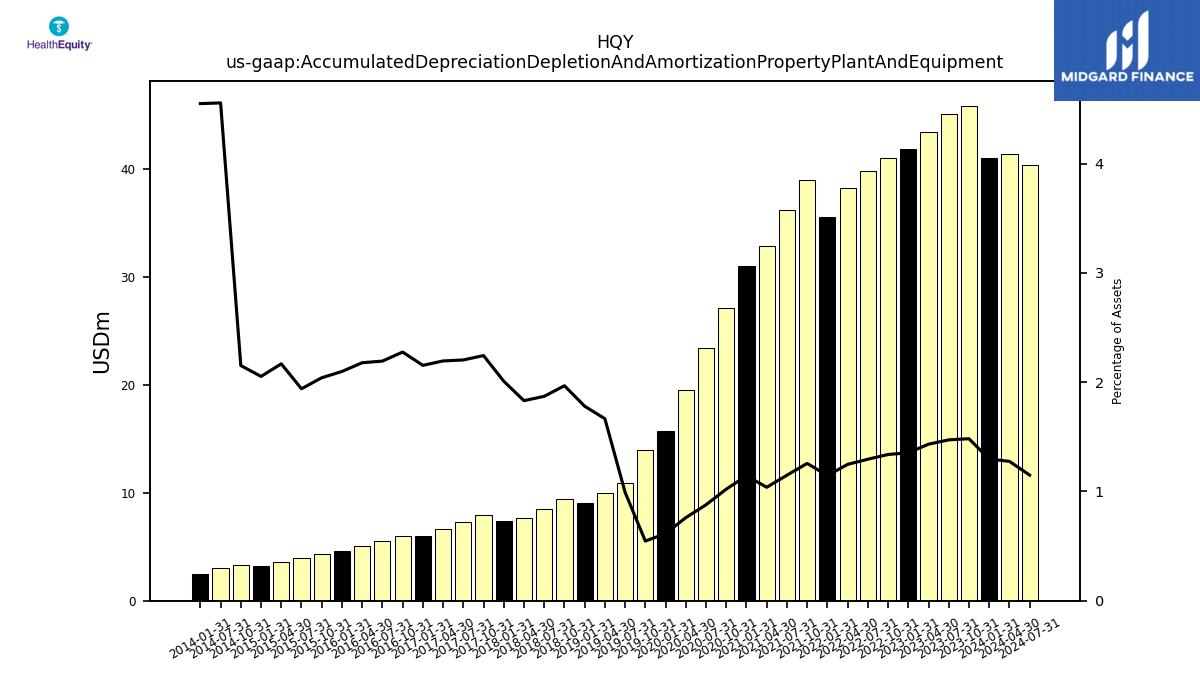
| Accumulated Depreciation Depletion And Amortization Property Plant And Equipment | 41.02 | 45.86 | 45.14 | 43.48 | 41.82 | 41.02 | 39.81 | 38.25 | 35.60 | 38.95 | 36.16 | 32.84 | 30.99 | 27.13 | 23.40 | 19.48 | 15.76 | 13.98 | 10.89 | 9.94 | 9.08 | 9.40 | 8.50 | 7.65 | 7.42 | 7.99 | 7.29 | 6.64 | 6.01 | 6.02 | 5.50 | 5.06 | 4.61 | 4.33 | 3.94 | 3.58 | 3.26 | 3.29 | 3.00 | NA | 2.51 | NA | NA | NA | |
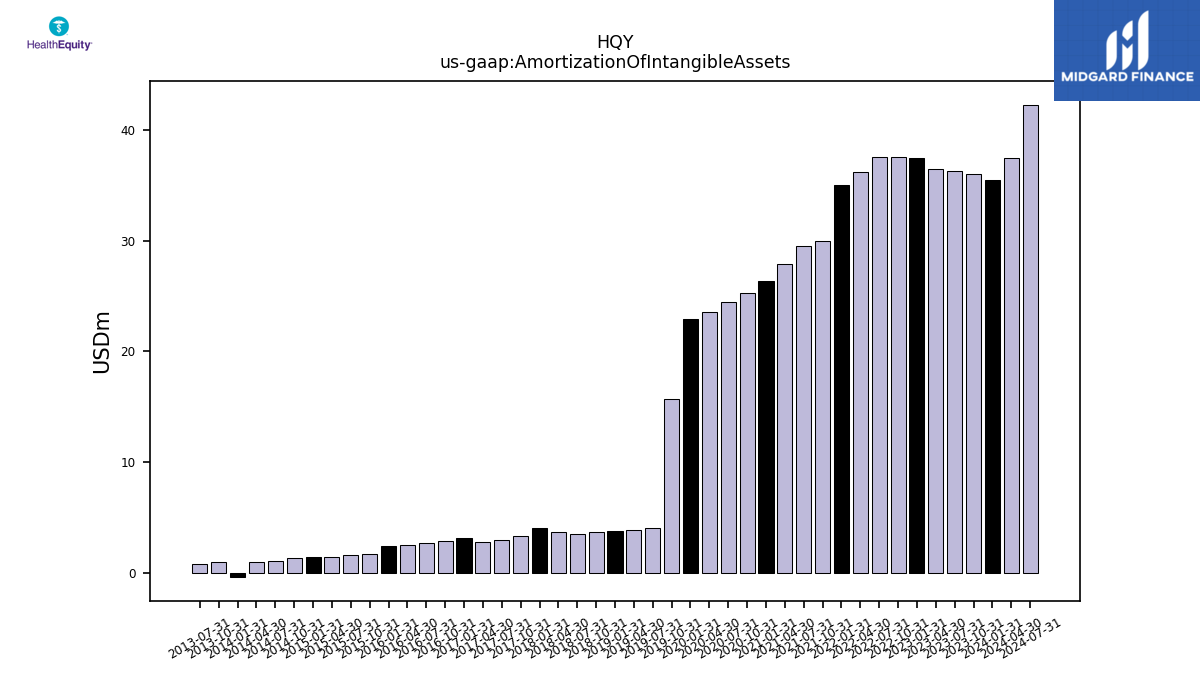
| Amortization Of Intangible Assets | 35.50 | 36.00 | 36.30 | 36.50 | 37.50 | 37.60 | 37.60 | 36.20 | 35.00 | 30.00 | 29.50 | 27.90 | 26.40 | 25.30 | 24.50 | 23.60 | 22.90 | 15.70 | 4.00 | 3.90 | 3.80 | 3.70 | 3.50 | 3.70 | 4.00 | 3.30 | 3.00 | 2.80 | 3.10 | 2.90 | 2.70 | 2.50 | 2.40 | 1.70 | 1.60 | 1.40 | 1.40 | 1.30 | 1.10 | 1.00 | -0.40 | 0.94 | 0.82 | NA | |
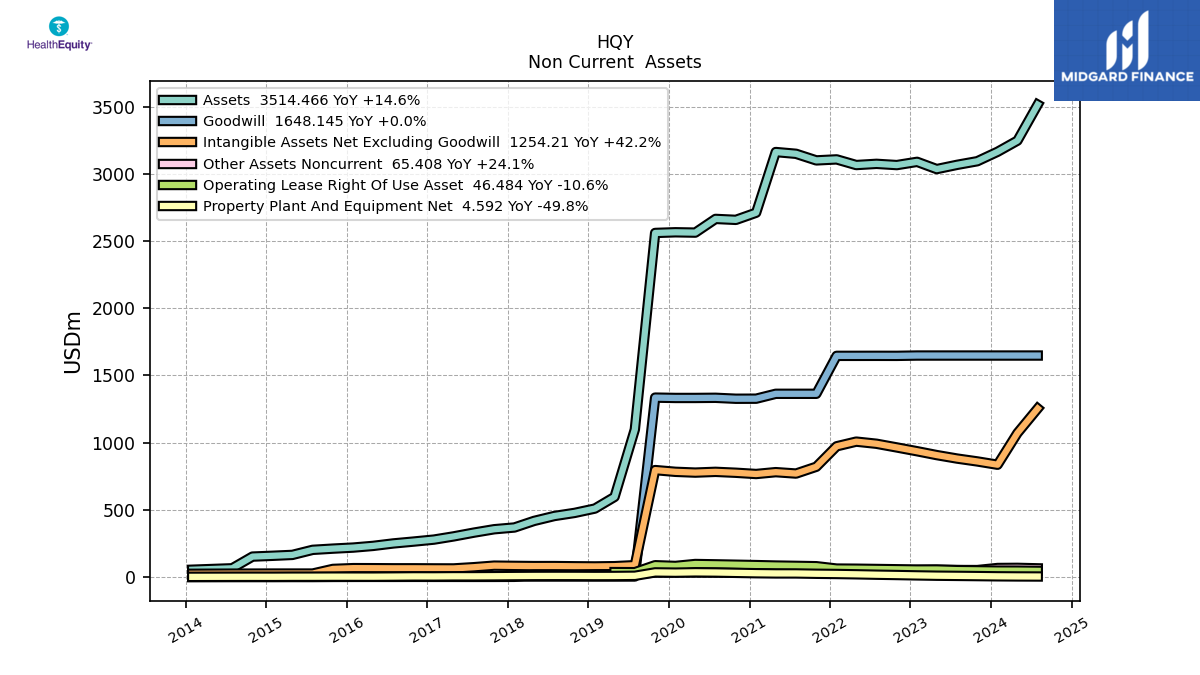
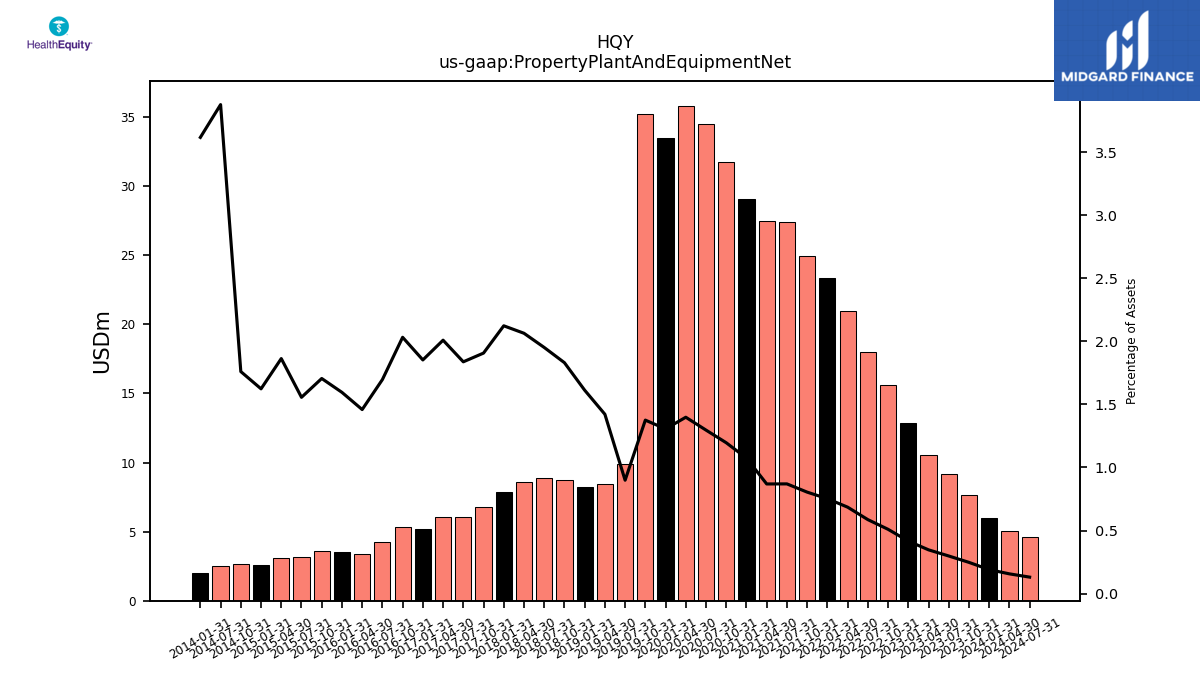
| Property Plant And Equipment Net | 6.01 | 7.66 | 9.14 | 10.53 | 12.86 | 15.62 | 18.03 | 21.00 | 23.37 | 24.93 | 27.38 | 27.48 | 29.11 | 31.77 | 34.53 | 35.82 | 33.49 | 35.20 | 9.87 | 8.48 | 8.22 | 8.74 | 8.87 | 8.63 | 7.84 | 6.79 | 6.08 | 6.08 | 5.17 | 5.37 | 4.25 | 3.39 | 3.51 | 3.61 | 3.16 | 3.08 | 2.58 | 2.69 | 2.55 | NA | 1.99 | NA | NA | NA | |
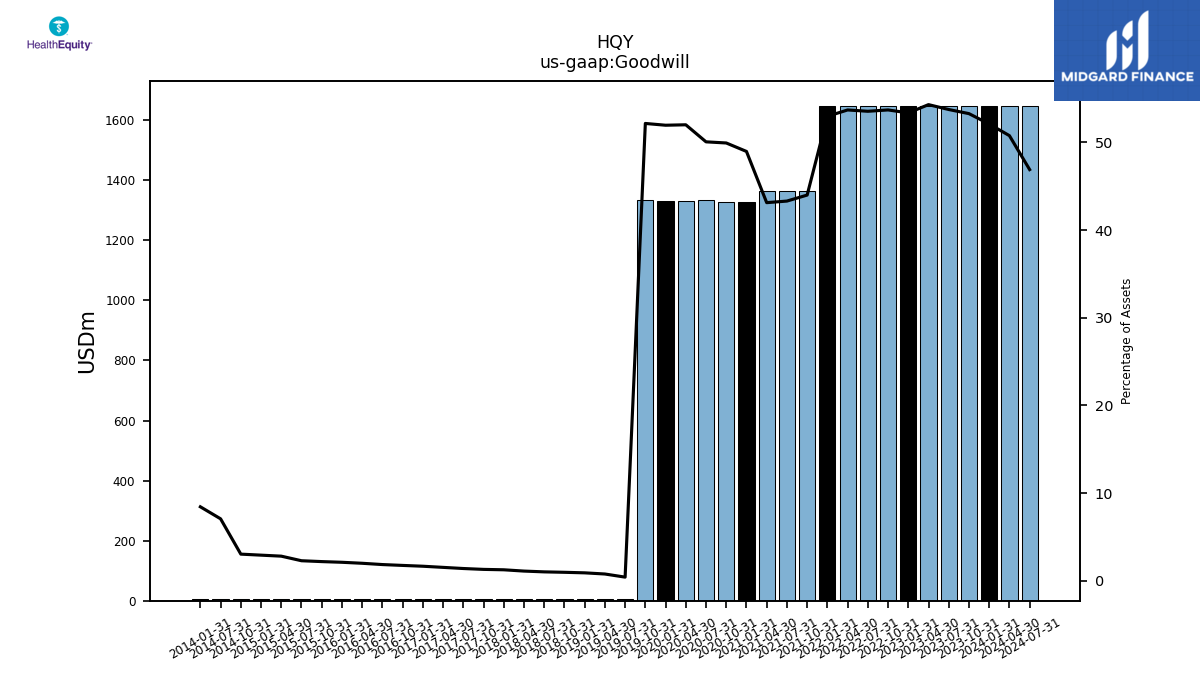
| Goodwill | 1648.14 | 1648.14 | 1648.14 | 1648.14 | 1648.14 | 1645.76 | 1646.00 | 1645.84 | 1645.84 | 1363.55 | 1363.57 | 1363.57 | 1327.19 | 1326.79 | 1333.81 | 1332.63 | 1332.63 | 1335.19 | 4.65 | 4.65 | 4.65 | 4.65 | 4.65 | 4.65 | 4.65 | 4.65 | 4.65 | 4.65 | 4.65 | 4.65 | 4.65 | 4.65 | 4.65 | 4.65 | 4.65 | 4.65 | 4.65 | 4.65 | 4.65 | NA | 4.65 | NA | NA | NA | |
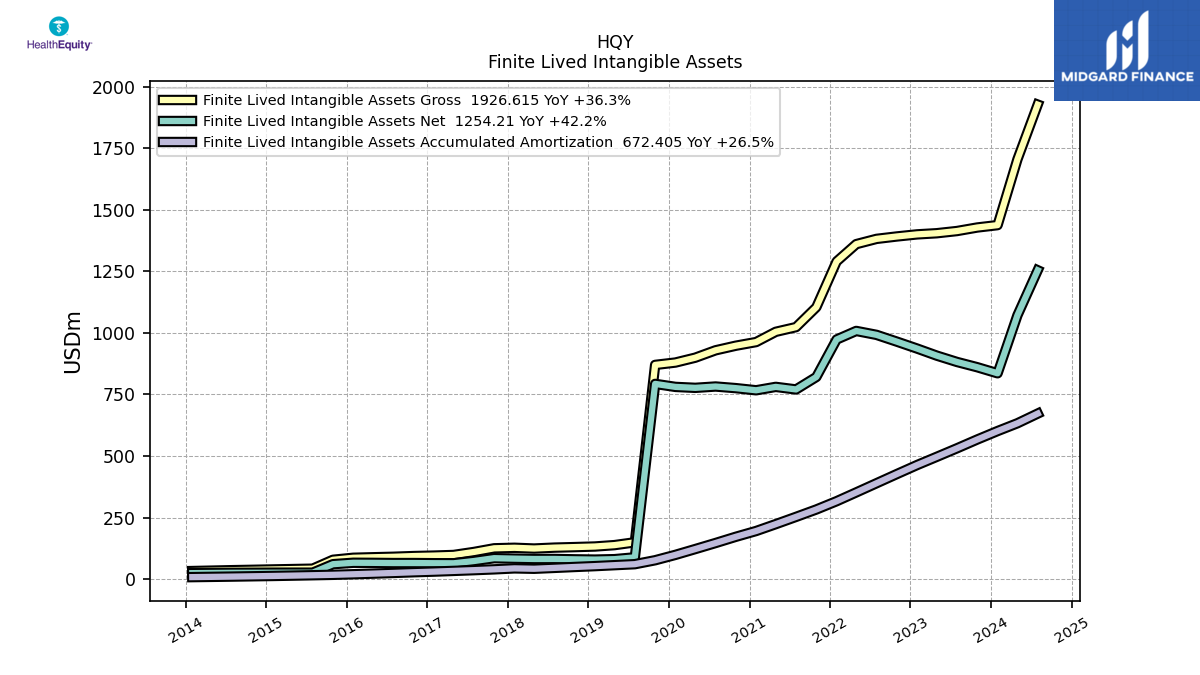
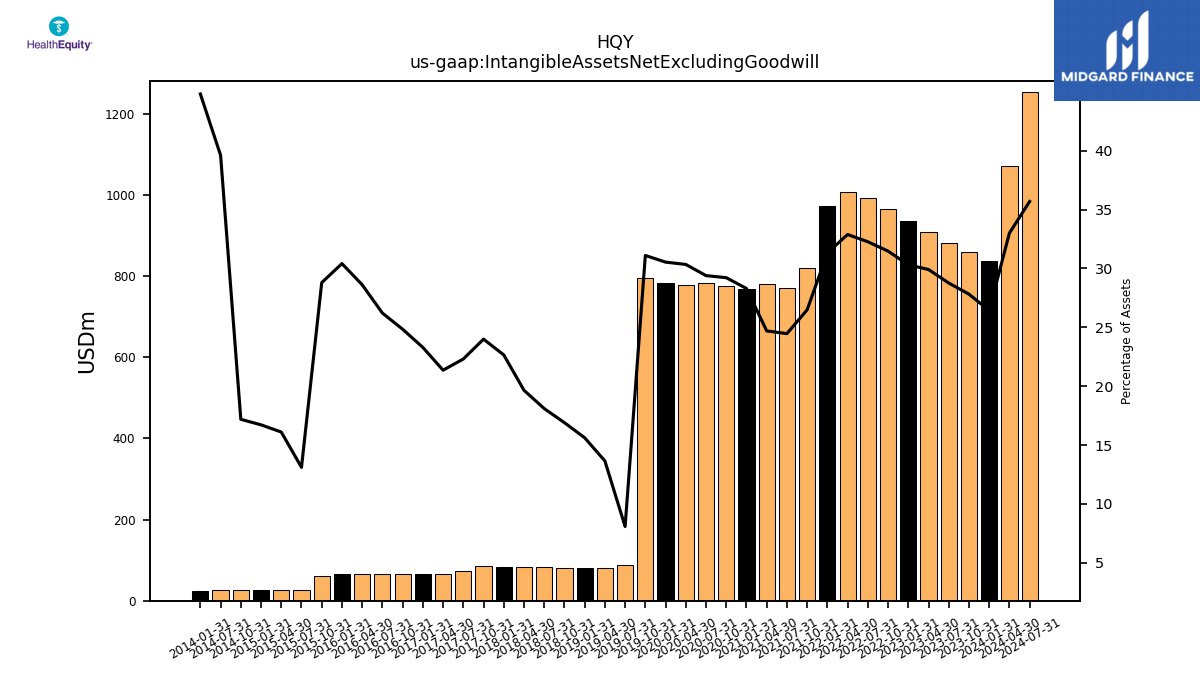
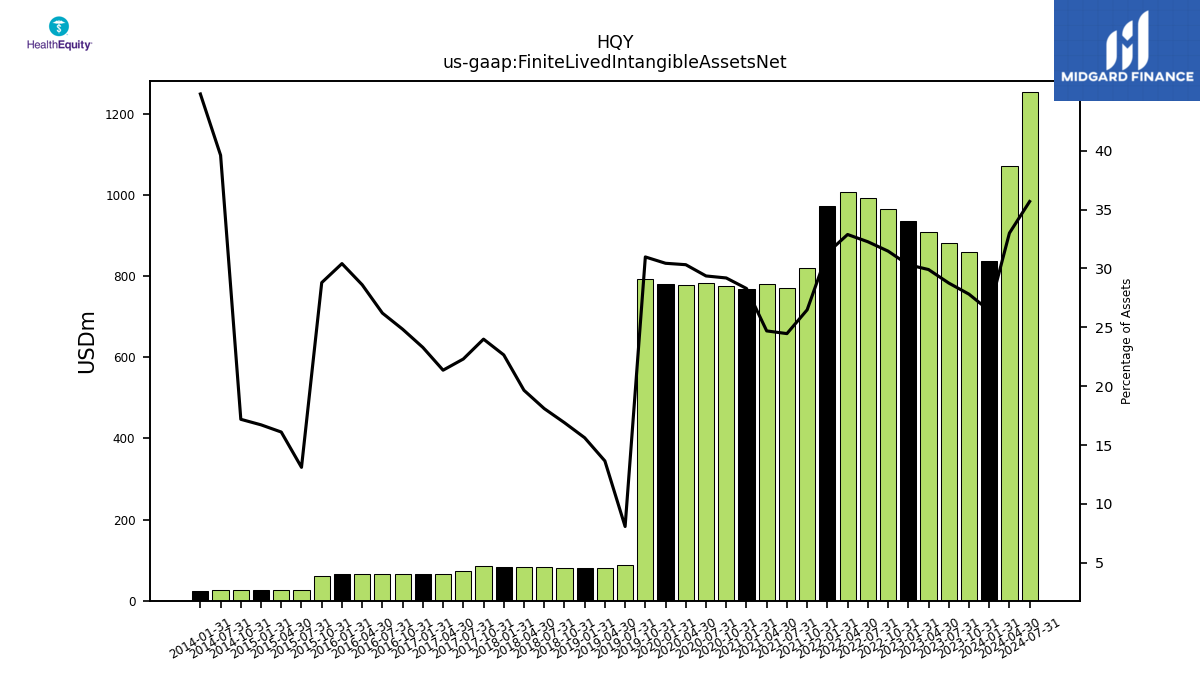
| Intangible Assets Net Excluding Goodwill | 835.95 | 860.51 | 881.94 | 907.70 | 936.36 | 964.53 | 991.95 | 1007.86 | 973.14 | 820.95 | 770.33 | 780.79 | 767.00 | 776.31 | 783.11 | 777.48 | 783.28 | 796.23 | 88.77 | 81.44 | 79.67 | 80.73 | 82.28 | 82.15 | 83.64 | 85.45 | 73.83 | 64.68 | 65.02 | 65.69 | 65.67 | 66.45 | 66.84 | 61.04 | 26.60 | 26.62 | 26.54 | 26.25 | 26.05 | NA | 24.69 | NA | NA | NA | |
| Finite Lived Intangible Assets Net | 835.95 | 860.51 | 881.94 | 907.70 | 936.36 | 964.53 | 991.95 | 1007.86 | 973.14 | 820.95 | 770.33 | 780.79 | 767.00 | 775.70 | 782.32 | 776.89 | 780.75 | 792.99 | 88.77 | 81.44 | 79.67 | 80.73 | 82.28 | 82.15 | 83.64 | 85.45 | 73.83 | 64.68 | 65.02 | 65.69 | 65.67 | 66.45 | 66.84 | 61.04 | 26.60 | 26.62 | 26.54 | 26.25 | 26.05 | NA | 24.69 | NA | NA | NA | |
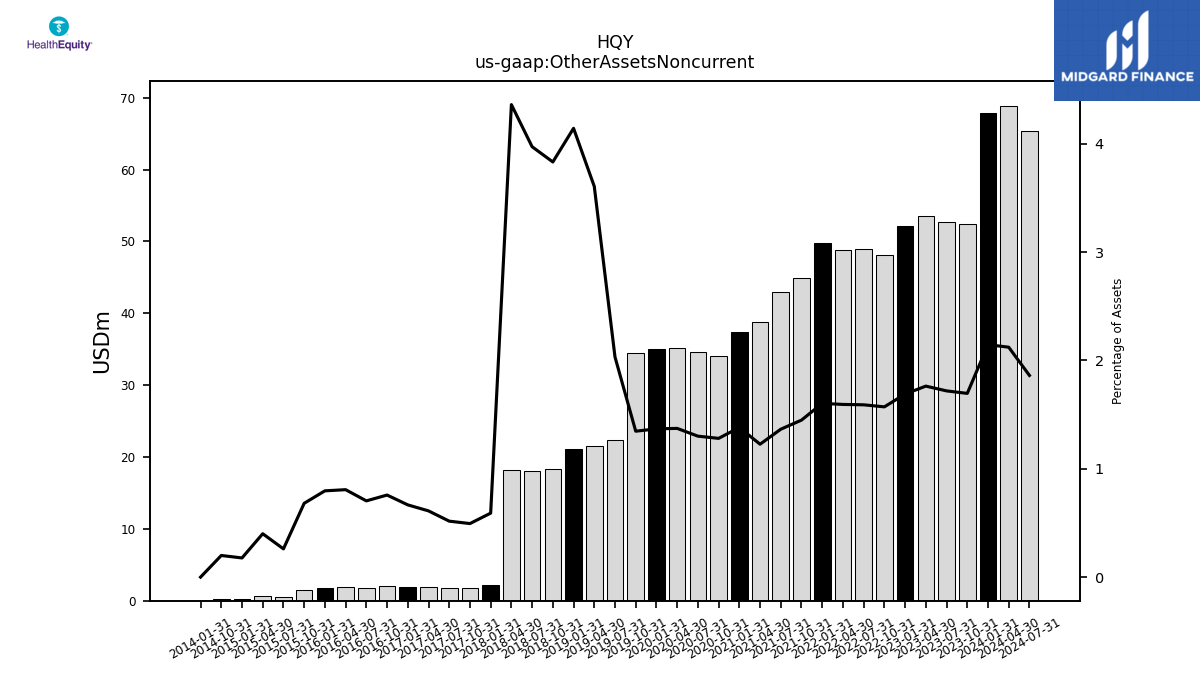
| Other Assets Noncurrent | 67.87 | 52.45 | 52.70 | 53.49 | 52.18 | 48.15 | 48.88 | 48.84 | 49.81 | 44.91 | 42.97 | 38.78 | 37.42 | 34.02 | 34.66 | 35.17 | 35.09 | 34.47 | 22.31 | 21.51 | 21.12 | 18.30 | 18.05 | 18.23 | 2.18 | 1.76 | 1.71 | 1.85 | 1.86 | 2.00 | 1.76 | 1.87 | 1.75 | 1.44 | 0.53 | 0.66 | 0.28 | 0.30 | NA | NA | 0.00 | NA | NA | NA |
| 2024-01-31 | 2023-10-31 | 2023-07-31 | 2023-04-30 | 2023-01-31 | 2022-10-31 | 2022-07-31 | 2022-04-30 | 2022-01-31 | 2021-10-31 | 2021-07-31 | 2021-04-30 | 2021-01-31 | 2020-10-31 | 2020-07-31 | 2020-04-30 | 2020-01-31 | 2019-10-31 | 2019-07-31 | 2019-04-30 | 2019-01-31 | 2018-10-31 | 2018-07-31 | 2018-04-30 | 2018-01-31 | 2017-10-31 | 2017-07-31 | 2017-04-30 | 2017-01-31 | 2016-10-31 | 2016-07-31 | 2016-04-30 | 2016-01-31 | 2015-10-31 | 2015-07-31 | 2015-04-30 | 2015-01-31 | 2014-10-31 | 2014-07-31 | 2014-04-30 | 2014-01-31 | 2013-10-31 | 2013-07-31 | 2013-04-30 | ||
|---|---|---|---|---|---|---|---|---|---|---|---|---|---|---|---|---|---|---|---|---|---|---|---|---|---|---|---|---|---|---|---|---|---|---|---|---|---|---|---|---|---|---|---|---|---|
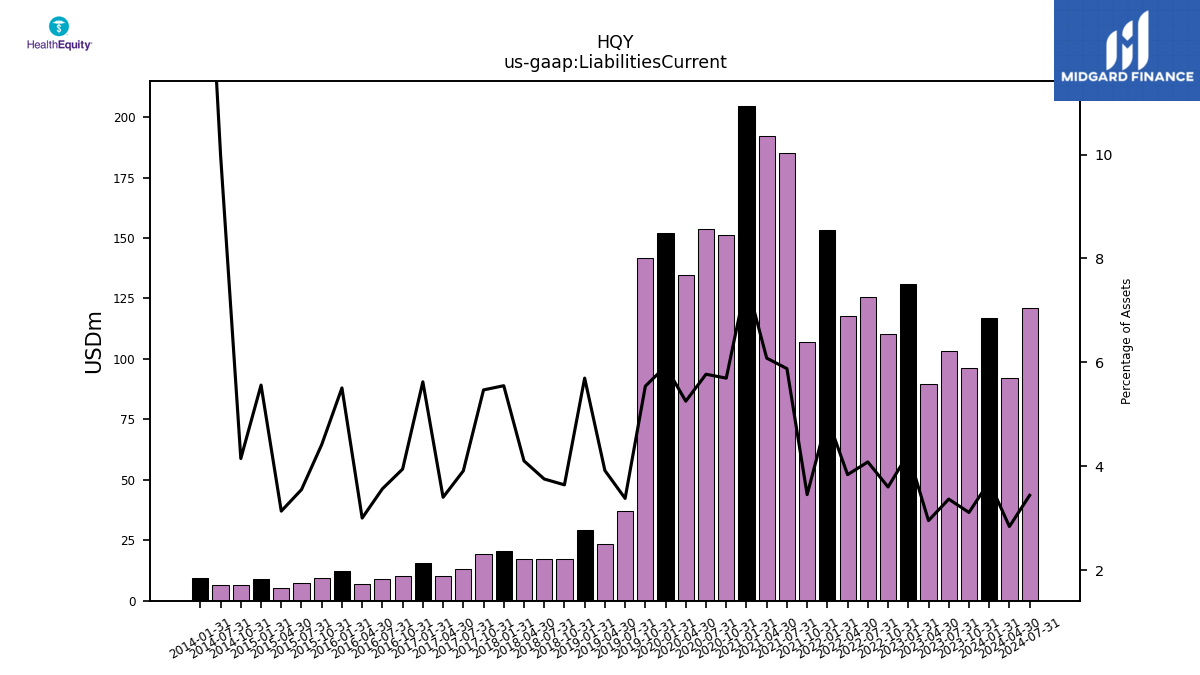
| Liabilities Current | 117.09 | 96.24 | 103.27 | 89.66 | 131.06 | 110.38 | 125.52 | 117.65 | 153.19 | 107.07 | 185.12 | 192.30 | 204.70 | 151.36 | 153.78 | 134.60 | 151.94 | 141.86 | 37.14 | 23.38 | 29.05 | 17.40 | 17.07 | 17.15 | 20.49 | 19.48 | 12.94 | 10.30 | 15.70 | 10.44 | 8.94 | 6.97 | 12.11 | 9.36 | 7.21 | 5.18 | 8.83 | 6.34 | 6.57 | NA | 9.43 | NA | NA | NA | |
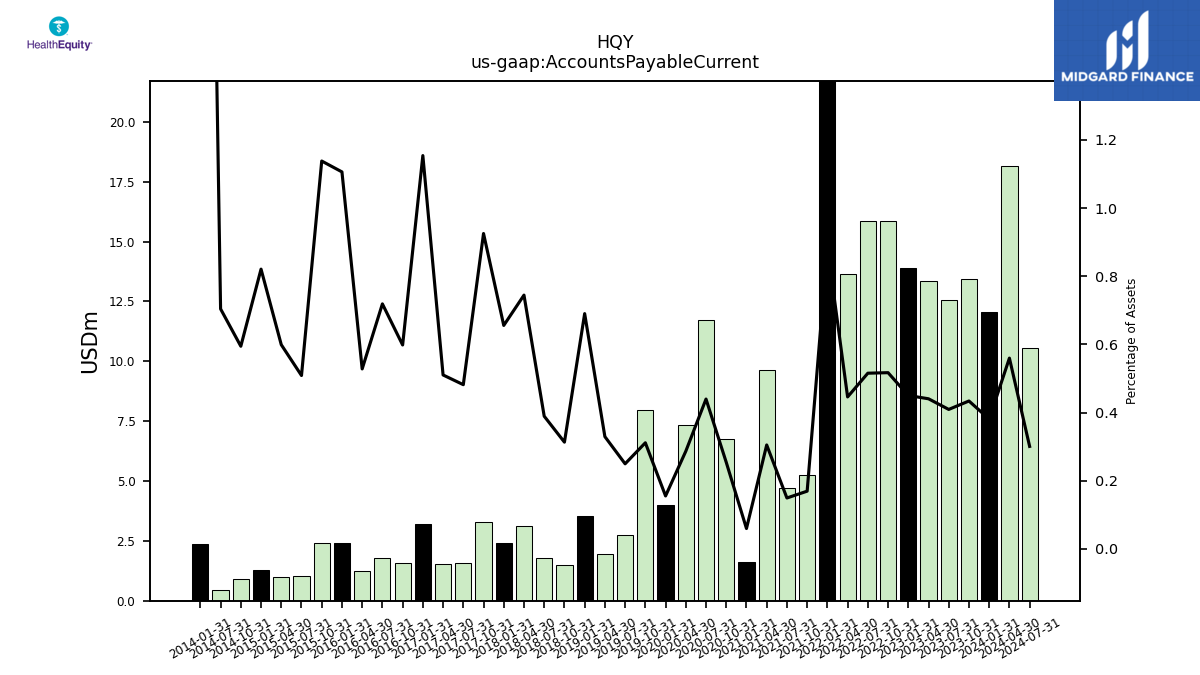
| Accounts Payable Current | 12.04 | 13.42 | 12.54 | 13.36 | 13.90 | 15.84 | 15.84 | 13.66 | 27.54 | 5.24 | 4.70 | 9.64 | 1.61 | 6.75 | 11.71 | 7.34 | 3.98 | 7.97 | 2.74 | 1.96 | 3.52 | 1.50 | 1.77 | 3.11 | 2.42 | 3.29 | 1.59 | 1.54 | 3.22 | 1.58 | 1.80 | 1.23 | 2.43 | 2.41 | 1.03 | 0.99 | 1.30 | 0.91 | 0.46 | NA | 2.37 | NA | NA | NA | |
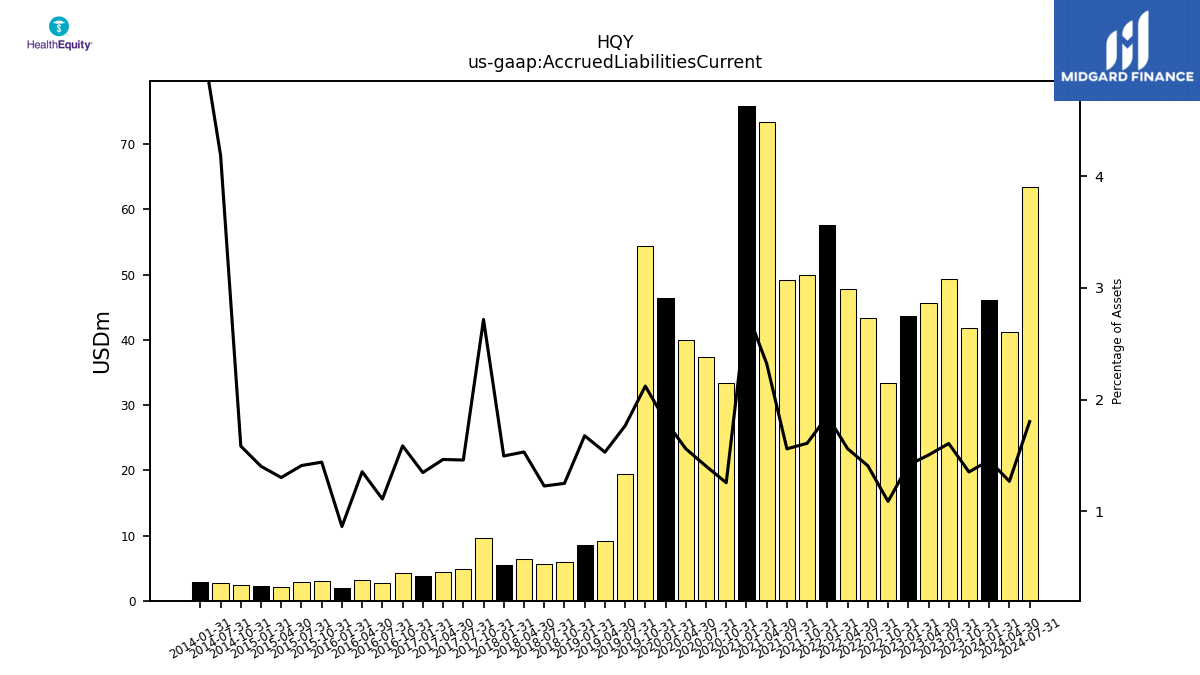
| Accrued Liabilities Current | 46.04 | 41.84 | 49.28 | 45.65 | 43.67 | 33.37 | 43.29 | 47.84 | 57.59 | 49.88 | 49.10 | 73.45 | 75.88 | 33.38 | 37.42 | 39.98 | 46.37 | 54.30 | 19.39 | 9.13 | 8.55 | 5.97 | 5.58 | 6.40 | 5.52 | 9.68 | 4.83 | 4.43 | 3.76 | 4.20 | 2.78 | 3.15 | 1.90 | 3.05 | 2.86 | 2.15 | 2.23 | 2.42 | 2.75 | NA | 2.93 | NA | NA | NA |
| 2024-01-31 | 2023-10-31 | 2023-07-31 | 2023-04-30 | 2023-01-31 | 2022-10-31 | 2022-07-31 | 2022-04-30 | 2022-01-31 | 2021-10-31 | 2021-07-31 | 2021-04-30 | 2021-01-31 | 2020-10-31 | 2020-07-31 | 2020-04-30 | 2020-01-31 | 2019-10-31 | 2019-07-31 | 2019-04-30 | 2019-01-31 | 2018-10-31 | 2018-07-31 | 2018-04-30 | 2018-01-31 | 2017-10-31 | 2017-07-31 | 2017-04-30 | 2017-01-31 | 2016-10-31 | 2016-07-31 | 2016-04-30 | 2016-01-31 | 2015-10-31 | 2015-07-31 | 2015-04-30 | 2015-01-31 | 2014-10-31 | 2014-07-31 | 2014-04-30 | 2014-01-31 | 2013-10-31 | 2013-07-31 | 2013-04-30 | ||
|---|---|---|---|---|---|---|---|---|---|---|---|---|---|---|---|---|---|---|---|---|---|---|---|---|---|---|---|---|---|---|---|---|---|---|---|---|---|---|---|---|---|---|---|---|---|
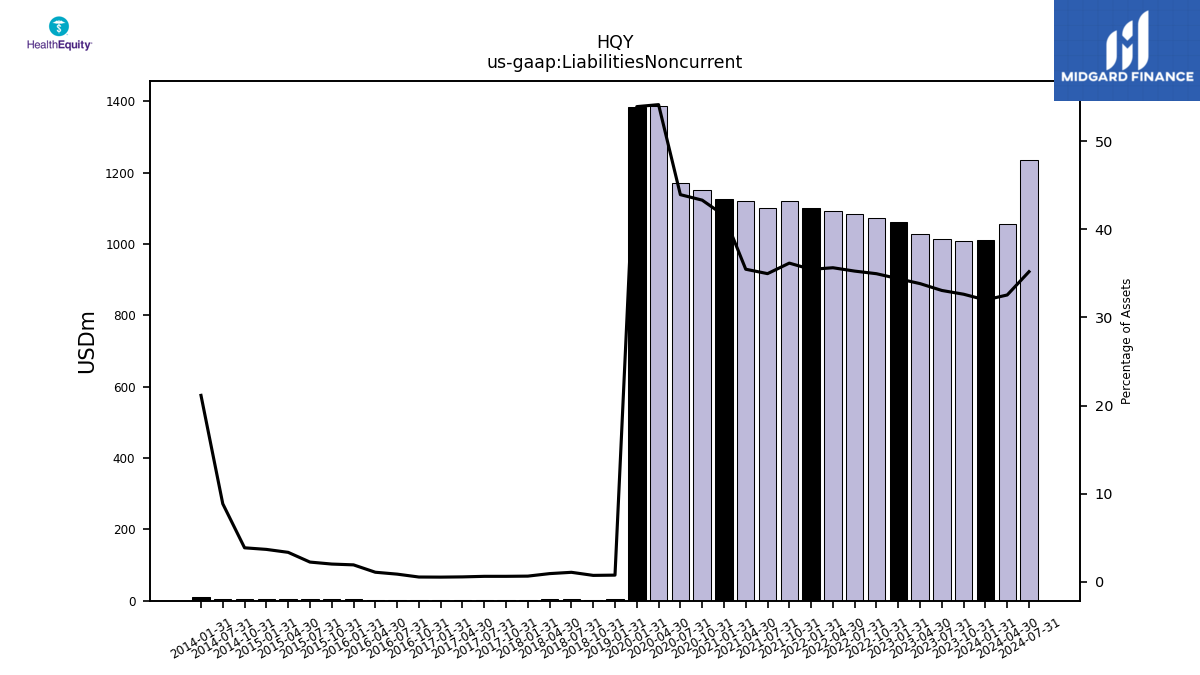
| Liabilities Noncurrent | 1011.68 | 1009.30 | 1013.57 | 1026.76 | 1062.20 | 1071.26 | 1083.61 | 1092.15 | 1101.34 | 1120.69 | 1100.84 | 1121.30 | 1126.98 | 1150.65 | 1170.27 | 1387.22 | 1382.75 | NA | NA | NA | 3.88 | 3.50 | 4.91 | 3.90 | 2.40 | 2.23 | 2.07 | 1.70 | 1.49 | 1.44 | 2.19 | 2.53 | 4.23 | 4.28 | 4.55 | 5.53 | 5.84 | 5.90 | 5.82 | NA | 11.65 | NA | NA | NA | |
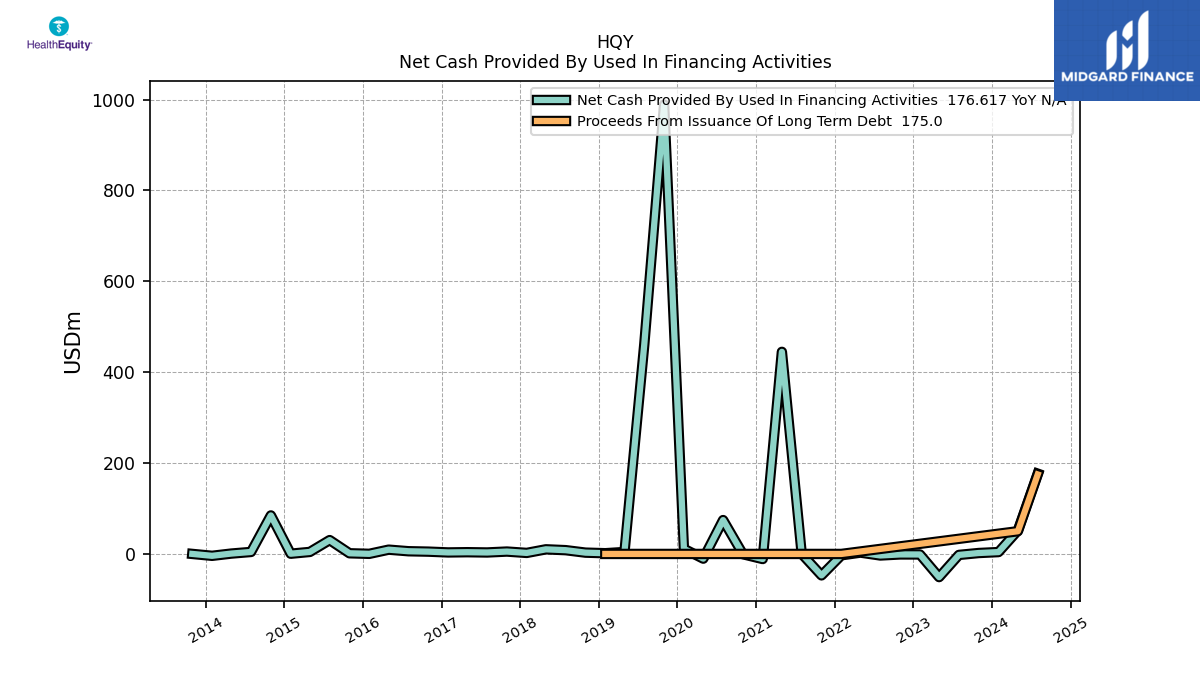
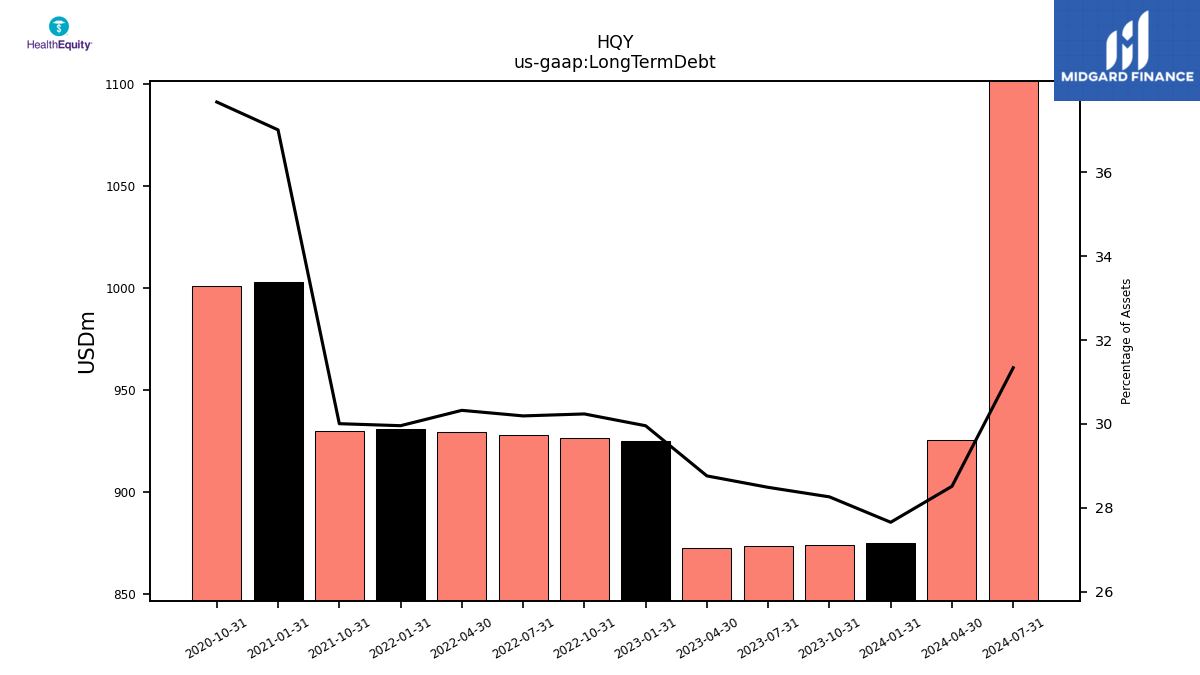
| Long Term Debt | 874.97 | 874.27 | 873.58 | 872.90 | 925.34 | 926.72 | 928.09 | 929.45 | 930.83 | 930.06 | NA | NA | 1003.12 | 1001.10 | NA | NA | NA | NA | NA | NA | NA | NA | NA | NA | NA | NA | NA | NA | NA | NA | NA | NA | NA | NA | NA | NA | NA | NA | NA | NA | NA | NA | NA | NA | |
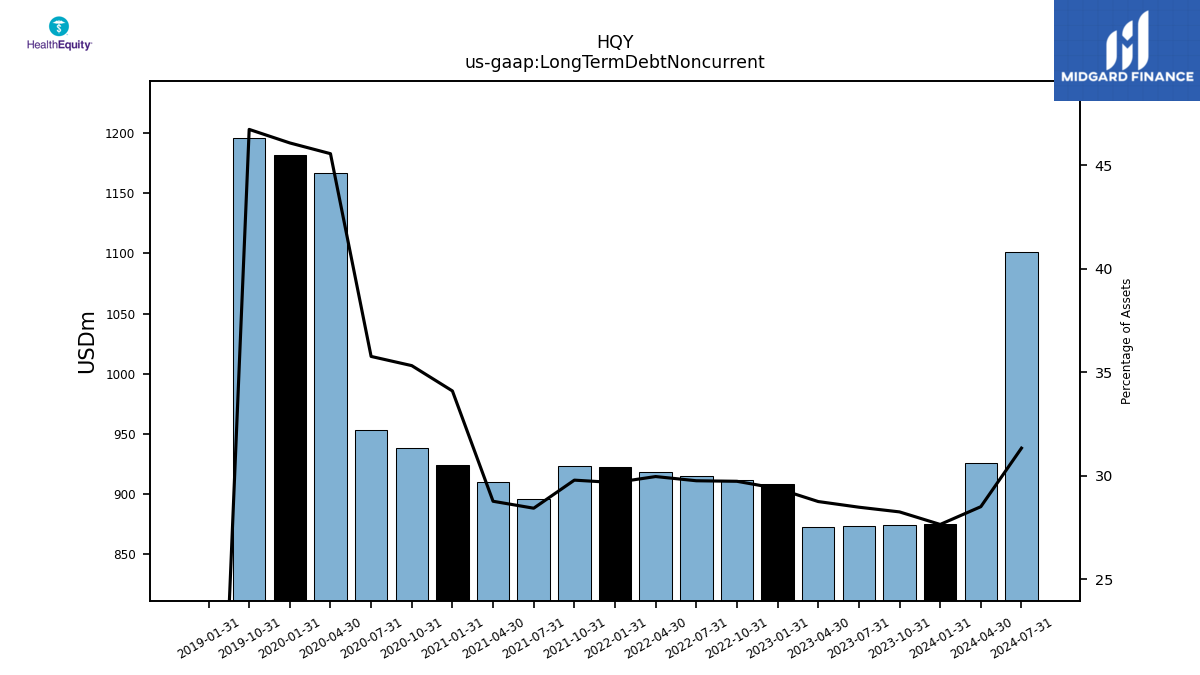
| Long Term Debt Noncurrent | 874.97 | 874.27 | 873.58 | 872.90 | 907.84 | 911.41 | 914.97 | 918.51 | 922.08 | 923.50 | 895.45 | 909.82 | 924.22 | 938.56 | 952.90 | 1167.19 | 1181.62 | 1196.02 | NA | NA | 0.00 | NA | NA | NA | NA | NA | NA | NA | NA | NA | NA | NA | NA | NA | NA | NA | NA | NA | NA | NA | NA | NA | NA | NA | |
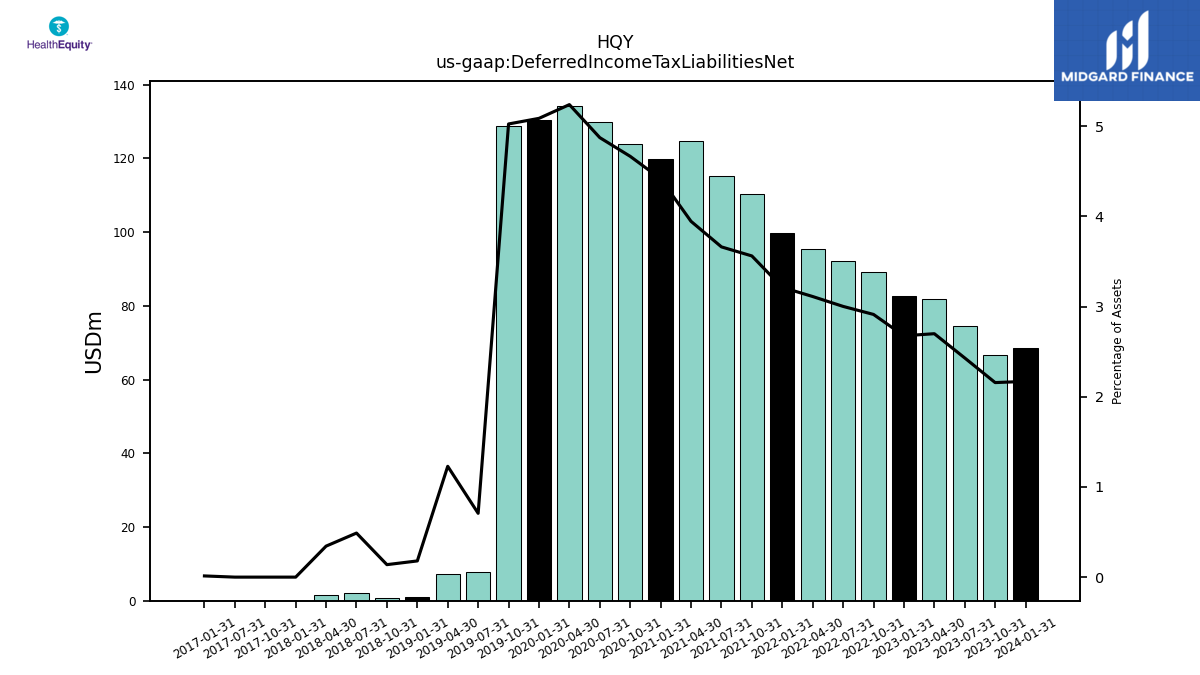
| Deferred Income Tax Liabilities Net | 68.67 | 66.74 | 74.53 | 81.93 | 82.67 | 89.28 | 92.29 | 95.38 | 99.85 | 110.40 | 115.31 | 124.75 | 119.73 | 123.99 | 129.86 | 134.27 | 130.49 | 128.64 | 7.77 | 7.33 | 0.92 | 0.66 | 2.22 | 1.44 | 0.00 | 0.00 | 0.00 | NA | 0.04 | NA | NA | NA | NA | NA | NA | NA | NA | NA | NA | NA | NA | NA | NA | NA | |
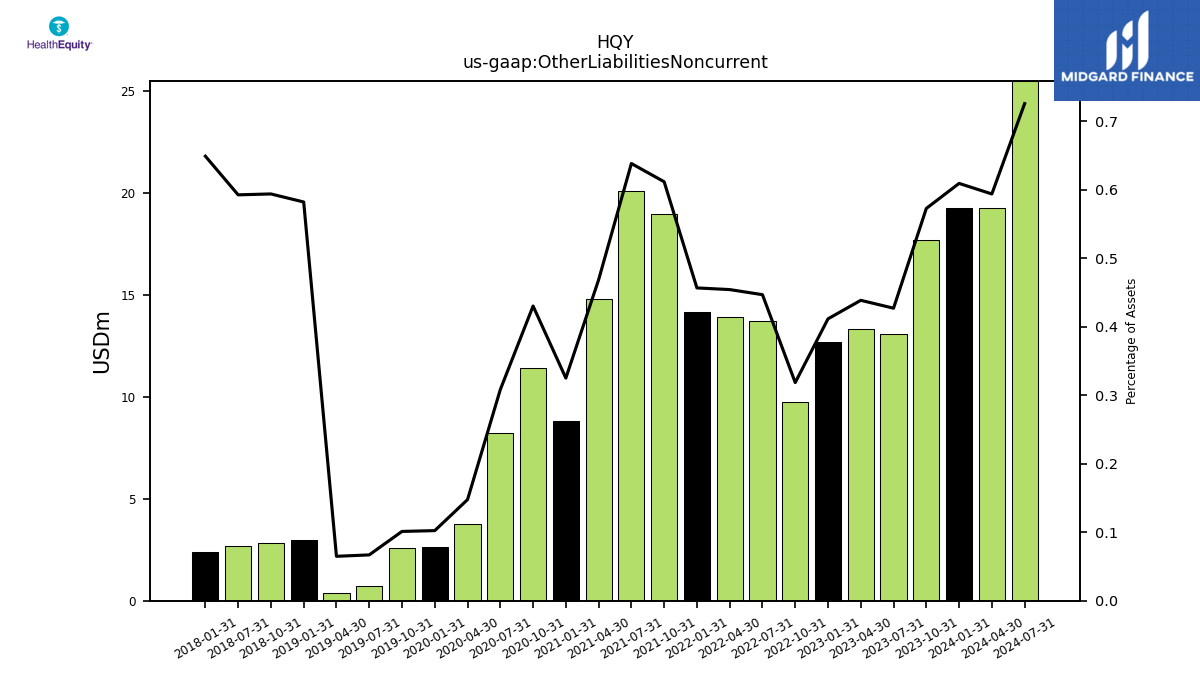
| Other Liabilities Noncurrent | 19.27 | 17.71 | 13.09 | 13.31 | 12.71 | 9.76 | 13.73 | 13.92 | 14.19 | 18.95 | 20.09 | 14.81 | 8.81 | 11.43 | 8.21 | 3.78 | 2.62 | 2.59 | 0.73 | 0.39 | 2.97 | 2.84 | 2.69 | NA | 2.40 | NA | NA | NA | NA | NA | NA | NA | NA | NA | NA | NA | NA | NA | NA | NA | NA | NA | NA | NA | |
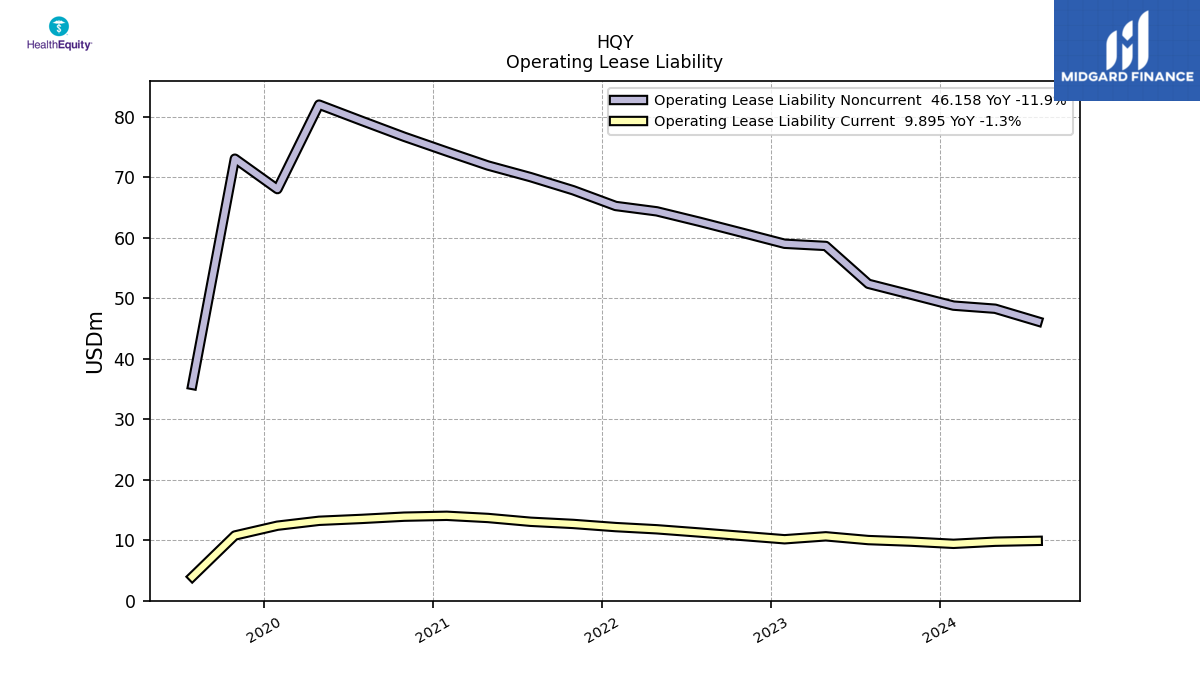
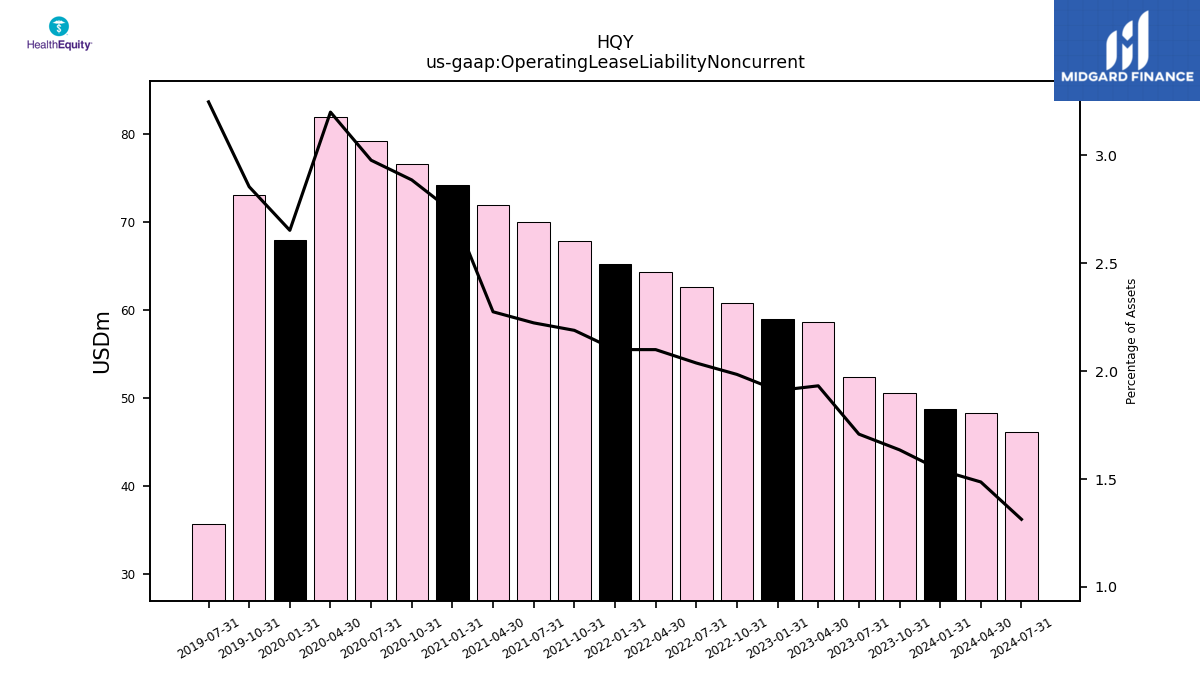
| Operating Lease Liability Noncurrent | 48.77 | 50.58 | 52.37 | 58.62 | 58.99 | 60.82 | 62.63 | 64.34 | 65.23 | 67.84 | 70.00 | 71.92 | 74.22 | 76.67 | 79.30 | 81.98 | 68.02 | 73.05 | 35.66 | NA | NA | NA | NA | NA | NA | NA | NA | NA | NA | NA | NA | NA | NA | NA | NA | NA | NA | NA | NA | NA | NA | NA | NA | NA |
| 2024-01-31 | 2023-10-31 | 2023-07-31 | 2023-04-30 | 2023-01-31 | 2022-10-31 | 2022-07-31 | 2022-04-30 | 2022-01-31 | 2021-10-31 | 2021-07-31 | 2021-04-30 | 2021-01-31 | 2020-10-31 | 2020-07-31 | 2020-04-30 | 2020-01-31 | 2019-10-31 | 2019-07-31 | 2019-04-30 | 2019-01-31 | 2018-10-31 | 2018-07-31 | 2018-04-30 | 2018-01-31 | 2017-10-31 | 2017-07-31 | 2017-04-30 | 2017-01-31 | 2016-10-31 | 2016-07-31 | 2016-04-30 | 2016-01-31 | 2015-10-31 | 2015-07-31 | 2015-04-30 | 2015-01-31 | 2014-10-31 | 2014-07-31 | 2014-04-30 | 2014-01-31 | 2013-10-31 | 2013-07-31 | 2013-04-30 | ||
|---|---|---|---|---|---|---|---|---|---|---|---|---|---|---|---|---|---|---|---|---|---|---|---|---|---|---|---|---|---|---|---|---|---|---|---|---|---|---|---|---|---|---|---|---|---|
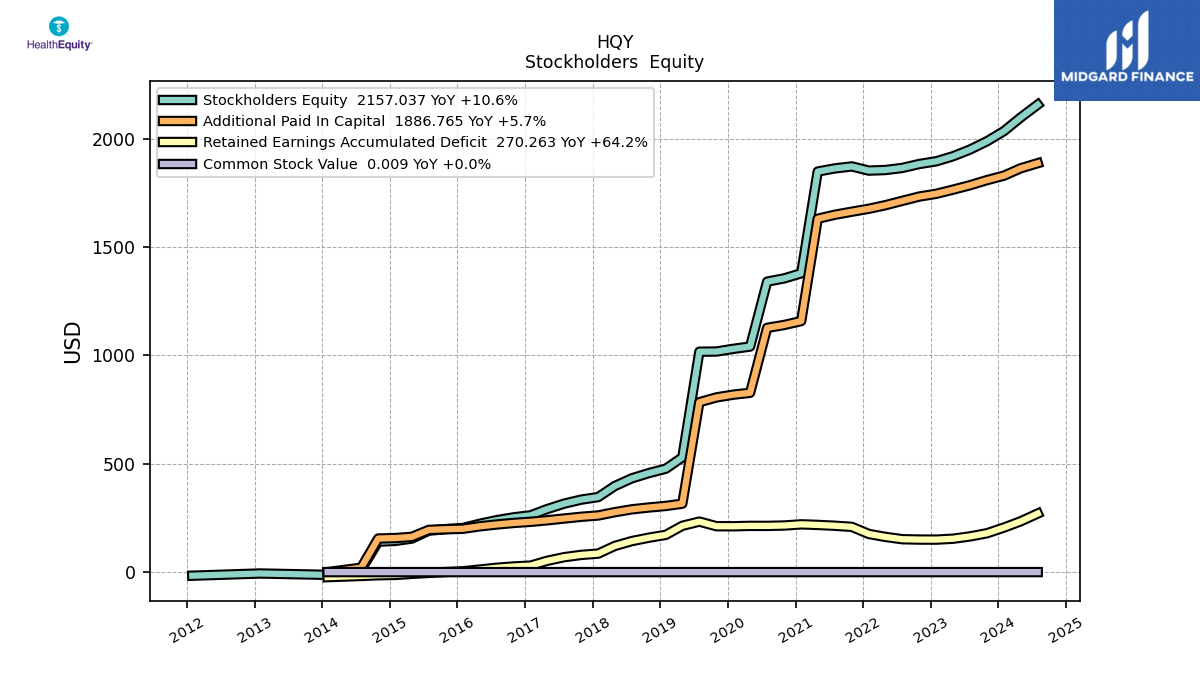
| Stockholders Equity | 2035.02 | 1987.97 | 1949.61 | 1918.59 | 1895.64 | 1883.12 | 1864.90 | 1855.26 | 1852.58 | 1871.85 | 1862.67 | 1848.27 | 1378.73 | 1355.26 | 1340.34 | 1040.65 | 1030.30 | 1017.76 | 1017.03 | 529.30 | 477.08 | 456.80 | 432.62 | 396.97 | 346.27 | 334.41 | 315.93 | 290.84 | 261.94 | 252.59 | 239.46 | 222.74 | 203.46 | 198.32 | 191.16 | 154.57 | 144.09 | 140.50 | 10.68 | NA | -12.71 | NA | NA | NA | |
| Common Stock Value | 0.01 | 0.01 | 0.01 | 0.01 | 0.01 | 0.01 | 0.01 | 0.01 | 0.01 | 0.01 | 0.01 | 0.01 | 0.01 | 0.01 | 0.01 | 0.01 | 0.01 | 0.01 | 0.01 | 0.01 | 0.01 | 0.01 | 0.01 | 0.01 | 0.01 | 0.01 | 0.01 | 0.01 | 0.01 | 0.01 | 0.01 | 0.01 | 0.01 | 0.01 | 0.01 | 0.01 | 0.01 | 0.01 | 0.00 | NA | 0.00 | NA | NA | NA | |
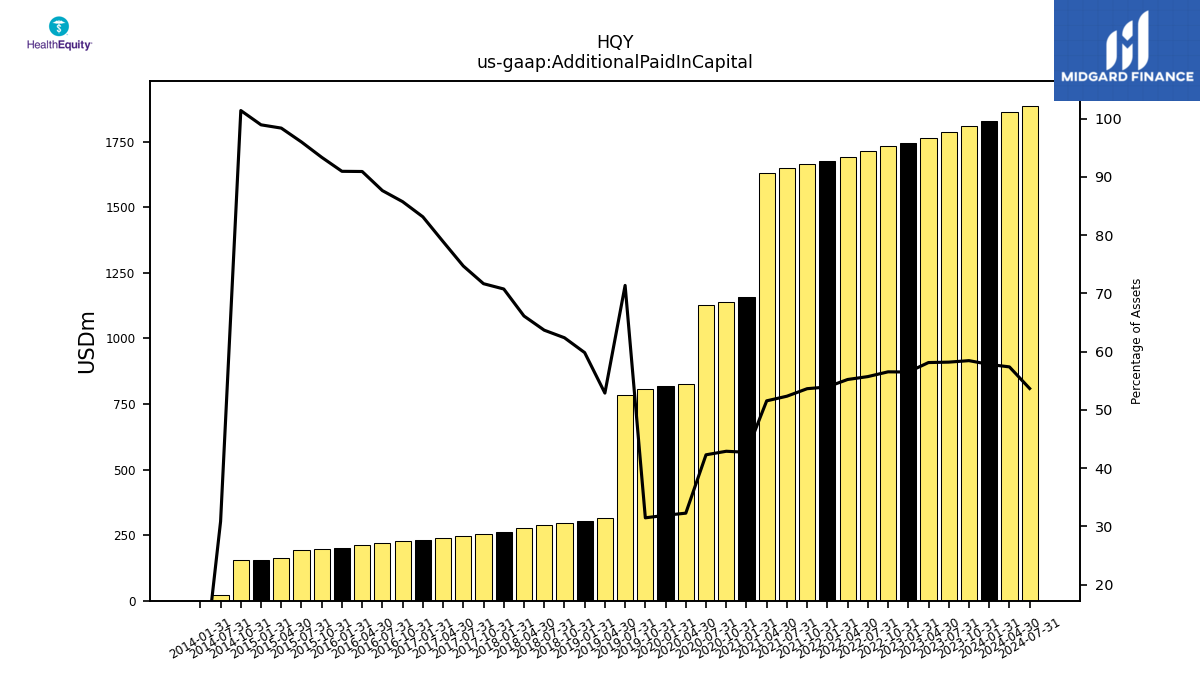
| Additional Paid In Capital | 1829.38 | 1808.69 | 1785.01 | 1764.57 | 1745.72 | 1732.98 | 1713.12 | 1692.84 | 1676.51 | 1662.96 | 1648.74 | 1630.53 | 1158.37 | 1140.27 | 1127.14 | 827.30 | 818.77 | 806.05 | 783.99 | 315.62 | 305.22 | 298.06 | 289.57 | 276.44 | 261.24 | 255.25 | 247.25 | 238.95 | 232.11 | 226.79 | 219.65 | 211.19 | 199.94 | 197.91 | 194.79 | 162.61 | 157.09 | 154.87 | 20.30 | NA | 0.00 | NA | NA | NA | |
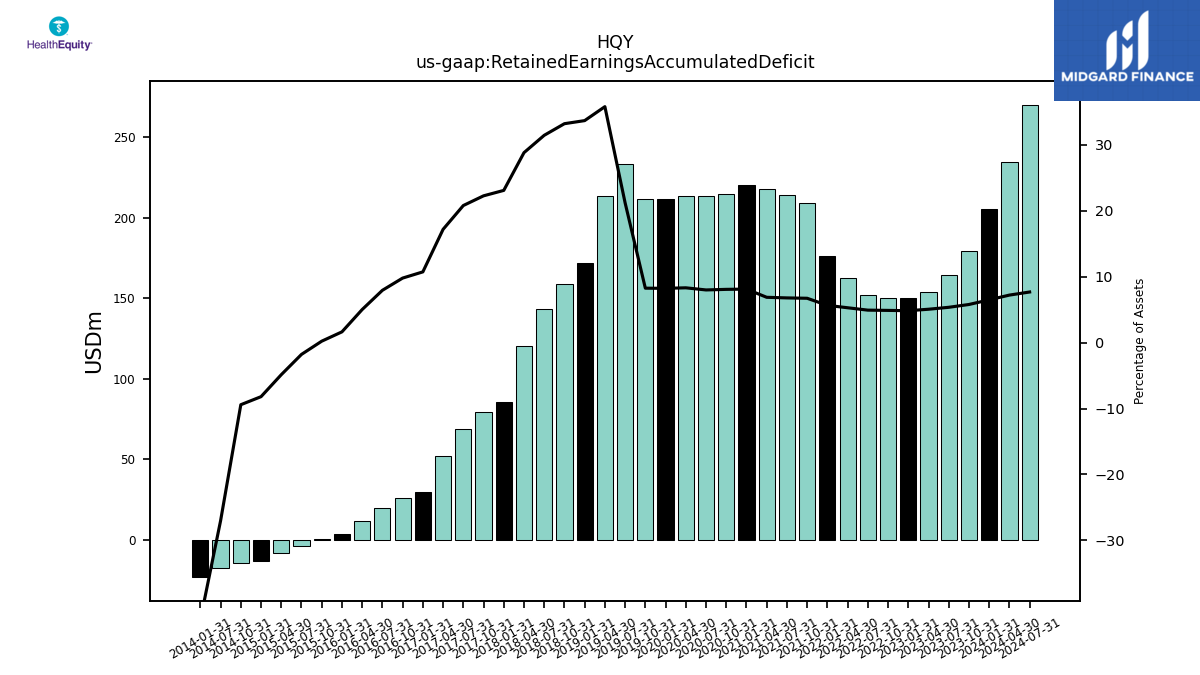
| Retained Earnings Accumulated Deficit | 205.63 | 179.26 | 164.59 | 154.01 | 149.92 | 150.12 | 151.77 | 162.42 | 176.06 | 208.88 | 213.91 | 217.73 | 220.35 | 214.98 | 213.19 | 213.34 | 211.51 | 211.70 | 233.04 | 213.67 | 171.85 | 158.73 | 143.04 | 120.53 | 85.30 | 79.35 | 68.87 | 52.08 | 29.98 | 25.92 | 19.91 | 11.68 | 3.61 | 0.48 | -3.61 | -8.03 | -13.00 | -14.38 | -17.77 | NA | -23.17 | NA | NA | NA |
| 2024-01-31 | 2023-10-31 | 2023-07-31 | 2023-04-30 | 2023-01-31 | 2022-10-31 | 2022-07-31 | 2022-04-30 | 2022-01-31 | 2021-10-31 | 2021-07-31 | 2021-04-30 | 2021-01-31 | 2020-10-31 | 2020-07-31 | 2020-04-30 | 2020-01-31 | 2019-10-31 | 2019-07-31 | 2019-04-30 | 2019-01-31 | 2018-10-31 | 2018-07-31 | 2018-04-30 | 2018-01-31 | 2017-10-31 | 2017-07-31 | 2017-04-30 | 2017-01-31 | 2016-10-31 | 2016-07-31 | 2016-04-30 | 2016-01-31 | 2015-10-31 | 2015-07-31 | 2015-04-30 | 2015-01-31 | 2014-10-31 | 2014-07-31 | 2014-04-30 | 2014-01-31 | 2013-10-31 | 2013-07-31 | 2013-04-30 | ||
|---|---|---|---|---|---|---|---|---|---|---|---|---|---|---|---|---|---|---|---|---|---|---|---|---|---|---|---|---|---|---|---|---|---|---|---|---|---|---|---|---|---|---|---|---|---|
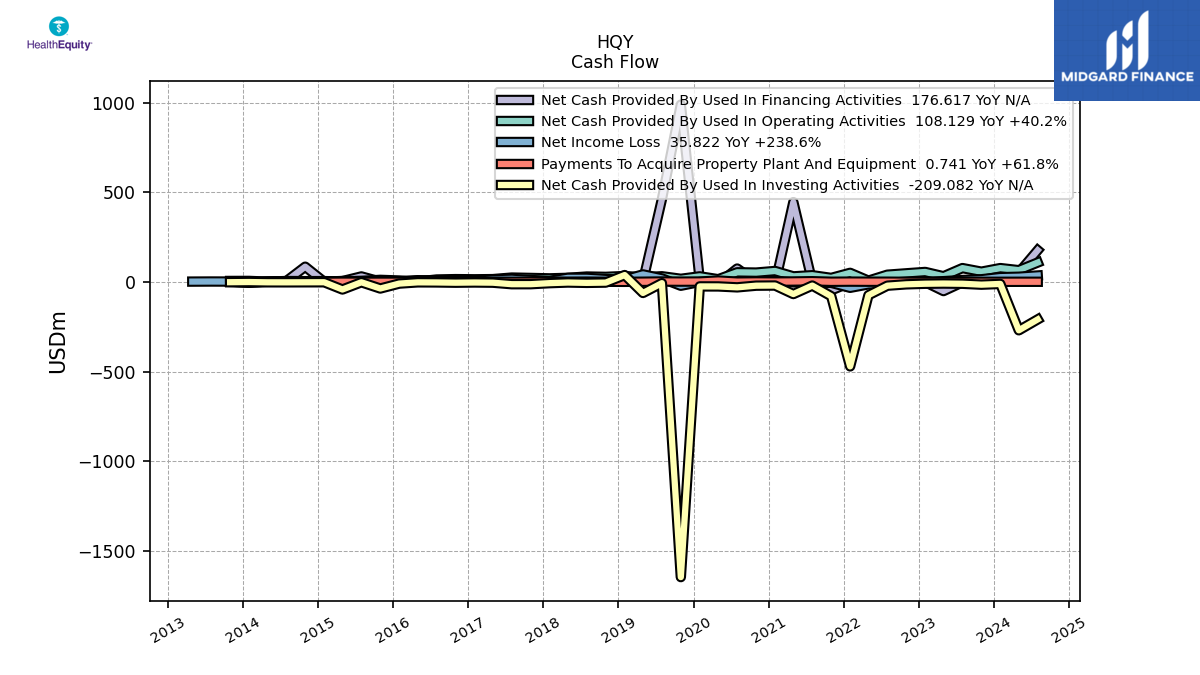
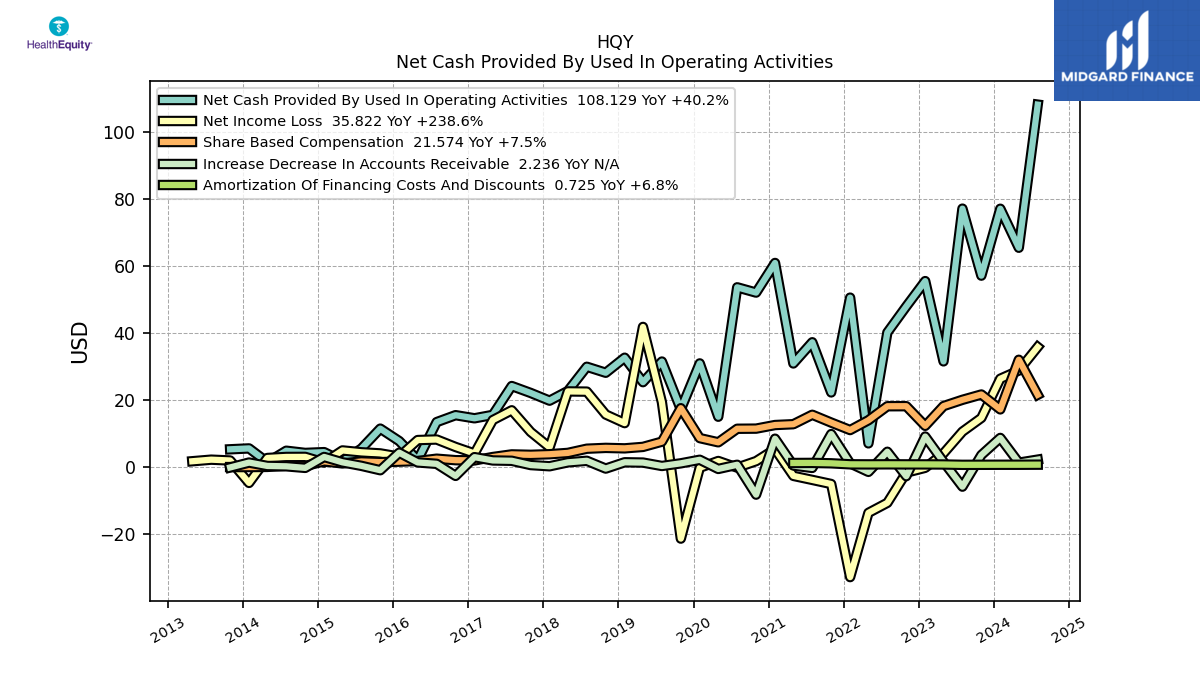
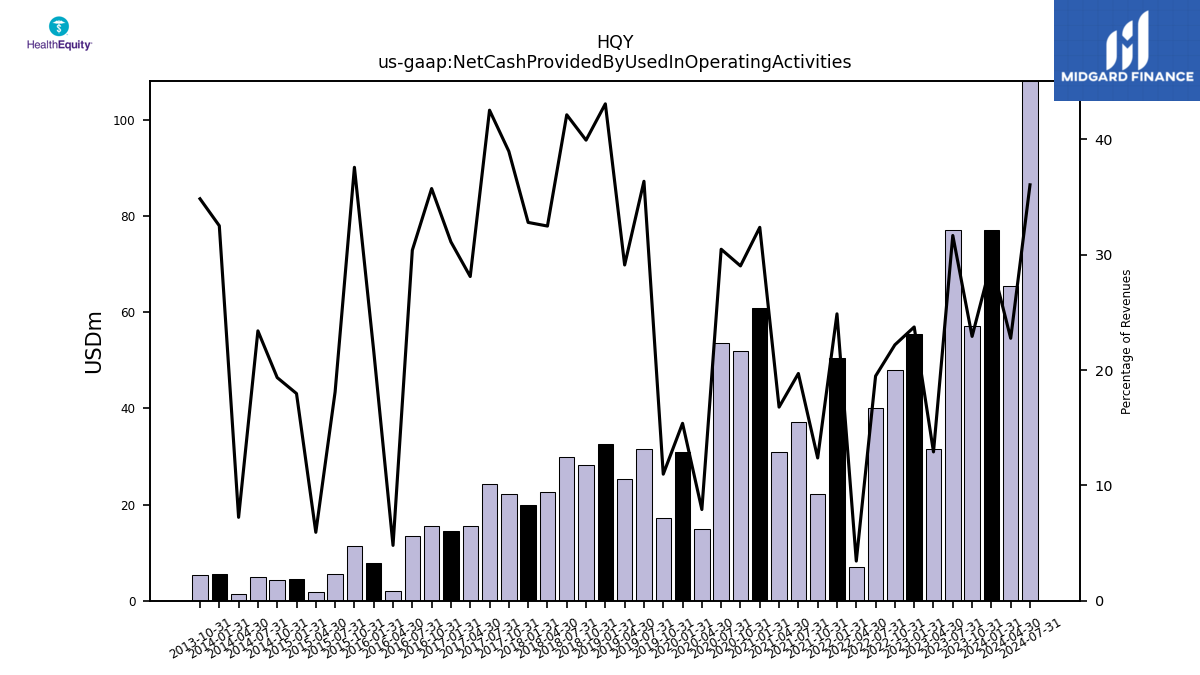
| Net Cash Provided By Used In Operating Activities | 77.07 | 57.11 | 77.11 | 31.54 | 55.49 | 47.93 | 40.15 | 7.08 | 50.56 | 22.27 | 37.25 | 30.92 | 60.90 | 52.05 | 53.64 | 15.03 | 30.94 | 17.24 | 31.50 | 25.34 | 32.64 | 28.14 | 29.94 | 22.70 | 19.82 | 22.12 | 24.18 | 15.58 | 14.56 | 15.49 | 13.43 | 2.11 | 7.77 | 11.48 | 5.52 | 1.77 | 4.47 | 4.23 | 4.89 | 1.46 | 5.58 | 5.31 | NA | NA | |
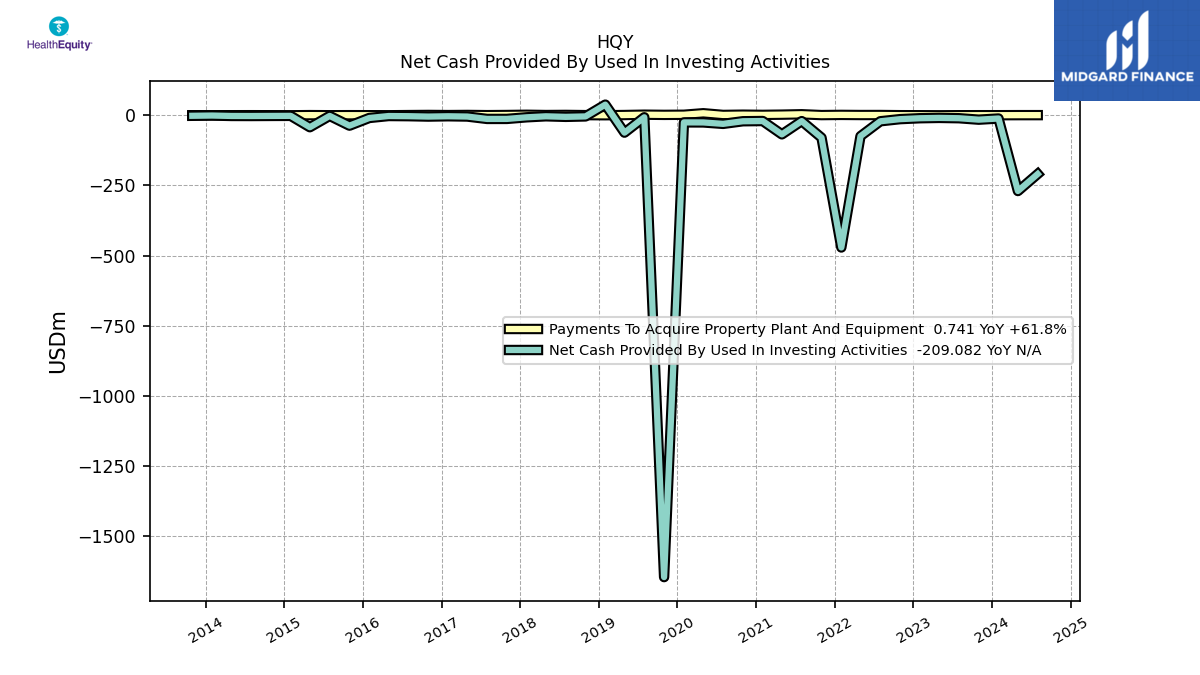
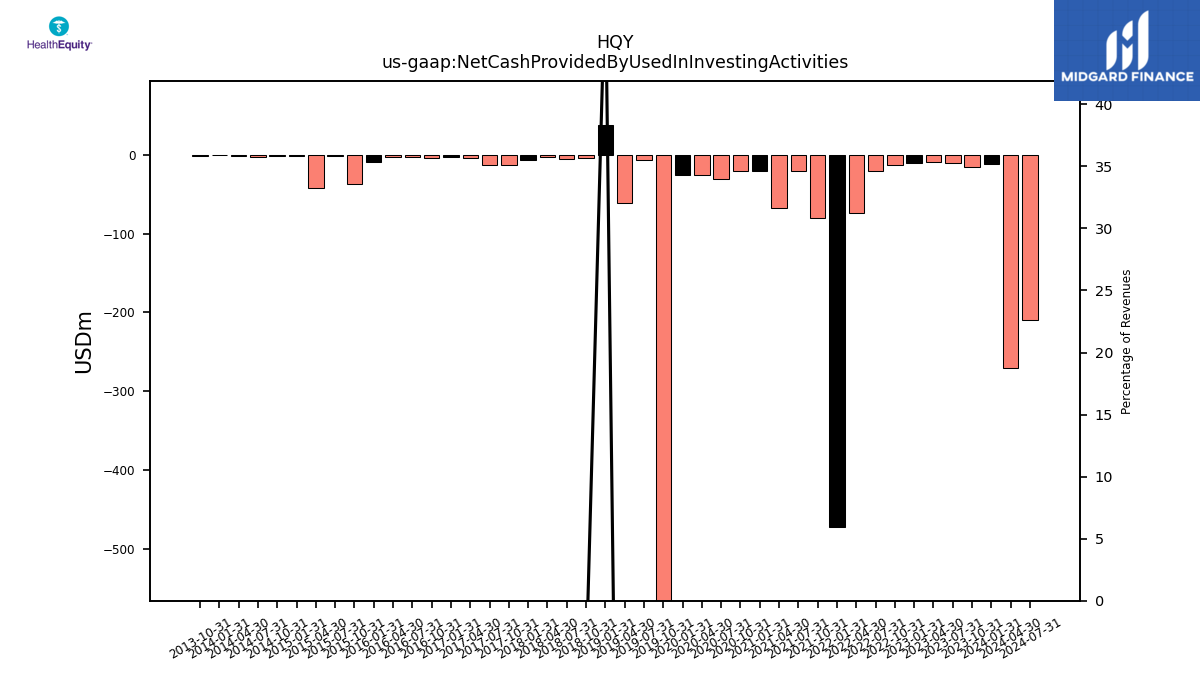
| Net Cash Provided By Used In Investing Activities | -11.27 | -15.42 | -10.25 | -9.13 | -10.28 | -13.53 | -21.12 | -74.20 | -471.30 | -79.68 | -20.47 | -67.80 | -20.23 | -21.03 | -30.40 | -25.29 | -25.10 | -1646.80 | -6.86 | -61.73 | 38.24 | -3.81 | -5.38 | -3.40 | -6.96 | -12.72 | -12.79 | -4.27 | -3.27 | -4.39 | -2.98 | -2.41 | -9.38 | -36.80 | -2.04 | -42.34 | -1.80 | -2.07 | -2.37 | -2.19 | -0.68 | -1.56 | NA | NA | |
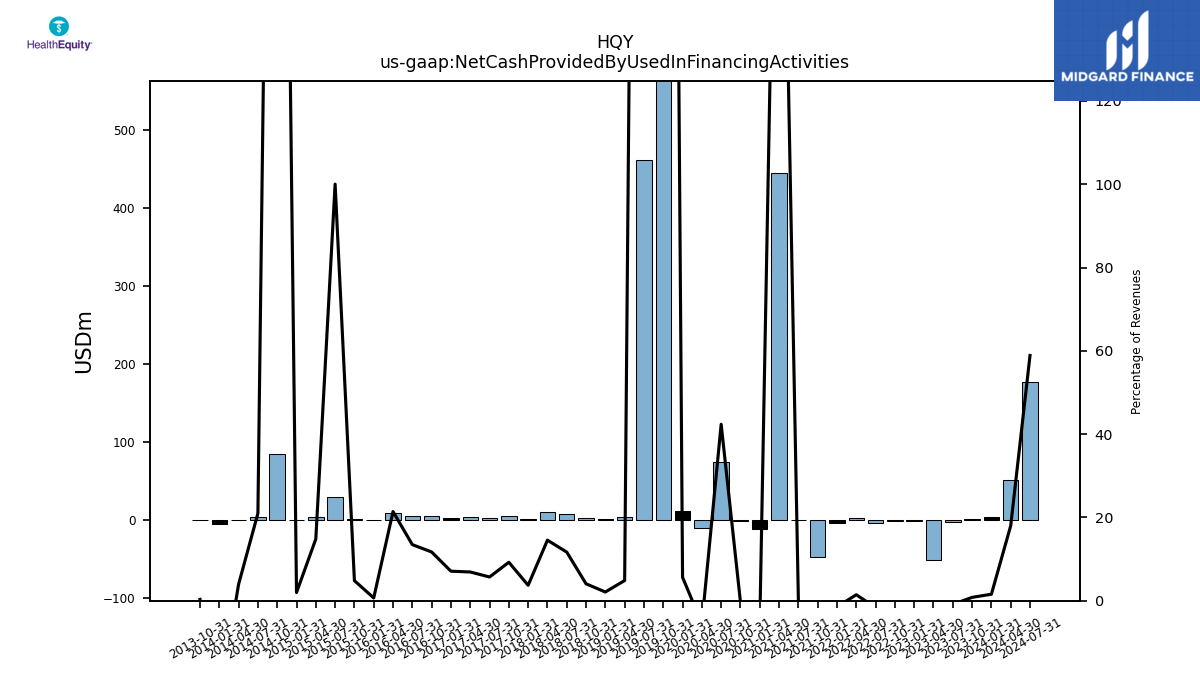
| Net Cash Provided By Used In Financing Activities | 4.12 | 2.03 | -2.15 | -51.03 | -1.15 | -1.09 | -3.39 | 2.96 | -2.97 | -47.22 | 0.20 | 444.85 | -11.22 | -0.57 | 74.58 | -10.37 | 11.33 | 988.96 | 461.22 | 4.23 | 1.59 | 2.87 | 8.30 | 10.17 | 2.24 | 5.25 | 3.24 | 3.83 | 3.32 | 5.08 | 5.95 | 9.42 | 0.24 | 1.48 | 30.51 | 4.42 | 0.49 | 84.81 | 4.38 | 0.80 | -4.11 | 0.05 | NA | NA |
| 2024-01-31 | 2023-10-31 | 2023-07-31 | 2023-04-30 | 2023-01-31 | 2022-10-31 | 2022-07-31 | 2022-04-30 | 2022-01-31 | 2021-10-31 | 2021-07-31 | 2021-04-30 | 2021-01-31 | 2020-10-31 | 2020-07-31 | 2020-04-30 | 2020-01-31 | 2019-10-31 | 2019-07-31 | 2019-04-30 | 2019-01-31 | 2018-10-31 | 2018-07-31 | 2018-04-30 | 2018-01-31 | 2017-10-31 | 2017-07-31 | 2017-04-30 | 2017-01-31 | 2016-10-31 | 2016-07-31 | 2016-04-30 | 2016-01-31 | 2015-10-31 | 2015-07-31 | 2015-04-30 | 2015-01-31 | 2014-10-31 | 2014-07-31 | 2014-04-30 | 2014-01-31 | 2013-10-31 | 2013-07-31 | 2013-04-30 | ||
|---|---|---|---|---|---|---|---|---|---|---|---|---|---|---|---|---|---|---|---|---|---|---|---|---|---|---|---|---|---|---|---|---|---|---|---|---|---|---|---|---|---|---|---|---|---|
| Net Cash Provided By Used In Operating Activities | 77.07 | 57.11 | 77.11 | 31.54 | 55.49 | 47.93 | 40.15 | 7.08 | 50.56 | 22.27 | 37.25 | 30.92 | 60.90 | 52.05 | 53.64 | 15.03 | 30.94 | 17.24 | 31.50 | 25.34 | 32.64 | 28.14 | 29.94 | 22.70 | 19.82 | 22.12 | 24.18 | 15.58 | 14.56 | 15.49 | 13.43 | 2.11 | 7.77 | 11.48 | 5.52 | 1.77 | 4.47 | 4.23 | 4.89 | 1.46 | 5.58 | 5.31 | NA | NA | |
| Net Income Loss | 26.36 | 14.67 | 10.58 | 4.09 | -0.21 | -1.64 | -10.65 | -13.64 | -32.82 | -5.04 | -3.82 | -2.62 | 5.37 | 1.79 | -0.15 | 1.83 | -0.19 | -21.33 | 19.37 | 41.82 | 13.12 | 15.69 | 22.52 | 22.58 | 5.91 | 10.48 | 16.95 | 14.03 | 4.06 | 6.01 | 8.23 | 8.07 | 3.13 | 4.09 | 4.42 | 4.98 | 1.37 | 3.05 | 3.03 | 2.72 | -4.72 | 1.98 | 2.22 | 1.75 | |
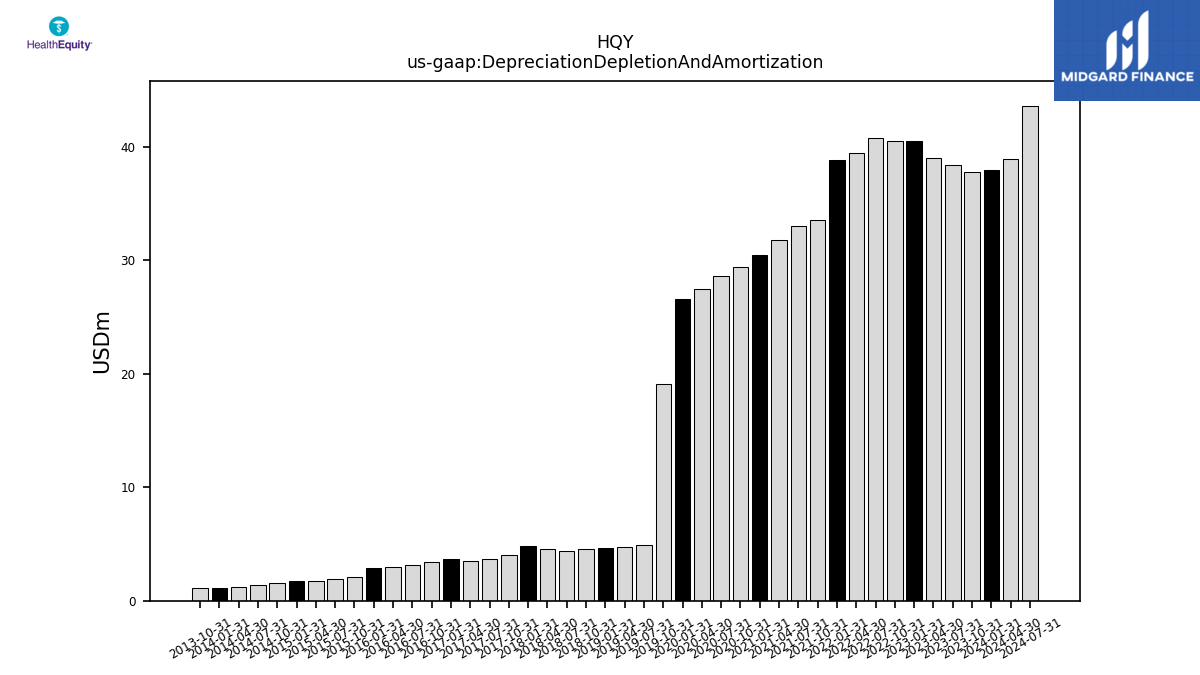
| Depreciation Depletion And Amortization | 37.91 | 37.78 | 38.35 | 39.04 | 40.48 | 40.50 | 40.74 | 39.49 | 38.82 | 33.55 | 33.05 | 31.77 | 30.42 | 29.38 | 28.60 | 27.51 | 26.56 | 19.07 | 4.95 | 4.77 | 4.69 | 4.58 | 4.40 | 4.52 | 4.81 | 4.01 | 3.65 | 3.48 | 3.64 | 3.42 | 3.18 | 2.95 | 2.87 | 2.06 | 1.92 | 1.75 | 1.70 | 1.54 | 1.39 | 1.25 | 1.13 | 1.15 | NA | NA | |
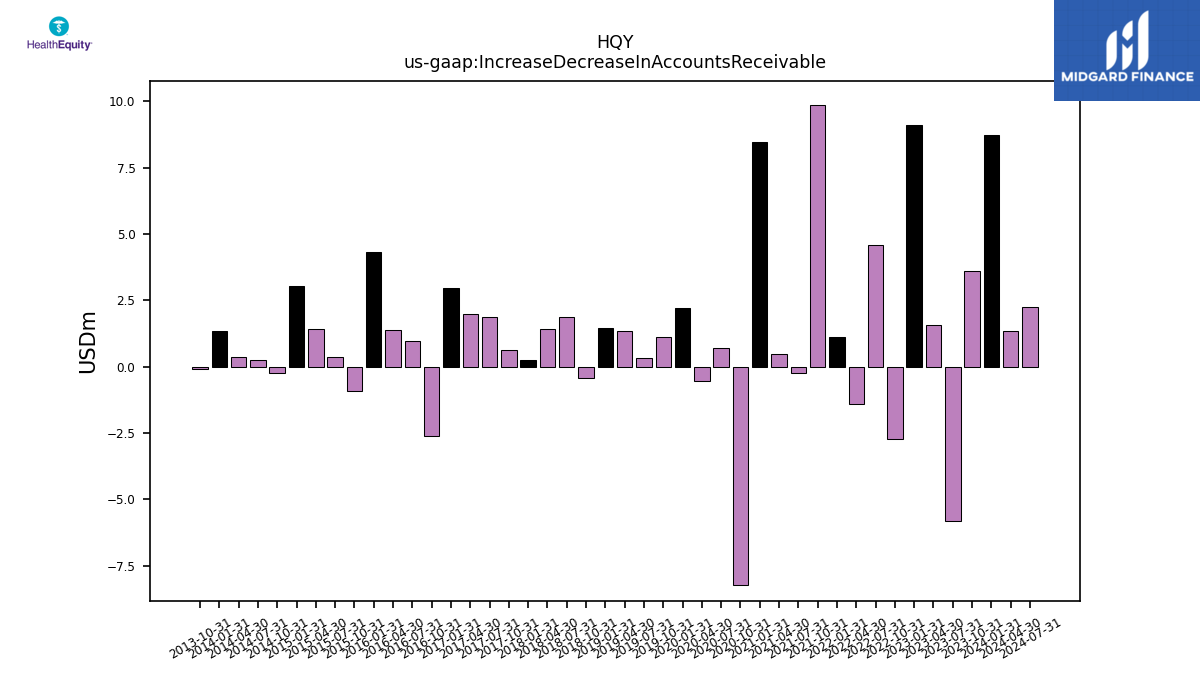
| Increase Decrease In Accounts Receivable | 8.71 | 3.60 | -5.83 | 1.58 | 9.12 | -2.71 | 4.59 | -1.43 | 1.11 | 9.86 | -0.24 | 0.47 | 8.48 | -8.21 | 0.70 | -0.55 | 2.19 | 1.13 | 0.34 | 1.35 | 1.44 | -0.44 | 1.88 | 1.42 | 0.25 | 0.61 | 1.89 | 1.99 | 2.97 | -2.62 | 0.97 | 1.40 | 4.31 | -0.93 | 0.38 | 1.43 | 3.03 | -0.23 | 0.24 | 0.34 | 1.36 | -0.10 | NA | NA | |
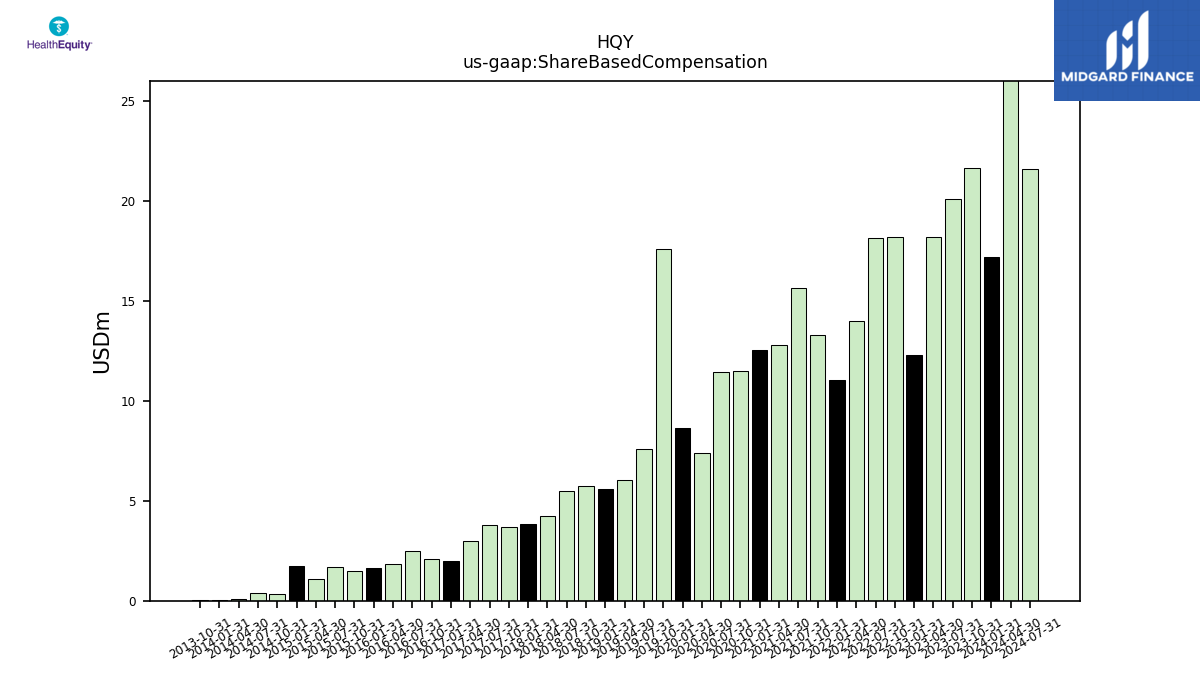
| Share Based Compensation | 17.21 | 21.66 | 20.07 | 18.20 | 12.30 | 18.17 | 18.15 | 13.99 | 11.05 | 13.28 | 15.62 | 12.80 | 12.55 | 11.48 | 11.44 | 7.40 | 8.65 | 17.58 | 7.59 | 6.03 | 5.60 | 5.73 | 5.49 | 4.24 | 3.84 | 3.67 | 3.79 | 3.01 | 2.00 | 2.07 | 2.51 | 1.82 | 1.63 | 1.48 | 1.68 | 1.09 | 1.73 | 0.33 | 0.40 | 0.07 | 0.01 | 0.01 | NA | NA |
| 2024-01-31 | 2023-10-31 | 2023-07-31 | 2023-04-30 | 2023-01-31 | 2022-10-31 | 2022-07-31 | 2022-04-30 | 2022-01-31 | 2021-10-31 | 2021-07-31 | 2021-04-30 | 2021-01-31 | 2020-10-31 | 2020-07-31 | 2020-04-30 | 2020-01-31 | 2019-10-31 | 2019-07-31 | 2019-04-30 | 2019-01-31 | 2018-10-31 | 2018-07-31 | 2018-04-30 | 2018-01-31 | 2017-10-31 | 2017-07-31 | 2017-04-30 | 2017-01-31 | 2016-10-31 | 2016-07-31 | 2016-04-30 | 2016-01-31 | 2015-10-31 | 2015-07-31 | 2015-04-30 | 2015-01-31 | 2014-10-31 | 2014-07-31 | 2014-04-30 | 2014-01-31 | 2013-10-31 | 2013-07-31 | 2013-04-30 | ||
|---|---|---|---|---|---|---|---|---|---|---|---|---|---|---|---|---|---|---|---|---|---|---|---|---|---|---|---|---|---|---|---|---|---|---|---|---|---|---|---|---|---|---|---|---|---|
| Net Cash Provided By Used In Investing Activities | -11.27 | -15.42 | -10.25 | -9.13 | -10.28 | -13.53 | -21.12 | -74.20 | -471.30 | -79.68 | -20.47 | -67.80 | -20.23 | -21.03 | -30.40 | -25.29 | -25.10 | -1646.80 | -6.86 | -61.73 | 38.24 | -3.81 | -5.38 | -3.40 | -6.96 | -12.72 | -12.79 | -4.27 | -3.27 | -4.39 | -2.98 | -2.41 | -9.38 | -36.80 | -2.04 | -42.34 | -1.80 | -2.07 | -2.37 | -2.19 | -0.68 | -1.56 | NA | NA | |
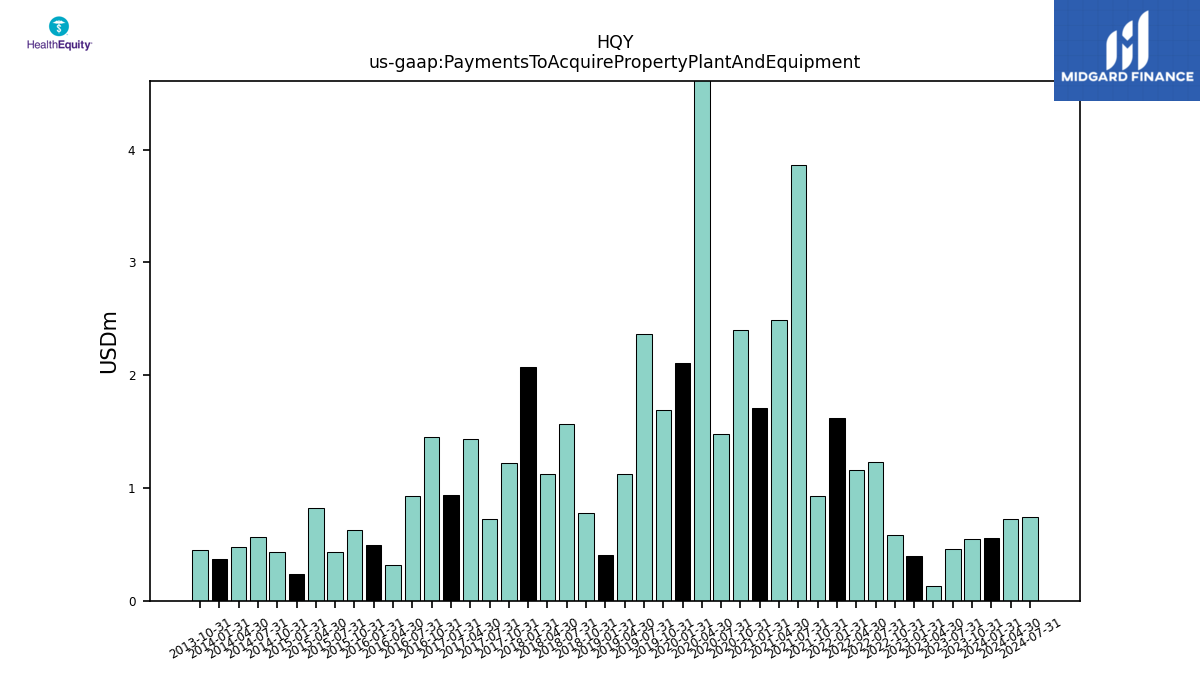
| Payments To Acquire Property Plant And Equipment | 0.56 | 0.54 | 0.46 | 0.13 | 0.40 | 0.59 | 1.23 | 1.16 | 1.62 | 0.93 | 3.86 | 2.49 | 1.71 | 2.40 | 1.48 | 7.51 | 2.11 | 1.69 | 2.37 | 1.13 | 0.40 | 0.78 | 1.57 | 1.12 | 2.08 | 1.22 | 0.72 | 1.44 | 0.94 | 1.46 | 0.93 | 0.32 | 0.49 | 0.62 | 0.43 | 0.83 | 0.23 | 0.43 | 0.57 | 0.48 | 0.37 | 0.45 | NA | NA |
| 2024-01-31 | 2023-10-31 | 2023-07-31 | 2023-04-30 | 2023-01-31 | 2022-10-31 | 2022-07-31 | 2022-04-30 | 2022-01-31 | 2021-10-31 | 2021-07-31 | 2021-04-30 | 2021-01-31 | 2020-10-31 | 2020-07-31 | 2020-04-30 | 2020-01-31 | 2019-10-31 | 2019-07-31 | 2019-04-30 | 2019-01-31 | 2018-10-31 | 2018-07-31 | 2018-04-30 | 2018-01-31 | 2017-10-31 | 2017-07-31 | 2017-04-30 | 2017-01-31 | 2016-10-31 | 2016-07-31 | 2016-04-30 | 2016-01-31 | 2015-10-31 | 2015-07-31 | 2015-04-30 | 2015-01-31 | 2014-10-31 | 2014-07-31 | 2014-04-30 | 2014-01-31 | 2013-10-31 | 2013-07-31 | 2013-04-30 | ||
|---|---|---|---|---|---|---|---|---|---|---|---|---|---|---|---|---|---|---|---|---|---|---|---|---|---|---|---|---|---|---|---|---|---|---|---|---|---|---|---|---|---|---|---|---|---|
| Net Cash Provided By Used In Financing Activities | 4.12 | 2.03 | -2.15 | -51.03 | -1.15 | -1.09 | -3.39 | 2.96 | -2.97 | -47.22 | 0.20 | 444.85 | -11.22 | -0.57 | 74.58 | -10.37 | 11.33 | 988.96 | 461.22 | 4.23 | 1.59 | 2.87 | 8.30 | 10.17 | 2.24 | 5.25 | 3.24 | 3.83 | 3.32 | 5.08 | 5.95 | 9.42 | 0.24 | 1.48 | 30.51 | 4.42 | 0.49 | 84.81 | 4.38 | 0.80 | -4.11 | 0.05 | NA | NA |
| 2024-01-31 | 2023-10-31 | 2023-07-31 | 2023-04-30 | 2023-01-31 | 2022-10-31 | 2022-07-31 | 2022-04-30 | 2022-01-31 | 2021-10-31 | 2021-07-31 | 2021-04-30 | 2021-01-31 | 2020-10-31 | 2020-07-31 | 2020-04-30 | 2020-01-31 | 2019-10-31 | 2019-07-31 | 2019-04-30 | 2019-01-31 | 2018-10-31 | 2018-07-31 | 2018-04-30 | 2018-01-31 | 2017-10-31 | 2017-07-31 | 2017-04-30 | 2017-01-31 | 2016-10-31 | 2016-07-31 | 2016-04-30 | 2016-01-31 | 2015-10-31 | 2015-07-31 | 2015-04-30 | 2015-01-31 | 2014-10-31 | 2014-07-31 | 2014-04-30 | 2014-01-31 | 2013-10-31 | 2013-07-31 | 2013-04-30 | ||
|---|---|---|---|---|---|---|---|---|---|---|---|---|---|---|---|---|---|---|---|---|---|---|---|---|---|---|---|---|---|---|---|---|---|---|---|---|---|---|---|---|---|---|---|---|---|
| Revenues | 262.39 | 249.22 | 243.55 | 244.43 | 233.84 | 216.09 | 206.14 | 205.68 | 203.30 | 179.95 | 189.10 | 184.20 | 188.17 | 179.35 | 176.04 | 190.01 | 201.20 | 157.12 | 86.62 | 87.05 | 75.78 | 70.50 | 71.07 | 69.90 | 60.44 | 56.79 | 56.88 | 55.42 | 46.81 | 43.36 | 44.19 | 44.01 | 35.89 | 30.56 | 30.49 | 29.85 | 24.87 | 21.86 | 20.89 | 20.23 | 17.16 | 15.25 | 14.98 | 14.62 | |
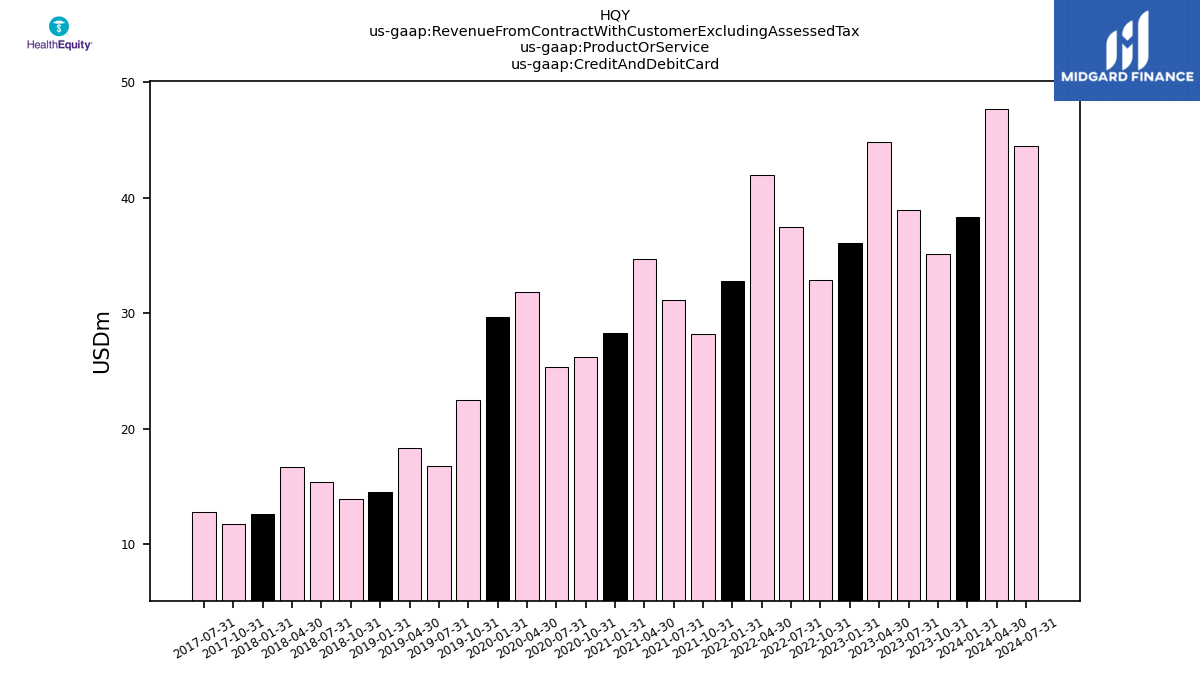
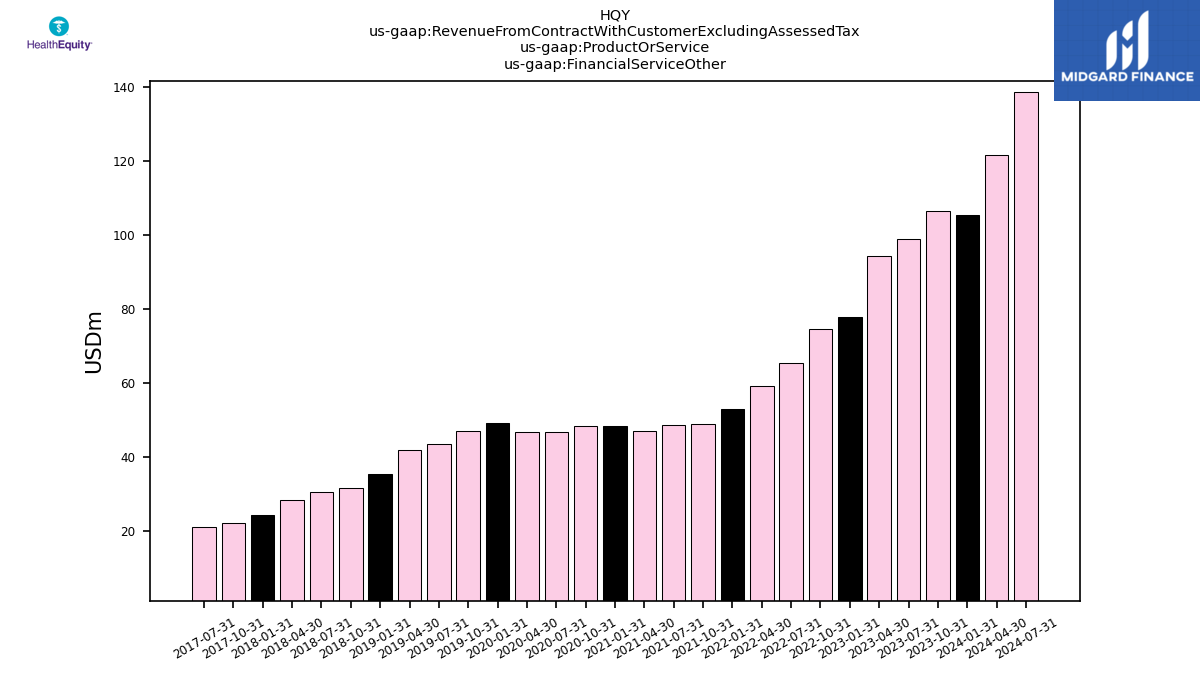
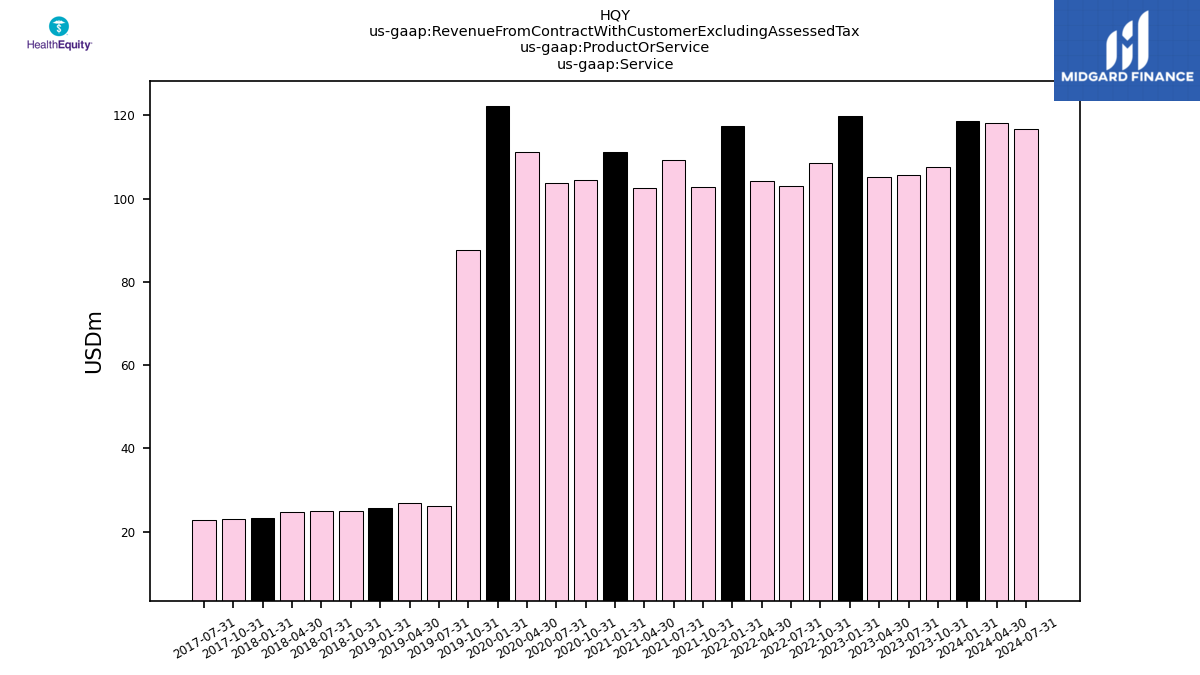
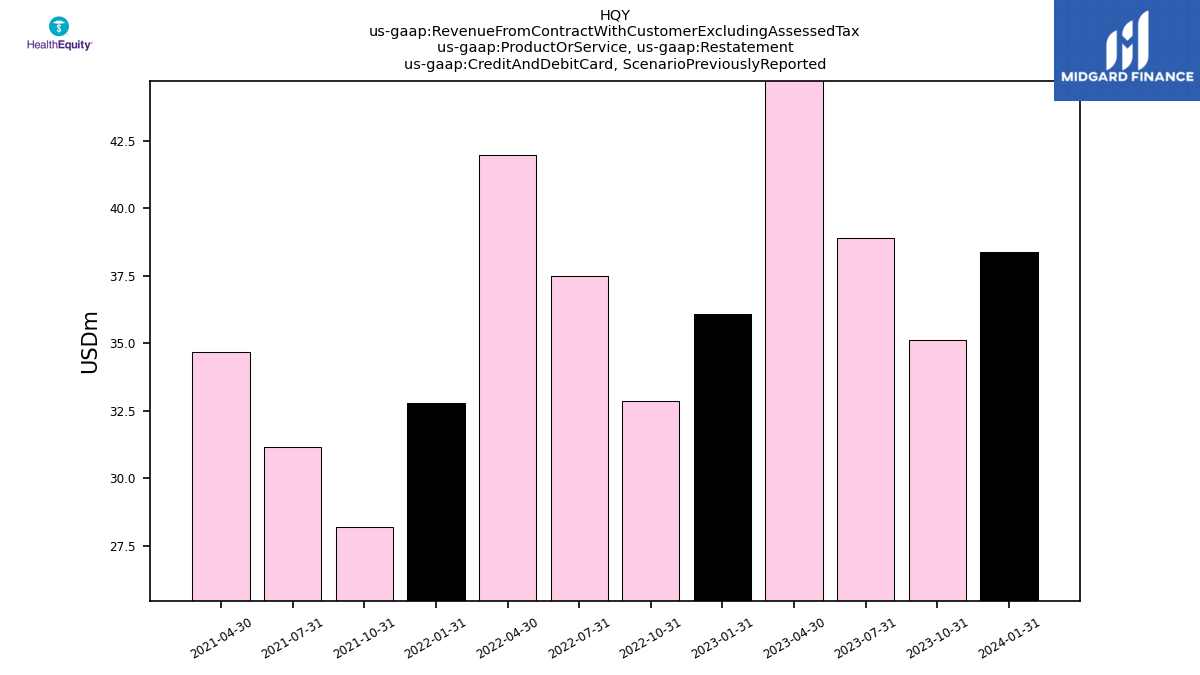
| Revenue From Contract With Customer Excluding Assessed Tax | 262.39 | 249.22 | 243.55 | 244.43 | 233.84 | 216.09 | 206.14 | 205.68 | 203.30 | 179.95 | 189.10 | 184.20 | 188.17 | 179.35 | 176.04 | 190.01 | 201.20 | 157.12 | 86.62 | 87.05 | 75.78 | 70.50 | 71.07 | 69.90 | 60.44 | 56.79 | 56.88 | 55.42 | 46.81 | 43.36 | 44.19 | 44.01 | 35.89 | 30.56 | 30.49 | 29.85 | 24.87 | 21.86 | 20.89 | 20.23 | 17.16 | 15.25 | 14.98 | 14.62 | |
| Credit And Debit Card | 38.38 | 35.13 | 38.91 | 44.88 | 36.10 | 32.86 | 37.51 | 41.97 | 32.78 | 28.21 | 31.14 | 34.69 | 28.26 | 26.25 | 25.32 | 31.84 | 29.69 | 22.53 | 16.73 | 18.29 | 14.54 | 13.89 | 15.42 | 16.65 | 12.62 | 11.72 | 12.79 | NA | NA | NA | NA | NA | NA | NA | NA | NA | NA | NA | NA | NA | NA | NA | NA | NA | |
| Financial Service Other | 105.43 | 106.58 | 98.92 | 94.44 | 77.89 | 74.64 | 65.60 | 59.37 | 53.13 | 49.01 | 48.78 | 46.98 | 48.58 | 48.54 | 46.91 | 46.90 | 49.35 | 46.97 | 43.61 | 41.95 | 35.47 | 31.56 | 30.71 | 28.43 | 24.45 | 22.11 | 21.29 | NA | NA | NA | NA | NA | NA | NA | NA | NA | NA | NA | NA | NA | NA | NA | NA | NA | |
| Service | 118.58 | 107.51 | 105.72 | 105.11 | 119.85 | 108.58 | 103.03 | 104.35 | 117.39 | 102.73 | 109.18 | 102.53 | 111.33 | 104.56 | 103.81 | 111.27 | 122.16 | 87.62 | 26.28 | 26.81 | 25.77 | 25.04 | 24.93 | 24.82 | 23.36 | 22.96 | 22.81 | NA | NA | NA | NA | NA | NA | NA | NA | NA | NA | NA | NA | NA | NA | NA | NA | NA | |
| Credit And Debit Card, | 38.38 | 35.13 | 38.91 | 44.88 | 36.10 | 32.86 | 37.51 | 41.97 | 32.78 | 28.21 | 31.14 | 34.69 | NA | NA | NA | NA | NA | NA | NA | NA | NA | NA | NA | NA | NA | NA | NA | NA | NA | NA | NA | NA | NA | NA | NA | NA | NA | NA | NA | NA | NA | NA | NA | NA | |
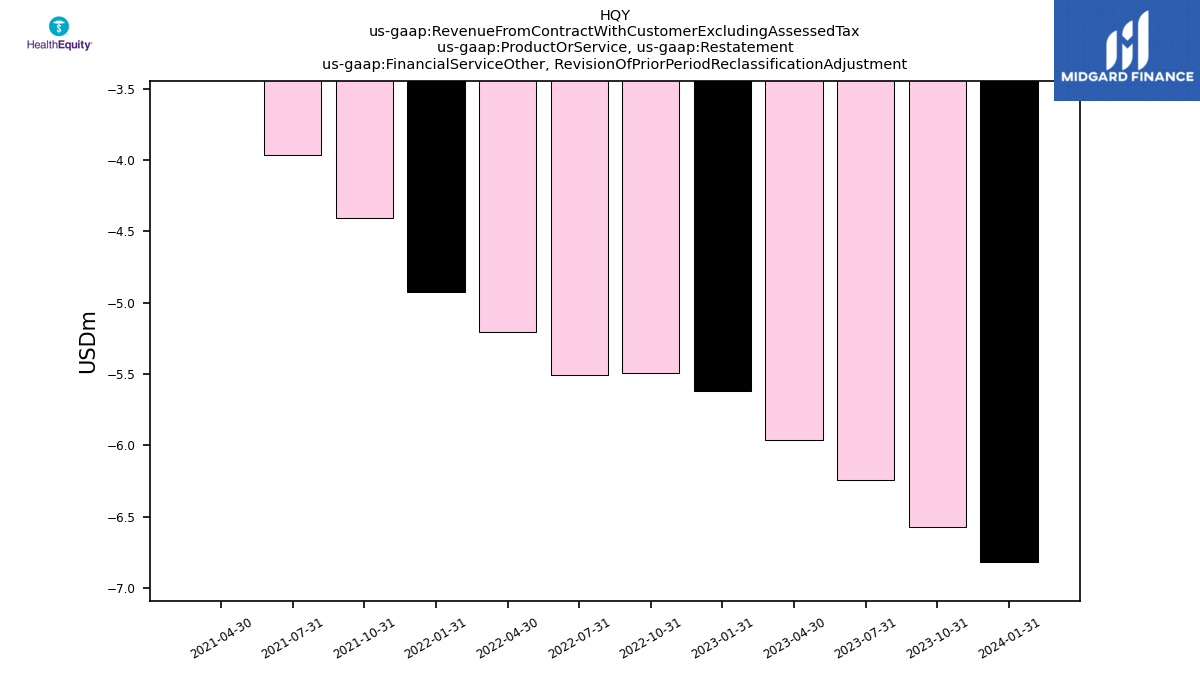
| Financial Service Other, | -6.82 | -6.57 | -6.24 | -5.96 | -5.62 | -5.50 | -5.51 | -5.21 | -4.92 | -4.41 | -3.96 | -3.40 | NA | NA | NA | NA | NA | NA | NA | NA | NA | NA | NA | NA | NA | NA | NA | NA | NA | NA | NA | NA | NA | NA | NA | NA | NA | NA | NA | NA | NA | NA | NA | NA | |
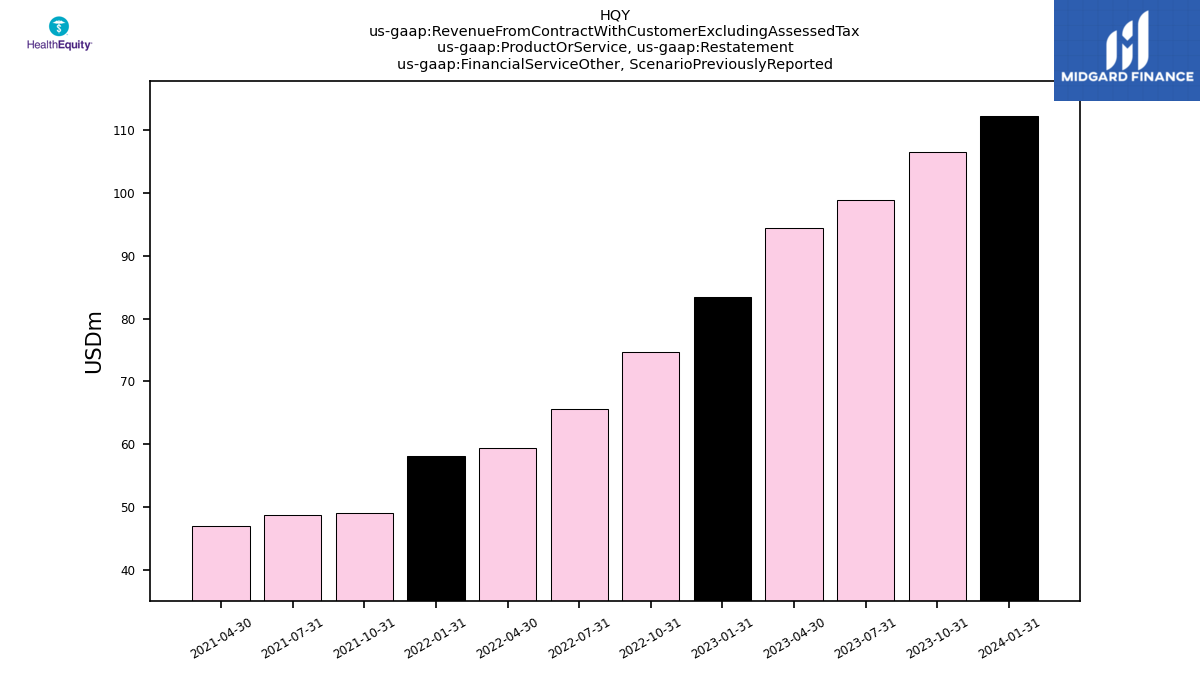
| Financial Service Other, | 112.25 | 106.58 | 98.92 | 94.44 | 83.51 | 74.64 | 65.60 | 59.37 | 58.06 | 49.01 | 48.78 | 46.98 | NA | NA | NA | NA | NA | NA | NA | NA | NA | NA | NA | NA | NA | NA | NA | NA | NA | NA | NA | NA | NA | NA | NA | NA | NA | NA | NA | NA | NA | NA | NA | NA | |
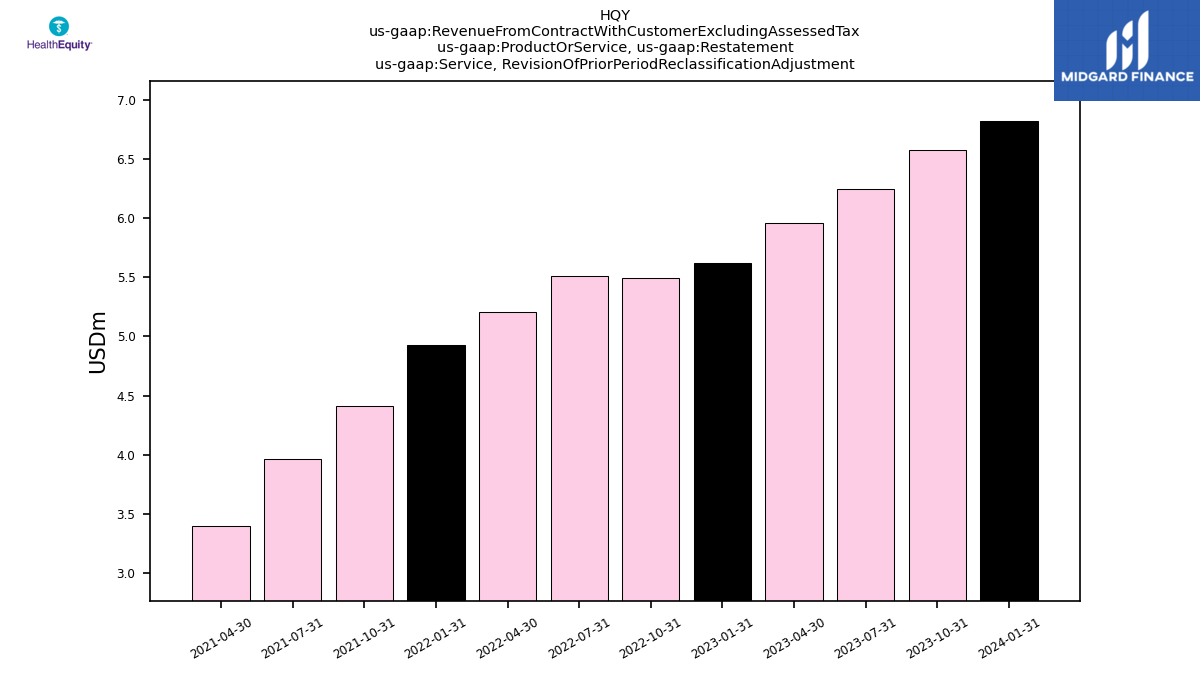
| Service, | 6.82 | 6.57 | 6.24 | 5.96 | 5.62 | 5.50 | 5.51 | 5.21 | 4.92 | 4.41 | 3.96 | 3.40 | NA | NA | NA | NA | NA | NA | NA | NA | NA | NA | NA | NA | NA | NA | NA | NA | NA | NA | NA | NA | NA | NA | NA | NA | NA | NA | NA | NA | NA | NA | NA | NA | |
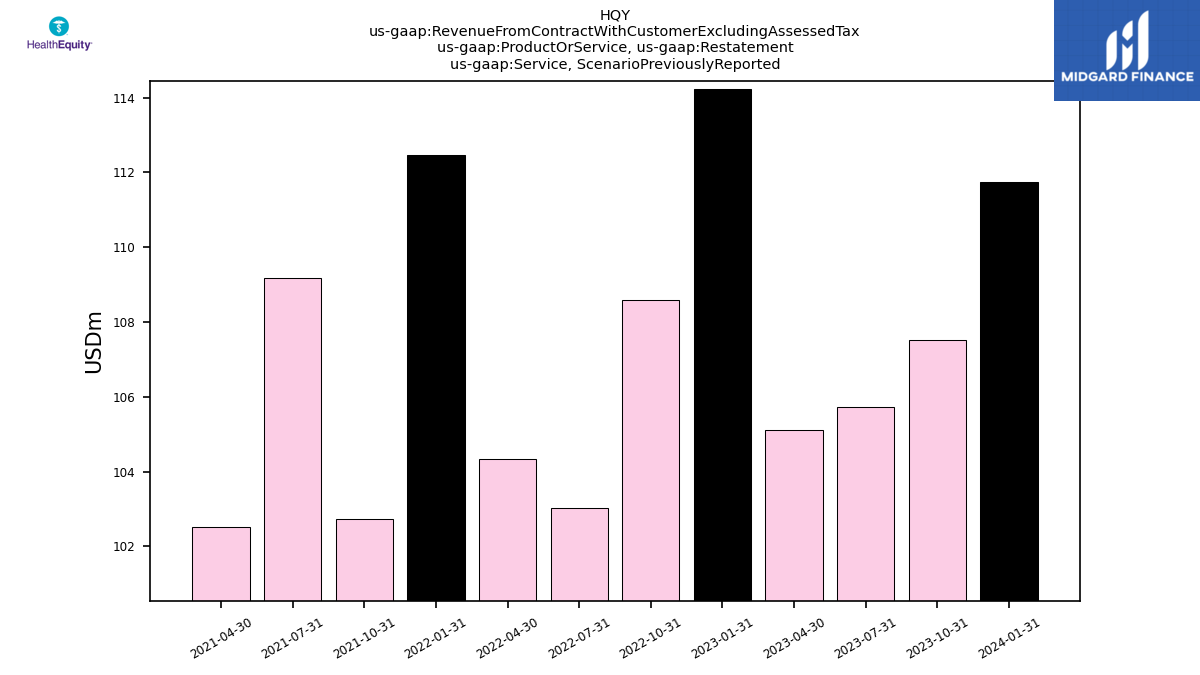
| Service, | 111.76 | 107.51 | 105.72 | 105.11 | 114.23 | 108.58 | 103.03 | 104.35 | 112.46 | 102.73 | 109.18 | 102.53 | NA | NA | NA | NA | NA | NA | NA | NA | NA | NA | NA | NA | NA | NA | NA | NA | NA | NA | NA | NA | NA | NA | NA | NA | NA | NA | NA | NA | NA | NA | NA | NA | |
| 262.39 | 249.22 | 243.55 | 244.43 | 233.84 | 216.09 | 206.14 | 205.68 | 203.30 | 179.95 | 189.10 | 184.20 | NA | NA | NA | NA | NA | NA | NA | NA | NA | NA | NA | NA | NA | NA | NA | NA | NA | NA | NA | NA | NA | NA | NA | NA | NA | NA | NA | NA | NA | NA | NA | NA |