
| 2023-12-31 | 2023-09-30 | 2023-06-30 | 2023-03-31 | 2022-12-31 | 2022-09-30 | 2022-06-30 | 2022-03-31 | 2021-12-31 | 2021-09-30 | 2021-06-30 | 2021-03-31 | 2020-12-31 | 2020-09-30 | 2020-06-30 | 2020-03-31 | ||
|---|---|---|---|---|---|---|---|---|---|---|---|---|---|---|---|---|---|
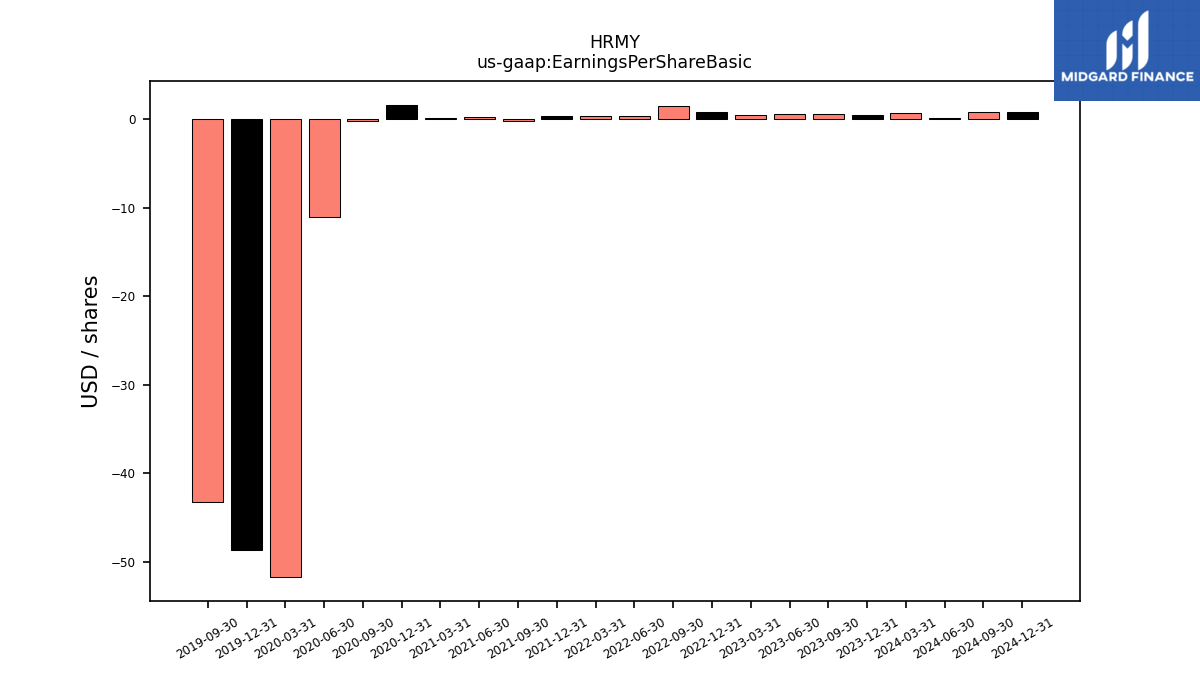
| Earnings Per Share Basic | 0.46 | 0.64 | 0.57 | 0.49 | 0.82 | 1.48 | 0.40 | 0.36 | 0.39 | -0.17 | 0.25 | 0.13 | 1.67 | -0.14 | -11.01 | -51.77 | |
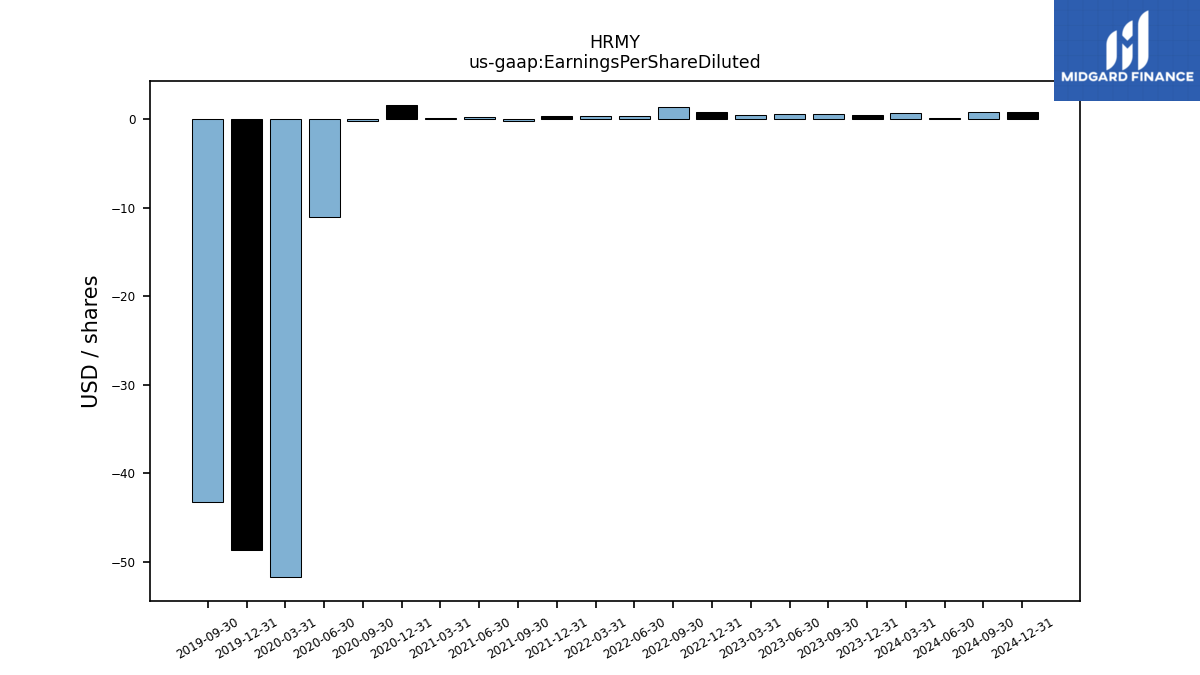
| Earnings Per Share Diluted | 0.45 | 0.63 | 0.56 | 0.48 | 0.79 | 1.44 | 0.39 | 0.35 | 0.38 | -0.17 | 0.24 | 0.13 | 1.67 | -0.14 | -11.01 | -51.77 |
| 2023-12-31 | 2023-09-30 | 2023-06-30 | 2023-03-31 | 2022-12-31 | 2022-09-30 | 2022-06-30 | 2022-03-31 | 2021-12-31 | 2021-09-30 | 2021-06-30 | 2021-03-31 | 2020-12-31 | 2020-09-30 | 2020-06-30 | 2020-03-31 | ||
|---|---|---|---|---|---|---|---|---|---|---|---|---|---|---|---|---|---|
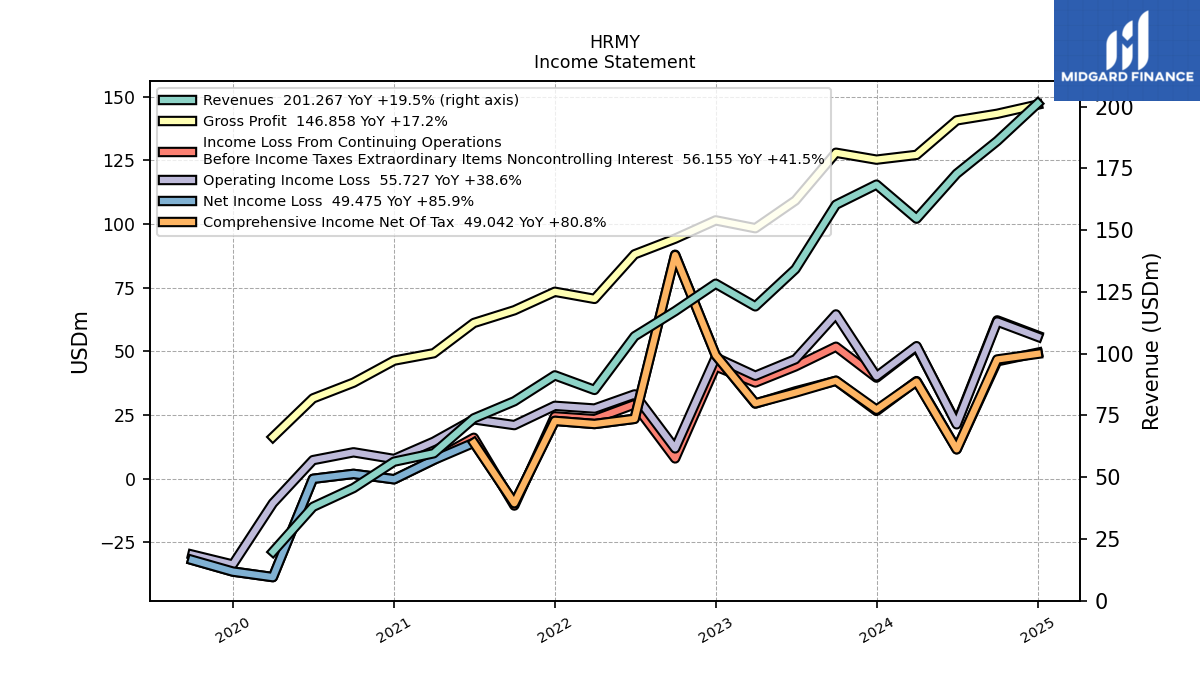
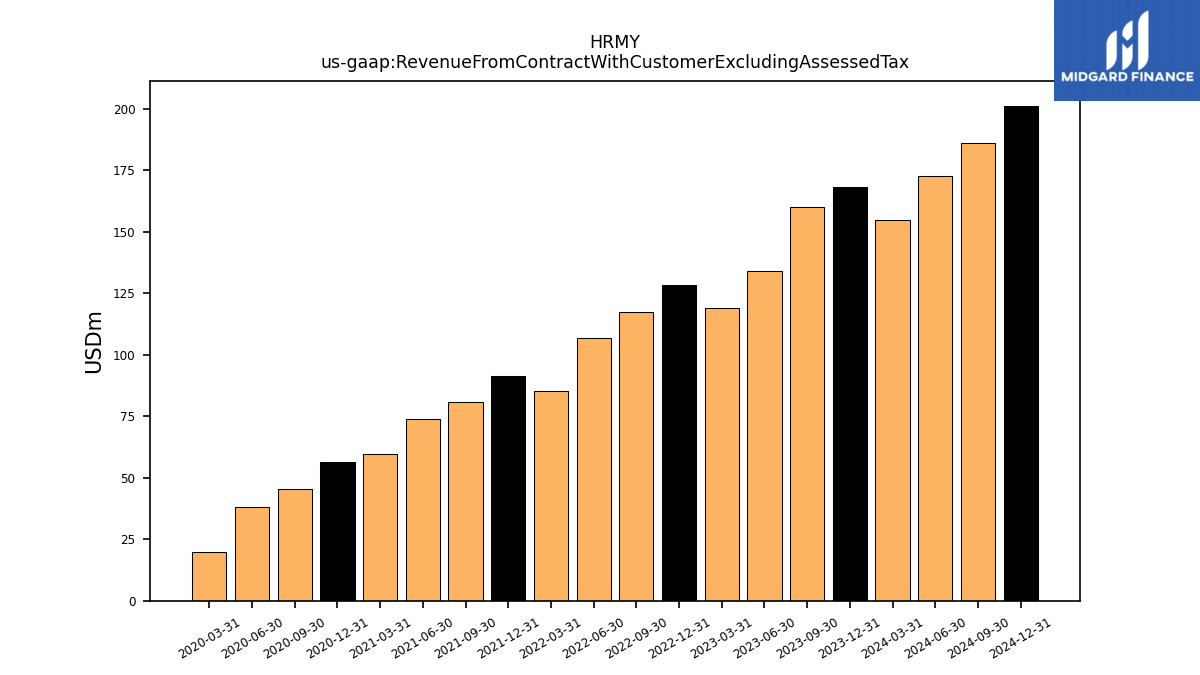
| Revenue From Contract With Customer Excluding Assessed Tax | 168.41 | 160.27 | 134.22 | 119.13 | 128.31 | 117.21 | 107.03 | 85.31 | 91.21 | 80.73 | 73.82 | 59.67 | 56.29 | 45.61 | 38.01 | 19.84 | |
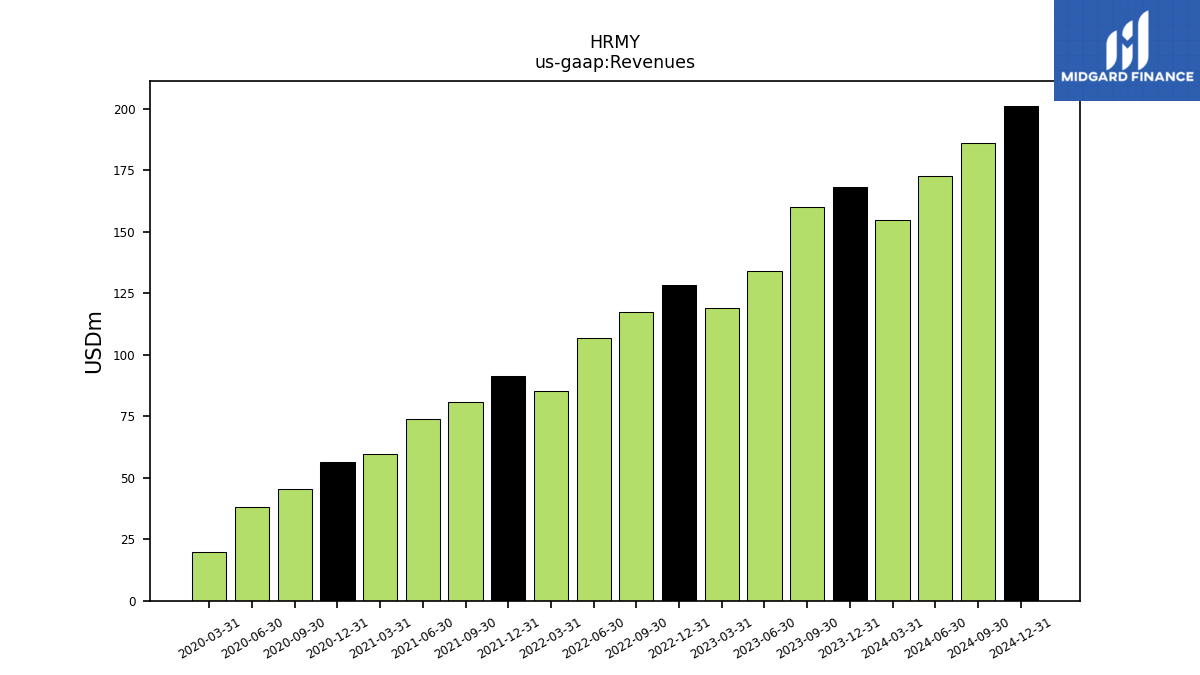
| Revenues | 168.41 | 160.27 | 134.22 | 119.13 | 128.31 | 117.21 | 107.03 | 85.31 | 91.21 | 80.73 | 73.82 | 59.67 | 56.29 | 45.61 | 38.01 | 19.84 | |
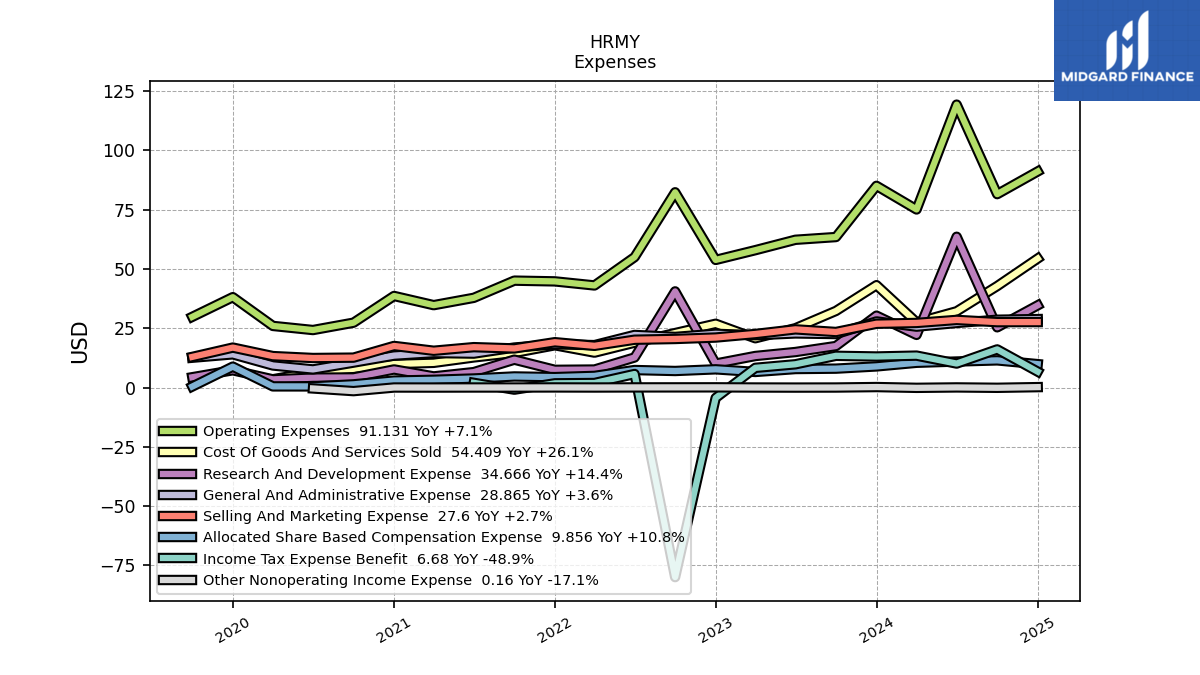
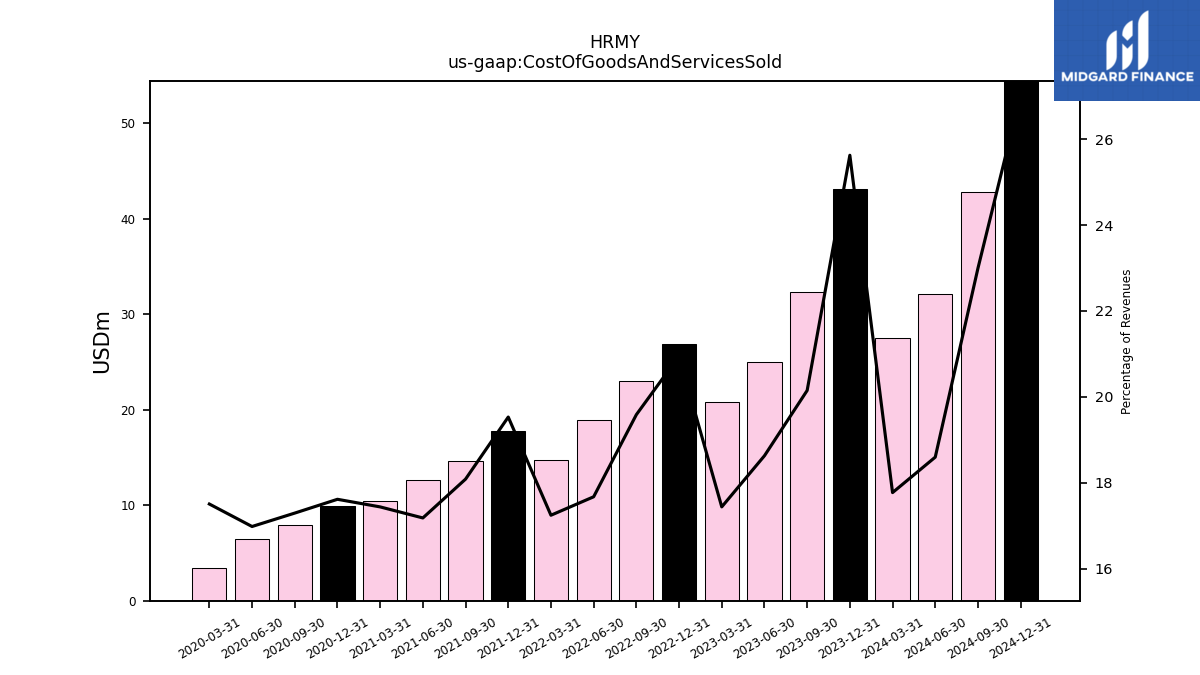
| Cost Of Goods And Services Sold | 43.15 | 32.30 | 25.01 | 20.78 | 26.89 | 22.96 | 18.92 | 14.72 | 17.82 | 14.60 | 12.69 | 10.41 | 9.92 | 7.89 | 6.46 | 3.47 | |
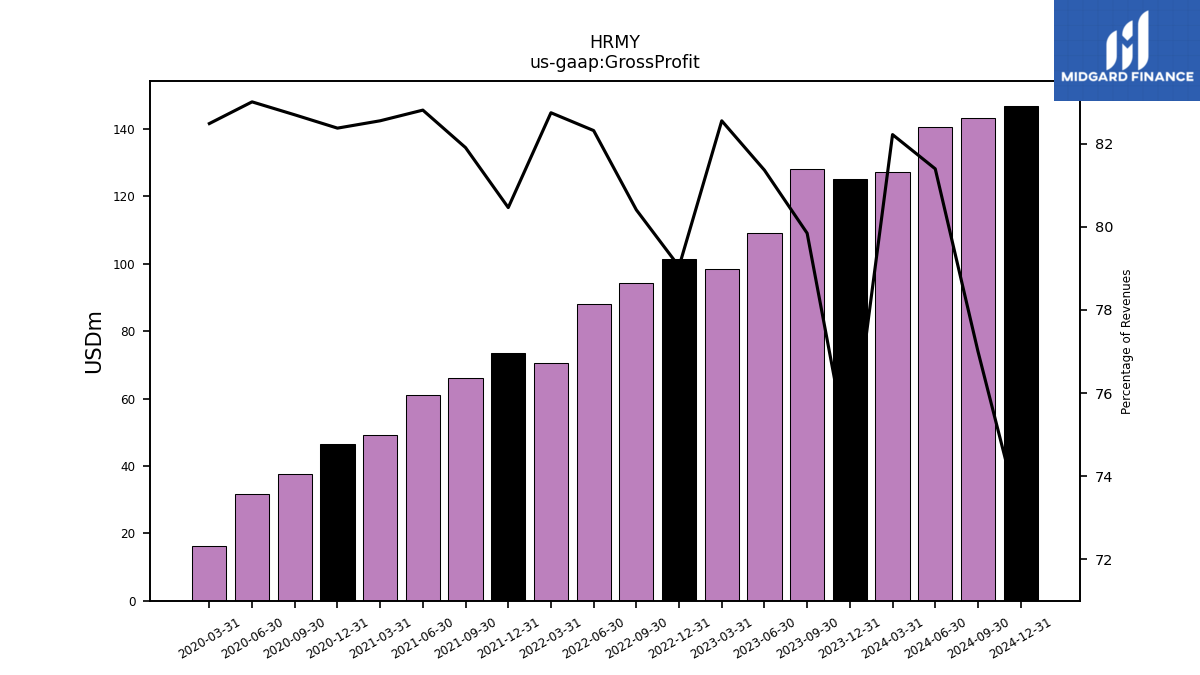
| Gross Profit | 125.26 | 127.97 | 109.21 | 98.35 | 101.42 | 94.25 | 88.11 | 70.60 | 73.40 | 66.13 | 61.13 | 49.27 | 46.37 | 37.72 | 31.55 | 16.37 | |
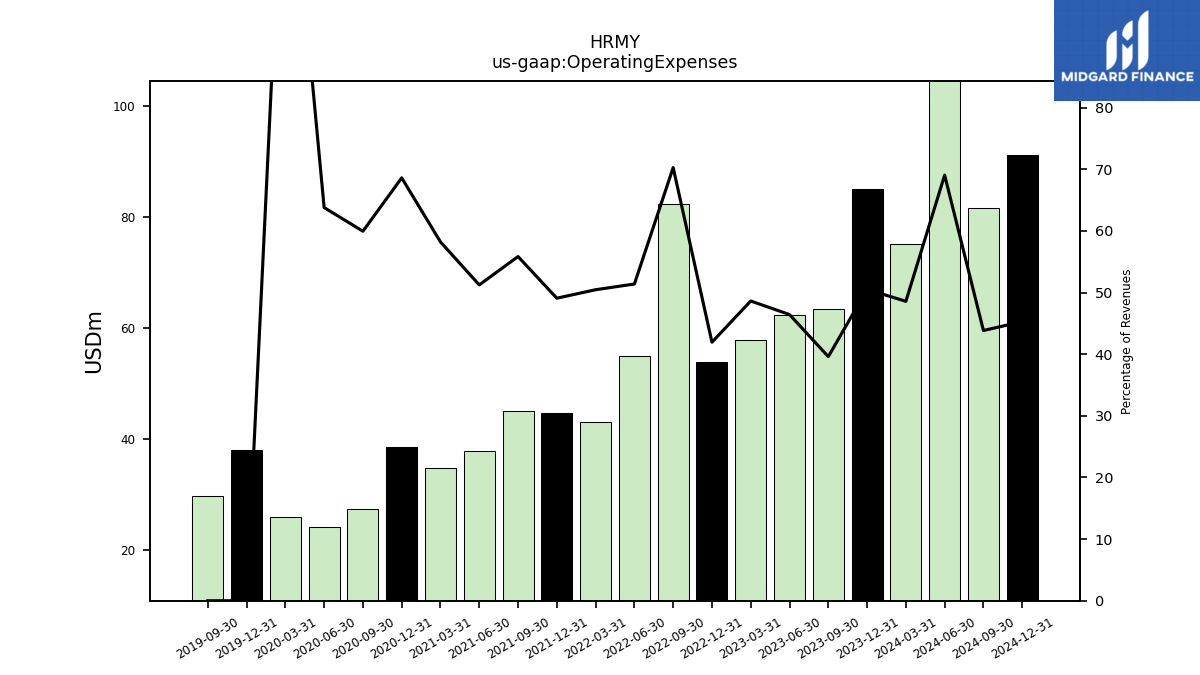
| Operating Expenses | 85.06 | 63.46 | 62.31 | 57.92 | 53.81 | 82.35 | 54.99 | 43.04 | 44.77 | 45.08 | 37.82 | 34.73 | 38.61 | 27.34 | 24.24 | 25.98 | |
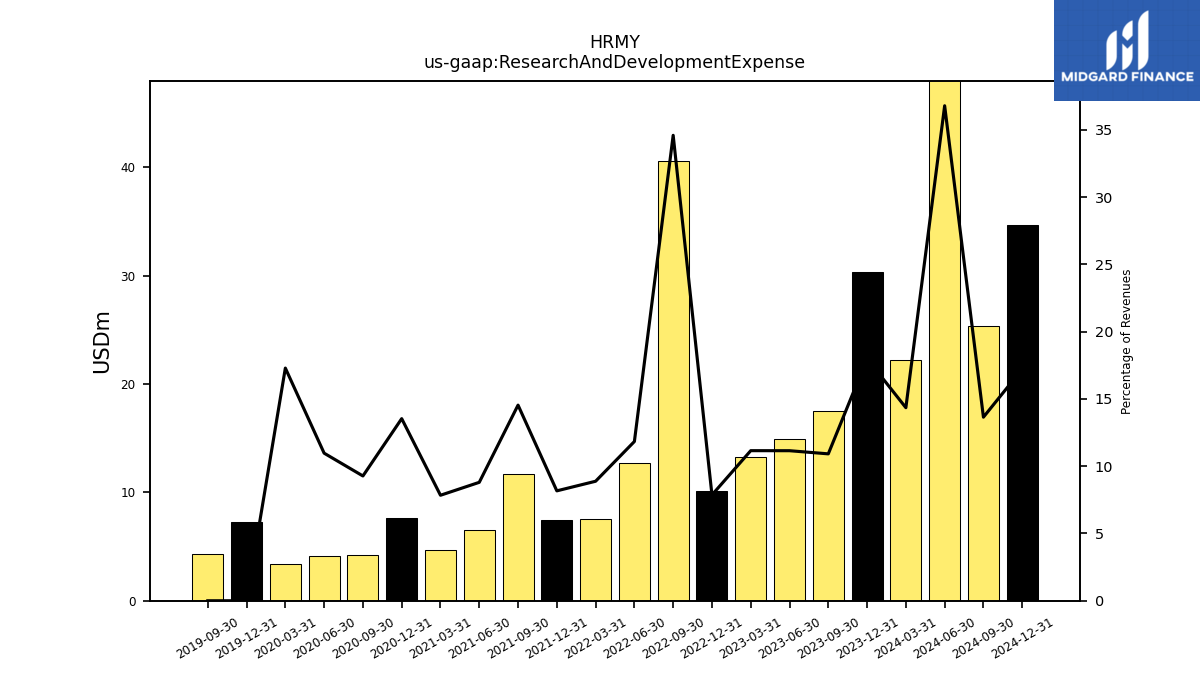
| Research And Development Expense | 30.31 | 17.50 | 14.97 | 13.29 | 10.09 | 40.55 | 12.67 | 7.58 | 7.45 | 11.74 | 6.50 | 4.68 | 7.62 | 4.23 | 4.17 | 3.43 | |
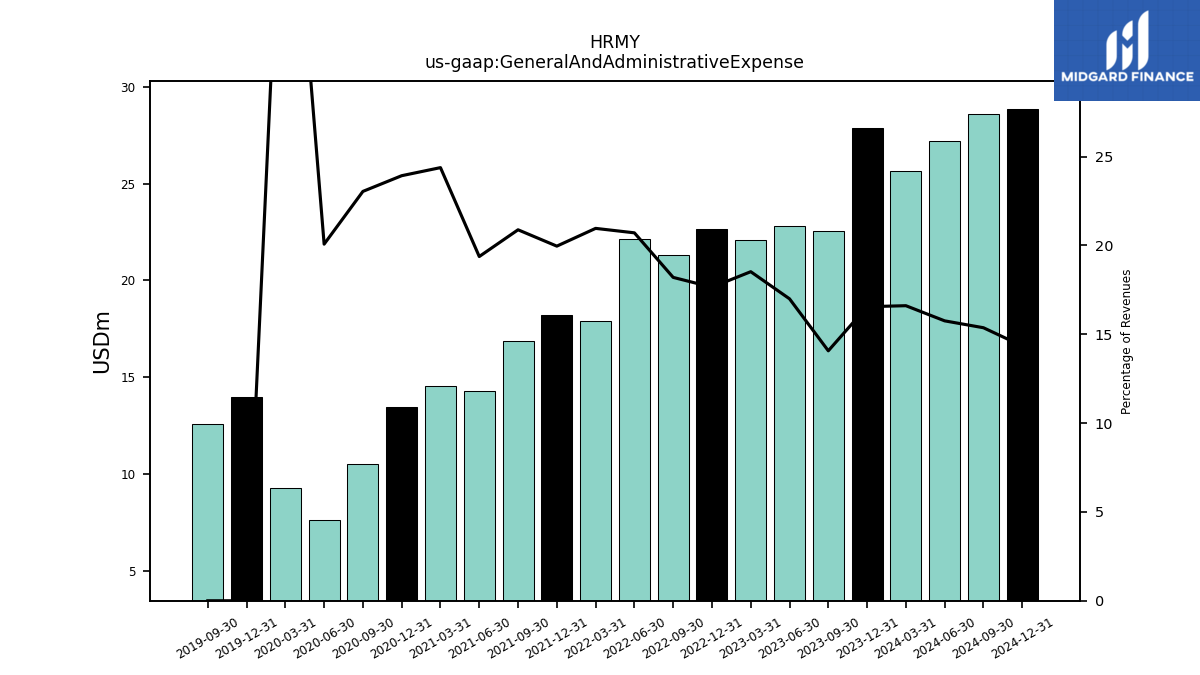
| General And Administrative Expense | 27.87 | 22.55 | 22.81 | 22.06 | 22.64 | 21.33 | 22.16 | 17.88 | 18.20 | 16.86 | 14.30 | 14.55 | 13.47 | 10.51 | 7.63 | 9.29 | |
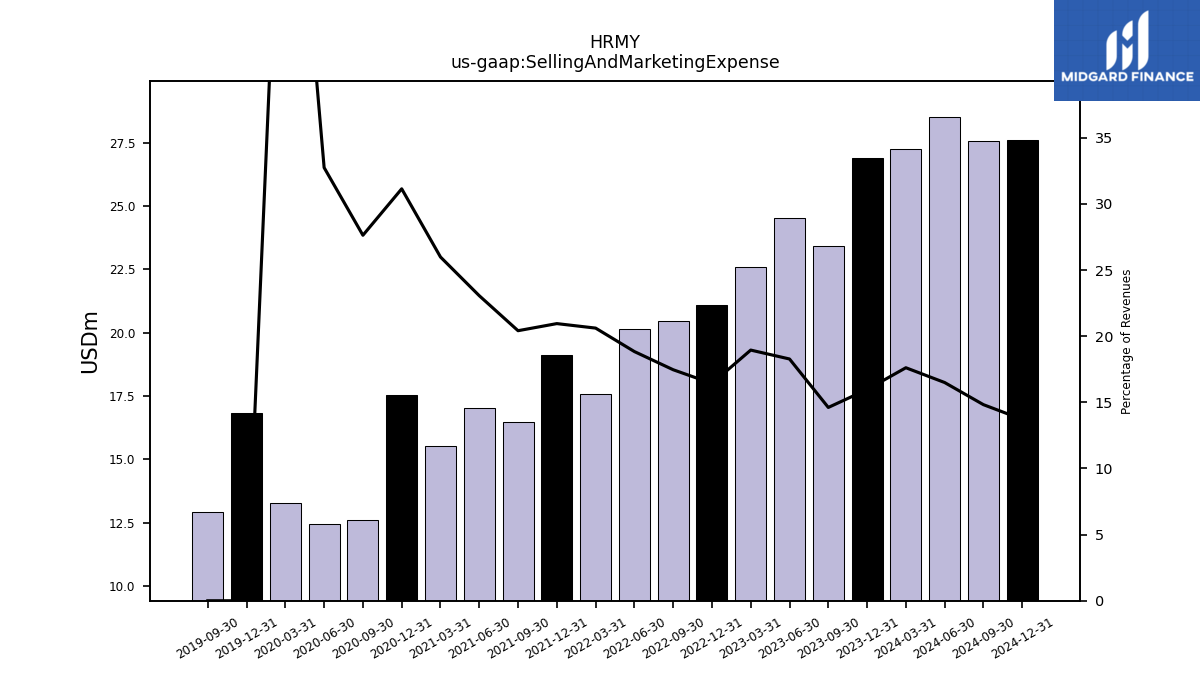
| Selling And Marketing Expense | 26.89 | 23.42 | 24.53 | 22.57 | 21.07 | 20.47 | 20.16 | 17.58 | 19.11 | 16.48 | 17.02 | 15.51 | 17.53 | 12.60 | 12.44 | 13.25 | |
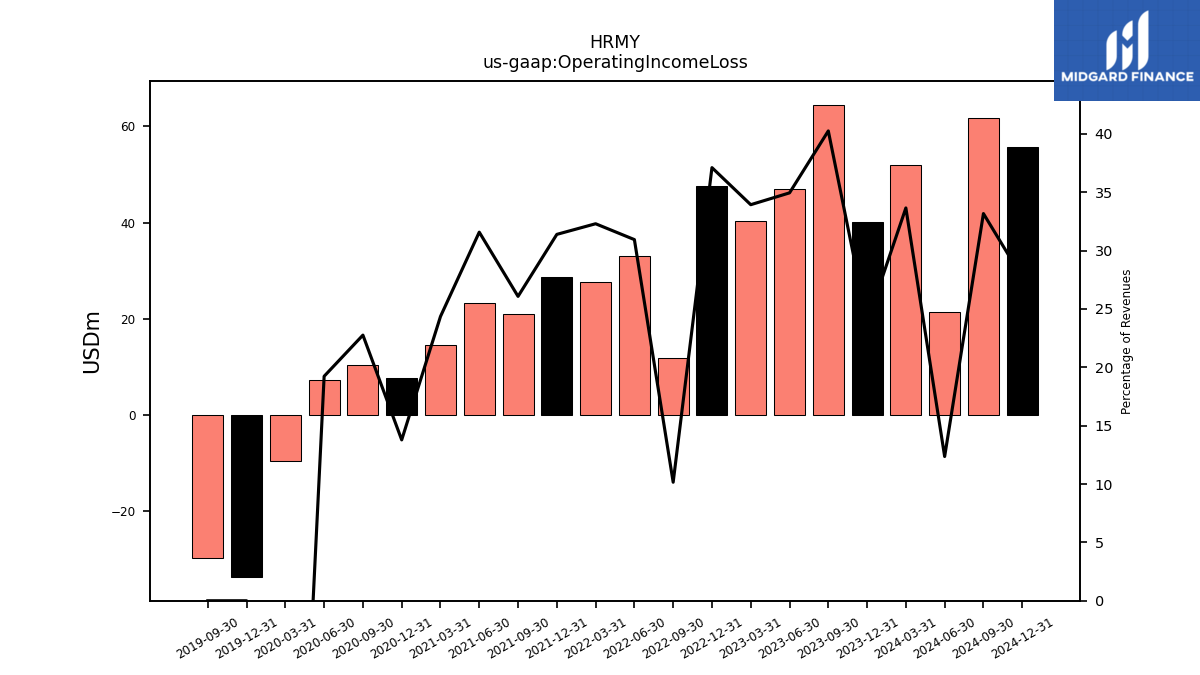
| Operating Income Loss | 40.20 | 64.51 | 46.90 | 40.42 | 47.61 | 11.90 | 33.12 | 27.56 | 28.63 | 21.05 | 23.31 | 14.53 | 7.76 | 10.38 | 7.31 | -9.61 | |
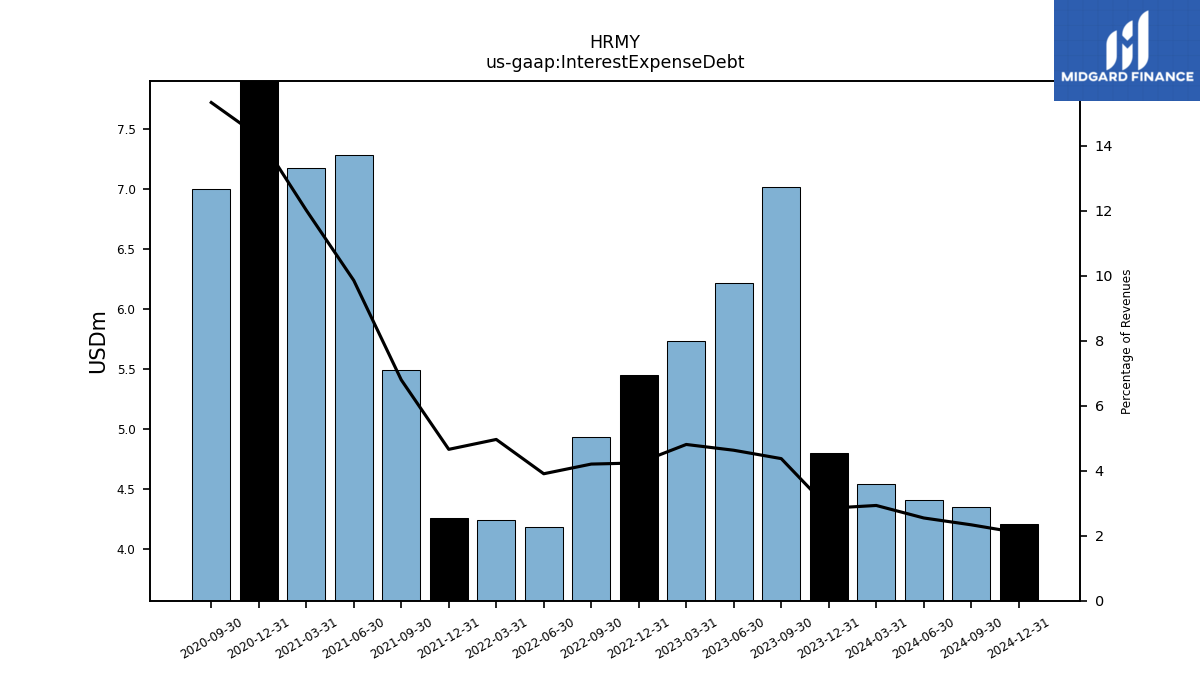
| Interest Expense Debt | 4.80 | 7.01 | 6.22 | 5.73 | 5.44 | 4.93 | 4.18 | 4.24 | 4.25 | 5.49 | 7.28 | 7.17 | 8.05 | 7.00 | NA | NA | |
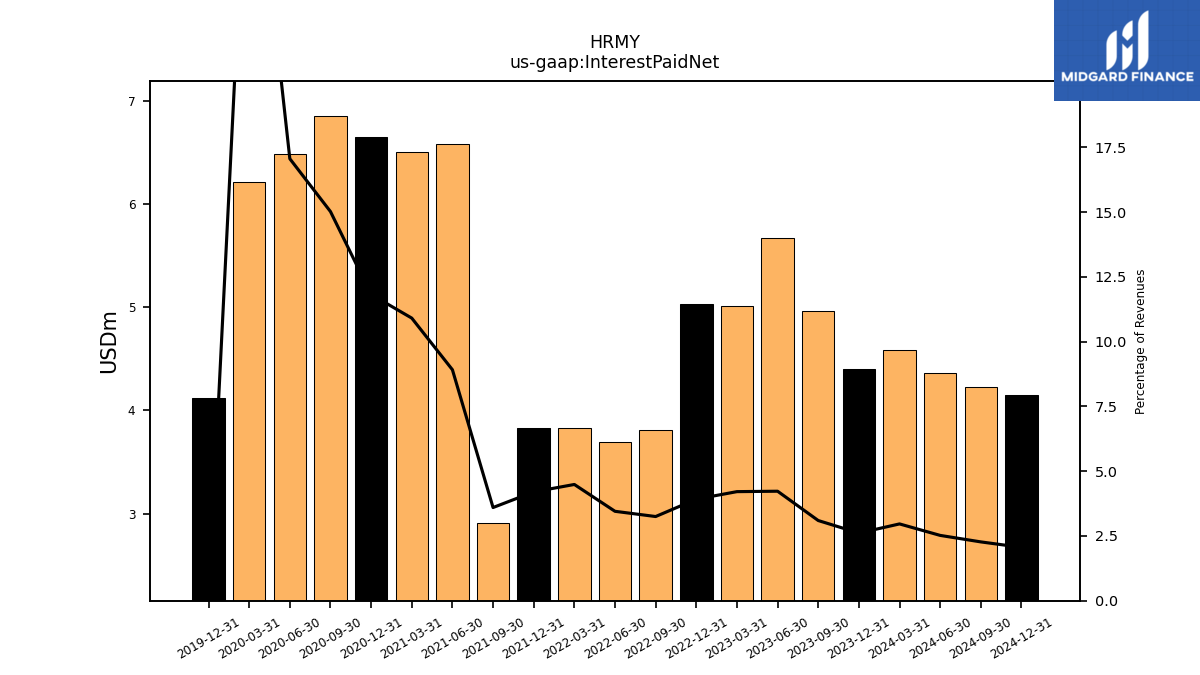
| Interest Paid Net | 4.40 | 4.96 | 5.67 | 5.02 | 5.03 | 3.81 | 3.69 | 3.83 | 3.83 | 2.90 | 6.58 | 6.51 | 6.65 | 6.85 | 6.48 | 6.21 | |
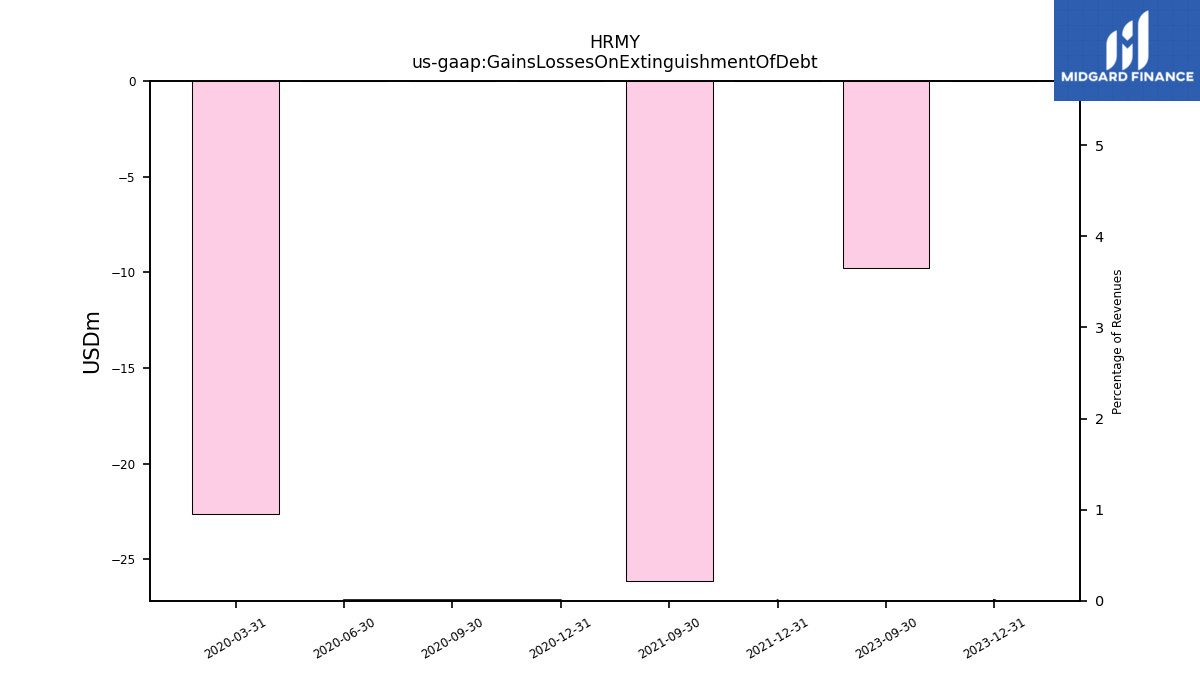
| Gains Losses On Extinguishment Of Debt | 0.00 | -9.77 | NA | NA | NA | NA | NA | NA | 0.00 | -26.15 | NA | NA | 0.00 | 0.00 | 0.00 | -22.64 | |
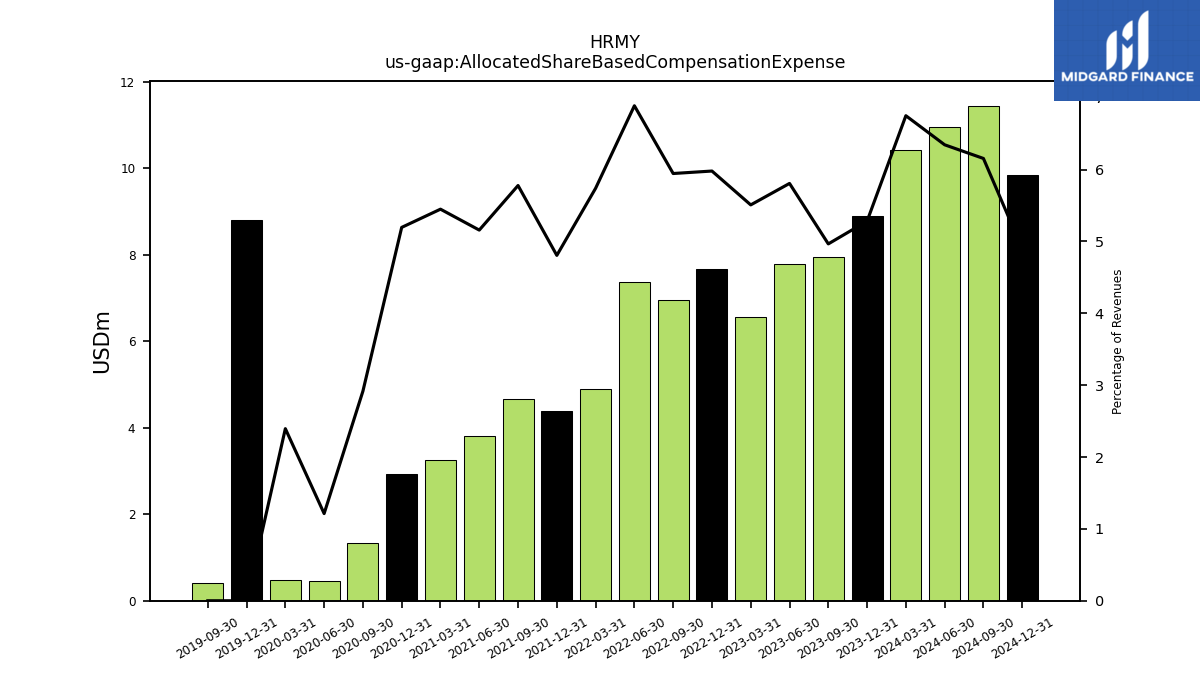
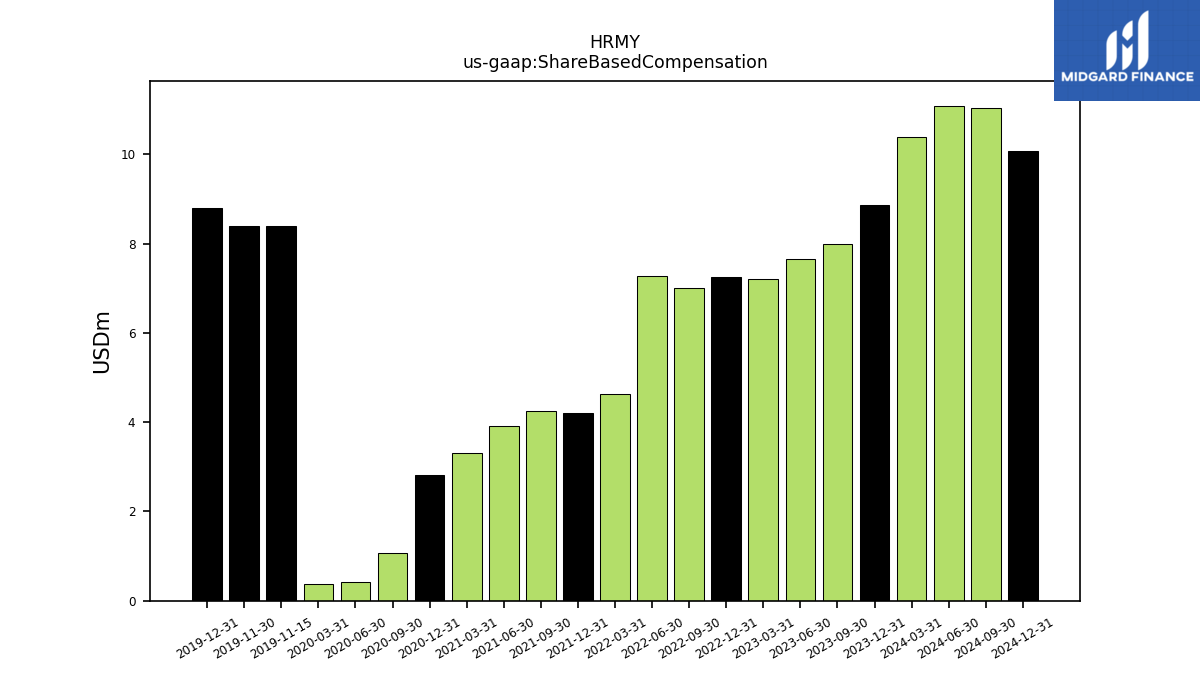
| Allocated Share Based Compensation Expense | 8.89 | 7.96 | 7.79 | 6.56 | 7.67 | 6.97 | 7.37 | 4.90 | 4.38 | 4.66 | 3.81 | 3.25 | 2.92 | 1.33 | 0.46 | 0.47 | |
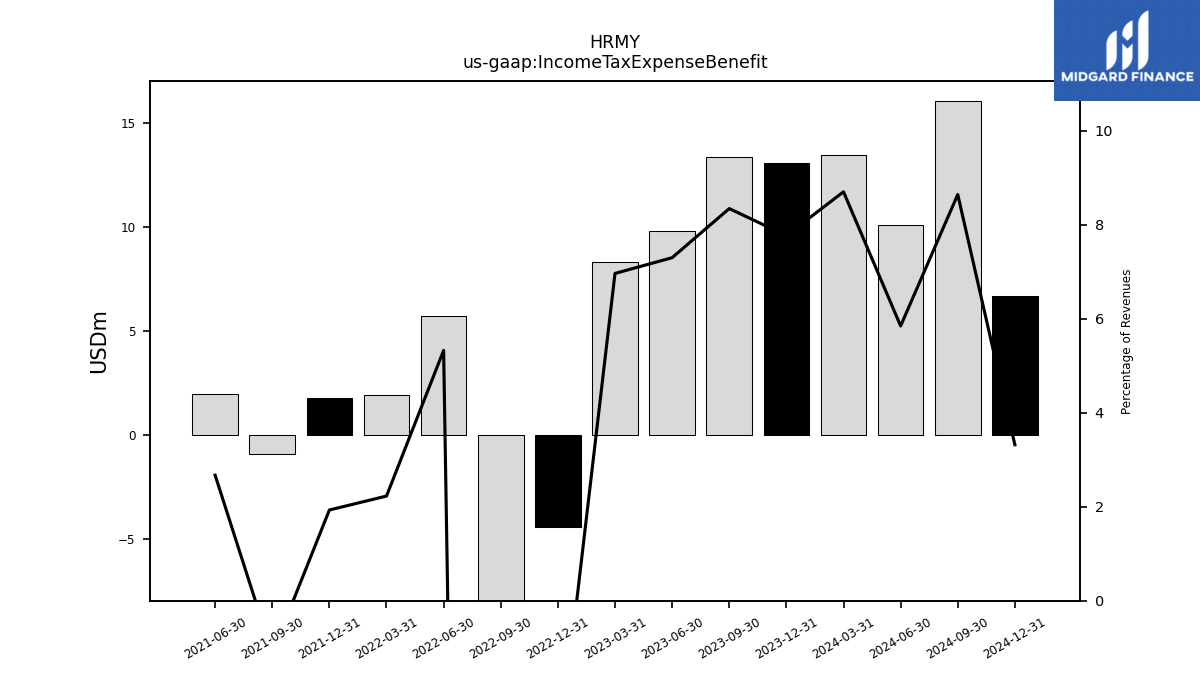
| Income Tax Expense Benefit | 13.08 | 13.37 | 9.79 | 8.29 | -4.41 | -79.98 | 5.70 | 1.90 | 1.76 | -0.90 | 1.97 | NA | NA | NA | NA | NA | |
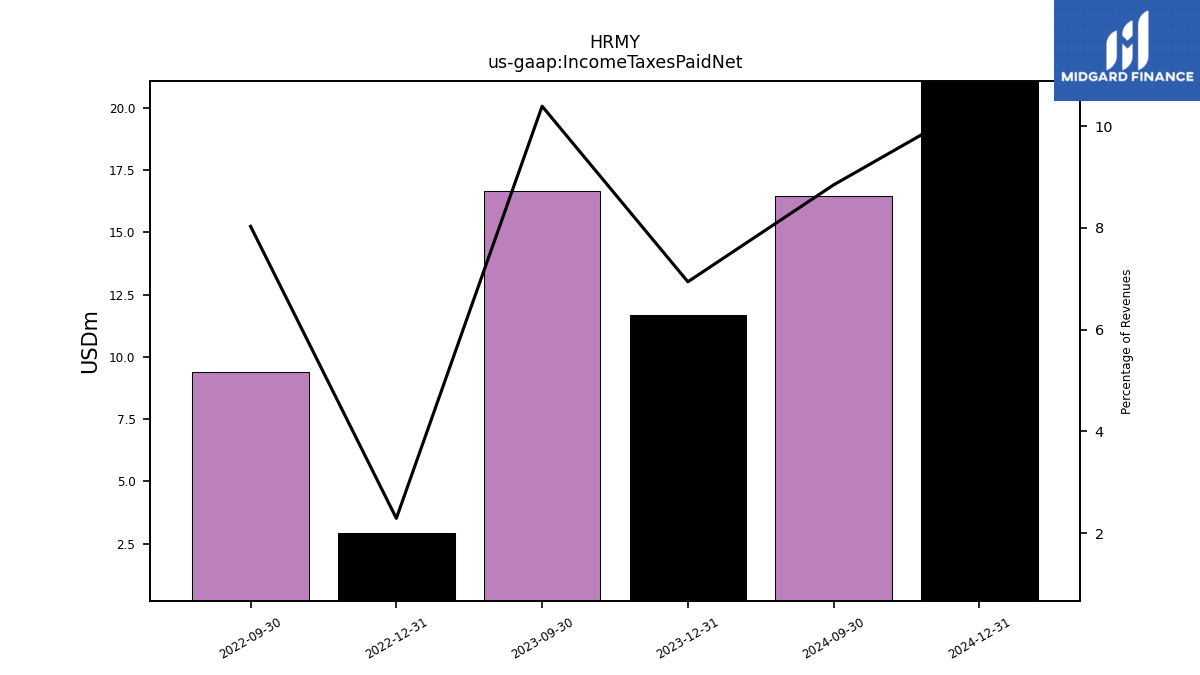
| Income Taxes Paid Net | 11.69 | 16.65 | NA | NA | 2.94 | 9.41 | NA | NA | NA | NA | NA | NA | NA | NA | NA | NA | |
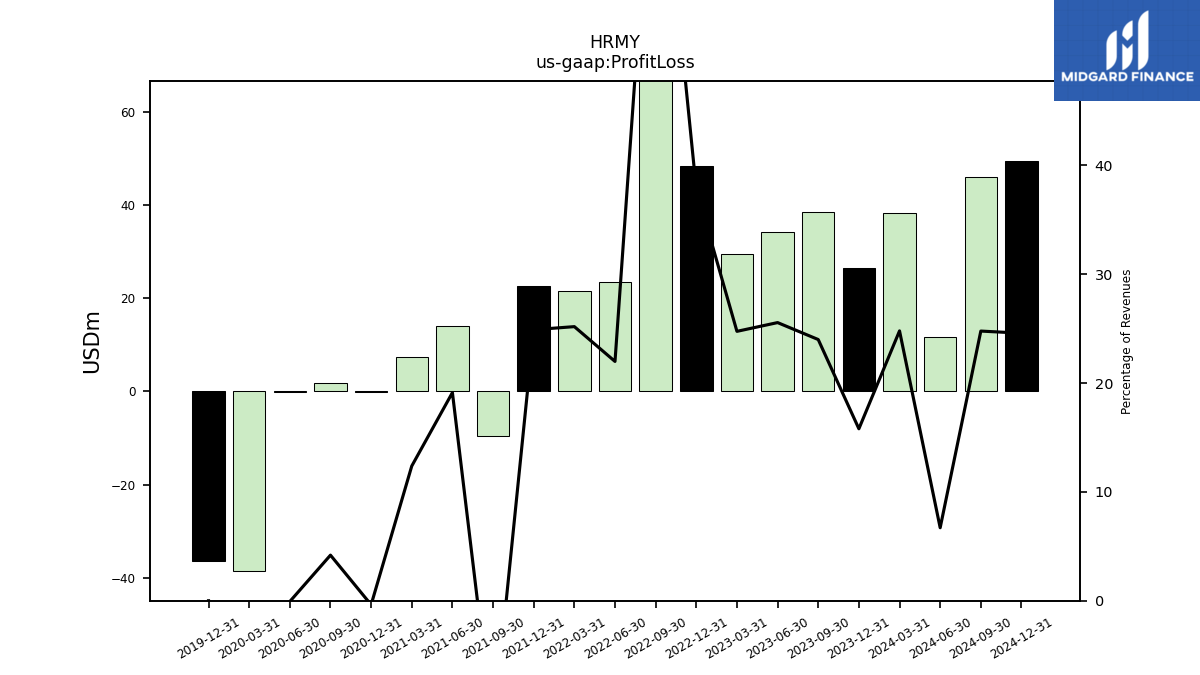
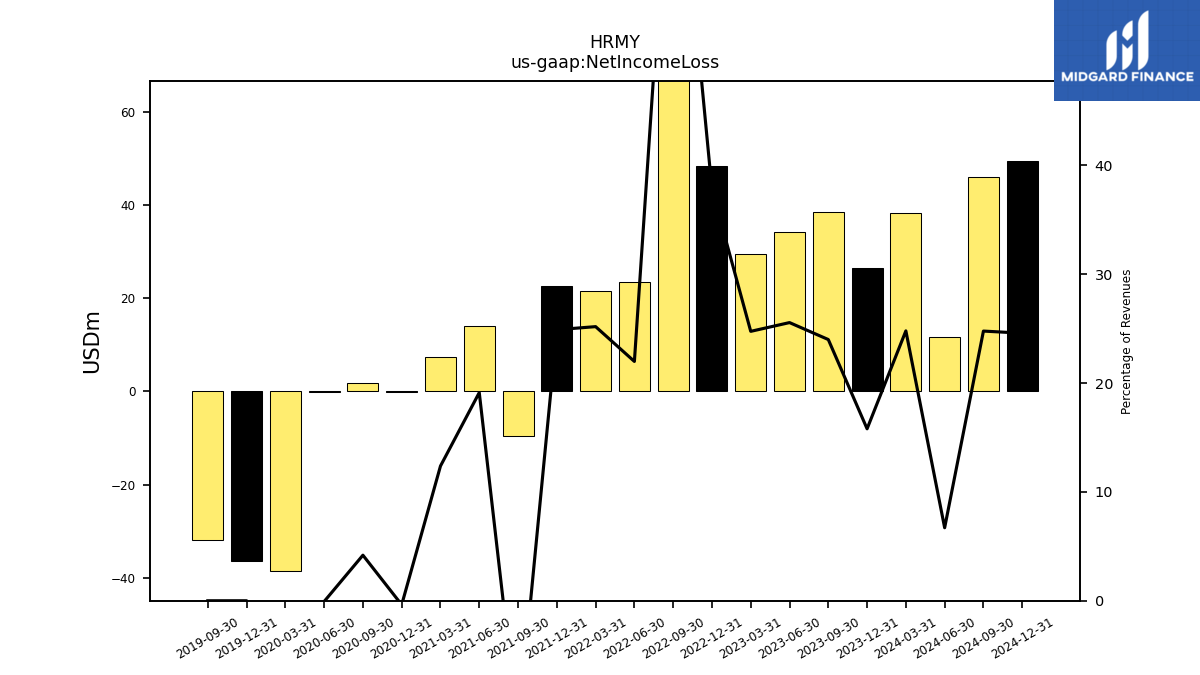
| Profit Loss | 26.61 | 38.46 | 34.30 | 29.48 | 48.51 | 87.94 | 23.53 | 21.48 | 22.71 | -9.62 | 14.12 | 7.39 | -0.21 | 1.91 | -0.03 | -38.62 | |
| Net Income Loss | 26.61 | 38.46 | 34.30 | 29.48 | 48.51 | 87.94 | 23.53 | 21.48 | 22.71 | -9.62 | 14.12 | 7.39 | -0.21 | 1.91 | -0.03 | -38.62 | |
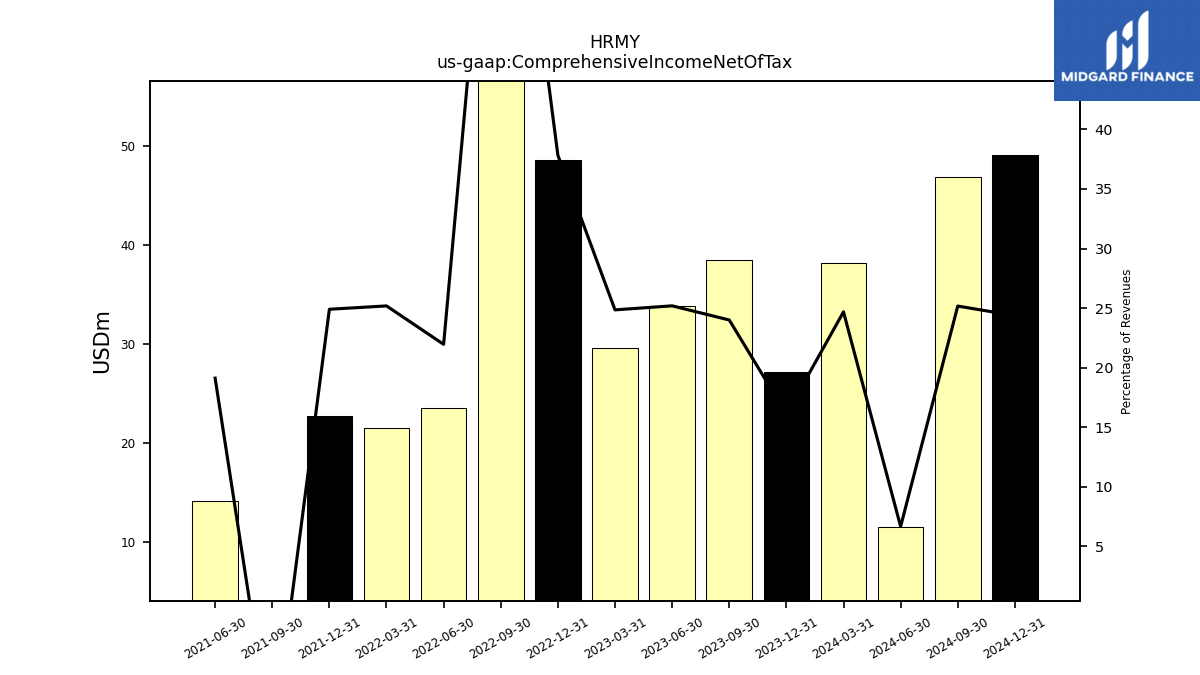
| Comprehensive Income Net Of Tax | 27.12 | 38.47 | 33.81 | 29.61 | 48.54 | 87.79 | 23.50 | 21.48 | 22.71 | -9.62 | 14.12 | NA | NA | NA | NA | NA |
| 2023-12-31 | 2023-09-30 | 2023-06-30 | 2023-03-31 | 2022-12-31 | 2022-09-30 | 2022-06-30 | 2022-03-31 | 2021-12-31 | 2021-09-30 | 2021-06-30 | 2021-03-31 | 2020-12-31 | 2020-09-30 | 2020-06-30 | 2020-03-31 | ||
|---|---|---|---|---|---|---|---|---|---|---|---|---|---|---|---|---|---|
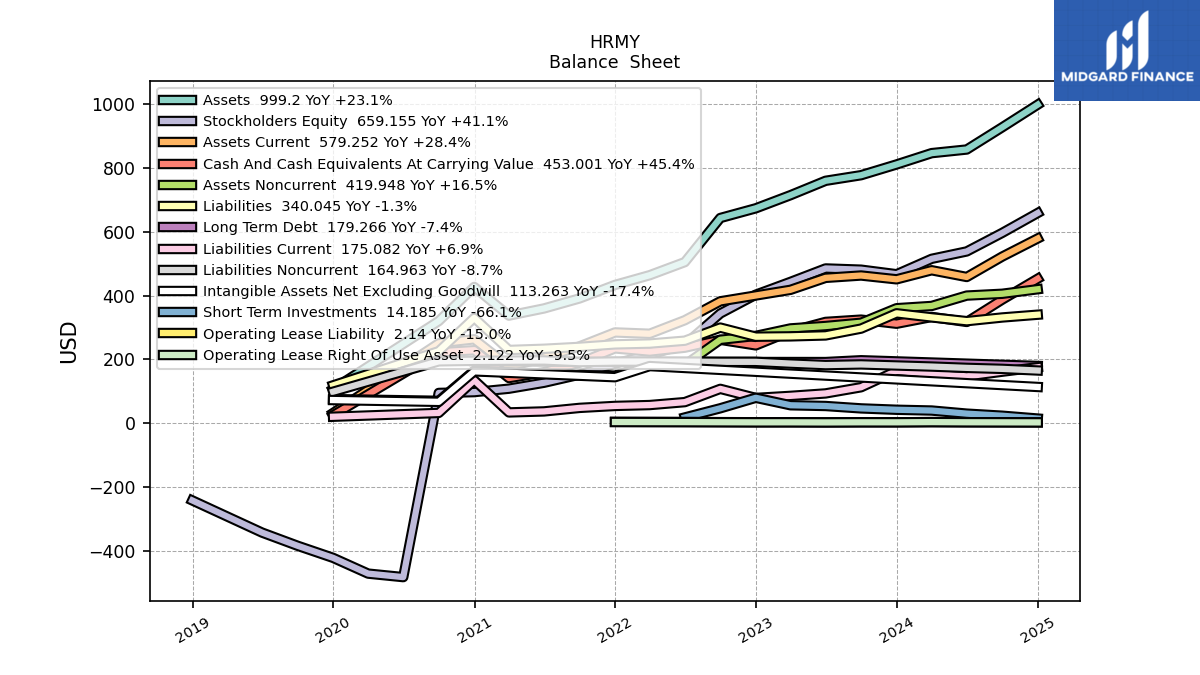
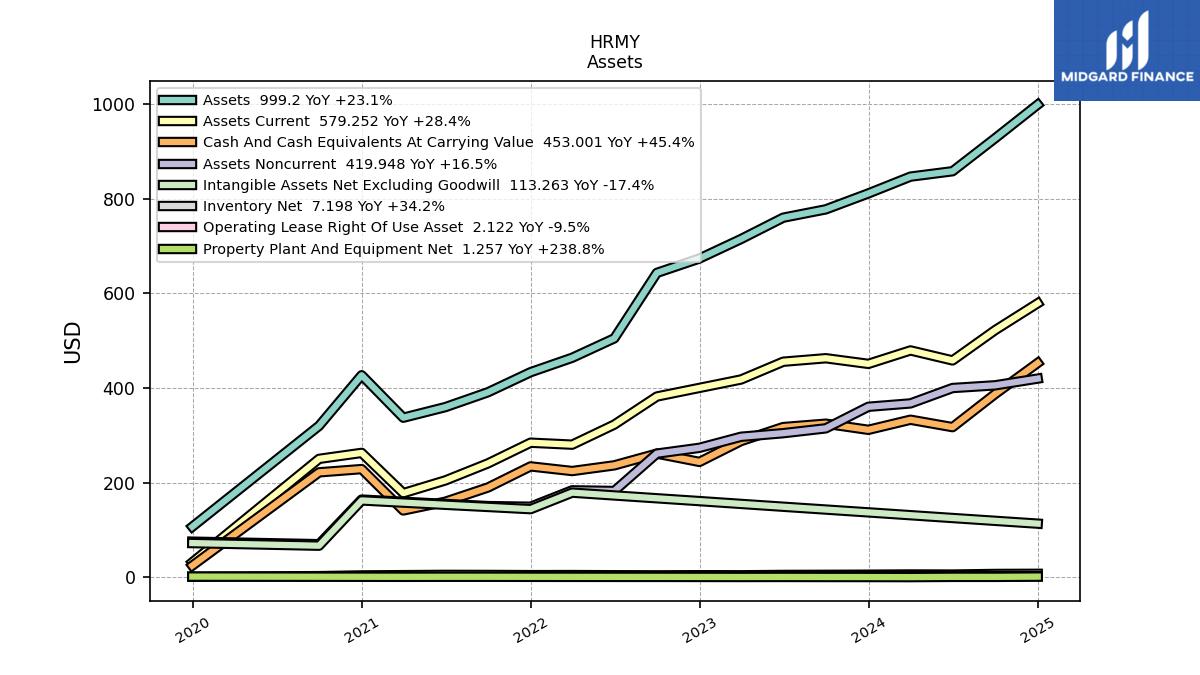
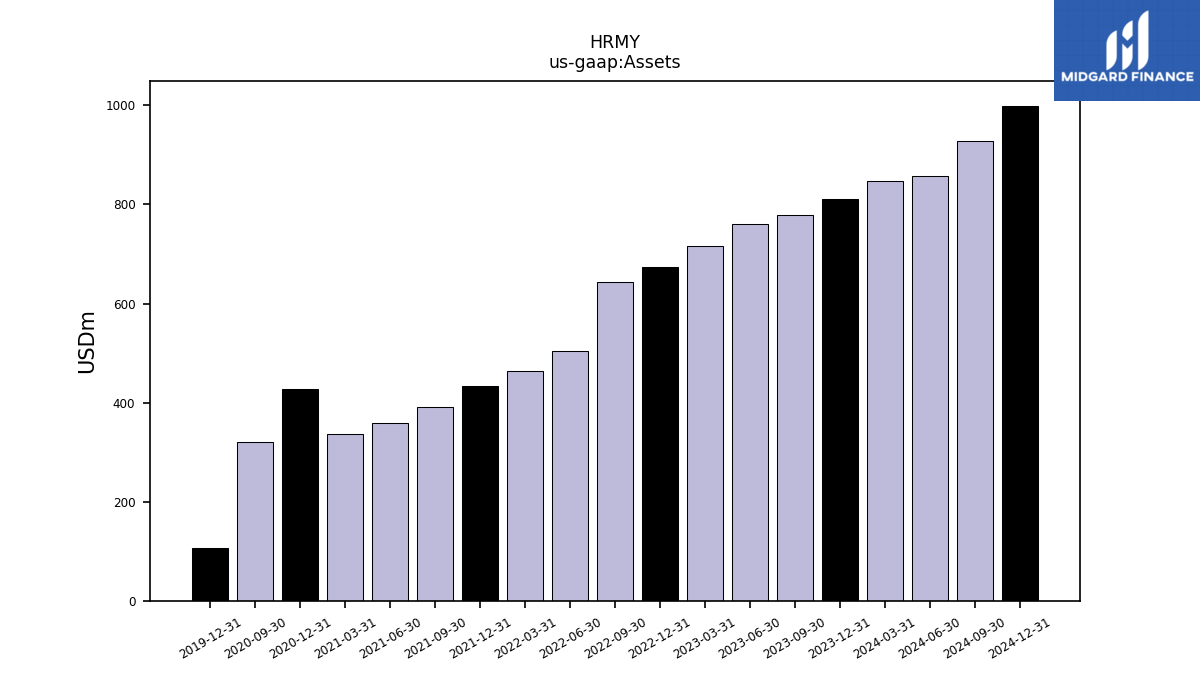
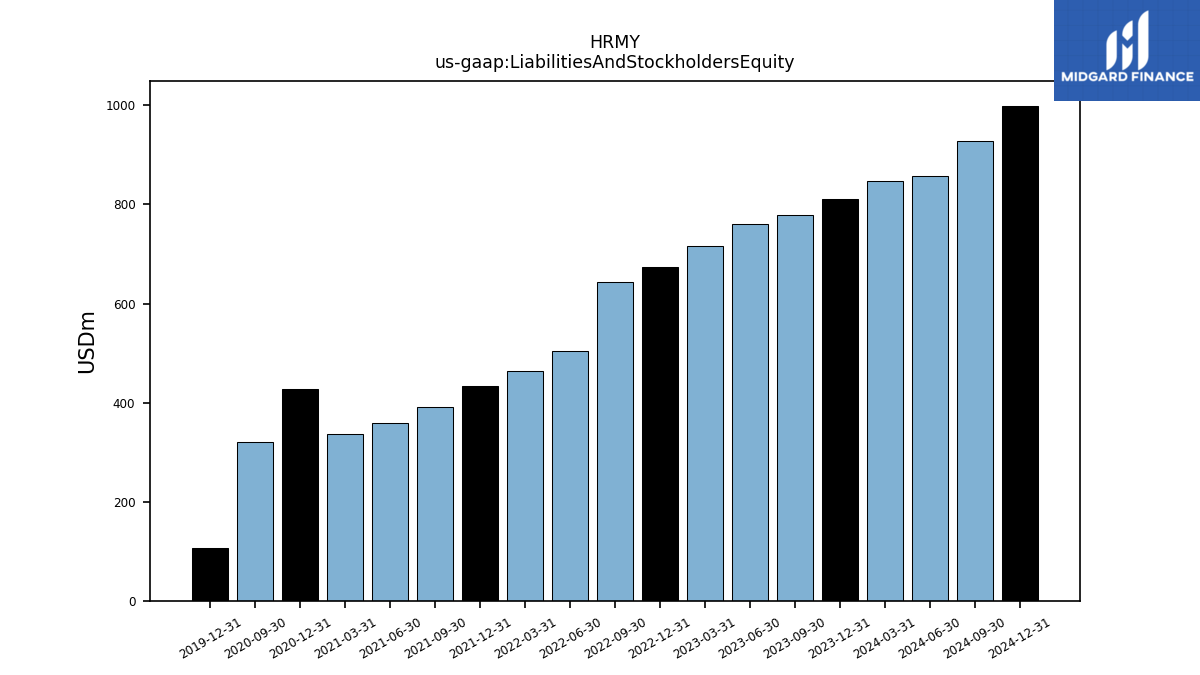
| Assets | 811.45 | 777.77 | 760.18 | 715.09 | 673.87 | 643.46 | 505.03 | 464.00 | 433.44 | 391.09 | 359.69 | 337.25 | 427.07 | 320.07 | NA | NA | |
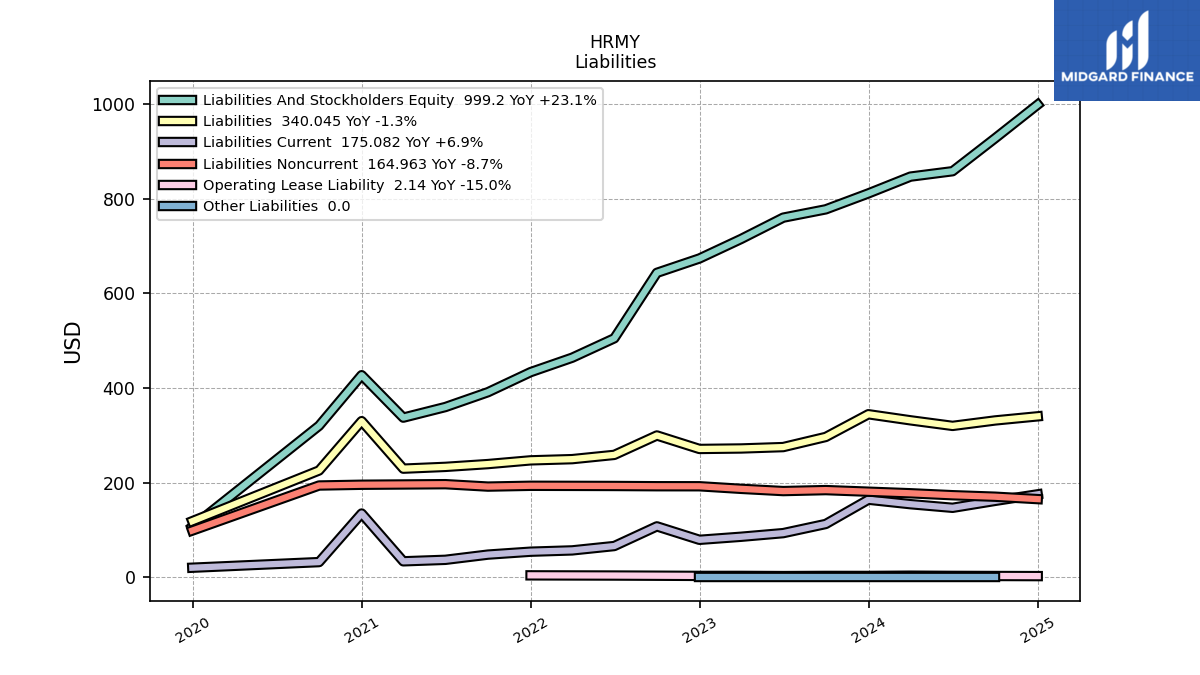
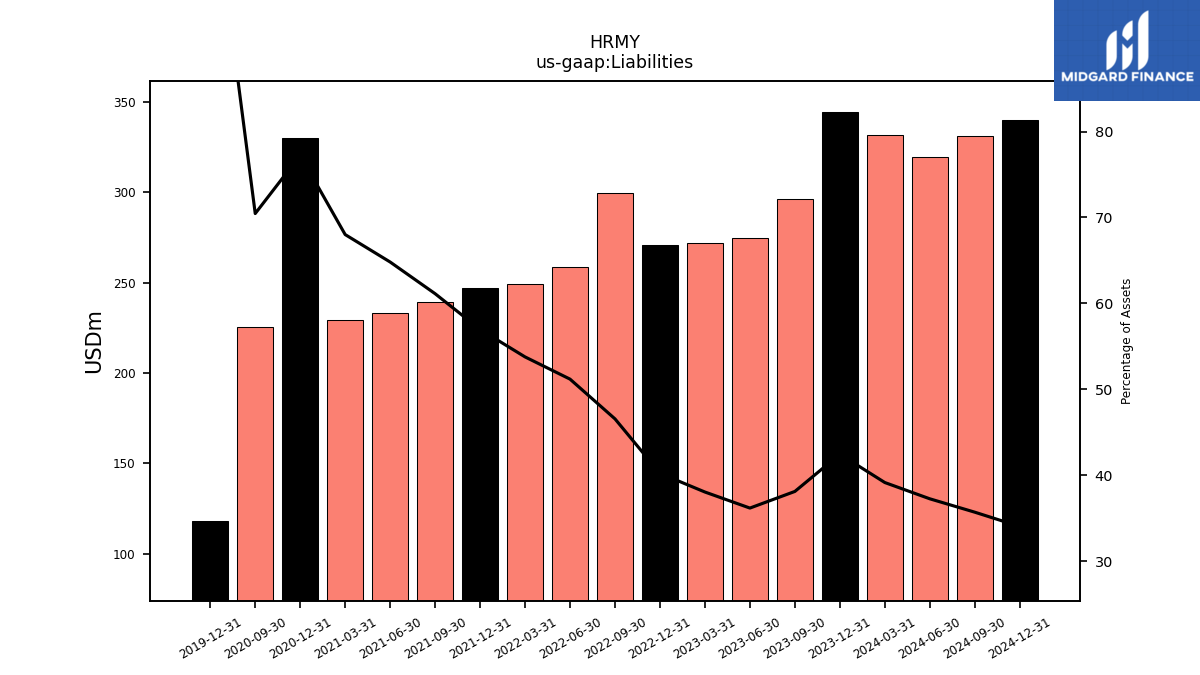
| Liabilities | 344.46 | 296.43 | 275.01 | 272.05 | 271.03 | 299.58 | 258.50 | 249.50 | 246.94 | 239.07 | 233.14 | 229.37 | 329.89 | 225.52 | NA | NA | |
| Liabilities And Stockholders Equity | 811.45 | 777.77 | 760.18 | 715.09 | 673.87 | 643.46 | 505.03 | 464.00 | 433.44 | 391.09 | 359.69 | 337.25 | 427.07 | 320.07 | NA | NA | |
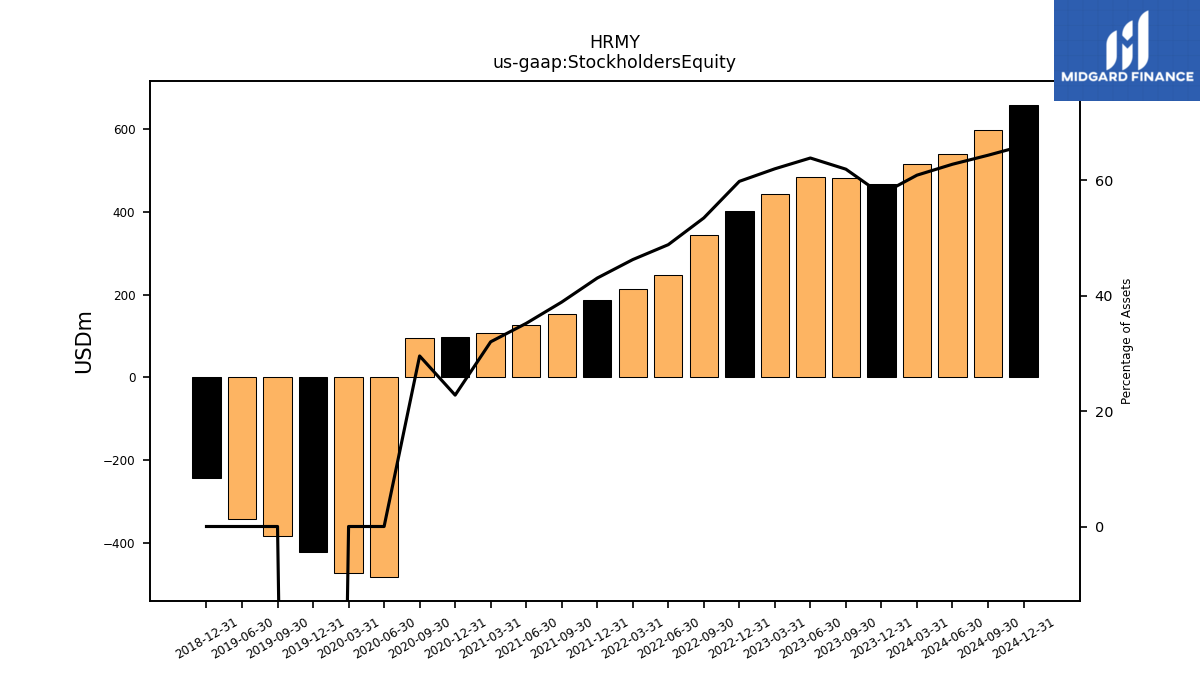
| Stockholders Equity | 466.99 | 481.33 | 485.17 | 443.04 | 402.84 | 343.88 | 246.53 | 214.50 | 186.51 | 152.02 | 126.55 | 107.88 | 97.18 | 94.55 | -483.36 | -472.33 |
| 2023-12-31 | 2023-09-30 | 2023-06-30 | 2023-03-31 | 2022-12-31 | 2022-09-30 | 2022-06-30 | 2022-03-31 | 2021-12-31 | 2021-09-30 | 2021-06-30 | 2021-03-31 | 2020-12-31 | 2020-09-30 | 2020-06-30 | 2020-03-31 | ||
|---|---|---|---|---|---|---|---|---|---|---|---|---|---|---|---|---|---|
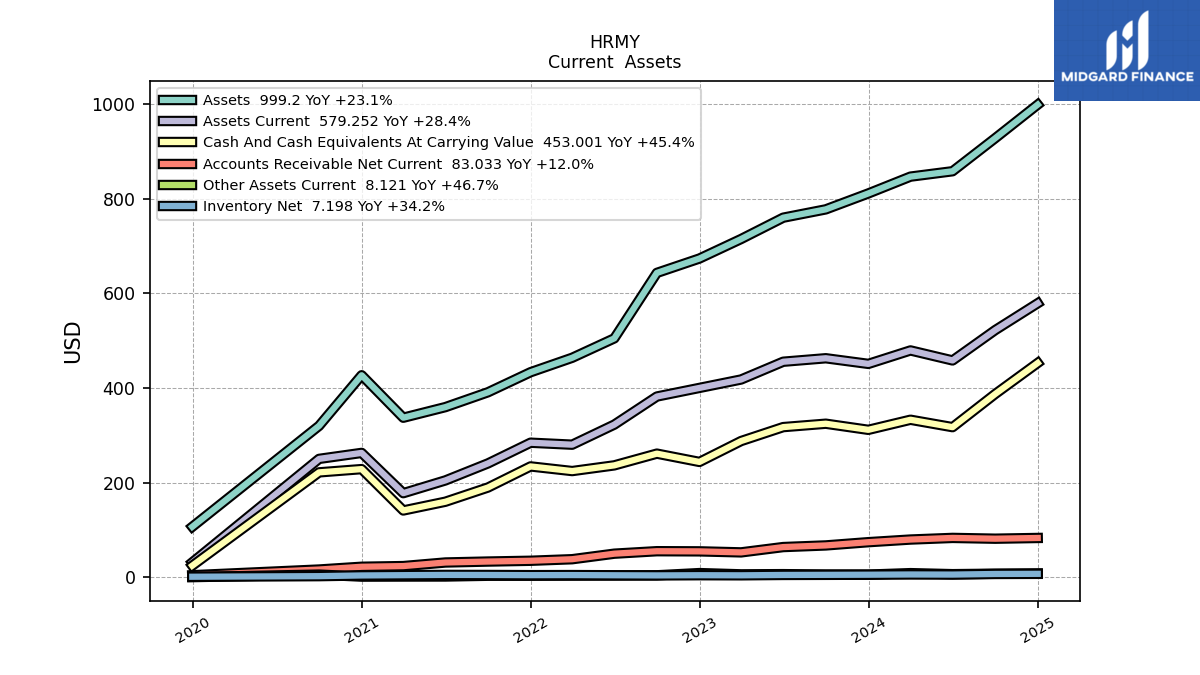
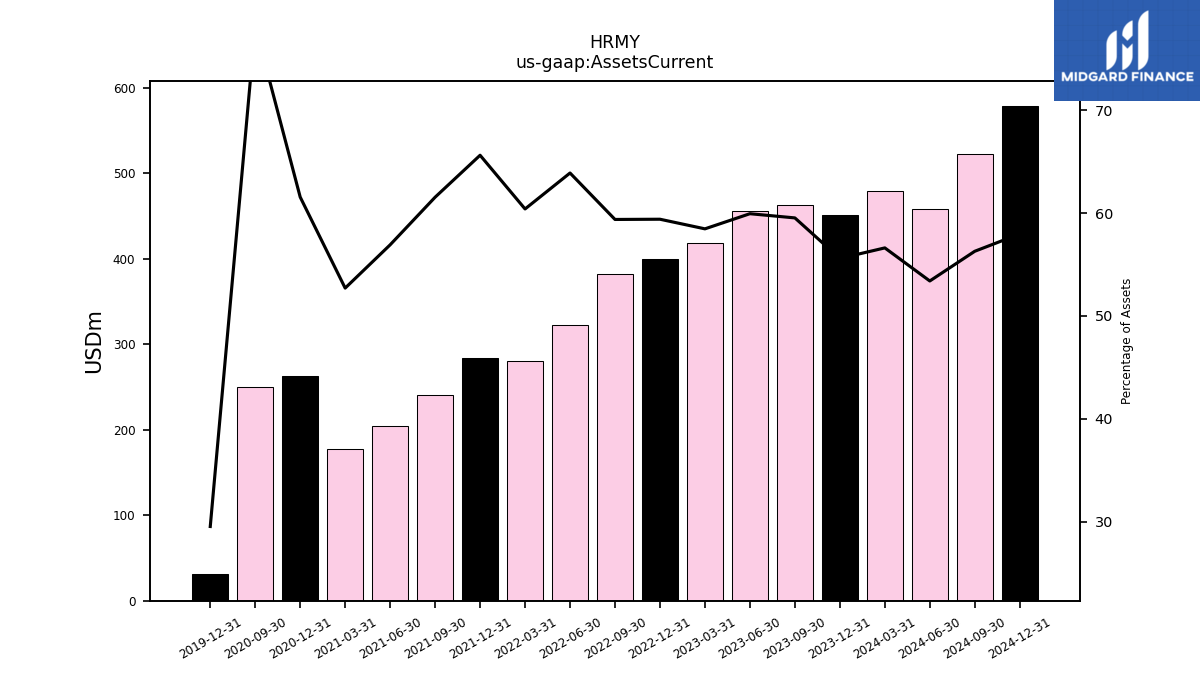
| Assets Current | 451.07 | 463.00 | 455.64 | 418.09 | 400.29 | 382.08 | 322.70 | 280.26 | 284.44 | 240.69 | 204.71 | 177.74 | 262.89 | 250.24 | NA | NA | |
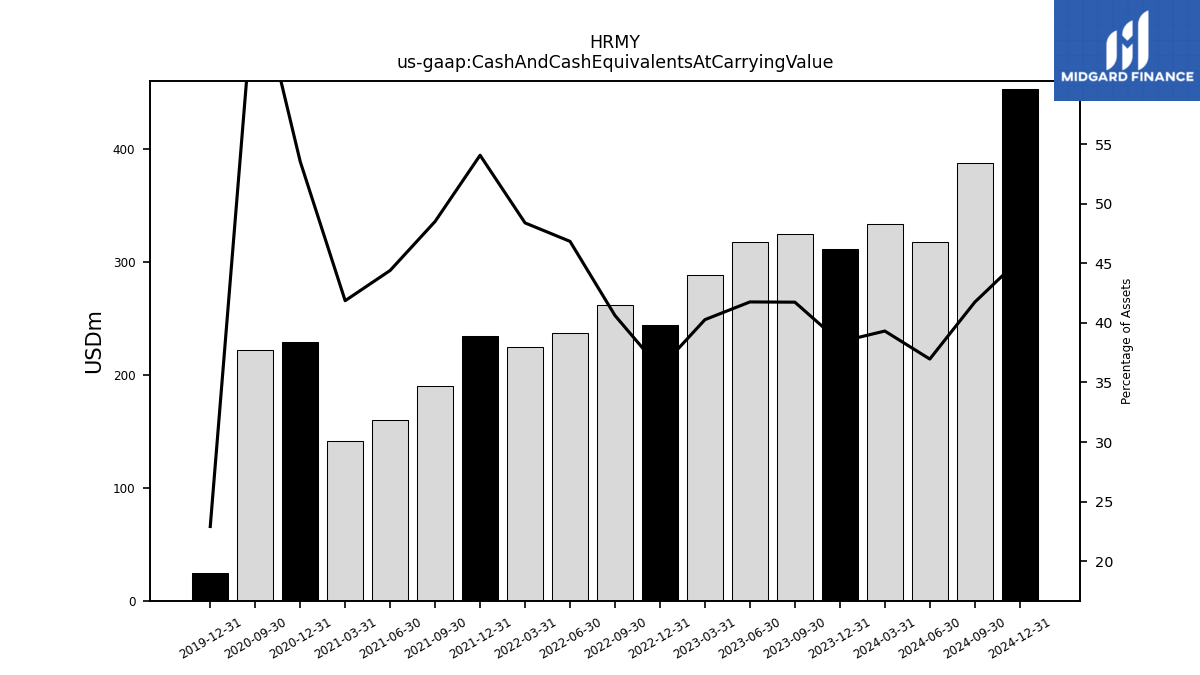
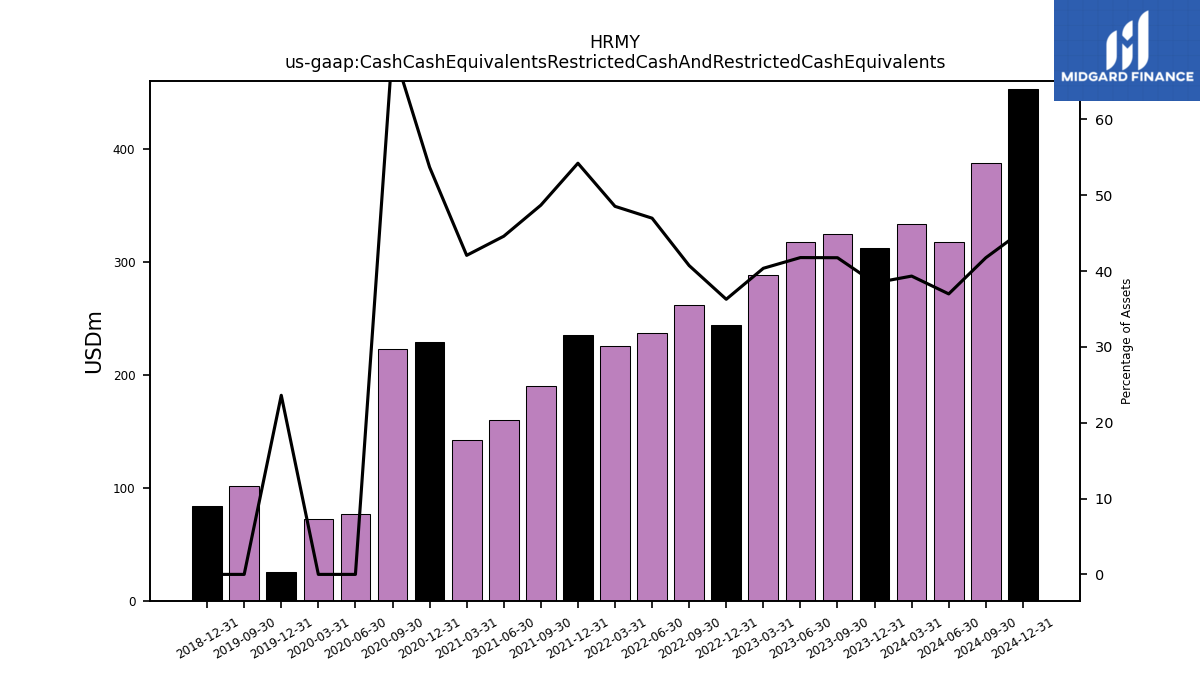
| Cash And Cash Equivalents At Carrying Value | 311.66 | 324.60 | 317.42 | 287.96 | 243.78 | 261.34 | 236.53 | 224.50 | 234.31 | 189.70 | 159.69 | 141.17 | 228.63 | 221.74 | NA | NA | |
| Cash Cash Equivalents Restricted Cash And Restricted Cash Equivalents | 311.93 | 324.85 | 317.67 | 288.71 | 244.53 | 262.09 | 237.28 | 225.25 | 235.06 | 190.45 | 160.44 | 141.92 | 229.38 | 222.49 | 77.03 | 72.27 | |
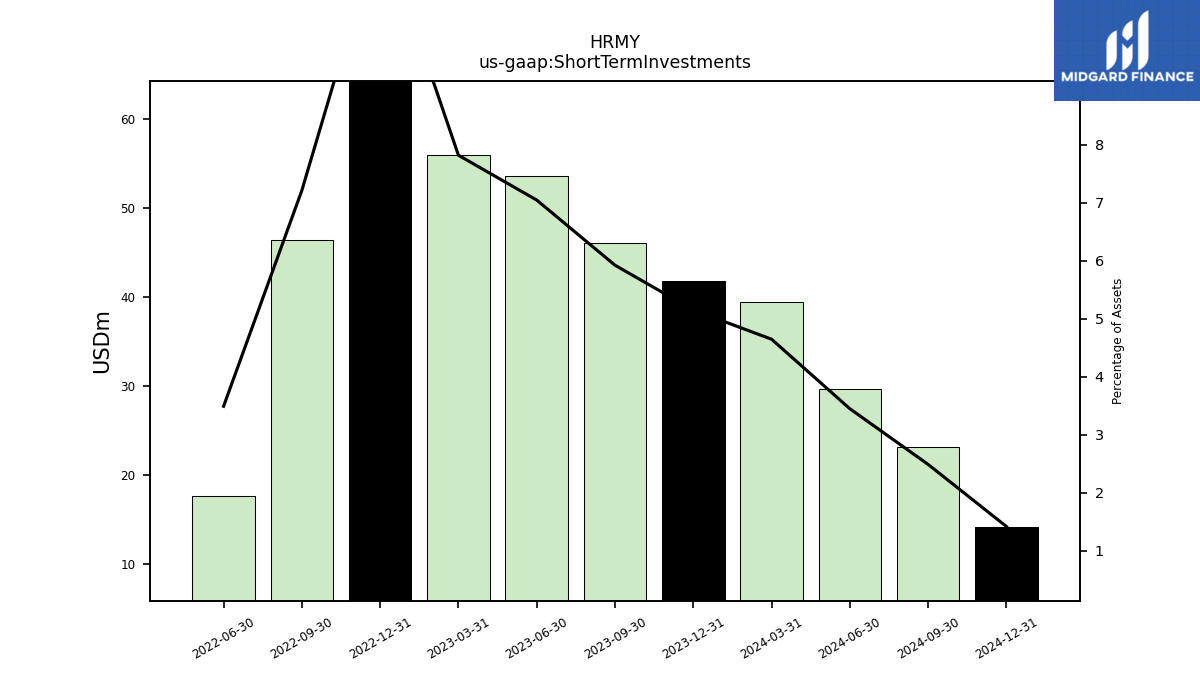
| Short Term Investments | 41.80 | 46.07 | 53.57 | 55.92 | 79.33 | 46.42 | 17.64 | NA | NA | NA | NA | NA | NA | NA | NA | NA | |
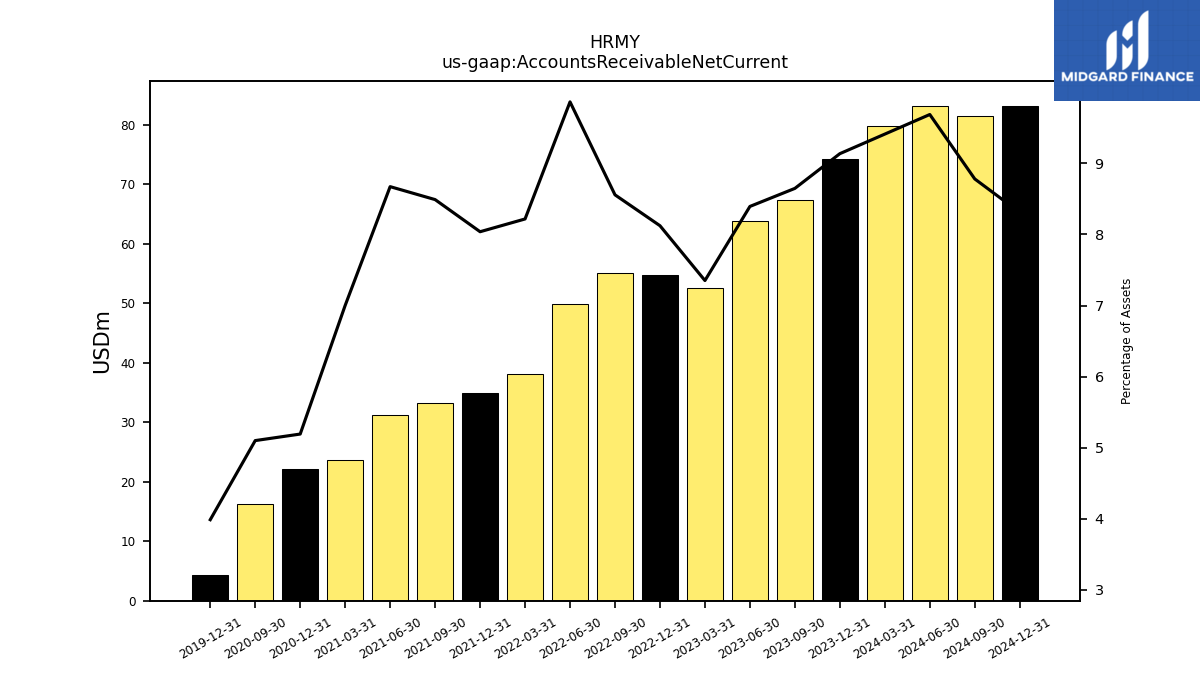
| Accounts Receivable Net Current | 74.14 | 67.26 | 63.81 | 52.58 | 54.74 | 55.06 | 49.82 | 38.13 | 34.84 | 33.21 | 31.20 | 23.61 | 22.18 | 16.33 | NA | NA | |
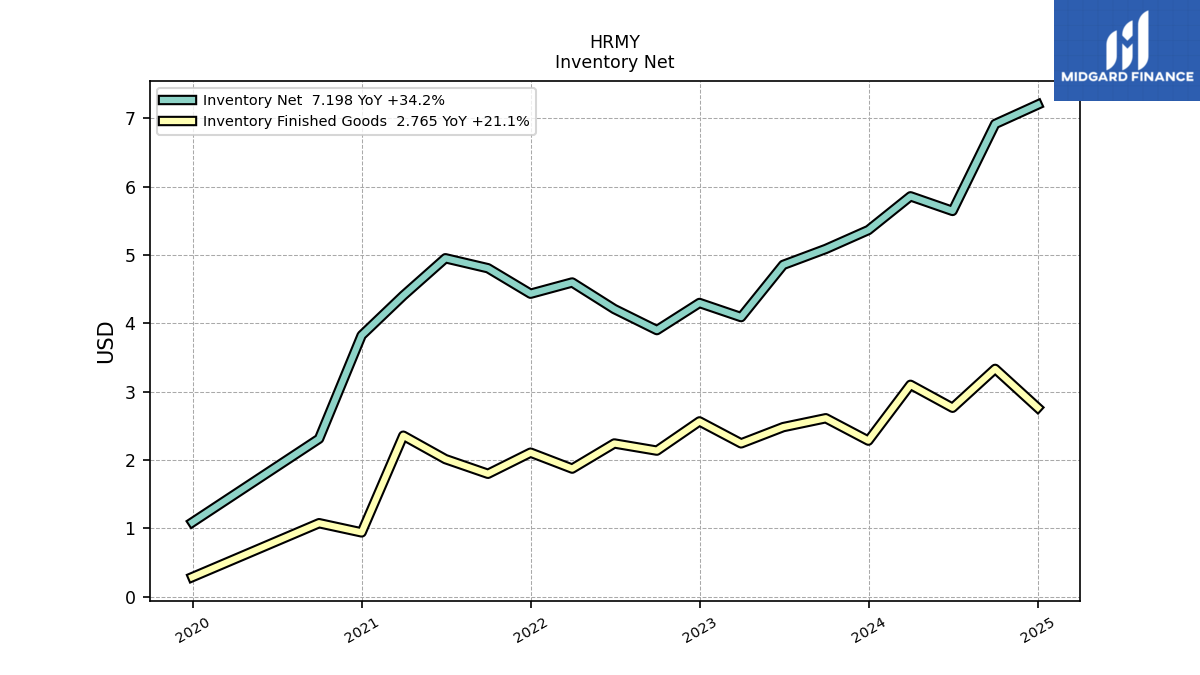
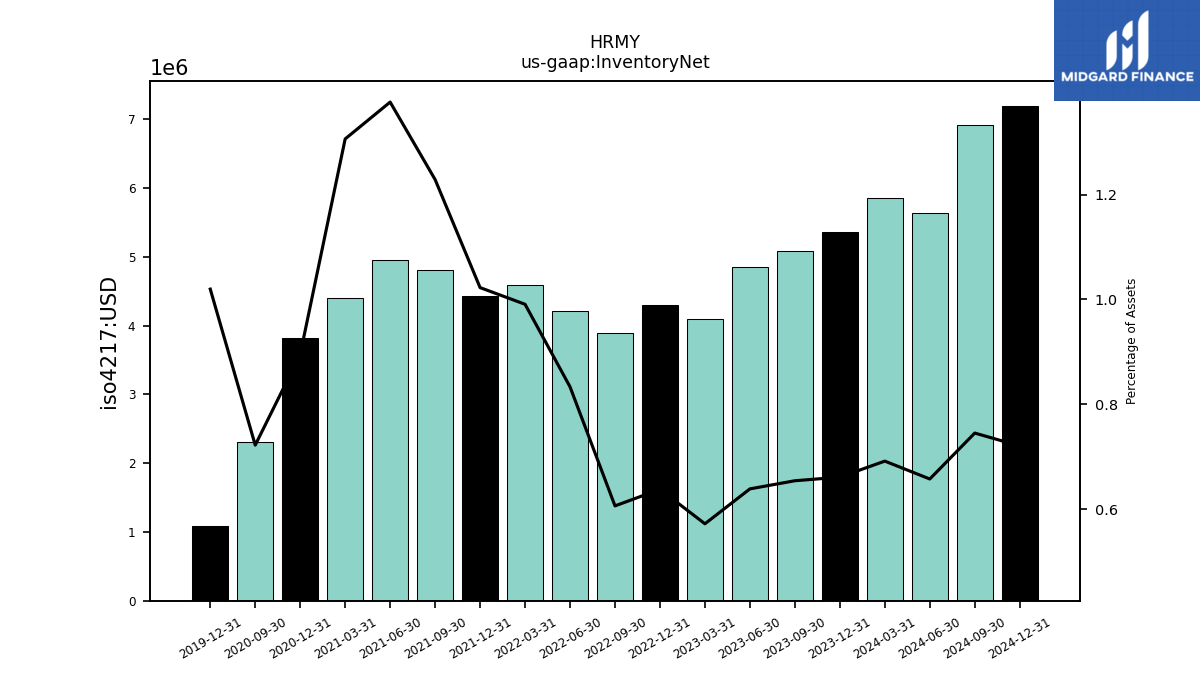
| Inventory Net | 5.36 | 5.09 | 4.85 | 4.09 | 4.30 | 3.90 | 4.21 | 4.60 | 4.43 | 4.80 | 4.95 | 4.41 | 3.82 | 2.31 | NA | NA | |
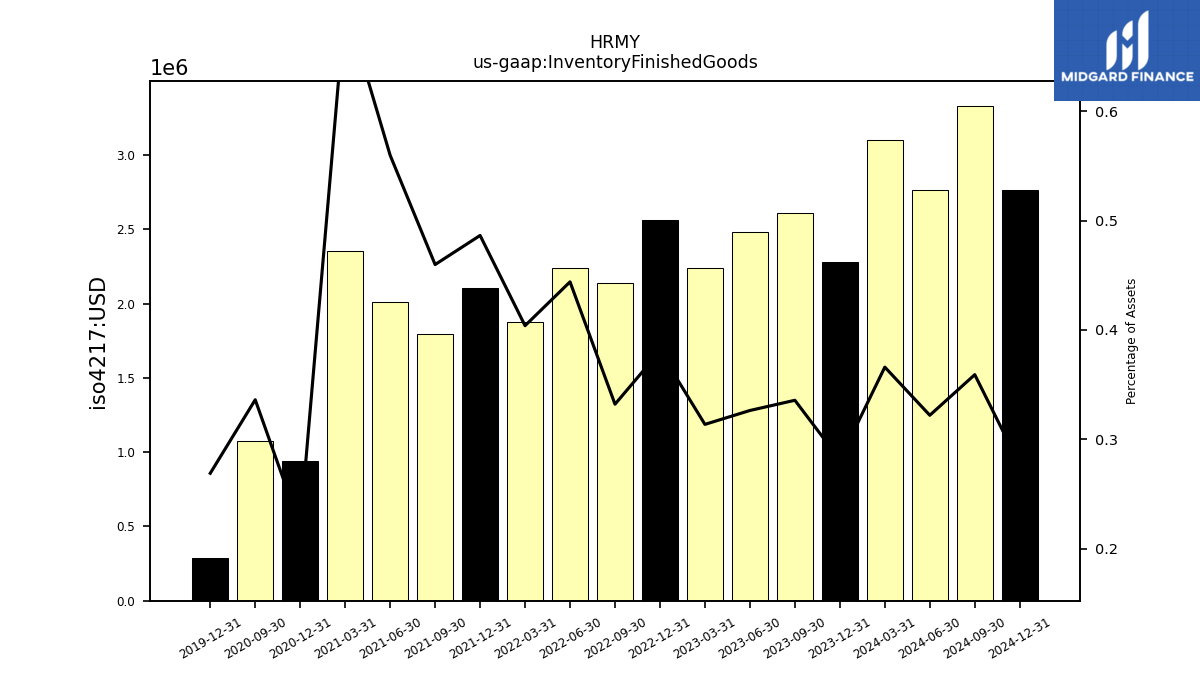
| Inventory Finished Goods | 2.28 | 2.61 | 2.48 | 2.24 | 2.56 | 2.14 | 2.24 | 1.87 | 2.11 | 1.80 | 2.01 | 2.36 | 0.94 | 1.08 | NA | NA | |
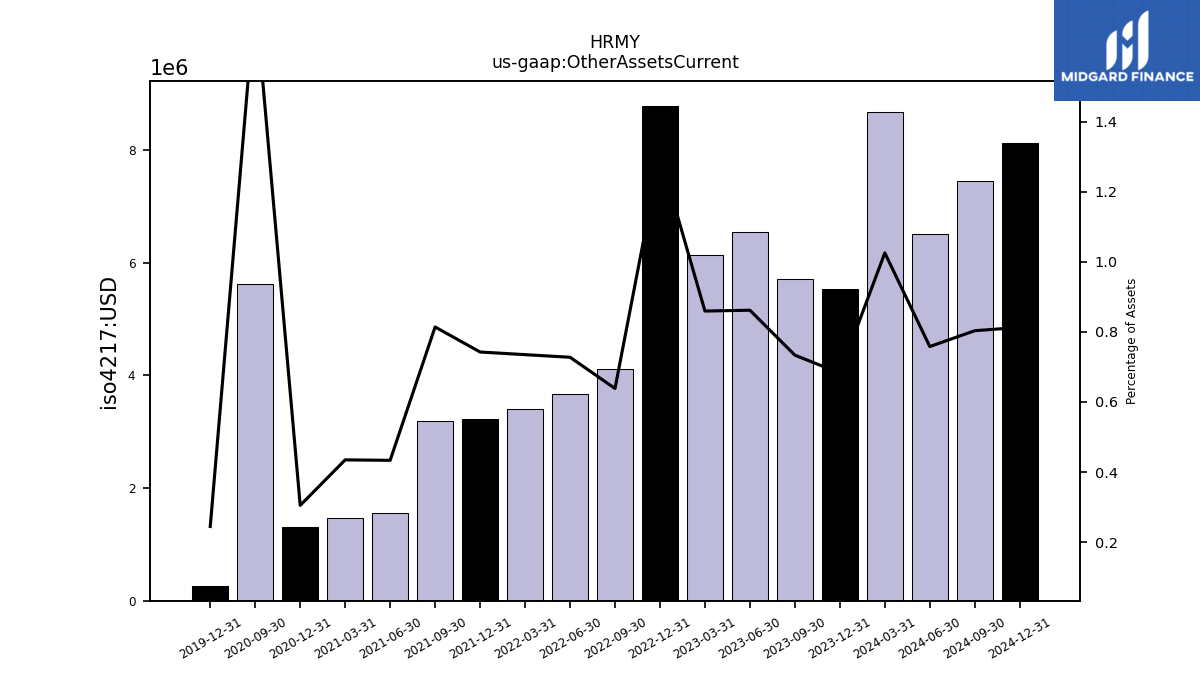
| Other Assets Current | 5.54 | 5.70 | 6.55 | 6.14 | 8.79 | 4.11 | 3.67 | 3.41 | 3.22 | 3.18 | 1.56 | 1.47 | 1.30 | 5.62 | NA | NA |
| 2023-12-31 | 2023-09-30 | 2023-06-30 | 2023-03-31 | 2022-12-31 | 2022-09-30 | 2022-06-30 | 2022-03-31 | 2021-12-31 | 2021-09-30 | 2021-06-30 | 2021-03-31 | 2020-12-31 | 2020-09-30 | 2020-06-30 | 2020-03-31 | ||
|---|---|---|---|---|---|---|---|---|---|---|---|---|---|---|---|---|---|
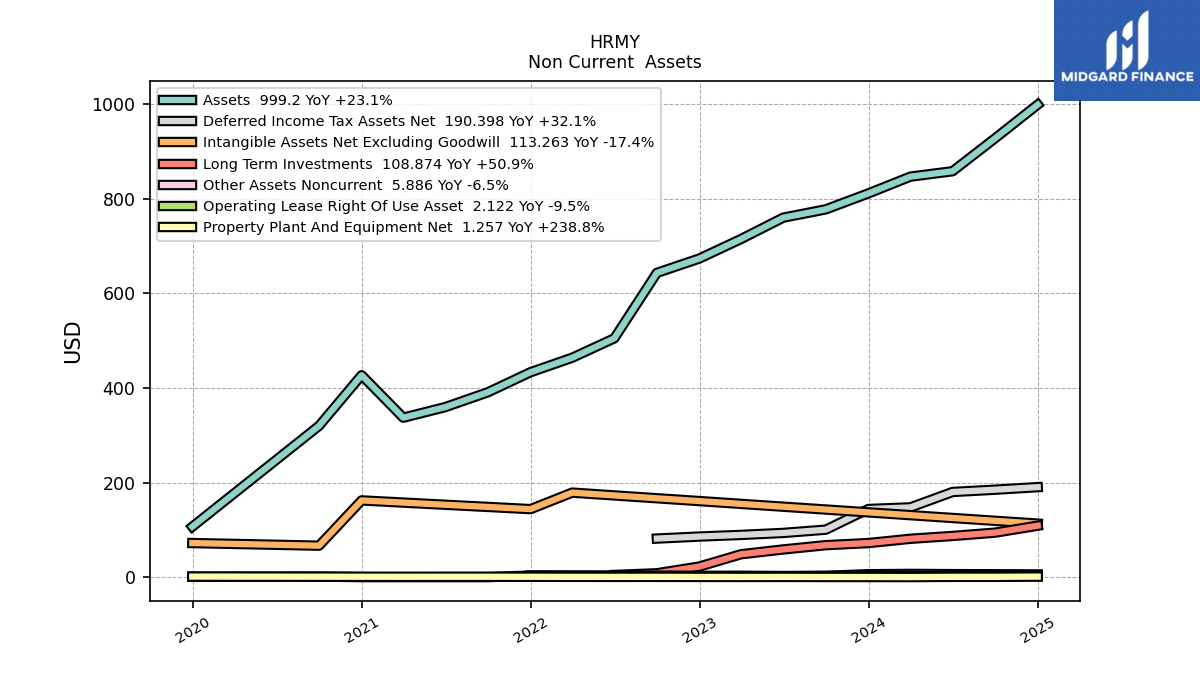
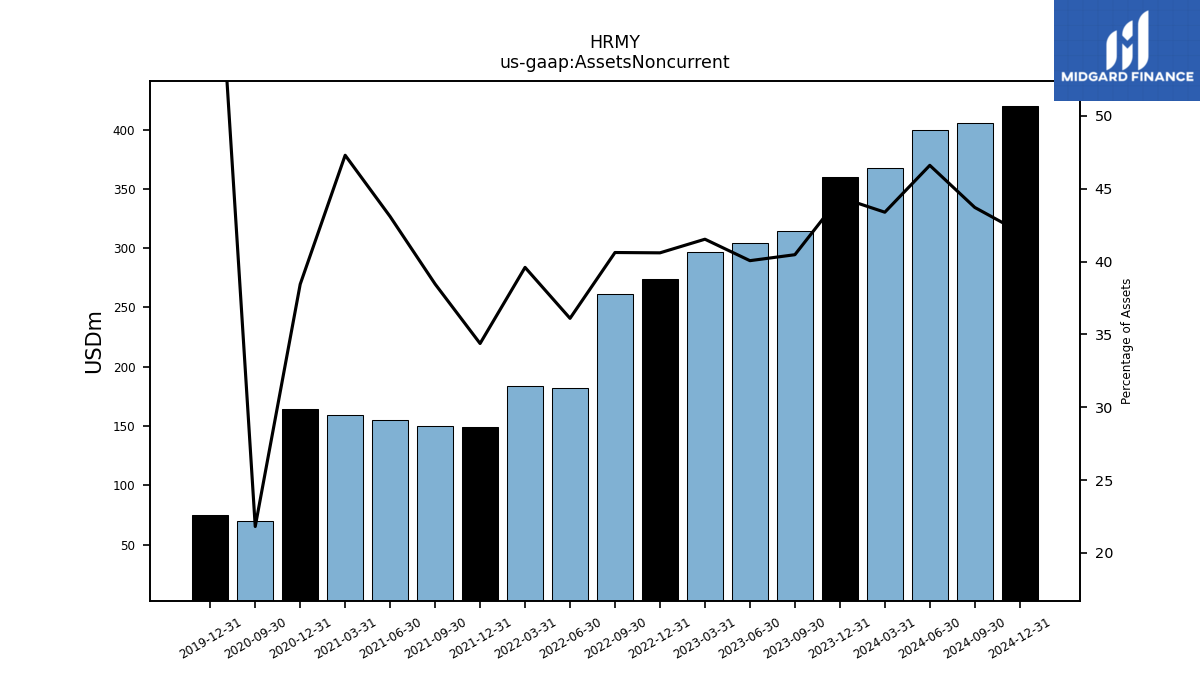
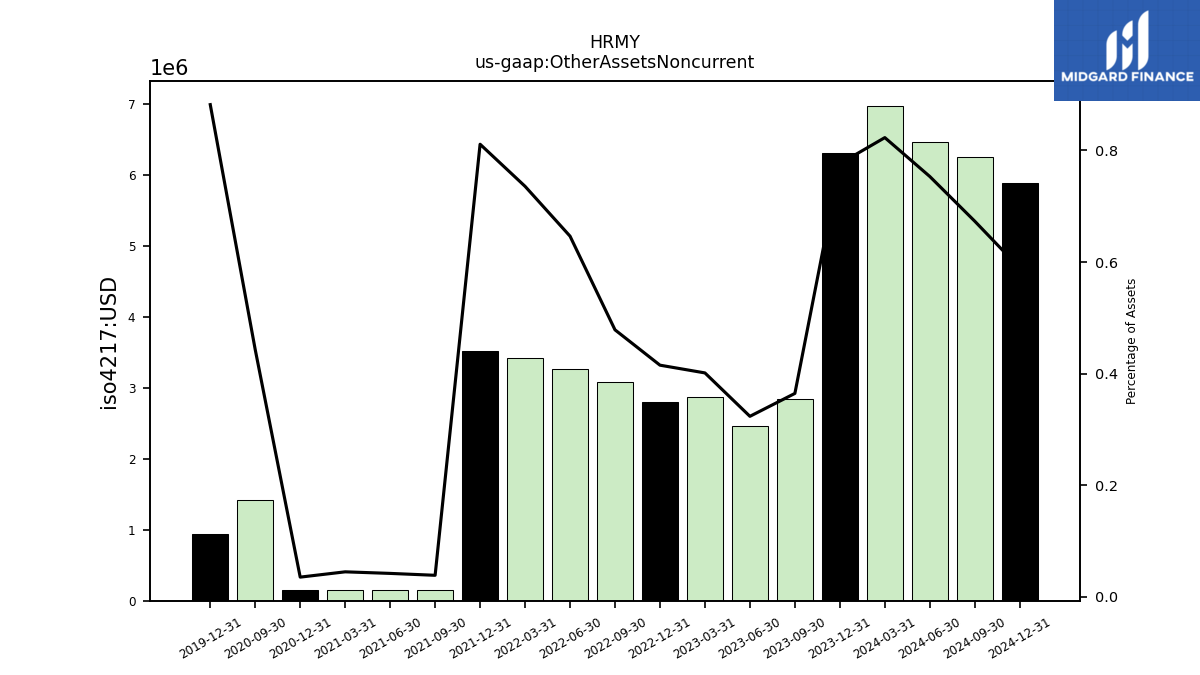
| Assets Noncurrent | 360.38 | 314.77 | 304.54 | 297.00 | 273.58 | 261.38 | 182.33 | 183.75 | 149.00 | 150.40 | 154.98 | 159.51 | 164.18 | 69.83 | NA | NA | |
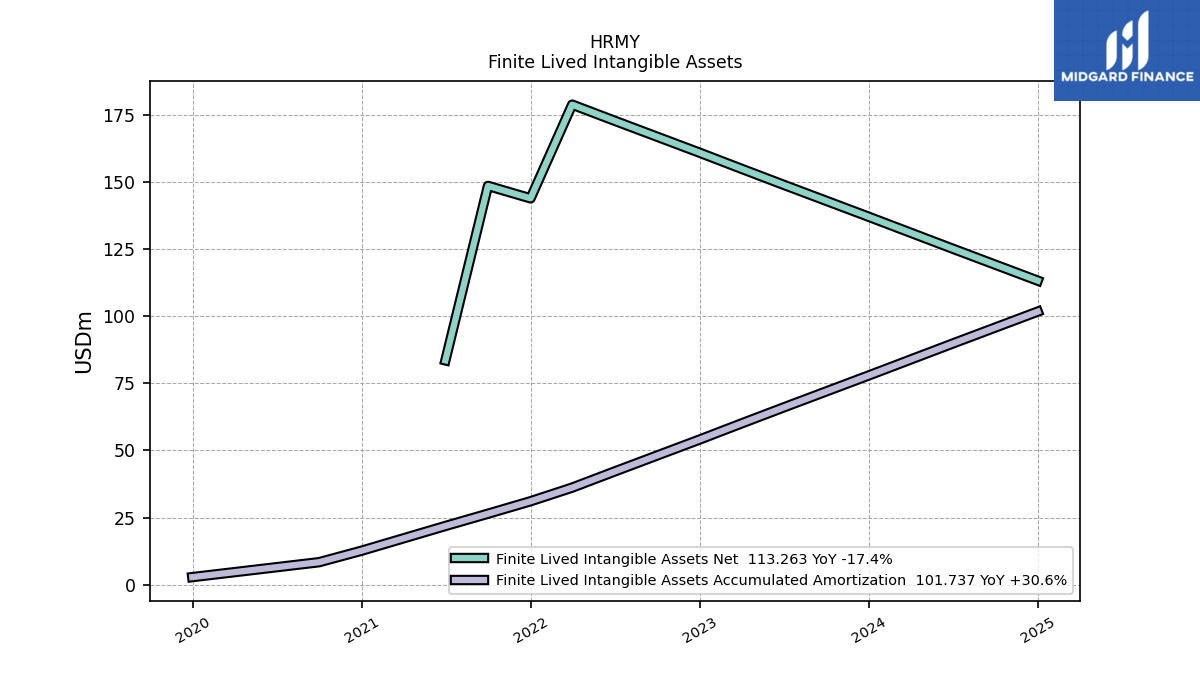
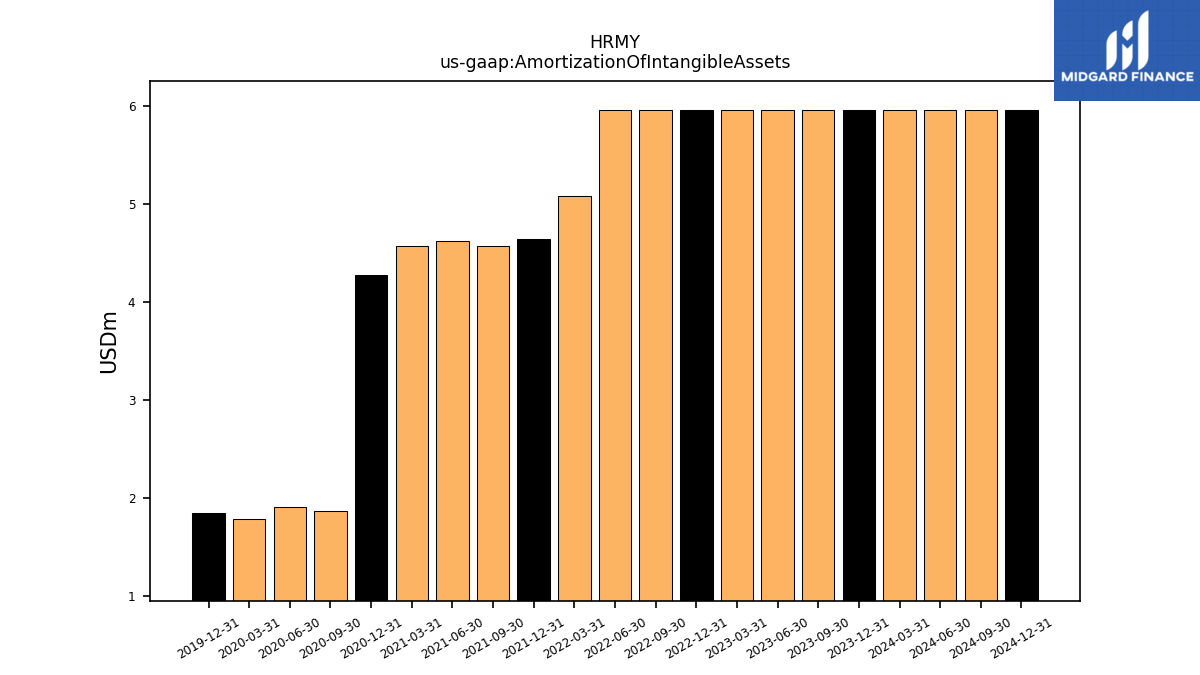
| Amortization Of Intangible Assets | 5.96 | 5.96 | 5.96 | 5.96 | 5.96 | 5.96 | 5.96 | 5.08 | 4.64 | 4.57 | 4.63 | 4.58 | 4.28 | 1.87 | 1.91 | 1.79 | |
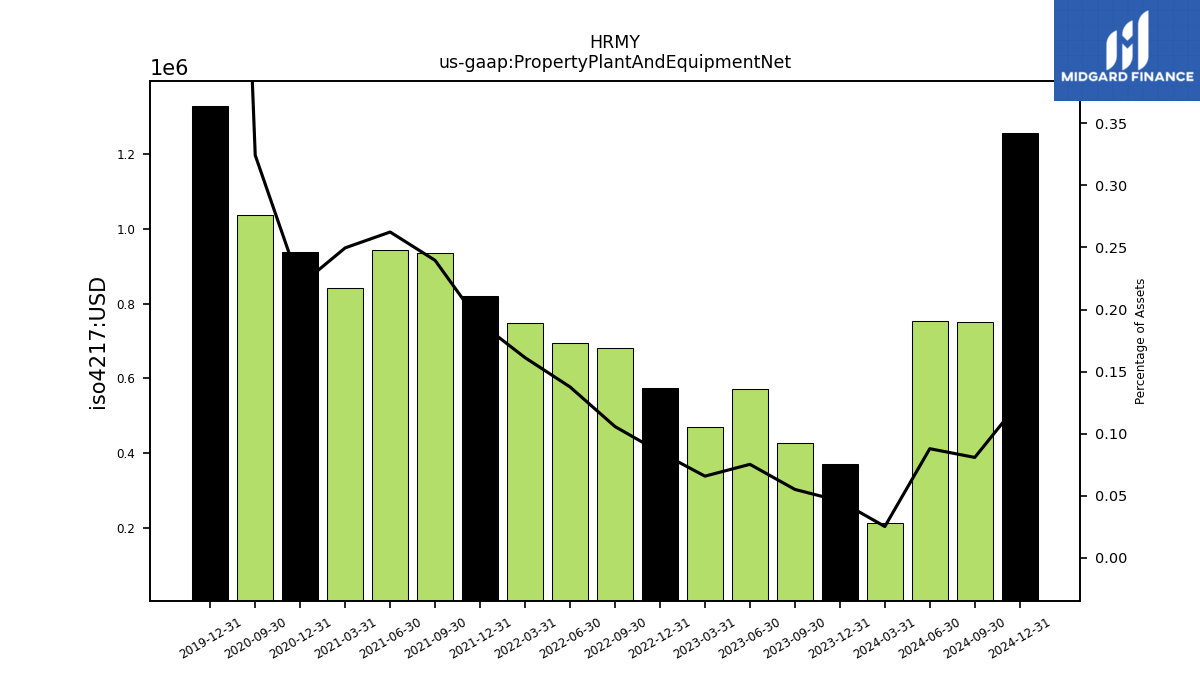
| Property Plant And Equipment Net | 0.37 | 0.43 | 0.57 | 0.47 | 0.57 | 0.68 | 0.69 | 0.75 | 0.82 | 0.94 | 0.94 | 0.84 | 0.94 | 1.04 | NA | NA | |
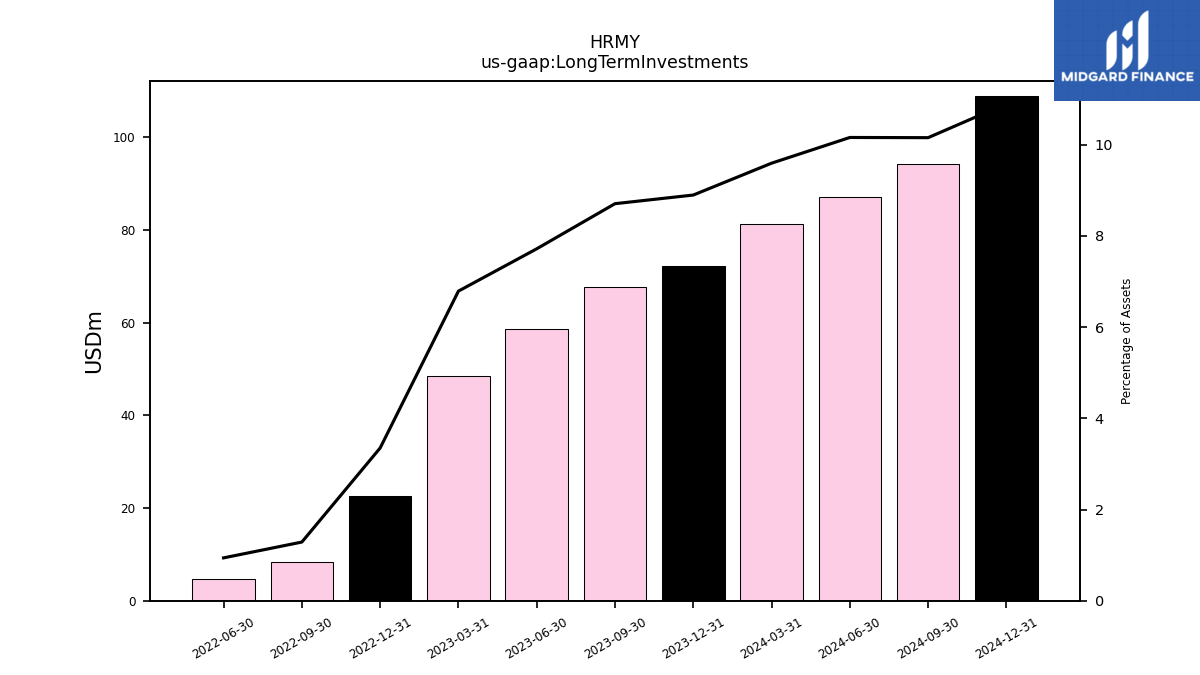
| Long Term Investments | 72.17 | 67.70 | 58.65 | 48.54 | 22.57 | 8.28 | 4.75 | NA | NA | NA | NA | NA | NA | NA | NA | NA | |
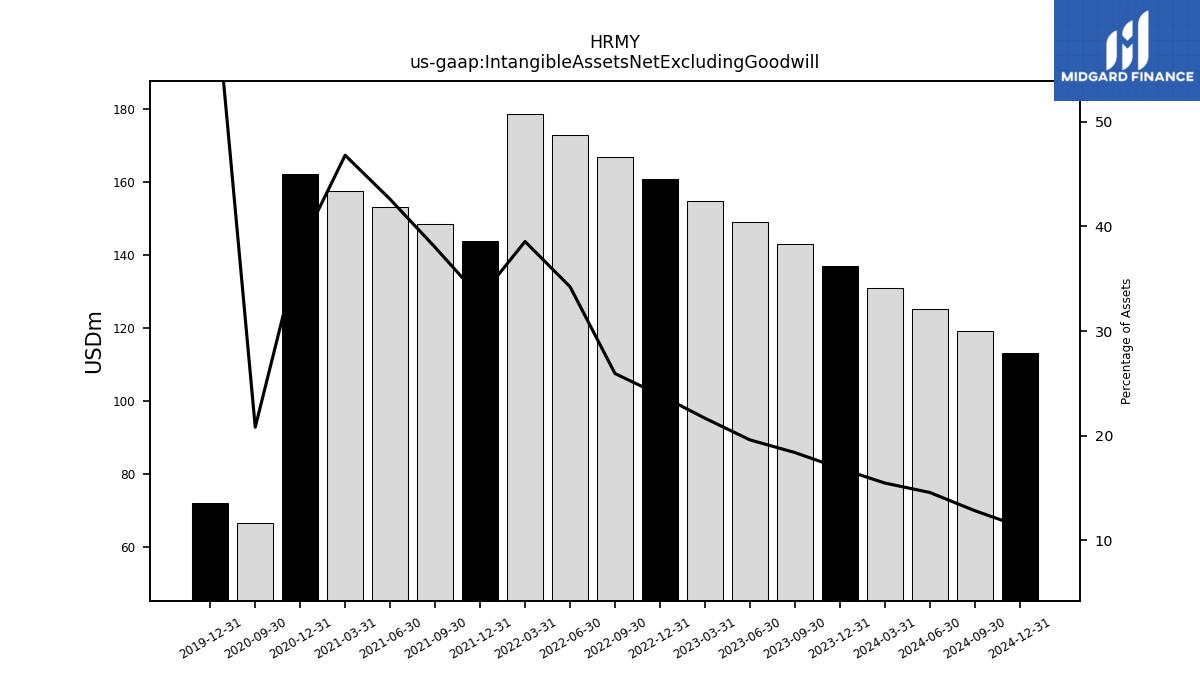
| Intangible Assets Net Excluding Goodwill | 137.11 | 143.07 | 149.03 | 154.99 | 160.95 | 166.91 | 172.88 | 178.84 | 143.92 | 148.56 | 153.13 | 157.76 | 162.34 | 66.62 | NA | NA | |
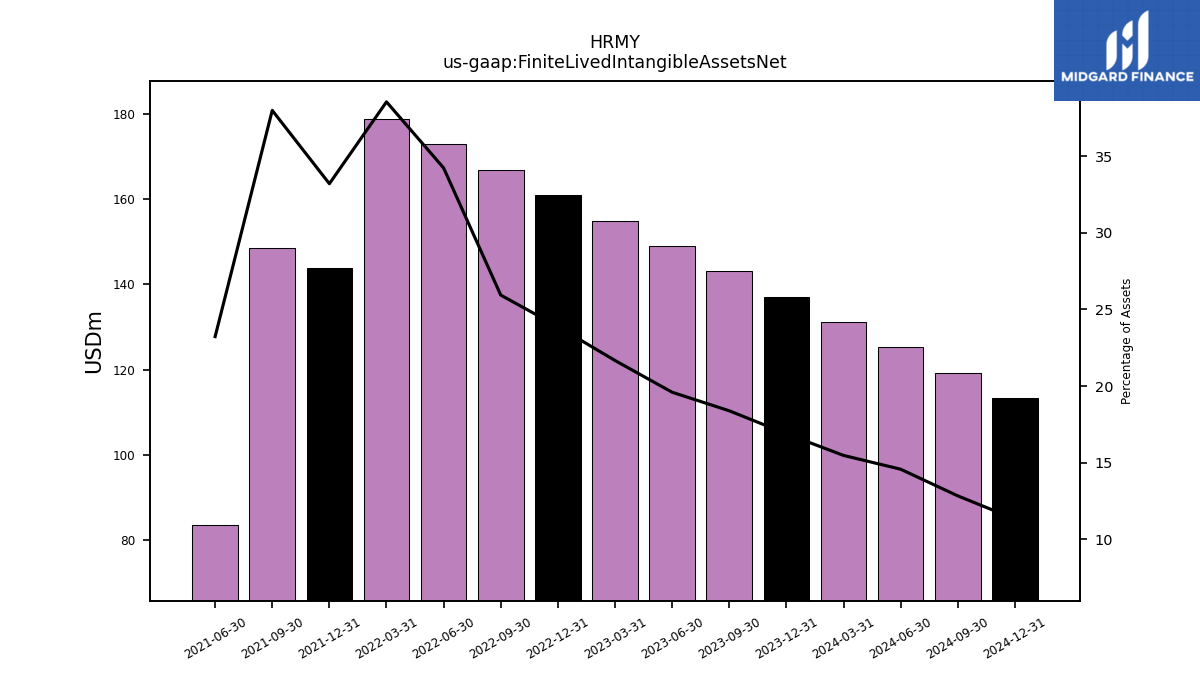
| Finite Lived Intangible Assets Net | 137.11 | 143.07 | 149.03 | 154.99 | 160.95 | 166.91 | 172.88 | 178.84 | 143.92 | 148.56 | 83.56 | NA | NA | NA | NA | NA | |
| Other Assets Noncurrent | 6.30 | 2.84 | 2.46 | 2.87 | 2.80 | 3.08 | 3.26 | 3.41 | 3.52 | 0.15 | 0.15 | 0.15 | 0.15 | 1.42 | NA | NA |
| 2023-12-31 | 2023-09-30 | 2023-06-30 | 2023-03-31 | 2022-12-31 | 2022-09-30 | 2022-06-30 | 2022-03-31 | 2021-12-31 | 2021-09-30 | 2021-06-30 | 2021-03-31 | 2020-12-31 | 2020-09-30 | 2020-06-30 | 2020-03-31 | ||
|---|---|---|---|---|---|---|---|---|---|---|---|---|---|---|---|---|---|
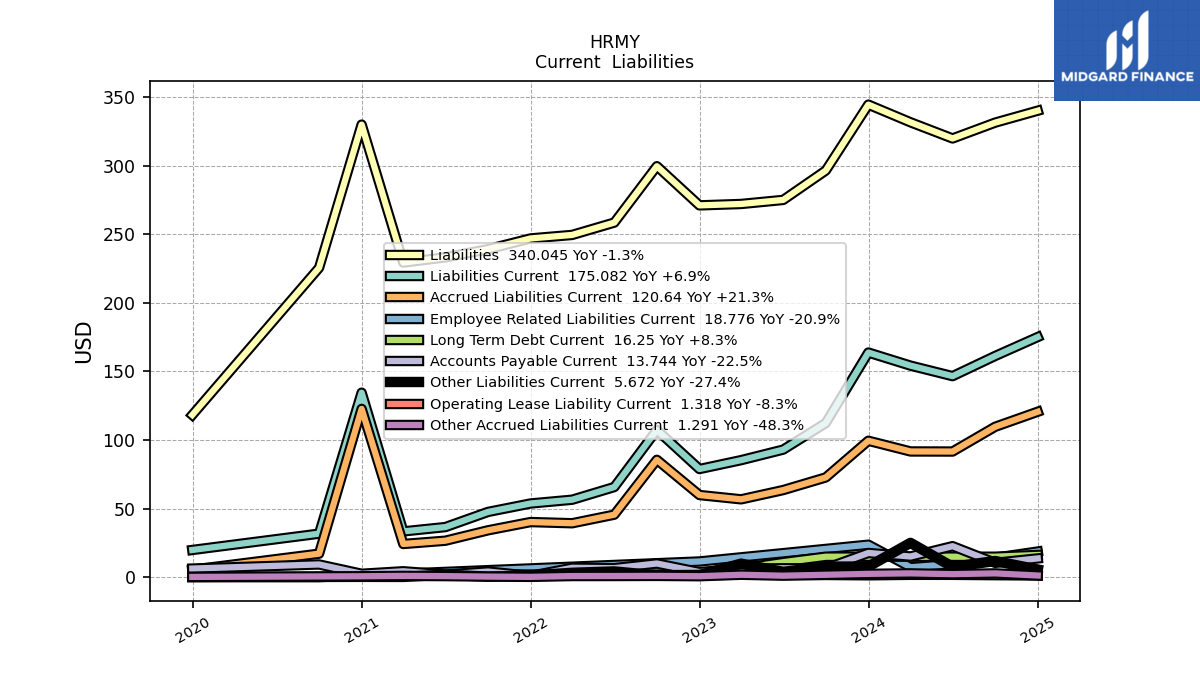
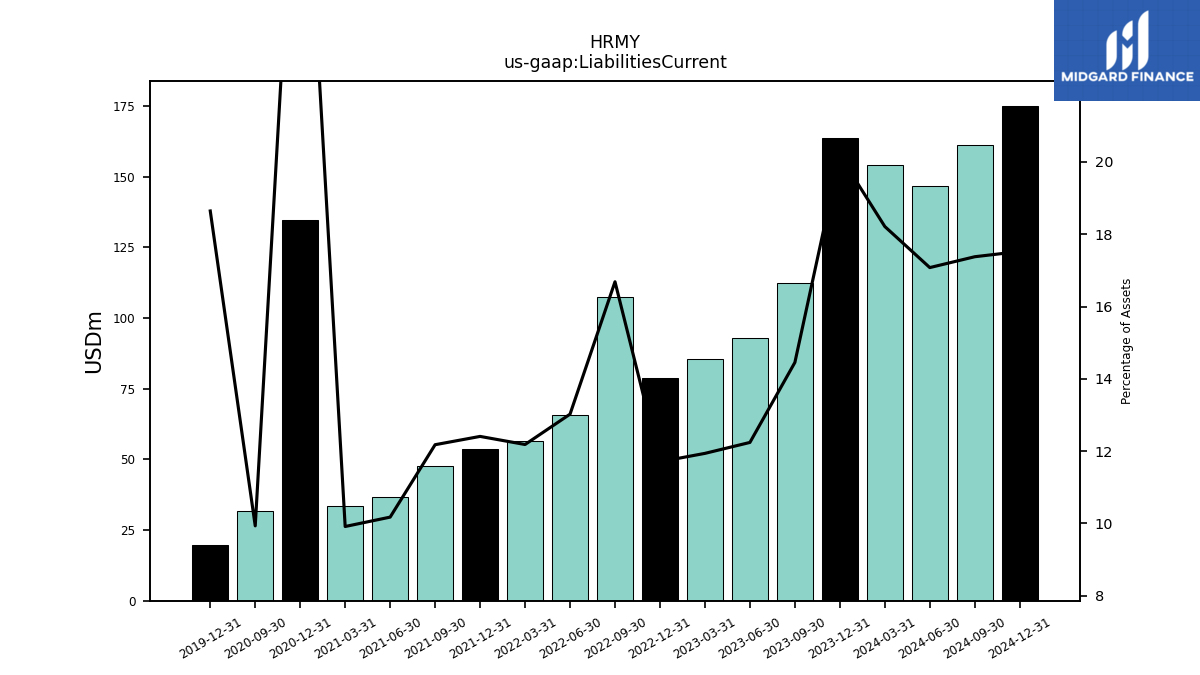
| Liabilities Current | 163.78 | 112.41 | 93.05 | 85.36 | 78.88 | 107.36 | 65.76 | 56.53 | 53.77 | 47.62 | 36.59 | 33.44 | 134.54 | 31.79 | NA | NA | |
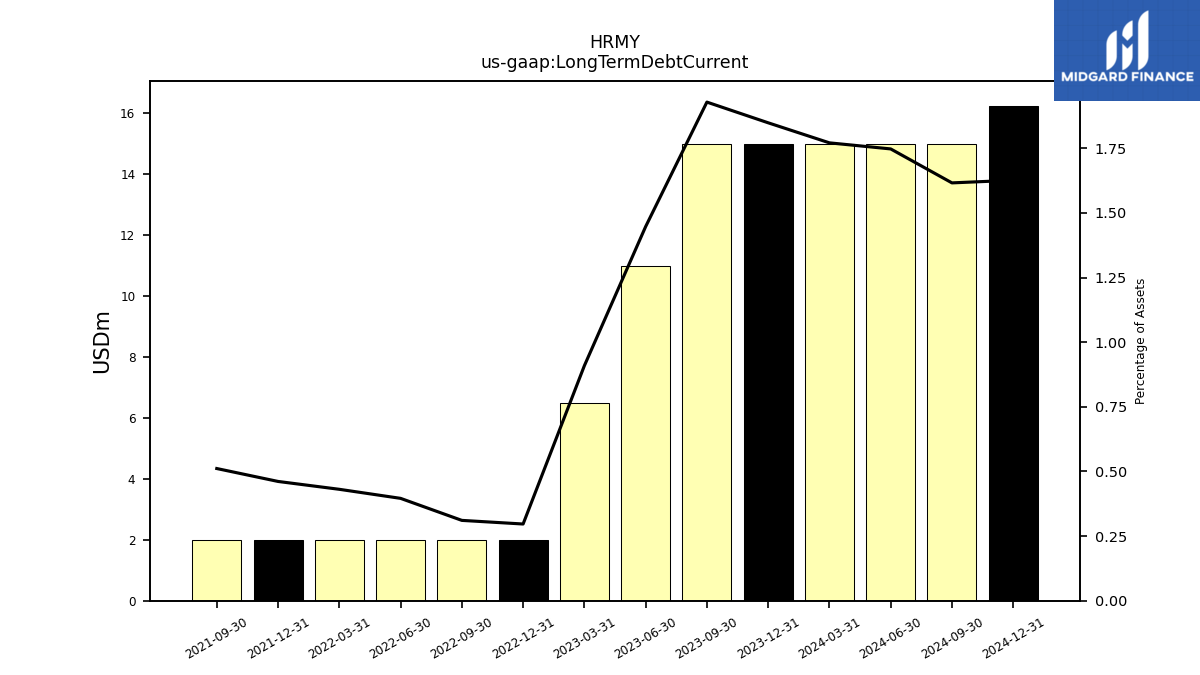
| Long Term Debt Current | 15.00 | 15.00 | 11.00 | 6.50 | 2.00 | 2.00 | 2.00 | 2.00 | 2.00 | 2.00 | NA | NA | NA | NA | NA | NA | |
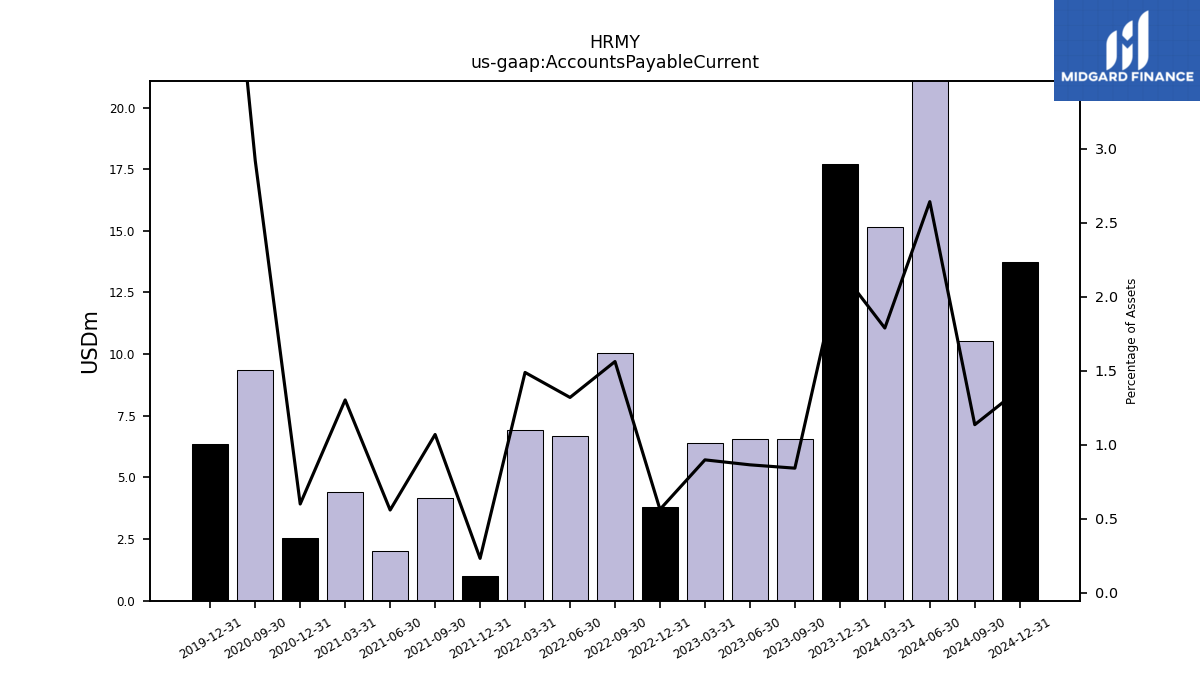
| Accounts Payable Current | 17.73 | 6.54 | 6.56 | 6.41 | 3.79 | 10.05 | 6.66 | 6.90 | 1.00 | 4.18 | 2.01 | 4.39 | 2.56 | 9.35 | NA | NA | |
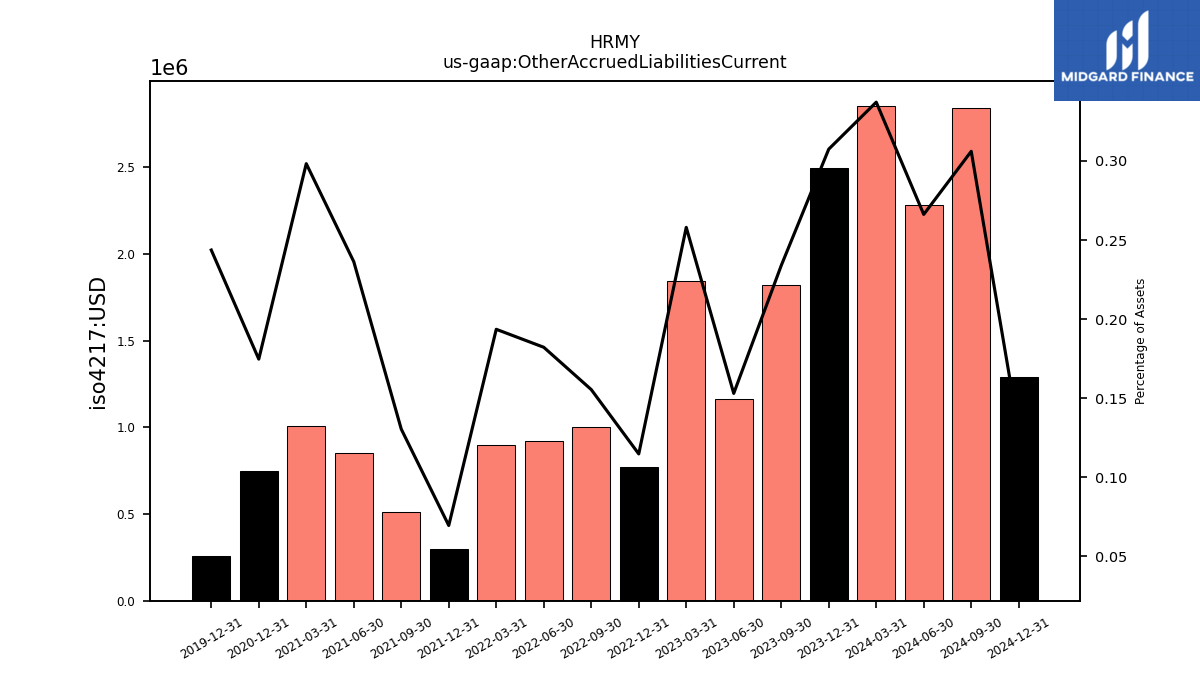
| Other Accrued Liabilities Current | 2.50 | 1.82 | 1.16 | 1.84 | 0.77 | 1.00 | 0.92 | 0.90 | 0.30 | 0.51 | 0.85 | 1.01 | 0.75 | NA | NA | NA | |
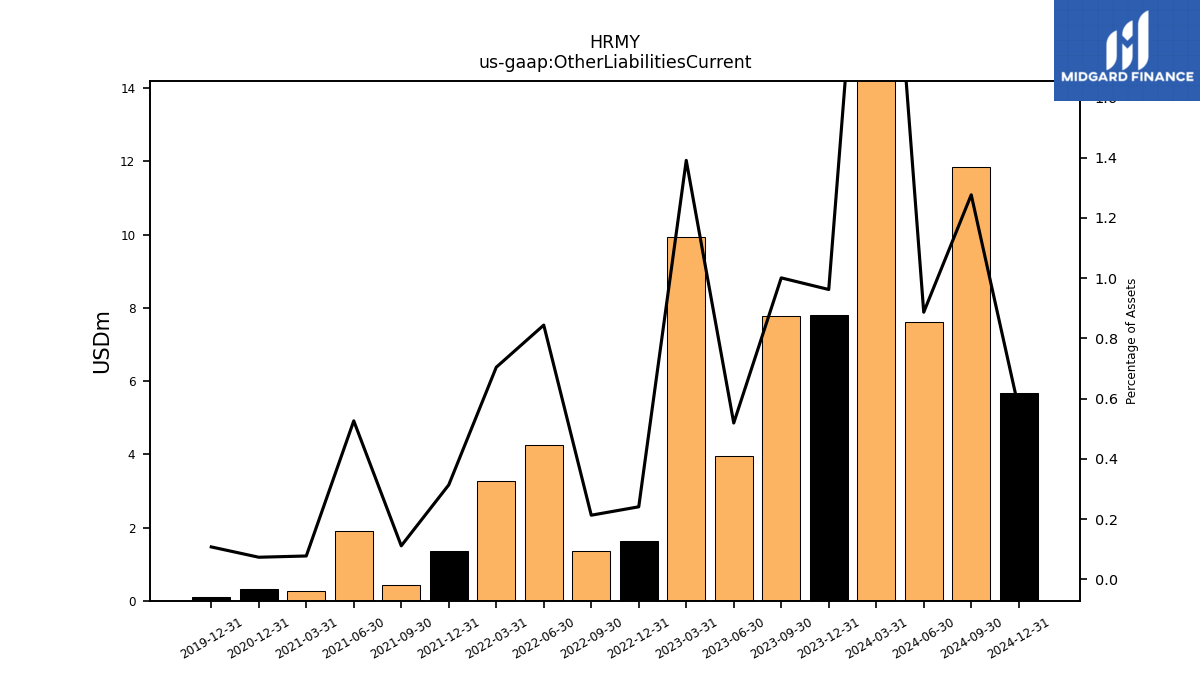
| Other Liabilities Current | 7.81 | 7.79 | 3.95 | 9.95 | 1.62 | 1.37 | 4.26 | 3.27 | 1.36 | 0.44 | 1.89 | 0.26 | 0.31 | NA | NA | NA |
| 2023-12-31 | 2023-09-30 | 2023-06-30 | 2023-03-31 | 2022-12-31 | 2022-09-30 | 2022-06-30 | 2022-03-31 | 2021-12-31 | 2021-09-30 | 2021-06-30 | 2021-03-31 | 2020-12-31 | 2020-09-30 | 2020-06-30 | 2020-03-31 | ||
|---|---|---|---|---|---|---|---|---|---|---|---|---|---|---|---|---|---|
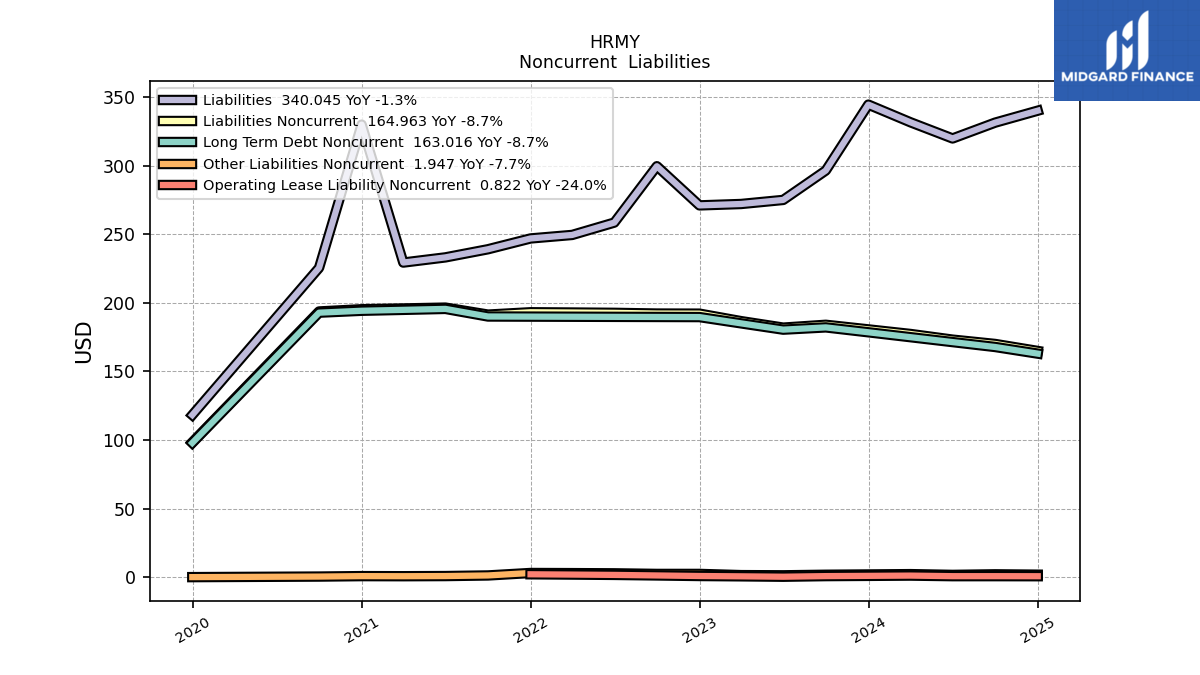
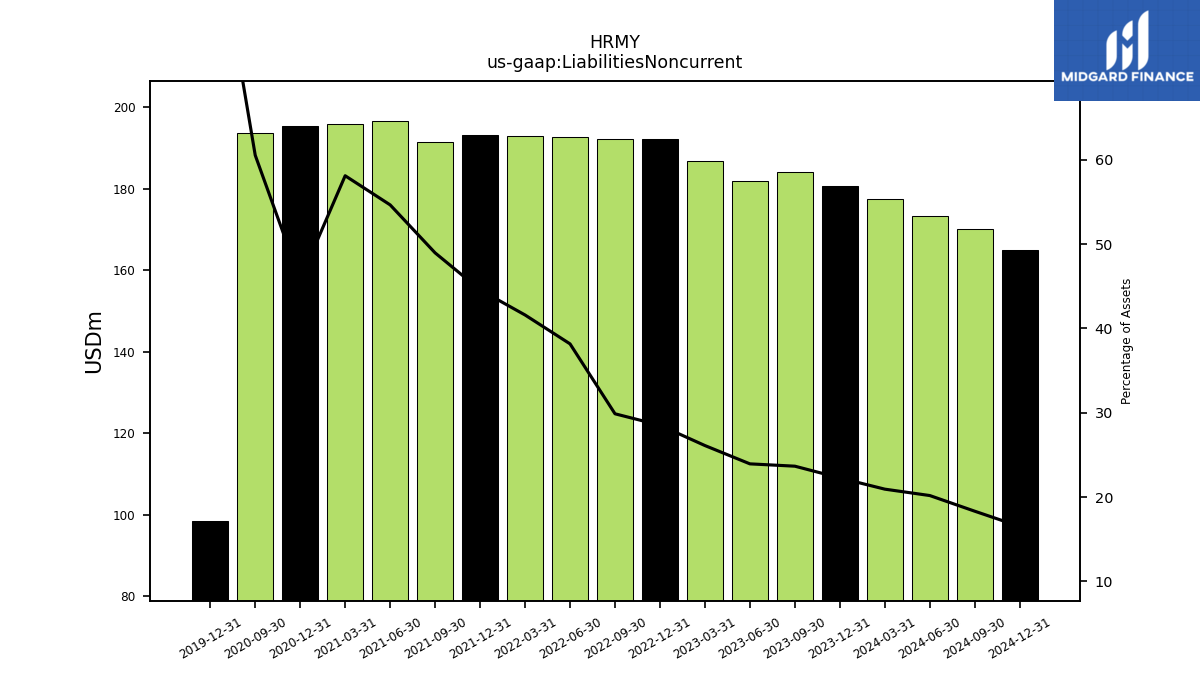
| Liabilities Noncurrent | 180.68 | 184.03 | 181.97 | 186.69 | 192.15 | 192.22 | 192.74 | 192.97 | 193.16 | 191.45 | 196.55 | 195.94 | 195.35 | 193.73 | NA | NA | |
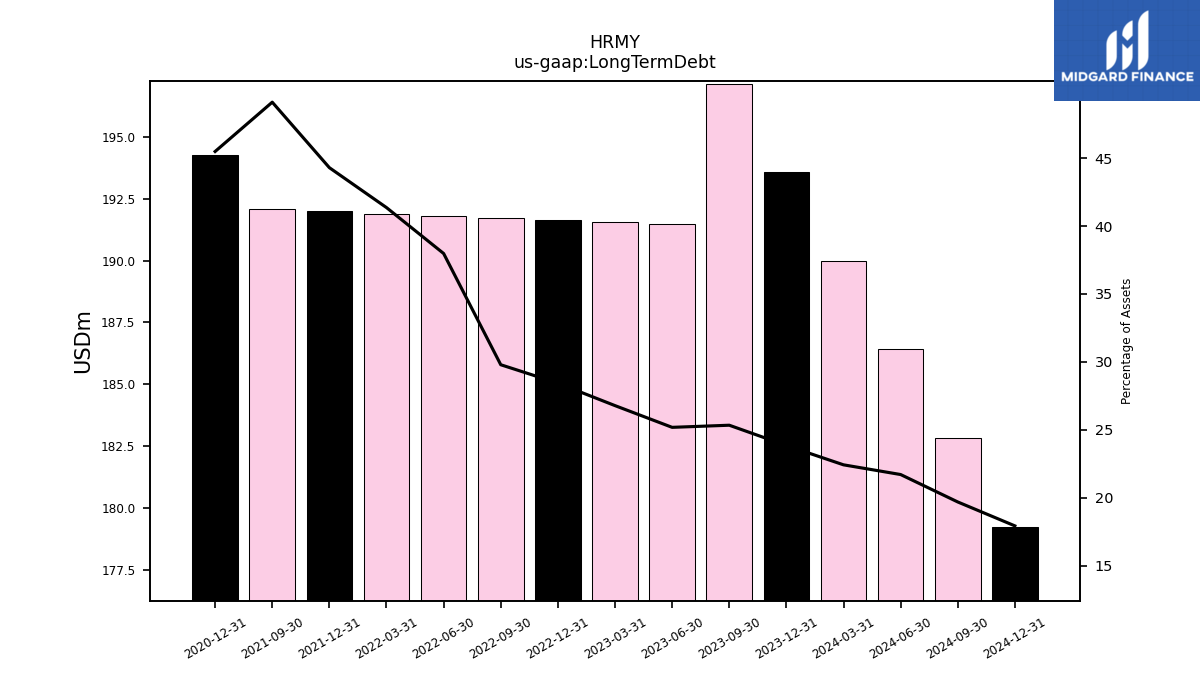
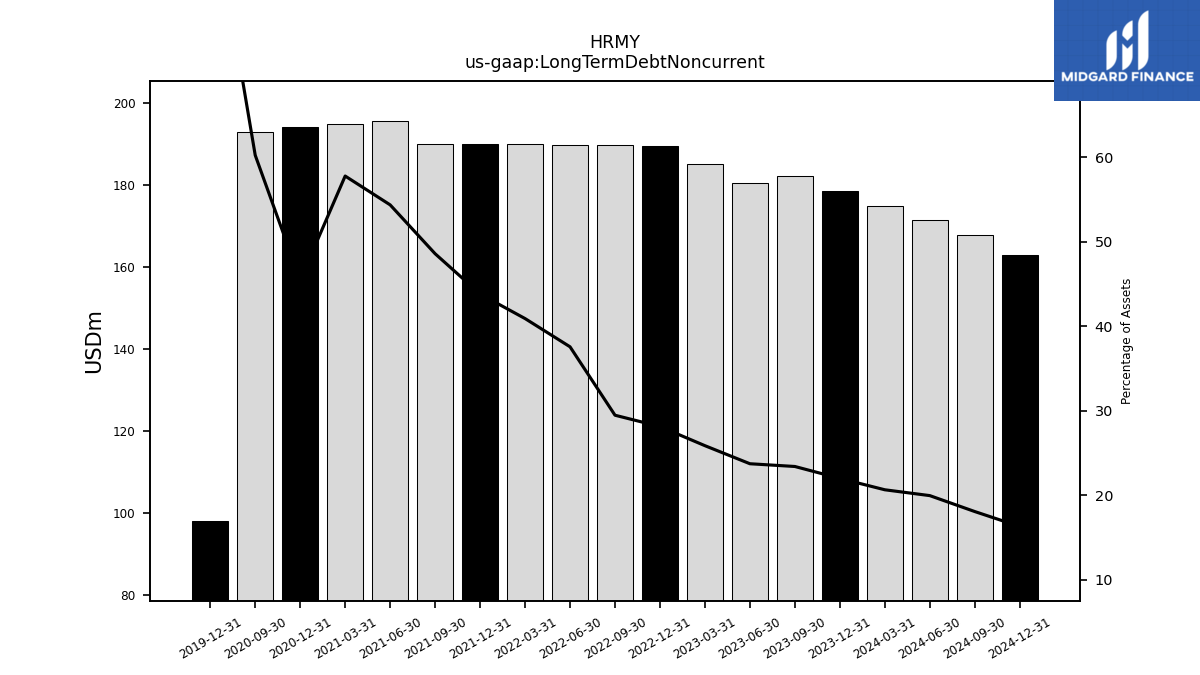
| Long Term Debt | 193.57 | 197.13 | 191.49 | 191.56 | 191.65 | 191.72 | 191.81 | 191.90 | 191.98 | 192.07 | NA | NA | 194.25 | NA | NA | NA | |
| Long Term Debt Noncurrent | 178.57 | 182.13 | 180.49 | 185.06 | 189.65 | 189.72 | 189.81 | 189.90 | 189.98 | 190.07 | 195.61 | 194.91 | 194.25 | 192.86 | NA | NA | |
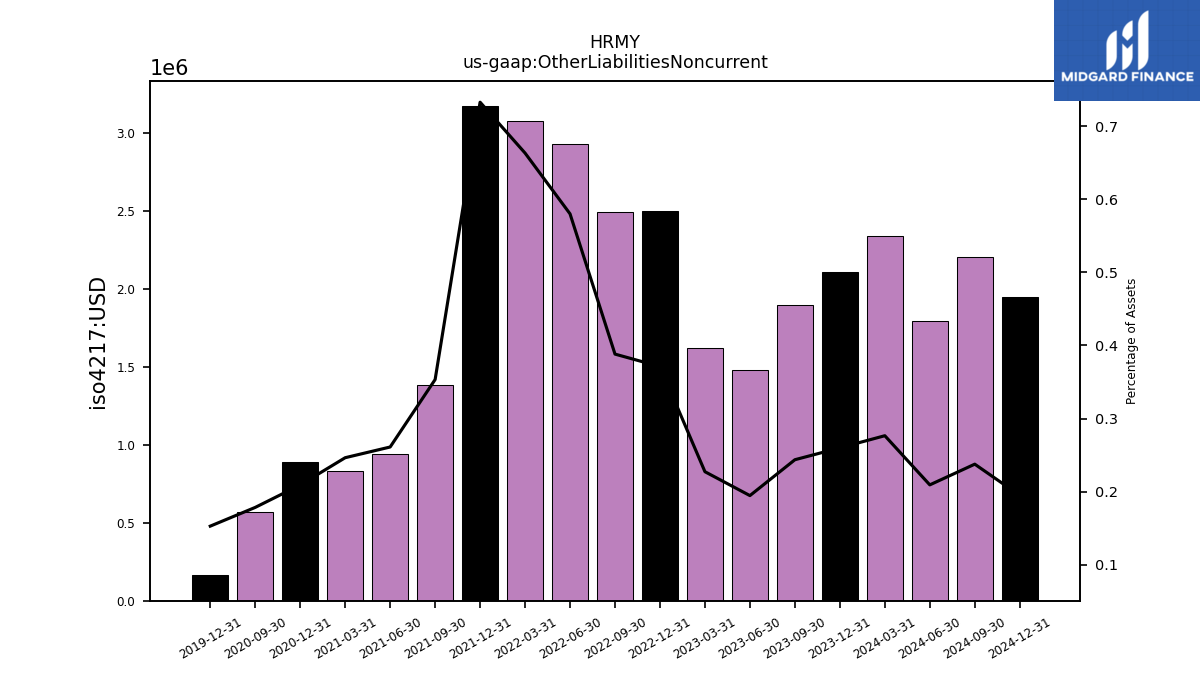
| Other Liabilities Noncurrent | 2.11 | 1.90 | 1.48 | 1.62 | 2.50 | 2.50 | 2.93 | 3.08 | 3.18 | 1.38 | 0.94 | 0.83 | 0.89 | 0.57 | NA | NA | |
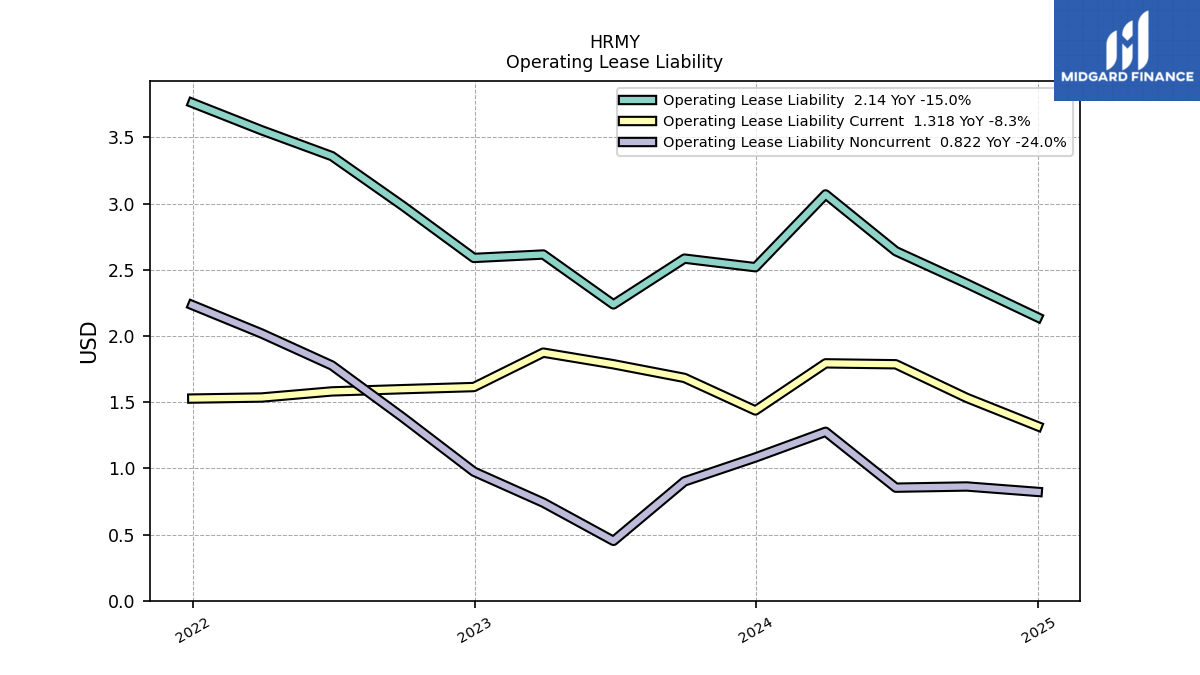
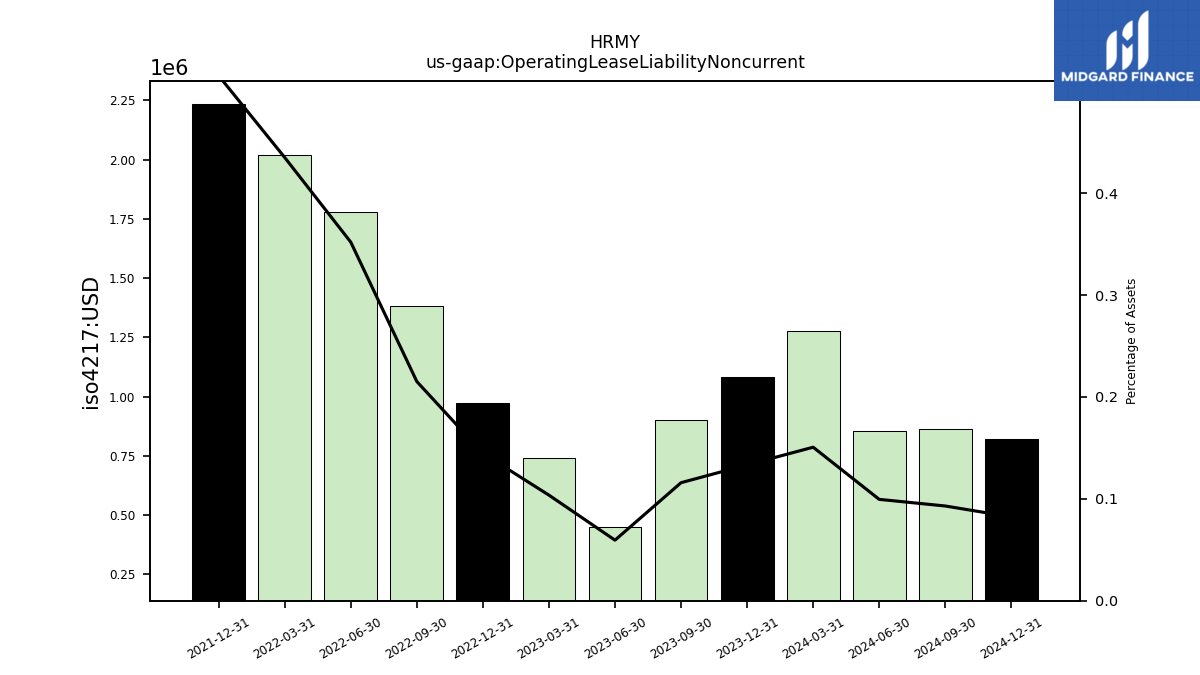
| Operating Lease Liability Noncurrent | 1.08 | 0.90 | 0.45 | 0.74 | 0.97 | 1.38 | 1.78 | 2.02 | 2.23 | NA | NA | NA | NA | NA | NA | NA |
| 2023-12-31 | 2023-09-30 | 2023-06-30 | 2023-03-31 | 2022-12-31 | 2022-09-30 | 2022-06-30 | 2022-03-31 | 2021-12-31 | 2021-09-30 | 2021-06-30 | 2021-03-31 | 2020-12-31 | 2020-09-30 | 2020-06-30 | 2020-03-31 | ||
|---|---|---|---|---|---|---|---|---|---|---|---|---|---|---|---|---|---|
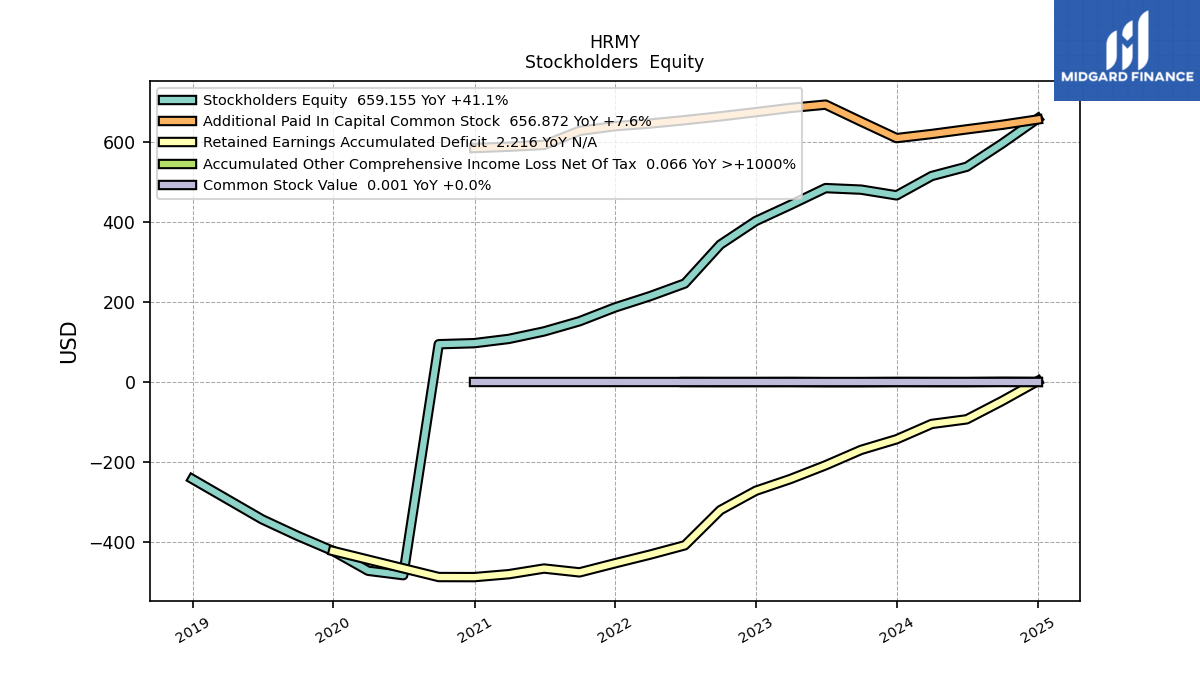
| Stockholders Equity | 466.99 | 481.33 | 485.17 | 443.04 | 402.84 | 343.88 | 246.53 | 214.50 | 186.51 | 152.02 | 126.55 | 107.88 | 97.18 | 94.55 | -483.36 | -472.33 | |
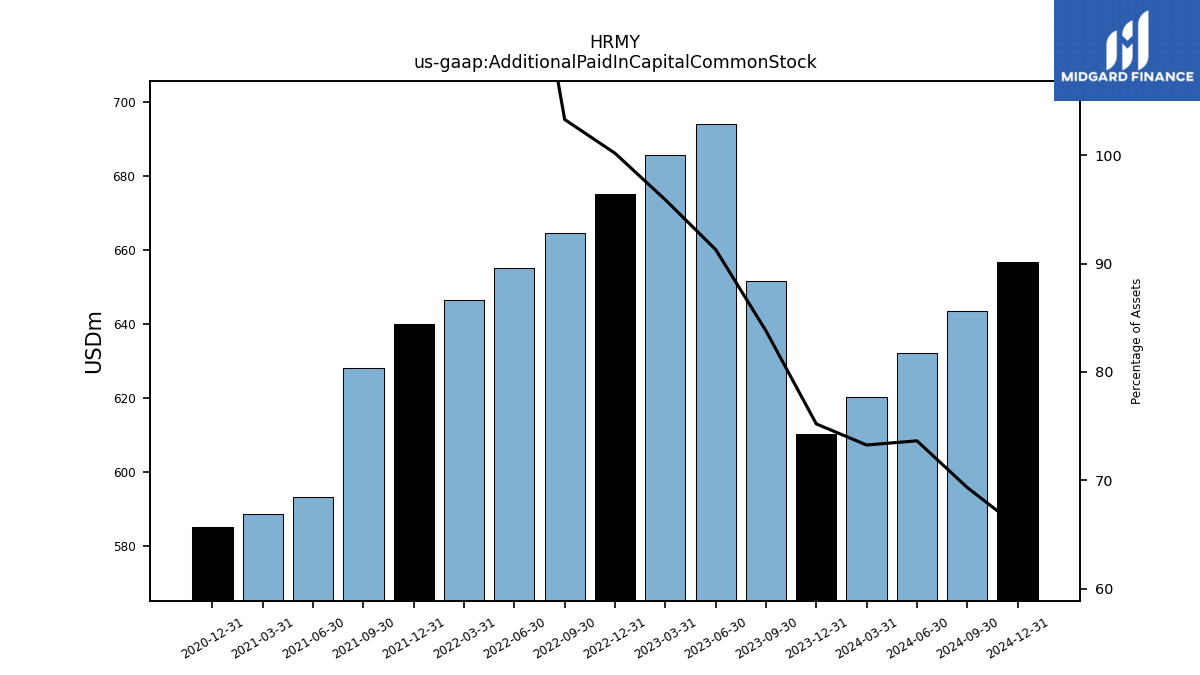
| Additional Paid In Capital Common Stock | 610.27 | 651.73 | 694.04 | 685.72 | 675.12 | 664.70 | 655.14 | 646.62 | 640.10 | 628.33 | 593.24 | 588.69 | 585.37 | NA | NA | NA | |
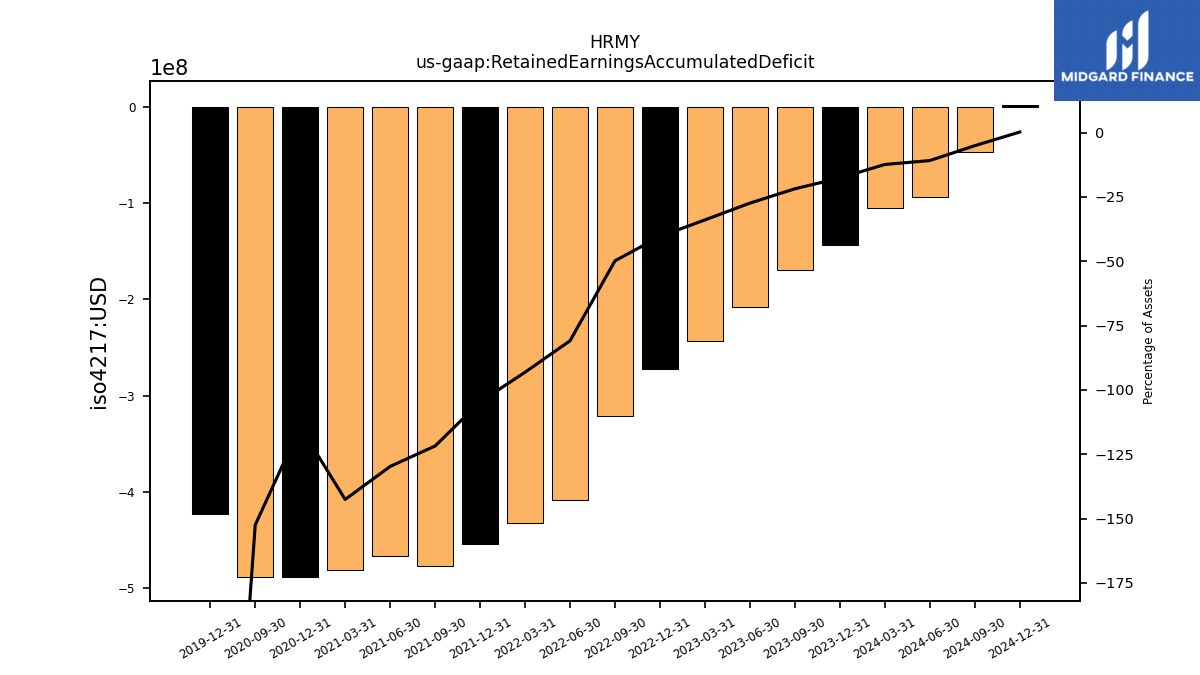
| Retained Earnings Accumulated Deficit | -143.28 | -169.88 | -208.34 | -242.65 | -272.13 | -320.64 | -408.58 | -432.11 | -453.60 | -476.31 | -466.69 | -480.81 | -488.19 | -487.99 | NA | NA | |
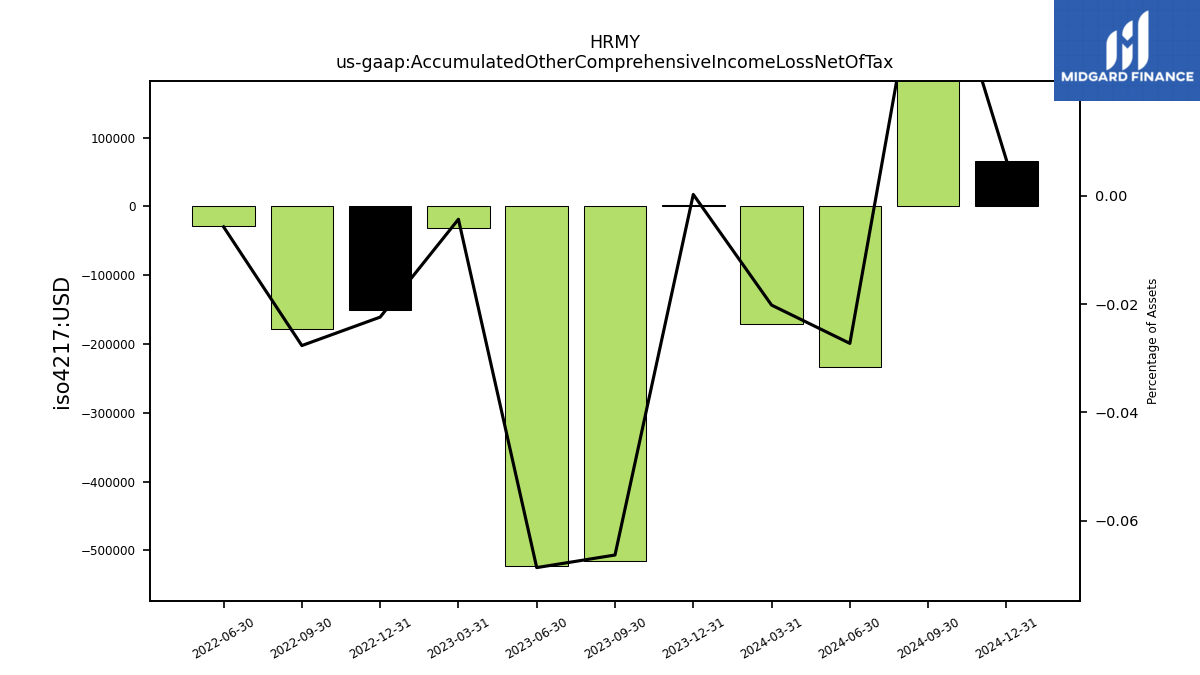
| Accumulated Other Comprehensive Income Loss Net Of Tax | 0.00 | -0.52 | -0.52 | -0.03 | -0.15 | -0.18 | -0.03 | NA | NA | NA | NA | NA | NA | NA | NA | NA | |
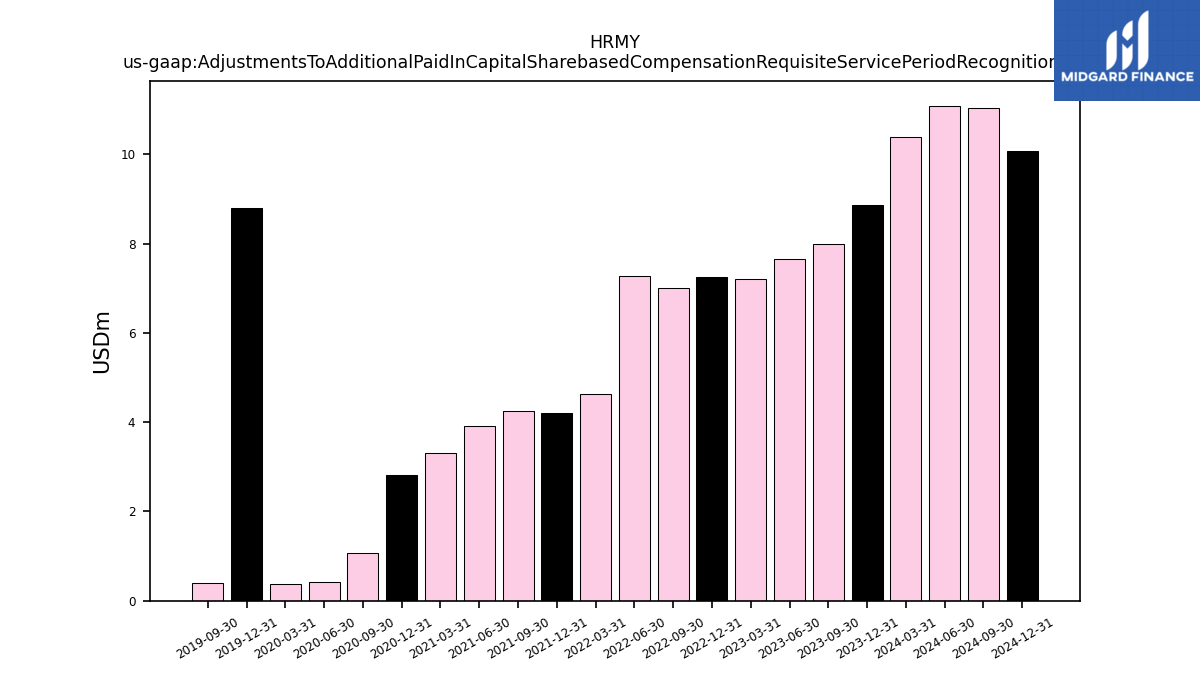
| Adjustments To Additional Paid In Capital Sharebased Compensation Requisite Service Period Recognition Value | 8.86 | 7.99 | 7.65 | 7.20 | 7.26 | 7.01 | 7.28 | 4.63 | 4.20 | 4.25 | 3.91 | 3.30 | 2.82 | 1.07 | 0.43 | 0.37 |
| 2023-12-31 | 2023-09-30 | 2023-06-30 | 2023-03-31 | 2022-12-31 | 2022-09-30 | 2022-06-30 | 2022-03-31 | 2021-12-31 | 2021-09-30 | 2021-06-30 | 2021-03-31 | 2020-12-31 | 2020-09-30 | 2020-06-30 | 2020-03-31 | ||
|---|---|---|---|---|---|---|---|---|---|---|---|---|---|---|---|---|---|
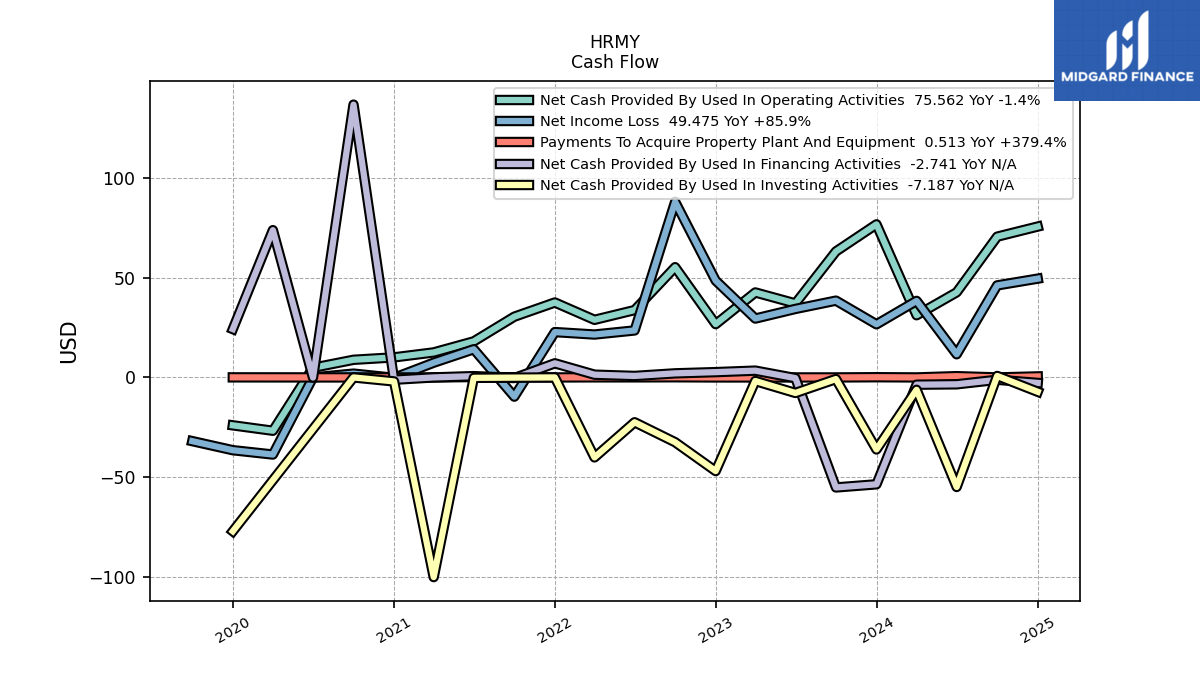
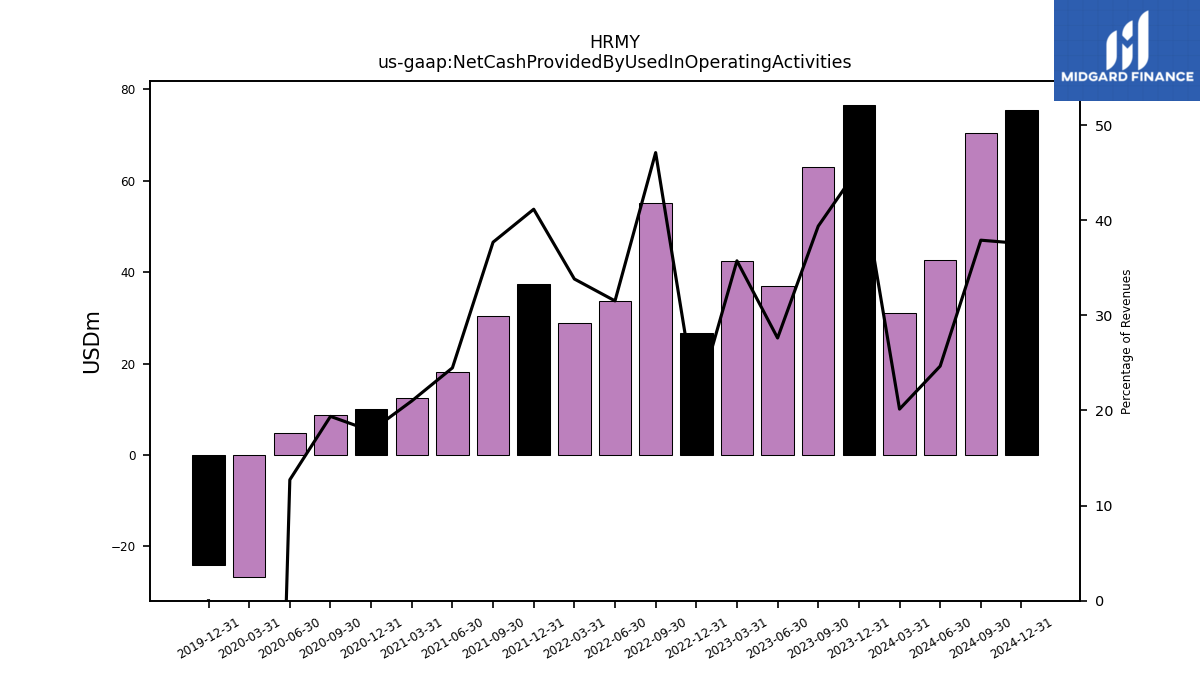
| Net Cash Provided By Used In Operating Activities | 76.67 | 63.10 | 37.06 | 42.56 | 26.68 | 55.20 | 33.73 | 28.85 | 37.53 | 30.42 | 18.07 | 12.53 | 10.05 | 8.84 | 4.83 | -26.70 | |
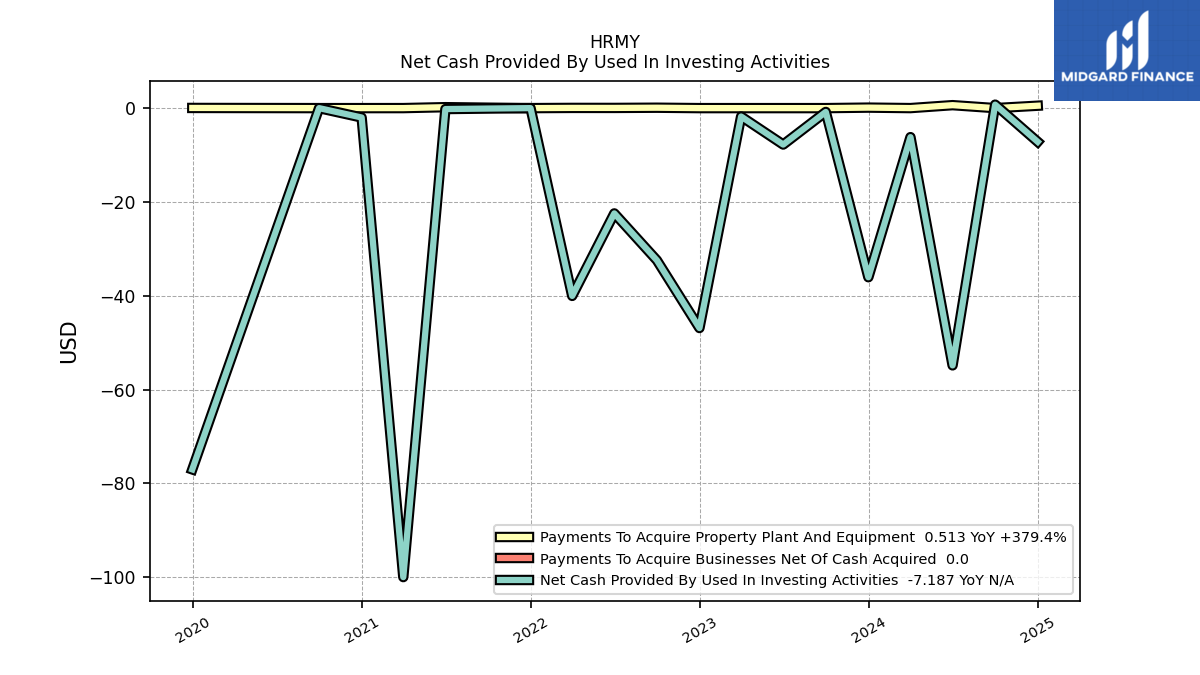
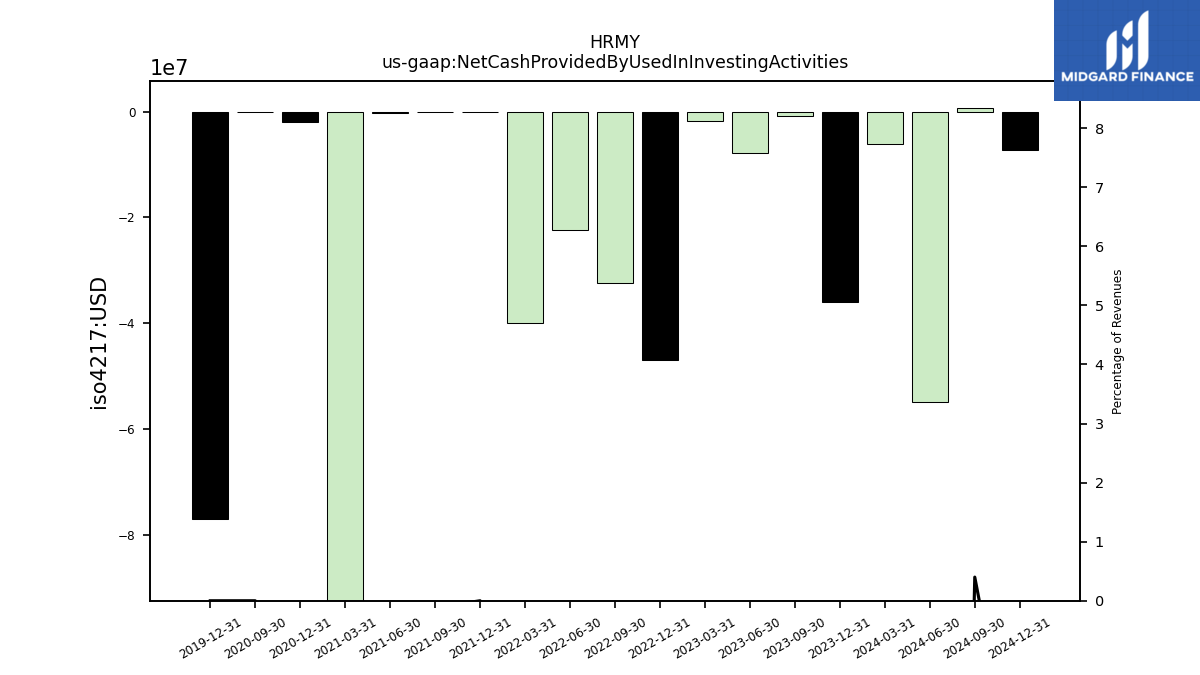
| Net Cash Provided By Used In Investing Activities | -36.06 | -0.81 | -7.77 | -1.79 | -46.90 | -32.45 | -22.45 | -40.05 | 0.00 | -0.09 | -0.20 | -100.00 | -2.00 | 0.00 | NA | NA | |
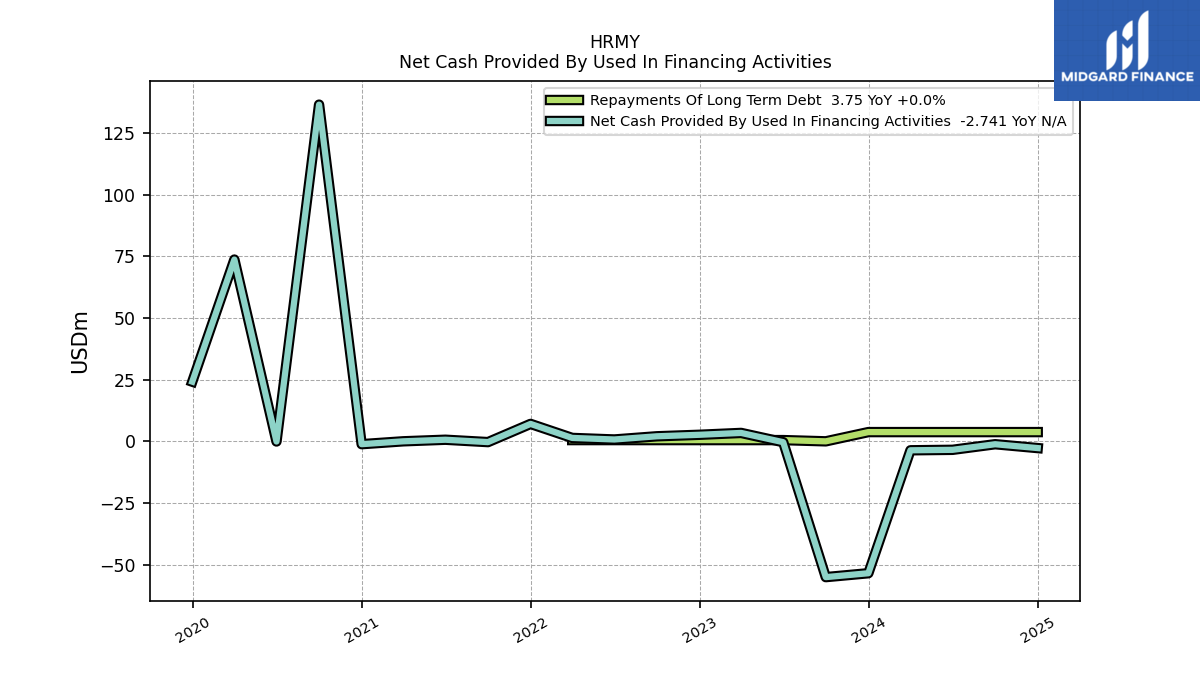
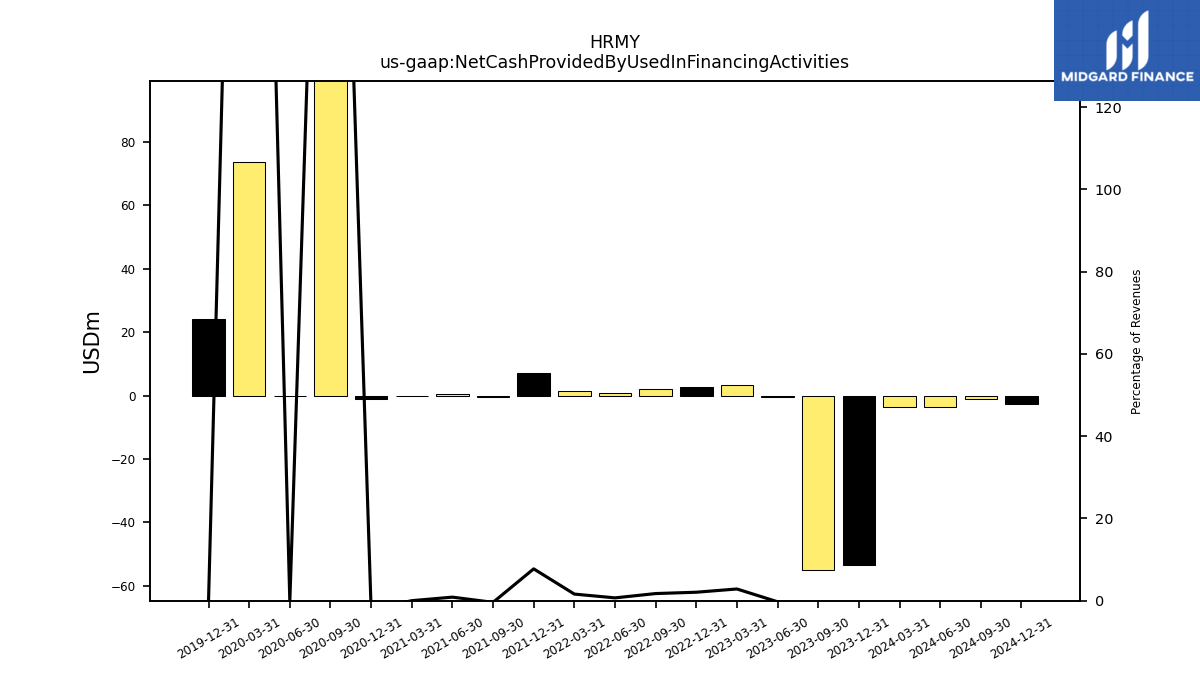
| Net Cash Provided By Used In Financing Activities | -53.52 | -55.10 | -0.34 | 3.41 | 2.66 | 2.05 | 0.75 | 1.38 | 7.07 | -0.31 | 0.65 | 0.01 | -1.16 | 136.62 | -0.07 | 73.76 |
| 2023-12-31 | 2023-09-30 | 2023-06-30 | 2023-03-31 | 2022-12-31 | 2022-09-30 | 2022-06-30 | 2022-03-31 | 2021-12-31 | 2021-09-30 | 2021-06-30 | 2021-03-31 | 2020-12-31 | 2020-09-30 | 2020-06-30 | 2020-03-31 | ||
|---|---|---|---|---|---|---|---|---|---|---|---|---|---|---|---|---|---|
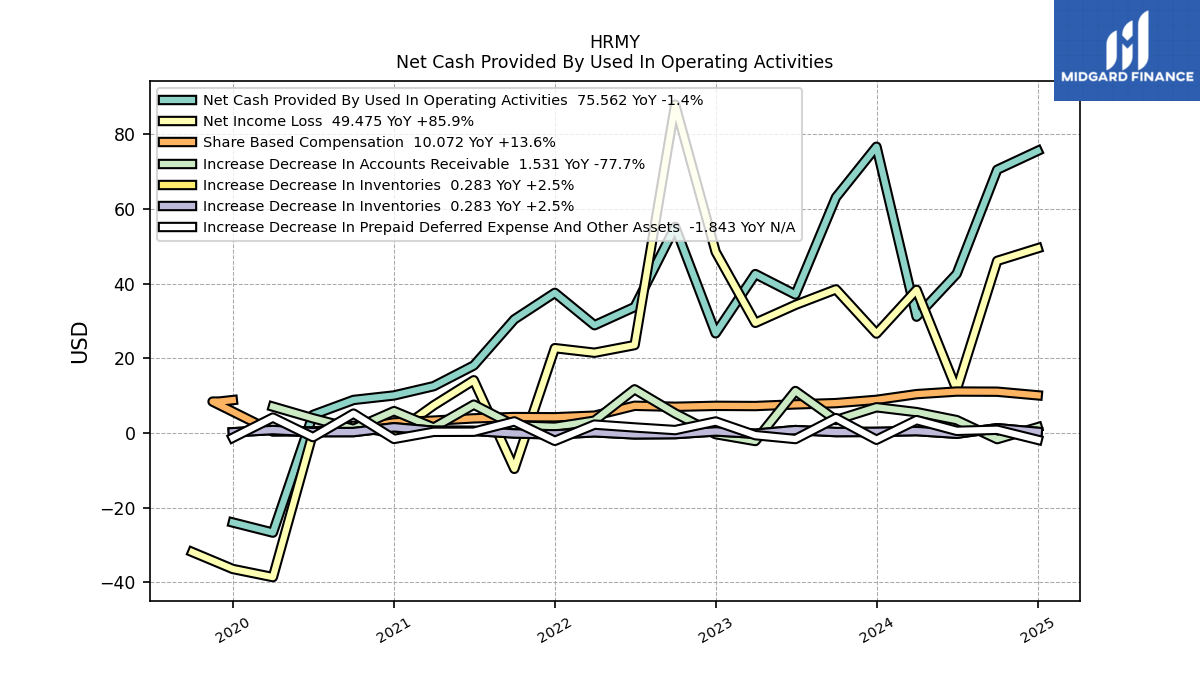
| Net Cash Provided By Used In Operating Activities | 76.67 | 63.10 | 37.06 | 42.56 | 26.68 | 55.20 | 33.73 | 28.85 | 37.53 | 30.42 | 18.07 | 12.53 | 10.05 | 8.84 | 4.83 | -26.70 | |
| Net Income Loss | 26.61 | 38.46 | 34.30 | 29.48 | 48.51 | 87.94 | 23.53 | 21.48 | 22.71 | -9.62 | 14.12 | 7.39 | -0.21 | 1.91 | -0.03 | -38.62 | |
| Profit Loss | 26.61 | 38.46 | 34.30 | 29.48 | 48.51 | 87.94 | 23.53 | 21.48 | 22.71 | -9.62 | 14.12 | 7.39 | -0.21 | 1.91 | -0.03 | -38.62 | |
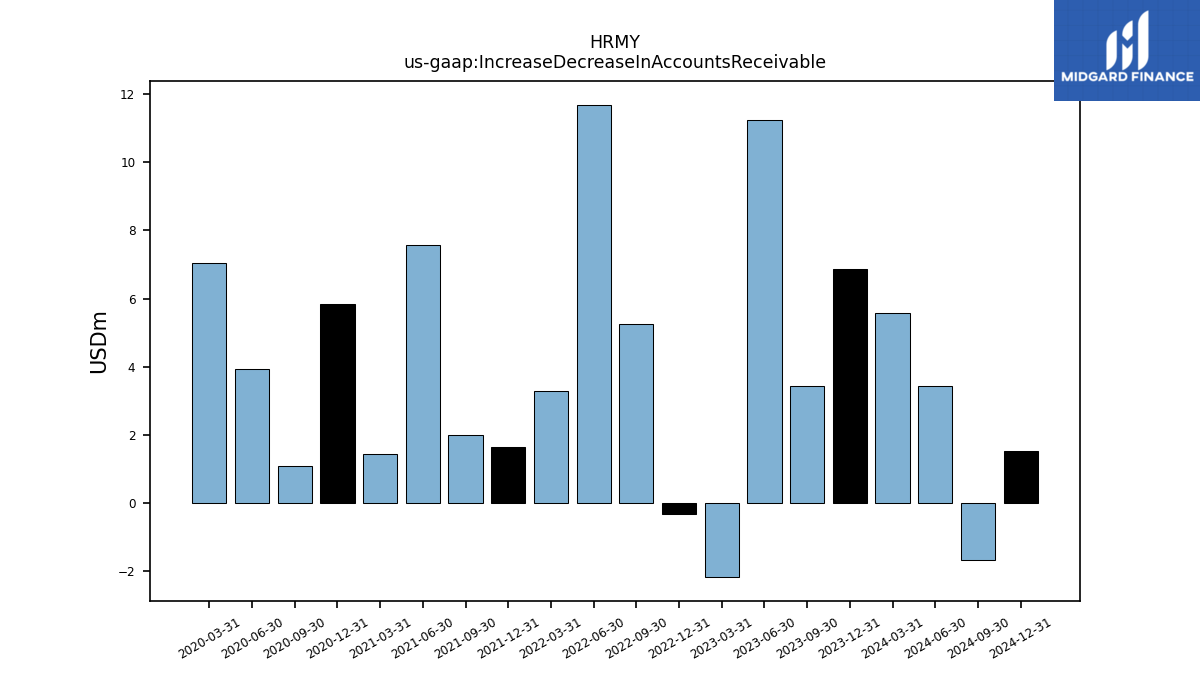
| Increase Decrease In Accounts Receivable | 6.88 | 3.45 | 11.24 | -2.17 | -0.33 | 5.24 | 11.69 | 3.29 | 1.64 | 2.01 | 7.58 | 1.44 | 5.85 | 1.09 | 3.93 | 7.05 | |
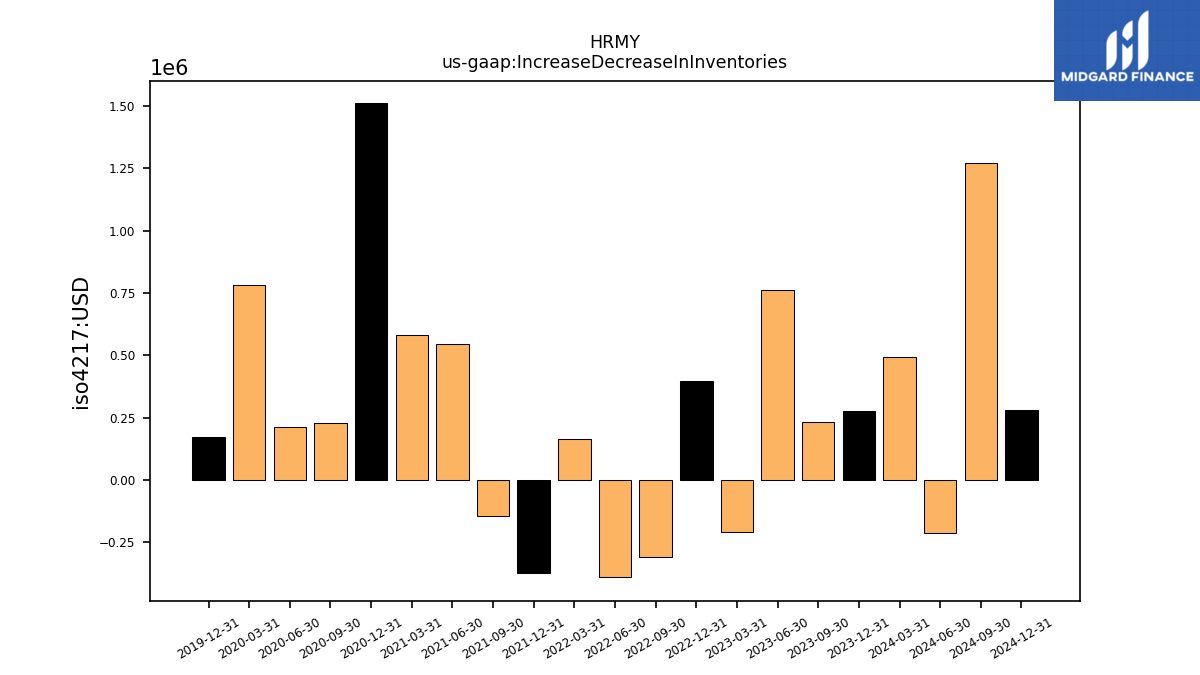
| Increase Decrease In Inventories | 0.28 | 0.23 | 0.76 | -0.21 | 0.40 | -0.31 | -0.39 | 0.17 | -0.37 | -0.15 | 0.55 | 0.58 | 1.51 | 0.23 | 0.21 | 0.78 | |
| Share Based Compensation | 8.86 | 7.99 | 7.65 | 7.20 | 7.26 | 7.01 | 7.28 | 4.63 | 4.20 | 4.25 | 3.91 | 3.30 | 2.82 | 1.07 | 0.43 | 0.37 | |
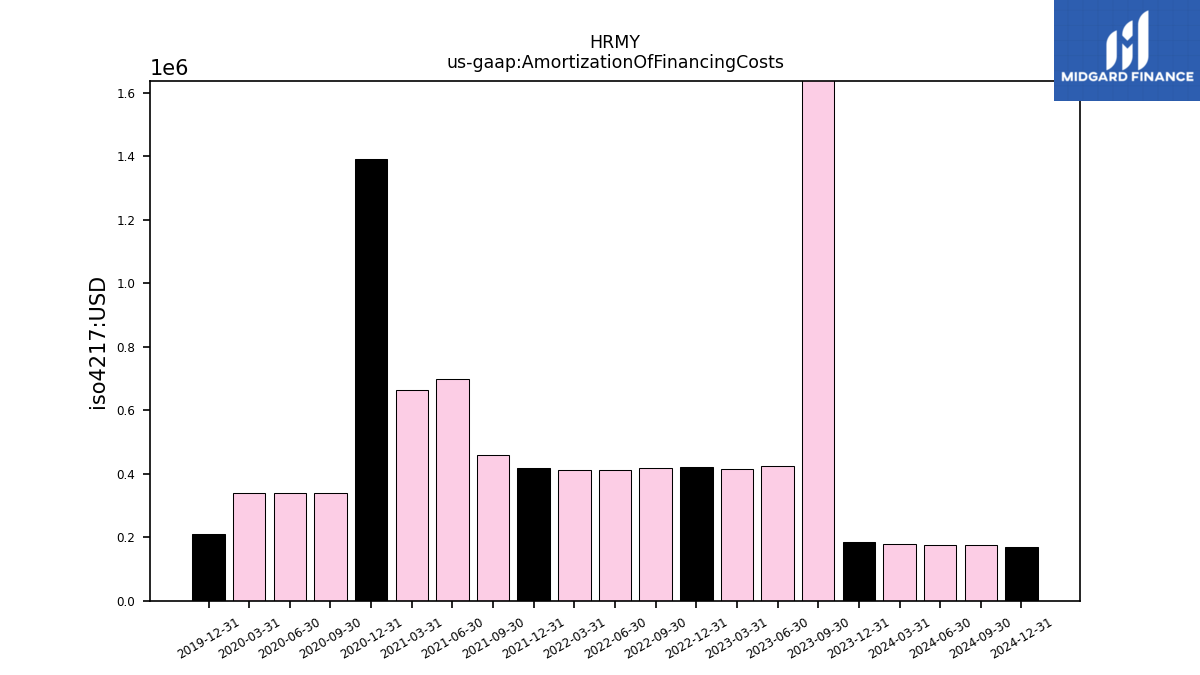
| Amortization Of Financing Costs | 0.18 | 2.22 | 0.42 | 0.42 | 0.42 | 0.42 | 0.41 | 0.41 | 0.42 | 0.46 | 0.70 | 0.66 | 1.39 | 0.34 | 0.34 | 0.34 |
| 2023-12-31 | 2023-09-30 | 2023-06-30 | 2023-03-31 | 2022-12-31 | 2022-09-30 | 2022-06-30 | 2022-03-31 | 2021-12-31 | 2021-09-30 | 2021-06-30 | 2021-03-31 | 2020-12-31 | 2020-09-30 | 2020-06-30 | 2020-03-31 | ||
|---|---|---|---|---|---|---|---|---|---|---|---|---|---|---|---|---|---|
| Net Cash Provided By Used In Investing Activities | -36.06 | -0.81 | -7.77 | -1.79 | -46.90 | -32.45 | -22.45 | -40.05 | 0.00 | -0.09 | -0.20 | -100.00 | -2.00 | 0.00 | NA | NA | |
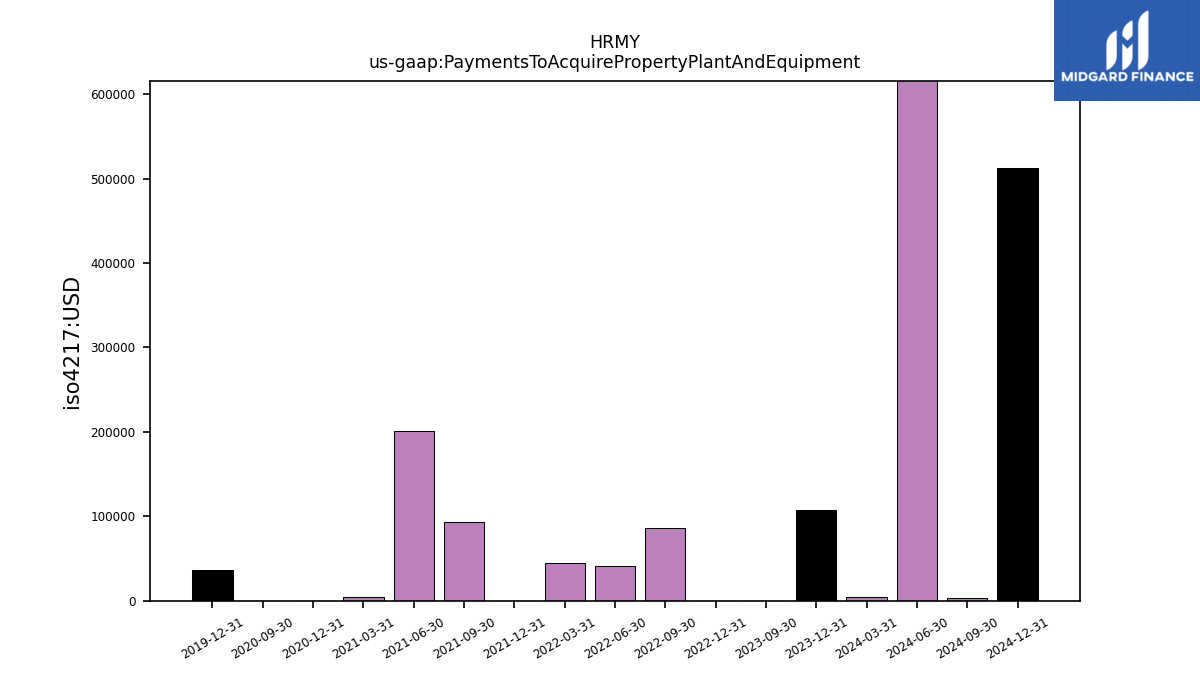
| Payments To Acquire Property Plant And Equipment | 0.11 | 0.00 | NA | NA | 0.00 | 0.09 | 0.04 | 0.04 | 0.00 | 0.09 | 0.20 | 0.00 | 0.00 | 0.00 | NA | NA |
| 2023-12-31 | 2023-09-30 | 2023-06-30 | 2023-03-31 | 2022-12-31 | 2022-09-30 | 2022-06-30 | 2022-03-31 | 2021-12-31 | 2021-09-30 | 2021-06-30 | 2021-03-31 | 2020-12-31 | 2020-09-30 | 2020-06-30 | 2020-03-31 | ||
|---|---|---|---|---|---|---|---|---|---|---|---|---|---|---|---|---|---|
| Net Cash Provided By Used In Financing Activities | -53.52 | -55.10 | -0.34 | 3.41 | 2.66 | 2.05 | 0.75 | 1.38 | 7.07 | -0.31 | 0.65 | 0.01 | -1.16 | 136.62 | -0.07 | 73.76 | |
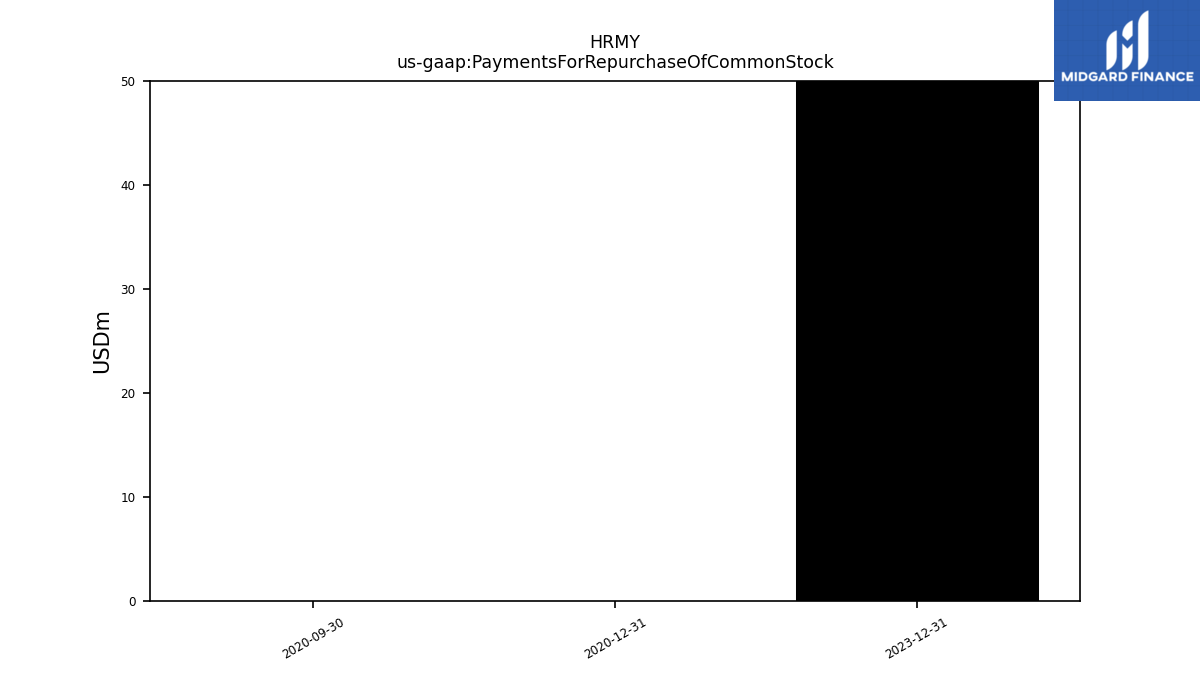
| Payments For Repurchase Of Common Stock | 50.00 | NA | NA | NA | NA | NA | NA | NA | NA | NA | NA | NA | 0.00 | 0.00 | NA | NA |
| 2023-12-31 | 2023-09-30 | 2023-06-30 | 2023-03-31 | 2022-12-31 | 2022-09-30 | 2022-06-30 | 2022-03-31 | 2021-12-31 | 2021-09-30 | 2021-06-30 | 2021-03-31 | 2020-12-31 | 2020-09-30 | 2020-06-30 | 2020-03-31 | ||
|---|---|---|---|---|---|---|---|---|---|---|---|---|---|---|---|---|---|
| Revenues | 168.41 | 160.27 | 134.22 | 119.13 | 128.31 | 117.21 | 107.03 | 85.31 | 91.21 | 80.73 | 73.82 | 59.67 | 56.29 | 45.61 | 38.01 | 19.84 | |
| Revenue From Contract With Customer Excluding Assessed Tax | 168.41 | 160.27 | 134.22 | 119.13 | 128.31 | 117.21 | 107.03 | 85.31 | 91.21 | 80.73 | 73.82 | 59.67 | 56.29 | 45.61 | 38.01 | 19.84 |