
| 2023-12-29 | 2023-09-29 | 2023-06-30 | 2023-03-31 | 2022-12-30 | 2022-09-30 | 2022-07-01 | 2022-06-30 | 2022-04-01 | 2022-03-31 | 2021-12-31 | 2021-09-24 | 2021-06-25 | 2021-03-26 | 2020-12-25 | 2020-09-25 | 2020-06-26 | 2020-03-27 | 2019-12-27 | 2019-09-27 | 2019-06-28 | 2019-03-29 | 2018-12-28 | 2018-09-28 | 2018-06-29 | 2018-03-30 | 2017-12-29 | 2017-09-29 | 2017-06-30 | 2017-03-31 | 2016-12-30 | 2016-09-23 | 2016-06-24 | 2016-03-25 | ||
|---|---|---|---|---|---|---|---|---|---|---|---|---|---|---|---|---|---|---|---|---|---|---|---|---|---|---|---|---|---|---|---|---|---|---|---|
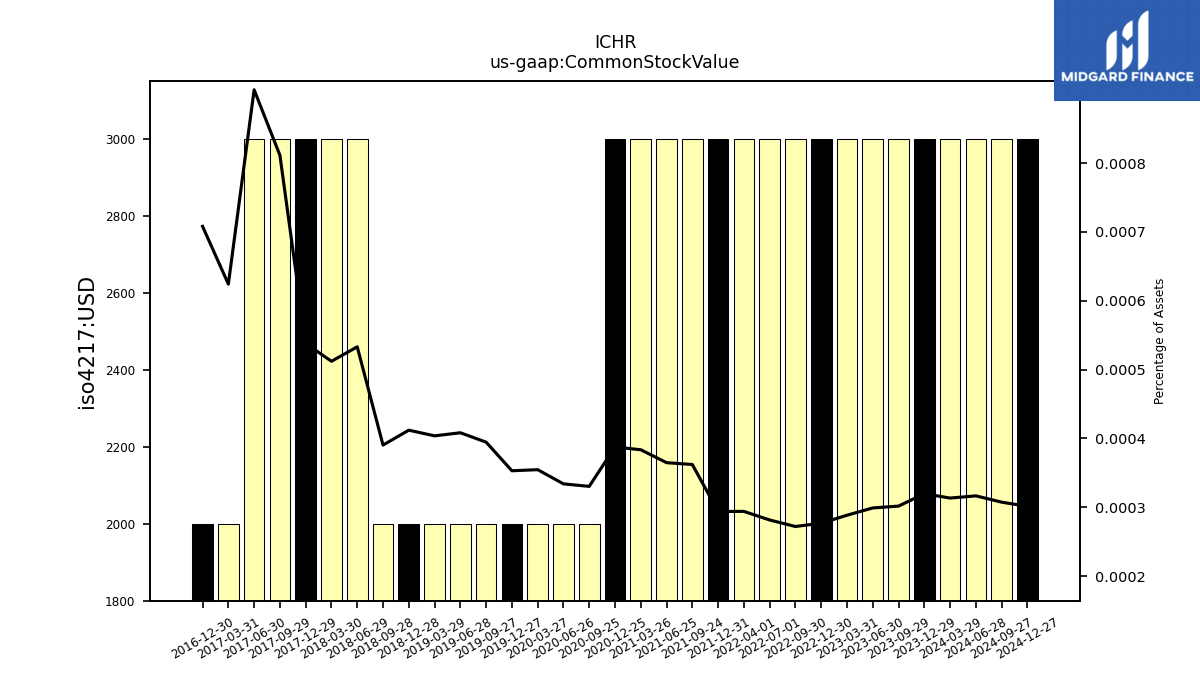
| Common Stock Value | 0.00 | 0.00 | 0.00 | 0.00 | 0.00 | 0.00 | 0.00 | NA | 0.00 | NA | 0.00 | NA | 0.00 | 0.00 | 0.00 | 0.00 | 0.00 | 0.00 | 0.00 | 0.00 | 0.00 | 0.00 | 0.00 | 0.00 | 0.00 | 0.00 | 0.00 | 0.00 | 0.00 | 0.00 | 0.00 | NA | NA | NA | |
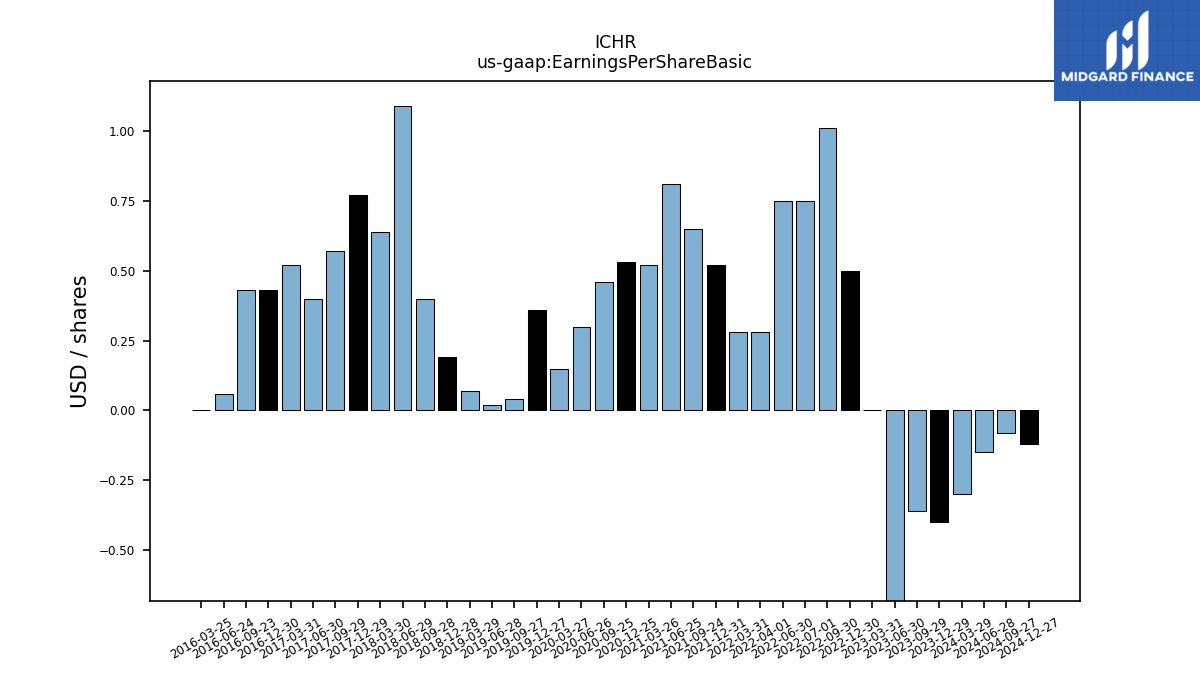
| Earnings Per Share Basic | -0.40 | -0.36 | -0.71 | 0.00 | 0.50 | 1.01 | 0.75 | 0.75 | 0.28 | 0.28 | 0.52 | 0.65 | 0.81 | 0.52 | 0.53 | 0.46 | 0.30 | 0.15 | 0.36 | 0.04 | 0.02 | 0.07 | 0.19 | 0.40 | 1.09 | 0.64 | 0.77 | 0.57 | 0.40 | 0.52 | 0.43 | 0.43 | 0.06 | 0.00 | |
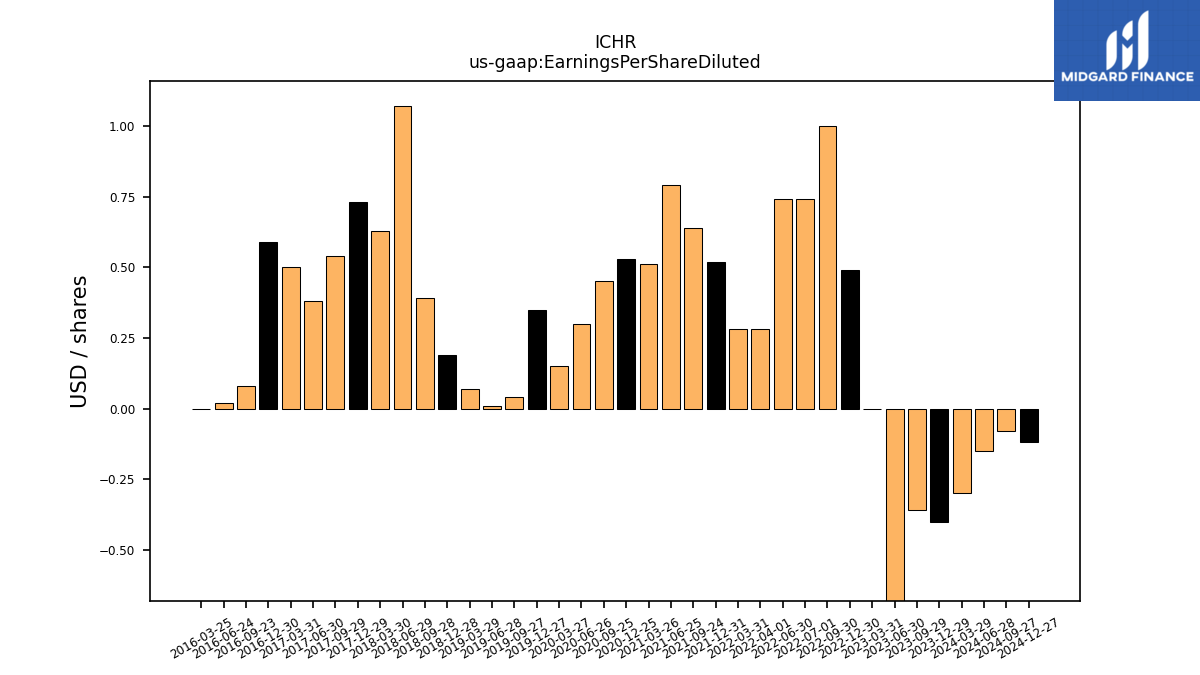
| Earnings Per Share Diluted | -0.40 | -0.36 | -0.71 | 0.00 | 0.49 | 1.00 | 0.74 | 0.74 | 0.28 | 0.28 | 0.52 | 0.64 | 0.79 | 0.51 | 0.53 | 0.45 | 0.30 | 0.15 | 0.35 | 0.04 | 0.01 | 0.07 | 0.19 | 0.39 | 1.07 | 0.63 | 0.73 | 0.54 | 0.38 | 0.50 | 0.59 | 0.08 | 0.02 | 0.00 |
| 2023-12-29 | 2023-09-29 | 2023-06-30 | 2023-03-31 | 2022-12-30 | 2022-09-30 | 2022-07-01 | 2022-06-30 | 2022-04-01 | 2022-03-31 | 2021-12-31 | 2021-09-24 | 2021-06-25 | 2021-03-26 | 2020-12-25 | 2020-09-25 | 2020-06-26 | 2020-03-27 | 2019-12-27 | 2019-09-27 | 2019-06-28 | 2019-03-29 | 2018-12-28 | 2018-09-28 | 2018-06-29 | 2018-03-30 | 2017-12-29 | 2017-09-29 | 2017-06-30 | 2017-03-31 | 2016-12-30 | 2016-09-23 | 2016-06-24 | 2016-03-25 | ||
|---|---|---|---|---|---|---|---|---|---|---|---|---|---|---|---|---|---|---|---|---|---|---|---|---|---|---|---|---|---|---|---|---|---|---|---|
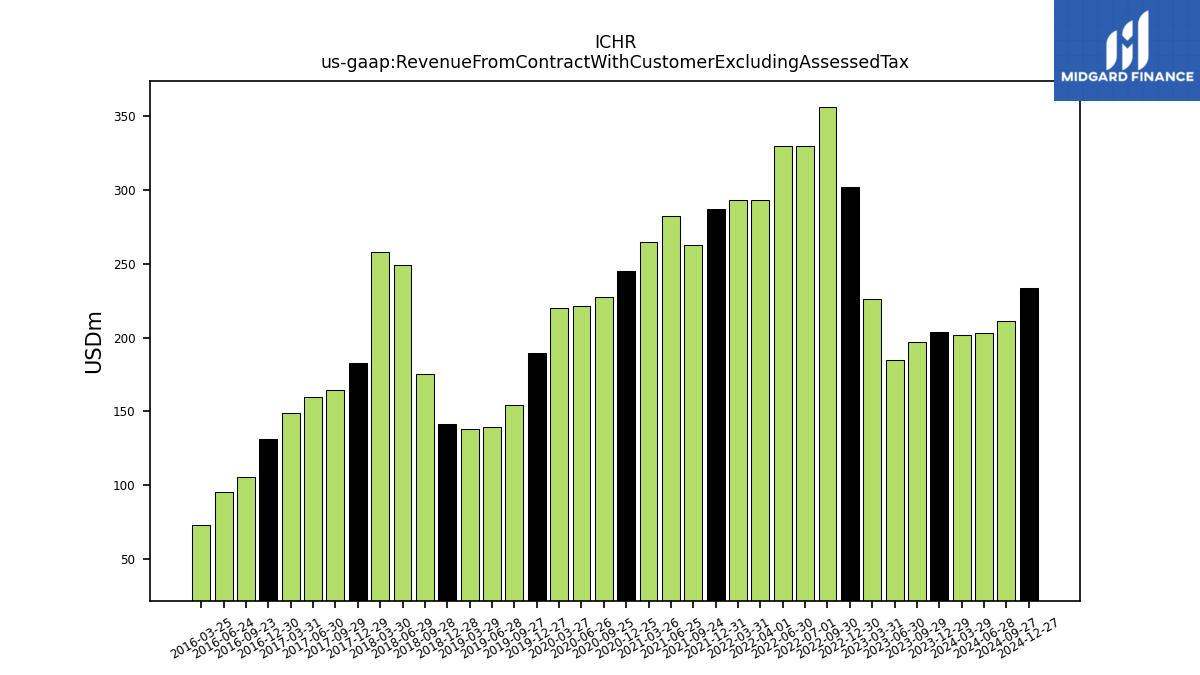
| Revenue From Contract With Customer Excluding Assessed Tax | 203.48 | 196.76 | 185.01 | 225.87 | 301.72 | 355.64 | 329.56 | 329.56 | 293.15 | 293.15 | 287.19 | 262.86 | 282.31 | 264.57 | 244.97 | 227.68 | 221.56 | 220.03 | 189.35 | 154.46 | 139.19 | 137.83 | 141.40 | 175.21 | 248.97 | 258.03 | 182.94 | 164.52 | 159.73 | 148.70 | 131.41 | 105.69 | 95.36 | 73.29 | |
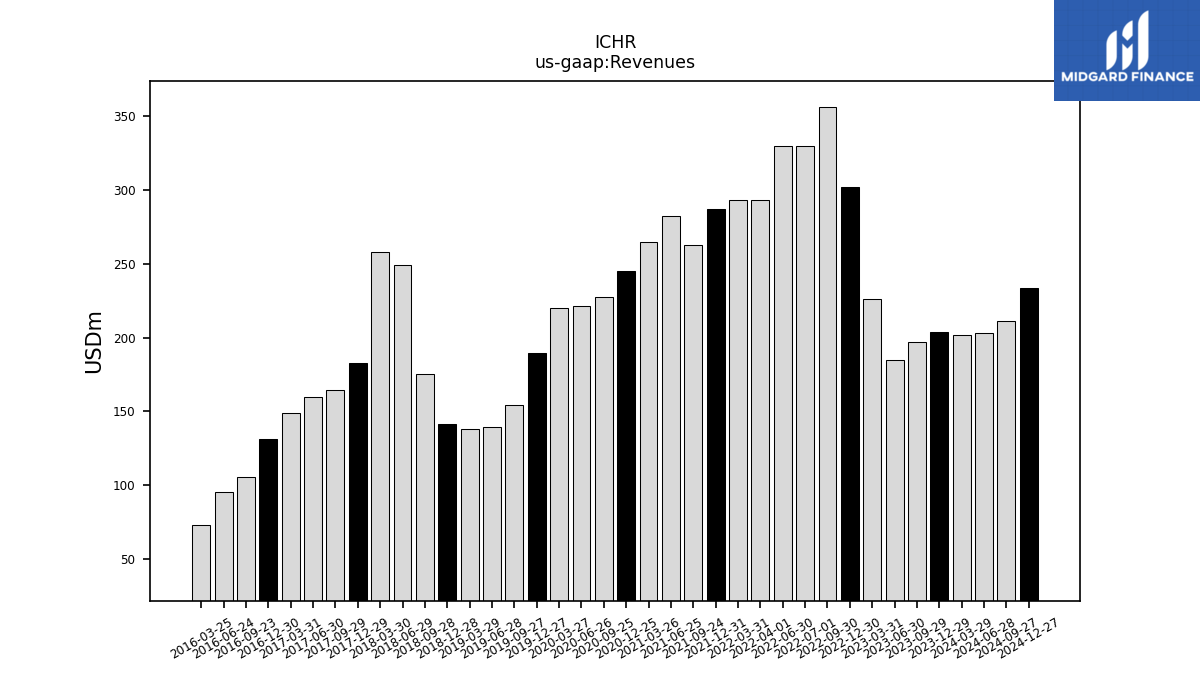
| Revenues | 203.48 | 196.76 | 185.01 | 225.87 | 301.72 | 355.64 | 329.56 | 329.56 | 293.15 | 293.15 | 287.19 | 262.86 | 282.31 | 264.57 | 244.97 | 227.68 | 221.56 | 220.03 | 189.35 | 154.46 | 139.19 | 137.83 | 141.40 | 175.21 | 248.97 | 258.03 | 182.94 | 164.52 | 159.73 | 148.70 | 131.41 | 105.69 | 95.36 | 73.29 | |
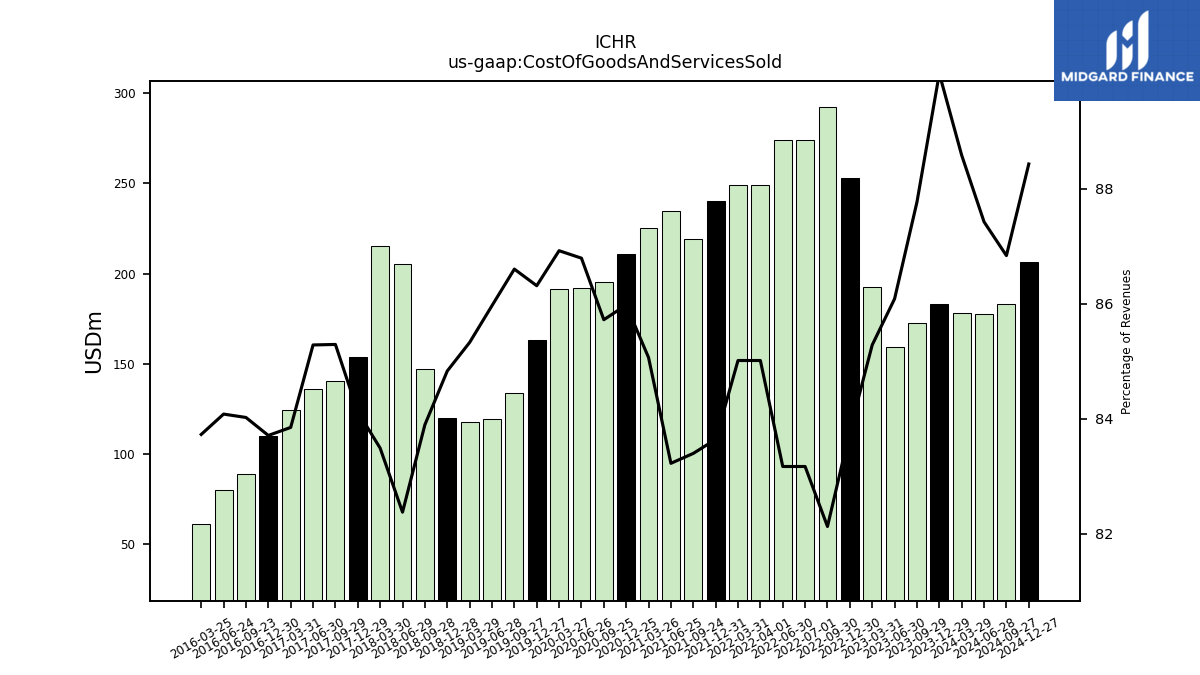
| Cost Of Goods And Services Sold | 183.14 | 172.69 | 159.27 | 192.63 | 252.81 | 292.08 | 274.10 | 274.10 | 249.21 | 249.21 | 240.21 | 219.22 | 234.96 | 225.05 | 210.62 | 195.17 | 192.30 | 191.25 | 163.44 | 133.76 | 119.66 | 117.61 | 119.95 | 146.99 | 205.10 | 215.43 | 153.89 | 140.32 | 136.23 | 124.69 | 110.00 | 88.80 | 80.19 | 61.36 | |
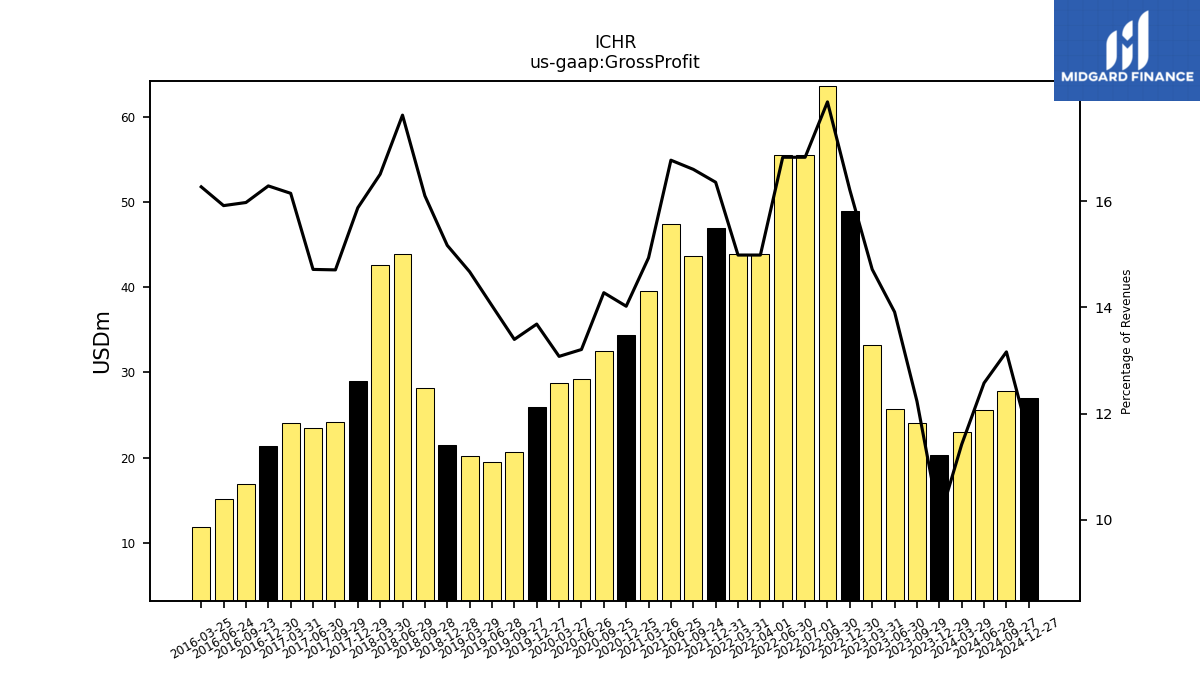
| Gross Profit | 20.34 | 24.07 | 25.74 | 33.24 | 48.91 | 63.56 | 55.46 | 55.46 | 43.93 | 43.93 | 46.98 | 43.64 | 47.35 | 39.51 | 34.35 | 32.51 | 29.26 | 28.77 | 25.91 | 20.69 | 19.53 | 20.22 | 21.45 | 28.21 | 43.88 | 42.60 | 29.04 | 24.20 | 23.51 | 24.02 | 21.41 | 16.89 | 15.18 | 11.93 | |
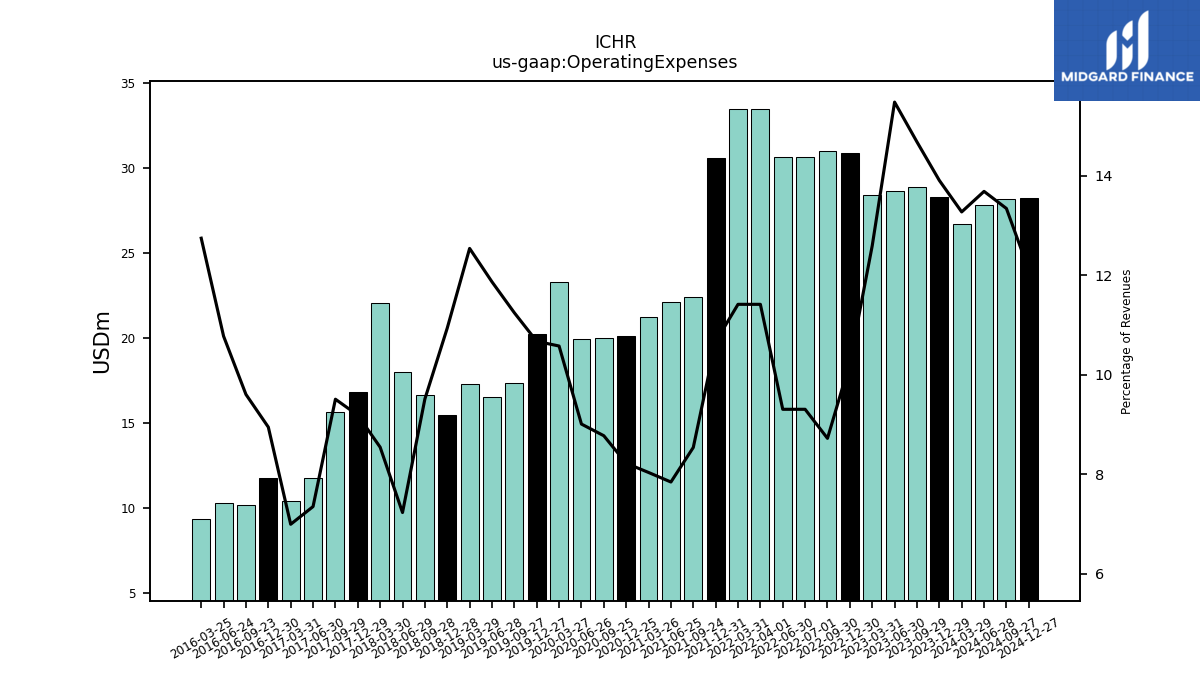
| Operating Expenses | 28.30 | 28.89 | 28.65 | 28.45 | 30.90 | 31.01 | 30.66 | 30.66 | 33.47 | 33.47 | 30.63 | 22.44 | 22.14 | 21.25 | 20.13 | 19.97 | 19.96 | 23.27 | 20.21 | 17.37 | 16.52 | 17.29 | 15.47 | 16.67 | 18.00 | 22.04 | 16.80 | 15.64 | 11.74 | 10.40 | 11.76 | 10.15 | 10.28 | 9.34 | |
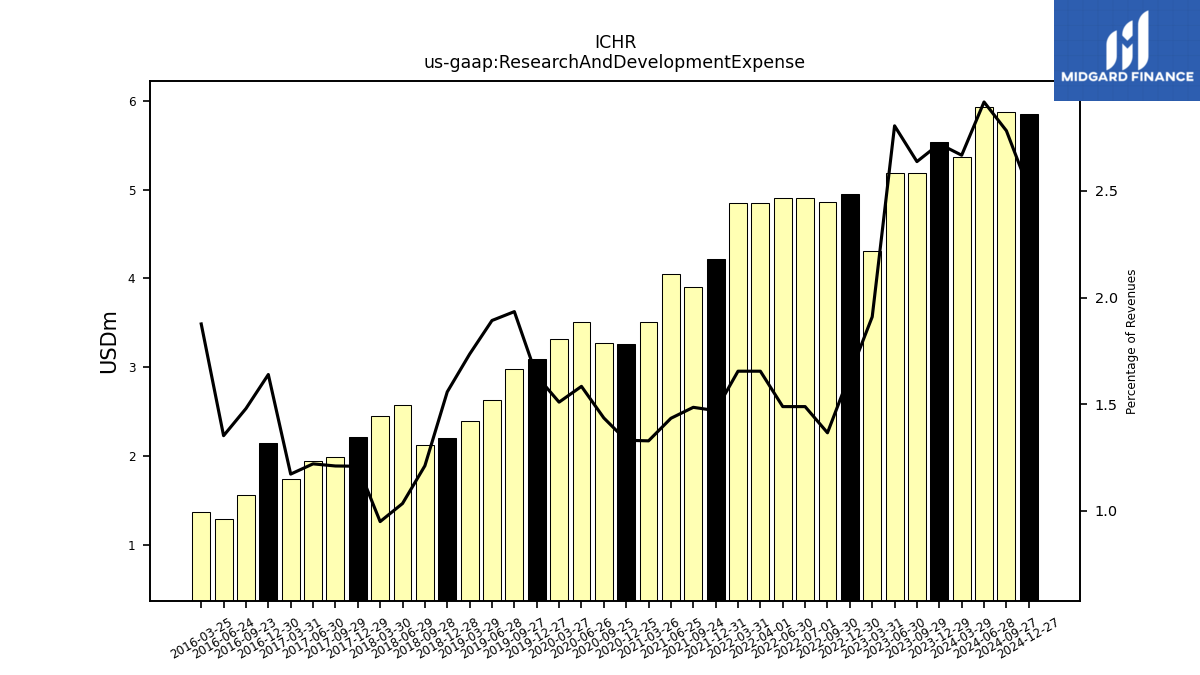
| Research And Development Expense | 5.53 | 5.19 | 5.19 | 4.31 | 4.95 | 4.86 | 4.91 | 4.91 | 4.85 | 4.85 | 4.22 | 3.90 | 4.05 | 3.52 | 3.26 | 3.27 | 3.51 | 3.32 | 3.09 | 2.99 | 2.63 | 2.39 | 2.20 | 2.12 | 2.58 | 2.45 | 2.21 | 1.99 | 1.95 | 1.74 | 2.15 | 1.56 | 1.29 | 1.38 | |
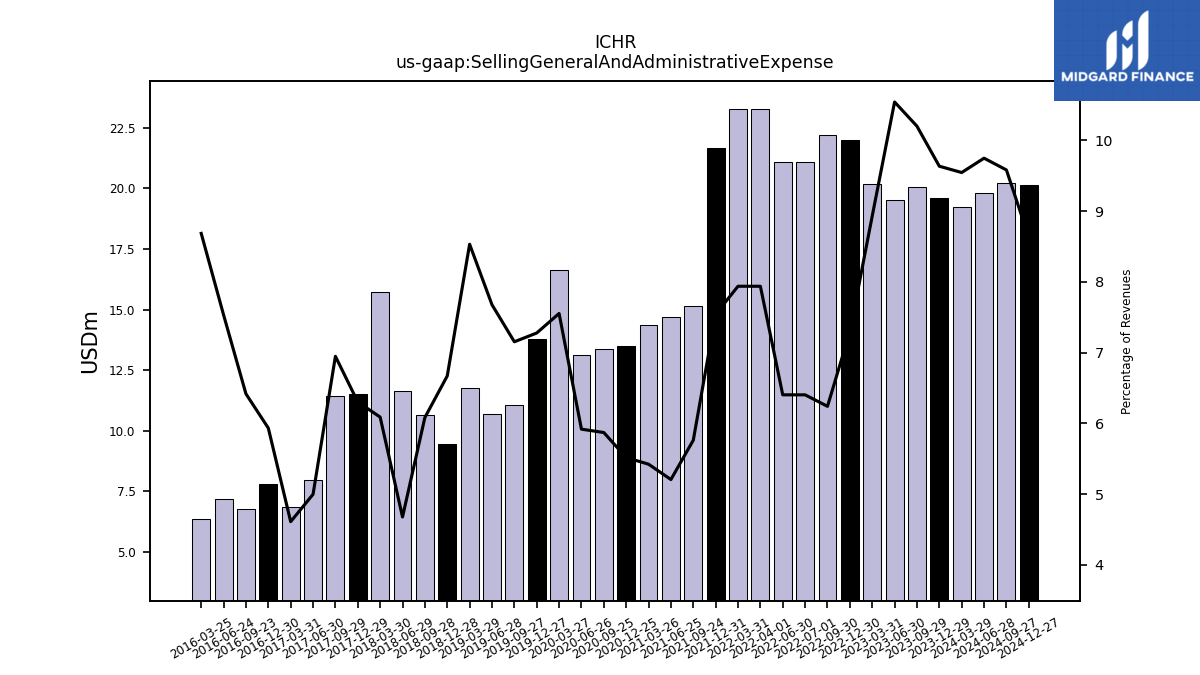
| Selling General And Administrative Expense | 19.60 | 20.07 | 19.50 | 20.17 | 22.01 | 22.20 | 21.10 | 21.10 | 23.27 | 23.27 | 21.66 | 15.15 | 14.70 | 14.35 | 13.52 | 13.37 | 13.11 | 16.62 | 13.78 | 11.05 | 10.69 | 11.76 | 9.43 | 10.66 | 11.65 | 15.71 | 11.53 | 11.43 | 7.98 | 6.86 | 7.80 | 6.78 | 7.18 | 6.36 | |
| Operating Income Loss | -7.96 | -4.82 | -2.91 | 4.79 | 18.02 | 32.55 | 24.80 | 24.80 | 10.46 | 10.46 | 16.34 | 21.20 | 25.21 | 18.26 | 14.22 | 12.53 | 9.30 | 5.50 | 5.71 | 3.32 | 3.01 | 2.94 | 5.98 | 11.55 | 25.88 | 20.56 | 12.24 | 8.55 | 11.77 | 13.62 | 9.65 | 6.74 | 4.90 | 2.58 | |
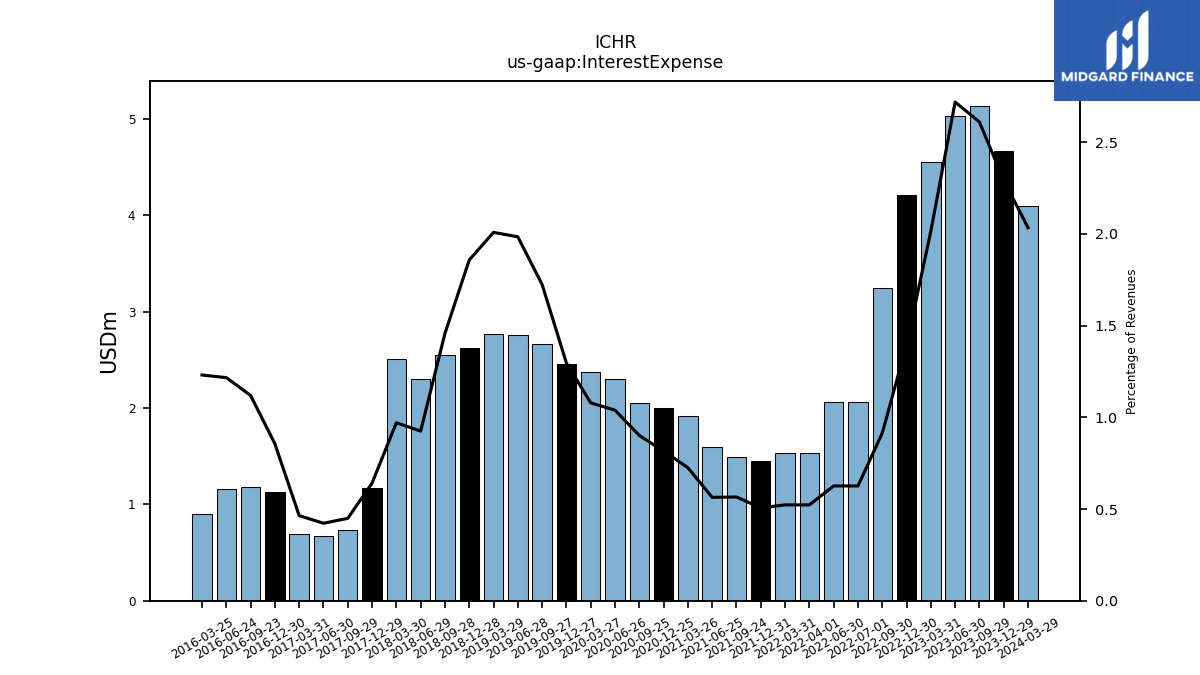
| Interest Expense | 4.66 | 5.14 | 5.03 | 4.55 | 4.21 | 3.25 | 2.06 | 2.06 | 1.53 | 1.53 | 1.45 | 1.49 | 1.59 | 1.92 | 2.00 | 2.05 | 2.30 | 2.37 | 2.45 | 2.66 | 2.76 | 2.77 | 2.63 | 2.55 | 2.30 | 2.50 | 1.17 | 0.74 | 0.68 | 0.69 | 1.12 | 1.18 | 1.16 | 0.90 | |
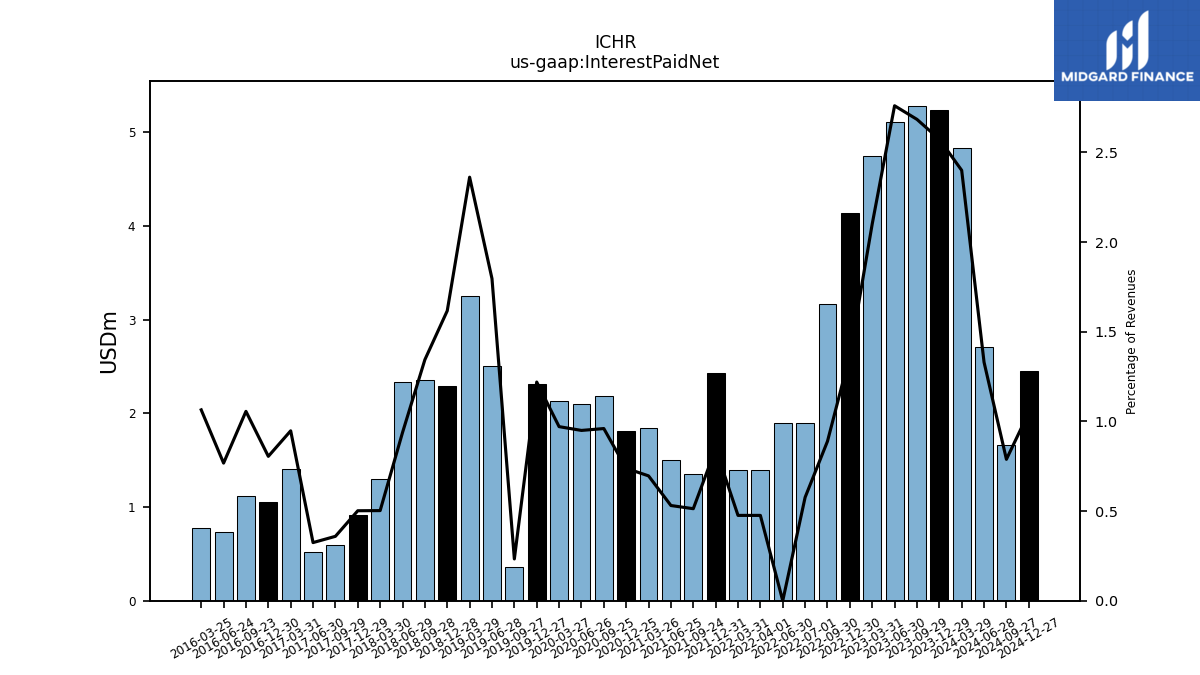
| Interest Paid Net | 5.24 | NA | 5.11 | 4.75 | 4.13 | 3.16 | 1.90 | 1.90 | 1.40 | 1.40 | 2.43 | 1.35 | 1.50 | 1.84 | 1.81 | 2.19 | 2.10 | 2.14 | 2.31 | 0.36 | 2.50 | 3.25 | 2.29 | 2.35 | 2.33 | 1.30 | 0.92 | 0.59 | 0.52 | 1.41 | 1.06 | 1.12 | 0.73 | 0.78 | |
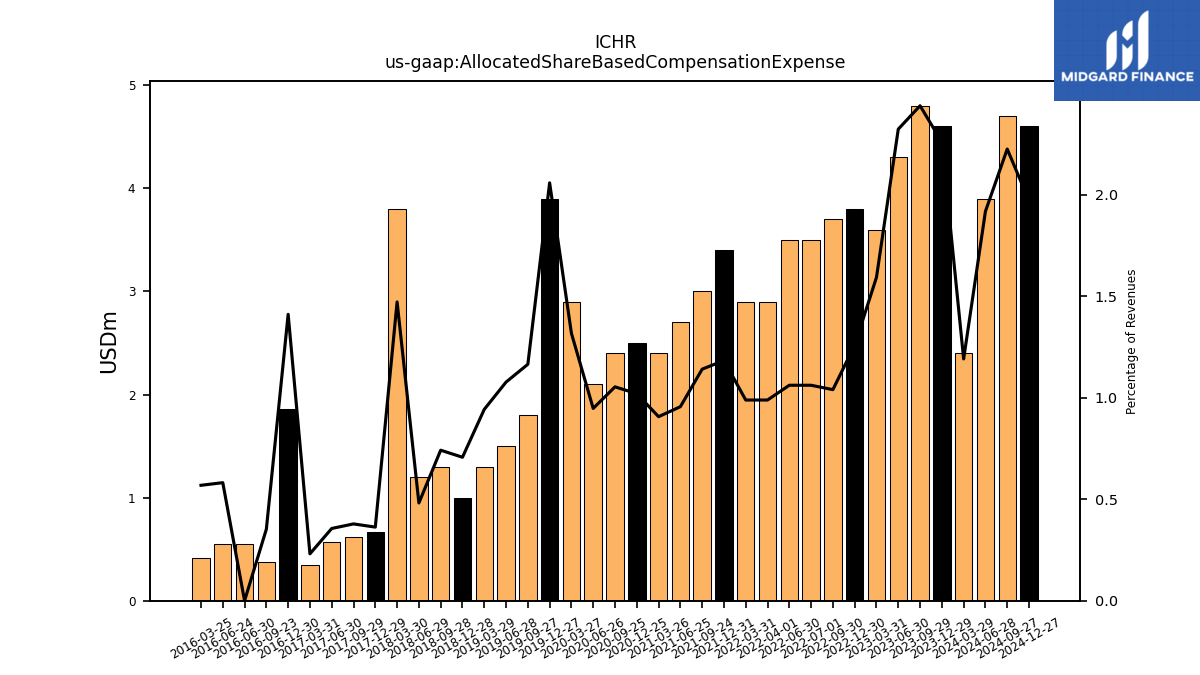
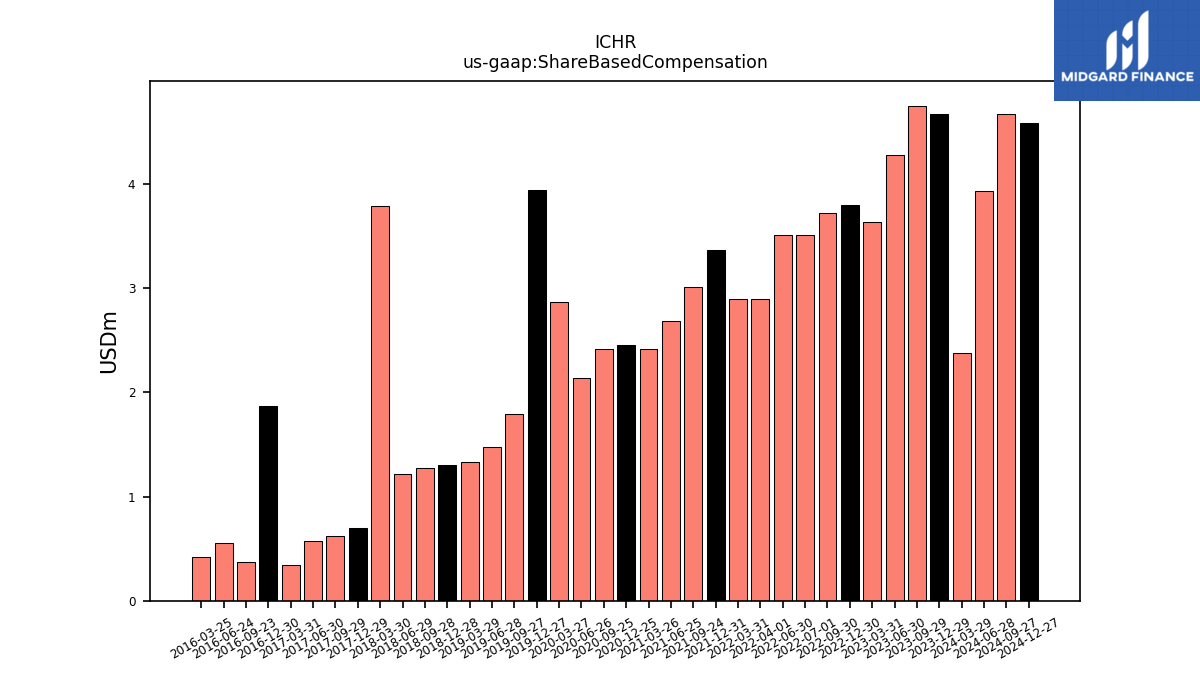
| Allocated Share Based Compensation Expense | 4.60 | 4.80 | 4.30 | 3.60 | 3.80 | 3.70 | 3.50 | 3.50 | 2.90 | 2.90 | 3.40 | 3.00 | 2.70 | 2.40 | 2.50 | 2.40 | 2.10 | 2.90 | 3.90 | 1.80 | 1.50 | 1.30 | 1.00 | 1.30 | 1.20 | 3.80 | 0.66 | 0.62 | 0.57 | 0.34 | 1.85 | 0.37 | 0.56 | 0.42 | |
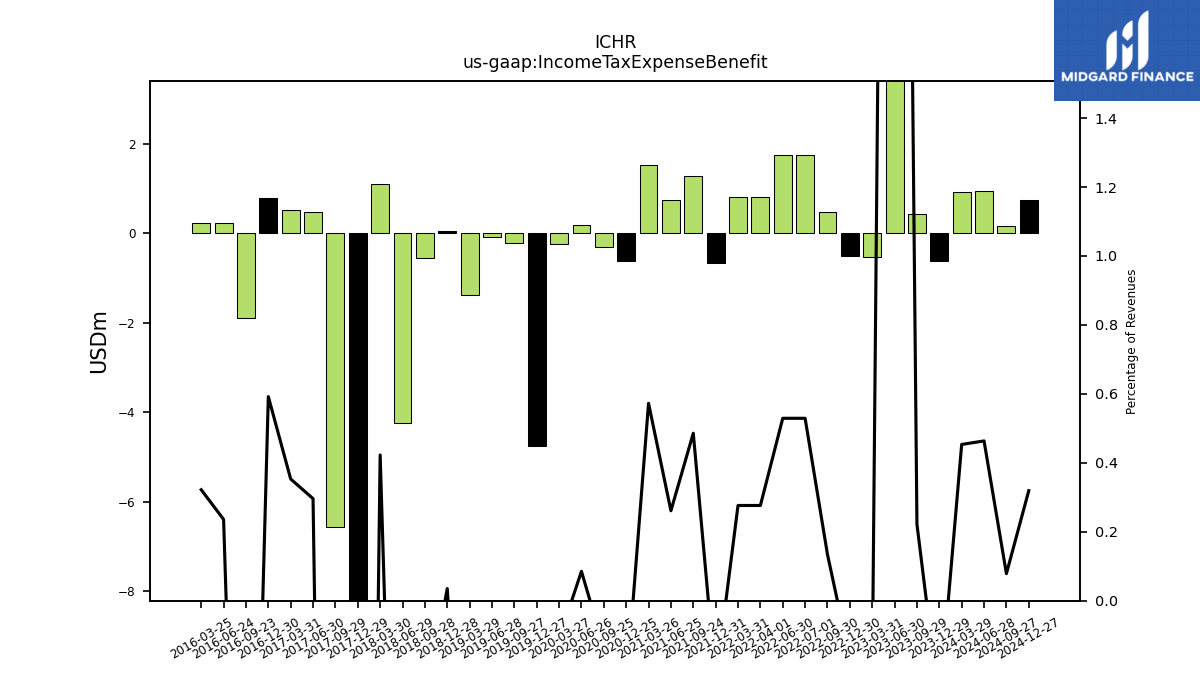
| Income Tax Expense Benefit | -0.61 | 0.44 | 12.62 | -0.54 | -0.51 | 0.48 | 1.74 | 1.74 | 0.81 | 0.81 | -0.67 | 1.28 | 0.74 | 1.51 | -0.62 | -0.31 | 0.19 | -0.24 | -4.77 | -0.22 | -0.09 | -1.37 | 0.05 | -0.56 | -4.25 | 1.09 | -8.33 | -6.56 | 0.47 | 0.53 | 0.78 | -1.89 | 0.23 | 0.24 | |
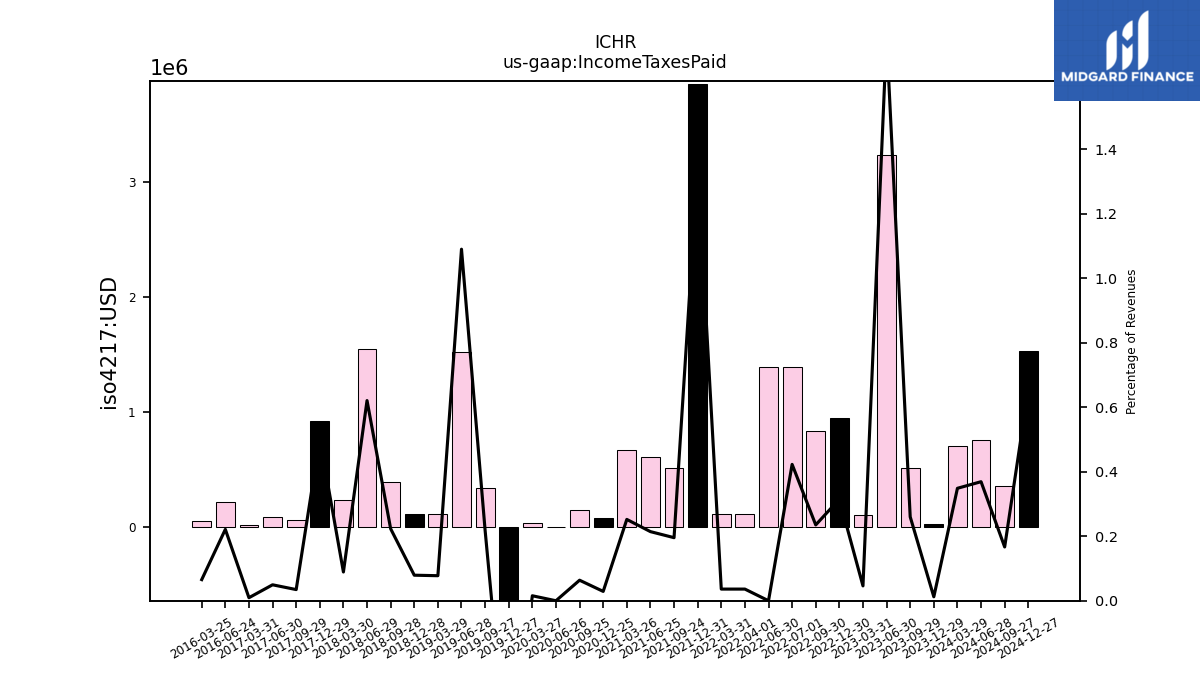
| Income Taxes Paid | 0.03 | NA | 3.24 | 0.10 | 0.95 | 0.84 | 1.39 | 1.39 | 0.11 | 0.11 | 3.86 | 0.51 | 0.60 | 0.67 | 0.07 | 0.14 | 0.00 | 0.03 | -1.06 | 0.34 | 1.52 | 0.11 | 0.11 | 0.39 | 1.54 | 0.23 | 0.92 | 0.06 | 0.08 | 0.01 | NA | NA | 0.21 | 0.05 | |
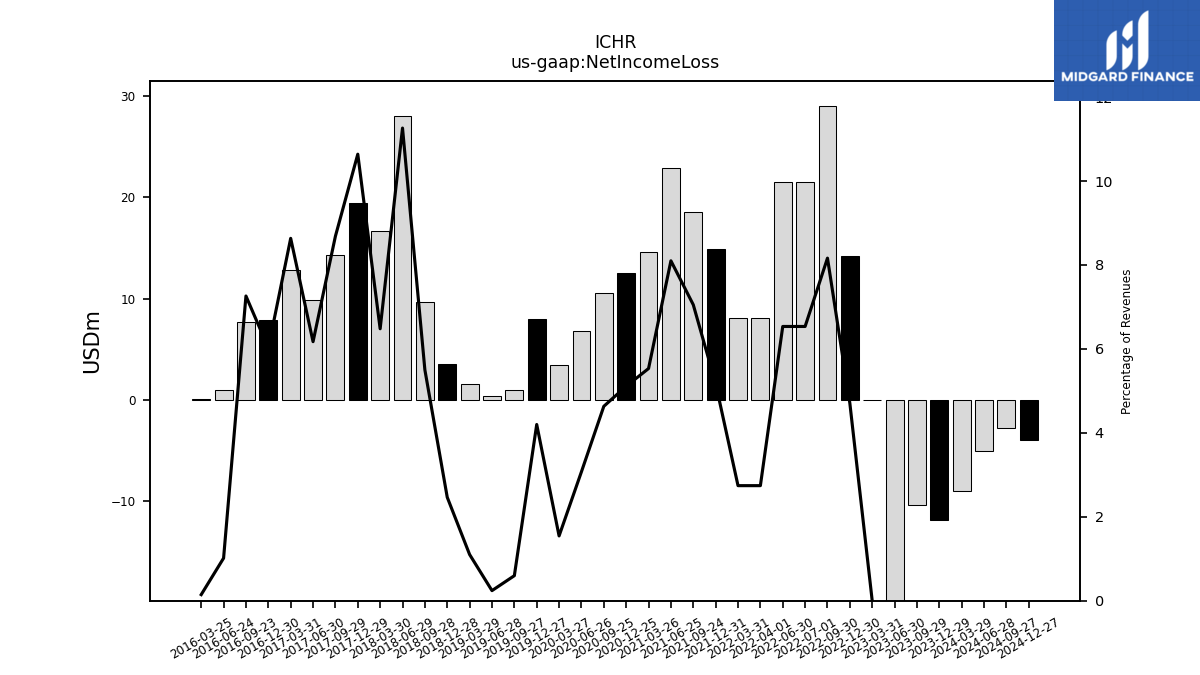
| Net Income Loss | -11.90 | -10.43 | -20.66 | -0.01 | 14.20 | 29.03 | 21.54 | 21.54 | 8.04 | 8.04 | 14.86 | 18.54 | 22.86 | 14.64 | 12.52 | 10.55 | 6.81 | 3.40 | 7.95 | 0.92 | 0.34 | 1.52 | 3.48 | 9.64 | 28.04 | 16.72 | 19.46 | 14.29 | 9.86 | 12.84 | 7.91 | 7.67 | 0.97 | 0.11 |
| 2023-12-29 | 2023-09-29 | 2023-06-30 | 2023-03-31 | 2022-12-30 | 2022-09-30 | 2022-07-01 | 2022-06-30 | 2022-04-01 | 2022-03-31 | 2021-12-31 | 2021-09-24 | 2021-06-25 | 2021-03-26 | 2020-12-25 | 2020-09-25 | 2020-06-26 | 2020-03-27 | 2019-12-27 | 2019-09-27 | 2019-06-28 | 2019-03-29 | 2018-12-28 | 2018-09-28 | 2018-06-29 | 2018-03-30 | 2017-12-29 | 2017-09-29 | 2017-06-30 | 2017-03-31 | 2016-12-30 | 2016-09-23 | 2016-06-24 | 2016-03-25 | ||
|---|---|---|---|---|---|---|---|---|---|---|---|---|---|---|---|---|---|---|---|---|---|---|---|---|---|---|---|---|---|---|---|---|---|---|---|
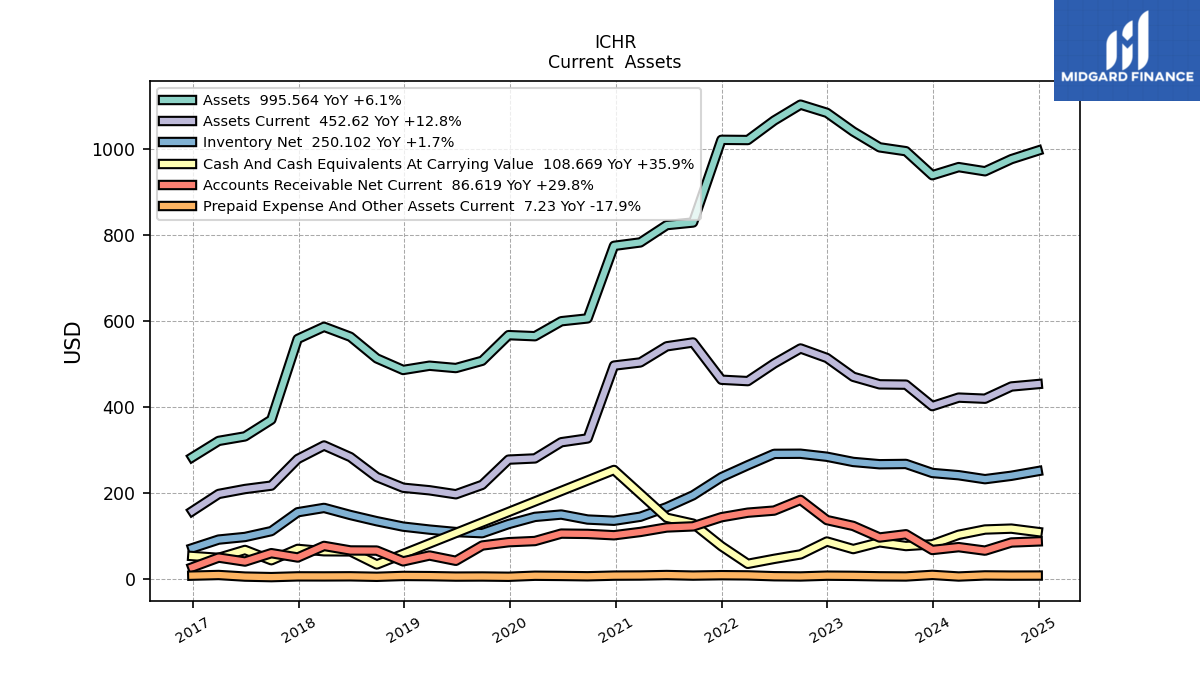
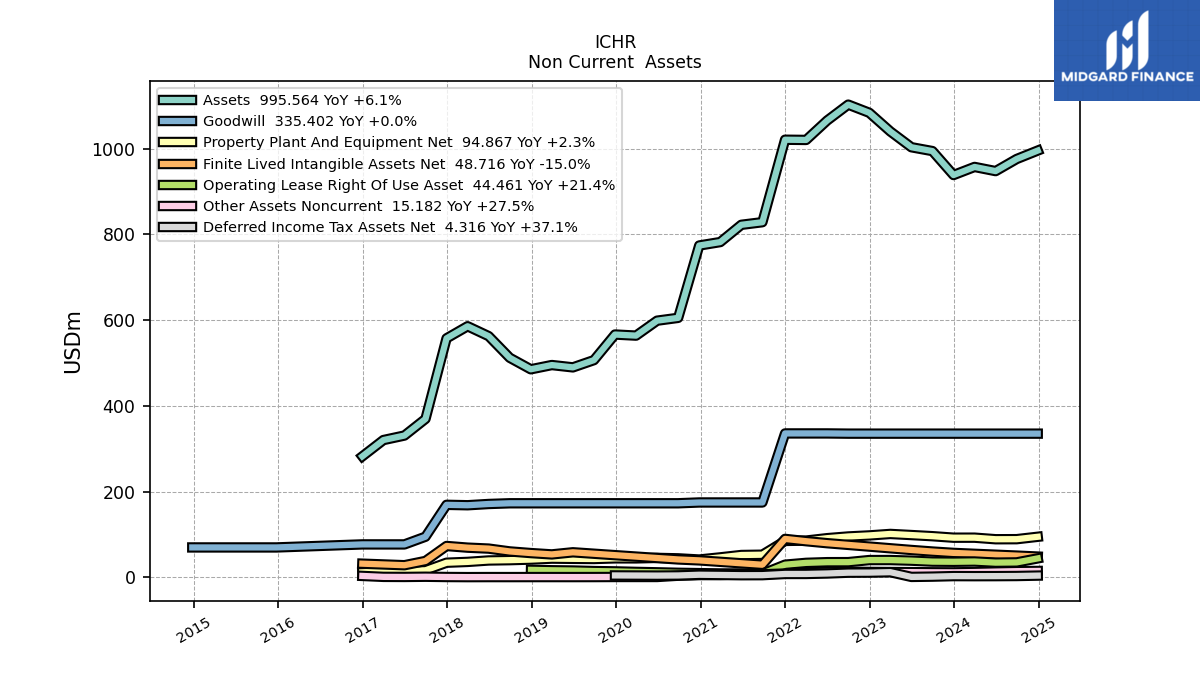
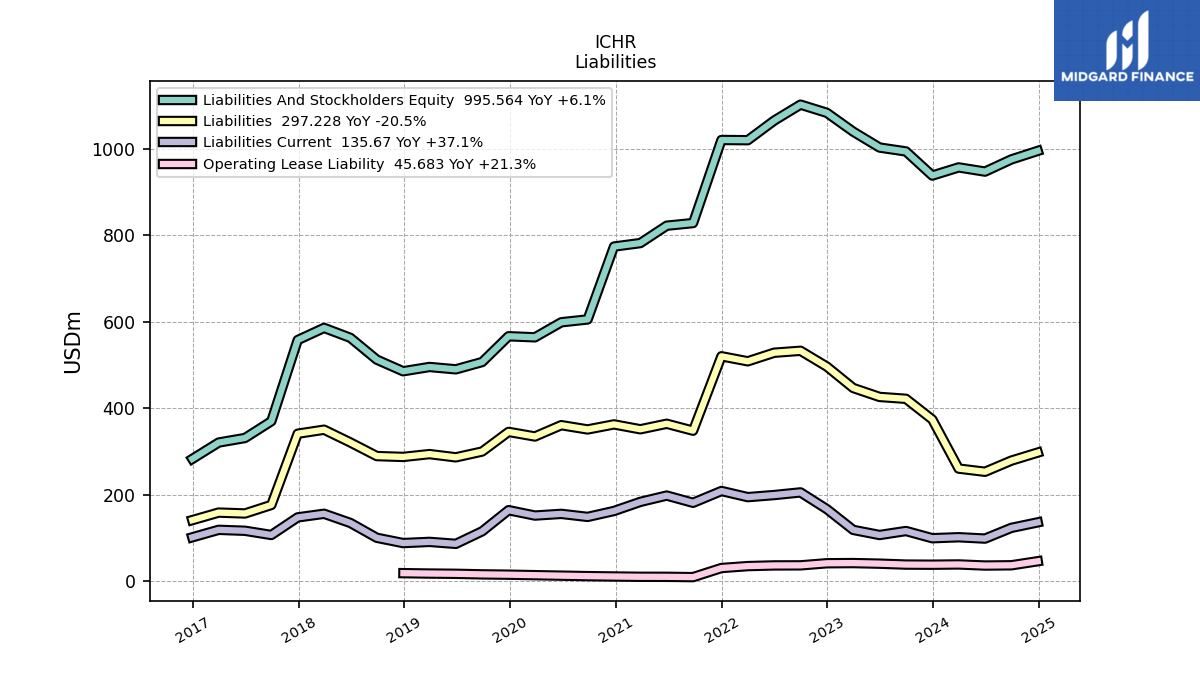
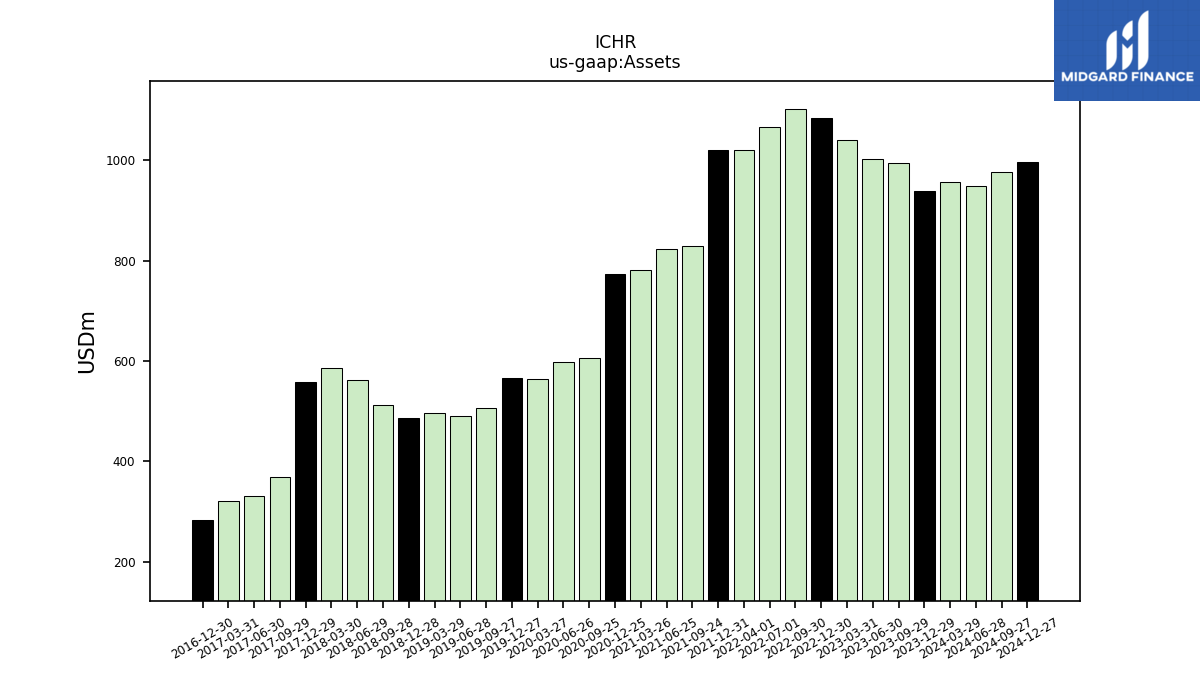
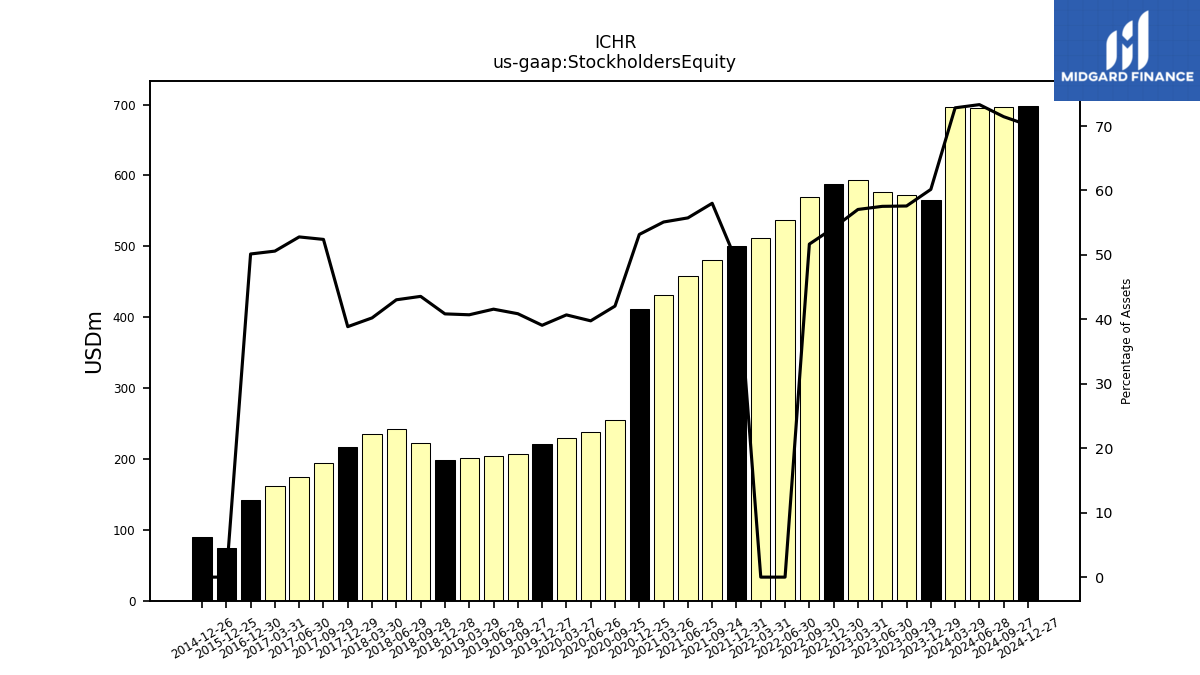
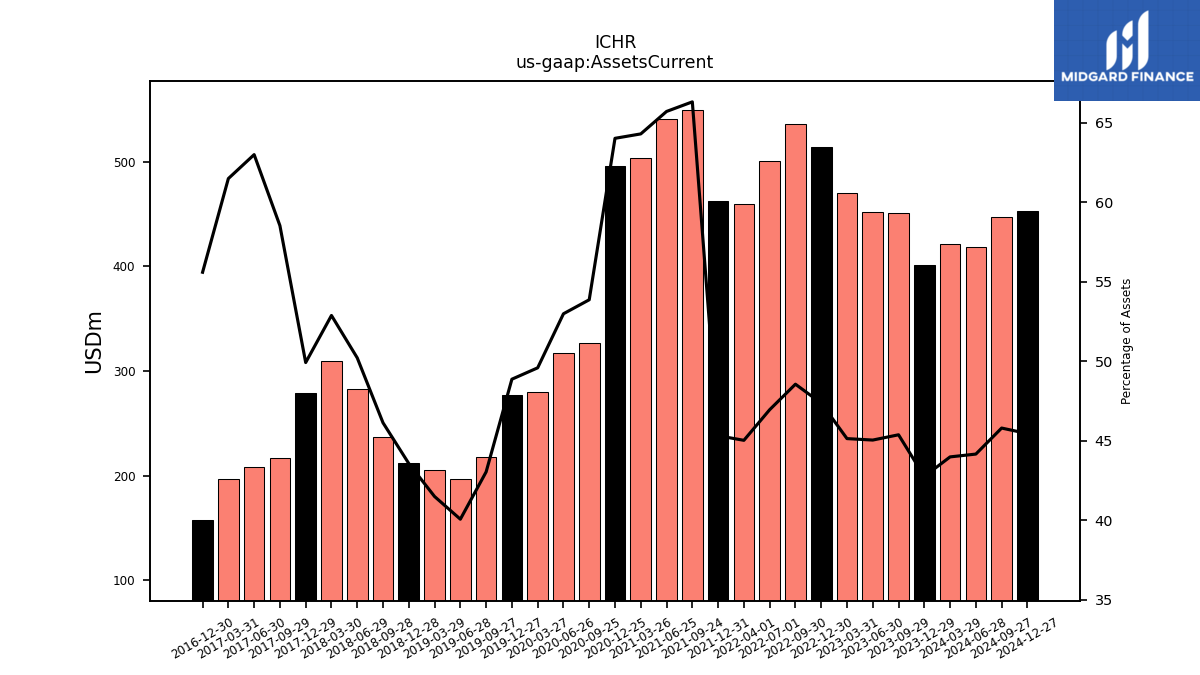
| Assets | 938.48 | 994.38 | 1003.36 | 1040.15 | 1083.74 | 1102.73 | 1065.70 | NA | 1020.36 | NA | 1020.88 | NA | 822.45 | 782.21 | 774.17 | 605.44 | 598.88 | 564.02 | 566.55 | 506.87 | 489.95 | 495.39 | 485.49 | 512.36 | 562.82 | 585.88 | 557.68 | 369.78 | 330.99 | 320.46 | 282.49 | NA | NA | NA | |
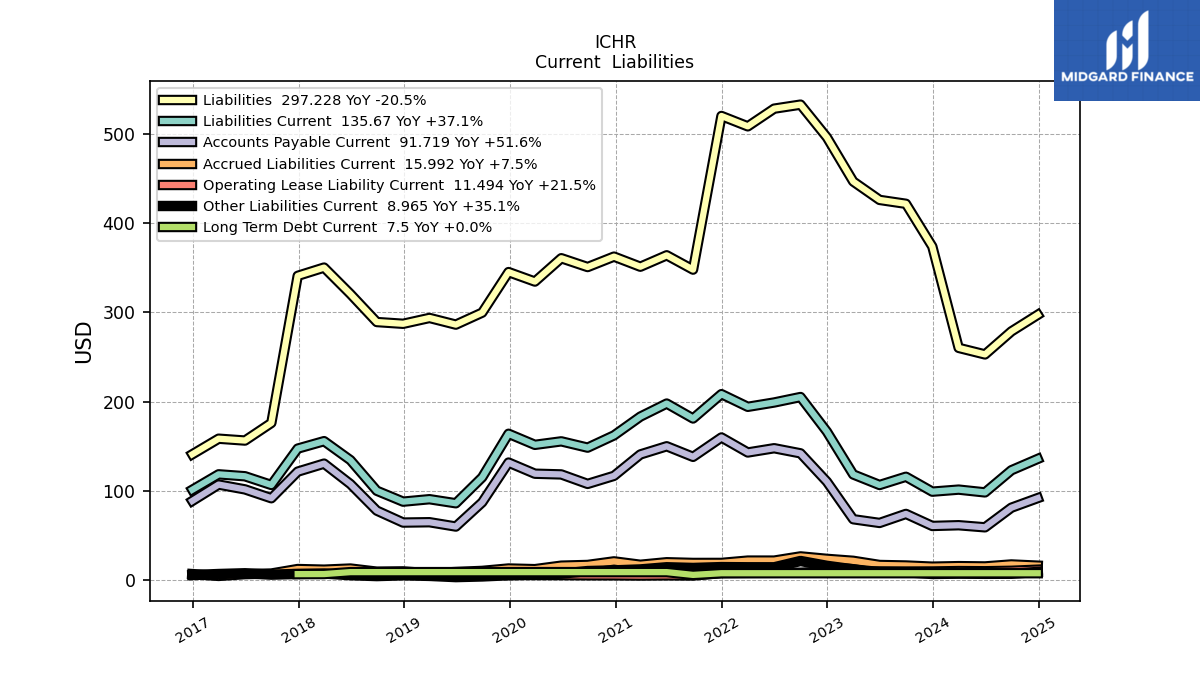
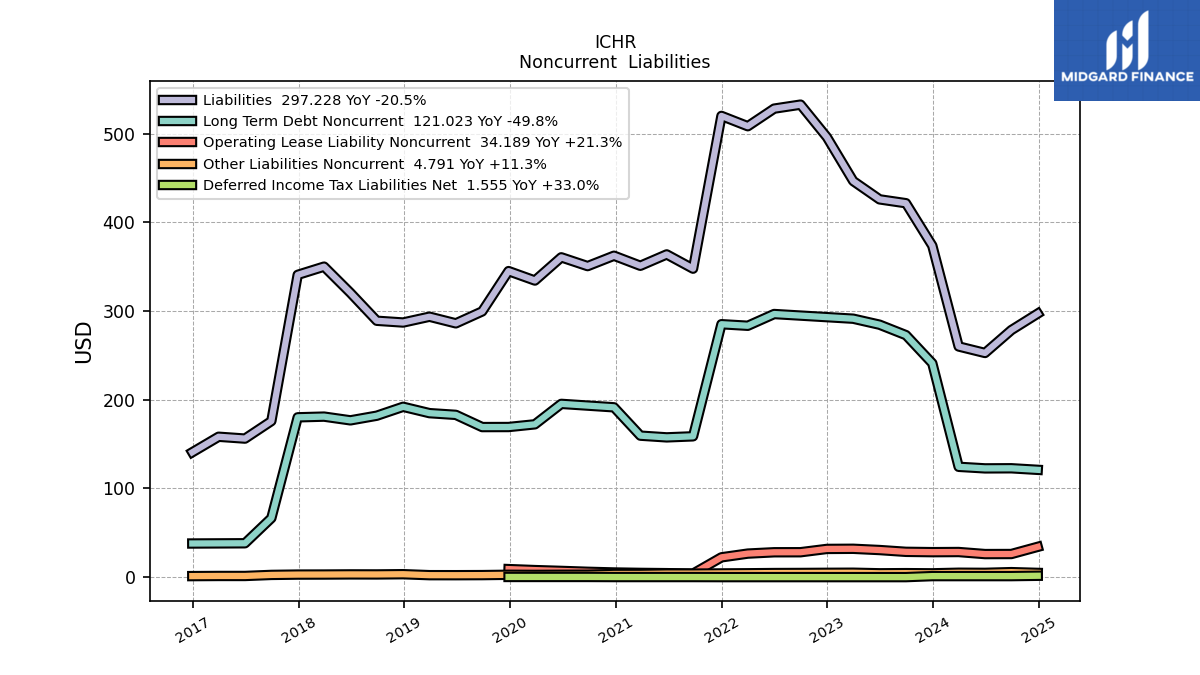
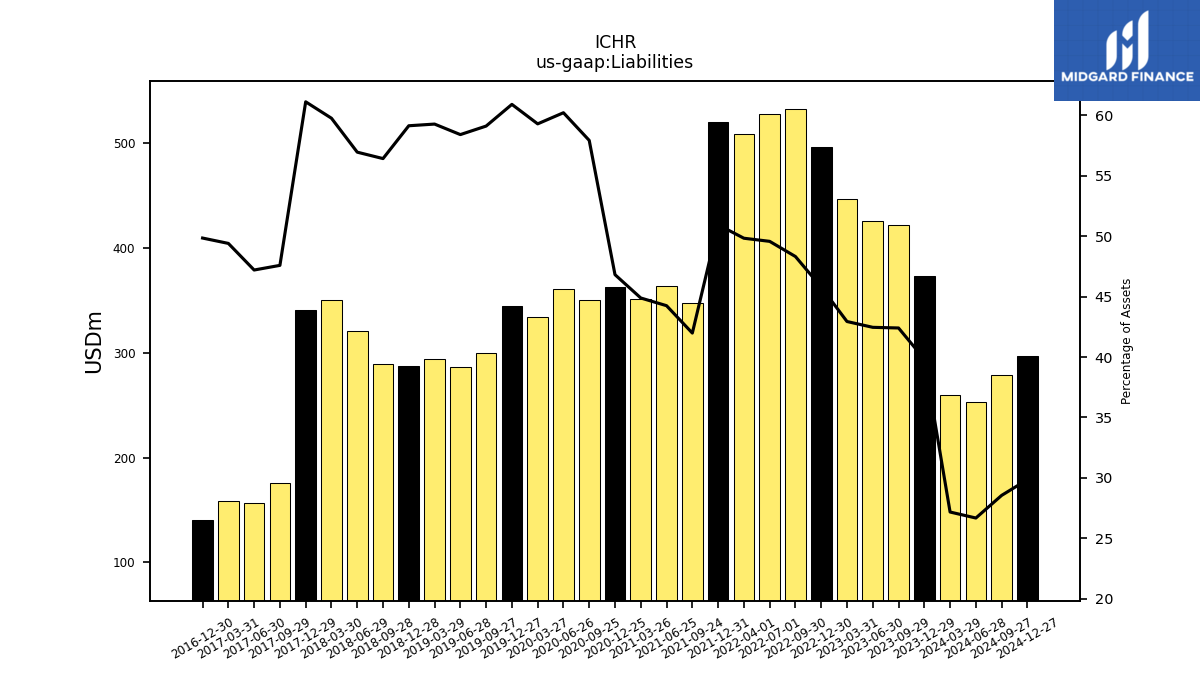
| Liabilities | 373.80 | 421.70 | 426.05 | 446.69 | 496.25 | 532.89 | 528.38 | NA | 508.53 | NA | 520.16 | NA | 363.97 | 351.15 | 362.48 | 350.77 | 360.69 | 334.50 | 345.14 | 299.68 | 286.22 | 293.71 | 287.16 | 289.14 | 320.60 | 350.19 | 340.92 | 175.98 | 156.25 | 158.34 | 140.83 | NA | NA | NA | |
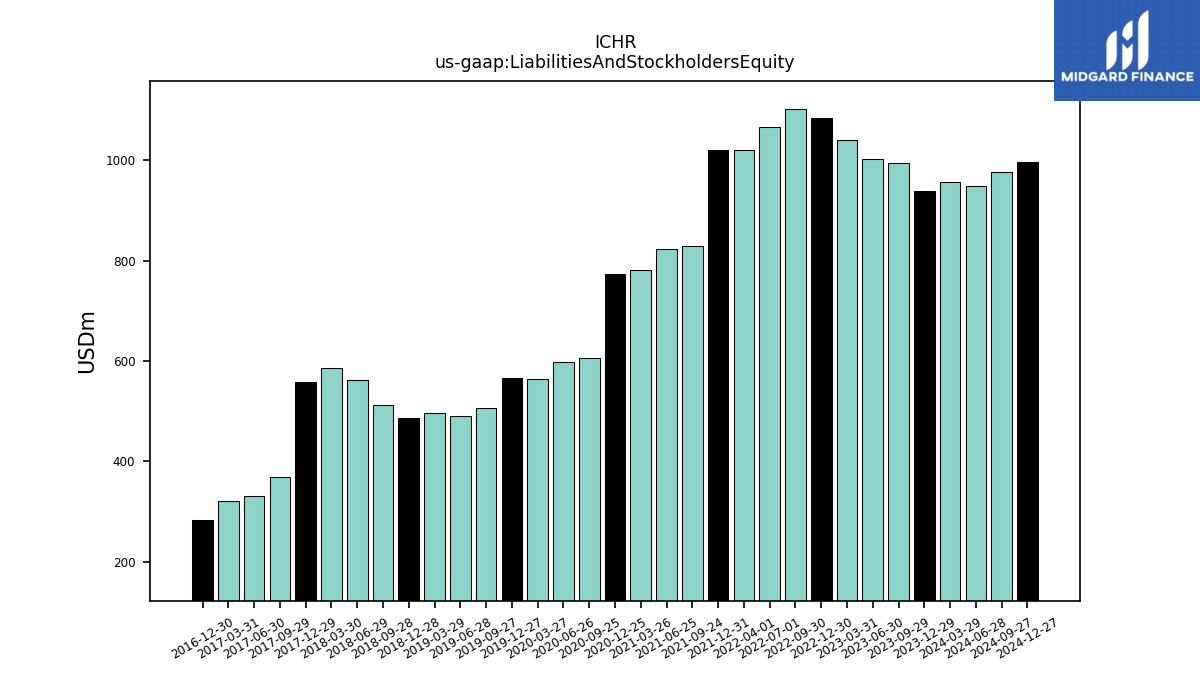
| Liabilities And Stockholders Equity | 938.48 | 994.38 | 1003.36 | 1040.15 | 1083.74 | 1102.73 | 1065.70 | NA | 1020.36 | NA | 1020.88 | NA | 822.45 | 782.21 | 774.17 | 605.44 | 598.88 | 564.02 | 566.55 | 506.87 | 489.95 | 495.39 | 485.49 | 512.36 | 562.82 | 585.88 | 557.68 | 369.78 | 330.99 | 320.46 | 282.49 | NA | NA | NA | |
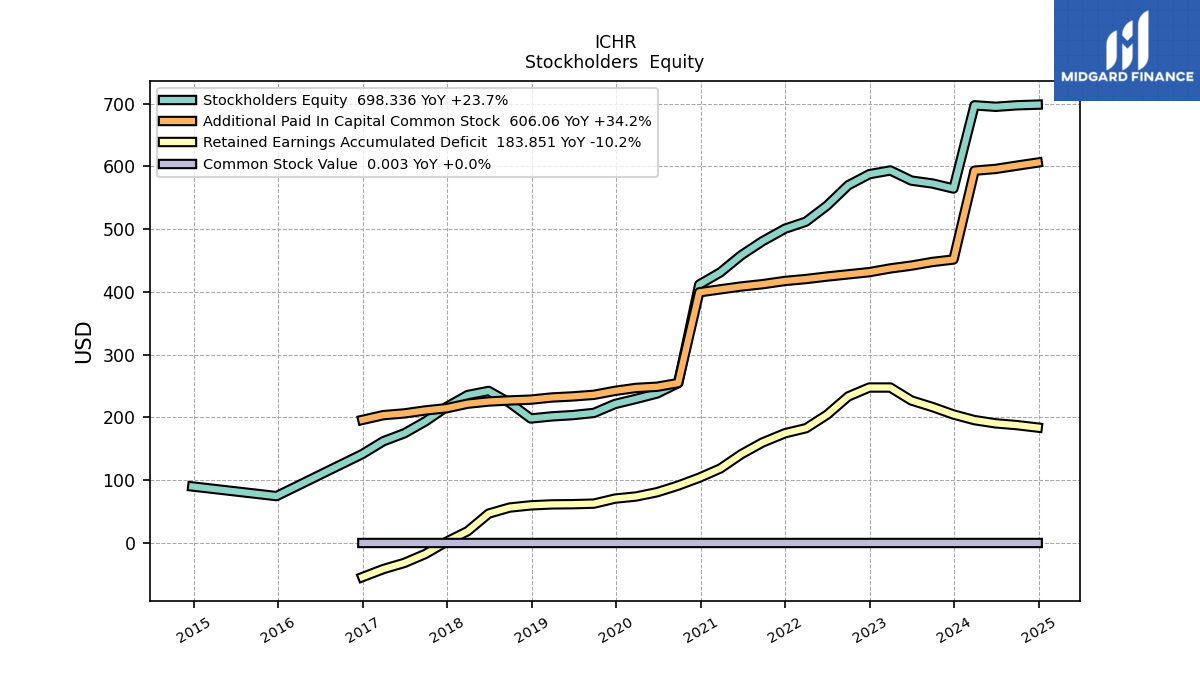
| Stockholders Equity | 564.68 | 572.68 | 577.30 | 593.46 | 587.50 | 569.85 | NA | 537.32 | NA | 511.83 | 500.71 | 480.66 | 458.48 | 431.06 | 411.69 | 254.67 | 238.19 | 229.52 | 221.42 | 207.19 | 203.73 | 201.68 | 198.33 | 223.22 | 242.22 | 235.68 | 216.76 | 193.79 | 174.74 | 162.12 | 141.66 | NA | NA | NA |
| 2023-12-29 | 2023-09-29 | 2023-06-30 | 2023-03-31 | 2022-12-30 | 2022-09-30 | 2022-07-01 | 2022-06-30 | 2022-04-01 | 2022-03-31 | 2021-12-31 | 2021-09-24 | 2021-06-25 | 2021-03-26 | 2020-12-25 | 2020-09-25 | 2020-06-26 | 2020-03-27 | 2019-12-27 | 2019-09-27 | 2019-06-28 | 2019-03-29 | 2018-12-28 | 2018-09-28 | 2018-06-29 | 2018-03-30 | 2017-12-29 | 2017-09-29 | 2017-06-30 | 2017-03-31 | 2016-12-30 | 2016-09-23 | 2016-06-24 | 2016-03-25 | ||
|---|---|---|---|---|---|---|---|---|---|---|---|---|---|---|---|---|---|---|---|---|---|---|---|---|---|---|---|---|---|---|---|---|---|---|---|
| Assets Current | 401.37 | 451.32 | 452.06 | 469.60 | 513.46 | 535.58 | 500.49 | NA | 459.56 | NA | 462.77 | NA | 540.52 | 503.03 | 495.71 | 326.20 | 317.39 | 279.75 | 276.95 | 218.22 | 196.37 | 205.62 | 211.57 | 236.41 | 282.67 | 309.88 | 278.45 | 216.47 | 208.54 | 197.08 | 157.09 | NA | NA | NA | |
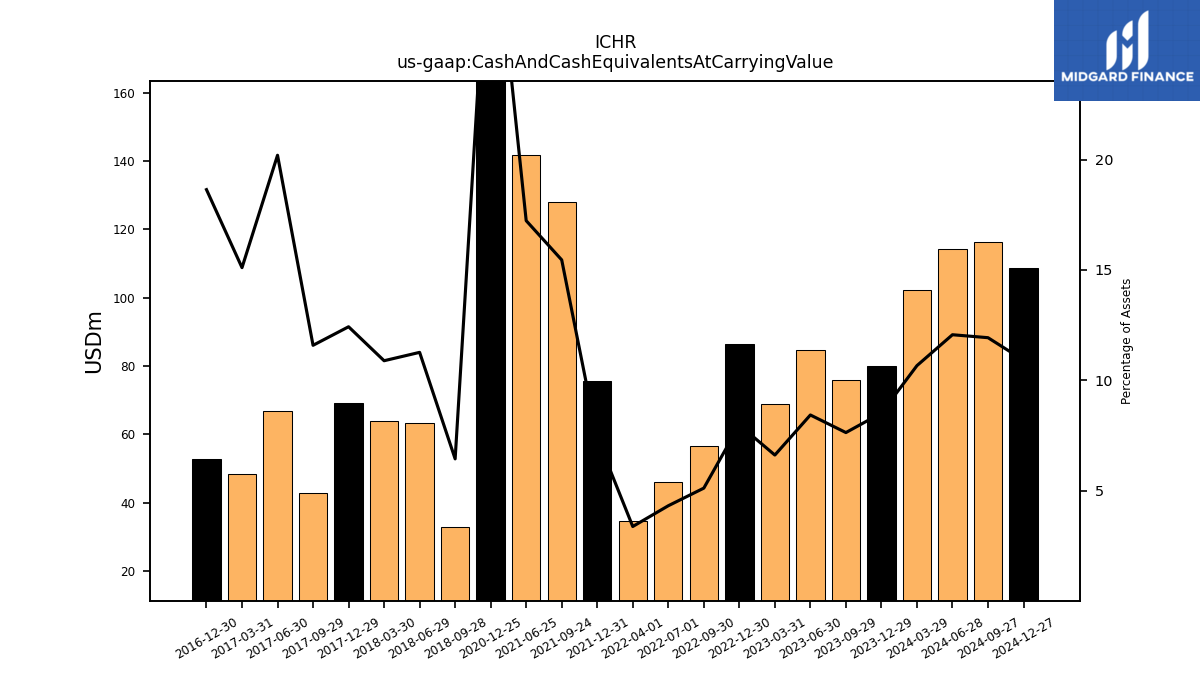
| Cash And Cash Equivalents At Carrying Value | 79.95 | 75.93 | 84.61 | 68.84 | 86.47 | 56.46 | 46.06 | NA | 34.52 | NA | 75.50 | NA | 141.71 | NA | 252.90 | NA | NA | NA | NA | NA | NA | NA | NA | 33.02 | 63.42 | 63.80 | 69.30 | 42.85 | 66.84 | 48.40 | 52.65 | NA | NA | NA | |
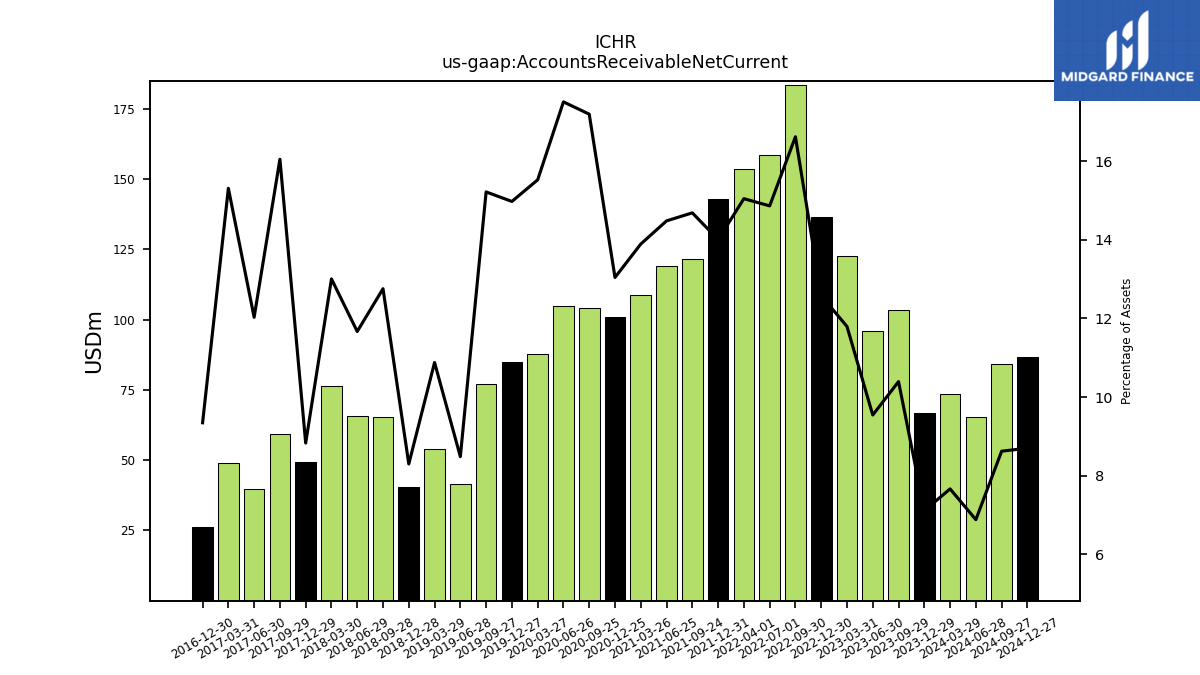
| Accounts Receivable Net Current | 66.72 | 103.35 | 95.76 | 122.69 | 136.32 | 183.30 | 158.40 | NA | 153.53 | NA | 142.99 | NA | 119.11 | 108.67 | 100.98 | 104.12 | 104.86 | 87.57 | 84.85 | 77.14 | 41.57 | 53.90 | 40.29 | 65.36 | 65.67 | 76.20 | 49.25 | 59.35 | 39.82 | 49.06 | 26.40 | NA | NA | NA | |
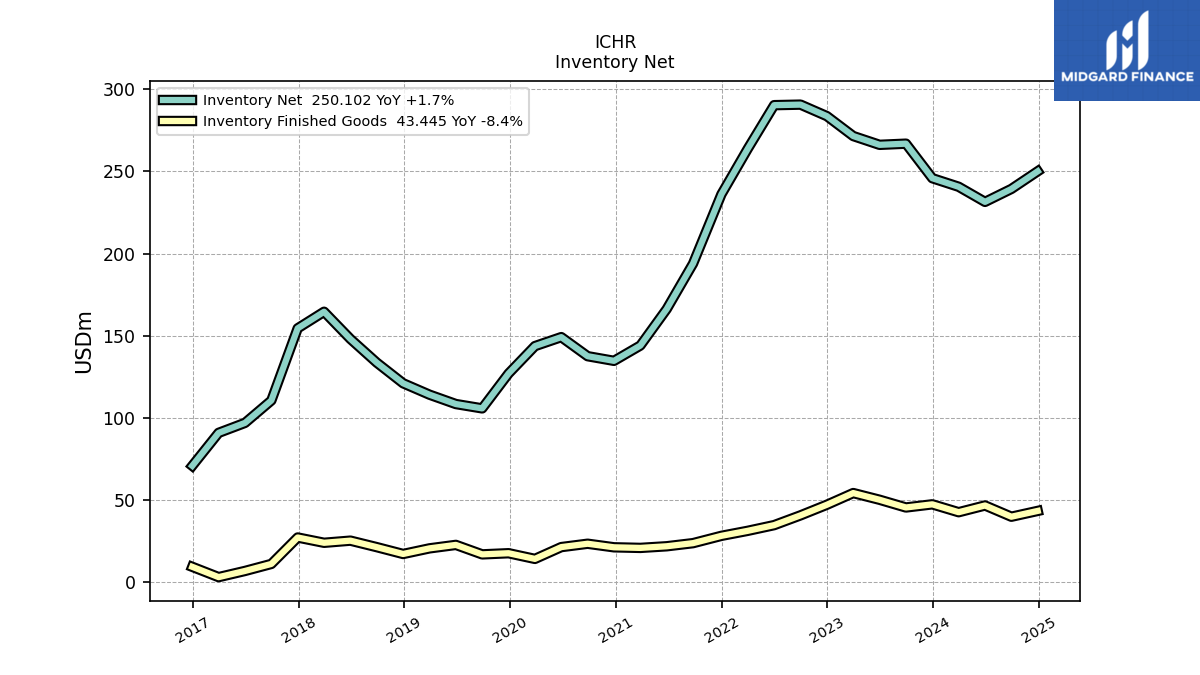
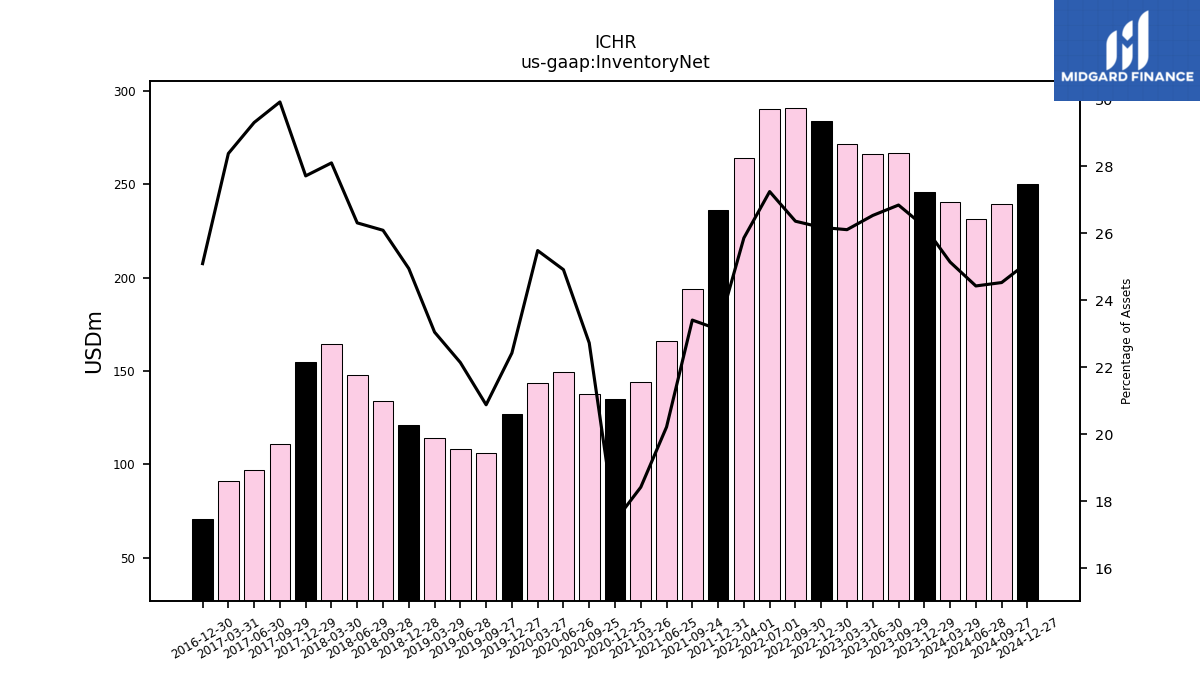
| Inventory Net | 245.88 | 266.90 | 266.19 | 271.54 | 283.66 | 290.66 | 290.33 | NA | 263.85 | NA | 236.13 | NA | 166.26 | 144.06 | 134.76 | 137.58 | 149.19 | 143.72 | 127.04 | 105.82 | 108.47 | 114.17 | 121.11 | 133.66 | 148.07 | 164.62 | 154.54 | 110.63 | 97.00 | 90.94 | 70.88 | NA | NA | NA | |
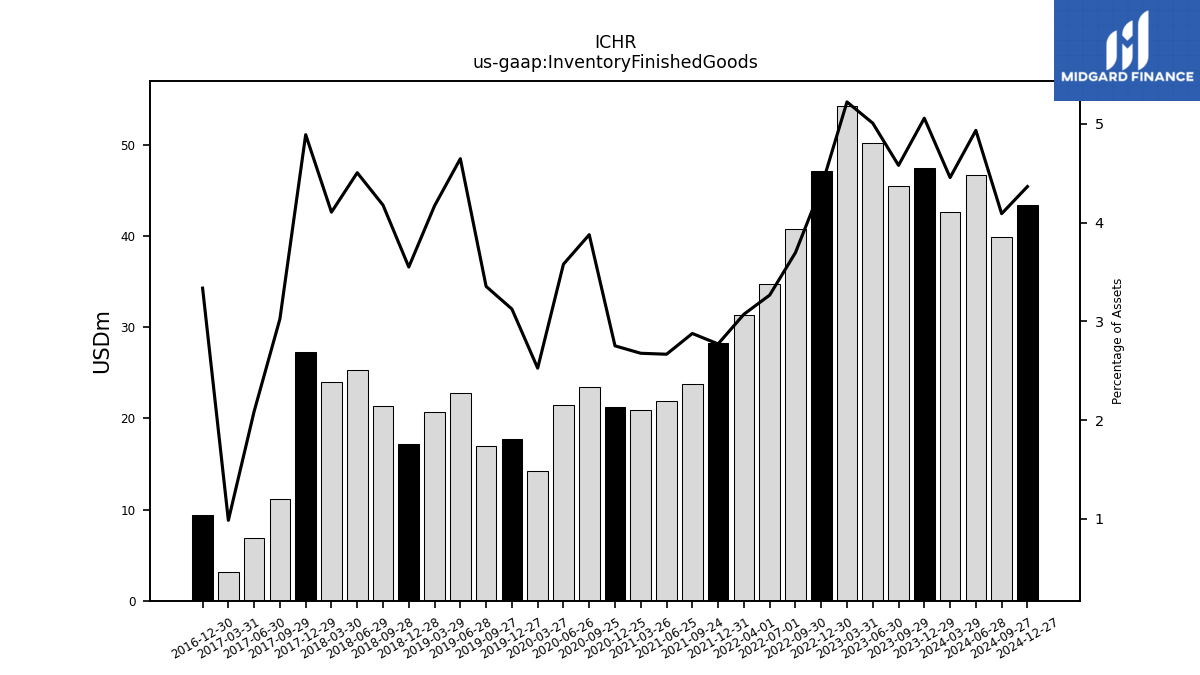
| Inventory Finished Goods | 47.45 | 45.53 | 50.23 | 54.31 | 47.19 | 40.74 | 34.79 | NA | 31.34 | NA | 28.28 | NA | 21.93 | 20.93 | 21.30 | 23.47 | 21.43 | 14.24 | 17.70 | 17.00 | 22.76 | 20.66 | 17.23 | 21.40 | 25.35 | 24.05 | 27.27 | 11.18 | 6.91 | 3.15 | 9.42 | NA | NA | NA | |
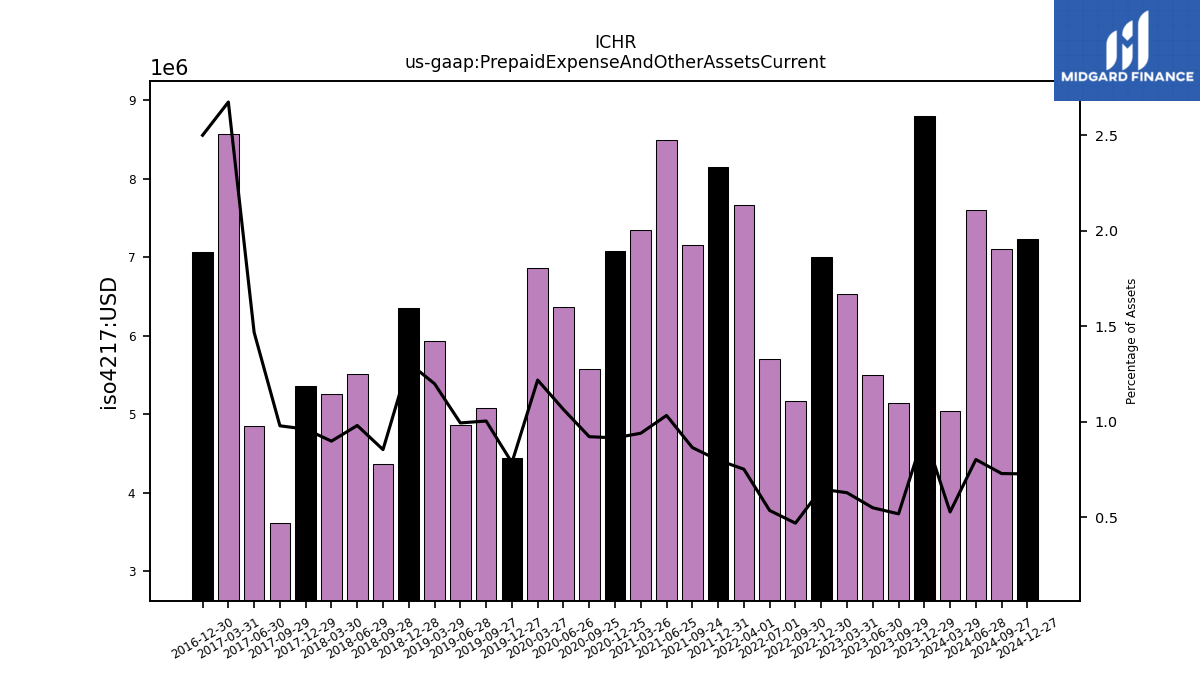
| Prepaid Expense And Other Assets Current | 8.80 | 5.14 | 5.51 | 6.53 | 7.01 | 5.16 | 5.70 | NA | 7.66 | NA | 8.15 | NA | 8.49 | 7.35 | 7.08 | 5.58 | 6.37 | 6.87 | 4.45 | 5.08 | 4.87 | 5.94 | 6.35 | 4.37 | 5.51 | 5.26 | 5.36 | 3.62 | 4.86 | 8.57 | 7.06 | NA | NA | NA |
| 2023-12-29 | 2023-09-29 | 2023-06-30 | 2023-03-31 | 2022-12-30 | 2022-09-30 | 2022-07-01 | 2022-06-30 | 2022-04-01 | 2022-03-31 | 2021-12-31 | 2021-09-24 | 2021-06-25 | 2021-03-26 | 2020-12-25 | 2020-09-25 | 2020-06-26 | 2020-03-27 | 2019-12-27 | 2019-09-27 | 2019-06-28 | 2019-03-29 | 2018-12-28 | 2018-09-28 | 2018-06-29 | 2018-03-30 | 2017-12-29 | 2017-09-29 | 2017-06-30 | 2017-03-31 | 2016-12-30 | 2016-09-23 | 2016-06-24 | 2016-03-25 | ||
|---|---|---|---|---|---|---|---|---|---|---|---|---|---|---|---|---|---|---|---|---|---|---|---|---|---|---|---|---|---|---|---|---|---|---|---|
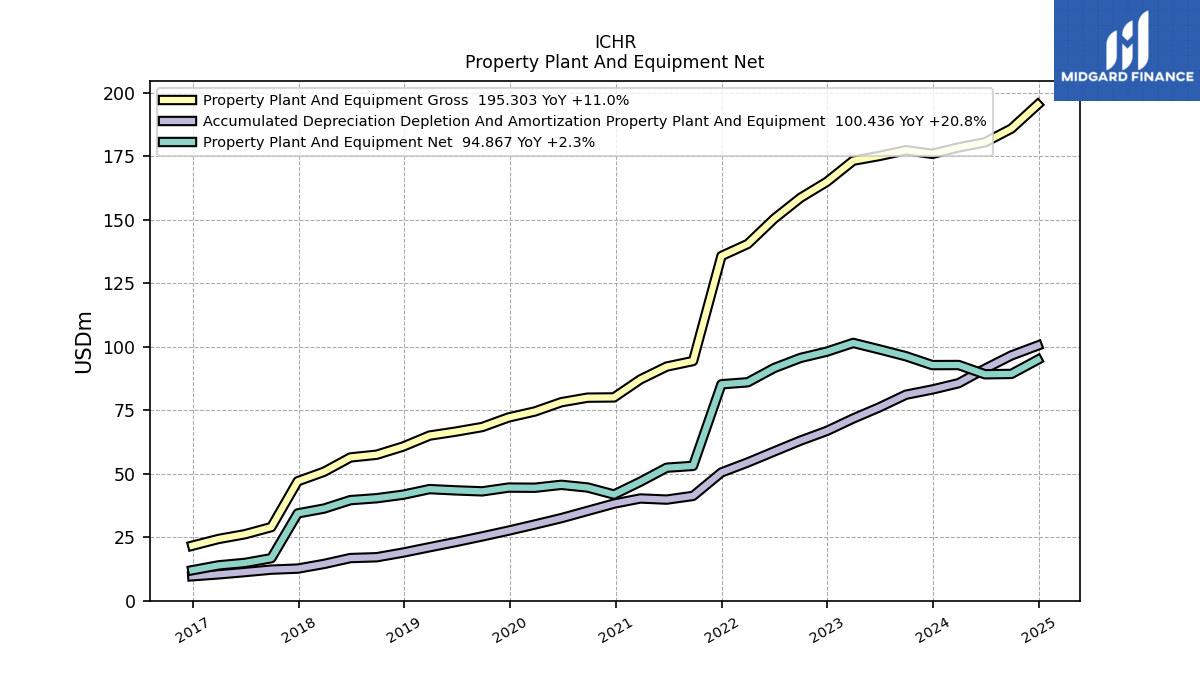
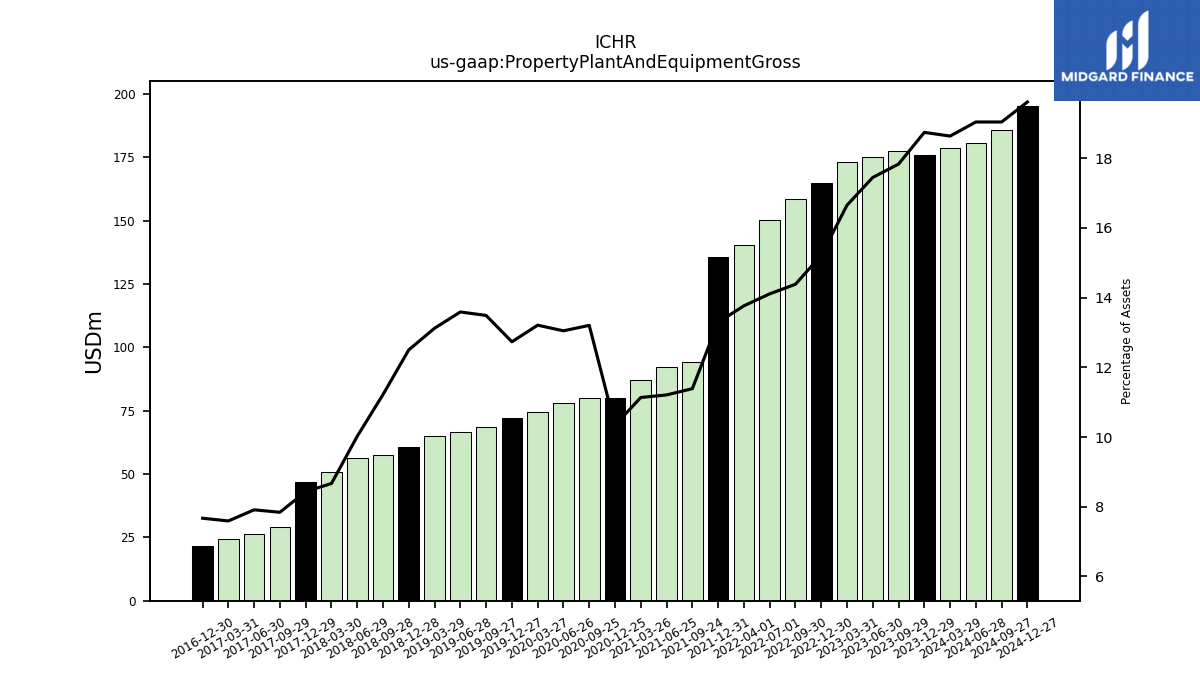
| Property Plant And Equipment Gross | 175.91 | 177.34 | 175.09 | 173.21 | 164.91 | 158.62 | 150.36 | NA | 140.45 | NA | 135.71 | NA | 92.18 | 87.11 | 80.04 | 79.95 | 78.14 | 74.51 | 72.14 | 68.38 | 66.58 | 65.01 | 60.70 | 57.49 | 56.41 | 50.77 | 47.03 | 28.99 | 26.18 | 24.33 | 21.67 | NA | NA | NA | |
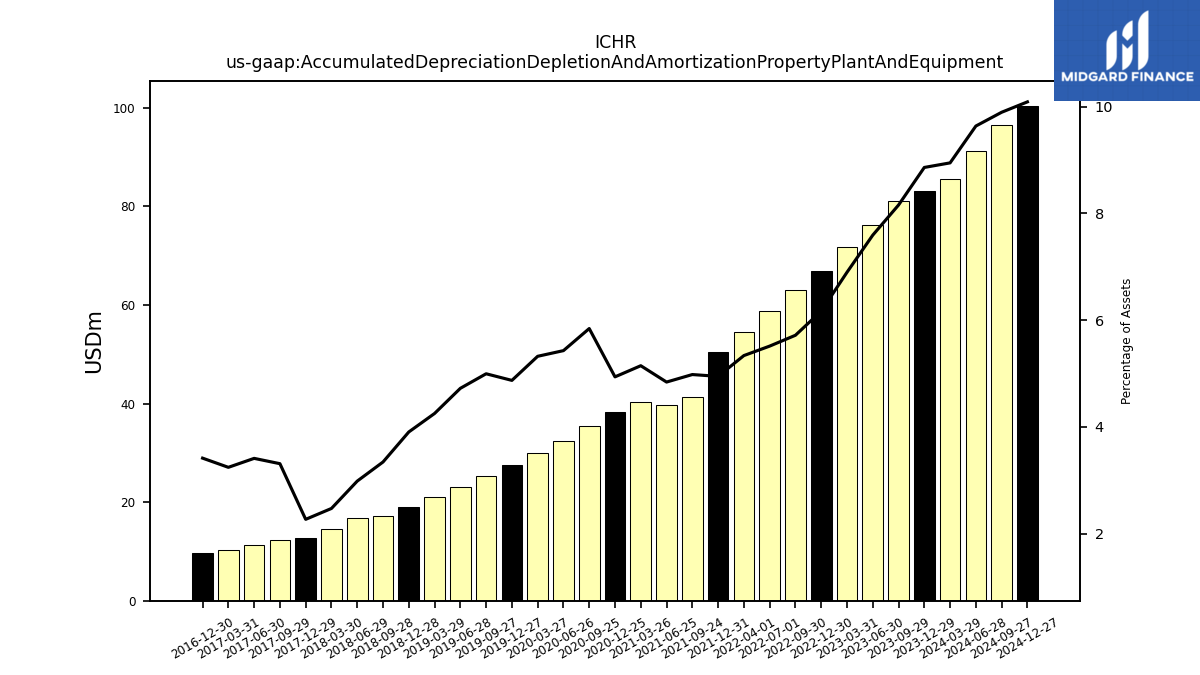
| Accumulated Depreciation Depletion And Amortization Property Plant And Equipment | 83.15 | 81.10 | 76.18 | 71.73 | 66.85 | 63.04 | 58.76 | NA | 54.45 | NA | 50.50 | NA | 39.81 | 40.26 | 38.23 | 35.37 | 32.51 | 30.02 | 27.60 | 25.32 | 23.14 | 21.06 | 18.96 | 17.13 | 16.80 | 14.49 | 12.65 | 12.24 | 11.29 | 10.39 | 9.65 | NA | NA | NA | |
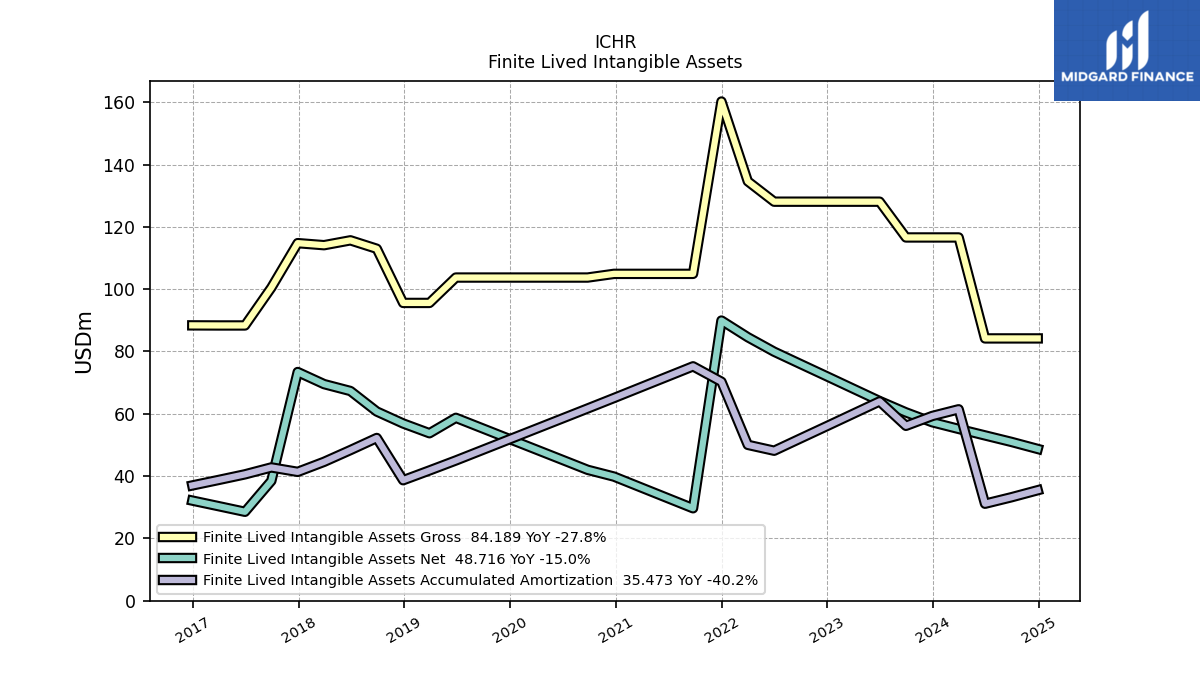
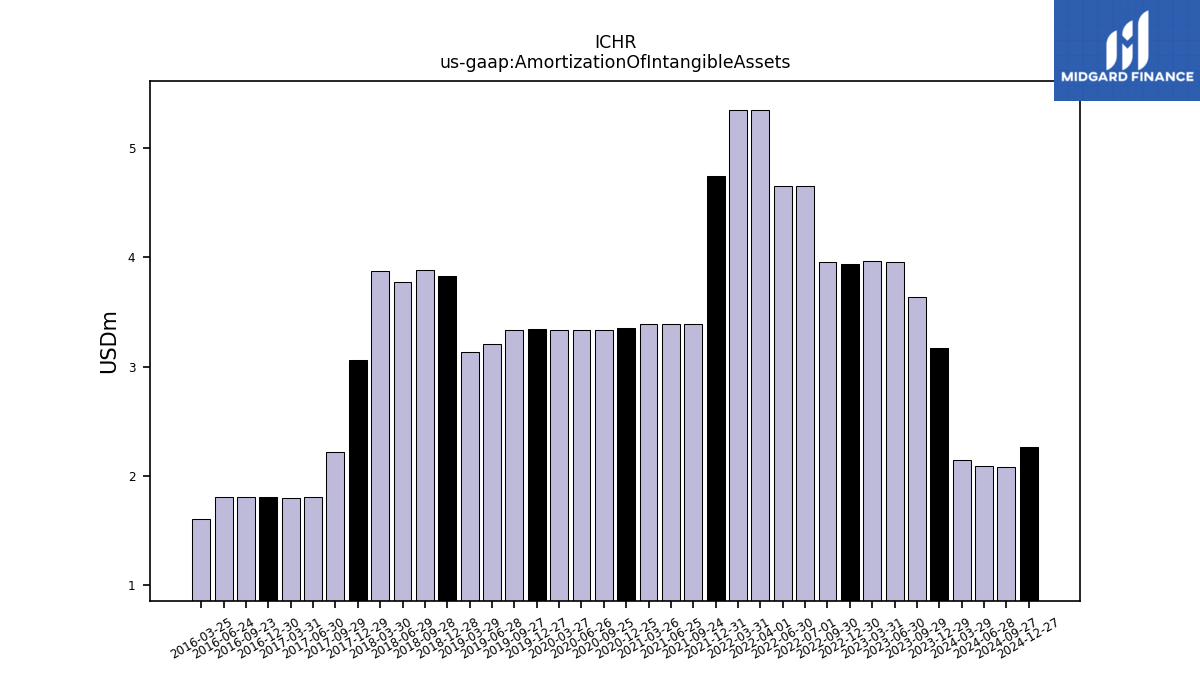
| Amortization Of Intangible Assets | 3.17 | 3.64 | 3.96 | 3.97 | 3.94 | 3.96 | 4.66 | 4.66 | 5.35 | 5.35 | 4.75 | 3.39 | 3.39 | 3.39 | 3.36 | 3.34 | 3.34 | 3.33 | 3.34 | 3.34 | 3.20 | 3.14 | 3.83 | 3.88 | 3.77 | 3.88 | 3.06 | 2.22 | 1.80 | 1.79 | 1.80 | 1.80 | 1.80 | 1.60 | |
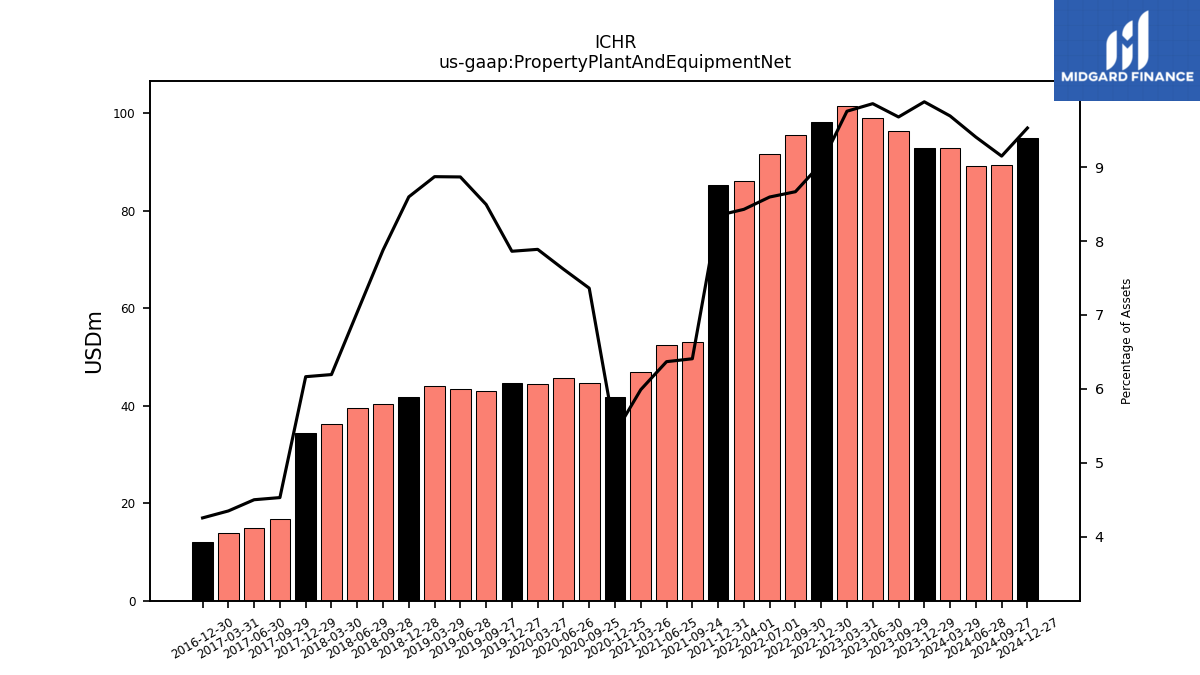
| Property Plant And Equipment Net | 92.75 | 96.24 | 98.91 | 101.48 | 98.06 | 95.58 | 91.60 | NA | 86.00 | NA | 85.20 | NA | 52.37 | 46.85 | 41.81 | 44.57 | 45.63 | 44.49 | 44.54 | 43.06 | 43.44 | 43.95 | 41.74 | 40.36 | 39.60 | 36.29 | 34.38 | 16.75 | 14.89 | 13.94 | 12.02 | NA | NA | NA | |
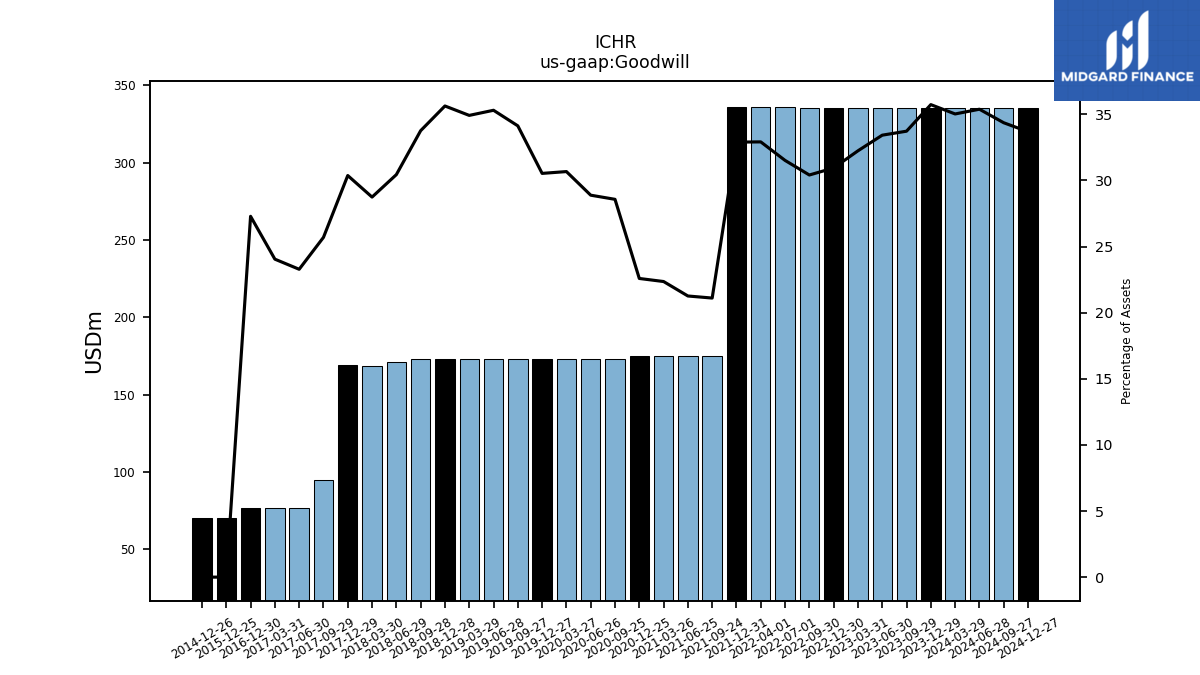
| Goodwill | 335.40 | 335.40 | 335.40 | 335.40 | 335.40 | 335.40 | 335.90 | NA | 335.90 | NA | 335.90 | NA | 174.89 | 174.89 | 174.89 | 173.01 | 173.01 | 173.01 | 173.01 | 173.01 | 173.01 | 173.01 | 173.01 | 173.00 | 171.34 | 168.41 | 169.40 | 95.03 | 77.07 | 77.07 | 77.09 | NA | NA | NA | |
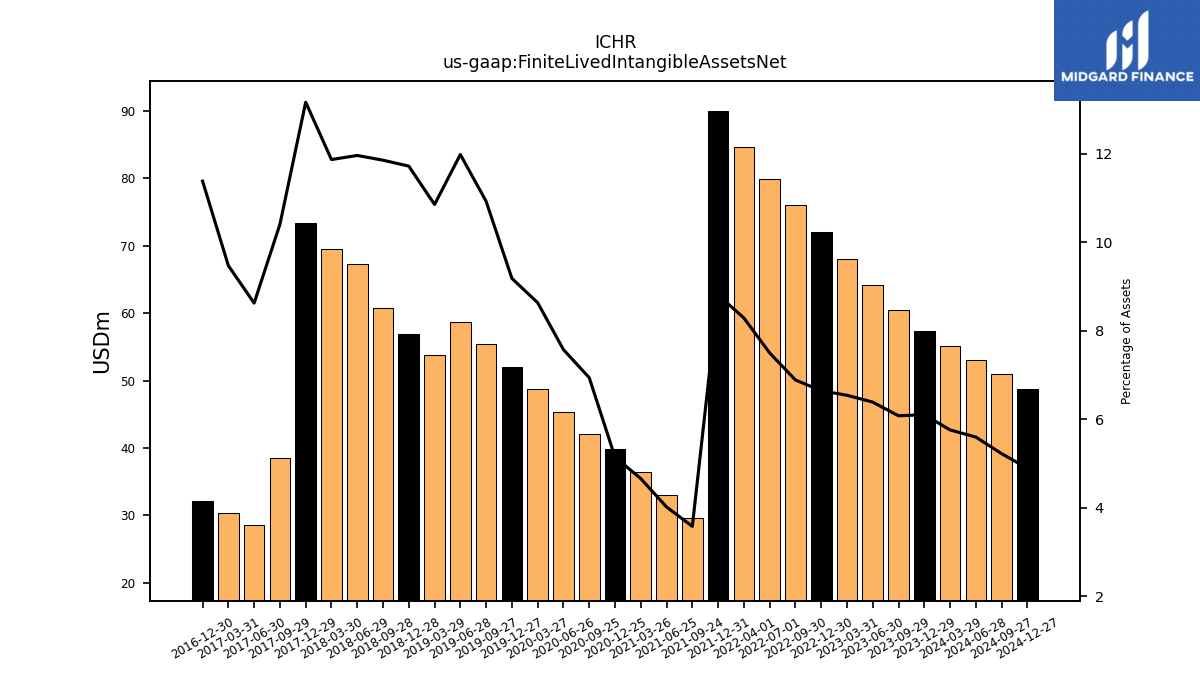
| Finite Lived Intangible Assets Net | 57.29 | 60.46 | 64.10 | 68.06 | 72.02 | 75.96 | 79.92 | NA | 84.58 | NA | 89.93 | NA | 33.06 | 36.45 | 39.84 | 42.02 | 45.36 | 48.69 | 52.03 | 55.37 | 58.70 | 53.76 | 56.90 | 60.73 | 67.31 | 69.53 | 73.41 | 38.47 | 28.55 | 30.35 | 32.15 | NA | NA | NA | |
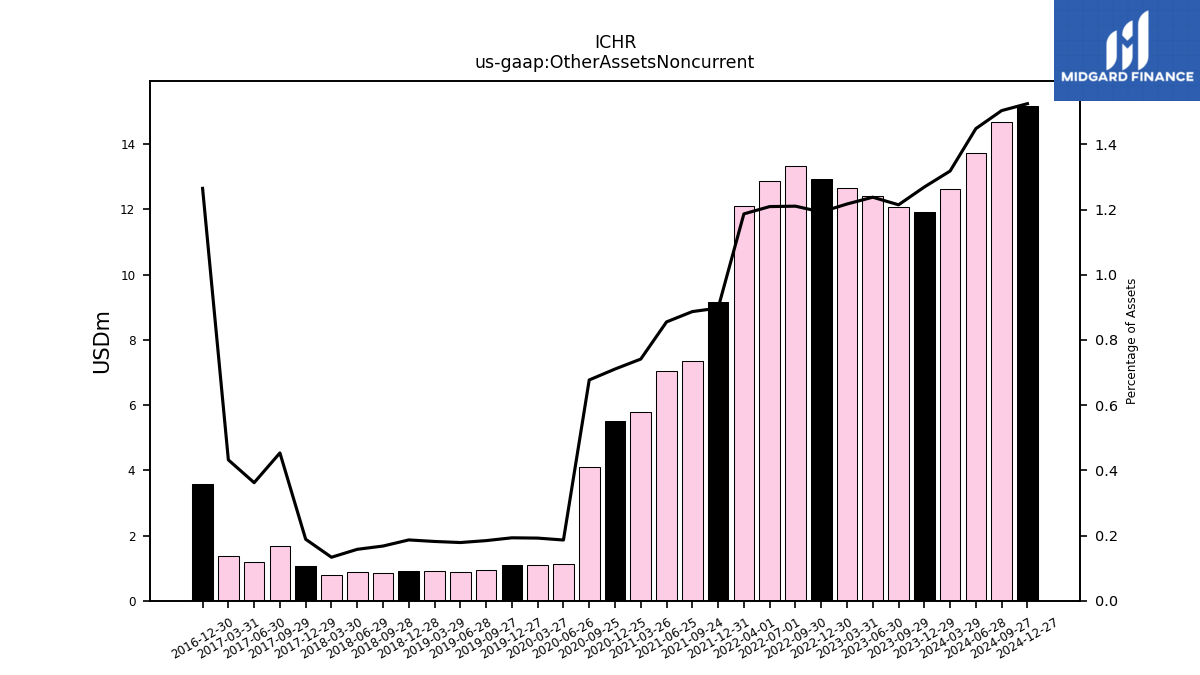
| Other Assets Noncurrent | 11.91 | 12.08 | 12.42 | 12.66 | 12.93 | 13.35 | 12.89 | NA | 12.11 | NA | 9.17 | NA | 7.04 | 5.80 | 5.50 | 4.10 | 1.12 | 1.08 | 1.09 | 0.94 | 0.88 | 0.90 | 0.91 | 0.86 | 0.89 | 0.78 | 1.05 | 1.68 | 1.20 | 1.39 | 3.57 | NA | NA | NA |
| 2023-12-29 | 2023-09-29 | 2023-06-30 | 2023-03-31 | 2022-12-30 | 2022-09-30 | 2022-07-01 | 2022-06-30 | 2022-04-01 | 2022-03-31 | 2021-12-31 | 2021-09-24 | 2021-06-25 | 2021-03-26 | 2020-12-25 | 2020-09-25 | 2020-06-26 | 2020-03-27 | 2019-12-27 | 2019-09-27 | 2019-06-28 | 2019-03-29 | 2018-12-28 | 2018-09-28 | 2018-06-29 | 2018-03-30 | 2017-12-29 | 2017-09-29 | 2017-06-30 | 2017-03-31 | 2016-12-30 | 2016-09-23 | 2016-06-24 | 2016-03-25 | ||
|---|---|---|---|---|---|---|---|---|---|---|---|---|---|---|---|---|---|---|---|---|---|---|---|---|---|---|---|---|---|---|---|---|---|---|---|
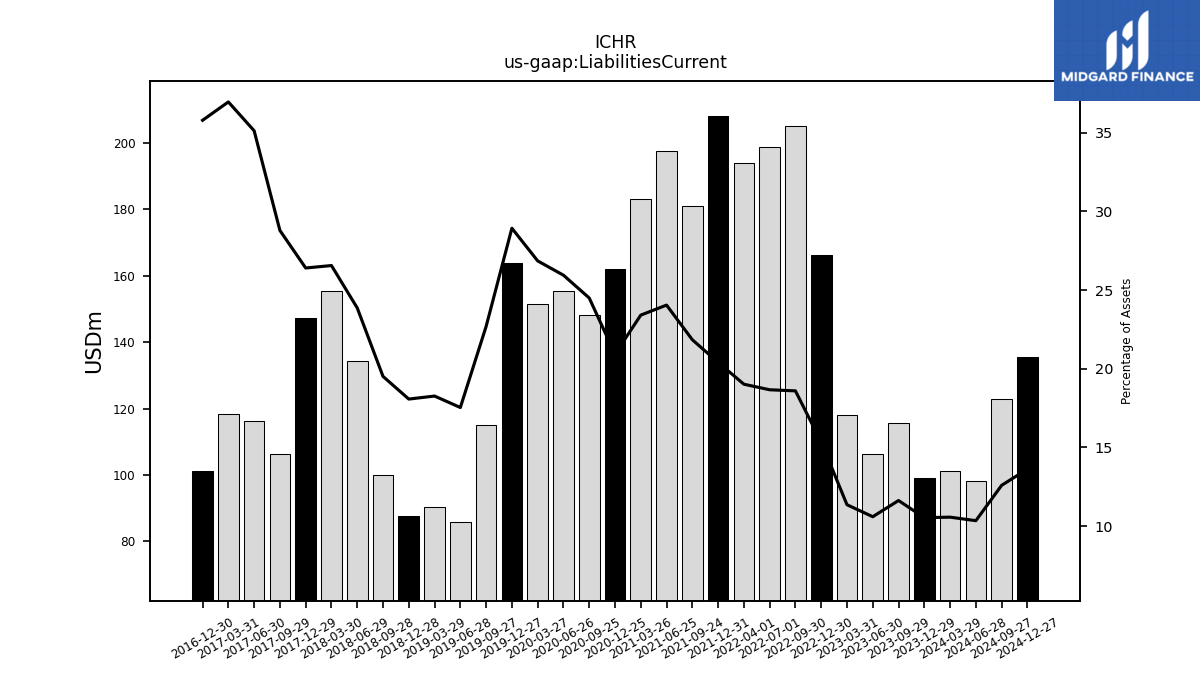
| Liabilities Current | 98.96 | 115.67 | 106.40 | 118.22 | 166.29 | 205.06 | 198.92 | NA | 194.07 | NA | 208.30 | NA | 197.74 | 183.08 | 162.03 | 148.30 | 155.36 | 151.44 | 163.87 | 115.00 | 85.93 | 90.49 | 87.75 | 99.98 | 134.30 | 155.57 | 147.22 | 106.44 | 116.22 | 118.39 | 101.07 | NA | NA | NA | |
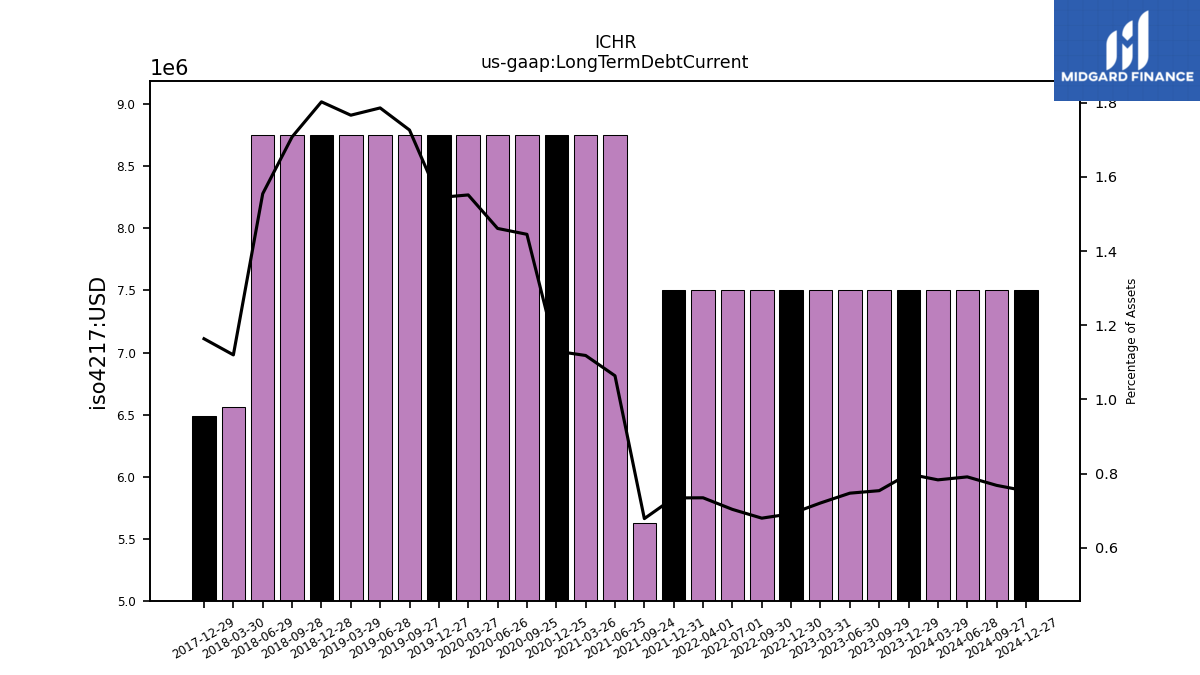
| Long Term Debt Current | 7.50 | 7.50 | 7.50 | 7.50 | 7.50 | 7.50 | 7.50 | NA | 7.50 | NA | 7.50 | NA | 8.75 | 8.75 | 8.75 | 8.75 | 8.75 | 8.75 | 8.75 | 8.75 | 8.75 | 8.75 | 8.75 | 8.75 | 8.75 | 6.56 | 6.49 | NA | NA | NA | NA | NA | NA | NA | |
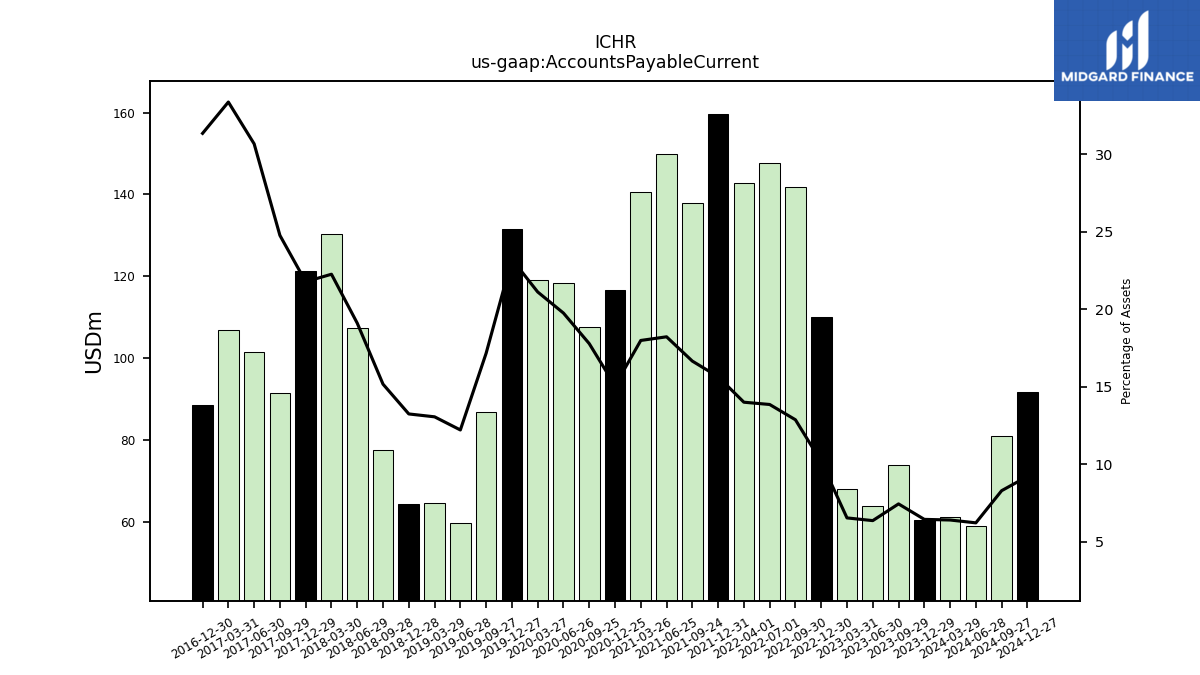
| Accounts Payable Current | 60.49 | 74.01 | 63.87 | 68.03 | 110.17 | 141.91 | 147.65 | NA | 142.87 | NA | 159.73 | NA | 149.84 | 140.67 | 116.66 | 107.65 | 118.28 | 119.08 | 131.58 | 86.96 | 59.83 | 64.69 | 64.30 | 77.70 | 107.49 | 130.38 | 121.41 | 91.55 | 101.49 | 106.90 | 88.53 | NA | NA | NA | |
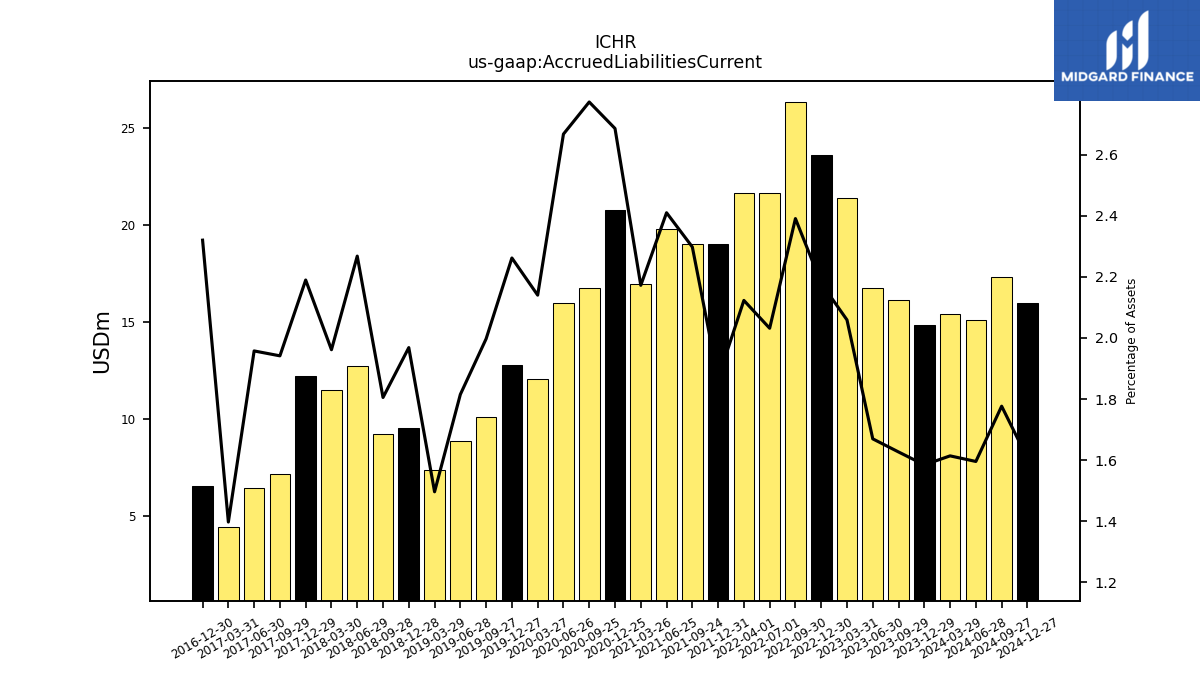
| Accrued Liabilities Current | 14.87 | 16.18 | 16.75 | 21.42 | 23.62 | 26.36 | 21.65 | NA | 21.66 | NA | 19.07 | NA | 19.82 | 16.99 | 20.79 | 16.79 | 15.97 | 12.07 | 12.81 | 10.12 | 8.89 | 7.41 | 9.56 | 9.25 | 12.76 | 11.49 | 12.21 | 7.18 | 6.48 | 4.48 | 6.55 | NA | NA | NA | |
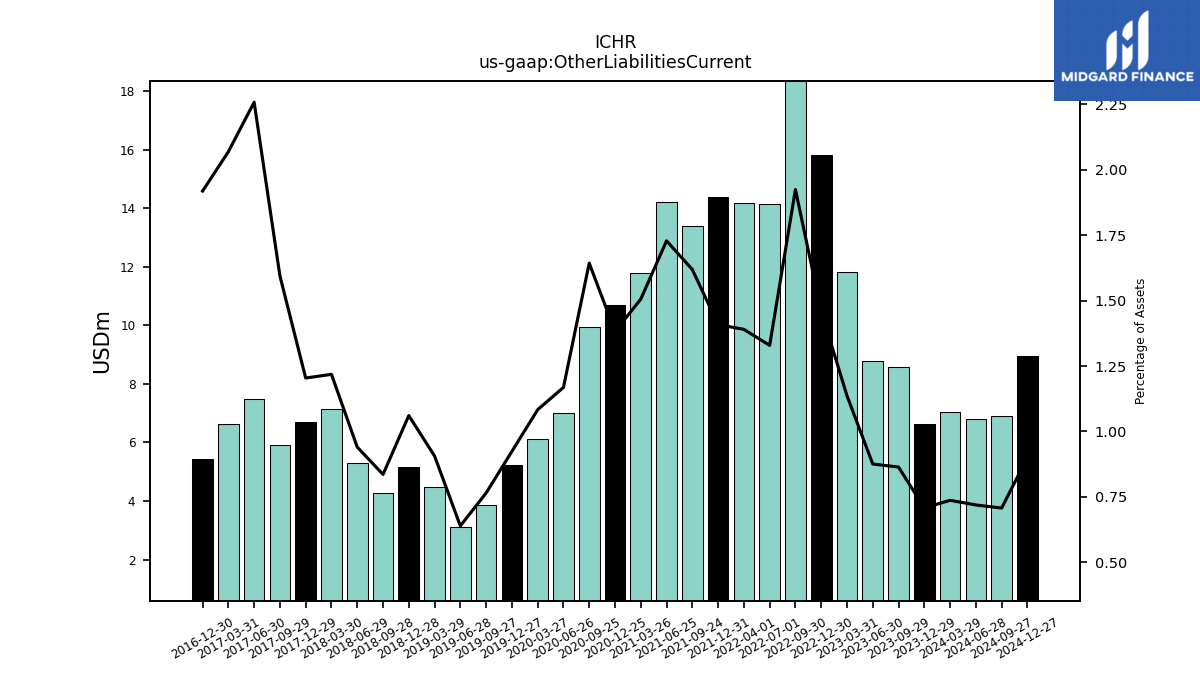
| Other Liabilities Current | 6.64 | 8.59 | 8.78 | 11.82 | 15.81 | 21.22 | 14.16 | NA | 14.19 | NA | 14.38 | NA | 14.22 | 11.78 | 10.70 | 9.95 | 7.00 | 6.11 | 5.23 | 3.88 | 3.13 | 4.49 | 5.15 | 4.28 | 5.29 | 7.14 | 6.71 | 5.90 | 7.48 | 6.63 | 5.42 | NA | NA | NA |
| 2023-12-29 | 2023-09-29 | 2023-06-30 | 2023-03-31 | 2022-12-30 | 2022-09-30 | 2022-07-01 | 2022-06-30 | 2022-04-01 | 2022-03-31 | 2021-12-31 | 2021-09-24 | 2021-06-25 | 2021-03-26 | 2020-12-25 | 2020-09-25 | 2020-06-26 | 2020-03-27 | 2019-12-27 | 2019-09-27 | 2019-06-28 | 2019-03-29 | 2018-12-28 | 2018-09-28 | 2018-06-29 | 2018-03-30 | 2017-12-29 | 2017-09-29 | 2017-06-30 | 2017-03-31 | 2016-12-30 | 2016-09-23 | 2016-06-24 | 2016-03-25 | ||
|---|---|---|---|---|---|---|---|---|---|---|---|---|---|---|---|---|---|---|---|---|---|---|---|---|---|---|---|---|---|---|---|---|---|---|---|
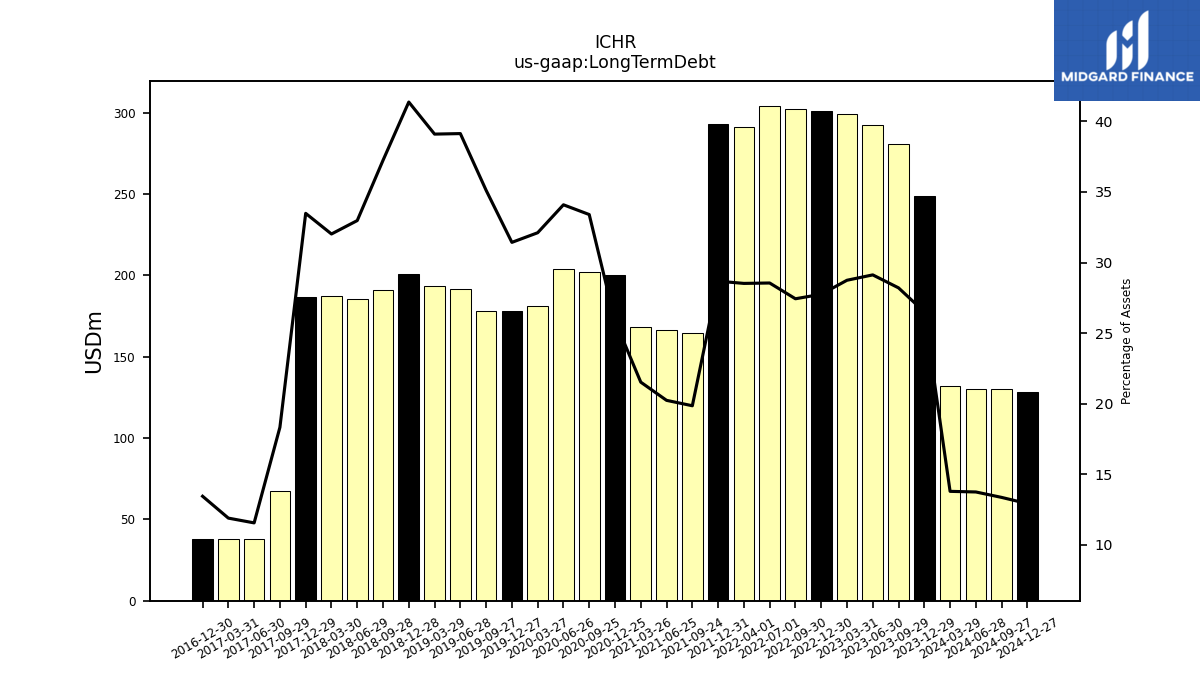
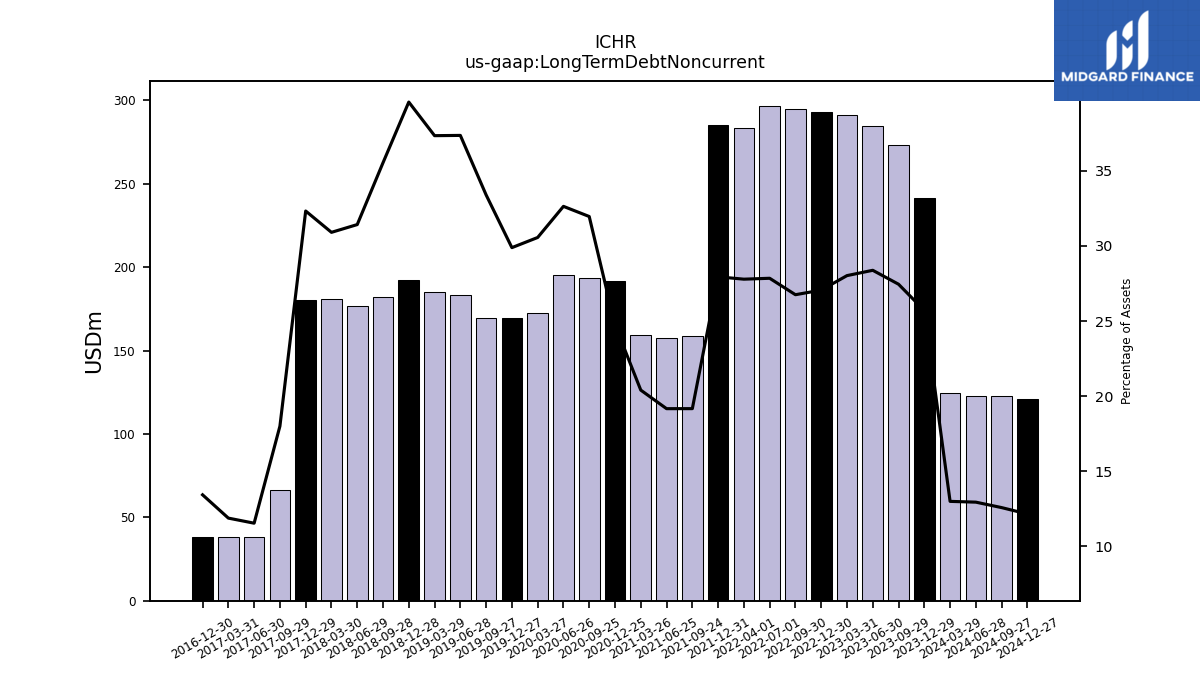
| Long Term Debt | 248.68 | 280.44 | 292.20 | 298.96 | 300.72 | 302.48 | 304.24 | NA | 291.00 | NA | 292.75 | NA | 166.38 | 168.33 | 200.27 | 202.22 | 204.16 | 181.11 | 178.05 | 178.00 | 191.76 | 193.70 | 200.87 | 190.81 | 185.57 | 187.60 | 186.74 | 67.74 | 38.21 | 38.08 | 37.94 | NA | NA | NA | |
| Long Term Debt Noncurrent | 241.18 | 272.94 | 284.70 | 291.46 | 293.22 | 294.98 | 296.74 | NA | 283.50 | NA | 285.25 | NA | 157.63 | 159.58 | 191.52 | 193.47 | 195.41 | 172.36 | 169.30 | 169.25 | 183.01 | 184.95 | 192.12 | 182.06 | 176.82 | 181.04 | 180.25 | 66.56 | 38.21 | 38.08 | 37.94 | NA | NA | NA | |
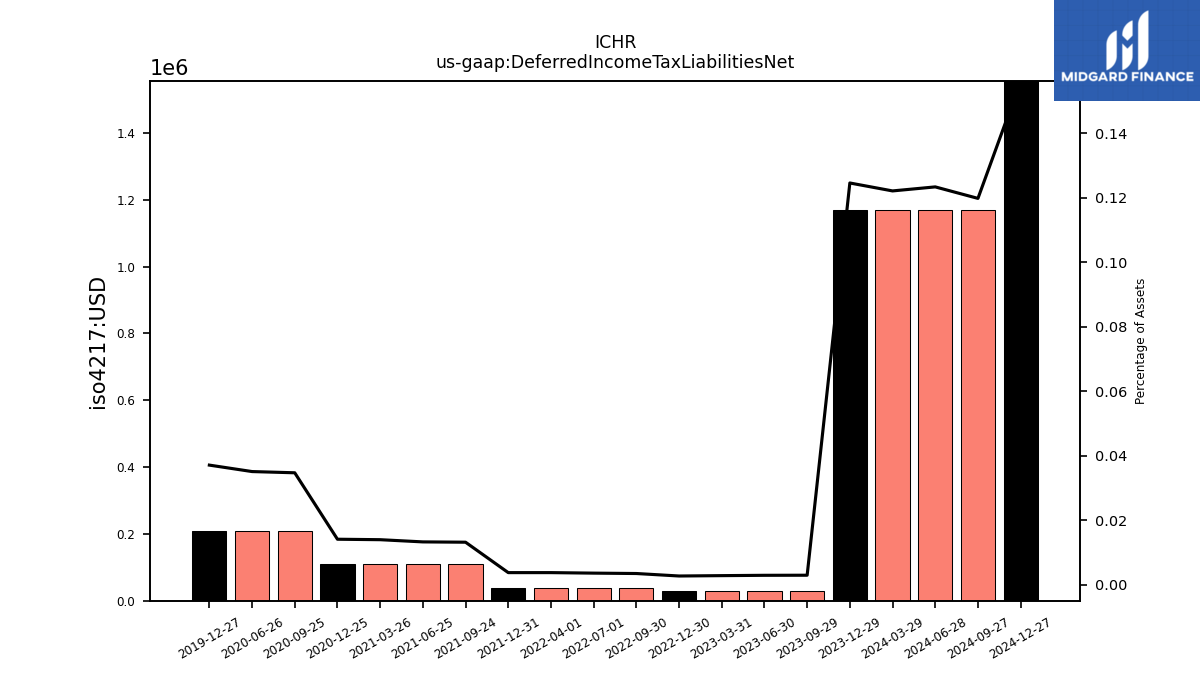
| Deferred Income Tax Liabilities Net | 1.17 | 0.03 | 0.03 | 0.03 | 0.03 | 0.04 | 0.04 | NA | 0.04 | NA | 0.04 | NA | 0.11 | 0.11 | 0.11 | 0.21 | 0.21 | NA | 0.21 | NA | NA | NA | NA | NA | NA | NA | NA | NA | NA | NA | NA | NA | NA | NA | |
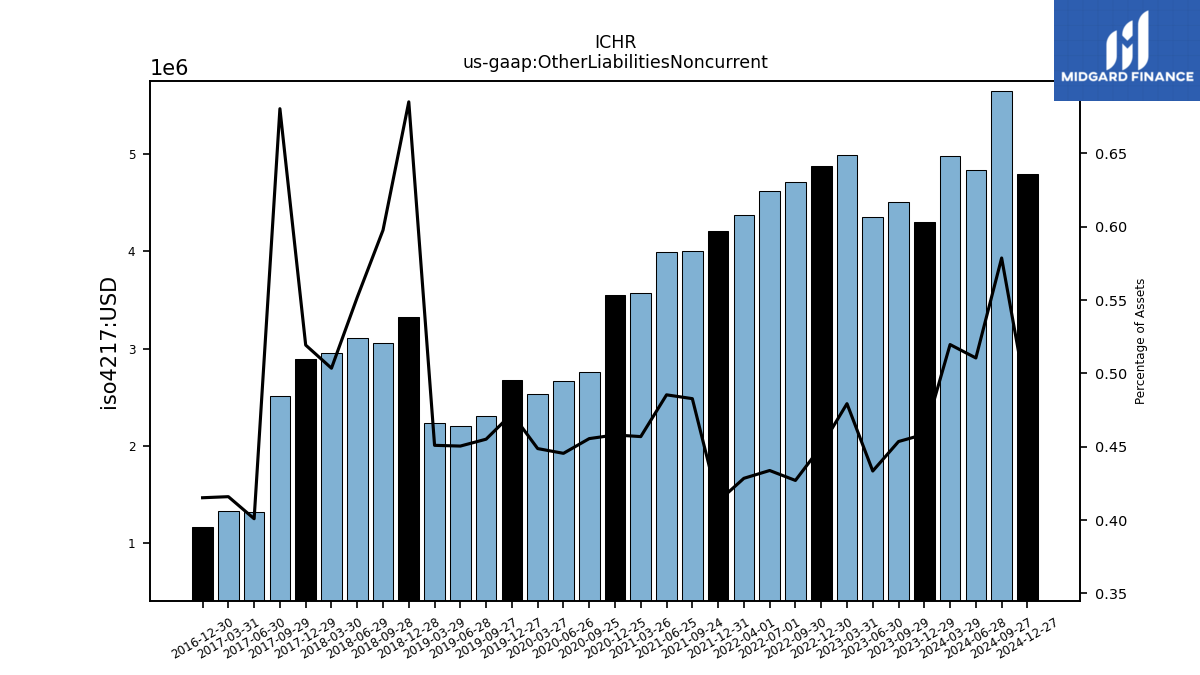
| Other Liabilities Noncurrent | 4.30 | 4.51 | 4.35 | 4.99 | 4.88 | 4.71 | 4.62 | NA | 4.37 | NA | 4.21 | NA | 3.99 | 3.57 | 3.55 | 2.76 | 2.67 | 2.53 | 2.68 | 2.31 | 2.21 | 2.23 | 3.33 | 3.06 | 3.11 | 2.95 | 2.90 | 2.52 | 1.33 | 1.33 | 1.17 | NA | NA | NA | |
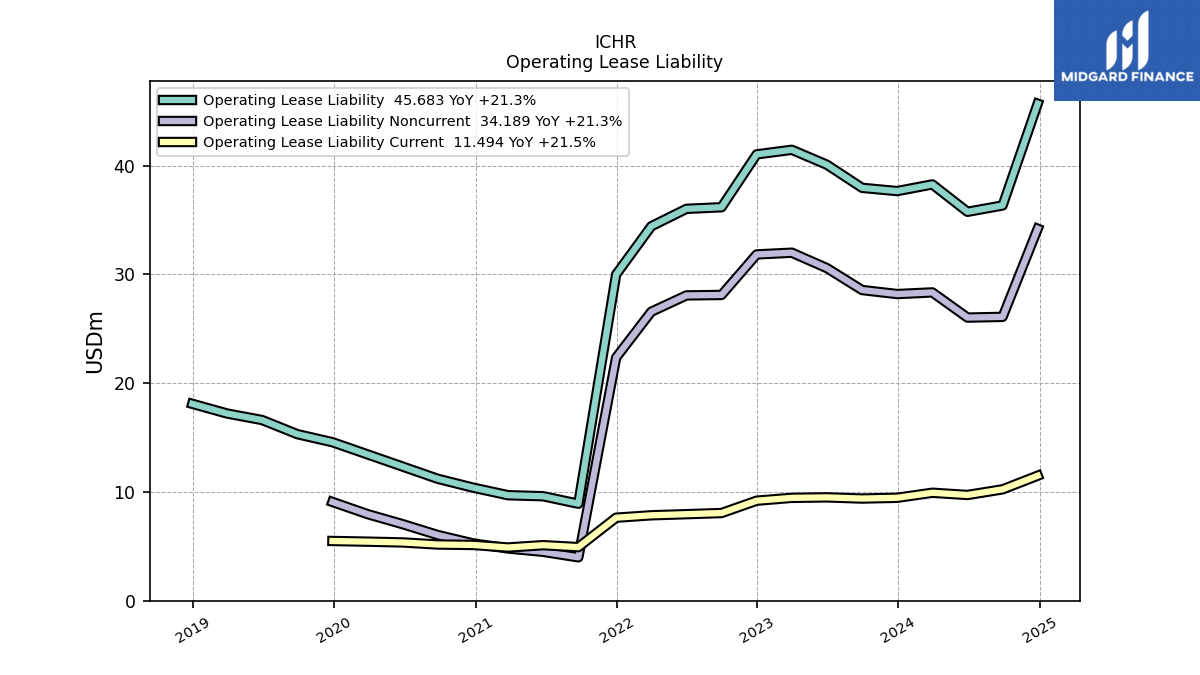
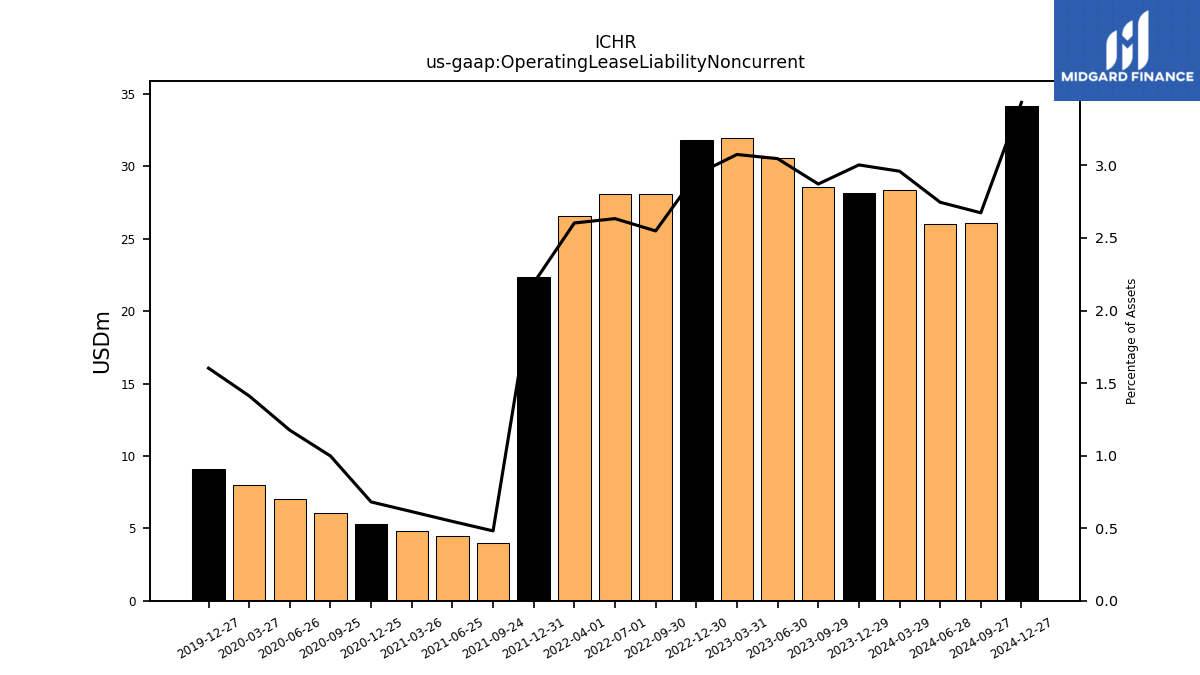
| Operating Lease Liability Noncurrent | 28.19 | 28.56 | 30.57 | 31.99 | 31.83 | 28.10 | 28.06 | NA | 26.56 | NA | 22.35 | NA | 4.50 | 4.80 | 5.27 | 6.04 | 7.04 | 7.96 | 9.08 | NA | NA | NA | NA | NA | NA | NA | NA | NA | NA | NA | NA | NA | NA | NA |
| 2023-12-29 | 2023-09-29 | 2023-06-30 | 2023-03-31 | 2022-12-30 | 2022-09-30 | 2022-07-01 | 2022-06-30 | 2022-04-01 | 2022-03-31 | 2021-12-31 | 2021-09-24 | 2021-06-25 | 2021-03-26 | 2020-12-25 | 2020-09-25 | 2020-06-26 | 2020-03-27 | 2019-12-27 | 2019-09-27 | 2019-06-28 | 2019-03-29 | 2018-12-28 | 2018-09-28 | 2018-06-29 | 2018-03-30 | 2017-12-29 | 2017-09-29 | 2017-06-30 | 2017-03-31 | 2016-12-30 | 2016-09-23 | 2016-06-24 | 2016-03-25 | ||
|---|---|---|---|---|---|---|---|---|---|---|---|---|---|---|---|---|---|---|---|---|---|---|---|---|---|---|---|---|---|---|---|---|---|---|---|
| Stockholders Equity | 564.68 | 572.68 | 577.30 | 593.46 | 587.50 | 569.85 | NA | 537.32 | NA | 511.83 | 500.71 | 480.66 | 458.48 | 431.06 | 411.69 | 254.67 | 238.19 | 229.52 | 221.42 | 207.19 | 203.73 | 201.68 | 198.33 | 223.22 | 242.22 | 235.68 | 216.76 | 193.79 | 174.74 | 162.12 | 141.66 | NA | NA | NA | |
| Common Stock Value | 0.00 | 0.00 | 0.00 | 0.00 | 0.00 | 0.00 | 0.00 | NA | 0.00 | NA | 0.00 | NA | 0.00 | 0.00 | 0.00 | 0.00 | 0.00 | 0.00 | 0.00 | 0.00 | 0.00 | 0.00 | 0.00 | 0.00 | 0.00 | 0.00 | 0.00 | 0.00 | 0.00 | 0.00 | 0.00 | NA | NA | NA | |
| Additional Paid In Capital Common Stock | 451.58 | 447.68 | 441.88 | 437.39 | 431.42 | 427.96 | 424.47 | NA | 420.51 | NA | 417.44 | NA | 408.63 | 404.05 | 399.31 | 254.81 | 248.88 | 247.02 | 242.32 | 236.04 | 233.51 | 231.79 | 228.36 | 227.08 | 225.36 | 221.90 | 214.70 | 211.19 | 206.43 | 203.67 | 196.05 | NA | NA | NA | |
| Retained Earnings Accumulated Deficit | 204.67 | 216.57 | 227.00 | 247.65 | 247.66 | 233.46 | 204.43 | NA | 182.89 | NA | 174.85 | NA | 141.46 | 118.59 | 103.95 | 91.43 | 80.88 | 74.07 | 70.67 | 62.72 | 61.80 | 61.46 | 59.95 | 56.46 | 46.82 | 18.78 | 2.06 | -17.40 | -31.69 | -41.55 | -54.39 | NA | NA | NA | |
| Adjustments To Additional Paid In Capital Sharebased Compensation Requisite Service Period Recognition Value | 4.67 | 4.75 | 4.28 | 3.64 | 3.80 | 3.72 | 3.51 | 3.51 | 2.90 | 2.90 | 3.37 | 3.01 | 2.68 | 2.42 | 2.45 | 2.42 | 2.14 | 2.87 | 3.94 | 1.79 | 1.48 | 1.33 | 1.30 | 1.27 | 1.22 | 3.79 | 0.69 | 0.62 | 0.57 | 0.34 | NA | NA | NA | NA |
| 2023-12-29 | 2023-09-29 | 2023-06-30 | 2023-03-31 | 2022-12-30 | 2022-09-30 | 2022-07-01 | 2022-06-30 | 2022-04-01 | 2022-03-31 | 2021-12-31 | 2021-09-24 | 2021-06-25 | 2021-03-26 | 2020-12-25 | 2020-09-25 | 2020-06-26 | 2020-03-27 | 2019-12-27 | 2019-09-27 | 2019-06-28 | 2019-03-29 | 2018-12-28 | 2018-09-28 | 2018-06-29 | 2018-03-30 | 2017-12-29 | 2017-09-29 | 2017-06-30 | 2017-03-31 | 2016-12-30 | 2016-09-23 | 2016-06-24 | 2016-03-25 | ||
|---|---|---|---|---|---|---|---|---|---|---|---|---|---|---|---|---|---|---|---|---|---|---|---|---|---|---|---|---|---|---|---|---|---|---|---|
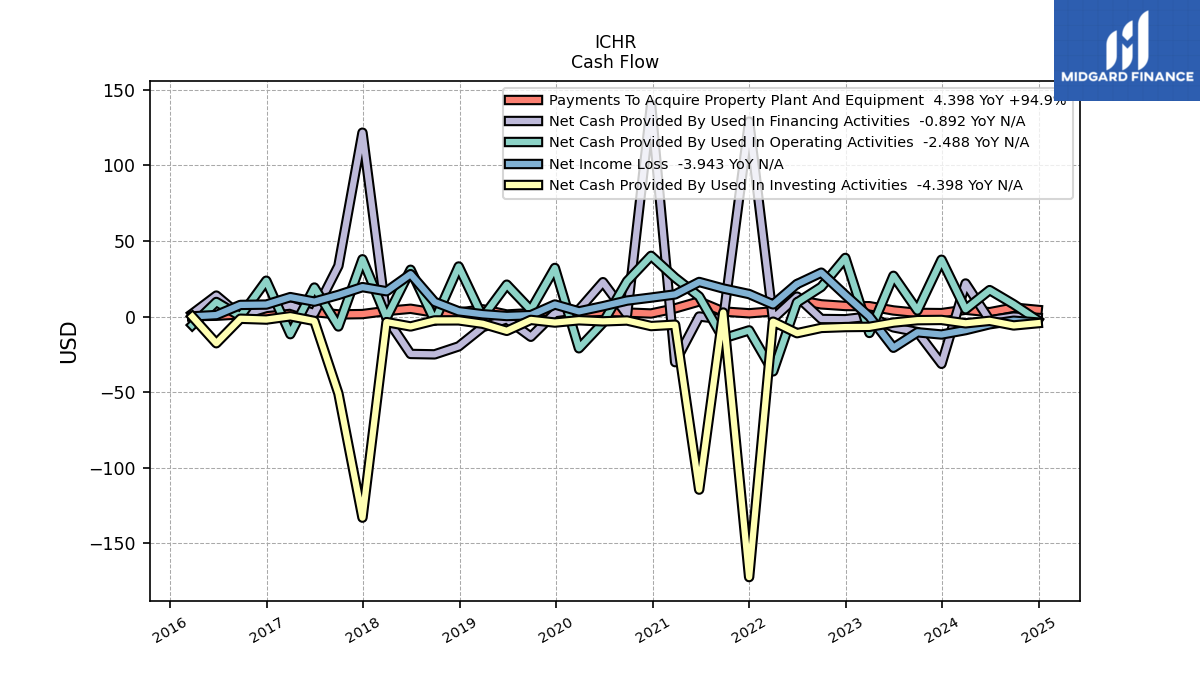
| Net Cash Provided By Used In Operating Activities | 37.57 | NA | 26.94 | -10.87 | 38.77 | 19.57 | 9.38 | 9.38 | -36.28 | -36.28 | -9.14 | -14.48 | 13.24 | 25.65 | 40.14 | 23.30 | -4.15 | -21.04 | 32.15 | 4.34 | 21.08 | -0.42 | 33.10 | -2.79 | 30.94 | -0.78 | 37.88 | -6.58 | 19.18 | -11.68 | 23.70 | 0.12 | 9.63 | -5.72 | |
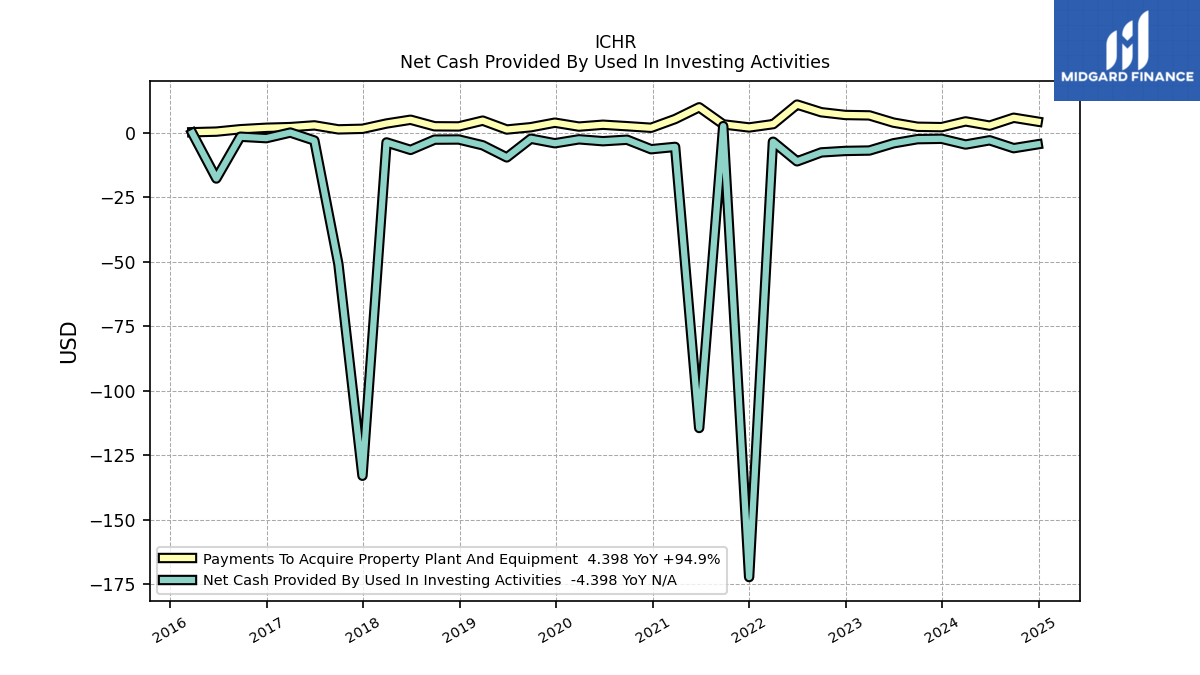
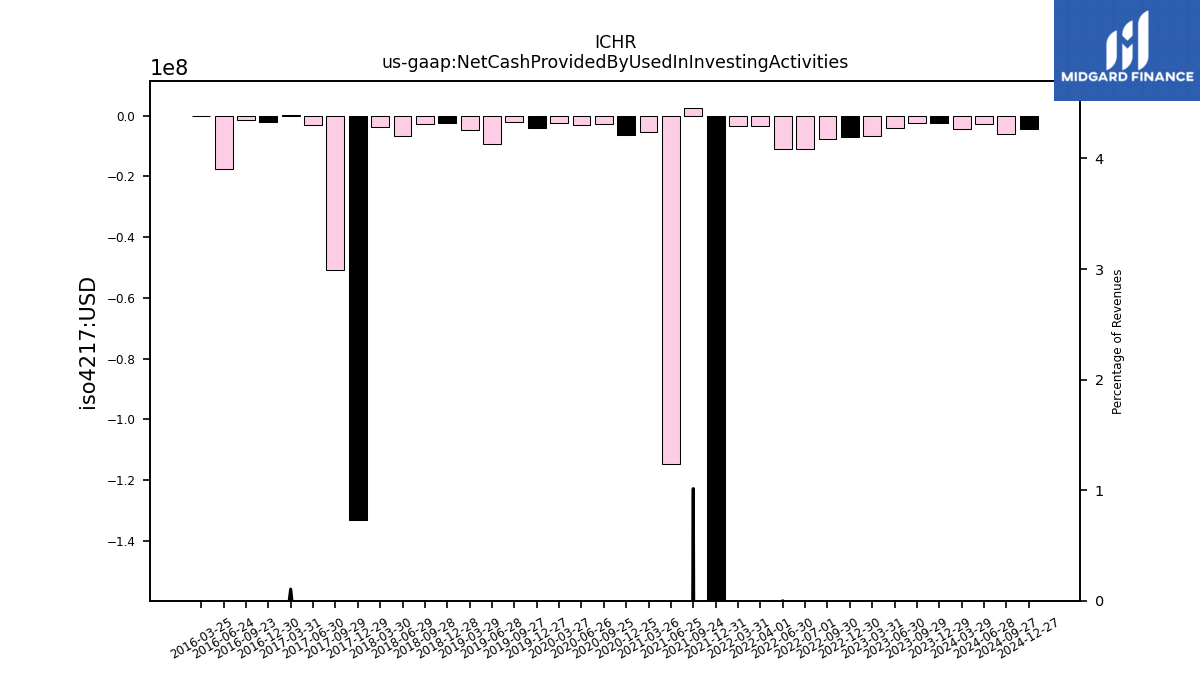
| Net Cash Provided By Used In Investing Activities | -2.26 | NA | -4.01 | -6.82 | -6.97 | -7.54 | -11.00 | -11.00 | -3.42 | -3.42 | -172.35 | 2.67 | -114.50 | -5.40 | -6.31 | -2.63 | -3.19 | -2.47 | -4.00 | -2.23 | -9.48 | -4.78 | -2.54 | -2.59 | -6.57 | -3.67 | -133.03 | -50.94 | -2.94 | 0.16 | -2.02 | -1.45 | -17.68 | -0.05 | |
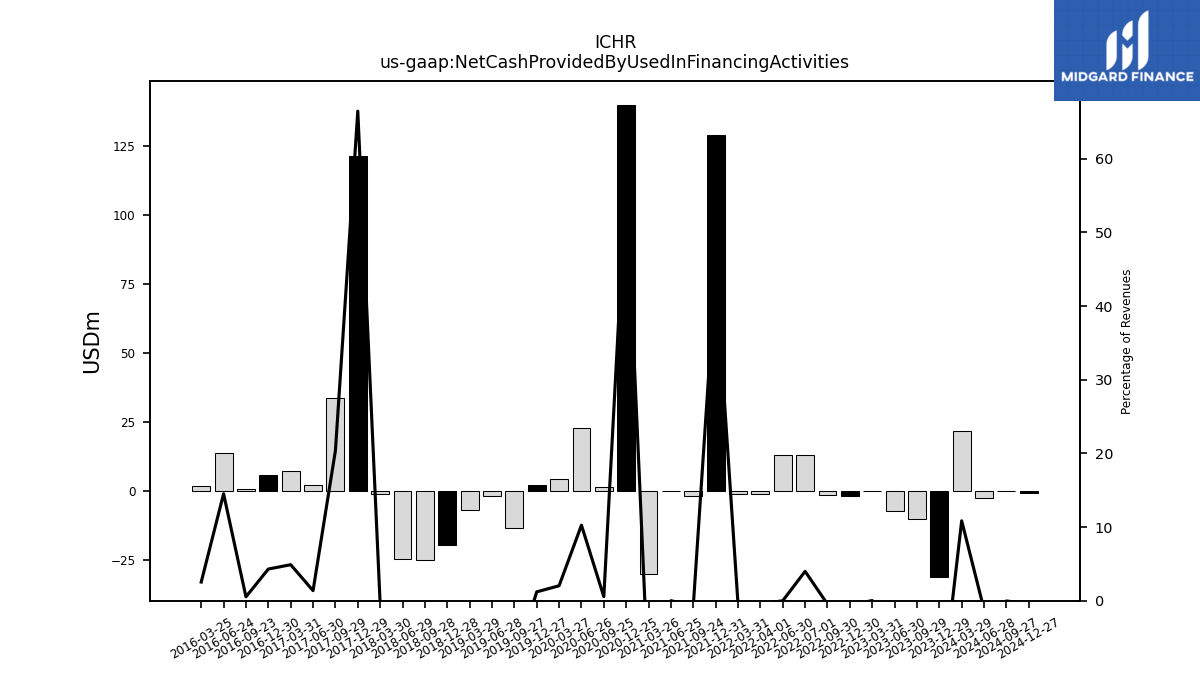
| Net Cash Provided By Used In Financing Activities | -31.30 | NA | -7.16 | 0.06 | -1.79 | -1.63 | 13.16 | 13.16 | -1.28 | -1.28 | 128.95 | -1.86 | 0.03 | -30.20 | 140.15 | 1.27 | 22.73 | 4.48 | 2.29 | -13.39 | -1.76 | -7.02 | -19.76 | -25.02 | -24.75 | -1.06 | 121.61 | 33.53 | 2.19 | 7.28 | 5.66 | 0.57 | 13.85 | 1.86 |
| 2023-12-29 | 2023-09-29 | 2023-06-30 | 2023-03-31 | 2022-12-30 | 2022-09-30 | 2022-07-01 | 2022-06-30 | 2022-04-01 | 2022-03-31 | 2021-12-31 | 2021-09-24 | 2021-06-25 | 2021-03-26 | 2020-12-25 | 2020-09-25 | 2020-06-26 | 2020-03-27 | 2019-12-27 | 2019-09-27 | 2019-06-28 | 2019-03-29 | 2018-12-28 | 2018-09-28 | 2018-06-29 | 2018-03-30 | 2017-12-29 | 2017-09-29 | 2017-06-30 | 2017-03-31 | 2016-12-30 | 2016-09-23 | 2016-06-24 | 2016-03-25 | ||
|---|---|---|---|---|---|---|---|---|---|---|---|---|---|---|---|---|---|---|---|---|---|---|---|---|---|---|---|---|---|---|---|---|---|---|---|
| Net Cash Provided By Used In Operating Activities | 37.57 | NA | 26.94 | -10.87 | 38.77 | 19.57 | 9.38 | 9.38 | -36.28 | -36.28 | -9.14 | -14.48 | 13.24 | 25.65 | 40.14 | 23.30 | -4.15 | -21.04 | 32.15 | 4.34 | 21.08 | -0.42 | 33.10 | -2.79 | 30.94 | -0.78 | 37.88 | -6.58 | 19.18 | -11.68 | 23.70 | 0.12 | 9.63 | -5.72 | |
| Net Income Loss | -11.90 | -10.43 | -20.66 | -0.01 | 14.20 | 29.03 | 21.54 | 21.54 | 8.04 | 8.04 | 14.86 | 18.54 | 22.86 | 14.64 | 12.52 | 10.55 | 6.81 | 3.40 | 7.95 | 0.92 | 0.34 | 1.52 | 3.48 | 9.64 | 28.04 | 16.72 | 19.46 | 14.29 | 9.86 | 12.84 | 7.91 | 7.67 | 0.97 | 0.11 | |
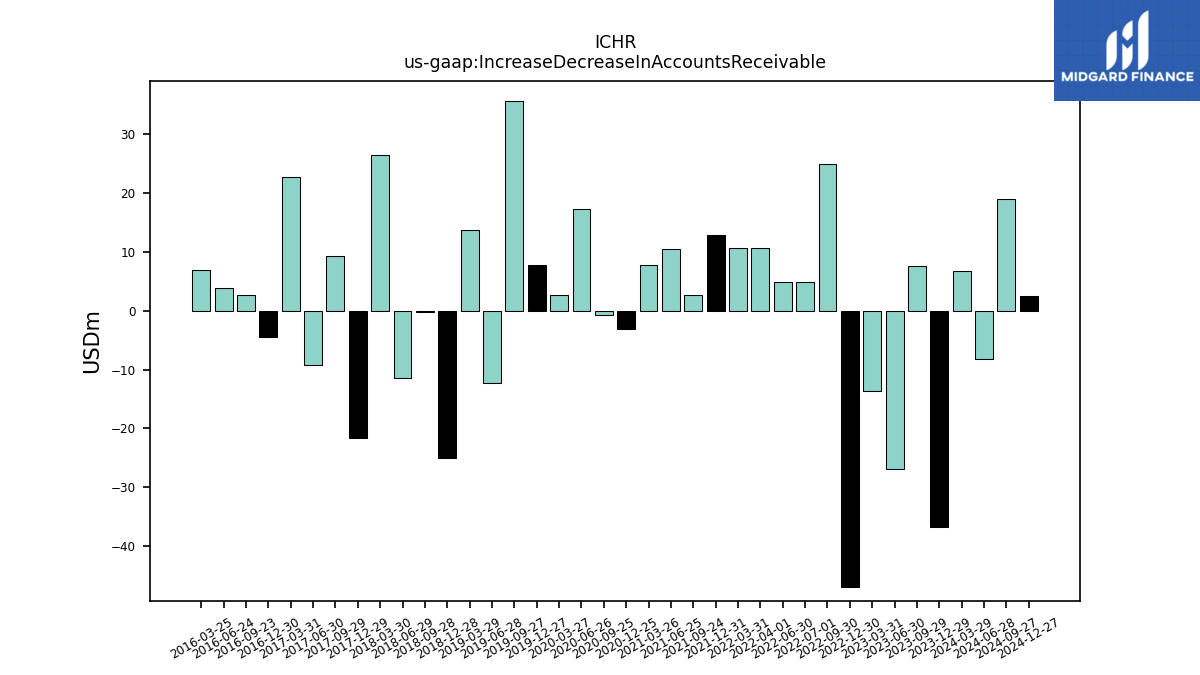
| Increase Decrease In Accounts Receivable | -36.63 | NA | -26.93 | -13.63 | -46.98 | 24.89 | 4.87 | 4.87 | 10.54 | 10.54 | 12.75 | 2.57 | 10.43 | 7.70 | -3.14 | -0.74 | 17.29 | 2.72 | 7.71 | 35.57 | -12.33 | 13.61 | -25.07 | -0.31 | -11.39 | 26.35 | -21.57 | 9.21 | -9.24 | 22.66 | -4.41 | 2.69 | 3.87 | 6.86 | |
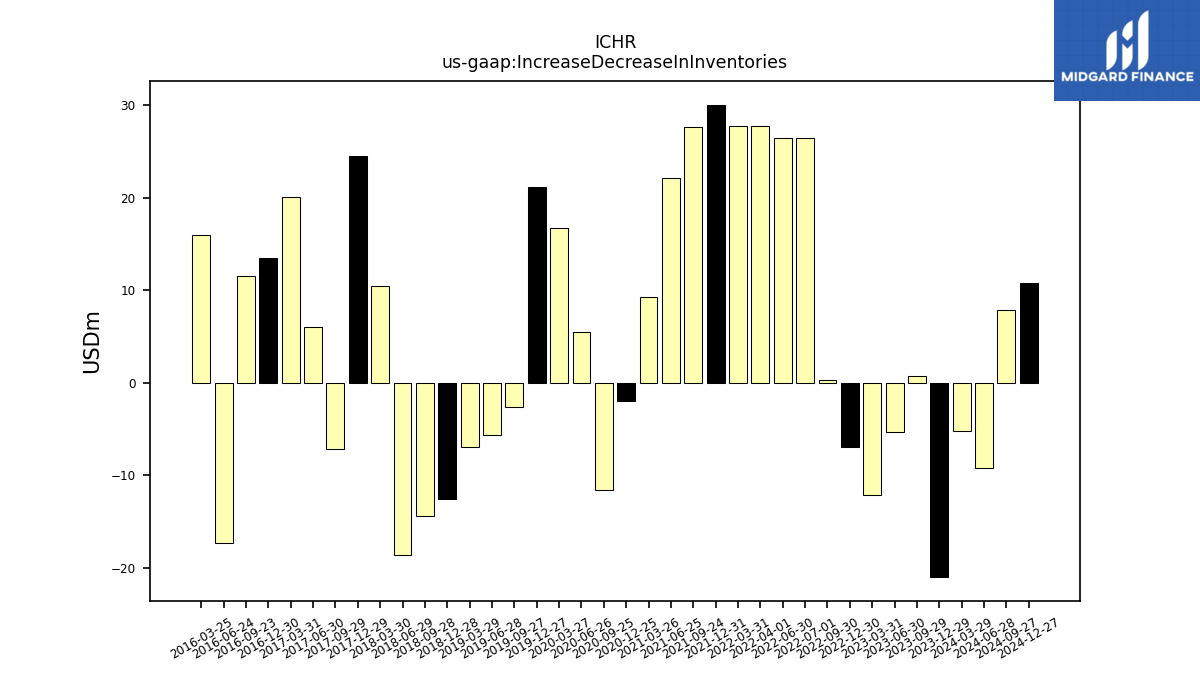
| Increase Decrease In Inventories | -21.02 | NA | -5.35 | -12.12 | -7.00 | 0.33 | 26.48 | 26.48 | 27.72 | 27.72 | 30.07 | 27.67 | 22.19 | 9.31 | -2.02 | -11.61 | 5.47 | 16.68 | 21.21 | -2.65 | -5.70 | -6.93 | -12.56 | -14.40 | -18.64 | 10.47 | 24.51 | -7.20 | 6.05 | 20.06 | 13.48 | 11.52 | -17.29 | 16.00 | |
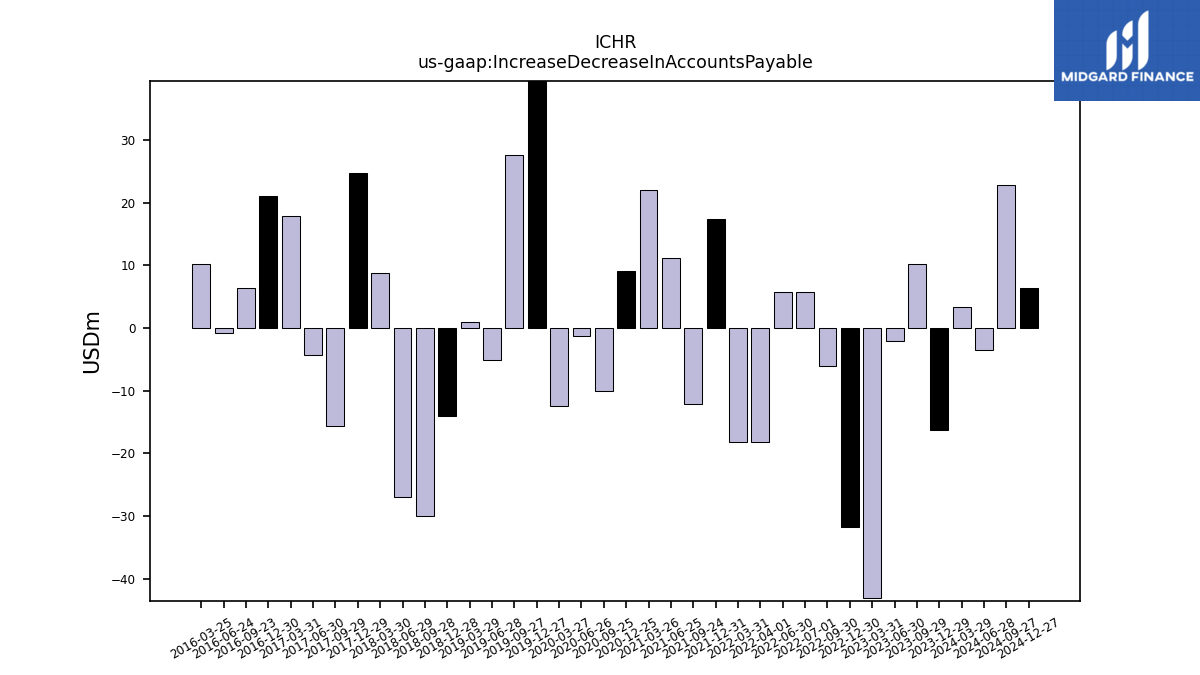
| Increase Decrease In Accounts Payable | -16.22 | NA | -2.03 | -43.02 | -31.67 | -6.05 | 5.76 | 5.76 | -18.21 | -18.21 | 17.41 | -12.07 | 11.20 | 22.10 | 9.18 | -9.98 | -1.34 | -12.38 | 44.55 | 27.59 | -5.07 | 0.90 | -14.07 | -29.91 | -26.92 | 8.73 | 24.69 | -15.67 | -4.31 | 17.90 | 21.10 | 6.34 | -0.84 | 10.16 | |
| Share Based Compensation | 4.67 | NA | 4.28 | 3.64 | 3.80 | 3.72 | 3.51 | 3.51 | 2.90 | 2.90 | 3.37 | 3.01 | 2.68 | 2.42 | 2.45 | 2.42 | 2.14 | 2.87 | 3.94 | 1.79 | 1.48 | 1.33 | 1.30 | 1.27 | 1.22 | 3.79 | 0.69 | 0.62 | 0.57 | 0.34 | 1.87 | 0.37 | 0.56 | 0.42 | |
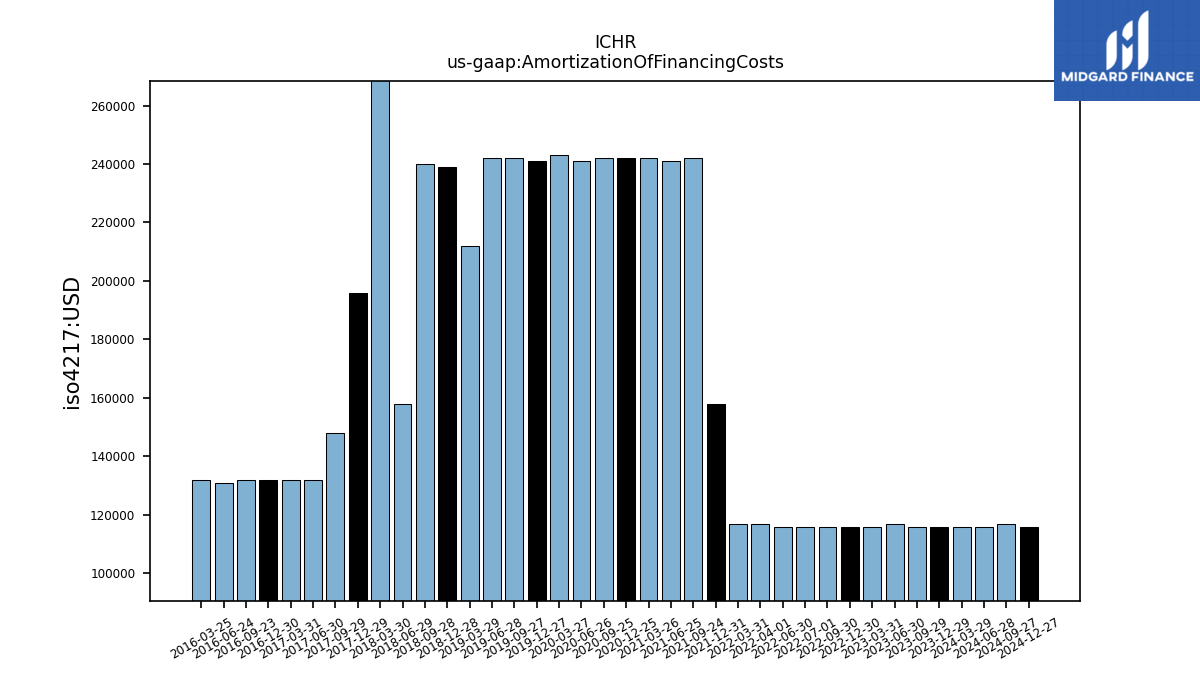
| Amortization Of Financing Costs | 0.12 | NA | 0.12 | 0.12 | 0.12 | 0.12 | 0.12 | 0.12 | 0.12 | 0.12 | 0.16 | 0.24 | 0.24 | 0.24 | 0.24 | 0.24 | 0.24 | 0.24 | 0.24 | 0.24 | 0.24 | 0.21 | 0.24 | 0.24 | 0.16 | 0.33 | 0.20 | 0.15 | 0.13 | 0.13 | 0.13 | 0.13 | 0.13 | 0.13 |
| 2023-12-29 | 2023-09-29 | 2023-06-30 | 2023-03-31 | 2022-12-30 | 2022-09-30 | 2022-07-01 | 2022-06-30 | 2022-04-01 | 2022-03-31 | 2021-12-31 | 2021-09-24 | 2021-06-25 | 2021-03-26 | 2020-12-25 | 2020-09-25 | 2020-06-26 | 2020-03-27 | 2019-12-27 | 2019-09-27 | 2019-06-28 | 2019-03-29 | 2018-12-28 | 2018-09-28 | 2018-06-29 | 2018-03-30 | 2017-12-29 | 2017-09-29 | 2017-06-30 | 2017-03-31 | 2016-12-30 | 2016-09-23 | 2016-06-24 | 2016-03-25 | ||
|---|---|---|---|---|---|---|---|---|---|---|---|---|---|---|---|---|---|---|---|---|---|---|---|---|---|---|---|---|---|---|---|---|---|---|---|
| Net Cash Provided By Used In Investing Activities | -2.26 | NA | -4.01 | -6.82 | -6.97 | -7.54 | -11.00 | -11.00 | -3.42 | -3.42 | -172.35 | 2.67 | -114.50 | -5.40 | -6.31 | -2.63 | -3.19 | -2.47 | -4.00 | -2.23 | -9.48 | -4.78 | -2.54 | -2.59 | -6.57 | -3.67 | -133.03 | -50.94 | -2.94 | 0.16 | -2.02 | -1.45 | -17.68 | -0.05 | |
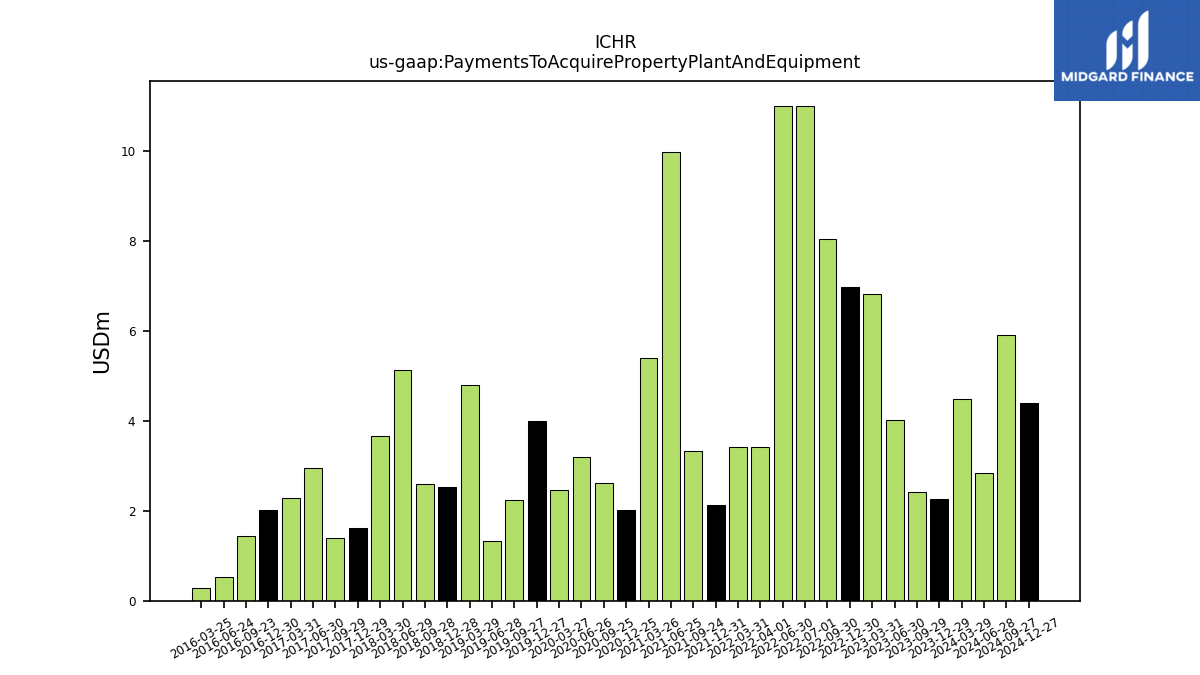
| Payments To Acquire Property Plant And Equipment | 2.26 | NA | 4.01 | 6.82 | 6.97 | 8.04 | 11.00 | 11.00 | 3.42 | 3.42 | 2.13 | 3.33 | 9.97 | 5.40 | 2.01 | 2.63 | 3.19 | 2.47 | 4.00 | 2.23 | 1.33 | 4.78 | 2.54 | 2.59 | 5.13 | 3.67 | 1.62 | 1.40 | 2.94 | 2.27 | 2.02 | 1.45 | 0.52 | 0.28 |
| 2023-12-29 | 2023-09-29 | 2023-06-30 | 2023-03-31 | 2022-12-30 | 2022-09-30 | 2022-07-01 | 2022-06-30 | 2022-04-01 | 2022-03-31 | 2021-12-31 | 2021-09-24 | 2021-06-25 | 2021-03-26 | 2020-12-25 | 2020-09-25 | 2020-06-26 | 2020-03-27 | 2019-12-27 | 2019-09-27 | 2019-06-28 | 2019-03-29 | 2018-12-28 | 2018-09-28 | 2018-06-29 | 2018-03-30 | 2017-12-29 | 2017-09-29 | 2017-06-30 | 2017-03-31 | 2016-12-30 | 2016-09-23 | 2016-06-24 | 2016-03-25 | ||
|---|---|---|---|---|---|---|---|---|---|---|---|---|---|---|---|---|---|---|---|---|---|---|---|---|---|---|---|---|---|---|---|---|---|---|---|
| Net Cash Provided By Used In Financing Activities | -31.30 | NA | -7.16 | 0.06 | -1.79 | -1.63 | 13.16 | 13.16 | -1.28 | -1.28 | 128.95 | -1.86 | 0.03 | -30.20 | 140.15 | 1.27 | 22.73 | 4.48 | 2.29 | -13.39 | -1.76 | -7.02 | -19.76 | -25.02 | -24.75 | -1.06 | 121.61 | 33.53 | 2.19 | 7.28 | 5.66 | 0.57 | 13.85 | 1.86 |
| 2023-12-29 | 2023-09-29 | 2023-06-30 | 2023-03-31 | 2022-12-30 | 2022-09-30 | 2022-07-01 | 2022-06-30 | 2022-04-01 | 2022-03-31 | 2021-12-31 | 2021-09-24 | 2021-06-25 | 2021-03-26 | 2020-12-25 | 2020-09-25 | 2020-06-26 | 2020-03-27 | 2019-12-27 | 2019-09-27 | 2019-06-28 | 2019-03-29 | 2018-12-28 | 2018-09-28 | 2018-06-29 | 2018-03-30 | 2017-12-29 | 2017-09-29 | 2017-06-30 | 2017-03-31 | 2016-12-30 | 2016-09-23 | 2016-06-24 | 2016-03-25 | ||
|---|---|---|---|---|---|---|---|---|---|---|---|---|---|---|---|---|---|---|---|---|---|---|---|---|---|---|---|---|---|---|---|---|---|---|---|
| Revenues | 203.48 | 196.76 | 185.01 | 225.87 | 301.72 | 355.64 | 329.56 | 329.56 | 293.15 | 293.15 | 287.19 | 262.86 | 282.31 | 264.57 | 244.97 | 227.68 | 221.56 | 220.03 | 189.35 | 154.46 | 139.19 | 137.83 | 141.40 | 175.21 | 248.97 | 258.03 | 182.94 | 164.52 | 159.73 | 148.70 | 131.41 | 105.69 | 95.36 | 73.29 | |
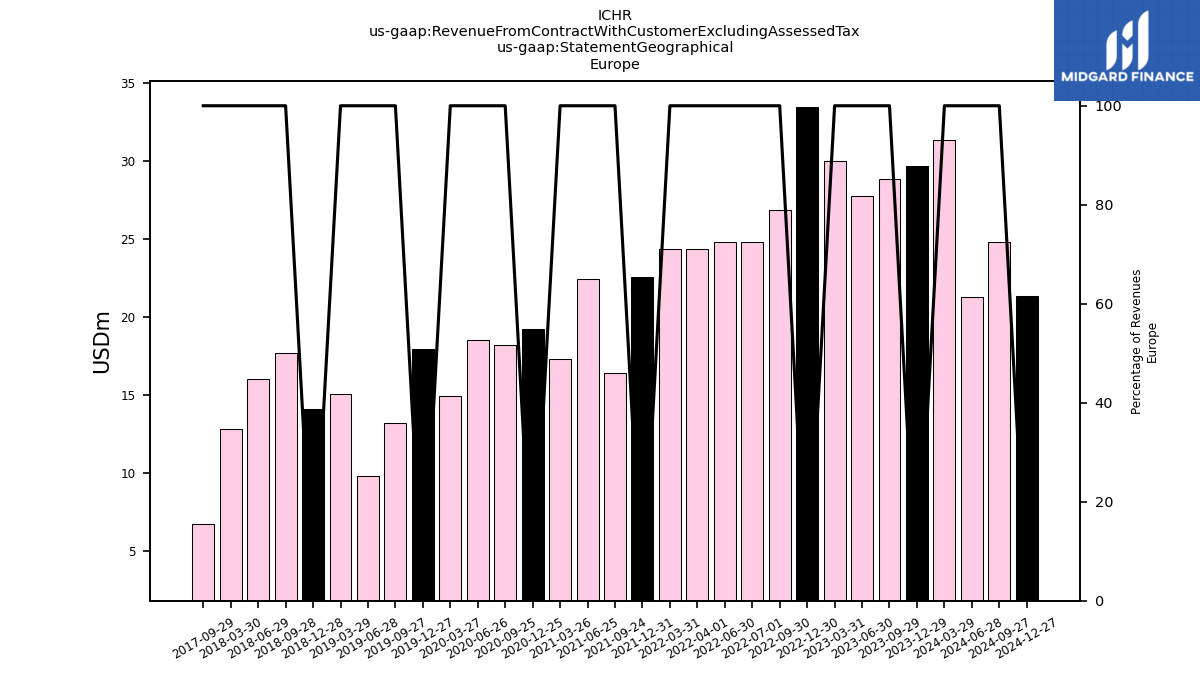
| 29.69 | 28.88 | 27.76 | 29.99 | 33.46 | 26.89 | 24.81 | 24.81 | 24.39 | 24.39 | 22.55 | 16.43 | 22.44 | 17.33 | 19.23 | 18.19 | 18.54 | 14.96 | 17.98 | 13.22 | 9.80 | 15.09 | 14.12 | 17.69 | 16.04 | 12.84 | NA | 6.74 | NA | NA | NA | NA | NA | NA | ||
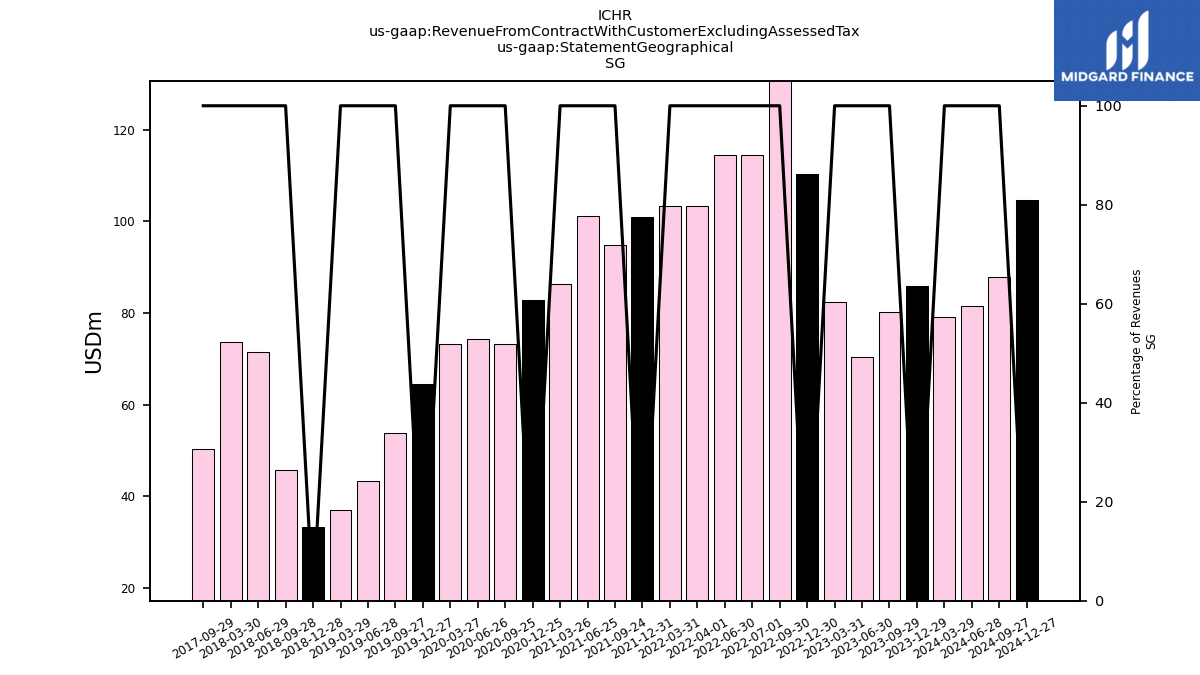
| 85.91 | 80.22 | 70.37 | 82.29 | 110.31 | 132.56 | 114.40 | 114.40 | 103.30 | 103.30 | 100.91 | 94.83 | 101.21 | 86.32 | 82.71 | 73.20 | 74.33 | 73.21 | 64.57 | 53.81 | 43.30 | 36.98 | 33.39 | 45.63 | 71.48 | 73.74 | NA | 50.27 | NA | NA | NA | NA | NA | NA | ||
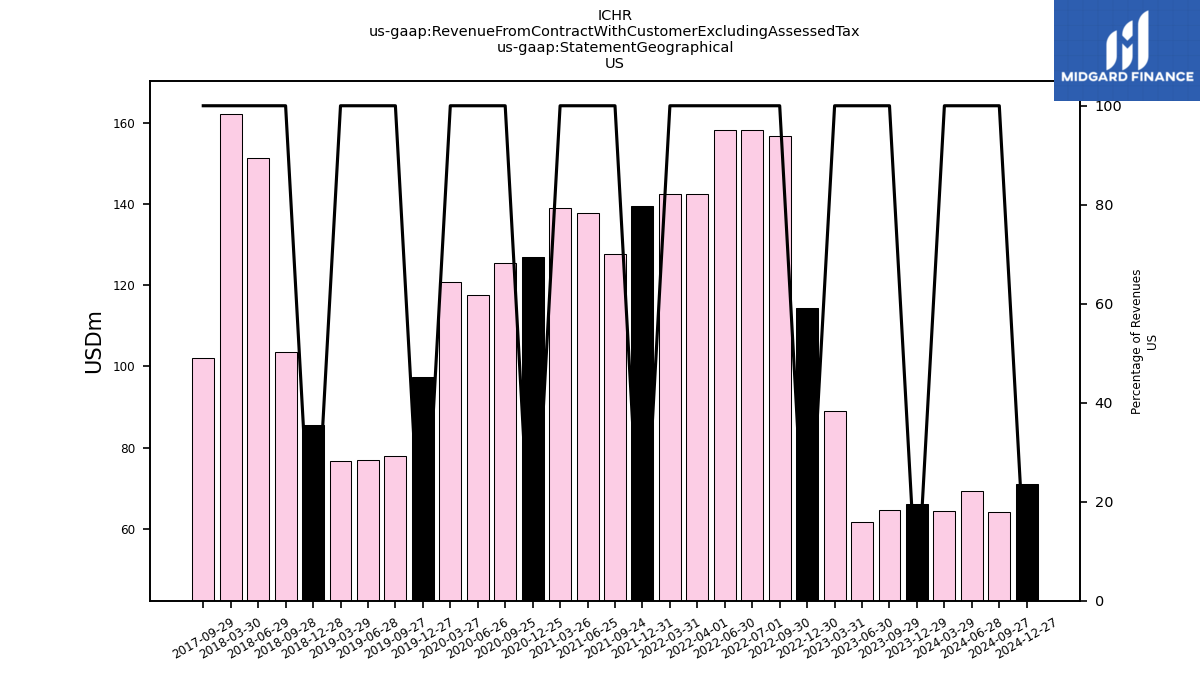
| US | 66.09 | 64.53 | 61.62 | 89.05 | 114.38 | 156.91 | 158.37 | 158.37 | 142.47 | 142.47 | 139.56 | 127.67 | 137.75 | 139.13 | 126.89 | 125.54 | 117.69 | 120.84 | 97.51 | 78.00 | 76.90 | 76.63 | 85.54 | 103.56 | 151.40 | 162.24 | NA | 101.97 | NA | NA | NA | NA | NA | NA | |
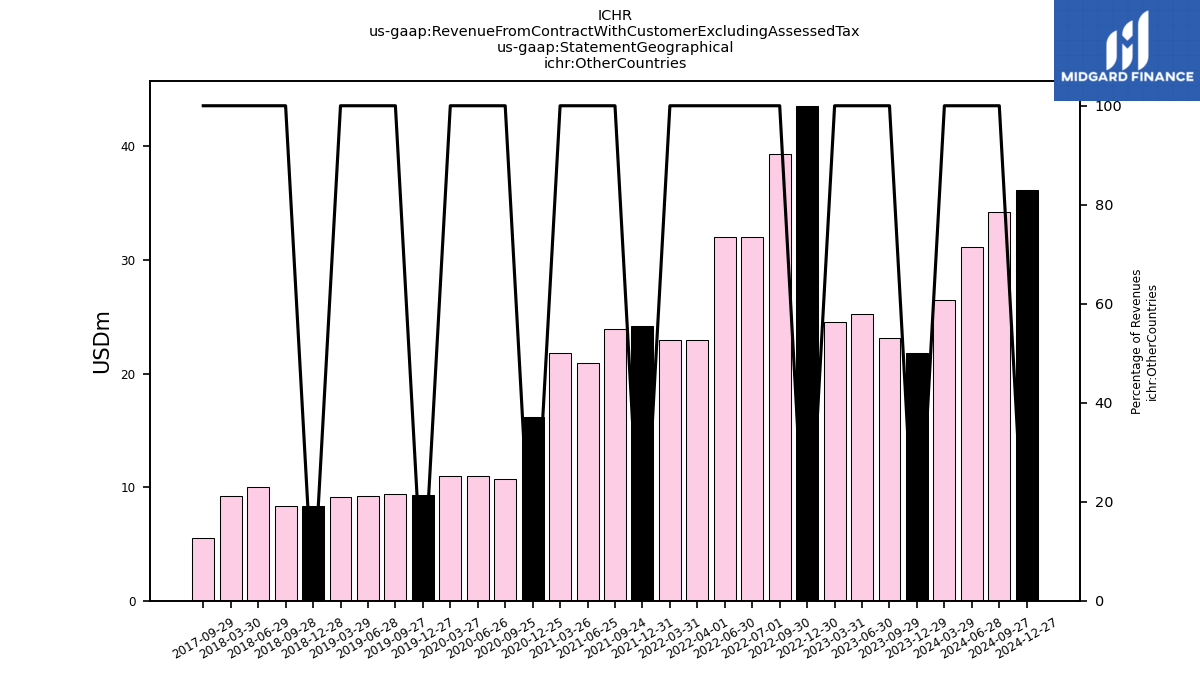
| Other Countries | 21.79 | 23.13 | 25.25 | 24.55 | 43.57 | 39.29 | 31.98 | 31.98 | 22.99 | 22.99 | 24.18 | 23.92 | 20.91 | 21.78 | 16.13 | 10.75 | 11.01 | 11.02 | 9.30 | 9.43 | 9.20 | 9.13 | 8.35 | 8.33 | 10.05 | 9.22 | NA | 5.53 | NA | NA | NA | NA | NA | NA | |
| Revenue From Contract With Customer Excluding Assessed Tax | 203.48 | 196.76 | 185.01 | 225.87 | 301.72 | 355.64 | 329.56 | 329.56 | 293.15 | 293.15 | 287.19 | 262.86 | 282.31 | 264.57 | 244.97 | 227.68 | 221.56 | 220.03 | 189.35 | 154.46 | 139.19 | 137.83 | 141.40 | 175.21 | 248.97 | 258.03 | 182.94 | 164.52 | 159.73 | 148.70 | 131.41 | 105.69 | 95.36 | 73.29 | |
| 29.69 | 28.88 | 27.76 | 29.99 | 33.46 | 26.89 | 24.81 | 24.81 | 24.39 | 24.39 | 22.55 | 16.43 | 22.44 | 17.33 | 19.23 | 18.19 | 18.54 | 14.96 | 17.98 | 13.22 | 9.80 | 15.09 | 14.12 | 17.69 | 16.04 | 12.84 | NA | 6.74 | NA | NA | NA | NA | NA | NA | ||
| 85.91 | 80.22 | 70.37 | 82.29 | 110.31 | 132.56 | 114.40 | 114.40 | 103.30 | 103.30 | 100.91 | 94.83 | 101.21 | 86.32 | 82.71 | 73.20 | 74.33 | 73.21 | 64.57 | 53.81 | 43.30 | 36.98 | 33.39 | 45.63 | 71.48 | 73.74 | NA | 50.27 | NA | NA | NA | NA | NA | NA | ||
| US | 66.09 | 64.53 | 61.62 | 89.05 | 114.38 | 156.91 | 158.37 | 158.37 | 142.47 | 142.47 | 139.56 | 127.67 | 137.75 | 139.13 | 126.89 | 125.54 | 117.69 | 120.84 | 97.51 | 78.00 | 76.90 | 76.63 | 85.54 | 103.56 | 151.40 | 162.24 | NA | 101.97 | NA | NA | NA | NA | NA | NA | |
| Other Countries | 21.79 | 23.13 | 25.25 | 24.55 | 43.57 | 39.29 | 31.98 | 31.98 | 22.99 | 22.99 | 24.18 | 23.92 | 20.91 | 21.78 | 16.13 | 10.75 | 11.01 | 11.02 | 9.30 | 9.43 | 9.20 | 9.13 | 8.35 | 8.33 | 10.05 | 9.22 | NA | 5.53 | NA | NA | NA | NA | NA | NA |
