
| 2023-06-30 | 2023-03-31 | 2022-12-31 | 2022-09-30 | 2022-06-30 | 2022-03-31 | 2021-12-31 | 2021-09-30 | 2021-06-30 | 2021-03-31 | 2020-12-31 | 2020-09-30 | 2020-06-30 | 2020-03-31 | 2019-12-31 | 2019-09-30 | 2019-06-30 | 2019-03-31 | 2018-12-31 | 2018-09-30 | 2018-06-30 | 2018-03-31 | 2017-12-31 | 2017-09-30 | 2017-06-30 | 2017-03-31 | 2016-12-31 | 2016-09-30 | 2016-06-30 | 2016-03-31 | 2015-12-31 | 2015-09-30 | 2015-06-30 | 2015-03-31 | 2014-12-31 | 2014-09-30 | 2014-06-30 | 2014-03-31 | 2013-12-31 | 2013-09-30 | 2013-06-30 | 2013-03-31 | 2012-12-31 | 2012-09-30 | 2012-06-30 | 2012-03-31 | 2011-12-31 | 2011-09-30 | 2011-06-30 | 2011-03-31 | 2010-12-31 | 2010-09-30 | 2010-06-30 | ||
|---|---|---|---|---|---|---|---|---|---|---|---|---|---|---|---|---|---|---|---|---|---|---|---|---|---|---|---|---|---|---|---|---|---|---|---|---|---|---|---|---|---|---|---|---|---|---|---|---|---|---|---|---|---|---|
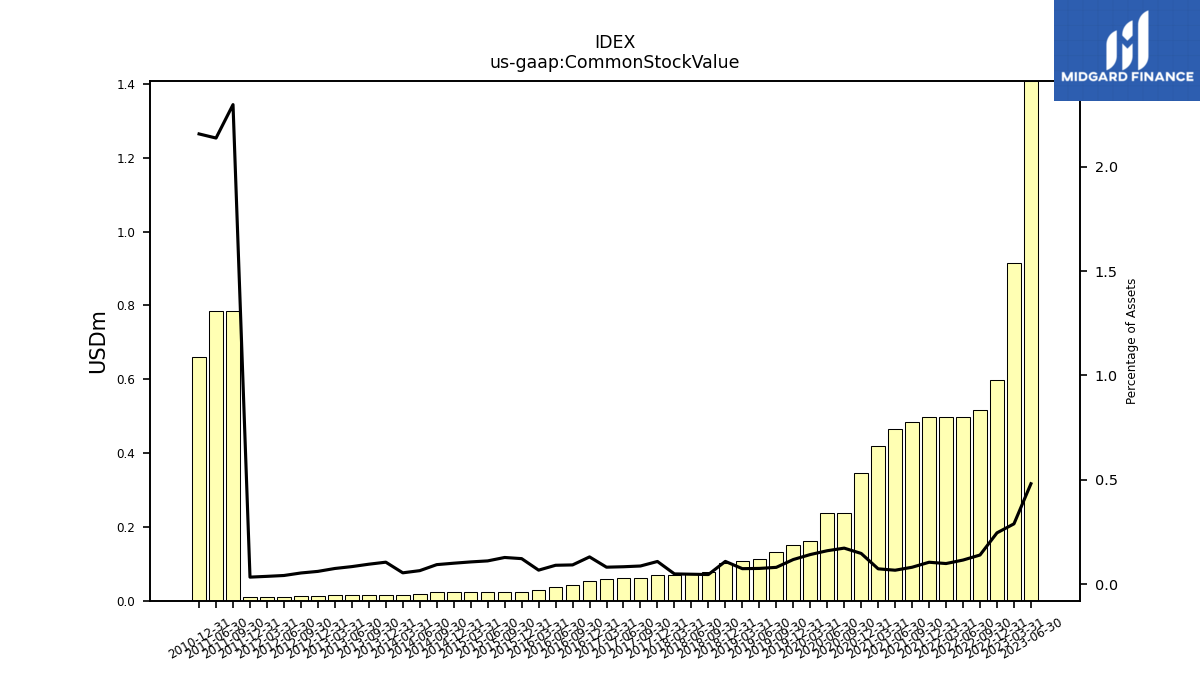
| Common Stock Value | 1.41 | 0.92 | 0.60 | 0.52 | 0.50 | 0.50 | 0.50 | 0.48 | 0.47 | 0.42 | 0.34 | 0.24 | 0.24 | 0.16 | 0.15 | 0.13 | 0.11 | 0.11 | 0.10 | 0.08 | 0.07 | 0.07 | 0.07 | 0.06 | 0.06 | 0.06 | 0.05 | 0.04 | 0.04 | 0.03 | 0.02 | 0.02 | 0.02 | 0.02 | 0.02 | 0.02 | 0.02 | 0.02 | 0.02 | 0.02 | 0.02 | 0.01 | 0.01 | 0.01 | 0.01 | 0.01 | 0.01 | 0.79 | 0.79 | NA | 0.66 | NA | NA | |
| dei: Entity Common Stock Shares Outstanding | NA | NA | NA | NA | NA | NA | NA | NA | NA | NA | NA | NA | NA | NA | NA | NA | NA | NA | NA | NA | NA | NA | NA | NA | NA | NA | NA | NA | NA | NA | NA | NA | NA | NA | NA | NA | NA | NA | NA | NA | NA | NA | NA | NA | NA | NA | NA | NA | NA | NA | NA | NA | NA | |
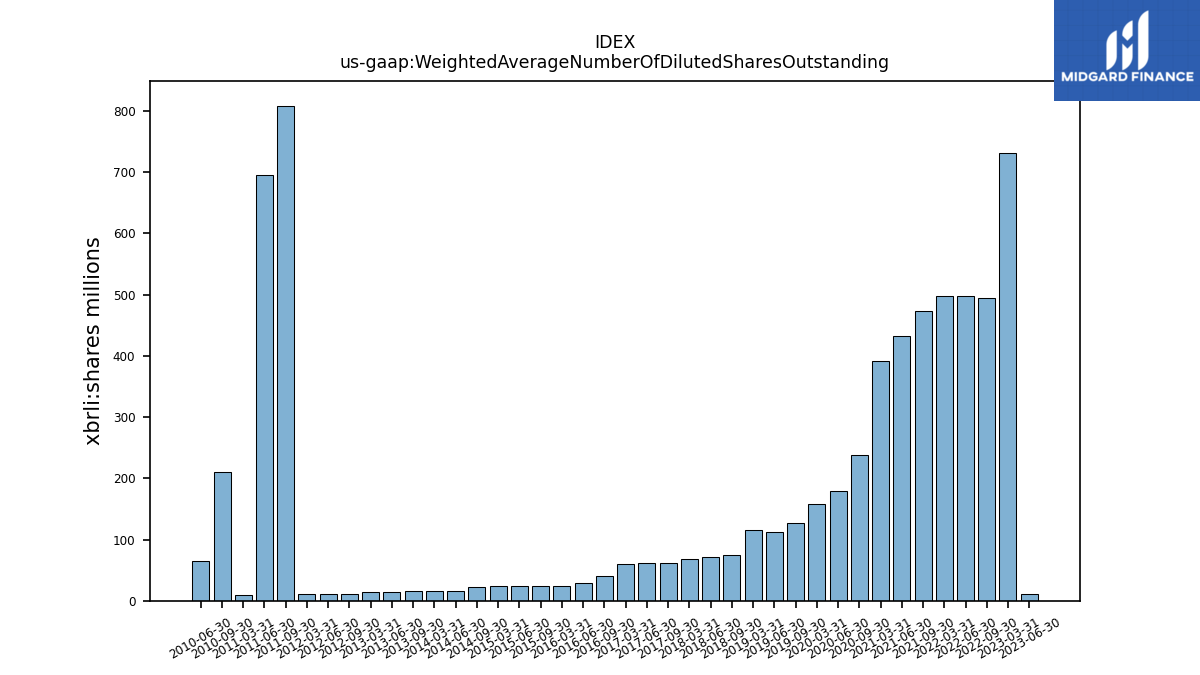
| Weighted Average Number Of Diluted Shares Outstanding | 10.27 | 731.00 | NA | 494.06 | 497.79 | 497.36 | NA | 473.83 | 433.10 | 391.13 | NA | 237.54 | 180.03 | 157.86 | NA | 127.61 | 112.46 | 116.30 | NA | 74.06 | 71.79 | 68.82 | NA | 62.15 | 61.18 | 60.72 | NA | 41.18 | 29.20 | 24.48 | NA | 24.00 | 23.85 | 23.82 | NA | 22.01 | 16.60 | 15.93 | NA | 15.55 | 14.94 | 14.60 | NA | 11.29 | 10.53 | 10.47 | NA | 808.57 | 695.00 | 8.81 | NA | 209.66 | 65.09 | |
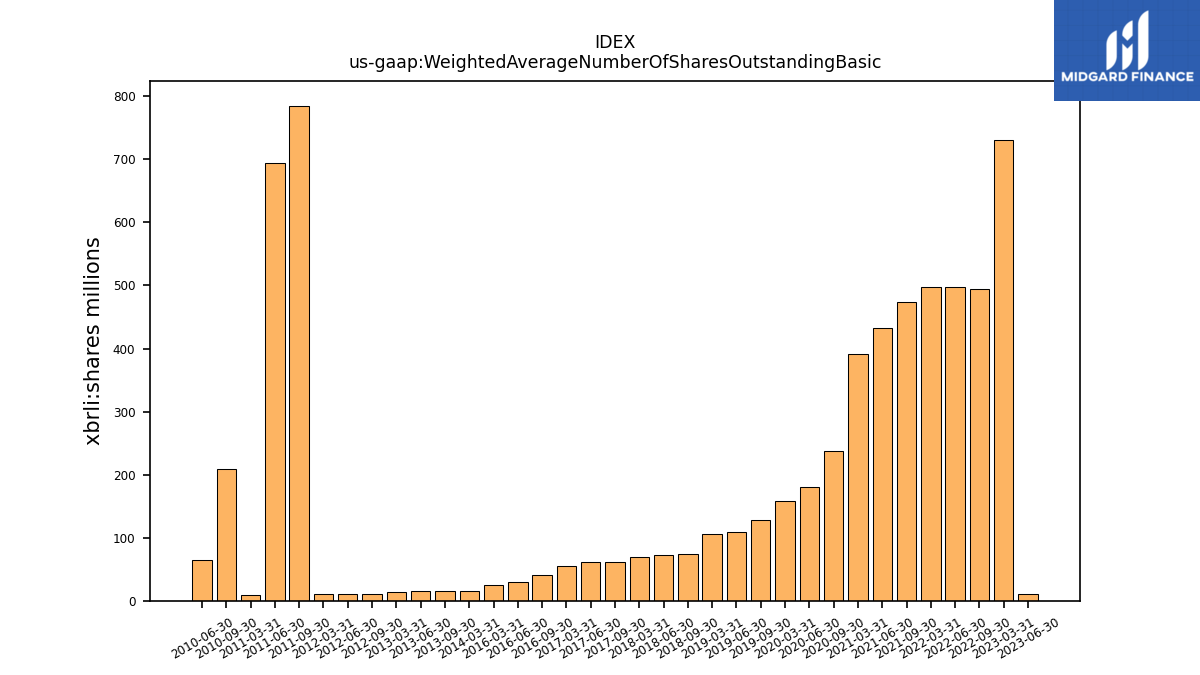
| Weighted Average Number Of Shares Outstanding Basic | 10.27 | 731.00 | NA | 494.06 | 497.79 | 497.36 | NA | 473.83 | 433.10 | 391.13 | NA | 237.54 | 180.03 | 157.86 | NA | 127.61 | 108.69 | 105.35 | NA | 74.06 | 71.79 | 68.82 | NA | 62.15 | 61.18 | 55.38 | NA | 41.18 | 29.20 | 24.48 | NA | NA | NA | NA | NA | NA | NA | 15.93 | NA | 15.55 | 14.94 | 14.60 | NA | 11.29 | 10.53 | 10.47 | NA | 785.03 | 695.00 | 8.81 | NA | 209.66 | 65.09 | |
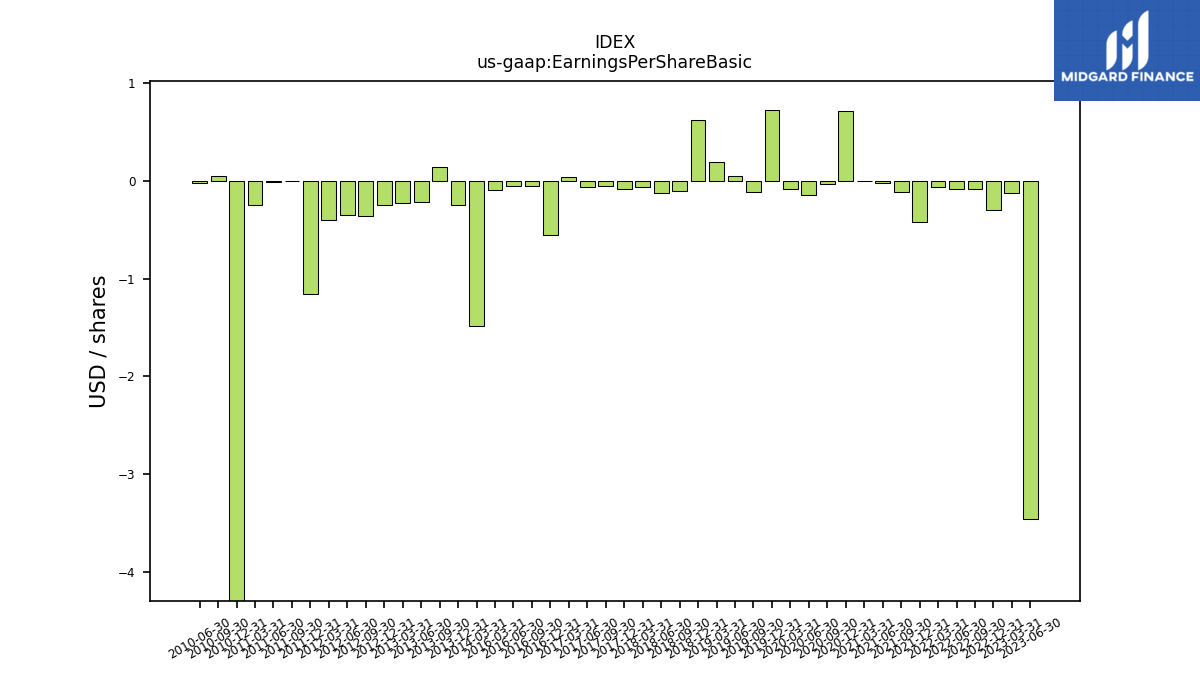
| Earnings Per Share Basic | -3.46 | -0.12 | -0.30 | -0.08 | -0.08 | -0.06 | -0.42 | -0.11 | -0.02 | 0.00 | 0.71 | -0.03 | -0.15 | -0.08 | 0.72 | -0.11 | 0.05 | 0.19 | 0.62 | -0.10 | -0.12 | -0.06 | -0.08 | -0.05 | -0.06 | 0.04 | -0.55 | -0.05 | -0.05 | -0.09 | NA | NA | NA | NA | NA | NA | NA | -1.48 | -0.25 | 0.14 | -0.22 | -0.23 | -0.25 | -0.36 | -0.35 | -0.40 | -1.16 | 0.00 | -0.01 | -0.25 | -5.29 | 0.05 | -0.02 | |
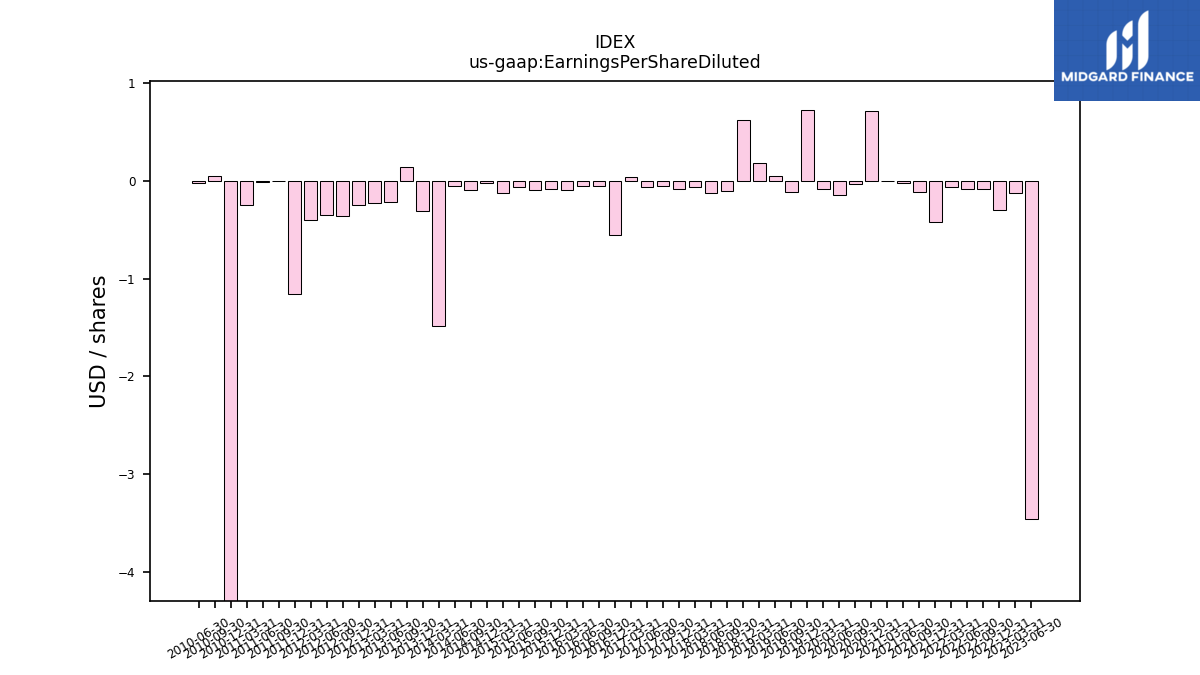
| Earnings Per Share Diluted | -3.46 | -0.12 | -0.30 | -0.08 | -0.08 | -0.06 | -0.42 | -0.11 | -0.02 | 0.00 | 0.71 | -0.03 | -0.15 | -0.08 | 0.72 | -0.11 | 0.05 | 0.18 | 0.62 | -0.10 | -0.12 | -0.06 | -0.08 | -0.05 | -0.06 | 0.04 | -0.55 | -0.05 | -0.05 | -0.09 | -0.08 | -0.09 | -0.06 | -0.12 | -0.02 | -0.09 | -0.05 | -1.48 | -0.31 | 0.14 | -0.22 | -0.23 | -0.25 | -0.36 | -0.35 | -0.40 | -1.16 | 0.00 | -0.01 | -0.25 | -5.29 | 0.05 | -0.02 | |
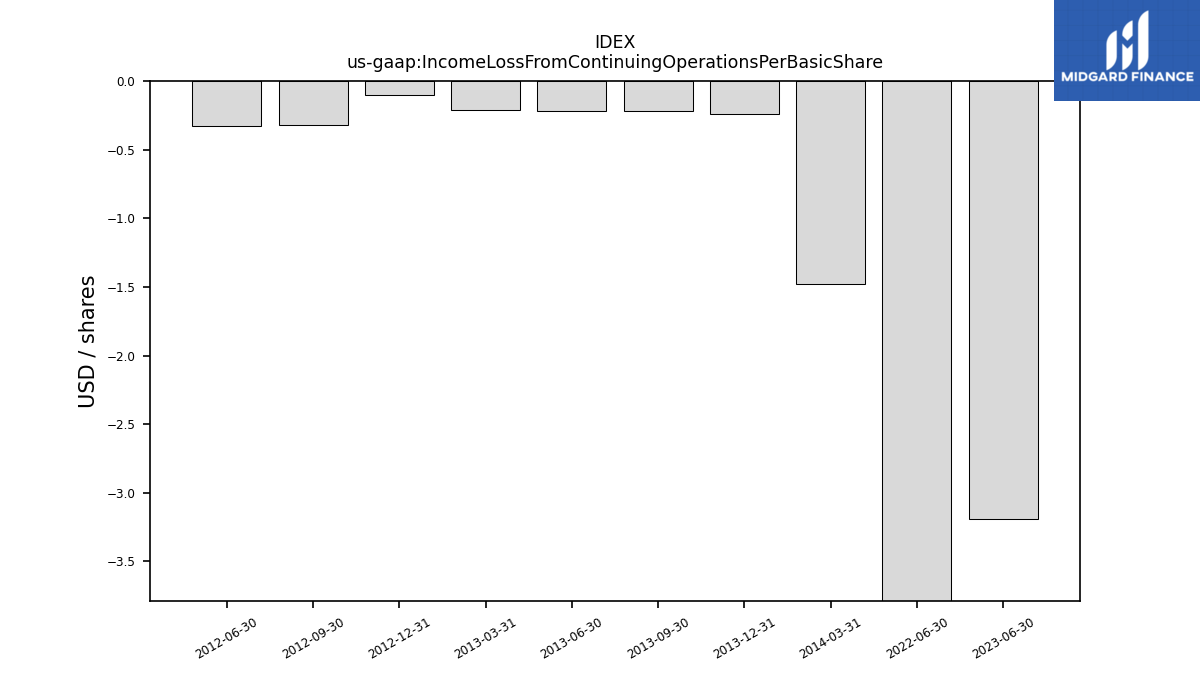
| Income Loss From Continuing Operations Per Basic Share | -0.00 | NA | NA | NA | -0.00 | NA | NA | NA | NA | NA | NA | NA | NA | NA | NA | NA | NA | NA | NA | NA | NA | NA | NA | NA | NA | NA | NA | NA | NA | NA | NA | NA | NA | NA | NA | NA | NA | -0.00 | -0.00 | -0.00 | -0.00 | -0.00 | -0.00 | -0.00 | -0.00 | NA | NA | NA | NA | NA | NA | NA | NA | |
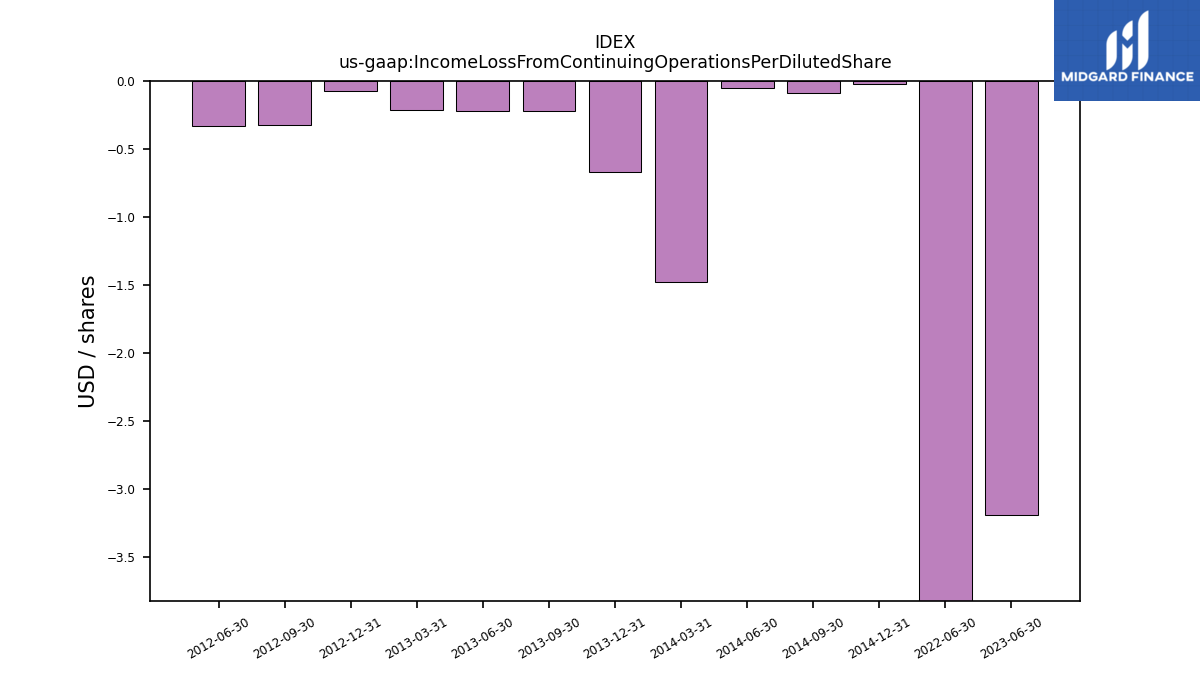
| Income Loss From Continuing Operations Per Diluted Share | -0.00 | NA | NA | NA | -0.00 | NA | NA | NA | NA | NA | NA | NA | NA | NA | NA | NA | NA | NA | NA | NA | NA | NA | NA | NA | NA | NA | NA | NA | NA | NA | NA | NA | NA | NA | -0.00 | -0.00 | -0.00 | -0.00 | -0.00 | -0.00 | -0.00 | -0.00 | -0.00 | -0.00 | -0.00 | NA | NA | NA | NA | NA | NA | NA | NA |
| 2023-06-30 | 2023-03-31 | 2022-12-31 | 2022-09-30 | 2022-06-30 | 2022-03-31 | 2021-12-31 | 2021-09-30 | 2021-06-30 | 2021-03-31 | 2020-12-31 | 2020-09-30 | 2020-06-30 | 2020-03-31 | 2019-12-31 | 2019-09-30 | 2019-06-30 | 2019-03-31 | 2018-12-31 | 2018-09-30 | 2018-06-30 | 2018-03-31 | 2017-12-31 | 2017-09-30 | 2017-06-30 | 2017-03-31 | 2016-12-31 | 2016-09-30 | 2016-06-30 | 2016-03-31 | 2015-12-31 | 2015-09-30 | 2015-06-30 | 2015-03-31 | 2014-12-31 | 2014-09-30 | 2014-06-30 | 2014-03-31 | 2013-12-31 | 2013-09-30 | 2013-06-30 | 2013-03-31 | 2012-12-31 | 2012-09-30 | 2012-06-30 | 2012-03-31 | 2011-12-31 | 2011-09-30 | 2011-06-30 | 2011-03-31 | 2010-12-31 | 2010-09-30 | 2010-06-30 | ||
|---|---|---|---|---|---|---|---|---|---|---|---|---|---|---|---|---|---|---|---|---|---|---|---|---|---|---|---|---|---|---|---|---|---|---|---|---|---|---|---|---|---|---|---|---|---|---|---|---|---|---|---|---|---|---|
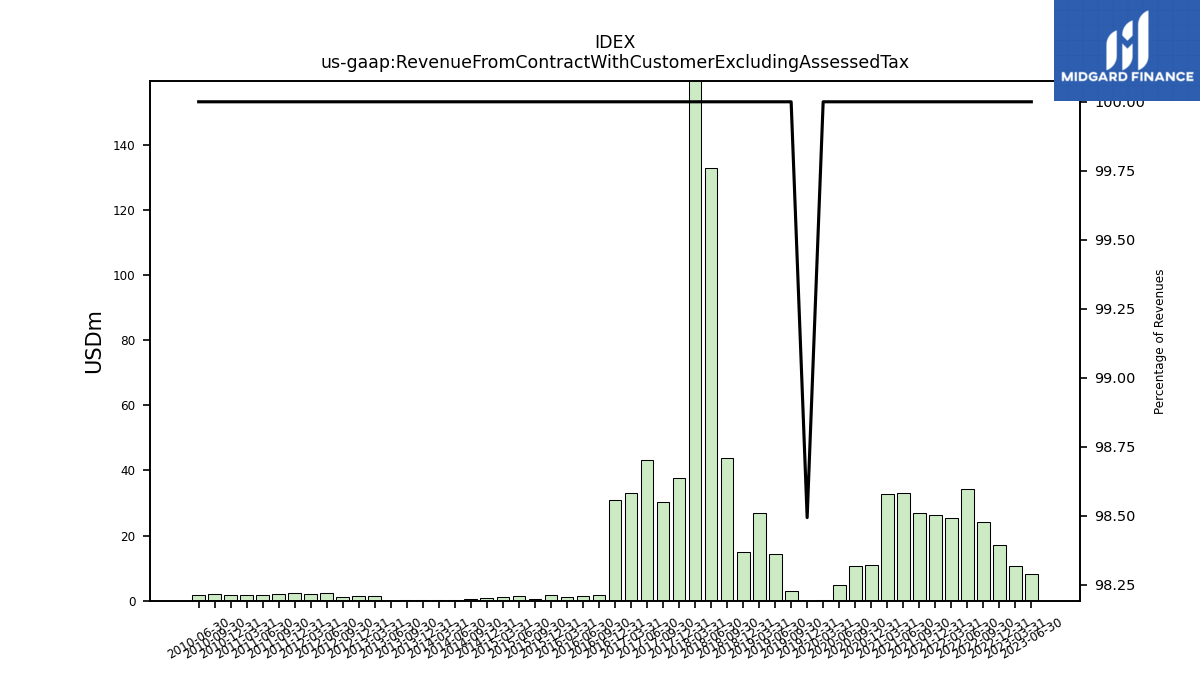
| Revenue From Contract With Customer Excluding Assessed Tax | 8.18 | 10.56 | 17.07 | 24.28 | 34.20 | 25.39 | 26.25 | 27.05 | 33.22 | 32.71 | 11.07 | 10.62 | 4.69 | 0.38 | 0.06 | 3.10 | 14.45 | 26.95 | 15.11 | 43.71 | 132.99 | 185.93 | 37.61 | 30.23 | 43.33 | 33.16 | 30.81 | 1.63 | 1.48 | 1.27 | 1.62 | 0.48 | 1.48 | 1.03 | 1.00 | 0.64 | 0.18 | 0.14 | 0.16 | 0.10 | 0.05 | 1.31 | 1.36 | 1.19 | 2.28 | 2.04 | 2.29 | 1.98 | 1.89 | 1.70 | 1.90 | 2.05 | 1.82 | |
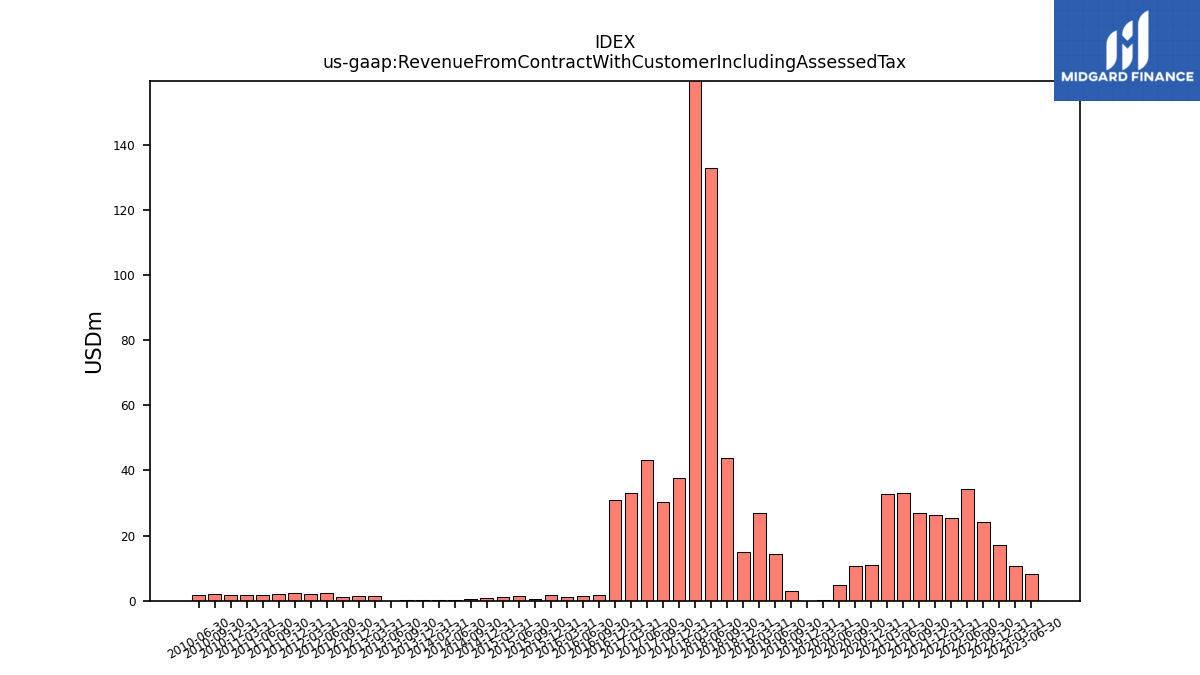
| Revenue From Contract With Customer Including Assessed Tax | 8.18 | 10.56 | 17.07 | 24.28 | 34.20 | 25.39 | 26.25 | 27.05 | 33.22 | 32.71 | 11.07 | 10.62 | 4.69 | 0.38 | 0.06 | 3.10 | 14.45 | 26.95 | 15.11 | 43.71 | 132.99 | 185.93 | 37.61 | 30.23 | 43.33 | 33.16 | 30.81 | 1.63 | 1.48 | 1.27 | 1.62 | 0.48 | 1.48 | 1.03 | 1.00 | 0.64 | 0.18 | 0.14 | 0.16 | 0.10 | 0.05 | 1.31 | 1.36 | 1.19 | 2.28 | 2.04 | 2.29 | 1.98 | 1.89 | 1.70 | 1.90 | 2.05 | 1.82 | |
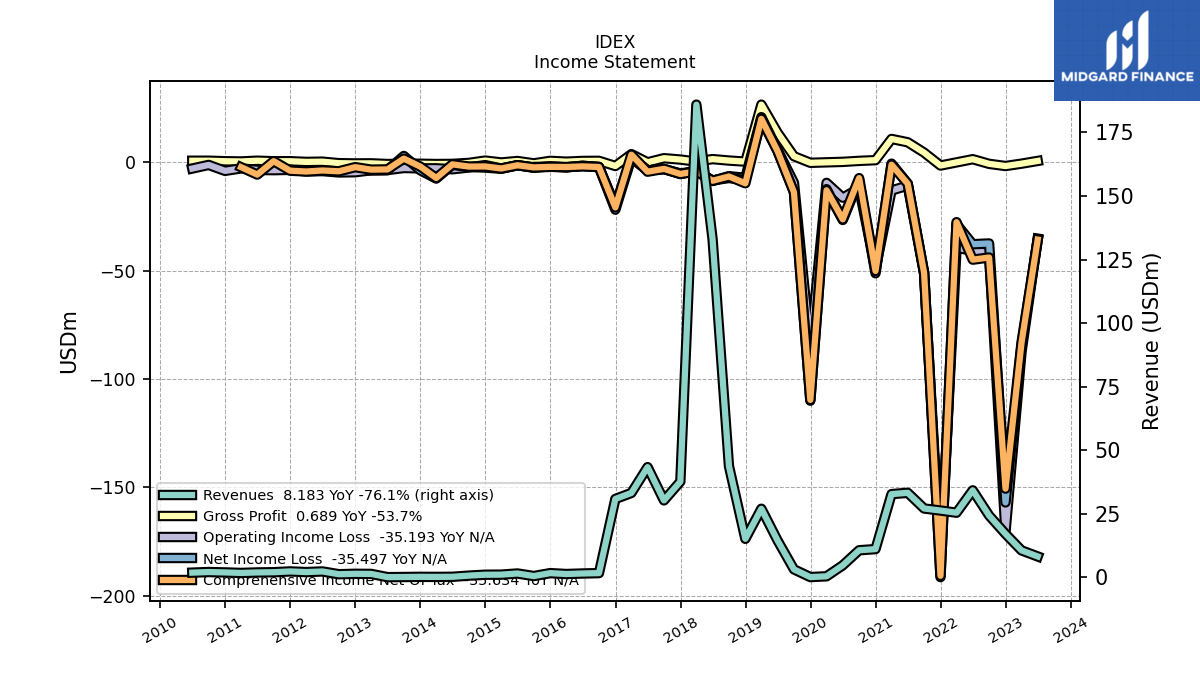
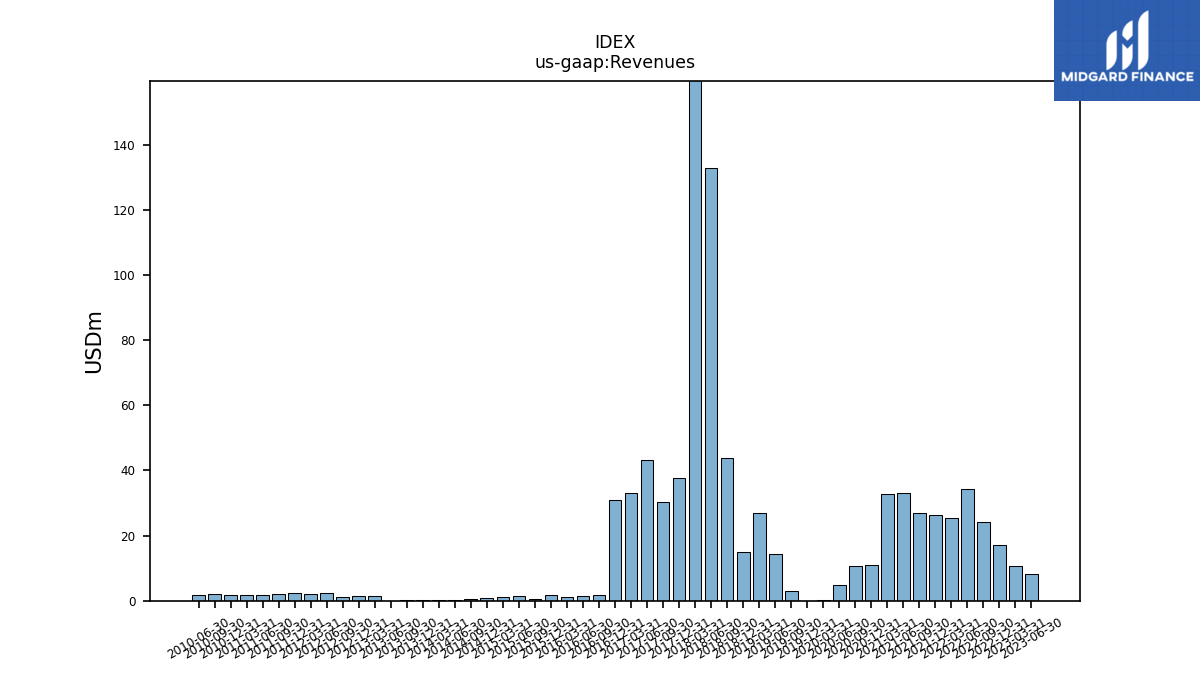
| Revenues | 8.18 | 10.56 | 17.07 | 24.28 | 34.20 | 25.39 | 26.25 | 27.05 | 33.22 | 32.71 | 11.07 | 10.62 | 4.69 | 0.38 | 0.06 | 3.10 | 14.45 | 26.95 | 15.11 | 43.71 | 132.99 | 185.93 | 37.61 | 30.23 | 43.33 | 33.16 | 30.81 | 1.63 | 1.48 | 1.27 | 1.62 | 0.48 | 1.48 | 1.03 | 1.00 | 0.64 | 0.18 | 0.14 | 0.16 | 0.10 | 0.05 | 1.31 | 1.36 | 1.19 | 2.28 | 2.04 | 2.29 | 1.98 | 1.89 | 1.70 | 1.90 | 2.05 | 1.82 | |
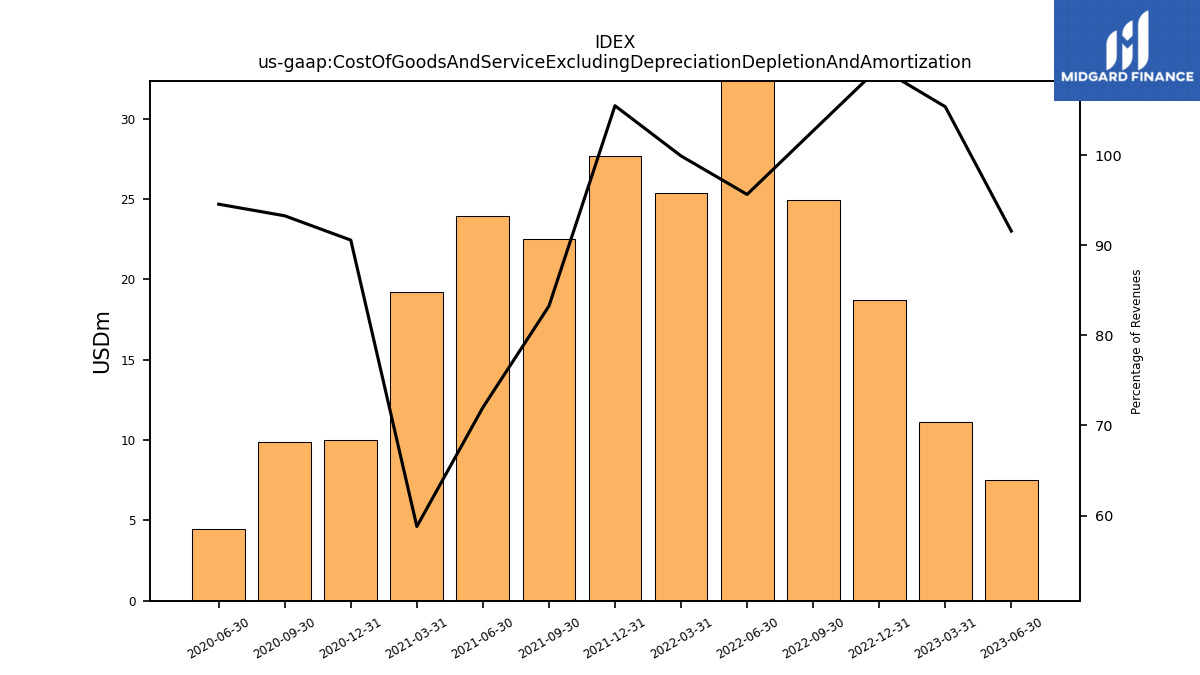
| Cost Of Goods And Service Excluding Depreciation Depletion And Amortization | 7.49 | 11.13 | 18.73 | 24.94 | 32.71 | 25.37 | 27.69 | 22.52 | 23.92 | 19.23 | 10.03 | 9.91 | 4.44 | NA | NA | NA | NA | NA | NA | NA | NA | NA | NA | NA | NA | NA | NA | NA | NA | NA | NA | NA | NA | NA | NA | NA | NA | NA | NA | NA | NA | NA | NA | NA | NA | NA | NA | NA | NA | NA | NA | NA | NA | |
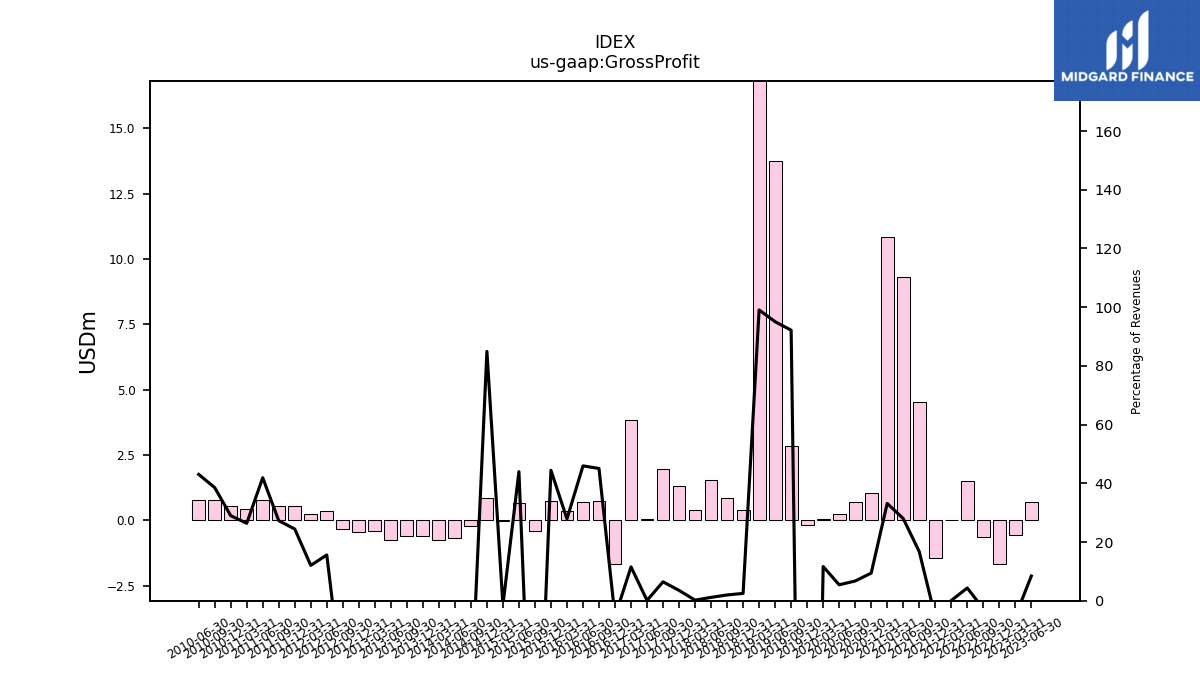
| Gross Profit | 0.69 | -0.57 | -1.67 | -0.66 | 1.49 | 0.02 | -1.44 | 4.53 | 9.30 | 10.84 | 1.04 | 0.71 | 0.26 | 0.04 | -0.18 | 2.86 | 13.74 | 26.69 | 0.38 | 0.86 | 1.53 | 0.39 | 1.33 | 1.95 | 0.05 | 3.82 | -1.66 | 0.73 | 0.68 | 0.35 | 0.72 | -0.42 | 0.65 | -0.02 | 0.85 | -0.23 | -0.67 | -0.74 | -0.61 | -0.62 | -0.74 | -0.42 | -0.46 | -0.35 | 0.36 | 0.25 | 0.56 | 0.54 | 0.79 | 0.45 | 0.55 | 0.79 | 0.78 | |
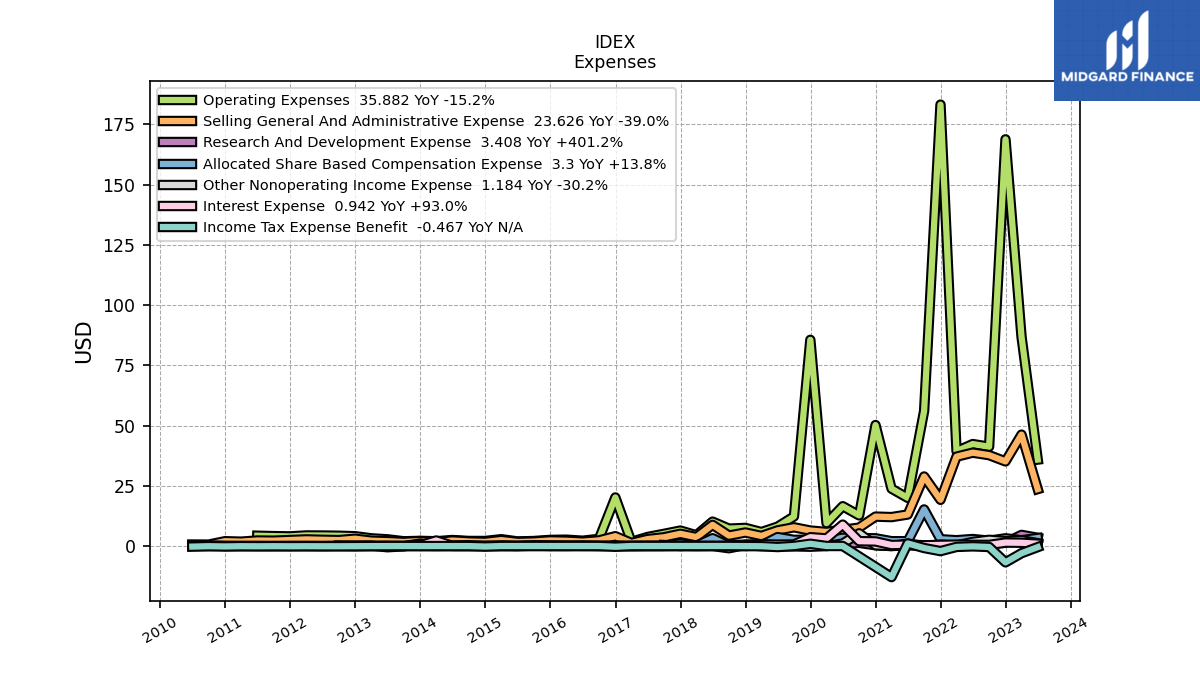
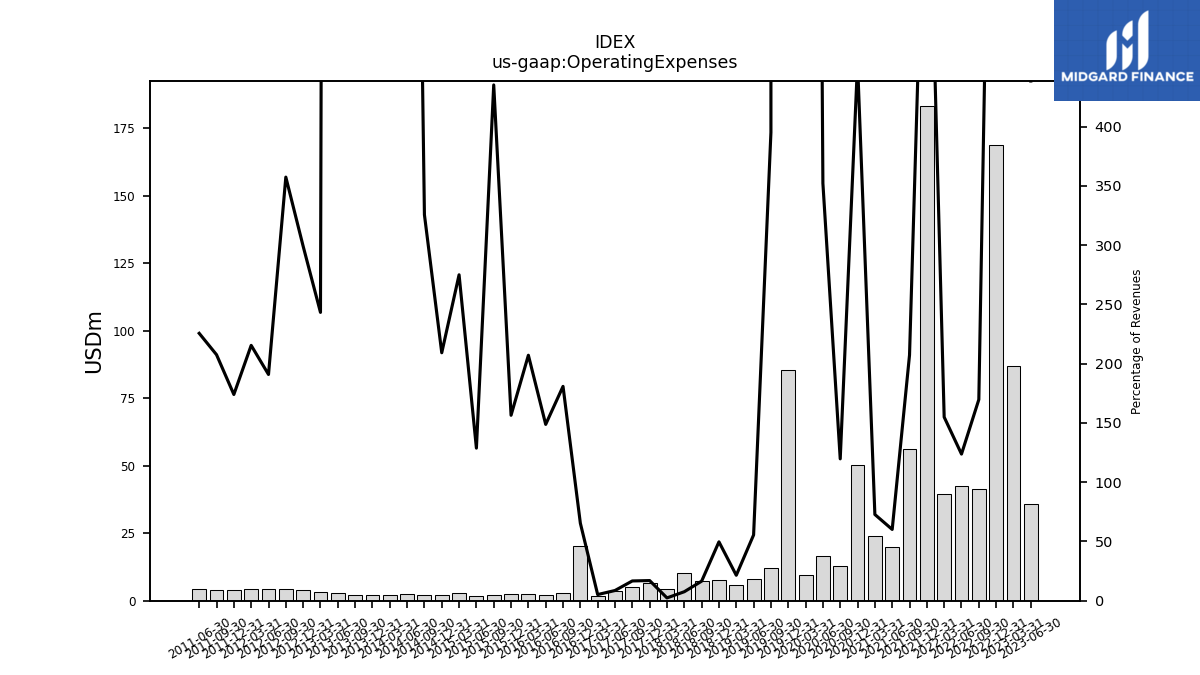
| Operating Expenses | 35.88 | 86.90 | 168.84 | 41.21 | 42.33 | 39.34 | 183.24 | 56.06 | 19.98 | 23.80 | 50.22 | 12.71 | 16.52 | 9.48 | 85.60 | 12.26 | 8.02 | 5.79 | 7.51 | 7.22 | 10.12 | 4.46 | 6.40 | 5.05 | 3.75 | 1.73 | 20.16 | 2.94 | 2.20 | 2.63 | 2.54 | 2.07 | 1.91 | 2.83 | 2.09 | 2.10 | 2.49 | 1.98 | 2.14 | 1.96 | 2.78 | 3.19 | 4.06 | 4.27 | 4.36 | 4.39 | 3.99 | 4.11 | 4.27 | NA | NA | NA | NA | |
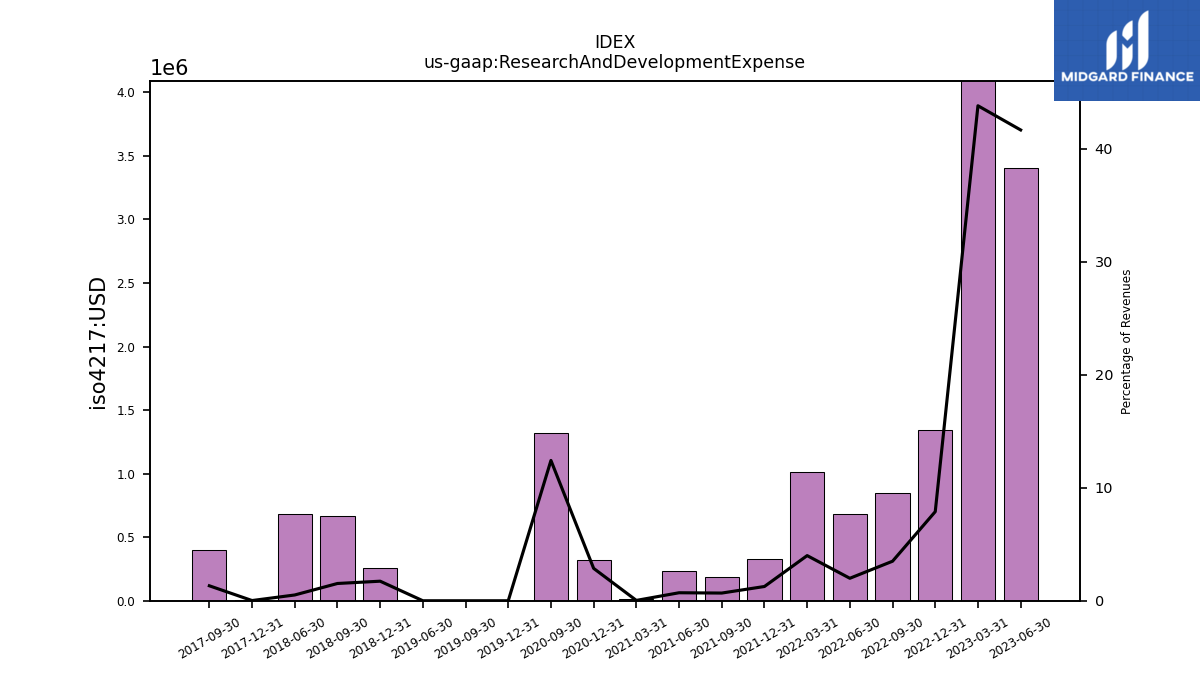
| Research And Development Expense | 3.41 | 4.62 | 1.34 | 0.85 | 0.68 | 1.01 | 0.33 | 0.18 | 0.23 | 0.01 | 0.32 | 1.32 | NA | NA | 0.00 | 0.00 | 0.00 | NA | 0.26 | 0.67 | 0.68 | NA | 0.01 | 0.40 | NA | NA | NA | NA | NA | NA | NA | NA | NA | NA | NA | NA | NA | NA | NA | NA | NA | NA | NA | NA | NA | NA | NA | NA | NA | NA | NA | NA | NA | |
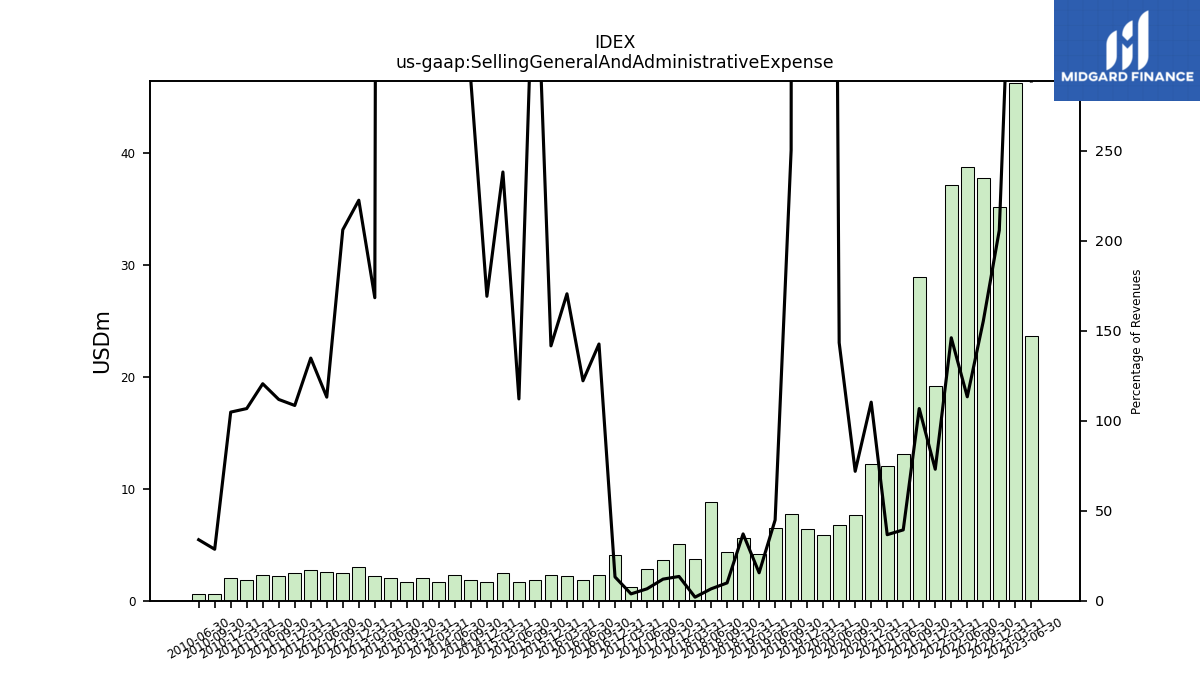
| Selling General And Administrative Expense | 23.63 | 46.24 | 35.12 | 37.71 | 38.75 | 37.09 | 19.18 | 28.88 | 13.08 | 12.01 | 12.21 | 7.64 | 6.72 | 5.83 | 6.42 | 7.77 | 6.48 | 4.19 | 5.61 | 4.33 | 8.79 | 3.69 | 5.08 | 3.63 | 2.88 | 1.27 | 4.08 | 2.32 | 1.81 | 2.17 | 2.30 | 1.83 | 1.66 | 2.45 | 1.69 | 1.86 | 2.27 | 1.64 | 2.05 | 1.66 | 2.00 | 2.21 | 3.02 | 2.46 | 2.58 | 2.75 | 2.49 | 2.21 | 2.28 | 1.81 | 1.99 | 0.59 | 0.62 | |
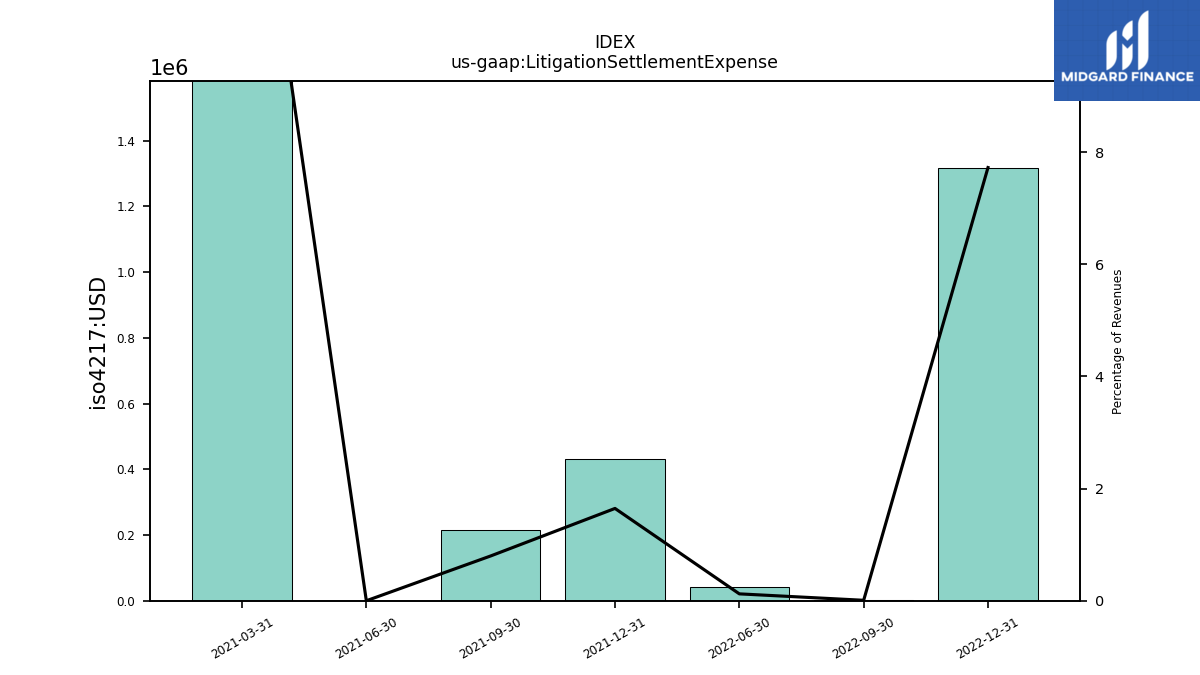
| Litigation Settlement Expense | NA | NA | 1.32 | 0.00 | 0.04 | NA | 0.43 | 0.22 | 0.00 | 5.00 | NA | NA | NA | NA | NA | NA | NA | NA | NA | NA | NA | NA | NA | NA | NA | NA | NA | NA | NA | NA | NA | NA | NA | NA | NA | NA | NA | NA | NA | NA | NA | NA | NA | NA | NA | NA | NA | NA | NA | NA | NA | NA | NA | |
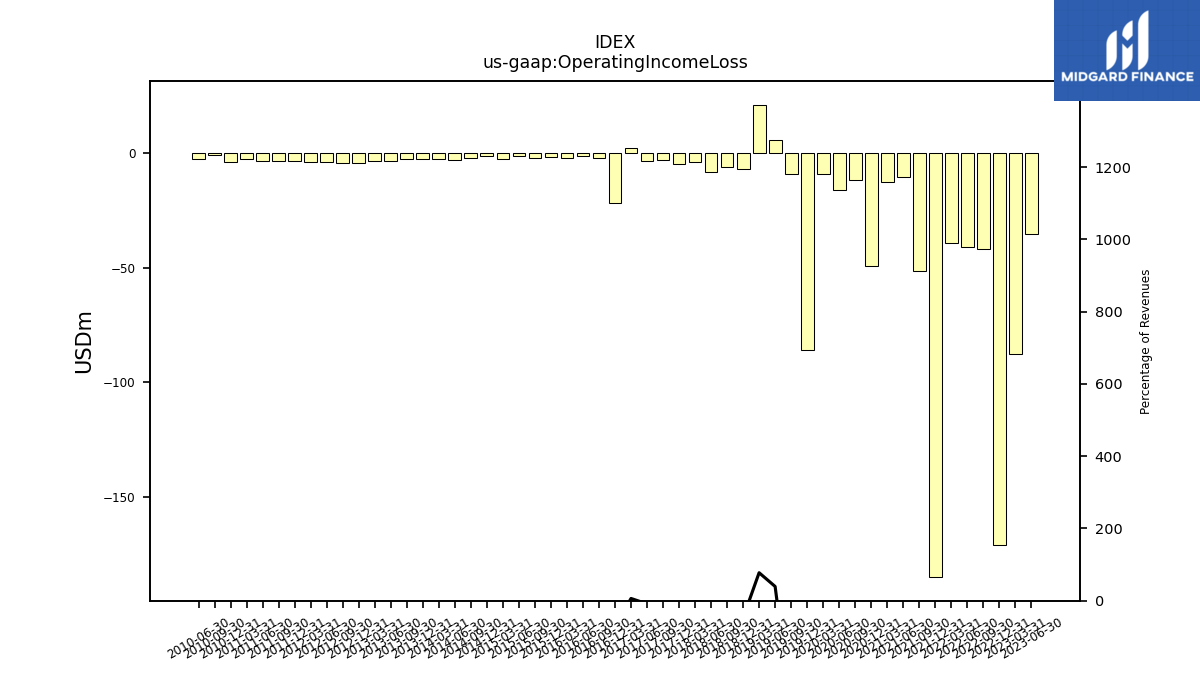
| Operating Income Loss | -35.19 | -87.47 | -170.50 | -41.87 | -40.84 | -39.32 | -184.68 | -51.53 | -10.68 | -12.96 | -49.18 | -12.00 | -16.27 | -9.44 | -85.78 | -9.40 | 5.71 | 20.90 | -7.13 | -6.36 | -8.59 | -4.07 | -5.08 | -3.10 | -3.70 | 2.09 | -21.82 | -2.21 | -1.52 | -2.28 | -1.82 | -2.50 | -1.25 | -2.84 | -1.24 | -2.33 | -3.16 | -2.71 | -2.75 | -2.58 | -3.52 | -3.61 | -4.52 | -4.62 | -4.00 | -4.14 | -3.43 | -3.57 | -3.48 | -2.76 | -3.90 | -1.16 | -2.82 | |
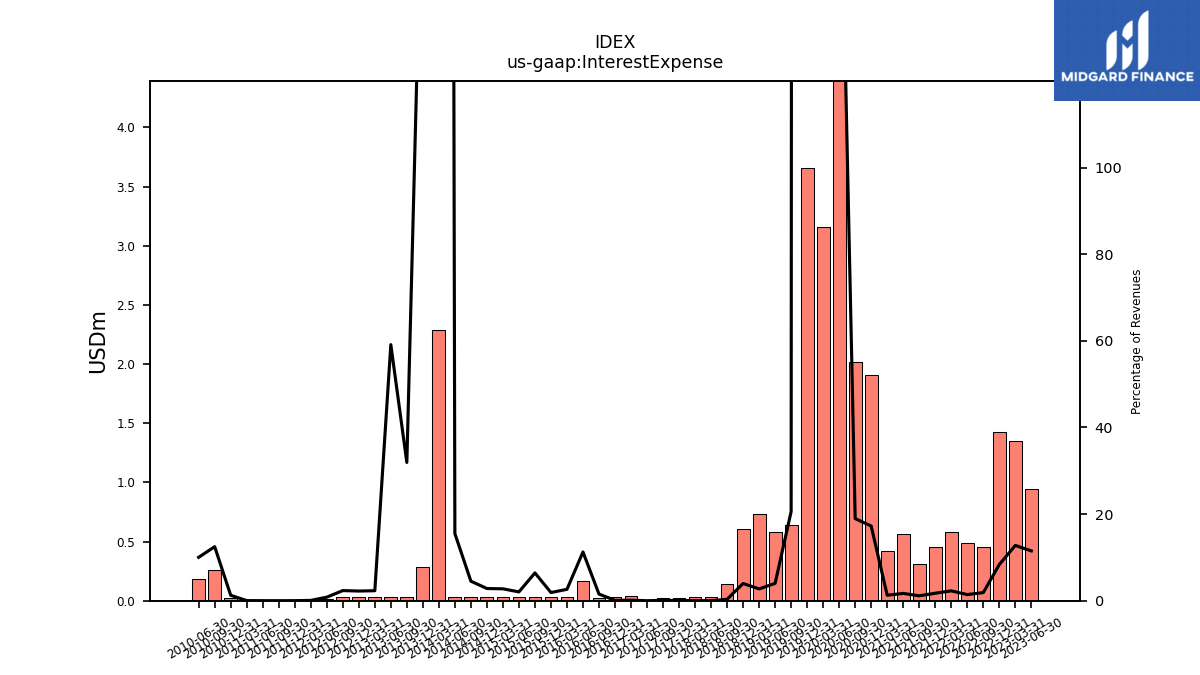
| Interest Expense | 0.94 | 1.35 | 1.43 | 0.46 | 0.49 | 0.58 | 0.46 | 0.31 | 0.56 | 0.42 | 1.91 | 2.01 | 8.89 | 3.16 | 3.66 | 0.64 | 0.58 | 0.74 | 0.60 | 0.15 | 0.03 | 0.03 | 0.02 | 0.03 | 0.00 | 0.04 | 0.03 | 0.02 | 0.17 | 0.03 | 0.03 | 0.03 | 0.03 | 0.03 | 0.03 | 0.03 | 0.03 | 2.29 | 0.28 | 0.03 | 0.03 | 0.03 | 0.03 | 0.03 | 0.02 | 0.00 | 0.00 | 0.00 | 0.00 | 0.00 | 0.02 | 0.26 | 0.18 | |
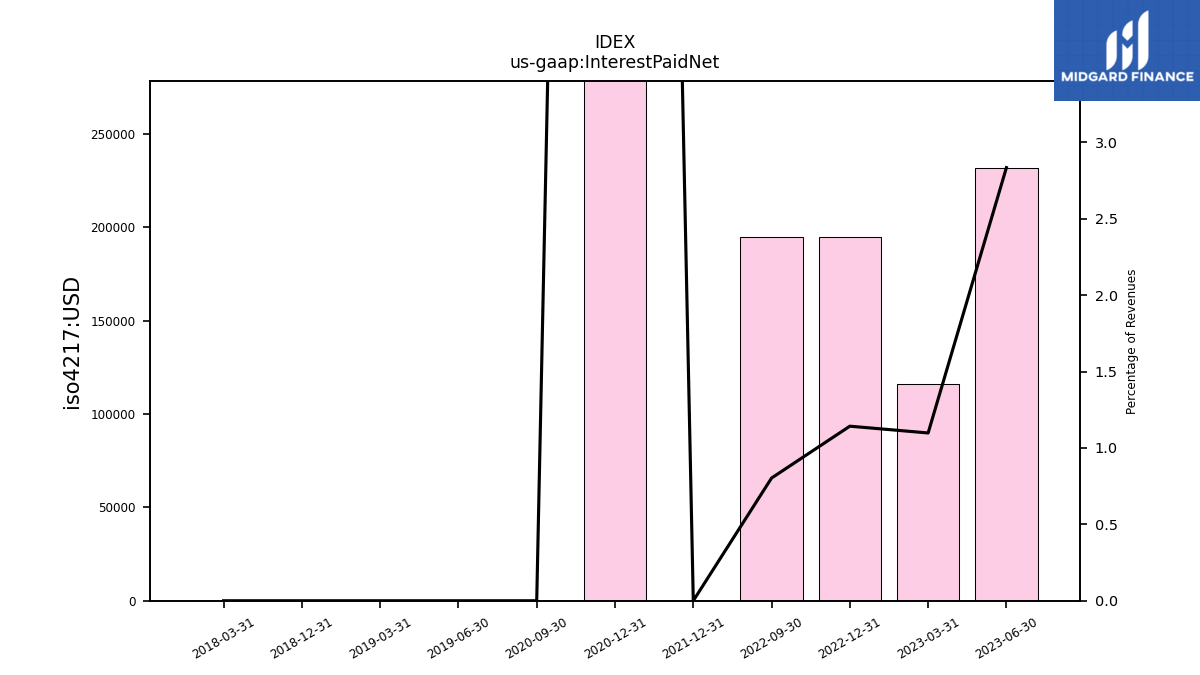
| Interest Paid Net | 0.23 | 0.12 | 0.20 | 0.20 | NA | NA | 0.00 | NA | NA | NA | 2.69 | 0.00 | NA | NA | NA | NA | 0.00 | 0.00 | 0.00 | NA | NA | 0.00 | NA | NA | NA | NA | NA | NA | NA | NA | NA | NA | NA | NA | NA | NA | NA | NA | NA | NA | NA | NA | NA | NA | NA | NA | NA | NA | NA | NA | NA | NA | NA | |
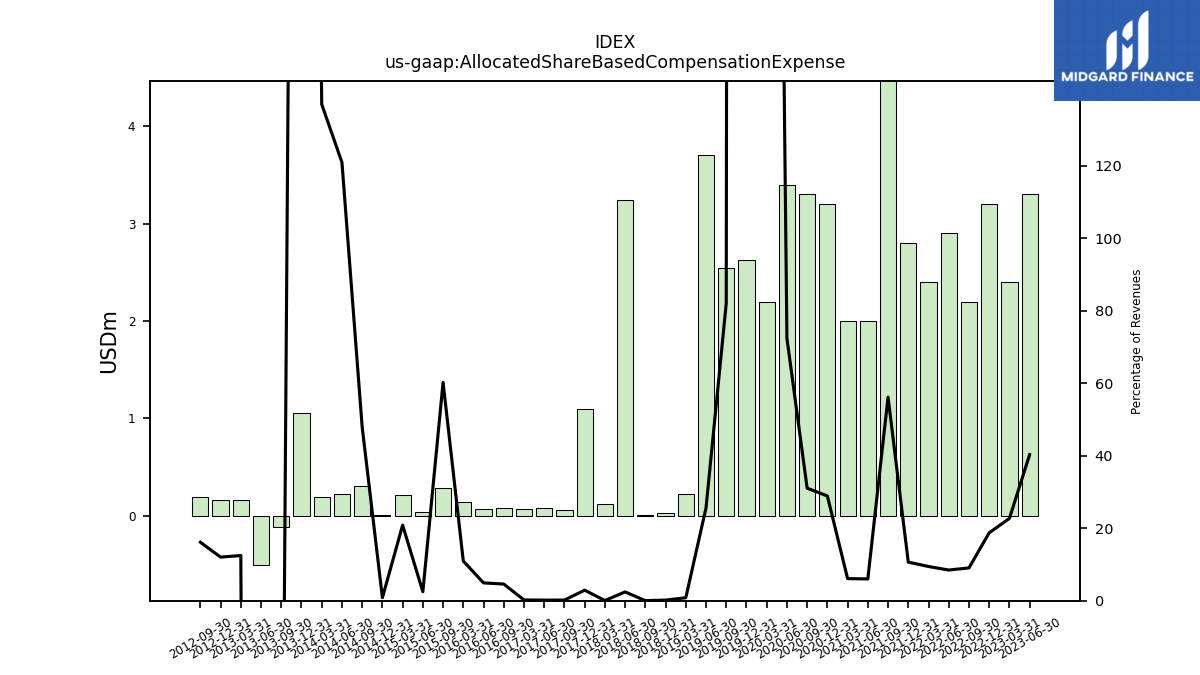
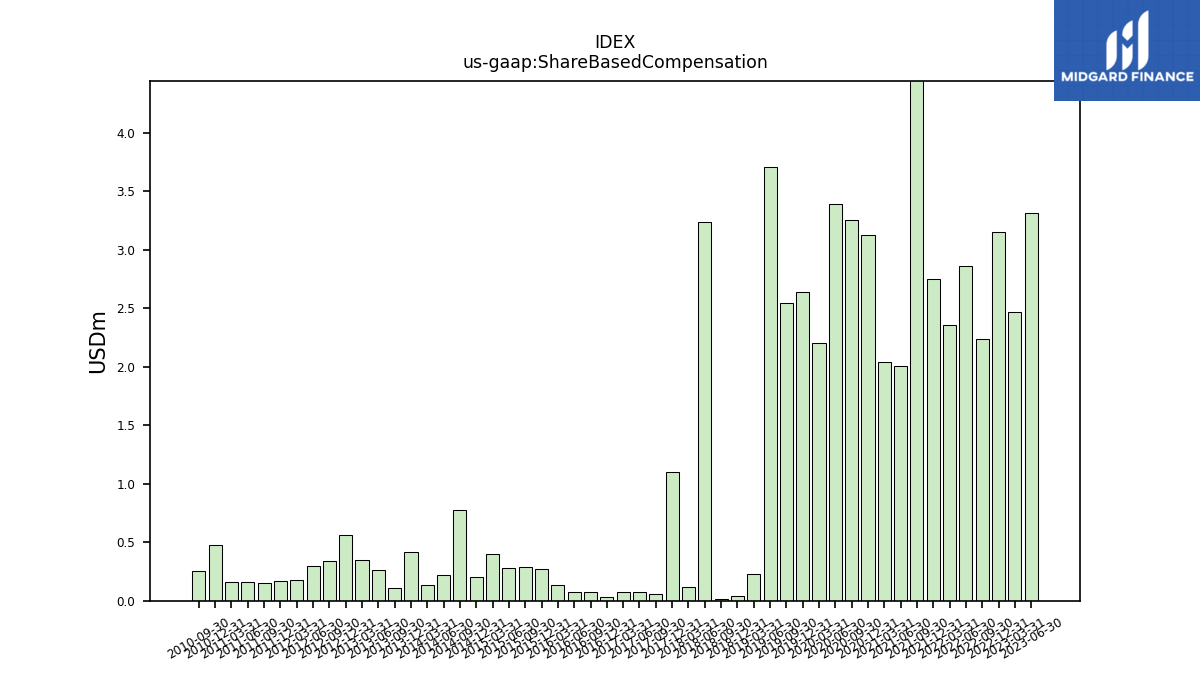
| Allocated Share Based Compensation Expense | 3.30 | 2.40 | 3.20 | 2.20 | 2.90 | 2.40 | 2.80 | 15.20 | 2.00 | 2.00 | 3.20 | 3.30 | 3.40 | 2.20 | 2.63 | 2.55 | 3.70 | 0.22 | 0.03 | 0.01 | 3.24 | 0.12 | 1.10 | 0.05 | 0.08 | 0.07 | NA | 0.07 | 0.07 | 0.14 | NA | 0.29 | 0.04 | 0.21 | 0.01 | 0.31 | 0.22 | 0.19 | 1.05 | -0.11 | -0.51 | 0.16 | 0.16 | 0.19 | NA | NA | NA | NA | NA | NA | NA | NA | NA | |
| Income Loss From Continuing Operations | -32.74 | NA | NA | NA | -35.28 | NA | NA | NA | NA | NA | NA | NA | NA | NA | NA | NA | NA | NA | NA | NA | NA | NA | NA | NA | NA | NA | NA | NA | NA | NA | NA | NA | NA | NA | NA | NA | NA | NA | NA | NA | NA | NA | NA | NA | NA | NA | NA | NA | NA | NA | NA | NA | NA | |
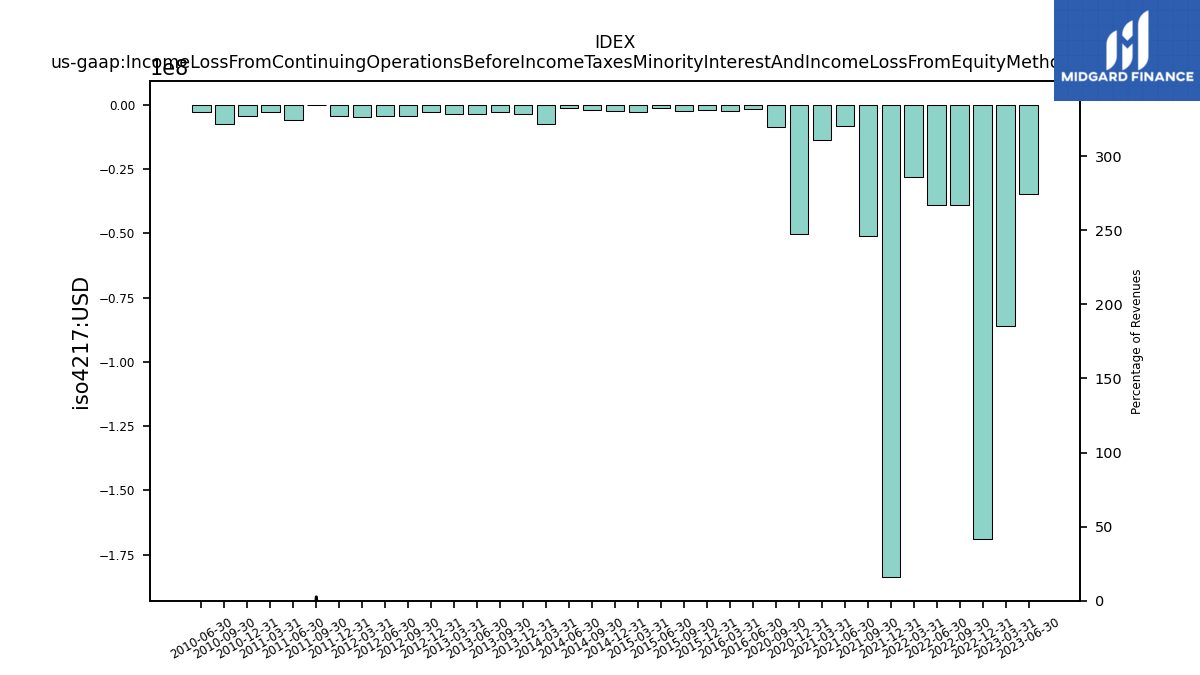
| Income Loss From Continuing Operations Before Income Taxes Minority Interest And Income Loss From Equity Method Investments | -34.80 | -86.09 | -169.02 | -38.82 | -38.83 | -28.13 | -183.69 | -51.12 | -8.07 | -13.79 | -50.35 | -8.73 | NA | NA | NA | NA | NA | NA | NA | NA | NA | NA | NA | NA | NA | NA | NA | NA | -1.62 | -2.28 | -1.97 | -2.34 | -1.33 | -2.93 | -2.59 | -2.14 | -1.12 | -7.47 | -3.63 | -2.63 | -3.52 | -3.71 | -2.89 | -4.54 | -4.36 | -4.86 | -4.41 | 0.05 | -5.93 | -2.72 | -4.46 | -7.51 | -2.98 | |
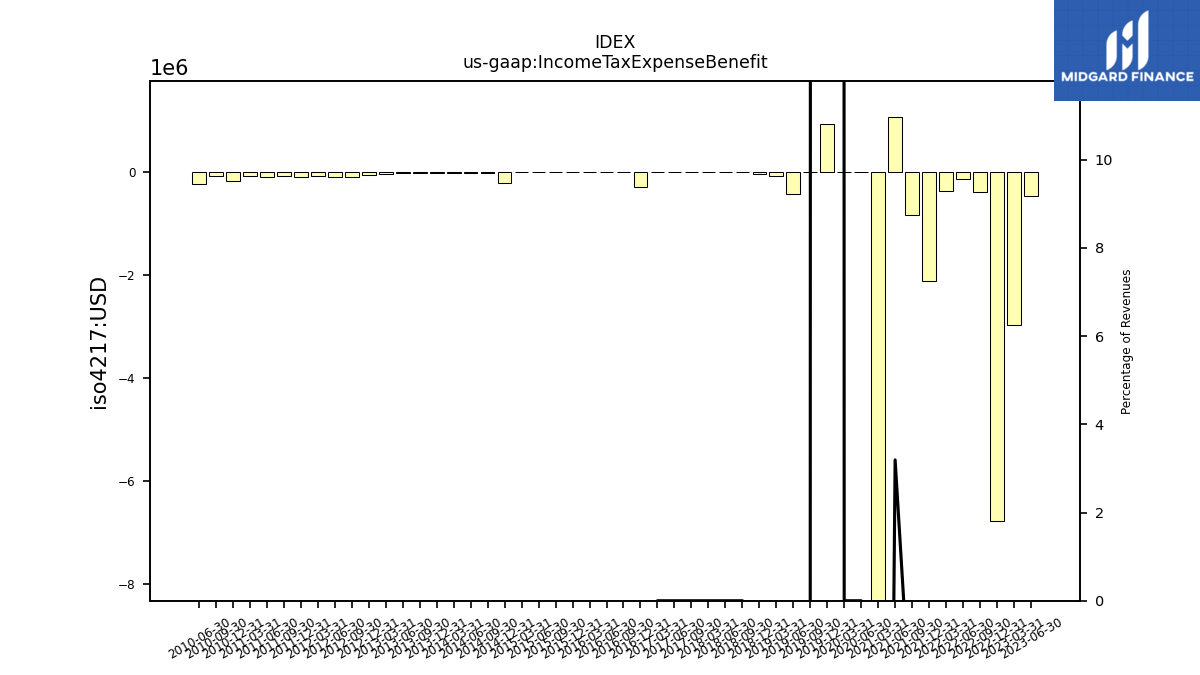
| Income Tax Expense Benefit | -0.47 | -2.98 | -6.79 | -0.40 | -0.15 | -0.38 | -2.12 | -0.84 | 1.06 | -12.92 | NA | NA | 0.00 | 0.00 | 0.93 | 0.00 | -0.43 | -0.09 | -0.04 | 0.00 | 0.00 | 0.00 | NA | 0.00 | 0.00 | 0.00 | -0.30 | -0.01 | -0.01 | -0.01 | -0.01 | -0.01 | -0.01 | -0.01 | -0.22 | -0.03 | -0.03 | -0.02 | -0.03 | -0.02 | -0.03 | -0.04 | -0.07 | -0.10 | -0.11 | -0.08 | -0.11 | -0.07 | -0.11 | -0.08 | -0.18 | -0.08 | -0.25 | |
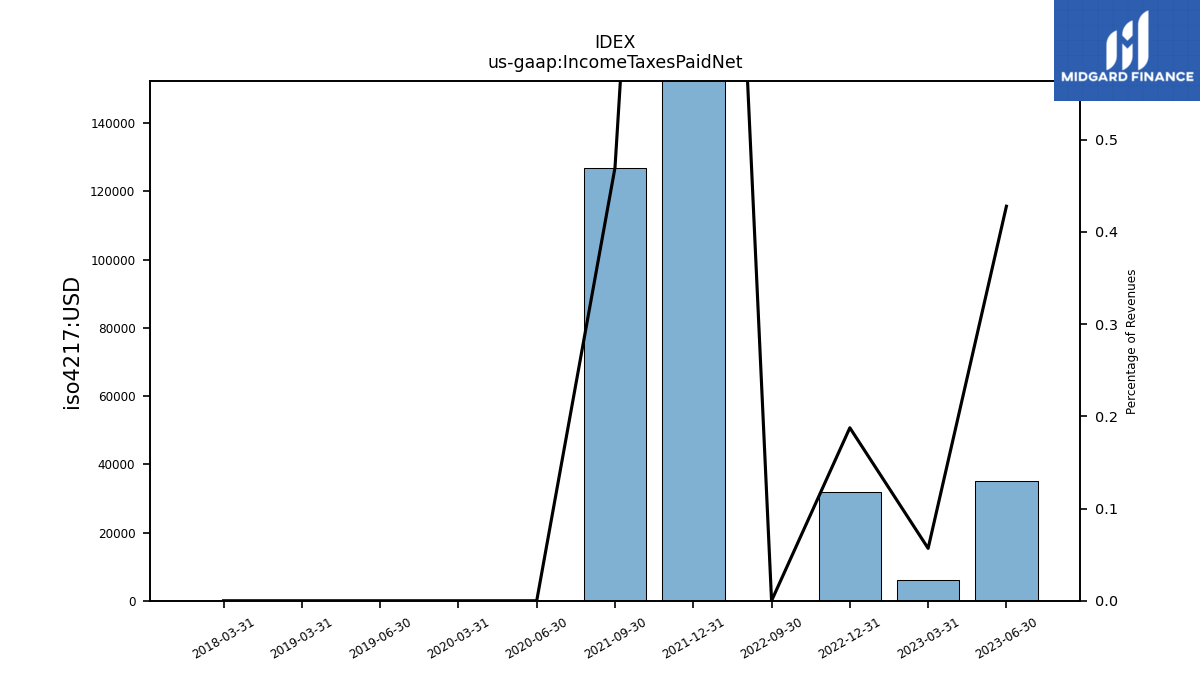
| Income Taxes Paid Net | 0.04 | 0.01 | 0.03 | 0.00 | NA | NA | 0.48 | 0.13 | NA | NA | NA | NA | 0.00 | 0.00 | NA | NA | 0.00 | 0.00 | NA | NA | NA | 0.00 | NA | NA | NA | NA | NA | NA | NA | NA | NA | NA | NA | NA | NA | NA | NA | NA | NA | NA | NA | NA | NA | NA | NA | NA | NA | NA | NA | NA | NA | NA | NA | |
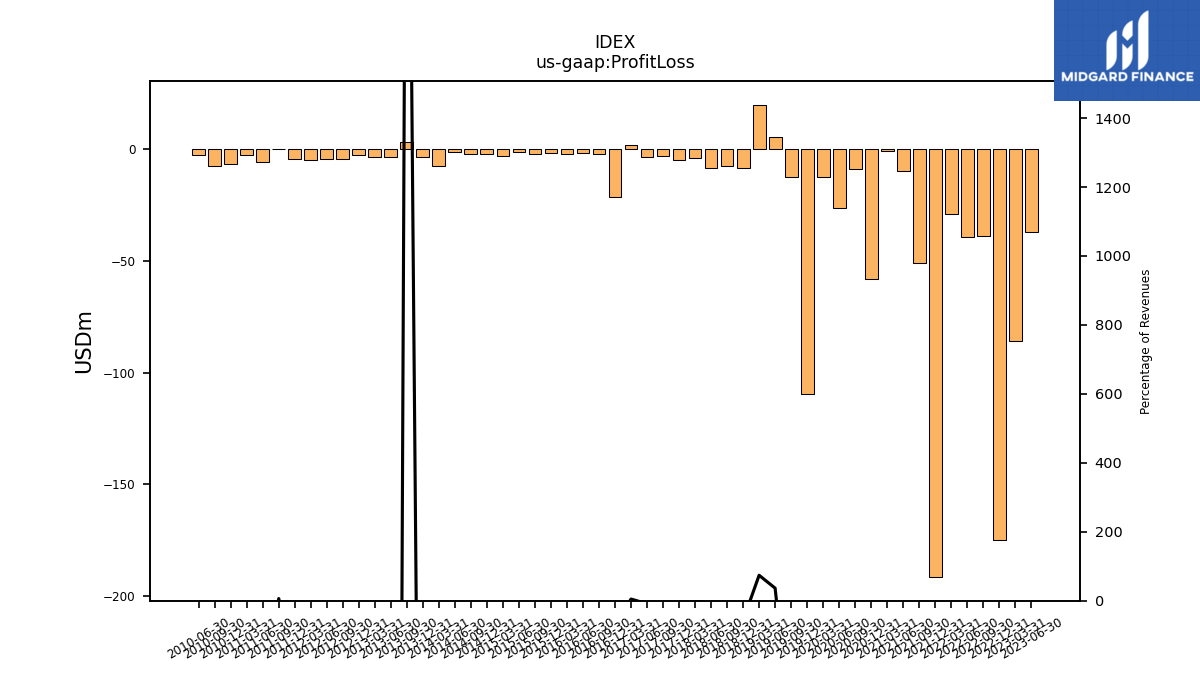
| Profit Loss | -37.09 | -85.89 | -174.90 | -38.85 | -39.27 | -29.09 | -191.59 | -51.09 | -9.99 | -0.74 | -58.28 | -8.72 | -26.42 | -12.62 | -109.71 | -12.30 | 5.28 | 19.91 | -8.56 | -7.44 | -8.61 | -4.16 | -5.09 | -3.02 | -3.72 | 1.64 | -21.40 | -2.15 | -1.61 | -2.27 | -1.96 | -2.34 | -1.32 | -2.92 | -2.37 | -2.12 | -1.09 | -7.45 | -3.60 | 2.98 | -3.59 | -3.68 | -2.82 | -4.44 | -4.25 | -4.78 | -4.30 | 0.13 | -5.82 | -2.65 | -6.59 | -7.44 | -2.74 | |
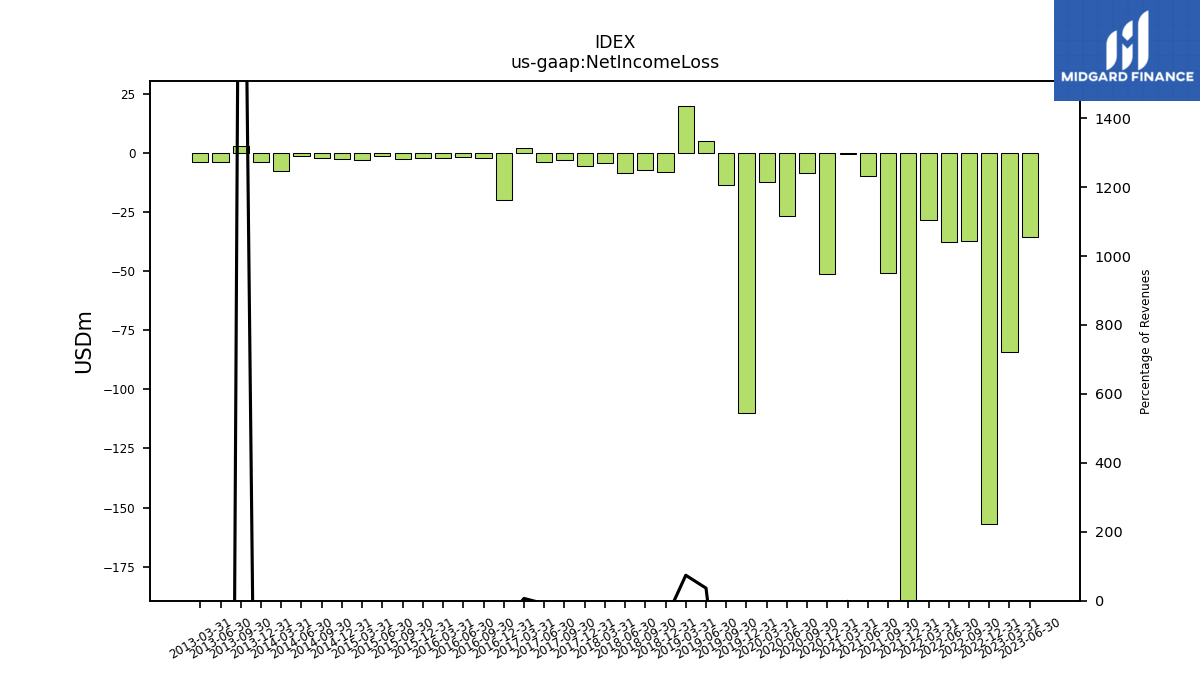
| Net Income Loss | -35.50 | -84.32 | -157.00 | -37.41 | -37.77 | -28.51 | -191.49 | -50.85 | -9.79 | -0.57 | -51.19 | -8.29 | -26.58 | -12.35 | -110.01 | -13.71 | 5.29 | 19.93 | -8.20 | -7.19 | -8.32 | -4.07 | -5.34 | -3.04 | -3.66 | 2.21 | -20.06 | -2.05 | -1.61 | -2.27 | -1.96 | -2.34 | -1.32 | -2.92 | -2.37 | -2.12 | -1.09 | -7.45 | -3.60 | 2.98 | -3.59 | -3.68 | NA | NA | NA | NA | NA | NA | NA | NA | NA | NA | NA | |
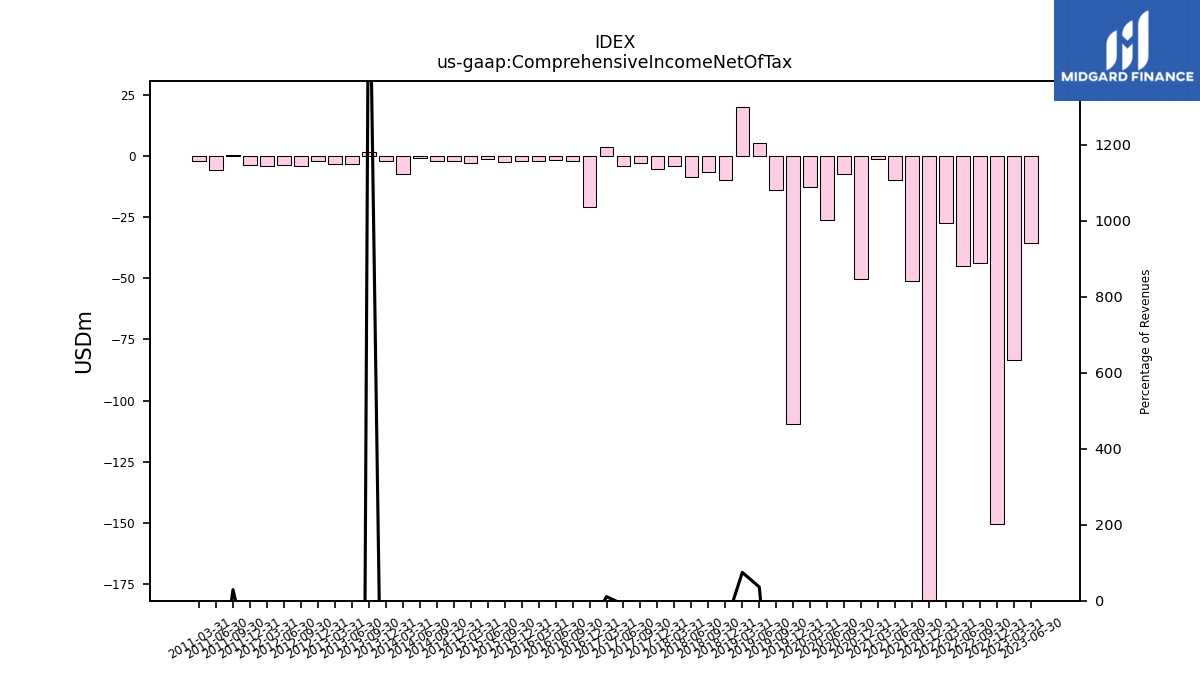
| Comprehensive Income Net Of Tax | -35.63 | -83.26 | -150.63 | -43.91 | -44.90 | -27.59 | -190.85 | -51.04 | -9.84 | -1.04 | -50.12 | -7.25 | -26.25 | -12.86 | -109.66 | -13.75 | 5.22 | 20.10 | -9.64 | -6.49 | -8.46 | -4.09 | -5.33 | -2.98 | -4.28 | 3.56 | -20.77 | -2.12 | -1.82 | -2.12 | -2.05 | -2.29 | -1.32 | -2.80 | -1.85 | -1.91 | -0.89 | -7.19 | -1.89 | 1.76 | -3.24 | -3.33 | -2.19 | -4.09 | -3.72 | -4.19 | -3.81 | 0.58 | -5.62 | -2.19 | NA | NA | NA | |
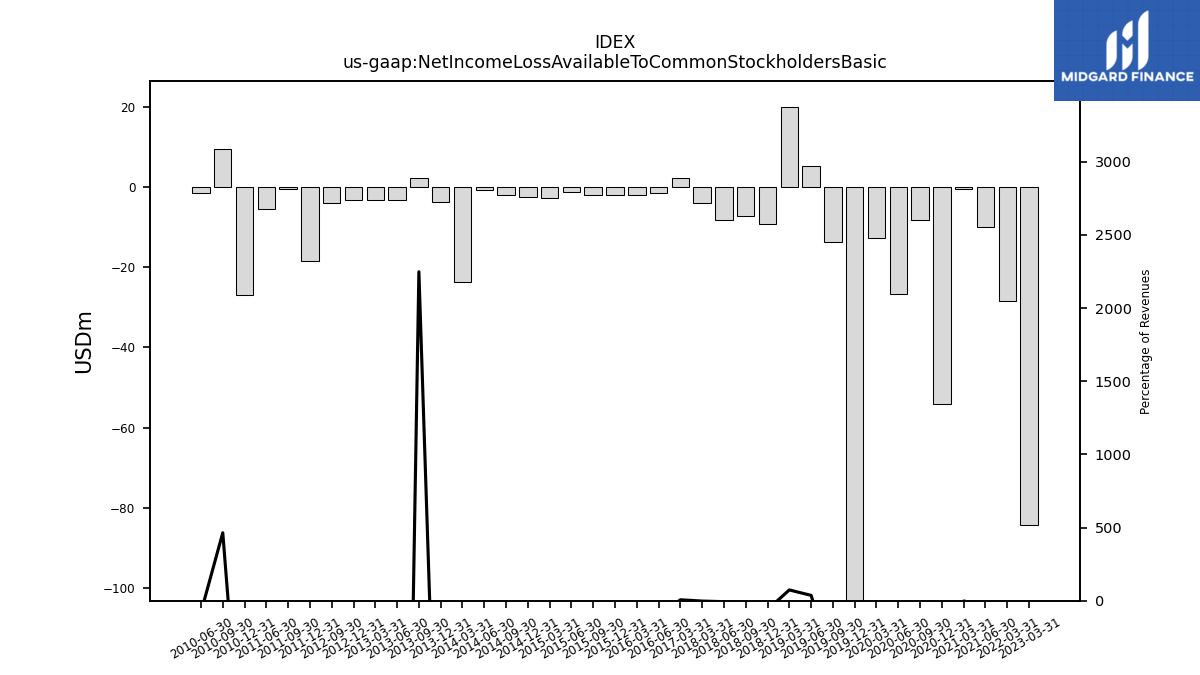
| Net Income Loss Available To Common Stockholders Basic | NA | -84.32 | NA | NA | NA | -28.51 | NA | NA | -9.99 | -0.57 | -54.05 | -8.29 | -26.58 | -12.73 | -109.16 | -13.71 | 5.29 | 19.93 | -9.19 | -7.19 | -8.32 | -4.07 | NA | NA | NA | 2.21 | NA | NA | -1.59 | -2.14 | -1.90 | -2.09 | -1.32 | -2.80 | -2.45 | -1.95 | -0.79 | -23.62 | -3.71 | 2.14 | -3.28 | -3.34 | -3.15 | -4.05 | NA | NA | -18.54 | -0.54 | -5.58 | NA | -26.99 | 9.55 | -1.42 |
| 2023-06-30 | 2023-03-31 | 2022-12-31 | 2022-09-30 | 2022-06-30 | 2022-03-31 | 2021-12-31 | 2021-09-30 | 2021-06-30 | 2021-03-31 | 2020-12-31 | 2020-09-30 | 2020-06-30 | 2020-03-31 | 2019-12-31 | 2019-09-30 | 2019-06-30 | 2019-03-31 | 2018-12-31 | 2018-09-30 | 2018-06-30 | 2018-03-31 | 2017-12-31 | 2017-09-30 | 2017-06-30 | 2017-03-31 | 2016-12-31 | 2016-09-30 | 2016-06-30 | 2016-03-31 | 2015-12-31 | 2015-09-30 | 2015-06-30 | 2015-03-31 | 2014-12-31 | 2014-09-30 | 2014-06-30 | 2014-03-31 | 2013-12-31 | 2013-09-30 | 2013-06-30 | 2013-03-31 | 2012-12-31 | 2012-09-30 | 2012-06-30 | 2012-03-31 | 2011-12-31 | 2011-09-30 | 2011-06-30 | 2011-03-31 | 2010-12-31 | 2010-09-30 | 2010-06-30 | ||
|---|---|---|---|---|---|---|---|---|---|---|---|---|---|---|---|---|---|---|---|---|---|---|---|---|---|---|---|---|---|---|---|---|---|---|---|---|---|---|---|---|---|---|---|---|---|---|---|---|---|---|---|---|---|---|
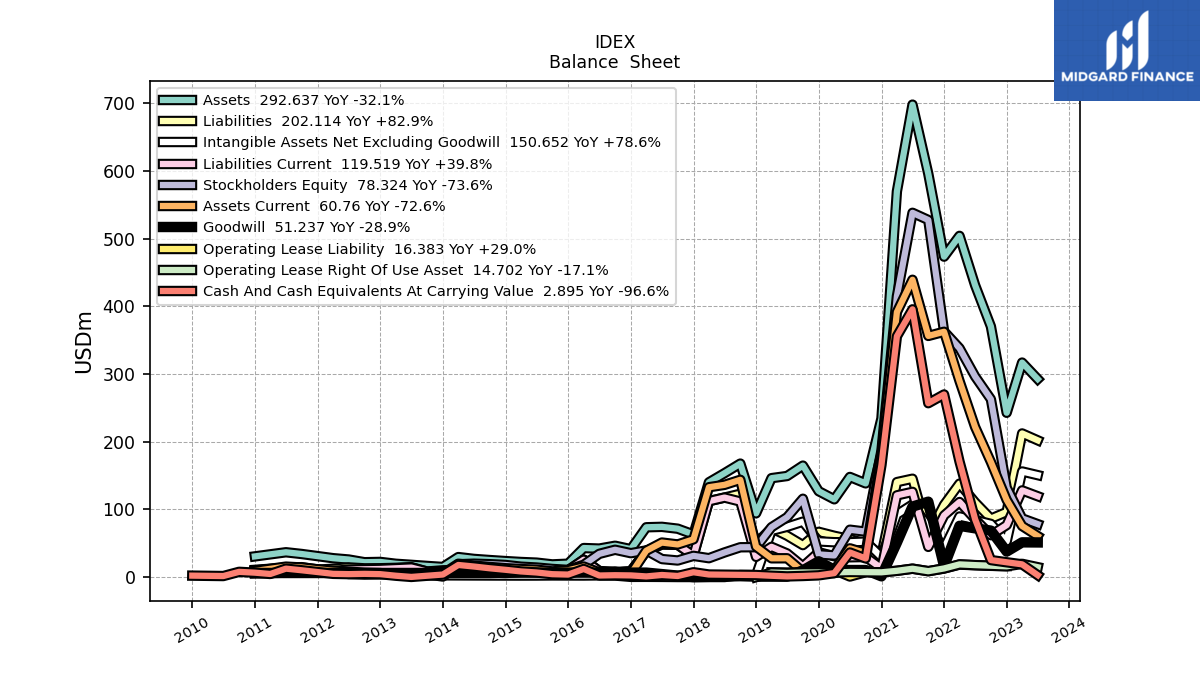
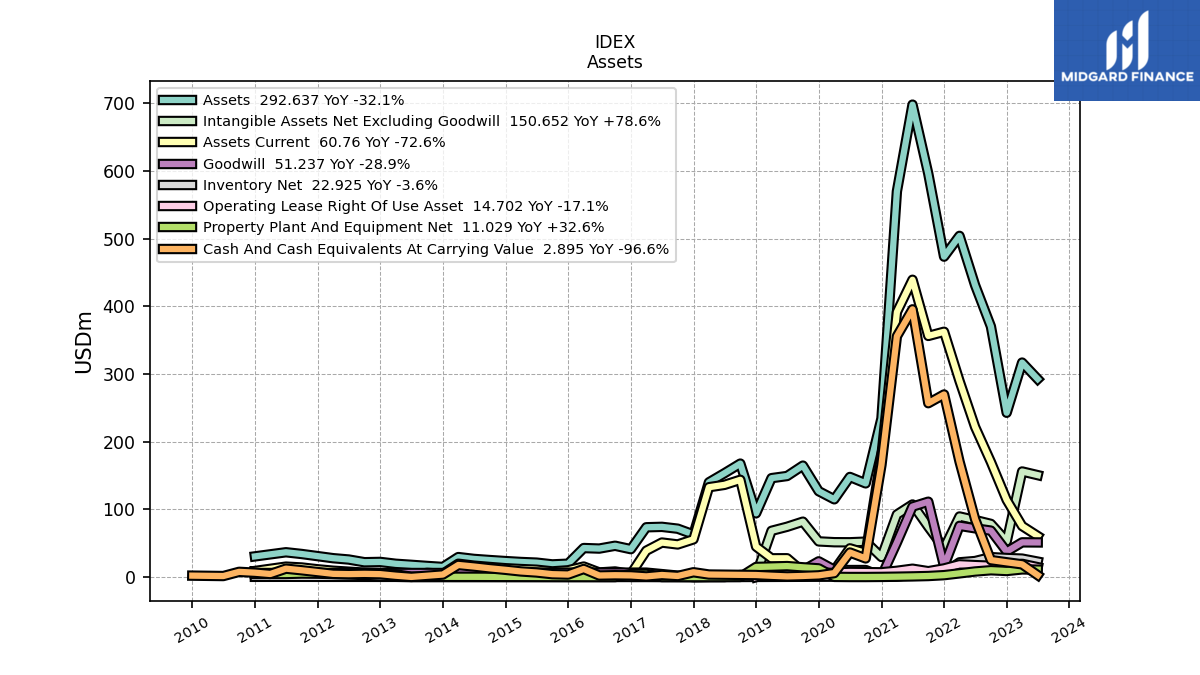
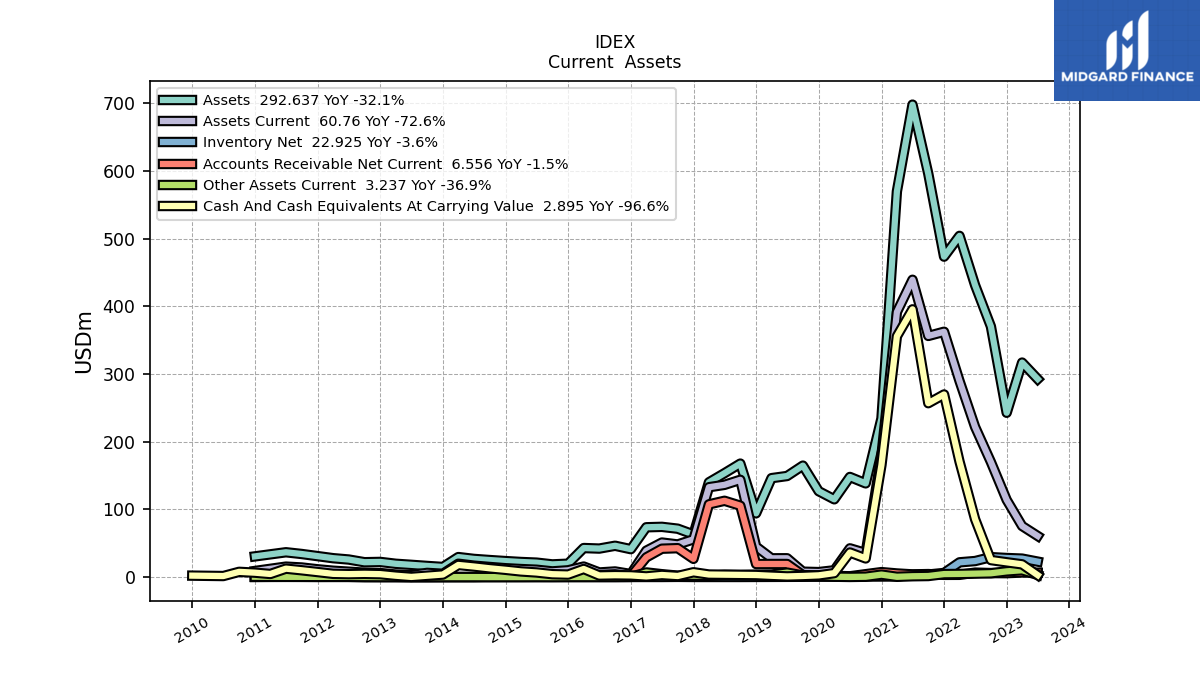
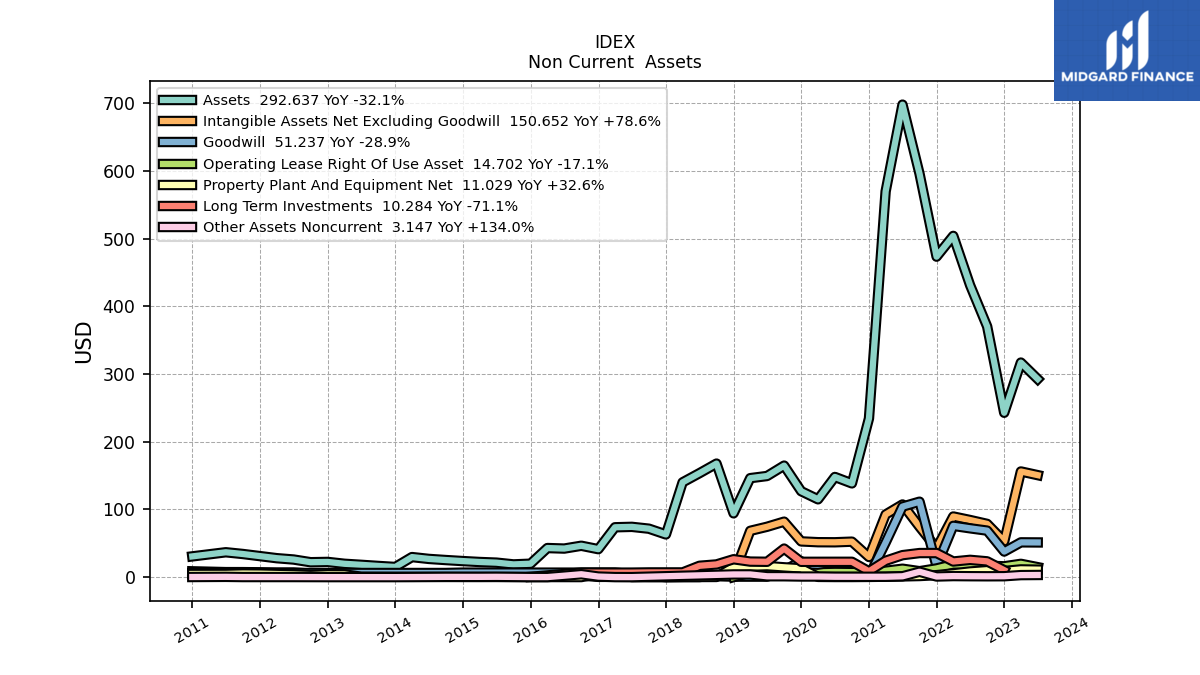
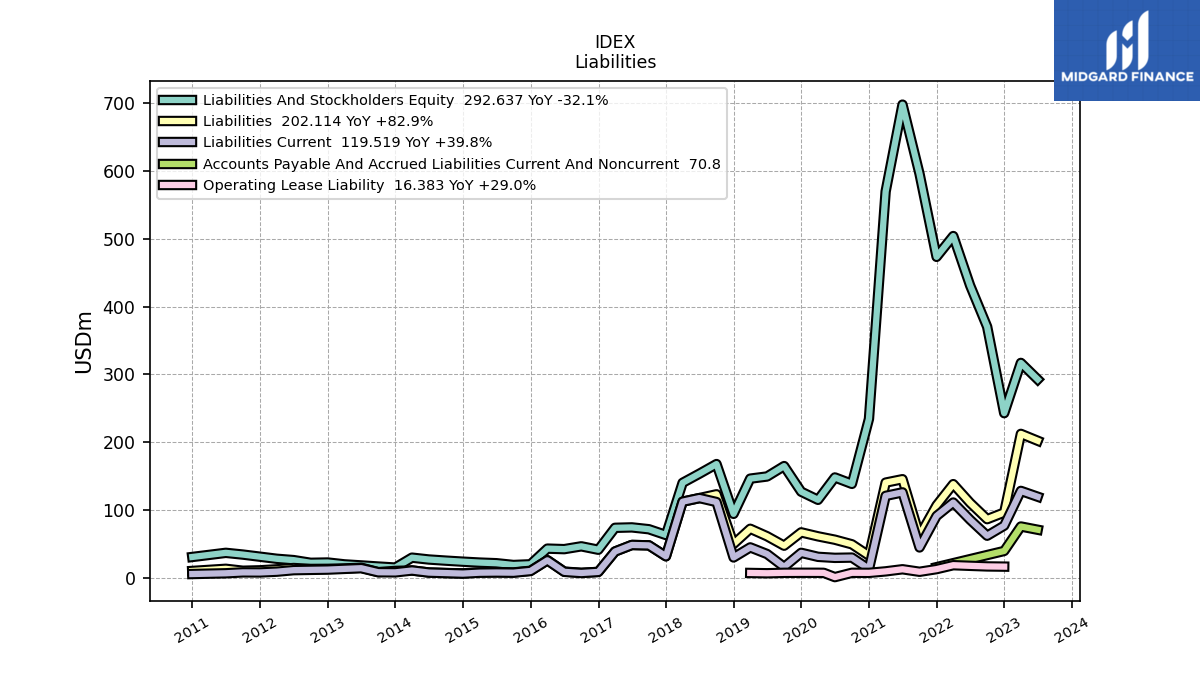
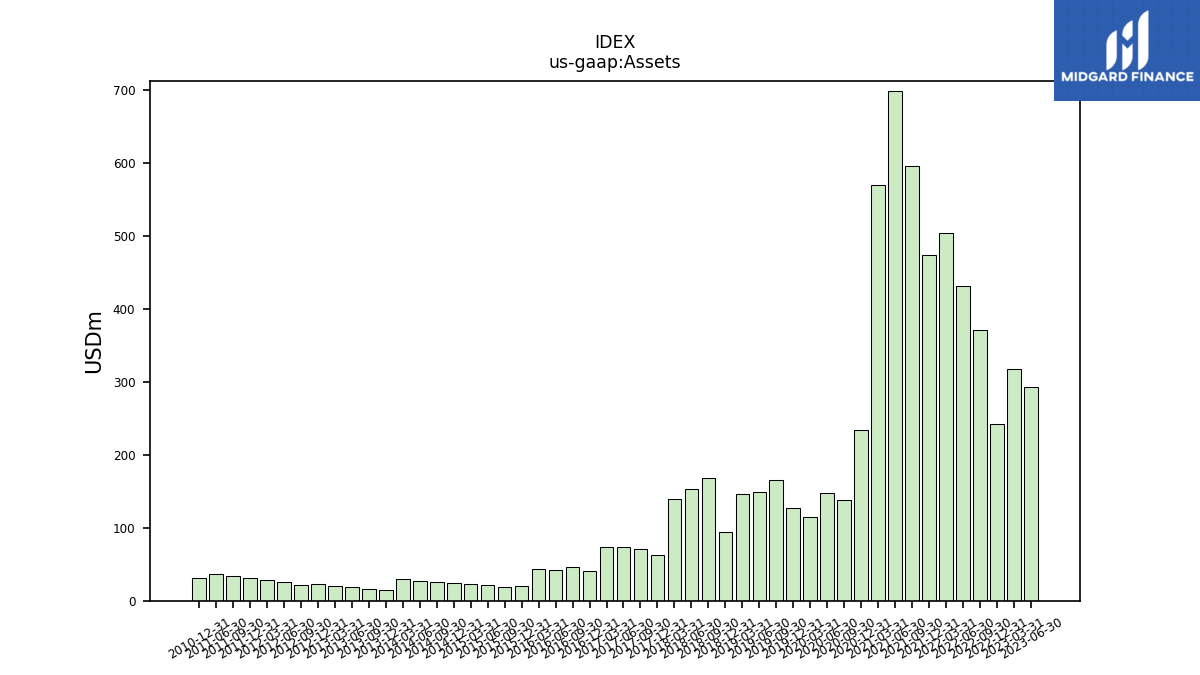
| Assets | 292.64 | 316.99 | 242.80 | 370.32 | 431.20 | 504.17 | 473.44 | 595.88 | 698.05 | 569.90 | 234.41 | 138.46 | 147.99 | 114.94 | 126.94 | 164.76 | 149.40 | 146.22 | 94.24 | 167.72 | 153.57 | 140.06 | 63.04 | 71.56 | 74.27 | 73.65 | 41.30 | 46.34 | 42.19 | 42.97 | 19.83 | 18.80 | 21.41 | 22.37 | 23.70 | 25.23 | 26.91 | 29.63 | 15.00 | 16.52 | 18.17 | 19.73 | 22.46 | 22.03 | 26.01 | 27.98 | 31.06 | 34.17 | 36.73 | NA | 30.63 | NA | NA | |
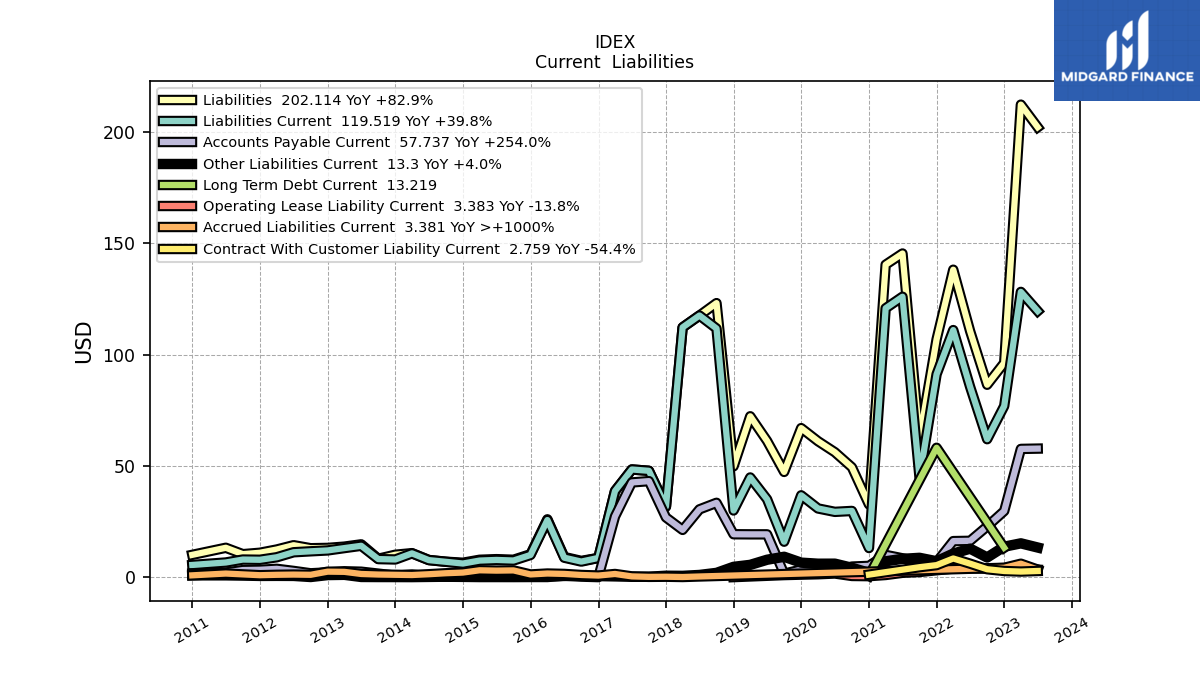
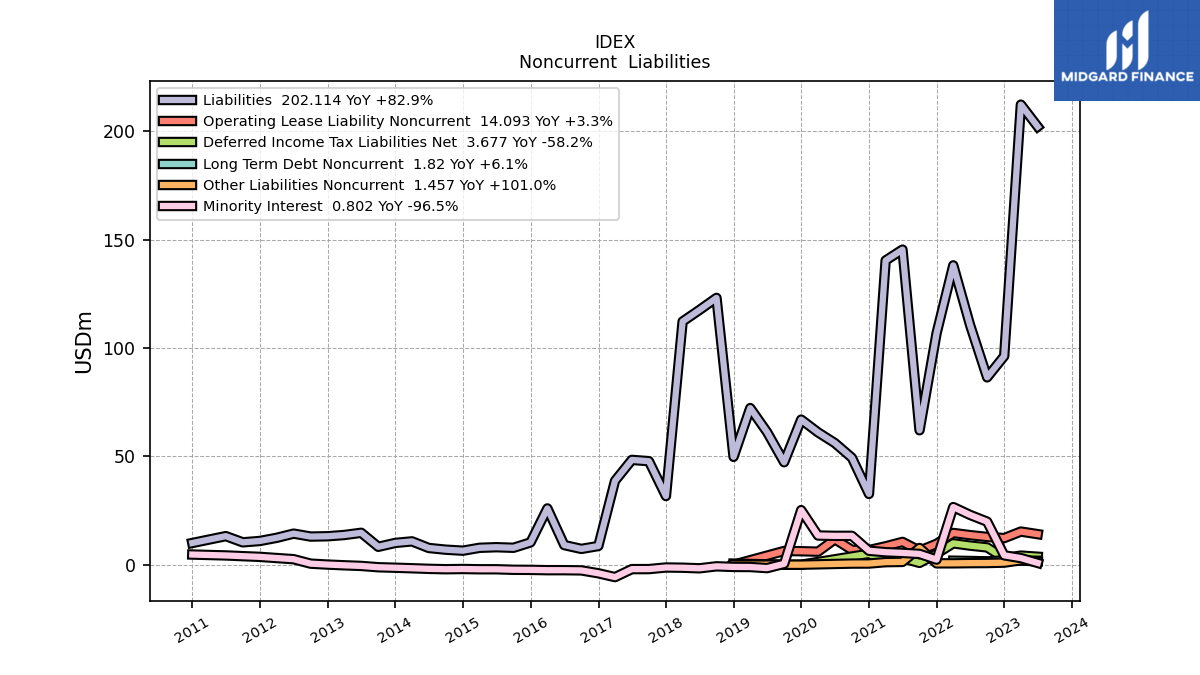
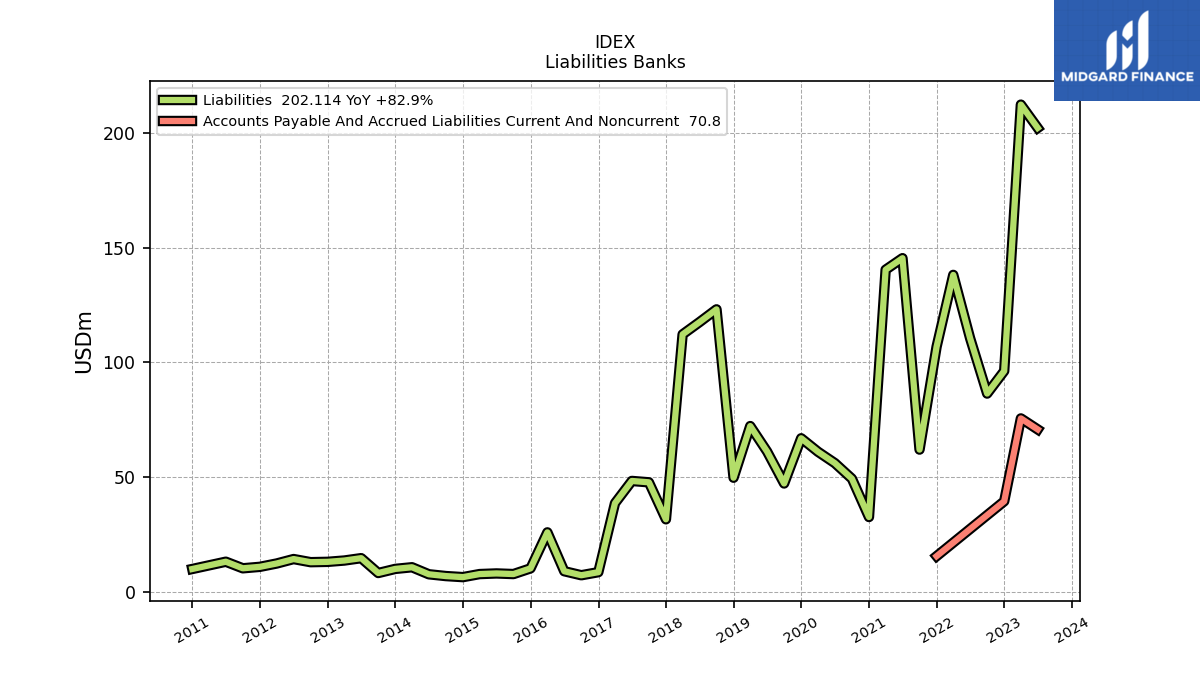
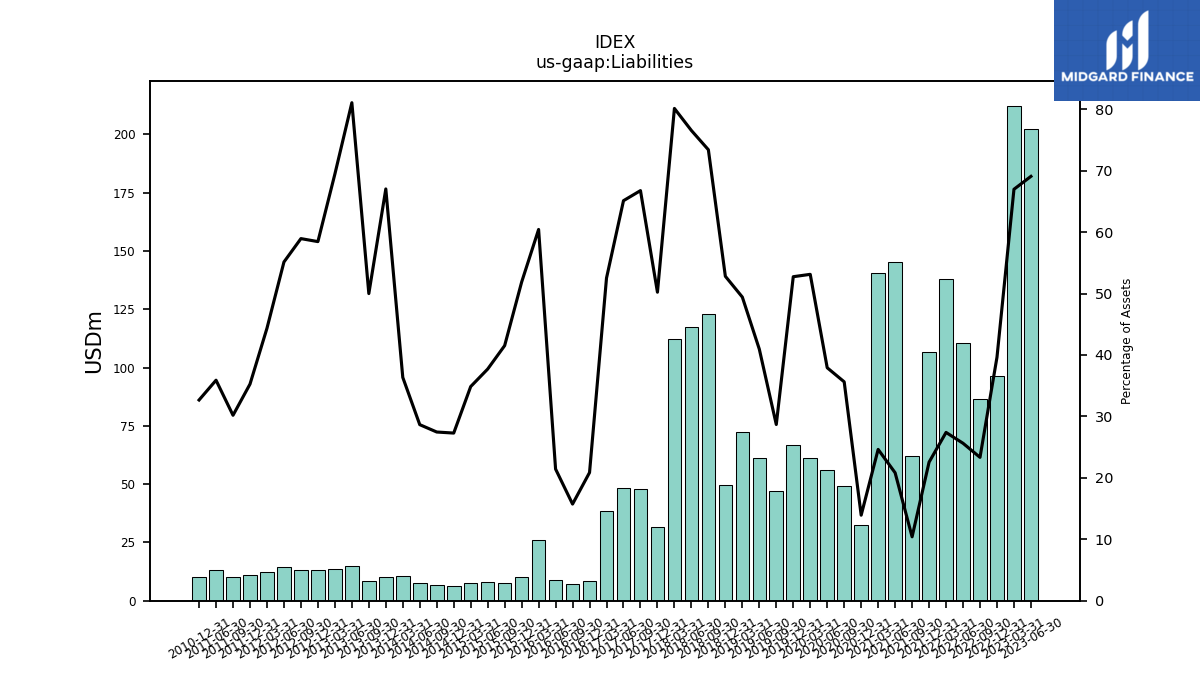
| Liabilities | 202.11 | 212.27 | 96.24 | 86.42 | 110.51 | 138.11 | 106.81 | 62.01 | 145.39 | 140.37 | 32.64 | 49.33 | 56.12 | 61.06 | 66.95 | 47.26 | 61.18 | 72.26 | 49.76 | 123.11 | 117.53 | 112.21 | 31.66 | 47.76 | 48.36 | 38.68 | 8.62 | 7.29 | 9.04 | 25.97 | 10.28 | 7.80 | 8.07 | 7.80 | 6.47 | 6.93 | 7.71 | 10.77 | 10.05 | 8.26 | 14.73 | 13.70 | 13.13 | 12.98 | 14.34 | 12.41 | 10.95 | 10.31 | 13.18 | NA | 10.01 | NA | NA | |
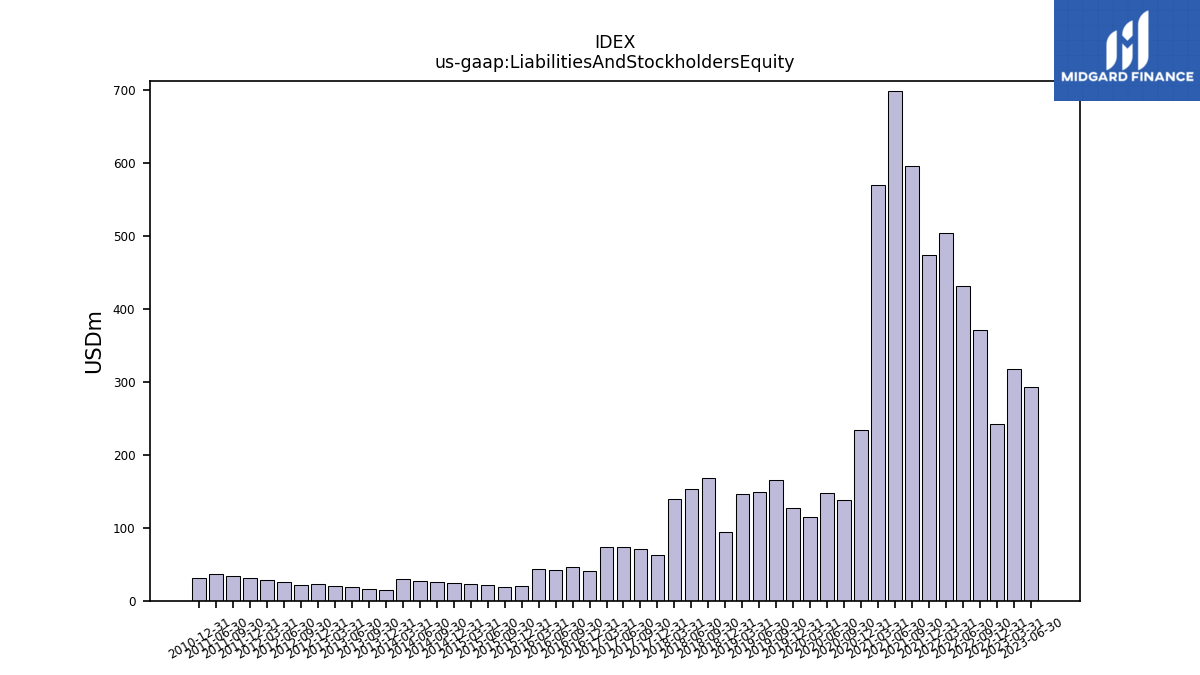
| Liabilities And Stockholders Equity | 292.64 | 316.99 | 242.80 | 370.32 | 431.20 | 504.17 | 473.44 | 595.88 | 698.05 | 569.90 | 234.41 | 138.46 | 147.99 | 114.94 | 126.94 | 164.76 | 149.40 | 146.22 | 94.24 | 167.72 | 153.57 | 140.06 | 63.04 | 71.56 | 74.27 | 73.65 | 41.30 | 46.34 | 42.19 | 42.97 | 19.83 | 18.80 | 21.41 | 22.37 | 23.70 | 25.23 | 26.91 | 29.63 | 15.00 | 16.52 | 18.17 | 19.73 | 22.46 | 22.03 | 26.01 | 27.98 | 31.06 | 34.17 | 36.73 | NA | 30.63 | NA | NA | |
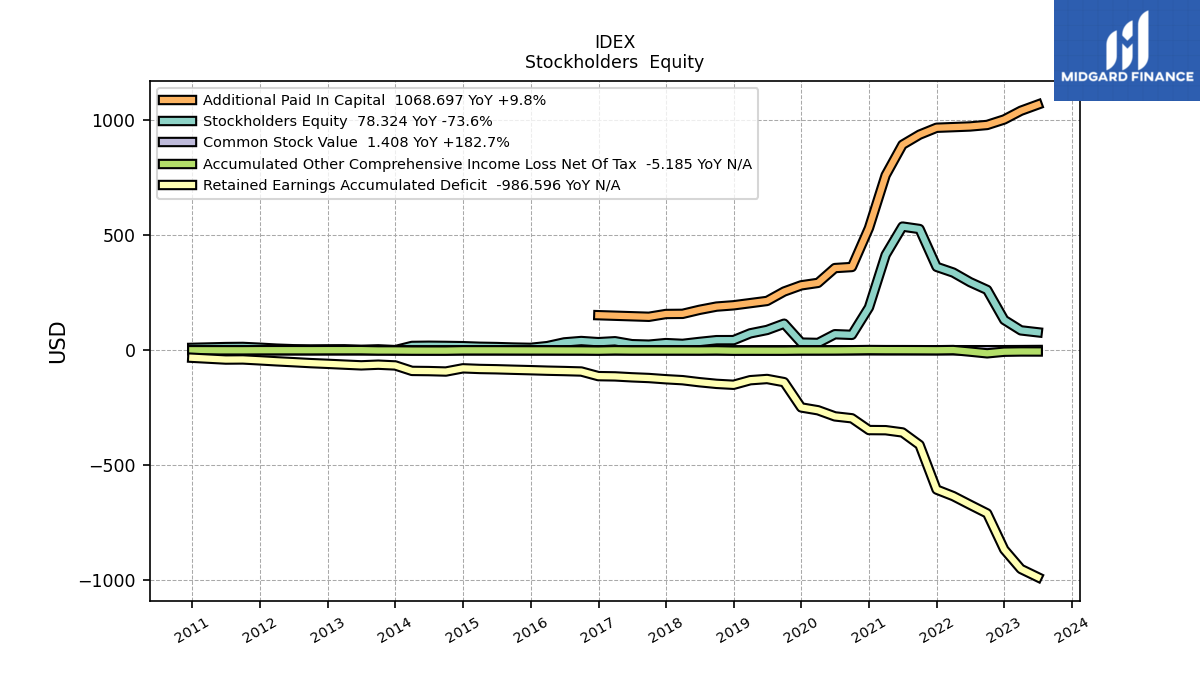
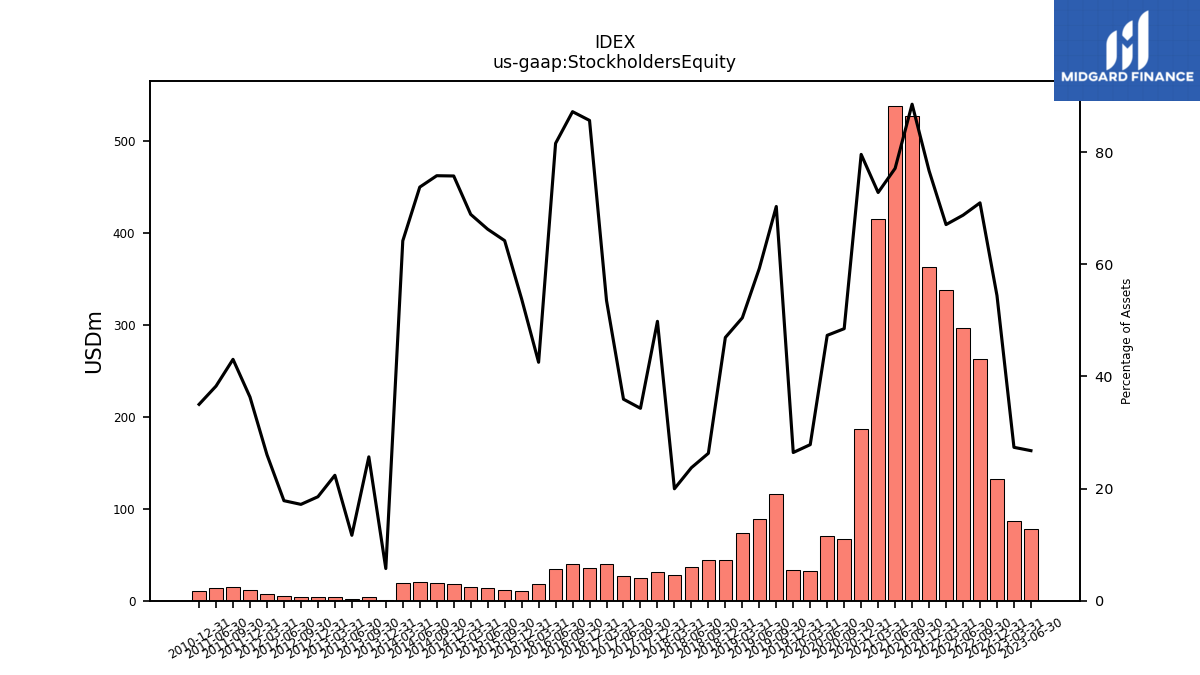
| Stockholders Equity | 78.32 | 86.72 | 132.12 | 262.77 | 296.47 | 338.21 | 363.03 | 527.63 | 538.24 | 414.90 | 186.58 | 67.18 | 70.04 | 32.00 | 33.56 | 115.84 | 88.53 | 73.77 | 44.24 | 44.10 | 36.44 | 27.97 | 31.41 | 24.56 | 26.70 | 39.44 | 35.37 | 40.41 | 34.41 | 18.27 | 10.67 | 12.07 | 14.18 | 15.41 | 17.96 | 19.12 | 19.85 | 19.02 | 0.86 | 4.24 | 2.12 | 4.41 | 4.17 | 3.79 | 4.64 | 7.29 | 11.28 | 14.71 | 14.06 | NA | 10.73 | NA | NA |
| 2023-06-30 | 2023-03-31 | 2022-12-31 | 2022-09-30 | 2022-06-30 | 2022-03-31 | 2021-12-31 | 2021-09-30 | 2021-06-30 | 2021-03-31 | 2020-12-31 | 2020-09-30 | 2020-06-30 | 2020-03-31 | 2019-12-31 | 2019-09-30 | 2019-06-30 | 2019-03-31 | 2018-12-31 | 2018-09-30 | 2018-06-30 | 2018-03-31 | 2017-12-31 | 2017-09-30 | 2017-06-30 | 2017-03-31 | 2016-12-31 | 2016-09-30 | 2016-06-30 | 2016-03-31 | 2015-12-31 | 2015-09-30 | 2015-06-30 | 2015-03-31 | 2014-12-31 | 2014-09-30 | 2014-06-30 | 2014-03-31 | 2013-12-31 | 2013-09-30 | 2013-06-30 | 2013-03-31 | 2012-12-31 | 2012-09-30 | 2012-06-30 | 2012-03-31 | 2011-12-31 | 2011-09-30 | 2011-06-30 | 2011-03-31 | 2010-12-31 | 2010-09-30 | 2010-06-30 | ||
|---|---|---|---|---|---|---|---|---|---|---|---|---|---|---|---|---|---|---|---|---|---|---|---|---|---|---|---|---|---|---|---|---|---|---|---|---|---|---|---|---|---|---|---|---|---|---|---|---|---|---|---|---|---|---|
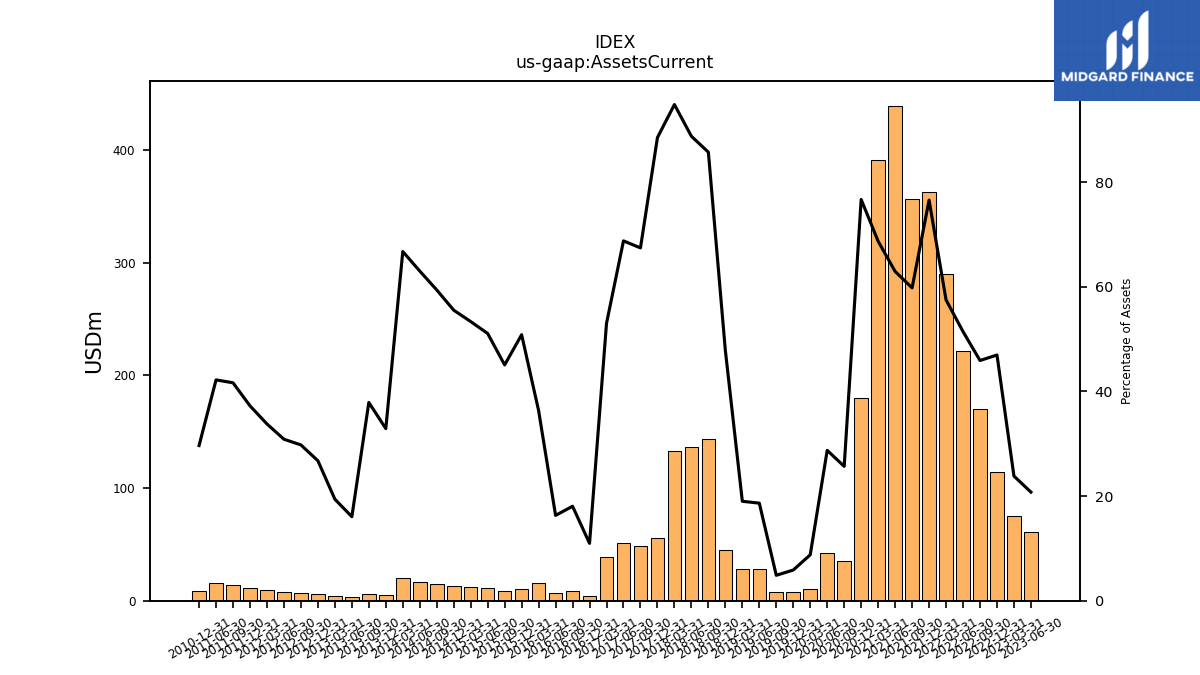
| Assets Current | 60.76 | 75.51 | 114.04 | 170.03 | 221.81 | 289.84 | 362.51 | 356.31 | 439.34 | 391.57 | 179.76 | 35.56 | 42.54 | 10.09 | 7.45 | 8.01 | 27.87 | 27.80 | 45.07 | 143.79 | 136.32 | 132.83 | 55.80 | 48.25 | 51.08 | 39.05 | 4.53 | 8.37 | 6.88 | 15.62 | 10.08 | 8.47 | 10.93 | 11.93 | 13.16 | 14.98 | 16.95 | 19.78 | 4.93 | 6.26 | 2.92 | 3.83 | 6.01 | 6.56 | 8.03 | 9.45 | 11.57 | 14.23 | 15.50 | NA | 9.09 | NA | NA | |
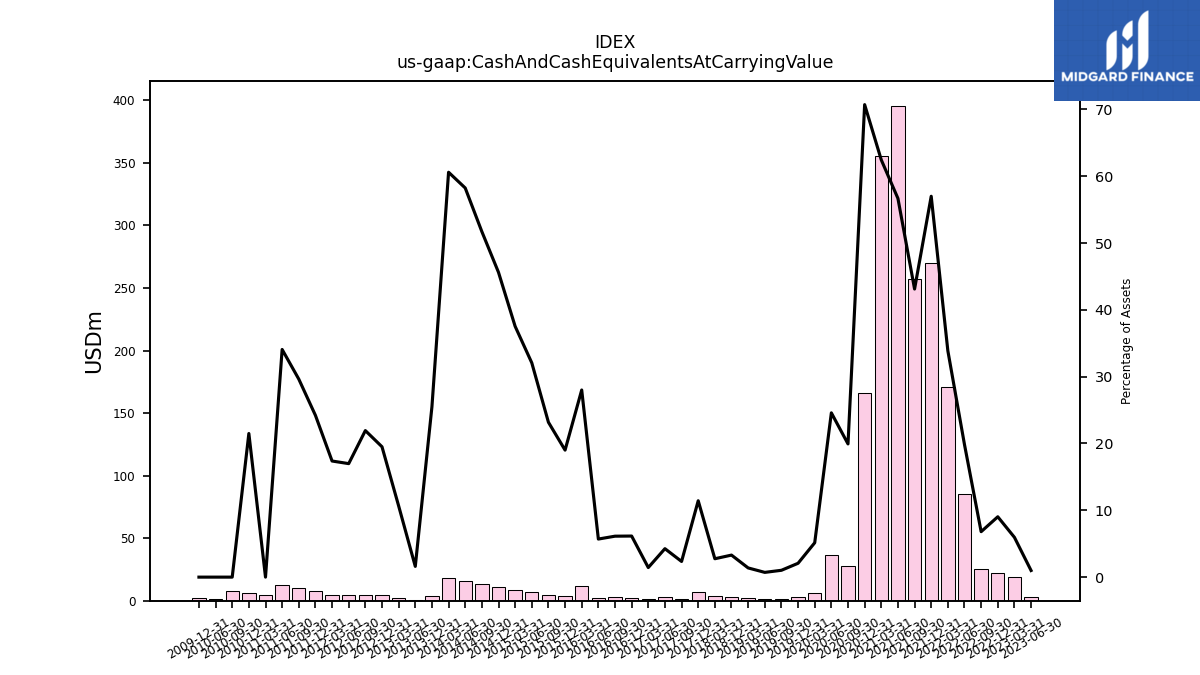
| Cash And Cash Equivalents At Carrying Value | 2.90 | 18.88 | 21.93 | 25.19 | 85.51 | 170.76 | 269.86 | 256.93 | 395.64 | 355.86 | 165.76 | 27.61 | 36.38 | 5.91 | 2.63 | 1.69 | 1.06 | 2.01 | 3.11 | NA | NA | 3.85 | 7.21 | 1.68 | 3.16 | 1.05 | 2.54 | 2.84 | 2.40 | 12.04 | 3.77 | 4.36 | 6.87 | 8.40 | 10.81 | 13.05 | 15.67 | 17.95 | 3.82 | NA | 0.29 | 2.10 | 4.38 | 4.83 | 4.42 | 4.86 | 7.52 | 10.13 | 12.51 | 4.65 | 6.58 | 7.81 | 1.61 | |
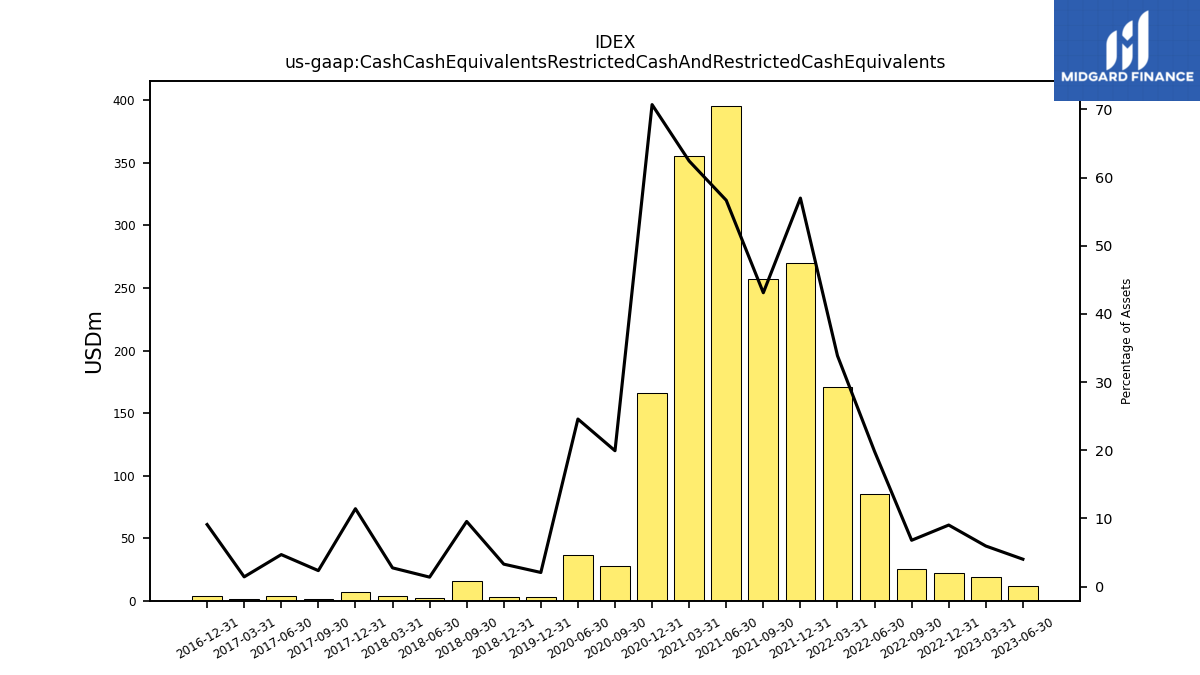
| Cash Cash Equivalents Restricted Cash And Restricted Cash Equivalents | 11.77 | 18.88 | 21.93 | 25.19 | 85.51 | 170.76 | 269.86 | 256.93 | 395.64 | 355.86 | 165.76 | 27.61 | 36.38 | NA | 2.63 | NA | NA | NA | 3.11 | 16.03 | 2.14 | 3.85 | 7.21 | 1.68 | 3.49 | 1.05 | 3.76 | NA | NA | NA | NA | NA | NA | NA | NA | NA | NA | NA | NA | NA | NA | NA | NA | NA | NA | NA | NA | NA | NA | NA | NA | NA | NA | |
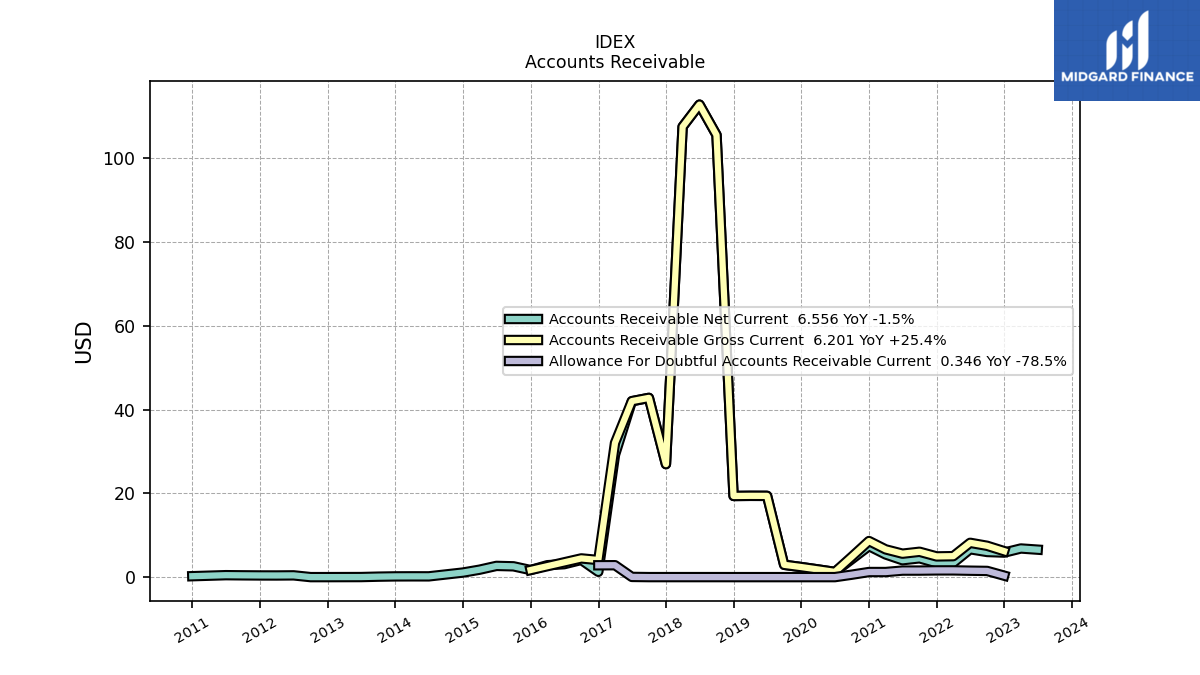
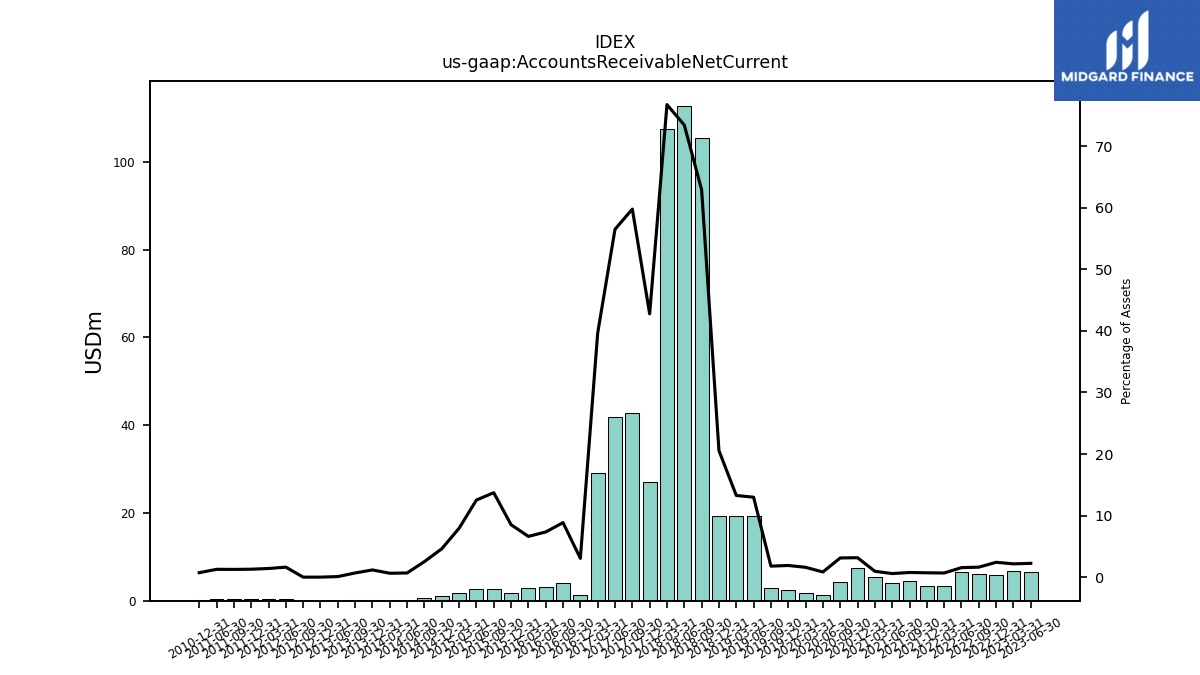
| Accounts Receivable Net Current | 6.56 | 6.83 | 5.86 | 6.00 | 6.66 | 3.39 | 3.34 | 4.49 | 4.04 | 5.41 | 7.40 | 4.32 | 1.24 | 1.83 | 2.40 | 2.94 | 19.40 | 19.41 | 19.37 | 105.53 | 112.79 | 107.51 | 26.96 | 42.78 | 41.97 | 29.20 | 1.26 | 4.10 | 3.09 | 2.84 | 1.69 | 2.58 | 2.68 | 1.78 | 1.09 | 0.64 | 0.18 | 0.19 | 0.18 | 0.11 | 0.02 | NA | 0.00 | 0.00 | 0.42 | 0.39 | 0.40 | 0.43 | 0.47 | NA | 0.22 | NA | NA | |
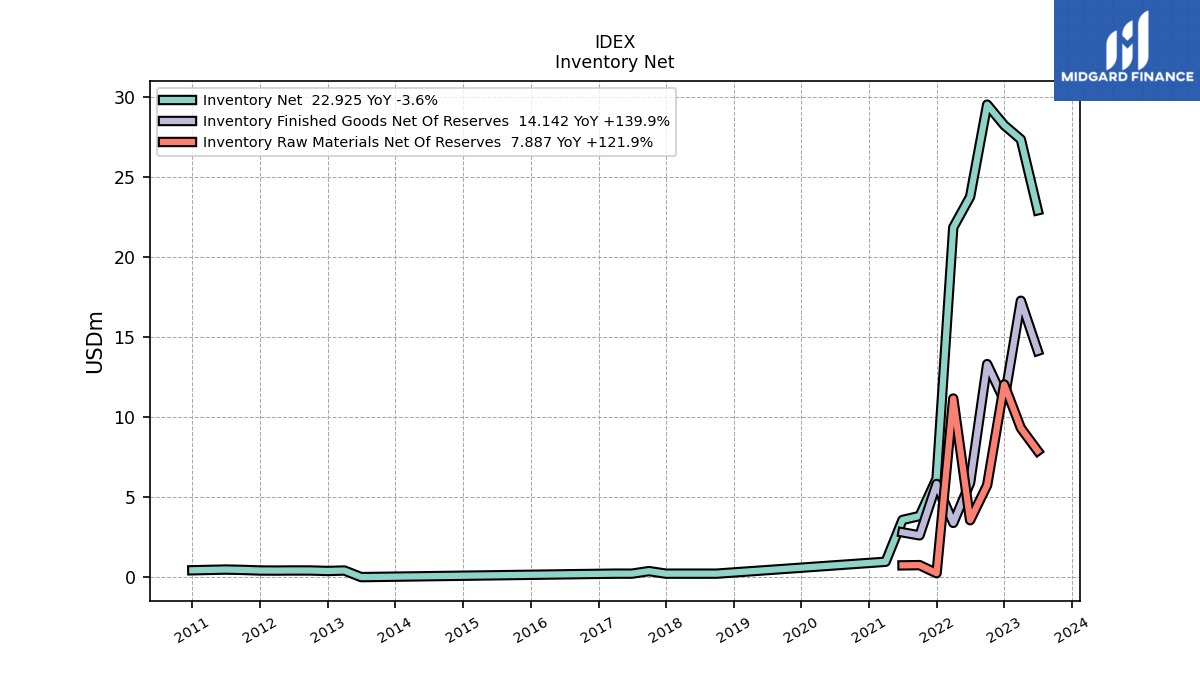
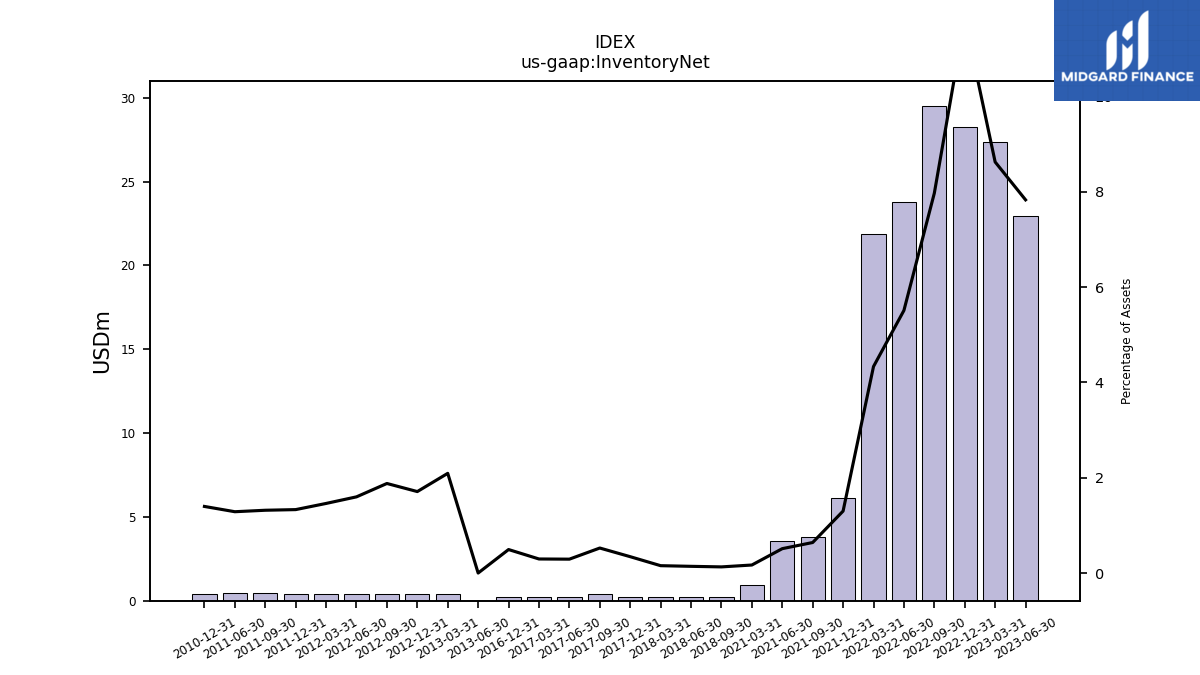
| Inventory Net | 22.93 | 27.35 | 28.25 | 29.53 | 23.77 | 21.86 | 6.16 | 3.82 | 3.57 | 0.96 | NA | NA | NA | NA | NA | NA | NA | NA | NA | 0.22 | 0.22 | 0.22 | 0.22 | 0.38 | 0.22 | 0.22 | 0.20 | NA | NA | NA | NA | NA | NA | NA | NA | NA | NA | NA | NA | NA | 0.00 | 0.41 | 0.38 | 0.41 | 0.42 | 0.41 | 0.41 | 0.45 | 0.47 | NA | 0.43 | NA | NA | |
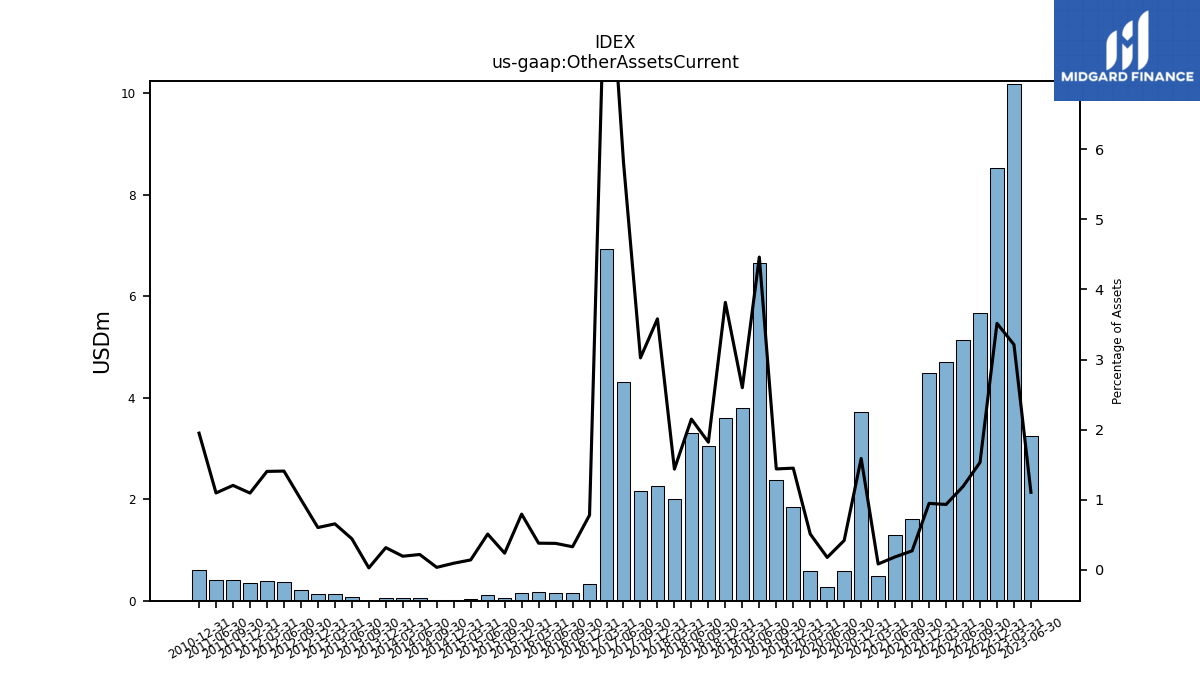
| Other Assets Current | 3.24 | 10.19 | 8.54 | 5.67 | 5.13 | 4.70 | 4.49 | 1.62 | 1.29 | 0.48 | 3.73 | 0.58 | 0.26 | 0.59 | 1.84 | 2.37 | 6.66 | 3.80 | 3.59 | 3.05 | 3.30 | 2.01 | 2.26 | 2.16 | 4.32 | 6.93 | 0.32 | 0.15 | 0.16 | 0.16 | 0.16 | 0.04 | 0.11 | 0.03 | 0.02 | 0.01 | 0.06 | 0.06 | 0.05 | 0.00 | 0.08 | 0.13 | 0.14 | 0.22 | 0.37 | 0.39 | 0.34 | 0.41 | 0.40 | NA | 0.60 | NA | NA |
| 2023-06-30 | 2023-03-31 | 2022-12-31 | 2022-09-30 | 2022-06-30 | 2022-03-31 | 2021-12-31 | 2021-09-30 | 2021-06-30 | 2021-03-31 | 2020-12-31 | 2020-09-30 | 2020-06-30 | 2020-03-31 | 2019-12-31 | 2019-09-30 | 2019-06-30 | 2019-03-31 | 2018-12-31 | 2018-09-30 | 2018-06-30 | 2018-03-31 | 2017-12-31 | 2017-09-30 | 2017-06-30 | 2017-03-31 | 2016-12-31 | 2016-09-30 | 2016-06-30 | 2016-03-31 | 2015-12-31 | 2015-09-30 | 2015-06-30 | 2015-03-31 | 2014-12-31 | 2014-09-30 | 2014-06-30 | 2014-03-31 | 2013-12-31 | 2013-09-30 | 2013-06-30 | 2013-03-31 | 2012-12-31 | 2012-09-30 | 2012-06-30 | 2012-03-31 | 2011-12-31 | 2011-09-30 | 2011-06-30 | 2011-03-31 | 2010-12-31 | 2010-09-30 | 2010-06-30 | ||
|---|---|---|---|---|---|---|---|---|---|---|---|---|---|---|---|---|---|---|---|---|---|---|---|---|---|---|---|---|---|---|---|---|---|---|---|---|---|---|---|---|---|---|---|---|---|---|---|---|---|---|---|---|---|---|
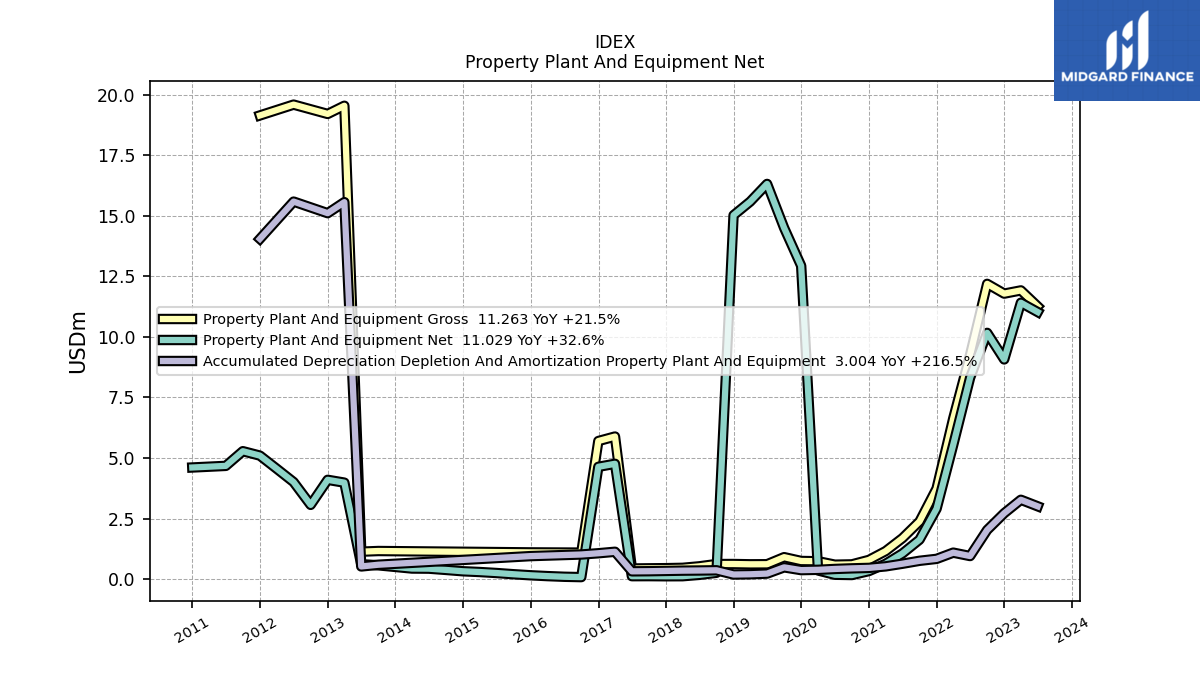
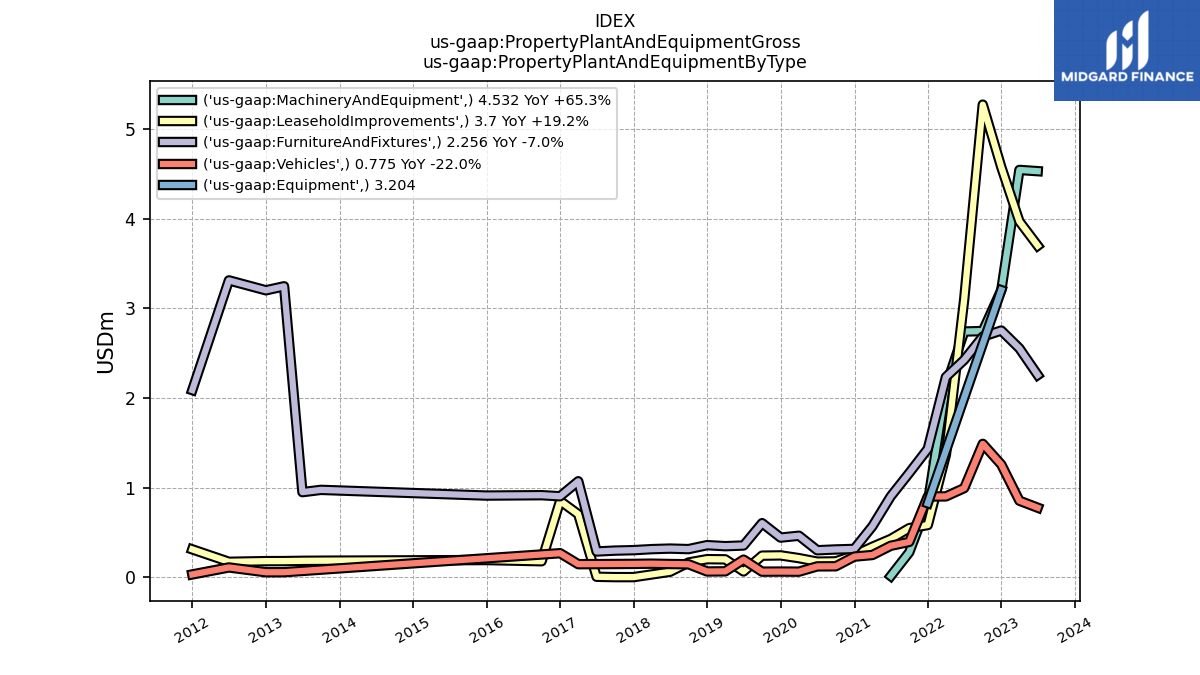
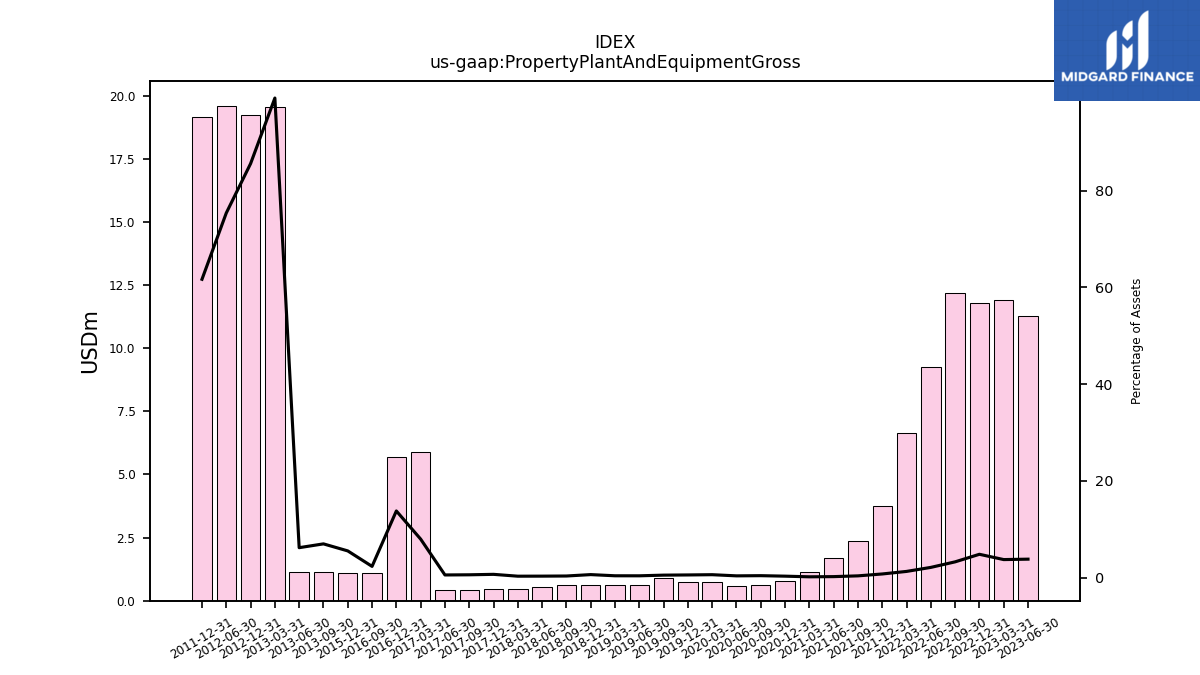
| Property Plant And Equipment Gross | 11.26 | 11.92 | 11.79 | 12.20 | 9.27 | 6.64 | 3.74 | 2.38 | 1.69 | 1.15 | 0.79 | 0.61 | 0.59 | 0.73 | 0.75 | 0.90 | 0.61 | 0.61 | 0.62 | 0.62 | 0.53 | 0.46 | 0.45 | 0.44 | 0.44 | 5.89 | 5.70 | 1.09 | NA | NA | 1.10 | NA | NA | NA | NA | NA | NA | NA | NA | 1.16 | 1.13 | 19.55 | 19.21 | NA | 19.60 | NA | 19.15 | NA | NA | NA | NA | NA | NA | |
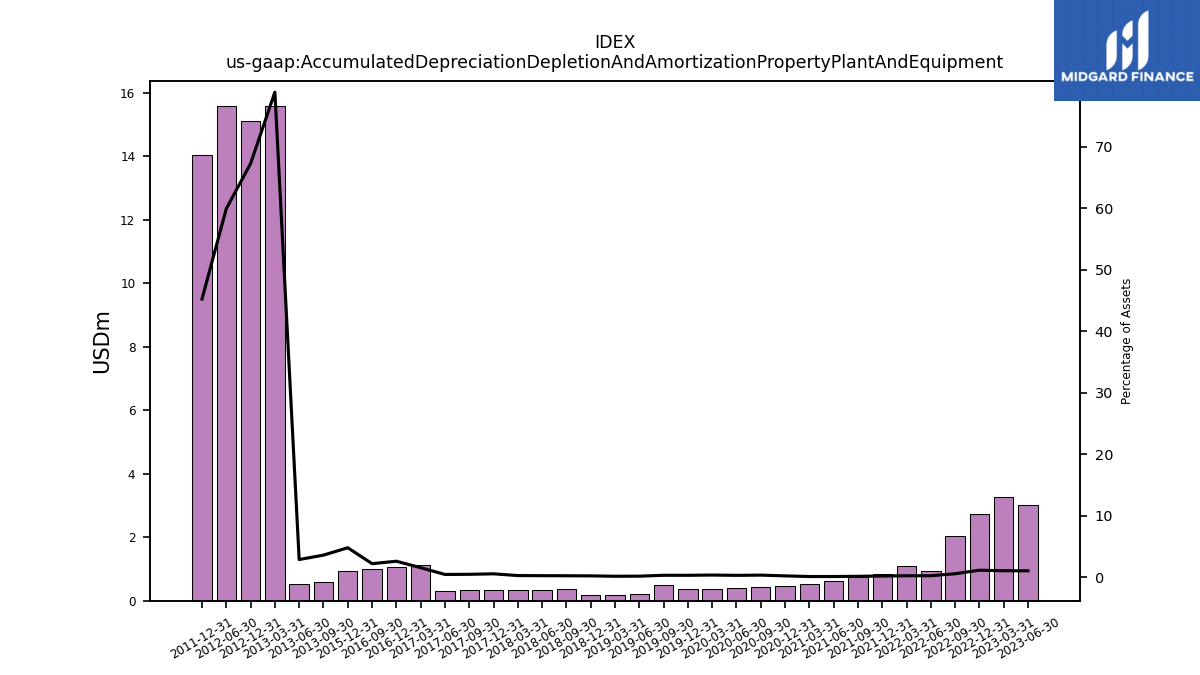
| Accumulated Depreciation Depletion And Amortization Property Plant And Equipment | 3.00 | 3.27 | 2.72 | 2.02 | 0.95 | 1.09 | 0.83 | 0.75 | 0.63 | 0.52 | 0.46 | 0.44 | 0.42 | 0.38 | 0.37 | 0.48 | 0.22 | 0.20 | 0.19 | 0.36 | 0.35 | 0.35 | 0.33 | 0.32 | 0.32 | 1.13 | 1.06 | 1.01 | NA | NA | 0.95 | NA | NA | NA | NA | NA | NA | NA | NA | 0.59 | 0.52 | 15.57 | 15.11 | NA | 15.59 | NA | 14.05 | NA | NA | NA | NA | NA | NA | |
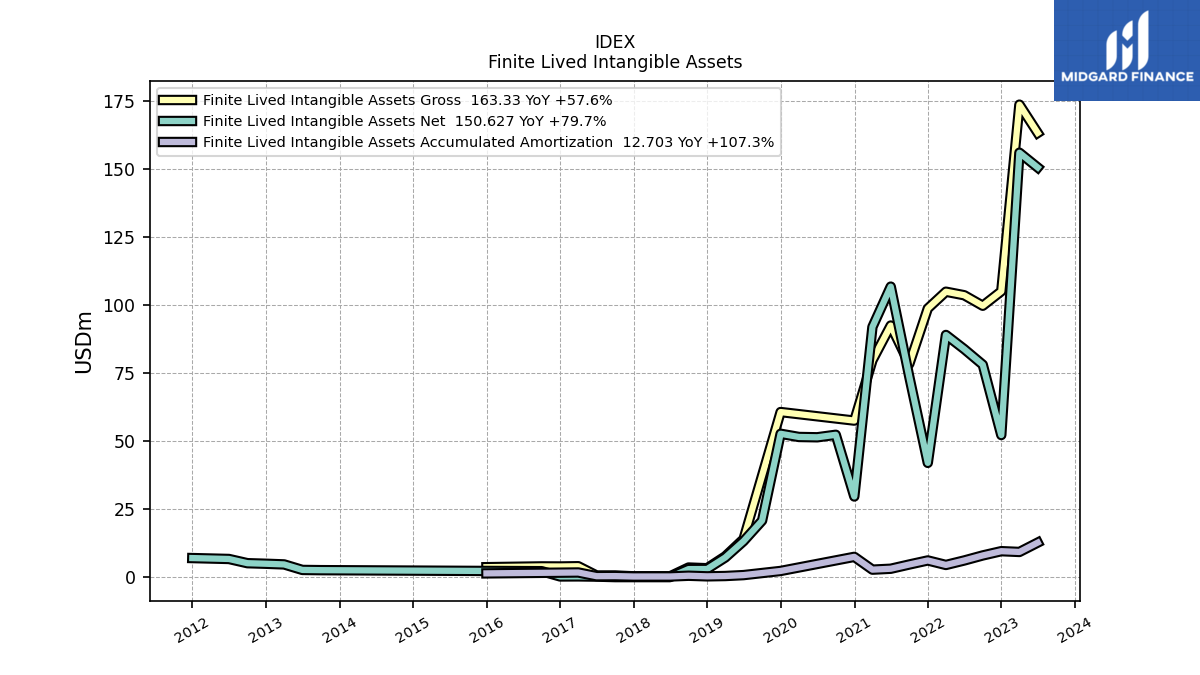
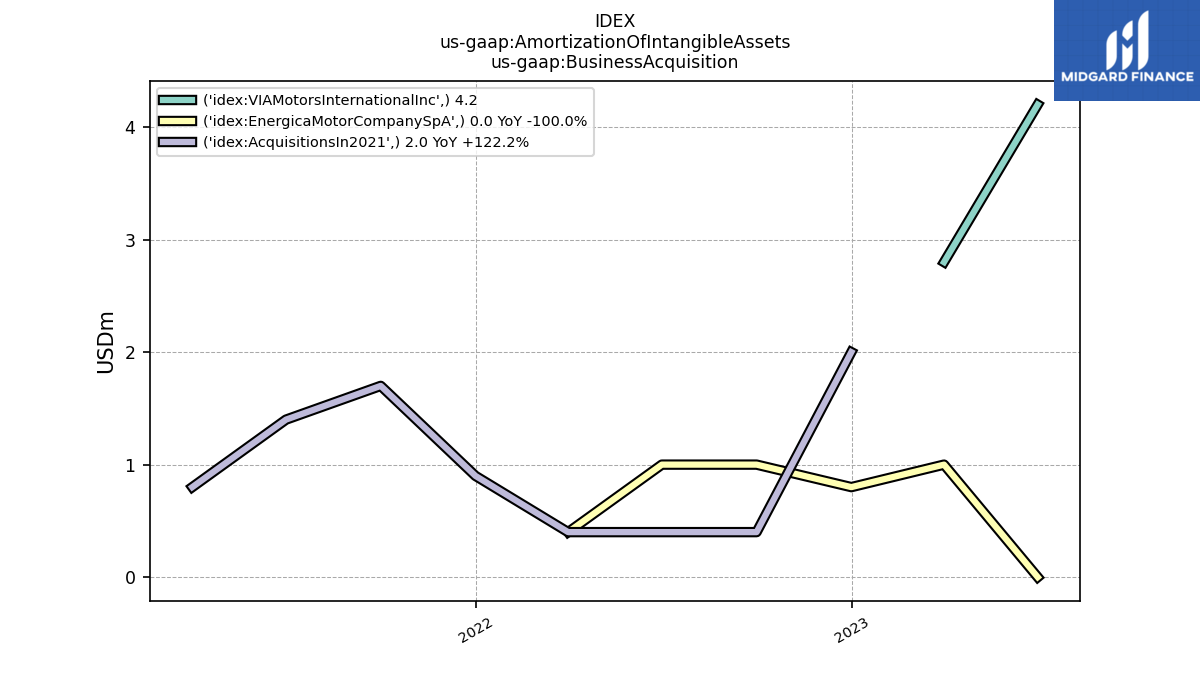
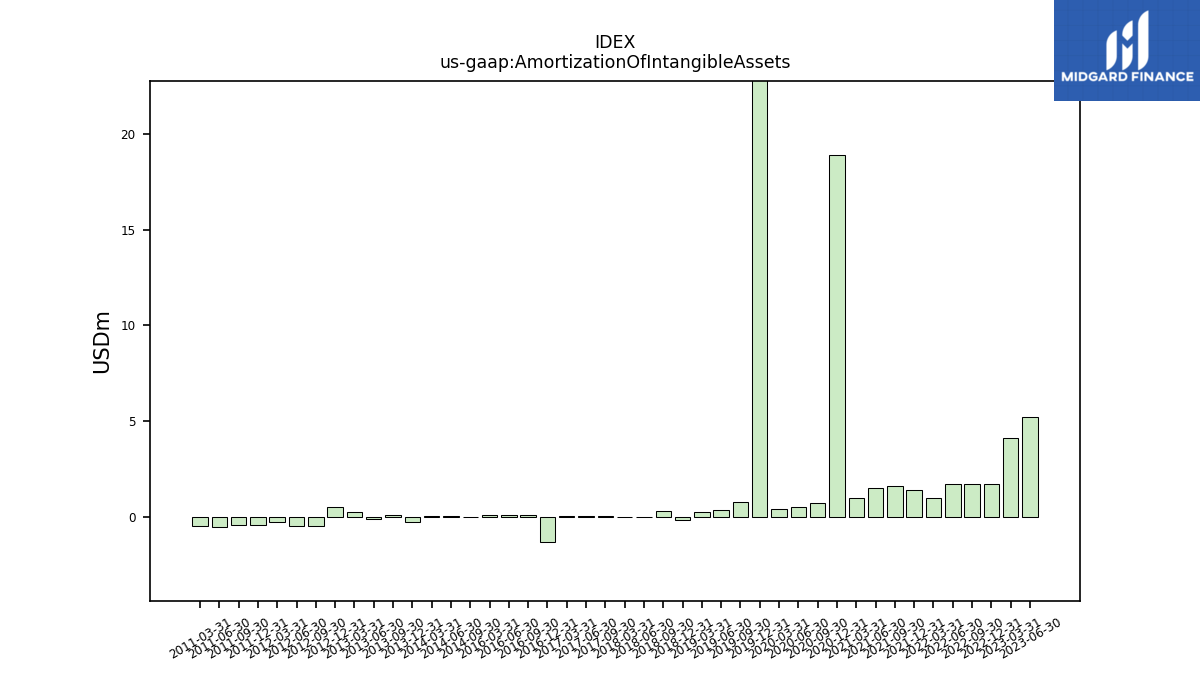
| Amortization Of Intangible Assets | 5.20 | 4.10 | 1.70 | 1.70 | 1.70 | 1.00 | 1.40 | 1.60 | 1.50 | 1.00 | 18.90 | 0.70 | 0.50 | 0.40 | 65.48 | 0.76 | 0.33 | 0.23 | -0.18 | 0.28 | 0.00 | 0.00 | NA | 0.03 | 0.03 | 0.03 | -1.33 | 0.09 | 0.09 | 0.06 | NA | NA | NA | NA | NA | -0.01 | 0.04 | 0.04 | -0.27 | 0.08 | -0.10 | 0.27 | 0.52 | -0.50 | -0.52 | -0.27 | -0.46 | -0.44 | -0.52 | -0.49 | NA | NA | NA | |
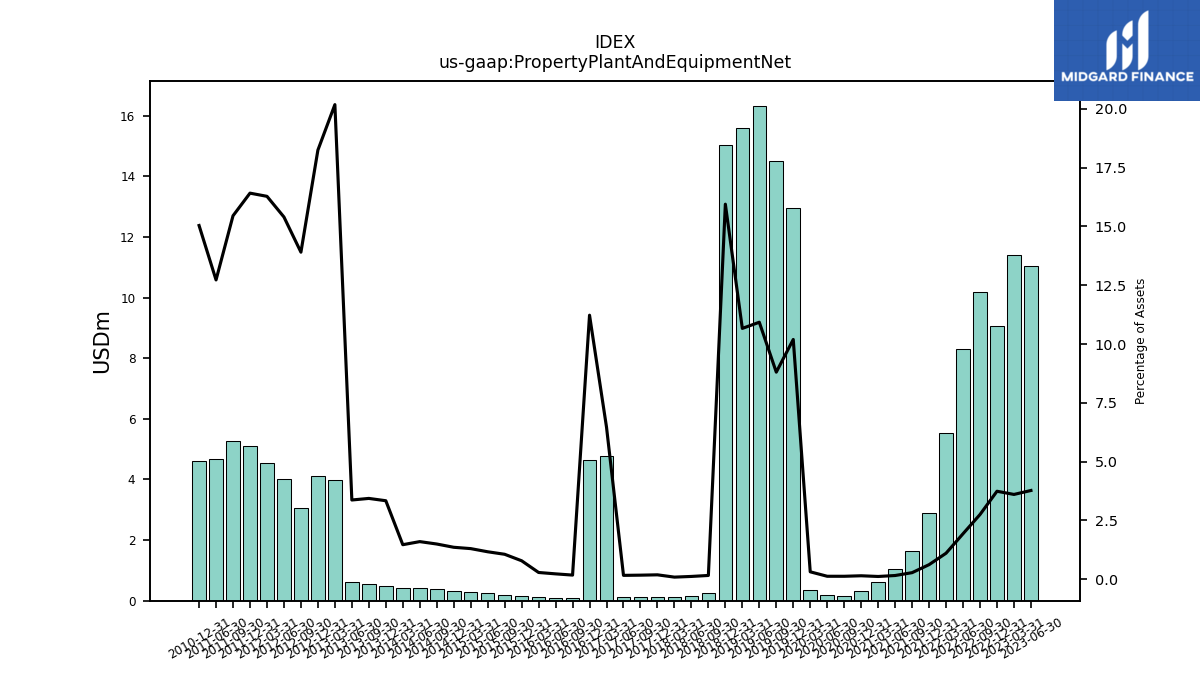
| Property Plant And Equipment Net | 11.03 | 11.41 | 9.07 | 10.17 | 8.32 | 5.55 | 2.90 | 1.63 | 1.06 | 0.63 | 0.33 | 0.17 | 0.18 | 0.35 | 12.94 | 14.50 | 16.32 | 15.59 | 15.03 | 0.26 | 0.17 | 0.12 | 0.11 | 0.12 | 0.12 | 4.76 | 4.64 | 0.08 | 0.09 | 0.12 | 0.15 | 0.20 | 0.25 | 0.29 | 0.32 | 0.38 | 0.43 | 0.43 | 0.50 | 0.57 | 0.61 | 3.98 | 4.10 | 3.06 | 4.01 | 4.56 | 5.10 | 5.28 | 4.67 | NA | 4.61 | NA | NA | |
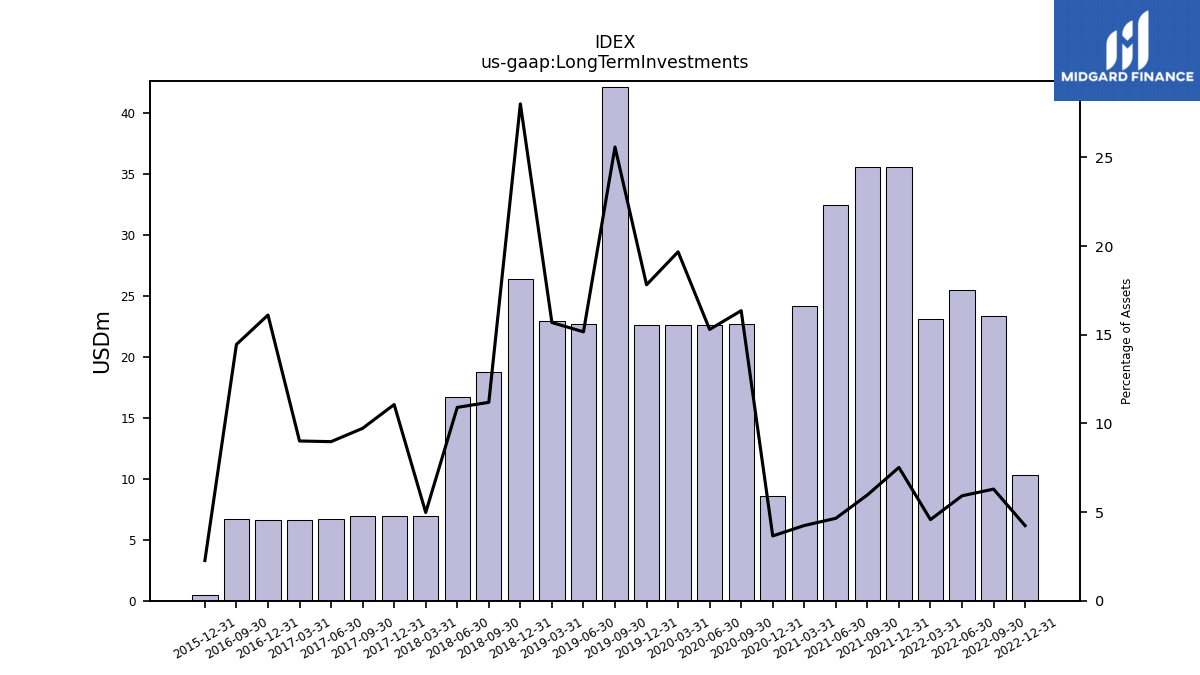
| Long Term Investments | NA | NA | 10.28 | 23.32 | 25.52 | 23.07 | 35.59 | 35.55 | 32.46 | 24.18 | 8.57 | 22.65 | 22.64 | 22.62 | 22.62 | 42.16 | 22.66 | 22.94 | 26.41 | 18.77 | 16.75 | 6.97 | 6.98 | 6.96 | 6.66 | 6.64 | 6.65 | 6.70 | NA | NA | 0.45 | NA | NA | NA | NA | NA | NA | NA | NA | NA | NA | NA | NA | NA | NA | NA | NA | NA | NA | NA | NA | NA | NA | |
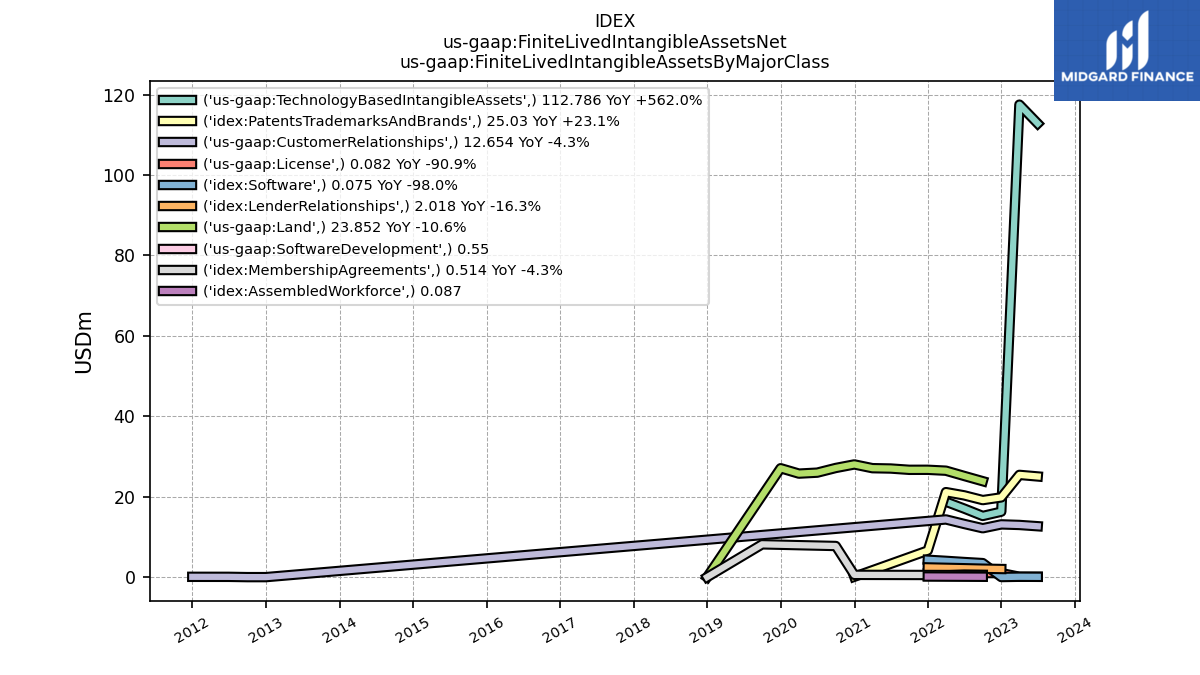
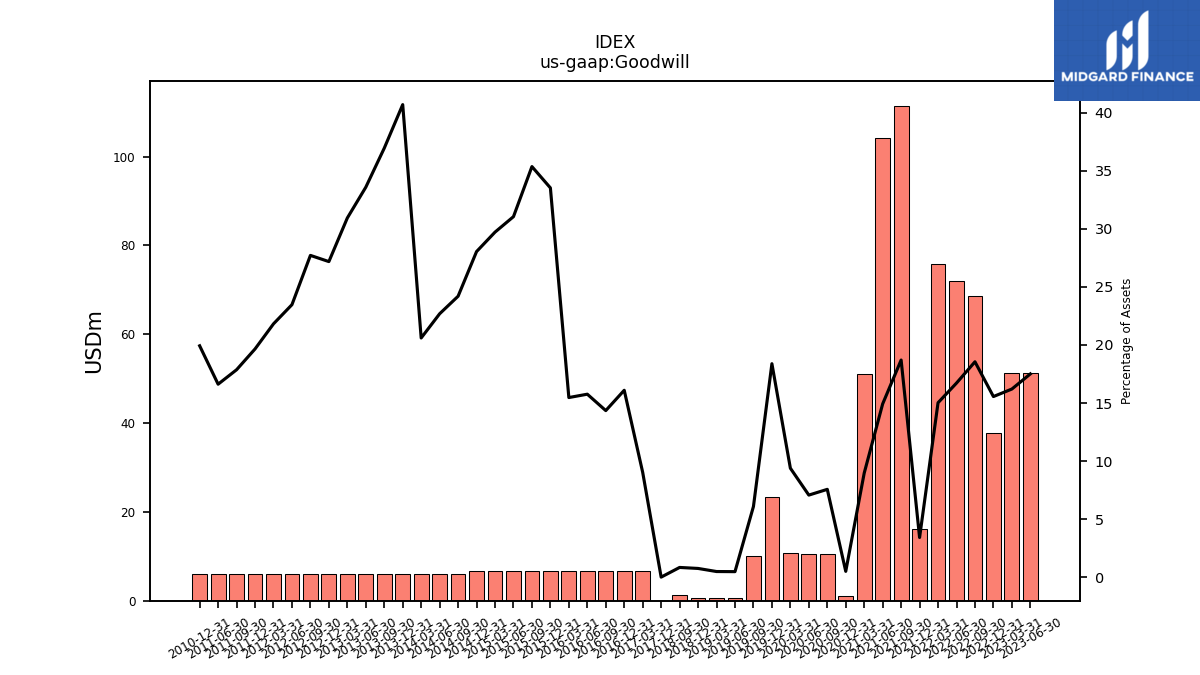
| Goodwill | 51.24 | 51.37 | 37.77 | 68.71 | 72.10 | 75.75 | 16.16 | 111.46 | 104.19 | 51.08 | 1.17 | 10.47 | 10.46 | 10.79 | 23.34 | 10.03 | 0.70 | 0.70 | 0.70 | 1.40 | NA | NA | 0.00 | NA | NA | 6.65 | 6.65 | 6.65 | 6.65 | 6.65 | 6.65 | 6.65 | 6.65 | 6.65 | 6.65 | 6.11 | 6.11 | 6.11 | 6.11 | 6.11 | 6.11 | 6.11 | 6.11 | 6.11 | 6.11 | 6.11 | 6.11 | 6.11 | 6.11 | NA | 6.11 | NA | NA | |
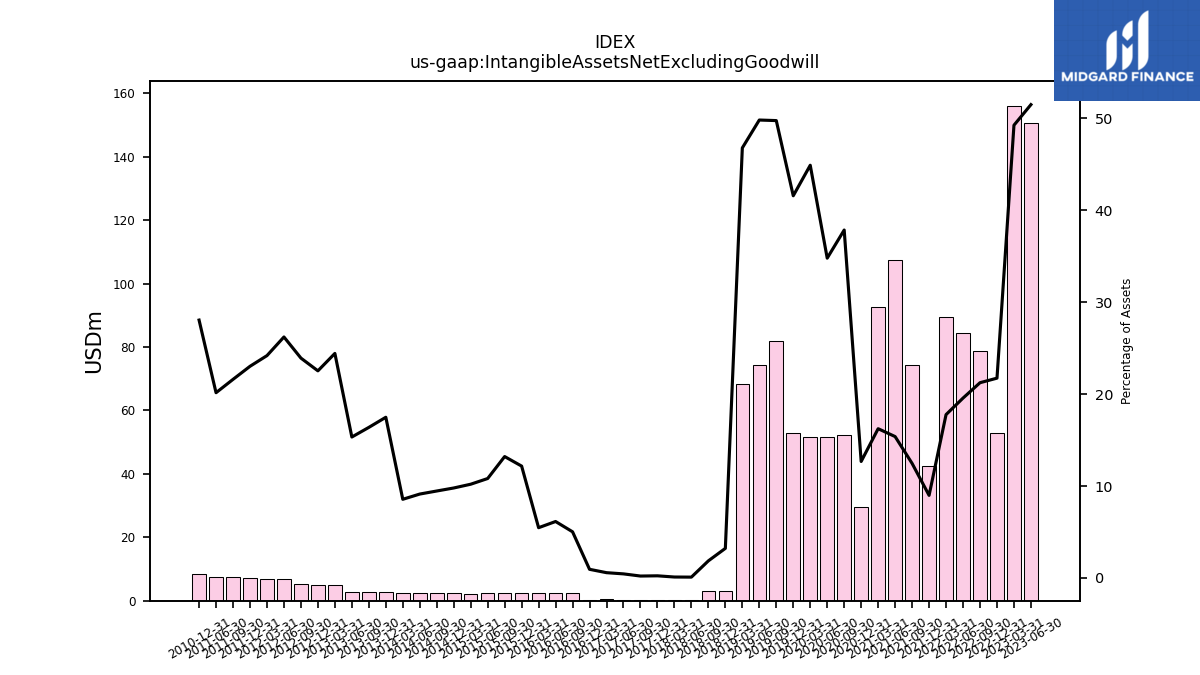
| Intangible Assets Net Excluding Goodwill | 150.65 | 156.09 | 52.77 | 78.64 | 84.37 | 89.58 | 42.55 | 74.25 | 107.35 | 92.53 | 29.70 | 52.40 | 51.48 | 51.59 | 52.77 | 81.96 | 74.41 | 68.39 | 3.04 | 3.12 | 0.14 | 0.15 | 0.15 | 0.15 | 0.33 | 0.43 | 0.39 | 2.33 | 2.59 | 2.35 | 2.41 | 2.48 | 2.32 | 2.28 | 2.32 | 2.39 | 2.46 | 2.54 | 2.62 | 2.71 | 2.79 | 4.82 | 5.06 | 5.27 | 6.82 | 6.77 | 7.15 | 7.38 | 7.40 | NA | 8.59 | NA | NA | |
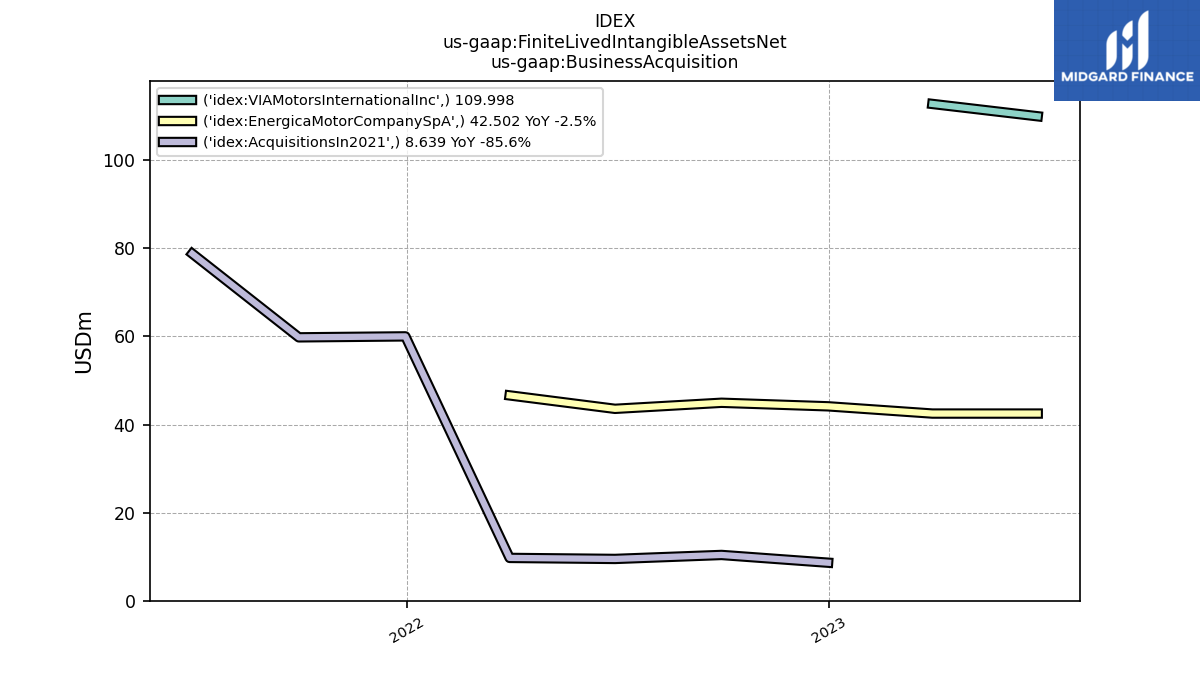
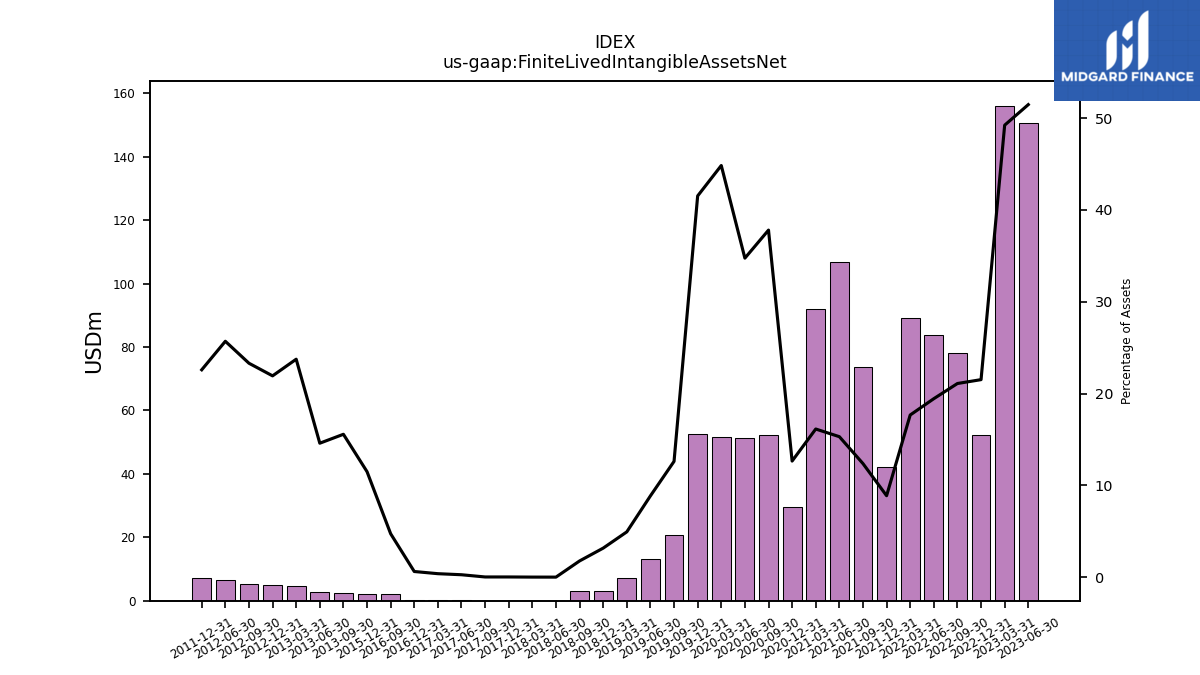
| Finite Lived Intangible Assets Net | 150.63 | 156.06 | 52.24 | 78.12 | 83.84 | 89.06 | 42.02 | 73.72 | 106.83 | 91.97 | 29.65 | 52.34 | 51.43 | 51.54 | 52.72 | 20.78 | 13.23 | 7.22 | 2.98 | 2.97 | 0.01 | 0.01 | 0.01 | 0.02 | 0.20 | 0.28 | 0.26 | 2.19 | NA | NA | 2.28 | NA | NA | NA | NA | NA | NA | NA | NA | 2.57 | 2.65 | 4.68 | 4.92 | 5.13 | 6.68 | NA | 7.02 | NA | NA | NA | NA | NA | NA | |
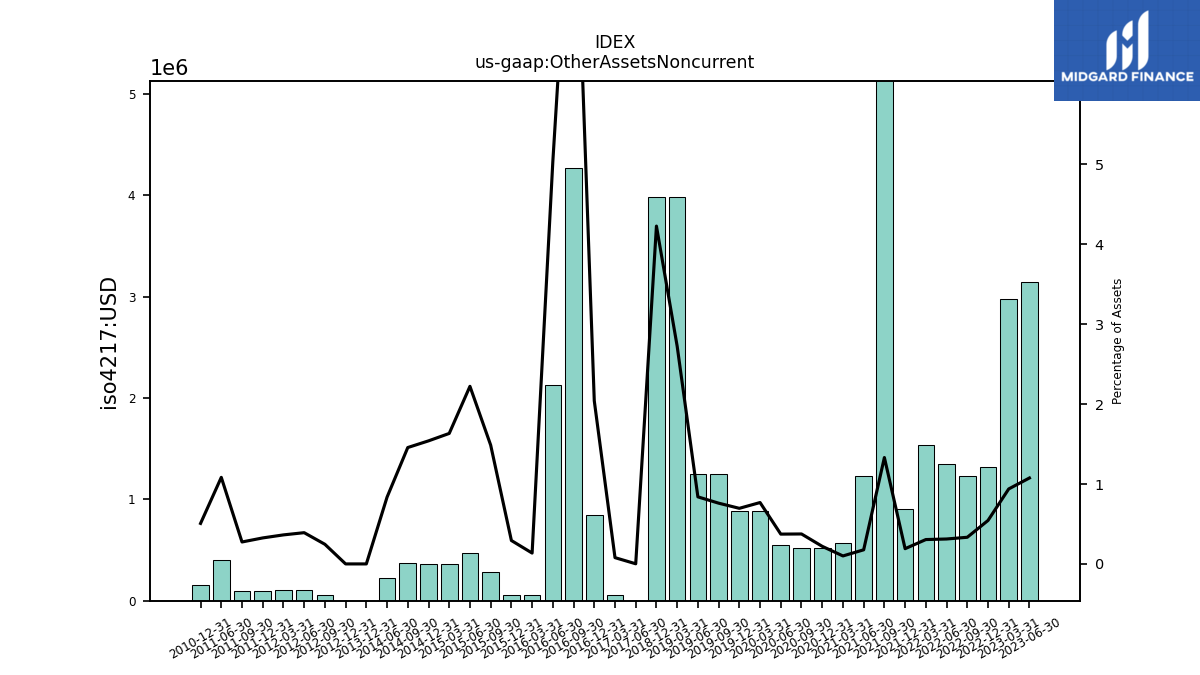
| Other Assets Noncurrent | 3.15 | 2.97 | 1.32 | 1.24 | 1.34 | 1.54 | 0.90 | 7.93 | 1.23 | 0.57 | 0.52 | 0.52 | 0.55 | 0.88 | 0.88 | 1.25 | 1.25 | 3.98 | 3.98 | NA | NA | NA | NA | NA | 0.00 | 0.06 | 0.84 | 4.27 | 2.12 | 0.06 | 0.06 | 0.28 | 0.48 | 0.37 | 0.37 | 0.37 | 0.22 | NA | 0.00 | NA | NA | NA | 0.00 | 0.05 | 0.10 | 0.10 | 0.10 | 0.09 | 0.40 | NA | 0.16 | NA | NA |
| 2023-06-30 | 2023-03-31 | 2022-12-31 | 2022-09-30 | 2022-06-30 | 2022-03-31 | 2021-12-31 | 2021-09-30 | 2021-06-30 | 2021-03-31 | 2020-12-31 | 2020-09-30 | 2020-06-30 | 2020-03-31 | 2019-12-31 | 2019-09-30 | 2019-06-30 | 2019-03-31 | 2018-12-31 | 2018-09-30 | 2018-06-30 | 2018-03-31 | 2017-12-31 | 2017-09-30 | 2017-06-30 | 2017-03-31 | 2016-12-31 | 2016-09-30 | 2016-06-30 | 2016-03-31 | 2015-12-31 | 2015-09-30 | 2015-06-30 | 2015-03-31 | 2014-12-31 | 2014-09-30 | 2014-06-30 | 2014-03-31 | 2013-12-31 | 2013-09-30 | 2013-06-30 | 2013-03-31 | 2012-12-31 | 2012-09-30 | 2012-06-30 | 2012-03-31 | 2011-12-31 | 2011-09-30 | 2011-06-30 | 2011-03-31 | 2010-12-31 | 2010-09-30 | 2010-06-30 | ||
|---|---|---|---|---|---|---|---|---|---|---|---|---|---|---|---|---|---|---|---|---|---|---|---|---|---|---|---|---|---|---|---|---|---|---|---|---|---|---|---|---|---|---|---|---|---|---|---|---|---|---|---|---|---|---|
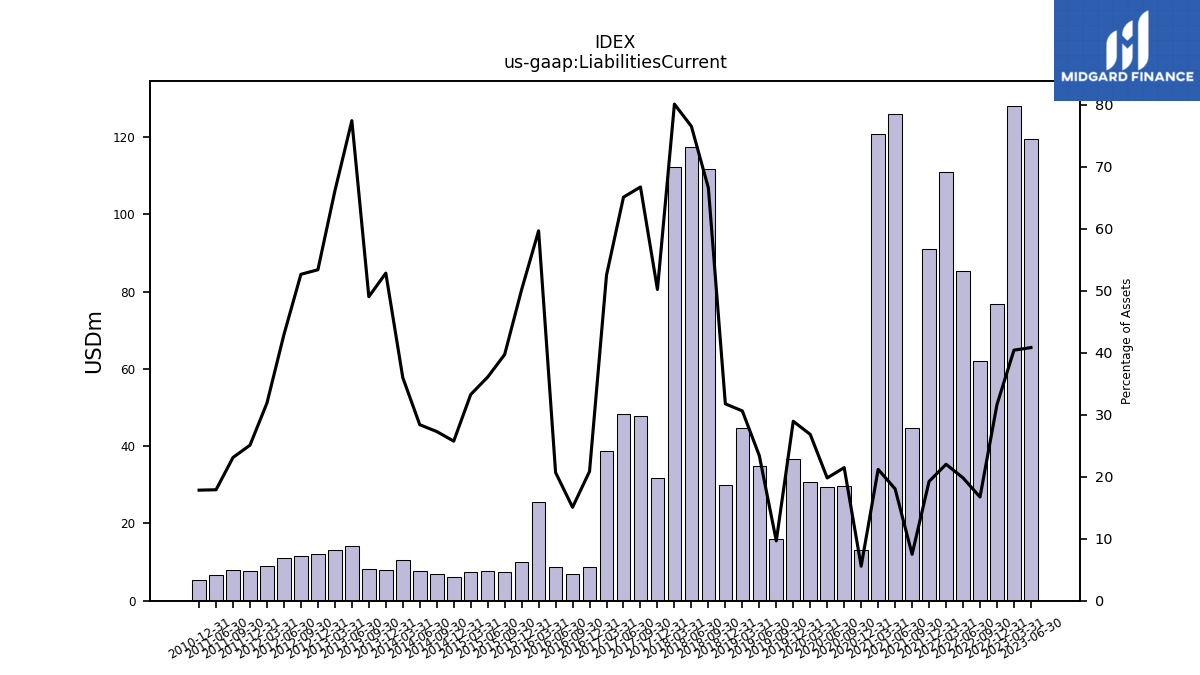
| Liabilities Current | 119.52 | 128.14 | 76.86 | 61.96 | 85.49 | 110.99 | 91.12 | 44.66 | 125.97 | 120.78 | 13.06 | 29.73 | 29.32 | 30.85 | 36.76 | 15.91 | 34.98 | 44.78 | 29.93 | 111.70 | 117.53 | 112.21 | 31.66 | 47.76 | 48.36 | 38.68 | 8.62 | 6.99 | 8.73 | 25.65 | 9.95 | 7.47 | 7.72 | 7.44 | 6.10 | 6.89 | 7.64 | 10.67 | 7.93 | 8.10 | 14.08 | 13.04 | 11.99 | 11.60 | 11.17 | 8.93 | 7.80 | 7.90 | 6.58 | NA | 5.47 | NA | NA | |
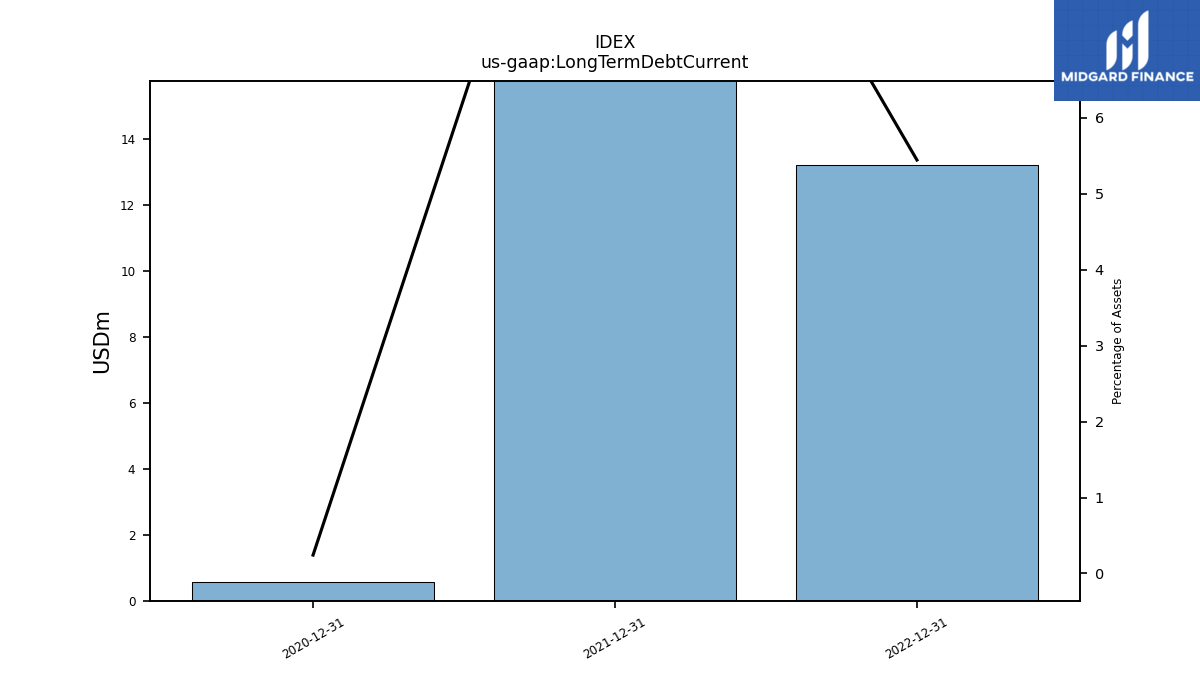
| Long Term Debt Current | NA | NA | 13.22 | NA | NA | NA | 58.12 | NA | NA | NA | 0.57 | NA | NA | NA | NA | NA | NA | NA | NA | NA | NA | NA | NA | NA | NA | NA | NA | NA | NA | NA | NA | NA | NA | NA | NA | NA | NA | NA | NA | NA | NA | NA | NA | NA | NA | NA | NA | NA | NA | NA | NA | NA | NA | |
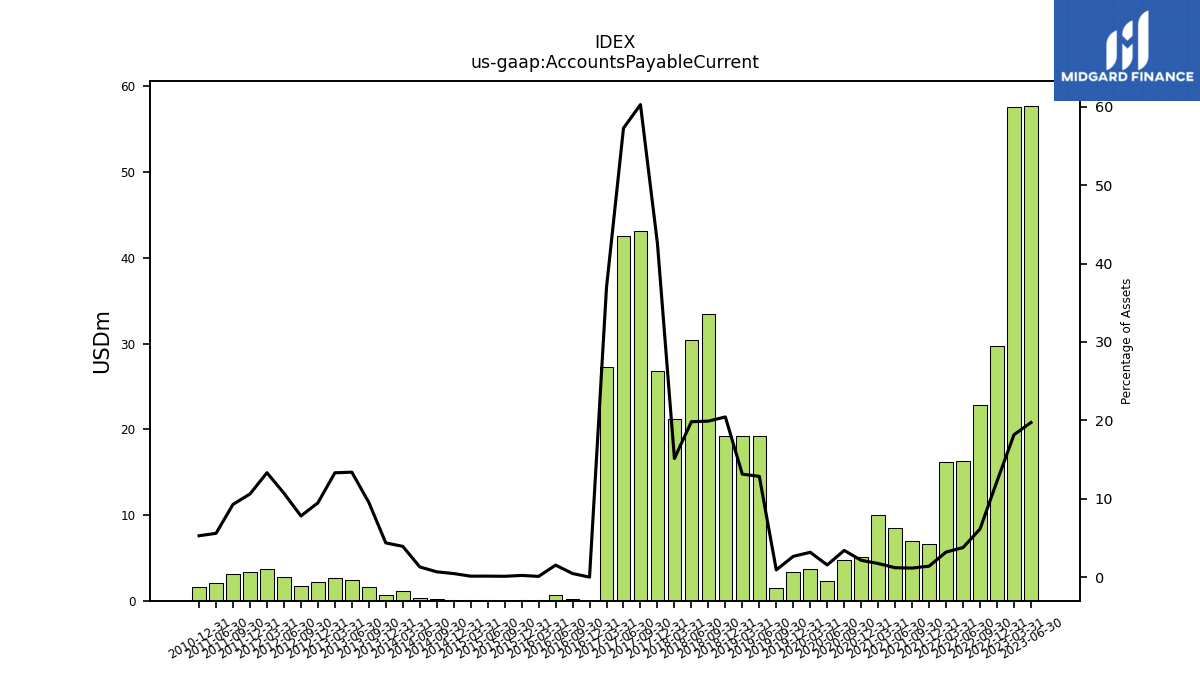
| Accounts Payable Current | 57.74 | 57.60 | 29.70 | 22.78 | 16.31 | 16.18 | 6.67 | 6.94 | 8.46 | 9.98 | 5.06 | 4.74 | 2.31 | 3.66 | 3.38 | 1.54 | 19.22 | 19.22 | 19.27 | 33.39 | 30.45 | 21.21 | 26.83 | 43.13 | 42.54 | 27.23 | 0.01 | 0.22 | 0.65 | 0.05 | 0.05 | 0.02 | 0.03 | 0.03 | 0.11 | 0.17 | 0.35 | 1.17 | 0.66 | 1.58 | 2.43 | 2.63 | 2.13 | 1.72 | 2.79 | 3.73 | 3.30 | 3.18 | 2.06 | NA | 1.62 | NA | NA | |
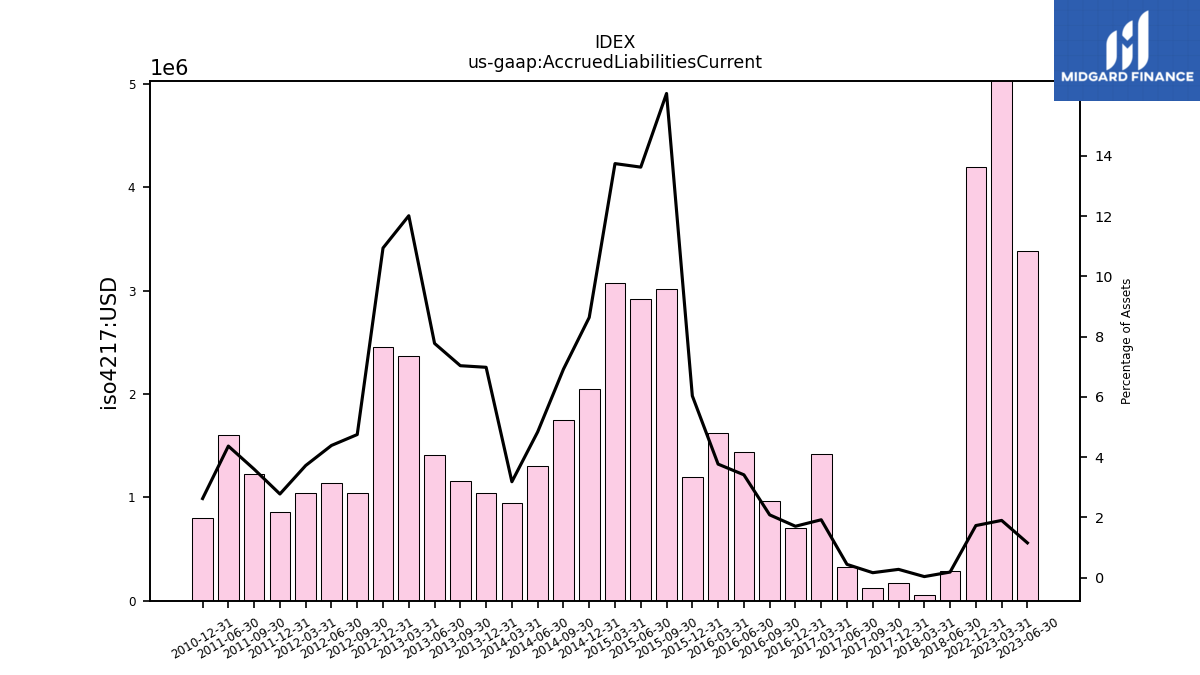
| Accrued Liabilities Current | 3.38 | 6.02 | 4.20 | NA | NA | NA | NA | NA | NA | NA | NA | NA | NA | NA | NA | NA | NA | NA | NA | NA | 0.29 | 0.05 | 0.17 | 0.12 | 0.33 | 1.42 | 0.70 | 0.97 | 1.44 | 1.62 | 1.20 | 3.02 | 2.92 | 3.07 | 2.05 | 1.75 | 1.30 | 0.94 | 1.05 | 1.16 | 1.41 | 2.37 | 2.46 | 1.05 | 1.14 | 1.04 | 0.86 | 1.23 | 1.60 | NA | 0.80 | NA | NA | |
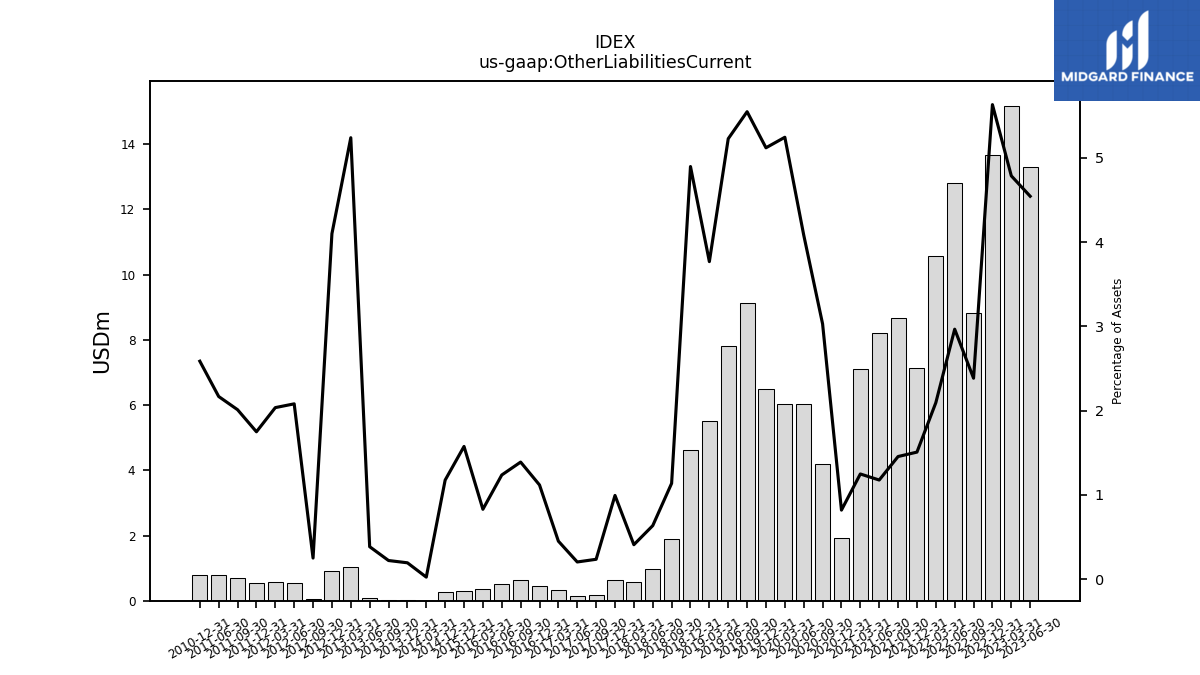
| Other Liabilities Current | 13.30 | 15.17 | 13.68 | 8.83 | 12.79 | 10.56 | 7.14 | 8.67 | 8.21 | 7.11 | 1.92 | 4.20 | 6.04 | 6.03 | 6.50 | 9.14 | 7.81 | 5.51 | 4.62 | 1.91 | 0.97 | 0.57 | 0.63 | 0.17 | 0.15 | 0.33 | 0.46 | 0.64 | 0.52 | 0.36 | 0.31 | NA | NA | NA | 0.28 | NA | NA | 0.01 | 0.03 | 0.04 | 0.07 | 1.03 | 0.92 | 0.06 | 0.54 | 0.57 | 0.54 | 0.69 | 0.80 | NA | 0.79 | NA | NA | |
| Contract With Customer Liability Current | 2.76 | 2.50 | 2.75 | 3.54 | 6.05 | 8.37 | 5.39 | 4.46 | NA | NA | 1.13 | NA | NA | NA | NA | NA | NA | NA | NA | NA | NA | NA | NA | NA | NA | NA | NA | NA | NA | NA | NA | NA | NA | NA | NA | NA | NA | NA | NA | NA | NA | NA | NA | NA | NA | NA | NA | NA | NA | NA | NA | NA | NA |
| 2023-06-30 | 2023-03-31 | 2022-12-31 | 2022-09-30 | 2022-06-30 | 2022-03-31 | 2021-12-31 | 2021-09-30 | 2021-06-30 | 2021-03-31 | 2020-12-31 | 2020-09-30 | 2020-06-30 | 2020-03-31 | 2019-12-31 | 2019-09-30 | 2019-06-30 | 2019-03-31 | 2018-12-31 | 2018-09-30 | 2018-06-30 | 2018-03-31 | 2017-12-31 | 2017-09-30 | 2017-06-30 | 2017-03-31 | 2016-12-31 | 2016-09-30 | 2016-06-30 | 2016-03-31 | 2015-12-31 | 2015-09-30 | 2015-06-30 | 2015-03-31 | 2014-12-31 | 2014-09-30 | 2014-06-30 | 2014-03-31 | 2013-12-31 | 2013-09-30 | 2013-06-30 | 2013-03-31 | 2012-12-31 | 2012-09-30 | 2012-06-30 | 2012-03-31 | 2011-12-31 | 2011-09-30 | 2011-06-30 | 2011-03-31 | 2010-12-31 | 2010-09-30 | 2010-06-30 | ||
|---|---|---|---|---|---|---|---|---|---|---|---|---|---|---|---|---|---|---|---|---|---|---|---|---|---|---|---|---|---|---|---|---|---|---|---|---|---|---|---|---|---|---|---|---|---|---|---|---|---|---|---|---|---|---|
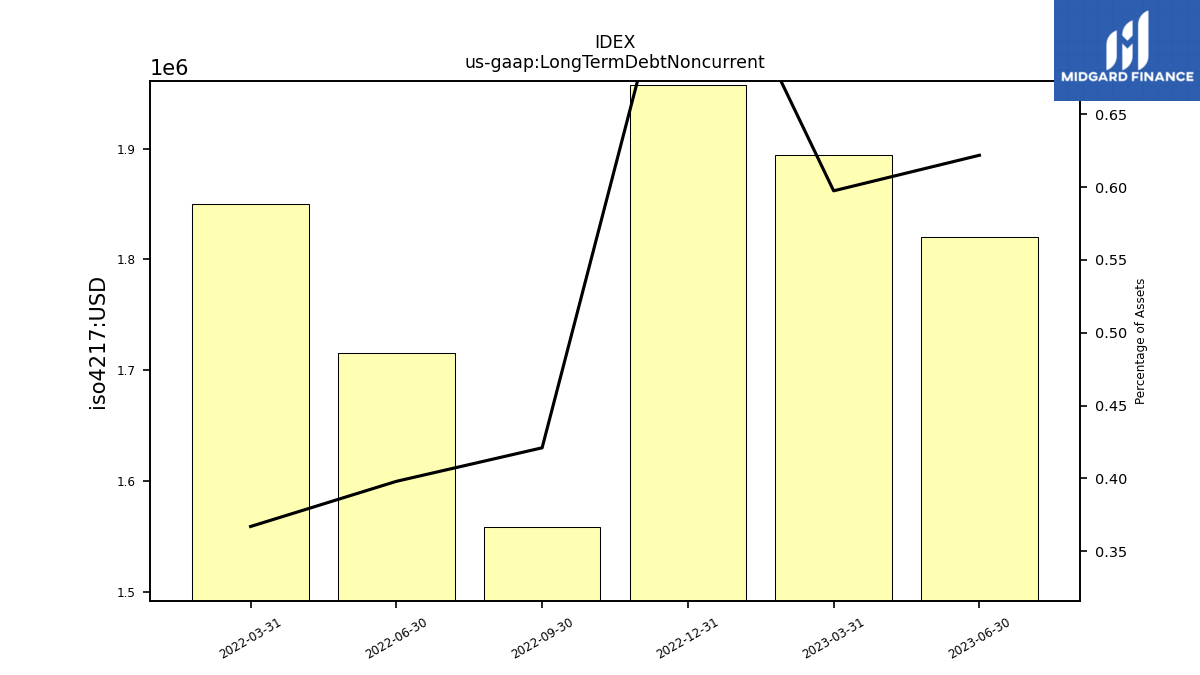
| Long Term Debt Noncurrent | 1.82 | 1.89 | 1.96 | 1.56 | 1.72 | 1.85 | NA | NA | NA | NA | NA | NA | NA | NA | NA | NA | NA | NA | NA | NA | NA | NA | NA | NA | NA | NA | NA | NA | NA | NA | NA | NA | NA | NA | NA | NA | NA | NA | NA | NA | NA | NA | NA | NA | NA | NA | NA | NA | NA | NA | NA | NA | NA | |
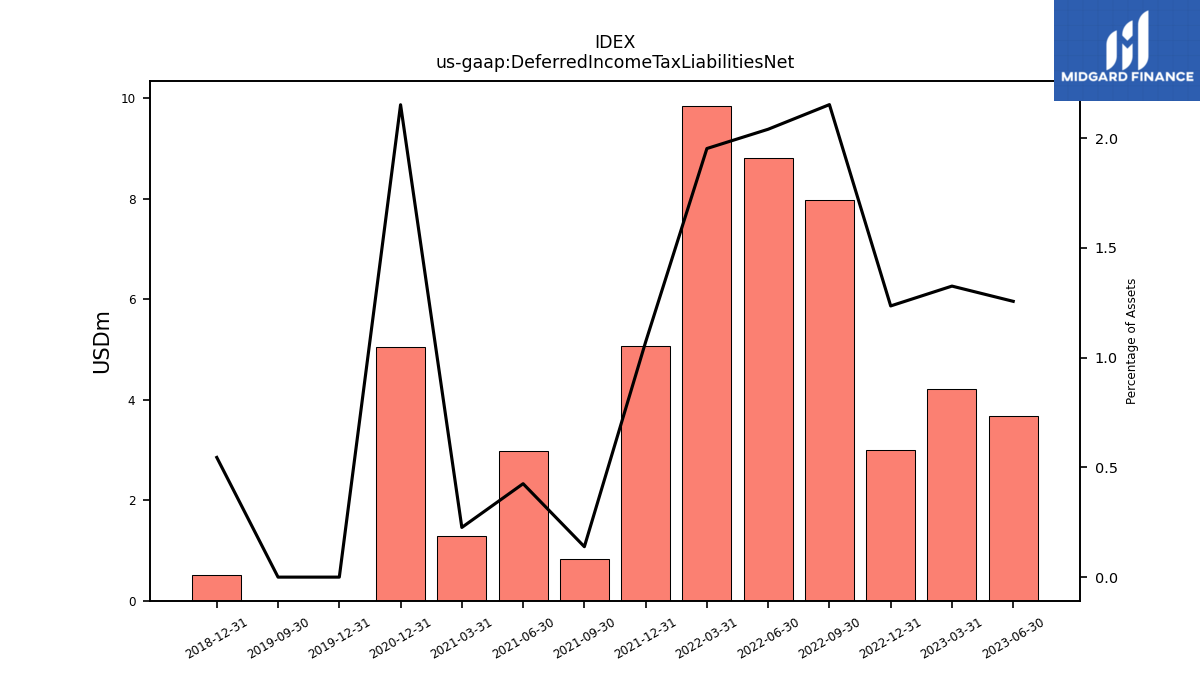
| Deferred Income Tax Liabilities Net | 3.68 | 4.20 | 3.00 | 7.97 | 8.80 | 9.85 | 5.07 | 0.83 | 2.97 | 1.29 | 5.04 | NA | NA | NA | 0.00 | 0.00 | NA | NA | 0.51 | NA | NA | NA | NA | NA | NA | NA | NA | NA | NA | NA | NA | NA | NA | NA | NA | NA | NA | NA | NA | NA | NA | NA | NA | NA | NA | NA | NA | NA | NA | NA | NA | NA | NA | |
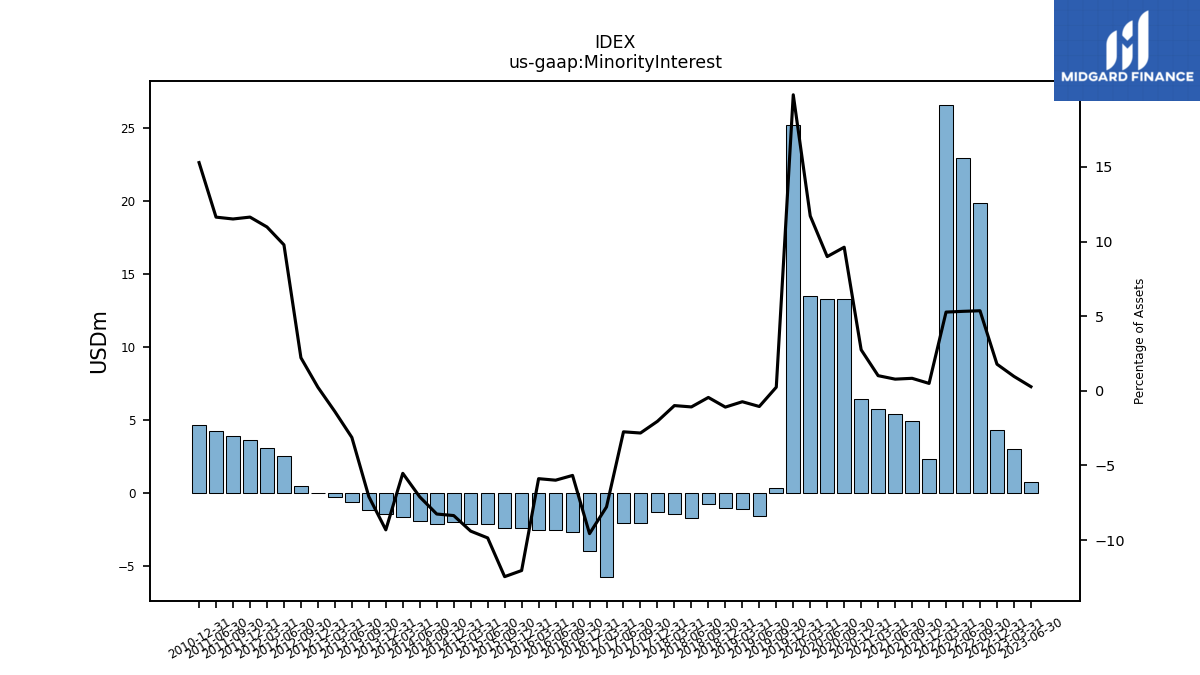
| Minority Interest | 0.80 | 3.06 | 4.33 | 19.86 | 22.96 | 26.59 | 2.34 | 4.98 | 5.44 | 5.77 | 6.44 | 13.32 | 13.31 | 13.47 | 25.18 | 0.40 | -1.57 | -1.07 | -1.03 | -0.75 | -1.66 | -1.39 | -1.29 | -2.03 | -2.04 | -5.73 | -3.95 | -2.63 | -2.53 | -2.53 | -2.39 | -2.34 | -2.11 | -2.10 | -1.98 | -2.08 | -1.91 | -1.64 | -1.40 | -1.17 | -0.57 | -0.28 | 0.05 | 0.49 | 2.54 | 3.07 | 3.61 | 3.93 | 4.27 | NA | 4.68 | NA | NA | |
| Other Liabilities Noncurrent | 1.46 | 2.02 | 0.96 | 0.77 | 0.72 | 0.63 | 0.62 | 7.71 | 1.28 | 1.18 | 0.54 | 0.51 | NA | NA | 0.00 | NA | NA | NA | 0.00 | NA | NA | NA | NA | NA | NA | NA | NA | NA | NA | NA | NA | NA | NA | NA | NA | NA | NA | NA | NA | NA | NA | NA | NA | NA | NA | NA | NA | NA | NA | NA | NA | NA | NA | |
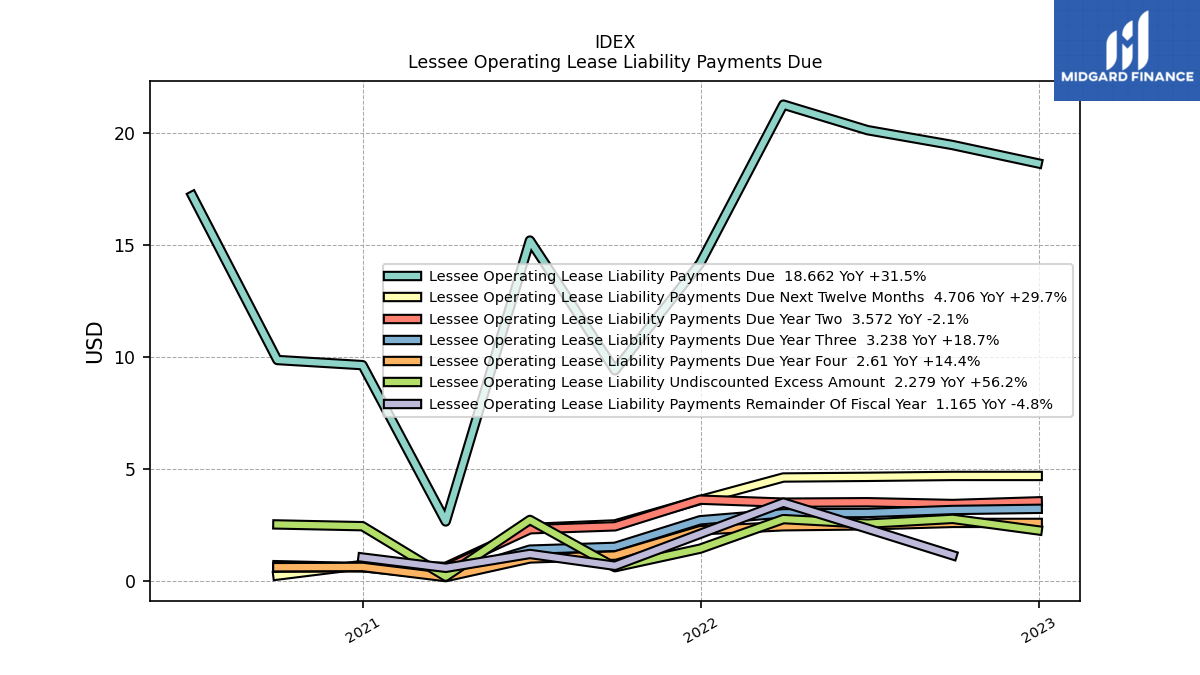
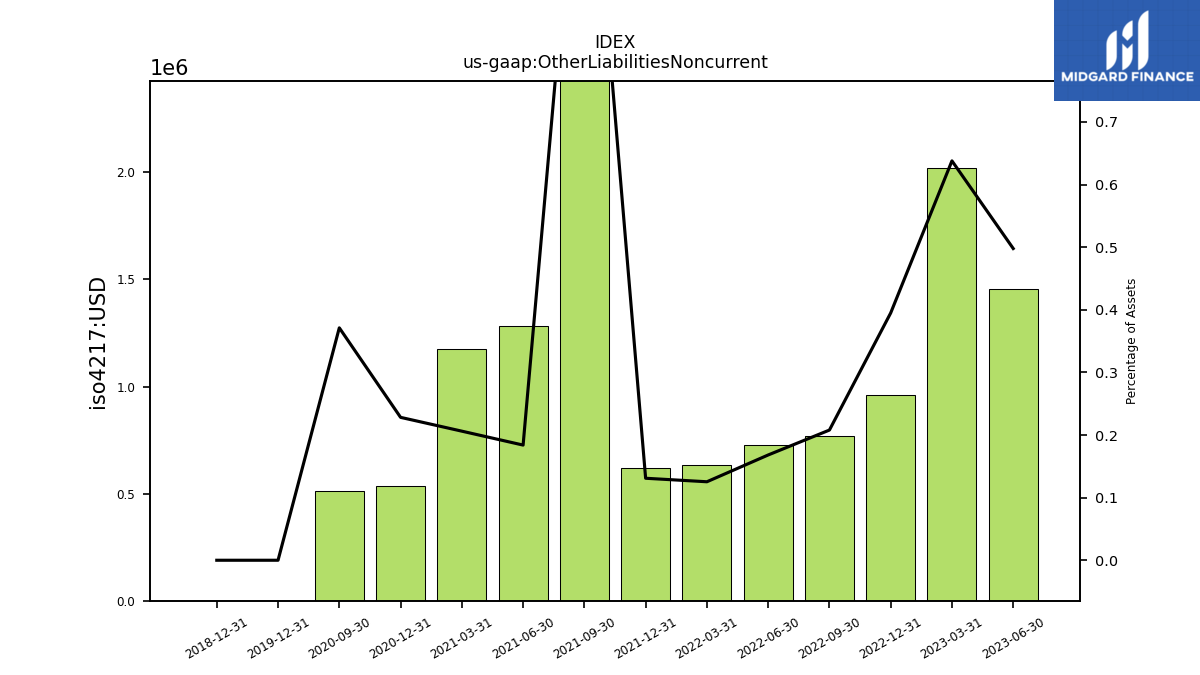
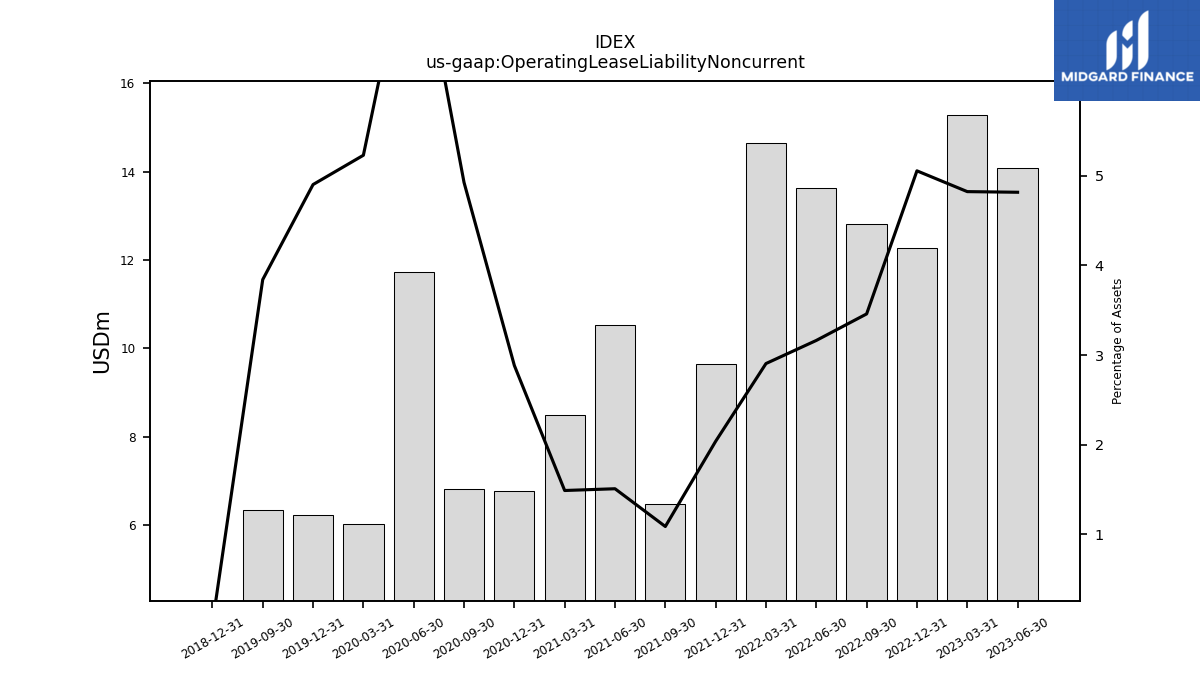
| Operating Lease Liability Noncurrent | 14.09 | 15.29 | 12.27 | 12.81 | 13.64 | 14.65 | 9.65 | 6.48 | 10.53 | 8.48 | 6.76 | 6.82 | 11.72 | 6.01 | 6.22 | 6.33 | NA | NA | 0.00 | NA | NA | NA | NA | NA | NA | NA | NA | NA | NA | NA | NA | NA | NA | NA | NA | NA | NA | NA | NA | NA | NA | NA | NA | NA | NA | NA | NA | NA | NA | NA | NA | NA | NA |
| 2023-06-30 | 2023-03-31 | 2022-12-31 | 2022-09-30 | 2022-06-30 | 2022-03-31 | 2021-12-31 | 2021-09-30 | 2021-06-30 | 2021-03-31 | 2020-12-31 | 2020-09-30 | 2020-06-30 | 2020-03-31 | 2019-12-31 | 2019-09-30 | 2019-06-30 | 2019-03-31 | 2018-12-31 | 2018-09-30 | 2018-06-30 | 2018-03-31 | 2017-12-31 | 2017-09-30 | 2017-06-30 | 2017-03-31 | 2016-12-31 | 2016-09-30 | 2016-06-30 | 2016-03-31 | 2015-12-31 | 2015-09-30 | 2015-06-30 | 2015-03-31 | 2014-12-31 | 2014-09-30 | 2014-06-30 | 2014-03-31 | 2013-12-31 | 2013-09-30 | 2013-06-30 | 2013-03-31 | 2012-12-31 | 2012-09-30 | 2012-06-30 | 2012-03-31 | 2011-12-31 | 2011-09-30 | 2011-06-30 | 2011-03-31 | 2010-12-31 | 2010-09-30 | 2010-06-30 | ||
|---|---|---|---|---|---|---|---|---|---|---|---|---|---|---|---|---|---|---|---|---|---|---|---|---|---|---|---|---|---|---|---|---|---|---|---|---|---|---|---|---|---|---|---|---|---|---|---|---|---|---|---|---|---|---|
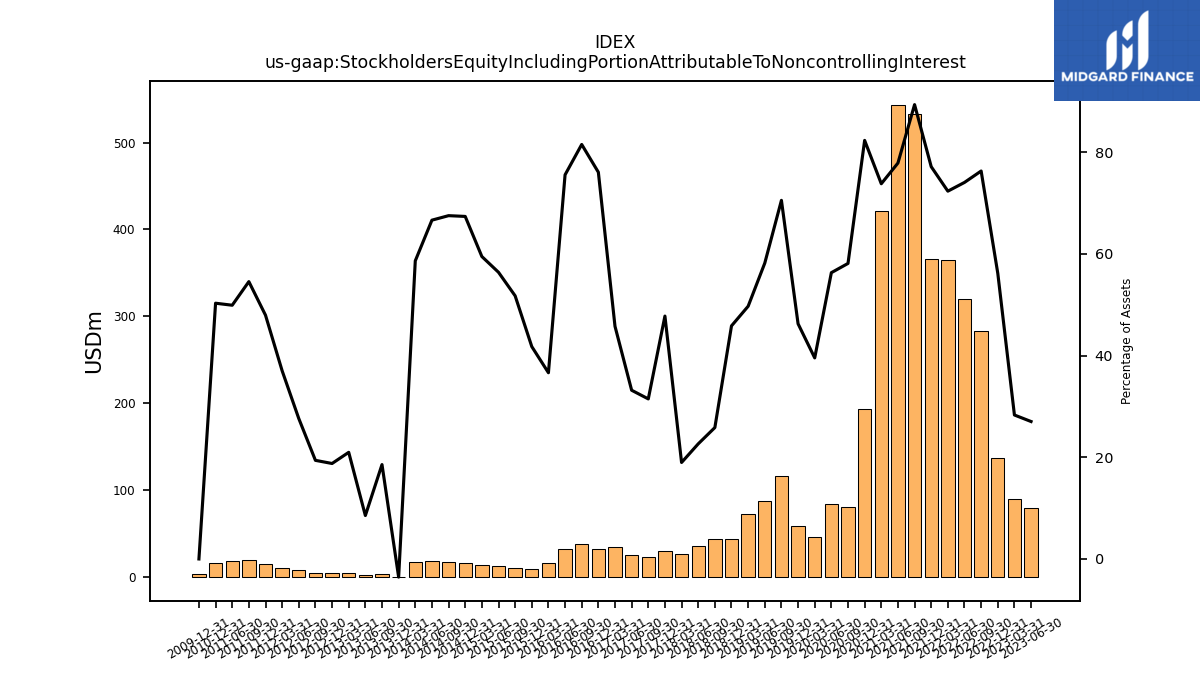
| Stockholders Equity | 78.32 | 86.72 | 132.12 | 262.77 | 296.47 | 338.21 | 363.03 | 527.63 | 538.24 | 414.90 | 186.58 | 67.18 | 70.04 | 32.00 | 33.56 | 115.84 | 88.53 | 73.77 | 44.24 | 44.10 | 36.44 | 27.97 | 31.41 | 24.56 | 26.70 | 39.44 | 35.37 | 40.41 | 34.41 | 18.27 | 10.67 | 12.07 | 14.18 | 15.41 | 17.96 | 19.12 | 19.85 | 19.02 | 0.86 | 4.24 | 2.12 | 4.41 | 4.17 | 3.79 | 4.64 | 7.29 | 11.28 | 14.71 | 14.06 | NA | 10.73 | NA | NA | |
| Stockholders Equity Including Portion Attributable To Noncontrolling Interest | 79.13 | 89.78 | 136.45 | 282.64 | 319.43 | 364.80 | 365.37 | 532.60 | 543.68 | 420.67 | 193.02 | 80.50 | 83.35 | 45.47 | 58.74 | 116.24 | 86.96 | 72.70 | 43.21 | 43.36 | 34.78 | 26.58 | 30.12 | 22.53 | 24.65 | 33.71 | 31.42 | 37.79 | 31.88 | 15.74 | 8.28 | 9.73 | 12.07 | 13.31 | 15.97 | 17.04 | 17.94 | 17.38 | -0.54 | 3.07 | 1.55 | 4.14 | 4.22 | 4.27 | 7.18 | 10.36 | 14.90 | 18.64 | 18.33 | NA | 15.41 | NA | NA | |
| Common Stock Value | 1.41 | 0.92 | 0.60 | 0.52 | 0.50 | 0.50 | 0.50 | 0.48 | 0.47 | 0.42 | 0.34 | 0.24 | 0.24 | 0.16 | 0.15 | 0.13 | 0.11 | 0.11 | 0.10 | 0.08 | 0.07 | 0.07 | 0.07 | 0.06 | 0.06 | 0.06 | 0.05 | 0.04 | 0.04 | 0.03 | 0.02 | 0.02 | 0.02 | 0.02 | 0.02 | 0.02 | 0.02 | 0.02 | 0.02 | 0.02 | 0.02 | 0.01 | 0.01 | 0.01 | 0.01 | 0.01 | 0.01 | 0.79 | 0.79 | NA | 0.66 | NA | NA | |
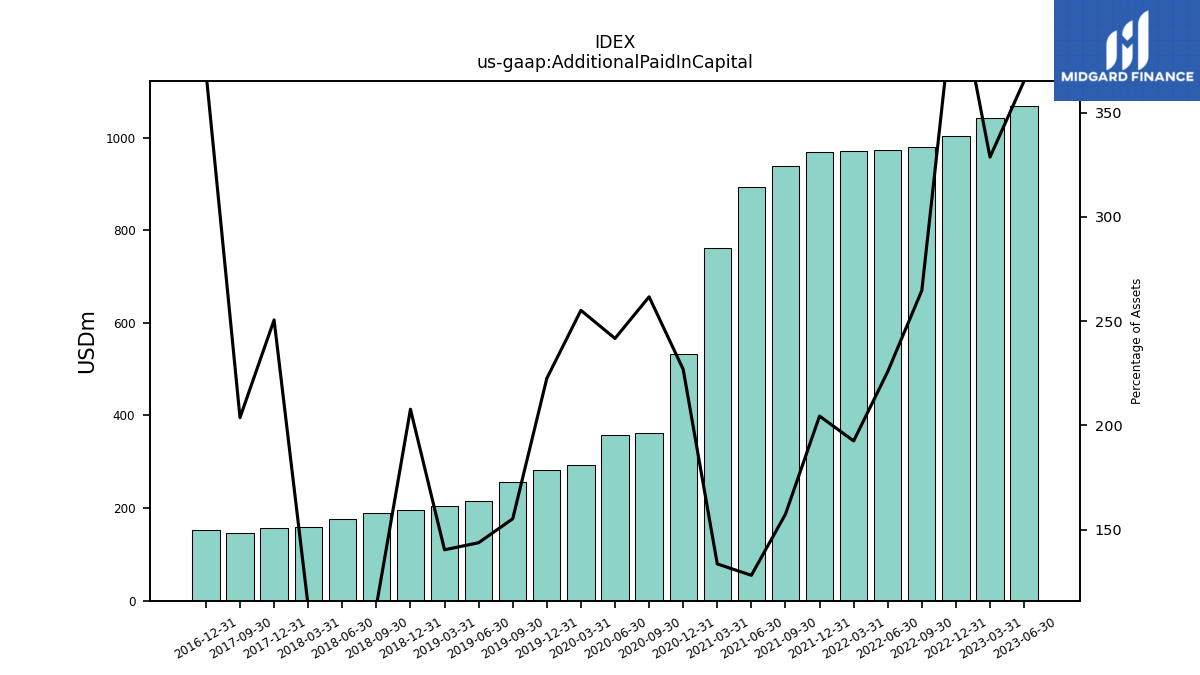
| Additional Paid In Capital | 1068.70 | 1041.95 | 1004.08 | 980.23 | 973.70 | 970.84 | 968.07 | 938.01 | 894.28 | 761.15 | 531.87 | 362.35 | 357.72 | 293.35 | 282.55 | 255.74 | 214.74 | 205.20 | 195.78 | 190.19 | 176.03 | 158.62 | 157.97 | 145.79 | NA | NA | 152.76 | NA | NA | NA | NA | NA | NA | NA | NA | NA | NA | NA | NA | NA | NA | NA | NA | NA | NA | NA | NA | NA | NA | NA | NA | NA | NA | |
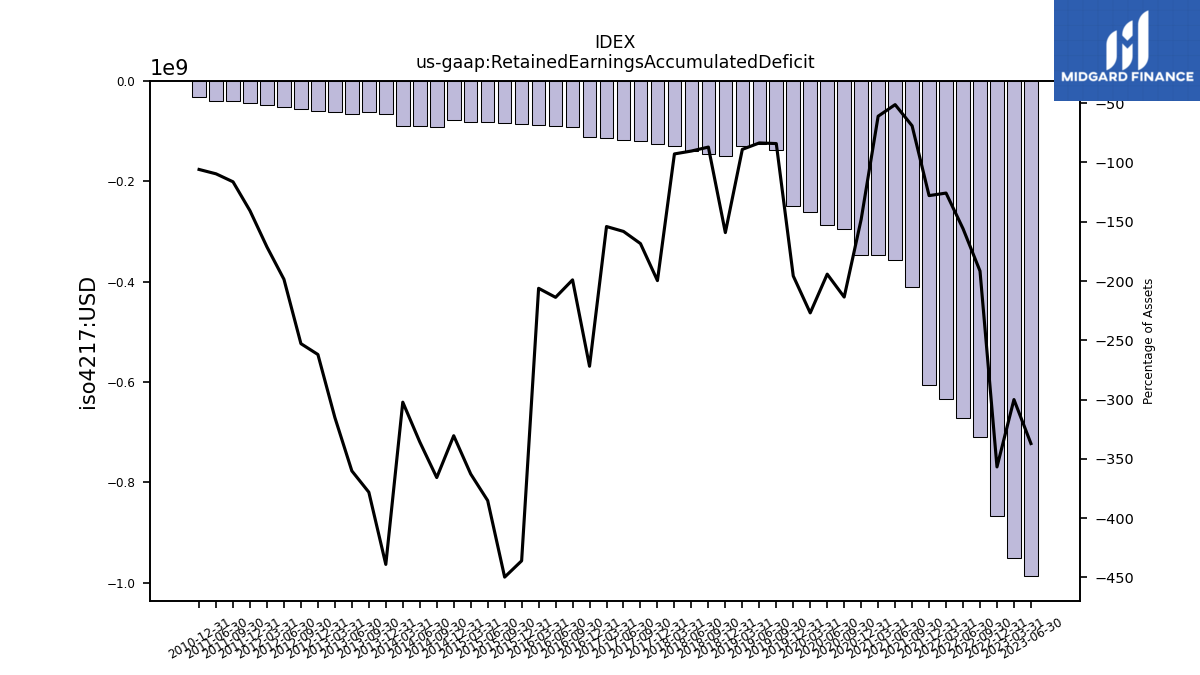
| Retained Earnings Accumulated Deficit | -986.60 | -951.10 | -866.45 | -709.45 | -672.04 | -634.27 | -605.76 | -411.41 | -357.25 | -347.46 | -346.88 | -295.69 | -287.41 | -260.83 | -248.48 | -138.47 | -124.76 | -130.05 | -149.98 | -145.92 | -138.73 | -129.94 | -125.87 | -120.52 | -117.48 | -113.46 | -112.29 | -92.23 | -90.18 | -88.59 | -86.46 | -84.56 | -82.47 | -81.16 | -78.36 | -92.29 | -90.35 | -89.55 | -65.86 | -62.48 | -65.47 | -62.19 | -58.84 | -55.69 | -51.65 | -47.92 | -43.70 | -39.74 | -40.25 | NA | -32.43 | NA | NA | |
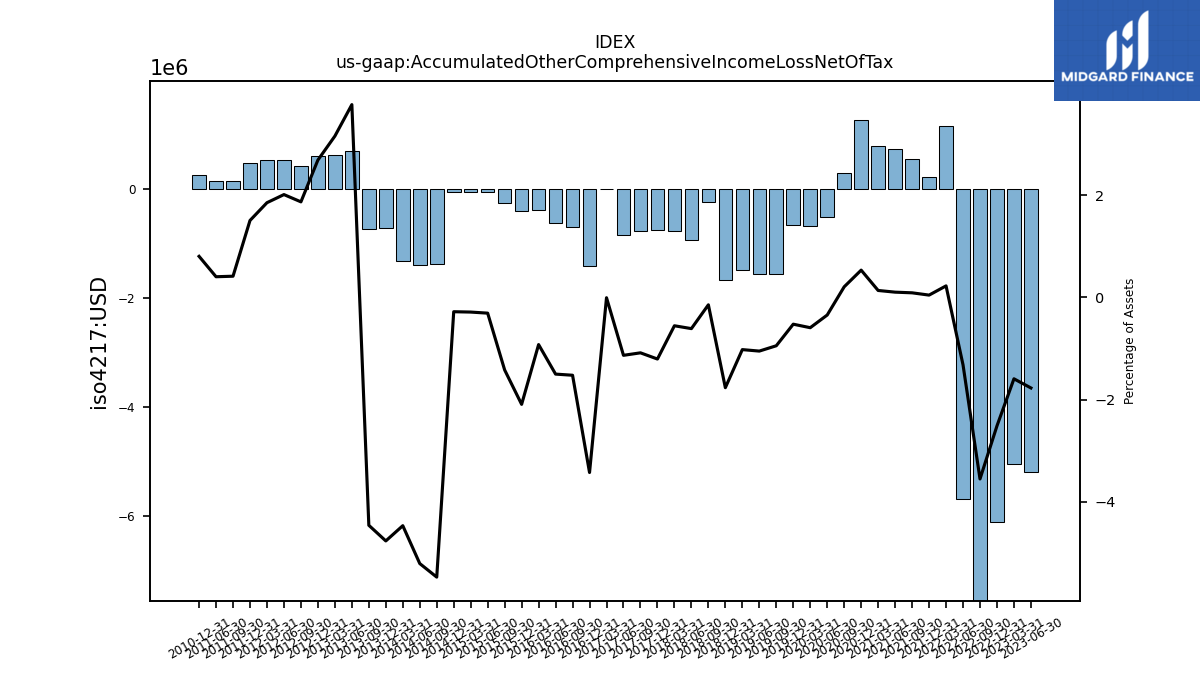
| Accumulated Other Comprehensive Income Loss Net Of Tax | -5.18 | -5.05 | -6.10 | -13.16 | -5.69 | 1.15 | 0.22 | 0.55 | 0.73 | 0.78 | 1.26 | 0.29 | -0.51 | -0.68 | -0.66 | -1.56 | -1.57 | -1.49 | -1.66 | -0.24 | -0.94 | -0.78 | -0.76 | -0.78 | -0.84 | -0.00 | -1.42 | -0.71 | -0.63 | -0.40 | -0.41 | -0.27 | -0.07 | -0.06 | -0.07 | -1.38 | -1.40 | -1.32 | -0.72 | -0.74 | 0.69 | 0.62 | 0.60 | 0.41 | 0.52 | 0.52 | 0.47 | 0.14 | 0.15 | NA | 0.25 | NA | NA | |
| Minority Interest | 0.80 | 3.06 | 4.33 | 19.86 | 22.96 | 26.59 | 2.34 | 4.98 | 5.44 | 5.77 | 6.44 | 13.32 | 13.31 | 13.47 | 25.18 | 0.40 | -1.57 | -1.07 | -1.03 | -0.75 | -1.66 | -1.39 | -1.29 | -2.03 | -2.04 | -5.73 | -3.95 | -2.63 | -2.53 | -2.53 | -2.39 | -2.34 | -2.11 | -2.10 | -1.98 | -2.08 | -1.91 | -1.64 | -1.40 | -1.17 | -0.57 | -0.28 | 0.05 | 0.49 | 2.54 | 3.07 | 3.61 | 3.93 | 4.27 | NA | 4.68 | NA | NA | |
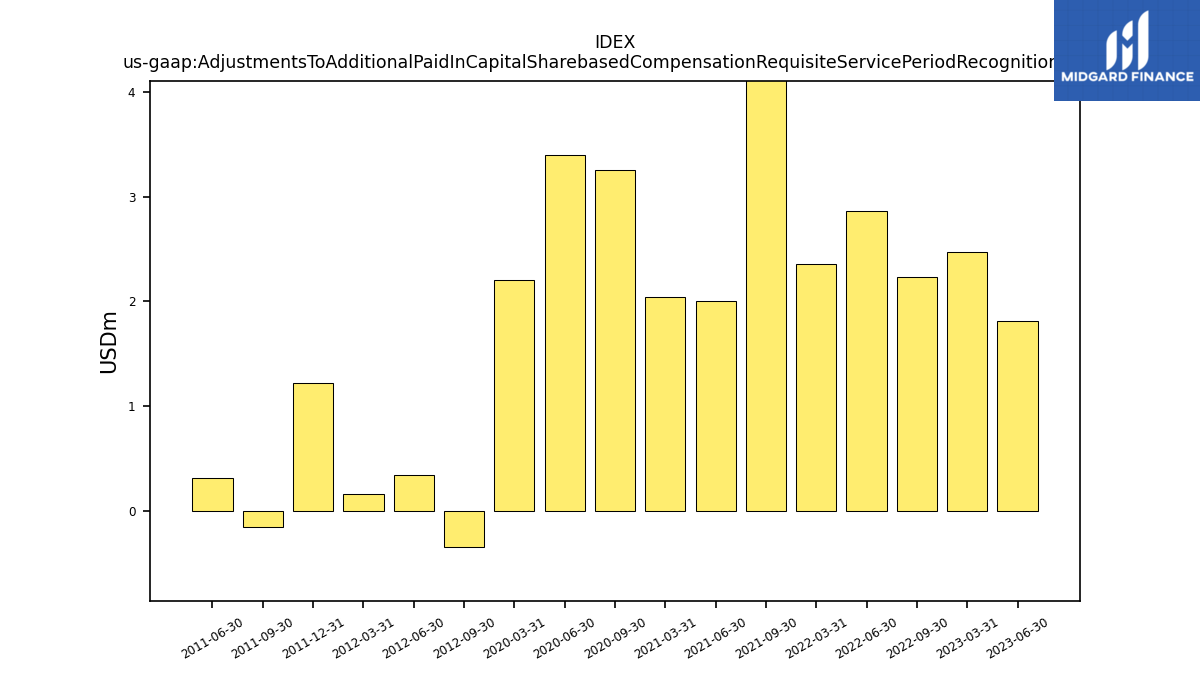
| Adjustments To Additional Paid In Capital Sharebased Compensation Requisite Service Period Recognition Value | 1.82 | 2.47 | NA | 2.23 | 2.86 | 2.35 | NA | 15.19 | 2.01 | 2.04 | NA | 3.25 | 3.39 | 2.20 | NA | NA | NA | NA | NA | NA | NA | NA | NA | NA | NA | NA | NA | NA | NA | NA | NA | NA | NA | NA | NA | NA | NA | NA | NA | NA | NA | NA | NA | -0.34 | 0.34 | 0.16 | 1.22 | -0.15 | 0.31 | NA | NA | NA | NA |
| 2023-06-30 | 2023-03-31 | 2022-12-31 | 2022-09-30 | 2022-06-30 | 2022-03-31 | 2021-12-31 | 2021-09-30 | 2021-06-30 | 2021-03-31 | 2020-12-31 | 2020-09-30 | 2020-06-30 | 2020-03-31 | 2019-12-31 | 2019-09-30 | 2019-06-30 | 2019-03-31 | 2018-12-31 | 2018-09-30 | 2018-06-30 | 2018-03-31 | 2017-12-31 | 2017-09-30 | 2017-06-30 | 2017-03-31 | 2016-12-31 | 2016-09-30 | 2016-06-30 | 2016-03-31 | 2015-12-31 | 2015-09-30 | 2015-06-30 | 2015-03-31 | 2014-12-31 | 2014-09-30 | 2014-06-30 | 2014-03-31 | 2013-12-31 | 2013-09-30 | 2013-06-30 | 2013-03-31 | 2012-12-31 | 2012-09-30 | 2012-06-30 | 2012-03-31 | 2011-12-31 | 2011-09-30 | 2011-06-30 | 2011-03-31 | 2010-12-31 | 2010-09-30 | 2010-06-30 | ||
|---|---|---|---|---|---|---|---|---|---|---|---|---|---|---|---|---|---|---|---|---|---|---|---|---|---|---|---|---|---|---|---|---|---|---|---|---|---|---|---|---|---|---|---|---|---|---|---|---|---|---|---|---|---|---|
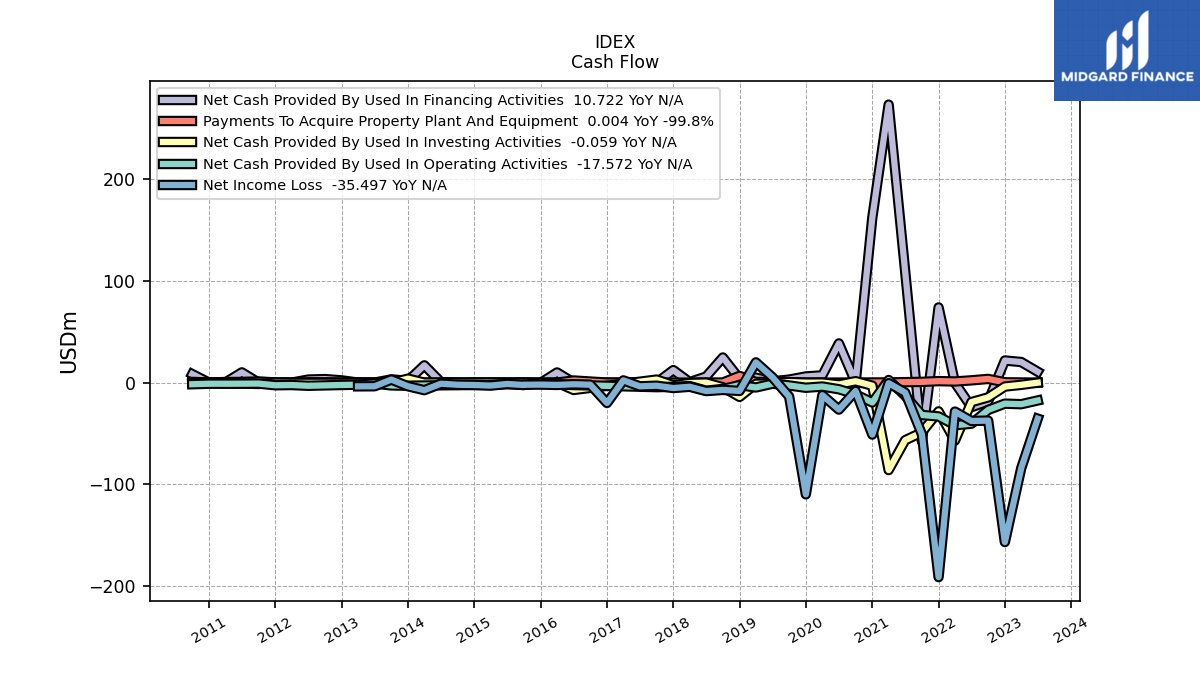
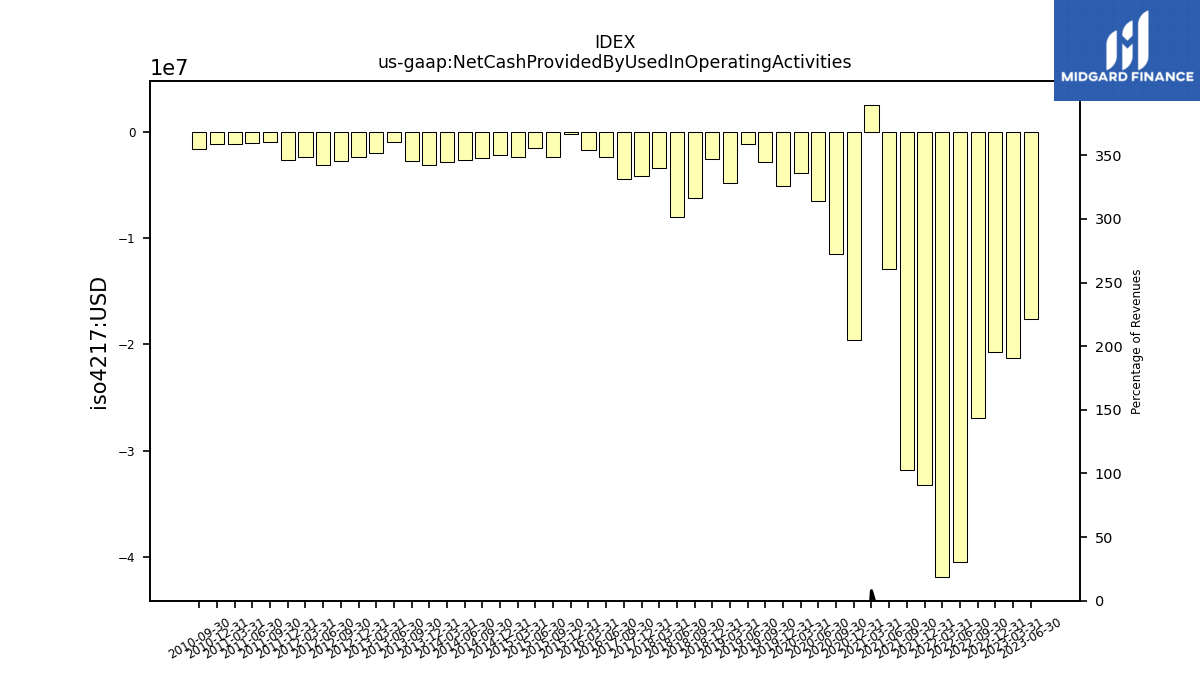
| Net Cash Provided By Used In Operating Activities | -17.57 | -21.25 | -20.70 | -26.92 | -40.45 | -41.92 | -33.29 | -31.87 | -12.94 | 2.57 | -19.55 | -11.53 | -6.53 | -3.86 | -5.07 | -2.82 | -1.12 | -4.77 | -2.52 | -6.22 | -8.02 | -3.40 | -4.13 | -4.46 | NA | NA | NA | NA | -2.36 | -1.73 | -0.22 | -2.34 | -1.48 | -2.40 | -2.18 | -2.50 | -2.65 | -2.84 | -3.07 | -2.77 | -0.91 | -2.02 | -2.34 | -2.73 | -3.12 | -2.40 | -2.61 | -0.96 | -1.05 | -1.12 | -1.10 | -1.59 | NA | |
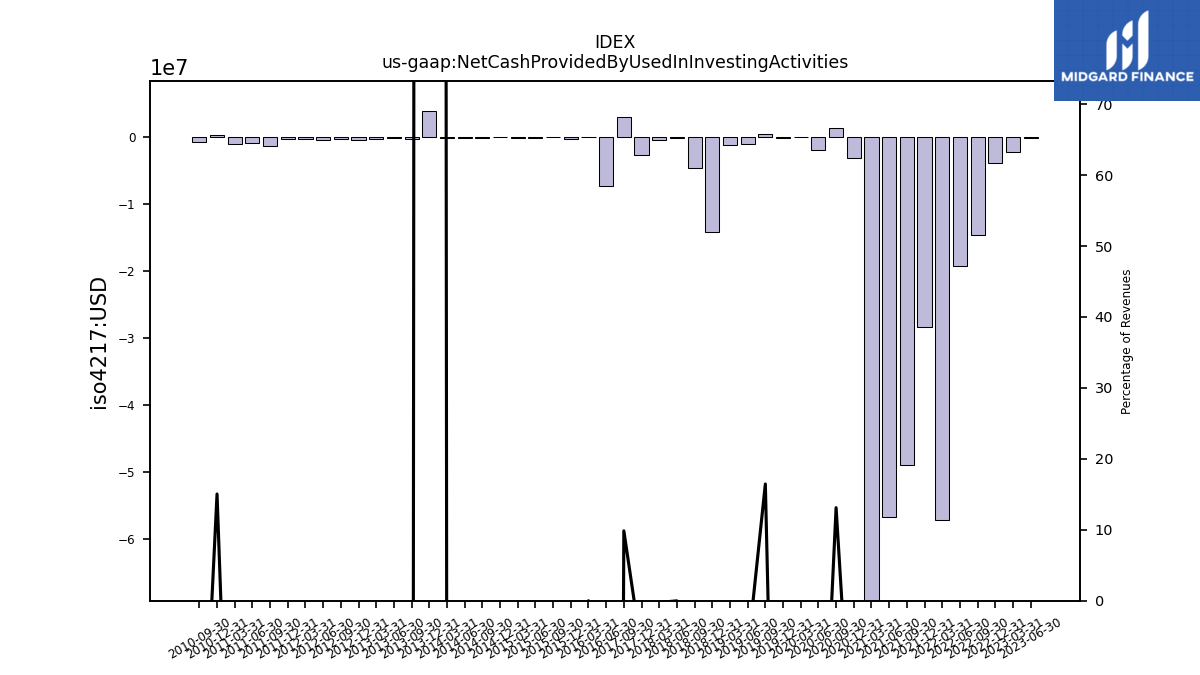
| Net Cash Provided By Used In Investing Activities | -0.06 | -2.20 | -3.87 | -14.53 | -19.16 | -57.16 | -28.30 | -48.95 | -56.71 | -86.13 | -3.01 | 1.39 | -1.86 | -0.01 | -0.06 | 0.51 | -1.05 | -1.20 | -14.10 | -4.59 | -0.02 | -0.44 | -2.64 | 2.98 | NA | NA | NA | NA | -7.23 | 0.00 | -0.17 | -0.02 | -0.04 | -0.02 | -0.00 | -0.16 | -0.06 | -0.06 | 3.91 | -0.25 | -0.12 | -0.26 | -0.32 | -0.30 | -0.32 | -0.29 | -0.18 | -1.32 | -0.88 | -0.92 | 0.29 | -0.74 | NA | |
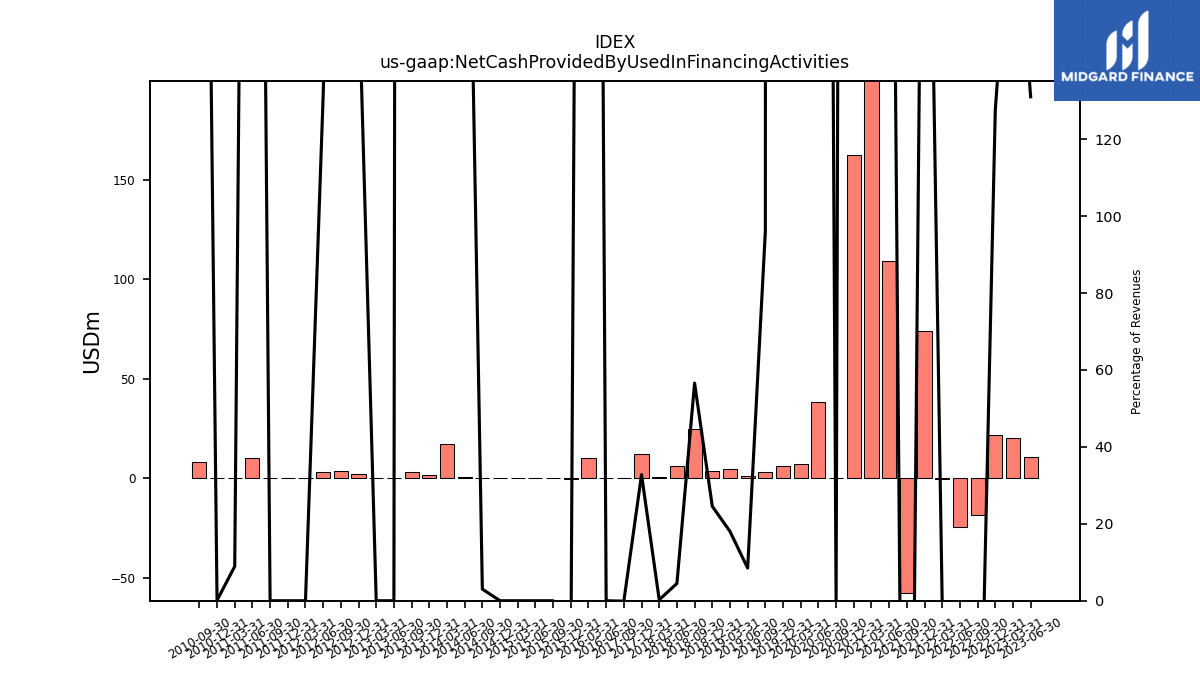
| Net Cash Provided By Used In Financing Activities | 10.72 | 20.26 | 21.76 | -18.37 | -24.19 | -0.23 | 74.00 | -57.76 | 109.39 | 273.66 | 162.31 | 0.00 | 38.59 | 7.15 | 6.05 | 2.98 | 1.23 | 4.86 | 3.71 | 24.73 | 5.97 | 0.49 | 12.33 | -0.03 | NA | NA | NA | NA | 0.00 | 10.00 | -0.31 | 0.00 | 0.00 | 0.00 | 0.00 | 0.02 | 0.47 | 17.02 | 1.76 | 3.15 | 0.00 | 0.00 | 2.19 | 3.47 | 3.00 | 0.00 | 0.00 | 0.00 | 10.10 | 0.15 | 0.00 | 8.38 | NA |
| 2023-06-30 | 2023-03-31 | 2022-12-31 | 2022-09-30 | 2022-06-30 | 2022-03-31 | 2021-12-31 | 2021-09-30 | 2021-06-30 | 2021-03-31 | 2020-12-31 | 2020-09-30 | 2020-06-30 | 2020-03-31 | 2019-12-31 | 2019-09-30 | 2019-06-30 | 2019-03-31 | 2018-12-31 | 2018-09-30 | 2018-06-30 | 2018-03-31 | 2017-12-31 | 2017-09-30 | 2017-06-30 | 2017-03-31 | 2016-12-31 | 2016-09-30 | 2016-06-30 | 2016-03-31 | 2015-12-31 | 2015-09-30 | 2015-06-30 | 2015-03-31 | 2014-12-31 | 2014-09-30 | 2014-06-30 | 2014-03-31 | 2013-12-31 | 2013-09-30 | 2013-06-30 | 2013-03-31 | 2012-12-31 | 2012-09-30 | 2012-06-30 | 2012-03-31 | 2011-12-31 | 2011-09-30 | 2011-06-30 | 2011-03-31 | 2010-12-31 | 2010-09-30 | 2010-06-30 | ||
|---|---|---|---|---|---|---|---|---|---|---|---|---|---|---|---|---|---|---|---|---|---|---|---|---|---|---|---|---|---|---|---|---|---|---|---|---|---|---|---|---|---|---|---|---|---|---|---|---|---|---|---|---|---|---|
| Net Cash Provided By Used In Operating Activities | -17.57 | -21.25 | -20.70 | -26.92 | -40.45 | -41.92 | -33.29 | -31.87 | -12.94 | 2.57 | -19.55 | -11.53 | -6.53 | -3.86 | -5.07 | -2.82 | -1.12 | -4.77 | -2.52 | -6.22 | -8.02 | -3.40 | -4.13 | -4.46 | NA | NA | NA | NA | -2.36 | -1.73 | -0.22 | -2.34 | -1.48 | -2.40 | -2.18 | -2.50 | -2.65 | -2.84 | -3.07 | -2.77 | -0.91 | -2.02 | -2.34 | -2.73 | -3.12 | -2.40 | -2.61 | -0.96 | -1.05 | -1.12 | -1.10 | -1.59 | NA | |
| Net Income Loss | -35.50 | -84.32 | -157.00 | -37.41 | -37.77 | -28.51 | -191.49 | -50.85 | -9.79 | -0.57 | -51.19 | -8.29 | -26.58 | -12.35 | -110.01 | -13.71 | 5.29 | 19.93 | -8.20 | -7.19 | -8.32 | -4.07 | -5.34 | -3.04 | -3.66 | 2.21 | -20.06 | -2.05 | -1.61 | -2.27 | -1.96 | -2.34 | -1.32 | -2.92 | -2.37 | -2.12 | -1.09 | -7.45 | -3.60 | 2.98 | -3.59 | -3.68 | NA | NA | NA | NA | NA | NA | NA | NA | NA | NA | NA | |
| Profit Loss | -37.09 | -85.89 | -174.90 | -38.85 | -39.27 | -29.09 | -191.59 | -51.09 | -9.99 | -0.74 | -58.28 | -8.72 | -26.42 | -12.62 | -109.71 | -12.30 | 5.28 | 19.91 | -8.56 | -7.44 | -8.61 | -4.16 | -5.09 | -3.02 | -3.72 | 1.64 | -21.40 | -2.15 | -1.61 | -2.27 | -1.96 | -2.34 | -1.32 | -2.92 | -2.37 | -2.12 | -1.09 | -7.45 | -3.60 | 2.98 | -3.59 | -3.68 | -2.82 | -4.44 | -4.25 | -4.78 | -4.30 | 0.13 | -5.82 | -2.65 | -6.59 | -7.44 | -2.74 | |
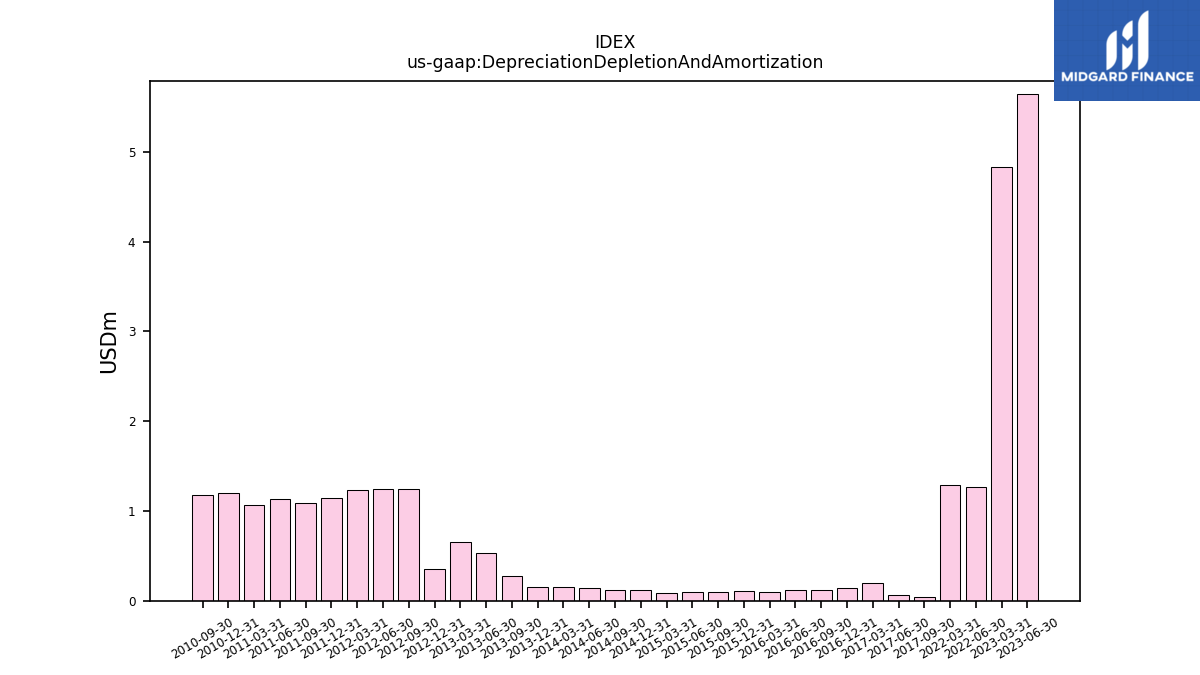
| Depreciation Depletion And Amortization | 5.65 | 4.83 | NA | NA | 1.26 | 1.28 | NA | NA | NA | NA | NA | NA | NA | NA | NA | NA | NA | NA | NA | NA | NA | NA | NA | 0.04 | 0.06 | 0.20 | 0.15 | 0.12 | 0.12 | 0.10 | 0.11 | 0.10 | 0.10 | 0.09 | 0.12 | 0.12 | 0.14 | 0.15 | 0.15 | 0.27 | 0.53 | 0.66 | 0.36 | 1.25 | 1.25 | 1.23 | 1.14 | 1.09 | 1.13 | 1.07 | 1.20 | 1.18 | NA | |
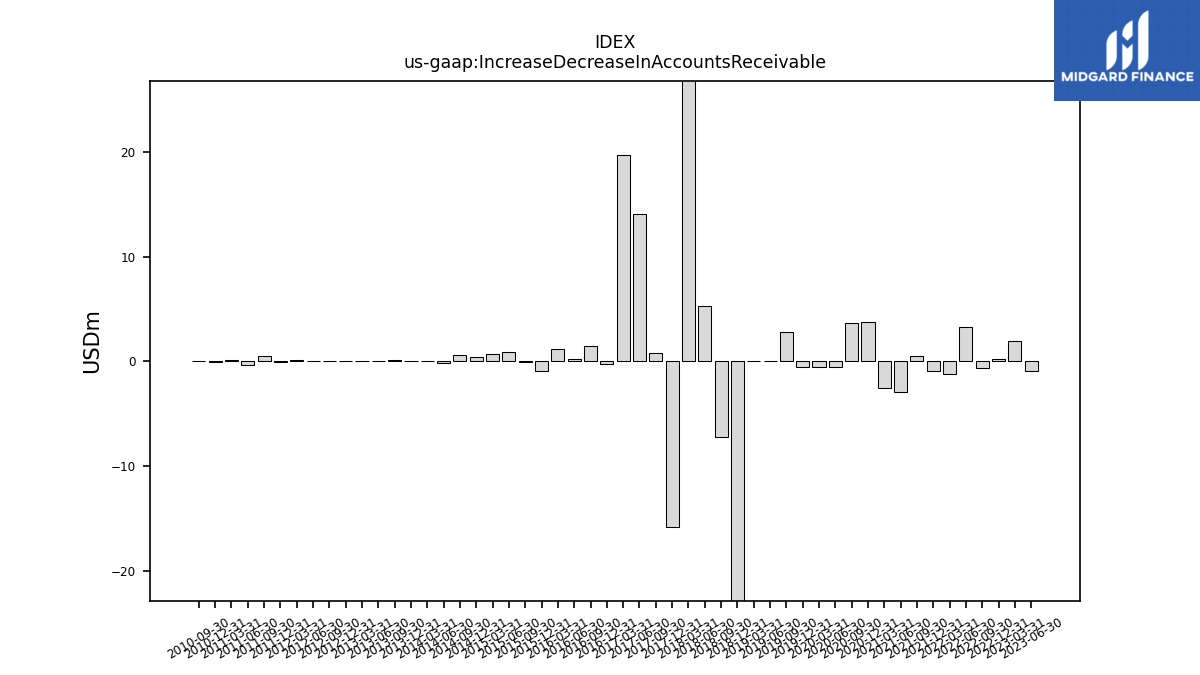
| Increase Decrease In Accounts Receivable | -0.92 | 1.97 | 0.23 | -0.66 | 3.26 | -1.18 | -0.90 | 0.46 | -2.90 | -2.60 | 3.72 | 3.66 | -0.59 | -0.57 | -0.54 | 2.79 | -0.01 | 0.04 | -86.16 | -7.25 | 5.28 | 80.55 | -15.78 | 0.82 | 14.09 | 19.67 | -0.27 | 1.49 | 0.25 | 1.15 | -0.89 | -0.10 | 0.90 | 0.69 | 0.45 | 0.60 | -0.16 | 0.02 | 0.06 | 0.10 | 0.02 | 0.00 | 0.00 | -0.00 | 0.05 | 0.14 | -0.04 | 0.48 | -0.34 | 0.10 | -0.11 | 0.07 | NA | |
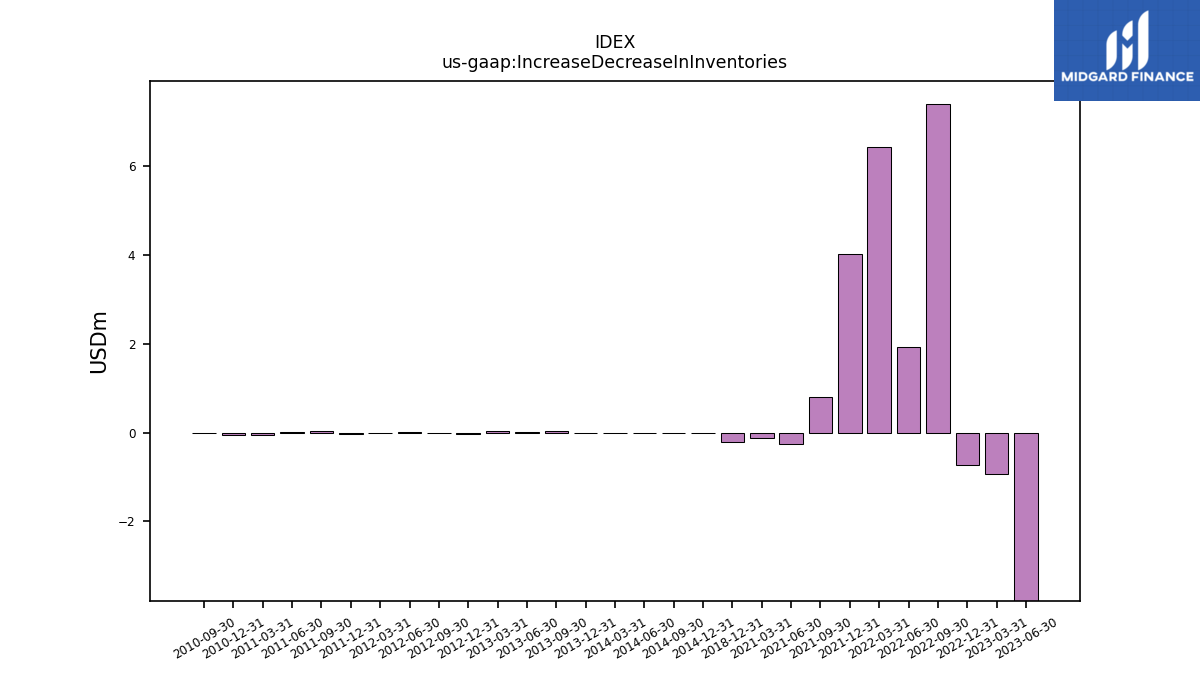
| Increase Decrease In Inventories | -3.78 | -0.94 | -0.74 | 7.39 | 1.91 | 6.43 | 4.01 | 0.79 | -0.26 | -0.12 | NA | NA | NA | NA | NA | NA | NA | NA | -0.22 | NA | NA | NA | NA | NA | NA | NA | NA | NA | NA | NA | NA | NA | NA | NA | 0.00 | 0.00 | 0.00 | 0.00 | 0.00 | 0.03 | 0.01 | 0.03 | -0.03 | -0.00 | 0.01 | -0.01 | -0.04 | 0.04 | 0.01 | -0.05 | -0.05 | -0.01 | NA | |
| Share Based Compensation | 3.32 | 2.47 | 3.15 | 2.23 | 2.86 | 2.35 | 2.75 | 15.19 | 2.01 | 2.04 | 3.12 | 3.25 | 3.39 | 2.20 | 2.64 | 2.55 | 3.70 | 0.22 | 0.04 | 0.01 | 3.24 | 0.12 | 1.10 | 0.05 | 0.08 | 0.07 | 0.03 | 0.07 | 0.07 | 0.14 | 0.27 | 0.29 | 0.28 | 0.40 | 0.21 | 0.77 | 0.22 | 0.14 | 0.42 | 0.11 | 0.27 | 0.35 | 0.56 | 0.34 | 0.30 | 0.18 | 0.17 | 0.15 | 0.16 | 0.16 | 0.48 | 0.26 | NA |
| 2023-06-30 | 2023-03-31 | 2022-12-31 | 2022-09-30 | 2022-06-30 | 2022-03-31 | 2021-12-31 | 2021-09-30 | 2021-06-30 | 2021-03-31 | 2020-12-31 | 2020-09-30 | 2020-06-30 | 2020-03-31 | 2019-12-31 | 2019-09-30 | 2019-06-30 | 2019-03-31 | 2018-12-31 | 2018-09-30 | 2018-06-30 | 2018-03-31 | 2017-12-31 | 2017-09-30 | 2017-06-30 | 2017-03-31 | 2016-12-31 | 2016-09-30 | 2016-06-30 | 2016-03-31 | 2015-12-31 | 2015-09-30 | 2015-06-30 | 2015-03-31 | 2014-12-31 | 2014-09-30 | 2014-06-30 | 2014-03-31 | 2013-12-31 | 2013-09-30 | 2013-06-30 | 2013-03-31 | 2012-12-31 | 2012-09-30 | 2012-06-30 | 2012-03-31 | 2011-12-31 | 2011-09-30 | 2011-06-30 | 2011-03-31 | 2010-12-31 | 2010-09-30 | 2010-06-30 | ||
|---|---|---|---|---|---|---|---|---|---|---|---|---|---|---|---|---|---|---|---|---|---|---|---|---|---|---|---|---|---|---|---|---|---|---|---|---|---|---|---|---|---|---|---|---|---|---|---|---|---|---|---|---|---|---|
| Net Cash Provided By Used In Investing Activities | -0.06 | -2.20 | -3.87 | -14.53 | -19.16 | -57.16 | -28.30 | -48.95 | -56.71 | -86.13 | -3.01 | 1.39 | -1.86 | -0.01 | -0.06 | 0.51 | -1.05 | -1.20 | -14.10 | -4.59 | -0.02 | -0.44 | -2.64 | 2.98 | NA | NA | NA | NA | -7.23 | 0.00 | -0.17 | -0.02 | -0.04 | -0.02 | -0.00 | -0.16 | -0.06 | -0.06 | 3.91 | -0.25 | -0.12 | -0.26 | -0.32 | -0.30 | -0.32 | -0.29 | -0.18 | -1.32 | -0.88 | -0.92 | 0.29 | -0.74 | NA | |
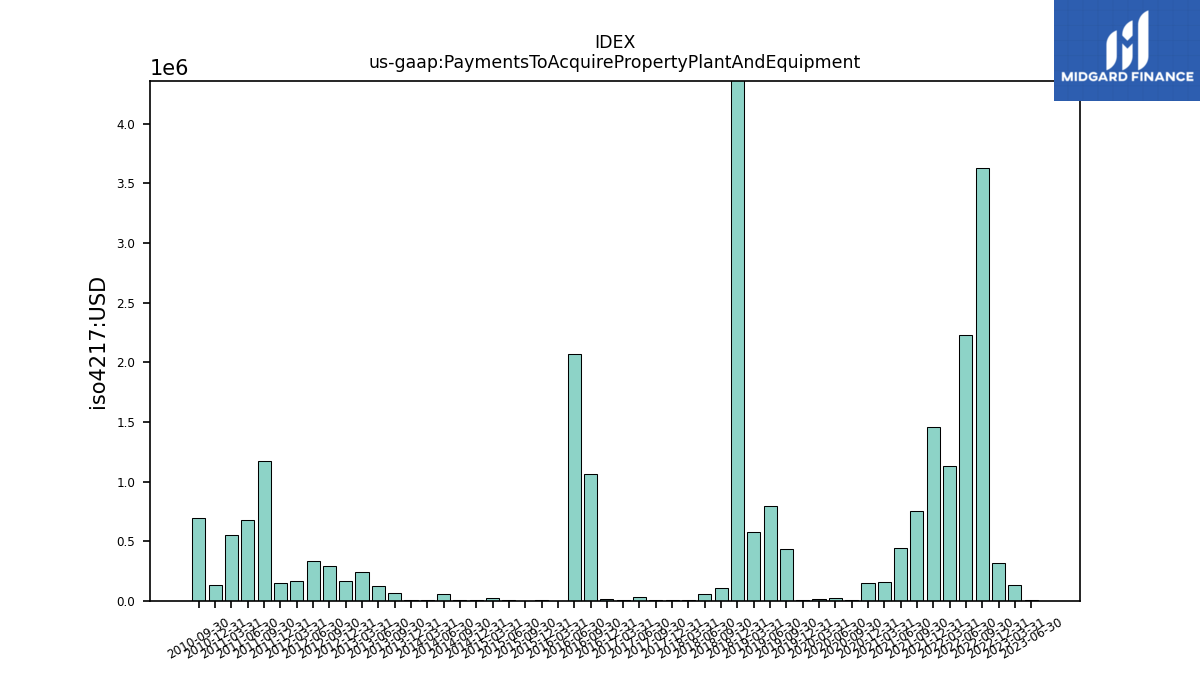
| Payments To Acquire Property Plant And Equipment | 0.00 | 0.13 | 0.32 | 3.63 | 2.23 | 1.13 | 1.46 | 0.75 | 0.45 | 0.16 | 0.15 | 0.00 | 0.03 | 0.01 | 0.01 | 0.43 | 0.80 | 0.58 | 6.59 | 0.10 | 0.06 | 0.01 | 0.00 | 0.01 | 0.03 | 0.01 | 0.01 | 1.06 | 2.07 | 0.00 | 0.00 | 0.00 | 0.01 | 0.02 | 0.01 | 0.00 | 0.05 | 0.00 | 0.01 | 0.06 | 0.12 | 0.24 | 0.16 | 0.29 | 0.33 | 0.16 | 0.15 | 1.17 | 0.67 | 0.55 | 0.13 | 0.69 | NA |
| 2023-06-30 | 2023-03-31 | 2022-12-31 | 2022-09-30 | 2022-06-30 | 2022-03-31 | 2021-12-31 | 2021-09-30 | 2021-06-30 | 2021-03-31 | 2020-12-31 | 2020-09-30 | 2020-06-30 | 2020-03-31 | 2019-12-31 | 2019-09-30 | 2019-06-30 | 2019-03-31 | 2018-12-31 | 2018-09-30 | 2018-06-30 | 2018-03-31 | 2017-12-31 | 2017-09-30 | 2017-06-30 | 2017-03-31 | 2016-12-31 | 2016-09-30 | 2016-06-30 | 2016-03-31 | 2015-12-31 | 2015-09-30 | 2015-06-30 | 2015-03-31 | 2014-12-31 | 2014-09-30 | 2014-06-30 | 2014-03-31 | 2013-12-31 | 2013-09-30 | 2013-06-30 | 2013-03-31 | 2012-12-31 | 2012-09-30 | 2012-06-30 | 2012-03-31 | 2011-12-31 | 2011-09-30 | 2011-06-30 | 2011-03-31 | 2010-12-31 | 2010-09-30 | 2010-06-30 | ||
|---|---|---|---|---|---|---|---|---|---|---|---|---|---|---|---|---|---|---|---|---|---|---|---|---|---|---|---|---|---|---|---|---|---|---|---|---|---|---|---|---|---|---|---|---|---|---|---|---|---|---|---|---|---|---|
| Net Cash Provided By Used In Financing Activities | 10.72 | 20.26 | 21.76 | -18.37 | -24.19 | -0.23 | 74.00 | -57.76 | 109.39 | 273.66 | 162.31 | 0.00 | 38.59 | 7.15 | 6.05 | 2.98 | 1.23 | 4.86 | 3.71 | 24.73 | 5.97 | 0.49 | 12.33 | -0.03 | NA | NA | NA | NA | 0.00 | 10.00 | -0.31 | 0.00 | 0.00 | 0.00 | 0.00 | 0.02 | 0.47 | 17.02 | 1.76 | 3.15 | 0.00 | 0.00 | 2.19 | 3.47 | 3.00 | 0.00 | 0.00 | 0.00 | 10.10 | 0.15 | 0.00 | 8.38 | NA |
| 2023-06-30 | 2023-03-31 | 2022-12-31 | 2022-09-30 | 2022-06-30 | 2022-03-31 | 2021-12-31 | 2021-09-30 | 2021-06-30 | 2021-03-31 | 2020-12-31 | 2020-09-30 | 2020-06-30 | 2020-03-31 | 2019-12-31 | 2019-09-30 | 2019-06-30 | 2019-03-31 | 2018-12-31 | 2018-09-30 | 2018-06-30 | 2018-03-31 | 2017-12-31 | 2017-09-30 | 2017-06-30 | 2017-03-31 | 2016-12-31 | 2016-09-30 | 2016-06-30 | 2016-03-31 | 2015-12-31 | 2015-09-30 | 2015-06-30 | 2015-03-31 | 2014-12-31 | 2014-09-30 | 2014-06-30 | 2014-03-31 | 2013-12-31 | 2013-09-30 | 2013-06-30 | 2013-03-31 | 2012-12-31 | 2012-09-30 | 2012-06-30 | 2012-03-31 | 2011-12-31 | 2011-09-30 | 2011-06-30 | 2011-03-31 | 2010-12-31 | 2010-09-30 | 2010-06-30 | ||
|---|---|---|---|---|---|---|---|---|---|---|---|---|---|---|---|---|---|---|---|---|---|---|---|---|---|---|---|---|---|---|---|---|---|---|---|---|---|---|---|---|---|---|---|---|---|---|---|---|---|---|---|---|---|---|
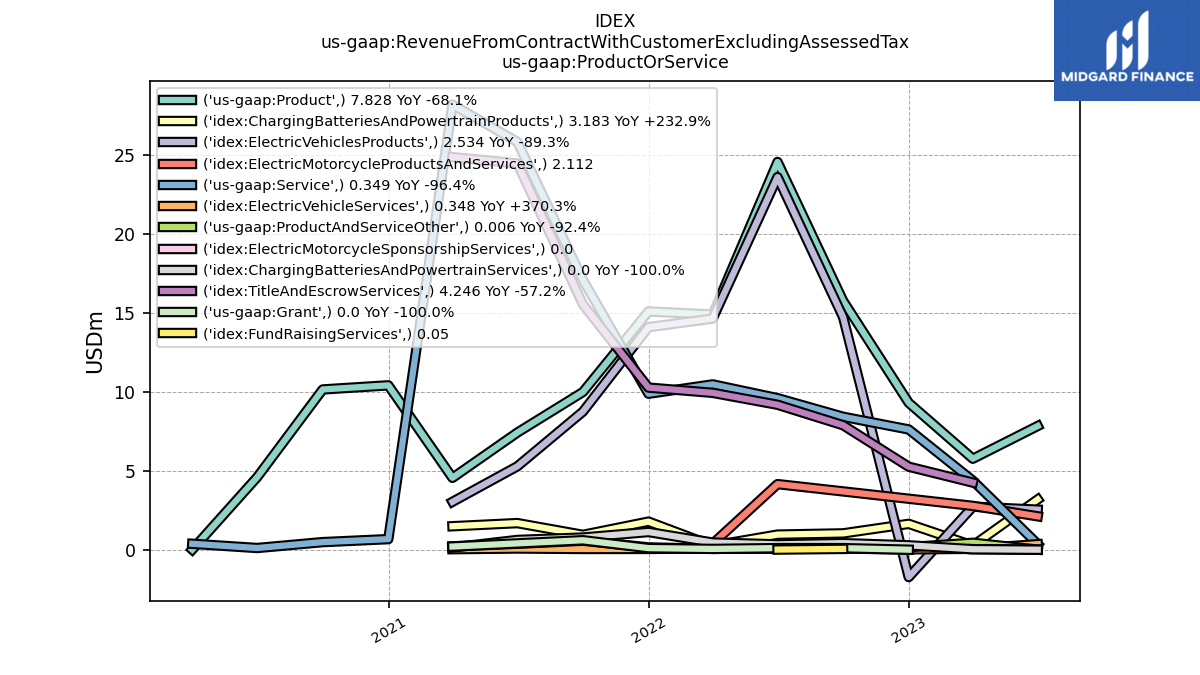
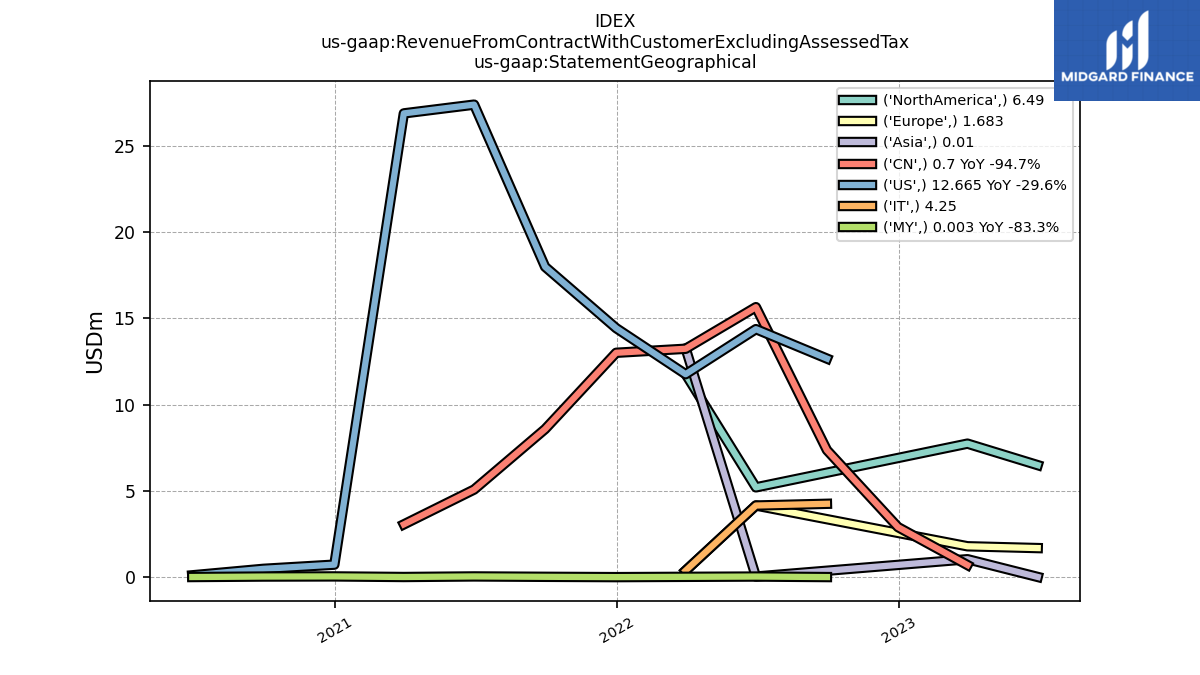
| Revenues | 8.18 | 10.56 | 17.07 | 24.28 | 34.20 | 25.39 | 26.25 | 27.05 | 33.22 | 32.71 | 11.07 | 10.62 | 4.69 | 0.38 | 0.06 | 3.10 | 14.45 | 26.95 | 15.11 | 43.71 | 132.99 | 185.93 | 37.61 | 30.23 | 43.33 | 33.16 | 30.81 | 1.63 | 1.48 | 1.27 | 1.62 | 0.48 | 1.48 | 1.03 | 1.00 | 0.64 | 0.18 | 0.14 | 0.16 | 0.10 | 0.05 | 1.31 | 1.36 | 1.19 | 2.28 | 2.04 | 2.29 | 1.98 | 1.89 | 1.70 | 1.90 | 2.05 | 1.82 | |
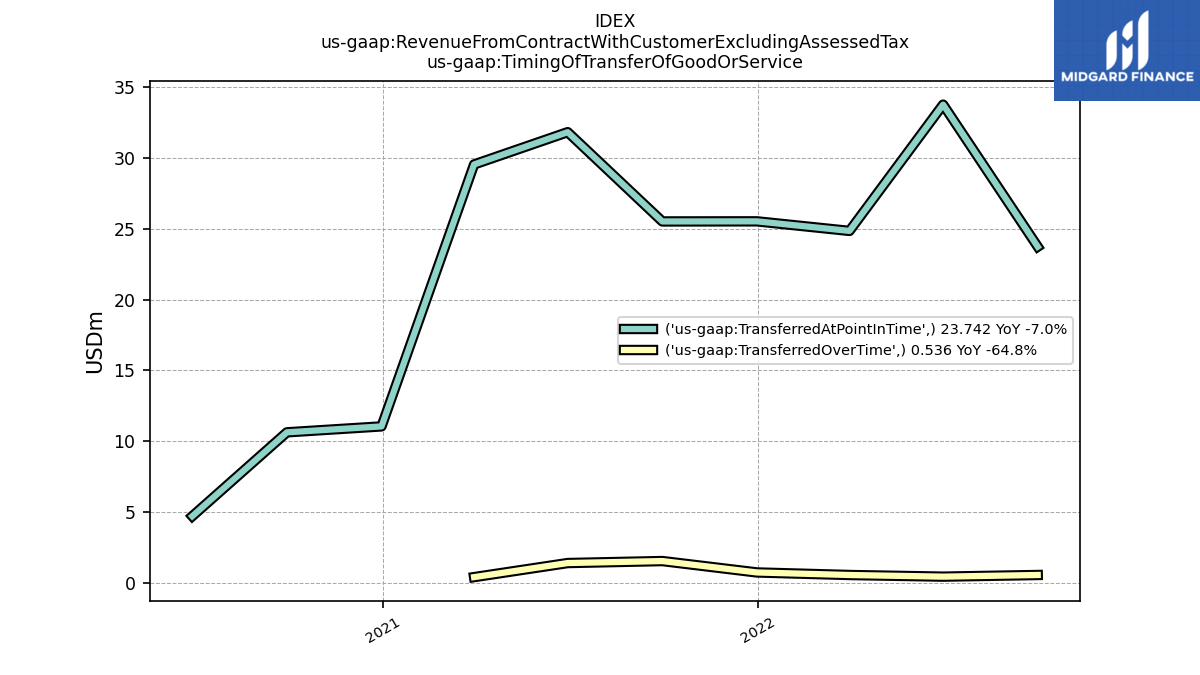
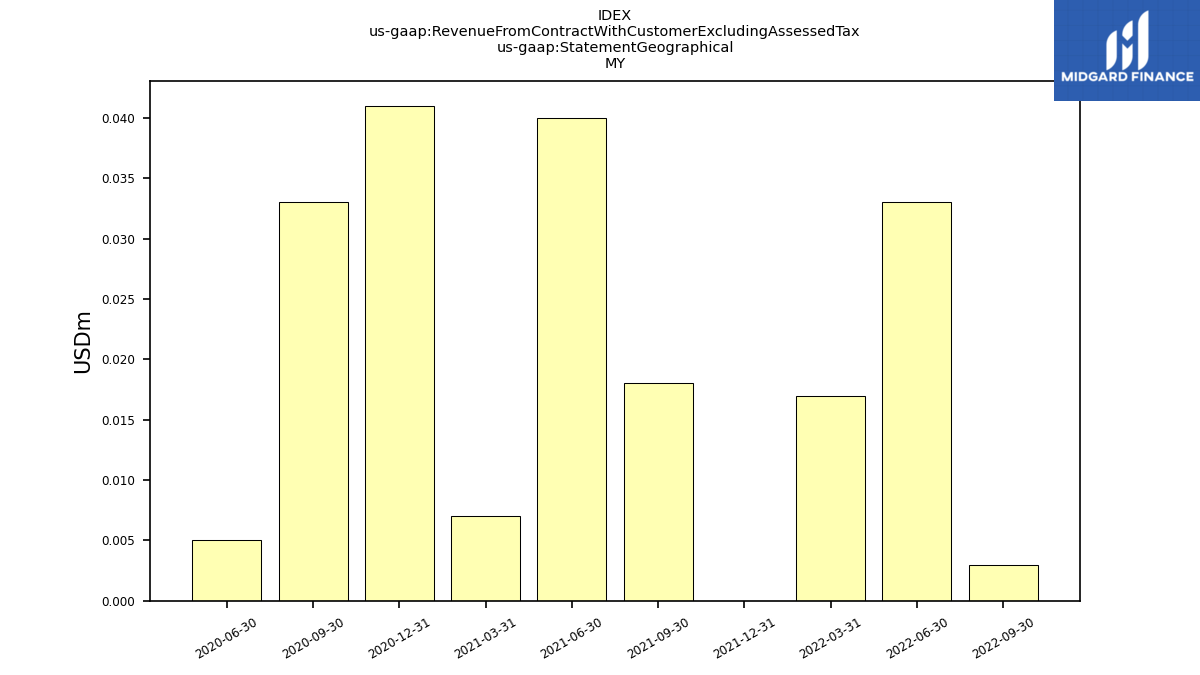
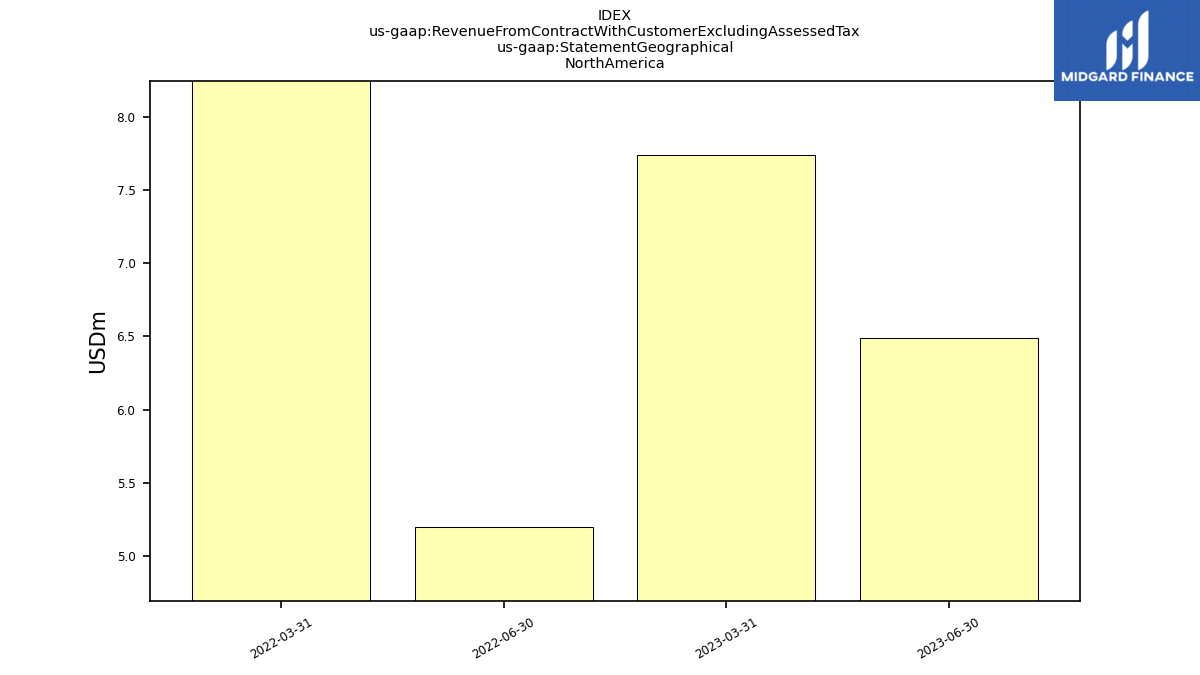
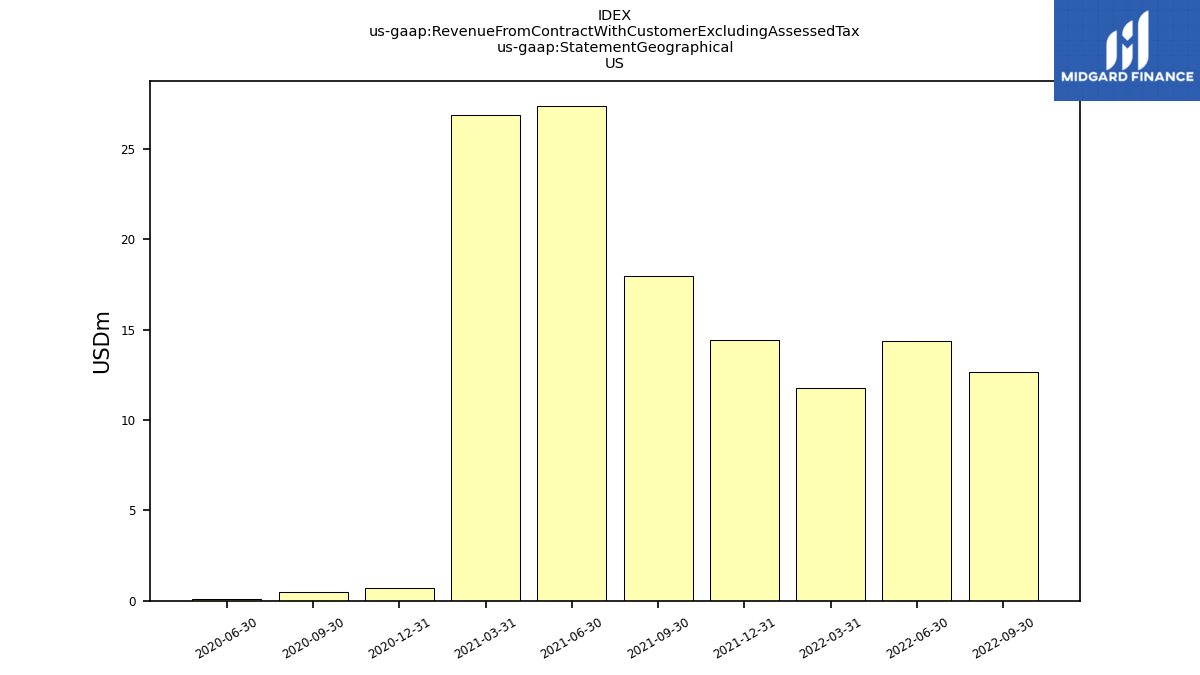
| Revenue From Contract With Customer Excluding Assessed Tax | 8.18 | 10.56 | 17.07 | 24.28 | 34.20 | 25.39 | 26.25 | 27.05 | 33.22 | 32.71 | 11.07 | 10.62 | 4.69 | 0.38 | 0.06 | 3.10 | 14.45 | 26.95 | 15.11 | 43.71 | 132.99 | 185.93 | 37.61 | 30.23 | 43.33 | 33.16 | 30.81 | 1.63 | 1.48 | 1.27 | 1.62 | 0.48 | 1.48 | 1.03 | 1.00 | 0.64 | 0.18 | 0.14 | 0.16 | 0.10 | 0.05 | 1.31 | 1.36 | 1.19 | 2.28 | 2.04 | 2.29 | 1.98 | 1.89 | 1.70 | 1.90 | 2.05 | 1.82 | |
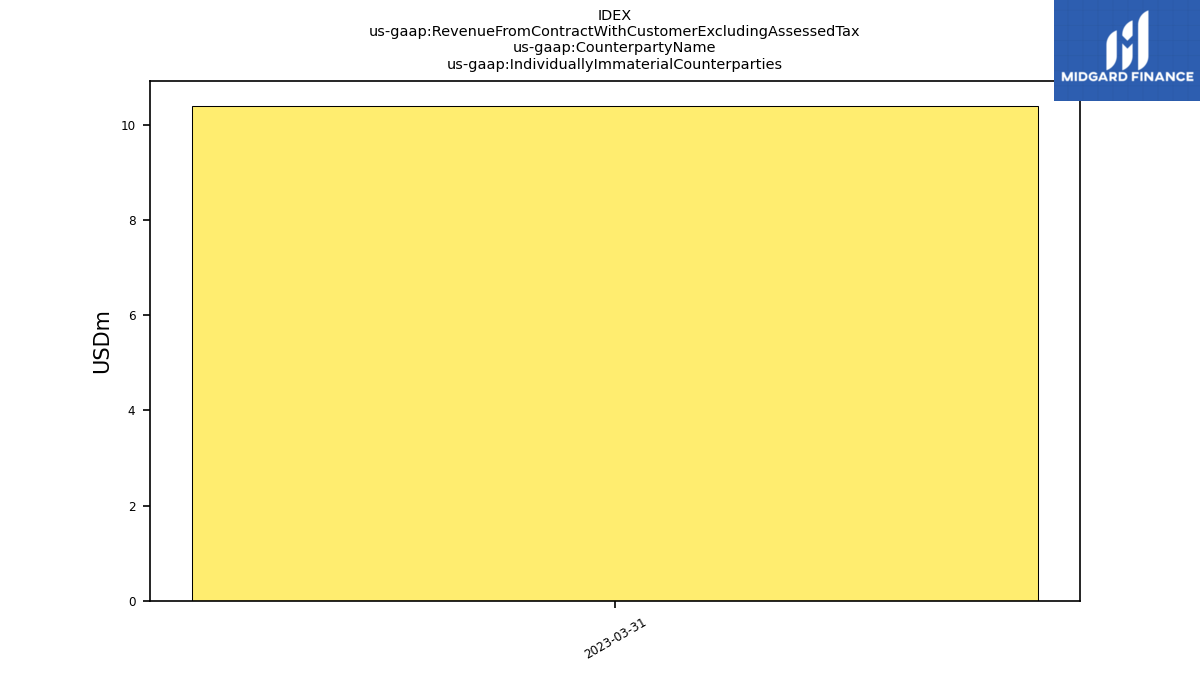
| Individually Immaterial Counterparties | NA | 10.40 | NA | NA | NA | NA | NA | NA | NA | NA | NA | NA | NA | NA | NA | NA | NA | NA | NA | NA | NA | NA | NA | NA | NA | NA | NA | NA | NA | NA | NA | NA | NA | NA | NA | NA | NA | NA | NA | NA | NA | NA | NA | NA | NA | NA | NA | NA | NA | NA | NA | NA | NA | |
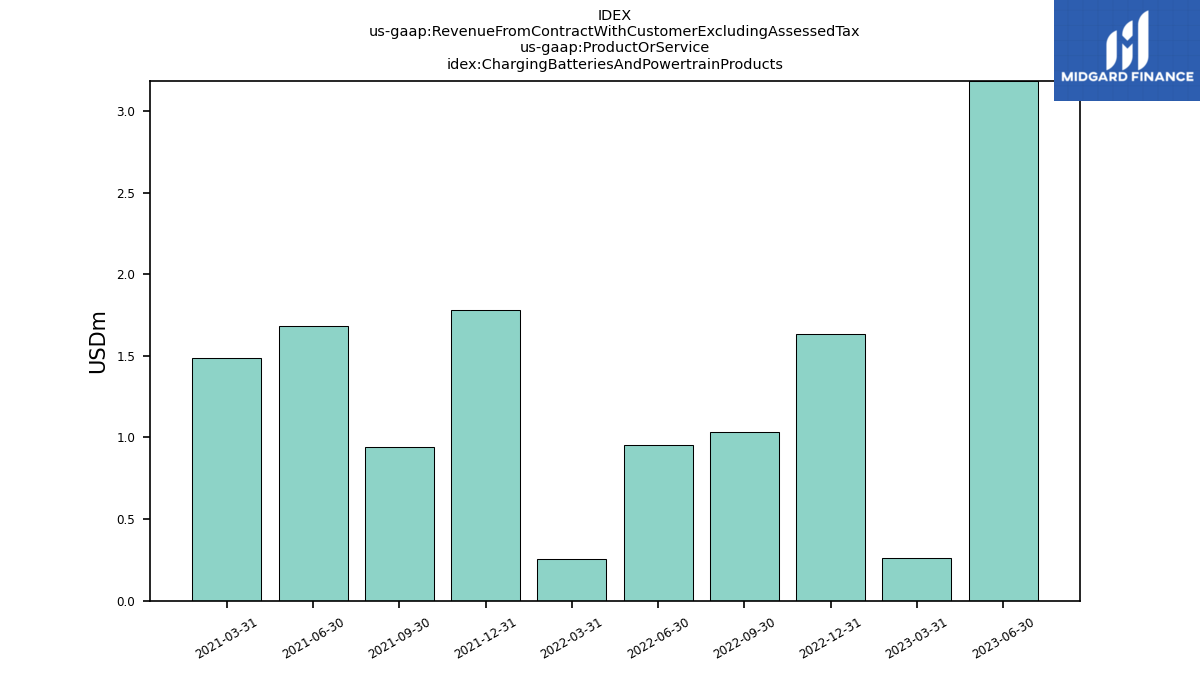
| Charging Batteries And Powertrain Products | 3.18 | 0.26 | 1.64 | 1.03 | 0.96 | 0.25 | 1.78 | 0.94 | 1.68 | 1.49 | NA | NA | NA | NA | NA | NA | NA | NA | NA | NA | NA | NA | NA | NA | NA | NA | NA | NA | NA | NA | NA | NA | NA | NA | NA | NA | NA | NA | NA | NA | NA | NA | NA | NA | NA | NA | NA | NA | NA | NA | NA | NA | NA | |
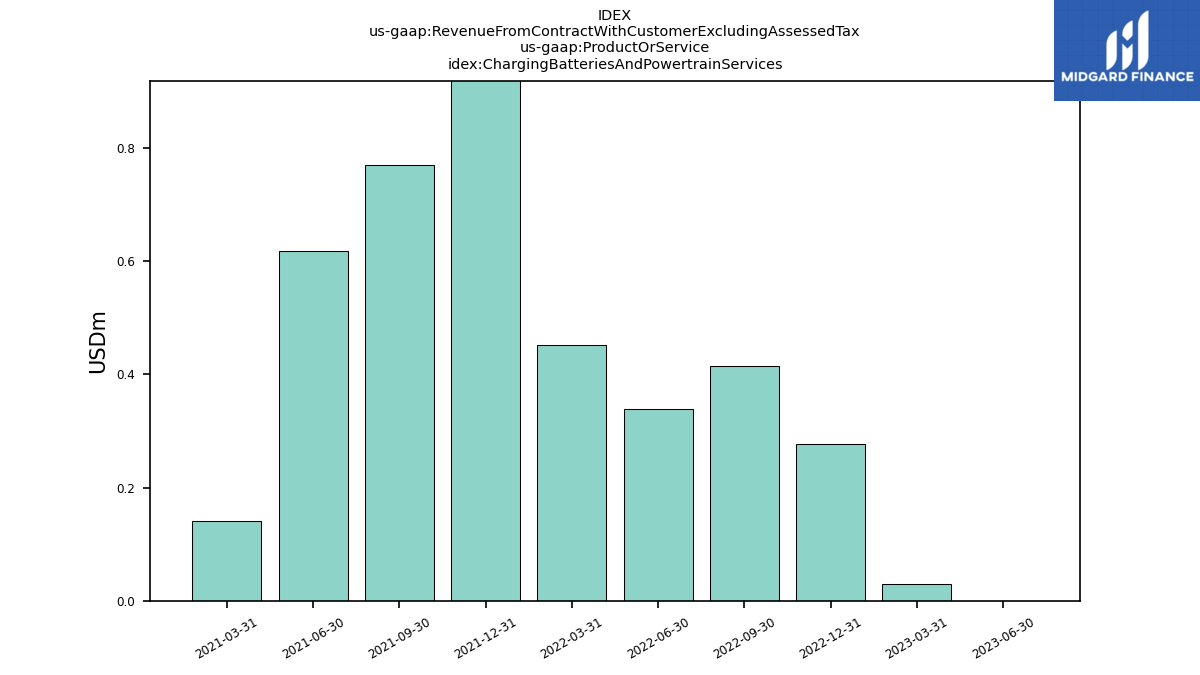
| Charging Batteries And Powertrain Services | 0.00 | 0.03 | 0.28 | 0.41 | 0.34 | 0.45 | 1.12 | 0.77 | 0.62 | 0.14 | NA | NA | NA | NA | NA | NA | NA | NA | NA | NA | NA | NA | NA | NA | NA | NA | NA | NA | NA | NA | NA | NA | NA | NA | NA | NA | NA | NA | NA | NA | NA | NA | NA | NA | NA | NA | NA | NA | NA | NA | NA | NA | NA | |
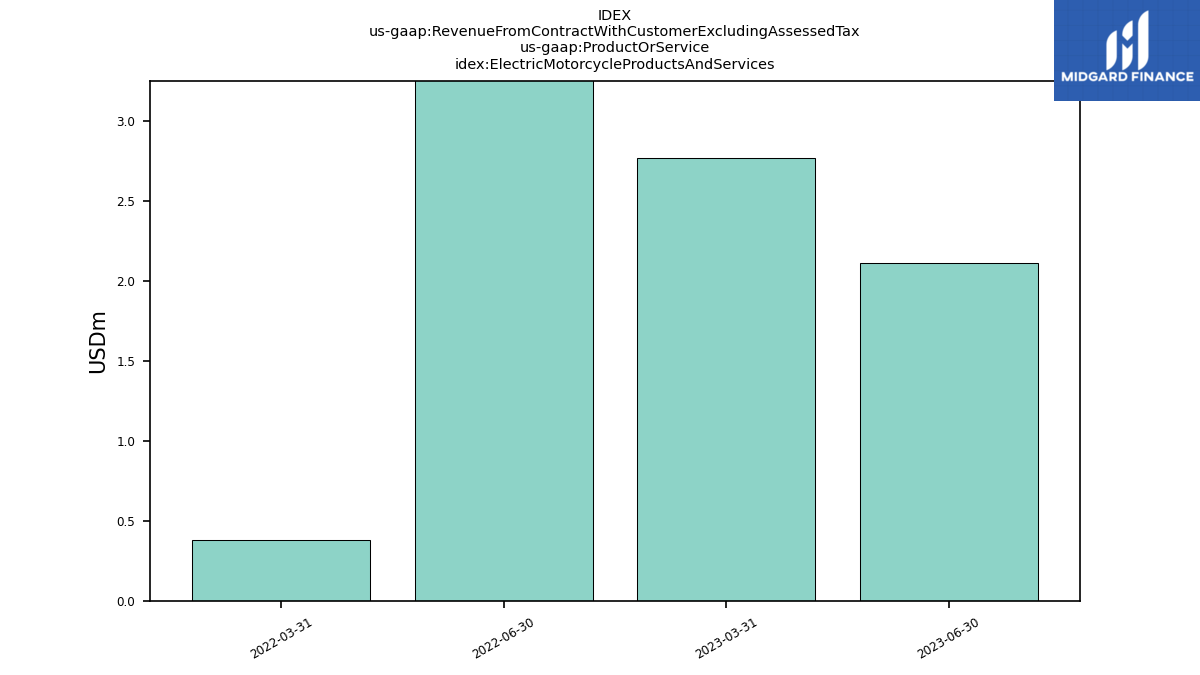
| Electric Motorcycle Products And Services | 2.11 | 2.77 | NA | NA | 4.15 | 0.38 | NA | NA | NA | NA | NA | NA | NA | NA | NA | NA | NA | NA | NA | NA | NA | NA | NA | NA | NA | NA | NA | NA | NA | NA | NA | NA | NA | NA | NA | NA | NA | NA | NA | NA | NA | NA | NA | NA | NA | NA | NA | NA | NA | NA | NA | NA | NA | |
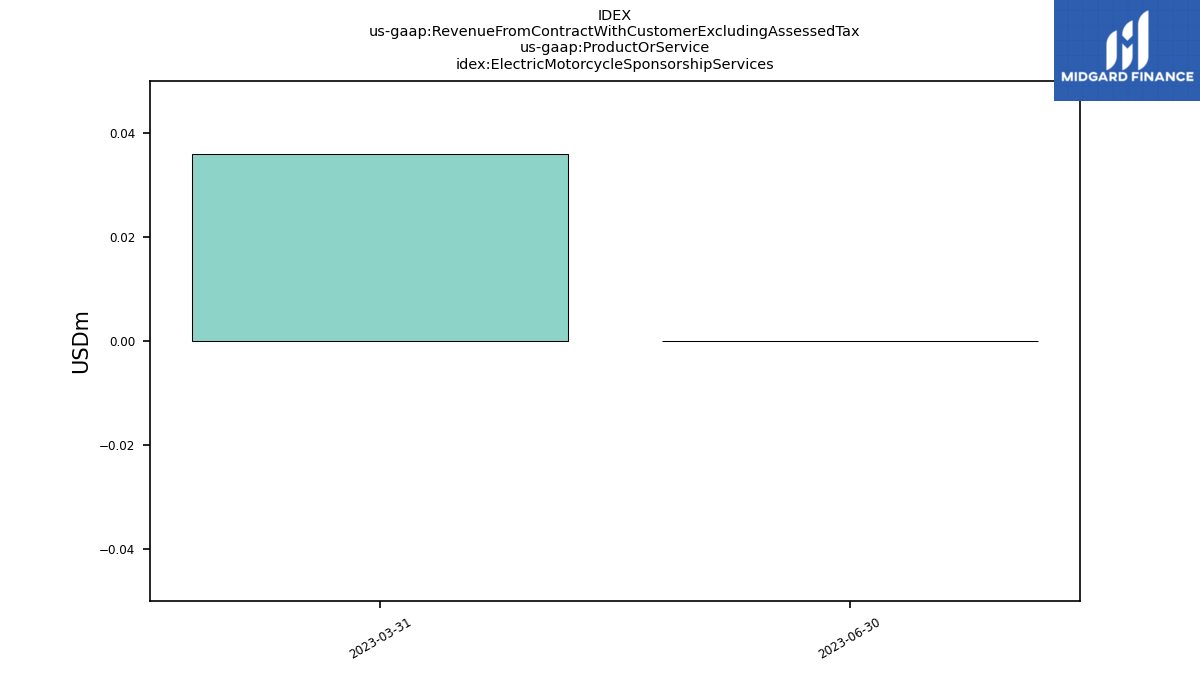
| Electric Motorcycle Sponsorship Services | 0.00 | 0.04 | NA | NA | NA | NA | NA | NA | NA | NA | NA | NA | NA | NA | NA | NA | NA | NA | NA | NA | NA | NA | NA | NA | NA | NA | NA | NA | NA | NA | NA | NA | NA | NA | NA | NA | NA | NA | NA | NA | NA | NA | NA | NA | NA | NA | NA | NA | NA | NA | NA | NA | NA | |
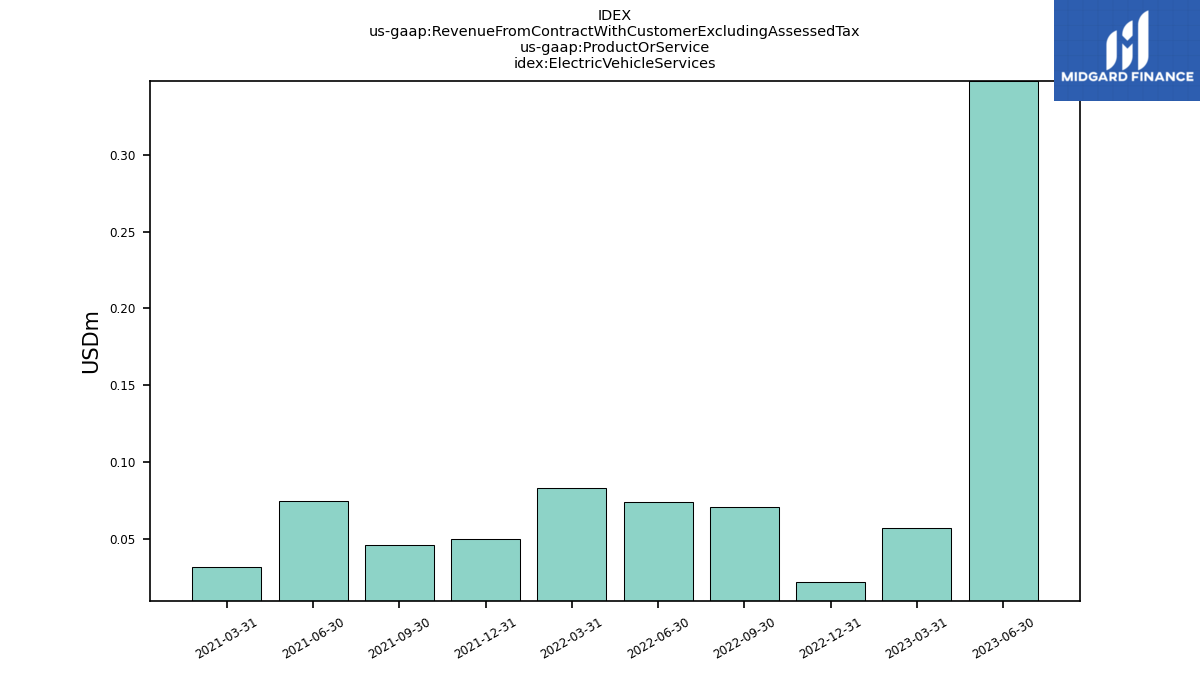
| Electric Vehicle Services | 0.35 | 0.06 | 0.02 | 0.07 | 0.07 | 0.08 | 0.05 | 0.05 | 0.07 | 0.03 | NA | NA | NA | NA | NA | NA | NA | NA | NA | NA | NA | NA | NA | NA | NA | NA | NA | NA | NA | NA | NA | NA | NA | NA | NA | NA | NA | NA | NA | NA | NA | NA | NA | NA | NA | NA | NA | NA | NA | NA | NA | NA | NA | |
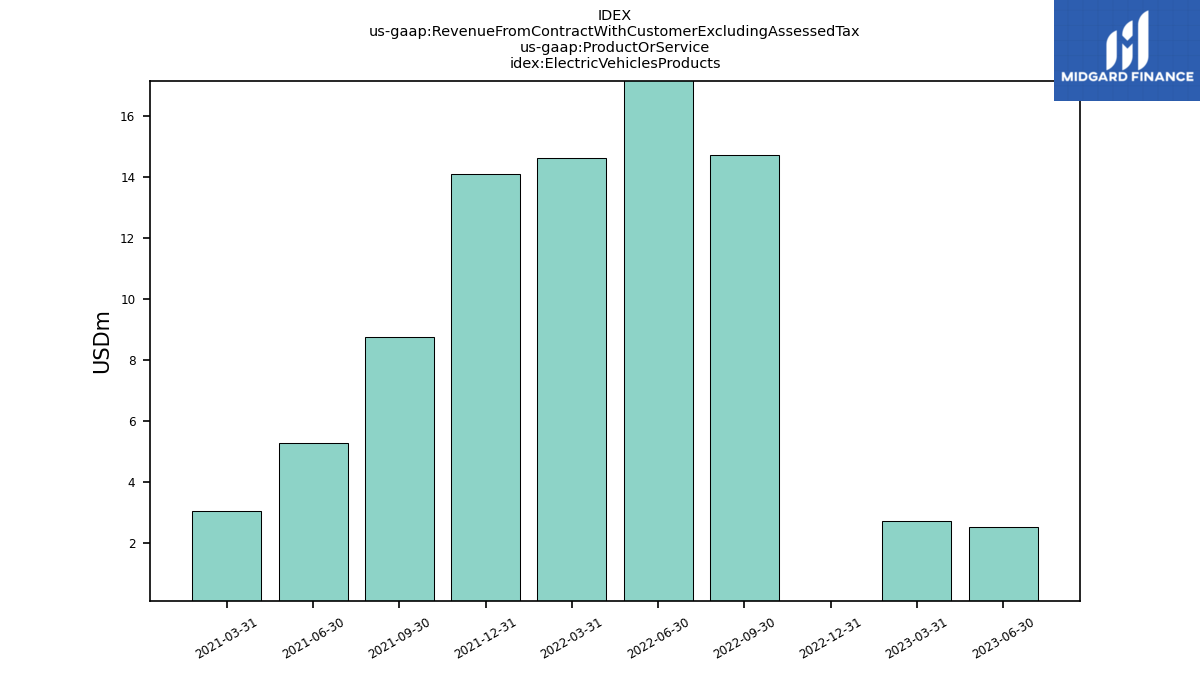
| Electric Vehicles Products | 2.53 | 2.72 | -1.74 | 14.71 | 23.58 | 14.62 | 14.08 | 8.74 | 5.27 | 3.03 | NA | NA | NA | NA | NA | NA | NA | NA | NA | NA | NA | NA | NA | NA | NA | NA | NA | NA | NA | NA | NA | NA | NA | NA | NA | NA | NA | NA | NA | NA | NA | NA | NA | NA | NA | NA | NA | NA | NA | NA | NA | NA | NA | |
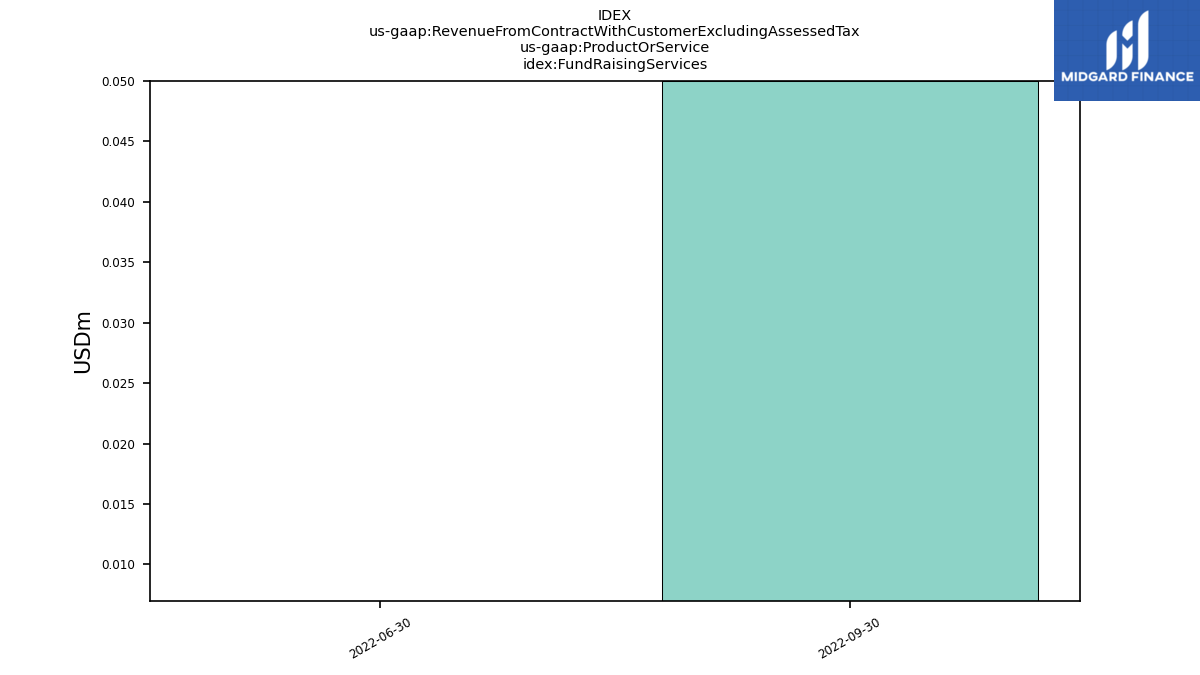
| Fund Raising Services | NA | NA | NA | 0.05 | 0.01 | NA | NA | NA | NA | NA | NA | NA | NA | NA | NA | NA | NA | NA | NA | NA | NA | NA | NA | NA | NA | NA | NA | NA | NA | NA | NA | NA | NA | NA | NA | NA | NA | NA | NA | NA | NA | NA | NA | NA | NA | NA | NA | NA | NA | NA | NA | NA | NA | |
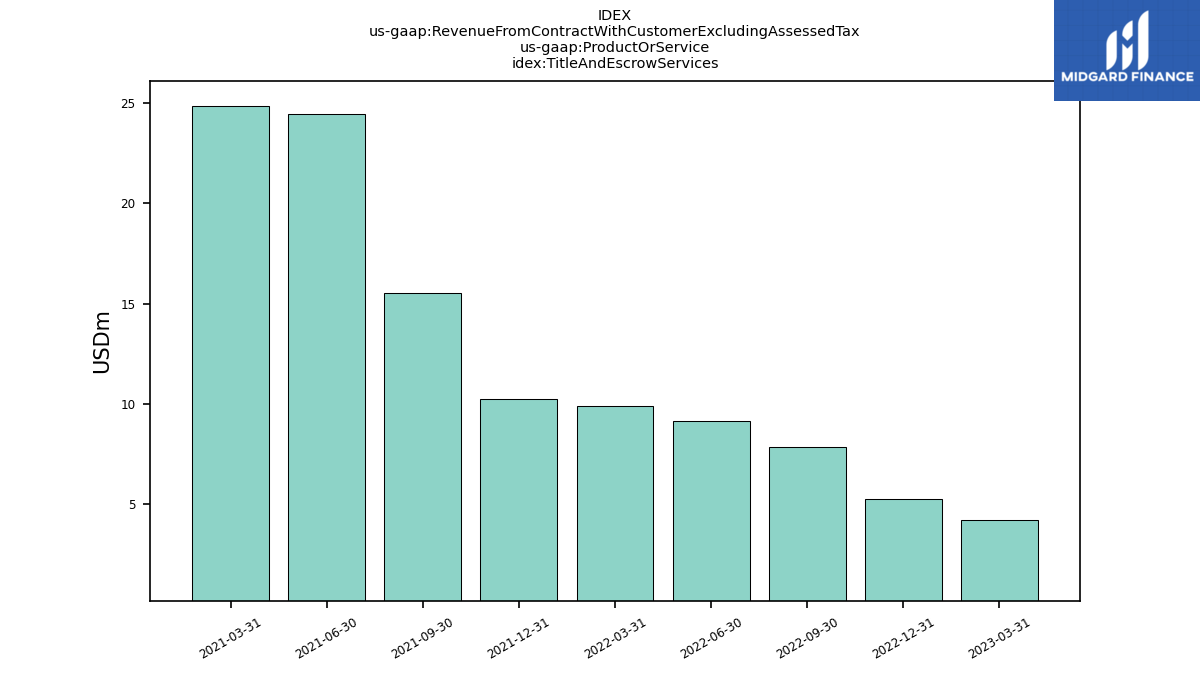
| Title And Escrow Services | NA | 4.25 | 5.25 | 7.88 | 9.17 | 9.93 | 10.26 | 15.52 | 24.44 | 24.84 | NA | NA | NA | NA | NA | NA | NA | NA | NA | NA | NA | NA | NA | NA | NA | NA | NA | NA | NA | NA | NA | NA | NA | NA | NA | NA | NA | NA | NA | NA | NA | NA | NA | NA | NA | NA | NA | NA | NA | NA | NA | NA | NA | |
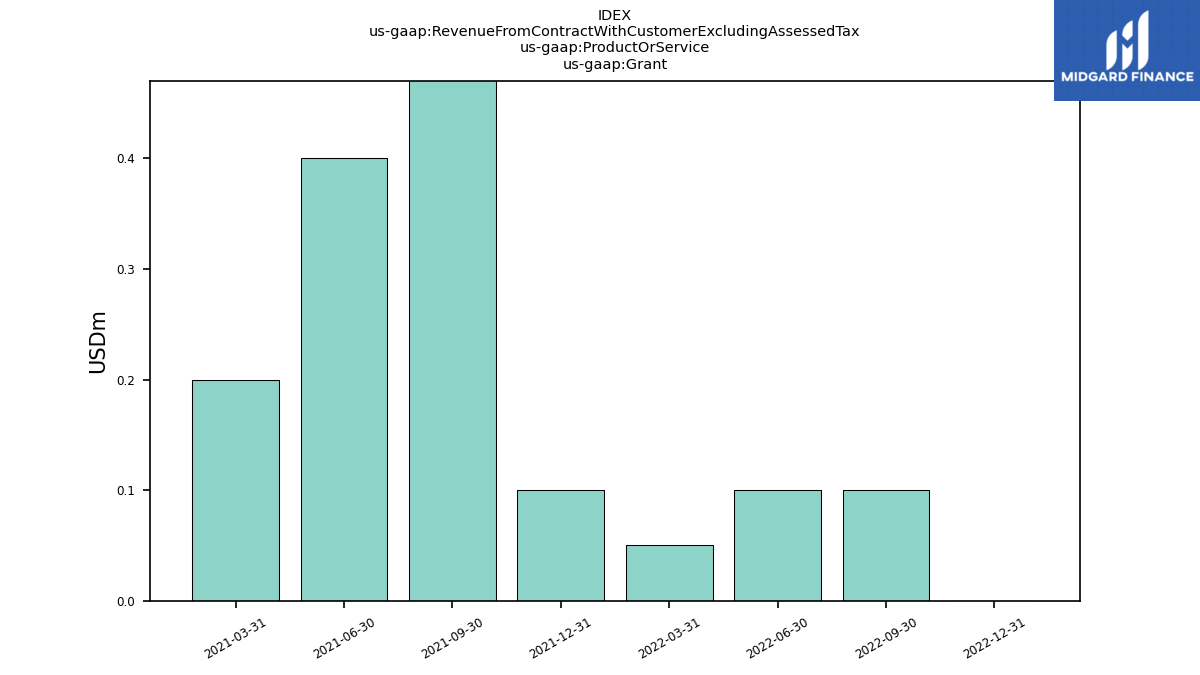
| Grant | NA | NA | 0.00 | 0.10 | 0.10 | 0.05 | 0.10 | 0.60 | 0.40 | 0.20 | NA | NA | NA | NA | NA | NA | NA | NA | NA | NA | NA | NA | NA | NA | NA | NA | NA | NA | NA | NA | NA | NA | NA | NA | NA | NA | NA | NA | NA | NA | NA | NA | NA | NA | NA | NA | NA | NA | NA | NA | NA | NA | NA | |
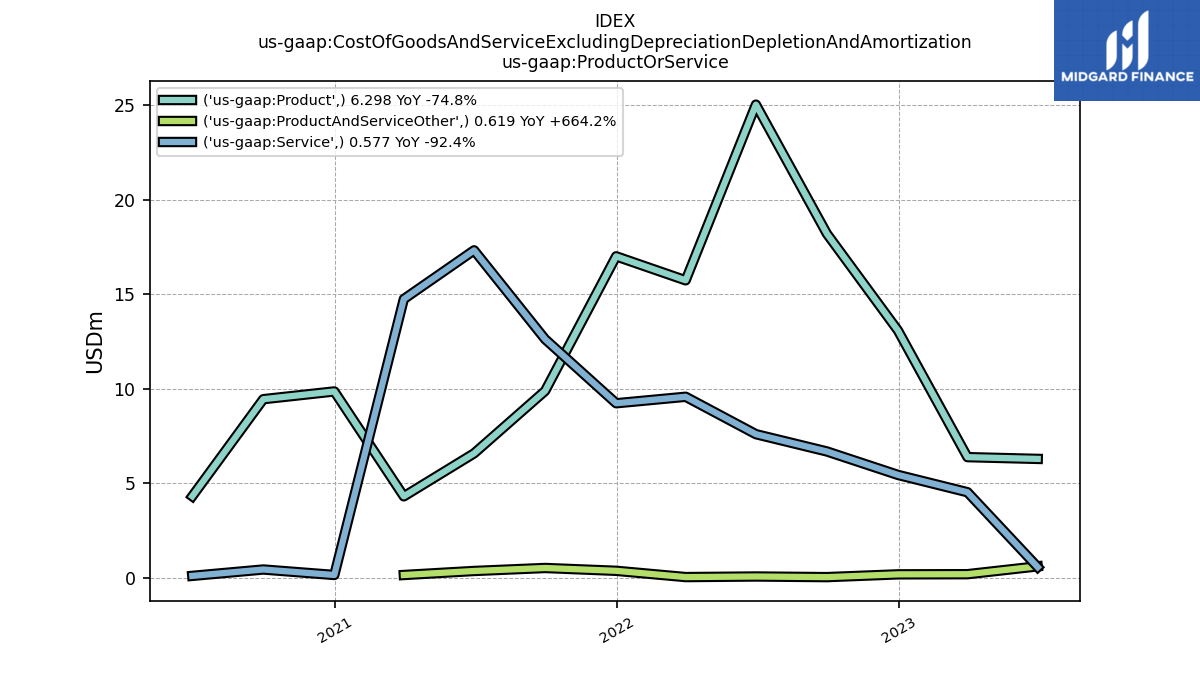
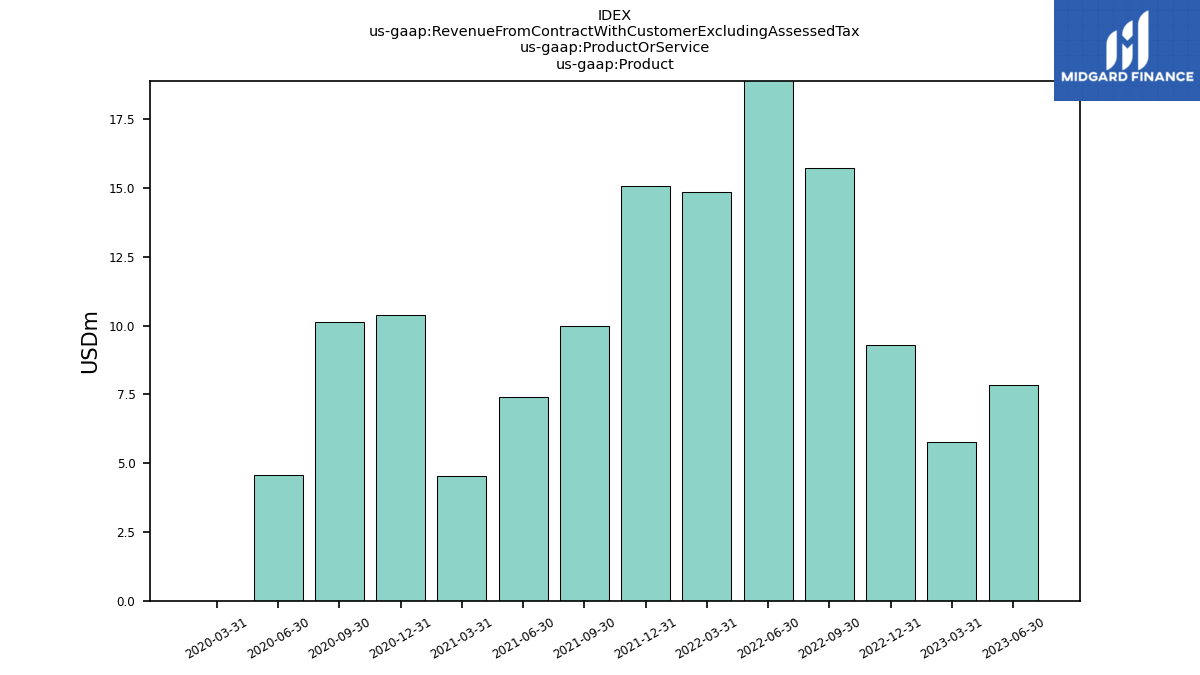
| Product | 7.83 | 5.76 | 9.29 | 15.75 | 24.53 | 14.88 | 15.07 | 9.98 | 7.41 | 4.55 | 10.40 | 10.14 | 4.58 | 0.00 | NA | NA | NA | NA | NA | NA | NA | NA | NA | NA | NA | NA | NA | NA | NA | NA | NA | NA | NA | NA | NA | NA | NA | NA | NA | NA | NA | NA | NA | NA | NA | NA | NA | NA | NA | NA | NA | NA | NA | |
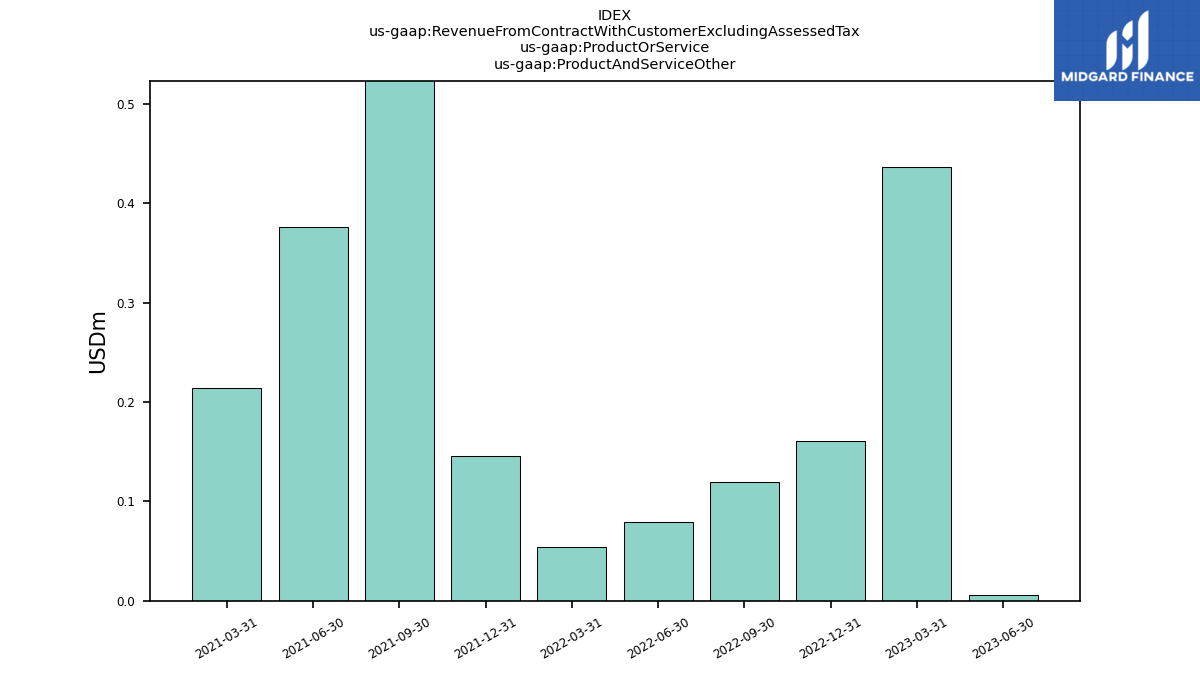
| Product And Service Other | 0.01 | 0.44 | 0.16 | 0.12 | 0.08 | 0.05 | 0.15 | 0.57 | 0.38 | 0.21 | NA | NA | NA | NA | NA | NA | NA | NA | NA | NA | NA | NA | NA | NA | NA | NA | NA | NA | NA | NA | NA | NA | NA | NA | NA | NA | NA | NA | NA | NA | NA | NA | NA | NA | NA | NA | NA | NA | NA | NA | NA | NA | NA | |
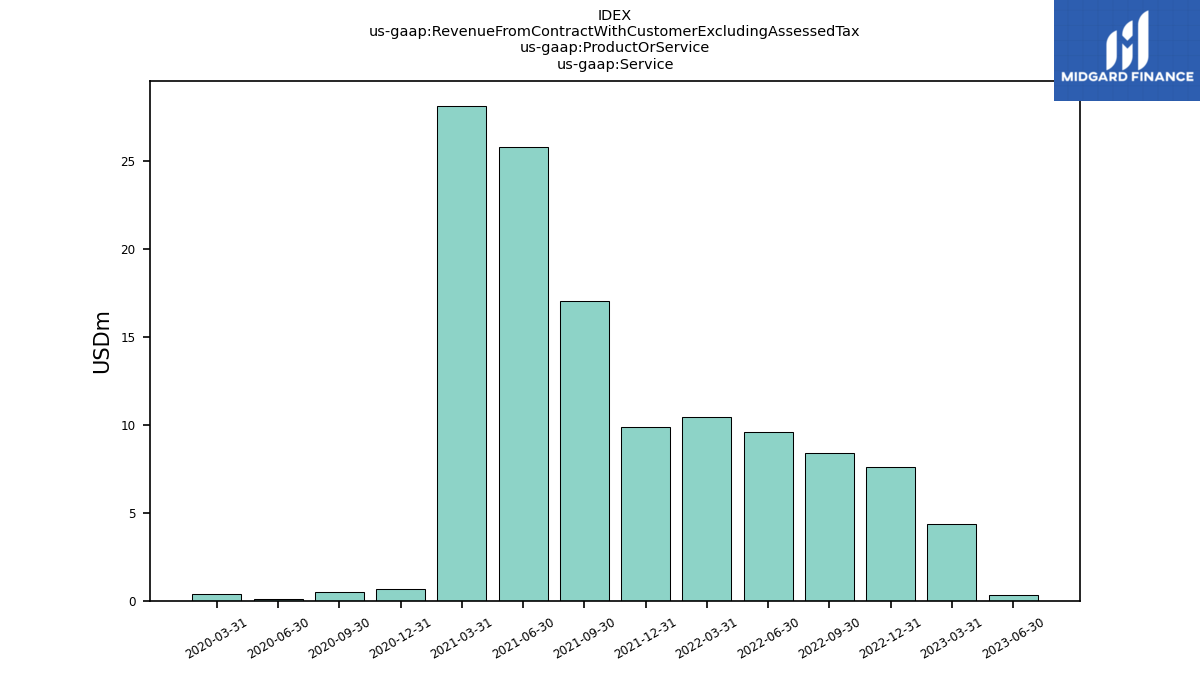
| Service | 0.35 | 4.37 | 7.61 | 8.41 | 9.59 | 10.46 | 9.87 | 17.07 | 25.81 | 28.16 | 0.67 | 0.48 | 0.11 | 0.38 | NA | NA | NA | NA | NA | NA | NA | NA | NA | NA | NA | NA | NA | NA | NA | NA | NA | NA | NA | NA | NA | NA | NA | NA | NA | NA | NA | NA | NA | NA | NA | NA | NA | NA | NA | NA | NA | NA | NA | |
| 0.01 | 1.04 | NA | NA | 0.03 | 13.25 | NA | NA | NA | NA | NA | NA | NA | NA | NA | NA | NA | NA | NA | NA | NA | NA | NA | NA | NA | NA | NA | NA | NA | NA | NA | NA | NA | NA | NA | NA | NA | NA | NA | NA | NA | NA | NA | NA | NA | NA | NA | NA | NA | NA | NA | NA | NA | ||
| NA | 0.70 | 2.90 | 7.36 | 15.65 | 13.23 | 13.00 | 8.58 | 5.07 | 3.06 | NA | NA | NA | NA | NA | NA | NA | NA | NA | NA | NA | NA | NA | NA | NA | NA | NA | NA | NA | NA | NA | NA | NA | NA | NA | NA | NA | NA | NA | NA | NA | NA | NA | NA | NA | NA | NA | NA | NA | NA | NA | NA | NA | ||
| 1.68 | 1.79 | NA | NA | 4.15 | 0.38 | NA | NA | NA | NA | NA | NA | NA | NA | NA | NA | NA | NA | NA | NA | NA | NA | NA | NA | NA | NA | NA | NA | NA | NA | NA | NA | NA | NA | NA | NA | NA | NA | NA | NA | NA | NA | NA | NA | NA | NA | NA | NA | NA | NA | NA | NA | NA | ||
| NA | NA | NA | 4.25 | 4.15 | 0.38 | NA | NA | NA | NA | NA | NA | NA | NA | NA | NA | NA | NA | NA | NA | NA | NA | NA | NA | NA | NA | NA | NA | NA | NA | NA | NA | NA | NA | NA | NA | NA | NA | NA | NA | NA | NA | NA | NA | NA | NA | NA | NA | NA | NA | NA | NA | NA | ||
| NA | NA | NA | 0.00 | 0.03 | 0.02 | 0.00 | 0.02 | 0.04 | 0.01 | 0.04 | 0.03 | 0.01 | NA | NA | NA | NA | NA | NA | NA | NA | NA | NA | NA | NA | NA | NA | NA | NA | NA | NA | NA | NA | NA | NA | NA | NA | NA | NA | NA | NA | NA | NA | NA | NA | NA | NA | NA | NA | NA | NA | NA | NA | ||
| 6.49 | 7.74 | NA | NA | 5.20 | 11.76 | NA | NA | NA | NA | NA | NA | NA | NA | NA | NA | NA | NA | NA | NA | NA | NA | NA | NA | NA | NA | NA | NA | NA | NA | NA | NA | NA | NA | NA | NA | NA | NA | NA | NA | NA | NA | NA | NA | NA | NA | NA | NA | NA | NA | NA | NA | NA | ||
| US | NA | NA | NA | 12.66 | 14.37 | 11.76 | 14.43 | 17.98 | 27.38 | 26.88 | 0.72 | 0.48 | 0.10 | NA | NA | NA | NA | NA | NA | NA | NA | NA | NA | NA | NA | NA | NA | NA | NA | NA | NA | NA | NA | NA | NA | NA | NA | NA | NA | NA | NA | NA | NA | NA | NA | NA | NA | NA | NA | NA | NA | NA | NA | |
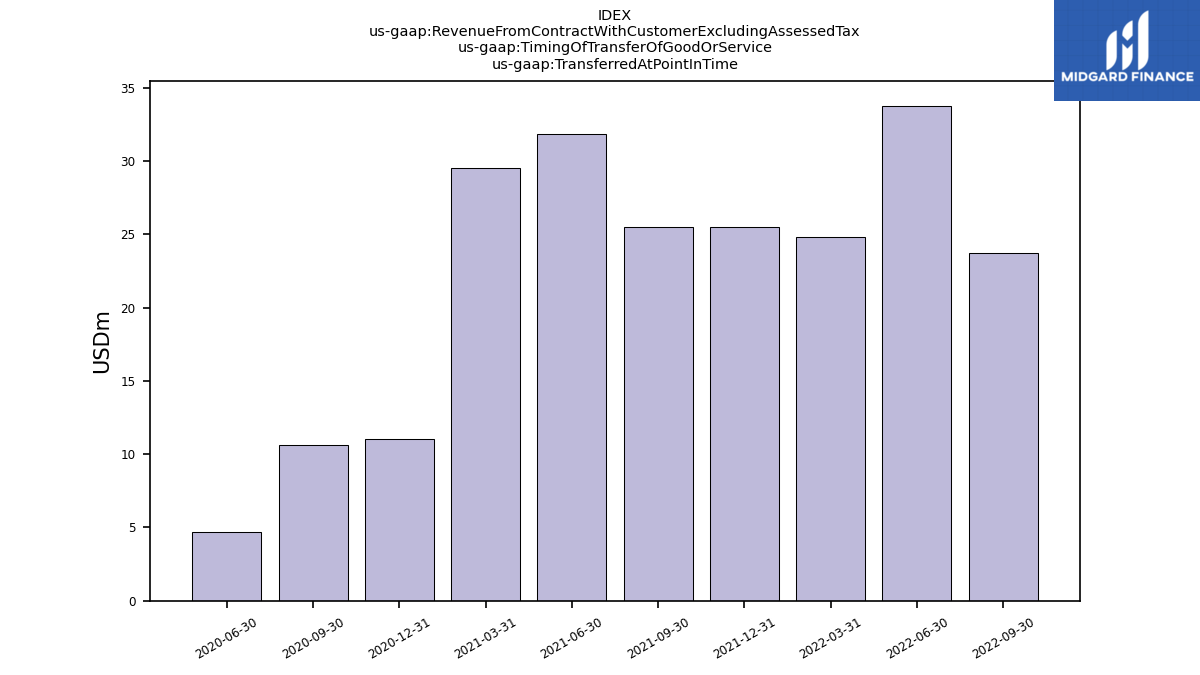
| Transferred At Point In Time | NA | NA | NA | 23.74 | 33.78 | 24.86 | 25.53 | 25.53 | 31.84 | 29.55 | 11.04 | 10.62 | 4.69 | NA | NA | NA | NA | NA | NA | NA | NA | NA | NA | NA | NA | NA | NA | NA | NA | NA | NA | NA | NA | NA | NA | NA | NA | NA | NA | NA | NA | NA | NA | NA | NA | NA | NA | NA | NA | NA | NA | NA | NA | |
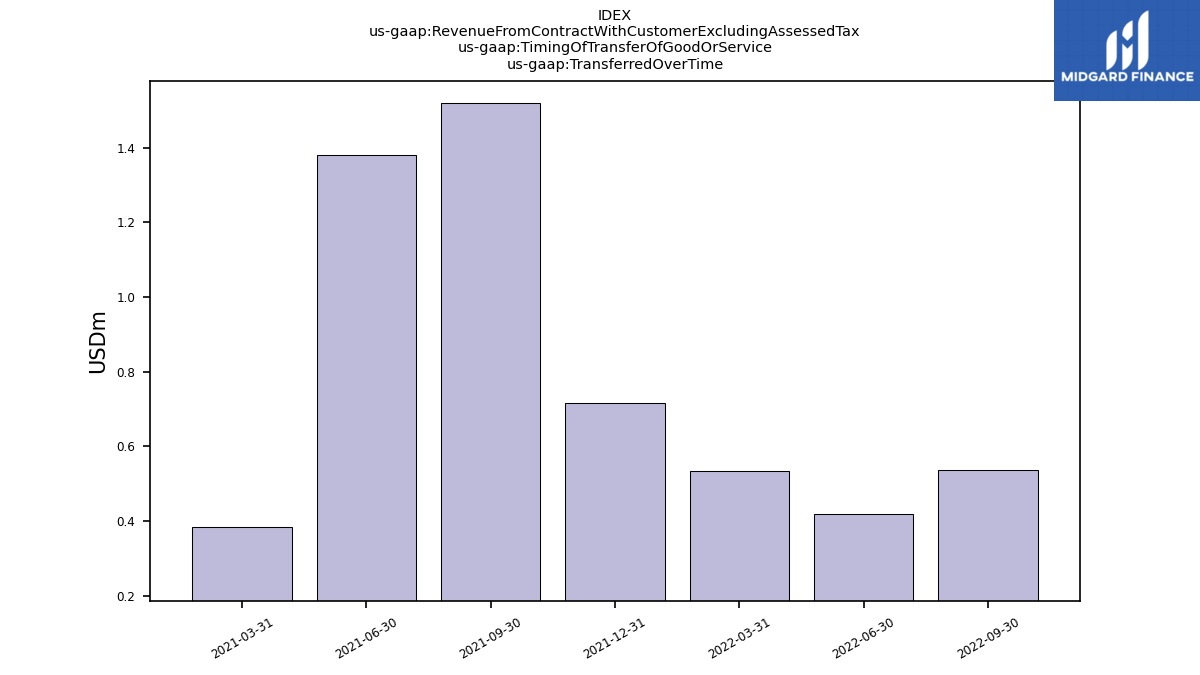
| Transferred Over Time | NA | NA | NA | 0.54 | 0.42 | 0.54 | 0.71 | 1.52 | 1.38 | 0.39 | NA | NA | NA | NA | NA | NA | NA | NA | NA | NA | NA | NA | NA | NA | NA | NA | NA | NA | NA | NA | NA | NA | NA | NA | NA | NA | NA | NA | NA | NA | NA | NA | NA | NA | NA | NA | NA | NA | NA | NA | NA | NA | NA | |
| Revenue From Contract With Customer Including Assessed Tax | 8.18 | 10.56 | 17.07 | 24.28 | 34.20 | 25.39 | 26.25 | 27.05 | 33.22 | 32.71 | 11.07 | 10.62 | 4.69 | 0.38 | 0.06 | 3.10 | 14.45 | 26.95 | 15.11 | 43.71 | 132.99 | 185.93 | 37.61 | 30.23 | 43.33 | 33.16 | 30.81 | 1.63 | 1.48 | 1.27 | 1.62 | 0.48 | 1.48 | 1.03 | 1.00 | 0.64 | 0.18 | 0.14 | 0.16 | 0.10 | 0.05 | 1.31 | 1.36 | 1.19 | 2.28 | 2.04 | 2.29 | 1.98 | 1.89 | 1.70 | 1.90 | 2.05 | 1.82 |