
| 2023-12-31 | 2023-09-30 | 2023-06-30 | 2023-03-31 | 2022-12-31 | 2022-09-30 | 2022-06-30 | 2022-03-31 | 2021-12-31 | 2021-09-30 | 2021-06-30 | 2021-03-31 | 2020-12-31 | 2020-09-30 | 2020-06-30 | 2020-03-31 | 2019-12-31 | 2019-09-30 | 2019-06-30 | 2019-03-31 | 2018-12-31 | 2018-09-30 | 2018-06-30 | 2018-03-31 | 2017-12-31 | 2017-09-30 | 2017-06-30 | 2017-03-31 | 2016-12-31 | 2016-09-30 | 2016-06-30 | 2016-03-31 | 2015-12-31 | 2015-09-30 | 2015-06-30 | 2015-03-31 | 2014-12-31 | 2014-09-30 | 2014-06-30 | 2014-03-31 | 2013-12-31 | 2013-09-30 | 2013-06-30 | 2013-03-31 | 2012-12-31 | 2012-09-30 | 2012-06-30 | 2012-03-31 | 2011-12-31 | 2011-09-30 | 2011-06-30 | 2011-03-31 | 2010-12-31 | 2010-09-30 | 2010-06-30 | 2010-03-31 | ||
|---|---|---|---|---|---|---|---|---|---|---|---|---|---|---|---|---|---|---|---|---|---|---|---|---|---|---|---|---|---|---|---|---|---|---|---|---|---|---|---|---|---|---|---|---|---|---|---|---|---|---|---|---|---|---|---|---|---|
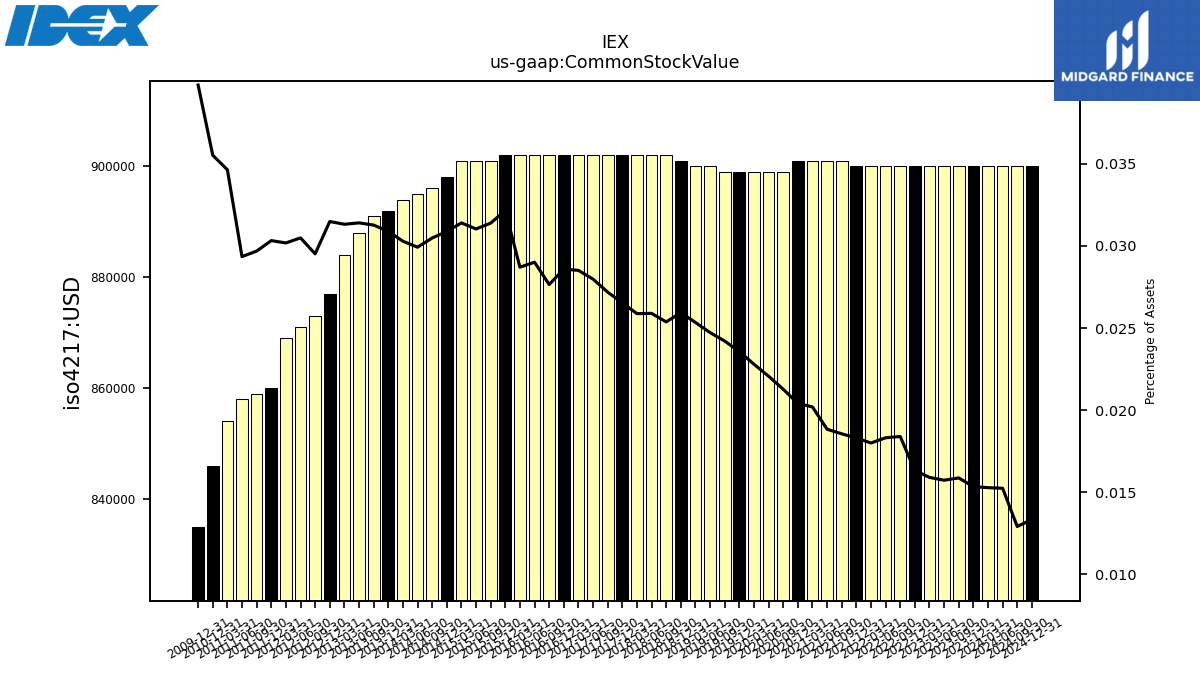
| Common Stock Value | 0.90 | 0.90 | 0.90 | 0.90 | 0.90 | 0.90 | 0.90 | 0.90 | 0.90 | 0.90 | 0.90 | 0.90 | 0.90 | 0.90 | 0.90 | 0.90 | 0.90 | 0.90 | 0.90 | 0.90 | 0.90 | 0.90 | 0.90 | 0.90 | 0.90 | 0.90 | 0.90 | 0.90 | 0.90 | 0.90 | 0.90 | 0.90 | 0.90 | 0.90 | 0.90 | 0.90 | 0.90 | 0.90 | 0.90 | 0.89 | 0.89 | 0.89 | 0.89 | 0.88 | 0.88 | 0.87 | 0.87 | 0.87 | 0.86 | 0.86 | 0.86 | 0.85 | 0.85 | NA | NA | NA | |
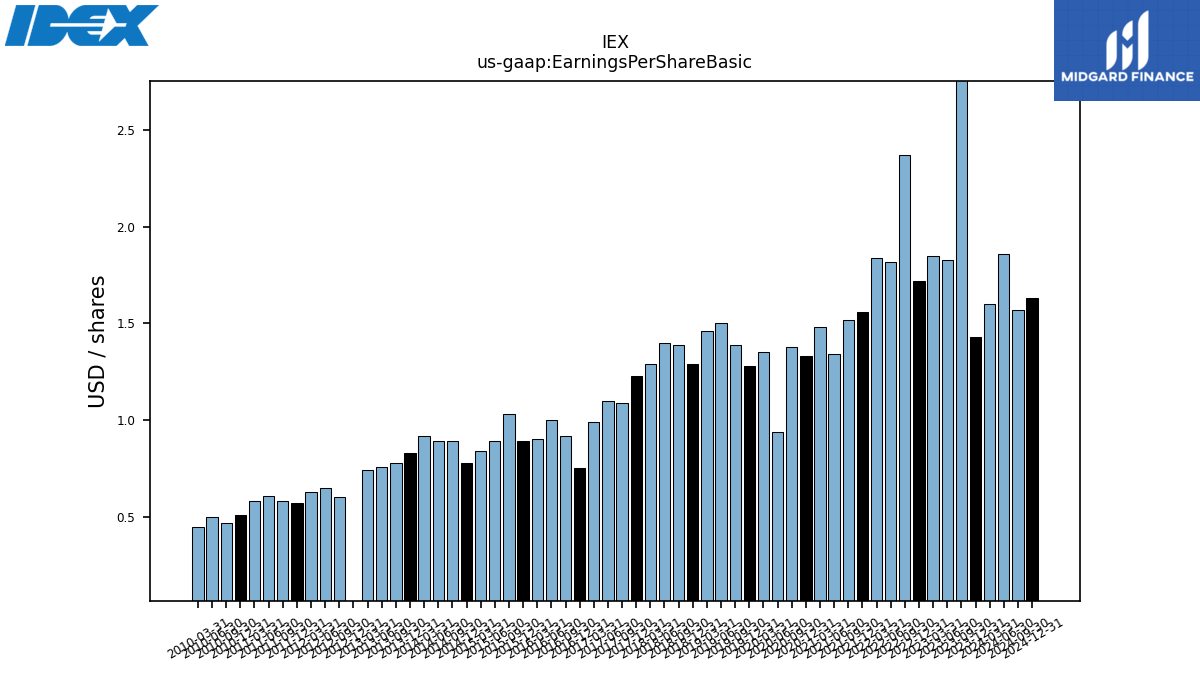
| Earnings Per Share Basic | 1.43 | 2.76 | 1.83 | 1.85 | 1.72 | 2.37 | 1.82 | 1.84 | 1.56 | 1.52 | 1.34 | 1.48 | 1.33 | 1.38 | 0.94 | 1.35 | 1.28 | 1.39 | 1.50 | 1.46 | 1.29 | 1.39 | 1.40 | 1.29 | 1.23 | 1.09 | 1.10 | 0.99 | 0.75 | 0.92 | 1.00 | 0.90 | 0.89 | 1.03 | 0.89 | 0.84 | 0.78 | 0.89 | 0.89 | 0.92 | 0.83 | 0.78 | 0.76 | 0.74 | -1.45 | 0.60 | 0.65 | 0.63 | 0.57 | 0.58 | 0.61 | 0.58 | 0.51 | 0.47 | 0.50 | 0.45 | |
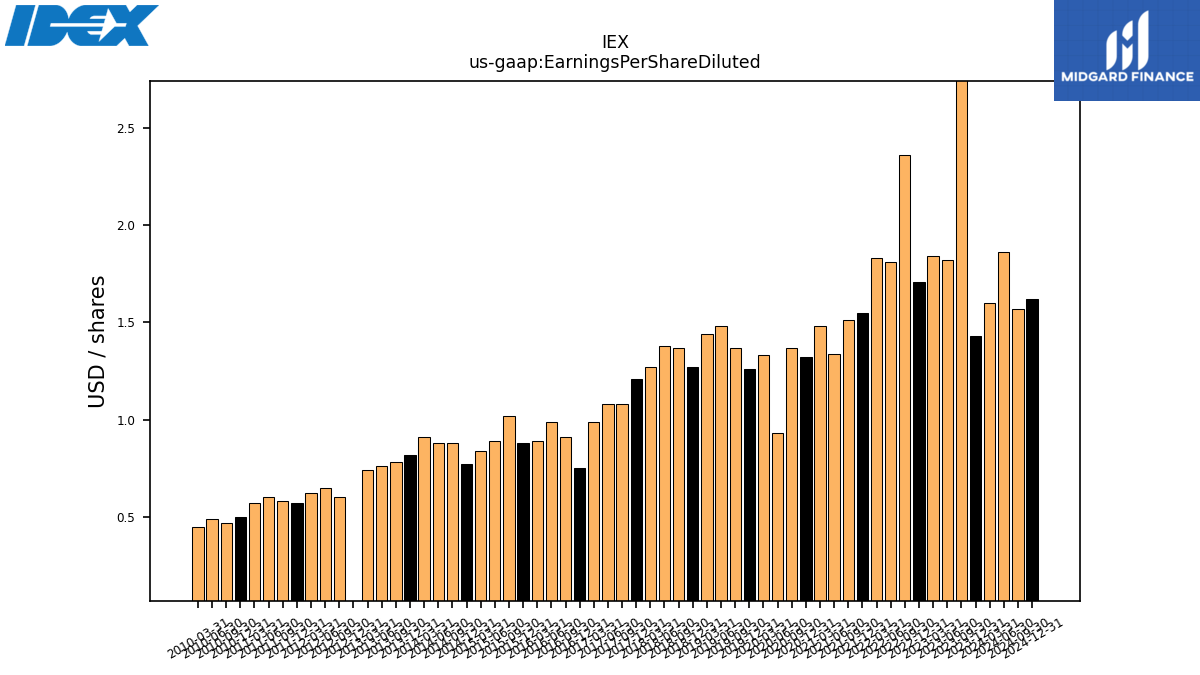
| Earnings Per Share Diluted | 1.43 | 2.75 | 1.82 | 1.84 | 1.71 | 2.36 | 1.81 | 1.83 | 1.55 | 1.51 | 1.34 | 1.48 | 1.32 | 1.37 | 0.93 | 1.33 | 1.26 | 1.37 | 1.48 | 1.44 | 1.27 | 1.37 | 1.38 | 1.27 | 1.21 | 1.08 | 1.08 | 0.99 | 0.75 | 0.91 | 0.99 | 0.89 | 0.88 | 1.02 | 0.89 | 0.84 | 0.77 | 0.88 | 0.88 | 0.91 | 0.82 | 0.78 | 0.76 | 0.74 | -1.45 | 0.60 | 0.65 | 0.62 | 0.57 | 0.58 | 0.60 | 0.57 | 0.50 | 0.47 | 0.49 | 0.45 |
| 2023-12-31 | 2023-09-30 | 2023-06-30 | 2023-03-31 | 2022-12-31 | 2022-09-30 | 2022-06-30 | 2022-03-31 | 2021-12-31 | 2021-09-30 | 2021-06-30 | 2021-03-31 | 2020-12-31 | 2020-09-30 | 2020-06-30 | 2020-03-31 | 2019-12-31 | 2019-09-30 | 2019-06-30 | 2019-03-31 | 2018-12-31 | 2018-09-30 | 2018-06-30 | 2018-03-31 | 2017-12-31 | 2017-09-30 | 2017-06-30 | 2017-03-31 | 2016-12-31 | 2016-09-30 | 2016-06-30 | 2016-03-31 | 2015-12-31 | 2015-09-30 | 2015-06-30 | 2015-03-31 | 2014-12-31 | 2014-09-30 | 2014-06-30 | 2014-03-31 | 2013-12-31 | 2013-09-30 | 2013-06-30 | 2013-03-31 | 2012-12-31 | 2012-09-30 | 2012-06-30 | 2012-03-31 | 2011-12-31 | 2011-09-30 | 2011-06-30 | 2011-03-31 | 2010-12-31 | 2010-09-30 | 2010-06-30 | 2010-03-31 | ||
|---|---|---|---|---|---|---|---|---|---|---|---|---|---|---|---|---|---|---|---|---|---|---|---|---|---|---|---|---|---|---|---|---|---|---|---|---|---|---|---|---|---|---|---|---|---|---|---|---|---|---|---|---|---|---|---|---|---|
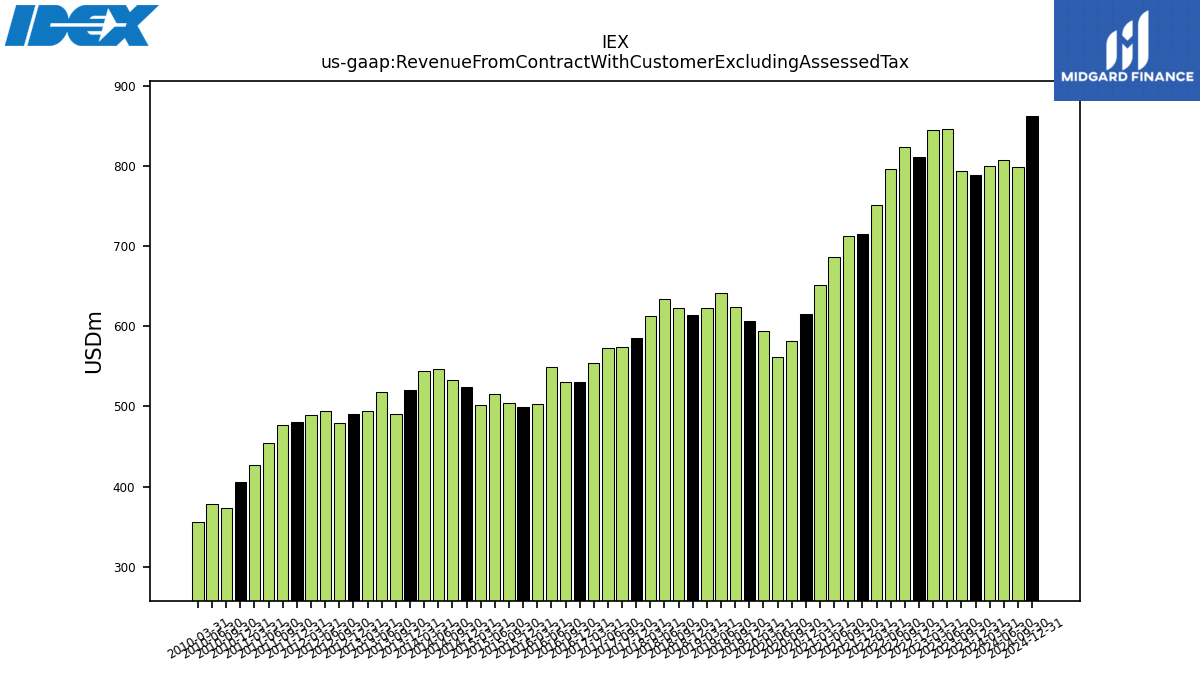
| Revenue From Contract With Customer Excluding Assessed Tax | 788.90 | 793.40 | 846.20 | 845.40 | 810.70 | 824.00 | 796.10 | 751.10 | 714.80 | 712.02 | 685.95 | 652.04 | 614.82 | 581.11 | 561.25 | 594.46 | 606.00 | 624.25 | 642.10 | 622.23 | 614.09 | 622.89 | 634.36 | 612.32 | 585.90 | 574.49 | 573.37 | 553.55 | 530.42 | 530.36 | 549.70 | 502.57 | 499.80 | 503.79 | 514.88 | 502.20 | 523.90 | 533.18 | 546.69 | 544.00 | 520.62 | 490.62 | 518.45 | 494.45 | 490.84 | 479.86 | 494.14 | 489.42 | 480.68 | 476.88 | 453.80 | 427.09 | 405.22 | 373.73 | 378.53 | 355.60 | |
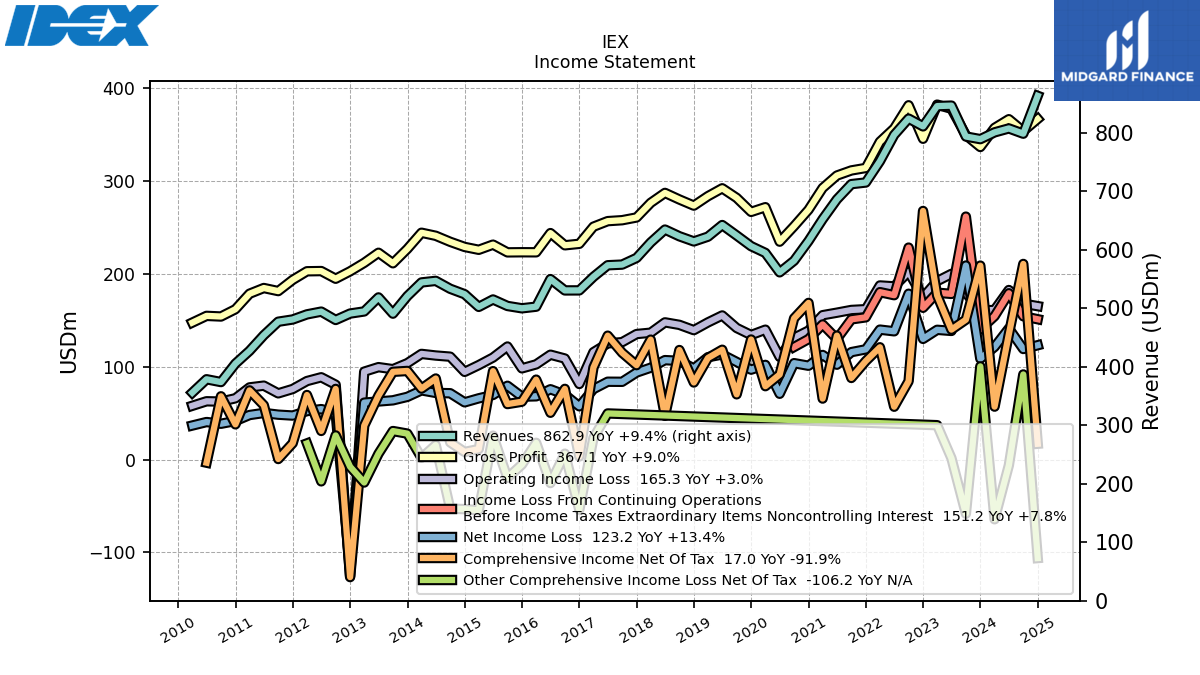
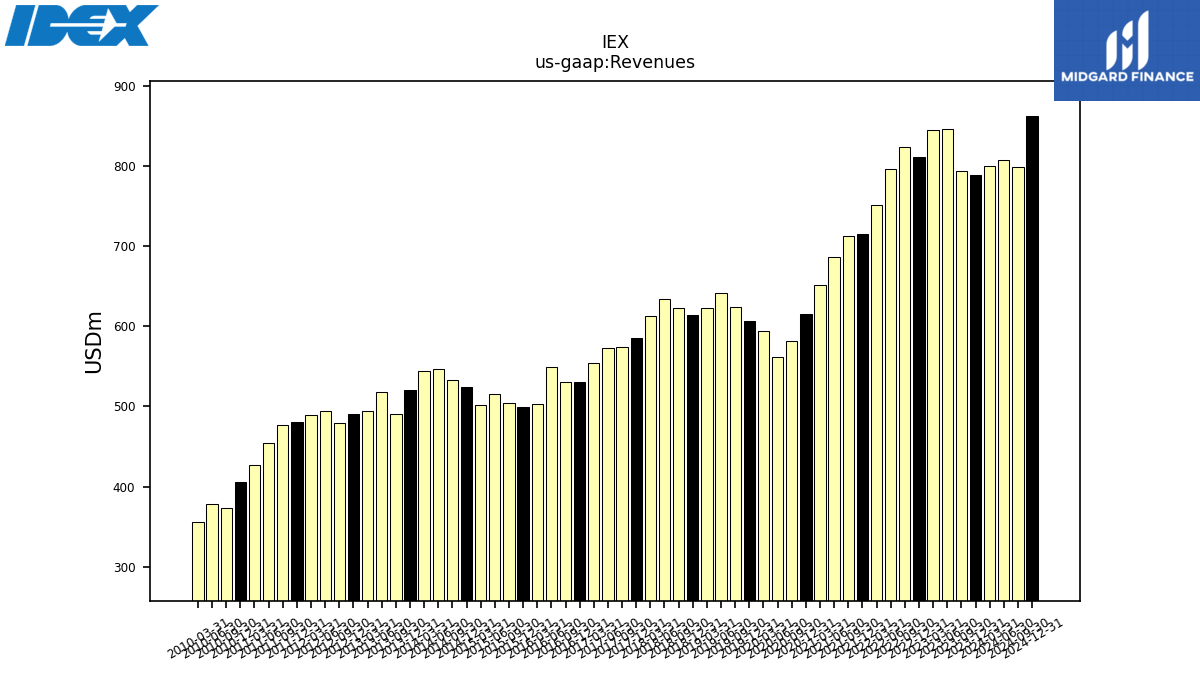
| Revenues | 788.90 | 793.40 | 846.20 | 845.40 | 810.70 | 824.00 | 796.10 | 751.10 | 714.80 | 712.02 | 685.95 | 652.04 | 614.82 | 581.11 | 561.25 | 594.46 | 606.00 | 624.25 | 642.10 | 622.23 | 614.09 | 622.89 | 634.36 | 612.32 | 585.90 | 574.49 | 573.37 | 553.55 | 530.42 | 530.36 | 549.70 | 502.57 | 499.80 | 503.79 | 514.88 | 502.20 | 523.90 | 533.18 | 546.69 | 544.00 | 520.62 | 490.62 | 518.45 | 494.45 | 490.84 | 479.86 | 494.14 | 489.42 | 480.68 | 476.88 | 453.80 | 427.09 | 405.22 | 373.73 | 378.53 | 355.60 | |
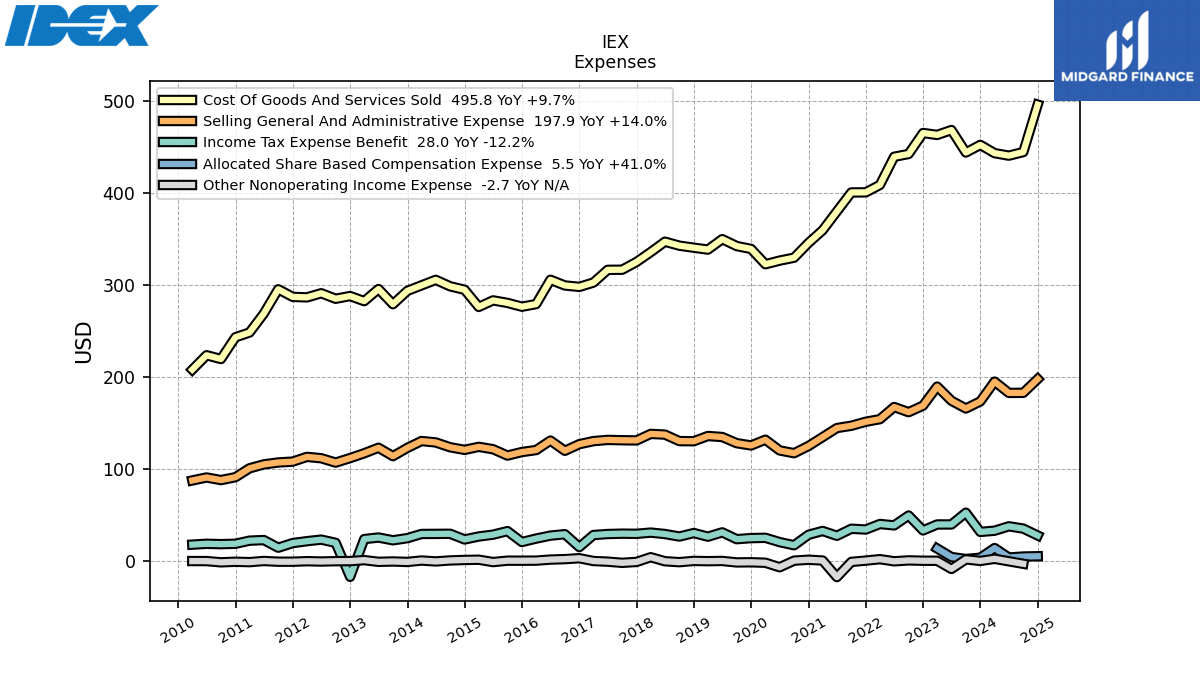
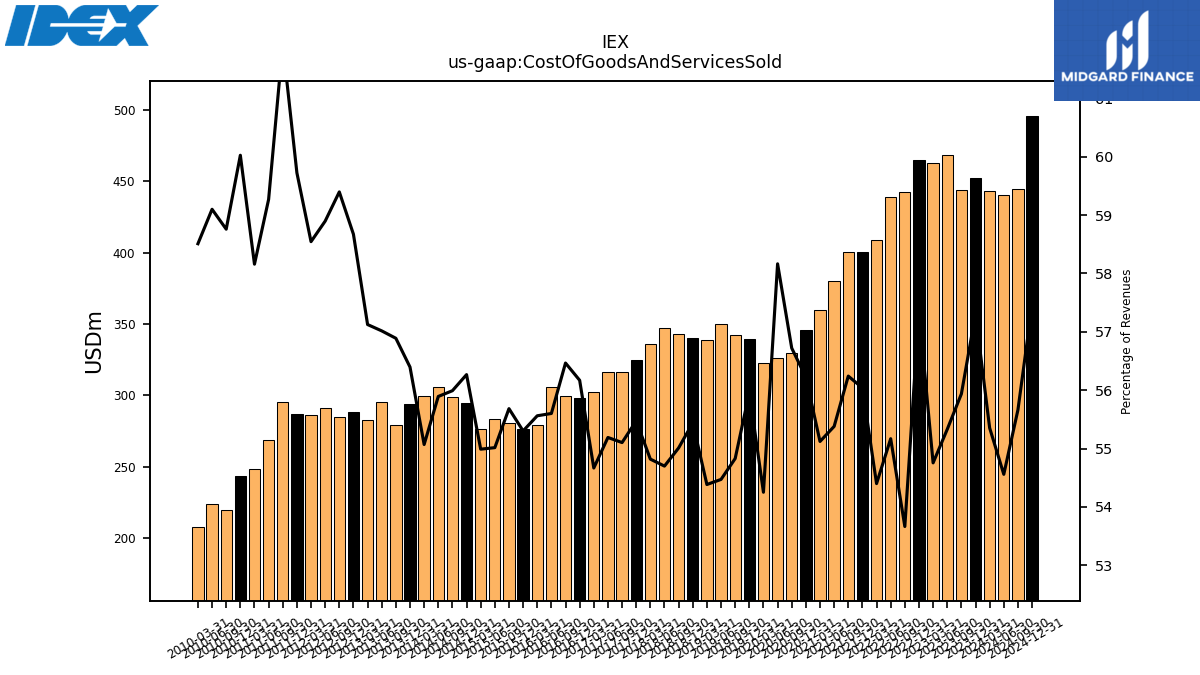
| Cost Of Goods And Services Sold | 452.10 | 443.80 | 468.20 | 462.90 | 465.00 | 442.20 | 439.20 | 408.60 | 400.56 | 400.45 | 379.88 | 359.41 | 345.65 | 329.61 | 326.45 | 322.51 | 339.11 | 342.27 | 349.76 | 338.40 | 340.45 | 342.65 | 346.99 | 335.67 | 325.02 | 316.56 | 316.44 | 302.61 | 297.93 | 299.47 | 305.64 | 279.24 | 276.40 | 280.53 | 283.27 | 276.16 | 294.78 | 298.53 | 305.56 | 299.58 | 293.61 | 279.11 | 295.60 | 282.45 | 287.98 | 285.02 | 291.03 | 286.53 | 287.08 | 295.35 | 268.96 | 248.39 | 243.23 | 219.60 | 223.71 | 208.06 | |
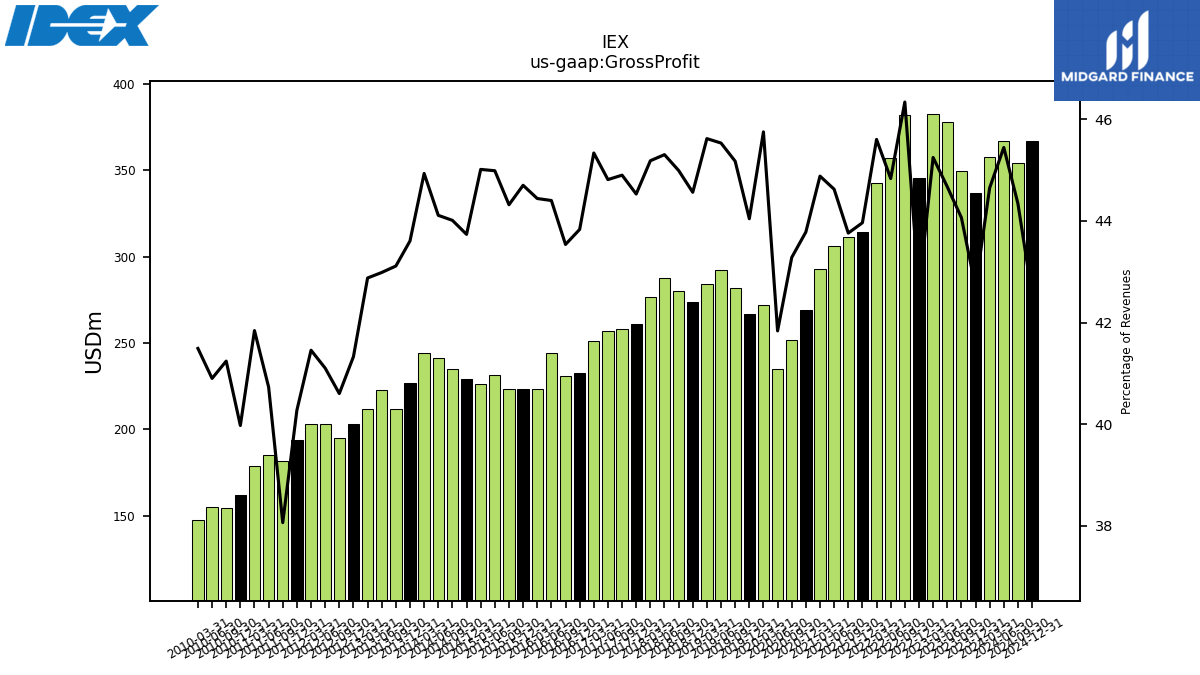
| Gross Profit | 336.80 | 349.60 | 378.00 | 382.50 | 345.70 | 381.80 | 356.90 | 342.50 | 314.24 | 311.57 | 306.07 | 292.62 | 269.17 | 251.50 | 234.80 | 271.96 | 266.88 | 281.98 | 292.34 | 283.83 | 273.64 | 280.23 | 287.37 | 276.65 | 260.88 | 257.93 | 256.93 | 250.94 | 232.49 | 230.89 | 244.06 | 223.34 | 223.40 | 223.26 | 231.62 | 226.04 | 229.12 | 234.65 | 241.13 | 244.42 | 227.01 | 211.51 | 222.85 | 212.00 | 202.86 | 194.84 | 203.11 | 202.89 | 193.60 | 181.53 | 184.84 | 178.70 | 161.99 | 154.13 | 154.82 | 147.54 | |
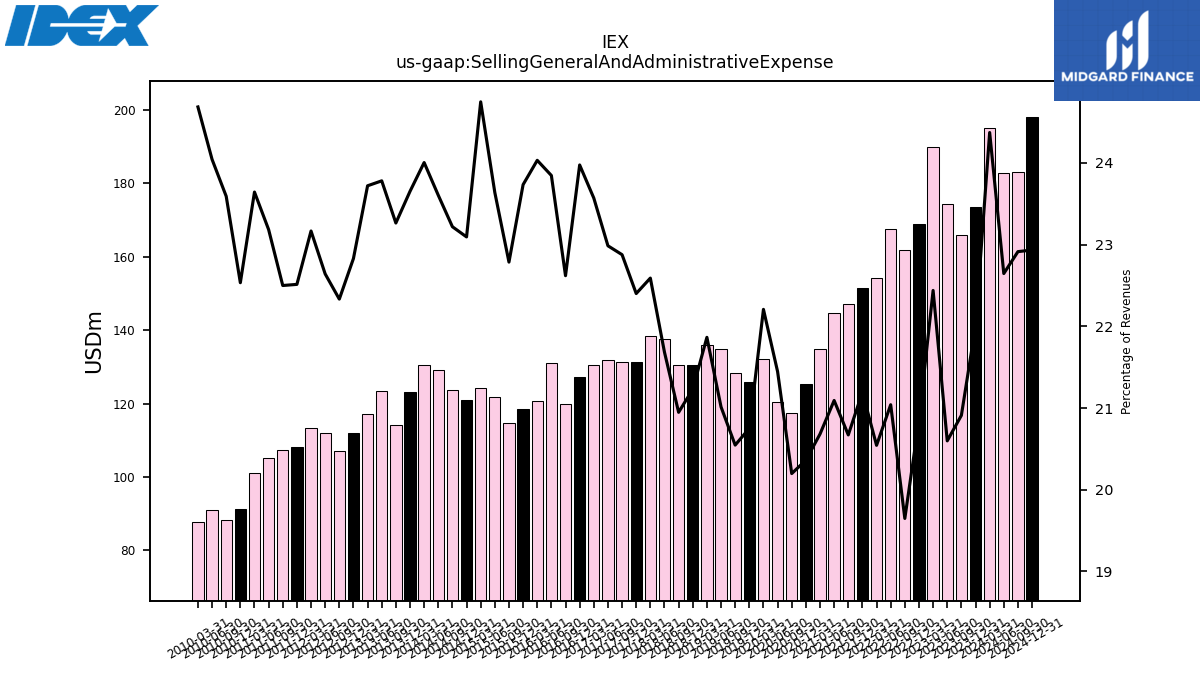
| Selling General And Administrative Expense | 173.60 | 165.90 | 174.30 | 189.70 | 169.00 | 161.90 | 167.50 | 154.30 | 151.49 | 147.18 | 144.68 | 134.85 | 125.19 | 117.37 | 120.36 | 132.01 | 125.75 | 128.26 | 134.93 | 136.05 | 130.37 | 130.48 | 137.55 | 138.33 | 131.25 | 131.43 | 131.79 | 130.47 | 127.17 | 119.97 | 131.08 | 120.78 | 118.62 | 114.79 | 121.71 | 124.28 | 120.99 | 123.80 | 129.04 | 130.59 | 123.14 | 114.14 | 123.29 | 117.28 | 112.06 | 107.17 | 111.88 | 113.38 | 108.22 | 107.30 | 105.21 | 100.98 | 91.31 | 88.17 | 91.01 | 87.78 | |
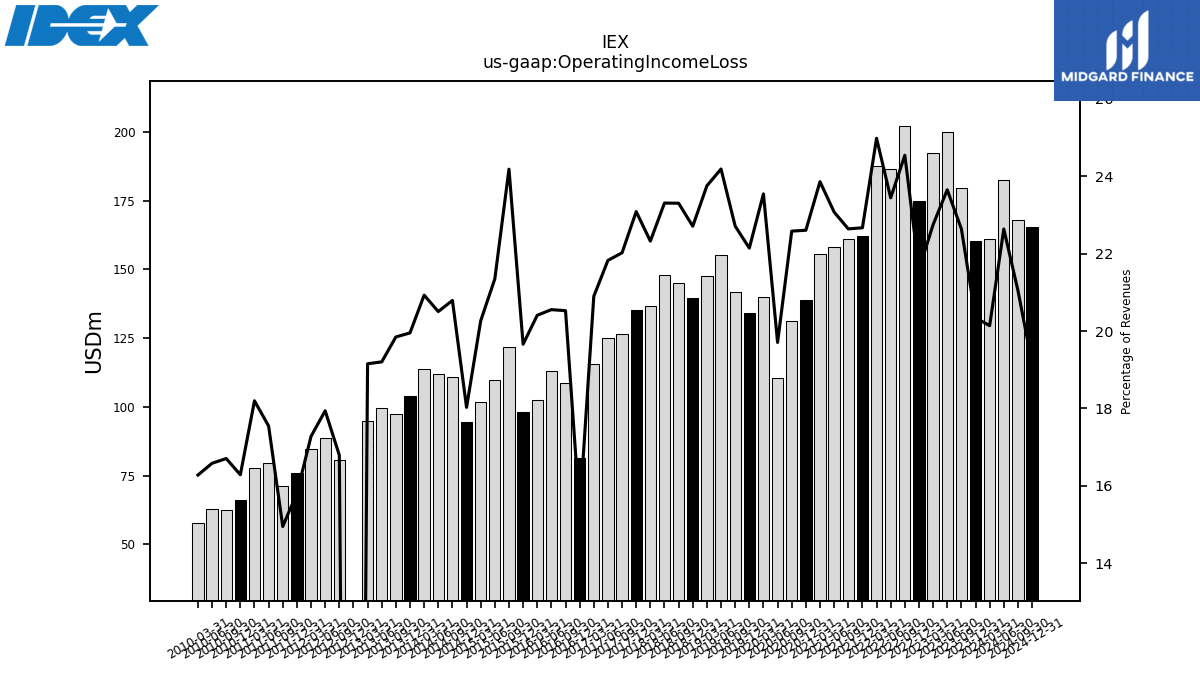
| Operating Income Loss | 160.50 | 179.60 | 200.10 | 192.30 | 175.00 | 202.20 | 186.60 | 187.60 | 162.01 | 161.19 | 158.26 | 155.55 | 138.97 | 131.21 | 110.59 | 139.94 | 134.17 | 141.76 | 155.28 | 147.78 | 139.44 | 145.13 | 147.83 | 136.68 | 135.25 | 126.50 | 125.13 | 115.67 | 81.41 | 108.86 | 112.98 | 102.56 | 98.26 | 121.81 | 109.91 | 101.76 | 94.45 | 110.85 | 112.09 | 113.83 | 103.87 | 97.37 | 99.56 | 94.71 | -125.59 | 80.59 | 88.65 | 84.57 | 76.00 | 71.31 | 79.63 | 77.72 | 66.00 | 62.44 | 62.78 | 57.89 | |
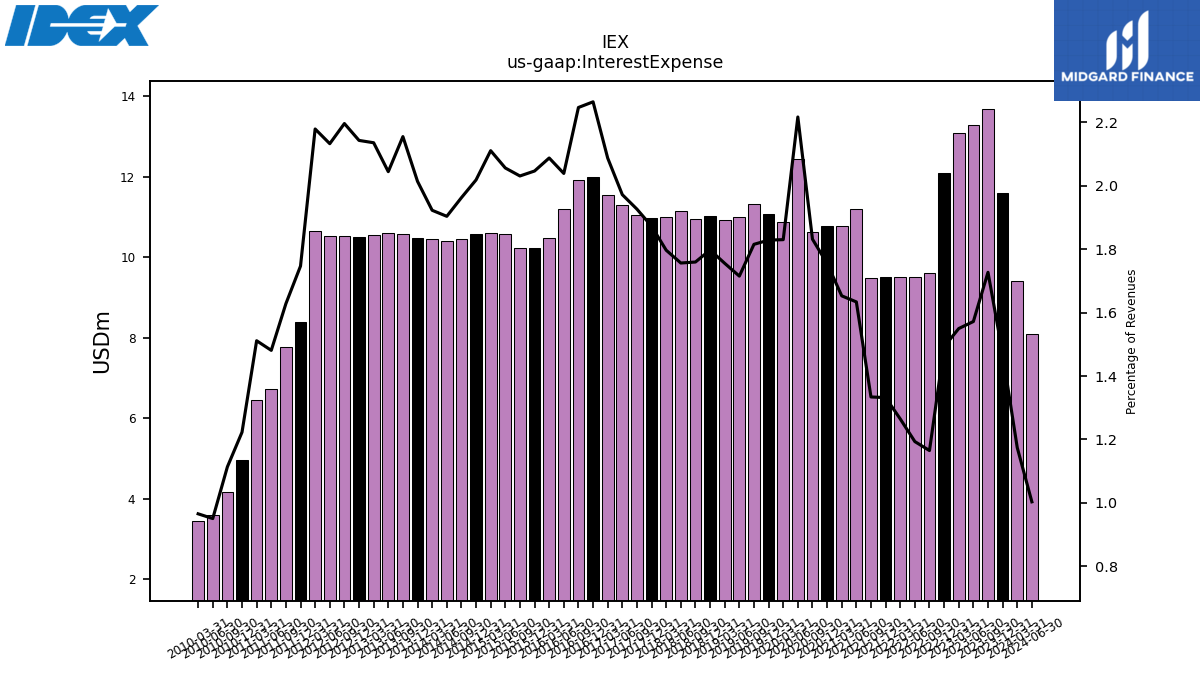
| Interest Expense | 11.60 | 13.70 | 13.30 | 13.10 | 12.10 | 9.60 | 9.50 | 9.50 | 9.52 | 9.50 | 11.21 | 10.78 | 10.79 | 10.64 | 12.44 | 10.88 | 11.08 | 11.33 | 11.01 | 10.92 | 11.04 | 10.96 | 11.14 | 11.00 | 10.97 | 11.06 | 11.30 | 11.55 | 12.01 | 11.91 | 11.21 | 10.49 | 10.23 | 10.23 | 10.58 | 10.60 | 10.57 | 10.46 | 10.40 | 10.46 | 10.48 | 10.57 | 10.60 | 10.56 | 10.52 | 10.54 | 10.54 | 10.66 | 8.39 | 7.76 | 6.72 | 6.45 | 4.96 | 4.16 | 3.60 | 3.43 | |
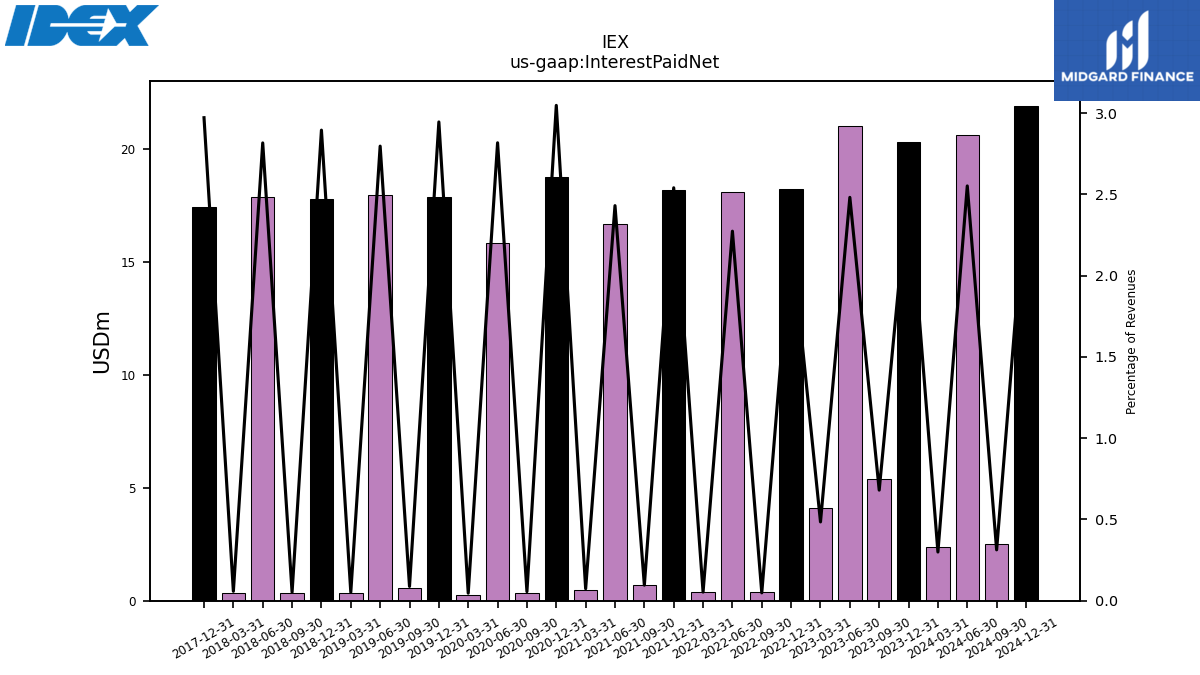
| Interest Paid Net | 20.30 | 5.40 | 21.00 | 4.10 | 18.20 | 0.40 | 18.10 | 0.40 | 18.16 | 0.68 | 16.67 | 0.48 | 18.74 | 0.33 | 15.81 | 0.28 | 17.85 | 0.55 | 17.96 | 0.32 | 17.78 | 0.32 | 17.87 | 0.35 | 17.41 | NA | NA | NA | NA | NA | NA | NA | NA | NA | NA | NA | NA | NA | NA | NA | NA | NA | NA | NA | NA | NA | NA | NA | NA | NA | NA | NA | NA | NA | NA | NA | |
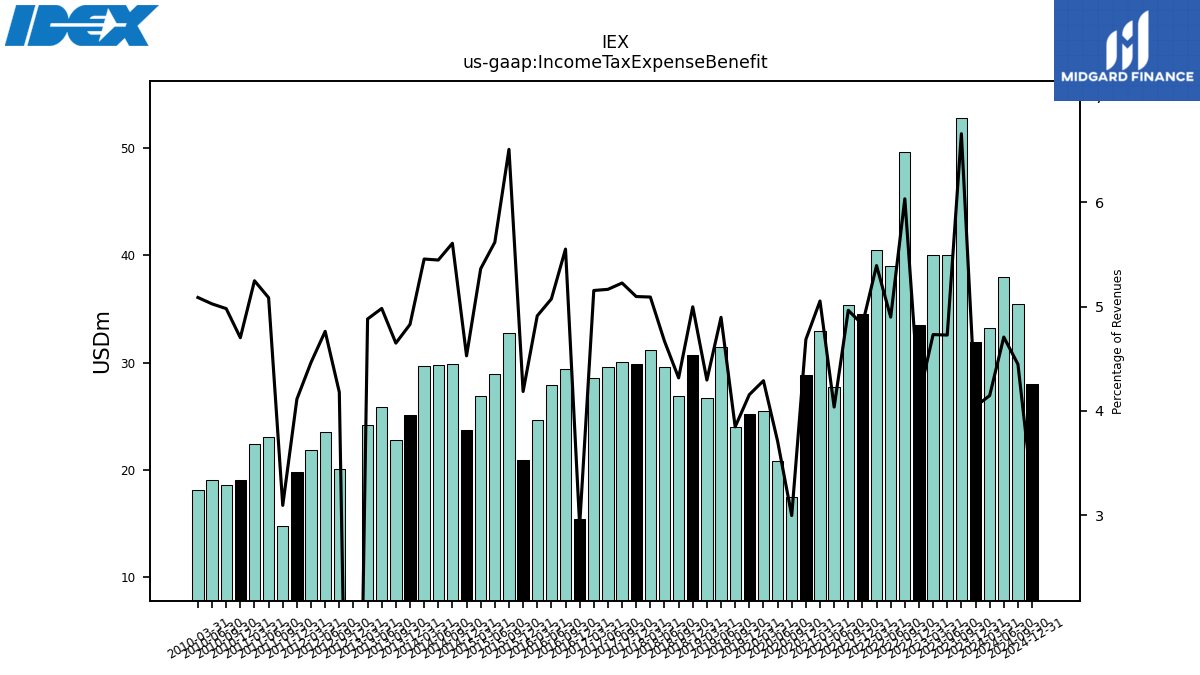
| Income Tax Expense Benefit | 31.90 | 52.80 | 40.00 | 40.00 | 33.50 | 49.70 | 39.00 | 40.50 | 34.51 | 35.34 | 27.70 | 32.95 | 28.80 | 17.43 | 20.83 | 25.50 | 25.19 | 24.02 | 31.44 | 26.73 | 30.69 | 26.89 | 29.61 | 31.17 | 29.86 | 30.02 | 29.61 | 28.53 | 15.40 | 29.43 | 27.89 | 24.68 | 20.92 | 32.77 | 28.91 | 26.93 | 23.72 | 29.89 | 29.77 | 29.67 | 25.14 | 22.81 | 25.83 | 24.13 | -16.87 | 20.06 | 23.53 | 21.85 | 19.78 | 14.77 | 23.07 | 22.41 | 19.05 | 18.61 | 19.02 | 18.09 | |
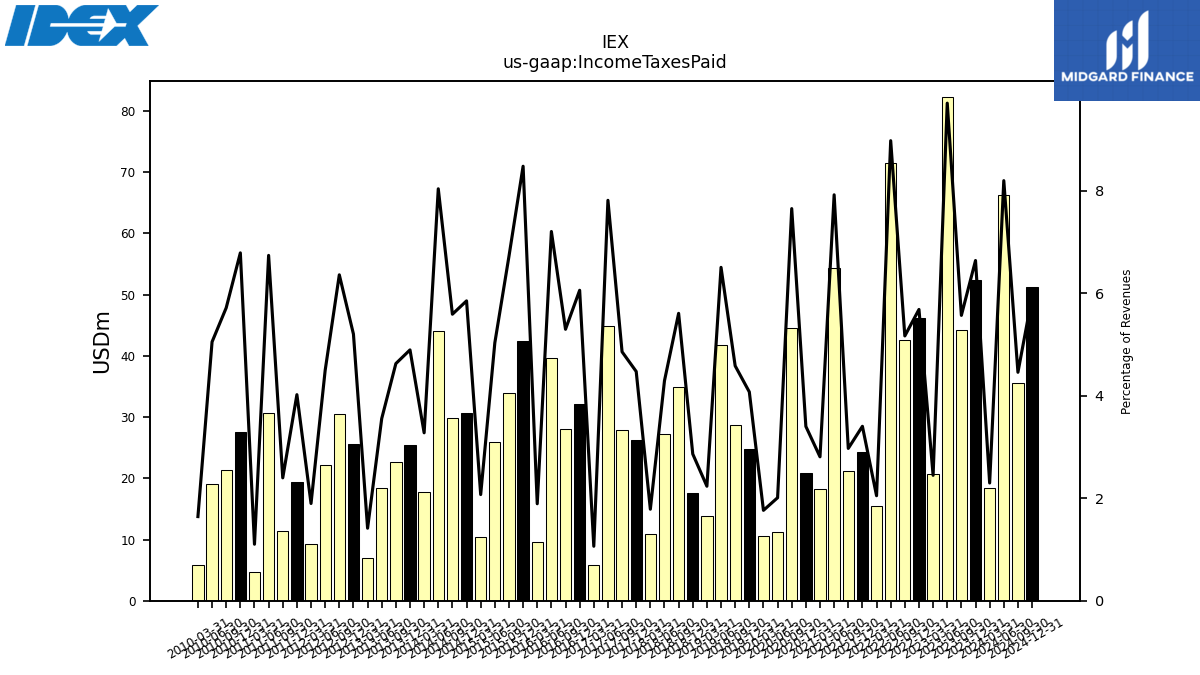
| Income Taxes Paid | 52.40 | 44.20 | 82.20 | 20.70 | 46.10 | 42.60 | 71.50 | 15.40 | 24.34 | 21.18 | 54.36 | 18.32 | 20.93 | 44.49 | 11.29 | 10.49 | 24.71 | 28.62 | 41.79 | 13.91 | 17.59 | 34.95 | 27.25 | 10.94 | 26.22 | 27.92 | 44.82 | 5.89 | 32.15 | 28.11 | 39.63 | 9.52 | 42.40 | 33.88 | 25.93 | 10.41 | 30.67 | 29.82 | 43.97 | 17.84 | 25.50 | 22.72 | 18.44 | 7.00 | 25.55 | 30.53 | 22.23 | 9.29 | 19.34 | 11.44 | 30.59 | 4.71 | 27.52 | 21.37 | 19.13 | 5.84 | |
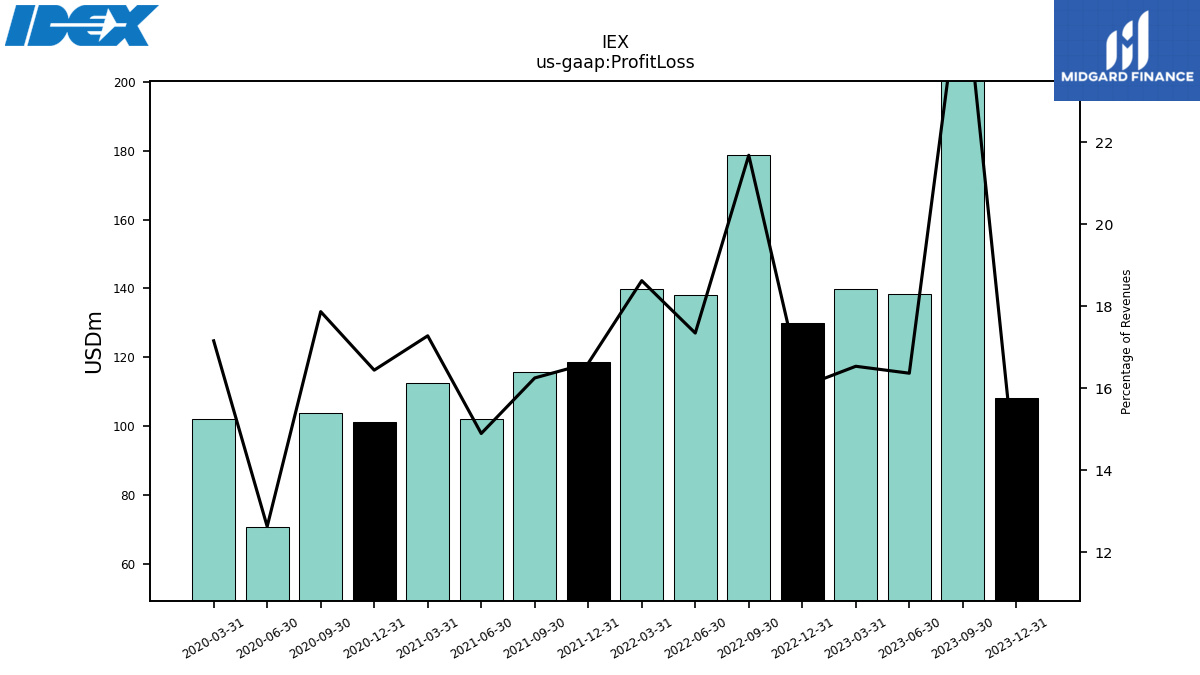
| Profit Loss | 108.30 | 209.00 | 138.50 | 139.80 | 130.00 | 178.70 | 138.10 | 139.90 | 118.73 | 115.71 | 102.18 | 112.67 | 101.09 | 103.85 | 70.86 | 102.00 | NA | NA | NA | NA | NA | NA | NA | NA | NA | NA | NA | NA | NA | NA | NA | NA | NA | NA | NA | NA | NA | NA | NA | NA | NA | NA | NA | NA | NA | NA | NA | NA | NA | NA | NA | NA | NA | NA | NA | NA | |
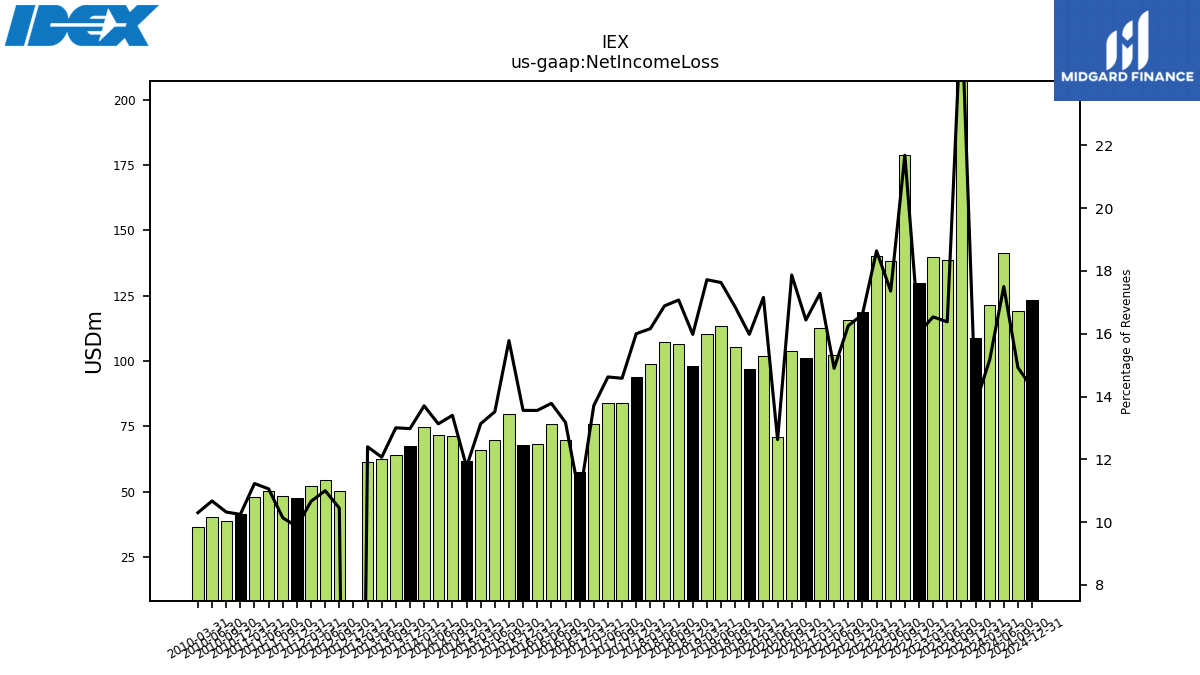
| Net Income Loss | 108.60 | 209.10 | 138.60 | 139.80 | 130.00 | 178.70 | 138.20 | 140.00 | 118.75 | 115.74 | 102.19 | 112.71 | 101.07 | 103.85 | 70.86 | 102.00 | 96.85 | 105.19 | 113.21 | 110.27 | 98.14 | 106.35 | 107.13 | 98.96 | 93.75 | 83.77 | 83.84 | 75.90 | 57.35 | 69.87 | 75.76 | 68.13 | 67.76 | 79.50 | 69.58 | 65.95 | 61.62 | 71.44 | 71.78 | 74.55 | 67.56 | 63.80 | 62.56 | 61.30 | -119.02 | 50.13 | 54.35 | 52.17 | 47.39 | 48.34 | 50.18 | 47.95 | 41.51 | 38.56 | 40.40 | 36.62 | |
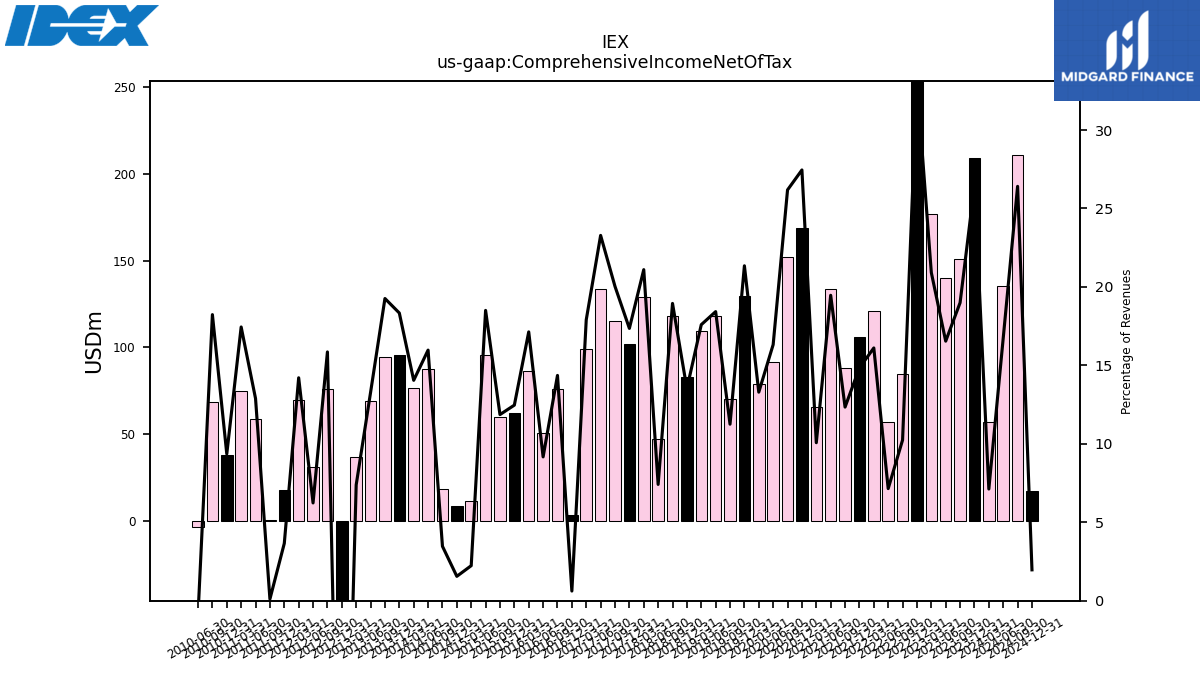
| Comprehensive Income Net Of Tax | 209.00 | 150.70 | 140.00 | 176.80 | 267.90 | 84.40 | 56.90 | 121.00 | 106.11 | 87.88 | 133.53 | 65.68 | 168.79 | 152.15 | 91.62 | 79.03 | 129.37 | 70.24 | 118.32 | 109.48 | 83.01 | 118.03 | 47.04 | 129.21 | 101.70 | 115.09 | 133.50 | 99.11 | 3.28 | 76.16 | 50.40 | 86.11 | 62.31 | 59.78 | 95.27 | 11.23 | 8.15 | 18.51 | 87.32 | 76.43 | 95.47 | 94.50 | 68.83 | 36.51 | -126.75 | 76.09 | 30.80 | 69.55 | 17.57 | 0.51 | 58.49 | 74.52 | 37.91 | 68.15 | -3.40 | NA |
| 2023-12-31 | 2023-09-30 | 2023-06-30 | 2023-03-31 | 2022-12-31 | 2022-09-30 | 2022-06-30 | 2022-03-31 | 2021-12-31 | 2021-09-30 | 2021-06-30 | 2021-03-31 | 2020-12-31 | 2020-09-30 | 2020-06-30 | 2020-03-31 | 2019-12-31 | 2019-09-30 | 2019-06-30 | 2019-03-31 | 2018-12-31 | 2018-09-30 | 2018-06-30 | 2018-03-31 | 2017-12-31 | 2017-09-30 | 2017-06-30 | 2017-03-31 | 2016-12-31 | 2016-09-30 | 2016-06-30 | 2016-03-31 | 2015-12-31 | 2015-09-30 | 2015-06-30 | 2015-03-31 | 2014-12-31 | 2014-09-30 | 2014-06-30 | 2014-03-31 | 2013-12-31 | 2013-09-30 | 2013-06-30 | 2013-03-31 | 2012-12-31 | 2012-09-30 | 2012-06-30 | 2012-03-31 | 2011-12-31 | 2011-09-30 | 2011-06-30 | 2011-03-31 | 2010-12-31 | 2010-09-30 | 2010-06-30 | 2010-03-31 | ||
|---|---|---|---|---|---|---|---|---|---|---|---|---|---|---|---|---|---|---|---|---|---|---|---|---|---|---|---|---|---|---|---|---|---|---|---|---|---|---|---|---|---|---|---|---|---|---|---|---|---|---|---|---|---|---|---|---|---|
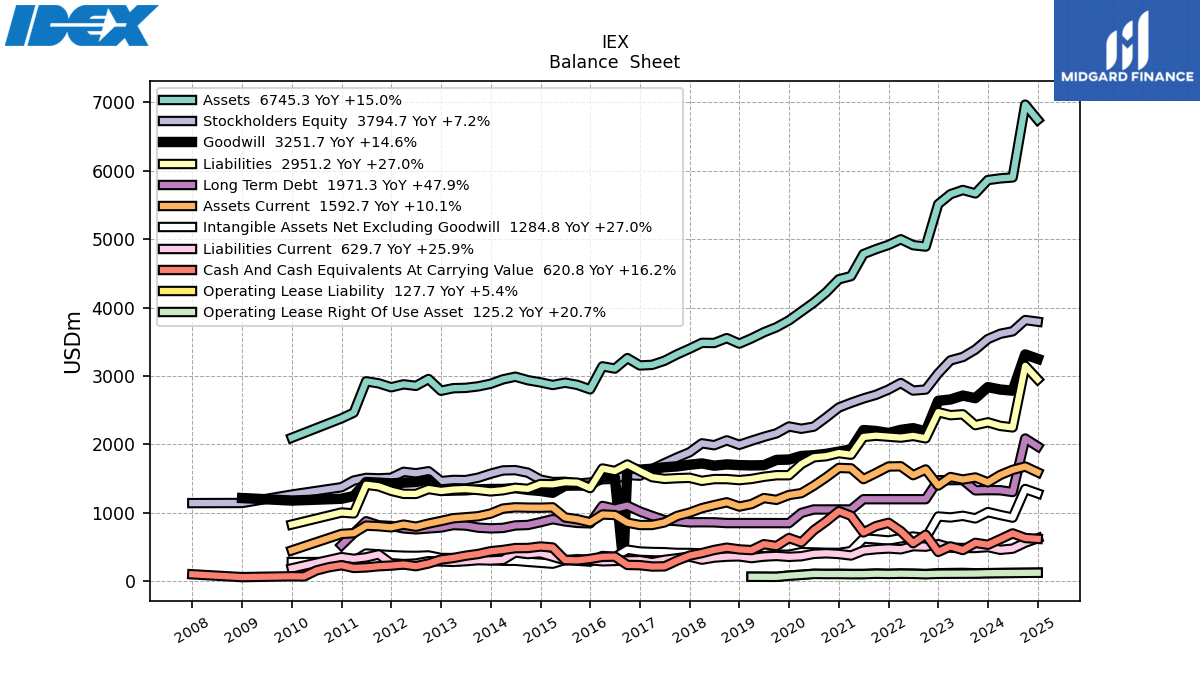
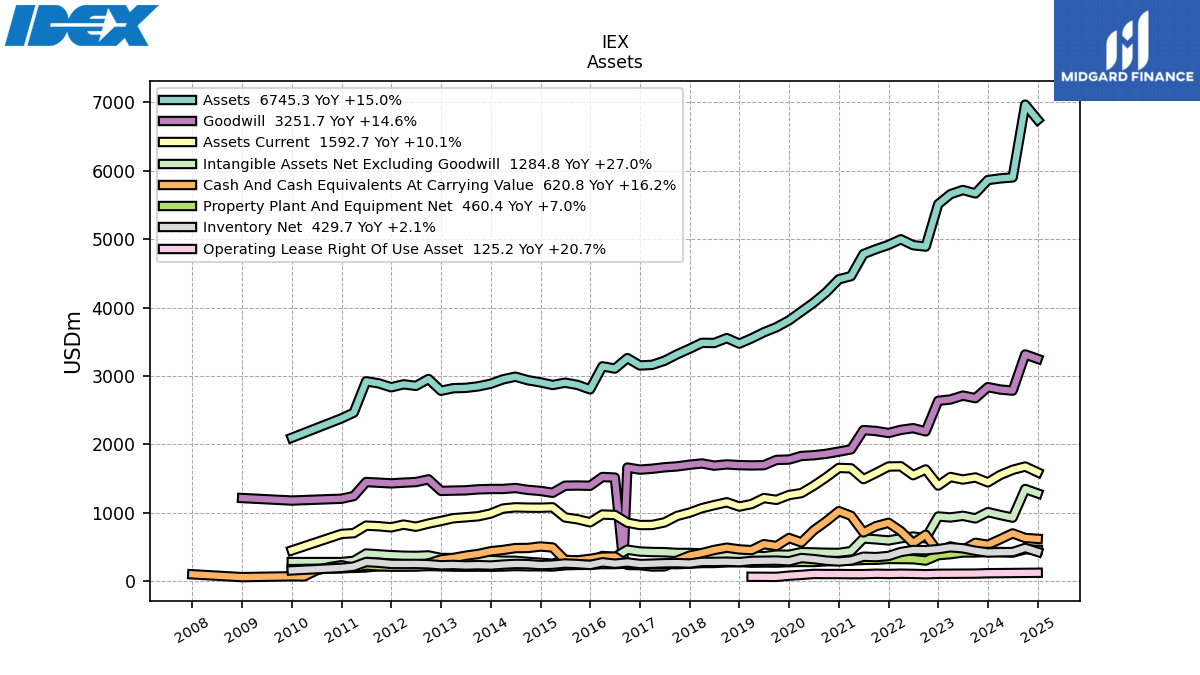
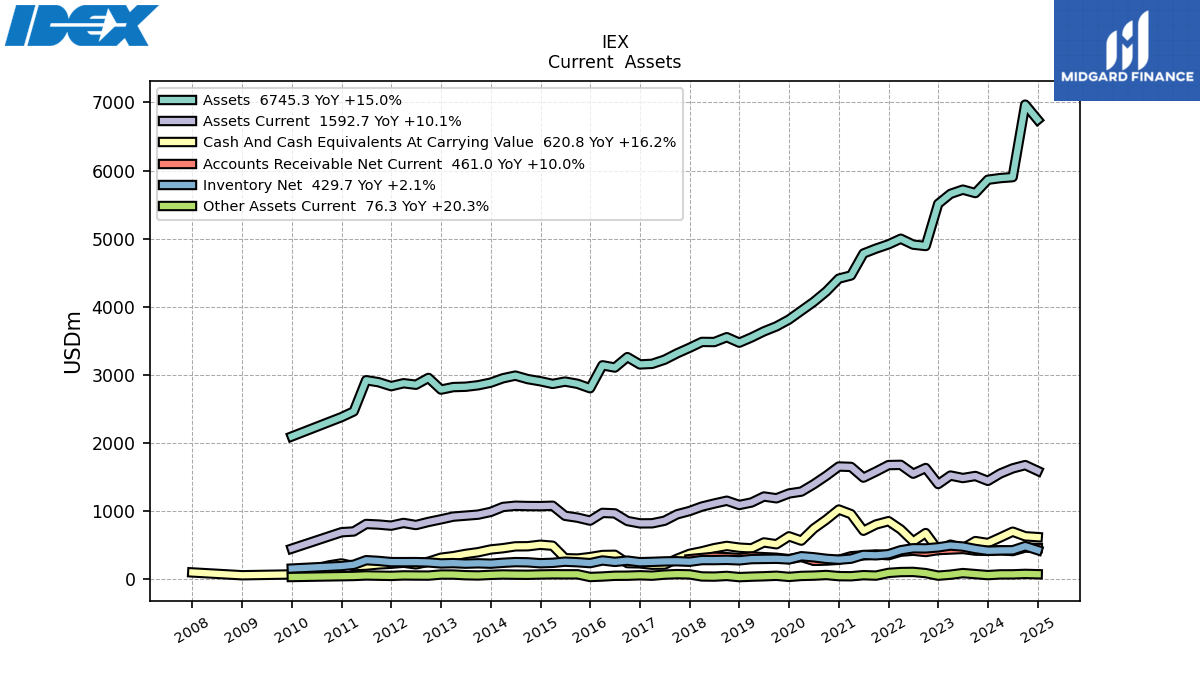
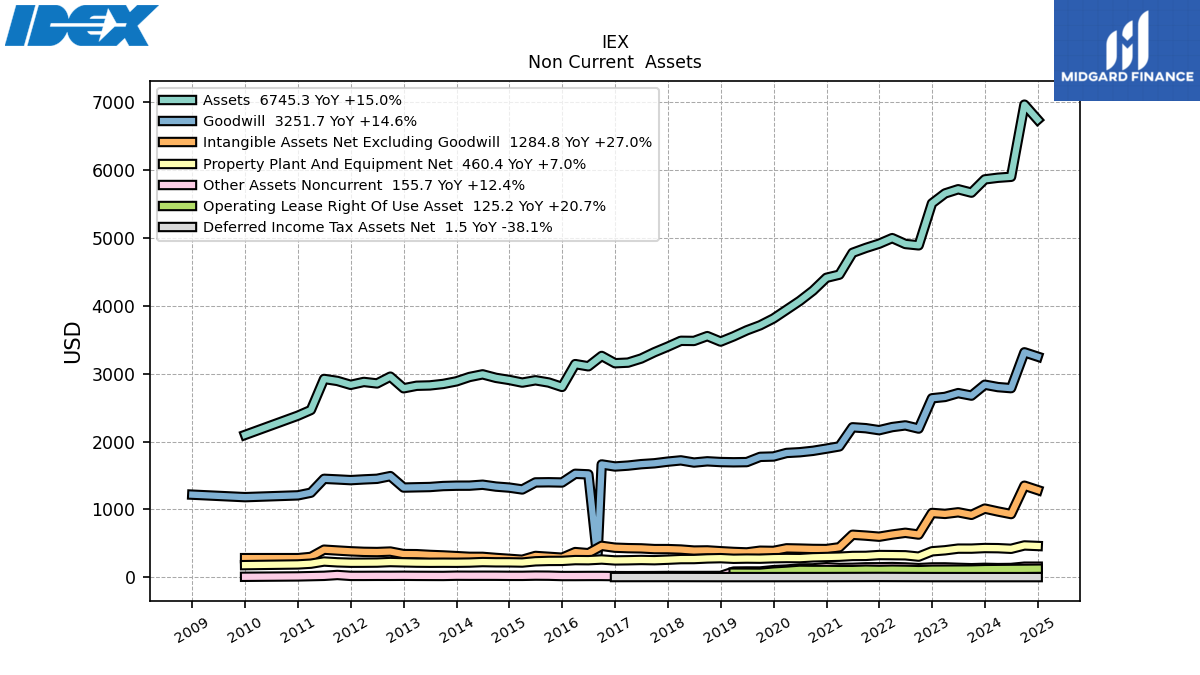
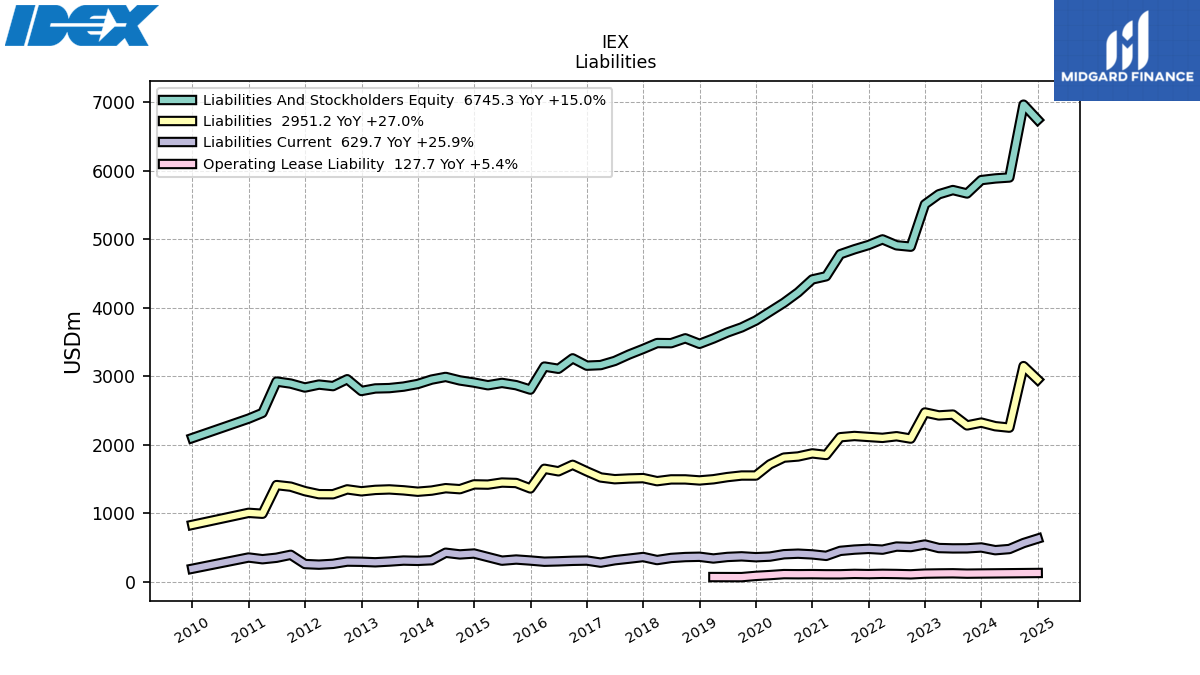
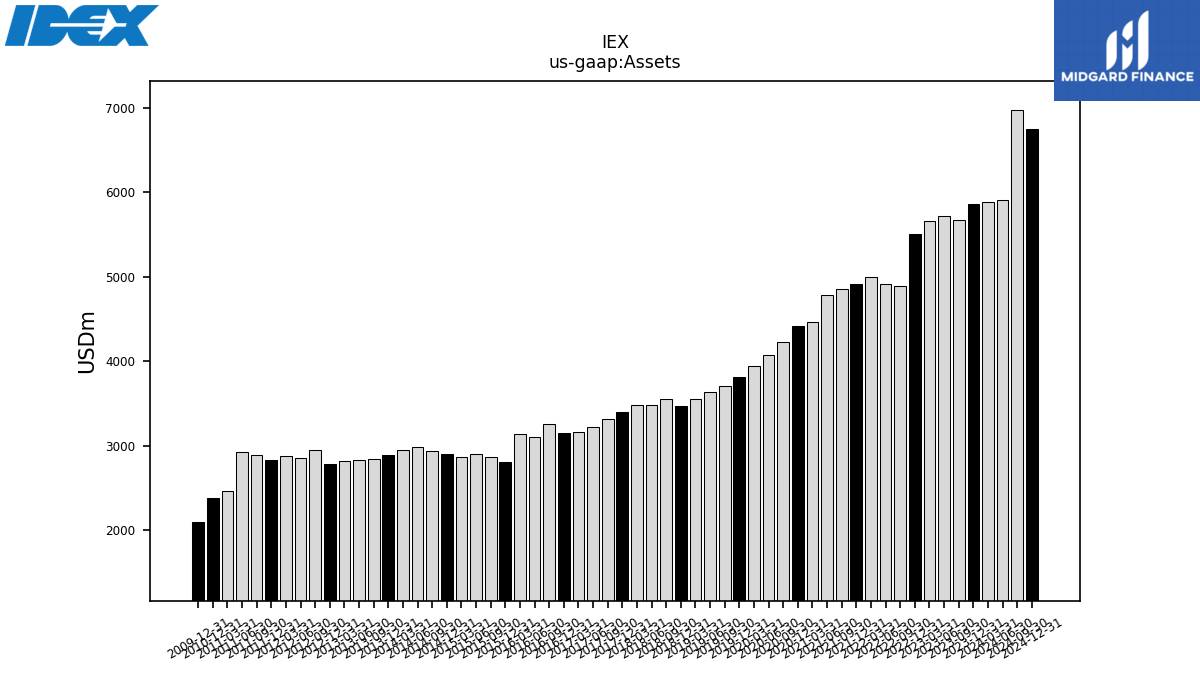
| Assets | 5865.20 | 5669.60 | 5719.90 | 5658.00 | 5511.90 | 4892.60 | 4912.80 | 4999.70 | 4917.20 | 4854.58 | 4783.00 | 4460.73 | 4414.40 | 4225.60 | 4073.59 | 3943.68 | 3813.91 | 3713.89 | 3640.22 | 3551.46 | 3473.86 | 3554.81 | 3483.46 | 3485.46 | 3399.63 | 3317.76 | 3224.16 | 3163.78 | 3154.94 | 3262.46 | 3109.36 | 3142.30 | 2805.44 | 2870.36 | 2903.36 | 2869.15 | 2908.07 | 2939.31 | 2991.00 | 2951.82 | 2887.58 | 2849.38 | 2827.65 | 2822.60 | 2785.39 | 2957.43 | 2856.80 | 2879.13 | 2836.11 | 2893.73 | 2923.32 | 2465.43 | 2381.70 | NA | NA | NA | |
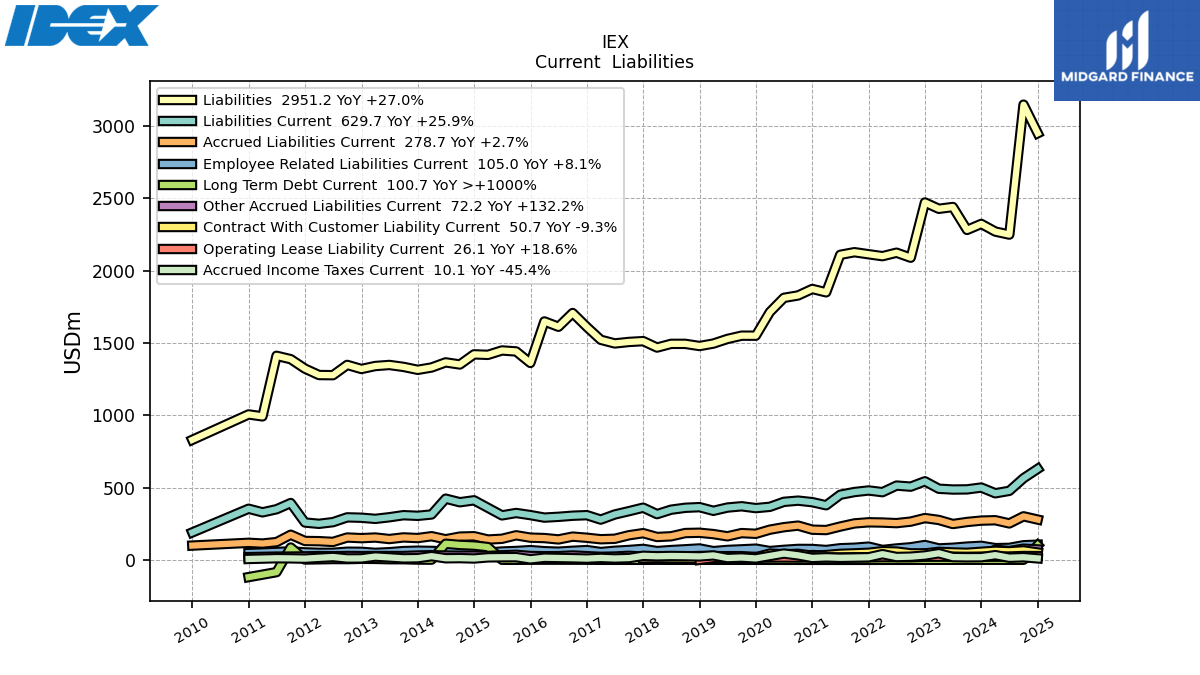
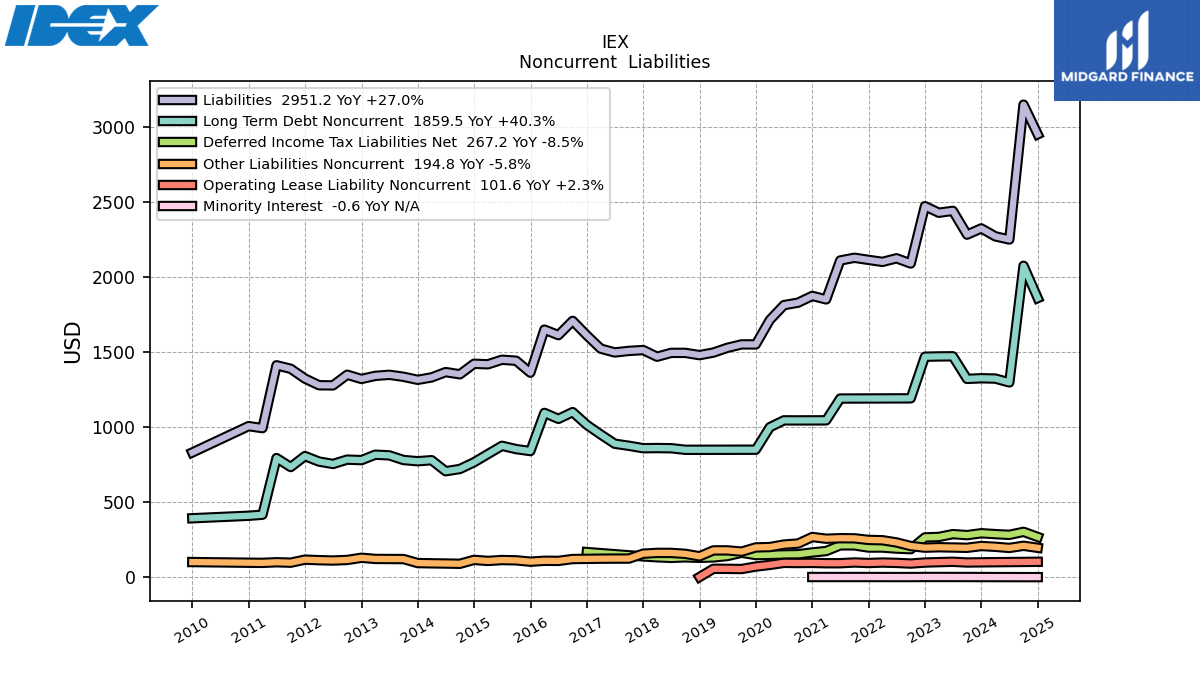
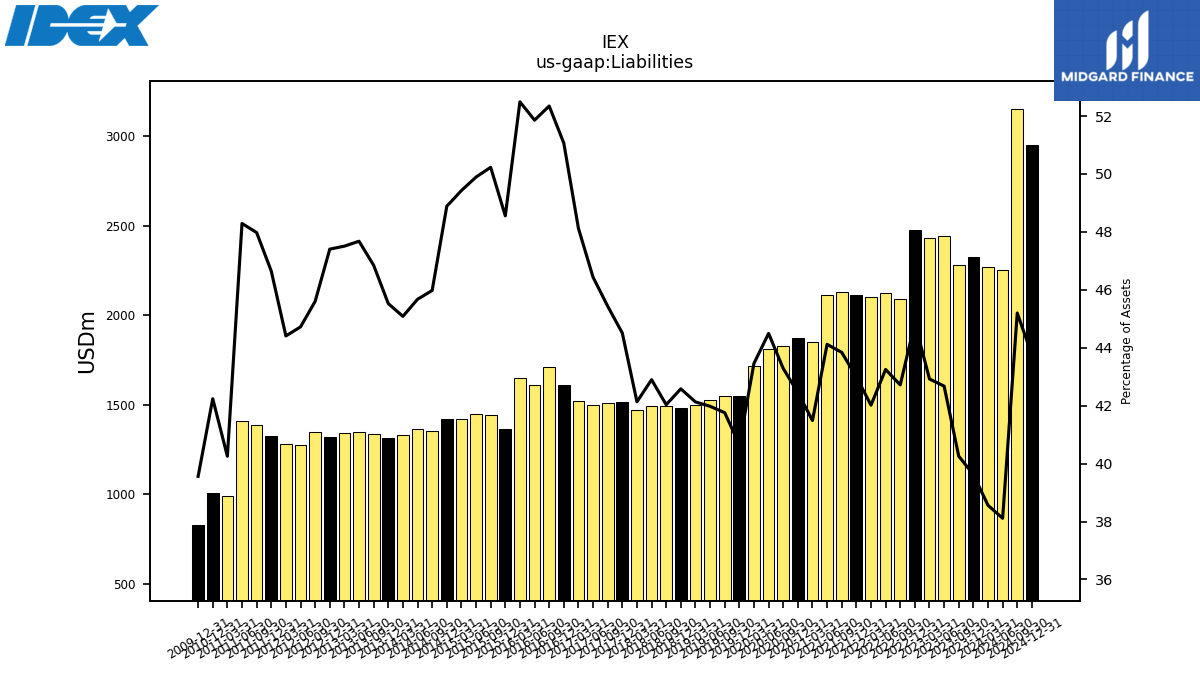
| Liabilities | 2324.00 | 2282.40 | 2441.00 | 2428.50 | 2472.30 | 2090.00 | 2124.80 | 2100.80 | 2114.10 | 2128.30 | 2110.13 | 1850.72 | 1874.07 | 1829.07 | 1812.56 | 1713.89 | 1550.68 | 1550.84 | 1528.17 | 1496.23 | 1479.22 | 1494.23 | 1494.31 | 1468.57 | 1513.09 | 1507.45 | 1497.15 | 1522.48 | 1611.05 | 1707.72 | 1612.43 | 1649.39 | 1362.15 | 1441.77 | 1448.55 | 1418.16 | 1421.62 | 1351.41 | 1366.11 | 1330.82 | 1314.59 | 1334.86 | 1348.16 | 1340.95 | 1320.39 | 1348.60 | 1277.55 | 1278.56 | 1322.97 | 1388.31 | 1411.67 | 992.44 | 1006.03 | NA | NA | NA | |
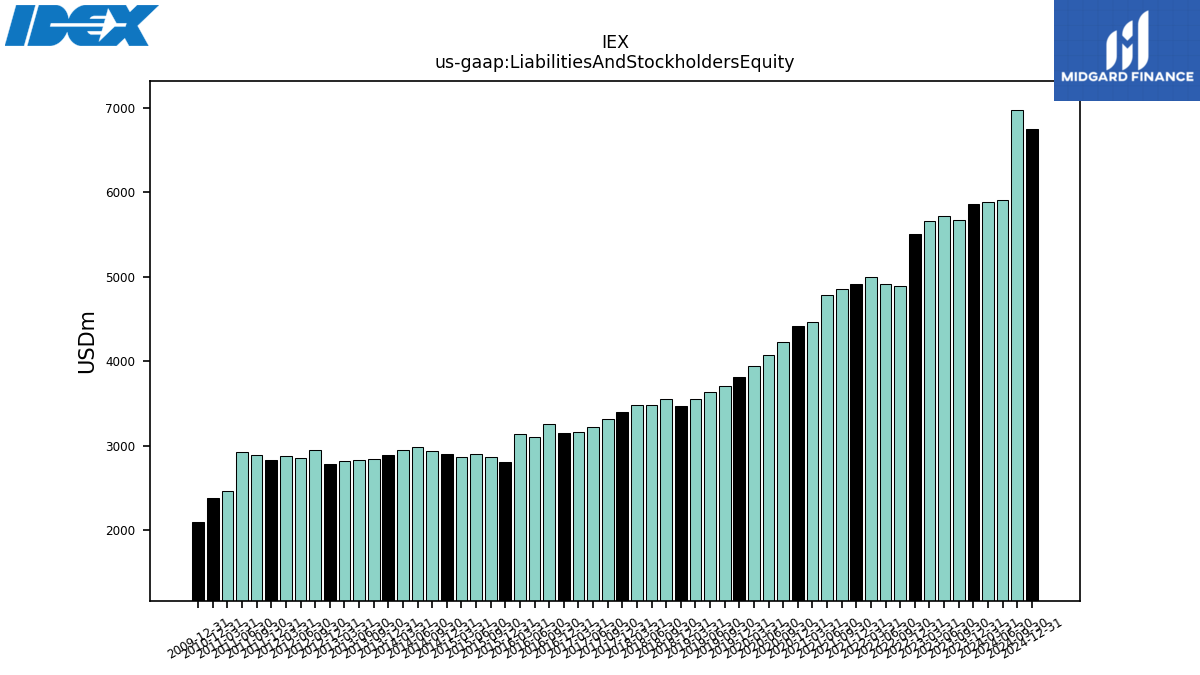
| Liabilities And Stockholders Equity | 5865.20 | 5669.60 | 5719.90 | 5658.00 | 5511.90 | 4892.60 | 4912.80 | 4999.70 | 4917.20 | 4854.58 | 4783.00 | 4460.73 | 4414.40 | 4225.60 | 4073.59 | 3943.68 | 3813.91 | 3713.89 | 3640.22 | 3551.46 | 3473.86 | 3554.81 | 3483.46 | 3485.46 | 3399.63 | 3317.76 | 3224.16 | 3163.78 | 3154.94 | 3262.46 | 3109.36 | 3142.30 | 2805.44 | 2870.36 | 2903.36 | 2869.15 | 2908.07 | 2939.31 | 2991.00 | 2951.82 | 2887.58 | 2849.38 | 2827.65 | 2822.60 | 2785.39 | 2957.43 | 2856.80 | 2879.13 | 2836.11 | 2893.73 | 2923.32 | 2465.43 | 2381.70 | NA | NA | NA | |
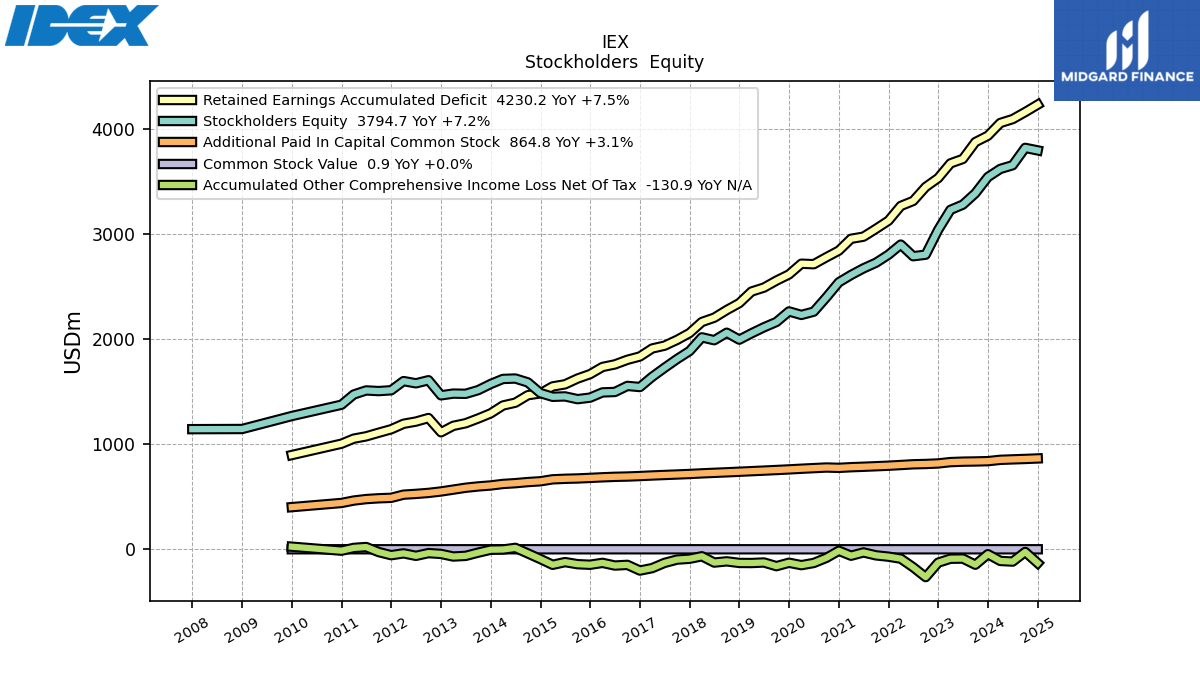
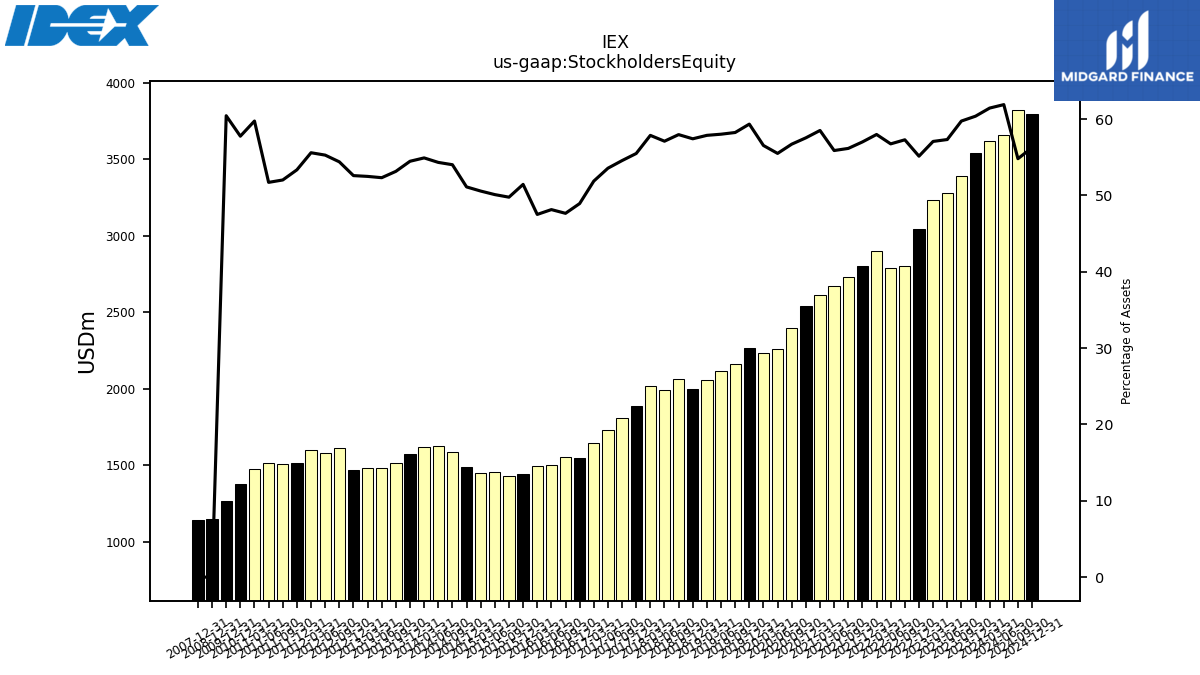
| Stockholders Equity | 3541.40 | 3387.10 | 3278.70 | 3229.20 | 3039.30 | 2802.80 | 2788.20 | 2899.00 | 2803.10 | 2726.24 | 2672.80 | 2609.93 | 2540.20 | 2396.53 | 2261.04 | 2229.79 | 2263.23 | 2163.05 | 2112.04 | 2055.23 | 1994.64 | 2060.57 | 1989.15 | 2016.88 | 1886.54 | 1810.31 | 1727.01 | 1641.31 | 1543.89 | 1554.74 | 1496.93 | 1492.91 | 1443.29 | 1428.59 | 1454.81 | 1450.99 | 1486.45 | 1587.90 | 1624.89 | 1621.00 | 1572.99 | 1514.52 | 1479.49 | 1481.65 | 1465.00 | 1608.84 | 1579.25 | 1600.57 | 1513.13 | 1505.42 | 1511.65 | 1472.99 | 1375.66 | NA | NA | NA |
| 2023-12-31 | 2023-09-30 | 2023-06-30 | 2023-03-31 | 2022-12-31 | 2022-09-30 | 2022-06-30 | 2022-03-31 | 2021-12-31 | 2021-09-30 | 2021-06-30 | 2021-03-31 | 2020-12-31 | 2020-09-30 | 2020-06-30 | 2020-03-31 | 2019-12-31 | 2019-09-30 | 2019-06-30 | 2019-03-31 | 2018-12-31 | 2018-09-30 | 2018-06-30 | 2018-03-31 | 2017-12-31 | 2017-09-30 | 2017-06-30 | 2017-03-31 | 2016-12-31 | 2016-09-30 | 2016-06-30 | 2016-03-31 | 2015-12-31 | 2015-09-30 | 2015-06-30 | 2015-03-31 | 2014-12-31 | 2014-09-30 | 2014-06-30 | 2014-03-31 | 2013-12-31 | 2013-09-30 | 2013-06-30 | 2013-03-31 | 2012-12-31 | 2012-09-30 | 2012-06-30 | 2012-03-31 | 2011-12-31 | 2011-09-30 | 2011-06-30 | 2011-03-31 | 2010-12-31 | 2010-09-30 | 2010-06-30 | 2010-03-31 | ||
|---|---|---|---|---|---|---|---|---|---|---|---|---|---|---|---|---|---|---|---|---|---|---|---|---|---|---|---|---|---|---|---|---|---|---|---|---|---|---|---|---|---|---|---|---|---|---|---|---|---|---|---|---|---|---|---|---|---|
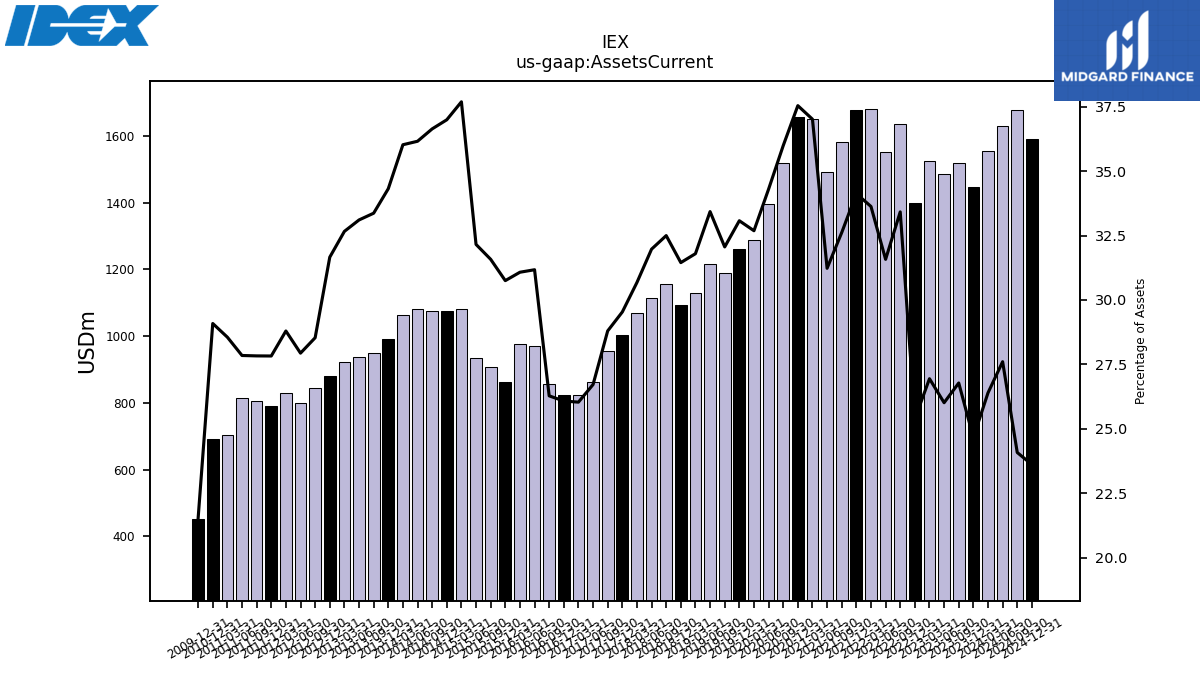
| Assets Current | 1446.30 | 1518.20 | 1487.90 | 1524.50 | 1399.30 | 1635.00 | 1551.30 | 1681.30 | 1678.00 | 1583.36 | 1493.69 | 1651.14 | 1657.23 | 1520.75 | 1397.25 | 1289.07 | 1261.44 | 1190.62 | 1216.88 | 1129.23 | 1092.53 | 1155.24 | 1113.74 | 1069.29 | 1004.04 | 955.48 | 861.42 | 823.68 | 822.72 | 857.35 | 969.28 | 976.51 | 862.68 | 906.40 | 933.60 | 1081.39 | 1075.79 | 1076.96 | 1081.53 | 1063.38 | 990.95 | 950.77 | 936.10 | 921.92 | 881.87 | 843.86 | 798.09 | 829.07 | 789.16 | 805.31 | 814.00 | 704.01 | 692.76 | NA | NA | NA | |
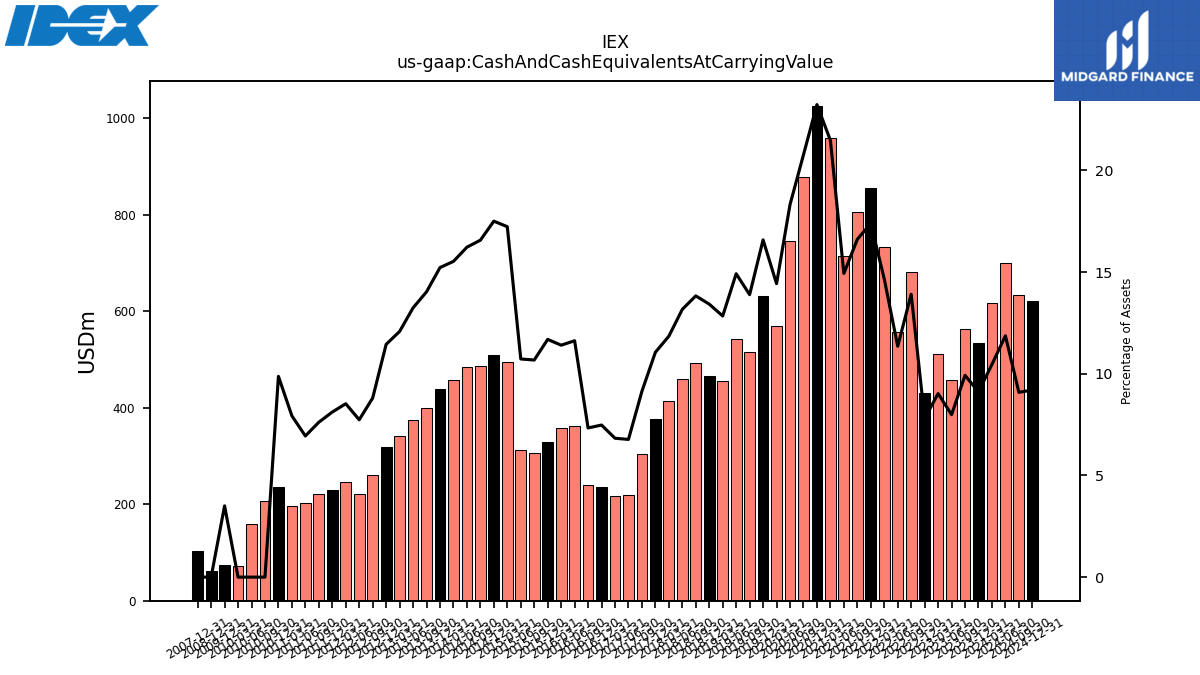
| Cash And Cash Equivalents At Carrying Value | 534.30 | 562.70 | 457.00 | 510.70 | 430.20 | 680.70 | 557.80 | 733.20 | 855.40 | 806.50 | 714.38 | 958.14 | 1025.85 | 877.76 | 746.35 | 569.22 | 632.58 | 515.99 | 543.19 | 456.13 | 466.41 | 491.77 | 458.75 | 412.97 | 375.95 | 303.29 | 218.36 | 216.09 | 235.96 | 239.40 | 361.49 | 358.44 | 328.02 | 306.48 | 311.50 | 494.50 | 509.14 | 487.07 | 485.33 | 458.38 | 439.63 | 399.81 | 374.49 | 341.05 | 318.86 | 260.50 | 221.11 | 245.54 | 230.26 | 220.46 | 202.96 | 195.55 | 235.14 | 206.05 | 159.14 | 71.39 | |
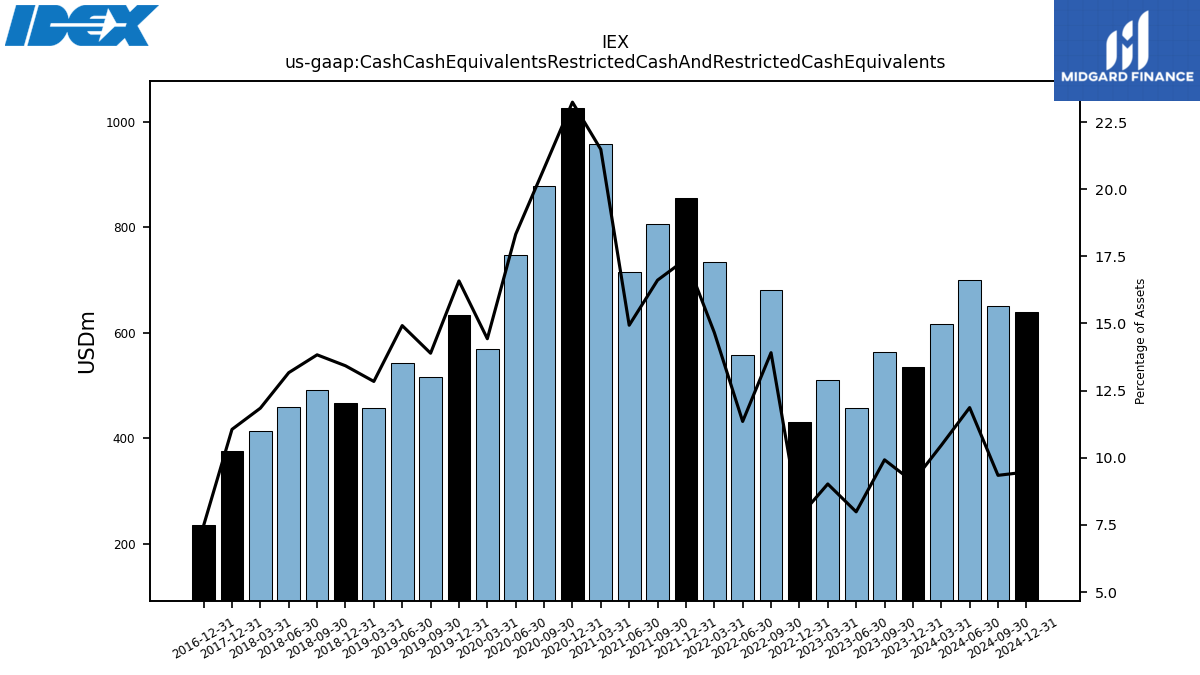
| Cash Cash Equivalents Restricted Cash And Restricted Cash Equivalents | 534.30 | 562.70 | 457.00 | 510.70 | 430.20 | 680.70 | 557.80 | 733.20 | 855.40 | 806.50 | 714.38 | 958.14 | 1025.85 | 877.76 | 746.35 | 569.22 | 632.58 | 515.99 | 543.19 | 456.13 | 466.41 | 491.77 | 458.75 | 412.97 | 375.95 | NA | NA | NA | 235.96 | NA | NA | NA | NA | NA | NA | NA | NA | NA | NA | NA | NA | NA | NA | NA | NA | NA | NA | NA | NA | NA | NA | NA | NA | NA | NA | NA | |
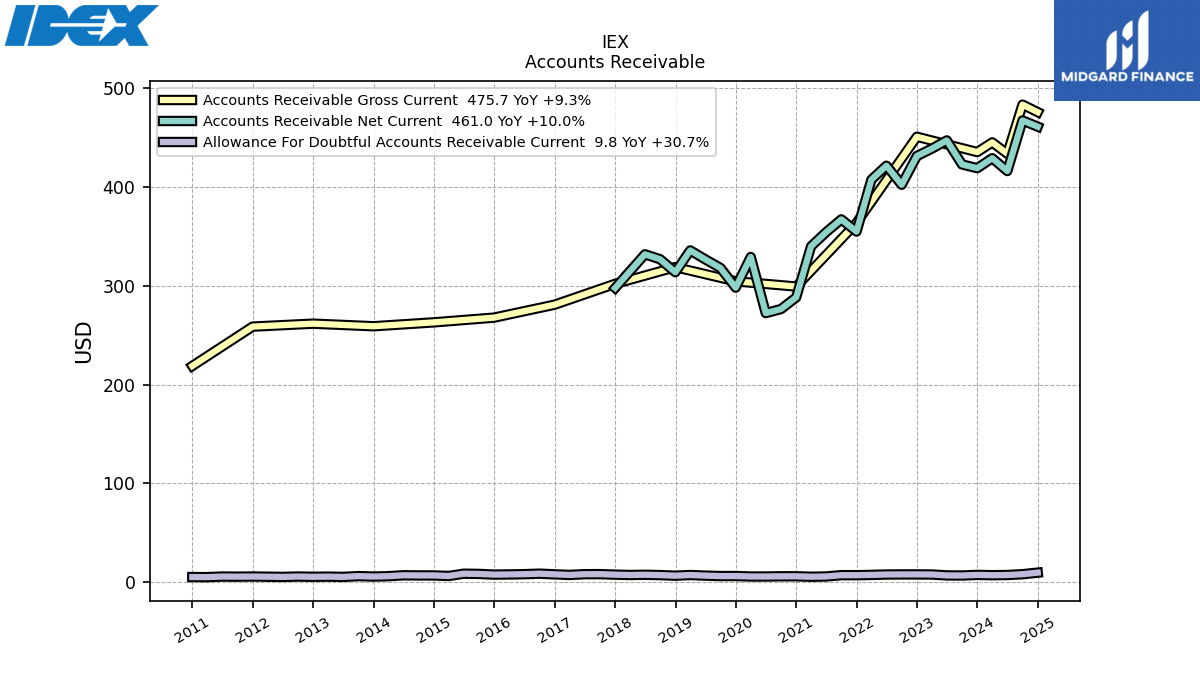
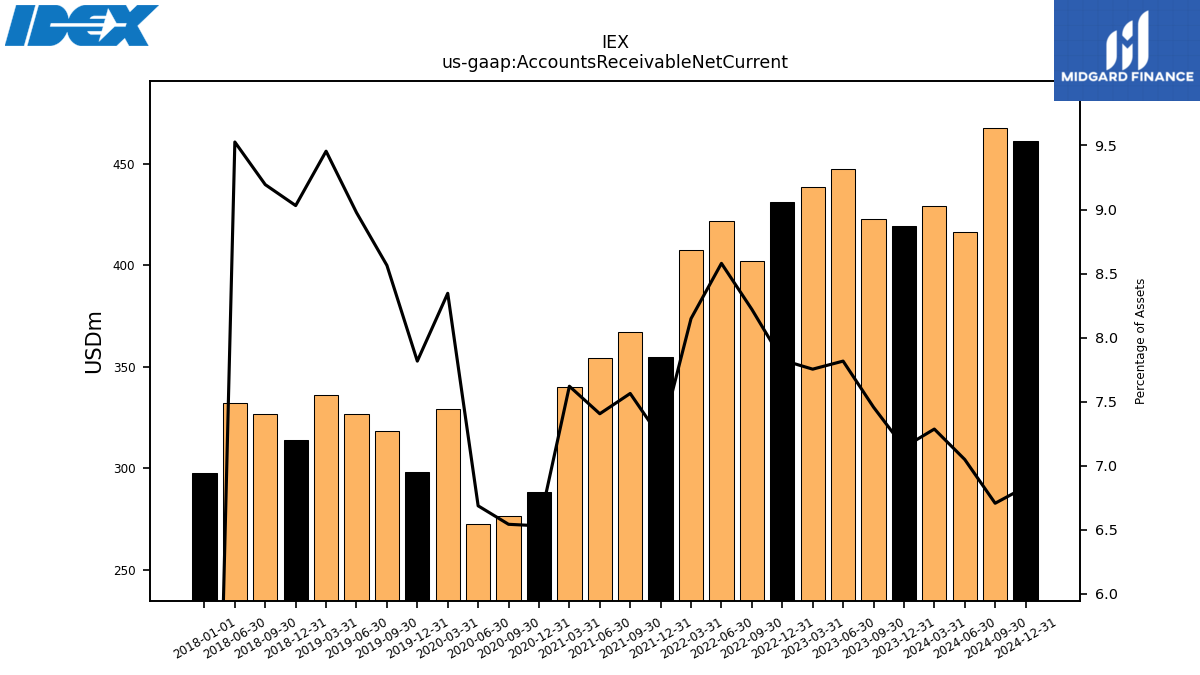
| Accounts Receivable Net Current | 419.00 | 422.80 | 447.10 | 438.70 | 431.30 | 402.20 | 421.50 | 407.40 | 354.90 | 367.19 | 354.20 | 339.92 | 288.29 | 276.46 | 272.39 | 329.13 | 298.12 | 318.06 | 326.75 | 335.80 | 313.72 | 326.84 | 331.87 | NA | NA | NA | NA | NA | NA | NA | NA | NA | NA | NA | NA | NA | NA | NA | NA | NA | NA | NA | NA | NA | NA | NA | NA | NA | NA | NA | NA | NA | NA | NA | NA | NA | |
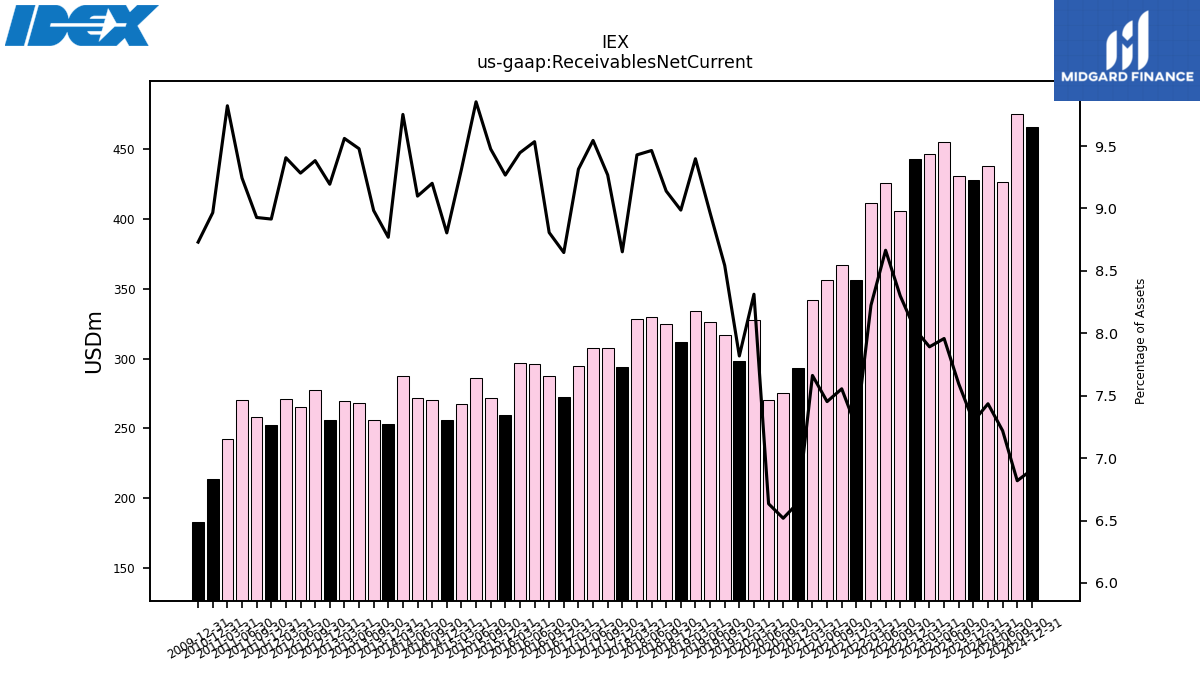
| Receivables Net Current | 427.80 | 430.60 | 455.20 | 446.50 | 442.80 | 406.10 | 425.70 | 411.20 | 356.40 | 366.78 | 356.47 | 341.79 | 293.15 | 275.43 | 270.25 | 327.83 | 298.19 | 317.31 | 326.36 | 333.78 | 312.19 | 324.89 | 329.69 | 328.66 | 294.17 | 307.50 | 307.75 | 294.71 | 272.81 | 287.33 | 296.48 | 296.83 | 260.00 | 272.01 | 286.11 | 267.21 | 256.04 | 270.47 | 272.15 | 287.90 | 253.23 | 255.98 | 268.04 | 269.87 | 256.10 | 277.50 | 265.21 | 270.82 | 252.84 | 258.35 | 270.23 | 242.18 | 213.55 | NA | NA | NA | |
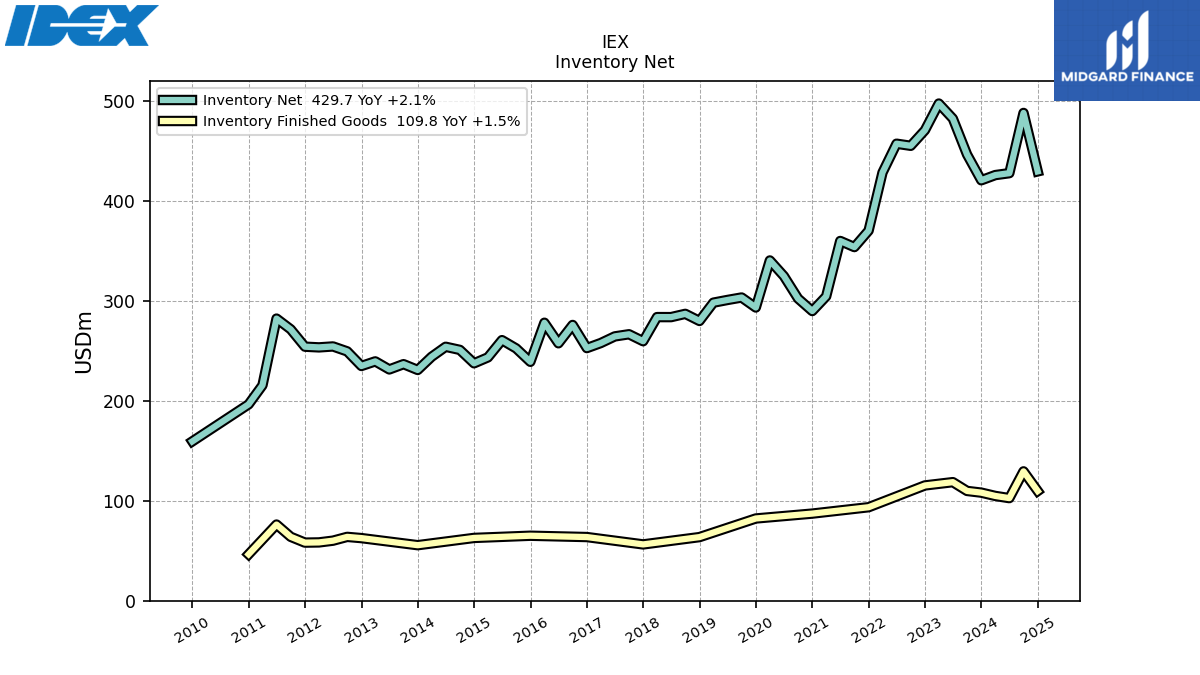
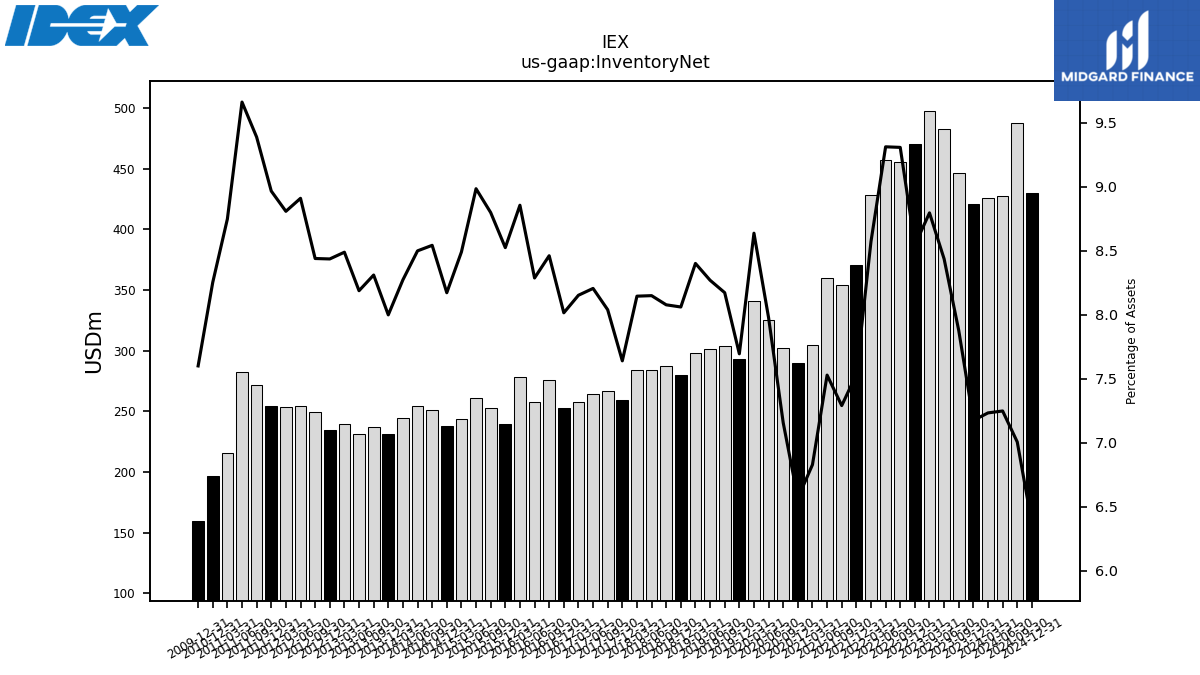
| Inventory Net | 420.80 | 446.60 | 482.50 | 497.60 | 470.90 | 455.30 | 457.40 | 428.50 | 370.40 | 353.92 | 360.08 | 304.64 | 289.91 | 302.41 | 324.93 | 340.58 | 293.47 | 303.49 | 301.01 | 298.33 | 280.00 | 287.13 | 283.85 | 283.88 | 259.72 | 266.70 | 264.55 | 257.90 | 252.86 | 276.01 | 257.66 | 278.23 | 239.12 | 252.52 | 260.81 | 243.56 | 237.63 | 251.06 | 254.18 | 244.18 | 230.97 | 236.77 | 231.50 | 239.57 | 234.95 | 249.56 | 254.50 | 253.56 | 254.26 | 271.62 | 282.38 | 215.65 | 196.55 | NA | NA | NA | |
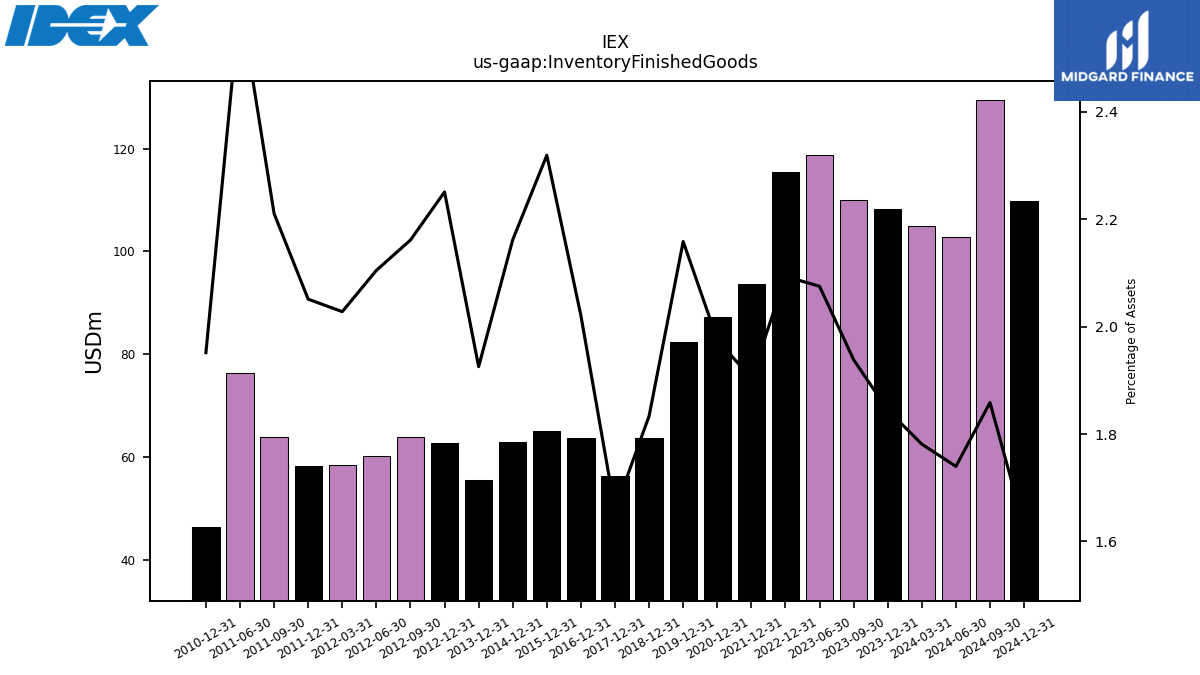
| Inventory Finished Goods | 108.20 | 109.90 | 118.70 | NA | 115.40 | NA | NA | NA | 93.60 | NA | NA | NA | 87.23 | NA | NA | NA | 82.32 | NA | NA | NA | 63.70 | NA | NA | NA | 56.38 | NA | NA | NA | 63.75 | NA | NA | NA | 65.07 | NA | NA | NA | 62.87 | NA | NA | NA | 55.60 | NA | NA | NA | 62.70 | 63.92 | 60.13 | 58.39 | 58.17 | 63.97 | 76.27 | NA | 46.48 | NA | NA | NA | |
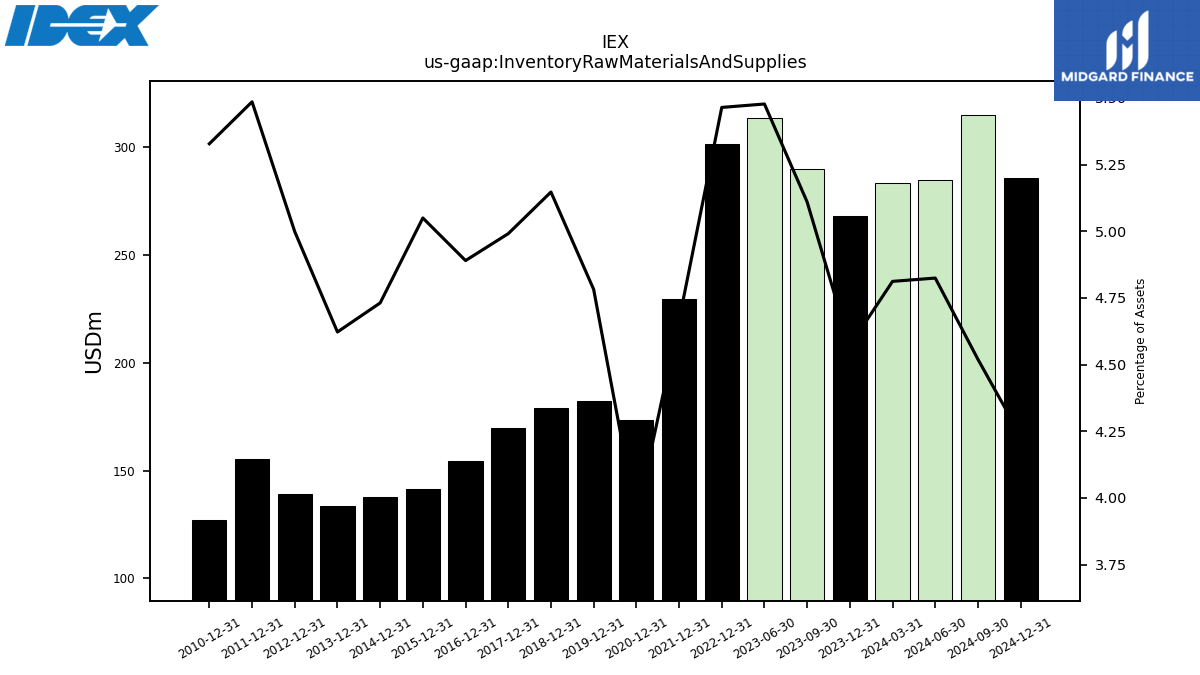
| Inventory Raw Materials And Supplies | 268.10 | 289.70 | 313.30 | NA | 301.20 | NA | NA | NA | 229.40 | NA | NA | NA | 173.25 | NA | NA | NA | 182.38 | NA | NA | NA | 178.81 | NA | NA | NA | 169.68 | NA | NA | NA | 154.28 | NA | NA | NA | 141.67 | NA | NA | NA | 137.58 | NA | NA | NA | 133.47 | NA | NA | NA | 139.23 | NA | NA | NA | 155.58 | NA | NA | NA | 126.90 | NA | NA | NA | |
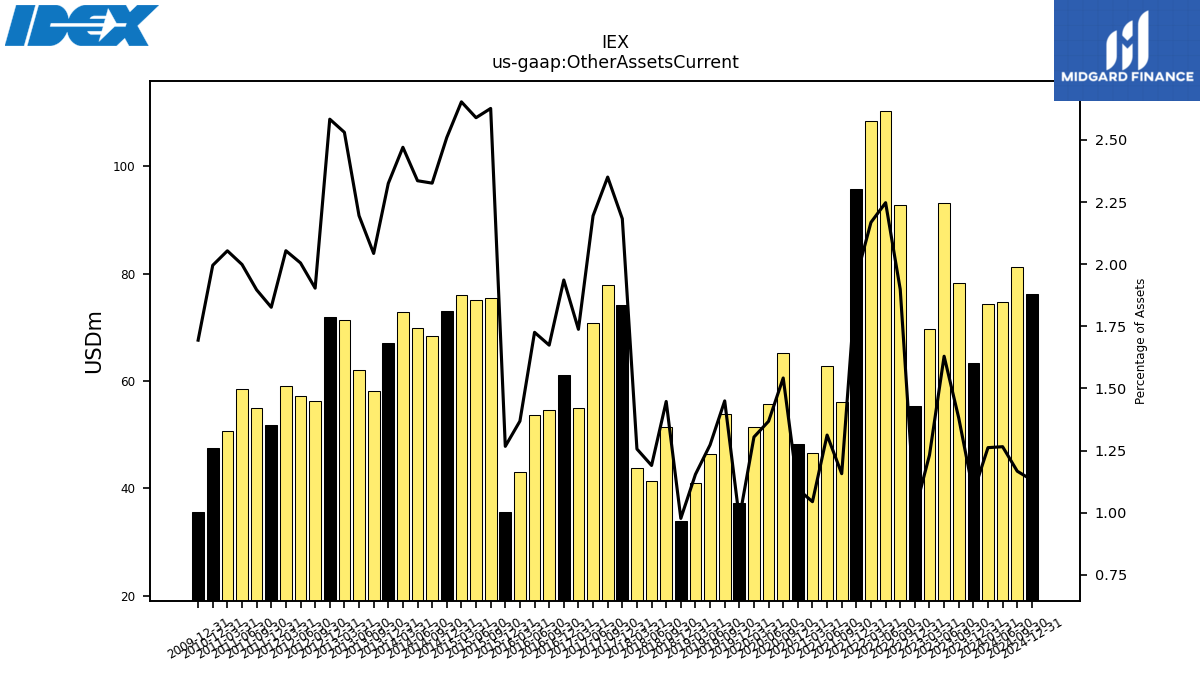
| Other Assets Current | 63.40 | 78.30 | 93.20 | 69.70 | 55.40 | 92.90 | 110.40 | 108.40 | 95.80 | 56.16 | 62.76 | 46.57 | 48.32 | 65.15 | 55.72 | 51.44 | 37.21 | 53.84 | 46.33 | 40.99 | 33.94 | 51.45 | 41.45 | 43.78 | 74.20 | 77.98 | 70.76 | 54.98 | 61.09 | 54.61 | 53.66 | 43.00 | 35.54 | 75.39 | 75.18 | 76.12 | 72.98 | 68.37 | 69.86 | 72.92 | 67.13 | 58.22 | 62.07 | 71.42 | 71.96 | 56.29 | 57.27 | 59.14 | 51.80 | 54.88 | 58.43 | 50.63 | 47.52 | NA | NA | NA | |
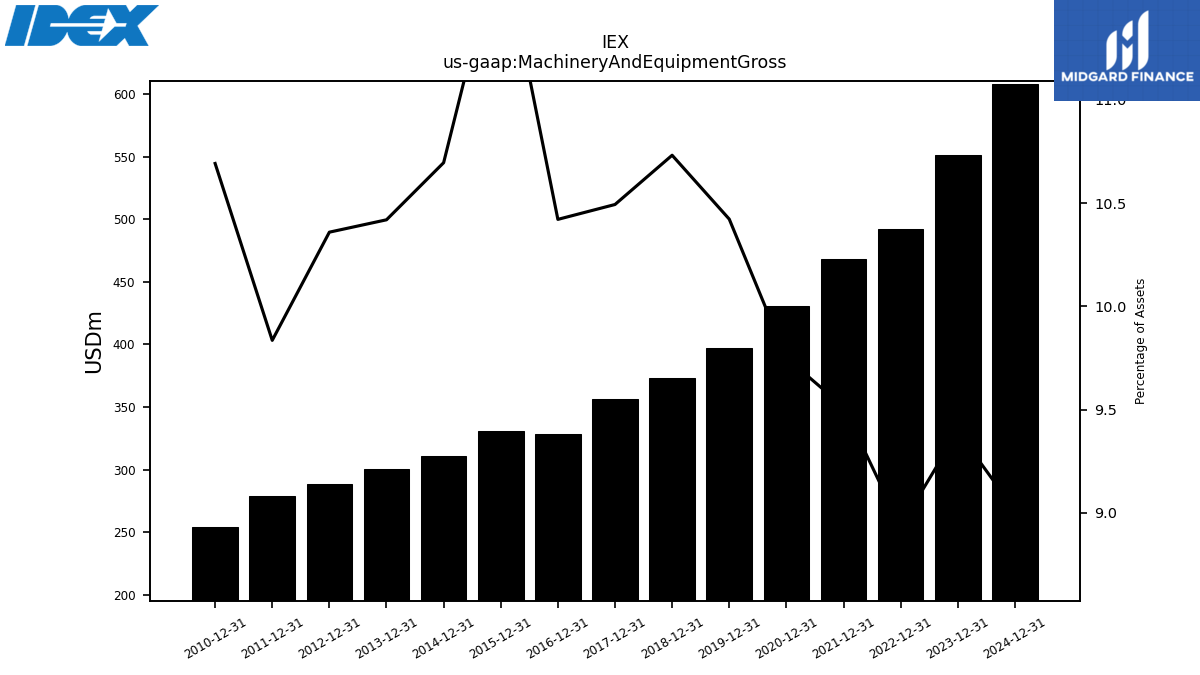
| Machinery And Equipment Gross | 551.00 | NA | NA | NA | 492.40 | NA | NA | NA | 467.80 | NA | NA | NA | 430.42 | NA | NA | NA | 397.50 | NA | NA | NA | 372.80 | NA | NA | NA | 356.73 | NA | NA | NA | 328.78 | NA | NA | NA | 331.15 | NA | NA | NA | 311.04 | NA | NA | NA | 300.86 | NA | NA | NA | 288.54 | NA | NA | NA | 278.94 | NA | NA | NA | 254.65 | NA | NA | NA |
| 2023-12-31 | 2023-09-30 | 2023-06-30 | 2023-03-31 | 2022-12-31 | 2022-09-30 | 2022-06-30 | 2022-03-31 | 2021-12-31 | 2021-09-30 | 2021-06-30 | 2021-03-31 | 2020-12-31 | 2020-09-30 | 2020-06-30 | 2020-03-31 | 2019-12-31 | 2019-09-30 | 2019-06-30 | 2019-03-31 | 2018-12-31 | 2018-09-30 | 2018-06-30 | 2018-03-31 | 2017-12-31 | 2017-09-30 | 2017-06-30 | 2017-03-31 | 2016-12-31 | 2016-09-30 | 2016-06-30 | 2016-03-31 | 2015-12-31 | 2015-09-30 | 2015-06-30 | 2015-03-31 | 2014-12-31 | 2014-09-30 | 2014-06-30 | 2014-03-31 | 2013-12-31 | 2013-09-30 | 2013-06-30 | 2013-03-31 | 2012-12-31 | 2012-09-30 | 2012-06-30 | 2012-03-31 | 2011-12-31 | 2011-09-30 | 2011-06-30 | 2011-03-31 | 2010-12-31 | 2010-09-30 | 2010-06-30 | 2010-03-31 | ||
|---|---|---|---|---|---|---|---|---|---|---|---|---|---|---|---|---|---|---|---|---|---|---|---|---|---|---|---|---|---|---|---|---|---|---|---|---|---|---|---|---|---|---|---|---|---|---|---|---|---|---|---|---|---|---|---|---|---|
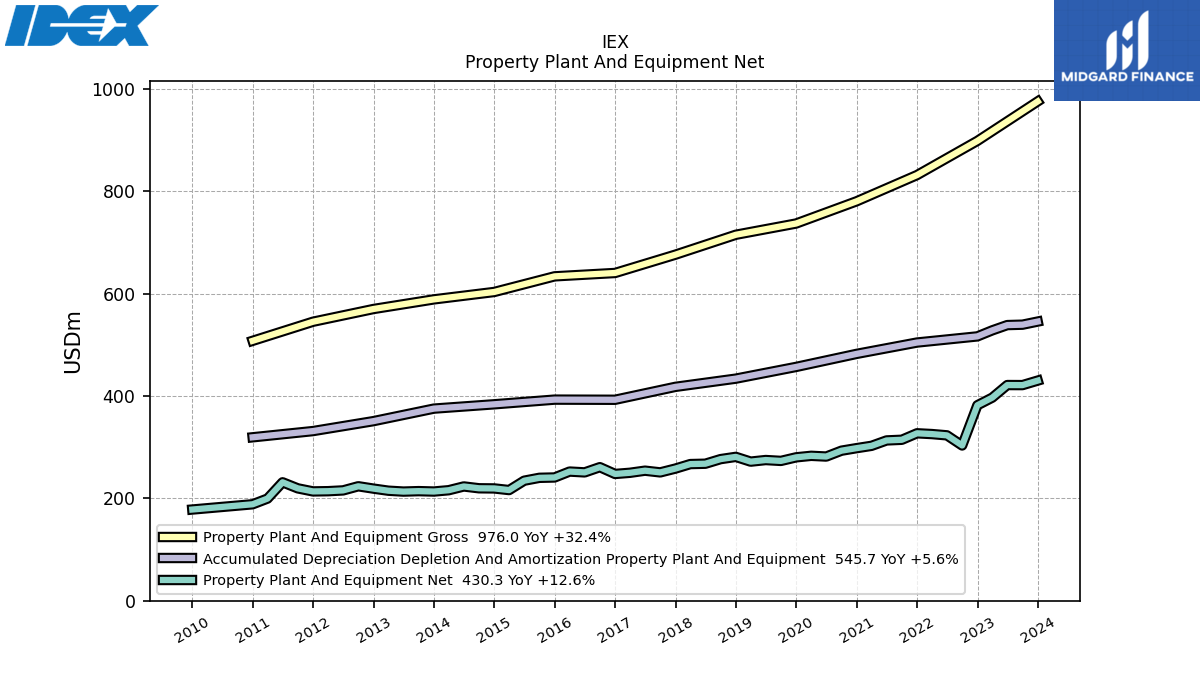
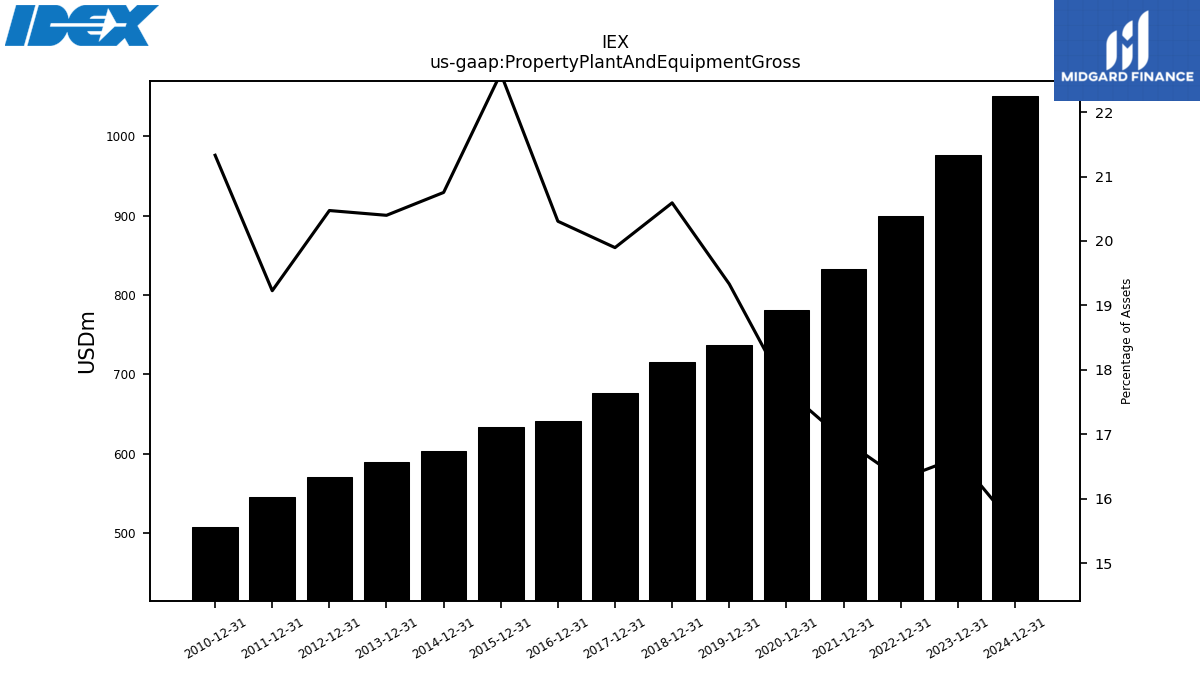
| Property Plant And Equipment Gross | 976.00 | NA | NA | NA | 898.80 | NA | NA | NA | 832.00 | NA | NA | NA | 780.81 | NA | NA | NA | 737.34 | NA | NA | NA | 715.33 | NA | NA | NA | 676.43 | NA | NA | NA | 640.65 | NA | NA | NA | 634.06 | NA | NA | NA | 603.52 | NA | NA | NA | 589.02 | NA | NA | NA | 570.24 | NA | NA | NA | 545.35 | NA | NA | NA | 508.02 | NA | NA | NA | |
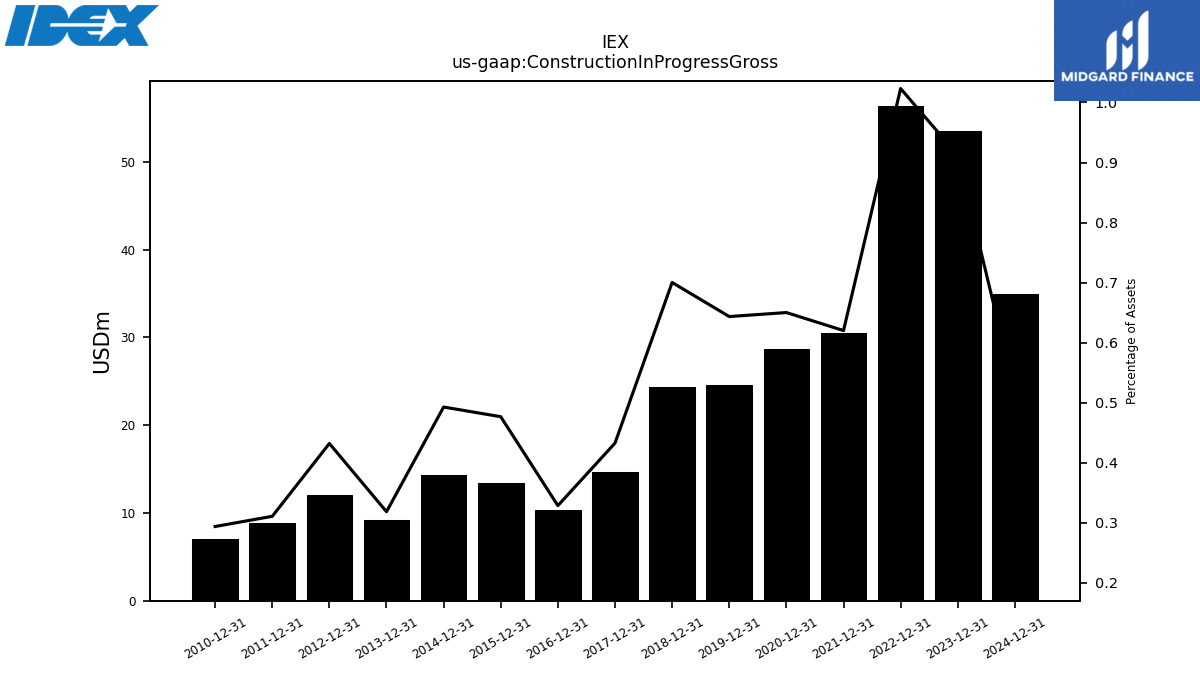
| Construction In Progress Gross | 53.50 | NA | NA | NA | 56.40 | NA | NA | NA | 30.50 | NA | NA | NA | 28.70 | NA | NA | NA | 24.55 | NA | NA | NA | 24.33 | NA | NA | NA | 14.71 | NA | NA | NA | 10.37 | NA | NA | NA | 13.38 | NA | NA | NA | 14.34 | NA | NA | NA | 9.20 | NA | NA | NA | 12.04 | NA | NA | NA | 8.82 | NA | NA | NA | 7.00 | NA | NA | NA | |
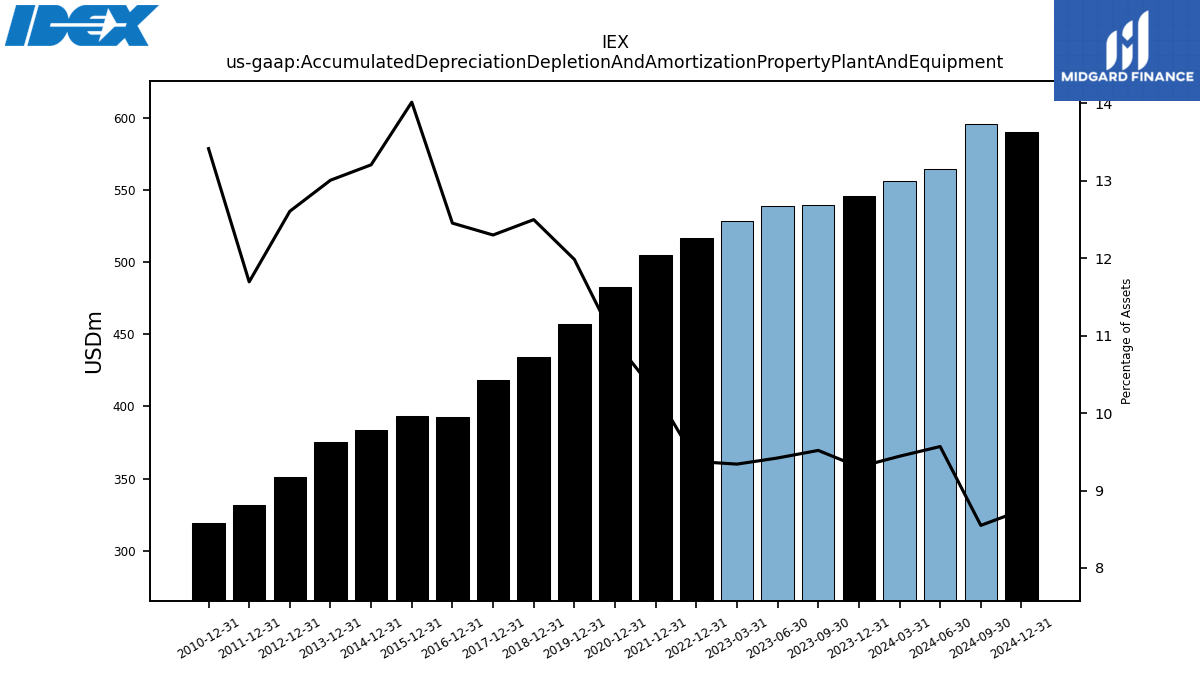
| Accumulated Depreciation Depletion And Amortization Property Plant And Equipment | 545.70 | 539.60 | 538.80 | 528.50 | 516.70 | NA | NA | NA | 504.70 | NA | NA | NA | 482.54 | NA | NA | NA | 457.03 | NA | NA | NA | 434.11 | NA | NA | NA | 418.08 | NA | NA | NA | 392.83 | NA | NA | NA | 393.12 | NA | NA | NA | 383.98 | NA | NA | NA | 375.53 | NA | NA | NA | 351.08 | NA | NA | NA | 331.63 | NA | NA | NA | 319.46 | NA | NA | NA | |
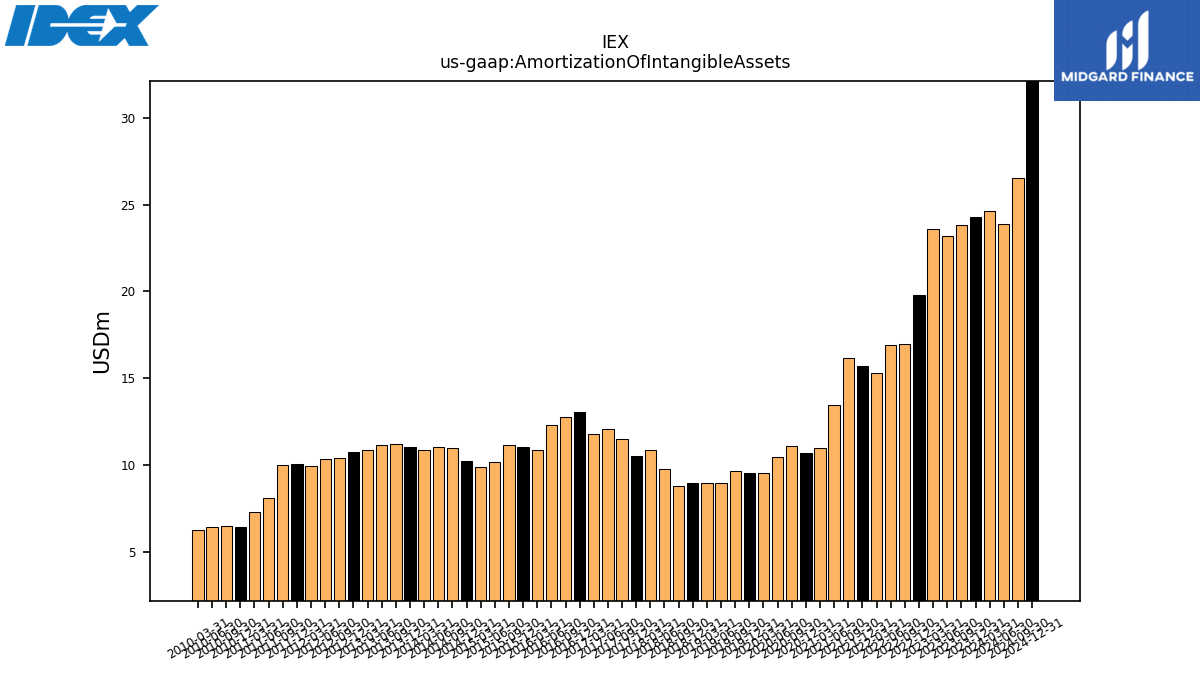
| Amortization Of Intangible Assets | 24.30 | 23.80 | 23.20 | 23.60 | 19.80 | 17.00 | 16.90 | 15.30 | 15.72 | 16.20 | 13.50 | 10.99 | 10.72 | 11.10 | 10.50 | 9.54 | 9.59 | 9.70 | 9.00 | 9.00 | 8.99 | 8.80 | 9.80 | 10.87 | 10.52 | 11.50 | 12.10 | 11.79 | 13.07 | 12.80 | 12.30 | 10.89 | 11.09 | 11.20 | 10.20 | 9.93 | 10.23 | 11.02 | 11.07 | 10.86 | 11.04 | 11.21 | 11.18 | 10.89 | 10.75 | 10.43 | 10.35 | 9.95 | 10.06 | 10.00 | 8.15 | 7.30 | 6.46 | 6.55 | 6.46 | 6.27 | |
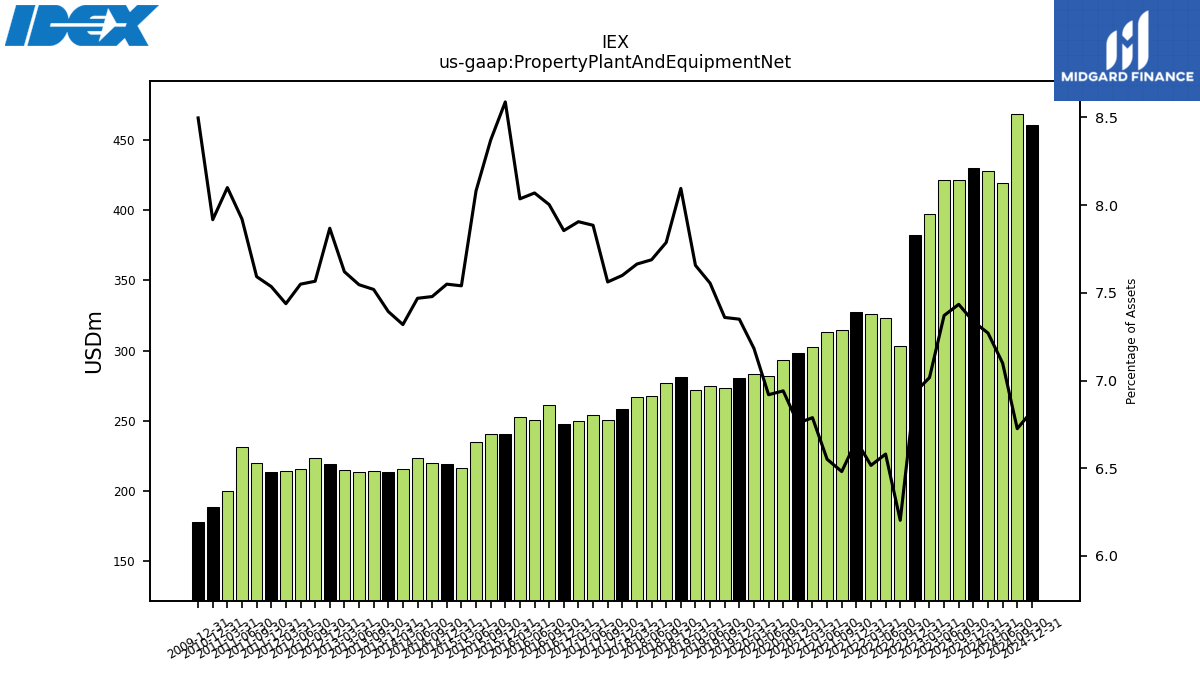
| Property Plant And Equipment Net | 430.30 | 421.50 | 421.60 | 397.00 | 382.10 | 303.50 | 323.30 | 325.80 | 327.30 | 314.63 | 313.35 | 302.81 | 298.27 | 293.30 | 281.85 | 283.28 | 280.32 | 273.33 | 275.02 | 271.92 | 281.22 | 276.82 | 267.83 | 267.13 | 258.35 | 250.89 | 254.23 | 250.11 | 247.82 | 261.09 | 250.90 | 252.51 | 240.94 | 240.27 | 234.63 | 216.34 | 219.54 | 219.82 | 223.40 | 216.04 | 213.49 | 214.25 | 213.38 | 215.09 | 219.16 | 223.76 | 215.67 | 214.15 | 213.72 | 219.70 | 231.54 | 199.70 | 188.56 | NA | NA | NA | |
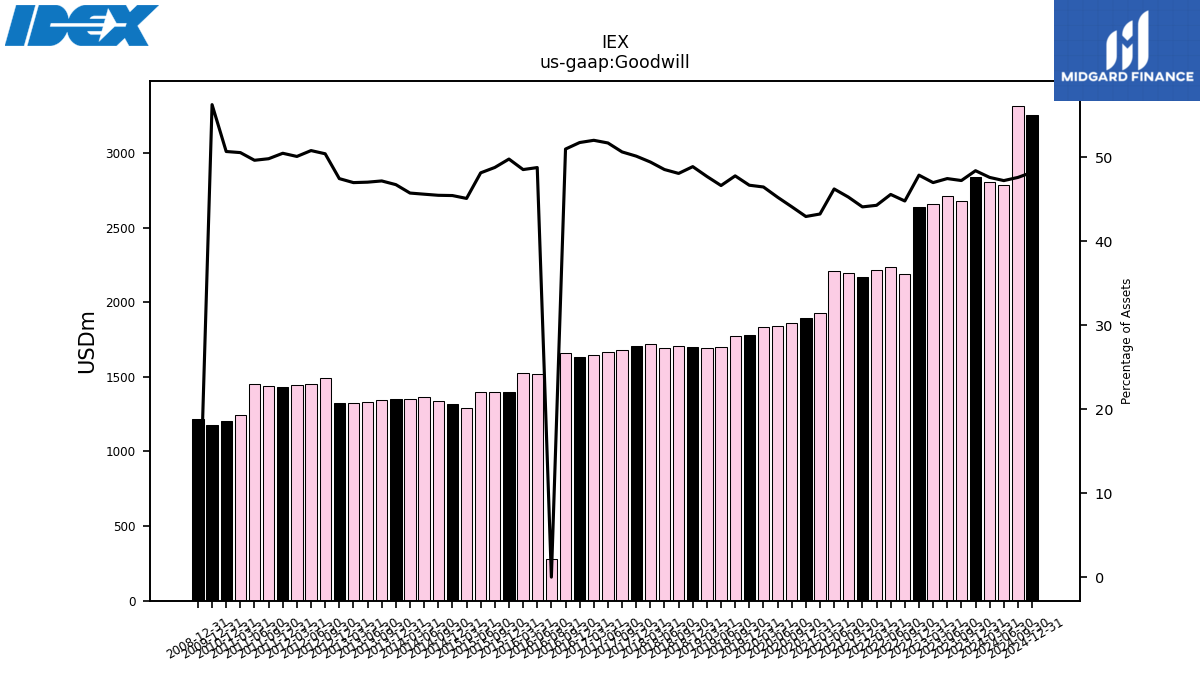
| Goodwill | 2838.30 | 2677.30 | 2714.40 | 2657.90 | 2638.10 | 2191.20 | 2238.60 | 2213.50 | 2167.70 | 2197.08 | 2210.57 | 1928.66 | 1895.57 | 1863.58 | 1842.73 | 1831.97 | 1779.74 | 1774.39 | 1697.33 | 1694.41 | 1697.95 | 1708.78 | 1690.57 | 1722.77 | 1704.16 | 1679.77 | 1666.75 | 1645.57 | 1632.59 | 1662.89 | 1516.30 | 1524.93 | 1396.53 | 1400.18 | 1397.66 | 1293.77 | 1321.28 | 1336.35 | 1363.75 | 1349.93 | 1349.46 | 1344.18 | 1329.80 | 1325.94 | 1321.73 | 1490.82 | 1450.97 | 1442.16 | 1431.37 | 1441.64 | 1450.99 | 1246.26 | 1207.00 | NA | NA | NA | |
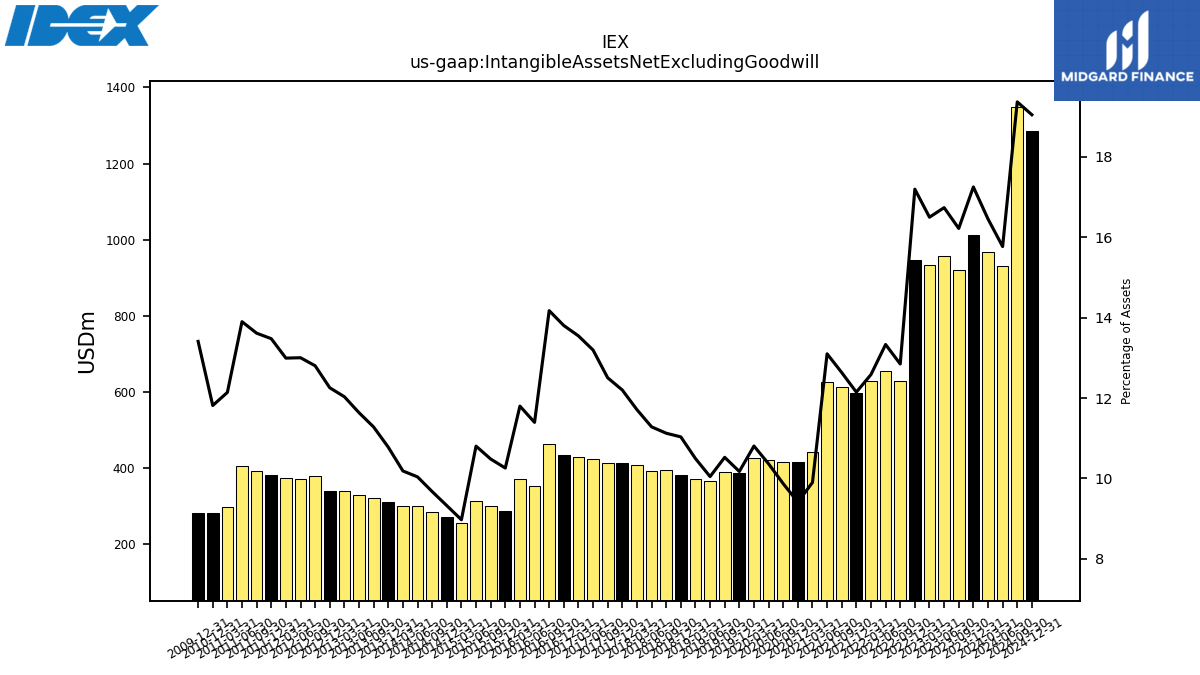
| Intangible Assets Net Excluding Goodwill | 1011.80 | 919.60 | 957.30 | 933.50 | 947.80 | 628.60 | 655.00 | 629.20 | 597.30 | 613.37 | 626.59 | 441.64 | 415.56 | 417.08 | 422.23 | 426.20 | 388.03 | 390.91 | 365.74 | 372.74 | 383.33 | 395.50 | 393.09 | 408.19 | 414.75 | 414.85 | 425.43 | 428.58 | 435.50 | 462.43 | 354.33 | 370.79 | 287.84 | 300.92 | 313.69 | 257.46 | 271.16 | 284.36 | 300.27 | 300.71 | 311.23 | 321.40 | 329.03 | 339.64 | 341.37 | 378.66 | 371.48 | 374.11 | 382.22 | 393.95 | 406.34 | 299.33 | 281.39 | NA | NA | NA | |
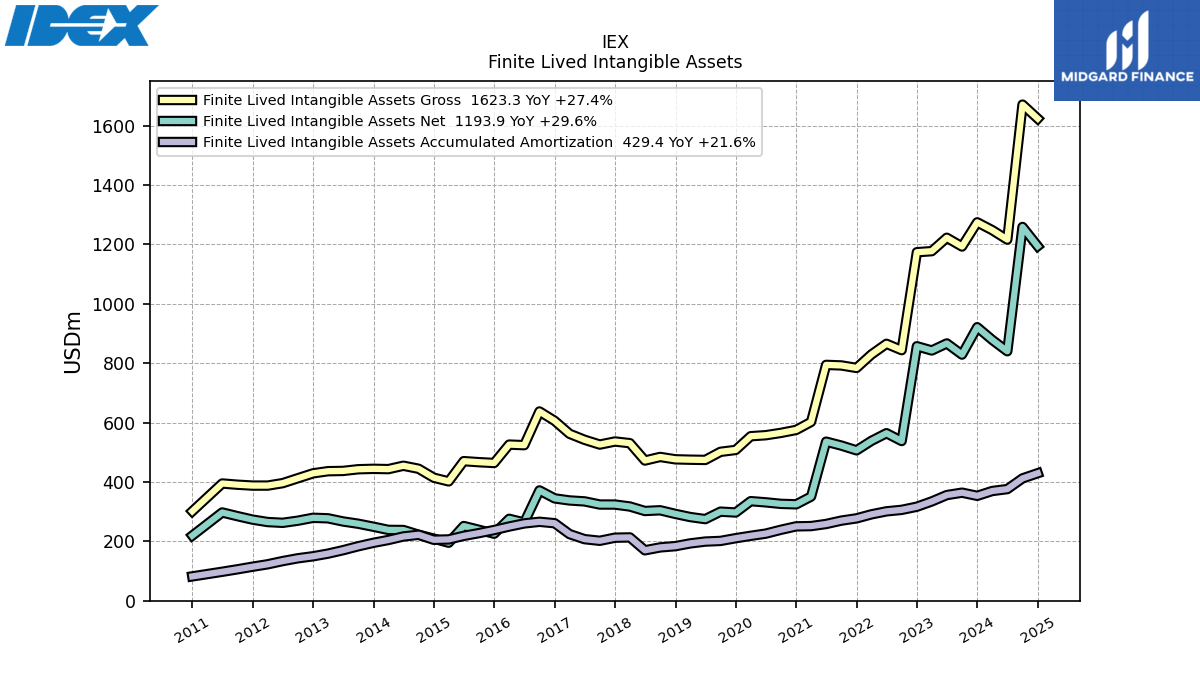
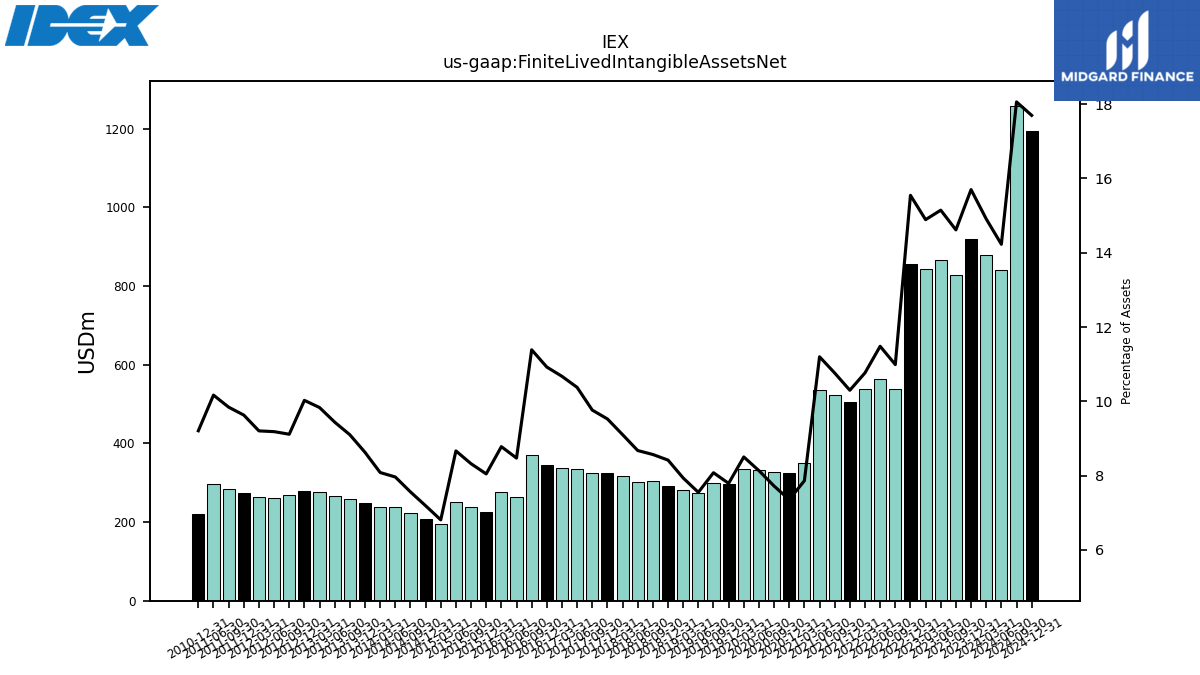
| Finite Lived Intangible Assets Net | 920.90 | 828.70 | 866.40 | 842.60 | 856.90 | 537.70 | 564.10 | 538.30 | 506.40 | 522.47 | 535.69 | 350.74 | 324.66 | 326.18 | 331.33 | 335.31 | 297.13 | 300.01 | 274.84 | 281.84 | 292.43 | 304.60 | 302.19 | 317.29 | 323.85 | 323.95 | 334.53 | 337.68 | 344.60 | 371.53 | 263.44 | 275.89 | 225.74 | 238.82 | 251.59 | 195.36 | 209.06 | 222.26 | 238.18 | 238.61 | 249.13 | 259.30 | 266.93 | 277.54 | 279.27 | 269.55 | 262.37 | 265.00 | 273.11 | 284.84 | 297.23 | NA | 219.29 | NA | NA | NA | |
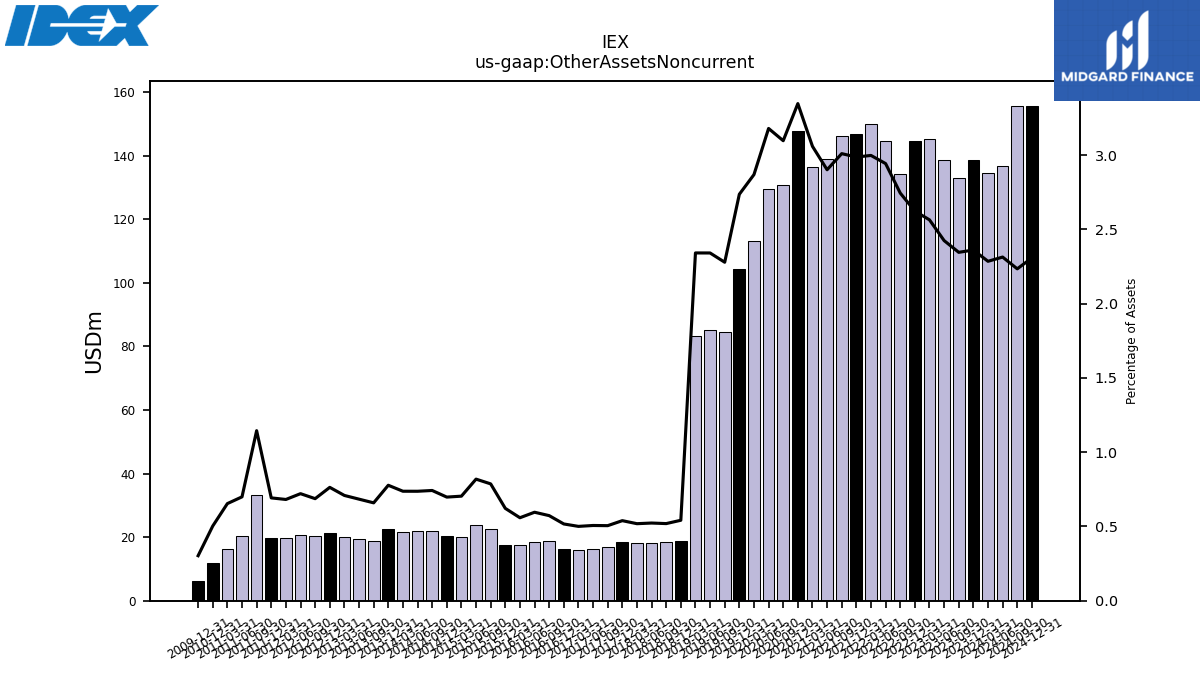
| Other Assets Noncurrent | 138.50 | 133.00 | 138.70 | 145.10 | 144.60 | 134.30 | 144.60 | 149.90 | 146.90 | 146.14 | 138.80 | 136.48 | 147.76 | 130.88 | 129.53 | 113.15 | 104.38 | 84.64 | 85.23 | 83.16 | 18.82 | 18.47 | 18.23 | 18.09 | 18.33 | 16.77 | 16.34 | 15.84 | 16.31 | 18.70 | 18.53 | 17.56 | 17.45 | 22.59 | 23.77 | 20.20 | 20.30 | 21.82 | 22.05 | 21.77 | 22.45 | 18.78 | 19.34 | 20.01 | 21.27 | 20.33 | 20.60 | 19.63 | 19.64 | 33.13 | 20.45 | 16.13 | 11.98 | NA | NA | NA |
| 2023-12-31 | 2023-09-30 | 2023-06-30 | 2023-03-31 | 2022-12-31 | 2022-09-30 | 2022-06-30 | 2022-03-31 | 2021-12-31 | 2021-09-30 | 2021-06-30 | 2021-03-31 | 2020-12-31 | 2020-09-30 | 2020-06-30 | 2020-03-31 | 2019-12-31 | 2019-09-30 | 2019-06-30 | 2019-03-31 | 2018-12-31 | 2018-09-30 | 2018-06-30 | 2018-03-31 | 2017-12-31 | 2017-09-30 | 2017-06-30 | 2017-03-31 | 2016-12-31 | 2016-09-30 | 2016-06-30 | 2016-03-31 | 2015-12-31 | 2015-09-30 | 2015-06-30 | 2015-03-31 | 2014-12-31 | 2014-09-30 | 2014-06-30 | 2014-03-31 | 2013-12-31 | 2013-09-30 | 2013-06-30 | 2013-03-31 | 2012-12-31 | 2012-09-30 | 2012-06-30 | 2012-03-31 | 2011-12-31 | 2011-09-30 | 2011-06-30 | 2011-03-31 | 2010-12-31 | 2010-09-30 | 2010-06-30 | 2010-03-31 | ||
|---|---|---|---|---|---|---|---|---|---|---|---|---|---|---|---|---|---|---|---|---|---|---|---|---|---|---|---|---|---|---|---|---|---|---|---|---|---|---|---|---|---|---|---|---|---|---|---|---|---|---|---|---|---|---|---|---|---|
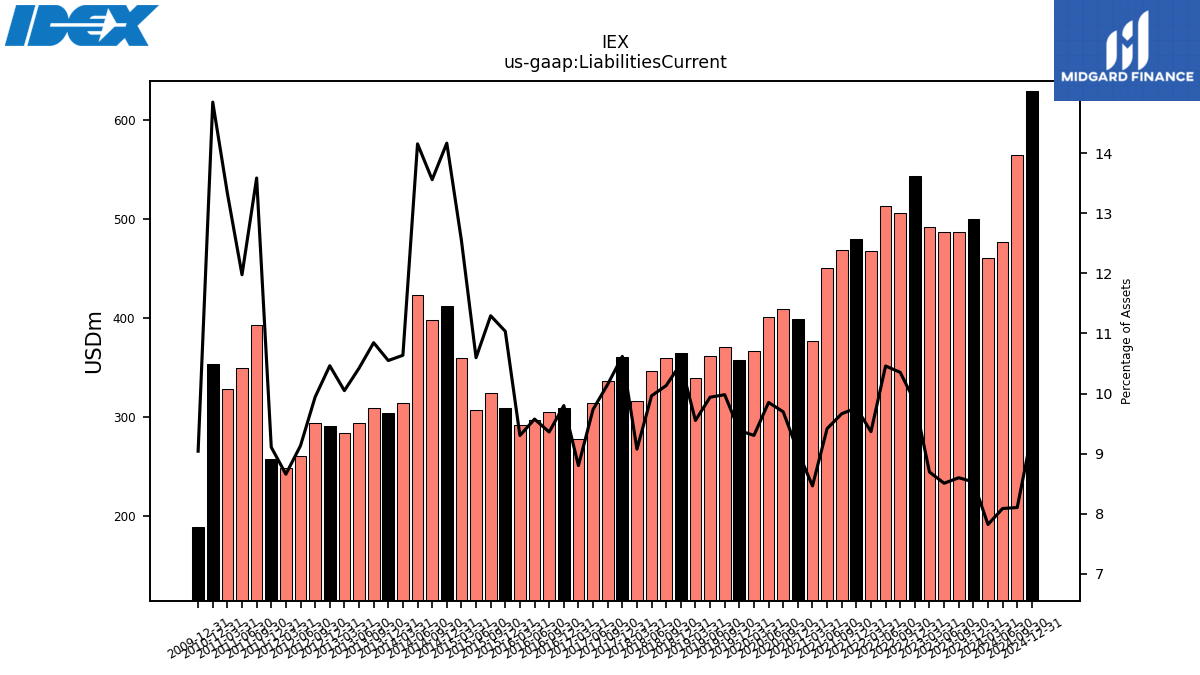
| Liabilities Current | 500.30 | 487.50 | 486.60 | 491.90 | 543.60 | 506.50 | 513.80 | 468.30 | 480.00 | 469.11 | 450.36 | 377.51 | 399.06 | 409.70 | 401.31 | 366.89 | 357.88 | 370.67 | 361.79 | 339.25 | 364.66 | 360.21 | 347.03 | 316.28 | 360.98 | 336.85 | 313.90 | 278.45 | 309.16 | 305.36 | 297.71 | 292.28 | 309.60 | 324.19 | 307.67 | 360.04 | 411.97 | 398.55 | 423.38 | 313.98 | 304.61 | 309.04 | 294.68 | 283.62 | 291.43 | 294.04 | 260.90 | 249.26 | 258.28 | 393.16 | 350.13 | 328.71 | 353.67 | NA | NA | NA | |
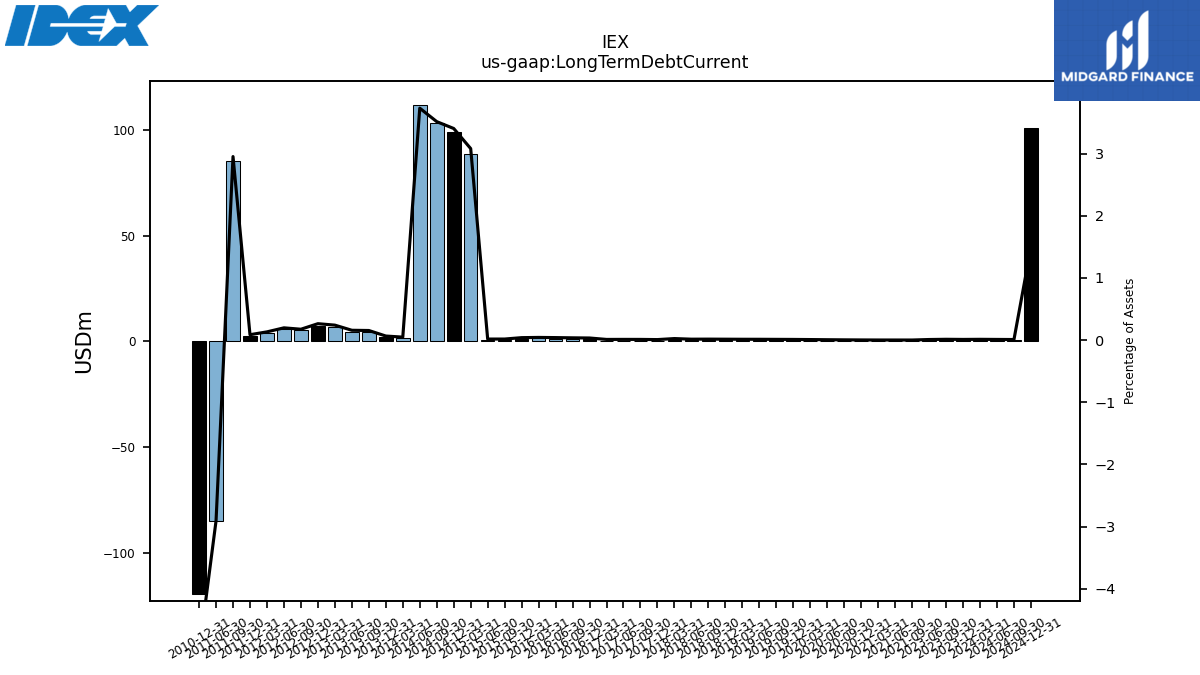
| Long Term Debt Current | 0.60 | 0.70 | 0.50 | NA | NA | NA | NA | NA | NA | 0.04 | 0.04 | 0.05 | 0.09 | 0.15 | 0.23 | 0.32 | 0.39 | 0.42 | 0.45 | 0.46 | 0.48 | 0.54 | 0.50 | 0.83 | 0.26 | 0.35 | 0.35 | 0.32 | 1.05 | 1.17 | 1.23 | 1.33 | 1.09 | 0.47 | 0.47 | 88.35 | 98.95 | 103.25 | 111.54 | 1.39 | 1.87 | 4.38 | 4.45 | 6.78 | 7.33 | 5.15 | 5.62 | 3.80 | 2.44 | 85.39 | -85.02 | NA | -119.44 | NA | NA | NA | |
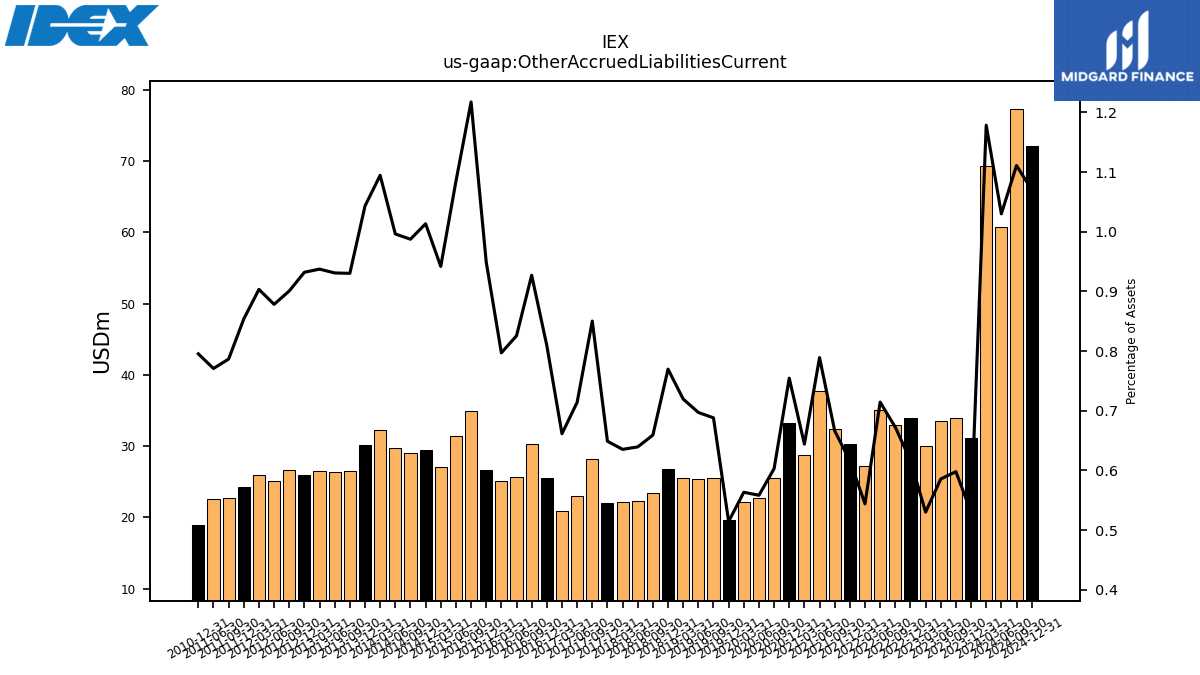
| Other Accrued Liabilities Current | 31.10 | 33.90 | 33.50 | 30.00 | 34.00 | 32.90 | 35.10 | 27.20 | 30.30 | 32.35 | 37.74 | 28.73 | 33.31 | 25.48 | 22.75 | 22.22 | 19.62 | 25.56 | 25.38 | 25.56 | 26.74 | 23.43 | 22.28 | 22.14 | 22.06 | 28.21 | 23.02 | 20.93 | 25.53 | 30.25 | 25.67 | 25.05 | 26.63 | 34.94 | 31.48 | 27.02 | 29.47 | 29.02 | 29.80 | 32.30 | 30.12 | 26.50 | 26.32 | 26.46 | 25.96 | 26.64 | 25.09 | 26.01 | 24.22 | 22.76 | 22.53 | NA | 18.94 | NA | NA | NA | |
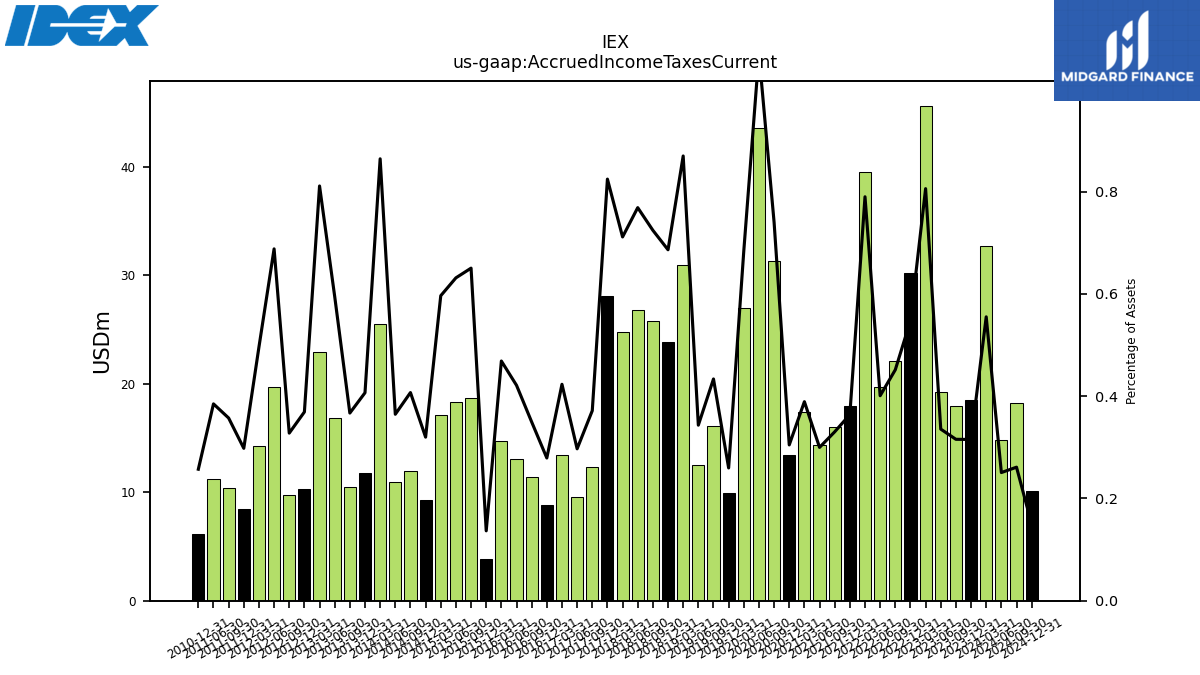
| Accrued Income Taxes Current | 18.50 | 17.90 | 19.20 | 45.60 | 30.20 | 22.10 | 19.70 | 39.50 | 17.90 | 16.04 | 14.34 | 17.36 | 13.45 | 31.28 | 43.59 | 26.98 | 9.90 | 16.11 | 12.50 | 30.89 | 23.84 | 25.75 | 26.78 | 24.80 | 28.03 | 12.33 | 9.58 | 13.39 | 8.81 | 11.41 | 13.10 | 14.73 | 3.84 | 18.67 | 18.33 | 17.12 | 9.30 | 11.97 | 10.91 | 25.51 | 11.75 | 10.46 | 16.83 | 22.90 | 10.28 | 9.70 | 19.66 | 14.28 | 8.46 | 10.34 | 11.26 | NA | 6.13 | NA | NA | NA | |
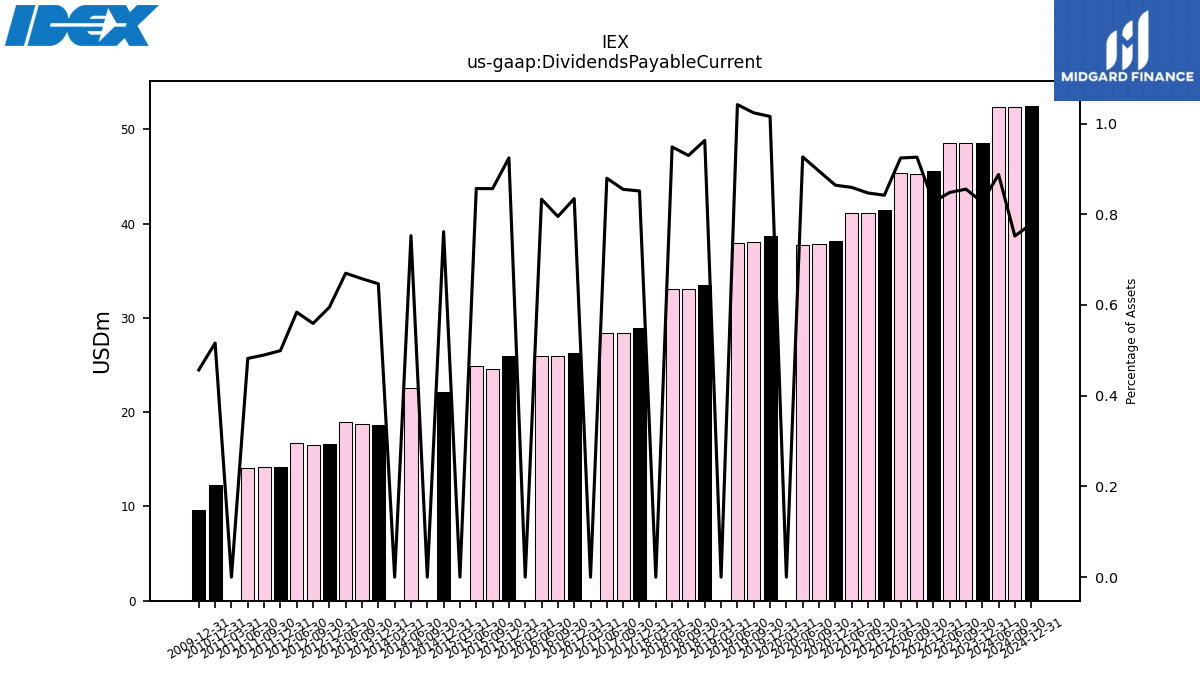
| Dividends Payable Current | 48.50 | 48.50 | 48.50 | NA | 45.60 | 45.30 | 45.40 | NA | 41.40 | 41.12 | 41.10 | NA | 38.15 | 37.83 | 37.73 | 0.00 | 38.74 | 38.02 | 37.92 | 0.00 | 33.45 | 33.05 | 33.04 | 0.00 | 28.95 | 28.36 | 28.35 | 0.00 | 26.33 | 25.94 | 25.91 | 0.00 | 25.93 | 24.58 | 24.88 | 0.00 | 22.15 | 0.00 | 22.52 | 0.00 | 18.68 | 18.75 | 18.95 | NA | 16.57 | 16.54 | 16.69 | NA | 14.16 | 14.17 | 14.10 | 0.00 | 12.29 | NA | NA | NA | |
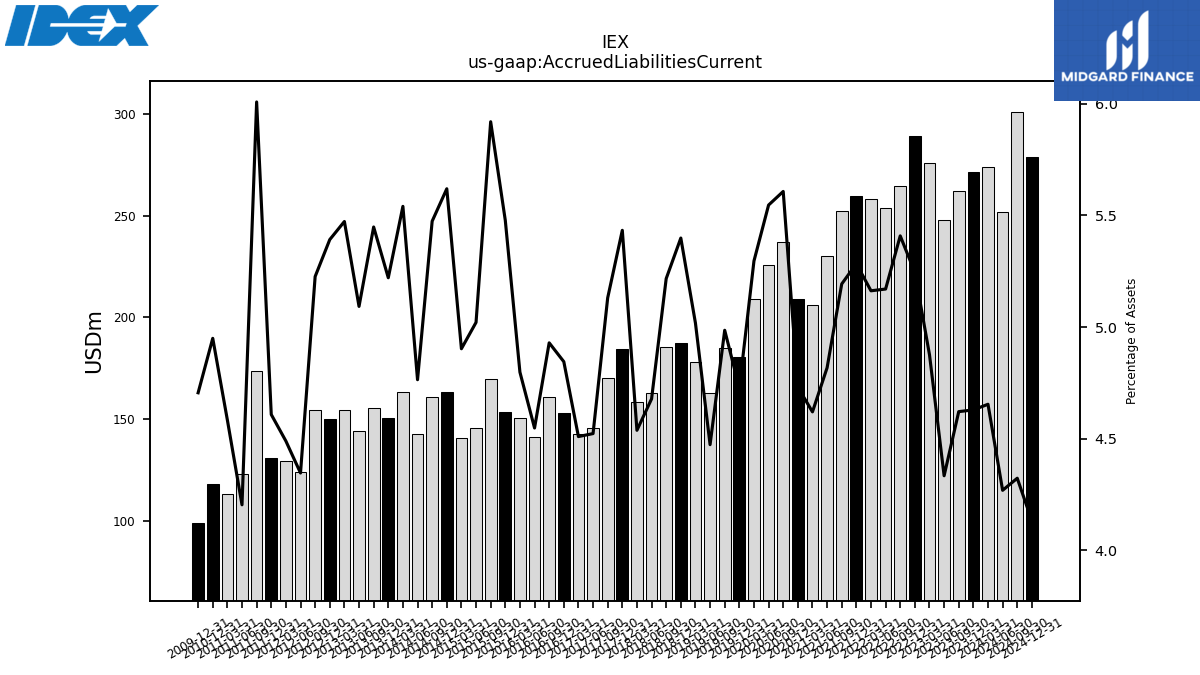
| Accrued Liabilities Current | 271.50 | 262.00 | 247.90 | 275.90 | 289.10 | 264.60 | 254.00 | 258.10 | 259.80 | 252.09 | 230.43 | 206.09 | 208.83 | 236.94 | 225.93 | 208.85 | 180.29 | 185.16 | 162.84 | 178.20 | 187.54 | 185.45 | 162.96 | 158.16 | 184.71 | 170.22 | 145.82 | 142.67 | 152.85 | 160.82 | 141.41 | 150.77 | 153.67 | 169.91 | 145.77 | 140.67 | 163.41 | 160.90 | 142.49 | 163.54 | 150.75 | 155.24 | 143.99 | 154.47 | 150.18 | 154.56 | 124.17 | 129.25 | 130.70 | 173.85 | 122.89 | 113.00 | 117.88 | NA | NA | NA | |
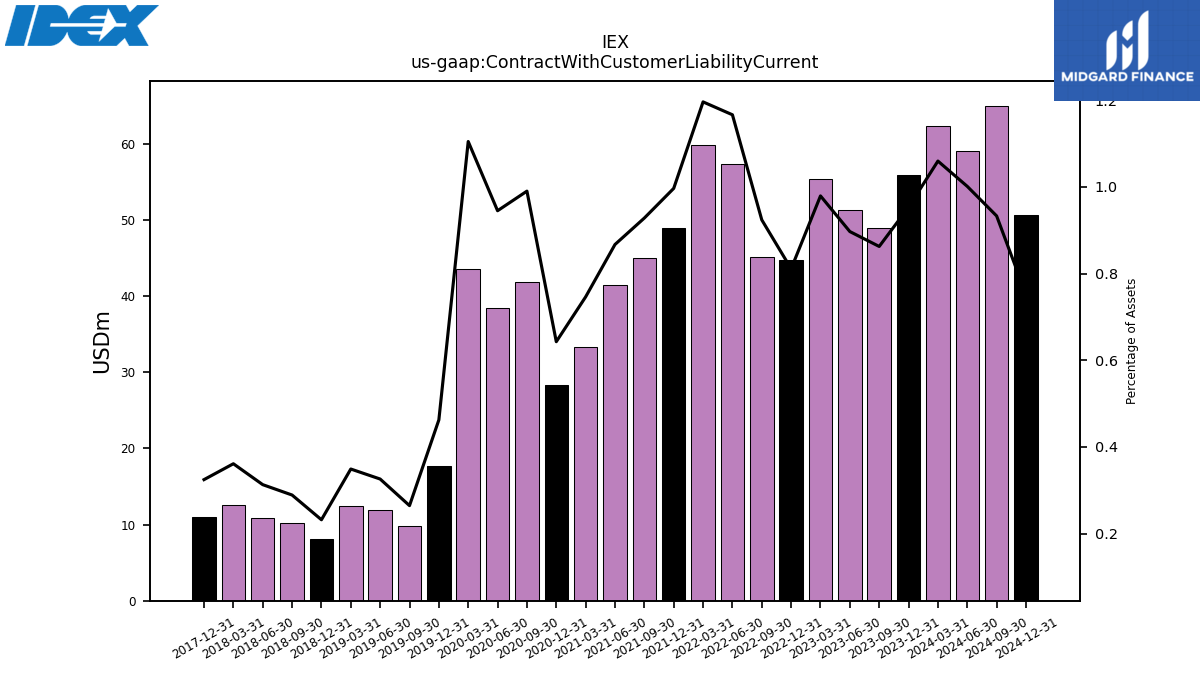
| Contract With Customer Liability Current | 55.90 | 48.90 | 51.30 | 55.40 | 44.70 | 45.20 | 57.30 | 59.80 | 49.00 | 45.05 | 41.47 | 33.29 | 28.37 | 41.84 | 38.49 | 43.56 | 17.63 | 9.82 | 11.86 | 12.39 | 8.05 | 10.27 | 10.90 | 12.59 | 11.03 | NA | NA | NA | NA | NA | NA | NA | NA | NA | NA | NA | NA | NA | NA | NA | NA | NA | NA | NA | NA | NA | NA | NA | NA | NA | NA | NA | NA | NA | NA | NA |
| 2023-12-31 | 2023-09-30 | 2023-06-30 | 2023-03-31 | 2022-12-31 | 2022-09-30 | 2022-06-30 | 2022-03-31 | 2021-12-31 | 2021-09-30 | 2021-06-30 | 2021-03-31 | 2020-12-31 | 2020-09-30 | 2020-06-30 | 2020-03-31 | 2019-12-31 | 2019-09-30 | 2019-06-30 | 2019-03-31 | 2018-12-31 | 2018-09-30 | 2018-06-30 | 2018-03-31 | 2017-12-31 | 2017-09-30 | 2017-06-30 | 2017-03-31 | 2016-12-31 | 2016-09-30 | 2016-06-30 | 2016-03-31 | 2015-12-31 | 2015-09-30 | 2015-06-30 | 2015-03-31 | 2014-12-31 | 2014-09-30 | 2014-06-30 | 2014-03-31 | 2013-12-31 | 2013-09-30 | 2013-06-30 | 2013-03-31 | 2012-12-31 | 2012-09-30 | 2012-06-30 | 2012-03-31 | 2011-12-31 | 2011-09-30 | 2011-06-30 | 2011-03-31 | 2010-12-31 | 2010-09-30 | 2010-06-30 | 2010-03-31 | ||
|---|---|---|---|---|---|---|---|---|---|---|---|---|---|---|---|---|---|---|---|---|---|---|---|---|---|---|---|---|---|---|---|---|---|---|---|---|---|---|---|---|---|---|---|---|---|---|---|---|---|---|---|---|---|---|---|---|---|
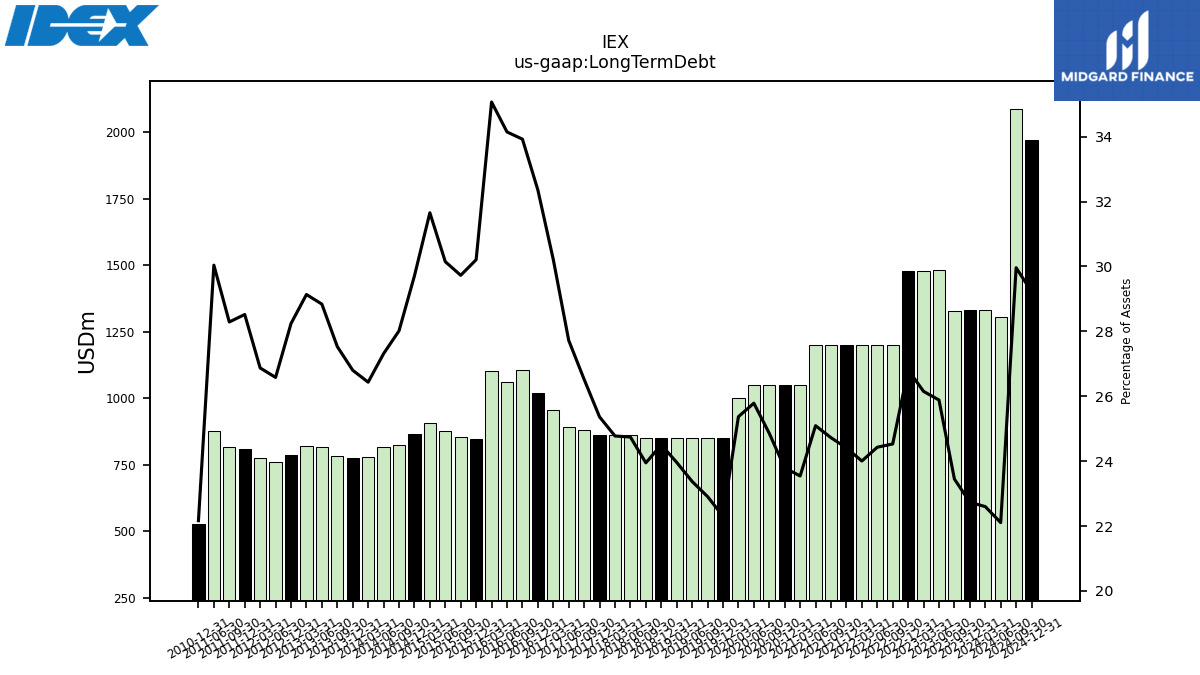
| Long Term Debt | 1333.30 | 1329.40 | 1480.50 | 1479.50 | 1477.80 | 1200.10 | 1200.10 | 1200.10 | 1200.10 | 1200.13 | 1200.15 | 1050.16 | 1050.21 | 1050.28 | 1050.37 | 1000.48 | 850.62 | 850.74 | 850.82 | 850.93 | 851.08 | 851.26 | 861.86 | 863.49 | 862.19 | 879.80 | 893.78 | 955.87 | 1020.87 | 1106.69 | 1061.65 | 1101.89 | 847.44 | 853.25 | 875.25 | 908.21 | 863.95 | 823.42 | 816.87 | 780.25 | 773.88 | 784.42 | 815.46 | 822.34 | 786.58 | NA | 759.34 | 773.65 | 808.81 | 818.60 | 878.14 | NA | 527.89 | NA | NA | NA | |
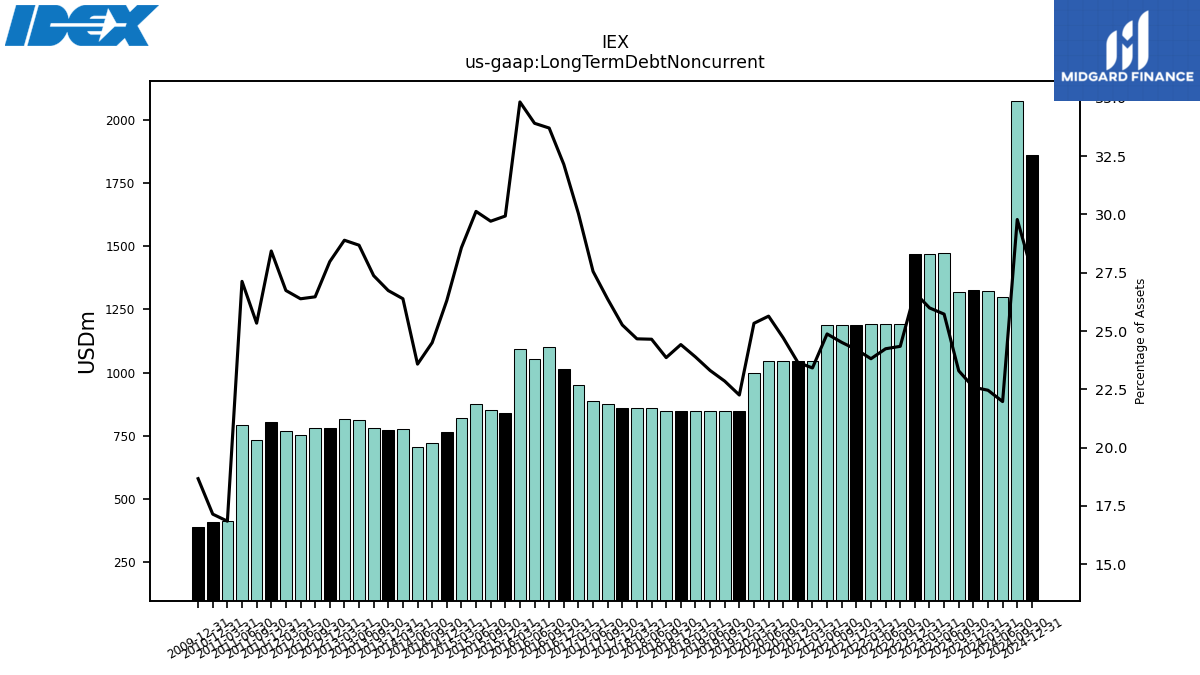
| Long Term Debt Noncurrent | 1325.10 | 1320.80 | 1471.50 | 1470.70 | 1468.70 | 1191.10 | 1190.90 | 1190.60 | 1190.30 | 1190.08 | 1189.83 | 1044.59 | 1044.35 | 1044.11 | 1044.44 | 999.02 | 848.86 | 848.73 | 848.55 | 848.44 | 848.34 | 848.25 | 858.66 | 859.73 | 858.79 | 874.85 | 888.50 | 950.28 | 1014.24 | 1099.60 | 1054.33 | 1094.23 | 839.71 | 852.78 | 874.78 | 819.86 | 765.01 | 720.17 | 705.33 | 778.85 | 772.00 | 780.04 | 811.01 | 815.56 | 779.24 | 782.77 | 753.73 | 769.85 | 806.37 | 733.20 | 793.12 | 415.38 | 408.45 | NA | NA | NA | |
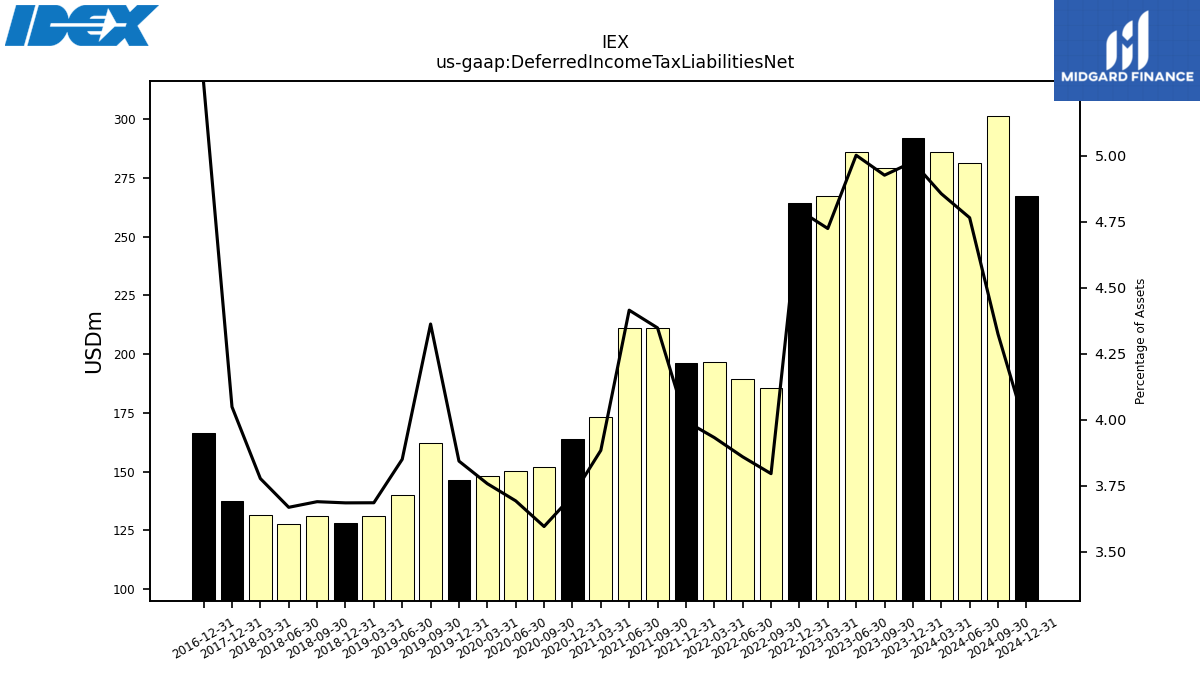
| Deferred Income Tax Liabilities Net | 291.90 | 279.30 | 286.10 | 267.30 | 264.20 | 185.70 | 189.60 | 196.60 | 196.40 | 211.07 | 211.16 | 173.24 | 163.86 | 151.92 | 150.42 | 148.19 | 146.57 | 162.02 | 140.15 | 130.88 | 128.01 | 131.15 | 127.77 | 131.65 | 137.64 | NA | NA | NA | 166.43 | NA | NA | NA | NA | NA | NA | NA | NA | NA | NA | NA | NA | NA | NA | NA | NA | NA | NA | NA | NA | NA | NA | NA | NA | NA | NA | NA | |
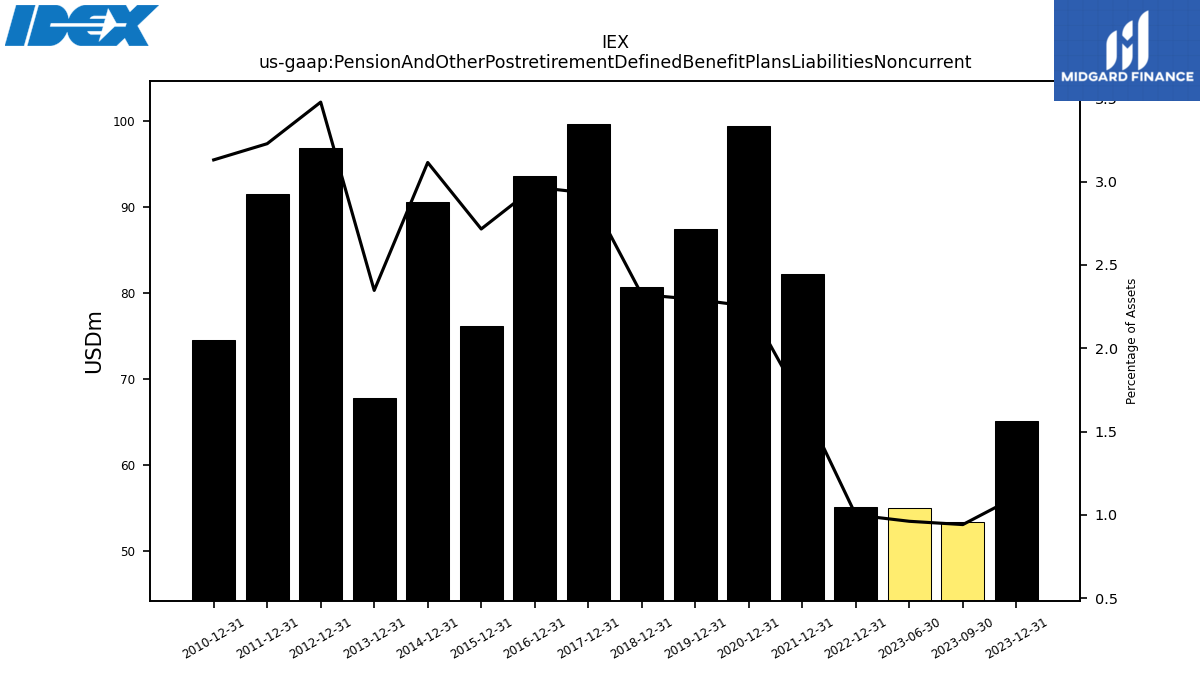
| Pension And Other Postretirement Defined Benefit Plans Liabilities Noncurrent | 65.10 | 53.40 | 55.00 | NA | 55.10 | NA | NA | NA | 82.20 | NA | NA | NA | 99.42 | NA | NA | NA | 87.48 | NA | NA | NA | 80.67 | NA | NA | NA | 99.65 | NA | NA | NA | 93.60 | NA | NA | NA | 76.19 | NA | NA | NA | 90.58 | NA | NA | NA | 67.78 | NA | NA | NA | 96.85 | NA | NA | NA | 91.54 | NA | NA | NA | 74.56 | NA | NA | NA | |
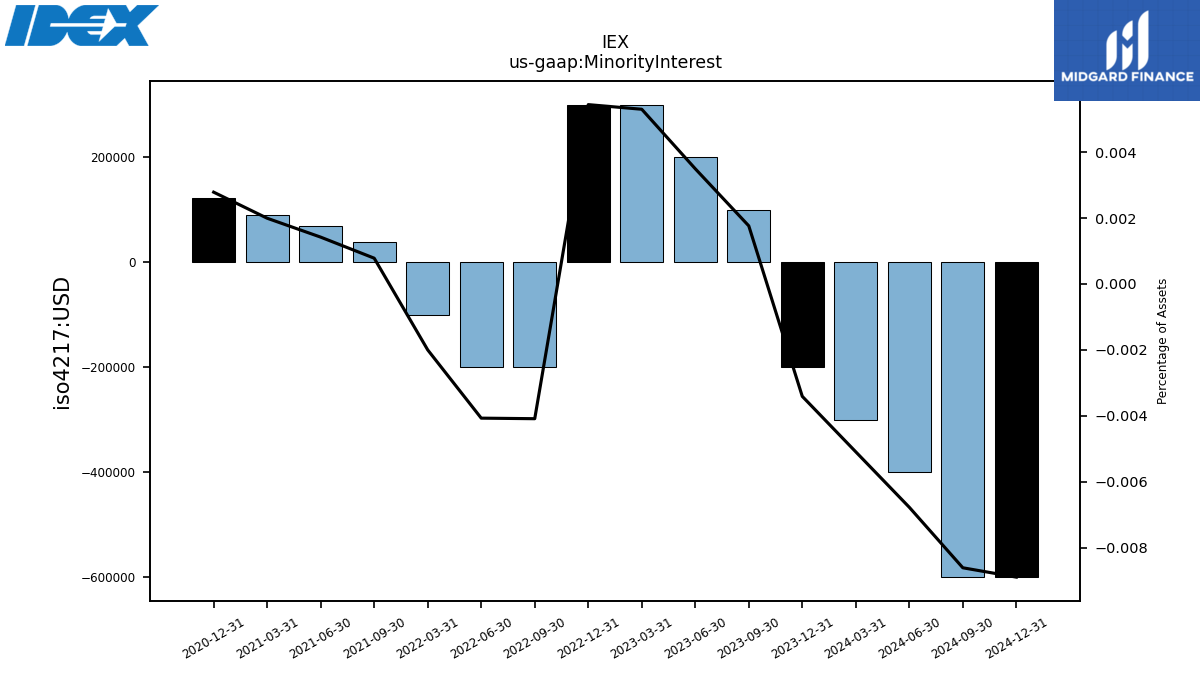
| Minority Interest | -0.20 | 0.10 | 0.20 | 0.30 | 0.30 | -0.20 | -0.20 | -0.10 | NA | 0.04 | 0.07 | 0.09 | 0.12 | NA | NA | NA | NA | NA | NA | NA | NA | NA | NA | NA | NA | NA | NA | NA | NA | NA | NA | NA | NA | NA | NA | NA | NA | NA | NA | NA | NA | NA | NA | NA | NA | NA | NA | NA | NA | NA | NA | NA | NA | NA | NA | NA | |
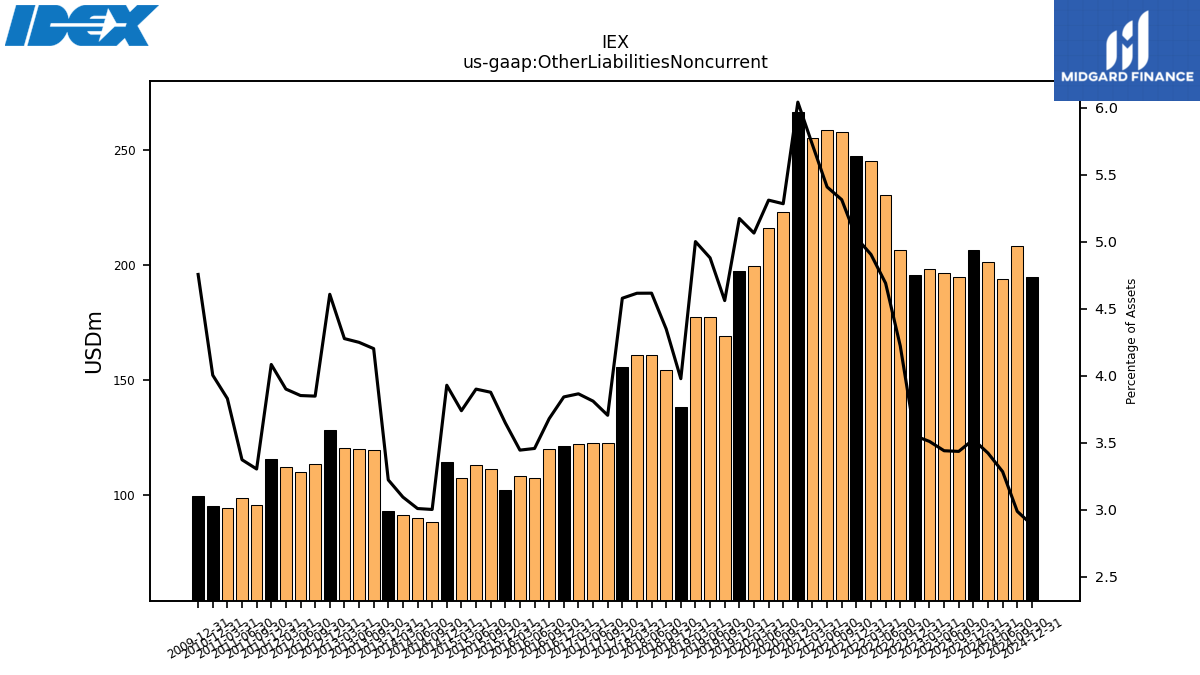
| Other Liabilities Noncurrent | 206.70 | 194.80 | 196.80 | 198.60 | 195.80 | 206.70 | 230.50 | 245.30 | 247.40 | 258.04 | 258.78 | 255.37 | 266.80 | 223.33 | 216.39 | 199.79 | 197.37 | 169.43 | 177.68 | 177.66 | 138.21 | 154.62 | 160.84 | 160.91 | 155.69 | 122.94 | 122.88 | 122.30 | 121.23 | 120.08 | 107.51 | 108.26 | 102.36 | 111.30 | 113.26 | 107.30 | 114.28 | 88.25 | 90.00 | 91.35 | 93.07 | 119.77 | 120.18 | 120.75 | 128.38 | 113.82 | 110.07 | 112.32 | 115.85 | 95.62 | 98.62 | 94.44 | 95.38 | NA | NA | NA | |
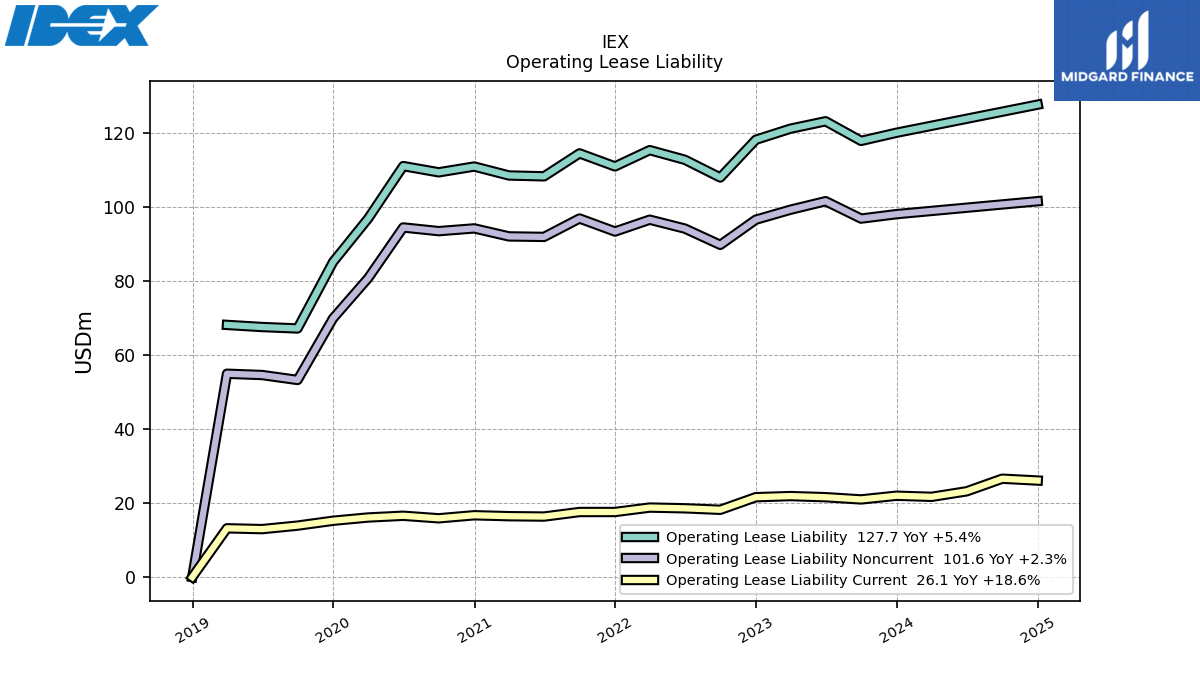
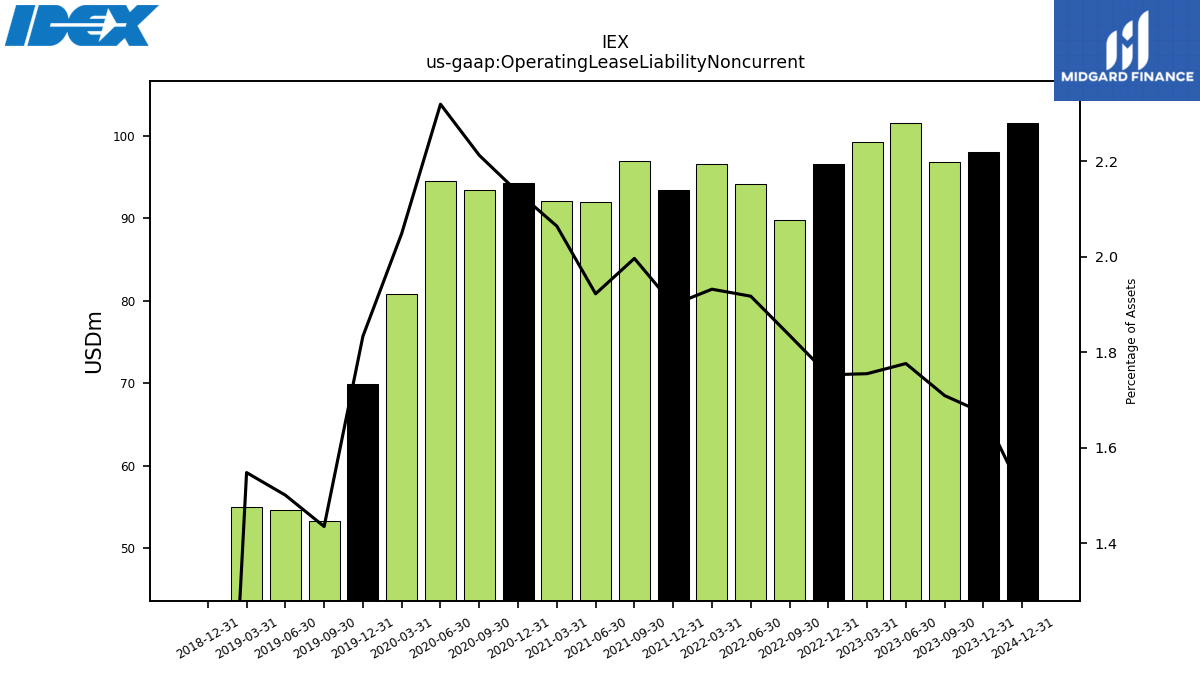
| Operating Lease Liability Noncurrent | 98.10 | 96.90 | 101.60 | 99.30 | 96.60 | 89.80 | 94.20 | 96.60 | 93.40 | 96.93 | 91.95 | 92.08 | 94.25 | 93.51 | 94.50 | 80.80 | 69.93 | 53.28 | 54.62 | 54.97 | 0.00 | NA | NA | NA | NA | NA | NA | NA | NA | NA | NA | NA | NA | NA | NA | NA | NA | NA | NA | NA | NA | NA | NA | NA | NA | NA | NA | NA | NA | NA | NA | NA | NA | NA | NA | NA |
| 2023-12-31 | 2023-09-30 | 2023-06-30 | 2023-03-31 | 2022-12-31 | 2022-09-30 | 2022-06-30 | 2022-03-31 | 2021-12-31 | 2021-09-30 | 2021-06-30 | 2021-03-31 | 2020-12-31 | 2020-09-30 | 2020-06-30 | 2020-03-31 | 2019-12-31 | 2019-09-30 | 2019-06-30 | 2019-03-31 | 2018-12-31 | 2018-09-30 | 2018-06-30 | 2018-03-31 | 2017-12-31 | 2017-09-30 | 2017-06-30 | 2017-03-31 | 2016-12-31 | 2016-09-30 | 2016-06-30 | 2016-03-31 | 2015-12-31 | 2015-09-30 | 2015-06-30 | 2015-03-31 | 2014-12-31 | 2014-09-30 | 2014-06-30 | 2014-03-31 | 2013-12-31 | 2013-09-30 | 2013-06-30 | 2013-03-31 | 2012-12-31 | 2012-09-30 | 2012-06-30 | 2012-03-31 | 2011-12-31 | 2011-09-30 | 2011-06-30 | 2011-03-31 | 2010-12-31 | 2010-09-30 | 2010-06-30 | 2010-03-31 | ||
|---|---|---|---|---|---|---|---|---|---|---|---|---|---|---|---|---|---|---|---|---|---|---|---|---|---|---|---|---|---|---|---|---|---|---|---|---|---|---|---|---|---|---|---|---|---|---|---|---|---|---|---|---|---|---|---|---|---|
| Stockholders Equity | 3541.40 | 3387.10 | 3278.70 | 3229.20 | 3039.30 | 2802.80 | 2788.20 | 2899.00 | 2803.10 | 2726.24 | 2672.80 | 2609.93 | 2540.20 | 2396.53 | 2261.04 | 2229.79 | 2263.23 | 2163.05 | 2112.04 | 2055.23 | 1994.64 | 2060.57 | 1989.15 | 2016.88 | 1886.54 | 1810.31 | 1727.01 | 1641.31 | 1543.89 | 1554.74 | 1496.93 | 1492.91 | 1443.29 | 1428.59 | 1454.81 | 1450.99 | 1486.45 | 1587.90 | 1624.89 | 1621.00 | 1572.99 | 1514.52 | 1479.49 | 1481.65 | 1465.00 | 1608.84 | 1579.25 | 1600.57 | 1513.13 | 1505.42 | 1511.65 | 1472.99 | 1375.66 | NA | NA | NA | |
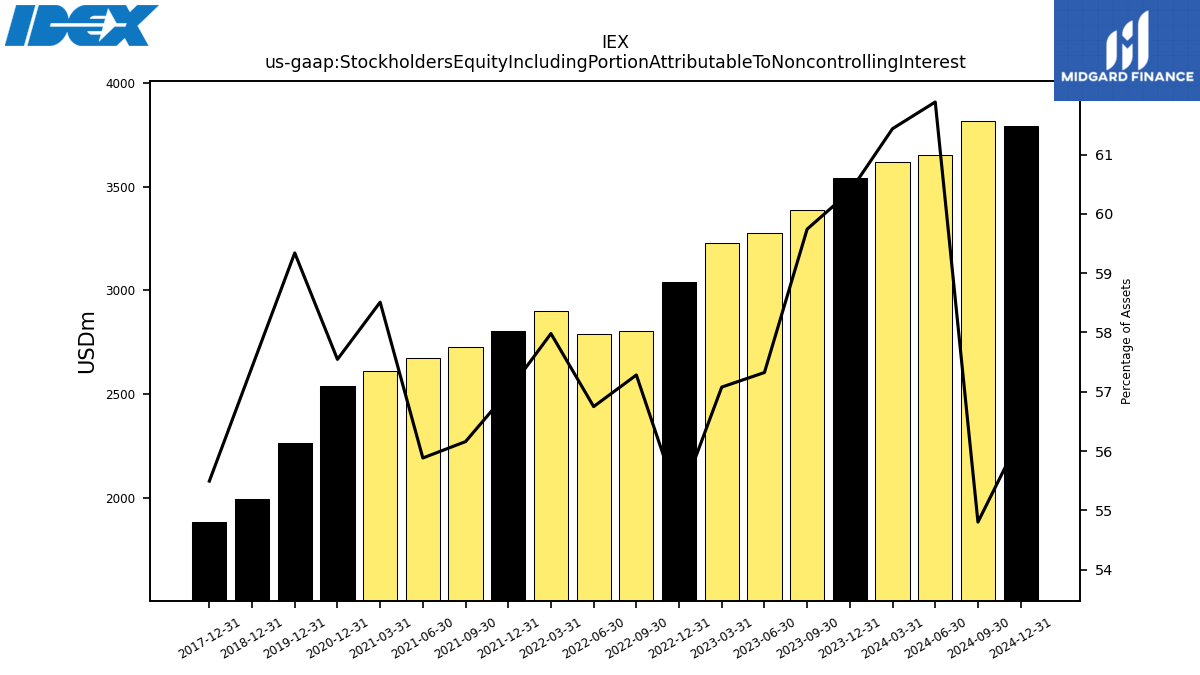
| Stockholders Equity Including Portion Attributable To Noncontrolling Interest | 3541.20 | 3387.20 | 3278.90 | 3229.50 | 3039.60 | 2802.60 | 2788.00 | 2898.90 | 2803.10 | 2726.28 | 2672.86 | 2610.01 | 2540.33 | NA | NA | NA | 2263.23 | NA | NA | NA | 1994.64 | NA | NA | NA | 1886.54 | NA | NA | NA | NA | NA | NA | NA | NA | NA | NA | NA | NA | NA | NA | NA | NA | NA | NA | NA | NA | NA | NA | NA | NA | NA | NA | NA | NA | NA | NA | NA | |
| Common Stock Value | 0.90 | 0.90 | 0.90 | 0.90 | 0.90 | 0.90 | 0.90 | 0.90 | 0.90 | 0.90 | 0.90 | 0.90 | 0.90 | 0.90 | 0.90 | 0.90 | 0.90 | 0.90 | 0.90 | 0.90 | 0.90 | 0.90 | 0.90 | 0.90 | 0.90 | 0.90 | 0.90 | 0.90 | 0.90 | 0.90 | 0.90 | 0.90 | 0.90 | 0.90 | 0.90 | 0.90 | 0.90 | 0.90 | 0.90 | 0.89 | 0.89 | 0.89 | 0.89 | 0.88 | 0.88 | 0.87 | 0.87 | 0.87 | 0.86 | 0.86 | 0.86 | 0.85 | 0.85 | NA | NA | NA | |
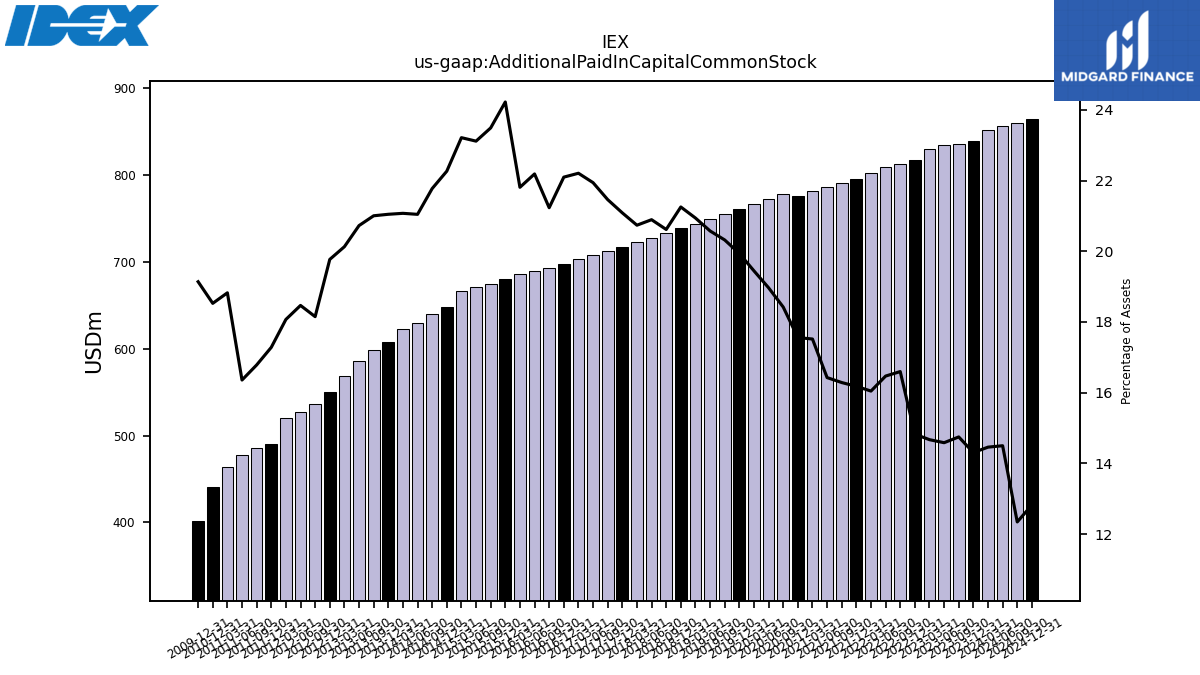
| Additional Paid In Capital Common Stock | 839.00 | 836.10 | 834.20 | 830.00 | 817.20 | 812.00 | 809.10 | 802.20 | 795.60 | 790.63 | 785.67 | 781.43 | 775.15 | 778.47 | 772.67 | 766.92 | 760.45 | 754.70 | 749.01 | 743.74 | 738.34 | 732.94 | 727.86 | 722.84 | 716.91 | 712.09 | 707.47 | 702.64 | 697.21 | 692.73 | 689.95 | 685.38 | 679.62 | 674.29 | 671.18 | 666.10 | 647.55 | 640.04 | 629.49 | 622.09 | 607.77 | 598.52 | 586.11 | 568.20 | 550.68 | 536.80 | 527.61 | 520.31 | 490.13 | 485.67 | 478.17 | 464.13 | 441.27 | NA | NA | NA | |
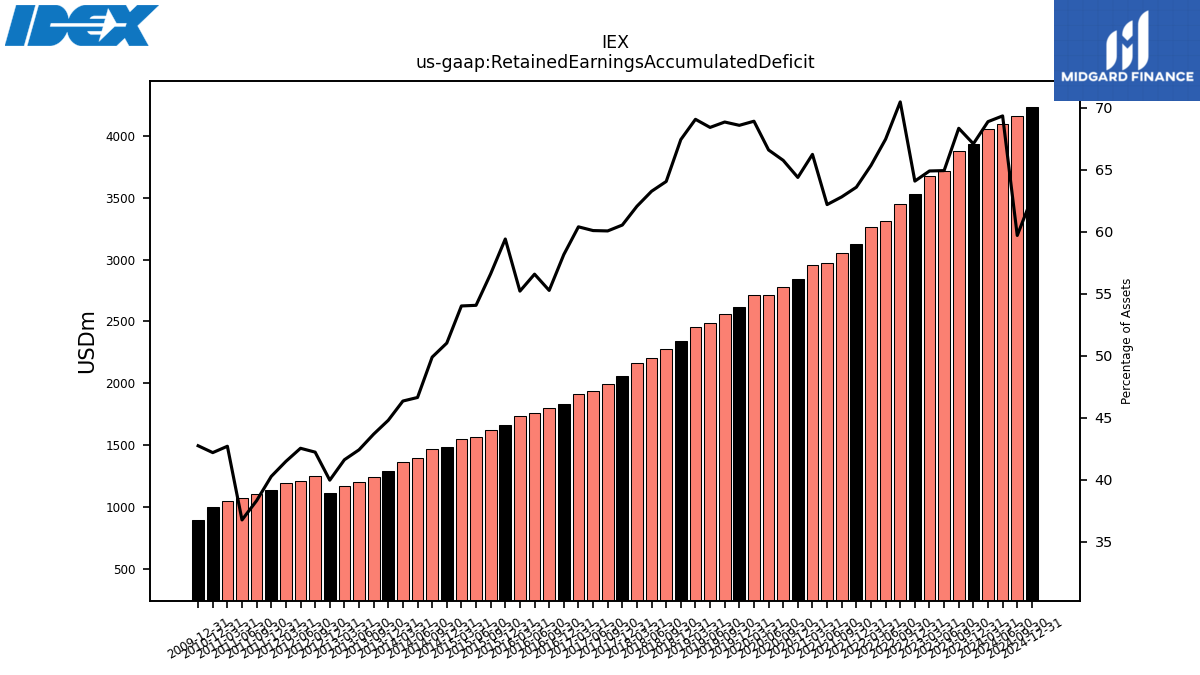
| Retained Earnings Accumulated Deficit | 3934.30 | 3874.00 | 3713.40 | 3671.50 | 3531.70 | 3447.10 | 3313.80 | 3266.50 | 3126.50 | 3048.86 | 2974.16 | 2954.25 | 2841.55 | 2778.13 | 2712.31 | 2717.13 | 2615.13 | 2556.42 | 2489.91 | 2452.38 | 2342.08 | 2276.63 | 2203.47 | 2162.66 | 2057.91 | 1992.64 | 1937.36 | 1910.64 | 1834.74 | 1803.06 | 1759.16 | 1734.81 | 1666.68 | 1624.76 | 1569.73 | 1549.78 | 1483.82 | 1466.47 | 1395.03 | 1368.29 | 1293.74 | 1244.80 | 1199.61 | 1174.84 | 1113.54 | 1249.13 | 1215.52 | 1194.58 | 1142.41 | 1109.17 | 1075.01 | 1052.99 | 1005.04 | NA | NA | NA | |
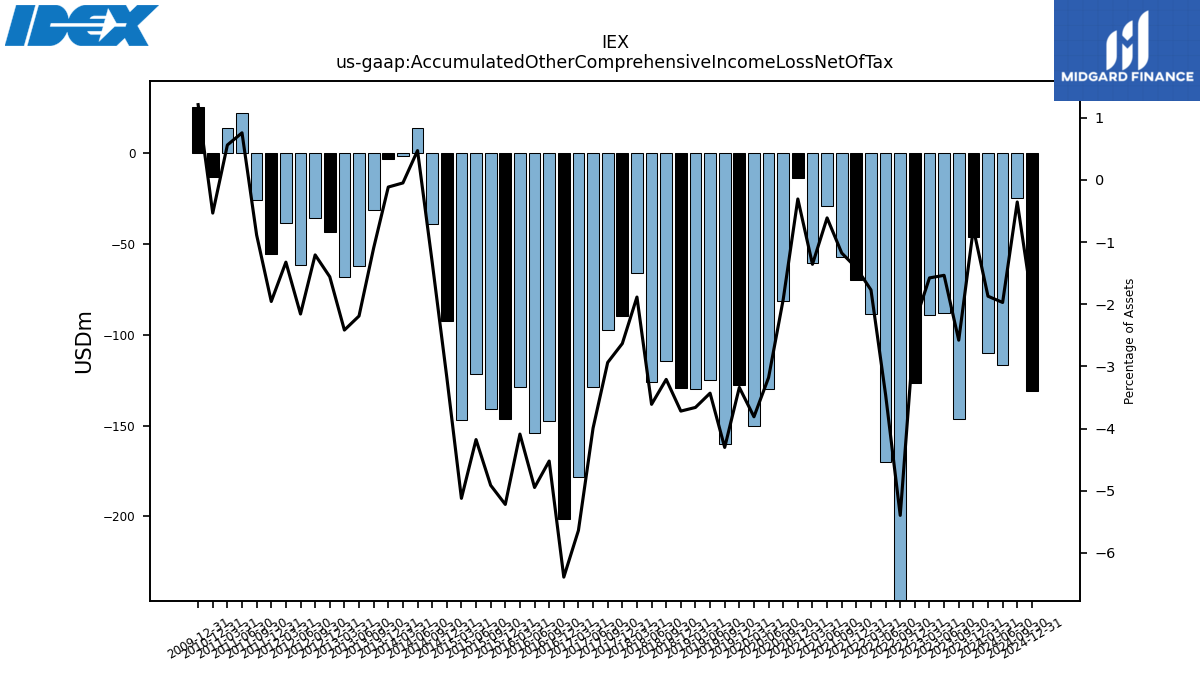
| Accumulated Other Comprehensive Income Loss Net Of Tax | -45.80 | -146.20 | -87.80 | -89.20 | -126.20 | -264.10 | -169.80 | -88.50 | -69.60 | -57.09 | -29.22 | -60.55 | -13.53 | -81.25 | -129.56 | -150.31 | -127.34 | -159.86 | -124.91 | -130.02 | -129.22 | -114.10 | -125.78 | -65.69 | -89.51 | -97.46 | -128.78 | -178.44 | -201.65 | -147.59 | -153.87 | -128.51 | -146.50 | -141.04 | -121.32 | -147.00 | -92.28 | -38.81 | 14.12 | -1.43 | -3.31 | -31.22 | -61.92 | -68.19 | -43.40 | -35.67 | -61.64 | -38.09 | -55.47 | -25.65 | 22.17 | 13.86 | -12.71 | NA | NA | NA | |
| Minority Interest | -0.20 | 0.10 | 0.20 | 0.30 | 0.30 | -0.20 | -0.20 | -0.10 | NA | 0.04 | 0.07 | 0.09 | 0.12 | NA | NA | NA | NA | NA | NA | NA | NA | NA | NA | NA | NA | NA | NA | NA | NA | NA | NA | NA | NA | NA | NA | NA | NA | NA | NA | NA | NA | NA | NA | NA | NA | NA | NA | NA | NA | NA | NA | NA | NA | NA | NA | NA | |
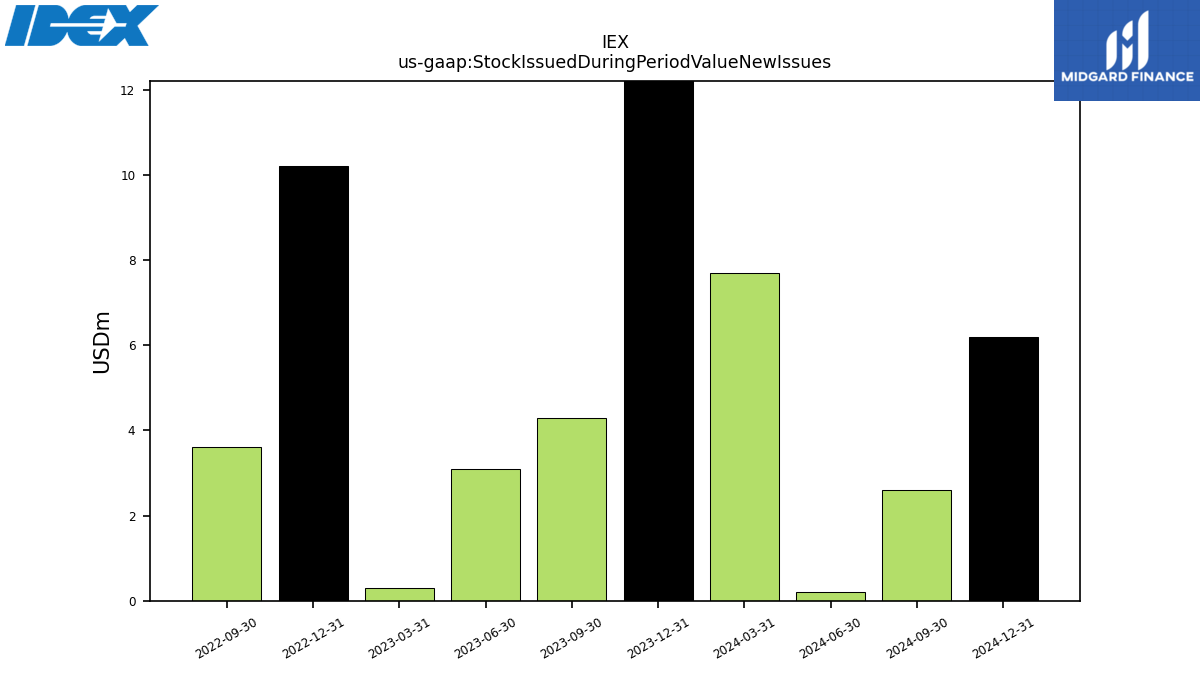
| Stock Issued During Period Value New Issues | 13.80 | 4.30 | NA | NA | 10.20 | 3.60 | NA | NA | NA | NA | NA | NA | NA | NA | NA | NA | NA | NA | NA | NA | NA | NA | NA | NA | NA | NA | NA | NA | NA | NA | NA | NA | NA | NA | NA | NA | NA | NA | NA | NA | NA | NA | NA | NA | NA | NA | NA | NA | NA | NA | NA | NA | NA | NA | NA | NA |
| 2023-12-31 | 2023-09-30 | 2023-06-30 | 2023-03-31 | 2022-12-31 | 2022-09-30 | 2022-06-30 | 2022-03-31 | 2021-12-31 | 2021-09-30 | 2021-06-30 | 2021-03-31 | 2020-12-31 | 2020-09-30 | 2020-06-30 | 2020-03-31 | 2019-12-31 | 2019-09-30 | 2019-06-30 | 2019-03-31 | 2018-12-31 | 2018-09-30 | 2018-06-30 | 2018-03-31 | 2017-12-31 | 2017-09-30 | 2017-06-30 | 2017-03-31 | 2016-12-31 | 2016-09-30 | 2016-06-30 | 2016-03-31 | 2015-12-31 | 2015-09-30 | 2015-06-30 | 2015-03-31 | 2014-12-31 | 2014-09-30 | 2014-06-30 | 2014-03-31 | 2013-12-31 | 2013-09-30 | 2013-06-30 | 2013-03-31 | 2012-12-31 | 2012-09-30 | 2012-06-30 | 2012-03-31 | 2011-12-31 | 2011-09-30 | 2011-06-30 | 2011-03-31 | 2010-12-31 | 2010-09-30 | 2010-06-30 | 2010-03-31 | ||
|---|---|---|---|---|---|---|---|---|---|---|---|---|---|---|---|---|---|---|---|---|---|---|---|---|---|---|---|---|---|---|---|---|---|---|---|---|---|---|---|---|---|---|---|---|---|---|---|---|---|---|---|---|---|---|---|---|---|
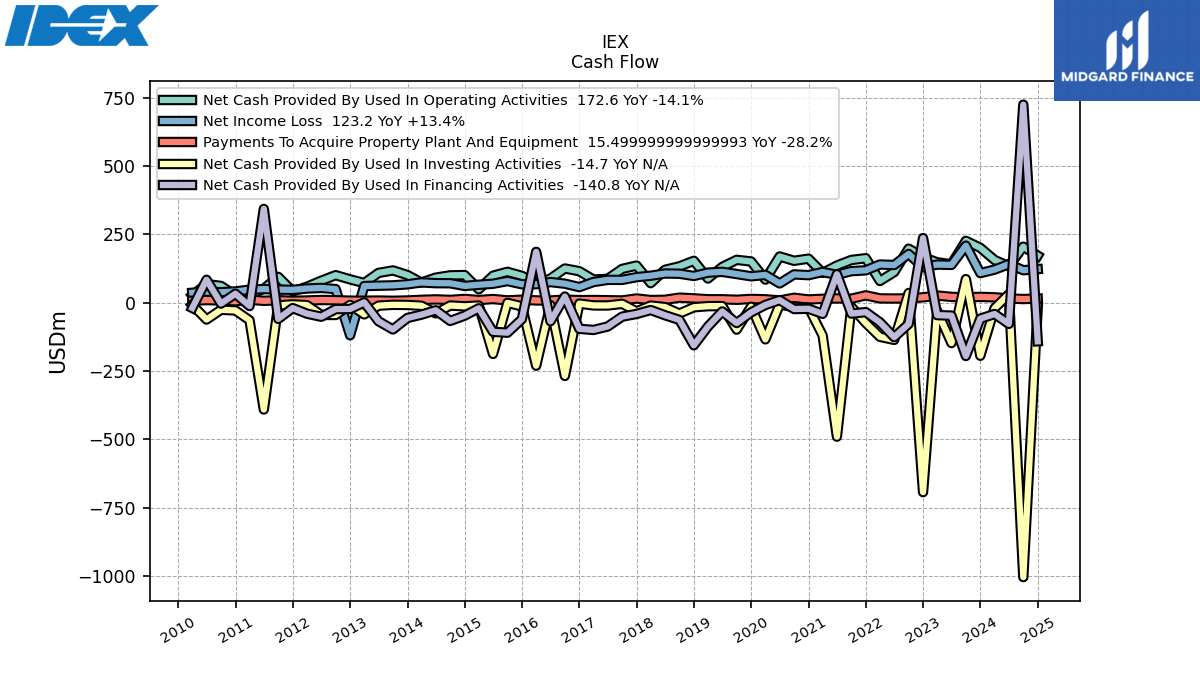
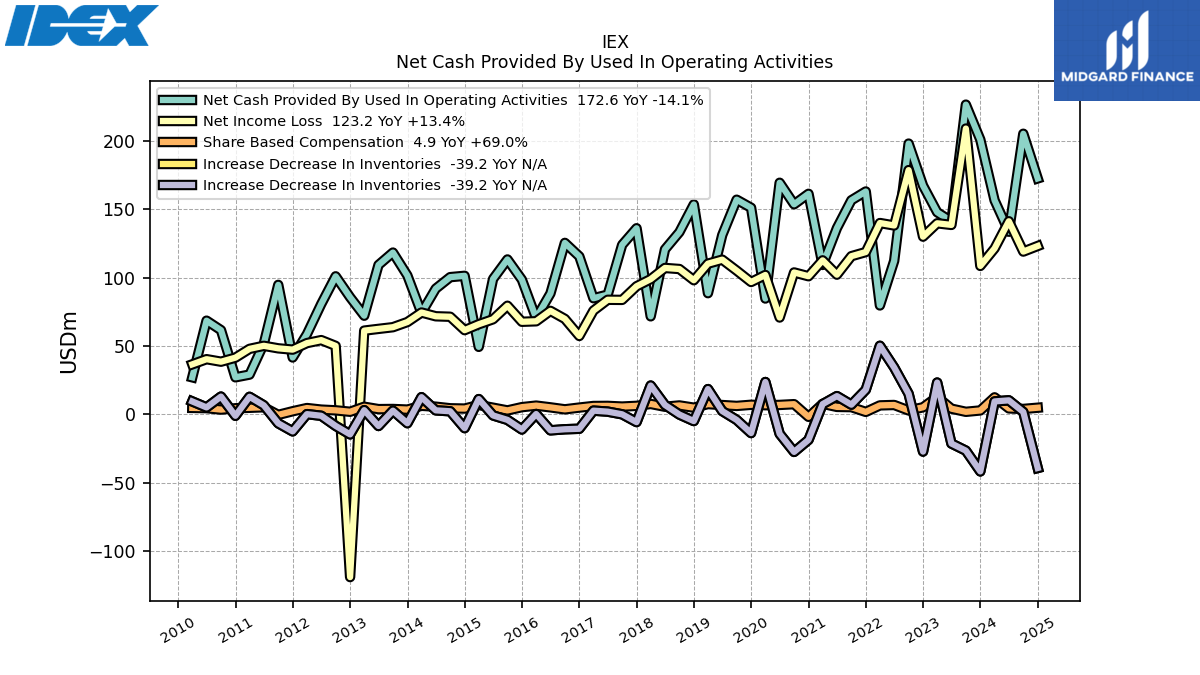
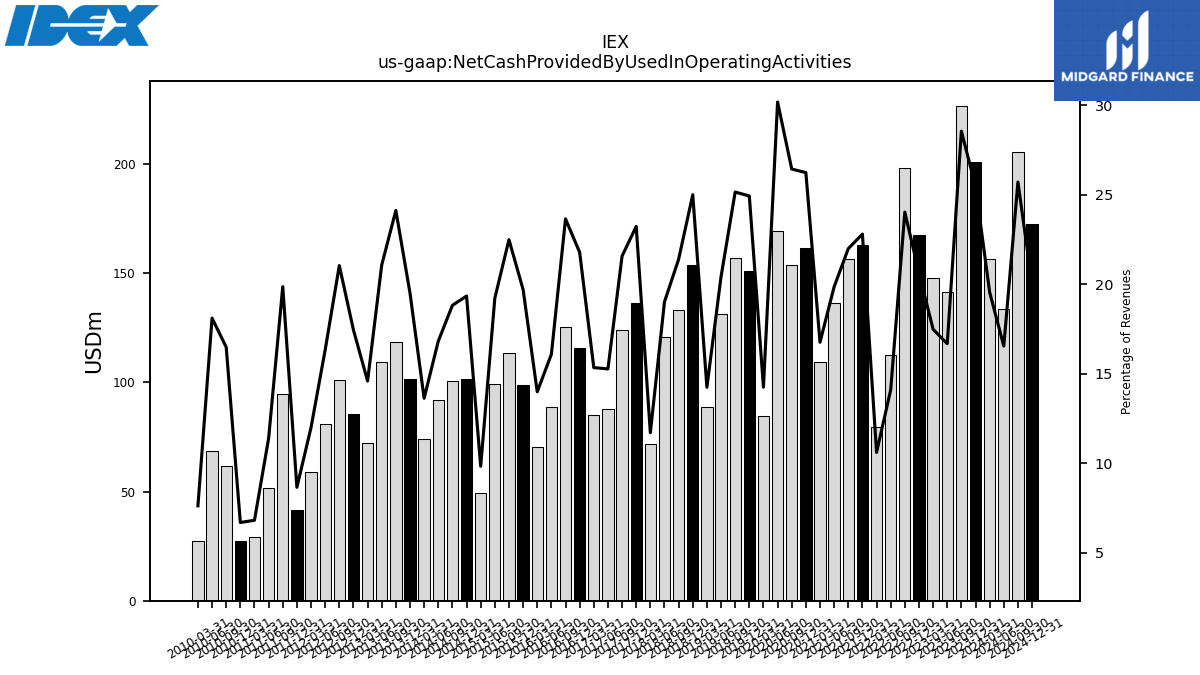
| Net Cash Provided By Used In Operating Activities | 201.00 | 226.60 | 141.20 | 147.90 | 167.30 | 198.10 | 112.30 | 79.70 | 163.07 | 156.63 | 136.27 | 109.32 | 161.37 | 153.69 | 169.45 | 84.76 | 151.16 | 157.06 | 131.18 | 88.66 | 153.59 | 133.33 | 120.70 | 71.73 | 136.17 | 124.00 | 87.60 | 84.98 | 115.59 | 125.48 | 88.48 | 70.36 | 98.54 | 113.35 | 99.02 | 49.40 | 101.38 | 100.40 | 92.00 | 74.19 | 101.61 | 118.40 | 109.32 | 72.19 | 85.68 | 101.02 | 80.74 | 58.74 | 41.63 | 94.77 | 51.71 | 29.13 | 27.13 | 61.64 | 68.57 | 27.13 | |
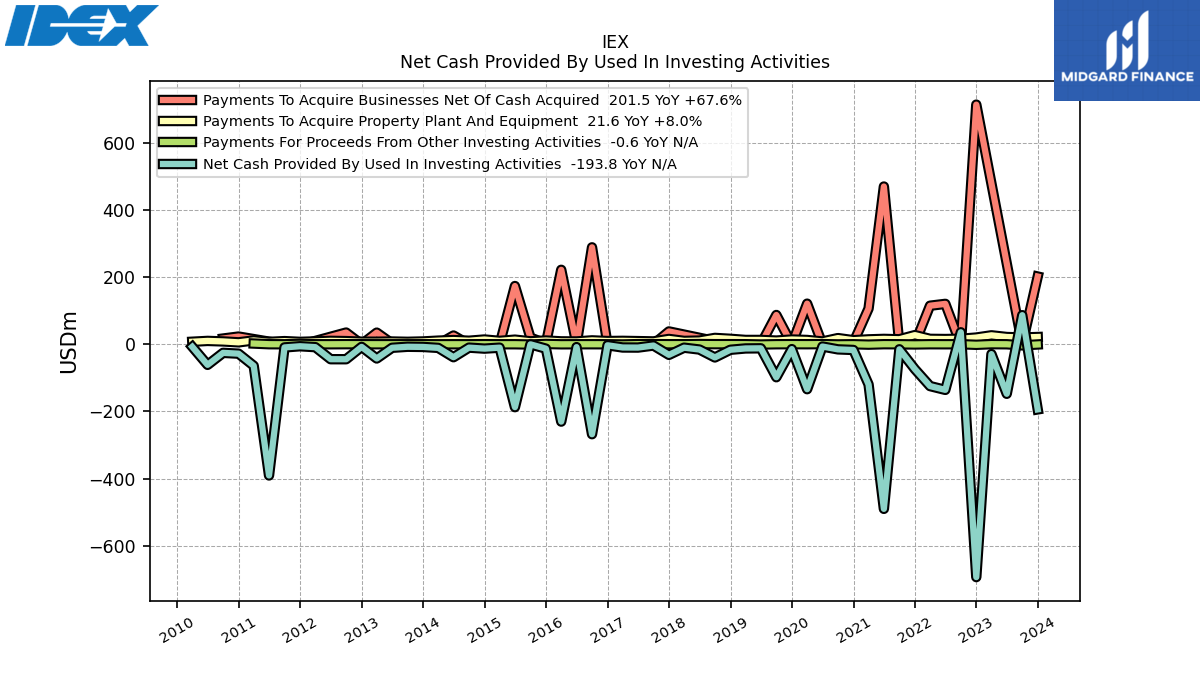
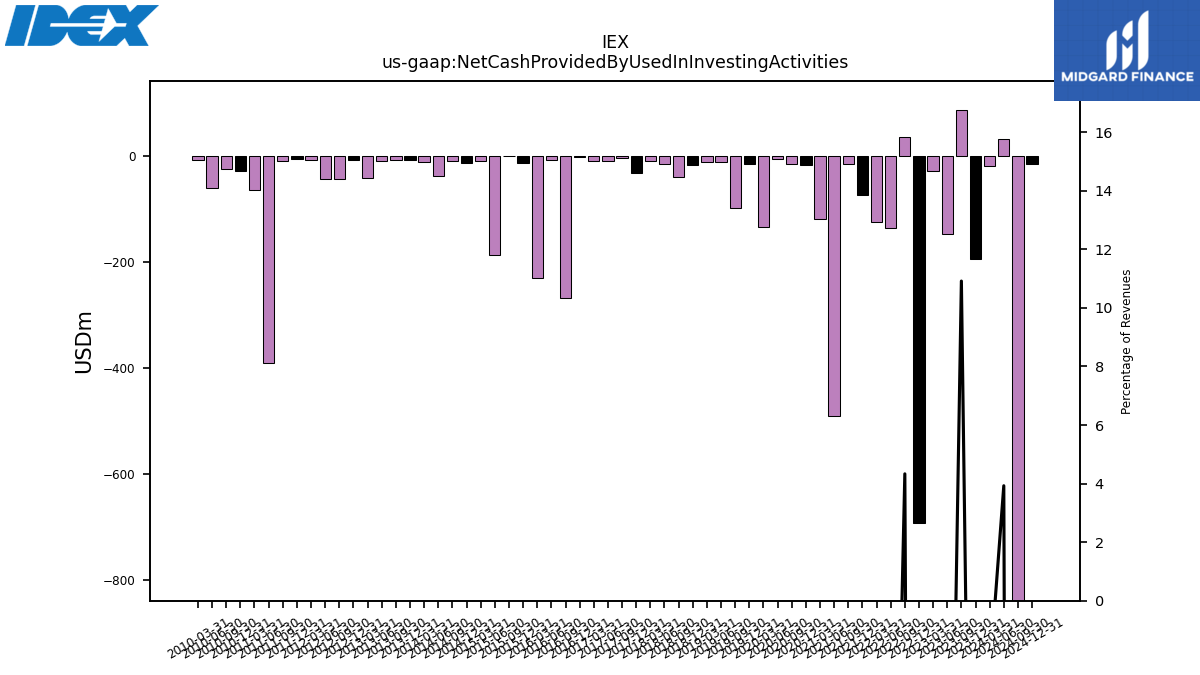
| Net Cash Provided By Used In Investing Activities | -193.80 | 86.60 | -147.40 | -29.20 | -692.80 | 35.70 | -135.70 | -124.40 | -73.93 | -14.92 | -489.72 | -119.53 | -16.97 | -15.16 | -6.73 | -133.72 | -14.43 | -98.13 | -12.02 | -12.44 | -16.40 | -39.20 | -15.64 | -10.19 | -31.51 | -3.79 | -9.83 | -9.62 | -3.01 | -267.61 | -8.47 | -230.12 | -13.04 | -0.19 | -187.14 | -10.12 | -12.95 | -9.99 | -38.53 | -10.79 | -7.96 | -7.41 | -10.47 | -42.33 | -7.77 | -44.52 | -44.42 | -8.55 | -5.87 | -9.36 | -390.37 | -63.93 | -27.97 | -25.53 | -61.26 | -7.55 | |
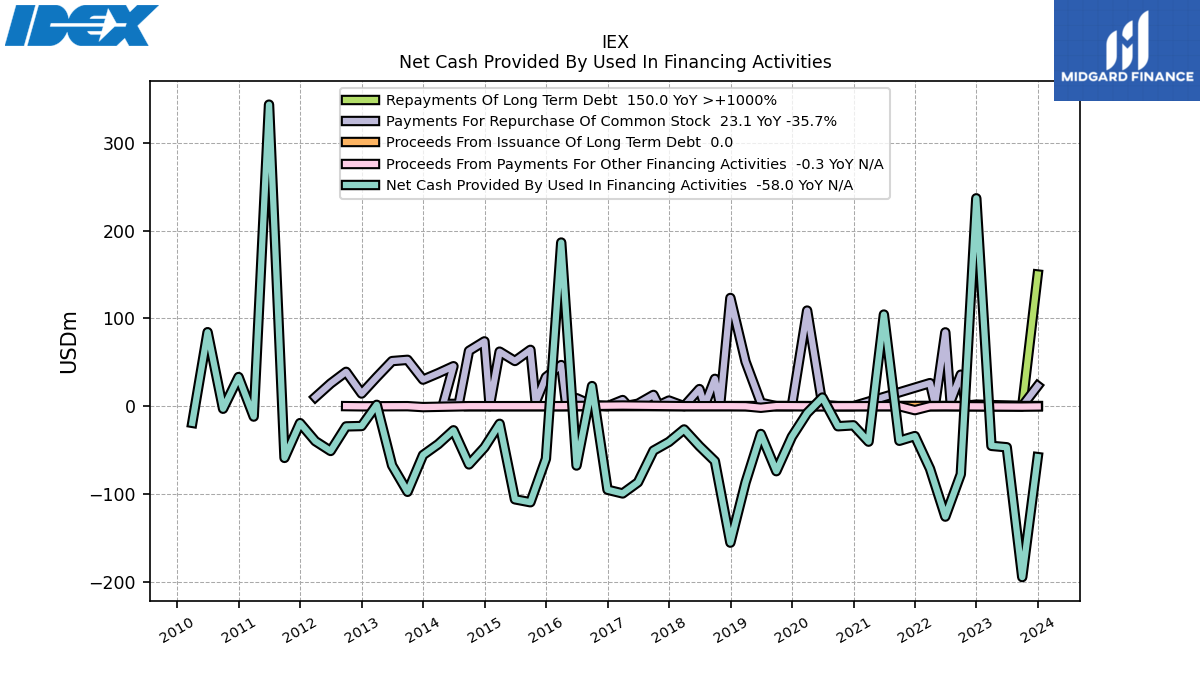
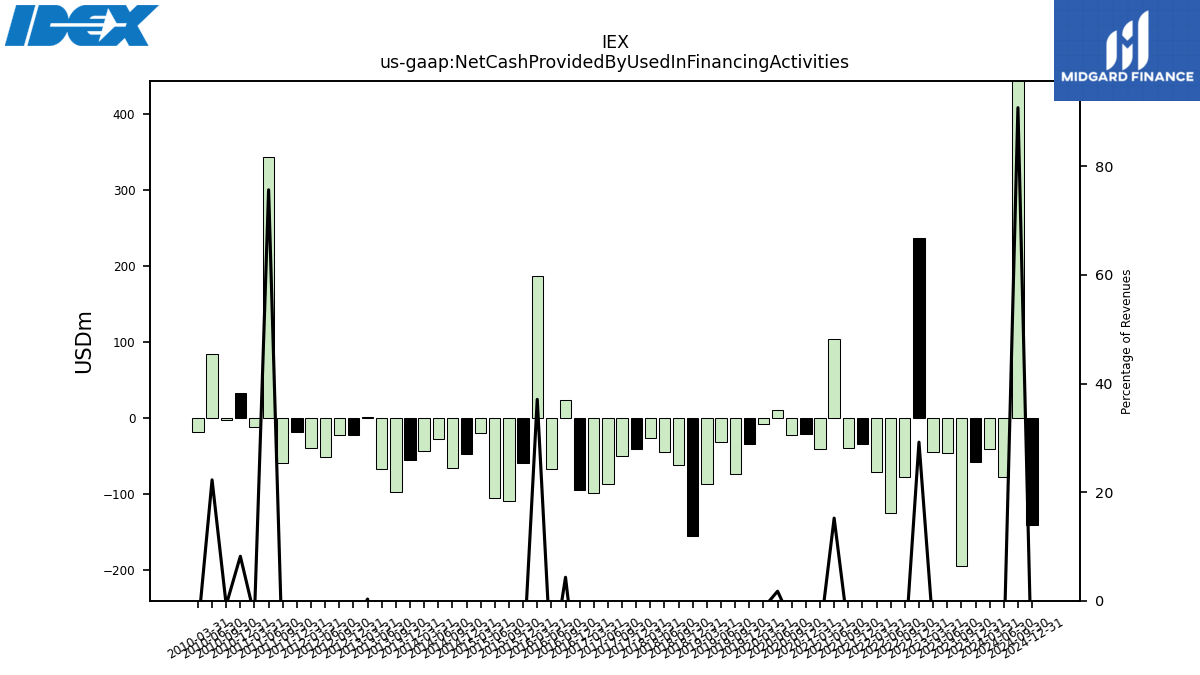
| Net Cash Provided By Used In Financing Activities | -58.00 | -194.70 | -46.80 | -45.20 | 236.80 | -77.50 | -125.80 | -71.30 | -34.05 | -39.41 | 104.39 | -40.42 | -21.79 | -22.86 | 9.85 | -7.80 | -34.91 | -74.04 | -31.65 | -86.98 | -155.44 | -62.61 | -45.47 | -26.49 | -40.69 | -50.64 | -86.70 | -99.39 | -95.17 | 22.92 | -67.61 | 186.41 | -59.95 | -109.43 | -106.09 | -20.06 | -46.98 | -66.34 | -27.44 | -43.30 | -55.65 | -97.54 | -67.40 | 1.55 | -22.61 | -23.03 | -51.03 | -39.82 | -19.27 | -58.92 | 343.46 | -11.86 | 33.20 | -2.94 | 84.29 | -19.02 |
| 2023-12-31 | 2023-09-30 | 2023-06-30 | 2023-03-31 | 2022-12-31 | 2022-09-30 | 2022-06-30 | 2022-03-31 | 2021-12-31 | 2021-09-30 | 2021-06-30 | 2021-03-31 | 2020-12-31 | 2020-09-30 | 2020-06-30 | 2020-03-31 | 2019-12-31 | 2019-09-30 | 2019-06-30 | 2019-03-31 | 2018-12-31 | 2018-09-30 | 2018-06-30 | 2018-03-31 | 2017-12-31 | 2017-09-30 | 2017-06-30 | 2017-03-31 | 2016-12-31 | 2016-09-30 | 2016-06-30 | 2016-03-31 | 2015-12-31 | 2015-09-30 | 2015-06-30 | 2015-03-31 | 2014-12-31 | 2014-09-30 | 2014-06-30 | 2014-03-31 | 2013-12-31 | 2013-09-30 | 2013-06-30 | 2013-03-31 | 2012-12-31 | 2012-09-30 | 2012-06-30 | 2012-03-31 | 2011-12-31 | 2011-09-30 | 2011-06-30 | 2011-03-31 | 2010-12-31 | 2010-09-30 | 2010-06-30 | 2010-03-31 | ||
|---|---|---|---|---|---|---|---|---|---|---|---|---|---|---|---|---|---|---|---|---|---|---|---|---|---|---|---|---|---|---|---|---|---|---|---|---|---|---|---|---|---|---|---|---|---|---|---|---|---|---|---|---|---|---|---|---|---|
| Net Cash Provided By Used In Operating Activities | 201.00 | 226.60 | 141.20 | 147.90 | 167.30 | 198.10 | 112.30 | 79.70 | 163.07 | 156.63 | 136.27 | 109.32 | 161.37 | 153.69 | 169.45 | 84.76 | 151.16 | 157.06 | 131.18 | 88.66 | 153.59 | 133.33 | 120.70 | 71.73 | 136.17 | 124.00 | 87.60 | 84.98 | 115.59 | 125.48 | 88.48 | 70.36 | 98.54 | 113.35 | 99.02 | 49.40 | 101.38 | 100.40 | 92.00 | 74.19 | 101.61 | 118.40 | 109.32 | 72.19 | 85.68 | 101.02 | 80.74 | 58.74 | 41.63 | 94.77 | 51.71 | 29.13 | 27.13 | 61.64 | 68.57 | 27.13 | |
| Net Income Loss | 108.60 | 209.10 | 138.60 | 139.80 | 130.00 | 178.70 | 138.20 | 140.00 | 118.75 | 115.74 | 102.19 | 112.71 | 101.07 | 103.85 | 70.86 | 102.00 | 96.85 | 105.19 | 113.21 | 110.27 | 98.14 | 106.35 | 107.13 | 98.96 | 93.75 | 83.77 | 83.84 | 75.90 | 57.35 | 69.87 | 75.76 | 68.13 | 67.76 | 79.50 | 69.58 | 65.95 | 61.62 | 71.44 | 71.78 | 74.55 | 67.56 | 63.80 | 62.56 | 61.30 | -119.02 | 50.13 | 54.35 | 52.17 | 47.39 | 48.34 | 50.18 | 47.95 | 41.51 | 38.56 | 40.40 | 36.62 | |
| Profit Loss | 108.30 | 209.00 | 138.50 | 139.80 | 130.00 | 178.70 | 138.10 | 139.90 | 118.73 | 115.71 | 102.18 | 112.67 | 101.09 | 103.85 | 70.86 | 102.00 | NA | NA | NA | NA | NA | NA | NA | NA | NA | NA | NA | NA | NA | NA | NA | NA | NA | NA | NA | NA | NA | NA | NA | NA | NA | NA | NA | NA | NA | NA | NA | NA | NA | NA | NA | NA | NA | NA | NA | NA | |
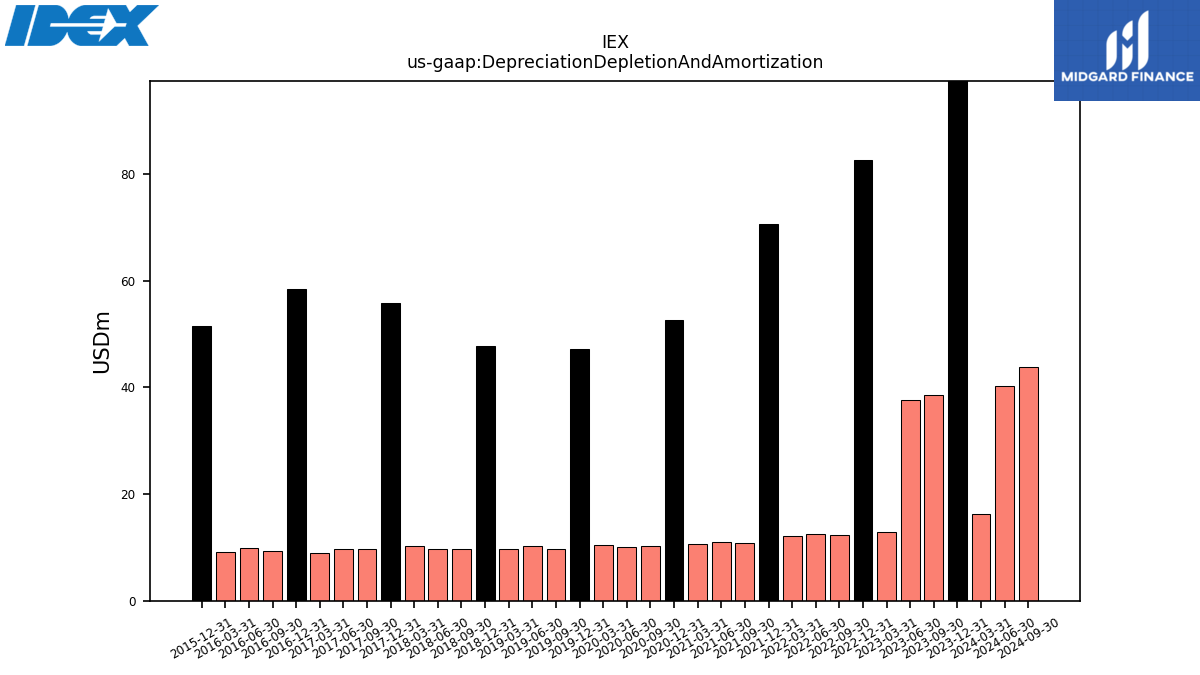
| Depreciation Depletion And Amortization | 110.20 | 14.70 | 14.40 | 12.80 | 82.70 | 12.30 | 12.50 | 12.20 | 70.72 | 10.80 | 10.93 | 10.55 | 52.64 | 10.26 | 10.14 | 10.45 | 47.28 | 9.73 | 10.21 | 9.66 | 47.82 | 9.77 | 9.77 | 10.18 | 55.79 | 9.79 | 9.73 | 8.90 | 58.53 | 9.37 | 9.92 | 9.07 | 51.49 | NA | NA | NA | NA | NA | NA | NA | NA | NA | NA | NA | NA | NA | NA | NA | NA | NA | NA | NA | NA | NA | NA | NA | |
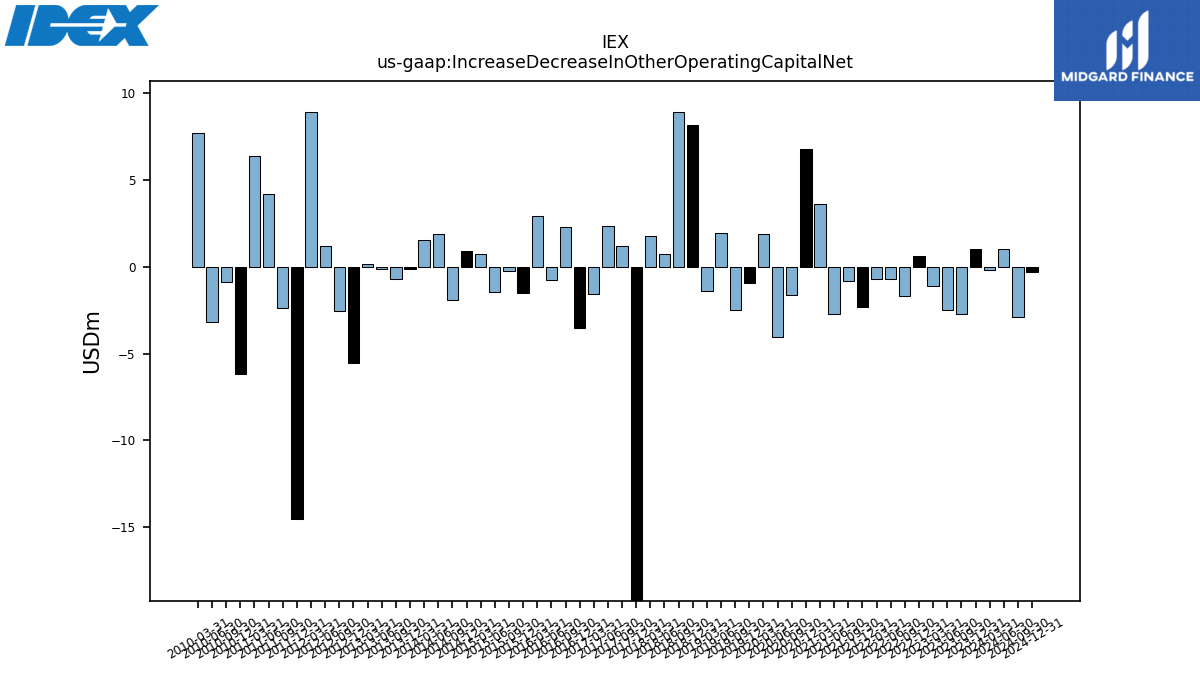
| Increase Decrease In Other Operating Capital Net | 1.00 | -2.70 | -2.50 | -1.10 | 0.60 | -1.70 | -0.70 | -0.70 | -2.33 | -0.85 | -2.75 | 3.63 | 6.79 | -1.61 | -4.04 | 1.90 | -0.96 | -2.47 | 1.92 | -1.41 | 8.17 | 8.92 | 0.73 | 1.75 | -26.37 | 1.16 | 2.36 | -1.56 | -3.52 | 2.31 | -0.76 | 2.89 | -1.51 | -0.27 | -1.47 | 0.71 | 0.90 | -1.90 | 1.89 | 1.52 | -0.12 | -0.73 | -0.14 | 0.17 | -5.56 | -2.57 | 1.20 | 8.92 | -14.54 | -2.41 | 4.20 | 6.34 | -6.21 | -0.89 | -3.17 | 7.71 | |
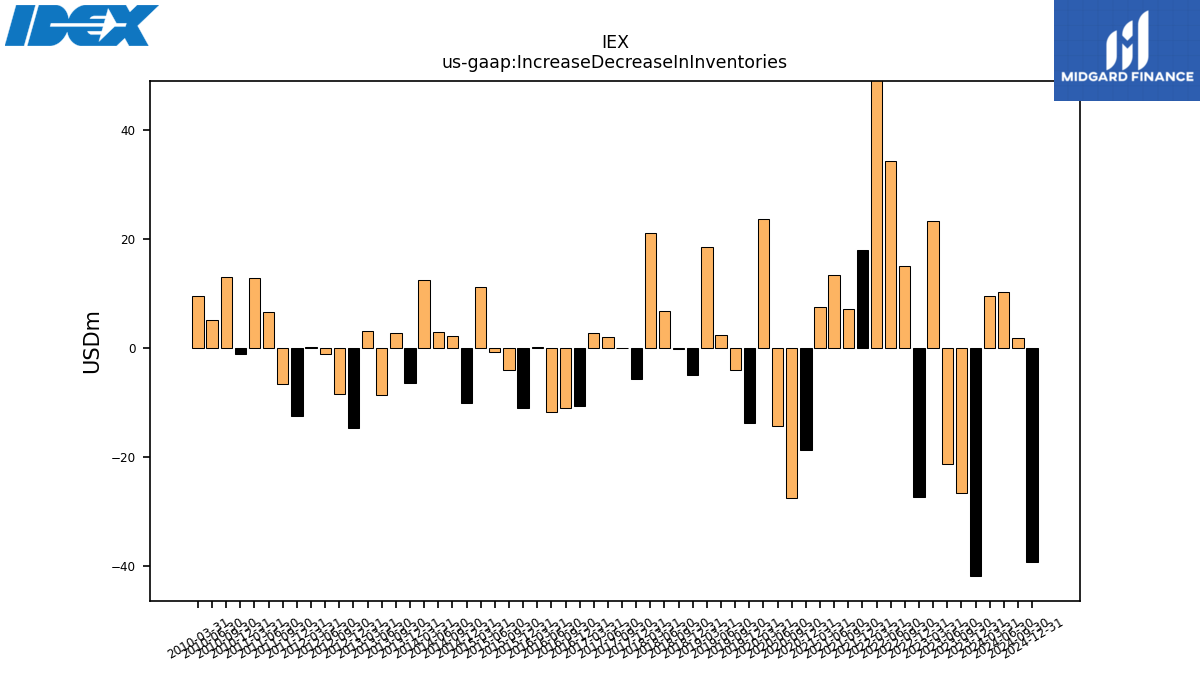
| Increase Decrease In Inventories | -41.70 | -26.50 | -21.30 | 23.30 | -27.20 | 15.10 | 34.30 | 50.20 | 18.03 | 7.14 | 13.40 | 7.54 | -18.60 | -27.45 | -14.19 | 23.72 | -13.66 | -4.02 | 2.46 | 18.55 | -4.87 | -0.11 | 6.89 | 21.12 | -5.63 | 0.07 | 2.04 | 2.76 | -10.50 | -10.86 | -11.66 | 0.27 | -11.03 | -4.00 | -0.74 | 11.21 | -10.07 | 2.30 | 2.98 | 12.61 | -6.44 | 2.74 | -8.49 | 3.12 | -14.61 | -8.40 | -1.00 | 0.21 | -12.42 | -6.51 | 6.66 | 12.88 | -1.01 | 13.05 | 5.12 | 9.50 | |
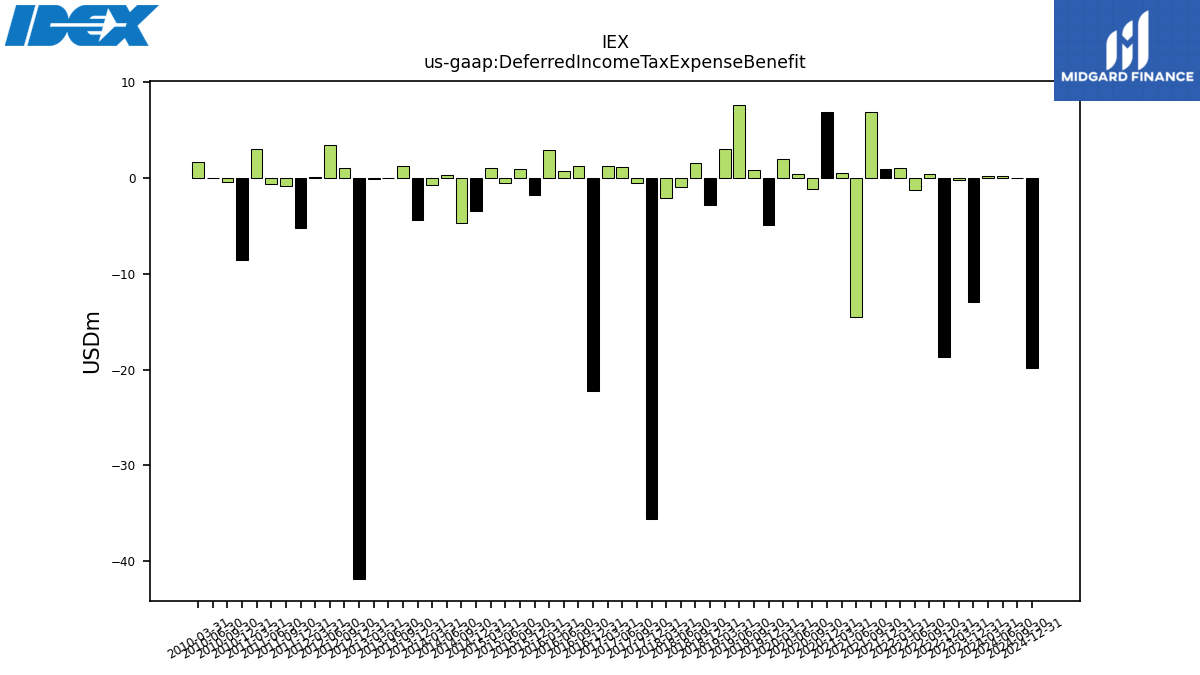
| Deferred Income Tax Expense Benefit | -12.90 | NA | NA | -0.20 | -18.70 | 0.40 | -1.20 | 1.00 | 0.97 | 6.91 | -14.54 | 0.56 | 6.92 | -1.10 | 0.41 | 2.01 | -4.90 | 0.84 | 7.66 | 3.03 | -2.87 | 1.54 | -0.98 | -2.04 | -35.63 | -0.53 | 1.12 | 1.29 | -22.19 | 1.21 | 0.72 | 2.95 | -1.81 | 0.95 | -0.48 | 1.00 | -3.42 | -4.70 | 0.28 | -0.75 | -4.34 | 1.25 | 0.05 | -0.12 | -41.85 | 1.08 | 3.46 | 0.07 | -5.20 | -0.80 | -0.58 | 3.01 | -8.55 | -0.45 | -0.01 | 1.66 | |
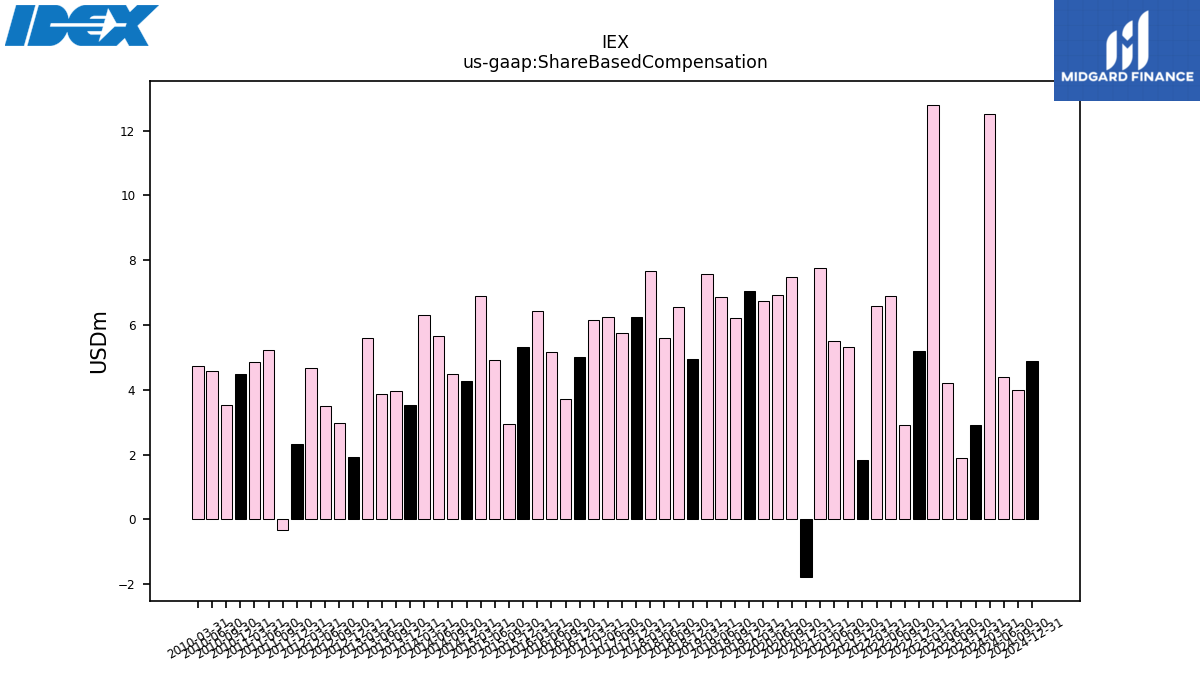
| Share Based Compensation | 2.90 | 1.90 | 4.20 | 12.80 | 5.20 | 2.90 | 6.90 | 6.60 | 1.82 | 5.33 | 5.49 | 7.75 | -1.78 | 7.49 | 6.93 | 6.73 | 7.05 | 6.21 | 6.85 | 7.56 | 4.94 | 6.56 | 5.60 | 7.65 | 6.26 | 5.75 | 6.24 | 6.16 | 5.00 | 3.72 | 5.16 | 6.44 | 5.31 | 2.93 | 4.92 | 6.88 | 4.27 | 4.48 | 5.65 | 6.31 | 3.53 | 3.98 | 3.88 | 5.61 | 1.94 | 2.99 | 3.52 | 4.66 | 2.32 | -0.33 | 5.23 | 4.85 | 4.50 | 3.53 | 4.58 | 4.75 |
| 2023-12-31 | 2023-09-30 | 2023-06-30 | 2023-03-31 | 2022-12-31 | 2022-09-30 | 2022-06-30 | 2022-03-31 | 2021-12-31 | 2021-09-30 | 2021-06-30 | 2021-03-31 | 2020-12-31 | 2020-09-30 | 2020-06-30 | 2020-03-31 | 2019-12-31 | 2019-09-30 | 2019-06-30 | 2019-03-31 | 2018-12-31 | 2018-09-30 | 2018-06-30 | 2018-03-31 | 2017-12-31 | 2017-09-30 | 2017-06-30 | 2017-03-31 | 2016-12-31 | 2016-09-30 | 2016-06-30 | 2016-03-31 | 2015-12-31 | 2015-09-30 | 2015-06-30 | 2015-03-31 | 2014-12-31 | 2014-09-30 | 2014-06-30 | 2014-03-31 | 2013-12-31 | 2013-09-30 | 2013-06-30 | 2013-03-31 | 2012-12-31 | 2012-09-30 | 2012-06-30 | 2012-03-31 | 2011-12-31 | 2011-09-30 | 2011-06-30 | 2011-03-31 | 2010-12-31 | 2010-09-30 | 2010-06-30 | 2010-03-31 | ||
|---|---|---|---|---|---|---|---|---|---|---|---|---|---|---|---|---|---|---|---|---|---|---|---|---|---|---|---|---|---|---|---|---|---|---|---|---|---|---|---|---|---|---|---|---|---|---|---|---|---|---|---|---|---|---|---|---|---|
| Net Cash Provided By Used In Investing Activities | -193.80 | 86.60 | -147.40 | -29.20 | -692.80 | 35.70 | -135.70 | -124.40 | -73.93 | -14.92 | -489.72 | -119.53 | -16.97 | -15.16 | -6.73 | -133.72 | -14.43 | -98.13 | -12.02 | -12.44 | -16.40 | -39.20 | -15.64 | -10.19 | -31.51 | -3.79 | -9.83 | -9.62 | -3.01 | -267.61 | -8.47 | -230.12 | -13.04 | -0.19 | -187.14 | -10.12 | -12.95 | -9.99 | -38.53 | -10.79 | -7.96 | -7.41 | -10.47 | -42.33 | -7.77 | -44.52 | -44.42 | -8.55 | -5.87 | -9.36 | -390.37 | -63.93 | -27.97 | -25.53 | -61.26 | -7.55 | |
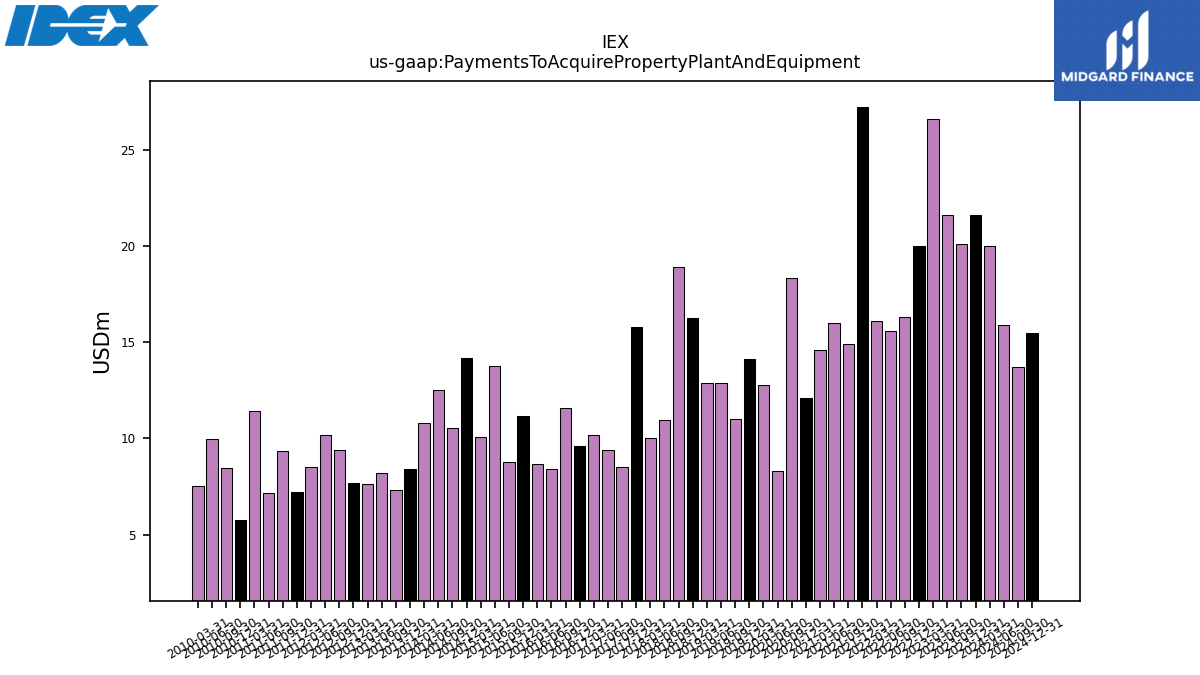
| Payments To Acquire Property Plant And Equipment | 21.60 | 20.10 | 21.60 | 26.60 | 20.00 | 16.30 | 15.60 | 16.10 | 27.21 | 14.89 | 15.98 | 14.61 | 12.11 | 18.35 | 8.32 | 12.76 | 14.14 | 11.03 | 12.87 | 12.88 | 16.23 | 18.89 | 10.96 | 10.01 | 15.80 | 8.52 | 9.38 | 10.16 | 9.60 | 11.59 | 8.40 | 8.65 | 11.16 | 8.79 | 13.75 | 10.08 | 14.18 | 10.52 | 12.49 | 10.81 | 8.40 | 7.32 | 8.20 | 7.62 | 7.70 | 9.42 | 10.17 | 8.52 | 7.19 | 9.37 | 7.18 | 11.44 | 5.73 | 8.47 | 9.98 | 7.55 |
| 2023-12-31 | 2023-09-30 | 2023-06-30 | 2023-03-31 | 2022-12-31 | 2022-09-30 | 2022-06-30 | 2022-03-31 | 2021-12-31 | 2021-09-30 | 2021-06-30 | 2021-03-31 | 2020-12-31 | 2020-09-30 | 2020-06-30 | 2020-03-31 | 2019-12-31 | 2019-09-30 | 2019-06-30 | 2019-03-31 | 2018-12-31 | 2018-09-30 | 2018-06-30 | 2018-03-31 | 2017-12-31 | 2017-09-30 | 2017-06-30 | 2017-03-31 | 2016-12-31 | 2016-09-30 | 2016-06-30 | 2016-03-31 | 2015-12-31 | 2015-09-30 | 2015-06-30 | 2015-03-31 | 2014-12-31 | 2014-09-30 | 2014-06-30 | 2014-03-31 | 2013-12-31 | 2013-09-30 | 2013-06-30 | 2013-03-31 | 2012-12-31 | 2012-09-30 | 2012-06-30 | 2012-03-31 | 2011-12-31 | 2011-09-30 | 2011-06-30 | 2011-03-31 | 2010-12-31 | 2010-09-30 | 2010-06-30 | 2010-03-31 | ||
|---|---|---|---|---|---|---|---|---|---|---|---|---|---|---|---|---|---|---|---|---|---|---|---|---|---|---|---|---|---|---|---|---|---|---|---|---|---|---|---|---|---|---|---|---|---|---|---|---|---|---|---|---|---|---|---|---|---|
| Net Cash Provided By Used In Financing Activities | -58.00 | -194.70 | -46.80 | -45.20 | 236.80 | -77.50 | -125.80 | -71.30 | -34.05 | -39.41 | 104.39 | -40.42 | -21.79 | -22.86 | 9.85 | -7.80 | -34.91 | -74.04 | -31.65 | -86.98 | -155.44 | -62.61 | -45.47 | -26.49 | -40.69 | -50.64 | -86.70 | -99.39 | -95.17 | 22.92 | -67.61 | 186.41 | -59.95 | -109.43 | -106.09 | -20.06 | -46.98 | -66.34 | -27.44 | -43.30 | -55.65 | -97.54 | -67.40 | 1.55 | -22.61 | -23.03 | -51.03 | -39.82 | -19.27 | -58.92 | 343.46 | -11.86 | 33.20 | -2.94 | 84.29 | -19.02 | |
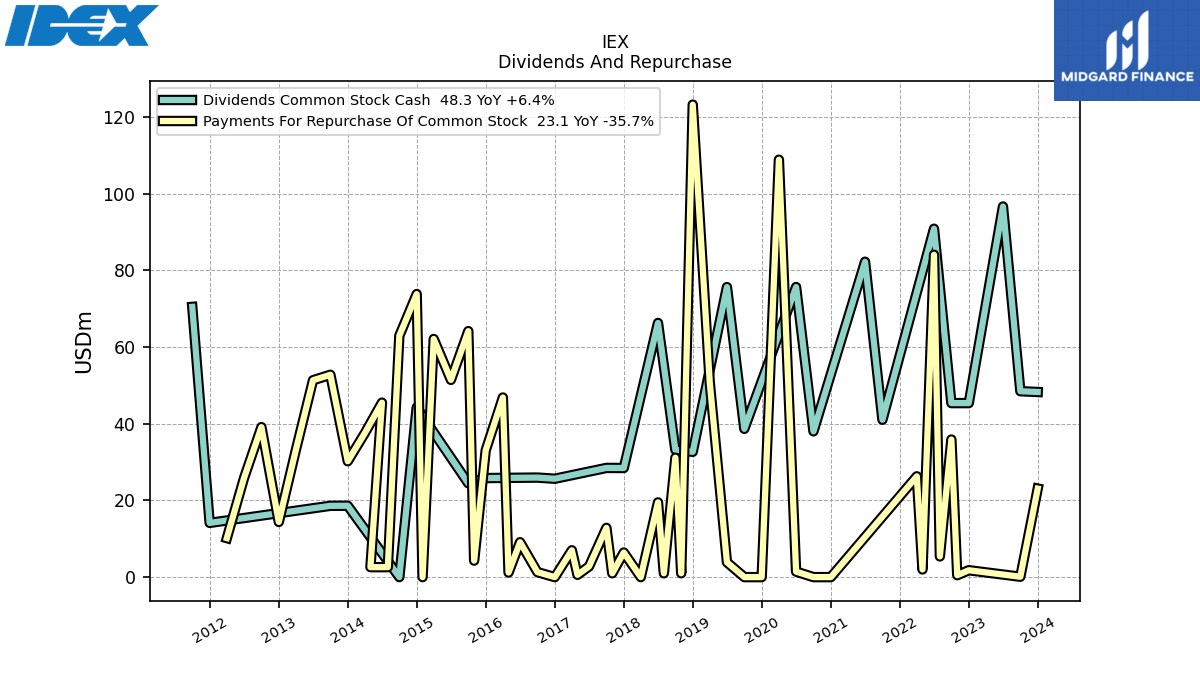
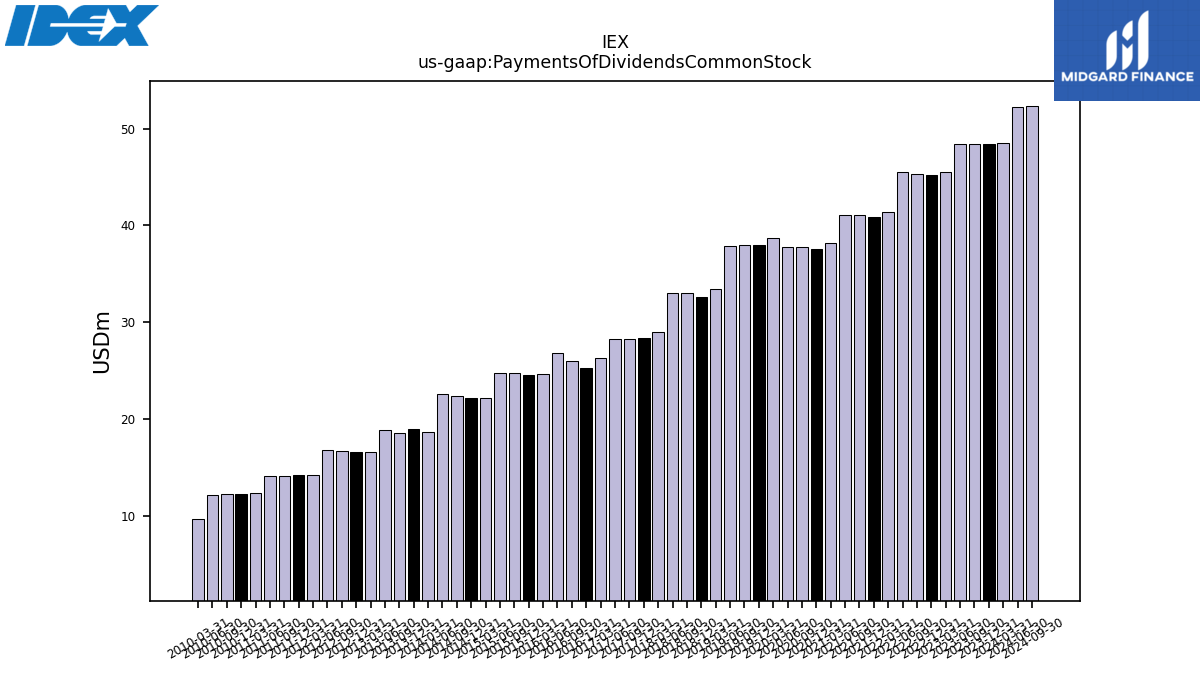
| Payments Of Dividends Common Stock | 48.40 | 48.40 | 48.40 | 45.50 | 45.20 | 45.30 | 45.50 | 41.40 | 40.81 | 41.05 | 41.09 | 38.15 | 37.59 | 37.75 | 37.76 | 38.74 | 37.98 | 37.94 | 37.84 | 33.45 | 32.56 | 33.00 | 32.97 | 28.95 | 28.30 | 28.30 | 28.25 | 26.33 | 25.28 | 25.94 | 26.77 | 24.66 | 24.50 | 24.76 | 24.76 | 22.15 | 22.20 | 22.33 | 22.57 | 18.63 | 18.95 | 18.54 | 18.85 | 16.57 | 16.54 | 16.66 | 16.73 | 14.16 | 14.15 | 14.10 | 14.07 | 12.29 | 12.25 | 12.21 | 12.17 | 9.70 | |
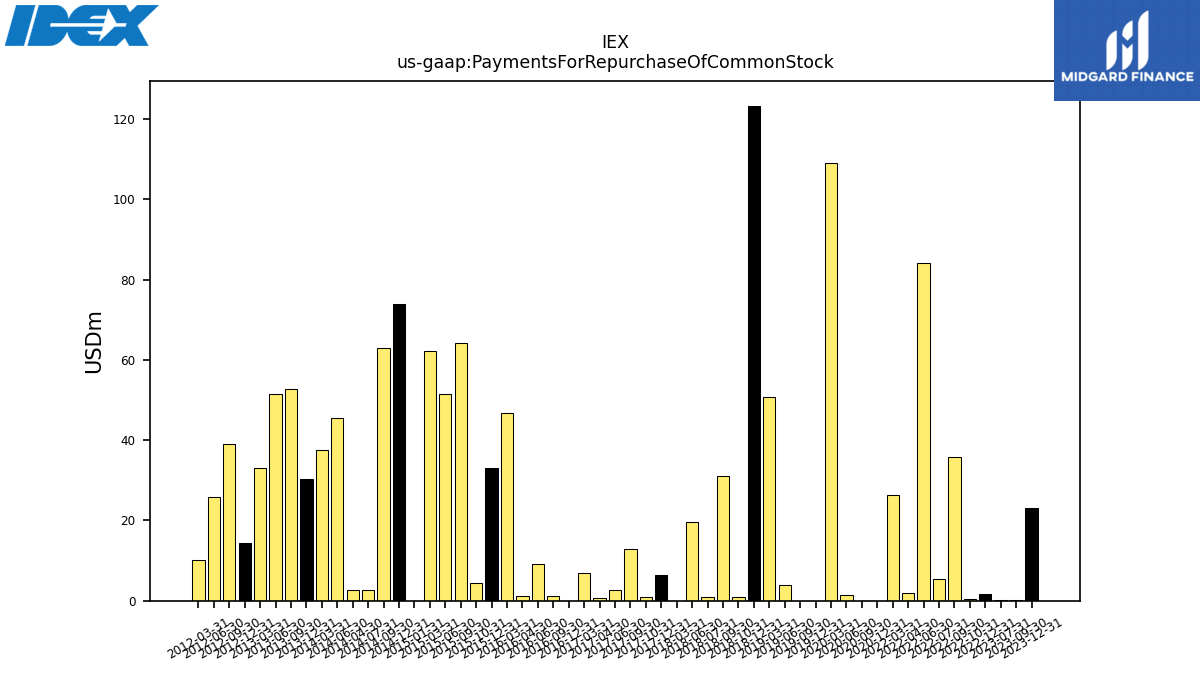
| Payments For Repurchase Of Common Stock | 23.10 | 0.10 | NA | NA | 1.80 | 35.90 | 84.10 | 26.30 | NA | NA | NA | NA | 0.00 | 0.00 | 1.44 | 108.91 | 0.00 | 0.00 | 3.87 | 50.80 | 123.27 | 31.16 | 19.50 | 0.00 | 6.42 | 12.85 | 2.79 | 7.00 | 0.00 | 1.30 | 9.11 | 46.86 | 33.05 | 64.18 | 51.46 | 62.13 | 73.85 | 62.98 | 45.52 | 37.54 | 30.23 | 52.79 | 51.36 | 33.12 | 14.39 | 39.13 | 25.86 | 10.18 | NA | NA | NA | NA | NA | NA | NA | NA |
| 2023-12-31 | 2023-09-30 | 2023-06-30 | 2023-03-31 | 2022-12-31 | 2022-09-30 | 2022-06-30 | 2022-03-31 | 2021-12-31 | 2021-09-30 | 2021-06-30 | 2021-03-31 | 2020-12-31 | 2020-09-30 | 2020-06-30 | 2020-03-31 | 2019-12-31 | 2019-09-30 | 2019-06-30 | 2019-03-31 | 2018-12-31 | 2018-09-30 | 2018-06-30 | 2018-03-31 | 2017-12-31 | 2017-09-30 | 2017-06-30 | 2017-03-31 | 2016-12-31 | 2016-09-30 | 2016-06-30 | 2016-03-31 | 2015-12-31 | 2015-09-30 | 2015-06-30 | 2015-03-31 | 2014-12-31 | 2014-09-30 | 2014-06-30 | 2014-03-31 | 2013-12-31 | 2013-09-30 | 2013-06-30 | 2013-03-31 | 2012-12-31 | 2012-09-30 | 2012-06-30 | 2012-03-31 | 2011-12-31 | 2011-09-30 | 2011-06-30 | 2011-03-31 | 2010-12-31 | 2010-09-30 | 2010-06-30 | 2010-03-31 | ||
|---|---|---|---|---|---|---|---|---|---|---|---|---|---|---|---|---|---|---|---|---|---|---|---|---|---|---|---|---|---|---|---|---|---|---|---|---|---|---|---|---|---|---|---|---|---|---|---|---|---|---|---|---|---|---|---|---|---|
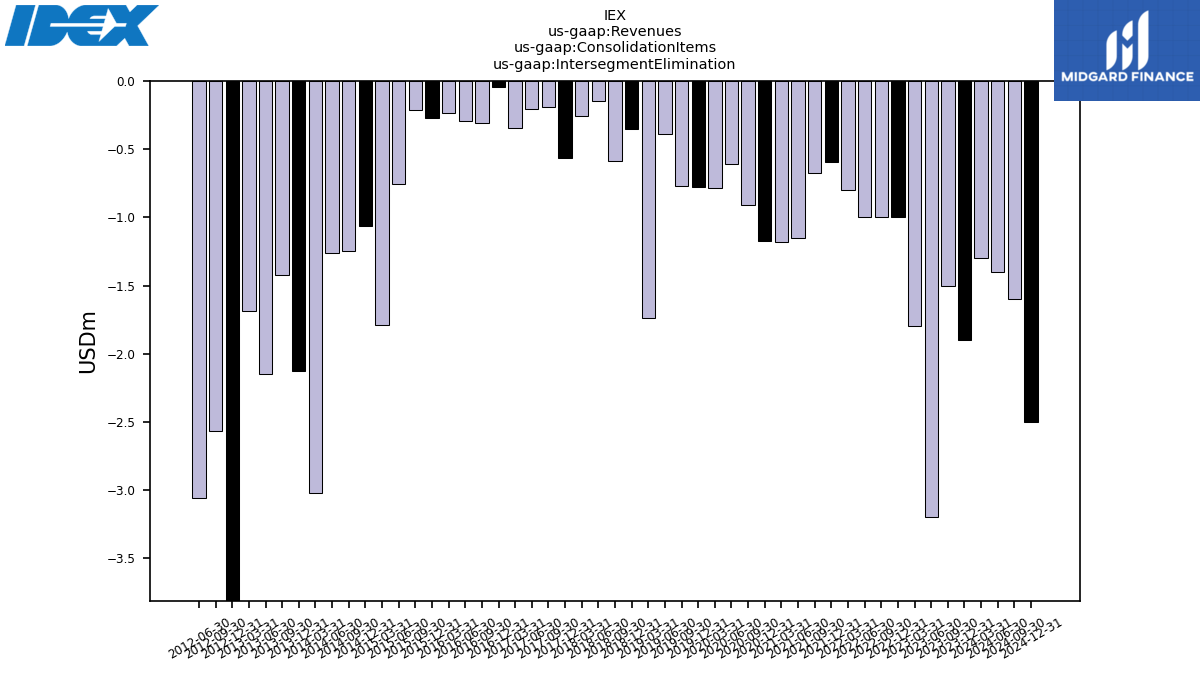
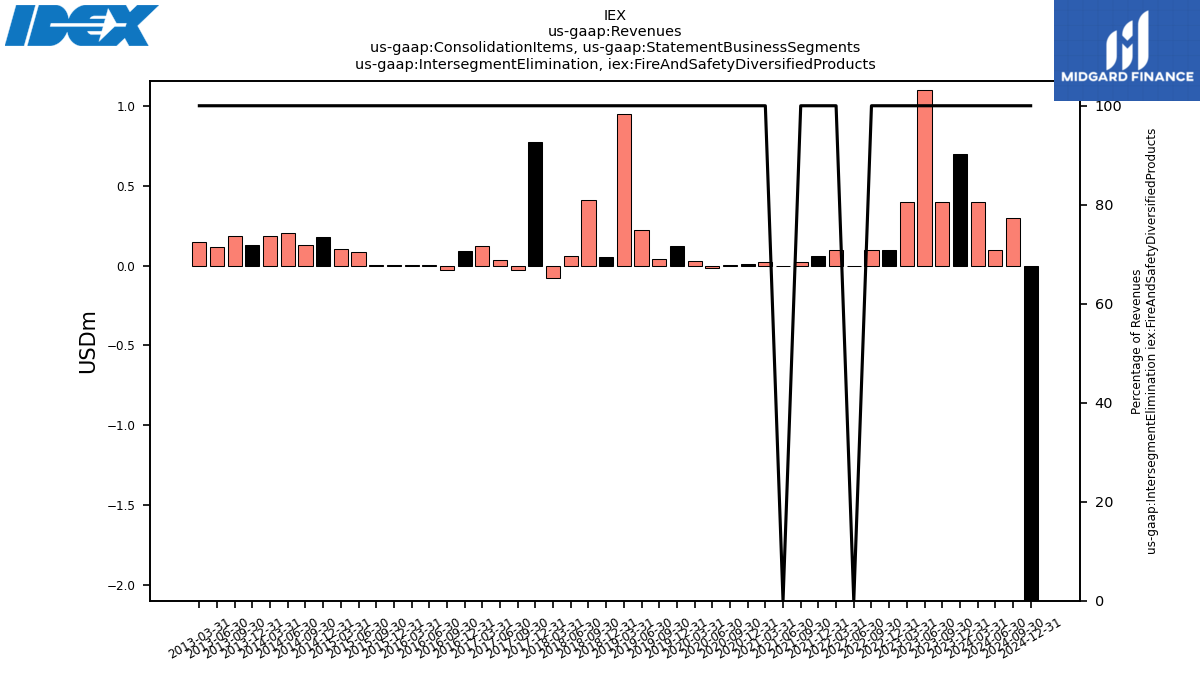
| Revenues | 788.90 | 793.40 | 846.20 | 845.40 | 810.70 | 824.00 | 796.10 | 751.10 | 714.80 | 712.02 | 685.95 | 652.04 | 614.82 | 581.11 | 561.25 | 594.46 | 606.00 | 624.25 | 642.10 | 622.23 | 614.09 | 622.89 | 634.36 | 612.32 | 585.90 | 574.49 | 573.37 | 553.55 | 530.42 | 530.36 | 549.70 | 502.57 | 499.80 | 503.79 | 514.88 | 502.20 | 523.90 | 533.18 | 546.69 | 544.00 | 520.62 | 490.62 | 518.45 | 494.45 | 490.84 | 479.86 | 494.14 | 489.42 | 480.68 | 476.88 | 453.80 | 427.09 | 405.22 | 373.73 | 378.53 | 355.60 | |
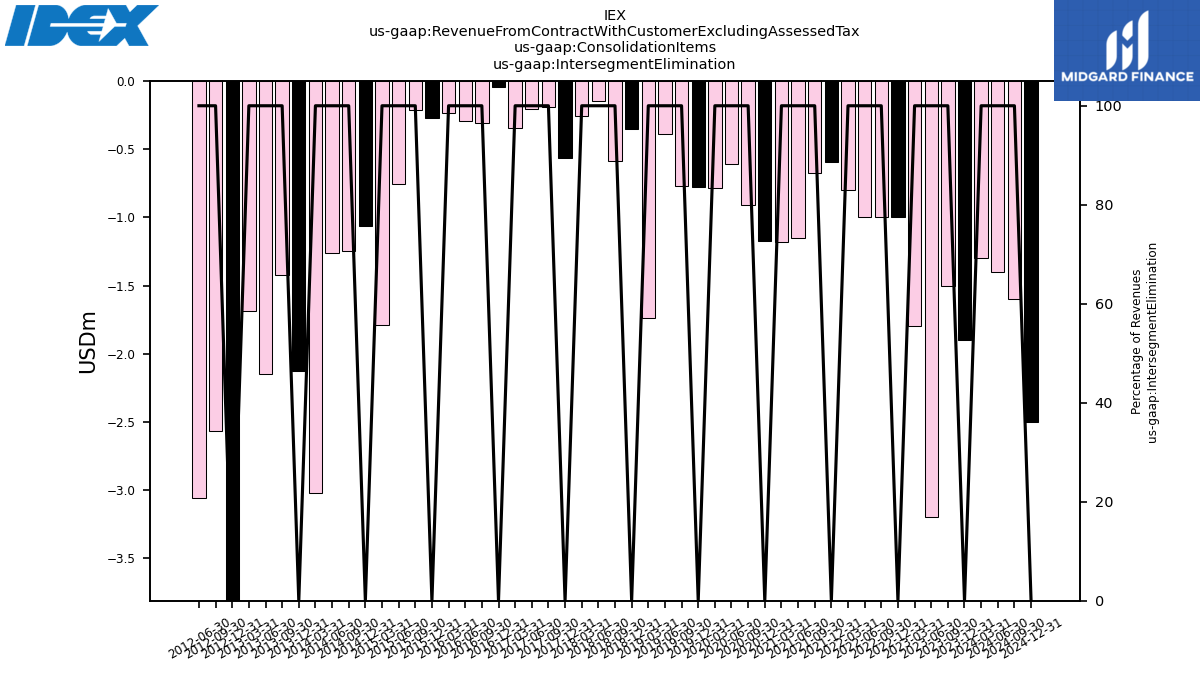
| Intersegment Elimination | -1.90 | -1.50 | -3.20 | -1.80 | -1.00 | -1.00 | -1.00 | -0.80 | -0.59 | -0.67 | -1.15 | -1.18 | -1.17 | -0.91 | -0.61 | -0.78 | -0.78 | -0.77 | -0.39 | -1.74 | -0.35 | -0.58 | -0.14 | -0.26 | -0.57 | -0.19 | -0.21 | -0.34 | -0.04 | -0.31 | -0.29 | -0.23 | -0.27 | -0.21 | -0.76 | -1.79 | -1.06 | -1.24 | -1.26 | -3.02 | -2.12 | -1.43 | -2.15 | -1.69 | -4.56 | -2.56 | -3.06 | NA | NA | NA | NA | NA | NA | NA | NA | NA | |
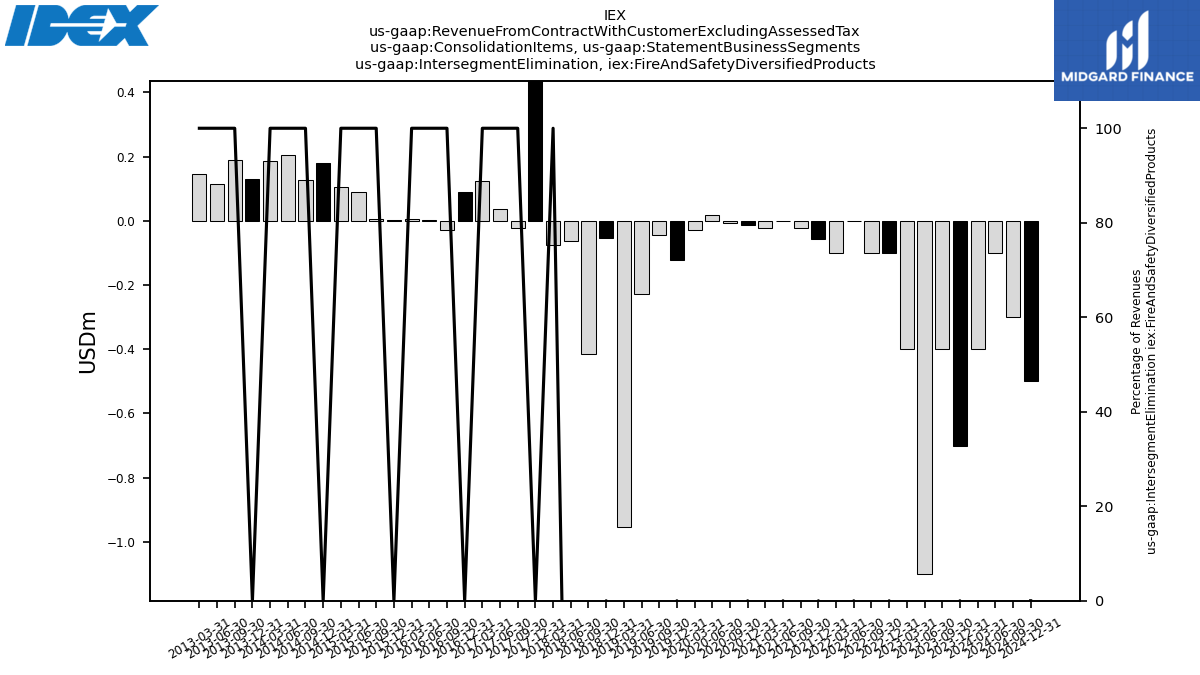
| Intersegment Elimination, Fire And Safety Diversified Products | 0.70 | 0.40 | 1.10 | 0.40 | 0.10 | 0.10 | 0.00 | 0.10 | 0.06 | 0.02 | 0.00 | 0.02 | 0.01 | 0.01 | -0.02 | 0.03 | 0.12 | 0.04 | 0.23 | 0.95 | 0.05 | 0.41 | 0.06 | -0.08 | 0.77 | -0.02 | 0.04 | 0.12 | 0.09 | -0.03 | 0.00 | 0.01 | 0.00 | 0.01 | 0.09 | 0.11 | 0.18 | 0.13 | 0.20 | 0.19 | 0.13 | 0.19 | 0.12 | 0.15 | NA | NA | NA | NA | NA | NA | NA | NA | NA | NA | NA | NA | |
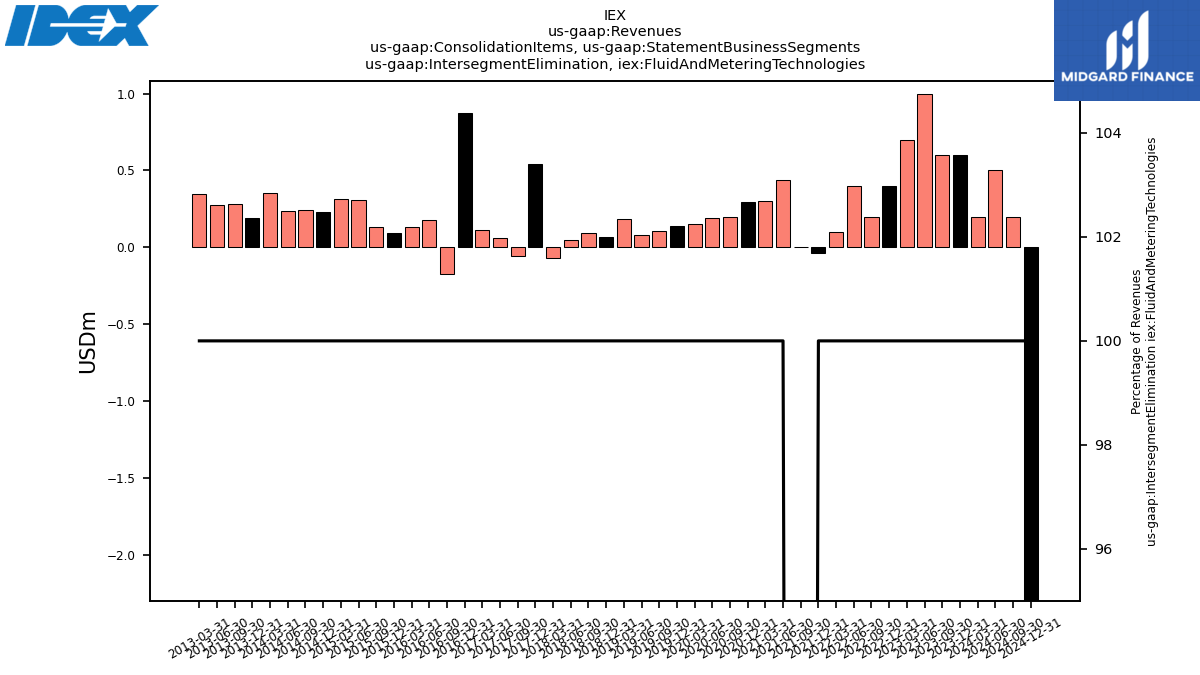
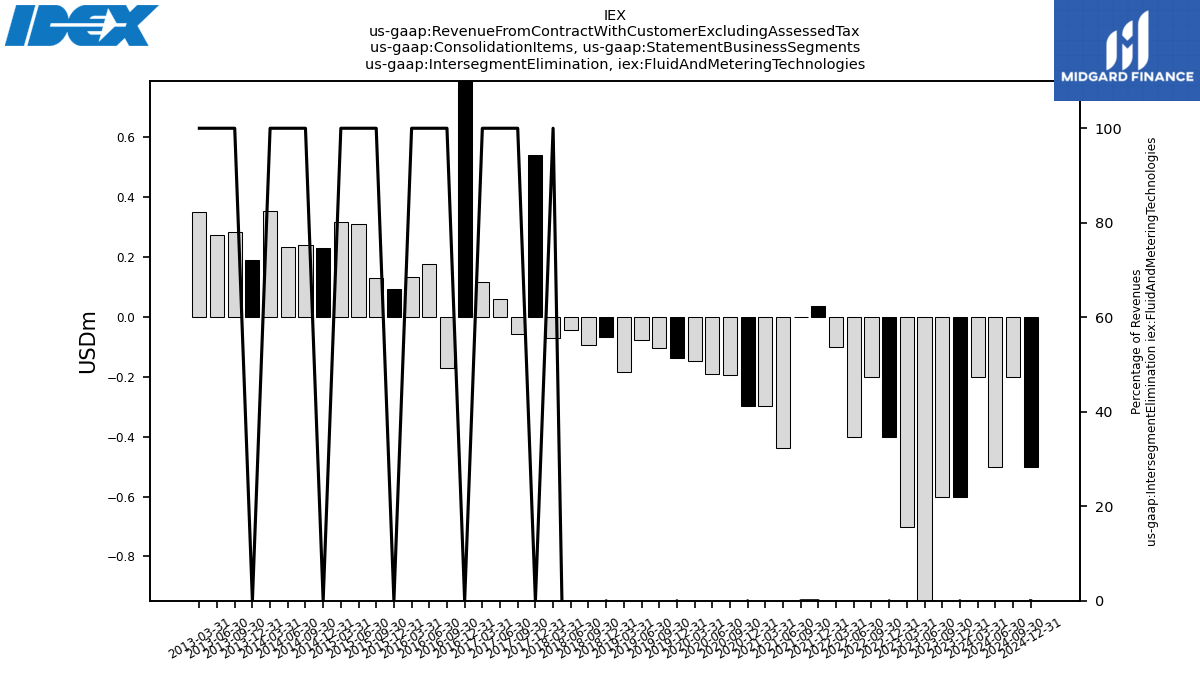
| Intersegment Elimination, Fluid And Metering Technologies | 0.60 | 0.60 | 1.00 | 0.70 | 0.40 | 0.20 | 0.40 | 0.10 | -0.04 | 0.00 | 0.44 | 0.30 | 0.30 | 0.19 | 0.19 | 0.15 | 0.14 | 0.10 | 0.08 | 0.19 | 0.07 | 0.09 | 0.04 | -0.07 | 0.54 | -0.06 | 0.06 | 0.12 | 0.87 | -0.17 | 0.17 | 0.13 | 0.09 | 0.13 | 0.31 | 0.32 | 0.23 | 0.24 | 0.23 | 0.35 | 0.19 | 0.28 | 0.27 | 0.35 | NA | NA | NA | NA | NA | NA | NA | NA | NA | NA | NA | NA | |
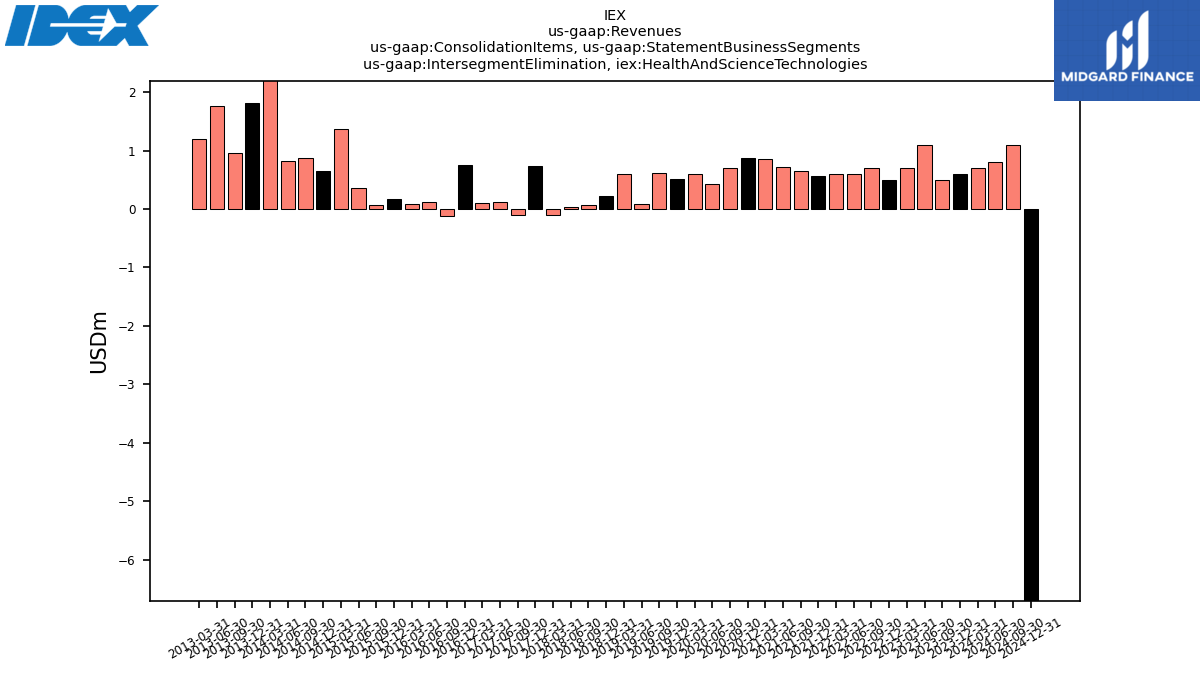
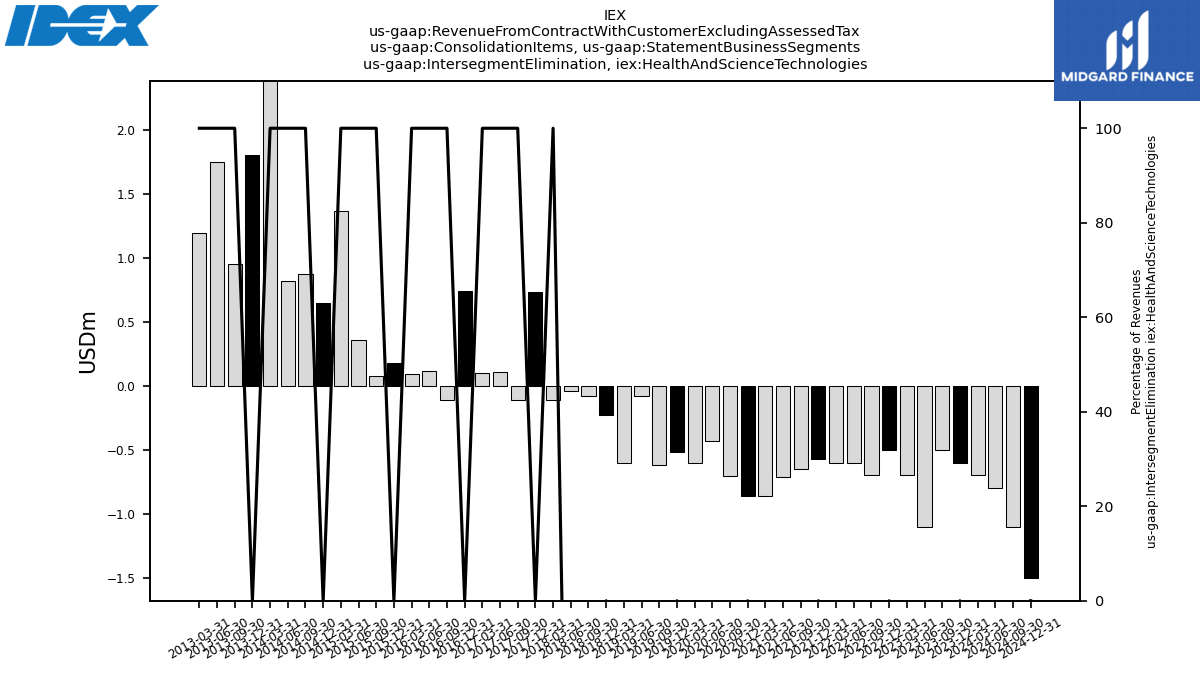
| Intersegment Elimination, Health And Science Technologies | 0.60 | 0.50 | 1.10 | 0.70 | 0.50 | 0.70 | 0.60 | 0.60 | 0.57 | 0.65 | 0.72 | 0.86 | 0.86 | 0.71 | 0.43 | 0.60 | 0.52 | 0.62 | 0.08 | 0.60 | 0.23 | 0.07 | 0.04 | -0.11 | 0.74 | -0.11 | 0.11 | 0.10 | 0.75 | -0.11 | 0.12 | 0.09 | 0.18 | 0.08 | 0.36 | 1.37 | 0.65 | 0.88 | 0.82 | 2.48 | 1.81 | 0.95 | 1.76 | 1.19 | NA | NA | NA | NA | NA | NA | NA | NA | NA | NA | NA | NA | |
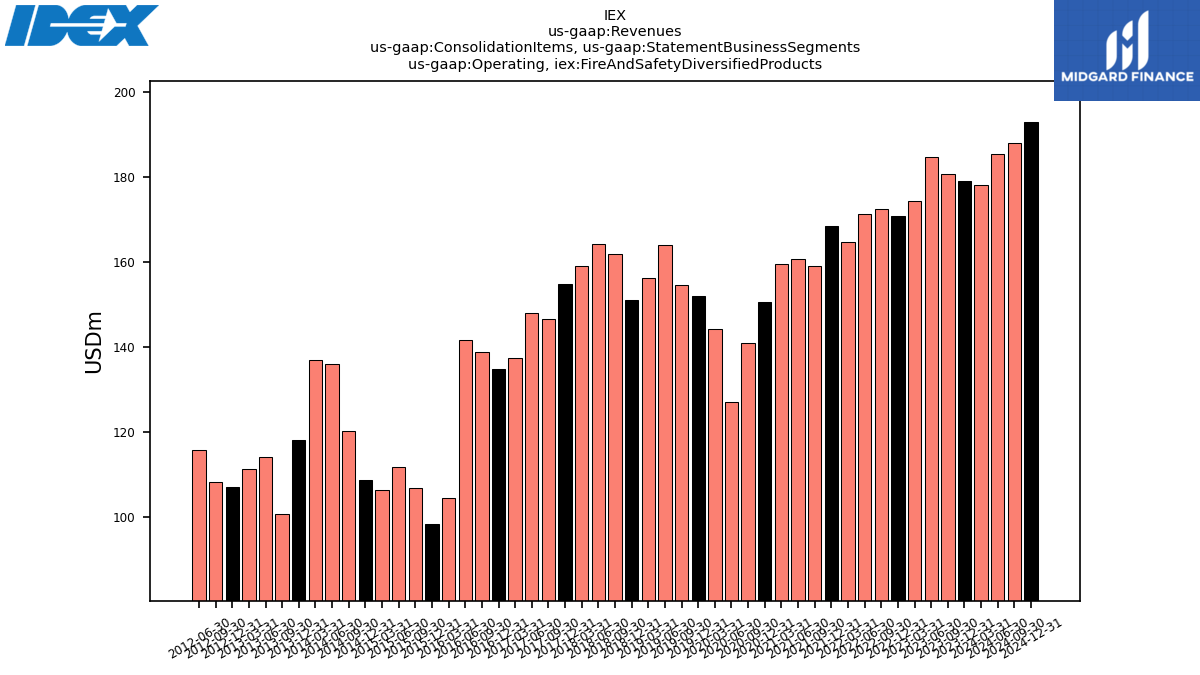
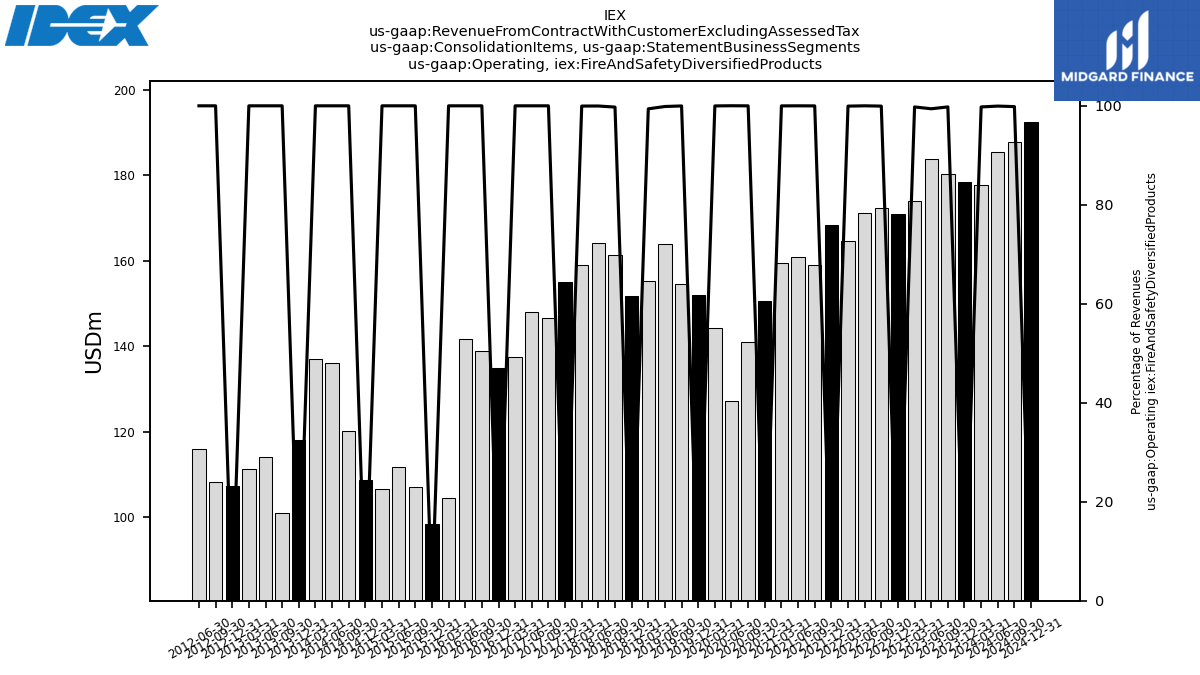
| Operating, Fire And Safety Diversified Products | 179.00 | 180.60 | 184.80 | 174.40 | 170.90 | 172.40 | 171.20 | 164.70 | 168.50 | 159.11 | 160.81 | 159.48 | 150.56 | 140.90 | 127.08 | 144.32 | 152.03 | 154.54 | 164.04 | 156.16 | 151.12 | 161.83 | 164.30 | 159.17 | 154.92 | 146.60 | 147.98 | 137.45 | 134.96 | 138.77 | 141.61 | 104.61 | 98.34 | 107.00 | 111.85 | 106.52 | 108.79 | 120.19 | 135.98 | 137.10 | 118.09 | 100.89 | 114.12 | 111.37 | 107.19 | 108.20 | 115.92 | NA | NA | NA | NA | NA | NA | NA | NA | NA | |
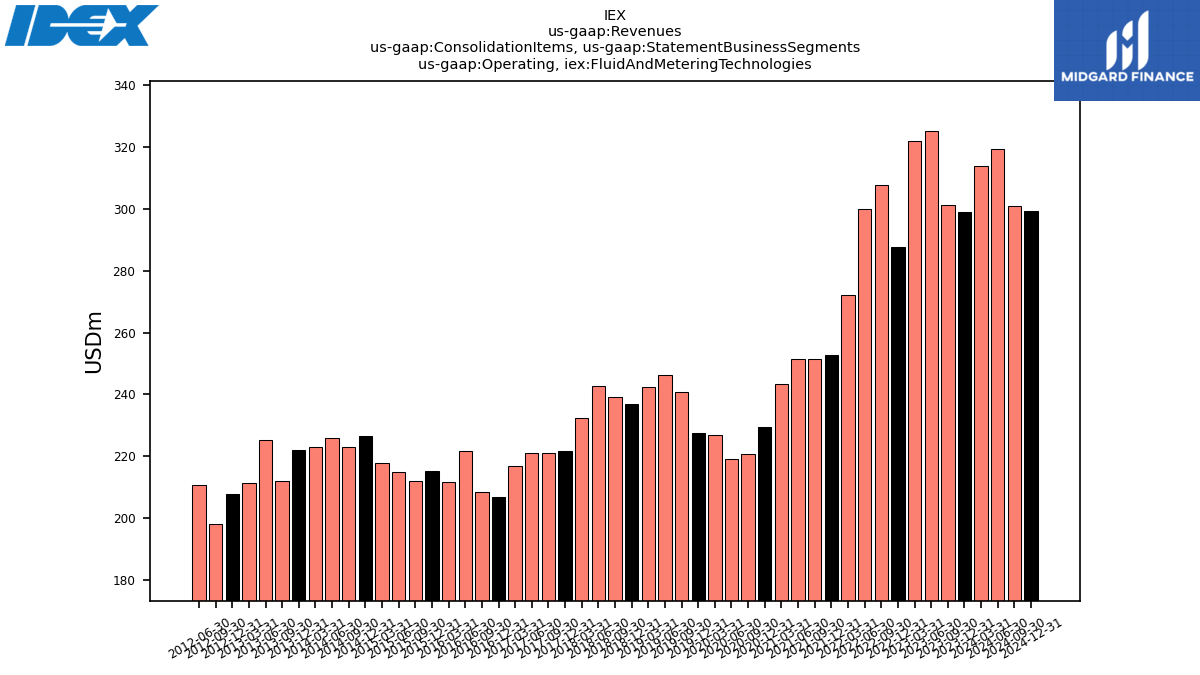
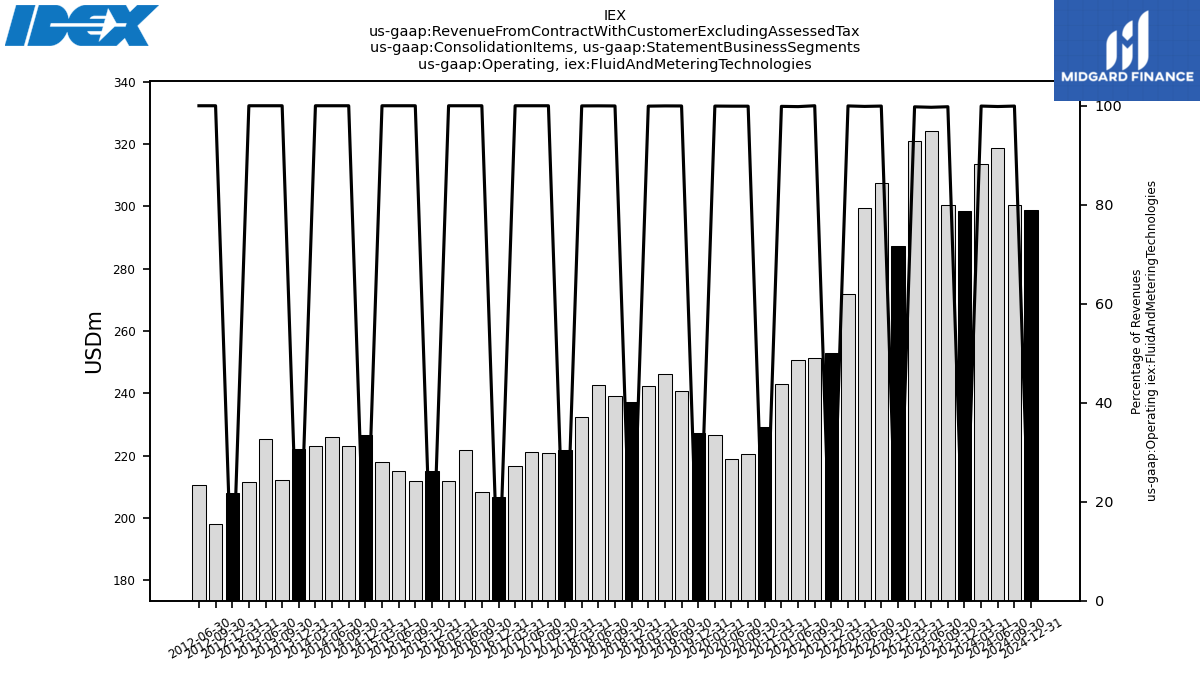
| Operating, Fluid And Metering Technologies | 299.10 | 301.10 | 325.10 | 321.80 | 287.80 | 307.60 | 299.90 | 272.00 | 252.76 | 251.30 | 251.28 | 243.37 | 229.58 | 220.75 | 219.11 | 226.86 | 227.46 | 240.86 | 246.19 | 242.52 | 236.93 | 239.21 | 242.80 | 232.33 | 221.74 | 220.95 | 221.18 | 216.77 | 206.72 | 208.34 | 221.63 | 211.71 | 215.06 | 211.97 | 214.98 | 217.93 | 226.64 | 223.02 | 225.87 | 223.01 | 222.04 | 212.05 | 225.21 | 211.41 | 207.89 | 198.00 | 210.72 | NA | NA | NA | NA | NA | NA | NA | NA | NA | |
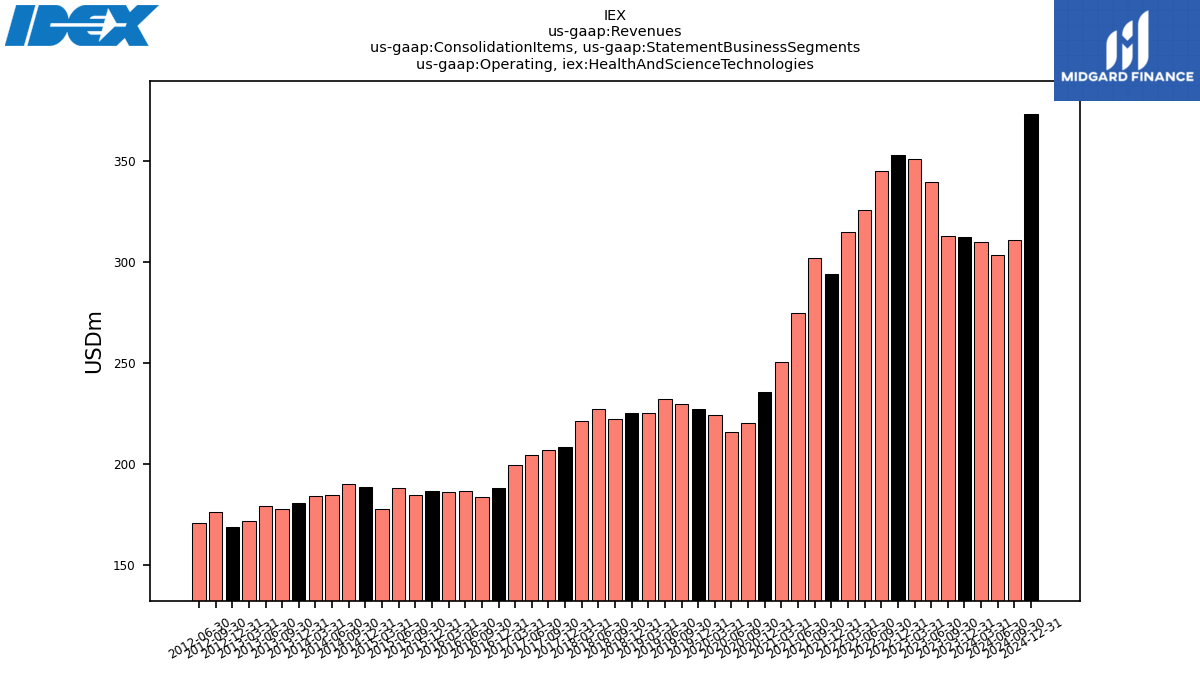
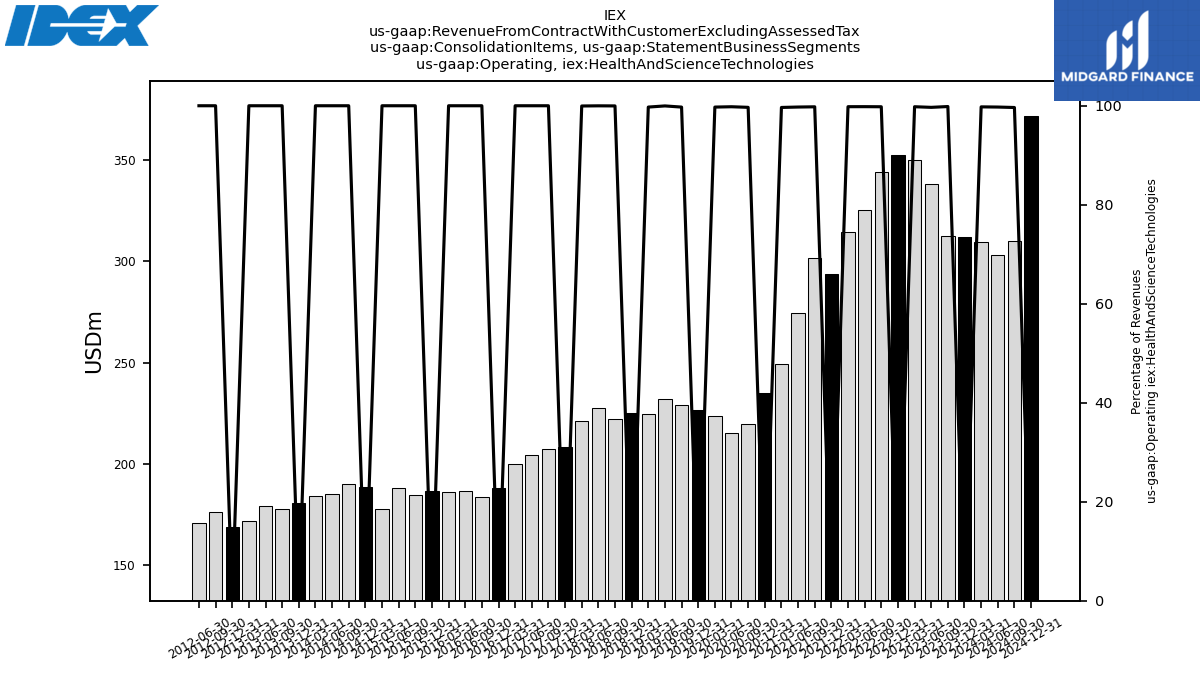
| Operating, Health And Science Technologies | 312.70 | 313.20 | 339.50 | 351.00 | 353.00 | 345.00 | 326.00 | 315.20 | 294.13 | 302.29 | 275.01 | 250.37 | 235.86 | 220.38 | 215.67 | 224.06 | 227.29 | 229.61 | 232.25 | 225.29 | 225.07 | 222.43 | 227.40 | 221.07 | 208.50 | 207.13 | 204.41 | 199.68 | 187.91 | 183.56 | 186.45 | 186.25 | 186.40 | 184.82 | 188.05 | 177.75 | 188.47 | 189.97 | 184.85 | 183.89 | 180.48 | 177.67 | 179.11 | 171.67 | 169.00 | 176.22 | 170.56 | NA | NA | NA | NA | NA | NA | NA | NA | NA | |
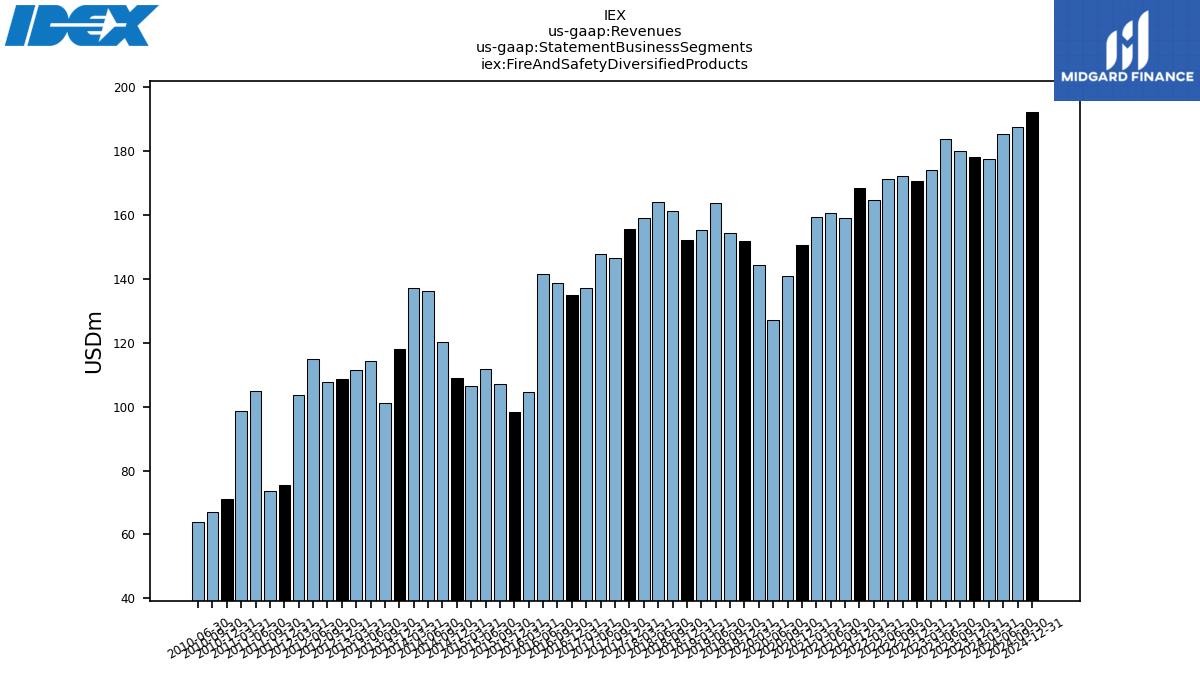
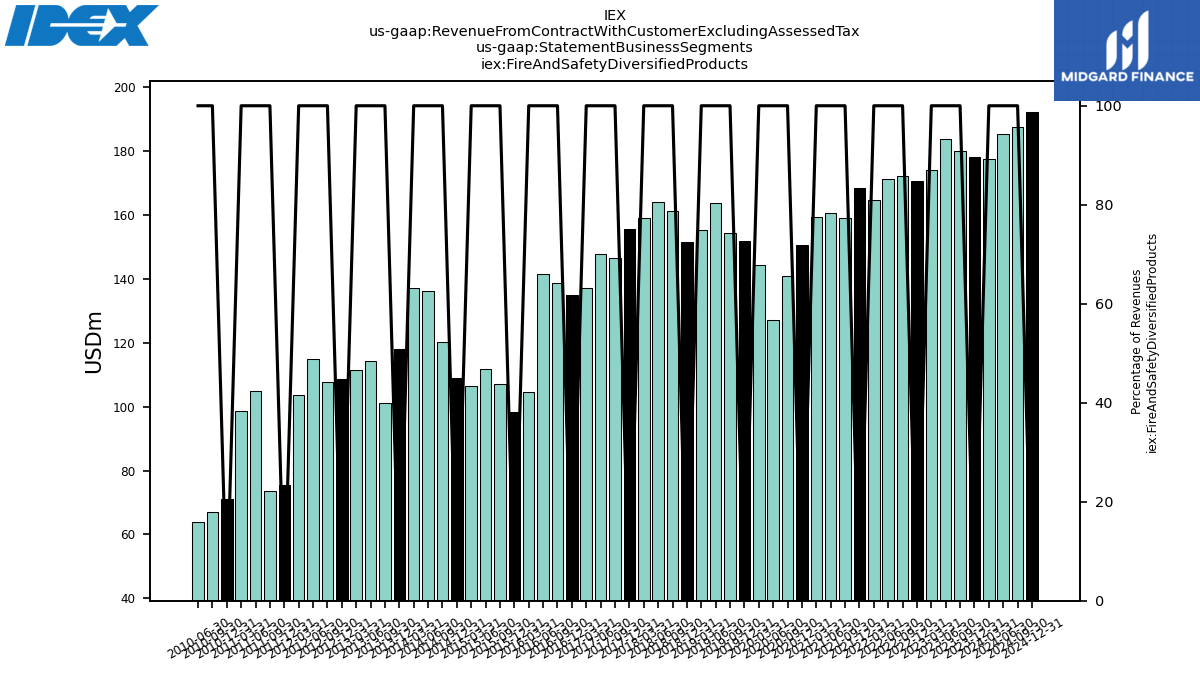
| Fire And Safety Diversified Products | 178.30 | 180.20 | 183.70 | 174.00 | 170.80 | 172.30 | 171.20 | 164.60 | 168.44 | 159.09 | 160.81 | 159.46 | 150.54 | 140.89 | 127.09 | 144.29 | 151.90 | 154.50 | 163.82 | 155.21 | 152.28 | 161.42 | 164.24 | 159.10 | 155.69 | 146.57 | 147.95 | 137.32 | 135.05 | 138.74 | 141.61 | 104.62 | 98.34 | 107.01 | 111.94 | 106.62 | 108.97 | 120.31 | 136.18 | 137.28 | 118.22 | 101.08 | 114.24 | 111.37 | 108.71 | 107.89 | 115.04 | 103.73 | 75.48 | 73.47 | 104.92 | 98.64 | 70.99 | 66.95 | 63.99 | NA | |
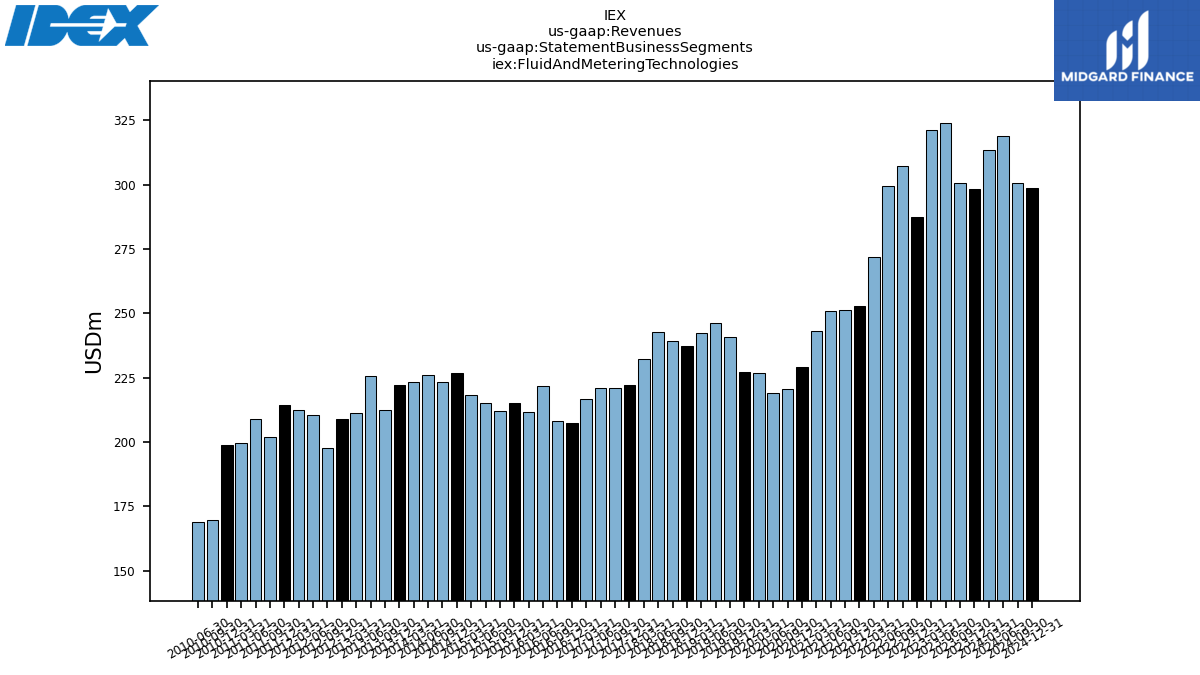
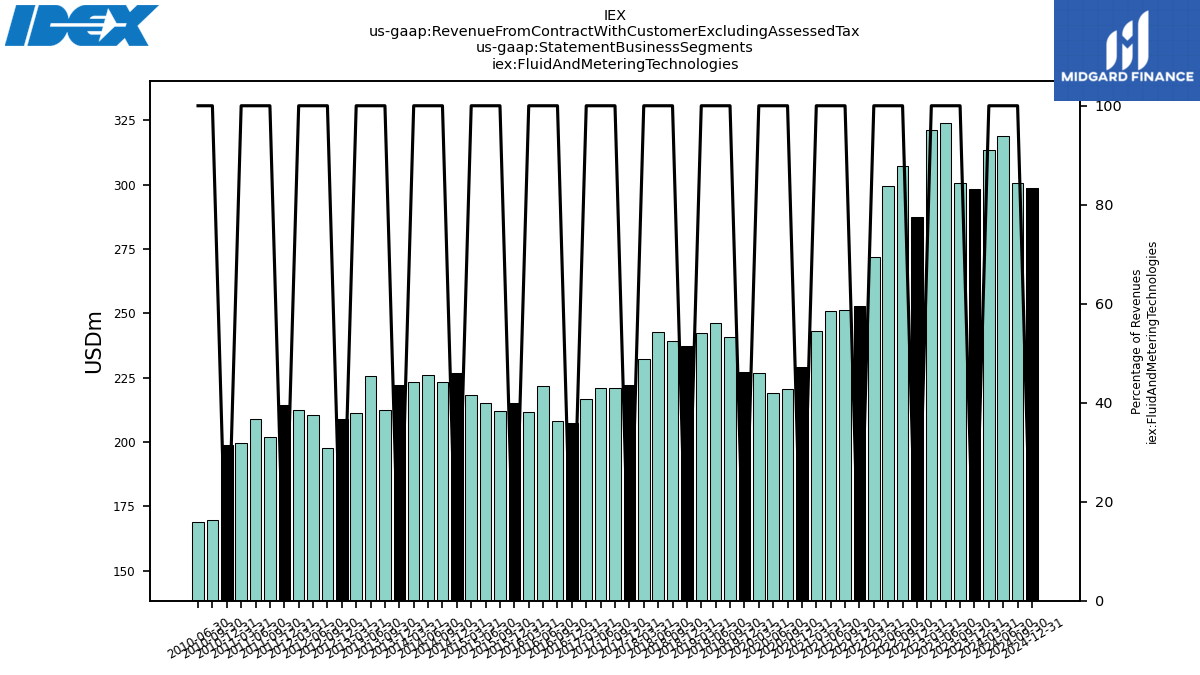
| Fluid And Metering Technologies | 298.50 | 300.50 | 324.10 | 321.10 | 287.40 | 307.40 | 299.50 | 271.90 | 252.80 | 251.30 | 250.84 | 243.07 | 229.29 | 220.55 | 218.92 | 226.71 | 227.32 | 240.76 | 246.11 | 242.34 | 237.42 | 239.12 | 242.75 | 232.26 | 222.28 | 220.90 | 221.12 | 216.66 | 207.59 | 208.16 | 221.81 | 211.84 | 215.15 | 212.10 | 215.29 | 218.25 | 226.87 | 223.26 | 226.10 | 223.36 | 222.23 | 212.34 | 225.49 | 211.41 | 208.87 | 197.62 | 210.37 | 212.47 | 214.30 | 201.82 | 208.80 | 199.53 | 199.05 | 169.57 | 168.80 | NA | |
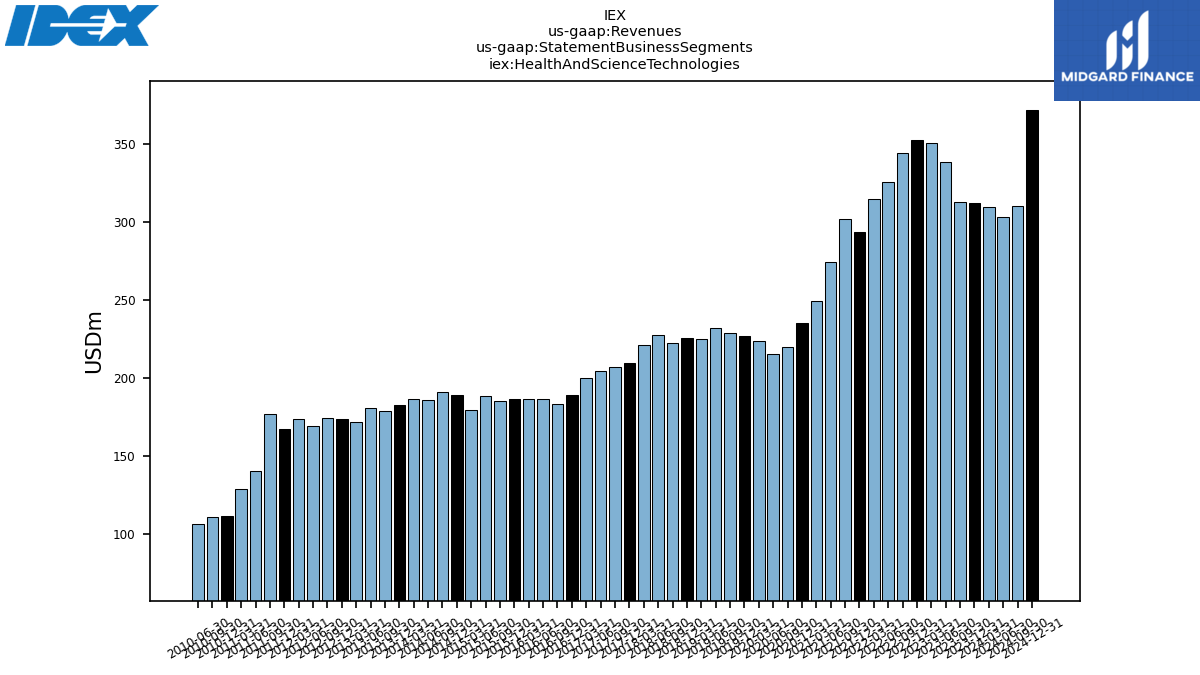
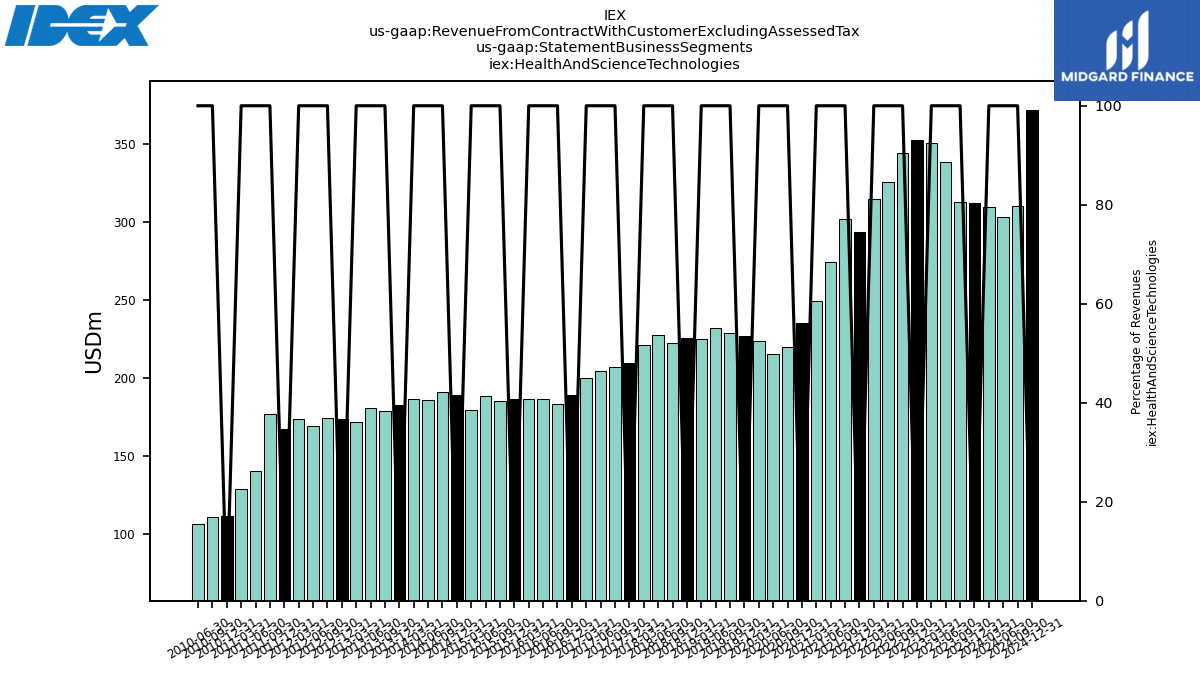
| Health And Science Technologies | 312.10 | 312.70 | 338.40 | 350.30 | 352.50 | 344.30 | 325.40 | 314.60 | 293.56 | 301.64 | 274.30 | 249.51 | 234.99 | 219.67 | 215.23 | 223.46 | 226.78 | 228.99 | 232.17 | 224.69 | 225.73 | 222.35 | 227.37 | 220.97 | 209.24 | 207.02 | 204.30 | 199.57 | 188.65 | 183.45 | 186.57 | 186.34 | 186.58 | 184.89 | 188.41 | 179.12 | 189.12 | 190.85 | 185.67 | 186.38 | 182.29 | 178.63 | 180.87 | 171.67 | 173.26 | 174.35 | 168.74 | 173.22 | 167.12 | 176.50 | 140.07 | 128.91 | 111.04 | 110.86 | 106.23 | NA | |
| Revenue From Contract With Customer Excluding Assessed Tax | 788.90 | 793.40 | 846.20 | 845.40 | 810.70 | 824.00 | 796.10 | 751.10 | 714.80 | 712.02 | 685.95 | 652.04 | 614.82 | 581.11 | 561.25 | 594.46 | 606.00 | 624.25 | 642.10 | 622.23 | 614.09 | 622.89 | 634.36 | 612.32 | 585.90 | 574.49 | 573.37 | 553.55 | 530.42 | 530.36 | 549.70 | 502.57 | 499.80 | 503.79 | 514.88 | 502.20 | 523.90 | 533.18 | 546.69 | 544.00 | 520.62 | 490.62 | 518.45 | 494.45 | 490.84 | 479.86 | 494.14 | 489.42 | 480.68 | 476.88 | 453.80 | 427.09 | 405.22 | 373.73 | 378.53 | 355.60 | |
| Intersegment Elimination | -1.90 | -1.50 | -3.20 | -1.80 | -1.00 | -1.00 | -1.00 | -0.80 | -0.59 | -0.67 | -1.15 | -1.18 | -1.17 | -0.91 | -0.61 | -0.78 | -0.78 | -0.77 | -0.39 | -1.74 | -0.35 | -0.58 | -0.14 | -0.26 | -0.57 | -0.19 | -0.21 | -0.34 | -0.04 | -0.31 | -0.29 | -0.23 | -0.27 | -0.21 | -0.76 | -1.79 | -1.06 | -1.24 | -1.26 | -3.02 | -2.12 | -1.43 | -2.15 | -1.69 | -4.56 | -2.56 | -3.06 | NA | NA | NA | NA | NA | NA | NA | NA | NA | |
| Intersegment Elimination, Fire And Safety Diversified Products | -0.70 | -0.40 | -1.10 | -0.40 | -0.10 | -0.10 | 0.00 | -0.10 | -0.06 | -0.02 | 0.00 | -0.02 | -0.01 | -0.01 | 0.02 | -0.03 | -0.12 | -0.04 | -0.23 | -0.95 | -0.05 | -0.41 | -0.06 | -0.08 | 0.77 | -0.02 | 0.04 | 0.12 | 0.09 | -0.03 | 0.00 | 0.01 | 0.00 | 0.01 | 0.09 | 0.11 | 0.18 | 0.13 | 0.20 | 0.19 | 0.13 | 0.19 | 0.12 | 0.15 | NA | NA | NA | NA | NA | NA | NA | NA | NA | NA | NA | NA | |
| Intersegment Elimination, Fluid And Metering Technologies | -0.60 | -0.60 | -1.00 | -0.70 | -0.40 | -0.20 | -0.40 | -0.10 | 0.04 | 0.00 | -0.44 | -0.30 | -0.30 | -0.19 | -0.19 | -0.15 | -0.14 | -0.10 | -0.08 | -0.19 | -0.07 | -0.09 | -0.04 | -0.07 | 0.54 | -0.06 | 0.06 | 0.12 | 0.87 | -0.17 | 0.17 | 0.13 | 0.09 | 0.13 | 0.31 | 0.32 | 0.23 | 0.24 | 0.23 | 0.35 | 0.19 | 0.28 | 0.27 | 0.35 | NA | NA | NA | NA | NA | NA | NA | NA | NA | NA | NA | NA | |
| Intersegment Elimination, Health And Science Technologies | -0.60 | -0.50 | -1.10 | -0.70 | -0.50 | -0.70 | -0.60 | -0.60 | -0.57 | -0.65 | -0.72 | -0.86 | -0.86 | -0.71 | -0.43 | -0.60 | -0.52 | -0.62 | -0.08 | -0.60 | -0.23 | -0.07 | -0.04 | -0.11 | 0.74 | -0.11 | 0.11 | 0.10 | 0.75 | -0.11 | 0.12 | 0.09 | 0.18 | 0.08 | 0.36 | 1.37 | 0.65 | 0.88 | 0.82 | 2.48 | 1.81 | 0.95 | 1.76 | 1.19 | NA | NA | NA | NA | NA | NA | NA | NA | NA | NA | NA | NA | |
| Operating, Fire And Safety Diversified Products | 178.30 | 180.20 | 183.70 | 174.00 | 170.80 | 172.30 | 171.20 | 164.60 | 168.44 | 159.09 | 160.81 | 159.46 | 150.54 | 140.89 | 127.09 | 144.29 | 151.90 | 154.50 | 163.82 | 155.21 | 151.67 | 161.42 | 164.24 | 159.10 | 154.92 | 146.60 | 147.98 | 137.45 | 134.96 | 138.77 | 141.61 | 104.61 | 98.34 | 107.00 | 111.85 | 106.52 | 108.79 | 120.19 | 135.98 | 137.10 | 118.09 | 100.89 | 114.12 | 111.37 | 107.19 | 108.20 | 115.92 | NA | NA | NA | NA | NA | NA | NA | NA | NA | |
| Operating, Fluid And Metering Technologies | 298.50 | 300.50 | 324.10 | 321.10 | 287.40 | 307.40 | 299.50 | 271.90 | 252.80 | 251.30 | 250.84 | 243.07 | 229.29 | 220.55 | 218.92 | 226.71 | 227.32 | 240.76 | 246.11 | 242.34 | 237.14 | 239.12 | 242.75 | 232.26 | 221.74 | 220.95 | 221.18 | 216.77 | 206.72 | 208.34 | 221.63 | 211.71 | 215.06 | 211.97 | 214.98 | 217.93 | 226.64 | 223.02 | 225.87 | 223.01 | 222.04 | 212.05 | 225.21 | 211.41 | 207.89 | 198.00 | 210.72 | NA | NA | NA | NA | NA | NA | NA | NA | NA | |
| Operating, Health And Science Technologies | 312.10 | 312.70 | 338.40 | 350.30 | 352.50 | 344.30 | 325.40 | 314.60 | 293.56 | 301.64 | 274.30 | 249.51 | 234.99 | 219.67 | 215.23 | 223.46 | 226.78 | 228.99 | 232.17 | 224.69 | 225.28 | 222.35 | 227.37 | 220.97 | 208.50 | 207.13 | 204.41 | 199.68 | 187.91 | 183.56 | 186.45 | 186.25 | 186.40 | 184.82 | 188.05 | 177.75 | 188.47 | 189.97 | 184.85 | 183.89 | 180.48 | 177.67 | 179.11 | 171.67 | 169.00 | 176.22 | 170.56 | NA | NA | NA | NA | NA | NA | NA | NA | NA | |
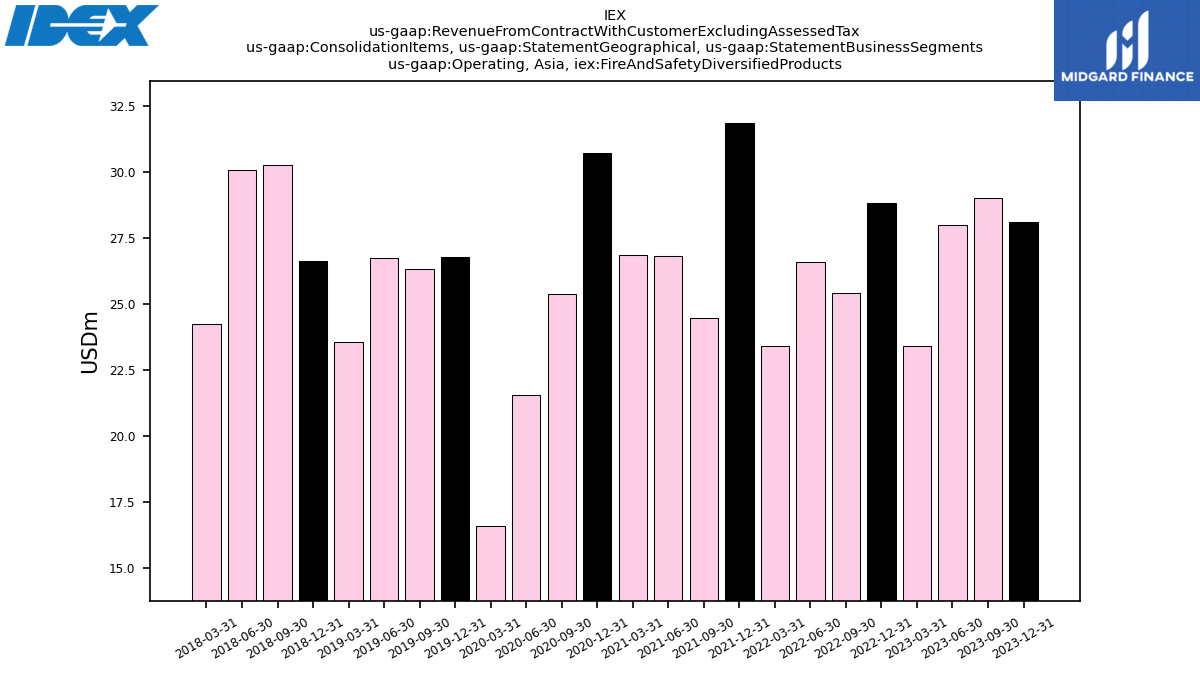
| Operating,, Fire And Safety Diversified Products | 28.10 | 29.00 | 28.00 | 23.40 | 28.80 | 25.40 | 26.60 | 23.40 | 31.85 | 24.46 | 26.83 | 26.86 | 30.72 | 25.38 | 21.54 | 16.58 | 26.76 | 26.32 | 26.74 | 23.56 | 26.61 | 30.27 | 30.07 | 24.23 | NA | NA | NA | NA | NA | NA | NA | NA | NA | NA | NA | NA | NA | NA | NA | NA | NA | NA | NA | NA | NA | NA | NA | NA | NA | NA | NA | NA | NA | NA | NA | NA | |
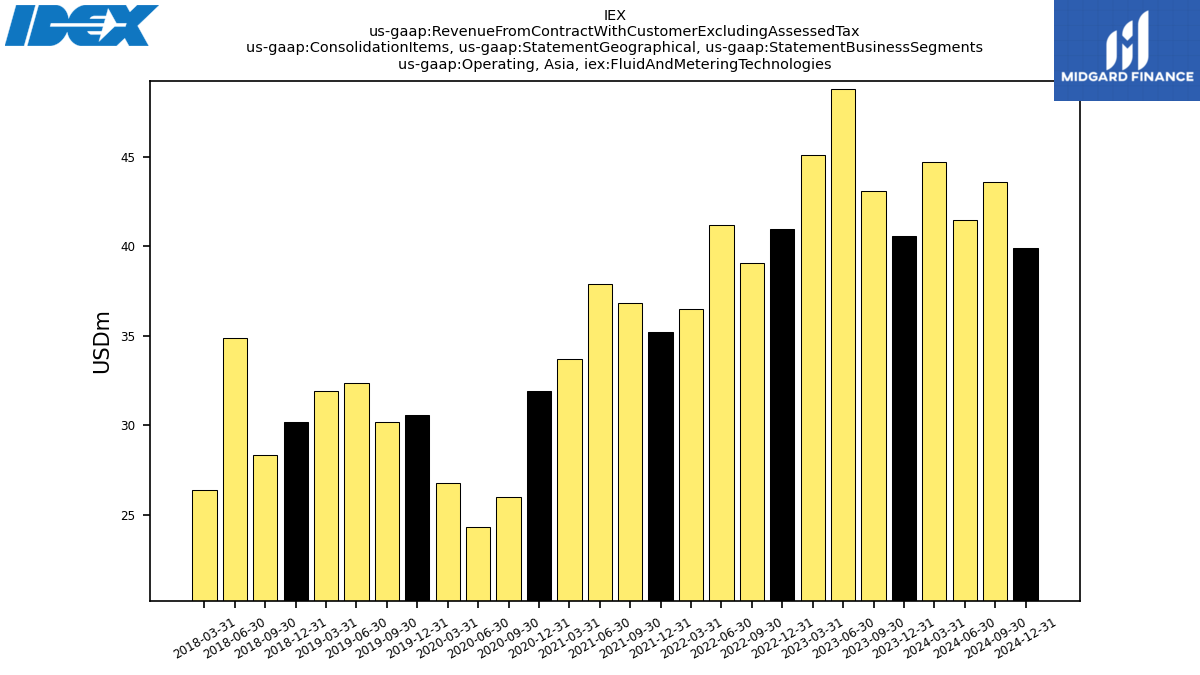
| Operating,, Fluid And Metering Technologies | 40.60 | 43.10 | 48.80 | 45.10 | 41.00 | 39.10 | 41.20 | 36.50 | 35.20 | 36.86 | 37.91 | 33.74 | 31.95 | 26.01 | 24.35 | 26.79 | 30.58 | 30.18 | 32.35 | 31.92 | 30.17 | 28.36 | 34.90 | 26.40 | NA | NA | NA | NA | NA | NA | NA | NA | NA | NA | NA | NA | NA | NA | NA | NA | NA | NA | NA | NA | NA | NA | NA | NA | NA | NA | NA | NA | NA | NA | NA | NA | |
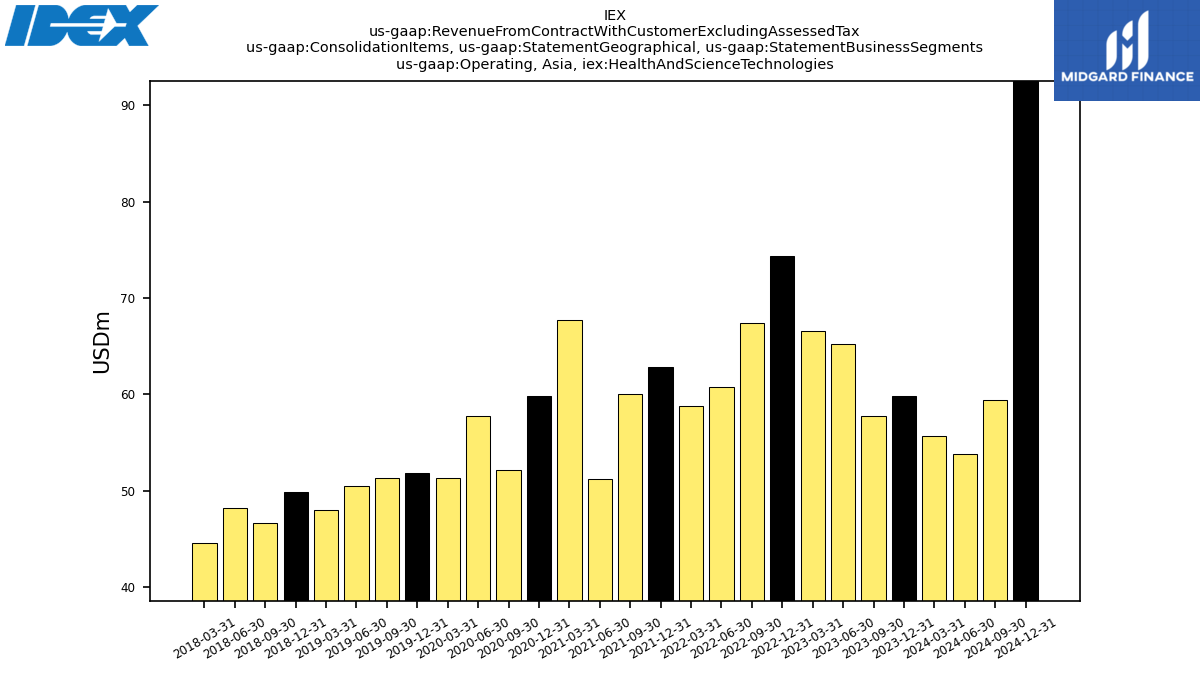
| Operating,, Health And Science Technologies | 59.80 | 57.80 | 65.20 | 66.60 | 74.30 | 67.40 | 60.80 | 58.80 | 62.83 | 59.99 | 51.26 | 67.72 | 59.80 | 52.20 | 57.81 | 51.34 | 51.83 | 51.38 | 50.50 | 48.06 | 49.92 | 46.63 | 48.24 | 44.55 | NA | NA | NA | NA | NA | NA | NA | NA | NA | NA | NA | NA | NA | NA | NA | NA | NA | NA | NA | NA | NA | NA | NA | NA | NA | NA | NA | NA | NA | NA | NA | NA | |
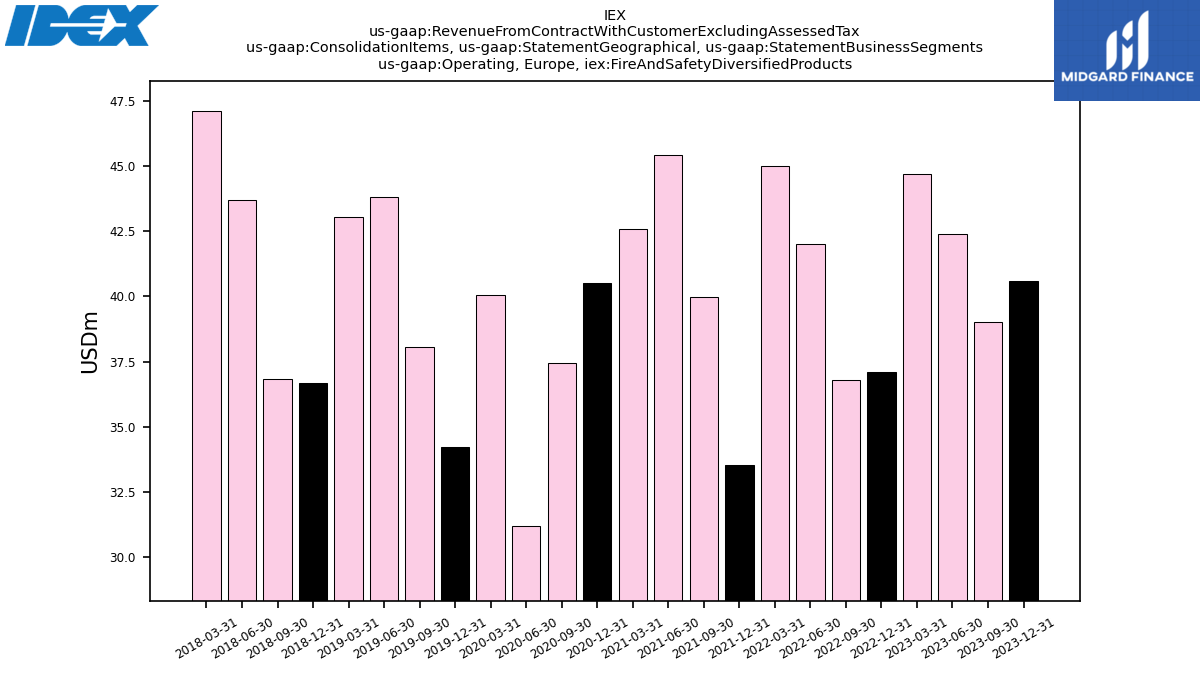
| Operating,, Fire And Safety Diversified Products | 40.60 | 39.00 | 42.40 | 44.70 | 37.10 | 36.80 | 42.00 | 45.00 | 33.55 | 39.97 | 45.41 | 42.57 | 40.50 | 37.44 | 31.18 | 40.07 | 34.23 | 38.08 | 43.81 | 43.06 | 36.66 | 36.82 | 43.70 | 47.12 | NA | NA | NA | NA | NA | NA | NA | NA | NA | NA | NA | NA | NA | NA | NA | NA | NA | NA | NA | NA | NA | NA | NA | NA | NA | NA | NA | NA | NA | NA | NA | NA | |
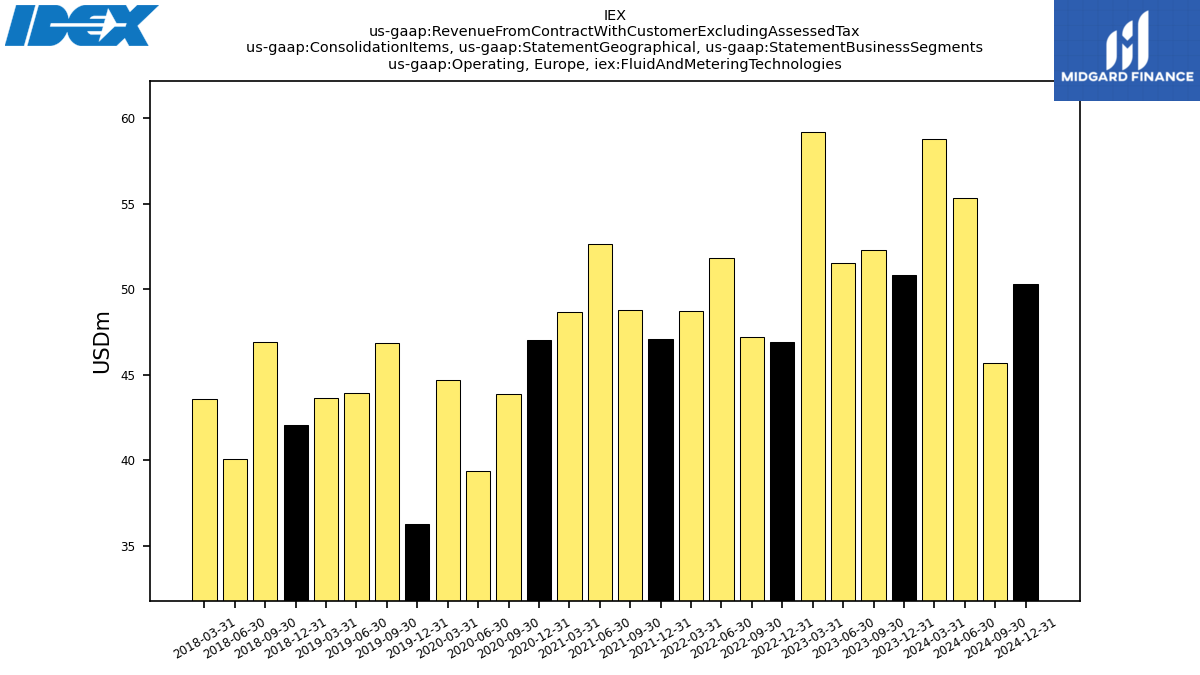
| Operating,, Fluid And Metering Technologies | 50.80 | 52.30 | 51.50 | 59.20 | 46.90 | 47.20 | 51.80 | 48.70 | 47.10 | 48.80 | 52.65 | 48.65 | 47.04 | 43.85 | 39.39 | 44.66 | 36.30 | 46.83 | 43.95 | 43.62 | 42.04 | 46.90 | 40.10 | 43.60 | NA | NA | NA | NA | NA | NA | NA | NA | NA | NA | NA | NA | NA | NA | NA | NA | NA | NA | NA | NA | NA | NA | NA | NA | NA | NA | NA | NA | NA | NA | NA | NA | |
| Operating,, Health And Science Technologies | 101.80 | 106.00 | 111.20 | 120.90 | 102.90 | 93.00 | 92.50 | 91.30 | 82.16 | 86.51 | 95.56 | 76.77 | 67.20 | 59.51 | 56.00 | 67.09 | 63.01 | 65.34 | 65.80 | 69.37 | 64.07 | 66.76 | 74.02 | 73.78 | NA | NA | NA | NA | NA | NA | NA | NA | NA | NA | NA | NA | NA | NA | NA | NA | NA | NA | NA | NA | NA | NA | NA | NA | NA | NA | NA | NA | NA | NA | NA | NA | |
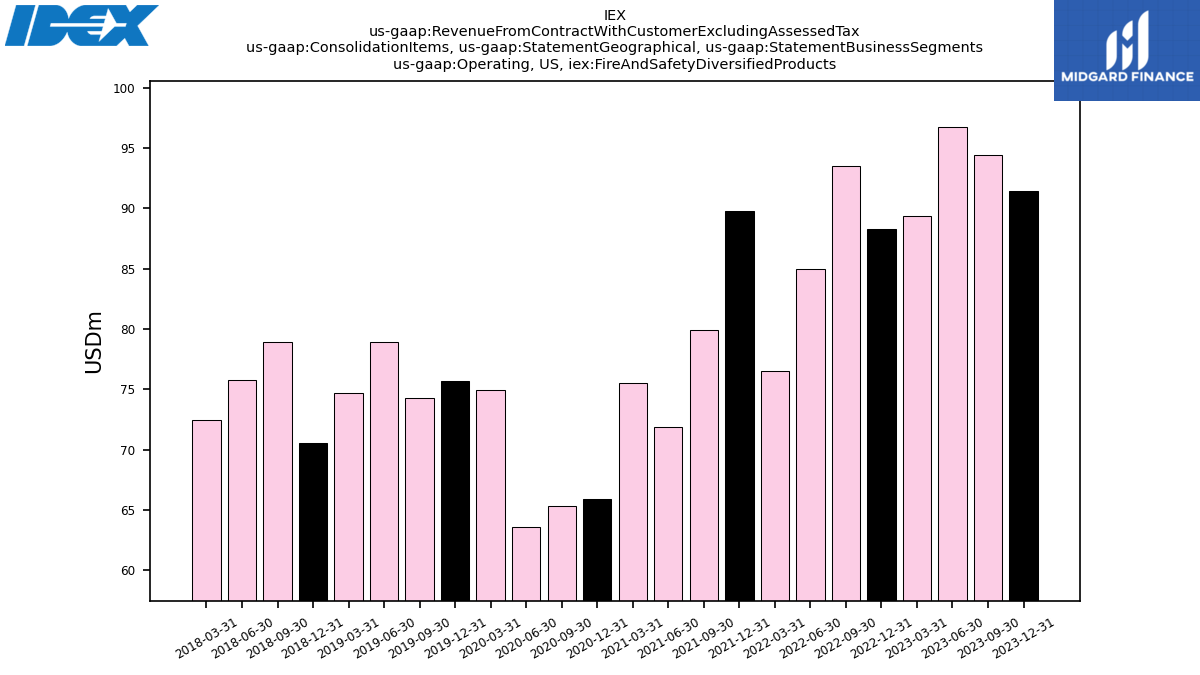
| Operating,US, Fire And Safety Diversified Products | 91.40 | 94.40 | 96.70 | 89.40 | 88.30 | 93.50 | 85.00 | 76.50 | 89.74 | 79.91 | 71.85 | 75.50 | 65.96 | 65.37 | 63.64 | 74.93 | 75.70 | 74.31 | 78.90 | 74.68 | 70.57 | 78.90 | 75.75 | 72.50 | NA | NA | NA | NA | NA | NA | NA | NA | NA | NA | NA | NA | NA | NA | NA | NA | NA | NA | NA | NA | NA | NA | NA | NA | NA | NA | NA | NA | NA | NA | NA | NA | |
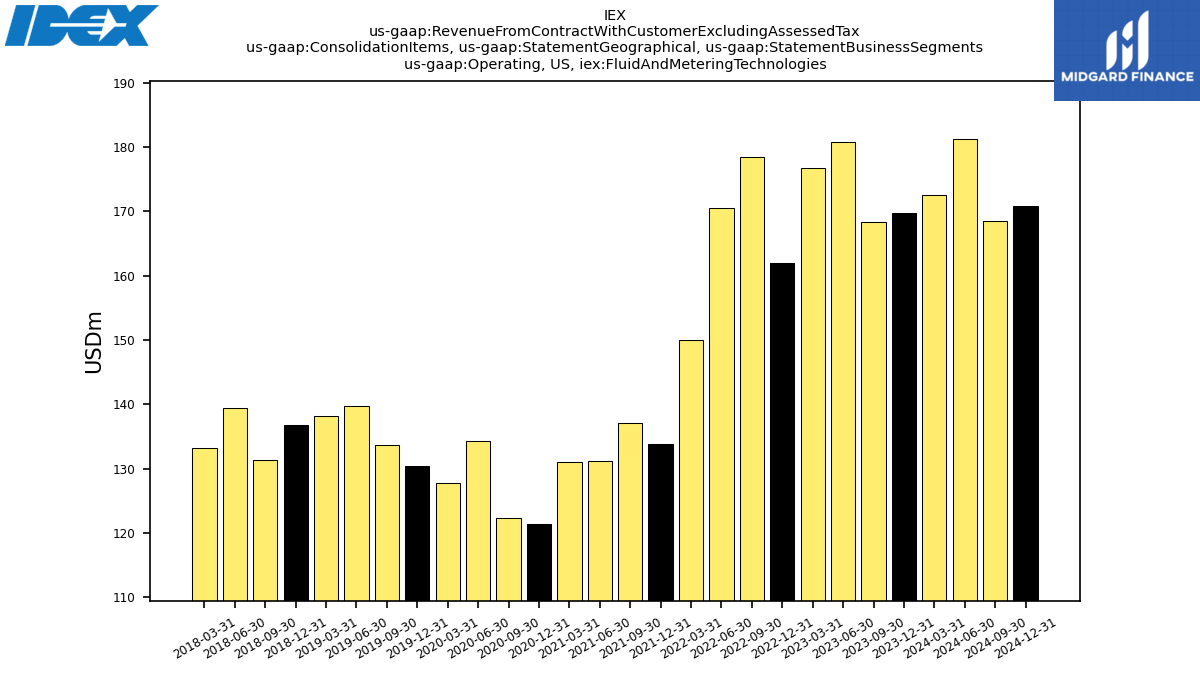
| Operating,US, Fluid And Metering Technologies | 169.80 | 168.40 | 180.70 | 176.80 | 161.90 | 178.40 | 170.50 | 150.00 | 133.78 | 137.05 | 131.12 | 130.96 | 121.33 | 122.35 | 134.30 | 127.78 | 130.35 | 133.71 | 139.79 | 138.15 | 136.79 | 131.40 | 139.35 | 133.15 | NA | NA | NA | NA | NA | NA | NA | NA | NA | NA | NA | NA | NA | NA | NA | NA | NA | NA | NA | NA | NA | NA | NA | NA | NA | NA | NA | NA | NA | NA | NA | NA | |
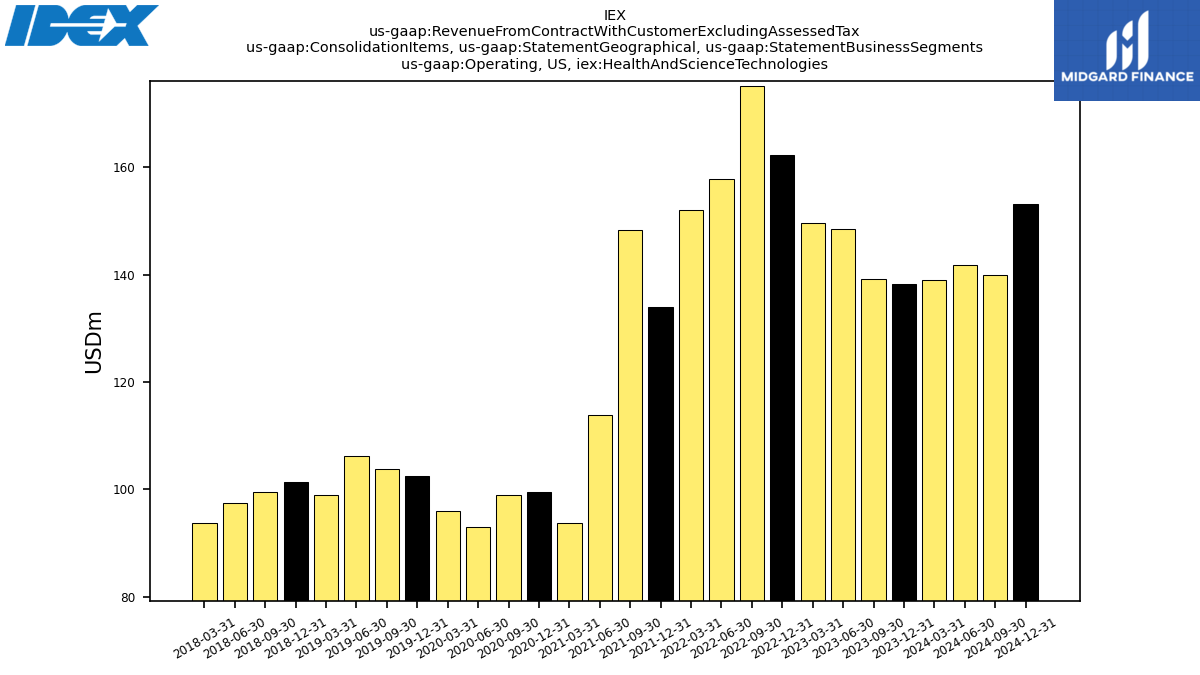
| Operating,US, Health And Science Technologies | 138.20 | 139.20 | 148.50 | 149.60 | 162.20 | 175.00 | 157.70 | 152.00 | 133.94 | 148.19 | 113.85 | 93.72 | 99.61 | 98.94 | 93.10 | 96.00 | 102.55 | 103.89 | 106.19 | 99.05 | 101.31 | 99.47 | 97.54 | 93.81 | NA | NA | NA | NA | NA | NA | NA | NA | NA | NA | NA | NA | NA | NA | NA | NA | NA | NA | NA | NA | NA | NA | NA | NA | NA | NA | NA | NA | NA | NA | NA | NA | |
| Operating, North America Excluding United States, Fire And Safety Diversified Products | 8.00 | 8.80 | 8.10 | 8.50 | 7.50 | 8.40 | 8.50 | 10.90 | 5.95 | 7.18 | 8.15 | 7.22 | 6.22 | 5.68 | 5.03 | 6.27 | 7.20 | 6.73 | 6.42 | 5.98 | 28.78 | 0.00 | 0.00 | 0.00 | NA | NA | NA | NA | NA | NA | NA | NA | NA | NA | NA | NA | NA | NA | NA | NA | NA | NA | NA | NA | NA | NA | NA | NA | NA | NA | NA | NA | NA | NA | NA | NA | |
| Operating, North America Excluding United States, Fluid And Metering Technologies | 17.50 | 15.50 | 17.90 | 19.40 | 17.20 | 20.40 | 16.60 | 17.30 | 18.95 | 13.69 | 14.13 | 14.83 | 14.08 | 13.71 | 11.36 | 13.68 | 16.92 | 13.65 | 14.63 | 13.06 | 57.92 | 0.00 | 0.00 | 0.00 | NA | NA | NA | NA | NA | NA | NA | NA | NA | NA | NA | NA | NA | NA | NA | NA | NA | NA | NA | NA | NA | NA | NA | NA | NA | NA | NA | NA | NA | NA | NA | NA | |
| Operating, North America Excluding United States, Health And Science Technologies | 6.00 | 3.20 | 8.20 | 5.20 | 5.50 | 3.30 | 9.50 | 7.50 | 7.01 | 5.19 | 4.42 | 7.07 | 5.41 | 5.42 | 4.53 | 5.97 | 5.90 | 5.45 | 5.50 | 4.89 | 18.77 | 0.00 | 0.00 | 0.00 | NA | NA | NA | NA | NA | NA | NA | NA | NA | NA | NA | NA | NA | NA | NA | NA | NA | NA | NA | NA | NA | NA | NA | NA | NA | NA | NA | NA | NA | NA | NA | NA | |
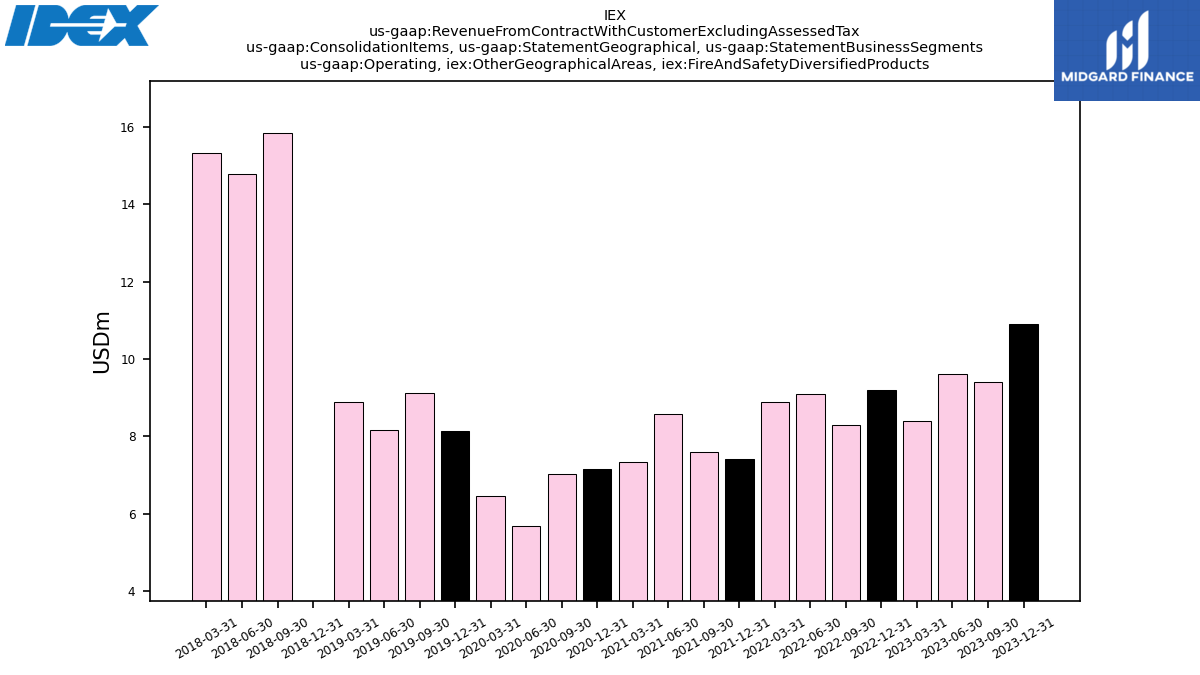
| Operating, Other Geographical Areas, Fire And Safety Diversified Products | 10.90 | 9.40 | 9.60 | 8.40 | 9.20 | 8.30 | 9.10 | 8.90 | 7.41 | 7.59 | 8.57 | 7.33 | 7.15 | 7.03 | 5.69 | 6.47 | 8.13 | 9.12 | 8.17 | 8.88 | -10.89 | 15.84 | 14.79 | 15.32 | NA | NA | NA | NA | NA | NA | NA | NA | NA | NA | NA | NA | NA | NA | NA | NA | NA | NA | NA | NA | NA | NA | NA | NA | NA | NA | NA | NA | NA | NA | NA | NA | |
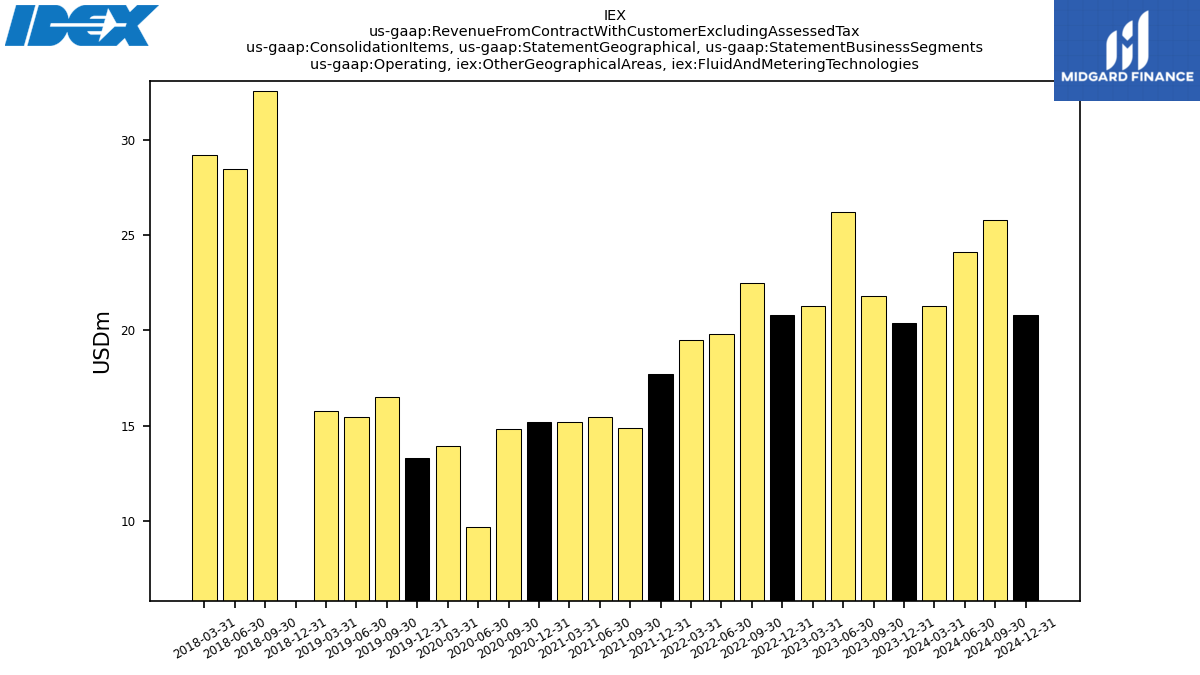
| Operating, Other Geographical Areas, Fluid And Metering Technologies | 20.40 | 21.80 | 26.20 | 21.30 | 20.80 | 22.50 | 19.80 | 19.50 | 17.73 | 14.90 | 15.47 | 15.19 | 15.19 | 14.82 | 9.72 | 13.96 | 13.31 | 16.49 | 15.47 | 15.78 | -29.71 | 32.56 | 28.46 | 29.18 | NA | NA | NA | NA | NA | NA | NA | NA | NA | NA | NA | NA | NA | NA | NA | NA | NA | NA | NA | NA | NA | NA | NA | NA | NA | NA | NA | NA | NA | NA | NA | NA | |
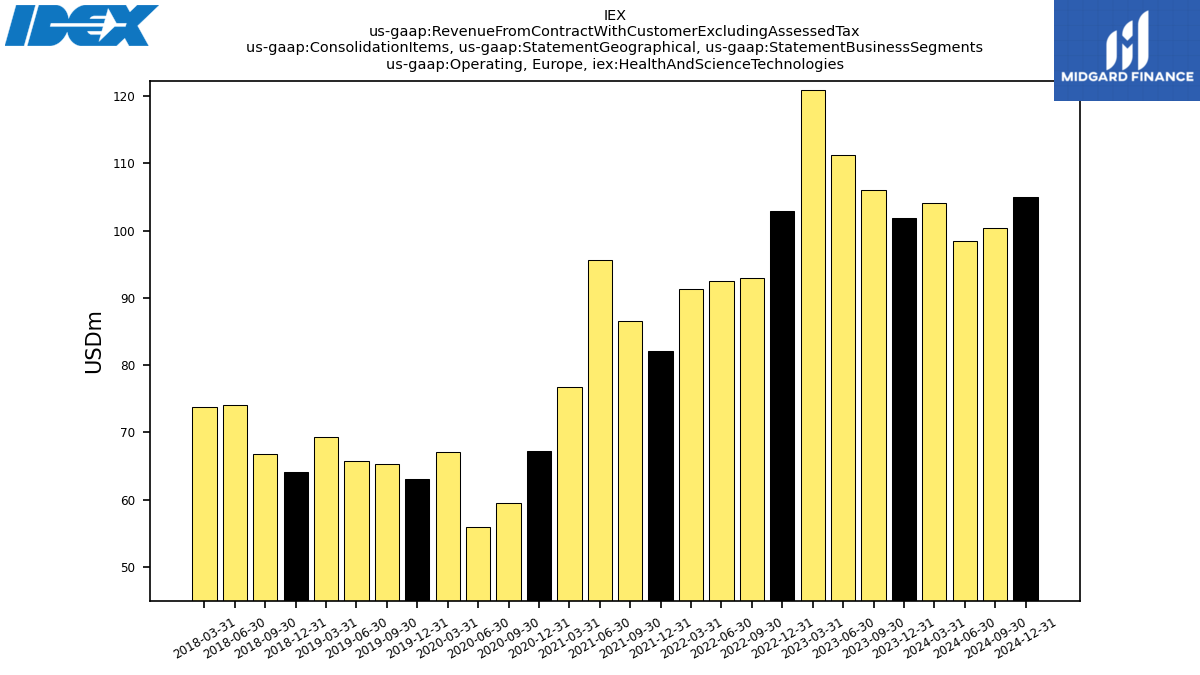
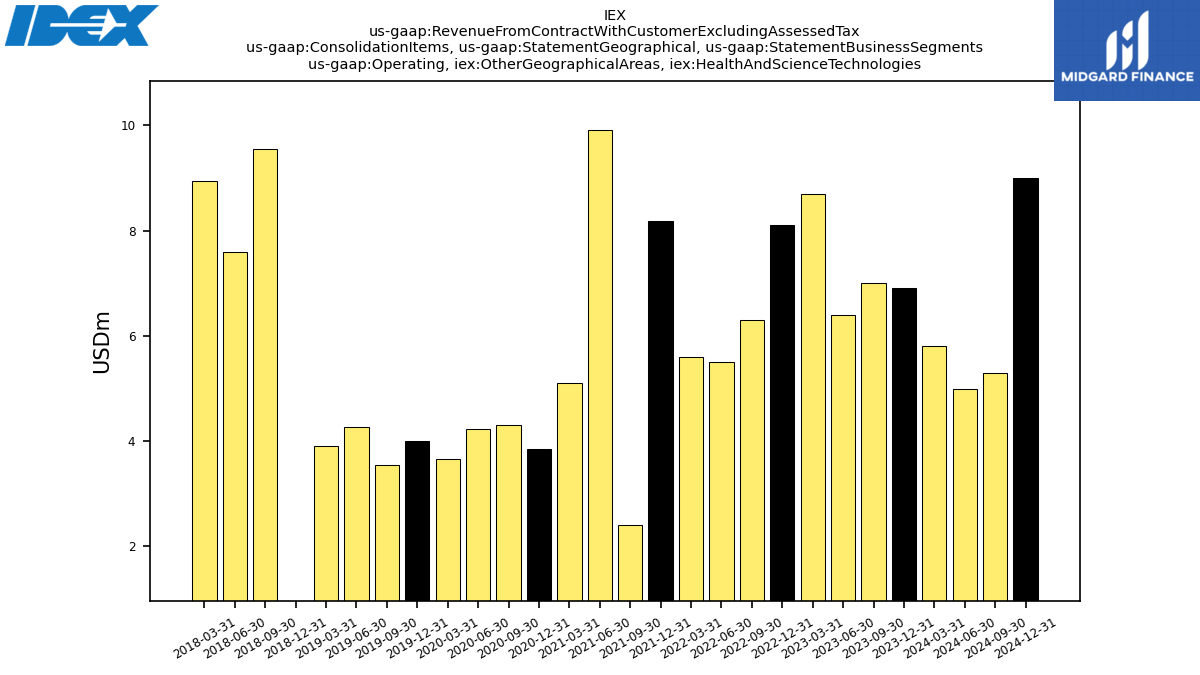
| Operating, Other Geographical Areas, Health And Science Technologies | 6.90 | 7.00 | 6.40 | 8.70 | 8.10 | 6.30 | 5.50 | 5.60 | 8.19 | 2.40 | 9.92 | 5.10 | 3.85 | 4.31 | 4.23 | 3.67 | 4.01 | 3.55 | 4.26 | 3.92 | -8.56 | 9.56 | 7.60 | 8.94 | NA | NA | NA | NA | NA | NA | NA | NA | NA | NA | NA | NA | NA | NA | NA | NA | NA | NA | NA | NA | NA | NA | NA | NA | NA | NA | NA | NA | NA | NA | NA | NA | |
| Fire And Safety Diversified Products | 178.30 | 180.20 | 183.70 | 174.00 | 170.80 | 172.30 | 171.20 | 164.60 | 168.44 | 159.09 | 160.81 | 159.46 | 150.54 | 140.89 | 127.09 | 144.29 | 151.90 | 154.50 | 163.82 | 155.21 | 151.67 | 161.42 | 164.24 | 159.10 | 155.69 | 146.57 | 147.95 | 137.32 | 135.05 | 138.74 | 141.61 | 104.62 | 98.34 | 107.01 | 111.94 | 106.62 | 108.97 | 120.31 | 136.18 | 137.28 | 118.22 | 101.08 | 114.24 | 111.37 | 108.71 | 107.89 | 115.04 | 103.73 | 75.48 | 73.47 | 104.92 | 98.64 | 70.99 | 66.95 | 63.99 | NA | |
| Fluid And Metering Technologies | 298.50 | 300.50 | 324.10 | 321.10 | 287.40 | 307.40 | 299.50 | 271.90 | 252.80 | 251.30 | 250.84 | 243.07 | 229.29 | 220.55 | 218.92 | 226.71 | 227.32 | 240.76 | 246.11 | 242.34 | 237.14 | 239.12 | 242.75 | 232.26 | 222.28 | 220.90 | 221.12 | 216.66 | 207.59 | 208.16 | 221.81 | 211.84 | 215.15 | 212.10 | 215.29 | 218.25 | 226.87 | 223.26 | 226.10 | 223.36 | 222.23 | 212.34 | 225.49 | 211.41 | 208.87 | 197.62 | 210.37 | 212.47 | 214.30 | 201.82 | 208.80 | 199.53 | 199.05 | 169.57 | 168.80 | NA | |
| Health And Science Technologies | 312.10 | 312.70 | 338.40 | 350.30 | 352.50 | 344.30 | 325.40 | 314.60 | 293.56 | 301.64 | 274.30 | 249.51 | 234.99 | 219.67 | 215.23 | 223.46 | 226.78 | 228.99 | 232.17 | 224.69 | 225.28 | 222.35 | 227.37 | 220.97 | 209.24 | 207.02 | 204.30 | 199.57 | 188.65 | 183.45 | 186.57 | 186.34 | 186.58 | 184.89 | 188.41 | 179.12 | 189.12 | 190.85 | 185.67 | 186.38 | 182.29 | 178.63 | 180.87 | 171.67 | 173.26 | 174.35 | 168.74 | 173.22 | 167.12 | 176.50 | 140.07 | 128.91 | 111.04 | 110.86 | 106.23 | NA |