
| 2023-09-30 | 2023-06-30 | 2023-03-31 | 2022-12-31 | 2022-09-30 | 2022-06-30 | 2022-03-31 | 2021-12-31 | 2021-09-30 | 2021-06-30 | 2021-03-31 | 2020-12-31 | 2020-09-30 | 2020-06-30 | 2020-03-31 | 2019-12-31 | 2019-09-30 | 2019-06-30 | 2019-05-01 | 2019-03-31 | 2018-12-31 | 2018-09-30 | 2018-06-30 | 2018-03-31 | 2017-12-31 | 2017-09-30 | 2017-06-30 | 2017-03-31 | 2016-12-31 | 2016-09-30 | 2016-06-30 | 2016-03-31 | 2015-12-31 | 2015-09-30 | 2015-06-30 | 2015-03-31 | 2014-12-31 | 2014-09-30 | 2014-06-30 | 2014-03-31 | 2013-12-31 | 2013-09-30 | 2013-06-30 | 2013-03-31 | 2012-12-31 | 2012-09-30 | 2012-06-30 | 2012-03-31 | 2011-12-31 | 2011-09-30 | 2011-06-30 | 2011-03-31 | 2010-12-31 | 2010-09-30 | 2010-06-30 | ||
|---|---|---|---|---|---|---|---|---|---|---|---|---|---|---|---|---|---|---|---|---|---|---|---|---|---|---|---|---|---|---|---|---|---|---|---|---|---|---|---|---|---|---|---|---|---|---|---|---|---|---|---|---|---|---|---|---|
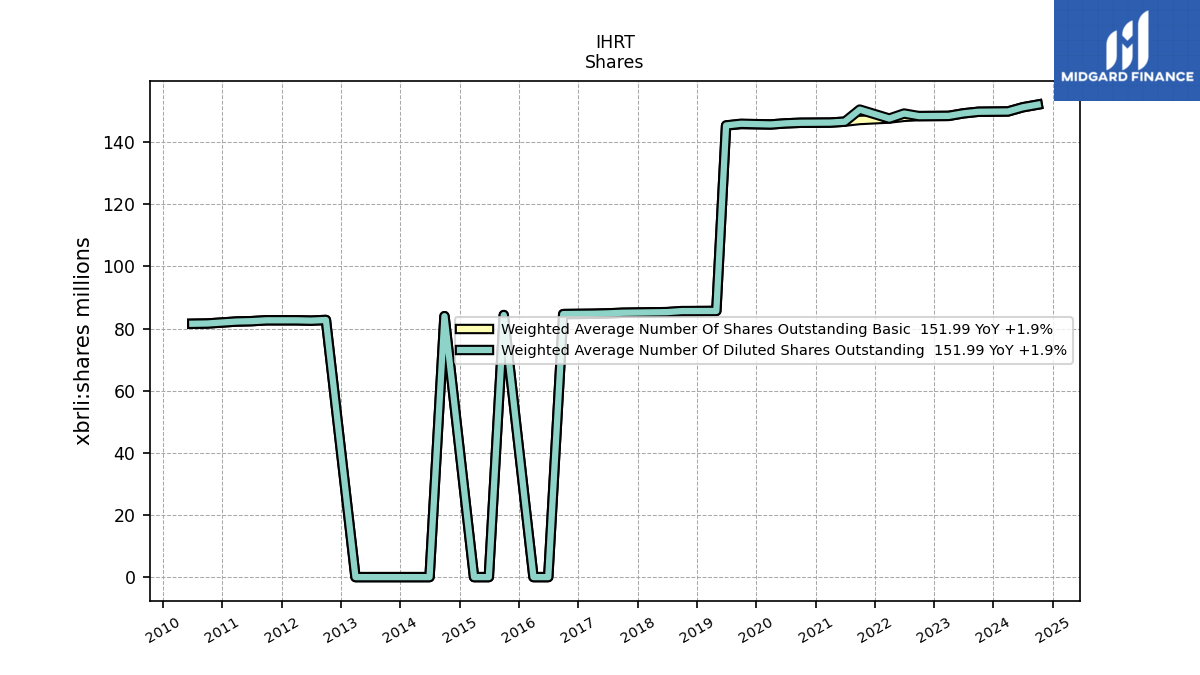
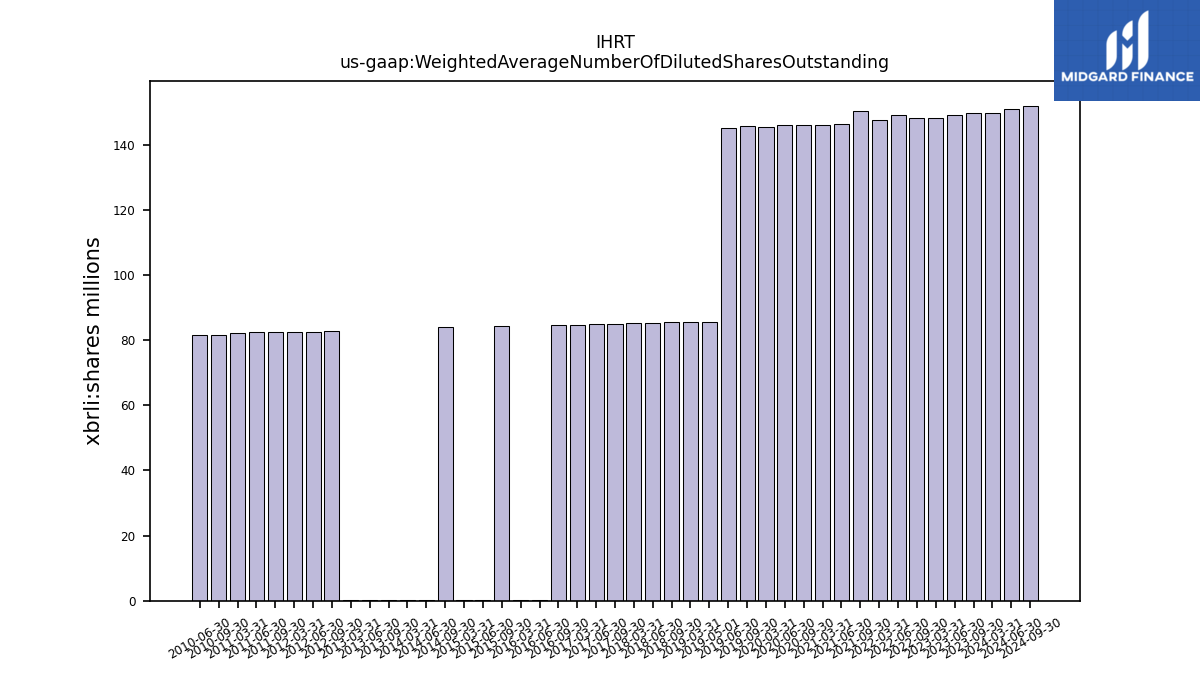
| Weighted Average Number Of Diluted Shares Outstanding | 149.69 | 149.18 | 148.37 | NA | 148.30 | 149.13 | 147.51 | NA | 150.40 | 146.51 | 146.21 | NA | 146.15 | 145.96 | 145.61 | NA | 145.84 | 145.30 | 85.65 | 85.65 | NA | 85.62 | 85.28 | 85.22 | NA | 85.07 | 84.87 | 84.75 | NA | 84.65 | 0.08 | 0.08 | NA | 84.35 | 0.08 | 0.08 | NA | 83.99 | 0.08 | 0.08 | NA | 0.08 | 0.08 | 0.08 | NA | 82.77 | 82.54 | 82.65 | NA | 82.65 | 82.38 | 82.26 | NA | 81.62 | 81.54 | |
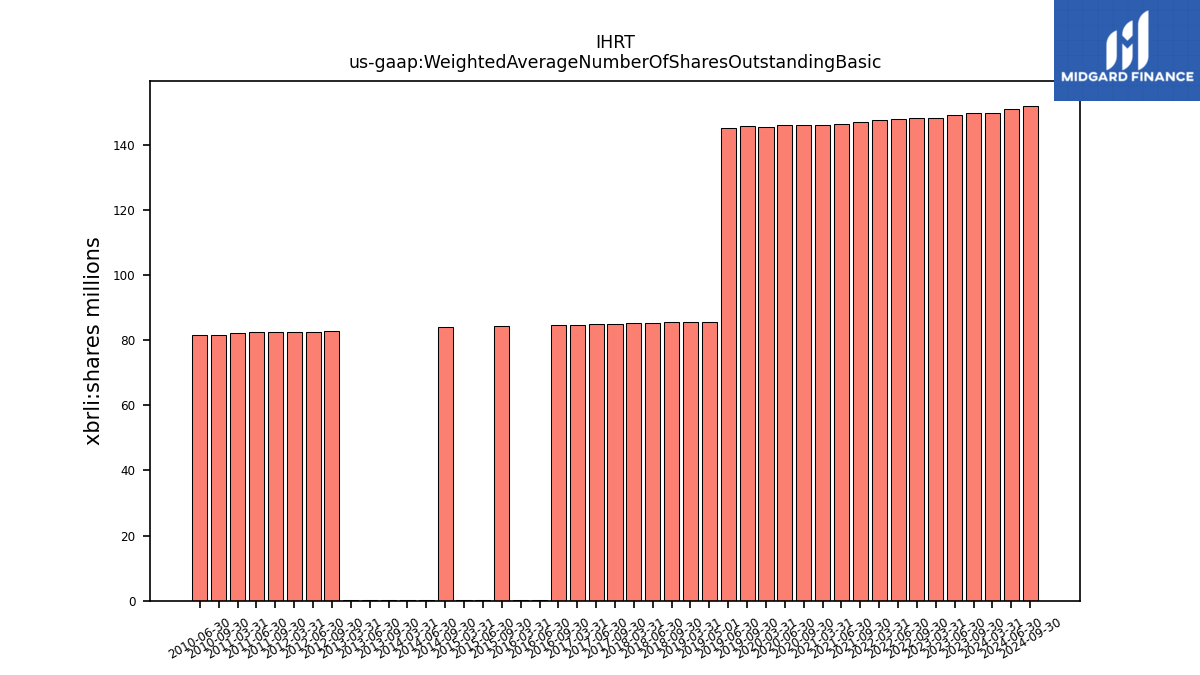
| Weighted Average Number Of Shares Outstanding Basic | 149.69 | 149.18 | 148.37 | NA | 148.30 | 148.05 | 147.51 | NA | 147.04 | 146.51 | 146.21 | NA | 146.15 | 145.96 | 145.61 | NA | 145.72 | 145.28 | 85.65 | 85.65 | NA | 85.54 | 85.28 | 85.22 | NA | 85.07 | 84.87 | 84.75 | NA | 84.65 | 0.08 | 0.08 | NA | 84.35 | 0.08 | 0.08 | NA | 83.99 | 0.08 | 0.08 | NA | 0.08 | 0.08 | 0.08 | NA | 82.77 | 82.54 | 82.65 | NA | 82.65 | 82.38 | 82.26 | NA | 81.62 | 81.54 | |
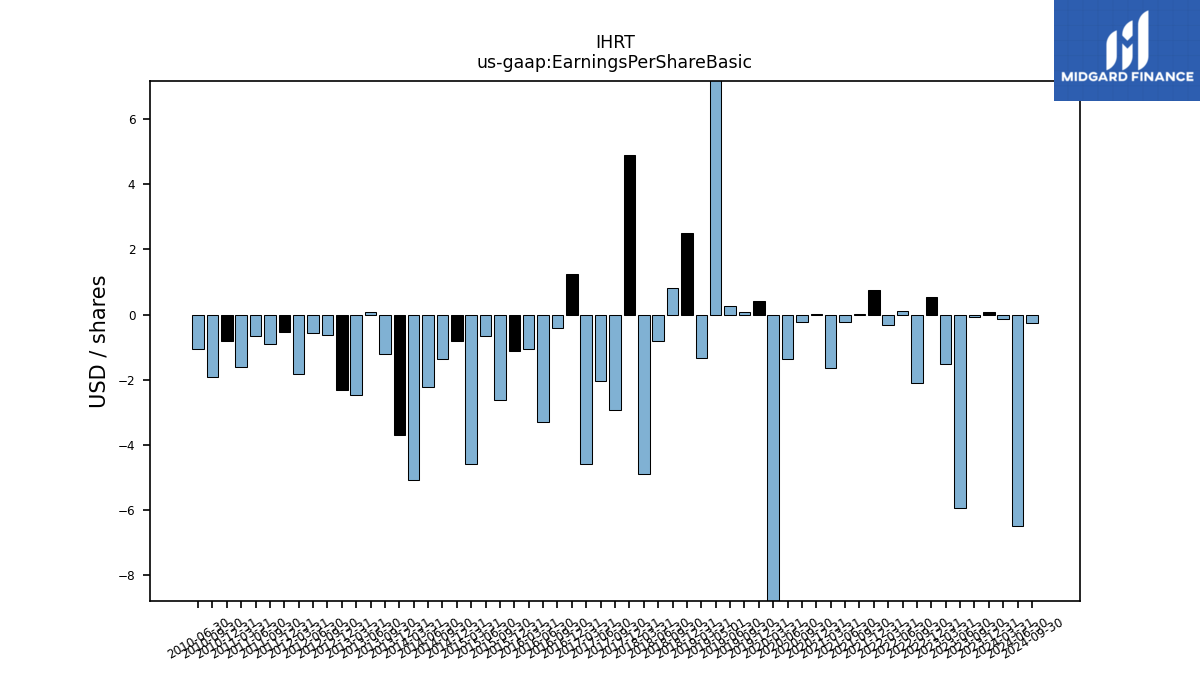
| Earnings Per Share Basic | -0.06 | -5.93 | -1.50 | 0.54 | -2.09 | 0.10 | -0.33 | 0.76 | 0.02 | -0.22 | -1.65 | 0.02 | -0.22 | -1.35 | -11.60 | 0.42 | 0.08 | 0.27 | 131.91 | -1.34 | 2.51 | 0.82 | -0.82 | -4.88 | 4.89 | -2.92 | -2.05 | -4.58 | 1.25 | -0.41 | -3.30 | -1.05 | -1.11 | -2.63 | -0.65 | -4.58 | -0.81 | -1.37 | -2.22 | -5.06 | -3.70 | -1.22 | 0.09 | -2.47 | -2.31 | -0.61 | -0.57 | -1.83 | -0.53 | -0.91 | -0.65 | -1.62 | -0.80 | -1.91 | -1.06 | |
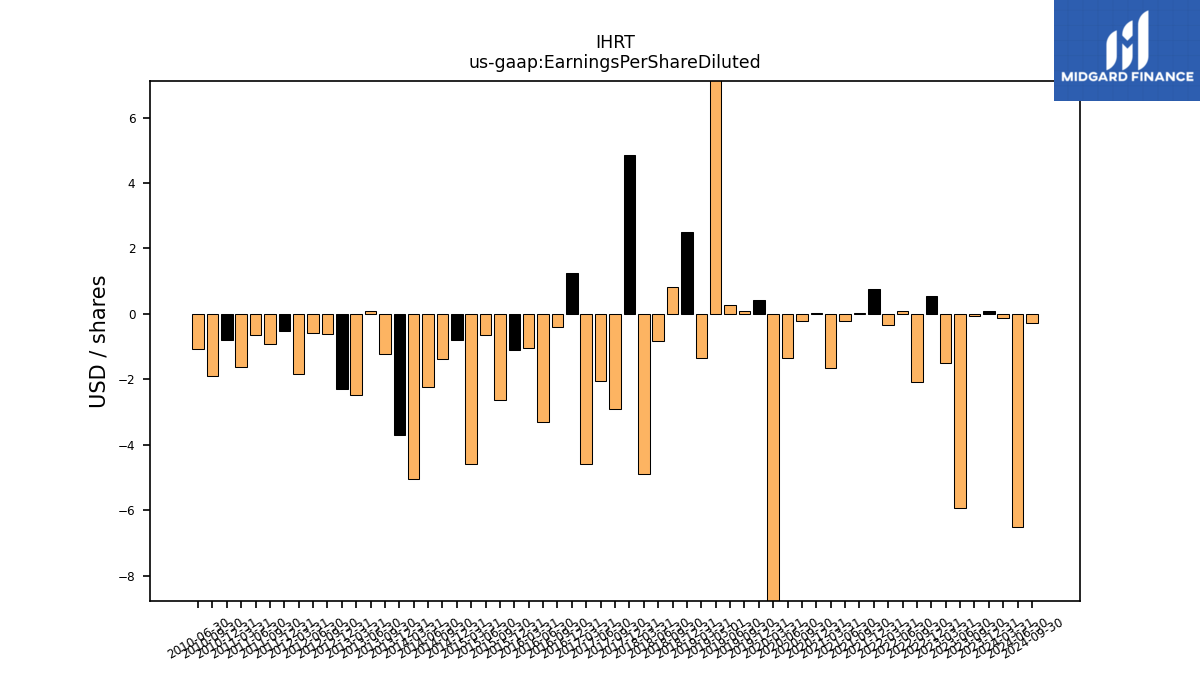
| Earnings Per Share Diluted | -0.06 | -5.93 | -1.50 | 0.54 | -2.09 | 0.10 | -0.33 | 0.76 | 0.02 | -0.22 | -1.65 | 0.02 | -0.22 | -1.35 | -11.60 | 0.42 | 0.08 | 0.27 | 131.91 | -1.34 | 2.51 | 0.82 | -0.82 | -4.88 | 4.85 | -2.92 | -2.05 | -4.58 | 1.24 | -0.41 | -3.30 | -1.05 | -1.11 | -2.63 | -0.65 | -4.58 | -0.81 | -1.37 | -2.22 | -5.06 | -3.70 | -1.22 | 0.09 | -2.47 | -2.31 | -0.61 | -0.57 | -1.83 | -0.53 | -0.91 | -0.65 | -1.62 | -0.80 | -1.91 | -1.06 |
| 2023-09-30 | 2023-06-30 | 2023-03-31 | 2022-12-31 | 2022-09-30 | 2022-06-30 | 2022-03-31 | 2021-12-31 | 2021-09-30 | 2021-06-30 | 2021-03-31 | 2020-12-31 | 2020-09-30 | 2020-06-30 | 2020-03-31 | 2019-12-31 | 2019-09-30 | 2019-06-30 | 2019-05-01 | 2019-03-31 | 2018-12-31 | 2018-09-30 | 2018-06-30 | 2018-03-31 | 2017-12-31 | 2017-09-30 | 2017-06-30 | 2017-03-31 | 2016-12-31 | 2016-09-30 | 2016-06-30 | 2016-03-31 | 2015-12-31 | 2015-09-30 | 2015-06-30 | 2015-03-31 | 2014-12-31 | 2014-09-30 | 2014-06-30 | 2014-03-31 | 2013-12-31 | 2013-09-30 | 2013-06-30 | 2013-03-31 | 2012-12-31 | 2012-09-30 | 2012-06-30 | 2012-03-31 | 2011-12-31 | 2011-09-30 | 2011-06-30 | 2011-03-31 | 2010-12-31 | 2010-09-30 | 2010-06-30 | ||
|---|---|---|---|---|---|---|---|---|---|---|---|---|---|---|---|---|---|---|---|---|---|---|---|---|---|---|---|---|---|---|---|---|---|---|---|---|---|---|---|---|---|---|---|---|---|---|---|---|---|---|---|---|---|---|---|---|
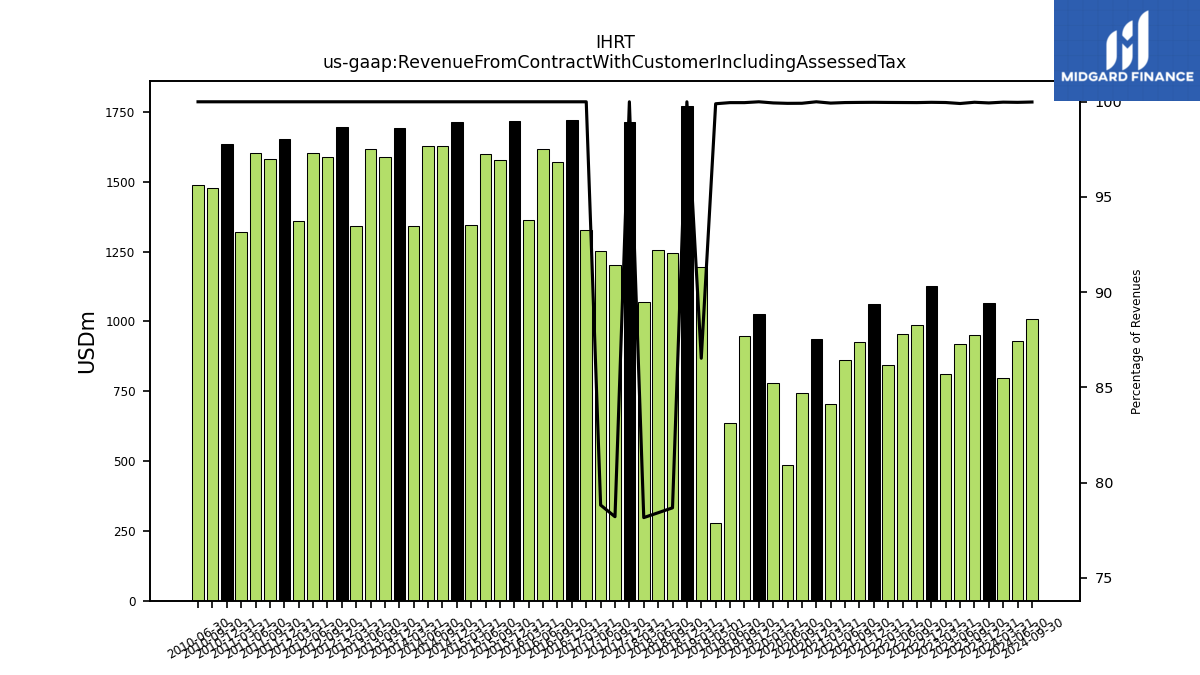
| Revenue From Contract With Customer Including Assessed Tax | 952.75 | 919.18 | 810.93 | 1125.58 | 988.51 | 953.64 | 843.17 | 1061.72 | 927.75 | 861.26 | 706.18 | 935.53 | 743.83 | 487.25 | 780.17 | 1026.07 | 947.92 | 635.37 | 277.39 | 1195.73 | 1772.53 | 1245.18 | 1255.26 | 1070.73 | 1713.89 | 1202.32 | 1253.45 | 1329.32 | 1721.12 | 1570.42 | 1618.53 | 1363.51 | 1717.58 | 1579.51 | 1599.86 | 1344.56 | 1715.80 | 1630.03 | 1630.15 | 1342.55 | 1694.37 | 1587.52 | 1618.10 | 1343.06 | 1696.34 | 1587.33 | 1602.49 | 1360.72 | 1652.79 | 1583.35 | 1604.39 | 1320.83 | 1634.55 | 1477.35 | 1490.01 | |
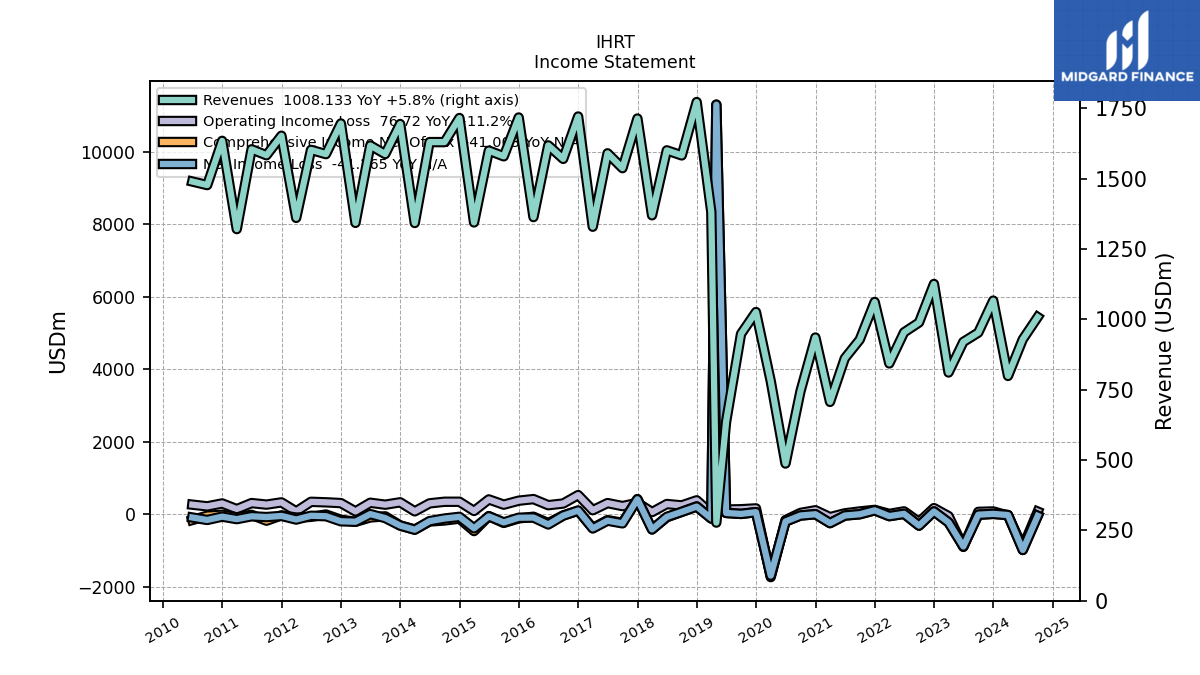
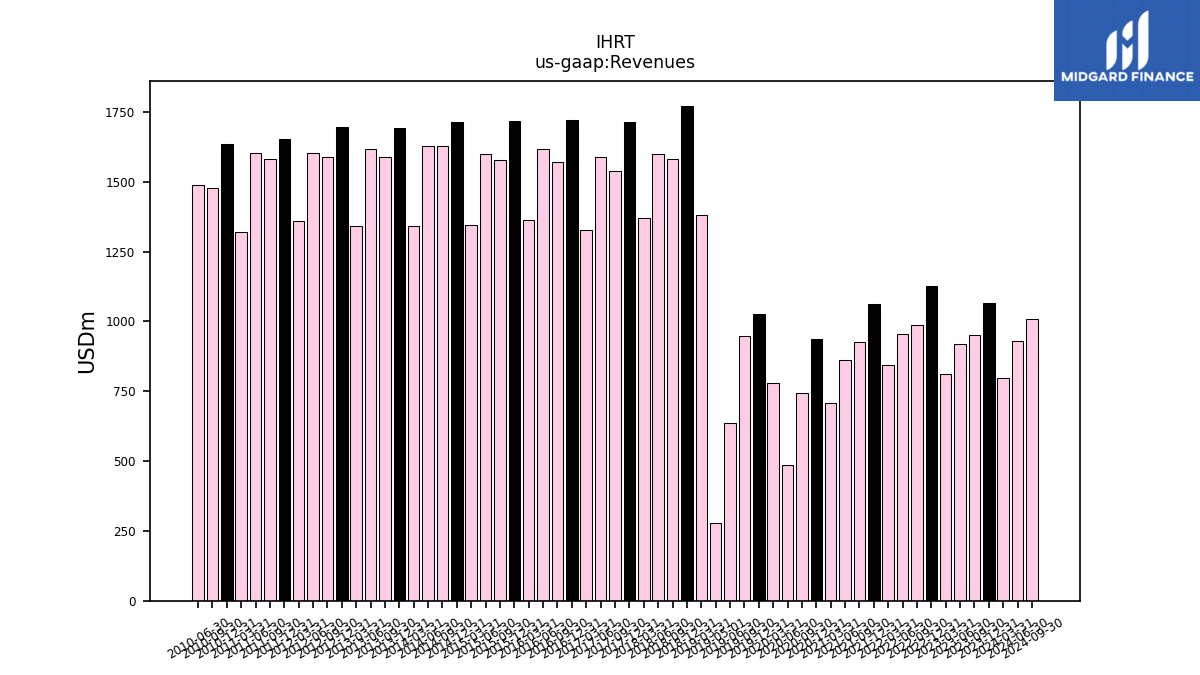
| Revenues | 952.99 | 920.01 | 811.24 | 1125.89 | 988.93 | 954.00 | 843.46 | 1062.02 | 928.05 | 861.61 | 706.66 | 935.53 | 744.41 | 487.65 | 780.63 | 1026.07 | 948.34 | 635.65 | 277.67 | 1381.90 | 1772.53 | 1582.77 | 1600.84 | 1369.96 | 1713.89 | 1537.42 | 1590.37 | 1329.32 | 1721.12 | 1570.42 | 1618.53 | 1363.51 | 1717.58 | 1579.51 | 1599.86 | 1344.56 | 1715.80 | 1630.03 | 1630.15 | 1342.55 | 1694.37 | 1587.52 | 1618.10 | 1343.06 | 1696.34 | 1587.33 | 1602.49 | 1360.72 | 1652.79 | 1583.35 | 1604.39 | 1320.83 | 1634.55 | 1477.35 | 1490.01 | |
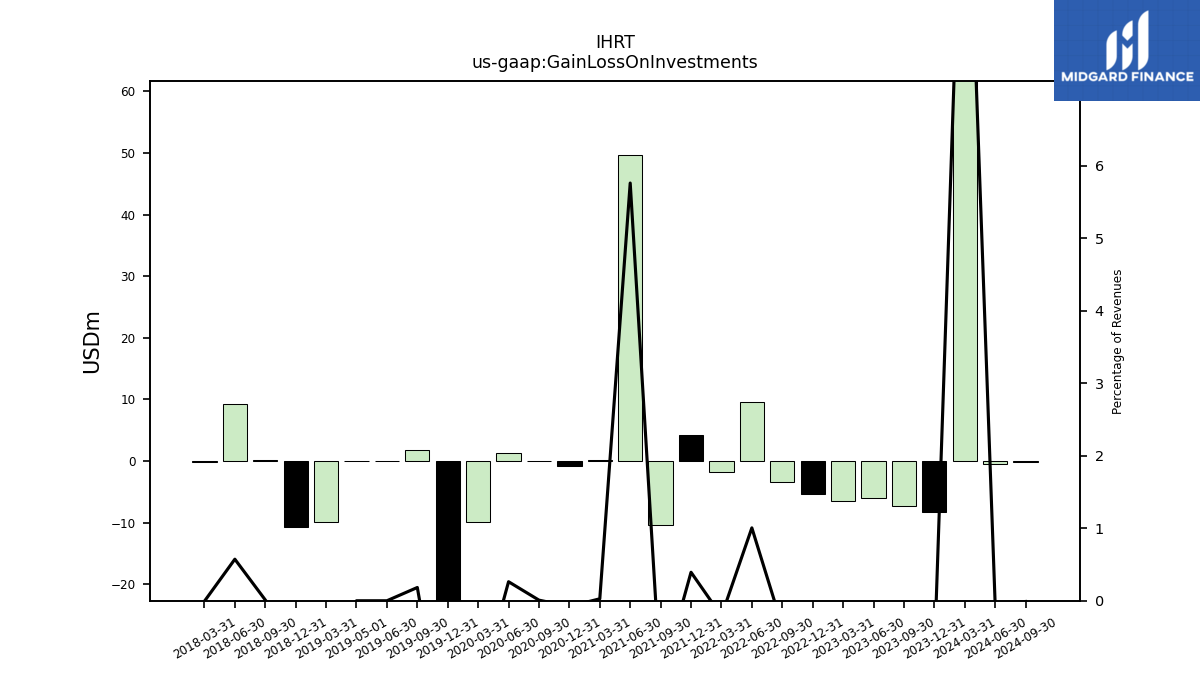
| Gain Loss On Investments | -7.38 | -6.04 | -6.50 | -5.40 | -3.47 | 9.59 | -1.76 | 4.17 | -10.37 | 49.64 | 0.19 | -0.73 | 0.06 | 1.28 | -9.96 | -22.66 | 1.74 | 0.00 | 0.00 | -9.96 | -10.64 | 0.19 | 9.18 | -0.09 | NA | NA | NA | NA | NA | NA | NA | NA | NA | NA | NA | NA | NA | NA | NA | NA | NA | NA | NA | NA | NA | NA | NA | NA | NA | NA | NA | NA | NA | NA | NA | |
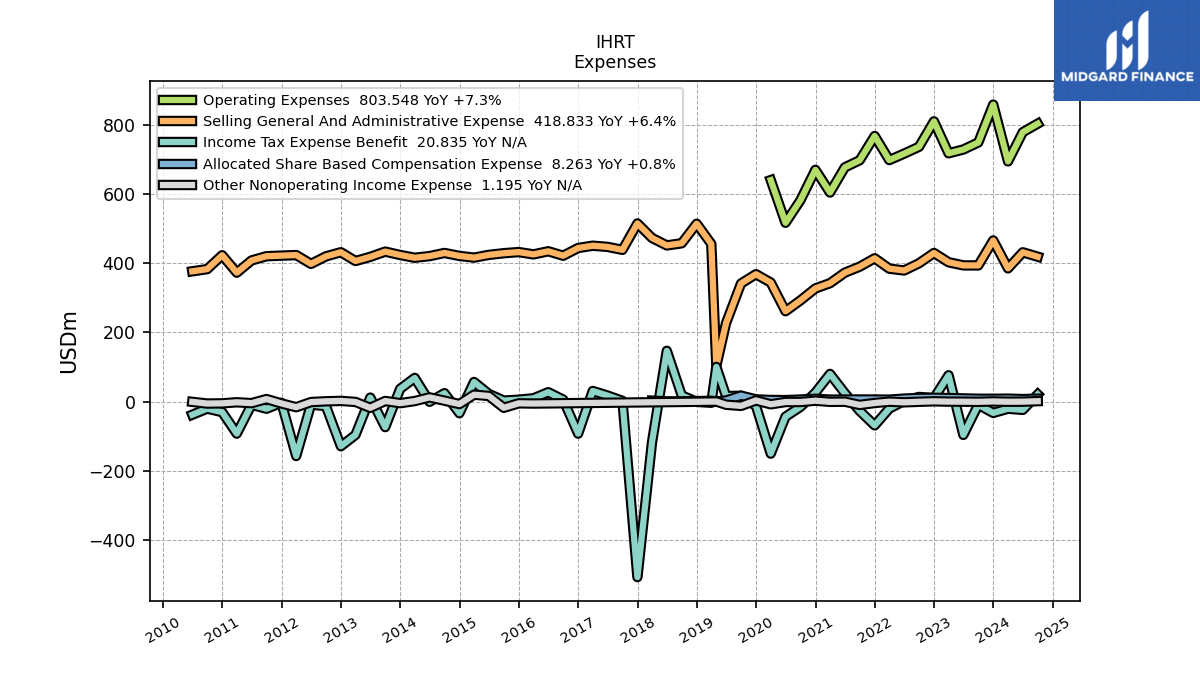
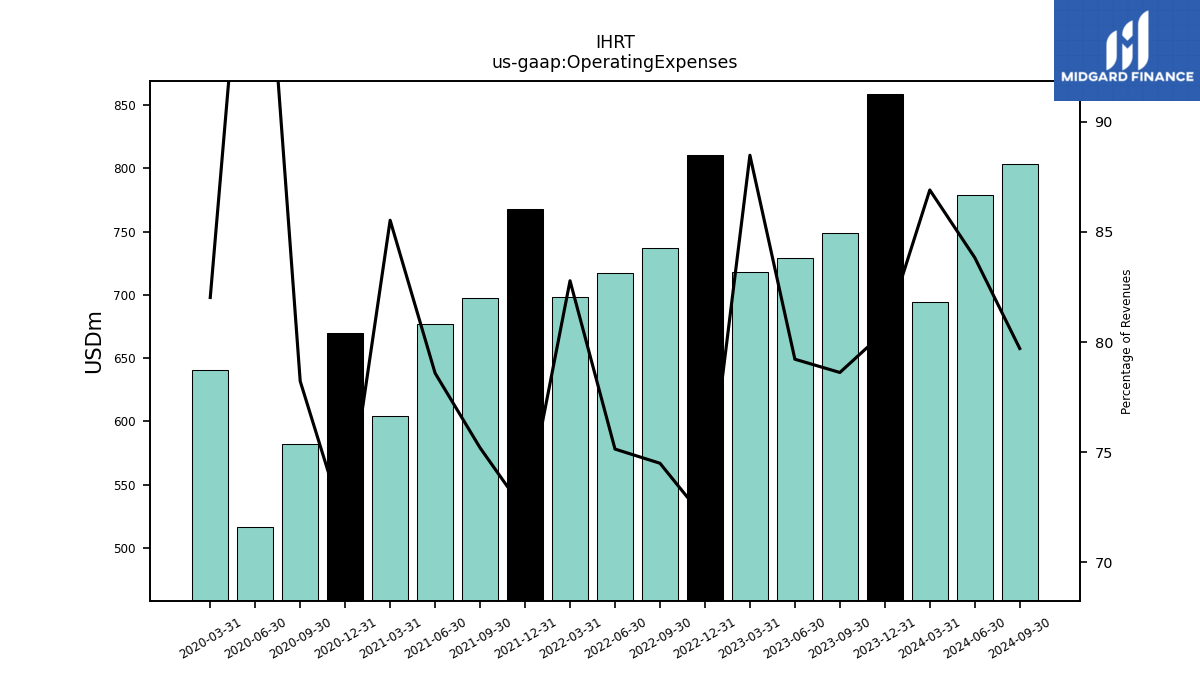
| Operating Expenses | 749.21 | 728.83 | 717.82 | 810.25 | 736.69 | 716.82 | 698.24 | 767.85 | 697.84 | 677.10 | 604.42 | 670.04 | 582.28 | 516.93 | 640.29 | NA | NA | NA | NA | NA | NA | NA | NA | NA | NA | NA | NA | NA | NA | NA | NA | NA | NA | NA | NA | NA | NA | NA | NA | NA | NA | NA | NA | NA | NA | NA | NA | NA | NA | NA | NA | NA | NA | NA | NA | |
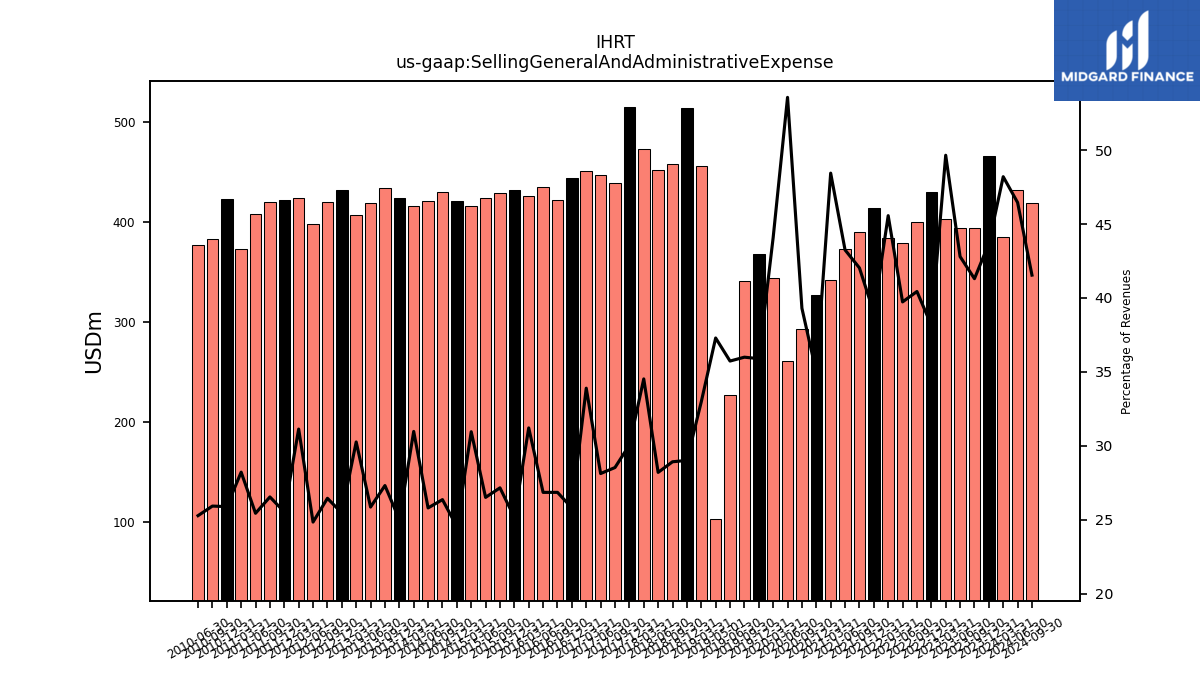
| Selling General And Administrative Expense | 393.63 | 393.77 | 402.80 | 429.65 | 399.89 | 379.06 | 384.34 | 414.30 | 390.09 | 372.64 | 342.33 | 327.16 | 292.58 | 261.22 | 344.14 | 368.31 | 341.35 | 227.14 | 103.55 | 455.72 | 514.27 | 457.76 | 451.49 | 472.99 | 515.08 | 438.65 | 447.29 | 450.62 | 444.05 | 421.70 | 434.58 | 425.57 | 432.24 | 428.97 | 424.16 | 416.19 | 421.12 | 429.69 | 420.58 | 415.83 | 423.80 | 433.60 | 418.42 | 406.44 | 431.84 | 419.86 | 398.12 | 423.63 | 421.95 | 420.26 | 408.11 | 372.71 | 423.15 | 383.00 | 376.64 | |
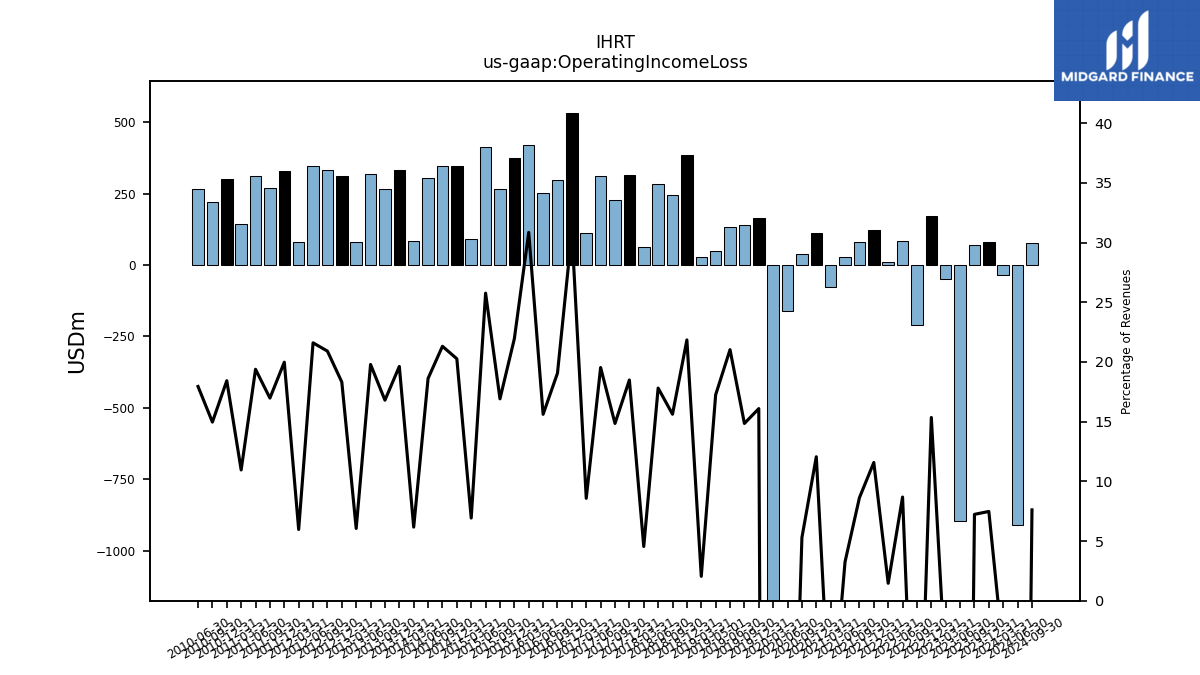
| Operating Income Loss | 68.97 | -897.19 | -48.86 | 172.84 | -211.19 | 82.87 | 12.34 | 122.98 | 80.11 | 28.13 | -76.36 | 112.85 | 39.40 | -159.09 | -1730.78 | 165.13 | 140.82 | 133.69 | 47.89 | 28.26 | 387.22 | 247.29 | 285.15 | 62.25 | 316.91 | 228.31 | 310.66 | 114.06 | 531.87 | 299.40 | 252.72 | 420.69 | 376.96 | 267.13 | 412.20 | 93.14 | 347.77 | 347.44 | 303.57 | 82.81 | 332.53 | 266.71 | 320.22 | 81.33 | 310.73 | 331.91 | 346.20 | 81.22 | 330.22 | 268.76 | 311.04 | 144.70 | 301.24 | 221.10 | 267.43 | |
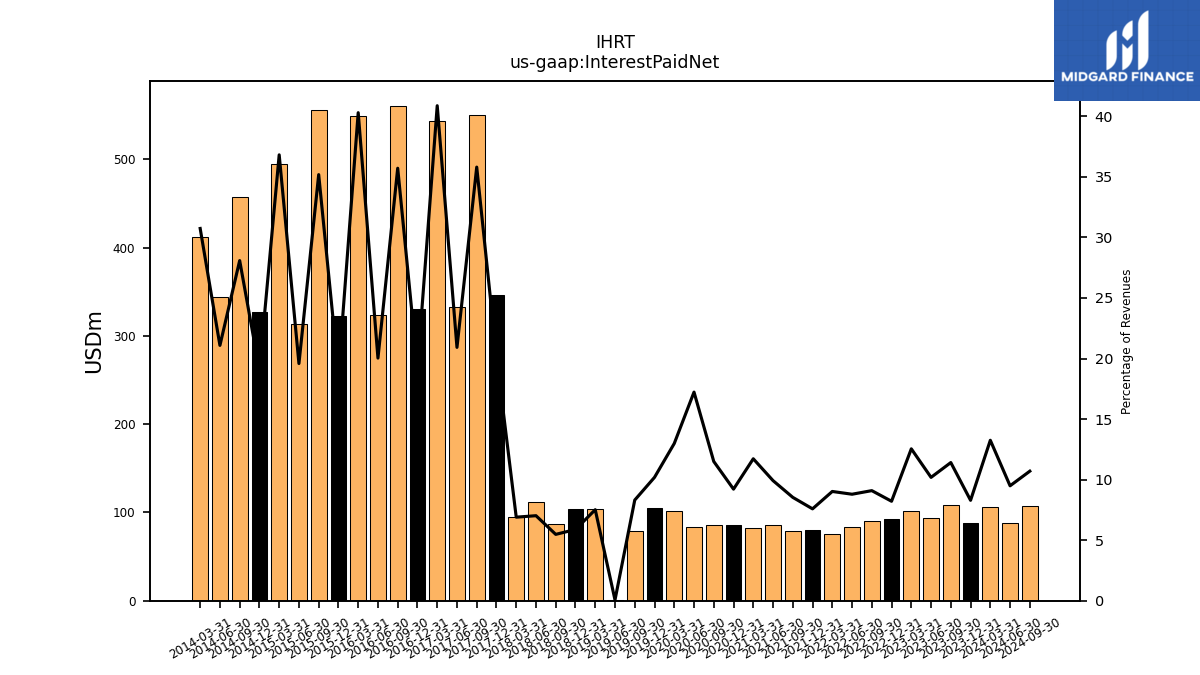
| Interest Paid Net | 108.73 | 93.72 | 101.76 | 92.48 | 89.91 | 83.90 | 76.10 | 80.59 | 79.22 | 85.46 | 82.83 | 86.20 | 85.60 | 84.00 | 101.36 | 104.54 | 78.83 | 0.43 | NA | 103.90 | 104.30 | 86.74 | 112.42 | 94.53 | 345.97 | 550.44 | 332.69 | 543.32 | 330.29 | 560.78 | 324.26 | 549.44 | 322.93 | 555.70 | 313.35 | 495.01 | 326.73 | 457.81 | 343.68 | 412.64 | NA | NA | NA | NA | NA | NA | NA | NA | NA | NA | NA | NA | NA | NA | NA | |
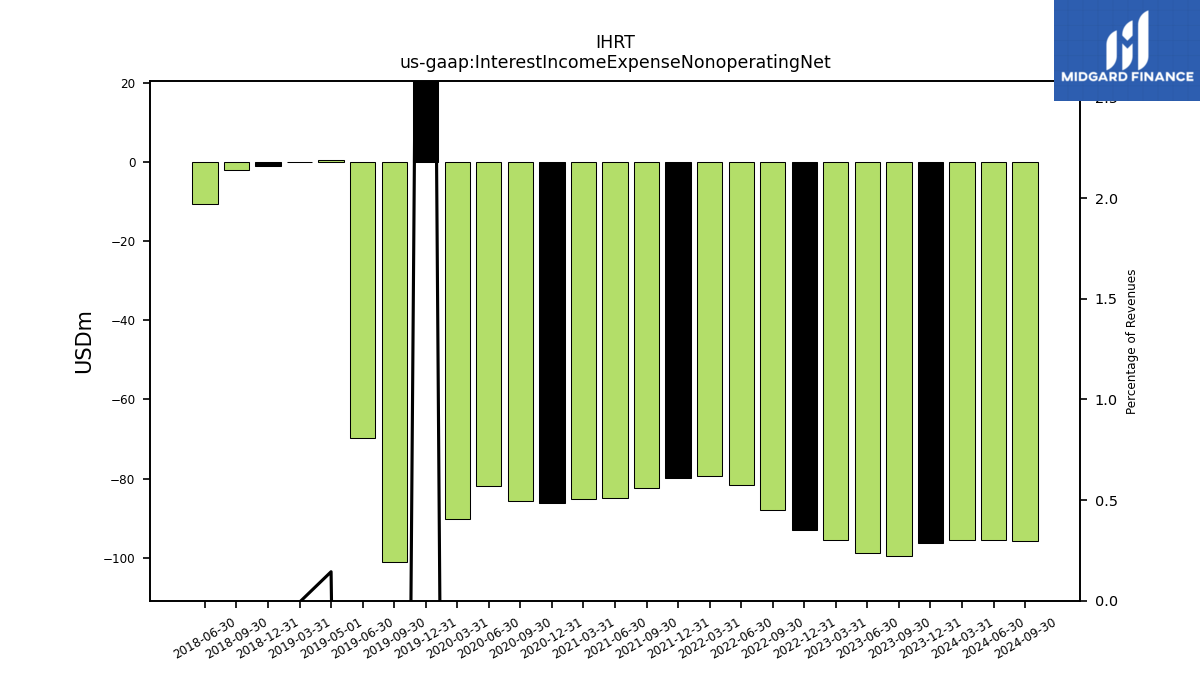
| Interest Income Expense Nonoperating Net | -99.51 | -98.69 | -95.46 | -93.07 | -87.89 | -81.49 | -79.22 | -79.89 | -82.48 | -84.89 | -85.12 | -86.13 | -85.56 | -81.96 | -90.09 | 96.09 | -100.97 | -69.71 | 0.40 | -0.10 | -0.95 | -2.10 | -10.61 | NA | NA | NA | NA | NA | NA | NA | NA | NA | NA | NA | NA | NA | NA | NA | NA | NA | NA | NA | NA | NA | NA | NA | NA | NA | NA | NA | NA | NA | NA | NA | NA | |
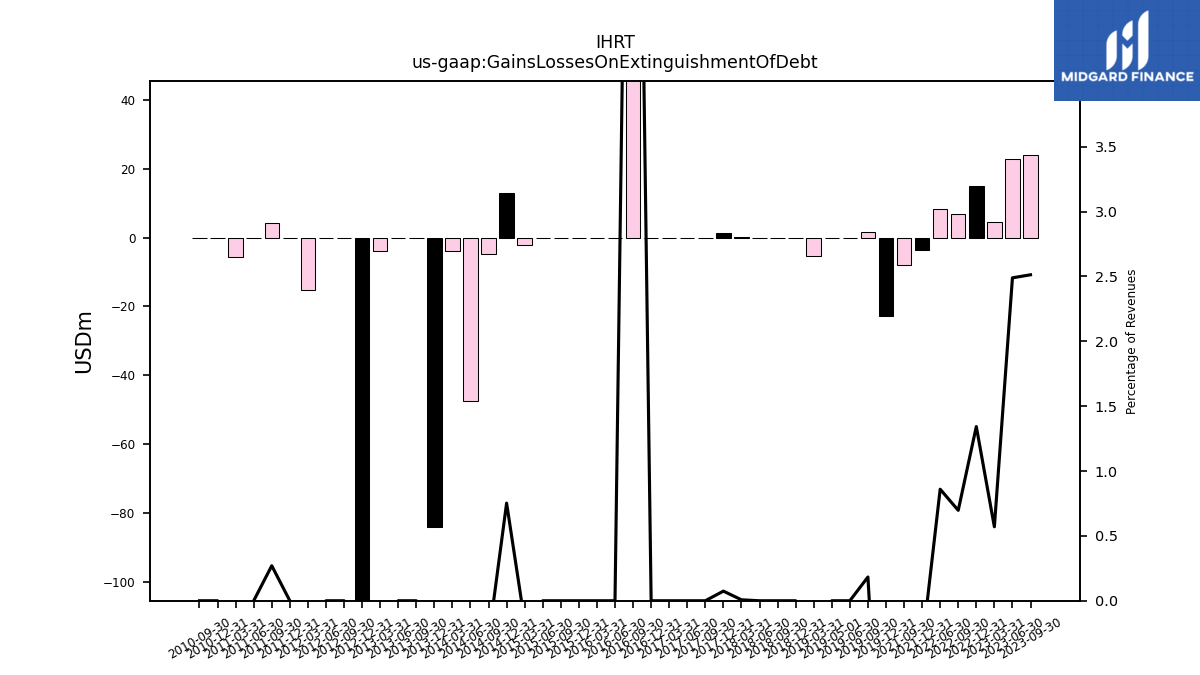
| Gains Losses On Extinguishment Of Debt | 23.95 | 22.90 | 4.62 | 15.12 | 6.89 | 8.20 | NA | -3.70 | -7.90 | NA | NA | NA | NA | NA | NA | -22.66 | 1.74 | 0.00 | 0.00 | -5.47 | 0.00 | 0.00 | 0.00 | 0.10 | 1.27 | 0.00 | 0.00 | 0.00 | 0.00 | 157.56 | 0.00 | 0.00 | 0.00 | 0.00 | 0.00 | -2.20 | 12.91 | -4.84 | -47.50 | -3.92 | -83.98 | 0.00 | 0.00 | -3.89 | -239.56 | 0.00 | 0.00 | -15.17 | 0.00 | 4.27 | 0.00 | -5.72 | 0.00 | 0.00 | NA | |
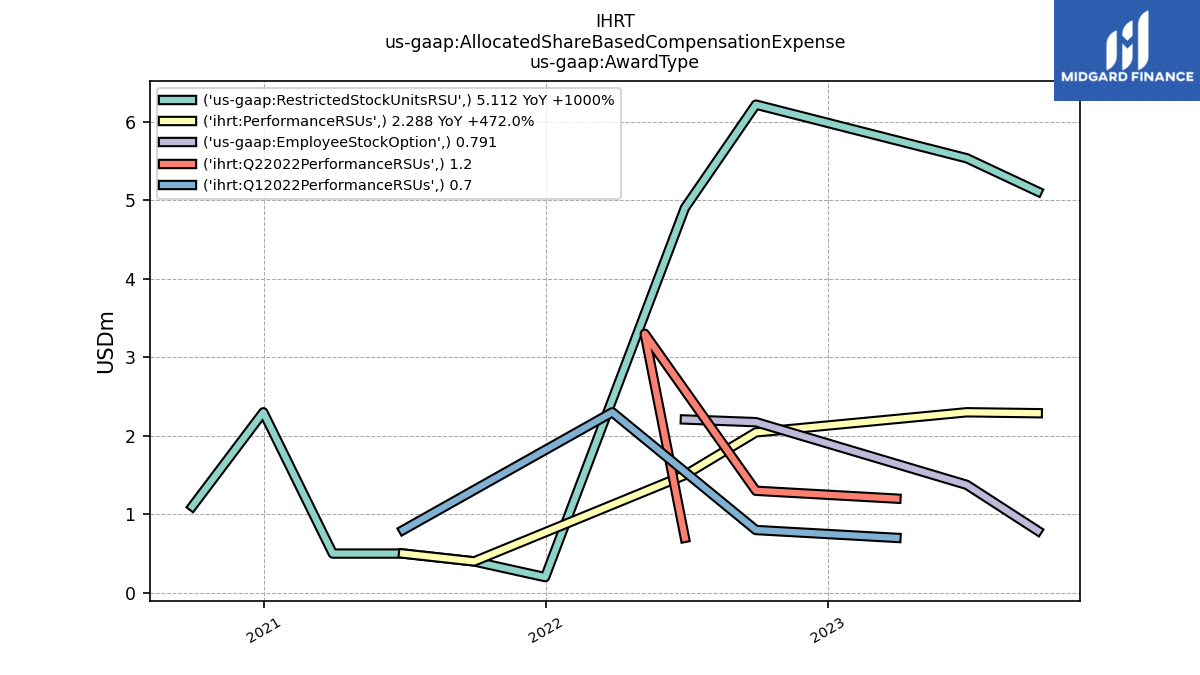
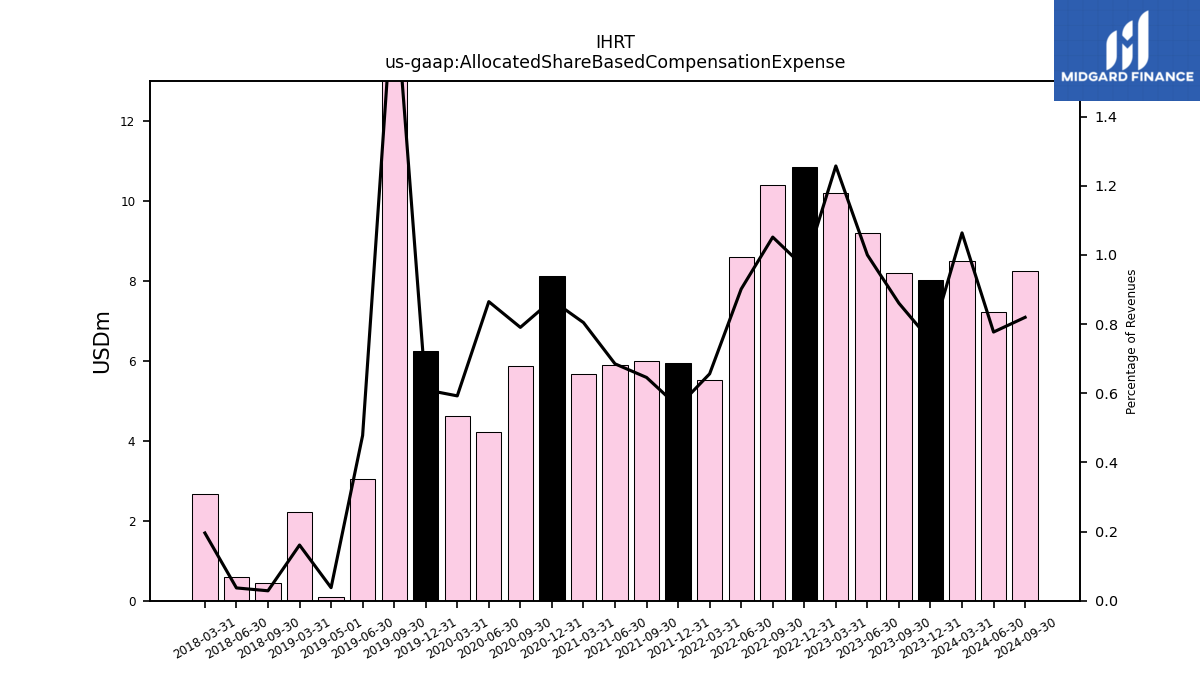
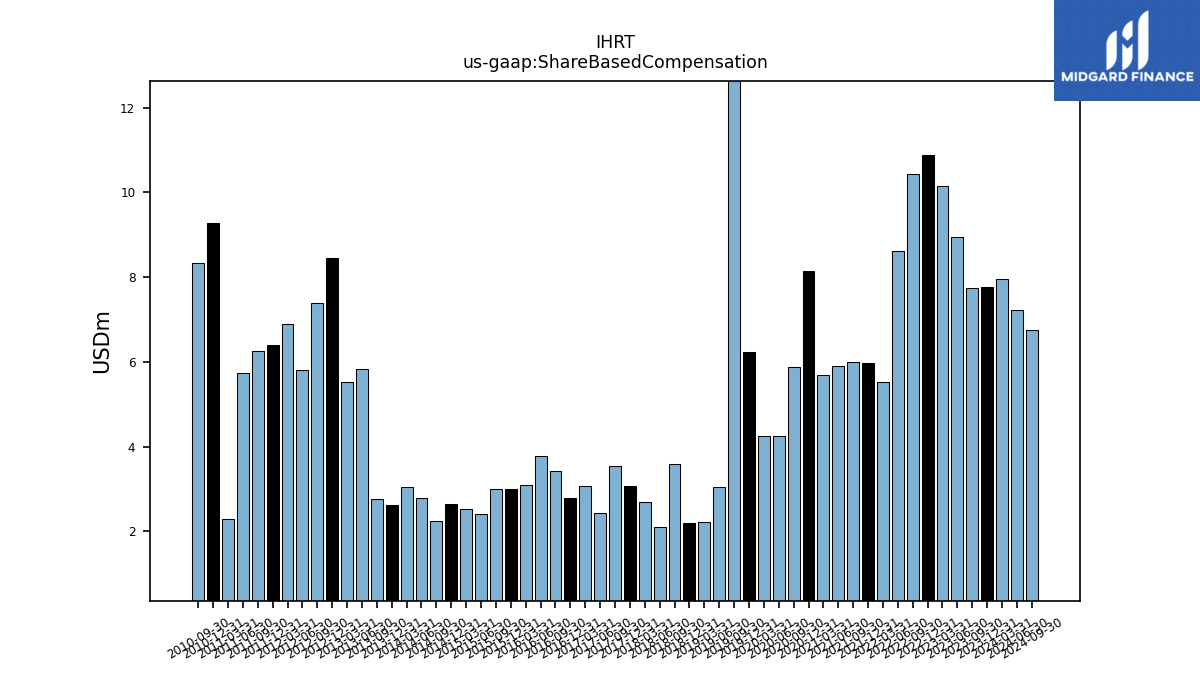
| Allocated Share Based Compensation Expense | 8.20 | 9.20 | 10.20 | 10.86 | 10.40 | 8.60 | 5.54 | 5.96 | 5.99 | 5.90 | 5.68 | 8.13 | 5.88 | 4.22 | 4.62 | 6.26 | 17.11 | 3.04 | 0.10 | 2.23 | NA | 0.46 | 0.59 | 2.68 | NA | NA | NA | NA | NA | NA | NA | NA | NA | NA | NA | NA | NA | NA | NA | NA | NA | NA | NA | NA | NA | NA | NA | NA | NA | NA | NA | NA | NA | NA | NA | |
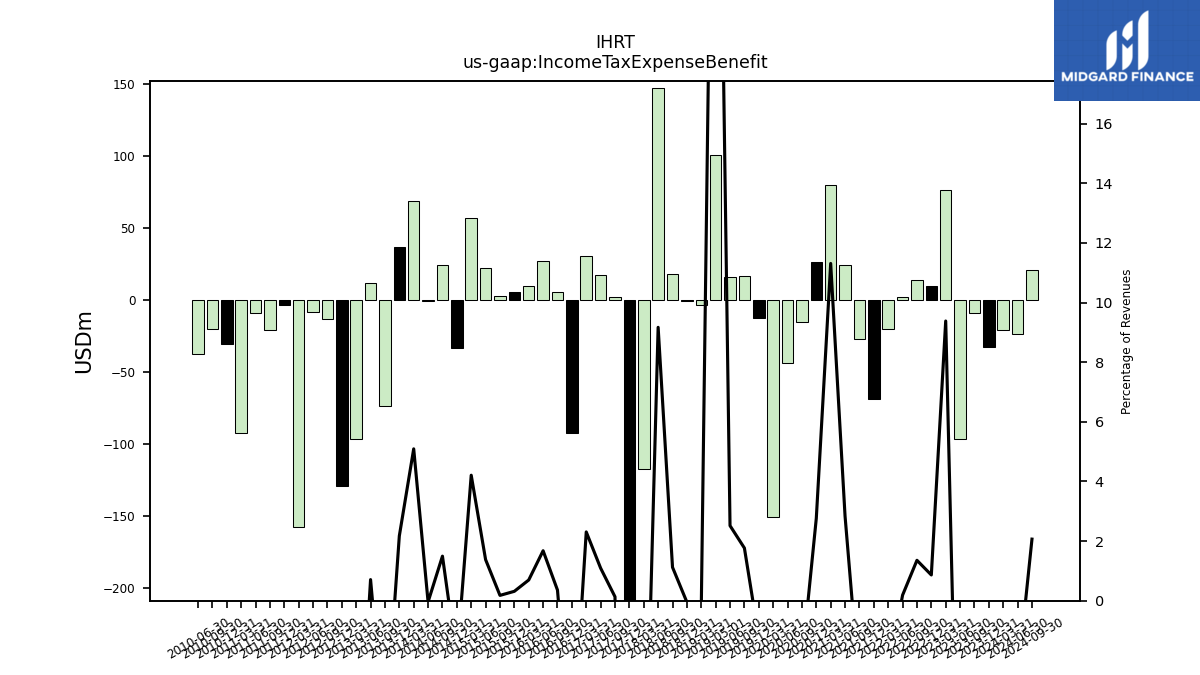
| Income Tax Expense Benefit | -9.26 | -96.36 | 76.11 | 9.73 | 13.41 | 1.78 | -20.21 | -68.85 | -27.15 | 24.45 | 79.94 | 25.86 | -15.23 | -43.74 | -150.51 | -12.67 | 16.76 | 16.00 | 100.29 | -3.43 | -0.84 | 17.77 | 146.78 | -117.37 | -507.55 | 2.05 | 17.41 | 30.68 | -92.72 | 5.61 | 27.14 | 9.49 | 5.43 | 2.84 | 22.08 | 56.60 | -33.65 | 24.38 | -0.62 | 68.39 | 36.83 | -73.80 | 11.48 | -96.33 | -128.99 | -13.23 | -8.66 | -157.40 | -3.47 | -20.66 | -9.18 | -92.66 | -30.40 | -20.41 | -37.98 | |
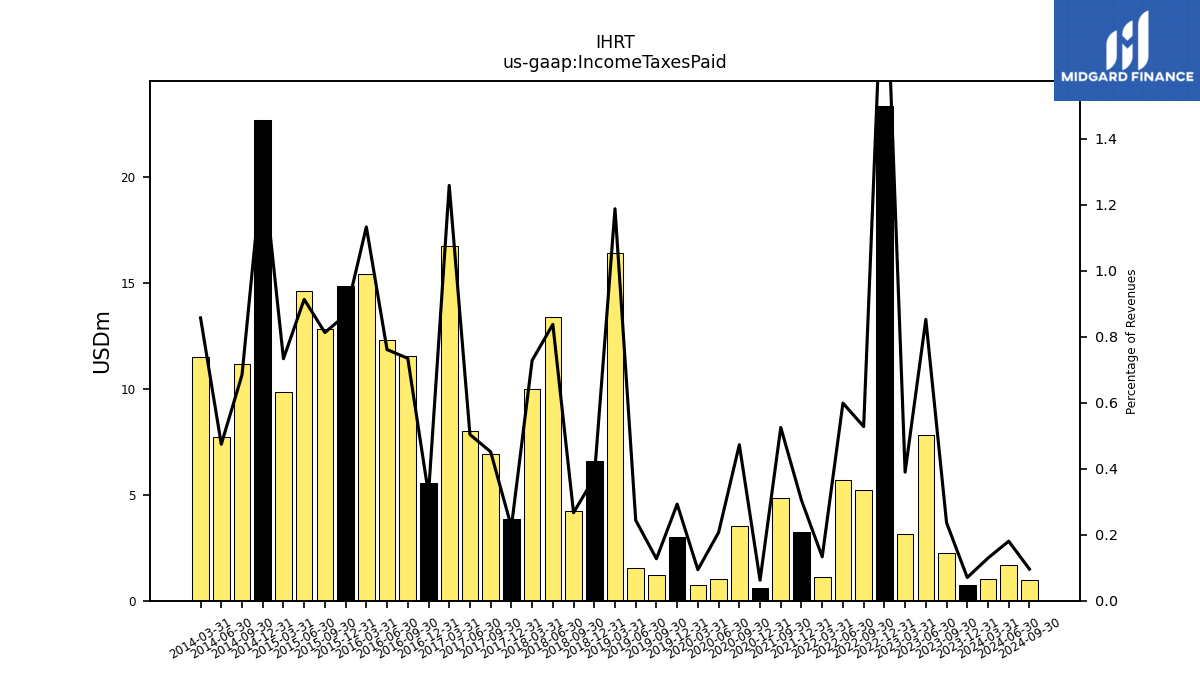
| Income Taxes Paid | 2.25 | 7.84 | 3.16 | 23.36 | 5.22 | 5.71 | 1.12 | 3.23 | 4.87 | NA | NA | 0.58 | 3.52 | 1.01 | 0.73 | 3.00 | 1.21 | 1.55 | NA | 16.41 | 6.61 | 4.22 | 13.40 | 9.97 | 3.84 | 6.94 | 8.01 | 16.73 | 5.56 | 11.53 | 12.31 | 15.44 | 14.87 | 12.83 | 14.61 | 9.86 | 22.69 | 11.15 | 7.73 | 11.50 | NA | NA | NA | NA | NA | NA | NA | NA | NA | NA | NA | NA | NA | NA | NA | |
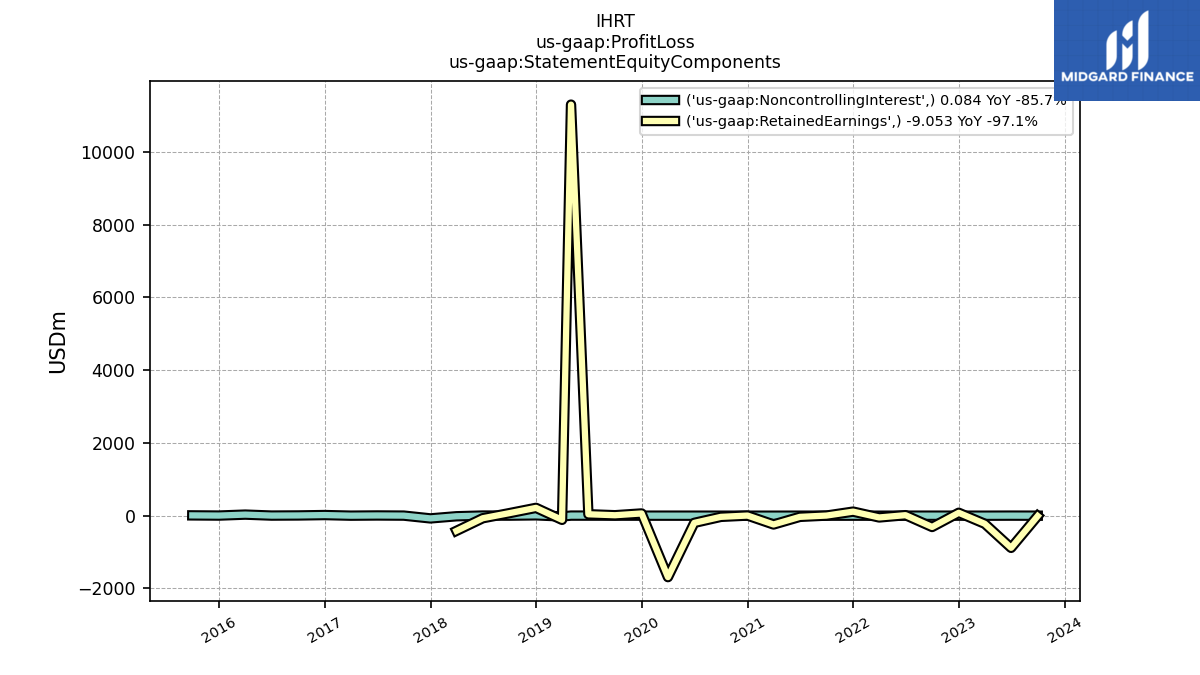
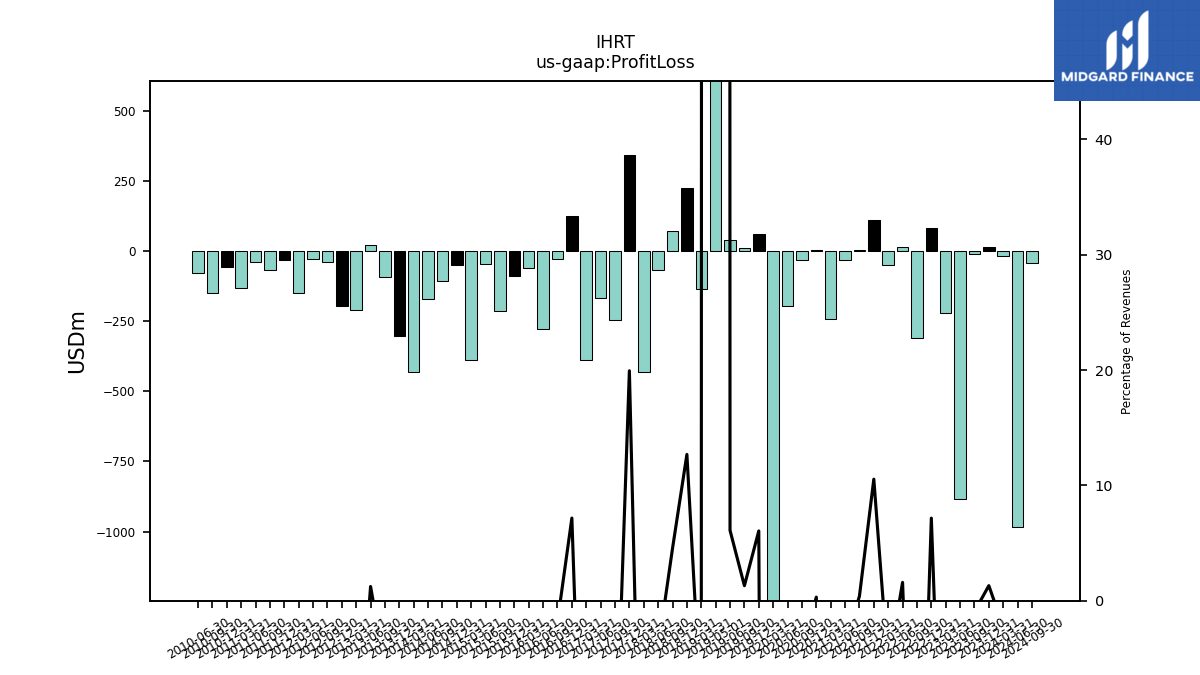
| Profit Loss | -8.97 | -882.98 | -222.36 | 80.66 | -309.78 | 15.18 | -48.74 | 111.95 | 3.67 | -31.96 | -242.06 | 2.94 | -32.11 | -197.32 | -1688.74 | 62.13 | 12.37 | 38.79 | 11300.71 | -135.60 | 224.91 | 71.78 | -66.29 | -431.55 | 341.76 | -246.18 | -168.02 | -387.58 | 123.40 | -28.48 | -276.04 | -58.89 | -90.07 | -213.47 | -47.31 | -386.63 | -50.16 | -107.82 | -171.78 | -432.39 | -302.23 | -92.17 | 20.01 | -209.12 | -196.78 | -38.58 | -27.71 | -148.12 | -31.40 | -67.29 | -37.98 | -131.36 | -55.63 | -150.39 | -77.21 | |
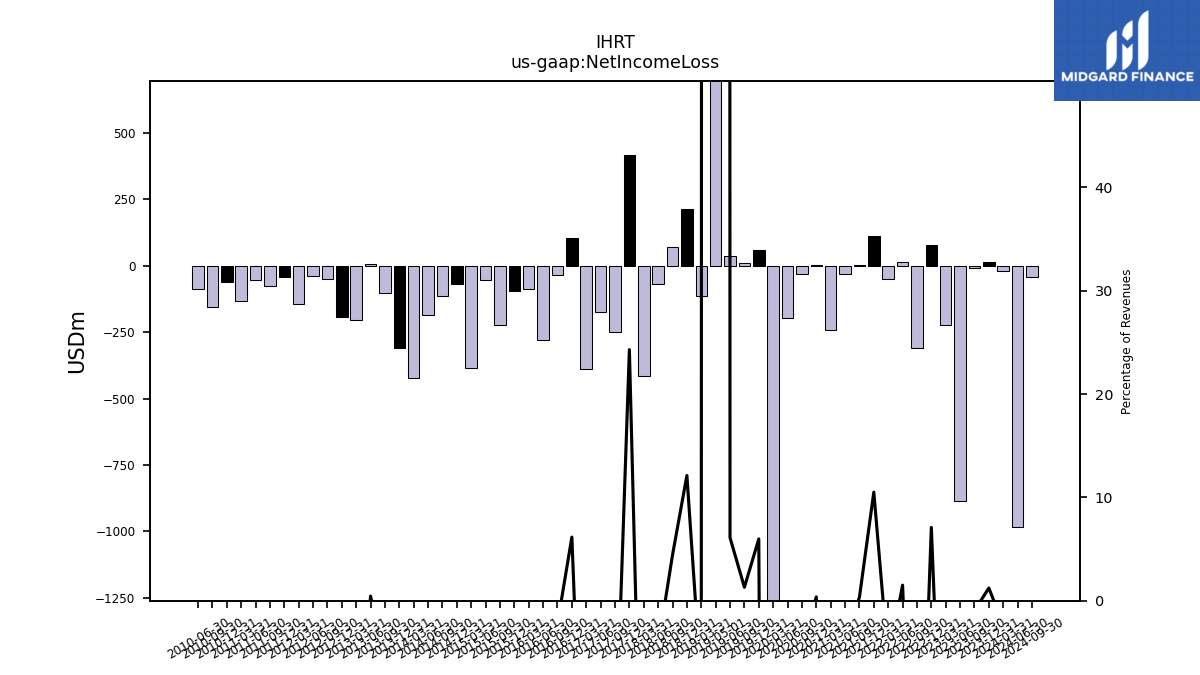
| Net Income Loss | -9.05 | -884.47 | -222.26 | 79.88 | -310.36 | 14.40 | -48.58 | 111.63 | 3.18 | -32.29 | -241.72 | 3.47 | -32.11 | -197.32 | -1688.74 | 61.38 | 12.37 | 38.79 | 11298.52 | -114.38 | 214.91 | 70.08 | -69.90 | -415.65 | 416.54 | -248.18 | -174.04 | -388.21 | 106.04 | -34.95 | -278.89 | -88.52 | -93.27 | -221.92 | -54.47 | -384.97 | -68.09 | -114.85 | -186.63 | -424.19 | -309.23 | -101.86 | 7.20 | -203.00 | -191.26 | -50.56 | -39.02 | -143.63 | -43.03 | -74.06 | -53.18 | -131.83 | -62.67 | -154.69 | -86.32 | |
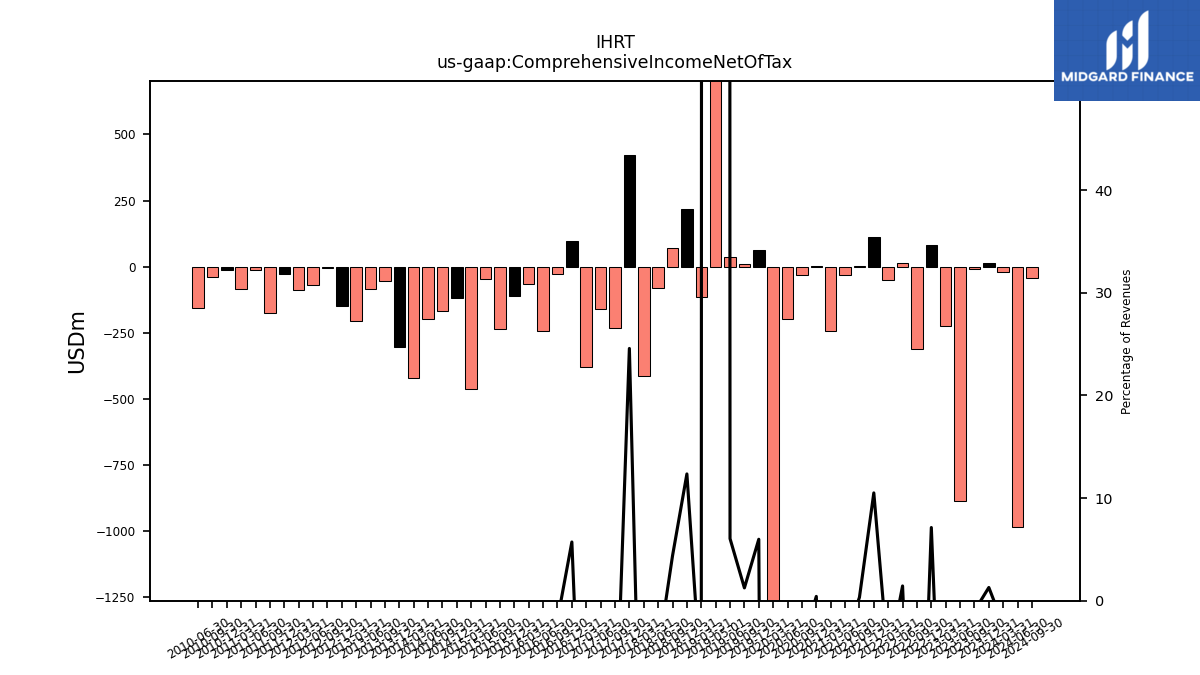
| Comprehensive Income Net Of Tax | -9.38 | -884.55 | -222.31 | 80.31 | -310.97 | 13.75 | -48.83 | 111.57 | 3.05 | -32.33 | -241.94 | 3.96 | -31.84 | -197.03 | -1688.84 | 61.46 | 11.88 | 38.47 | 11295.82 | -115.64 | 218.95 | 69.21 | -79.93 | -414.16 | 421.19 | -233.57 | -159.47 | -378.73 | 98.50 | -28.93 | -241.51 | -65.86 | -111.26 | -235.63 | -48.03 | -461.10 | -117.77 | -168.25 | -197.29 | -419.05 | -304.95 | -54.83 | -84.97 | -204.93 | -148.74 | -4.51 | -68.96 | -89.50 | -27.88 | -174.67 | -13.33 | -82.84 | -11.55 | -38.12 | -155.75 | |
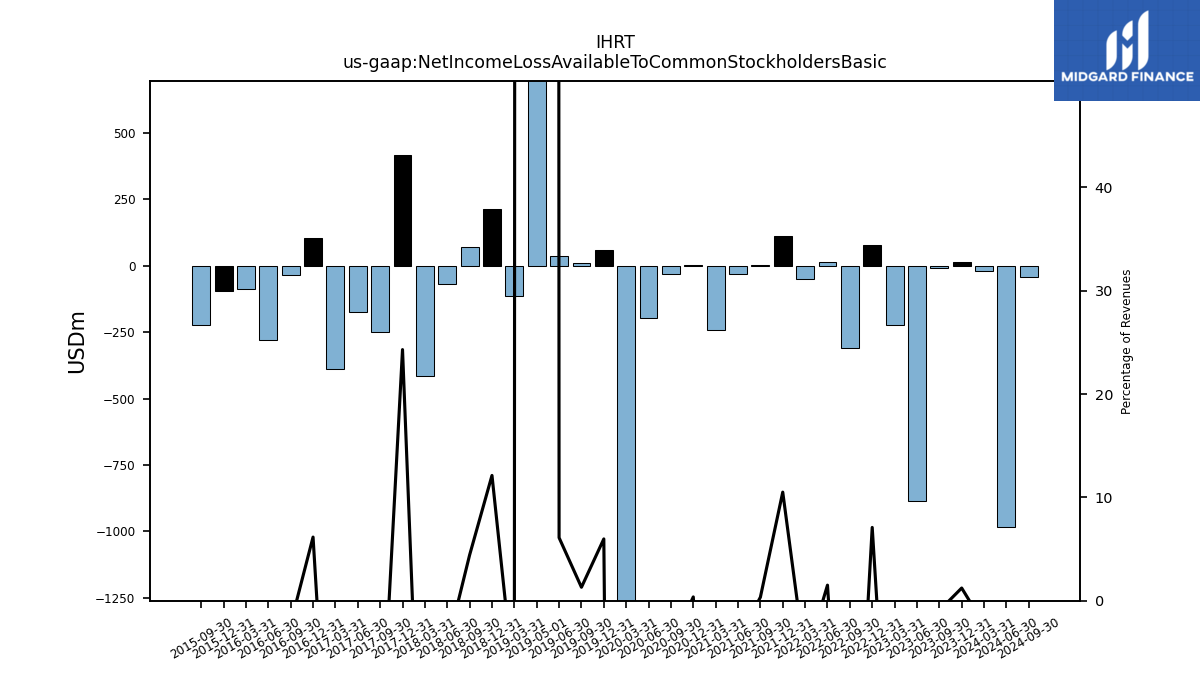
| Net Income Loss Available To Common Stockholders Basic | -9.05 | -884.47 | -222.26 | 79.88 | -310.36 | 14.40 | -48.58 | 111.63 | 3.18 | -32.29 | -241.72 | 3.47 | -32.11 | -197.32 | -1688.74 | 61.38 | 12.37 | 38.79 | 11298.52 | -114.38 | 214.91 | 70.08 | -69.90 | -415.65 | 416.54 | -248.18 | -174.04 | -388.21 | 106.04 | -34.95 | -278.90 | -88.50 | -93.27 | -221.92 | NA | NA | NA | NA | NA | NA | NA | NA | NA | NA | NA | NA | NA | NA | NA | NA | NA | NA | NA | NA | NA | |
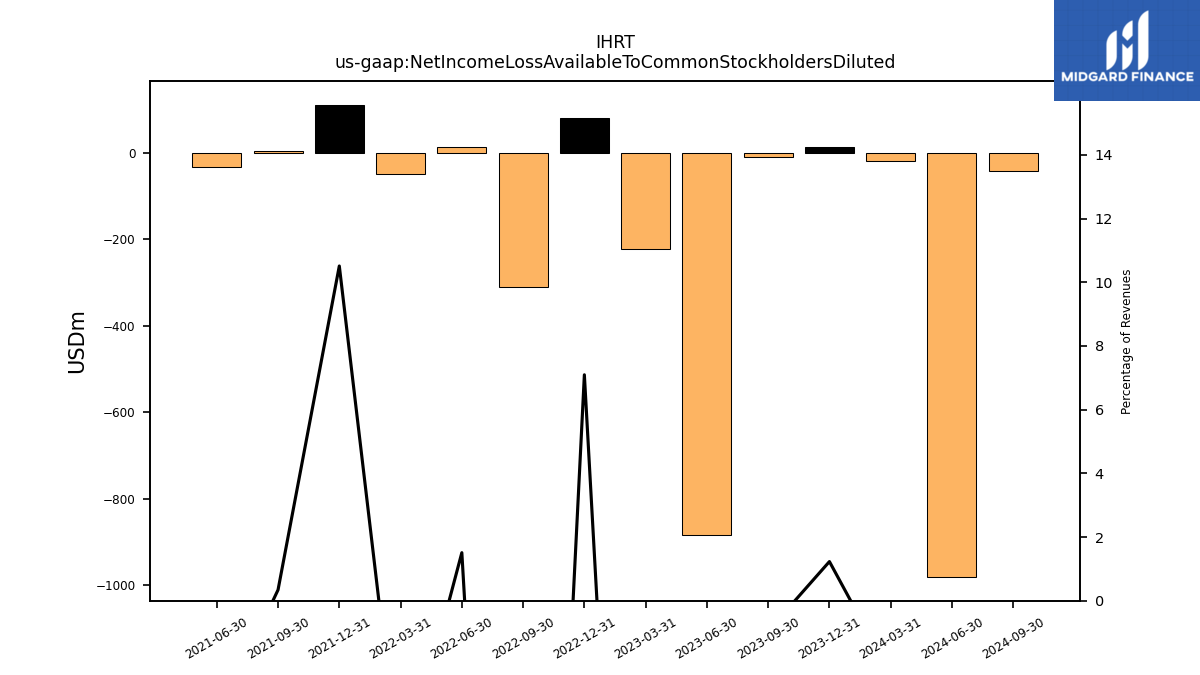
| Net Income Loss Available To Common Stockholders Diluted | -9.05 | -884.47 | -222.26 | 79.88 | -310.36 | 14.40 | -48.58 | 111.63 | 3.18 | -32.29 | NA | NA | NA | NA | NA | NA | NA | NA | NA | NA | NA | NA | NA | NA | NA | NA | NA | NA | NA | NA | NA | NA | NA | NA | NA | NA | NA | NA | NA | NA | NA | NA | NA | NA | NA | NA | NA | NA | NA | NA | NA | NA | NA | NA | NA | |
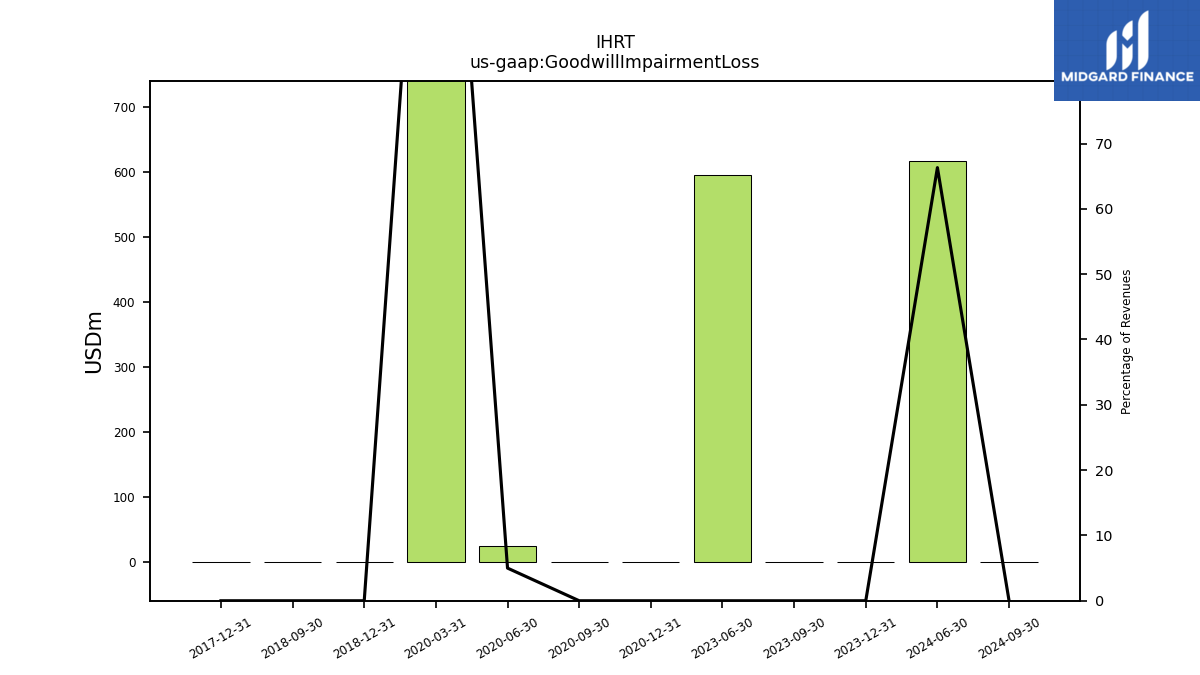
| Goodwill Impairment Loss | -0.04 | 595.50 | NA | NA | NA | NA | NA | NA | NA | NA | NA | 0.00 | 0.00 | 24.37 | 1200.00 | NA | NA | NA | NA | NA | 0.00 | 0.00 | NA | NA | 0.00 | NA | NA | NA | NA | NA | NA | NA | NA | NA | NA | NA | NA | NA | NA | NA | NA | NA | NA | NA | NA | NA | NA | NA | NA | NA | NA | NA | NA | NA | NA |
| 2023-09-30 | 2023-06-30 | 2023-03-31 | 2022-12-31 | 2022-09-30 | 2022-06-30 | 2022-03-31 | 2021-12-31 | 2021-09-30 | 2021-06-30 | 2021-03-31 | 2020-12-31 | 2020-09-30 | 2020-06-30 | 2020-03-31 | 2019-12-31 | 2019-09-30 | 2019-06-30 | 2019-05-01 | 2019-03-31 | 2018-12-31 | 2018-09-30 | 2018-06-30 | 2018-03-31 | 2017-12-31 | 2017-09-30 | 2017-06-30 | 2017-03-31 | 2016-12-31 | 2016-09-30 | 2016-06-30 | 2016-03-31 | 2015-12-31 | 2015-09-30 | 2015-06-30 | 2015-03-31 | 2014-12-31 | 2014-09-30 | 2014-06-30 | 2014-03-31 | 2013-12-31 | 2013-09-30 | 2013-06-30 | 2013-03-31 | 2012-12-31 | 2012-09-30 | 2012-06-30 | 2012-03-31 | 2011-12-31 | 2011-09-30 | 2011-06-30 | 2011-03-31 | 2010-12-31 | 2010-09-30 | 2010-06-30 | ||
|---|---|---|---|---|---|---|---|---|---|---|---|---|---|---|---|---|---|---|---|---|---|---|---|---|---|---|---|---|---|---|---|---|---|---|---|---|---|---|---|---|---|---|---|---|---|---|---|---|---|---|---|---|---|---|---|---|
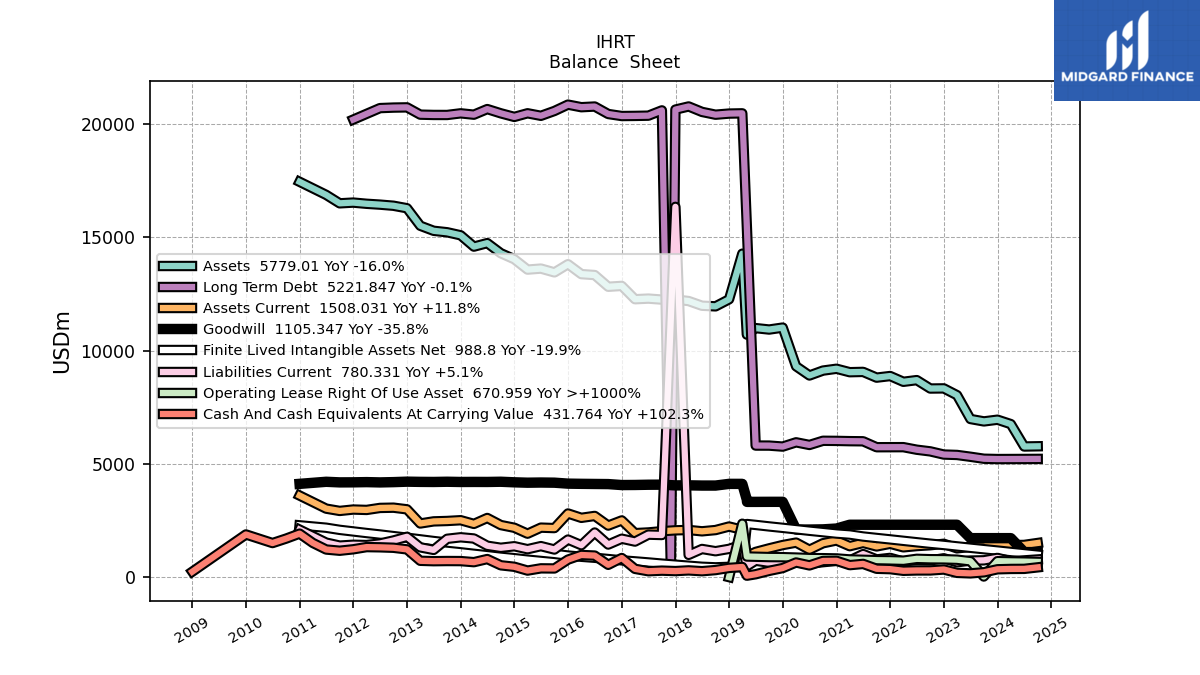
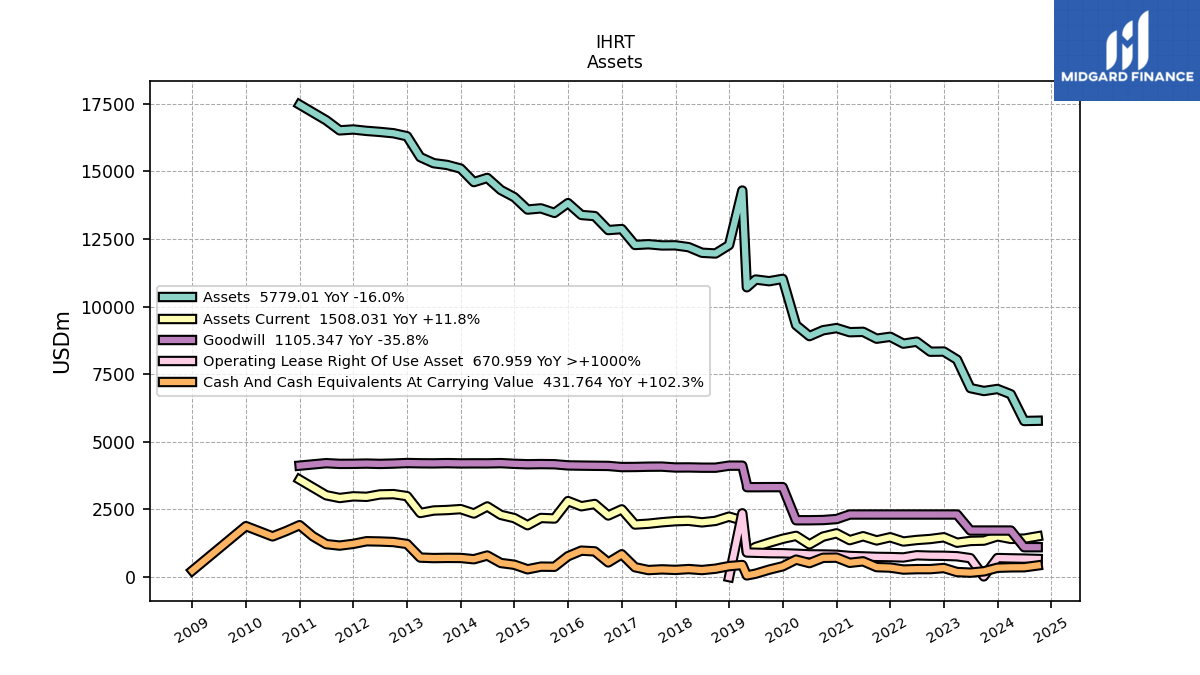
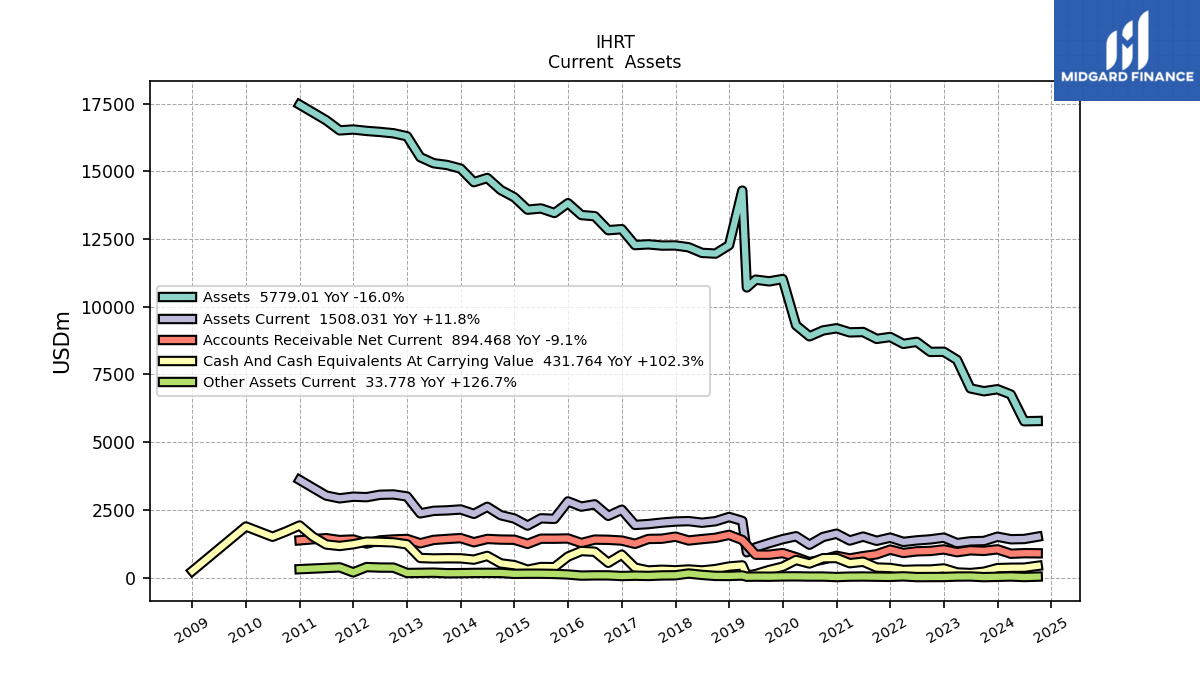
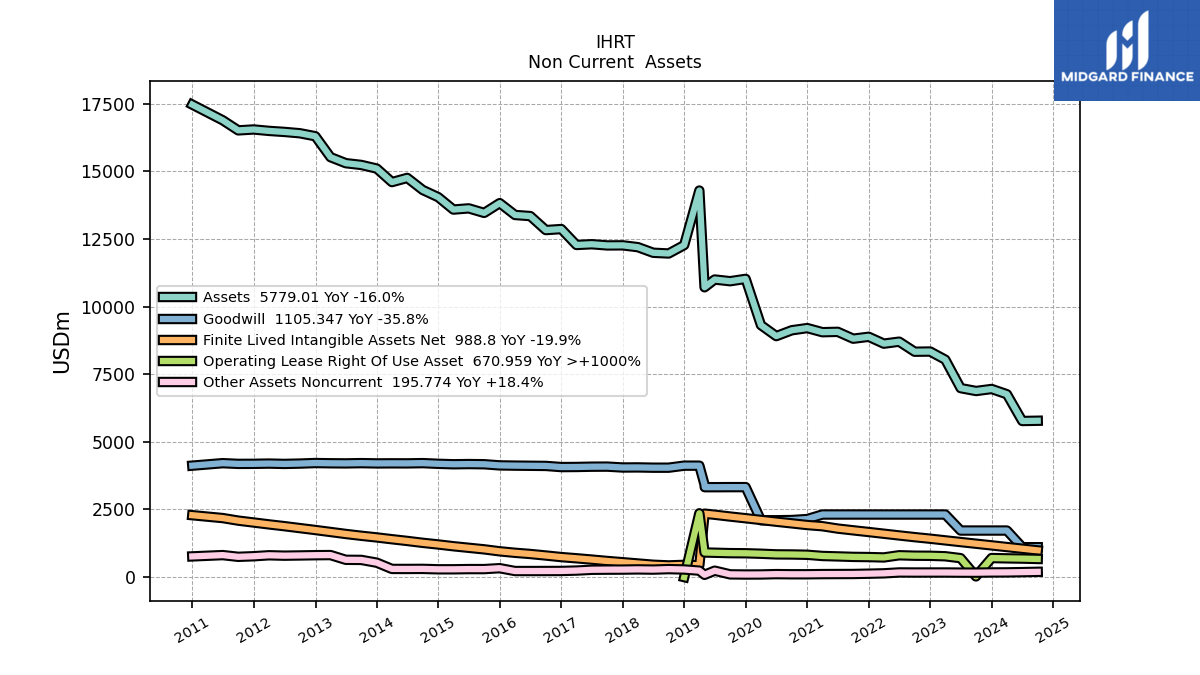
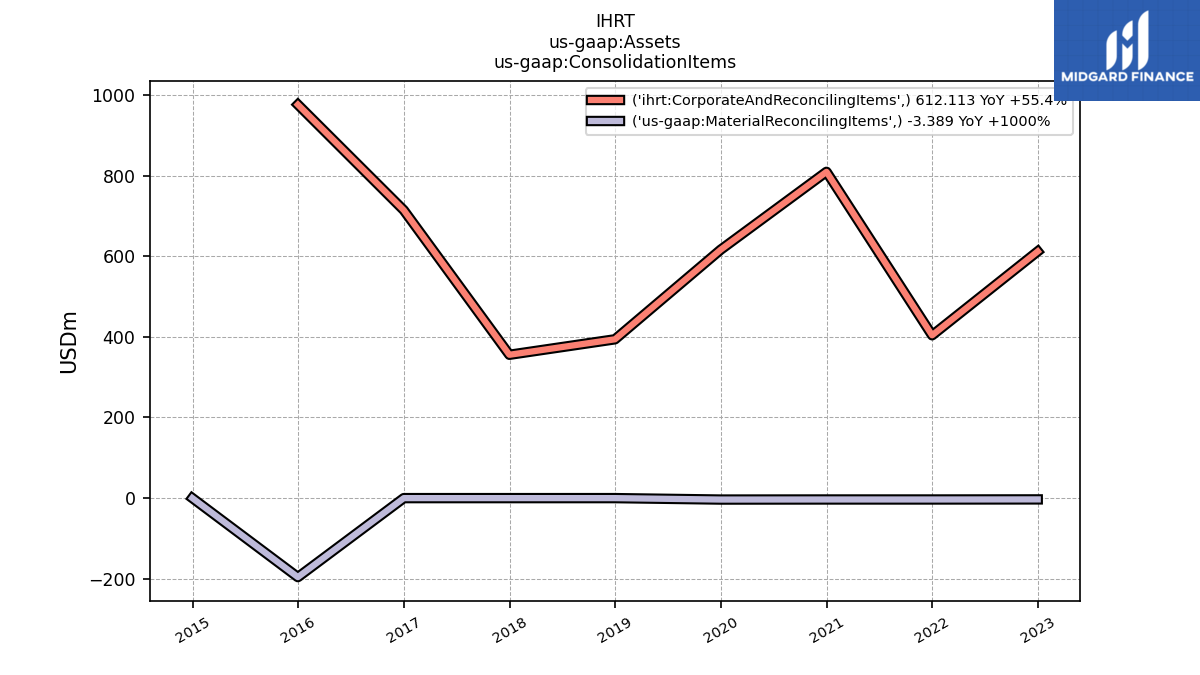
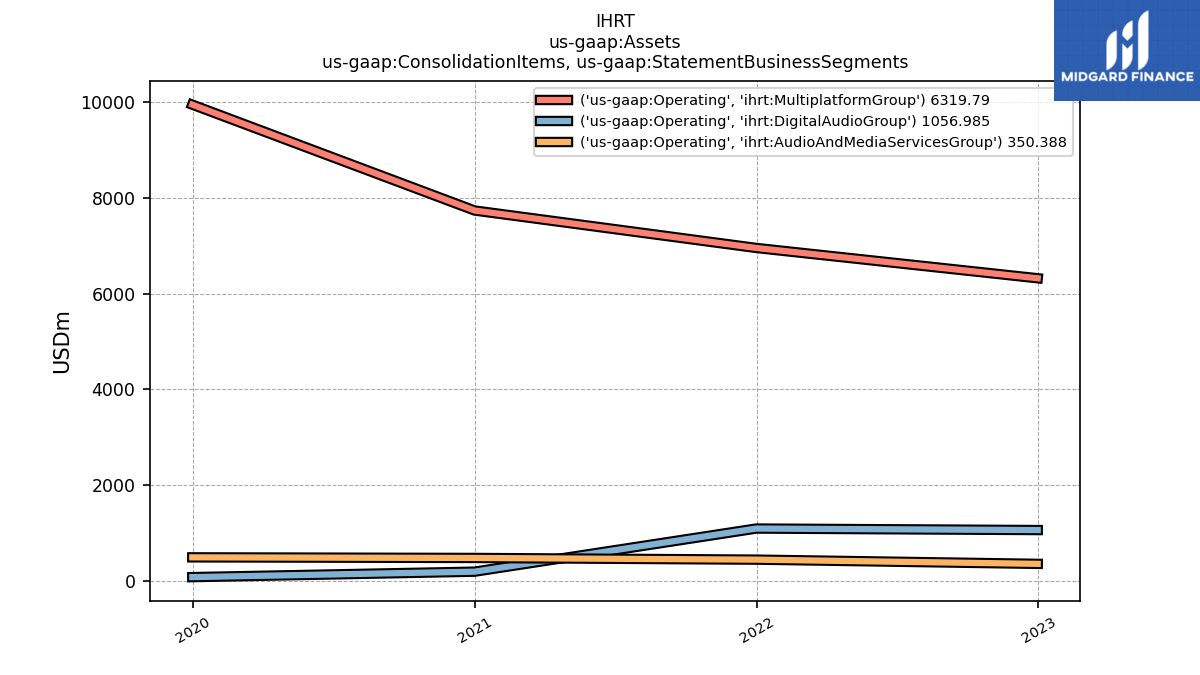
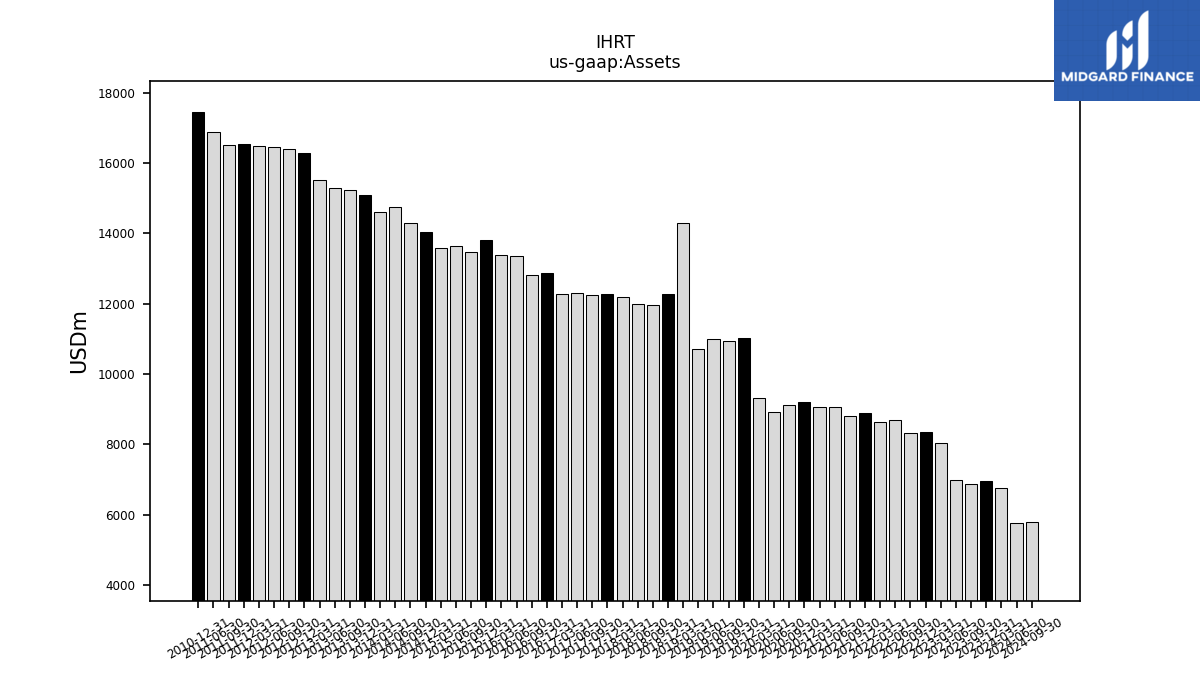
| Assets | 6877.52 | 6983.81 | 8035.19 | 8335.89 | 8329.70 | 8701.12 | 8627.01 | 8881.31 | 8810.61 | 9064.13 | 9051.00 | 9202.96 | 9122.11 | 8905.86 | 9312.06 | 11021.10 | 10934.95 | 10997.82 | 10710.21 | 14285.97 | 12269.51 | 11959.31 | 11986.25 | 12192.99 | 12260.43 | 12257.26 | 12301.45 | 12273.74 | 12862.25 | 12824.27 | 13341.37 | 13382.67 | 13821.10 | 13459.23 | 13626.94 | 13581.93 | 14040.24 | 14306.03 | 14752.18 | 14597.13 | 15097.30 | 15231.18 | 15296.48 | 15519.15 | 16292.71 | 16402.32 | 16451.82 | 16489.34 | 16542.04 | 16508.95 | 16882.05 | NA | 17460.38 | NA | NA | |
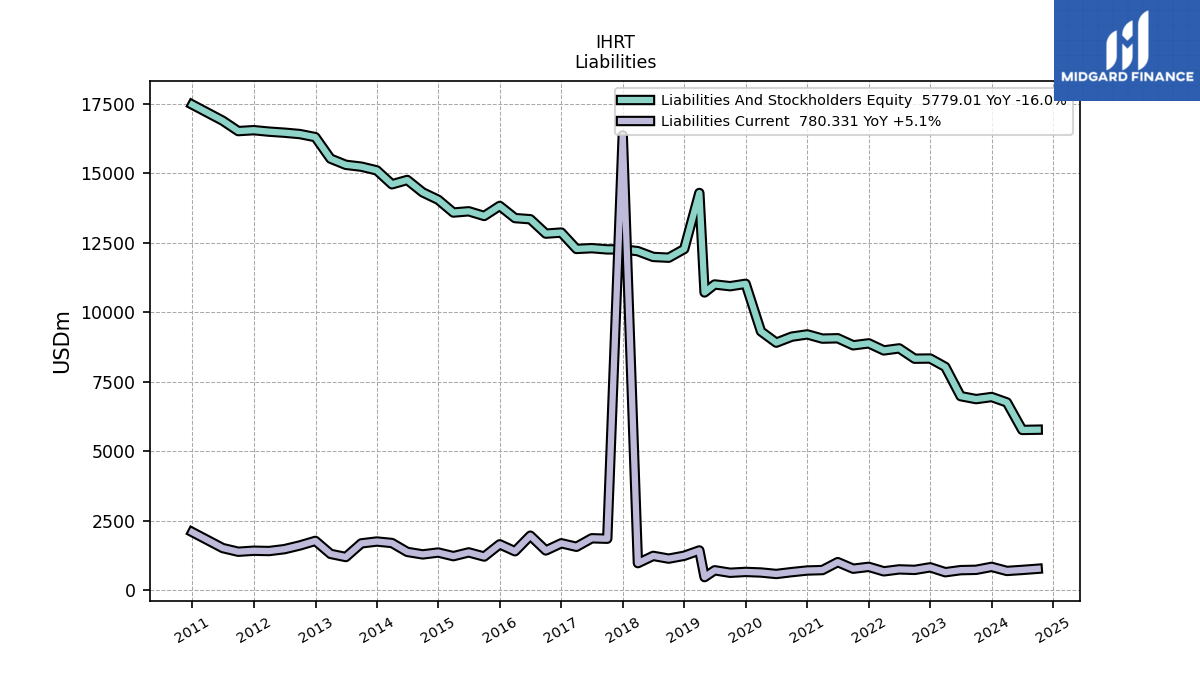
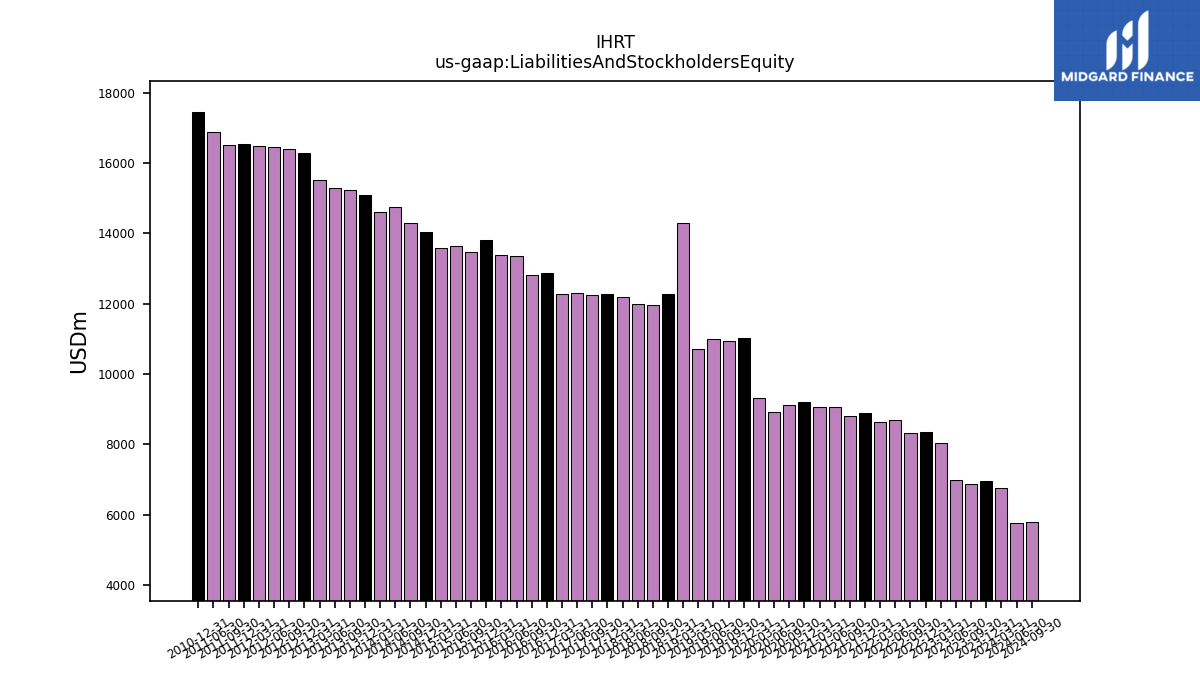
| Liabilities And Stockholders Equity | 6877.52 | 6983.81 | 8035.19 | 8335.89 | 8329.70 | 8701.12 | 8627.01 | 8881.31 | 8810.61 | 9064.13 | 9051.00 | 9202.96 | 9122.11 | 8905.86 | 9312.06 | 11021.10 | 10934.95 | 10997.82 | 10710.21 | 14285.97 | 12269.51 | 11959.31 | 11986.25 | 12192.99 | 12260.43 | 12257.26 | 12301.45 | 12273.74 | 12862.25 | 12824.27 | 13341.37 | 13382.67 | 13821.10 | 13459.23 | 13626.94 | 13581.93 | 14040.24 | 14306.03 | 14752.18 | 14597.13 | 15097.30 | 15231.18 | 15296.48 | 15519.15 | 16292.71 | 16402.32 | 16451.82 | 16489.34 | 16542.04 | 16508.95 | 16882.05 | NA | 17460.38 | NA | NA |
| 2023-09-30 | 2023-06-30 | 2023-03-31 | 2022-12-31 | 2022-09-30 | 2022-06-30 | 2022-03-31 | 2021-12-31 | 2021-09-30 | 2021-06-30 | 2021-03-31 | 2020-12-31 | 2020-09-30 | 2020-06-30 | 2020-03-31 | 2019-12-31 | 2019-09-30 | 2019-06-30 | 2019-05-01 | 2019-03-31 | 2018-12-31 | 2018-09-30 | 2018-06-30 | 2018-03-31 | 2017-12-31 | 2017-09-30 | 2017-06-30 | 2017-03-31 | 2016-12-31 | 2016-09-30 | 2016-06-30 | 2016-03-31 | 2015-12-31 | 2015-09-30 | 2015-06-30 | 2015-03-31 | 2014-12-31 | 2014-09-30 | 2014-06-30 | 2014-03-31 | 2013-12-31 | 2013-09-30 | 2013-06-30 | 2013-03-31 | 2012-12-31 | 2012-09-30 | 2012-06-30 | 2012-03-31 | 2011-12-31 | 2011-09-30 | 2011-06-30 | 2011-03-31 | 2010-12-31 | 2010-09-30 | 2010-06-30 | ||
|---|---|---|---|---|---|---|---|---|---|---|---|---|---|---|---|---|---|---|---|---|---|---|---|---|---|---|---|---|---|---|---|---|---|---|---|---|---|---|---|---|---|---|---|---|---|---|---|---|---|---|---|---|---|---|---|---|
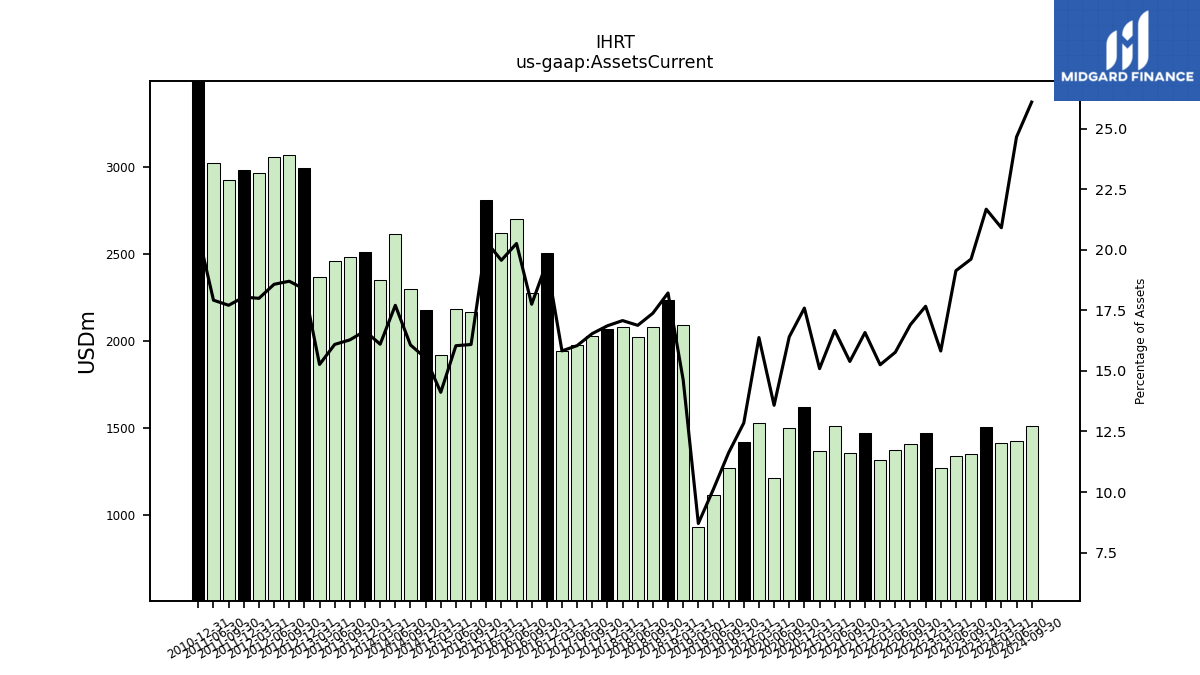
| Assets Current | 1349.00 | 1336.39 | 1271.33 | 1472.78 | 1408.58 | 1372.12 | 1315.90 | 1472.87 | 1356.02 | 1511.04 | 1366.08 | 1618.98 | 1496.52 | 1209.55 | 1524.96 | 1416.35 | 1271.16 | 1113.68 | 932.28 | 2090.05 | 2235.02 | 2078.79 | 2023.37 | 2082.20 | 2067.35 | 2027.47 | 1973.59 | 1942.53 | 2504.69 | 2276.52 | 2702.81 | 2618.39 | 2810.88 | 2165.60 | 2185.84 | 1917.55 | 2180.14 | 2299.52 | 2612.01 | 2350.39 | 2513.29 | 2479.74 | 2461.72 | 2369.15 | 2993.81 | 3067.41 | 3055.87 | 2967.34 | 2985.28 | 2923.59 | 3025.02 | NA | 3603.17 | NA | NA | |
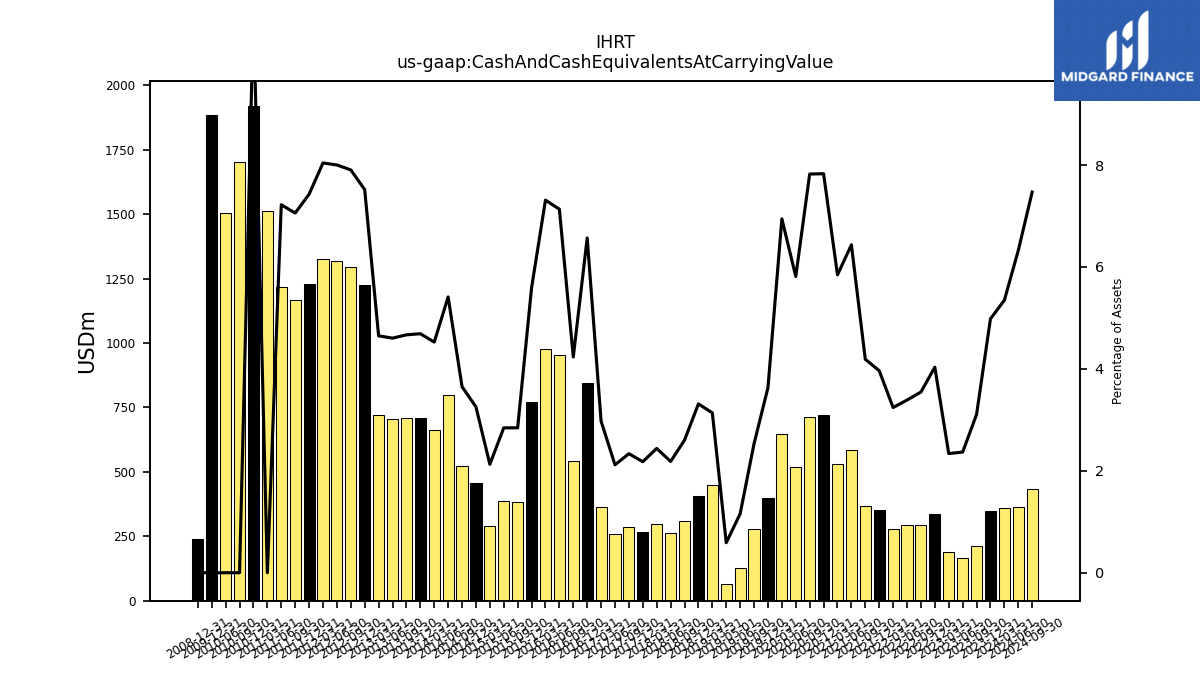
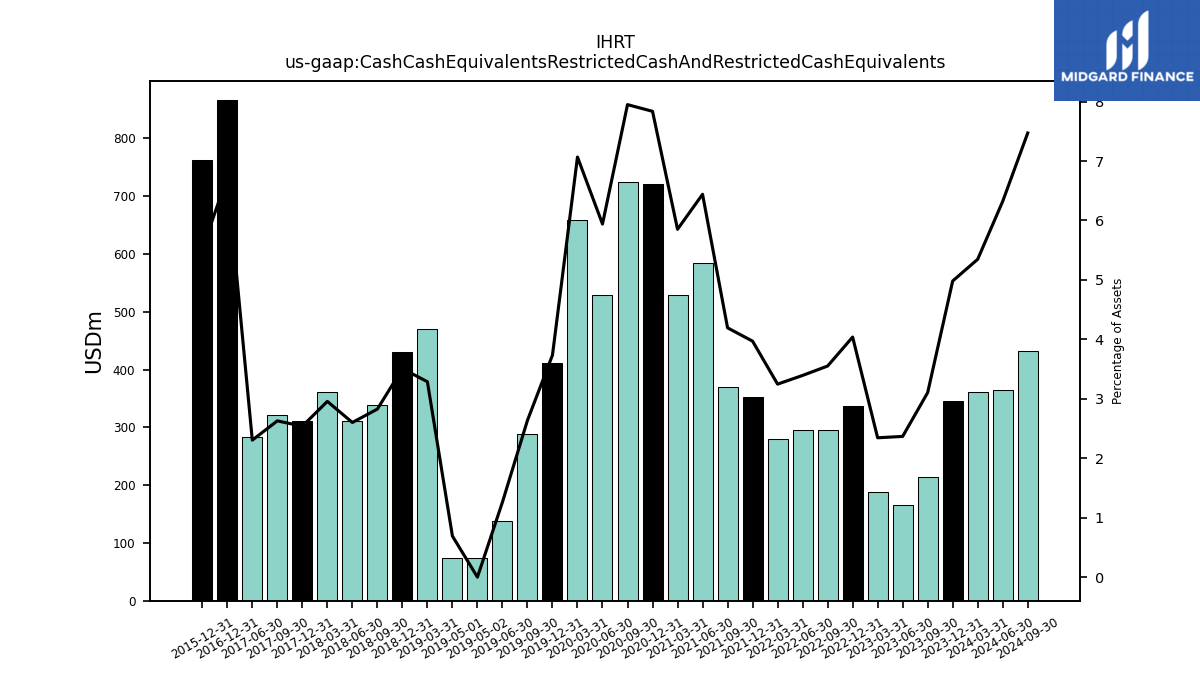
| Cash And Cash Equivalents At Carrying Value | 213.48 | 165.32 | 187.93 | 336.24 | 295.40 | 294.83 | 279.68 | 352.13 | 369.09 | 583.34 | 529.13 | 720.66 | 713.73 | 517.68 | 646.77 | 400.30 | 277.05 | 127.16 | 63.14 | 448.13 | 406.49 | 311.16 | 261.76 | 297.41 | 267.11 | 286.37 | 260.46 | 365.04 | 845.00 | 542.91 | 951.85 | 978.54 | 772.68 | 382.85 | 387.45 | 289.01 | 457.02 | 522.36 | 798.44 | 660.74 | 708.15 | 711.05 | 704.17 | 721.57 | 1225.01 | 1296.64 | 1316.52 | 1326.06 | 1228.68 | 1165.38 | 1219.16 | 1510.80 | 1920.93 | 1700.83 | 1504.73 | |
| Cash Cash Equivalents Restricted Cash And Restricted Cash Equivalents | 213.48 | 165.32 | 188.36 | 336.66 | 295.82 | 295.26 | 280.11 | 352.55 | 369.52 | 583.76 | 529.66 | 721.19 | 725.13 | 529.03 | 658.12 | 411.62 | 288.34 | 138.75 | 74.01 | 469.59 | 430.33 | 338.10 | 311.85 | 360.50 | 311.30 | 322.20 | 283.50 | NA | 866.18 | NA | NA | NA | 761.87 | NA | NA | NA | NA | NA | NA | NA | NA | NA | NA | NA | NA | NA | NA | NA | NA | NA | NA | NA | NA | NA | NA | |
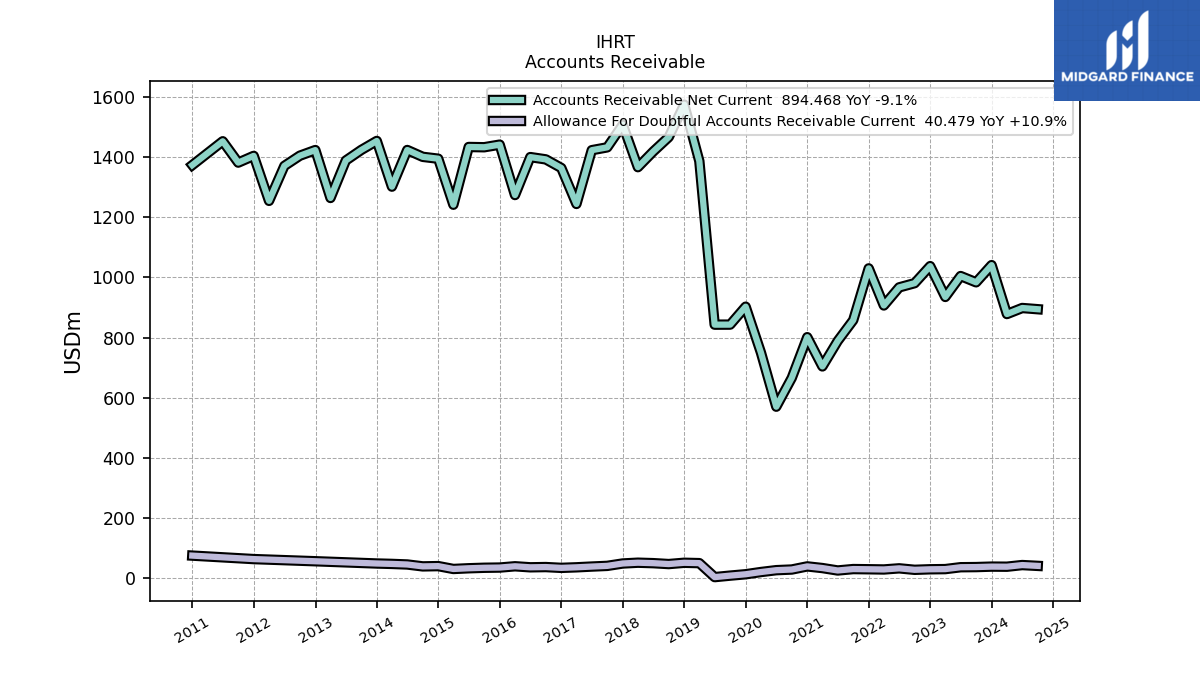
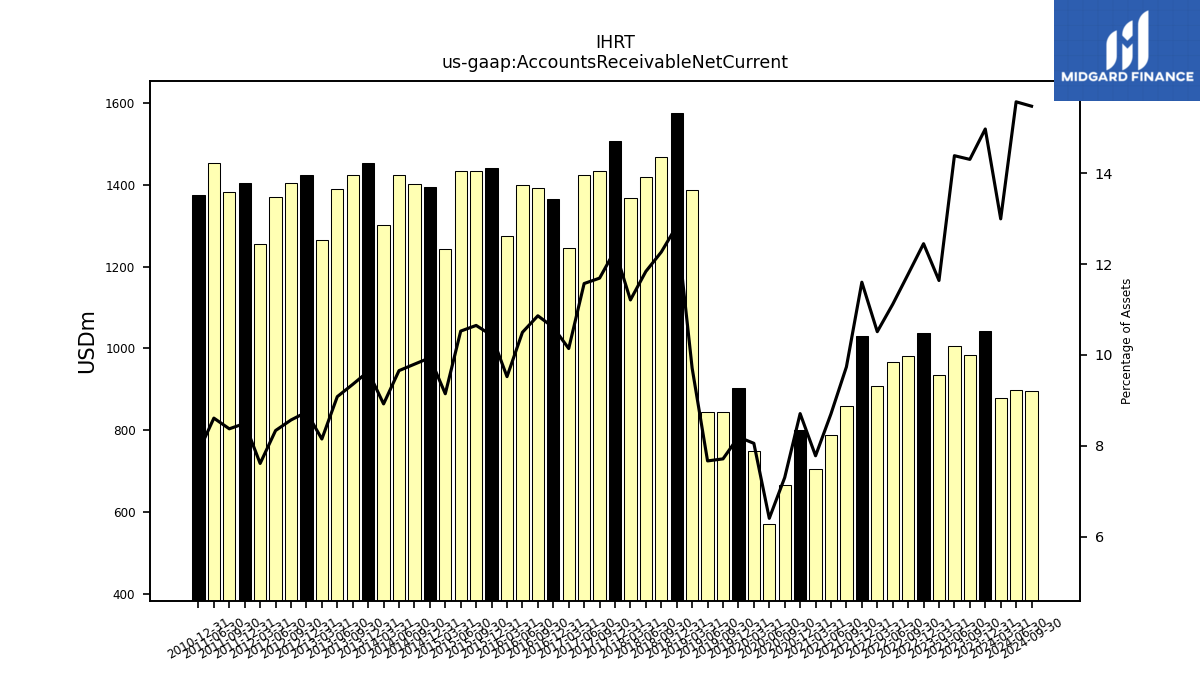
| Accounts Receivable Net Current | 983.93 | 1004.81 | 935.23 | 1037.83 | 981.14 | 967.12 | 906.90 | 1030.38 | 857.97 | 788.87 | 704.10 | 801.38 | 665.85 | 570.12 | 749.92 | 902.91 | 843.19 | 843.06 | NA | 1387.12 | 1575.17 | 1466.92 | 1419.04 | 1367.01 | 1508.37 | 1433.02 | 1423.58 | 1244.65 | 1364.40 | 1393.00 | 1400.60 | 1274.29 | 1442.04 | 1433.35 | 1434.23 | 1242.08 | 1395.25 | 1401.45 | 1424.23 | 1302.24 | 1454.35 | 1424.37 | 1389.14 | 1264.53 | 1424.00 | 1405.26 | 1371.28 | 1254.94 | 1404.67 | 1382.27 | 1453.26 | NA | 1373.88 | NA | NA | |
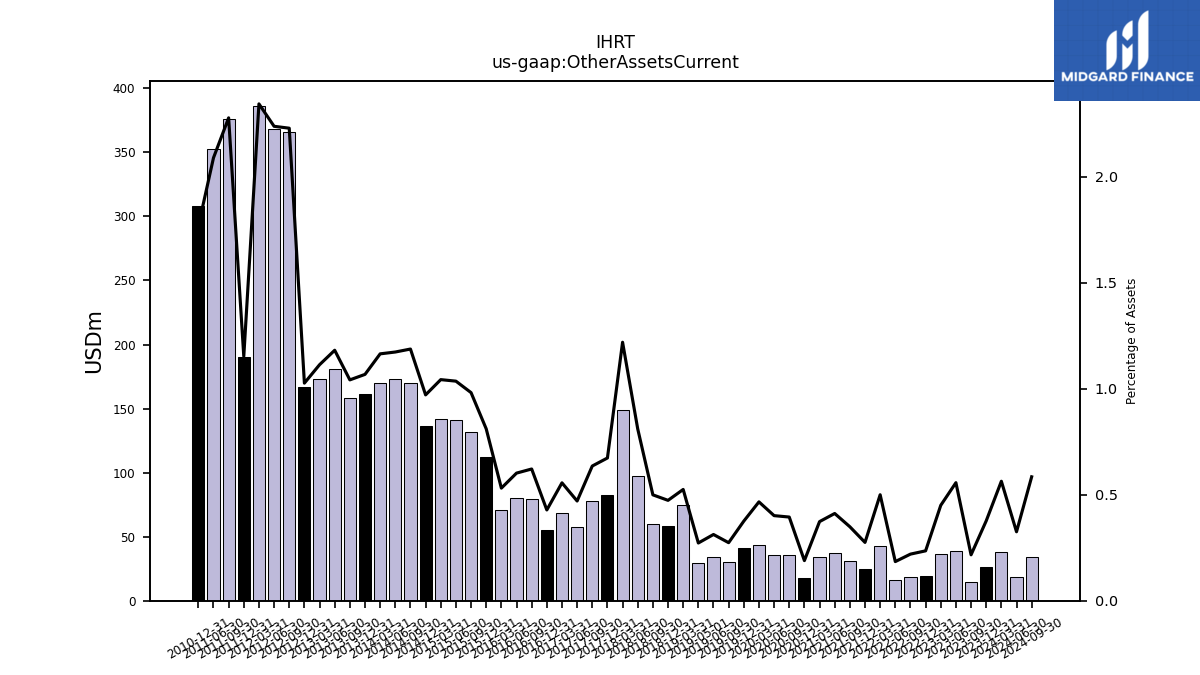
| Other Assets Current | 14.90 | 38.88 | 36.15 | 19.62 | 18.32 | 16.07 | 43.12 | 24.43 | 30.75 | 37.30 | 33.78 | 17.43 | 36.00 | 35.74 | 43.42 | 41.38 | 29.94 | 34.36 | 29.16 | 74.98 | 58.09 | 59.73 | 97.13 | 148.64 | 82.54 | 77.88 | 57.86 | 68.25 | 55.06 | 79.68 | 80.30 | 71.07 | 112.04 | 132.09 | 141.11 | 141.62 | 136.30 | 169.81 | 173.03 | 169.95 | 161.16 | 158.63 | 180.69 | 172.72 | 167.21 | 365.51 | 368.08 | 386.35 | 190.61 | 375.94 | 352.60 | NA | 308.37 | NA | NA | |
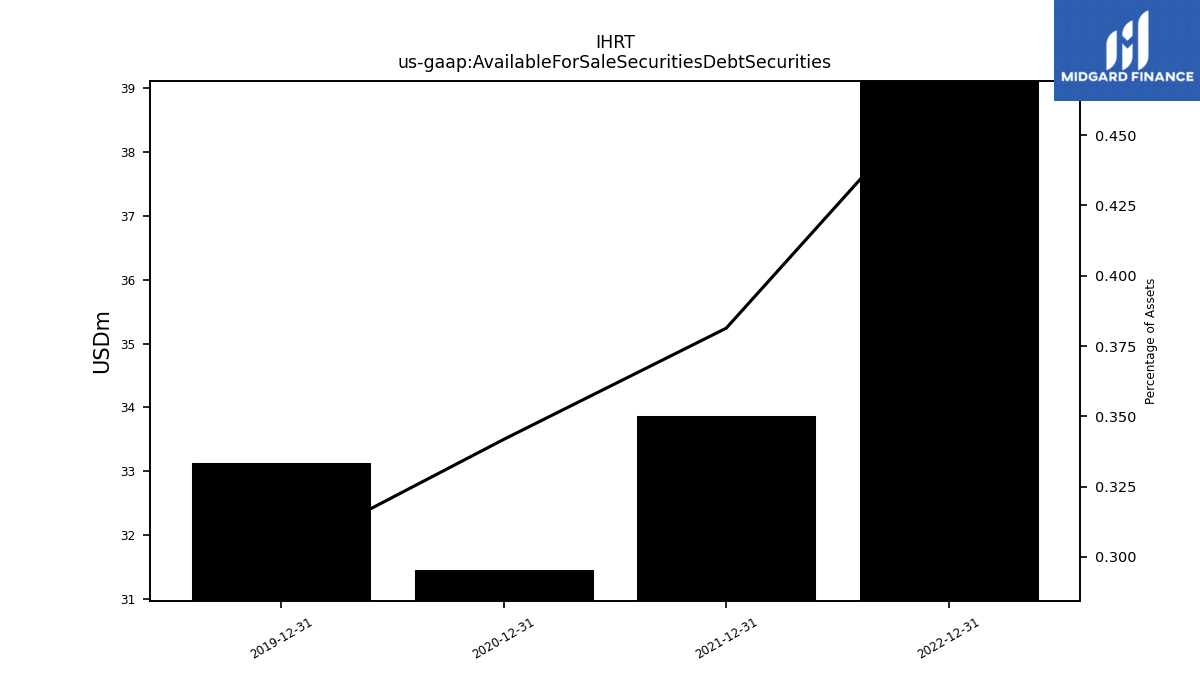
| Available For Sale Securities Debt Securities | NA | NA | NA | 39.11 | NA | NA | NA | 33.87 | NA | NA | NA | 31.46 | NA | NA | NA | 33.13 | NA | NA | NA | NA | NA | NA | NA | NA | NA | NA | NA | NA | NA | NA | NA | NA | NA | NA | NA | NA | NA | NA | NA | NA | NA | NA | NA | NA | NA | NA | NA | NA | NA | NA | NA | NA | NA | NA | NA |
| 2023-09-30 | 2023-06-30 | 2023-03-31 | 2022-12-31 | 2022-09-30 | 2022-06-30 | 2022-03-31 | 2021-12-31 | 2021-09-30 | 2021-06-30 | 2021-03-31 | 2020-12-31 | 2020-09-30 | 2020-06-30 | 2020-03-31 | 2019-12-31 | 2019-09-30 | 2019-06-30 | 2019-05-01 | 2019-03-31 | 2018-12-31 | 2018-09-30 | 2018-06-30 | 2018-03-31 | 2017-12-31 | 2017-09-30 | 2017-06-30 | 2017-03-31 | 2016-12-31 | 2016-09-30 | 2016-06-30 | 2016-03-31 | 2015-12-31 | 2015-09-30 | 2015-06-30 | 2015-03-31 | 2014-12-31 | 2014-09-30 | 2014-06-30 | 2014-03-31 | 2013-12-31 | 2013-09-30 | 2013-06-30 | 2013-03-31 | 2012-12-31 | 2012-09-30 | 2012-06-30 | 2012-03-31 | 2011-12-31 | 2011-09-30 | 2011-06-30 | 2011-03-31 | 2010-12-31 | 2010-09-30 | 2010-06-30 | ||
|---|---|---|---|---|---|---|---|---|---|---|---|---|---|---|---|---|---|---|---|---|---|---|---|---|---|---|---|---|---|---|---|---|---|---|---|---|---|---|---|---|---|---|---|---|---|---|---|---|---|---|---|---|---|---|---|---|
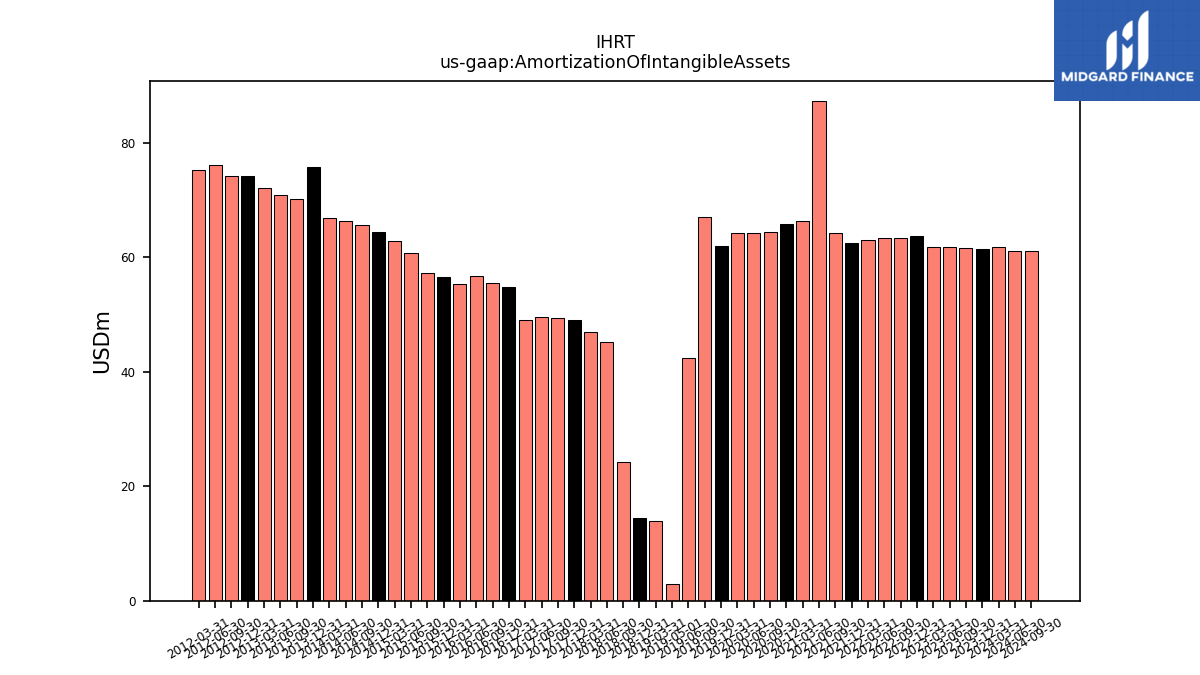
| Amortization Of Intangible Assets | 61.70 | 61.80 | 61.80 | 63.70 | 63.40 | 63.40 | 63.10 | 62.60 | 64.30 | 87.40 | 66.30 | 65.90 | 64.50 | 64.30 | 64.30 | 62.00 | 67.00 | 42.50 | 3.00 | 13.90 | 14.50 | 24.20 | 45.30 | 47.00 | 49.00 | 49.50 | 49.60 | 49.10 | 54.90 | 55.60 | 56.80 | 55.30 | 56.60 | 57.30 | 60.70 | 62.90 | 64.50 | 65.70 | 66.30 | 66.90 | 75.80 | 70.20 | 70.90 | 72.10 | 74.20 | 74.30 | 76.20 | 75.30 | NA | NA | NA | NA | NA | NA | NA | |
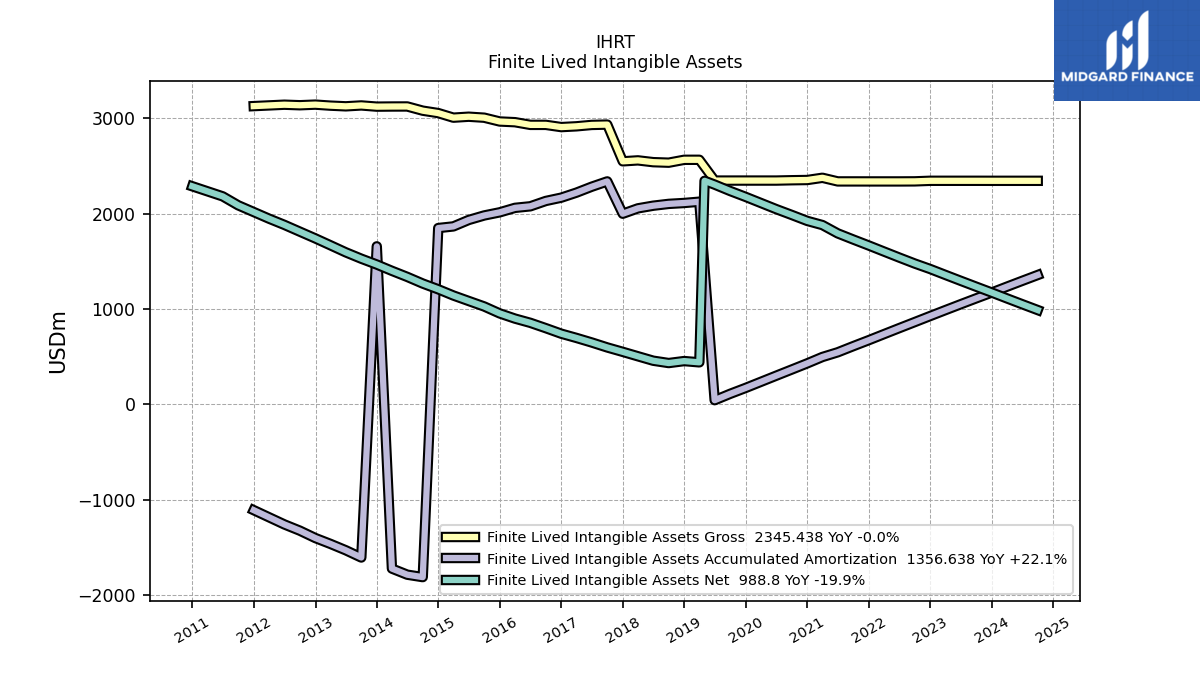
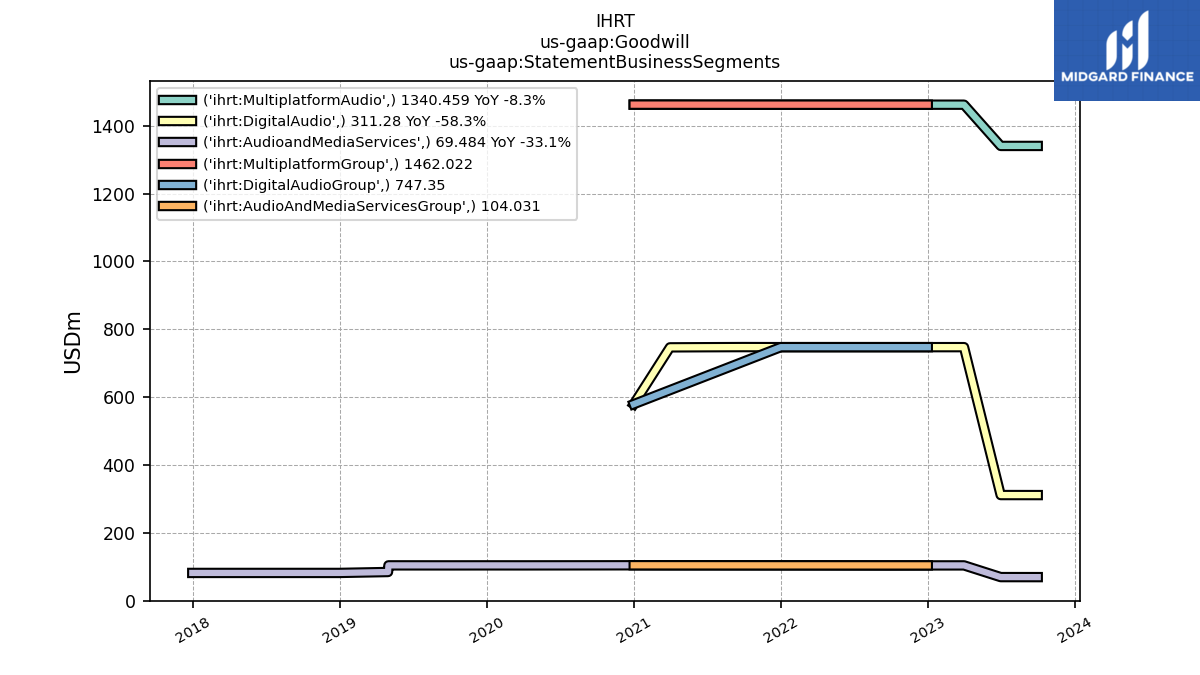
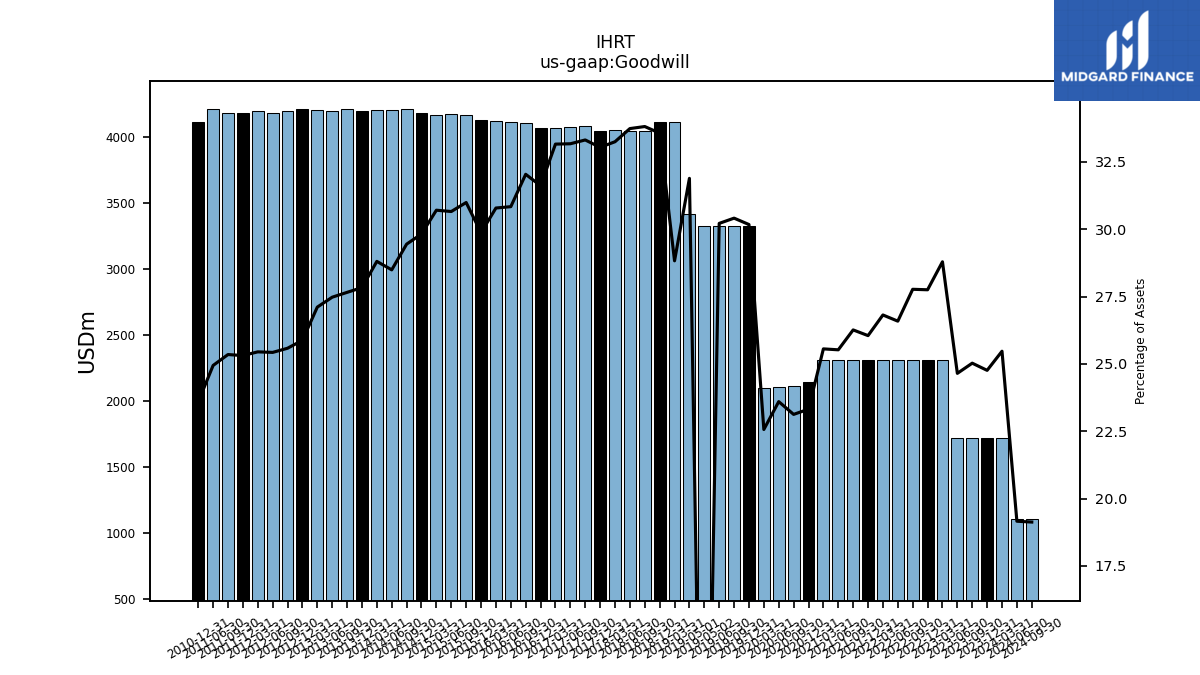
| Goodwill | 1721.22 | 1721.41 | 2313.44 | 2313.40 | 2313.18 | 2313.35 | 2313.49 | 2313.58 | 2313.82 | 2313.43 | 2313.22 | 2145.93 | 2109.49 | 2101.66 | 2101.20 | 3325.62 | 3325.55 | 3323.21 | 3415.49 | 4118.31 | 4118.76 | 4043.94 | 4043.91 | 4054.10 | 4051.08 | 4083.59 | 4080.93 | 4070.14 | 4066.57 | 4108.95 | 4114.33 | 4120.24 | 4128.89 | 4171.35 | 4177.77 | 4170.63 | 4187.42 | 4212.61 | 4203.27 | 4204.90 | 4202.19 | 4212.38 | 4202.93 | 4206.96 | 4216.09 | 4195.86 | 4183.16 | 4196.01 | 4186.72 | 4184.57 | 4210.77 | NA | 4119.33 | NA | NA | |
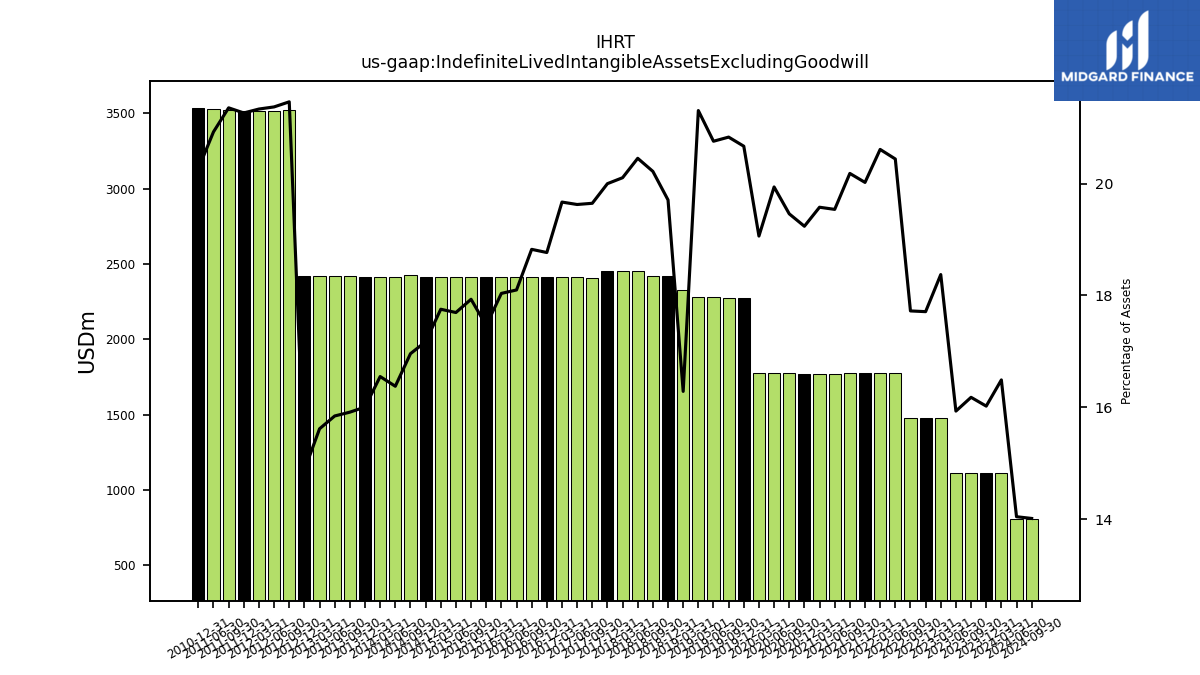
| Indefinite Lived Intangible Assets Excluding Goodwill | 1112.75 | 1112.75 | 1476.32 | 1476.32 | 1476.32 | 1778.40 | 1777.99 | 1778.05 | 1778.05 | 1770.96 | 1771.88 | 1770.35 | 1775.01 | 1775.72 | 1775.00 | 2277.74 | 2277.73 | 2282.70 | 2281.72 | 2326.53 | 2417.91 | 2417.83 | 2451.29 | 2451.29 | 2451.81 | 2408.18 | 2414.22 | 2414.09 | 2413.90 | 2414.04 | 2414.54 | 2413.79 | 2413.48 | 2413.48 | 2411.29 | 2411.26 | 2411.07 | 2426.18 | 2416.03 | 2415.92 | 2416.41 | 2423.95 | 2423.87 | 2423.66 | 2423.98 | 3519.97 | 3515.67 | 3517.43 | 3517.07 | 3525.16 | 3532.26 | NA | 3538.24 | NA | NA | |
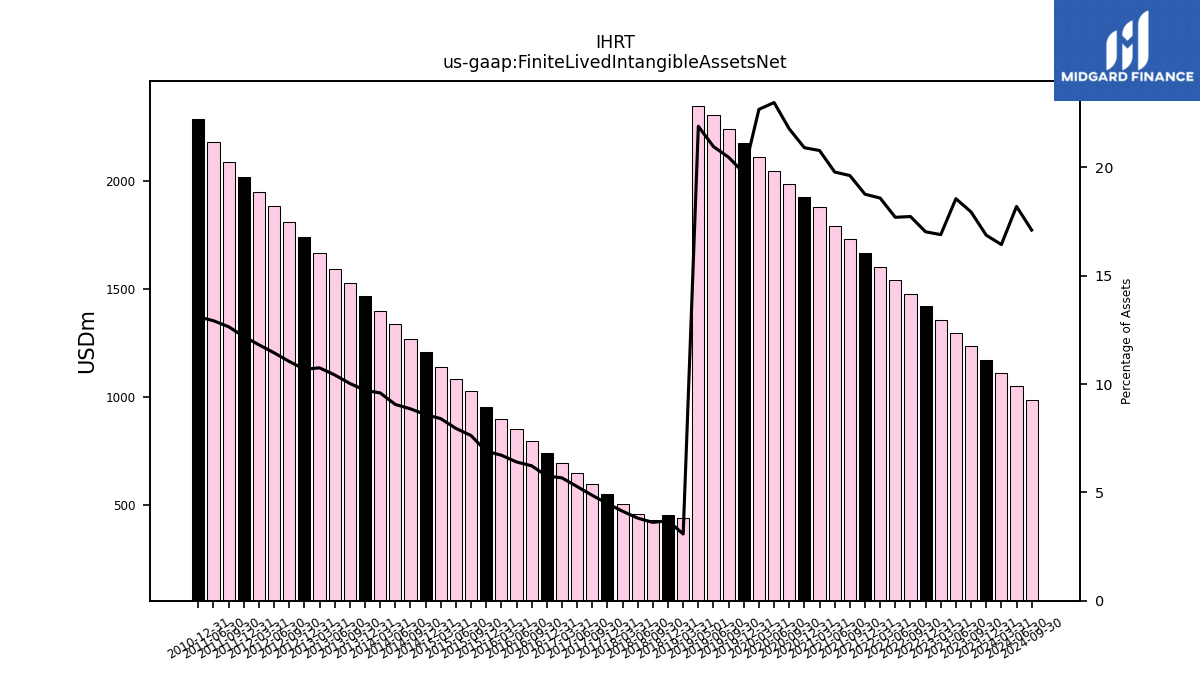
| Finite Lived Intangible Assets Net | 1234.36 | 1296.10 | 1357.88 | 1419.67 | 1477.34 | 1540.09 | 1603.51 | 1666.60 | 1729.37 | 1793.67 | 1881.02 | 1924.49 | 1986.95 | 2047.95 | 2112.24 | 2176.54 | 2238.42 | 2305.41 | 2345.41 | 439.86 | 453.28 | 432.50 | 457.05 | 503.66 | 550.06 | 596.29 | 648.23 | 696.18 | 740.51 | 798.74 | 854.67 | 899.12 | 953.66 | 1026.37 | 1083.98 | 1141.48 | 1206.73 | 1267.09 | 1336.79 | 1400.32 | 1466.55 | 1527.74 | 1594.50 | 1668.36 | 1740.79 | 1811.68 | 1882.90 | 1948.05 | 2017.76 | 2088.06 | 2181.99 | NA | 2288.15 | NA | NA | |
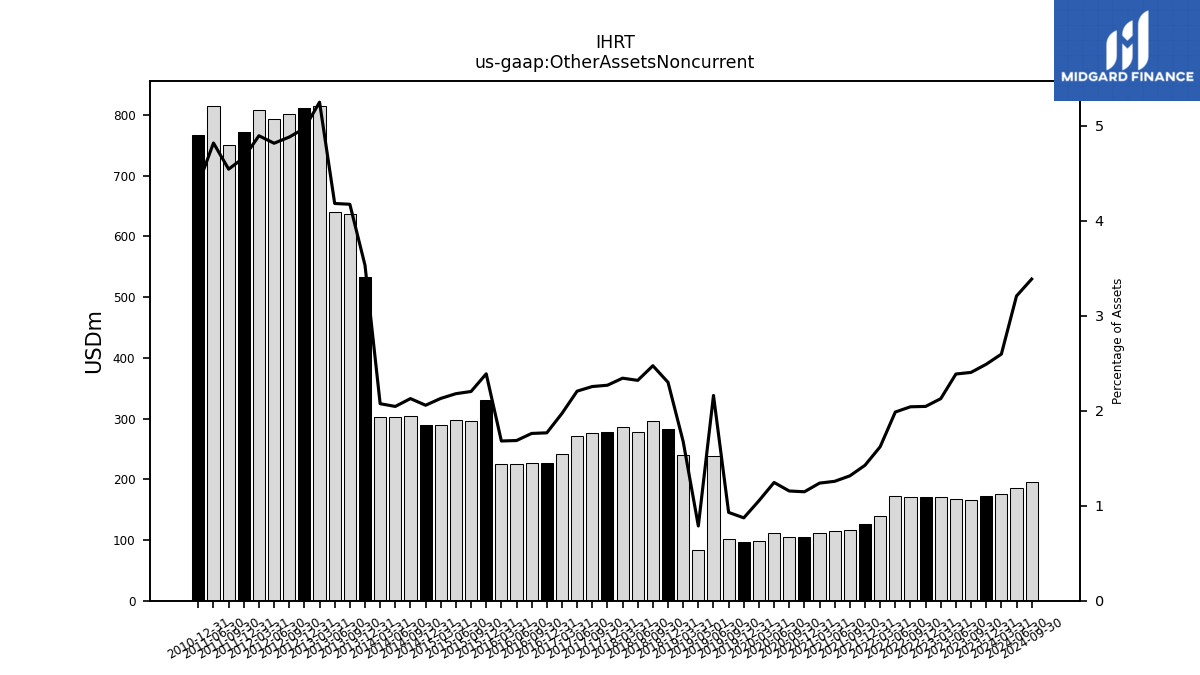
| Other Assets Noncurrent | 165.40 | 166.75 | 171.02 | 170.59 | 170.15 | 172.92 | 139.87 | 126.71 | 115.89 | 114.02 | 112.12 | 105.62 | 105.43 | 110.92 | 98.08 | 96.22 | 101.74 | 237.84 | 84.34 | 239.53 | 282.24 | 296.00 | 278.19 | 285.79 | 278.27 | 276.51 | 271.55 | 242.15 | 227.45 | 225.97 | 225.12 | 225.15 | 330.30 | 296.61 | 297.16 | 289.41 | 289.06 | 304.56 | 301.87 | 302.89 | 533.46 | 635.96 | 639.96 | 814.82 | 810.48 | 800.96 | 792.68 | 807.50 | 771.88 | 750.34 | 813.81 | NA | 765.94 | NA | NA |
| 2023-09-30 | 2023-06-30 | 2023-03-31 | 2022-12-31 | 2022-09-30 | 2022-06-30 | 2022-03-31 | 2021-12-31 | 2021-09-30 | 2021-06-30 | 2021-03-31 | 2020-12-31 | 2020-09-30 | 2020-06-30 | 2020-03-31 | 2019-12-31 | 2019-09-30 | 2019-06-30 | 2019-05-01 | 2019-03-31 | 2018-12-31 | 2018-09-30 | 2018-06-30 | 2018-03-31 | 2017-12-31 | 2017-09-30 | 2017-06-30 | 2017-03-31 | 2016-12-31 | 2016-09-30 | 2016-06-30 | 2016-03-31 | 2015-12-31 | 2015-09-30 | 2015-06-30 | 2015-03-31 | 2014-12-31 | 2014-09-30 | 2014-06-30 | 2014-03-31 | 2013-12-31 | 2013-09-30 | 2013-06-30 | 2013-03-31 | 2012-12-31 | 2012-09-30 | 2012-06-30 | 2012-03-31 | 2011-12-31 | 2011-09-30 | 2011-06-30 | 2011-03-31 | 2010-12-31 | 2010-09-30 | 2010-06-30 | ||
|---|---|---|---|---|---|---|---|---|---|---|---|---|---|---|---|---|---|---|---|---|---|---|---|---|---|---|---|---|---|---|---|---|---|---|---|---|---|---|---|---|---|---|---|---|---|---|---|---|---|---|---|---|---|---|---|---|
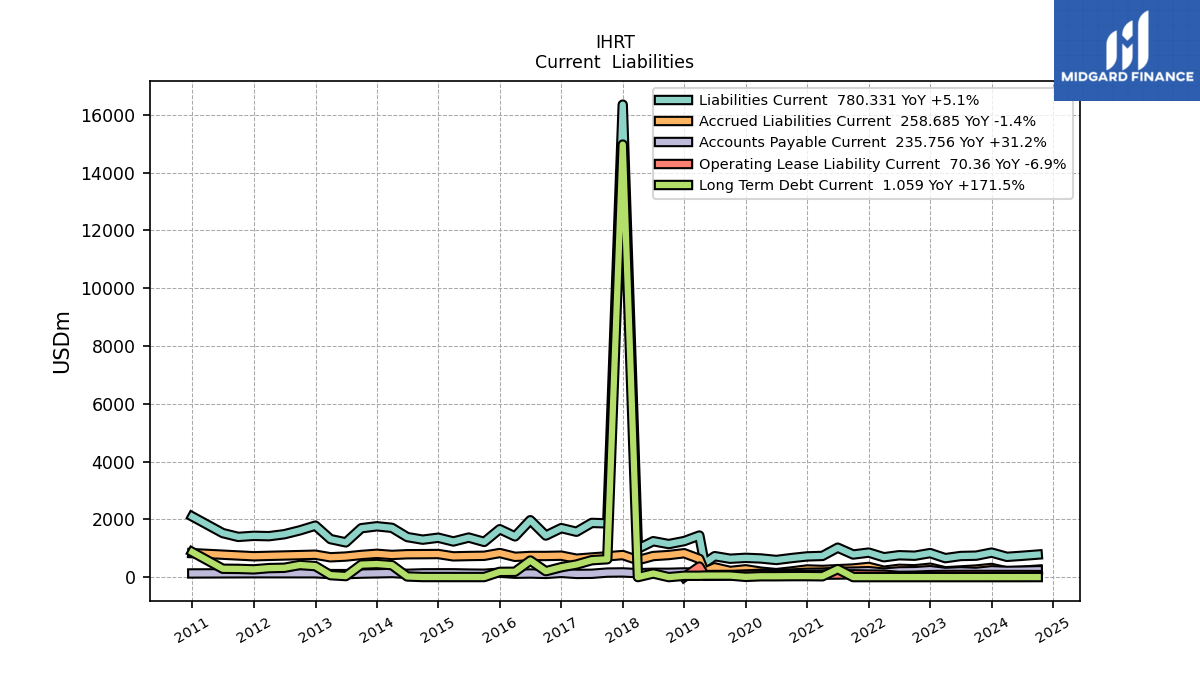
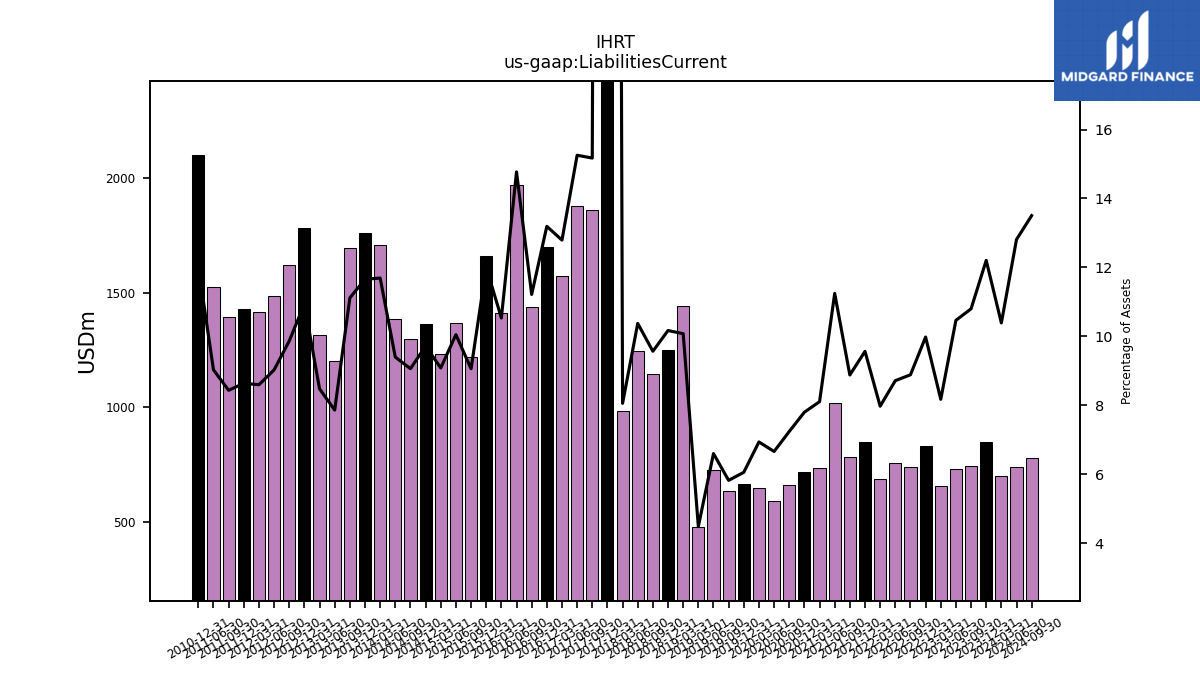
| Liabilities Current | 742.66 | 730.82 | 656.70 | 831.82 | 740.04 | 758.18 | 687.85 | 849.42 | 782.29 | 1019.13 | 733.46 | 717.80 | 660.37 | 593.08 | 645.84 | 667.40 | 636.56 | 725.59 | 480.13 | 1439.57 | 1247.65 | 1144.21 | 1243.45 | 982.28 | 16354.60 | 1859.62 | 1876.37 | 1570.01 | 1696.57 | 1438.28 | 1970.51 | 1409.47 | 1659.23 | 1219.28 | 1369.30 | 1233.66 | 1364.29 | 1296.36 | 1386.38 | 1706.54 | 1759.59 | 1692.80 | 1202.29 | 1315.69 | 1782.14 | 1618.11 | 1484.94 | 1417.25 | 1428.96 | 1392.32 | 1524.06 | NA | 2098.58 | NA | NA | |
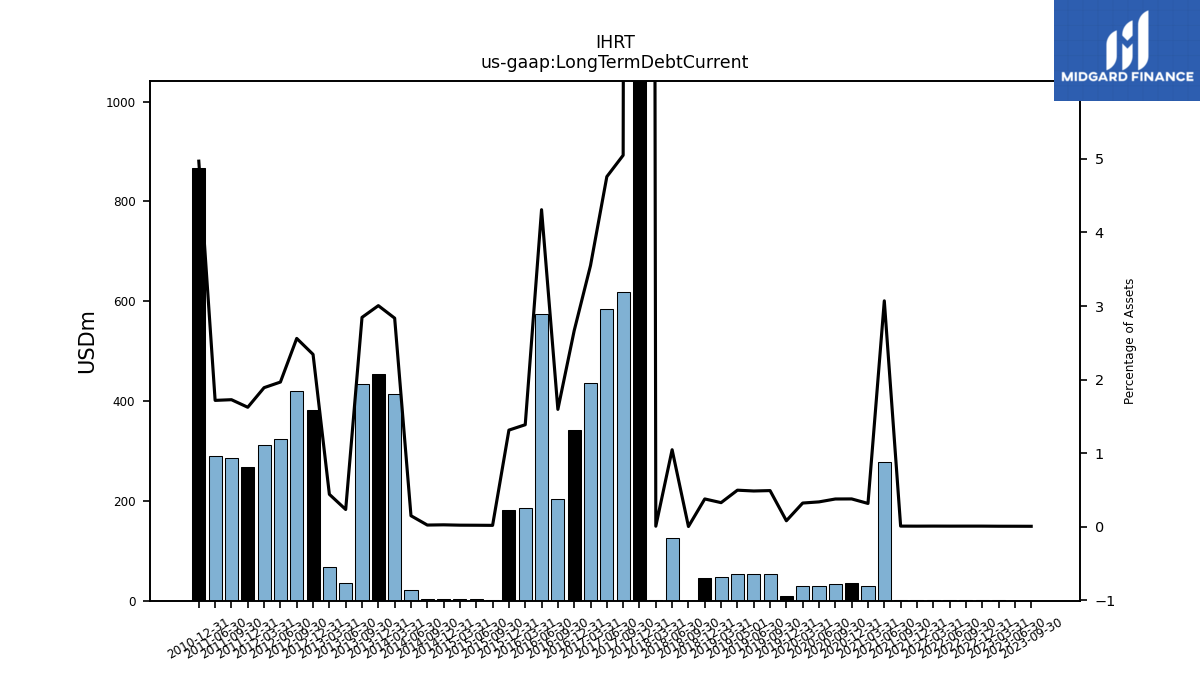
| Long Term Debt Current | 0.39 | 0.44 | 0.53 | 0.66 | 0.67 | 0.68 | 0.72 | 0.67 | 0.72 | 278.34 | 28.63 | 34.77 | 34.38 | 30.06 | 29.97 | 8.91 | 53.70 | 53.41 | 53.19 | 46.74 | 46.33 | 0.35 | 125.43 | 0.82 | 14972.37 | 619.00 | 585.45 | 435.88 | 342.91 | 204.59 | 575.00 | 185.55 | 181.51 | 2.46 | 2.73 | 2.84 | 3.60 | 3.23 | 22.02 | 413.88 | 453.73 | 433.46 | 35.82 | 68.35 | 381.73 | 419.88 | 323.53 | 311.73 | 268.64 | 285.08 | 289.94 | NA | 867.74 | NA | NA | |
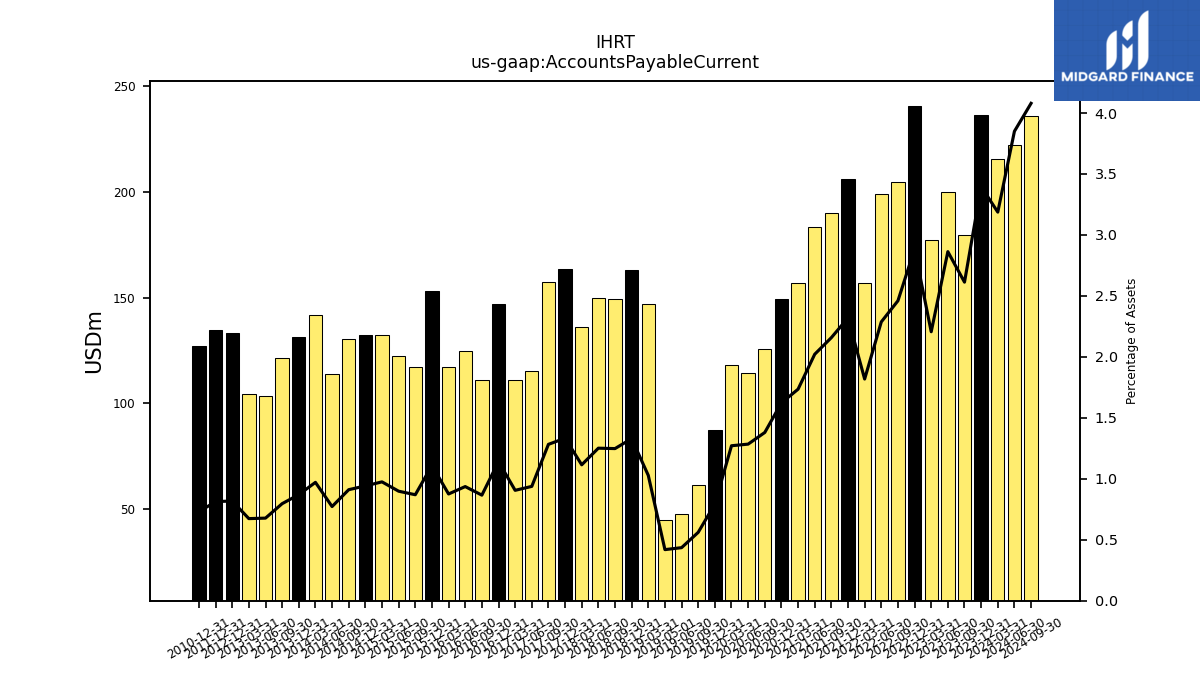
| Accounts Payable Current | 179.71 | 199.95 | 177.27 | 240.45 | 204.92 | 198.98 | 156.88 | 206.01 | 190.12 | 183.24 | 157.03 | 149.33 | 125.89 | 114.40 | 118.38 | 87.37 | 61.35 | 47.88 | 44.91 | 146.85 | 163.15 | 149.24 | 149.98 | 135.95 | 163.45 | 157.22 | 115.38 | 111.15 | 146.77 | 111.07 | 124.93 | 117.17 | 153.28 | 117.02 | 122.42 | 132.42 | 132.26 | 130.30 | 113.97 | 141.73 | 131.37 | 121.27 | 103.66 | 104.53 | 133.23 | NA | NA | NA | 134.58 | NA | NA | NA | 127.26 | NA | NA | |
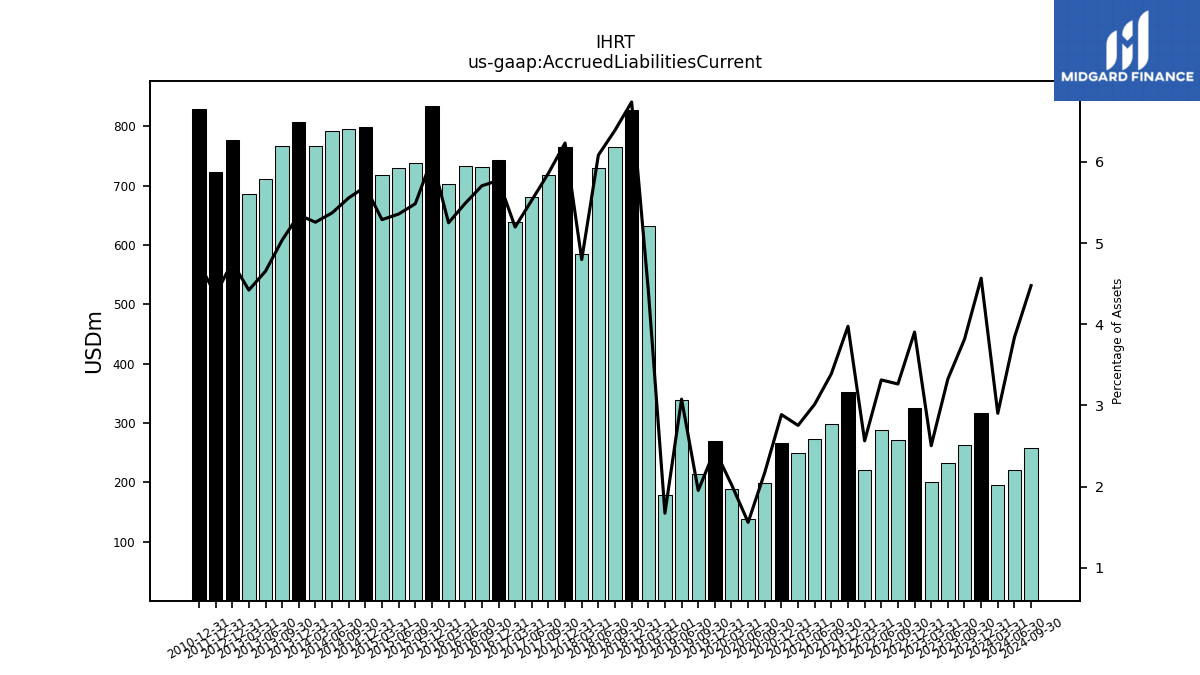
| Accrued Liabilities Current | 262.40 | 232.23 | 201.16 | 325.43 | 271.85 | 288.36 | 221.14 | 353.05 | 298.68 | 273.25 | 249.22 | 265.65 | 198.35 | 138.82 | 188.53 | 270.06 | 213.43 | 338.40 | 178.96 | 632.08 | 826.87 | 764.35 | 729.28 | 584.96 | 764.27 | 718.46 | 680.19 | 638.00 | 742.62 | 731.79 | 732.49 | 702.67 | 834.42 | 738.28 | 730.22 | 718.42 | 799.48 | 795.11 | 792.55 | 767.49 | 807.21 | 767.28 | 711.90 | 686.16 | 776.05 | NA | NA | NA | 722.15 | NA | NA | NA | 829.60 | NA | NA |
| 2023-09-30 | 2023-06-30 | 2023-03-31 | 2022-12-31 | 2022-09-30 | 2022-06-30 | 2022-03-31 | 2021-12-31 | 2021-09-30 | 2021-06-30 | 2021-03-31 | 2020-12-31 | 2020-09-30 | 2020-06-30 | 2020-03-31 | 2019-12-31 | 2019-09-30 | 2019-06-30 | 2019-05-01 | 2019-03-31 | 2018-12-31 | 2018-09-30 | 2018-06-30 | 2018-03-31 | 2017-12-31 | 2017-09-30 | 2017-06-30 | 2017-03-31 | 2016-12-31 | 2016-09-30 | 2016-06-30 | 2016-03-31 | 2015-12-31 | 2015-09-30 | 2015-06-30 | 2015-03-31 | 2014-12-31 | 2014-09-30 | 2014-06-30 | 2014-03-31 | 2013-12-31 | 2013-09-30 | 2013-06-30 | 2013-03-31 | 2012-12-31 | 2012-09-30 | 2012-06-30 | 2012-03-31 | 2011-12-31 | 2011-09-30 | 2011-06-30 | 2011-03-31 | 2010-12-31 | 2010-09-30 | 2010-06-30 | ||
|---|---|---|---|---|---|---|---|---|---|---|---|---|---|---|---|---|---|---|---|---|---|---|---|---|---|---|---|---|---|---|---|---|---|---|---|---|---|---|---|---|---|---|---|---|---|---|---|---|---|---|---|---|---|---|---|---|
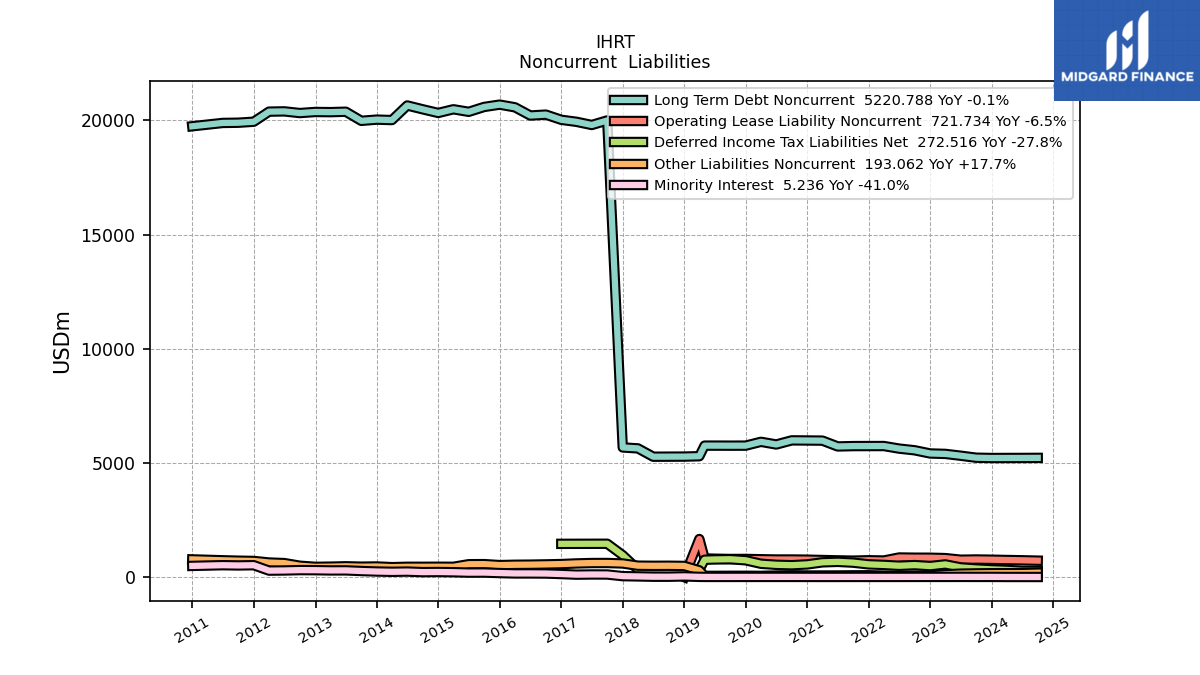
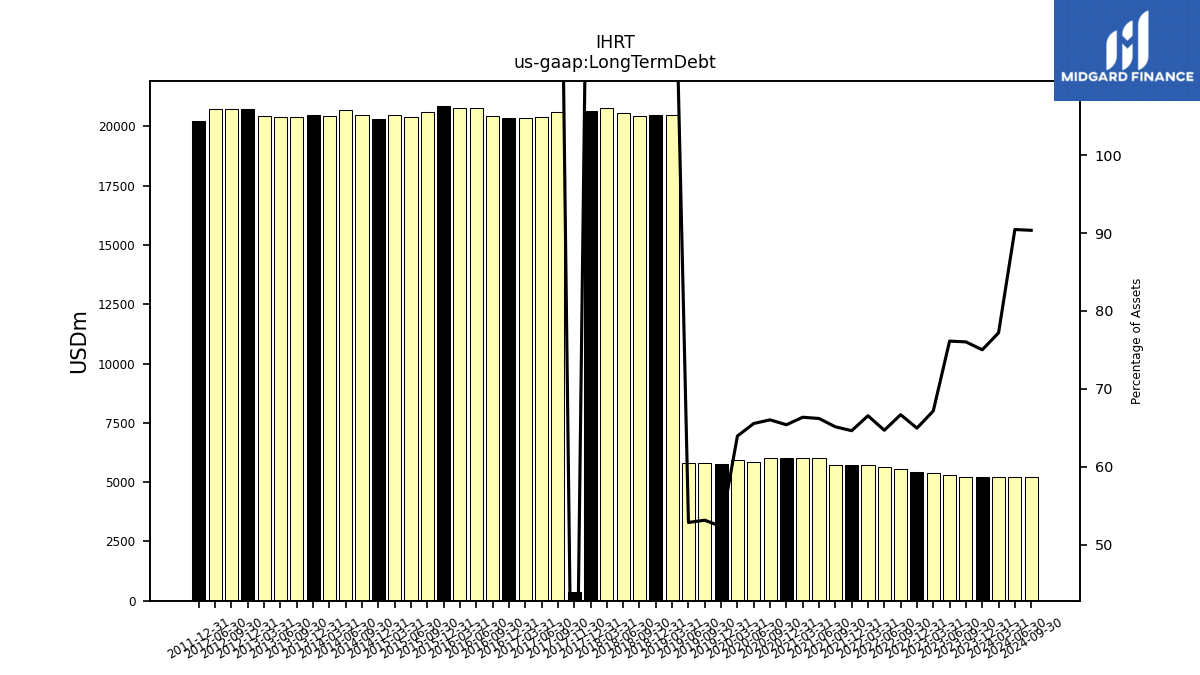
| Long Term Debt | 5228.71 | 5316.40 | 5395.46 | 5414.17 | 5553.71 | 5627.42 | 5740.14 | 5738.87 | 5737.38 | 5999.38 | 6004.99 | 6016.93 | 6021.82 | 5837.12 | 5953.64 | 5765.42 | 5809.01 | 5810.50 | NA | 20483.86 | 20472.92 | 20423.79 | 20546.74 | 20787.68 | 20649.18 | 20614.90 | 20380.88 | 20370.46 | 20364.99 | 20454.40 | 20784.67 | 20754.41 | 20868.59 | 20588.42 | 20374.53 | 20486.04 | 20326.02 | 20484.78 | 20672.07 | 20424.39 | 20484.21 | 20411.24 | 20412.14 | 20426.14 | 20747.10 | 20737.81 | 20714.82 | NA | 20207.17 | NA | NA | NA | NA | NA | NA | |
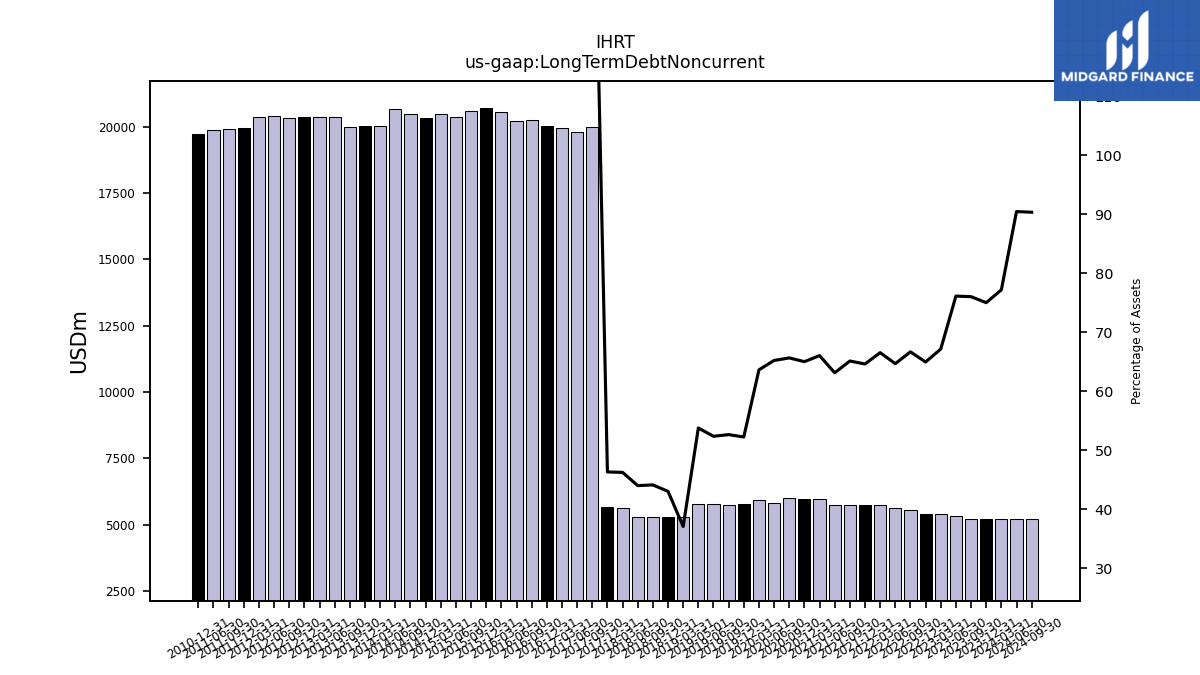
| Long Term Debt Noncurrent | 5228.32 | 5315.95 | 5394.93 | 5413.50 | 5553.05 | 5626.74 | 5739.42 | 5738.19 | 5736.65 | 5721.04 | 5976.36 | 5982.15 | 5987.45 | 5807.06 | 5923.67 | 5756.50 | 5755.31 | 5757.10 | 5756.93 | 5293.40 | 5277.11 | 5274.49 | 5272.10 | 5636.67 | 5676.81 | 19995.90 | 19795.43 | 19934.58 | 20022.08 | 20249.81 | 20209.67 | 20568.86 | 20687.08 | 20585.95 | 20371.80 | 20483.19 | 20322.41 | 20481.55 | 20650.05 | 20010.50 | 20030.48 | 19977.78 | 20376.33 | 20357.79 | 20365.37 | 20317.93 | 20391.29 | 20380.38 | 19938.53 | 19894.72 | 19885.06 | NA | 19739.62 | NA | NA | |
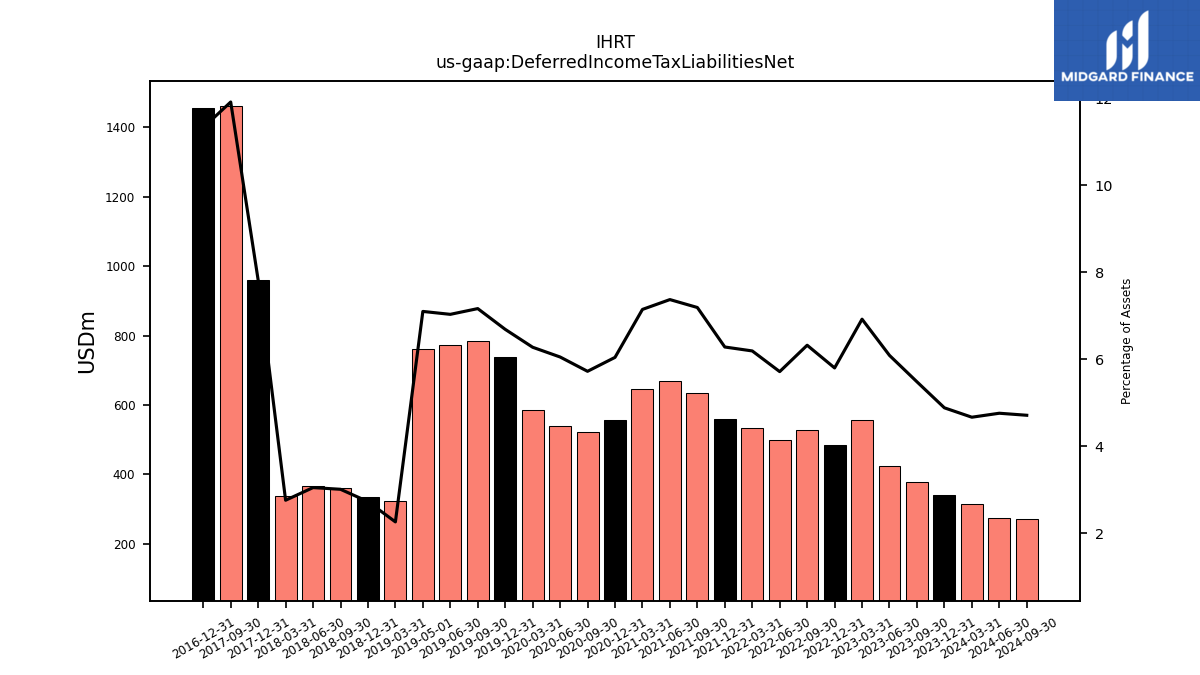
| Deferred Income Tax Liabilities Net | 377.25 | 425.45 | 556.43 | 483.81 | 526.93 | 497.64 | 534.43 | 558.22 | 633.80 | 668.53 | 647.10 | 556.48 | 522.37 | 539.29 | 584.77 | 737.44 | 783.86 | 773.82 | 760.76 | 323.43 | 335.01 | 360.43 | 365.91 | 336.79 | 959.39 | 1460.88 | NA | NA | 1457.10 | NA | NA | NA | NA | NA | NA | NA | NA | NA | NA | NA | NA | NA | NA | NA | NA | NA | NA | NA | NA | NA | NA | NA | NA | NA | NA | |
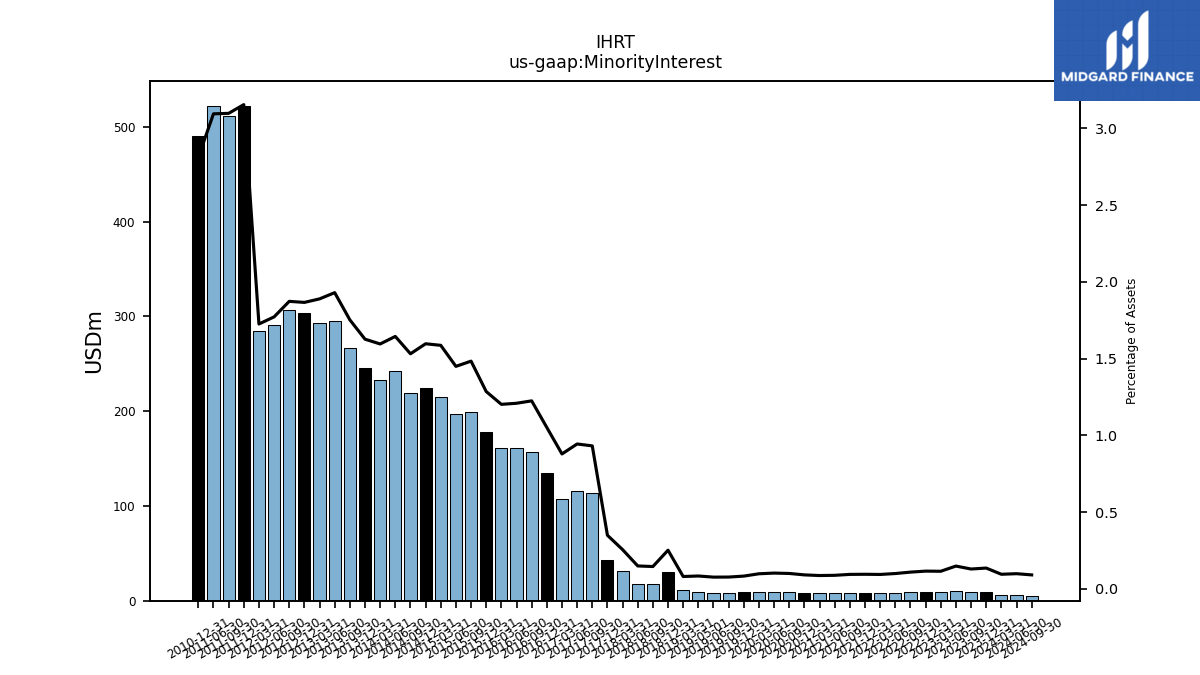
| Minority Interest | 8.87 | 10.35 | 9.19 | 9.61 | 9.06 | 8.66 | 8.07 | 8.41 | 8.27 | 7.97 | 7.83 | 8.35 | 9.12 | 9.12 | 9.12 | 9.12 | 8.37 | 8.37 | 8.94 | 11.44 | 30.87 | 17.35 | 17.86 | 31.14 | 42.76 | 114.13 | 116.06 | 107.85 | 135.18 | 157.03 | 161.27 | 160.82 | 177.62 | 199.64 | 197.48 | 215.44 | 224.14 | 219.05 | 242.56 | 232.84 | 245.53 | 266.89 | 295.14 | 293.13 | 304.00 | 307.17 | 291.45 | 284.47 | 521.79 | 511.36 | 522.41 | NA | 490.92 | NA | NA | |
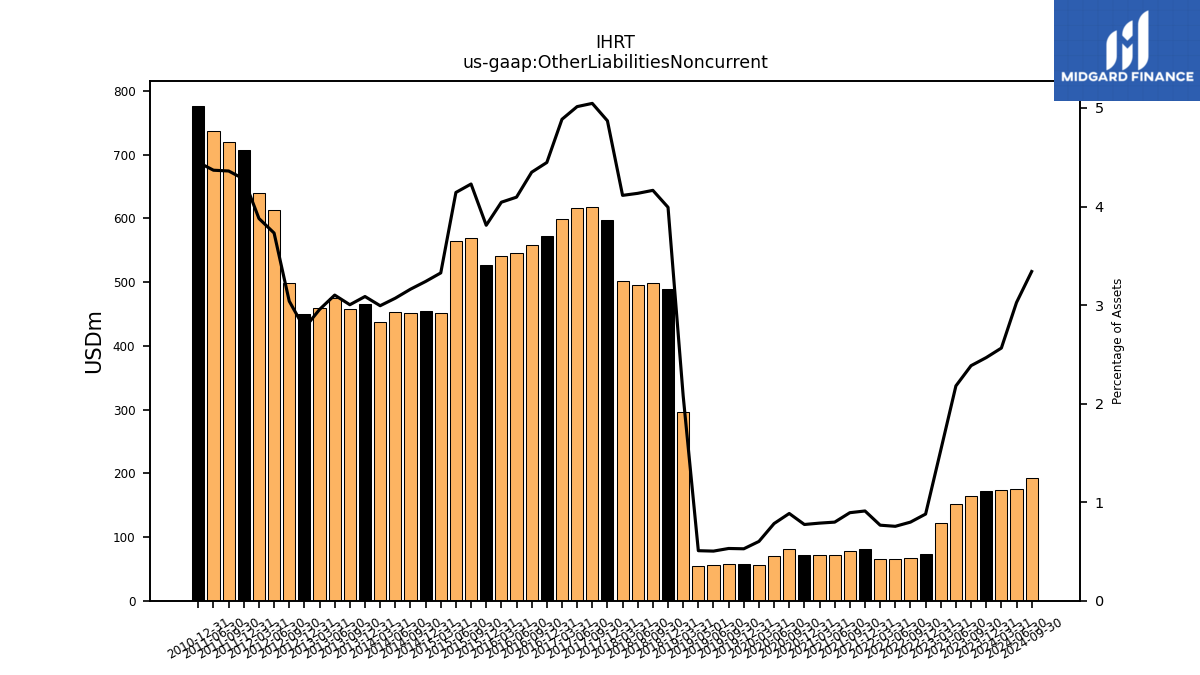
| Other Liabilities Noncurrent | 164.05 | 152.25 | 122.76 | 73.33 | 66.46 | 65.72 | 66.15 | 80.90 | 78.72 | 72.31 | 71.29 | 71.22 | 80.78 | 69.77 | 56.06 | 58.11 | 58.00 | 55.40 | 54.39 | 296.90 | 489.83 | 498.00 | 495.50 | 501.53 | 597.09 | 618.58 | 616.79 | 599.59 | 571.98 | 557.63 | 546.34 | 541.16 | 526.57 | 569.11 | 564.54 | 451.80 | 454.86 | 452.22 | 452.89 | 436.99 | 466.05 | 457.49 | 474.41 | 458.67 | 450.52 | 498.59 | 613.85 | 639.59 | 707.89 | 719.90 | 737.48 | NA | 776.68 | NA | NA | |
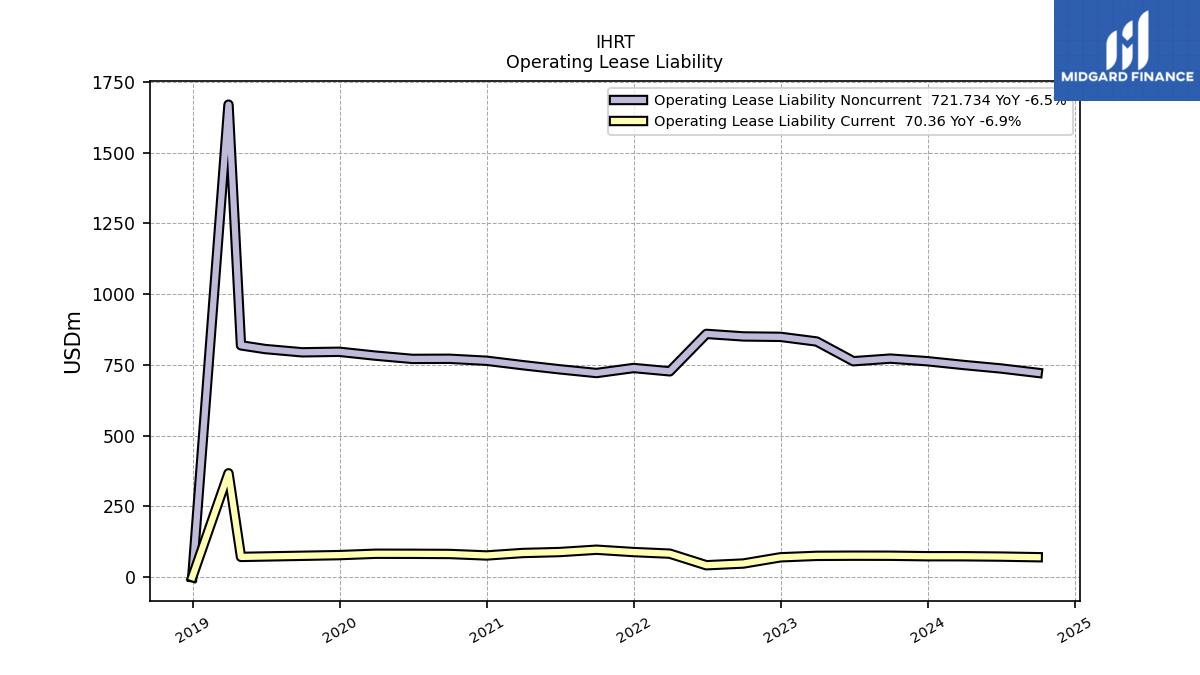
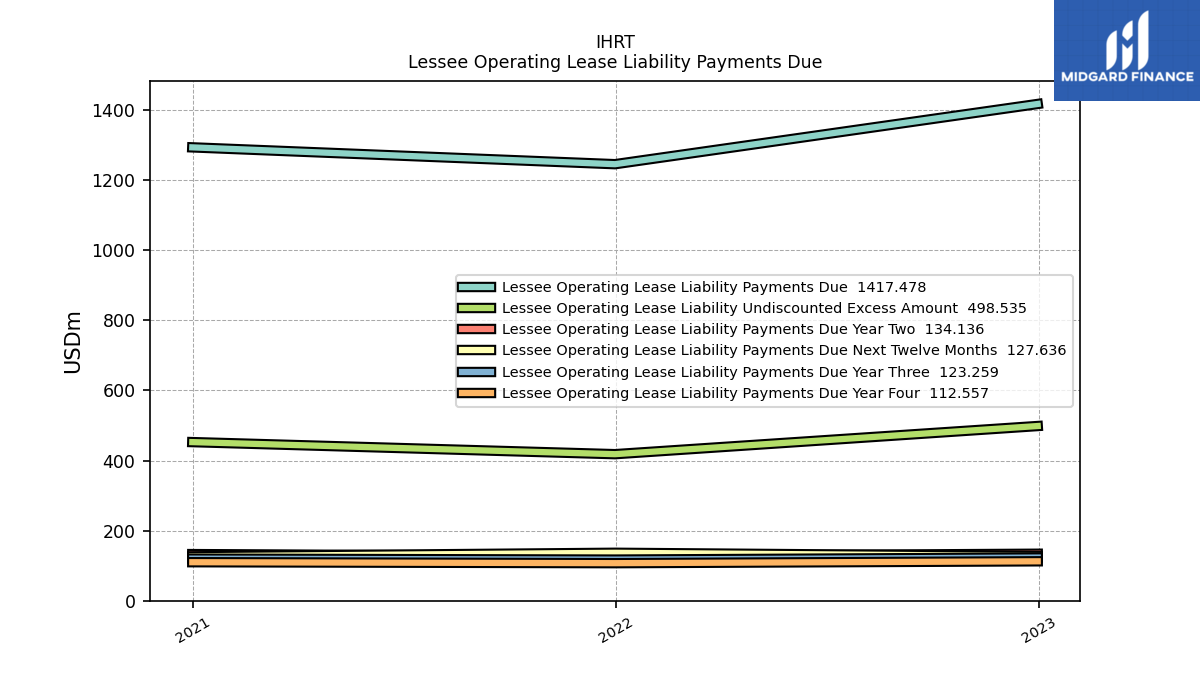
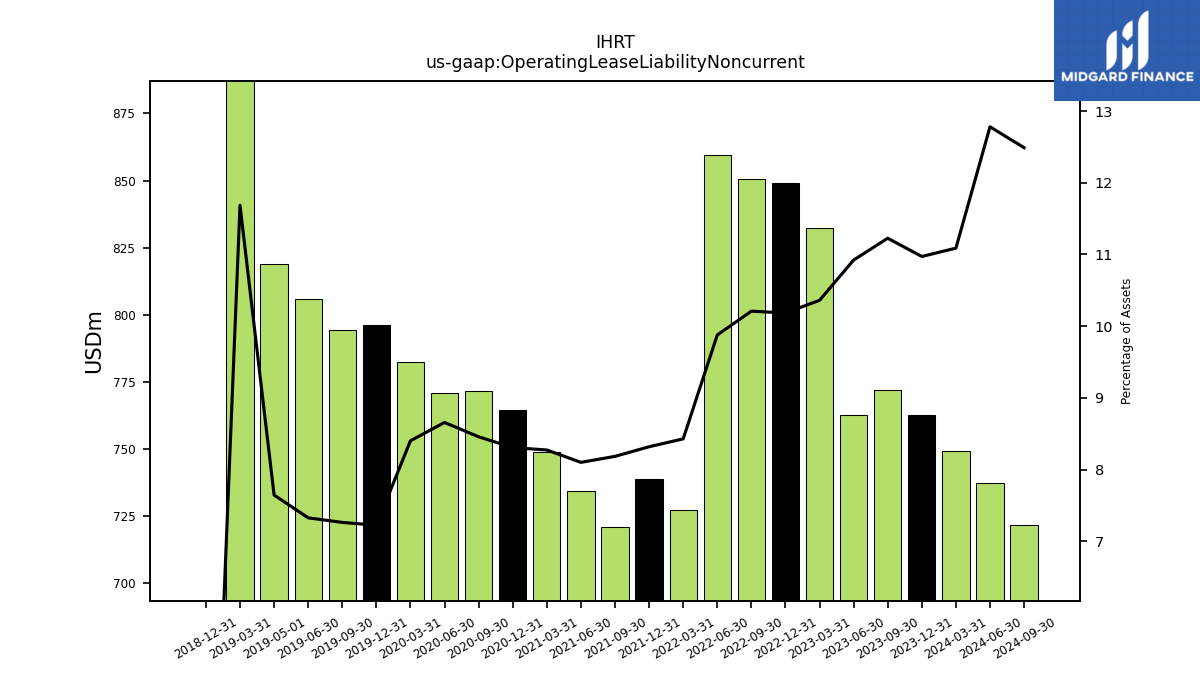
| Operating Lease Liability Noncurrent | 772.07 | 762.79 | 832.47 | 848.92 | 850.41 | 859.42 | 727.14 | 738.81 | 721.13 | 734.27 | 748.84 | 764.49 | 771.50 | 771.01 | 782.42 | 796.20 | 794.31 | 805.87 | 818.88 | 1669.45 | 0.00 | NA | NA | NA | NA | NA | NA | NA | NA | NA | NA | NA | NA | NA | NA | NA | NA | NA | NA | NA | NA | NA | NA | NA | NA | NA | NA | NA | NA | NA | NA | NA | NA | NA | NA |
| 2023-09-30 | 2023-06-30 | 2023-03-31 | 2022-12-31 | 2022-09-30 | 2022-06-30 | 2022-03-31 | 2021-12-31 | 2021-09-30 | 2021-06-30 | 2021-03-31 | 2020-12-31 | 2020-09-30 | 2020-06-30 | 2020-03-31 | 2019-12-31 | 2019-09-30 | 2019-06-30 | 2019-05-01 | 2019-03-31 | 2018-12-31 | 2018-09-30 | 2018-06-30 | 2018-03-31 | 2017-12-31 | 2017-09-30 | 2017-06-30 | 2017-03-31 | 2016-12-31 | 2016-09-30 | 2016-06-30 | 2016-03-31 | 2015-12-31 | 2015-09-30 | 2015-06-30 | 2015-03-31 | 2014-12-31 | 2014-09-30 | 2014-06-30 | 2014-03-31 | 2013-12-31 | 2013-09-30 | 2013-06-30 | 2013-03-31 | 2012-12-31 | 2012-09-30 | 2012-06-30 | 2012-03-31 | 2011-12-31 | 2011-09-30 | 2011-06-30 | 2011-03-31 | 2010-12-31 | 2010-09-30 | 2010-06-30 | ||
|---|---|---|---|---|---|---|---|---|---|---|---|---|---|---|---|---|---|---|---|---|---|---|---|---|---|---|---|---|---|---|---|---|---|---|---|---|---|---|---|---|---|---|---|---|---|---|---|---|---|---|---|---|---|---|---|---|
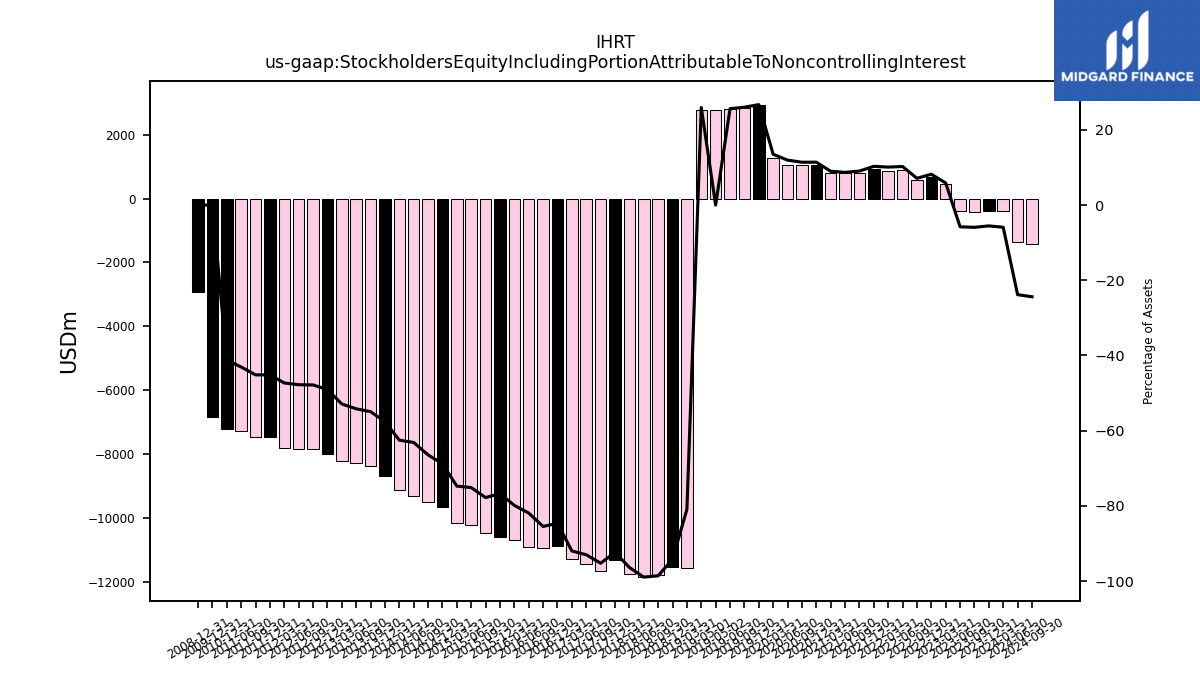
| Stockholders Equity Including Portion Attributable To Noncontrolling Interest | -406.82 | -403.46 | 471.90 | 684.51 | 592.81 | 893.42 | 872.02 | 915.76 | 798.02 | 788.85 | 813.95 | 1050.82 | 1039.65 | 1065.64 | 1259.30 | 2945.44 | 2846.92 | 2820.05 | 2779.11 | -11566.11 | -11560.34 | -11793.24 | -11862.33 | -11752.67 | -11327.45 | -11677.72 | -11442.21 | -11291.30 | -10885.48 | -10962.78 | -10930.21 | -10689.84 | -10606.68 | -10474.04 | -10240.78 | -10153.68 | -9665.21 | -9506.21 | -9315.24 | -9127.95 | -8696.64 | -8370.75 | -8289.16 | -8209.70 | -7995.19 | -7847.34 | -7861.94 | -7802.56 | -7471.94 | -7456.03 | -7270.02 | NA | -7204.69 | NA | NA | |
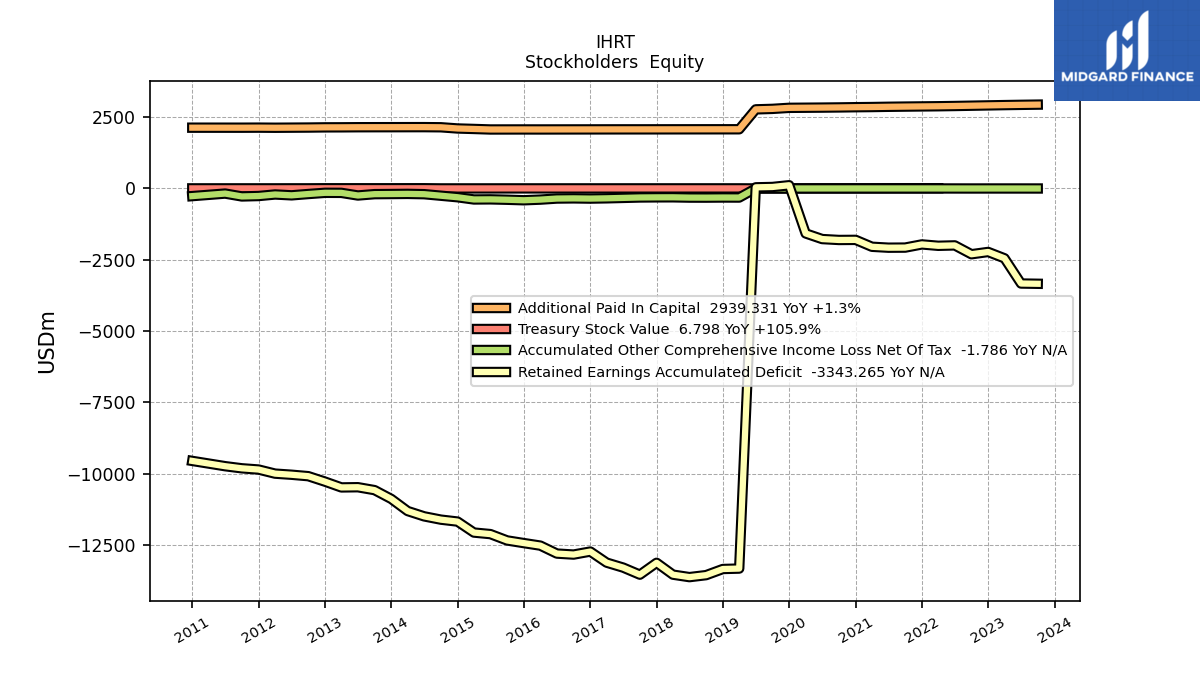
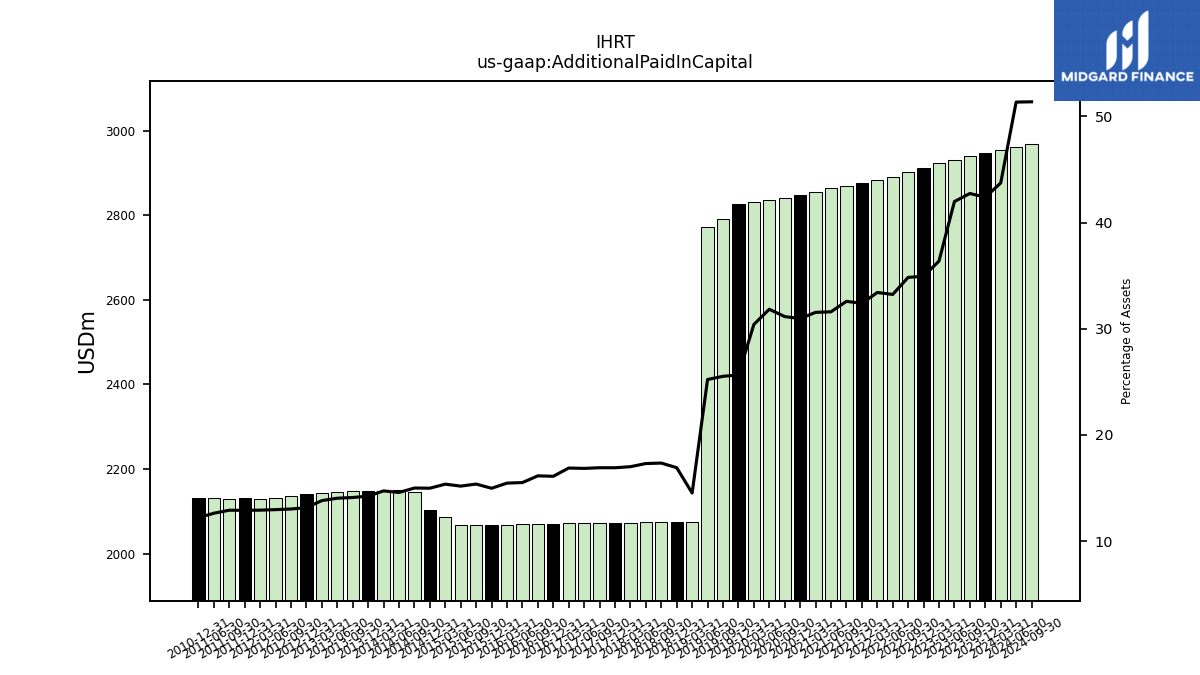
| Additional Paid In Capital | 2939.33 | 2931.60 | 2922.65 | 2912.50 | 2901.62 | 2891.13 | 2882.51 | 2876.57 | 2870.39 | 2863.66 | 2854.65 | 2849.02 | 2840.89 | 2835.01 | 2830.79 | 2826.53 | 2790.18 | 2773.15 | NA | 2075.03 | 2074.63 | 2074.19 | 2073.74 | 2073.14 | 2072.57 | 2072.09 | 2071.96 | 2071.44 | 2070.57 | 2069.90 | 2069.16 | 2068.43 | 2068.95 | 2068.26 | 2067.66 | 2086.01 | 2102.79 | 2145.05 | 2149.87 | 2149.33 | 2148.30 | 2147.76 | 2146.70 | 2143.21 | 2141.92 | 2135.26 | 2131.87 | 2128.58 | 2132.37 | 2130.24 | 2130.52 | NA | 2130.87 | NA | NA | |
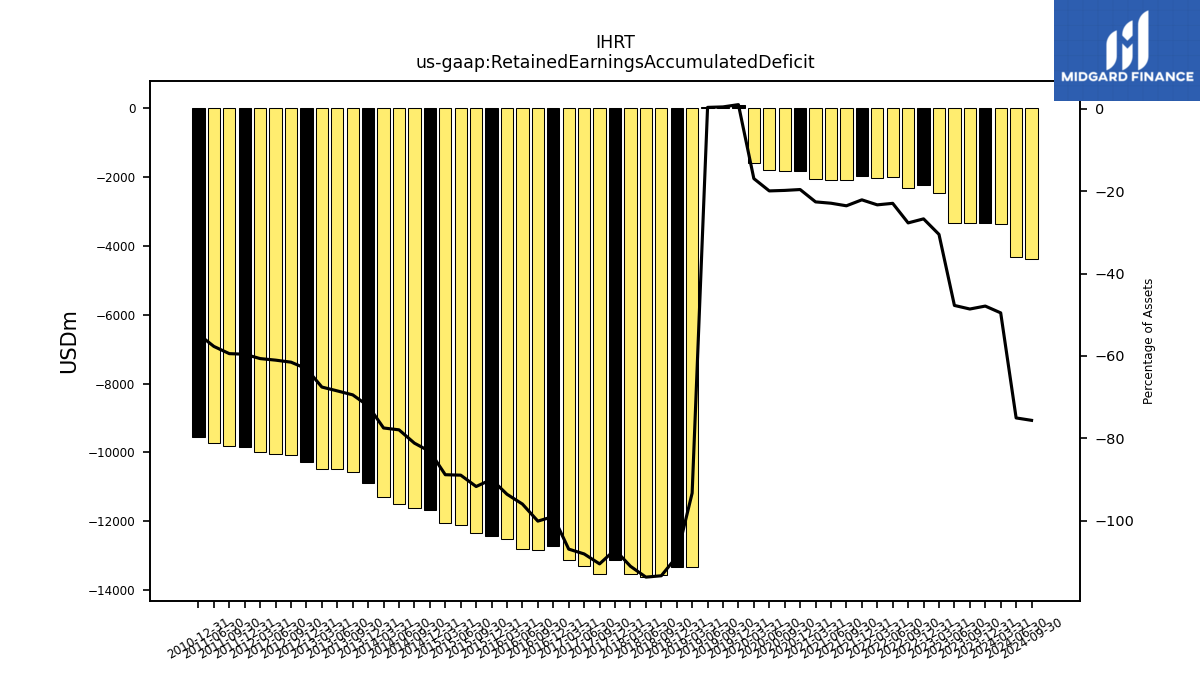
| Retained Earnings Accumulated Deficit | -3343.26 | -3334.21 | -2449.74 | -2227.48 | -2307.36 | -1997.00 | -2011.40 | -1962.82 | -2074.45 | -2077.63 | -2045.34 | -1803.62 | -1807.09 | -1774.97 | -1577.66 | 112.55 | 51.17 | 38.79 | NA | -13330.82 | -13345.35 | -13560.25 | -13630.33 | -13543.50 | -13127.84 | -13544.38 | -13296.20 | -13122.17 | -12733.33 | -12839.37 | -12804.42 | -12525.53 | -12437.01 | -12343.74 | -12121.82 | -12067.36 | -11682.39 | -11614.30 | -11499.45 | -11312.82 | -10888.63 | -10579.40 | -10477.55 | -10484.75 | -10281.75 | -10090.48 | -10039.92 | -10000.90 | -9857.27 | -9814.24 | -9740.18 | NA | -9555.17 | NA | NA | |
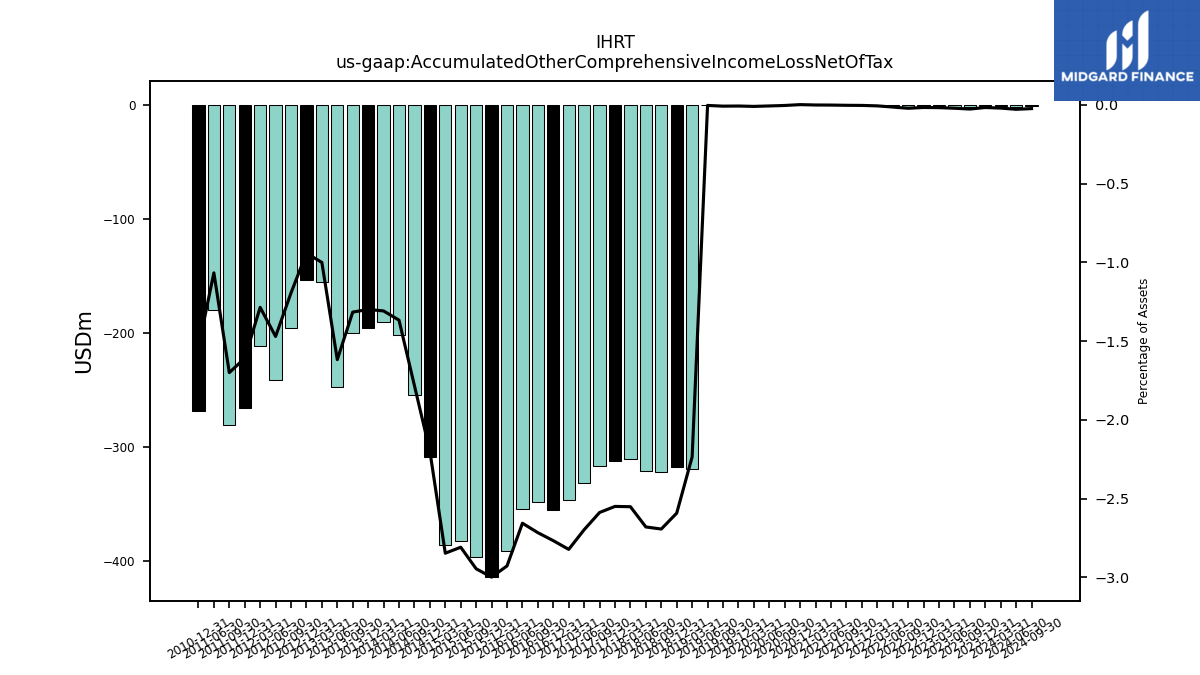
| Accumulated Other Comprehensive Income Loss Net Of Tax | -1.79 | -1.45 | -1.38 | -1.33 | -1.76 | -1.15 | -0.50 | -0.26 | -0.19 | -0.06 | -0.02 | 0.19 | -0.29 | -0.56 | -0.85 | -0.75 | -0.83 | -0.33 | NA | -319.28 | -318.03 | -322.07 | -321.20 | -311.07 | -312.56 | -317.21 | -331.82 | -346.39 | -355.88 | -348.34 | -354.36 | -391.75 | -414.41 | -396.42 | -382.71 | -386.61 | -308.59 | -254.99 | -201.59 | -190.93 | -196.07 | -200.35 | -247.38 | -155.21 | -153.28 | -195.81 | -241.85 | -211.92 | -266.04 | -280.59 | -179.98 | NA | -268.82 | NA | NA | |
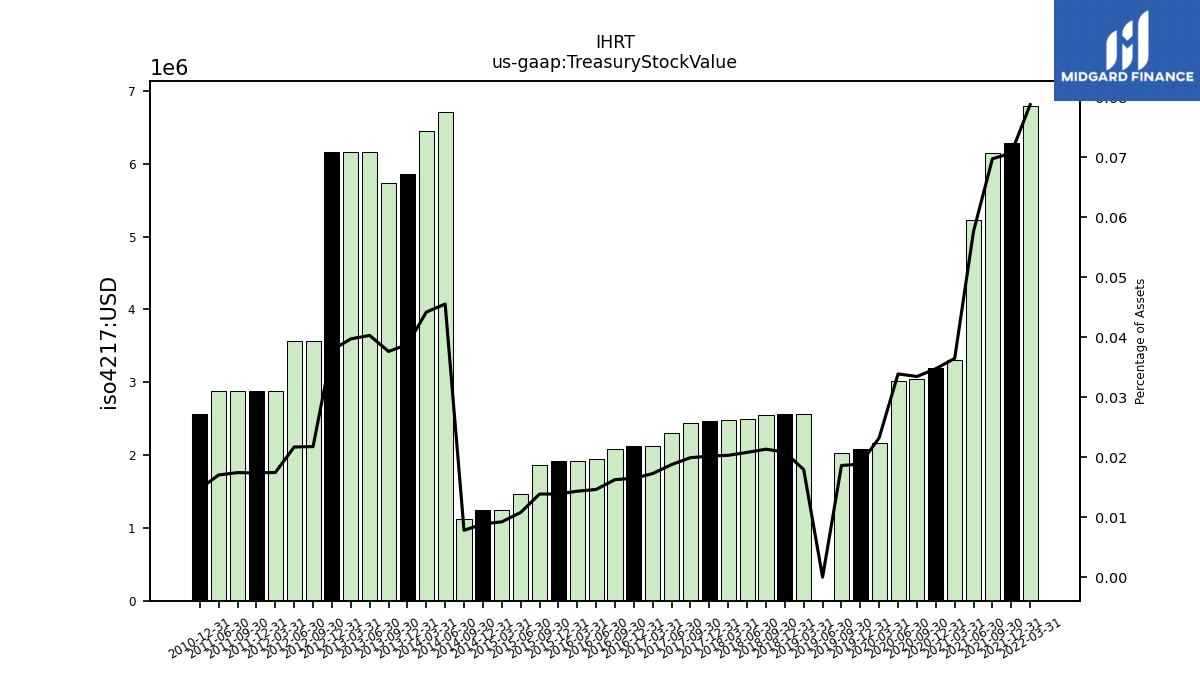
| Treasury Stock Value | NA | NA | NA | NA | NA | NA | 6.80 | 6.28 | 6.15 | 5.23 | 3.30 | 3.20 | 3.05 | 3.02 | 2.17 | 2.08 | 2.04 | 0.00 | NA | 2.56 | 2.56 | 2.55 | 2.49 | 2.48 | 2.47 | 2.44 | 2.31 | 2.12 | 2.12 | 2.08 | 1.95 | 1.92 | 1.92 | 1.86 | 1.47 | 1.25 | 1.25 | 1.12 | 6.72 | 6.45 | 5.86 | 5.73 | 6.17 | 6.17 | 6.17 | 3.57 | 3.57 | 2.88 | 2.88 | 2.88 | 2.88 | NA | 2.57 | NA | NA | |
| Minority Interest | 8.87 | 10.35 | 9.19 | 9.61 | 9.06 | 8.66 | 8.07 | 8.41 | 8.27 | 7.97 | 7.83 | 8.35 | 9.12 | 9.12 | 9.12 | 9.12 | 8.37 | 8.37 | 8.94 | 11.44 | 30.87 | 17.35 | 17.86 | 31.14 | 42.76 | 114.13 | 116.06 | 107.85 | 135.18 | 157.03 | 161.27 | 160.82 | 177.62 | 199.64 | 197.48 | 215.44 | 224.14 | 219.05 | 242.56 | 232.84 | 245.53 | 266.89 | 295.14 | 293.13 | 304.00 | 307.17 | 291.45 | 284.47 | 521.79 | 511.36 | 522.41 | NA | 490.92 | NA | NA |
| 2023-09-30 | 2023-06-30 | 2023-03-31 | 2022-12-31 | 2022-09-30 | 2022-06-30 | 2022-03-31 | 2021-12-31 | 2021-09-30 | 2021-06-30 | 2021-03-31 | 2020-12-31 | 2020-09-30 | 2020-06-30 | 2020-03-31 | 2019-12-31 | 2019-09-30 | 2019-06-30 | 2019-05-01 | 2019-03-31 | 2018-12-31 | 2018-09-30 | 2018-06-30 | 2018-03-31 | 2017-12-31 | 2017-09-30 | 2017-06-30 | 2017-03-31 | 2016-12-31 | 2016-09-30 | 2016-06-30 | 2016-03-31 | 2015-12-31 | 2015-09-30 | 2015-06-30 | 2015-03-31 | 2014-12-31 | 2014-09-30 | 2014-06-30 | 2014-03-31 | 2013-12-31 | 2013-09-30 | 2013-06-30 | 2013-03-31 | 2012-12-31 | 2012-09-30 | 2012-06-30 | 2012-03-31 | 2011-12-31 | 2011-09-30 | 2011-06-30 | 2011-03-31 | 2010-12-31 | 2010-09-30 | 2010-06-30 | ||
|---|---|---|---|---|---|---|---|---|---|---|---|---|---|---|---|---|---|---|---|---|---|---|---|---|---|---|---|---|---|---|---|---|---|---|---|---|---|---|---|---|---|---|---|---|---|---|---|---|---|---|---|---|---|---|---|---|
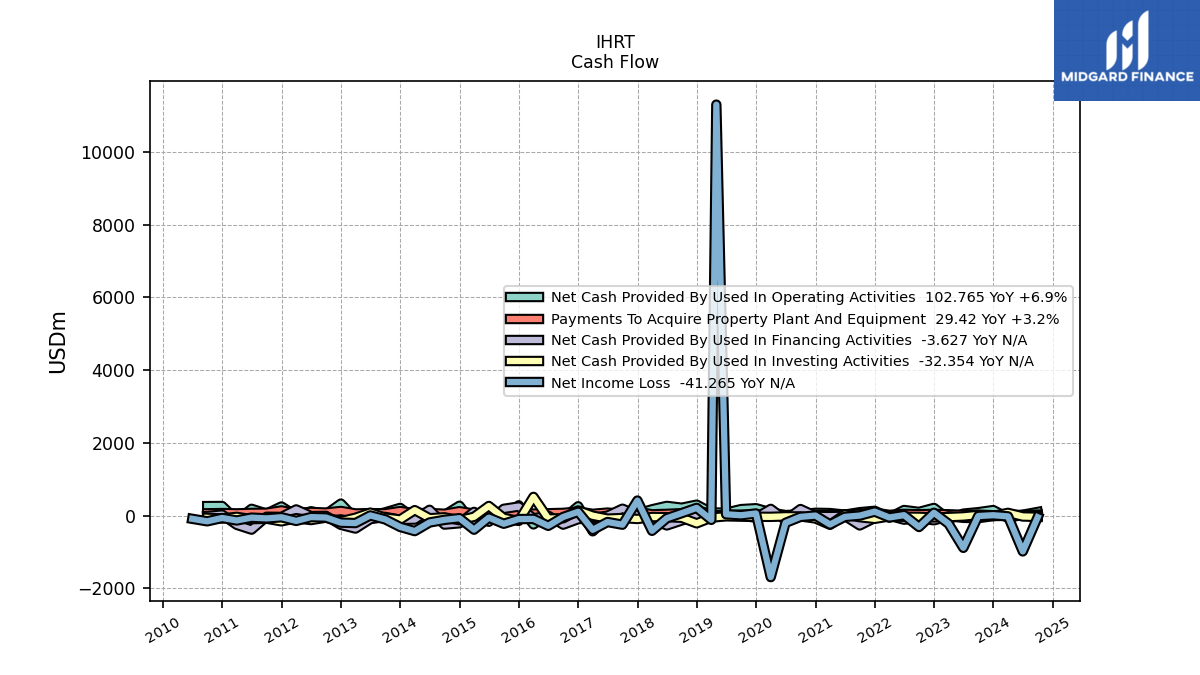
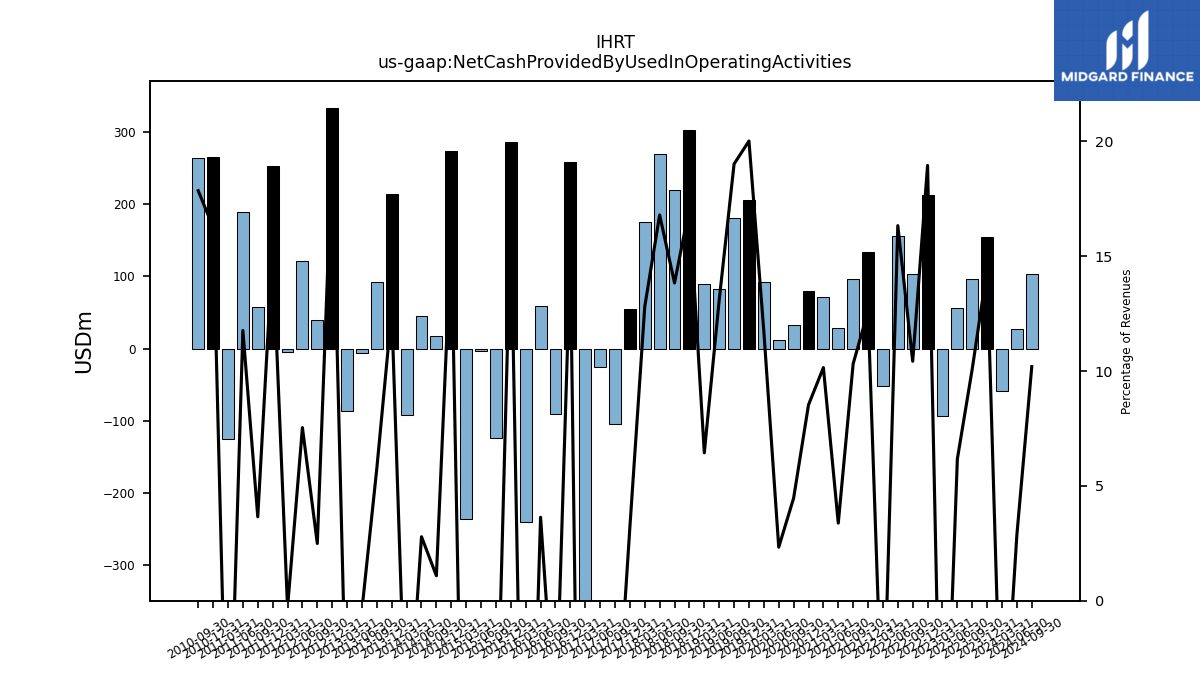
| Net Cash Provided By Used In Operating Activities | 96.17 | 56.77 | -93.98 | 213.38 | 103.11 | 155.80 | -52.21 | 133.98 | 95.74 | 29.13 | 71.73 | 79.78 | 33.25 | 11.37 | 91.54 | 205.36 | 180.34 | 83.20 | NA | 88.99 | 303.32 | 218.99 | 268.88 | 175.48 | 54.98 | -104.34 | -25.41 | -428.96 | 258.60 | -90.93 | 58.84 | -240.49 | 285.85 | -123.54 | -3.39 | -236.21 | 273.58 | 17.74 | 45.44 | -91.65 | 214.03 | 91.66 | -6.22 | -86.59 | 332.53 | 39.56 | 120.80 | -4.20 | 252.58 | 57.88 | 188.81 | -125.31 | 265.83 | 263.75 | NA | |
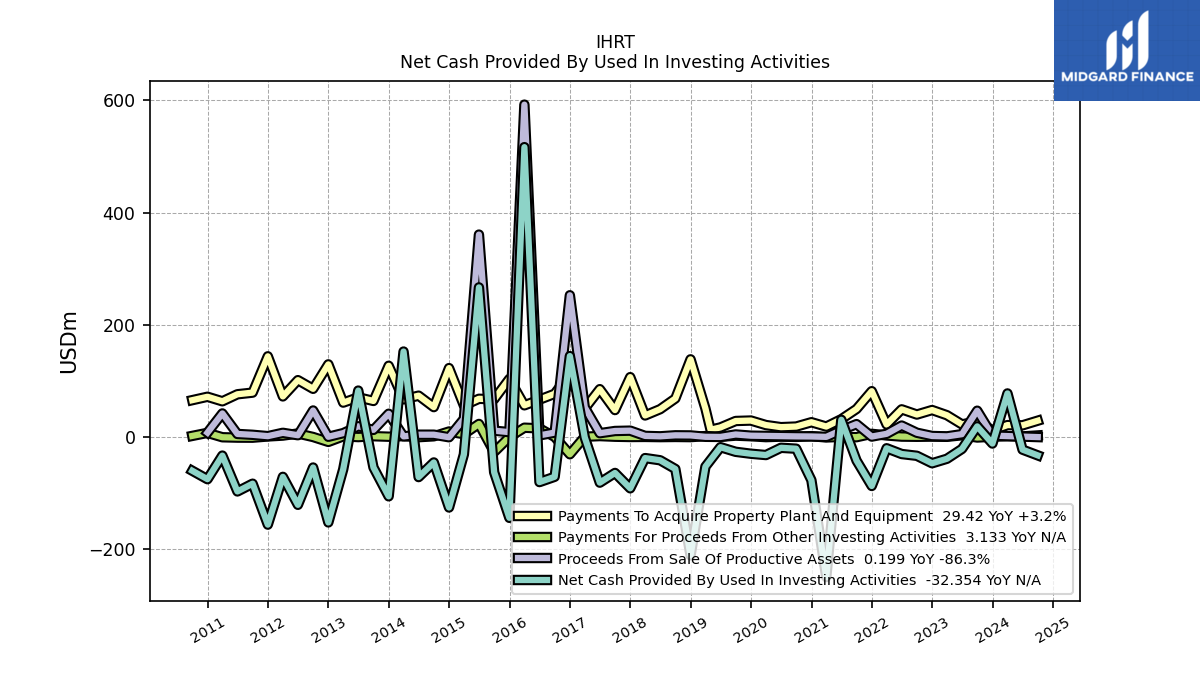
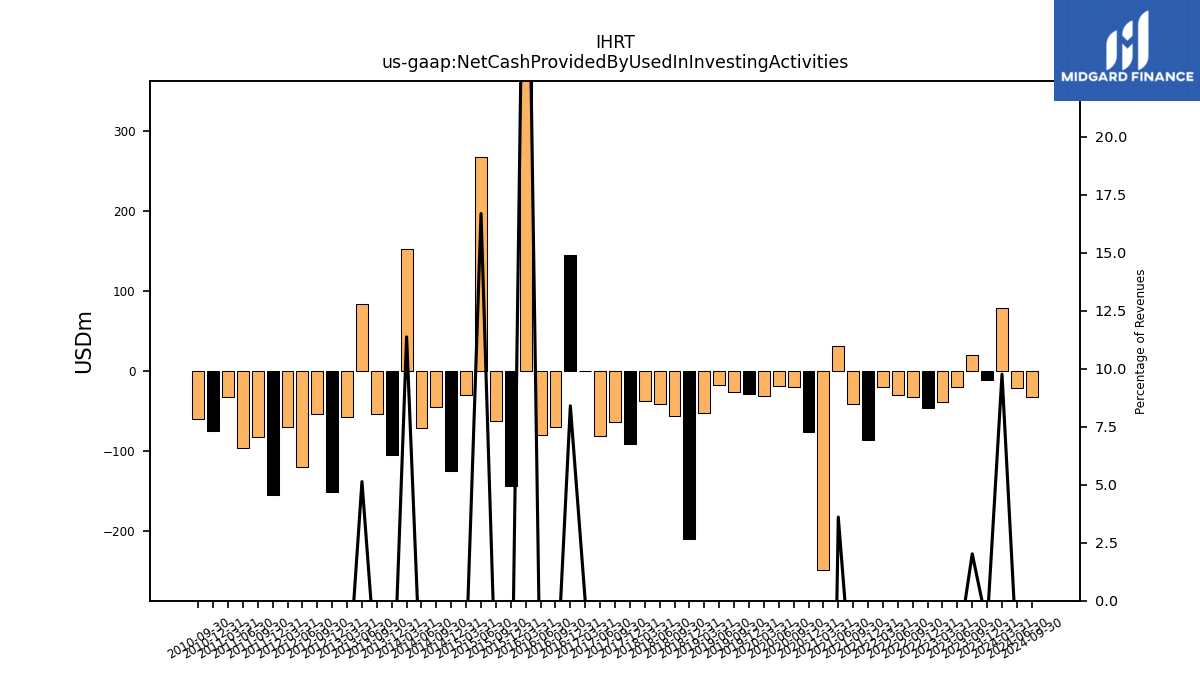
| Net Cash Provided By Used In Investing Activities | 19.27 | -20.84 | -38.42 | -46.42 | -33.15 | -29.97 | -19.69 | -86.89 | -41.63 | 31.06 | -249.32 | -76.64 | -20.49 | -18.88 | -31.80 | -29.46 | -26.03 | -17.79 | NA | -52.41 | -210.59 | -56.61 | -41.09 | -37.20 | -91.09 | -63.71 | -80.98 | -0.29 | 144.60 | -70.55 | -79.98 | 516.84 | -143.72 | -62.42 | 266.94 | -30.57 | -125.28 | -44.97 | -71.09 | 152.65 | -105.38 | -53.85 | 83.07 | -57.21 | -151.88 | -54.00 | -120.49 | -70.64 | -155.82 | -82.82 | -96.67 | -32.77 | -74.86 | -59.79 | NA | |
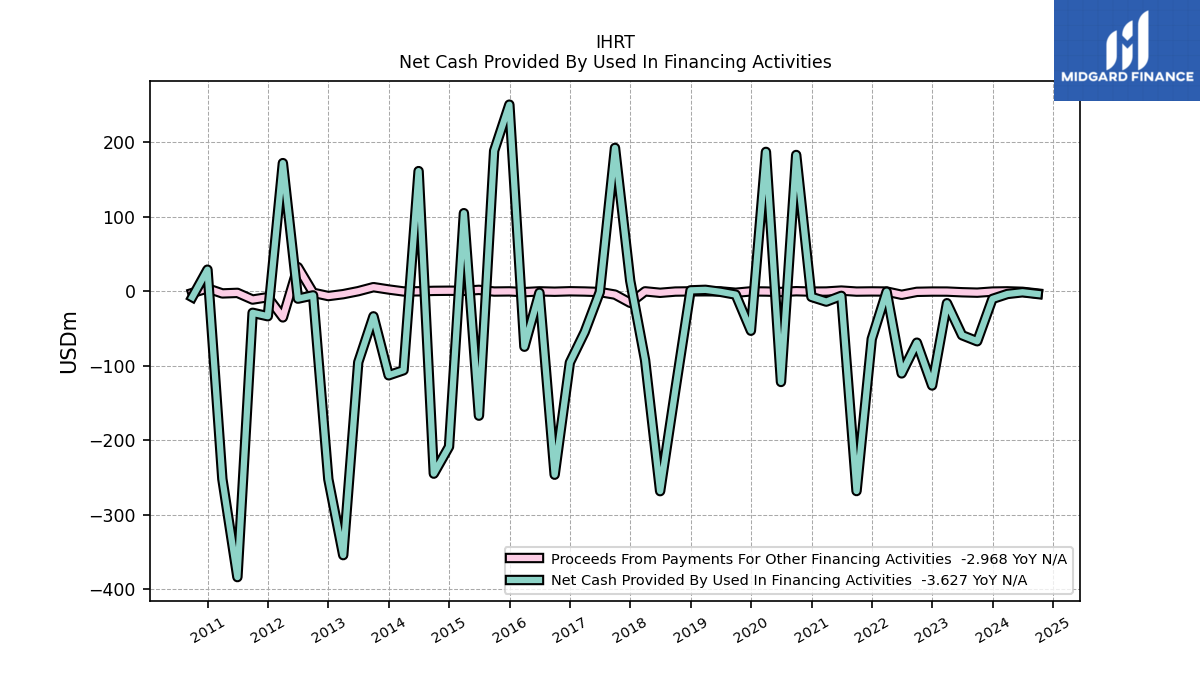
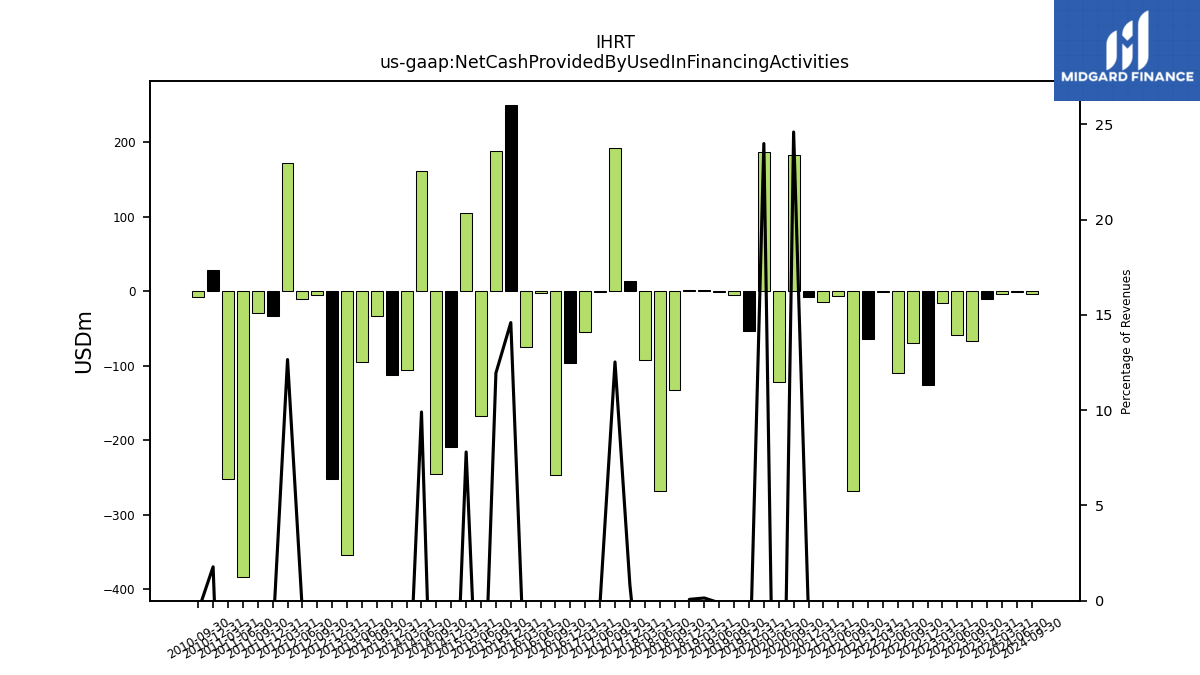
| Net Cash Provided By Used In Financing Activities | -67.08 | -58.94 | -15.94 | -126.45 | -68.95 | -110.25 | -0.46 | -64.01 | -268.24 | -6.07 | -13.81 | -7.46 | 183.12 | -121.77 | 187.28 | -52.94 | -4.41 | -0.68 | NA | 2.00 | 1.31 | -132.29 | -268.38 | -92.44 | 14.27 | 192.65 | -1.02 | -54.55 | -95.65 | -246.27 | -1.92 | -74.39 | 250.71 | 188.75 | -167.03 | 104.98 | -208.64 | -244.86 | 161.49 | -105.98 | -112.78 | -33.57 | -95.25 | -354.28 | -252.28 | -5.43 | -9.86 | 172.22 | -33.45 | -28.83 | -383.78 | -252.04 | 29.12 | -7.86 | NA |
| 2023-09-30 | 2023-06-30 | 2023-03-31 | 2022-12-31 | 2022-09-30 | 2022-06-30 | 2022-03-31 | 2021-12-31 | 2021-09-30 | 2021-06-30 | 2021-03-31 | 2020-12-31 | 2020-09-30 | 2020-06-30 | 2020-03-31 | 2019-12-31 | 2019-09-30 | 2019-06-30 | 2019-05-01 | 2019-03-31 | 2018-12-31 | 2018-09-30 | 2018-06-30 | 2018-03-31 | 2017-12-31 | 2017-09-30 | 2017-06-30 | 2017-03-31 | 2016-12-31 | 2016-09-30 | 2016-06-30 | 2016-03-31 | 2015-12-31 | 2015-09-30 | 2015-06-30 | 2015-03-31 | 2014-12-31 | 2014-09-30 | 2014-06-30 | 2014-03-31 | 2013-12-31 | 2013-09-30 | 2013-06-30 | 2013-03-31 | 2012-12-31 | 2012-09-30 | 2012-06-30 | 2012-03-31 | 2011-12-31 | 2011-09-30 | 2011-06-30 | 2011-03-31 | 2010-12-31 | 2010-09-30 | 2010-06-30 | ||
|---|---|---|---|---|---|---|---|---|---|---|---|---|---|---|---|---|---|---|---|---|---|---|---|---|---|---|---|---|---|---|---|---|---|---|---|---|---|---|---|---|---|---|---|---|---|---|---|---|---|---|---|---|---|---|---|---|
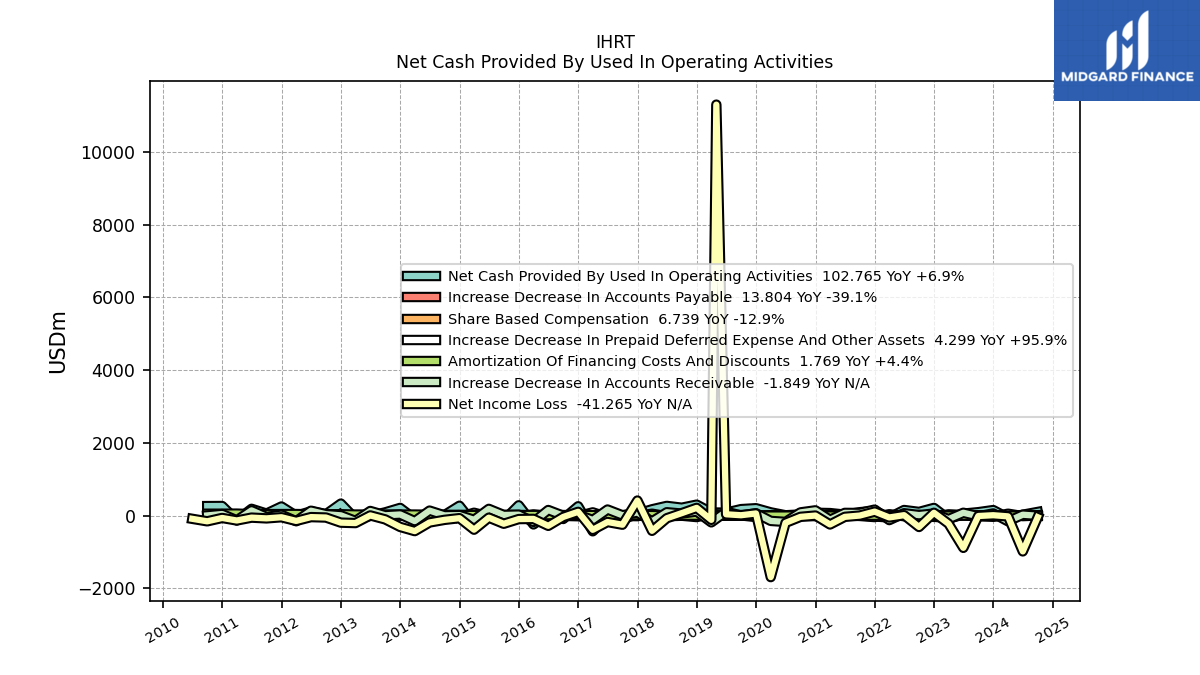
| Net Cash Provided By Used In Operating Activities | 96.17 | 56.77 | -93.98 | 213.38 | 103.11 | 155.80 | -52.21 | 133.98 | 95.74 | 29.13 | 71.73 | 79.78 | 33.25 | 11.37 | 91.54 | 205.36 | 180.34 | 83.20 | NA | 88.99 | 303.32 | 218.99 | 268.88 | 175.48 | 54.98 | -104.34 | -25.41 | -428.96 | 258.60 | -90.93 | 58.84 | -240.49 | 285.85 | -123.54 | -3.39 | -236.21 | 273.58 | 17.74 | 45.44 | -91.65 | 214.03 | 91.66 | -6.22 | -86.59 | 332.53 | 39.56 | 120.80 | -4.20 | 252.58 | 57.88 | 188.81 | -125.31 | 265.83 | 263.75 | NA | |
| Net Income Loss | -9.05 | -884.47 | -222.26 | 79.88 | -310.36 | 14.40 | -48.58 | 111.63 | 3.18 | -32.29 | -241.72 | 3.47 | -32.11 | -197.32 | -1688.74 | 61.38 | 12.37 | 38.79 | 11298.52 | -114.38 | 214.91 | 70.08 | -69.90 | -415.65 | 416.54 | -248.18 | -174.04 | -388.21 | 106.04 | -34.95 | -278.89 | -88.52 | -93.27 | -221.92 | -54.47 | -384.97 | -68.09 | -114.85 | -186.63 | -424.19 | -309.23 | -101.86 | 7.20 | -203.00 | -191.26 | -50.56 | -39.02 | -143.63 | -43.03 | -74.06 | -53.18 | -131.83 | -62.67 | -154.69 | -86.32 | |
| Profit Loss | -8.97 | -882.98 | -222.36 | 80.66 | -309.78 | 15.18 | -48.74 | 111.95 | 3.67 | -31.96 | -242.06 | 2.94 | -32.11 | -197.32 | -1688.74 | 62.13 | 12.37 | 38.79 | 11300.71 | -135.60 | 224.91 | 71.78 | -66.29 | -431.55 | 341.76 | -246.18 | -168.02 | -387.58 | 123.40 | -28.48 | -276.04 | -58.89 | -90.07 | -213.47 | -47.31 | -386.63 | -50.16 | -107.82 | -171.78 | -432.39 | -302.23 | -92.17 | 20.01 | -209.12 | -196.78 | -38.58 | -27.71 | -148.12 | -31.40 | -67.29 | -37.98 | -131.36 | -55.63 | -150.39 | -77.21 | |
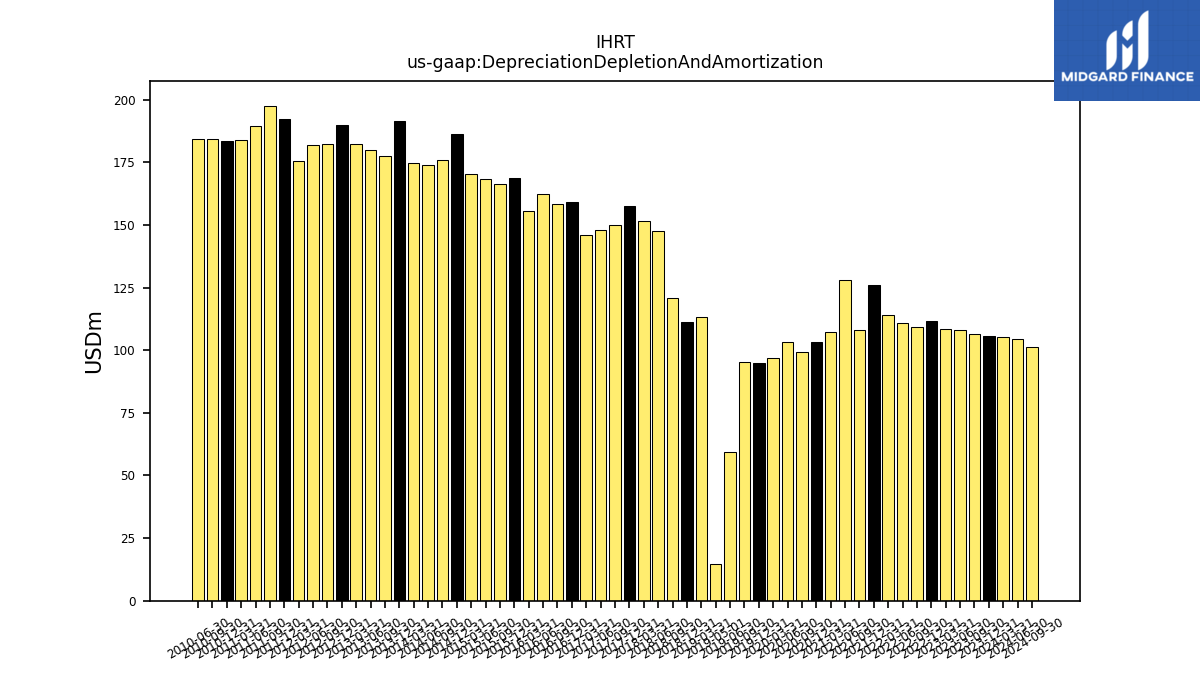
| Depreciation Depletion And Amortization | 106.45 | 108.06 | 108.51 | 111.52 | 109.31 | 110.79 | 114.05 | 126.01 | 108.10 | 127.94 | 107.36 | 103.44 | 99.38 | 103.35 | 96.77 | 94.97 | 95.27 | 59.38 | 14.54 | 113.37 | 111.12 | 120.70 | 147.64 | 151.43 | 157.65 | 149.75 | 147.79 | 146.11 | 159.17 | 158.45 | 162.14 | 155.46 | 168.82 | 166.32 | 168.39 | 170.45 | 186.10 | 175.87 | 174.06 | 174.87 | 191.58 | 177.33 | 179.73 | 182.18 | 189.73 | 182.35 | 181.84 | 175.37 | 192.42 | 197.53 | 189.64 | 183.71 | 183.28 | 184.08 | 184.18 | |
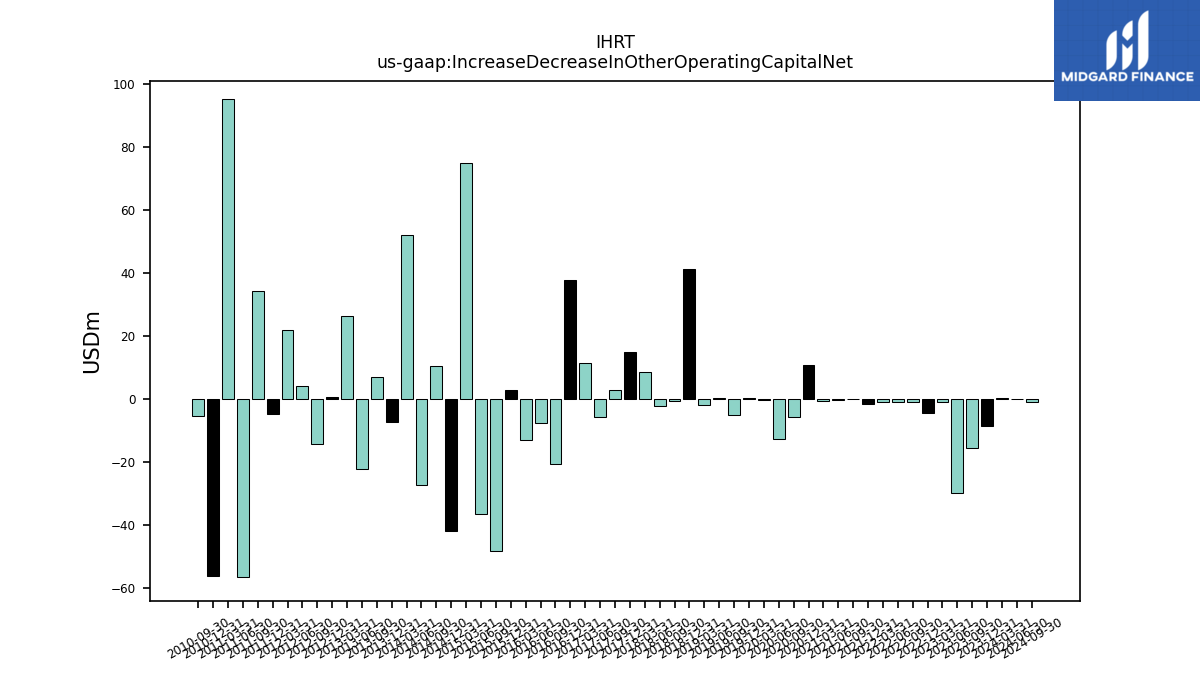
| Increase Decrease In Other Operating Capital Net | -15.43 | -30.01 | -1.09 | -4.34 | -0.94 | -1.01 | -1.05 | -1.58 | -0.09 | -0.17 | -0.54 | 10.82 | -5.72 | -12.56 | -0.44 | 0.39 | -5.12 | 0.22 | NA | -1.95 | 41.38 | -0.54 | -2.12 | 8.63 | 14.99 | 2.77 | -5.67 | 11.31 | 37.89 | -20.70 | -7.72 | -13.02 | 2.82 | -48.23 | -36.51 | 74.85 | -41.81 | 10.52 | -27.17 | 52.09 | -7.28 | 6.90 | -22.31 | 26.22 | 0.72 | -14.35 | 4.19 | 21.93 | -4.79 | 34.20 | -56.50 | 95.45 | -56.09 | -5.25 | NA | |
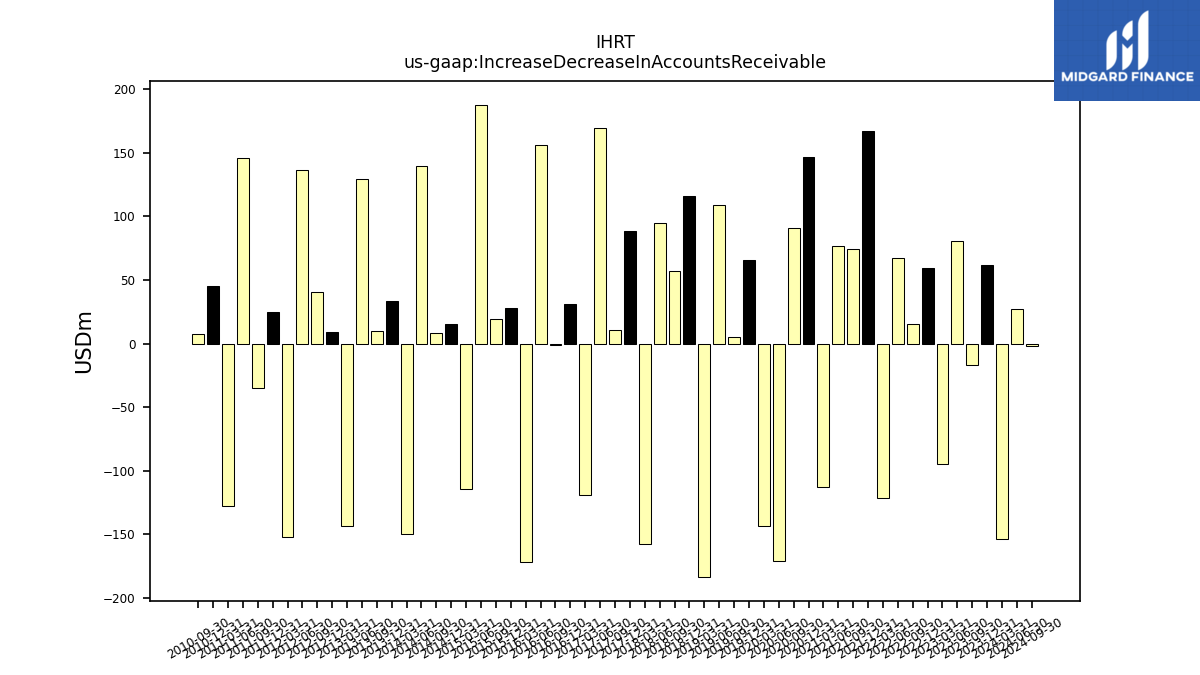
| Increase Decrease In Accounts Receivable | -16.71 | 80.70 | -94.76 | 59.55 | 15.55 | 67.10 | -121.34 | 167.42 | 74.06 | 76.88 | -113.17 | 146.71 | 90.47 | -171.10 | -143.42 | 65.63 | 5.24 | 108.61 | NA | -183.70 | 115.86 | 57.23 | 94.83 | -157.86 | 88.36 | 10.85 | 169.37 | -119.24 | 31.38 | -1.09 | 156.20 | -172.02 | 28.26 | 19.55 | 187.85 | -114.08 | 15.41 | 8.20 | 139.69 | -149.41 | 33.31 | 10.12 | 129.59 | -143.41 | 9.44 | 40.41 | 136.66 | -152.27 | 24.43 | -34.85 | 145.73 | -127.47 | 45.15 | 7.72 | NA | |
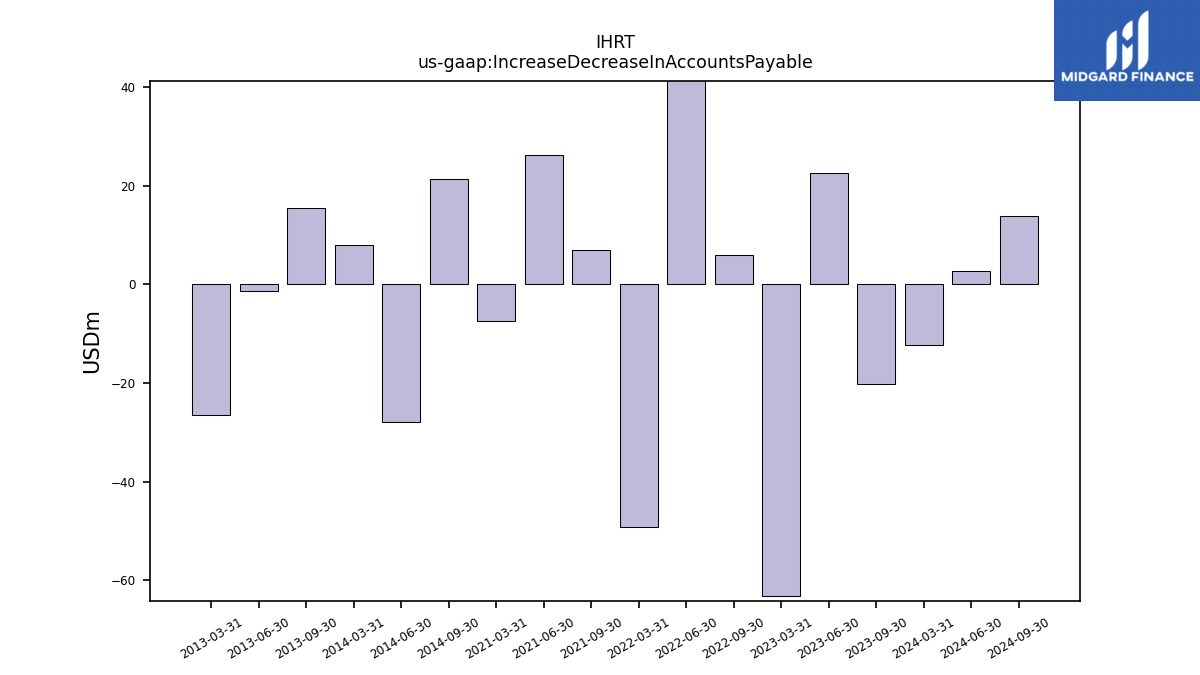
| Increase Decrease In Accounts Payable | -20.23 | 22.67 | -63.19 | NA | 6.04 | 42.17 | -49.13 | NA | 6.89 | 26.21 | -7.42 | NA | NA | NA | NA | NA | NA | NA | NA | NA | NA | NA | NA | NA | NA | NA | NA | NA | NA | NA | NA | NA | NA | NA | NA | NA | NA | 21.35 | -27.94 | 8.01 | NA | 15.56 | -1.26 | -26.42 | NA | NA | NA | NA | NA | NA | NA | NA | NA | NA | NA | |
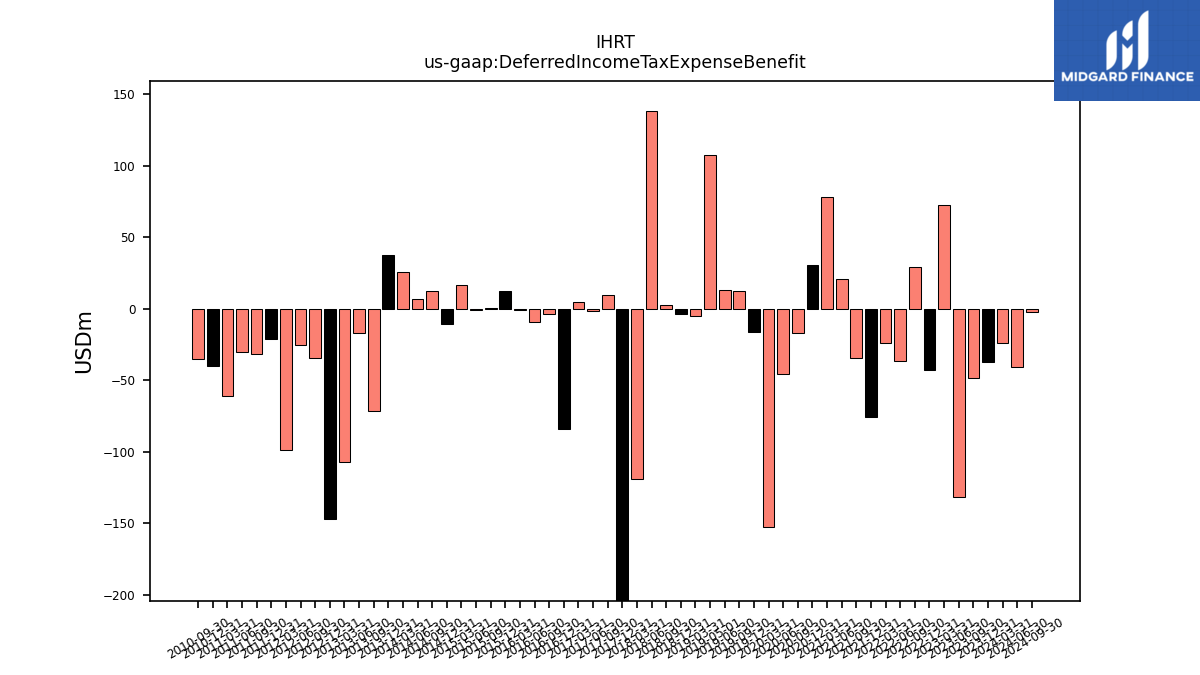
| Deferred Income Tax Expense Benefit | -48.19 | -131.52 | 72.62 | -43.11 | 29.28 | -36.80 | -23.79 | -75.39 | -34.80 | 20.97 | 78.35 | 30.35 | -16.93 | -45.47 | -152.22 | -16.36 | 12.42 | 13.06 | 107.24 | -5.36 | -3.98 | 2.79 | 137.93 | -118.70 | -500.72 | 9.40 | -1.47 | 4.57 | -84.00 | -3.73 | -9.12 | -1.26 | 12.16 | 0.70 | -1.23 | 16.22 | -10.94 | 12.69 | 6.87 | 25.31 | 37.19 | -71.71 | -16.65 | -106.99 | -146.65 | -34.38 | -25.14 | -98.44 | -21.06 | -31.99 | -30.23 | -60.67 | -40.29 | -35.08 | NA | |
| Share Based Compensation | 7.73 | 8.95 | 10.15 | 10.88 | 10.44 | 8.61 | 5.54 | 5.96 | 5.99 | 5.90 | 5.68 | 8.13 | 5.89 | 4.24 | 4.26 | 6.23 | 17.11 | 3.04 | NA | 2.23 | 2.20 | 3.59 | 2.11 | 2.68 | 3.06 | 3.54 | 2.42 | 3.06 | 2.78 | 3.43 | 3.79 | 3.09 | 3.00 | 2.99 | 2.40 | 2.52 | 2.65 | 2.25 | 2.78 | 3.04 | 2.62 | 2.75 | 5.82 | 5.52 | 8.45 | 7.38 | 5.82 | 6.90 | 6.39 | 6.25 | 5.74 | 2.29 | 9.28 | 8.34 | NA |
| 2023-09-30 | 2023-06-30 | 2023-03-31 | 2022-12-31 | 2022-09-30 | 2022-06-30 | 2022-03-31 | 2021-12-31 | 2021-09-30 | 2021-06-30 | 2021-03-31 | 2020-12-31 | 2020-09-30 | 2020-06-30 | 2020-03-31 | 2019-12-31 | 2019-09-30 | 2019-06-30 | 2019-05-01 | 2019-03-31 | 2018-12-31 | 2018-09-30 | 2018-06-30 | 2018-03-31 | 2017-12-31 | 2017-09-30 | 2017-06-30 | 2017-03-31 | 2016-12-31 | 2016-09-30 | 2016-06-30 | 2016-03-31 | 2015-12-31 | 2015-09-30 | 2015-06-30 | 2015-03-31 | 2014-12-31 | 2014-09-30 | 2014-06-30 | 2014-03-31 | 2013-12-31 | 2013-09-30 | 2013-06-30 | 2013-03-31 | 2012-12-31 | 2012-09-30 | 2012-06-30 | 2012-03-31 | 2011-12-31 | 2011-09-30 | 2011-06-30 | 2011-03-31 | 2010-12-31 | 2010-09-30 | 2010-06-30 | ||
|---|---|---|---|---|---|---|---|---|---|---|---|---|---|---|---|---|---|---|---|---|---|---|---|---|---|---|---|---|---|---|---|---|---|---|---|---|---|---|---|---|---|---|---|---|---|---|---|---|---|---|---|---|---|---|---|---|
| Net Cash Provided By Used In Investing Activities | 19.27 | -20.84 | -38.42 | -46.42 | -33.15 | -29.97 | -19.69 | -86.89 | -41.63 | 31.06 | -249.32 | -76.64 | -20.49 | -18.88 | -31.80 | -29.46 | -26.03 | -17.79 | NA | -52.41 | -210.59 | -56.61 | -41.09 | -37.20 | -91.09 | -63.71 | -80.98 | -0.29 | 144.60 | -70.55 | -79.98 | 516.84 | -143.72 | -62.42 | 266.94 | -30.57 | -125.28 | -44.97 | -71.09 | 152.65 | -105.38 | -53.85 | 83.07 | -57.21 | -151.88 | -54.00 | -120.49 | -70.64 | -155.82 | -82.82 | -96.67 | -32.77 | -74.86 | -59.79 | NA | |
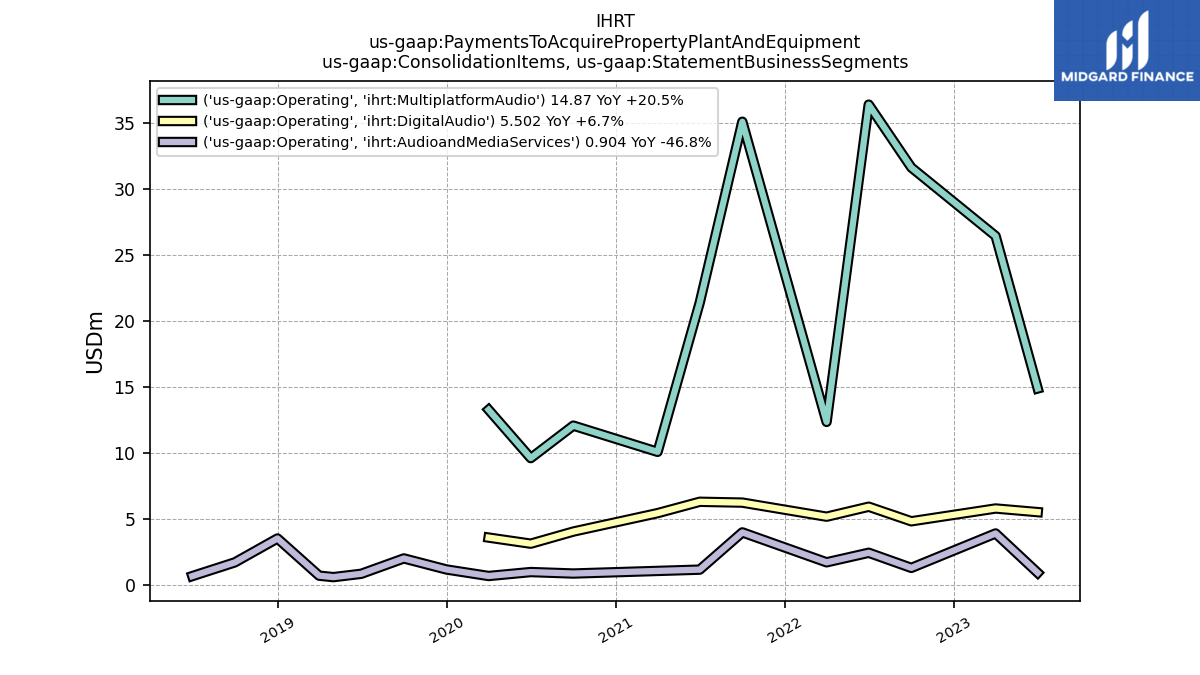
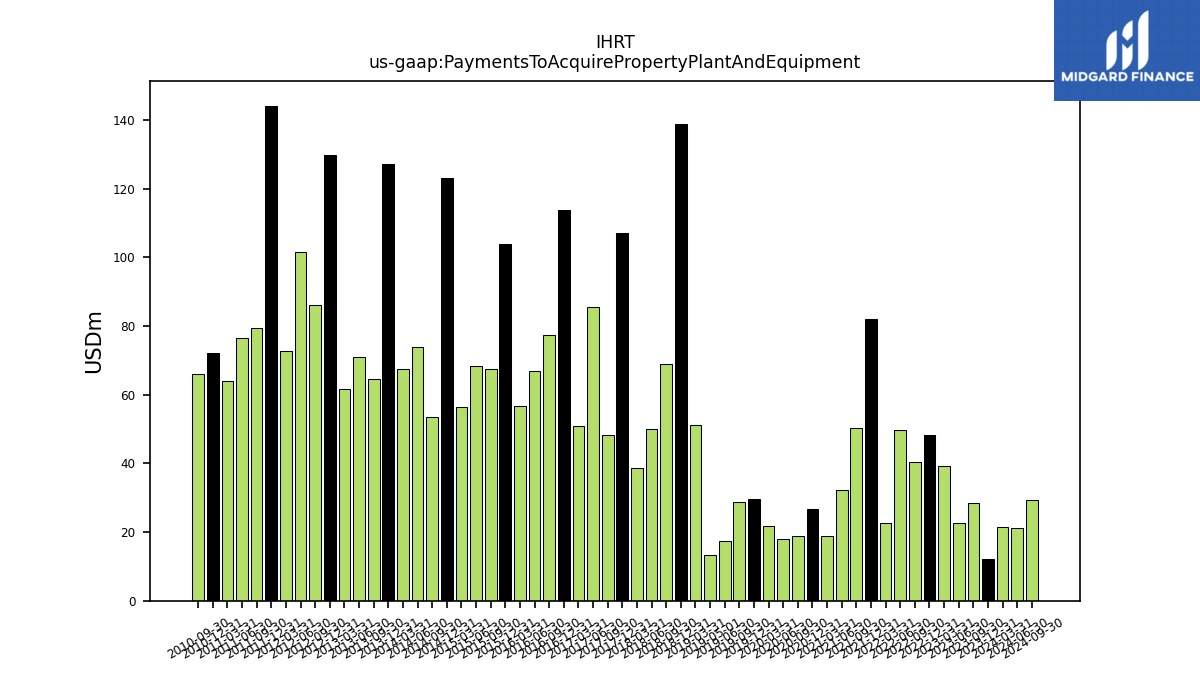
| Payments To Acquire Property Plant And Equipment | 28.52 | 22.77 | 39.16 | 48.40 | 40.36 | 49.65 | 22.56 | 82.04 | 50.27 | 32.11 | 18.95 | 26.68 | 18.98 | 17.88 | 21.66 | 29.69 | 28.87 | 17.43 | 13.24 | 51.13 | 138.75 | 68.95 | 49.92 | 38.70 | 107.02 | 48.32 | 85.59 | 51.03 | 113.68 | 77.33 | 66.93 | 56.78 | 103.89 | 67.61 | 68.42 | 56.45 | 123.16 | 53.59 | 74.01 | 67.41 | 127.27 | 64.58 | 71.06 | 61.62 | 129.80 | 86.19 | 101.64 | 72.65 | 144.15 | 79.43 | 76.48 | 63.97 | 72.06 | 66.00 | NA |
| 2023-09-30 | 2023-06-30 | 2023-03-31 | 2022-12-31 | 2022-09-30 | 2022-06-30 | 2022-03-31 | 2021-12-31 | 2021-09-30 | 2021-06-30 | 2021-03-31 | 2020-12-31 | 2020-09-30 | 2020-06-30 | 2020-03-31 | 2019-12-31 | 2019-09-30 | 2019-06-30 | 2019-05-01 | 2019-03-31 | 2018-12-31 | 2018-09-30 | 2018-06-30 | 2018-03-31 | 2017-12-31 | 2017-09-30 | 2017-06-30 | 2017-03-31 | 2016-12-31 | 2016-09-30 | 2016-06-30 | 2016-03-31 | 2015-12-31 | 2015-09-30 | 2015-06-30 | 2015-03-31 | 2014-12-31 | 2014-09-30 | 2014-06-30 | 2014-03-31 | 2013-12-31 | 2013-09-30 | 2013-06-30 | 2013-03-31 | 2012-12-31 | 2012-09-30 | 2012-06-30 | 2012-03-31 | 2011-12-31 | 2011-09-30 | 2011-06-30 | 2011-03-31 | 2010-12-31 | 2010-09-30 | 2010-06-30 | ||
|---|---|---|---|---|---|---|---|---|---|---|---|---|---|---|---|---|---|---|---|---|---|---|---|---|---|---|---|---|---|---|---|---|---|---|---|---|---|---|---|---|---|---|---|---|---|---|---|---|---|---|---|---|---|---|---|---|
| Net Cash Provided By Used In Financing Activities | -67.08 | -58.94 | -15.94 | -126.45 | -68.95 | -110.25 | -0.46 | -64.01 | -268.24 | -6.07 | -13.81 | -7.46 | 183.12 | -121.77 | 187.28 | -52.94 | -4.41 | -0.68 | NA | 2.00 | 1.31 | -132.29 | -268.38 | -92.44 | 14.27 | 192.65 | -1.02 | -54.55 | -95.65 | -246.27 | -1.92 | -74.39 | 250.71 | 188.75 | -167.03 | 104.98 | -208.64 | -244.86 | 161.49 | -105.98 | -112.78 | -33.57 | -95.25 | -354.28 | -252.28 | -5.43 | -9.86 | 172.22 | -33.45 | -28.83 | -383.78 | -252.04 | 29.12 | -7.86 | NA |
| 2023-09-30 | 2023-06-30 | 2023-03-31 | 2022-12-31 | 2022-09-30 | 2022-06-30 | 2022-03-31 | 2021-12-31 | 2021-09-30 | 2021-06-30 | 2021-03-31 | 2020-12-31 | 2020-09-30 | 2020-06-30 | 2020-03-31 | 2019-12-31 | 2019-09-30 | 2019-06-30 | 2019-05-01 | 2019-03-31 | 2018-12-31 | 2018-09-30 | 2018-06-30 | 2018-03-31 | 2017-12-31 | 2017-09-30 | 2017-06-30 | 2017-03-31 | 2016-12-31 | 2016-09-30 | 2016-06-30 | 2016-03-31 | 2015-12-31 | 2015-09-30 | 2015-06-30 | 2015-03-31 | 2014-12-31 | 2014-09-30 | 2014-06-30 | 2014-03-31 | 2013-12-31 | 2013-09-30 | 2013-06-30 | 2013-03-31 | 2012-12-31 | 2012-09-30 | 2012-06-30 | 2012-03-31 | 2011-12-31 | 2011-09-30 | 2011-06-30 | 2011-03-31 | 2010-12-31 | 2010-09-30 | 2010-06-30 | ||
|---|---|---|---|---|---|---|---|---|---|---|---|---|---|---|---|---|---|---|---|---|---|---|---|---|---|---|---|---|---|---|---|---|---|---|---|---|---|---|---|---|---|---|---|---|---|---|---|---|---|---|---|---|---|---|---|---|
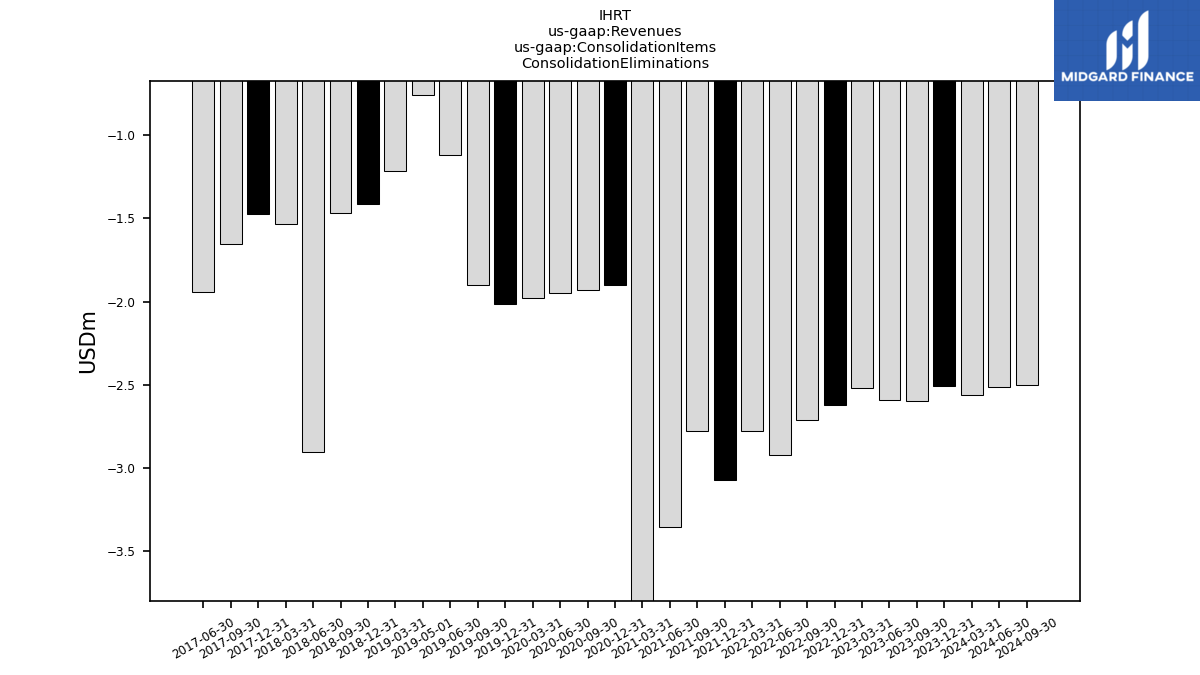
| Revenues | 952.99 | 920.01 | 811.24 | 1125.89 | 988.93 | 954.00 | 843.46 | 1062.02 | 928.05 | 861.61 | 706.66 | 935.53 | 744.41 | 487.65 | 780.63 | 1026.07 | 948.34 | 635.65 | 277.67 | 1381.90 | 1772.53 | 1582.77 | 1600.84 | 1369.96 | 1713.89 | 1537.42 | 1590.37 | 1329.32 | 1721.12 | 1570.42 | 1618.53 | 1363.51 | 1717.58 | 1579.51 | 1599.86 | 1344.56 | 1715.80 | 1630.03 | 1630.15 | 1342.55 | 1694.37 | 1587.52 | 1618.10 | 1343.06 | 1696.34 | 1587.33 | 1602.49 | 1360.72 | 1652.79 | 1583.35 | 1604.39 | 1320.83 | 1634.55 | 1477.35 | 1490.01 | |
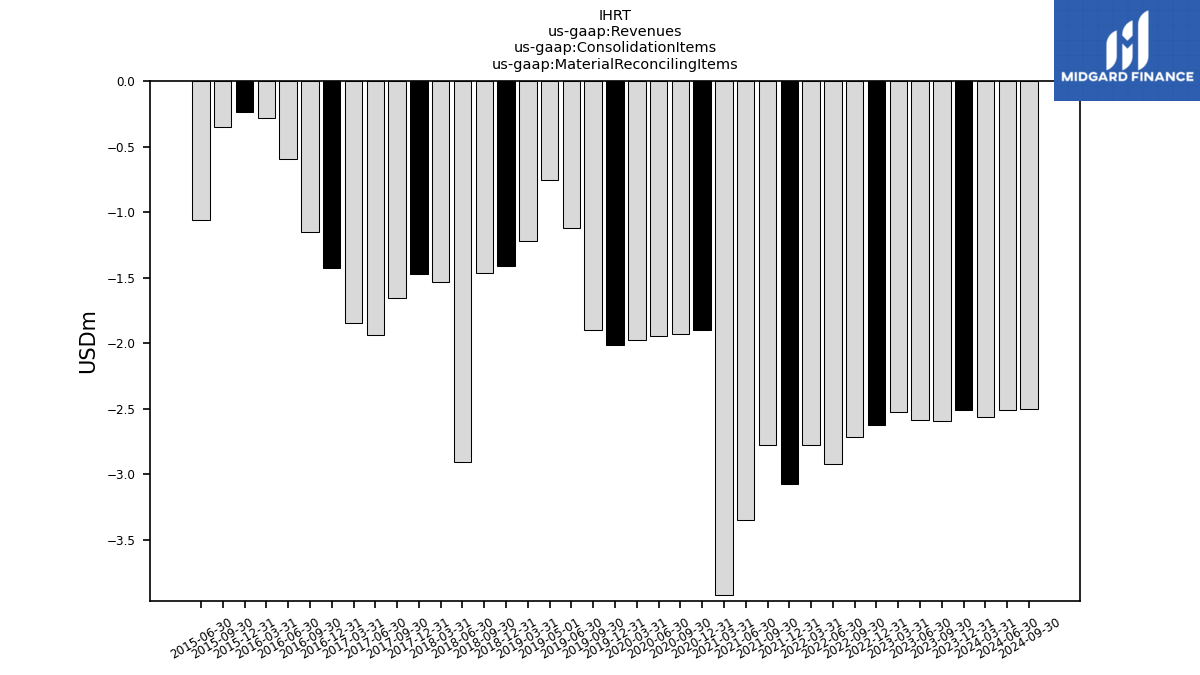
| -2.60 | -2.59 | -2.52 | -2.62 | -2.71 | -2.92 | -2.78 | -3.07 | -2.77 | -3.35 | -3.92 | -1.90 | -1.93 | -1.95 | -1.98 | -2.02 | -1.90 | -1.12 | -0.76 | -1.22 | -1.41 | -1.47 | -2.90 | -1.54 | -1.47 | -1.66 | -1.94 | NA | NA | NA | NA | NA | NA | NA | NA | NA | NA | NA | NA | NA | NA | NA | NA | NA | NA | NA | NA | NA | NA | NA | NA | NA | NA | NA | NA | ||
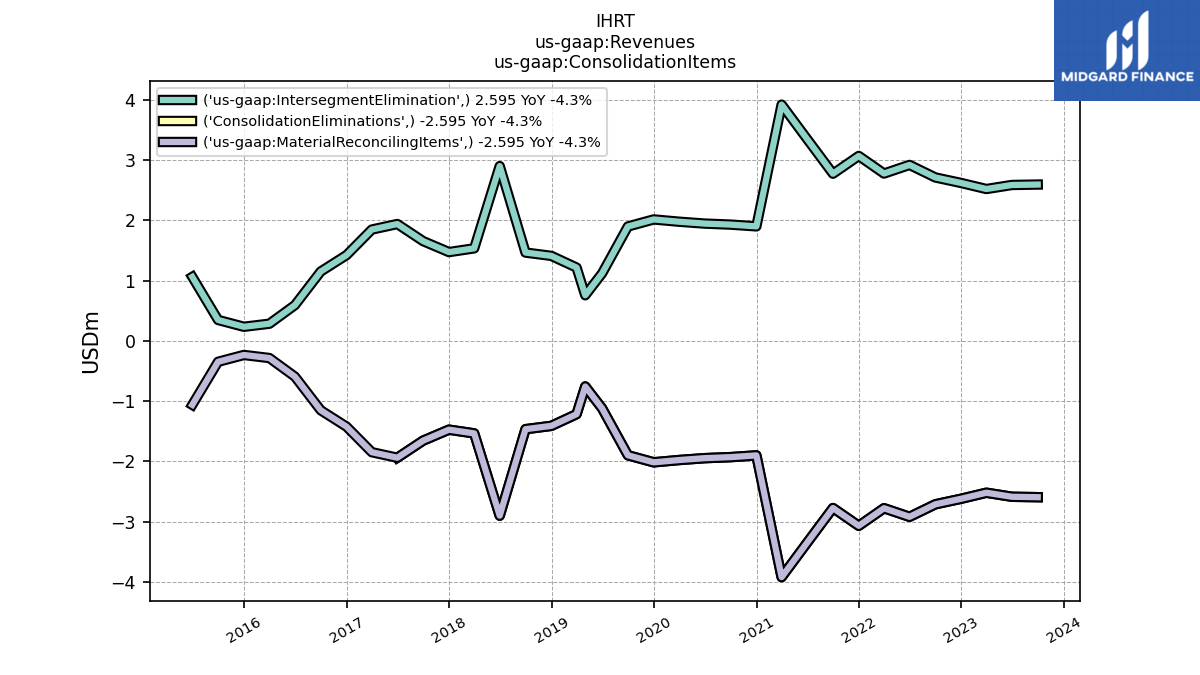
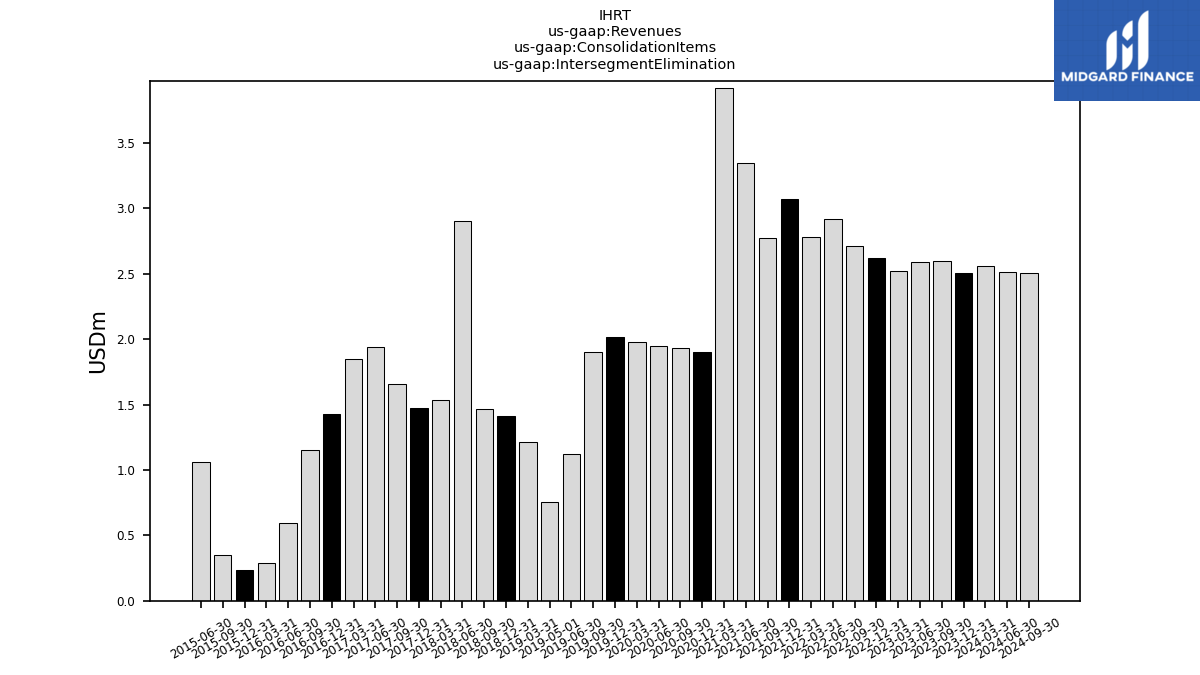
| Intersegment Elimination | 2.60 | 2.59 | 2.52 | 2.62 | 2.71 | 2.92 | 2.78 | 3.07 | 2.77 | 3.35 | 3.92 | 1.90 | 1.93 | 1.95 | 1.98 | 2.02 | 1.90 | 1.12 | 0.76 | 1.22 | 1.41 | 1.47 | 2.90 | 1.54 | 1.47 | 1.66 | 1.94 | 1.85 | 1.42 | 1.15 | 0.59 | 0.28 | 0.23 | 0.35 | 1.06 | NA | NA | NA | NA | NA | NA | NA | NA | NA | NA | NA | NA | NA | NA | NA | NA | NA | NA | NA | NA | |
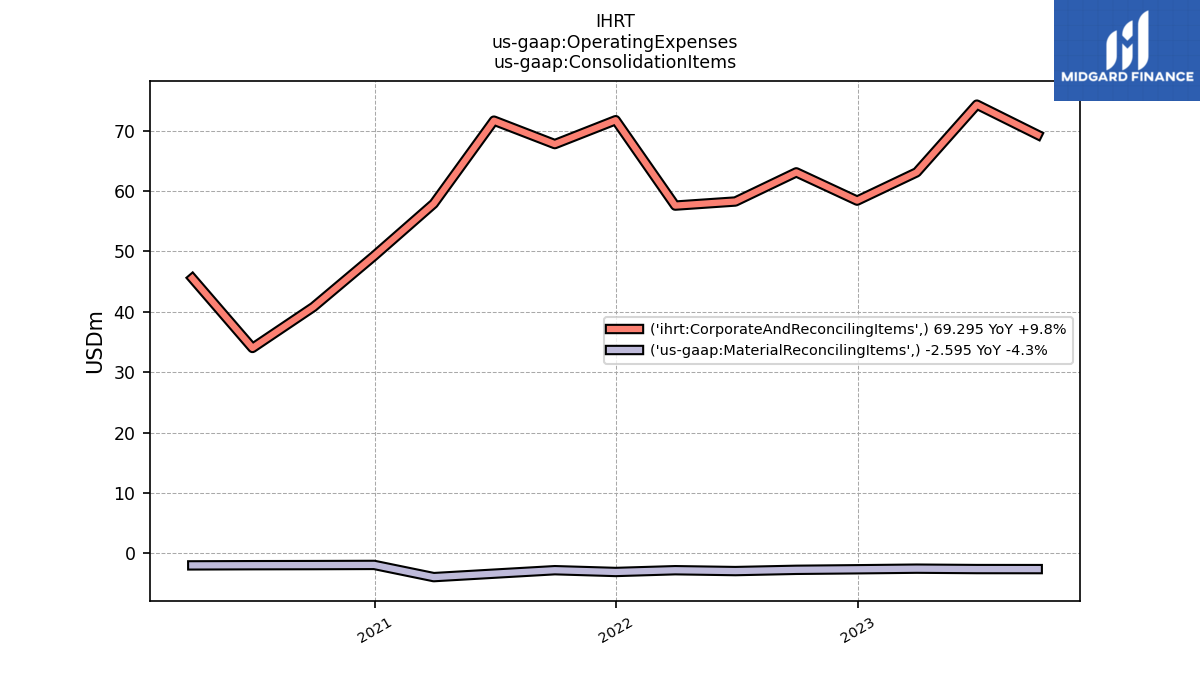
| Material Reconciling Items | -2.60 | -2.59 | -2.52 | -2.62 | -2.71 | -2.92 | -2.78 | -3.07 | -2.77 | -3.35 | -3.92 | -1.90 | -1.93 | -1.95 | -1.98 | -2.02 | -1.90 | -1.12 | -0.76 | -1.22 | -1.41 | -1.47 | -2.90 | -1.54 | -1.47 | -1.66 | -1.94 | -1.85 | -1.42 | -1.15 | -0.59 | -0.28 | -0.23 | -0.35 | -1.06 | NA | NA | NA | NA | NA | NA | NA | NA | NA | NA | NA | NA | NA | NA | NA | NA | NA | NA | NA | NA | |
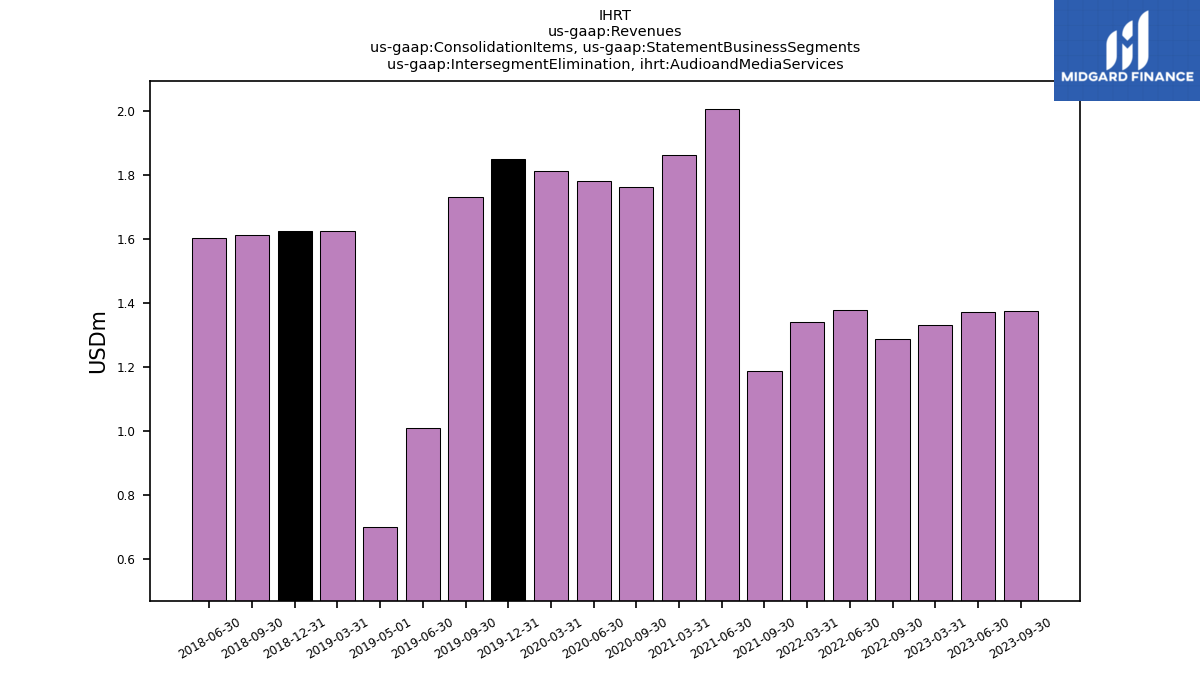
| Intersegment Elimination, Audioand Media Services | 1.37 | 1.37 | 1.33 | NA | 1.29 | 1.38 | 1.34 | NA | 1.19 | 2.00 | 1.86 | NA | 1.76 | 1.78 | 1.81 | 1.85 | 1.73 | 1.01 | 0.70 | 1.62 | 1.62 | 1.61 | 1.60 | NA | NA | NA | NA | NA | NA | NA | NA | NA | NA | NA | NA | NA | NA | NA | NA | NA | NA | NA | NA | NA | NA | NA | NA | NA | NA | NA | NA | NA | NA | NA | NA | |
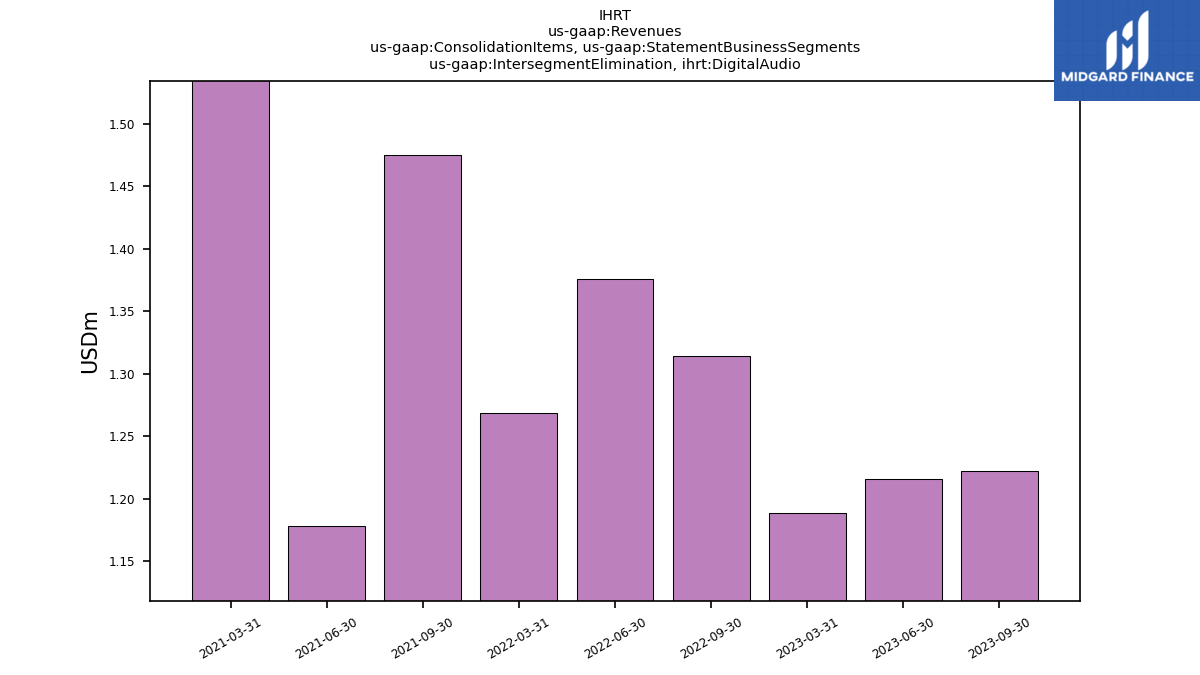
| Intersegment Elimination, Digital Audio | 1.22 | 1.22 | 1.19 | NA | 1.31 | 1.38 | 1.27 | NA | 1.48 | 1.18 | 1.89 | NA | NA | NA | NA | NA | NA | NA | NA | NA | NA | NA | NA | NA | NA | NA | NA | NA | NA | NA | NA | NA | NA | NA | NA | NA | NA | NA | NA | NA | NA | NA | NA | NA | NA | NA | NA | NA | NA | NA | NA | NA | NA | NA | NA | |
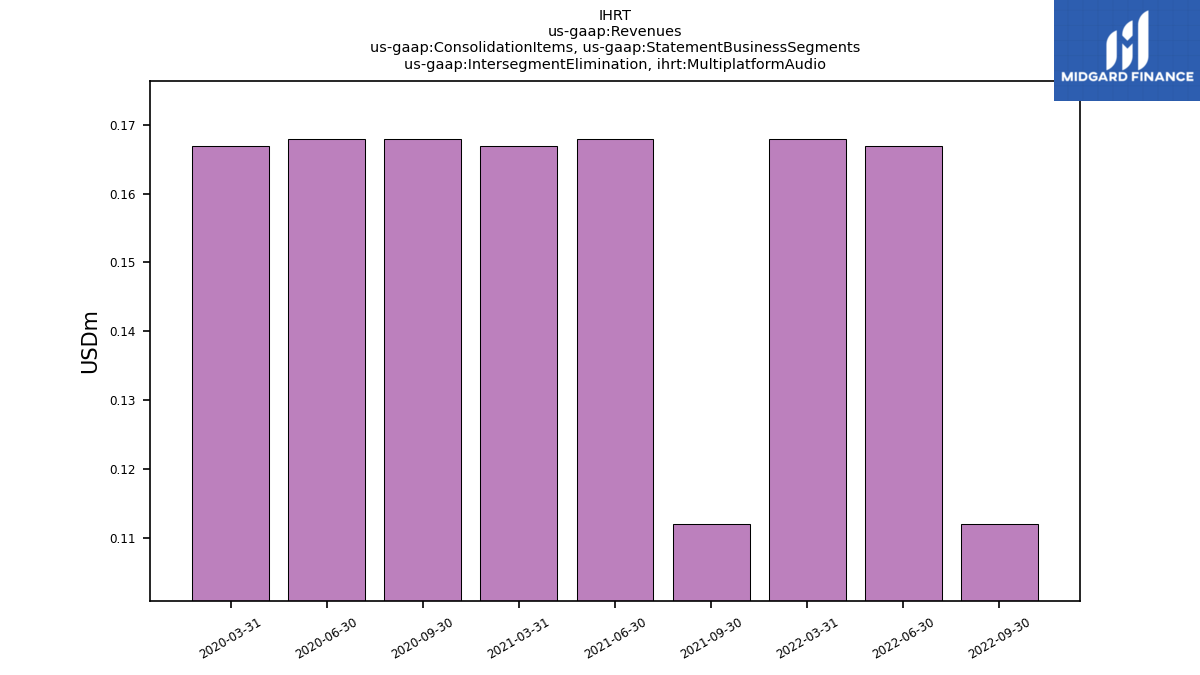
| Intersegment Elimination, Multiplatform Audio | NA | NA | NA | NA | 0.11 | 0.17 | 0.17 | NA | 0.11 | 0.17 | 0.17 | NA | 0.17 | 0.17 | 0.17 | NA | NA | NA | NA | NA | NA | NA | NA | NA | NA | NA | NA | NA | NA | NA | NA | NA | NA | NA | NA | NA | NA | NA | NA | NA | NA | NA | NA | NA | NA | NA | NA | NA | NA | NA | NA | NA | NA | NA | NA | |
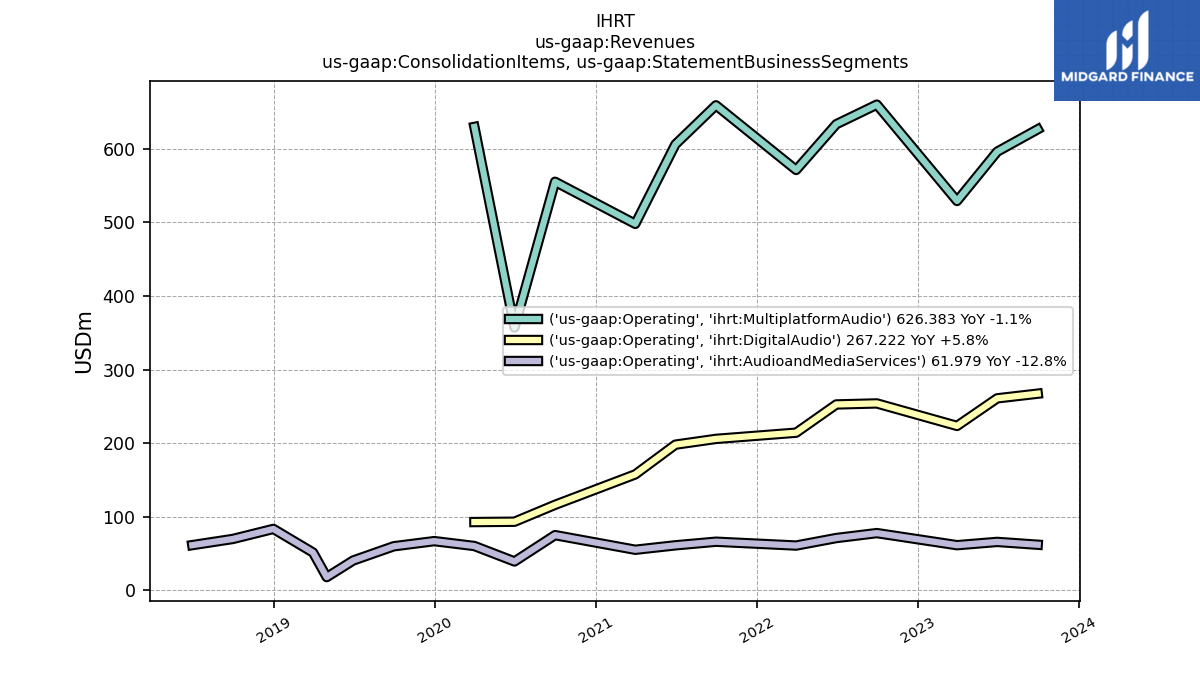
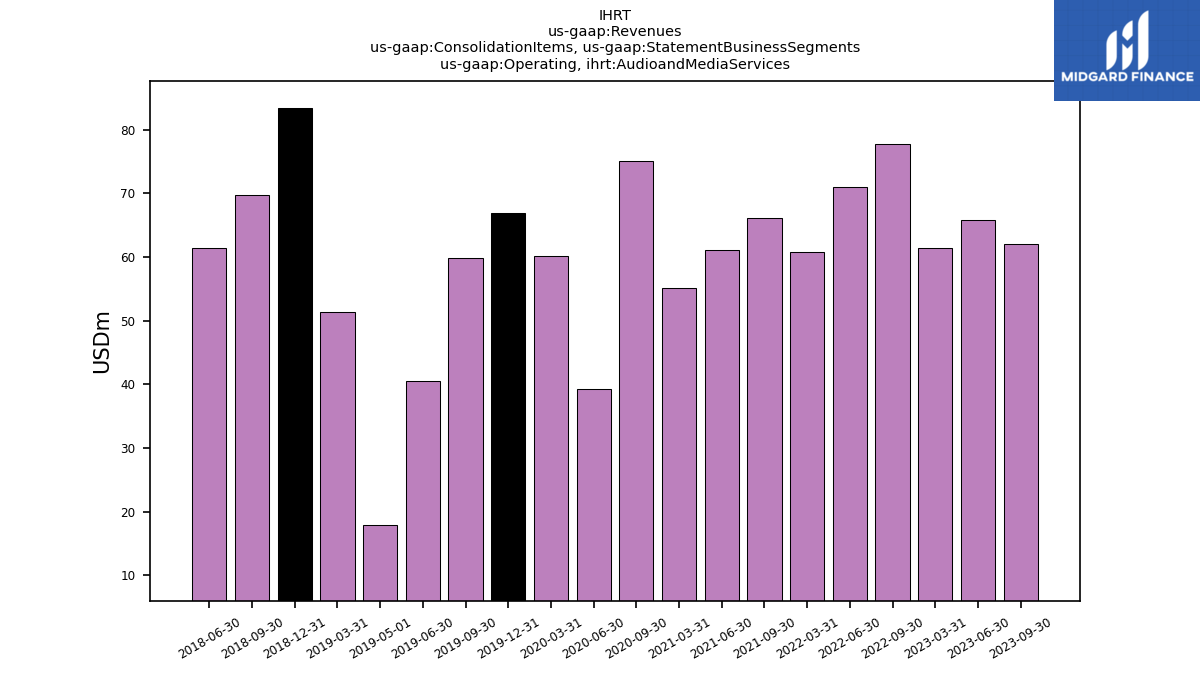
| Operating, Audioand Media Services | 61.98 | 65.80 | 61.35 | NA | 77.79 | 71.06 | 60.86 | NA | 66.08 | 61.17 | 55.14 | NA | 75.04 | 39.25 | 60.23 | 66.88 | 59.87 | 40.54 | 17.97 | 51.39 | 83.48 | 69.82 | 61.42 | NA | NA | NA | NA | NA | NA | NA | NA | NA | NA | NA | NA | NA | NA | NA | NA | NA | NA | NA | NA | NA | NA | NA | NA | NA | NA | NA | NA | NA | NA | NA | NA | |
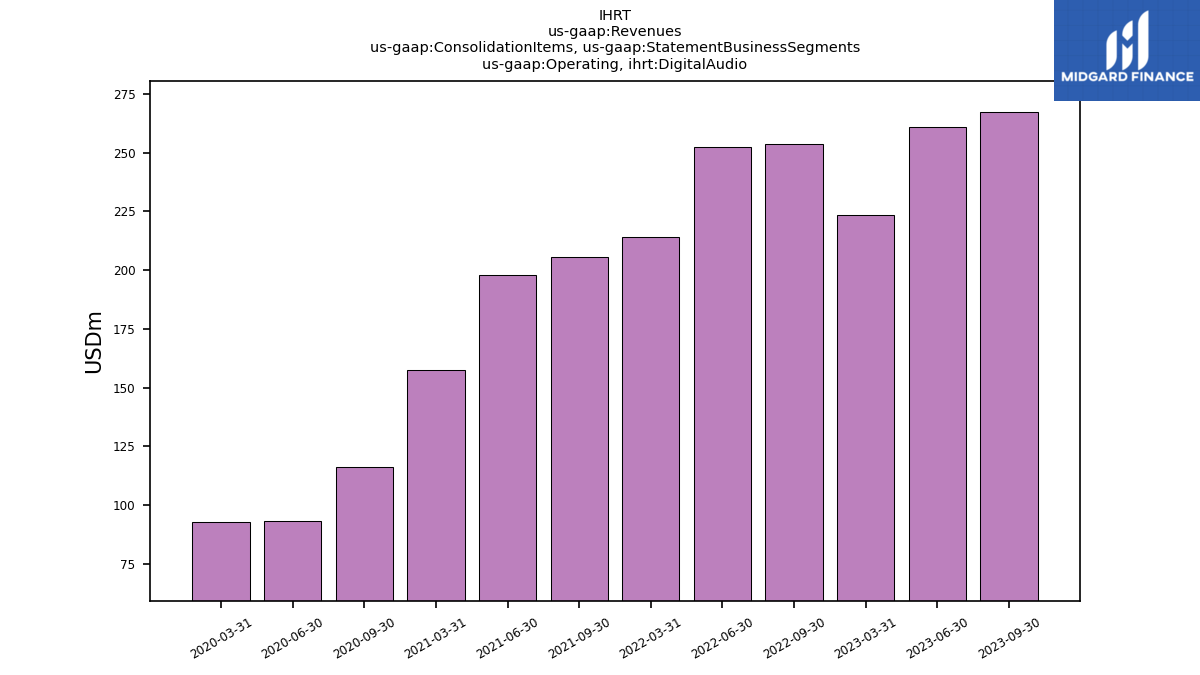
| Operating, Digital Audio | 267.22 | 260.85 | 223.40 | NA | 253.95 | 252.56 | 214.22 | NA | 205.77 | 197.93 | 157.55 | NA | 116.20 | 93.23 | 92.78 | NA | NA | NA | NA | NA | NA | NA | NA | NA | NA | NA | NA | NA | NA | NA | NA | NA | NA | NA | NA | NA | NA | NA | NA | NA | NA | NA | NA | NA | NA | NA | NA | NA | NA | NA | NA | NA | NA | NA | NA | |
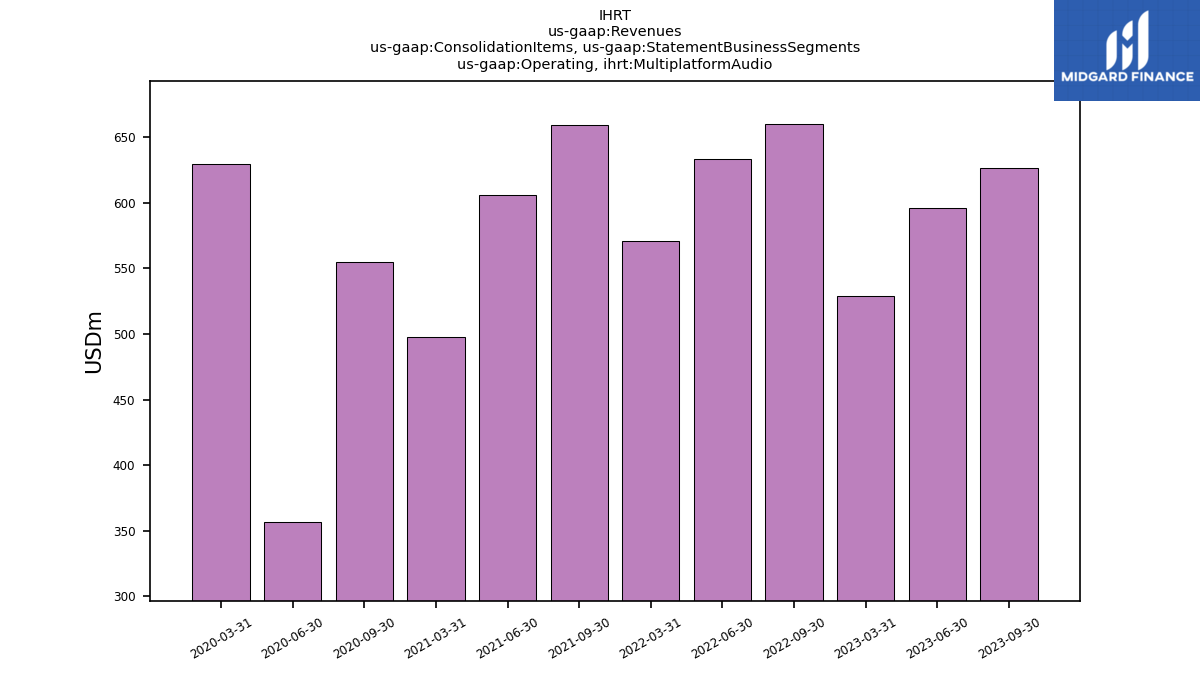
| Operating, Multiplatform Audio | 626.38 | 595.94 | 529.01 | NA | 659.90 | 633.30 | 571.16 | NA | 658.98 | 605.85 | 497.90 | NA | 555.10 | 357.12 | 629.61 | NA | NA | NA | NA | NA | NA | NA | NA | NA | NA | NA | NA | NA | NA | NA | NA | NA | NA | NA | NA | NA | NA | NA | NA | NA | NA | NA | NA | NA | NA | NA | NA | NA | NA | NA | NA | NA | NA | NA | NA | |
| Revenue From Contract With Customer Including Assessed Tax | 952.75 | 919.18 | 810.93 | 1125.58 | 988.51 | 953.64 | 843.17 | 1061.72 | 927.75 | 861.26 | 706.18 | 935.53 | 743.83 | 487.25 | 780.17 | 1026.07 | 947.92 | 635.37 | 277.39 | 1195.73 | 1772.53 | 1245.18 | 1255.26 | 1070.73 | 1713.89 | 1202.32 | 1253.45 | 1329.32 | 1721.12 | 1570.42 | 1618.53 | 1363.51 | 1717.58 | 1579.51 | 1599.86 | 1344.56 | 1715.80 | 1630.03 | 1630.15 | 1342.55 | 1694.37 | 1587.52 | 1618.10 | 1343.06 | 1696.34 | 1587.33 | 1602.49 | 1360.72 | 1652.79 | 1583.35 | 1604.39 | 1320.83 | 1634.55 | 1477.35 | 1490.01 |
