
| 2023-09-30 | 2023-06-30 | 2023-03-31 | 2022-12-31 | 2022-09-30 | 2022-06-30 | 2022-03-31 | 2021-12-31 | 2021-09-30 | 2021-06-30 | 2021-03-31 | 2020-12-31 | 2020-09-30 | 2020-06-30 | 2020-03-31 | 2019-12-31 | 2019-09-30 | ||
|---|---|---|---|---|---|---|---|---|---|---|---|---|---|---|---|---|---|---|
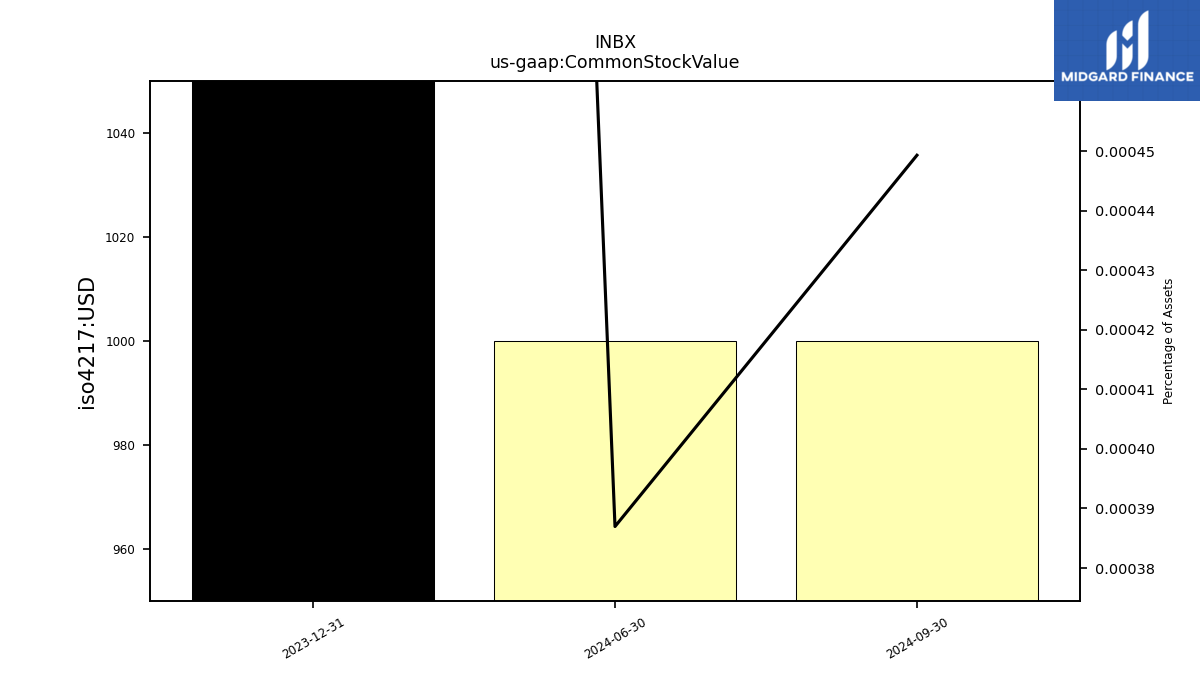
| Common Stock Value | 0.01 | 0.00 | 0.00 | 0.00 | 0.00 | 0.00 | 0.00 | 0.00 | 0.00 | 0.00 | 0.00 | 0.00 | 0.00 | NA | NA | 0.00 | NA | |
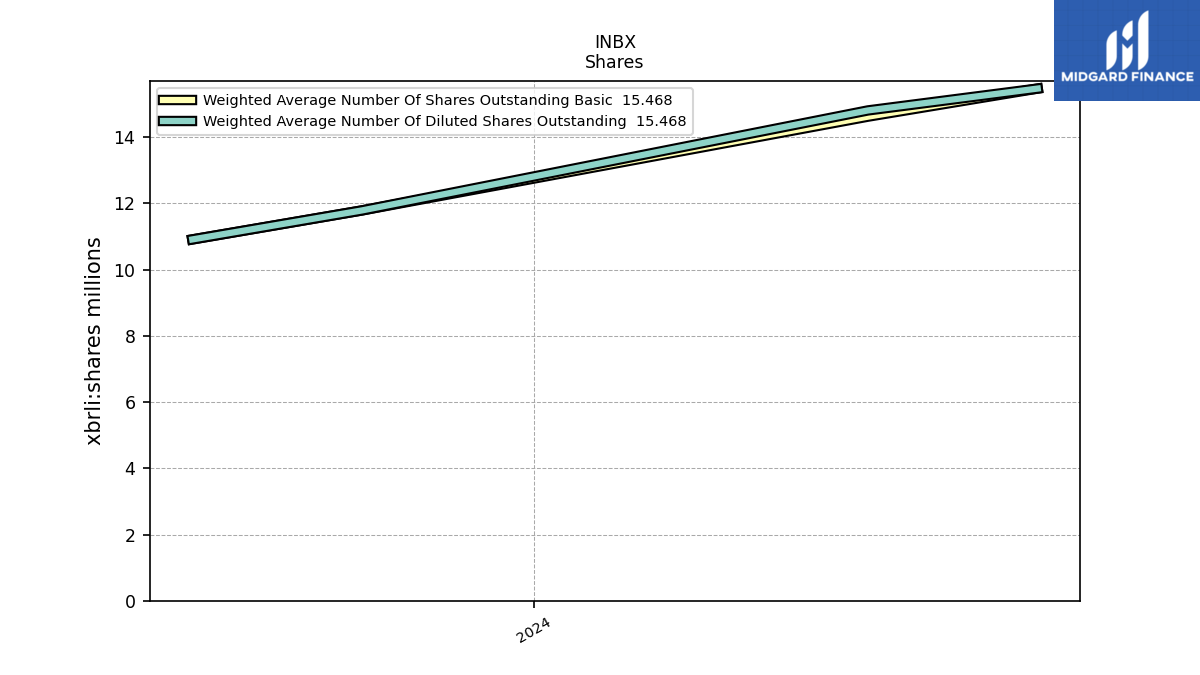
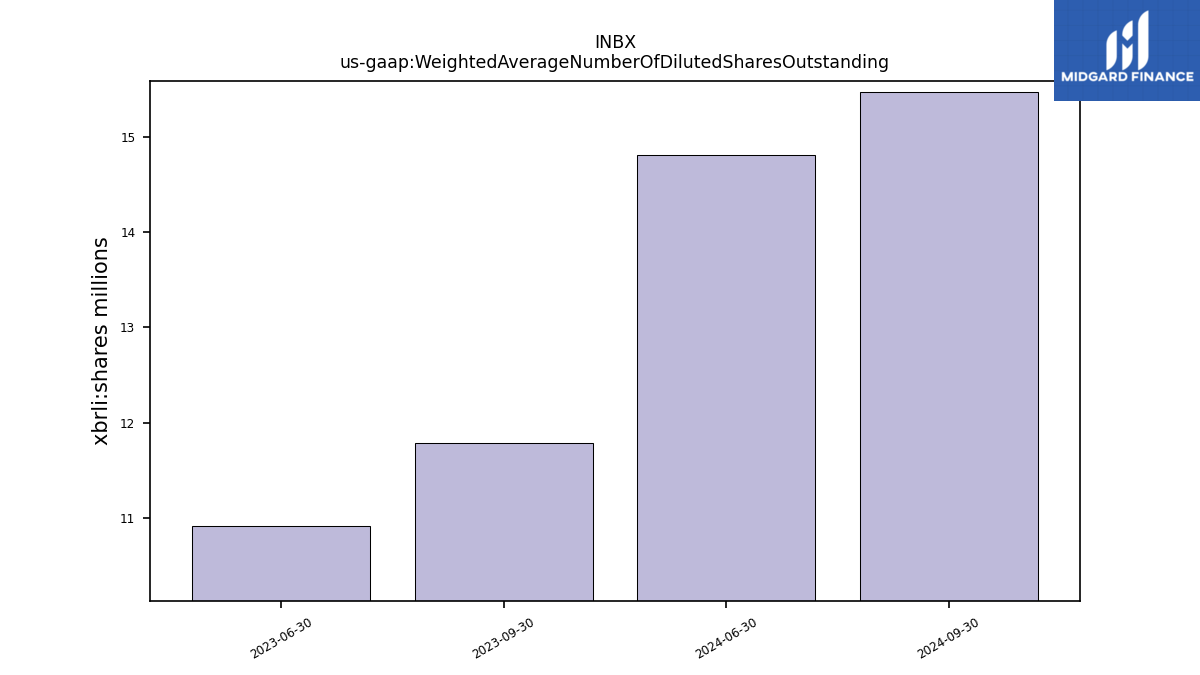
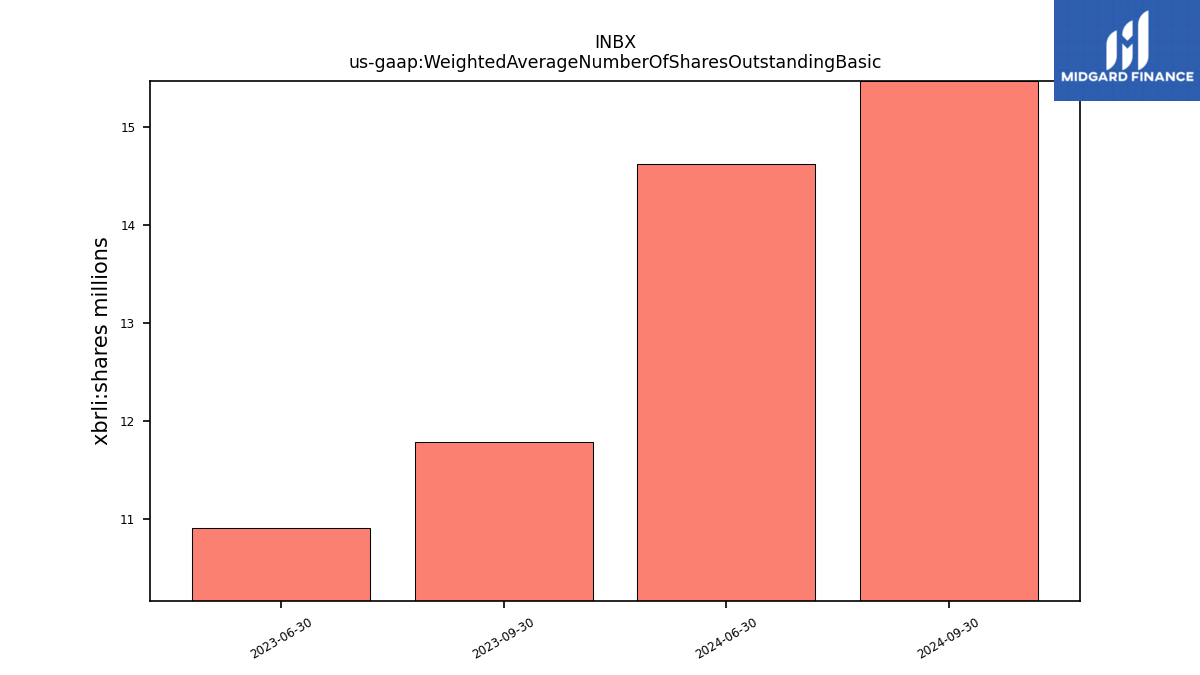
| Weighted Average Number Of Diluted Shares Outstanding | 47.15 | 43.64 | 43.58 | NA | 39.07 | 39.04 | 39.02 | NA | 37.89 | 37.82 | 37.74 | NA | 26.75 | 10.44 | NA | NA | NA | |
| Weighted Average Number Of Shares Outstanding Basic | 47.15 | 43.64 | 43.58 | NA | 39.07 | 39.04 | 39.02 | NA | 37.89 | 37.82 | 37.74 | NA | 26.75 | 10.44 | NA | NA | NA | |
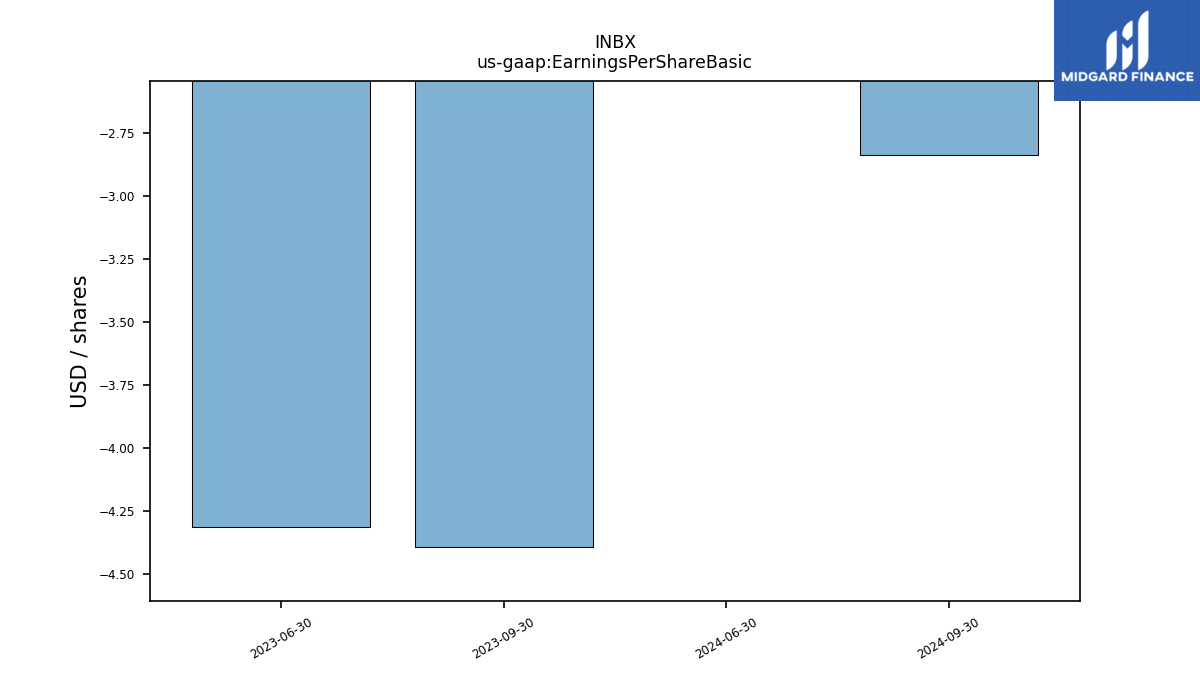
| Earnings Per Share Basic | -1.10 | -1.08 | -1.12 | -0.95 | -0.90 | -0.97 | -0.80 | -0.55 | -0.54 | -0.55 | -0.51 | -0.23 | -0.77 | -1.72 | NA | NA | NA | |
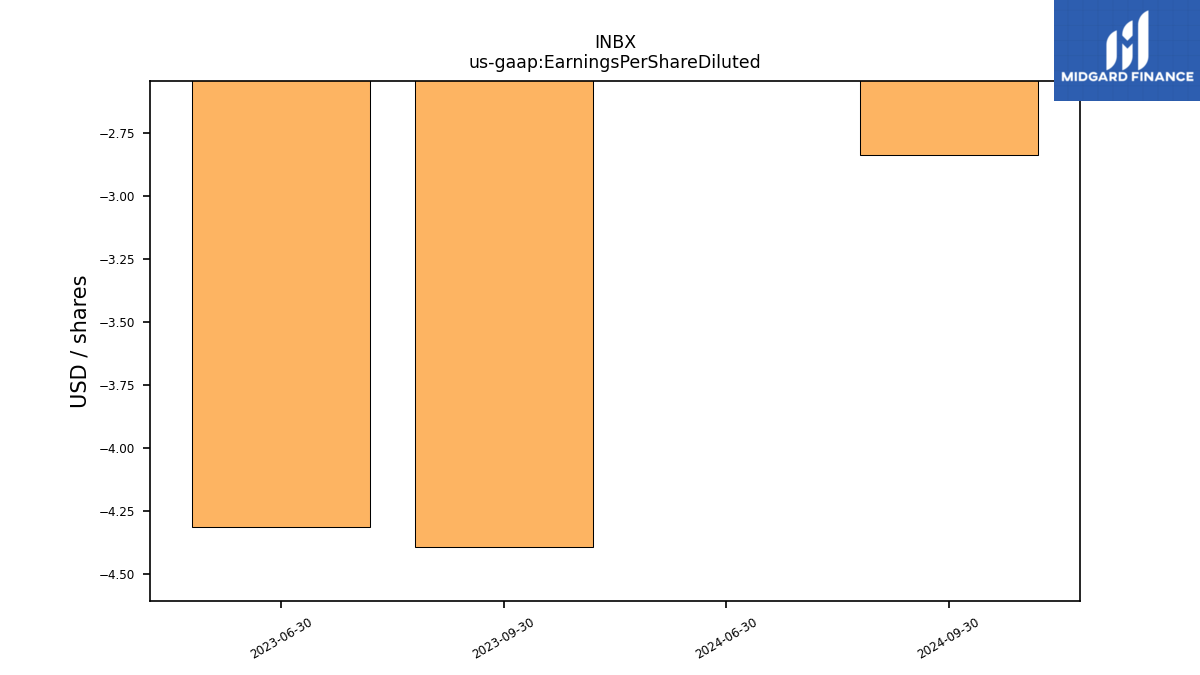
| Earnings Per Share Diluted | -1.10 | -1.08 | -1.12 | -0.95 | -0.90 | -0.97 | -0.80 | -0.55 | -0.54 | -0.55 | -0.51 | -0.23 | -0.77 | -1.72 | NA | NA | NA |
| 2023-09-30 | 2023-06-30 | 2023-03-31 | 2022-12-31 | 2022-09-30 | 2022-06-30 | 2022-03-31 | 2021-12-31 | 2021-09-30 | 2021-06-30 | 2021-03-31 | 2020-12-31 | 2020-09-30 | 2020-06-30 | 2020-03-31 | 2019-12-31 | 2019-09-30 | ||
|---|---|---|---|---|---|---|---|---|---|---|---|---|---|---|---|---|---|---|
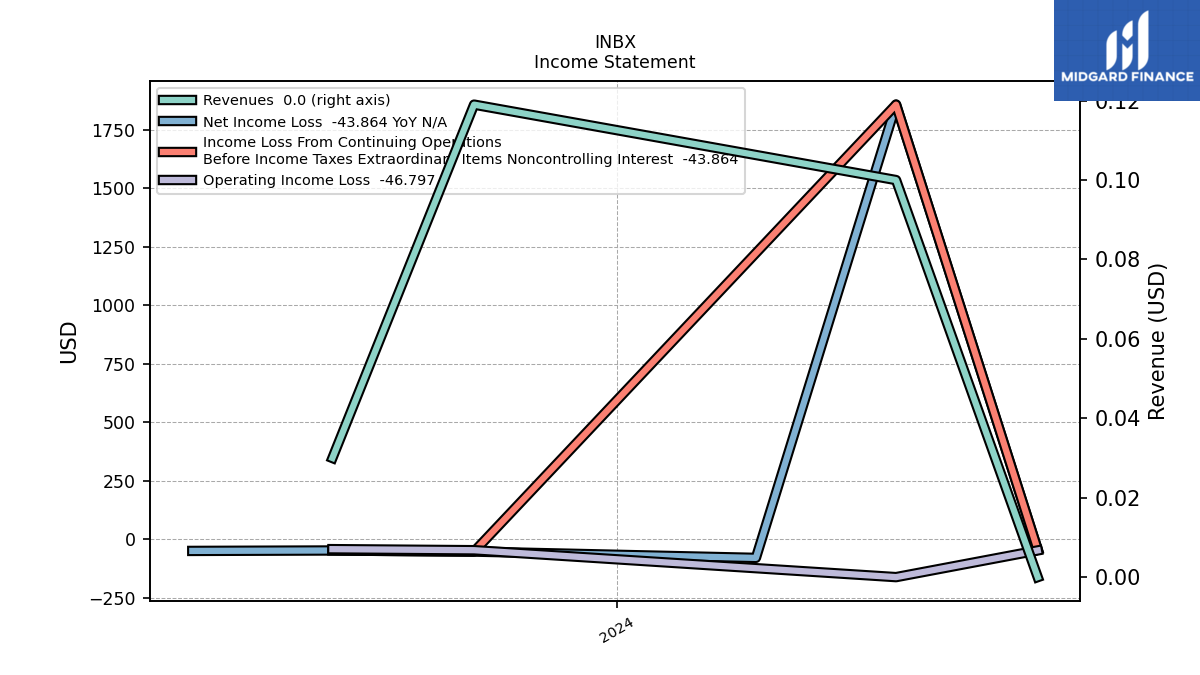
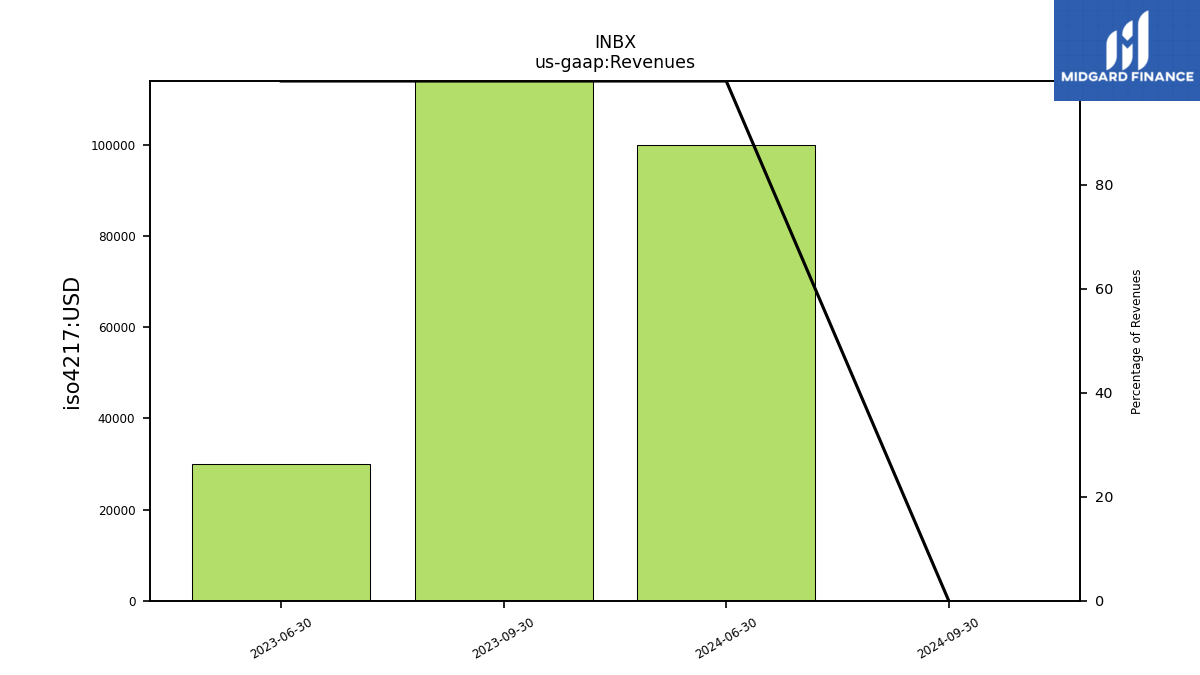
| Revenues | 0.12 | 0.03 | 0.02 | 0.27 | 0.28 | 0.71 | 0.93 | 2.86 | 2.53 | 0.95 | 0.89 | 2.78 | 5.90 | 3.34 | 0.87 | 0.26 | 1.22 | |
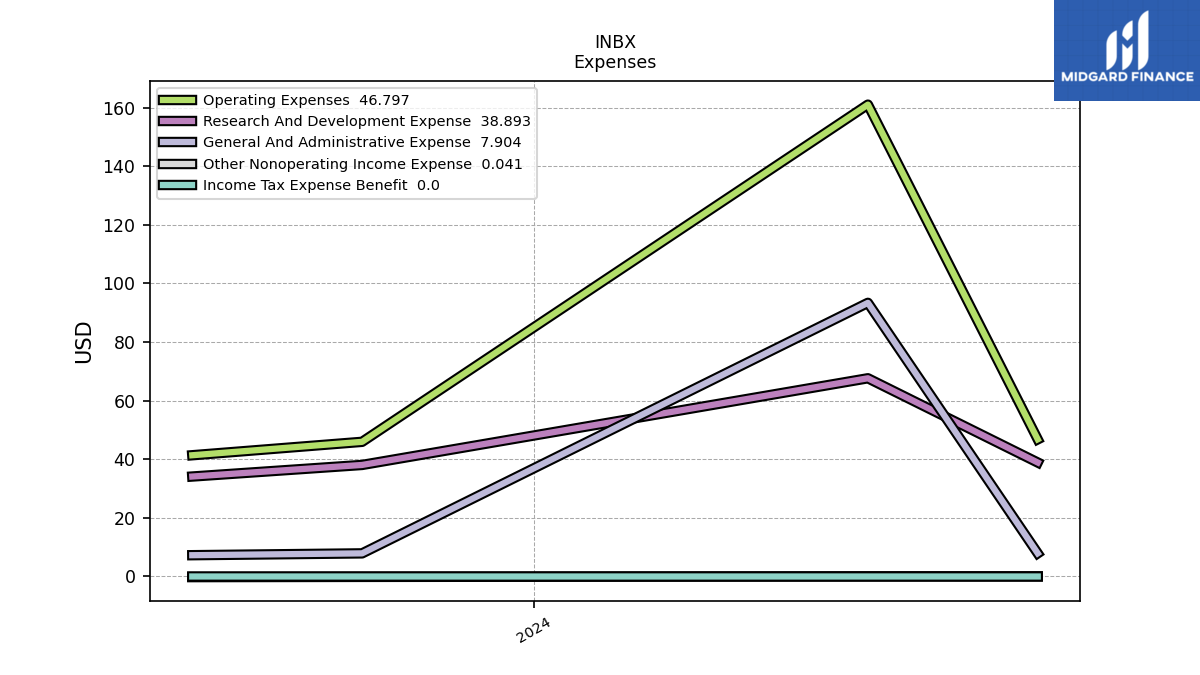
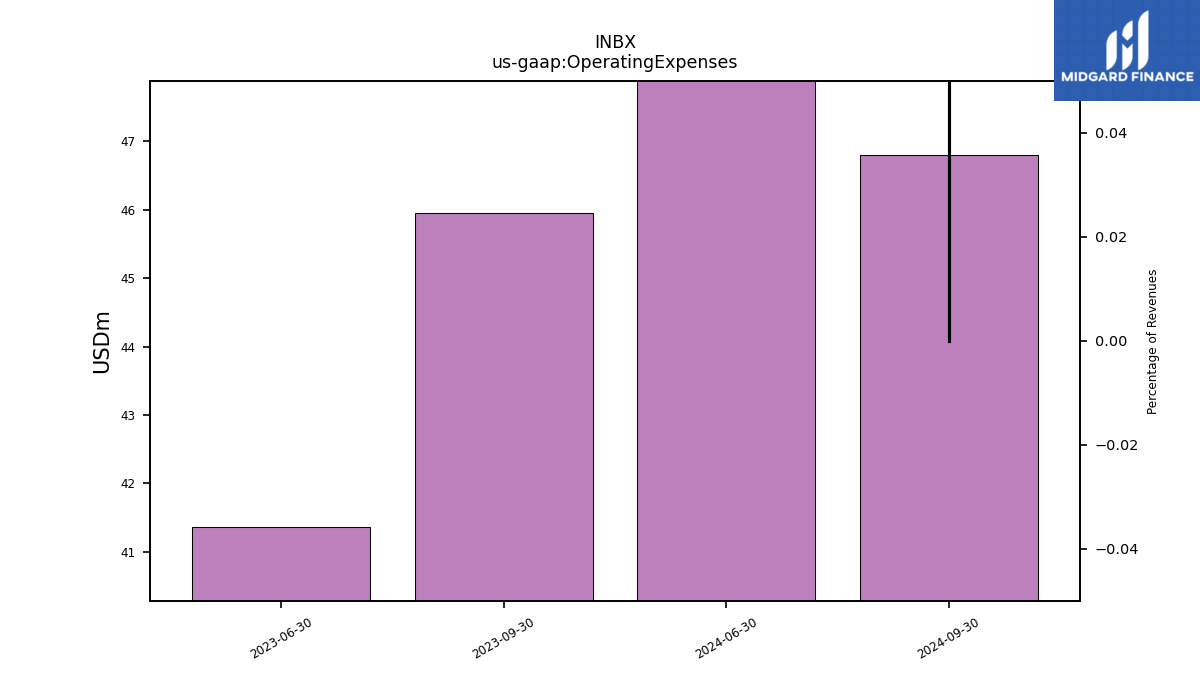
| Operating Expenses | 45.95 | 41.37 | 43.78 | 35.77 | 30.28 | 35.31 | 29.95 | 22.26 | 21.33 | 20.75 | 19.45 | 19.88 | 21.46 | 20.51 | 18.48 | 16.72 | 14.27 | |
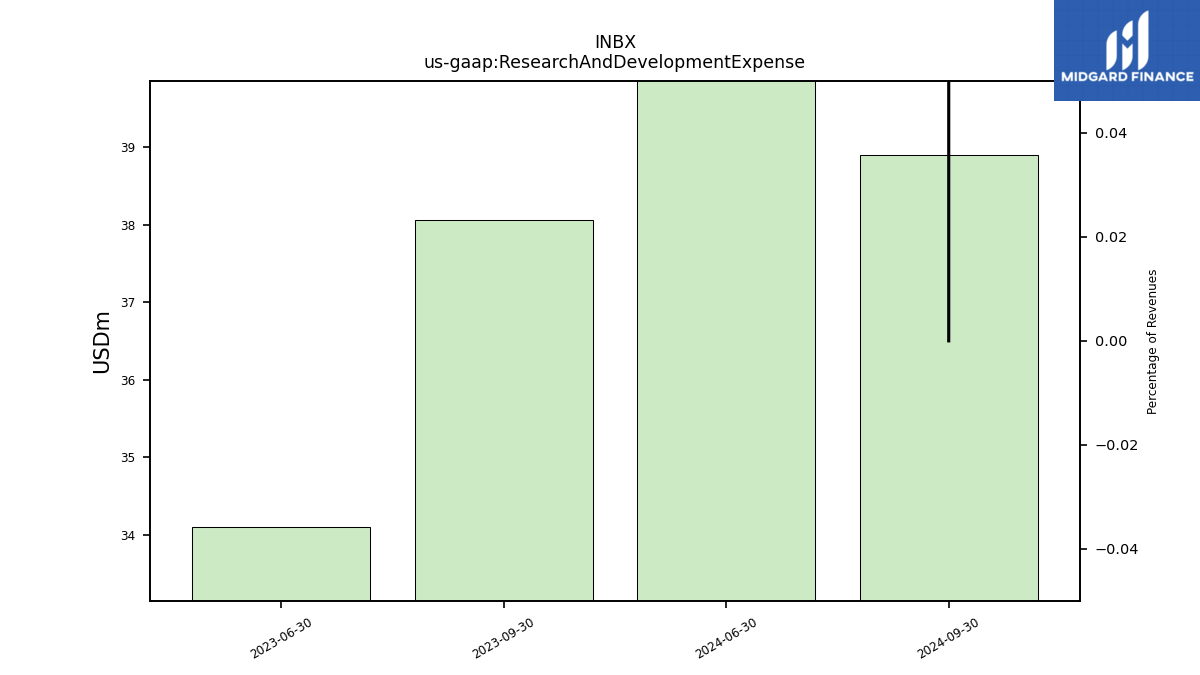
| Research And Development Expense | 38.06 | 34.11 | 37.39 | 30.45 | 24.93 | 29.91 | 24.89 | 18.61 | 18.48 | 17.90 | 16.44 | 17.67 | 19.84 | 18.97 | 17.02 | 12.28 | 12.79 | |
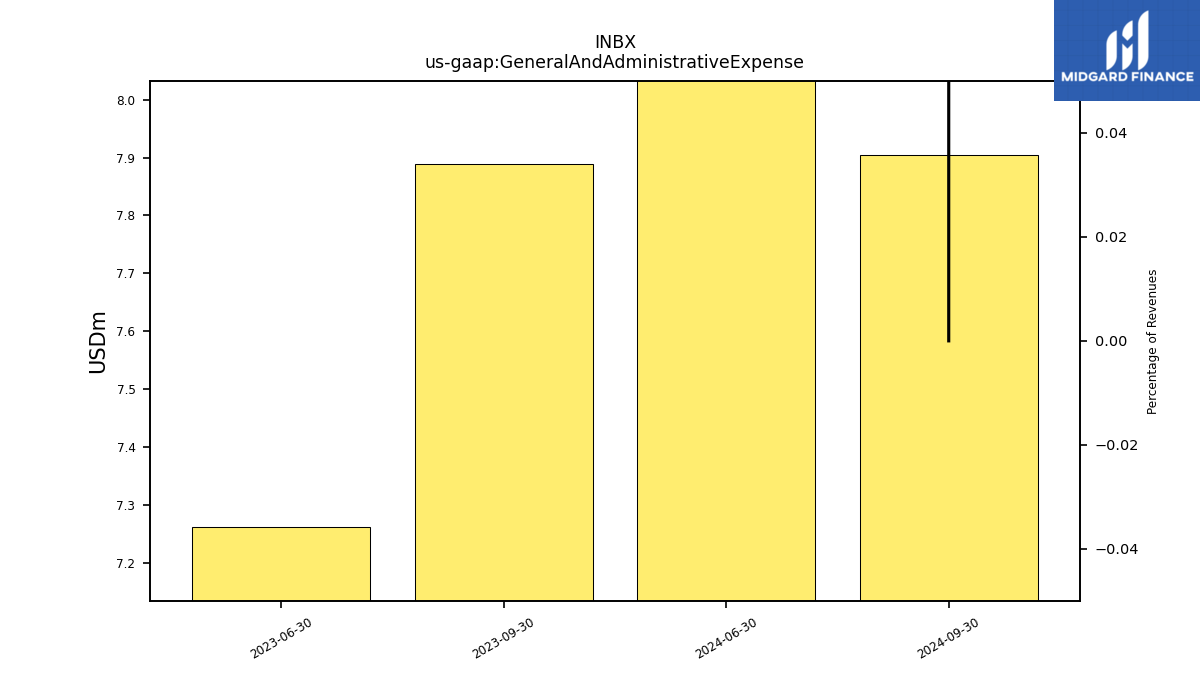
| General And Administrative Expense | 7.89 | 7.26 | 6.40 | 5.32 | 5.35 | 5.40 | 5.05 | 3.65 | 2.85 | 2.85 | 3.01 | 2.21 | 1.62 | 1.53 | 1.47 | 1.67 | 1.48 | |
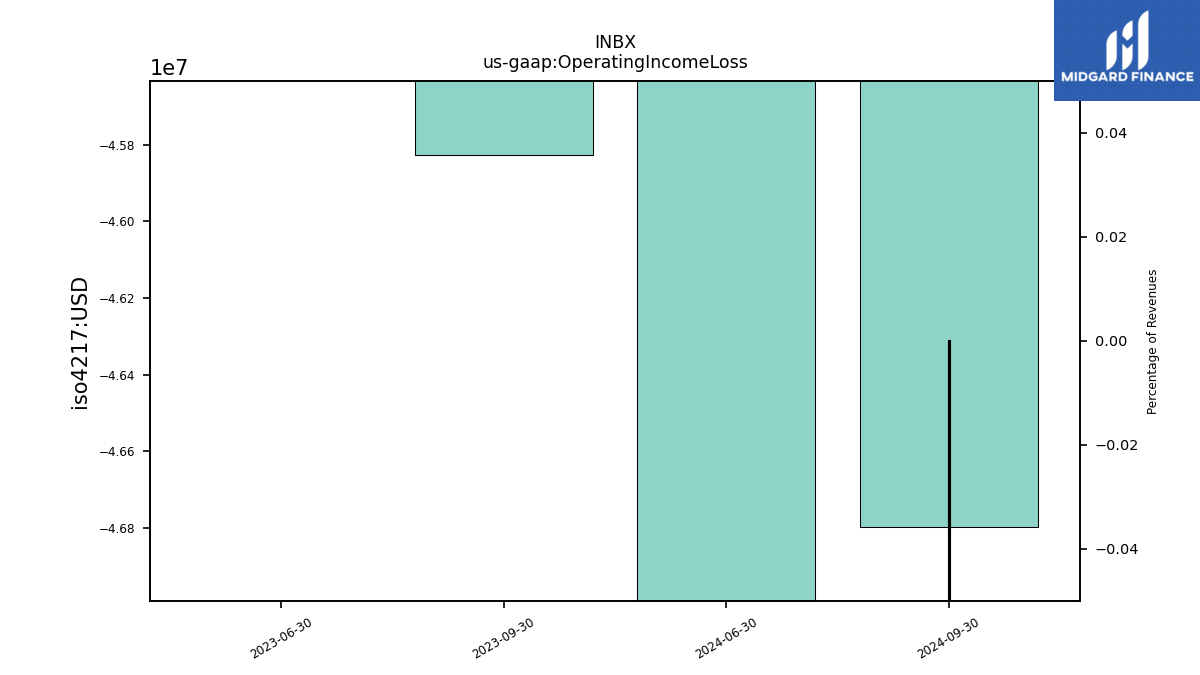
| Operating Income Loss | -45.83 | -41.34 | -43.77 | -35.50 | -30.00 | -34.60 | -29.02 | -19.40 | -18.80 | -19.80 | -18.56 | -17.11 | -15.56 | -17.17 | -17.61 | -16.45 | -13.05 | |
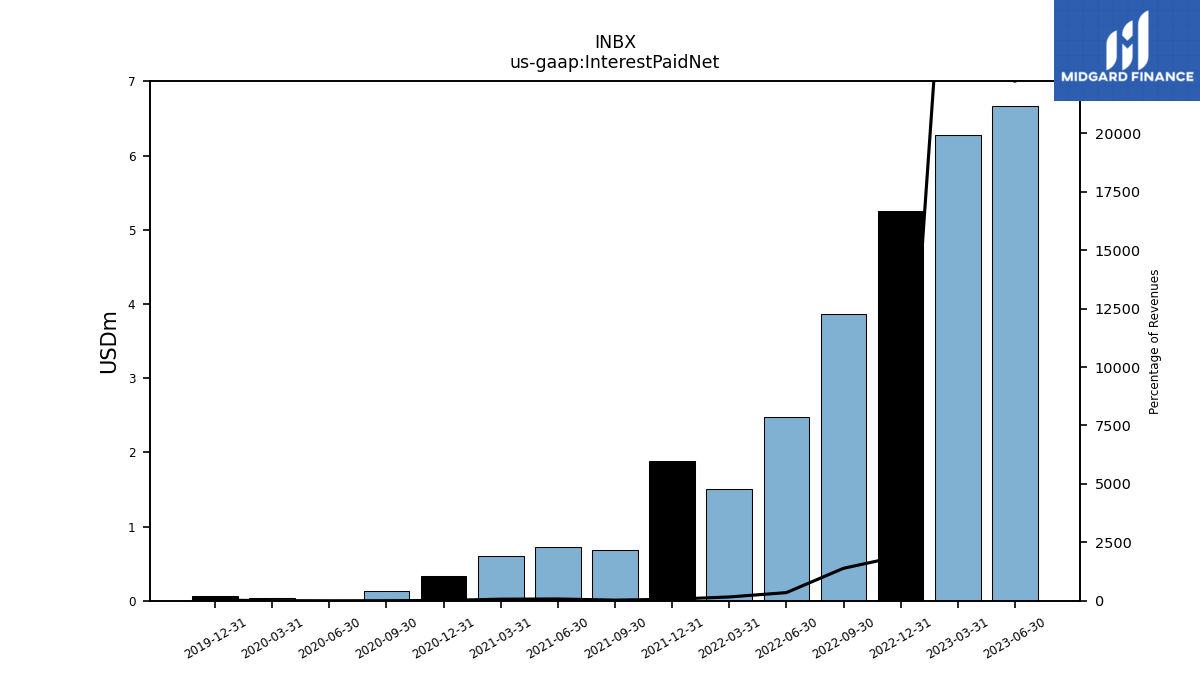
| Interest Paid Net | NA | 6.67 | 6.28 | 5.26 | 3.86 | 2.47 | 1.50 | 1.89 | 0.68 | 0.72 | 0.60 | 0.33 | 0.13 | 0.00 | 0.04 | 0.07 | NA | |
| Interest Income Expense Nonoperating Net | NA | NA | -5.08 | -5.34 | -5.34 | -3.15 | -2.27 | -1.78 | -1.78 | -0.91 | -0.74 | -0.53 | -4.43 | -3.40 | -2.45 | -2.31 | -2.67 | |
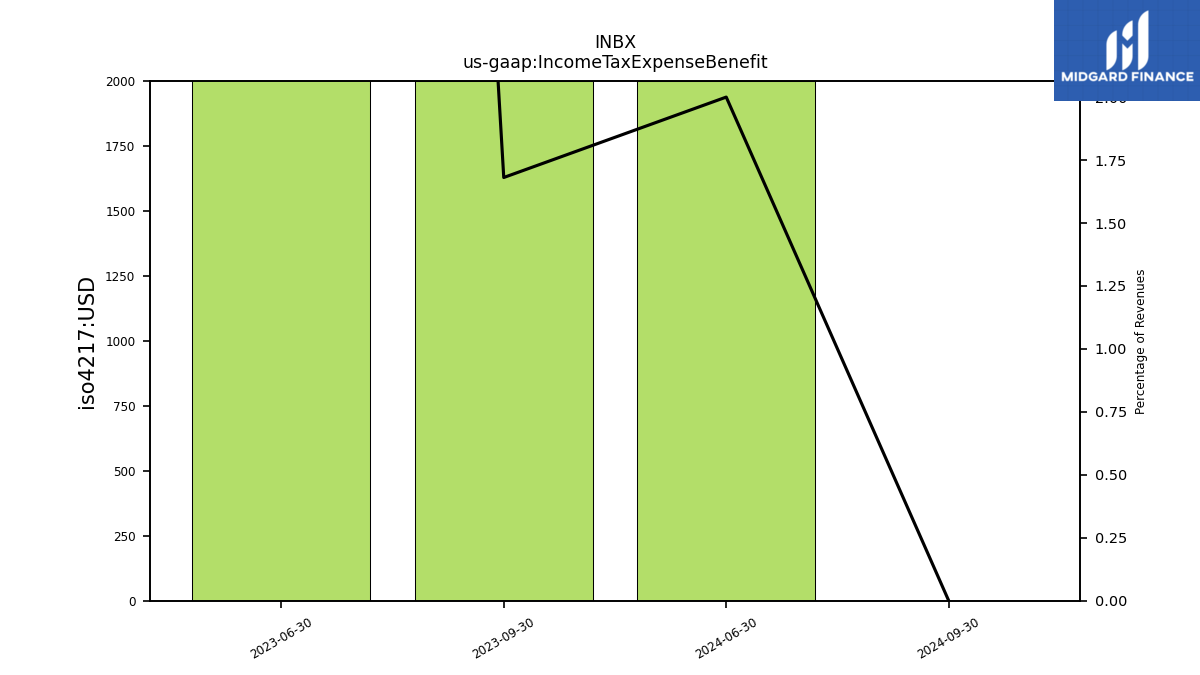
| Income Tax Expense Benefit | 0.00 | 0.01 | NA | -0.00 | 0.00 | 0.00 | NA | 0.00 | 0.00 | 0.00 | 0.00 | NA | NA | NA | NA | 0.00 | 0.90 | |
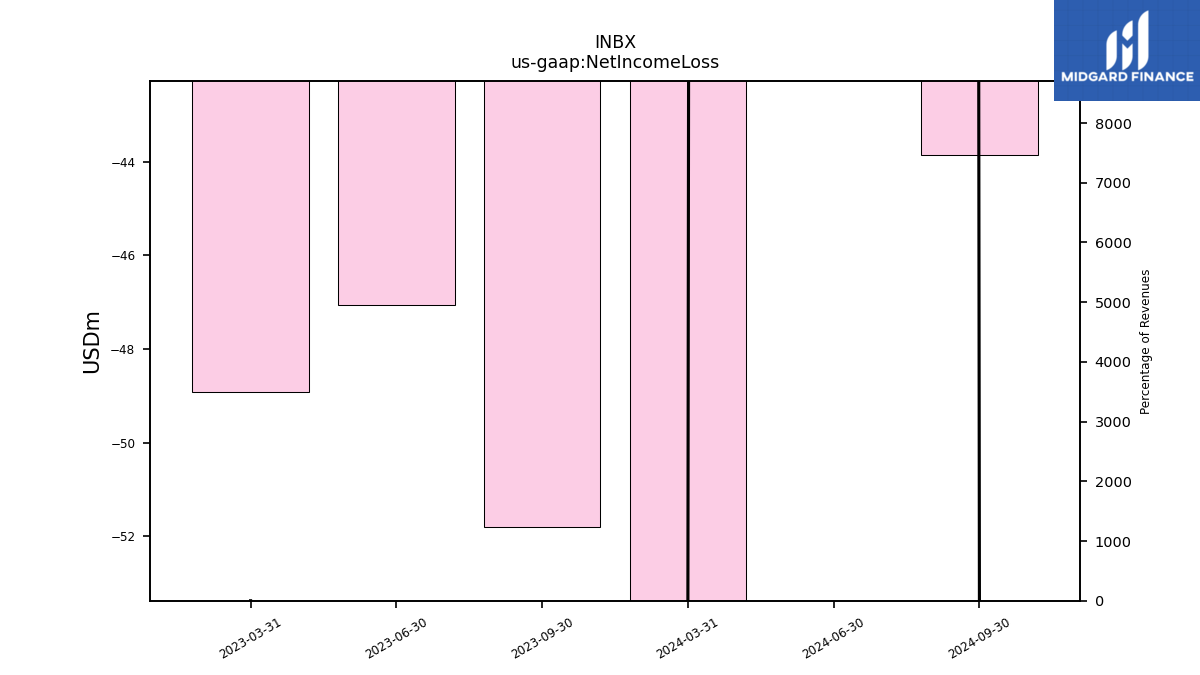
| Net Income Loss | -51.79 | -47.05 | -48.92 | -40.91 | -35.33 | -37.73 | -31.25 | -21.19 | -20.58 | -20.71 | -19.29 | -17.65 | -20.50 | -17.89 | -20.09 | -16.30 | -20.16 |
| 2023-09-30 | 2023-06-30 | 2023-03-31 | 2022-12-31 | 2022-09-30 | 2022-06-30 | 2022-03-31 | 2021-12-31 | 2021-09-30 | 2021-06-30 | 2021-03-31 | 2020-12-31 | 2020-09-30 | 2020-06-30 | 2020-03-31 | 2019-12-31 | 2019-09-30 | ||
|---|---|---|---|---|---|---|---|---|---|---|---|---|---|---|---|---|---|---|
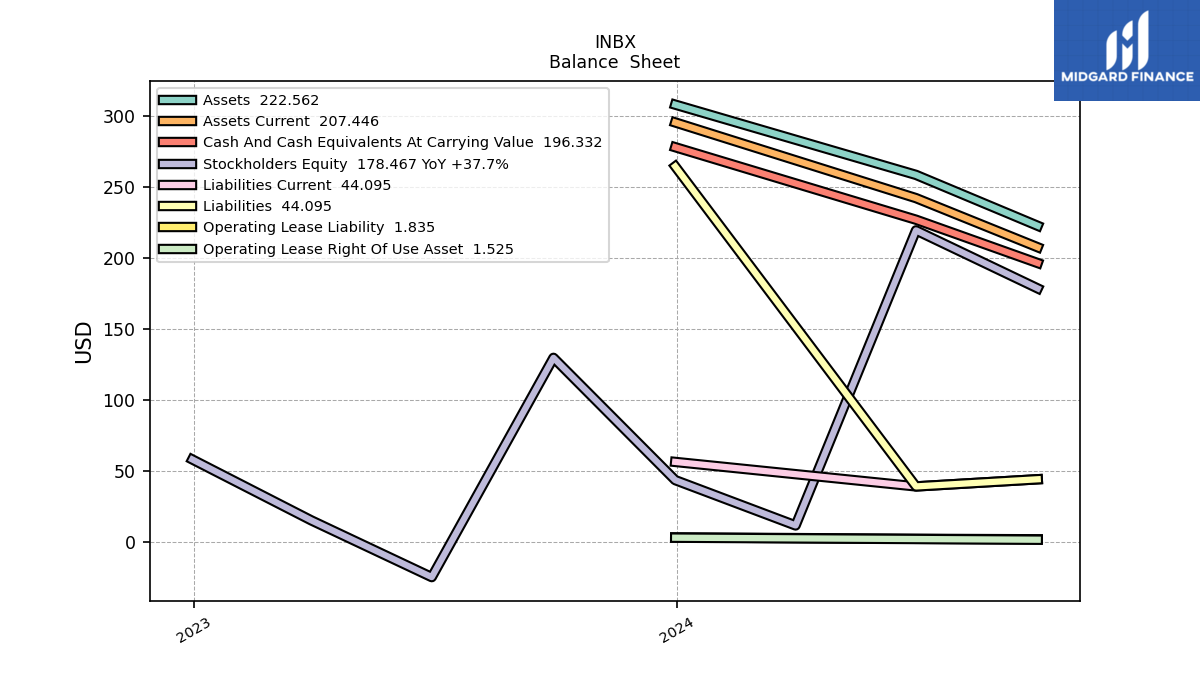
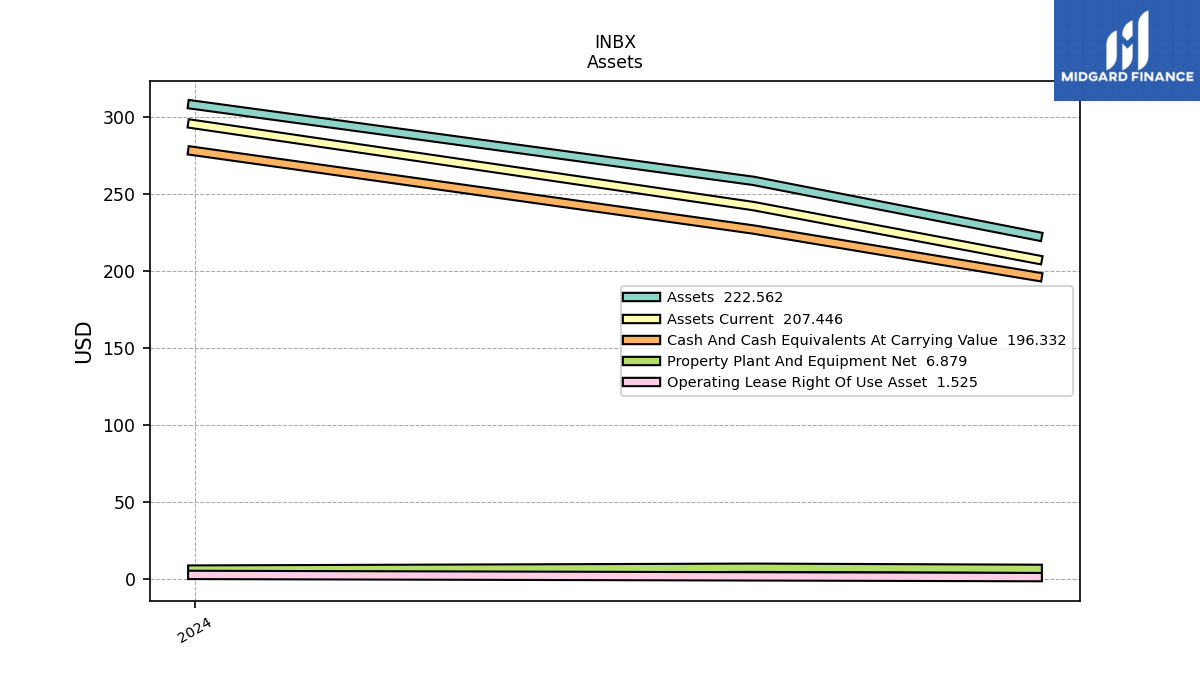
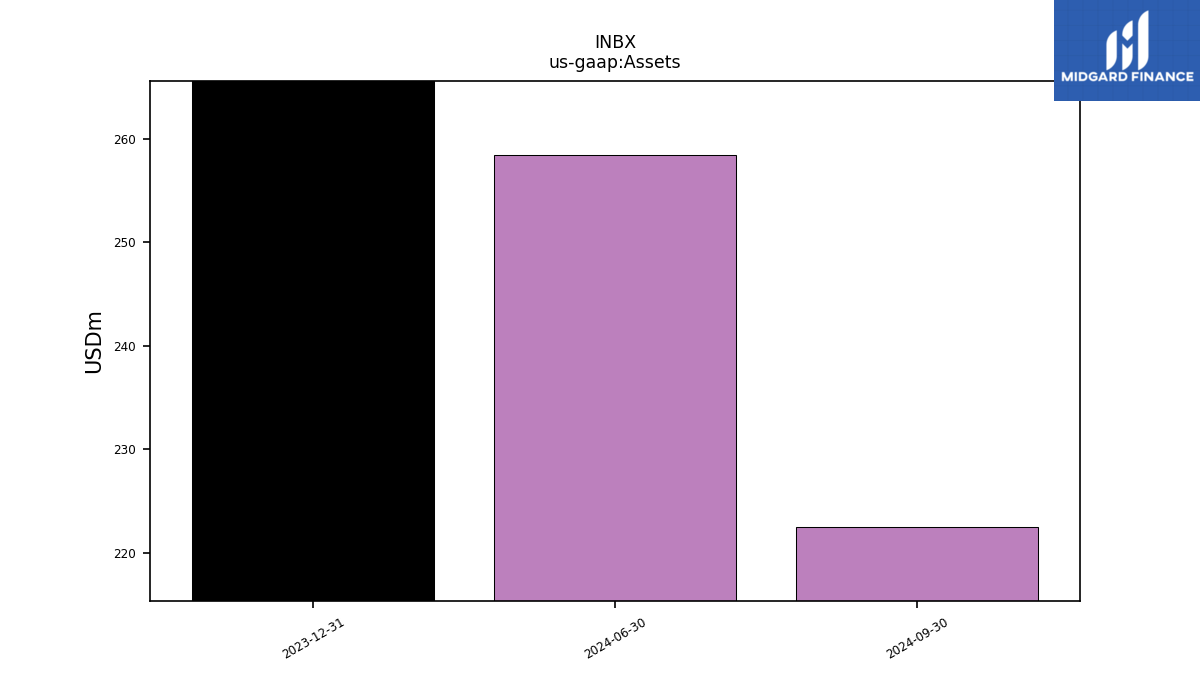
| Assets | 372.73 | 213.17 | 253.72 | 290.88 | 164.85 | 193.21 | 161.18 | 150.45 | 129.18 | 141.89 | 124.50 | 143.74 | 143.55 | NA | NA | 26.49 | NA | |
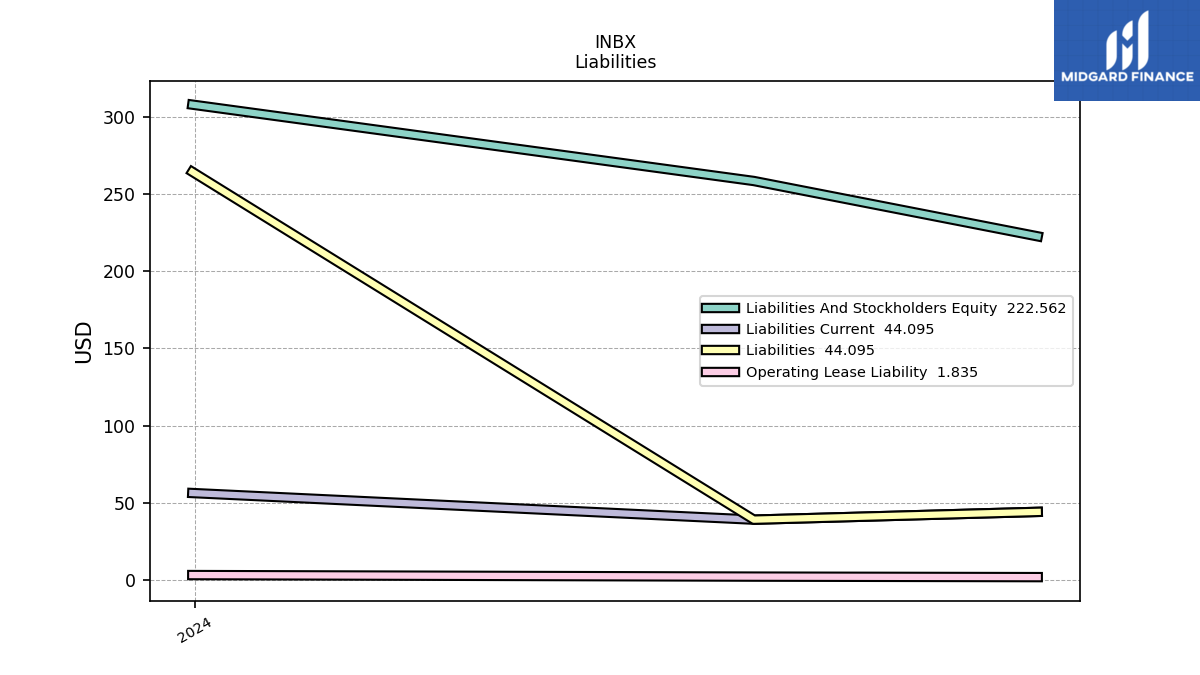
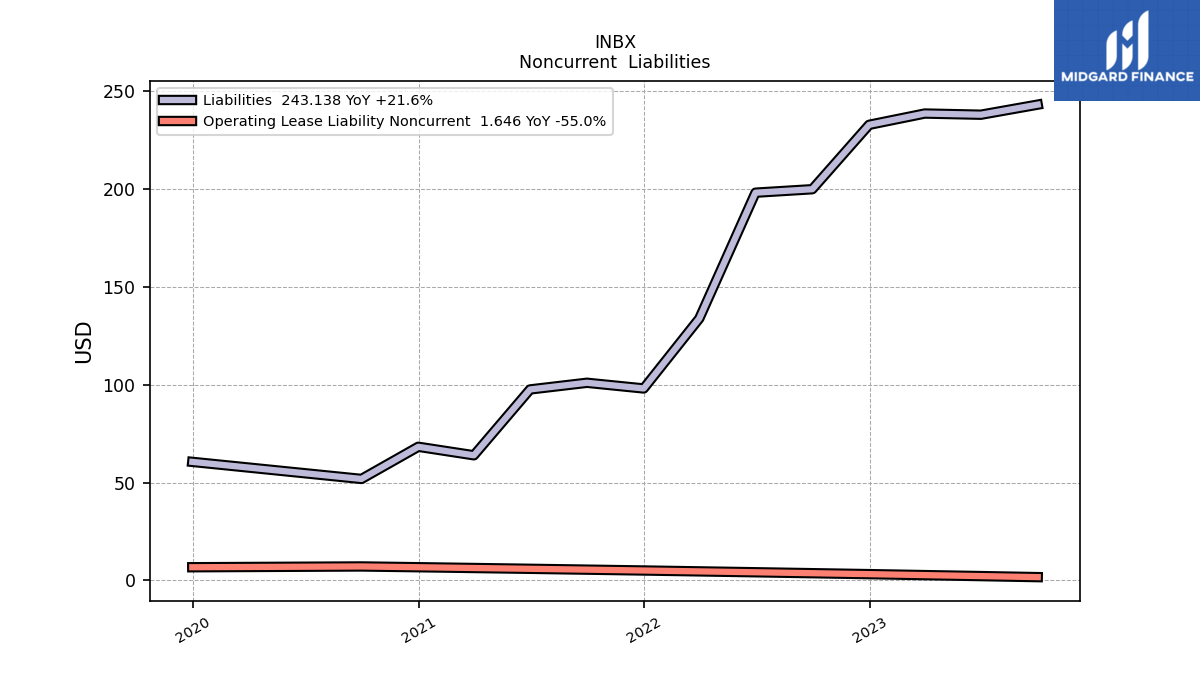
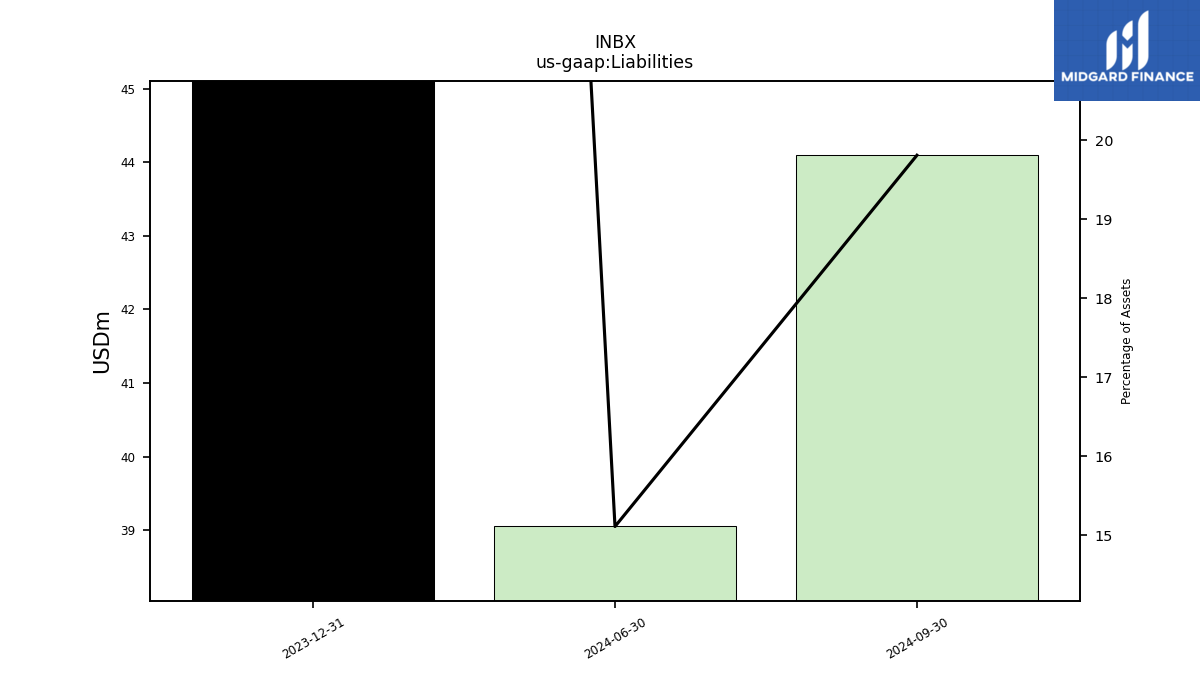
| Liabilities | 243.14 | 237.98 | 238.58 | 232.82 | 199.90 | 198.13 | 133.83 | 98.07 | 100.98 | 97.57 | 63.91 | 68.27 | 51.83 | NA | NA | 60.55 | NA | |
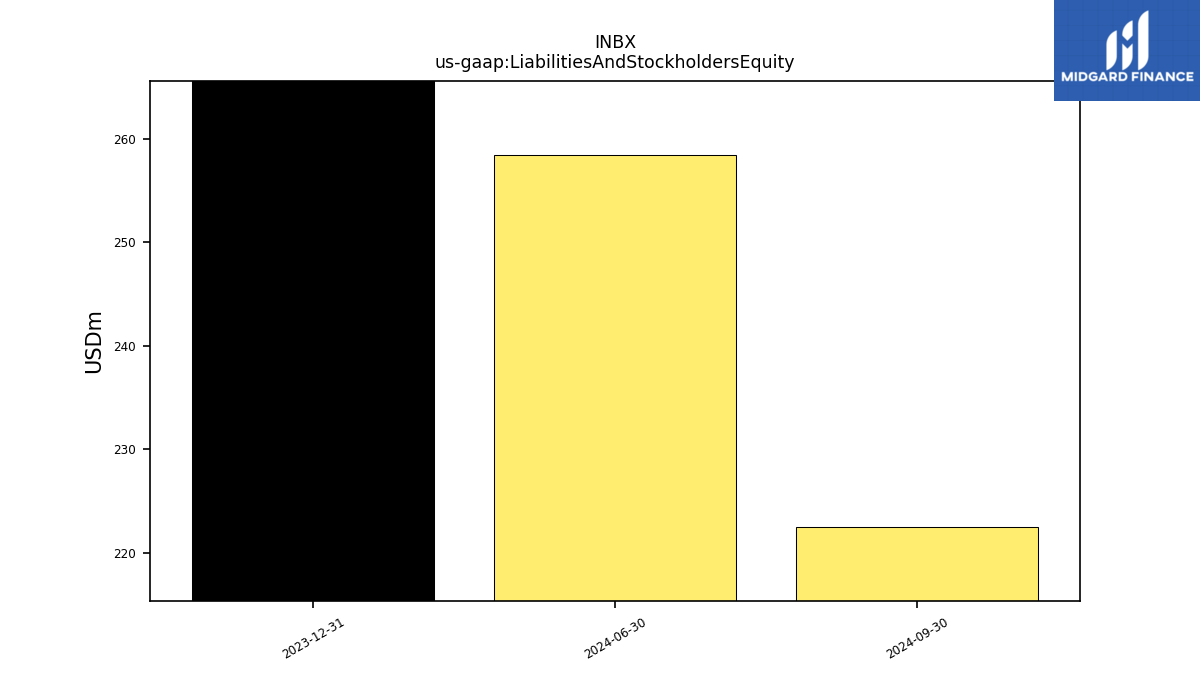
| Liabilities And Stockholders Equity | 372.73 | 213.17 | 253.72 | 290.88 | 164.85 | 193.21 | 161.18 | 150.45 | 129.18 | 141.89 | 124.50 | 143.74 | 143.55 | NA | NA | 26.49 | NA | |
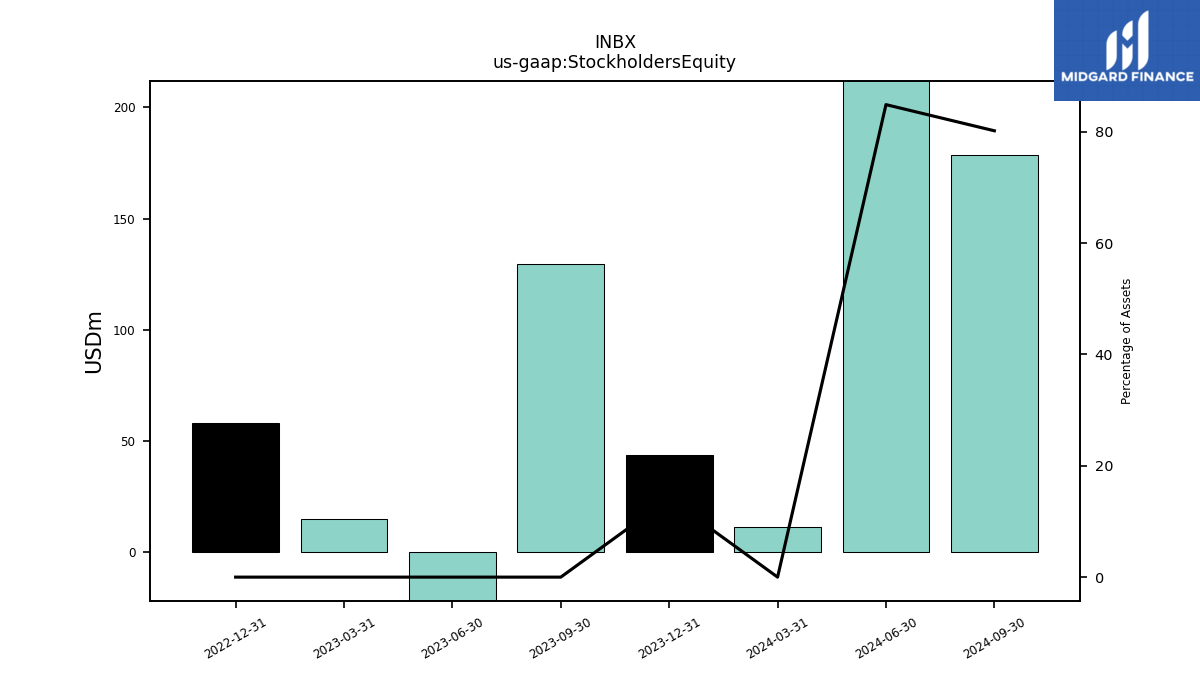
| Stockholders Equity | 129.59 | -24.81 | 15.13 | 58.06 | -35.05 | -4.92 | 27.35 | 52.38 | 28.20 | 44.32 | 60.59 | 75.47 | 91.73 | NA | NA | -93.57 | NA |
| 2023-09-30 | 2023-06-30 | 2023-03-31 | 2022-12-31 | 2022-09-30 | 2022-06-30 | 2022-03-31 | 2021-12-31 | 2021-09-30 | 2021-06-30 | 2021-03-31 | 2020-12-31 | 2020-09-30 | 2020-06-30 | 2020-03-31 | 2019-12-31 | 2019-09-30 | ||
|---|---|---|---|---|---|---|---|---|---|---|---|---|---|---|---|---|---|---|
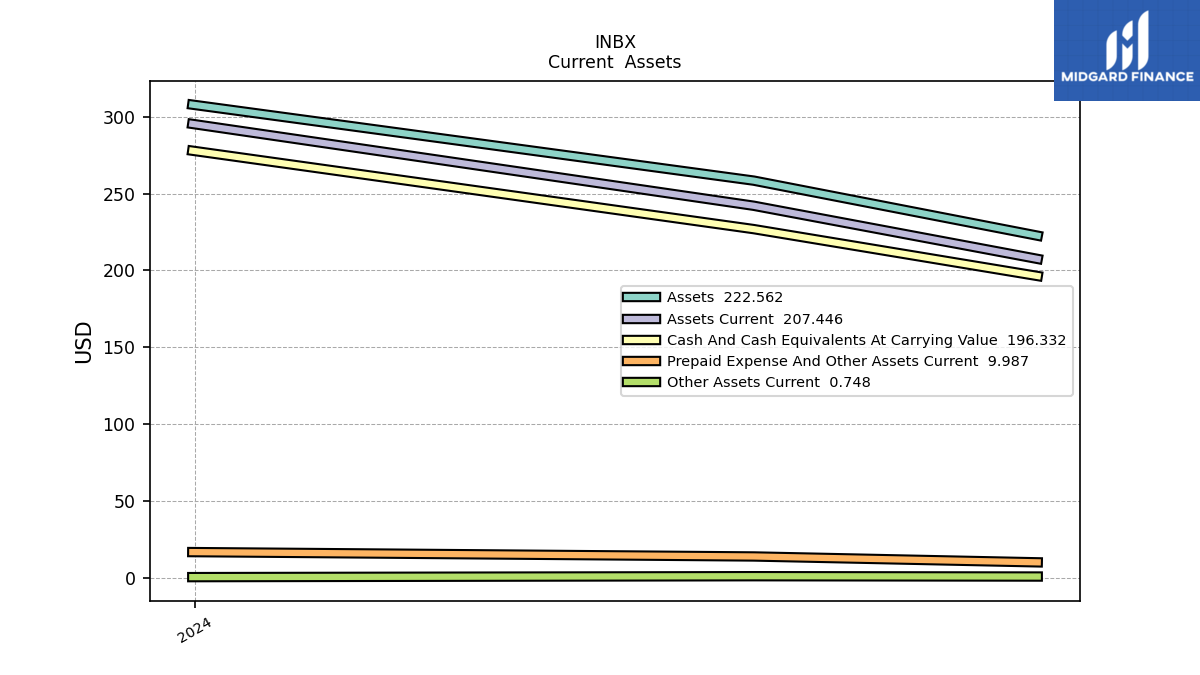
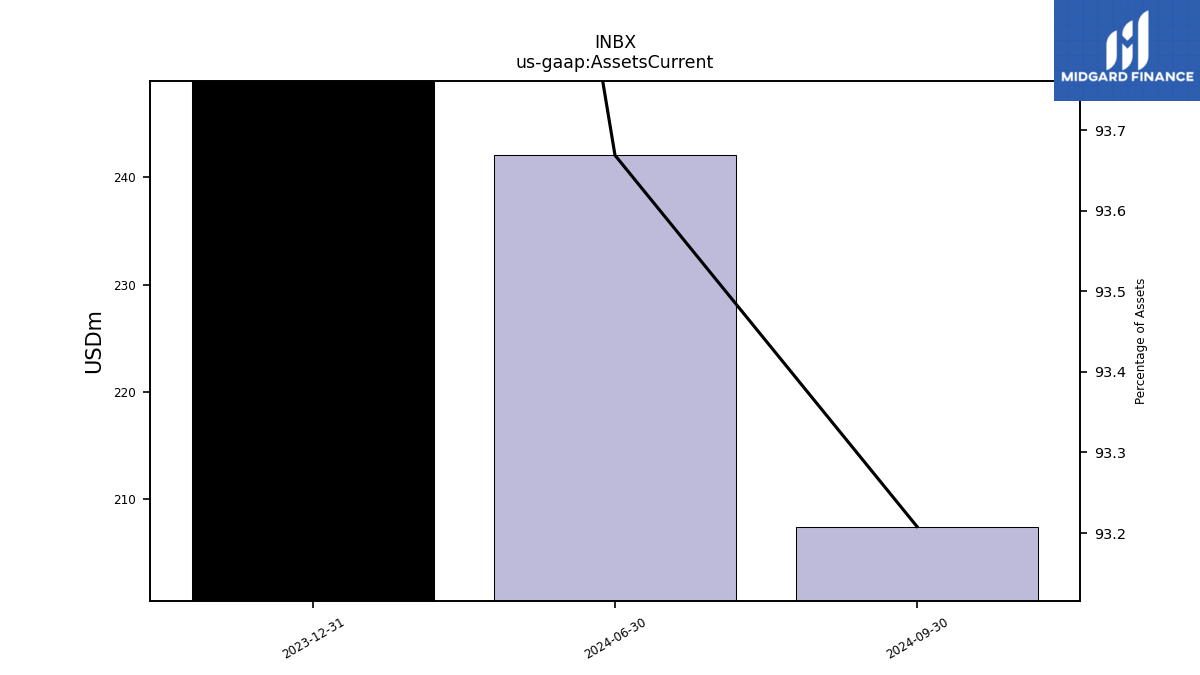
| Assets Current | 363.30 | 203.32 | 243.78 | 280.49 | 153.75 | 181.62 | 150.40 | 139.11 | 119.03 | 131.28 | 113.40 | 132.17 | 131.85 | NA | NA | 15.56 | NA | |
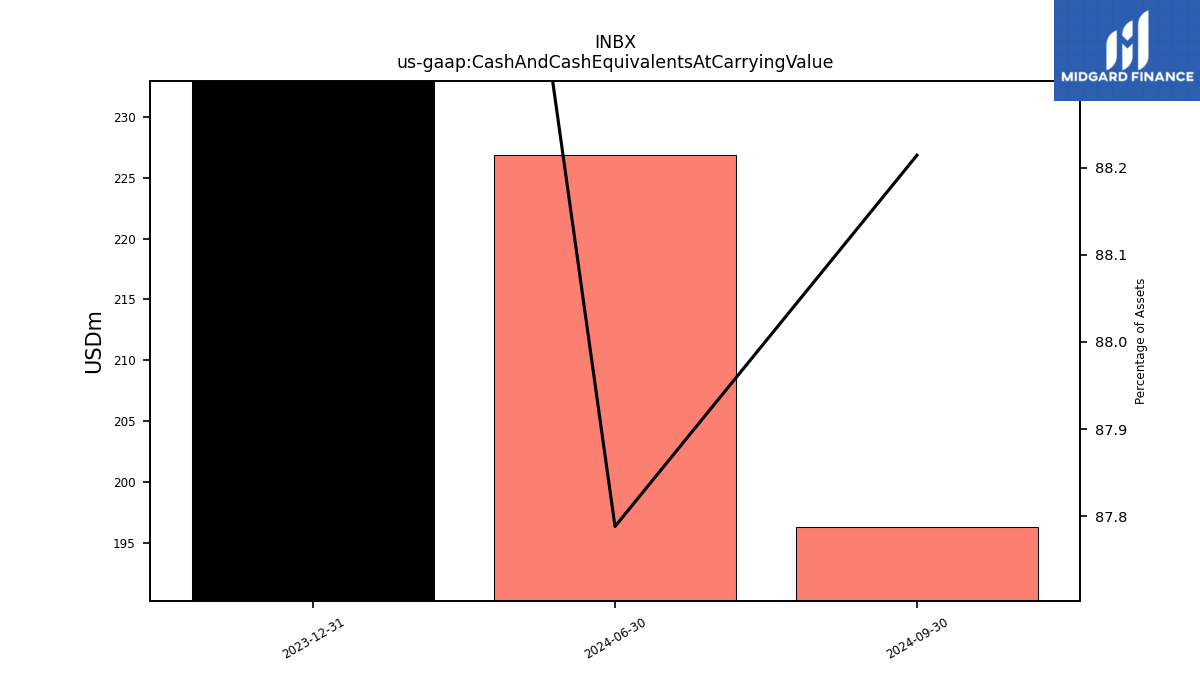
| Cash And Cash Equivalents At Carrying Value | 337.33 | 192.49 | 234.25 | 273.87 | 146.07 | 176.38 | 143.47 | 131.30 | 112.70 | 125.73 | 107.99 | 128.66 | 127.67 | NA | NA | 11.54 | NA | |
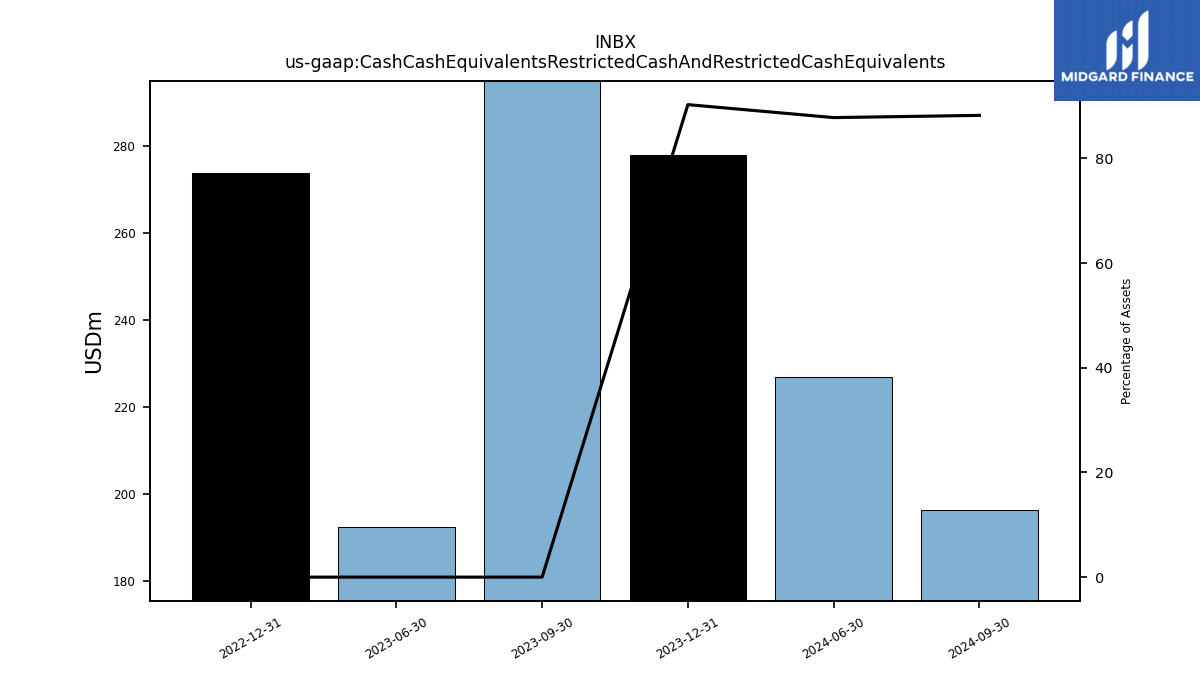
| Cash Cash Equivalents Restricted Cash And Restricted Cash Equivalents | 337.33 | 192.49 | 234.25 | 273.87 | 146.07 | 176.38 | 143.47 | 131.30 | 112.70 | 125.73 | 107.99 | 128.66 | 127.67 | 5.63 | 0.43 | 11.54 | 24.26 | |
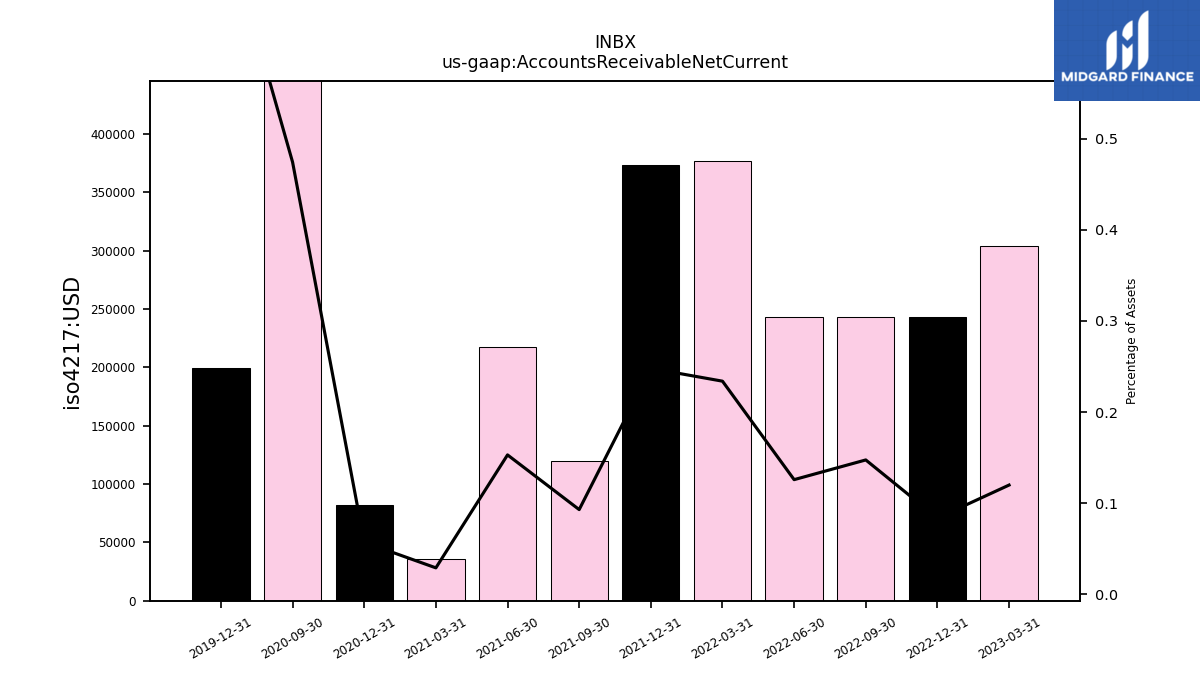
| Accounts Receivable Net Current | NA | NA | 0.30 | 0.24 | 0.24 | 0.24 | 0.38 | 0.37 | 0.12 | 0.22 | 0.04 | 0.08 | 0.68 | NA | NA | 0.20 | NA | |
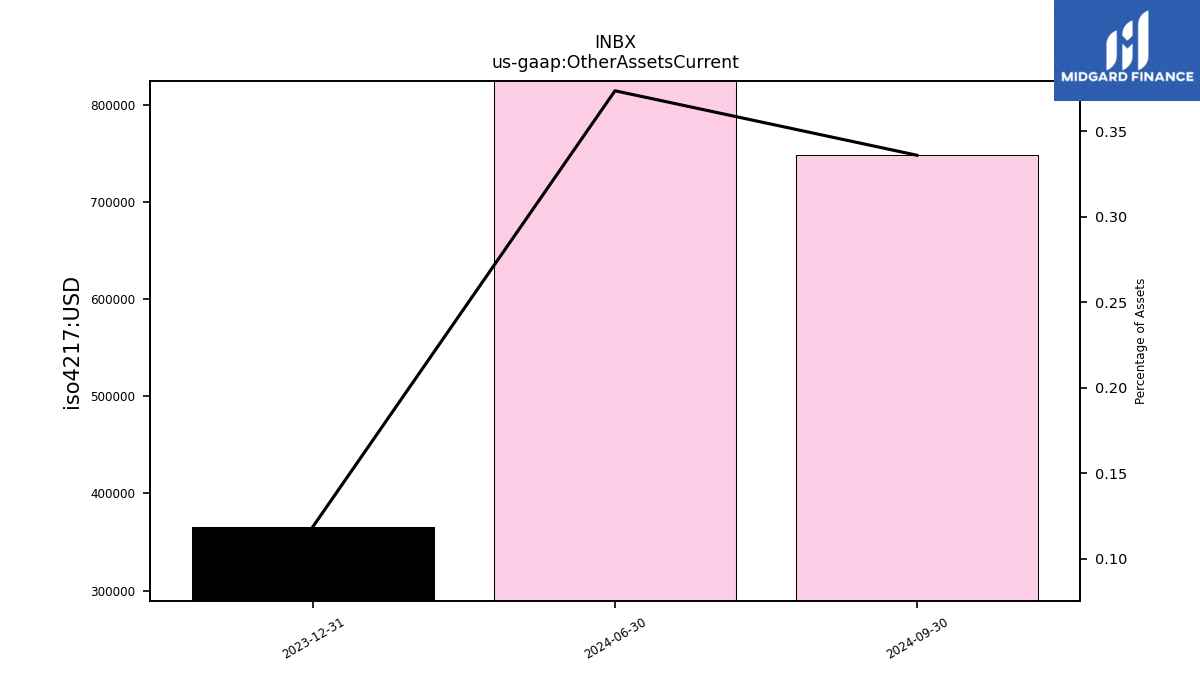
| Other Assets Current | 0.34 | 0.32 | 0.21 | 0.67 | 0.83 | 0.61 | 0.60 | 0.59 | 0.75 | 0.62 | 0.68 | 0.69 | 0.97 | NA | NA | 0.38 | NA | |
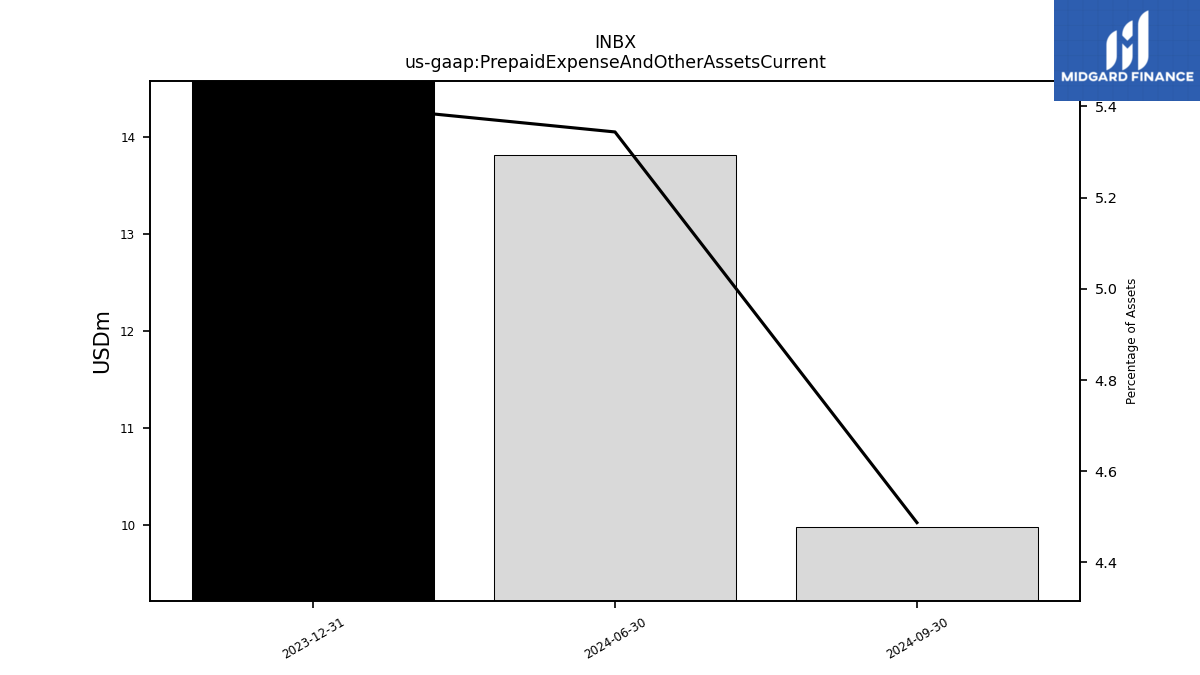
| Prepaid Expense And Other Assets Current | 25.64 | 10.50 | 9.22 | 6.37 | 7.37 | 4.95 | 6.50 | 6.93 | 5.83 | 5.02 | 5.05 | 2.89 | 3.22 | NA | NA | 3.58 | NA |
| 2023-09-30 | 2023-06-30 | 2023-03-31 | 2022-12-31 | 2022-09-30 | 2022-06-30 | 2022-03-31 | 2021-12-31 | 2021-09-30 | 2021-06-30 | 2021-03-31 | 2020-12-31 | 2020-09-30 | 2020-06-30 | 2020-03-31 | 2019-12-31 | 2019-09-30 | ||
|---|---|---|---|---|---|---|---|---|---|---|---|---|---|---|---|---|---|---|
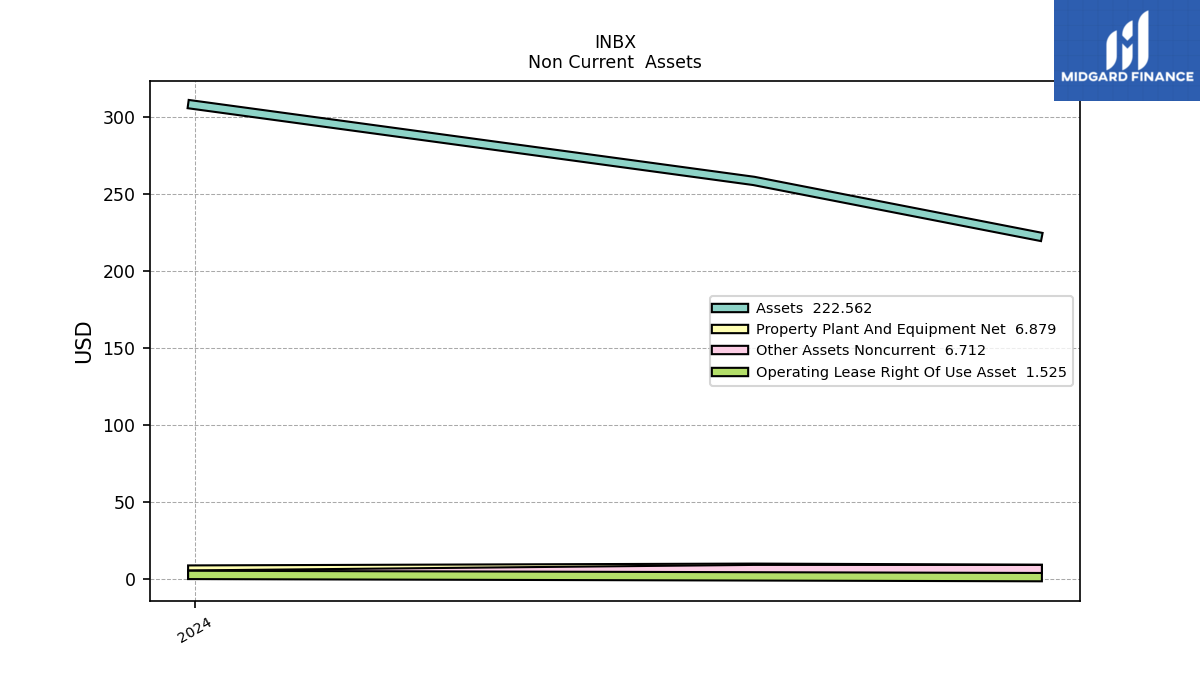
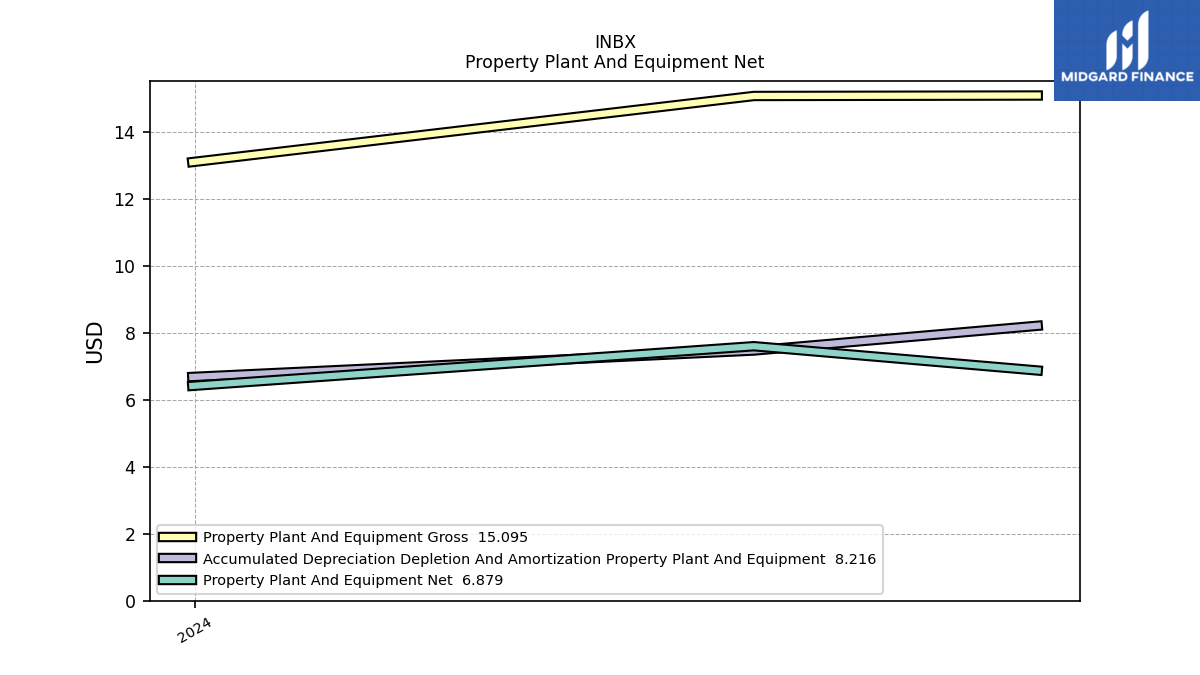
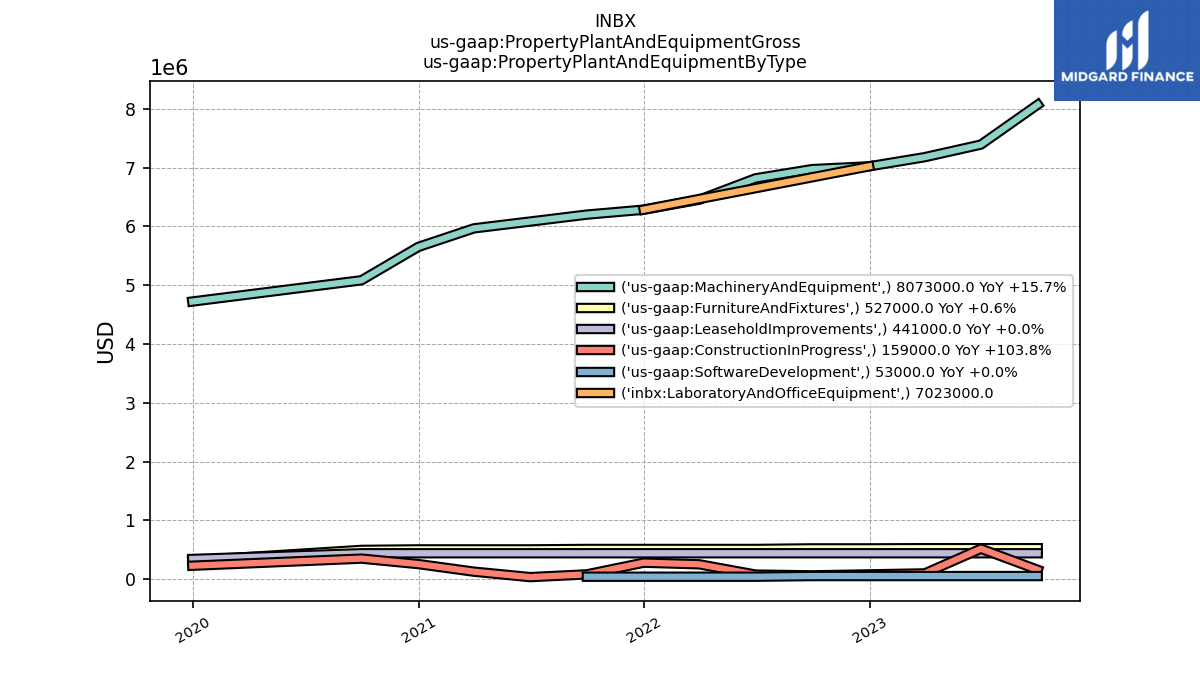
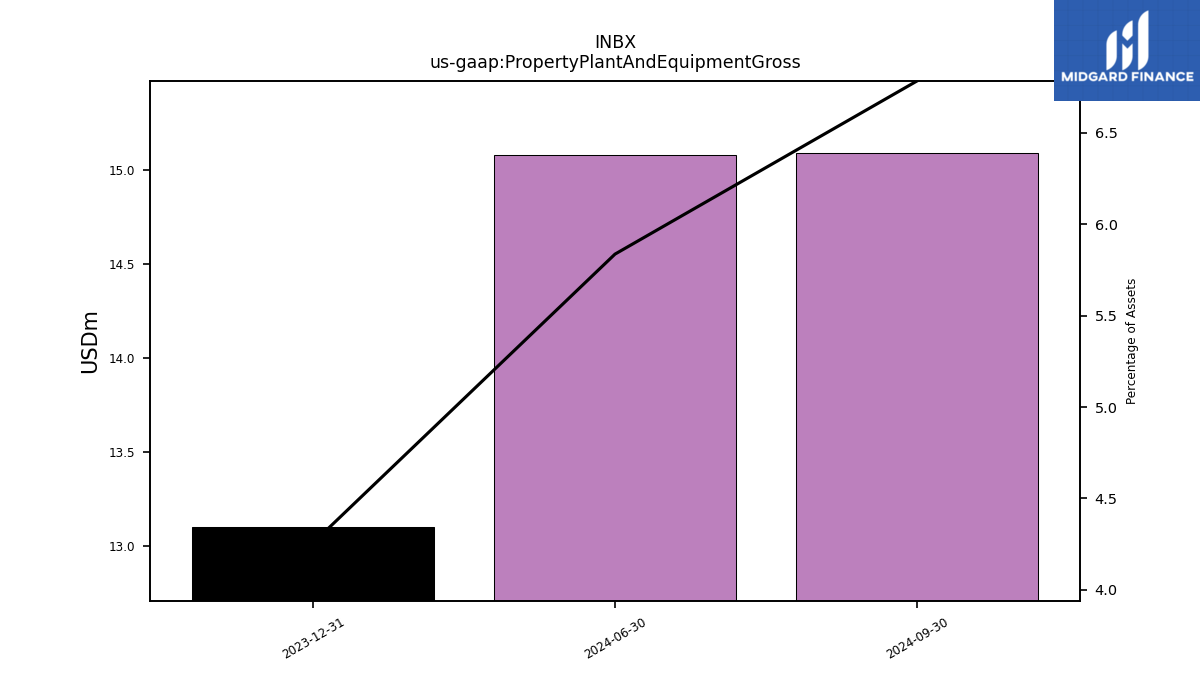
| Property Plant And Equipment Gross | 9.25 | 8.93 | 8.30 | 8.04 | 8.06 | 7.89 | 7.71 | 7.56 | 7.28 | 7.07 | 7.04 | 6.86 | 6.37 | NA | NA | 5.61 | NA | |
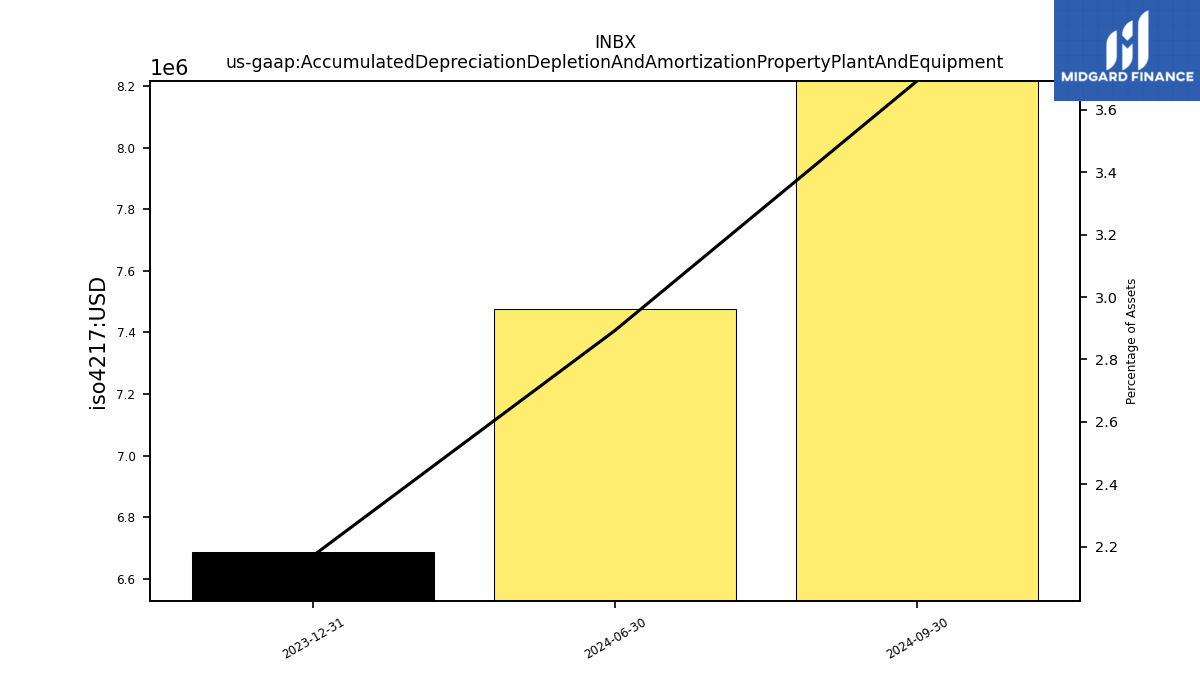
| Accumulated Depreciation Depletion And Amortization Property Plant And Equipment | 6.39 | 6.10 | 5.81 | 5.54 | 5.26 | 5.02 | 4.72 | 4.41 | 4.10 | 3.80 | 3.66 | 3.37 | 3.10 | NA | NA | 2.38 | NA | |
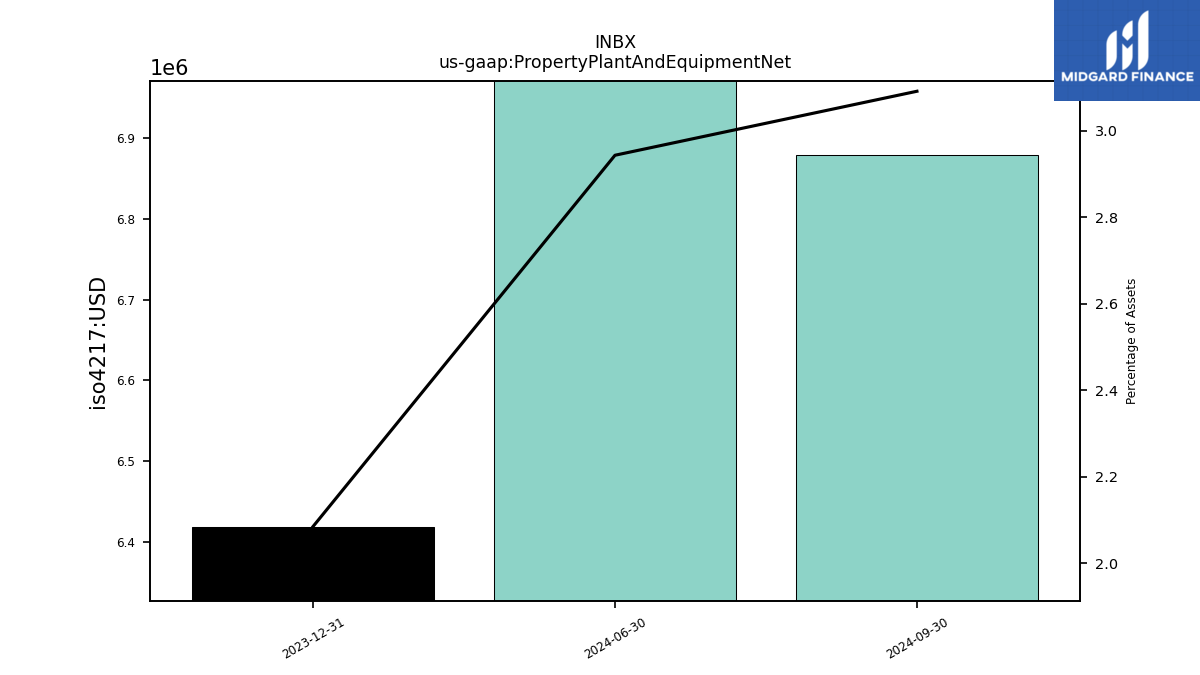
| Property Plant And Equipment Net | 2.86 | 2.83 | 2.48 | 2.50 | 2.80 | 2.88 | 2.99 | 3.15 | 3.18 | 3.26 | 3.39 | 3.49 | 3.27 | NA | NA | 3.23 | NA | |
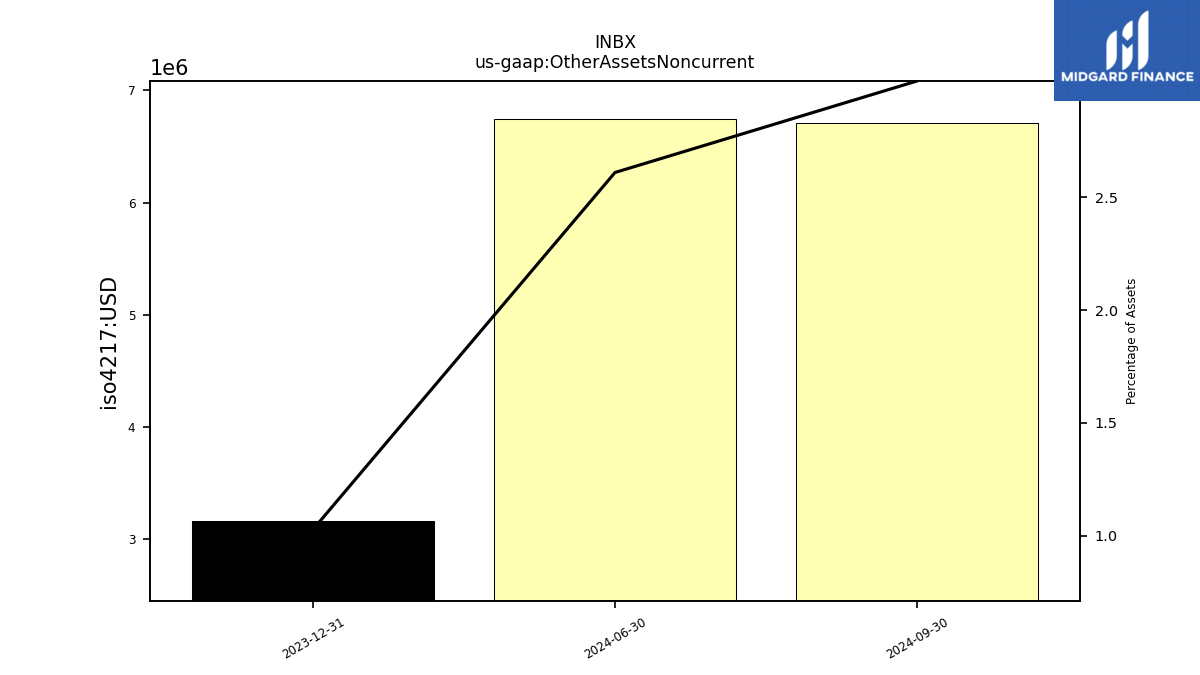
| Other Assets Noncurrent | 3.16 | 3.16 | 3.16 | 3.16 | 3.16 | 3.16 | 1.85 | 1.85 | 0.24 | 0.24 | 0.24 | 0.24 | 0.24 | NA | NA | 0.24 | NA | |
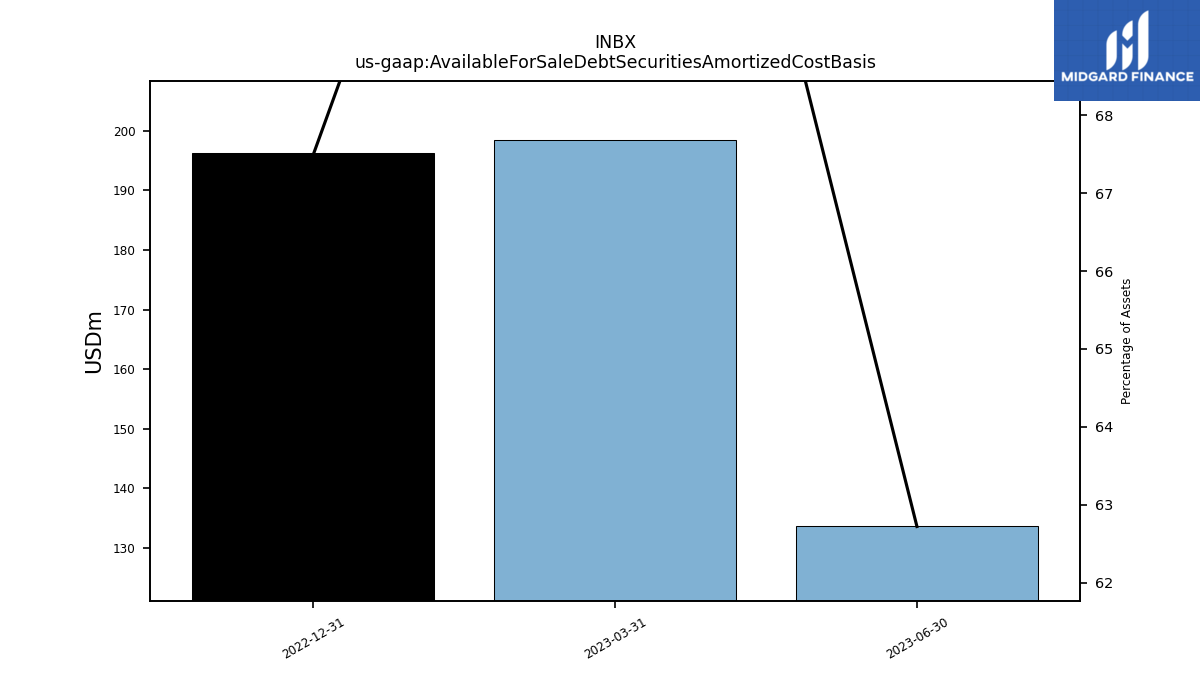
| Available For Sale Debt Securities Amortized Cost Basis | NA | 133.70 | 198.40 | 196.30 | NA | NA | NA | NA | NA | NA | NA | NA | NA | NA | NA | NA | NA |
| 2023-09-30 | 2023-06-30 | 2023-03-31 | 2022-12-31 | 2022-09-30 | 2022-06-30 | 2022-03-31 | 2021-12-31 | 2021-09-30 | 2021-06-30 | 2021-03-31 | 2020-12-31 | 2020-09-30 | 2020-06-30 | 2020-03-31 | 2019-12-31 | 2019-09-30 | ||
|---|---|---|---|---|---|---|---|---|---|---|---|---|---|---|---|---|---|---|
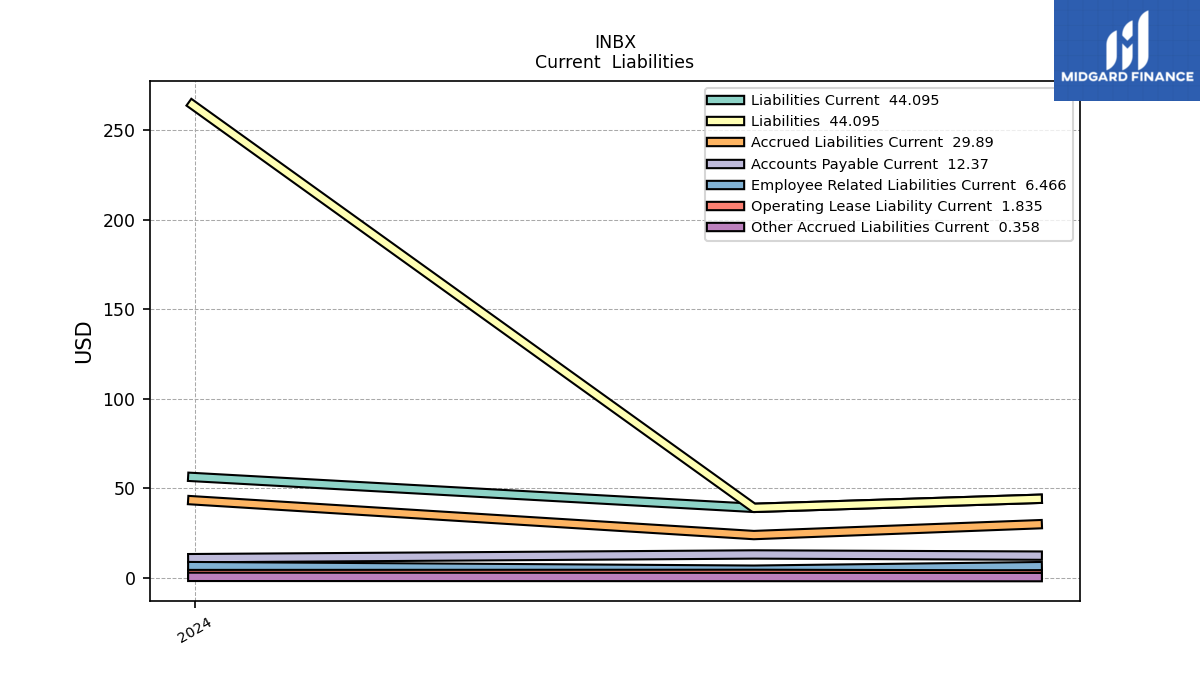
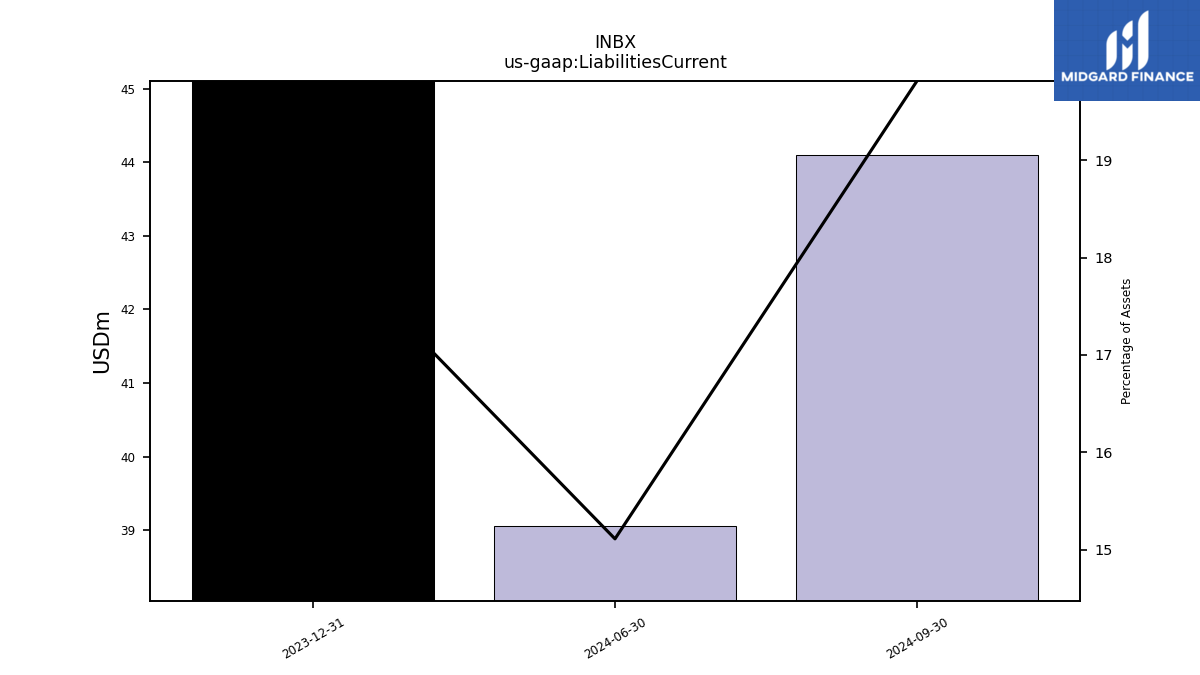
| Liabilities Current | 35.77 | 31.33 | 32.64 | 27.58 | 25.43 | 24.20 | 20.11 | 22.45 | 25.15 | 21.67 | 27.85 | 31.40 | 34.74 | NA | NA | 20.57 | NA | |
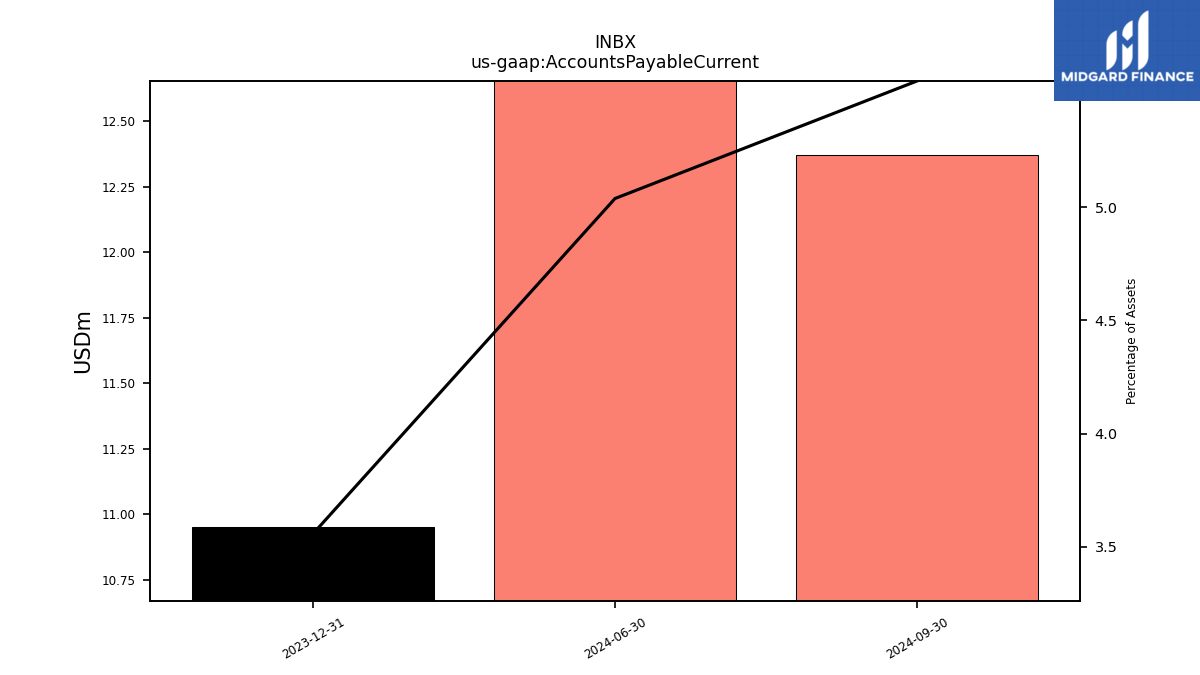
| Accounts Payable Current | 7.86 | 9.70 | 10.92 | 8.33 | 8.57 | 9.25 | 7.89 | 9.12 | 12.43 | 9.86 | 14.29 | 13.46 | 15.19 | NA | NA | 3.12 | NA | |
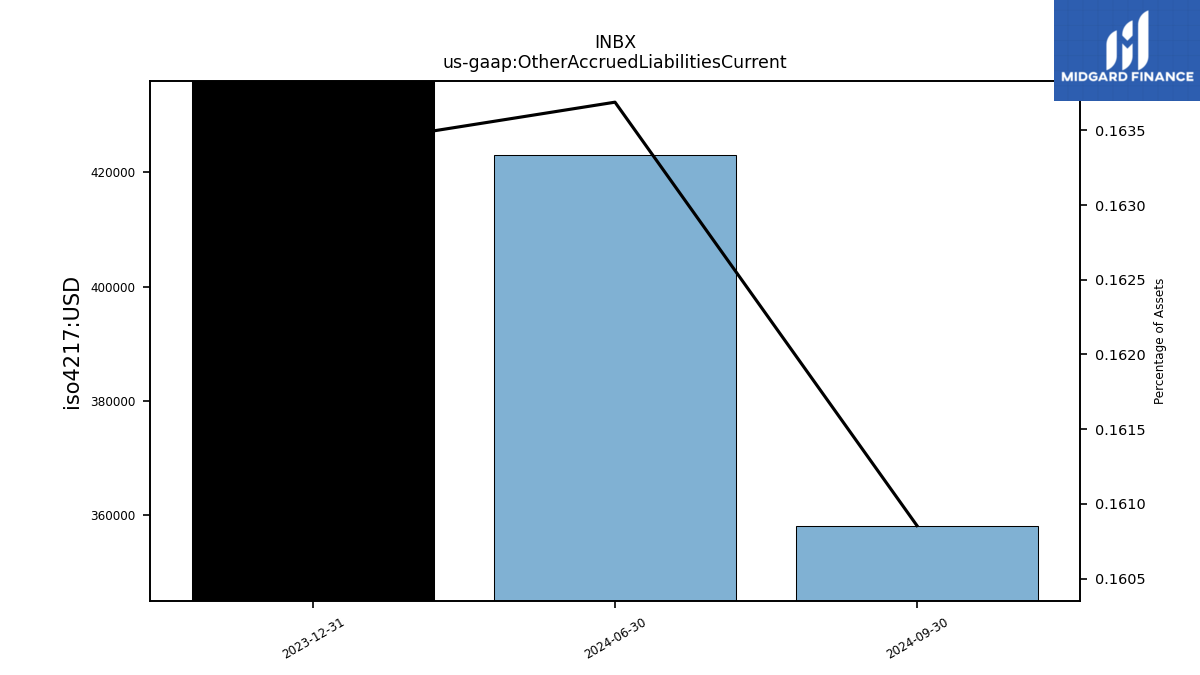
| Other Accrued Liabilities Current | 0.34 | 0.34 | 0.46 | 0.23 | 1.82 | 1.01 | 0.90 | 0.65 | 0.60 | 0.40 | 0.41 | 0.38 | 0.17 | NA | NA | 0.29 | NA | |
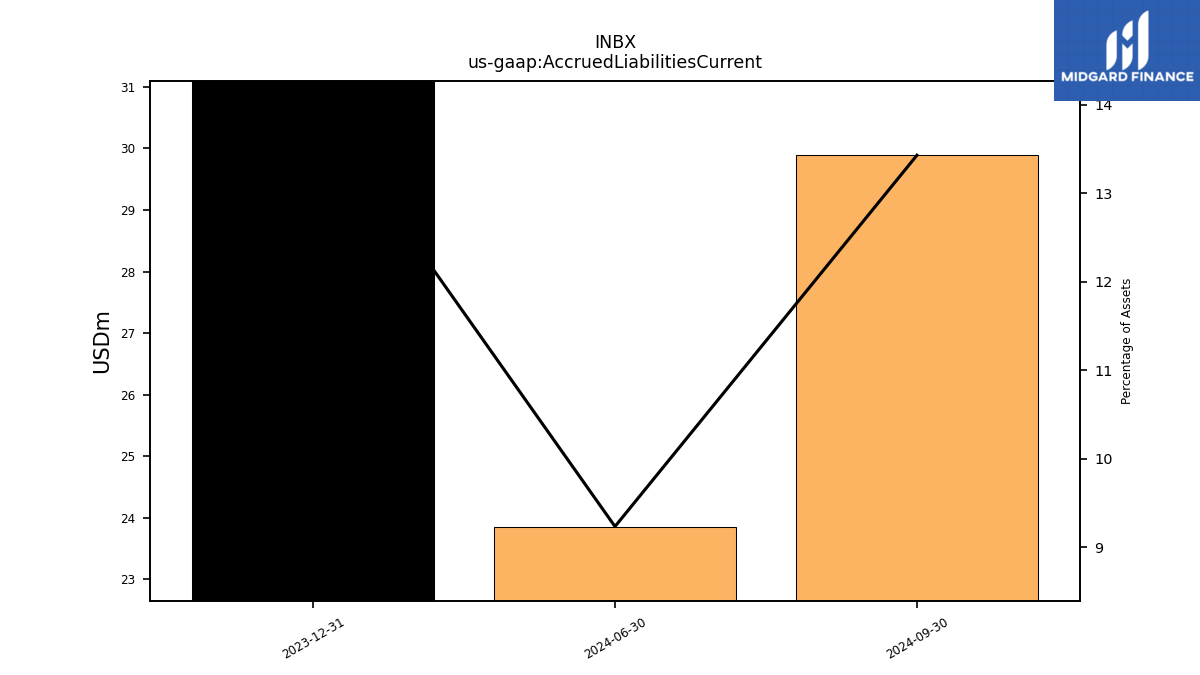
| Accrued Liabilities Current | 25.90 | 19.55 | 19.67 | 17.22 | 14.61 | 12.47 | 9.27 | 9.62 | 8.33 | 6.98 | 7.94 | 13.36 | 11.04 | NA | NA | 4.83 | NA | |
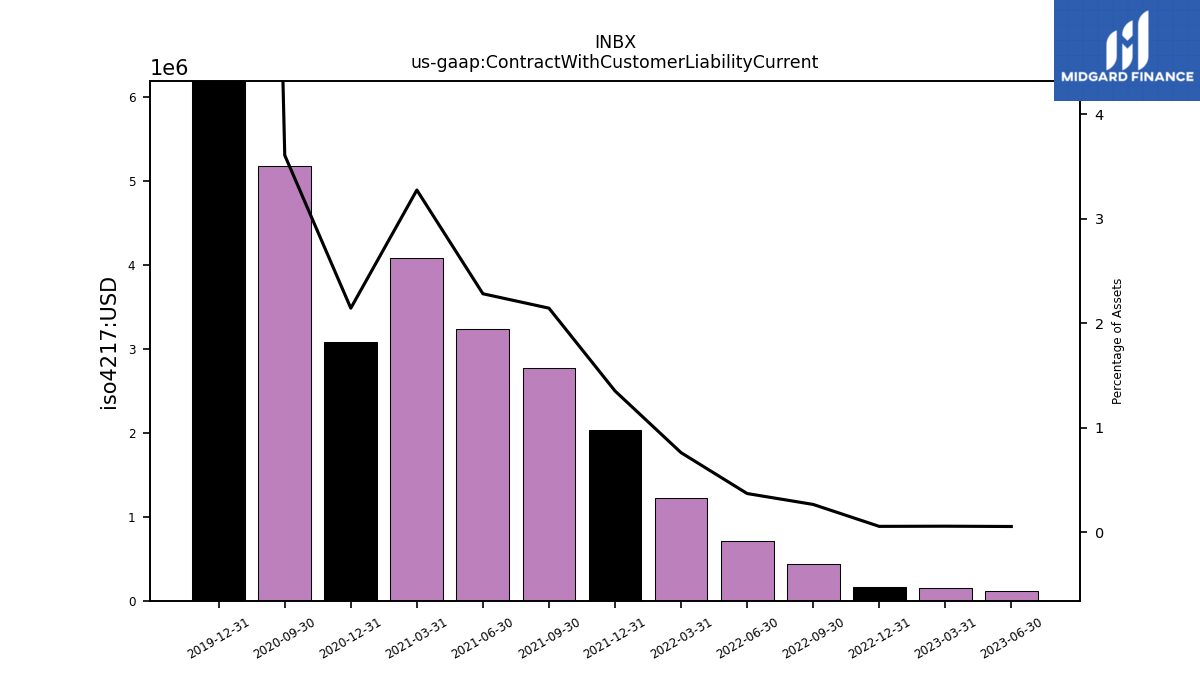
| Contract With Customer Liability Current | NA | 0.12 | 0.15 | 0.17 | 0.44 | 0.72 | 1.23 | 2.03 | 2.77 | 3.24 | 4.08 | 3.08 | 5.18 | NA | NA | 7.94 | NA |
| 2023-09-30 | 2023-06-30 | 2023-03-31 | 2022-12-31 | 2022-09-30 | 2022-06-30 | 2022-03-31 | 2021-12-31 | 2021-09-30 | 2021-06-30 | 2021-03-31 | 2020-12-31 | 2020-09-30 | 2020-06-30 | 2020-03-31 | 2019-12-31 | 2019-09-30 | ||
|---|---|---|---|---|---|---|---|---|---|---|---|---|---|---|---|---|---|---|
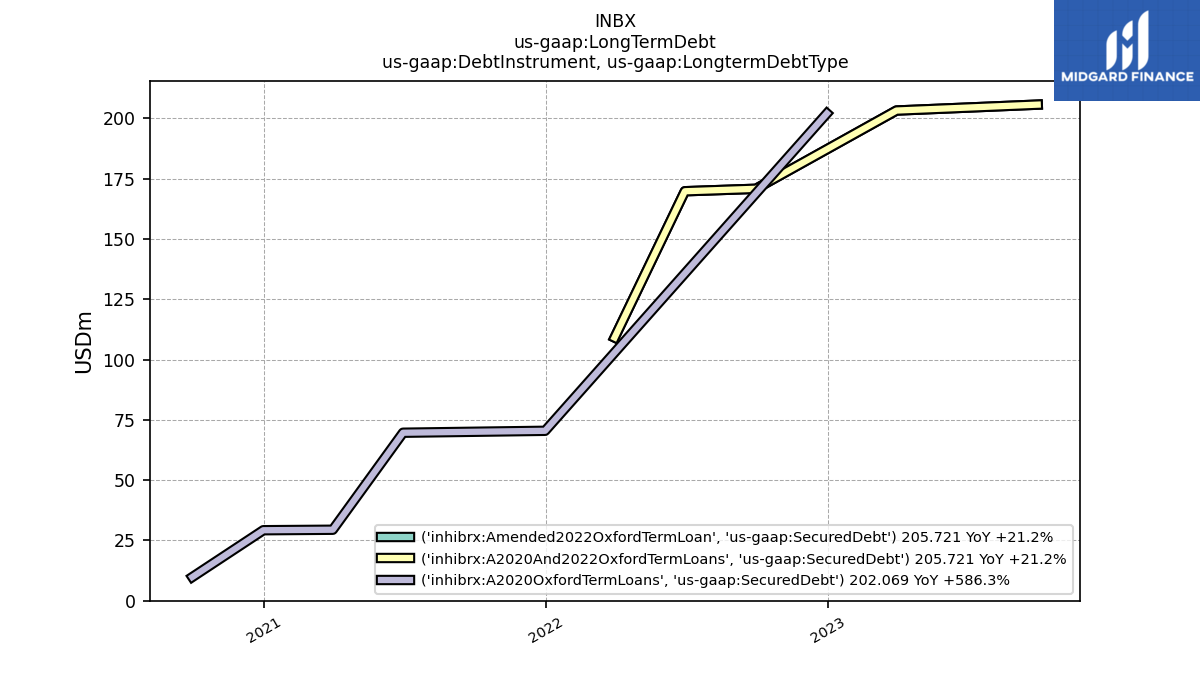
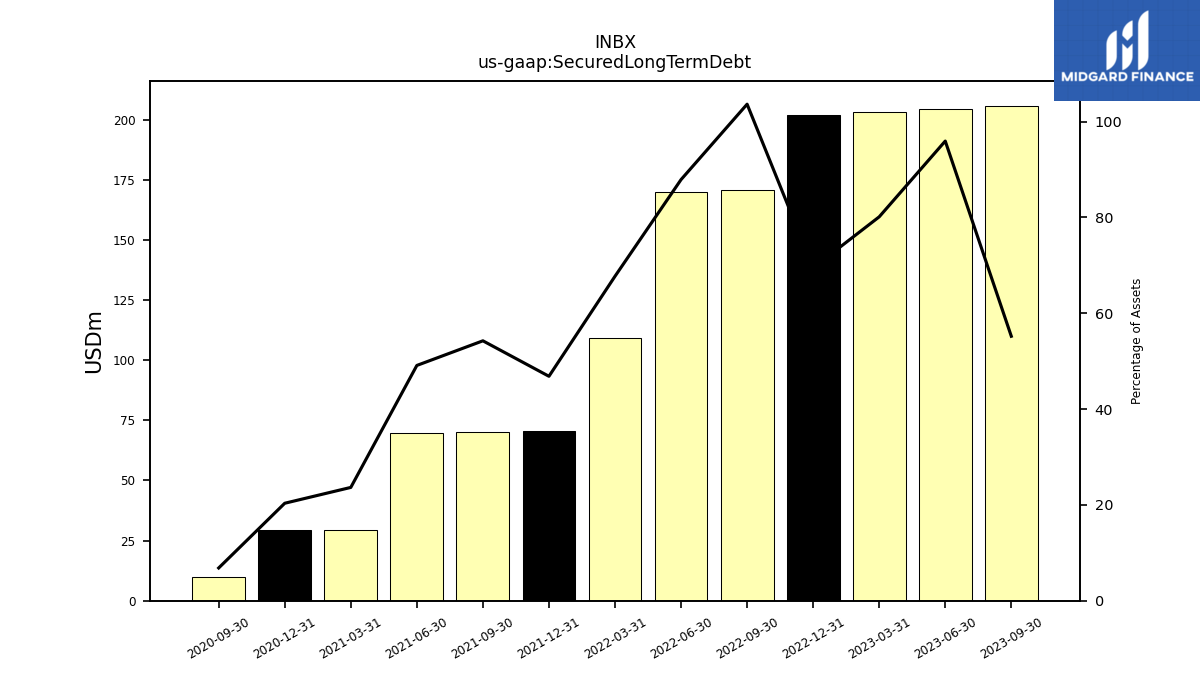
| Secured Long Term Debt | 205.72 | 204.48 | 203.26 | 202.07 | 170.82 | 169.80 | 109.14 | 70.47 | 70.07 | 69.67 | 29.45 | 29.24 | 9.82 | NA | NA | NA | NA | |
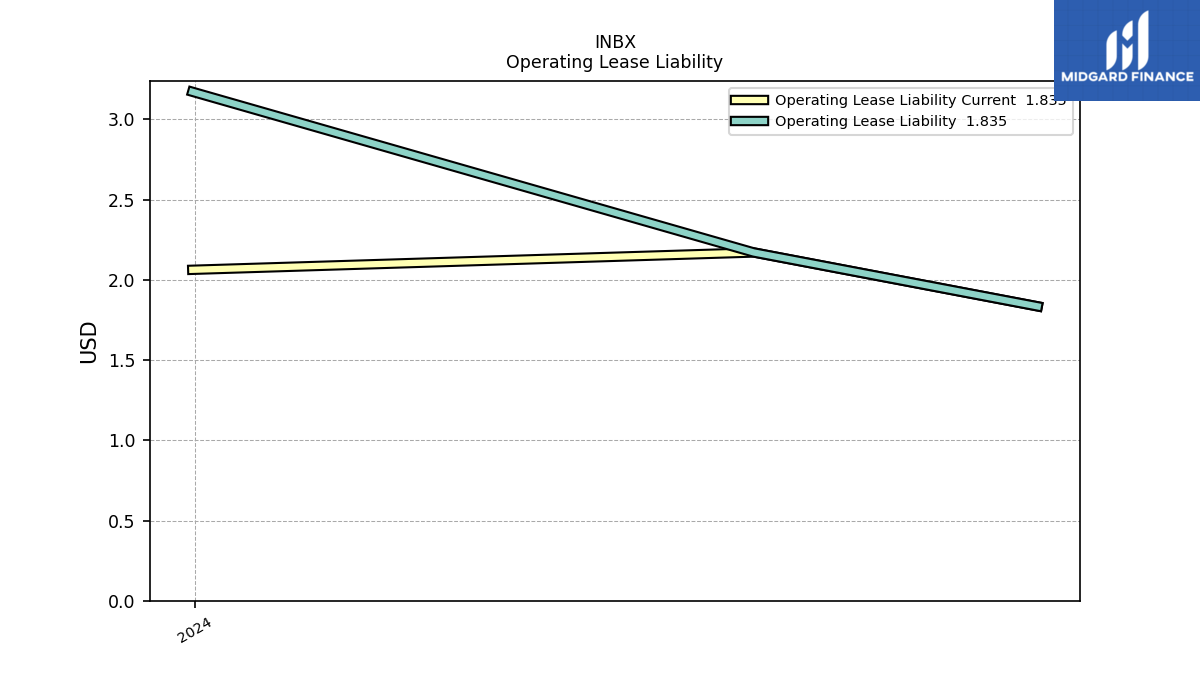
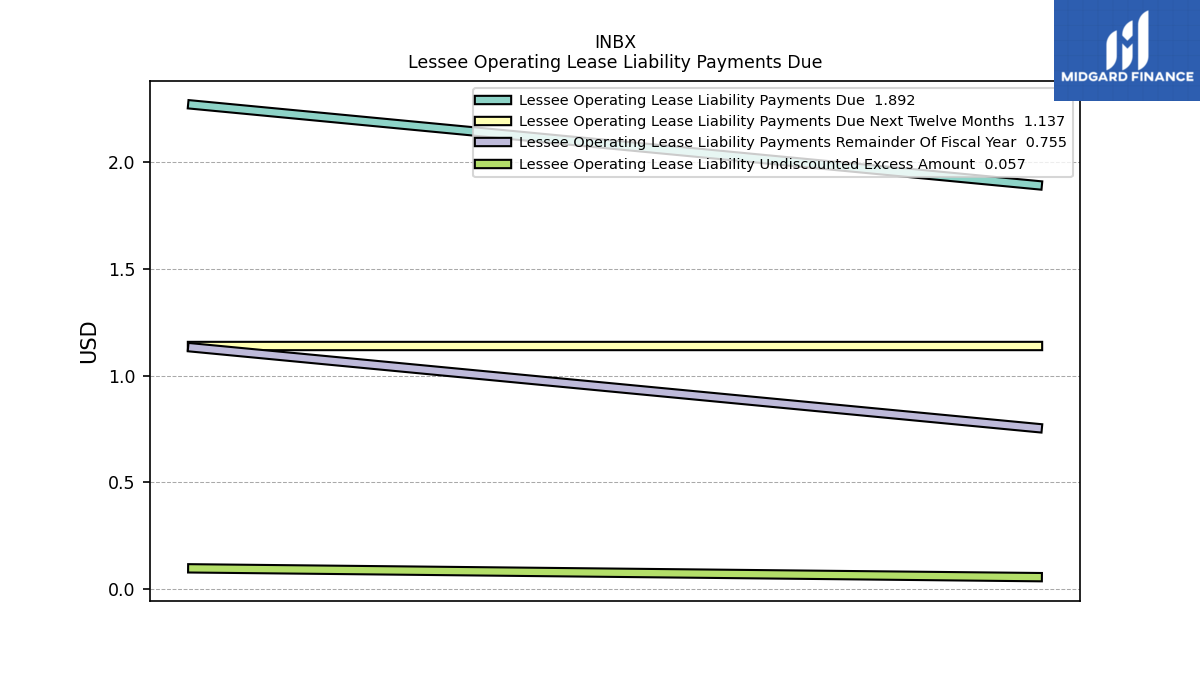
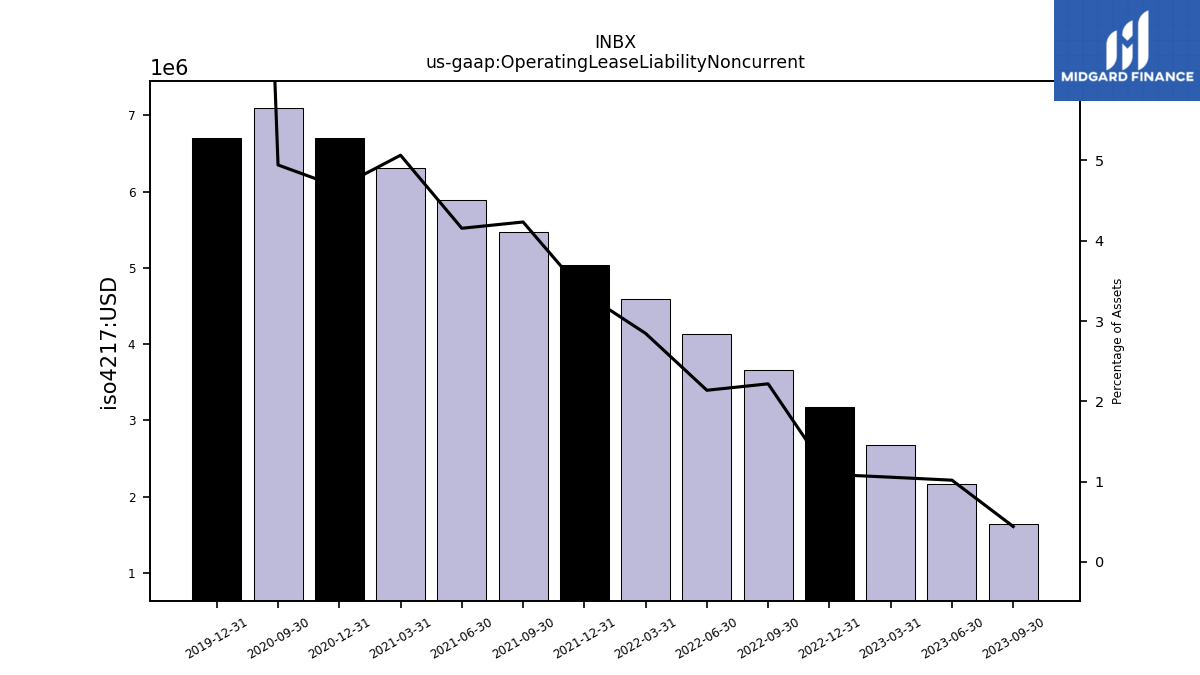
| Operating Lease Liability Noncurrent | 1.65 | 2.17 | 2.68 | 3.17 | 3.66 | 4.13 | 4.59 | 5.03 | 5.47 | 5.90 | 6.31 | 6.71 | 7.10 | NA | NA | 6.70 | NA |
| 2023-09-30 | 2023-06-30 | 2023-03-31 | 2022-12-31 | 2022-09-30 | 2022-06-30 | 2022-03-31 | 2021-12-31 | 2021-09-30 | 2021-06-30 | 2021-03-31 | 2020-12-31 | 2020-09-30 | 2020-06-30 | 2020-03-31 | 2019-12-31 | 2019-09-30 | ||
|---|---|---|---|---|---|---|---|---|---|---|---|---|---|---|---|---|---|---|
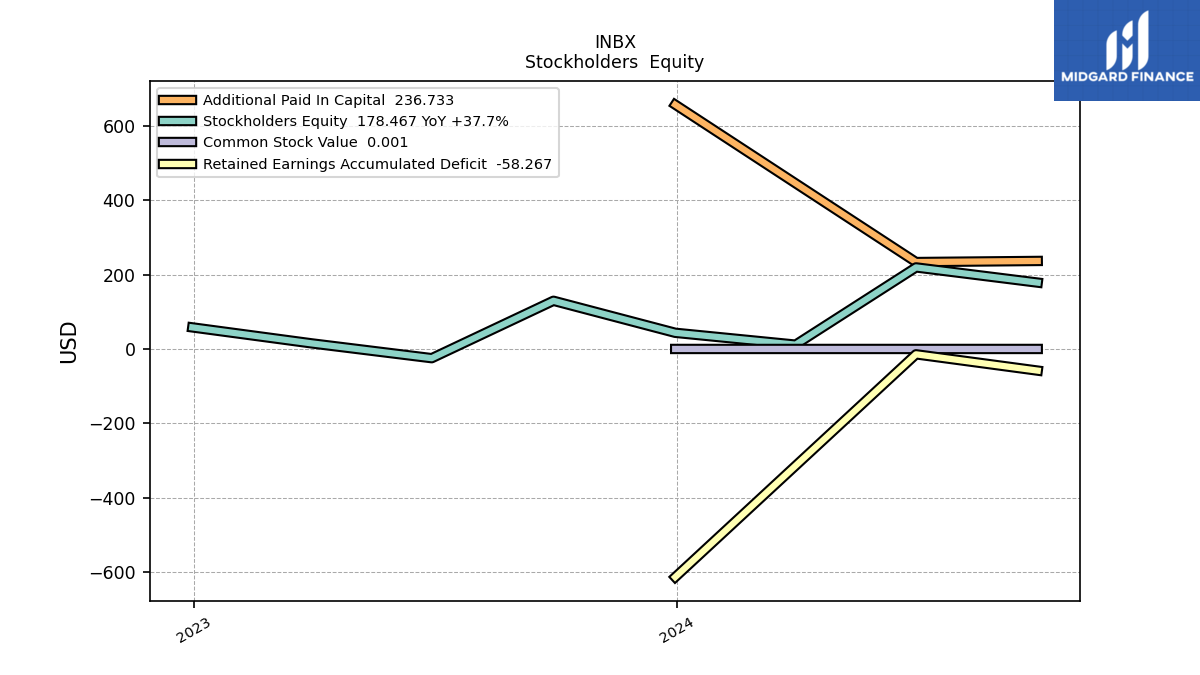
| Stockholders Equity | 129.59 | -24.81 | 15.13 | 58.06 | -35.05 | -4.92 | 27.35 | 52.38 | 28.20 | 44.32 | 60.59 | 75.47 | 91.73 | NA | NA | -93.57 | NA | |
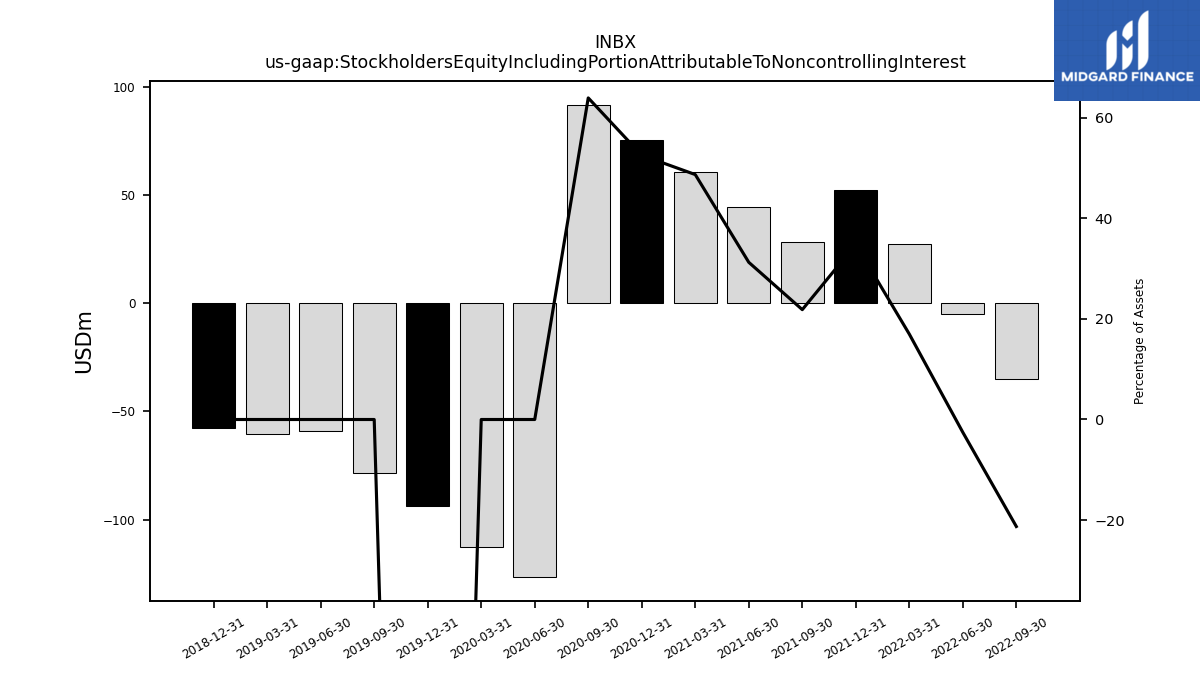
| Stockholders Equity Including Portion Attributable To Noncontrolling Interest | NA | NA | NA | NA | -35.05 | -4.92 | 27.35 | 52.38 | 28.20 | 44.32 | 60.59 | 75.47 | 91.73 | -126.54 | -112.57 | -93.57 | -78.39 | |
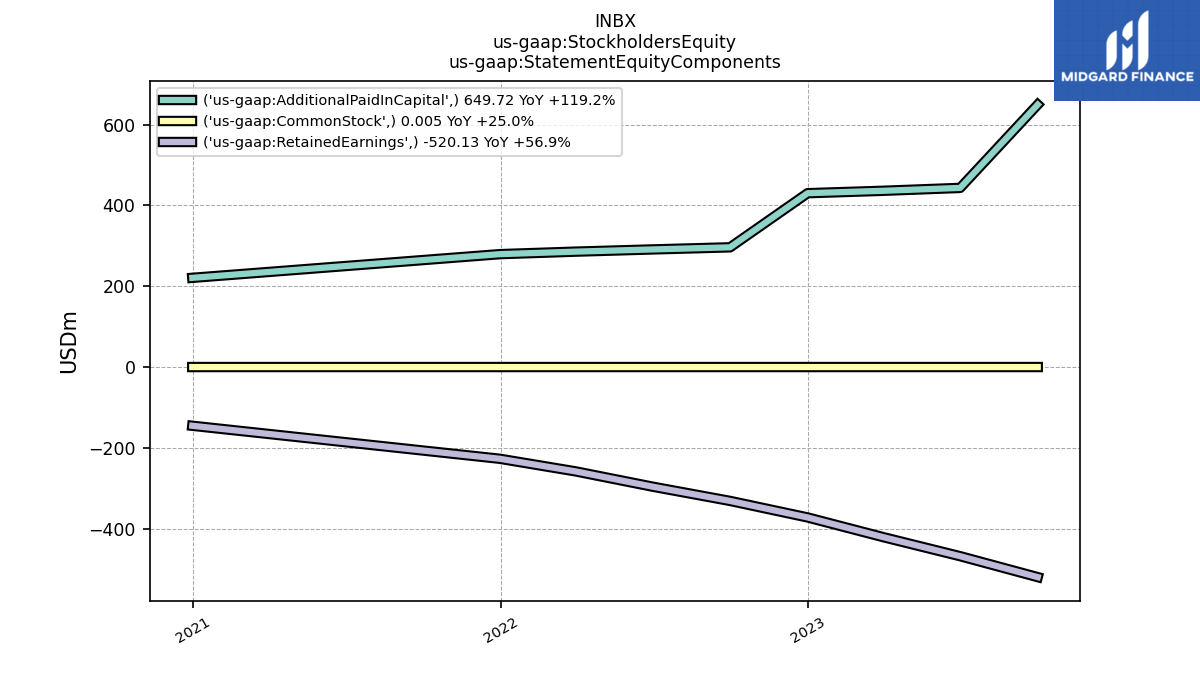
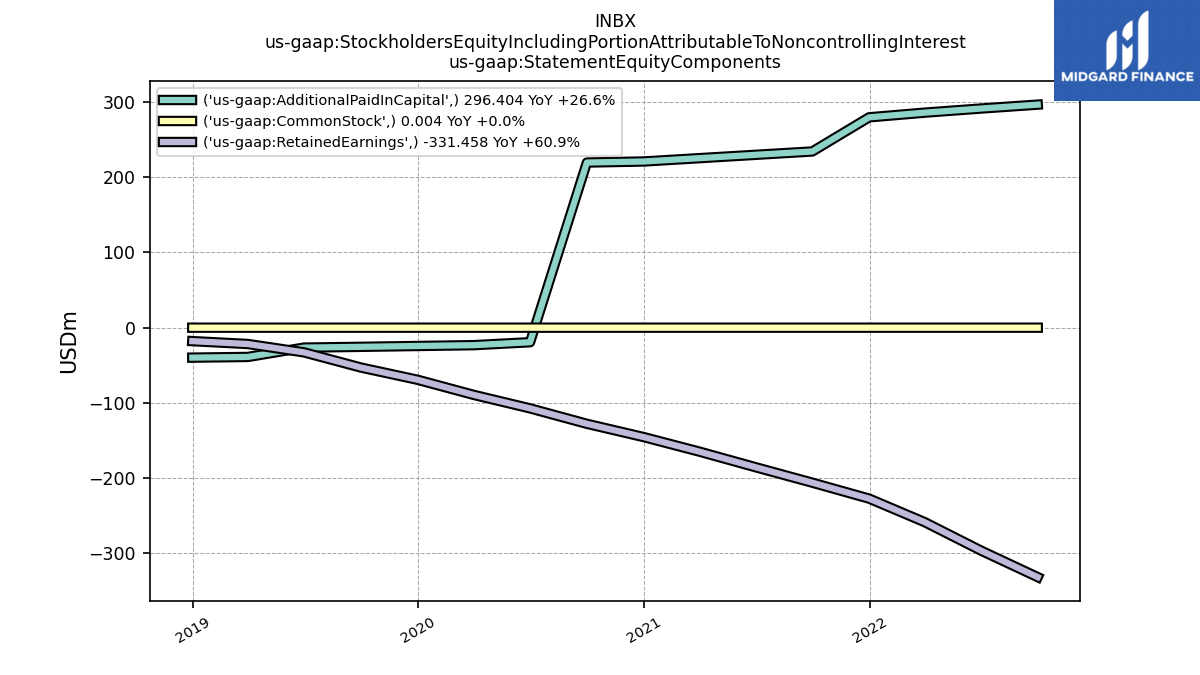
| Common Stock Value | 0.01 | 0.00 | 0.00 | 0.00 | 0.00 | 0.00 | 0.00 | 0.00 | 0.00 | 0.00 | 0.00 | 0.00 | 0.00 | NA | NA | 0.00 | NA | |
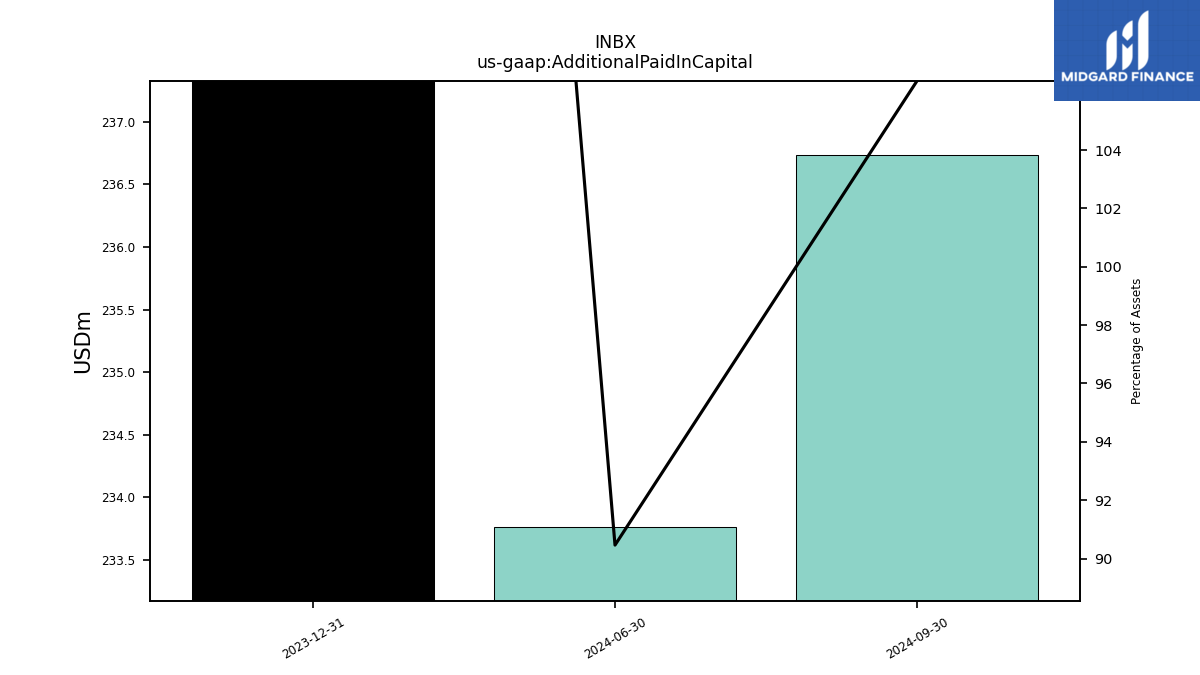
| Additional Paid In Capital | 649.72 | 443.52 | 436.42 | 430.43 | 296.40 | 291.21 | 285.75 | 279.53 | 234.15 | 229.69 | 225.26 | 220.85 | 219.46 | NA | NA | -24.32 | NA | |
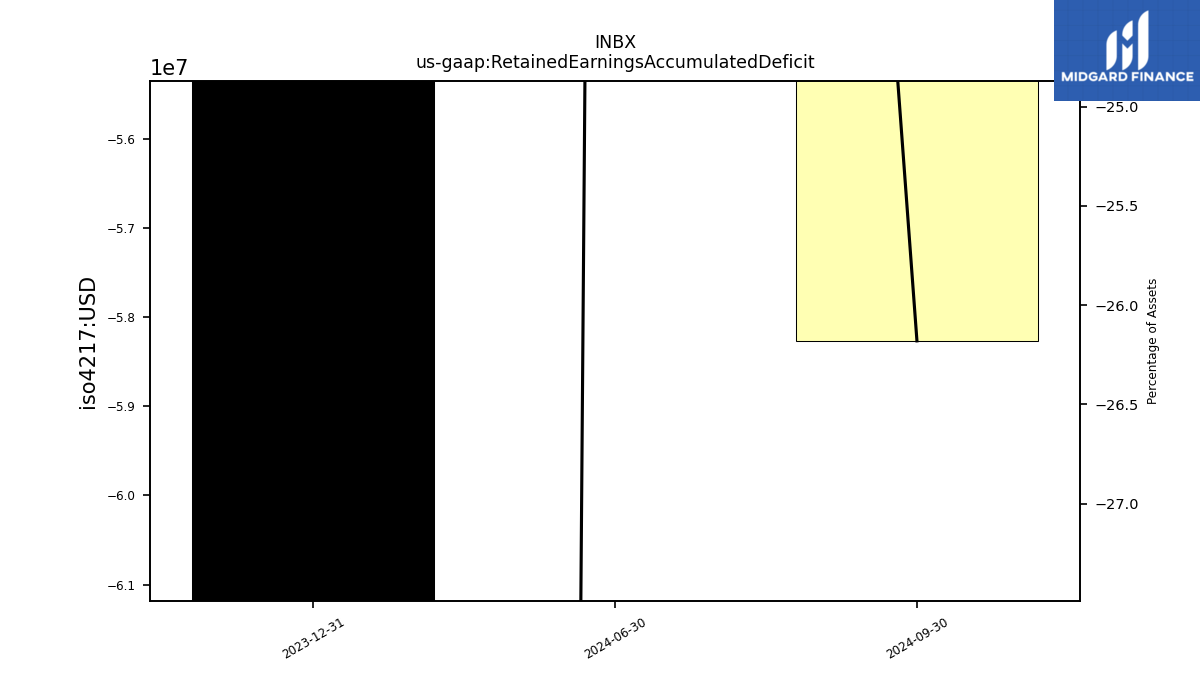
| Retained Earnings Accumulated Deficit | -520.13 | -468.34 | -421.29 | -372.37 | -331.46 | -296.13 | -258.40 | -227.15 | -205.96 | -185.38 | -164.67 | -145.38 | -127.73 | NA | NA | -69.25 | NA | |
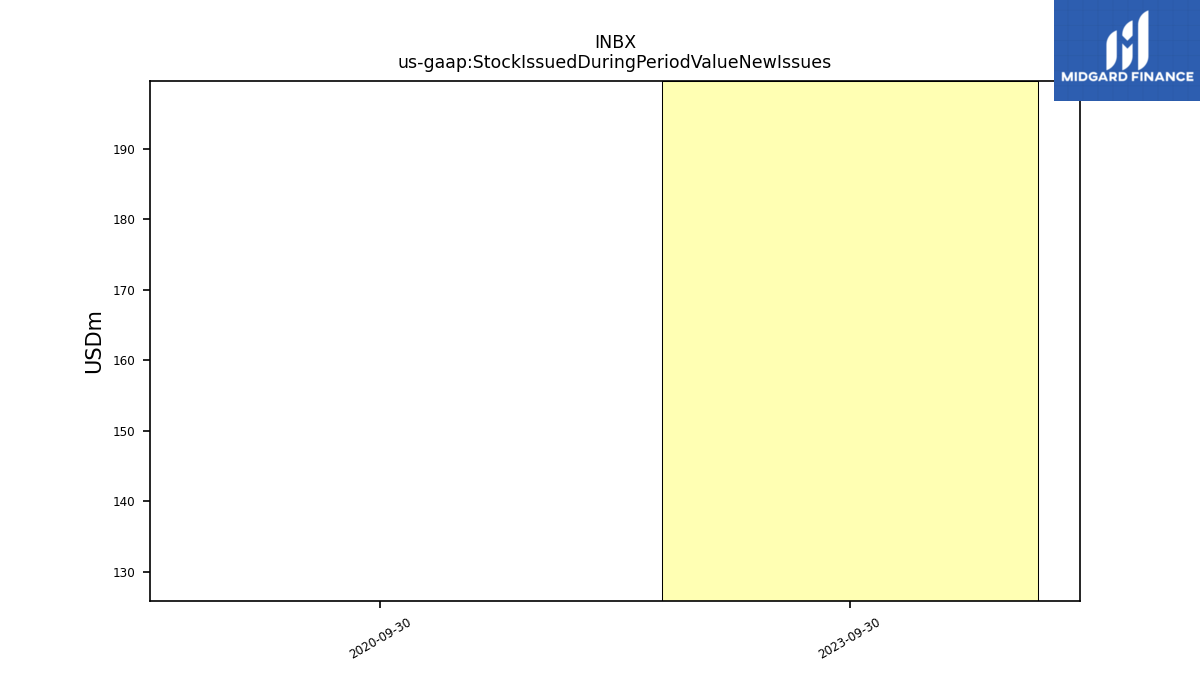
| Stock Issued During Period Value New Issues | 199.65 | NA | NA | NA | NA | NA | NA | NA | NA | NA | NA | NA | 125.86 | NA | NA | NA | NA | |
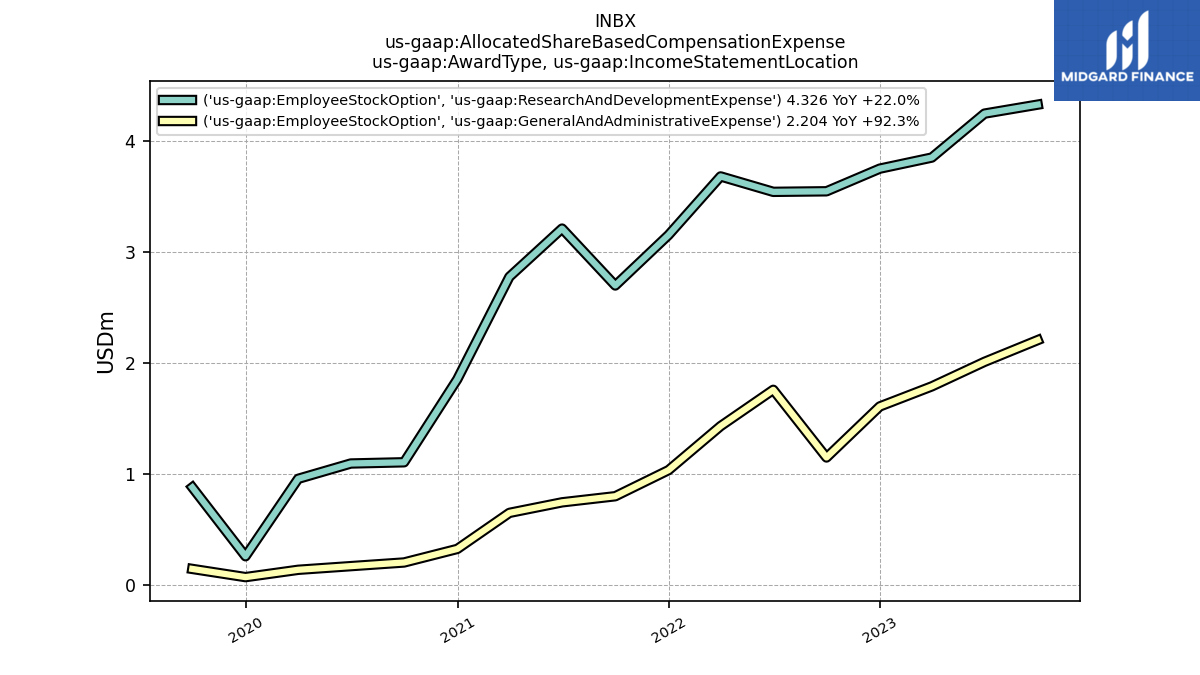
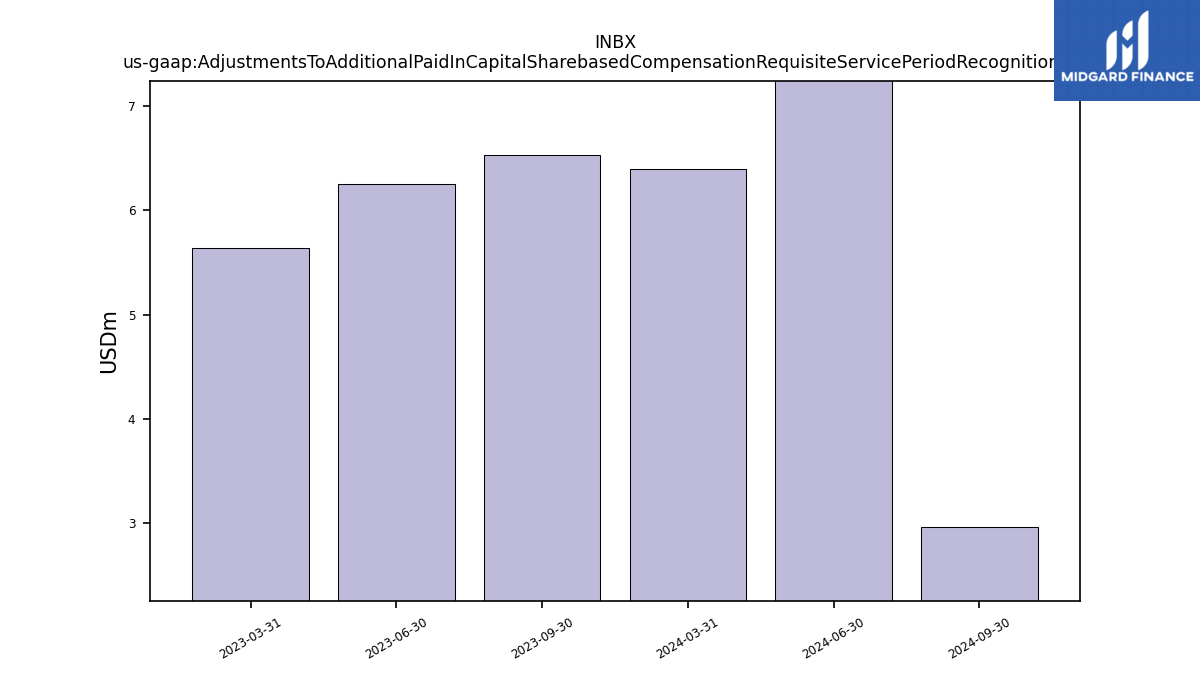
| Adjustments To Additional Paid In Capital Sharebased Compensation Requisite Service Period Recognition Value | 6.53 | 6.25 | 5.64 | NA | 4.69 | 5.30 | 5.11 | NA | 3.49 | 3.95 | 3.42 | NA | 1.30 | 1.26 | 1.09 | NA | 1.02 |
| 2023-09-30 | 2023-06-30 | 2023-03-31 | 2022-12-31 | 2022-09-30 | 2022-06-30 | 2022-03-31 | 2021-12-31 | 2021-09-30 | 2021-06-30 | 2021-03-31 | 2020-12-31 | 2020-09-30 | 2020-06-30 | 2020-03-31 | 2019-12-31 | 2019-09-30 | ||
|---|---|---|---|---|---|---|---|---|---|---|---|---|---|---|---|---|---|---|
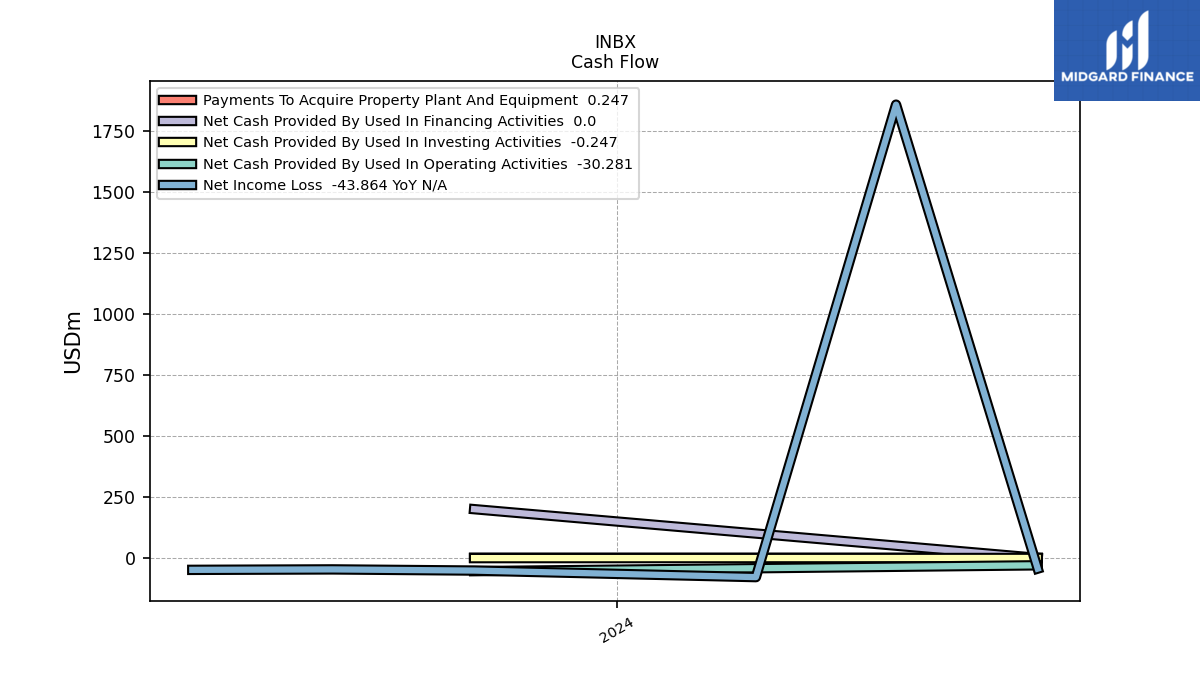
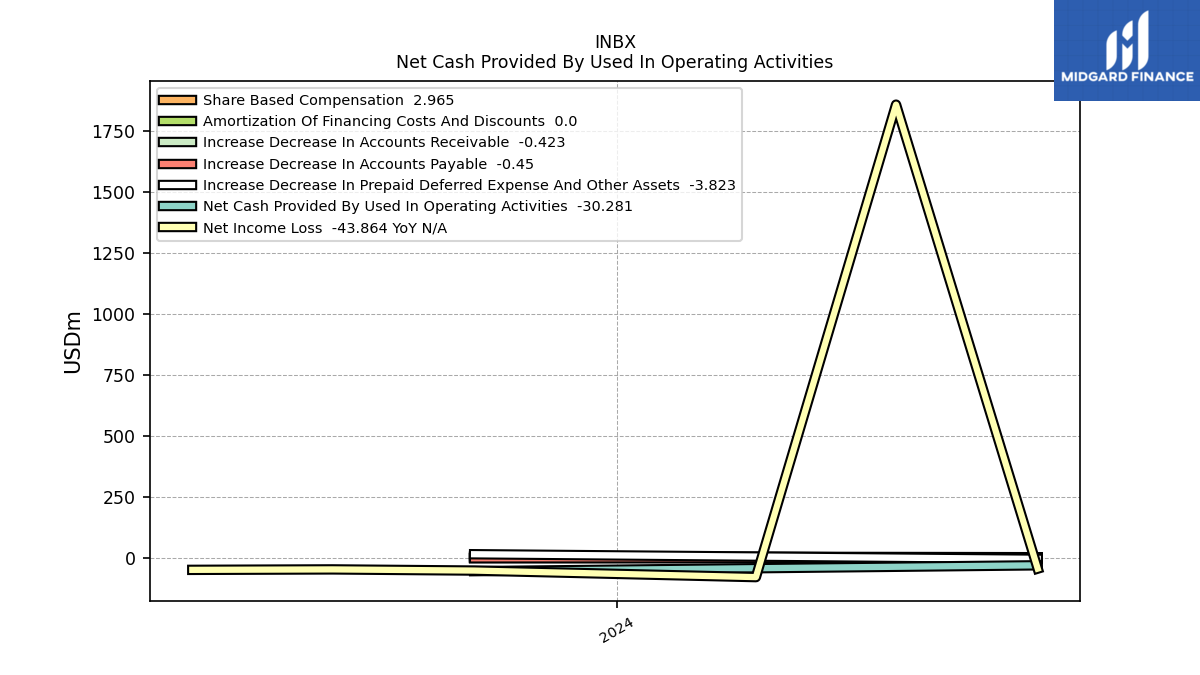
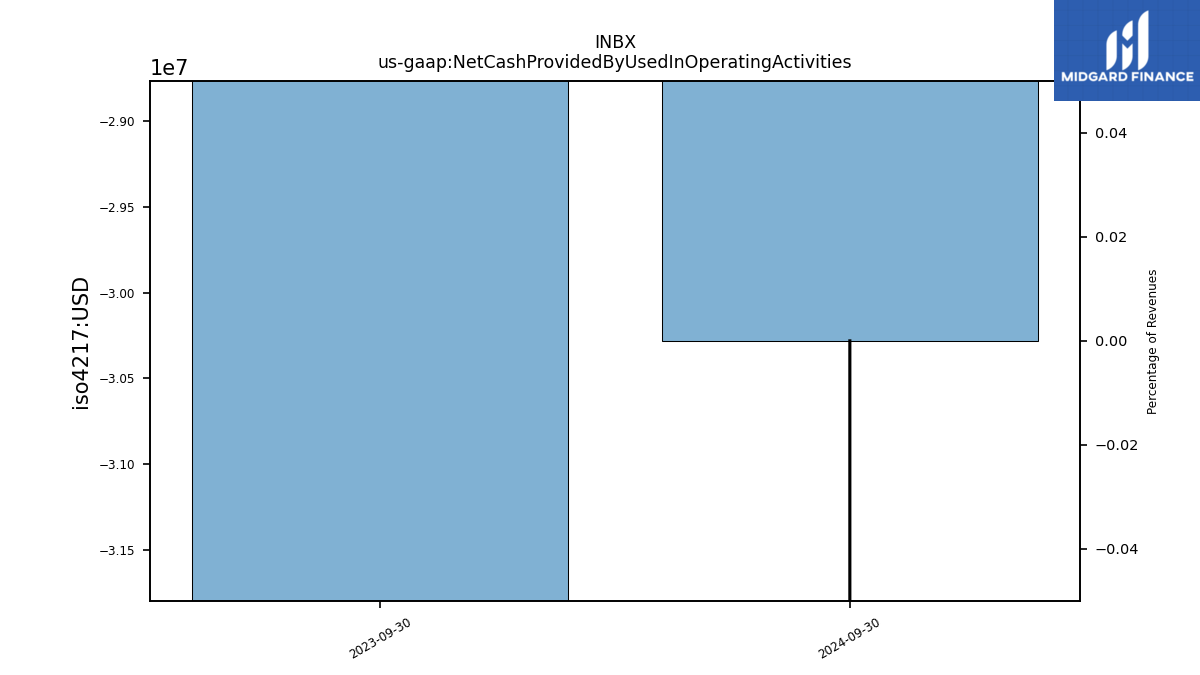
| Net Cash Provided By Used In Operating Activities | -54.24 | -42.30 | -39.94 | -30.60 | -30.84 | -26.92 | -26.94 | -22.62 | -13.68 | -22.38 | -21.65 | -15.39 | -13.88 | -11.31 | -7.39 | -11.94 | NA | |
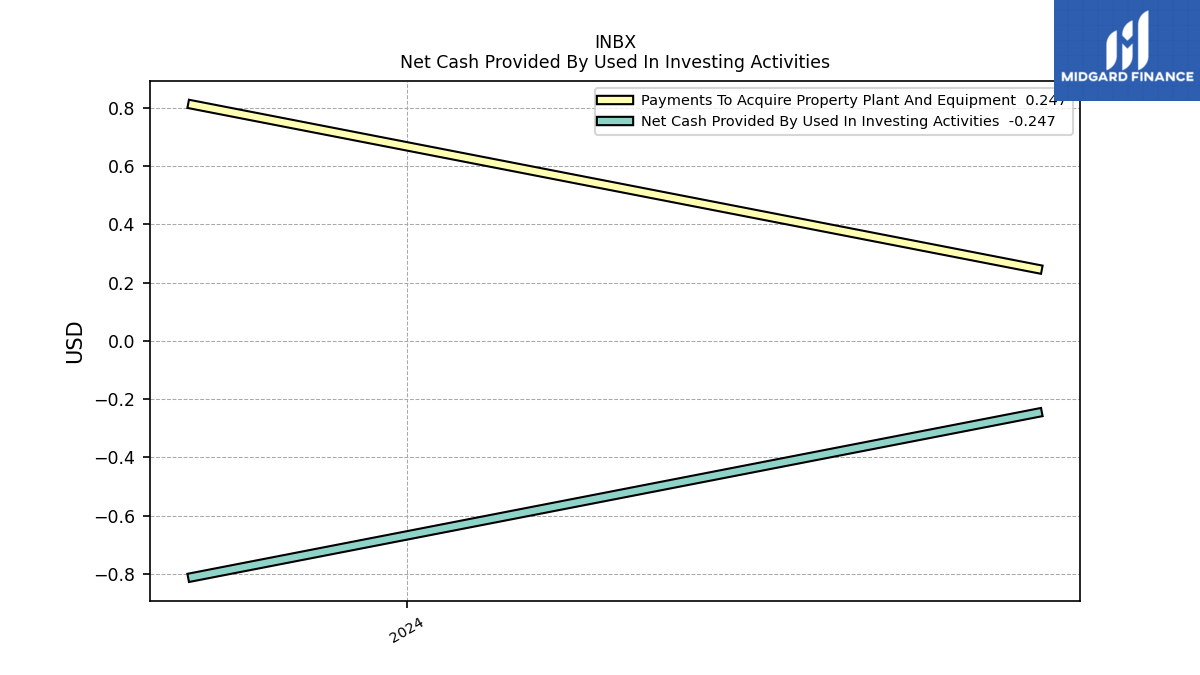
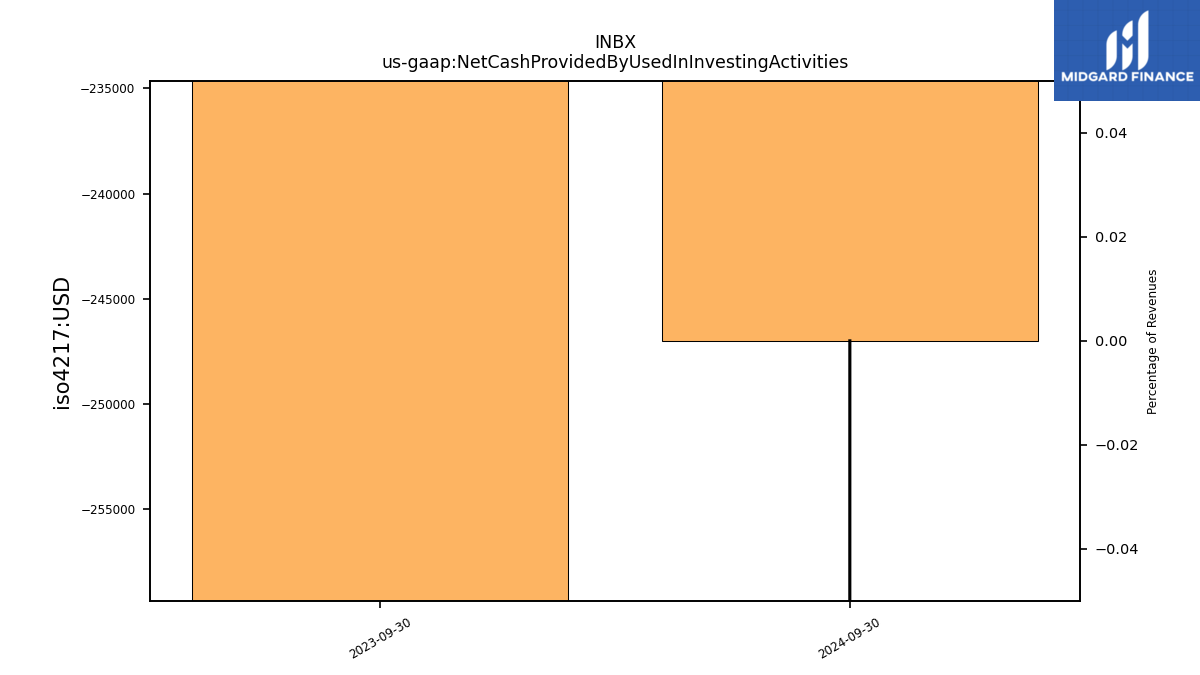
| Net Cash Provided By Used In Investing Activities | -0.81 | -0.32 | -0.02 | -0.27 | 0.02 | -0.32 | -0.12 | -0.27 | -0.17 | -0.36 | -0.01 | -0.61 | -0.30 | -0.36 | -0.09 | -0.34 | NA | |
| Net Cash Provided By Used In Financing Activities | 199.89 | 0.85 | 0.36 | 158.66 | 0.51 | 60.16 | 39.22 | 41.48 | 0.82 | 40.48 | 0.99 | 17.00 | 136.22 | 16.88 | -3.63 | -0.44 | NA |
| 2023-09-30 | 2023-06-30 | 2023-03-31 | 2022-12-31 | 2022-09-30 | 2022-06-30 | 2022-03-31 | 2021-12-31 | 2021-09-30 | 2021-06-30 | 2021-03-31 | 2020-12-31 | 2020-09-30 | 2020-06-30 | 2020-03-31 | 2019-12-31 | 2019-09-30 | ||
|---|---|---|---|---|---|---|---|---|---|---|---|---|---|---|---|---|---|---|
| Net Cash Provided By Used In Operating Activities | -54.24 | -42.30 | -39.94 | -30.60 | -30.84 | -26.92 | -26.94 | -22.62 | -13.68 | -22.38 | -21.65 | -15.39 | -13.88 | -11.31 | -7.39 | -11.94 | NA | |
| Net Income Loss | -51.79 | -47.05 | -48.92 | -40.91 | -35.33 | -37.73 | -31.25 | -21.19 | -20.58 | -20.71 | -19.29 | -17.65 | -20.50 | -17.89 | -20.09 | -16.30 | -20.16 | |
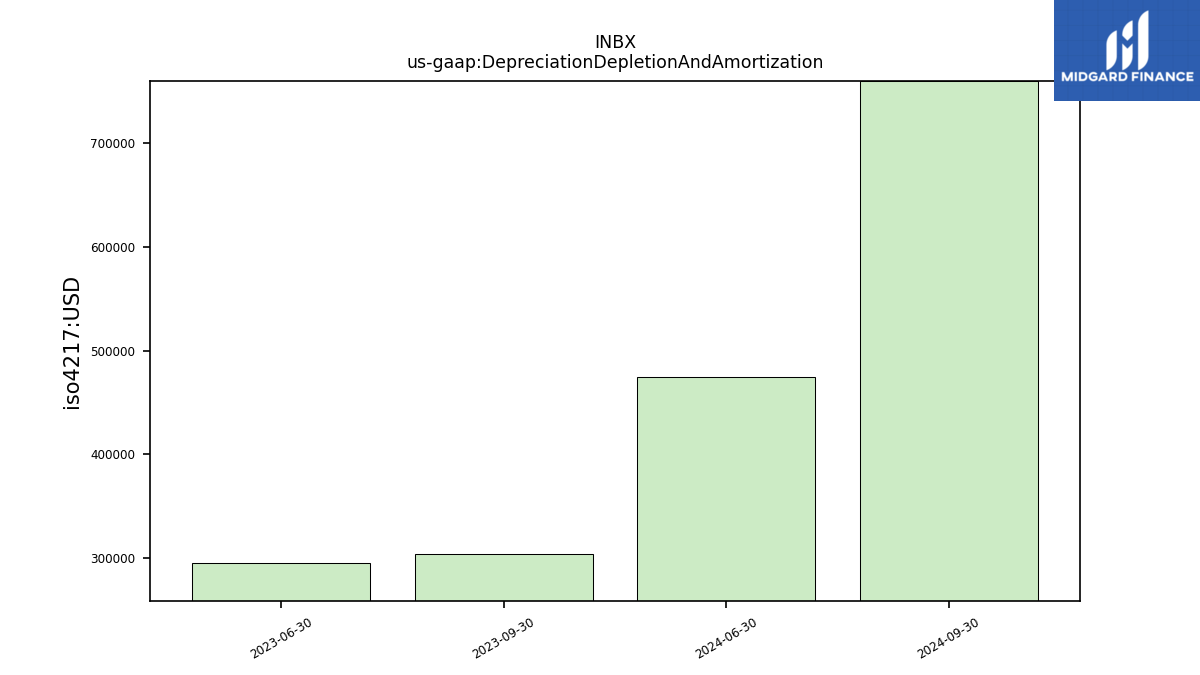
| Depreciation Depletion And Amortization | 0.30 | 0.30 | 0.29 | 0.30 | 0.30 | 0.30 | 0.31 | 0.31 | 0.30 | 0.30 | 0.29 | 0.27 | 0.30 | 0.20 | 0.26 | 0.24 | 0.50 | |
| Increase Decrease In Accounts Receivable | 0.00 | 0.02 | 0.06 | 0.00 | 0.00 | -0.13 | 0.00 | 0.13 | -0.10 | 0.18 | -0.05 | -0.60 | 0.68 | 0.01 | -0.20 | -2.17 | NA | |
| Increase Decrease In Accounts Payable | -1.59 | -1.54 | 2.33 | 0.02 | -0.94 | 1.47 | -1.26 | -3.41 | 2.34 | -4.23 | 0.66 | -1.18 | 5.93 | -0.63 | 6.30 | -0.46 | NA | |
| Share Based Compensation | 6.53 | 6.25 | 5.64 | 5.36 | 4.69 | 5.30 | 5.11 | 4.18 | 3.49 | 3.95 | 3.42 | 1.37 | 1.30 | 1.26 | 1.09 | 1.12 | NA |
| 2023-09-30 | 2023-06-30 | 2023-03-31 | 2022-12-31 | 2022-09-30 | 2022-06-30 | 2022-03-31 | 2021-12-31 | 2021-09-30 | 2021-06-30 | 2021-03-31 | 2020-12-31 | 2020-09-30 | 2020-06-30 | 2020-03-31 | 2019-12-31 | 2019-09-30 | ||
|---|---|---|---|---|---|---|---|---|---|---|---|---|---|---|---|---|---|---|
| Net Cash Provided By Used In Investing Activities | -0.81 | -0.32 | -0.02 | -0.27 | 0.02 | -0.32 | -0.12 | -0.27 | -0.17 | -0.36 | -0.01 | -0.61 | -0.30 | -0.36 | -0.09 | -0.34 | NA | |
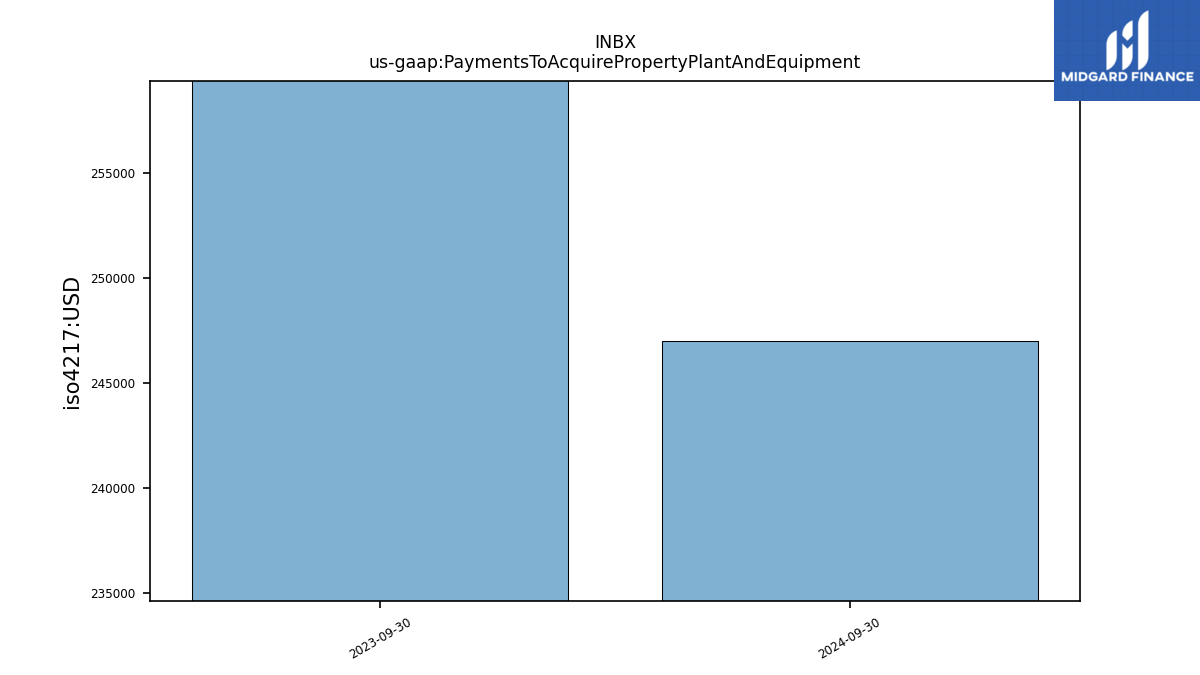
| Payments To Acquire Property Plant And Equipment | 0.81 | 0.32 | 0.02 | 0.27 | -0.02 | 0.32 | 0.12 | 0.27 | 0.17 | 0.41 | 0.01 | 0.61 | 0.30 | 0.36 | 0.09 | 0.34 | NA |
| 2023-09-30 | 2023-06-30 | 2023-03-31 | 2022-12-31 | 2022-09-30 | 2022-06-30 | 2022-03-31 | 2021-12-31 | 2021-09-30 | 2021-06-30 | 2021-03-31 | 2020-12-31 | 2020-09-30 | 2020-06-30 | 2020-03-31 | 2019-12-31 | 2019-09-30 | ||
|---|---|---|---|---|---|---|---|---|---|---|---|---|---|---|---|---|---|---|
| Net Cash Provided By Used In Financing Activities | 199.89 | 0.85 | 0.36 | 158.66 | 0.51 | 60.16 | 39.22 | 41.48 | 0.82 | 40.48 | 0.99 | 17.00 | 136.22 | 16.88 | -3.63 | -0.44 | NA |
| 2023-09-30 | 2023-06-30 | 2023-03-31 | 2022-12-31 | 2022-09-30 | 2022-06-30 | 2022-03-31 | 2021-12-31 | 2021-09-30 | 2021-06-30 | 2021-03-31 | 2020-12-31 | 2020-09-30 | 2020-06-30 | 2020-03-31 | 2019-12-31 | 2019-09-30 | ||
|---|---|---|---|---|---|---|---|---|---|---|---|---|---|---|---|---|---|---|
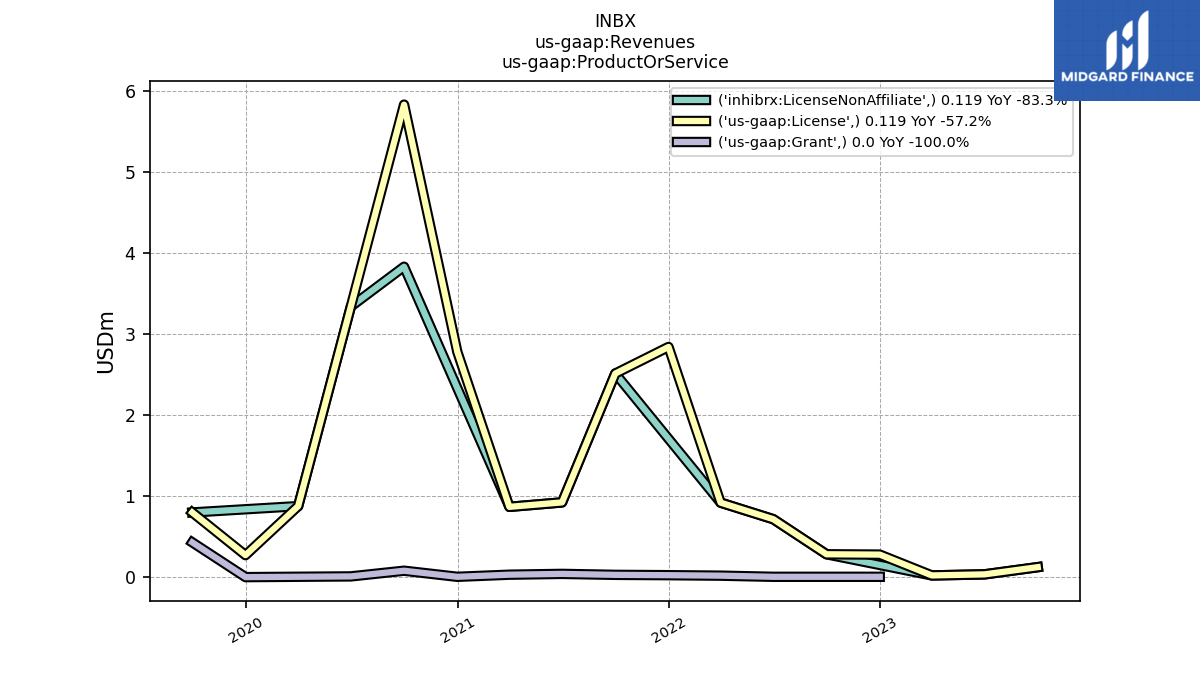
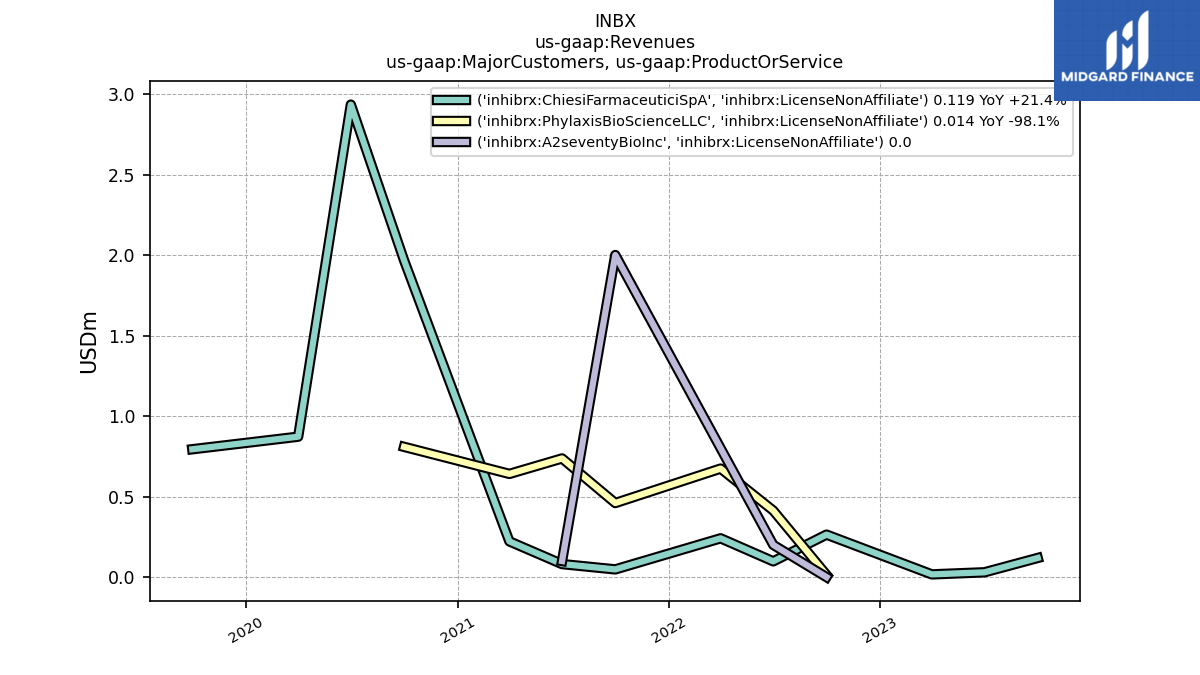
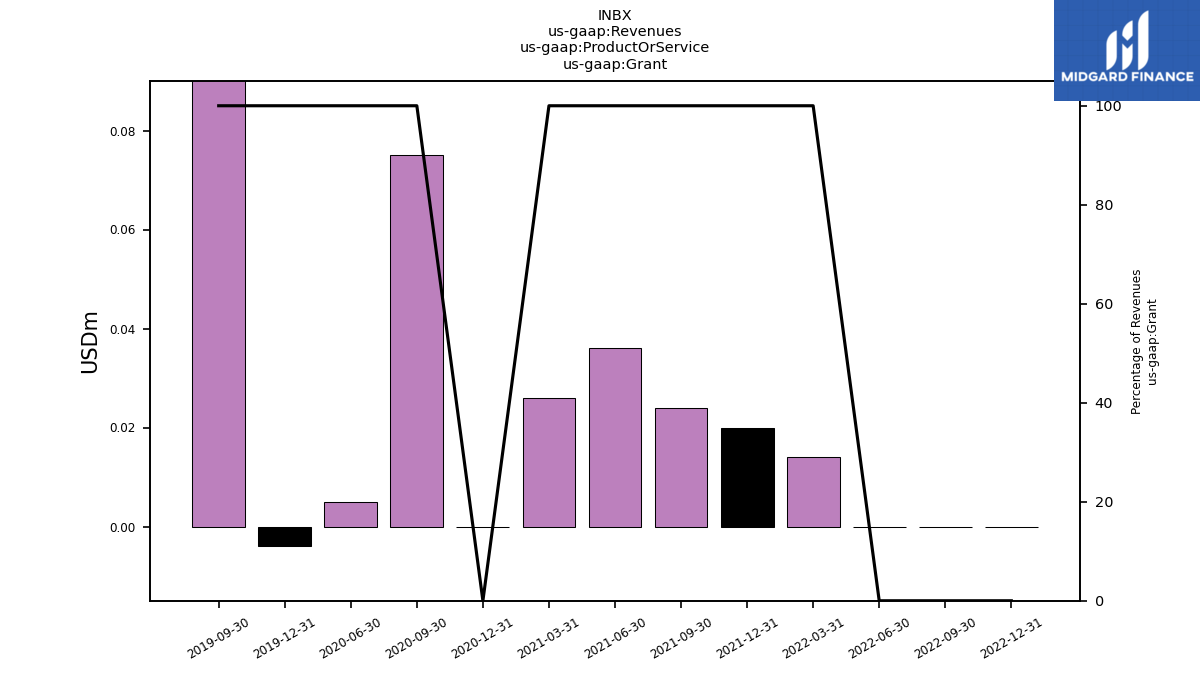
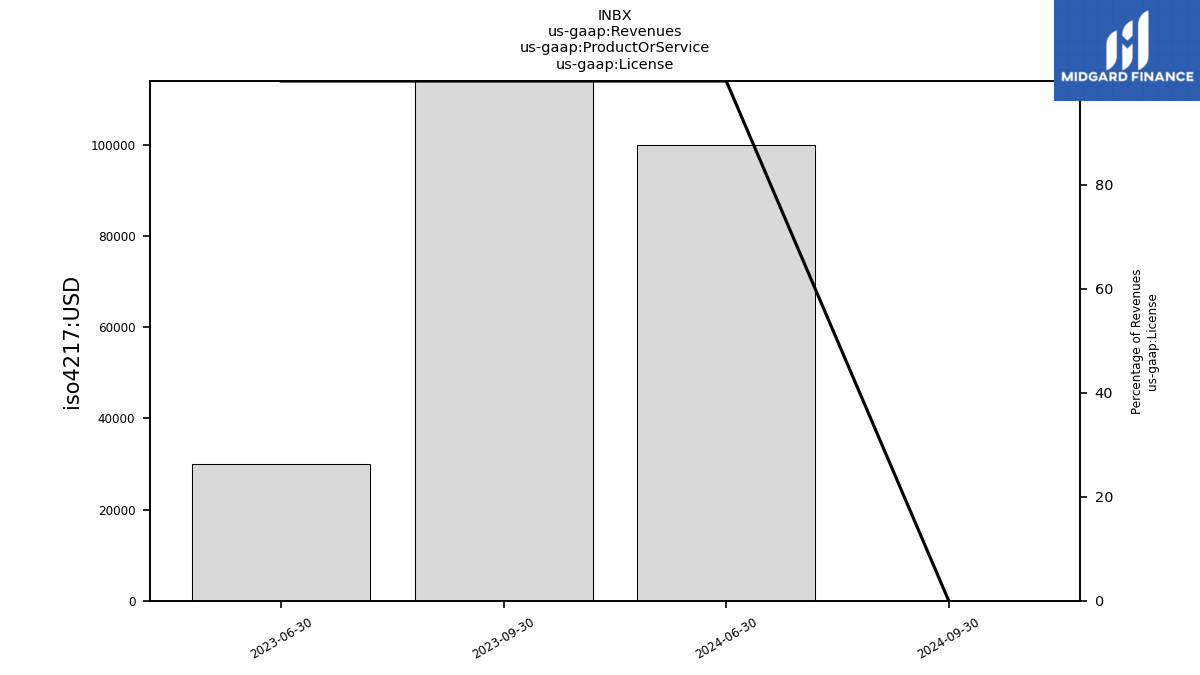
| Revenues | 0.12 | 0.03 | 0.02 | 0.27 | 0.28 | 0.71 | 0.93 | 2.86 | 2.53 | 0.95 | 0.89 | 2.78 | 5.90 | 3.34 | 0.87 | 0.26 | 1.22 | |
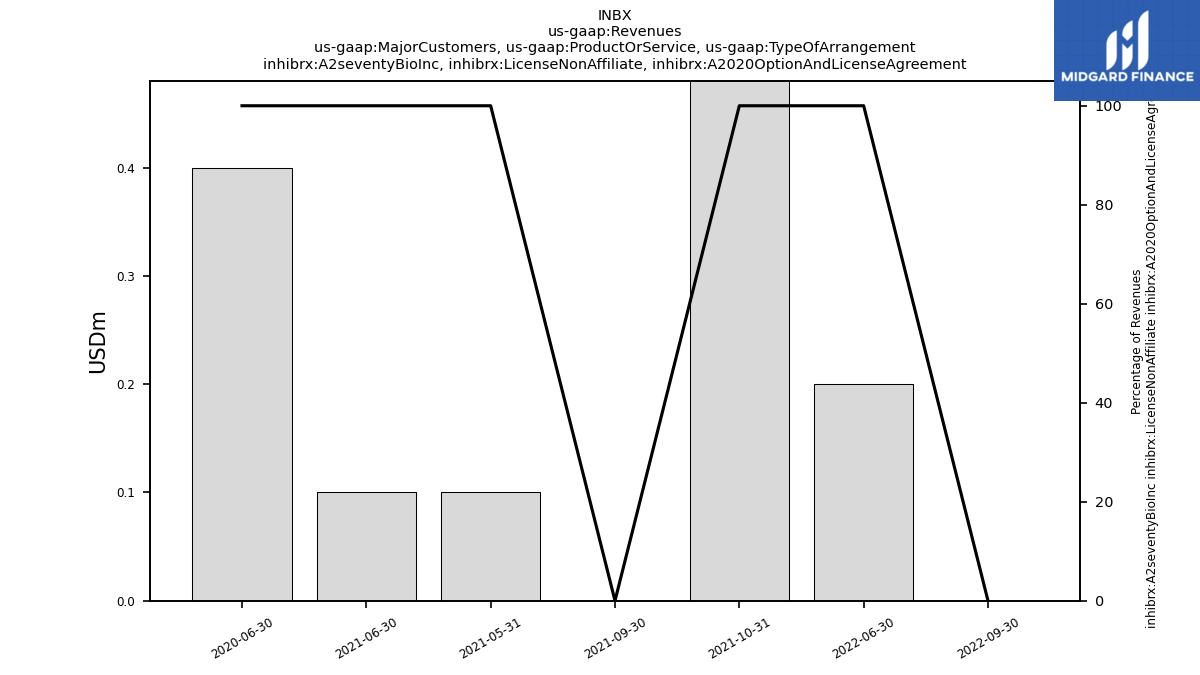
| A2seventy Bio Inc, License Non Affiliate | NA | NA | NA | NA | 0.00 | 0.20 | NA | NA | 2.00 | 0.10 | NA | NA | NA | NA | NA | NA | NA | |
| Chiesi Farmaceutici Sp A, License Non Affiliate | 0.12 | 0.03 | 0.02 | NA | 0.26 | 0.10 | 0.24 | NA | 0.05 | 0.08 | 0.22 | NA | 1.97 | 2.93 | 0.87 | NA | 0.79 | |
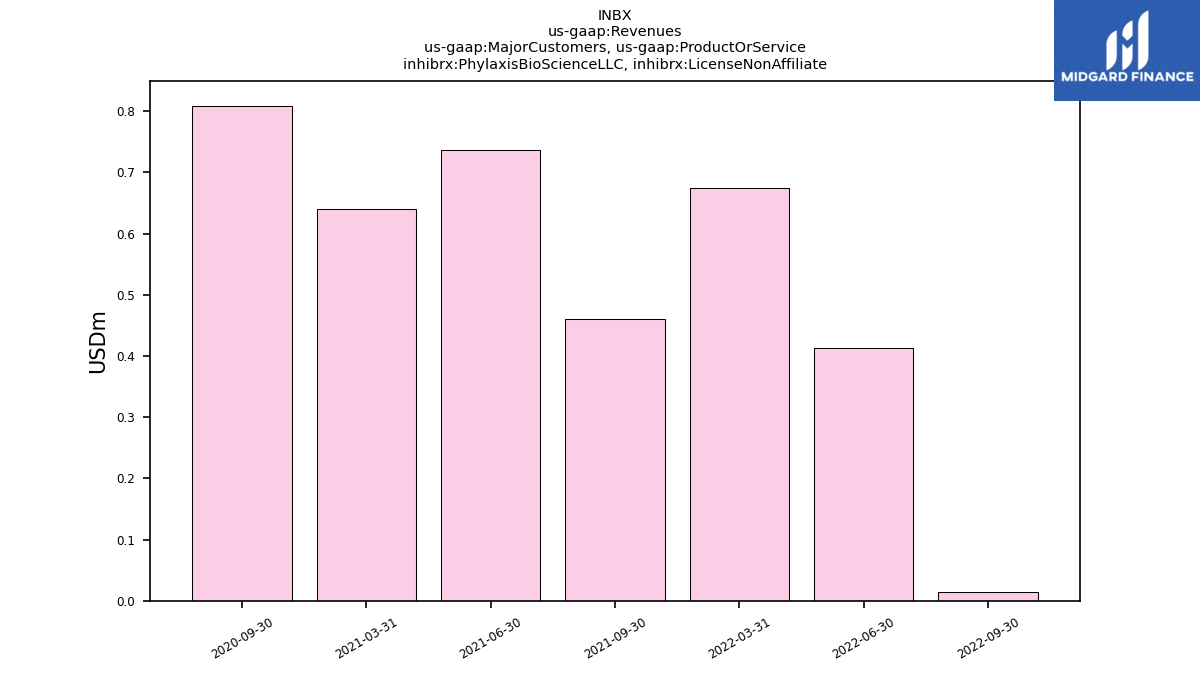
| Phylaxis Bio Science L L C, License Non Affiliate | NA | NA | NA | NA | 0.01 | 0.41 | 0.67 | NA | 0.46 | 0.74 | 0.64 | NA | 0.81 | NA | NA | NA | NA | |
| A2seventy Bio Inc, License Non Affiliate, A2020 Option And License Agreement | NA | NA | NA | NA | 0.00 | 0.20 | NA | NA | 0.00 | 0.10 | NA | NA | NA | 0.40 | NA | NA | NA | |
| License Non Affiliate | 0.12 | 0.03 | 0.02 | NA | 0.28 | 0.71 | 0.92 | NA | 2.51 | 0.92 | 0.86 | NA | 3.83 | 3.33 | 0.87 | NA | 0.79 | |
| Grant | NA | NA | NA | 0.00 | 0.00 | 0.00 | 0.01 | 0.02 | 0.02 | 0.04 | 0.03 | 0.00 | 0.07 | 0.01 | NA | -0.00 | 0.42 | |
| License | 0.12 | 0.03 | 0.02 | 0.27 | 0.28 | 0.71 | 0.92 | 2.84 | 2.51 | 0.92 | 0.86 | 2.78 | 5.83 | 3.33 | 0.87 | 0.27 | 0.79 |

