
| 2023-07-01 | 2023-04-01 | 2022-12-31 | 2022-09-24 | 2022-06-25 | 2022-03-26 | 2021-12-25 | 2021-09-25 | 2021-06-26 | 2021-03-27 | 2020-12-26 | 2020-09-26 | 2020-06-27 | 2020-03-28 | 2019-12-28 | 2019-09-28 | 2019-06-29 | 2019-03-30 | 2018-12-29 | 2018-09-29 | 2018-06-30 | 2018-03-31 | 2017-12-30 | 2017-09-30 | 2017-07-01 | 2017-04-01 | 2016-12-31 | 2016-09-24 | 2016-06-25 | 2016-03-26 | 2015-12-26 | 2015-09-26 | 2015-06-27 | 2015-03-28 | 2014-12-27 | 2014-09-27 | 2014-06-28 | 2014-03-29 | 2013-12-28 | 2013-09-28 | 2013-06-29 | 2013-03-30 | 2012-12-29 | 2012-09-29 | 2012-06-30 | 2012-03-31 | 2011-12-31 | 2011-09-24 | 2011-06-25 | 2011-03-26 | 2010-12-25 | 2010-09-25 | 2010-06-26 | ||
|---|---|---|---|---|---|---|---|---|---|---|---|---|---|---|---|---|---|---|---|---|---|---|---|---|---|---|---|---|---|---|---|---|---|---|---|---|---|---|---|---|---|---|---|---|---|---|---|---|---|---|---|---|---|---|
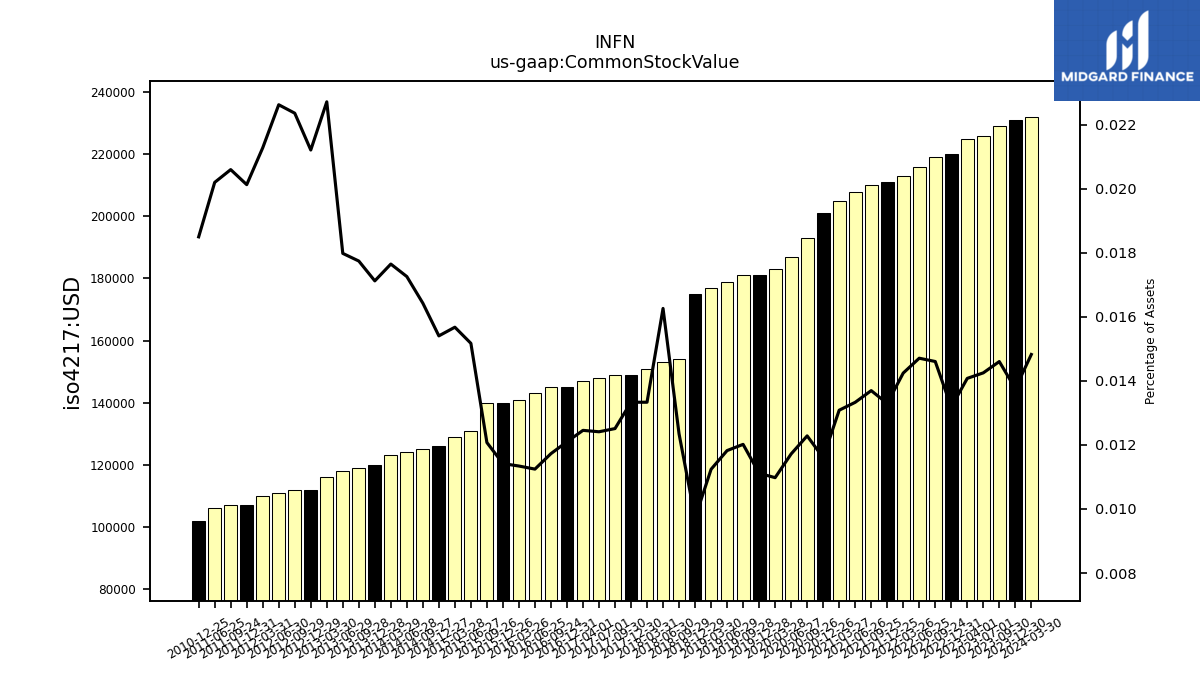
| Common Stock Value | 0.23 | 0.23 | 0.22 | 0.22 | 0.22 | 0.21 | 0.21 | 0.21 | 0.21 | 0.20 | 0.20 | 0.19 | 0.19 | 0.18 | 0.18 | 0.18 | 0.18 | 0.18 | 0.17 | 0.15 | 0.15 | 0.15 | 0.15 | 0.15 | 0.15 | 0.15 | 0.14 | 0.14 | 0.14 | 0.14 | 0.14 | 0.14 | 0.13 | 0.13 | 0.13 | 0.12 | 0.12 | 0.12 | 0.12 | 0.12 | 0.12 | 0.12 | 0.11 | 0.11 | 0.11 | 0.11 | 0.11 | 0.11 | 0.11 | NA | 0.10 | NA | NA | |
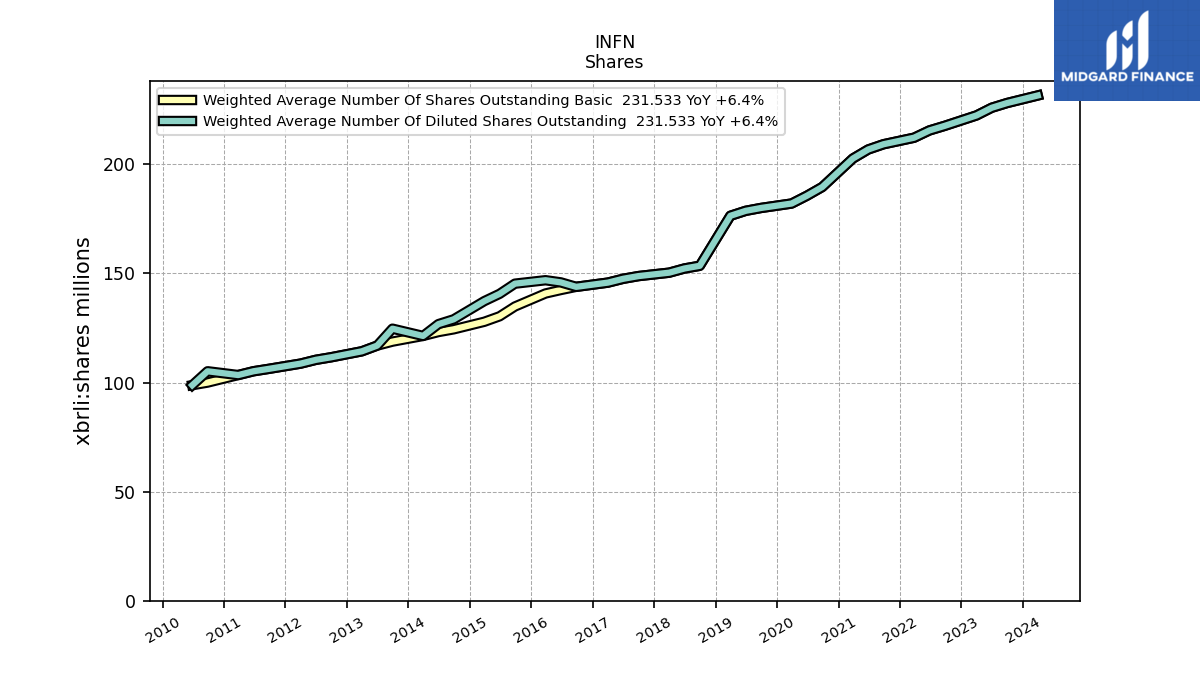
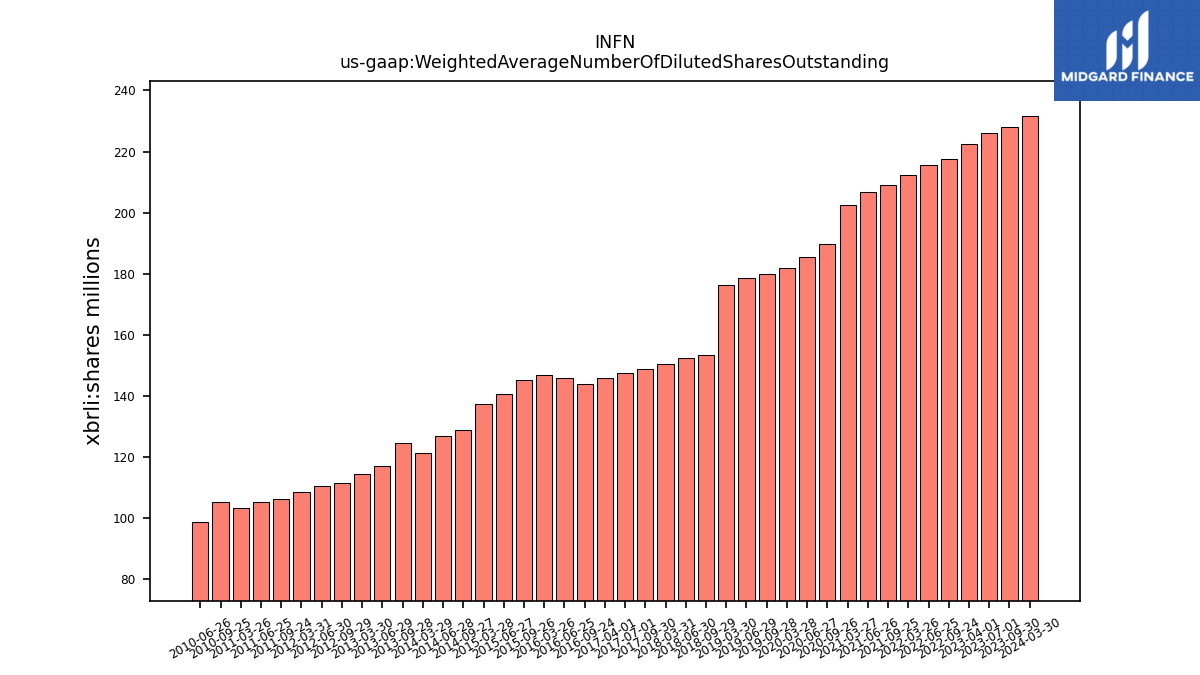
| Weighted Average Number Of Diluted Shares Outstanding | 225.92 | 222.39 | NA | 217.62 | 215.51 | 212.18 | NA | 209.18 | 206.78 | 202.64 | NA | 189.59 | 185.60 | 182.02 | NA | 179.99 | 178.68 | 176.41 | NA | 153.49 | 152.26 | 150.33 | NA | 148.78 | 147.54 | 145.79 | NA | 143.85 | 145.89 | 146.88 | NA | 145.30 | 140.64 | 137.30 | NA | 128.96 | 126.76 | 121.35 | NA | 124.68 | 116.91 | 114.31 | NA | 111.58 | 110.40 | 108.67 | NA | 106.26 | 105.17 | 103.43 | NA | 105.16 | 98.78 | |
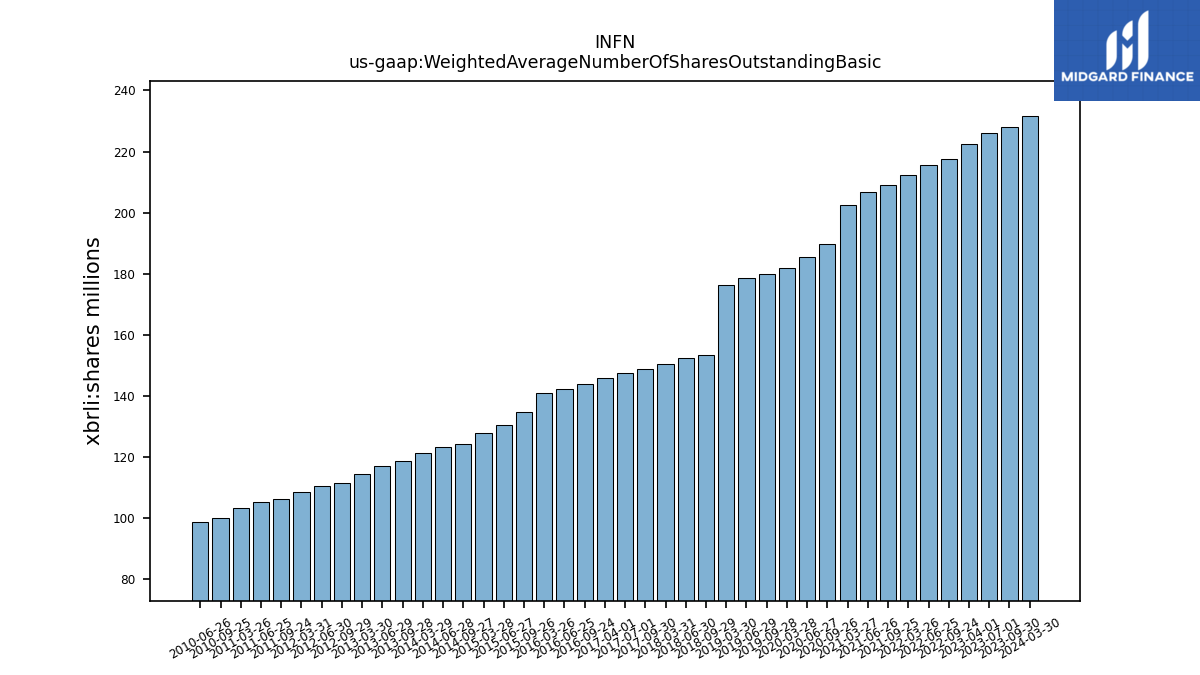
| Weighted Average Number Of Shares Outstanding Basic | 225.92 | 222.39 | NA | 217.62 | 215.51 | 212.18 | NA | 209.18 | 206.78 | 202.64 | NA | 189.59 | 185.60 | 182.02 | NA | 179.99 | 178.68 | 176.41 | NA | 153.49 | 152.26 | 150.33 | NA | 148.78 | 147.54 | 145.79 | NA | 143.85 | 142.40 | 140.81 | NA | 134.83 | 130.35 | 127.84 | NA | 124.38 | 123.13 | 121.35 | NA | 118.74 | 116.91 | 114.31 | NA | 111.58 | 110.40 | 108.67 | NA | 106.26 | 105.17 | 103.43 | NA | 99.98 | 98.78 | |
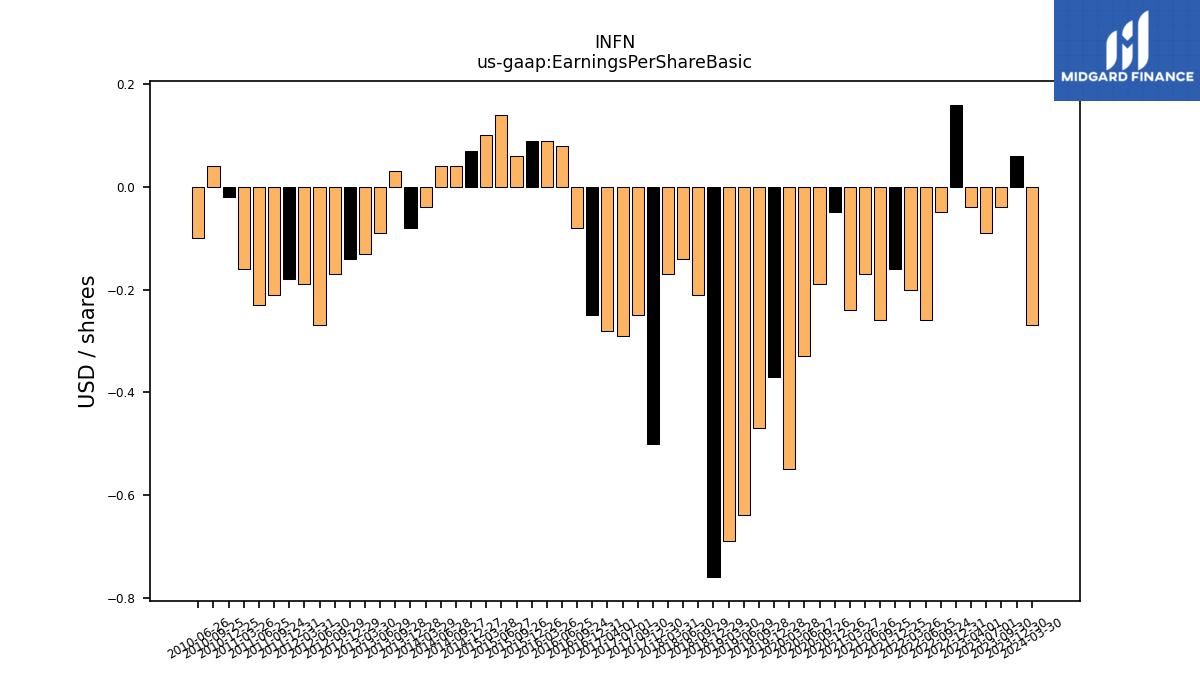
| Earnings Per Share Basic | -0.09 | -0.04 | 0.16 | -0.05 | -0.26 | -0.20 | -0.16 | -0.26 | -0.17 | -0.24 | -0.05 | -0.19 | -0.33 | -0.55 | -0.37 | -0.47 | -0.64 | -0.69 | -0.76 | -0.21 | -0.14 | -0.17 | -0.50 | -0.25 | -0.29 | -0.28 | -0.25 | -0.08 | 0.08 | 0.09 | 0.09 | 0.06 | 0.14 | 0.10 | 0.07 | 0.04 | 0.04 | -0.04 | -0.08 | 0.03 | -0.09 | -0.13 | -0.14 | -0.17 | -0.27 | -0.19 | -0.18 | -0.21 | -0.23 | -0.16 | -0.02 | 0.04 | -0.10 | |
| Earnings Per Share Diluted | -0.09 | -0.04 | 0.16 | -0.05 | -0.26 | -0.20 | -0.16 | -0.26 | -0.17 | -0.24 | -0.05 | -0.19 | -0.33 | -0.55 | -0.37 | -0.47 | -0.64 | -0.69 | -0.76 | -0.21 | -0.14 | -0.17 | -0.50 | -0.25 | -0.29 | -0.28 | -0.25 | -0.08 | 0.08 | 0.08 | 0.08 | 0.06 | 0.13 | 0.09 | 0.06 | 0.04 | 0.04 | -0.04 | -0.08 | 0.03 | -0.09 | -0.13 | -0.14 | -0.17 | -0.27 | -0.19 | -0.18 | -0.21 | -0.23 | -0.16 | -0.02 | 0.04 | -0.10 |
| 2023-07-01 | 2023-04-01 | 2022-12-31 | 2022-09-24 | 2022-06-25 | 2022-03-26 | 2021-12-25 | 2021-09-25 | 2021-06-26 | 2021-03-27 | 2020-12-26 | 2020-09-26 | 2020-06-27 | 2020-03-28 | 2019-12-28 | 2019-09-28 | 2019-06-29 | 2019-03-30 | 2018-12-29 | 2018-09-29 | 2018-06-30 | 2018-03-31 | 2017-12-30 | 2017-09-30 | 2017-07-01 | 2017-04-01 | 2016-12-31 | 2016-09-24 | 2016-06-25 | 2016-03-26 | 2015-12-26 | 2015-09-26 | 2015-06-27 | 2015-03-28 | 2014-12-27 | 2014-09-27 | 2014-06-28 | 2014-03-29 | 2013-12-28 | 2013-09-28 | 2013-06-29 | 2013-03-30 | 2012-12-29 | 2012-09-29 | 2012-06-30 | 2012-03-31 | 2011-12-31 | 2011-09-24 | 2011-06-25 | 2011-03-26 | 2010-12-25 | 2010-09-25 | 2010-06-26 | ||
|---|---|---|---|---|---|---|---|---|---|---|---|---|---|---|---|---|---|---|---|---|---|---|---|---|---|---|---|---|---|---|---|---|---|---|---|---|---|---|---|---|---|---|---|---|---|---|---|---|---|---|---|---|---|---|
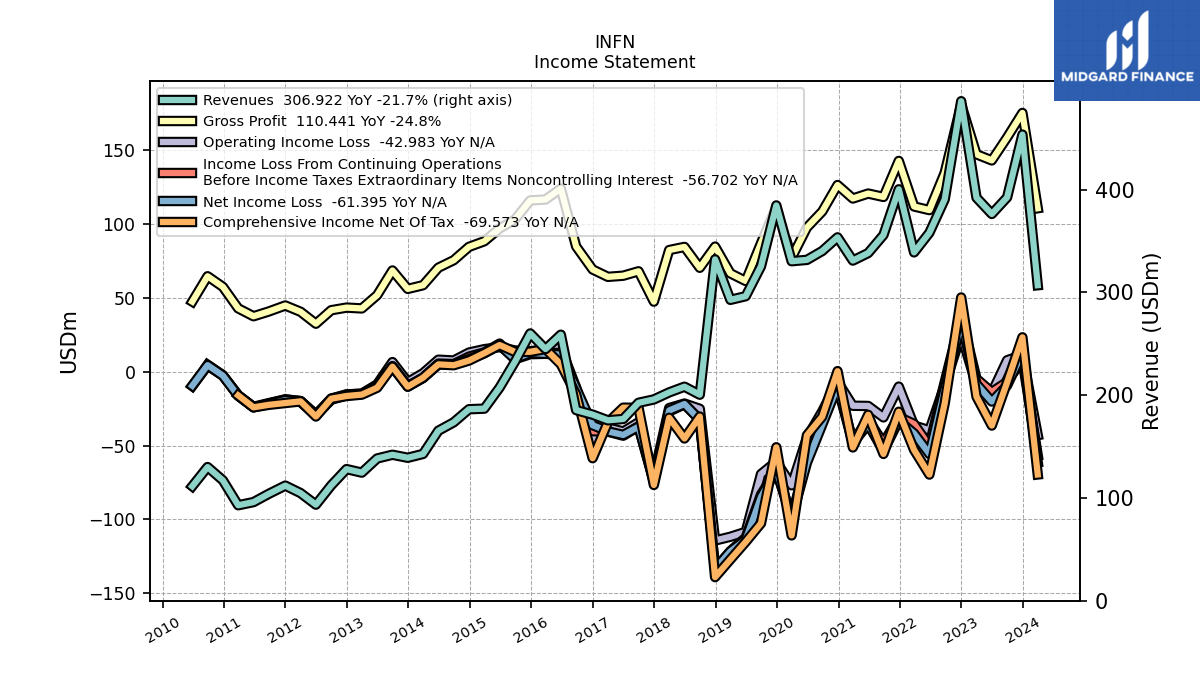
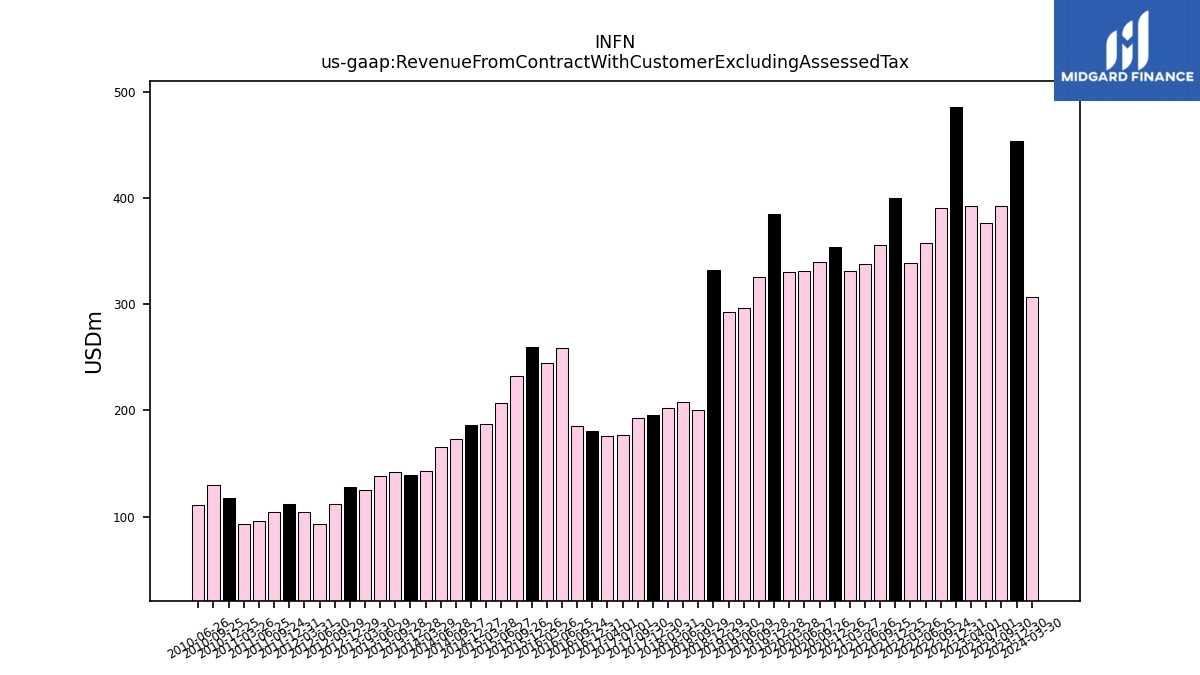
| Revenue From Contract With Customer Excluding Assessed Tax | 376.23 | 392.07 | 485.94 | 390.45 | 357.99 | 338.87 | 400.26 | 355.81 | 338.23 | 330.91 | 353.52 | 340.21 | 331.59 | 330.27 | 384.57 | 325.34 | 296.25 | 292.71 | 332.06 | 200.41 | 208.23 | 202.68 | 195.82 | 192.58 | 176.82 | 175.52 | 181.04 | 185.45 | 258.82 | 244.82 | 260.03 | 232.47 | 207.35 | 186.86 | 186.31 | 173.56 | 165.40 | 142.81 | 139.09 | 142.02 | 138.38 | 124.62 | 128.06 | 112.21 | 93.46 | 104.70 | 112.01 | 104.02 | 95.96 | 92.89 | 117.13 | 130.06 | 111.40 | |
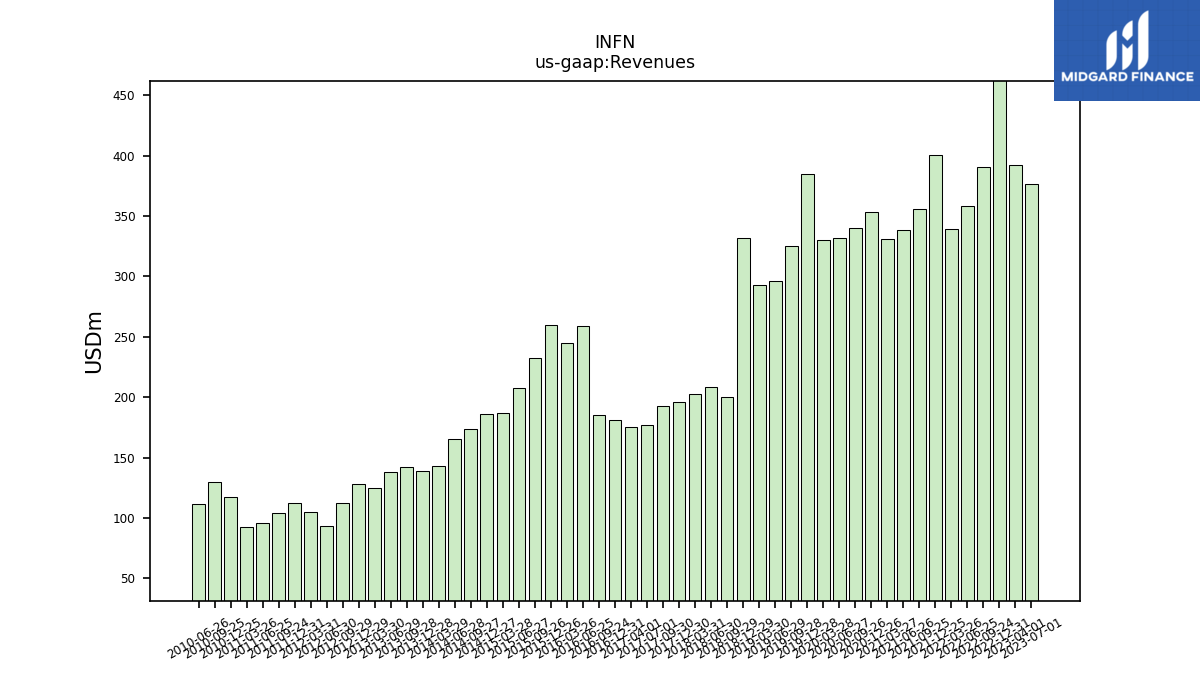
| Revenues | 376.23 | 392.07 | 485.94 | 390.45 | 357.99 | 338.87 | 400.26 | 355.81 | 338.23 | 330.91 | 353.52 | 340.21 | 331.59 | 330.27 | 384.57 | 325.34 | 296.25 | 292.71 | 332.06 | 200.41 | 208.23 | 202.68 | 195.82 | 192.58 | 176.82 | 175.52 | 181.04 | 185.45 | 258.82 | 244.82 | 260.03 | 232.47 | 207.35 | 186.86 | 186.31 | 173.56 | 165.40 | 142.81 | 139.09 | 142.02 | 138.38 | 124.62 | 128.06 | 112.21 | 93.46 | 104.70 | 112.01 | 104.02 | 95.96 | 92.89 | 117.13 | 130.06 | 111.40 | |
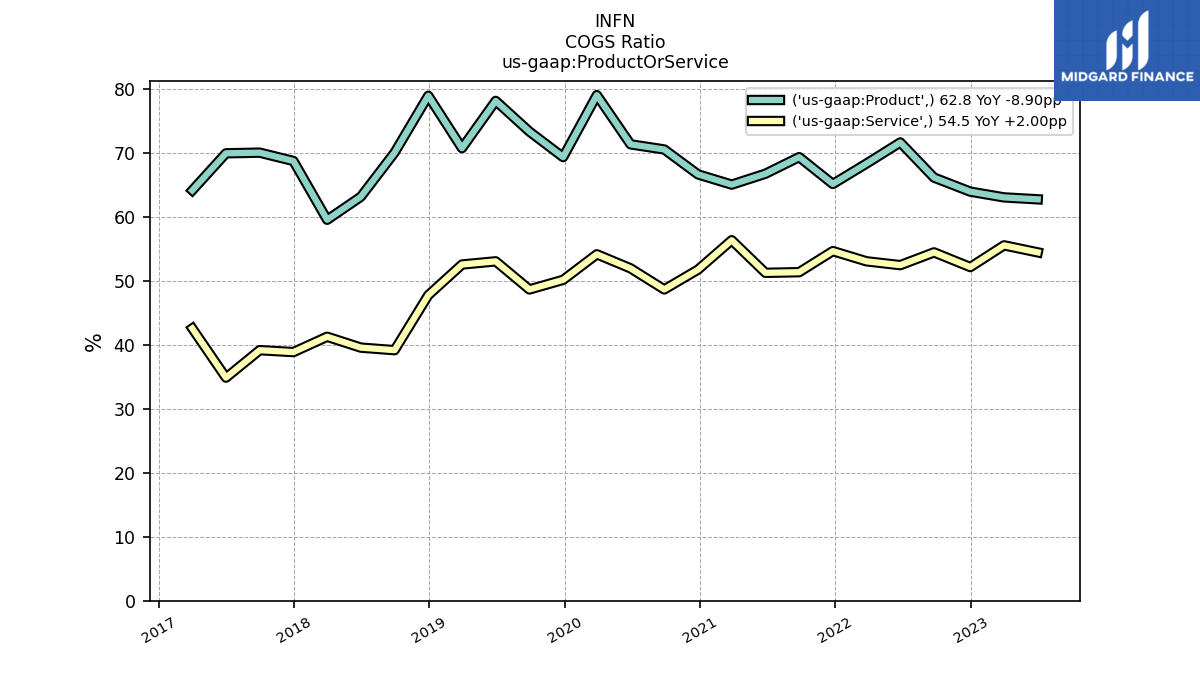
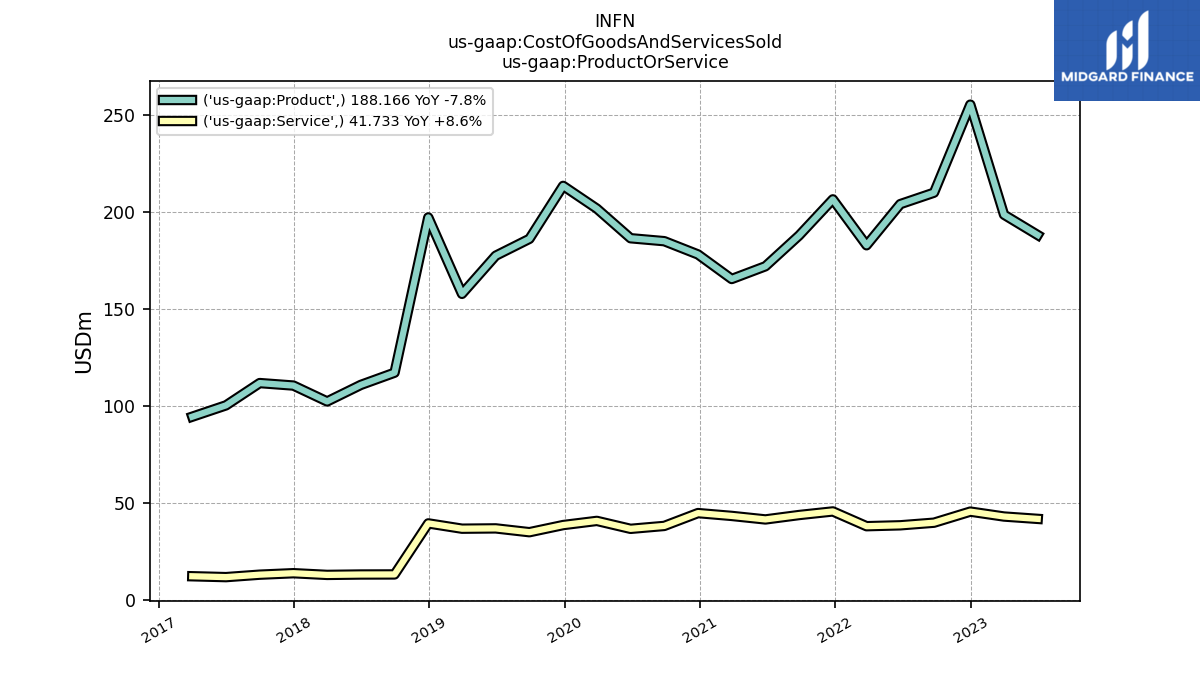
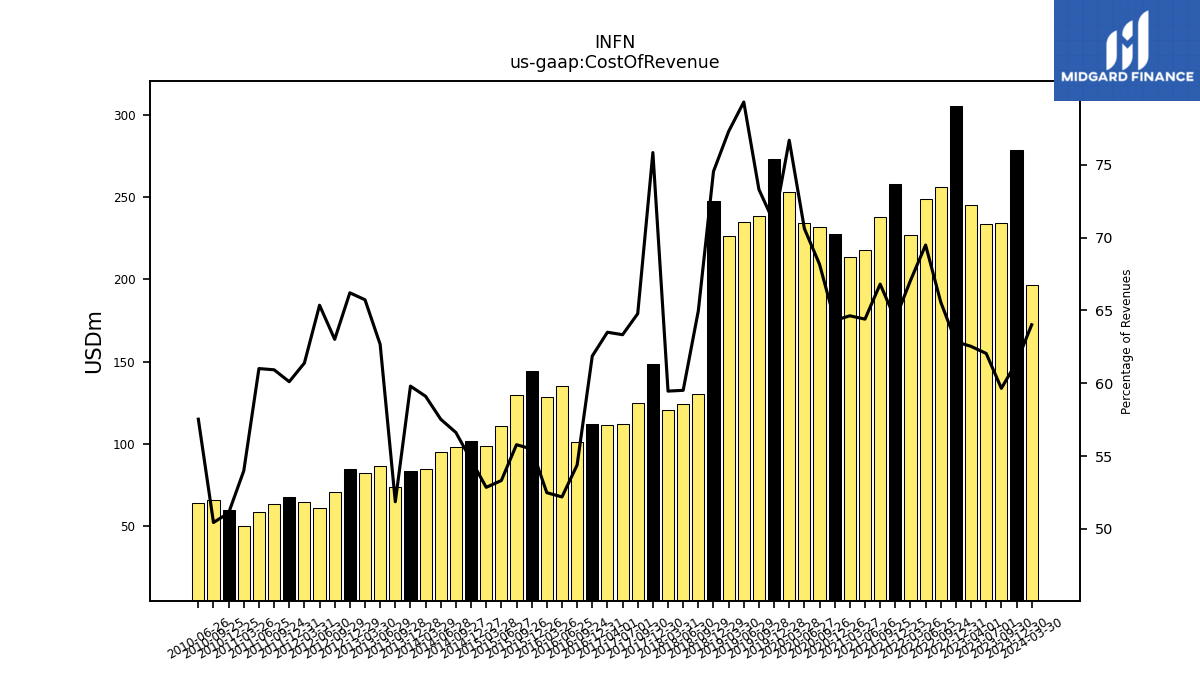
| Cost Of Revenue | 233.44 | 245.18 | 305.42 | 256.03 | 248.78 | 227.23 | 257.79 | 237.72 | 217.84 | 213.88 | 227.38 | 231.94 | 234.18 | 253.31 | 273.16 | 238.51 | 234.99 | 226.28 | 247.56 | 130.23 | 123.92 | 120.51 | 148.53 | 124.75 | 111.99 | 111.47 | 112.01 | 100.85 | 135.08 | 128.48 | 144.27 | 129.67 | 110.55 | 98.75 | 101.96 | 98.26 | 95.15 | 84.41 | 83.18 | 73.65 | 86.73 | 81.92 | 84.80 | 70.71 | 61.08 | 64.27 | 67.33 | 63.37 | 58.54 | 50.15 | 59.84 | 65.59 | 64.09 | |
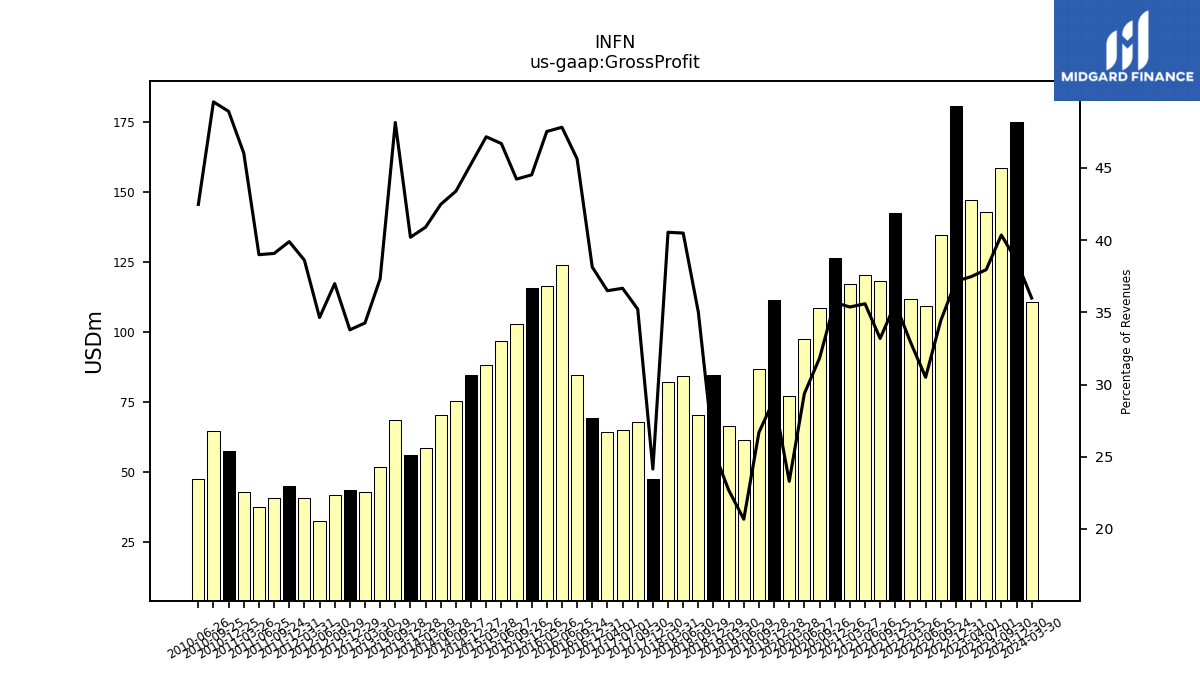
| Gross Profit | 142.79 | 146.90 | 180.51 | 134.41 | 109.20 | 111.65 | 142.47 | 118.09 | 120.38 | 117.03 | 126.14 | 108.28 | 97.41 | 76.97 | 111.41 | 86.83 | 61.26 | 66.43 | 84.50 | 70.18 | 84.31 | 82.17 | 47.29 | 67.83 | 64.83 | 64.06 | 69.03 | 84.60 | 123.75 | 116.34 | 115.76 | 102.81 | 96.80 | 88.11 | 84.34 | 75.30 | 70.25 | 58.41 | 55.91 | 68.37 | 51.65 | 42.70 | 43.27 | 41.50 | 32.37 | 40.43 | 44.68 | 40.65 | 37.41 | 42.74 | 57.29 | 64.47 | 47.31 | |
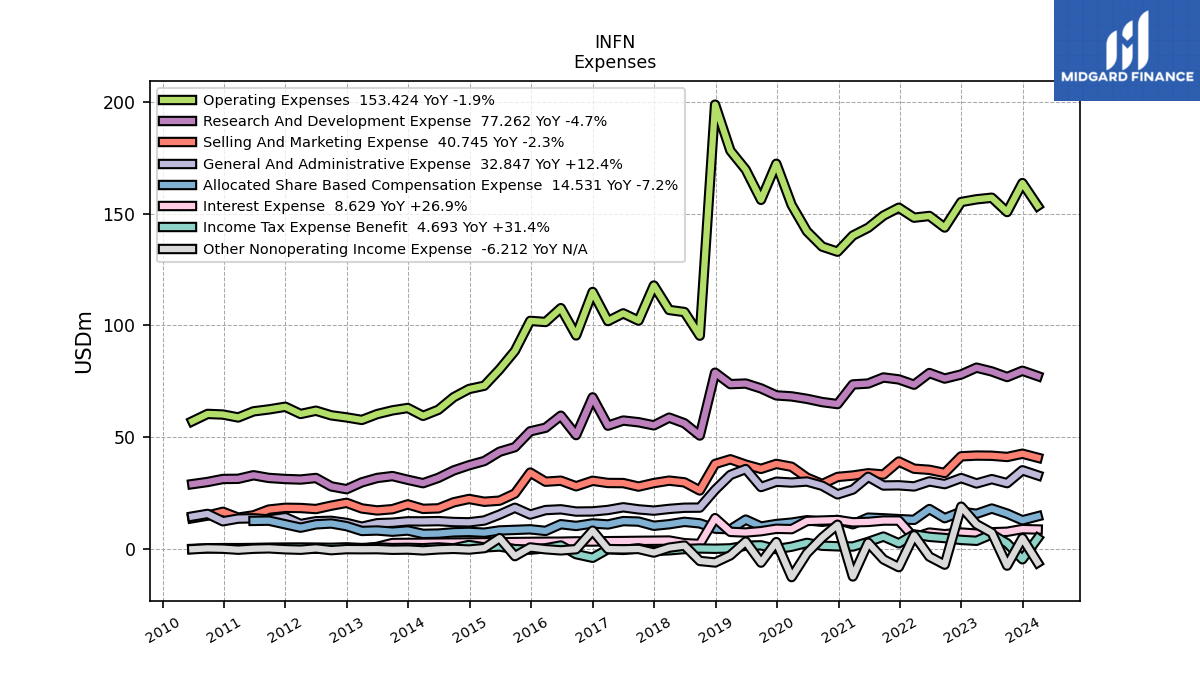
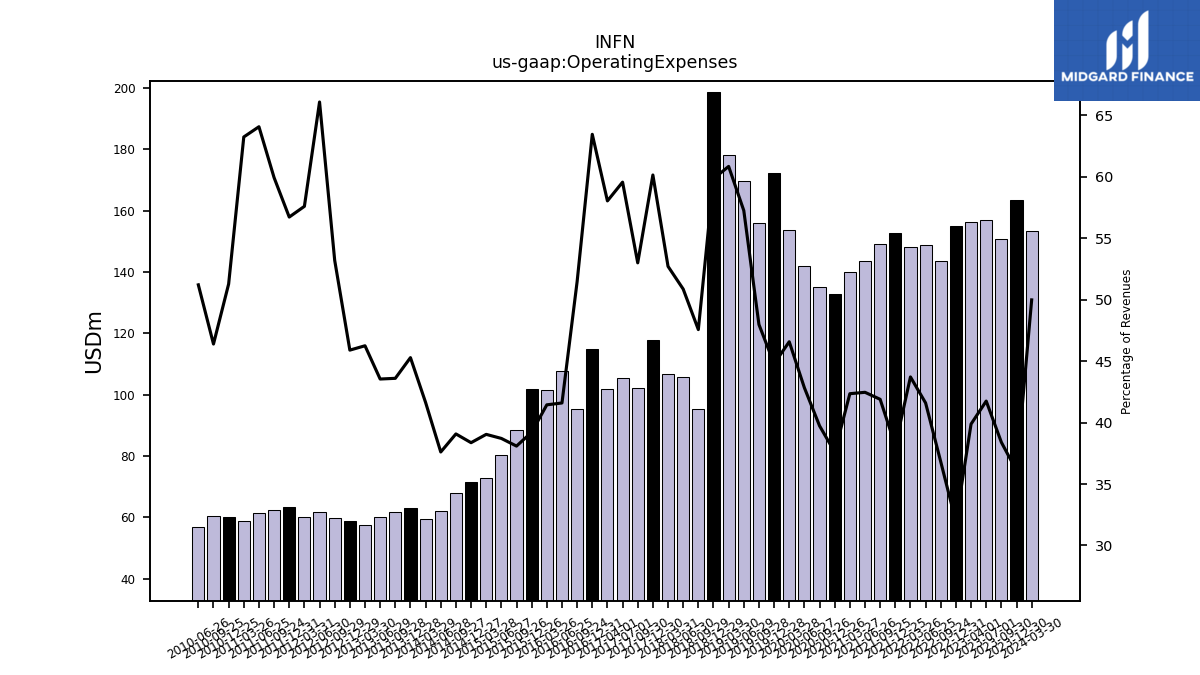
| Operating Expenses | 157.08 | 156.36 | 155.16 | 143.72 | 148.91 | 148.14 | 152.61 | 149.07 | 143.63 | 140.15 | 132.92 | 135.19 | 142.03 | 153.85 | 172.28 | 156.12 | 169.64 | 178.12 | 198.73 | 95.34 | 105.92 | 106.85 | 117.79 | 102.07 | 105.34 | 101.88 | 114.90 | 95.46 | 107.66 | 101.47 | 101.97 | 88.55 | 80.27 | 72.95 | 71.48 | 67.82 | 62.20 | 59.46 | 62.99 | 61.93 | 60.26 | 57.64 | 58.78 | 59.70 | 61.77 | 60.31 | 63.54 | 62.35 | 61.49 | 58.75 | 60.07 | 60.34 | 57.05 | |
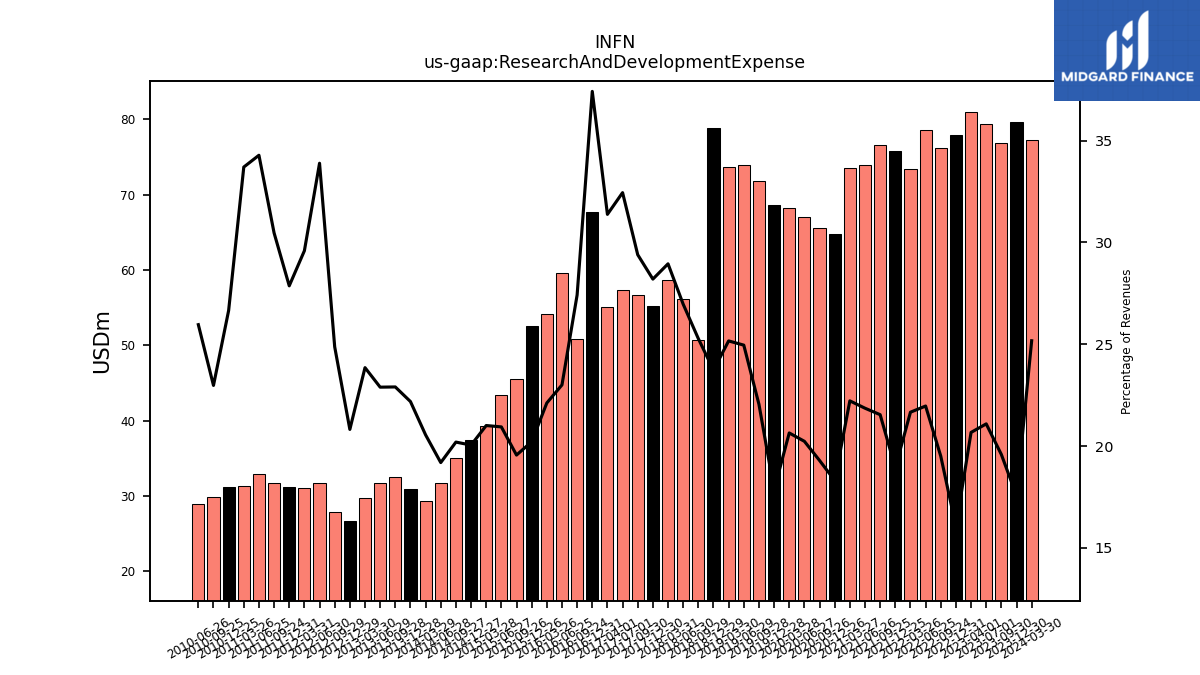
| Research And Development Expense | 79.35 | 81.04 | 77.99 | 76.16 | 78.64 | 73.41 | 75.78 | 76.65 | 73.93 | 73.53 | 64.73 | 65.64 | 67.09 | 68.18 | 68.63 | 71.75 | 73.94 | 73.66 | 78.81 | 50.66 | 56.16 | 58.68 | 55.22 | 56.62 | 57.38 | 55.08 | 67.75 | 50.85 | 59.54 | 54.15 | 52.56 | 45.47 | 43.42 | 39.26 | 37.35 | 35.05 | 31.74 | 29.35 | 30.86 | 32.53 | 31.68 | 29.73 | 26.66 | 27.91 | 31.68 | 30.98 | 31.22 | 31.69 | 32.90 | 31.31 | 31.23 | 29.89 | 28.92 | |
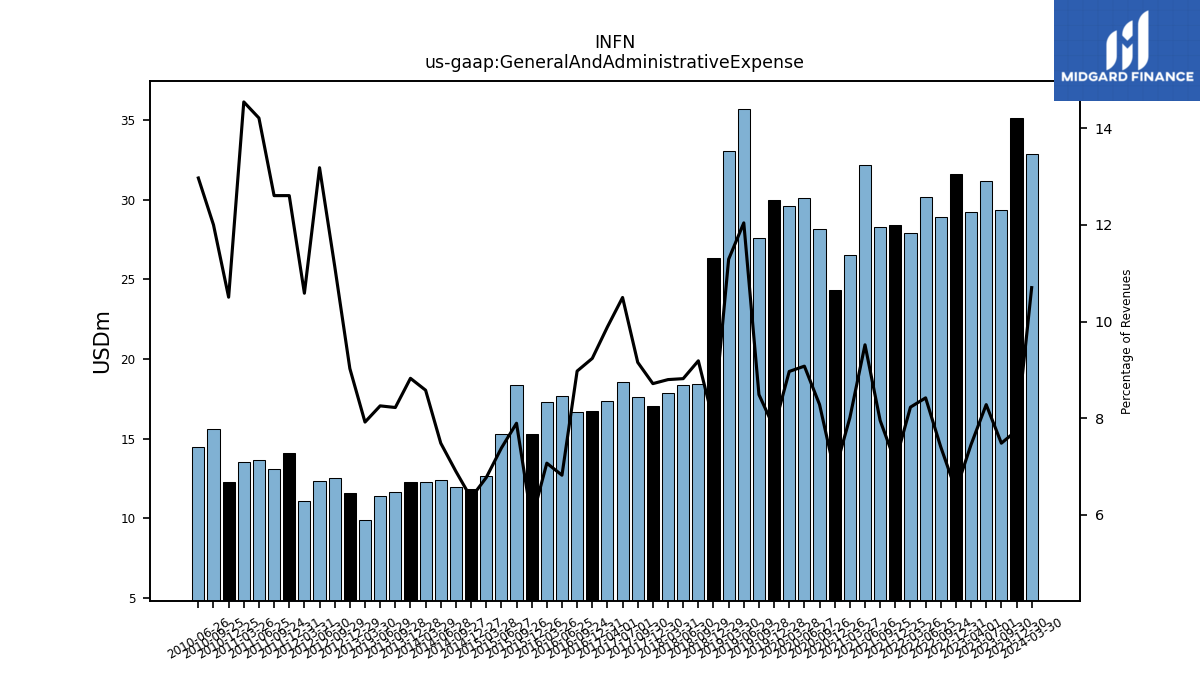
| General And Administrative Expense | 31.16 | 29.23 | 31.64 | 28.92 | 30.15 | 27.89 | 28.41 | 28.30 | 32.20 | 26.51 | 24.34 | 28.18 | 30.10 | 29.62 | 30.01 | 27.62 | 35.67 | 33.04 | 26.34 | 18.41 | 18.36 | 17.84 | 17.07 | 17.63 | 18.56 | 17.36 | 16.73 | 16.65 | 17.66 | 17.31 | 15.32 | 18.36 | 15.31 | 12.66 | 11.84 | 11.98 | 12.38 | 12.25 | 12.28 | 11.68 | 11.43 | 9.87 | 11.56 | 12.51 | 12.32 | 11.08 | 14.12 | 13.11 | 13.63 | 13.51 | 12.30 | 15.61 | 14.45 | |
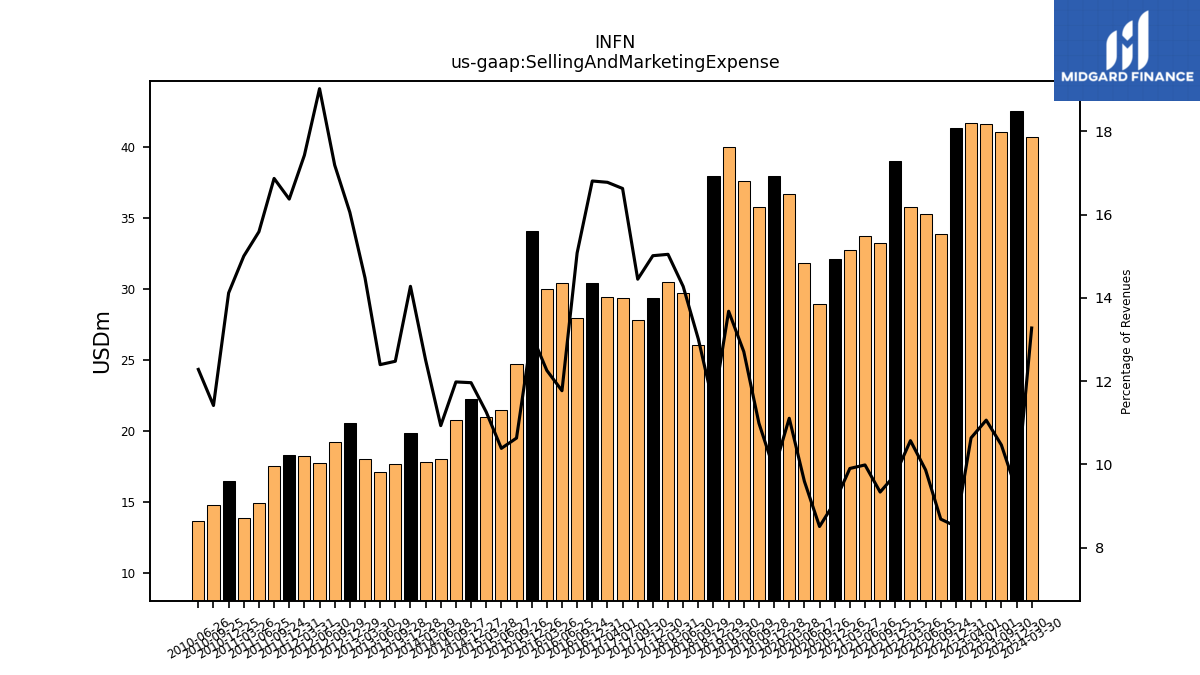
| Selling And Marketing Expense | 41.62 | 41.71 | 41.37 | 33.92 | 35.33 | 35.82 | 39.05 | 33.22 | 33.78 | 32.77 | 32.15 | 28.95 | 31.82 | 36.69 | 37.98 | 35.76 | 37.65 | 40.04 | 37.95 | 26.07 | 29.72 | 30.49 | 29.39 | 27.82 | 29.40 | 29.44 | 30.42 | 27.96 | 30.46 | 30.01 | 34.10 | 24.72 | 21.54 | 21.04 | 22.29 | 20.79 | 18.08 | 17.86 | 19.86 | 17.72 | 17.16 | 18.05 | 20.56 | 19.29 | 17.78 | 18.24 | 18.34 | 17.55 | 14.96 | 13.94 | 16.54 | 14.85 | 13.68 | |
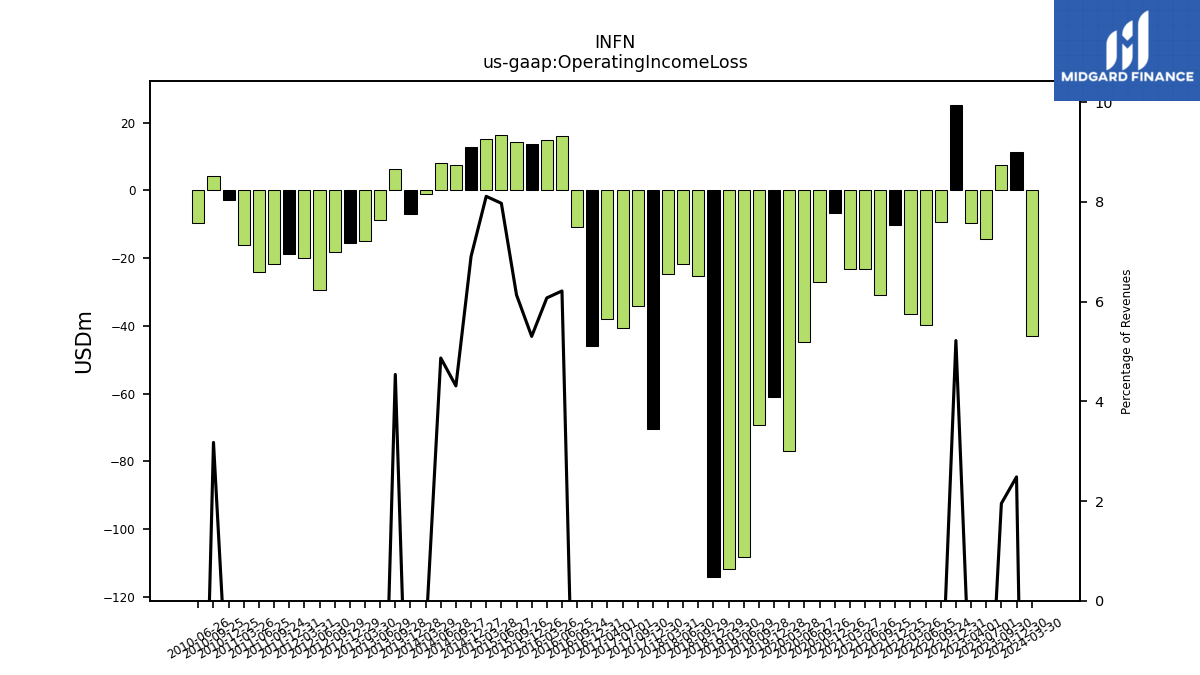
| Operating Income Loss | -14.29 | -9.46 | 25.36 | -9.31 | -39.71 | -36.49 | -10.14 | -30.98 | -23.25 | -23.11 | -6.78 | -26.92 | -44.63 | -76.88 | -60.87 | -69.29 | -108.38 | -111.69 | -114.22 | -25.16 | -21.62 | -24.68 | -70.51 | -34.25 | -40.51 | -37.83 | -45.87 | -10.86 | 16.08 | 14.87 | 13.79 | 14.26 | 16.53 | 15.16 | 12.87 | 7.48 | 8.05 | -1.06 | -7.08 | 6.45 | -8.61 | -14.94 | -15.51 | -18.20 | -29.40 | -19.88 | -18.86 | -21.70 | -24.08 | -16.01 | -2.78 | 4.13 | -9.74 | |
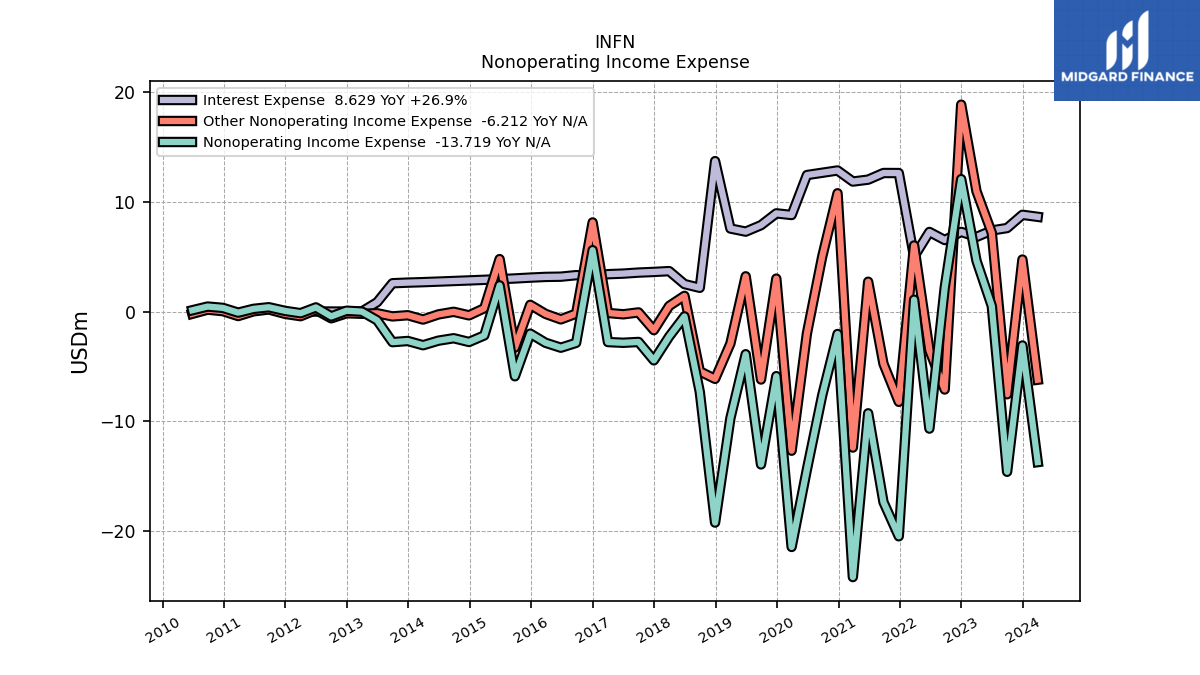
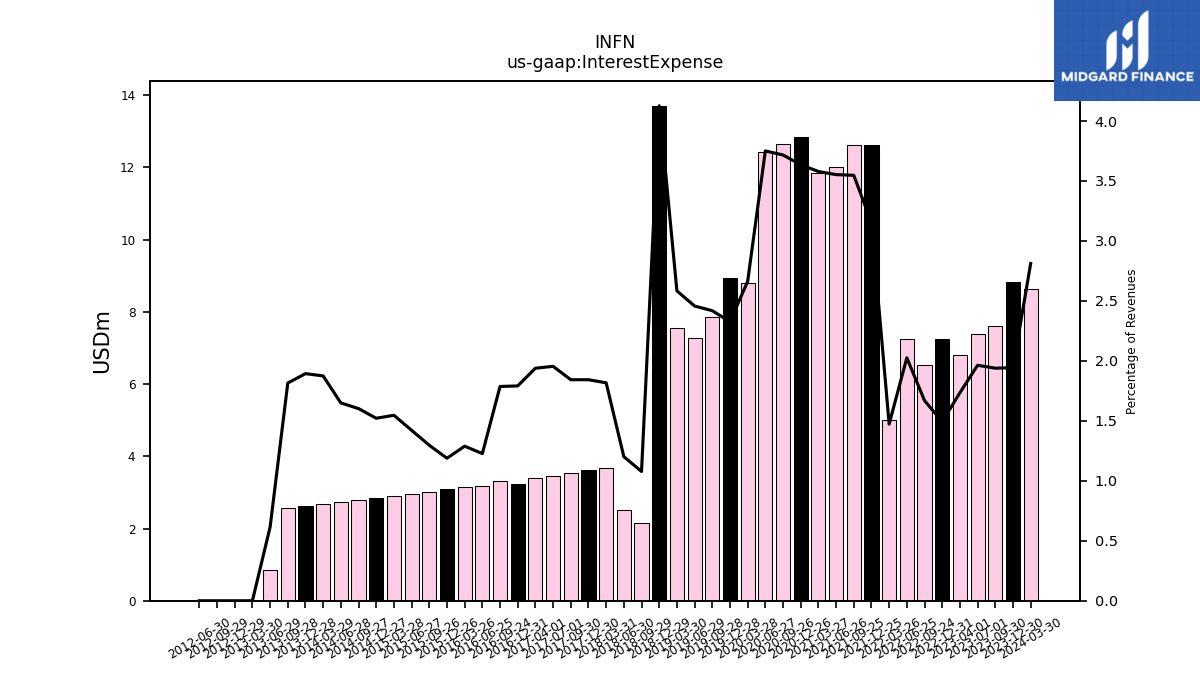
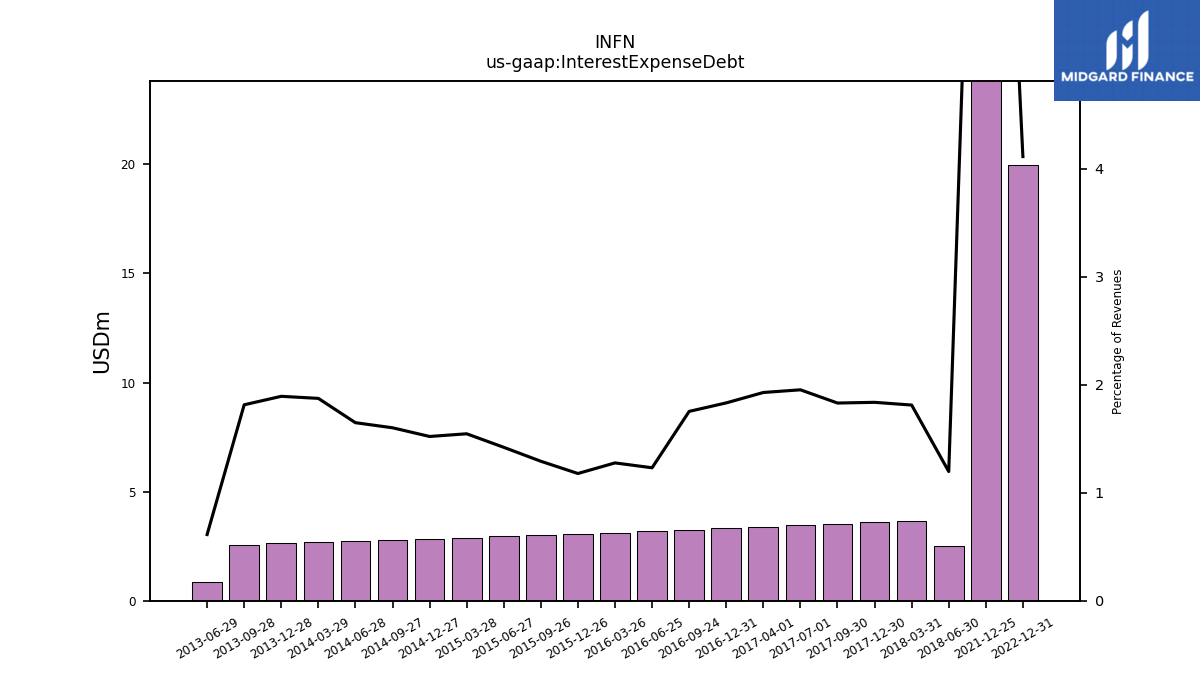
| Interest Expense | 7.39 | 6.80 | 7.25 | 6.52 | 7.25 | 4.99 | 12.62 | 12.62 | 12.02 | 11.84 | 12.85 | 12.64 | 12.44 | 8.79 | 8.95 | 7.87 | 7.28 | 7.56 | 13.71 | 2.16 | 2.50 | 3.68 | 3.61 | 3.55 | 3.46 | 3.40 | 3.24 | 3.31 | 3.18 | 3.15 | 3.09 | 3.01 | 2.95 | 2.89 | 2.83 | 2.78 | 2.73 | 2.68 | 2.63 | 2.58 | 0.85 | 0.00 | 0.00 | 0.00 | 0.00 | NA | NA | NA | NA | NA | NA | NA | NA | |
| Interest Expense Debt | NA | NA | 19.99 | NA | NA | NA | 44.86 | NA | NA | NA | NA | NA | NA | NA | NA | NA | NA | NA | NA | NA | 2.49 | 3.67 | 3.60 | 3.53 | 3.46 | 3.39 | 3.32 | 3.25 | 3.19 | 3.13 | 3.06 | 3.00 | 2.95 | 2.89 | 2.83 | 2.78 | 2.73 | 2.68 | 2.63 | 2.58 | 0.85 | NA | NA | NA | NA | NA | NA | NA | NA | NA | NA | NA | NA | |
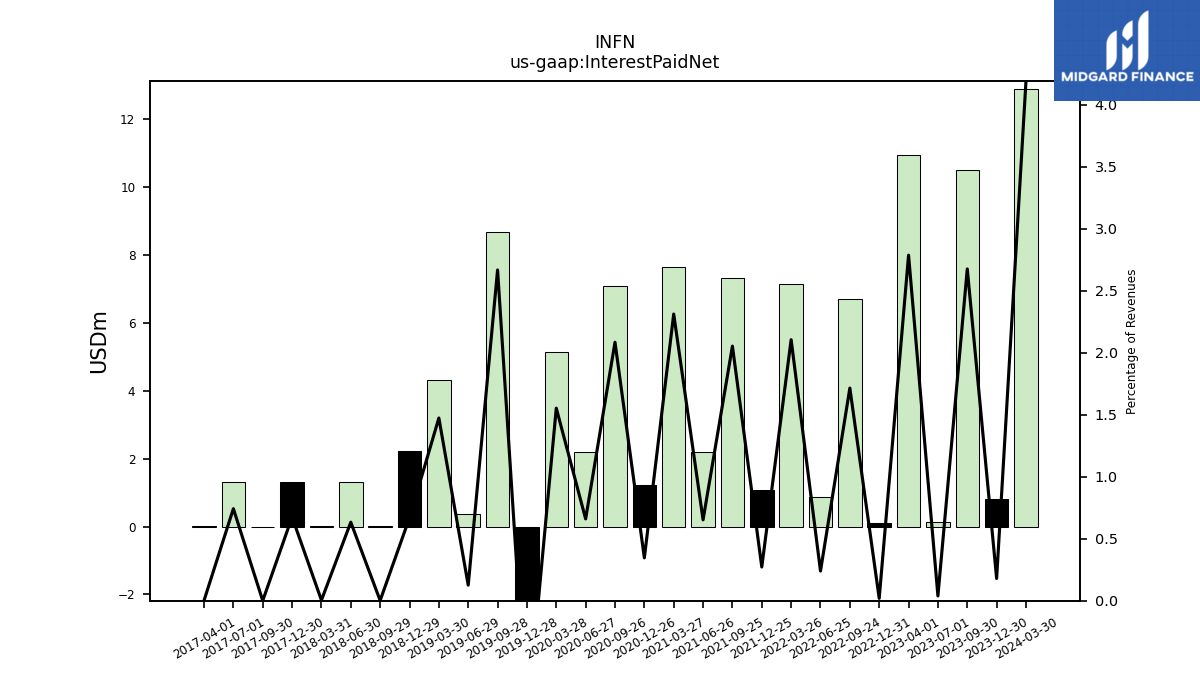
| Interest Paid Net | 0.14 | 10.93 | 0.09 | 6.70 | 0.86 | 7.14 | 1.09 | 7.31 | 2.21 | 7.65 | 1.22 | 7.09 | 2.19 | 5.13 | -3.81 | 8.68 | 0.37 | 4.32 | 2.22 | 0.00 | 1.32 | 0.01 | 1.32 | 0.00 | 1.31 | 0.00 | NA | NA | NA | NA | NA | NA | NA | NA | NA | NA | NA | NA | NA | NA | NA | NA | NA | NA | NA | NA | NA | NA | NA | NA | NA | NA | NA | |
| Gains Losses On Extinguishment Of Debt | NA | NA | 0.00 | 15.52 | NA | NA | NA | NA | NA | NA | NA | NA | NA | NA | NA | NA | NA | NA | NA | NA | NA | NA | NA | NA | NA | NA | NA | NA | NA | NA | NA | NA | NA | NA | NA | NA | NA | NA | NA | NA | NA | NA | NA | NA | NA | NA | NA | NA | NA | NA | NA | NA | NA | |
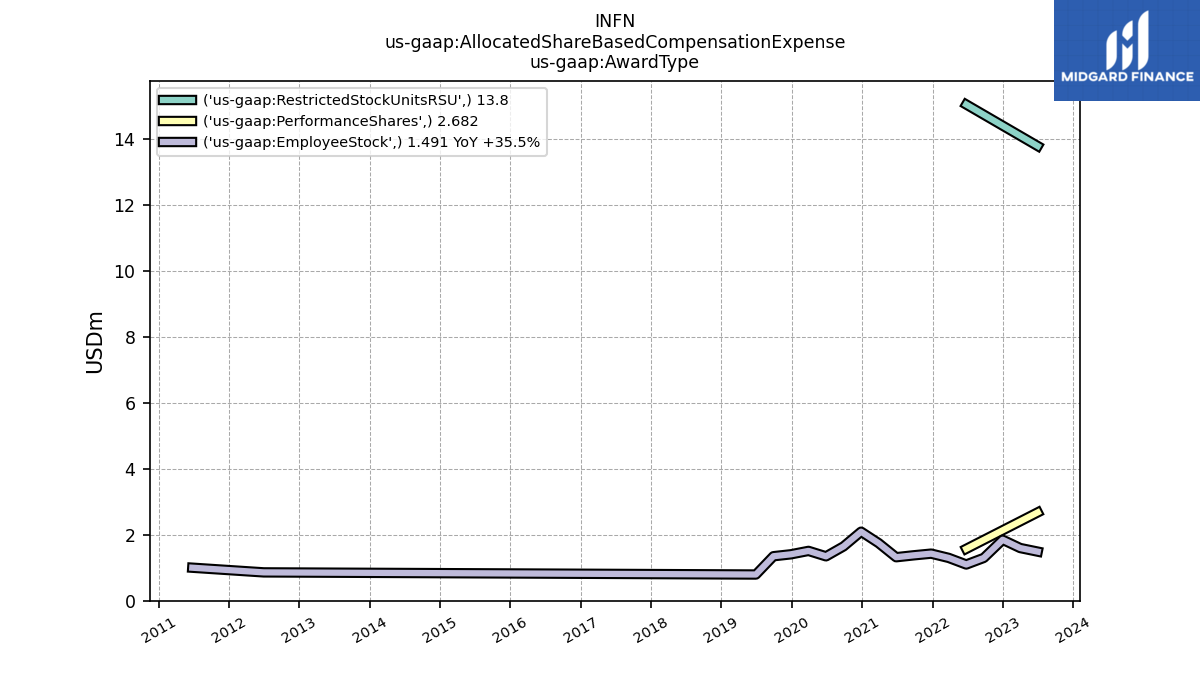
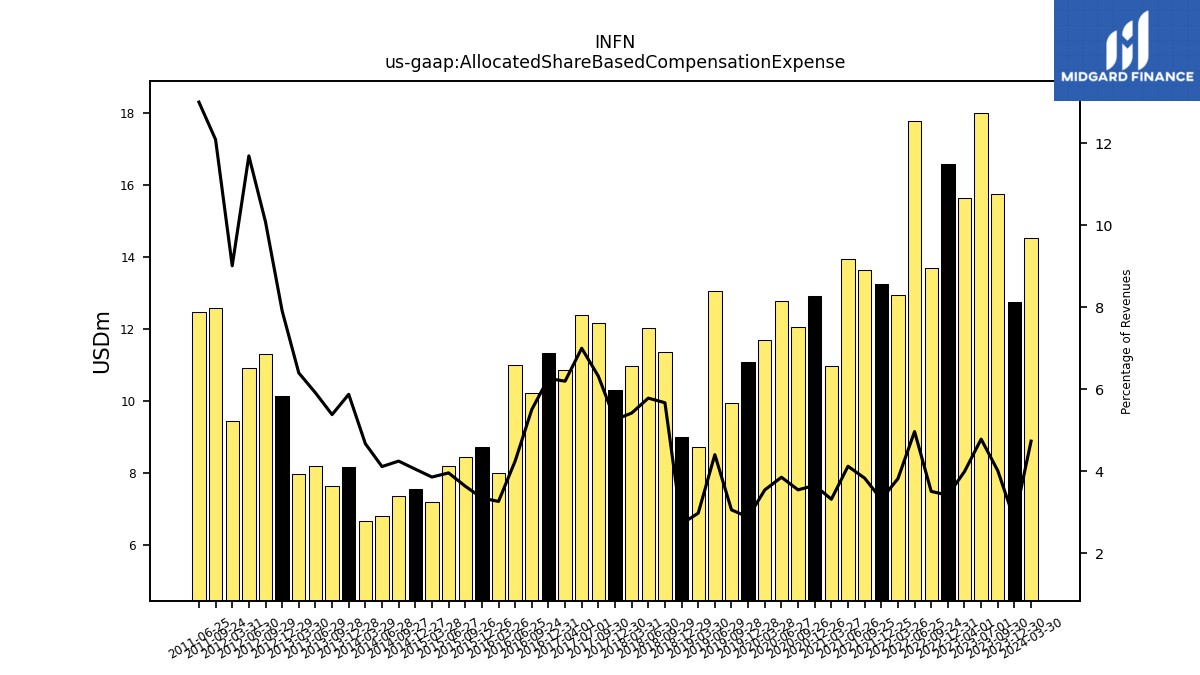
| Allocated Share Based Compensation Expense | 18.00 | 15.65 | 16.60 | 13.70 | 17.78 | 12.94 | 13.27 | 13.63 | 13.94 | 10.97 | 12.92 | 12.06 | 12.78 | 11.70 | 11.07 | 9.95 | 13.05 | 8.71 | 9.02 | 11.37 | 12.04 | 10.98 | 10.30 | 12.17 | 12.38 | 10.88 | 11.34 | 10.21 | 10.99 | 7.99 | 8.71 | 8.45 | 8.21 | 7.21 | 7.55 | 7.37 | 6.80 | 6.67 | 8.17 | 7.64 | 8.18 | 7.97 | 10.13 | 11.32 | 10.93 | 9.44 | NA | 12.58 | 12.48 | NA | NA | NA | NA | |
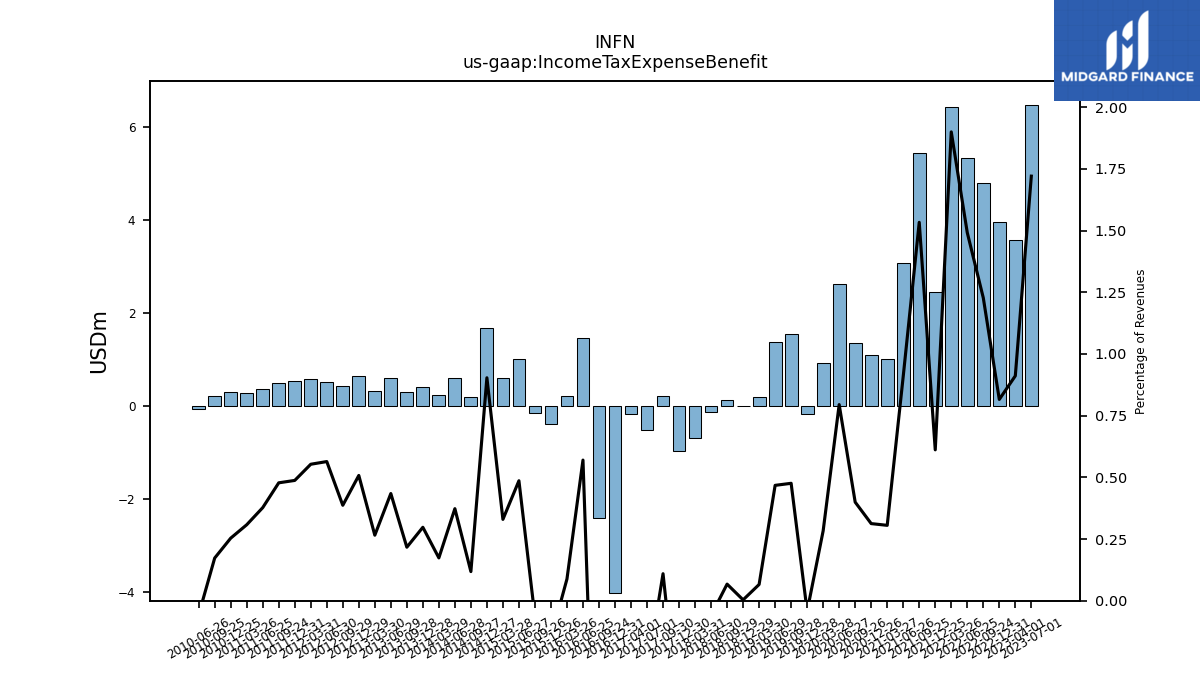
| Income Tax Expense Benefit | 6.47 | 3.57 | 3.96 | 4.79 | 5.34 | 6.44 | 2.45 | 5.46 | 3.08 | 1.01 | 1.10 | 1.36 | 2.63 | 0.94 | -0.16 | 1.55 | 1.39 | 0.19 | 0.01 | 0.14 | -0.12 | -0.68 | -0.97 | 0.21 | -0.51 | -0.16 | -4.03 | -2.42 | 1.48 | 0.22 | -0.39 | -0.15 | 1.01 | 0.62 | 1.68 | 0.20 | 0.62 | 0.25 | 0.41 | 0.31 | 0.60 | 0.33 | 0.65 | 0.43 | 0.53 | 0.58 | 0.55 | 0.50 | 0.36 | 0.29 | 0.30 | 0.23 | -0.06 | |
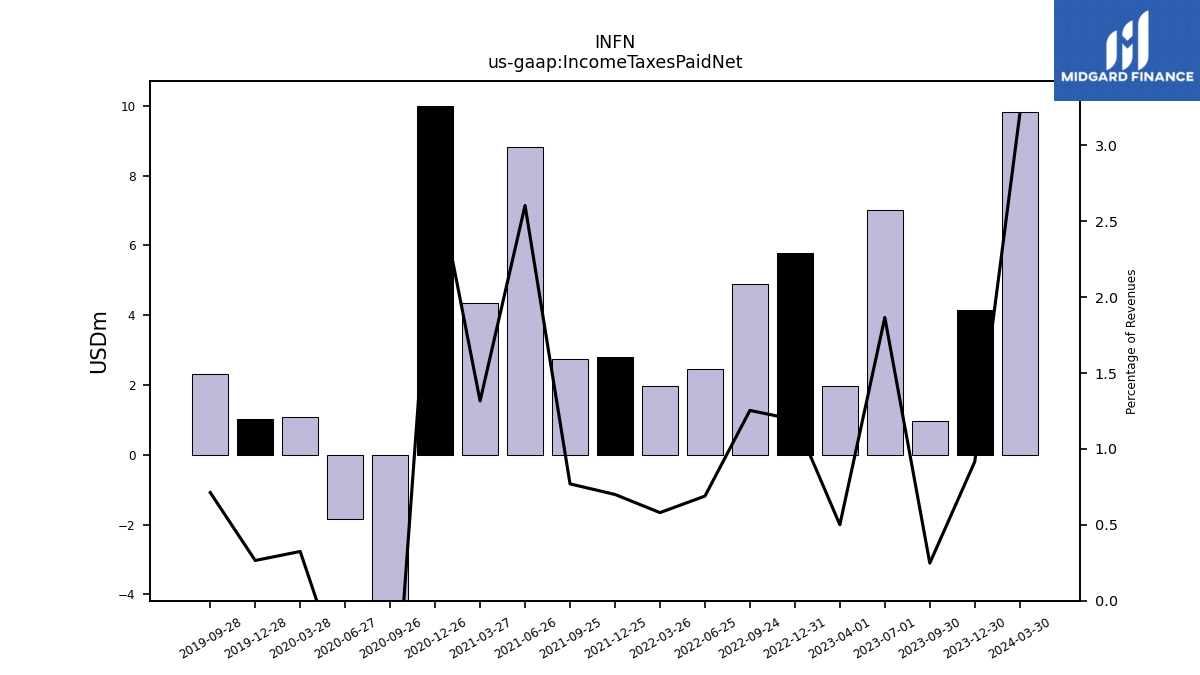
| Income Taxes Paid Net | 7.02 | 1.96 | 5.80 | 4.89 | 2.47 | 1.97 | 2.80 | 2.74 | 8.81 | 4.36 | 10.00 | -4.19 | -1.84 | 1.07 | 1.02 | 2.32 | NA | NA | NA | NA | NA | NA | NA | NA | NA | NA | NA | NA | NA | NA | NA | NA | NA | NA | NA | NA | NA | NA | NA | NA | NA | NA | NA | NA | NA | NA | NA | NA | NA | NA | NA | NA | NA | |
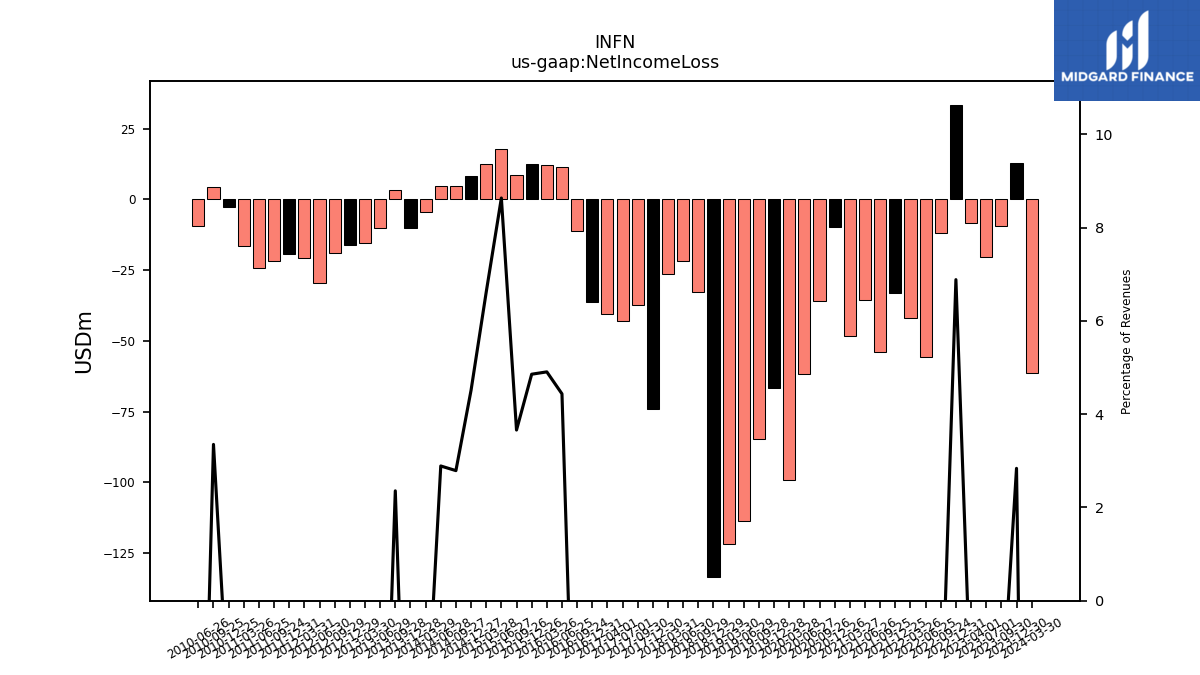
| Net Income Loss | -20.26 | -8.41 | 33.46 | -11.93 | -55.72 | -41.85 | -33.07 | -53.79 | -35.59 | -48.32 | -9.92 | -35.90 | -61.63 | -99.27 | -66.59 | -84.77 | -113.66 | -121.60 | -133.47 | -32.61 | -21.94 | -26.28 | -73.98 | -37.23 | -42.84 | -40.45 | -36.25 | -11.17 | 11.48 | 12.02 | 12.63 | 8.51 | 17.91 | 12.37 | 8.41 | 4.84 | 4.78 | -4.37 | -10.18 | 3.35 | -10.01 | -15.28 | -16.09 | -19.08 | -29.55 | -20.61 | -19.35 | -21.81 | -24.19 | -16.39 | -2.74 | 4.36 | -9.56 | |
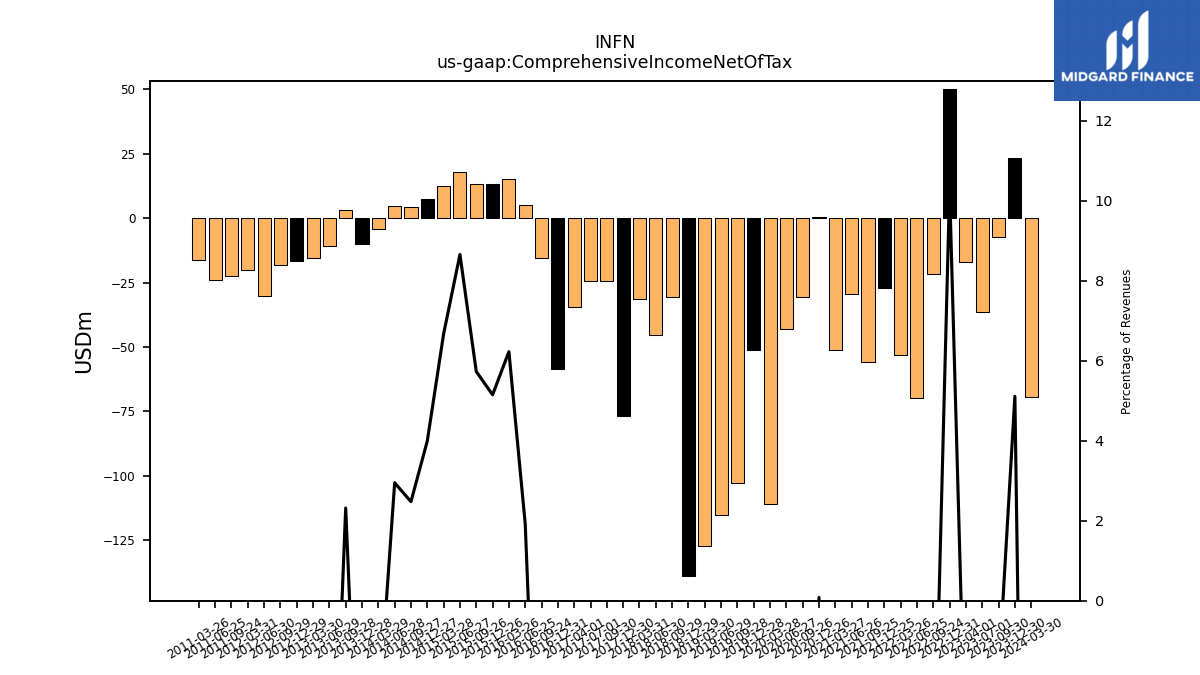
| Comprehensive Income Net Of Tax | -36.50 | -16.96 | 50.12 | -21.53 | -69.65 | -52.96 | -27.16 | -55.67 | -29.25 | -51.29 | 0.29 | -30.45 | -43.06 | -110.77 | -51.17 | -102.59 | -115.18 | -127.02 | -138.98 | -30.41 | -45.23 | -31.22 | -76.68 | -24.54 | -24.39 | -34.32 | -58.57 | -15.45 | 4.97 | 15.25 | 13.39 | 13.33 | 17.96 | 12.47 | 7.45 | 4.30 | 4.88 | -4.10 | -10.19 | 3.29 | -10.91 | -15.57 | -16.50 | -18.33 | -30.39 | -20.14 | NA | -22.48 | -24.16 | -16.09 | NA | NA | NA |
| 2023-07-01 | 2023-04-01 | 2022-12-31 | 2022-09-24 | 2022-06-25 | 2022-03-26 | 2021-12-25 | 2021-09-25 | 2021-06-26 | 2021-03-27 | 2020-12-26 | 2020-09-26 | 2020-06-27 | 2020-03-28 | 2019-12-28 | 2019-09-28 | 2019-06-29 | 2019-03-30 | 2018-12-29 | 2018-09-29 | 2018-06-30 | 2018-03-31 | 2017-12-30 | 2017-09-30 | 2017-07-01 | 2017-04-01 | 2016-12-31 | 2016-09-24 | 2016-06-25 | 2016-03-26 | 2015-12-26 | 2015-09-26 | 2015-06-27 | 2015-03-28 | 2014-12-27 | 2014-09-27 | 2014-06-28 | 2014-03-29 | 2013-12-28 | 2013-09-28 | 2013-06-29 | 2013-03-30 | 2012-12-29 | 2012-09-29 | 2012-06-30 | 2012-03-31 | 2011-12-31 | 2011-09-24 | 2011-06-25 | 2011-03-26 | 2010-12-25 | 2010-09-25 | 2010-06-26 | ||
|---|---|---|---|---|---|---|---|---|---|---|---|---|---|---|---|---|---|---|---|---|---|---|---|---|---|---|---|---|---|---|---|---|---|---|---|---|---|---|---|---|---|---|---|---|---|---|---|---|---|---|---|---|---|---|
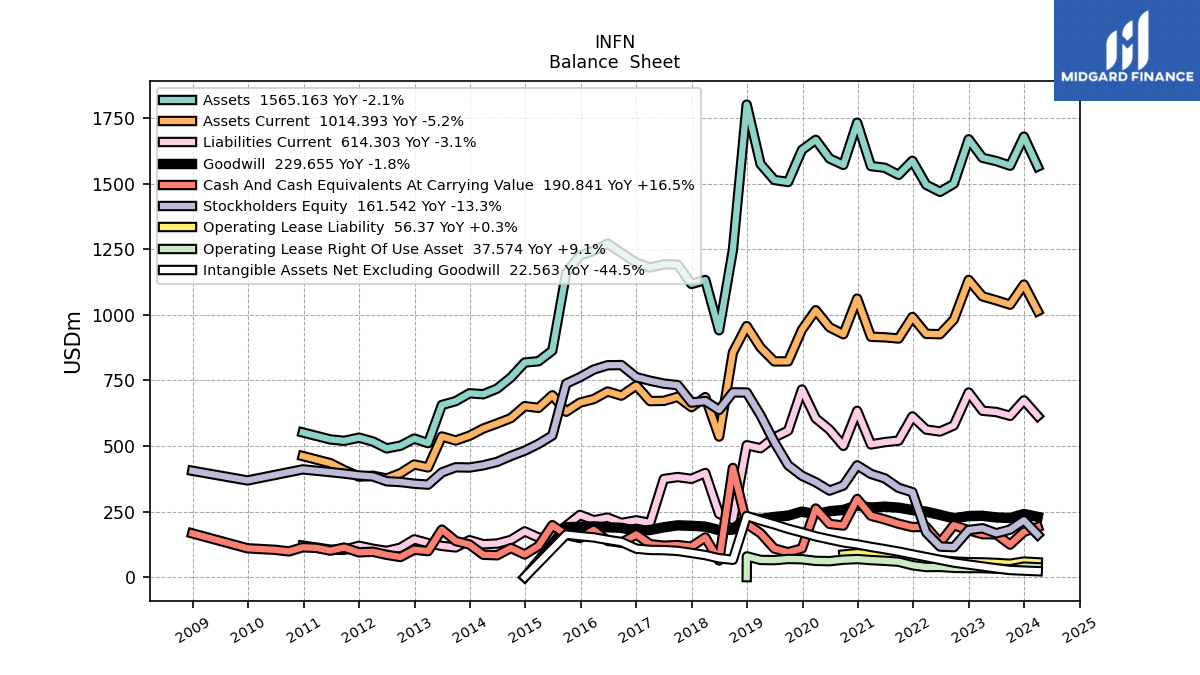
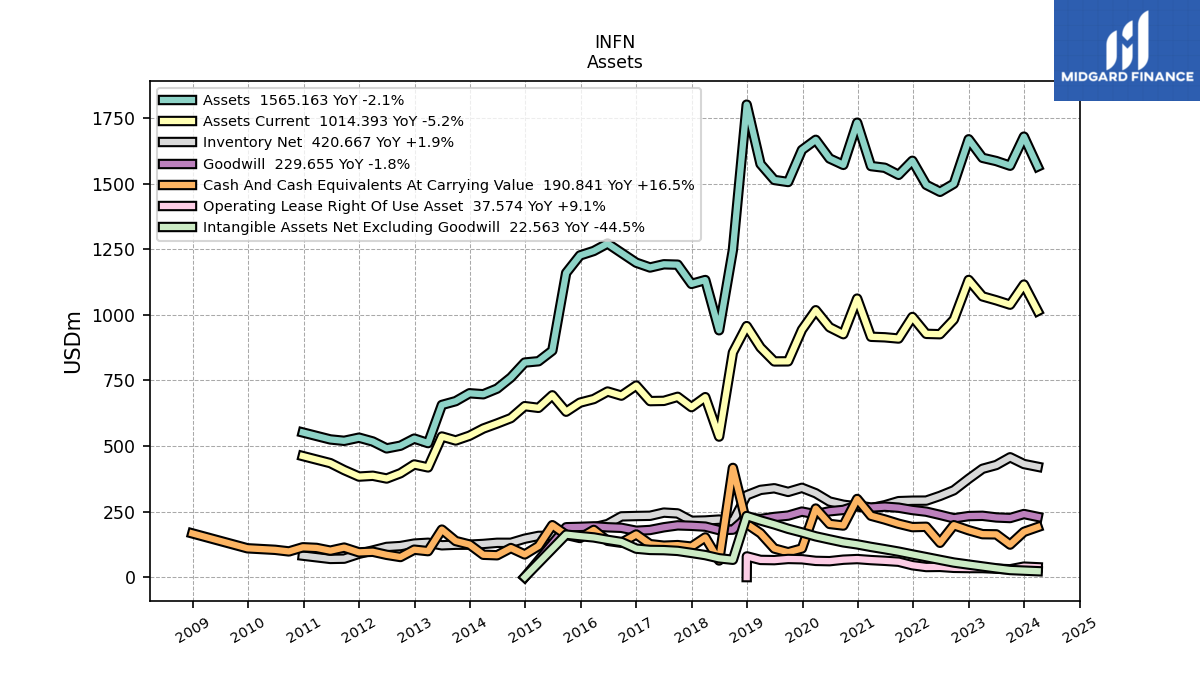
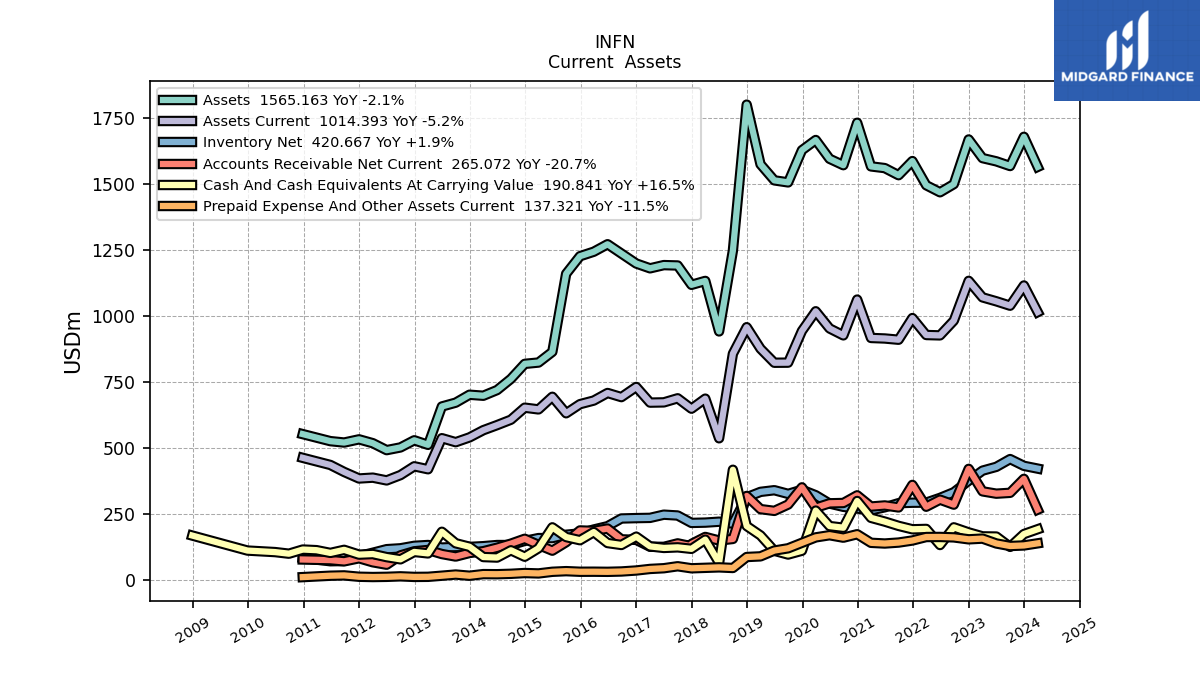
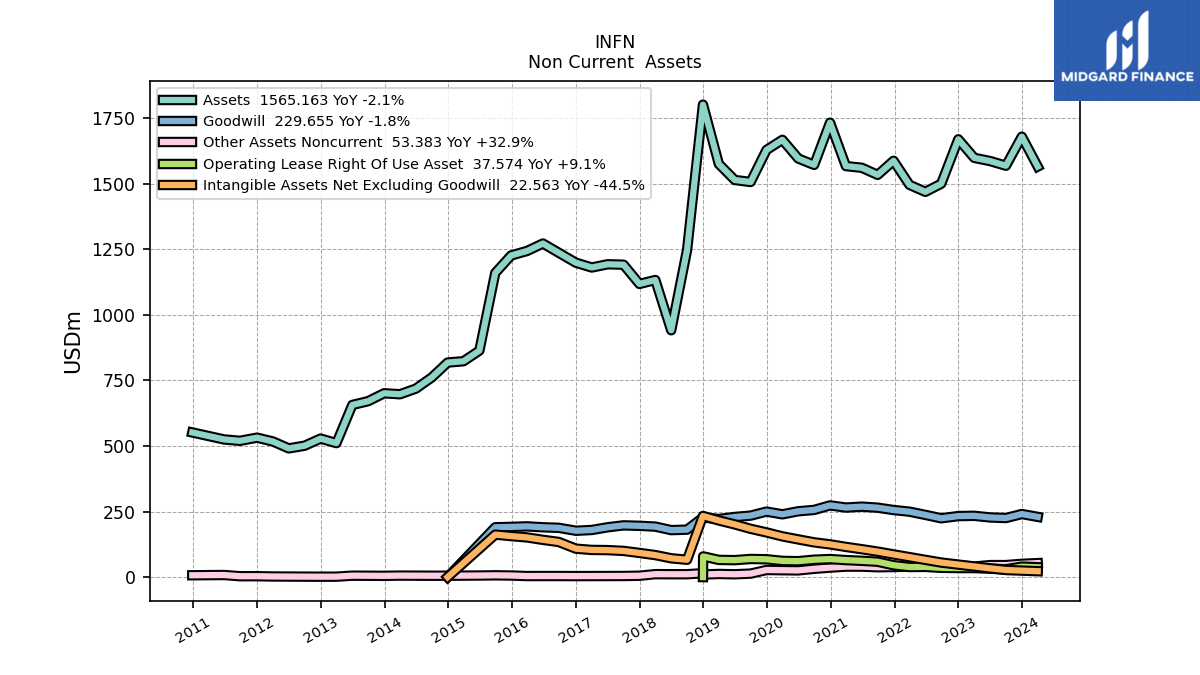
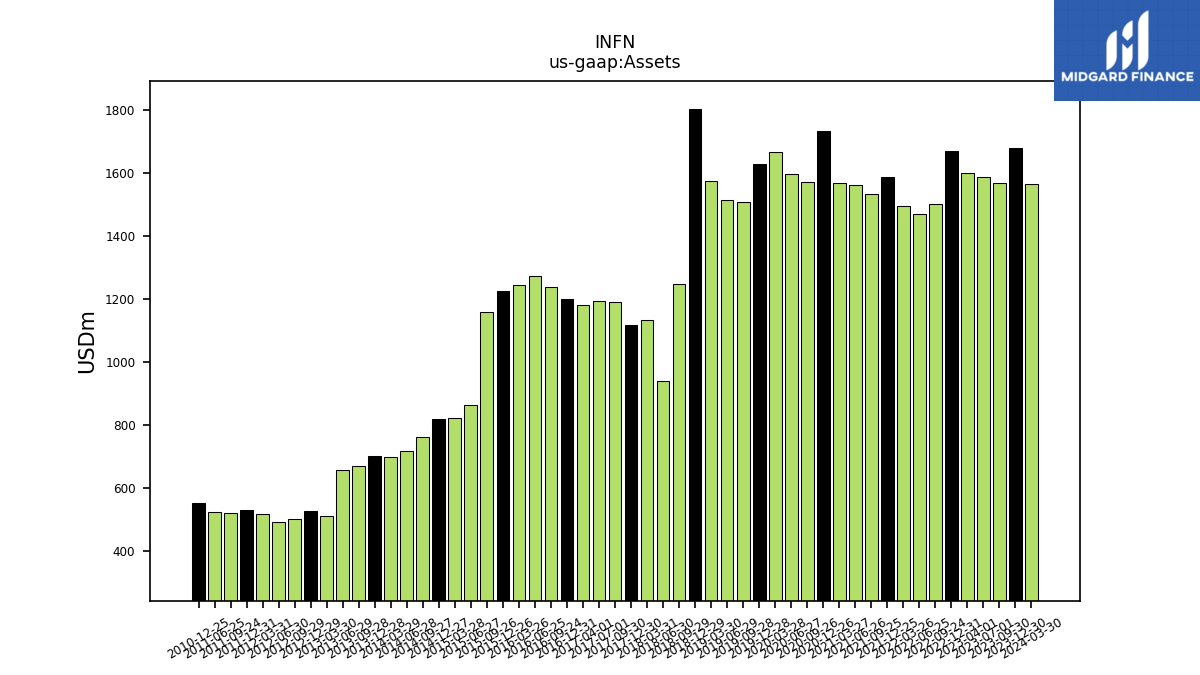
| Assets | 1586.14 | 1598.39 | 1669.14 | 1499.69 | 1468.80 | 1495.54 | 1587.22 | 1533.46 | 1560.53 | 1566.95 | 1732.50 | 1571.47 | 1595.86 | 1667.13 | 1628.34 | 1506.27 | 1514.02 | 1574.95 | 1801.27 | 1247.40 | 940.98 | 1132.66 | 1117.67 | 1191.10 | 1192.62 | 1180.36 | 1198.58 | 1236.46 | 1271.77 | 1243.36 | 1226.29 | 1159.59 | 863.54 | 823.03 | 818.02 | 761.09 | 718.65 | 697.09 | 700.93 | 670.83 | 656.36 | 510.80 | 528.17 | 501.02 | 490.76 | 517.07 | 531.70 | 519.59 | 524.90 | NA | 551.52 | NA | NA | |
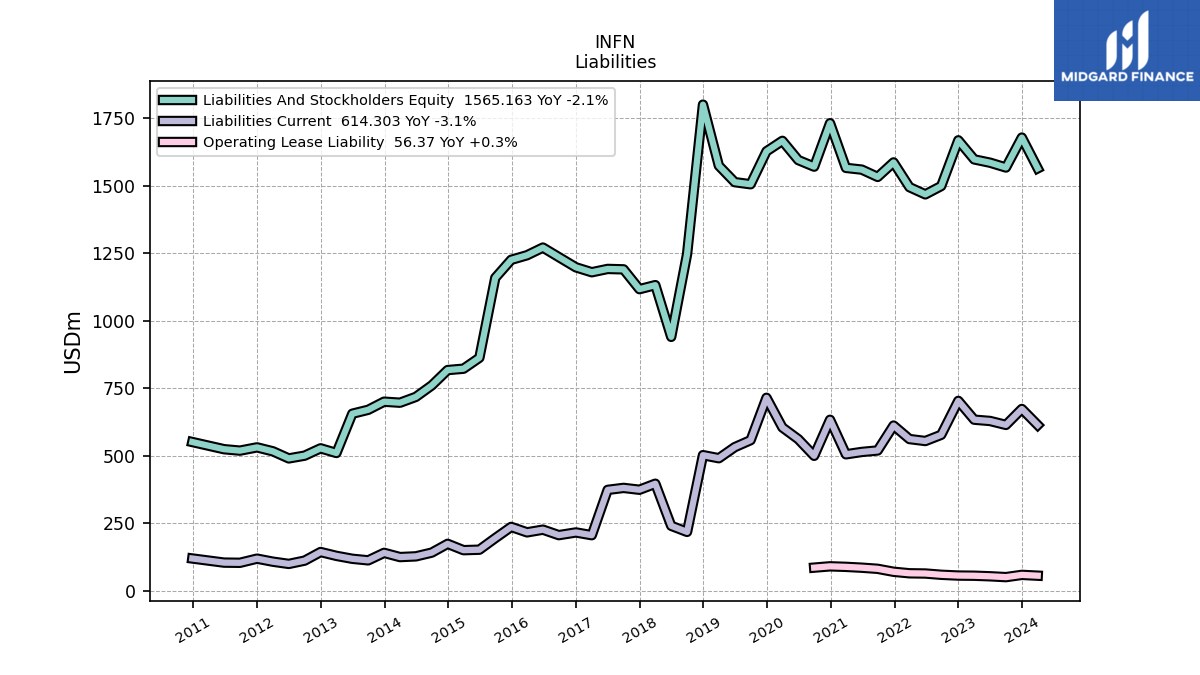
| Liabilities And Stockholders Equity | 1586.14 | 1598.39 | 1669.14 | 1499.69 | 1468.80 | 1495.54 | 1587.22 | 1533.46 | 1560.53 | 1566.95 | 1732.50 | 1571.47 | 1595.86 | 1667.13 | 1628.34 | 1506.27 | 1514.02 | 1574.95 | 1801.27 | 1247.40 | 940.98 | 1132.66 | 1117.67 | 1191.10 | 1192.62 | 1180.36 | 1198.58 | 1236.46 | 1271.77 | 1243.36 | 1226.29 | 1159.59 | 863.54 | 823.03 | 818.02 | 761.09 | 718.65 | 697.09 | 700.93 | 670.83 | 656.36 | 510.80 | 528.17 | 501.02 | 490.76 | 517.07 | 531.70 | 519.59 | 524.90 | NA | 551.52 | NA | NA | |
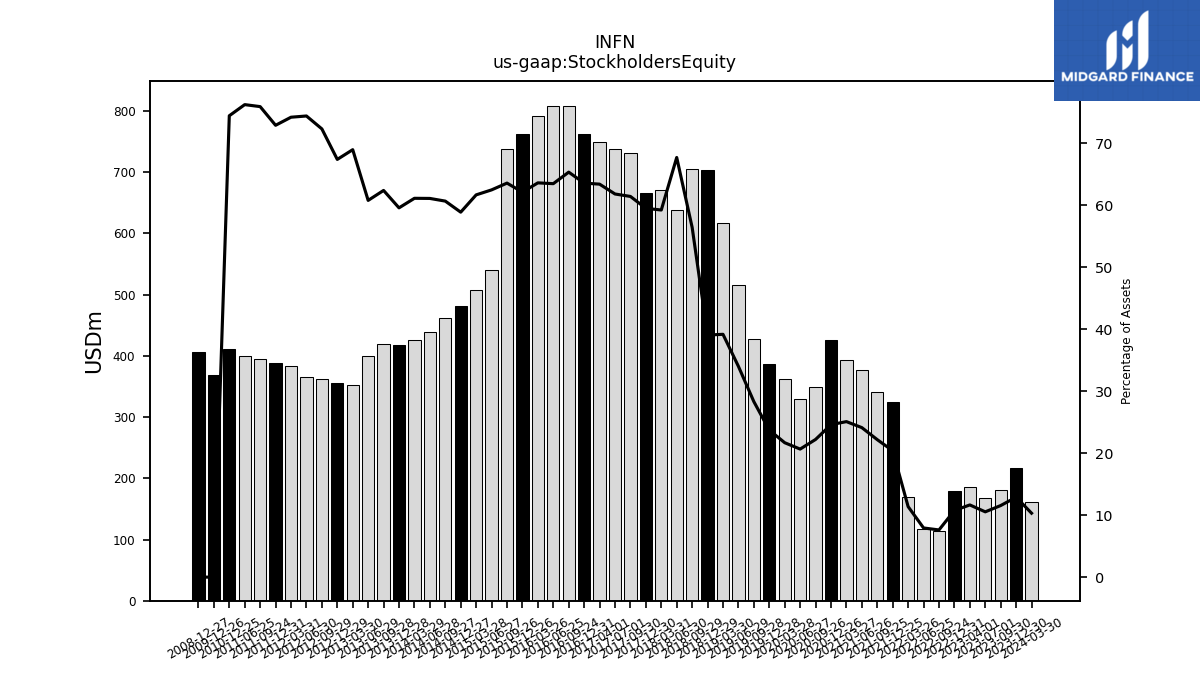
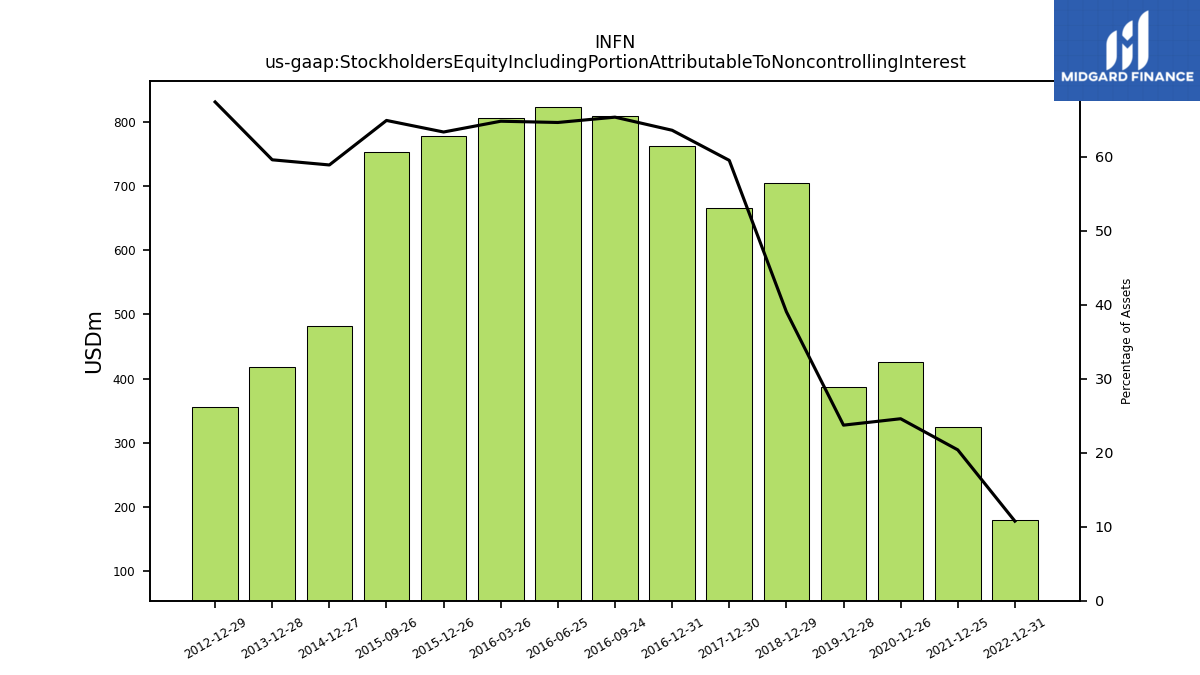
| Stockholders Equity | 167.18 | 186.26 | 179.65 | 114.20 | 116.56 | 170.21 | 323.77 | 340.27 | 376.59 | 393.35 | 426.28 | 349.23 | 329.85 | 361.72 | 386.54 | 426.70 | 515.07 | 617.30 | 703.82 | 704.32 | 637.41 | 671.21 | 665.37 | 731.94 | 737.59 | 748.76 | 762.33 | 808.31 | 807.73 | 791.30 | 762.15 | 737.54 | 539.79 | 507.83 | 481.91 | 461.96 | 439.31 | 426.27 | 417.81 | 418.74 | 399.15 | 352.44 | 356.14 | 362.50 | 365.31 | 383.87 | 387.80 | 394.63 | 400.35 | NA | 410.75 | NA | NA |
| 2023-07-01 | 2023-04-01 | 2022-12-31 | 2022-09-24 | 2022-06-25 | 2022-03-26 | 2021-12-25 | 2021-09-25 | 2021-06-26 | 2021-03-27 | 2020-12-26 | 2020-09-26 | 2020-06-27 | 2020-03-28 | 2019-12-28 | 2019-09-28 | 2019-06-29 | 2019-03-30 | 2018-12-29 | 2018-09-29 | 2018-06-30 | 2018-03-31 | 2017-12-30 | 2017-09-30 | 2017-07-01 | 2017-04-01 | 2016-12-31 | 2016-09-24 | 2016-06-25 | 2016-03-26 | 2015-12-26 | 2015-09-26 | 2015-06-27 | 2015-03-28 | 2014-12-27 | 2014-09-27 | 2014-06-28 | 2014-03-29 | 2013-12-28 | 2013-09-28 | 2013-06-29 | 2013-03-30 | 2012-12-29 | 2012-09-29 | 2012-06-30 | 2012-03-31 | 2011-12-31 | 2011-09-24 | 2011-06-25 | 2011-03-26 | 2010-12-25 | 2010-09-25 | 2010-06-26 | ||
|---|---|---|---|---|---|---|---|---|---|---|---|---|---|---|---|---|---|---|---|---|---|---|---|---|---|---|---|---|---|---|---|---|---|---|---|---|---|---|---|---|---|---|---|---|---|---|---|---|---|---|---|---|---|---|
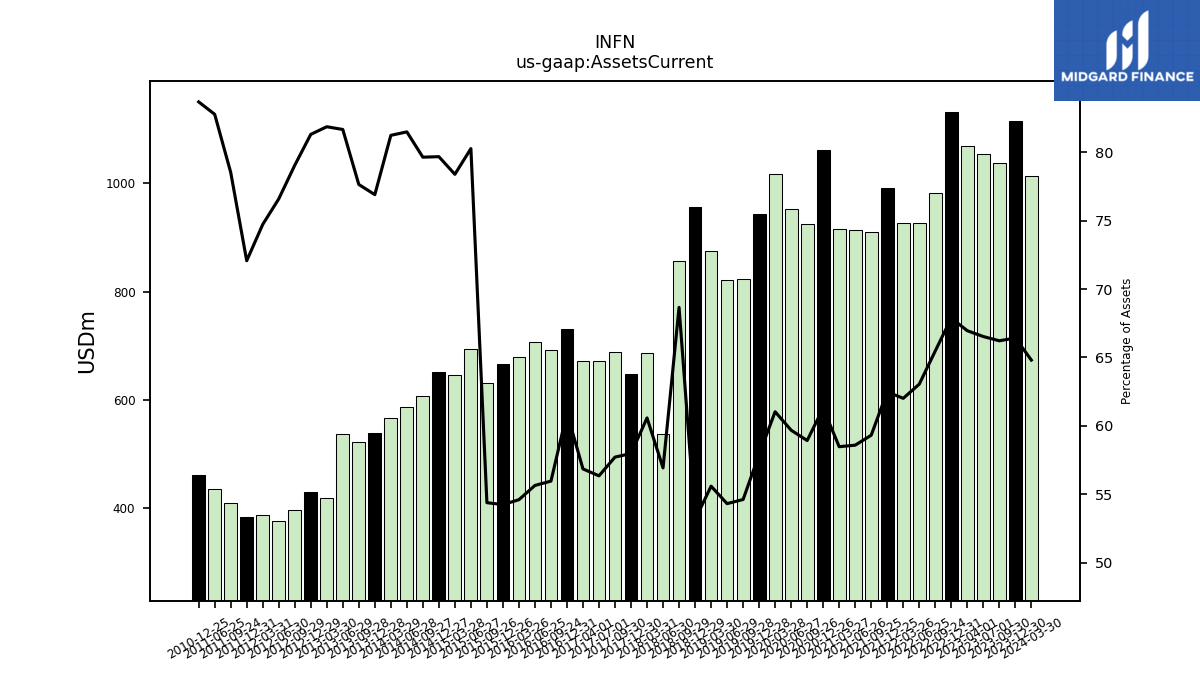
| Assets Current | 1055.27 | 1070.24 | 1132.97 | 981.87 | 926.01 | 927.40 | 991.76 | 909.51 | 914.23 | 916.24 | 1061.87 | 925.97 | 952.41 | 1017.48 | 942.83 | 822.60 | 822.24 | 875.43 | 957.10 | 856.49 | 535.64 | 686.11 | 647.94 | 687.40 | 671.94 | 671.00 | 730.42 | 691.85 | 707.60 | 678.83 | 665.12 | 630.56 | 693.22 | 645.23 | 651.86 | 606.21 | 585.71 | 566.36 | 539.07 | 520.92 | 536.09 | 418.23 | 429.50 | 396.10 | 375.91 | 386.40 | 383.23 | 408.09 | 434.54 | NA | 461.60 | NA | NA | |
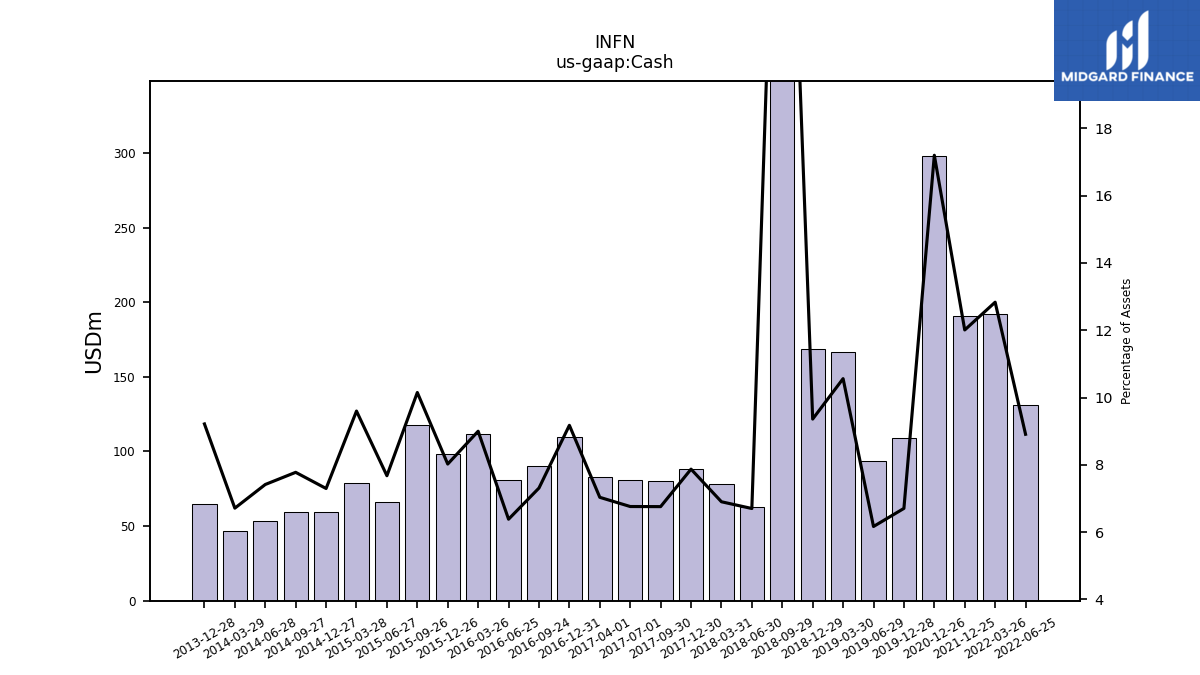
| Cash | NA | NA | NA | NA | 130.86 | 191.94 | 190.61 | NA | NA | NA | 298.00 | NA | NA | NA | 109.20 | NA | 93.39 | 166.35 | 168.62 | 416.36 | 63.08 | 78.19 | 87.99 | 80.51 | 80.65 | 83.05 | 109.98 | 90.40 | 81.20 | 111.90 | 98.40 | 117.70 | 66.30 | 79.00 | 59.70 | 59.20 | 53.30 | 46.80 | 64.60 | NA | NA | NA | NA | NA | NA | NA | NA | NA | NA | NA | NA | NA | NA | |
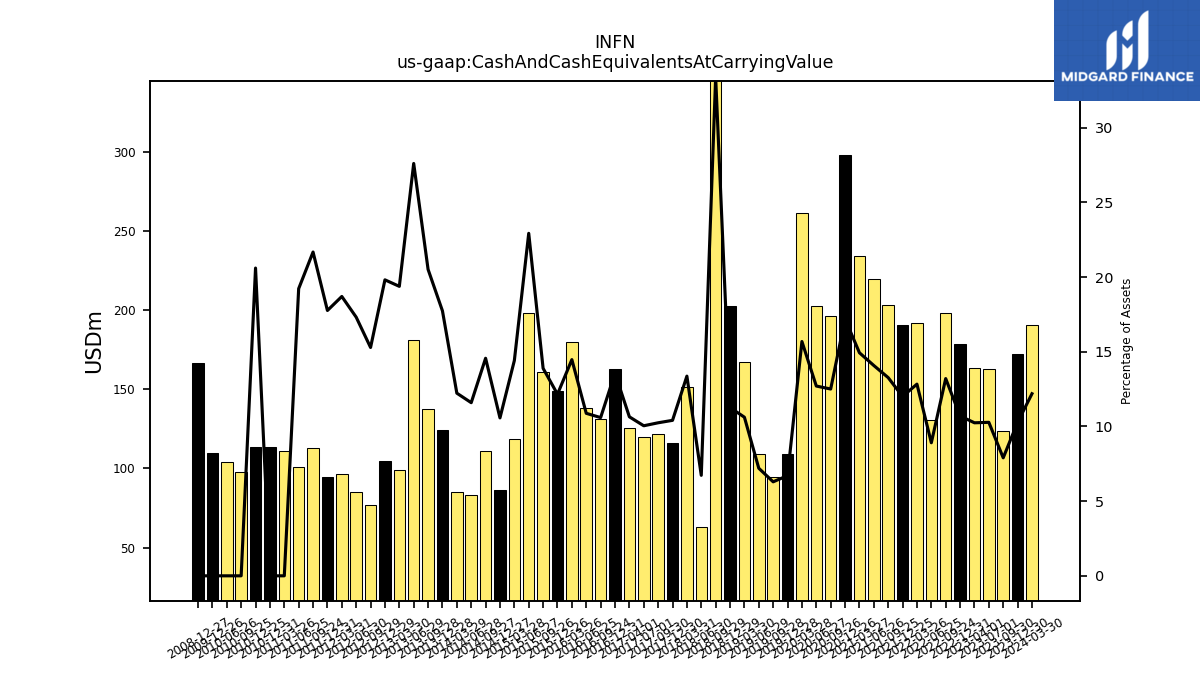
| Cash And Cash Equivalents At Carrying Value | 163.01 | 163.76 | 178.66 | 198.04 | 130.86 | 191.94 | 190.61 | 203.48 | 219.74 | 234.03 | 298.01 | 196.55 | 202.78 | 261.53 | 109.20 | 94.80 | 109.03 | 167.26 | 202.95 | 416.41 | 63.31 | 151.44 | 116.34 | 122.04 | 119.82 | 125.66 | 162.64 | 131.00 | 138.38 | 179.97 | 149.10 | 161.10 | 198.02 | 118.62 | 86.50 | 110.86 | 83.31 | 85.25 | 124.33 | 137.63 | 181.21 | 99.00 | 104.67 | 76.60 | 84.99 | 96.71 | 94.46 | 112.64 | 100.93 | 111.35 | 113.65 | 97.98 | 104.07 | |
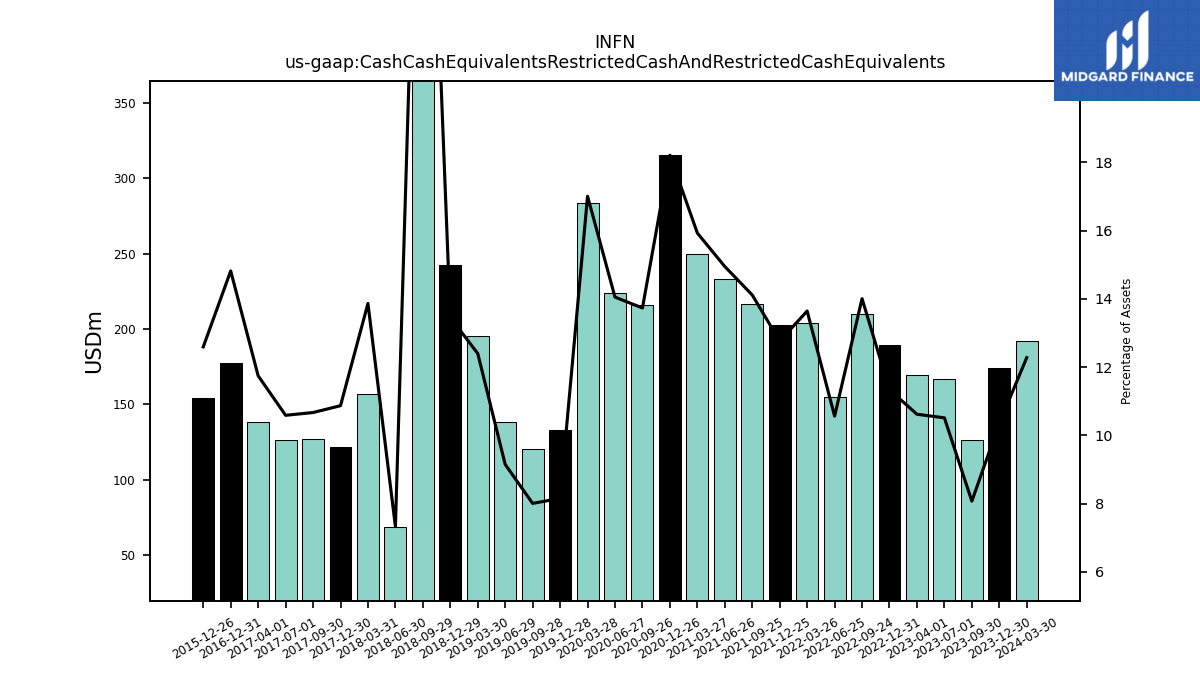
| Cash Cash Equivalents Restricted Cash And Restricted Cash Equivalents | 166.76 | 169.73 | 189.20 | 210.02 | 155.18 | 204.03 | 202.52 | 216.40 | 233.23 | 249.54 | 315.38 | 215.78 | 224.20 | 283.47 | 132.80 | 120.63 | 138.52 | 195.25 | 242.34 | 422.24 | 68.99 | 157.03 | 121.49 | 127.08 | 126.27 | 138.65 | 177.58 | NA | NA | NA | 154.41 | NA | NA | NA | NA | NA | NA | NA | NA | NA | NA | NA | NA | NA | NA | NA | NA | NA | NA | NA | NA | NA | NA | |
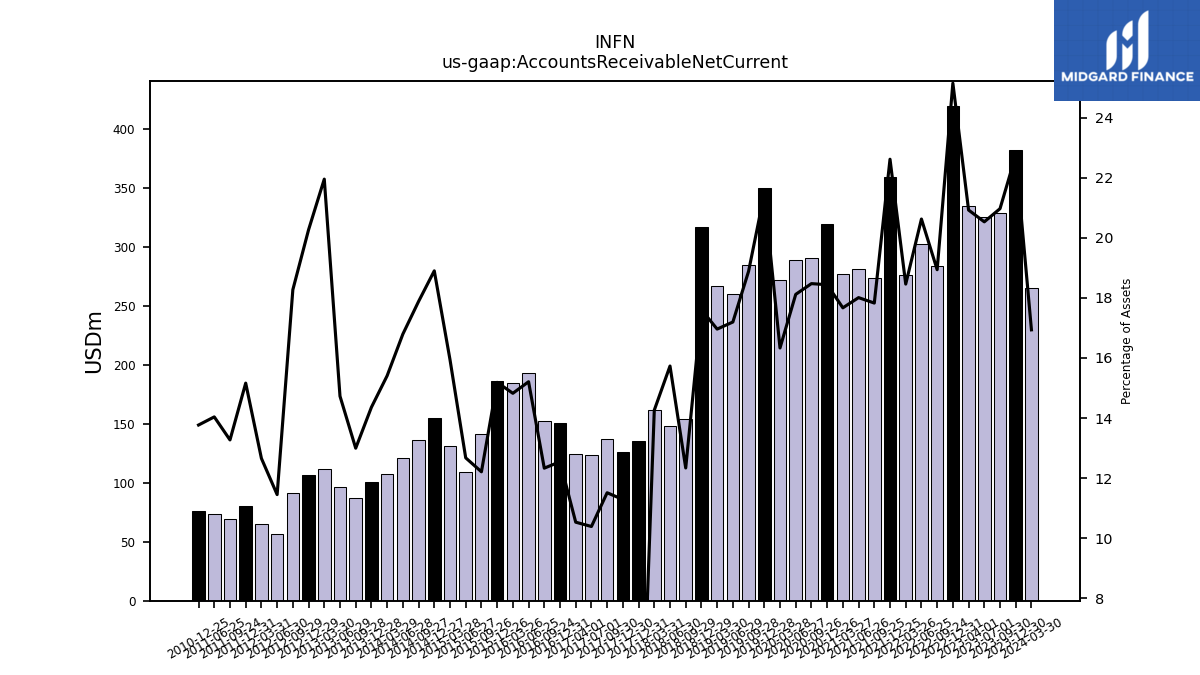
| Accounts Receivable Net Current | 325.65 | 334.43 | 419.74 | 284.00 | 302.93 | 276.06 | 358.95 | 273.37 | 281.02 | 276.86 | 319.43 | 290.32 | 289.11 | 272.28 | 349.64 | 284.45 | 260.35 | 267.12 | 317.12 | 153.90 | 148.03 | 161.54 | 126.15 | 137.13 | 123.90 | 124.33 | 150.37 | 152.47 | 193.41 | 184.31 | 186.24 | 141.59 | 109.45 | 131.22 | 154.60 | 136.09 | 120.69 | 107.41 | 100.64 | 87.18 | 96.67 | 112.13 | 107.04 | 91.54 | 56.20 | 65.44 | 80.62 | 68.95 | 73.68 | NA | 75.93 | NA | NA | |
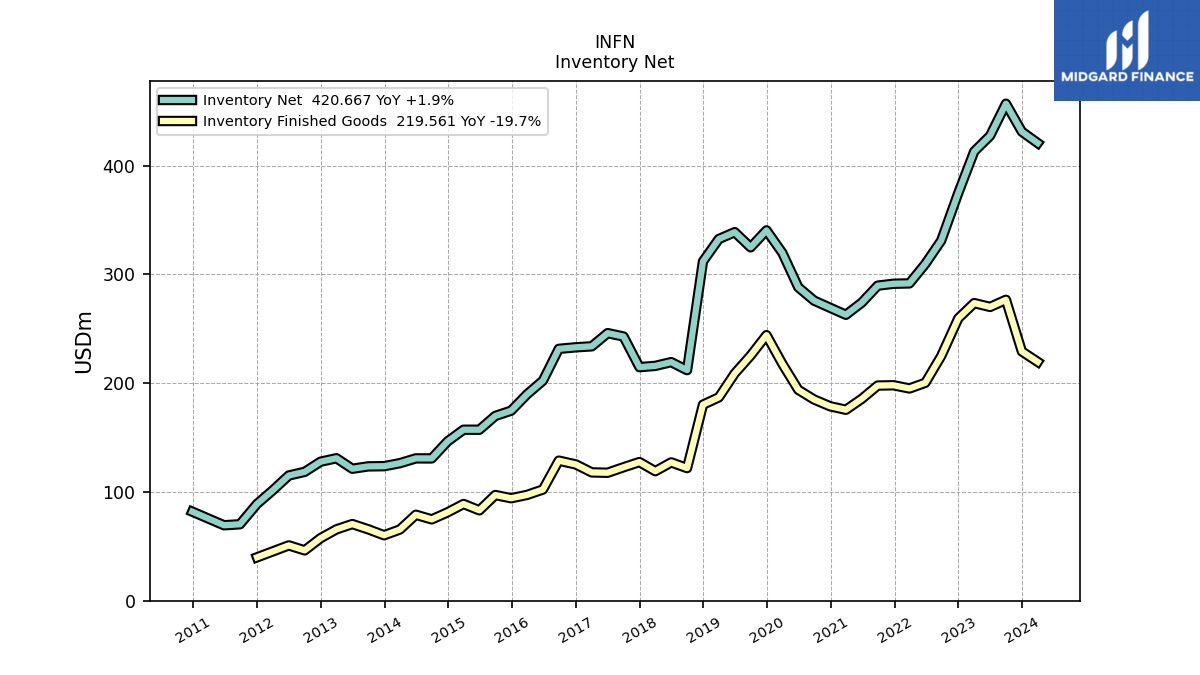
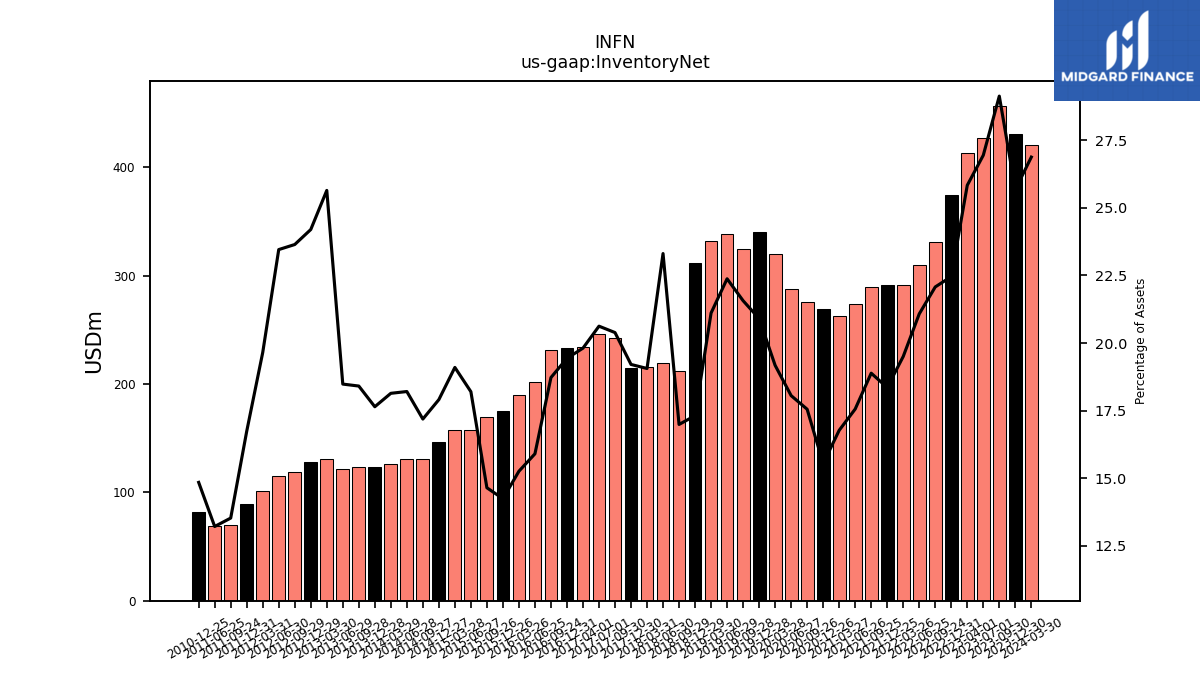
| Inventory Net | 427.39 | 412.94 | 374.86 | 331.06 | 309.60 | 291.69 | 291.37 | 289.61 | 274.03 | 262.83 | 269.31 | 275.84 | 288.16 | 319.70 | 340.43 | 324.85 | 338.79 | 332.50 | 311.89 | 211.94 | 219.34 | 215.89 | 214.70 | 242.85 | 245.98 | 233.86 | 232.96 | 231.53 | 202.28 | 189.74 | 174.70 | 169.88 | 157.18 | 157.19 | 146.50 | 130.83 | 130.85 | 126.47 | 123.69 | 123.50 | 121.32 | 130.99 | 127.81 | 118.46 | 115.12 | 101.61 | 89.00 | 70.30 | 69.38 | NA | 81.89 | NA | NA | |
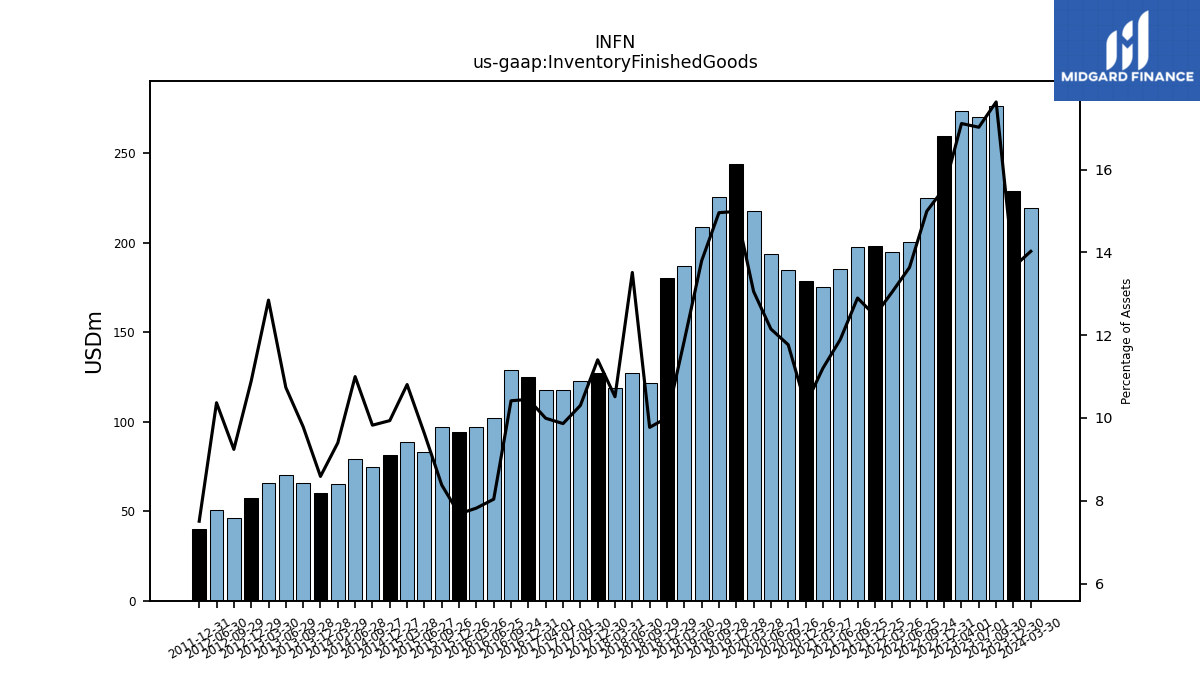
| Inventory Finished Goods | 270.06 | 273.59 | 259.58 | 224.94 | 200.33 | 195.11 | 198.06 | 197.80 | 185.61 | 175.54 | 178.78 | 184.95 | 193.90 | 217.69 | 244.11 | 225.37 | 208.90 | 186.96 | 180.22 | 121.92 | 127.19 | 119.09 | 127.47 | 122.70 | 117.65 | 117.96 | 125.26 | 128.79 | 102.23 | 97.27 | 94.22 | 97.18 | 83.09 | 88.95 | 81.28 | 74.79 | 79.05 | 65.52 | 60.20 | 65.67 | 70.48 | 65.63 | 57.52 | 46.30 | 50.88 | NA | 39.91 | NA | NA | NA | NA | NA | NA | |
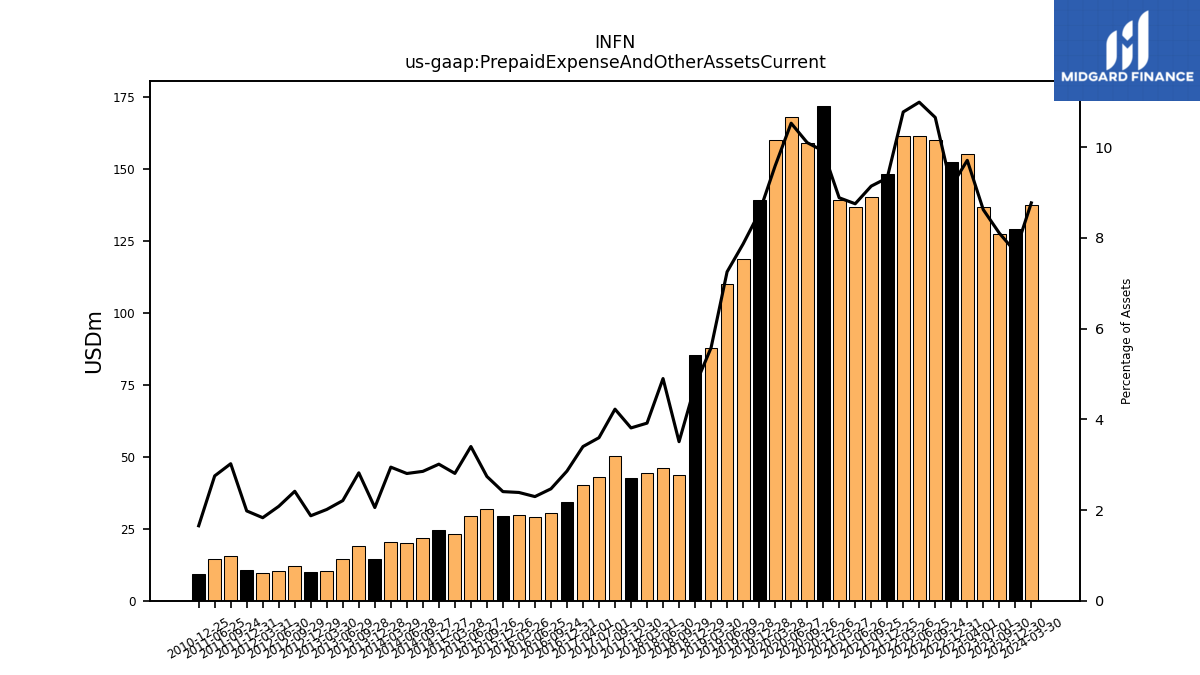
| Prepaid Expense And Other Assets Current | 136.78 | 155.23 | 152.45 | 159.82 | 161.48 | 161.19 | 147.99 | 140.20 | 136.61 | 139.25 | 171.83 | 158.76 | 168.05 | 159.84 | 139.22 | 118.50 | 109.82 | 87.87 | 85.40 | 43.76 | 46.10 | 44.36 | 42.60 | 50.32 | 42.88 | 40.13 | 34.27 | 30.52 | 29.21 | 29.69 | 29.51 | 31.78 | 29.37 | 23.11 | 24.64 | 21.71 | 20.17 | 20.54 | 14.41 | 18.92 | 14.49 | 10.28 | 9.90 | 12.09 | 10.22 | 9.47 | 10.53 | 15.70 | 14.45 | NA | 9.12 | NA | NA |
| 2023-07-01 | 2023-04-01 | 2022-12-31 | 2022-09-24 | 2022-06-25 | 2022-03-26 | 2021-12-25 | 2021-09-25 | 2021-06-26 | 2021-03-27 | 2020-12-26 | 2020-09-26 | 2020-06-27 | 2020-03-28 | 2019-12-28 | 2019-09-28 | 2019-06-29 | 2019-03-30 | 2018-12-29 | 2018-09-29 | 2018-06-30 | 2018-03-31 | 2017-12-30 | 2017-09-30 | 2017-07-01 | 2017-04-01 | 2016-12-31 | 2016-09-24 | 2016-06-25 | 2016-03-26 | 2015-12-26 | 2015-09-26 | 2015-06-27 | 2015-03-28 | 2014-12-27 | 2014-09-27 | 2014-06-28 | 2014-03-29 | 2013-12-28 | 2013-09-28 | 2013-06-29 | 2013-03-30 | 2012-12-29 | 2012-09-29 | 2012-06-30 | 2012-03-31 | 2011-12-31 | 2011-09-24 | 2011-06-25 | 2011-03-26 | 2010-12-25 | 2010-09-25 | 2010-06-26 | ||
|---|---|---|---|---|---|---|---|---|---|---|---|---|---|---|---|---|---|---|---|---|---|---|---|---|---|---|---|---|---|---|---|---|---|---|---|---|---|---|---|---|---|---|---|---|---|---|---|---|---|---|---|---|---|---|
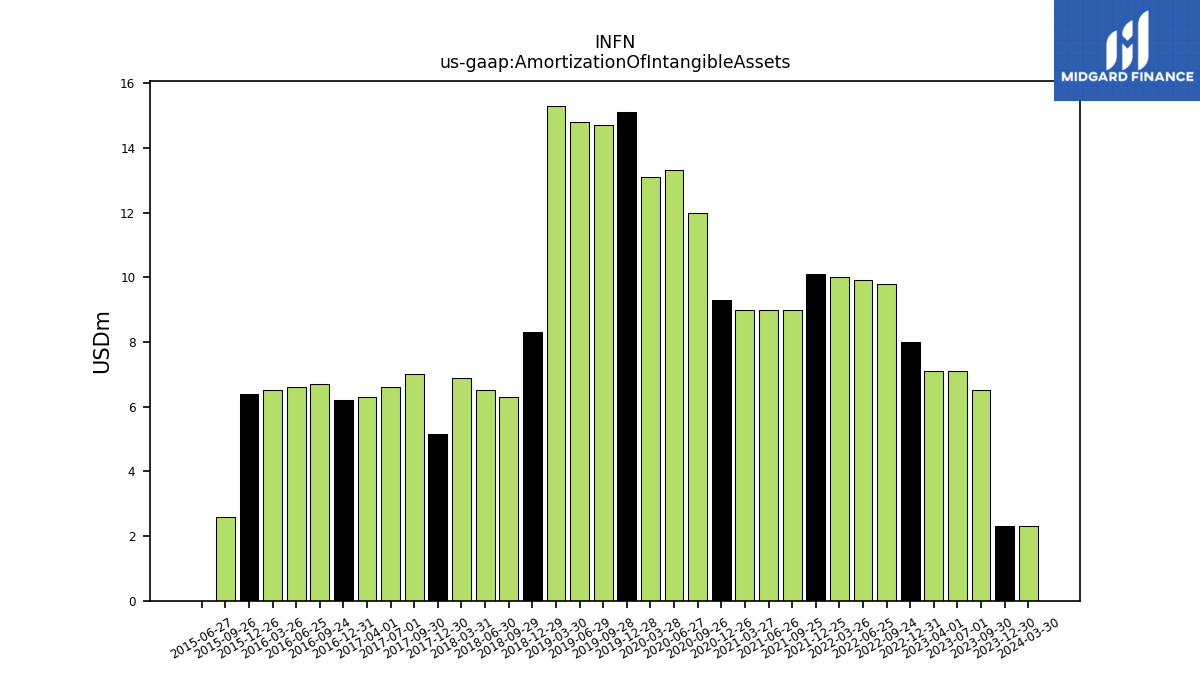
| Amortization Of Intangible Assets | 7.10 | 7.10 | 8.00 | 9.80 | 9.90 | 10.00 | 10.10 | 9.00 | 9.00 | 9.00 | 9.30 | 12.00 | 13.30 | 13.10 | 15.10 | 14.70 | 14.80 | 15.30 | 8.31 | 6.30 | 6.50 | 6.90 | 5.17 | 7.00 | 6.60 | 6.30 | 6.20 | 6.70 | 6.60 | 6.50 | 6.40 | 2.60 | 0.00 | NA | NA | NA | NA | NA | NA | NA | NA | NA | NA | NA | NA | NA | NA | NA | NA | NA | NA | NA | NA | |
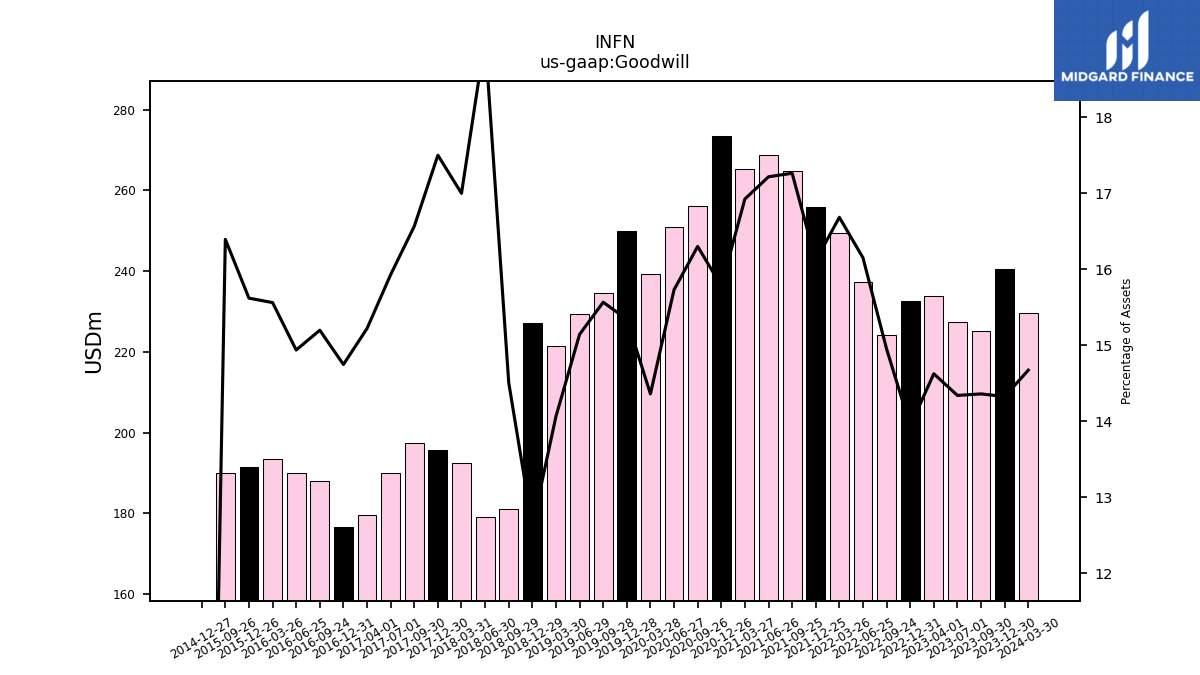
| Goodwill | 227.46 | 233.77 | 232.66 | 224.24 | 237.25 | 249.53 | 255.79 | 264.76 | 268.70 | 265.22 | 273.43 | 256.18 | 251.05 | 239.41 | 249.85 | 234.49 | 229.28 | 221.52 | 227.23 | 180.99 | 179.16 | 192.56 | 195.62 | 197.32 | 189.99 | 179.67 | 176.76 | 187.93 | 189.98 | 193.50 | 191.56 | 190.12 | NA | NA | 0.00 | NA | NA | NA | NA | NA | NA | NA | NA | NA | NA | NA | NA | NA | NA | NA | NA | NA | NA | |
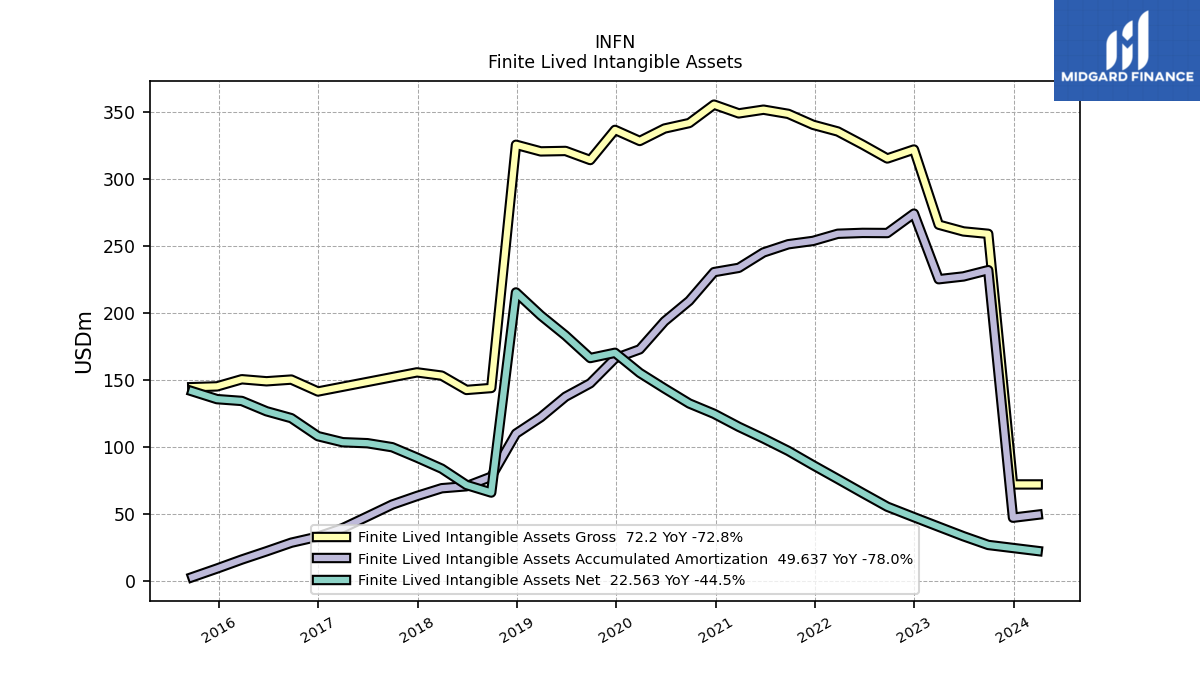
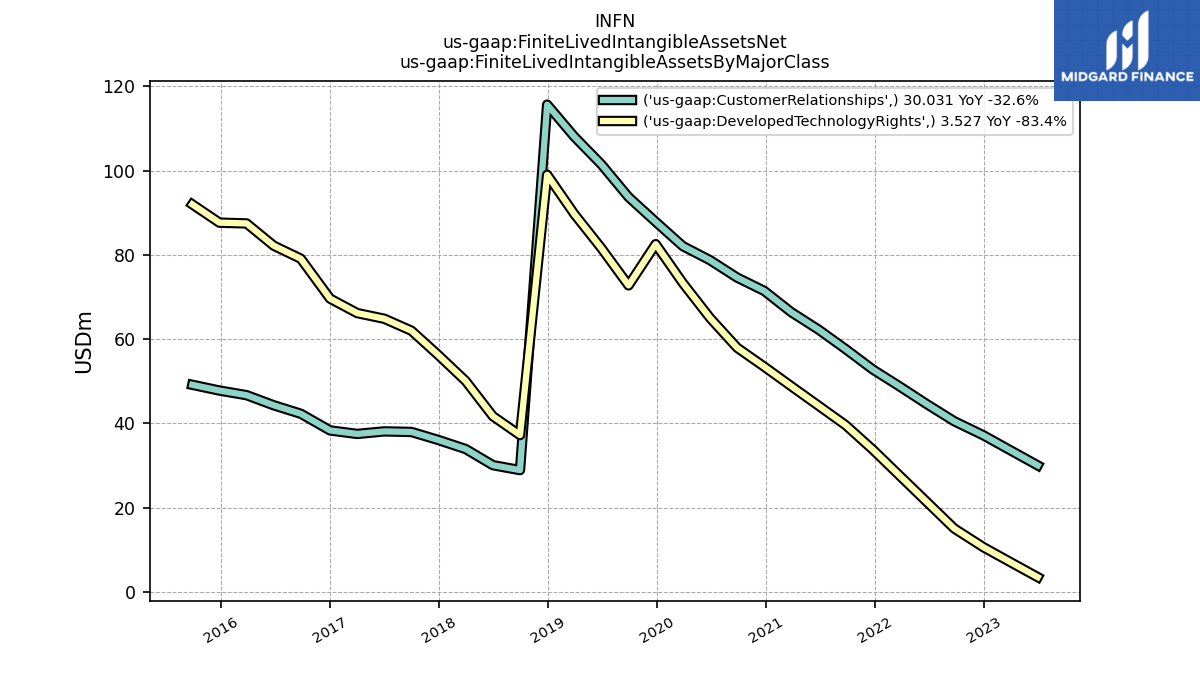
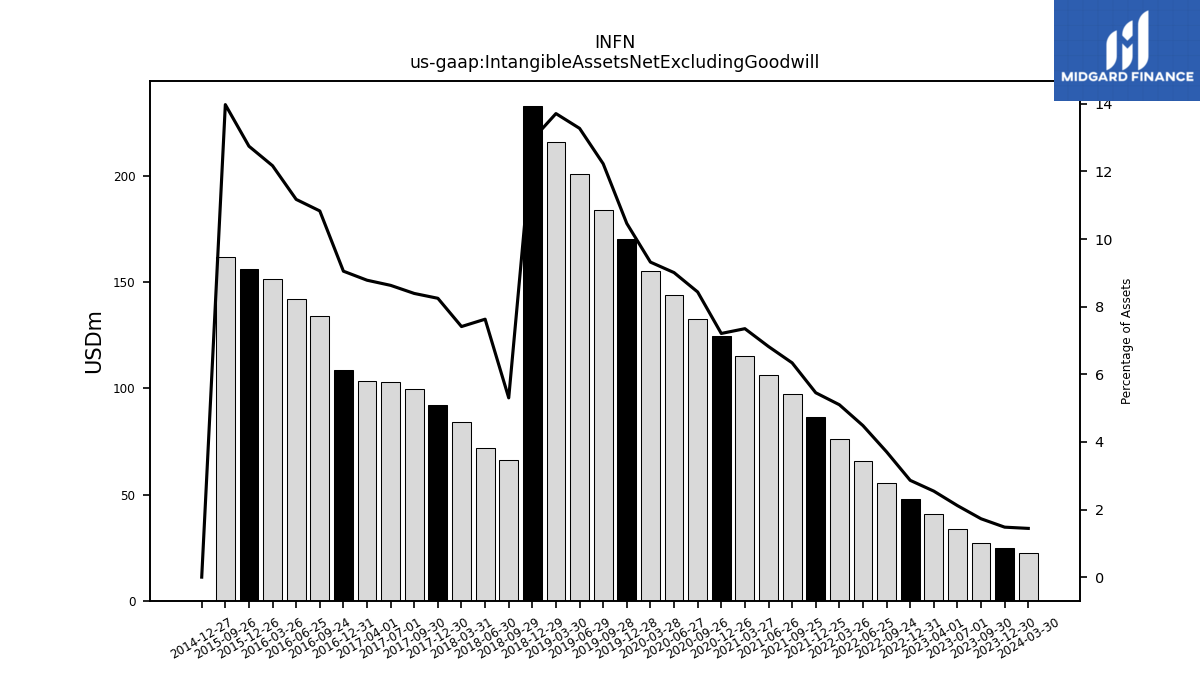
| Intangible Assets Net Excluding Goodwill | 33.56 | 40.66 | 47.79 | 55.58 | 65.83 | 76.27 | 86.57 | 97.21 | 106.45 | 115.16 | 124.88 | 132.56 | 143.76 | 155.36 | 170.35 | 184.18 | 200.99 | 215.96 | 233.12 | 66.14 | 71.80 | 83.96 | 92.19 | 99.95 | 102.93 | 103.67 | 108.47 | 133.94 | 142.11 | 151.31 | 156.32 | 162.08 | NA | NA | 0.00 | NA | NA | NA | NA | NA | NA | NA | NA | NA | NA | NA | NA | NA | NA | NA | NA | NA | NA | |
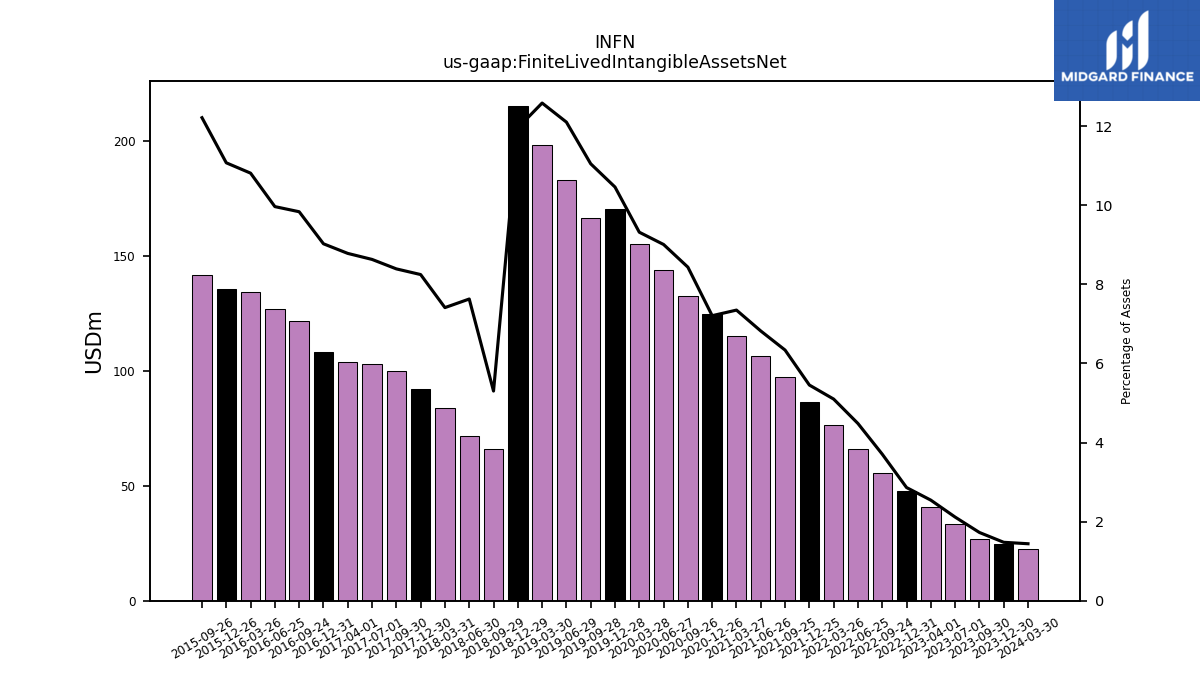
| Finite Lived Intangible Assets Net | 33.56 | 40.66 | 47.79 | 55.58 | 65.83 | 76.27 | 86.57 | 97.21 | 106.45 | 115.16 | 124.88 | 132.56 | 143.76 | 155.36 | 170.35 | 166.43 | 183.24 | 198.21 | 215.37 | 66.14 | 71.80 | 83.96 | 92.19 | 99.95 | 102.93 | 103.67 | 108.19 | 121.63 | 126.75 | 134.44 | 135.80 | 141.64 | NA | NA | NA | NA | NA | NA | NA | NA | NA | NA | NA | NA | NA | NA | NA | NA | NA | NA | NA | NA | NA | |
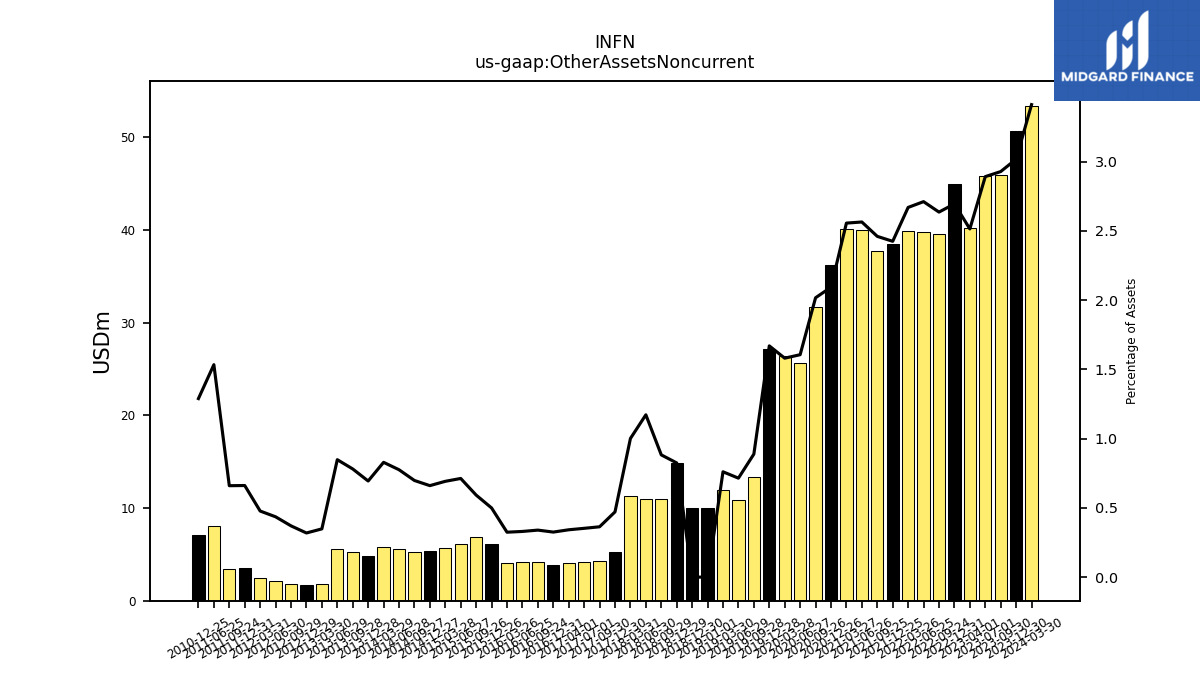
| Other Assets Noncurrent | 45.85 | 40.17 | 44.97 | 39.52 | 39.81 | 39.91 | 38.48 | 37.72 | 40.00 | 40.04 | 36.26 | 31.69 | 25.62 | 26.35 | 27.18 | 13.38 | 10.82 | 11.97 | 14.85 | 11.01 | 11.03 | 11.34 | 5.26 | 4.33 | 4.20 | 4.03 | 3.90 | 4.20 | 4.19 | 4.03 | 6.12 | 6.87 | 6.15 | 5.69 | 5.40 | 5.31 | 5.57 | 5.78 | 4.86 | 5.24 | 5.56 | 1.78 | 1.68 | 1.85 | 2.14 | 2.47 | 3.52 | 3.43 | 8.05 | NA | 7.11 | NA | NA |
| 2023-07-01 | 2023-04-01 | 2022-12-31 | 2022-09-24 | 2022-06-25 | 2022-03-26 | 2021-12-25 | 2021-09-25 | 2021-06-26 | 2021-03-27 | 2020-12-26 | 2020-09-26 | 2020-06-27 | 2020-03-28 | 2019-12-28 | 2019-09-28 | 2019-06-29 | 2019-03-30 | 2018-12-29 | 2018-09-29 | 2018-06-30 | 2018-03-31 | 2017-12-30 | 2017-09-30 | 2017-07-01 | 2017-04-01 | 2016-12-31 | 2016-09-24 | 2016-06-25 | 2016-03-26 | 2015-12-26 | 2015-09-26 | 2015-06-27 | 2015-03-28 | 2014-12-27 | 2014-09-27 | 2014-06-28 | 2014-03-29 | 2013-12-28 | 2013-09-28 | 2013-06-29 | 2013-03-30 | 2012-12-29 | 2012-09-29 | 2012-06-30 | 2012-03-31 | 2011-12-31 | 2011-09-24 | 2011-06-25 | 2011-03-26 | 2010-12-25 | 2010-09-25 | 2010-06-26 | ||
|---|---|---|---|---|---|---|---|---|---|---|---|---|---|---|---|---|---|---|---|---|---|---|---|---|---|---|---|---|---|---|---|---|---|---|---|---|---|---|---|---|---|---|---|---|---|---|---|---|---|---|---|---|---|---|
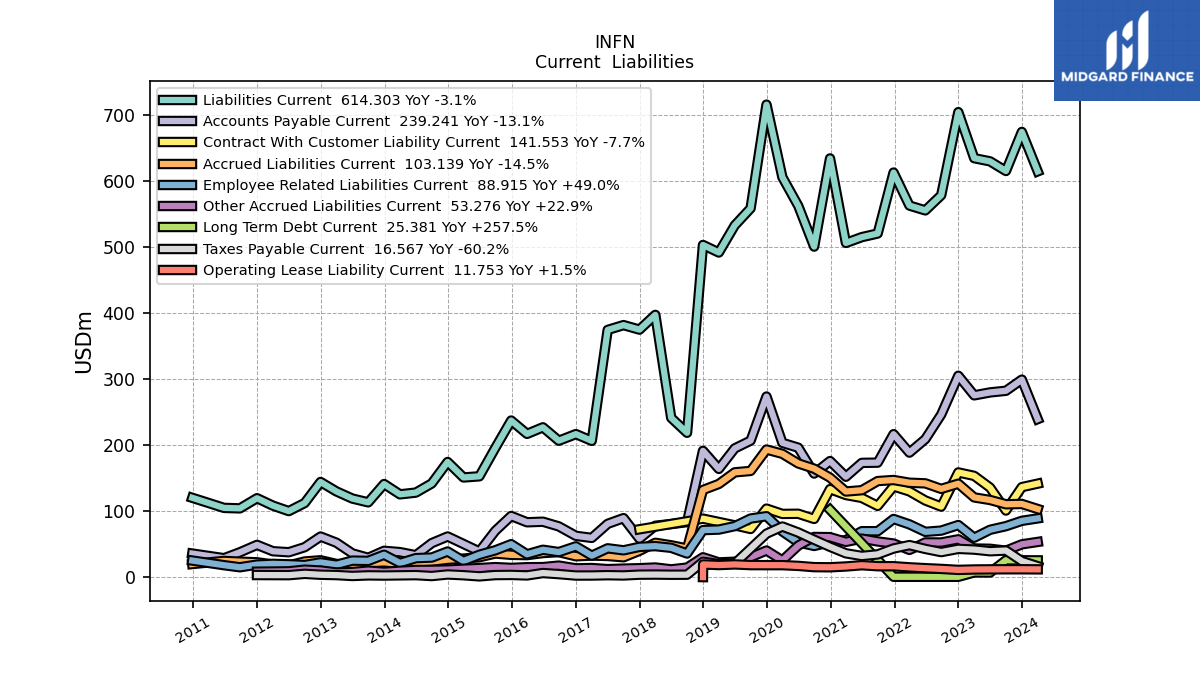
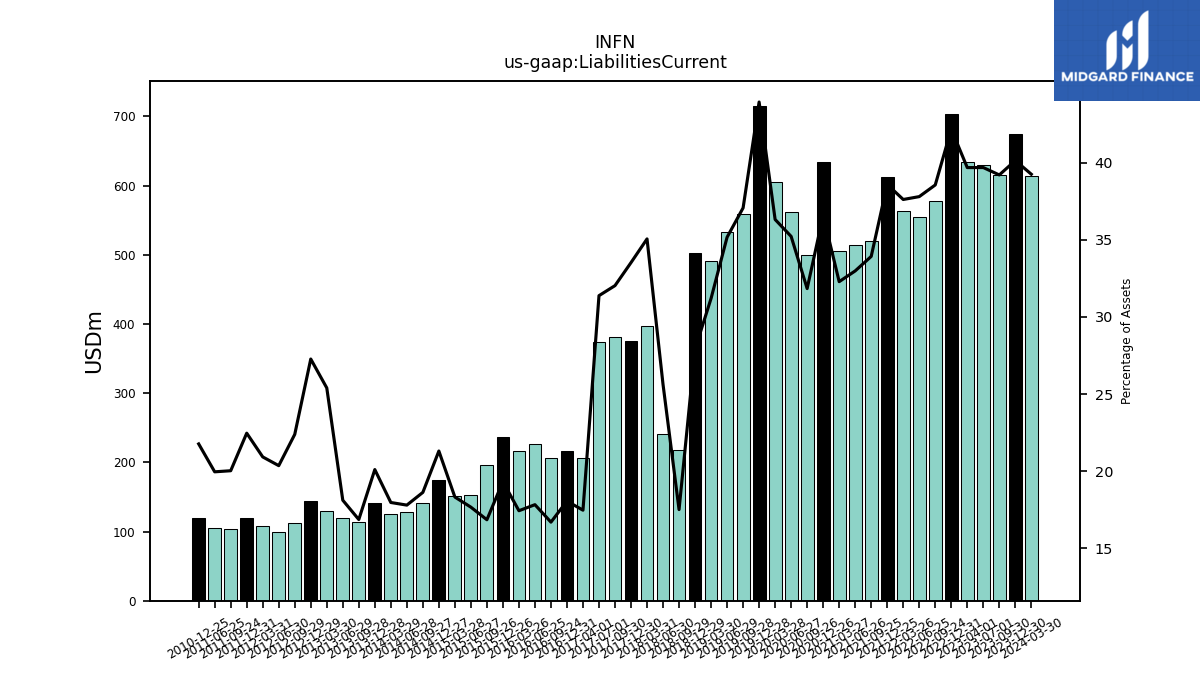
| Liabilities Current | 629.41 | 634.23 | 703.94 | 578.18 | 555.18 | 562.50 | 612.49 | 520.19 | 514.71 | 505.93 | 633.89 | 500.33 | 562.05 | 605.44 | 715.32 | 558.33 | 532.43 | 491.43 | 502.87 | 218.51 | 241.10 | 397.07 | 374.68 | 381.52 | 374.24 | 206.30 | 216.53 | 206.53 | 226.82 | 216.87 | 237.04 | 195.49 | 152.61 | 150.86 | 174.33 | 141.80 | 127.97 | 125.31 | 140.95 | 113.19 | 118.96 | 129.74 | 144.05 | 112.19 | 99.94 | 108.22 | 119.47 | 104.09 | 104.79 | NA | 120.08 | NA | NA | |
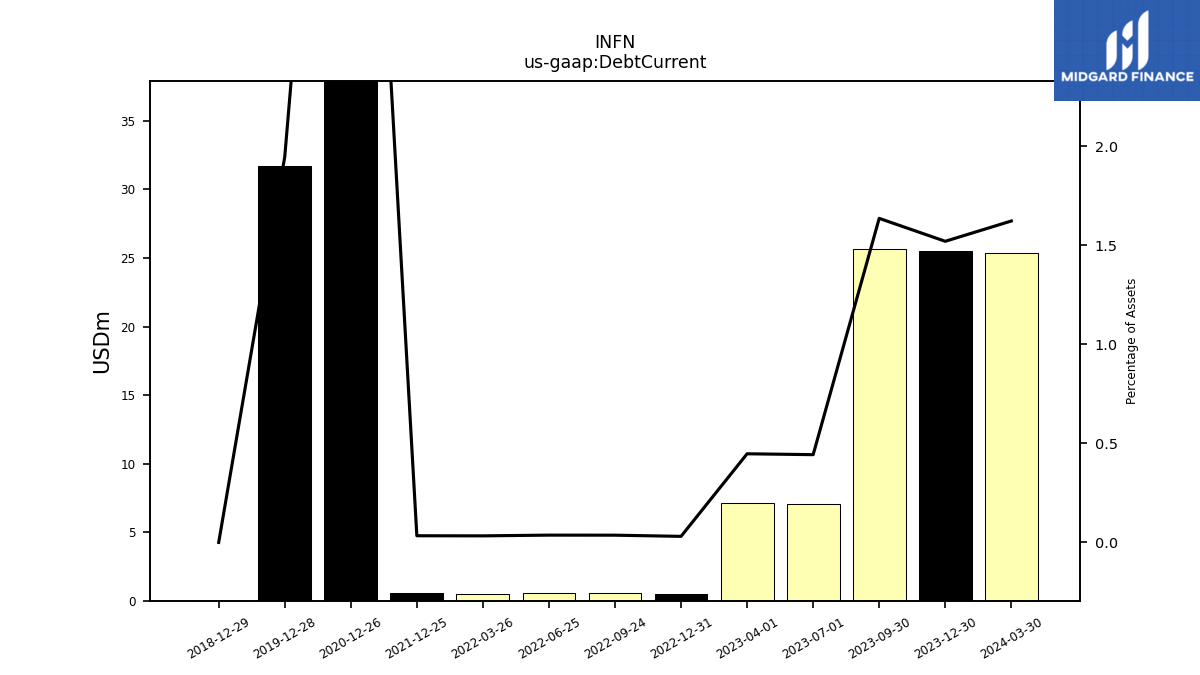
| Debt Current | 7.02 | 7.15 | 0.51 | 0.55 | 0.54 | 0.49 | 0.53 | NA | NA | NA | 101.98 | NA | NA | NA | 31.67 | NA | NA | NA | 0.00 | NA | NA | NA | NA | NA | NA | NA | NA | NA | NA | NA | NA | NA | NA | NA | NA | NA | NA | NA | NA | NA | NA | NA | NA | NA | NA | NA | NA | NA | NA | NA | NA | NA | NA | |
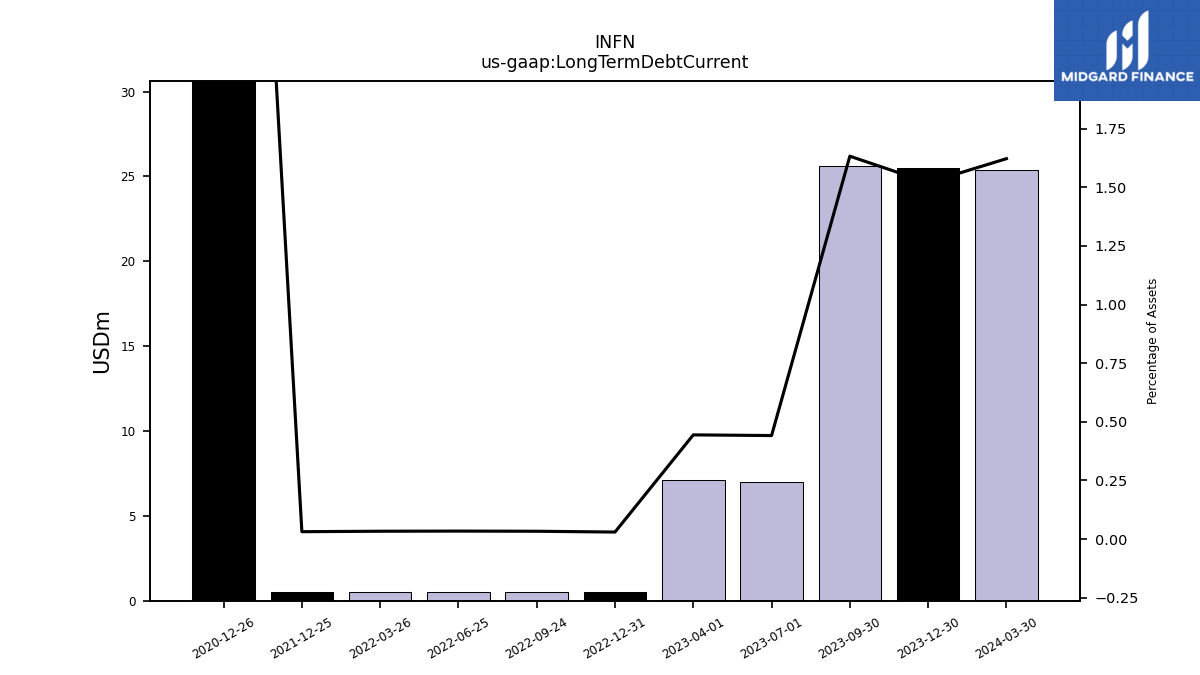
| Long Term Debt Current | 7.00 | 7.10 | 0.50 | 0.50 | 0.50 | 0.50 | 0.50 | NA | NA | NA | 102.00 | NA | NA | NA | NA | NA | NA | NA | NA | NA | NA | NA | NA | NA | NA | NA | NA | NA | NA | NA | NA | NA | NA | NA | NA | NA | NA | NA | NA | NA | NA | NA | NA | NA | NA | NA | NA | NA | NA | NA | NA | NA | NA | |
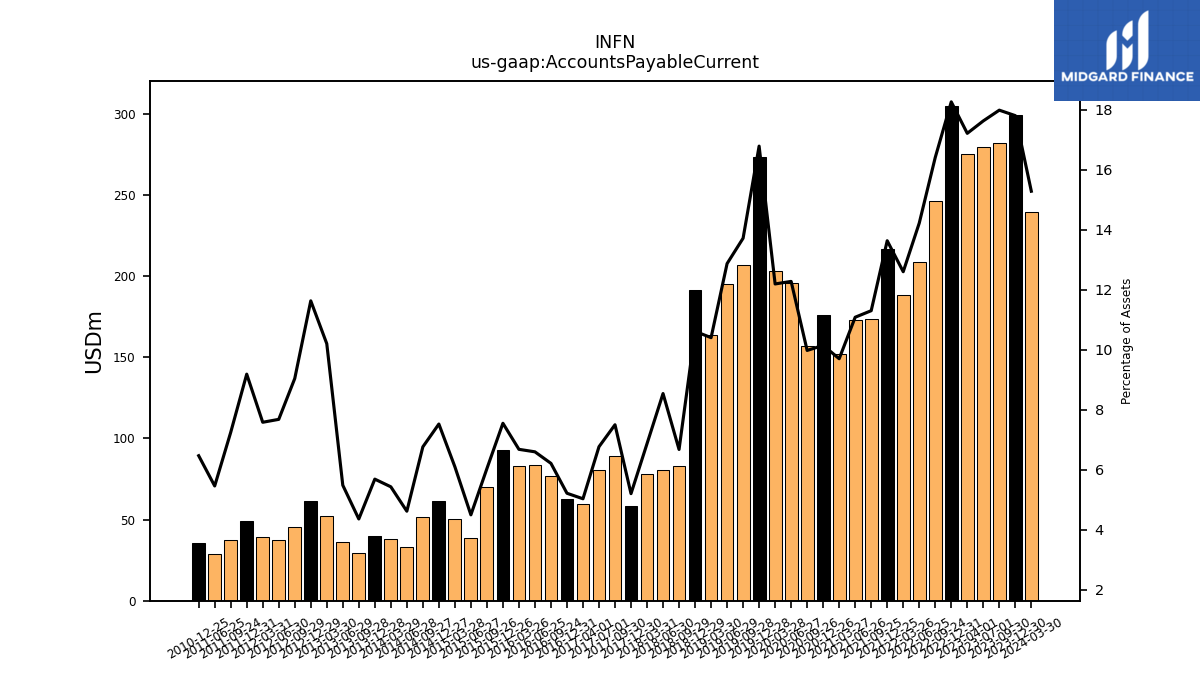
| Accounts Payable Current | 279.64 | 275.18 | 304.88 | 246.12 | 208.88 | 188.46 | 216.40 | 173.30 | 172.96 | 151.98 | 175.76 | 156.78 | 195.95 | 203.28 | 273.40 | 206.64 | 194.88 | 163.83 | 191.19 | 83.25 | 80.34 | 77.78 | 58.12 | 89.31 | 80.68 | 59.37 | 62.49 | 76.79 | 83.88 | 83.03 | 92.55 | 69.98 | 38.81 | 50.18 | 61.53 | 51.46 | 33.16 | 37.84 | 39.84 | 29.22 | 35.98 | 52.10 | 61.43 | 45.29 | 37.68 | 39.20 | 48.84 | 37.64 | 28.64 | NA | 35.66 | NA | NA | |
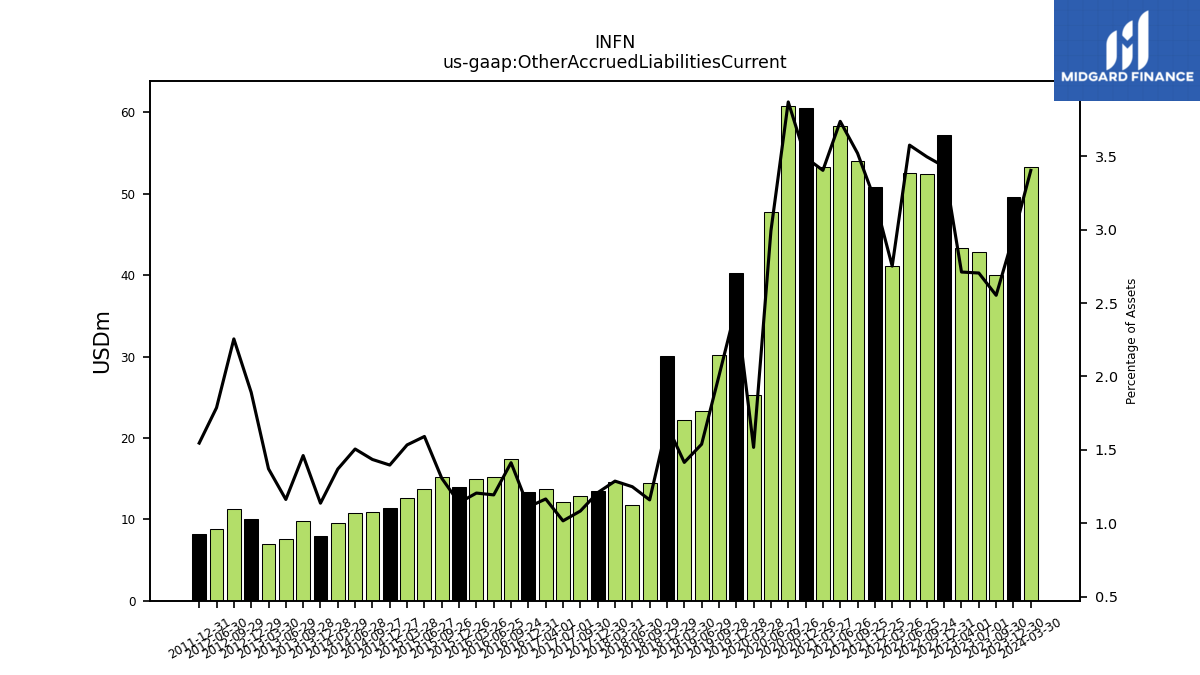
| Other Accrued Liabilities Current | 42.90 | 43.34 | 57.26 | 52.44 | 52.53 | 41.15 | 50.84 | 53.99 | 58.34 | 53.35 | 60.50 | 60.83 | 47.75 | 25.28 | 40.29 | 30.17 | 23.29 | 22.27 | 30.04 | 14.45 | 11.74 | 14.57 | 13.50 | 12.89 | 12.11 | 13.75 | 13.31 | 17.46 | 15.17 | 14.98 | 13.97 | 15.15 | 13.74 | 12.62 | 11.42 | 10.91 | 10.82 | 9.54 | 7.96 | 9.80 | 7.62 | 7.00 | 9.99 | 11.30 | 8.77 | NA | 8.22 | NA | NA | NA | NA | NA | NA | |
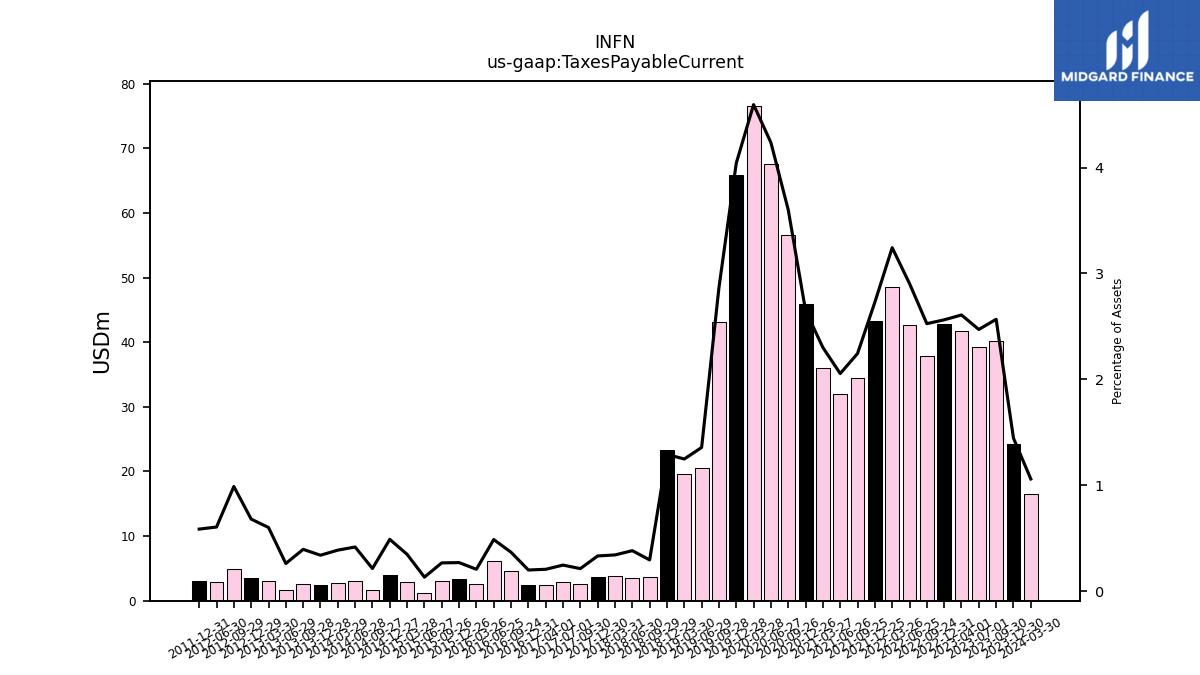
| Taxes Payable Current | 39.19 | 41.68 | 42.76 | 37.87 | 42.66 | 48.50 | 43.31 | 34.40 | 32.05 | 36.04 | 45.88 | 56.58 | 67.58 | 76.59 | 65.81 | 43.17 | 20.53 | 19.64 | 23.25 | 3.67 | 3.59 | 3.86 | 3.71 | 2.52 | 2.92 | 2.42 | 2.38 | 4.53 | 6.19 | 2.56 | 3.29 | 3.08 | 1.14 | 2.85 | 3.99 | 1.62 | 2.99 | 2.69 | 2.37 | 2.64 | 1.71 | 3.07 | 3.59 | 4.95 | 2.97 | NA | 3.11 | NA | NA | NA | NA | NA | NA | |
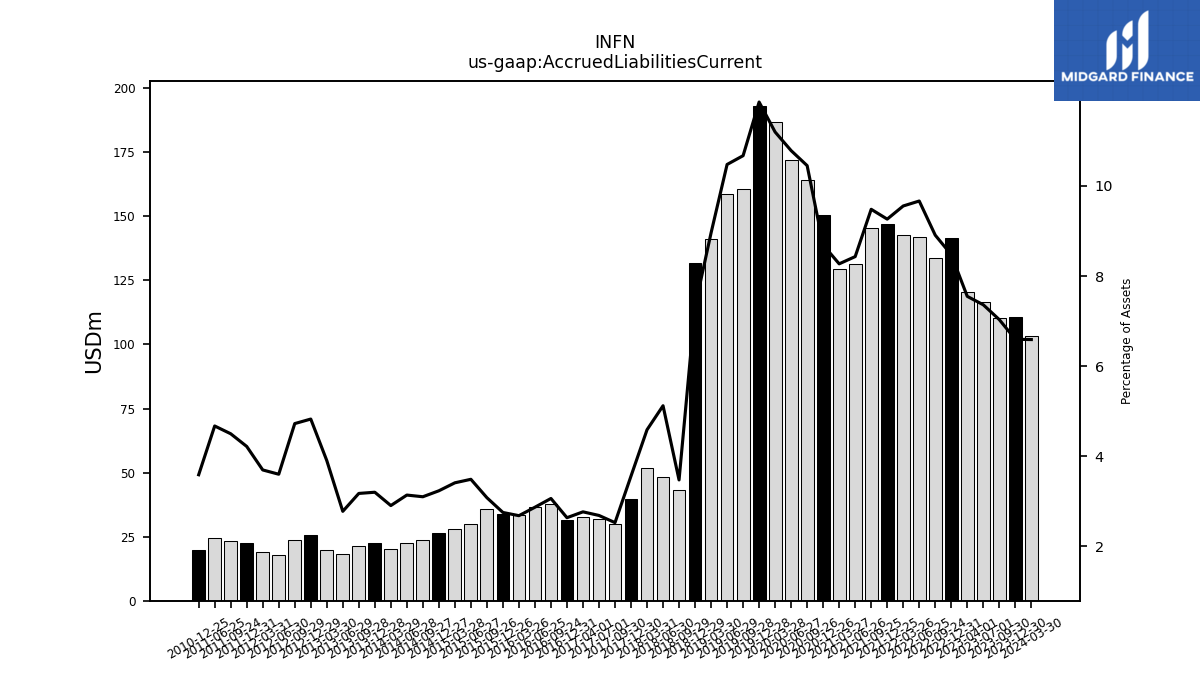
| Accrued Liabilities Current | 116.77 | 120.66 | 141.45 | 133.58 | 141.97 | 142.90 | 147.03 | 145.39 | 131.57 | 129.60 | 150.55 | 164.23 | 172.10 | 186.67 | 193.17 | 160.75 | 158.62 | 141.09 | 131.89 | 43.32 | 48.18 | 51.95 | 39.78 | 30.08 | 32.02 | 32.64 | 31.58 | 37.86 | 36.47 | 33.32 | 33.74 | 35.70 | 30.11 | 28.06 | 26.44 | 23.59 | 22.55 | 20.24 | 22.43 | 21.29 | 18.22 | 19.94 | 25.48 | 23.67 | 17.67 | 19.11 | 22.42 | 23.37 | 24.52 | NA | 19.79 | NA | NA | |
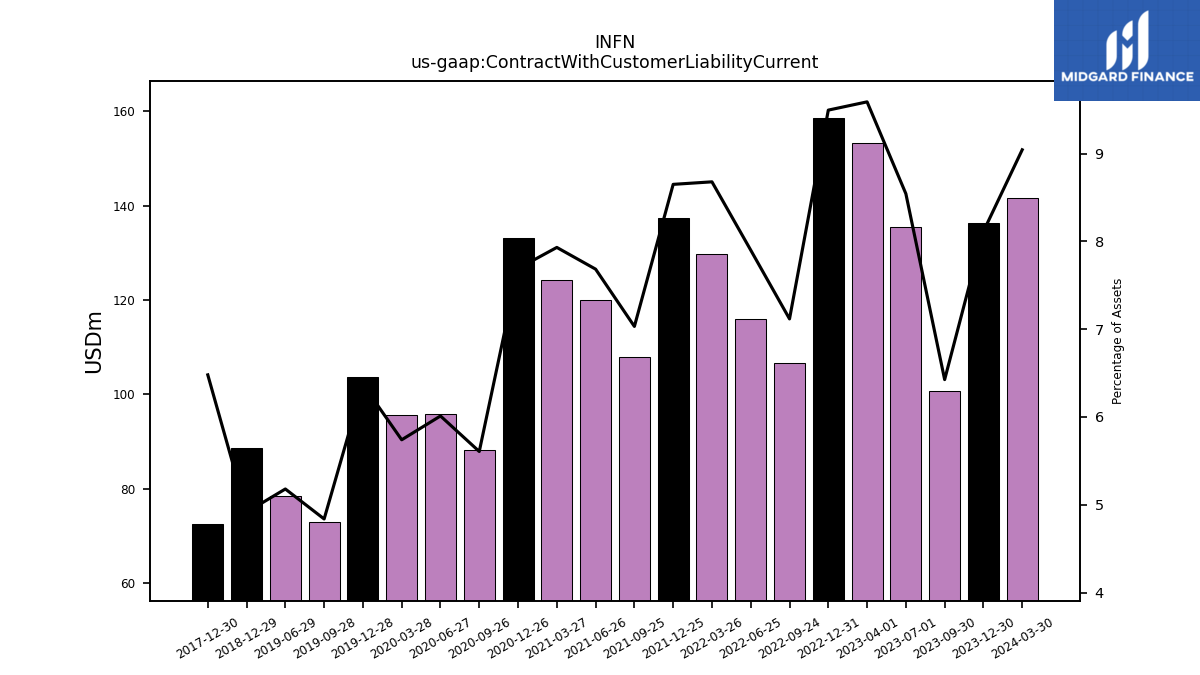
| Contract With Customer Liability Current | 135.51 | 153.29 | 158.50 | 106.74 | 116.04 | 129.80 | 137.30 | 107.83 | 119.91 | 124.28 | 133.25 | 88.11 | 95.93 | 95.69 | 103.75 | 72.87 | 78.42 | NA | 88.53 | NA | NA | NA | 72.42 | NA | NA | NA | NA | NA | NA | NA | NA | NA | NA | NA | NA | NA | NA | NA | NA | NA | NA | NA | NA | NA | NA | NA | NA | NA | NA | NA | NA | NA | NA |
| 2023-07-01 | 2023-04-01 | 2022-12-31 | 2022-09-24 | 2022-06-25 | 2022-03-26 | 2021-12-25 | 2021-09-25 | 2021-06-26 | 2021-03-27 | 2020-12-26 | 2020-09-26 | 2020-06-27 | 2020-03-28 | 2019-12-28 | 2019-09-28 | 2019-06-29 | 2019-03-30 | 2018-12-29 | 2018-09-29 | 2018-06-30 | 2018-03-31 | 2017-12-30 | 2017-09-30 | 2017-07-01 | 2017-04-01 | 2016-12-31 | 2016-09-24 | 2016-06-25 | 2016-03-26 | 2015-12-26 | 2015-09-26 | 2015-06-27 | 2015-03-28 | 2014-12-27 | 2014-09-27 | 2014-06-28 | 2014-03-29 | 2013-12-28 | 2013-09-28 | 2013-06-29 | 2013-03-30 | 2012-12-29 | 2012-09-29 | 2012-06-30 | 2012-03-31 | 2011-12-31 | 2011-09-24 | 2011-06-25 | 2011-03-26 | 2010-12-25 | 2010-09-25 | 2010-06-26 | ||
|---|---|---|---|---|---|---|---|---|---|---|---|---|---|---|---|---|---|---|---|---|---|---|---|---|---|---|---|---|---|---|---|---|---|---|---|---|---|---|---|---|---|---|---|---|---|---|---|---|---|---|---|---|---|---|
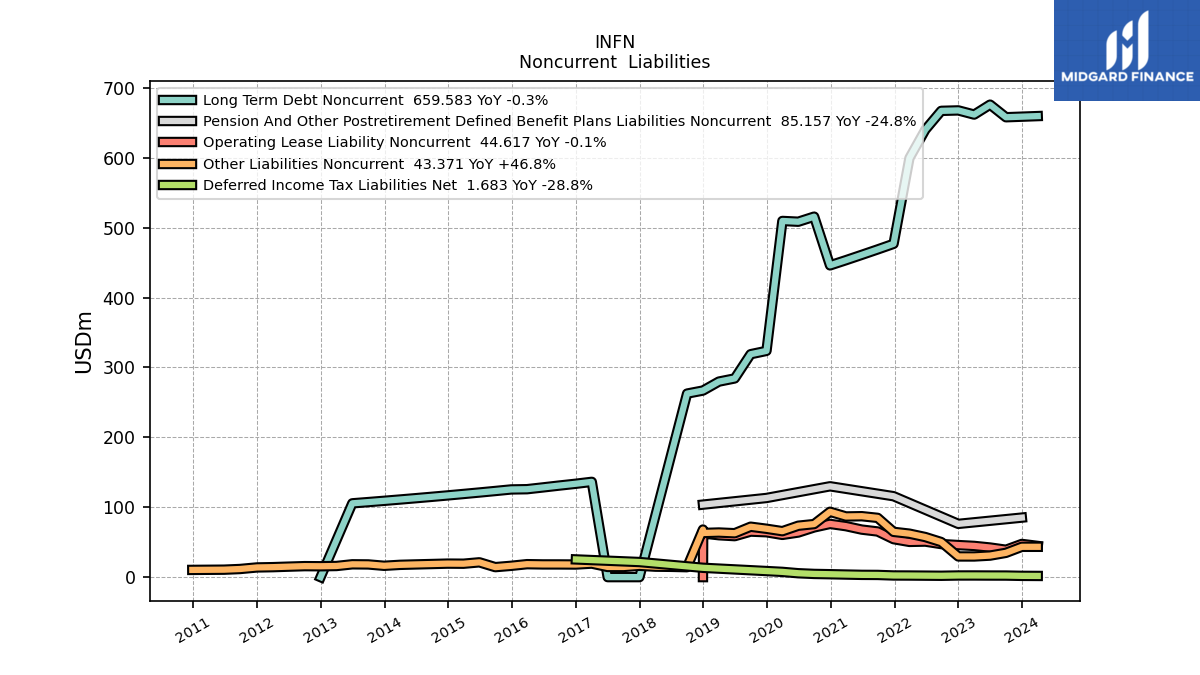
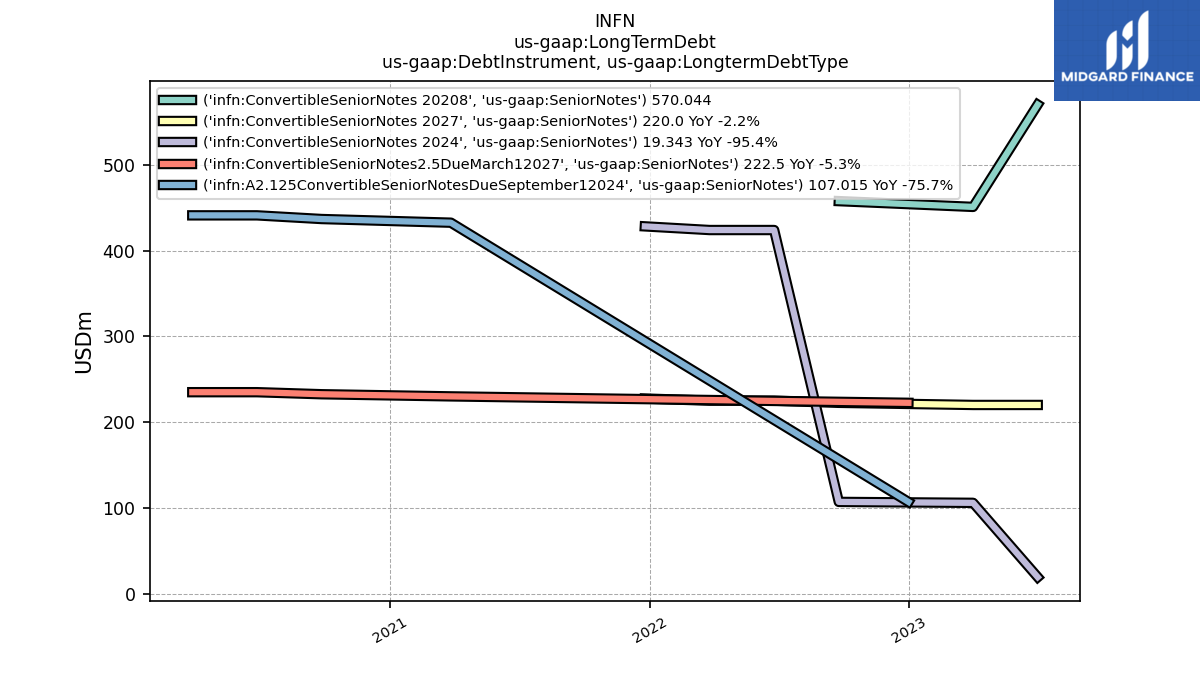
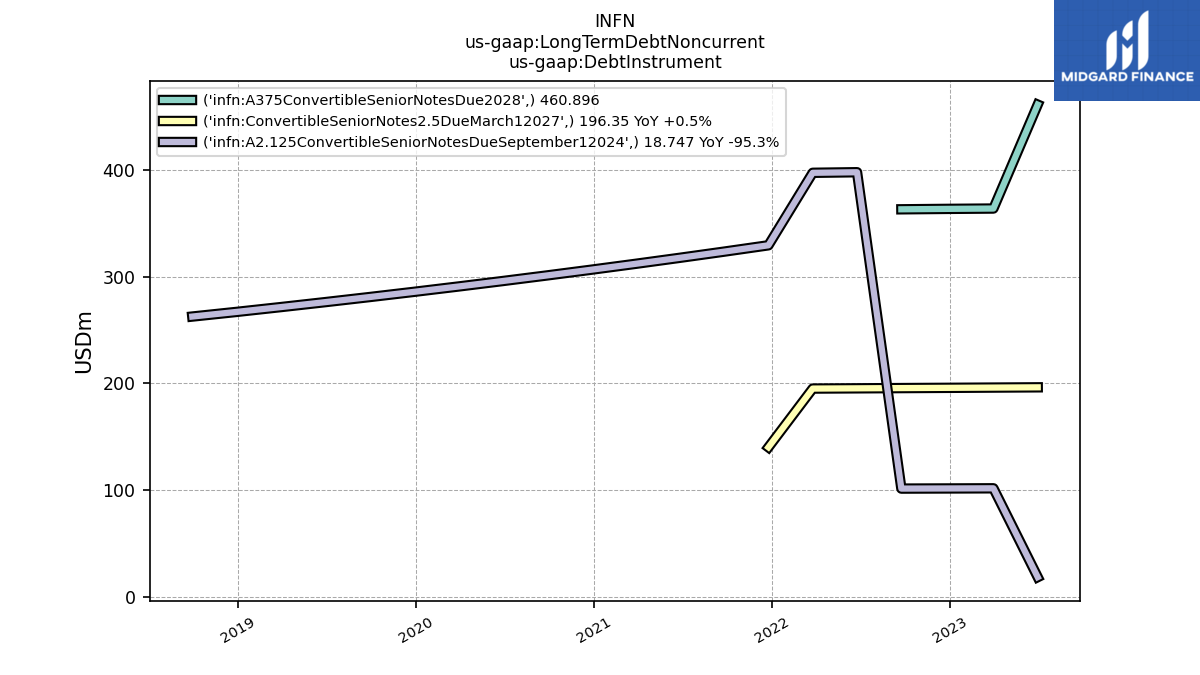
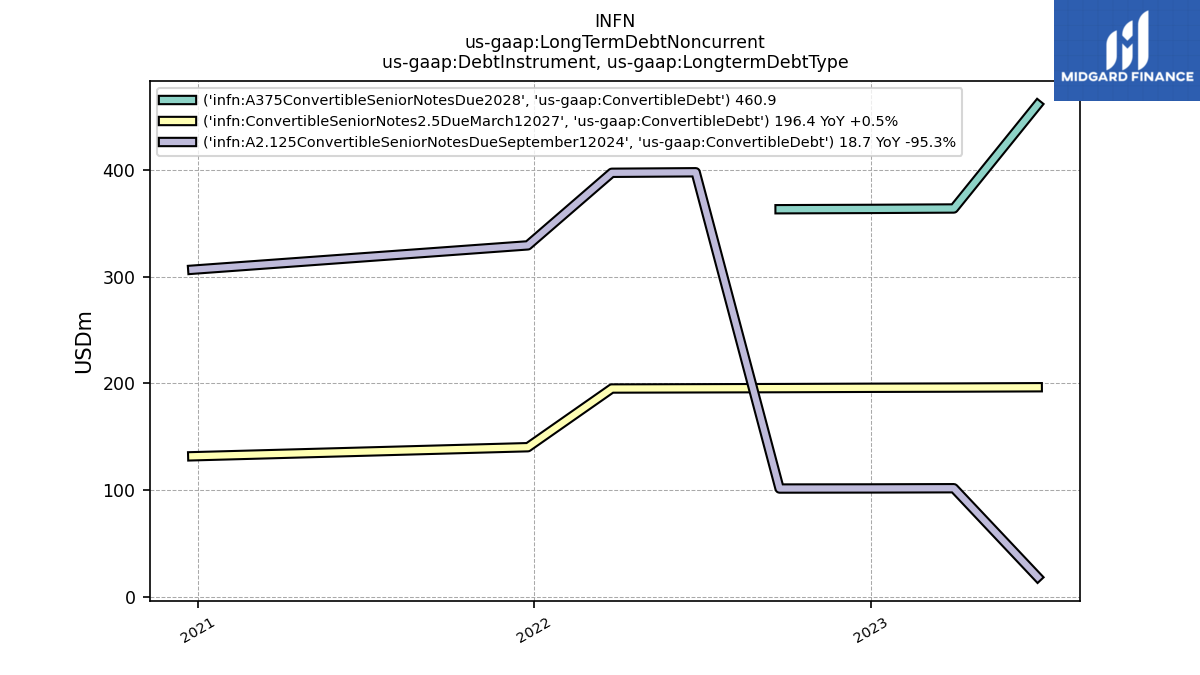
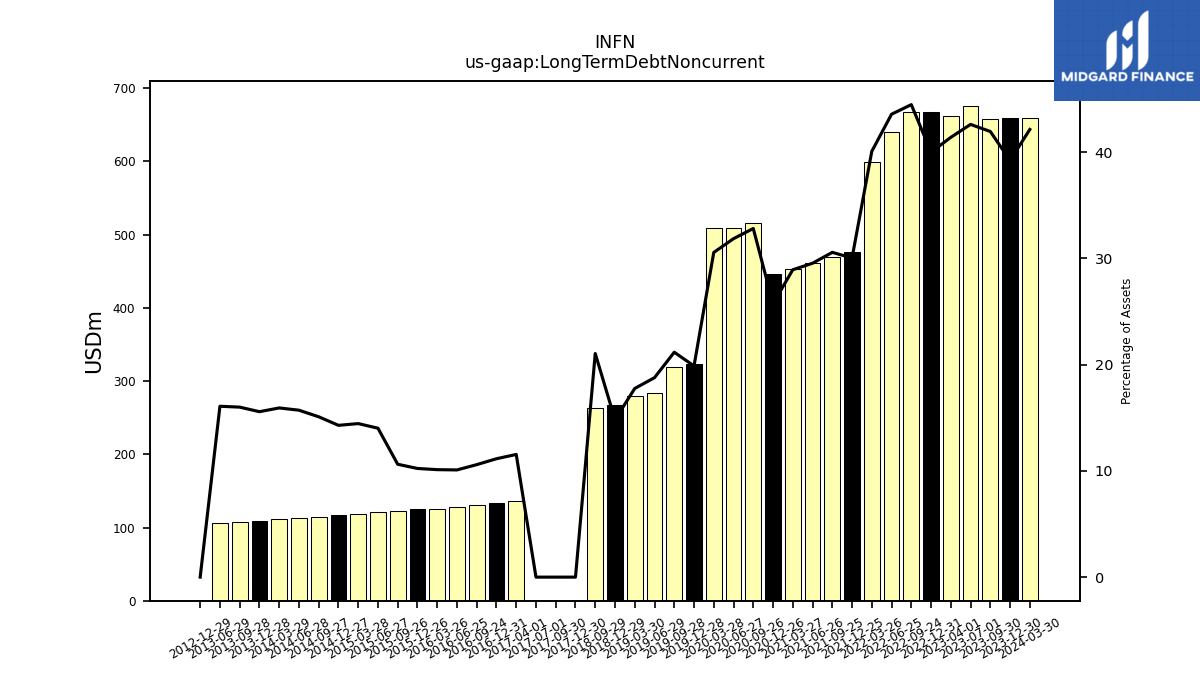
| Long Term Debt Noncurrent | 675.99 | 661.74 | 667.72 | 667.07 | 640.08 | 599.47 | 476.79 | 468.84 | 461.08 | 453.43 | 446.00 | 515.74 | 508.46 | 509.56 | 323.68 | 318.92 | 284.27 | 279.74 | 266.93 | 262.58 | NA | NA | 0.00 | 0.00 | 0.00 | 136.32 | 133.59 | 130.92 | 128.33 | 125.80 | 125.44 | 123.22 | 121.06 | 118.95 | 116.89 | 114.89 | 112.93 | 111.02 | 109.16 | 107.35 | 105.58 | NA | 0.00 | NA | NA | NA | NA | NA | NA | NA | NA | NA | NA | |
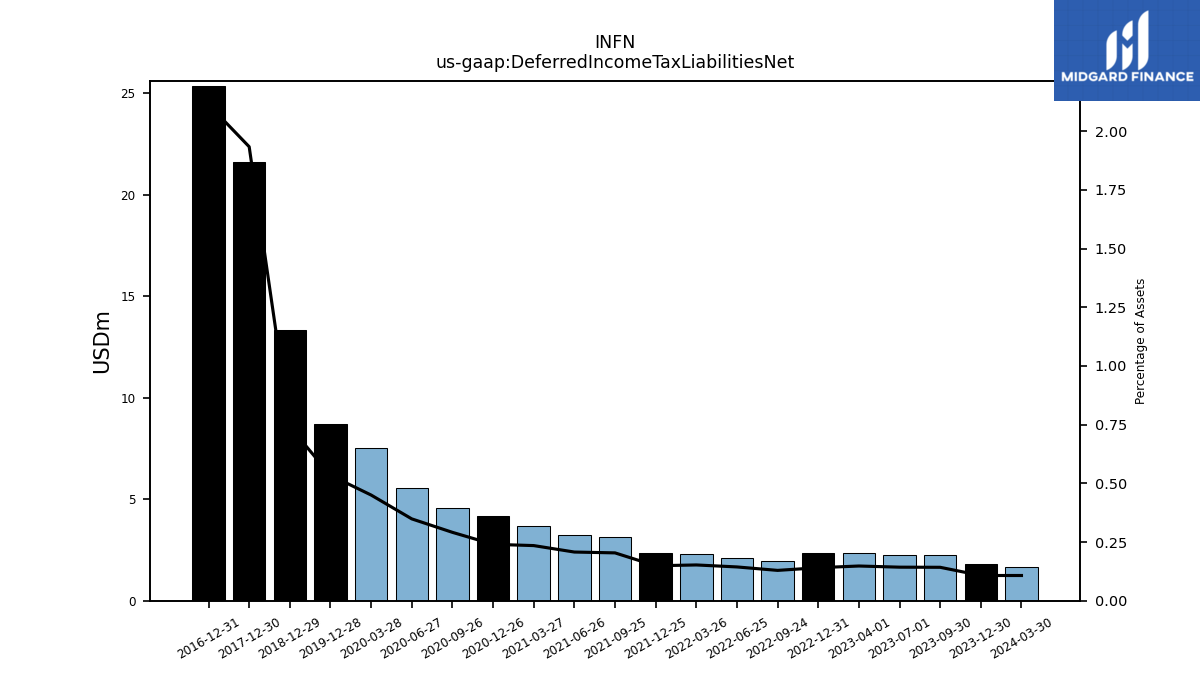
| Deferred Income Tax Liabilities Net | 2.27 | 2.37 | 2.35 | 1.94 | 2.12 | 2.28 | 2.36 | 3.13 | 3.24 | 3.68 | 4.16 | 4.58 | 5.56 | 7.50 | 8.70 | NA | NA | NA | 13.35 | NA | NA | NA | 21.61 | NA | NA | NA | 25.33 | NA | NA | NA | NA | NA | NA | NA | NA | NA | NA | NA | NA | NA | NA | NA | NA | NA | NA | NA | NA | NA | NA | NA | NA | NA | NA | |
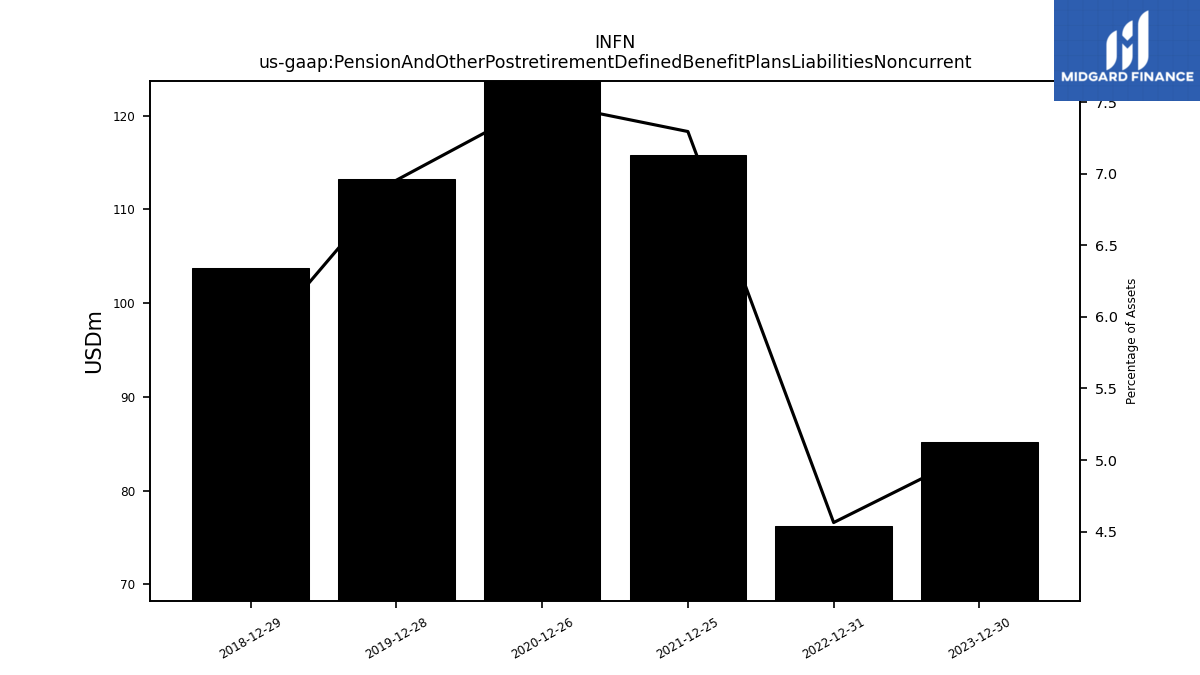
| Pension And Other Postretirement Defined Benefit Plans Liabilities Noncurrent | NA | NA | 76.17 | NA | NA | NA | 115.77 | NA | NA | NA | 129.94 | NA | NA | NA | 113.23 | NA | NA | NA | 103.72 | NA | NA | NA | NA | NA | NA | NA | NA | NA | NA | NA | NA | NA | NA | NA | NA | NA | NA | NA | NA | NA | NA | NA | NA | NA | NA | NA | NA | NA | NA | NA | NA | NA | NA | |
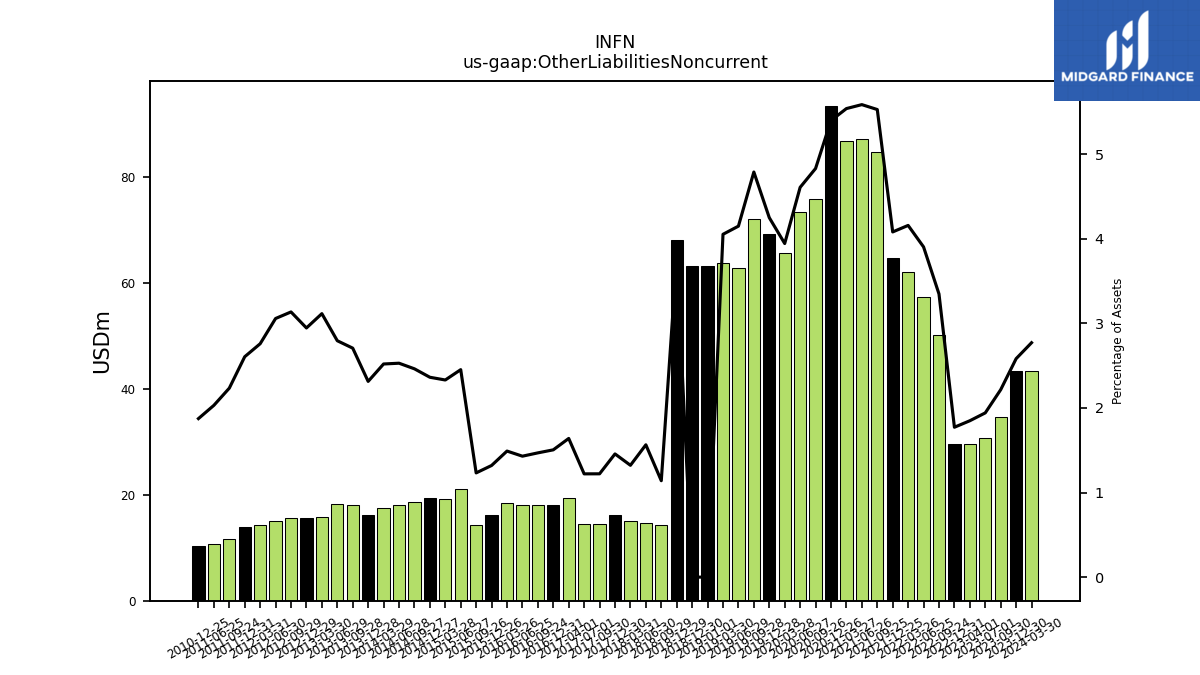
| Other Liabilities Noncurrent | 30.80 | 29.55 | 29.57 | 50.20 | 57.33 | 62.18 | 64.77 | 84.76 | 87.16 | 86.79 | 93.51 | 75.91 | 73.53 | 65.75 | 69.19 | 72.13 | 62.82 | 63.83 | 68.08 | 14.22 | 14.72 | 14.97 | 16.28 | 14.55 | 14.56 | 19.35 | 18.04 | 18.16 | 18.18 | 18.53 | 16.18 | 14.29 | 21.18 | 19.18 | 19.33 | 18.74 | 18.17 | 17.56 | 16.22 | 18.16 | 18.34 | 15.91 | 15.56 | 15.71 | 15.00 | 14.27 | 13.85 | 11.61 | 10.66 | NA | 10.34 | NA | NA | |
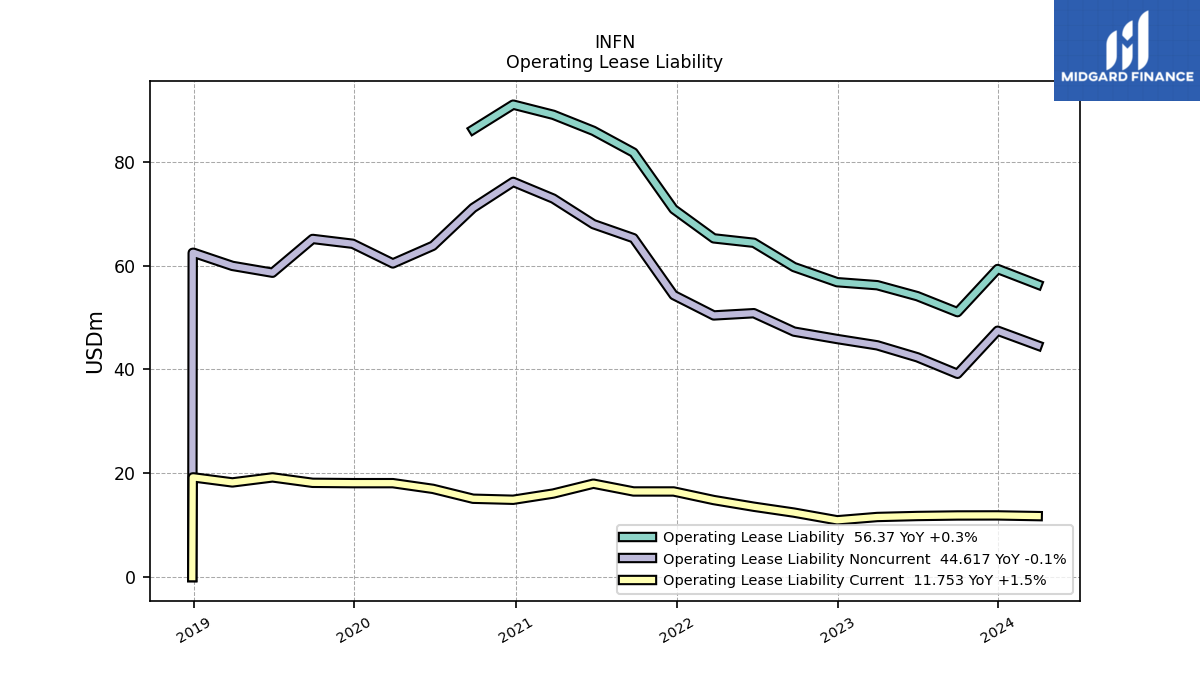
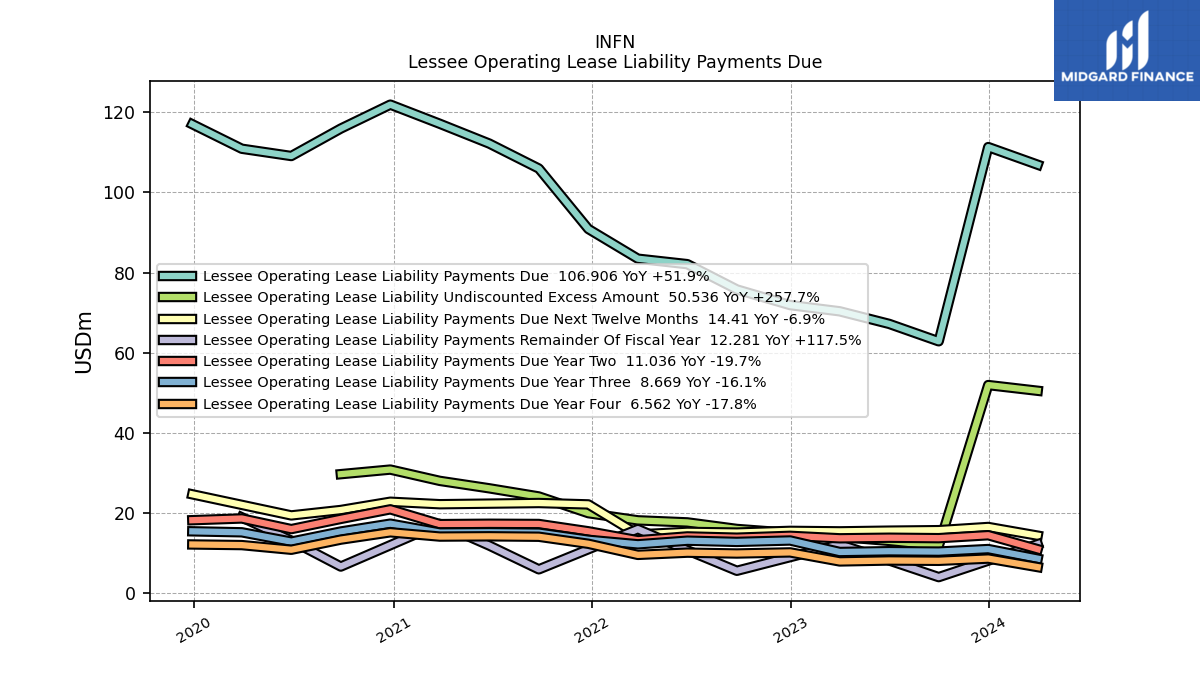
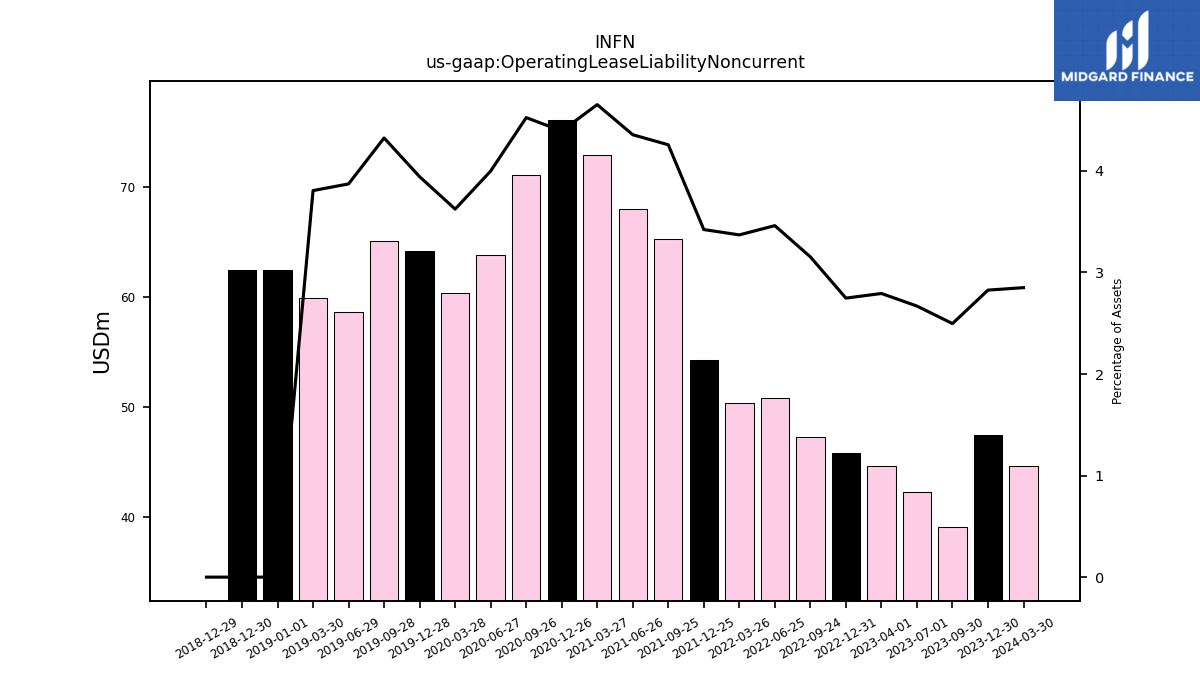
| Operating Lease Liability Noncurrent | 42.34 | 44.65 | 45.86 | 47.29 | 50.84 | 50.40 | 54.33 | 65.29 | 67.98 | 72.91 | 76.13 | 71.11 | 63.82 | 60.42 | 64.21 | 65.14 | 58.63 | 59.95 | 0.00 | NA | NA | NA | NA | NA | NA | NA | NA | NA | NA | NA | NA | NA | NA | NA | NA | NA | NA | NA | NA | NA | NA | NA | NA | NA | NA | NA | NA | NA | NA | NA | NA | NA | NA |
| 2023-07-01 | 2023-04-01 | 2022-12-31 | 2022-09-24 | 2022-06-25 | 2022-03-26 | 2021-12-25 | 2021-09-25 | 2021-06-26 | 2021-03-27 | 2020-12-26 | 2020-09-26 | 2020-06-27 | 2020-03-28 | 2019-12-28 | 2019-09-28 | 2019-06-29 | 2019-03-30 | 2018-12-29 | 2018-09-29 | 2018-06-30 | 2018-03-31 | 2017-12-30 | 2017-09-30 | 2017-07-01 | 2017-04-01 | 2016-12-31 | 2016-09-24 | 2016-06-25 | 2016-03-26 | 2015-12-26 | 2015-09-26 | 2015-06-27 | 2015-03-28 | 2014-12-27 | 2014-09-27 | 2014-06-28 | 2014-03-29 | 2013-12-28 | 2013-09-28 | 2013-06-29 | 2013-03-30 | 2012-12-29 | 2012-09-29 | 2012-06-30 | 2012-03-31 | 2011-12-31 | 2011-09-24 | 2011-06-25 | 2011-03-26 | 2010-12-25 | 2010-09-25 | 2010-06-26 | ||
|---|---|---|---|---|---|---|---|---|---|---|---|---|---|---|---|---|---|---|---|---|---|---|---|---|---|---|---|---|---|---|---|---|---|---|---|---|---|---|---|---|---|---|---|---|---|---|---|---|---|---|---|---|---|---|
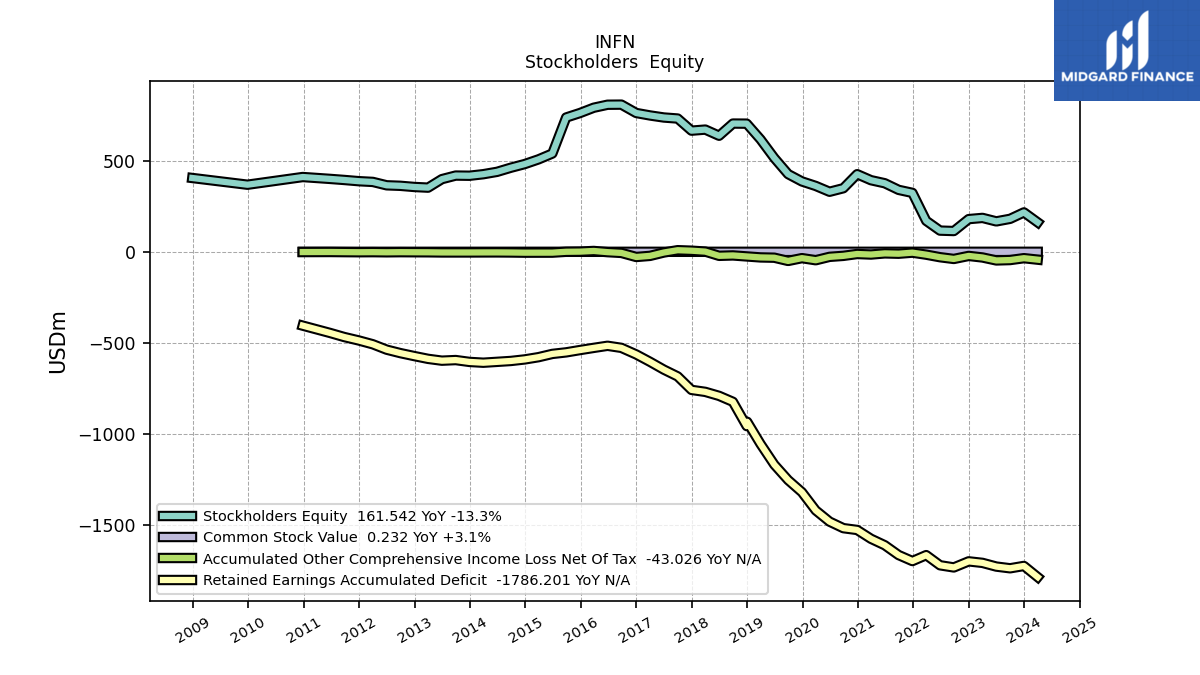
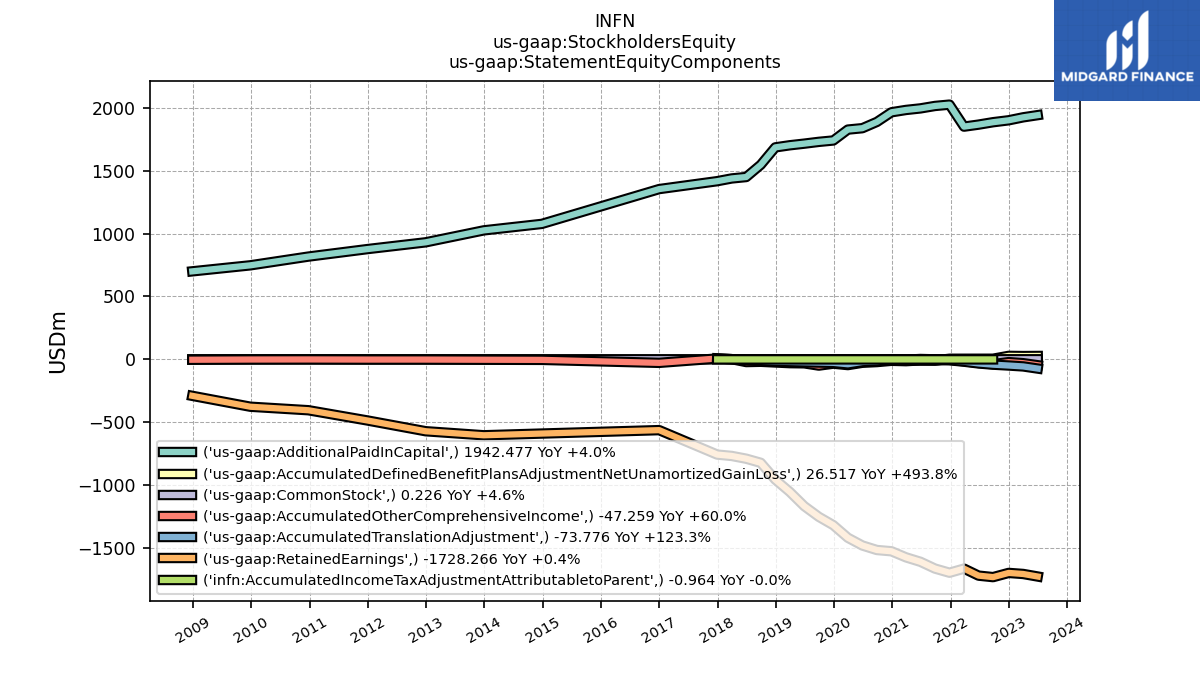
| Stockholders Equity | 167.18 | 186.26 | 179.65 | 114.20 | 116.56 | 170.21 | 323.77 | 340.27 | 376.59 | 393.35 | 426.28 | 349.23 | 329.85 | 361.72 | 386.54 | 426.70 | 515.07 | 617.30 | 703.82 | 704.32 | 637.41 | 671.21 | 665.37 | 731.94 | 737.59 | 748.76 | 762.33 | 808.31 | 807.73 | 791.30 | 762.15 | 737.54 | 539.79 | 507.83 | 481.91 | 461.96 | 439.31 | 426.27 | 417.81 | 418.74 | 399.15 | 352.44 | 356.14 | 362.50 | 365.31 | 383.87 | 387.80 | 394.63 | 400.35 | NA | 410.75 | NA | NA | |
| Stockholders Equity Including Portion Attributable To Noncontrolling Interest | NA | NA | 179.65 | NA | NA | NA | 323.77 | NA | NA | NA | 426.28 | NA | NA | NA | 386.54 | NA | NA | NA | 703.82 | NA | NA | NA | 665.37 | NA | NA | NA | 762.33 | 808.31 | 822.26 | 806.00 | 777.06 | 752.91 | NA | NA | 481.91 | NA | NA | NA | 417.81 | NA | NA | NA | 356.14 | NA | NA | NA | NA | NA | NA | NA | NA | NA | NA | |
| Common Stock Value | 0.23 | 0.23 | 0.22 | 0.22 | 0.22 | 0.21 | 0.21 | 0.21 | 0.21 | 0.20 | 0.20 | 0.19 | 0.19 | 0.18 | 0.18 | 0.18 | 0.18 | 0.18 | 0.17 | 0.15 | 0.15 | 0.15 | 0.15 | 0.15 | 0.15 | 0.15 | 0.14 | 0.14 | 0.14 | 0.14 | 0.14 | 0.14 | 0.13 | 0.13 | 0.13 | 0.12 | 0.12 | 0.12 | 0.12 | 0.12 | 0.12 | 0.12 | 0.11 | 0.11 | 0.11 | 0.11 | 0.11 | 0.11 | 0.11 | NA | 0.10 | NA | NA | |
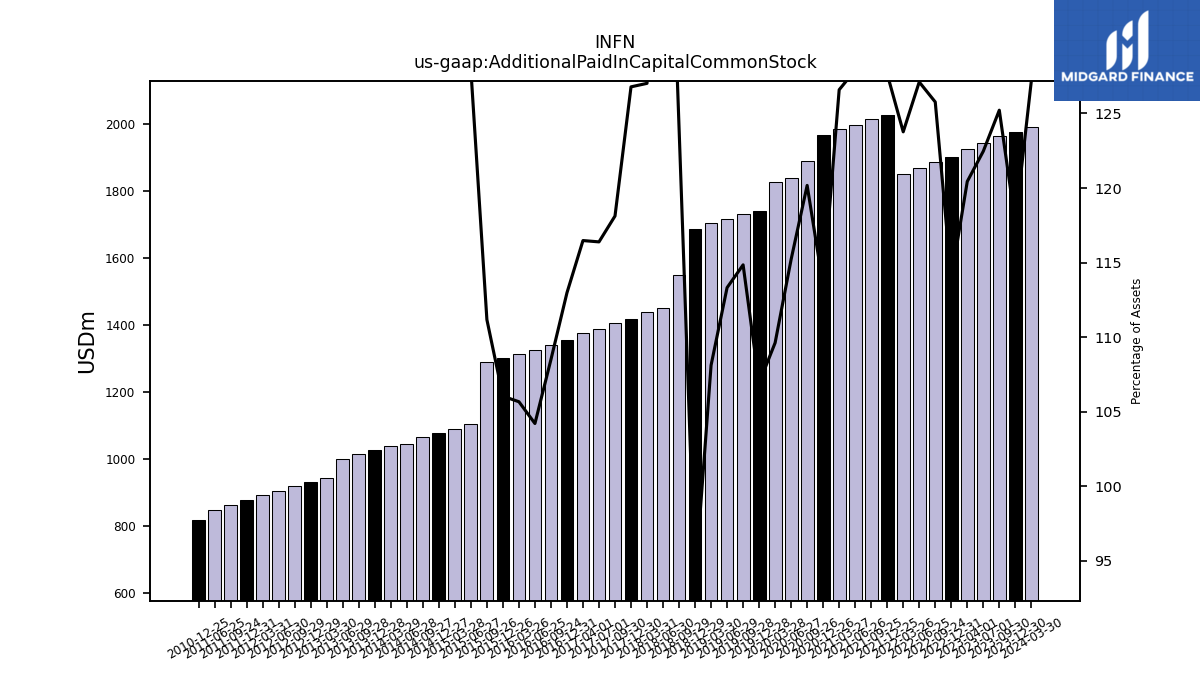
| Additional Paid In Capital Common Stock | 1942.48 | 1925.06 | 1901.49 | 1886.17 | 1867.00 | 1851.00 | 2026.10 | 2015.44 | 1996.09 | 1983.60 | 1965.24 | 1888.49 | 1838.68 | 1827.48 | 1740.88 | 1729.88 | 1715.66 | 1702.71 | 1685.92 | 1547.45 | 1450.14 | 1438.70 | 1417.04 | 1406.94 | 1388.05 | 1374.83 | 1354.08 | 1341.50 | 1325.24 | 1313.78 | 1300.30 | 1289.09 | 1104.67 | 1090.68 | 1077.22 | 1064.72 | 1046.38 | 1038.22 | 1025.66 | 1016.40 | 1000.11 | 942.49 | 930.62 | 920.48 | 904.96 | 893.13 | 876.93 | 863.80 | 847.05 | NA | 817.20 | NA | NA | |
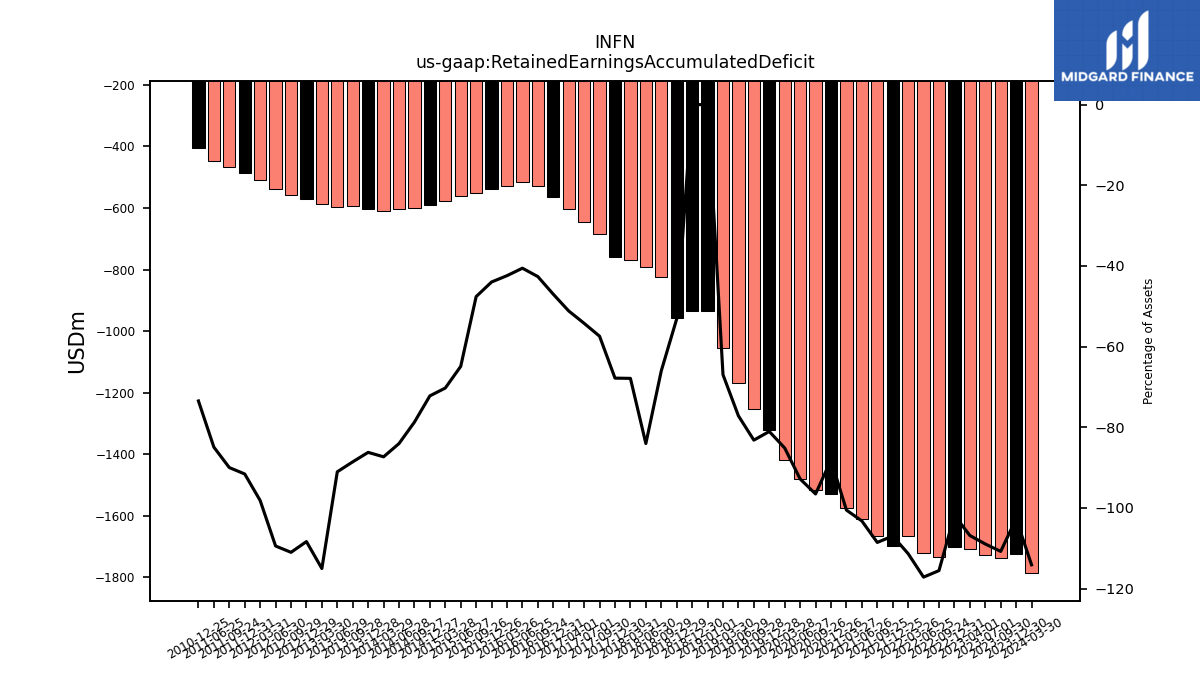
| Retained Earnings Accumulated Deficit | -1728.27 | -1708.00 | -1699.59 | -1733.05 | -1721.12 | -1665.40 | -1698.04 | -1664.97 | -1611.18 | -1575.59 | -1527.26 | -1517.34 | -1481.44 | -1419.81 | -1319.89 | -1253.30 | -1168.53 | -1054.87 | -956.97 | -823.50 | -790.89 | -768.96 | -758.08 | -684.10 | -646.87 | -604.03 | -563.58 | -527.32 | -515.91 | -527.40 | -539.41 | -552.04 | -560.55 | -578.46 | -590.83 | -599.24 | -604.08 | -608.86 | -604.49 | -594.31 | -597.65 | -587.64 | -572.37 | -556.28 | -537.20 | -507.65 | -487.04 | -467.69 | -445.88 | NA | -405.29 | NA | NA | |
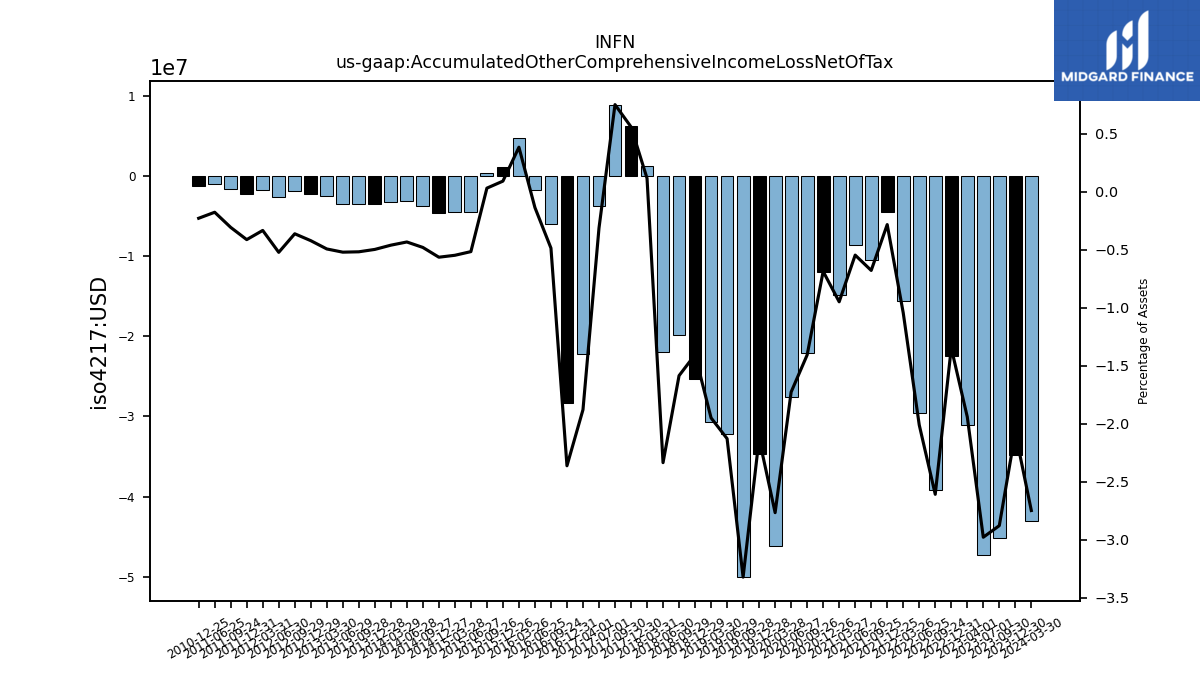
| Accumulated Other Comprehensive Income Loss Net Of Tax | -47.26 | -31.03 | -22.47 | -39.13 | -29.54 | -15.61 | -4.50 | -10.41 | -8.53 | -14.87 | -11.90 | -22.12 | -27.57 | -46.14 | -34.64 | -50.06 | -32.24 | -30.71 | -25.30 | -19.79 | -21.98 | 1.31 | 6.25 | 8.95 | -3.74 | -22.19 | -28.32 | -6.01 | -1.74 | 4.77 | 1.12 | 0.36 | -4.46 | -4.51 | -4.62 | -3.65 | -3.11 | -3.21 | -3.49 | -3.47 | -3.42 | -2.52 | -2.23 | -1.82 | -2.56 | -1.73 | -2.19 | -1.60 | -0.93 | NA | -1.26 | NA | NA | |
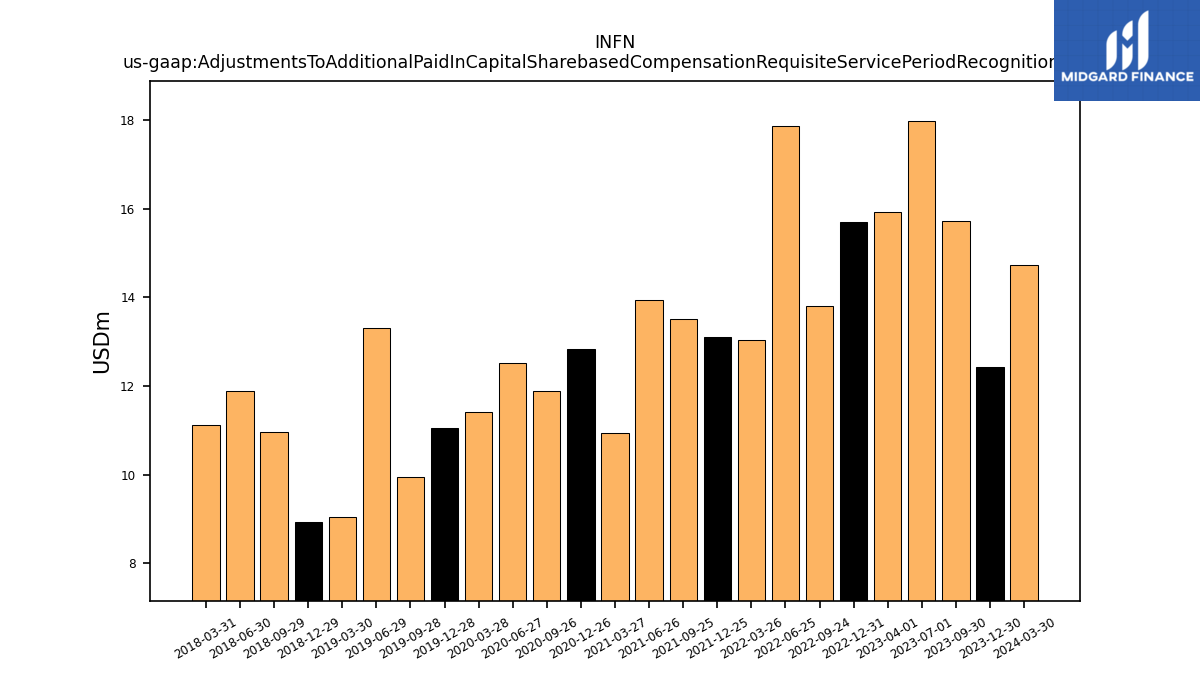
| Adjustments To Additional Paid In Capital Sharebased Compensation Requisite Service Period Recognition Value | 17.98 | 15.94 | 15.69 | 13.81 | 17.86 | 13.04 | 13.11 | 13.52 | 13.95 | 10.95 | 12.84 | 11.88 | 12.51 | 11.41 | 11.04 | 9.95 | 13.30 | 9.06 | 8.94 | 10.97 | 11.88 | 11.11 | NA | NA | NA | NA | NA | NA | NA | NA | NA | NA | NA | NA | NA | NA | NA | NA | NA | NA | NA | NA | NA | NA | NA | NA | NA | NA | NA | NA | NA | NA | NA |
| 2023-07-01 | 2023-04-01 | 2022-12-31 | 2022-09-24 | 2022-06-25 | 2022-03-26 | 2021-12-25 | 2021-09-25 | 2021-06-26 | 2021-03-27 | 2020-12-26 | 2020-09-26 | 2020-06-27 | 2020-03-28 | 2019-12-28 | 2019-09-28 | 2019-06-29 | 2019-03-30 | 2018-12-29 | 2018-09-29 | 2018-06-30 | 2018-03-31 | 2017-12-30 | 2017-09-30 | 2017-07-01 | 2017-04-01 | 2016-12-31 | 2016-09-24 | 2016-06-25 | 2016-03-26 | 2015-12-26 | 2015-09-26 | 2015-06-27 | 2015-03-28 | 2014-12-27 | 2014-09-27 | 2014-06-28 | 2014-03-29 | 2013-12-28 | 2013-09-28 | 2013-06-29 | 2013-03-30 | 2012-12-29 | 2012-09-29 | 2012-06-30 | 2012-03-31 | 2011-12-31 | 2011-09-24 | 2011-06-25 | 2011-03-26 | 2010-12-25 | 2010-09-25 | 2010-06-26 | ||
|---|---|---|---|---|---|---|---|---|---|---|---|---|---|---|---|---|---|---|---|---|---|---|---|---|---|---|---|---|---|---|---|---|---|---|---|---|---|---|---|---|---|---|---|---|---|---|---|---|---|---|---|---|---|---|
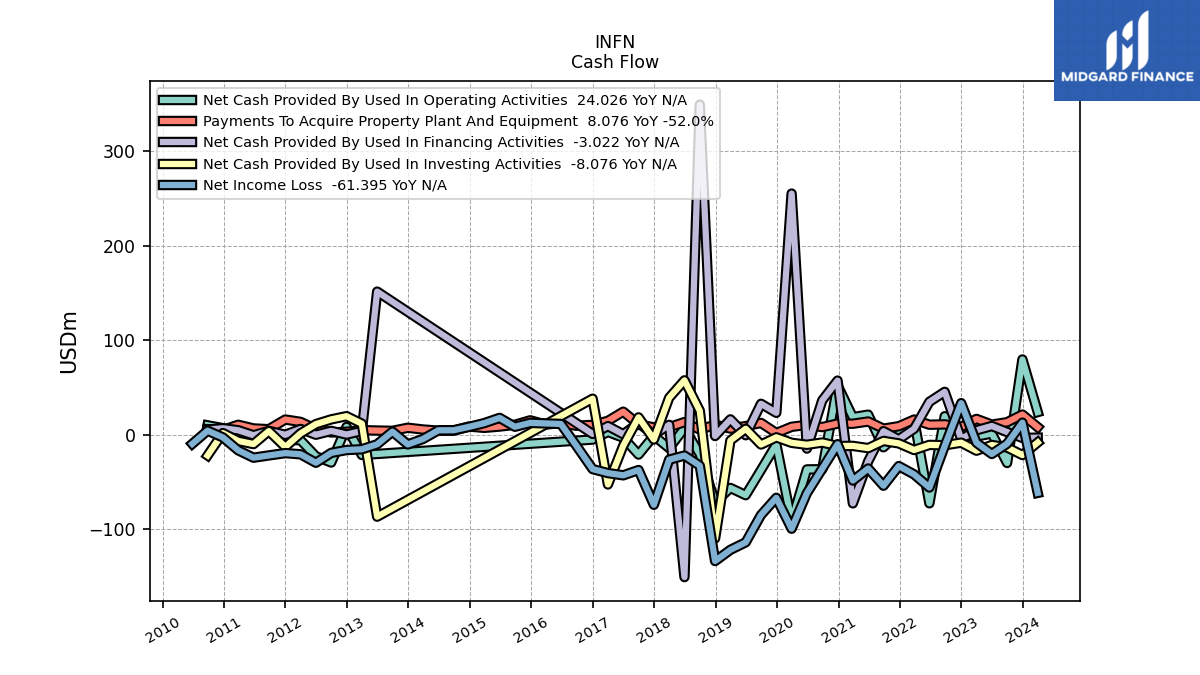
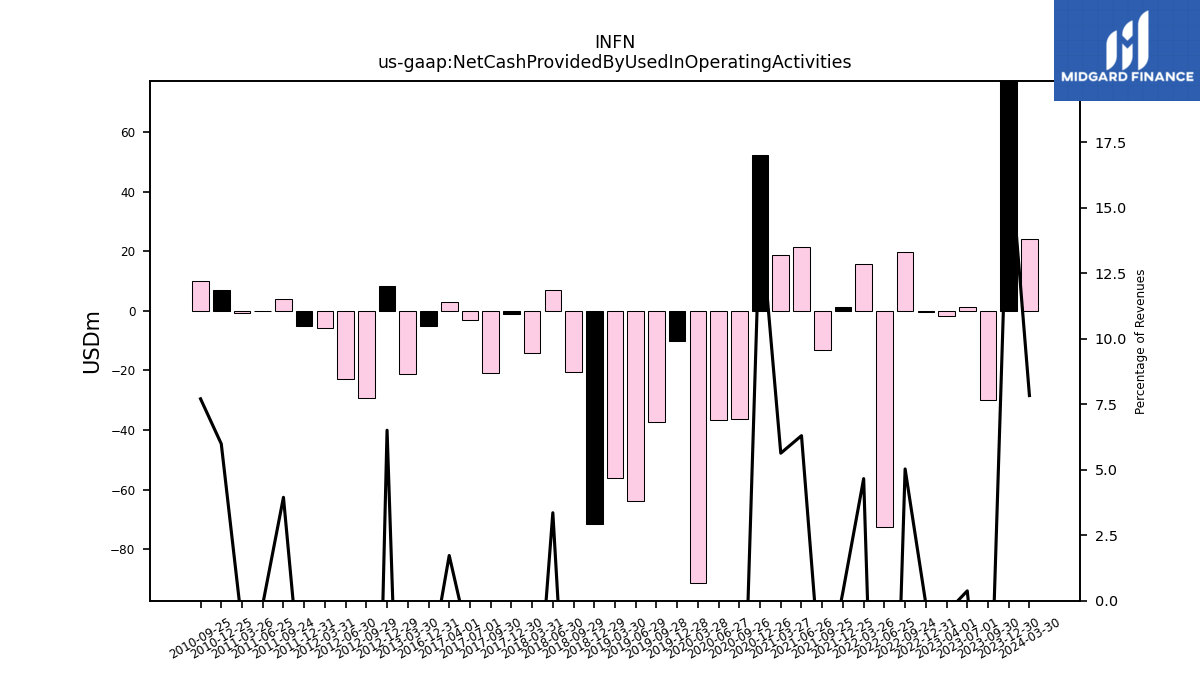
| Net Cash Provided By Used In Operating Activities | 1.42 | -1.77 | -0.56 | 19.64 | -72.42 | 15.79 | 1.37 | -13.18 | 21.30 | 18.63 | 52.22 | -36.43 | -36.57 | -91.52 | -10.19 | -37.19 | -63.81 | -56.15 | -71.55 | -20.41 | 6.99 | -14.11 | -1.01 | -20.90 | -3.05 | 3.03 | -5.03 | NA | NA | NA | NA | NA | NA | NA | NA | NA | NA | NA | NA | NA | NA | -21.30 | 8.33 | -29.30 | -22.74 | -5.76 | -5.08 | 4.11 | -0.14 | -0.85 | 7.01 | 10.02 | NA | |
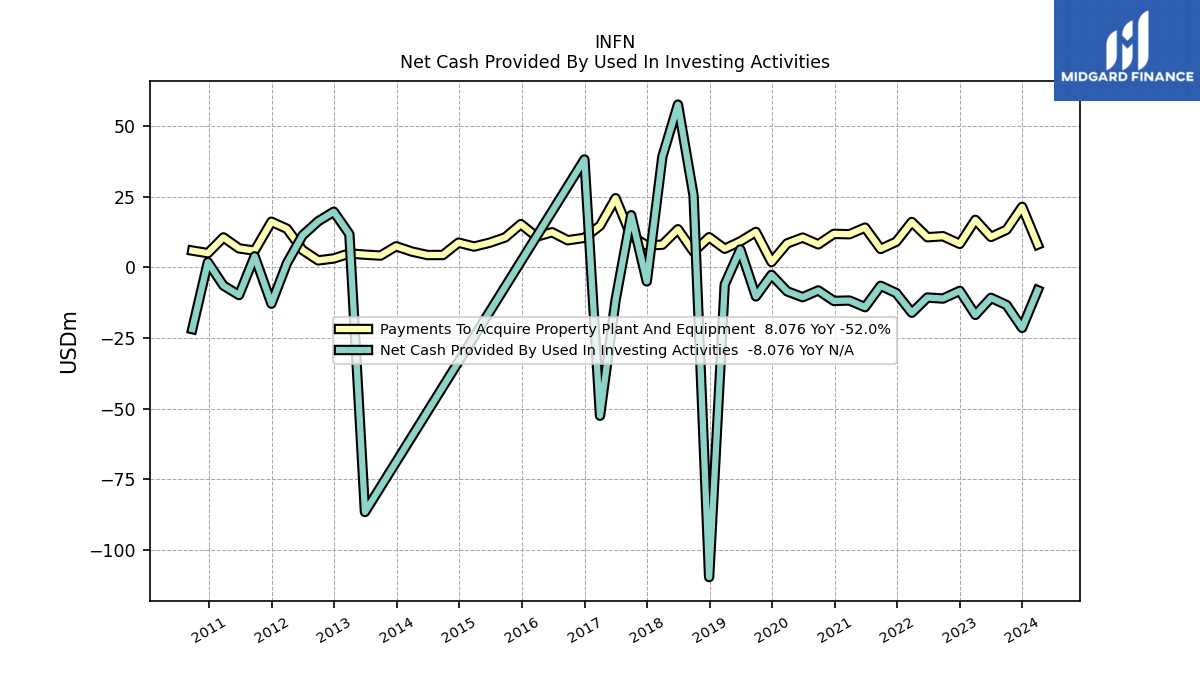
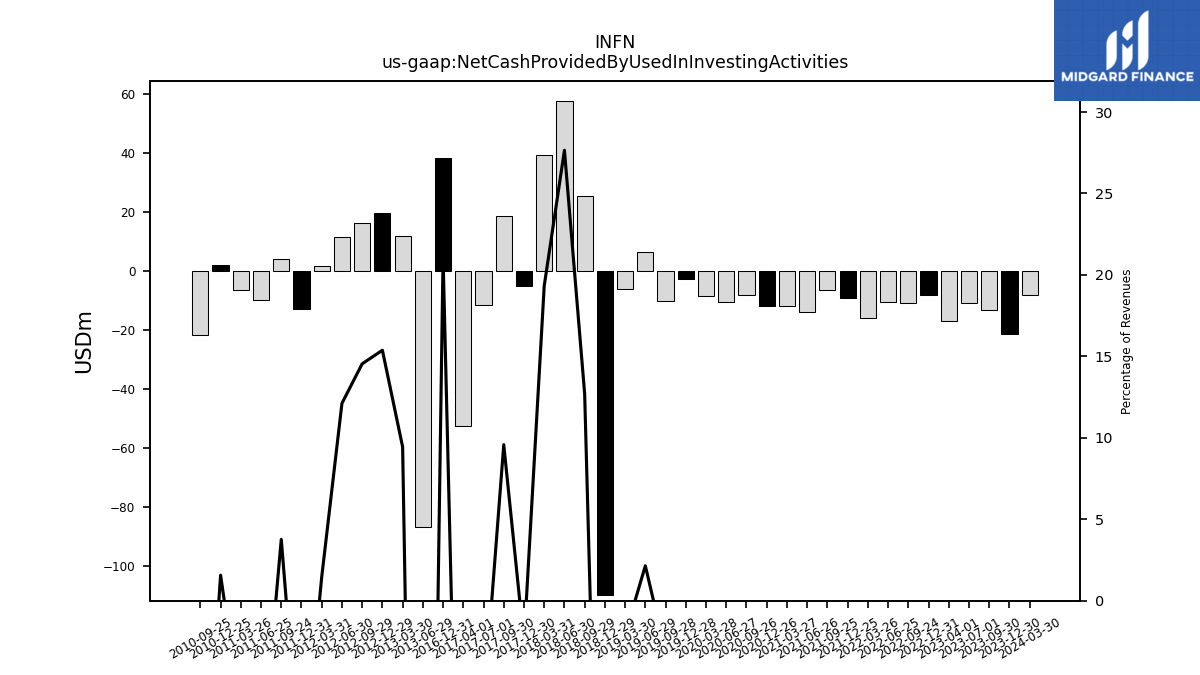
| Net Cash Provided By Used In Investing Activities | -10.77 | -16.81 | -8.30 | -11.02 | -10.67 | -16.06 | -9.06 | -6.53 | -14.07 | -11.72 | -11.86 | -8.15 | -10.54 | -8.46 | -2.65 | -10.27 | 6.36 | -6.05 | -109.56 | 25.45 | 57.57 | 39.16 | -4.95 | 18.45 | -11.57 | -52.49 | 38.18 | NA | NA | NA | NA | NA | NA | NA | NA | NA | NA | NA | NA | NA | -86.54 | 11.77 | 19.69 | 16.32 | 11.33 | 1.53 | -12.84 | 3.92 | -9.80 | -6.45 | 1.84 | -21.84 | NA | |
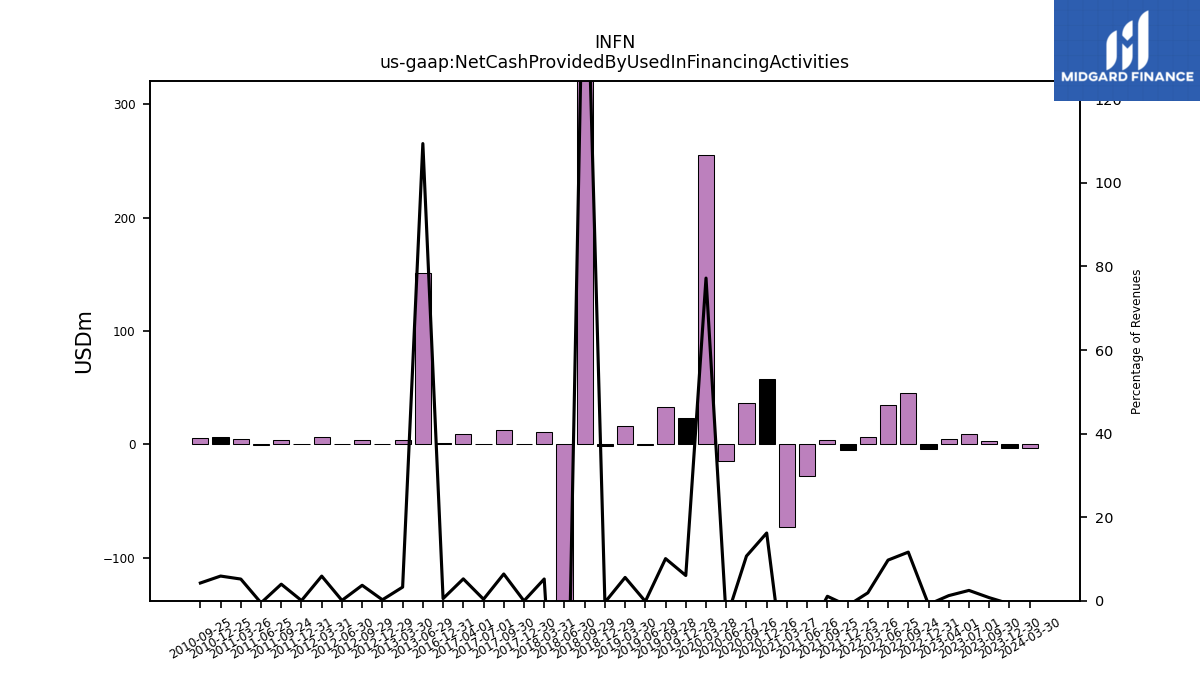
| Net Cash Provided By Used In Financing Activities | 9.31 | 4.81 | -4.33 | 45.43 | 34.83 | 6.41 | -4.82 | 3.81 | -28.07 | -72.47 | 57.31 | 36.39 | -14.56 | 255.02 | 23.24 | 32.80 | -0.45 | 16.32 | -1.26 | 349.05 | -150.44 | 10.55 | -0.07 | 12.33 | 0.64 | 9.19 | 0.93 | NA | NA | NA | NA | NA | NA | NA | NA | NA | NA | NA | NA | NA | 151.40 | 4.07 | 0.29 | 4.15 | 0.08 | 6.17 | 0.05 | 4.12 | -0.48 | 4.82 | 6.92 | 5.52 | NA |
| 2023-07-01 | 2023-04-01 | 2022-12-31 | 2022-09-24 | 2022-06-25 | 2022-03-26 | 2021-12-25 | 2021-09-25 | 2021-06-26 | 2021-03-27 | 2020-12-26 | 2020-09-26 | 2020-06-27 | 2020-03-28 | 2019-12-28 | 2019-09-28 | 2019-06-29 | 2019-03-30 | 2018-12-29 | 2018-09-29 | 2018-06-30 | 2018-03-31 | 2017-12-30 | 2017-09-30 | 2017-07-01 | 2017-04-01 | 2016-12-31 | 2016-09-24 | 2016-06-25 | 2016-03-26 | 2015-12-26 | 2015-09-26 | 2015-06-27 | 2015-03-28 | 2014-12-27 | 2014-09-27 | 2014-06-28 | 2014-03-29 | 2013-12-28 | 2013-09-28 | 2013-06-29 | 2013-03-30 | 2012-12-29 | 2012-09-29 | 2012-06-30 | 2012-03-31 | 2011-12-31 | 2011-09-24 | 2011-06-25 | 2011-03-26 | 2010-12-25 | 2010-09-25 | 2010-06-26 | ||
|---|---|---|---|---|---|---|---|---|---|---|---|---|---|---|---|---|---|---|---|---|---|---|---|---|---|---|---|---|---|---|---|---|---|---|---|---|---|---|---|---|---|---|---|---|---|---|---|---|---|---|---|---|---|---|
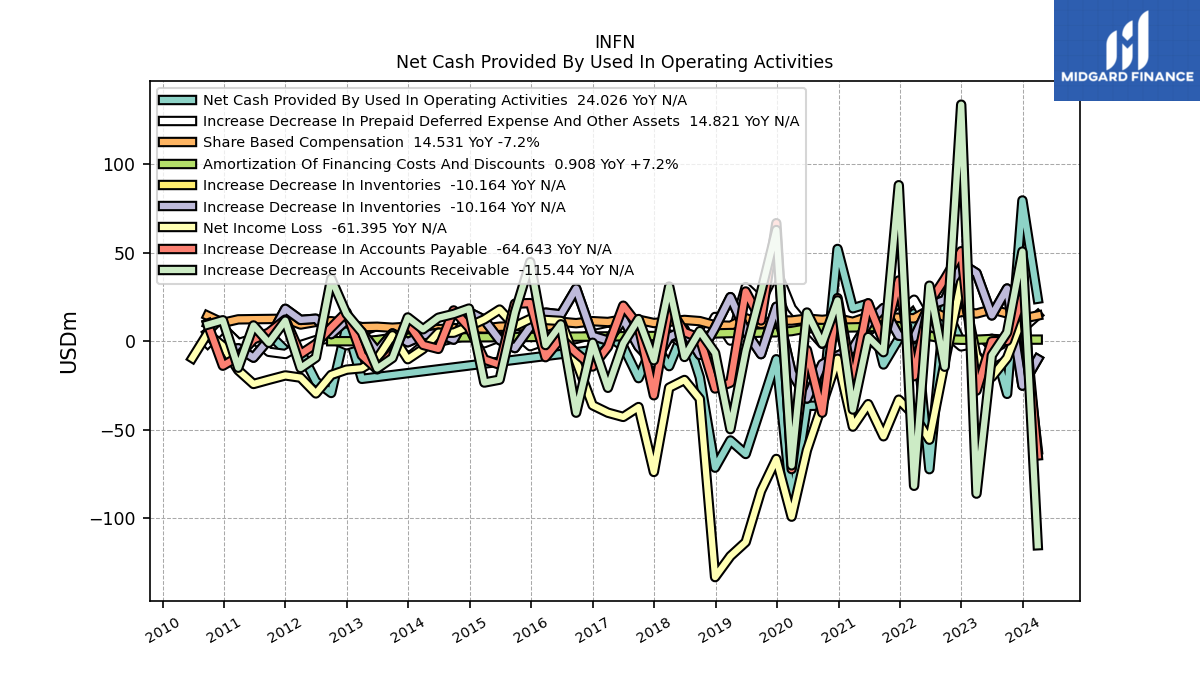
| Net Cash Provided By Used In Operating Activities | 1.42 | -1.77 | -0.56 | 19.64 | -72.42 | 15.79 | 1.37 | -13.18 | 21.30 | 18.63 | 52.22 | -36.43 | -36.57 | -91.52 | -10.19 | -37.19 | -63.81 | -56.15 | -71.55 | -20.41 | 6.99 | -14.11 | -1.01 | -20.90 | -3.05 | 3.03 | -5.03 | NA | NA | NA | NA | NA | NA | NA | NA | NA | NA | NA | NA | NA | NA | -21.30 | 8.33 | -29.30 | -22.74 | -5.76 | -5.08 | 4.11 | -0.14 | -0.85 | 7.01 | 10.02 | NA | |
| Net Income Loss | -20.26 | -8.41 | 33.46 | -11.93 | -55.72 | -41.85 | -33.07 | -53.79 | -35.59 | -48.32 | -9.92 | -35.90 | -61.63 | -99.27 | -66.59 | -84.77 | -113.66 | -121.60 | -133.47 | -32.61 | -21.94 | -26.28 | -73.98 | -37.23 | -42.84 | -40.45 | -36.25 | -11.17 | 11.48 | 12.02 | 12.63 | 8.51 | 17.91 | 12.37 | 8.41 | 4.84 | 4.78 | -4.37 | -10.18 | 3.35 | -10.01 | -15.28 | -16.09 | -19.08 | -29.55 | -20.61 | -19.35 | -21.81 | -24.19 | -16.39 | -2.74 | 4.36 | -9.56 | |
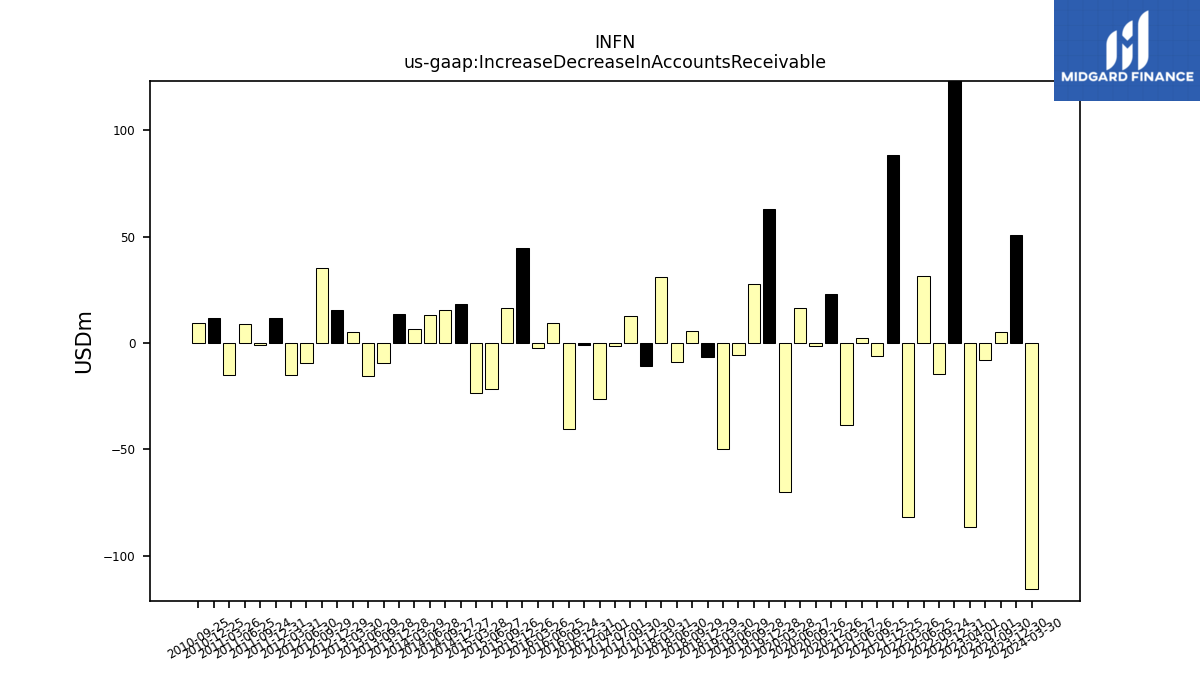
| Increase Decrease In Accounts Receivable | -7.98 | -86.24 | 133.86 | -14.44 | 31.42 | -81.82 | 88.28 | -6.21 | 2.38 | -38.67 | 23.10 | -1.26 | 16.25 | -70.24 | 62.92 | 27.70 | -5.46 | -49.75 | -6.62 | 5.71 | -8.91 | 30.93 | -10.77 | 12.55 | -1.26 | -26.37 | -0.85 | -40.45 | 9.57 | -2.17 | 44.81 | 16.30 | -21.75 | -23.39 | 18.49 | 15.42 | 13.28 | 6.76 | 13.46 | -9.47 | -15.43 | 5.09 | 15.50 | 35.44 | -9.24 | -15.17 | 11.66 | -0.90 | 8.93 | -15.01 | 11.87 | 9.37 | NA | |
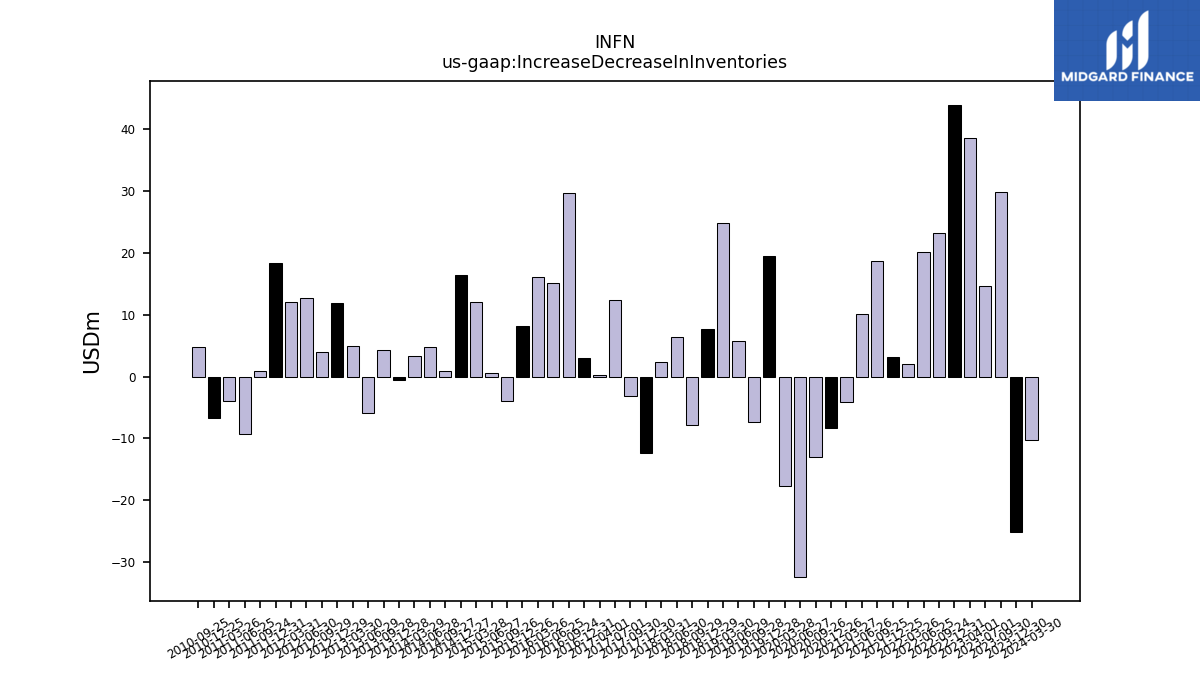
| Increase Decrease In Inventories | 14.61 | 38.55 | 44.01 | 23.29 | 20.25 | 1.98 | 3.13 | 18.77 | 10.18 | -4.06 | -8.22 | -13.04 | -32.43 | -17.74 | 19.50 | -7.30 | 5.70 | 24.94 | 7.69 | -7.78 | 6.37 | 2.33 | -12.33 | -3.10 | 12.37 | 0.33 | 3.02 | 29.77 | 15.15 | 16.16 | 8.21 | -3.87 | 0.67 | 12.10 | 16.47 | 0.91 | 4.75 | 3.35 | -0.57 | 4.39 | -5.83 | 5.04 | 11.85 | 4.00 | 12.72 | 12.05 | 18.34 | 0.94 | -9.28 | -3.99 | -6.64 | 4.75 | NA | |
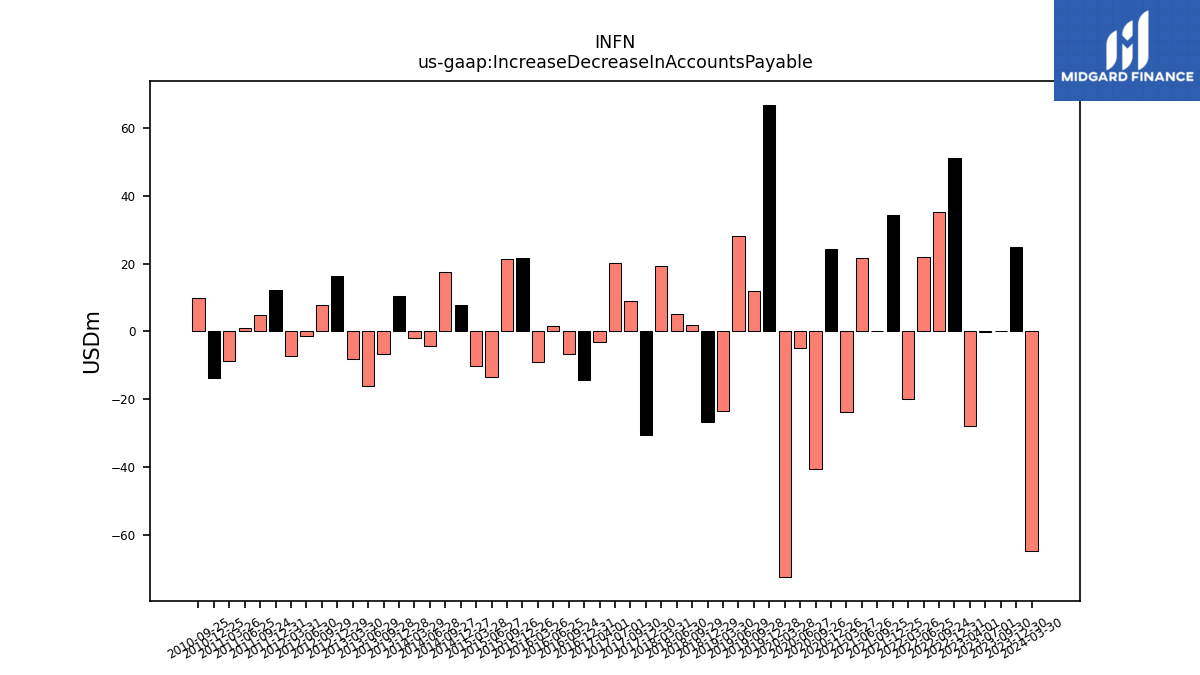
| Increase Decrease In Accounts Payable | -0.05 | -27.97 | 50.93 | 35.21 | 21.95 | -19.83 | 34.38 | 0.01 | 21.50 | -23.58 | 24.41 | -40.47 | -5.00 | -72.36 | 66.78 | 11.76 | 28.16 | -23.44 | -26.77 | 1.80 | 5.17 | 19.29 | -30.60 | 8.91 | 20.11 | -3.18 | -14.32 | -6.60 | 1.70 | -9.04 | 21.56 | 21.26 | -13.28 | -10.32 | 7.80 | 17.44 | -4.35 | -2.08 | 10.42 | -6.64 | -15.94 | -8.04 | 16.46 | 7.71 | -1.49 | -7.27 | 12.23 | 4.88 | 0.98 | -8.75 | -13.86 | 9.99 | NA | |
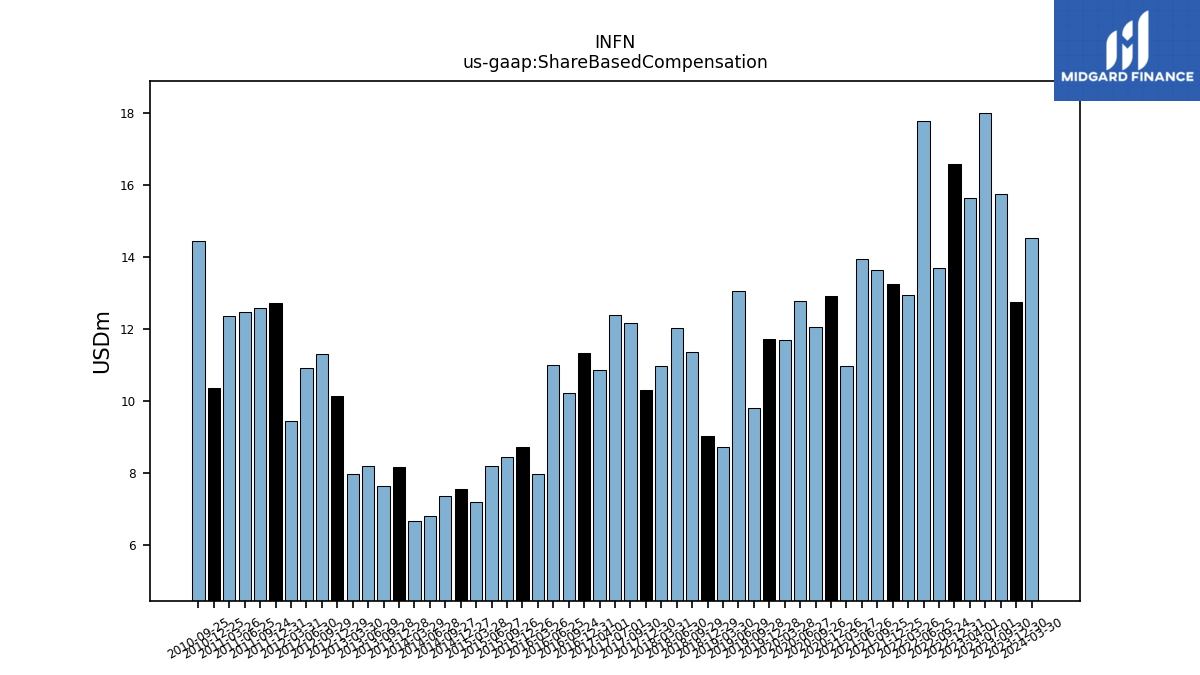
| Share Based Compensation | 18.00 | 15.65 | 16.60 | 13.70 | 17.78 | 12.94 | 13.27 | 13.63 | 13.94 | 10.97 | 12.92 | 12.06 | 12.78 | 11.70 | 11.73 | 9.80 | 13.05 | 8.71 | 9.02 | 11.37 | 12.04 | 10.98 | 10.30 | 12.17 | 12.38 | 10.88 | 11.34 | 10.21 | 10.99 | 7.99 | 8.71 | 8.45 | 8.21 | 7.21 | 7.55 | 7.37 | 6.80 | 6.67 | 8.17 | 7.64 | 8.18 | 7.97 | 10.13 | 11.32 | 10.93 | 9.44 | 12.73 | 12.58 | 12.48 | 12.37 | 10.37 | 14.44 | NA |
| 2023-07-01 | 2023-04-01 | 2022-12-31 | 2022-09-24 | 2022-06-25 | 2022-03-26 | 2021-12-25 | 2021-09-25 | 2021-06-26 | 2021-03-27 | 2020-12-26 | 2020-09-26 | 2020-06-27 | 2020-03-28 | 2019-12-28 | 2019-09-28 | 2019-06-29 | 2019-03-30 | 2018-12-29 | 2018-09-29 | 2018-06-30 | 2018-03-31 | 2017-12-30 | 2017-09-30 | 2017-07-01 | 2017-04-01 | 2016-12-31 | 2016-09-24 | 2016-06-25 | 2016-03-26 | 2015-12-26 | 2015-09-26 | 2015-06-27 | 2015-03-28 | 2014-12-27 | 2014-09-27 | 2014-06-28 | 2014-03-29 | 2013-12-28 | 2013-09-28 | 2013-06-29 | 2013-03-30 | 2012-12-29 | 2012-09-29 | 2012-06-30 | 2012-03-31 | 2011-12-31 | 2011-09-24 | 2011-06-25 | 2011-03-26 | 2010-12-25 | 2010-09-25 | 2010-06-26 | ||
|---|---|---|---|---|---|---|---|---|---|---|---|---|---|---|---|---|---|---|---|---|---|---|---|---|---|---|---|---|---|---|---|---|---|---|---|---|---|---|---|---|---|---|---|---|---|---|---|---|---|---|---|---|---|---|
| Net Cash Provided By Used In Investing Activities | -10.77 | -16.81 | -8.30 | -11.02 | -10.67 | -16.06 | -9.06 | -6.53 | -14.07 | -11.72 | -11.86 | -8.15 | -10.54 | -8.46 | -2.65 | -10.27 | 6.36 | -6.05 | -109.56 | 25.45 | 57.57 | 39.16 | -4.95 | 18.45 | -11.57 | -52.49 | 38.18 | NA | NA | NA | NA | NA | NA | NA | NA | NA | NA | NA | NA | NA | -86.54 | 11.77 | 19.69 | 16.32 | 11.33 | 1.53 | -12.84 | 3.92 | -9.80 | -6.45 | 1.84 | -21.84 | NA | |
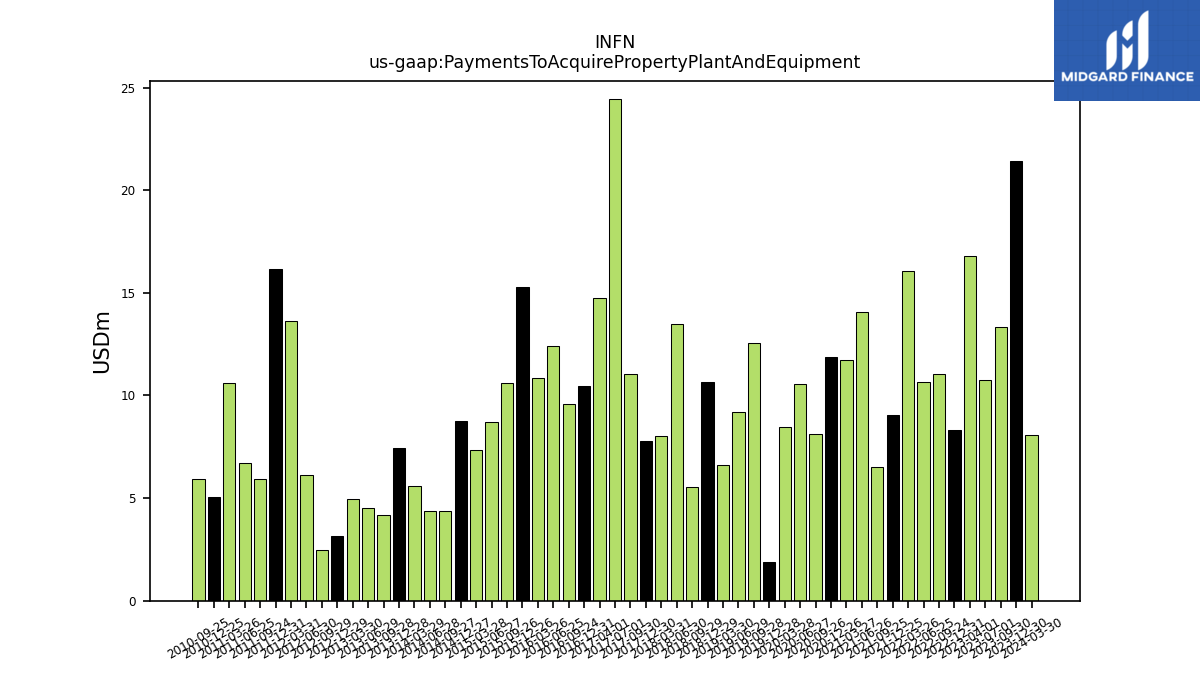
| Payments To Acquire Property Plant And Equipment | 10.77 | 16.81 | 8.30 | 11.02 | 10.67 | 16.06 | 9.06 | 6.53 | 14.07 | 11.72 | 11.86 | 8.15 | 10.54 | 8.46 | 1.87 | 12.55 | 9.19 | 6.59 | 10.66 | 5.52 | 13.48 | 8.02 | 7.79 | 11.05 | 24.46 | 14.74 | 10.46 | 9.60 | 12.43 | 10.84 | 15.31 | 10.61 | 8.73 | 7.37 | 8.76 | 4.38 | 4.38 | 5.61 | 7.46 | 4.17 | 4.50 | 4.94 | 3.16 | 2.47 | 6.12 | 13.65 | 16.15 | 5.91 | 6.72 | 10.60 | 5.03 | 5.94 | NA |
| 2023-07-01 | 2023-04-01 | 2022-12-31 | 2022-09-24 | 2022-06-25 | 2022-03-26 | 2021-12-25 | 2021-09-25 | 2021-06-26 | 2021-03-27 | 2020-12-26 | 2020-09-26 | 2020-06-27 | 2020-03-28 | 2019-12-28 | 2019-09-28 | 2019-06-29 | 2019-03-30 | 2018-12-29 | 2018-09-29 | 2018-06-30 | 2018-03-31 | 2017-12-30 | 2017-09-30 | 2017-07-01 | 2017-04-01 | 2016-12-31 | 2016-09-24 | 2016-06-25 | 2016-03-26 | 2015-12-26 | 2015-09-26 | 2015-06-27 | 2015-03-28 | 2014-12-27 | 2014-09-27 | 2014-06-28 | 2014-03-29 | 2013-12-28 | 2013-09-28 | 2013-06-29 | 2013-03-30 | 2012-12-29 | 2012-09-29 | 2012-06-30 | 2012-03-31 | 2011-12-31 | 2011-09-24 | 2011-06-25 | 2011-03-26 | 2010-12-25 | 2010-09-25 | 2010-06-26 | ||
|---|---|---|---|---|---|---|---|---|---|---|---|---|---|---|---|---|---|---|---|---|---|---|---|---|---|---|---|---|---|---|---|---|---|---|---|---|---|---|---|---|---|---|---|---|---|---|---|---|---|---|---|---|---|---|
| Net Cash Provided By Used In Financing Activities | 9.31 | 4.81 | -4.33 | 45.43 | 34.83 | 6.41 | -4.82 | 3.81 | -28.07 | -72.47 | 57.31 | 36.39 | -14.56 | 255.02 | 23.24 | 32.80 | -0.45 | 16.32 | -1.26 | 349.05 | -150.44 | 10.55 | -0.07 | 12.33 | 0.64 | 9.19 | 0.93 | NA | NA | NA | NA | NA | NA | NA | NA | NA | NA | NA | NA | NA | 151.40 | 4.07 | 0.29 | 4.15 | 0.08 | 6.17 | 0.05 | 4.12 | -0.48 | 4.82 | 6.92 | 5.52 | NA |
| 2023-07-01 | 2023-04-01 | 2022-12-31 | 2022-09-24 | 2022-06-25 | 2022-03-26 | 2021-12-25 | 2021-09-25 | 2021-06-26 | 2021-03-27 | 2020-12-26 | 2020-09-26 | 2020-06-27 | 2020-03-28 | 2019-12-28 | 2019-09-28 | 2019-06-29 | 2019-03-30 | 2018-12-29 | 2018-09-29 | 2018-06-30 | 2018-03-31 | 2017-12-30 | 2017-09-30 | 2017-07-01 | 2017-04-01 | 2016-12-31 | 2016-09-24 | 2016-06-25 | 2016-03-26 | 2015-12-26 | 2015-09-26 | 2015-06-27 | 2015-03-28 | 2014-12-27 | 2014-09-27 | 2014-06-28 | 2014-03-29 | 2013-12-28 | 2013-09-28 | 2013-06-29 | 2013-03-30 | 2012-12-29 | 2012-09-29 | 2012-06-30 | 2012-03-31 | 2011-12-31 | 2011-09-24 | 2011-06-25 | 2011-03-26 | 2010-12-25 | 2010-09-25 | 2010-06-26 | ||
|---|---|---|---|---|---|---|---|---|---|---|---|---|---|---|---|---|---|---|---|---|---|---|---|---|---|---|---|---|---|---|---|---|---|---|---|---|---|---|---|---|---|---|---|---|---|---|---|---|---|---|---|---|---|---|
| Revenues | 376.23 | 392.07 | 485.94 | 390.45 | 357.99 | 338.87 | 400.26 | 355.81 | 338.23 | 330.91 | 353.52 | 340.21 | 331.59 | 330.27 | 384.57 | 325.34 | 296.25 | 292.71 | 332.06 | 200.41 | 208.23 | 202.68 | 195.82 | 192.58 | 176.82 | 175.52 | 181.04 | 185.45 | 258.82 | 244.82 | 260.03 | 232.47 | 207.35 | 186.86 | 186.31 | 173.56 | 165.40 | 142.81 | 139.09 | 142.02 | 138.38 | 124.62 | 128.06 | 112.21 | 93.46 | 104.70 | 112.01 | 104.02 | 95.96 | 92.89 | 117.13 | 130.06 | 111.40 | |
| Revenue From Contract With Customer Excluding Assessed Tax | 376.23 | 392.07 | 485.94 | 390.45 | 357.99 | 338.87 | 400.26 | 355.81 | 338.23 | 330.91 | 353.52 | 340.21 | 331.59 | 330.27 | 384.57 | 325.34 | 296.25 | 292.71 | 332.06 | 200.41 | 208.23 | 202.68 | 195.82 | 192.58 | 176.82 | 175.52 | 181.04 | 185.45 | 258.82 | 244.82 | 260.03 | 232.47 | 207.35 | 186.86 | 186.31 | 173.56 | 165.40 | 142.81 | 139.09 | 142.02 | 138.38 | 124.62 | 128.06 | 112.21 | 93.46 | 104.70 | 112.01 | 104.02 | 95.96 | 92.89 | 117.13 | 130.06 | 111.40 | |
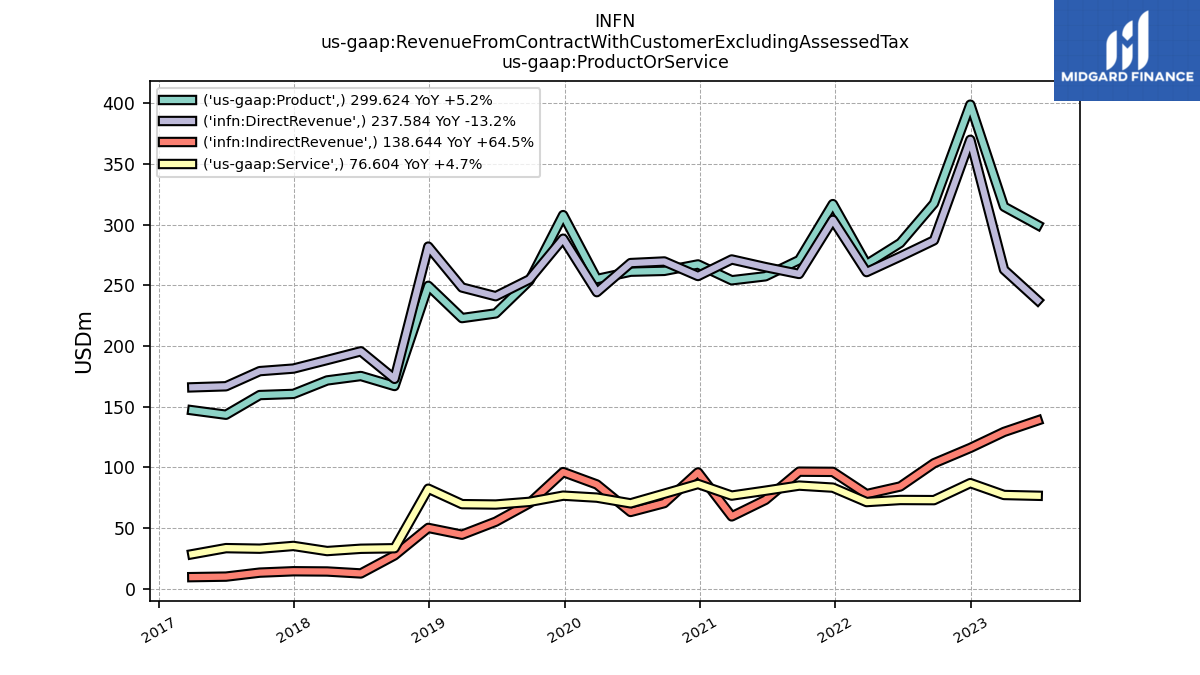
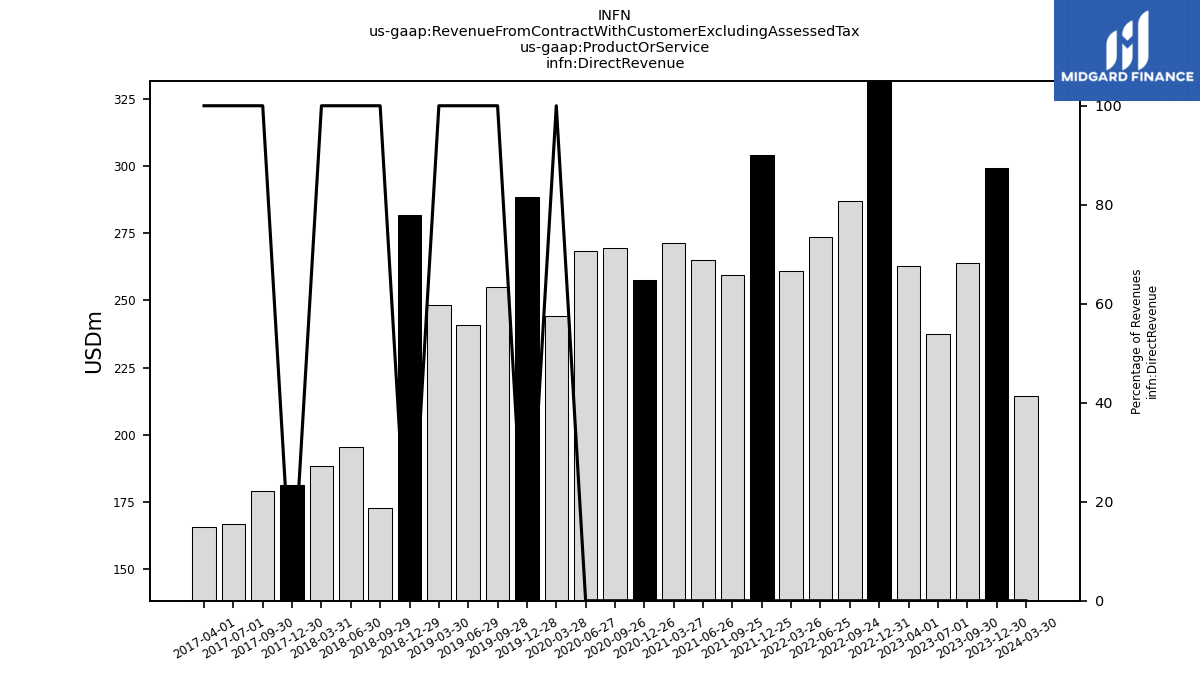
| Direct Revenue | 237.58 | 262.86 | 369.92 | 287.06 | 273.72 | 260.89 | 303.96 | 259.35 | 265.02 | 271.30 | 257.65 | 269.65 | 268.33 | 244.35 | 288.43 | 254.89 | 241.02 | 248.20 | 281.93 | 172.92 | 195.62 | 188.46 | 181.40 | 179.30 | 166.83 | 165.95 | NA | NA | NA | NA | NA | NA | NA | NA | NA | NA | NA | NA | NA | NA | NA | NA | NA | NA | NA | NA | NA | NA | NA | NA | NA | NA | NA | |
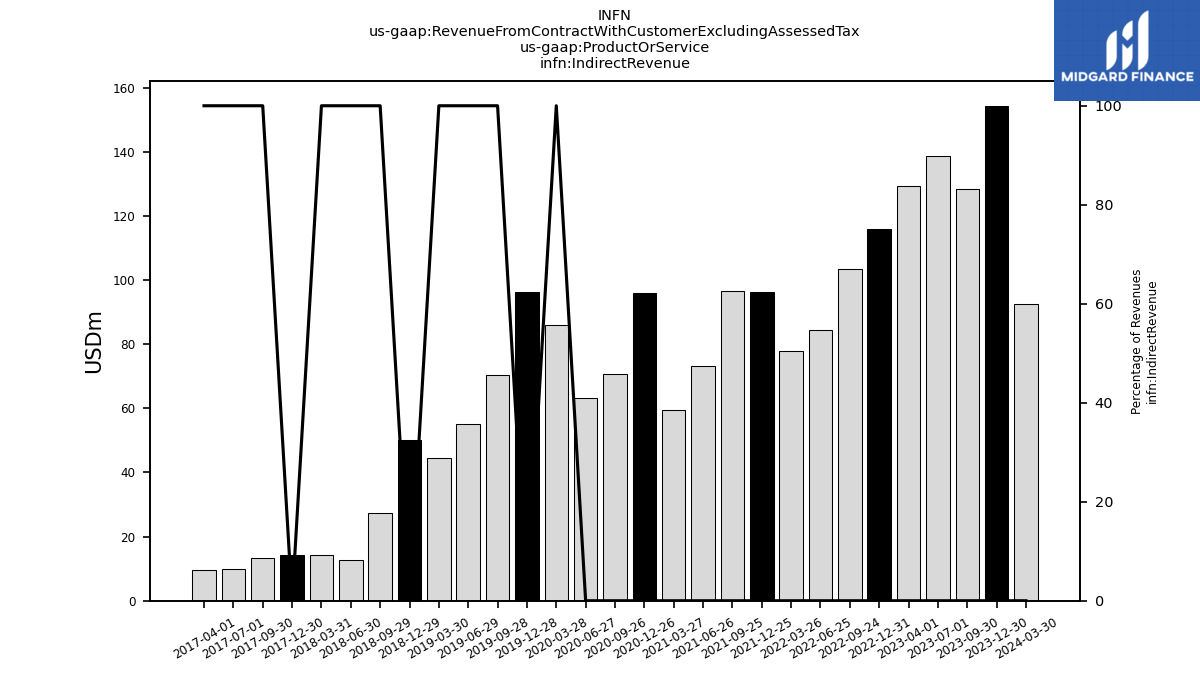
| Indirect Revenue | 138.64 | 129.21 | 116.02 | 103.39 | 84.27 | 77.98 | 96.30 | 96.47 | 73.20 | 59.61 | 95.88 | 70.56 | 63.26 | 85.92 | 96.14 | 70.45 | 55.23 | 44.51 | 50.13 | 27.50 | 12.60 | 14.22 | 14.42 | 13.28 | 9.99 | 9.58 | NA | NA | NA | NA | NA | NA | NA | NA | NA | NA | NA | NA | NA | NA | NA | NA | NA | NA | NA | NA | NA | NA | NA | NA | NA | NA | NA | |
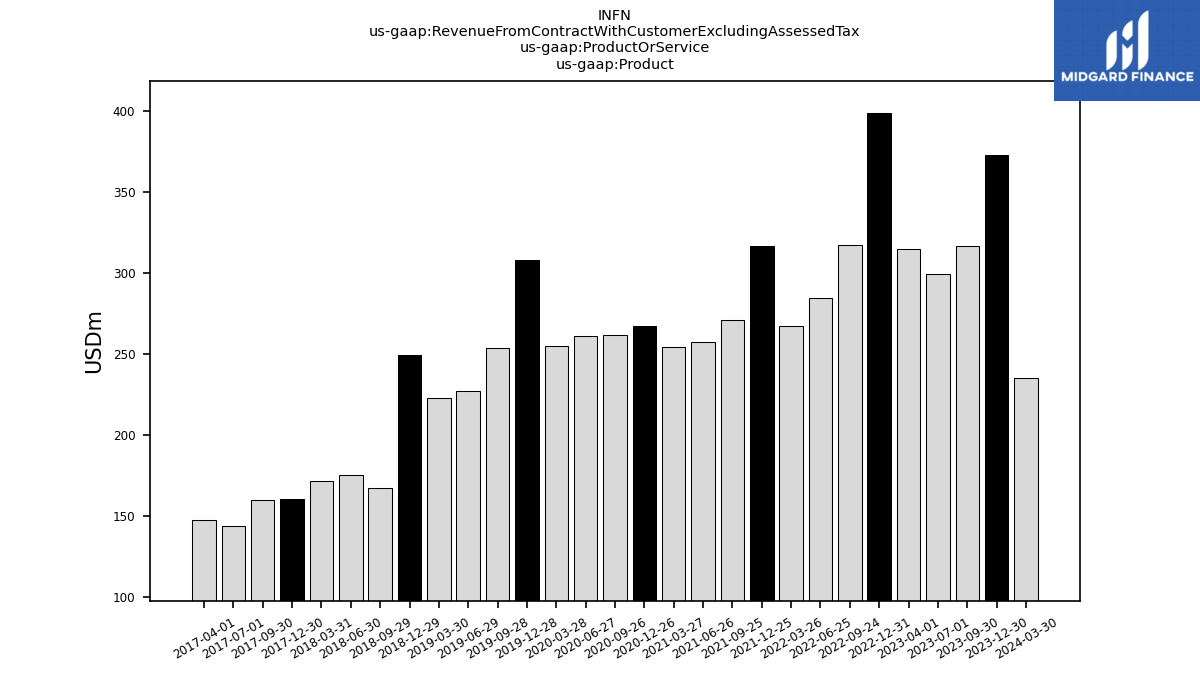
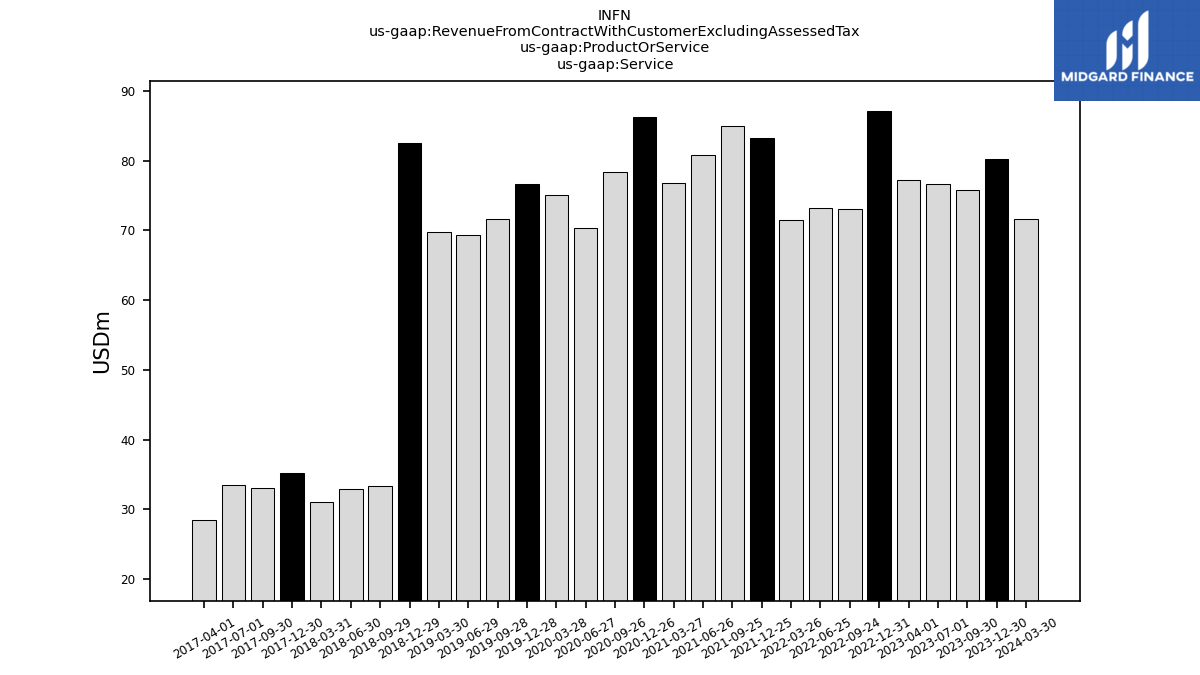
| Product | 299.62 | 314.82 | 398.88 | 317.44 | 284.85 | 267.45 | 316.96 | 270.82 | 257.44 | 254.16 | 267.23 | 261.91 | 261.23 | 255.19 | 307.86 | 253.75 | 226.87 | 223.01 | 249.61 | 167.03 | 175.29 | 171.63 | 160.54 | 159.58 | 143.36 | 147.05 | NA | NA | NA | NA | NA | NA | NA | NA | NA | NA | NA | NA | NA | NA | NA | NA | NA | NA | NA | NA | NA | NA | NA | NA | NA | NA | NA | |
| Service | 76.60 | 77.25 | 87.06 | 73.01 | 73.13 | 71.42 | 83.30 | 85.00 | 80.79 | 76.75 | 86.30 | 78.31 | 70.36 | 75.08 | 76.71 | 71.59 | 69.38 | 69.70 | 82.45 | 33.38 | 32.94 | 31.05 | 35.27 | 33.00 | 33.46 | 28.47 | NA | NA | NA | NA | NA | NA | NA | NA | NA | NA | NA | NA | NA | NA | NA | NA | NA | NA | NA | NA | NA | NA | NA | NA | NA | NA | NA | |
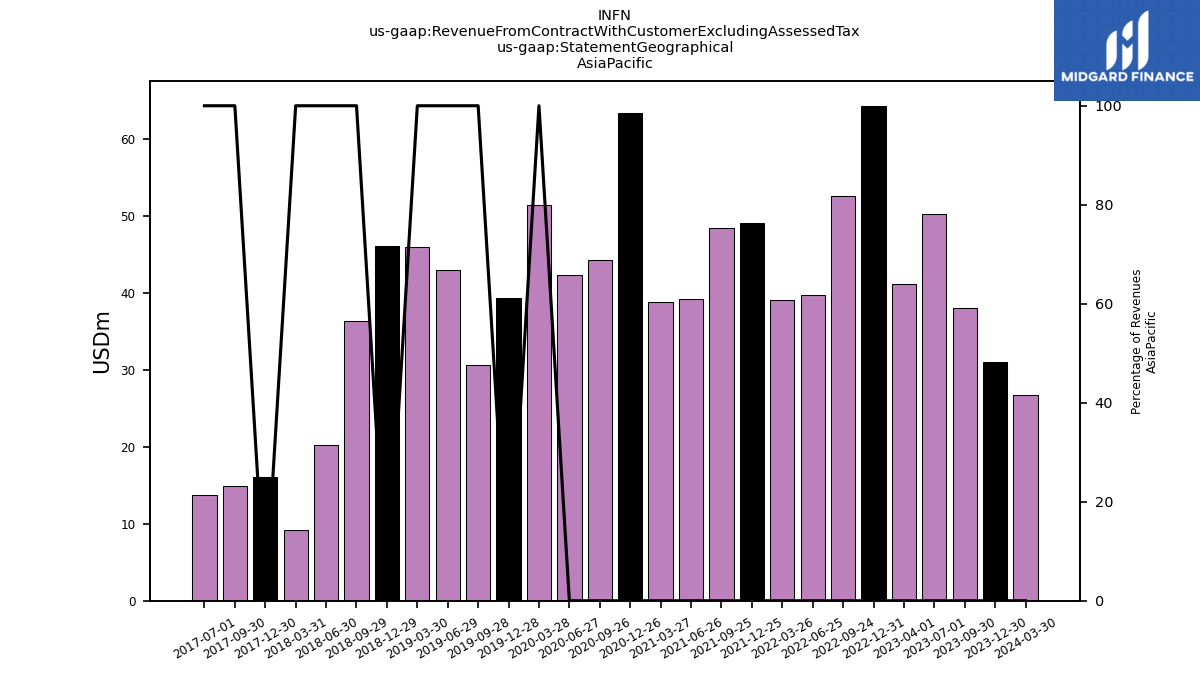
| 50.31 | 41.23 | 64.37 | 52.70 | 39.79 | 39.17 | 49.10 | 48.54 | 39.19 | 38.82 | 63.45 | 44.31 | 42.36 | 51.48 | 39.41 | 30.70 | 43.03 | 46.06 | 46.17 | 36.41 | 20.20 | 9.24 | 16.13 | 14.94 | 13.74 | NA | NA | NA | NA | NA | NA | NA | NA | NA | NA | NA | NA | NA | NA | NA | NA | NA | NA | NA | NA | NA | NA | NA | NA | NA | NA | NA | NA | ||
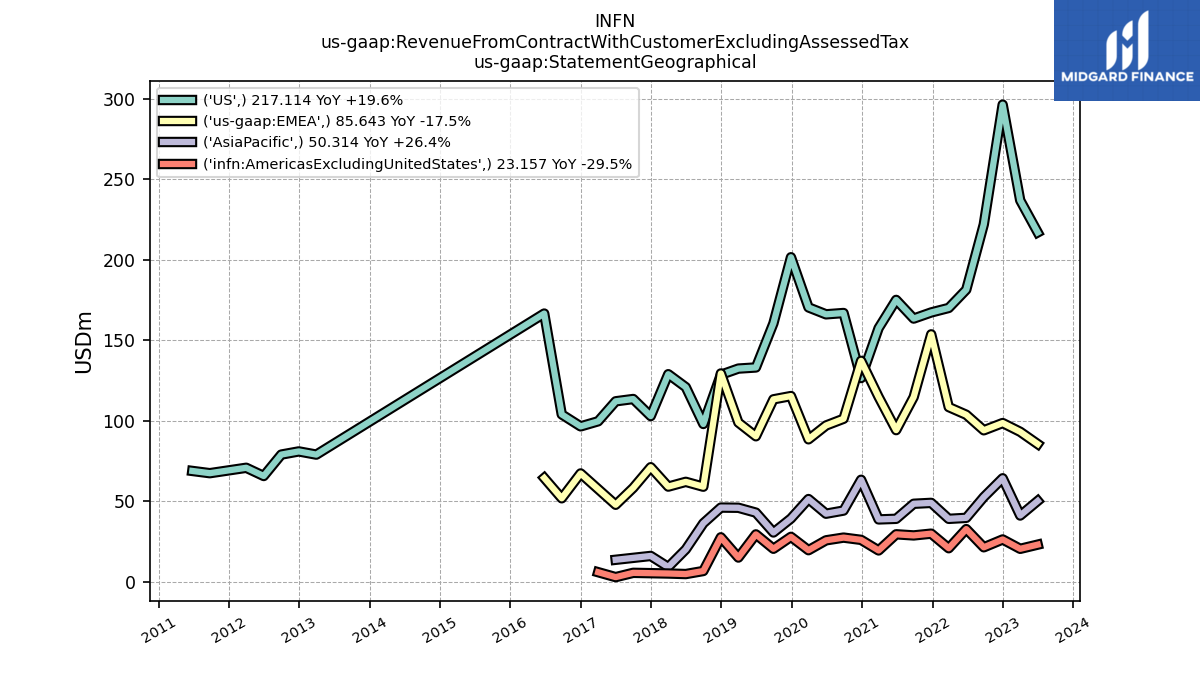
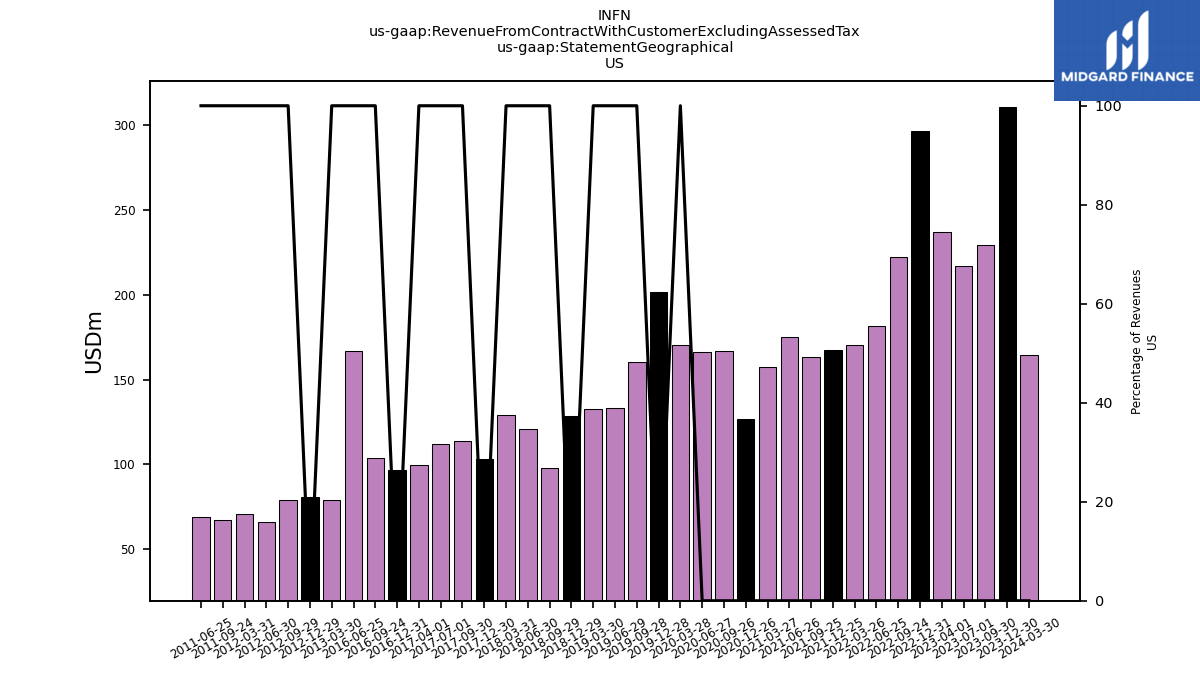
| US | 217.11 | 237.03 | 296.50 | 222.07 | 181.53 | 170.19 | 167.39 | 163.58 | 175.18 | 157.65 | 126.63 | 167.04 | 166.22 | 170.53 | 201.69 | 160.65 | 133.21 | 132.52 | 128.68 | 98.10 | 120.99 | 129.03 | 103.00 | 113.62 | 112.20 | 99.78 | 96.62 | 104.05 | 166.71 | NA | NA | NA | NA | NA | NA | NA | NA | NA | NA | NA | NA | 79.07 | 81.07 | 79.09 | 65.79 | 70.90 | NA | 67.54 | 68.94 | NA | NA | NA | NA | |
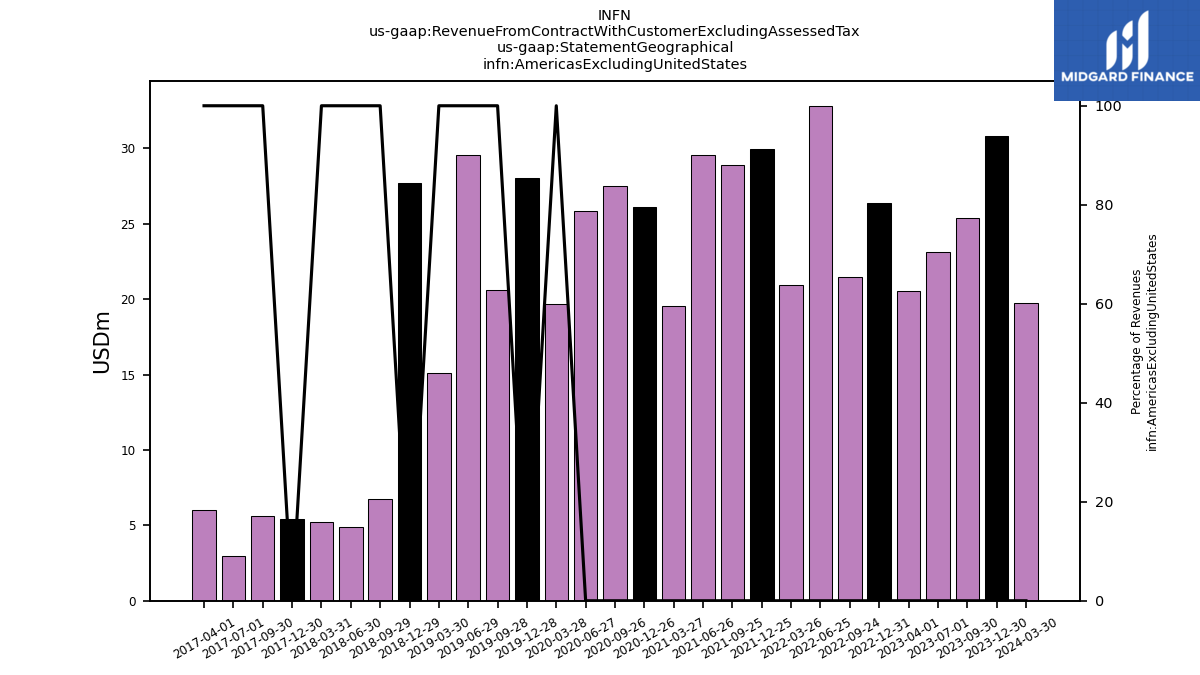
| Americas Excluding United States | 23.16 | 20.55 | 26.37 | 21.50 | 32.83 | 20.91 | 29.98 | 28.88 | 29.58 | 19.53 | 26.12 | 27.52 | 25.83 | 19.69 | 28.01 | 20.57 | 29.54 | 15.13 | 27.71 | 6.78 | 4.88 | 5.21 | 5.43 | 5.64 | 2.97 | 6.04 | NA | NA | NA | NA | NA | NA | NA | NA | NA | NA | NA | NA | NA | NA | NA | NA | NA | NA | NA | NA | NA | NA | NA | NA | NA | NA | NA | |
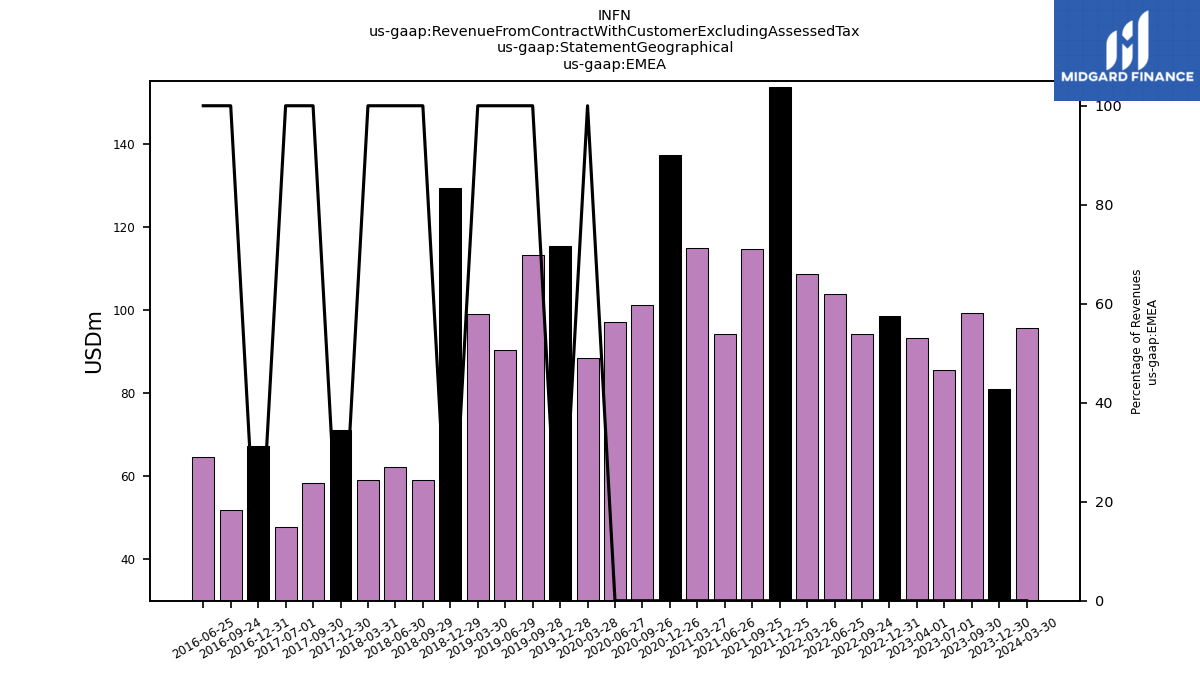
| EMEA | 85.64 | 93.25 | 98.70 | 94.18 | 103.84 | 108.61 | 153.79 | 114.81 | 94.28 | 114.91 | 137.33 | 101.33 | 97.17 | 88.58 | 115.46 | 113.42 | 90.47 | 98.99 | 129.50 | 59.13 | 62.16 | 59.20 | 71.26 | 58.39 | 47.91 | NA | 67.40 | 51.94 | 64.57 | NA | NA | NA | NA | NA | NA | NA | NA | NA | NA | NA | NA | NA | NA | NA | NA | NA | NA | NA | NA | NA | NA | NA | NA |