
| 2023-09-30 | 2023-06-30 | 2023-03-31 | 2022-12-31 | 2022-09-30 | 2022-06-30 | 2022-03-31 | 2021-12-31 | 2021-09-30 | 2021-06-30 | 2021-03-31 | 2020-12-31 | 2020-09-30 | 2020-06-30 | 2020-03-31 | ||
|---|---|---|---|---|---|---|---|---|---|---|---|---|---|---|---|---|
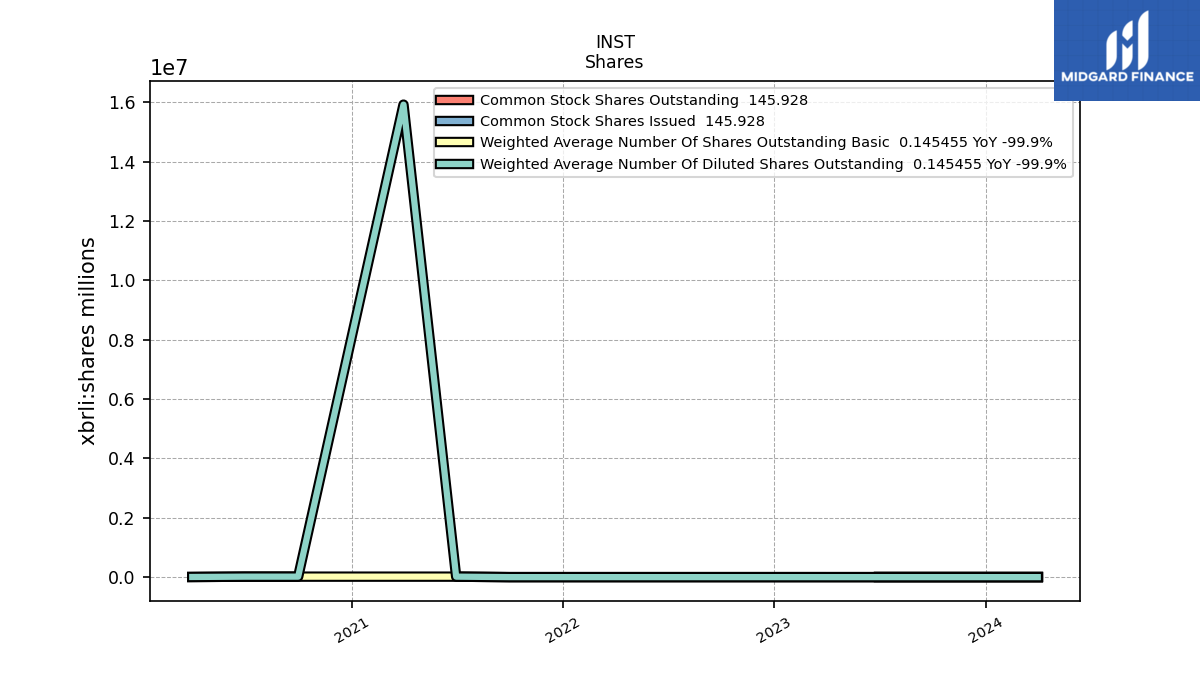
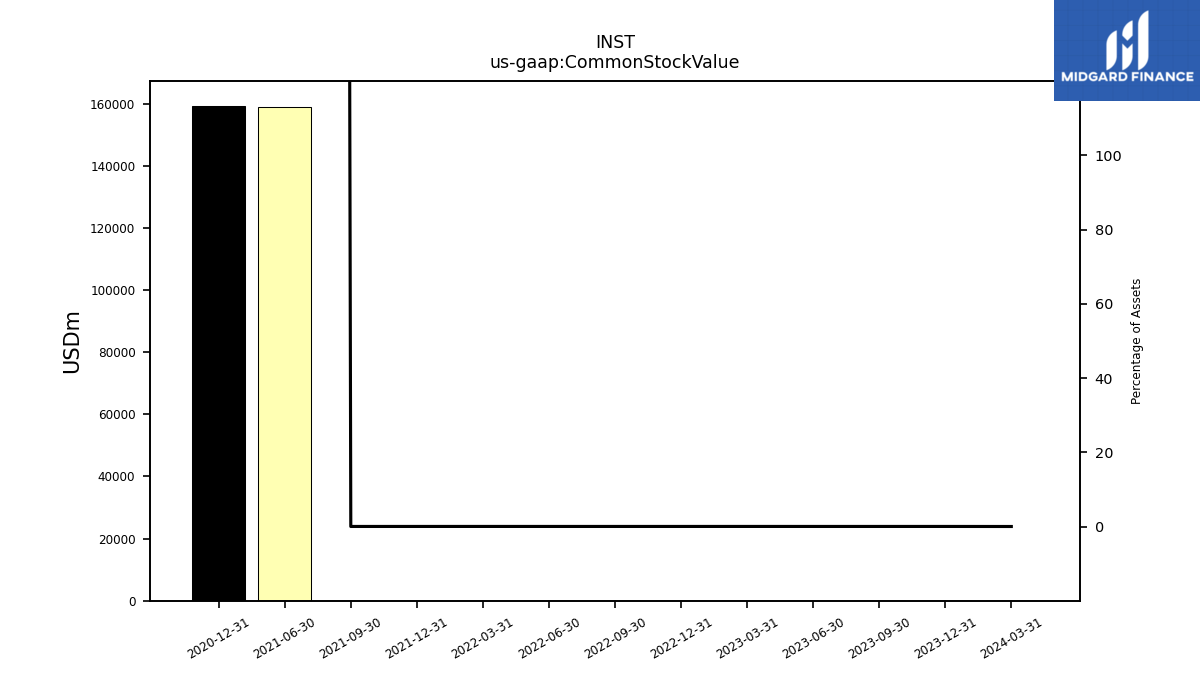
| Common Stock Value | 1.45 | 1.44 | 1.44 | 1.43 | 1.43 | 1.42 | 1.41 | 1.41 | 1.40 | 159062.17 | NA | 159314.65 | NA | NA | NA | |
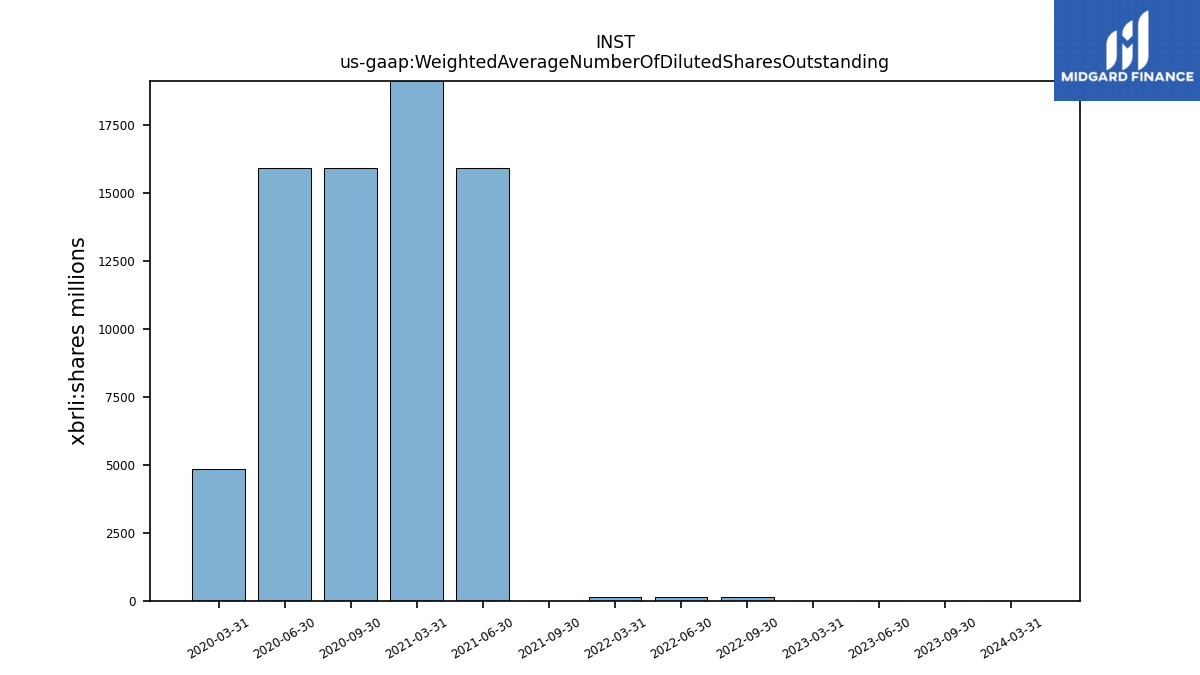
| Weighted Average Number Of Diluted Shares Outstanding | 0.14 | 0.14 | 0.14 | NA | 142.11 | 141.53 | 140.95 | NA | 0.14 | 15912.40 | 15920986.75 | NA | 15936.51 | 15936.51 | 4843.70 | |
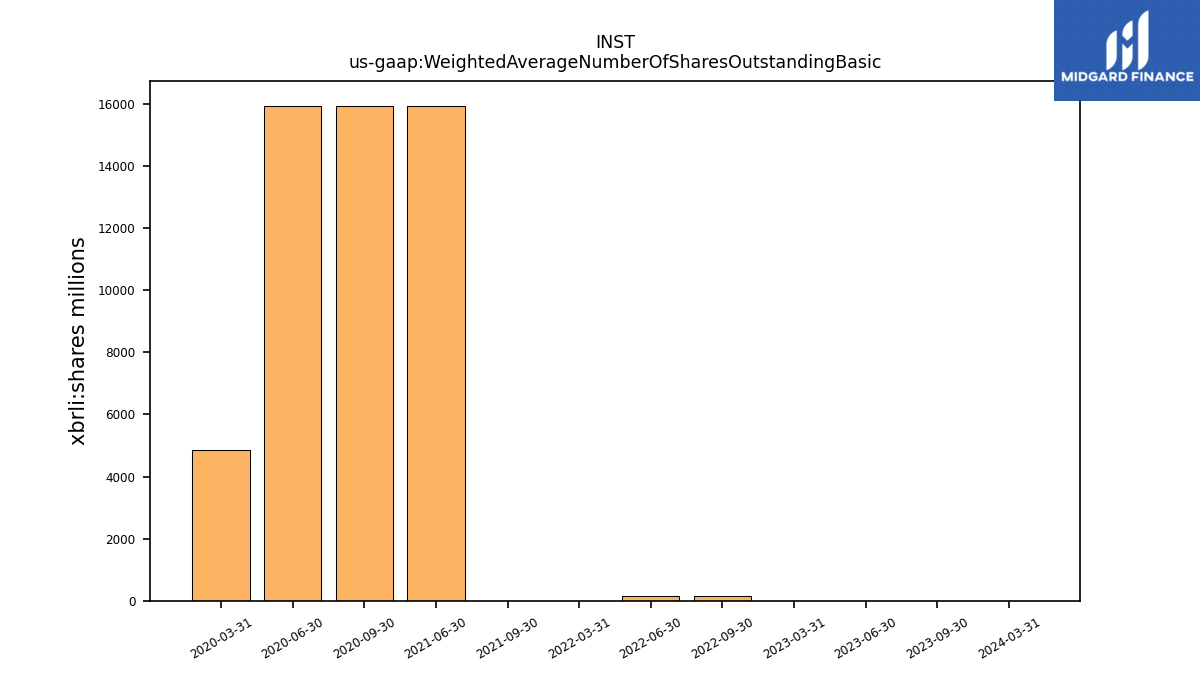
| Weighted Average Number Of Shares Outstanding Basic | 0.14 | 0.14 | 0.14 | NA | 142.11 | 141.53 | 0.14 | NA | 0.14 | 15912.40 | NA | NA | 15936.51 | 15936.51 | 4843.70 | |
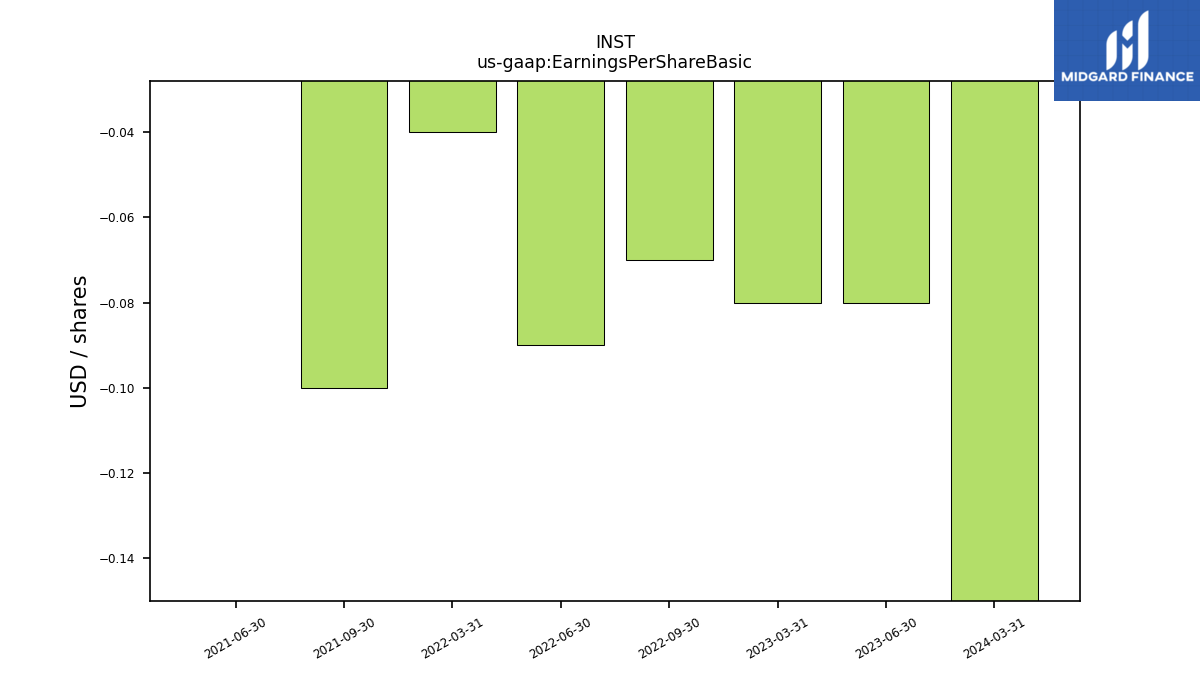
| Earnings Per Share Basic | NA | -0.08 | -0.08 | NA | -0.07 | -0.09 | -0.04 | NA | -0.10 | -0.00 | NA | NA | NA | NA | NA | |
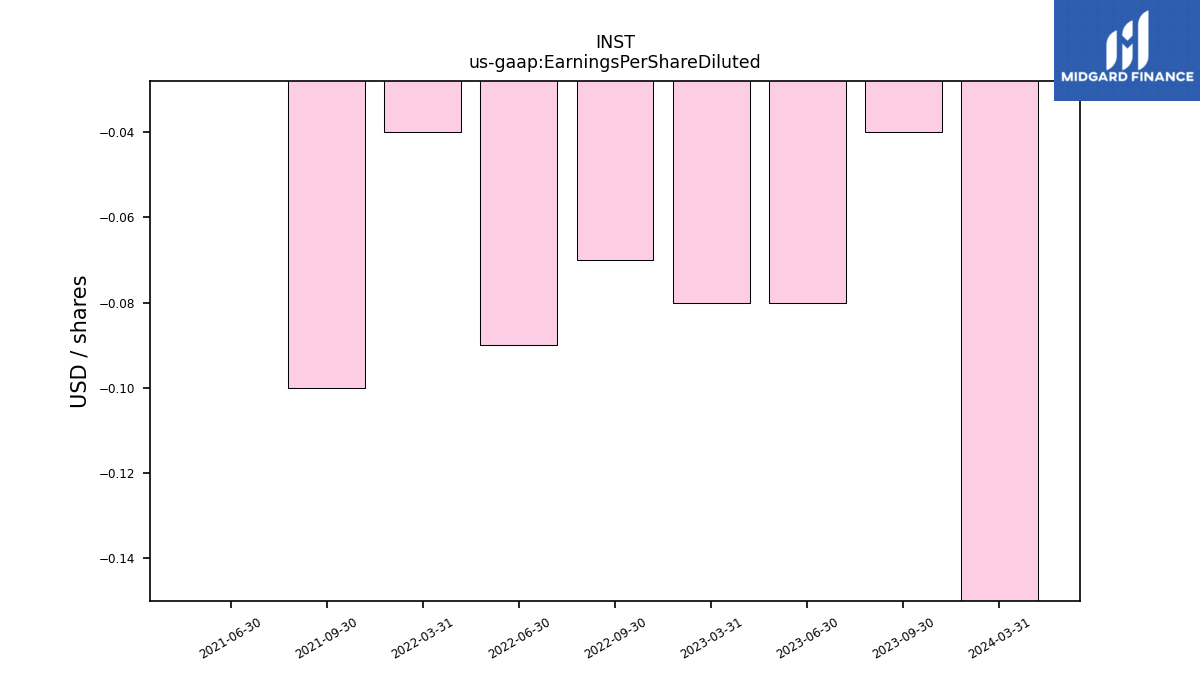
| Earnings Per Share Diluted | -0.04 | -0.08 | -0.08 | NA | -0.07 | -0.09 | -0.04 | NA | -0.10 | -0.00 | NA | NA | NA | NA | NA | |
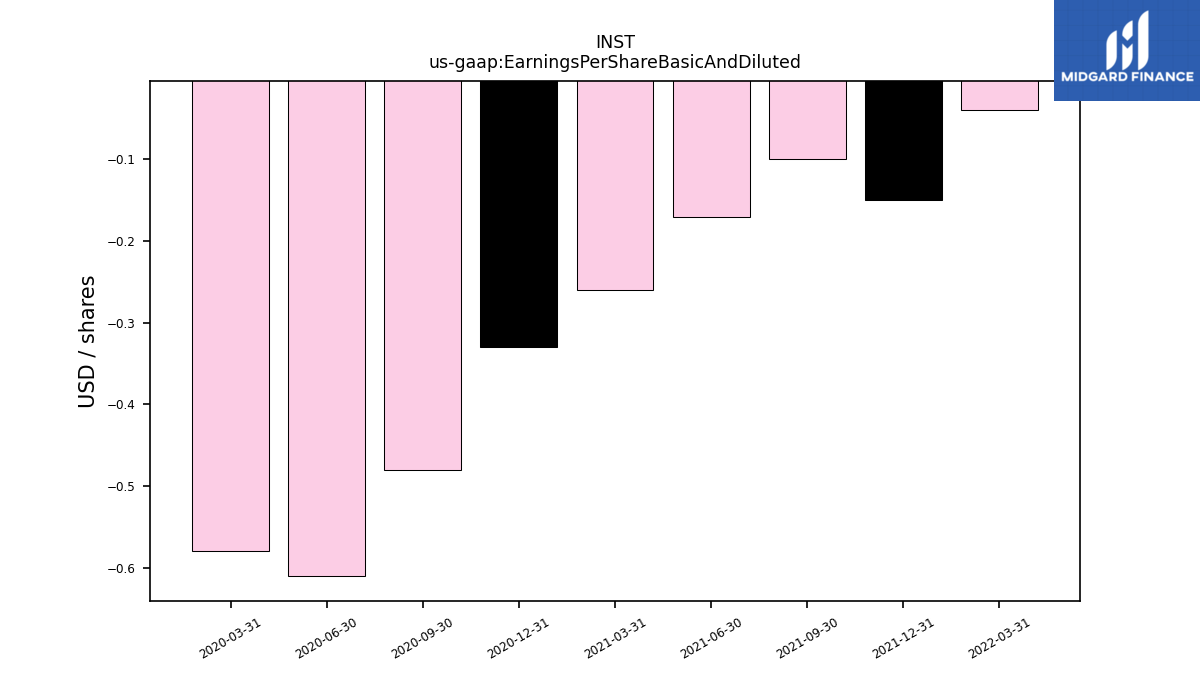
| Earnings Per Share Basic And Diluted | NA | NA | NA | NA | NA | NA | -0.04 | -0.15 | -0.10 | -0.17 | -0.26 | -0.33 | -0.48 | -0.61 | -0.58 | |
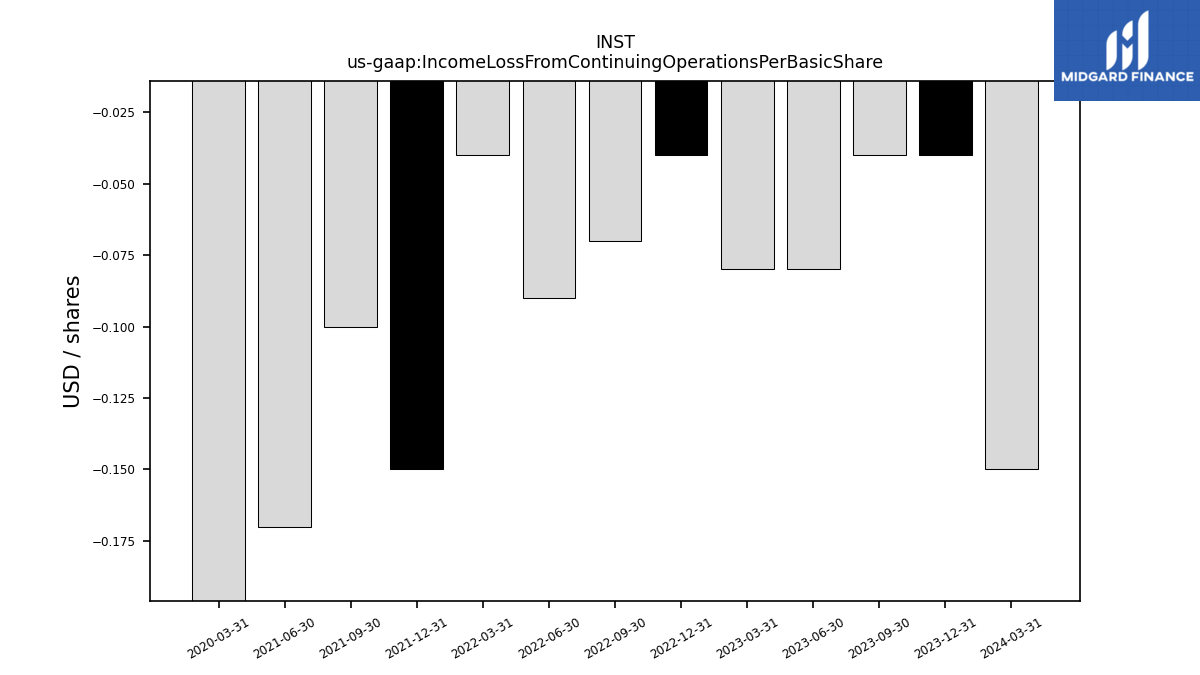
| Income Loss From Continuing Operations Per Basic Share | -0.00 | -0.00 | -0.00 | -0.00 | -0.00 | -0.00 | -0.00 | -0.00 | -0.00 | -0.00 | NA | NA | NA | NA | -0.00 | |
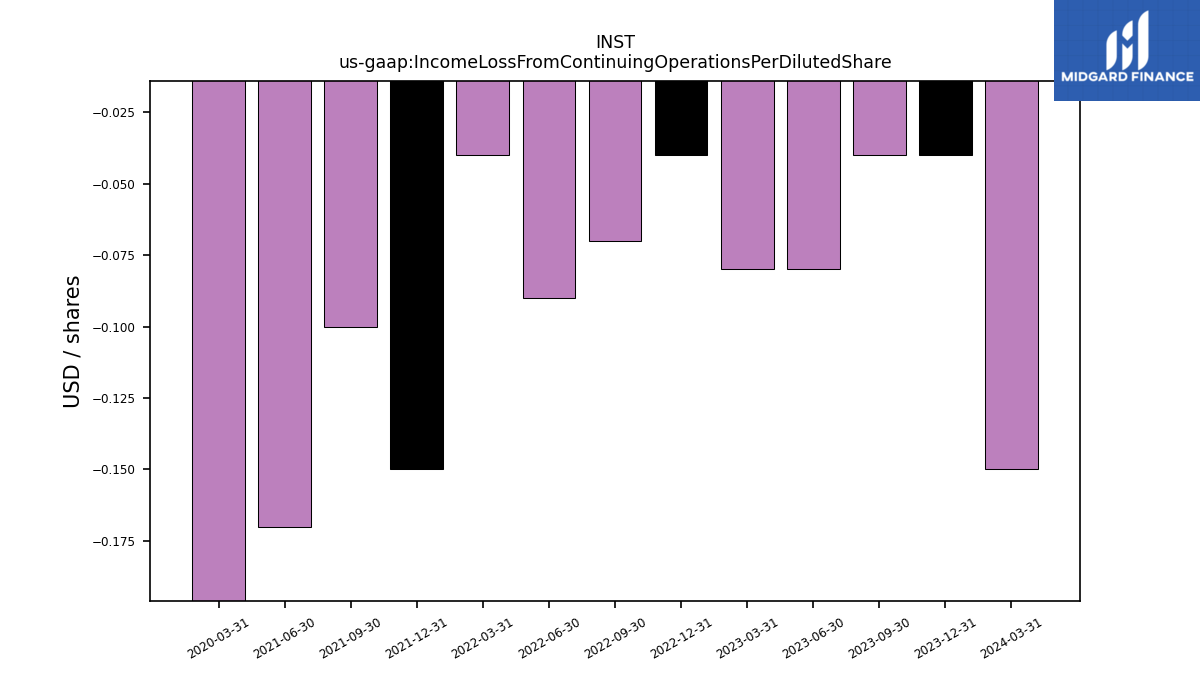
| Income Loss From Continuing Operations Per Diluted Share | -0.00 | -0.00 | -0.00 | -0.00 | -0.00 | -0.00 | -0.00 | -0.00 | -0.00 | -0.00 | NA | NA | NA | NA | -0.00 |
| 2023-09-30 | 2023-06-30 | 2023-03-31 | 2022-12-31 | 2022-09-30 | 2022-06-30 | 2022-03-31 | 2021-12-31 | 2021-09-30 | 2021-06-30 | 2021-03-31 | 2020-12-31 | 2020-09-30 | 2020-06-30 | 2020-03-31 | ||
|---|---|---|---|---|---|---|---|---|---|---|---|---|---|---|---|---|
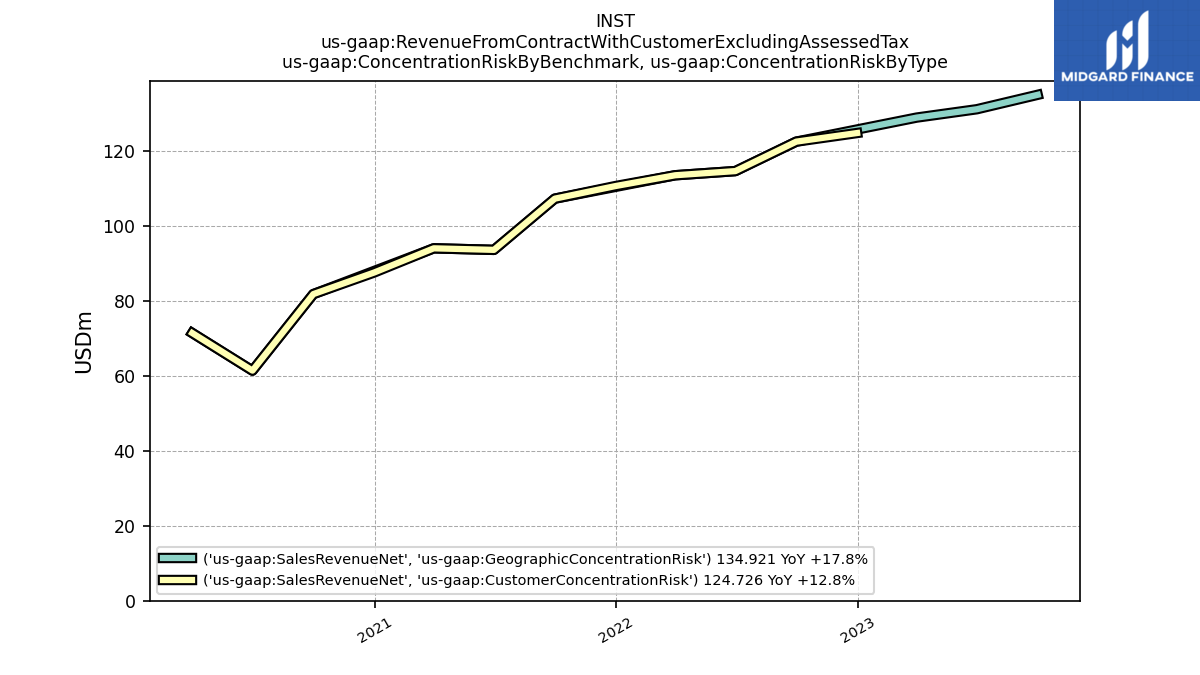
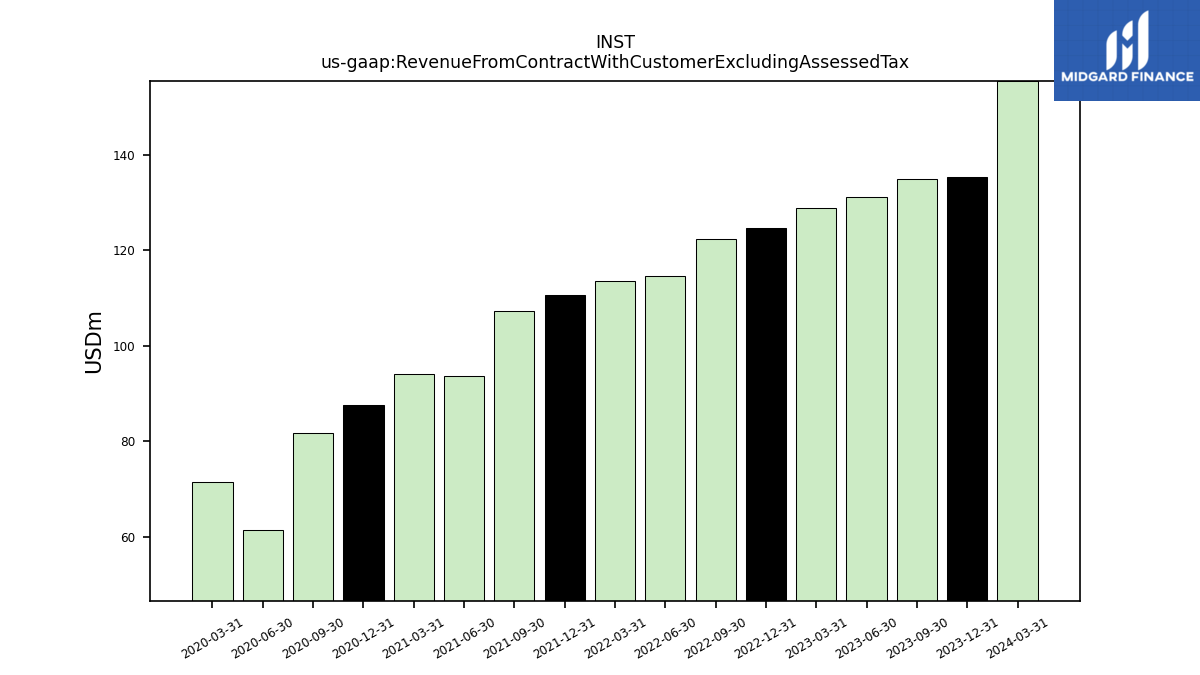
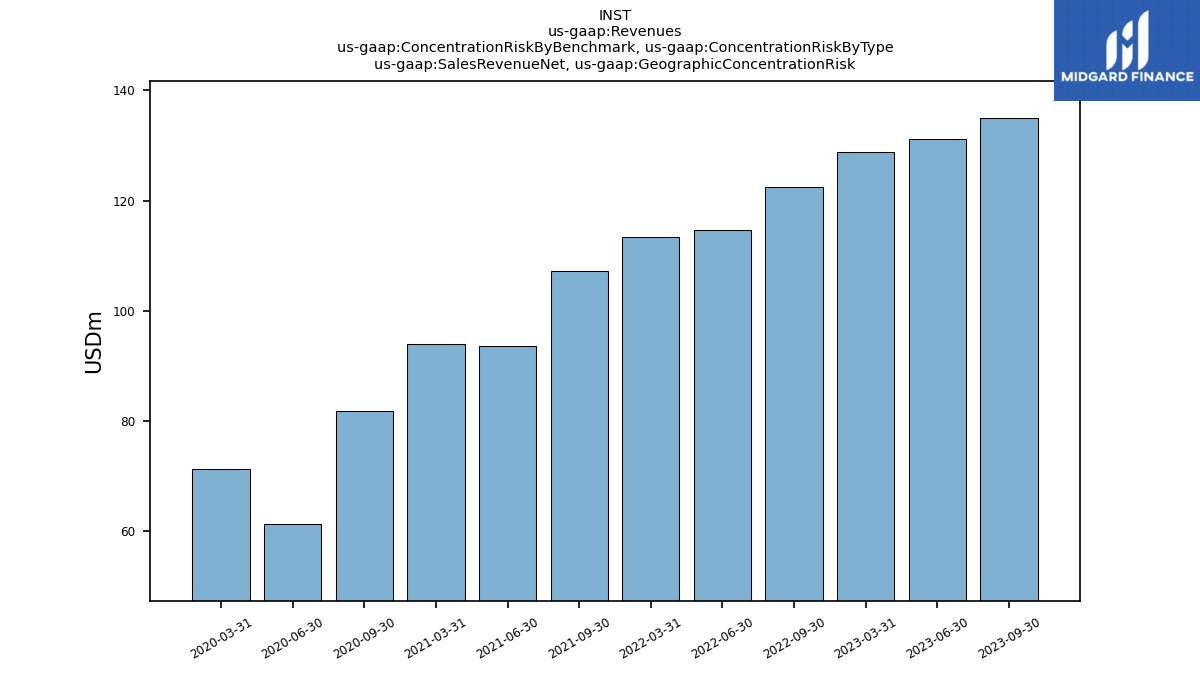
| Revenue From Contract With Customer Excluding Assessed Tax | 134.92 | 131.07 | 128.84 | 124.73 | 122.43 | 114.58 | 113.46 | 110.59 | 107.22 | 93.57 | 93.98 | 87.53 | 81.77 | 61.37 | 71.39 | |
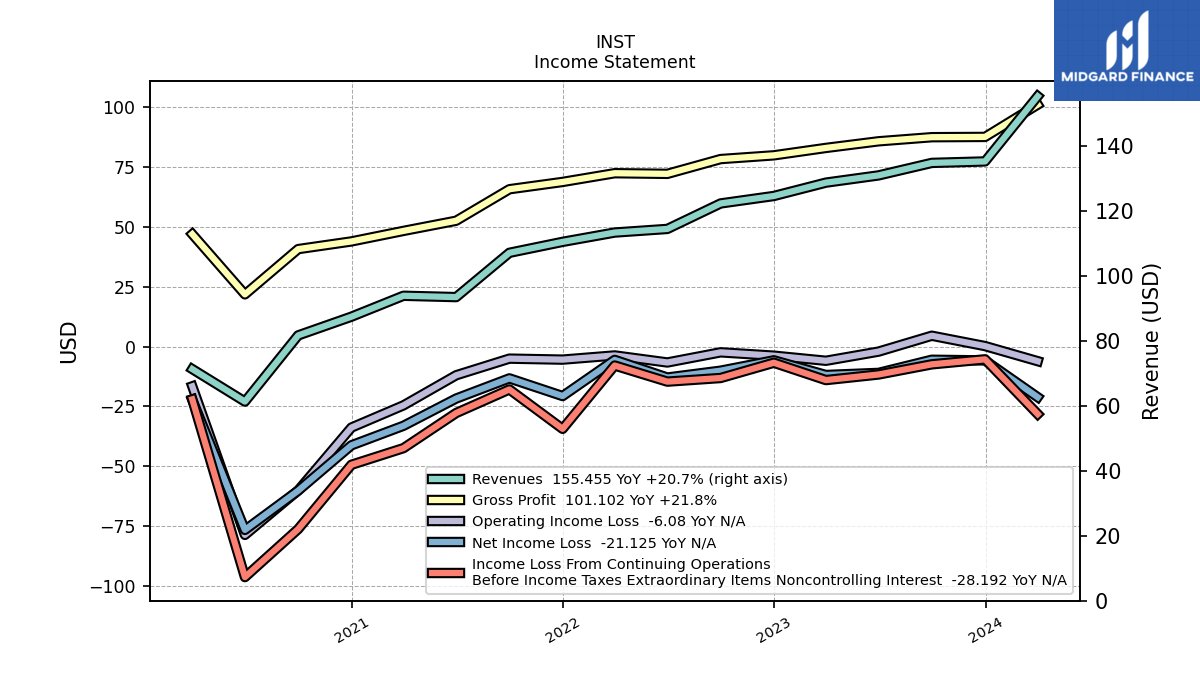
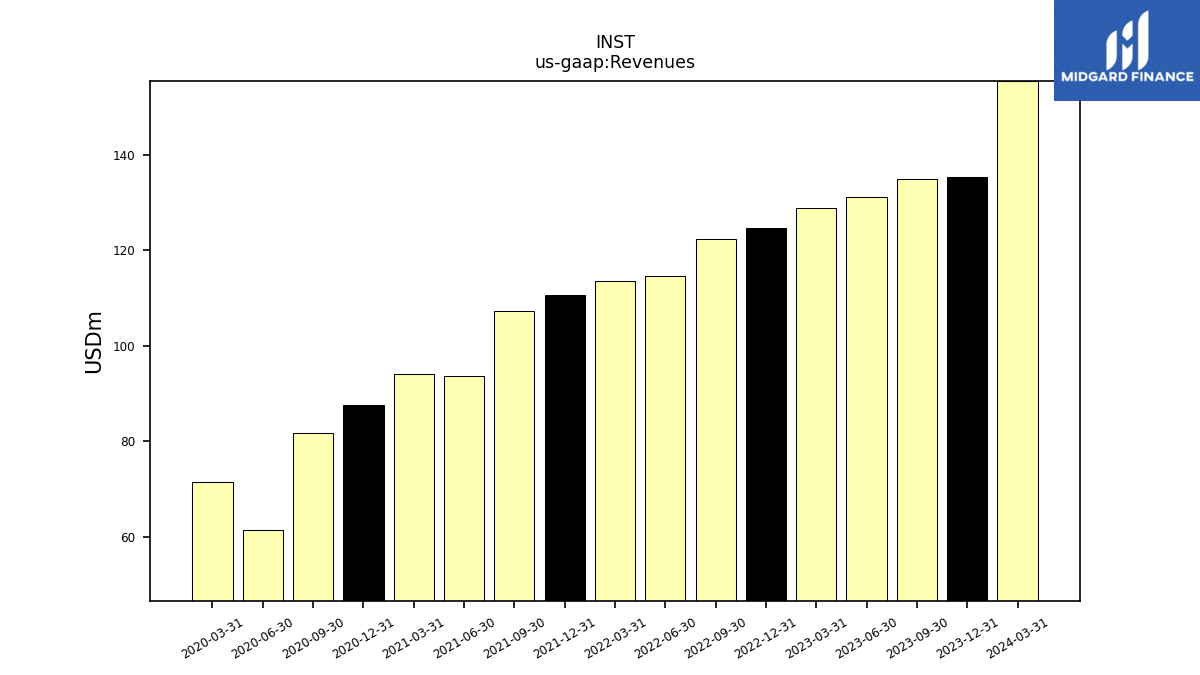
| Revenues | 134.92 | 131.07 | 128.84 | 124.73 | 122.43 | 114.58 | 113.46 | 110.59 | 107.22 | 93.57 | 93.98 | 87.53 | 81.77 | 61.37 | 71.39 | |
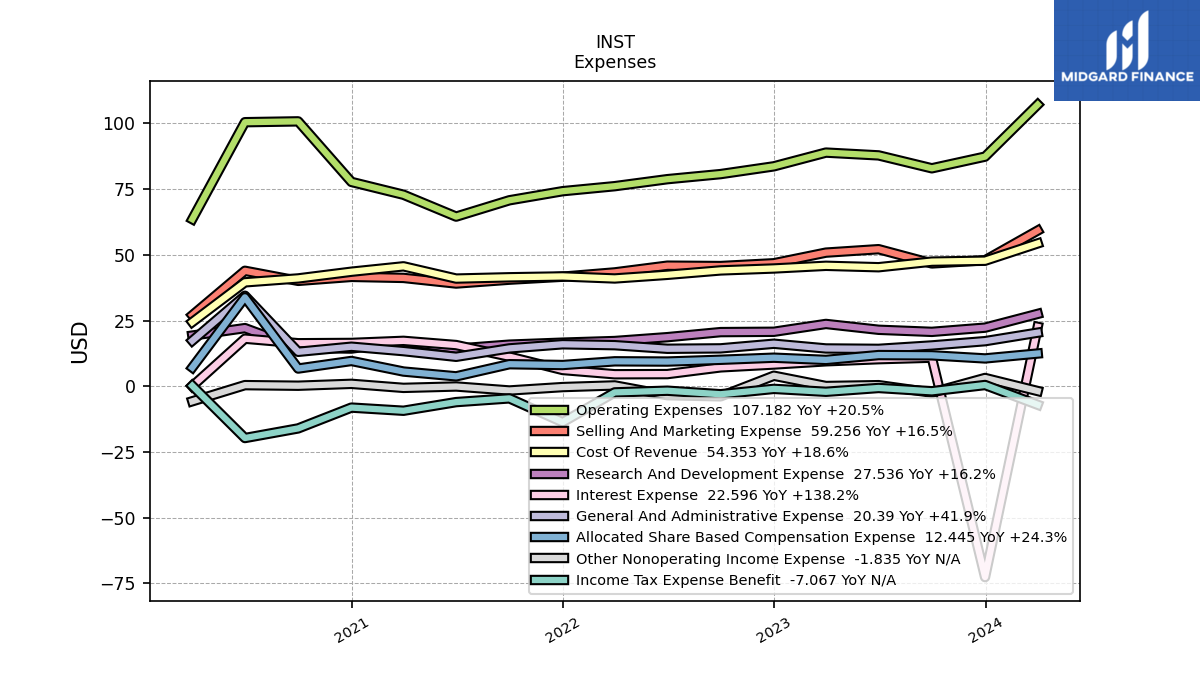
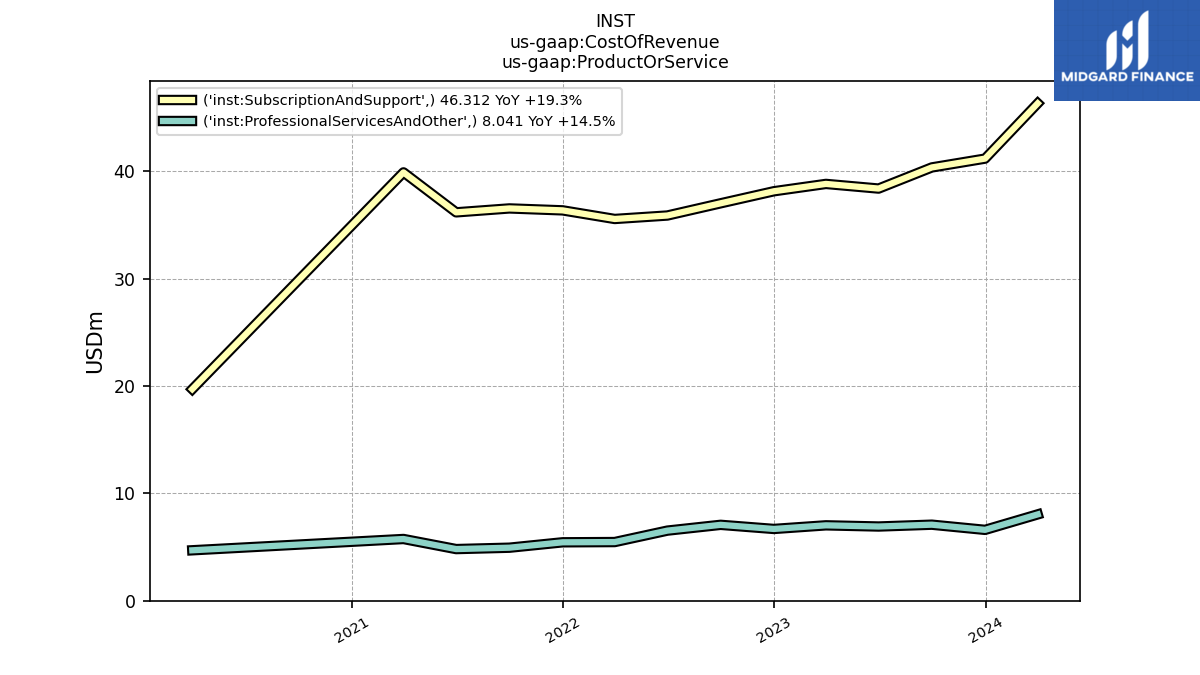
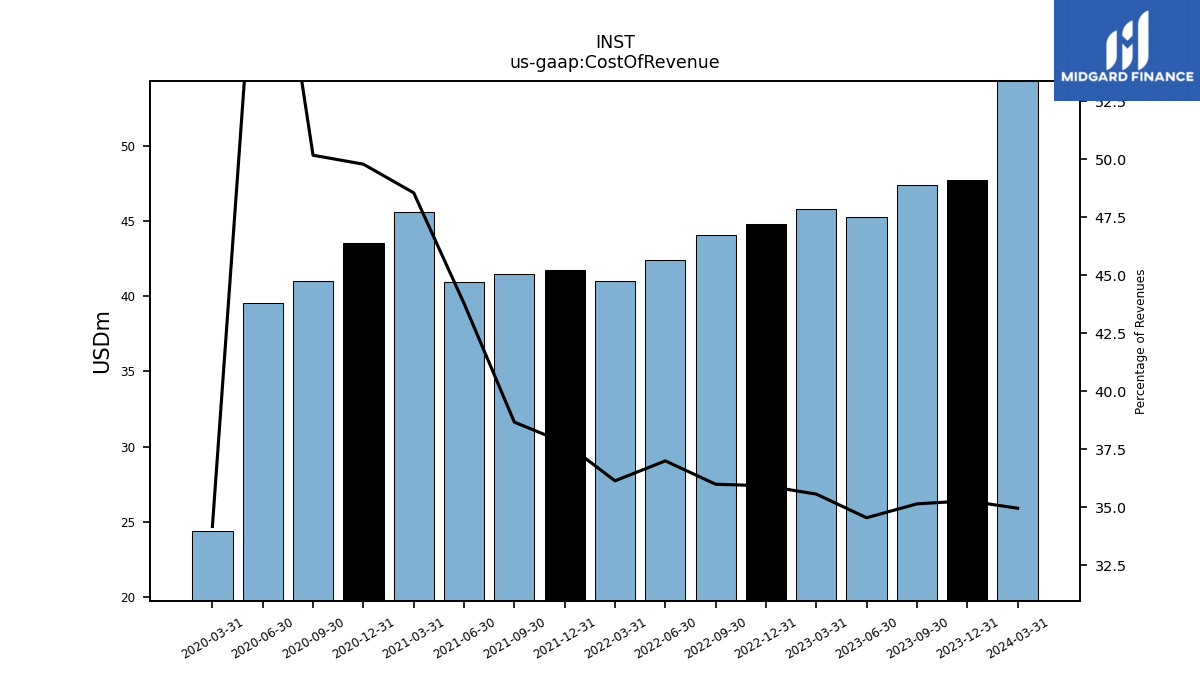
| Cost Of Revenue | 47.43 | 45.29 | 45.83 | 44.81 | 44.07 | 42.40 | 41.01 | 41.79 | 41.47 | 40.97 | 45.63 | 43.58 | 41.03 | 39.54 | 24.40 | |
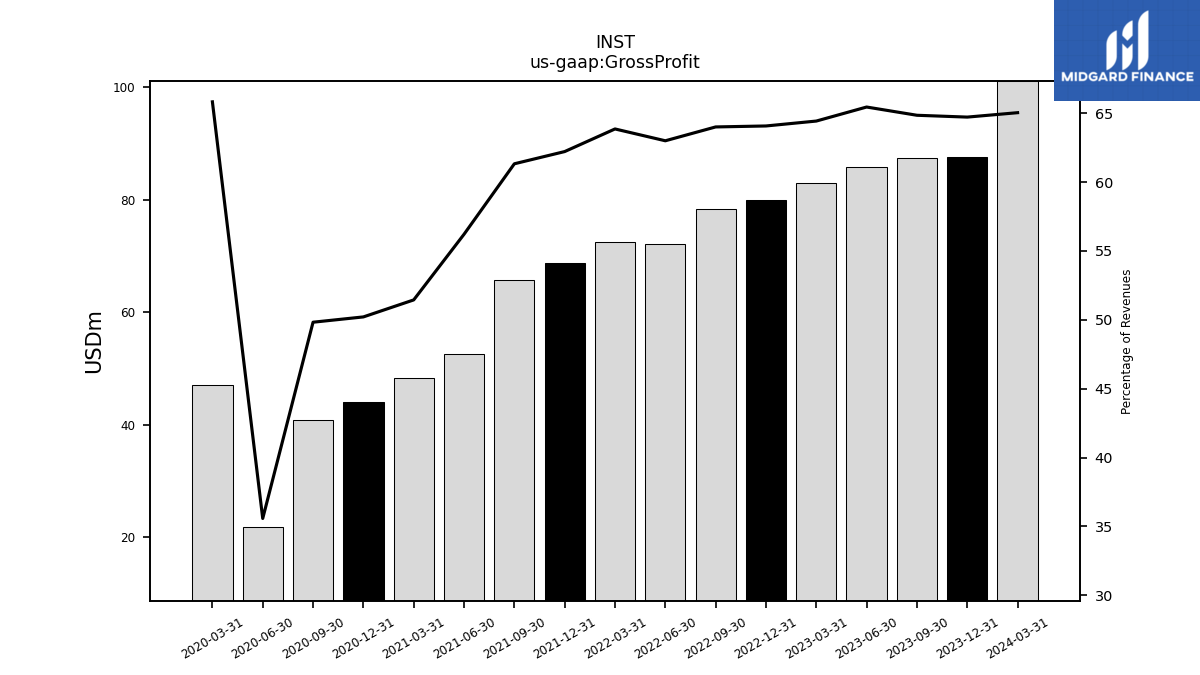
| Gross Profit | 87.49 | 85.78 | 83.01 | 79.91 | 78.36 | 72.18 | 72.45 | 68.80 | 65.75 | 52.59 | 48.35 | 43.95 | 40.74 | 21.83 | 46.99 | |
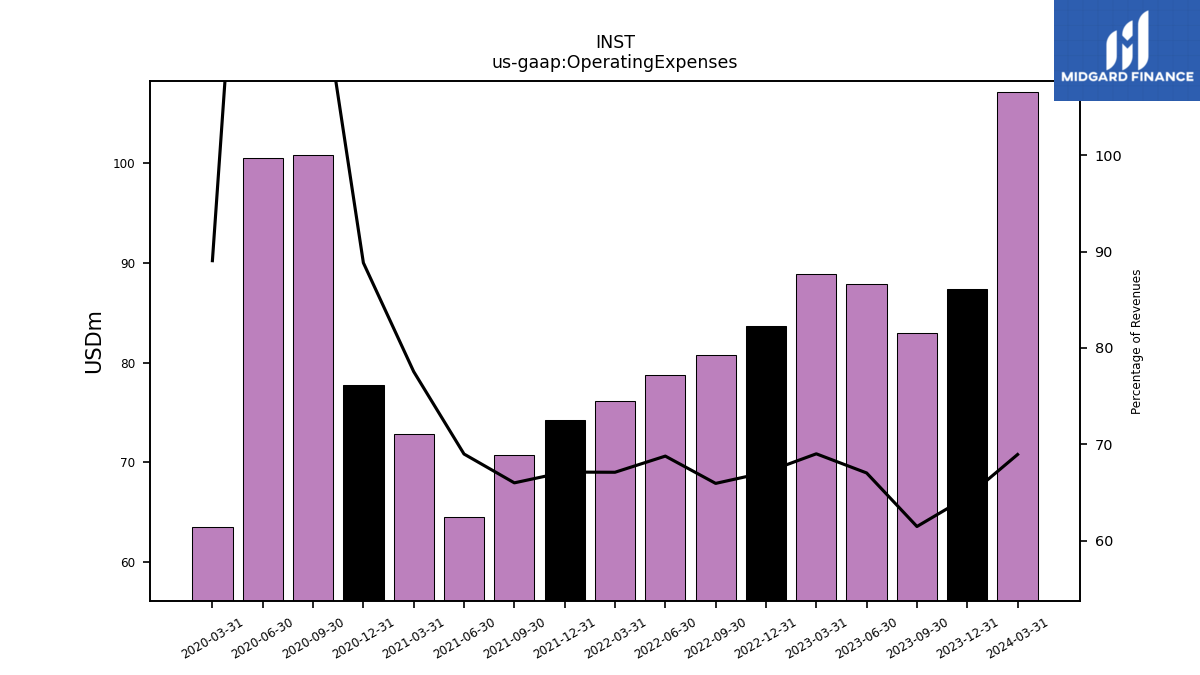
| Operating Expenses | 82.94 | 87.86 | 88.92 | 83.69 | 80.74 | 78.81 | 76.14 | 74.23 | 70.77 | 64.56 | 72.88 | 77.76 | 100.81 | 100.49 | 63.58 | |
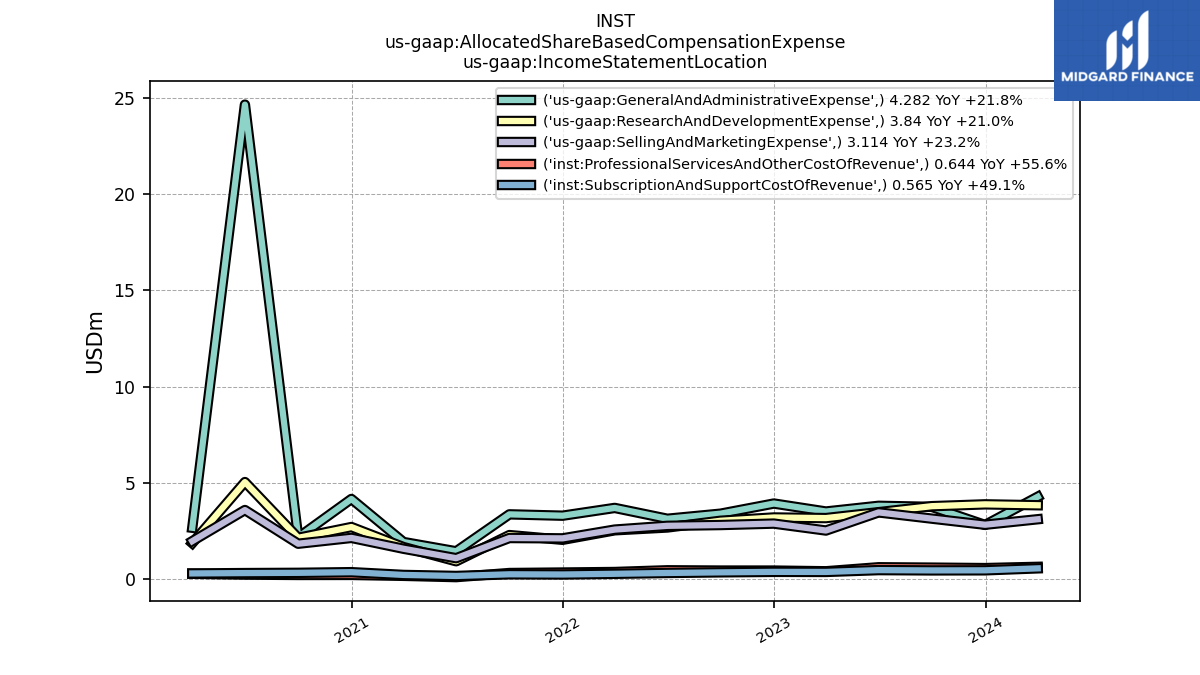
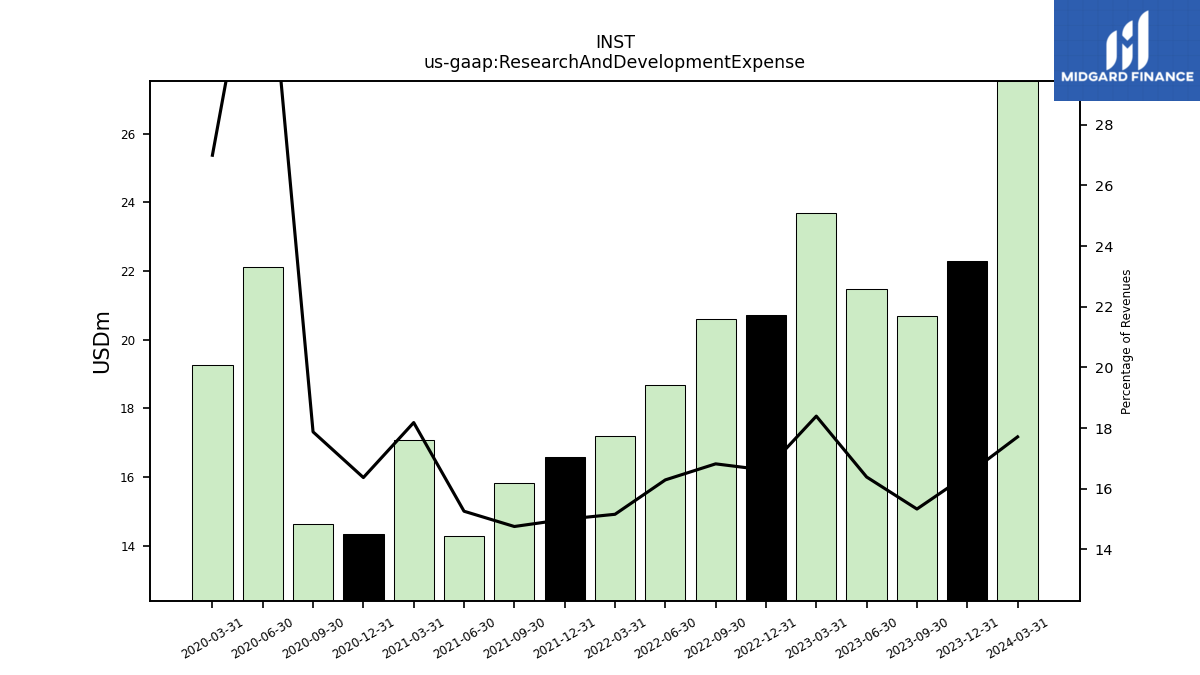
| Research And Development Expense | 20.69 | 21.48 | 23.70 | 20.72 | 20.60 | 18.67 | 17.20 | 16.58 | 15.82 | 14.28 | 17.09 | 14.33 | 14.62 | 22.12 | 19.27 | |
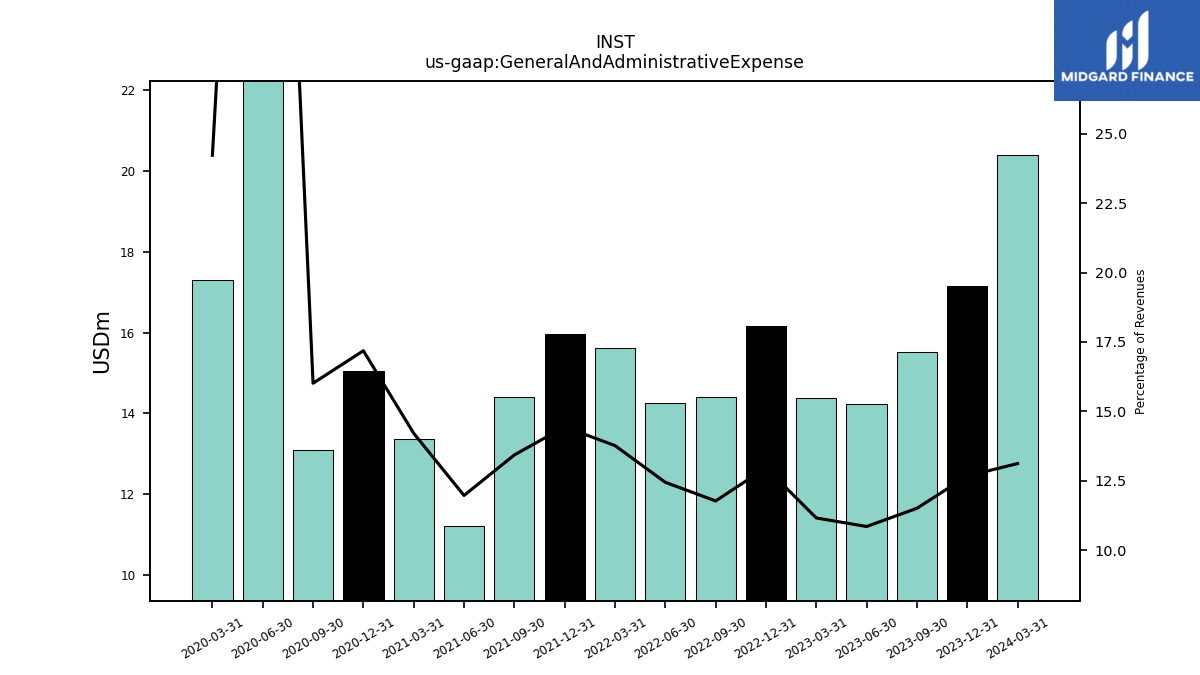
| General And Administrative Expense | 15.52 | 14.22 | 14.37 | 16.17 | 14.41 | 14.25 | 15.62 | 15.97 | 14.40 | 11.20 | 13.35 | 15.04 | 13.09 | 34.44 | 17.30 | |
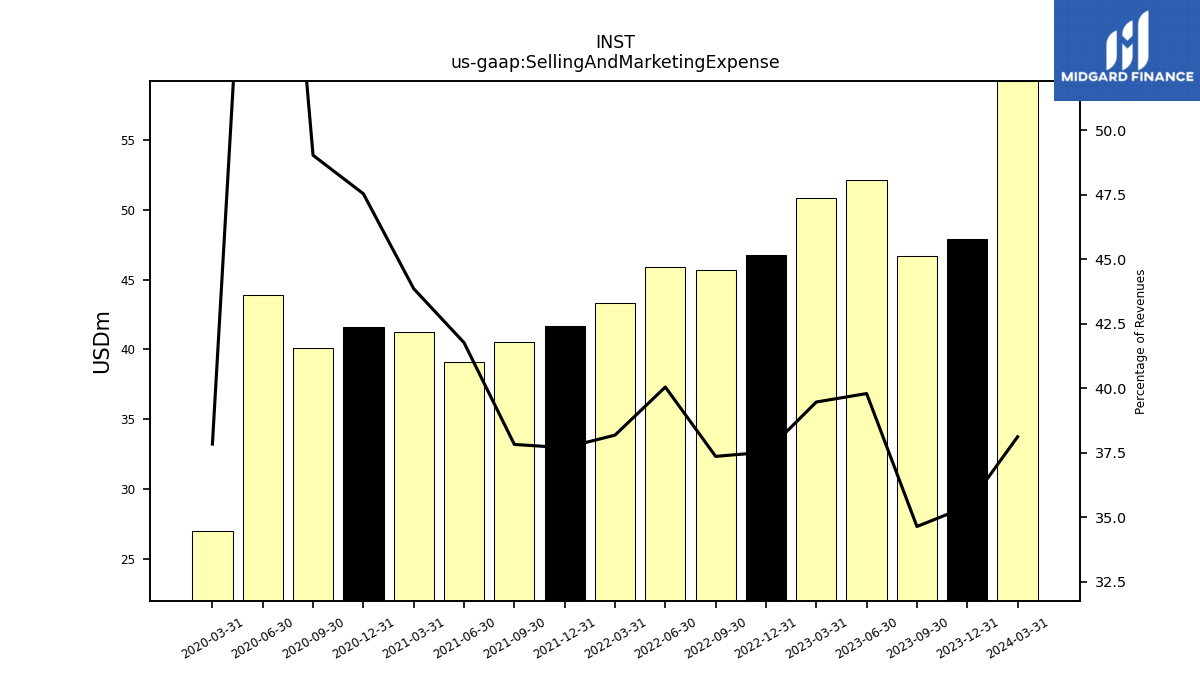
| Selling And Marketing Expense | 46.73 | 52.16 | 50.85 | 46.80 | 45.74 | 45.88 | 43.32 | 41.69 | 40.55 | 39.08 | 41.22 | 41.62 | 40.10 | 43.93 | 27.01 | |
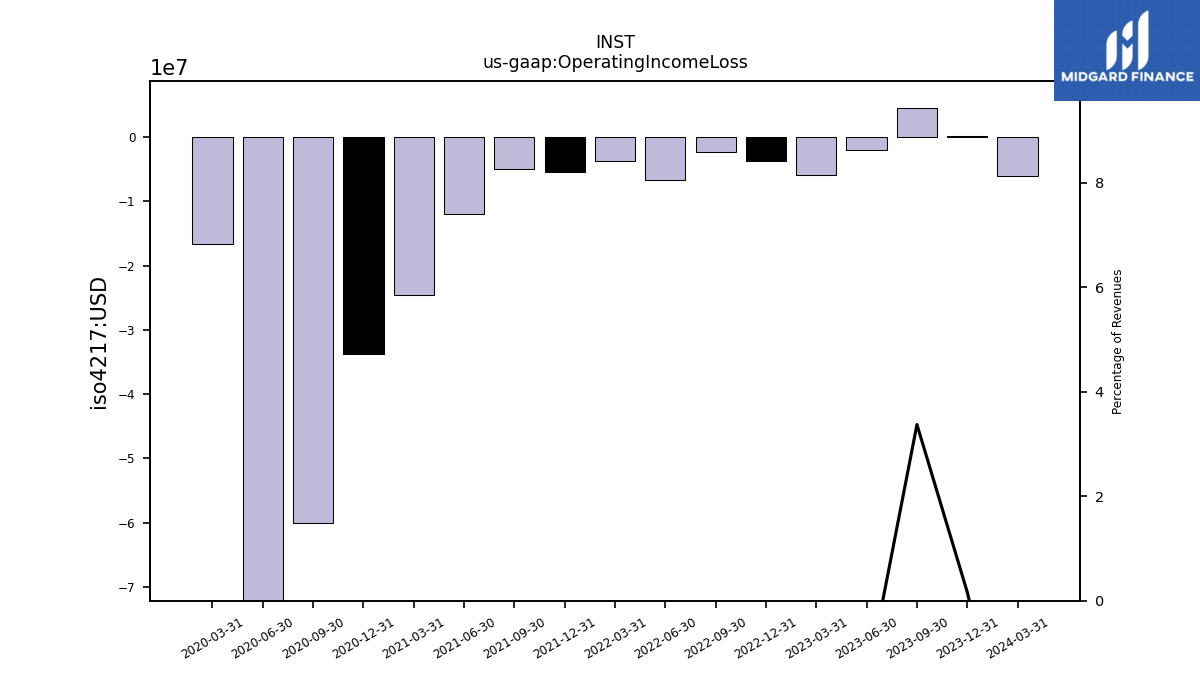
| Operating Income Loss | 4.55 | -2.08 | -5.91 | -3.78 | -2.38 | -6.63 | -3.69 | -5.43 | -5.02 | -11.96 | -24.53 | -33.81 | -60.07 | -78.66 | -16.59 | |
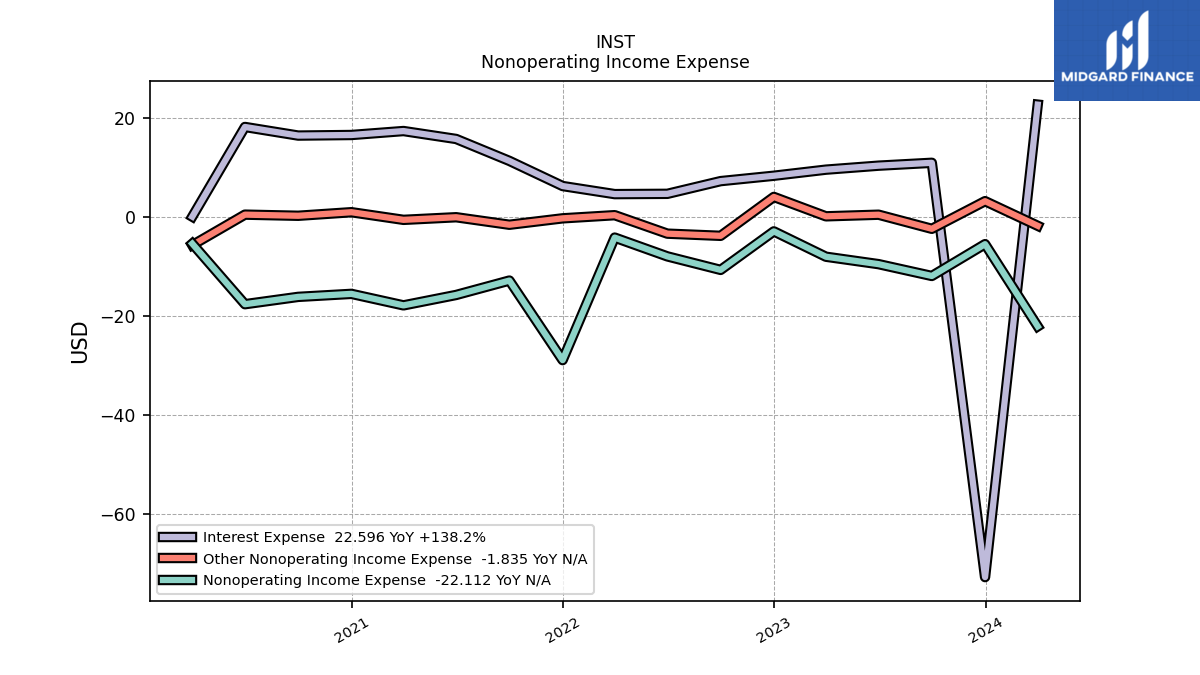
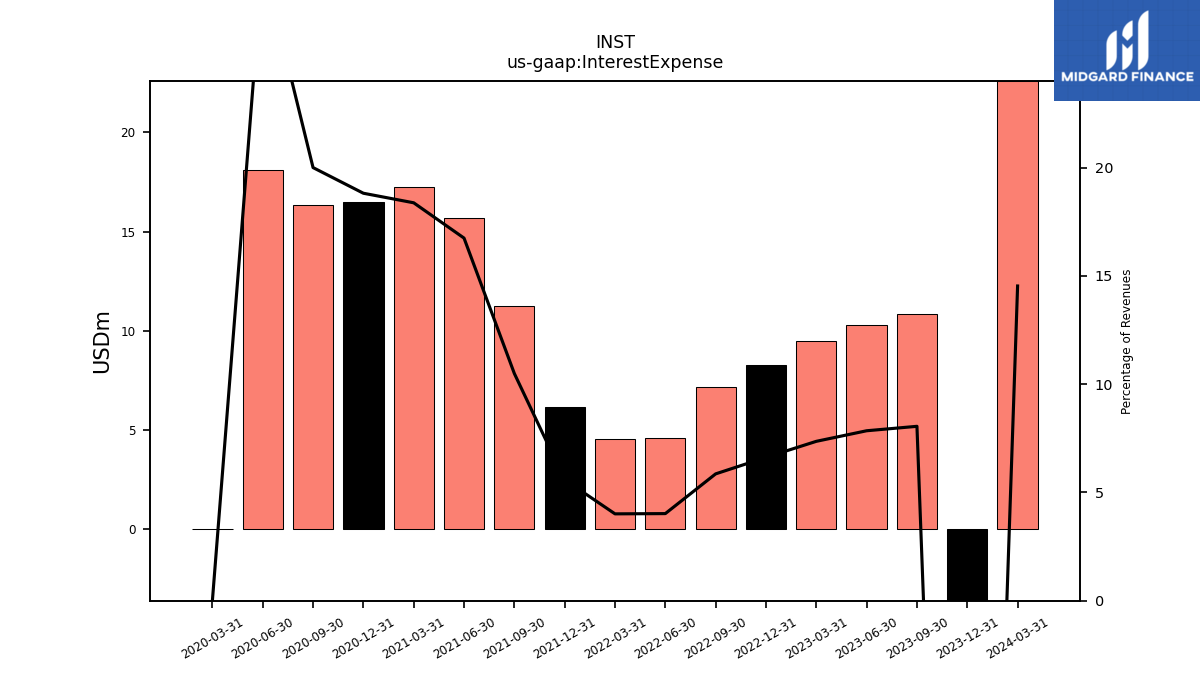
| Interest Expense | 10.87 | 10.29 | 9.48 | 8.26 | 7.17 | 4.61 | 4.55 | 6.18 | 11.25 | 15.67 | 17.27 | 16.47 | 16.36 | 18.09 | 0.01 | |
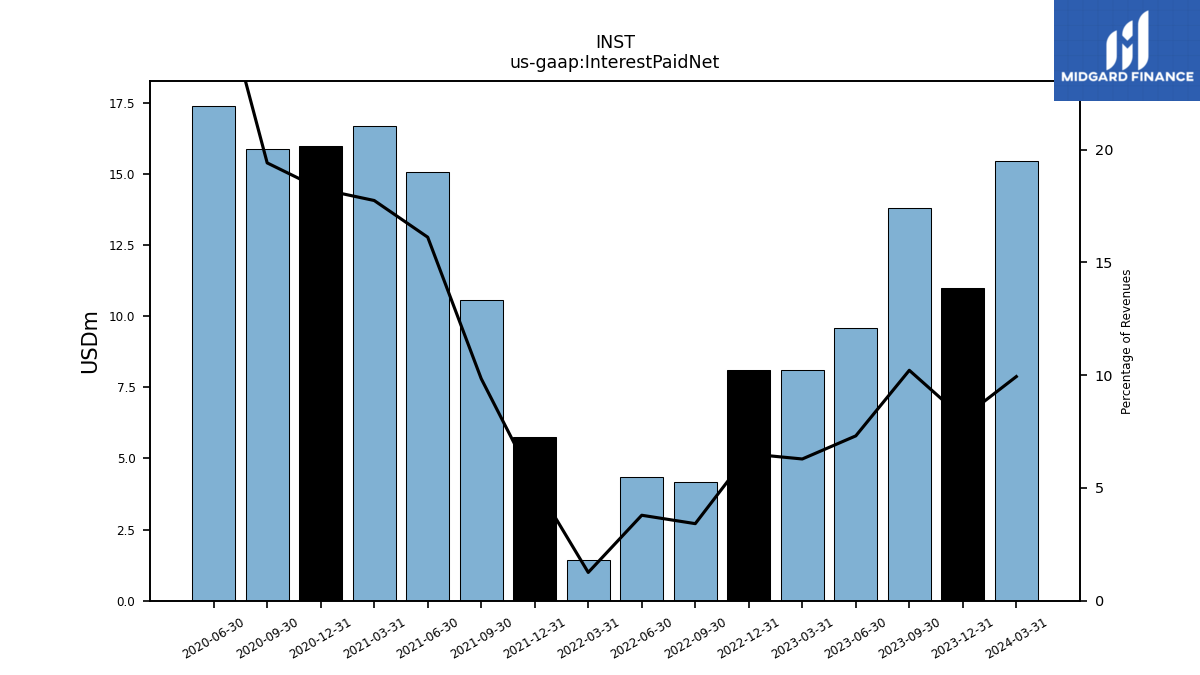
| Interest Paid Net | 13.78 | 9.58 | 8.10 | 8.12 | 4.18 | 4.34 | 1.42 | 5.76 | 10.55 | 15.08 | 16.67 | 15.97 | 15.87 | 17.39 | NA | |
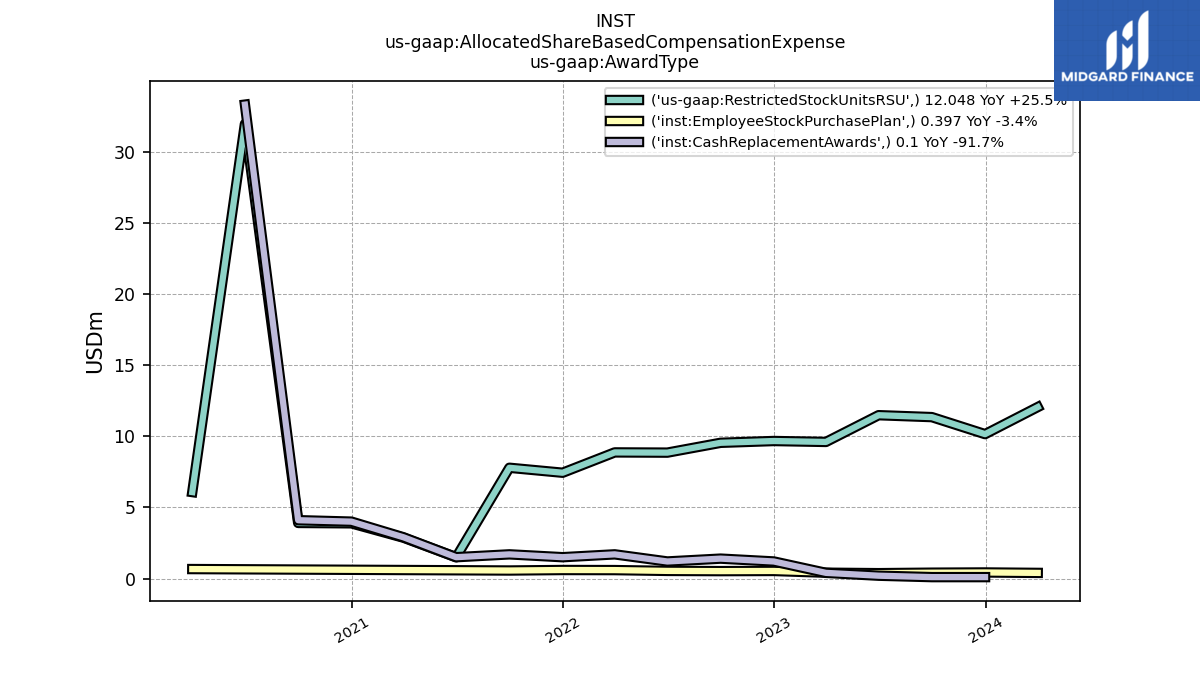
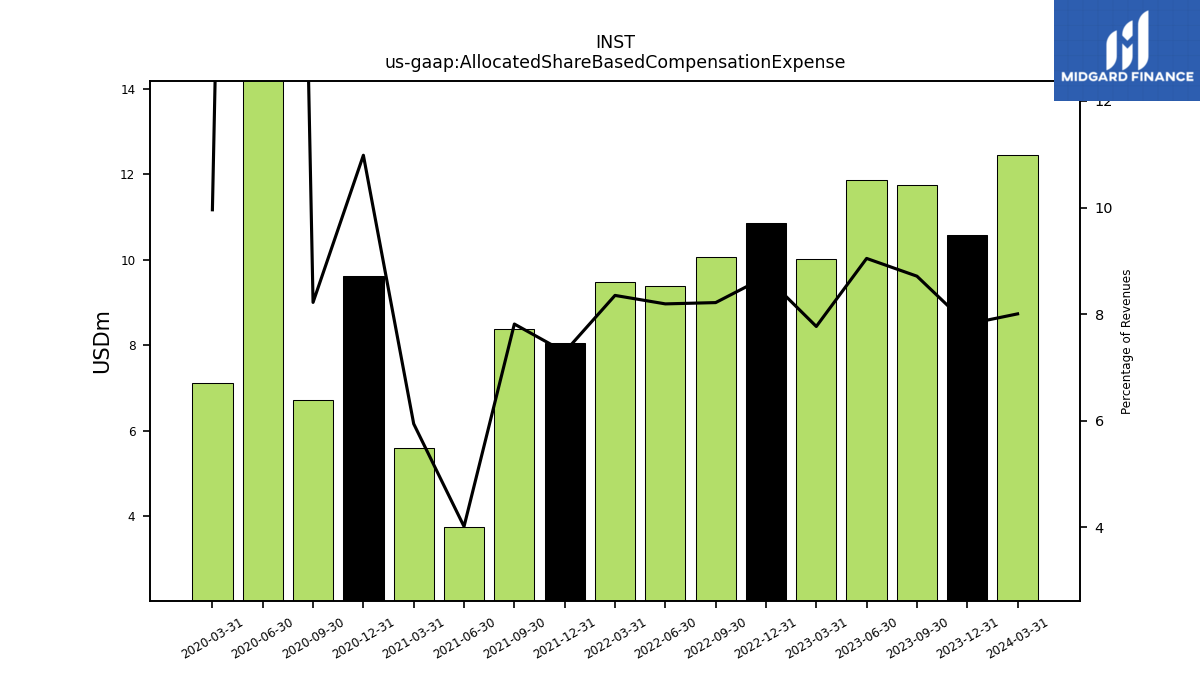
| Allocated Share Based Compensation Expense | 11.76 | 11.86 | 10.01 | 10.86 | 10.06 | 9.39 | 9.48 | 8.06 | 8.38 | 3.76 | 5.58 | 9.61 | 6.72 | 33.83 | 7.11 | |
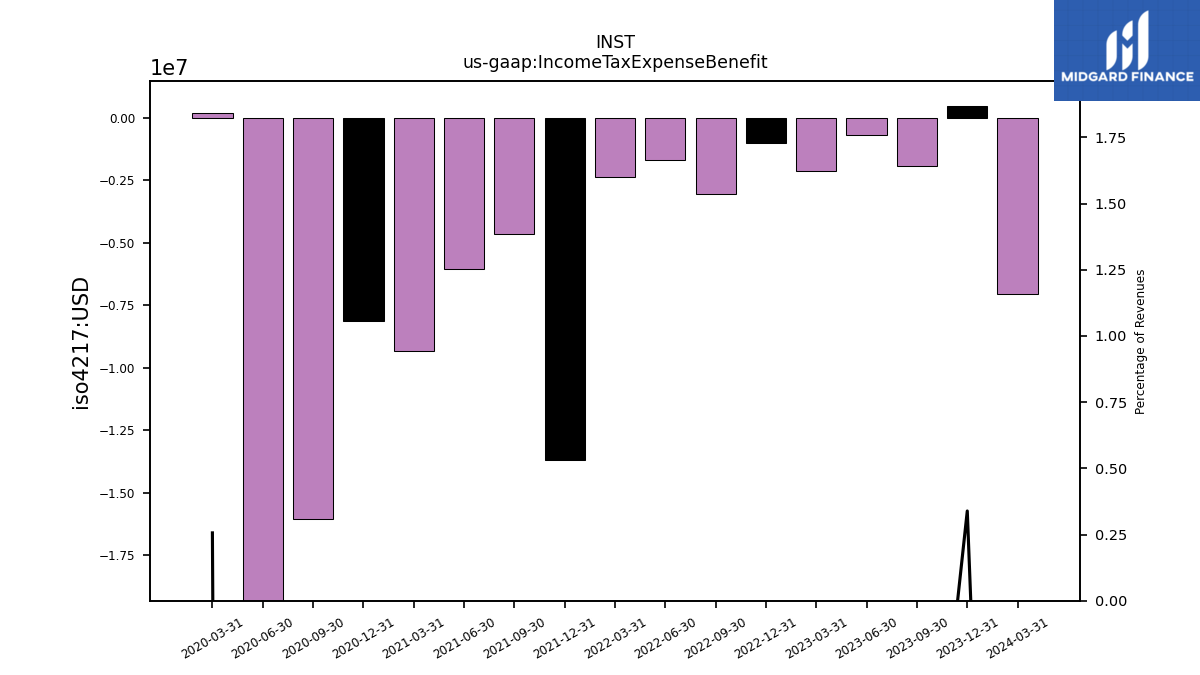
| Income Tax Expense Benefit | -1.92 | -0.67 | -2.12 | -1.01 | -3.06 | -1.71 | -2.35 | -13.70 | -4.63 | -6.05 | -9.34 | -8.14 | -16.06 | -19.73 | 0.18 | |
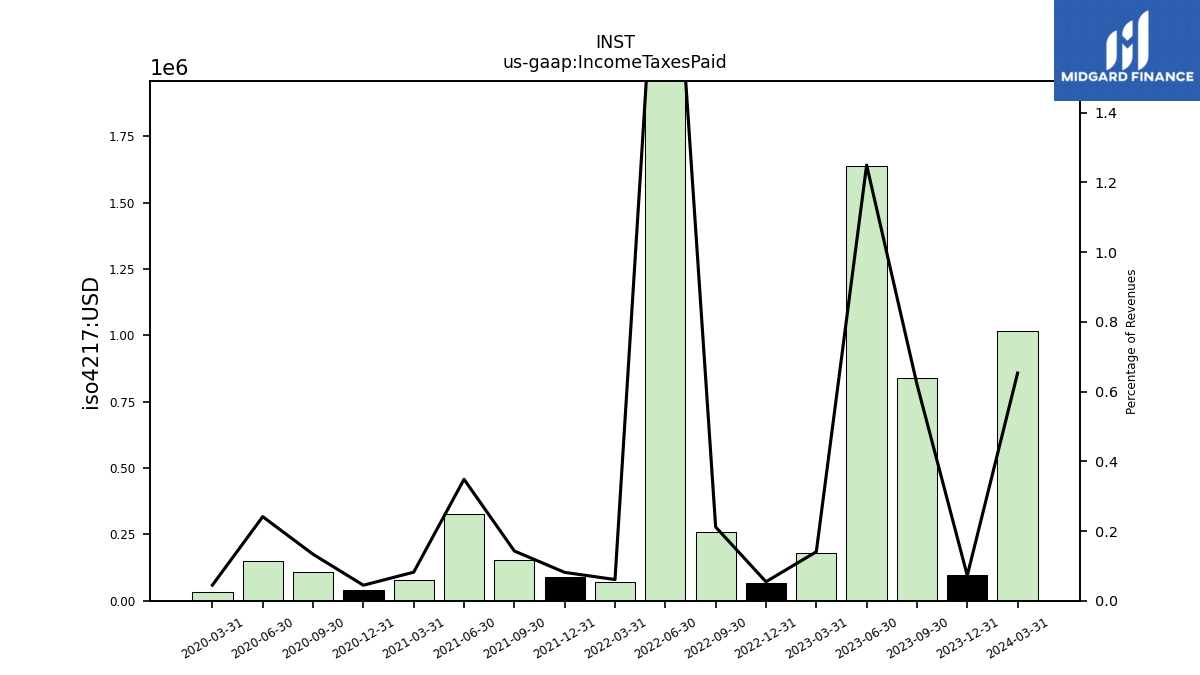
| Income Taxes Paid | 0.84 | 1.64 | 0.18 | 0.07 | 0.26 | 2.71 | 0.07 | 0.09 | 0.15 | 0.33 | 0.08 | 0.04 | 0.11 | 0.15 | 0.03 | |
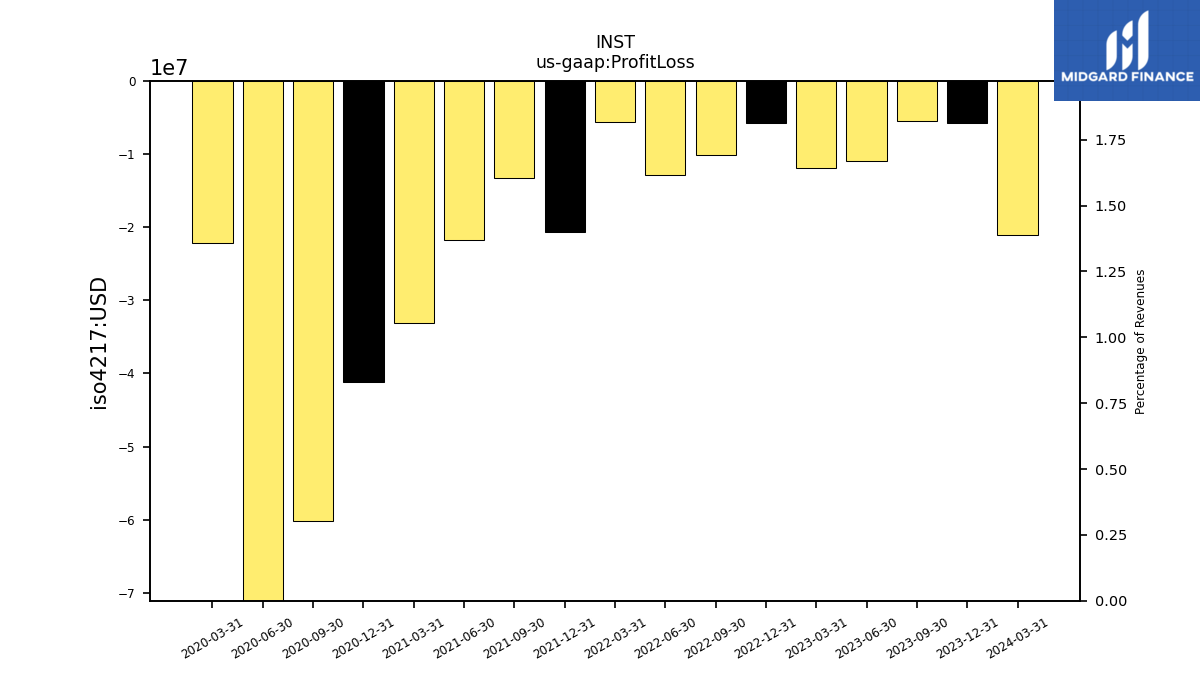
| Profit Loss | -5.48 | -10.97 | -11.86 | -5.72 | -10.05 | -12.92 | -5.54 | -20.65 | -13.26 | -21.69 | -33.07 | -41.23 | -60.17 | -76.57 | -22.20 | |
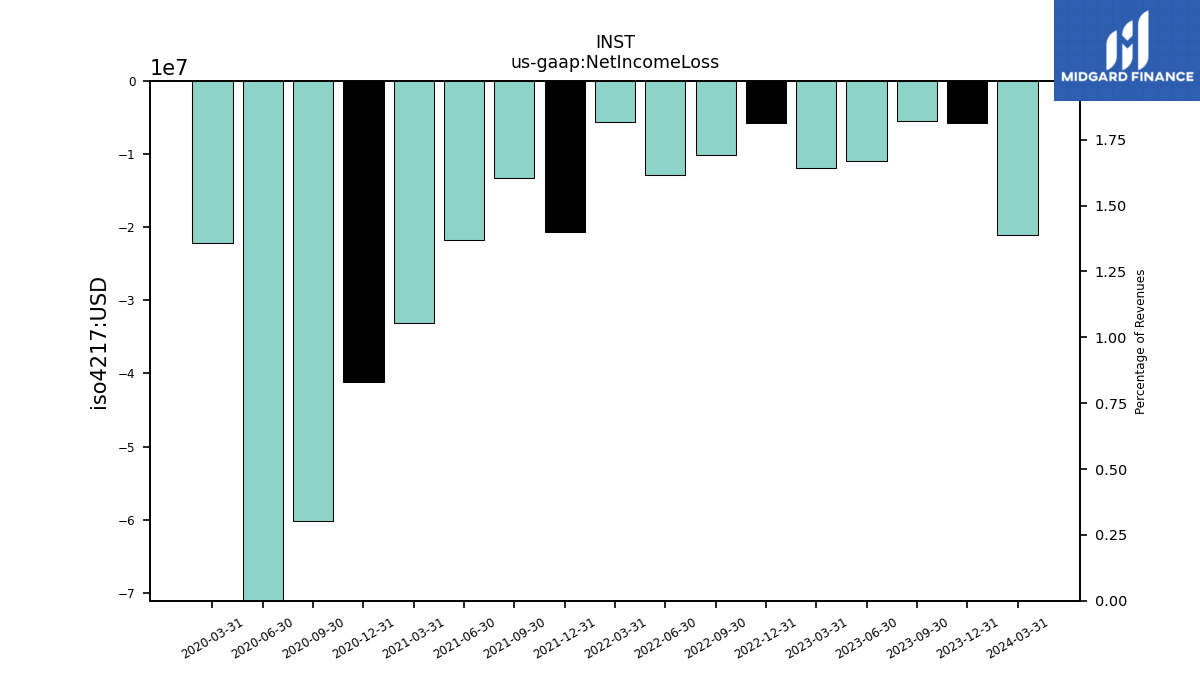
| Net Income Loss | -5.48 | -10.97 | -11.86 | -5.72 | -10.05 | -12.92 | -5.54 | -20.65 | -13.26 | -21.69 | -33.07 | -41.23 | -60.17 | -76.57 | -22.20 | |
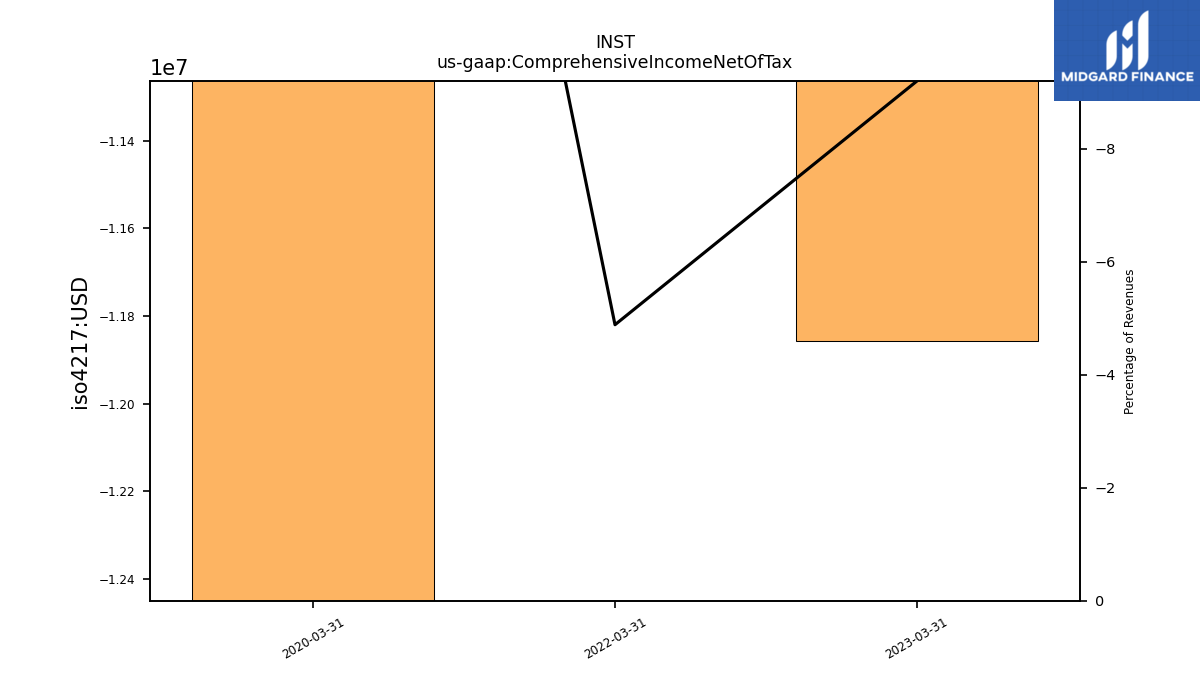
| Comprehensive Income Net Of Tax | NA | NA | -11.86 | NA | NA | NA | -5.54 | NA | NA | NA | NA | NA | NA | NA | -22.20 |
| 2023-09-30 | 2023-06-30 | 2023-03-31 | 2022-12-31 | 2022-09-30 | 2022-06-30 | 2022-03-31 | 2021-12-31 | 2021-09-30 | 2021-06-30 | 2021-03-31 | 2020-12-31 | 2020-09-30 | 2020-06-30 | 2020-03-31 | ||
|---|---|---|---|---|---|---|---|---|---|---|---|---|---|---|---|---|
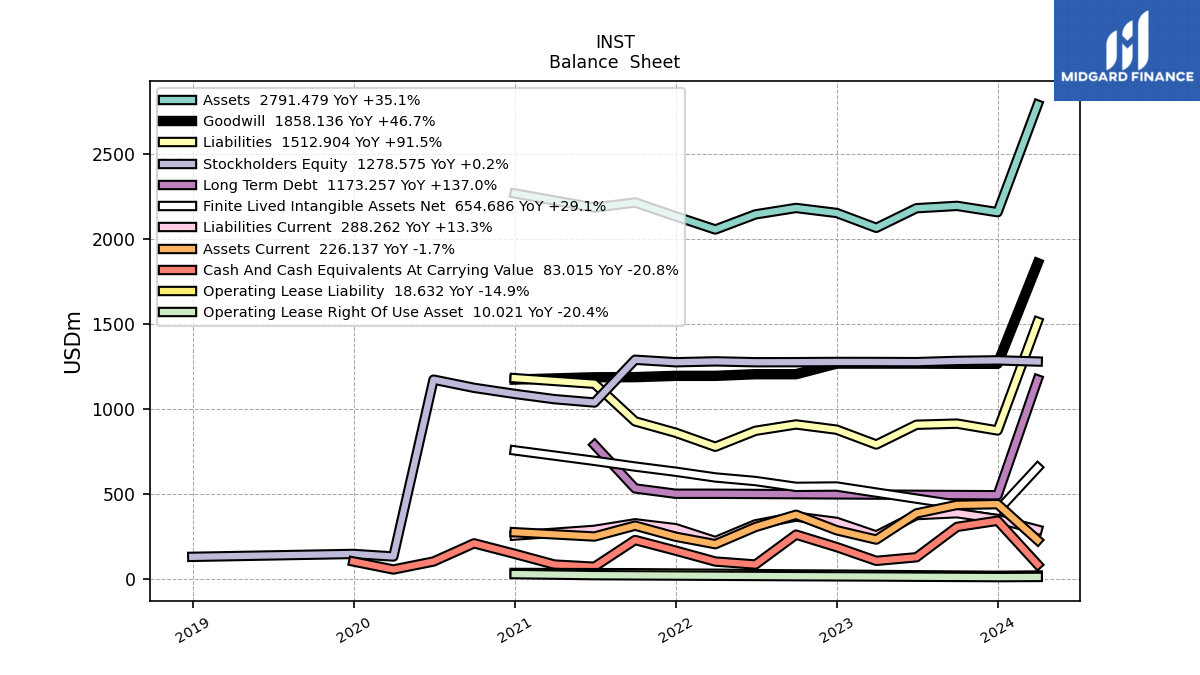
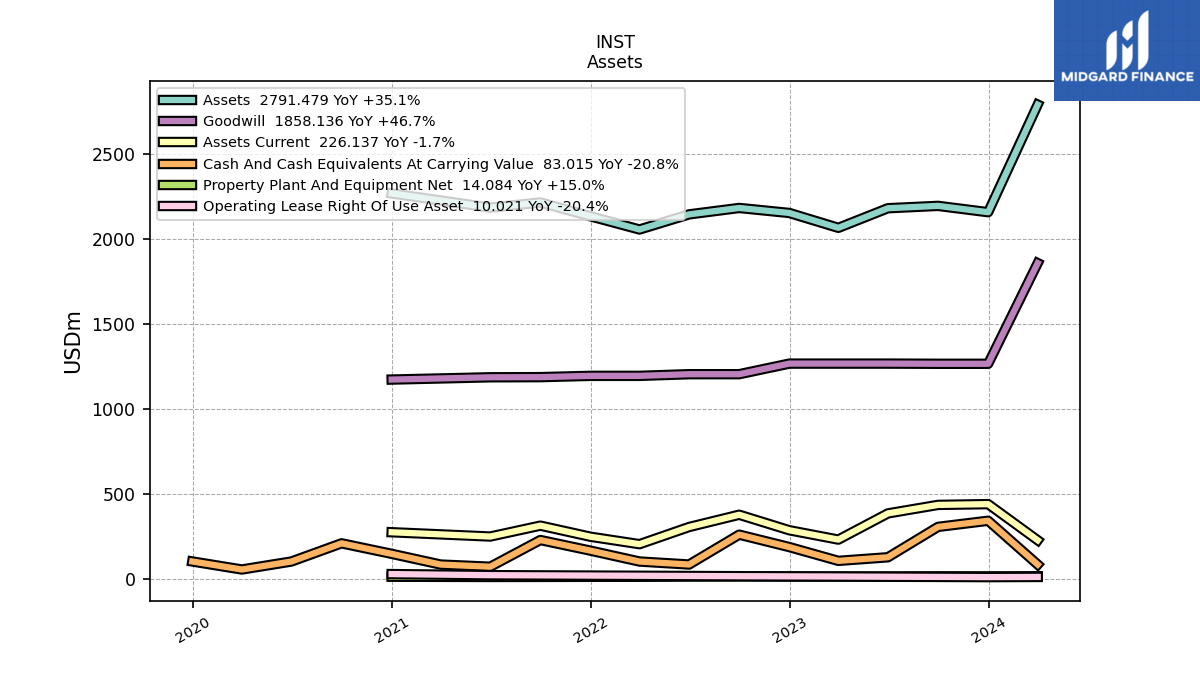
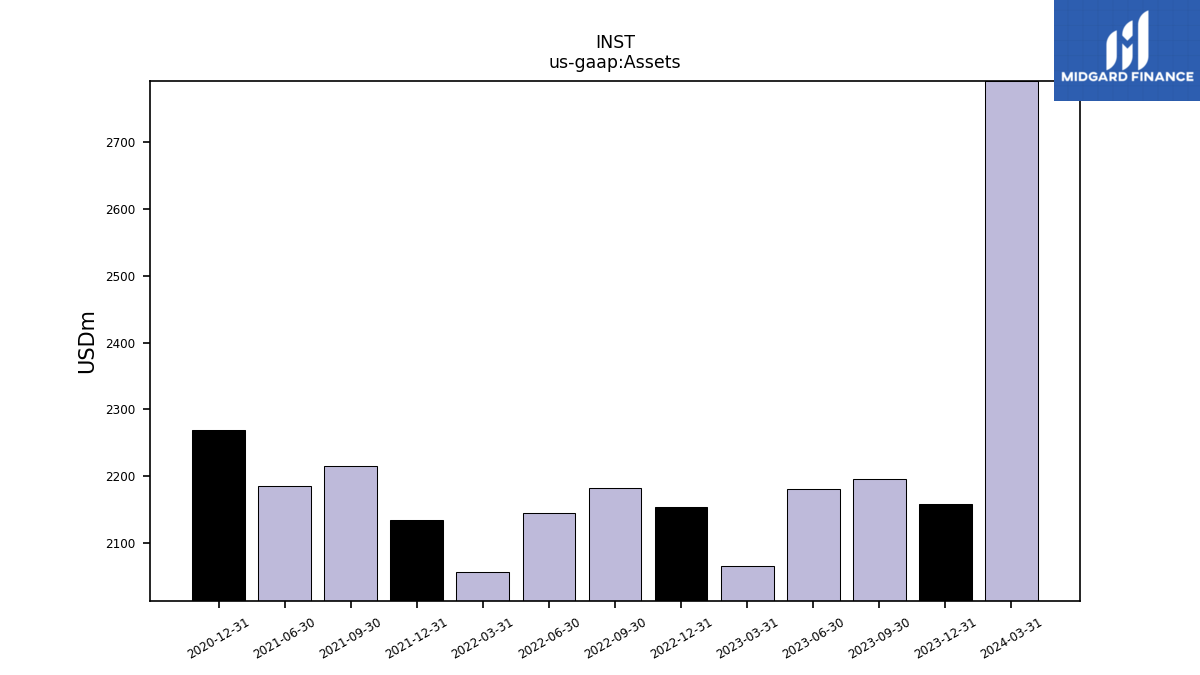
| Assets | 2195.20 | 2181.39 | 2065.87 | 2153.49 | 2182.92 | 2145.17 | 2056.14 | 2133.78 | 2215.29 | 2184.84 | NA | 2268.63 | NA | NA | NA | |
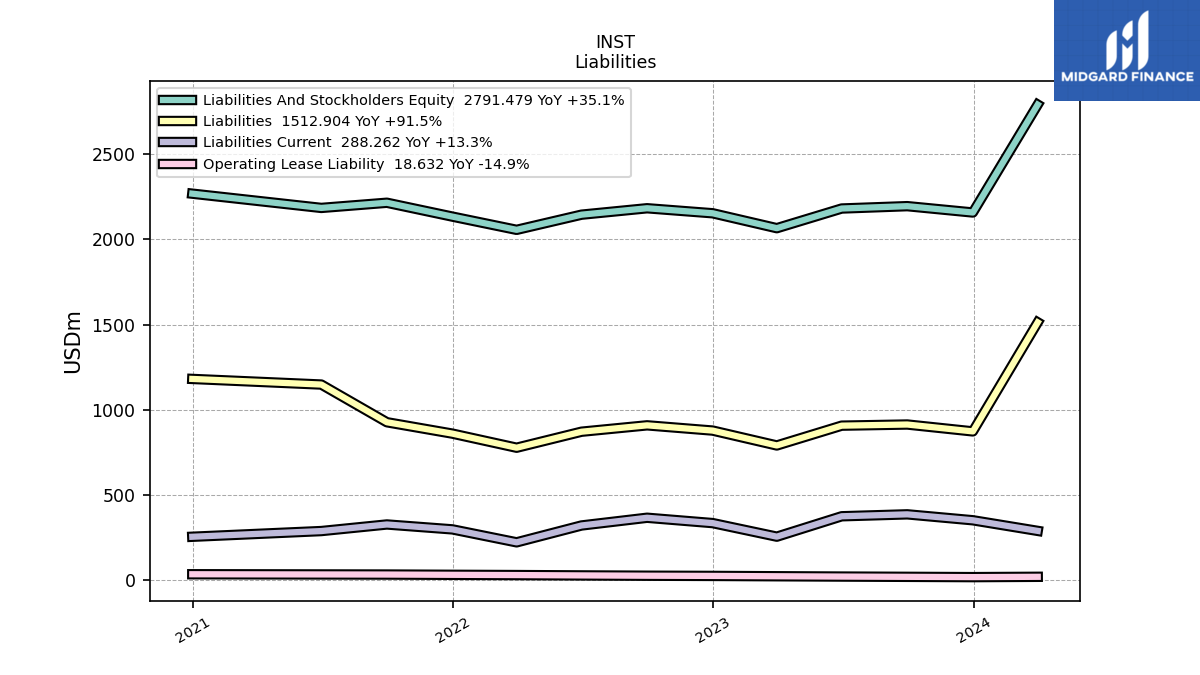
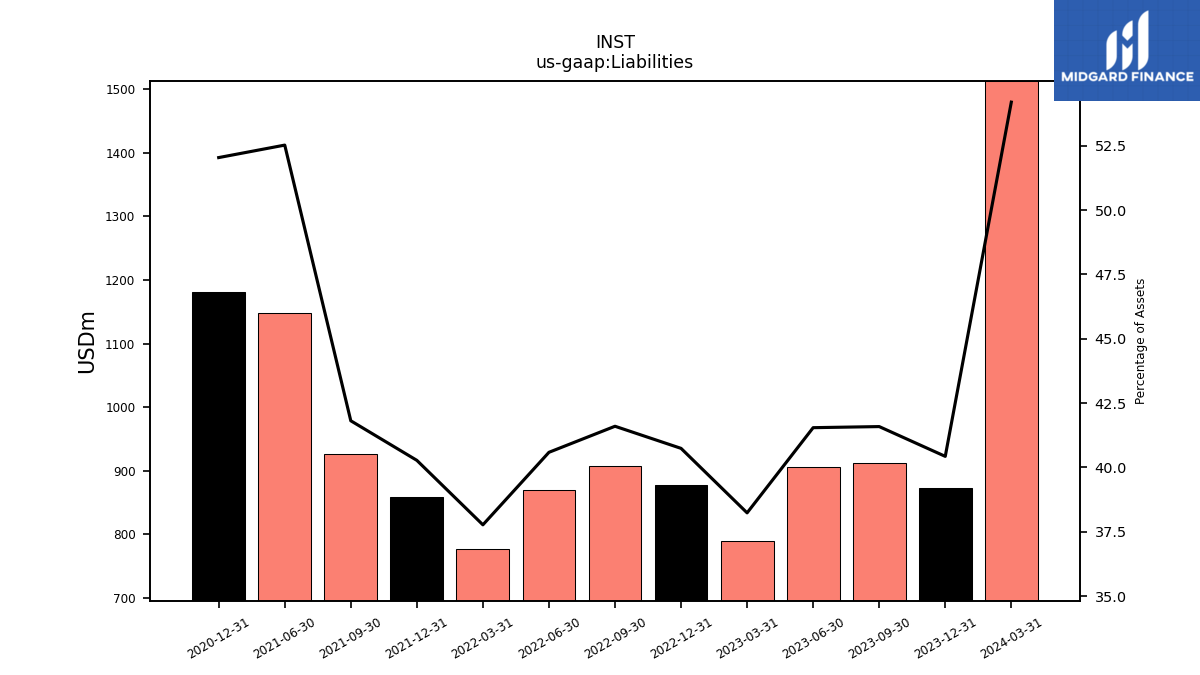
| Liabilities | 912.94 | 906.27 | 789.89 | 877.36 | 908.11 | 870.68 | 776.62 | 859.40 | 926.30 | 1147.64 | NA | 1180.65 | NA | NA | NA | |
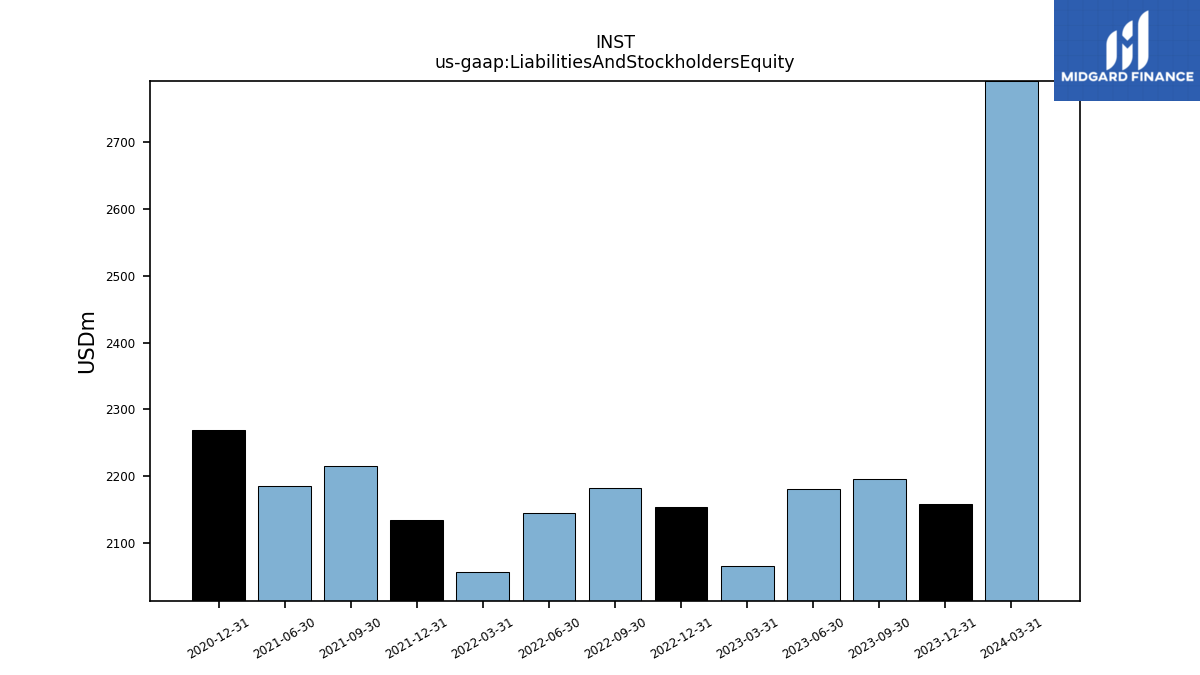
| Liabilities And Stockholders Equity | 2195.20 | 2181.39 | 2065.87 | 2153.49 | 2182.92 | 2145.17 | 2056.14 | 2133.78 | 2215.29 | 2184.84 | NA | 2268.63 | NA | NA | NA | |
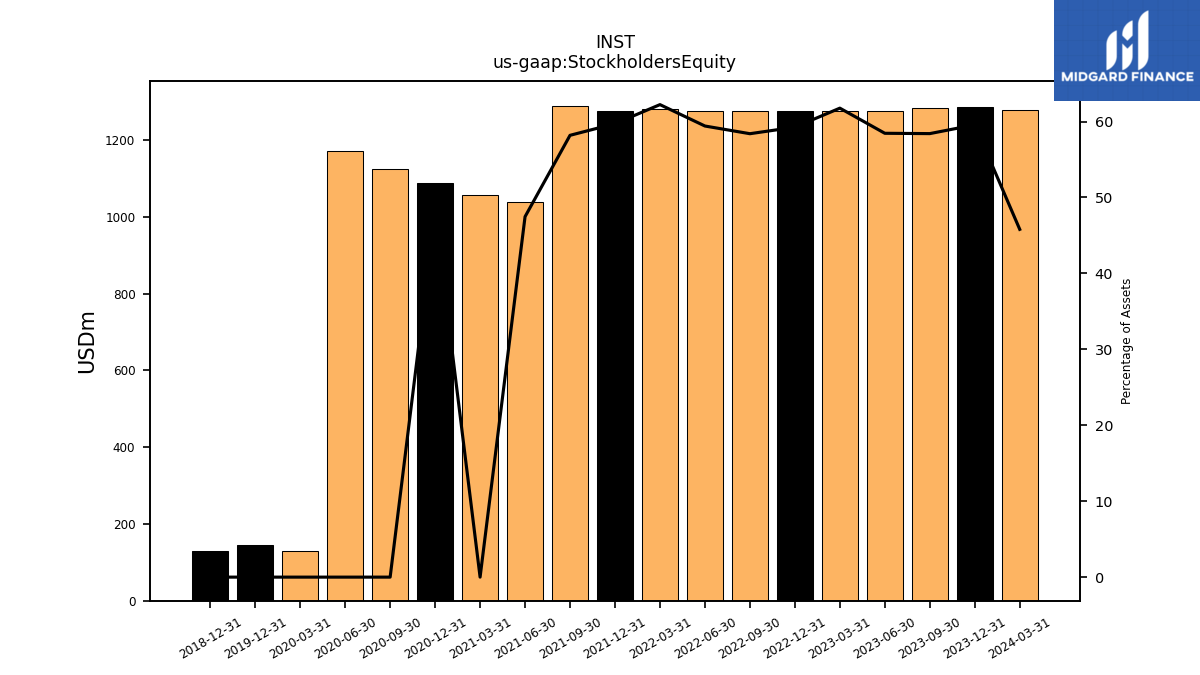
| Stockholders Equity | 1282.26 | 1275.12 | 1275.98 | 1276.13 | 1274.81 | 1274.49 | 1279.53 | 1274.38 | 1288.99 | 1037.20 | 1057.02 | 1087.98 | 1123.68 | 1172.05 | 130.32 |
| 2023-09-30 | 2023-06-30 | 2023-03-31 | 2022-12-31 | 2022-09-30 | 2022-06-30 | 2022-03-31 | 2021-12-31 | 2021-09-30 | 2021-06-30 | 2021-03-31 | 2020-12-31 | 2020-09-30 | 2020-06-30 | 2020-03-31 | ||
|---|---|---|---|---|---|---|---|---|---|---|---|---|---|---|---|---|
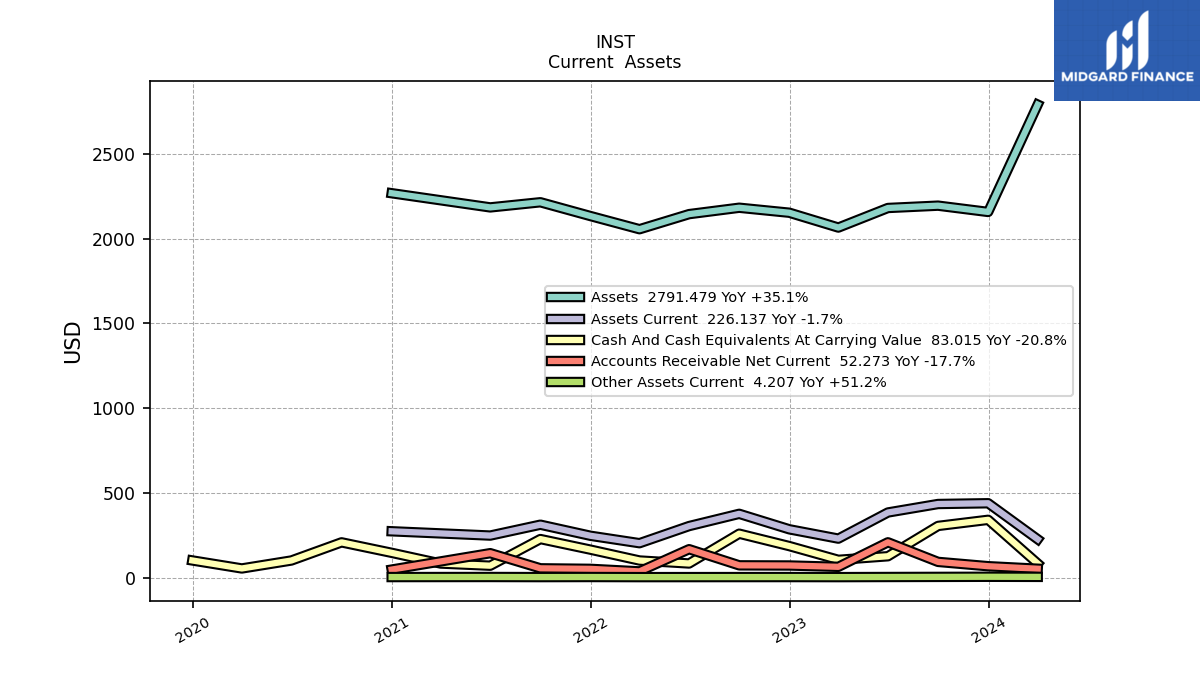
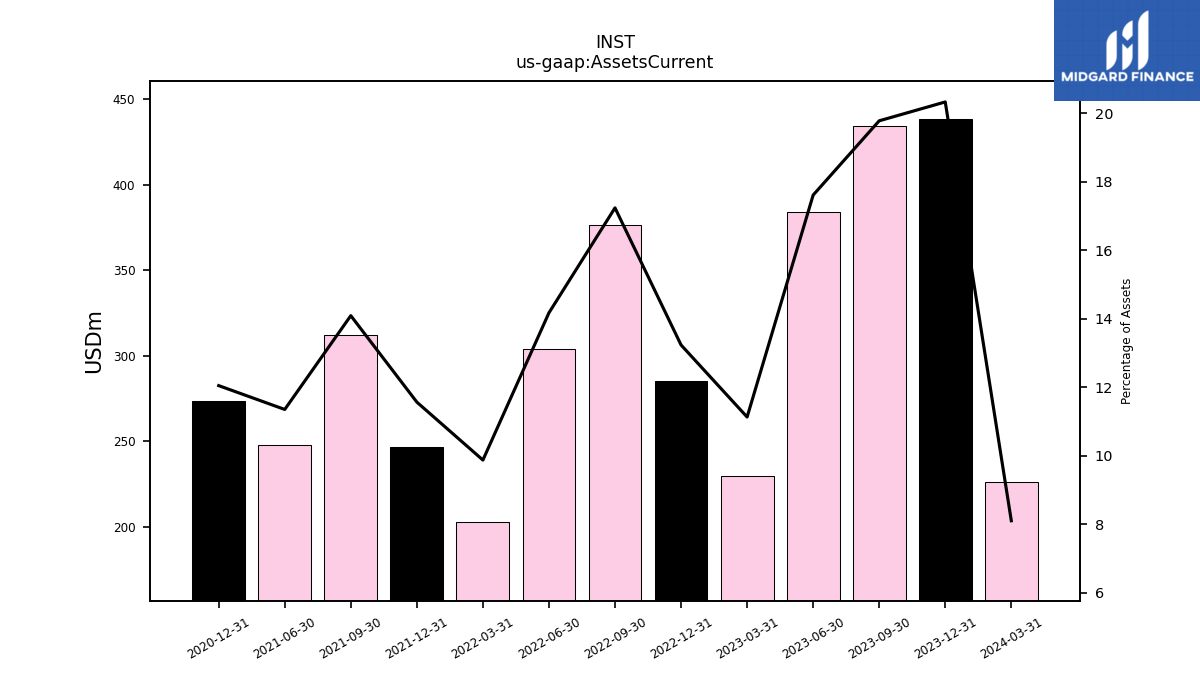
| Assets Current | 434.30 | 384.24 | 229.95 | 285.04 | 376.35 | 304.08 | 203.03 | 246.81 | 312.18 | 248.03 | NA | 273.34 | NA | NA | NA | |
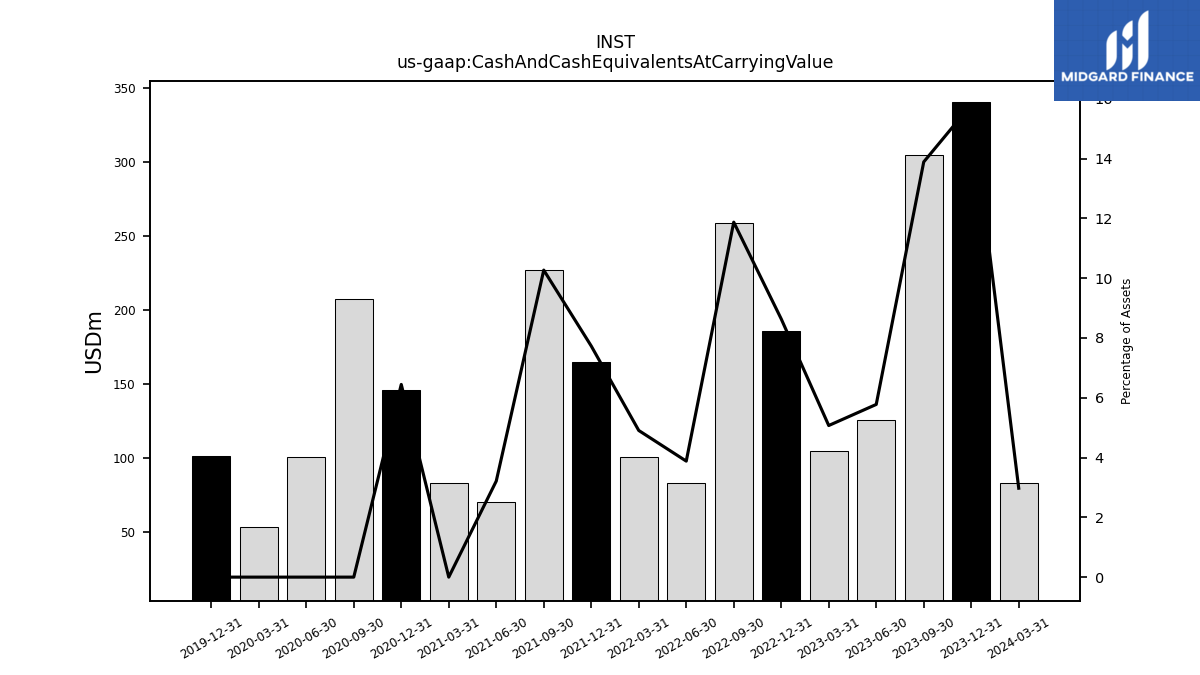
| Cash And Cash Equivalents At Carrying Value | 304.86 | 126.00 | 104.76 | 185.95 | 259.16 | 83.23 | 100.85 | 164.93 | 227.49 | 70.20 | 83.01 | 146.21 | 208.01 | 100.97 | 53.89 | |
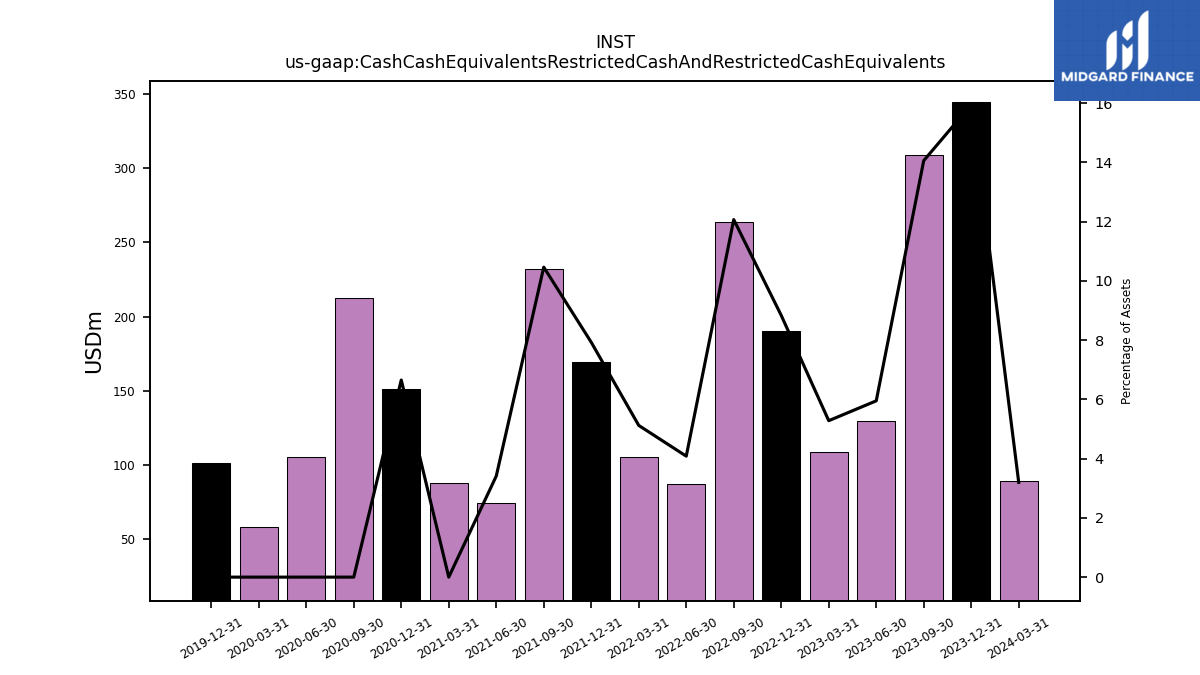
| Cash Cash Equivalents Restricted Cash And Restricted Cash Equivalents | 308.64 | 129.82 | NA | 190.27 | 263.44 | 87.60 | 105.30 | 169.15 | 231.79 | 74.53 | 87.73 | 150.95 | 212.54 | 105.78 | 58.70 | |
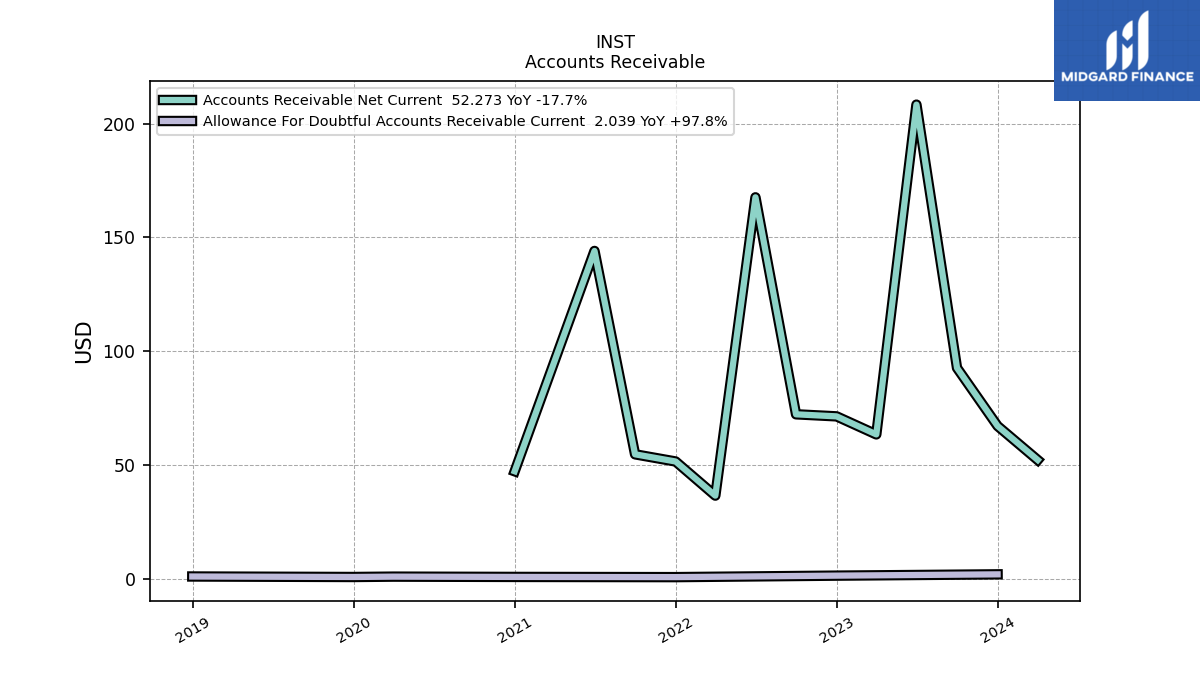
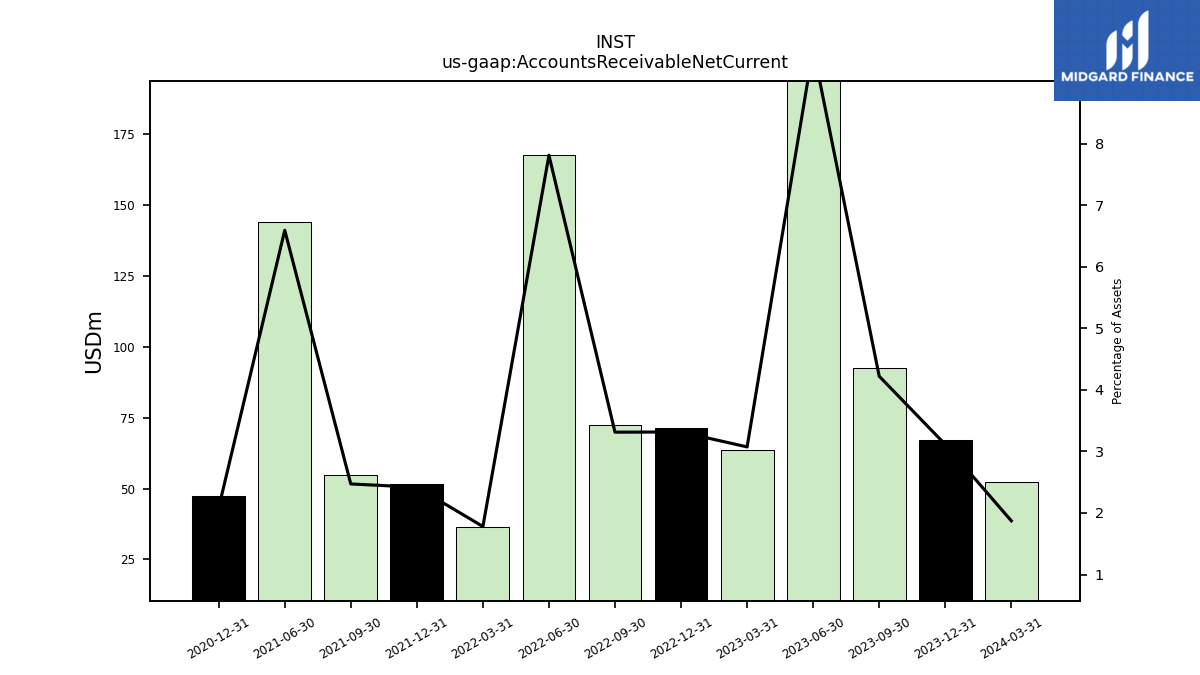
| Accounts Receivable Net Current | 92.71 | 208.37 | 63.51 | 71.43 | 72.33 | 167.65 | 36.61 | 51.61 | 54.76 | 144.10 | NA | 47.31 | NA | NA | NA | |
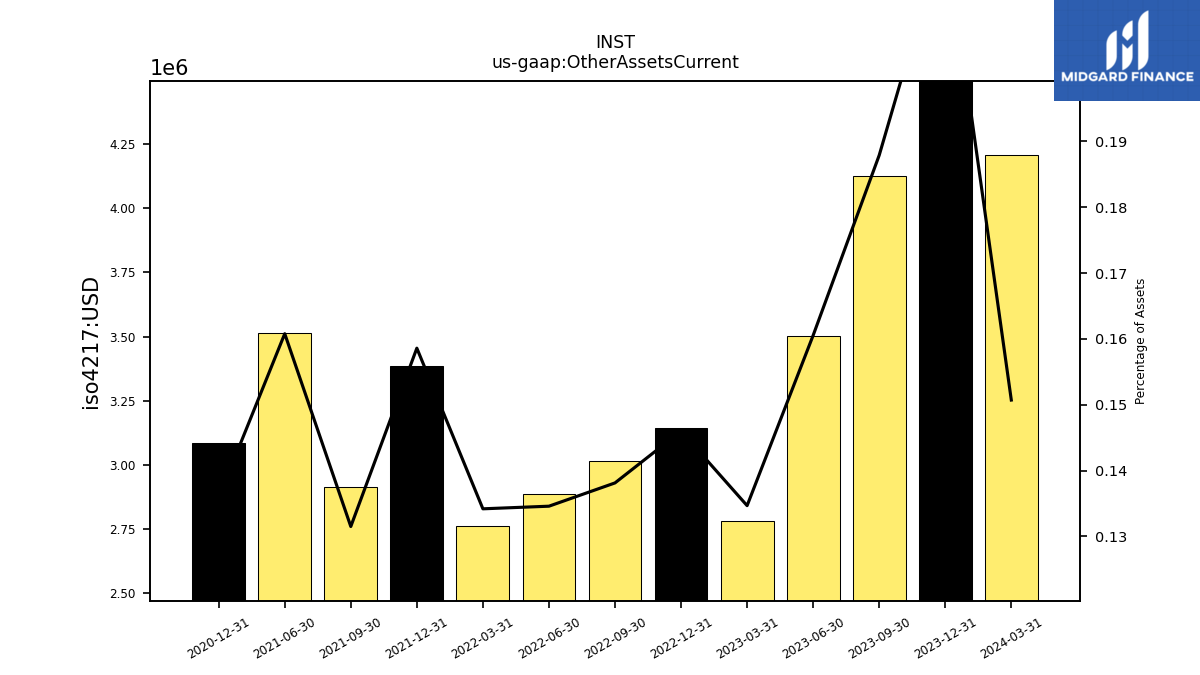
| Other Assets Current | 4.12 | 3.50 | 2.78 | 3.14 | 3.02 | 2.89 | 2.76 | 3.38 | 2.91 | 3.51 | NA | 3.08 | NA | NA | NA |
| 2023-09-30 | 2023-06-30 | 2023-03-31 | 2022-12-31 | 2022-09-30 | 2022-06-30 | 2022-03-31 | 2021-12-31 | 2021-09-30 | 2021-06-30 | 2021-03-31 | 2020-12-31 | 2020-09-30 | 2020-06-30 | 2020-03-31 | ||
|---|---|---|---|---|---|---|---|---|---|---|---|---|---|---|---|---|
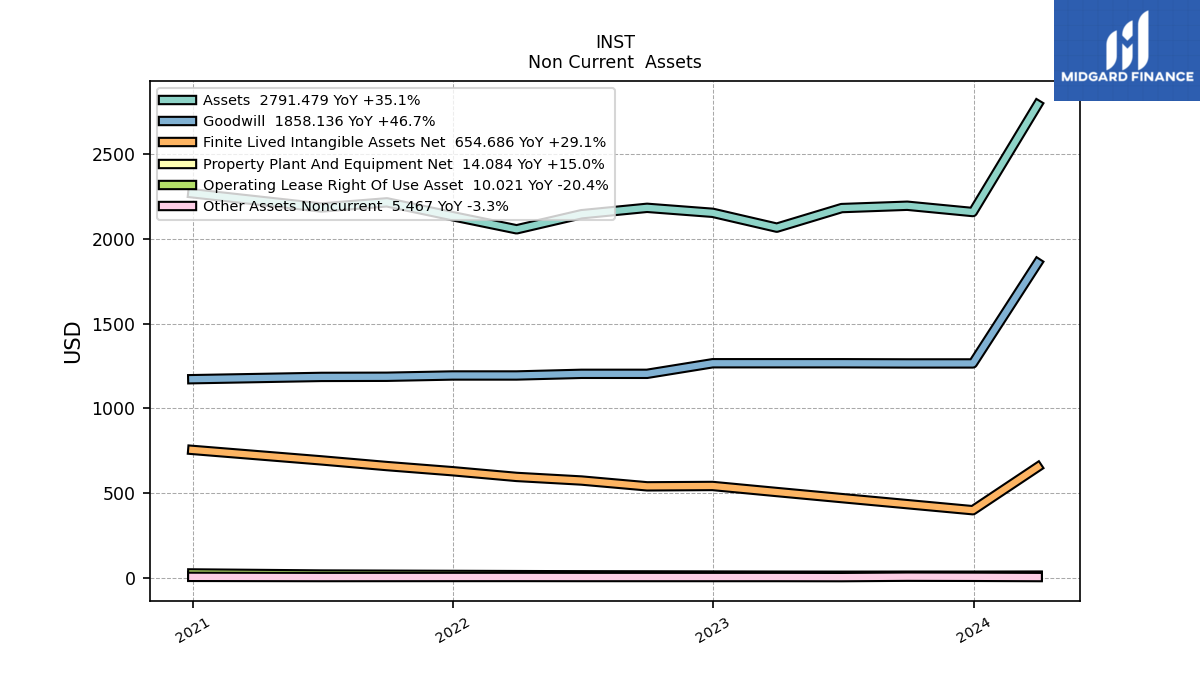
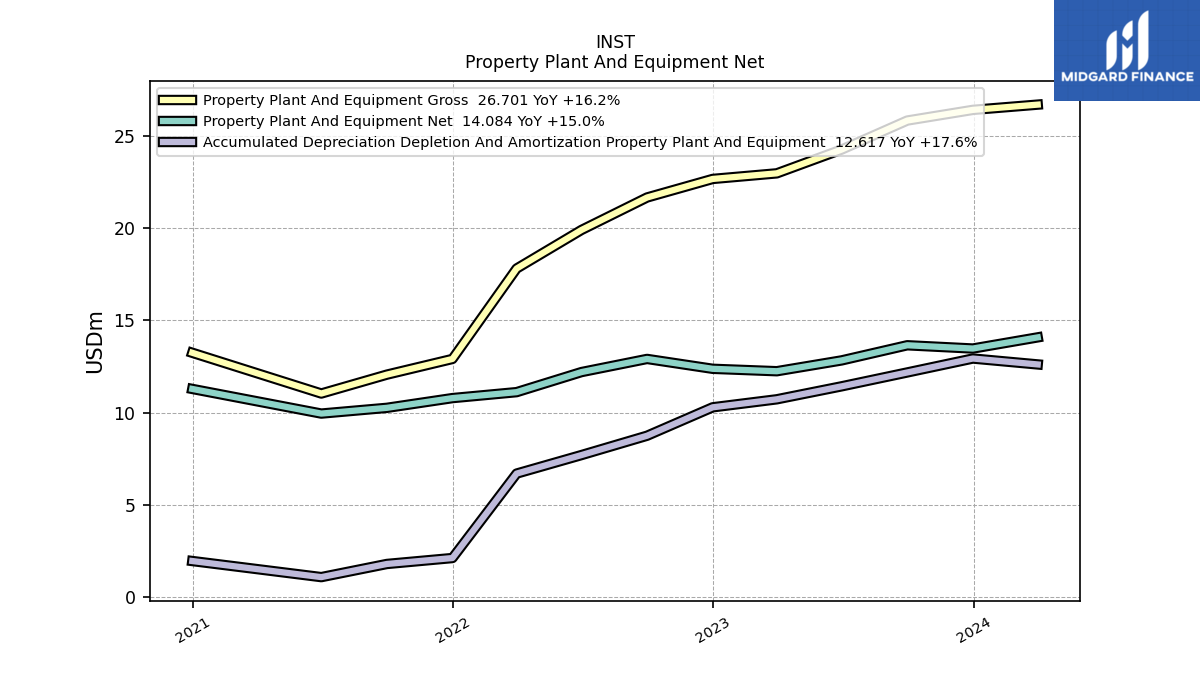
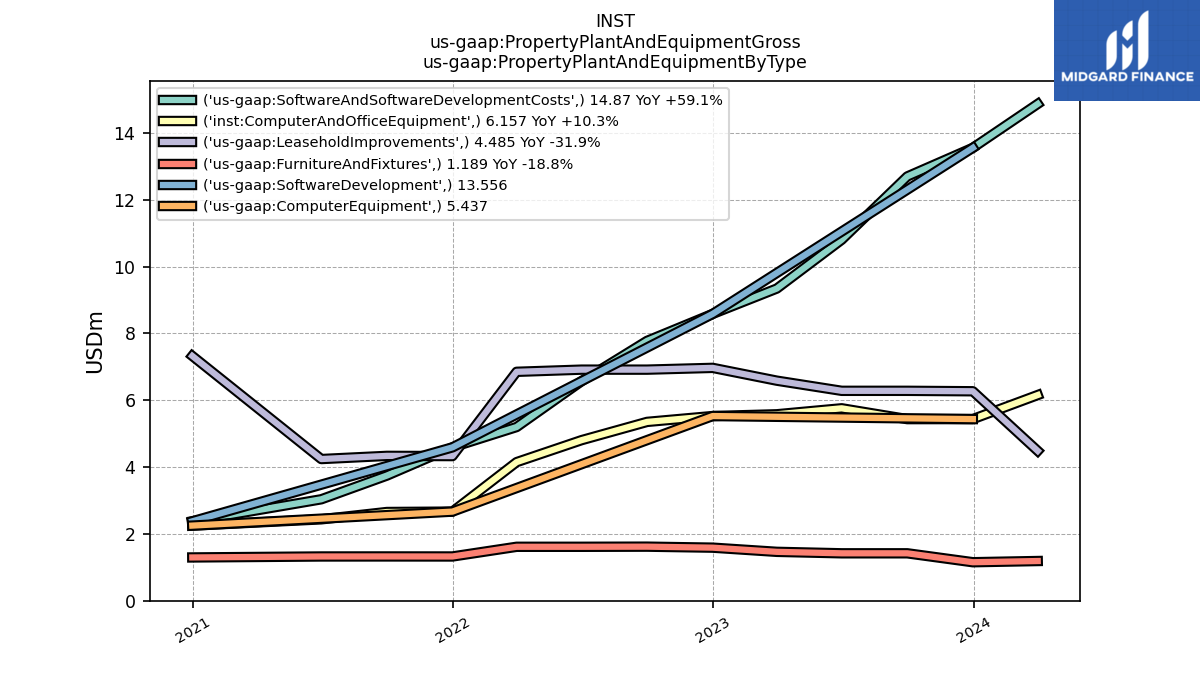
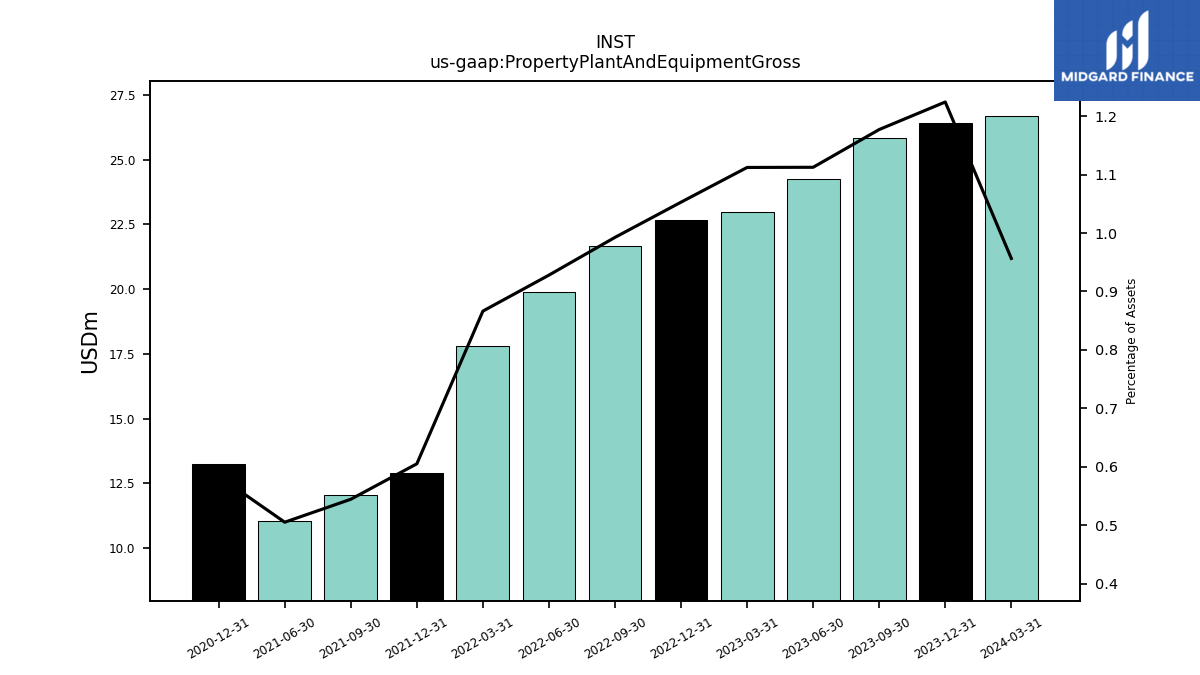
| Property Plant And Equipment Gross | 25.84 | 24.27 | 22.98 | 22.67 | 21.67 | 19.91 | 17.82 | 12.91 | 12.06 | 11.04 | NA | 13.25 | NA | NA | NA | |
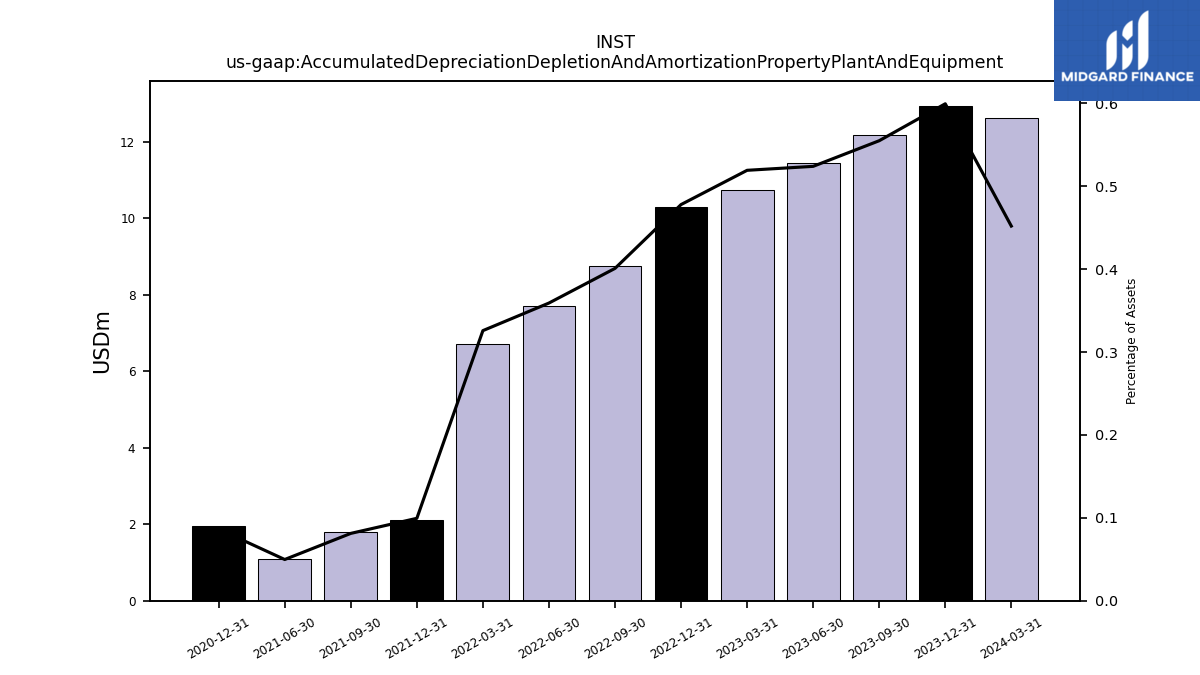
| Accumulated Depreciation Depletion And Amortization Property Plant And Equipment | 12.18 | 11.43 | 10.73 | 10.29 | 8.75 | 7.70 | 6.70 | 2.12 | 1.80 | 1.09 | NA | 1.96 | NA | NA | NA | |
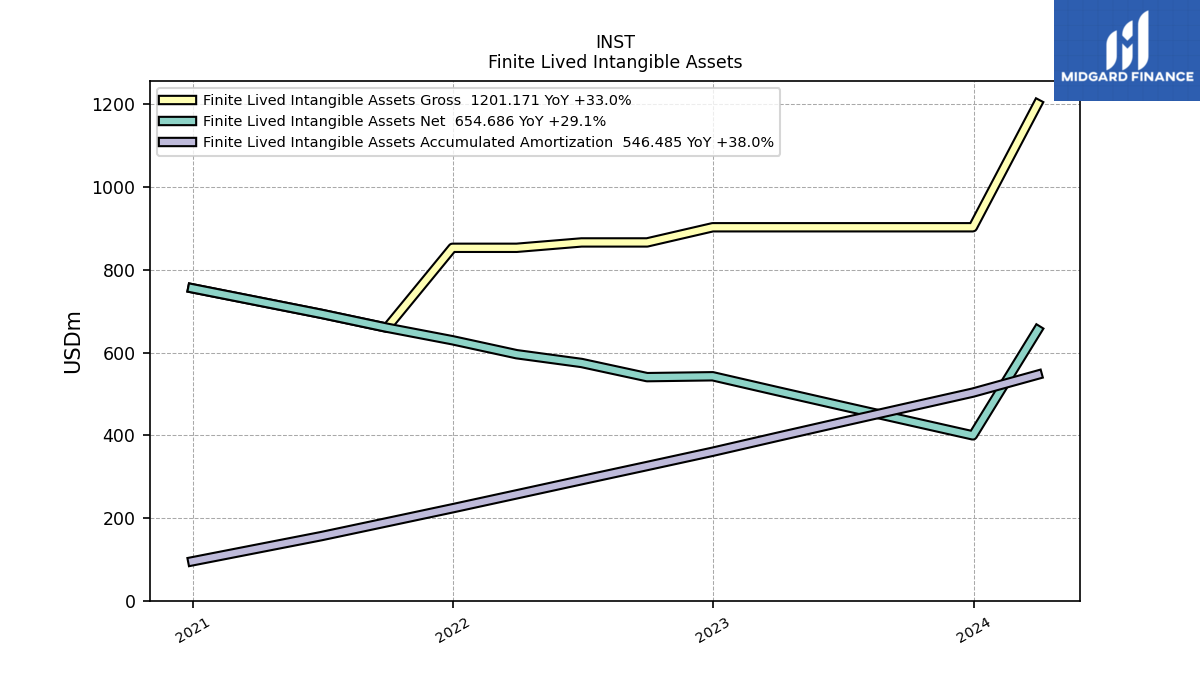
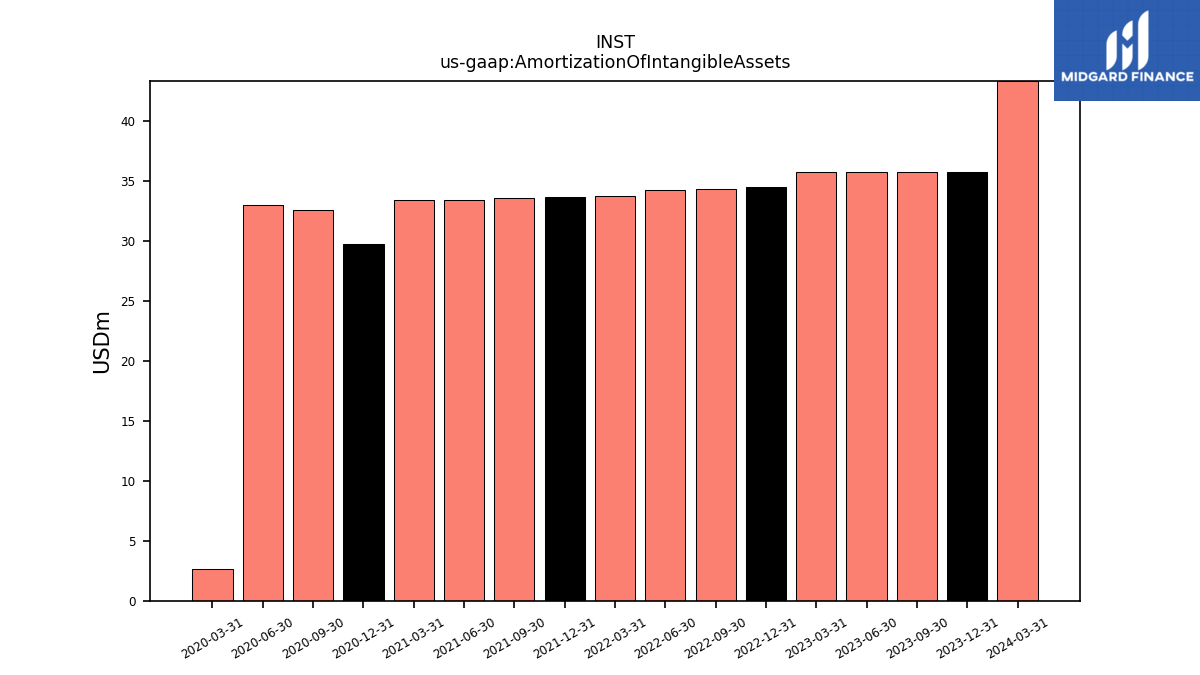
| Amortization Of Intangible Assets | 35.70 | 35.70 | 35.75 | 34.52 | 34.30 | 34.20 | 33.74 | 33.68 | 33.60 | 33.40 | 33.37 | 29.71 | 32.60 | 32.98 | 2.62 | |
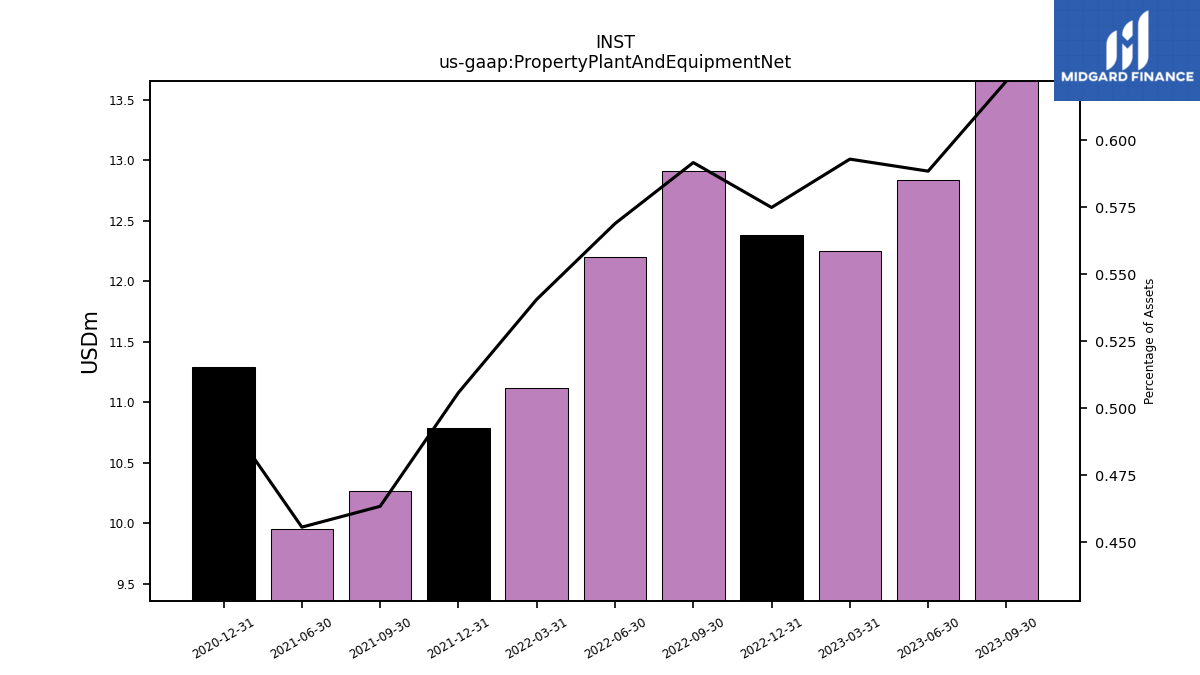
| Property Plant And Equipment Net | 13.66 | 12.84 | 12.25 | 12.38 | 12.91 | 12.20 | 11.12 | 10.79 | 10.26 | 9.95 | NA | 11.29 | NA | NA | NA | |
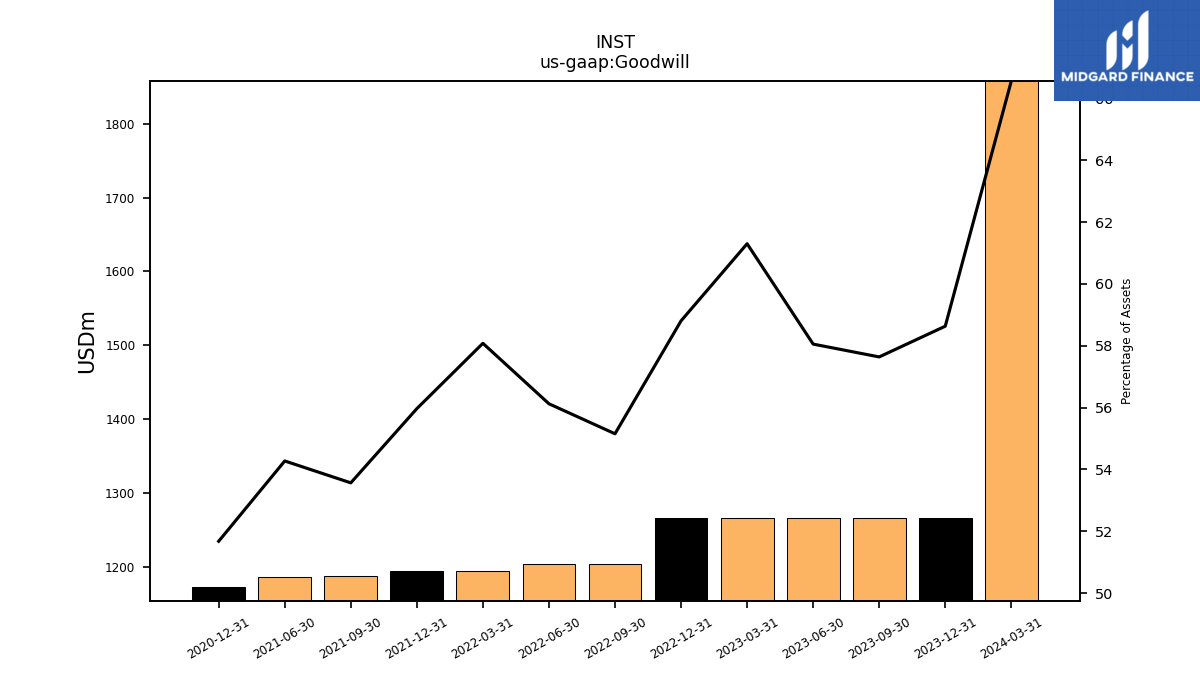
| Goodwill | 1265.32 | 1266.40 | 1266.40 | 1266.40 | 1203.98 | 1203.98 | 1194.22 | 1194.22 | 1186.68 | 1185.82 | NA | 1172.39 | NA | NA | NA | |
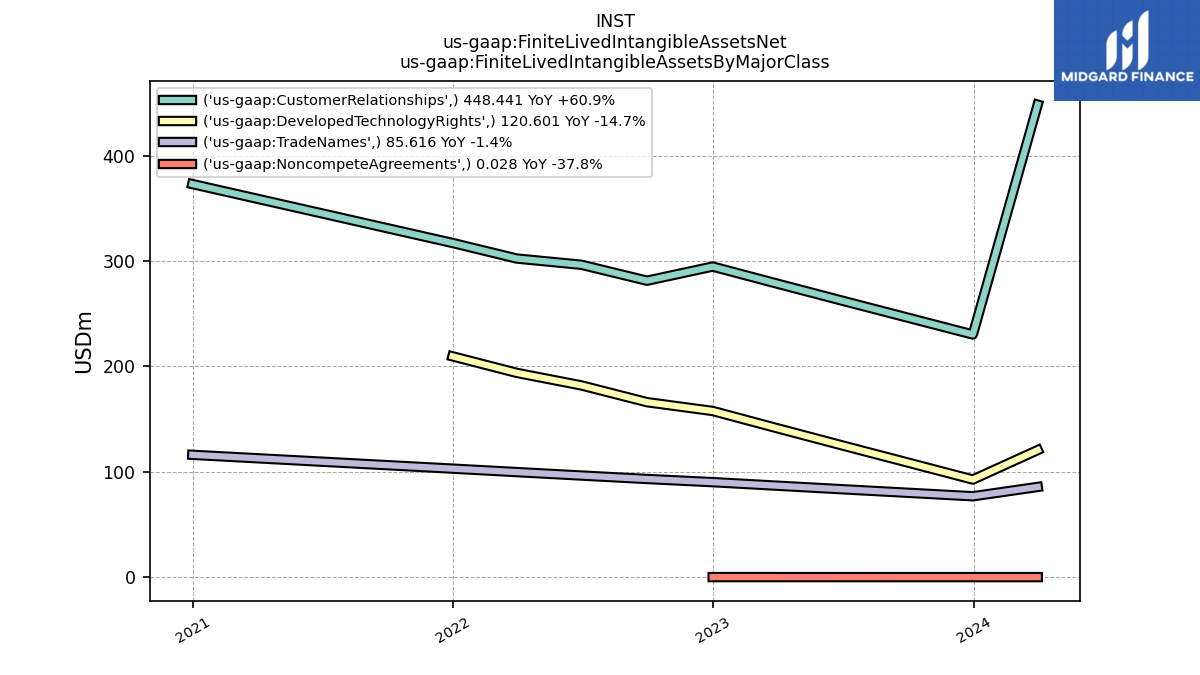
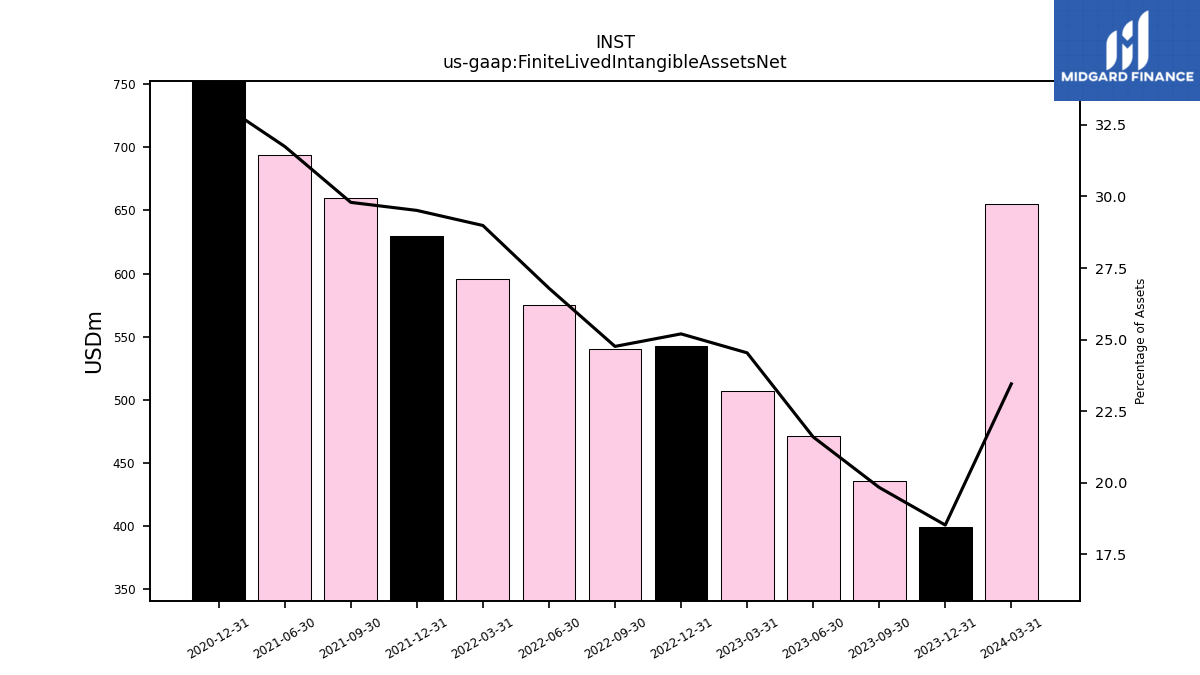
| Finite Lived Intangible Assets Net | 435.44 | 471.19 | 506.93 | 542.68 | 540.55 | 574.81 | 596.00 | 629.75 | 660.03 | 693.62 | NA | 755.35 | NA | NA | NA | |
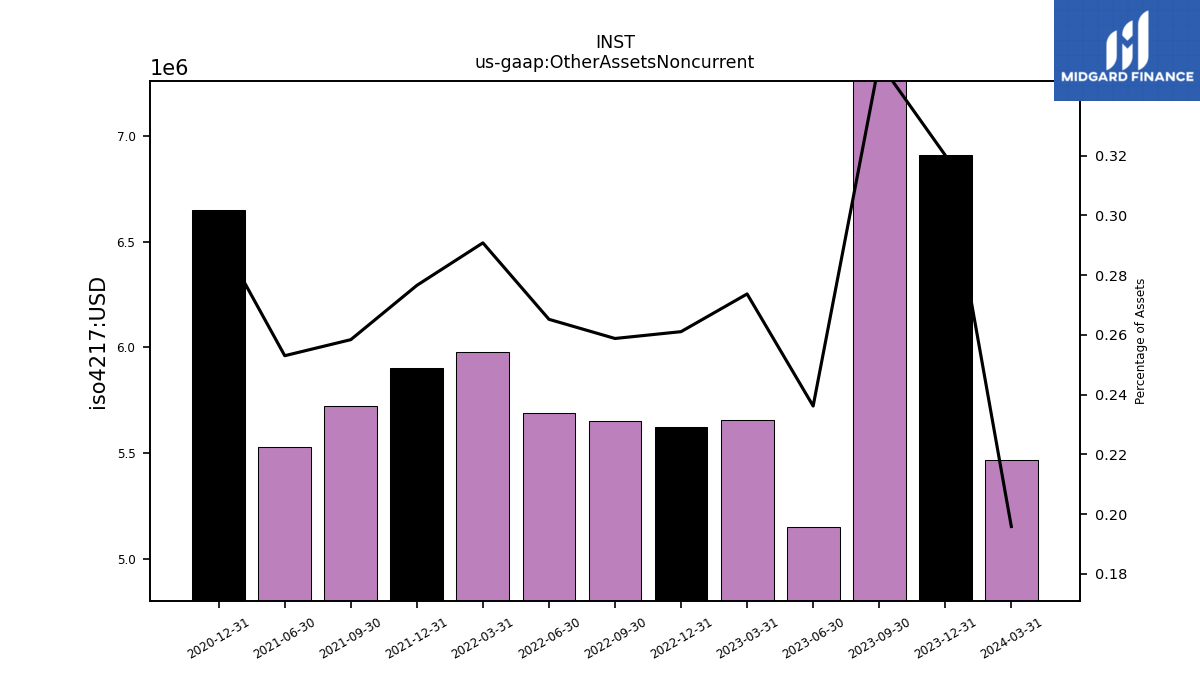
| Other Assets Noncurrent | 7.71 | 5.15 | 5.65 | 5.62 | 5.65 | 5.69 | 5.98 | 5.90 | 5.72 | 5.53 | NA | 6.65 | NA | NA | NA |
| 2023-09-30 | 2023-06-30 | 2023-03-31 | 2022-12-31 | 2022-09-30 | 2022-06-30 | 2022-03-31 | 2021-12-31 | 2021-09-30 | 2021-06-30 | 2021-03-31 | 2020-12-31 | 2020-09-30 | 2020-06-30 | 2020-03-31 | ||
|---|---|---|---|---|---|---|---|---|---|---|---|---|---|---|---|---|
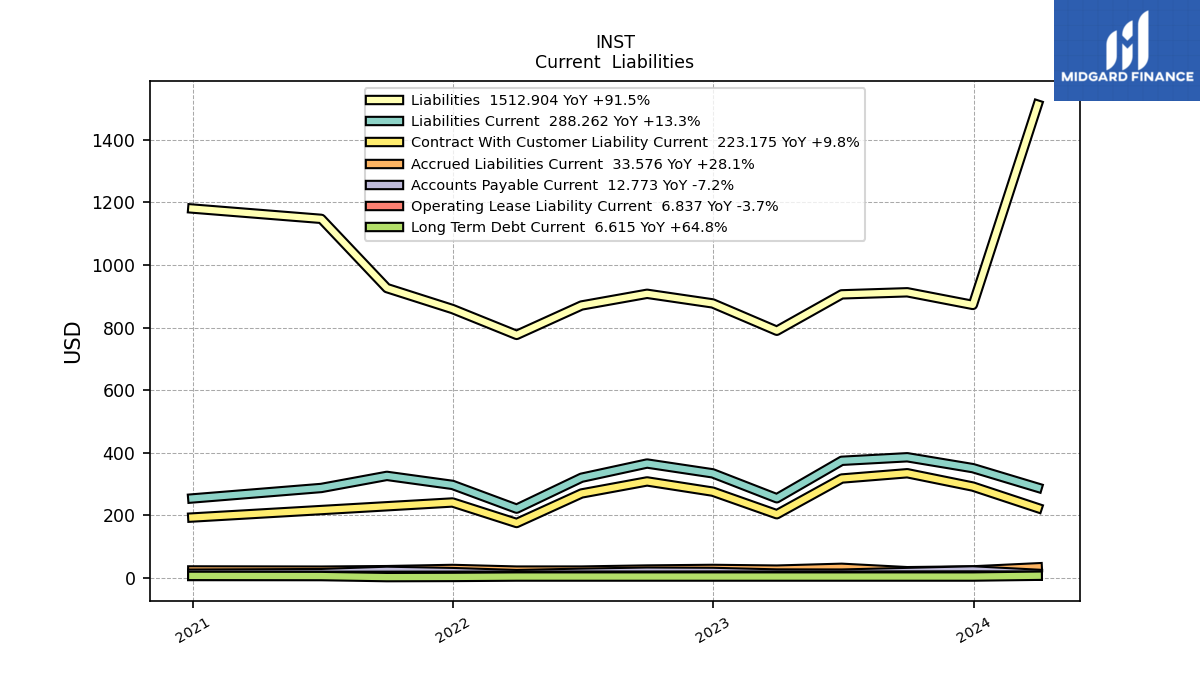
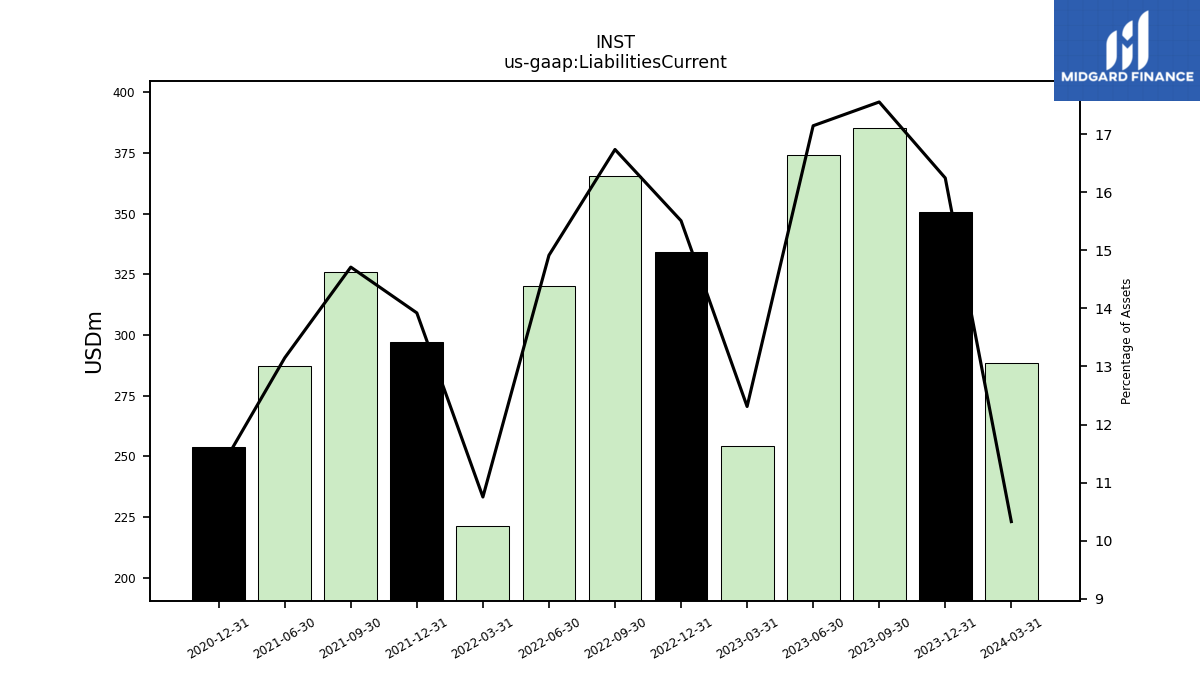
| Liabilities Current | 385.47 | 374.10 | 254.32 | 334.06 | 365.44 | 320.00 | 221.05 | 297.10 | 325.94 | 287.29 | NA | 253.79 | NA | NA | NA | |
| Long Term Debt Current | 4.01 | 4.01 | 4.01 | 4.01 | 4.01 | 4.01 | 4.01 | 2.76 | 2.23 | 5.64 | NA | 6.12 | NA | NA | NA | |
| Accounts Payable Current | 18.54 | 13.46 | 13.77 | 18.79 | 19.67 | 16.13 | 11.88 | 18.32 | 22.27 | 15.01 | NA | 13.30 | NA | NA | NA | |
| Accrued Liabilities Current | 21.16 | 32.02 | 26.21 | 28.48 | 26.56 | 23.20 | 23.07 | 28.41 | 24.53 | 22.96 | NA | 23.64 | NA | NA | NA | |
| Contract With Customer Liability Current | 334.40 | 317.44 | 203.23 | 275.56 | 308.23 | 269.65 | 175.20 | 240.94 | NA | NA | NA | 192.86 | NA | NA | NA |
| 2023-09-30 | 2023-06-30 | 2023-03-31 | 2022-12-31 | 2022-09-30 | 2022-06-30 | 2022-03-31 | 2021-12-31 | 2021-09-30 | 2021-06-30 | 2021-03-31 | 2020-12-31 | 2020-09-30 | 2020-06-30 | 2020-03-31 | ||
|---|---|---|---|---|---|---|---|---|---|---|---|---|---|---|---|---|
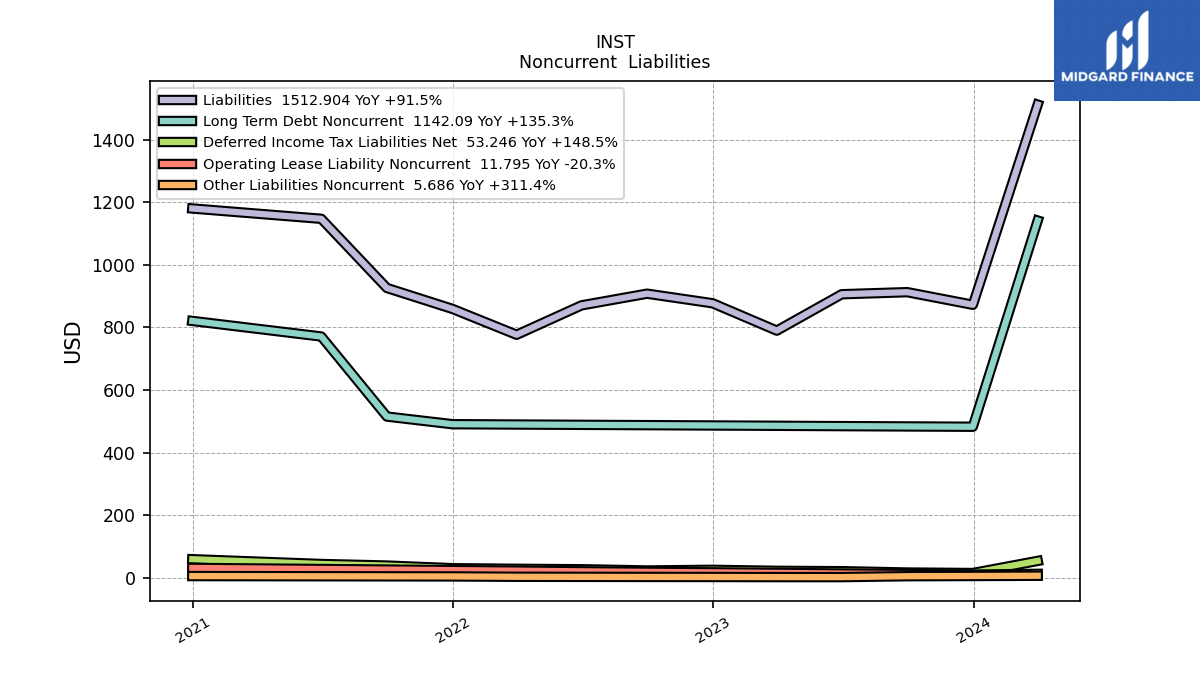
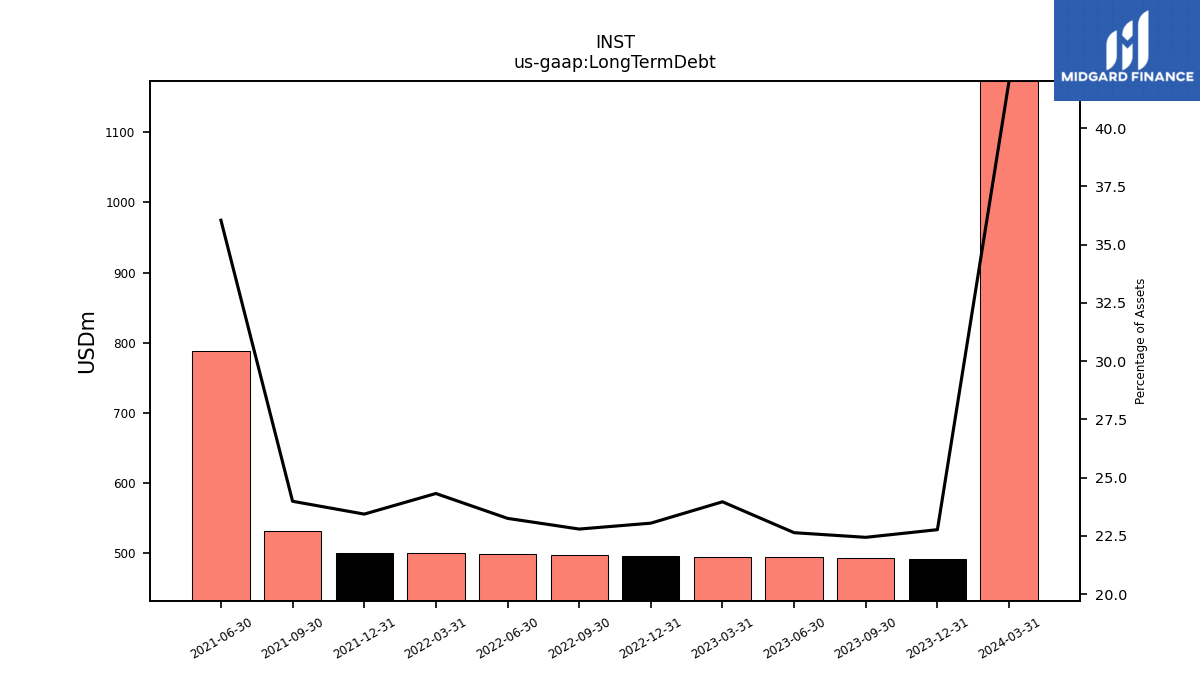
| Long Term Debt | 492.50 | 493.75 | 495.00 | 496.25 | 497.50 | 498.75 | 500.00 | 500.00 | 531.31 | 787.65 | NA | NA | NA | NA | NA | |
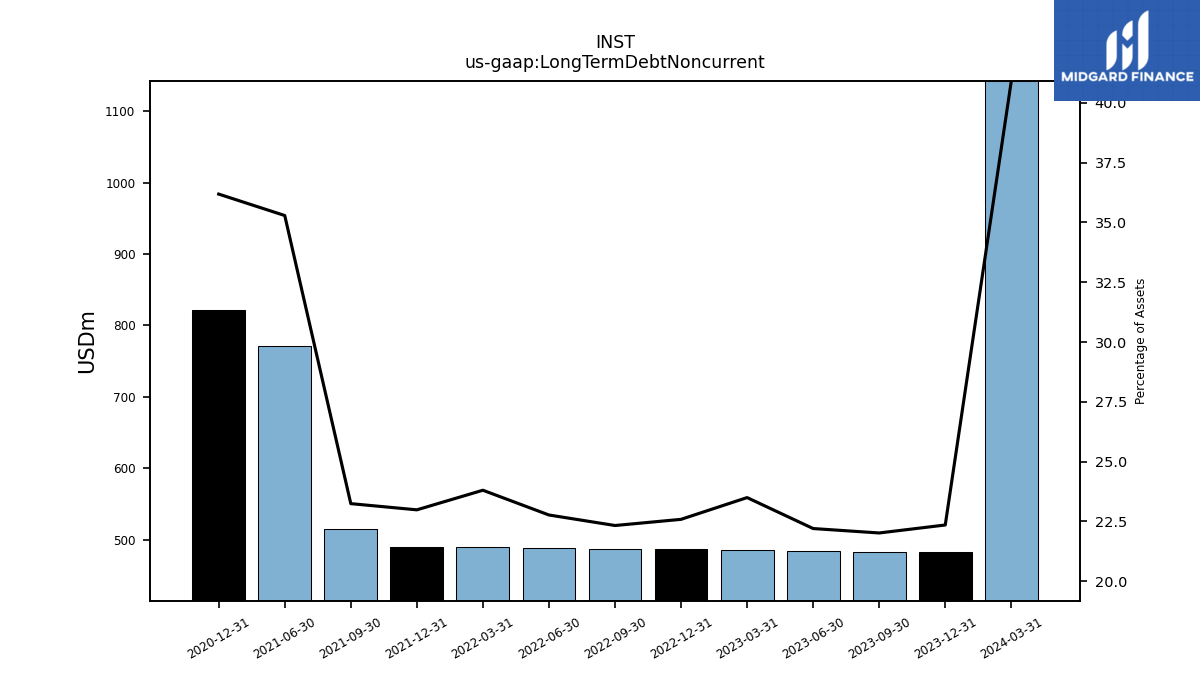
| Long Term Debt Noncurrent | 483.38 | 484.38 | 485.47 | 486.47 | 487.49 | 488.49 | 489.50 | 490.50 | 514.97 | 771.03 | NA | 820.92 | NA | NA | NA | |
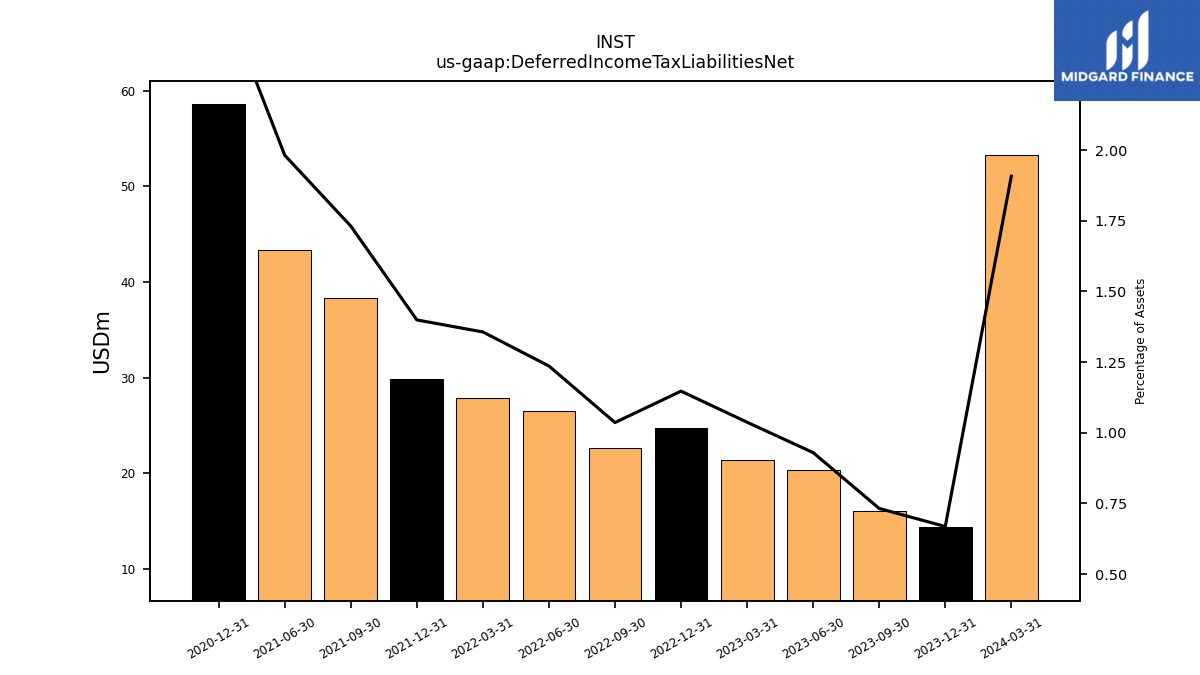
| Deferred Income Tax Liabilities Net | 16.07 | 20.28 | 21.43 | 24.70 | 22.61 | 26.51 | 27.89 | 29.85 | 38.35 | 43.29 | NA | 58.60 | NA | NA | NA | |
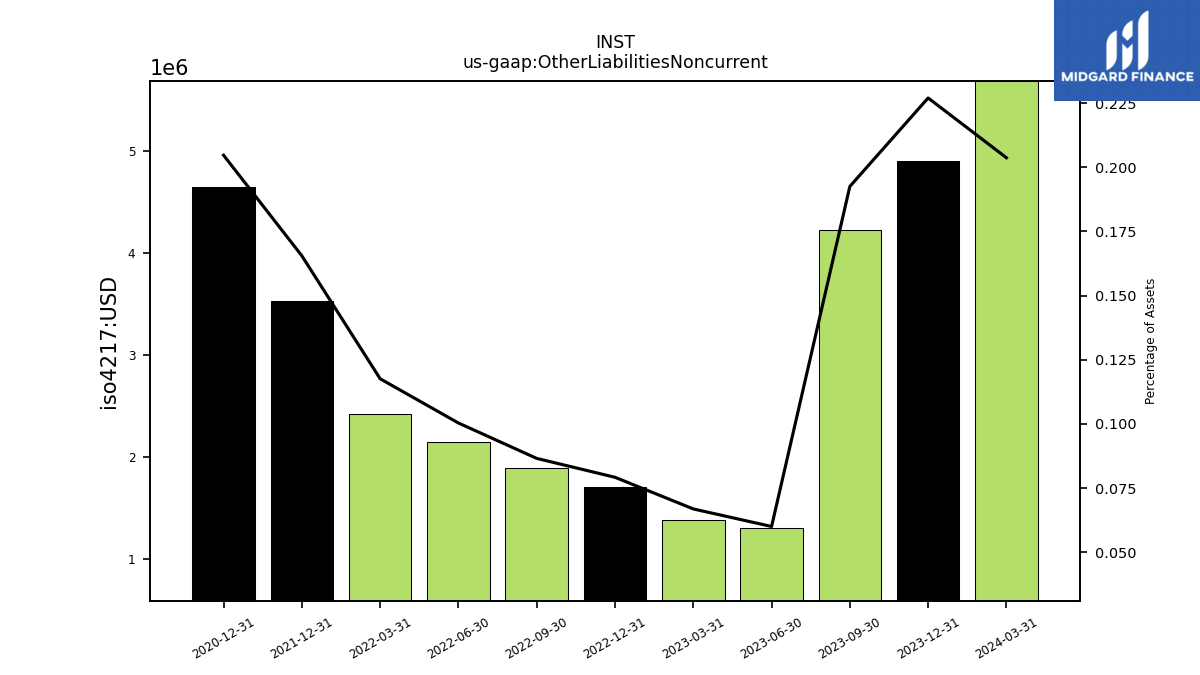
| Other Liabilities Noncurrent | 4.23 | 1.31 | 1.38 | 1.71 | 1.89 | 2.15 | 2.42 | 3.53 | NA | NA | NA | 4.64 | NA | NA | NA | |
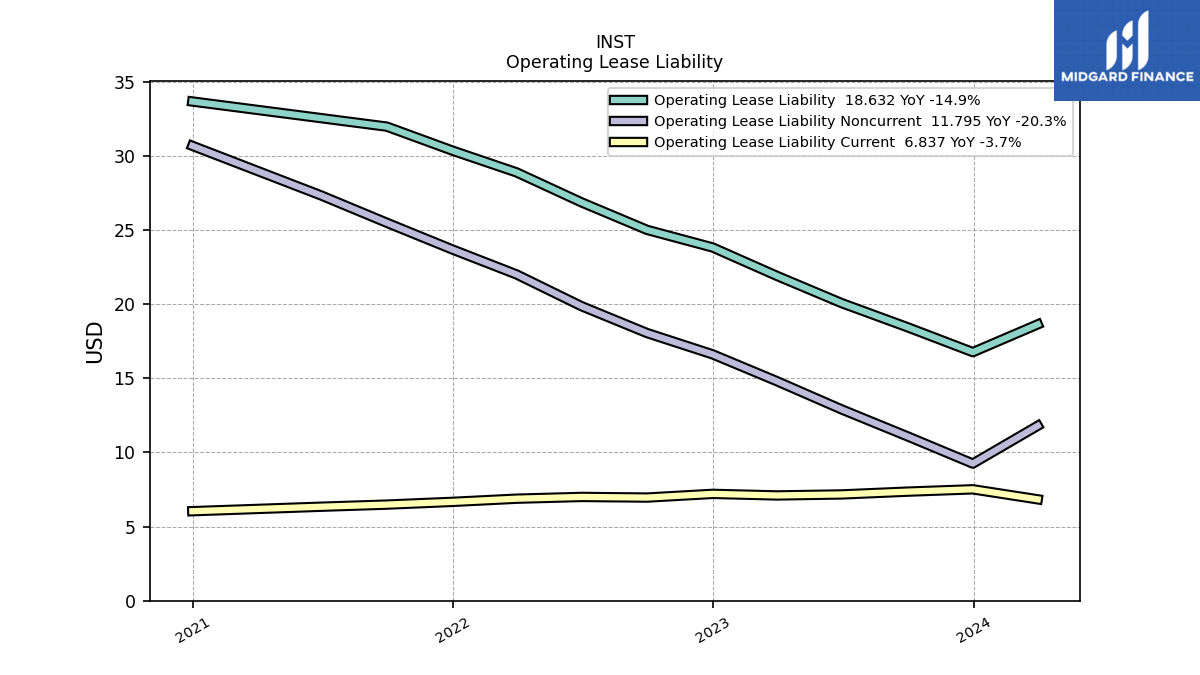
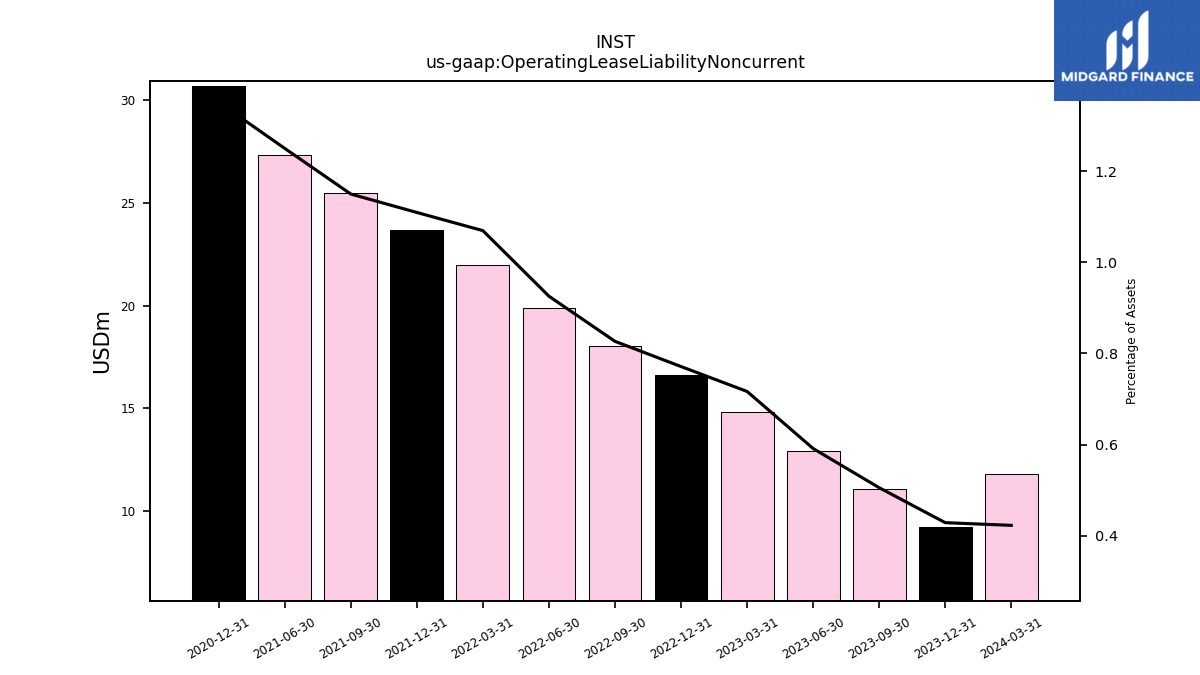
| Operating Lease Liability Noncurrent | 11.09 | 12.90 | 14.80 | 16.61 | 18.05 | 19.86 | 22.00 | 23.68 | 25.48 | 27.32 | NA | 30.67 | NA | NA | NA |
| 2023-09-30 | 2023-06-30 | 2023-03-31 | 2022-12-31 | 2022-09-30 | 2022-06-30 | 2022-03-31 | 2021-12-31 | 2021-09-30 | 2021-06-30 | 2021-03-31 | 2020-12-31 | 2020-09-30 | 2020-06-30 | 2020-03-31 | ||
|---|---|---|---|---|---|---|---|---|---|---|---|---|---|---|---|---|
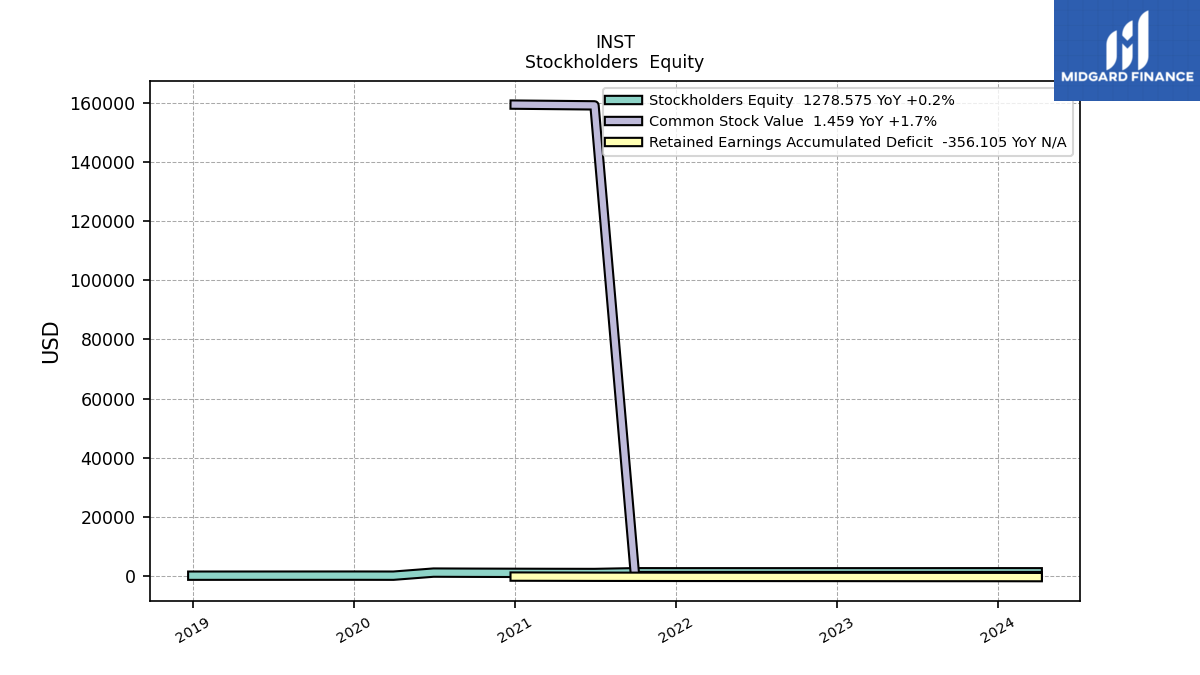
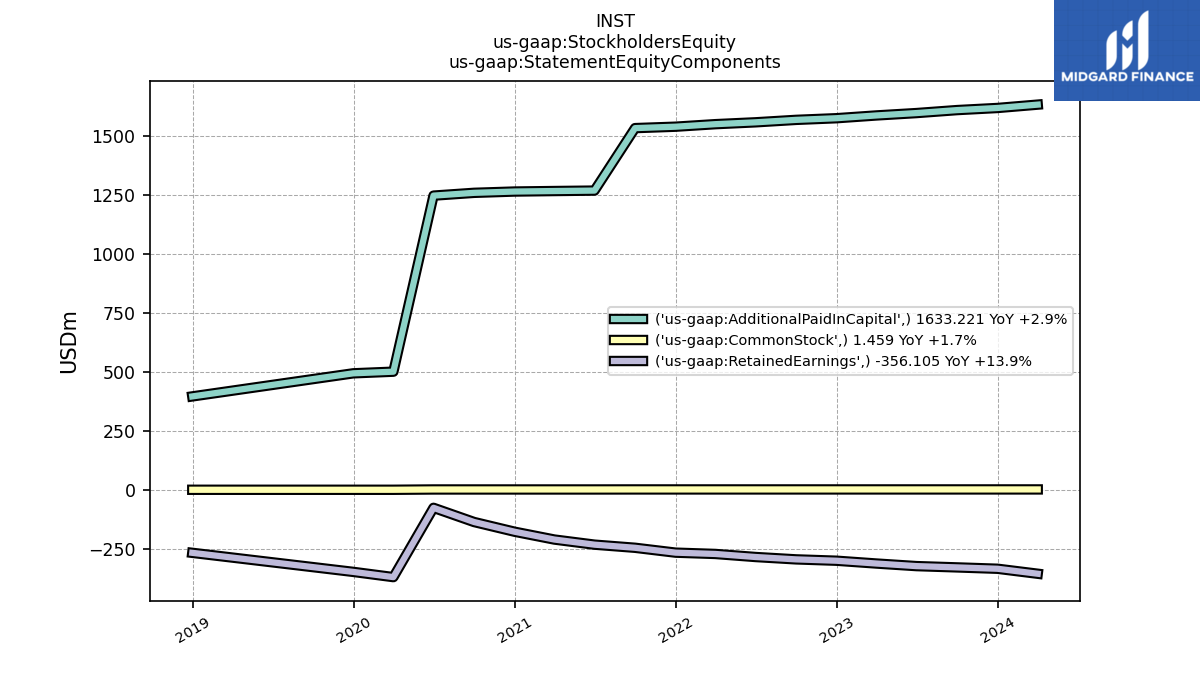
| Stockholders Equity | 1282.26 | 1275.12 | 1275.98 | 1276.13 | 1274.81 | 1274.49 | 1279.53 | 1274.38 | 1288.99 | 1037.20 | 1057.02 | 1087.98 | 1123.68 | 1172.05 | 130.32 | |
| Common Stock Value | 1.45 | 1.44 | 1.44 | 1.43 | 1.43 | 1.42 | 1.41 | 1.41 | 1.40 | 159062.17 | NA | 159314.65 | NA | NA | NA | |
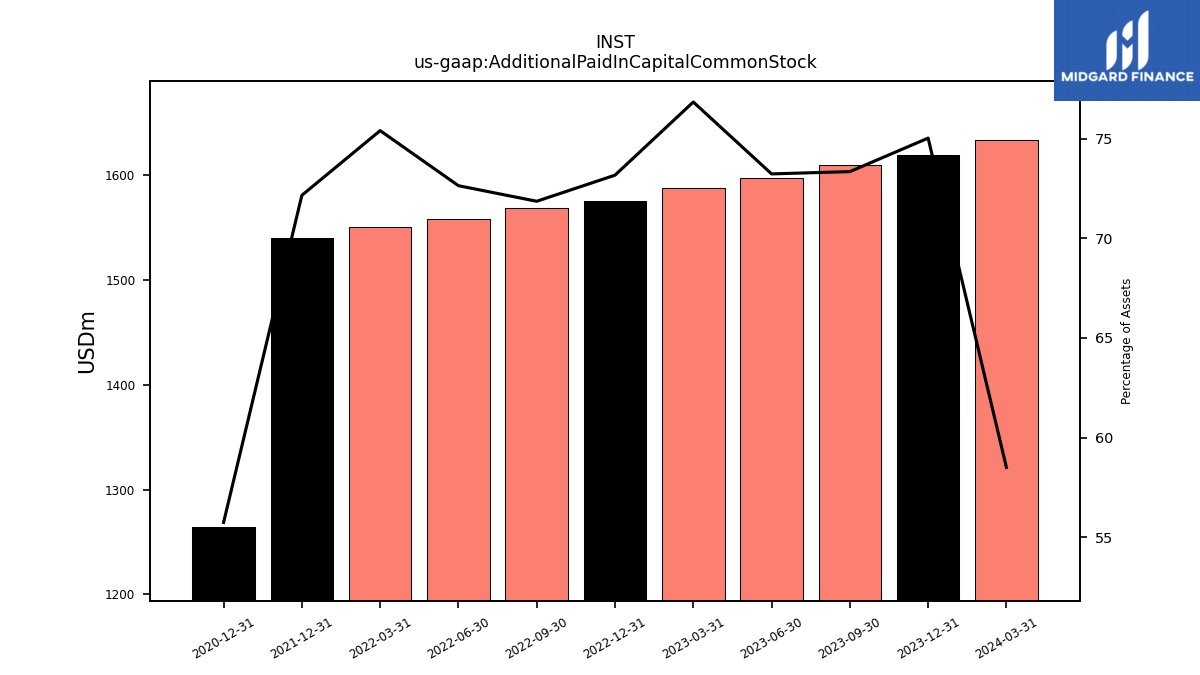
| Additional Paid In Capital Common Stock | 1610.03 | 1597.41 | 1587.30 | 1575.60 | 1568.56 | 1558.19 | 1550.32 | 1539.64 | NA | NA | NA | 1264.70 | NA | NA | NA | |
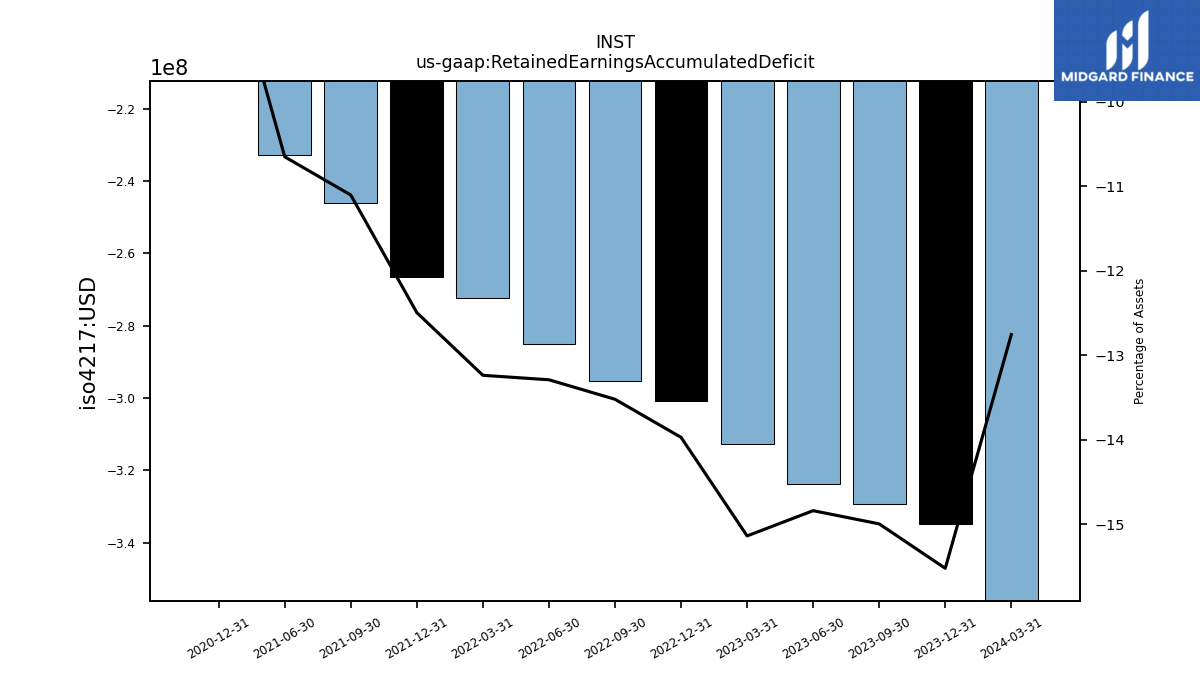
| Retained Earnings Accumulated Deficit | -329.21 | -323.73 | -312.76 | -300.90 | -295.18 | -285.12 | -272.20 | -266.66 | -246.01 | -232.75 | NA | -177.98 | NA | NA | NA | |
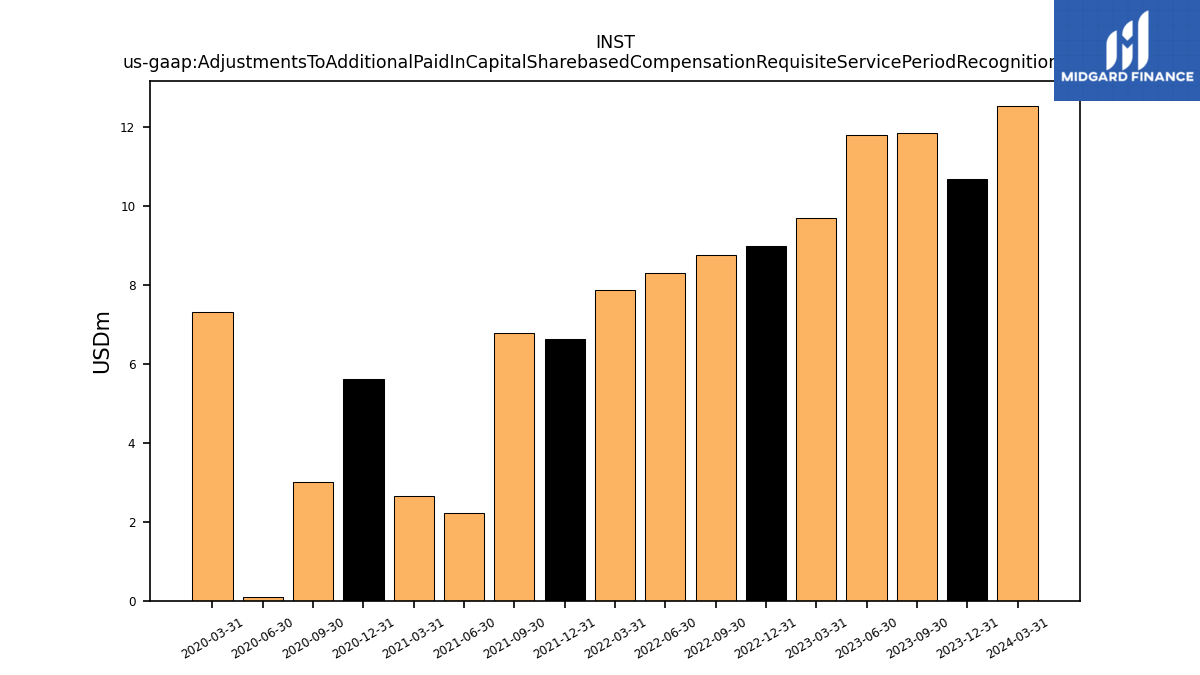
| Adjustments To Additional Paid In Capital Sharebased Compensation Requisite Service Period Recognition Value | 11.86 | 11.82 | 9.69 | 8.98 | 8.77 | 8.31 | 7.87 | 6.65 | 6.78 | 2.23 | 2.67 | 5.62 | 3.01 | 0.10 | 7.31 |
| 2023-09-30 | 2023-06-30 | 2023-03-31 | 2022-12-31 | 2022-09-30 | 2022-06-30 | 2022-03-31 | 2021-12-31 | 2021-09-30 | 2021-06-30 | 2021-03-31 | 2020-12-31 | 2020-09-30 | 2020-06-30 | 2020-03-31 | ||
|---|---|---|---|---|---|---|---|---|---|---|---|---|---|---|---|---|
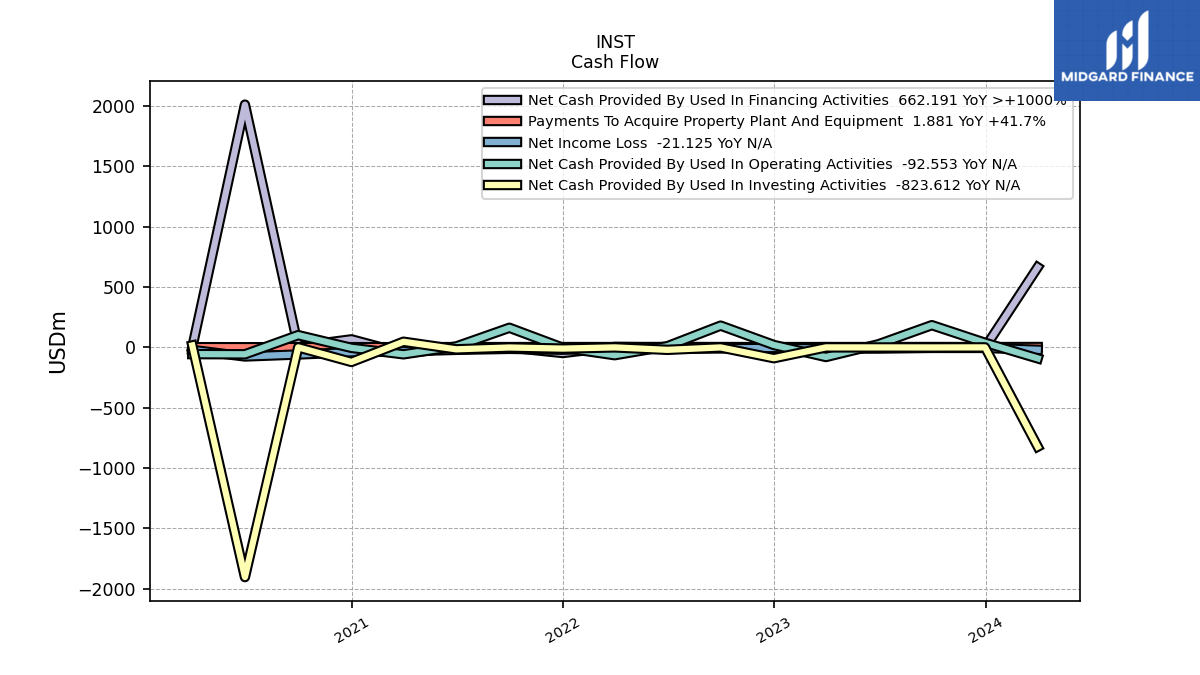
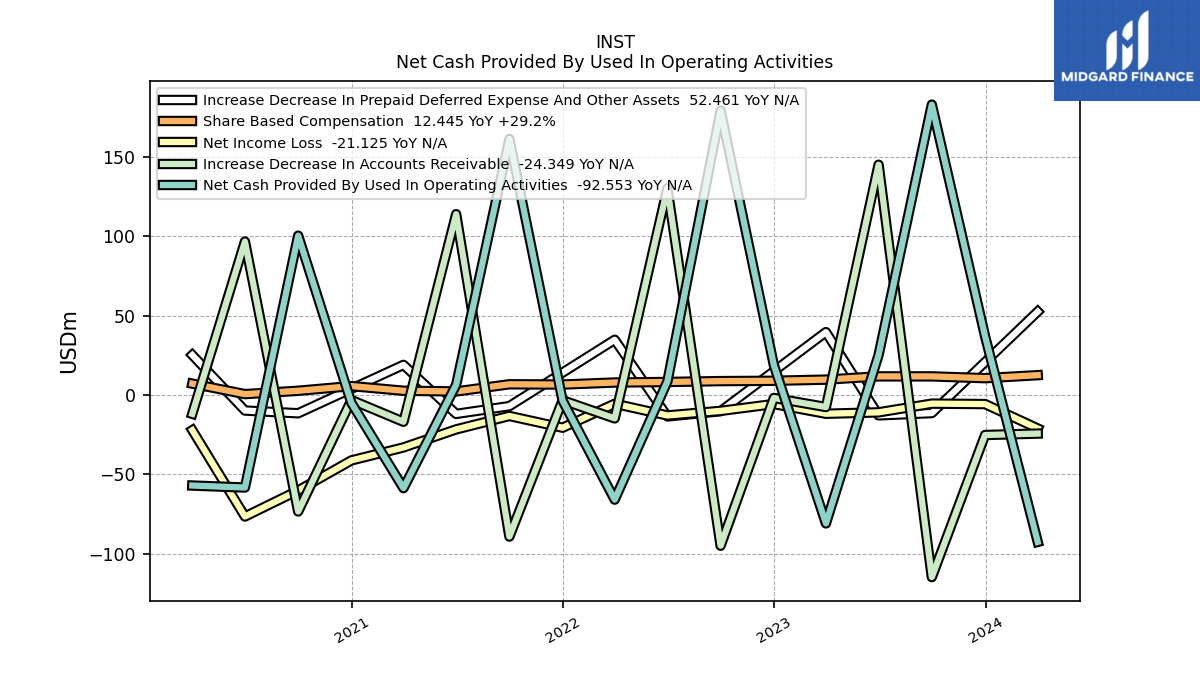
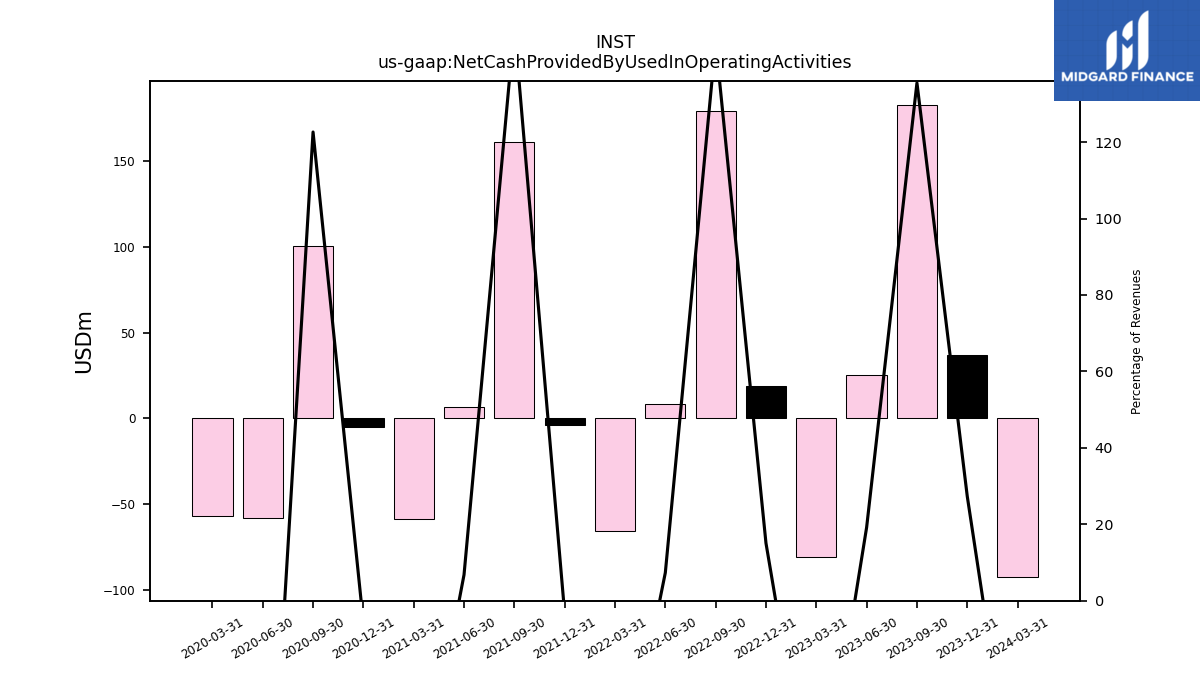
| Net Cash Provided By Used In Operating Activities | 182.81 | 25.16 | -80.92 | 18.80 | 179.01 | 8.40 | -65.94 | -3.67 | 161.18 | 6.37 | -58.73 | -5.08 | 100.28 | -58.33 | -57.06 | |
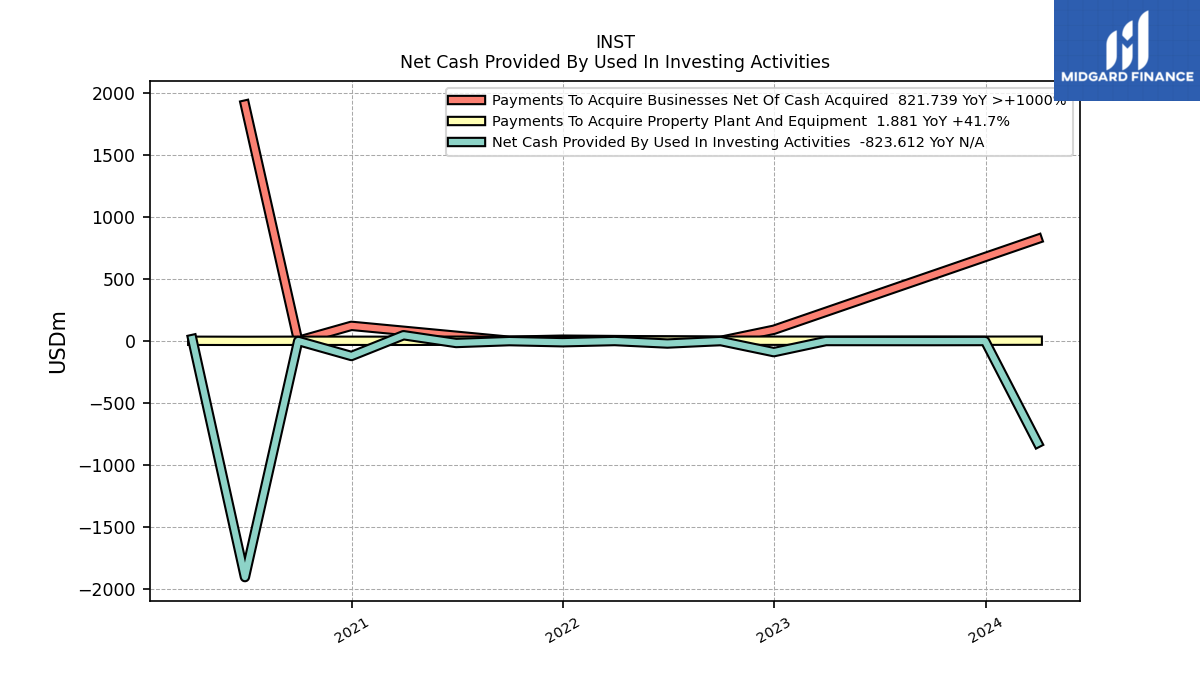
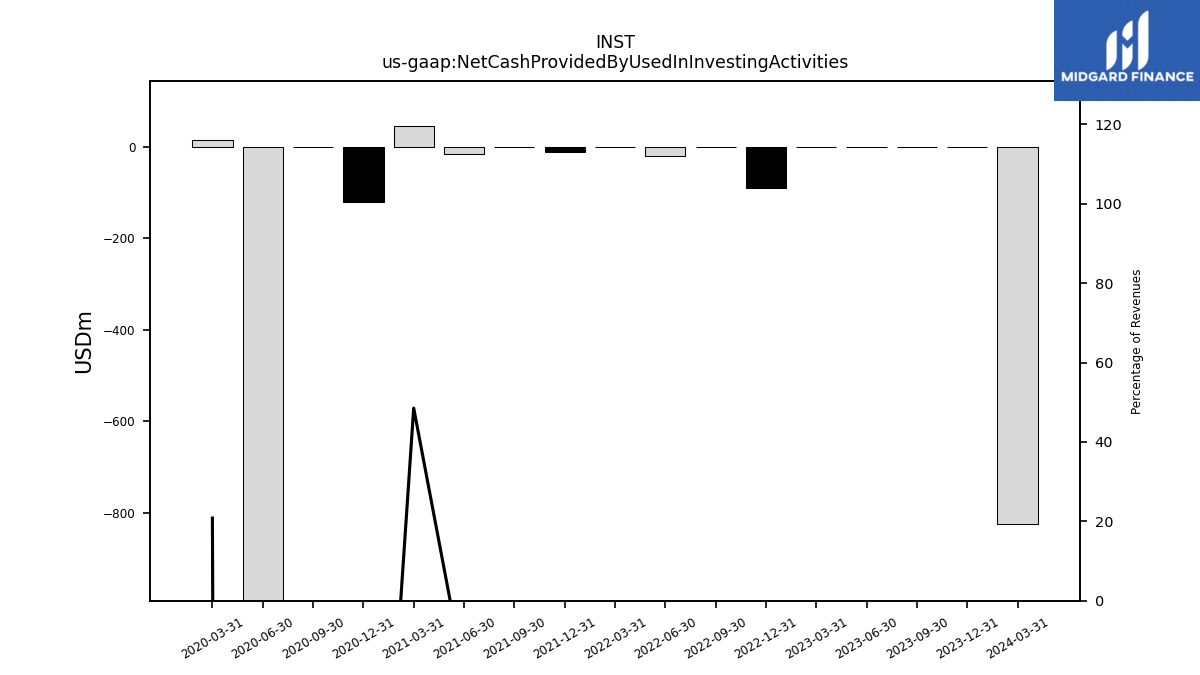
| Net Cash Provided By Used In Investing Activities | -1.80 | -1.54 | -1.32 | -90.87 | -1.56 | -21.55 | -1.31 | -11.14 | -2.03 | -17.21 | 45.62 | -121.94 | -0.77 | -1904.09 | 14.87 | |
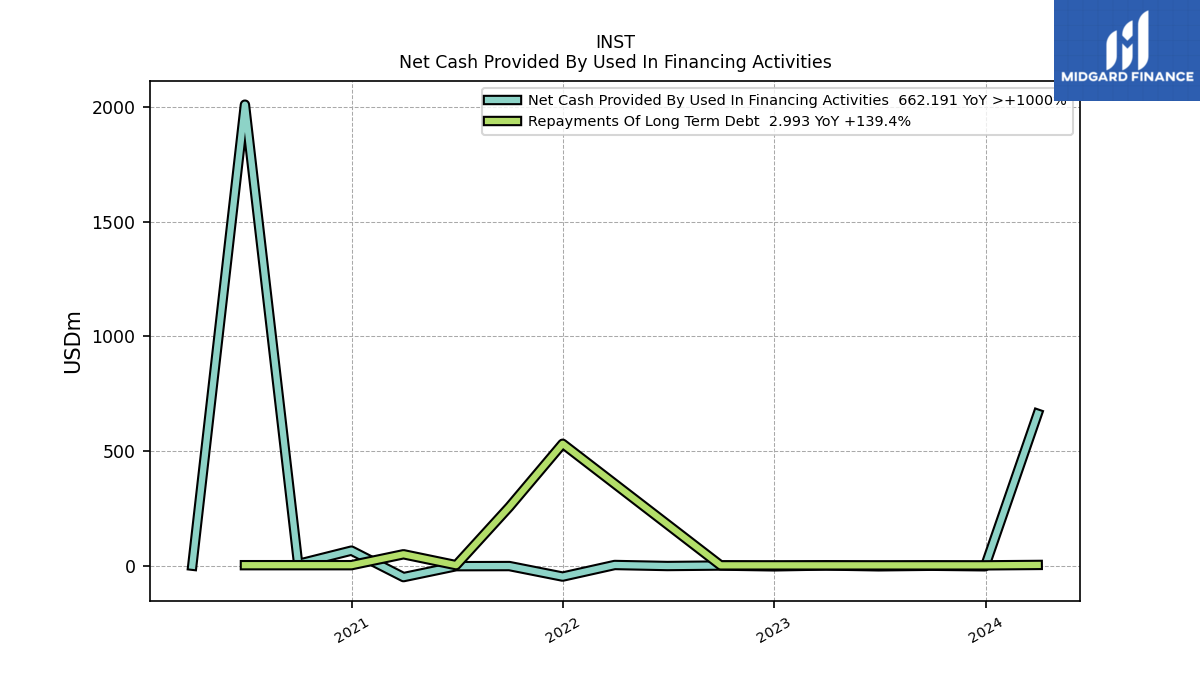
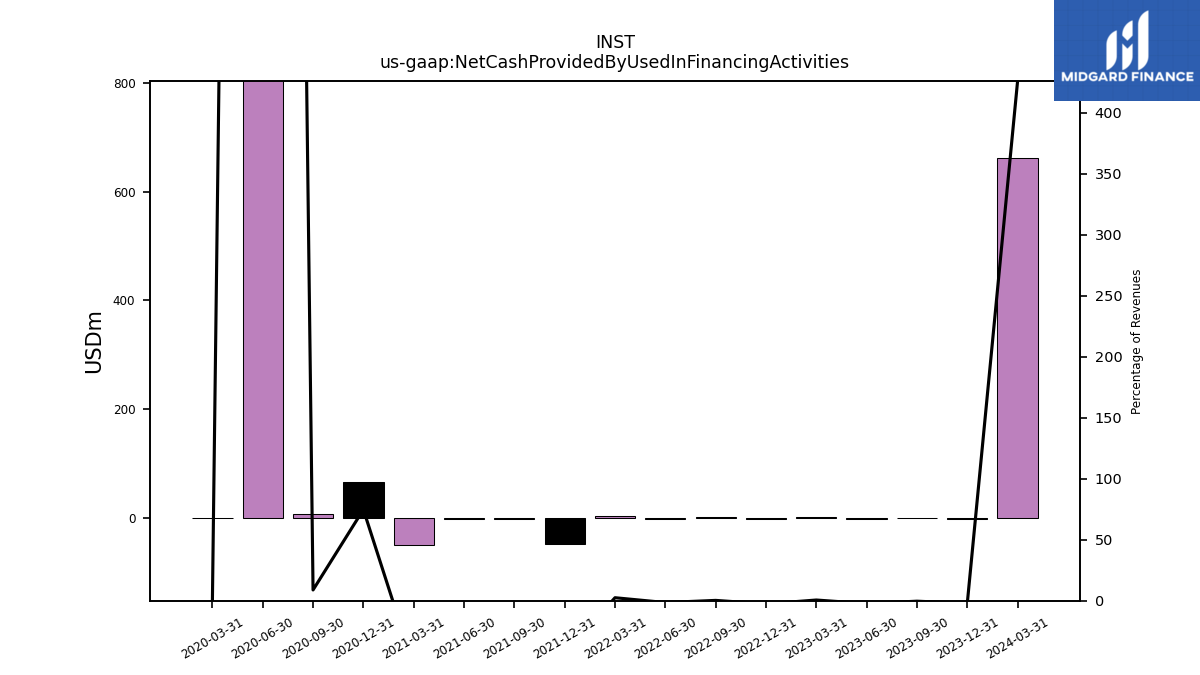
| Net Cash Provided By Used In Financing Activities | -0.49 | -3.04 | 0.77 | -3.21 | 0.36 | -1.68 | 2.81 | -47.82 | -1.90 | -2.35 | -50.10 | 65.43 | 7.25 | 2009.48 | -0.35 |
| 2023-09-30 | 2023-06-30 | 2023-03-31 | 2022-12-31 | 2022-09-30 | 2022-06-30 | 2022-03-31 | 2021-12-31 | 2021-09-30 | 2021-06-30 | 2021-03-31 | 2020-12-31 | 2020-09-30 | 2020-06-30 | 2020-03-31 | ||
|---|---|---|---|---|---|---|---|---|---|---|---|---|---|---|---|---|
| Net Cash Provided By Used In Operating Activities | 182.81 | 25.16 | -80.92 | 18.80 | 179.01 | 8.40 | -65.94 | -3.67 | 161.18 | 6.37 | -58.73 | -5.08 | 100.28 | -58.33 | -57.06 | |
| Net Income Loss | -5.48 | -10.97 | -11.86 | -5.72 | -10.05 | -12.92 | -5.54 | -20.65 | -13.26 | -21.69 | -33.07 | -41.23 | -60.17 | -76.57 | -22.20 | |
| Profit Loss | -5.48 | -10.97 | -11.86 | -5.72 | -10.05 | -12.92 | -5.54 | -20.65 | -13.26 | -21.69 | -33.07 | -41.23 | -60.17 | -76.57 | -22.20 | |
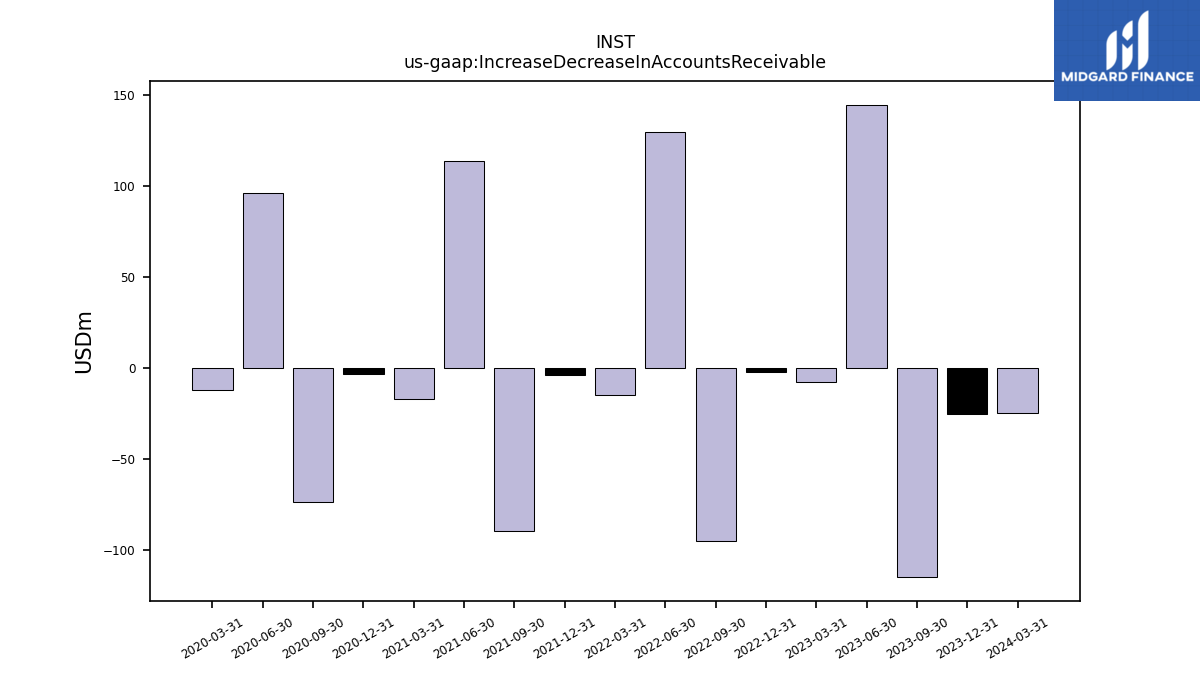
| Increase Decrease In Accounts Receivable | -114.74 | 144.96 | -7.63 | -1.90 | -94.96 | 130.09 | -14.78 | -3.39 | -89.21 | 113.82 | -16.91 | -3.23 | -73.41 | 96.59 | -11.90 | |
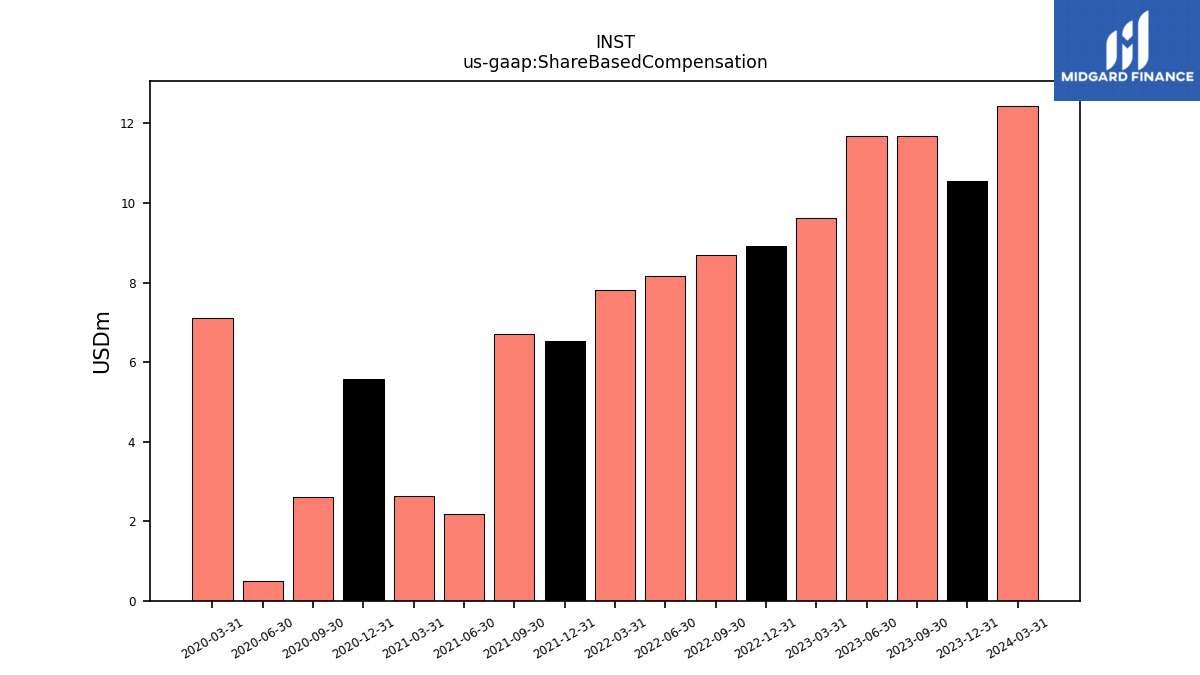
| Share Based Compensation | 11.68 | 11.68 | 9.63 | 8.91 | 8.70 | 8.16 | 7.81 | 6.54 | 6.71 | 2.19 | 2.63 | 5.57 | 2.62 | 0.50 | 7.11 | |
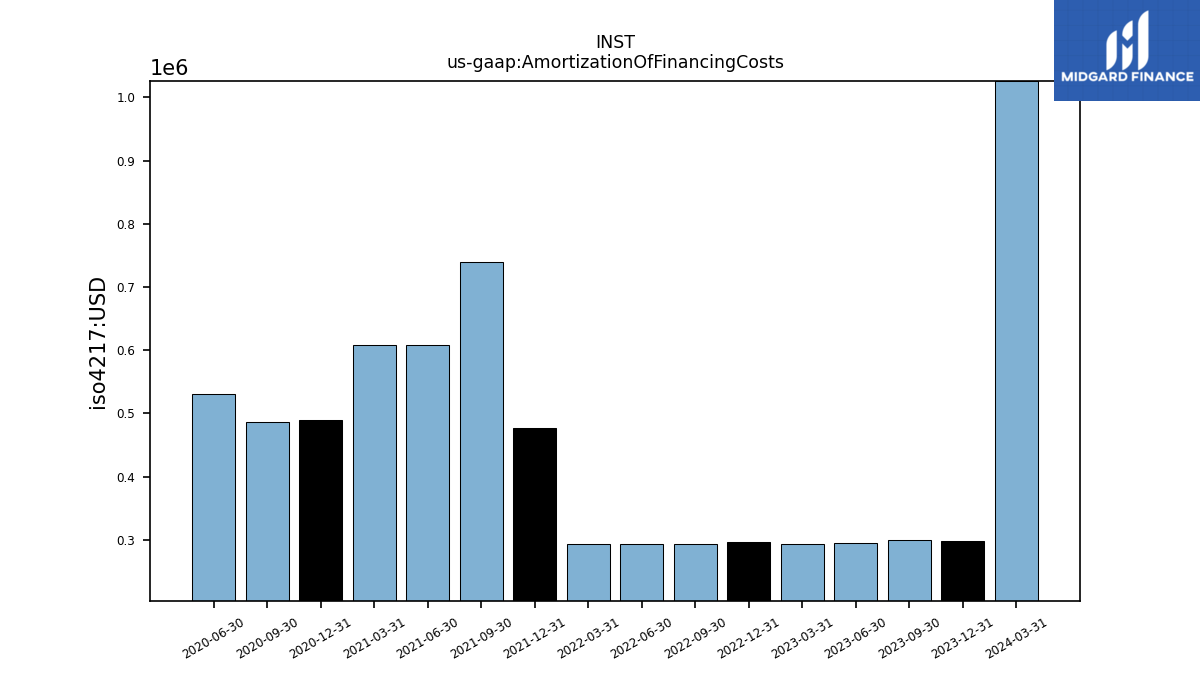
| Amortization Of Financing Costs | 0.30 | 0.29 | 0.29 | 0.30 | 0.29 | 0.29 | 0.29 | 0.48 | 0.74 | 0.61 | 0.61 | 0.49 | 0.49 | 0.53 | NA |
| 2023-09-30 | 2023-06-30 | 2023-03-31 | 2022-12-31 | 2022-09-30 | 2022-06-30 | 2022-03-31 | 2021-12-31 | 2021-09-30 | 2021-06-30 | 2021-03-31 | 2020-12-31 | 2020-09-30 | 2020-06-30 | 2020-03-31 | ||
|---|---|---|---|---|---|---|---|---|---|---|---|---|---|---|---|---|
| Net Cash Provided By Used In Investing Activities | -1.80 | -1.54 | -1.32 | -90.87 | -1.56 | -21.55 | -1.31 | -11.14 | -2.03 | -17.21 | 45.62 | -121.94 | -0.77 | -1904.09 | 14.87 | |
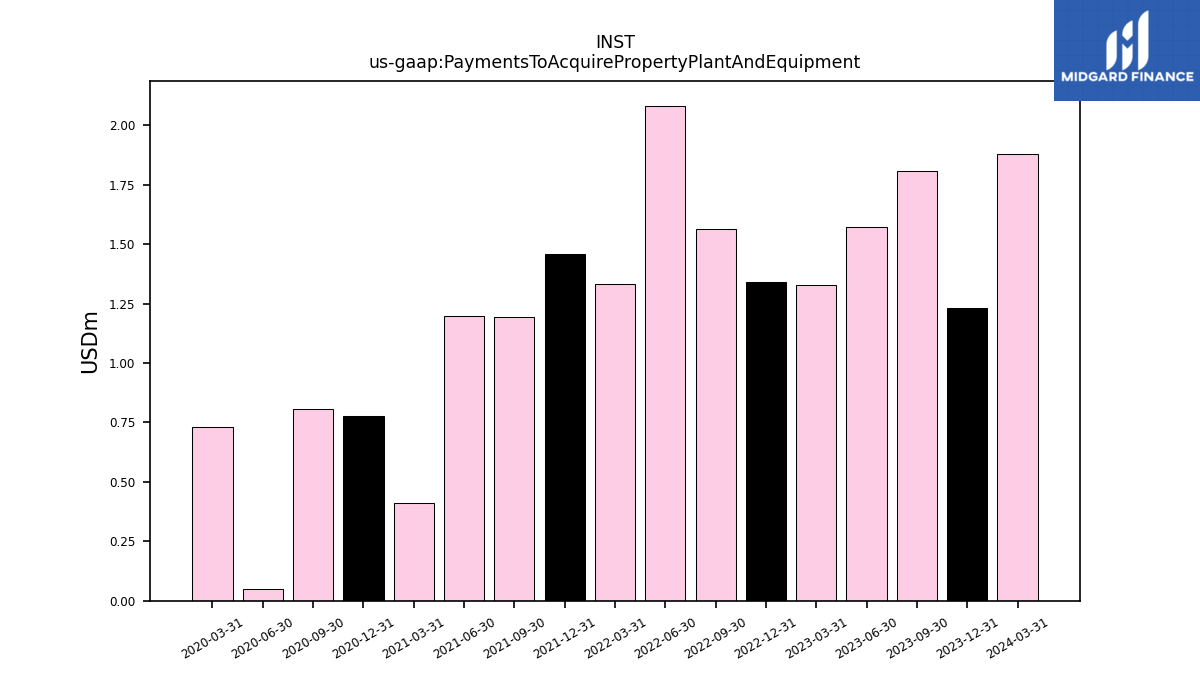
| Payments To Acquire Property Plant And Equipment | 1.81 | 1.57 | 1.33 | 1.34 | 1.56 | 2.08 | 1.33 | 1.46 | 1.19 | 1.20 | 0.41 | 0.78 | 0.81 | 0.05 | 0.73 |
| 2023-09-30 | 2023-06-30 | 2023-03-31 | 2022-12-31 | 2022-09-30 | 2022-06-30 | 2022-03-31 | 2021-12-31 | 2021-09-30 | 2021-06-30 | 2021-03-31 | 2020-12-31 | 2020-09-30 | 2020-06-30 | 2020-03-31 | ||
|---|---|---|---|---|---|---|---|---|---|---|---|---|---|---|---|---|
| Net Cash Provided By Used In Financing Activities | -0.49 | -3.04 | 0.77 | -3.21 | 0.36 | -1.68 | 2.81 | -47.82 | -1.90 | -2.35 | -50.10 | 65.43 | 7.25 | 2009.48 | -0.35 |
| 2023-09-30 | 2023-06-30 | 2023-03-31 | 2022-12-31 | 2022-09-30 | 2022-06-30 | 2022-03-31 | 2021-12-31 | 2021-09-30 | 2021-06-30 | 2021-03-31 | 2020-12-31 | 2020-09-30 | 2020-06-30 | 2020-03-31 | ||
|---|---|---|---|---|---|---|---|---|---|---|---|---|---|---|---|---|
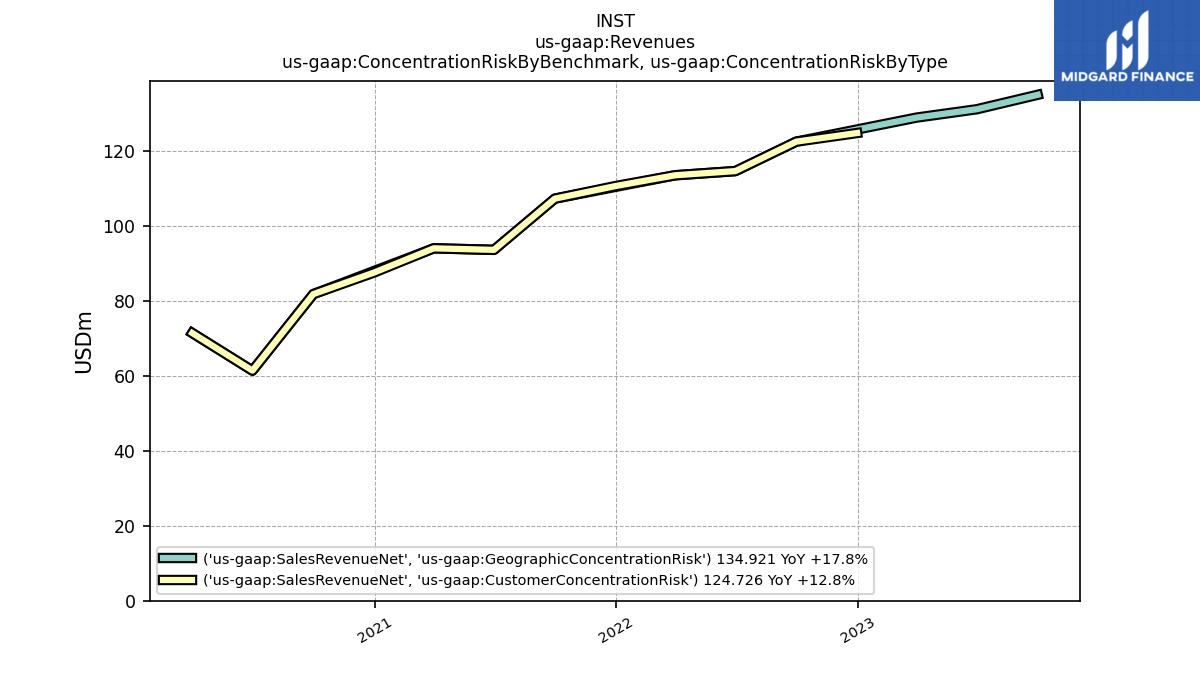
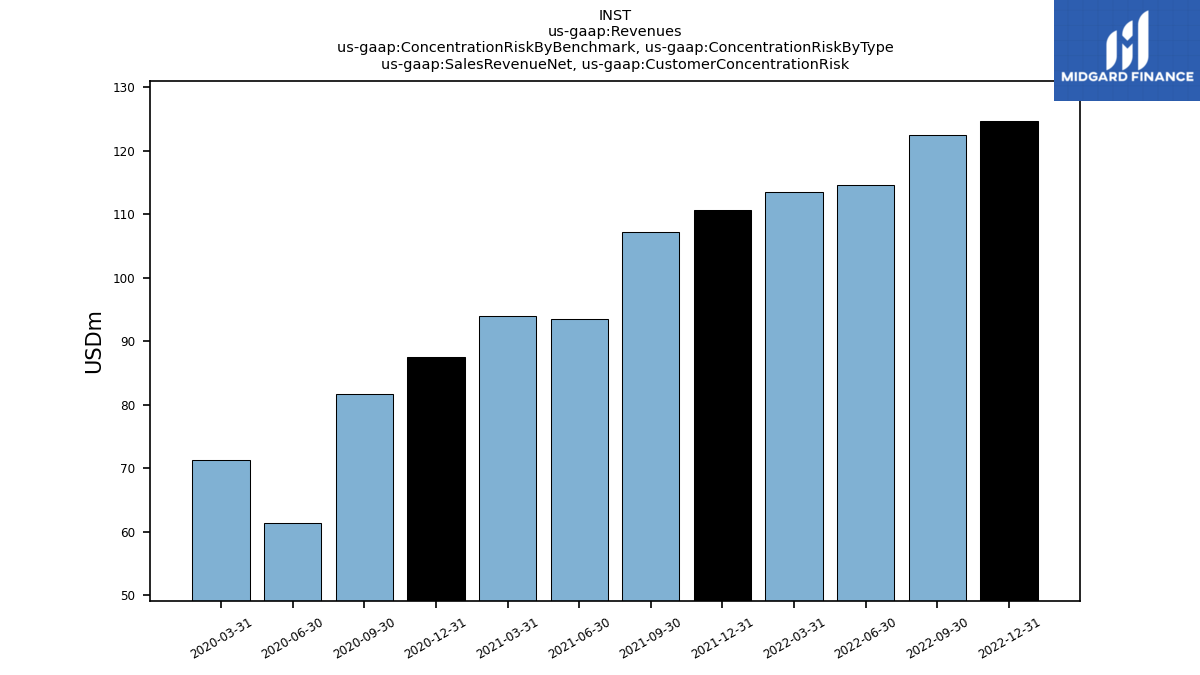
| Revenues | 134.92 | 131.07 | 128.84 | 124.73 | 122.43 | 114.58 | 113.46 | 110.59 | 107.22 | 93.57 | 93.98 | 87.53 | 81.77 | 61.37 | 71.39 | |
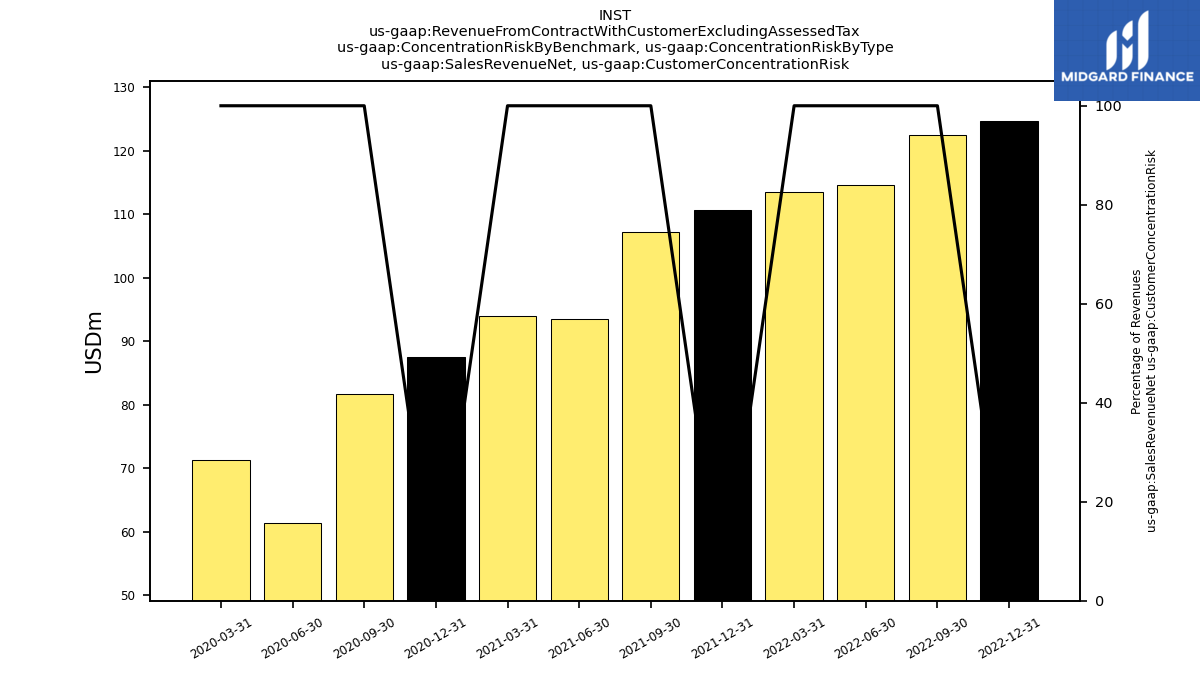
| Sales Revenue Net, Customer Concentration Risk | NA | NA | NA | 124.73 | 122.43 | 114.58 | 113.46 | 110.59 | 107.22 | 93.57 | 93.98 | 87.53 | 81.77 | 61.37 | 71.39 | |
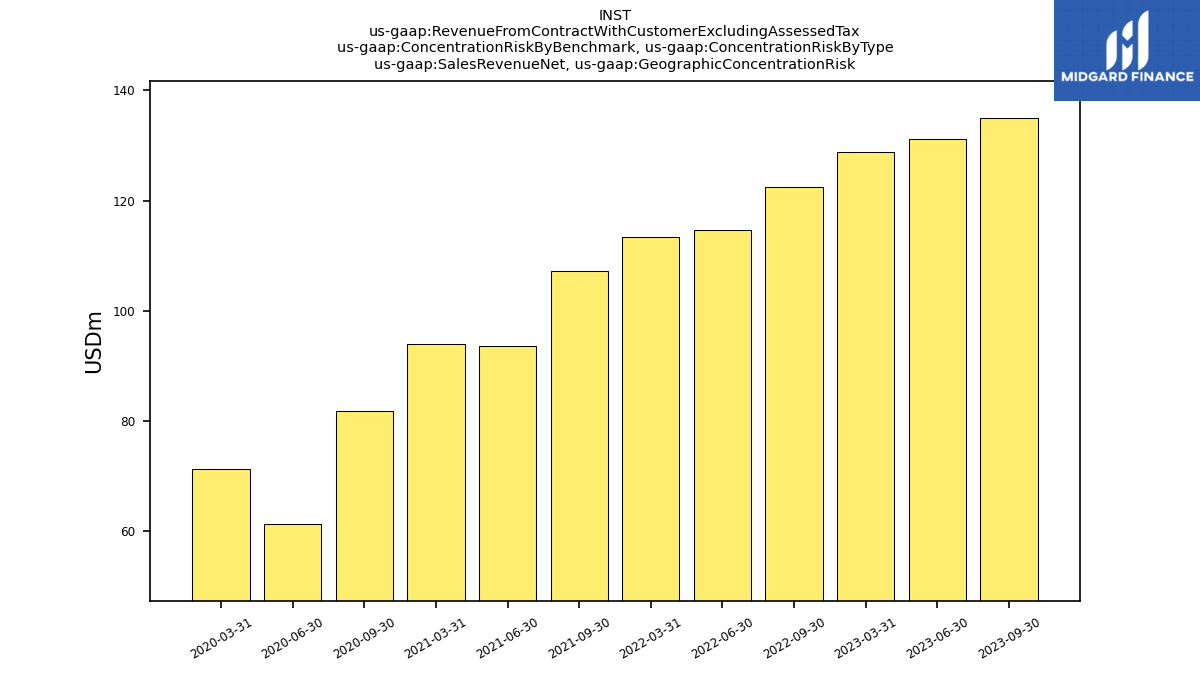
| Sales Revenue Net, Geographic Concentration Risk | 134.92 | 131.07 | 128.84 | NA | 122.43 | 114.58 | 113.46 | NA | 107.22 | 93.57 | 93.98 | NA | 81.77 | 61.37 | 71.39 | |
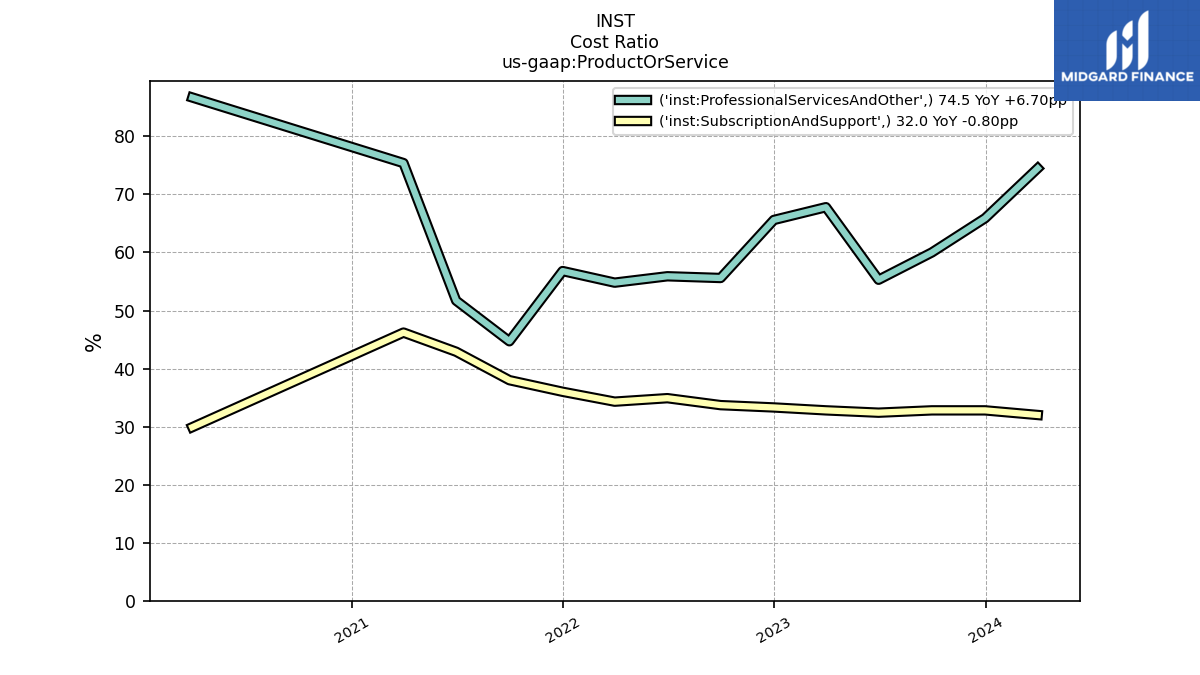
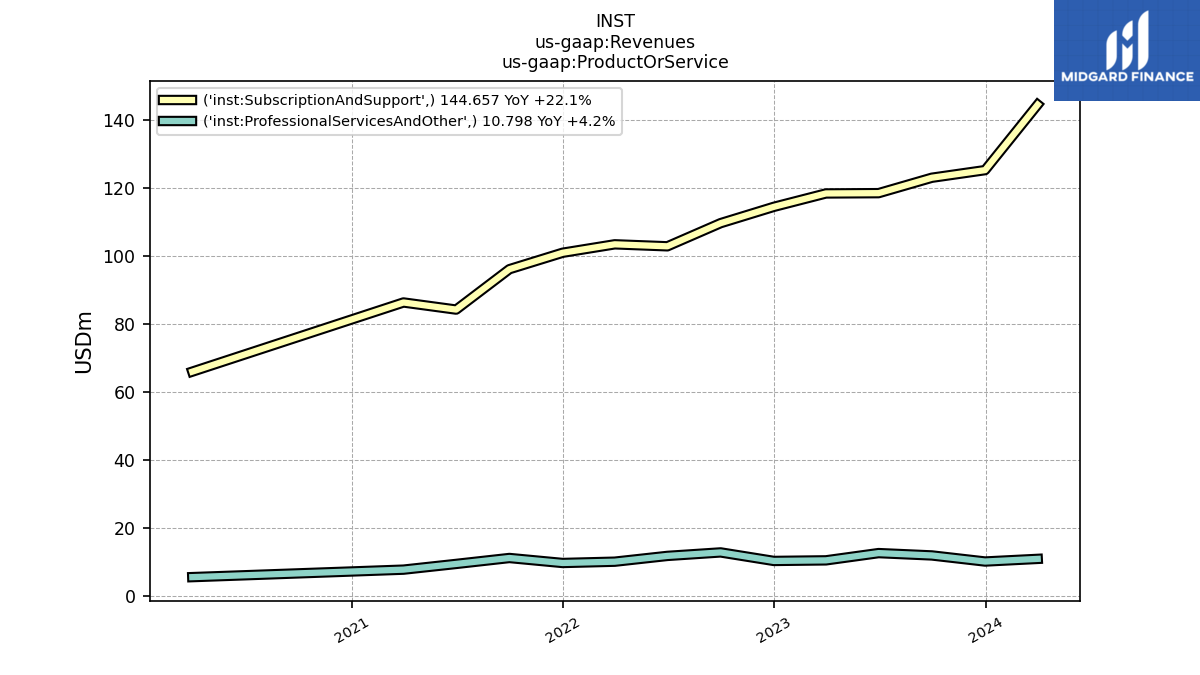
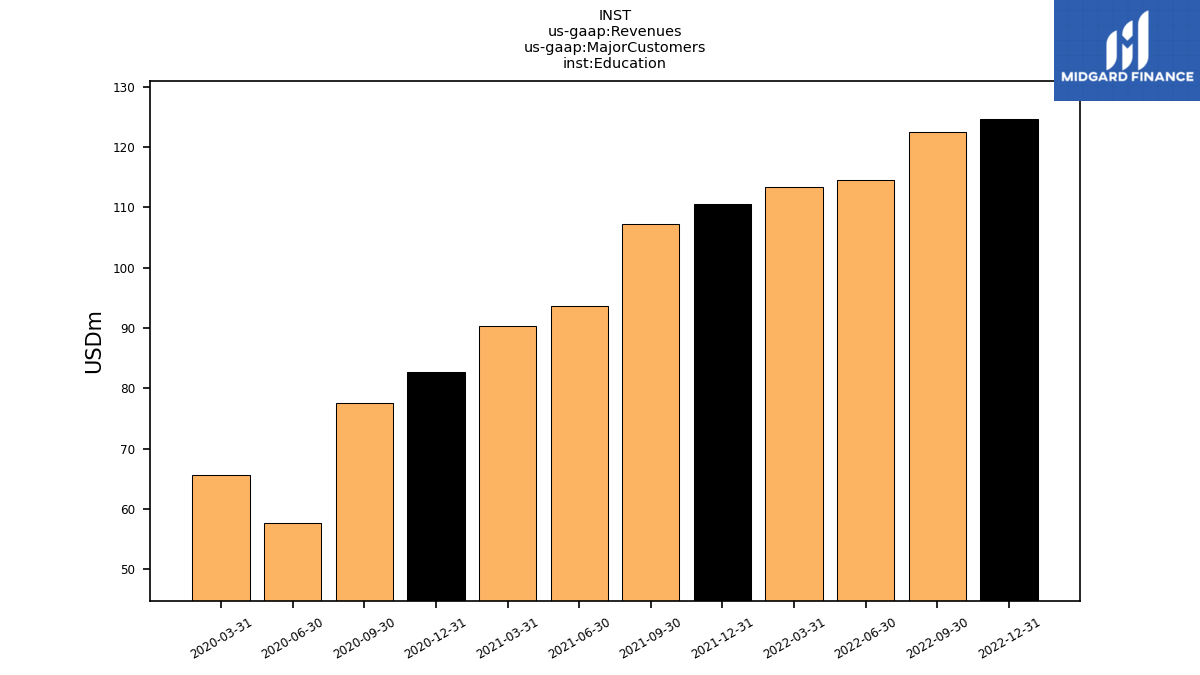
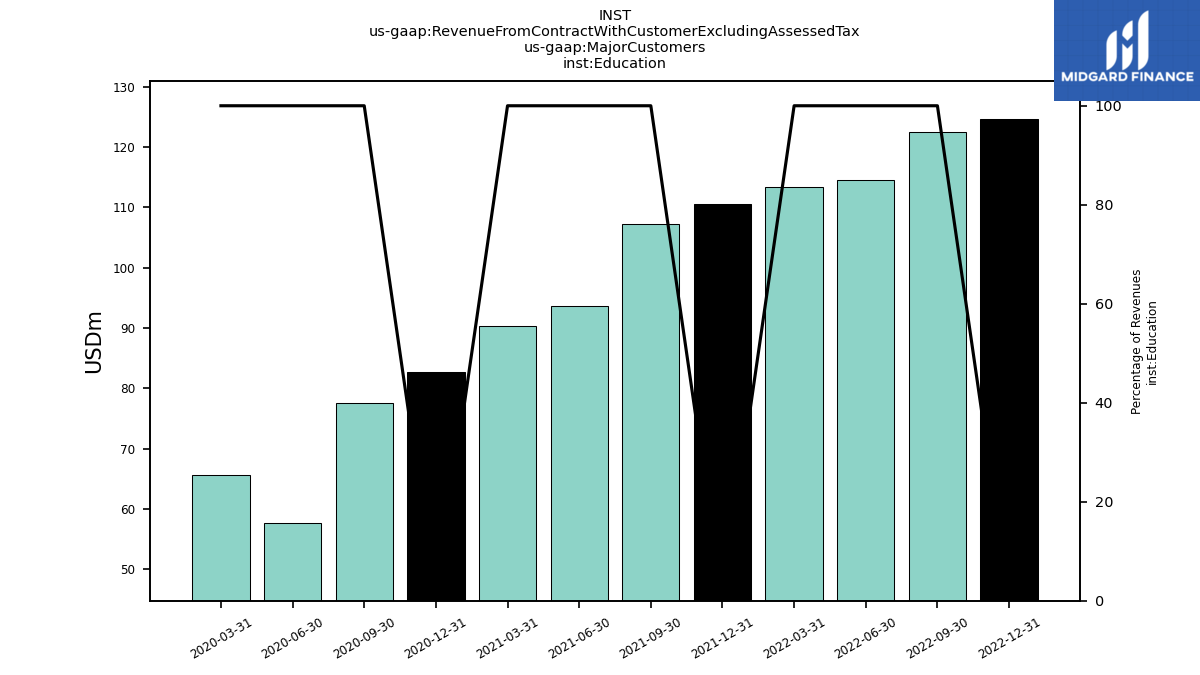
| Education | NA | NA | NA | 124.73 | 122.43 | 114.58 | 113.46 | 110.59 | 107.22 | 93.57 | 90.32 | 82.67 | 77.58 | 57.71 | 65.56 | |
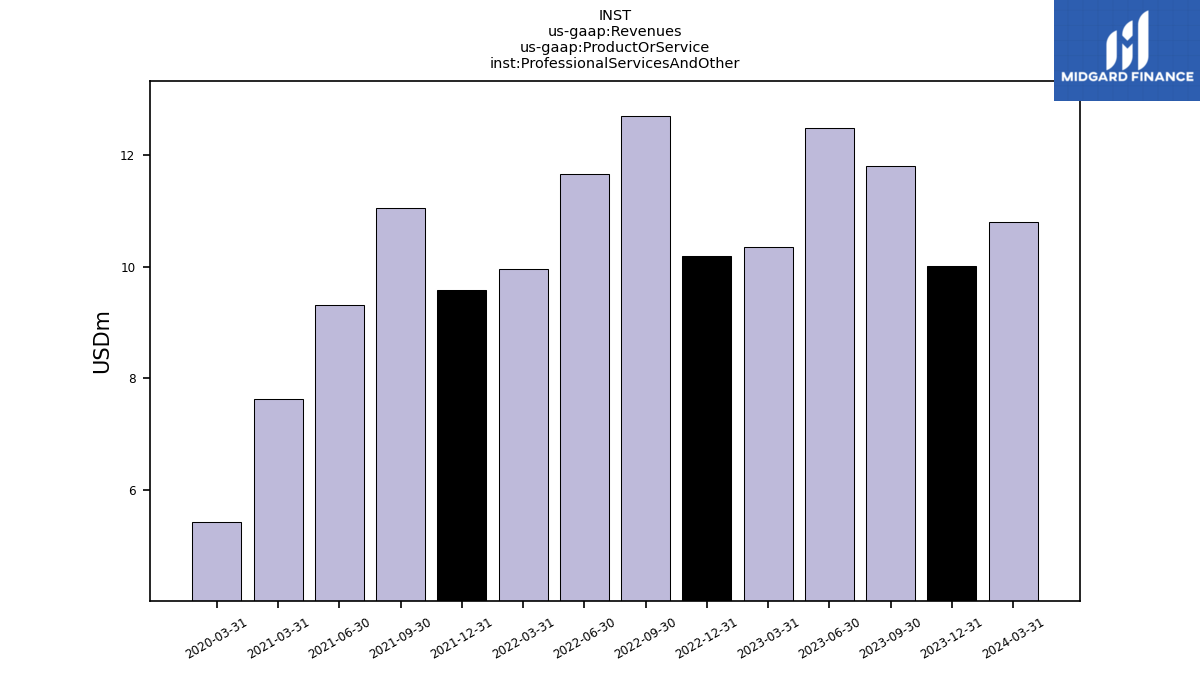
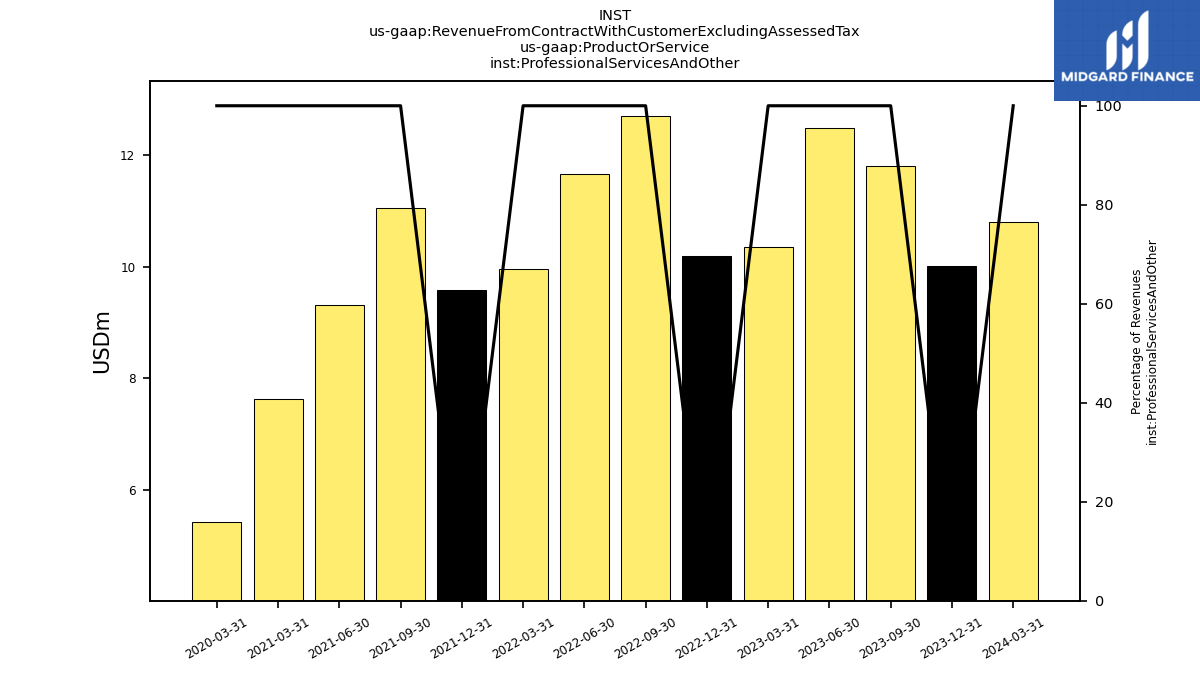
| Professional Services And Other | 11.81 | 12.50 | 10.36 | 10.19 | 12.70 | 11.67 | 9.97 | 9.59 | 11.06 | 9.31 | 7.63 | NA | NA | NA | 5.42 | |
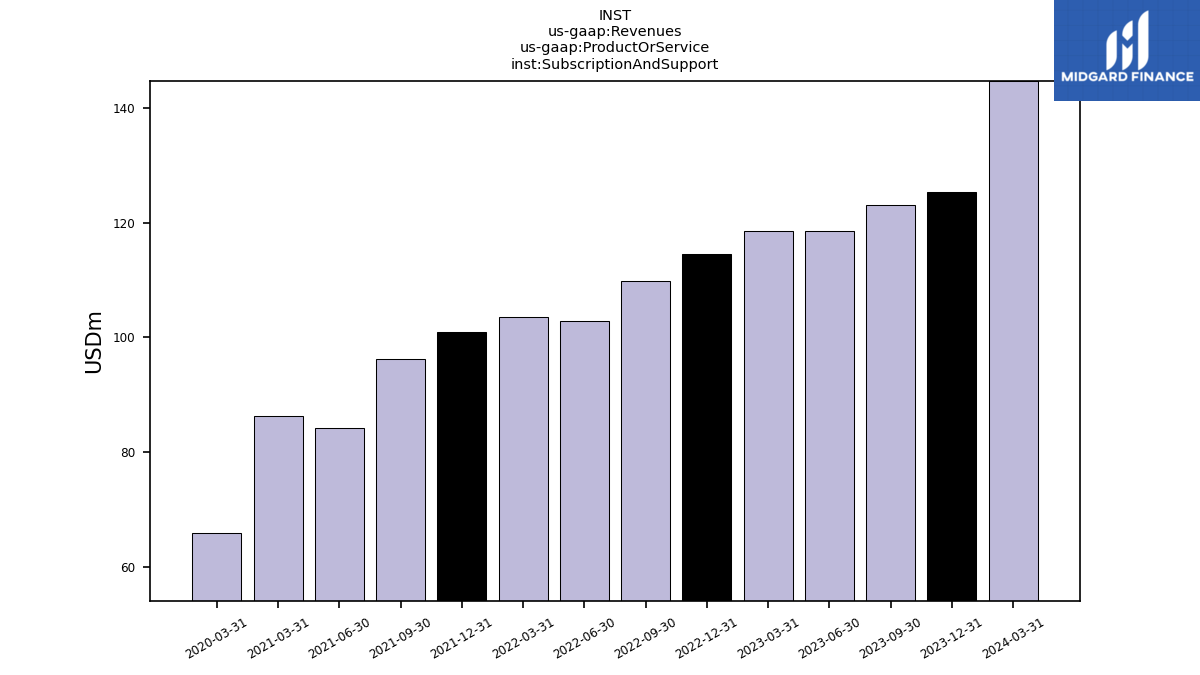
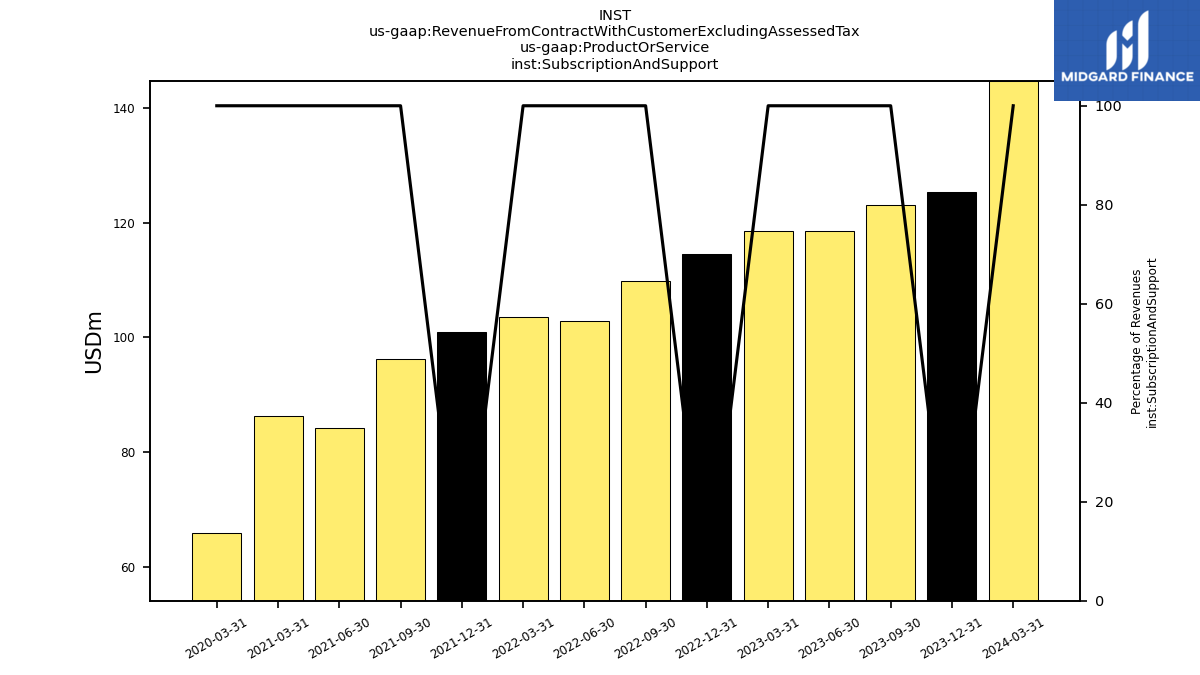
| Subscription And Support | 123.11 | 118.57 | 118.48 | 114.54 | 109.73 | 102.91 | 103.49 | 101.01 | 96.16 | 84.26 | 86.35 | NA | NA | NA | 65.97 | |
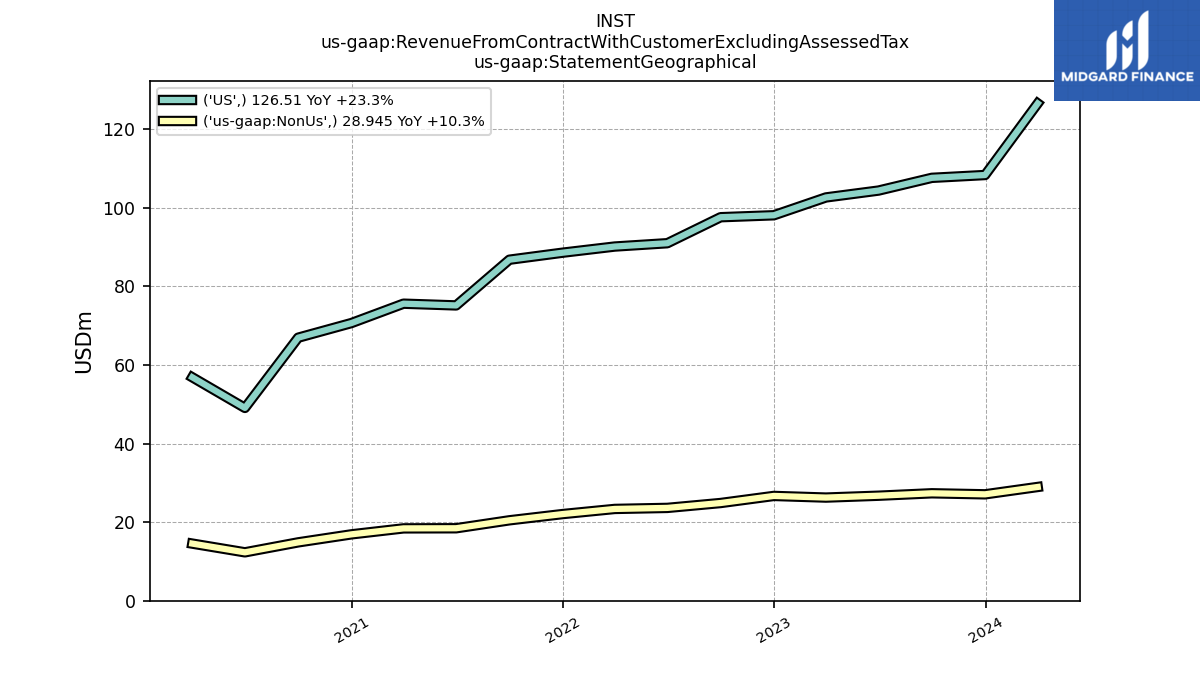
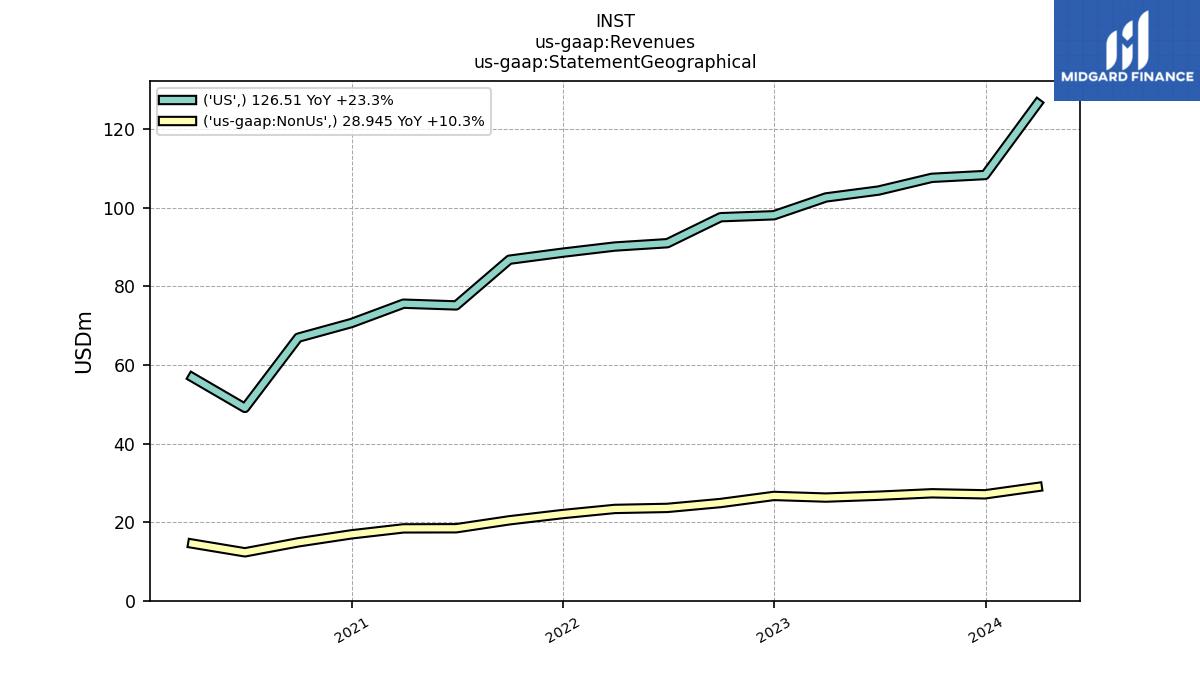
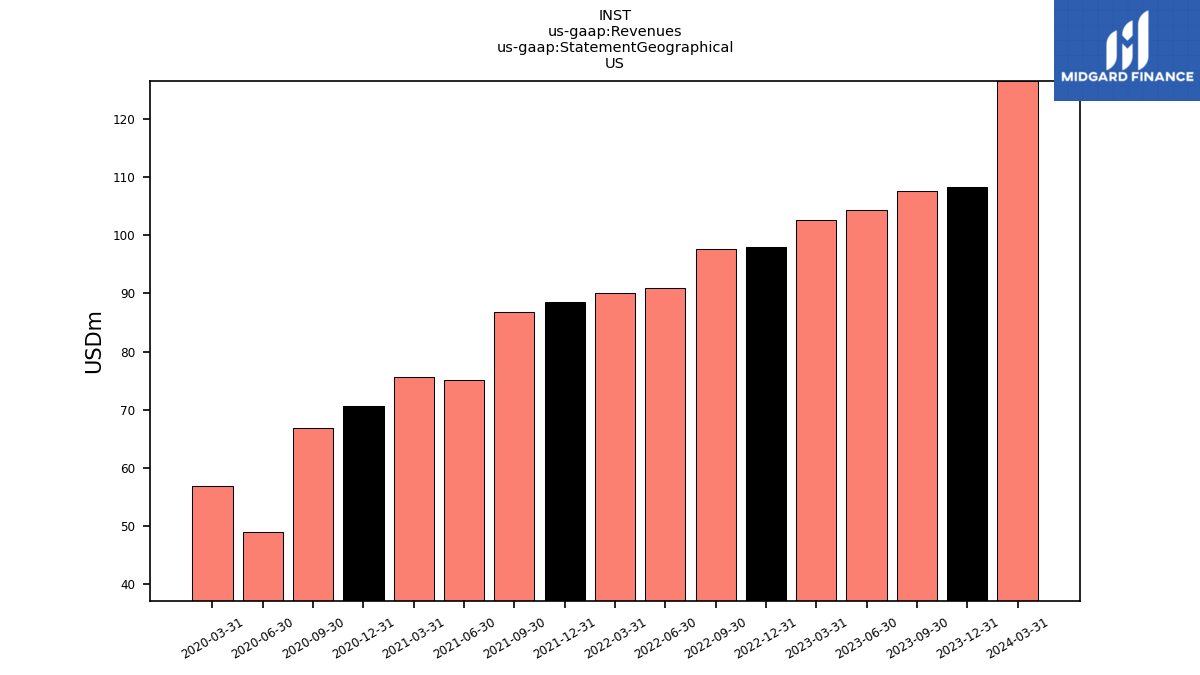
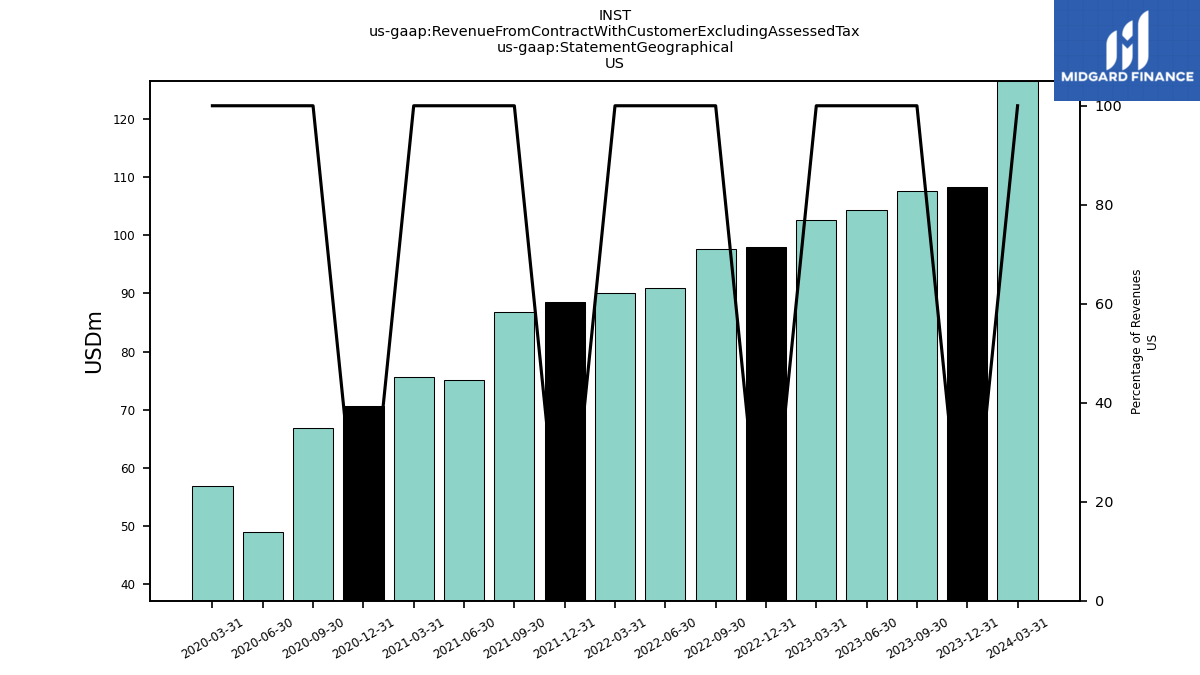
| US | 107.58 | 104.35 | 102.60 | 98.06 | 97.57 | 90.96 | 90.11 | 88.54 | 86.76 | 75.13 | 75.57 | 70.64 | 66.92 | 49.05 | 56.85 | |
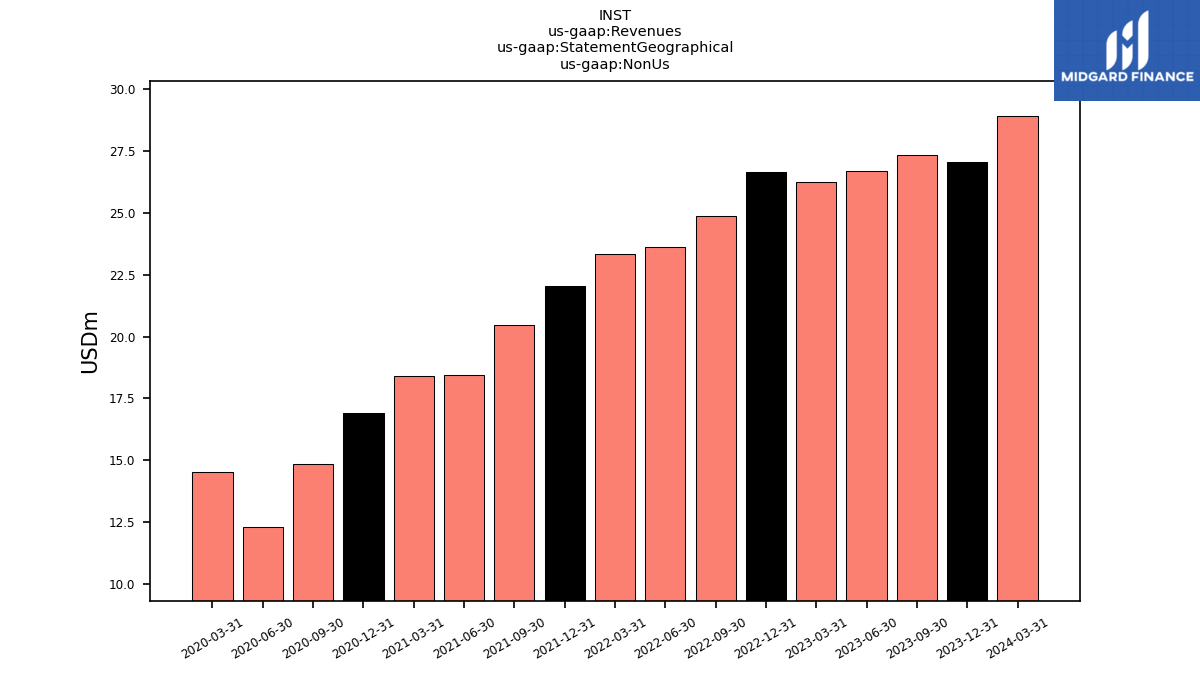
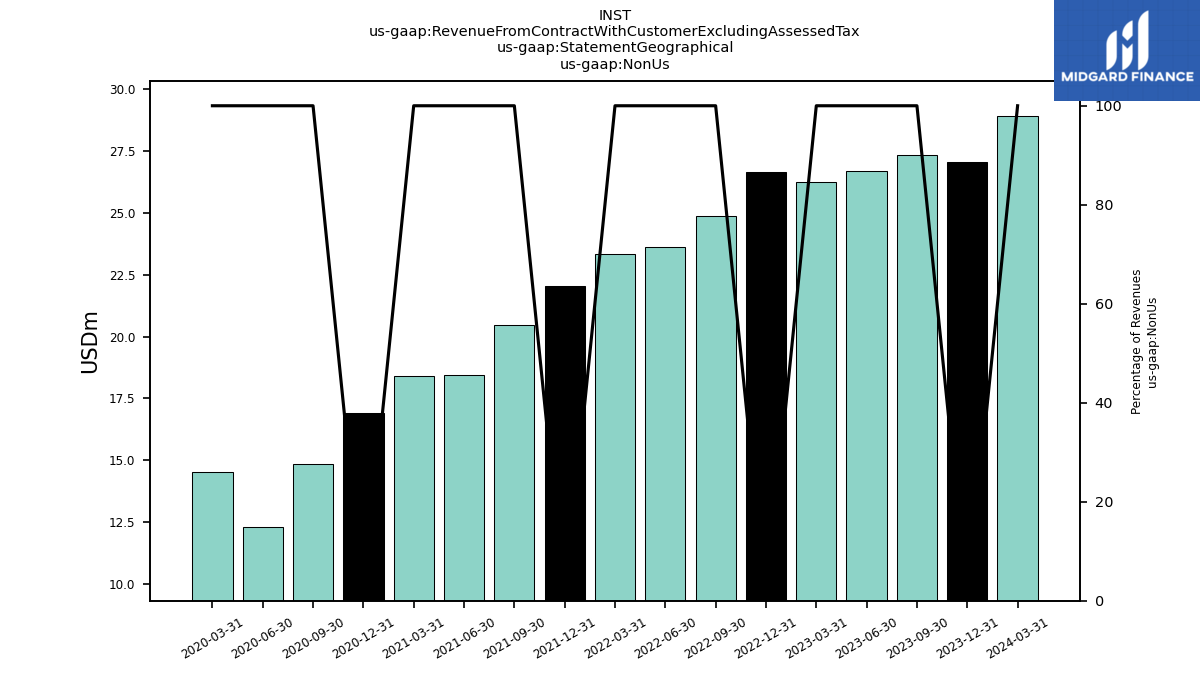
| Non Us | 27.34 | 26.72 | 26.25 | 26.66 | 24.86 | 23.62 | 23.36 | 22.05 | 20.46 | 18.44 | 18.41 | 16.89 | 14.85 | 12.32 | 14.54 | |
| Revenue From Contract With Customer Excluding Assessed Tax | 134.92 | 131.07 | 128.84 | 124.73 | 122.43 | 114.58 | 113.46 | 110.59 | 107.22 | 93.57 | 93.98 | 87.53 | 81.77 | 61.37 | 71.39 | |
| Sales Revenue Net, Customer Concentration Risk | NA | NA | NA | 124.73 | 122.43 | 114.58 | 113.46 | 110.59 | 107.22 | 93.57 | 93.98 | 87.53 | 81.77 | 61.37 | 71.39 | |
| Sales Revenue Net, Geographic Concentration Risk | 134.92 | 131.07 | 128.84 | NA | 122.43 | 114.58 | 113.46 | NA | 107.22 | 93.57 | 93.98 | NA | 81.77 | 61.37 | 71.39 | |
| Education | NA | NA | NA | 124.73 | 122.43 | 114.58 | 113.46 | 110.59 | 107.22 | 93.57 | 90.32 | 82.67 | 77.58 | 57.71 | 65.56 | |
| Professional Services And Other | 11.81 | 12.50 | 10.36 | 10.19 | 12.70 | 11.67 | 9.97 | 9.59 | 11.06 | 9.31 | 7.63 | NA | NA | NA | 5.42 | |
| Subscription And Support | 123.11 | 118.57 | 118.48 | 114.54 | 109.73 | 102.91 | 103.49 | 101.01 | 96.16 | 84.26 | 86.35 | NA | NA | NA | 65.97 | |
| US | 107.58 | 104.35 | 102.60 | 98.06 | 97.57 | 90.96 | 90.11 | 88.54 | 86.76 | 75.13 | 75.57 | 70.64 | 66.92 | 49.05 | 56.85 | |
| Non Us | 27.34 | 26.72 | 26.25 | 26.66 | 24.86 | 23.62 | 23.36 | 22.05 | 20.46 | 18.44 | 18.41 | 16.89 | 14.85 | 12.32 | 14.54 |
