
| 2023-12-31 | 2023-09-30 | 2023-06-30 | 2023-03-31 | 2022-12-31 | 2022-09-30 | 2022-06-30 | 2022-03-31 | 2021-12-31 | 2021-09-30 | 2021-06-30 | 2021-03-31 | 2020-12-31 | 2020-09-30 | 2020-06-30 | 2020-03-31 | 2019-12-31 | 2019-09-30 | 2019-06-30 | 2019-03-31 | 2018-12-31 | 2018-09-30 | 2018-06-30 | 2018-03-31 | 2017-12-31 | 2017-09-30 | 2017-06-30 | 2017-03-31 | 2016-12-31 | 2016-09-30 | 2016-06-30 | 2016-03-31 | 2015-12-31 | 2015-09-30 | 2015-06-30 | 2015-03-31 | 2014-12-31 | 2014-09-30 | 2014-06-30 | 2014-03-31 | 2013-12-31 | 2013-09-30 | 2013-06-30 | 2013-03-31 | 2012-12-31 | 2012-09-30 | 2012-06-30 | 2012-03-31 | 2011-12-31 | 2011-09-30 | 2011-06-30 | 2011-03-31 | 2010-12-31 | 2010-09-30 | 2010-06-30 | 2010-03-31 | ||
|---|---|---|---|---|---|---|---|---|---|---|---|---|---|---|---|---|---|---|---|---|---|---|---|---|---|---|---|---|---|---|---|---|---|---|---|---|---|---|---|---|---|---|---|---|---|---|---|---|---|---|---|---|---|---|---|---|---|
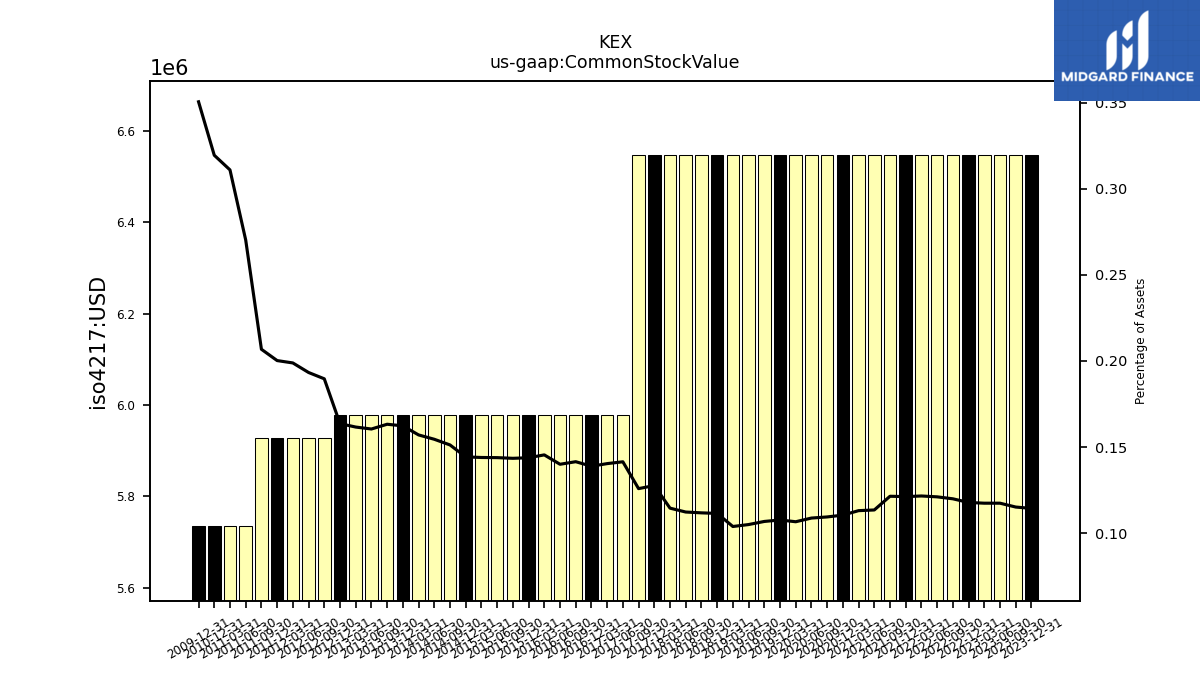
| Common Stock Value | 6.55 | 6.55 | 6.55 | 6.55 | 6.55 | 6.55 | 6.55 | 6.55 | 6.55 | 6.55 | 6.55 | 6.55 | 6.55 | 6.55 | 6.55 | 6.55 | 6.55 | 6.55 | 6.55 | 6.55 | 6.55 | 6.55 | 6.55 | 6.55 | 6.55 | 6.55 | 5.98 | 5.98 | 5.98 | 5.98 | 5.98 | 5.98 | 5.98 | 5.98 | 5.98 | 5.98 | 5.98 | 5.98 | 5.98 | 5.98 | 5.98 | 5.98 | 5.98 | 5.98 | 5.98 | 5.93 | 5.93 | 5.93 | 5.93 | 5.93 | 5.73 | 5.73 | 5.73 | NA | NA | NA | |
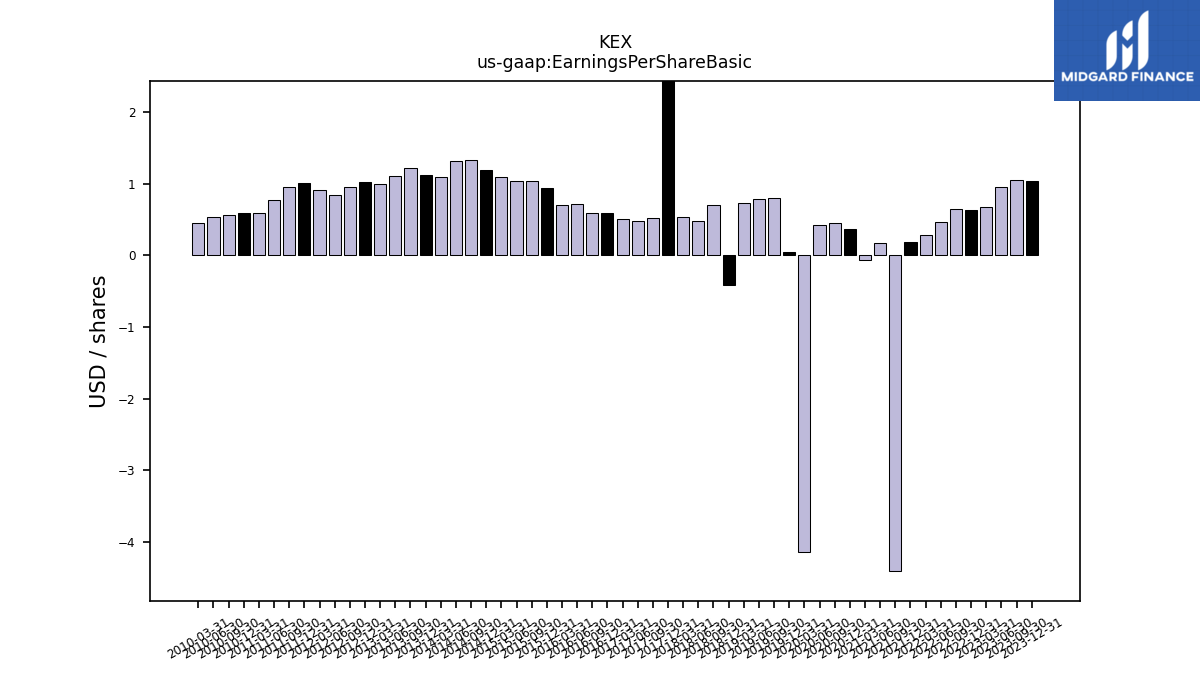
| Earnings Per Share Basic | 1.04 | 1.06 | 0.96 | 0.68 | 0.63 | 0.65 | 0.47 | 0.29 | 0.19 | -4.41 | 0.17 | -0.06 | 0.37 | 0.46 | 0.42 | -4.15 | 0.05 | 0.80 | 0.79 | 0.74 | -0.41 | 0.70 | 0.48 | 0.54 | 3.88 | 0.52 | 0.48 | 0.51 | 0.60 | 0.59 | 0.72 | 0.71 | 0.94 | 1.04 | 1.04 | 1.09 | 1.19 | 1.34 | 1.32 | 1.09 | 1.13 | 1.22 | 1.11 | 1.00 | 1.03 | 0.95 | 0.85 | 0.91 | 1.01 | 0.95 | 0.78 | 0.60 | 0.59 | 0.57 | 0.54 | 0.46 | |
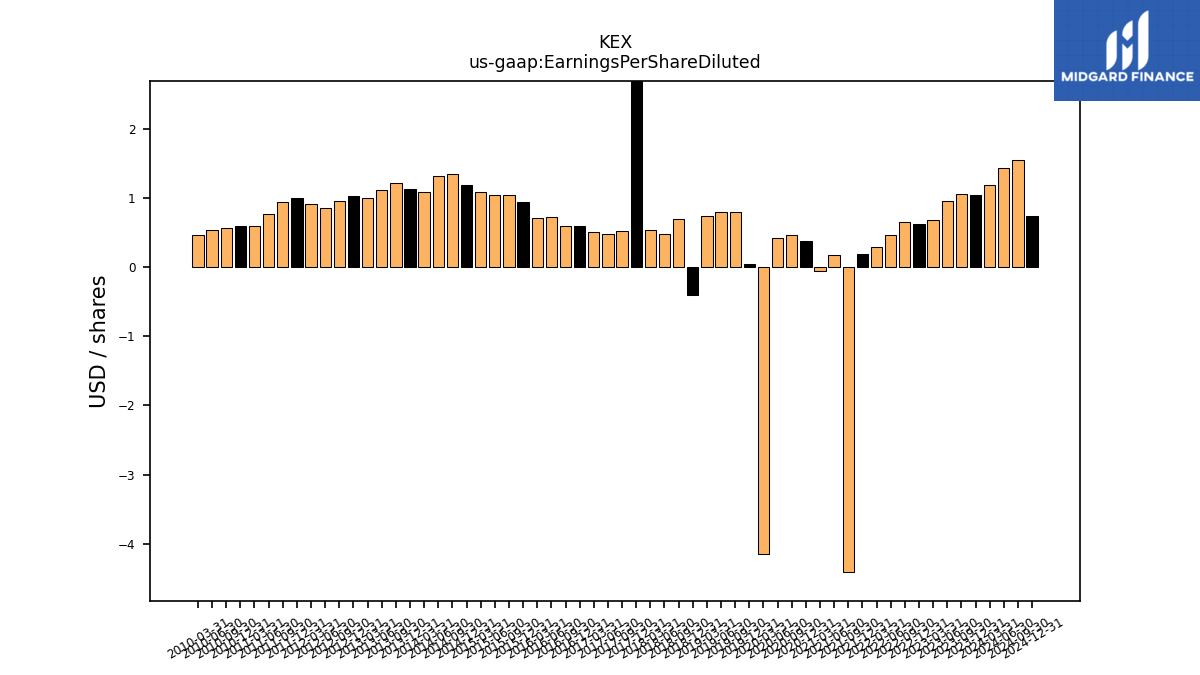
| Earnings Per Share Diluted | 1.04 | 1.05 | 0.95 | 0.68 | 0.62 | 0.65 | 0.47 | 0.29 | 0.19 | -4.41 | 0.17 | -0.06 | 0.37 | 0.46 | 0.42 | -4.15 | 0.05 | 0.80 | 0.79 | 0.74 | -0.41 | 0.70 | 0.48 | 0.54 | 3.87 | 0.52 | 0.48 | 0.51 | 0.60 | 0.59 | 0.72 | 0.71 | 0.94 | 1.04 | 1.04 | 1.09 | 1.19 | 1.34 | 1.31 | 1.09 | 1.13 | 1.21 | 1.11 | 1.00 | 1.03 | 0.95 | 0.85 | 0.91 | 1.00 | 0.94 | 0.77 | 0.60 | 0.59 | 0.57 | 0.54 | 0.46 |
| 2023-12-31 | 2023-09-30 | 2023-06-30 | 2023-03-31 | 2022-12-31 | 2022-09-30 | 2022-06-30 | 2022-03-31 | 2021-12-31 | 2021-09-30 | 2021-06-30 | 2021-03-31 | 2020-12-31 | 2020-09-30 | 2020-06-30 | 2020-03-31 | 2019-12-31 | 2019-09-30 | 2019-06-30 | 2019-03-31 | 2018-12-31 | 2018-09-30 | 2018-06-30 | 2018-03-31 | 2017-12-31 | 2017-09-30 | 2017-06-30 | 2017-03-31 | 2016-12-31 | 2016-09-30 | 2016-06-30 | 2016-03-31 | 2015-12-31 | 2015-09-30 | 2015-06-30 | 2015-03-31 | 2014-12-31 | 2014-09-30 | 2014-06-30 | 2014-03-31 | 2013-12-31 | 2013-09-30 | 2013-06-30 | 2013-03-31 | 2012-12-31 | 2012-09-30 | 2012-06-30 | 2012-03-31 | 2011-12-31 | 2011-09-30 | 2011-06-30 | 2011-03-31 | 2010-12-31 | 2010-09-30 | 2010-06-30 | 2010-03-31 | ||
|---|---|---|---|---|---|---|---|---|---|---|---|---|---|---|---|---|---|---|---|---|---|---|---|---|---|---|---|---|---|---|---|---|---|---|---|---|---|---|---|---|---|---|---|---|---|---|---|---|---|---|---|---|---|---|---|---|---|
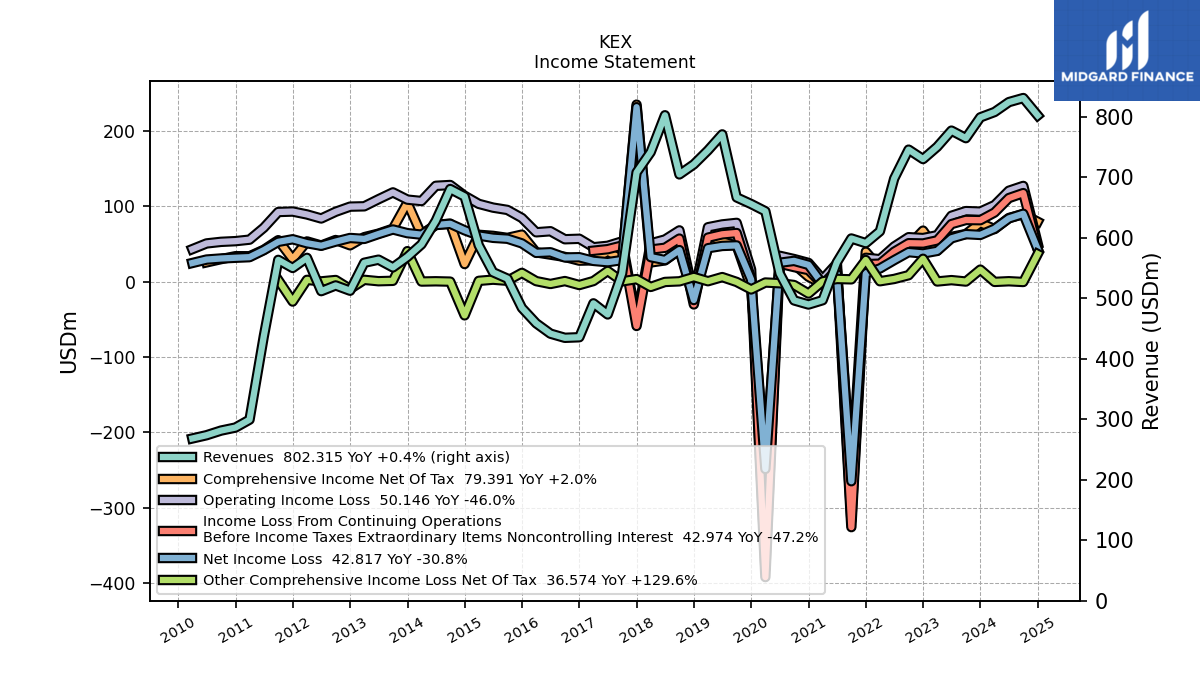
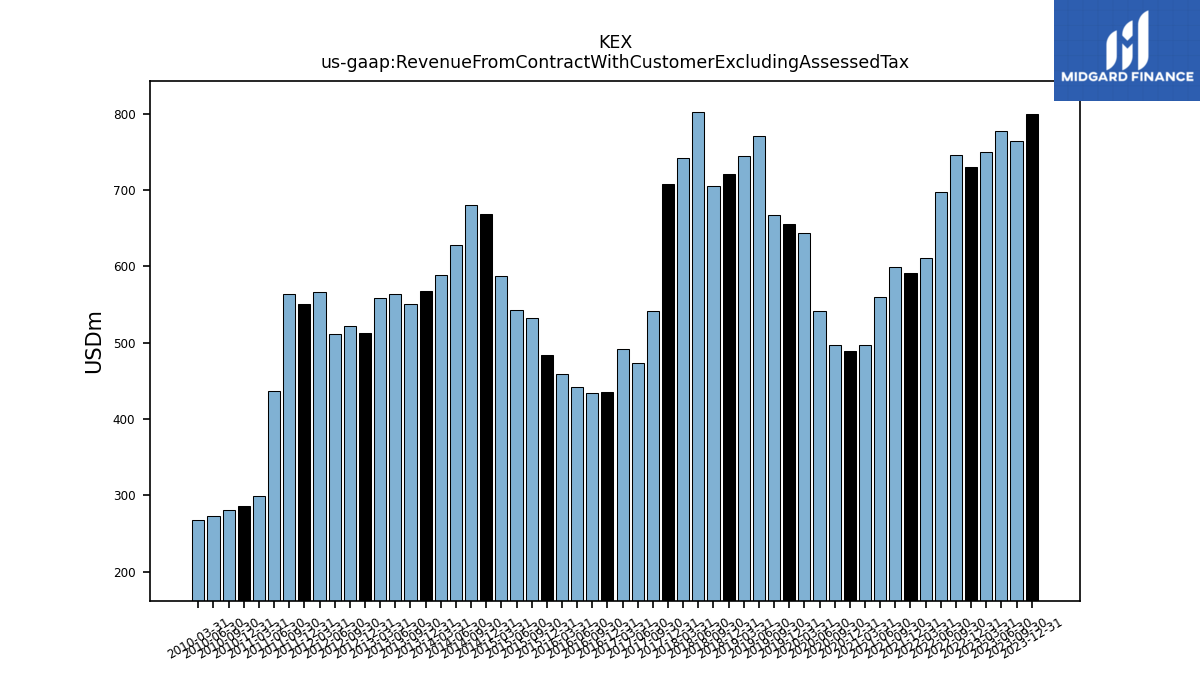
| Revenue From Contract With Customer Excluding Assessed Tax | 799.18 | 764.77 | 777.25 | 750.44 | 730.16 | 745.84 | 697.96 | 610.78 | 591.27 | 598.92 | 559.62 | 496.85 | 489.76 | 496.57 | 541.16 | 643.93 | 655.93 | 666.81 | 771.04 | 744.62 | 721.49 | 704.85 | 802.67 | 741.69 | 708.11 | 541.27 | 473.33 | 491.70 | 435.65 | 434.71 | 441.58 | 458.73 | 484.14 | 532.57 | 543.16 | 587.67 | 668.30 | 680.72 | 628.05 | 589.25 | 568.40 | 551.11 | 563.91 | 558.78 | 512.55 | 521.32 | 511.85 | 566.93 | 550.14 | 563.58 | 437.33 | 299.36 | 286.32 | 281.32 | 273.67 | 268.25 | |
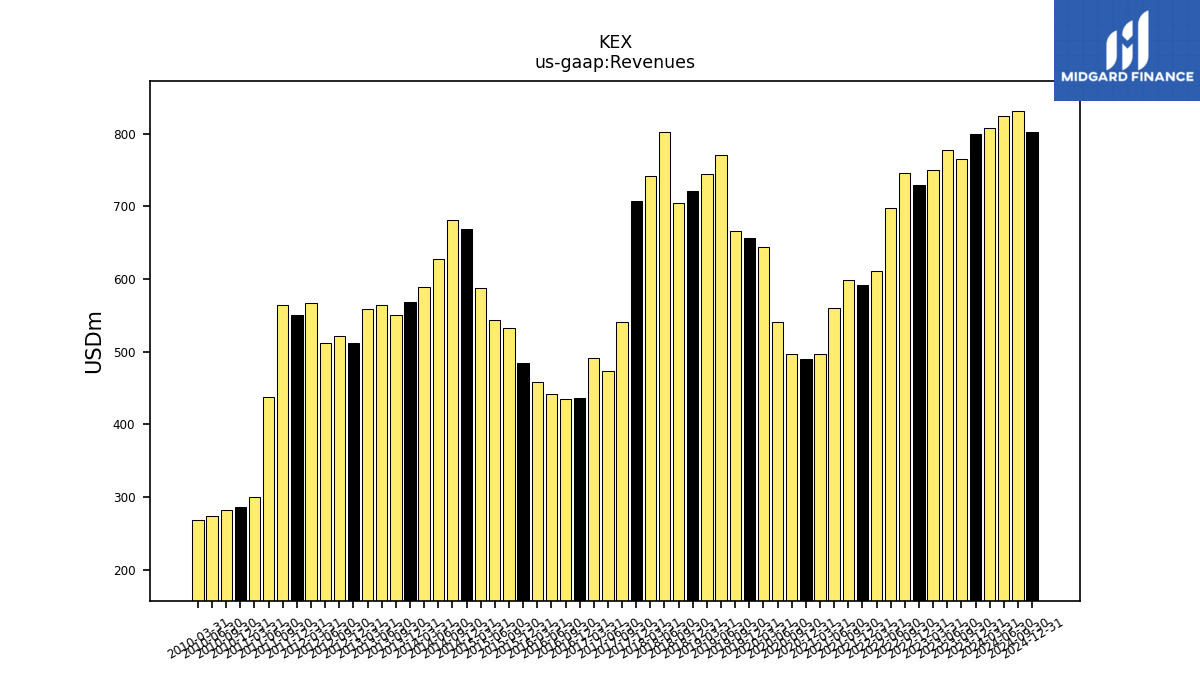
| Revenues | 799.18 | 764.77 | 777.25 | 750.44 | 730.16 | 745.84 | 697.96 | 610.78 | 591.27 | 598.92 | 559.62 | 496.85 | 489.76 | 496.57 | 541.16 | 643.93 | 655.93 | 666.81 | 771.04 | 744.62 | 721.49 | 704.85 | 802.67 | 741.69 | 708.11 | 541.27 | 473.33 | 491.70 | 435.65 | 434.71 | 441.58 | 458.73 | 484.14 | 532.57 | 543.16 | 587.67 | 668.30 | 680.72 | 628.05 | 589.25 | 568.40 | 551.11 | 563.91 | 558.78 | 512.55 | 521.32 | 511.85 | 566.93 | 550.14 | 563.58 | 437.33 | 299.36 | 286.32 | 281.32 | 273.67 | 268.25 | |
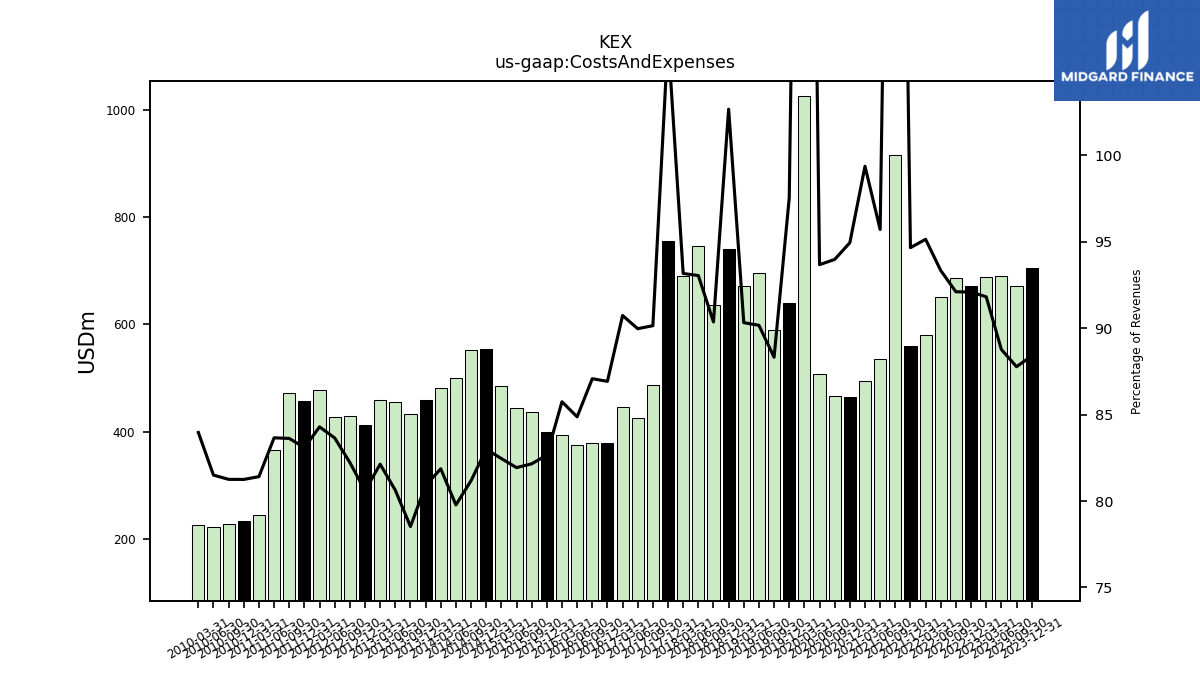
| Costs And Expenses | 706.36 | 671.25 | 689.95 | 688.99 | 672.42 | 686.94 | 651.43 | 581.09 | 559.66 | 915.85 | 535.60 | 493.69 | 464.98 | 466.66 | 506.91 | 1025.69 | 639.75 | 588.91 | 695.20 | 672.51 | 740.73 | 636.89 | 746.82 | 690.97 | 755.99 | 487.91 | 425.85 | 446.13 | 378.68 | 378.52 | 374.77 | 393.33 | 400.18 | 437.51 | 445.02 | 484.58 | 554.65 | 552.60 | 501.03 | 482.39 | 459.81 | 432.77 | 454.66 | 458.94 | 413.10 | 428.69 | 428.15 | 477.88 | 457.12 | 471.27 | 365.85 | 243.72 | 232.63 | 228.58 | 223.04 | 225.24 | |
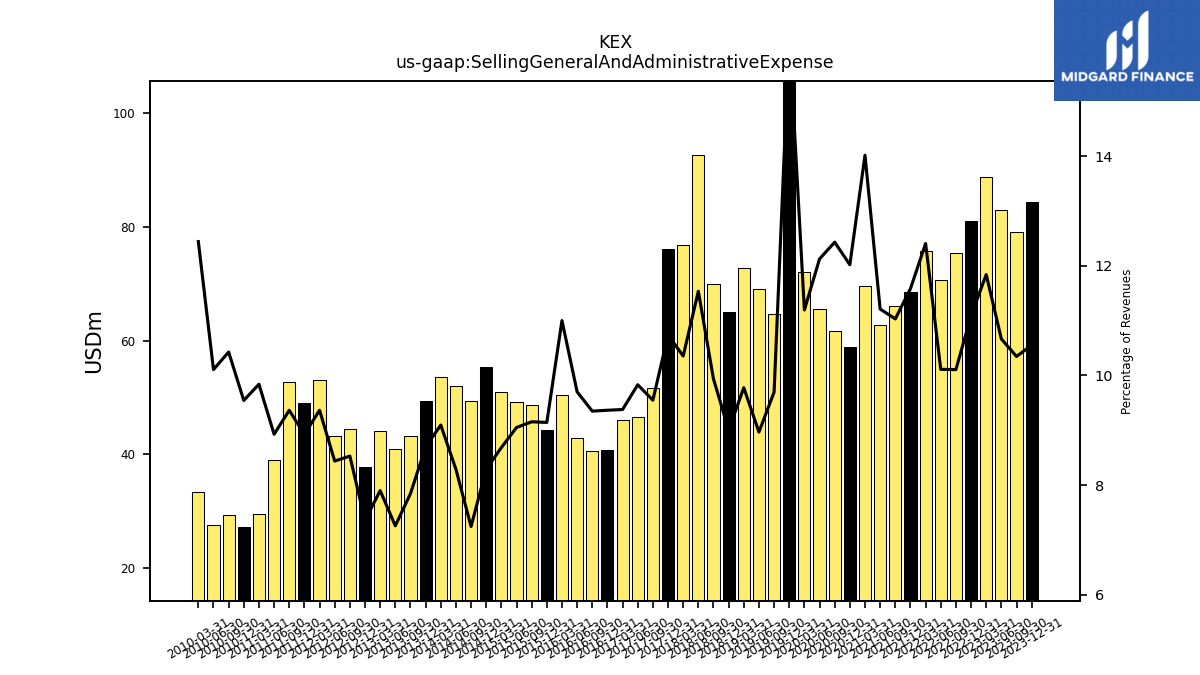
| Selling General And Administrative Expense | 84.34 | 79.12 | 82.90 | 88.85 | 80.97 | 75.38 | 70.58 | 75.77 | 68.48 | 66.06 | 62.74 | 69.63 | 58.86 | 61.72 | 65.61 | 72.08 | 106.31 | 64.66 | 69.15 | 72.80 | 64.98 | 70.03 | 92.59 | 76.80 | 76.03 | 51.69 | 46.53 | 46.12 | 40.80 | 40.65 | 42.84 | 50.46 | 44.27 | 48.76 | 49.16 | 51.04 | 55.42 | 49.33 | 52.06 | 53.60 | 49.43 | 43.24 | 40.94 | 44.16 | 37.71 | 44.47 | 43.20 | 53.10 | 49.10 | 52.78 | 39.05 | 29.46 | 27.33 | 29.33 | 27.66 | 33.37 | |
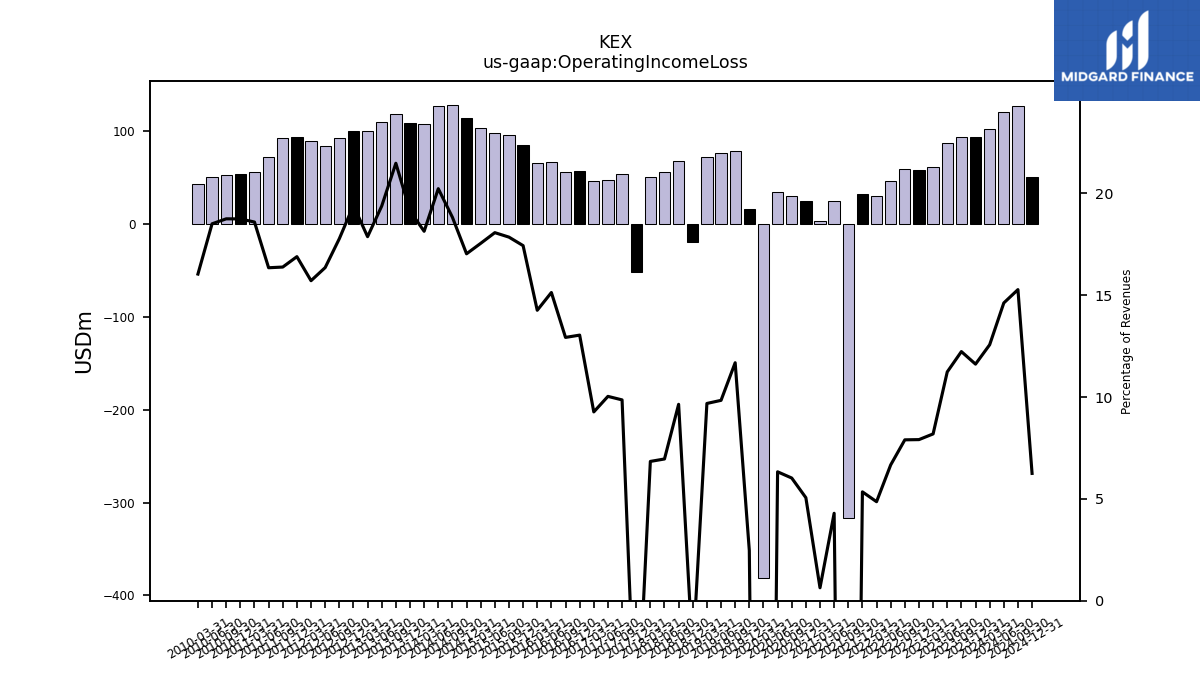
| Operating Income Loss | 92.82 | 93.52 | 87.30 | 61.45 | 57.75 | 58.91 | 46.54 | 29.69 | 31.60 | -316.93 | 24.03 | 3.16 | 24.77 | 29.91 | 34.25 | -381.76 | 16.18 | 77.90 | 75.84 | 72.11 | -19.24 | 67.96 | 55.85 | 50.72 | -52.17 | 53.36 | 47.48 | 45.57 | 56.80 | 56.19 | 66.81 | 65.40 | 84.39 | 95.05 | 98.13 | 103.09 | 113.81 | 128.13 | 127.03 | 106.85 | 108.74 | 118.34 | 109.25 | 99.85 | 99.44 | 92.64 | 83.70 | 89.06 | 92.91 | 92.31 | 71.48 | 55.64 | 53.66 | 52.73 | 50.63 | 43.01 | |
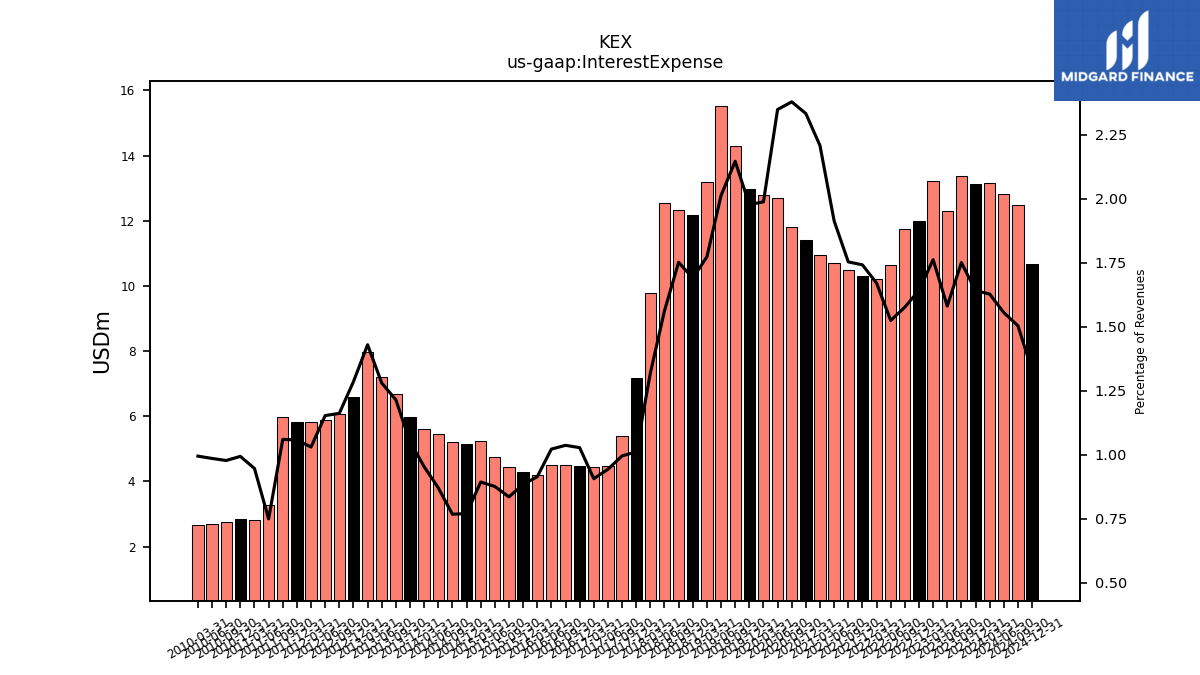
| Interest Expense | 13.12 | 13.39 | 12.29 | 13.22 | 11.99 | 11.76 | 10.64 | 10.20 | 10.30 | 10.50 | 10.71 | 10.97 | 11.42 | 11.81 | 12.71 | 12.80 | 12.97 | 14.31 | 15.52 | 13.20 | 12.19 | 12.35 | 12.54 | 9.78 | 7.16 | 5.39 | 4.46 | 4.46 | 4.48 | 4.51 | 4.51 | 4.19 | 4.28 | 4.45 | 4.76 | 5.25 | 5.15 | 5.22 | 5.47 | 5.62 | 5.97 | 6.69 | 7.22 | 7.99 | 6.59 | 6.06 | 5.90 | 5.84 | 5.82 | 5.97 | 3.28 | 2.83 | 2.85 | 2.75 | 2.70 | 2.67 | |
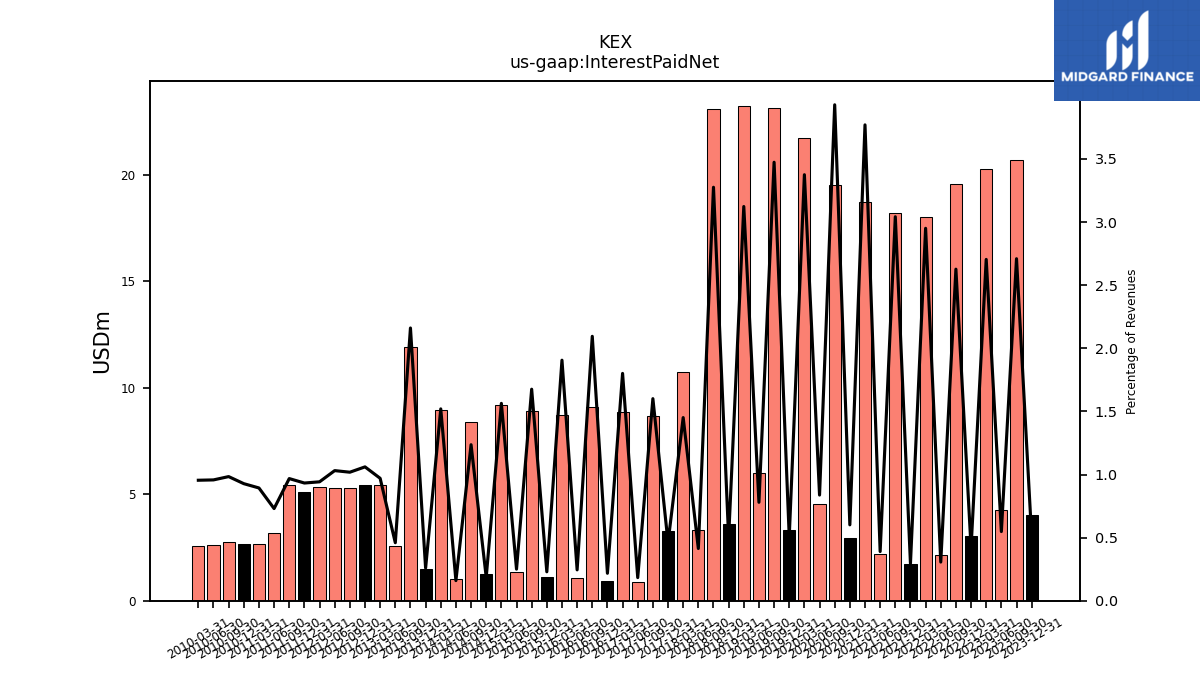
| Interest Paid Net | 4.04 | 20.72 | 4.26 | 20.29 | 3.06 | 19.59 | 2.14 | 18.02 | 1.74 | 18.22 | 2.18 | 18.73 | 2.94 | 19.51 | 4.53 | 21.73 | 3.33 | 23.16 | 6.01 | 23.26 | 3.60 | 23.09 | 3.32 | 10.76 | 3.27 | 8.67 | 0.87 | 8.86 | 0.95 | 9.11 | 1.08 | 8.74 | 1.11 | 8.93 | 1.36 | 9.19 | 1.25 | 8.41 | 1.00 | 8.96 | 1.47 | 11.91 | 2.59 | 5.42 | 5.44 | 5.31 | 5.28 | 5.34 | 5.13 | 5.46 | 3.19 | 2.67 | 2.66 | 2.77 | 2.62 | 2.56 | |
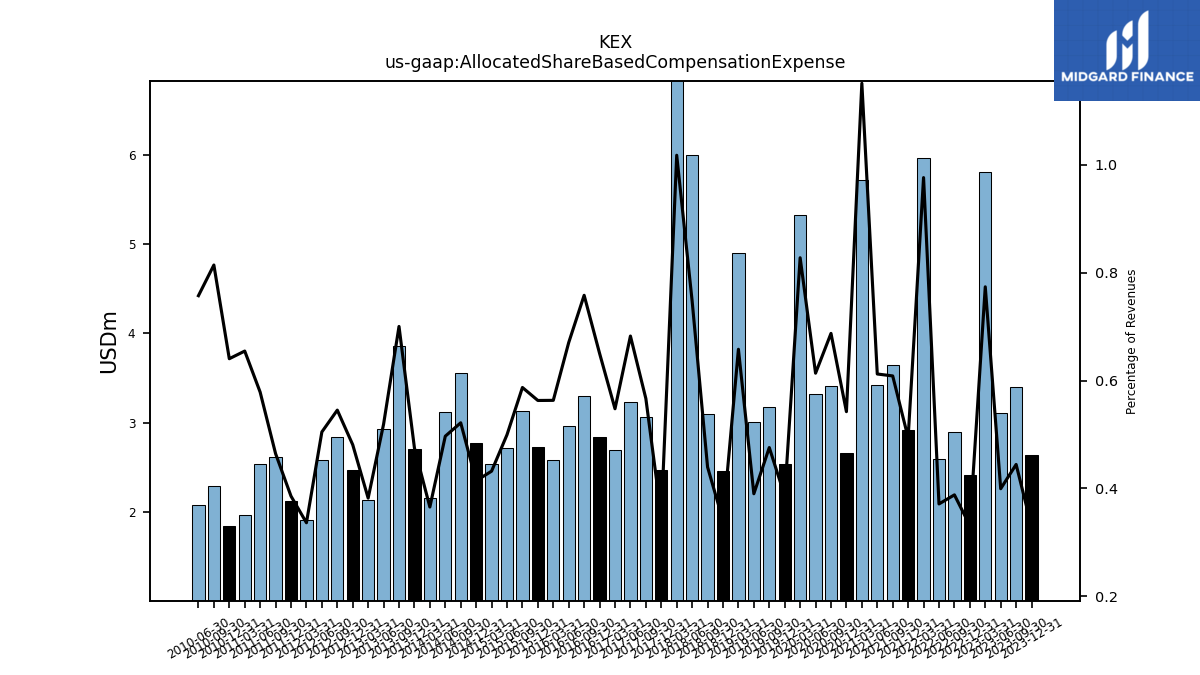
| Allocated Share Based Compensation Expense | 2.63 | 3.40 | 3.10 | 5.81 | 2.42 | 2.89 | 2.59 | 5.96 | 2.92 | 3.65 | 3.43 | 5.72 | 2.66 | 3.41 | 3.32 | 5.33 | 2.53 | 3.17 | 3.01 | 4.90 | 2.46 | 3.10 | 6.00 | 7.55 | 2.47 | 3.07 | 3.23 | 2.69 | 2.83 | 3.30 | 2.96 | 2.58 | 2.73 | 3.13 | 2.71 | 2.54 | 2.77 | 3.55 | 3.12 | 2.15 | 2.70 | 3.86 | 2.93 | 2.13 | 2.46 | 2.84 | 2.58 | 1.91 | 2.12 | 2.62 | 2.53 | 1.96 | 1.83 | 2.29 | 2.07 | NA | |
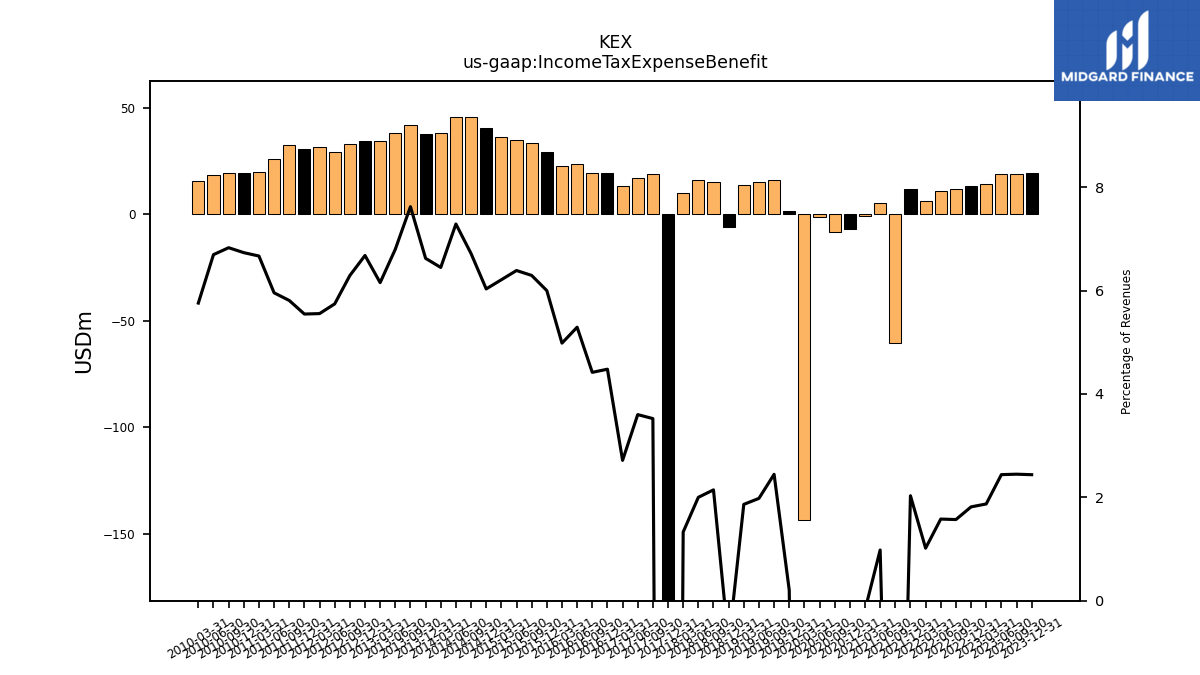
| Income Tax Expense Benefit | 19.49 | 18.72 | 18.96 | 14.05 | 13.26 | 11.71 | 11.03 | 6.21 | 12.01 | -60.44 | 5.49 | -0.89 | -7.10 | -8.42 | -1.43 | -143.65 | 1.35 | 16.30 | 15.27 | 13.88 | -5.96 | 15.12 | 16.06 | 9.87 | -290.36 | 19.07 | 17.04 | 13.35 | 19.51 | 19.21 | 23.36 | 22.86 | 29.04 | 33.51 | 34.70 | 36.49 | 40.31 | 45.72 | 45.77 | 37.99 | 37.65 | 42.01 | 38.34 | 34.38 | 34.23 | 32.79 | 29.39 | 31.49 | 30.51 | 32.73 | 26.05 | 19.96 | 19.28 | 19.21 | 18.32 | 15.45 | |
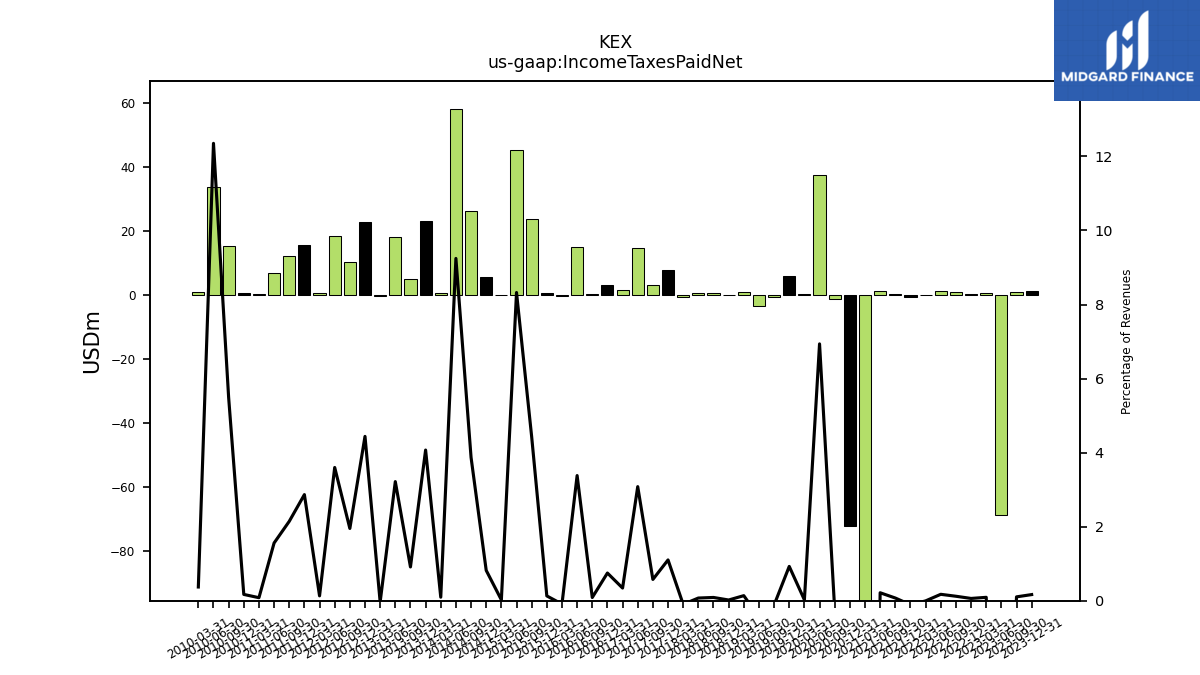
| Income Taxes Paid Net | 1.33 | 0.80 | -68.61 | 0.69 | 0.46 | 0.91 | 1.21 | -0.02 | -0.64 | 0.44 | 1.21 | -117.66 | -72.07 | -1.21 | 37.54 | 0.16 | 6.08 | -0.76 | -3.42 | 1.02 | 0.14 | 0.63 | 0.59 | -0.72 | 7.81 | 3.11 | 14.59 | 1.69 | 3.26 | 0.38 | 14.93 | -0.41 | 0.63 | 23.59 | 45.22 | 0.14 | 5.48 | 26.35 | 58.07 | 0.56 | 23.14 | 5.03 | 18.15 | -0.18 | 22.75 | 10.18 | 18.43 | 0.75 | 15.77 | 12.09 | 6.82 | 0.25 | 0.49 | 15.45 | 33.81 | 1.00 | |
| Profit Loss | 61.96 | 63.00 | 57.32 | 40.62 | 37.33 | 39.24 | 28.61 | 17.59 | 11.15 | -265.15 | 10.35 | -3.12 | 22.41 | 27.69 | 25.26 | -248.19 | 2.97 | 48.15 | 47.44 | 44.46 | -24.33 | 41.95 | 28.79 | 32.67 | 231.50 | 28.79 | 25.97 | 27.64 | 32.86 | 32.35 | 39.11 | 38.48 | 51.07 | 57.11 | 58.38 | 61.41 | 68.47 | 77.21 | 75.91 | 63.01 | 65.26 | 69.70 | 63.79 | 57.55 | 58.57 | 53.73 | 48.44 | 51.88 | 56.77 | 53.59 | 42.23 | 32.90 | 31.92 | 30.91 | 29.64 | 24.91 | |
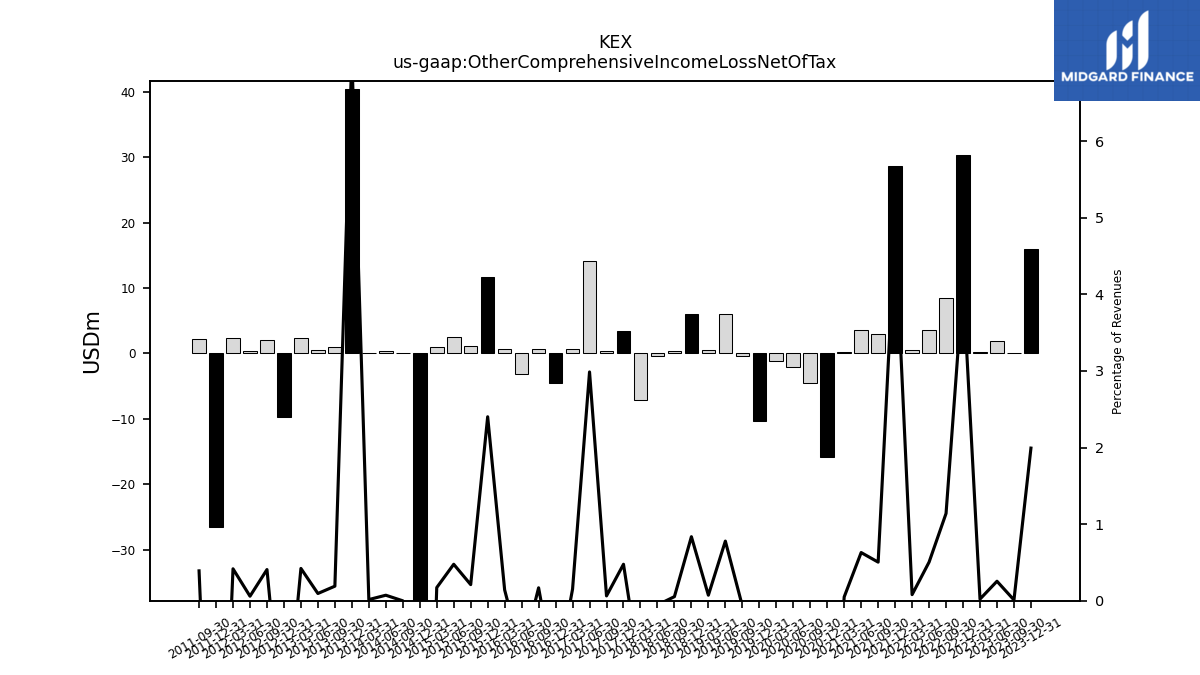
| Other Comprehensive Income Loss Net Of Tax | 15.93 | 0.08 | 1.98 | 0.16 | 30.31 | 8.50 | 3.52 | 0.49 | 28.70 | 3.02 | 3.52 | 0.25 | -15.82 | -4.52 | -2.13 | -1.19 | -10.39 | -0.45 | 6.00 | 0.54 | 6.03 | 0.38 | -0.44 | -7.08 | 3.37 | 0.34 | 14.14 | 0.75 | -4.56 | 0.73 | -3.15 | 0.65 | 11.63 | 1.12 | 2.59 | 1.01 | -44.78 | -0.01 | 0.45 | 0.09 | 40.40 | 1.05 | 0.53 | 2.36 | -9.74 | 2.12 | 0.30 | 2.36 | -26.46 | 2.20 | NA | NA | NA | NA | NA | NA | |
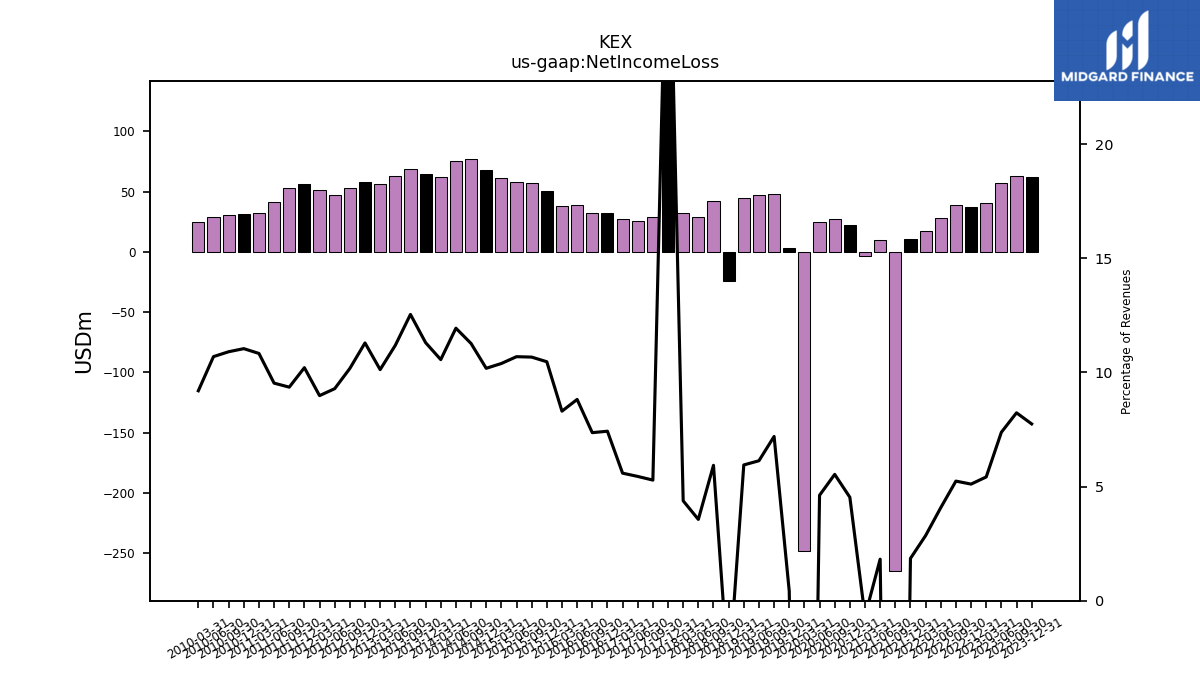
| Net Income Loss | 61.91 | 62.96 | 57.37 | 40.70 | 37.31 | 39.09 | 28.46 | 17.43 | 10.96 | -264.73 | 10.19 | -3.38 | 22.20 | 27.49 | 25.00 | -248.47 | 2.78 | 47.99 | 47.29 | 44.30 | -24.44 | 41.82 | 28.60 | 32.47 | 231.32 | 28.61 | 25.78 | 27.48 | 32.35 | 32.01 | 38.94 | 38.10 | 50.69 | 56.84 | 58.08 | 61.08 | 68.05 | 76.72 | 74.99 | 62.25 | 64.27 | 69.12 | 63.09 | 56.58 | 57.89 | 53.05 | 47.55 | 50.94 | 56.17 | 52.73 | 41.69 | 32.43 | 31.62 | 30.69 | 29.27 | 24.67 | |
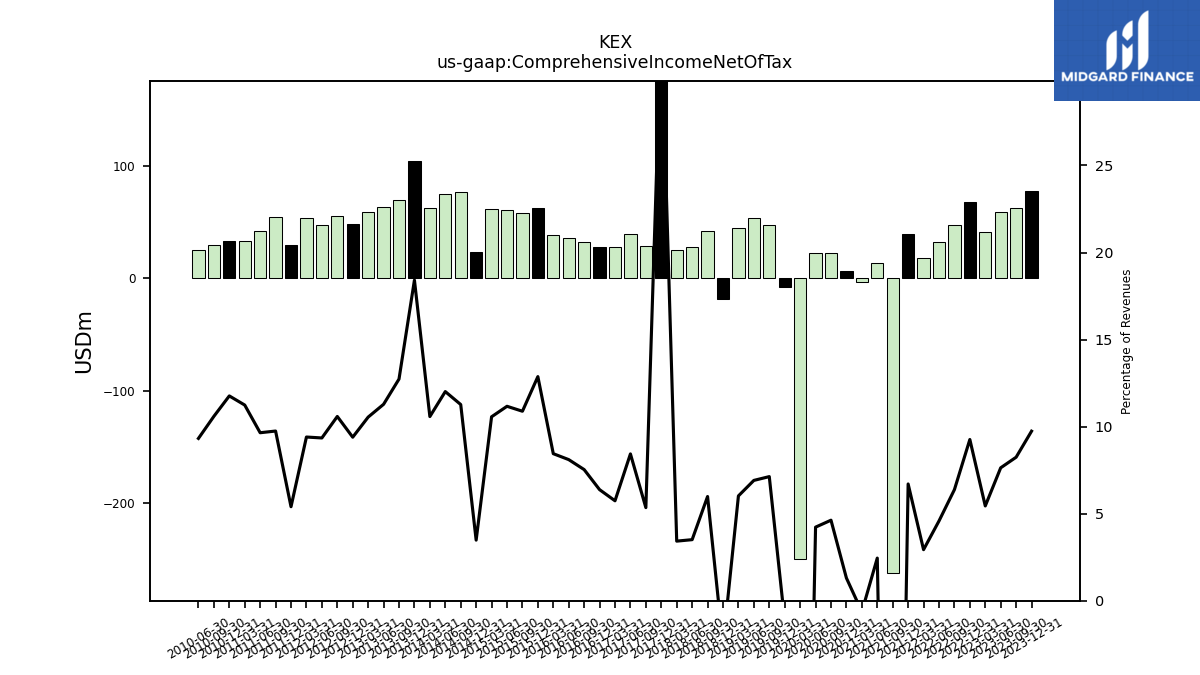
| Comprehensive Income Net Of Tax | 77.83 | 63.05 | 59.35 | 40.86 | 67.62 | 47.59 | 31.98 | 17.92 | 39.66 | -261.71 | 13.71 | -3.13 | 6.39 | 22.97 | 22.88 | -249.66 | -7.61 | 47.54 | 53.29 | 44.84 | -18.40 | 42.19 | 28.16 | 25.40 | 234.69 | 28.95 | 39.92 | 28.23 | 27.80 | 32.74 | 35.79 | 38.75 | 62.32 | 57.97 | 60.66 | 62.09 | 23.27 | 76.71 | 75.44 | 62.34 | 104.66 | 70.17 | 63.63 | 58.93 | 48.15 | 55.18 | 47.85 | 53.31 | 29.71 | 54.93 | 42.20 | 33.65 | 33.68 | 29.79 | 25.51 | NA | |
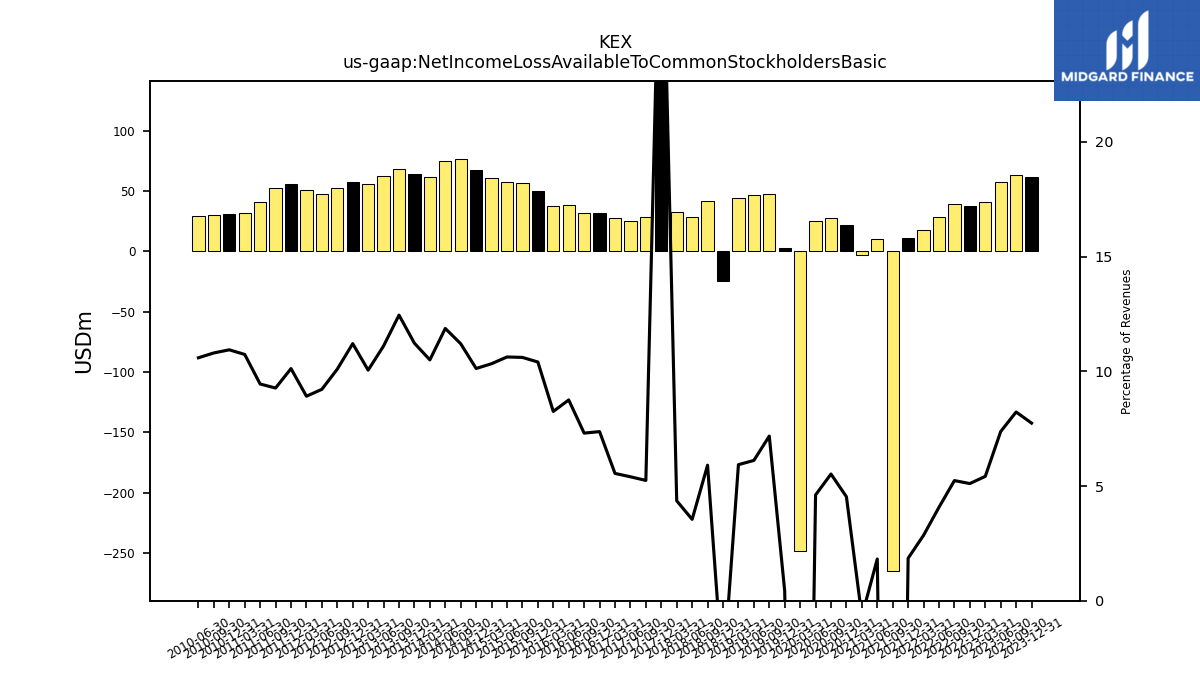
| Net Income Loss Available To Common Stockholders Basic | 61.89 | 62.93 | 57.34 | 40.70 | 37.30 | 39.07 | 28.45 | 17.43 | 10.96 | -264.73 | 10.18 | -3.38 | 22.20 | 27.43 | 24.96 | -248.47 | 2.78 | 47.86 | 47.16 | 44.18 | -24.32 | 41.65 | 28.49 | 32.31 | 229.71 | 28.39 | 25.58 | 27.29 | 32.12 | 31.77 | 38.66 | 37.86 | 50.39 | 56.50 | 57.73 | 60.73 | 67.66 | 76.27 | 74.56 | 61.88 | 63.81 | 68.62 | 62.63 | 56.18 | 57.45 | 52.65 | 47.18 | 50.55 | 55.68 | 52.27 | 41.32 | 32.14 | 31.32 | 30.39 | 28.99 | NA | |
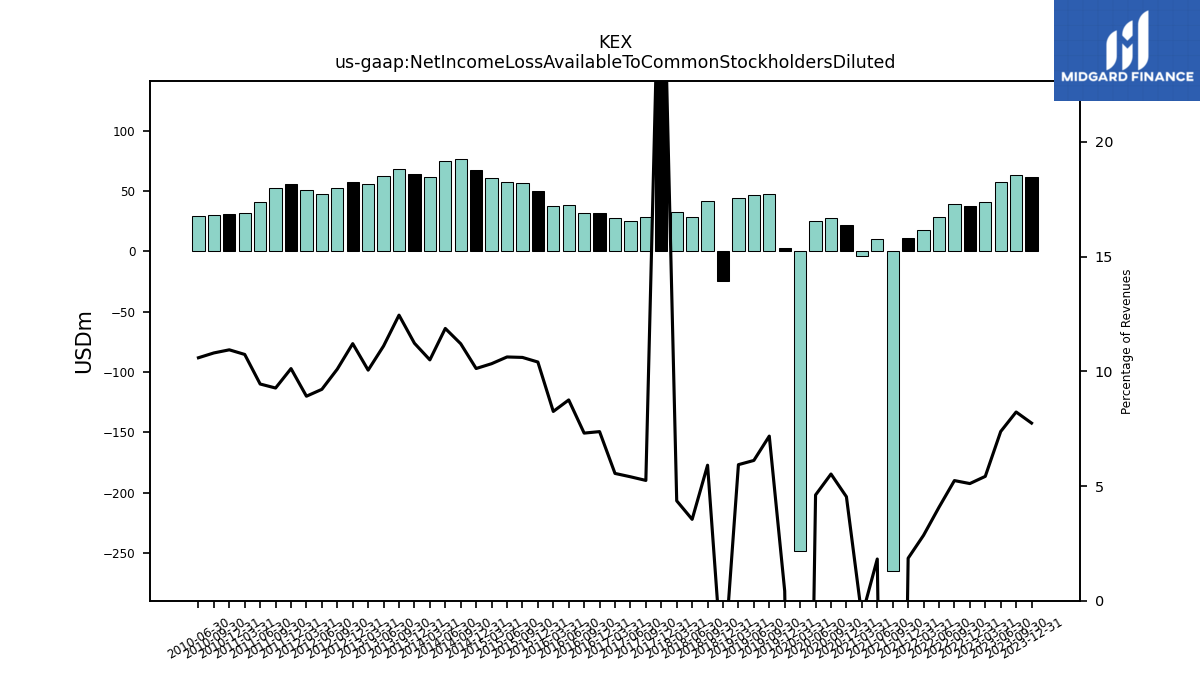
| Net Income Loss Available To Common Stockholders Diluted | 61.89 | 62.93 | 57.34 | 40.70 | 37.30 | 39.07 | 28.45 | 17.43 | 10.96 | -264.73 | 10.18 | -3.38 | 22.20 | 27.43 | 24.96 | -248.47 | 2.78 | 47.86 | 47.16 | 44.18 | -24.32 | 41.65 | 28.49 | 32.31 | 229.71 | 28.39 | 25.58 | 27.29 | 32.12 | 31.77 | 38.66 | 37.86 | 50.39 | 56.50 | 57.73 | 60.73 | 67.66 | 76.27 | 74.56 | 61.88 | 63.81 | 68.62 | 62.64 | 56.18 | 57.45 | 52.65 | 47.18 | 50.55 | 55.68 | 52.27 | 41.32 | 32.15 | 31.32 | 30.39 | 28.99 | NA |
| 2023-12-31 | 2023-09-30 | 2023-06-30 | 2023-03-31 | 2022-12-31 | 2022-09-30 | 2022-06-30 | 2022-03-31 | 2021-12-31 | 2021-09-30 | 2021-06-30 | 2021-03-31 | 2020-12-31 | 2020-09-30 | 2020-06-30 | 2020-03-31 | 2019-12-31 | 2019-09-30 | 2019-06-30 | 2019-03-31 | 2018-12-31 | 2018-09-30 | 2018-06-30 | 2018-03-31 | 2017-12-31 | 2017-09-30 | 2017-06-30 | 2017-03-31 | 2016-12-31 | 2016-09-30 | 2016-06-30 | 2016-03-31 | 2015-12-31 | 2015-09-30 | 2015-06-30 | 2015-03-31 | 2014-12-31 | 2014-09-30 | 2014-06-30 | 2014-03-31 | 2013-12-31 | 2013-09-30 | 2013-06-30 | 2013-03-31 | 2012-12-31 | 2012-09-30 | 2012-06-30 | 2012-03-31 | 2011-12-31 | 2011-09-30 | 2011-06-30 | 2011-03-31 | 2010-12-31 | 2010-09-30 | 2010-06-30 | 2010-03-31 | ||
|---|---|---|---|---|---|---|---|---|---|---|---|---|---|---|---|---|---|---|---|---|---|---|---|---|---|---|---|---|---|---|---|---|---|---|---|---|---|---|---|---|---|---|---|---|---|---|---|---|---|---|---|---|---|---|---|---|---|
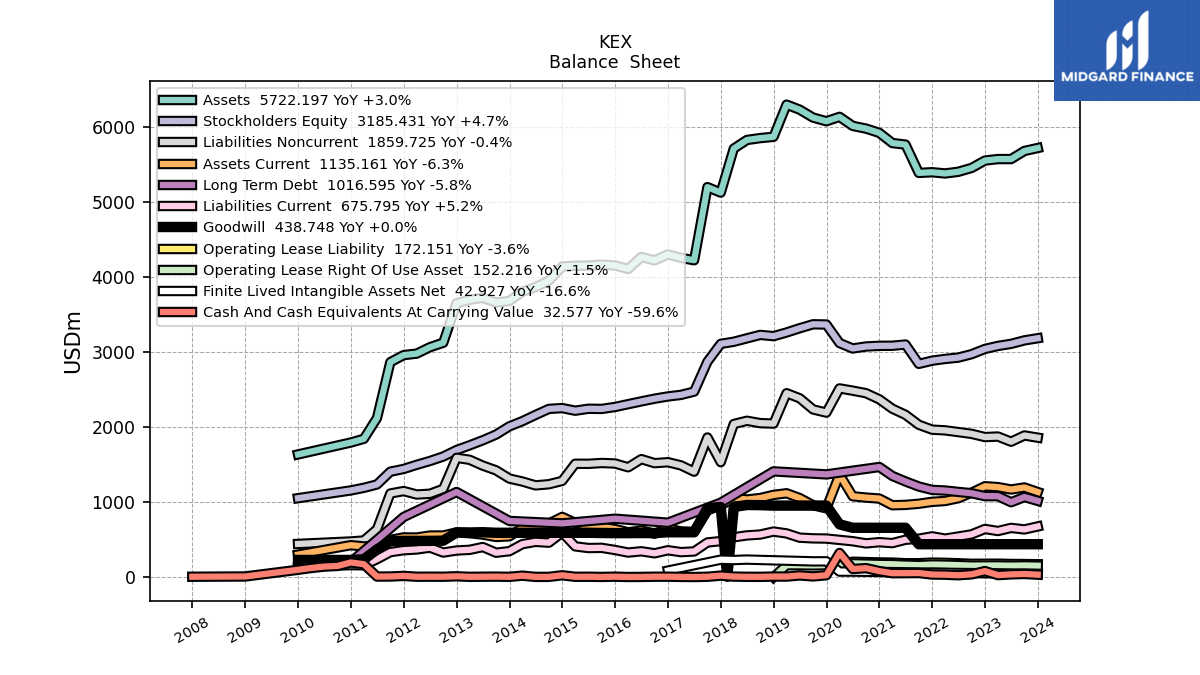
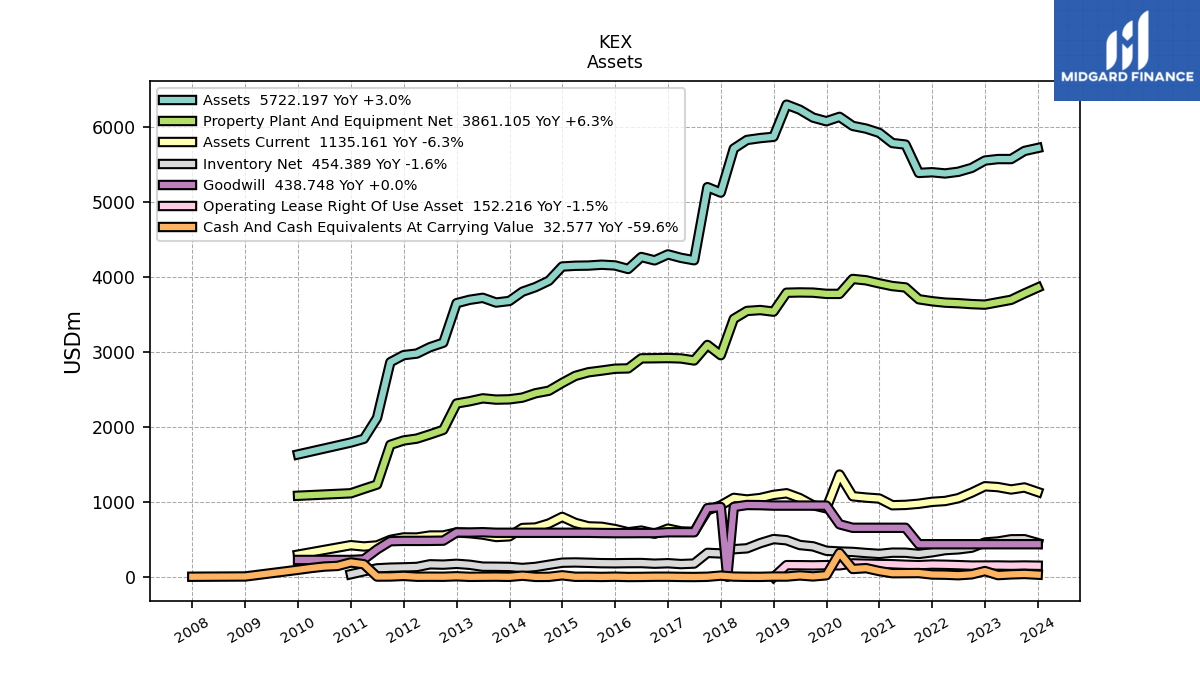
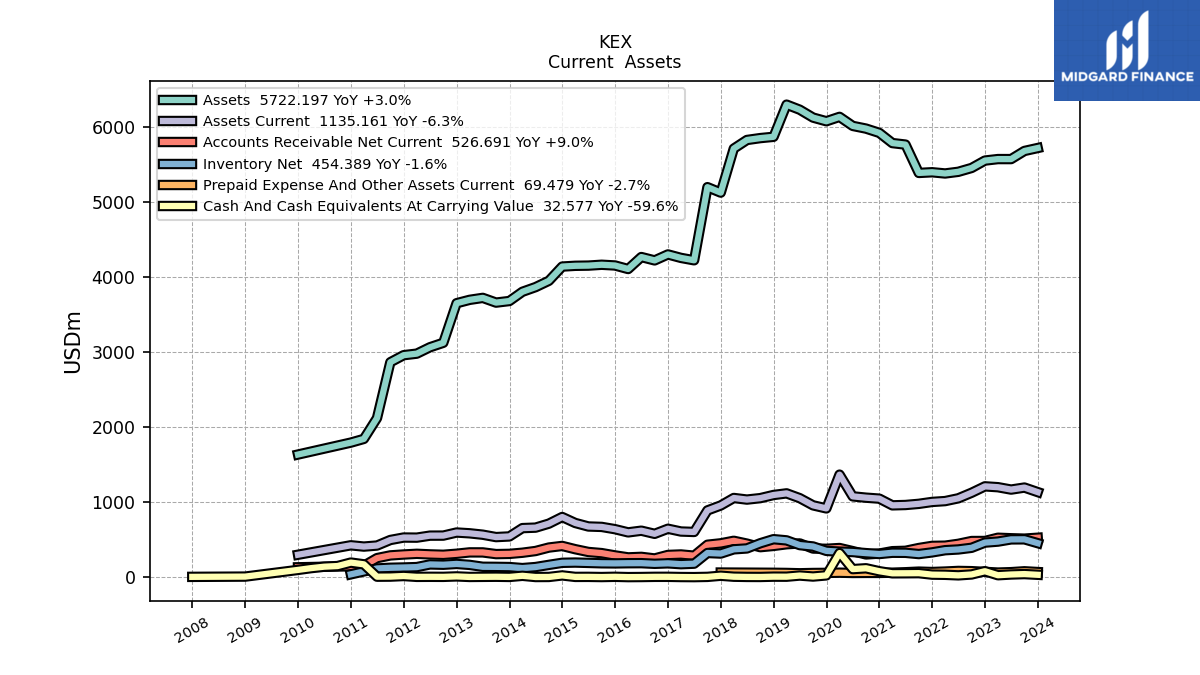
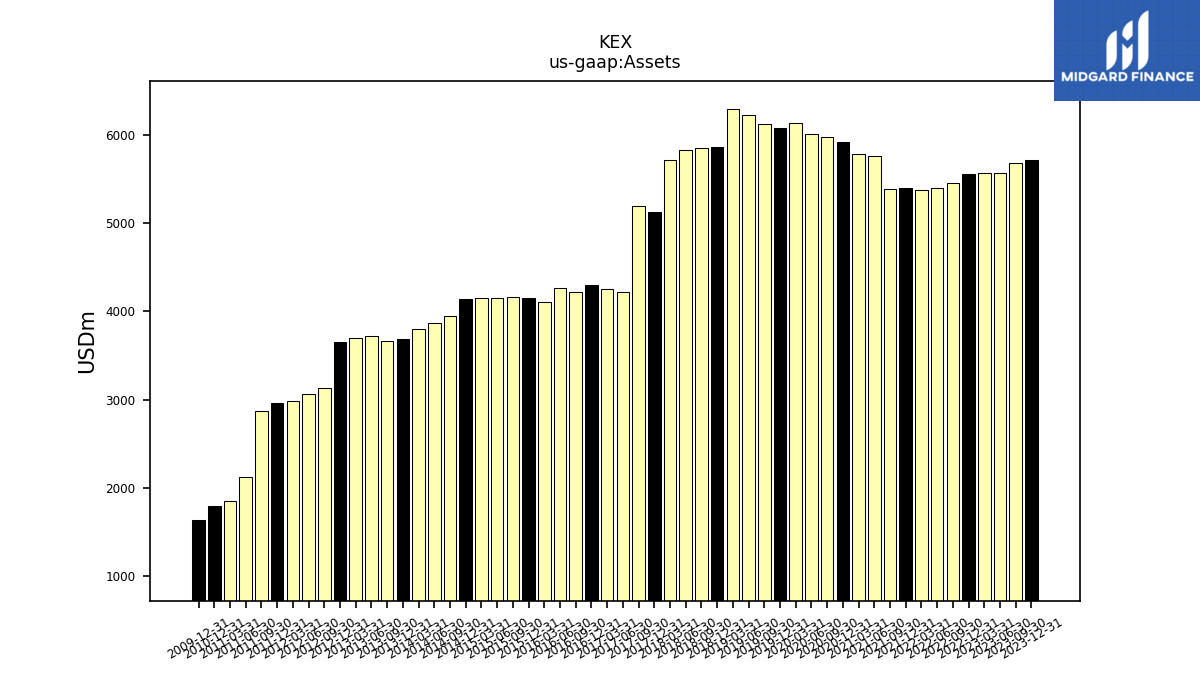
| Assets | 5722.20 | 5682.88 | 5574.58 | 5574.75 | 5554.92 | 5456.30 | 5405.16 | 5382.79 | 5399.06 | 5389.88 | 5767.81 | 5788.09 | 5924.17 | 5981.12 | 6017.01 | 6137.58 | 6079.10 | 6127.89 | 6232.89 | 6300.69 | 5871.59 | 5854.33 | 5829.28 | 5714.50 | 5127.43 | 5200.41 | 4225.36 | 4257.29 | 4303.50 | 4223.83 | 4268.81 | 4108.99 | 4156.27 | 4165.94 | 4154.50 | 4151.89 | 4141.91 | 3952.13 | 3867.88 | 3805.70 | 3682.52 | 3661.31 | 3724.31 | 3698.09 | 3653.13 | 3125.61 | 3066.28 | 2980.87 | 2960.41 | 2866.51 | 2121.72 | 1844.09 | 1794.94 | NA | NA | NA | |
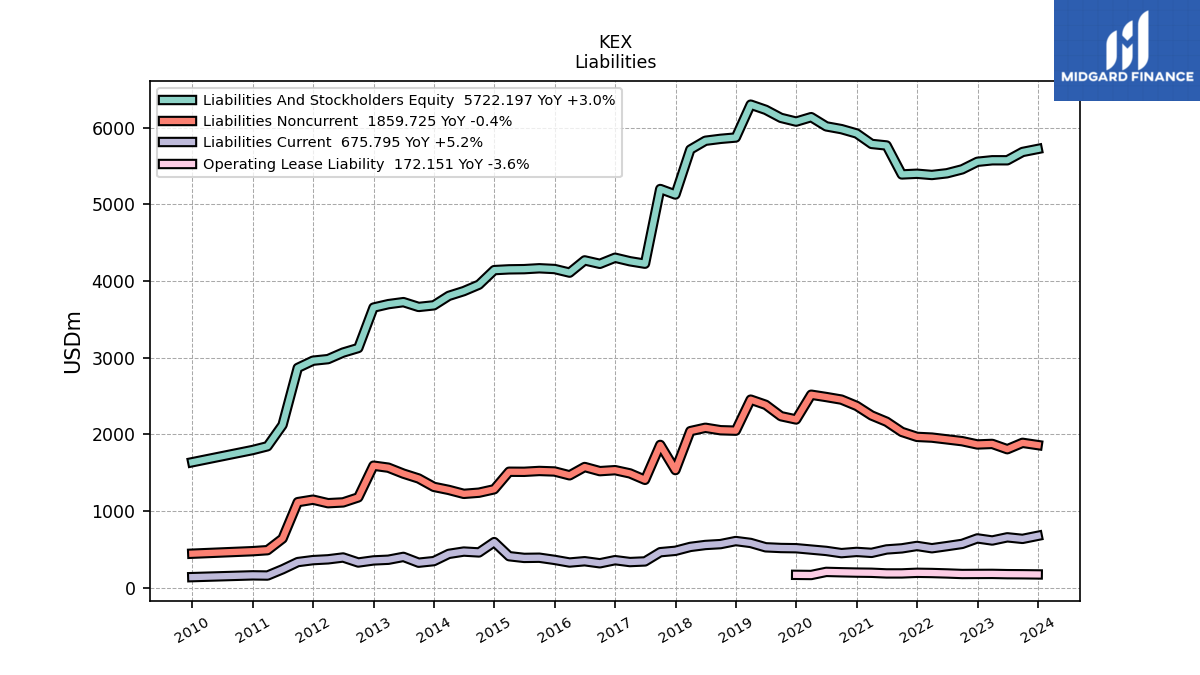
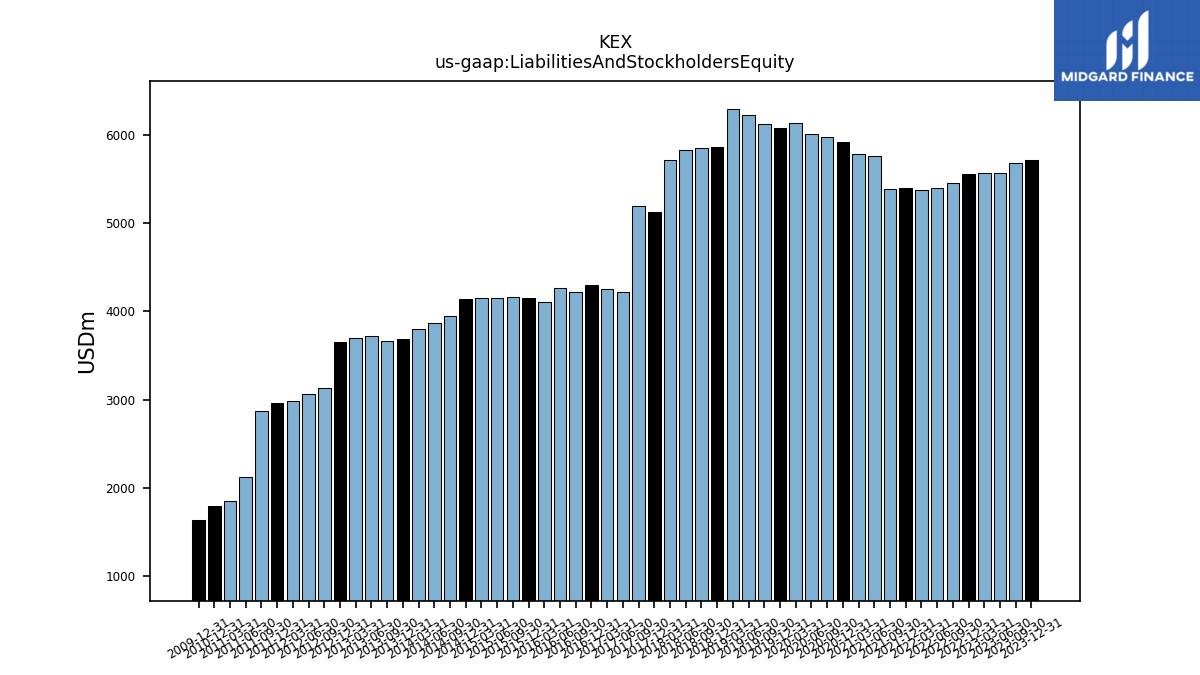
| Liabilities And Stockholders Equity | 5722.20 | 5682.88 | 5574.58 | 5574.75 | 5554.92 | 5456.30 | 5405.16 | 5382.79 | 5399.06 | 5389.88 | 5767.81 | 5788.09 | 5924.17 | 5981.12 | 6017.01 | 6137.58 | 6079.10 | 6127.89 | 6232.89 | 6300.69 | 5871.59 | 5854.33 | 5829.28 | 5714.50 | 5127.43 | 5200.41 | 4225.36 | 4257.29 | 4303.50 | 4223.83 | 4268.81 | 4108.99 | 4156.27 | 4165.94 | 4154.50 | 4151.89 | 4141.91 | 3952.13 | 3867.88 | 3805.70 | 3682.52 | 3661.31 | 3724.31 | 3698.09 | 3653.13 | 3125.61 | 3066.28 | 2980.87 | 2960.41 | 2866.51 | 2121.72 | 1844.09 | 1794.94 | NA | NA | NA | |
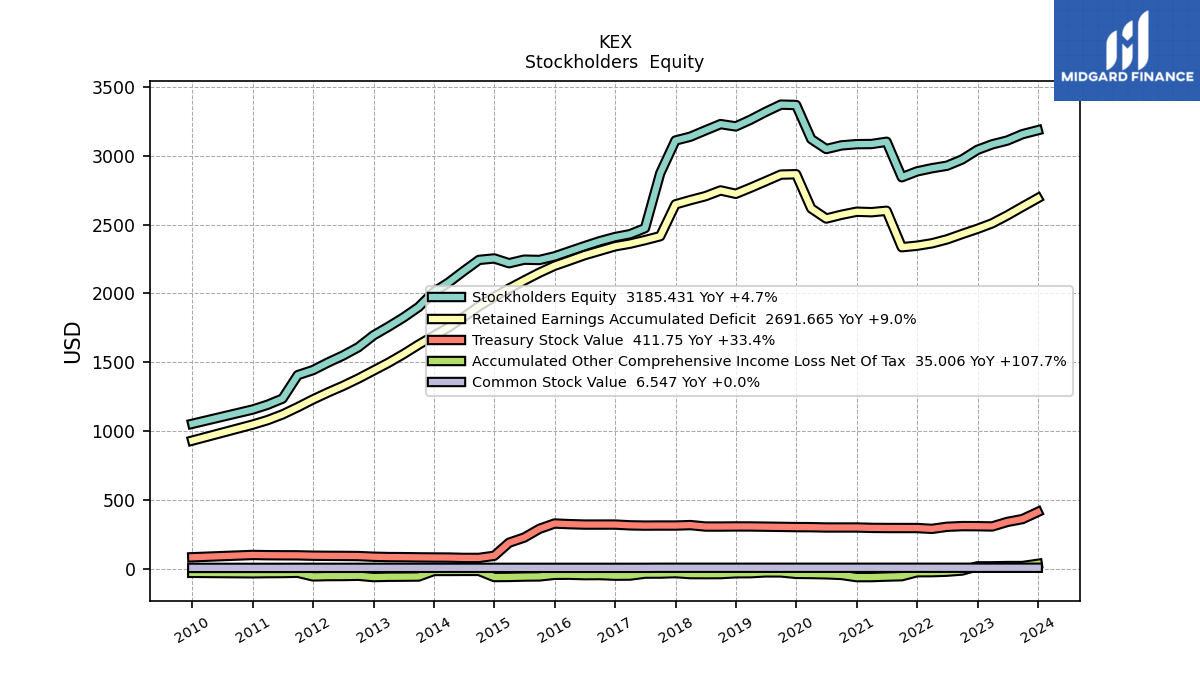
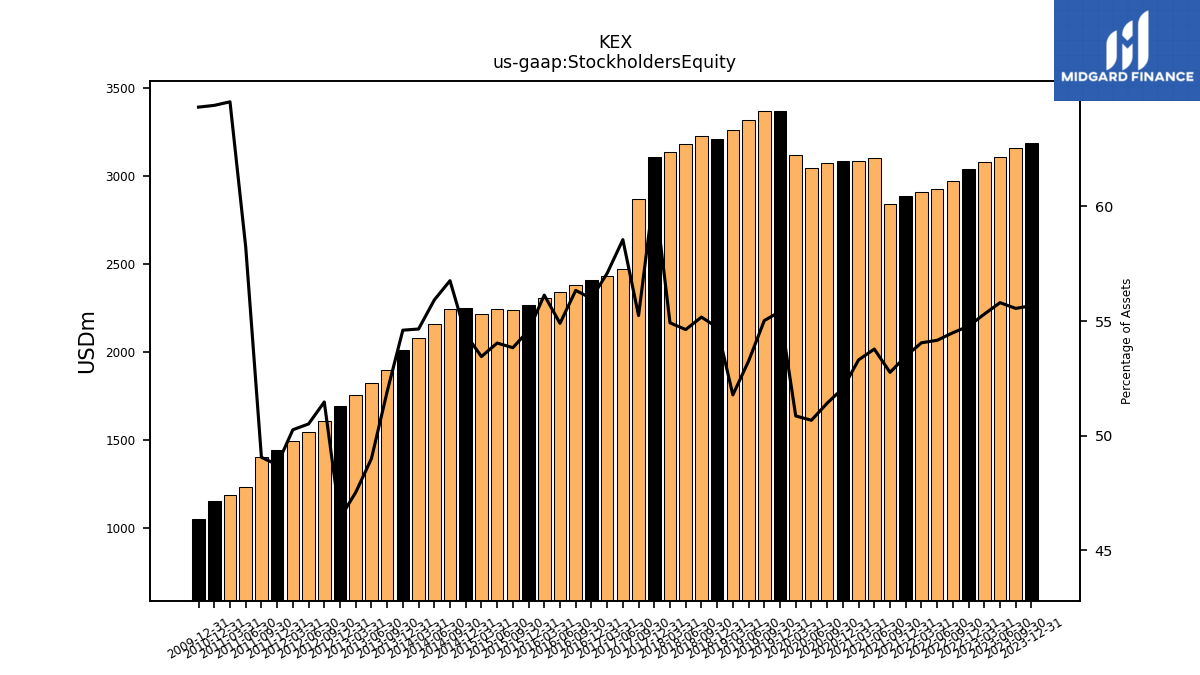
| Stockholders Equity | 3185.43 | 3156.89 | 3110.64 | 3082.93 | 3042.88 | 2973.06 | 2927.39 | 2909.45 | 2886.32 | 2843.75 | 3101.69 | 3085.27 | 3084.31 | 3075.26 | 3048.88 | 3121.48 | 3368.62 | 3371.52 | 3319.15 | 3262.34 | 3213.19 | 3229.91 | 3184.35 | 3138.49 | 3110.82 | 2872.68 | 2473.89 | 2430.17 | 2409.32 | 2379.52 | 2343.53 | 2306.40 | 2268.81 | 2242.77 | 2245.04 | 2219.12 | 2254.04 | 2243.24 | 2162.87 | 2079.85 | 2010.69 | 1900.89 | 1824.72 | 1757.47 | 1694.97 | 1608.68 | 1548.78 | 1498.07 | 1442.53 | 1406.15 | 1235.61 | 1190.62 | 1156.10 | NA | NA | NA |
| 2023-12-31 | 2023-09-30 | 2023-06-30 | 2023-03-31 | 2022-12-31 | 2022-09-30 | 2022-06-30 | 2022-03-31 | 2021-12-31 | 2021-09-30 | 2021-06-30 | 2021-03-31 | 2020-12-31 | 2020-09-30 | 2020-06-30 | 2020-03-31 | 2019-12-31 | 2019-09-30 | 2019-06-30 | 2019-03-31 | 2018-12-31 | 2018-09-30 | 2018-06-30 | 2018-03-31 | 2017-12-31 | 2017-09-30 | 2017-06-30 | 2017-03-31 | 2016-12-31 | 2016-09-30 | 2016-06-30 | 2016-03-31 | 2015-12-31 | 2015-09-30 | 2015-06-30 | 2015-03-31 | 2014-12-31 | 2014-09-30 | 2014-06-30 | 2014-03-31 | 2013-12-31 | 2013-09-30 | 2013-06-30 | 2013-03-31 | 2012-12-31 | 2012-09-30 | 2012-06-30 | 2012-03-31 | 2011-12-31 | 2011-09-30 | 2011-06-30 | 2011-03-31 | 2010-12-31 | 2010-09-30 | 2010-06-30 | 2010-03-31 | ||
|---|---|---|---|---|---|---|---|---|---|---|---|---|---|---|---|---|---|---|---|---|---|---|---|---|---|---|---|---|---|---|---|---|---|---|---|---|---|---|---|---|---|---|---|---|---|---|---|---|---|---|---|---|---|---|---|---|---|
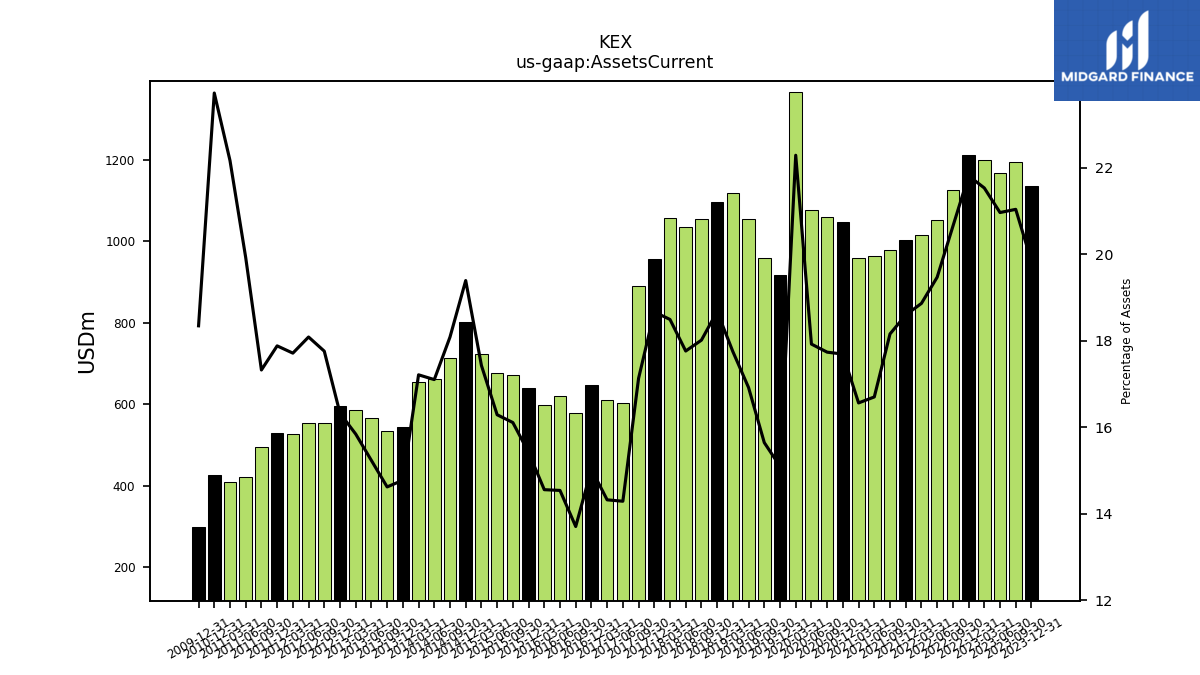
| Assets Current | 1135.16 | 1195.57 | 1168.66 | 1200.37 | 1211.76 | 1126.38 | 1052.26 | 1015.33 | 1003.87 | 978.59 | 963.14 | 958.52 | 1047.97 | 1060.72 | 1078.31 | 1368.01 | 917.58 | 958.53 | 1054.26 | 1118.25 | 1096.49 | 1054.52 | 1035.33 | 1056.65 | 957.08 | 890.76 | 603.64 | 609.59 | 646.55 | 578.75 | 620.53 | 598.01 | 640.78 | 670.98 | 676.63 | 723.56 | 803.15 | 714.71 | 661.40 | 654.98 | 544.01 | 535.18 | 567.17 | 585.79 | 596.26 | 555.03 | 554.54 | 527.97 | 529.33 | 496.55 | 422.70 | 408.78 | 425.92 | NA | NA | NA | |
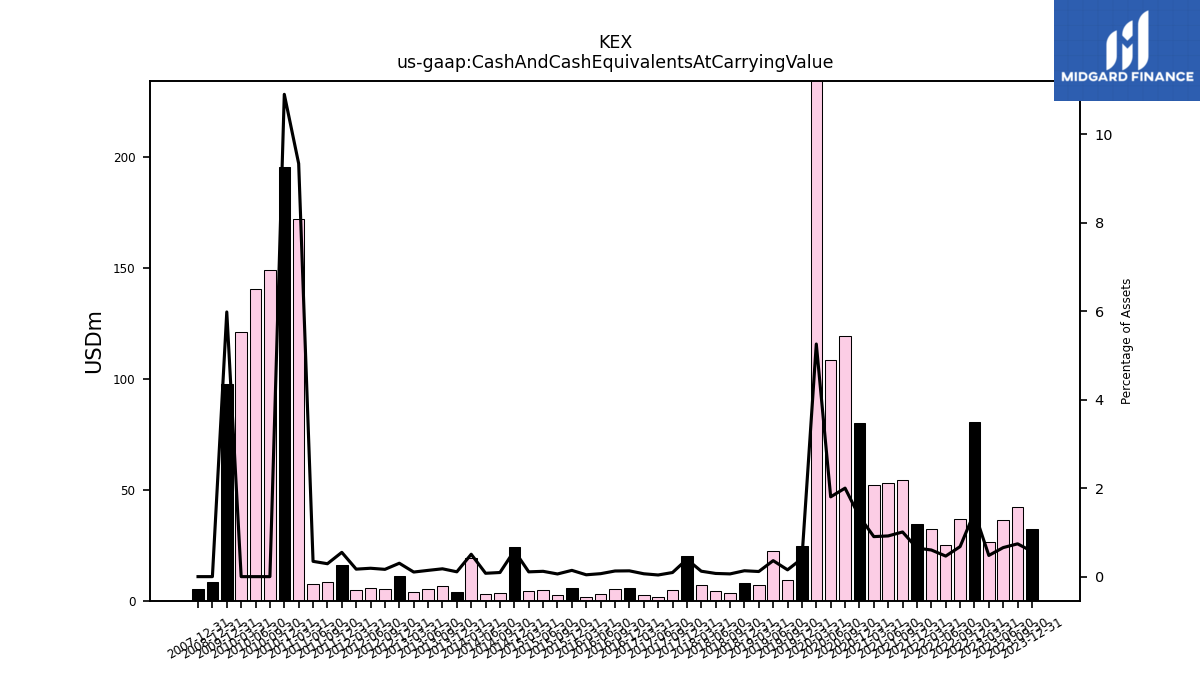
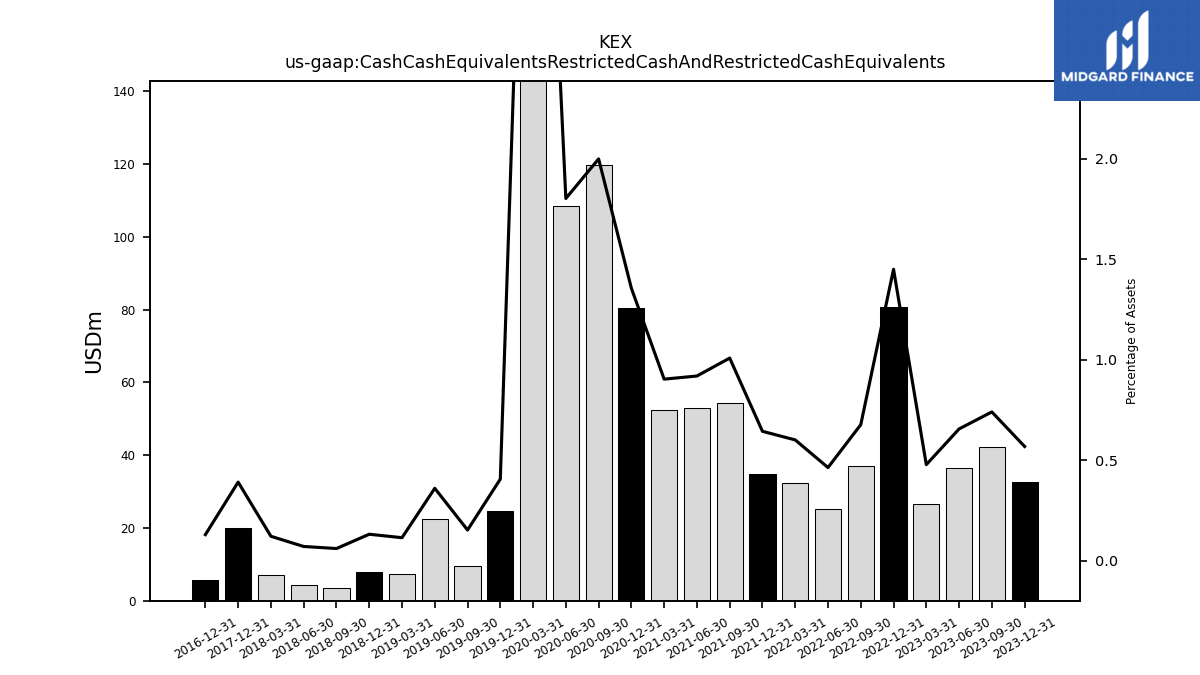
| Cash And Cash Equivalents At Carrying Value | 32.58 | 42.12 | 36.60 | 26.70 | 80.58 | 36.99 | 25.10 | 32.40 | 34.81 | 54.38 | 53.05 | 52.33 | 80.34 | 119.59 | 108.47 | 322.57 | 24.74 | 9.43 | 22.52 | 7.29 | 7.80 | 3.62 | 4.20 | 7.01 | 20.10 | 4.83 | 1.58 | 2.76 | 5.63 | 5.38 | 2.86 | 1.72 | 5.88 | 2.52 | 4.99 | 4.49 | 24.30 | 3.68 | 2.93 | 19.24 | 4.02 | 6.48 | 5.26 | 3.84 | 11.06 | 5.14 | 5.80 | 5.04 | 16.25 | 8.37 | 7.33 | 172.09 | 195.60 | 149.20 | 140.75 | 121.36 | |
| Cash Cash Equivalents Restricted Cash And Restricted Cash Equivalents | 32.58 | 42.12 | 36.60 | 26.70 | 80.58 | 36.99 | 25.10 | 32.40 | 34.81 | 54.38 | 53.05 | 52.33 | 80.34 | 119.59 | 108.47 | 322.57 | 24.74 | 9.43 | 22.52 | 7.29 | 7.80 | 3.62 | 4.20 | 7.01 | 20.10 | NA | NA | NA | 5.63 | NA | NA | NA | NA | NA | NA | NA | NA | NA | NA | NA | NA | NA | NA | NA | NA | NA | NA | NA | NA | NA | NA | NA | NA | NA | NA | NA | |
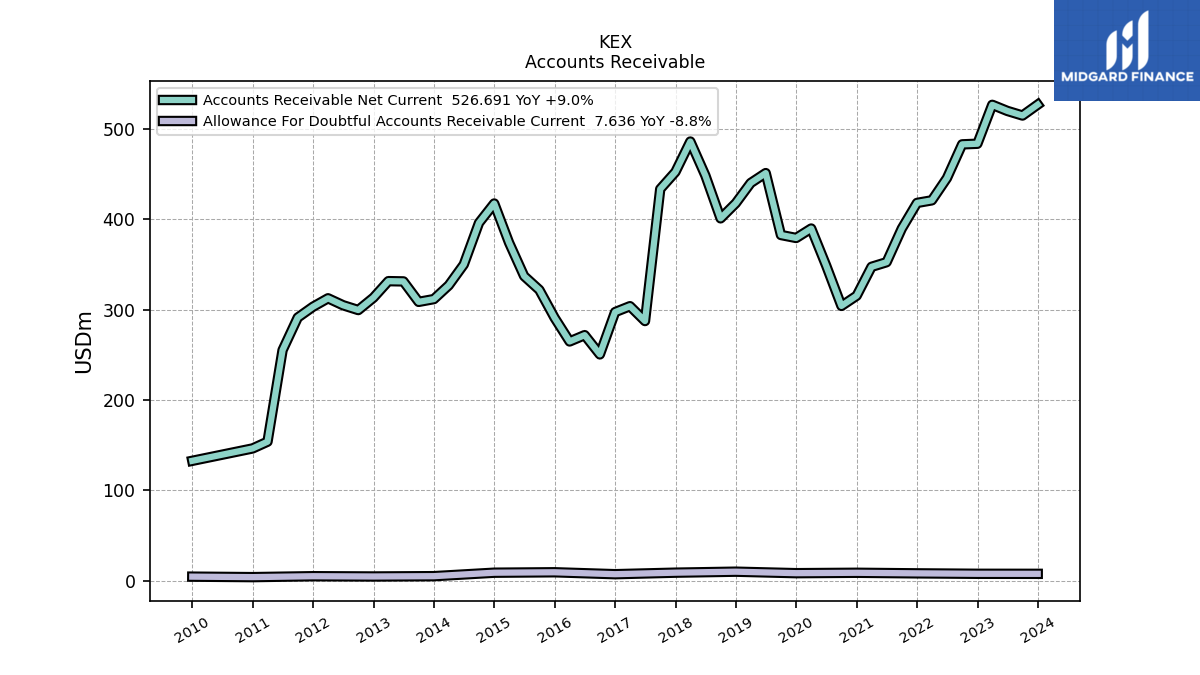
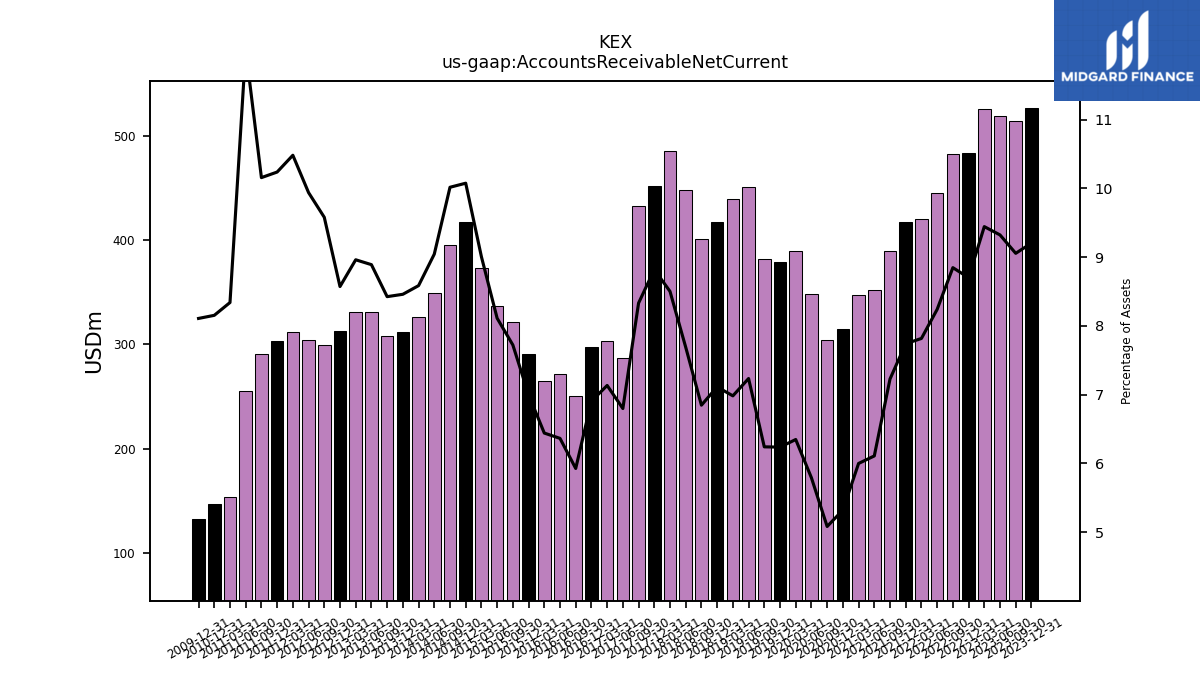
| Accounts Receivable Net Current | 526.69 | 514.63 | 519.74 | 526.49 | 483.41 | 482.74 | 445.43 | 420.82 | 417.96 | 389.58 | 352.37 | 347.27 | 315.28 | 304.02 | 348.45 | 389.62 | 379.17 | 382.46 | 450.96 | 439.98 | 417.64 | 400.87 | 448.28 | 485.87 | 452.22 | 433.30 | 287.28 | 303.72 | 297.18 | 250.36 | 271.70 | 264.70 | 290.93 | 321.73 | 337.01 | 373.92 | 417.32 | 395.87 | 349.82 | 326.76 | 311.55 | 308.50 | 331.13 | 331.42 | 313.18 | 299.44 | 304.76 | 312.46 | 303.09 | 291.15 | 255.03 | 153.81 | 146.36 | NA | NA | NA | |
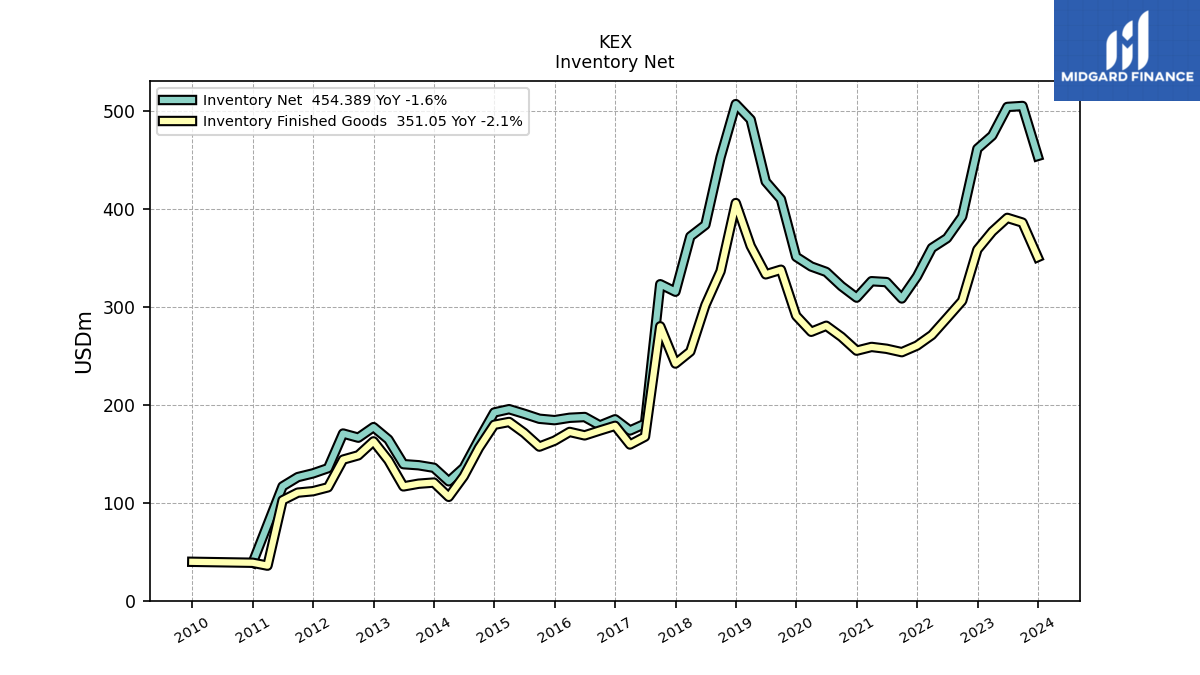
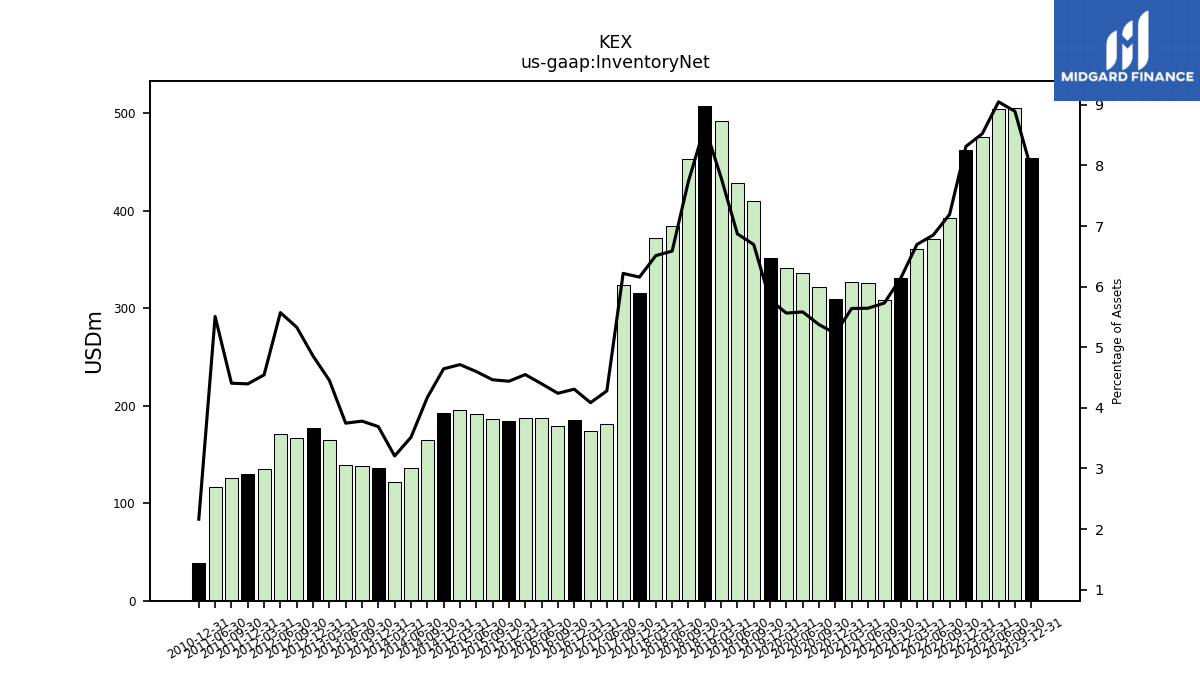
| Inventory Net | 454.39 | 505.51 | 504.51 | 475.22 | 461.85 | 392.47 | 370.38 | 360.46 | 331.35 | 308.82 | 325.55 | 326.48 | 309.68 | 321.43 | 335.96 | 341.50 | 351.40 | 410.26 | 428.26 | 491.57 | 507.44 | 453.17 | 384.01 | 372.18 | 315.73 | 323.40 | 180.84 | 173.93 | 185.40 | 179.11 | 187.72 | 186.93 | 184.51 | 185.94 | 191.06 | 195.73 | 192.35 | 164.84 | 135.93 | 122.01 | 135.89 | 138.44 | 139.55 | 164.73 | 177.40 | 166.60 | 170.85 | 135.45 | 130.13 | 126.32 | 116.87 | NA | 38.82 | NA | NA | NA | |
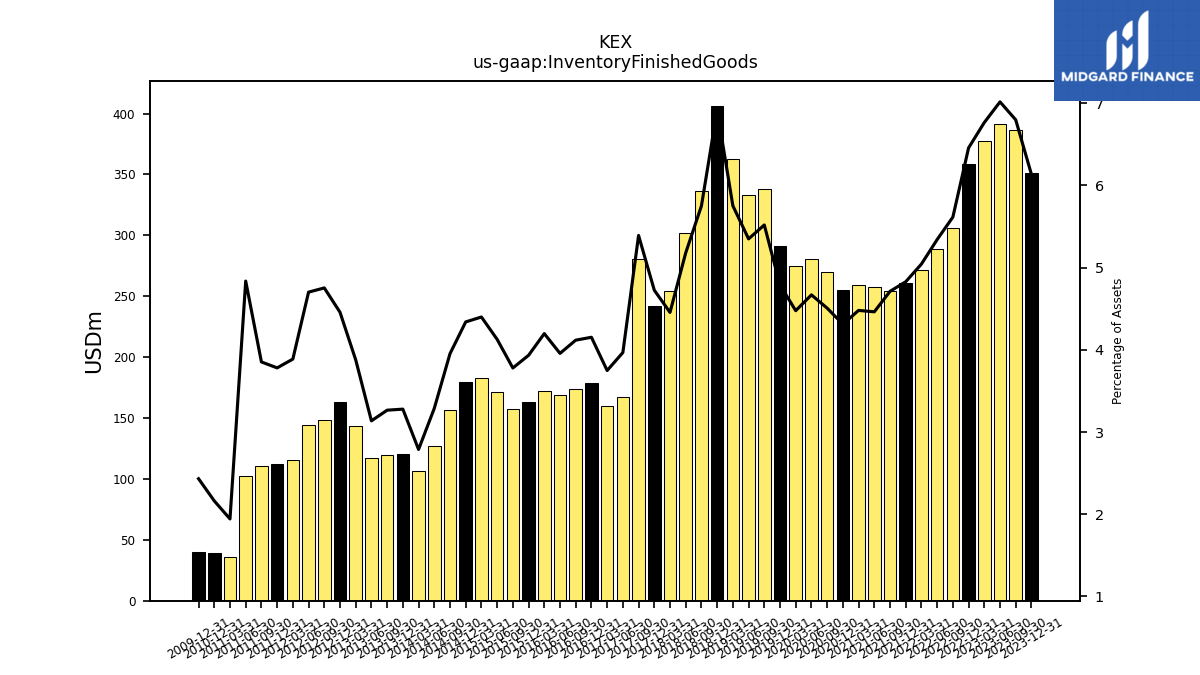
| Inventory Finished Goods | 351.05 | 386.35 | 391.19 | 377.19 | 358.70 | 306.39 | 288.76 | 271.52 | 260.71 | 253.96 | 257.43 | 259.32 | 255.49 | 269.60 | 280.95 | 274.77 | 291.21 | 338.23 | 333.47 | 362.50 | 406.36 | 336.70 | 301.98 | 254.63 | 242.33 | 280.39 | 167.64 | 159.60 | 178.74 | 173.94 | 168.94 | 172.50 | 163.50 | 157.46 | 171.48 | 182.68 | 179.76 | 156.24 | 127.19 | 106.13 | 120.75 | 119.59 | 116.82 | 143.45 | 162.86 | 148.58 | 144.19 | 115.90 | 111.93 | 110.45 | 102.63 | 35.84 | 38.82 | NA | NA | NA | |
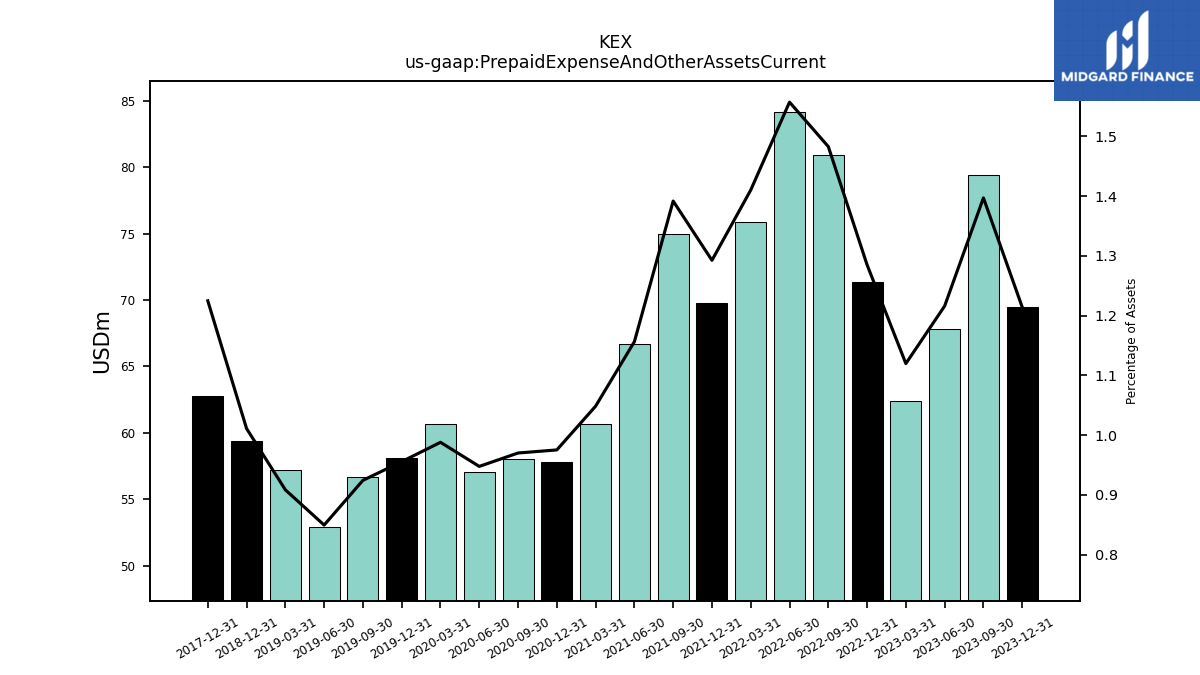
| Prepaid Expense And Other Assets Current | 69.48 | 79.38 | 67.79 | 62.42 | 71.37 | 80.90 | 84.16 | 75.90 | 69.78 | 75.00 | 66.70 | 60.69 | 57.78 | 58.02 | 57.02 | 60.64 | 58.09 | 56.65 | 52.95 | 57.24 | 59.37 | NA | NA | NA | 62.80 | NA | NA | NA | NA | NA | NA | NA | NA | NA | NA | NA | NA | NA | NA | NA | NA | NA | NA | NA | NA | NA | NA | NA | NA | NA | NA | NA | NA | NA | NA | NA |
| 2023-12-31 | 2023-09-30 | 2023-06-30 | 2023-03-31 | 2022-12-31 | 2022-09-30 | 2022-06-30 | 2022-03-31 | 2021-12-31 | 2021-09-30 | 2021-06-30 | 2021-03-31 | 2020-12-31 | 2020-09-30 | 2020-06-30 | 2020-03-31 | 2019-12-31 | 2019-09-30 | 2019-06-30 | 2019-03-31 | 2018-12-31 | 2018-09-30 | 2018-06-30 | 2018-03-31 | 2017-12-31 | 2017-09-30 | 2017-06-30 | 2017-03-31 | 2016-12-31 | 2016-09-30 | 2016-06-30 | 2016-03-31 | 2015-12-31 | 2015-09-30 | 2015-06-30 | 2015-03-31 | 2014-12-31 | 2014-09-30 | 2014-06-30 | 2014-03-31 | 2013-12-31 | 2013-09-30 | 2013-06-30 | 2013-03-31 | 2012-12-31 | 2012-09-30 | 2012-06-30 | 2012-03-31 | 2011-12-31 | 2011-09-30 | 2011-06-30 | 2011-03-31 | 2010-12-31 | 2010-09-30 | 2010-06-30 | 2010-03-31 | ||
|---|---|---|---|---|---|---|---|---|---|---|---|---|---|---|---|---|---|---|---|---|---|---|---|---|---|---|---|---|---|---|---|---|---|---|---|---|---|---|---|---|---|---|---|---|---|---|---|---|---|---|---|---|---|---|---|---|---|
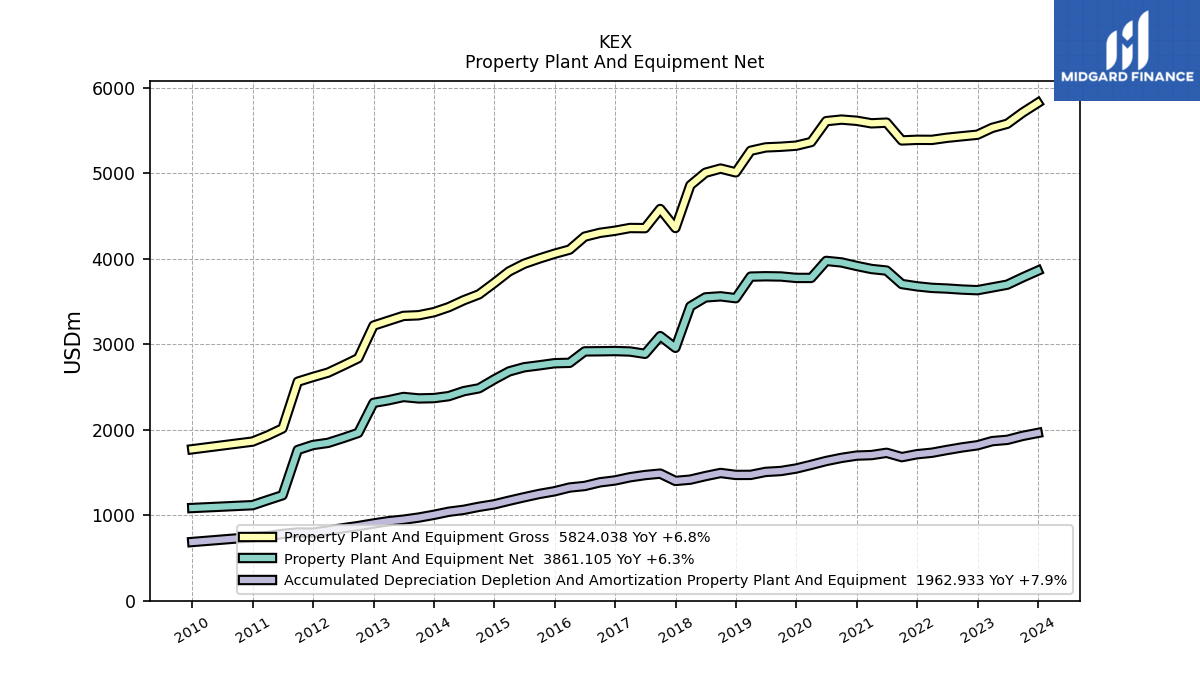
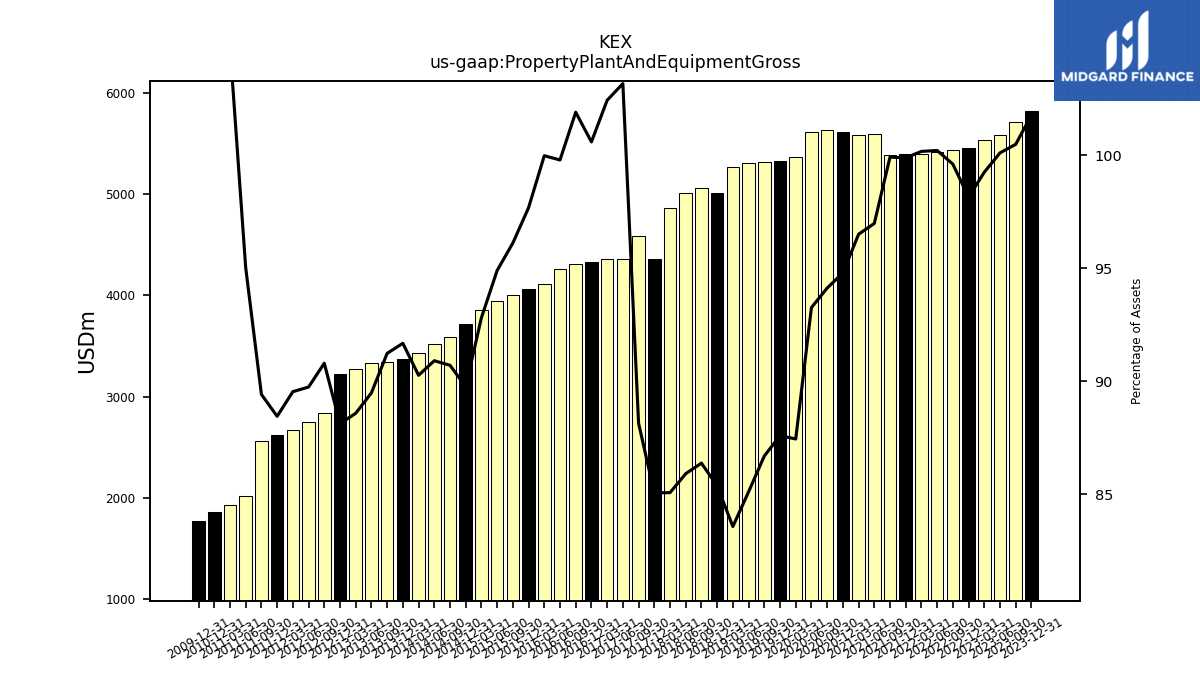
| Property Plant And Equipment Gross | 5824.04 | 5710.44 | 5580.41 | 5532.95 | 5452.14 | 5434.74 | 5416.56 | 5391.99 | 5392.85 | 5385.48 | 5593.65 | 5585.57 | 5615.40 | 5629.36 | 5611.18 | 5366.60 | 5324.09 | 5311.75 | 5304.06 | 5265.02 | 5011.82 | 5056.34 | 5007.38 | 4860.84 | 4360.88 | 4583.44 | 4359.36 | 4360.89 | 4328.90 | 4304.27 | 4259.90 | 4108.14 | 4059.76 | 4004.02 | 3942.53 | 3853.29 | 3717.40 | 3584.63 | 3515.99 | 3434.94 | 3375.89 | 3340.16 | 3332.46 | 3275.60 | 3219.11 | 2837.79 | 2751.61 | 2668.83 | 2618.27 | 2562.96 | 2016.03 | 1932.65 | 1862.31 | NA | NA | NA | |
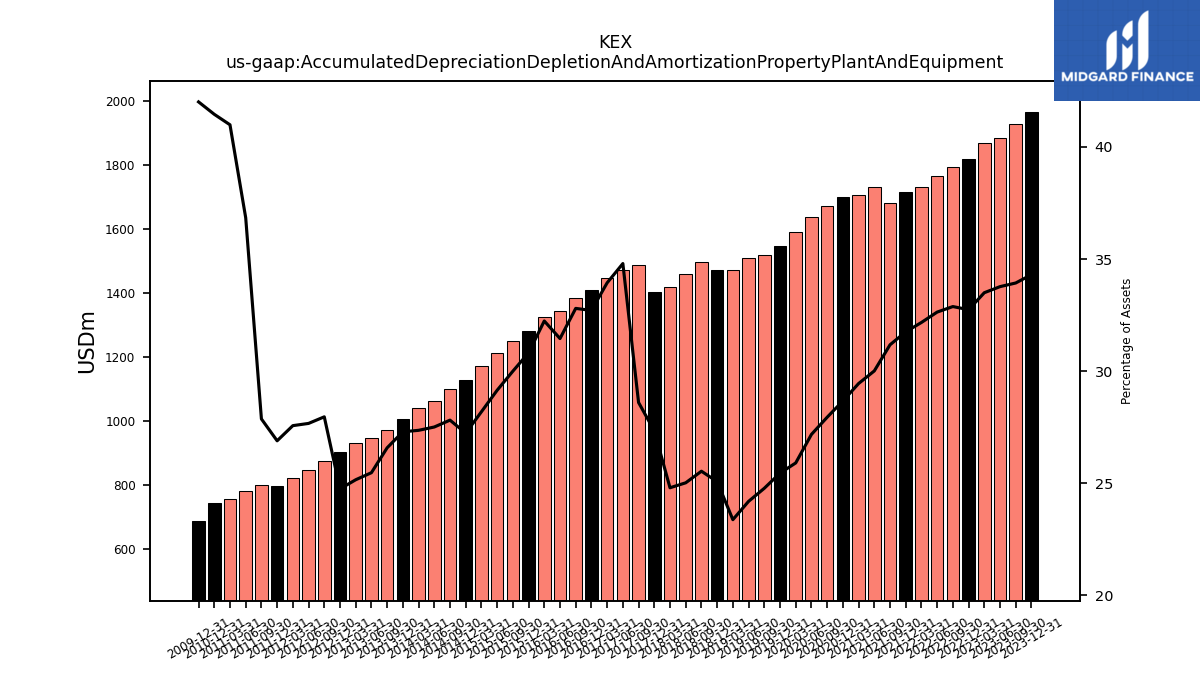
| Accumulated Depreciation Depletion And Amortization Property Plant And Equipment | 1962.93 | 1928.32 | 1882.47 | 1867.44 | 1818.68 | 1794.05 | 1763.91 | 1731.67 | 1714.34 | 1680.23 | 1730.85 | 1704.30 | 1698.33 | 1671.22 | 1635.16 | 1589.81 | 1546.98 | 1518.02 | 1507.64 | 1472.58 | 1472.02 | 1494.84 | 1458.31 | 1416.97 | 1401.62 | 1487.33 | 1470.35 | 1444.89 | 1407.52 | 1385.35 | 1342.64 | 1324.63 | 1280.78 | 1249.66 | 1210.87 | 1170.26 | 1127.90 | 1099.20 | 1063.91 | 1041.17 | 1005.09 | 973.12 | 948.50 | 930.17 | 903.95 | 873.94 | 848.33 | 821.74 | 796.10 | 798.79 | 781.71 | 755.90 | 744.15 | NA | NA | NA | |
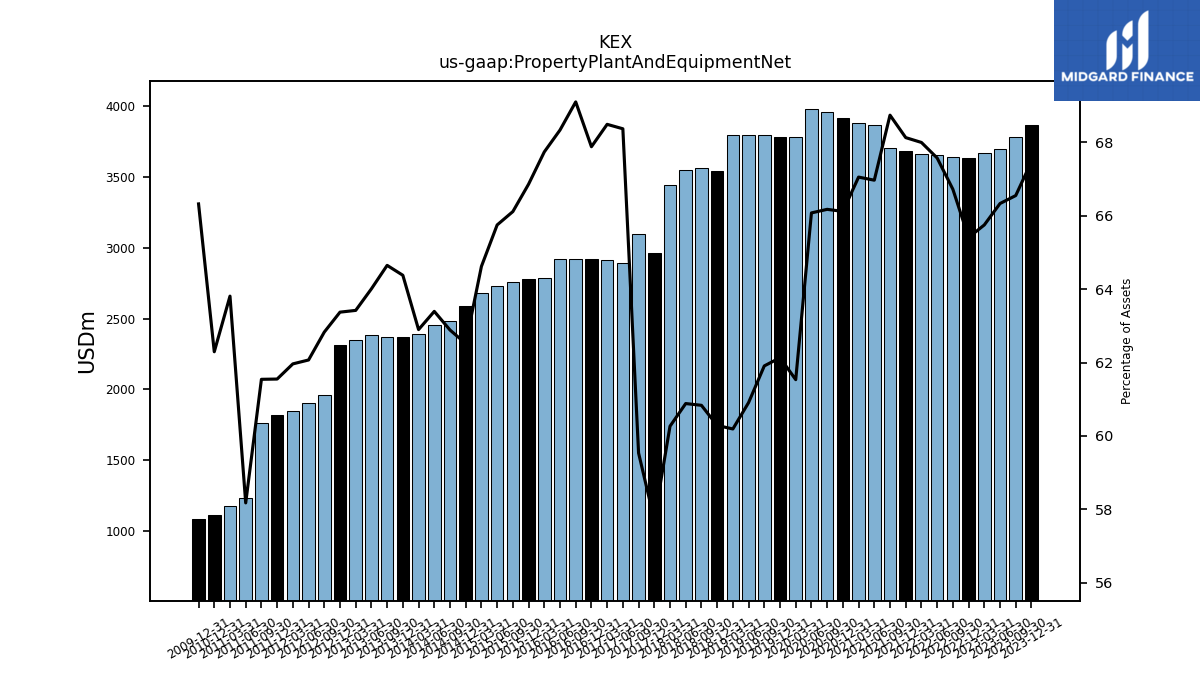
| Property Plant And Equipment Net | 3861.11 | 3782.12 | 3697.94 | 3665.51 | 3633.46 | 3640.69 | 3652.65 | 3660.31 | 3678.51 | 3705.25 | 3862.81 | 3881.27 | 3917.07 | 3958.14 | 3976.03 | 3776.78 | 3777.11 | 3793.73 | 3796.42 | 3792.44 | 3539.80 | 3561.50 | 3549.07 | 3443.87 | 2959.26 | 3096.11 | 2889.01 | 2916.00 | 2921.37 | 2918.91 | 2917.25 | 2783.51 | 2778.98 | 2754.36 | 2731.66 | 2683.03 | 2589.50 | 2485.43 | 2452.07 | 2393.78 | 2370.80 | 2367.05 | 2383.96 | 2345.43 | 2315.16 | 1963.85 | 1903.28 | 1847.09 | 1822.17 | 1764.17 | 1234.33 | 1176.75 | 1118.16 | NA | NA | NA | |
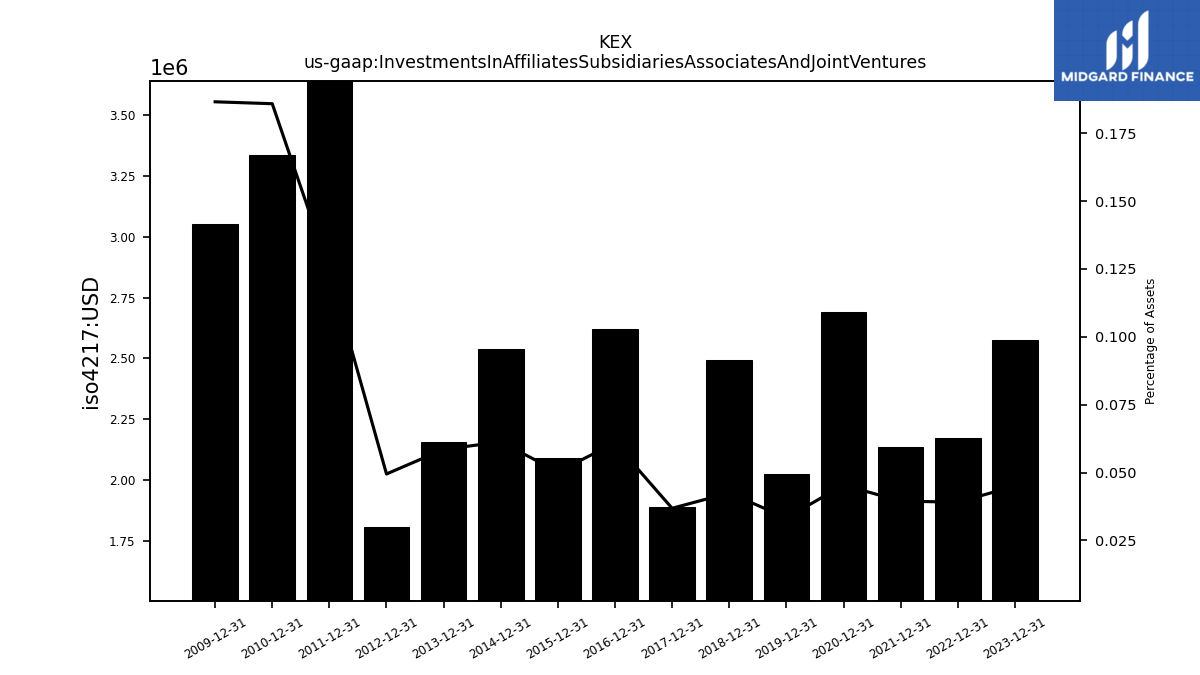
| Investments In Affiliates Subsidiaries Associates And Joint Ventures | 2.58 | NA | NA | NA | 2.17 | NA | NA | NA | 2.13 | NA | NA | NA | 2.69 | NA | NA | NA | 2.02 | NA | NA | NA | 2.50 | NA | NA | NA | 1.89 | NA | NA | NA | 2.62 | NA | NA | NA | 2.09 | NA | NA | NA | 2.54 | NA | NA | NA | 2.16 | NA | NA | NA | 1.81 | NA | NA | NA | 3.68 | NA | NA | NA | 3.34 | NA | NA | NA | |
| Goodwill | 438.75 | 438.75 | 438.75 | 438.75 | 438.75 | 438.75 | 438.75 | 438.75 | 438.75 | 438.75 | 657.80 | 657.80 | 657.80 | 657.80 | 657.83 | 704.10 | 953.83 | 953.83 | 953.83 | 953.83 | 953.83 | 960.01 | 961.75 | 935.75 | 935.13 | 919.28 | 598.13 | 598.13 | 598.13 | 587.70 | 587.70 | 586.72 | 586.72 | 588.24 | 591.40 | 591.40 | 591.40 | 591.40 | 591.40 | 591.40 | 591.40 | 591.36 | 599.00 | 595.23 | 596.03 | 486.15 | 483.89 | 483.01 | 483.47 | 478.92 | 369.33 | 237.14 | 228.87 | NA | NA | NA | |
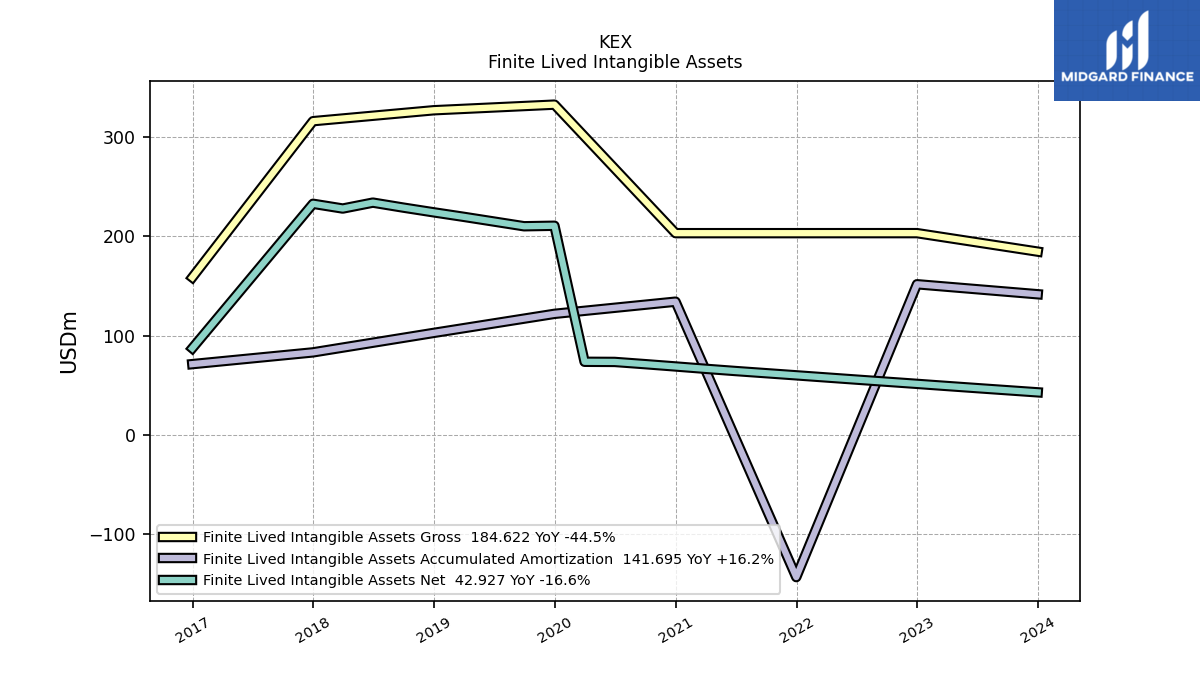
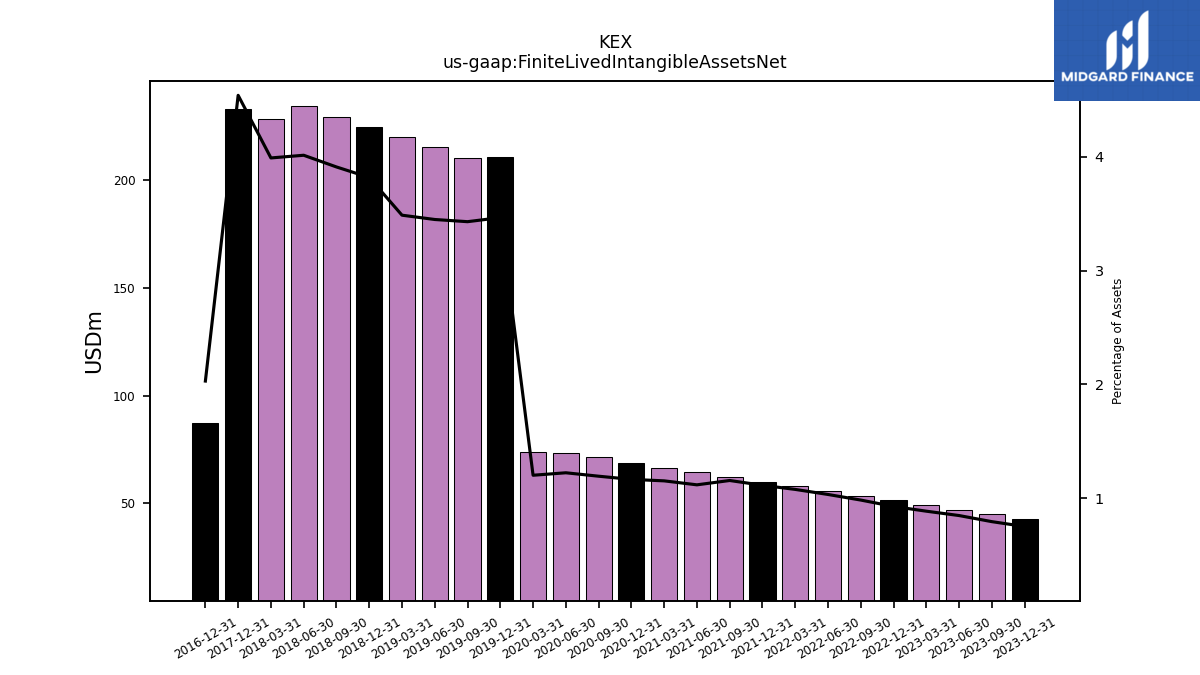
| Finite Lived Intangible Assets Net | 42.93 | 45.06 | 47.19 | 49.33 | 51.46 | 53.62 | 55.77 | 57.93 | 60.07 | 62.23 | 64.40 | 66.65 | 68.98 | 71.31 | 73.56 | 73.69 | 210.68 | 210.17 | 214.97 | 219.70 | 224.20 | 228.96 | 233.97 | 228.01 | 232.81 | NA | NA | NA | 87.31 | NA | NA | NA | NA | NA | NA | NA | NA | NA | NA | NA | NA | NA | NA | NA | NA | NA | NA | NA | NA | NA | NA | NA | NA | NA | NA | NA | |
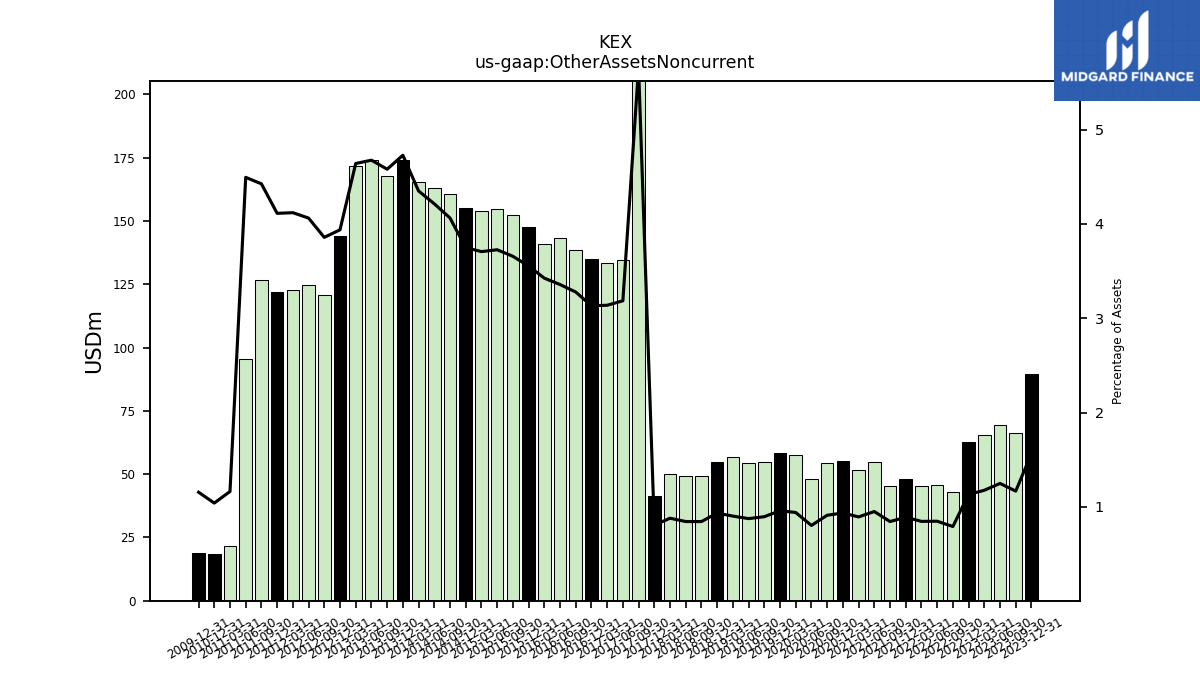
| Other Assets Noncurrent | 89.46 | 66.28 | 69.54 | 65.49 | 62.81 | 43.14 | 45.76 | 45.48 | 48.00 | 45.44 | 54.76 | 51.65 | 55.35 | 54.43 | 48.24 | 57.66 | 58.23 | 54.82 | 54.49 | 56.77 | 54.78 | 49.35 | 49.16 | 50.21 | 41.25 | 294.26 | 134.57 | 133.58 | 134.82 | 138.46 | 143.33 | 140.75 | 147.70 | 152.36 | 154.81 | 153.90 | 155.31 | 160.59 | 163.00 | 165.55 | 174.15 | 167.72 | 174.17 | 171.64 | 143.87 | 120.58 | 124.57 | 122.80 | 121.76 | 126.87 | 95.36 | 21.43 | 18.65 | NA | NA | NA |
| 2023-12-31 | 2023-09-30 | 2023-06-30 | 2023-03-31 | 2022-12-31 | 2022-09-30 | 2022-06-30 | 2022-03-31 | 2021-12-31 | 2021-09-30 | 2021-06-30 | 2021-03-31 | 2020-12-31 | 2020-09-30 | 2020-06-30 | 2020-03-31 | 2019-12-31 | 2019-09-30 | 2019-06-30 | 2019-03-31 | 2018-12-31 | 2018-09-30 | 2018-06-30 | 2018-03-31 | 2017-12-31 | 2017-09-30 | 2017-06-30 | 2017-03-31 | 2016-12-31 | 2016-09-30 | 2016-06-30 | 2016-03-31 | 2015-12-31 | 2015-09-30 | 2015-06-30 | 2015-03-31 | 2014-12-31 | 2014-09-30 | 2014-06-30 | 2014-03-31 | 2013-12-31 | 2013-09-30 | 2013-06-30 | 2013-03-31 | 2012-12-31 | 2012-09-30 | 2012-06-30 | 2012-03-31 | 2011-12-31 | 2011-09-30 | 2011-06-30 | 2011-03-31 | 2010-12-31 | 2010-09-30 | 2010-06-30 | 2010-03-31 | ||
|---|---|---|---|---|---|---|---|---|---|---|---|---|---|---|---|---|---|---|---|---|---|---|---|---|---|---|---|---|---|---|---|---|---|---|---|---|---|---|---|---|---|---|---|---|---|---|---|---|---|---|---|---|---|---|---|---|---|
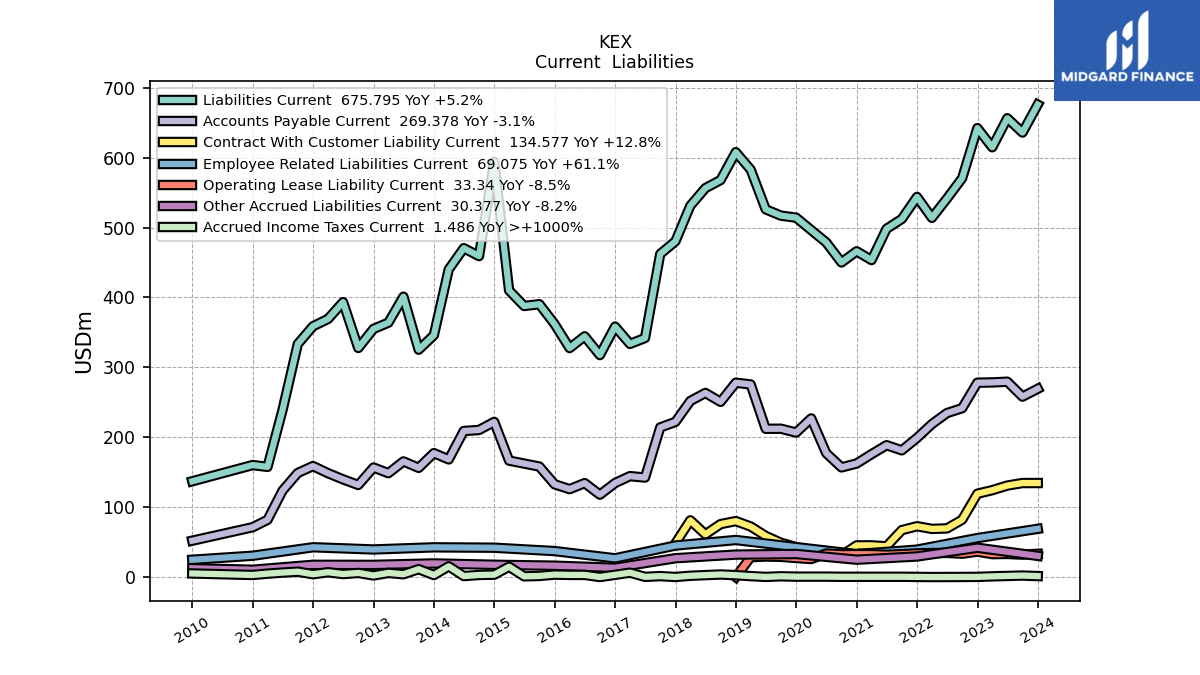
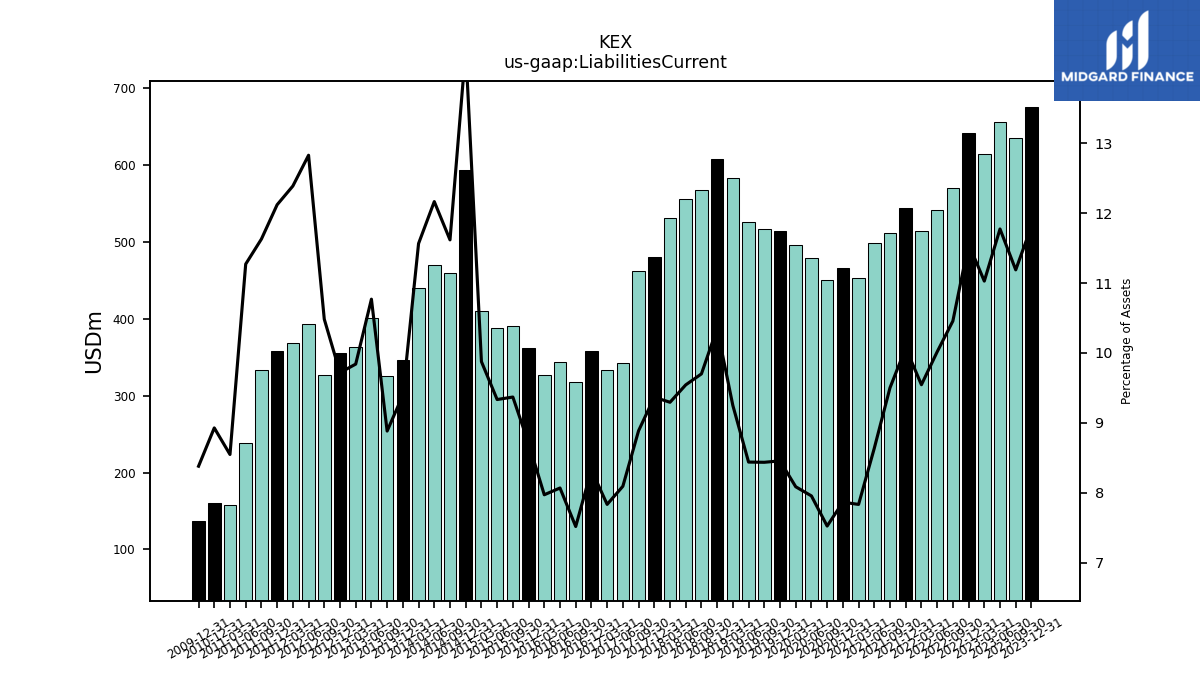
| Liabilities Current | 675.79 | 635.85 | 656.30 | 614.79 | 642.20 | 570.56 | 541.37 | 513.84 | 543.77 | 512.20 | 498.22 | 453.44 | 466.03 | 450.06 | 478.70 | 496.33 | 514.12 | 516.99 | 526.03 | 582.72 | 607.78 | 567.93 | 556.32 | 531.16 | 480.31 | 462.19 | 341.99 | 333.54 | 358.34 | 317.56 | 344.45 | 327.58 | 361.92 | 390.34 | 387.79 | 410.08 | 594.03 | 459.14 | 470.51 | 440.13 | 345.99 | 325.25 | 401.09 | 363.93 | 355.02 | 327.66 | 393.33 | 369.25 | 358.80 | 333.35 | 239.14 | 157.64 | 160.26 | NA | NA | NA | |
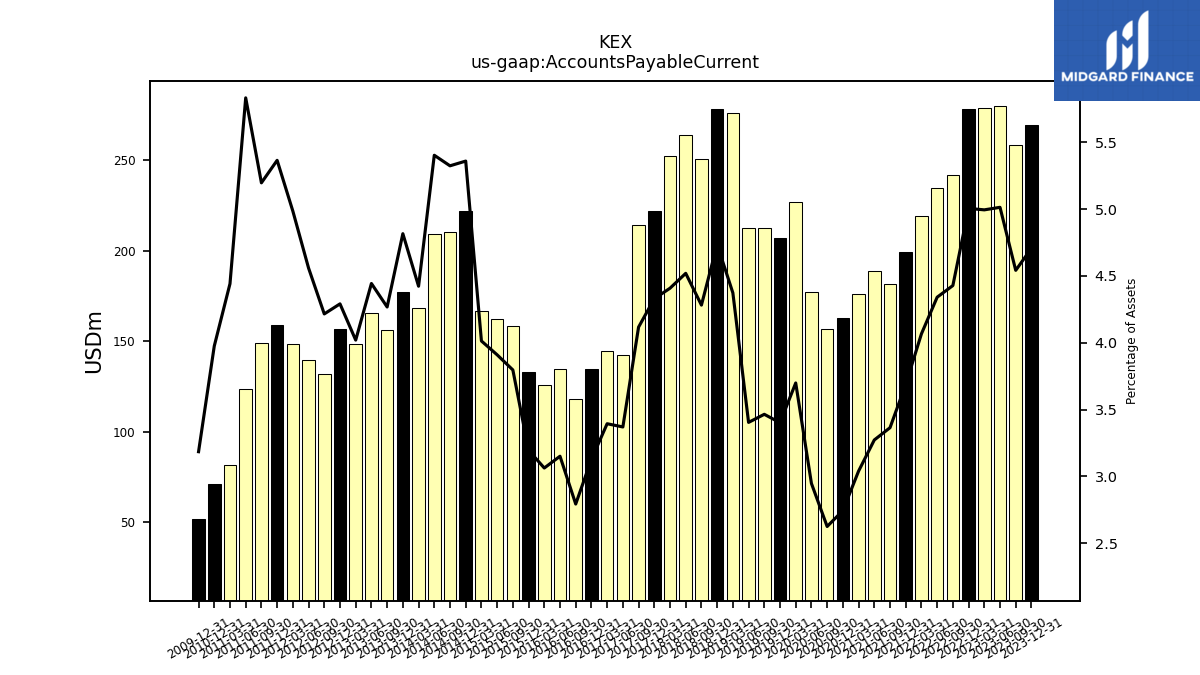
| Accounts Payable Current | 269.38 | 258.13 | 279.52 | 278.47 | 278.08 | 241.62 | 234.64 | 218.91 | 199.09 | 181.31 | 188.72 | 175.89 | 162.51 | 156.95 | 177.29 | 227.02 | 206.78 | 212.28 | 212.15 | 275.57 | 278.06 | 250.68 | 263.47 | 251.92 | 222.00 | 214.11 | 142.37 | 144.48 | 134.57 | 117.94 | 134.48 | 125.81 | 132.80 | 158.15 | 162.43 | 166.63 | 222.02 | 210.45 | 209.02 | 168.34 | 177.38 | 156.26 | 165.50 | 148.66 | 156.76 | 131.77 | 139.80 | 148.62 | 158.85 | 148.99 | 123.78 | 81.92 | 71.35 | NA | NA | NA | |
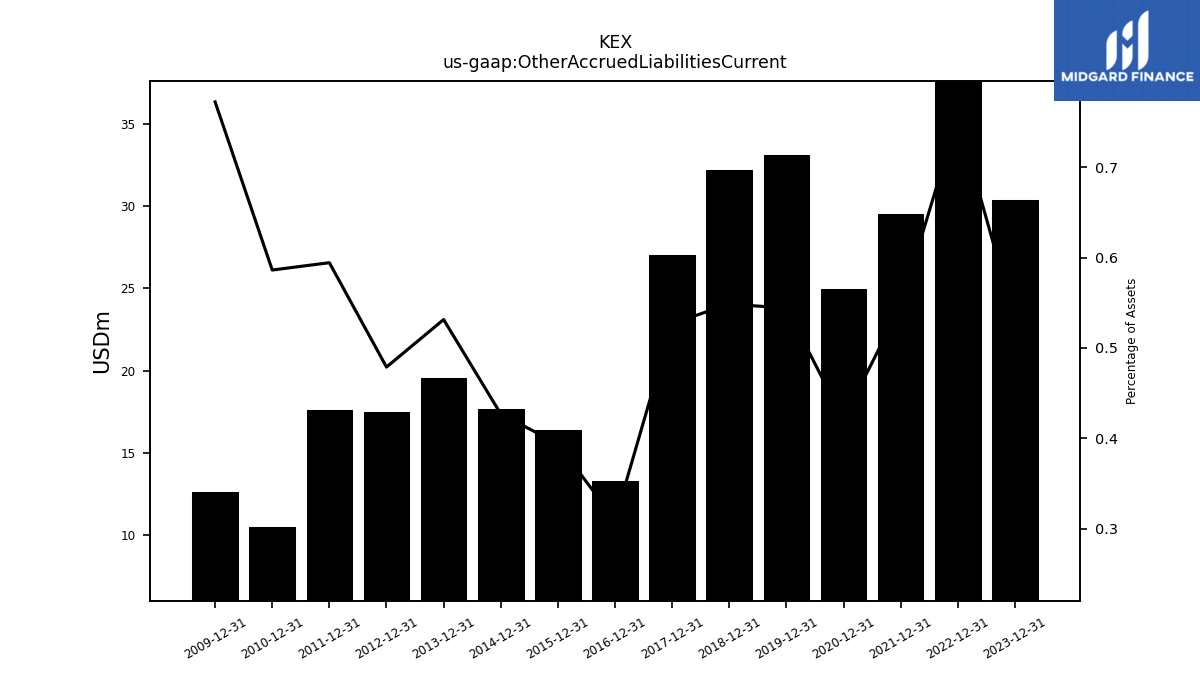
| Other Accrued Liabilities Current | 30.38 | NA | NA | NA | 42.01 | NA | NA | NA | 29.51 | NA | NA | NA | 24.94 | NA | NA | NA | 33.08 | NA | NA | NA | 32.22 | NA | NA | NA | 27.03 | NA | NA | NA | 13.31 | NA | NA | NA | 16.37 | NA | NA | NA | 17.68 | NA | NA | NA | 19.57 | NA | NA | NA | 17.49 | NA | NA | NA | 17.60 | NA | NA | NA | 10.53 | NA | NA | NA | |
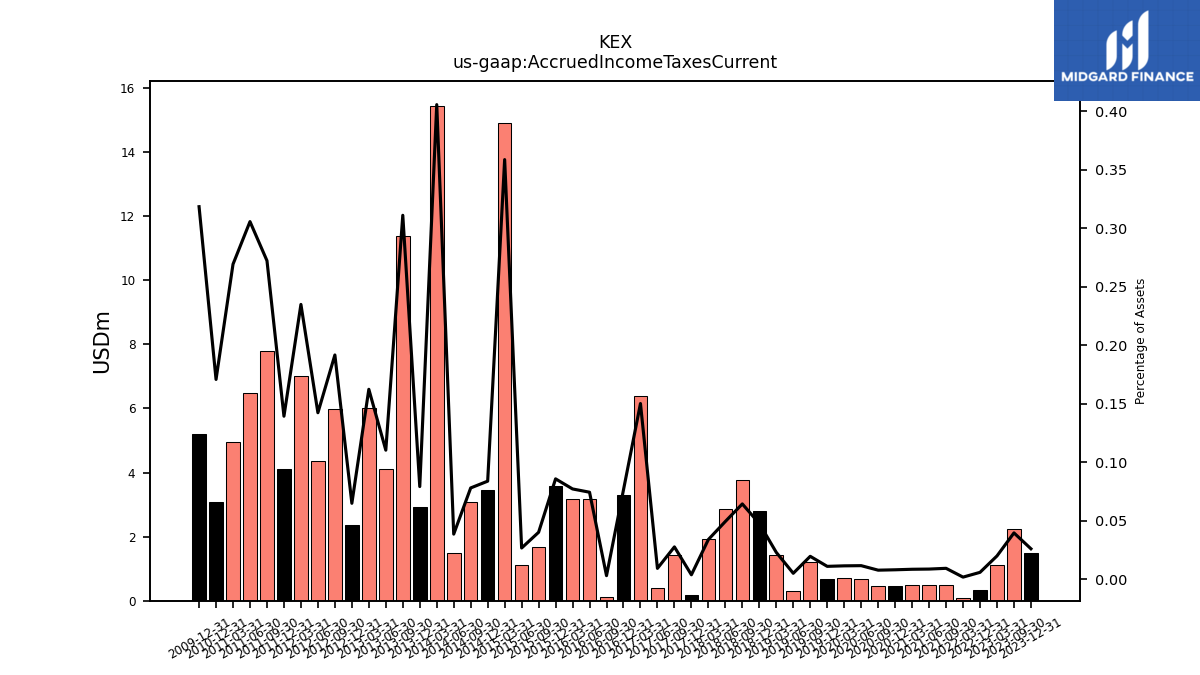
| Accrued Income Taxes Current | 1.49 | 2.25 | NA | 1.11 | 0.32 | NA | NA | 0.09 | NA | 0.50 | 0.50 | 0.49 | 0.47 | 0.46 | 0.69 | 0.70 | 0.67 | 1.20 | 0.31 | 1.44 | 2.79 | 3.77 | 2.88 | 1.94 | 0.19 | 1.43 | 0.39 | 6.39 | 3.29 | 0.13 | 3.17 | 3.17 | 3.56 | 1.67 | 1.11 | 14.89 | 3.47 | 3.08 | 1.49 | 15.44 | 2.92 | 11.39 | 4.11 | 6.00 | 2.37 | 5.99 | 4.36 | 7.00 | 4.12 | 7.80 | 6.49 | 4.97 | 3.06 | NA | NA | NA | |
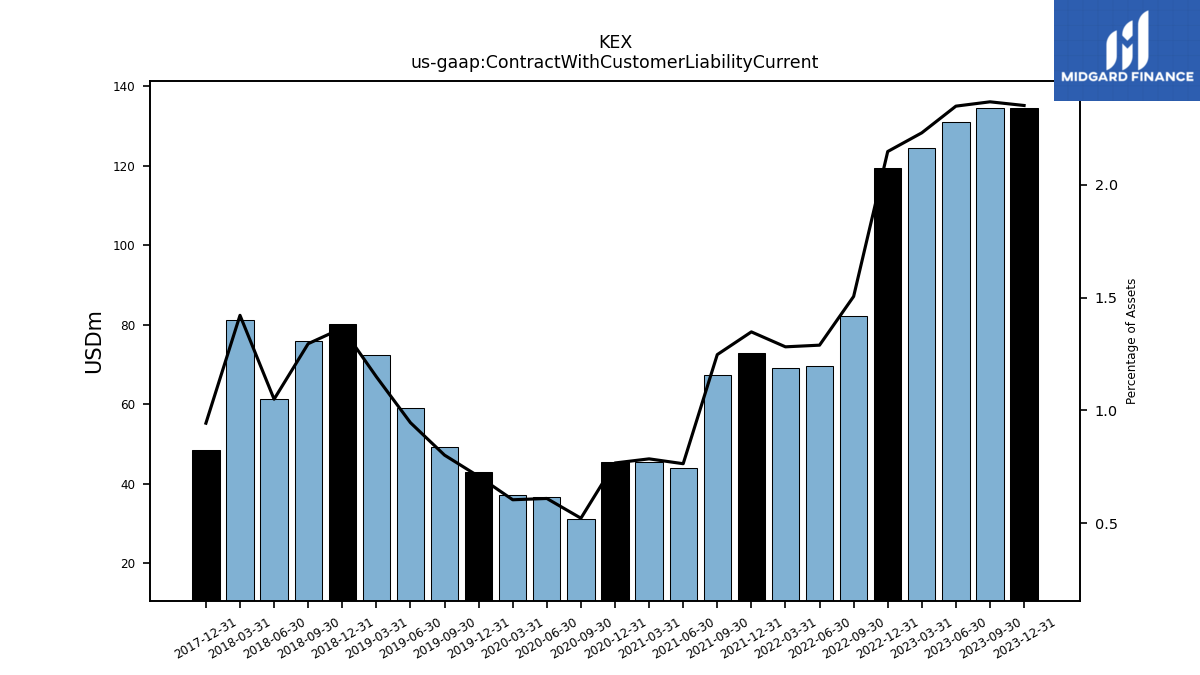
| Contract With Customer Liability Current | 134.58 | 134.58 | 130.94 | 124.36 | 119.31 | 82.12 | 69.67 | 68.98 | 72.77 | 67.21 | 44.02 | 45.42 | 45.41 | 31.19 | 36.65 | 37.03 | 42.98 | 49.10 | 58.91 | 72.39 | 80.12 | 75.84 | 61.16 | 81.22 | 48.35 | NA | NA | NA | NA | NA | NA | NA | NA | NA | NA | NA | NA | NA | NA | NA | NA | NA | NA | NA | NA | NA | NA | NA | NA | NA | NA | NA | NA | NA | NA | NA |
| 2023-12-31 | 2023-09-30 | 2023-06-30 | 2023-03-31 | 2022-12-31 | 2022-09-30 | 2022-06-30 | 2022-03-31 | 2021-12-31 | 2021-09-30 | 2021-06-30 | 2021-03-31 | 2020-12-31 | 2020-09-30 | 2020-06-30 | 2020-03-31 | 2019-12-31 | 2019-09-30 | 2019-06-30 | 2019-03-31 | 2018-12-31 | 2018-09-30 | 2018-06-30 | 2018-03-31 | 2017-12-31 | 2017-09-30 | 2017-06-30 | 2017-03-31 | 2016-12-31 | 2016-09-30 | 2016-06-30 | 2016-03-31 | 2015-12-31 | 2015-09-30 | 2015-06-30 | 2015-03-31 | 2014-12-31 | 2014-09-30 | 2014-06-30 | 2014-03-31 | 2013-12-31 | 2013-09-30 | 2013-06-30 | 2013-03-31 | 2012-12-31 | 2012-09-30 | 2012-06-30 | 2012-03-31 | 2011-12-31 | 2011-09-30 | 2011-06-30 | 2011-03-31 | 2010-12-31 | 2010-09-30 | 2010-06-30 | 2010-03-31 | ||
|---|---|---|---|---|---|---|---|---|---|---|---|---|---|---|---|---|---|---|---|---|---|---|---|---|---|---|---|---|---|---|---|---|---|---|---|---|---|---|---|---|---|---|---|---|---|---|---|---|---|---|---|---|---|---|---|---|---|
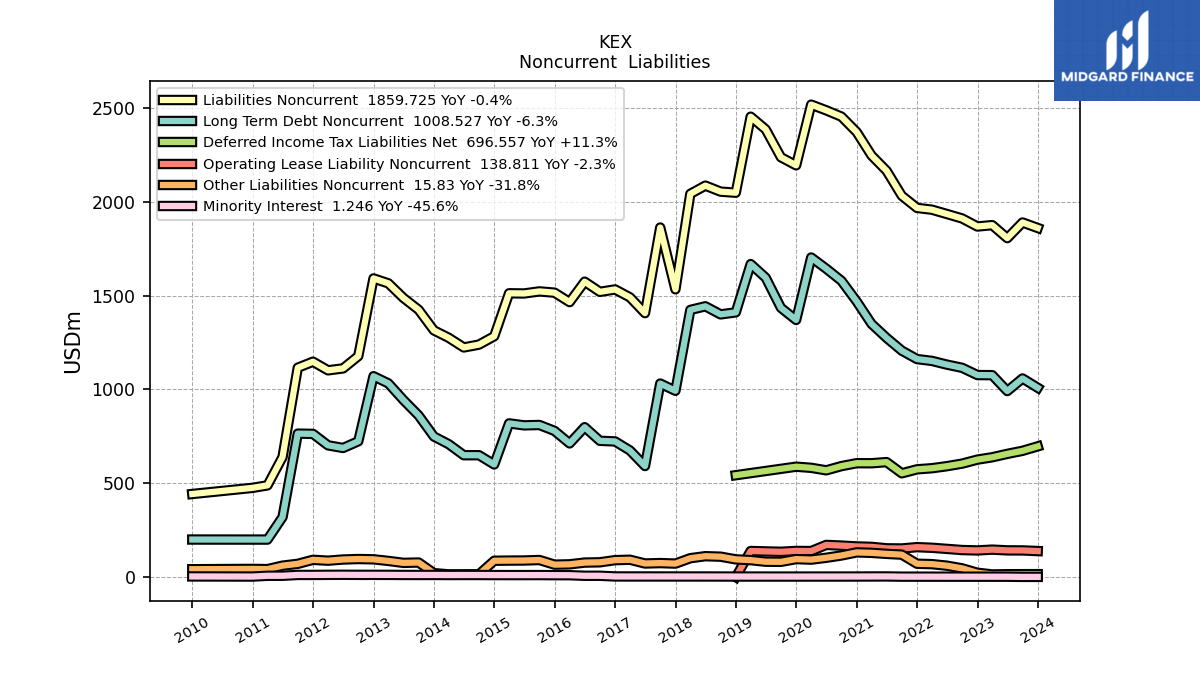
| Liabilities Noncurrent | 1859.72 | 1888.95 | 1805.47 | 1874.82 | 1867.56 | 1910.37 | 1934.04 | 1957.09 | 1966.51 | 2031.46 | 2164.26 | 2245.90 | 2370.59 | 2452.69 | 2486.33 | 2516.72 | 2193.39 | 2236.40 | 2384.68 | 2452.56 | 2047.51 | 2053.26 | 2085.27 | 2041.47 | 1532.90 | 1862.10 | 1405.97 | 1490.08 | 1532.29 | 1519.51 | 1573.69 | 1464.74 | 1515.15 | 1521.92 | 1510.87 | 1511.89 | 1282.97 | 1238.55 | 1223.26 | 1274.66 | 1314.38 | 1423.81 | 1487.06 | 1564.72 | 1591.05 | 1177.24 | 1111.73 | 1101.45 | 1147.45 | 1115.40 | 639.74 | 488.74 | 475.54 | NA | NA | NA | |
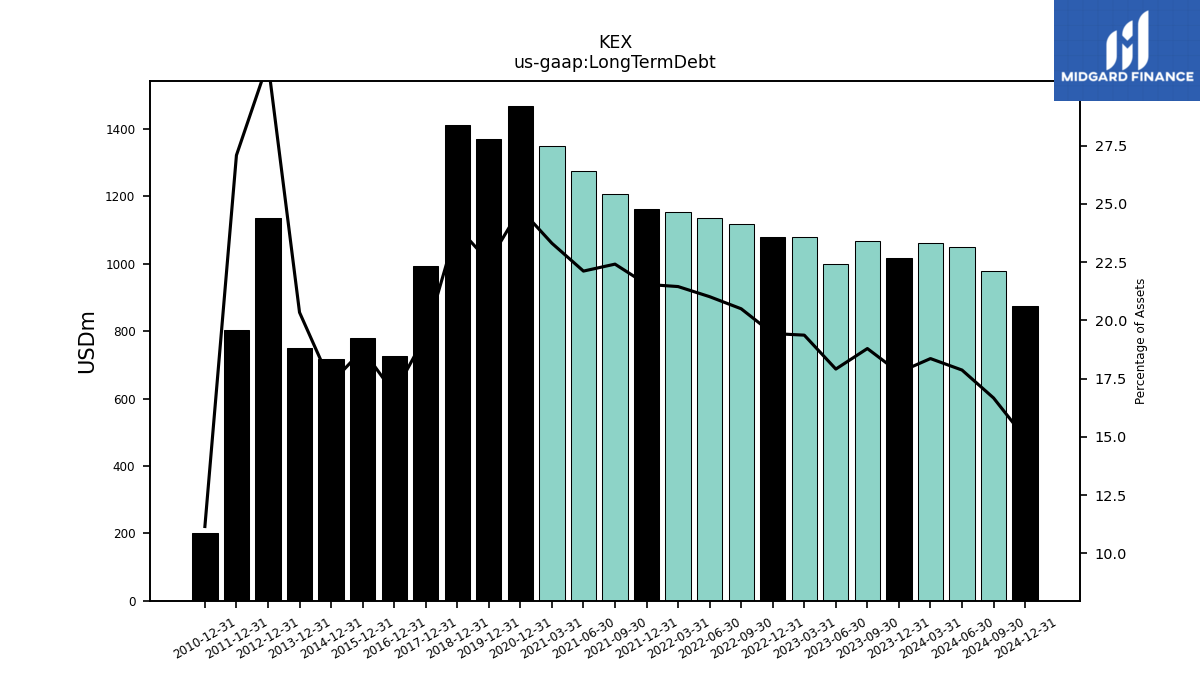
| Long Term Debt | 1016.60 | 1067.86 | 998.40 | 1079.64 | 1079.62 | 1118.46 | 1136.06 | 1154.73 | 1163.37 | 1208.18 | 1275.68 | 1349.34 | 1468.59 | NA | NA | NA | 1369.77 | NA | NA | NA | 1410.19 | NA | NA | NA | 992.41 | NA | NA | NA | 725.99 | NA | NA | NA | 778.83 | NA | NA | NA | 716.70 | NA | NA | NA | 749.15 | NA | NA | NA | 1135.11 | NA | NA | NA | 802.00 | NA | NA | NA | 200.13 | NA | NA | NA | |
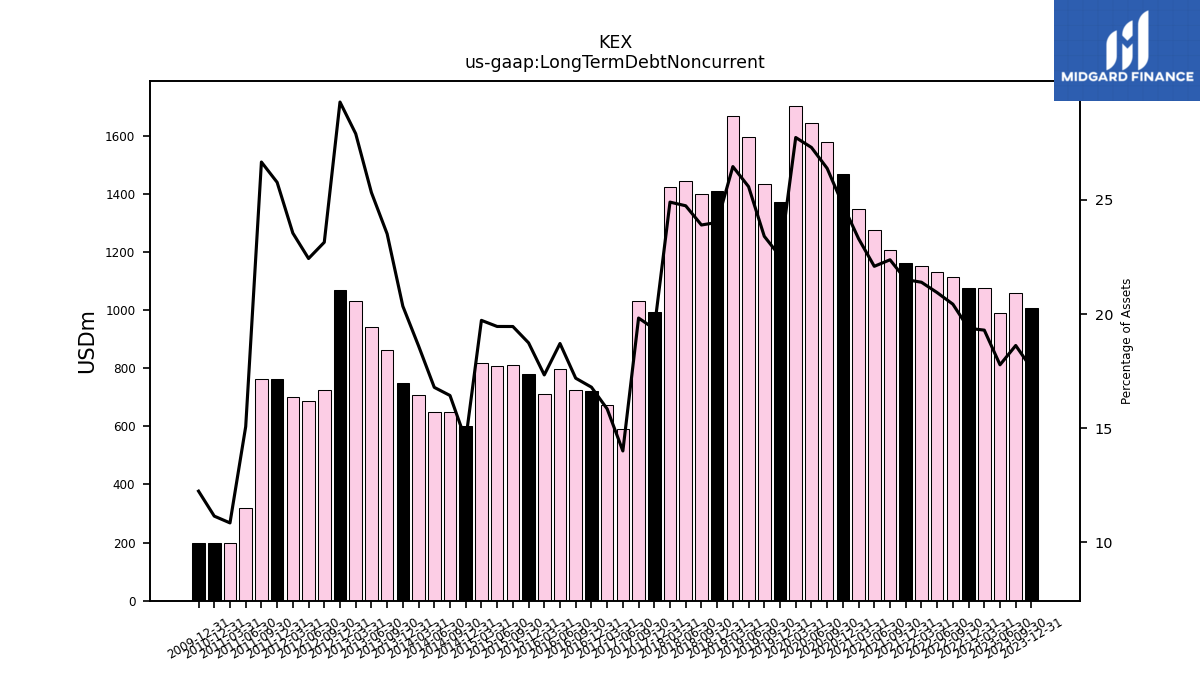
| Long Term Debt Noncurrent | 1008.53 | 1058.25 | 990.95 | 1075.66 | 1076.33 | 1114.86 | 1131.85 | 1151.64 | 1161.43 | 1206.19 | 1274.26 | 1348.90 | 1468.55 | 1578.19 | 1642.83 | 1702.48 | 1369.75 | 1434.42 | 1594.69 | 1667.46 | 1410.17 | 1399.42 | 1442.51 | 1423.27 | 992.40 | 1031.03 | 591.53 | 674.55 | 722.80 | 726.00 | 798.69 | 712.16 | 778.83 | 810.45 | 808.30 | 818.90 | 600.00 | 649.35 | 649.30 | 708.00 | 749.15 | 860.93 | 943.24 | 1031.96 | 1070.11 | 723.47 | 687.90 | 701.95 | 763.00 | 764.31 | 319.70 | 200.00 | 200.01 | NA | NA | NA | |
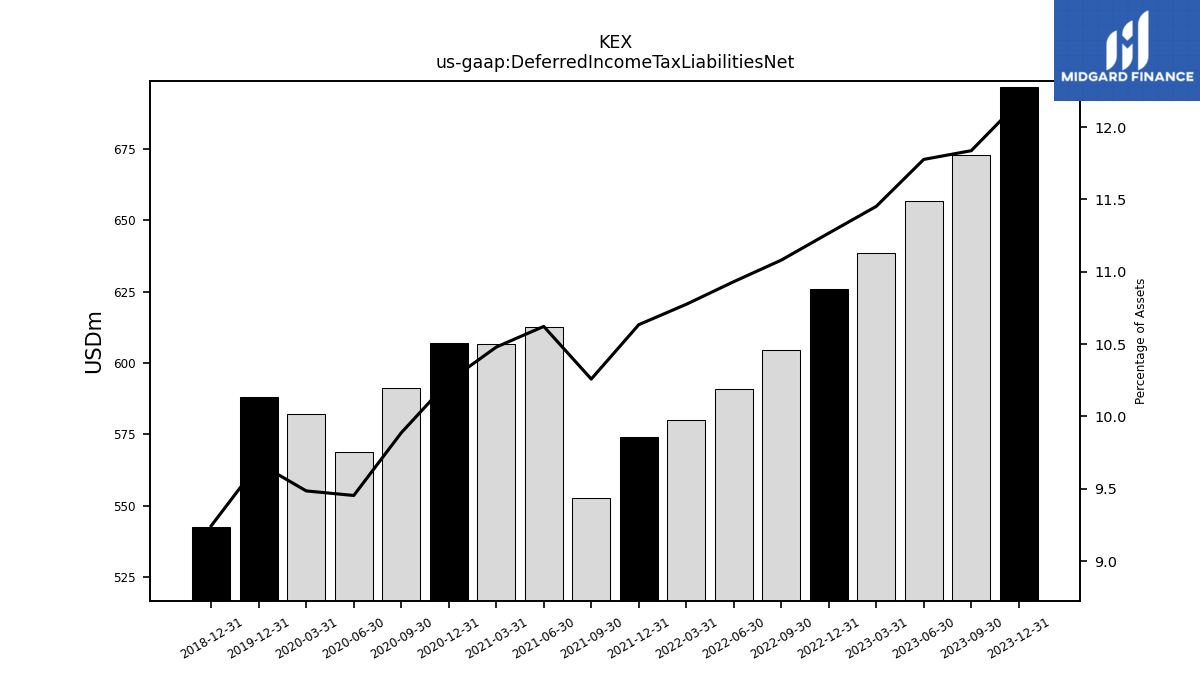
| Deferred Income Tax Liabilities Net | 696.56 | 672.71 | 656.53 | 638.44 | 625.88 | 604.60 | 590.88 | 580.01 | 574.15 | 552.91 | 612.68 | 606.56 | 606.84 | 591.35 | 568.82 | 582.15 | 588.20 | NA | NA | NA | 542.78 | NA | NA | NA | NA | NA | NA | NA | NA | NA | NA | NA | NA | NA | NA | NA | NA | NA | NA | NA | NA | NA | NA | NA | NA | NA | NA | NA | NA | NA | NA | NA | NA | NA | NA | NA | |
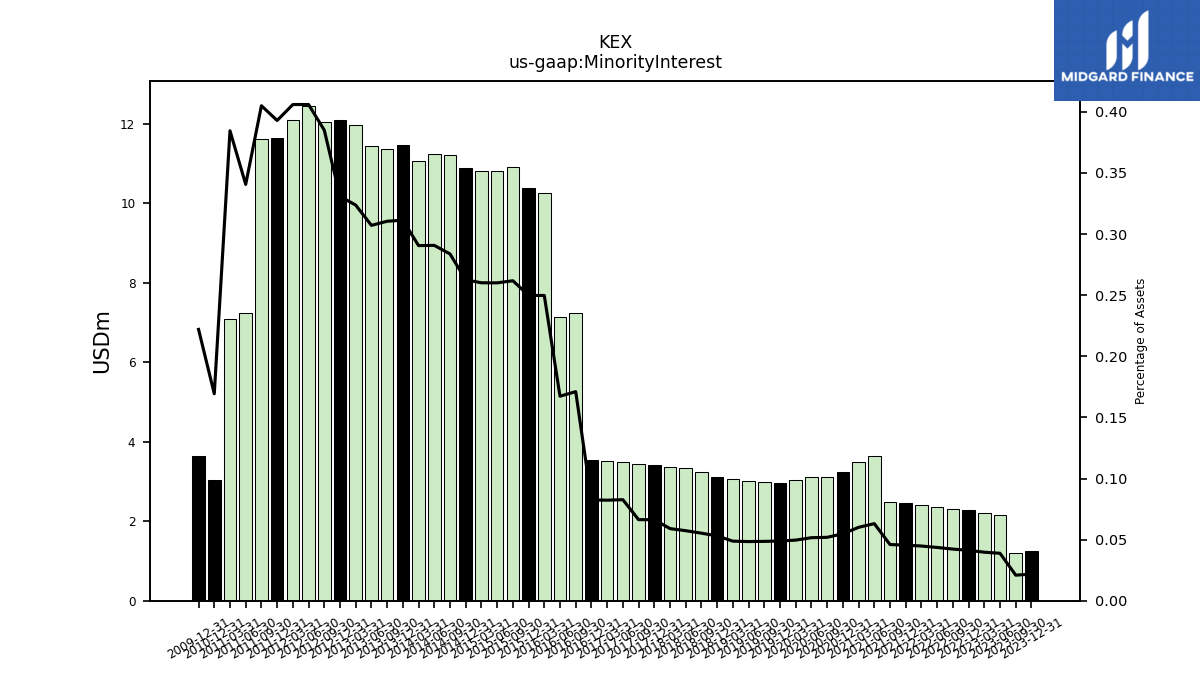
| Minority Interest | 1.25 | 1.19 | 2.17 | 2.21 | 2.29 | 2.31 | 2.36 | 2.41 | 2.46 | 2.48 | 3.64 | 3.48 | 3.25 | 3.10 | 3.10 | 3.04 | 2.97 | 2.98 | 3.02 | 3.07 | 3.11 | 3.24 | 3.34 | 3.37 | 3.40 | 3.45 | 3.49 | 3.50 | 3.55 | 7.23 | 7.14 | 10.26 | 10.38 | 10.91 | 10.81 | 10.80 | 10.88 | 11.21 | 11.25 | 11.06 | 11.47 | 11.37 | 11.44 | 11.97 | 12.09 | 12.04 | 12.45 | 12.10 | 11.63 | 11.61 | 7.23 | 7.09 | 3.04 | NA | NA | NA | |
| Other Liabilities Noncurrent | 15.83 | 15.75 | 15.52 | 14.28 | 23.21 | 46.72 | 60.96 | 69.17 | 71.25 | 119.74 | 123.86 | 129.30 | 131.70 | 115.27 | 103.05 | 93.21 | 95.98 | 81.45 | 82.07 | 90.50 | 94.56 | 108.95 | 111.47 | 100.79 | 72.04 | 74.80 | 72.62 | 92.57 | 90.44 | 78.99 | 77.48 | 68.19 | 66.51 | 91.15 | 88.51 | 88.08 | 87.20 | 15.05 | 14.95 | 14.71 | 21.11 | 77.86 | 75.94 | 86.26 | 94.85 | 96.42 | 93.81 | 87.55 | 92.10 | 70.83 | 61.11 | 42.65 | 43.76 | NA | NA | NA | |
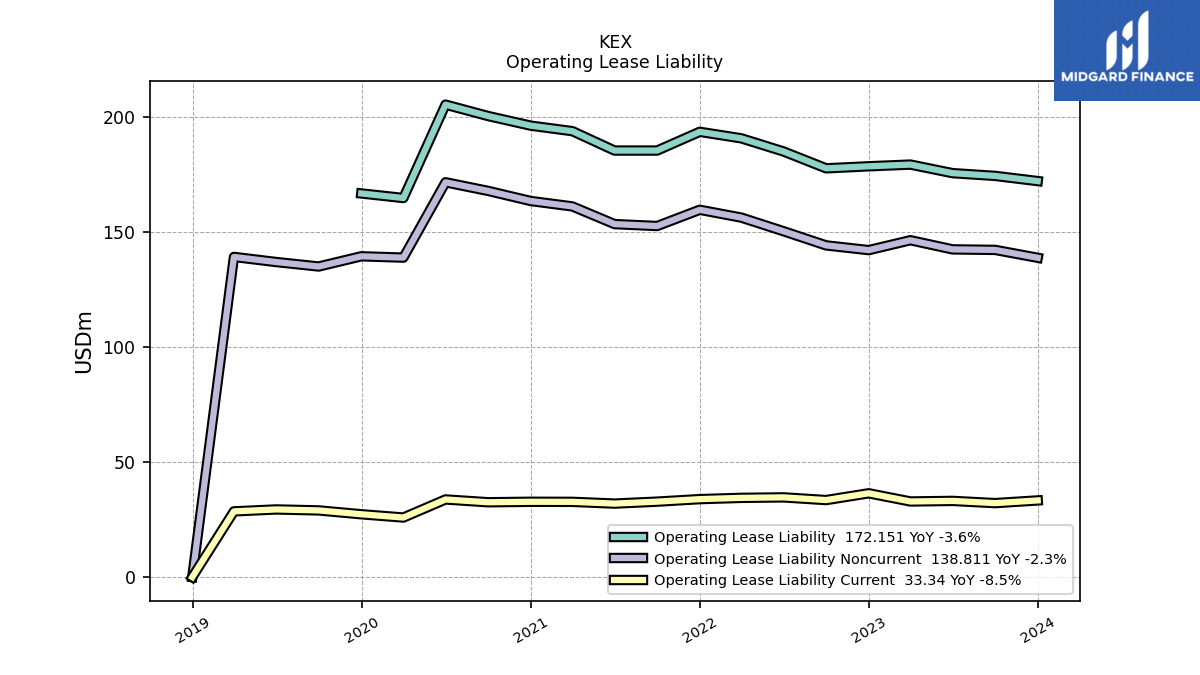
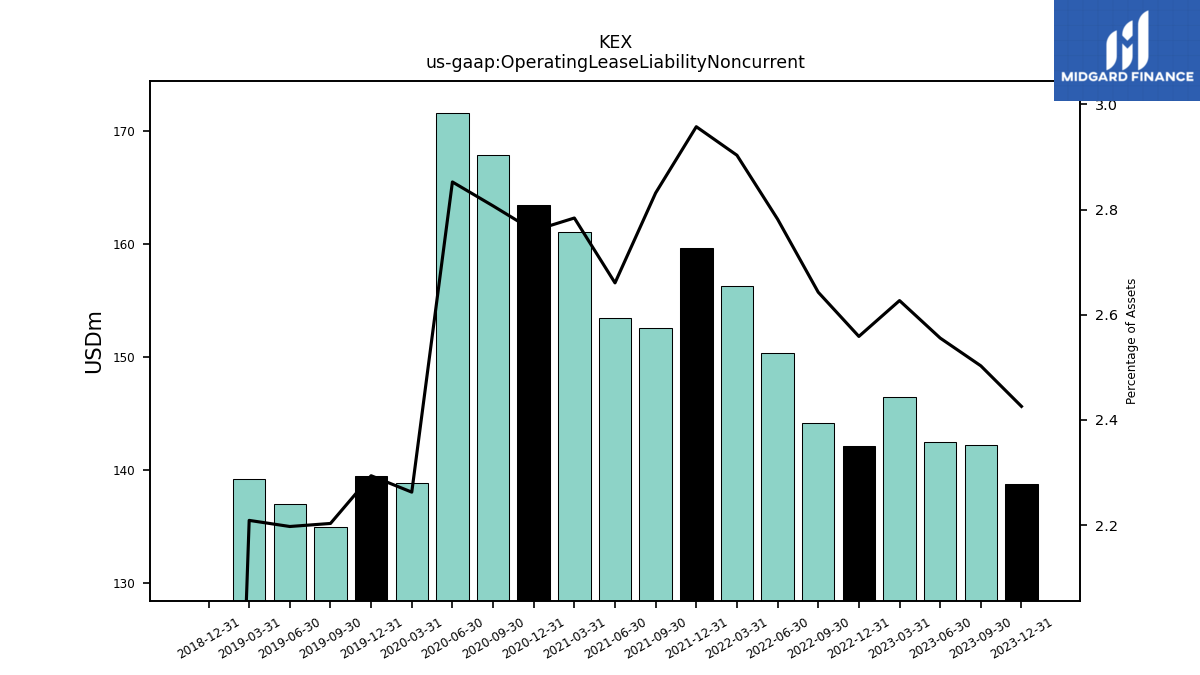
| Operating Lease Liability Noncurrent | 138.81 | 142.24 | 142.47 | 146.44 | 142.14 | 144.20 | 150.35 | 156.27 | 159.67 | 152.62 | 153.46 | 161.13 | 163.50 | 167.88 | 171.63 | 138.88 | 139.46 | 135.02 | 136.97 | 139.19 | 0.00 | NA | NA | NA | NA | NA | NA | NA | NA | NA | NA | NA | NA | NA | NA | NA | NA | NA | NA | NA | NA | NA | NA | NA | NA | NA | NA | NA | NA | NA | NA | NA | NA | NA | NA | NA |
| 2023-12-31 | 2023-09-30 | 2023-06-30 | 2023-03-31 | 2022-12-31 | 2022-09-30 | 2022-06-30 | 2022-03-31 | 2021-12-31 | 2021-09-30 | 2021-06-30 | 2021-03-31 | 2020-12-31 | 2020-09-30 | 2020-06-30 | 2020-03-31 | 2019-12-31 | 2019-09-30 | 2019-06-30 | 2019-03-31 | 2018-12-31 | 2018-09-30 | 2018-06-30 | 2018-03-31 | 2017-12-31 | 2017-09-30 | 2017-06-30 | 2017-03-31 | 2016-12-31 | 2016-09-30 | 2016-06-30 | 2016-03-31 | 2015-12-31 | 2015-09-30 | 2015-06-30 | 2015-03-31 | 2014-12-31 | 2014-09-30 | 2014-06-30 | 2014-03-31 | 2013-12-31 | 2013-09-30 | 2013-06-30 | 2013-03-31 | 2012-12-31 | 2012-09-30 | 2012-06-30 | 2012-03-31 | 2011-12-31 | 2011-09-30 | 2011-06-30 | 2011-03-31 | 2010-12-31 | 2010-09-30 | 2010-06-30 | 2010-03-31 | ||
|---|---|---|---|---|---|---|---|---|---|---|---|---|---|---|---|---|---|---|---|---|---|---|---|---|---|---|---|---|---|---|---|---|---|---|---|---|---|---|---|---|---|---|---|---|---|---|---|---|---|---|---|---|---|---|---|---|---|
| Stockholders Equity | 3185.43 | 3156.89 | 3110.64 | 3082.93 | 3042.88 | 2973.06 | 2927.39 | 2909.45 | 2886.32 | 2843.75 | 3101.69 | 3085.27 | 3084.31 | 3075.26 | 3048.88 | 3121.48 | 3368.62 | 3371.52 | 3319.15 | 3262.34 | 3213.19 | 3229.91 | 3184.35 | 3138.49 | 3110.82 | 2872.68 | 2473.89 | 2430.17 | 2409.32 | 2379.52 | 2343.53 | 2306.40 | 2268.81 | 2242.77 | 2245.04 | 2219.12 | 2254.04 | 2243.24 | 2162.87 | 2079.85 | 2010.69 | 1900.89 | 1824.72 | 1757.47 | 1694.97 | 1608.68 | 1548.78 | 1498.07 | 1442.53 | 1406.15 | 1235.61 | 1190.62 | 1156.10 | NA | NA | NA | |
| Stockholders Equity Including Portion Attributable To Noncontrolling Interest | 3186.68 | 3158.08 | 3112.81 | 3085.14 | 3045.17 | 2975.36 | 2929.74 | 2911.86 | 2888.78 | 2846.22 | 3105.33 | 3088.74 | 3087.55 | 3078.37 | 3051.98 | 3124.53 | 3371.59 | 3374.50 | 3322.17 | 3265.41 | 3216.30 | 3233.15 | 3187.69 | 3141.87 | 3114.22 | 2876.13 | 2477.39 | 2433.67 | 2412.87 | 2386.75 | 2350.68 | 2316.66 | 2279.20 | 2253.68 | 2255.84 | 2229.92 | 2264.91 | 2254.45 | 2174.11 | 2090.91 | 2022.15 | 1912.26 | 1836.16 | 1769.44 | 1707.05 | 1620.71 | 1561.23 | 1510.17 | 1454.16 | 1417.76 | 1242.84 | 1197.71 | 1159.14 | NA | NA | NA | |
| Common Stock Value | 6.55 | 6.55 | 6.55 | 6.55 | 6.55 | 6.55 | 6.55 | 6.55 | 6.55 | 6.55 | 6.55 | 6.55 | 6.55 | 6.55 | 6.55 | 6.55 | 6.55 | 6.55 | 6.55 | 6.55 | 6.55 | 6.55 | 6.55 | 6.55 | 6.55 | 6.55 | 5.98 | 5.98 | 5.98 | 5.98 | 5.98 | 5.98 | 5.98 | 5.98 | 5.98 | 5.98 | 5.98 | 5.98 | 5.98 | 5.98 | 5.98 | 5.98 | 5.98 | 5.98 | 5.98 | 5.93 | 5.93 | 5.93 | 5.93 | 5.93 | 5.73 | 5.73 | 5.73 | NA | NA | NA | |
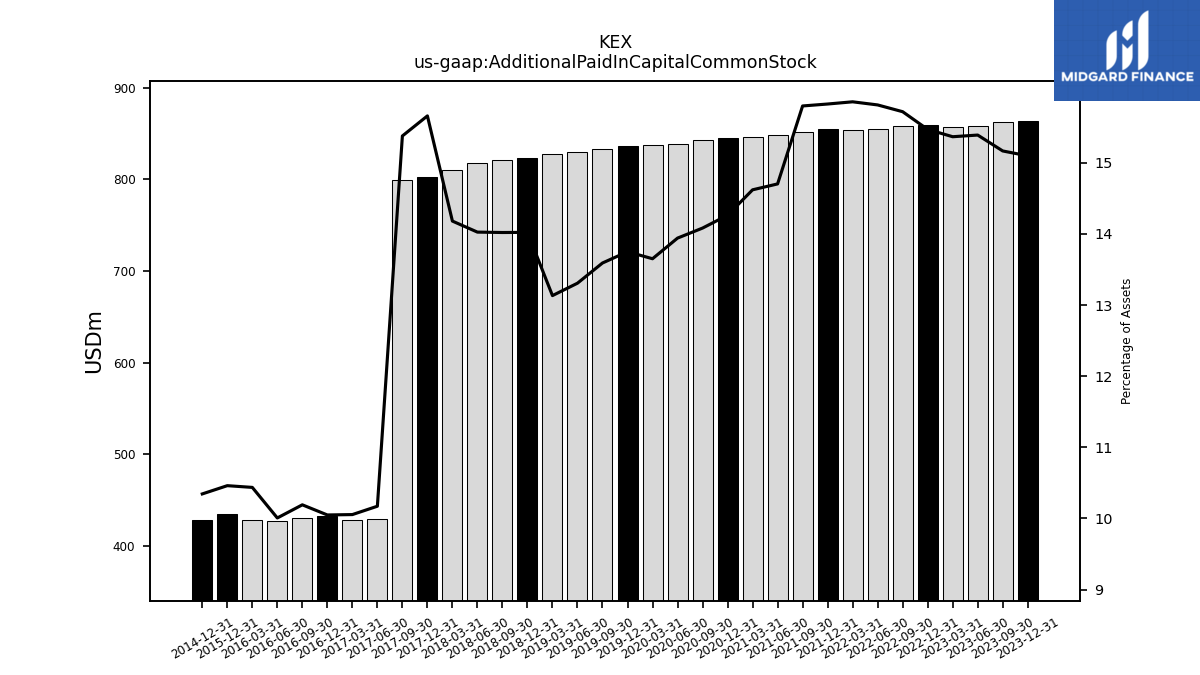
| Additional Paid In Capital Common Stock | 863.96 | 861.93 | 857.97 | 856.68 | 859.35 | 857.67 | 854.78 | 853.61 | 854.51 | 851.59 | 848.08 | 846.26 | 844.98 | 842.30 | 838.87 | 837.88 | 835.90 | 832.89 | 829.46 | 827.50 | 823.35 | 820.80 | 817.61 | 810.38 | 802.96 | 799.71 | 429.80 | 428.05 | 432.46 | 430.48 | 427.17 | 428.84 | 434.78 | NA | NA | NA | 428.48 | NA | NA | NA | NA | NA | NA | NA | NA | NA | NA | NA | NA | NA | NA | NA | NA | NA | NA | NA | |
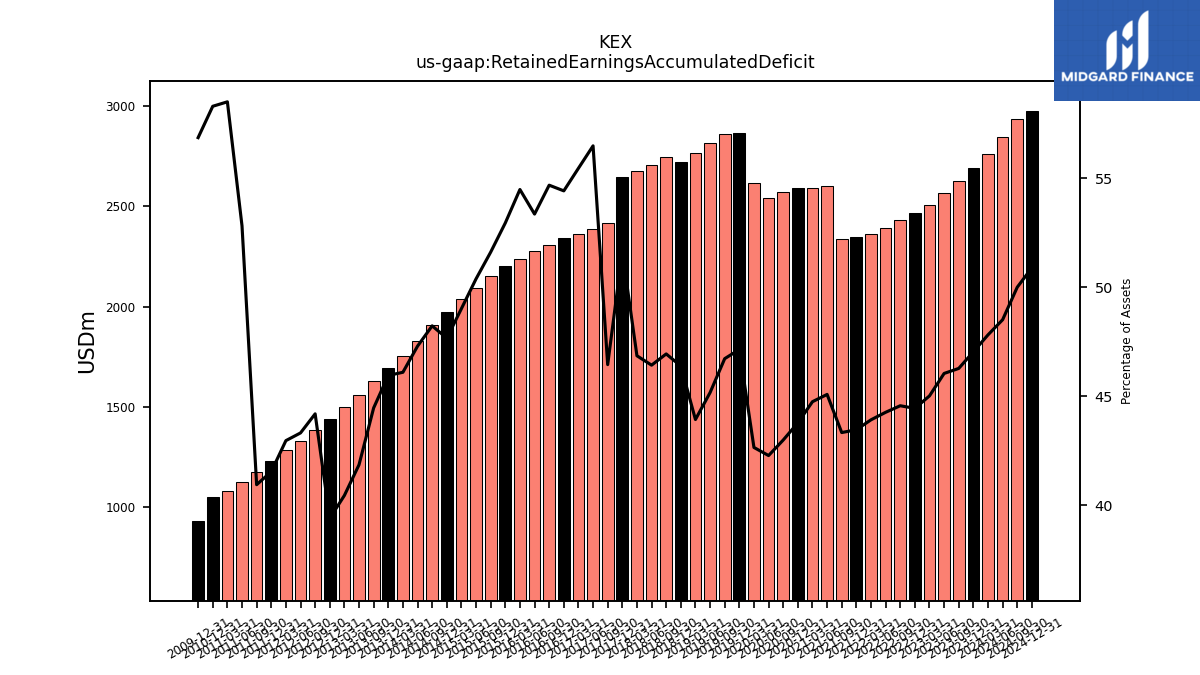
| Retained Earnings Accumulated Deficit | 2691.66 | 2629.76 | 2566.80 | 2509.43 | 2468.73 | 2431.42 | 2392.33 | 2363.87 | 2346.44 | 2335.48 | 2600.21 | 2590.02 | 2593.39 | 2571.19 | 2543.70 | 2617.47 | 2865.94 | 2863.16 | 2815.18 | 2767.89 | 2723.59 | 2748.03 | 2706.21 | 2677.61 | 2646.94 | 2415.62 | 2387.01 | 2361.23 | 2342.24 | 2309.88 | 2277.87 | 2238.93 | 2200.83 | 2150.14 | 2093.30 | 2035.22 | 1974.15 | 1906.10 | 1829.38 | 1754.39 | 1692.14 | 1627.87 | 1558.75 | 1495.66 | 1439.08 | 1381.19 | 1328.14 | 1280.59 | 1229.64 | 1173.47 | 1120.74 | 1079.05 | 1046.62 | NA | NA | NA | |
| Accumulated Other Comprehensive Income Loss Net Of Tax | 35.01 | 19.08 | 19.00 | 17.02 | 16.85 | -13.46 | -21.96 | -25.48 | -25.97 | -54.66 | -57.68 | -61.20 | -61.45 | -45.63 | -41.12 | -38.99 | -37.80 | -27.41 | -26.97 | -32.97 | -33.51 | -39.54 | -39.92 | -39.48 | -32.41 | -35.78 | -36.12 | -50.26 | -51.01 | -46.45 | -47.19 | -44.04 | -44.69 | -56.32 | -57.44 | -60.03 | -61.04 | -16.25 | -16.25 | -16.70 | -16.79 | -57.19 | -58.24 | -58.77 | -61.13 | -51.39 | -53.51 | -53.81 | -56.18 | -29.72 | -31.92 | -32.43 | -33.64 | NA | NA | NA | |
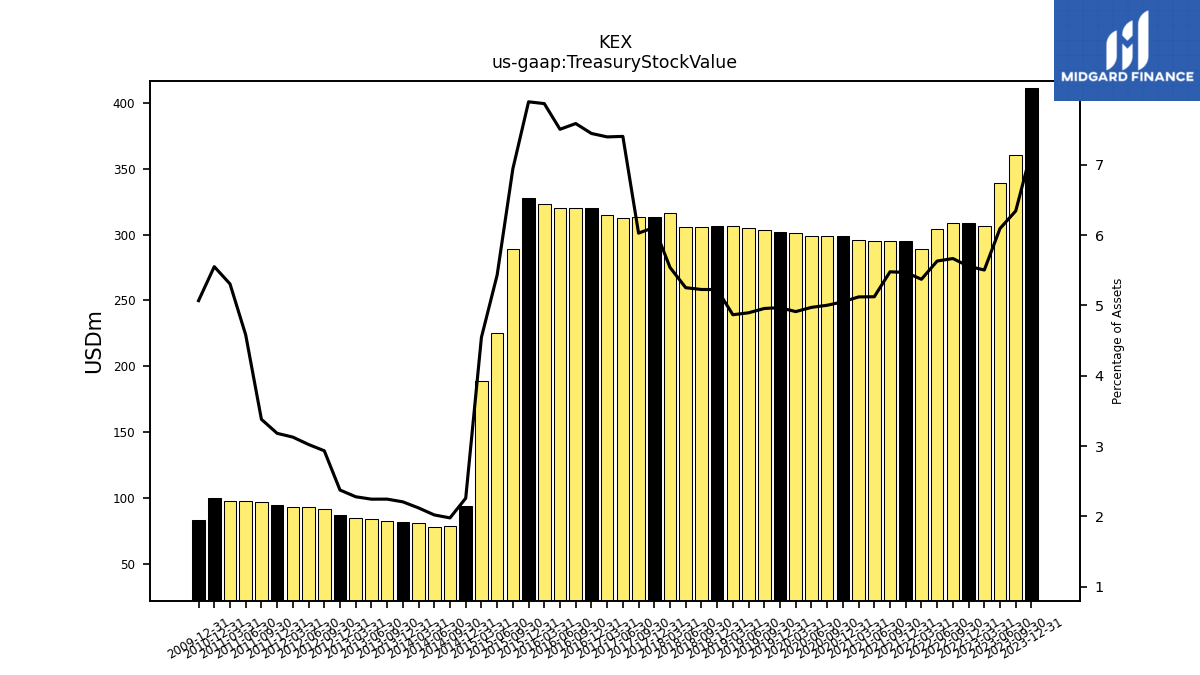
| Treasury Stock Value | 411.75 | 360.42 | 339.66 | 306.75 | 308.60 | 309.13 | 304.31 | 289.10 | 295.21 | 295.20 | 295.46 | 296.35 | 299.16 | 299.14 | 299.12 | 301.42 | 301.96 | 303.67 | 305.06 | 306.62 | 306.79 | 305.93 | 306.10 | 316.56 | 313.22 | 313.42 | 312.77 | 314.83 | 320.35 | 320.36 | 320.30 | 323.31 | 328.09 | 289.17 | 225.64 | 188.70 | 93.53 | 78.19 | 78.15 | 80.68 | 81.25 | 82.20 | 83.60 | 84.28 | 86.75 | 91.67 | 92.66 | 93.20 | 94.16 | 96.88 | 97.18 | 97.83 | 99.62 | NA | NA | NA | |
| Minority Interest | 1.25 | 1.19 | 2.17 | 2.21 | 2.29 | 2.31 | 2.36 | 2.41 | 2.46 | 2.48 | 3.64 | 3.48 | 3.25 | 3.10 | 3.10 | 3.04 | 2.97 | 2.98 | 3.02 | 3.07 | 3.11 | 3.24 | 3.34 | 3.37 | 3.40 | 3.45 | 3.49 | 3.50 | 3.55 | 7.23 | 7.14 | 10.26 | 10.38 | 10.91 | 10.81 | 10.80 | 10.88 | 11.21 | 11.25 | 11.06 | 11.47 | 11.37 | 11.44 | 11.97 | 12.09 | 12.04 | 12.45 | 12.10 | 11.63 | 11.61 | 7.23 | 7.09 | 3.04 | NA | NA | NA | |
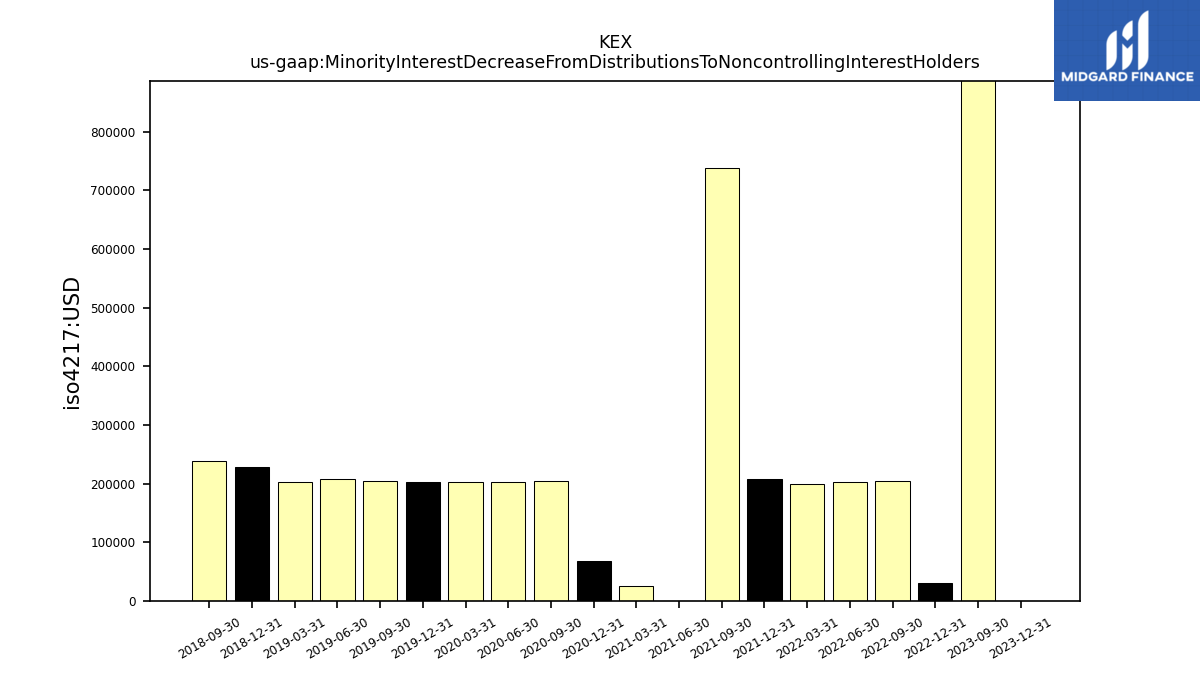
| Minority Interest Decrease From Distributions To Noncontrolling Interest Holders | 0.00 | 1.01 | NA | NA | 0.03 | 0.20 | 0.20 | 0.20 | 0.21 | 0.74 | 0.00 | 0.03 | 0.07 | 0.20 | 0.20 | 0.20 | 0.20 | 0.20 | 0.21 | 0.20 | 0.23 | 0.24 | NA | NA | NA | NA | NA | NA | NA | NA | NA | NA | NA | NA | NA | NA | NA | NA | NA | NA | NA | NA | NA | NA | NA | NA | NA | NA | NA | NA | NA | NA | NA | NA | NA | NA |
| 2023-12-31 | 2023-09-30 | 2023-06-30 | 2023-03-31 | 2022-12-31 | 2022-09-30 | 2022-06-30 | 2022-03-31 | 2021-12-31 | 2021-09-30 | 2021-06-30 | 2021-03-31 | 2020-12-31 | 2020-09-30 | 2020-06-30 | 2020-03-31 | 2019-12-31 | 2019-09-30 | 2019-06-30 | 2019-03-31 | 2018-12-31 | 2018-09-30 | 2018-06-30 | 2018-03-31 | 2017-12-31 | 2017-09-30 | 2017-06-30 | 2017-03-31 | 2016-12-31 | 2016-09-30 | 2016-06-30 | 2016-03-31 | 2015-12-31 | 2015-09-30 | 2015-06-30 | 2015-03-31 | 2014-12-31 | 2014-09-30 | 2014-06-30 | 2014-03-31 | 2013-12-31 | 2013-09-30 | 2013-06-30 | 2013-03-31 | 2012-12-31 | 2012-09-30 | 2012-06-30 | 2012-03-31 | 2011-12-31 | 2011-09-30 | 2011-06-30 | 2011-03-31 | 2010-12-31 | 2010-09-30 | 2010-06-30 | 2010-03-31 | ||
|---|---|---|---|---|---|---|---|---|---|---|---|---|---|---|---|---|---|---|---|---|---|---|---|---|---|---|---|---|---|---|---|---|---|---|---|---|---|---|---|---|---|---|---|---|---|---|---|---|---|---|---|---|---|---|---|---|---|
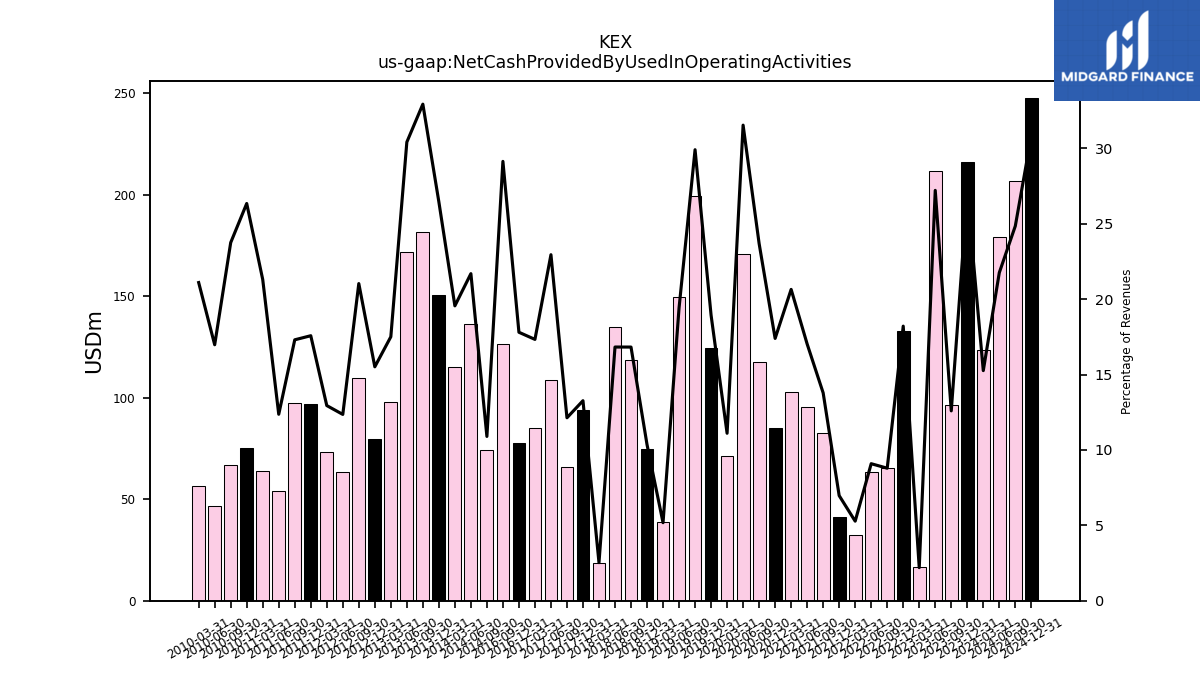
| Net Cash Provided By Used In Operating Activities | 216.00 | 96.28 | 211.47 | 16.48 | 132.94 | 65.54 | 63.42 | 32.22 | 41.21 | 82.54 | 95.26 | 102.56 | 85.18 | 117.62 | 170.64 | 71.50 | 124.21 | 199.40 | 149.67 | 38.53 | 74.69 | 118.55 | 135.02 | 18.73 | 93.92 | 65.66 | 108.59 | 85.20 | 77.55 | 126.63 | NA | NA | NA | NA | NA | NA | NA | 74.16 | 136.20 | 115.21 | 150.32 | 181.44 | 171.48 | 97.80 | 79.50 | 109.63 | 63.23 | 73.37 | 96.67 | 97.50 | 54.07 | 63.76 | 75.41 | 66.80 | 46.45 | 56.59 | |
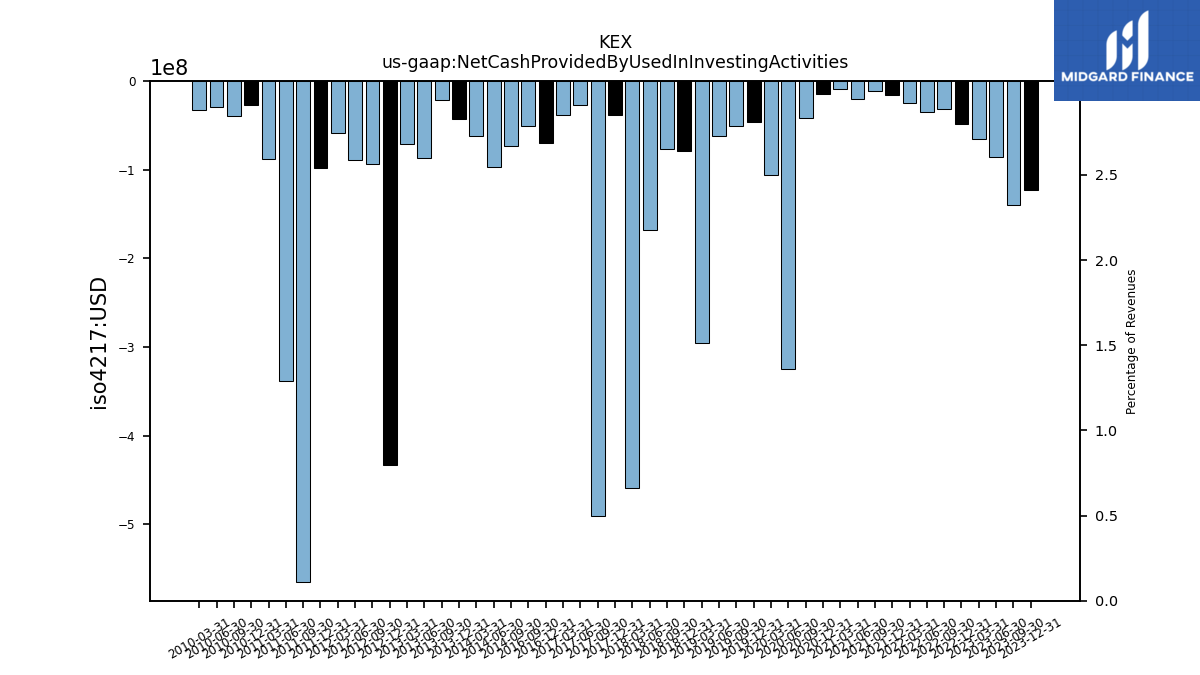
| Net Cash Provided By Used In Investing Activities | -122.53 | -139.90 | -85.55 | -65.17 | -48.34 | -31.61 | -34.95 | -24.70 | -15.51 | -11.17 | -19.81 | -9.30 | -14.24 | -41.45 | -324.50 | -105.65 | -45.88 | -50.37 | -61.53 | -295.21 | -79.44 | -76.24 | -168.17 | -458.76 | -38.18 | -490.37 | -26.74 | -37.81 | -69.72 | -50.91 | NA | NA | NA | NA | NA | NA | NA | -73.04 | -97.52 | -61.89 | -42.59 | -21.59 | -87.30 | -71.41 | -432.72 | -93.53 | -88.76 | -58.43 | -97.91 | -564.63 | -338.34 | -87.86 | -26.58 | -39.12 | -28.89 | -32.53 | |
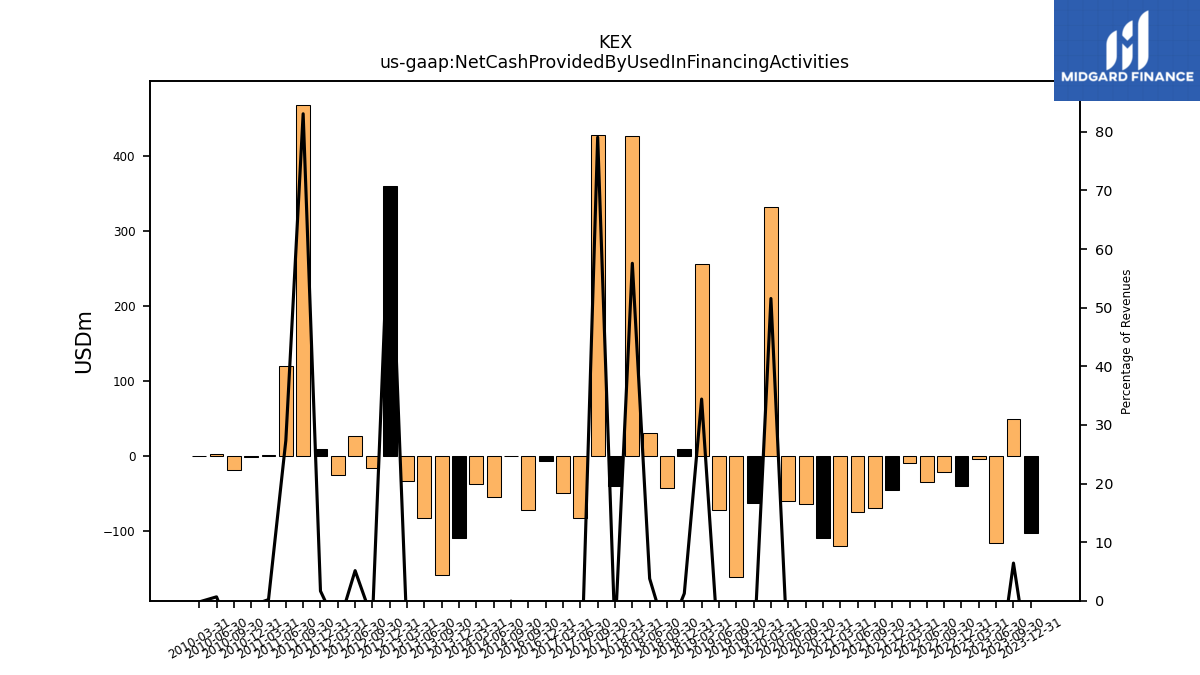
| Net Cash Provided By Used In Financing Activities | -103.01 | 49.14 | -116.02 | -5.19 | -41.02 | -22.04 | -35.76 | -9.94 | -45.27 | -70.05 | -74.73 | -121.27 | -110.18 | -65.06 | -60.24 | 331.99 | -63.02 | -162.12 | -72.91 | 256.18 | 8.93 | -42.89 | 30.34 | 426.93 | -40.47 | 427.96 | -83.04 | -50.27 | -7.58 | -73.20 | NA | NA | NA | NA | NA | NA | NA | -0.36 | -54.99 | -38.09 | -110.19 | -158.63 | -82.75 | -33.61 | 359.13 | -16.76 | 26.29 | -26.14 | 9.12 | 468.16 | 119.51 | 0.59 | -2.43 | -19.22 | 1.83 | -0.54 |
| 2023-12-31 | 2023-09-30 | 2023-06-30 | 2023-03-31 | 2022-12-31 | 2022-09-30 | 2022-06-30 | 2022-03-31 | 2021-12-31 | 2021-09-30 | 2021-06-30 | 2021-03-31 | 2020-12-31 | 2020-09-30 | 2020-06-30 | 2020-03-31 | 2019-12-31 | 2019-09-30 | 2019-06-30 | 2019-03-31 | 2018-12-31 | 2018-09-30 | 2018-06-30 | 2018-03-31 | 2017-12-31 | 2017-09-30 | 2017-06-30 | 2017-03-31 | 2016-12-31 | 2016-09-30 | 2016-06-30 | 2016-03-31 | 2015-12-31 | 2015-09-30 | 2015-06-30 | 2015-03-31 | 2014-12-31 | 2014-09-30 | 2014-06-30 | 2014-03-31 | 2013-12-31 | 2013-09-30 | 2013-06-30 | 2013-03-31 | 2012-12-31 | 2012-09-30 | 2012-06-30 | 2012-03-31 | 2011-12-31 | 2011-09-30 | 2011-06-30 | 2011-03-31 | 2010-12-31 | 2010-09-30 | 2010-06-30 | 2010-03-31 | ||
|---|---|---|---|---|---|---|---|---|---|---|---|---|---|---|---|---|---|---|---|---|---|---|---|---|---|---|---|---|---|---|---|---|---|---|---|---|---|---|---|---|---|---|---|---|---|---|---|---|---|---|---|---|---|---|---|---|---|
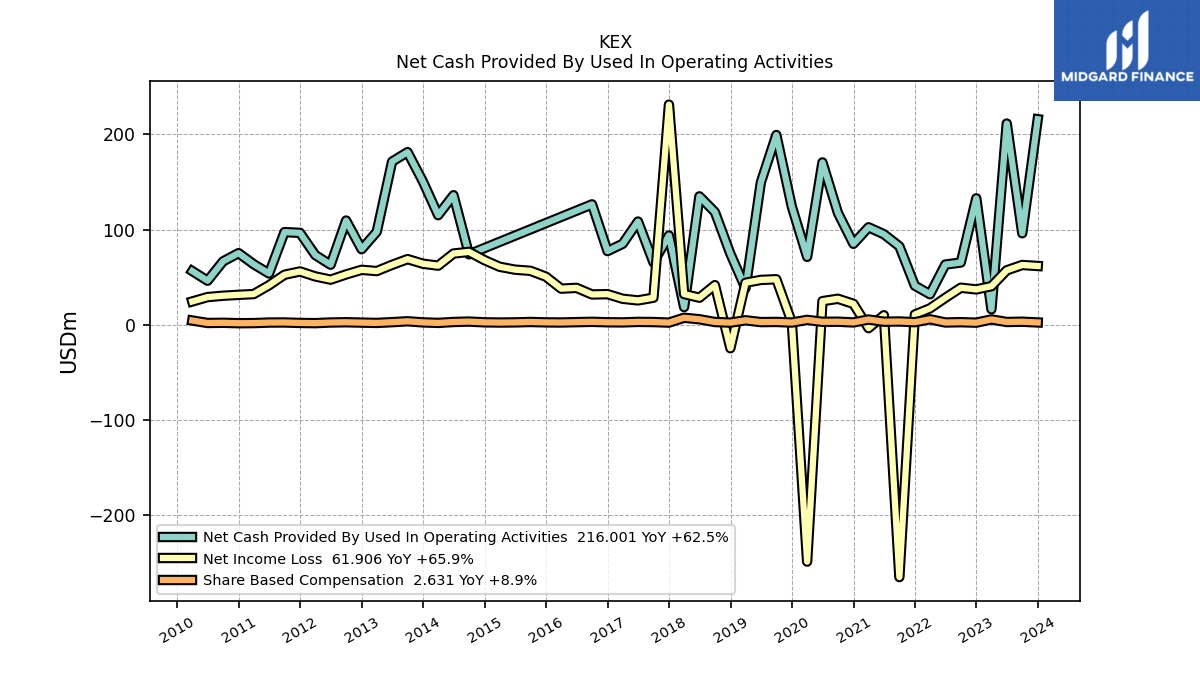
| Net Cash Provided By Used In Operating Activities | 216.00 | 96.28 | 211.47 | 16.48 | 132.94 | 65.54 | 63.42 | 32.22 | 41.21 | 82.54 | 95.26 | 102.56 | 85.18 | 117.62 | 170.64 | 71.50 | 124.21 | 199.40 | 149.67 | 38.53 | 74.69 | 118.55 | 135.02 | 18.73 | 93.92 | 65.66 | 108.59 | 85.20 | 77.55 | 126.63 | NA | NA | NA | NA | NA | NA | NA | 74.16 | 136.20 | 115.21 | 150.32 | 181.44 | 171.48 | 97.80 | 79.50 | 109.63 | 63.23 | 73.37 | 96.67 | 97.50 | 54.07 | 63.76 | 75.41 | 66.80 | 46.45 | 56.59 | |
| Net Income Loss | 61.91 | 62.96 | 57.37 | 40.70 | 37.31 | 39.09 | 28.46 | 17.43 | 10.96 | -264.73 | 10.19 | -3.38 | 22.20 | 27.49 | 25.00 | -248.47 | 2.78 | 47.99 | 47.29 | 44.30 | -24.44 | 41.82 | 28.60 | 32.47 | 231.32 | 28.61 | 25.78 | 27.48 | 32.35 | 32.01 | 38.94 | 38.10 | 50.69 | 56.84 | 58.08 | 61.08 | 68.05 | 76.72 | 74.99 | 62.25 | 64.27 | 69.12 | 63.09 | 56.58 | 57.89 | 53.05 | 47.55 | 50.94 | 56.17 | 52.73 | 41.69 | 32.43 | 31.62 | 30.69 | 29.27 | 24.67 | |
| Profit Loss | 61.96 | 63.00 | 57.32 | 40.62 | 37.33 | 39.24 | 28.61 | 17.59 | 11.15 | -265.15 | 10.35 | -3.12 | 22.41 | 27.69 | 25.26 | -248.19 | 2.97 | 48.15 | 47.44 | 44.46 | -24.33 | 41.95 | 28.79 | 32.67 | 231.50 | 28.79 | 25.97 | 27.64 | 32.86 | 32.35 | 39.11 | 38.48 | 51.07 | 57.11 | 58.38 | 61.41 | 68.47 | 77.21 | 75.91 | 63.01 | 65.26 | 69.70 | 63.79 | 57.55 | 58.57 | 53.73 | 48.44 | 51.88 | 56.77 | 53.59 | 42.23 | 32.90 | 31.92 | 30.91 | 29.64 | 24.91 | |
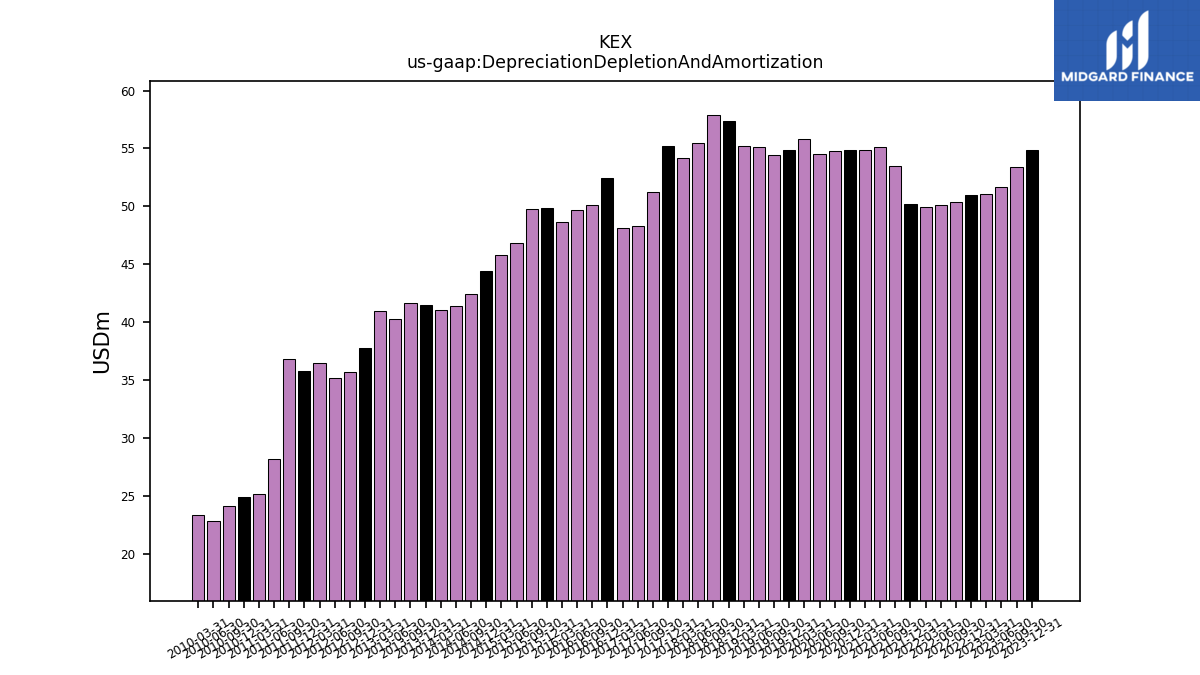
| Depreciation Depletion And Amortization | 54.91 | 53.45 | 51.70 | 51.11 | 50.95 | 50.42 | 50.12 | 49.96 | 50.23 | 53.46 | 55.13 | 54.89 | 54.85 | 54.78 | 54.50 | 55.79 | 54.86 | 54.45 | 55.09 | 55.22 | 57.33 | 57.93 | 55.49 | 54.22 | 55.21 | 51.21 | 48.29 | 48.17 | 52.49 | 50.14 | 49.66 | 48.62 | 49.89 | 49.76 | 46.83 | 45.77 | 44.44 | 42.43 | 41.41 | 41.04 | 41.53 | 41.64 | 40.27 | 41.00 | 37.75 | 35.73 | 35.20 | 36.47 | 35.80 | 36.83 | 28.21 | 25.19 | 24.94 | 24.14 | 22.85 | 23.37 | |
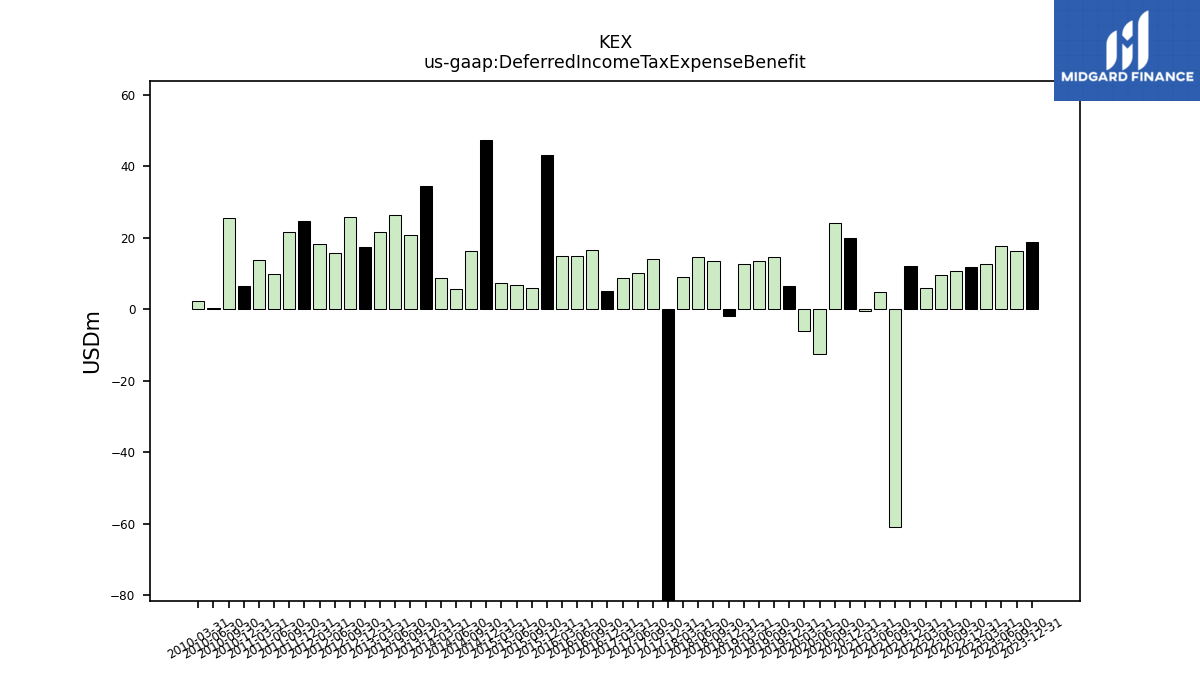
| Deferred Income Tax Expense Benefit | 18.86 | 16.20 | 17.66 | 12.57 | 11.80 | 10.65 | 9.48 | 5.86 | 12.03 | -60.83 | 4.91 | -0.53 | 19.78 | 23.97 | -12.51 | -6.08 | 6.34 | 14.49 | 13.52 | 12.49 | -1.96 | 13.46 | 14.54 | 8.85 | -289.05 | 14.13 | 10.09 | 8.56 | 5.03 | 16.58 | 14.97 | 14.71 | 43.03 | 5.92 | 6.62 | 7.18 | 47.25 | 16.31 | 5.63 | 8.78 | 34.53 | 20.64 | 26.39 | 21.50 | 17.34 | 25.89 | 15.59 | 18.18 | 24.62 | 21.64 | 9.93 | 13.81 | 6.41 | 25.61 | 0.18 | 2.24 | |
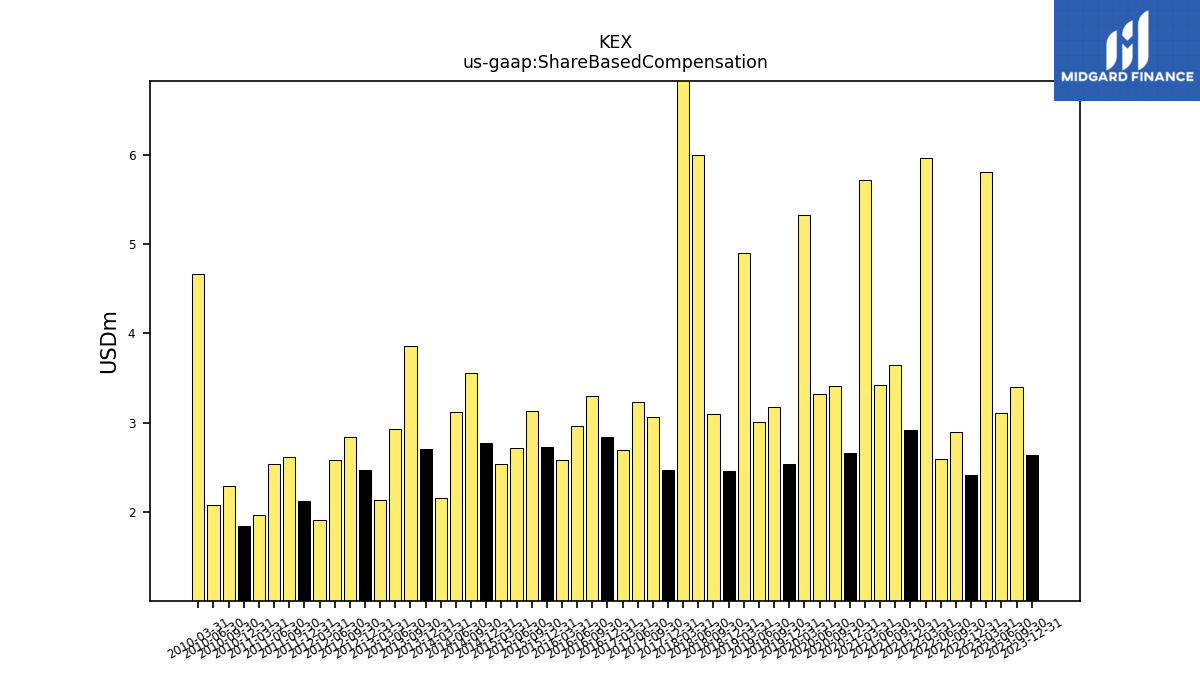
| Share Based Compensation | 2.63 | 3.40 | 3.10 | 5.81 | 2.42 | 2.89 | 2.59 | 5.96 | 2.92 | 3.65 | 3.43 | 5.72 | 2.66 | 3.41 | 3.32 | 5.33 | 2.53 | 3.17 | 3.01 | 4.90 | 2.46 | 3.10 | 6.00 | 7.55 | 2.47 | 3.07 | 3.23 | 2.69 | 2.83 | 3.30 | 2.96 | 2.58 | 2.73 | 3.13 | 2.71 | 2.54 | 2.77 | 3.55 | 3.12 | 2.15 | 2.70 | 3.86 | 2.93 | 2.13 | 2.46 | 2.84 | 2.58 | 1.91 | 2.12 | 2.62 | 2.53 | 1.96 | 1.83 | 2.29 | 2.07 | 4.67 |
| 2023-12-31 | 2023-09-30 | 2023-06-30 | 2023-03-31 | 2022-12-31 | 2022-09-30 | 2022-06-30 | 2022-03-31 | 2021-12-31 | 2021-09-30 | 2021-06-30 | 2021-03-31 | 2020-12-31 | 2020-09-30 | 2020-06-30 | 2020-03-31 | 2019-12-31 | 2019-09-30 | 2019-06-30 | 2019-03-31 | 2018-12-31 | 2018-09-30 | 2018-06-30 | 2018-03-31 | 2017-12-31 | 2017-09-30 | 2017-06-30 | 2017-03-31 | 2016-12-31 | 2016-09-30 | 2016-06-30 | 2016-03-31 | 2015-12-31 | 2015-09-30 | 2015-06-30 | 2015-03-31 | 2014-12-31 | 2014-09-30 | 2014-06-30 | 2014-03-31 | 2013-12-31 | 2013-09-30 | 2013-06-30 | 2013-03-31 | 2012-12-31 | 2012-09-30 | 2012-06-30 | 2012-03-31 | 2011-12-31 | 2011-09-30 | 2011-06-30 | 2011-03-31 | 2010-12-31 | 2010-09-30 | 2010-06-30 | 2010-03-31 | ||
|---|---|---|---|---|---|---|---|---|---|---|---|---|---|---|---|---|---|---|---|---|---|---|---|---|---|---|---|---|---|---|---|---|---|---|---|---|---|---|---|---|---|---|---|---|---|---|---|---|---|---|---|---|---|---|---|---|---|
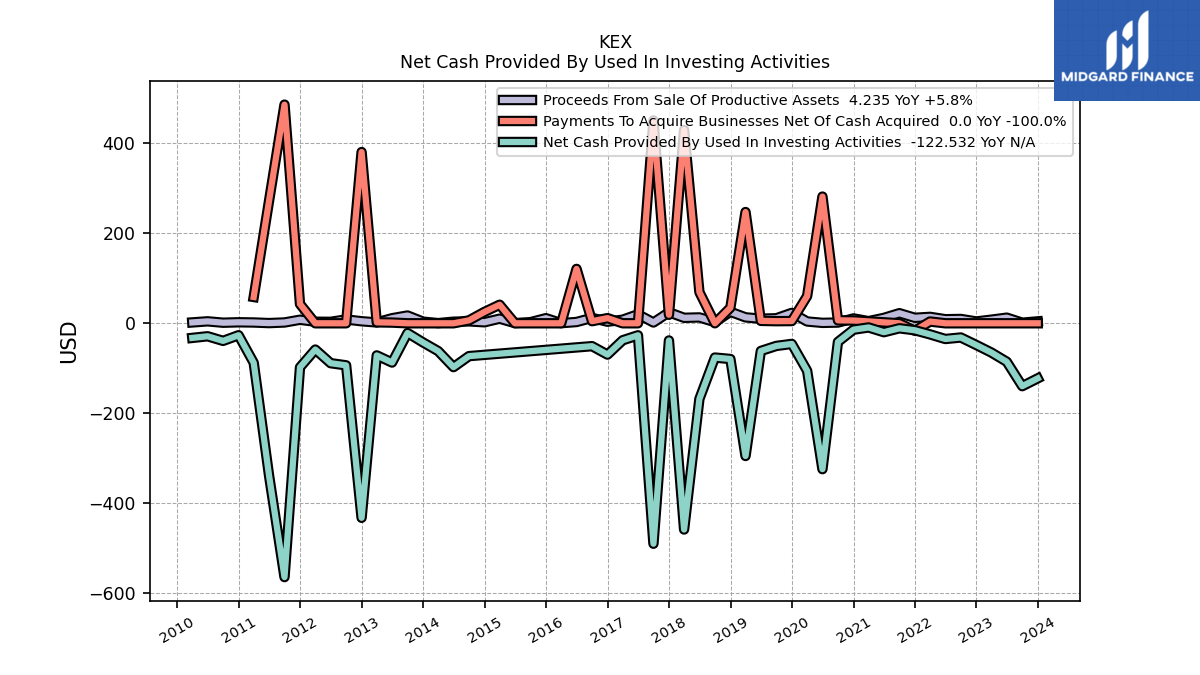
| Net Cash Provided By Used In Investing Activities | -122.53 | -139.90 | -85.55 | -65.17 | -48.34 | -31.61 | -34.95 | -24.70 | -15.51 | -11.17 | -19.81 | -9.30 | -14.24 | -41.45 | -324.50 | -105.65 | -45.88 | -50.37 | -61.53 | -295.21 | -79.44 | -76.24 | -168.17 | -458.76 | -38.18 | -490.37 | -26.74 | -37.81 | -69.72 | -50.91 | NA | NA | NA | NA | NA | NA | NA | -73.04 | -97.52 | -61.89 | -42.59 | -21.59 | -87.30 | -71.41 | -432.72 | -93.53 | -88.76 | -58.43 | -97.91 | -564.63 | -338.34 | -87.86 | -26.58 | -39.12 | -28.89 | -32.53 | |
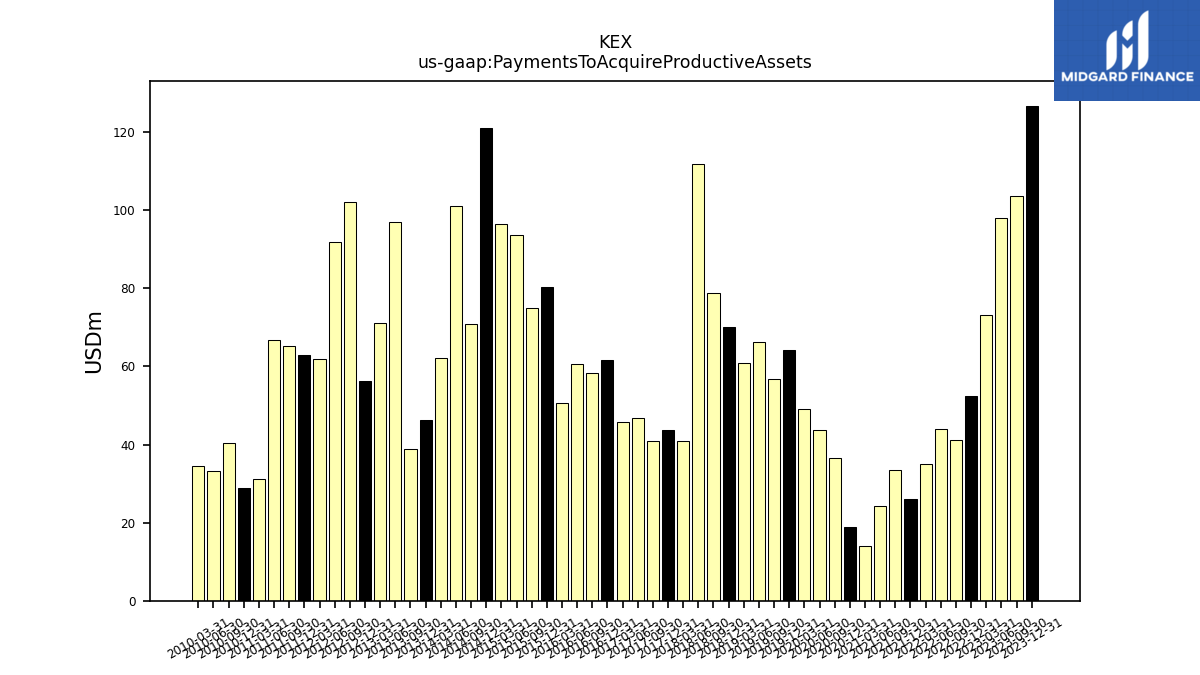
| Payments To Acquire Productive Assets | 126.77 | 103.72 | 98.05 | 73.20 | 52.34 | 41.20 | 43.98 | 35.08 | 26.05 | 33.60 | 24.32 | 14.05 | 18.81 | 36.54 | 43.60 | 49.23 | 64.10 | 56.80 | 66.34 | 60.93 | 70.11 | 78.84 | 111.95 | 40.96 | 43.78 | 40.93 | 46.74 | 45.77 | 61.76 | 58.26 | 60.52 | 50.52 | 80.27 | 75.05 | 93.62 | 96.53 | 121.05 | 70.80 | 101.04 | 62.26 | 46.18 | 38.87 | 97.02 | 71.16 | 56.28 | 102.04 | 91.98 | 61.87 | 63.03 | 65.24 | 66.86 | 31.11 | 28.80 | 40.40 | 33.21 | 34.42 |
| 2023-12-31 | 2023-09-30 | 2023-06-30 | 2023-03-31 | 2022-12-31 | 2022-09-30 | 2022-06-30 | 2022-03-31 | 2021-12-31 | 2021-09-30 | 2021-06-30 | 2021-03-31 | 2020-12-31 | 2020-09-30 | 2020-06-30 | 2020-03-31 | 2019-12-31 | 2019-09-30 | 2019-06-30 | 2019-03-31 | 2018-12-31 | 2018-09-30 | 2018-06-30 | 2018-03-31 | 2017-12-31 | 2017-09-30 | 2017-06-30 | 2017-03-31 | 2016-12-31 | 2016-09-30 | 2016-06-30 | 2016-03-31 | 2015-12-31 | 2015-09-30 | 2015-06-30 | 2015-03-31 | 2014-12-31 | 2014-09-30 | 2014-06-30 | 2014-03-31 | 2013-12-31 | 2013-09-30 | 2013-06-30 | 2013-03-31 | 2012-12-31 | 2012-09-30 | 2012-06-30 | 2012-03-31 | 2011-12-31 | 2011-09-30 | 2011-06-30 | 2011-03-31 | 2010-12-31 | 2010-09-30 | 2010-06-30 | 2010-03-31 | ||
|---|---|---|---|---|---|---|---|---|---|---|---|---|---|---|---|---|---|---|---|---|---|---|---|---|---|---|---|---|---|---|---|---|---|---|---|---|---|---|---|---|---|---|---|---|---|---|---|---|---|---|---|---|---|---|---|---|---|
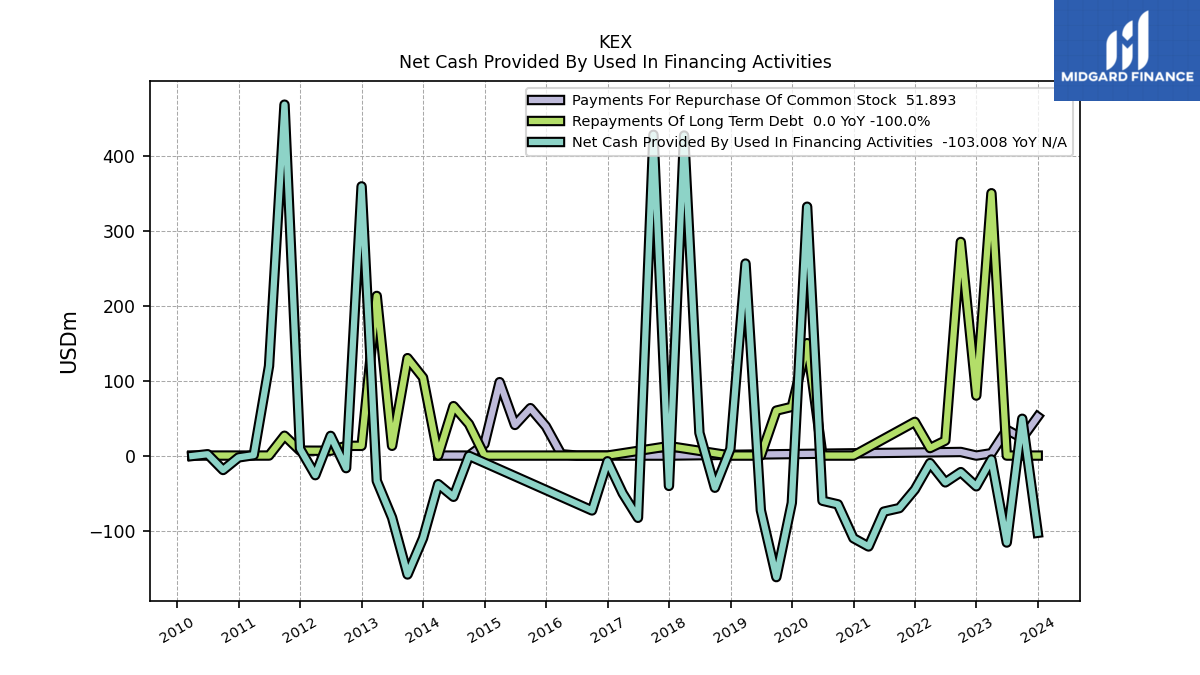
| Net Cash Provided By Used In Financing Activities | -103.01 | 49.14 | -116.02 | -5.19 | -41.02 | -22.04 | -35.76 | -9.94 | -45.27 | -70.05 | -74.73 | -121.27 | -110.18 | -65.06 | -60.24 | 331.99 | -63.02 | -162.12 | -72.91 | 256.18 | 8.93 | -42.89 | 30.34 | 426.93 | -40.47 | 427.96 | -83.04 | -50.27 | -7.58 | -73.20 | NA | NA | NA | NA | NA | NA | NA | -0.36 | -54.99 | -38.09 | -110.19 | -158.63 | -82.75 | -33.61 | 359.13 | -16.76 | 26.29 | -26.14 | 9.12 | 468.16 | 119.51 | 0.59 | -2.43 | -19.22 | 1.83 | -0.54 | |
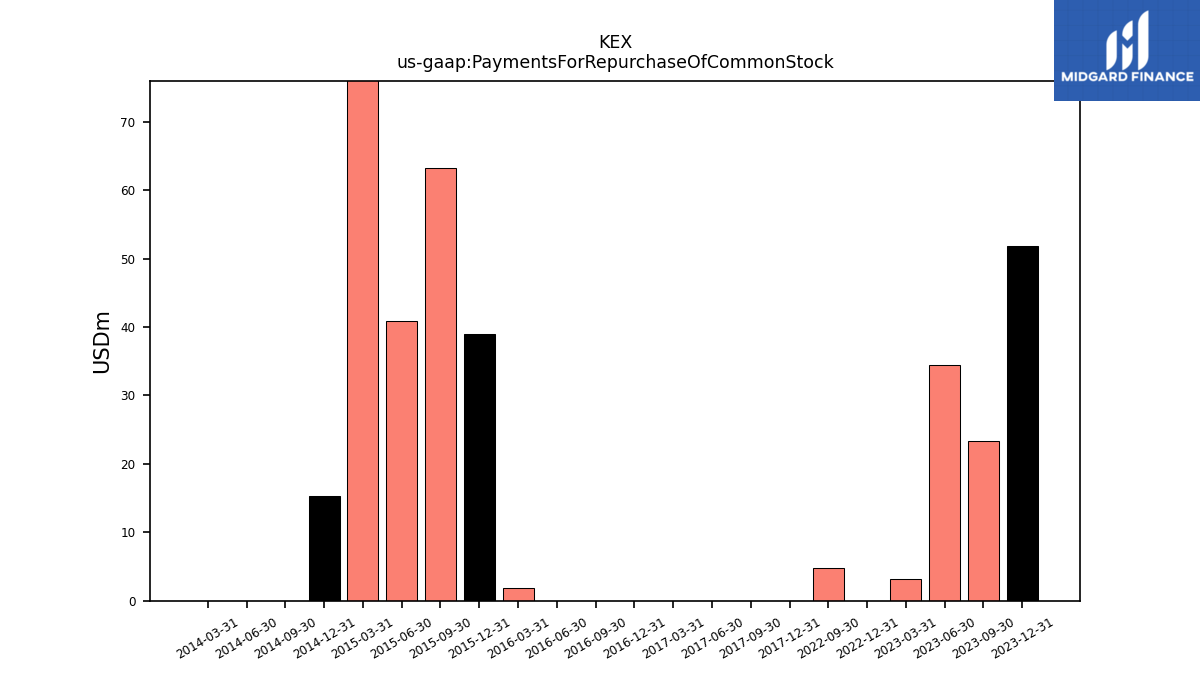
| Payments For Repurchase Of Common Stock | 51.89 | 23.31 | 34.42 | 3.18 | 0.00 | 4.82 | NA | NA | NA | NA | NA | NA | NA | NA | NA | NA | NA | NA | NA | NA | NA | NA | NA | NA | 0.00 | 0.00 | 0.00 | 0.00 | 0.00 | 0.00 | 0.00 | 1.83 | 38.95 | 63.30 | 40.84 | 98.01 | 15.32 | 0.00 | 0.00 | 0.00 | NA | NA | NA | NA | NA | NA | NA | NA | NA | NA | NA | NA | NA | NA | NA | NA |
| 2023-12-31 | 2023-09-30 | 2023-06-30 | 2023-03-31 | 2022-12-31 | 2022-09-30 | 2022-06-30 | 2022-03-31 | 2021-12-31 | 2021-09-30 | 2021-06-30 | 2021-03-31 | 2020-12-31 | 2020-09-30 | 2020-06-30 | 2020-03-31 | 2019-12-31 | 2019-09-30 | 2019-06-30 | 2019-03-31 | 2018-12-31 | 2018-09-30 | 2018-06-30 | 2018-03-31 | 2017-12-31 | 2017-09-30 | 2017-06-30 | 2017-03-31 | 2016-12-31 | 2016-09-30 | 2016-06-30 | 2016-03-31 | 2015-12-31 | 2015-09-30 | 2015-06-30 | 2015-03-31 | 2014-12-31 | 2014-09-30 | 2014-06-30 | 2014-03-31 | 2013-12-31 | 2013-09-30 | 2013-06-30 | 2013-03-31 | 2012-12-31 | 2012-09-30 | 2012-06-30 | 2012-03-31 | 2011-12-31 | 2011-09-30 | 2011-06-30 | 2011-03-31 | 2010-12-31 | 2010-09-30 | 2010-06-30 | 2010-03-31 | ||
|---|---|---|---|---|---|---|---|---|---|---|---|---|---|---|---|---|---|---|---|---|---|---|---|---|---|---|---|---|---|---|---|---|---|---|---|---|---|---|---|---|---|---|---|---|---|---|---|---|---|---|---|---|---|---|---|---|---|
| Revenues | 799.18 | 764.77 | 777.25 | 750.44 | 730.16 | 745.84 | 697.96 | 610.78 | 591.27 | 598.92 | 559.62 | 496.85 | 489.76 | 496.57 | 541.16 | 643.93 | 655.93 | 666.81 | 771.04 | 744.62 | 721.49 | 704.85 | 802.67 | 741.69 | 708.11 | 541.27 | 473.33 | 491.70 | 435.65 | 434.71 | 441.58 | 458.73 | 484.14 | 532.57 | 543.16 | 587.67 | 668.30 | 680.72 | 628.05 | 589.25 | 568.40 | 551.11 | 563.91 | 558.78 | 512.55 | 521.32 | 511.85 | 566.93 | 550.14 | 563.58 | 437.33 | 299.36 | 286.32 | 281.32 | 273.67 | 268.25 | |
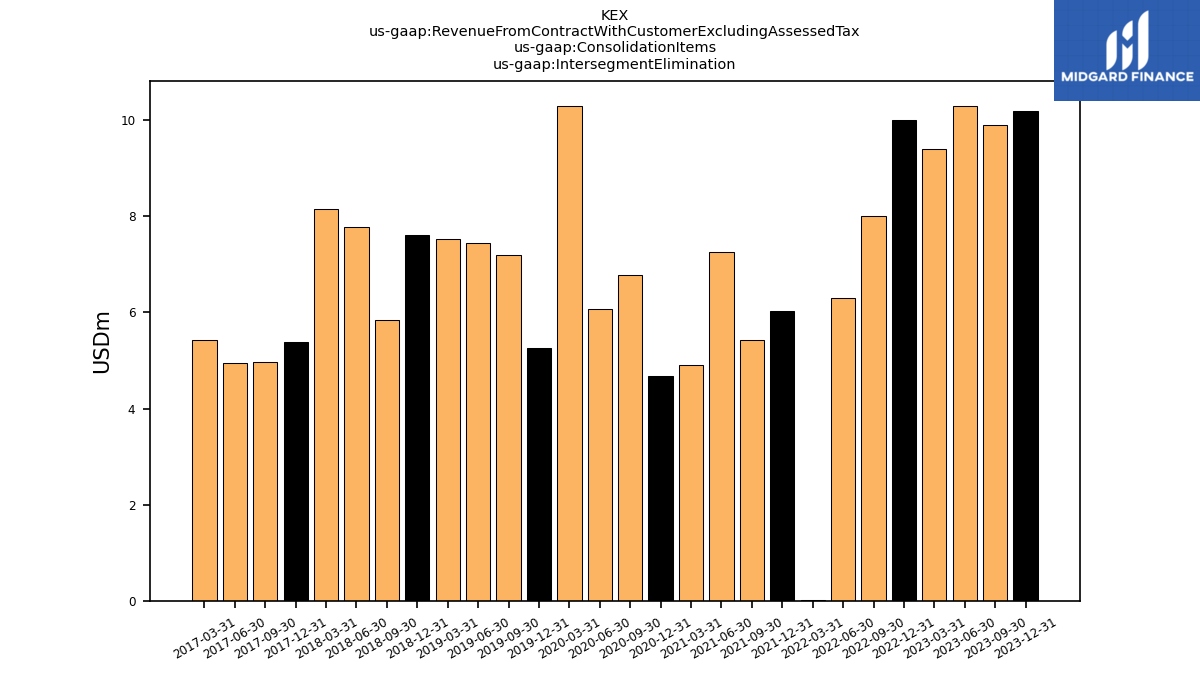
| Revenue From Contract With Customer Excluding Assessed Tax | 799.18 | 764.77 | 777.25 | 750.44 | 730.16 | 745.84 | 697.96 | 610.78 | 591.27 | 598.92 | 559.62 | 496.85 | 489.76 | 496.57 | 541.16 | 643.93 | 655.93 | 666.81 | 771.04 | 744.62 | 721.49 | 704.85 | 802.67 | 741.69 | 708.11 | 541.27 | 473.33 | 491.70 | 435.65 | 434.71 | 441.58 | 458.73 | 484.14 | 532.57 | 543.16 | 587.67 | 668.30 | 680.72 | 628.05 | 589.25 | 568.40 | 551.11 | 563.91 | 558.78 | 512.55 | 521.32 | 511.85 | 566.93 | 550.14 | 563.58 | 437.33 | 299.36 | 286.32 | 281.32 | 273.67 | 268.25 | |
| Intersegment Elimination | 10.20 | 9.90 | 10.30 | 9.40 | 10.00 | 8.00 | 6.30 | 0.01 | 6.04 | 5.44 | 7.25 | 4.90 | 4.67 | 6.77 | 6.06 | 10.29 | 5.26 | 7.20 | 7.45 | 7.54 | 7.61 | 5.84 | 7.77 | 8.15 | 5.38 | 4.97 | 4.95 | 5.43 | NA | NA | NA | NA | NA | NA | NA | NA | NA | NA | NA | NA | NA | NA | NA | NA | NA | NA | NA | NA | NA | NA | NA | NA | NA | NA | NA | NA | |
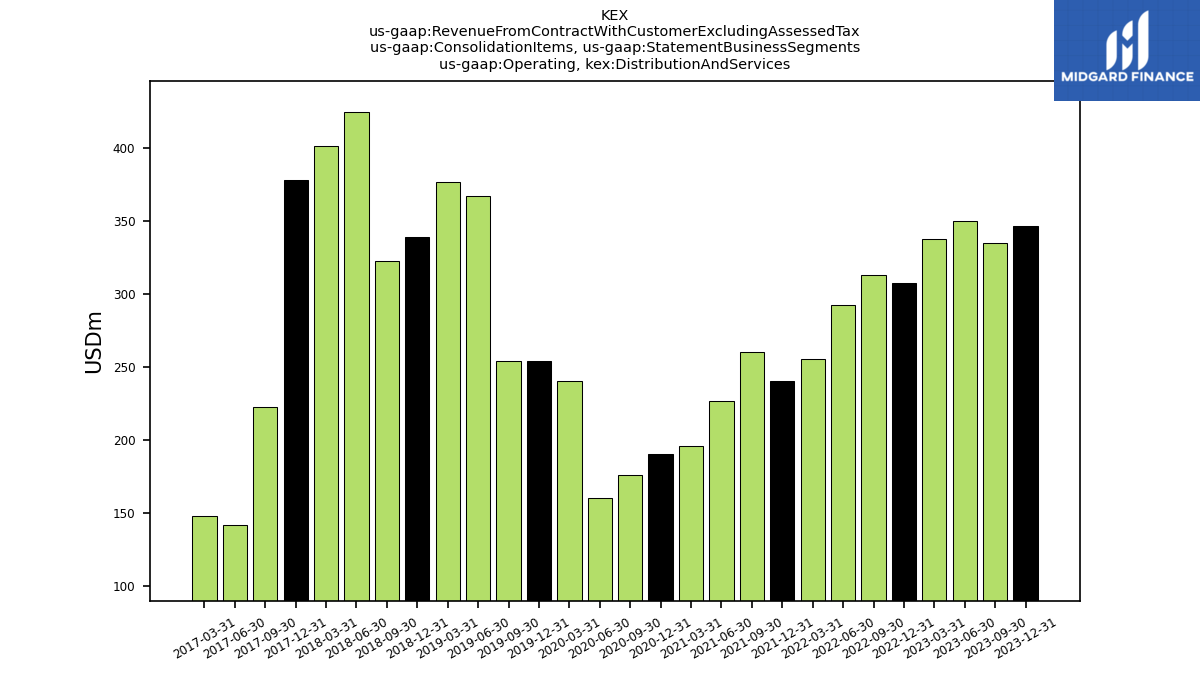
| Operating, Distribution And Services | 346.58 | 334.89 | 350.29 | 337.95 | 307.43 | 312.80 | 292.31 | 255.25 | 240.70 | 260.41 | 226.74 | 195.90 | 190.34 | 175.97 | 160.17 | 240.67 | 253.92 | 254.14 | 366.76 | 376.50 | 338.96 | 322.81 | 424.51 | 401.29 | 377.73 | 222.46 | 142.06 | 148.05 | NA | NA | NA | NA | NA | NA | NA | NA | NA | NA | NA | NA | NA | NA | NA | NA | NA | NA | NA | NA | NA | NA | NA | NA | NA | NA | NA | NA | |
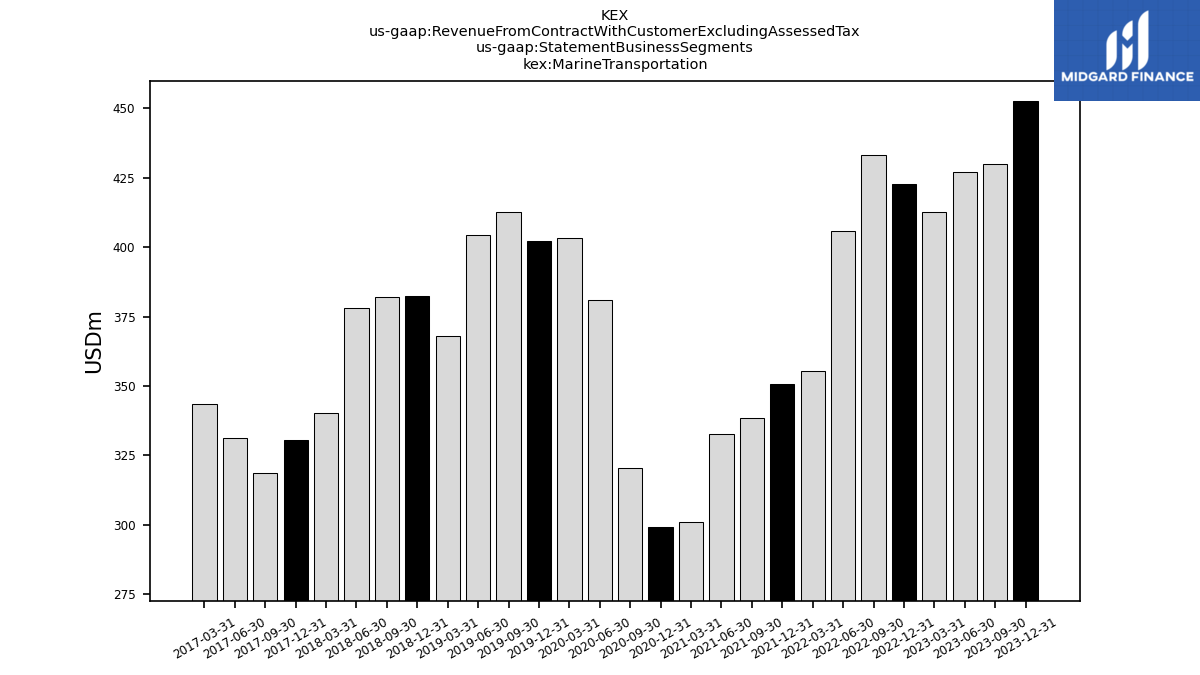
| Operating, Marine Transportation | 452.60 | 429.88 | 426.96 | 412.50 | 422.74 | 433.04 | 405.65 | 355.54 | 350.57 | 338.51 | 332.89 | 300.95 | 299.42 | 320.60 | 380.99 | 403.26 | 402.01 | 412.67 | 404.29 | 368.12 | 382.54 | 382.04 | 378.16 | 340.40 | 330.38 | 318.81 | 331.26 | 343.65 | NA | NA | NA | NA | NA | NA | NA | NA | NA | NA | NA | NA | NA | NA | NA | NA | NA | NA | NA | NA | NA | NA | NA | NA | NA | NA | NA | NA | |
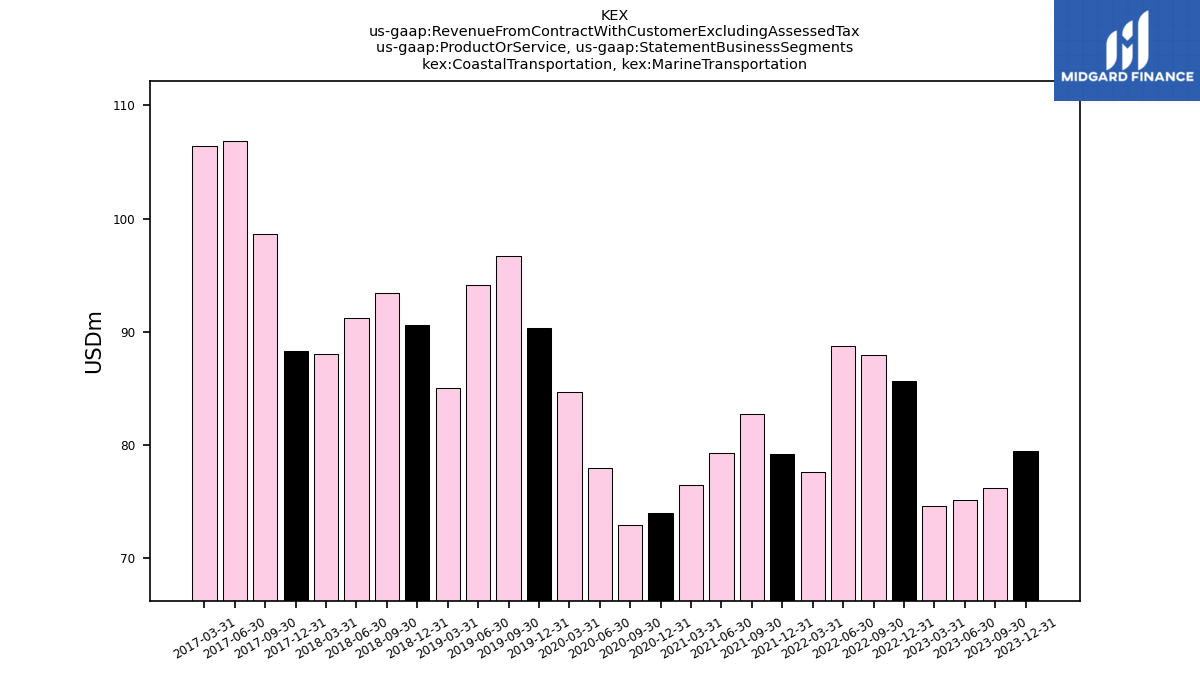
| Coastal Transportation, Marine Transportation | 79.44 | 76.25 | 75.16 | 74.61 | 85.64 | 87.99 | 88.71 | 77.63 | 79.25 | 82.72 | 79.30 | 76.50 | 74.01 | 72.95 | 77.97 | 84.69 | 90.38 | 96.67 | 94.12 | 85.04 | 90.56 | 93.47 | 91.24 | 88.05 | 88.34 | 98.63 | 106.80 | 106.41 | NA | NA | NA | NA | NA | NA | NA | NA | NA | NA | NA | NA | NA | NA | NA | NA | NA | NA | NA | NA | NA | NA | NA | NA | NA | NA | NA | NA | |
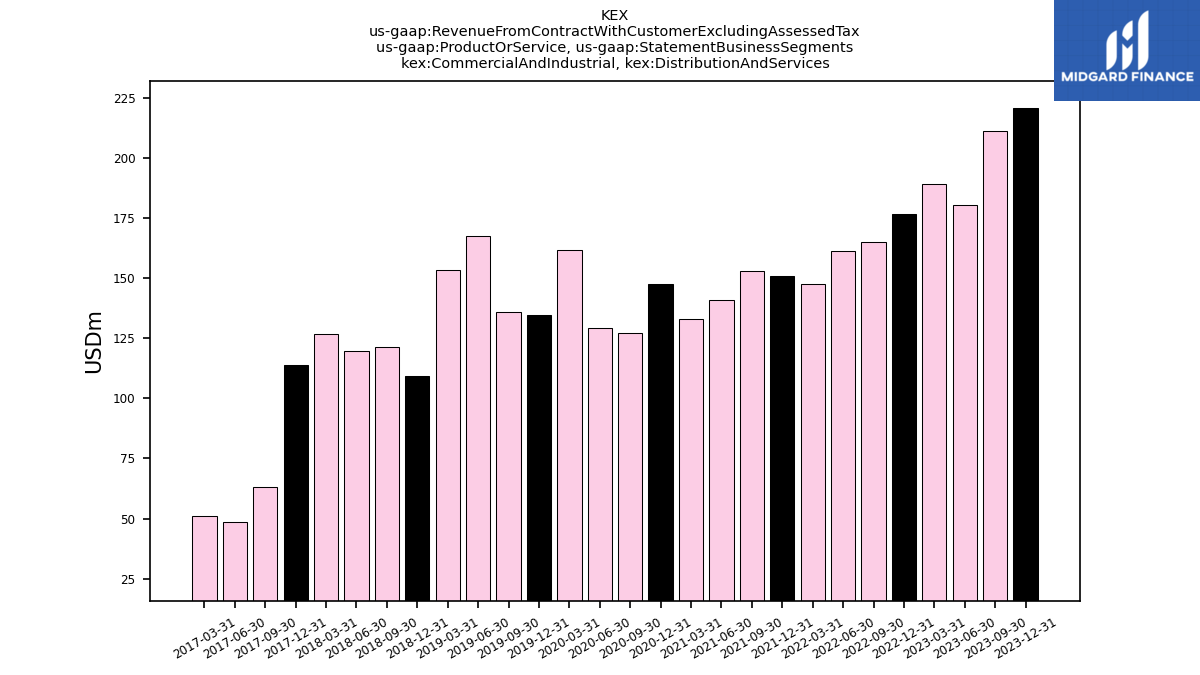
| Commercial And Industrial, Distribution And Services | 221.20 | 211.49 | 180.40 | 189.39 | 177.05 | 165.36 | 161.62 | 147.53 | 151.08 | 153.06 | 140.97 | 132.91 | 147.56 | 127.22 | 129.55 | 161.99 | 134.61 | 136.05 | 167.89 | 153.40 | 109.37 | 121.33 | 119.65 | 126.79 | 113.90 | 62.97 | 48.36 | 50.95 | NA | NA | NA | NA | NA | NA | NA | NA | NA | NA | NA | NA | NA | NA | NA | NA | NA | NA | NA | NA | NA | NA | NA | NA | NA | NA | NA | NA | |
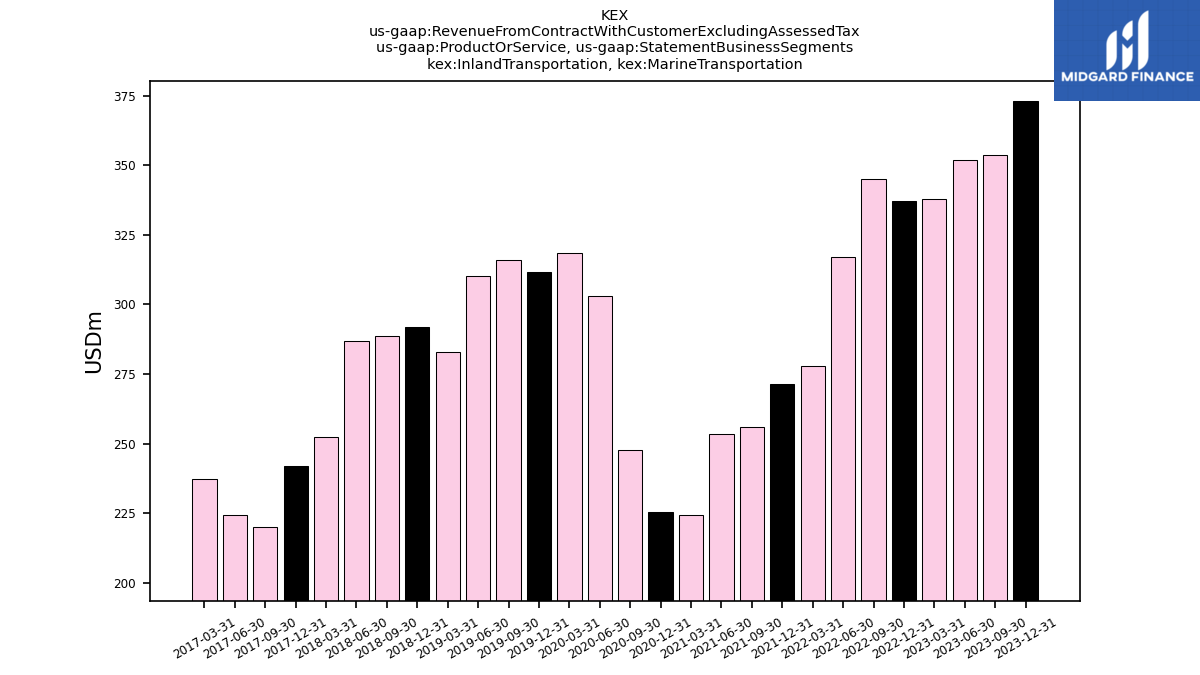
| Inland Transportation, Marine Transportation | 373.15 | 353.63 | 351.81 | 337.89 | 337.10 | 345.05 | 316.95 | 277.91 | 271.31 | 255.79 | 253.59 | 224.45 | 225.41 | 247.65 | 303.01 | 318.56 | 311.63 | 316.00 | 310.16 | 283.08 | 291.97 | 288.57 | 286.92 | 252.35 | 242.04 | 220.18 | 224.46 | 237.24 | NA | NA | NA | NA | NA | NA | NA | NA | NA | NA | NA | NA | NA | NA | NA | NA | NA | NA | NA | NA | NA | NA | NA | NA | NA | NA | NA | NA | |
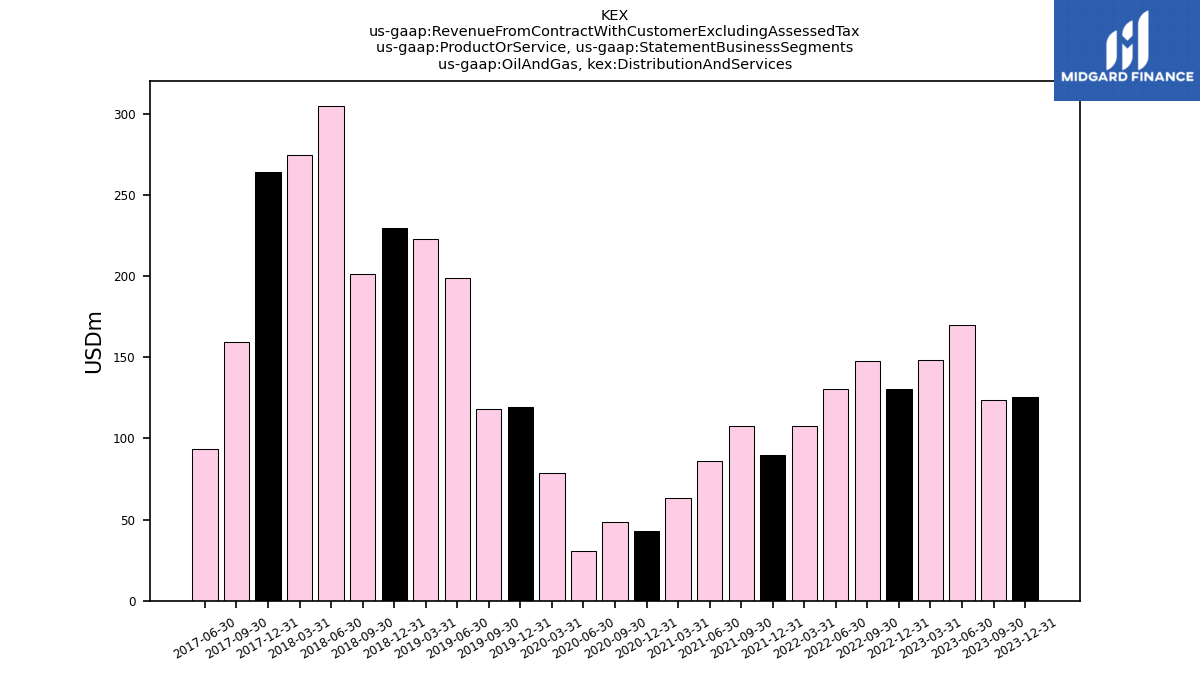
| Oil And Gas, Distribution And Services | 125.38 | 123.40 | 169.89 | 148.56 | 130.38 | 147.44 | 130.69 | 107.71 | 89.62 | 107.35 | 85.77 | 62.99 | 42.77 | 48.74 | 30.62 | 78.68 | 119.30 | 118.10 | 198.86 | 223.10 | 229.59 | 201.47 | 304.86 | 274.49 | 263.83 | 159.49 | 93.70 | NA | NA | NA | NA | NA | NA | NA | NA | NA | NA | NA | NA | NA | NA | NA | NA | NA | NA | NA | NA | NA | NA | NA | NA | NA | NA | NA | NA | NA | |
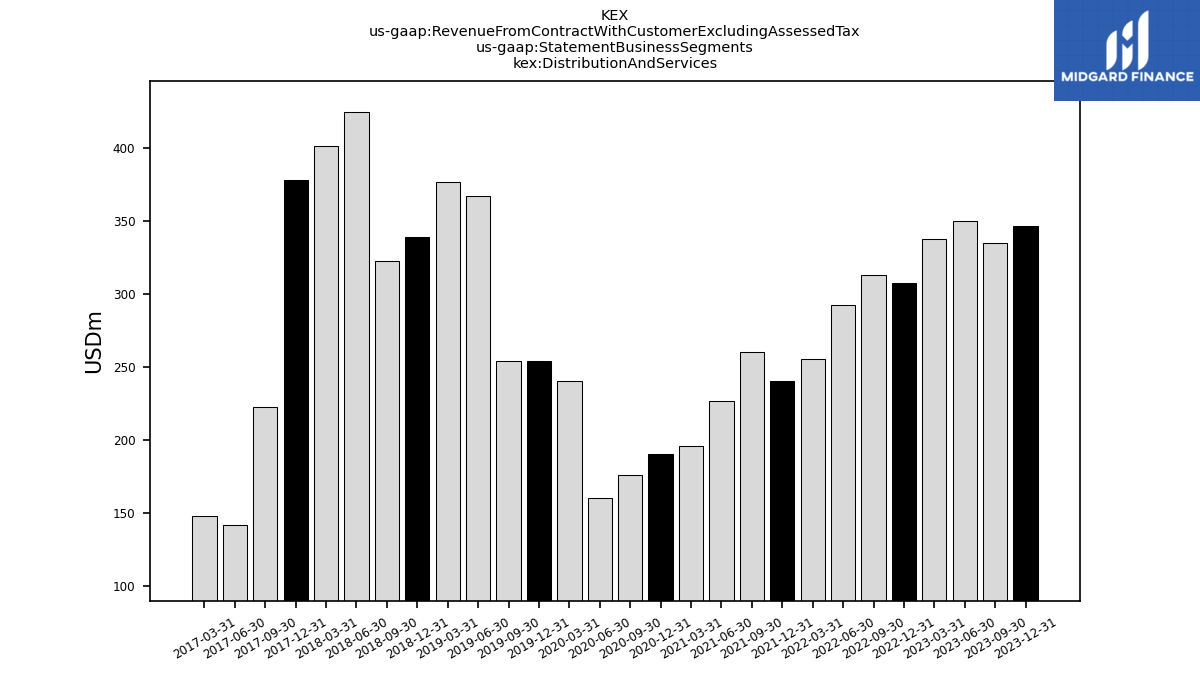
| Distribution And Services | 346.58 | 334.89 | 350.29 | 337.95 | 307.43 | 312.80 | 292.31 | 255.25 | 240.70 | 260.41 | 226.74 | 195.90 | 190.34 | 175.97 | 160.17 | 240.67 | 253.92 | 254.14 | 366.76 | 376.50 | 338.96 | 322.81 | 424.51 | 401.29 | 377.73 | 222.46 | 142.06 | 148.05 | NA | NA | NA | NA | NA | NA | NA | NA | NA | NA | NA | NA | NA | NA | NA | NA | NA | NA | NA | NA | NA | NA | NA | NA | NA | NA | NA | NA | |
| Marine Transportation | 452.60 | 429.88 | 426.96 | 412.50 | 422.74 | 433.04 | 405.65 | 355.54 | 350.57 | 338.51 | 332.89 | 300.95 | 299.42 | 320.60 | 380.99 | 403.26 | 402.01 | 412.67 | 404.29 | 368.12 | 382.54 | 382.04 | 378.16 | 340.40 | 330.38 | 318.81 | 331.26 | 343.65 | NA | NA | NA | NA | NA | NA | NA | NA | NA | NA | NA | NA | NA | NA | NA | NA | NA | NA | NA | NA | NA | NA | NA | NA | NA | NA | NA | NA |


