
| 2023-12-31 | 2023-09-30 | 2023-06-30 | 2023-03-31 | 2022-12-31 | 2022-09-30 | 2022-06-30 | 2022-03-31 | 2021-12-31 | 2021-09-30 | 2021-06-30 | 2021-03-31 | 2020-12-31 | 2020-09-30 | 2020-06-30 | 2020-03-31 | 2019-12-31 | 2019-09-30 | 2019-06-30 | 2019-03-31 | 2018-12-31 | 2018-09-30 | 2018-06-30 | 2018-03-31 | 2017-12-31 | 2017-09-30 | 2017-06-30 | 2017-03-31 | ||
|---|---|---|---|---|---|---|---|---|---|---|---|---|---|---|---|---|---|---|---|---|---|---|---|---|---|---|---|---|---|
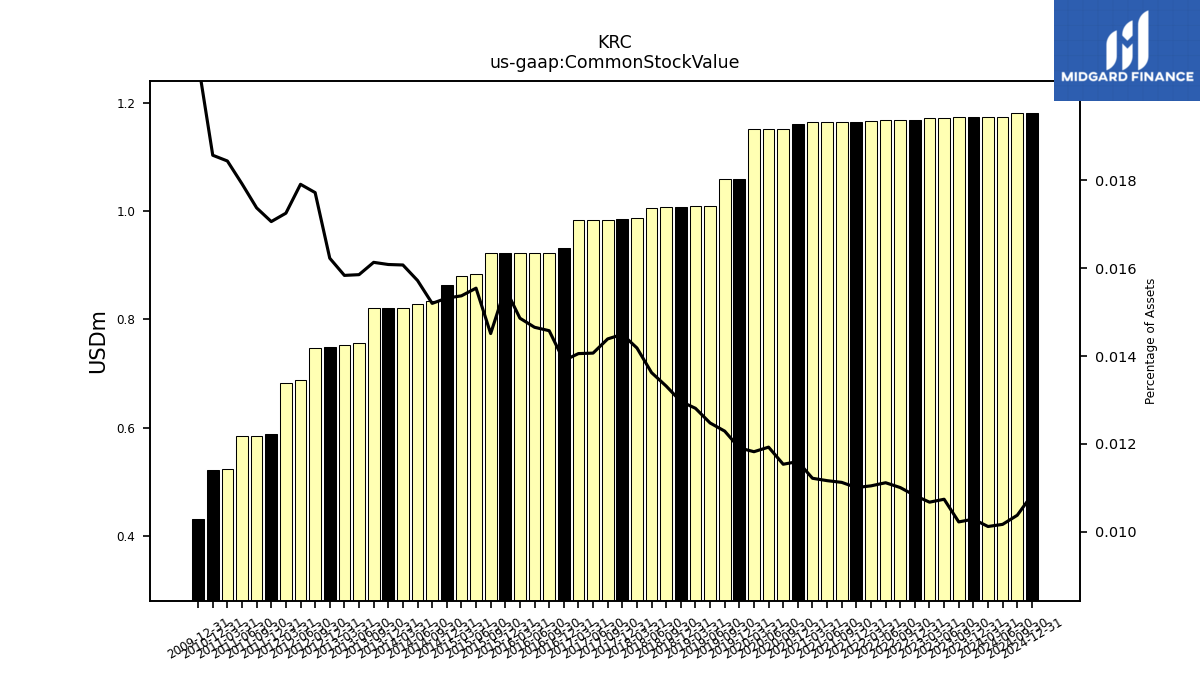
| Common Stock Value | 1.17 | 1.17 | 1.17 | 1.17 | 1.17 | 1.17 | 1.17 | 1.17 | 1.17 | 1.17 | 1.17 | 1.17 | 1.16 | 1.15 | 1.15 | 1.15 | 1.06 | 1.06 | 1.01 | 1.01 | 1.01 | 1.01 | 1.01 | 0.99 | 0.99 | 0.98 | 0.98 | 0.98 | |
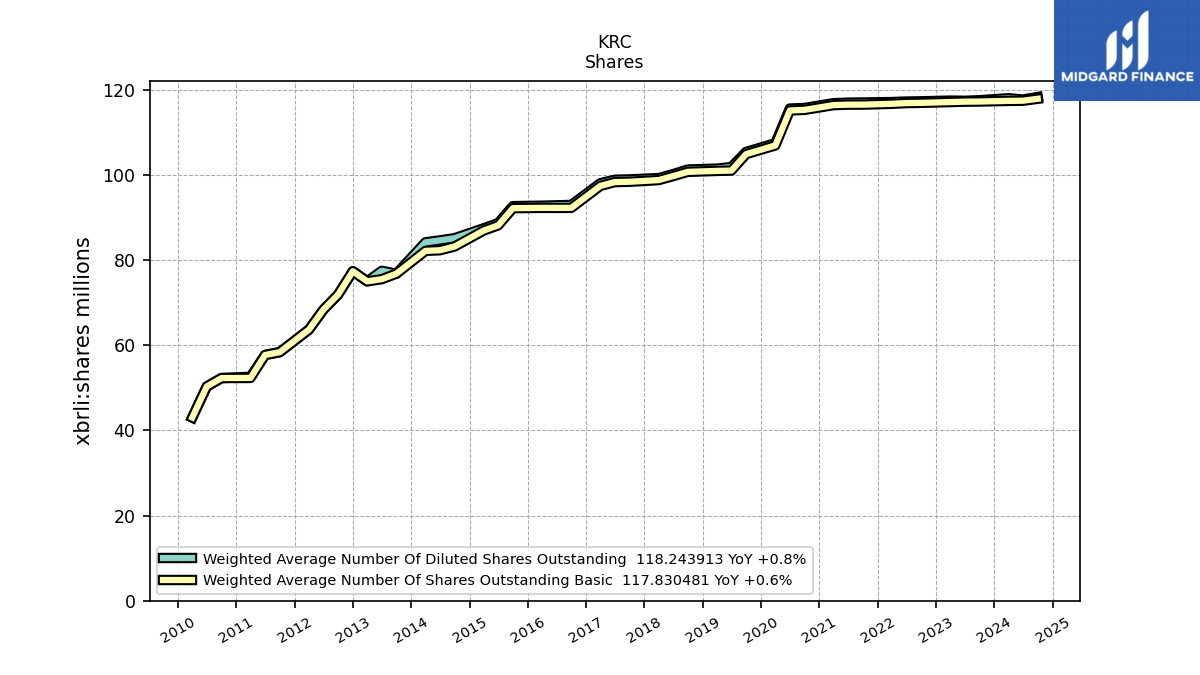
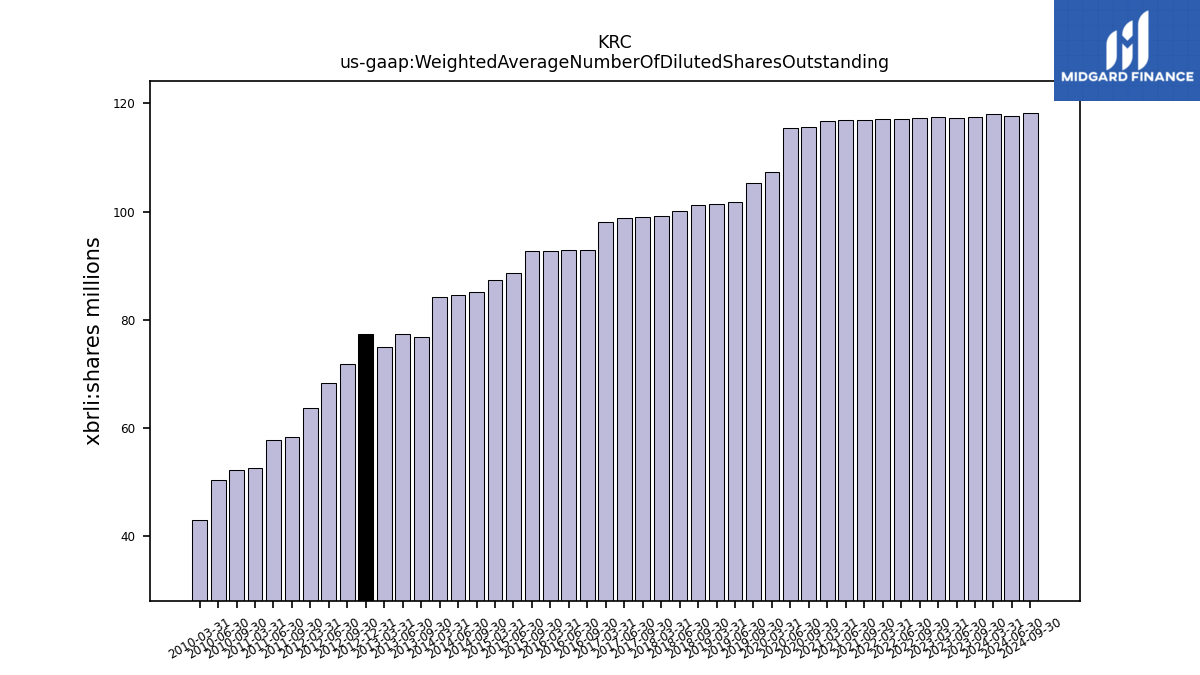
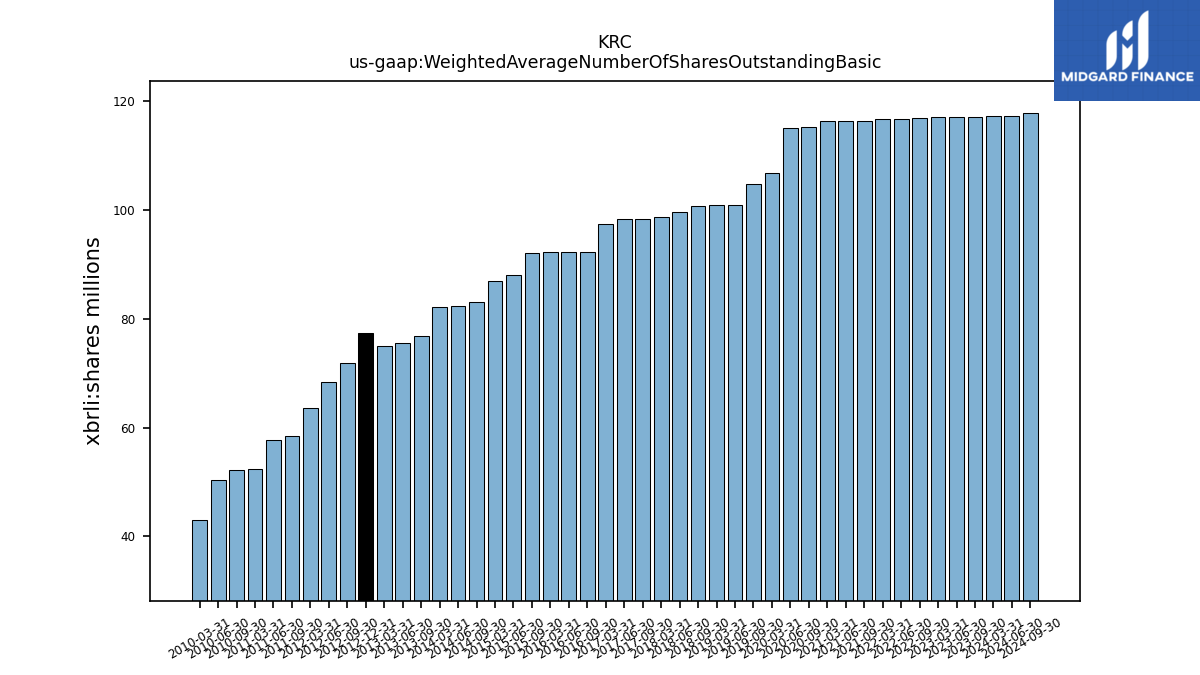
| Weighted Average Number Of Diluted Shares Outstanding | NA | 117.50 | 117.36 | 117.41 | NA | 117.24 | 117.18 | 117.06 | NA | 116.96 | 116.92 | 116.80 | NA | 115.67 | 115.54 | 107.39 | NA | 105.36 | 101.81 | 101.44 | NA | 101.23 | 100.15 | 99.21 | NA | 98.91 | 98.83 | 98.02 | |
| Weighted Average Number Of Shares Outstanding Basic | NA | 117.18 | 117.15 | 117.06 | NA | 116.87 | 116.82 | 116.65 | NA | 116.46 | 116.45 | 116.34 | NA | 115.23 | 115.08 | 106.88 | NA | 104.84 | 100.97 | 100.90 | NA | 100.68 | 99.69 | 98.74 | NA | 98.35 | 98.28 | 97.39 | |
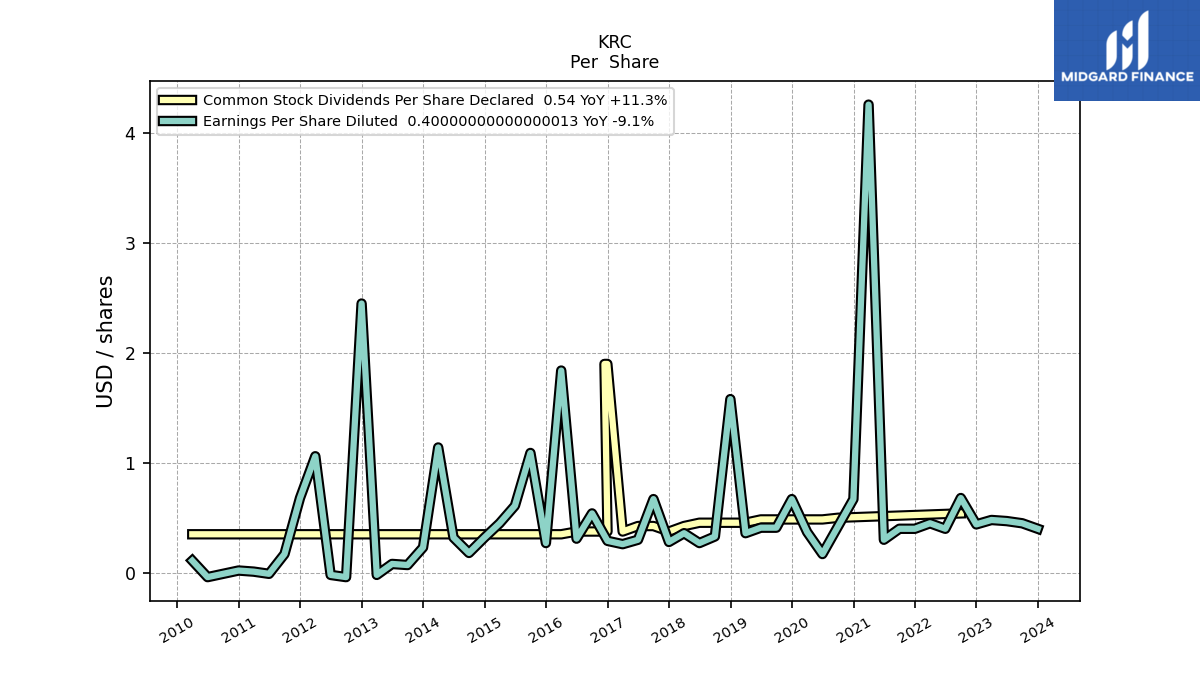
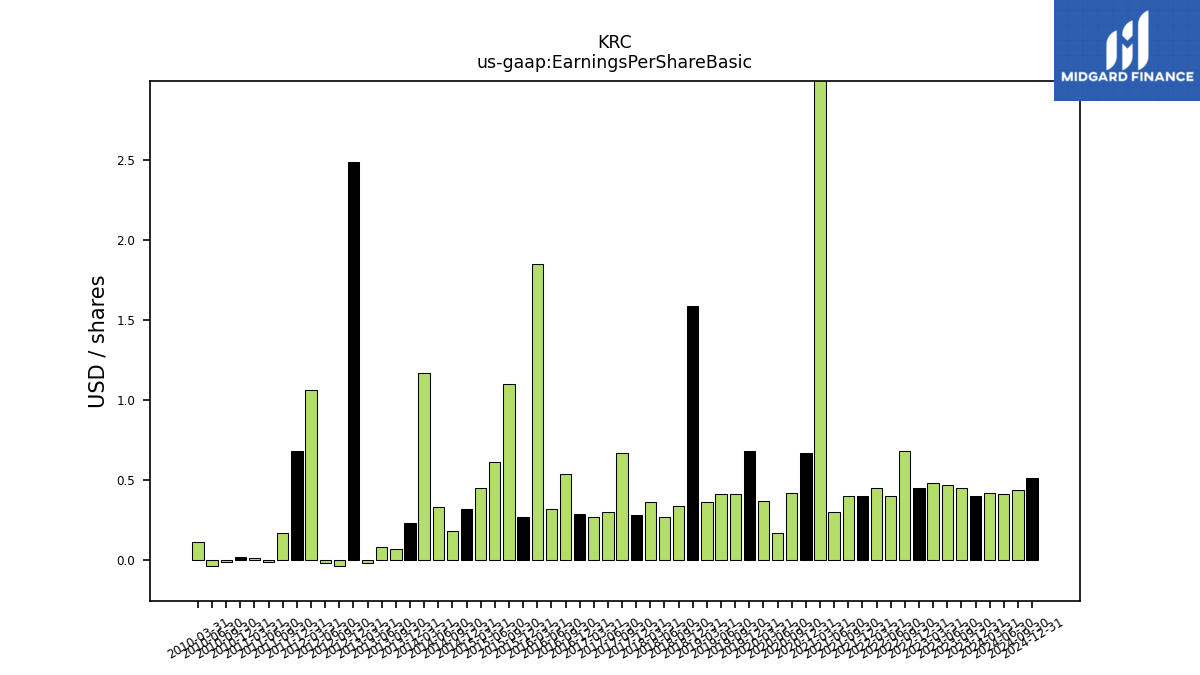
| Earnings Per Share Basic | 0.40 | 0.45 | 0.47 | 0.48 | 0.45 | 0.68 | 0.40 | 0.45 | 0.40 | 0.40 | 0.30 | 4.27 | 0.67 | 0.42 | 0.17 | 0.37 | 0.68 | 0.41 | 0.41 | 0.36 | 1.59 | 0.34 | 0.27 | 0.36 | 0.28 | 0.67 | 0.30 | 0.27 | |
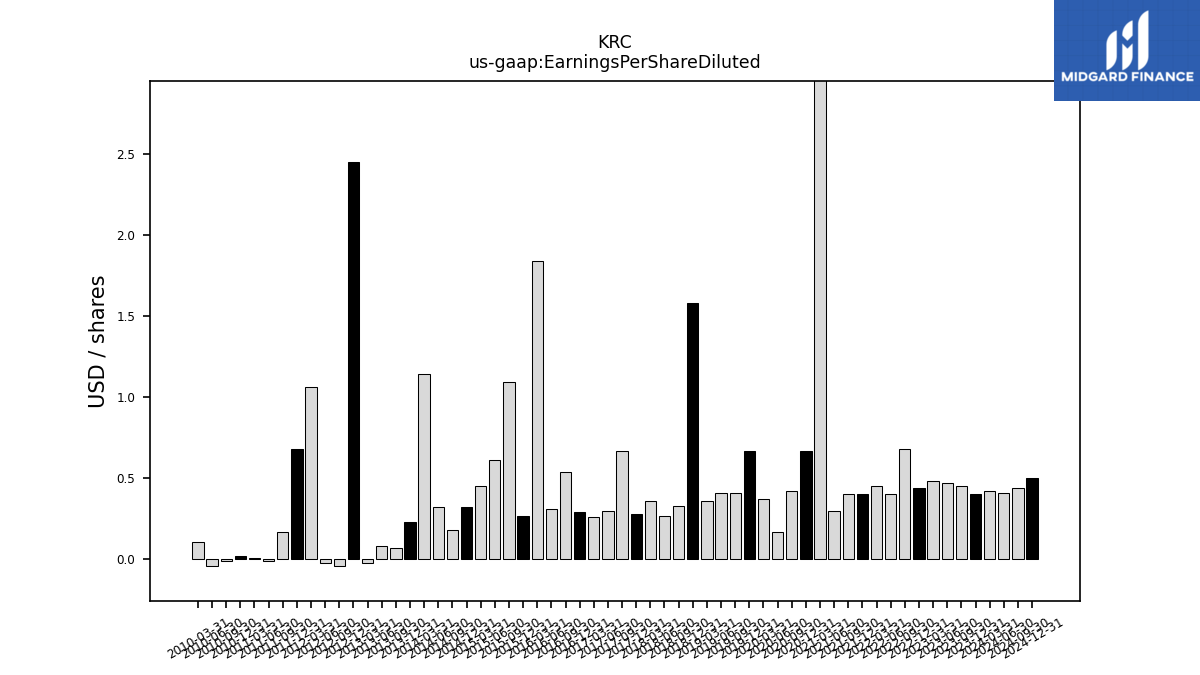
| Earnings Per Share Diluted | 0.40 | 0.45 | 0.47 | 0.48 | 0.44 | 0.68 | 0.40 | 0.45 | 0.40 | 0.40 | 0.30 | 4.26 | 0.67 | 0.42 | 0.17 | 0.37 | 0.67 | 0.41 | 0.41 | 0.36 | 1.58 | 0.33 | 0.27 | 0.36 | 0.28 | 0.67 | 0.30 | 0.26 |
| 2023-12-31 | 2023-09-30 | 2023-06-30 | 2023-03-31 | 2022-12-31 | 2022-09-30 | 2022-06-30 | 2022-03-31 | 2021-12-31 | 2021-09-30 | 2021-06-30 | 2021-03-31 | 2020-12-31 | 2020-09-30 | 2020-06-30 | 2020-03-31 | 2019-12-31 | 2019-09-30 | 2019-06-30 | 2019-03-31 | 2018-12-31 | 2018-09-30 | 2018-06-30 | 2018-03-31 | 2017-12-31 | 2017-09-30 | 2017-06-30 | 2017-03-31 | ||
|---|---|---|---|---|---|---|---|---|---|---|---|---|---|---|---|---|---|---|---|---|---|---|---|---|---|---|---|---|---|
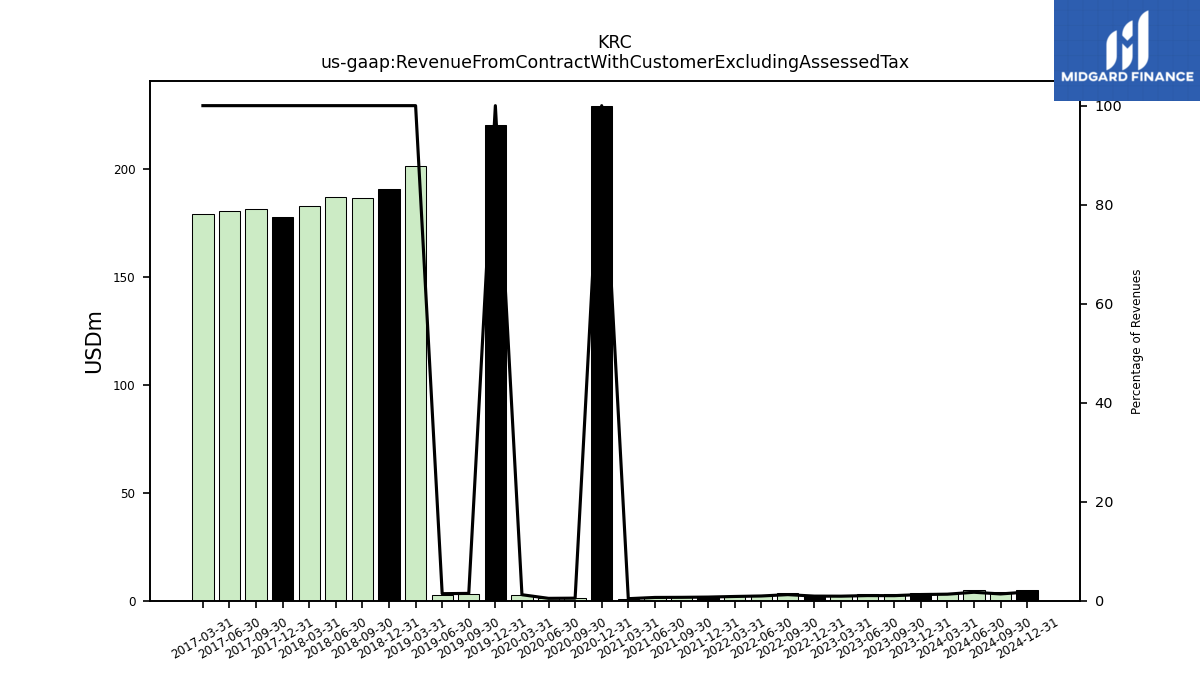
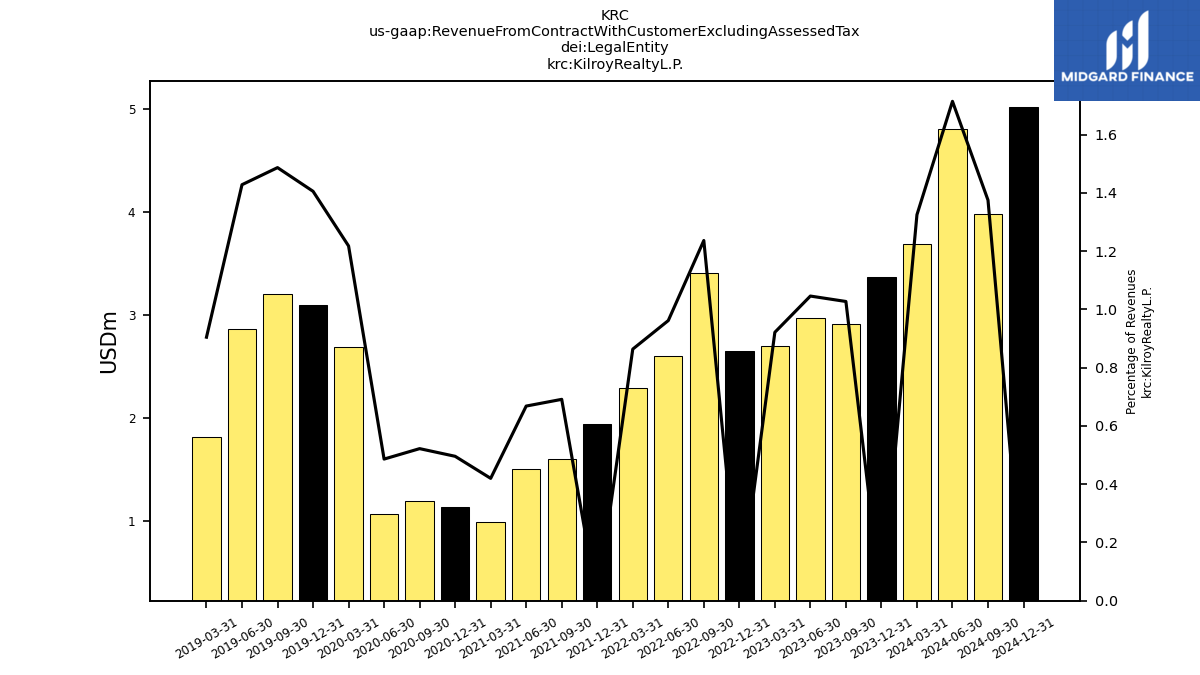
| Revenue From Contract With Customer Excluding Assessed Tax | 3.37 | 2.91 | 2.97 | 2.70 | 2.66 | 3.41 | 2.61 | 2.29 | 1.94 | 1.61 | 1.51 | 0.99 | 229.33 | 1.19 | 1.07 | 2.69 | 220.24 | 3.20 | 2.86 | 201.20 | 190.84 | 186.56 | 187.07 | 182.82 | 177.56 | 181.53 | 180.60 | 179.31 | |
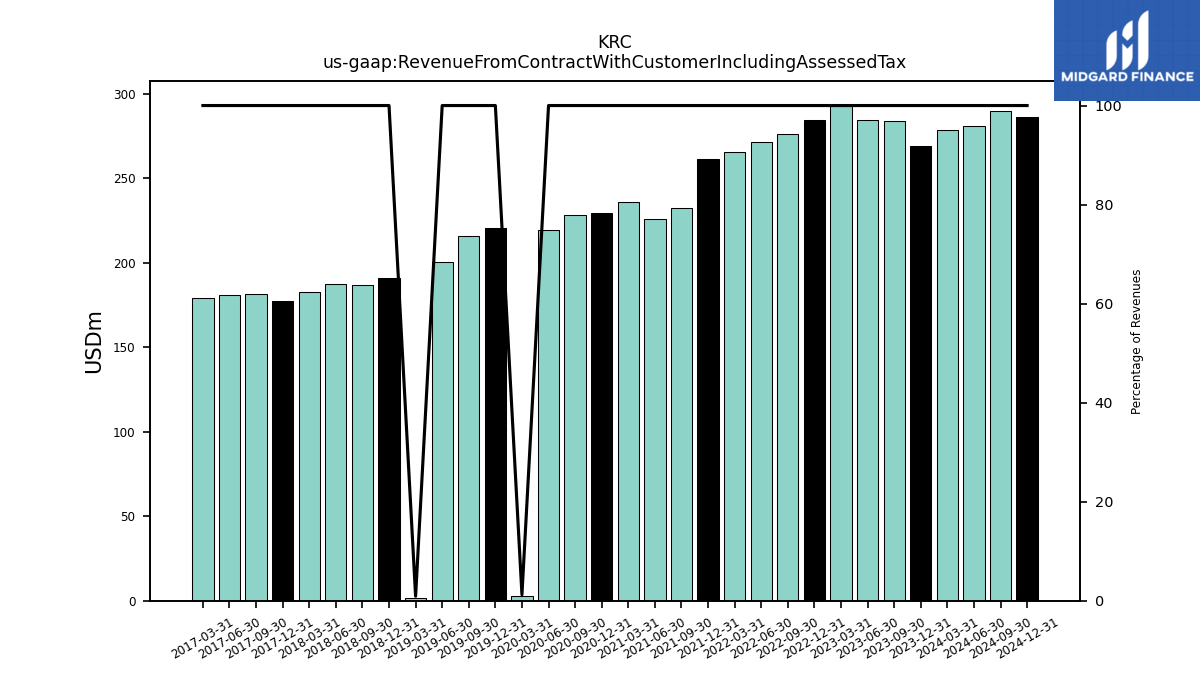
| Revenue From Contract With Customer Including Assessed Tax | 269.02 | 283.59 | 284.28 | 292.80 | 284.34 | 275.96 | 271.18 | 265.50 | 261.08 | 232.33 | 225.98 | 235.65 | 229.33 | 228.31 | 219.42 | 2.69 | 220.24 | 215.53 | 200.49 | 1.82 | 190.84 | 186.56 | 187.07 | 182.82 | 177.56 | 181.53 | 180.60 | 179.31 | |
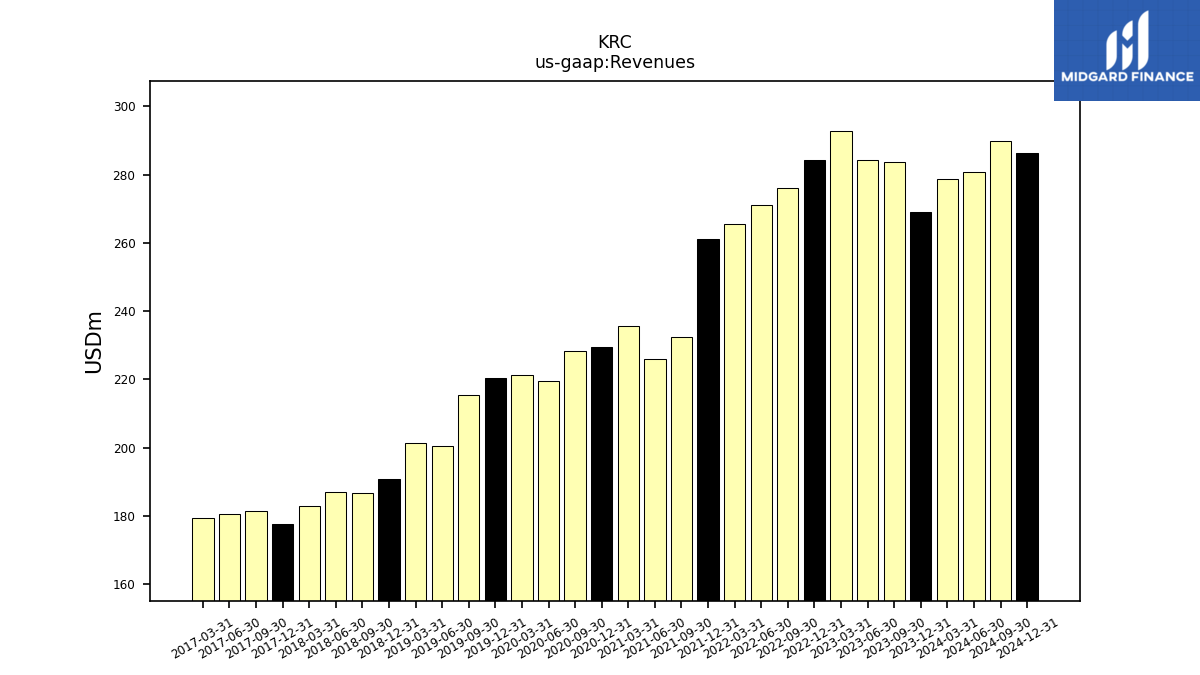
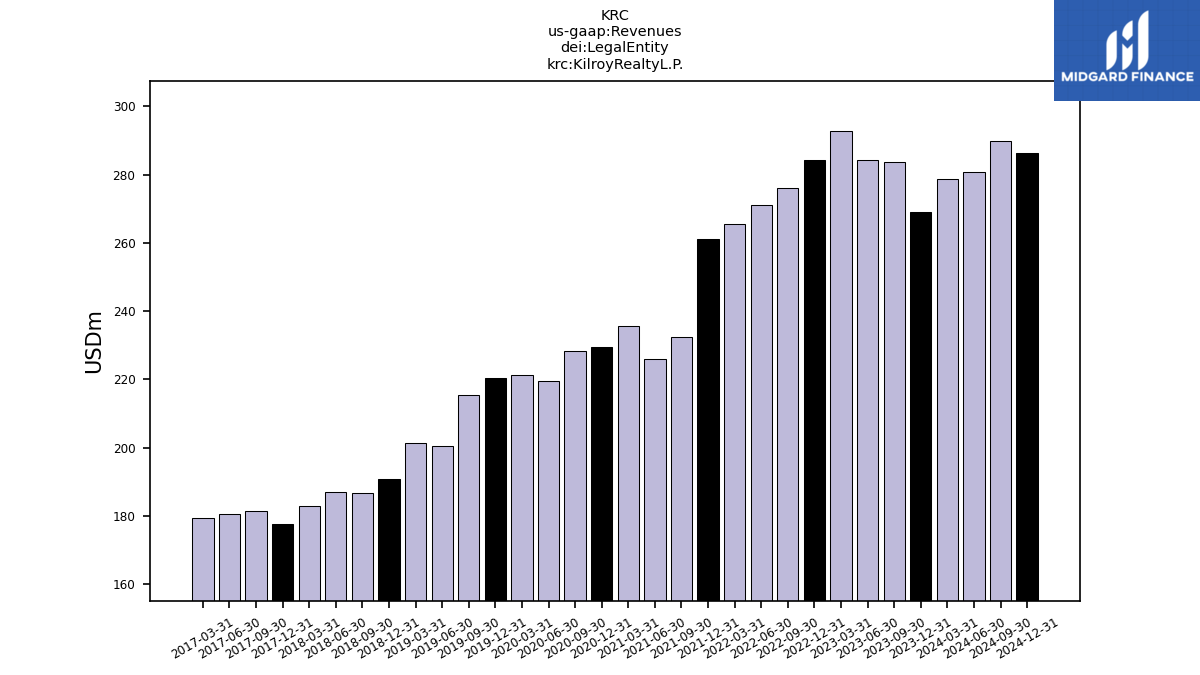
| Revenues | 269.02 | 283.59 | 284.28 | 292.80 | 284.34 | 275.96 | 271.18 | 265.50 | 261.08 | 232.33 | 225.98 | 235.65 | 229.33 | 228.31 | 219.42 | 221.33 | 220.24 | 215.53 | 200.49 | 201.20 | 190.84 | 186.56 | 187.07 | 182.82 | 177.56 | 181.53 | 180.60 | 179.31 | |
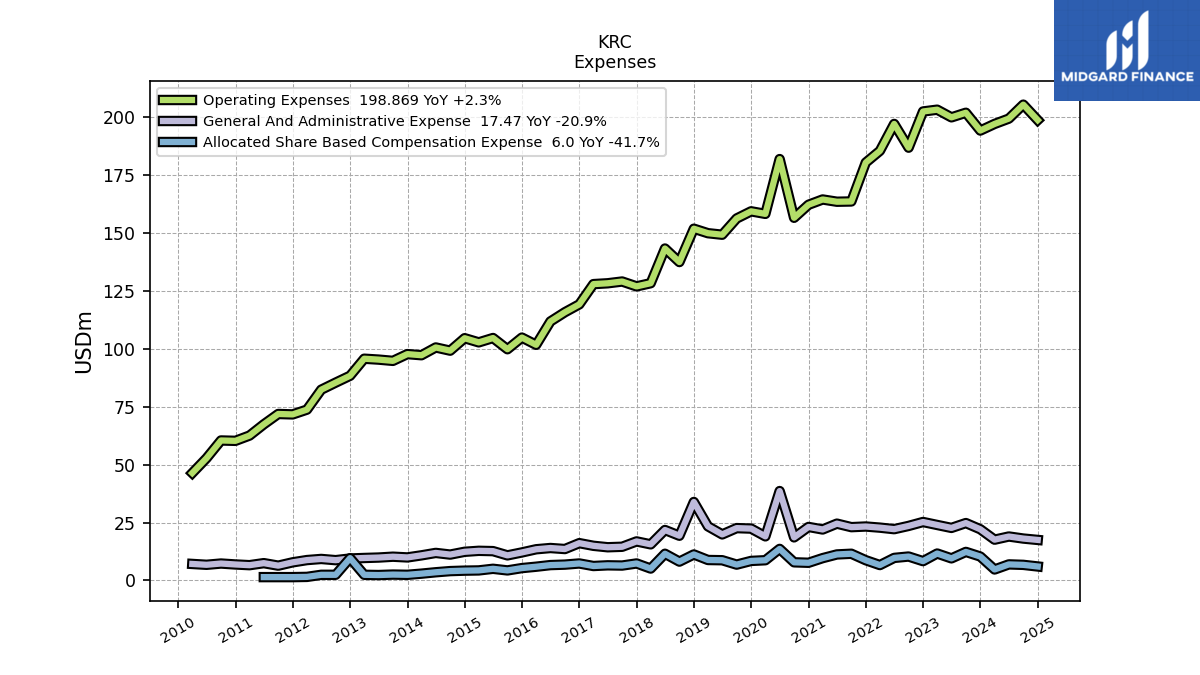
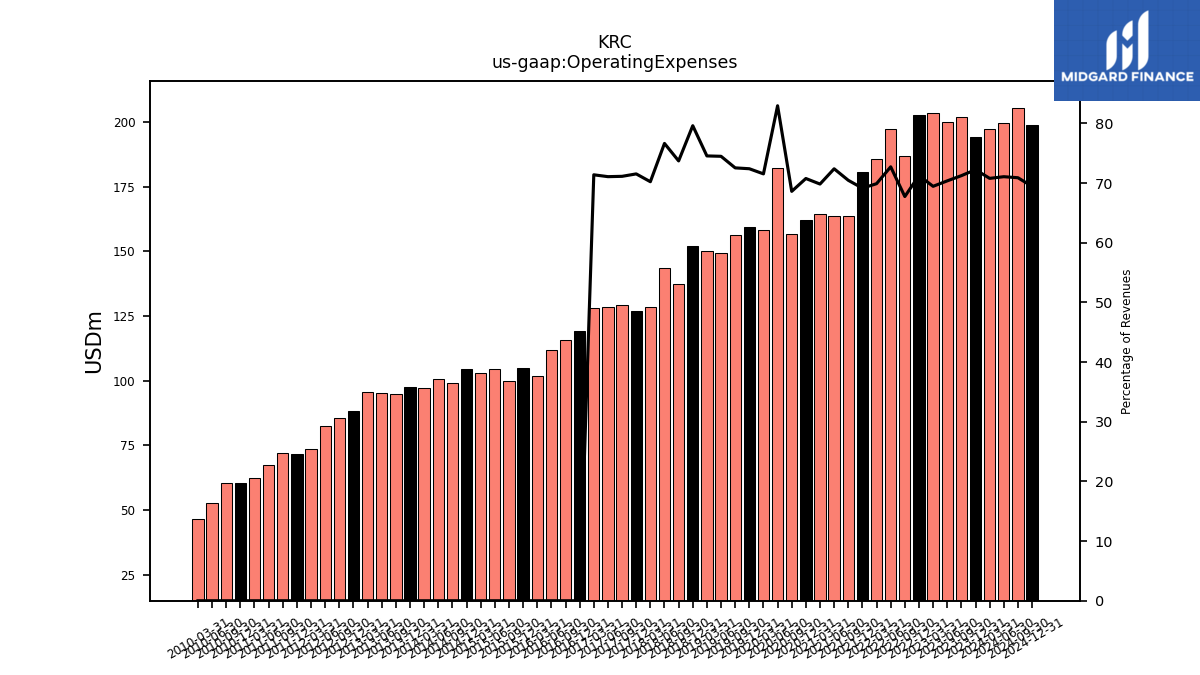
| Operating Expenses | 194.34 | 202.03 | 200.04 | 203.36 | 202.58 | 186.94 | 197.21 | 185.57 | 180.51 | 163.70 | 163.59 | 164.56 | 162.28 | 156.64 | 182.03 | 158.34 | 159.45 | 156.35 | 149.34 | 149.99 | 151.94 | 137.52 | 143.38 | 128.39 | 127.02 | 129.12 | 128.36 | 128.00 | |
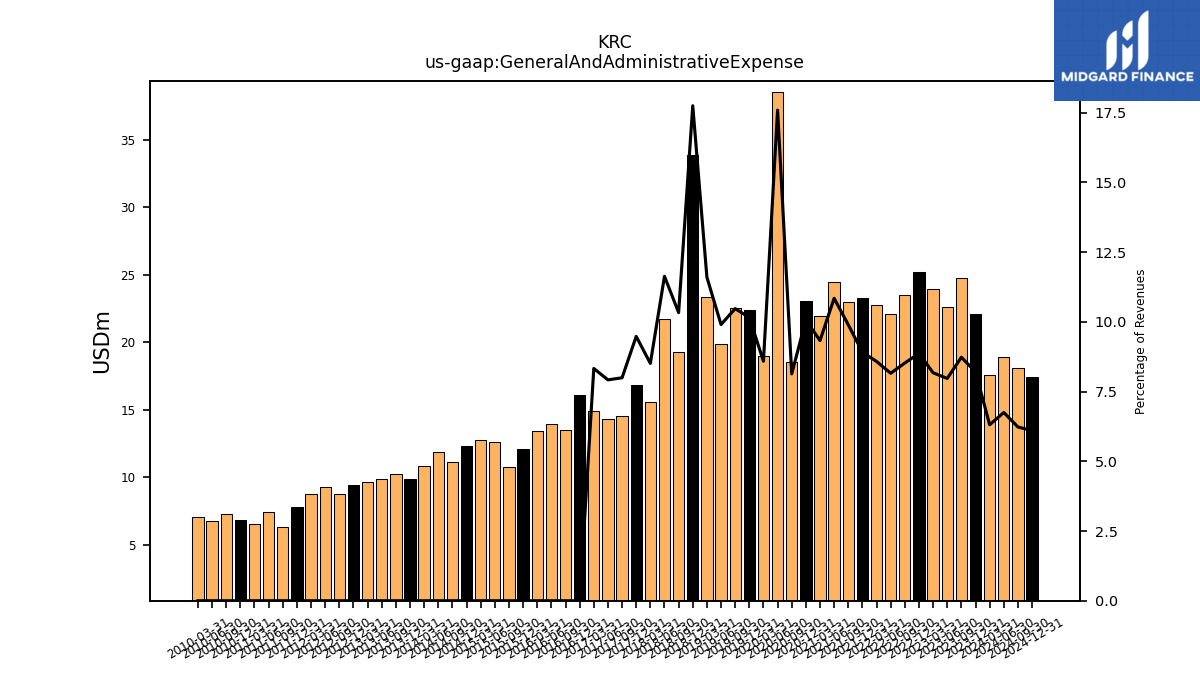
| General And Administrative Expense | 22.08 | 24.76 | 22.66 | 23.94 | 25.22 | 23.52 | 22.12 | 22.78 | 23.27 | 22.99 | 24.51 | 21.98 | 23.09 | 18.57 | 38.60 | 19.01 | 22.36 | 22.58 | 19.86 | 23.34 | 33.87 | 19.28 | 21.76 | 15.56 | 16.83 | 14.51 | 14.30 | 14.93 | |
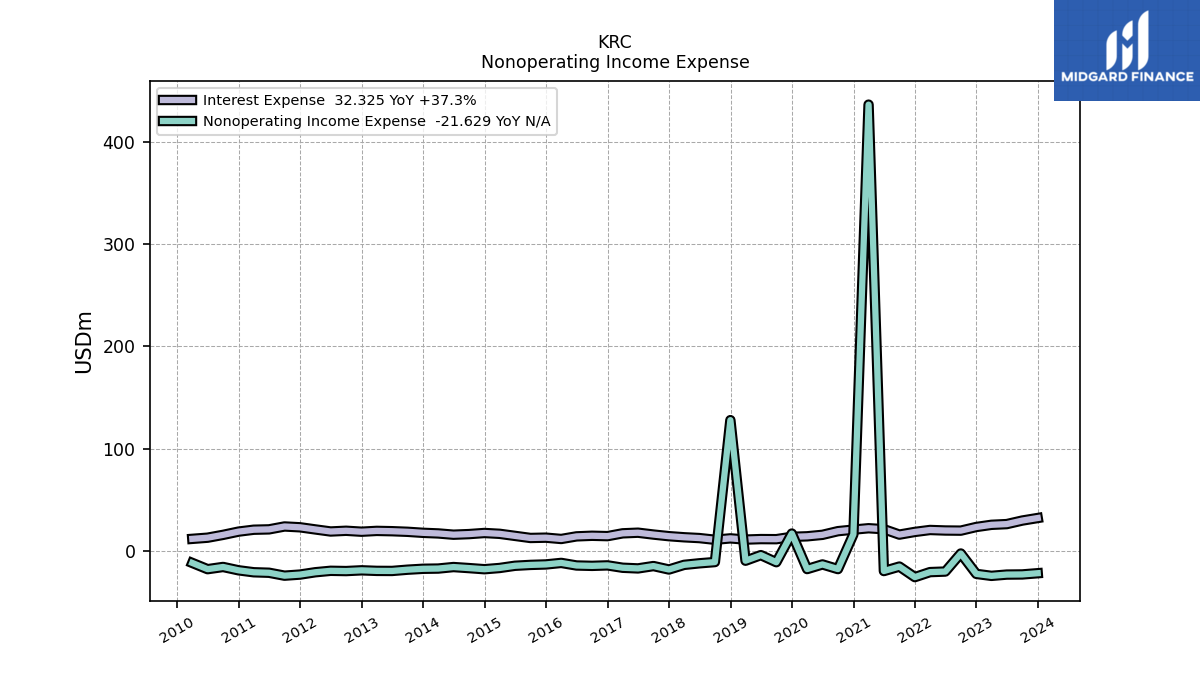
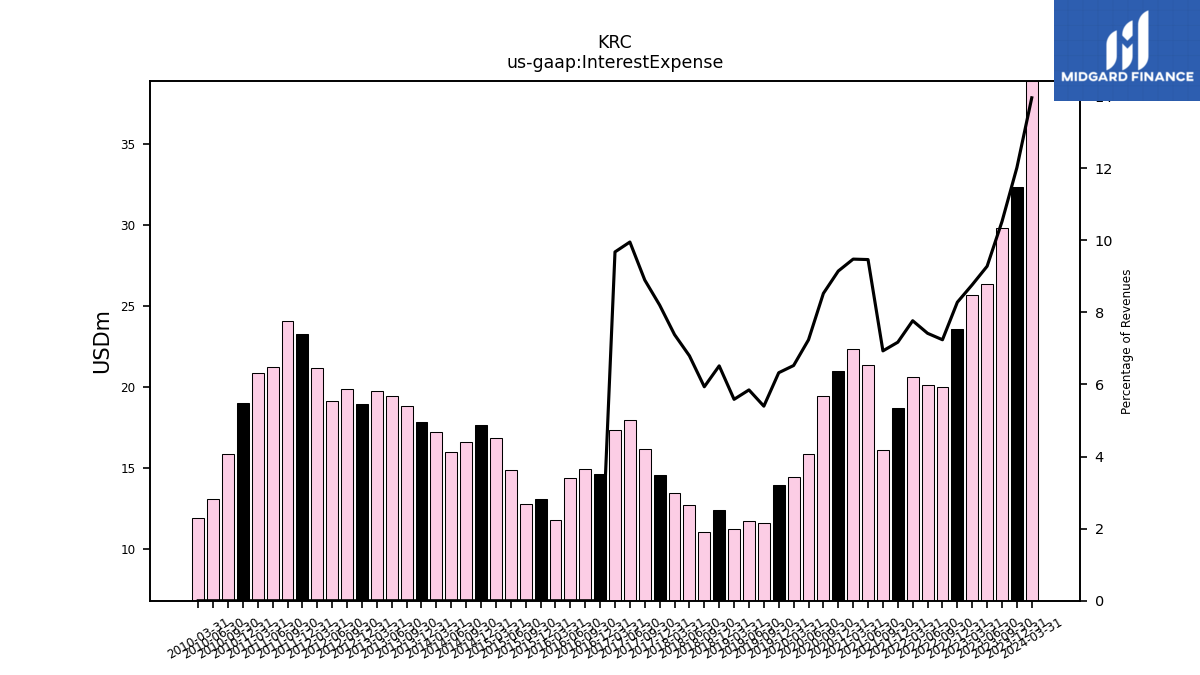
| Interest Expense | 32.33 | 29.84 | 26.38 | 25.67 | 23.55 | 19.98 | 20.12 | 20.62 | 18.73 | 16.11 | 21.39 | 22.33 | 20.98 | 19.47 | 15.88 | 14.44 | 13.93 | 11.63 | 11.73 | 11.24 | 12.44 | 11.07 | 12.71 | 13.50 | 14.56 | 16.15 | 17.97 | 17.35 | |
| Interest Paid Net | 45.24 | 12.24 | 39.31 | 8.98 | 35.80 | 4.13 | 34.97 | 4.74 | 29.20 | 6.31 | 29.13 | 12.39 | 25.84 | 10.40 | 15.46 | 10.04 | 15.47 | 5.13 | 18.30 | 4.71 | 12.52 | 7.04 | 15.44 | 9.70 | 20.46 | 15.90 | 12.77 | 18.21 | |
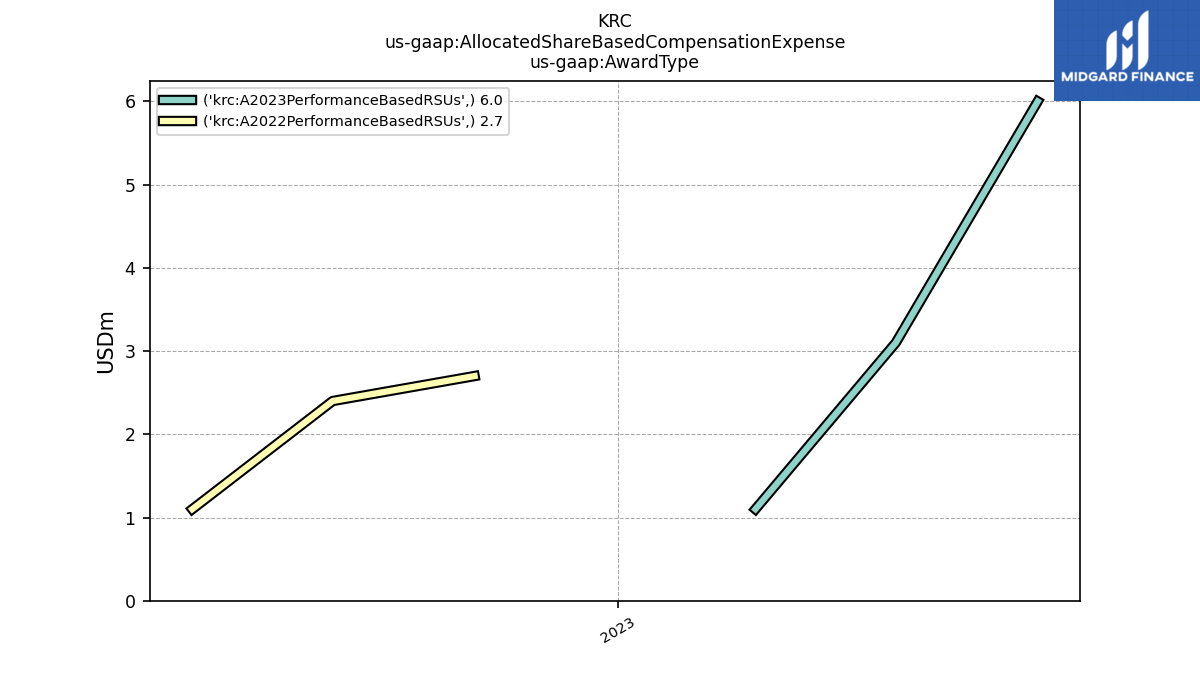
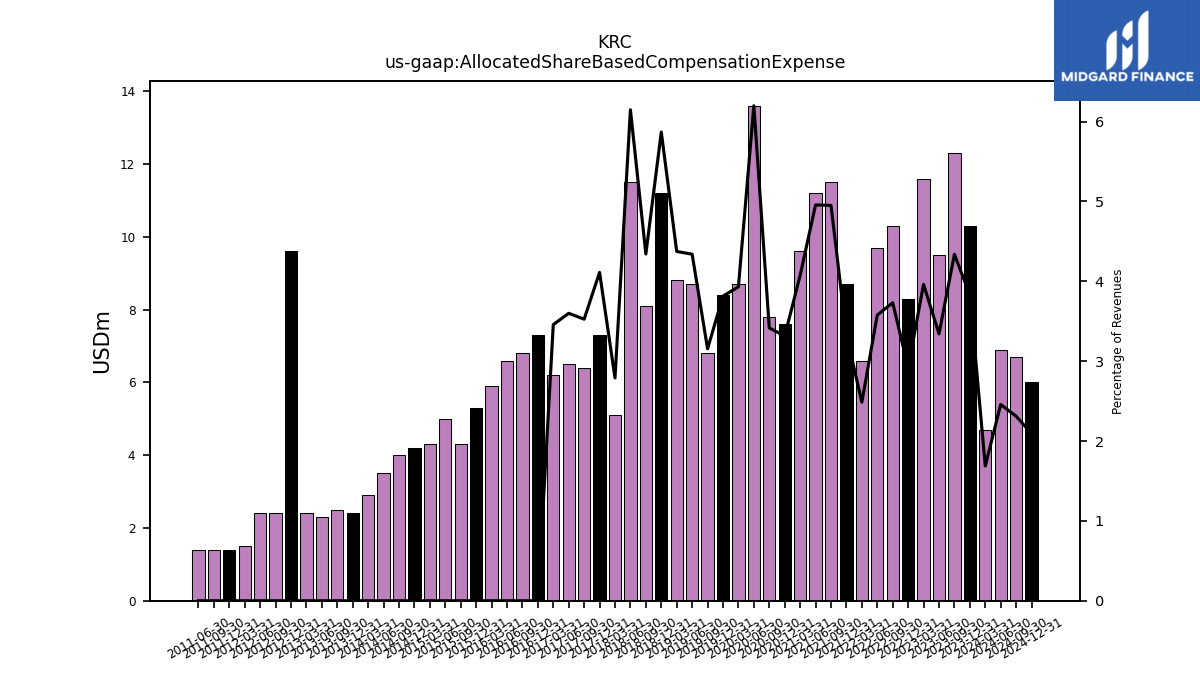
| Allocated Share Based Compensation Expense | 10.30 | 12.30 | 9.50 | 11.60 | 8.30 | 10.30 | 9.70 | 6.60 | 8.70 | 11.50 | 11.20 | 9.60 | 7.60 | 7.80 | 13.60 | 8.70 | 8.40 | 6.80 | 8.70 | 8.80 | 11.20 | 8.10 | 11.50 | 5.10 | 7.30 | 6.40 | 6.50 | 6.20 | |
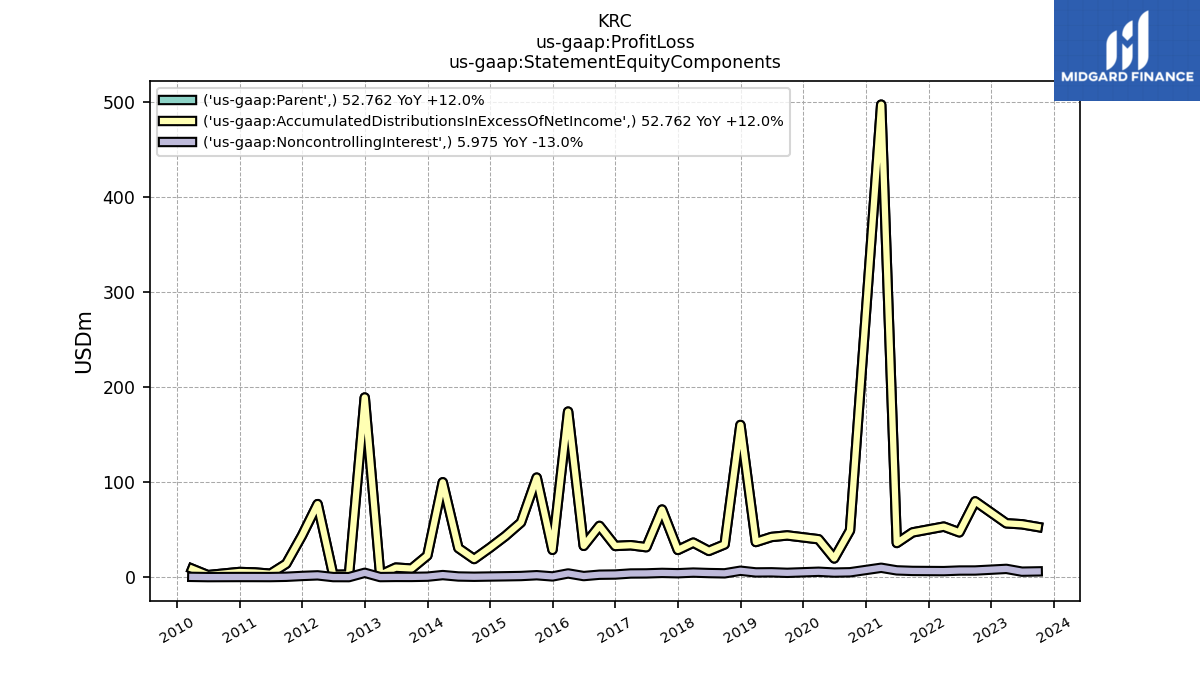
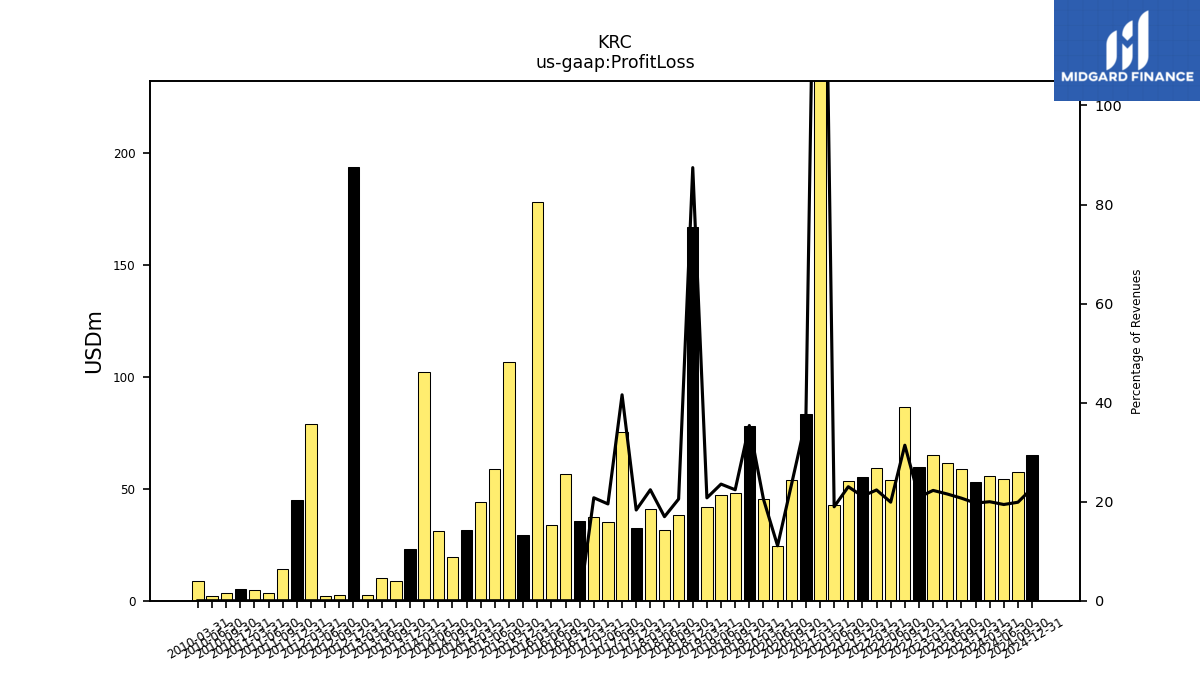
| Profit Loss | 53.05 | 58.74 | 61.27 | 65.23 | 59.48 | 86.66 | 53.98 | 59.38 | 55.13 | 53.49 | 42.88 | 507.41 | 83.45 | 54.07 | 24.35 | 45.42 | 77.92 | 48.30 | 47.22 | 41.79 | 166.89 | 38.31 | 31.75 | 40.97 | 32.54 | 75.49 | 35.31 | 37.28 | |
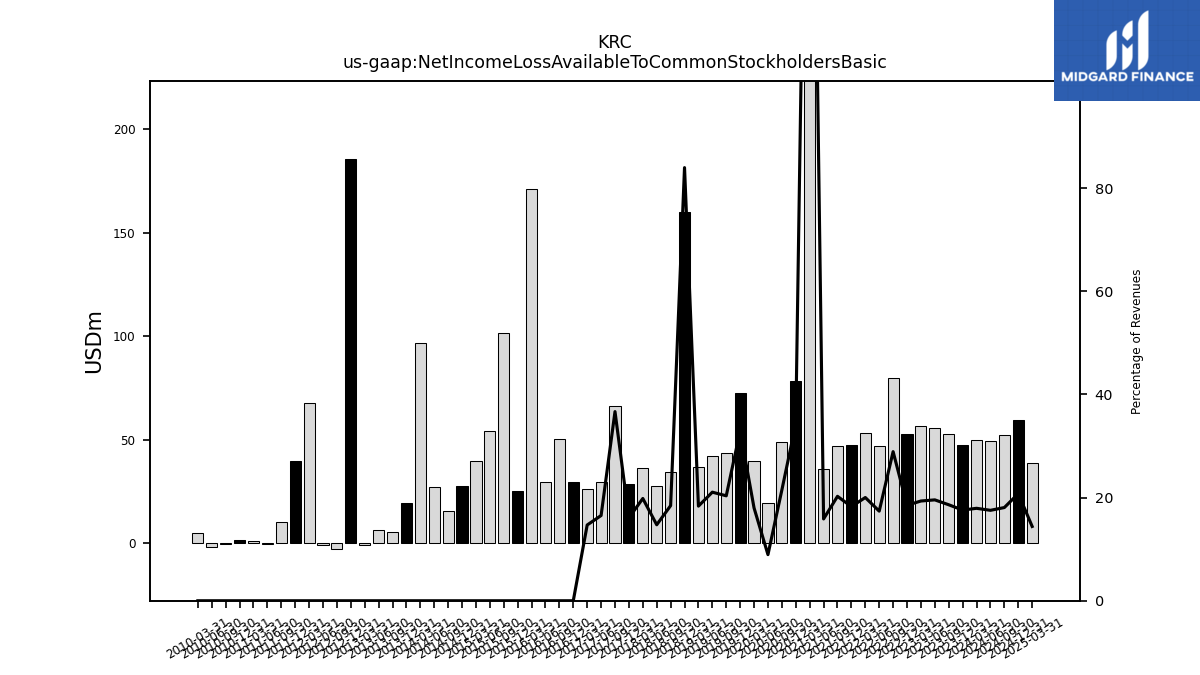
| Net Income Loss Available To Common Stockholders Basic | 47.28 | 52.76 | 55.59 | 56.61 | 52.62 | 79.76 | 47.10 | 53.13 | 47.65 | 47.03 | 35.84 | 497.63 | 78.64 | 49.03 | 19.62 | 39.82 | 72.50 | 43.85 | 42.19 | 36.90 | 160.22 | 34.40 | 27.55 | 36.25 | 28.53 | 66.56 | 29.83 | 26.33 |
| 2023-12-31 | 2023-09-30 | 2023-06-30 | 2023-03-31 | 2022-12-31 | 2022-09-30 | 2022-06-30 | 2022-03-31 | 2021-12-31 | 2021-09-30 | 2021-06-30 | 2021-03-31 | 2020-12-31 | 2020-09-30 | 2020-06-30 | 2020-03-31 | 2019-12-31 | 2019-09-30 | 2019-06-30 | 2019-03-31 | 2018-12-31 | 2018-09-30 | 2018-06-30 | 2018-03-31 | 2017-12-31 | 2017-09-30 | 2017-06-30 | 2017-03-31 | ||
|---|---|---|---|---|---|---|---|---|---|---|---|---|---|---|---|---|---|---|---|---|---|---|---|---|---|---|---|---|---|
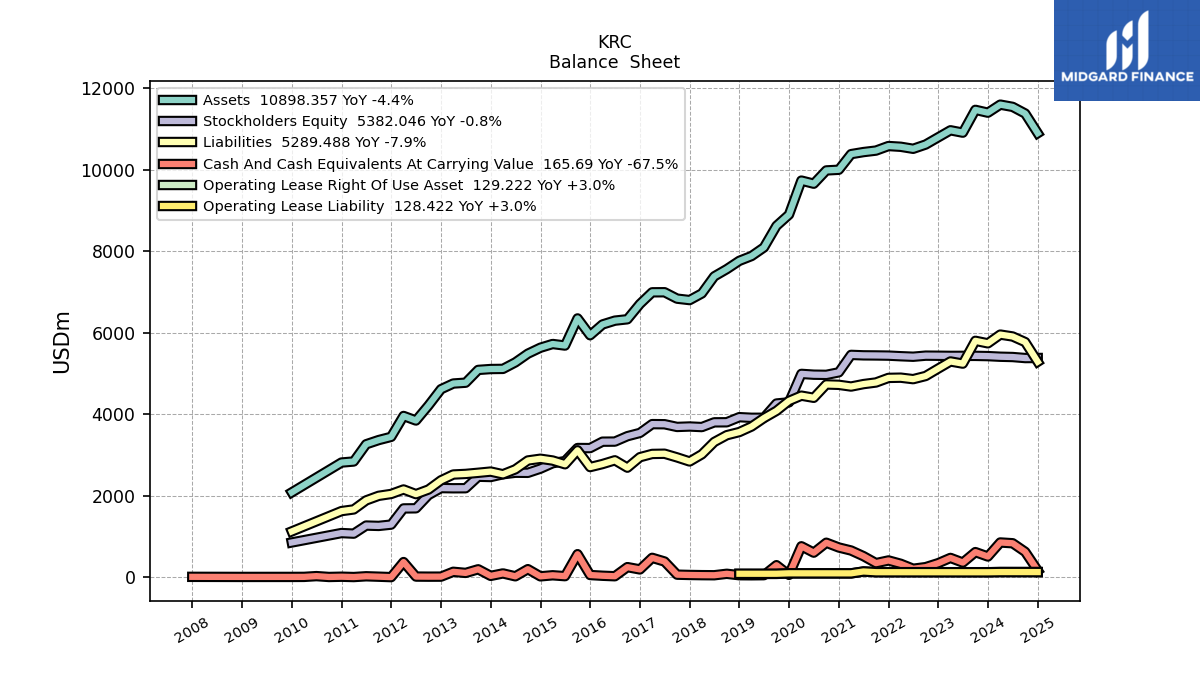
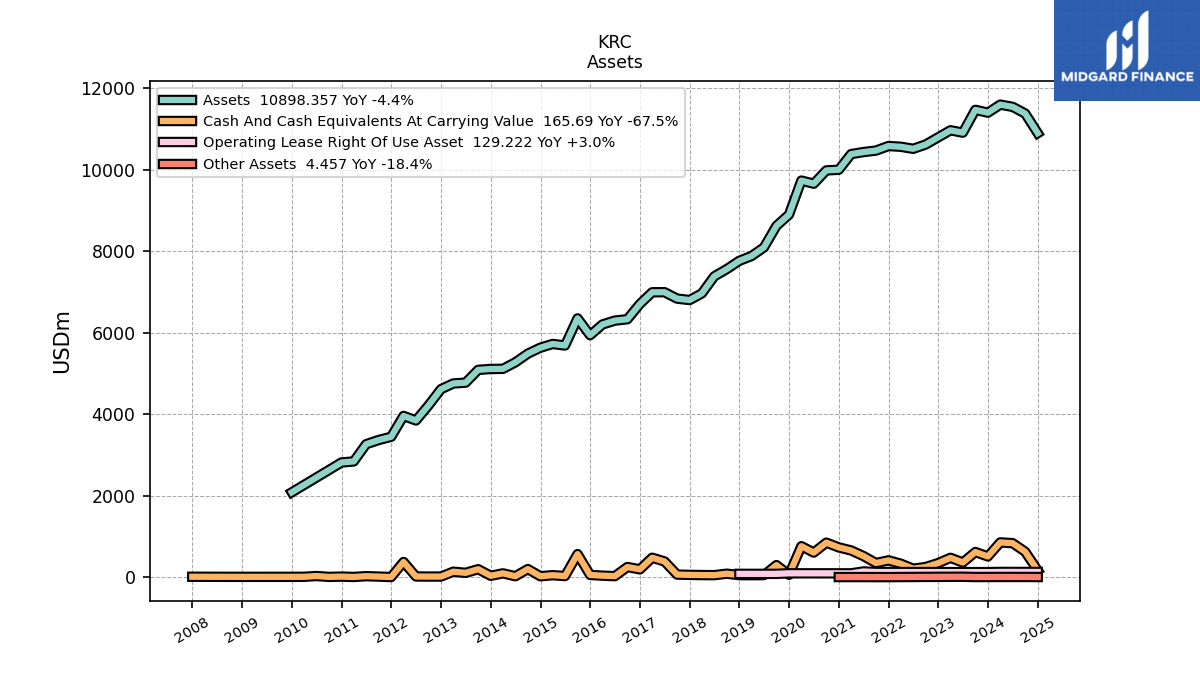
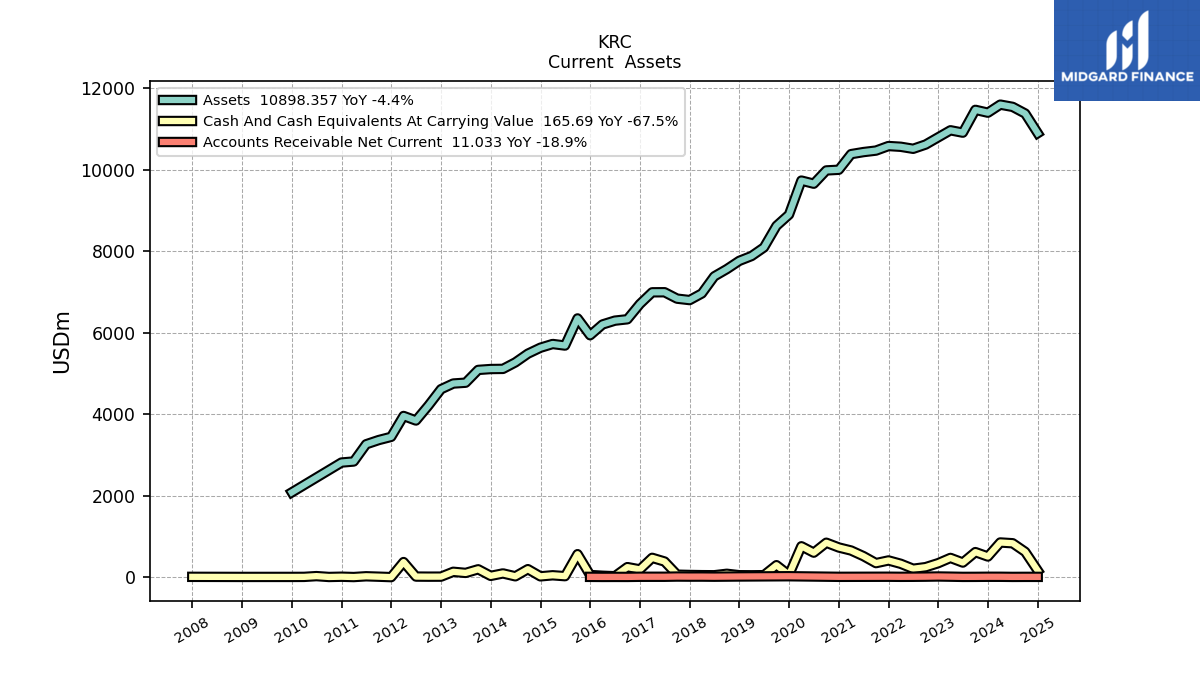
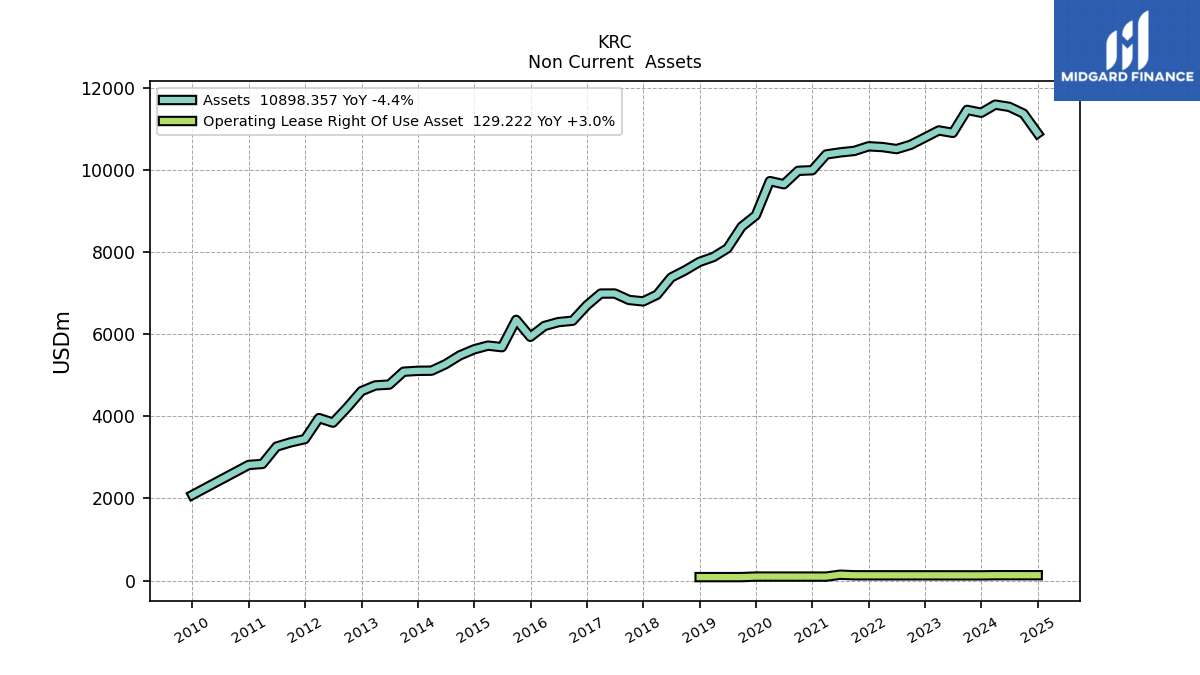
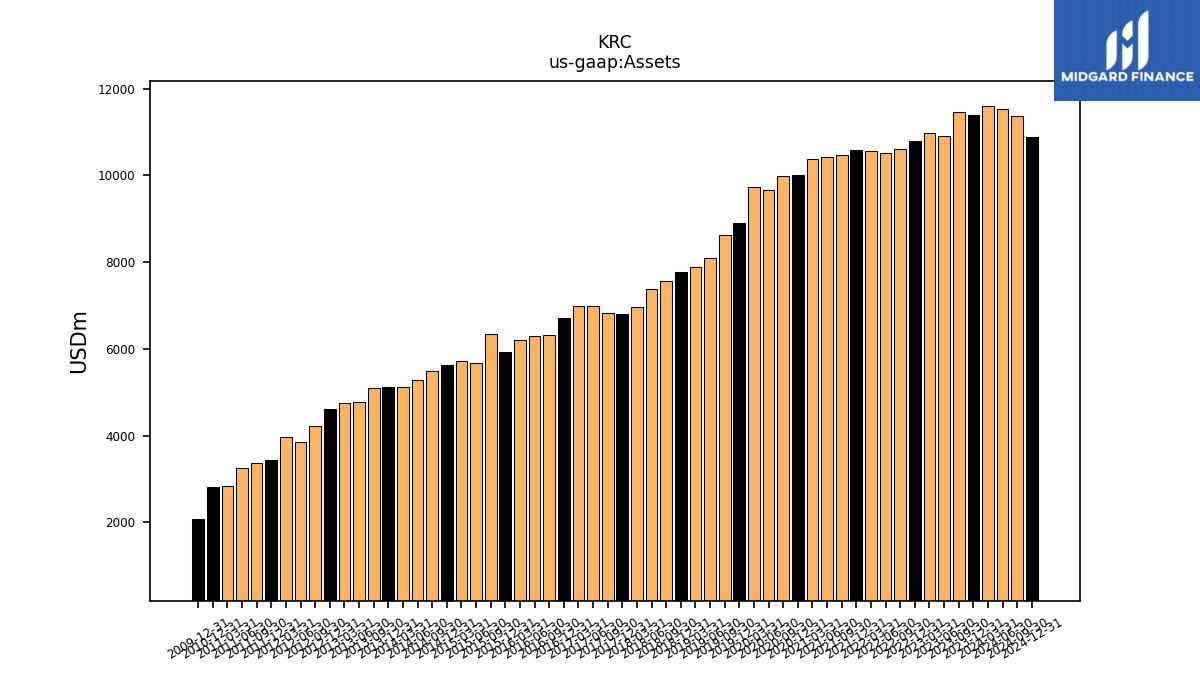
| Assets | 11401.05 | 11471.12 | 10911.03 | 10969.39 | 10796.99 | 10619.99 | 10515.24 | 10564.82 | 10583.40 | 10471.52 | 10434.77 | 10384.35 | 10000.71 | 9984.61 | 9658.67 | 9735.15 | 8900.09 | 8623.82 | 8094.72 | 7883.99 | 7765.71 | 7562.24 | 7384.78 | 6965.93 | 6802.84 | 6838.30 | 6995.37 | 6993.66 | |
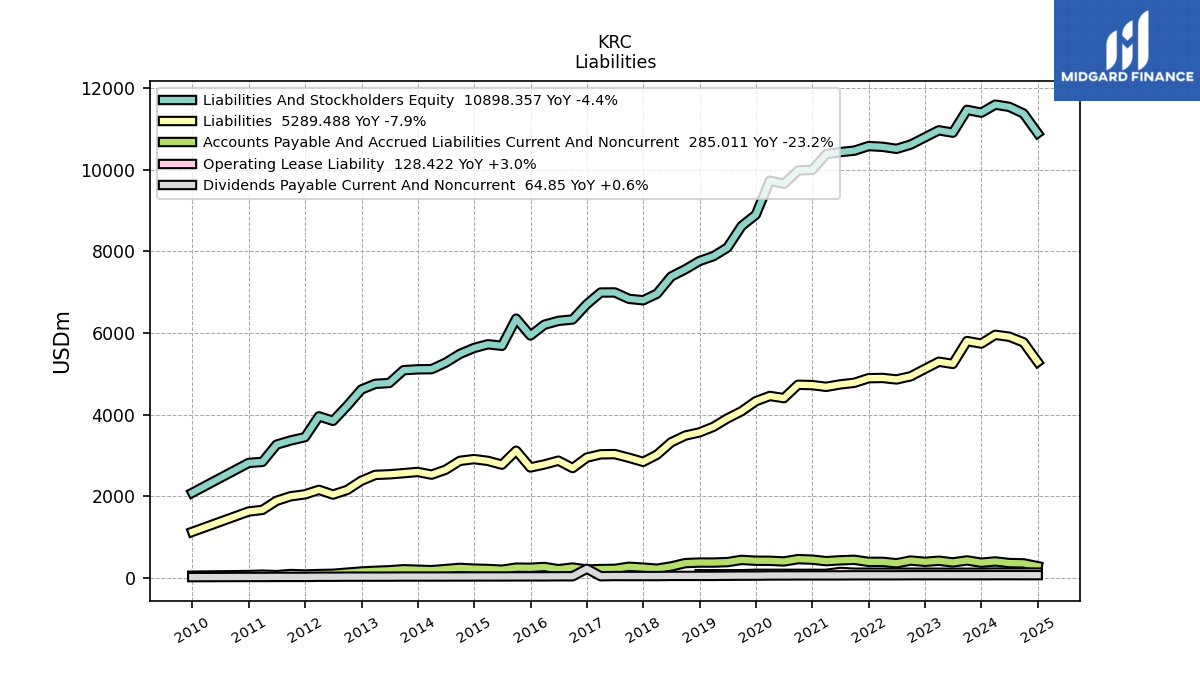
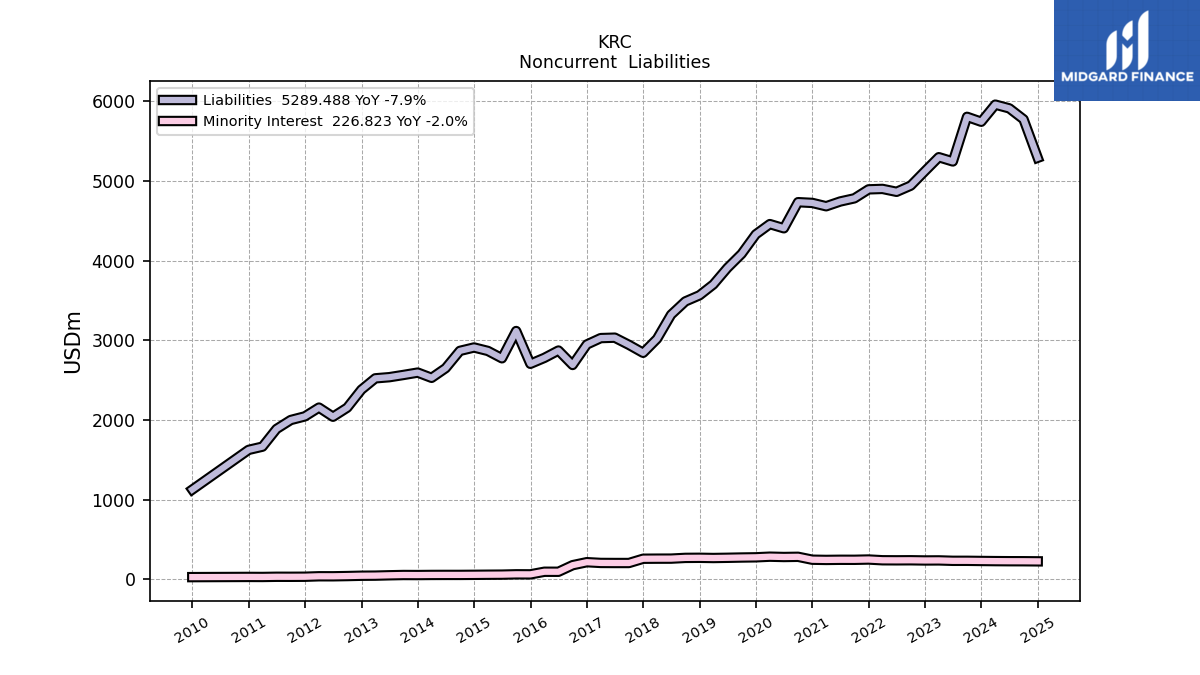
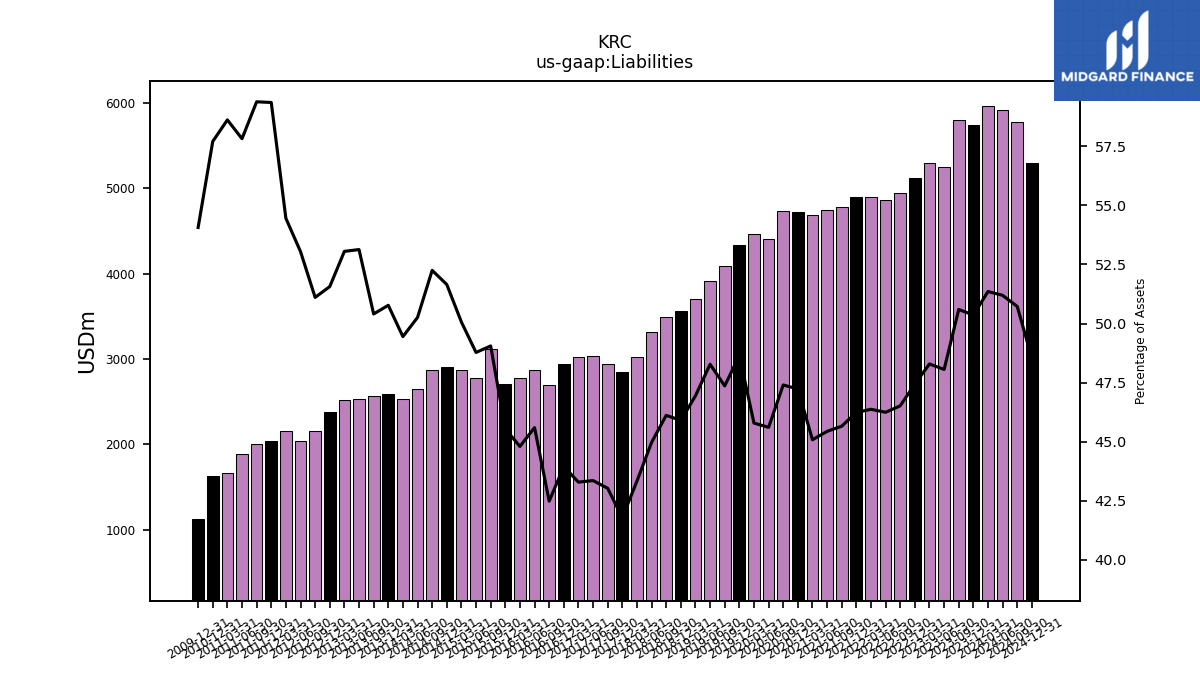
| Liabilities | 5741.35 | 5803.60 | 5243.44 | 5296.97 | 5122.03 | 4940.22 | 4862.69 | 4899.06 | 4893.53 | 4780.88 | 4741.30 | 4681.46 | 4723.39 | 4732.64 | 4405.08 | 4457.63 | 4329.24 | 4084.31 | 3907.82 | 3700.80 | 3564.45 | 3487.32 | 3320.91 | 3018.46 | 2842.52 | 2942.42 | 3032.90 | 3027.52 | |
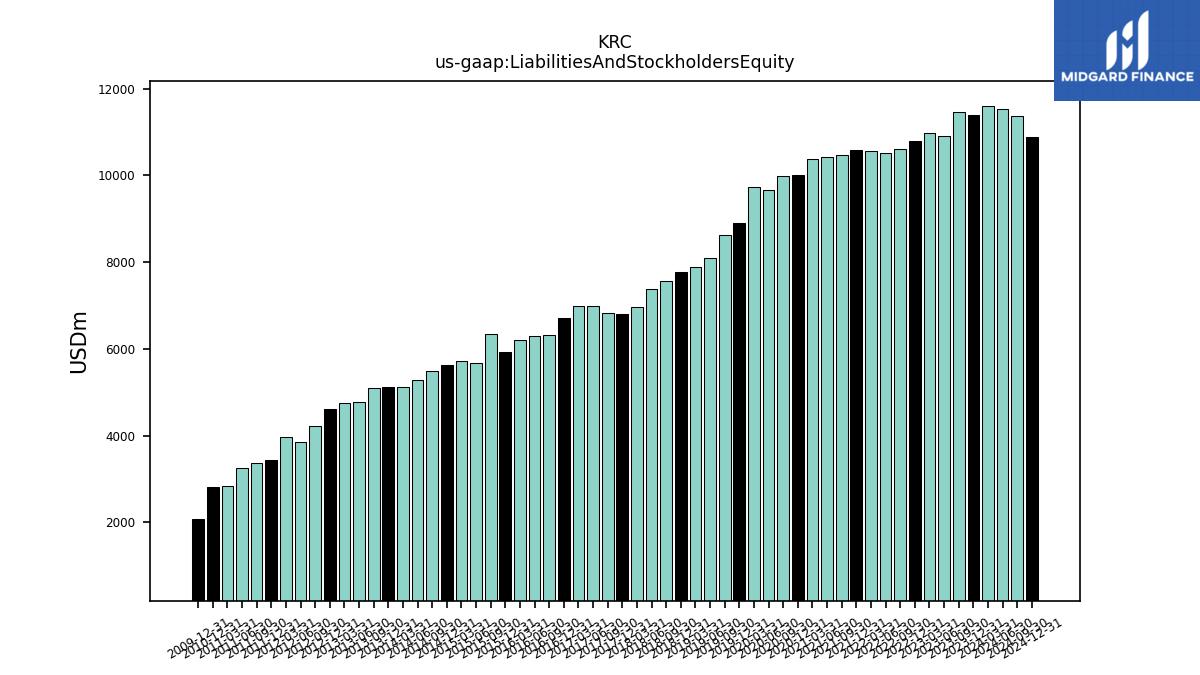
| Liabilities And Stockholders Equity | 11401.05 | 11471.12 | 10911.03 | 10969.39 | 10796.99 | 10619.99 | 10515.24 | 10564.82 | 10583.40 | 10471.52 | 10434.77 | 10384.35 | 10000.71 | 9984.61 | 9658.67 | 9735.15 | 8900.09 | 8623.82 | 8094.72 | 7883.99 | 7765.71 | 7562.24 | 7384.78 | 6965.93 | 6802.84 | 6838.30 | 6995.37 | 6993.66 | |
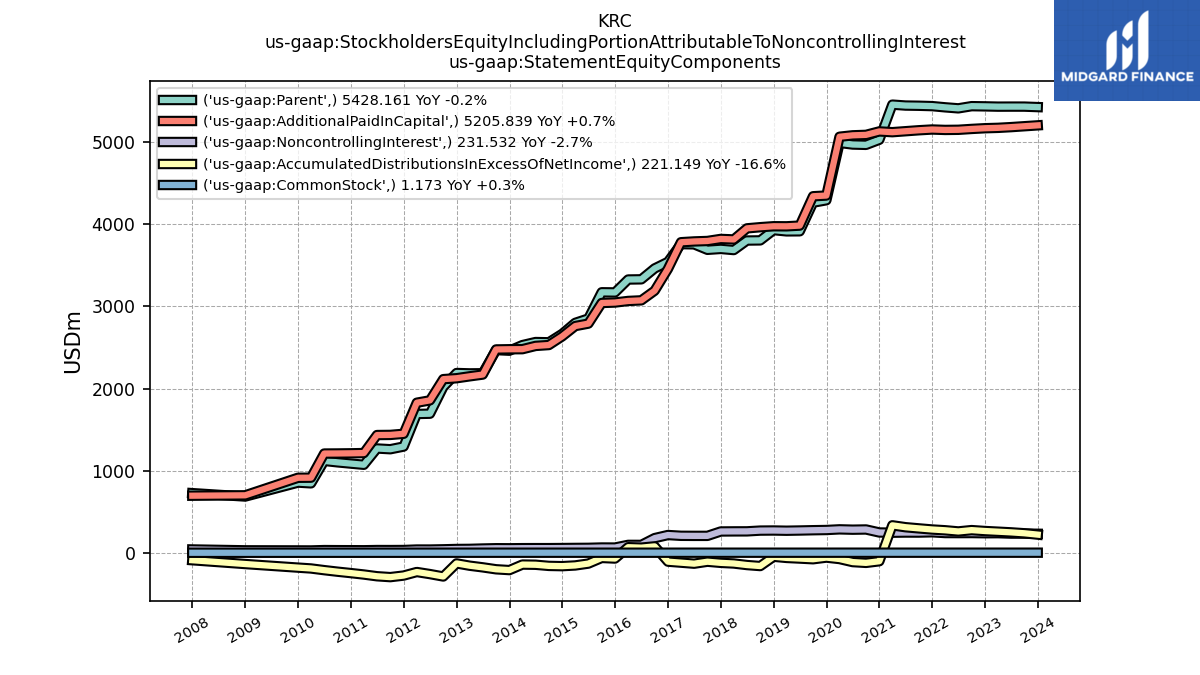
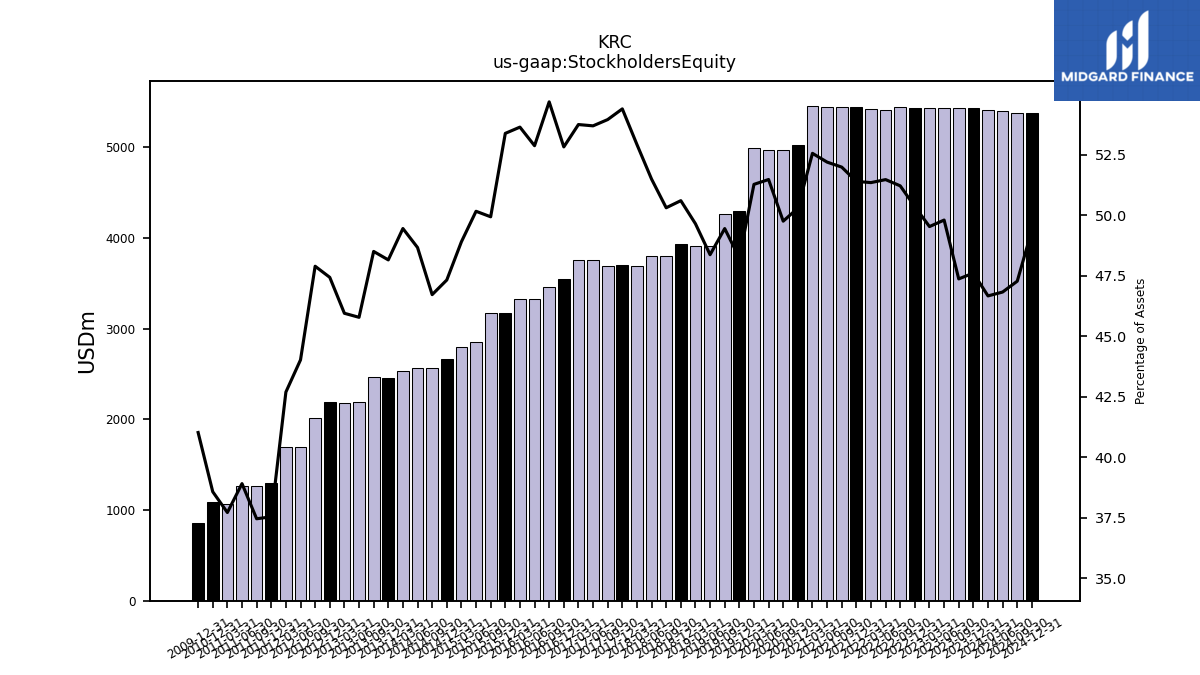
| Stockholders Equity | 5428.16 | 5433.94 | 5434.09 | 5433.65 | 5437.05 | 5439.40 | 5412.89 | 5425.33 | 5440.06 | 5444.46 | 5446.94 | 5458.24 | 5029.94 | 4968.14 | 4972.29 | 4992.15 | 4293.51 | 4264.65 | 3915.53 | 3914.52 | 3929.91 | 3804.76 | 3802.93 | 3686.86 | 3700.79 | 3689.86 | 3756.47 | 3759.32 |
| 2023-12-31 | 2023-09-30 | 2023-06-30 | 2023-03-31 | 2022-12-31 | 2022-09-30 | 2022-06-30 | 2022-03-31 | 2021-12-31 | 2021-09-30 | 2021-06-30 | 2021-03-31 | 2020-12-31 | 2020-09-30 | 2020-06-30 | 2020-03-31 | 2019-12-31 | 2019-09-30 | 2019-06-30 | 2019-03-31 | 2018-12-31 | 2018-09-30 | 2018-06-30 | 2018-03-31 | 2017-12-31 | 2017-09-30 | 2017-06-30 | 2017-03-31 | ||
|---|---|---|---|---|---|---|---|---|---|---|---|---|---|---|---|---|---|---|---|---|---|---|---|---|---|---|---|---|---|
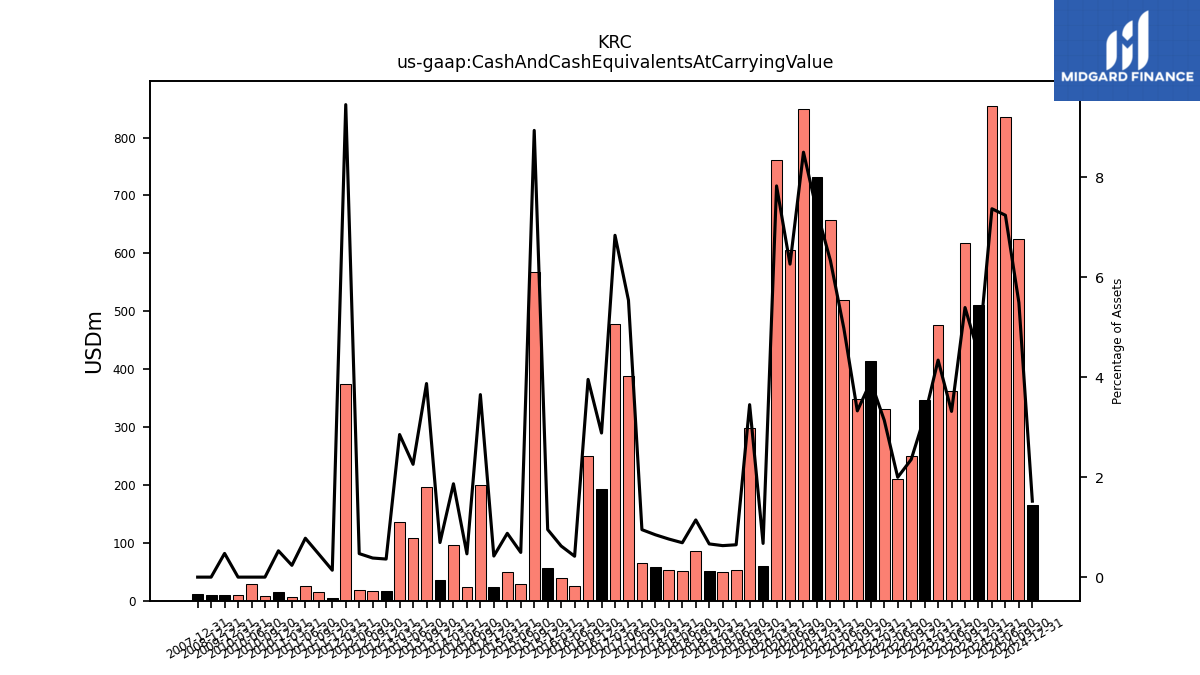
| Cash And Cash Equivalents At Carrying Value | 510.16 | 618.79 | 361.88 | 476.36 | 347.38 | 249.98 | 210.04 | 331.69 | 414.08 | 348.42 | 519.31 | 657.82 | 731.99 | 849.01 | 605.01 | 762.13 | 60.04 | 297.62 | 52.41 | 49.69 | 51.60 | 86.52 | 50.82 | 53.07 | 57.65 | 64.95 | 387.62 | 478.39 | |
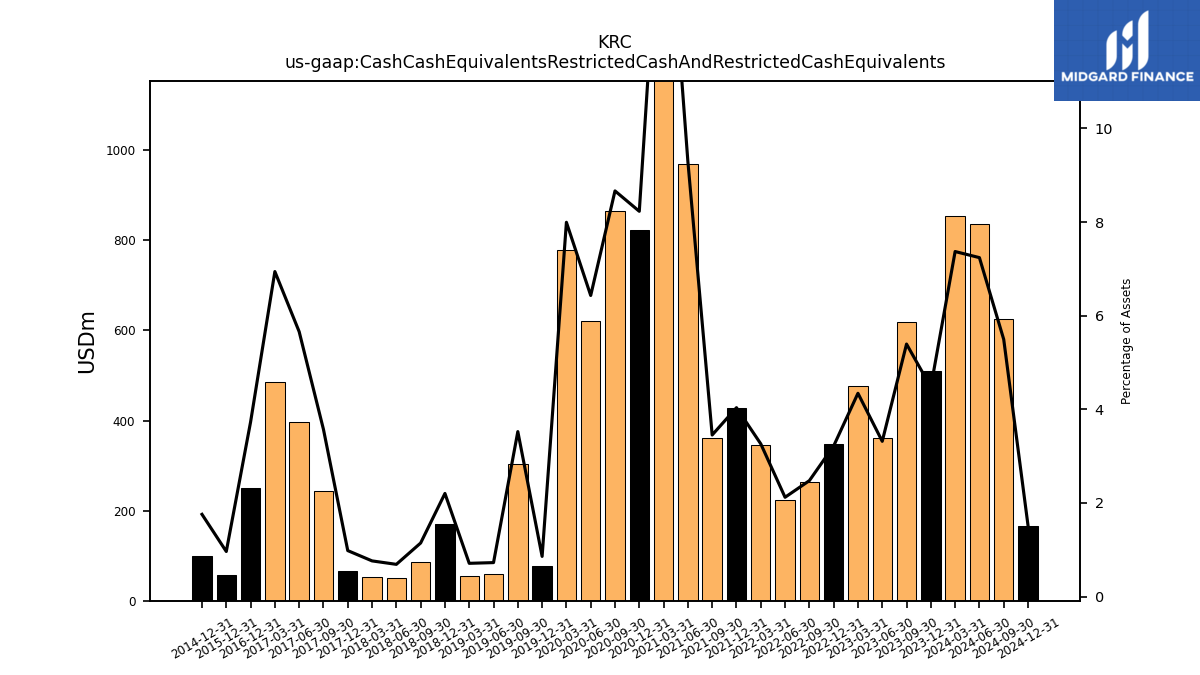
| Cash Cash Equivalents Restricted Cash And Restricted Cash Equivalents | 510.16 | 618.79 | 361.88 | 476.36 | 347.38 | 262.99 | 223.05 | 344.69 | 427.08 | 361.46 | 969.76 | 1686.58 | 823.13 | 865.31 | 621.31 | 778.43 | 76.34 | 303.92 | 58.72 | 55.99 | 171.03 | 86.52 | 50.82 | 53.07 | 66.80 | 244.23 | 395.87 | 485.59 | |
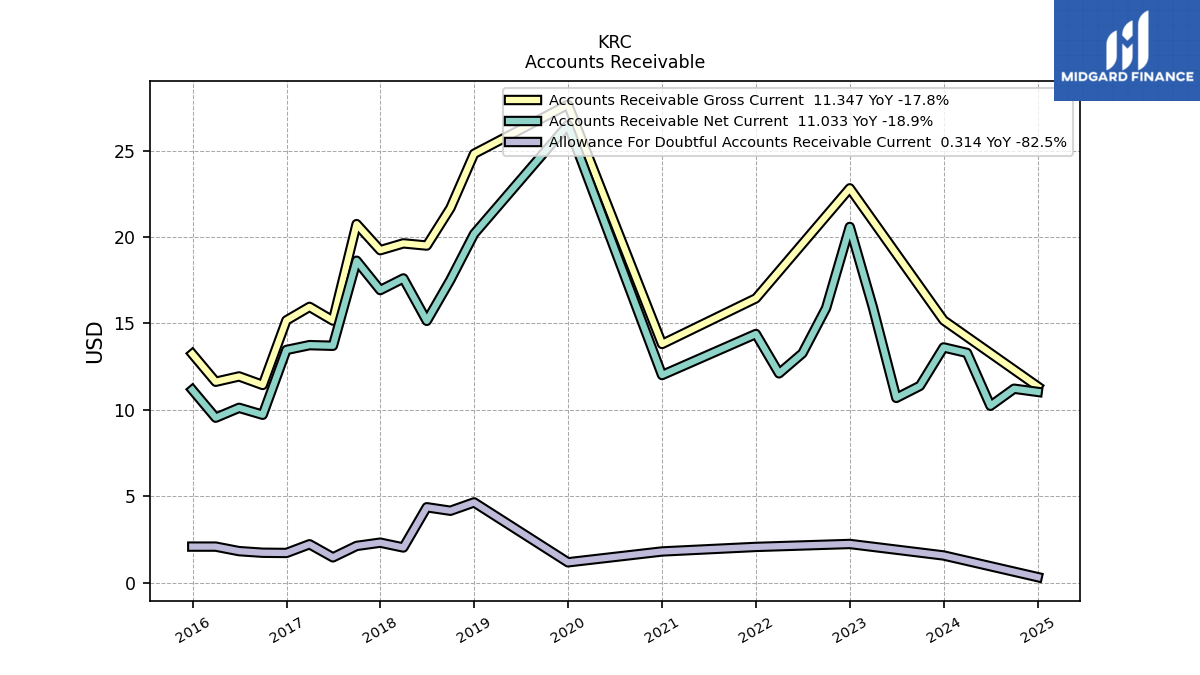
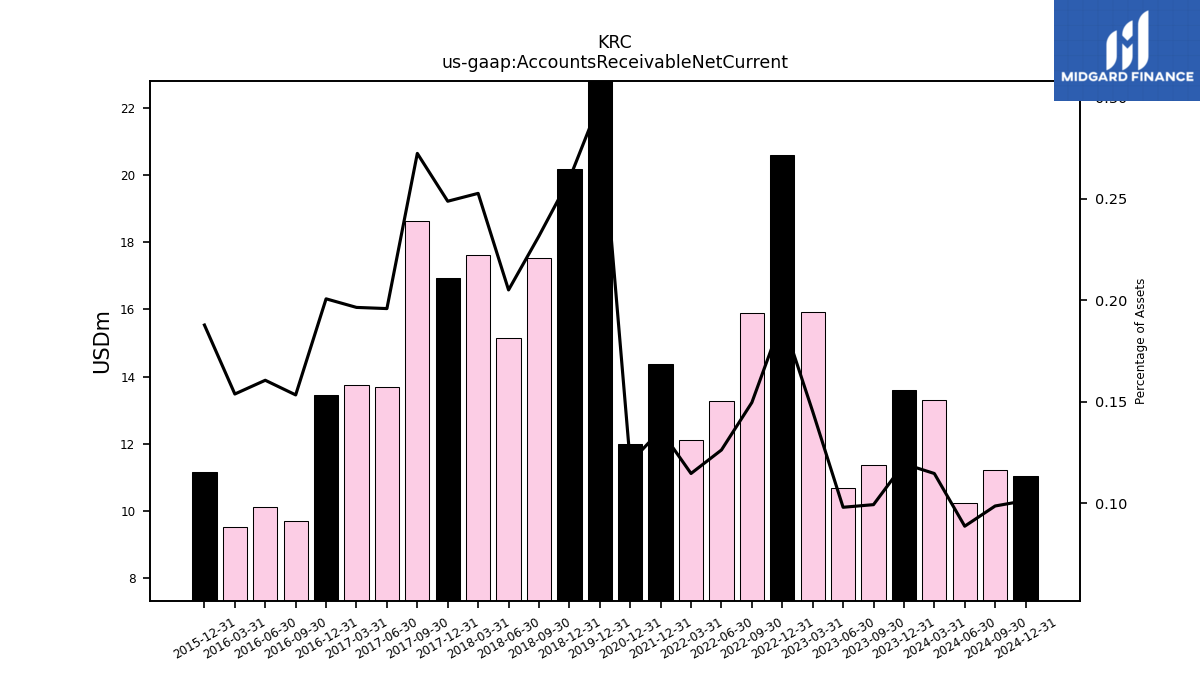
| Accounts Receivable Net Current | 13.61 | 11.38 | 10.69 | 15.93 | 20.58 | 15.88 | 13.27 | 12.11 | 14.39 | NA | NA | NA | 12.01 | NA | NA | NA | 26.49 | NA | NA | NA | 20.18 | 17.52 | 15.14 | 17.60 | 16.93 | 18.63 | 13.70 | 13.74 |
| 2023-12-31 | 2023-09-30 | 2023-06-30 | 2023-03-31 | 2022-12-31 | 2022-09-30 | 2022-06-30 | 2022-03-31 | 2021-12-31 | 2021-09-30 | 2021-06-30 | 2021-03-31 | 2020-12-31 | 2020-09-30 | 2020-06-30 | 2020-03-31 | 2019-12-31 | 2019-09-30 | 2019-06-30 | 2019-03-31 | 2018-12-31 | 2018-09-30 | 2018-06-30 | 2018-03-31 | 2017-12-31 | 2017-09-30 | 2017-06-30 | 2017-03-31 | ||
|---|---|---|---|---|---|---|---|---|---|---|---|---|---|---|---|---|---|---|---|---|---|---|---|---|---|---|---|---|---|
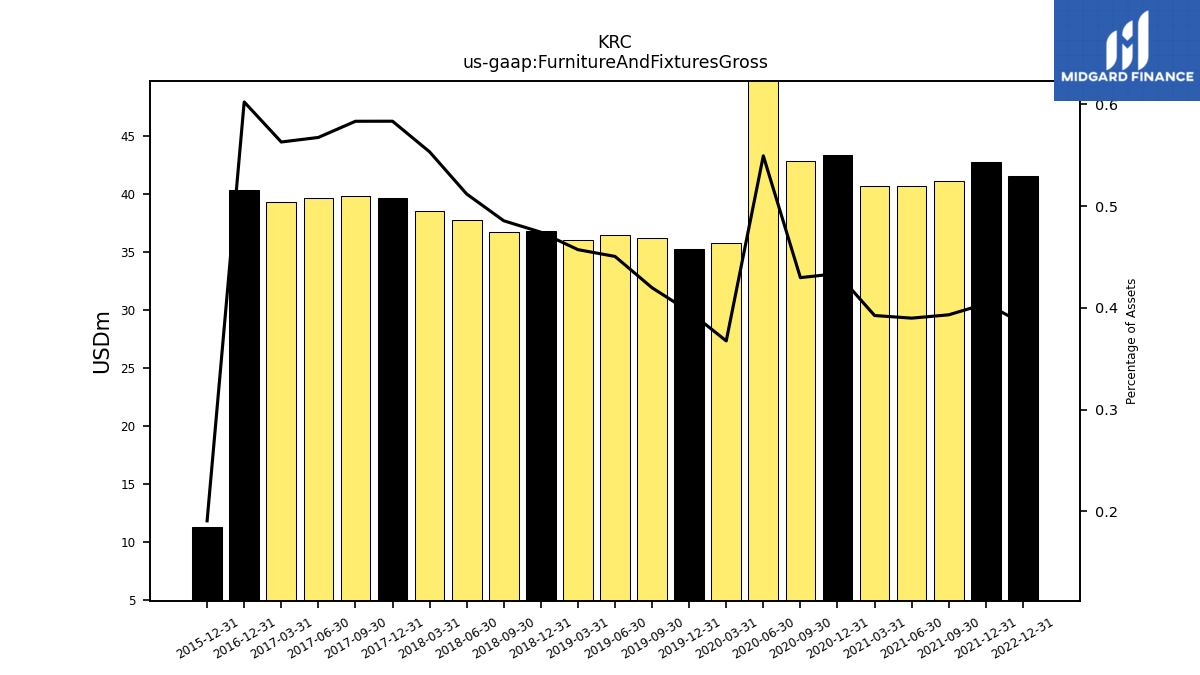
| Furniture And Fixtures Gross | NA | NA | NA | NA | 41.54 | NA | NA | NA | 42.76 | 41.16 | 40.68 | 40.75 | 43.37 | 42.90 | 53.06 | 35.78 | 35.29 | 36.19 | 36.47 | 36.04 | 36.83 | 36.72 | 37.80 | 38.54 | 39.69 | 39.89 | 39.69 | 39.37 |
| 2023-12-31 | 2023-09-30 | 2023-06-30 | 2023-03-31 | 2022-12-31 | 2022-09-30 | 2022-06-30 | 2022-03-31 | 2021-12-31 | 2021-09-30 | 2021-06-30 | 2021-03-31 | 2020-12-31 | 2020-09-30 | 2020-06-30 | 2020-03-31 | 2019-12-31 | 2019-09-30 | 2019-06-30 | 2019-03-31 | 2018-12-31 | 2018-09-30 | 2018-06-30 | 2018-03-31 | 2017-12-31 | 2017-09-30 | 2017-06-30 | 2017-03-31 | ||
|---|---|---|---|---|---|---|---|---|---|---|---|---|---|---|---|---|---|---|---|---|---|---|---|---|---|---|---|---|---|
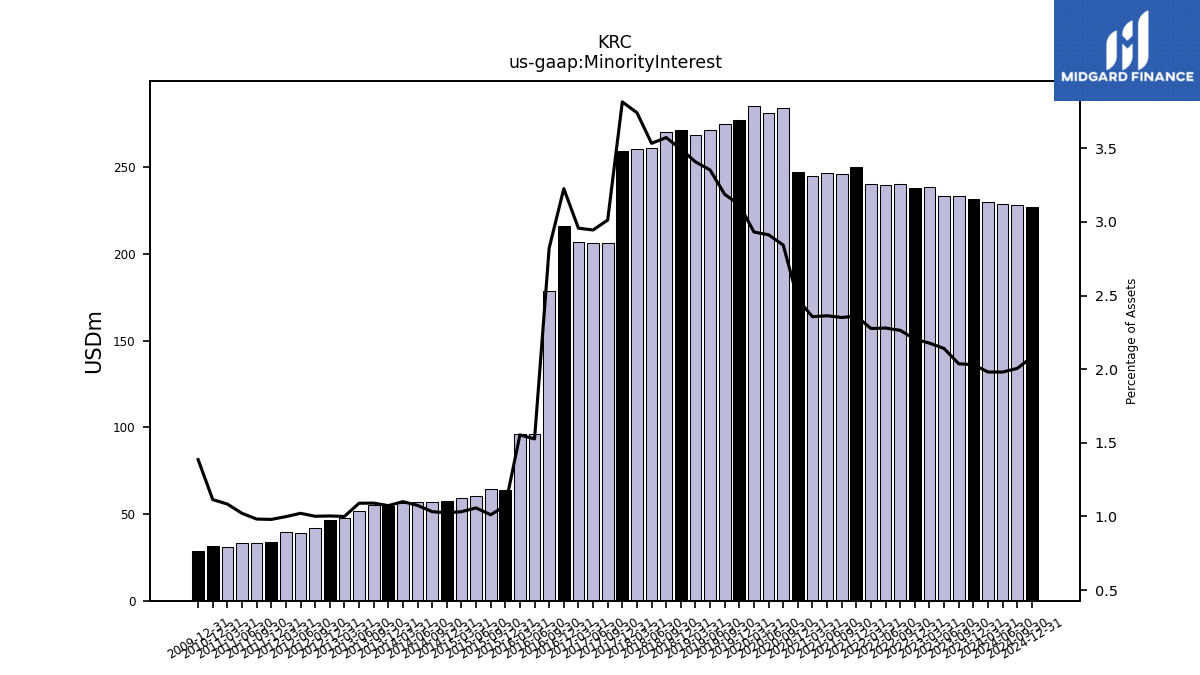
| Minority Interest | 231.53 | 233.58 | 233.50 | 238.77 | 237.91 | 240.38 | 239.66 | 240.43 | 249.81 | 246.17 | 246.52 | 244.65 | 247.38 | 283.82 | 281.30 | 285.37 | 277.35 | 274.86 | 271.37 | 268.66 | 271.35 | 270.16 | 260.95 | 260.61 | 259.52 | 206.02 | 206.00 | 206.82 |
| 2023-12-31 | 2023-09-30 | 2023-06-30 | 2023-03-31 | 2022-12-31 | 2022-09-30 | 2022-06-30 | 2022-03-31 | 2021-12-31 | 2021-09-30 | 2021-06-30 | 2021-03-31 | 2020-12-31 | 2020-09-30 | 2020-06-30 | 2020-03-31 | 2019-12-31 | 2019-09-30 | 2019-06-30 | 2019-03-31 | 2018-12-31 | 2018-09-30 | 2018-06-30 | 2018-03-31 | 2017-12-31 | 2017-09-30 | 2017-06-30 | 2017-03-31 | ||
|---|---|---|---|---|---|---|---|---|---|---|---|---|---|---|---|---|---|---|---|---|---|---|---|---|---|---|---|---|---|
| Stockholders Equity | 5428.16 | 5433.94 | 5434.09 | 5433.65 | 5437.05 | 5439.40 | 5412.89 | 5425.33 | 5440.06 | 5444.46 | 5446.94 | 5458.24 | 5029.94 | 4968.14 | 4972.29 | 4992.15 | 4293.51 | 4264.65 | 3915.53 | 3914.52 | 3929.91 | 3804.76 | 3802.93 | 3686.86 | 3700.79 | 3689.86 | 3756.47 | 3759.32 | |
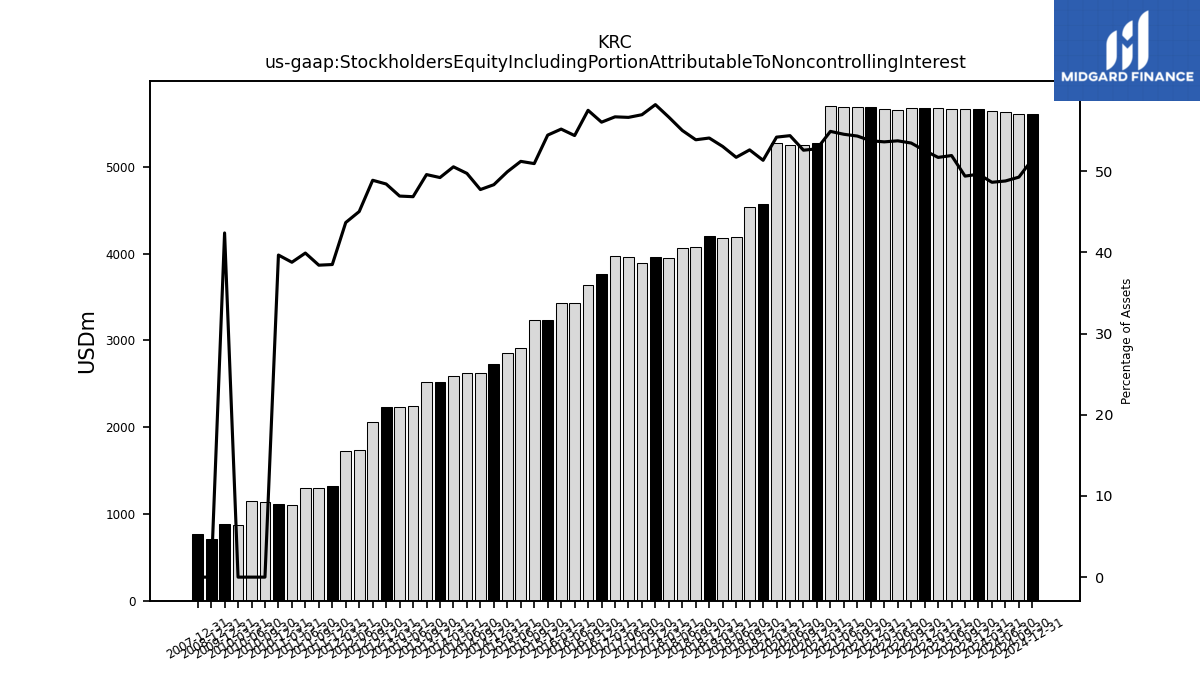
| Stockholders Equity Including Portion Attributable To Noncontrolling Interest | 5659.69 | 5667.52 | 5667.59 | 5672.42 | 5674.96 | 5679.78 | 5652.55 | 5665.76 | 5689.87 | 5690.64 | 5693.47 | 5702.89 | 5277.32 | 5251.96 | 5253.59 | 5277.52 | 4570.86 | 4539.51 | 4186.90 | 4183.18 | 4201.26 | 4074.92 | 4063.87 | 3947.47 | 3960.32 | 3895.88 | 3962.47 | 3966.14 | |
| Common Stock Value | 1.17 | 1.17 | 1.17 | 1.17 | 1.17 | 1.17 | 1.17 | 1.17 | 1.17 | 1.17 | 1.17 | 1.17 | 1.16 | 1.15 | 1.15 | 1.15 | 1.06 | 1.06 | 1.01 | 1.01 | 1.01 | 1.01 | 1.01 | 0.99 | 0.99 | 0.98 | 0.98 | 0.98 | |
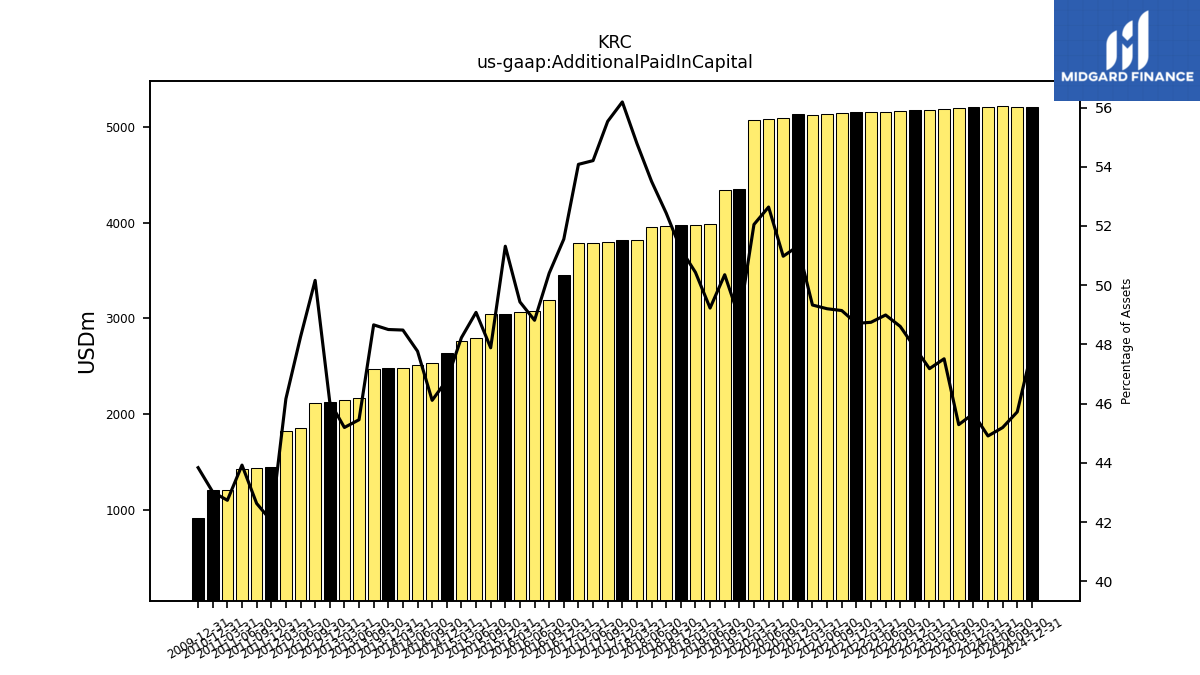
| Additional Paid In Capital | 5205.84 | 5195.11 | 5184.23 | 5175.40 | 5170.76 | 5162.09 | 5151.70 | 5149.97 | 5155.23 | 5146.05 | 5134.32 | 5122.58 | 5131.92 | 5089.93 | 5084.36 | 5067.18 | 4350.92 | 4342.30 | 3984.87 | 3976.20 | 3976.95 | 3965.41 | 3951.29 | 3816.39 | 3822.49 | 3797.55 | 3792.03 | 3782.29 | |
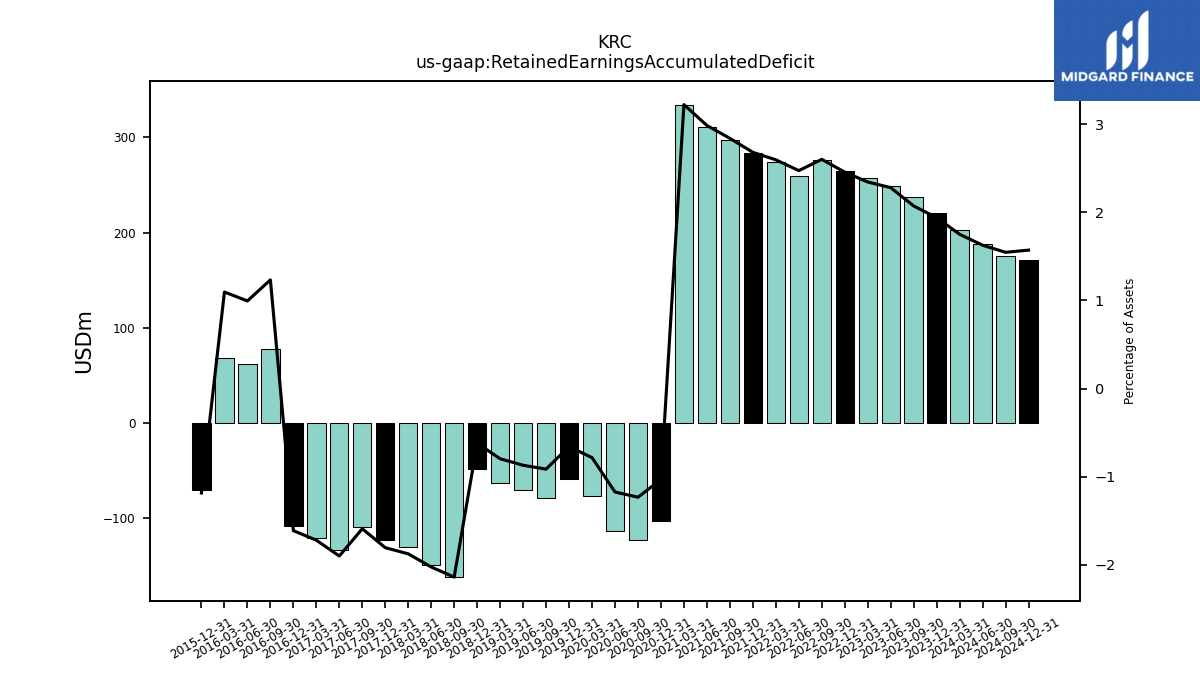
| Retained Earnings Accumulated Deficit | 221.15 | 237.66 | 248.69 | 257.08 | 265.12 | 276.14 | 260.02 | 274.19 | 283.66 | 297.25 | 311.46 | 334.50 | -103.13 | -122.94 | -113.22 | -76.18 | -58.47 | -78.71 | -70.34 | -62.69 | -48.05 | -161.65 | -149.37 | -130.51 | -122.69 | -108.67 | -132.80 | -120.21 | |
| Minority Interest | 231.53 | 233.58 | 233.50 | 238.77 | 237.91 | 240.38 | 239.66 | 240.43 | 249.81 | 246.17 | 246.52 | 244.65 | 247.38 | 283.82 | 281.30 | 285.37 | 277.35 | 274.86 | 271.37 | 268.66 | 271.35 | 270.16 | 260.95 | 260.61 | 259.52 | 206.02 | 206.00 | 206.82 | |
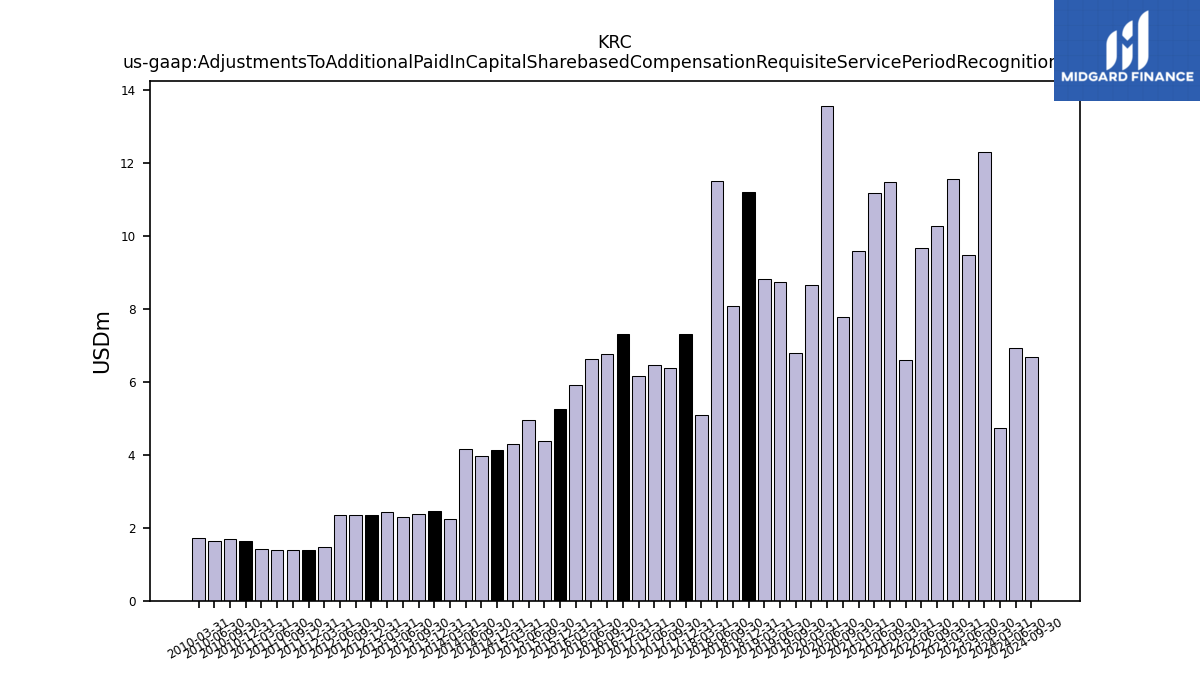
| Adjustments To Additional Paid In Capital Sharebased Compensation Requisite Service Period Recognition Value | NA | 12.31 | 9.50 | 11.57 | NA | 10.29 | 9.66 | 6.60 | NA | 11.48 | 11.19 | 9.60 | NA | 7.79 | 13.58 | 8.65 | NA | 6.81 | 8.73 | 8.82 | 11.21 | 8.08 | 11.50 | 5.09 | 7.31 | 6.38 | 6.46 | 6.17 | |
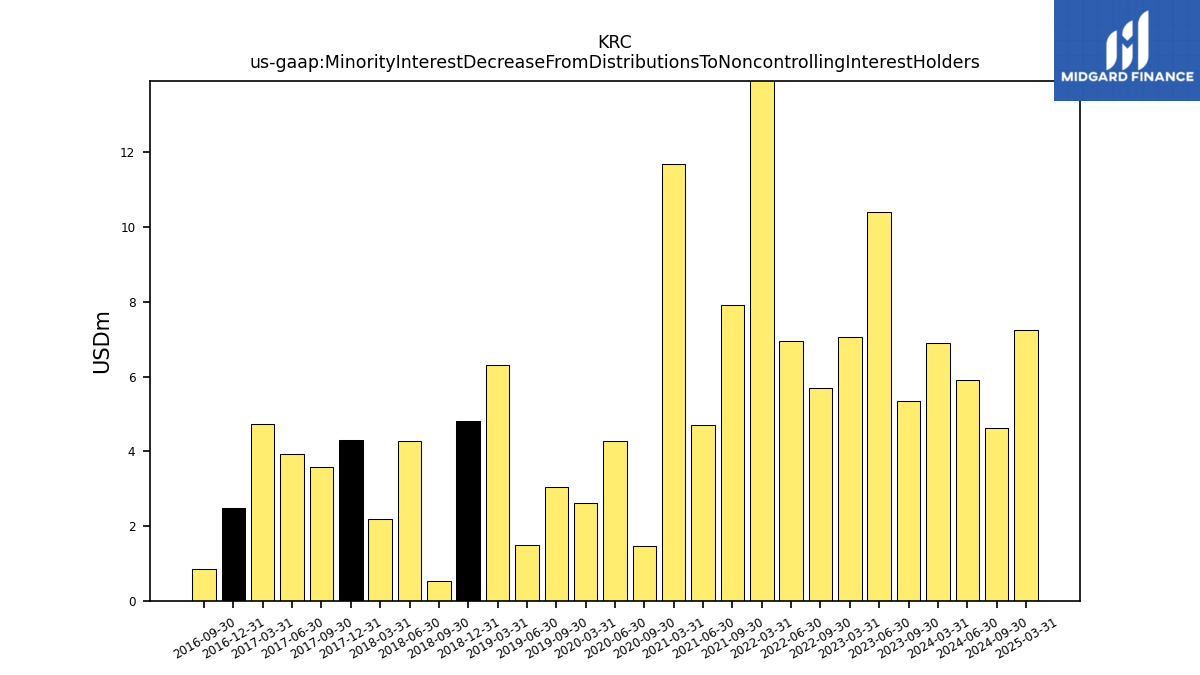
| Minority Interest Decrease From Distributions To Noncontrolling Interest Holders | NA | 5.35 | 10.39 | 7.07 | NA | 5.70 | 6.95 | 14.84 | NA | 7.92 | 4.69 | 11.68 | NA | 1.46 | 4.28 | 2.62 | NA | 3.04 | 1.49 | 6.31 | 4.80 | 0.54 | 4.29 | 2.18 | 4.31 | 3.58 | 3.92 | 4.73 |
| 2023-12-31 | 2023-09-30 | 2023-06-30 | 2023-03-31 | 2022-12-31 | 2022-09-30 | 2022-06-30 | 2022-03-31 | 2021-12-31 | 2021-09-30 | 2021-06-30 | 2021-03-31 | 2020-12-31 | 2020-09-30 | 2020-06-30 | 2020-03-31 | 2019-12-31 | 2019-09-30 | 2019-06-30 | 2019-03-31 | 2018-12-31 | 2018-09-30 | 2018-06-30 | 2018-03-31 | 2017-12-31 | 2017-09-30 | 2017-06-30 | 2017-03-31 | ||
|---|---|---|---|---|---|---|---|---|---|---|---|---|---|---|---|---|---|---|---|---|---|---|---|---|---|---|---|---|---|
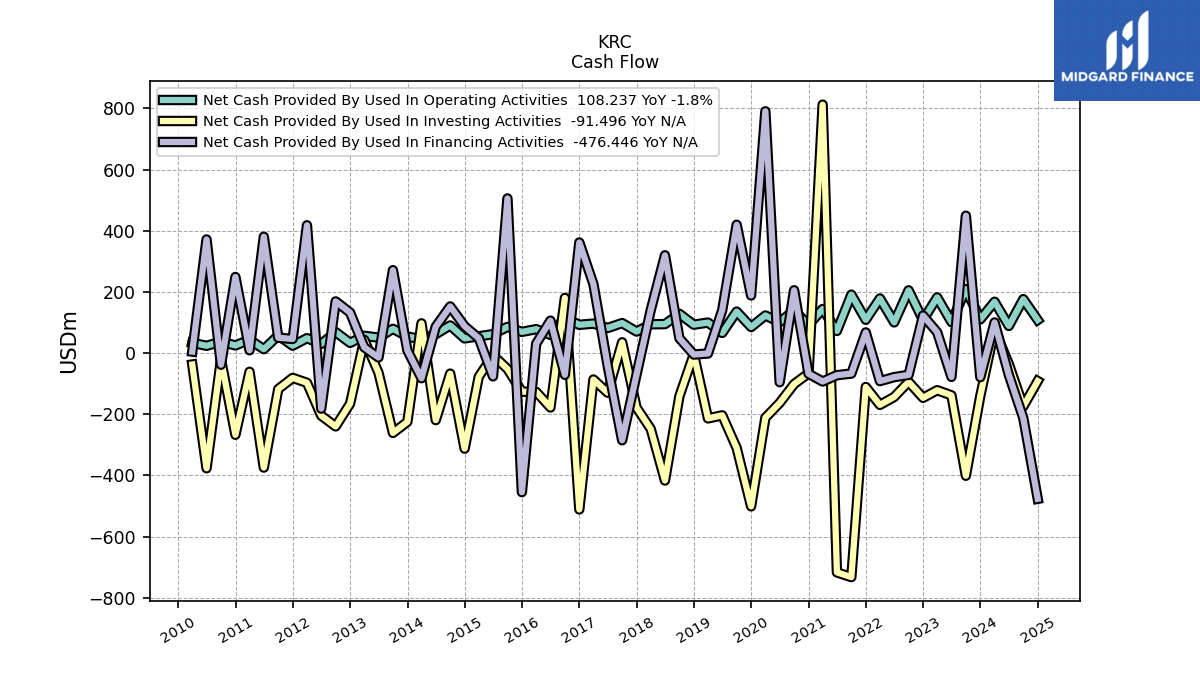
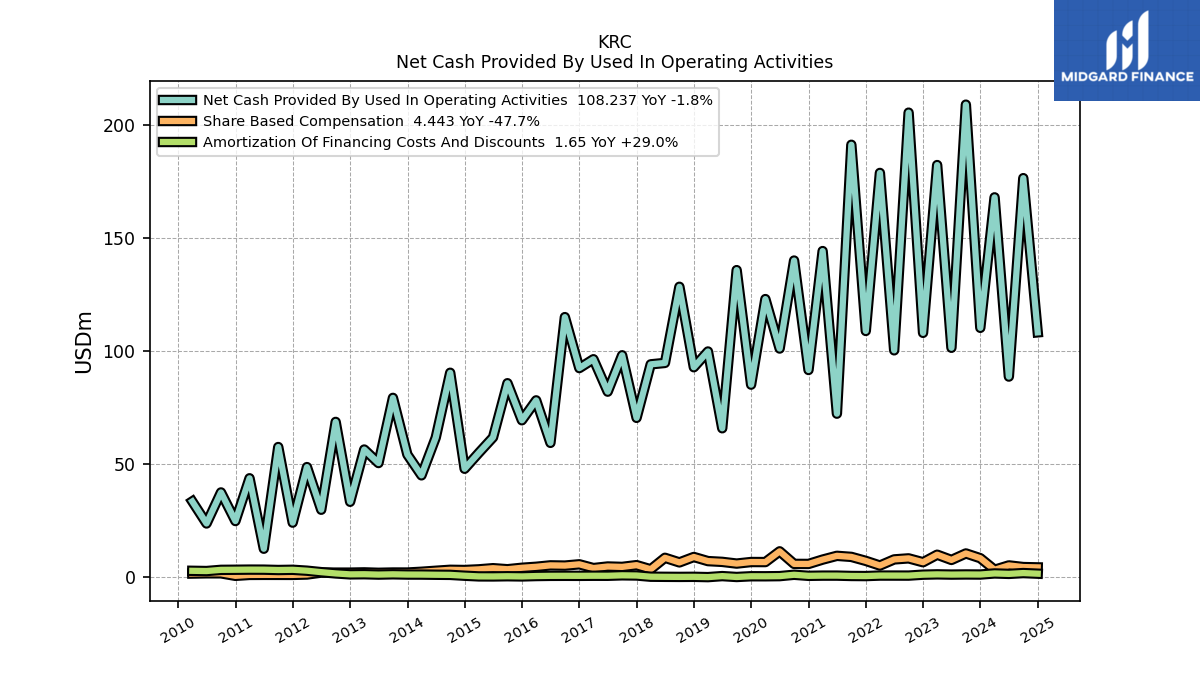
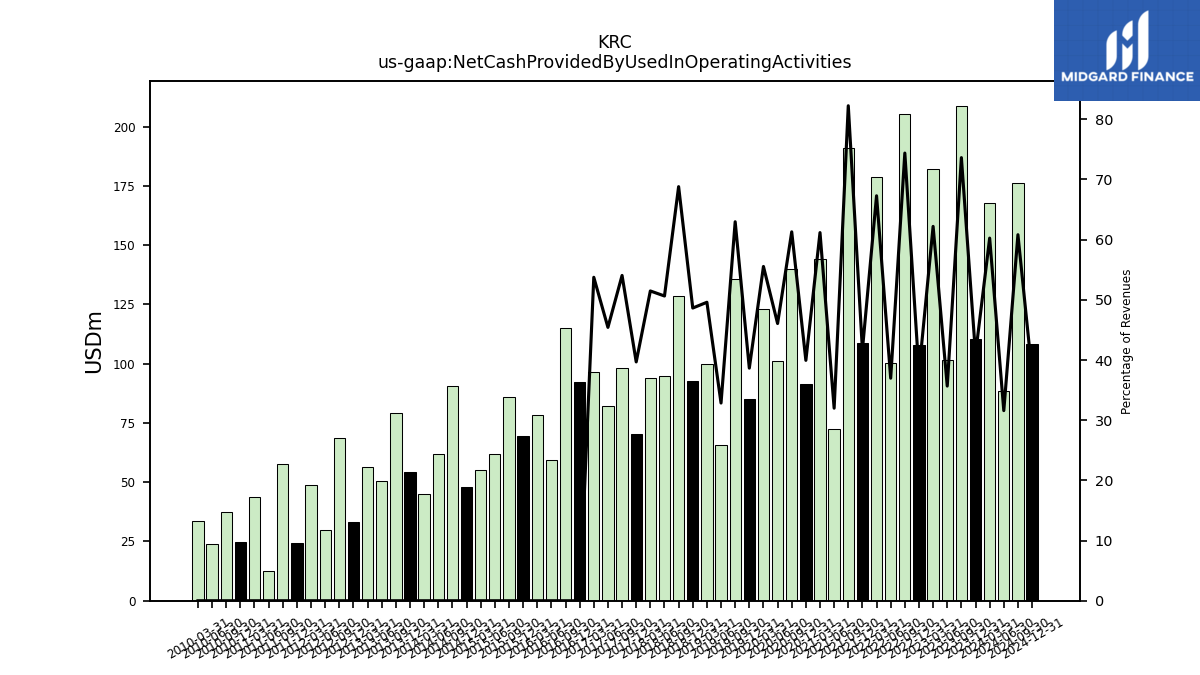
| Net Cash Provided By Used In Operating Activities | 110.22 | 208.82 | 101.41 | 182.14 | 108.00 | 205.28 | 100.29 | 178.66 | 108.84 | 191.09 | 72.31 | 144.15 | 91.61 | 139.96 | 101.08 | 122.94 | 85.13 | 135.73 | 65.87 | 99.79 | 92.83 | 128.37 | 94.73 | 94.11 | 70.47 | 98.13 | 82.04 | 96.38 | |
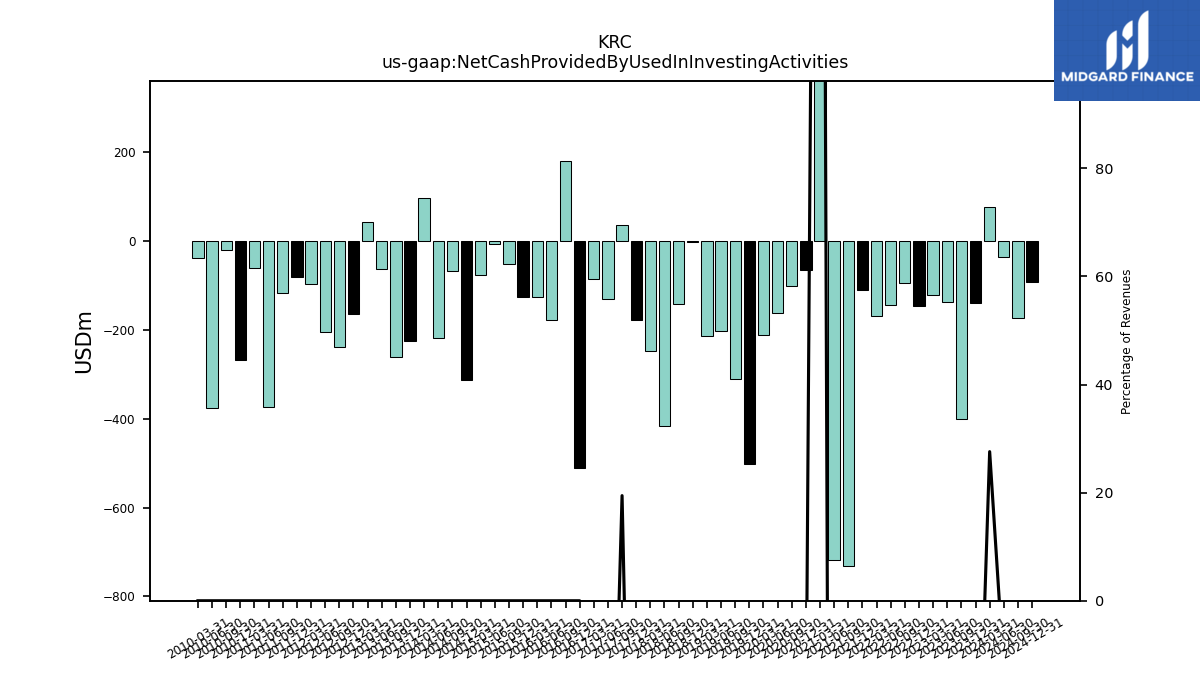
| Net Cash Provided By Used In Investing Activities | -139.92 | -401.09 | -138.04 | -121.35 | -146.34 | -94.14 | -143.34 | -169.37 | -110.76 | -732.42 | -716.95 | 812.25 | -66.43 | -101.36 | -162.93 | -211.41 | -501.10 | -310.15 | -203.50 | -213.53 | -3.52 | -141.05 | -416.69 | -247.66 | -178.39 | 35.31 | -129.63 | -86.39 | |
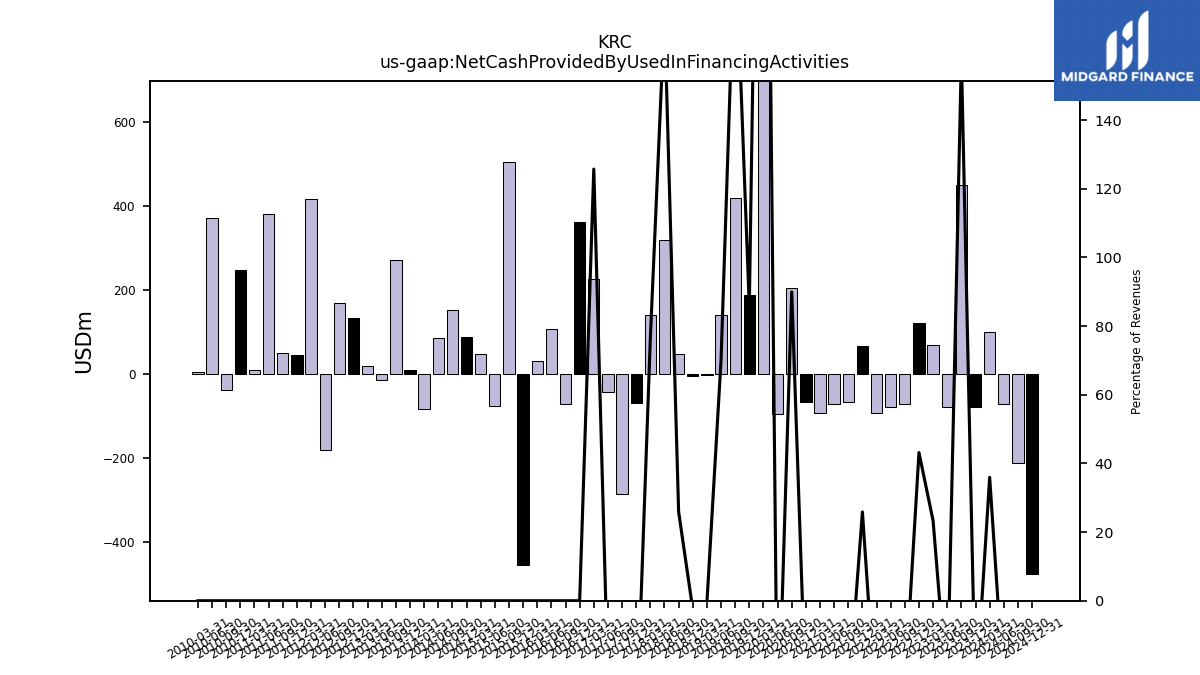
| Net Cash Provided By Used In Financing Activities | -78.93 | 449.18 | -77.84 | 68.19 | 122.72 | -71.21 | -78.58 | -91.68 | 67.54 | -66.98 | -72.18 | -92.95 | -67.36 | 205.40 | -95.28 | 790.56 | 188.39 | 419.62 | 140.36 | -1.30 | -4.80 | 48.38 | 319.70 | 139.82 | -69.51 | -285.07 | -42.14 | 225.47 |
| 2023-12-31 | 2023-09-30 | 2023-06-30 | 2023-03-31 | 2022-12-31 | 2022-09-30 | 2022-06-30 | 2022-03-31 | 2021-12-31 | 2021-09-30 | 2021-06-30 | 2021-03-31 | 2020-12-31 | 2020-09-30 | 2020-06-30 | 2020-03-31 | 2019-12-31 | 2019-09-30 | 2019-06-30 | 2019-03-31 | 2018-12-31 | 2018-09-30 | 2018-06-30 | 2018-03-31 | 2017-12-31 | 2017-09-30 | 2017-06-30 | 2017-03-31 | ||
|---|---|---|---|---|---|---|---|---|---|---|---|---|---|---|---|---|---|---|---|---|---|---|---|---|---|---|---|---|---|
| Net Cash Provided By Used In Operating Activities | 110.22 | 208.82 | 101.41 | 182.14 | 108.00 | 205.28 | 100.29 | 178.66 | 108.84 | 191.09 | 72.31 | 144.15 | 91.61 | 139.96 | 101.08 | 122.94 | 85.13 | 135.73 | 65.87 | 99.79 | 92.83 | 128.37 | 94.73 | 94.11 | 70.47 | 98.13 | 82.04 | 96.38 | |
| Profit Loss | 53.05 | 58.74 | 61.27 | 65.23 | 59.48 | 86.66 | 53.98 | 59.38 | 55.13 | 53.49 | 42.88 | 507.41 | 83.45 | 54.07 | 24.35 | 45.42 | 77.92 | 48.30 | 47.22 | 41.79 | 166.89 | 38.31 | 31.75 | 40.97 | 32.54 | 75.49 | 35.31 | 37.28 | |
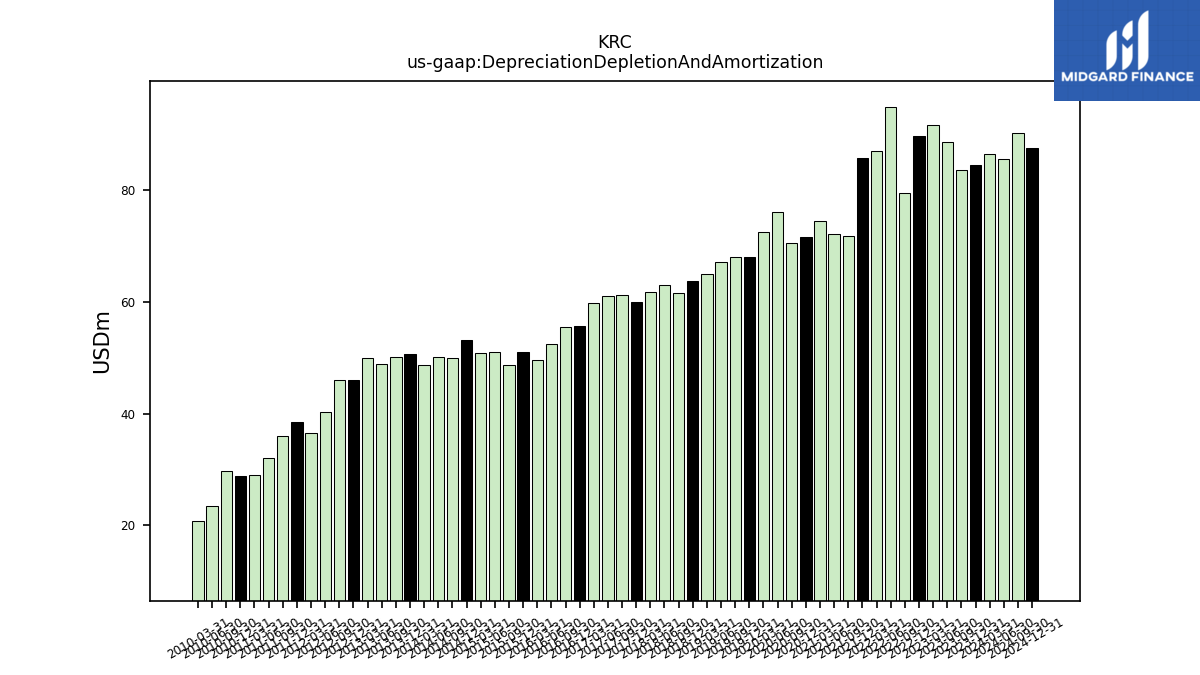
| Depreciation Depletion And Amortization | 84.40 | 83.52 | 88.47 | 91.67 | 89.54 | 79.41 | 94.72 | 87.00 | 85.63 | 71.70 | 72.04 | 74.43 | 71.51 | 70.42 | 75.98 | 72.44 | 68.08 | 67.98 | 67.01 | 64.97 | 63.64 | 61.61 | 62.96 | 61.68 | 59.99 | 61.14 | 61.00 | 59.73 | |
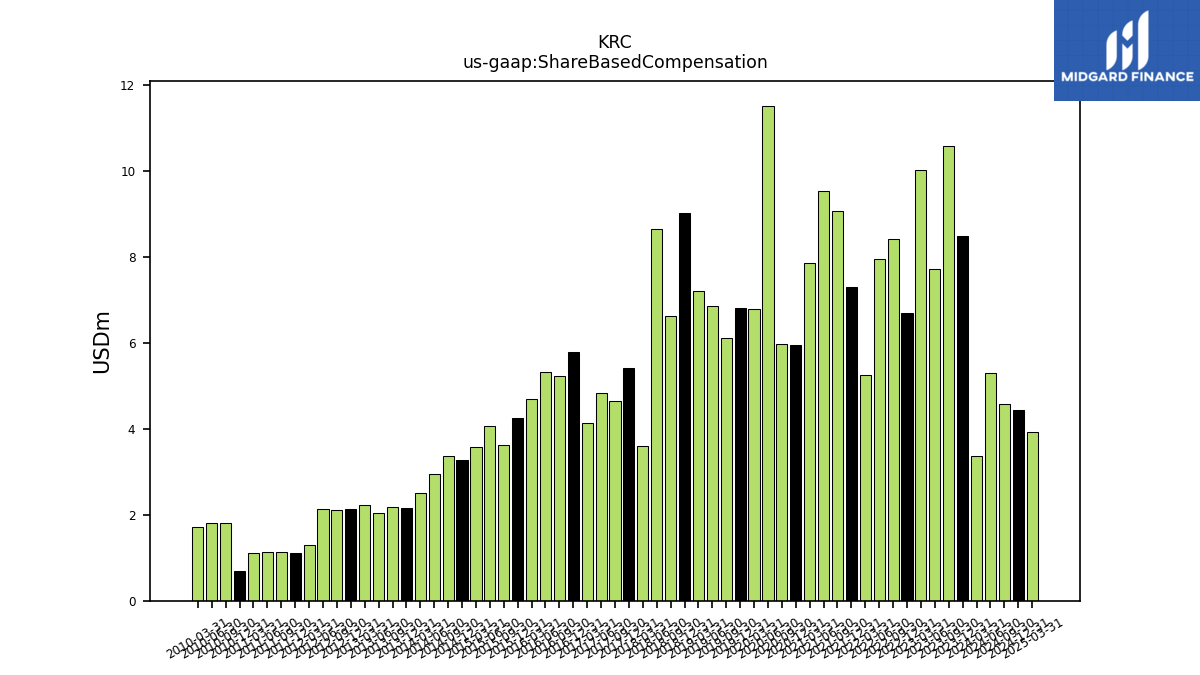
| Share Based Compensation | 8.50 | 10.60 | 7.72 | 10.04 | 6.71 | 8.42 | 7.96 | 5.26 | 7.31 | 9.07 | 9.54 | 7.88 | 5.96 | 5.98 | 11.53 | 6.78 | 6.81 | 6.12 | 6.87 | 7.21 | 9.03 | 6.63 | 8.67 | 3.60 | 5.43 | 4.65 | 4.83 | 4.13 |
| 2023-12-31 | 2023-09-30 | 2023-06-30 | 2023-03-31 | 2022-12-31 | 2022-09-30 | 2022-06-30 | 2022-03-31 | 2021-12-31 | 2021-09-30 | 2021-06-30 | 2021-03-31 | 2020-12-31 | 2020-09-30 | 2020-06-30 | 2020-03-31 | 2019-12-31 | 2019-09-30 | 2019-06-30 | 2019-03-31 | 2018-12-31 | 2018-09-30 | 2018-06-30 | 2018-03-31 | 2017-12-31 | 2017-09-30 | 2017-06-30 | 2017-03-31 | ||
|---|---|---|---|---|---|---|---|---|---|---|---|---|---|---|---|---|---|---|---|---|---|---|---|---|---|---|---|---|---|
| Net Cash Provided By Used In Investing Activities | -139.92 | -401.09 | -138.04 | -121.35 | -146.34 | -94.14 | -143.34 | -169.37 | -110.76 | -732.42 | -716.95 | 812.25 | -66.43 | -101.36 | -162.93 | -211.41 | -501.10 | -310.15 | -203.50 | -213.53 | -3.52 | -141.05 | -416.69 | -247.66 | -178.39 | 35.31 | -129.63 | -86.39 |
| 2023-12-31 | 2023-09-30 | 2023-06-30 | 2023-03-31 | 2022-12-31 | 2022-09-30 | 2022-06-30 | 2022-03-31 | 2021-12-31 | 2021-09-30 | 2021-06-30 | 2021-03-31 | 2020-12-31 | 2020-09-30 | 2020-06-30 | 2020-03-31 | 2019-12-31 | 2019-09-30 | 2019-06-30 | 2019-03-31 | 2018-12-31 | 2018-09-30 | 2018-06-30 | 2018-03-31 | 2017-12-31 | 2017-09-30 | 2017-06-30 | 2017-03-31 | ||
|---|---|---|---|---|---|---|---|---|---|---|---|---|---|---|---|---|---|---|---|---|---|---|---|---|---|---|---|---|---|
| Net Cash Provided By Used In Financing Activities | -78.93 | 449.18 | -77.84 | 68.19 | 122.72 | -71.21 | -78.58 | -91.68 | 67.54 | -66.98 | -72.18 | -92.95 | -67.36 | 205.40 | -95.28 | 790.56 | 188.39 | 419.62 | 140.36 | -1.30 | -4.80 | 48.38 | 319.70 | 139.82 | -69.51 | -285.07 | -42.14 | 225.47 | |
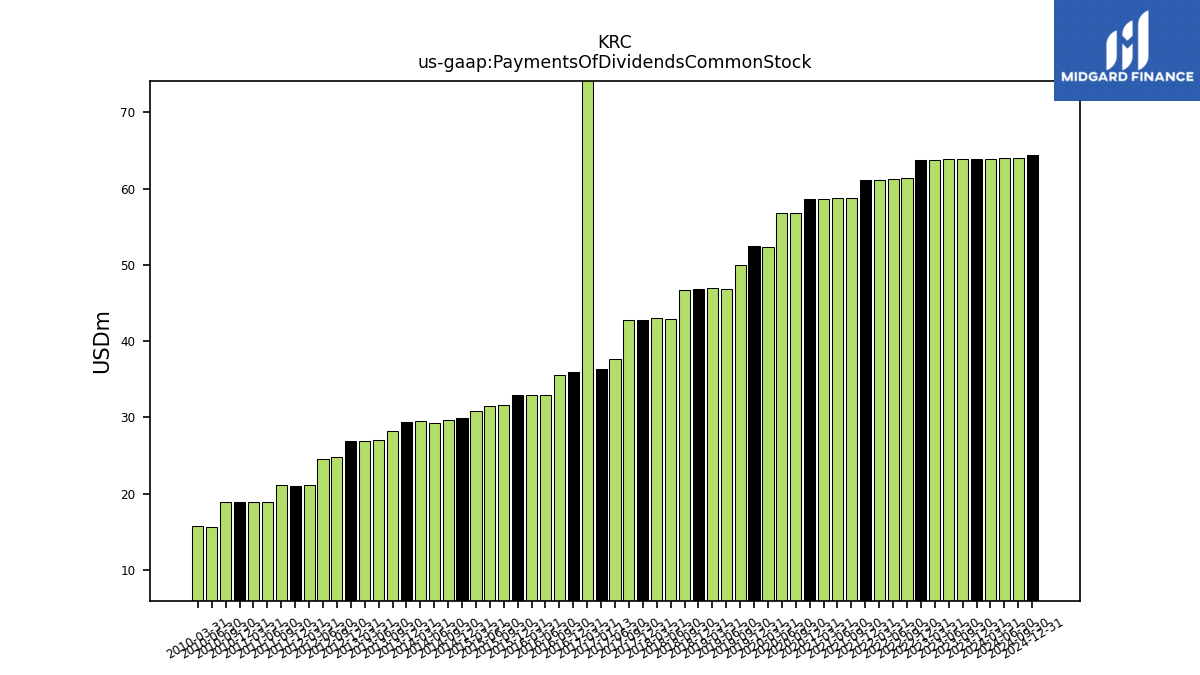
| Payments Of Dividends Common Stock | 63.93 | 63.90 | 63.87 | 63.73 | 63.73 | 61.37 | 61.29 | 61.16 | 61.16 | 58.80 | 58.80 | 58.59 | 58.59 | 56.80 | 56.79 | 52.40 | 52.44 | 49.95 | 46.86 | 47.00 | 46.77 | 46.71 | 42.90 | 43.03 | 42.70 | 42.70 | 37.65 | 217.64 |
| 2023-12-31 | 2023-09-30 | 2023-06-30 | 2023-03-31 | 2022-12-31 | 2022-09-30 | 2022-06-30 | 2022-03-31 | 2021-12-31 | 2021-09-30 | 2021-06-30 | 2021-03-31 | 2020-12-31 | 2020-09-30 | 2020-06-30 | 2020-03-31 | 2019-12-31 | 2019-09-30 | 2019-06-30 | 2019-03-31 | 2018-12-31 | 2018-09-30 | 2018-06-30 | 2018-03-31 | 2017-12-31 | 2017-09-30 | 2017-06-30 | 2017-03-31 | ||
|---|---|---|---|---|---|---|---|---|---|---|---|---|---|---|---|---|---|---|---|---|---|---|---|---|---|---|---|---|---|
| Revenues | 269.02 | 283.59 | 284.28 | 292.80 | 284.34 | 275.96 | 271.18 | 265.50 | 261.08 | 232.33 | 225.98 | 235.65 | 229.33 | 228.31 | 219.42 | 221.33 | 220.24 | 215.53 | 200.49 | 201.20 | 190.84 | 186.56 | 187.07 | 182.82 | 177.56 | 181.53 | 180.60 | 179.31 | |
| Kilroy Realty L. P. | 269.02 | 283.59 | 284.28 | 292.80 | 284.34 | 275.96 | 271.18 | 265.50 | 261.08 | 232.33 | 225.98 | 235.65 | 229.33 | 228.31 | 219.42 | 221.33 | 220.24 | 215.53 | 200.49 | 201.20 | 190.84 | 186.56 | 187.07 | 182.82 | 177.56 | 181.53 | 180.60 | 179.31 | |
| Revenue From Contract With Customer Excluding Assessed Tax | 3.37 | 2.91 | 2.97 | 2.70 | 2.66 | 3.41 | 2.61 | 2.29 | 1.94 | 1.61 | 1.51 | 0.99 | 229.33 | 1.19 | 1.07 | 2.69 | 220.24 | 3.20 | 2.86 | 201.20 | 190.84 | 186.56 | 187.07 | 182.82 | 177.56 | 181.53 | 180.60 | 179.31 | |
| Kilroy Realty L. P. | 3.37 | 2.91 | 2.97 | 2.70 | 2.66 | 3.41 | 2.61 | 2.29 | 1.94 | 1.61 | 1.51 | 0.99 | 1.14 | 1.19 | 1.07 | 2.69 | 3.10 | 3.20 | 2.86 | 1.82 | NA | NA | NA | NA | NA | NA | NA | NA | |
| Revenue From Contract With Customer Including Assessed Tax | 269.02 | 283.59 | 284.28 | 292.80 | 284.34 | 275.96 | 271.18 | 265.50 | 261.08 | 232.33 | 225.98 | 235.65 | 229.33 | 228.31 | 219.42 | 2.69 | 220.24 | 215.53 | 200.49 | 1.82 | 190.84 | 186.56 | 187.07 | 182.82 | 177.56 | 181.53 | 180.60 | 179.31 |

